urban ecosystem services ii - research repository
TRANSCRIPT
Edited by
Urban Ecosystem Services IIToward a Sustainable Future
Alessio Russo and Giuseppe T. CirellaPrinted Edition of the Special Issue Published in Land
www.mdpi.com/journal/land
Urban Ecosystem Services II: Toward aSustainable Future

Urban Ecosystem Services II: Toward aSustainable Future
Editors
Alessio RussoGiuseppe T. Cirella
MDPI • Basel • Beijing • Wuhan • Barcelona • Belgrade • Manchester • Tokyo • Cluj • Tianjin
Editors
Alessio Russo
School of Arts
University of Gloucestershire
Cheltenham
United Kingdom
Giuseppe T. Cirella
Faculty of Economics
University of Gdansk
Sopot
Poland
Editorial Office
MDPI
St. Alban-Anlage 66
4052 Basel, Switzerland
This is a reprint of articles from the Special Issue published online in the open access journal
Land (ISSN 2073-445X) (available at: www.mdpi.com/journal/land/special issues/2ndEd Urban
Ecosystem Services).
For citation purposes, cite each article independently as indicated on the article page online and as
indicated below:
LastName, A.A.; LastName, B.B.; LastName, C.C. Article Title. Journal Name Year, Volume Number,
Page Range.
ISBN 978-3-0365-1838-1 (Hbk)
ISBN 978-3-0365-1837-4 (PDF)
© 2021 by the authors. Articles in this book are Open Access and distributed under the Creative
Commons Attribution (CC BY) license, which allows users to download, copy and build upon
published articles, as long as the author and publisher are properly credited, which ensures maximum
dissemination and a wider impact of our publications.
The book as a whole is distributed by MDPI under the terms and conditions of the Creative Commons
license CC BY-NC-ND.
Contents
About the Editors . . . . . . . . . . . . . . . . . . . . . . . . . . . . . . . . . . . . . . . . . . . . . . vii
Preface to ”Urban Ecosystem Services II: Toward a Sustainable Future” . . . . . . . . . . . . . ix
Alessio Russo and Giuseppe T. CirellaUrban Ecosystem Services: Current Knowledge, Gaps, and Future ResearchReprinted from: Land 2021, 10, 811, doi:10.3390/land10080811 . . . . . . . . . . . . . . . . . . . . 1
Karen T. Lourdes, Chris N. Gibbins, Perrine Hamel, Ruzana Sanusi, Badrul Azhar and AlexM. LechnerA Review of Urban Ecosystem Services Research in Southeast AsiaReprinted from: Land 2021, 10, 40, doi:10.3390/land10010040 . . . . . . . . . . . . . . . . . . . . . 5
Alexandra Pineda-Guerrero, Francisco J. Escobedo and Fernando CarriazoGovernance, Nature’s Contributions to People, and Investing in Conservation Influence theValuation of Urban Green AreasReprinted from: Land 2020, 10, 14, doi:10.3390/land10010014 . . . . . . . . . . . . . . . . . . . . . 27
Swaroop Patankar, Ravi Jambhekar, Kulbhushansingh Ramesh Suryawanshi and HariniNagendraWhich Traits Influence Bird Survival in the City? A ReviewReprinted from: Land 2021, 10, 92, doi:10.3390/land10020092 . . . . . . . . . . . . . . . . . . . . . 47
Lorena Alves Carvalho Nascimento and Vivek ShandasIntegrating Diverse Perspectives for Managing Neighborhood Trees and Urban EcosystemServices in Portland, OR (US)Reprinted from: Land 2021, 10, 48, doi:10.3390/land10010048 . . . . . . . . . . . . . . . . . . . . . 69
Raghu Dharmapuri Tirumala and Piyush TiwariLand-Based Financing Elements in Infrastructure Policy Formulation: A Case of IndiaReprinted from: Land 2021, 10, 133, doi:10.3390/land10020133 . . . . . . . . . . . . . . . . . . . . 91
Harald Zepp and Luis InostrozaWho Pays the Bill? Assessing Ecosystem Services Losses in an Urban Planning ContextReprinted from: Land 2021, 10, 369, doi:10.3390/land10040369 . . . . . . . . . . . . . . . . . . . . 109
Jan Łukaszkiewicz, Beata Fortuna-Antoszkiewicz, Łukasz Oleszczuk and Jitka FialovaThe Potential of Tram Networks in the Revitalization of the Warsaw LandscapeReprinted from: Land 2021, 10, 375, doi:10.3390/land10040375 . . . . . . . . . . . . . . . . . . . . 127
Xuege Wang, Fengqin Yan, Yinwei Zeng, Ming Chen, Bin He, Lu Kang and Fenzhen SuEcosystem Services Changes on Farmland in Response to Urbanization in theGuangdong–Hong Kong–Macao Greater Bay Area of ChinaReprinted from: Land 2021, 10, 501, doi:10.3390/land10050501 . . . . . . . . . . . . . . . . . . . . 151
Xin Cheng, Sylvie Van Damme and Pieter UyttenhoveApplying the Evaluation of Cultural Ecosystem Services in Landscape Architecture Design:Challenges and OpportunitiesReprinted from: Land 2021, 10, 665, doi:10.3390/land10070665 . . . . . . . . . . . . . . . . . . . . 167
v

Alessio Russo, Wing Tung Chan and Giuseppe T. CirellaEstimating Air Pollution Removal and Monetary Value for Urban Green InfrastructureStrategies Using Web-Based ApplicationsReprinted from: Land 2021, 10, 788, doi:10.3390/land10080788 . . . . . . . . . . . . . . . . . . . . 181
vi
About the Editors
Alessio Russo
Alessio Russo is a senior lecturer and academic course leader for the Master of Landscape
Architecture at the University of Gloucestershire, Cheltenham, United Kingdom. Before joining the
University of Gloucestershire, he worked in Russia as an associate professor at RUDN University in
Moscow and as a professor and head of the Laboratory of Urban and Landscape Design at Far Eastern
Federal University in Vladivostok. He holds a Bachelor in Science in Plant Production from the
University of Naples, a Post-Graduate Specialization in Healing Garden Design from the University
of Milan, and a Master in Science in Landscape Design and Planning from the University of Pisa. He
received his Ph.D. in Urban Forestry from the University of Bologna. Outside of academia, Dr. Russo
has worked as a landscape architect in the United Kingdom, Italy, and the United Arab Emirates,
dealing with sustainable design and planning.
Giuseppe T. Cirella
Giuseppe T. Cirella is a professor of Human Geography at the Faculty of Economics, University
of Gdansk, Sopot, Poland. He received his Ph.D. in Environmental Engineering (specialization:
Sustainability) from Griffith University, Australia. He is the founder of the Polo Centre of
Sustainability and is the director and head of research. He has acted as a principal investigator and
coordinator in a number of international projects and is a reviewer and member of the editorial board
of several reputed international journals on sustainability and the environment. He has extensive
interdisciplinary and cross-cultural experience in socioeconomics as well as expertise in landscape
architecture, urban planning, and societal development.
vii

Preface to ”Urban Ecosystem Services II: Toward aSustainable Future”
Twenty years have passed since the Millennium Ecosystem Assessment was launched in 2001
and published in 2005, yet ecosystem services in the urban environment are more essential than ever
for the long sustainability of cities. The long-term sustainability of cities is also dependent on how
we plan cities and how ecosystem services become an integral part of spatial planning and design.
Twenty years have also passed since the death of Professor Ian McHarg who taught us that we need
to design with nature and that it is important for politicians, designers, and all people involved in the
city-design process to understand its role as well as any associated ecosystem services. In this regard,
the COVID-19 pandemic has presented an important integrative view in which urban economies,
urban social structures, and the urban-to-environment outlook have all been shocked. This shock
effect has produced novel research reflected in this book. The two editors strongly believe in the
sustainability of future cities and decided to publish a second book on urban ecosystem services
with the focus on building a sustainable future. Specifically, this second book provides updates on
the scientific literature by collecting eleven peer-reviewed articles published in the scientific journal
Land.
Alessio Russo, Giuseppe T. Cirella
Editors
ix

land
Editorial
Urban Ecosystem Services: Current Knowledge, Gaps, andFuture Research
Alessio Russo 1,* and Giuseppe T. Cirella 2
�����������������
Citation: Russo, A.; Cirella, G.T.
Urban Ecosystem Services: Current
Knowledge, Gaps, and Future
Research. Land 2021, 10, 811. https://
doi.org/10.3390/land10080811
Received: 28 July 2021
Accepted: 30 July 2021
Published: 1 August 2021
Publisher’s Note: MDPI stays neutral
with regard to jurisdictional claims in
published maps and institutional affil-
iations.
Copyright: © 2021 by the authors.
Licensee MDPI, Basel, Switzerland.
This article is an open access article
distributed under the terms and
conditions of the Creative Commons
Attribution (CC BY) license (https://
creativecommons.org/licenses/by/
4.0/).
1 School of Arts, Francis Close Hall Campus, University of Gloucestershire, Swindon Road,Cheltenham GL50 4AZ, UK
2 Faculty of Economics, University of Gdansk, 81-824 Sopot, Poland; [email protected]* Correspondence: [email protected]; Tel.: +44-(0)12-4271-4557
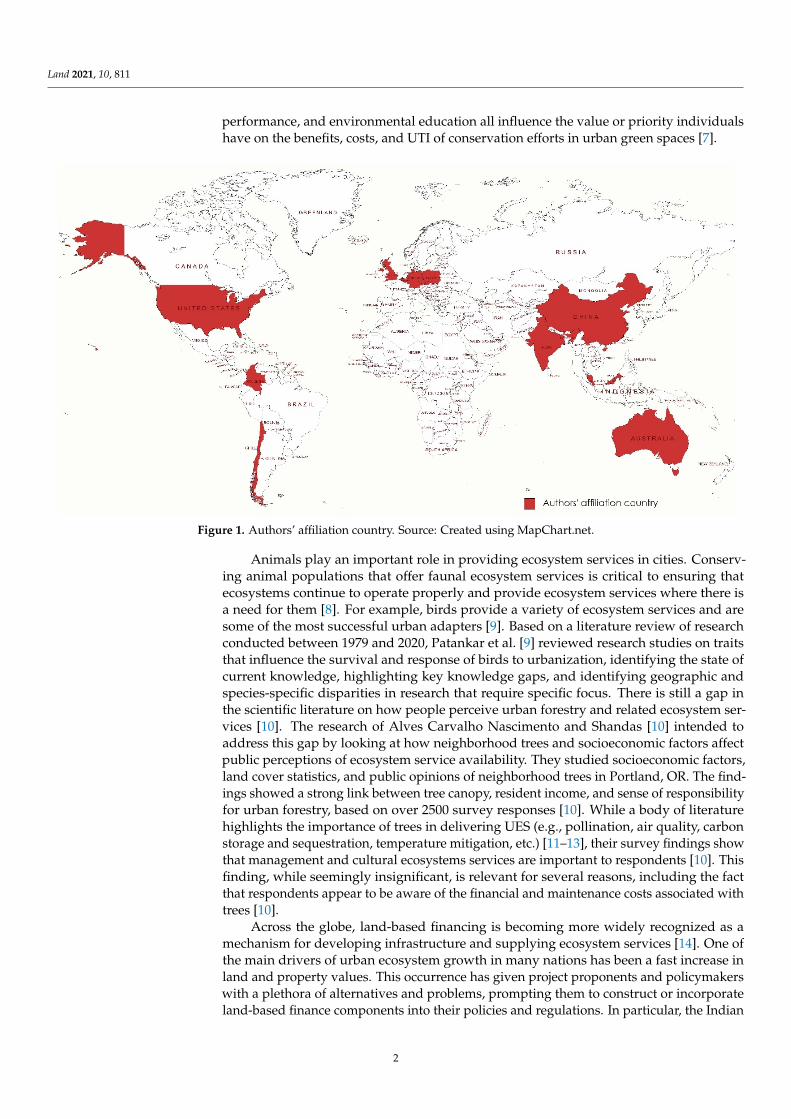
The term ecosystem services was coined to describe the societal benefit that naturalecosystems provide, as well as to raise awareness about biodiversity and ecosystem conser-vation [1]. Nowadays, with most people living in cities (i.e., over 50%) and the challengesthat come with it, such as the urban heat island effect, food security, floods, pollution, andso on, the concept of ecosystem services is linked to the built environment’s sustainabilityand livability [2,3]. Cities have long been one of the least researched ecosystems in thisregard [4]. Consequently, there is a growing interest in urban ecology as well as in urbanecosystem services (UES) that present solutions to the above issues within the environmentof the cityscape [2,4]. The need to study these “novel” ecosystems can mitigate the effects ofthe growing urban population and rural-to-urban transition. In this context, following thefirst special issue on UES [5], this second special issue aims to update existing knowledgeand identify gaps and potential areas for future research. This second issue, in particular,has 10 peer-reviewed papers authored by scholars from all over the world, spanning fivecontinents (Figure 1).
The structure of this article is to look at the current knowledge-base, point out gaps,and summarize future research findings within the dimension of UES. Lourdes et al. [6]point out that research on UES in the Global South has not been extensively examinedas it has been in the Global North. To address this issue, they conducted a systematicliterature review of UES in Southeast Asia over a two-decade period [6]. Their findings em-phasize the region’s unequal distribution of UES research and highlight common services,scales, and characteristics examined, as well as methodologies used [6]. They identifiedthat while most research analyze regulatory and cultural UES at a landscape scale, fewstudies looked at interconnections between services by evaluating synergies and trade-offs [6]. Their results also suggest the urgent need for multitemporal and scenario-basedresearch on the resilience of UES provision [6]. The researchers concluded that moreresearch is needed to incorporate a variety of monetary and non-monetary valuations,as well as increased stakeholder involvement in UES assessments, so that the valuationof UES can encourage more transparent tradeoff assessments to support sustainable cityplanning [6]. In the Global South, there is also little evidence available on how peopleperceive the benefits and costs of urban green spaces [7]. To fill this gap, Pineda-Guerreroet al. [7] used semi-structured surveys, statistical analyses, and econometrics to investigateuser perceptions of governance and the benefits and costs, i.e., ecosystem services andecosystem disservices, provided by neotropical green areas in Bogota, Colombia, as wellas their willingness to invest in their conservation. Despite the sub-severe watershed’sstormwater runoff concerns, their modeling reveals that air quality and biodiversity arevery important advantages while water control is not [7]. In terms of costs, inadequatelevels of maintenance and infrastructure in the investigated green areas were linked to asense of insecurity due to crime. The community’s unwillingness to invest (UTI) in greenspace protection was impacted by their perceptions of government openness, corruption,and performance [7]. The findings indicate that socioeconomic backgrounds, government
1
Land 2021, 10, 811
performance, and environmental education all influence the value or priority individualshave on the benefits, costs, and UTI of conservation efforts in urban green spaces [7].
Land 2021, 10, x. https://doi.org/10.3390/xxxxx www.mdpi.com/journal/land
Editorial
Urban Ecosystem Services: Current Knowledge, Gaps, and
Future Research
Alessio Russo 1,* and Giuseppe T. Cirella 2
1 School of Arts, Francis Close Hall Campus, University of Gloucestershire, Swindon Road,
Cheltenham GL50 4AZ, UK 2 Faculty of Economics, University of Gdansk, 81‐824 Sopot, Poland; [email protected]
* Correspondence: [email protected]; Tel.: +44‐(0)12‐4271‐4557
The term ecosystem services was coined to describe the societal benefit that natural
ecosystems provide, as well as to raise awareness about biodiversity and ecosystem con‐
servation [1]. Nowadays, with most people living in cities (i.e., over 50%) and the chal‐
lenges that come with it, such as the urban heat island effect, food security, floods, pollu‐
tion, and so on, the concept of ecosystem services is linked to the built environment’s sus‐
tainability and livability [2,3]. Cities have long been one of the least researched ecosystems
in this regard [4]. Consequently, there is a growing interest in urban ecology as well as in
urban ecosystem services (UES) that present solutions to the above issues within the en‐
vironment of the cityscape [2,4]. The need to study these “novel” ecosystems can mitigate
the effects of the growing urban population and rural‐to‐urban transition. In this context,
following the first special issue on UES [5], this second special issue aims to update exist‐
ing knowledge and identify gaps and potential areas for future research. This second is‐
sue, in particular, has 10 peer‐reviewed papers authored by scholars from all over the
world, spanning five continents (Figure 1).
Figure 1. Authors’ affiliation country. Source: Created using MapChart.net.
The structure of this article is to look at the current knowledge‐base, point out gaps,
and summarize future research findings within the dimension of UES. Lourdes et al. [6]
point out that research on UES in the Global South has not been extensively examined as
it has been in the Global North. To address this issue, they conducted a systematic litera‐
ture review of UES in Southeast Asia over a two‐decade period [6]. Their findings empha‐
size the region’s unequal distribution of UES research and highlight common services,
scales, and characteristics examined, as well as methodologies used [6]. They identified
Citation: Russo, A.; Cirella, G.T.
Urban Ecosystem Services: Current
Knowledge, Gaps, and Future
Research. Land 2021, 10, x.
https://doi.org/10.3390/xxxxx
Academic Editor: Andrew Milling‐
ton
Received: 28 July 2021
Accepted: 30 July 2021
Published: 1 August 2021
Publisher’s Note: MDPI stays neu‐
tral with regard to jurisdictional
claims in published maps and institu‐
tional affiliations.
Copyright: © 2021 by the authors.
Submitted for possible open access
publication under the terms and con‐
ditions of the Creative Commons At‐
tribution (CC BY) license (http://crea‐
tivecommons.org/licenses/by/4.0/).
Figure 1. Authors’ affiliation country. Source: Created using MapChart.net.
Animals play an important role in providing ecosystem services in cities. Conserv-ing animal populations that offer faunal ecosystem services is critical to ensuring thatecosystems continue to operate properly and provide ecosystem services where there isa need for them [8]. For example, birds provide a variety of ecosystem services and aresome of the most successful urban adapters [9]. Based on a literature review of researchconducted between 1979 and 2020, Patankar et al. [9] reviewed research studies on traitsthat influence the survival and response of birds to urbanization, identifying the state ofcurrent knowledge, highlighting key knowledge gaps, and identifying geographic andspecies-specific disparities in research that require specific focus. There is still a gap inthe scientific literature on how people perceive urban forestry and related ecosystem ser-vices [10]. The research of Alves Carvalho Nascimento and Shandas [10] intended toaddress this gap by looking at how neighborhood trees and socioeconomic factors affectpublic perceptions of ecosystem service availability. They studied socioeconomic factors,land cover statistics, and public opinions of neighborhood trees in Portland, OR. The find-ings showed a strong link between tree canopy, resident income, and sense of responsibilityfor urban forestry, based on over 2500 survey responses [10]. While a body of literaturehighlights the importance of trees in delivering UES (e.g., pollination, air quality, carbonstorage and sequestration, temperature mitigation, etc.) [11–13], their survey findings showthat management and cultural ecosystems services are important to respondents [10]. Thisfinding, while seemingly insignificant, is relevant for several reasons, including the factthat respondents appear to be aware of the financial and maintenance costs associated withtrees [10].
Across the globe, land-based financing is becoming more widely recognized as amechanism for developing infrastructure and supplying ecosystem services [14]. One ofthe main drivers of urban ecosystem growth in many nations has been a fast increase inland and property values. This occurrence has given project proponents and policymakerswith a plethora of alternatives and problems, prompting them to construct or incorporateland-based finance components into their policies and regulations. In particular, the Indian
2
Land 2021, 10, 811
government and state governments have attempted to monetize land through a varietyof methods in order to improve the financial sustainability of infrastructure and areadevelopment projects. In terms of land monetization approaches, Tirumala and Tiwari [14]examined Indian central and state infrastructure policies and relating acts. Key factors ofa successful strategy that captures a rise in land values are highlighted and reported onin their study [14]. Zepp and Inostroza [15] created an ad-hoc assessment to evaluate atypical environmental compensation technique using ecosystem services with an actualplanning and development scenario involving a planned route to a restructured formerindustrial site in Bochum, Germany. The researchers used both techniques to assess theimpact of the proposed construction choices [15]. In a subsequent phase, they chosethe alternative with the lowest effect and calculated the ecosystem service losses fromthe compensatory measures [15]. The findings demonstrate that an ecosystem servicesevaluation offers a sound foundation for selecting development alternatives, identifyingcompensation areas, and estimating compensation amounts, with the added advantageof enhancing the environmental quality of the impacted areas [15]. When utilizing Zeppand Inostroza’s method, there are two main limitations to consider. The first limitationis that they utilized a broad outline of the proposed roadways. In a more comprehensiveanalysis, the exact demarcation as described in engineering drawings should be used [15].The second limitation is that they did not examine the area compensated in terms of urbanstructural subtypes in great depth. In general, adding nature-based solutions to existingurban settings may always enhance the provision of ecosystem services [15]. However,depending on the morphology of the city, a more precise estimate is required [15].
Greening tram lanes in cities appear to be an important strategy for the developmentof green corridors as well as enhancing UES [16]. Łukaszkiewicz et al. [16] demonstratedhow to revitalize the Warsaw cityscape by converting existing tram lines where viable anddeveloping new ones from a “green perspective.” Green tram lanes reduce the noise levelduring tram operation, improve the aesthetic experience of city streets, and, when skillfully-applied, allow the sound level from traffic to be reduced by 10.0 to 15.0 dB [16]. Theirresearch exemplifies future UES-based thinking and moves the bar on how infrastructure,design, and planning come together in a 21st century city. Expanding on this unity-concept,Wang et al. [17] used multiperiod datasets from the Land Use and Land Cover of Chinadatabases to study farmland loss owing to urbanization in China’s Guangdong–HongKong–Macao Greater Bay Area from 1980 to 2018. Then, using valuation methodologies,they produced agricultural ecosystem service values (ESVs) to quantify the ecosystemservice changes induced by urbanization in the research region [17]. The findings revealedthat over the last 38 years, urbanization has resulted in a total area of farmland loss of3711.3 km2, resulting in a direct decrease in total ESVs of 5036.7 million yuan [17]. Asense of urbanization urgency pinpoints the need for better UES knowledge and howthe cityscape is growing and changing. Due to this urban upsurge, landscape architectsare under increasing strain and require practical knowledge, skills, and methodologies tosupport their designs [18]. Cultural ecosystem services (CES) have been linked to landscapearchitecture research, and the findings of CES assessments have the potential to helplandscape architecture practice [18]. However, there have been few attempts to investigateCES in landscape architecture research in a systematic manner [18]. Furthermore, how CESassessments are carried out in in landscape architecture studies are rarely investigated.The goal of Cheng et al.’s [18] study points out some of these challenges and recommendsemploying CES assessments in landscape architecture practice, with an emphasis onlandscape architecture design [18]. In the last paper, Russo et al. [19] used Bristol CityCentre as an example to illustrate two free user-friendly web resources (i.e., i-Tree Canopyand the Office for National Statistics). They showed that both tools are simple to use andeffectively convey ecosystem services and monetary values. Their research has updatedthe literature on the evaluation of green infrastructure tools in the United Kingdom, as wellas identified topics for further research. As such, important UES gains have been made inthe past year in which researchers have had to ponder and work within the new COVID-19
3
Land 2021, 10, 811
era. These abrupt changes have resulted in some UES rethinking, as demonstrated in thisarticle, and from the new work environments city planners and urbanists have faced.
Author Contributions: Visualization and writing—original draft preparation, A.R.; writing—reviewand editing, A.R. and G.T.C. Both authors have read and agreed to the published version of the manuscript.
Funding: This research received no external funding.
Institutional Review Board Statement: Not applicable.
Informed Consent Statement: Not applicable.
Data Availability Statement: Not applicable.
Acknowledgments: We are grateful to the MDPI Land team of academic editors and reviewers forassisting with the Special Issue’s academic excellence. MapChart.net was used to create the authors’affiliation country.
Conflicts of Interest: The authors declare no conflict of interest.
References1. Birkhofer, K.; Diehl, E.; Andersson, J.; Ekroos, J.; Früh-Müller, A.; Machnikowski, F.; Mader, V.L.; Nilsson, L.; Sasaki, K.; Rundlöf,
M.; et al. Ecosystem services—Current challenges and opportunities for ecological research. Front. Ecol. Evol. 2015, 2, 87.[CrossRef]
2. Russo, A.; Cirella, G.T. Urban Sustainability: Integrating Ecology in City Design and Planning. In Sustainable Human—NatureRelations: Environmental Scholarship, Economic Evaluation, Urban Strategies; Cirella, G.T., Ed.; Springer Singapore: Singapore, 2020;pp. 187–204. ISBN 978-981-15-3049-4.
3. Russo, A.; Cirella, G.T. Edible urbanism 5.0. Palgrave Commun. 2019, 5, 1–9. [CrossRef]4. Stott, I.; Soga, M.; Inger, R.; Gaston, K.J. Land sparing is crucial for urban ecosystem services. Front. Ecol. Environ. 2015, 13,
387–393. [CrossRef]5. Russo, A.; Cirella, G.T. Urban ecosystem services: New findings for landscape architects, urban planners, and policymakers. Land
2021, 10, 88. [CrossRef]6. Lourdes, K.; Gibbins, C.; Hamel, P.; Sanusi, R.; Azhar, B.; Lechner, A. A review of urban ecosystem services research in southeast
asia. Land 2021, 10, 40. [CrossRef]7. Pineda-Guerrero, A.; Escobedo, F.J.; Carriazo, F. Governance, nature’s contributions to people, and investing in conservation
influence the valuation of urban green areas. Land 2020, 10, 14. [CrossRef]8. Gutierrez-Arellano, C.; Mulligan, M. A review of regulation ecosystem services and disservices from faunal populations and
potential impacts of agriculturalisation on their provision, globally. Nat. Conserv. 2018, 30, 1–39. [CrossRef]9. Patankar, S.; Jambhekar, R.; Suryawanshi, K.R.; Nagendra, H. Which traits influence bird survival in the city? A review. Land
2021, 10, 92. [CrossRef]10. Alves Carvalho Nascimento, L.; Shandas, V. Integrating diverse perspectives for managing neighborhood trees and urban
ecosystem services in portland, OR (US). Land 2021, 10, 48. [CrossRef]11. Roy, S.; Byrne, J.; Pickering, C. A systematic quantitative review of urban tree benefits, costs, and assessment methods across
cities in different climatic zones. Urban. For. Urban. Green. 2012, 11, 351–363. [CrossRef]12. Speak, A.; Escobedo, F.J.; Russo, A.; Zerbe, S. Total urban tree carbon storage and waste management emissions estimated using a
combination of LiDAR, field measurements and an end-of-life wood approach. J. Clean. Prod. 2020, 256, 120420. [CrossRef]13. Salmond, J.A.; Tadaki, M.; Vardoulakis, S.; Arbuthnott, K.; Coutts, A.; Demuzere, M.; Dirks, K.N.; Heaviside, C.; Lim, S.;
Macintyre, H.; et al. Health and climate related ecosystem services provided by street trees in the urban environment. Environ.Health 2016, 15, S36. [CrossRef] [PubMed]
14. Tirumala, R.D.; Tiwari, P. Land-based financing elements in infrastructure policy formulation: A case of india. Land 2021, 10, 133.[CrossRef]
15. Zepp, H.; Inostroza, L. Who pays the bill? Assessing ecosystem services losses in an urban planning context. Land 2021, 10, 369.[CrossRef]
16. Łukaszkiewicz, J.; Fortuna-Antoszkiewicz, B.; Oleszczuk, Ł.; Fialová, J. The potential of tram networks in the revitalization of thewarsaw landscape. Land 2021, 10, 375. [CrossRef]
17. Wang, X.; Yan, F.; Zeng, Y.; Chen, M.; He, B.; Kang, L.; Su, F. Ecosystem Services changes on farmland in response to urbanizationin the Guangdong–Hong Kong–Macao greater bay area of china. Land 2021, 10, 501. [CrossRef]
18. Cheng, X.; Van Damme, S.; Uyttenhove, P. Applying the evaluation of cultural ecosystem services in landscape architecturedesign: Challenges and opportunities. Land 2021, 10, 665. [CrossRef]
19. Russo, A.; Chan, W.T.; Cirella, G.T. Estimating air pollution removal and monetary value for urban green infrastructure strategiesusing web-based applications. Land 2021, 10, 788. [CrossRef]
4
land
Review
A Review of Urban Ecosystem Services Research inSoutheast Asia
Karen T. Lourdes 1 , Chris N. Gibbins 2, Perrine Hamel 3,4 , Ruzana Sanusi 5,6, Badrul Azhar 5
and Alex M. Lechner 1,7,*
�����������������
Citation: Lourdes, K.T.; Gibbins,
C.N.; Hamel, P.; Sanusi, R.; Azhar, B.;
Lechner, A.M. A Review of Urban
Ecosystem Services Research in
Southeast Asia. Land 2021, 10, 40.
https://doi.org/10.3390/land10010040
Received: 10 December 2020
Accepted: 28 December 2020
Published: 5 January 2021
Publisher’s Note: MDPI stays neu-
tral with regard to jurisdictional clai-
ms in published maps and institutio-
nal affiliations.
Copyright: © 2021 by the authors. Li-
censee MDPI, Basel, Switzerland.
This article is an open access article
distributed under the terms and con-
ditions of the Creative Commons At-
tribution (CC BY) license (https://
creativecommons.org/licenses/by/
4.0/).
1 Landscape Ecology and Conservation Lab, School of Environmental and Geographical Sciences,University of Nottingham Malaysia, Semenyih 43500, Malaysia; [email protected]
2 School of Environmental and Geographical Sciences, University of Nottingham Malaysia,Semenyih 43500, Malaysia; [email protected]
3 Asian School of the Environment, Nanyang Technological University, 50 Nanyang Avenue,Singapore 639798, Singapore; [email protected]
4 Natural Capital Project, Woods Institute for the Environment, Stanford University, 371 Serra Mall,Stanford, CA 94305, USA
5 Department of Forestry Science and Biodiversity, Faculty of Forestry and Environment, Universiti PutraMalaysia, Serdang 43400, Malaysia; [email protected] (R.S.); [email protected] (B.A.)
6 Laboratory of Sustainable Resources Management (BIOREM), Institute of Tropical Forestry and ForestProducts, Universiti Putra Malaysia, Serdang 43400, Malaysia
7 Lincoln Centre for Water and Planetary Health, School of Geography, University of Lincoln,Lincoln LN6 7TS, UK
* Correspondence: [email protected]
Abstract: Urban blue-green spaces hold immense potential for supporting the sustainability andliveability of cities through the provision of urban ecosystem services (UES). However, research onUES in the Global South has not been reviewed as systematically as in the Global North. In SoutheastAsia, the nature and extent of the biases, imbalances and gaps in UES research are unclear. We addressthis issue by conducting a systematic review of UES research in Southeast Asia over the last twentyyears. Our findings draw attention to the unequal distribution of UES research within the region,and highlight common services, scales and features studied, as well as methods undertaken in UESresearch. We found that while studies tend to assess regulating and cultural UES at a landscapescale, few studies examined interactions between services by assessing synergies and tradeoffs.Moreover, the bias in research towards megacities in the region may overlook less-developed nations,rural areas, and peri-urban regions and their unique perspectives and preferences towards UESmanagement. We discuss the challenges and considerations for integrating and conducting researchon UES in Southeast Asia based on its unique and diverse socio-cultural characteristics. We concludeour review by highlighting aspects of UES research that need more attention in order to support landuse planning and decision-making in Southeast Asia.
Keywords: natural capital; blue-green infrastructure; urban environmental challenges; Global South;tropical cities
1. Introduction
The global urban population has grown rapidly in the last few decades, with over70% of the population in the Global North now residing in urban areas [1]. Similar trendsare evident in the Global South and while developed regions may be better equipped tomanage urban transformations [2], cities in developing regions such as Southeast Asiaface increasing environmental pressures. In 2018, an estimated 320 million people livedin the urban areas of Southeast Asia (49% of the region’s total population), and thisfigure is expected to increase to 66% of the total population by 2050 [1,3]. This rapidurbanisation has been accompanied by a range of environmental problems, including
5

Land 2021, 10, 40
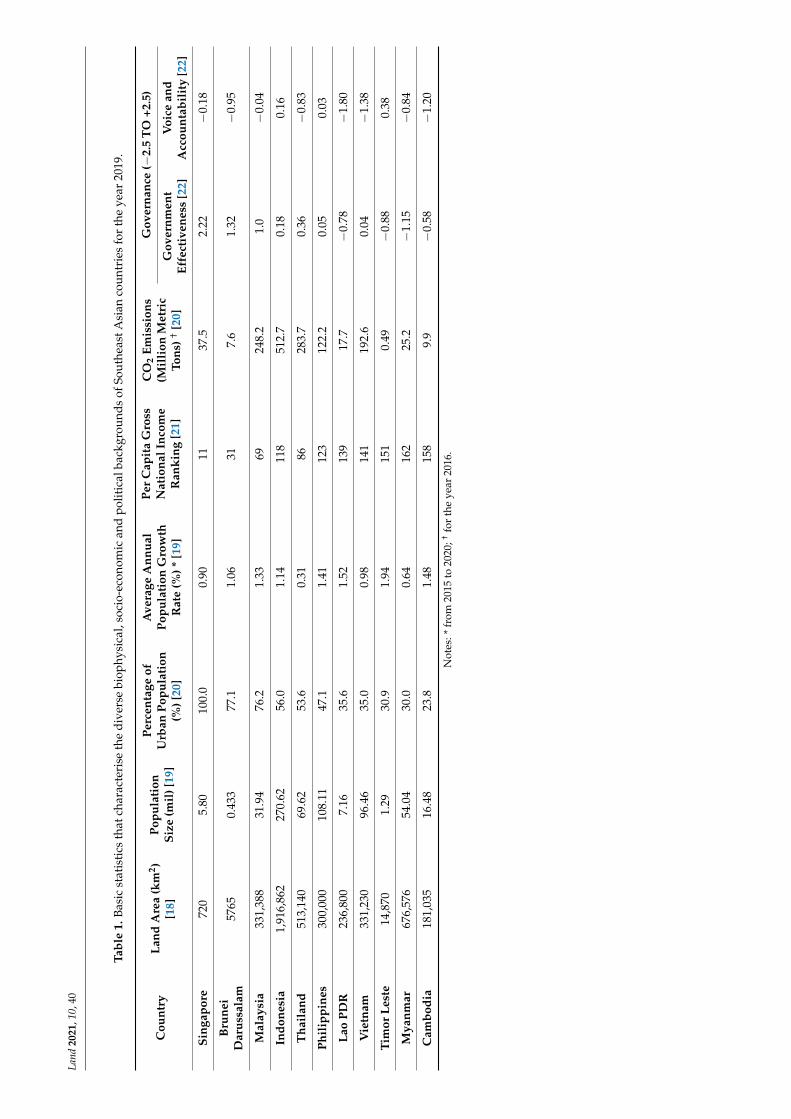
the urban heat island effect, floods, poor air quality and noise pollution, all of whichdirectly impact the health of urban residents [4–11]. These issues are expected to be furtherexacerbated by the general vulnerability of the region to climate change impacts [12–14].Moreover, countries within Southeast Asia have extremely diverse biophysical, cultural,socio-economic and political characteristics (Table 1). Levels of urbanisation range from23% (Cambodia) to 100% (Singapore) and gross national incomes range from the 11th(Singapore) to the 162nd (Myanmar) rank globally. Efforts to mitigate urban environmentalchallenges should take into consideration these characteristics, in so doing provide context-specific solutions [15–17].
6
Land
2021
,10,
40
Tabl
e1.
Basi
cst
atis
tics
that
char
acte
rise
the
dive
rse
biop
hysi
cal,
soci
o-ec
onom
ican
dpo
litic
alba
ckgr
ound
sof
Sout
heas
tAsi
anco
untr
ies
for
the
year
2019
.
Cou
ntry
Land
Are
a(k
m2 )
[18]
Popu
lati
onSi
ze(m
il)[
19]
Perc
enta
geof
Urb
anPo
pula
tion
(%)[
20]
Ave
rage
Ann
ual
Popu
lati
onG
row
thR
ate
(%)*
[19]
Per
Cap
ita
Gro
ssN
atio
nalI
ncom
eR
anki
ng[2
1]
CO
2Em
issi
ons
(Mil
lion
Met
ric
Tons
)†[2
0]
Gov
erna
nce
(−2.
5T
O+2
.5)
Gov
ernm
ent
Effe
ctiv
enes
s[2
2]V
oice
and
Acc
ount
abil
ity
[22]
Sing
apor
e72
05.
8010
0.0
0.90
1137
.52.
22−
0.18
Bru
nei
Dar
ussa
lam
5765
0.43
377
.11.
0631
7.6
1.32
−0.
95
Mal
aysi
a33
1,38
831
.94
76.2
1.33
6924
8.2
1.0
−0.
04
Indo
nesi
a1,
916,
862
270.
6256
.01.
1411
851
2.7
0.18
0.16
Tha
ilan
d51
3,14
069
.62
53.6
0.31
8628
3.7
0.36
−0.
83
Phil
ippi
nes
300,
000
108.
1147
.11.
4112
312
2.2
0.05
0.03
Lao
PDR
236,
800
7.16
35.6
1.52
139
17.7
−0.
78−
1.80
Vie
tnam
331,
230
96.4
635
.00.
9814
119
2.6
0.04
−1.
38
Tim
orLe
ste
14,8
701.
2930
.91.
9415
10.
49−
0.88
0.38
Mya
nmar
676,
576
54.0
430
.00.
6416
225
.2−
1.15
−0.
84
Cam
bodi
a18
1,03
516
.48
23.8
1.48
158
9.9
−0.
58−
1.20
Not
es:*
from
2015
to20
20;†
for
the
year
2016
.
Land 2021, 10, 40
Planning and designing cities to incorporate blue-green spaces is vital for mitigatingsocio-environmental problems affecting health and well-being [23–25]. Urban blue-greenspaces promote greater resilience, sustainability and liveability in cities through the provi-sion of services such as shading and cooling, carbon sequestration, stormwater manage-ment, noise attenuation, habitat for biodiversity and recreational opportunities [26–30].These services, termed ‘urban ecosystem services’ (UES), capture the role of water (blue)(i.e., lakes and wetlands) and vegetation (green) (i.e., parks and urban forests) in or nearthe built environment at different spatial scales (streets, buildings, cities, regions) [31–33].Generated through the functions and processes of blue-green structures, UES can alle-viate the environmental pressures of urbanisation and enhance the wellbeing of urbanresidents [34–39].
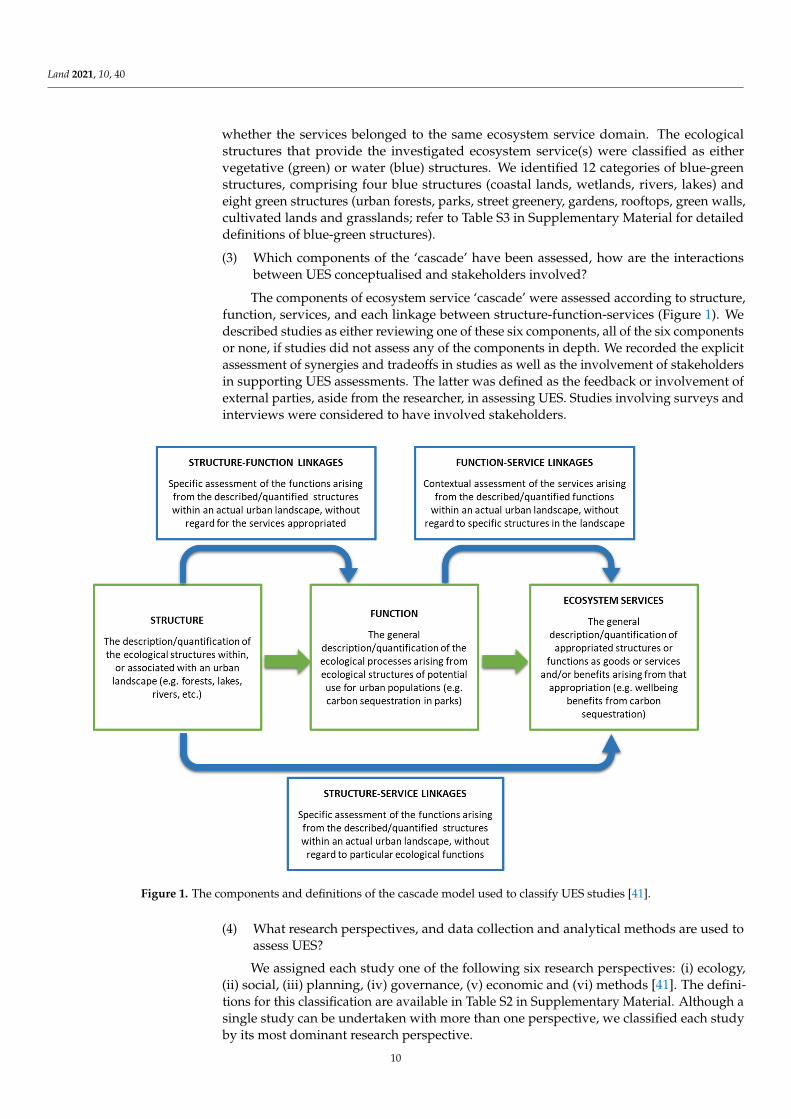
The complex pathways through which UES are delivered can be analysed by therelationships between (i) structures (e.g., mangrove forests), (ii) their biophysical processesand functions (e.g., wave attenuation), and (iii) the derived services that deliver goodsand benefits to humans (e.g., coastal flood protection) [40]. The interactions betweenthese different components can be illustrated through frameworks such as the cascademodel, which acts as a communication tool between experts and local stakeholders tohelp support UES assessments for urban planning [41]. Moreover, incorporating UES intourban planning requires an understanding of the various interactions between services,which are linked to one another as they stem from the same structures and functions of aparticular ecosystem [42,43]. These interactions include synergies and tradeoffs, describedrespectively as positive-positive or positive-negative relationships between two or moreservices [44,45].
Research on UES can also be undertaken from various perspectives, given the in-terdisciplinary nature of the concept. The field has gained prominence for its ability tointegrate natural and social sciences, communicating the dependence of society on ecologi-cal structures [43]. A wide range of methods have been used to characterise UES and assesstheir value to humans. These methods range from biophysical modelling to social surveysapplied at various scales (e.g., landscape scale, site-based scale), with benefits valuedbiophysically (e.g., tonnes of carbon sequestered per year), economically (e.g., $500 perhectare per year) and socio-culturally (e.g., sense of place) [46–48]. UES hold diverse valuesto various communities and the valuation of UES is necessary to understand local demandsor benefits [30,49]. Valuations should be supported by the involvement of stakeholders tofurther deepen the understanding of local UES needs, while promoting the considerationof alternative management options [50,51].
Previous reviews of global UES research by Haase [28] and Luederitz [41] highlightthat research has mostly been undertaken in Europe and North America, with research inAsia dominated by China. Although these reviews have explored the scope and nature ofresearch on a global scale, they lack the finer resolution needed to understand patterns andtraits of research in any one region. Despite the rapid economic growth and urbanisation inSoutheast Asian countries, UES research across this region has not been reviewed. Hence,a systematic review of UES is timely, to assess the nature and extent of research on UES inSoutheast Asia.
This review covers the last 20 years, the period within which the global UES literaturehas burgeoned. Inspired by Luederitz [41], we address four specific research questions:(1) How is UES research distributed across Southeast Asia and at what scale(s) are UESanalysed? (2) Does UES research focus on single or multiple services and what type ofblue-green structure are assessed? (3) Which components of the ‘cascade’ are assessed, andhow are the interactions between UES conceptualised and stakeholders involved? (4) Whatresearch perspectives, and data collection and analytical methods are used to assess UES?Upon reviewing the current state of research in the region, we discuss the challenges andconsiderations for integrating UES research given the unique context of Southeast Asia. Weconclude our review with recommendations for UES research in order to support planningin the region.
8
Land 2021, 10, 40
2. Methods
The search string composed terms that expressed the geographical area of interest(‘Southeast Asia’ and all the countries within the region), the topic of interest (‘ecosystemservice’, its alternative term ‘natural capital’ and, to capture studies that did not explicitlyrefer to these two phrases, we included the keywords ‘human’, ‘environment’ and ‘benefit’)as well as terms that further specified the subtopic of interest (i.e., the urban environment).The search was applied to publication Titles, Abstracts and Keywords in the Scopus andWeb of Science database as shown below:
(TITLE-ABS-KEY ((“Southeast Asia” OR “South East Asia” OR “Indonesia” OR “Viet-nam” OR “Thailand” OR “Malaysia” OR “Singapore” OR “Philippines” OR “Cambodia”OR “Laos” OR “Myanmar” OR “Brunei” OR “Timor-Leste”))) AND (TITLE-ABS-KEY((“ecosystem service*” OR “natural capital” OR (“human” AND “environment” AND“benefit*”)))) AND (TITLE-ABS-KEY (“urban” OR “city” OR “cities”))
The initial search return was refined to include only journal articles, book chapters andconference papers (see Supplementary Material for complete search string). This searchreturned a total of 255 unique articles published in the English language. The abstracts ofthe returned articles were screened manually to include publications within the scope ofthis review based on the following guiding criteria:
• Studies conducted in urban or peri-urban areas in Southeast Asian countries.• Focuses on ecosystem services or benefits provided to an urban population.• Explicitly includes the phrase ‘ecosystem services’ or ‘natural capital’, otherwise
describes the link between the environment and the benefits provided to urban popu-lations.
The final list comprised 149 empirical articles, assessing one or more ecosystemservices in urban Southeast Asia (see Table S1 in Supplementary Material). Studies thatinvestigated multiple urban areas within and outside of Southeast Asia were included inthe review, if at least one study site was located within Southeast Asia. Each article wasclassified to identify information relevant to the four research questions, as described inthe sections which follow. Refer to Table S2 in Supplementary Material for further detailson definitions and classification protocol.
(1) How is UES research distributed across Southeast Asia and at what scale(s) have theybeen analysed?
Following the TEEB classification for ecosystem services [52], we classified the ecosys-tem services studied into four main categories: (i) provisioning, (ii) regulating, (iii) sup-porting and (iv) cultural. These four categories will be hereafter referred to as ‘ecosystemservice domains’. We chose the TEEB classification of ecosystem services over the twoother common approaches to classifying ecosystem services—the Millennium EcosystemAssessment (MEA) and Common International Classification of Ecosystem Services (CI-CES). TEEB is well-known in the context of environmental economics and provides arobust framework for applications in urban planning and policies [53]. Moreover, the TEEBframework emphasises the need for valuing ecosystem services such that the wide rangeof benefits of ecosystems and biodiversity is recognised by decision-makers [54]. We alsorecorded the location (e.g., city and country) of studies and quantified the number of timesecosystem service domains were assessed for each country. To analyse the scale of UESassessment, we recorded the population size and area of study sites, scale of assessment aswell as distinguished between ‘urban’ and/or ‘peri-urban’ areas.
(2) Does UES research focus on single or multiple services and what type of blue-greenstructure have been assessed?
We recorded the ecosystem services assessed as one of the 17 ecosystem servicesdefined by the TEEB framework [52]. As studies can mention more ecosystem servicesthan those that were empirically assessed, we only classified ecosystem services that wereexplicitly investigated. We evaluated the number of services assessed in each study and
9
Land 2021, 10, 40
whether the services belonged to the same ecosystem service domain. The ecologicalstructures that provide the investigated ecosystem service(s) were classified as eithervegetative (green) or water (blue) structures. We identified 12 categories of blue-greenstructures, comprising four blue structures (coastal lands, wetlands, rivers, lakes) andeight green structures (urban forests, parks, street greenery, gardens, rooftops, green walls,cultivated lands and grasslands; refer to Table S3 in Supplementary Material for detaileddefinitions of blue-green structures).
(3) Which components of the ‘cascade’ have been assessed, how are the interactionsbetween UES conceptualised and stakeholders involved?
The components of ecosystem service ‘cascade’ were assessed according to structure,function, services, and each linkage between structure-function-services (Figure 1). Wedescribed studies as either reviewing one of these six components, all of the six componentsor none, if studies did not assess any of the components in depth. We recorded the explicitassessment of synergies and tradeoffs in studies as well as the involvement of stakeholdersin supporting UES assessments. The latter was defined as the feedback or involvement ofexternal parties, aside from the researcher, in assessing UES. Studies involving surveys andinterviews were considered to have involved stakeholders.
Land 2021, 9, x FOR PEER REVIEW 6 of 21
structures that provide the investigated ecosystem service(s) were classified as either veg-etative (green) or water (blue) structures. We identified 12 categories of blue-green struc-tures, comprising four blue structures (coastal lands, wetlands, rivers, lakes) and eight green structures (urban forests, parks, street greenery, gardens, rooftops, green walls, cul-tivated lands and grasslands; refer to Table S3 in Supplementary Material for detailed definitions of blue-green structures).
(3) Which components of the ‘cascade’ have been assessed, how are the interactions be-tween UES conceptualised and stakeholders involved?
The components of ecosystem service ‘cascade’ were assessed according to structure, function, services, and each linkage between structure-function-services (Figure 1). We described studies as either reviewing one of these six components, all of the six compo-nents or none, if studies did not assess any of the components in depth. We recorded the explicit assessment of synergies and tradeoffs in studies as well as the involvement of stakeholders in supporting UES assessments. The latter was defined as the feedback or involvement of external parties, aside from the researcher, in assessing UES. Studies in-volving surveys and interviews were considered to have involved stakeholders.
Figure 1. The components and definitions of the cascade model used to classify UES studies [41].
(4) What research perspectives, and data collection and analytical methods are used to assess UES? We assigned each study one of the following six research perspectives: (i) ecology,
(ii) social, (iii) planning, (iv) governance, (v) economic and (vi) methods [41]. The defini-tions for this classification are available in Table S2 in Supplementary Material. Although a single study can be undertaken with more than one perspective, we classified each study by its most dominant research perspective.
Data collection methods were classified into four categories: (i) ‘field-based empiri-cal’, (ii) ‘biophysical modelling’ which is sub-divided into ‘process/mechanistic model-ling’ and ‘land cover proxy’ (e.g., remote sensing of land cover), and (iii) ‘social surveys’
Figure 1. The components and definitions of the cascade model used to classify UES studies [41].
(4) What research perspectives, and data collection and analytical methods are used toassess UES?
We assigned each study one of the following six research perspectives: (i) ecology,(ii) social, (iii) planning, (iv) governance, (v) economic and (vi) methods [41]. The defini-tions for this classification are available in Table S2 in Supplementary Material. Although asingle study can be undertaken with more than one perspective, we classified each studyby its most dominant research perspective.
10
Land 2021, 10, 40
Data collection methods were classified into four categories: (i) ‘field-based empirical’,(ii) ‘biophysical modelling’ which is sub-divided into ‘process/mechanistic modelling’ and‘land cover proxy’ (e.g., remote sensing of land cover), and (iii) ‘social surveys’ and (iv)case studies. We also recorded the type of data collected (i.e., ‘quantitative’, ‘qualitative’, or‘both’) and the temporal focus of the study. Studies were also reviewed for the valuation ofUES and where valuations were conducted, we distinguished between ‘monetary valuation’(i.e., economic) and/or ‘non-monetary valuation’ (i.e., social or biophysical).
3. Results3.1. Distribution and Scale of UES Assessment across Southeast Asia
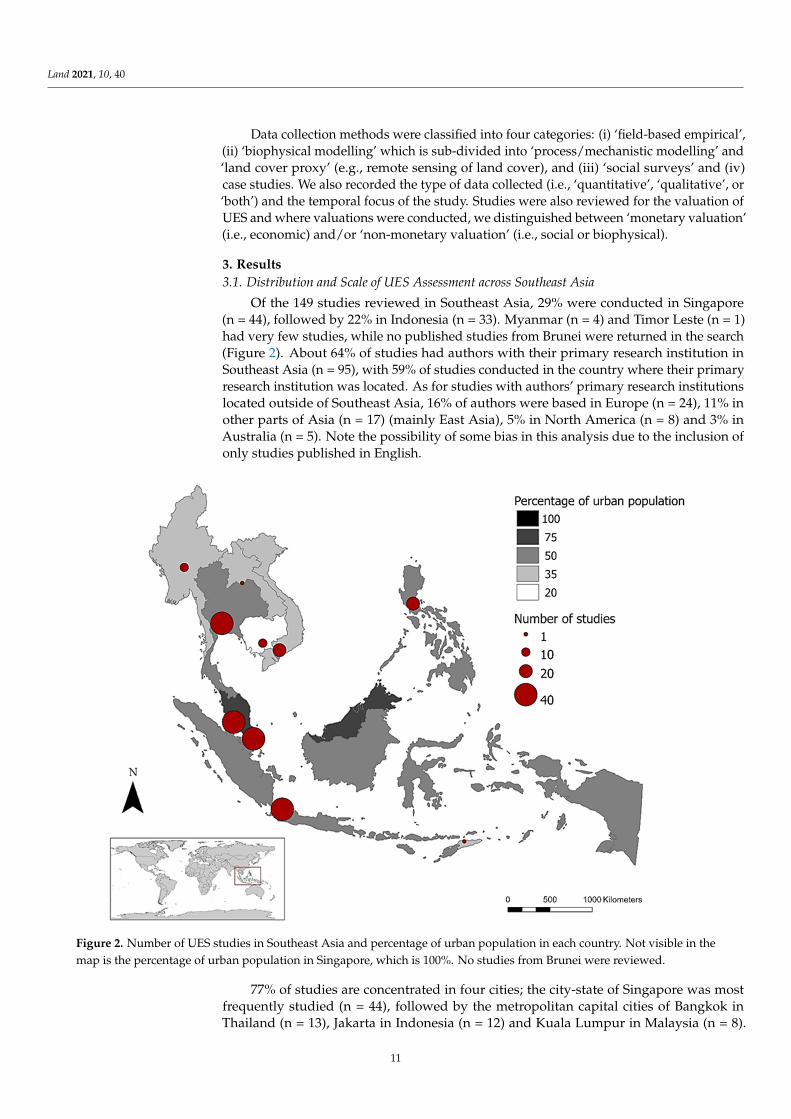
Of the 149 studies reviewed in Southeast Asia, 29% were conducted in Singapore(n = 44), followed by 22% in Indonesia (n = 33). Myanmar (n = 4) and Timor Leste (n = 1)had very few studies, while no published studies from Brunei were returned in the search(Figure 2). About 64% of studies had authors with their primary research institution inSoutheast Asia (n = 95), with 59% of studies conducted in the country where their primaryresearch institution was located. As for studies with authors’ primary research institutionslocated outside of Southeast Asia, 16% of authors were based in Europe (n = 24), 11% inother parts of Asia (n = 17) (mainly East Asia), 5% in North America (n = 8) and 3% inAustralia (n = 5). Note the possibility of some bias in this analysis due to the inclusion ofonly studies published in English.
Land 2021, 9, x FOR PEER REVIEW 7 of 21
and (iv) case studies. We also recorded the type of data collected (i.e., ‘quantitative’, ‘qual-itative’, or ‘both’) and the temporal focus of the study. Studies were also reviewed for the valuation of UES and where valuations were conducted, we distinguished between ‘mon-etary valuation’ (i.e., economic) and/or ‘non-monetary valuation’ (i.e., social or biophysi-cal).
3. Results 3.1. Distribution and Scale of UES Assessment across Southeast Asia
Of the 149 studies reviewed in Southeast Asia, 29% were conducted in Singapore (n = 44), followed by 22% in Indonesia (n = 33). Myanmar (n = 4) and Timor Leste (n = 1) had very few studies, while no published studies from Brunei were returned in the search (Figure 2). About 64% of studies had authors with their primary research institution in Southeast Asia (n = 95), with 59% of studies conducted in the country where their primary research institution was located. As for studies with authors’ primary research institutions located outside of Southeast Asia, 16% of authors were based in Europe (n = 24), 11% in other parts of Asia (n = 17) (mainly East Asia), 5% in North America (n = 8) and 3% in Australia (n = 5). Note the possibility of some bias in this analysis due to the inclusion of only studies published in English.
Figure 2. Number of UES studies in Southeast Asia and percentage of urban population in each country. Not visible in the map is the percentage of urban population in Singapore, which is 100%. No studies from Brunei were reviewed.
77% of studies are concentrated in four cities; the city-state of Singapore was most frequently studied (n = 44), followed by the metropolitan capital cities of Bangkok in Thai-land (n = 13), Jakarta in Indonesia (n = 12) and Kuala Lumpur in Malaysia (n = 8). In terms of the type of urban area assessed, 76% of studies were conducted in fully urban areas (n = 113), 15% in peri-urban areas (n = 23) and 8% of studies spanned both urban and peri-urban areas (n = 13). Around 43% of studies were conducted at a ‘single-city scale’ (n = 64), followed by 32% at the ‘sites within cities’ scale (n = 48) (Figure 3). Only 17% of studies
Figure 2. Number of UES studies in Southeast Asia and percentage of urban population in each country. Not visible in themap is the percentage of urban population in Singapore, which is 100%. No studies from Brunei were reviewed.
77% of studies are concentrated in four cities; the city-state of Singapore was mostfrequently studied (n = 44), followed by the metropolitan capital cities of Bangkok inThailand (n = 13), Jakarta in Indonesia (n = 12) and Kuala Lumpur in Malaysia (n = 8).
11
Land 2021, 10, 40
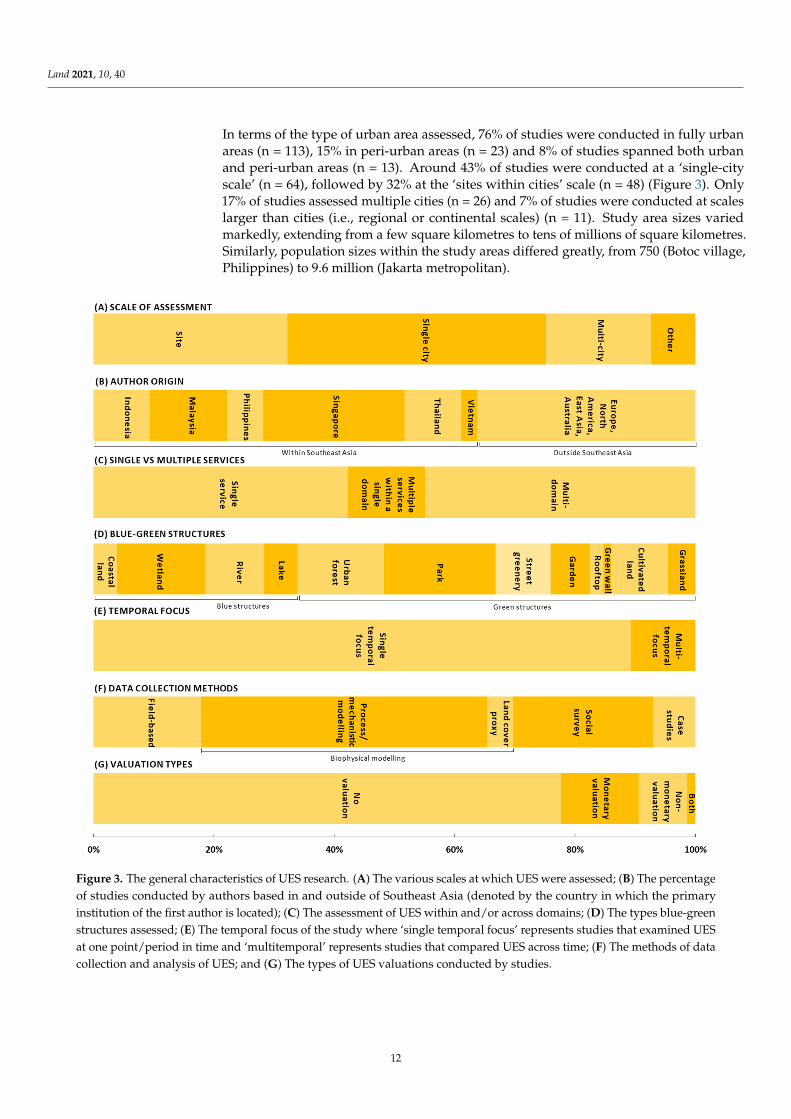
In terms of the type of urban area assessed, 76% of studies were conducted in fully urbanareas (n = 113), 15% in peri-urban areas (n = 23) and 8% of studies spanned both urbanand peri-urban areas (n = 13). Around 43% of studies were conducted at a ‘single-cityscale’ (n = 64), followed by 32% at the ‘sites within cities’ scale (n = 48) (Figure 3). Only17% of studies assessed multiple cities (n = 26) and 7% of studies were conducted at scaleslarger than cities (i.e., regional or continental scales) (n = 11). Study area sizes variedmarkedly, extending from a few square kilometres to tens of millions of square kilometres.Similarly, population sizes within the study areas differed greatly, from 750 (Botoc village,Philippines) to 9.6 million (Jakarta metropolitan).
Land 2021, 9, x FOR PEER REVIEW 8 of 21
assessed multiple cities (n = 26) and 7% of studies were conducted at scales larger than cities (i.e., regional or continental scales) (n = 11). Study area sizes varied markedly, ex-tending from a few square kilometres to tens of millions of square kilometres. Similarly, population sizes within the study areas differed greatly, from 750 (Botoc village, Philip-pines) to 9.6 million (Jakarta metropolitan).
Figure 3. The general characteristics of UES research. (A) The various scales at which UES were assessed; (B) The percent-age of studies conducted by authors based in and outside of Southeast Asia (denoted by the country in which the primary institution of the first author is located); (C) The assessment of UES within and/or across domains; (D) The types blue-green structures assessed; (E) The temporal focus of the study where ‘single temporal focus’ represents studies that exam-ined UES at one point/period in time and ‘multitemporal’ represents studies that compared UES across time; (F) The methods of data collection and analysis of UES; and (G) The types of UES valuations conducted by studies.
3.2. Services and Blue-Green Structures Assessed Of the four domains, regulating (36%) and cultural (26%) services were most as-
sessed. Most countries had studies encompassing services across all four domains; excep-tions were Laos and Timor Leste (Figure 4a). Studies comprised all 17 ecosystem services across all domains, with the ‘recreation and mental and physical health’ as the most fre-quently studied service (n = 54), followed by the ‘moderation of extreme events’ service (n = 51). The ‘medicinal resources’ and ‘biological control’ services were least assessed, with only 5 and 4 studies respectively (Table 2). Most studies took a multi-domain ap-proach (n = 67) by investigating ecosystem services across multiple domains. Around 42%
Figure 3. The general characteristics of UES research. (A) The various scales at which UES were assessed; (B) The percentageof studies conducted by authors based in and outside of Southeast Asia (denoted by the country in which the primaryinstitution of the first author is located); (C) The assessment of UES within and/or across domains; (D) The types blue-greenstructures assessed; (E) The temporal focus of the study where ‘single temporal focus’ represents studies that examined UESat one point/period in time and ‘multitemporal’ represents studies that compared UES across time; (F) The methods of datacollection and analysis of UES; and (G) The types of UES valuations conducted by studies.
12
Land 2021, 10, 40
3.2. Services and Blue-Green Structures Assessed
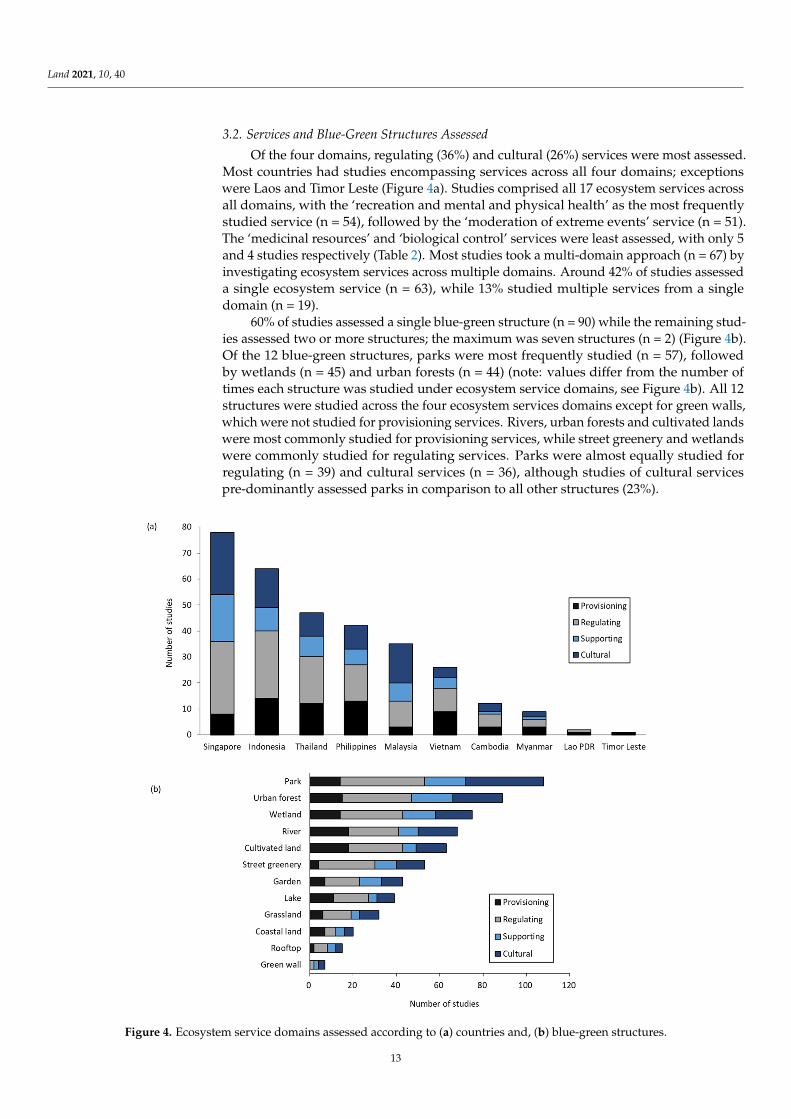
Of the four domains, regulating (36%) and cultural (26%) services were most assessed.Most countries had studies encompassing services across all four domains; exceptionswere Laos and Timor Leste (Figure 4a). Studies comprised all 17 ecosystem services acrossall domains, with the ‘recreation and mental and physical health’ as the most frequentlystudied service (n = 54), followed by the ‘moderation of extreme events’ service (n = 51).The ‘medicinal resources’ and ‘biological control’ services were least assessed, with only 5and 4 studies respectively (Table 2). Most studies took a multi-domain approach (n = 67) byinvestigating ecosystem services across multiple domains. Around 42% of studies assesseda single ecosystem service (n = 63), while 13% studied multiple services from a singledomain (n = 19).
60% of studies assessed a single blue-green structure (n = 90) while the remaining stud-ies assessed two or more structures; the maximum was seven structures (n = 2) (Figure 4b).Of the 12 blue-green structures, parks were most frequently studied (n = 57), followedby wetlands (n = 45) and urban forests (n = 44) (note: values differ from the number oftimes each structure was studied under ecosystem service domains, see Figure 4b). All 12structures were studied across the four ecosystem services domains except for green walls,which were not studied for provisioning services. Rivers, urban forests and cultivated landswere most commonly studied for provisioning services, while street greenery and wetlandswere commonly studied for regulating services. Parks were almost equally studied forregulating (n = 39) and cultural services (n = 36), although studies of cultural servicespre-dominantly assessed parks in comparison to all other structures (23%).
Land 2021, 9, x FOR PEER REVIEW 9 of 21
of studies assessed a single ecosystem service (n = 63), while 13% studied multiple services from a single domain (n = 19).
Figure 4. Ecosystem service domains assessed according to (a) countries and, (b) blue-green structures.
Table 2. The number of studies that assessed each ecosystem service according to the TEEB classi-fication system [52]. Note that some studies assessed multiple ecosystem services; thus, the total number of ecosystem services assessed is greater than the 149 publications reviewed.
Domain Ecosystem Service Number of Studies
Provisioning
Food 40 Raw materials 29
Fresh water 18 Medicinal resources 4
Regulating
Local climate and air quality 44 Carbon sequestration and storage 27
Moderation of extreme events 51 Wastewater treatment 11
Erosion prevention and maintenance of soil fertility 15 Pollination 9
Biological control 5
Supporting Habitats for species 43
Maintenance of genetic diversity 8
Cultural Recreation and mental and physical health 54 Tourism 19
Figure 4. Ecosystem service domains assessed according to (a) countries and, (b) blue-green structures.
13
Land 2021, 10, 40
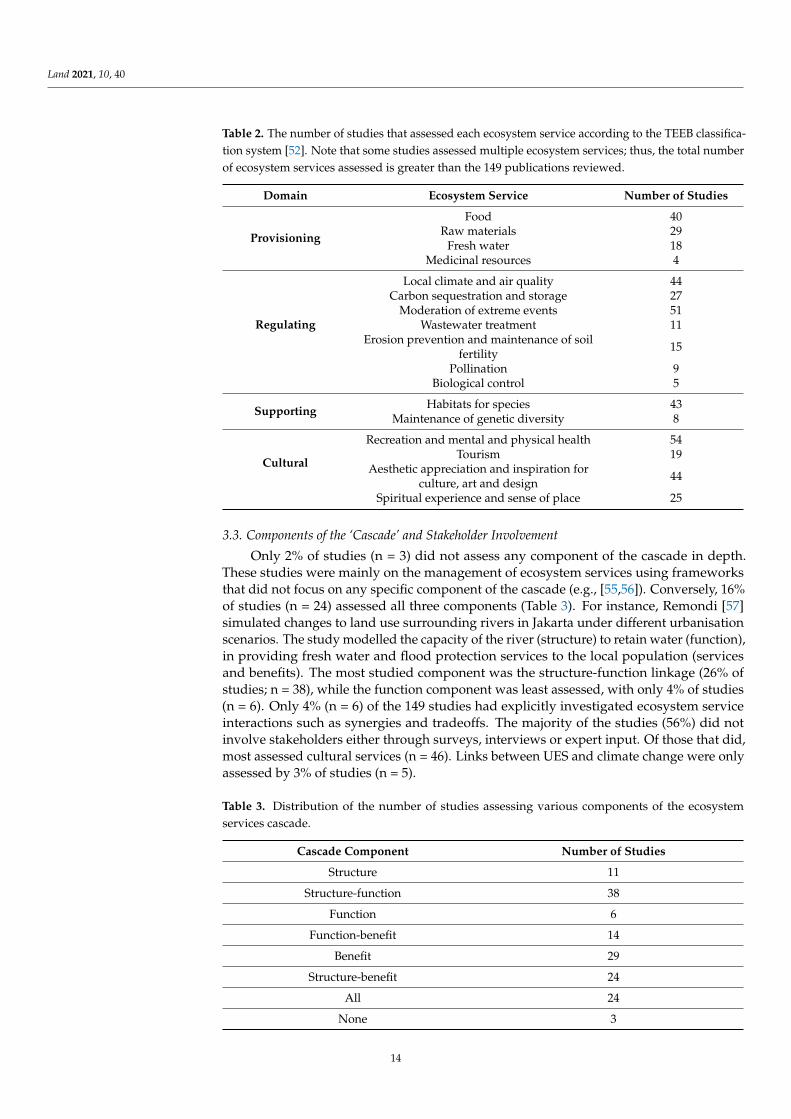
Table 2. The number of studies that assessed each ecosystem service according to the TEEB classifica-tion system [52]. Note that some studies assessed multiple ecosystem services; thus, the total numberof ecosystem services assessed is greater than the 149 publications reviewed.
Domain Ecosystem Service Number of Studies
Provisioning
Food 40Raw materials 29
Fresh water 18Medicinal resources 4
Regulating
Local climate and air quality 44Carbon sequestration and storage 27
Moderation of extreme events 51Wastewater treatment 11
Erosion prevention and maintenance of soilfertility 15
Pollination 9Biological control 5
Supporting Habitats for species 43Maintenance of genetic diversity 8
Cultural
Recreation and mental and physical health 54Tourism 19
Aesthetic appreciation and inspiration forculture, art and design 44
Spiritual experience and sense of place 25
3.3. Components of the ‘Cascade’ and Stakeholder Involvement
Only 2% of studies (n = 3) did not assess any component of the cascade in depth.These studies were mainly on the management of ecosystem services using frameworksthat did not focus on any specific component of the cascade (e.g., [55,56]). Conversely, 16%of studies (n = 24) assessed all three components (Table 3). For instance, Remondi [57]simulated changes to land use surrounding rivers in Jakarta under different urbanisationscenarios. The study modelled the capacity of the river (structure) to retain water (function),in providing fresh water and flood protection services to the local population (servicesand benefits). The most studied component was the structure-function linkage (26% ofstudies; n = 38), while the function component was least assessed, with only 4% of studies(n = 6). Only 4% (n = 6) of the 149 studies had explicitly investigated ecosystem serviceinteractions such as synergies and tradeoffs. The majority of the studies (56%) did notinvolve stakeholders either through surveys, interviews or expert input. Of those that did,most assessed cultural services (n = 46). Links between UES and climate change were onlyassessed by 3% of studies (n = 5).
Table 3. Distribution of the number of studies assessing various components of the ecosystemservices cascade.
Cascade Component Number of Studies
Structure 11
Structure-function 38
Function 6
Function-benefit 14
Benefit 29
Structure-benefit 24
All 24
None 3
14
Land 2021, 10, 40
3.4. Research Perspectives and Methods of UES Assessment
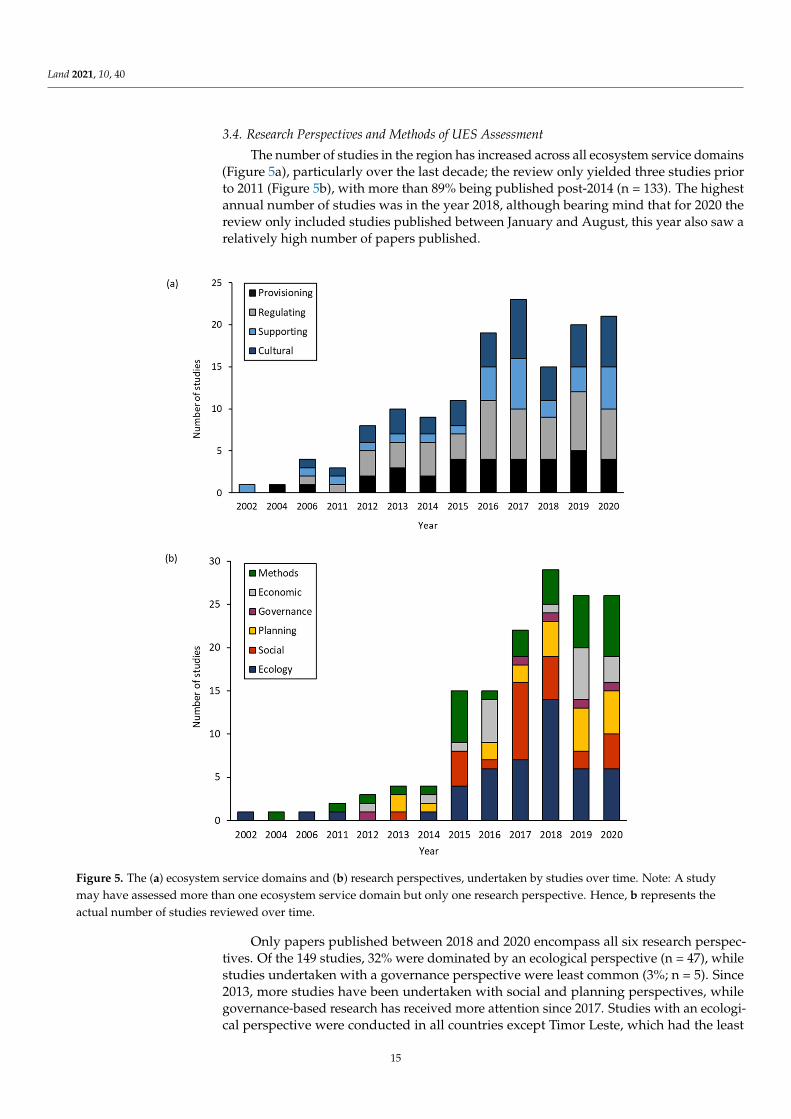
The number of studies in the region has increased across all ecosystem service domains(Figure 5a), particularly over the last decade; the review only yielded three studies priorto 2011 (Figure 5b), with more than 89% being published post-2014 (n = 133). The highestannual number of studies was in the year 2018, although bearing mind that for 2020 thereview only included studies published between January and August, this year also saw arelatively high number of papers published.
Land 2021, 9, x FOR PEER REVIEW 11 of 21
Figure 5. The (a) ecosystem service domains and (b) research perspectives, undertaken by studies over time. Note: A study may have assessed more than one ecosystem service domain but only one research perspective. Hence, Figure 5b represents the actual number of studies reviewed over time.
Only papers published between 2018 and 2020 encompass all six research perspec-tives. Of the 149 studies, 32% were dominated by an ecological perspective (n = 47), while studies undertaken with a governance perspective were least common (3%; n = 5). Since 2013, more studies have been undertaken with social and planning perspectives, while governance-based research has received more attention since 2017. Studies with an eco-logical perspective were conducted in all countries except Timor Leste, which had the least number of studies in the region (Figure 6a). Singapore, Indonesia, Thailand and Vi-etnam had studies comprising all six perspectives. About 34% (n = 15) of the 44 studies conducted in Singapore had an ecological perspective, while only 5% (n = 2) had an eco-nomic perspective and one study had a governance perspective. There were no studies with an economic or governance perspective in Malaysia, although the social perspective comprised 43% (n = 10) of studies in this country.
Figure 5. The (a) ecosystem service domains and (b) research perspectives, undertaken by studies over time. Note: A studymay have assessed more than one ecosystem service domain but only one research perspective. Hence, b represents theactual number of studies reviewed over time.
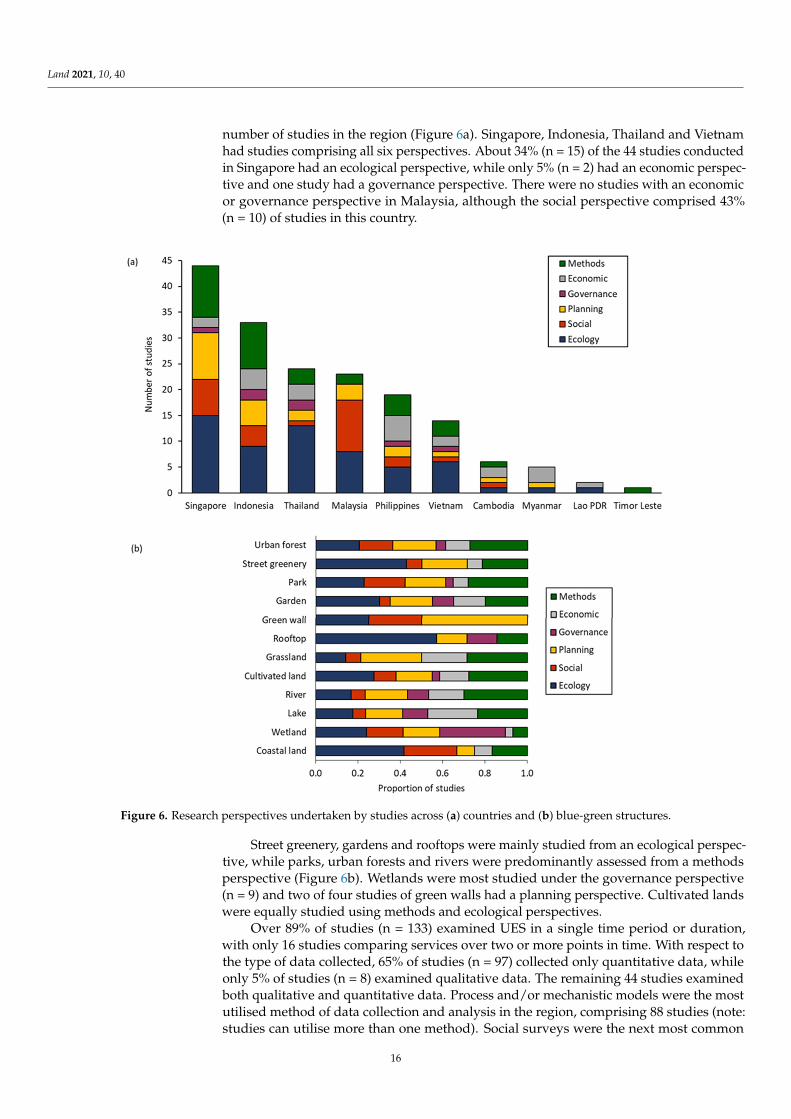
Only papers published between 2018 and 2020 encompass all six research perspec-tives. Of the 149 studies, 32% were dominated by an ecological perspective (n = 47), whilestudies undertaken with a governance perspective were least common (3%; n = 5). Since2013, more studies have been undertaken with social and planning perspectives, whilegovernance-based research has received more attention since 2017. Studies with an ecologi-cal perspective were conducted in all countries except Timor Leste, which had the least
15
Land 2021, 10, 40
number of studies in the region (Figure 6a). Singapore, Indonesia, Thailand and Vietnamhad studies comprising all six perspectives. About 34% (n = 15) of the 44 studies conductedin Singapore had an ecological perspective, while only 5% (n = 2) had an economic perspec-tive and one study had a governance perspective. There were no studies with an economicor governance perspective in Malaysia, although the social perspective comprised 43%(n = 10) of studies in this country.Land 2021, 9, x FOR PEER REVIEW 12 of 21
Figure 6. Research perspectives undertaken by studies across (a) countries and (b) blue-green structures.
Street greenery, gardens and rooftops were mainly studied from an ecological per-spective, while parks, urban forests and rivers were predominantly assessed from a meth-ods perspective (Figure 6b). Wetlands were most studied under the governance perspec-tive (n = 9) and two of four studies of green walls had a planning perspective. Cultivated lands were equally studied using methods and ecological perspectives.
Over 89% of studies (n = 133) examined UES in a single time period or duration, with only 16 studies comparing services over two or more points in time. With respect to the type of data collected, 65% of studies (n = 97) collected only quantitative data, while only 5% of studies (n = 8) examined qualitative data. The remaining 44 studies examined both qualitative and quantitative data. Process and/or mechanistic models were the most uti-lised method of data collection and analysis in the region, comprising 88 studies (note: studies can utilise more than one method). Social surveys were the next most common method (n = 43), followed by field sampling (n = 33). 13 studies used case studies to assess UES and 8 studies used landcover proxies. Only 23% (n = 34) of studies conducted valua-tions, of which over half were monetary (n = 19). Two studies conducted both monetary and non-monetary valuations, while the remaining studies (n = 12) conducted non-mon-etary valuations.
4. Discussion 4.1. Current State of Research
Figure 6. Research perspectives undertaken by studies across (a) countries and (b) blue-green structures.
Street greenery, gardens and rooftops were mainly studied from an ecological perspec-tive, while parks, urban forests and rivers were predominantly assessed from a methodsperspective (Figure 6b). Wetlands were most studied under the governance perspective(n = 9) and two of four studies of green walls had a planning perspective. Cultivated landswere equally studied using methods and ecological perspectives.
Over 89% of studies (n = 133) examined UES in a single time period or duration,with only 16 studies comparing services over two or more points in time. With respect tothe type of data collected, 65% of studies (n = 97) collected only quantitative data, whileonly 5% of studies (n = 8) examined qualitative data. The remaining 44 studies examinedboth qualitative and quantitative data. Process and/or mechanistic models were the mostutilised method of data collection and analysis in the region, comprising 88 studies (note:studies can utilise more than one method). Social surveys were the next most common
16
Land 2021, 10, 40
method (n = 43), followed by field sampling (n = 33). 13 studies used case studies toassess UES and 8 studies used landcover proxies. Only 23% (n = 34) of studies conductedvaluations, of which over half were monetary (n = 19). Two studies conducted bothmonetary and non-monetary valuations, while the remaining studies (n = 12) conductednon-monetary valuations.
4. Discussion4.1. Current State of Research
Our review found that the there was a growing body of research on UES in theSoutheast Asia, particularly in the last five years. The research was biased towards moredeveloped countries, in particular the city-state of Singapore, where about one third (29%)of published research was conducted. Previous reviews have also found that UES researchtends to focus on highly developed and urbanised countries [28,41]. It is also apparent thatlittle research has been conducted in less developed countries such as Myanmar, Cambodiaand Laos. While most papers were authored by researchers based in Southeast Asia, therewere no clear differences between the research foci of authors based in Southeast Asia andthose based outside of the region.
Studies in Southeast Asia provided sufficient contextual information in their assess-ment, contrary to the findings of Luederitz [41] in their global review. Studies provideddetailed descriptions of the boundary of respective the study areas, population size, loca-tion of ecological structures and type of structures studied. Of the four ecosystem servicedomains, in Southeast Asia, regulating and cultural services were predominantly assessed(62% of all studies). The two most commonly assessed services were recreation, mental andphysical health (n = 54) and moderation of extreme events services (n = 51). Parks were themost assessed blue-green structure, while there were few studies focused on coastal areas(n = 12), rooftops (n = 7) and green walls (n = 4).
Over half the studies examined multiple ecosystem services, within and across do-mains, and mostly at a landscape scale (i.e., city scale or larger). Studies also assessed multi-ple components of the cascade, although there is room for a more holistic research approach,as interactions, such as synergies and tradeoffs between services were rarely examined (4%).There was also a lack of studies with a multitemporal focus (11%). Process/mechanisticmodelling was the dominant method of UES assessment [58–60], although valuations ofservices were lacking.
Stakeholder involvement was higher in studies that examined regulating and culturalservices. Many studies that involved stakeholders also had social or planning researchperspectives suggesting a strong applied focus on managing UES. There were few studieswith a dominant governance perspective and this finding is not unique to Southeast Asia,as global reviews by Haase [28] and Luederitz [41] also report the lack of governancediscourse on UES research. While the nature of UES research within the region may havesome commonalities with its global counterpart, we highlight aspects of research that arespecific to Southeast Asia, discussing considerations and opportunities for integrating UESin the region below.
4.2. Specificity of Research in Southeast Asia
The transferability of research may be limited due to the diverse characteristics ofSoutheast Asian countries—in particular economic power and government effectiveness(see Table 1 and Figure 2) [17]. Furthermore, even within countries there can be diversity invalues. There is diversity in environmental conditions as well as the nature of urbanisationand cultural perspectives and values. For example, Hassan [61] highlighted substantialdifferences in wetland management preferences between urban and rural areas in Malaysia.While, in Singapore, contrary to popular assumptions around the desire for natural greenspaces, some urban residents do not favour high conservation value vegetation and un-managed secondary forests due to perceived wildlife threats and poor aesthetics [62,63].
17
Land 2021, 10, 40
If regional uniformity is assumed in how services are perceived and valued, the specificpreferences and/or needs of minority groups may be overlooked when managing UES.
Considering that countries in Southeast Asia are renowned agro-industrial producersand exporters [64], provisioning services and services from agricultural landscapes (e.g., oilpalm) were fairly understudied in the region. Although it is generally expected that highlyurbanised areas are less likely to include productive areas, agricultural landscapes can becommonly found within the urban matrix of Southeast Asia [65,66]. While this adds to theuniqueness of urban-scapes in the region, the interactions between provisioning servicesand other service types, as well as implications for different stakeholders is yet to be fullyunderstood.
Much remains to be learnt about biodiversity and UES in Southeast Asia. As Mam-mides [67] reported, despite most of the world’s biodiversity being concentrated in thetropics and the imminent threats it faces, research on tropical conservation is largely un-derrepresented. In our review, the initial search string, which contained only UES relatedterms, returned only 48 relevant publications. It was only through expanding our searchstring with more general keywords that we were able to increase the number of publica-tions. Like most other Global South regions, the underrepresentation of research couldbe attributed to Southeast Asia being data poor [68,69], which was noted in a number ofstudies [62,70,71].
Limitations in the quality, availability and access to data pose major challenges toUES research in the region. Databases and organisations that collect and provide open-access regional environmental data are few to none, compared to those in North Americaor Europe (e.g., United States Geological Survey, European Soil Data Centre, NationalBiodiversity Network, Biodiversity Information System for Europe, European EnvironmentAgency). This was reported in several studies such as Balmford [72] who used globalenvironmental data in their assessment of road networks in the Greater Mekong subregion,as finer scale, regional data was not available. Estoque [70] also utilised global ecosystemservice values reported by Costanza [73] due to the limited availability of local datain Baguio, Philippines. Estoque [74] highlighted the need for available and accessiblecity-scale data across Philippines for conducting heat vulnerability assessments, whileBelcher and Chisholm [62] reported that in Singapore LULC data is not publicly available.This limitation significantly affects research outputs as collection and generation of high-resolution regional data requires important human and time resources.
5. Conclusions: Research Needs to Move Forward
As Southeast Asian cities grow and the population density in urban areas rise, demandfor ecosystem services will become increasing important [75]. The recognised importanceof UES is also seen with the increased number of UES assessments in the region over thelast decade (Figure 5b). Increasing urbanisation and urban sprawls in Southeast Asia oftenresult in the loss of natural ecosystems due to the infrastructure demands of growing urbanpopulations [17]. Conserving nature and supporting the provision of UES is often morecost effective and practical than restoring degraded ecosystems [76,77], so a worthwhileobjective for cities in the region is avoiding the loss of natural ecosystems through theconsideration of UES in planning.
The prevalence of certain services within UES research suggests some UES are con-sidered to be more important than others, from a research perspective, in the SoutheastAsian context. For instance, the preservation of cultural services such as recreation services(n = 54) and aesthetic appreciation (n = 44), which are strongly associated with greenspaces [33,78], may be of high interest to urban residents, as these areas are being rapidlylost to high density development patterns, characteristic of urbanisation in Southeast Asiancities [79,80]. Similarly, climate regulating services (n = 44) appear to be valued for theirrole in reducing urban heat island effects, which is a common issue in the region’s denselyurbanised tropical cities, with high average temperatures [81–84]. These UES, which have
18
Land 2021, 10, 40
been the focus of research, may be valued for their direct contribution to the wellbeing ofurban populations and liveability of cities [33,85,86].
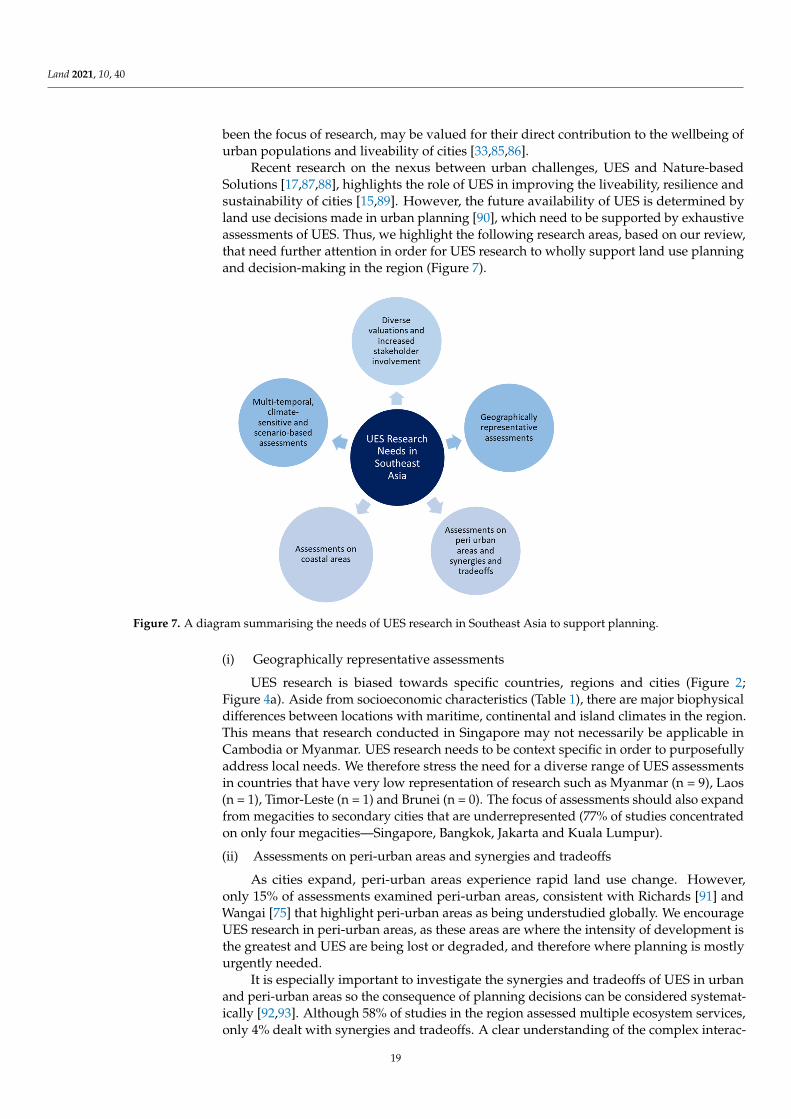
Recent research on the nexus between urban challenges, UES and Nature-basedSolutions [17,87,88], highlights the role of UES in improving the liveability, resilience andsustainability of cities [15,89]. However, the future availability of UES is determined byland use decisions made in urban planning [90], which need to be supported by exhaustiveassessments of UES. Thus, we highlight the following research areas, based on our review,that need further attention in order for UES research to wholly support land use planningand decision-making in the region (Figure 7).Land 2021, 9, x FOR PEER REVIEW 15 of 21
Figure 7. A diagram summarising the needs of UES research in Southeast Asia to support planning.
i) Geographically representative assessments UES research is biased towards specific countries, regions and cities (Figure 2; Figure
4a). Aside from socioeconomic characteristics (Table 1), there are major biophysical dif-ferences between locations with maritime, continental and island climates in the region. This means that research conducted in Singapore may not necessarily be applicable in Cambodia or Myanmar. UES research needs to be context specific in order to purposefully address local needs. We therefore stress the need for a diverse range of UES assessments in countries that have very low representation of research such as Myanmar (n = 9), Laos (n = 1), Timor-Leste (n = 1) and Brunei (n = 0). The focus of assessments should also expand from megacities to secondary cities that are underrepresented (77% of studies concen-trated on only four megacities—Singapore, Bangkok, Jakarta and Kuala Lumpur).
ii) Assessments on peri-urban areas and synergies and tradeoffs As cities expand, peri-urban areas experience rapid land use change. However, only
15% of assessments examined peri-urban areas, consistent with Richards [91] and Wangai [75] that highlight peri-urban areas as being understudied globally. We encourage UES research in peri-urban areas, as these areas are where the intensity of development is the greatest and UES are being lost or degraded, and therefore where planning is mostly ur-gently needed.
It is especially important to investigate the synergies and tradeoffs of UES in urban and peri-urban areas so the consequence of planning decisions can be considered system-atically [92,93]. Although 58% of studies in the region assessed multiple ecosystem ser-vices, only 4% dealt with synergies and tradeoffs. A clear understanding of the complex interactions between UES, as well as UES and land use management, is particularly im-portant in rapidly developing peri-urban areas.
We also highlight the need for synergy and tradeoffs assessments between urbanisa-tion and provisioning services. The spatial expansion of cities has negative impacts on urban/peri-urban agriculture [94], which is commonplace in Southeast Asia [66,95]. Given the importance of agricultural production to local livelihood in the region [96], the sus-tainability and multifunctional capacity of urban agricultural landscapes needs to be bet-ter understood [97,98]. Careful management of land use as peri-urban areas develop can yield more sustainable UES provision, than attempts to retrofit restoration efforts in the future.
iii) Assessments on coastal areas
Figure 7. A diagram summarising the needs of UES research in Southeast Asia to support planning.
(i) Geographically representative assessments
UES research is biased towards specific countries, regions and cities (Figure 2;Figure 4a). Aside from socioeconomic characteristics (Table 1), there are major biophysicaldifferences between locations with maritime, continental and island climates in the region.This means that research conducted in Singapore may not necessarily be applicable inCambodia or Myanmar. UES research needs to be context specific in order to purposefullyaddress local needs. We therefore stress the need for a diverse range of UES assessmentsin countries that have very low representation of research such as Myanmar (n = 9), Laos(n = 1), Timor-Leste (n = 1) and Brunei (n = 0). The focus of assessments should also expandfrom megacities to secondary cities that are underrepresented (77% of studies concentratedon only four megacities—Singapore, Bangkok, Jakarta and Kuala Lumpur).
(ii) Assessments on peri-urban areas and synergies and tradeoffs
As cities expand, peri-urban areas experience rapid land use change. However,only 15% of assessments examined peri-urban areas, consistent with Richards [91] andWangai [75] that highlight peri-urban areas as being understudied globally. We encourageUES research in peri-urban areas, as these areas are where the intensity of development isthe greatest and UES are being lost or degraded, and therefore where planning is mostlyurgently needed.
It is especially important to investigate the synergies and tradeoffs of UES in urbanand peri-urban areas so the consequence of planning decisions can be considered systemat-ically [92,93]. Although 58% of studies in the region assessed multiple ecosystem services,only 4% dealt with synergies and tradeoffs. A clear understanding of the complex interac-
19
Land 2021, 10, 40
tions between UES, as well as UES and land use management, is particularly important inrapidly developing peri-urban areas.
We also highlight the need for synergy and tradeoffs assessments between urban-isation and provisioning services. The spatial expansion of cities has negative impactson urban/peri-urban agriculture [94], which is commonplace in Southeast Asia [66,95].Given the importance of agricultural production to local livelihood in the region [96], thesustainability and multifunctional capacity of urban agricultural landscapes needs to bebetter understood [97,98]. Careful management of land use as peri-urban areas developcan yield more sustainable UES provision, than attempts to retrofit restoration efforts inthe future.
(iii) Assessments on coastal areas
Many of Southeast Asia’s densely populated cities are located along the coastlines(e.g., Greater Jakarta, Singapore, Ho Chi Minh, Bangkok, Manila), yet few studies examinedUES in coastal areas. Coastal cities are particularly vulnerable to coastal and riverine floods,coastal erosion, storm surges, monsoons and tsunamis [99,100], all of which bring adversehealth risks to the urban population [101,102]. Moreover, many of these extreme events areexpected to increase in frequency in Southeast Asia because of climate change effects [14,99].Thus, we bring to attention the exigency of assessments of coastal structures as a Nature-based Solution in coastal cities. Research should also focus on opportunities to support theresilience of urban communities through the sustainable provision of UES [103].
(iv) Multi-temporal, climate-sensitive and scenario-based assessments
Few studies (11%) have conducted temporal assessments of UES, which are key tounderstanding changes in service provision and demand [104]. This is challenging inpractice as there is limited information on how UES change over time and/or underdifferent future scenarios [57,105]. Moreover, Southeast Asian cities are seen to be highlyvulnerable to climate change effects [17,106,107], yet few studies have examined the linkbetween UES and climate resilience (n = 5). Assessments of changes in UES can be usedto identify areas vulnerable to weather-related disaster risks and/or support decisionson appropriate land use management strategies [14]. Our review highlights a pressingneed for multitemporal and/or scenario-based research on the resilience of UES provision.Research should also address the increased risk of diseases in tropical ecosystems due to theeffects of climate change [108,109], as well as the consequent impacts to UES, particularlyprovisioning services [110,111].
(v) Diverse valuations and increased stakeholder involvement
Literature supporting the valuation of ecosystem services is abundant [30,112–114],with recent research emphasising diverse perspectives in valuations through value plu-ralism [49]. However, our review found that only 23% of studies in the region conductedvaluations. Valuations support decision-making by providing explicit quantification of UESdemand, which can be in monetary or non-monetary terms [46]. The involvement of stake-holders (44%) in UES assessments can support valuations by identifying context-specificdemands and preferences of the people appropriating the services [41,49].
In line with TEEB and the Intergovernmental Panel on Biodiversity and EcosystemServices (IPBES) [49,115,116], we urge research to incorporate diverse valuations, mone-tary and non-monetary, as well as increase stakeholder involvement in UES assessments.Although contentious [117], the comprehensive representation of UES through valuationshas been proven to be effective in influencing decision-makers towards planning agen-das [118]. This is because valuations can be used as a tool to demonstrate the cost ofrestoring ecosystems or the critical importance of alternative land use options objectively todecision-makers [119–121]. As the invisibility of nature in economic choices often drives itsdepletion [53], valuation of UES can encourage more transparent assessments of tradeoffsto support the planning of sustainable cities.
20
Land 2021, 10, 40
Supplementary Materials: The following are available online at https://www.mdpi.com/2073-445X/10/1/40/s1, Search strings for Scopus and Web of Knowledge databases; Table S1: Bibliographyof the 149 studies analysed in this review; Table S2: Review categories, description and classificationmethod; Table S3: Ecological structures and definitions.
Author Contributions: This review is part of a PhD research by K.T.L. The idea for the paper wasconceived by K.T.L., A.M.L. and C.N.G., K.T.L. performed the literature search, data analysis anddrafted the original manuscript. A.M.L., C.N.G., P.H., R.S. and B.A. provided critical feedback andedited the manuscript. All authors have read and agreed to the published version of the manuscript.
Funding: This work is part of a PhD research that is funded by the Faculty of Science and Engineeringand the Landscape Ecology and Conservation Laboratory, School of Environmental and GeographicalSciences at the University of Nottingham Malaysia. We are also thankful for the funding receivedfrom the International Research Collaboration Award from the Research Knowledge and ExchangeHub, University of Nottingham Malaysia, Singapore’s National Research Foundation (NRFF12-2020-0009) and the Putra Grant-Putra Young Initiative (IPM) from Universiti Putra Malaysia (Grant No:GP-IPM/2018/9637800).
Institutional Review Board Statement: Not applicable.
Informed Consent Statement: Not applicable.
Data Availability Statement: The data presented in this study are available within the article andsupplementary materials.
Acknowledgments: We thank the reviewers for their kind and constructive feedback which hashelped improve the manuscript.
Conflicts of Interest: The authors declare no conflict of interest.
References1. United Nations. World Urbanization Prospects: The 2014 Revision, Highlights (ST/ESA/SER.A/352); Department of Economic and
Social Affairs, Population Division: New York, NY, USA, 2014.2. Nagendra, H.; Bai, X.; Brondizio, E.S.; Lwasa, S. The urban south and the predicament of global sustainability. Nat. Sustain. 2018,
1, 341–349. [CrossRef]3. Yuen, B.; Kong, L. Climate change and urban planning in Southeast Asia. SAPIENS 2009, 2. Available online: http://journals.
openedition.org/sapiens/881 (accessed on 10 December 2020).4. Jacobs, A.; Appleyard, D. Toward an Urban Design Manifesto Toward an Urban Design Manifesto. J. Am. Plan. Assoc. 1987, 53,
37–41. [CrossRef]5. Jones, G.W. Urbanisation and development in Southeast Asia. Malaysian J. Econ. Stud. 2014, 51, 103–120.6. Mahmoudi, M.; Ahmad, F.; Abbasi, B. Livable streets: The effects of physical problems on the quality and livability of Kuala
Lumpur streets. Cities 2015, 43, 104–114. [CrossRef]7. Morillas, J.B.; Gozalo, G.R.; González, D.M.; Moraga, P.A.; Vílchez-Gómez, R. Noise Pollution and Urban Planning. Curr. Pollut.
Rep. 2018, 4, 208–219. [CrossRef]8. Harun, Z.; Reda, E.; Abdulrazzaq, A.; Abbas, A.A.; Yusup, Y.; Zaki, S.A. Urban heat island in the modern tropical Kuala Lumpur:
Comparative weight of the different parameters. Alex. Eng. J. 2020, 59, 4475–4489. [CrossRef]9. Jusuf, S.K.; Wong, N.H.; Hagen, E.; Anggoro, R.; Hong, Y. The influence of land use on the urban heat island in Singapore. Habitat
Int. 2007, 31, 232–242. [CrossRef]10. Laeni, N.; Brink, M.V.D.; Arts, J. Is Bangkok becoming more resilient to flooding? A framing analysis of Bangkok’s flood resilience
policy combining insights from both insiders and outsiders. Cities 2019, 90, 157–167. [CrossRef]11. Padawangi, R.; Douglass, M. Water, Water Everywhere: Toward Participatory Solutions to Chronic Urban Flooding in Jakarta.
Pac. Aff. 2015, 88, 517–550. [CrossRef]12. Li, L.; Cao, R.; Wei, K.; Wang, W.; Chen, L. Adapting climate change challenge: A new vulnerability assessment framework from
the global perspective. J. Clean. Prod. 2019, 217, 216–224. [CrossRef]13. ADB. The Economics of Climate Change in Southeast Asia: A Regional Review; Asian Development Bank: Mandaluyong, Philippines,
2009.14. Yusuf, A.A.; Francisco, H. Hotspots! Mapping Climate Change Vulnerability in Southeast Asia; Worldfish Philippine Country Office:
Laguna, Philippines, 2010.15. Savage, V.R. Ecology matters: Sustainable development in Southeast Asia. Sustain. Sci. 2006, 1, 37–63. [CrossRef]16. Arfanuzzaman, M.; Dahiya, B. Sustainable urbanization in Southeast Asia and beyond: Challenges of population growth, land
use change, and environmental health. Growth Chang. 2019, 50, 725–744. [CrossRef]
21
Land 2021, 10, 40
17. Lechner, A.M.; Gomes, R.L.; Rodrigues, L.; Ashfold, M.J.; Selvam, S.B.; Wong, E.P.; Raymond, C.M.; Zieritz, A.; Sing, K.W.; Moug,P.; et al. Challenges and considerations of applying nature-based solutions in low- and middle-income countries in Southeast andEast Asia. Blue Green Syst. 2020, 2, 331–351. [CrossRef]
18. ASEANStats. Indicators ASEAN Member States 2020. Available online: https://data.aseanstats.org/ (accessed on 2 Decem-ber 2020).
19. UNdata. Statistics. 2020. Available online: https://www.data.un.org (accessed on 1 December 2020).20. Asian Development Bank. Key Indicators Database. 2020. Available online: https://kidb.adb.org/ (accessed on 2 December 2020).21. WorldBank. DataBank. 2020. Available online: https://databank.worldbank.org/databases/page/1/orderby/popularity/
direction/desc?qterm=grossnationalincomerank (accessed on 2 December 2020).22. WGI. Worldwide Governance Indicators, Interactive Data Access, 2020. Available online: https://info.worldbank.org/
governance/wgi/Home/Reports (accessed on 2 December 2020).23. El-Baghdadi, O.; Desha, C. Conceptualising a biophilic services model for urban areas. Urban For. Urban Green. 2017, 27, 399–408.
[CrossRef]24. Xue, F.; Gou, Z.; Lau, S. The green open space development model and associated use behaviors in dense urban settings: Lessons
from Hong Kong and Singapore. Urban Des. Int. 2017, 22, 287–302. [CrossRef]25. Kabisch, N.; Qureshi, S.; Haase, D. Human–environment interactions in urban green spaces-A systematic review of contemporary
issues and prospects for future research. Environ. Impact Assess. Rev. 2015, 50, 25–34. [CrossRef]26. Baharuddin, Z.M.; Rusli, N.; Ramli, L.; Othman, R.; Yaman, M. The Diversity of Birds and Frogs Species at Perdana Botanical
Lake Garden, Kuala Lumpur, Malaysia. Adv. Sci. Lett. 2017, 23, 6256–6260. [CrossRef]27. Cortinovis, C.; Geneletti, D. A performance-based planning approach integrating supply and demand of urban ecosystem
services. Landsc. Urban Plan. 2020, 201, 103842. [CrossRef]28. Haase, D.; Larondelle, N.; Andersson, E.; Artmann, M.; Borgström, S.; Breuste, J.; Gomez-Baggethun, E.; Gren, Å.; Hamstead,
Z.; Hansen, R.; et al. A Quantitative Review of Urban Ecosystem Service Assessments: Concepts, Models, and Implementation.Ambio 2014, 43, 413–433. [CrossRef]
29. Kanniah, K.D.; Siong, H.C. Tree canopy cover and its potential to reduce CO2 in South of Peninsular Malaysia. Chem. Eng. Trans.2018, 63, 13–18.
30. Keeler, B.L.; Hamel, P.; McPhearson, T.; Hamann, M.H.; Donahue, M.L.; Prado, K.A.M.; Arkema, K.K.; Bratman, G.N.; Brauman,K.A.; Finlay, J.C.; et al. Social-ecological and technological factors moderate the value of urban nature. Nat. Sustain. 2019, 2, 29–38.[CrossRef]
31. Bolund, P.; Hunhammar, S. Ecosystem services in urban areas. Ecol. Econ. 1999, 29, 293–301. [CrossRef]32. Gomez-Baggethun, E.; Gren, Å.; Barton, D.N.; Langemeyer, J.; McPhearson, T.; O’Farrell, P.; Andersson, E.; Hamstead, Z.; Kremer,
P. Urban Ecosystem Services. In Urbanization, Biodiversity and Ecosystem Services: Challenges and Opportunities; Springer Scienceand Business Media LLC: Dordrecht, The Netherlands, 2013; pp. 175–251.
33. Braat, L.C.; de Groot, R. The ecosystem services agenda:bridging the worlds of natural science and economics, conservation anddevelopment, and public and private policy. Ecosyst. Serv. 2012, 1, 4–15. [CrossRef]
34. Burls, A. People and green spaces: Promoting public health and mental well-being through ecotherapy. J. Public Ment. Health2007, 6, 24–39. [CrossRef]
35. Gascon, M.; Triguero-Mas, M.; Martínez, D.; Dadvand, P.; Forns, J.; Plasència, A.; Nieuwenhuijsen, M.J. Mental Health Benefitsof Long-Term Exposure to Residential Green and Blue Spaces: A Systematic Review. Int. J. Environ. Res. Public Health 2015, 12,4354–4379. [CrossRef]
36. Müller-Riemenschneider, F.; Petrunoff, N.; Sia, A.; Ramiah, A.; Ng, A.; Han, J.; Wong, M.; Tai, B.C.; Uijtdewilligen, L. PrescribingPhysical Activity in Parks to Improve Health and Wellbeing: Protocol of the Park Prescription Randomized Controlled Trial. Int.J. Environ. Res. Public Health 2018, 15, 1154. [CrossRef] [PubMed]
37. Cilliers, S. Social Aspects of Urban Biodiversity: An Overview. In Urban Biodiversity and Design; Müller, N., Werner, P., Kelcey,J.G., Eds.; Zoological Society of London: London, UK, 2010; p. 626.
38. Nath, T.K.; Han, S.S.Z.; Lechner, A.M. Urban green space and well-being in Kuala Lumpur, Malaysia. Urban For. Urban Green.2018, 36, 34–41. [CrossRef]
39. Sandifer, P.A.; Sutton-Grier, A.E.; Ward, B.P. Exploring connections among nature, biodiversity, ecosystem services, and humanhealth and well-being: Opportunities to enhance health and biodiversity conservation. Ecosyst. Serv. 2015, 12, 1–15. [CrossRef]
40. Potschin, M.B.; Haines-Young, R.H. Ecosystem services. Prog. Phys. Geogr. Earth Environ. 2011, 35, 575–594. [CrossRef]41. Luederitz, C.; Brink, E.; Gralla, F.; Hermelingmeier, V.; Meyer, M.; Niven, L.; Panzer, L.; Partelow, S.; Rau, A.-L.; Sasaki, R.; et al.
A review of urban ecosystem services: Six key challenges for future research. Ecosyst. Serv. 2015, 14, 98–112. [CrossRef]42. De Groot, R.S.; Wilson, M.A.; Boumans, R.M. A typology for the classification, description and valuation of ecosystem functions,
goods and services. Ecol. Econ. 2002, 41, 393–408. [CrossRef]43. Martínez, A.J.C.; García-Llorente, M.; Martín-López, B.; Palomo, I.; Iniesta-Arandia, I. Multidimensional approaches in ecosystem
services assessment. Earth Obs. Ecosyst. Serv. 2013, 441–468.44. Bennett, E.M.; Peterson, G.D.; Gordon, L.J. Understanding relationships among multiple ecosystem services. Ecol. Lett. 2009, 12,
1394–1404. [CrossRef]
22
Land 2021, 10, 40
45. La Notte, A.; D’Amato, D.; Mäkinen, H.; Paracchini, M.L.; Liquete, C.; Egoh, B.; Geneletti, D.; Crossman, N.D. Ecosystem servicesclassification: A systems ecology perspective of the cascade framework. Ecol. Indic. 2017, 74, 392–402. [CrossRef] [PubMed]
46. Conte, M.N. Valuing Ecosystem Services. Encycl. Biodivers. 2013, 7, 314–326. [CrossRef]47. Costanza, R.; de Groot, R.; Braat, L.; Kubiszewski, I.; Fioramonti, L.; Sutton, P.; Farber, S.; Grasso, M. Twenty years of ecosystem
services: How far have we come and how far do we still need to go? Ecosyst. Serv. 2017, 28, 1–16. [CrossRef]48. Gomez-Baggethun, E.; Gren, Å.; Barton, D.N.; Langemeyer, J.; McPhearson, T.; O’Farrell, P.; Andersson, E.; Hamstead, Z.; Kremer,
P. Urban Ecosystem Services. Urban. Biodivers. Ecosyst. Serv. Chall. Oppor. 2013, 175–251.49. Pascual, U.; Balvanera, P.; Díaz, S.; Pataki, G.; Roth, E.; Stenseke, M.; Watson, R.T.; Dessane, E.B.; Islar, M.; Kelemen, E.; et al.
Valuing nature’s contributions to people: The IPBES approach. Curr. Opin. Environ. Sustain. 2017, 26–27, 7–16. [CrossRef]50. Brown, G.; Stricklandmunro, J.K.; Kobryn, H.; Moore, S.A. Stakeholder analysis for marine conservation planning using public
participation GIS. Appl. Geogr. 2016, 67, 77–93. [CrossRef]51. Zoderer, B.M.; Tasser, E.; Carver, S.; Tappeiner, U. An integrated method for the mapping of landscape preferences at the regional
scale. Ecol. Indic. 2019, 106, 105430. [CrossRef]52. TEEB. The Economics of Ecosystems and Biodiversity Ecological and Economic Foundations; Earthscan: London, UK; Washington, DC,
USA, 2010.53. TEEB. TEEB Manual for Cities: Ecosystem services in Urban Management. TEEB Man. Cities Ecosyst. Serv. Urban Manag. 2011,
2–41.54. TEEB. The Economics of Ecosystems and Biodiversity Challenges and responses. Nat. Balanc. Econ. Biodivers. 2014, 135–152.55. Pierce, J.R.; Barton, M.A.; Tan, M.M.J.; Oertel, G.; Halder, M.D.; Lopez-Guijosa, P.A.; Nuttall, R. Actions, indicators, and outputs
in urban biodiversity plans: A multinational analysis of city practice. PLoS ONE 2020, 15, e0235773. [CrossRef]56. Warner, K.; Zommers, Z.; Wreford, A.; Hurlbert, M.; Viner, D.; Scantlan, J.; Halsey, K.; Halsey, K.; Tamang, C. Characteristics of
Transformational Adaptation in Climate-Land-Society Interactions. Sustainability 2019, 11, 356. [CrossRef]57. Remondi, F.; Burlando, P.; Vollmer, D. Exploring the hydrological impact of increasing urbanisation on a tropical river catchment
of the metropolitan Jakarta, Indonesia. Sustain. Cities Soc. 2016, 20, 210–221. [CrossRef]58. Achmad, A.; Ramli, I.; Irwansyah, M. The impacts of land use and cover changes on ecosystem services value in urban highland
areas. IOP Conf. Series Earth Environ. Sci. 2020, 447. [CrossRef]59. Nguyen, L.D.; Nguyen, C.T.; Le, H.S.; Tran, B.Q. Mangrove Mapping and Above-Ground Biomass Change Detection using
Satellite Images in Coastal Areas of Thai Binh Province, Vietnam. For. Soc. 2019, 3, 248–261. [CrossRef]60. Srichaichana, J.; Trisurat, Y.; Ongsomwang, S. Land Use and Land Cover Scenarios for Optimum Water Yield and Sediment
Retention Ecosystem Services in Klong U-Tapao Watershed, Songkhla, Thailand. Sustainability 2019, 11, 2895. [CrossRef]61. Hassan, S.; Olsen, S.B.; Thorsen, B.J. Urban-rural divides in preferences for wetland conservation in Malaysia. Land Use Policy
2019, 84, 226–237. [CrossRef]62. Belcher, R.N.; Chisholm, R.A. Tropical Vegetation and Residential Property Value: A Hedonic Pricing Analysis in Singapore. Ecol.
Econ. 2018, 149, 149–159. [CrossRef]63. Richards, D.; Fung, T.K.; Leong, R.A.T.; Sachidhanandam, U.; Drillet, Z.; Edwards, P.J. Demographic biases in engagement with
nature in a tropical Asian city. PLoS ONE 2020, 15, e0231576. [CrossRef]64. Kontgis, C.; Schneider, A.; Ozdogan, M.; Kucharik, C.; Tri, V.P.D.; Duc, N.H.; Schatz, J. Climate change impacts on rice productivity
in the Mekong River Delta. Appl. Geogr. 2019, 102, 71–83. [CrossRef]65. Budidarsono, S.; Susanti, A.; Zoomers, E.B. Biofuels-Economy, Environment and Sustainability; Zhen, F., Ed.; IntechOpen: London,
UK, 2013. Available online: https://www.intechopen.com/books/biofuels-economy-environment-and-sustainability/oil-palm-plantations-in-indonesia-the-implications-for-migration-settlement-resettlement-and-local-e (accessed on 10 December 2020).[CrossRef]
66. Shevade, V.S.; Loboda, T.V. Oil palm plantations in Peninsular Malaysia: Determinants and constraints on expansion. PLoS ONE2019, 14, e0210628. [CrossRef]
67. Mammides, C.; Goodale, U.M.; Corlett, R.T.; Chen, J.; Bawa, K.S.; Hariya, H.; Jarrad, F.; Primack, R.B.; Ewing, H.; Xia, X.; et al.Increasing geographic diversity in the international conservation literature: A stalled process? Biol. Conserv. 2016, 198, 78–83.[CrossRef]
68. Perez, L.P.; Santos, R.; De Almeida, G.M.J.A.; Carvalho, G.C. Spatial data in the Global South: A case study of alternative landmanagement tools for cities with limited resources. In Proceedings of the 2017 IEEE Global Humanitarian Technology Conference(GHTC), San Jose, CA, USA, 19–22 October 2017; pp. 1–10.
69. Karnad, D.; Martin, K.S. Assembling marine spatial planning in the global south: International agencies and the fate of fishingcommunities in India. Marit. Stud. 2020, 19, 375–387. [CrossRef]
70. Estoque, R.C.; Murayama, Y. Examining the potential impact of land use/cover changes on the ecosystem services of Baguio city,the Philippines: A scenario-based analysis. Appl. Geogr. 2012, 35, 316–326. [CrossRef]
71. Estoque, R.C.; Murayama, Y. Quantifying landscape pattern and ecosystem service value changes in four rapidly urbanizing hillstations of Southeast Asia. Landsc. Ecol. 2016, 31, 1481–1507. [CrossRef]
72. Balmford, A.; Chen, H.; Phalan, B.; Wang, M.; O’Connell, C.; Tayleur, C.; Xu, J.-C. Getting Road Expansion on the Right Track: AFramework for Smart Infrastructure Planning in the Mekong. PLoS Biol. 2016, 14, e2000266. [CrossRef]
23
Land 2021, 10, 40
73. Costanza, R.; d’Arge, R.; de Groot, R.; Farber, S.; Grasso, M.; Hannon, B.; Limburg, K.; Naeem, S.; O’Neill, R.V.; Paruelo, J.; et al.The value of the world’s ecosystem services and natural capital. Nature 1997, 387, 253–260. [CrossRef]
74. Estoque, R.C.; Ooba, M.; Seposo, X.T.; Togawa, T.; Hijioka, Y.; Takahashi, K.; Nakamura, S. Heat health risk assessment inPhilippine cities using remotely sensed data and social-ecological indicators. Nat. Commun. 2020, 11, 1–12. [CrossRef] [PubMed]
75. Wangai, P.W.; Burkhard, B.; Müller, F. A review of studies on ecosystem services in Africa. Int. J. Sustain. Built Environ. 2016, 5,225–245. [CrossRef]
76. Holl, K.D.; Howarth, R. Paying for Restoration. Restor. Ecol. 2000, 8, 260–267. [CrossRef]77. Loomis, J.; Kent, P.; Strange, L.; Fausch, K.; Covich, A. Measuring the total economic value of restoring ecosystem services in an
impaired river basin: Results from a contingent valuation survey. Ecol. Econ. 2000, 33, 103–117. [CrossRef]78. Liu, H.; Remme, R.P.; Hamel, P.; Nong, H.; Ren, H. Supply and demand assessment of urban recreation service and its implication
for greenspace planning-A case study on Guangzhou. Landsc. Urban Plan. 2020, 203, 103898. [CrossRef]79. Thiagarajah, J.; Wong, S.K.M.; Richards, D.R.; Friess, D.A. Historical and contemporary cultural ecosystem service values in the
rapidly urbanizing city state of Singapore. Ambio 2015, 44, 666–677. [CrossRef]80. Friess, D.A. Singapore as a long-term case study for tropical urban ecosystem services. Urban Ecosyst. 2016, 20, 277–291. [CrossRef]81. Buyadi, S.; Wan Mohd, W.; Misni, A. Quantifying Green Space Cooling Effects on the Urban Microclimate using Remote Sensing
and GIS Techniques. In Proceedings of the XXV International Federation of Surveyors, Kuala Lumpur, Malaysia, 16–21 June 2014;pp. 1–16.
82. Richards, D.; Edwards, P.J. Quantifying street tree regulating ecosystem services using Google Street View. Ecol. Indic. 2017, 77,31–40. [CrossRef]
83. Gunawardena, K.; Wells, M.; Kershaw, T. Utilising green and bluespace to mitigate urban heat island intensity. Sci. Total Environ.2017, 584, 1040–1055. [CrossRef]
84. Heng, S.L.; Chow, W.T. How ‘hot’ is too hot? Evaluating acceptable outdoor thermal comfort ranges in an equatorial urban park.Int. J. Biometeorol. 2019, 63, 801–816. [CrossRef]
85. Beck, H. Linking the quality of public spaces to quality of life. J. Place Manag. Dev. 2009, 2, 240–248. [CrossRef]86. Yap, K.S.; Thuzar, M. Urbanization in Southeast Asia: Issues & Impacts; Institute of Southeast Asian Studies: Singapore, 2012.87. Lafortezza, R.; Chen, J.; van den Bosch, C.K.; Randrup, T.B. Nature-based solutions for resilient landscapes and cities. Environ.
Res. 2018, 165, 431–441. [CrossRef] [PubMed]88. Almenar, J.B.; Elliot, T.; Rugani, B.; Philippe, B.; Gutierrez, T.N.; Sonnemann, G.; Geneletti, D. Nexus between nature-based
solutions, ecosystem services and urban challenges. Land Use Policy 2021, 100, 104898. [CrossRef]89. United Nations. The 2030 Agenda for Sustainable Development, A/RES/70/1; United Nations: New York, NY, USA, 2015; pp. 13–14.90. Geneletti, D.; Cortinovis, C.; Zardo, L.; Esmail, B.A. Planning for Ecosystem Services in Cities. In Environmental Education and
Ecotourism; Springer International Publishing: Berlin/Heidelberg, Germany, 2020.91. Richards, D.; Masoudi, M.; Oh, R.R.Y.; Yando, E.S.; Zhang, J.; Friess, D.A.; Grêt-Regamey, A.; Tan, P.Y.; Edwards, P. Global
Variation in Climate, Human Development, and Population Density Has Implications for Urban Ecosystem Services. Sustainability2019, 11, 6200. [CrossRef]
92. Mokondoko, P.; Manson, R.H.; Ricketts, T.H.; Geissert, D. Spatial analysis of ecosystem service relationships to improve targetingof payments for hydrological services. PLoS ONE 2018, 13, e0192560. [CrossRef]
93. Holt, A.R.; Mears, M.; Maltby, L.; Warren, P.H. Understanding spatial patterns in the production of multiple urban ecosystemservices. Ecosyst. Serv. 2015, 16, 33–46. [CrossRef]
94. Artmann, M.; Sartison, K. The Role of Urban Agriculture as a Nature-Based Solution: A Review for Developing a SystemicAssessment Framework. Sustainability 2018, 10, 1937. [CrossRef]
95. Arif, S.; Ae, A.; Hezri, A.A. From Forest Landscape to Agricultural Landscape in the Developing Tropical Country of Malaysia:Pattern, Process, and Their Significance on Policy. Environ. Manag. 2008, 42, 907–917.
96. Gasparatos, A.; Helen. Ecosystem Services Provision from Urban Farms in a Secondary City of Myanmar, Pyin Oo Lwin.Agriculture 2020, 10, 140. [CrossRef]
97. Aerts, R.; Dewaelheyns, V.; Achten, W. Potential ecosystem services of urban agriculture: A review. PeerJ Prepr. 2016, 4, e2286v1.98. Dressler, W.H.; Wilson, D.; Clendenning, J.; Cramb, R.A.; Keenan, R.; Mahanty, S.; Bruun, T.B.; Mertz, O.; Lasco, R.D. The impact
of swidden decline on livelihoods and ecosystem services in Southeast Asia: A review of the evidence from 1990 to 2015. Ambio2017, 46, 291–310. [CrossRef] [PubMed]
99. Eckstein, D.; Künzel, V.S.; Schäfer, L. Global Climate Risk Index 2020 Germanwatch e.V. 2020. Available online: https://www.germanwatch.org/en/17307 (accessed on 10 December 2020).
100. Hallegatte, S.; Green, C.; Nicholls, R.J.; Corfee-Morlot, J. Future flood losses in major coastal cities. Nat. Clim. Chang. 2013, 3,802–806. [CrossRef]
101. Wells, J.A.; Wilson, K.A.; Abram, N.K.; Nunn, M.; Gaveau, D.L.A.; Runting, R.K.; Tarniati, N.; Mengersen, K.L.; Meijaard, E.Rising floodwaters: Mapping impacts and perceptions of flooding in Indonesian Borneo. Environ. Res. Lett. 2016, 11, 064016.[CrossRef]
102. Arifin, H.S.; Nakagoshi, N. Landscape ecology and urban biodiversity in tropical Indonesian cities. Landsc. Ecol. Eng. 2011, 7,33–43. [CrossRef]
24
Land 2021, 10, 40
103. Uy, N.; Shaw, R. Ecosystem resilience and community values: Implications to ecosystem-based adaptation. J. Disaster Res. 2013, 8,201–202.
104. Willemen, L. It’s about time: Advancing spatial analyses of ecosystem services and their application. Ecosyst. Serv. 2020, 44,101125. [CrossRef]
105. McDougall, R.; Kristiansen, P.; Rader, R. Small-scale urban agriculture results in high yields but requires judicious managementof inputs to achieve sustainability. Proc. Natl. Acad. Sci. USA 2019, 116, 129–134. [CrossRef]
106. Matthews, T.; Wilby, R.L.; Murphy, C. Communicating the deadly consequences of global warming for human heat stress. Proc.Natl. Acad. Sci. USA 2017, 114, 3861–3866. [CrossRef]
107. Mora, C.; Dousset, B.; Caldwell, I.R.; Powell, F.E.; Geronimo, R.C.; Bielecki, C.R.; Counsell, C.W.W.; Dietrich, B.S.; Johnston, E.T.;Louis, L.V.; et al. Global risk of deadly heat. Nat. Clim. Chang. 2017, 7, 501–506. [CrossRef]
108. Bowen, K.J.; Ebi, K.L. Health risks of climate change in the World Health Organization South-East Asia Region. WHO South-EastAsia J. Public Health 2017, 6, 3–8. [CrossRef]
109. Saulnier, D.D.; Ribacke, K.B.; Von Schreeb, J. No Calm After the Storm: A Systematic Review of Human Health Following Floodand Storm Disasters. Prehospital Disaster Med. 2017, 32, 568–579. [CrossRef]
110. Bito-onon, J.B. Climate risk vulnerability assessment: Basis for decision making support for the agriculture sector in the provinceof Iloilo. Int. J. Innov. Creat. Chang. 2020, 13, 186–202.
111. Van Noordwijk, M.; Kim, Y.-S.; Leimona, B.; Hairiah, K.; Fisher, L.A. Metrics of water security, adaptive capacity, and agroforestryin Indonesia. Curr. Opin. Environ. Sustain. 2016, 21, 1–8. [CrossRef]
112. Sun, Y.; Xie, S.; Zhao, S.Q. Valuing urban green spaces in mitigating climate change: A city-wide estimate of aboveground carbonstored in urban green spaces of China’s Capital. Glob. Chang. Biol. 2019, 25, 1717–1732. [CrossRef]
113. Hermes, J.; Tabrizian, P.; Burkhard, B.; Plieninger, T.; Fagerholm, N.; Von Haaren, C.; Albert, C. Assessment and valuation ofrecreational ecosystem services of landscapes. Ecosyst. Serv. 2018, 31, 289–295. [CrossRef]
114. Gómez-Baggethun, E.; Barton, D.N. Classifying and valuing ecosystem services for urban planning. Ecol. Econ. 2013, 86, 235–245.[CrossRef]
115. TEEB. A Quick Guide to the Economics of Ecosystems and Biodiversity for Local and Regional Policy Makers; Earthscan: London,UK, 2010.
116. Díaz, S.; Pascual, U.; Stenseke, M.; Martín-López, B.; Watson, R.T.; Molnár, Z.; Hill, R.; Chan, K.M.A.; Baste, I.A.; Brauman,K.A.; et al. Assessing nature’s contributions to people: Recognizing culture, and diverse sources of knowledge, can improveassessments. Science 2018, 359, 270–272. [CrossRef]
117. Heikkinen, A.; Mäkelä, H.; Kujala, J.; Nieminen, J.; Jokinen, A.; Rekola, H. 7 Urban ecosystem services and stakeholders: Towardsa sustainable capability approach. In Strongly Sustainable Societies: Organising Human Activities on a Hot and Full Earth; Bonnedahl,K.J., Heikkurinen, P., Eds.; Routledge: London, UK; New York, NY, USA, 2019; pp. 116–133.
118. Kenter, J.O.; Hyde, T.; Christie, M.; Fazey, I. The importance of deliberation in valuing ecosystem services in developingcountries—Evidence from the Solomon Islands. Glob. Environ. Chang. 2011, 21, 505–521. [CrossRef]
119. Griffin, R.G.; Chaumont, N.; Denu, D.; Guerry, A.D.; Kim, C.-K.; Ruckelshaus, M.H. Incorporating the visibility of coastal energyinfrastructure into multi-criteria siting decisions. Mar. Policy 2015, 62, 218–223. [CrossRef]
120. Brown, G.; Donovan, S.M.; Pullar, D.; Pocewicz, A.; Toohey, R.; Ballesteros-Lopez, R. An empirical evaluation of workshop versussurvey PPGIS methods. Appl. Geogr. 2014, 48, 42–51. [CrossRef]
121. Rambonilaza, T.; Neang, M. Exploring the potential of local market in remunerating water ecosystem services in Cambodia: Anapplication for endogenous attribute non-attendance modelling. Water Resour. Econ. 2019, 25, 14–26. [CrossRef]
25

land
Article
Governance, Nature’s Contributions to People, and Investing inConservation Influence the Valuation of Urban Green Areas
Alexandra Pineda-Guerrero 1, Francisco J. Escobedo 2,* and Fernando Carriazo 3
�����������������
Citation: Pineda-Guerrero, A.;
Escobedo, F.J.; Carriazo, F.
Governance, Nature’s Contributions
to People, and Investing in
Conservation Influence the Valuation
of Urban Green Areas. Land 2021, 10,
14. https://dx.doi.org/10.3390/
land10010014
Received: 30 November 2020
Accepted: 23 December 2020
Published: 27 December 2020
Publisher’s Note: MDPI stays neu-
tral with regard to jurisdictional claims
in published maps and institutional
affiliations.
Copyright: © 2020 by the authors. Li-
censee MDPI, Basel, Switzerland. This
article is an open access article distributed
under the terms and conditions of the
Creative Commons Attribution (CC BY)
license (https://creativecommons.org/
licenses/by/4.0/).
1 Nelson Institute for Environmental Studies, University of Wisconsin Madison,550 North Park Street, Madison,WI 53706, USA; [email protected]
2 US Forest Service, Pacific Southwest Research Station, 4955 Canyon Crest Dr., Riverside, CA 92507, USA3 Urban Management and Development Program, School of Political Science, Government and International
Relations, Universidad del Rosario, Cra 6 No. 12C-13, Bogotá 111711, Colombia;[email protected]
* Correspondence: [email protected]; Tel.: +1-951-680-1544
Abstract: There is little information concerning how people in the Global South perceive the benefitsand costs associated with urban green areas. There is even less information on how governanceinfluences the way people value these highly complex socio-ecological systems. We used semi-structured surveys, statistical analyses, and econometrics to explore the perceptions of users regardinggovernance and the benefits and costs, or Ecosystem Services (ES) and Ecosystem Disservices (ED),provided by Neotropical green areas and their willingness to invest, or not, for their conservation. Thestudy area was the El Salitre sub-watershed in Bogota, Colombia, and 10 different sites representativeof its wetlands, parks, green areas, and socioeconomic contexts. Using a context-specific approachand methods, we identified the most important benefits and costs of green areas and the influenceof governance on how people valued these. Our modelling shows that air quality and biodiversitywere highly important benefits, while water regulation was the least important; despite the sub-watershed’s acute problems with stormwater runoff. In terms of costs, the feeling of insecuritydue to crime was related to poor levels of maintenance and infrastructure in the studied greenareas. Perceived transparency, corruption, and performance of government institutions influencedpeople’s Unwillingness to Invest (UTI) in green space conservation. Results show that socioeconomicbackgrounds, government performance, and environmental education will play a role in the valueor importance people place on the benefits, costs, and UTI in conservation efforts in urban greenareas. Similarly, care is warranted when directly applying frameworks and typologies developedin high income countries (i.e., ES) to the unique realities of cities in the Global South. Accordingly,alternative frameworks such as Nature’s Contributions to People is promising.
Keywords: urban biodiversity; urban watersheds; Bogota Colombia; corruption; Unwillingnessto Invest
1. Introduction
The link between human well-being and urban green areas, forests, parks, wetlands,and other natural and semi-natural ecosystems in cities has been well established [1,2] Sev-eral studies have valued multiple benefits using a diverse set of case studies, methods, andecosystem service frameworks like the Millennium Ecosystem Assessment, The Economicsof Ecosystem and Biodiversity, and others [3]. These have classified and defined urbanecosystem services as well as reviewed methods for their valuation. A similar body of liter-ature has also discussed ecosystem disservices, or the social, environmental, and economiccosts that these detrimental ecosystem functions have on people’s well-being [4–6].
This urban ecosystem service–disservice literature has primarily used case studiesin contexts such those of Europe and the United States to explore these functions as wellas the links between citizens and the benefits from green spaces [7–9] Similarly, several
27
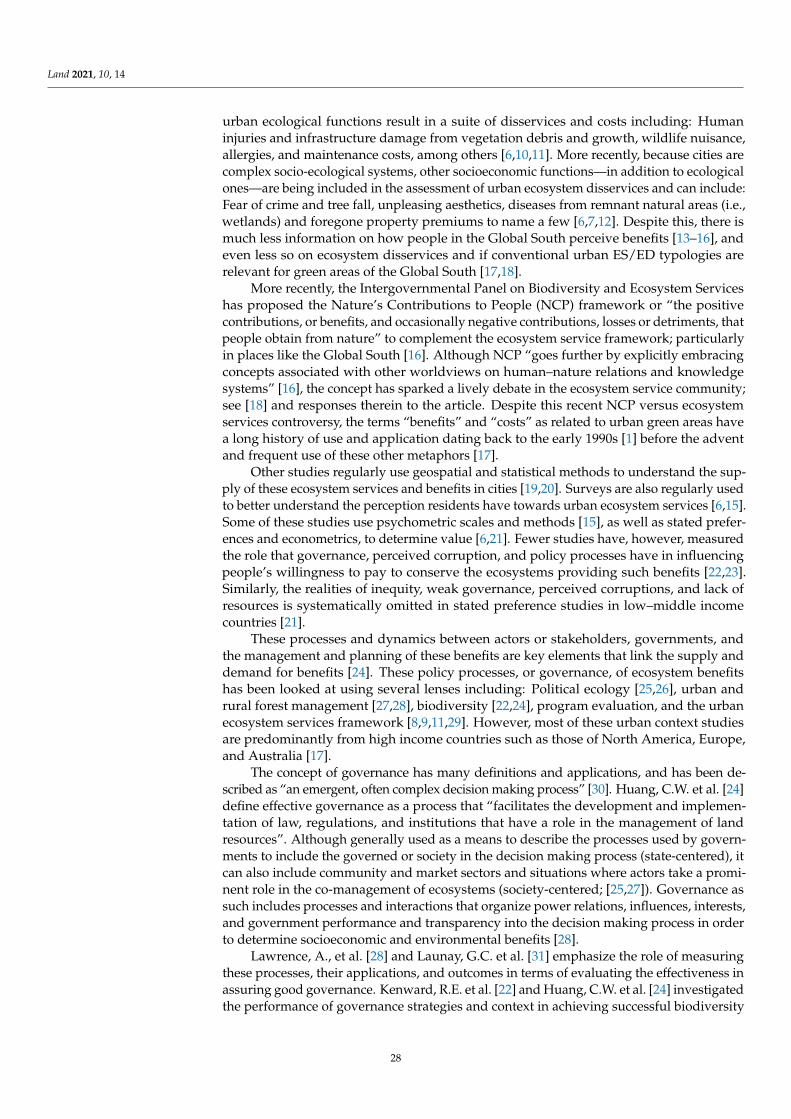
Land 2021, 10, 14
urban ecological functions result in a suite of disservices and costs including: Humaninjuries and infrastructure damage from vegetation debris and growth, wildlife nuisance,allergies, and maintenance costs, among others [6,10,11]. More recently, because cities arecomplex socio-ecological systems, other socioeconomic functions—in addition to ecologicalones—are being included in the assessment of urban ecosystem disservices and can include:Fear of crime and tree fall, unpleasing aesthetics, diseases from remnant natural areas (i.e.,wetlands) and foregone property premiums to name a few [6,7,12]. Despite this, there ismuch less information on how people in the Global South perceive benefits [13–16], andeven less so on ecosystem disservices and if conventional urban ES/ED typologies arerelevant for green areas of the Global South [17,18].
More recently, the Intergovernmental Panel on Biodiversity and Ecosystem Serviceshas proposed the Nature’s Contributions to People (NCP) framework or “the positivecontributions, or benefits, and occasionally negative contributions, losses or detriments, thatpeople obtain from nature” to complement the ecosystem service framework; particularlyin places like the Global South [16]. Although NCP “goes further by explicitly embracingconcepts associated with other worldviews on human–nature relations and knowledgesystems” [16], the concept has sparked a lively debate in the ecosystem service community;see [18] and responses therein to the article. Despite this recent NCP versus ecosystemservices controversy, the terms “benefits” and “costs” as related to urban green areas havea long history of use and application dating back to the early 1990s [1] before the adventand frequent use of these other metaphors [17].
Other studies regularly use geospatial and statistical methods to understand the sup-ply of these ecosystem services and benefits in cities [19,20]. Surveys are also regularly usedto better understand the perception residents have towards urban ecosystem services [6,15].Some of these studies use psychometric scales and methods [15], as well as stated prefer-ences and econometrics, to determine value [6,21]. Fewer studies have, however, measuredthe role that governance, perceived corruption, and policy processes have in influencingpeople’s willingness to pay to conserve the ecosystems providing such benefits [22,23].Similarly, the realities of inequity, weak governance, perceived corruptions, and lack ofresources is systematically omitted in stated preference studies in low–middle incomecountries [21].
These processes and dynamics between actors or stakeholders, governments, andthe management and planning of these benefits are key elements that link the supply anddemand for benefits [24]. These policy processes, or governance, of ecosystem benefitshas been looked at using several lenses including: Political ecology [25,26], urban andrural forest management [27,28], biodiversity [22,24], program evaluation, and the urbanecosystem services framework [8,9,11,29]. However, most of these urban context studiesare predominantly from high income countries such as those of North America, Europe,and Australia [17].
The concept of governance has many definitions and applications, and has been de-scribed as “an emergent, often complex decision making process” [30]. Huang, C.W. et al. [24]define effective governance as a process that “facilitates the development and implemen-tation of law, regulations, and institutions that have a role in the management of landresources”. Although generally used as a means to describe the processes used by govern-ments to include the governed or society in the decision making process (state-centered), itcan also include community and market sectors and situations where actors take a promi-nent role in the co-management of ecosystems (society-centered; [25,27]). Governance assuch includes processes and interactions that organize power relations, influences, interests,and government performance and transparency into the decision making process in orderto determine socioeconomic and environmental benefits [28].
Lawrence, A., et al. [28] and Launay, G.C. et al. [31] emphasize the role of measuringthese processes, their applications, and outcomes in terms of evaluating the effectiveness inassuring good governance. Kenward, R.E. et al. [22] and Huang, C.W. et al. [24] investigatedthe performance of governance strategies and context in achieving successful biodiversity
28
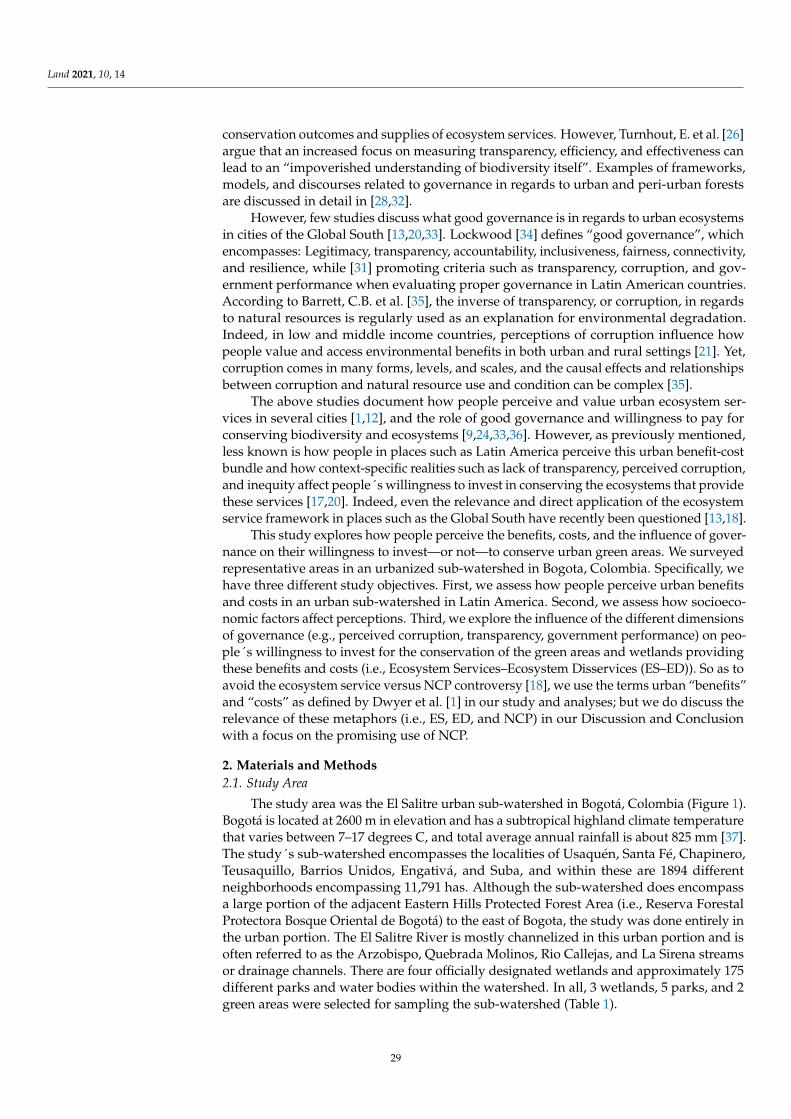
Land 2021, 10, 14
conservation outcomes and supplies of ecosystem services. However, Turnhout, E. et al. [26]argue that an increased focus on measuring transparency, efficiency, and effectiveness canlead to an “impoverished understanding of biodiversity itself”. Examples of frameworks,models, and discourses related to governance in regards to urban and peri-urban forestsare discussed in detail in [28,32].
However, few studies discuss what good governance is in regards to urban ecosystemsin cities of the Global South [13,20,33]. Lockwood [34] defines “good governance”, whichencompasses: Legitimacy, transparency, accountability, inclusiveness, fairness, connectivity,and resilience, while [31] promoting criteria such as transparency, corruption, and gov-ernment performance when evaluating proper governance in Latin American countries.According to Barrett, C.B. et al. [35], the inverse of transparency, or corruption, in regardsto natural resources is regularly used as an explanation for environmental degradation.Indeed, in low and middle income countries, perceptions of corruption influence howpeople value and access environmental benefits in both urban and rural settings [21]. Yet,corruption comes in many forms, levels, and scales, and the causal effects and relationshipsbetween corruption and natural resource use and condition can be complex [35].
The above studies document how people perceive and value urban ecosystem ser-vices in several cities [1,12], and the role of good governance and willingness to pay forconserving biodiversity and ecosystems [9,24,33,36]. However, as previously mentioned,less known is how people in places such as Latin America perceive this urban benefit-costbundle and how context-specific realities such as lack of transparency, perceived corruption,and inequity affect people´s willingness to invest in conserving the ecosystems that providethese services [17,20]. Indeed, even the relevance and direct application of the ecosystemservice framework in places such as the Global South have recently been questioned [13,18].
This study explores how people perceive the benefits, costs, and the influence of gover-nance on their willingness to invest—or not—to conserve urban green areas. We surveyedrepresentative areas in an urbanized sub-watershed in Bogota, Colombia. Specifically, wehave three different study objectives. First, we assess how people perceive urban benefitsand costs in an urban sub-watershed in Latin America. Second, we assess how socioeco-nomic factors affect perceptions. Third, we explore the influence of the different dimensionsof governance (e.g., perceived corruption, transparency, government performance) on peo-ple´s willingness to invest for the conservation of the green areas and wetlands providingthese benefits and costs (i.e., Ecosystem Services–Ecosystem Disservices (ES–ED)). So as toavoid the ecosystem service versus NCP controversy [18], we use the terms urban “benefits”and “costs” as defined by Dwyer et al. [1] in our study and analyses; but we do discuss therelevance of these metaphors (i.e., ES, ED, and NCP) in our Discussion and Conclusionwith a focus on the promising use of NCP.
2. Materials and Methods2.1. Study Area
The study area was the El Salitre urban sub-watershed in Bogotá, Colombia (Figure 1).Bogotá is located at 2600 m in elevation and has a subtropical highland climate temperaturethat varies between 7–17 degrees C, and total average annual rainfall is about 825 mm [37].The study´s sub-watershed encompasses the localities of Usaquén, Santa Fé, Chapinero,Teusaquillo, Barrios Unidos, Engativá, and Suba, and within these are 1894 differentneighborhoods encompassing 11,791 has. Although the sub-watershed does encompassa large portion of the adjacent Eastern Hills Protected Forest Area (i.e., Reserva ForestalProtectora Bosque Oriental de Bogotá) to the east of Bogota, the study was done entirely inthe urban portion. The El Salitre River is mostly channelized in this urban portion and isoften referred to as the Arzobispo, Quebrada Molinos, Rio Callejas, and La Sirena streamsor drainage channels. There are four officially designated wetlands and approximately 175different parks and water bodies within the watershed. In all, 3 wetlands, 5 parks, and 2green areas were selected for sampling the sub-watershed (Table 1).
29
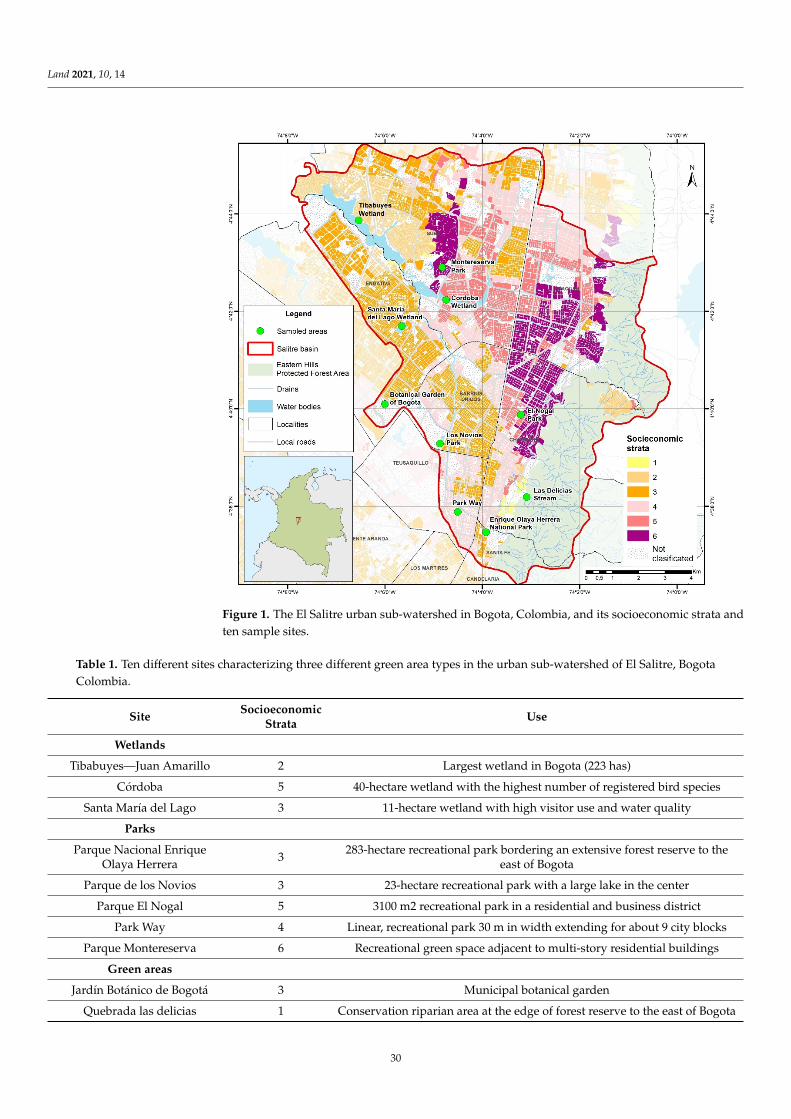
Land 2021, 10, 14
Land 2021, 10, x FOR PEER REVIEW 4 of 22
Forestal Protectora Bosque Oriental de Bogotá) to the east of Bogota, the study was done entirely in the urban portion. The El Salitre River is mostly channelized in this urban por-tion and is often referred to as the Arzobispo, Quebrada Molinos, Rio Callejas, and La Sirena streams or drainage channels. There are four officially designated wetlands and approximately 175 different parks and water bodies within the watershed. In all, 3 wet-lands, 5 parks, and 2 green areas were selected for sampling the sub-watershed (Table 1).
Figure 1. The El Salitre urban sub-watershed in Bogota, Colombia, and its socioeconomic strata and ten sample sites.
Table 1. Ten different sites characterizing three different green area types in the urban sub-watershed of El Salitre, Bogota Colombia.
Site Socioeconomic Strata Use Wetlands
Tibabuyes—Juan Amarillo 2 Largest wetland in Bogota (223 has)
Córdoba 5 40-hectare wetland with the highest number of registered bird species
Santa María del Lago 3 11-hectare wetland with high visitor use and water quality
Parks
Parque Nacional Enrique Olaya Herrera 3 283-hectare recreational park bordering an ex-tensive forest reserve to the east of Bogota
Parque de los Novios 3 23-hectare recreational park with a large lake in the center
Figure 1. The El Salitre urban sub-watershed in Bogota, Colombia, and its socioeconomic strata andten sample sites.
Table 1. Ten different sites characterizing three different green area types in the urban sub-watershed of El Salitre, BogotaColombia.
Site SocioeconomicStrata Use
Wetlands
Tibabuyes—Juan Amarillo 2 Largest wetland in Bogota (223 has)
Córdoba 5 40-hectare wetland with the highest number of registered bird species
Santa María del Lago 3 11-hectare wetland with high visitor use and water quality
Parks
Parque Nacional EnriqueOlaya Herrera 3 283-hectare recreational park bordering an extensive forest reserve to the
east of Bogota
Parque de los Novios 3 23-hectare recreational park with a large lake in the center
Parque El Nogal 5 3100 m2 recreational park in a residential and business district
Park Way 4 Linear, recreational park 30 m in width extending for about 9 city blocks
Parque Montereserva 6 Recreational green space adjacent to multi-story residential buildings
Green areas
Jardín Botánico de Bogotá 3 Municipal botanical garden
Quebrada las delicias 1 Conservation riparian area at the edge of forest reserve to the east of Bogota
30
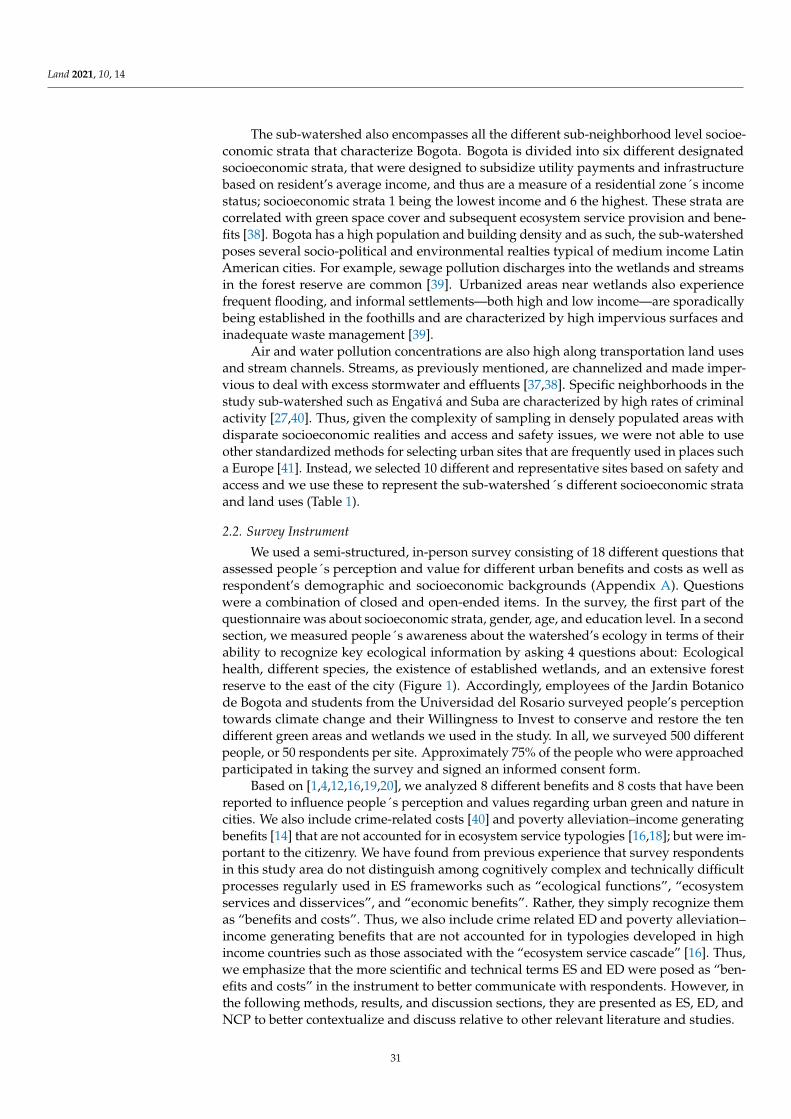
Land 2021, 10, 14
The sub-watershed also encompasses all the different sub-neighborhood level socioe-conomic strata that characterize Bogota. Bogota is divided into six different designatedsocioeconomic strata, that were designed to subsidize utility payments and infrastructurebased on resident’s average income, and thus are a measure of a residential zone´s incomestatus; socioeconomic strata 1 being the lowest income and 6 the highest. These strata arecorrelated with green space cover and subsequent ecosystem service provision and bene-fits [38]. Bogota has a high population and building density and as such, the sub-watershedposes several socio-political and environmental realties typical of medium income LatinAmerican cities. For example, sewage pollution discharges into the wetlands and streamsin the forest reserve are common [39]. Urbanized areas near wetlands also experiencefrequent flooding, and informal settlements—both high and low income—are sporadicallybeing established in the foothills and are characterized by high impervious surfaces andinadequate waste management [39].
Air and water pollution concentrations are also high along transportation land usesand stream channels. Streams, as previously mentioned, are channelized and made imper-vious to deal with excess stormwater and effluents [37,38]. Specific neighborhoods in thestudy sub-watershed such as Engativá and Suba are characterized by high rates of criminalactivity [27,40]. Thus, given the complexity of sampling in densely populated areas withdisparate socioeconomic realities and access and safety issues, we were not able to useother standardized methods for selecting urban sites that are frequently used in places sucha Europe [41]. Instead, we selected 10 different and representative sites based on safety andaccess and we use these to represent the sub-watershed´s different socioeconomic strataand land uses (Table 1).
2.2. Survey Instrument
We used a semi-structured, in-person survey consisting of 18 different questions thatassessed people´s perception and value for different urban benefits and costs as well asrespondent’s demographic and socioeconomic backgrounds (Appendix A). Questionswere a combination of closed and open-ended items. In the survey, the first part of thequestionnaire was about socioeconomic strata, gender, age, and education level. In a secondsection, we measured people´s awareness about the watershed’s ecology in terms of theirability to recognize key ecological information by asking 4 questions about: Ecologicalhealth, different species, the existence of established wetlands, and an extensive forestreserve to the east of the city (Figure 1). Accordingly, employees of the Jardin Botanicode Bogota and students from the Universidad del Rosario surveyed people’s perceptiontowards climate change and their Willingness to Invest to conserve and restore the tendifferent green areas and wetlands we used in the study. In all, we surveyed 500 differentpeople, or 50 respondents per site. Approximately 75% of the people who were approachedparticipated in taking the survey and signed an informed consent form.
Based on [1,4,12,16,19,20], we analyzed 8 different benefits and 8 costs that have beenreported to influence people´s perception and values regarding urban green and nature incities. We also include crime-related costs [40] and poverty alleviation–income generatingbenefits [14] that are not accounted for in ecosystem service typologies [16,18]; but were im-portant to the citizenry. We have found from previous experience that survey respondentsin this study area do not distinguish among cognitively complex and technically difficultprocesses regularly used in ES frameworks such as “ecological functions”, “ecosystemservices and disservices”, and “economic benefits”. Rather, they simply recognize themas “benefits and costs”. Thus, we also include crime related ED and poverty alleviation–income generating benefits that are not accounted for in typologies developed in highincome countries such as those associated with the “ecosystem service cascade” [16]. Thus,we emphasize that the more scientific and technical terms ES and ED were posed as “ben-efits and costs” in the instrument to better communicate with respondents. However, inthe following methods, results, and discussion sections, they are presented as ES, ED, andNCP to better contextualize and discuss relative to other relevant literature and studies.
31
Land 2021, 10, 14
2.3. Statistical and Econometric Analysis
Survey responses were in the form of dichotomous questions and Likert scales thatwere used to statistically characterize the survey population and their responses usingtwo approaches (Appendix A; [15]). First, we summarized respondent´s socioeconomicstrata, gender, age, and education level. Graphical analyses were used to identify trendsand patterns in responses towards benefits and costs. Then an ordinary least squares(OLS) regression with robust standard errors: 1. Explored the variables that can influenceperception towards different benefits and costs, and 2. identified variables for a subse-quent analysis using a more predictive model. Following the work of [42], the followingregression model (Equation (1)) accounted for the social–cultural dimensions of benefits(Bij):
Bene f itsij = β0 + β1EAi + β2SSi + β3 AEi + βkXi k + εi (1)
where Bene f itsij corresponds to the number of benefits identified by each individualsurveyed in three categories: Provision, environmental, and cultural. This variable wasmodelled according to three types of sites: Parks, wetlands, and green areas. The indepen-dent variable EAi was the environmental awareness of each individual; SSi is the sense ofsecurity; AEi is a dichotomic variable that takes the value of 1 when the individual has auniversity degree, and 0 when the individual has a lower degree than a university degree;Xi is a 3 by 1 vector of control variables. This vector includes the following variables: Age,a dichotomous variable if the individual is from Bogotá, and another dichotomous variableif the individual is aware of climate change.
Second, we used survey responses and most of the variables from our OLS model in alogistic regression to econometrically assess the effects of Weak Governance(Weak_governance) on respondent’s Unwillingness to Invest (UTI) using Equation (2).Per Colombian program evaluation standards [31], a response of not willing to invest (i.e.,UTI) included the following reasons for not doing so: 1. Perception of corruption or thatfunds will not be used appropriately, 2. conservation of green areas and wetlands is alreadypaid for in taxes, 3. the respondents already pay too much tax, and 4. it is the government´sresponsibility to conserve green areas. We recoded people´s Unwillingness to Invest as thedependent variable UTI = 1; conversely, UTI = 0 if people were Willing to Invest.
ProbUTI = β0 + β1 Weak_Governance + βkX + εi (2)
Thus, based on [31] and [34], the Weak_governance variable in Equation (2) was 1if there was a perception of weak governance and 0 otherwise. The X in Equation (1) isa vector representing the socioeconomic variables that were used as controls. We usedGender = 1 for female, and Age was a categorical variable. Strata were recorded accordingto respondent´s socioeconomic strata (1, 2, . . . .6). In order to avoid perfect collinearitywith the intercept of the model, stratum 1 was the omitted variable, as was Salitre if therespondent was from this locality and the city of Bogotá. Five of the 500 respondents didnot respond to the UTI question, therefore we used 495 responses for this analysis. Logisticregression estimates were reported using Odds Ratios. Both regression models and allstatistical analyses were done using the Stata Version 12 software.
3. Results3.1. Socioeconomic Characteristics
The majority of the respondents (68%) were between 18–45 years in age, and 55%were male (Table 2). About 32% had a university level education, and only 2.4% hadpost-graduate studies. Fifty % were in the middle-income strata (Strata 3 and 4), while 20%were in the lower income strata (Strata 1 and 2).
32
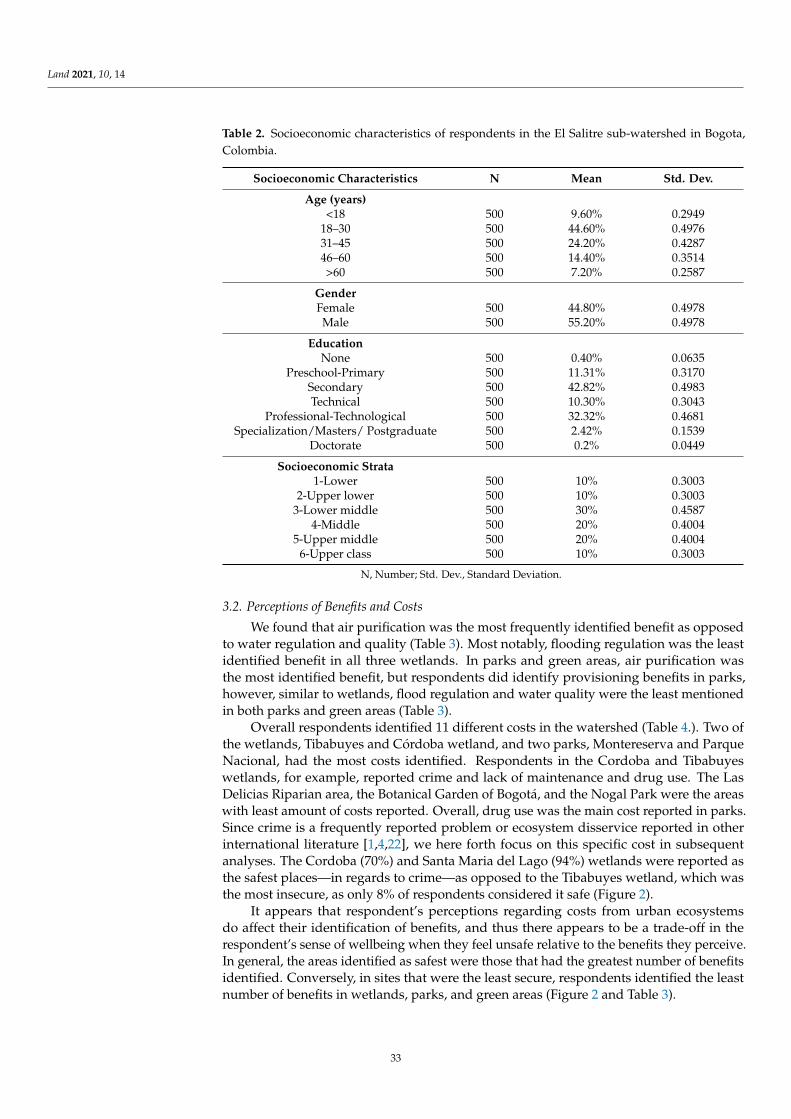
Land 2021, 10, 14
Table 2. Socioeconomic characteristics of respondents in the El Salitre sub-watershed in Bogota,Colombia.
Socioeconomic Characteristics N Mean Std. Dev.
Age (years)<18 500 9.60% 0.2949
18–30 500 44.60% 0.497631–45 500 24.20% 0.428746–60 500 14.40% 0.3514>60 500 7.20% 0.2587
GenderFemale 500 44.80% 0.4978Male 500 55.20% 0.4978
EducationNone 500 0.40% 0.0635
Preschool-Primary 500 11.31% 0.3170Secondary 500 42.82% 0.4983Technical 500 10.30% 0.3043
Professional-Technological 500 32.32% 0.4681Specialization/Masters/ Postgraduate 500 2.42% 0.1539
Doctorate 500 0.2% 0.0449
Socioeconomic Strata1-Lower 500 10% 0.3003
2-Upper lower 500 10% 0.30033-Lower middle 500 30% 0.4587
4-Middle 500 20% 0.40045-Upper middle 500 20% 0.4004
6-Upper class 500 10% 0.3003
N, Number; Std. Dev., Standard Deviation.
3.2. Perceptions of Benefits and Costs
We found that air purification was the most frequently identified benefit as opposedto water regulation and quality (Table 3). Most notably, flooding regulation was the leastidentified benefit in all three wetlands. In parks and green areas, air purification wasthe most identified benefit, but respondents did identify provisioning benefits in parks,however, similar to wetlands, flood regulation and water quality were the least mentionedin both parks and green areas (Table 3).
Overall respondents identified 11 different costs in the watershed (Table 4.). Two ofthe wetlands, Tibabuyes and Córdoba wetland, and two parks, Montereserva and ParqueNacional, had the most costs identified. Respondents in the Cordoba and Tibabuyeswetlands, for example, reported crime and lack of maintenance and drug use. The LasDelicias Riparian area, the Botanical Garden of Bogotá, and the Nogal Park were the areaswith least amount of costs reported. Overall, drug use was the main cost reported in parks.Since crime is a frequently reported problem or ecosystem disservice reported in otherinternational literature [1,4,22], we here forth focus on this specific cost in subsequentanalyses. The Cordoba (70%) and Santa Maria del Lago (94%) wetlands were reported asthe safest places—in regards to crime—as opposed to the Tibabuyes wetland, which wasthe most insecure, as only 8% of respondents considered it safe (Figure 2).
It appears that respondent’s perceptions regarding costs from urban ecosystemsdo affect their identification of benefits, and thus there appears to be a trade-off in therespondent’s sense of wellbeing when they feel unsafe relative to the benefits they perceive.In general, the areas identified as safest were those that had the greatest number of benefitsidentified. Conversely, in sites that were the least secure, respondents identified the leastnumber of benefits in wetlands, parks, and green areas (Figure 2 and Table 3).
33
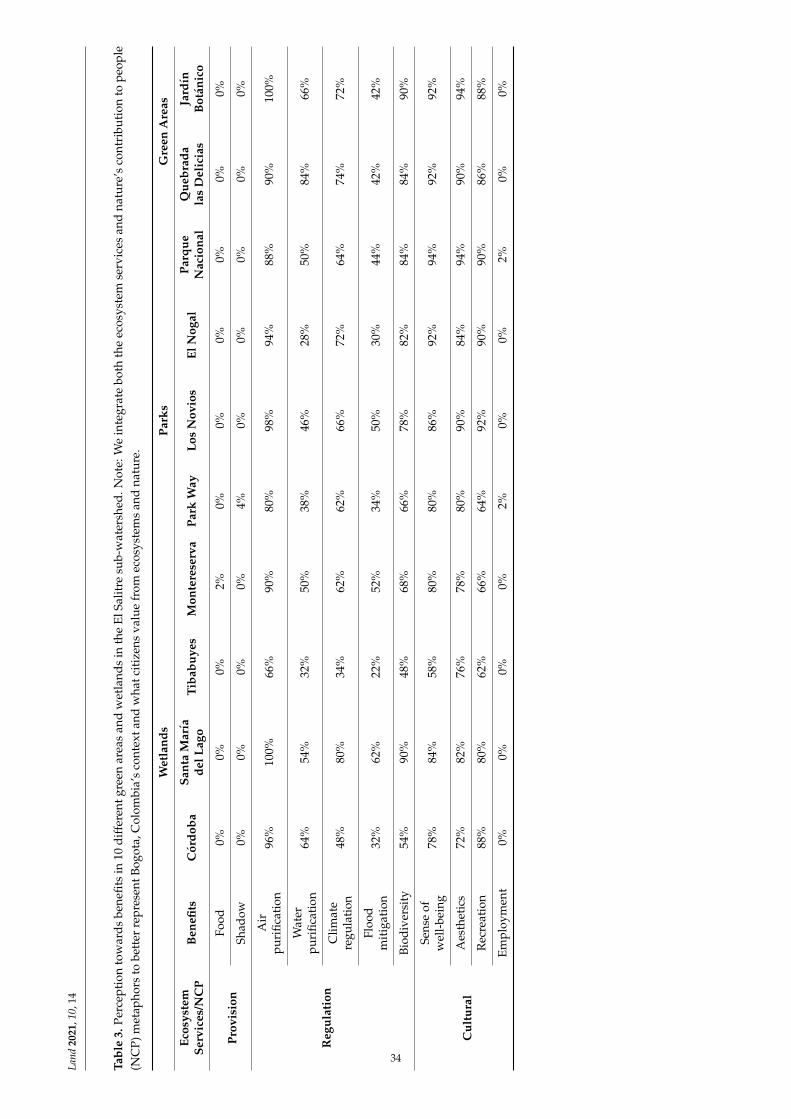
Land
2021
,10,
14
Tabl
e3.
Perc
epti
onto
war
ds
bene
fits
in10
dif
fere
ntgr
een
area
san
dw
etla
nds
inth
eE
lSal
itre
sub-
wat
ersh
ed.N
ote:
We
inte
grat
ebo
thth
eec
osys
tem
serv
ices
and
natu
re’s
cont
ribu
tion
tope
ople
(NC
P)m
etap
hors
tobe
tter
repr
esen
tBog
ota,
Col
ombi
a’s
cont
exta
ndw
hatc
itiz
ens
valu
efr
omec
osys
tem
san
dna
ture
.
Wet
land
sPa
rks
Gre
enA
reas
Ecos
yste
mSe
rvic
es/N
CP
Ben
efits
Cór
doba
Sant
aM
aría
delL
ago
Tiba
buye
sM
onte
rese
rva
Park
Way
Los
Nov
ios
ElN
ogal
Parq
ueN
acio
nal
Que
brad
ala
sD
elic
ias
Jard
ínB
otán
ico
Prov
isio
nFo
od0%
0%0%
2%0%
0%0%
0%0%
0%
Shad
ow0%
0%0%
0%4%
0%0%
0%0%
0%
Reg
ulat
ion
Air
puri
ficat
ion
96%
100%
66%
90%
80%
98%
94%
88%
90%
100%
Wat
erpu
rific
atio
n64
%54
%32
%50
%38
%46
%28
%50
%84
%66
%
Clim
ate
regu
lati
on48
%80
%34
%62
%62
%66
%72
%64
%74
%72
%
Floo
dm
itig
atio
n32
%62
%22
%52
%34
%50
%30
%44
%42
%42
%
Biod
iver
sity
54%
90%
48%
68%
66%
78%
82%
84%
84%
90%
Cul
tura
l
Sens
eof
wel
l-be
ing
78%
84%
58%
80%
80%
86%
92%
94%
92%
92%
Aes
thet
ics
72%
82%
76%
78%
80%
90%
84%
94%
90%
94%
Rec
reat
ion
88%
80%
62%
66%
64%
92%
90%
90%
86%
88%
Empl
oym
ent
0%0%
0%0%
2%0%
0%2%
0%0%
34
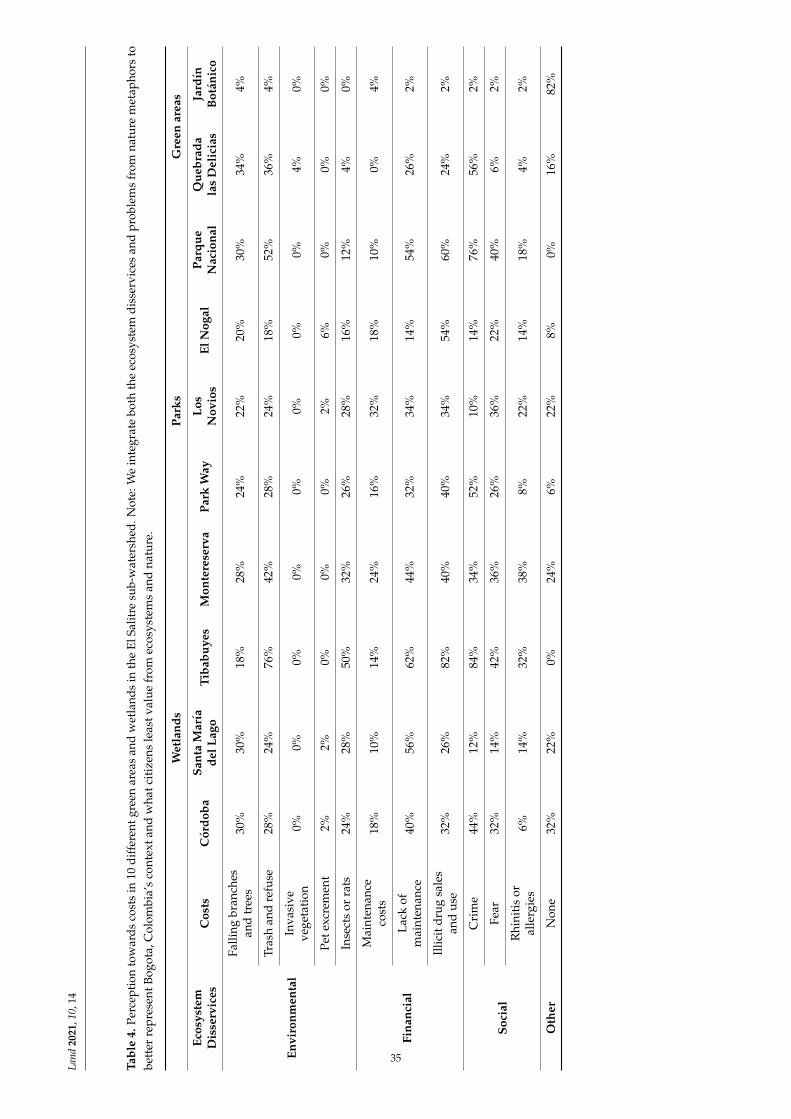
Land
2021
,10,
14
Tabl
e4.
Perc
eptio
nto
war
dsco
sts
in10
diff
eren
tgre
enar
eas
and
wet
land
sin
the
ElSa
litre
sub-
wat
ersh
ed.N
ote:
We
inte
grat
ebo
thth
eec
osys
tem
diss
ervi
ces
and
prob
lem
sfr
omna
ture
met
apho
rsto
bett
erre
pres
entB
ogot
a,C
olom
bia’
sco
ntex
tand
wha
tcit
izen
sle
astv
alue
from
ecos
yste
ms
and
natu
re.
Wet
land
sPa
rks
Gre
enar
eas
Ecos
yste
mD
isse
rvic
esC
osts
Cór
doba
Sant
aM
aría
delL
ago
Tiba
buye
sM
onte
rese
rva
Park
Way
Los
Nov
ios
ElN
ogal
Parq
ueN
acio
nal
Que
brad
ala
sD
elic
ias
Jard
ínB
otán
ico
Envi
ronm
enta
l
Falli
ngbr
anch
esan
dtr
ees
30%
30%
18%
28%
24%
22%
20%
30%
34%
4%
Tras
han
dre
fuse
28%
24%
76%
42%
28%
24%
18%
52%
36%
4%
Inva
sive
vege
tati
on0%
0%0%
0%0%
0%0%
0%4%
0%
Pete
xcre
men
t2%
2%0%
0%0%
2%6%
0%0%
0%
Inse
cts
orra
ts24
%28
%50
%32
%26
%28
%16
%12
%4%
0%
Fina
ncia
l
Mai
nten
ance
cost
s18
%10
%14
%24
%16
%32
%18
%10
%0%
4%
Lack
ofm
aint
enan
ce40
%56
%62
%44
%32
%34
%14
%54
%26
%2%
Illic
itdr
ugsa
les
and
use
32%
26%
82%
40%
40%
34%
54%
60%
24%
2%
Soci
al
Cri
me
44%
12%
84%
34%
52%
10%
14%
76%
56%
2%
Fear
32%
14%
42%
36%
26%
36%
22%
40%
6%2%
Rhi
niti
sor
alle
rgie
s6%
14%
32%
38%
8%22
%14
%18
%4%
2%
Oth
erN
one
32%
22%
0%24
%6%
22%
8%0%
16%
82%
35
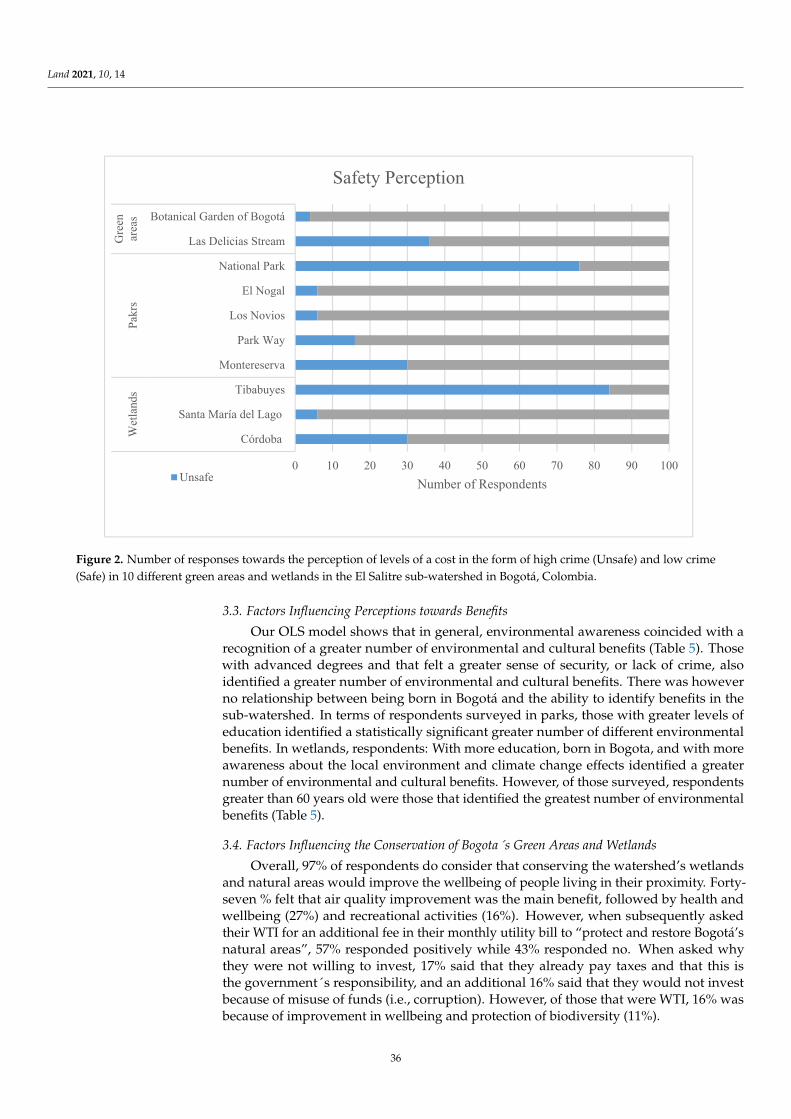
Land 2021, 10, 14
Land 2021, 10, x FOR PEER REVIEW 11 of 22
Figure 2. Number of responses towards the perception of levels of a cost in the form of high crime (Unsafe) and low crime (Safe) in 10 different green areas and wetlands in the El Salitre sub-watershed in Bogotá, Colombia.
It appears that respondent’s perceptions regarding costs from urban ecosystems do affect their identification of benefits, and thus there appears to be a trade-off in the re-spondent’s sense of wellbeing when they feel unsafe relative to the benefits they perceive. In general, the areas identified as safest were those that had the greatest number of bene-fits identified. Conversely, in sites that were the least secure, respondents identified the least number of benefits in wetlands, parks, and green areas (Figure 2 and Table 3).
3.3. Factors Influencing Perceptions towards Benefits Our OLS model shows that in general, environmental awareness coincided with a
recognition of a greater number of environmental and cultural benefits (Table 5). Those with advanced degrees and that felt a greater sense of security, or lack of crime, also iden-tified a greater number of environmental and cultural benefits. There was however no relationship between being born in Bogotá and the ability to identify benefits in the sub-watershed. In terms of respondents surveyed in parks, those with greater levels of educa-tion identified a statistically significant greater number of different environmental bene-fits. In wetlands, respondents: With more education, born in Bogota, and with more awareness about the local environment and climate change effects identified a greater number of environmental and cultural benefits. However, of those surveyed, respondents greater than 60 years old were those that identified the greatest number of environmental benefits (Table 5).
0 10 20 30 40 50 60 70 80 90 100
Córdoba
Santa María del Lago
Tibabuyes
Montereserva
Park Way
Los Novios
El Nogal
National Park
Las Delicias Stream
Botanical Garden of Bogotá
Wet
land
sPa
krs
Gre
enar
eas
Number of Respondents
Safety Perception
Unsafe
Figure 2. Number of responses towards the perception of levels of a cost in the form of high crime (Unsafe) and low crime(Safe) in 10 different green areas and wetlands in the El Salitre sub-watershed in Bogotá, Colombia.
3.3. Factors Influencing Perceptions towards Benefits
Our OLS model shows that in general, environmental awareness coincided with arecognition of a greater number of environmental and cultural benefits (Table 5). Thosewith advanced degrees and that felt a greater sense of security, or lack of crime, alsoidentified a greater number of environmental and cultural benefits. There was howeverno relationship between being born in Bogotá and the ability to identify benefits in thesub-watershed. In terms of respondents surveyed in parks, those with greater levels ofeducation identified a statistically significant greater number of different environmentalbenefits. In wetlands, respondents: With more education, born in Bogota, and with moreawareness about the local environment and climate change effects identified a greaternumber of environmental and cultural benefits. However, of those surveyed, respondentsgreater than 60 years old were those that identified the greatest number of environmentalbenefits (Table 5).
3.4. Factors Influencing the Conservation of Bogota´s Green Areas and Wetlands
Overall, 97% of respondents do consider that conserving the watershed’s wetlandsand natural areas would improve the wellbeing of people living in their proximity. Forty-seven % felt that air quality improvement was the main benefit, followed by health andwellbeing (27%) and recreational activities (16%). However, when subsequently askedtheir WTI for an additional fee in their monthly utility bill to “protect and restore Bogotá’snatural areas”, 57% responded positively while 43% responded no. When asked whythey were not willing to invest, 17% said that they already pay taxes and that this isthe government´s responsibility, and an additional 16% said that they would not investbecause of misuse of funds (i.e., corruption). However, of those that were WTI, 16% wasbecause of improvement in wellbeing and protection of biodiversity (11%).
36
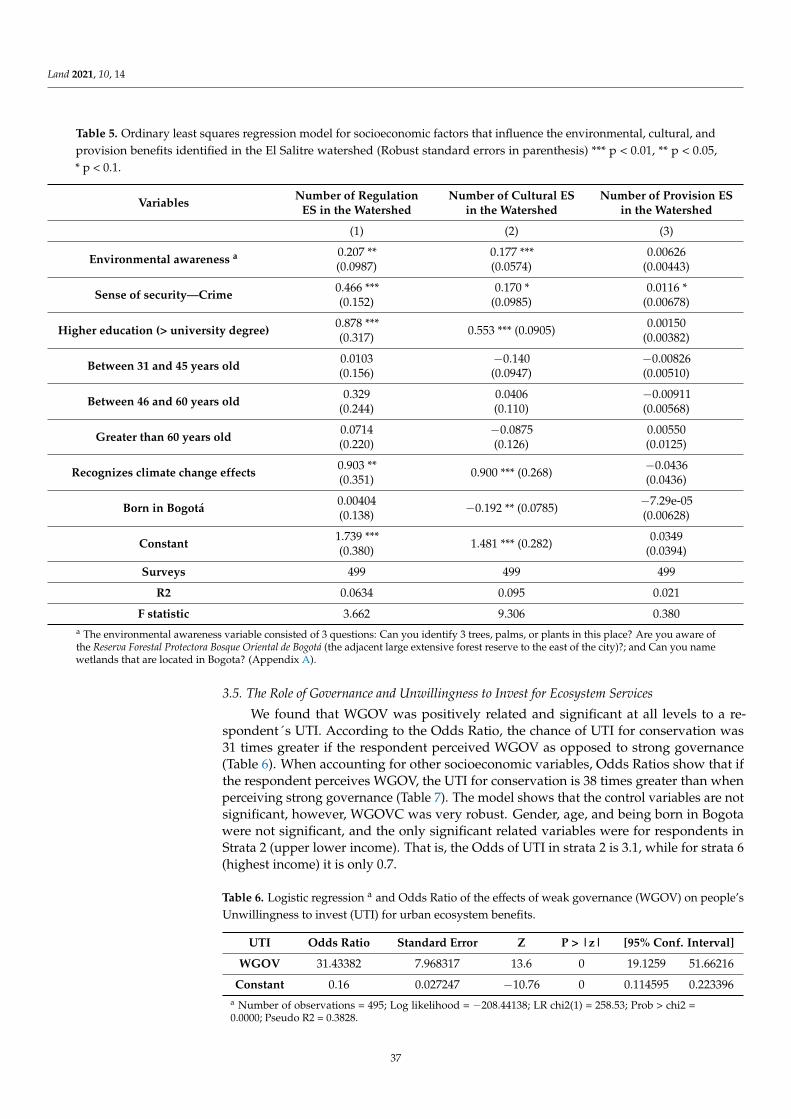
Land 2021, 10, 14
Table 5. Ordinary least squares regression model for socioeconomic factors that influence the environmental, cultural, andprovision benefits identified in the El Salitre watershed (Robust standard errors in parenthesis) *** p < 0.01, ** p < 0.05,* p < 0.1.
Variables Number of RegulationES in the Watershed
Number of Cultural ESin the Watershed
Number of Provision ESin the Watershed
(1) (2) (3)
Environmental awareness a 0.207 **(0.0987)
0.177 ***(0.0574)
0.00626(0.00443)
Sense of security—Crime 0.466 ***(0.152)
0.170 *(0.0985)
0.0116 *(0.00678)
Higher education (> university degree) 0.878 ***(0.317) 0.553 *** (0.0905) 0.00150
(0.00382)
Between 31 and 45 years old 0.0103(0.156)
−0.140(0.0947)
−0.00826(0.00510)
Between 46 and 60 years old 0.329(0.244)
0.0406(0.110)
−0.00911(0.00568)
Greater than 60 years old 0.0714(0.220)
−0.0875(0.126)
0.00550(0.0125)
Recognizes climate change effects 0.903 **(0.351) 0.900 *** (0.268) −0.0436
(0.0436)
Born in Bogotá 0.00404(0.138) −0.192 ** (0.0785) −7.29e-05
(0.00628)
Constant 1.739 ***(0.380) 1.481 *** (0.282) 0.0349
(0.0394)
Surveys 499 499 499
R2 0.0634 0.095 0.021
F statistic 3.662 9.306 0.380a The environmental awareness variable consisted of 3 questions: Can you identify 3 trees, palms, or plants in this place? Are you aware ofthe Reserva Forestal Protectora Bosque Oriental de Bogotá (the adjacent large extensive forest reserve to the east of the city)?; and Can you namewetlands that are located in Bogota? (Appendix A).
3.5. The Role of Governance and Unwillingness to Invest for Ecosystem Services
We found that WGOV was positively related and significant at all levels to a re-spondent´s UTI. According to the Odds Ratio, the chance of UTI for conservation was31 times greater if the respondent perceived WGOV as opposed to strong governance(Table 6). When accounting for other socioeconomic variables, Odds Ratios show that ifthe respondent perceives WGOV, the UTI for conservation is 38 times greater than whenperceiving strong governance (Table 7). The model shows that the control variables are notsignificant, however, WGOVC was very robust. Gender, age, and being born in Bogotawere not significant, and the only significant related variables were for respondents inStrata 2 (upper lower income). That is, the Odds of UTI in strata 2 is 3.1, while for strata 6(highest income) it is only 0.7.
Table 6. Logistic regression a and Odds Ratio of the effects of weak governance (WGOV) on people’sUnwillingness to invest (UTI) for urban ecosystem benefits.
UTI Odds Ratio Standard Error Z P > |z| [95% Conf. Interval]
WGOV 31.43382 7.968317 13.6 0 19.1259 51.66216
Constant 0.16 0.027247 −10.76 0 0.114595 0.223396a Number of observations = 495; Log likelihood = −208.44138; LR chi2(1) = 258.53; Prob > chi2 =0.0000; Pseudo R2 = 0.3828.
37
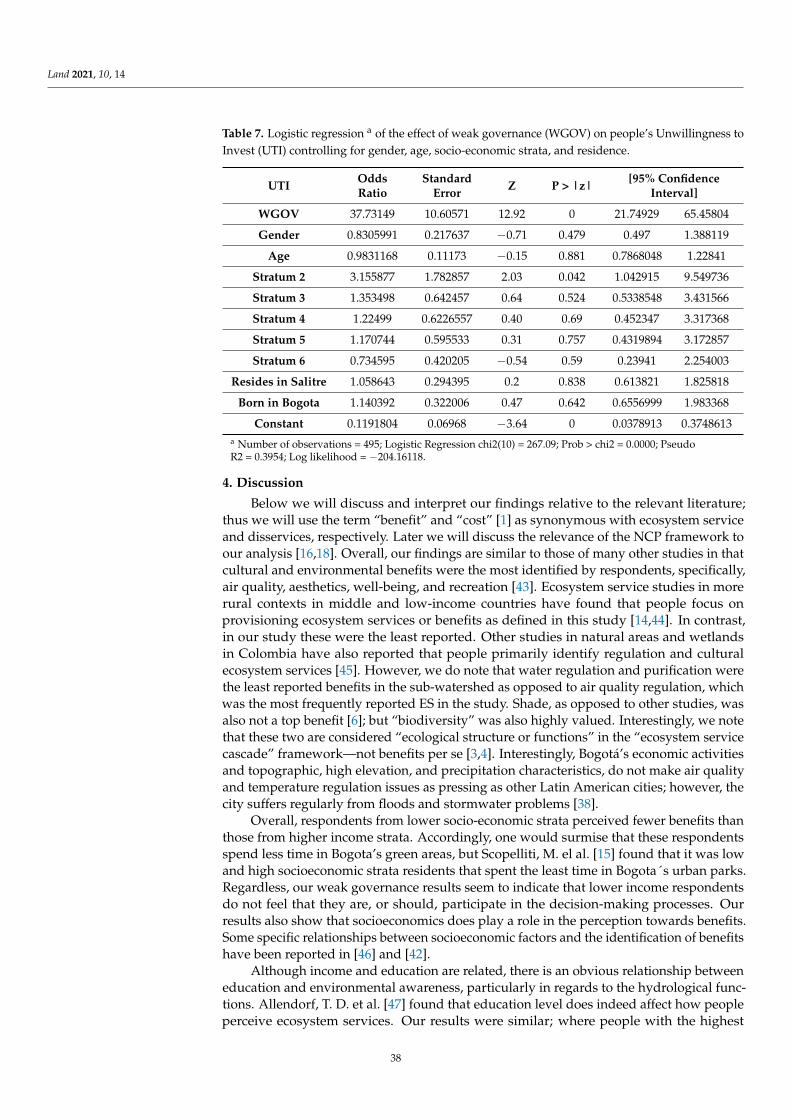
Land 2021, 10, 14
Table 7. Logistic regression a of the effect of weak governance (WGOV) on people’s Unwillingness toInvest (UTI) controlling for gender, age, socio-economic strata, and residence.
UTI OddsRatio
StandardError Z P > |z| [95% Confidence
Interval]
WGOV 37.73149 10.60571 12.92 0 21.74929 65.45804
Gender 0.8305991 0.217637 −0.71 0.479 0.497 1.388119
Age 0.9831168 0.11173 −0.15 0.881 0.7868048 1.22841
Stratum 2 3.155877 1.782857 2.03 0.042 1.042915 9.549736
Stratum 3 1.353498 0.642457 0.64 0.524 0.5338548 3.431566
Stratum 4 1.22499 0.6226557 0.40 0.69 0.452347 3.317368
Stratum 5 1.170744 0.595533 0.31 0.757 0.4319894 3.172857
Stratum 6 0.734595 0.420205 −0.54 0.59 0.23941 2.254003
Resides in Salitre 1.058643 0.294395 0.2 0.838 0.613821 1.825818
Born in Bogota 1.140392 0.322006 0.47 0.642 0.6556999 1.983368
Constant 0.1191804 0.06968 −3.64 0 0.0378913 0.3748613a Number of observations = 495; Logistic Regression chi2(10) = 267.09; Prob > chi2 = 0.0000; PseudoR2 = 0.3954; Log likelihood = −204.16118.
4. Discussion
Below we will discuss and interpret our findings relative to the relevant literature;thus we will use the term “benefit” and “cost” [1] as synonymous with ecosystem serviceand disservices, respectively. Later we will discuss the relevance of the NCP framework toour analysis [16,18]. Overall, our findings are similar to those of many other studies in thatcultural and environmental benefits were the most identified by respondents, specifically,air quality, aesthetics, well-being, and recreation [43]. Ecosystem service studies in morerural contexts in middle and low-income countries have found that people focus onprovisioning ecosystem services or benefits as defined in this study [14,44]. In contrast,in our study these were the least reported. Other studies in natural areas and wetlandsin Colombia have also reported that people primarily identify regulation and culturalecosystem services [45]. However, we do note that water regulation and purification werethe least reported benefits in the sub-watershed as opposed to air quality regulation, whichwas the most frequently reported ES in the study. Shade, as opposed to other studies, wasalso not a top benefit [6]; but “biodiversity” was also highly valued. Interestingly, we notethat these two are considered “ecological structure or functions” in the “ecosystem servicecascade” framework—not benefits per se [3,4]. Interestingly, Bogotá’s economic activitiesand topographic, high elevation, and precipitation characteristics, do not make air qualityand temperature regulation issues as pressing as other Latin American cities; however, thecity suffers regularly from floods and stormwater problems [38].
Overall, respondents from lower socio-economic strata perceived fewer benefits thanthose from higher income strata. Accordingly, one would surmise that these respondentsspend less time in Bogota’s green areas, but Scopelliti, M. el al. [15] found that it was lowand high socioeconomic strata residents that spent the least time in Bogota´s urban parks.Regardless, our weak governance results seem to indicate that lower income respondentsdo not feel that they are, or should, participate in the decision-making processes. Ourresults also show that socioeconomics does play a role in the perception towards benefits.Some specific relationships between socioeconomic factors and the identification of benefitshave been reported in [46] and [42].
Although income and education are related, there is an obvious relationship betweeneducation and environmental awareness, particularly in regards to the hydrological func-tions. Allendorf, T. D. et al. [47] found that education level does indeed affect how peopleperceive ecosystem services. Our results were similar; where people with the highest
38
Land 2021, 10, 14
level of education perceived more benefits than those without. One of the most insightfulfindings was the relationship between “wellbeing” and ecological structure-function-formin that the better maintained green areas were also those that were “safest” in terms ofcrime and where the majority of benefits were identified. Similarly, the majority of re-spondents were aware that there would be a loss in their wellbeing if these green areaswere lost to land use change. Other research in Bogota has shown that public areas withincreased tree-shrub-palm density and heights as well as tree plantings were related tolower incidences of crime and greater provision of benefits [19,38].
Based on Colombian program evaluation criteria [31] for principles and performanceoutcomes for good governance [34], our survey and modelling found that the perceptionof governance regarding public expenditures was playing an influential role in the WTIfor benefits. Particularly, perceived weak governance was statistically related to people’sUTI in conserving green areas. This finding suggests that transparency, performance, andperceived corruption of government institutions can and will influence buy in and thevalue citizens place on the benefits from urban ecosystems [33,34]. Furthermore, the effectof governance on the UTI for benefits was not homogeneous across all socio-economicstrata. Notably, respondents in Stratum 2 identified a weakness in governance, and thisaffected their subsequent odds of not investing for conservation–benefits related initiatives;this was on average three times greater than individuals from higher socio-economic strata.Although income and education were related [48], there is an obvious relationship betweeneducation and environmental awareness in particular to the hydrological functions andother co-benefits [13,49].
The perception of weak or strong governance on watershed and ecosystem manage-ment, conservation, and urban ecosystem services—or benefits as defined in this study—has been previously studied by [21,23,26,28,35]. Based on this literature and our findings,one of the main contributions of this study is that we have identified an influence of weakgovernance (i.e., lack of transparency, perceived corruption, and poor government per-formance) on how society values the urban green space benefits from Neotropical urbangreen areas and watersheds. Such information is key for improved governance, effectiveconservation, and sustainable provision of benefits to society [24,50].
Our literature review shows how governance is a complex metaphor, and that it hasmany definitions and is used in the context of urban ES and biodiversity studies; yet fewstudies have actually attempted to measure it and how it can influence urban benefits-costs,biodiversity, NCP or Nature-based Solutions [24,29]. Thus, to provide for a measure of gov-ernance, our study measured governance as consisting of: Transparency, corruption, andgovernment performance. Our measure also incorporated aspects of Launay G.C. et al. [31]and Lockwood, M.’s [34] definitions of good governance as encompassing: Legitimacy, trans-parency, accountability, inclusiveness, fairness, connectivity, and resilience. Accordingly, wefound that our corruption and transparency variables can be used as proxies for perceivedcorruption, and that funds intended for green area conservation might not be used appro-priately as perceived by respondents. Similarly, our tax payment variables accounted forlegitimacy, accountability, and government performance (i.e., trust). As such, we found thatalthough residents pay taxes, many respondents are seeing fewer direct benefits (Table 6).Additional variables regarding the government´s responsibility for maintaining green areasaccounted for the lack of inclusiveness, fairness, and overall transparency (Table 6). We foundthat even though respondents knew that the public areas they used and pay taxes for—andsubsequently received benefits from them—they indicated a lack of confidence and poorgovernment performance that inevitably affected their response.
We recognize that our use of “socio-economic and ecological processes”, “ES/ED”,and “benefits and costs” does not match the conventional ES typology and framework.Additionally, we note that we did not randomly sample individual sites in the watershedand that our sample size could have been greater. There will also be bias in our resultsbecause the surveyor did not randomly survey individuals or specific places in each site.Similarly, concepts such as governance and costs as pointed out by our literature review
39
Land 2021, 10, 14
are complex metaphors to define and measure. Environmental values, resource conflicts,power relationships, green infrastructure types, and structure will also affect how peopleperceive benefits-cost bundles [20]; these were not studied though. However, given securityand access issues and our review of the relevant literature, we feel that our approach andmodelling results do provide initial insights into the role of perception and the role ofgovernance on urban green area benefits and costs in a major Latin America city.
Future research could study the perceptions towards benefits and costs and the effectof other field and in situ cognitive measurements of green space and forest structureand composition. As indicated by a reviewer, the opportunity exists for also includingother questions as explanatory variables in our models for better understanding citizenopinions of these functions such as perceptions regarding costs, difference dimension ofgovernance, or other environmental and social capital factors and how they affect thevaluation of benefits. Indeed, other biophysical factors such as size and density of greenareas per neighborhood could also affect human well-being [2]. Similarly, using othermethods from environmental psychology and experimental economics could also offerother causal insights as well. That said, the approach used in our study to measure benefitsand effects of weak governance and institutional transparency can be used in adopting andimproving ecosystem service-governance frameworks such as those proposed by [13,51],and [24] to Latin American socio-ecological systems and their contexts [20]. Implicationscan also be made regarding the relevance and application of “Nature-Based Solutions” ora more culturally and context relevant approach such as the recently proposed “NCP”; aparticularly promising metaphor (Table 3) [18].
Indeed, management and governance of the wetlands and green areas in Bogotáas a public resource does require accounting for such multiple and complex issues andlanguage [3,50]. Our findings, for example, also show the importance of focusing envi-ronmental education efforts and topics on certain demographic groups. Although peoplewere knowledgeable about the environment, biodiversity, and nature and its benefits, therewas a notable lack of awareness regarding the important hydrological benefits provided bythe watershed’s green areas. As such, there is an opportunity to educate the public aboutthe existence and benefits of the positive ecological processes provided by wetlands andparks for the protection of lives and property in Bogotá. Finally, based on our study areaand findings, in order to get buy in from society in conservation efforts, it is essential thatpublic institutions improve their perceived lack of transparency an performance [31,33–35].
Sarkki, S. et al. [51] proposed different types of “governance services” for different are-nas (i.e., policy, markets, society, science) as a way to understand ecosystem service dynam-ics and incorporate them into management and planning frameworks. Falk, T. et al. [36]also proposed that governance types need to be adapted according to specific benefit typesand institutions. Therefore, key to linking well-being with governance and policy uptakeis to identify a given society´s perceptions and values concerning the benefits and costsfrom green areas [24,50]. However, much of this ecosystem services-governance literaturepresents concepts, conceptual frameworks, and case studies primarily from countries inthe Global North and wildland, rural ecosystem-based contexts [16,24,33]. However, ourfindings add to the emerging ecosystem services, NCP, and governance literature in thatwe: Addressed socio-ecological dynamics for low-middle income contexts, measured gov-ernance using evaluation metrics, and informed how policy processes and incentives canaffect citizen´s UTI in green space and wetland conservation.
5. Conclusions
Our findings provide very basic and useful, yet overlooked, information and guide-lines for managers, educators, policy makers, and local planners. In particular, urbanpark and wetland users can identify the various benefits from urban nature. However,as in the case of water regulation, information needs to be targeted and context-specific.That is, in surveyed wetlands, people perceived that air quality was more important thanwater regulation. Despite the fact that flooding and water quality problems are much more
40
Land 2021, 10, 14
acute problems in the sub-watershed than air quality issues. Additionally, we found thatconventional ES typologies and frameworks developed in high income countries need tobe adjusted and adapted in order to match the realities on the Global South. The NCPor Nature-Based Solutions approaches as such provide fertile grounds for future use andapplication in places such as Latin America cities.
Similarly, people’s perception of crime and the overall lack of maintenance and in-frastructure influenced the overall benefit’s they identified from green areas. This wasparticularly evident with respondents from lower socio-economic neighborhoods. So, peo-ple with different education and socioeconomic levels do weigh the tradeoffs of personalsecurity and perceived lack of governance against the conservation and provision benefitsof and from these areas in different ways. In particular, costs such as crime and litterdid affect them, but detrimental ecosystem structures and their negative functions areeasily addressed in a relatively low-cost manner and can effectively influence how peopleperceive these urban benefits. Thus, it is important for planners to consider safety andmaintenance of wetlands and parks because basic simple management, maintenance, andplanning activities can play a role in people´s perception and probably in attitudes andinvestment of public resources towards those areas.
Accordingly, conservation and effective management of wetlands, parks, and greenareas is key, and citizens can indeed identify the benefits versus the costs of conservingthem. In order to provide long-term benefits from urban ecosystems, effective governanceprocesses and environmental education efforts based on the premise that humans areintegral parts of social–ecological systems is key. The perception of good governance isregularly considered important in this link, but the perceived lack of transparency will be alimiting factor in people´s buy in and willingness to invest in and maintain the necessaryecological structure that provides the most benefits and minimizes costs. Accordingly, lackof governance processes and trust towards the institutions developing and implementingthem will affect the effectiveness of existing planning and management goals.
The benefits and costs of urban green areas—be they referred to as ecological processes,biodiversity, ES, ED, NCPs, or nature-based solutions, are key in improving the social,economic, and environmental well-being of citizens; regardless of the metaphor used.Participatory management and planning of urban green areas requires information onhow the different segments of society perceive both the benefits and costs of urban socio-ecosystem functions. Thus, effective institutional capacities and transparent state andnon-state centered processes require information on what the different actors perceiveabout not only ES/ED, but of the governance and policy processes inherent in deliveringthe supply of benefits—and the mitigation of costs—from wetlands and green areas. Indeed,where good governance is absent, “bottom up” initiatives by citizens are one means tomove towards improving the well-being of people living in urban and peri-urban areas ofthe Global South; regardless of what metaphors scientists from the Global North desire touse to describe these benefits and costs.
Author Contributions: Conceptualization, A.P.-G. and F.J.E.; methodology, F.J.E. and A.P.-G.; formalanalysis, A.P.-G., F.C., and F.J.E.; writing—original draft preparation, A.P.-G. and F.J.E.; writing—review and editing, F.J.E., A.P.-G., and F.C. All authors have read and agreed to the published versionof the manuscript.
Funding: This research received no external funding.
Data Availability Statement: The data presented in this study are available on request from A.P.-G.and the corresponding author. The data are not publicly available due to personal data and contactinformation collected as part of the survey.
Acknowledgments: We thank the Jardin Botánico de Bogotá- José Celestino Mutis for funding andleading this project particularly Carlos Fonseca, José Lopez, Catalina Lopera, and Maribel Vasquez fortheir assistance and coordination of field crews. We are also grateful to the Universidad del Rosario´sBiology Program’s undergraduate Socio-ecological Systems class for their valuable contributionto this work. In particular, we thank Mari Paula Otero, Sara Pedraza, Andrea Aragon, Daniel AQuevedo, and Nubia Vazquez.
41
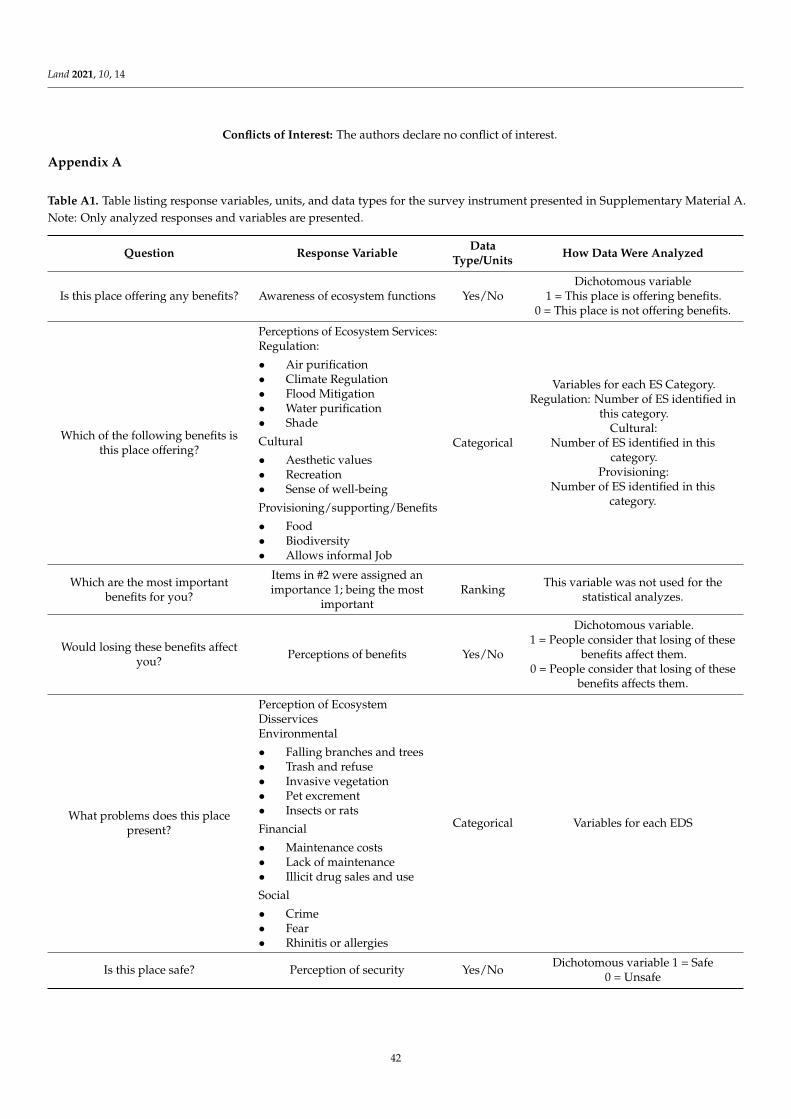
Land 2021, 10, 14
Conflicts of Interest: The authors declare no conflict of interest.
Appendix A
Table A1. Table listing response variables, units, and data types for the survey instrument presented in Supplementary Material A.Note: Only analyzed responses and variables are presented.
Question Response Variable DataType/Units How Data Were Analyzed
Is this place offering any benefits? Awareness of ecosystem functions Yes/NoDichotomous variable
1 = This place is offering benefits.0 = This place is not offering benefits.
Which of the following benefits isthis place offering?
Perceptions of Ecosystem Services:Regulation:
• Air purification• Climate Regulation• Flood Mitigation• Water purification• Shade
Cultural
• Aesthetic values• Recreation• Sense of well-being
Provisioning/supporting/Benefits
• Food• Biodiversity• Allows informal Job
Categorical
Variables for each ES Category.Regulation: Number of ES identified in
this category.Cultural:
Number of ES identified in thiscategory.
Provisioning:Number of ES identified in this
category.
Which are the most importantbenefits for you?
Items in #2 were assigned animportance 1; being the most
importantRanking This variable was not used for the
statistical analyzes.
Would losing these benefits affectyou? Perceptions of benefits Yes/No
Dichotomous variable.1 = People consider that losing of these
benefits affect them.0 = People consider that losing of these
benefits affects them.
What problems does this placepresent?
Perception of EcosystemDisservicesEnvironmental
• Falling branches and trees• Trash and refuse• Invasive vegetation• Pet excrement• Insects or rats
Financial
• Maintenance costs• Lack of maintenance• Illicit drug sales and use
Social
• Crime• Fear• Rhinitis or allergies
Categorical Variables for each EDS
Is this place safe? Perception of security Yes/No Dichotomous variable 1 = Safe0 = Unsafe
42
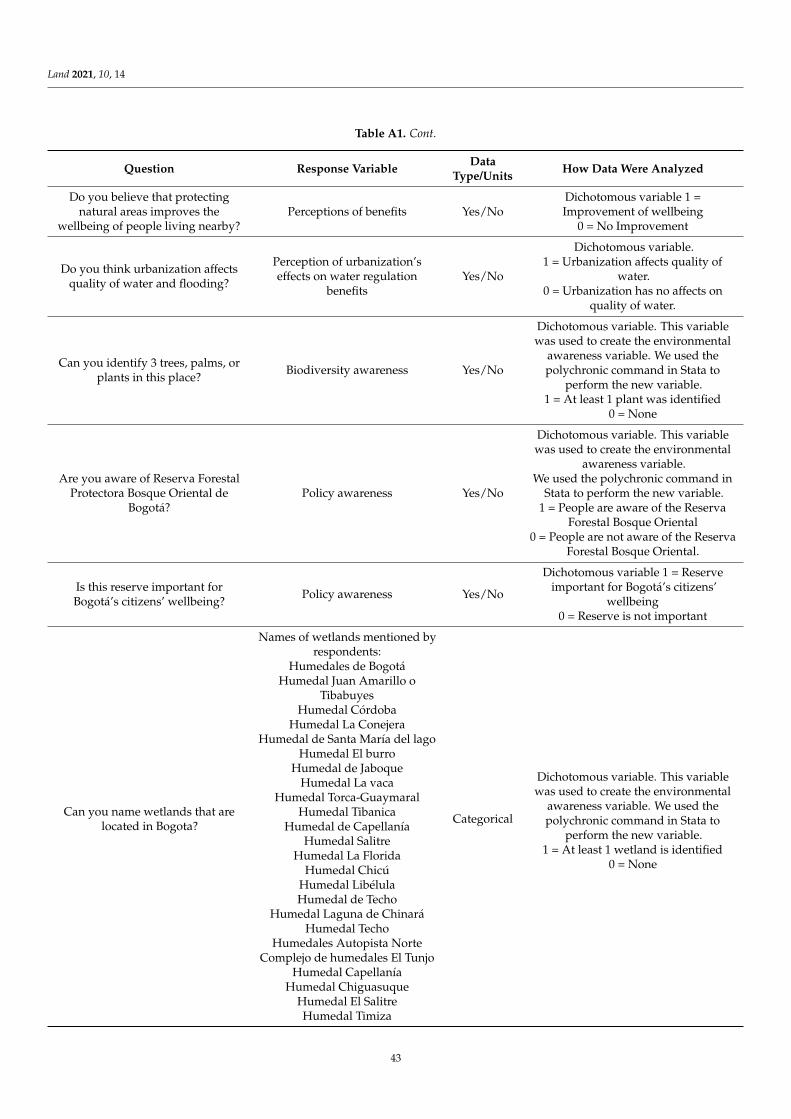
Land 2021, 10, 14
Table A1. Cont.
Question Response Variable DataType/Units How Data Were Analyzed
Do you believe that protectingnatural areas improves the
wellbeing of people living nearby?Perceptions of benefits Yes/No
Dichotomous variable 1 =Improvement of wellbeing
0 = No Improvement
Do you think urbanization affectsquality of water and flooding?
Perception of urbanization’seffects on water regulation
benefitsYes/No
Dichotomous variable.1 = Urbanization affects quality of
water.0 = Urbanization has no affects on
quality of water.
Can you identify 3 trees, palms, orplants in this place? Biodiversity awareness Yes/No
Dichotomous variable. This variablewas used to create the environmental
awareness variable. We used thepolychronic command in Stata to
perform the new variable.1 = At least 1 plant was identified
0 = None
Are you aware of Reserva ForestalProtectora Bosque Oriental de
Bogotá?Policy awareness Yes/No
Dichotomous variable. This variablewas used to create the environmental
awareness variable.We used the polychronic command in
Stata to perform the new variable.1 = People are aware of the Reserva
Forestal Bosque Oriental0 = People are not aware of the Reserva
Forestal Bosque Oriental.
Is this reserve important forBogotá’s citizens’ wellbeing? Policy awareness Yes/No
Dichotomous variable 1 = Reserveimportant for Bogotá’s citizens’
wellbeing0 = Reserve is not important
Can you name wetlands that arelocated in Bogota?
Names of wetlands mentioned byrespondents:
Categorical
Dichotomous variable. This variablewas used to create the environmental
awareness variable. We used thepolychronic command in Stata to
perform the new variable.1 = At least 1 wetland is identified
0 = None
Humedales de BogotáHumedal Juan Amarillo o
TibabuyesHumedal Córdoba
Humedal La ConejeraHumedal de Santa María del lago
Humedal El burroHumedal de Jaboque
Humedal La vacaHumedal Torca-Guaymaral
Humedal TibanicaHumedal de Capellanía
Humedal SalitreHumedal La Florida
Humedal ChicúHumedal LibélulaHumedal de Techo
Humedal Laguna de ChinaráHumedal Techo
Humedales Autopista NorteComplejo de humedales El Tunjo
Humedal CapellaníaHumedal Chiguasuque
Humedal El SalitreHumedal Timiza
43
Land 2021, 10, 14
Table A1. Cont.
Question Response Variable DataType/Units How Data Were Analyzed
Are you willing to invest anadditional amount in monthly
utilities for programs that protectand recover natural areas in
Bogotá?
Willingness to pay:
• Not willing to pay• $1000 to $4000 COP• $5000 to 10,000 COP• More than 10,000 COP• More than 30,000 COP
CategoricalColombian
Pesos(COP)
Dichotomous variable that was used tocreate Unwillingness to Invest (UTI). IfUTI = 1; conversely, UTI = 0 if people
were willing to pay.
Why are you willing to invest ornot?
Governance responses
• Taxes are already paid andit’s the government’sresponsibility/It is not myresponsibility
• Corruption• Lack of resources• It is our responsibility
Well-being/other responses
• Air purification• I use them• Improves citizens’ welfare• Urban biodiversity
conservation• I do not know• No answer
Categorical
Variable used to create weakgovernance if response was: 1.
Perception of corruption or funds notused appropriately, 2. Conservation of
green areas and wetlands is alreadypaid for in taxes, 3. The respondentsalready pay too much tax, and 4. It is
the government´s responsibility toconserve green areas.
Do you believe that climate changeis happening? Climate change awareness Yes/No
Dichotomous variable.1 = Believe in Climate change
2 = Do not believe in Climate change
References1. Nowak, D.J.; Dwyer, J.F. Understanding the benefits and costs of urban forest ecosystems. In Urban and Community Forestry in the
Northeast; Springer: Dordrecht, The Netherlands, 2007; pp. 25–46.2. Valente, D.; Pasimeni, M.R.; Petrosillo, I. The role of green infrastructures in Italian cities by linking natural and social capital.
Ecol. Indic. 2020, 108, 105694. [CrossRef]3. Haase, D.; Larondelle, N.; Andersson, E.; Artmann, M.; Borgström, S.; Breuste, J.; Gomez-Baggethun, E.; Gren, Å.; Hamstead, Z.;
Hansen, R.; et al. A quantitative review of urban ecosystem service assessments: Concepts, models, and implementation. Ambio2014, 43, 413–433. [CrossRef] [PubMed]
4. Escobedo, F.J.; Kroeger, T.; Wagner, J.E. Urban forests and pollution mitigation: Analyzing ecosystem services and disservices.Environ. Pollut. 2011, 159, 2078–2087. [CrossRef] [PubMed]
5. Lyytimäki, J.; Petersen, L.K.; Normander, B.; Bezák, P. Nature as a nuisance? Ecosystem services and disservices to urban lifestyle.Environ. Sci. 2008, 5, 161–172. [CrossRef]
6. Soto, J.R.; Escobedo, F.J.; Khachatryan, H.; Adams, D.C. Consumer demand for urban forest ecosystem services and disservices:Examining trade-offs using choice experiments and best-worst scaling. Ecosyst. Serv. 2018, 29, 31–39. [CrossRef]
7. Andersson, E.; Barthel, S.; Ahrné, K. Measuring social–Ecological dynamics behind the generation of ecosystem services. Ecol.Appl. 2007, 17, 1267–1278. [CrossRef]
8. Ernstson, H.; Barthel, S.; Andersson, E.; Borgström, S.T. Scale-crossing brokers and network governance of urban ecosystemservices: The case of stockholm. Ecol. Soc. 2010, 15, 28. [CrossRef]
9. Kabisch, N. Ecosystem service implementation and governance challenges in urban green space planning—The case of Berlin,Germany. Land Use Policy 2015, 42, 557–567. [CrossRef]
10. Lyytimäki, J.; Sipilä, M. Hopping on one leg–The challenge of ecosystem disservices for urban green management. Urban For.Urban Green. 2009, 8, 309–315. [CrossRef]
11. Andersson, E.; McPhearson, T.; Kremer, P.; Gomez-Baggethun, E.; Haase, D.; Tuvendal, M.; Wurster, D. Scale and contextdependence of ecosystem service providing units. Ecosyst. Serv. 2015, 12, 157–164. [CrossRef]
12. Haase, D.; Frantzeskaki, N.; Elmqvist, T. Ecosystem Services in Urban Landscapes: Practical Applications and GovernanceImplications. Ambio 2014, 43, 407–412. [CrossRef] [PubMed]
13. Balooni, K.; Gangopadhyay, K.; Kumar, B.M. Governance for private green spaces in a growing Indian city. Landsc. Urban Plan.2014, 123, 21–29. [CrossRef]
44
Land 2021, 10, 14
14. Daw, T.M.; Brown, K.; Rosendo, S.; Pomeroy, R. Applying the ecosystem services concept to poverty alleviation: The need todisaggregate human well-being. Environ. Conserv. 2011, 38, 370–379. [CrossRef]
15. Scopelliti, M.; Carrus, G.; Adinolfi, C.; Suárez-Cáceres, G.; Colangelo, G.; Lafortezza, R.; Panno, A.; Sanesi, G. Staying in touchwith nature and well-being in different income groups: The experience of urban parks in Bogotá. Landsc. Urban Plan. 2016, 148,139–148. [CrossRef]
16. Pascual, U.; Balvanera, P.; Díaz, S.; Pataki, G.; Roth, E.; Stenseke, M.; Watson, R.T.; Dessane, E.B.; Islar, M.; Kelemen, E.; et al.Valuing nature’s contributions to people: The IPBES approach. Curr. Opin. Environ. Sustain. 2017, 26–27, 7–16. [CrossRef]
17. Escobedo, F.J.; Giannico, V.; Jim, C.Y.; Sanesi, G.; Lafortezza, R. Urban forests, ecosystem services, green infrastructure andnature-based solutions: Nexus or evolving metaphors? Urban For. Urban Green. 2019, 37, 3–12. [CrossRef]
18. Dıaz, S.; Pascual, U.M.; Stenseke, B.; Martın-López, R.T.; Watson, Z.; Molnár, R.; Hill, K.M.; Chan, I.A.; Baste, K.A.; Brauman,S.; et al. Assessing nature’s contributions to people: Recognizing culture, and diverse sources of knowledge, can improveassessments. Science 2018, 359, 270–272.
19. Carriazo, F. Arborización y crimen urbano en Bogotá. IDEAS. 2017. Documentos CEDE 015286, Universidad de los Andes -CEDE. Available online: https://ideas.repec.org/p/col/000089/015286.html (accessed on 26 December 2020).
20. Dobbs, C.; Escobedo, F.J.; Clerici, N.; De La Barrera, F.; Eleuterio, A.A.; MacGregor-Fors, I.; Reyes-Paecke, S.; Vásquez, A.;Camaño, J.D.Z.; Hernández, H.J. Urban ecosystem Services in Latin America: Mismatch between global concepts and regionalrealities? Urban Ecosyst. 2019, 22, 173–187. [CrossRef]
21. Chaudhry, P.; Singh, B.; Tewari, V.P. Non-market economic valuation in developing countries: Role of participant observationmethod in CVM analysis. J. For. Econ. 2007, 13, 259–275. [CrossRef]
22. Kenward, R.E.; Whittingham, M.J.; Arampatzis, S.; Manos, B.D.; Hahn, T.; Terry, A.; Simoncini, R.; Alcorn, J.; Bastian, O.; Donlan,M.; et al. Identifying governance strategies that effectively support ecosystem services, resource sustainability, and biodiversity.Proc. Natl. Acad. Sci. USA 2011, 108, 5308–5312. [CrossRef]
23. Kreye, M.M.; Adams, D.C.; Escobedo, F.J.; Soto, J.R. Does policy process influence public values for forest-water resourceprotection in Florida? Ecol. Econ. 2016, 129, 122–131. [CrossRef]
24. Huang, C.-W.; McDonald, R.I.; Seto, K.C. The importance of land governance for biodiversity conservation in an era of globalurban expansion. Landsc. Urban Plan. 2018, 173, 44–50. [CrossRef]
25. Perkins, H.A. Out from the (Green) shadow? Neoliberal hegemony through the market logic of shared urban environmentalgovernance. Politi Geogr. 2009, 28, 395–405. [CrossRef]
26. Turnhout, E.; Neves, K.; De Lijster, E. ‘Measurementality’ in Biodiversity Governance: Knowledge, Transparency, and theIntergovernmental Science-Policy Platform on Biodiversity and Ecosystem Services (Ipbes). Environ. Plan. A Econ. Space 2014, 46,581–597. [CrossRef]
27. Bell, S.; Hindmoor, A. Governance without government? The case of the forest stewardship council. Public Adm. 2011, 90, 144–159.[CrossRef]
28. Lawrence, A.; De Vreese, R.; Johnston, M.; Bosch, C.C.K.V.D.; Sanesi, G. Urban forest governance: Towards a framework forcomparing approaches. Urban For. Urban Green. 2013, 12, 464–473. [CrossRef]
29. Connolly, J.J.; Svendsen, E.S.; Fisher, D.R.; Campbell, L.K. Organizing urban ecosystem services through environmental steward-ship governance in New York City. Landsc. Urban Plan. 2013, 109, 76–84. [CrossRef]
30. Van Den Bosch, C.C.K.; Rodbell, P.; Salbitano, F.; Sayers, K.; Villarpando, S.J.; Yokohari, M. The changing governance of urbanforests. Unasylva 2018, 69, 37–42.
31. Launay-Gama, C.; Pachón, M. Prácticas de evaluación de la gobernanza en América Latina; Universidad de Los Andes: Bogotá,Colombia, 2011.
32. Atmis, E.; Batuhan Günsen, H.; Yücedag, C.; Lise, W. Factors affecting the use of urban forests in Turkey. Turk. J. For. 2017, 18,1–10. [CrossRef]
33. Shackleton, R.T.; Angelstam, P.; Van Der Waal, B.; Elbakidze, M. Progress made in managing and valuing ecosystem services: Ahorizon scan of gaps in research, management and governance. Ecosyst. Serv. 2017, 27, 232–241. [CrossRef]
34. Lockwood, M. Good governance for terrestrial protected areas: A framework, principles and performance outcomes. J. Environ.Manag. 2010, 91, 754–766. [CrossRef] [PubMed]
35. Barrett, C.; Gibson, C.; Hoffman, B.; Mccubbins, M. The complex links between governance and biodiversity. Conserv. Biol. 2006,20, 1358–1366. [CrossRef] [PubMed]
36. Falk, T.; Spangenberg, J.H.; Siegmund-Schultze, M.; Kobbe, S.; Feike, T.; Kuebler, D.; Settele, J.; Vorlaufer, T. Identifying governancechallenges in ecosystem services management—Conceptual considerations and comparison of global forest cases. Ecosyst. Serv.2018, 32, 193–203. [CrossRef]
37. Piña, W.H.A.; Martínez, C.I.P. Urban material flow analysis: An approach for Bogotá, Colombia. Ecol. Indic. 2014, 42, 32–42.[CrossRef]
38. Escobedo, F.J.; Clerici, N.; Staudhammer, C.L.; Corzo, G.T. Socio-ecological dynamics and inequality in Bogotá, Colombia’s publicurban forests and their ecosystem services. Urban For. Urban Green. 2015, 14, 1040–1053. [CrossRef]
39. Meza, C.A. Crossroads and Conflict. Urbanization, Conservation and Rurality in the Eastern Mountains of Bogotá. Rev. Colomb.Antropol. 2008, 44, 439–480. [CrossRef]
45
Land 2021, 10, 14
40. Escobedo, F.J.; Clerici, N.; Staudhammer, C.L.; Feged-Rivadeneira, A.; Bohorquez, J.C.; Tovar, G. Trees and Crime in Bogota,Colombia: Is the link an ecosystem disservice or service? Land Use Policy 2018, 78, 583–592. [CrossRef]
41. Wurster, D.; Artmann, M. Development of a Concept for Non-monetary Assessment of Urban Ecosystem Services at the SiteLevel. Ambio 2014, 43, 454–465. [CrossRef]
42. Martín-López, B.; Iniesta-Arandia, I.; García-Llorente, M.; Palomo, I.; Casado-Arzuaga, I.; Del Amo, D.G.; Gómez-Baggethun, E.;Oteros-Rozas, E.; Palacios-Agundez, I.; Willaarts, B.; et al. Uncovering Ecosystem Service Bundles through Social Preferences.PLoS ONE 2012, 7, e38970. [CrossRef]
43. Dobbs, C.; Hernández-Moreno, Á.; Reyes-Paecke, S.; Miranda, M.D. Exploring temporal dynamics of urban ecosystem services inLatin America: The case of Bogota (Colombia) and Santiago (Chile). Ecol. Indic. 2018, 85, 1068–1080. [CrossRef]
44. Agbenyega, O.; Burgess, P.J.; Cook, M.; Morris, J. Application of an ecosystem function framework to perceptions of communitywoodlands. Land Use Policy 2009, 26, 551–557. [CrossRef]
45. Ricaurte, L.F.; Olaya-Rodríguez, M.H.; Cepeda-Valencia, J.; Lara, D.; Arroyave-Suárez, J.; Finlayson, C.M.; Palomo, I. Futureimpacts of drivers of change on wetland ecosystem services in Colombia. Glob. Environ. Chang. 2017, 44, 158–169. [CrossRef]
46. Hartter, J.; Goldman, A. Local responses to a forest park in western Uganda: Alternate narratives on fortress conservation. Oryx2010, 45, 60–68. [CrossRef]
47. Allendorf, T.D.; Yang, J. The role of ecosystem services in park–people relationships: The case of Gaoligongshan Nature Reservein southwest China. Biol. Conserv. 2013, 167, 187–193. [CrossRef]
48. García-Suaza, A.F.; Guataquí, J.C.; Guerra, J.A.; Maldonado, D. Beyond the Mincer equation: The internal rate of return to highereducation in Colombia. Educ Econ. 2014, 22, 328–344. [CrossRef]
49. Kadykalo, A.N.; López-Rodriguez, M.D.; Ainscough, J.; Droste, N.; Ryu, H.; Ávila-Flores, G.; Le Clec’H, S.; Muñoz, M.C.; Nilsson,L.; Rana, S.; et al. Disentangling ‘ecosystem services’ and ‘nature’s contributions to people’. Ecosyst. People 2019, 15, 269–287.[CrossRef]
50. Acey, C. Managing wickedness in the Niger Delta: Can a new approach to multi-stakeholder governance increase voice andsustainability? Landsc. Urban Plan. 2016, 154, 102–114. [CrossRef]
51. Sarkki, S. Governance services: Co-producing human well-being with ecosystem services. Ecosyst. Serv. 2017, 27, 82–91.[CrossRef]
46
land
Review
Which Traits Influence Bird Survival in the City? A Review
Swaroop Patankar 1,*, Ravi Jambhekar 1, Kulbhushansingh Ramesh Suryawanshi 2,3 and Harini Nagendra 1
�����������������
Citation: Patankar, S.; Jambhekar, R.;
Suryawanshi, K.R.; Nagendra, H.
Which Traits Influence Bird Survival
in the City? A Review. Land 2021, 10,
92. https://doi.org/10.3390/
land10020092
Academic Editors: Alessio Russo and
Giuseppe T. Cirella
Received: 26 November 2020
Accepted: 19 January 2021
Published: 20 January 2021
Publisher’s Note: MDPI stays neutral
with regard to jurisdictional claims in
published maps and institutional affil-
iations.
Copyright: © 2021 by the authors.
Licensee MDPI, Basel, Switzerland.
This article is an open access article
distributed under the terms and
conditions of the Creative Commons
Attribution (CC BY) license (https://
creativecommons.org/licenses/by/
4.0/).
1 Center for Climate Change and Sustainability, Azim Premji University, Bengaluru 562125, India;[email protected] (R.J.); [email protected] (H.N.)
2 Nature Conservation Foundation, 1311, ‘Amritha’, 12th A Main, Vijayanagar 1st Stage, Mysore 570017, India;[email protected]
3 Snow Leopard Trust, 4649 Sunnyside Avenue North, Suite 325, Seattle, WA 98103, USA* Correspondence: [email protected]
Abstract: Urbanization poses a major threat to biodiversity worldwide. We focused on birds asa well-studied taxon of interest, in order to review literature on traits that influence responses tourbanization. We review 226 papers that were published between 1979 and 2020, and aggregateinformation on five major groups of traits that have been widely studied: ecological traits, lifehistory, physiology, behavior and genetic traits. Some robust findings on trait changes in individualspecies as well as bird communities emerge. A lack of specific food and shelter resources has ledto the urban bird community being dominated by generalist species, while specialist species showdecline. Urbanized birds differ in the behavioral traits, showing an increase in song frequency andamplitude, and bolder behavior, as compared to rural populations of the same species. Differentialfood resources and predatory pressure results in changes in life history traits, including prolongedbreeding duration, and increases in clutch and brood size to compensate for lower survival. Otherspecies-specific changes include changes in hormonal state, body state, and genetic differencesfrom rural populations. We identify gaps in research, with a paucity of studies in tropical citiesand a need for greater examination of traits that influence persistence and success in native vs.introduced populations.
Keywords: urbanization; birds; ecosystem services; survival; adaptations; traits
1. Introduction
Today, urbanization presents a major threat to biodiversity [1,2]. By 2050, 68 percentof the world’s population will live in urban areas [3]. As urban settlements increase, thelandscape undergoes drastic change from its pristine state [4]. However, ecologicallyspeaking, urban areas are highly modified and fragmented habitats, in the form of severalmanaged and unmanaged urban green spaces, like public and private garden, nature re-serves within the city, vacant plots, to name a few, which are capable of providing resourcesto a small number of highly adaptable species of fauna [2,4–6]. Not only resident, butseveral migratory, species make use of this urban habitat [7]. The urban avian communityis composed of introduced and invasive species and highly adaptable native species [8,9],although Aronson et al. [8] observed that the community is dominated by locally adaptedspecies, with only five percent non-native species. The urban greenspace along with thebiodiversity it harbors, forms a unique ecosystem within the human dominated landscapes,capable of providing several ecosystem services to the cities [2]. Ecosystem services arethe services that are beneficial to humans as a result of naturally occurring processes [10],which render them all the more important in human dominated landscapes, like cities.
Birds, which are some of the most successful urban adapters, provide a range of ecosys-tem services. Birds, in general, are capable of significantly affecting ecosystem processes,due to their specific characters, like flight capability, high metabolic demand, which leadsto tolerance to discontinuous food sources; and, flock formation, which significantly affects
47
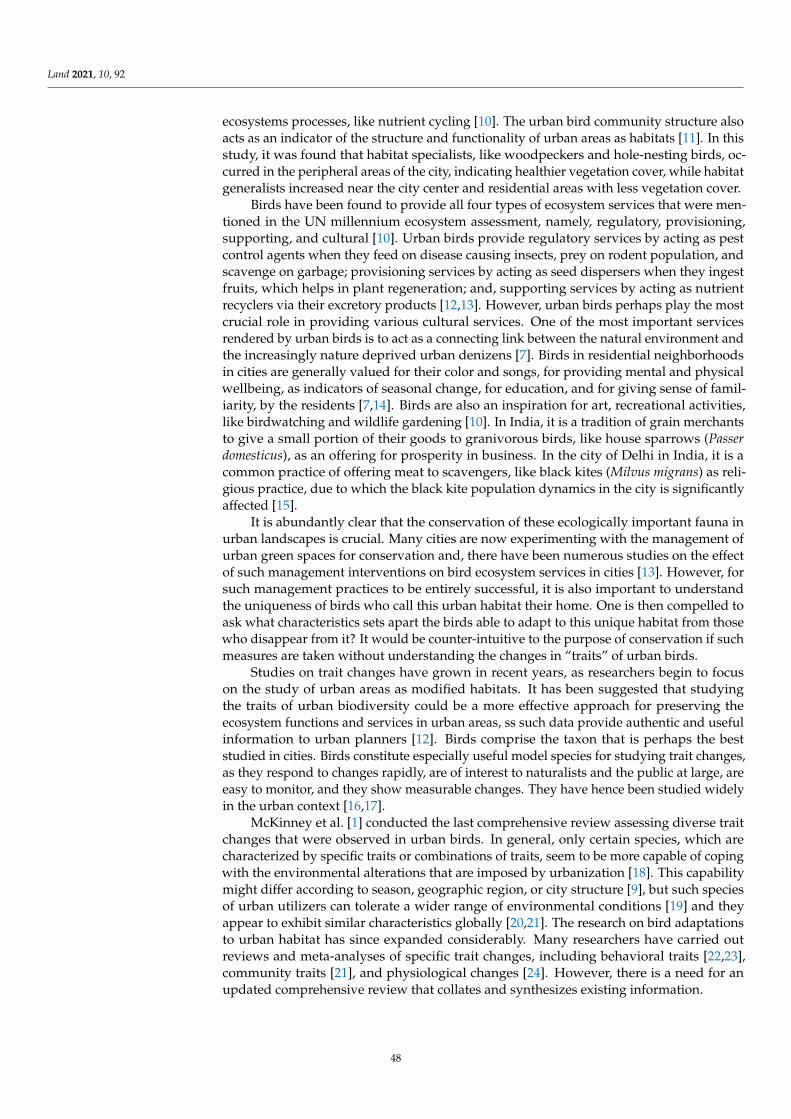
Land 2021, 10, 92
ecosystems processes, like nutrient cycling [10]. The urban bird community structure alsoacts as an indicator of the structure and functionality of urban areas as habitats [11]. In thisstudy, it was found that habitat specialists, like woodpeckers and hole-nesting birds, oc-curred in the peripheral areas of the city, indicating healthier vegetation cover, while habitatgeneralists increased near the city center and residential areas with less vegetation cover.
Birds have been found to provide all four types of ecosystem services that were men-tioned in the UN millennium ecosystem assessment, namely, regulatory, provisioning,supporting, and cultural [10]. Urban birds provide regulatory services by acting as pestcontrol agents when they feed on disease causing insects, prey on rodent population, andscavenge on garbage; provisioning services by acting as seed dispersers when they ingestfruits, which helps in plant regeneration; and, supporting services by acting as nutrientrecyclers via their excretory products [12,13]. However, urban birds perhaps play the mostcrucial role in providing various cultural services. One of the most important servicesrendered by urban birds is to act as a connecting link between the natural environment andthe increasingly nature deprived urban denizens [7]. Birds in residential neighborhoodsin cities are generally valued for their color and songs, for providing mental and physicalwellbeing, as indicators of seasonal change, for education, and for giving sense of famil-iarity, by the residents [7,14]. Birds are also an inspiration for art, recreational activities,like birdwatching and wildlife gardening [10]. In India, it is a tradition of grain merchantsto give a small portion of their goods to granivorous birds, like house sparrows (Passerdomesticus), as an offering for prosperity in business. In the city of Delhi in India, it is acommon practice of offering meat to scavengers, like black kites (Milvus migrans) as reli-gious practice, due to which the black kite population dynamics in the city is significantlyaffected [15].
It is abundantly clear that the conservation of these ecologically important fauna inurban landscapes is crucial. Many cities are now experimenting with the management ofurban green spaces for conservation and, there have been numerous studies on the effectof such management interventions on bird ecosystem services in cities [13]. However, forsuch management practices to be entirely successful, it is also important to understandthe uniqueness of birds who call this urban habitat their home. One is then compelled toask what characteristics sets apart the birds able to adapt to this unique habitat from thosewho disappear from it? It would be counter-intuitive to the purpose of conservation if suchmeasures are taken without understanding the changes in “traits” of urban birds.
Studies on trait changes have grown in recent years, as researchers begin to focuson the study of urban areas as modified habitats. It has been suggested that studyingthe traits of urban biodiversity could be a more effective approach for preserving theecosystem functions and services in urban areas, ss such data provide authentic and usefulinformation to urban planners [12]. Birds comprise the taxon that is perhaps the beststudied in cities. Birds constitute especially useful model species for studying trait changes,as they respond to changes rapidly, are of interest to naturalists and the public at large, areeasy to monitor, and they show measurable changes. They have hence been studied widelyin the urban context [16,17].
McKinney et al. [1] conducted the last comprehensive review assessing diverse traitchanges that were observed in urban birds. In general, only certain species, which arecharacterized by specific traits or combinations of traits, seem to be more capable of copingwith the environmental alterations that are imposed by urbanization [18]. This capabilitymight differ according to season, geographic region, or city structure [9], but such speciesof urban utilizers can tolerate a wider range of environmental conditions [19] and theyappear to exhibit similar characteristics globally [20,21]. The research on bird adaptationsto urban habitat has since expanded considerably. Many researchers have carried outreviews and meta-analyses of specific trait changes, including behavioral traits [22,23],community traits [21], and physiological changes [24]. However, there is a need for anupdated comprehensive review that collates and synthesizes existing information.
48
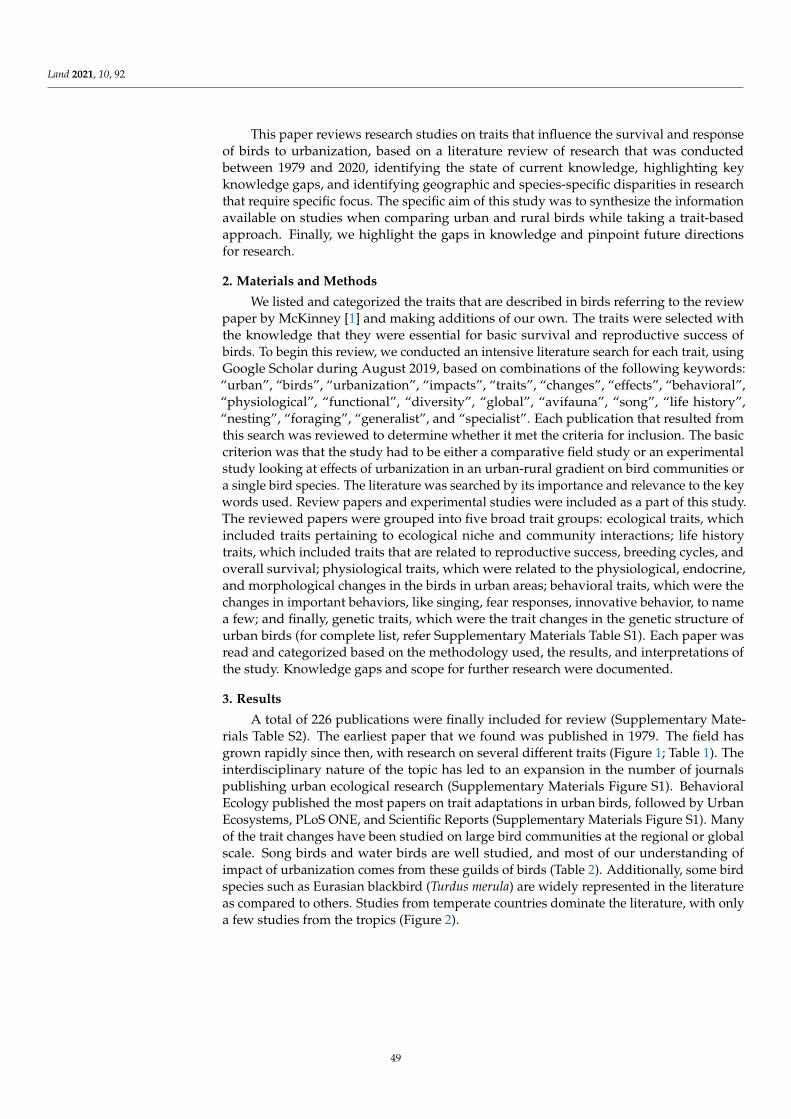
Land 2021, 10, 92
This paper reviews research studies on traits that influence the survival and responseof birds to urbanization, based on a literature review of research that was conductedbetween 1979 and 2020, identifying the state of current knowledge, highlighting keyknowledge gaps, and identifying geographic and species-specific disparities in researchthat require specific focus. The specific aim of this study was to synthesize the informationavailable on studies when comparing urban and rural birds while taking a trait-basedapproach. Finally, we highlight the gaps in knowledge and pinpoint future directionsfor research.
2. Materials and Methods
We listed and categorized the traits that are described in birds referring to the reviewpaper by McKinney [1] and making additions of our own. The traits were selected withthe knowledge that they were essential for basic survival and reproductive success ofbirds. To begin this review, we conducted an intensive literature search for each trait, usingGoogle Scholar during August 2019, based on combinations of the following keywords:“urban”, “birds”, “urbanization”, “impacts”, “traits”, “changes”, “effects”, “behavioral”,“physiological”, “functional”, “diversity”, “global”, “avifauna”, “song”, “life history”,“nesting”, “foraging”, “generalist”, and “specialist”. Each publication that resulted fromthis search was reviewed to determine whether it met the criteria for inclusion. The basiccriterion was that the study had to be either a comparative field study or an experimentalstudy looking at effects of urbanization in an urban-rural gradient on bird communities ora single bird species. The literature was searched by its importance and relevance to the keywords used. Review papers and experimental studies were included as a part of this study.The reviewed papers were grouped into five broad trait groups: ecological traits, whichincluded traits pertaining to ecological niche and community interactions; life historytraits, which included traits that are related to reproductive success, breeding cycles, andoverall survival; physiological traits, which were related to the physiological, endocrine,and morphological changes in the birds in urban areas; behavioral traits, which were thechanges in important behaviors, like singing, fear responses, innovative behavior, to namea few; and finally, genetic traits, which were the trait changes in the genetic structure ofurban birds (for complete list, refer Supplementary Materials Table S1). Each paper wasread and categorized based on the methodology used, the results, and interpretations ofthe study. Knowledge gaps and scope for further research were documented.
3. Results
A total of 226 publications were finally included for review (Supplementary Mate-rials Table S2). The earliest paper that we found was published in 1979. The field hasgrown rapidly since then, with research on several different traits (Figure 1; Table 1). Theinterdisciplinary nature of the topic has led to an expansion in the number of journalspublishing urban ecological research (Supplementary Materials Figure S1). BehavioralEcology published the most papers on trait adaptations in urban birds, followed by UrbanEcosystems, PLoS ONE, and Scientific Reports (Supplementary Materials Figure S1). Manyof the trait changes have been studied on large bird communities at the regional or globalscale. Song birds and water birds are well studied, and most of our understanding ofimpact of urbanization comes from these guilds of birds (Table 2). Additionally, some birdspecies such as Eurasian blackbird (Turdus merula) are widely represented in the literatureas compared to others. Studies from temperate countries dominate the literature, with onlya few studies from the tropics (Figure 2).
49
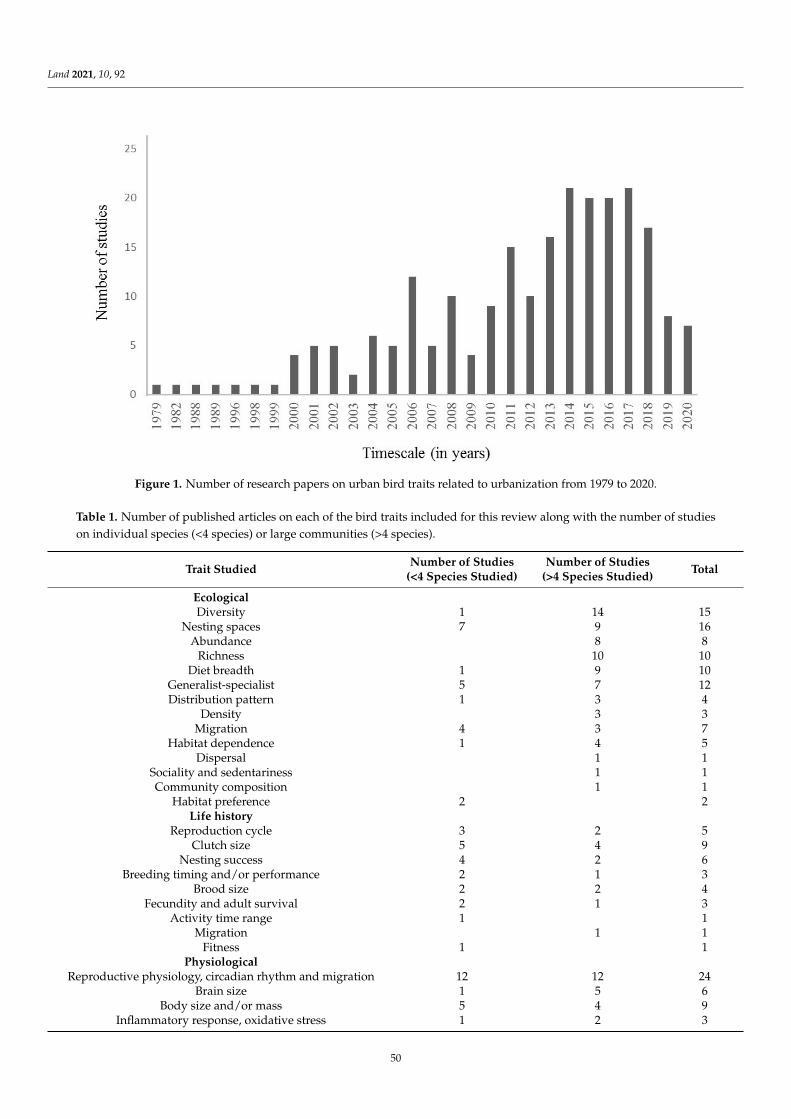
Land 2021, 10, 92
Figure 1. Number of research papers on urban bird traits related to urbanization from 1979 to 2020.
Table 1. Number of published articles on each of the bird traits included for this review along with the number of studieson individual species (<4 species) or large communities (>4 species).
Trait Studied Number of Studies(<4 Species Studied)
Number of Studies(>4 Species Studied) Total
EcologicalDiversity 1 14 15
Nesting spaces 7 9 16Abundance 8 8
Richness 10 10Diet breadth 1 9 10
Generalist-specialist 5 7 12Distribution pattern 1 3 4
Density 3 3Migration 4 3 7
Habitat dependence 1 4 5Dispersal 1 1
Sociality and sedentariness 1 1Community composition 1 1
Habitat preference 2 2Life history
Reproduction cycle 3 2 5Clutch size 5 4 9
Nesting success 4 2 6Breeding timing and/or performance 2 1 3
Brood size 2 2 4Fecundity and adult survival 2 1 3
Activity time range 1 1Migration 1 1
Fitness 1 1Physiological
Reproductive physiology, circadian rhythm and migration 12 12 24Brain size 1 5 6
Body size and/or mass 5 4 9Inflammatory response, oxidative stress 1 2 3
50
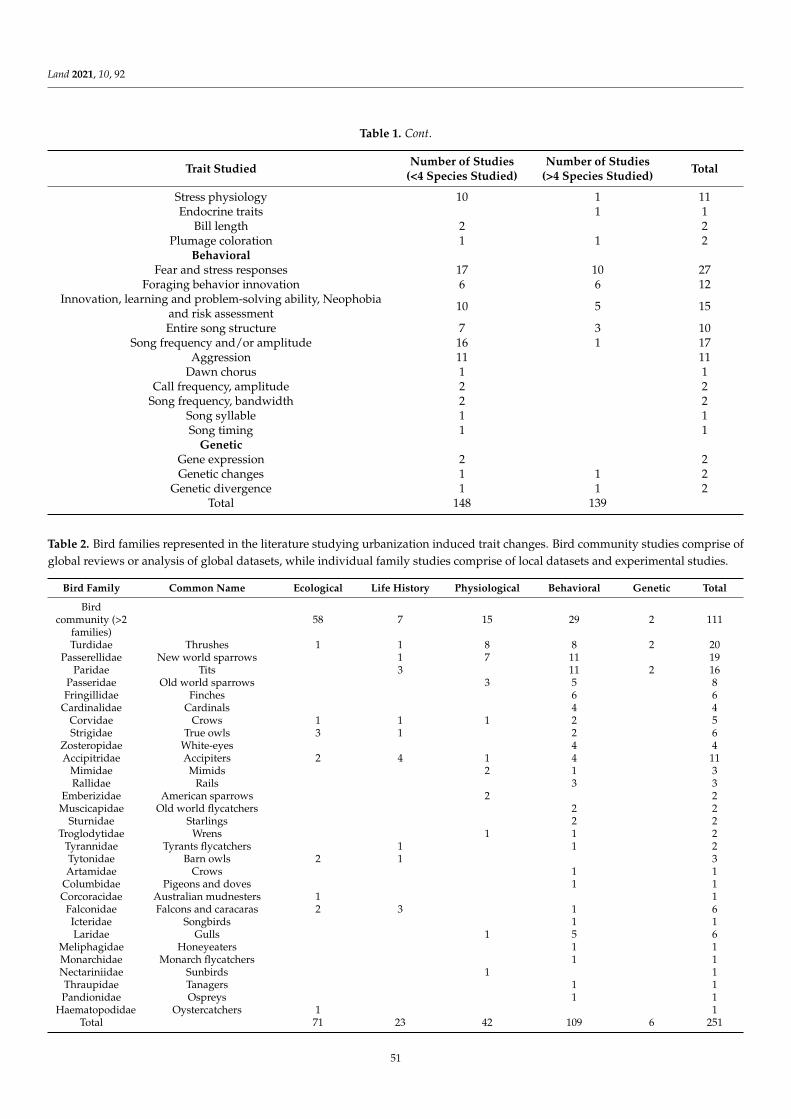
Land 2021, 10, 92
Table 1. Cont.
Trait Studied Number of Studies(<4 Species Studied)
Number of Studies(>4 Species Studied) Total
Stress physiology 10 1 11Endocrine traits 1 1
Bill length 2 2Plumage coloration 1 1 2
BehavioralFear and stress responses 17 10 27
Foraging behavior innovation 6 6 12Innovation, learning and problem-solving ability, Neophobia
and risk assessment 10 5 15
Entire song structure 7 3 10Song frequency and/or amplitude 16 1 17
Aggression 11 11Dawn chorus 1 1
Call frequency, amplitude 2 2Song frequency, bandwidth 2 2
Song syllable 1 1Song timing 1 1
GeneticGene expression 2 2Genetic changes 1 1 2
Genetic divergence 1 1 2Total 148 139
Table 2. Bird families represented in the literature studying urbanization induced trait changes. Bird community studies comprise ofglobal reviews or analysis of global datasets, while individual family studies comprise of local datasets and experimental studies.
Bird Family Common Name Ecological Life History Physiological Behavioral Genetic Total
Birdcommunity (>2
families)58 7 15 29 2 111
Turdidae Thrushes 1 1 8 8 2 20Passerellidae New world sparrows 1 7 11 19
Paridae Tits 3 11 2 16Passeridae Old world sparrows 3 5 8Fringillidae Finches 6 6
Cardinalidae Cardinals 4 4Corvidae Crows 1 1 1 2 5Strigidae True owls 3 1 2 6
Zosteropidae White-eyes 4 4Accipitridae Accipiters 2 4 1 4 11
Mimidae Mimids 2 1 3Rallidae Rails 3 3
Emberizidae American sparrows 2 2Muscicapidae Old world flycatchers 2 2
Sturnidae Starlings 2 2Troglodytidae Wrens 1 1 2
Tyrannidae Tyrants flycatchers 1 1 2Tytonidae Barn owls 2 1 3Artamidae Crows 1 1
Columbidae Pigeons and doves 1 1Corcoracidae Australian mudnesters 1 1
Falconidae Falcons and caracaras 2 3 1 6Icteridae Songbirds 1 1Laridae Gulls 1 5 6
Meliphagidae Honeyeaters 1 1Monarchidae Monarch flycatchers 1 1Nectariniidae Sunbirds 1 1Thraupidae Tanagers 1 1Pandionidae Ospreys 1 1
Haematopodidae Oystercatchers 1 1Total 71 23 42 109 6 251
51
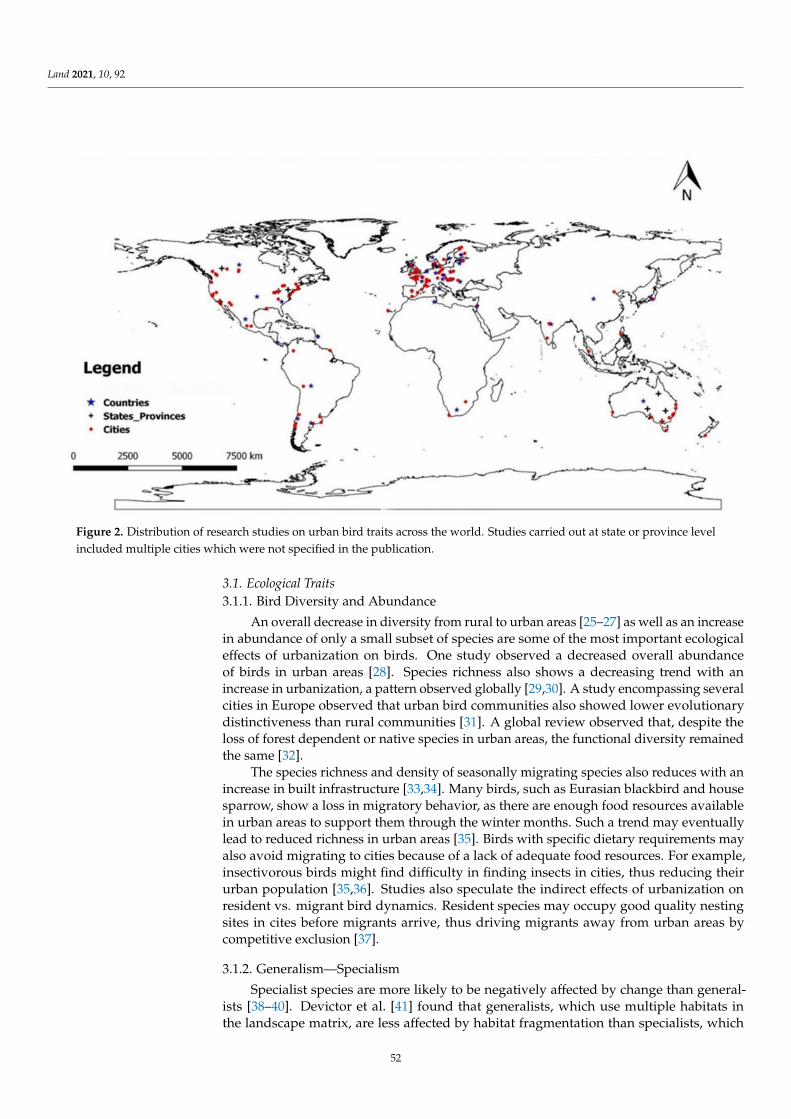
Land 2021, 10, 92
Figure 2. Distribution of research studies on urban bird traits across the world. Studies carried out at state or province levelincluded multiple cities which were not specified in the publication.
3.1. Ecological Traits3.1.1. Bird Diversity and Abundance
An overall decrease in diversity from rural to urban areas [25–27] as well as an increasein abundance of only a small subset of species are some of the most important ecologicaleffects of urbanization on birds. One study observed a decreased overall abundanceof birds in urban areas [28]. Species richness also shows a decreasing trend with anincrease in urbanization, a pattern observed globally [29,30]. A study encompassing severalcities in Europe observed that urban bird communities also showed lower evolutionarydistinctiveness than rural communities [31]. A global review observed that, despite theloss of forest dependent or native species in urban areas, the functional diversity remainedthe same [32].
The species richness and density of seasonally migrating species also reduces with anincrease in built infrastructure [33,34]. Many birds, such as Eurasian blackbird and housesparrow, show a loss in migratory behavior, as there are enough food resources availablein urban areas to support them through the winter months. Such a trend may eventuallylead to reduced richness in urban areas [35]. Birds with specific dietary requirements mayalso avoid migrating to cities because of a lack of adequate food resources. For example,insectivorous birds might find difficulty in finding insects in cities, thus reducing theirurban population [35,36]. Studies also speculate the indirect effects of urbanization onresident vs. migrant bird dynamics. Resident species may occupy good quality nestingsites in cites before migrants arrive, thus driving migrants away from urban areas bycompetitive exclusion [37].
3.1.2. Generalism—Specialism
Specialist species are more likely to be negatively affected by change than general-ists [38–40]. Devictor et al. [41] found that generalists, which use multiple habitats inthe landscape matrix, are less affected by habitat fragmentation than specialists, which
52
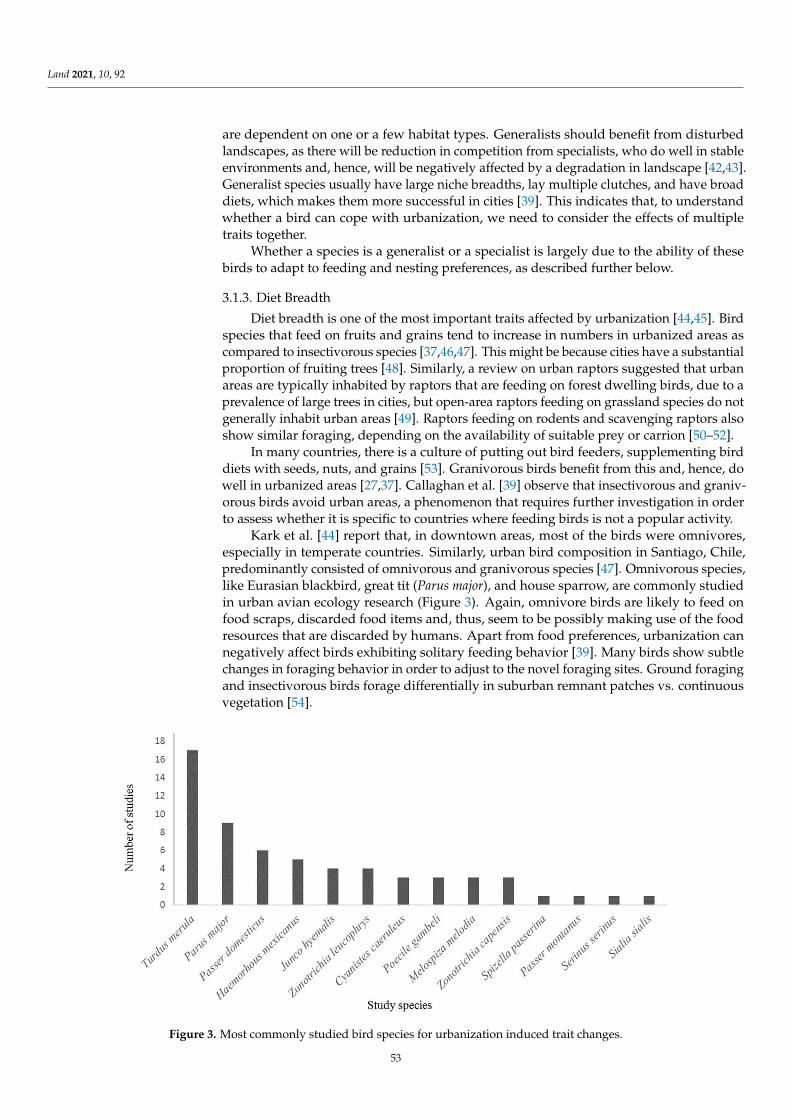
Land 2021, 10, 92
are dependent on one or a few habitat types. Generalists should benefit from disturbedlandscapes, as there will be reduction in competition from specialists, who do well in stableenvironments and, hence, will be negatively affected by a degradation in landscape [42,43].Generalist species usually have large niche breadths, lay multiple clutches, and have broaddiets, which makes them more successful in cities [39]. This indicates that, to understandwhether a bird can cope with urbanization, we need to consider the effects of multipletraits together.
Whether a species is a generalist or a specialist is largely due to the ability of thesebirds to adapt to feeding and nesting preferences, as described further below.
3.1.3. Diet Breadth
Diet breadth is one of the most important traits affected by urbanization [44,45]. Birdspecies that feed on fruits and grains tend to increase in numbers in urbanized areas ascompared to insectivorous species [37,46,47]. This might be because cities have a substantialproportion of fruiting trees [48]. Similarly, a review on urban raptors suggested that urbanareas are typically inhabited by raptors that are feeding on forest dwelling birds, due to aprevalence of large trees in cities, but open-area raptors feeding on grassland species do notgenerally inhabit urban areas [49]. Raptors feeding on rodents and scavenging raptors alsoshow similar foraging, depending on the availability of suitable prey or carrion [50–52].
In many countries, there is a culture of putting out bird feeders, supplementing birddiets with seeds, nuts, and grains [53]. Granivorous birds benefit from this and, hence, dowell in urbanized areas [27,37]. Callaghan et al. [39] observe that insectivorous and graniv-orous birds avoid urban areas, a phenomenon that requires further investigation in orderto assess whether it is specific to countries where feeding birds is not a popular activity.
Kark et al. [44] report that, in downtown areas, most of the birds were omnivores,especially in temperate countries. Similarly, urban bird composition in Santiago, Chile,predominantly consisted of omnivorous and granivorous species [47]. Omnivorous species,like Eurasian blackbird, great tit (Parus major), and house sparrow, are commonly studiedin urban avian ecology research (Figure 3). Again, omnivore birds are likely to feed onfood scraps, discarded food items and, thus, seem to be possibly making use of the foodresources that are discarded by humans. Apart from food preferences, urbanization cannegatively affect birds exhibiting solitary feeding behavior [39]. Many birds show subtlechanges in foraging behavior in order to adjust to the novel foraging sites. Ground foragingand insectivorous birds forage differentially in suburban remnant patches vs. continuousvegetation [54].
Figure 3. Most commonly studied bird species for urbanization induced trait changes.
53
Land 2021, 10, 92
3.1.4. Nesting Sites
The utilization of nesting sites is an important factor determining the success of birdspecies [45]. One of the most consistent effects of urbanization is on ground-nesting birds,whose abundance consistently decreased across most of the studies [16,55]. Small sizedground nesters are most impacted by urbanization in Australia [56]. Birds that nest onhigh trees and in tree cavities have a better chance of survival in cities [37,57]. Studiesspeculate that urbanization does not necessarily increase the availability of cavity nestingsites. However, cavity nesters might be less prone to predation, because of their nestinghabit, hence surviving better in cities [37]. Alternatively, cavity nesting birds might beusing artificial nesting sites, such as nest boxes provided in cities. Cities with good treecover will benefit birds that nest on trees, as there will not be a scarcity of nesting sites.
Birds that are more adaptable and use a variety of nesting strategies like makinguse of man-made structures, are more likely to do better in urban areas as comparedto birds with specialized nesting preferences [58–60]. Adaptive nesting strategy alsoensures better productivity, as is seen in the urban peregrine Falcon (Falco peregrinus), asmany artificial structures provide better protection against predators or the elements [61].Consequently, species that are adapted to urban conditions show higher abundance inurbanized areas [8,59,62]. Other birds, such as open-cup nesters, which require trees andshrubs to support their nests, are negatively associated with urbanized areas [59].
3.2. Life History Traits
Life history traits, such as clutch size and brood success, have a considerable positiveimpact on bird populations in urban areas [37]. Many urban species show an increase in theclutch size and brood size [63]. The increase in number of eggs and chicks helps these birdsto overcome the losses that occurred during predation or the effects of urbanization suchas mortality caused due to collision with cars or windows [37,61]. Urban birds tend to layeggs earlier than their rural counterparts [64–68]. This might be because of the improvedresource availability in cities. There are exceptions; Chamberlain et al. [69] found that, eventhough results vary from species to species, most urban bird populations are characterizedby slightly greater annual productivity and lower nestling weight. However, certain speciesdo not show such a pattern. For example, Marini et al. [70] find that clutch size does notdiffer in mountain chickadees (Poecile gambeli) as one moves along the urban-rural gradientin North America. Similarly, in magpies (Pica pica), a European species, the clutch size doesnot vary as one moves across the rural to urban gradient [71]. Brood size and nestlingsper nesting attempt did not show a consistent pattern of differences between urban andnon-urban areas [69]. Some raptor species also fledged fewer offspring in urban areaswhen there was a lack of prey or excessive human disturbance [68].
3.3. Physiological Traits3.3.1. Body Mass, Size, and Plumage Coloration
Birds may produce large broods in urban areas, but the condition (average body size,morphological features) of offspring is poor, because there is a high chance of survival, evenfor the low-quality offspring [72,73]. The change in diet preferences might be associatedwith higher survival rates, but poor body condition. Birds have ample resources availablethroughout the year in the city, which is perhaps the reason they do not accumulate morebody fat. Another possible reason is that temperatures in cities are higher due to urbanheat island effects; hence, birds have smaller sizes: as theory predicts that as temperaturesdrop, body size increases [73]. Adverse ecological effects may also constrain the bodysize or condition of offspring [73]. Nestlings in urban habitats are fed less amount offood, or lower quality food, and they reach a lower body mass [74,75]. However, theurban area-smaller mass relation is not observed in all urban birds. A study on silver gulls(Larus novaehollandiae) in Tasmania found that adult male gulls in urban areas had greaterbody mass than adult male gulls in rural areas [76]. Perhaps omnivorous species show anopposite trend in terms of body mass due to the consumption of a wide variety of foods.
54
Land 2021, 10, 92
Liker et al. [75] found that house sparrows were larger in rural areas as compared tourbanized areas. Sparrows in the Budapest city center were more than 5% lighter thansparrows at the least urbanized locations, and the leanness of urban birds was detectable,even when they compared differently urbanized habitats with similar utilization [75,77].
Although the literature on body size and mass of urban birds is comprehensive,research is only now emerging on changes in plumage coloration in urban birds. A recentstudy across three cities in Argentina showed that the amount of built area negativelyaffected the color diversity of bird communities. Hence, the bird community in the citywas predominantly composed of grey colored species [78]. Urbanization selects for birdswith similar colors, primarily those matching the surrounding habitat. Because plumagecoloration is an important trait, not only for the reproductive success of birds, but also as acamouflage to avoid detection, it is important to be studied on a larger spatial scale.
3.3.2. Brain Size
Birds and mammals with relatively larger brain size may be associated with theability to invade novel habitats [79,80]. Callaghan et al. [39] hypothesize that birds withlarge brain size might be favored in cities and, hence, such birds should be successfulin urban environments. Theory predicts that larger brains might be advantageous toindividuals in dealing with altered environments and it might help in innovative behaviorand learning [81]. Larger brain size implies that individuals might be more able to explorenovel environments and food resources, helping such birds adapt to city life [5]. However,experimental studies suggest that there is a lot of variation in brain size and success inurban environments [82,83]. More work is required in order to definitively declare whetherbrain size is actually related to success in urban environments.
3.3.3. Stress Response Physiology
Urban birds are exposed to a variety of stressors, like traffic noise [84,85], artificiallight pollution [86,87], uneven food distribution, and chemical pollution [85,88]. Stressresponse to such disturbances is indicated by the level of plasma corticosterone hormone(CORT) secretion [24,84,89–91]. Many studies have revealed changes in the baseline andinduced corticosterone levels in birds in response to urban stresses [85,88–90]. The Eurasianblackbird female shows an increased corticosterone secretion in response to artificial lightexposure [86], even though Partecke et al. [88] had observed an overall decrease in cor-ticosterone secretion in urban blackbirds. Urban birds also show reduced corticosteronesecretion in noisy environments when compared to rural populations, as is displayed bysong sparrows (Melospiza melodia) [84] and house wrens (Troglodytes aedon) [85]. Reducedcorticosterone in urban birds is associated with low protein diets [85]. The decrease inCORT secretion in species that have colonized urban areas for a long time could be due tohabituation to these stressors [84,86,89]. When male song sparrows from different parts ofcity were compared for CORT levels, they did not show any difference, which further indi-cates that these urban song sparrows might be adapted to urban stressors [84]. Bonier [24]reviewed the various endocrine trait changes in urban birds and found no consistentpattern in stress hormone change in all urban species. Even within the populations, thedifferences fluctuated according to the age and life history stage.
Elevated levels of baseline corticosterone may have a considerable effect on otherbehavioral and physiological functions. Brain Arginine Vasotocin immunoreactivity, whichis associated with various functions, like territoriality and social behavior, differs in re-sponse to changed plasma corticosterone in urban curve-billed thrashers (Toxostoma curvi-rostre) [92].
3.3.4. Reproductive Physiology
Living in urban areas influences reproduction in birds [24,93–96]. A global analysis ofpasserine species found that sexually dichromatic species were less likely to occur in urbanareas [97].
55
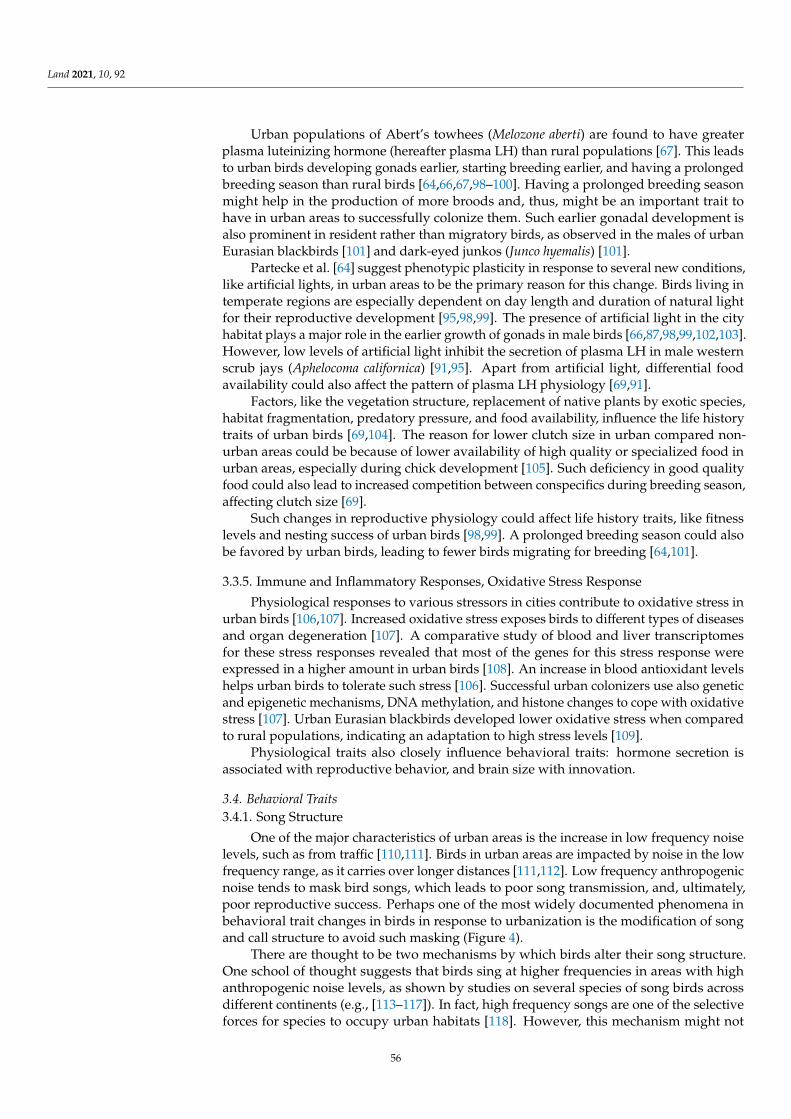
Land 2021, 10, 92
Urban populations of Abert’s towhees (Melozone aberti) are found to have greaterplasma luteinizing hormone (hereafter plasma LH) than rural populations [67]. This leadsto urban birds developing gonads earlier, starting breeding earlier, and having a prolongedbreeding season than rural birds [64,66,67,98–100]. Having a prolonged breeding seasonmight help in the production of more broods and, thus, might be an important trait tohave in urban areas to successfully colonize them. Such earlier gonadal development isalso prominent in resident rather than migratory birds, as observed in the males of urbanEurasian blackbirds [101] and dark-eyed junkos (Junco hyemalis) [101].
Partecke et al. [64] suggest phenotypic plasticity in response to several new conditions,like artificial lights, in urban areas to be the primary reason for this change. Birds living intemperate regions are especially dependent on day length and duration of natural lightfor their reproductive development [95,98,99]. The presence of artificial light in the cityhabitat plays a major role in the earlier growth of gonads in male birds [66,87,98,99,102,103].However, low levels of artificial light inhibit the secretion of plasma LH in male westernscrub jays (Aphelocoma californica) [91,95]. Apart from artificial light, differential foodavailability could also affect the pattern of plasma LH physiology [69,91].
Factors, like the vegetation structure, replacement of native plants by exotic species,habitat fragmentation, predatory pressure, and food availability, influence the life historytraits of urban birds [69,104]. The reason for lower clutch size in urban compared non-urban areas could be because of lower availability of high quality or specialized food inurban areas, especially during chick development [105]. Such deficiency in good qualityfood could also lead to increased competition between conspecifics during breeding season,affecting clutch size [69].
Such changes in reproductive physiology could affect life history traits, like fitnesslevels and nesting success of urban birds [98,99]. A prolonged breeding season could alsobe favored by urban birds, leading to fewer birds migrating for breeding [64,101].
3.3.5. Immune and Inflammatory Responses, Oxidative Stress Response
Physiological responses to various stressors in cities contribute to oxidative stress inurban birds [106,107]. Increased oxidative stress exposes birds to different types of diseasesand organ degeneration [107]. A comparative study of blood and liver transcriptomesfor these stress responses revealed that most of the genes for this stress response wereexpressed in a higher amount in urban birds [108]. An increase in blood antioxidant levelshelps urban birds to tolerate such stress [106]. Successful urban colonizers use also geneticand epigenetic mechanisms, DNA methylation, and histone changes to cope with oxidativestress [107]. Urban Eurasian blackbirds developed lower oxidative stress when comparedto rural populations, indicating an adaptation to high stress levels [109].
Physiological traits also closely influence behavioral traits: hormone secretion isassociated with reproductive behavior, and brain size with innovation.
3.4. Behavioral Traits3.4.1. Song Structure
One of the major characteristics of urban areas is the increase in low frequency noiselevels, such as from traffic [110,111]. Birds in urban areas are impacted by noise in the lowfrequency range, as it carries over longer distances [111,112]. Low frequency anthropogenicnoise tends to mask bird songs, which leads to poor song transmission, and, ultimately,poor reproductive success. Perhaps one of the most widely documented phenomena inbehavioral trait changes in birds in response to urbanization is the modification of songand call structure to avoid such masking (Figure 4).
There are thought to be two mechanisms by which birds alter their song structure.One school of thought suggests that birds sing at higher frequencies in areas with highanthropogenic noise levels, as shown by studies on several species of song birds acrossdifferent continents (e.g., [113–117]). In fact, high frequency songs are one of the selectiveforces for species to occupy urban habitats [118]. However, this mechanism might not
56
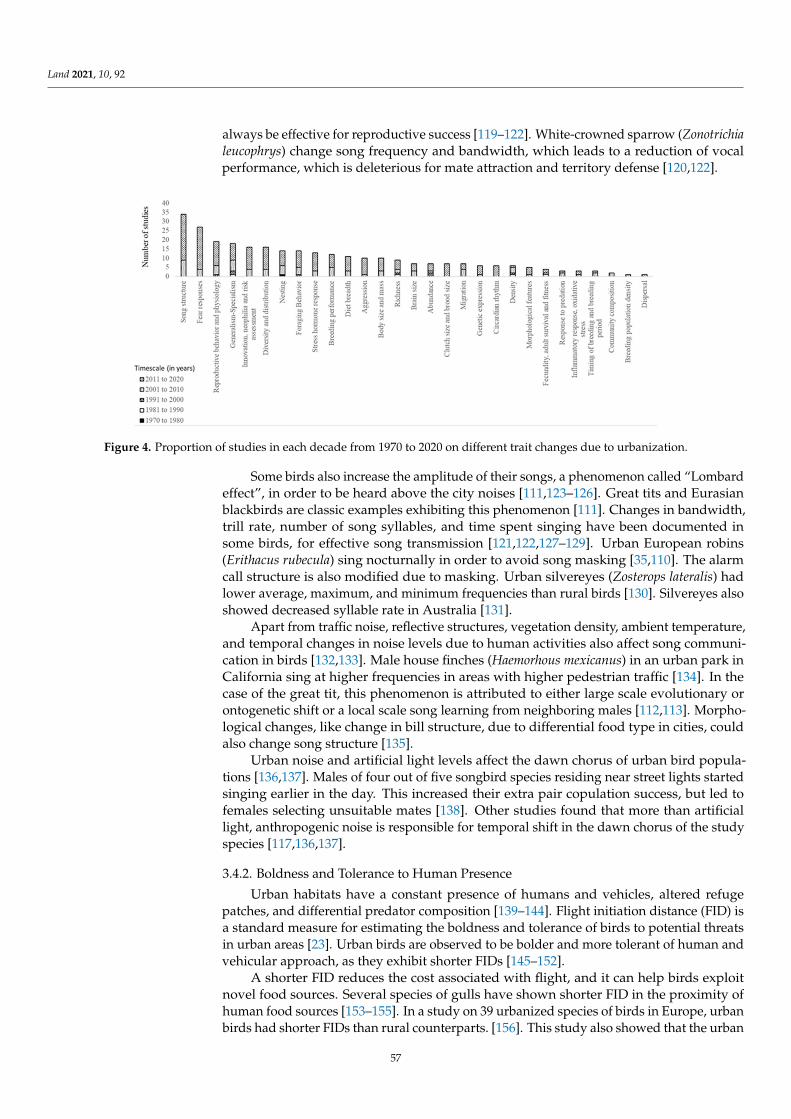
Land 2021, 10, 92
always be effective for reproductive success [119–122]. White-crowned sparrow (Zonotrichialeucophrys) change song frequency and bandwidth, which leads to a reduction of vocalperformance, which is deleterious for mate attraction and territory defense [120,122].
Figure 4. Proportion of studies in each decade from 1970 to 2020 on different trait changes due to urbanization.
Some birds also increase the amplitude of their songs, a phenomenon called “Lombardeffect”, in order to be heard above the city noises [111,123–126]. Great tits and Eurasianblackbirds are classic examples exhibiting this phenomenon [111]. Changes in bandwidth,trill rate, number of song syllables, and time spent singing have been documented insome birds, for effective song transmission [121,122,127–129]. Urban European robins(Erithacus rubecula) sing nocturnally in order to avoid song masking [35,110]. The alarmcall structure is also modified due to masking. Urban silvereyes (Zosterops lateralis) hadlower average, maximum, and minimum frequencies than rural birds [130]. Silvereyes alsoshowed decreased syllable rate in Australia [131].
Apart from traffic noise, reflective structures, vegetation density, ambient temperature,and temporal changes in noise levels due to human activities also affect song communi-cation in birds [132,133]. Male house finches (Haemorhous mexicanus) in an urban park inCalifornia sing at higher frequencies in areas with higher pedestrian traffic [134]. In thecase of the great tit, this phenomenon is attributed to either large scale evolutionary orontogenetic shift or a local scale song learning from neighboring males [112,113]. Morpho-logical changes, like change in bill structure, due to differential food type in cities, couldalso change song structure [135].
Urban noise and artificial light levels affect the dawn chorus of urban bird popula-tions [136,137]. Males of four out of five songbird species residing near street lights startedsinging earlier in the day. This increased their extra pair copulation success, but led tofemales selecting unsuitable mates [138]. Other studies found that more than artificiallight, anthropogenic noise is responsible for temporal shift in the dawn chorus of the studyspecies [117,136,137].
3.4.2. Boldness and Tolerance to Human Presence
Urban habitats have a constant presence of humans and vehicles, altered refugepatches, and differential predator composition [139–144]. Flight initiation distance (FID) isa standard measure for estimating the boldness and tolerance of birds to potential threatsin urban areas [23]. Urban birds are observed to be bolder and more tolerant of human andvehicular approach, as they exhibit shorter FIDs [145–152].
A shorter FID reduces the cost associated with flight, and it can help birds exploitnovel food sources. Several species of gulls have shown shorter FID in the proximity ofhuman food sources [153–155]. In a study on 39 urbanized species of birds in Europe, urbanbirds had shorter FIDs than rural counterparts. [156]. This study also showed that the urban
57
Land 2021, 10, 92
bird community had a larger variance in FID when compared to rural bird communities,but this variance decreased with increase in time since urbanization. This means that mostof the birds adapted to the threats in urban areas as the time since colonization increased.
Along with FID, urban birds have also adapted to the predation threat of feral animals,like cats and dogs. Urban Eurasian coots (Fulica atra) portrayed the same amount ofvigilance in the presence of domestic dogs as their natural predators [139].
Behavioral plasticity, which is the inherent ability of an organism to change in responseto external stimuli, is one of the main characteristics exhibited by birds who are capable ofchanging their fear responses. This is thought to be an important adaptation to possess inurban areas. [157–159]. However, it has been argued that habituation induced change isnot the reason for the higher tolerance of humans in urban areas. Those individuals whoalready had a bold personality in their natural habitat were able to colonize urban areas,while others were unsuccessful [82].
3.4.3. Neophobic and Innovative Behavior
Urban areas provide novel types of food resources in the form of artificial feedingor garbage dumps [153,160–162]. Novel urban food sources also come with new types ofrisks in the form of feral cats and dogs [160,163–165]. Not all native birds have the abilityto exploit such sources of food—it seems that bird species with innovative capability andbold personality have an increased capacity to thrive [152,166–168]. Several species of gullsexhibit a great ability to exploit human provided food, for example, by adjusting theirforaging time according to peak human activity timing, like school breaks or waste centeropening time [169]. Not just foraging innovation, but certain urban species, like Indianhouse crows (Corvus splendens), also show innovative nesting behavior after nesting failureduring breeding season [170].
Successful urban colonization requires a balance between neophilia and neopho-bia [162]. Urban great tits are more tolerant towards a novel object that is placed neartheir feeders than rural individuals [165]. However, two different studies on house spar-rows in Hungary and mountain chikadees in Reno, USA indicated no reduction in objectneophobia in urban populations [171,172]. Griffin et al. [162], in a review, suggested thatneophilia/neophobia and boldness might be species specific. Corvid species were moreneophobic towards novel objects than non-corvid species [173].
Exposure to pollutants and inferior quality food during chick development mightalso affect the ability to exploit novel food sources as well as learning from parents andconspecifics [162,167]. Research pin pointing the factors influencing the ability to exploitnovel urban resources is required.
The ability to innovate different foraging techniques is crucial for successful urbancolonization by birds [160,168,174]. The rate of innovation seems to be stronger duringearly invasion of novel urban areas [5]. The rate of innovativeness also seems to predictthe risk–taking ability of the species [168]. The rate of innovation has also been linked tobrain size in some urban birds, which also assists in successful urban colonization [175].Innovative foraging also leads to changes in dominance hierarchy, behavioral strategiesthat are based on human movement, and introduces new types of competitions [176].
3.4.4. Aggression
Aggressive behavior can be displayed towards competitors [176–179], can be foodrelated [180], due to exposure to chemical pollutants [181], or during nest defense [182].Urban great tits were more aggressive towards competitors, but they exhibited inconsistentreaction towards a simulated competition when compared to their rural counterparts [179].
Urban great tits also showed greater distress behavior when threatened [183]. Inanother study on northern mockingbird (Mimus polyglottos), urban birds that were exposedto higher amounts of lead were more aggressive towards simulated competition [181]. InEurasian coot populations residing in the same urban area, older and more establishedpopulations were consistently more territorially aggressive than recently colonized popu-
58
Land 2021, 10, 92
lation [184]. Urban sparrowhawks (Accipiter nisus) showed more aggressive nest defensethan rural sparrowhawks [182]. These changes might not be just behavioral adaptations,but a consequence of micro-evolution over the years in these birds causing changes in thebehavior. However, differences in territorial aggression in urban birds appears to be speciesand situation specific. The species that show increased aggressive behavior in urban areasalso generally exhibit bolder personality [155,176].
3.5. Genetic Traits
Although phenotypic trait changes in birds in response to urbanization have beenextensively studied, solid evidence for genetic basis for such phenotypes is limited. Studieshave focused on finding out the genetic modifications behind observed physiological traitchanges like inflammatory and oxidative stress response, morphological trait changes,like change in wing structure, behavioral changes, like risk assessment, migration andurban invasion by certain functional groups [107]. The urban populations of great tits inEurope had elevated gene expression for inflammatory, oxidative stress, and detoxificationresponses [185]. Similar results were obtained for urban blue tits (Parus caeruleus) [186].
Urban Eurasian blackbirds have undergone genetic divergence at a locus coding forrisk avoidance [187]. Human induced changes in habitat, along with various stressors,like the presence of novel predators, traffic noise, and pollutants, have led to acceleratedchanges in genotype in urban populations when compared to rural populations, with thepotential to create genetic divergence between urban and non-urban populations [185].However, an attempt to study the differences in overall genetic composition of Eurasianblackbirds yielded negative results [188]. This suggests that genetic differences betweenurban and rural populations have only occurred in selected genes, based on adaptiverequirements. Urban blackbirds diverged from their rural populations at a single locicoding for risk avoidance [187]. However, there is still little evidence for urbanization-induced micro-evolution.
4. Discussion
Some bird traits are beneficial for their survival in cities, while others could be harmful.This review demonstrates that the impact of urbanization on birds is immense: and yet,our understanding of it is still poor. It is evident that studying one trait might not give acomplete picture of how urbanization might affect birds or populations, but looking at acombination of traits would provide more insights.
Behavioral trait changes are dependent on plasticity, individual personalities of thebird populations, and, at least for a few species, the development of separate cognitiveskills that are specific to urban needs [22,170]. In particular, as our review demonstrates,behavioral trait changes in urban birds are often a combination of two or more trait changes.Such correlated changes create behavioral syndromes in urban birds [171]. An example ofsuch behavioral syndromes is the occurrence of increased aggression in birds with bolderpersonalities [176].
The consequences of trait change have not yet been studied in detail, and they requireattention. Urban birds could incur energetic and reproductive costs due to changedcorticosterone levels or increased aggression in urban areas. The ability to establish asuccessful breeding population in novel environments also depends on the population sizeand selection pressure [22]. Earlier and prolonged breeding seasons could have negativeeffects on reproductive health of urban birds, especially females. Therefore, even though,in the short term, birds might be adapting to urbanization by producing more broodsand laying more eggs, we need to understand whether these birds will be successful atsurviving in cities in the long term. Additionally, it is important to understand the reasonsbehind some birds showing a reduction in clutch and brood size in urban areas. Longterm data collection is needed for monitoring the population of birds inhabiting the cities.Popular citizen science initiatives can help to answer some of these questions.
59
Land 2021, 10, 92
In the context of physiological and morphological trait changes, the literature suggestschanges in stress hormone levels and reproductive hormone levels. The reason for thelack of consistent pattern in the differences in hormone levels in urban and non-urbanpopulations could be due to the selection of physiologically plastic species in urban areas,which affects the life-history traits and ultimate density of the populations. This couldmean potential extinction of species that are currently residing in urban areas, but are notable to adjust their physiology to the novel environment [24]. However, the effect of suchdifferences in hormone levels on the overall fitness of the bird species that are successful inchanging their endocrine traits has not yet been investigated in detail.
Trait changes in response to urbanization have the potential for creating geneticdivergence between urban and rural populations of a species. The most important traitchange contributing to genetic divergence is the change in reproductive behavior. Acombination of different traits, like singing behavior, timing of reproduction, and nestingsuccess, play a role in the reproductive pattern of birds. Urban areas modify these traits.Song birds possess high phenotypic plasticity and they have changed song structure inresponse to urban noise. Trait changes, coupled with isolation due to habitat fragmentationfurther leads to disconnect between urban and rural populations, leading to differentialtrait development in both populations. There is already evidence to suggest changes ingenetic makeup at certain loci in urban and rural populations. Geographical isolation,coupled with high phenotypic plasticity, has a potential for further genetic divergence inurban birds. Large scale spatial and temporal studies, investigating such microevolutiondue to urbanization, could help in predicting the course of genetic divergence of urbanbird populations in the future. Studying such urbanization induced genetic trait changescould help not only in conserving biodiversity in cities, but could also help to answer someof the basic questions in evolutionary ecology and also help in conserving the ecosystemservices in cities [185].
There is a large gap in our knowledge regarding the effects of urbanization on birds intropics, despite the fact that tropics support many more bird species and they are growingrapidly in terms of urbanization [55]. Future research in this area could also differentiatebetween introduced species and native species, in order to understand whether the traitsdiscussed in this review contribute to the success of introduced species.
A lack of information regarding how urbanization will affect avifauna in urban tropicscan be a major impeding factor while designing conservation strategies to protect thebiodiversity in these ever-growing cities. Moreover, a study on southeast Asian cities foundthat, the wealthier the cities get, the richer they become in terms of urban greenspaces andnatural aesthetics [189]. This could lead to potential habitat generation in growing cities,further affecting the bird traits.
Studies have started to emerge on the effect of urbanization on the traits of diurnal andnocturnal raptors in the last decade. Studies on urban raptors mainly focus on reproductivesuccess, foraging pattern, and aggression in urban areas. Studies on top predatory birdspecies are essential while making management decisions, as these top predators mightbe responsible for keeping invasive faunal populations in check. For example, an increasein rodent populations on islands has led to the extinction of several island dwelling birdsand other fauna [190]. Similar effects might affect bird populations in urban areas if propermanagement decisions are not taken at an appropriate time. Further, certain species arepoorly represented in the research. Most of the studies that focus on species specific traitchanges focus only on a few common species, such as great tits, Eurasian blackbirds, andhouse sparrows. Behavioral and physiological studies carried out on a couple of speciesmight skew the literature in concluding effects of urbanization, either positive or negativeand making generalizations. Caution should be taken that there is a lot of inter-speciesand intra-species variation and we need more studies looking at a variety of species and acombination of traits. For example, gulls seem to show extraordinary innovative abilityaround humans when compared to other urban birds. There is further scope to generate
60
Land 2021, 10, 92
species specific databases in order to understand the effects of urbanization on diverse birdspecies and communities.
Urban areas provide a unique habitat in which to study community dynamics of birds.For example, in urban parks where there is a surge in activity during weekends, communitycomposition of birds in these parks might be affected [78]. This could be very important, as,even though these are areas with good green cover, they might not be suitable nesting sitesas park visitors might cause disturbance to nesting birds and might lead to abandoning thenest. On the other hand, these areas might be good areas to forage for fruits, seeds, andinsects during the weekdays. An interesting hypothesis could be tested, looking at nestingsuccess in the parks and outside the parks to actually see the effects of disturbance on birdcommunities and individual species.
5. Conclusions
The most significant trait changes that we identify have implications for urban aviandiversity conservation, and they can be of use to park managers, citizen science groups,and urban planners. Omnivorous and cavity nesters have a better success in urban en-vironments when compared to insectivores and ground nesting birds. Urban plannersand park managers can maintain small patches of land that are enclosed to protect againstcommon urban predators. such as feral dogs, cats, and rodents, in order to provide groundnesting birds that are especially endangered with refugia for roosting and nesting. An-other important suggestion to bird enthusiasts and urban planners would be to include avariety of food items in bird feeders, as this might help birds with different diets to meettheir nutrition requirements. Studies have shown that frugivores and granivores seemto do well in cities, as these birds feed on the seeds that are provided by people in birdfeed. There has been evidence that, when artificial food is provided birds expand theirranges, thus having a positive effect on bird populations [78]. If dried insects and nuts areincluded in the food, it might help insectivorous birds in the city. If bigger cavity nests areprovided for birds, like owls and other larger species, then these species might bounce backin good numbers in the cities. Additionally, maintaining patches of native vegetation inurban habitats might be a great solution for supporting not only the bird species, but alsoinsects and small mammal communities that can serve as a prey base to the birds. Alongwith patches of native vegetation, it is also crucial to conserve the local water bodies incities, as these act as refuges for several migratory birds and local waders [46,191]. In theMediterranean, it was observed that the natural waterbodies were key habitat for severalspecies of owls [192]. Hence, the health of the lakes, ponds, and rivers is crucial for thesurvival of many urban species.
Species specific studies and detailed knowledge of local bird populations can greatlyhelp in effective management measures, as we find substantial, documented variation inhow birds of specific species respond to the pressures of urbanization. We hope for thelong- term monitoring of bird populations while using a combination of detailed scientificresearch and citizen science initiatives, as demonstrated in the papers reviewed here, canhelp to bridge gaps in knowledge and benefit the future survival of a diverse range ofbirds in urban environments. To conclude, using a trait-based approach will be useful forunderstanding the impacts of urbanization on bird species. Understanding the role of traitswith an understanding of urban changes will be most useful. In particular, we stress theneed for further research on the traits that influence bird survival in tropical cities, as wellas on individual species. A meta-analyses kind of an approach encompassing multipletraits together was out of scope for this study, as enough information on each trait is stillnot available. Some traits have enough literature, others have hardly a couple of studies.However, this review could act as a baseline for further research on urban wildlife andits ecology.
Supplementary Materials: The following are available online at https://www.mdpi.com/2073-445X/10/2/92/s1, Figure S1: List of journals which published the (>1) articles reviewed in the currentstudy; Table S1: All traits considered for selecting the literature were distributed under five broad
61
Land 2021, 10, 92
trait groups. In total, 32 sub-traits were considered for this study. The broad description of thesesub-traits is given below; Table S2: List of publications reviewed for this study.
Author Contributions: S.P.: Conceptualization, Methodology, Data Curation, Analysis, Writing—Original Draft Preparation, Reviewing and Editing. R.J.: Conceptualization, Methodology, DataCuration, Analysis, Writing—Original Draft Preparation, Reviewing and Editing. K.R.S.: Concep-tualization, Supervision, Writing—Reviewing and Editing. H.N.: Conceptualization, Methodology,Supervision, Writing—Original Draft Preparation, Reviewing and Editing, Project administration.All authors have read and agreed to the published version of the manuscript.
Funding: This research received no external funding.
Acknowledgments: The authors thank Azim Premji University, Bangalore for supporting this re-search. This research did not receive any specific grant from funding agencies in the public, commer-cial, or not-for-profit sectors.
Conflicts of Interest: The authors declare no conflict of interest.
References1. McKinney, M.L. Urbanization, biodiversity and conservation. BioScience 2002, 52, 883–890. [CrossRef]2. Kowarik, I. Novel urban ecosystems, biodiversity, and conservation. Environ. Pollut 2011, 159, 1974–1983. [CrossRef] [PubMed]3. UNDESA. 2018 The Sustainable Development Goals Report; United Nations: New York, NY, USA, 2018; Available online: https://
www.un.org/development/desa/publications/the-sustainable-development-goals-report-2018.html (accessed on 20 June 2020).4. Lepczyk, C.A.; Aronson, M.F.; Evans, K.L.; Goddard, M.A.; Lerman, S.B.; MacIvor, J.S. Biodiversity in the city: Fundamental
questions for understanding the ecology of urban green spaces for biodiversity conservation. BioScience 2017, 67, 799–807.[CrossRef]
5. Sol, D.; Duncan, R.P.; Blackburn, T.M.; Cassey, P.; Lefebvre, L. Big brains, enhanced cognition, and response of birds to novelenvironments. Proc. Natl. Acad. Sci. USA 2005, 102, 5460–5465. [CrossRef] [PubMed]
6. Liu, Z.; He, C.; Wu, J. The relationship between habitat loss and fragmentation during urbanization: An empirical evaluationfrom 16 world cities. PLoS ONE 2016, 11, e0154613. [CrossRef] [PubMed]
7. Belaire, J.A.; Westphal, L.M.; Whelan, C.J.; Minor, E.S. Urban residents’ perceptions of birds in the neighborhood: Biodiversity,cultural ecosystem services, and disservices. Condor 2015, 117, 192–202. [CrossRef]
8. Aronson, M.F.; la Sorte, F.A.; Nilon, C.H.; Katti, M.; Goddard, M.A.; Lepczyk, C.A.; Warren, P.S.; Williams, N.S.; Cilliers, S.;Clarkson, B.; et al. A global analysis of the impacts of urbanization on bird and plant diversity reveals key anthropogenic drivers.Proc. R. Soc. B Biol. Sci. 2014, 281, 20133330. [CrossRef]
9. Hensley, C.B.; Trisos, C.H.; Warren, P.S.; MacFarland, J.; Blumenshine, S.; Reece, J.; Katti, M. Effects of urbanization on native birdspecies in three southwestern US Cities. Front. Ecol. Evol. 2019, 7, 71. [CrossRef]
10. Whelan, C.J.; Wenny, D.G.; Marquis, R.J. Ecosystem services provided by birds. Ann. N. Y. Acad. Sci. 2008, 1134, 25–60. [CrossRef]11. Sandström, U.G.; Angelstam, P.; Mikusinski, G. Ecological diversity of birds in relation to the structure of urban green space.
Landsc. Urban Plan 2006, 77, 39–53. [CrossRef]12. Goodness, J.; Andersson, E.; Anderson, P.M.; Elmqvist, T. Exploring the links between functional traits and cultural ecosystem
services to enhance urban ecosystem management. Ecol. Indic. 2016, 70, 597–605. [CrossRef]13. Heyman, E.; Gunnarsson, B.; Dovydavicius, L. Management of urban nature and its impact on bird ecosystem services. In Ecology
and Conservation of Birds in Urban Environments; Murgui, E., Hedblom, M., Eds.; Springer: Cham, Switzerland, 2017; pp. 465–488.14. Gil, D.; Brumm, H. Avian Urban Ecology, 1st ed.; Oxford University Press: Oxford, UK, 2014; pp. xiii–xv.15. Kumar, N.; Gupta, U.; Malhotra, H.; Jhala, Y.V.; Qureshi, Q.; Gosler, A.G.; Sergio, F. The population density of an urban raptor is
inextricably tied to human cultural practices. Proc. R. Soc. B Biol. Sci. 2019, 286, 20182932. [CrossRef] [PubMed]16. Chace, J.F.; Walsh, J.J. Urban effects on native avifauna: A review. Landsc. Urban Plan 2006, 74, 46–69. [CrossRef]17. Palacio, F.X. Urban exploiters have broader dietary niches than urban avoiders. Ibis 2019, 162, 42–49. [CrossRef]18. Leveau, L.M. Bird traits in urban–rural gradients: How many functional groups are there? J. Ornithol. 2013, 154, 655–662.
[CrossRef]19. Lizée, M.H.; Mauffrey, J.F.; Tatoni, T.; Deschamps-Cottin, M. Monitoring urban environments on the basis of biological traits. Ecol.
Indic. 2011, 11, 353–361. [CrossRef]20. Rooney, T.P.; Wiegmann, S.M.; Rogers, D.A.; Waller, D.M. Biotic impoverishment and homogenization in unfragmented forest
understory communities. Conserv. Biol. 2004, 18, 787–798. [CrossRef]21. Shochat, E.; Lerman, S.; Fernández-Juricic, E. Birds in urban ecosystems: Population dynamics, community structure, biodiversity,
and conservation. In Urban Ecosystem Ecology, 1st ed.; Aitkenhead-Peterson, J.A., Volder, A., Eds.; American Agronomy Society:Madison, WI, USA, 2010; pp. 75–86.
22. Sol, D.; González-Lagos, C.; Moreira, D.; Maspons, J.; Lapiedra, O. Urbanization tolerance and the loss of avian diversity. Ecol.Lett. 2014, 17, 942–950. [CrossRef] [PubMed]
62
Land 2021, 10, 92
23. Blumstein, D.T. Attention, habituation, and antipredator behavior: Implications for urban birds. In Avian Urban Ecology; Diego,G., Henrik, B., Eds.; Oxford University Press: Oxford, UK, 2014; pp. 41–53.
24. Bonier, F. Hormones in the city: Endocrine ecology of urban birds. Horm. Behav. 2012, 61, 763–772. [CrossRef]25. Rayner, L.; Ikin, K.; Evans, M.J.; Gibbons, P.; Lindenmayer, D.B.; Manning, A.D. Avifauna and urban encroachment in time and
space. Divers. Distrib. 2015, 21, 428–440. [CrossRef]26. Leveau, L.M.; Leveau, C.M.; Villegas, M.; Cursach, J.A.; Suazo, C.G. Bird communities along urbanization gradients: A compara-
tive analysis among three neo-tropical cities. Ornitol. Neotrop. 2017, 28, 77–87.27. la Sorte, F.A.; Lepczyk, C.A.; Aronson, M.F.J.; Goddard, M.A.; Hedblom, M.; Katti, M.; MacGregor-Fors, I. The phylogenetic and
functional diversity of regional breeding bird assemblages is reduced and constricted through urbanization. Divers. Distrib. 2018,24, 928–938. [CrossRef]
28. Saari, S.; Richter, S.; Higgins, M.; Oberhofer, M.; Jennings, A.; Faeth, S.H. Urbanization is not associated with increased abundanceor decreased richness of terrestrial animals-dissecting the literature through meta-analysis. Urban Ecosyst. 2016, 19, 1251–1264.[CrossRef]
29. Ibáñez-Álamo, J.D.; Rubio, E.; Benedetti, Y.; Morelli, F. Global loss of avian evolutionary uniqueness in urban areas. Glob. Chang.Biol. 2017, 23, 2990–2998. [CrossRef] [PubMed]
30. Batáry, P.; Kurucz, K.; Suarez-Rubio, M.; Chamberlain, D.E. Non-linearities in bird responses across urbanization gradients:A meta-analysis. Glob. Chang. Biol. 2018, 24, 1046–1054. [CrossRef]
31. Morelli, F.; Benedetti, Y.; Ibáñez-Álamo, J.D.; Jokimäki, J.; Mänd, R.; Tryjanowski, P.; Møller, A.P. Evidence of evolutionaryhomogenization of bird communities in urban environments across Europe. Glob. Ecol. Biogeogr. 2016, 25, 1284–1293. [CrossRef]
32. Hagen, O.E.; Hagen, O.; Ibáñez-Álamo, J.D.; Petchey, O.L.; Evans, K.L. Impacts of urban areas and their characteristics on avianfunctional diversity. Front. Ecol. Evol. 2017, 5, 84. [CrossRef]
33. Shochat, E.; Warren, P.S.; Faeth, S.H.; McIntyre, N.E.; Hope, D. From patterns to emerging processes in mechanistic urban ecology.Trends Ecol. Evol. 2006, 21, 186–191. [CrossRef]
34. MacGregor-Fors, I.; Morales-Pérez, L.; Schondube, J.E. Migrating to the city: Responses of neo-tropical migrant bird communitiesto urbanization. Condor 2010, 112, 711–717. [CrossRef]
35. Leveau, L.M. Urbanization, environmental stabilization and temporal persistence of bird species: A view from Latin America.PeerJ 2018, 6, e6056. [CrossRef]
36. Faeth, S.H.; Bang, C.; Saari, S. Urban biodiversity: Patterns and mechanisms. Ann. N. Y. Acad. Sci. 2011, 1223, 69–81. [CrossRef][PubMed]
37. Paton, G.D.; Shoffner, A.V.; Wilson, A.M.; Gagne, S.A. The traits that predict the magnitude and spatial scale of forest birdresponses to urbanization intensity. PLoS ONE 2019, 14, e0220120. [CrossRef] [PubMed]
38. Julliard, R.; Jiguet, F.; Couvet, D. Common birds facing global changes: What makes a species at risk? Glob. Chang. Biol. 2004, 10,148–154. [CrossRef]
39. Callaghan, C.T.; Major, R.E.; Wilshire, J.H.; Martin, J.M.; Kingsford, R.T.; Cornwell, W.K. Generalists are the most urban-tolerantof birds: A phylogenetically controlled analysis of ecological and life history traits using a novel continuous measure of birdresponses to urbanization. Oikos 2019, 128, 845–858. [CrossRef]
40. Callaghan, C.T.; Benedetti, Y.; Wilshire, J.H.; Morelli, F. Avian trait specialization is negatively associated with urban tolerance.Oikos 2020, 129, 1541–1551. [CrossRef]
41. Devictor, V.; Julliard, R.; Couvet, D.; Lee, A.; Jiguet, F. Functional homogenization effect of urbanization on bird communities.Conserv. Biol. 2007, 21, 41–751. [CrossRef]
42. Futuyama, D.J.; Moreno, G. The evolution of ecological specialization. Annu. Rev. Ecol. Evol. S 1988, 19, 207–233. [CrossRef]43. Kitahara, M.; Sei, K.; Fujii, K. Patterns in the structure of grassland butterfly communities along a gradient of human disturbance:
Further analysis based on the generalist/specialist concept. Popul. Ecol. 2000, 42, 135–144. [CrossRef]44. Kark, S.; Iwaniuk, A.; Schalimtzek, A.; Banker, E. Living in the city: Can anyone become an ‘urban exploiter? J. Biogeogr. 2007, 34,
638–651. [CrossRef]45. Evans, K.L.; Chamberlain, D.E.; Hatchwell, B.J.; Gregory, R.D.; Gaston, K.J. What makes an urban bird? Glob. Chang. Biol. 2011,
17, 1365–2486. [CrossRef]46. Morelli, F.; Benedetti, Y.; Su, T.; Zhou, B.; Moravec, D.; Šímová, P.; Liang, W. Taxonomic diversity, functional diversity and
evolutionary uniqueness in bird communities of Beijing’s urban parks: Effects of land use and vegetation structure. Urban UrbanGreen. 2017, 23, 84–92. [CrossRef]
47. Gutiérrez-Tapia, P.; Azócar, M.I.; Castro, S.A. A citizen-based platform reveals the distribution of functional groups inside a largecity from the Southern Hemisphere: E-Bird and the urban birds of Santiago (Central Chile). Rev. Chil. Hist. Nat. 2018, 91, 3.[CrossRef]
48. Lim, H.C.; Sodhi, N.S. Responses of avian guilds to urbanization in a tropical city. Landsc. Urban Plan 2004, 66, 199–215. [CrossRef]49. Boal, C.W. Urban raptor communities: Why some raptors and not others occupy urban environments. In Urban Raptors; Boal,
C.W., Dykstra, C.R., Eds.; Island Press: Washington, DC, USA, 2018; pp. 36–50.50. Hindmarch, S.; Elliott, J.E. A specialist in the city: The diet of barn owls along a rural to urban gradient. Urban Ecosyst. 2015, 18,
477–488. [CrossRef]
63
Land 2021, 10, 92
51. Rullman, S.; Marzluff, J.M. Raptor presence along an urban–wildland gradient: Influences of prey abundance and land cover. J.Raptor Res. 2014, 48, 257–272. [CrossRef]
52. Thomson, V.K.; Stevens, T.; Jones, D.; Huijbers, C. Carrion preference in Australian coastal raptors: Effects of Urbanisation onscavenging. Sunbird 2016, 46, 16.
53. Jones, D.N.; Reynolds, J.S. Feeding birds in our towns and cities: A global research opportunity. J. Avian Biol. 2008, 39, 265–271.[CrossRef]
54. Hodgson, P.; French, K.; Major, R.E. Comparison of foraging behavior of small, urban-sensitive insectivores in continuouswoodland and woodland remnants in a suburban landscape. Wildl. Res. 2006, 33, 591–603. [CrossRef]
55. Marzluff, J.M.; Bowman, R.; Donnelly, R. (Eds.) A historical perspective on urban bird research: Trends, terms, and approaches.In Avian Ecology and Conservation in an Urbanizing; World Springer: Boston, MA, USA, 2001; pp. 1–17.
56. Ikin, K.; Knight, E.; Lindenmayer, D.B.; Fischer, J.; Manning, A.D. Linking bird species traits to vegetation characteristics in afuture urban development zone: Implications for urban planning. Urban Ecosyst. 2012, 15, 961–977. [CrossRef]
57. Croci, S.; Butet, A.; Clergeau, P. Does urbanization filter birds on the basis of their biological traits. Condor 2008, 110, 223–240.[CrossRef]
58. Reale, J.A.; Blair, R.B. Nesting success and life-history attributes of bird communities along an urbanization gradient. UrbanHabitats 2005, 3, 1–24.
59. Máthé, O.; Batáry, P. Insectivorous and open-cup nester bird species suffer the most from urbanization. Bird Study 2015, 62, 78–86.[CrossRef]
60. Dykstra, C.R. City Lifestyles: Behavioral Ecology of Urban Raptors. In Urban Raptors; Boal, C.W., Dykstra, C.R., Eds.; Island Press:Washington, DC, USA, 2018; pp. 18–35.
61. Gahbauer, M.A.; Bird, D.M.; Clark, K.E.; French, T.; Brauning, D.W.; Mcmorris, F.A. Productivity, mortality, and management ofurban peregrine falcons in northeastern North America. J. Wildl. Manag. 2015, 79, 10–19. [CrossRef]
62. Mason, C.F. Avian species richness and numbers in the built environment: Can new housing developments be good for birds? InHuman Exploitation and Biodiversity Conservation; Hawksworth, D.L., Bull, A.T., Eds.; Springer: Dordrecht, The Netherlands, 2006;pp. 2365–2378.
63. Thornton, M.; Todd, I.; Roos, S. Breeding success and productivity of urban and rural Eurasian Sparrowhawks Accipiter nisus inScotland. Écoscience 2017, 24, 115–126. [CrossRef]
64. Partecke, J.; Van’t-Hof, T.; Gwinner, E. Differences in the timing of reproduction between urban and forest European blackbirds(Turdus merula): Result of phenotypic flexibility or genetic differences? Proc. R. Soc. B Biol. Sci. 2004, 271, 1995–2001. [CrossRef]
65. Atwell, J.W.; Cardoso, G.; Whittaker, D.J.; Price, T.D.; Ketterson, E.D. Hormonal, behavioral, and life-history traits exhibitcorrelated shifts in relation to population establishment in a novel environment. Am. Nat. 2014, 184, E147–E160. [CrossRef]
66. Zhang, S.; Chen, X.; Zhang, J.; Li, H. Differences in the reproductive hormone rhythm of Tree sparrows (Passer montanus) fromurban and rural sites in Beijing: The effect of anthropogenic light sources. Gen. Comp. Endocrinol. 2014, 206, 24–29. [CrossRef]
67. Davies, S.; Behbahaninia, H.; Giraudeau, M.; Meddle, S.L.; Waites, K.; Deviche, P. Advanced seasonal reproductive developmentin a male urban bird is reflected in earlier plasma luteinizing hormone rise but not energetic status. Gen. Comp. Endocrinol. 2015,224, 1–10. [CrossRef]
68. Kettel, E.F.; Gentle, L.K.; Quinn, J.L.; Yarnell, R.W. The breeding performance of raptors in urban landscapes: A review andmeta-analysis. J. Ornithol. 2018, 159, 1–18. [CrossRef]
69. Chamberlain, D.E.; Cannon, A.R.; Toms, M.P.; Leech, D.I.; Hatchwell, B.J.; Gaston, K.J. Avian productivity in urban landscapes:A review and meta-analysis. Ibis 2009, 151, 1–18. [CrossRef]
70. Marini, K.L.D.; Otter, K.A.; LaZerte, S.E.; Reudink, M.W. Urban environments are associated with earlier clutches and fasternestling feather growth compared to natural habitats. Urban Ecosyst. 2017, 20, 1291–1300. [CrossRef]
71. Antonov, A.; Atanasova, D. Small-scale differences in the breeding ecology of urban and rural magpies (Pica pica). Ornis Fennica2003, 80, 21–30.
72. Shochat, E.; Lerman, S.B.; Katti, M.; Lewis, D.B. Linking optimal foraging behavior to bird community structure in an urban-desertlandscape: Field experiments with artificial food patches. Am. Nat. 2004, 164, 232–243. [CrossRef] [PubMed]
73. Caizergues, A.E.; Grégoire, A.; Charmantier, A. Urban versus forest ecotypes are not explained by divergent reproductiveselection. Proc. R. Soc. B Biol. Sci. 2018, 285, 20180261. [CrossRef]
74. Mennechez, G.; Clergeau, P. Effect of urbanization on habitat generalists: Starlings not so flexible? Acta Oecol. 2006, 30, 182–191.[CrossRef]
75. Liker, A.; Papp, Z.; Bókony, V.; Lendvai, A.Z. Lean birds in the city: Body size and condition of house sparrows along theurbanization gradient. J. Anim. Ecol. 2008, 77, 789–795. [CrossRef]
76. Auman, H.J.; Meathrel, C.E.; Richardson, A. Supersize me: Does anthropogenic food change the body condition of Silver Gulls?A comparison between urbanized and remote, non-urbanized areas. Waterbirds 2008, 31, 122–126. [CrossRef]
77. Bókony, V.; Seress, G.; Nagy, S.; Lendvai, A.Z.; Liker, A. Multiple indices of body condition reveal no negative effect of urbanizationin adult house sparrows. Landsc. Urban Plan 2012, 104, 75–84. [CrossRef]
78. Leveau, L.M. Urbanization induces bird color homogenization. Landsc. Urban Plan 2019, 192, 103645. [CrossRef]79. Sol, D.; Bacher, S.; Reader, S.M.; Lefebvre, L. Brain size predicts the success of mammal species introduced into novel environments.
Am. Nat. 2008, 172, 63–71. [CrossRef]
64
Land 2021, 10, 92
80. Maklakov, A.A.; Immler, S.; Gonzalez-Voyer, A.; Rönn, J.; Kolm, N. Brains and the city: Big-brained passerine birds succeed inurban environments. Biol. Lett. 2011, 7, 730–732. [CrossRef] [PubMed]
81. Carrete, M.; Tella, J.L. Inter-individual variability in fear of humans and relative brain size of the species are related to contempo-rary urban invasion in birds. PLoS ONE 2011, 6, e18859. [CrossRef] [PubMed]
82. Møller, A.P. Behavioural and ecological predictors of urbanization. In Avian Urban Ecology; Gil, D., Brumm, H., Eds.; OxfordUniversity Press: Oxford, UK, 2014; pp. 54–68.
83. Møller, A.P.; Erritzøe, J. Brain size and urbanization in birds. Avian Res. 2015, 6, 8. [CrossRef]84. Grunst, M.L.; Rotenberry, J.T.; Grunst, A.S. Variation in adrenocortical stress physiology and condition metrics within a
heterogeneous urban environment in the Song sparrow (Melospiza melodia). J. Avian Biol. 2014, 45, 574–583. [CrossRef]85. Davies, S.; Haddad, N.; Ouyang, J.Q. Stressful city sounds: Glucocorticoid responses to experimental traffic noise are environ-
mentally dependent. Biol. Lett. 2017, 13, 20170276. [CrossRef] [PubMed]86. Russ, A.; Reitemeier, S.; Weissmann, A.; Gottschalk, J.; Einspanier, A.; Klenke, R. Seasonal and urban effects on the endocrinology
of a wild passerine. Ecol. Evol. 2015, 5, 5698–5710. [CrossRef]87. Dominoni, D.M. The effects of light pollution on biological rhythms of birds: An integrated, mechanistic perspective. J. Ornithol.
2015, 156, 409–418. [CrossRef]88. Partecke, J.; Schwabl, I.; Gwinner, E. Stress and the city: Urbanization and its effects on the stress physiology in European
blackbirds. Ecology 2006, 87, 1945–1952. [CrossRef]89. Fokidis, H.B.; Deviche, P. Plasma corticosterone of city and desert Curve-billed Thrashers, (Toxostoma curvirostre), in response to
stress-related peptide administration. Comp. Biochem. Physiol. A Mol. Integr. Physiol. 2011, 159, 32–38. [CrossRef]90. Zhang, S.; Lei, F.; Liu, S.; Li, D.; Chen, C.; Wang, P. Variation in baseline corticosterone levels of Tree sparrow (Passer montanus)
populations along an urban gradient in Beijing, China. J. Ornithol. 2011, 152, 801–806. [CrossRef]91. Davies, S.; Rodriguez, N.S.; Sweazea, K.L.; Deviche, P. The effect of acute stress and long-term corticosteroid administration on
plasma metabolites in an urban and Desert songbird. Physiol. Biochem. Zool. 2013, 86, 47–60. [CrossRef] [PubMed]92. Fokidis, H.B.; Deviche, P. Brain arginine vasotocin immunoreactivity differs between urban and desert curve-billed thrashers,
(Toxostoma curvirostre): Relationships with territoriality and stress physiology. Brain Behav. Evol. 2012, 79, 84–97. [CrossRef][PubMed]
93. Yeh, P.J.; Price, T.D. Adaptive phenotypic plasticity and the successful colonization of a novel environment. Am. Nat. 2004, 164,531–542. [CrossRef] [PubMed]
94. Rodewald, A.D.; Shustack, D.P. Urban flight: Understanding individual and population-level responses of Nearctic–Neotropicalmigratory birds to urbanization. J. Anim. Ecol. 2008, 77, 83–91. [CrossRef] [PubMed]
95. Schoech, S.J.; Bowman, R.; Hahn, T.P.; Goymann, W.; Schwabl, I.; Bridge, E.S. The effects of low levels of light at night upon theendocrine physiology of Western scrub-jays (Aphelocoma californica). J. Exp. Zool. A Ecol. Integr. Physiol. 2013, 319, 527–538.[CrossRef] [PubMed]
96. Brown, L.M.; Graham, C.H. Demography, traits and vulnerability to urbanization: Can we make generalizations? J. Appl. Ecol.2015, 52, 1455–1464. [CrossRef]
97. Iglesias-Carrasco, M.; Duchêne, D.A.; Head, M.L.; Møller, A.P.; Cain, K. Sex in the city: Sexual selection and urban colonization inpasserines. Biol. Lett. 2019, 15, 20190257. [CrossRef]
98. Dominoni, D.M.; Quetting, M.; Partecke, J. Long-term effects of chronic light pollution on seasonal functions of Europeanblackbirds (Turdus merula). PLoS ONE 2013, 8, e85069. [CrossRef]
99. Dominoni, D.M.; Quetting, M.; Partecke, J. Artificial light at night advances avian reproductive physiology. Proc. R. Soc. B Biol.Sci. 2013, 280, 20123017. [CrossRef]
100. Fudickar, A.M.; Greives, T.J.; Abolins-Abols, M.; Atwell, J.W.; Meddle, S.L.; Friis, G.; Stricker, C.A.; Ketterson, E.D. Mechanismsassociated with an advance in the timing of seasonal reproduction in an urban songbird. Front. Ecol. Evol. 2017, 5, 85. [CrossRef]
101. Partecke, J.; Gwinner, E. Increased sedentariness in European blackbirds following urbanization: A consequence of localadaptation? Ecology 2007, 88, 882–890. [CrossRef] [PubMed]
102. Longcore, T. Sensory ecology: Night lights alter reproductive behavior of Blue tits. Curr. Biol. 2010, 20, R893–R895. [CrossRef][PubMed]
103. Dominoni, D.M.; Goymann, W.; Helm, B.; Partecke, J. Urban-like night illumination reduces melatonin release in Europeanblackbirds (Turdus merula): Implications of city life for biological time-keeping of songbirds. Front. Zool. 2013, 10, 60. [CrossRef][PubMed]
104. Reynolds, S.J.; Ibáñez-Álamo, J.D.; Sumasgutner, P.; Mainwaring, M.C. Urbanization and nest building in birds: A review ofthreats and opportunities. J. Ornithol. 2019, 160, 841–860. [CrossRef]
105. Wawrzyniak, J.; Kalinski, A.; Gladalski, M.; Banbura, M.; Markowski, M.; Skwarska, J.; Kalinski, P.; Cyzewska, I.; Banbura, J.Long-term variation in laying date and clutch size of the Great tit (Parus major) in central Poland: A comparison between urbanparkland and deciduous forest. Ardeola 2015, 62, 311–323. [CrossRef]
106. Møller, A.P. Successful city dwellers: A comparative study of the ecological characteristics of urban birds in the Western Palearctic.Oecologia 2009, 159, 849–858. [CrossRef] [PubMed]
107. Isaksson, C. Urbanization, oxidative stress and inflammation: A question of evolving, acclimatizing or coping with urbanenvironmental stress. Funct. Ecol. 2015, 29, 913–923. [CrossRef]
65
Land 2021, 10, 92
108. Watson, H.; Videvall, E.; Andersson, M.N.; Isaksson, C. Transcriptome analysis of a wild bird reveals physiological responses tothe urban environment. Sci. Rep. 2017, 7, 44180. [CrossRef]
109. Costantini, D.; Greives, T.J.; Hau, M.; Partecke, J. Does urban life change blood oxidative status in birds? J. Exp. Biol. 2014, 217,2994–2997. [CrossRef]
110. Fuller, R.A.; Warren, P.H.; Gaston, K.J. Daytime noise predicts nocturnal singing in urban robins. Biol. Lett. 2007, 3, 368–370.[CrossRef]
111. Nemeth, E.; Brumm, H. Birds and anthropogenic noise: Are urban songs adaptive? Am. Nat. 2010, 176, 465–475. [CrossRef][PubMed]
112. Slabbekoorn, H.; Ripmeester, E.A.P. Birdsong and anthropogenic noise: Implications and applications for conservation. Mol. Ecol.2008, 17, 72–83. [CrossRef] [PubMed]
113. Slabbekoorn, H.; Boer-Visser, A. Cities change the songs of birds. Curr. Biol. 2006, 16, 2326–2331. [CrossRef] [PubMed]114. Laiolo, P. The Rufous-Collared sparrow (Zonotrichia capensis) utters higher frequency songs in urban habitats. Rev. Catalana
d’Ornitologia 2011, 27, 25–30.115. Luther, D.A.; Derryberry, E.P. Birdsongs keep pace with city life: Changes in song over time in an urban songbird affects
communication. Anim. Behav. 2012, 83, 1059–1066. [CrossRef]116. Job, J.R.; Kohler, S.L.; Gill, S.A. Song adjustments by an open habitat bird to anthropogenic noise, urban structure, and vegetation.
Behav. Ecol. 2016, 27, 1734–1744. [CrossRef]117. LaZerte, S.E.; Otter, K.A.; Slabbekoorn, H. Mountain chickadees adjust songs, calls and chorus composition with increasing
ambient and experimental anthropogenic noise. Urban Ecosyst. 2017, 20, 989–1000. [CrossRef]118. Cardoso, G.C.; Hu, Y.; Francis, C.D. The comparative evidence for urban species sorting by anthropogenic noise. R Soc. Open Sci.
2018, 5, 172059. [CrossRef]119. Moiron, M.; González-Lagos, C.; Slabbekoorn, H.; Sol, D. Singing in the city: High song frequencies are no guarantee for urban
success in birds. Behav. Ecol. 2015, 26, 843–850. [CrossRef]120. Luther, D.A.; Phillips, J.; Derryberry, E.P. Not so sexy in the city: Urban birds adjust songs to noise but compromise vocal
performance. Behav. Ecol. 2016, 27, 332–340. [CrossRef]121. Narango, D.L.; Rodewald, A.D. Urban-associated drivers of song variation along a rural–urban gradient. Behav. Ecol. 2016, 27,
608–616. [CrossRef]122. Phillips, J.N.; Derryberry, E.P. Urban sparrows respond to a sexually selected trait with increased aggression in noise. Sci. Rep.
2018, 8, 7505. [CrossRef] [PubMed]123. Ríos-Chelén, A.A.; Quirós-Guerrero, E.; Gil, D.; Macías-Garcia, C. Dealing with urban noise: Vermilion flycatchers sing longer
songs in noisier territories. Behav. Ecol. Sociobiol. 2013, 67, 145–152. [CrossRef]124. Lowry, H.; Lill, A.; Wong, B.B.M. How noisy Does a noisy miner have to be? Amplitude adjustments of alarm calls in an avian
urban ‘adapter’. PLoS ONE 2011, 7, e29960. [CrossRef] [PubMed]125. Potvin, D.A.; Mulder, R.A. Immediate, independent adjustment of call pitch and amplitude in response to varying background
noise by Silvereyes (Zosterops lateralis). Behav. Ecol. 2013, 24, 1363–1368. [CrossRef]126. Knight, C.R.; Swaddle, J.P. Eastern Bluebirds alter their song in response to anthropogenic changes in the acoustic environment.
Integr. Comp. Biol. 2015, 55, 418–431. [CrossRef]127. Díaz, M.; Parra, A.; Gallardo, C. Serins respond to anthropogenic noise by increasing vocal activity. Behav. Ecol. 2011, 22, 332–336.
[CrossRef]128. Redondo, P.; Barrantes, G.; Sandoval, L. Urban noise influences vocalization structure in the House wren (Troglodytes aedon).
Ibis 2013, 155, 621–625. [CrossRef]129. Moseley, D.L.; Phillips, J.N.; Derryberry, E.P.; Luther, D.A. Evidence for differing trajectories of songs in urban and rural
populations. Behav. Ecol. 2019, 30, 1734–1742. [CrossRef]130. Potvin, D.A.; Mulder, R.A.; Parris, K.M. Silvereyes decrease acoustic frequency but increase efficacy of alarm calls in urban noise.
Anim. Behav. 2014, 98, 27–33. [CrossRef]131. Potvin, D.A.; Parris, K.M.; Mulder, R.A. Geographically pervasive effects of urban noise on frequency and syllable rate of songs
and calls in Silvereyes (Zosterops lateralis). Proc. R. Soc. B Biol. Sci. 2011, 278, 2464–2469. [CrossRef] [PubMed]132. Seger-Fullam, K.D.; Rodewald, A.D.; Soha, J.A. Urban noise predicts song frequency in Northern cardinals and American robins.
Bioacoustics 2011, 20, 267–276. [CrossRef]133. Shannon, G.; McKenna, M.F.; Angeloni, L.M.; Crooks, K.R.; Fristrup, K.M.; Brown, E.; Warner, K.A.; Nelson, M.D.; White, C.;
Briggs, J.; et al. A synthesis of two decades of research documenting the effects of noise on wildlife. Biol. Rev. 2016, 91, 982–1005.[CrossRef] [PubMed]
134. Fernández-Juricic, E.; Poston, R.; Collibus, K.D.; Morgan, T.; Bastain, B.; Martin, C.; Jones, K.; Treminio, R. Microhabitat selectionand singing behavior patterns of male house finches (Haemorhous mexicanus) in urban parks in a heavily urbanized landscapein the western U.S. Urban Habitats 2005, 3, 49–69.
135. Badyaev, A.V.; Young, R.L.; Oh, K.P.; Addison, C. Evolution on a local scale: Developmental, functional, and genetic basesof divergence in bill form and associated changes in song structure between adjacent habitats. Evolution 2008, 62, 1951–1964.[CrossRef] [PubMed]
66
Land 2021, 10, 92
136. Nordt, A.; Klenke, R. Sleepless in town—Drivers of the temporal shift in dawn song in urban European blackbirds. PLoS ONE2013, 8, e71476. [CrossRef]
137. Dorado-Correa, A.M.; Rodríguez-Rocha, M.; Brumm, H. Anthropogenic noise, but not artificial light levels predict song behaviorin an equatorial bird. R Soc. Open Sci. 2016, 3, 160231. [CrossRef]
138. Kempenaers, B.; Borgström, P.; Loës, P.; Schlicht, E.; Valcu, M. Artificial night lighting affects dawn song, extra-pair siring success,and lay date in songbirds. Curr. Biol. 2010, 20, 1735–1739. [CrossRef]
139. Randler, C. Disturbances by dog barking increase vigilance in coots Fulica atra. Eur. J. Wildl. Res. 2006, 52, 265–270. [CrossRef]140. Bonnington, C.; Gaston, K.J.; Evans, K.L. Fearing the feline: Domestic cats reduce avian fecundity through trait-mediated indirect
effects that increase nest predation by other species. J. Appl. Ecol. 2013, 50, 15–24. [CrossRef]141. Rebolo-Ifrán, N.; Carrete, M.; Sanz-Aguilar, A.; Rodríguez-Martínez, S.; Cabezas, S.; Marchant, T.A.; Bortolotti, G.R.; Tella, J.L.
Links between fear of humans, stress and survival support a non-random distribution of birds among urban and rural habitats.Sci. Rep. 2015, 5, 13723. [CrossRef] [PubMed]
142. Samia, D.S.M.; Nakagawa, S.; Nomura, F.; Rangel, T.F.; Blumstein, D.T. Increased tolerance to humans among disturbed wildlife.Nat. Commun. 2015, 6, 8877. [CrossRef] [PubMed]
143. Eötvösa, C.B.; Magura, T.; Lövei, G.L. A meta-analysis indicates reduced predation pressure with increasing urbanization. Landsc.Urban Plan 2018, 180, 54–59. [CrossRef]
144. Weaver, M.; Ligon, R.A.; Mousel, M.; McGraw, K.J. Avian anthrophobia? Behavioral and physiological responses of housefinches (Haemorhous mexicanus) to human and predator threats across an urban gradient. Landsc. Urban Plan 2018, 179, 46–54.[CrossRef]
145. McGiffin, A.; Lill, A.; Beckman, J.; Johnstone, C.P. Tolerance of human approaches by Common mynas along an urban-ruralgradient. EMU Austral Ornithol. 2013, 113, 154–160. [CrossRef]
146. Møller, A.P.; Grim, T.; Ibáñez-Álamo, J.D.; Markó, G.; Tryjanowski, P. Change in flight initiation distance between urban and ruralhabitats following a cold winter. Behav. Ecol. 2013, 24, 1211–1217. [CrossRef]
147. Møller, A.P.; Díaz, M.; Flensted-Jensen, E.; Grim, T.; Ibáñez-Álamo, J.D.; Jokimäki, J.; Mänd, R.; Markó, G.; Tryjanowski, P.Urbanized birds have superior establishment success in novel environments. Oecologia 2015, 178, 943–950. [CrossRef]
148. Vines, A.; Lill, A. Boldness and urban dwelling in little ravens. Wildl. Res. 2014, 42, 590–597. [CrossRef]149. Gravolin, I.; Key, M.; Lill, A. Boldness of urban Australian magpies and local traffic volume. Avian Biol. Res. 2014, 7, 244–250.
[CrossRef]150. Samia, D.S.M.; Blumstein, D.T.; Díaz, M.; Grim, T.; Ibáñez-Álamo, J.D.; Jokimäki, J.; Tätte, K.; Markó, G.; Tryjanowski, P.; Møller,
A.P. Rural-urban differences in escape behavior of European birds across a latitudinal gradient. Front. Ecol. Evol. 2017, 5, 66.[CrossRef]
151. Morelli, F.; Mikula, P.; Benedetti, Y.; Bussière, R.; Jerzak, L.; Tryjanowski, P. Escape behavior of birds in urban parks and cemeteriesacross Europe: Evidence of behavioral adaptation to human activity. Sci. Total Environ. 2018, 631, 803–810. [CrossRef] [PubMed]
152. Biondi, L.M.; Fuentes, G.M.; Córdoba, R.S.; Bó, M.S.; Cavalli, M.; Paterlini, C.A.; Castano, M.V.; García, G.O. Variation in boldnessand novelty response between rural and urban predatory birds: The Chimango Caracara (Milvago chimango) as study case.Behav. Process 2020, 173, 104064. [CrossRef] [PubMed]
153. Fleming, P.A.; Bateman, P.W. Scavenging opportunities modulate escape responses over a small geographic scale. Ethology 2017,123, 205–212. [CrossRef]
154. Feng, C.; Liang, W. Behavioral responses of black-headed gulls (Chroicocephalus ridibundus) to artificial provisioning in China.Glob. Ecol. Conserv. 2020, 21, e00873. [CrossRef]
155. Pavlova, O.; Wronski, T. City gulls and their rural neighbours: Changes in escape and agonistic behaviour along a rural-to-urbangradient. In Advances in Environmental Research; Nova Science Publishers, Inc.: Hauppauge, NY, USA, 2020.
156. Møller, A.P. Interspecific variation in fear responses predicts urbanization in birds. Behav. Ecol. 2010, 21, 365–371. [CrossRef]157. Kitchen, K.; Lill, A.; Price, M. Tolerance of human disturbance by urban magpie-larks. Aust. Field Ornithol. 2010, 27, 1.158. Gendall, J.; Lill, A.; Beckman, J. Tolerance of disturbance by humans in long-time resident and recent colonist urban doves. Avian
Res. 2015, 6, 7. [CrossRef]159. Sol, D.; Maspons, J.; Gonzalez-Voyer, A.; Morales-Castilla, I.; Garamszegi, L.Z.; Møller, A.P. Risk-taking behavior, urbanization
and the pace of life in birds. Behav. Ecol. Sociobiol. 2018, 72, 59–66. [CrossRef]160. Sol, D.; Griffin, A.S.; Bartomeus, I.; Boyce, H. Exploring or avoiding novel food resources? The novelty conflict in an invasive
bird. PLoS ONE 2011, 6, e19535. [CrossRef]161. Shanahan, D.F.; Strohbach, M.W.; Warren, P.S.; Fuller, R.A. The challenges of urban living. In Avian Urban Ecology; Diego, G.,
Henrik, B., Eds.; Oxford University Press: Oxford, UK, 2014; pp. 3–20.162. Griffin, A.S.; Netto, K.; Peneaux, C. Neophilia, innovation and learning in an urbanized world: A critical evaluation of mixed
findings. Curr. Opin. Behav. Sci. 2017, 17, 15–22. [CrossRef]163. Seress, G.; Bókony, V.; Heszberger, J.; Liker, A. Response to predation risk in urban and rural house sparrows. Ethology 2011, 117,
896–907. [CrossRef]164. Møller, A.P.; Ibáñez-Álamo, J.D. Escape behavior of birds provides evidence of predation being involved in urbanization. Anim.
Behav. 2012, 84, 341–348. [CrossRef]
67
Land 2021, 10, 92
165. Tryjanowski, P.; Møller, A.P.; Morelli, F.; Biadun, W.; Brauze, T.; Ciach, M.; Czechowski, P.; Czyz, S.; Dulisz, B.; Goławski, A.; et al.Urbanization affects neophilia and risk-taking at bird-feeders. Sci. Rep. 2016, 6, 28575. [CrossRef] [PubMed]
166. Audet, J.N.; Ducatez, S.; Lefebvre, L. The town bird and the country bird: Problem solving and immune-competence vary withurbanization. Behav. Ecol. 2016, 27, 637–644. [CrossRef]
167. Papp, S.; Vincze, E.; Preiszner, B.; Liker, A.; Bókony, V. A comparison of problem-solving success between urban and rural housesparrows. Behav. Ecol. Sociobiol. 2015, 9, 471–480. [CrossRef]
168. Ducatez, S.; Audet, J.N.; Ros, J.; Kayello, R.L.; Lefebvre, L. Innovativeness and the effects of urbanization on risk-taking behaviorsin wild Barbados birds. Anim. Cogn. 2017, 20, 33–42. [CrossRef]
169. Spelt, A.; Soutar, O.; Williamson, C.; Memmott, J.; Shamoun-Baranes, J.; Rock, P.; Windsor, S. Urban gulls adapt foraging scheduleto human-activity patterns. Ibis 2020, 163, 274–282. [CrossRef]
170. Yosef, R.; Zduniak, P.; Poliakov, Y.; Fingerman, A. Behavioural and reproductive flexibility of an invasive bird in an arid zone:A case of the Indian House Crow (Corvus splendens). J. Arid Environ. 2019, 168, 56–58. [CrossRef]
171. Bókony, V.; Kulcsár, A.; Tóth, Z.; Liker, A. Personality traits and behavioral syndromes in differently urbanized populations ofhouse sparrows (Passer domesticus). PLoS ONE 2012, 7, e36639. [CrossRef]
172. Kozlovsky, D.Y.; Weissgerber, E.A.; Pravosudov, V.V. What makes specialized food-caching mountain chickadees successful cityslickers? Proc. R. Soc. B Biol. Sci. 2017, 284, 20162613. [CrossRef]
173. Greggor, A.L.; Clayton, N.S.; Fulford, A.J.C.; Thornton, A. Street smart: Faster approach towards litter in urban areas by highlyneophobic corvids and less fearful birds. Anim. Behav. 2016, 117, 123–133. [CrossRef]
174. Lill, A.; Hales, E. Behavioral and ecological keys to urban colonization by Little Ravens (Corvus mellori). Open Ornithol. J. 2015, 8,22–31. [CrossRef]
175. Campbell, M. An animal geography of avian feeding habits in Peterborough, Ontario. Area 2008, 40, 472–480. [CrossRef]176. Evans, J.; Boudreau, K.; Hyman, J. Behavioral syndromes in urban and rural populations of Song sparrows. Ethology 2010, 116,
588–595.177. Scales, J.; Hyman, J.; Hughes, M. Behavioral syndromes break down in urban Song sparrow populations. Ethology 2011, 117,
887–895. [CrossRef]178. Hasegawa, M.; Ligon, R.A.; Giraudeau, M.; Watanabe, M.; McGraw, K.J. Urban and colorful male house finches are less aggressive.
Behav. Ecol. 2014, 25, 641–649. [CrossRef]179. Hardman, S.I.; Dalesman, S. Repeatability and degree of territorial aggression differs among urban and rural Great tits (Parus
major). Sci. Rep. 2018, 8, 5042. [CrossRef]180. Galbreath, D.M.; Ichinose, T.; Furutani, T.; Yan, W.; Higuchi, H. Urbanization and its implications for avian aggression: A case
study of urban black kites (Milvus migrans) along Sagami Bay in Japan. Landsc. Ecol. 2014, 29, 169–178. [CrossRef]181. McClelland, S.C.; Ribeiro, R.D.; Mielke, H.W.; Finkelstein, M.E.; Gonzales, C.R.; Jones, J.A.; Komdeur, J.; Derryberry, E.; Saltzberg,
E.B.; Karubian, J. Sub-lethal exposure to lead is associated with heightened aggression in an urban songbird. Sci. Total Environ.2019, 654, 593–603. [CrossRef]
182. Kunca, T.; Yosef, R. Differential nest-defense to perceived danger in urban and rural areas by female Eurasian sparrowhawk(Accipiter nisus). PeerJ 2016, 4, e2070. [CrossRef]
183. Senar, J.C.; Garamszegi, L.Z.; Tilgar, V.; Biard, C.; Moreno-Rueda, G.; Salmón, P.; Rivas, J.; Sprau, P.; Dingemanse, N.J.; Charmantier,A.; et al. Urban Great tits (Parus major) show higher distress calling and pecking rates than rural birds across Europe. Front. Ecol.Evol. 2017, 5, 163. [CrossRef]
184. Minias, P.; Jedlikowski, J.; Włodarczyk, R. Development of urban behavior is associated with time since urbanization ina reed-nesting waterbird. Urban Ecosyst. 2018, 21, 1021–1028. [CrossRef]
185. Alberti, M.; Marzluff, J.; Hunt, V.M. Urban driven phenotypic changes: Empirical observations and theoretical implications foreco-evolutionary feedback. Philos. Trans. R. Soc. B 2017, 372, 20160029. [CrossRef]
186. Capilla-Lasheras, P.; Dominoni, D.M.; Babayan, S.A.; O’Shaughnessy, P.J.; Mladenova, M.; Woodford, L.; Pollock, C.J.; Barr, T.;Baldini, F.; Helm, B. Elevated immune gene expression is associated with poor reproductive success of urban Blue tits. Front. Ecol.Evol. 2017, 5, 64. [CrossRef]
187. Mueller, J.C.; Partecke, J.; Hatchwell, B.J.; Gaston, K.J.; Evans, K.L. Candidate gene polymorphisms for behavioral adaptationsduring urbanization in blackbirds. Mol. Ecol. 2013, 22, 3629–3637. [CrossRef]
188. Partecke, J.; Gwinner, E.; Bensch, S. Is urbanization of European blackbirds (Turdus merula) associated with genetic differentiation?J. Ornithol. 2006, 147, 549–552. [CrossRef]
189. Richards, D.R.; Passy, P.; Oh, R.R. Impacts of population density and wealth on the quantity and structure of urban green space intropical Southeast Asia. Landsc. Urban Plan 2017, 157, 553–560. [CrossRef]
190. Harper, G.A.; Bunbury, N. Invasive rats on tropical islands: Their population biology and impacts on native species. Glob. Ecol.Conserv. 2015, 3, 607–627. [CrossRef]
191. Ferenc, M.; Sedlácek, O.; Fuchs, R. How to improve urban greenspace for woodland birds: Site and local-scale determinants ofbird species richness. Urban Ecosyst. 2014, 17, 625–640. [CrossRef]
192. Moreno-Mateos, D.; Rey Benayas, J.M.; Pérez-Camacho, L.; Montaña, E.D.L.; Rebollo, S.; Cayuela, L. Effects of land use onnocturnal birds in a Mediterranean agricultural landscape. Acta Ornithol. 2011, 46, 173–182. [CrossRef]
68
land
Article
Integrating Diverse Perspectives for Managing NeighborhoodTrees and Urban Ecosystem Services in Portland, OR (US)
Lorena Alves Carvalho Nascimento * and Vivek Shandas
�����������������
Citation: Alves Carvalho
Nascimento, L.; Shandas, V.
Integrating Diverse Perspectives for
Managing Neighborhood Trees and
Urban Ecosystem Services in
Portland, OR (US). Land 2021, 10, 48.
https://doi.org/10.3390/land1001
0048
Received: 30 November 2020
Accepted: 31 December 2020
Published: 7 January 2021
Publisher’s Note: MDPI stays neu-
tral with regard to jurisdictional clai-
ms in published maps and institutio-
nal affiliations.
Copyright: © 2021 by the authors. Li-
censee MDPI, Basel, Switzerland.
This article is an open access article
distributed under the terms and con-
ditions of the Creative Commons At-
tribution (CC BY) license (https://
creativecommons.org/licenses/by/
4.0/).
Nohad A. Toulan School of Urban Studies and Planning, Portland State University, Portland, OR 97201, USA;[email protected]* Correspondence: [email protected]
Abstract: Municipalities worldwide are increasingly recognizing the importance of urban greenspaces to mitigate climate change’s extreme effects and improve residents’ quality of life. Evenwith extensive earlier research examining the distribution of tree canopy in cities, we know littleabout human perceptions of urban forestry and related ecosystem services. This study aims tofill this gap by examining the variations in socioeconomic indicators and public perceptions byasking how neighborhood trees and socioeconomic indicators mediate public perceptions of ecosystem servicesavailability. Using Portland, Oregon (USA) as our case study, we assessed socioeconomic indicators,land cover data, and survey responses about public perceptions of neighborhood trees. Based onover 2500 survey responses, the results indicated a significant correlation among tree canopy, residentincome, and sense of ownership for urban forestry. We further identified the extent to which theabsence of trees amplifies environmental injustices and challenges for engaging communities withlandscape management. The results suggested that Portland residents are aware of tree maintenancechallenges, and the inclusion of cultural ecosystem services can better address existing environmentalinjustices. Our assessment of open-ended statements suggested the importance of conducting publicoutreach to identify specific priorities for a community-based approach to urban forestry.
Keywords: urban forestry; cultural ecosystem services; public survey; tree maintenance
1. Introduction
By 2050, the United Nations suggests that the world human population will near10 billion, with most living in urban centers. In the United States (US), eighty percentof the population already live in urban areas, which corresponds to only 3% of nationalland [1]. The fast pace of urbanization and landscape change caused by humans arethe major factors for transforming forests, urban and otherwise [2]. Some have arguedthat the transformation of urban landscapes brings an ‘extinction of experience’ withnature [3], which impacts the well-being, public health and empathy for natural features.The management of urban areas requires the consideration of multiple land-use possibilitiesfor conservation of built or natural environments. Roads, buildings, urban renewal, greeninfrastructure and new developments compete for limited urban space. This fact requiresmunicipalities to use strategic approaches to manage urban growth with civic services,including sewer, roadways and other gray infrastructures. Often with priories of grayinfrastructure, the available locations for tree canopy is reduced and existing tree canopy isremoved—a phenomenon that has been well documented across the US [4,5].
Several scholars have argued that urban tree canopy can be better managed by char-acterizing ecosystem services, which describes the benefits that trees and other naturallandscape features provide to humans. For urban trees and tree canopy, these are oftendescribed as improvement of air quality, reduction of heat, filtering and infiltration ofstormwater and a host of cultural attributes that improve the overall quality of life forresidents [6,7]. Ecosystem services, in the form of tree canopy, come in three essentialcategories: (a) those in parks, schools, open spaces and other natural areas; (b) those on
69
Land 2021, 10, 48
private lands, owned by somebody other than a public agency; (c) those on streets andother public rights-of-way.
Municipal governments generally manage the urban tree canopy through a distributedmodel that embeds tree specialists in different public agencies or through a central divisionthat works with other agencies. Few municipalities, if any, explicitly examine the hostof ecosystem services that constitute the urban forest. We argue that urban ecosystemservices as a management approach can help situate the urban forest within broader andpotentially more inclusive management of natural features. The rationale behind ourapproach for ecosystem services lies in these three points: (a) they offer a cost-effectiveand functionally-based solution to major challenges facing urban areas, including risingtemperatures, air pollution and flooding; (b) when properly applied, ecosystem servicescan support a more equitable distribution of canopy, which is currently highly centered onwealthy and white communities; (c) the consideration of ecosystem services can improvehuman-nature relationships, create a sense of ownership of places and provide stewardshipand community engagement opportunities. Together these functions of urban trees andforests compel their careful management, though the extent to which communities view oreven understand these ecosystems services remains unclear.
This study examines the role of community perspectives concerning urban canopymanagement by assessing the relationship between the quantity of neighborhood treecanopy, public perceptions of ecosystem services and socioeconomic indicators to supporturban environmental planning. Many studies have found a positive correlation betweentree canopy and residential income [8–10]. However, few examine the extent to whichpublic opinion about planting priorities, maintenance challenges and the expectationsfor urban ecosystem services can be central to decision-making processes. We posit thatengaging the public in myriad and creative ways in urban forestry efforts is increasinglyessential. Planting and maintaining trees can promote a connection between residentsand urban environmental services according to each neighborhood’s needs, regardingsocioeconomic, cultural and historical aspects.
Background
The use of urban ecosystem services (UES) in describing trees and forests is a relativelynew idea [6,7]. Four categories of UES classify the services provided by the maintenance,preservation and conservation of urban forestry. First, supporting UES contributes tonutrient cycling and soil formation through tree debris and habitat for decomposers.Second, provisioning UES for urban foraging of food and natural medicine [11]. Third,regulating UES, as local climate resilience that prevents urban heat islands [12], air qualitythat mitigates respiratory problems [13] and stormwater catchment that controls floodand water flow [14]. Fourth, cultural UES bring socio-ecological values through self-actualization, esteem and belonging [7], connection with biodiversity and personalizedecology [15]. The literature of ecosystem services [16] is gaining popularity, with researchthat includes public perception evaluations and how the ecosystem services adjust to reflectcommunity identity.
UES relies on urban forestry and green infrastructure management, including publicparticipation in strategic planning to recognize multiple ecological needs in diverse con-texts. People’s involvement in managing urban forests is often heralded as necessary forensuring a just and equitable distribution of ecosystem services. However, communities’engagement may be mediated by intersectional factors that are often not considered inplanning decisions [7]. For example, older adults and children are more vulnerable to res-piratory diseases and may be highly sensitive to degraded air quality; black communitieshave been historically excluded from desirable green areas [17]; queer identities struggle tobe accepted in heteronormative nature spaces [18]; low-income residents have less canopyaccess [8].
Urban forestry scholars have already acknowledged the link between socioeconomicfactors and access to ecosystem services in the municipalities. McPhearson et al. [19] called
70
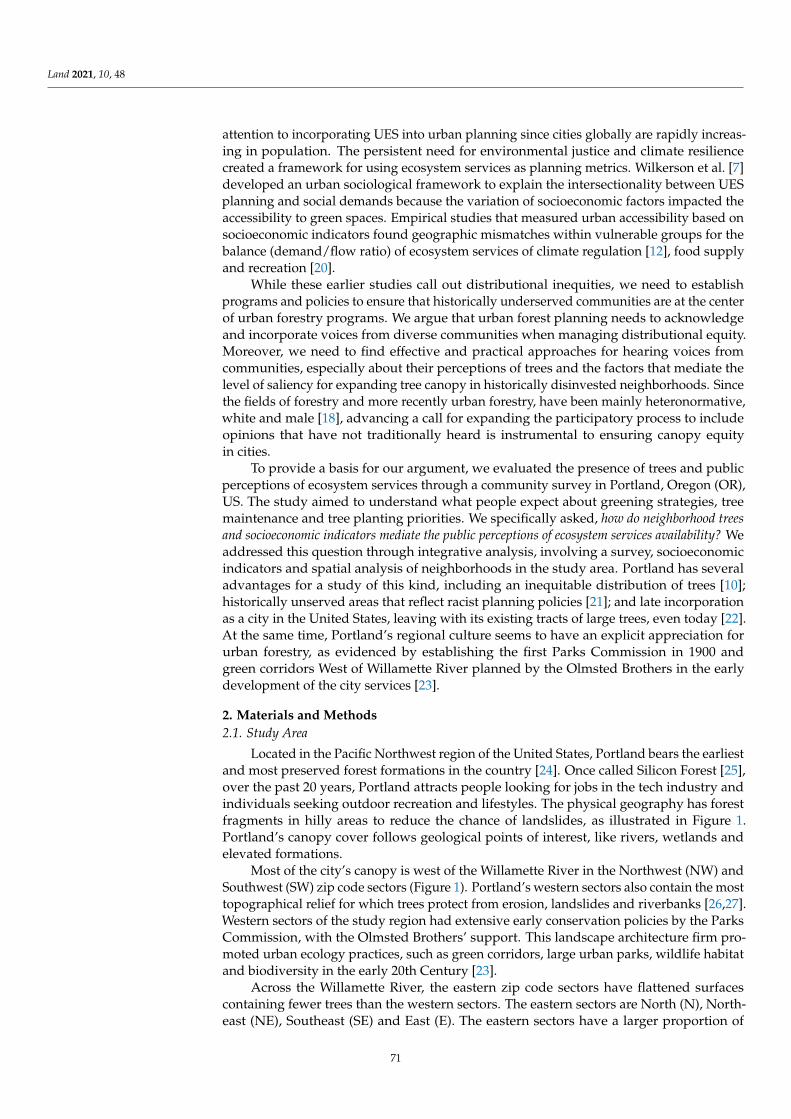
Land 2021, 10, 48
attention to incorporating UES into urban planning since cities globally are rapidly increas-ing in population. The persistent need for environmental justice and climate resiliencecreated a framework for using ecosystem services as planning metrics. Wilkerson et al. [7]developed an urban sociological framework to explain the intersectionality between UESplanning and social demands because the variation of socioeconomic factors impacted theaccessibility to green spaces. Empirical studies that measured urban accessibility based onsocioeconomic indicators found geographic mismatches within vulnerable groups for thebalance (demand/flow ratio) of ecosystem services of climate regulation [12], food supplyand recreation [20].
While these earlier studies call out distributional inequities, we need to establishprograms and policies to ensure that historically underserved communities are at the centerof urban forestry programs. We argue that urban forest planning needs to acknowledgeand incorporate voices from diverse communities when managing distributional equity.Moreover, we need to find effective and practical approaches for hearing voices fromcommunities, especially about their perceptions of trees and the factors that mediate thelevel of saliency for expanding tree canopy in historically disinvested neighborhoods. Sincethe fields of forestry and more recently urban forestry, have been mainly heteronormative,white and male [18], advancing a call for expanding the participatory process to includeopinions that have not traditionally heard is instrumental to ensuring canopy equityin cities.
To provide a basis for our argument, we evaluated the presence of trees and publicperceptions of ecosystem services through a community survey in Portland, Oregon (OR),US. The study aimed to understand what people expect about greening strategies, treemaintenance and tree planting priorities. We specifically asked, how do neighborhood treesand socioeconomic indicators mediate the public perceptions of ecosystem services availability? Weaddressed this question through integrative analysis, involving a survey, socioeconomicindicators and spatial analysis of neighborhoods in the study area. Portland has severaladvantages for a study of this kind, including an inequitable distribution of trees [10];historically unserved areas that reflect racist planning policies [21]; and late incorporationas a city in the United States, leaving with its existing tracts of large trees, even today [22].At the same time, Portland’s regional culture seems to have an explicit appreciation forurban forestry, as evidenced by establishing the first Parks Commission in 1900 andgreen corridors West of Willamette River planned by the Olmsted Brothers in the earlydevelopment of the city services [23].
2. Materials and Methods2.1. Study Area
Located in the Pacific Northwest region of the United States, Portland bears the earliestand most preserved forest formations in the country [24]. Once called Silicon Forest [25],over the past 20 years, Portland attracts people looking for jobs in the tech industry andindividuals seeking outdoor recreation and lifestyles. The physical geography has forestfragments in hilly areas to reduce the chance of landslides, as illustrated in Figure 1.Portland’s canopy cover follows geological points of interest, like rivers, wetlands andelevated formations.
Most of the city’s canopy is west of the Willamette River in the Northwest (NW) andSouthwest (SW) zip code sectors (Figure 1). Portland’s western sectors also contain the mosttopographical relief for which trees protect from erosion, landslides and riverbanks [26,27].Western sectors of the study region had extensive early conservation policies by the ParksCommission, with the Olmsted Brothers’ support. This landscape architecture firm pro-moted urban ecology practices, such as green corridors, large urban parks, wildlife habitatand biodiversity in the early 20th Century [23].
Across the Willamette River, the eastern zip code sectors have flattened surfacescontaining fewer trees than the western sectors. The eastern sectors are North (N), North-east (NE), Southeast (SE) and East (E). The eastern sectors have a larger proportion of
71
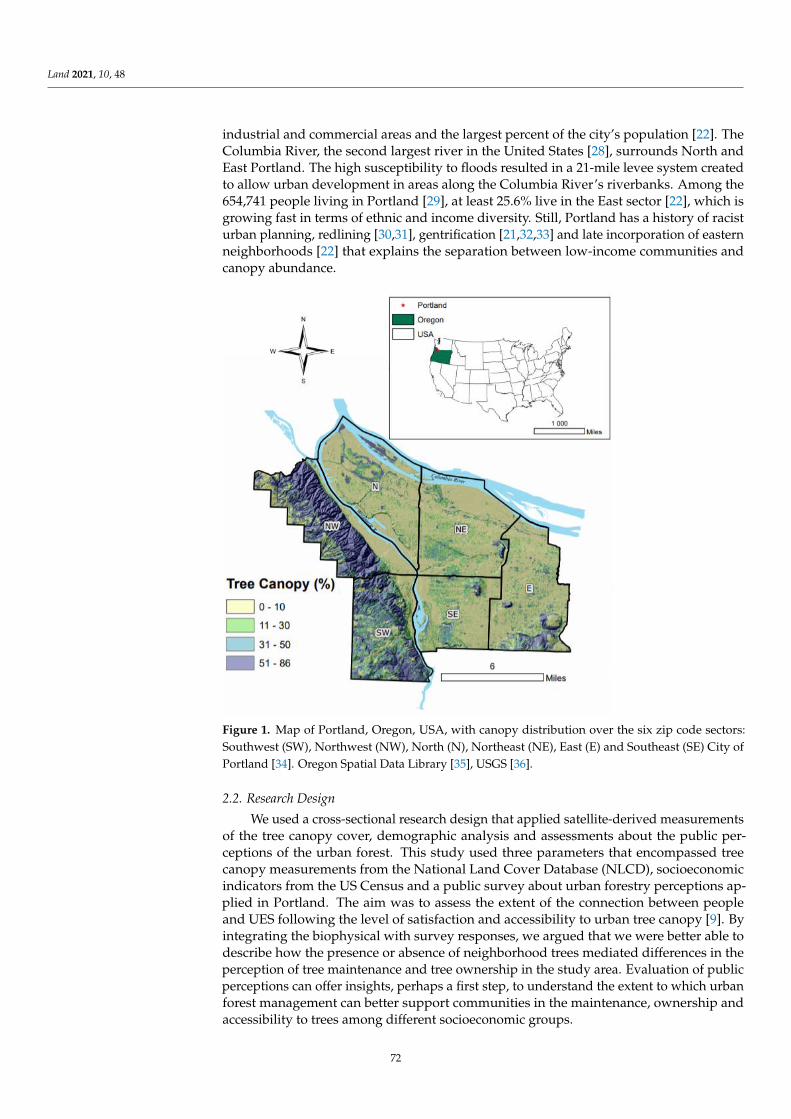
Land 2021, 10, 48
industrial and commercial areas and the largest percent of the city’s population [22]. TheColumbia River, the second largest river in the United States [28], surrounds North andEast Portland. The high susceptibility to floods resulted in a 21-mile levee system createdto allow urban development in areas along the Columbia River’s riverbanks. Among the654,741 people living in Portland [29], at least 25.6% live in the East sector [22], which isgrowing fast in terms of ethnic and income diversity. Still, Portland has a history of racisturban planning, redlining [30,31], gentrification [21,32,33] and late incorporation of easternneighborhoods [22] that explains the separation between low-income communities andcanopy abundance.
Land 2021, 10, x FOR PEER REVIEW 4 of 24
Across the Willamette River, the eastern zip code sectors have flattened surfaces con-
taining fewer trees than the western sectors. The eastern sectors are North (N), Northeast
(NE), Southeast (SE) and East (E). The eastern sectors have a larger proportion of indus-
trial and commercial areas and the largest percent of the city’s population [22]. The Co-
lumbia River, the second largest river in the United States [28], surrounds North and East
Portland. The high susceptibility to floods resulted in a 21-mile levee system created to
allow urban development in areas along the Columbia River’s riverbanks. Among the
654,741 people living in Portland [29], at least 25.6% live in the East sector [22], which is
growing fast in terms of ethnic and income diversity. Still, Portland has a history of racist
urban planning, redlining [30,31], gentrification [21,32,33] and late incorporation of east-
ern neighborhoods [22] that explains the separation between low-income communities
and canopy abundance.
Figure 1. Map of Portland, Oregon, USA, with canopy distribution over the six zip code sectors:
Southwest (SW), Northwest (NW), North (N), Northeast (NE), East (E) and Southeast (SE) City of
Portland [34]. Oregon Spatial Data Library [35], USGS [36].
2.2. Research Design
We used a cross-sectional research design that applied satellite-derived measure-
ments of the tree canopy cover, demographic analysis and assessments about the public
perceptions of the urban forest. This study used three parameters that encompassed tree
canopy measurements from the National Land Cover Database (NLCD), socioeconomic
indicators from the US Census and a public survey about urban forestry perceptions ap-
plied in Portland. The aim was to assess the extent of the connection between people and
UES following the level of satisfaction and accessibility to urban tree canopy [9]. By inte-
grating the biophysical with survey responses, we argued that we were better able to de-
scribe how the presence or absence of neighborhood trees mediated differences in the per-
ception of tree maintenance and tree ownership in the study area. Evaluation of public
Figure 1. Map of Portland, Oregon, USA, with canopy distribution over the six zip code sectors:Southwest (SW), Northwest (NW), North (N), Northeast (NE), East (E) and Southeast (SE) City ofPortland [34]. Oregon Spatial Data Library [35], USGS [36].
2.2. Research Design
We used a cross-sectional research design that applied satellite-derived measurementsof the tree canopy cover, demographic analysis and assessments about the public per-ceptions of the urban forest. This study used three parameters that encompassed treecanopy measurements from the National Land Cover Database (NLCD), socioeconomicindicators from the US Census and a public survey about urban forestry perceptions ap-plied in Portland. The aim was to assess the extent of the connection between peopleand UES following the level of satisfaction and accessibility to urban tree canopy [9]. Byintegrating the biophysical with survey responses, we argued that we were better able todescribe how the presence or absence of neighborhood trees mediated differences in theperception of tree maintenance and tree ownership in the study area. Evaluation of publicperceptions can offer insights, perhaps a first step, to understand the extent to which urbanforest management can better support communities in the maintenance, ownership andaccessibility to trees among different socioeconomic groups.
72
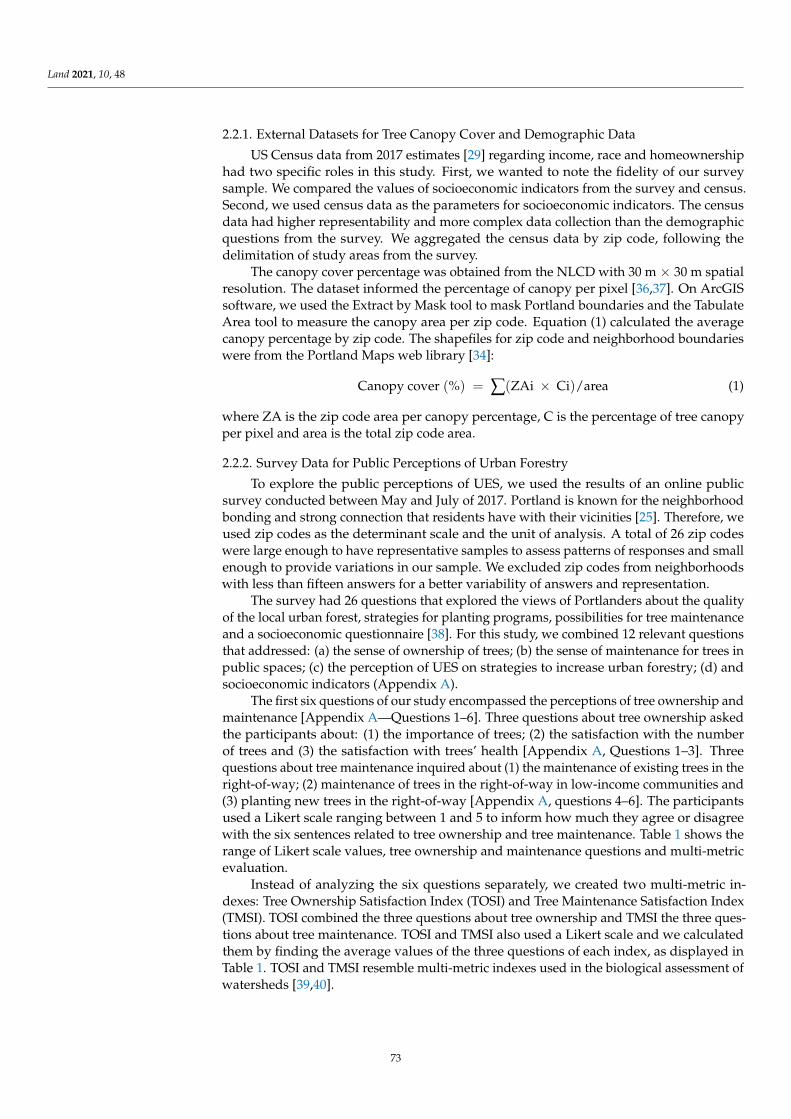
Land 2021, 10, 48
2.2.1. External Datasets for Tree Canopy Cover and Demographic Data
US Census data from 2017 estimates [29] regarding income, race and homeownershiphad two specific roles in this study. First, we wanted to note the fidelity of our surveysample. We compared the values of socioeconomic indicators from the survey and census.Second, we used census data as the parameters for socioeconomic indicators. The censusdata had higher representability and more complex data collection than the demographicquestions from the survey. We aggregated the census data by zip code, following thedelimitation of study areas from the survey.
The canopy cover percentage was obtained from the NLCD with 30 m × 30 m spatialresolution. The dataset informed the percentage of canopy per pixel [36,37]. On ArcGISsoftware, we used the Extract by Mask tool to mask Portland boundaries and the TabulateArea tool to measure the canopy area per zip code. Equation (1) calculated the averagecanopy percentage by zip code. The shapefiles for zip code and neighborhood boundarieswere from the Portland Maps web library [34]:
Canopy cover (%) = ∑(ZAi × Ci)/area (1)
where ZA is the zip code area per canopy percentage, C is the percentage of tree canopyper pixel and area is the total zip code area.
2.2.2. Survey Data for Public Perceptions of Urban Forestry
To explore the public perceptions of UES, we used the results of an online publicsurvey conducted between May and July of 2017. Portland is known for the neighborhoodbonding and strong connection that residents have with their vicinities [25]. Therefore, weused zip codes as the determinant scale and the unit of analysis. A total of 26 zip codeswere large enough to have representative samples to assess patterns of responses and smallenough to provide variations in our sample. We excluded zip codes from neighborhoodswith less than fifteen answers for a better variability of answers and representation.
The survey had 26 questions that explored the views of Portlanders about the qualityof the local urban forest, strategies for planting programs, possibilities for tree maintenanceand a socioeconomic questionnaire [38]. For this study, we combined 12 relevant questionsthat addressed: (a) the sense of ownership of trees; (b) the sense of maintenance for trees inpublic spaces; (c) the perception of UES on strategies to increase urban forestry; (d) andsocioeconomic indicators (Appendix A).
The first six questions of our study encompassed the perceptions of tree ownership andmaintenance [Appendix A—Questions 1–6]. Three questions about tree ownership askedthe participants about: (1) the importance of trees; (2) the satisfaction with the numberof trees and (3) the satisfaction with trees’ health [Appendix A, Questions 1–3]. Threequestions about tree maintenance inquired about (1) the maintenance of existing trees in theright-of-way; (2) maintenance of trees in the right-of-way in low-income communities and(3) planting new trees in the right-of-way [Appendix A, questions 4–6]. The participantsused a Likert scale ranging between 1 and 5 to inform how much they agree or disagreewith the six sentences related to tree ownership and tree maintenance. Table 1 shows therange of Likert scale values, tree ownership and maintenance questions and multi-metricevaluation.
Instead of analyzing the six questions separately, we created two multi-metric in-dexes: Tree Ownership Satisfaction Index (TOSI) and Tree Maintenance Satisfaction Index(TMSI). TOSI combined the three questions about tree ownership and TMSI the three ques-tions about tree maintenance. TOSI and TMSI also used a Likert scale and we calculatedthem by finding the average values of the three questions of each index, as displayed inTable 1. TOSI and TMSI resemble multi-metric indexes used in the biological assessment ofwatersheds [39,40].
73
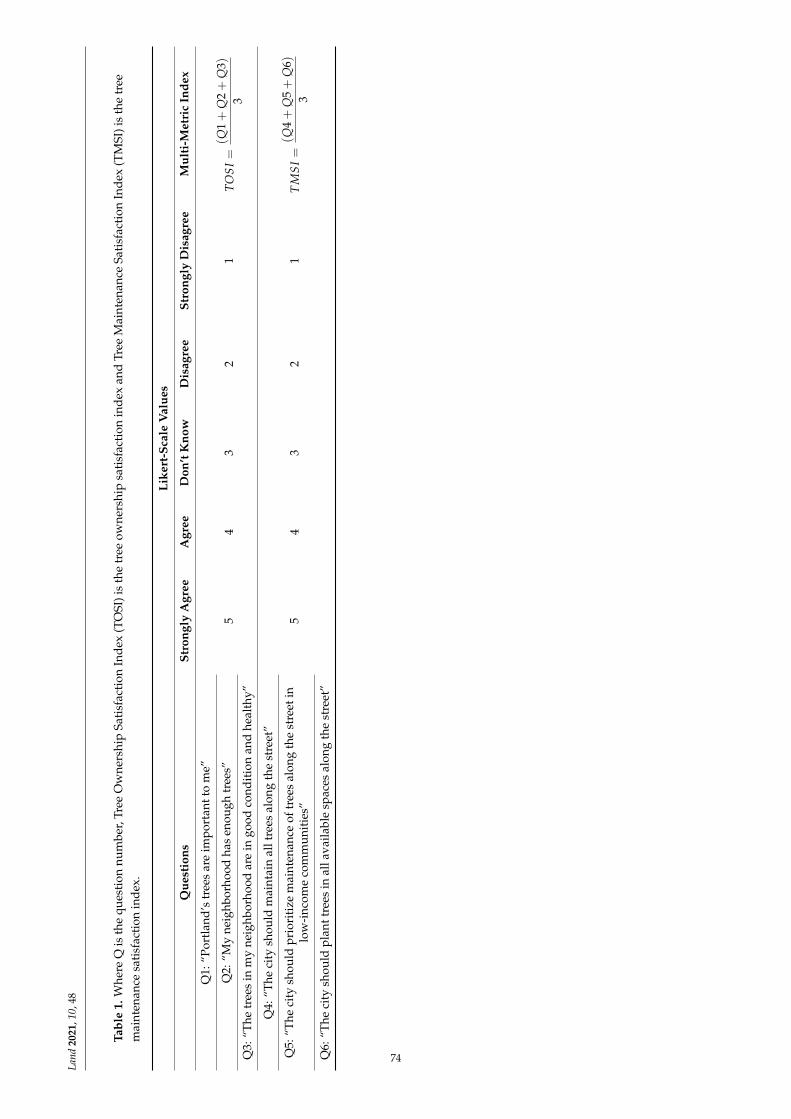
Land
2021
,10,
48
Tabl
e1.
Whe
reQ
isth
equ
esti
onnu
mbe
r,Tr
eeO
wne
rshi
pSa
tisf
acti
onIn
dex
(TO
SI)i
sth
etr
eeow
ners
hip
sati
sfac
tion
ind
exan
dTr
eeM
aint
enan
ceSa
tisf
acti
onIn
dex
(TM
SI)i
sth
etr
eem
aint
enan
cesa
tisf
acti
onin
dex.
Like
rt-S
cale
Val
ues
Que
stio
nsSt
rong
lyA
gree
Agr
eeD
on’t
Kno
wD
isag
ree
Stro
ngly
Dis
agre
eM
ulti
-Met
ric
Inde
x
Q1:
“Por
tlan
d’s
tree
sar
eim
port
antt
om
e”
54
32
1TO
SI=
(Q1+
Q2+
Q3 )
3Q
2:“M
yne
ighb
orho
odha
sen
ough
tree
s”
Q3:
“The
tree
sin
my
neig
hbor
hood
are
ingo
odco
ndit
ion
and
heal
thy”
Q4:
“The
city
shou
ldm
aint
ain
allt
rees
alon
gth
est
reet
”
54
32
1T
MS
I=
(Q4+
Q5+
Q6 )
3Q
5:“T
heci
tysh
ould
prio
riti
zem
aint
enan
ceof
tree
sal
ong
the
stre
etin
low
-inc
ome
com
mun
itie
s”
Q6:
“The
city
shou
ldpl
antt
rees
inal
lava
ilabl
esp
aces
alon
gth
est
reet
”
74
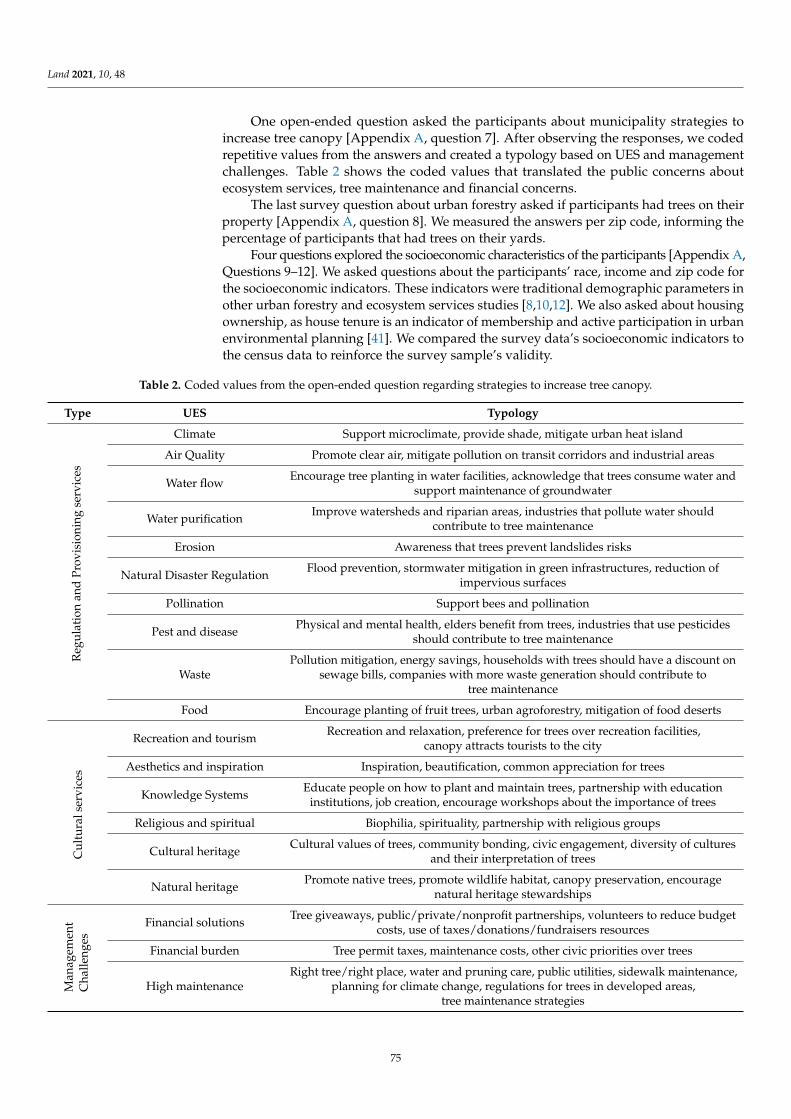
Land 2021, 10, 48
One open-ended question asked the participants about municipality strategies toincrease tree canopy [Appendix A, question 7]. After observing the responses, we codedrepetitive values from the answers and created a typology based on UES and managementchallenges. Table 2 shows the coded values that translated the public concerns aboutecosystem services, tree maintenance and financial concerns.
The last survey question about urban forestry asked if participants had trees on theirproperty [Appendix A, question 8]. We measured the answers per zip code, informing thepercentage of participants that had trees on their yards.
Four questions explored the socioeconomic characteristics of the participants [Appendix A,Questions 9–12]. We asked questions about the participants’ race, income and zip code forthe socioeconomic indicators. These indicators were traditional demographic parameters inother urban forestry and ecosystem services studies [8,10,12]. We also asked about housingownership, as house tenure is an indicator of membership and active participation in urbanenvironmental planning [41]. We compared the survey data’s socioeconomic indicators tothe census data to reinforce the survey sample’s validity.
Table 2. Coded values from the open-ended question regarding strategies to increase tree canopy.
Type UES Typology
Reg
ulat
ion
and
Prov
isio
ning
serv
ices
Climate Support microclimate, provide shade, mitigate urban heat island
Air Quality Promote clear air, mitigate pollution on transit corridors and industrial areas
Water flow Encourage tree planting in water facilities, acknowledge that trees consume water andsupport maintenance of groundwater
Water purification Improve watersheds and riparian areas, industries that pollute water shouldcontribute to tree maintenance
Erosion Awareness that trees prevent landslides risks
Natural Disaster Regulation Flood prevention, stormwater mitigation in green infrastructures, reduction ofimpervious surfaces
Pollination Support bees and pollination
Pest and disease Physical and mental health, elders benefit from trees, industries that use pesticidesshould contribute to tree maintenance
WastePollution mitigation, energy savings, households with trees should have a discount on
sewage bills, companies with more waste generation should contribute totree maintenance
Food Encourage planting of fruit trees, urban agroforestry, mitigation of food deserts
Cul
tura
lser
vice
s
Recreation and tourism Recreation and relaxation, preference for trees over recreation facilities,canopy attracts tourists to the city
Aesthetics and inspiration Inspiration, beautification, common appreciation for trees
Knowledge Systems Educate people on how to plant and maintain trees, partnership with educationinstitutions, job creation, encourage workshops about the importance of trees
Religious and spiritual Biophilia, spirituality, partnership with religious groups
Cultural heritage Cultural values of trees, community bonding, civic engagement, diversity of culturesand their interpretation of trees
Natural heritage Promote native trees, promote wildlife habitat, canopy preservation, encouragenatural heritage stewardships
Man
agem
ent
Cha
lleng
es
Financial solutions Tree giveaways, public/private/nonprofit partnerships, volunteers to reduce budgetcosts, use of taxes/donations/fundraisers resources
Financial burden Tree permit taxes, maintenance costs, other civic priorities over trees
High maintenanceRight tree/right place, water and pruning care, public utilities, sidewalk maintenance,
planning for climate change, regulations for trees in developed areas,tree maintenance strategies
75
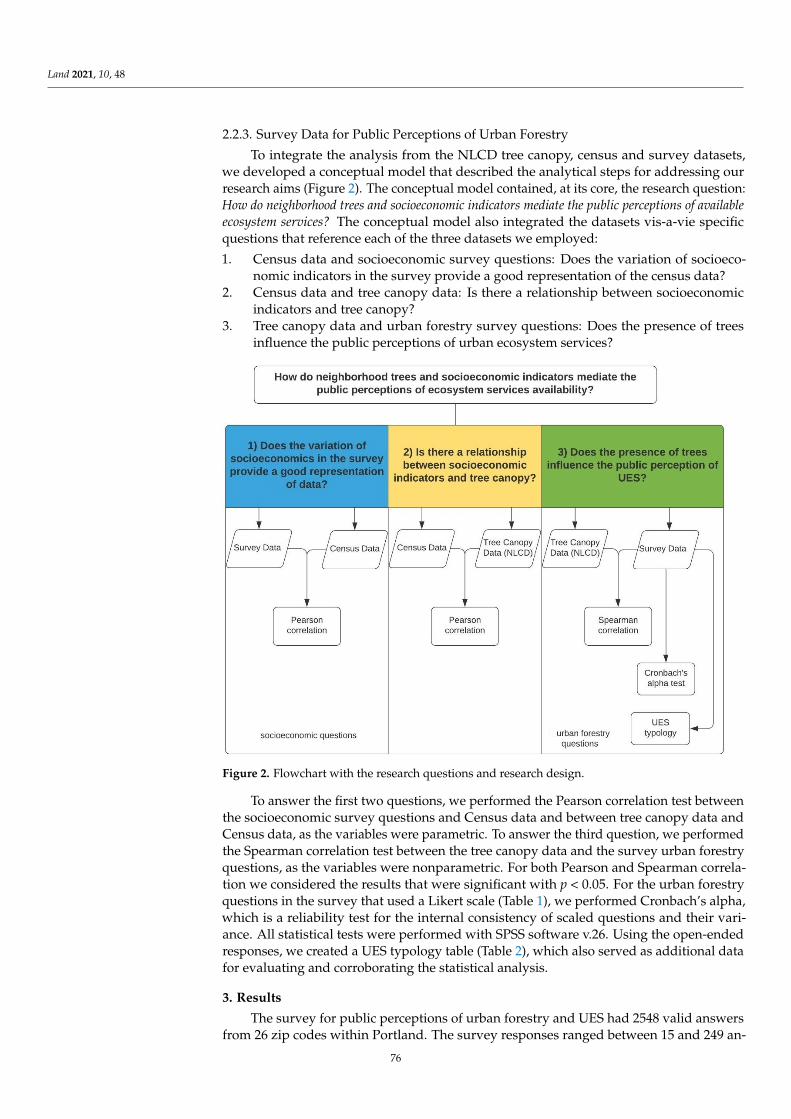
Land 2021, 10, 48
2.2.3. Survey Data for Public Perceptions of Urban Forestry
To integrate the analysis from the NLCD tree canopy, census and survey datasets,we developed a conceptual model that described the analytical steps for addressing ourresearch aims (Figure 2). The conceptual model contained, at its core, the research question:How do neighborhood trees and socioeconomic indicators mediate the public perceptions of availableecosystem services? The conceptual model also integrated the datasets vis-a-vie specificquestions that reference each of the three datasets we employed:
1. Census data and socioeconomic survey questions: Does the variation of socioeco-nomic indicators in the survey provide a good representation of the census data?
2. Census data and tree canopy data: Is there a relationship between socioeconomicindicators and tree canopy?
3. Tree canopy data and urban forestry survey questions: Does the presence of treesinfluence the public perceptions of urban ecosystem services?
Figure 2. Flowchart with the research questions and research design.
To answer the first two questions, we performed the Pearson correlation test betweenthe socioeconomic survey questions and Census data and between tree canopy data andCensus data, as the variables were parametric. To answer the third question, we performedthe Spearman correlation test between the tree canopy data and the survey urban forestryquestions, as the variables were nonparametric. For both Pearson and Spearman correla-tion we considered the results that were significant with p < 0.05. For the urban forestryquestions in the survey that used a Likert scale (Table 1), we performed Cronbach’s alpha,which is a reliability test for the internal consistency of scaled questions and their vari-ance. All statistical tests were performed with SPSS software v.26. Using the open-endedresponses, we created a UES typology table (Table 2), which also served as additional datafor evaluating and corroborating the statistical analysis.
3. Results
The survey for public perceptions of urban forestry and UES had 2548 valid answersfrom 26 zip codes within Portland. The survey responses ranged between 15 and 249 an-
76
Land 2021, 10, 48
swers per zip code [Appendix B, Figure A1; Appendix B, Table A1]. As a voluntary onlinesurvey distributed in community engagement platforms (municipal listserv, Nextdoor,social media channels, focus groups, public meetings), there was a high chance that theparticipants had previous interests in urban forestry and city planning. We obtainedcompleted answers and discarded those who did not complete the survey.
In the following subsections, we will answer the specific research questions regardingthe correlation between the variables of census data, survey data and tree canopy data.In the last subsection, we will summarize the core question “how do neighborhood trees andsocioeconomic indicators mediate the public perceptions of ecosystem services availability?” usingthe open-ended statements and their associations with the statistical findings.
3.1. Does the Variation of Socioeconomics in the Survey Provide a Good Representation of theCensus Data?
To answer this question, we compared the census data and survey’s socioeconomicindicators, which were both collected in 2017 (Table 3). The correlation between surveyanswers and the number of households per zip code was moderately strong (R = 0.554)and significant (p < 0.01). This result suggested that the number of respondents reflects thetotal population size within the zip codes.
We found strong Pearson correlation values between the census and the survey forthe variables of house ownership (R = 0.796; p < 0.01) and income (R = 0.922; p < 0.01).The percentage of house ownership was higher among the survey respondents (82.09%)than the values indicated by the census data (51.54%). We believed that our surveytargeted participants aware of the local public budget [39], as property owners have moreresponsibility with taxes that support tree maintenance.
For the race variable, both data from the census and the survey showed that Portlandhas a majority white population in all zip codes. Due to this fact, we labeled all non-whiteraces as people of color. People of color (POC) is a term commonly used in the US todescribe a population that is not white. The correlation values between the census andsurvey data for the POC variable was moderate (R = 0.402, p < 0.05). The percentagebetween POC in the census (22.22%) and survey (23.29%) had similar values.
Overall, the results suggest that for the specific characteristics the survey containeda representative sample for the city as a whole, which provides support to address theremaining questions. Our survey had a consistent representation with the Census data,with significant values for population size, race, income and house ownership.
Table 3. Pearson correlation values between socioeconomic indicators from the survey and census.
Variable Mean Value Per Zip Code Pearson Correlation
Surveys (N) 98 ± 660.554 **Households (N) 11318 ± 5076
Housing ownership census (%) 51.54 ± 15.200.796 **Housing ownership survey (%) 82.09 ± 12.87
People of color census (%) 22.22 ± 8.560.402 *People of color survey (%) 23.19 ± 7.26
Mean income census (US $) 87,813.04 ± 28,397.400.922 **Mean income survey (US $) 93,319.65 ± 20,275.61
* Level of significance = 0.05; ** level of significance = 0.01.
3.2. Is There a Relationship between Tree Canopy and Socioeconomic Indicators?
Earlier research from several studies across the United States [6–8] and Portland [36]suggested that historically underserved communities are less likely to have immediateaccess to tree canopy. In contrast, white and wealthier populations have greater access,partly due to historical policies that segregated neighborhoods [38]. This study was noexception and corroborated previous findings. Using Equation (1), we observed that zip
77
Land 2021, 10, 48
codes in NW and SW had higher tree canopy than zip codes in the eastern sectors (E, N, NE,SE) of the Willamette River. NW and SW had respectively 42.5% and 37% of canopy coverand $125,739 and $100,696 of household incomes (Table 4). East had the lowest income($57,104) and 12.4% of average canopy. The values of household income were obtainedfrom the census data.
Table 4. Average tree canopy and income within the zip codes sectors in the study area.
Variables E N NE NW SE SW
Canopy 12.39% 7.80% 7.30% 42.45% 10.24% 37.02%Income $57,104 $86,824 $95,714 $125,739 $93,200 $100,696
Pearson correlation values between tree canopy and census socioeconomic indicatorsfor income, race and house ownership (Table 5). The strongest correlation across allthe sociodemographic was between tree canopy and income (R = 0.625, p < 0.01). Thisresult supported the findings observed in Figure 1 and Table 4, with a high percentageof canopy cover in affluent neighborhoods of West Portland, suggesting that people withhigher income in Portland have more access to the urban tree canopy. The results forthe correlation between tree canopy with house ownership (R = 0.206; p > 0.3) and race(R = −0.186; p > 0.3) did not have significant values. As such, we conclude that income isthe only significant (and positively correlated) variable in relation to the amount of treecanopy for the study area, as found in other urban forestry studies that used Portland as acase study [10,38,42].
Table 5. Pearson correlation values between tree canopy and census socioeconomic indicators.
Correlation Variables Pearson Correlation
Tree Canopy and Income 0.625 **Tree Canopy and Race −0.186
Tree Canopy and House ownership 0.206** Level of significance = 0.01.
3.3. Does the Presence of Trees Influence the Public Perception of UES?3.3.1. TOSI and TMSI Indicators
We combined three questions to build the TOSI, regarding: (1) the satisfaction with thenumber of trees; (2) the good condition of trees and (3) the importance of trees. The TMSIcombined three questions about: (4) the maintenance of street trees; (5) the maintenanceof trees in low-income communities and (6) the planting of new trees. Table 6 showsCronbach’s alpha results for the questions that encompassed the indexes.
While the Cronbach’s alpha value of 0.490 can increase to 0.612 by removing Question 2of the TOSI and TMSI multi-metric, we maintained the question because only 78.63% ofrespondents addressed all six questions, while 8.70% respondents answered five questions,6.98% answered four questions, 5.61% answered three questions and 0.08% answered twoquestions. While multi-metric methods (ecosystem services coding, Likert scale, TOSI,TMSI) are reduced by including additional questions, some of which may not be addressed,doing so also increases the diversity and reliability of responses. In addition, surveys aboutpublic perceptions of urban forestry are relatively limited and the development of suchmetrics and observations, we expect, can contribute to further comparative studies.
78
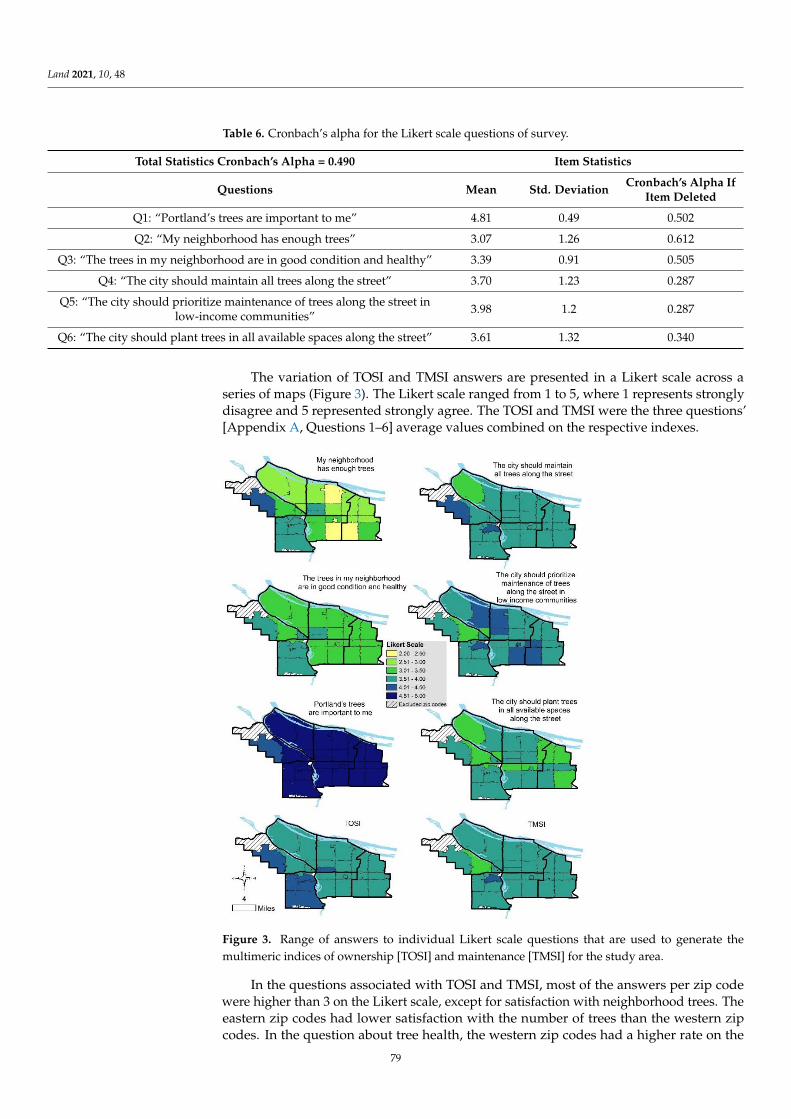
Land 2021, 10, 48
Table 6. Cronbach’s alpha for the Likert scale questions of survey.
Total Statistics Cronbach’s Alpha = 0.490 Item Statistics
Questions Mean Std. Deviation Cronbach’s Alpha IfItem Deleted
Q1: “Portland’s trees are important to me” 4.81 0.49 0.502
Q2: “My neighborhood has enough trees” 3.07 1.26 0.612
Q3: “The trees in my neighborhood are in good condition and healthy” 3.39 0.91 0.505
Q4: “The city should maintain all trees along the street” 3.70 1.23 0.287
Q5: “The city should prioritize maintenance of trees along the street inlow-income communities” 3.98 1.2 0.287
Q6: “The city should plant trees in all available spaces along the street” 3.61 1.32 0.340
The variation of TOSI and TMSI answers are presented in a Likert scale across aseries of maps (Figure 3). The Likert scale ranged from 1 to 5, where 1 represents stronglydisagree and 5 represented strongly agree. The TOSI and TMSI were the three questions’[Appendix A, Questions 1–6] average values combined on the respective indexes.
Land 2021, 10, x FOR PEER REVIEW 11 of 24
Table 6. Cronbach’s alpha for the Likert scale questions of survey.
Total Statistics Cronbach’s Alpha = 0.490 Item Statistics
Questions Mean Std. Devia-
tion
Cronbach’s Alpha if Item
Deleted
Q1: “Portland’s trees are important to me” 4.81 0.49 0.502
Q2: “My neighborhood has enough trees” 3.07 1.26 0.612
Q3: “The trees in my neighborhood are in good condition
and healthy” 3.39 0.91 0.505
Q4: “The city should maintain all trees along the street” 3.70 1.23 0.287
Q5: “The city should prioritize maintenance of trees along
the street in low-income communities” 3.98 1.2 0.287
Q6: “The city should plant trees in all available spaces
along the street” 3.61 1.32 0.340
The variation of TOSI and TMSI answers are presented in a Likert scale across a series
of maps (Figure 3). The Likert scale ranged from 1 to 5, where 1 represents strongly disa-
gree and 5 represented strongly agree. The TOSI and TMSI were the three questions’ [Ap-
pendix A, Questions 1–6] average values combined on the respective indexes.
Figure 3. Range of answers to individual Likert scale questions that are used to generate the multi-
meric indices of ownership [TOSI] and maintenance [TMSI] for the study area.
Figure 3. Range of answers to individual Likert scale questions that are used to generate themultimeric indices of ownership [TOSI] and maintenance [TMSI] for the study area.
In the questions associated with TOSI and TMSI, most of the answers per zip codewere higher than 3 on the Likert scale, except for satisfaction with neighborhood trees. Theeastern zip codes had lower satisfaction with the number of trees than the western zipcodes. In the question about tree health, the western zip codes had a higher rate on the
79
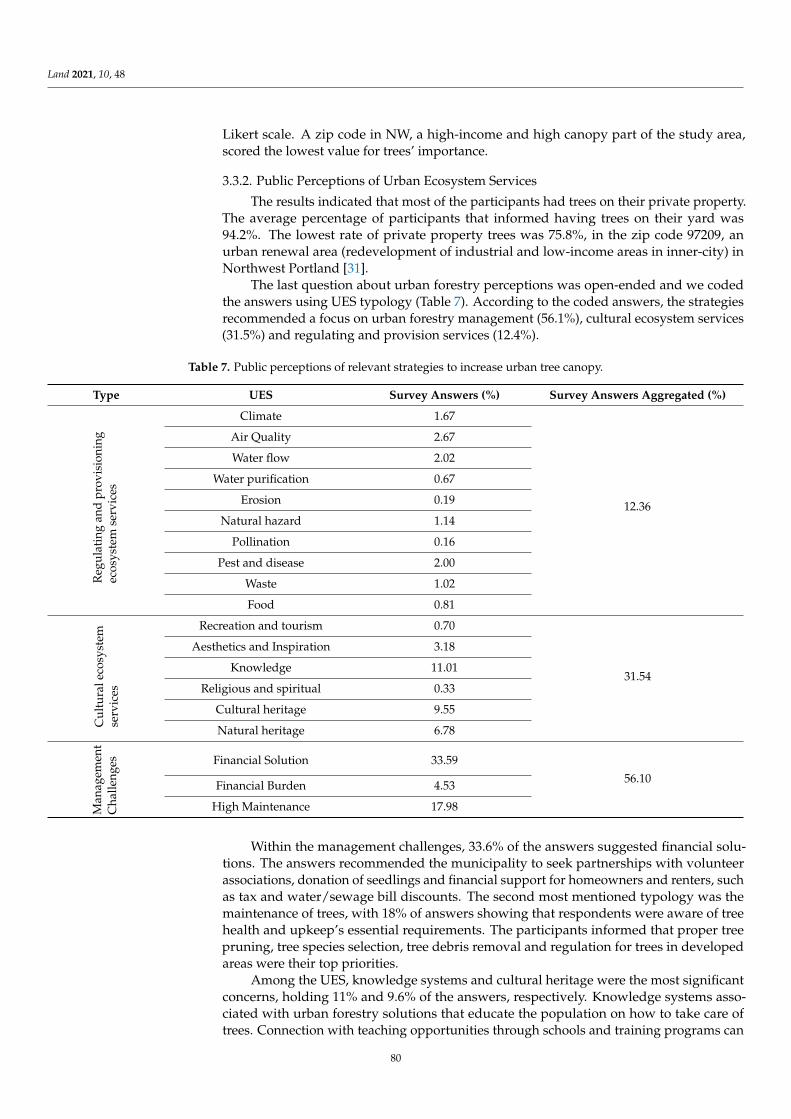
Land 2021, 10, 48
Likert scale. A zip code in NW, a high-income and high canopy part of the study area,scored the lowest value for trees’ importance.
3.3.2. Public Perceptions of Urban Ecosystem Services
The results indicated that most of the participants had trees on their private property.The average percentage of participants that informed having trees on their yard was94.2%. The lowest rate of private property trees was 75.8%, in the zip code 97209, anurban renewal area (redevelopment of industrial and low-income areas in inner-city) inNorthwest Portland [31].
The last question about urban forestry perceptions was open-ended and we codedthe answers using UES typology (Table 7). According to the coded answers, the strategiesrecommended a focus on urban forestry management (56.1%), cultural ecosystem services(31.5%) and regulating and provision services (12.4%).
Table 7. Public perceptions of relevant strategies to increase urban tree canopy.
Type UES Survey Answers (%) Survey Answers Aggregated (%)
Reg
ulat
ing
and
prov
isio
ning
ecos
yste
mse
rvic
es
Climate 1.67
12.36
Air Quality 2.67
Water flow 2.02
Water purification 0.67
Erosion 0.19
Natural hazard 1.14
Pollination 0.16
Pest and disease 2.00
Waste 1.02
Food 0.81
Cul
tura
leco
syst
emse
rvic
es
Recreation and tourism 0.70
31.54
Aesthetics and Inspiration 3.18
Knowledge 11.01
Religious and spiritual 0.33
Cultural heritage 9.55
Natural heritage 6.78
Man
agem
ent
Cha
lleng
es Financial Solution 33.5956.10Financial Burden 4.53
High Maintenance 17.98
Within the management challenges, 33.6% of the answers suggested financial solu-tions. The answers recommended the municipality to seek partnerships with volunteerassociations, donation of seedlings and financial support for homeowners and renters, suchas tax and water/sewage bill discounts. The second most mentioned typology was themaintenance of trees, with 18% of answers showing that respondents were aware of treehealth and upkeep’s essential requirements. The participants informed that proper treepruning, tree species selection, tree debris removal and regulation for trees in developedareas were their top priorities.
Among the UES, knowledge systems and cultural heritage were the most significantconcerns, holding 11% and 9.6% of the answers, respectively. Knowledge systems asso-ciated with urban forestry solutions that educate the population on how to take care oftrees. Connection with teaching opportunities through schools and training programs can
80
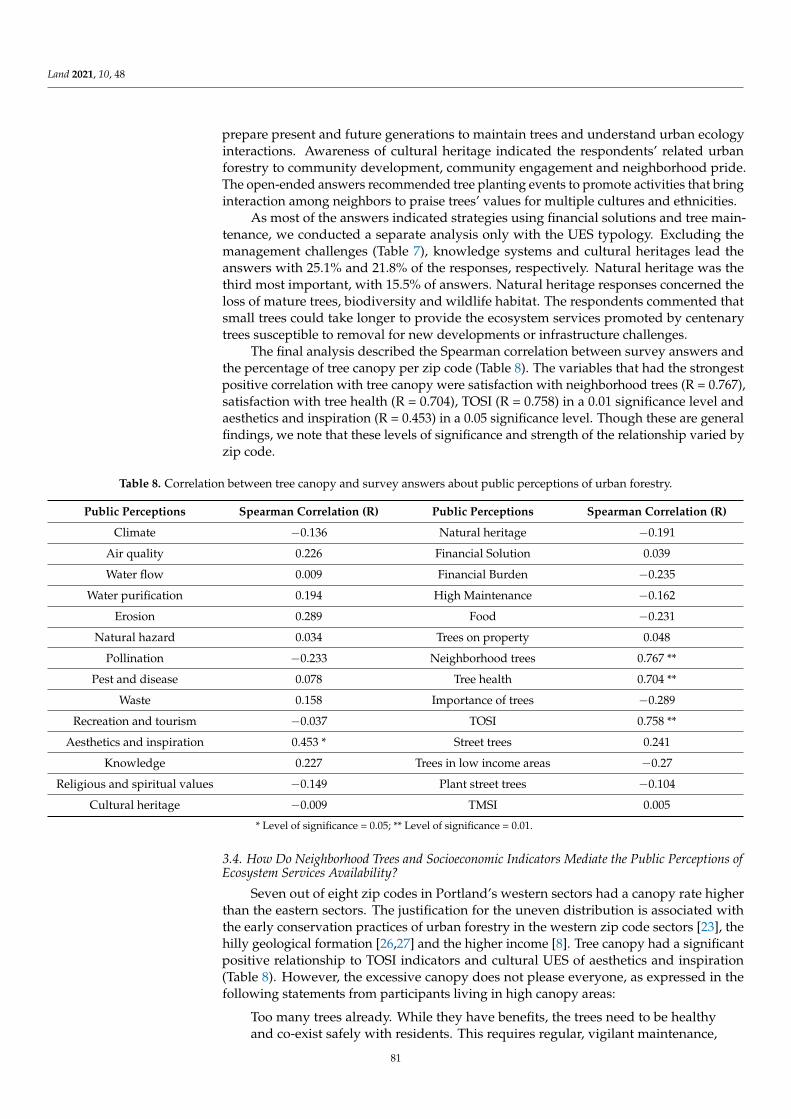
Land 2021, 10, 48
prepare present and future generations to maintain trees and understand urban ecologyinteractions. Awareness of cultural heritage indicated the respondents’ related urbanforestry to community development, community engagement and neighborhood pride.The open-ended answers recommended tree planting events to promote activities that bringinteraction among neighbors to praise trees’ values for multiple cultures and ethnicities.
As most of the answers indicated strategies using financial solutions and tree main-tenance, we conducted a separate analysis only with the UES typology. Excluding themanagement challenges (Table 7), knowledge systems and cultural heritages lead theanswers with 25.1% and 21.8% of the responses, respectively. Natural heritage was thethird most important, with 15.5% of answers. Natural heritage responses concerned theloss of mature trees, biodiversity and wildlife habitat. The respondents commented thatsmall trees could take longer to provide the ecosystem services promoted by centenarytrees susceptible to removal for new developments or infrastructure challenges.
The final analysis described the Spearman correlation between survey answers andthe percentage of tree canopy per zip code (Table 8). The variables that had the strongestpositive correlation with tree canopy were satisfaction with neighborhood trees (R = 0.767),satisfaction with tree health (R = 0.704), TOSI (R = 0.758) in a 0.01 significance level andaesthetics and inspiration (R = 0.453) in a 0.05 significance level. Though these are generalfindings, we note that these levels of significance and strength of the relationship varied byzip code.
Table 8. Correlation between tree canopy and survey answers about public perceptions of urban forestry.
Public Perceptions Spearman Correlation (R) Public Perceptions Spearman Correlation (R)
Climate −0.136 Natural heritage −0.191
Air quality 0.226 Financial Solution 0.039
Water flow 0.009 Financial Burden −0.235
Water purification 0.194 High Maintenance −0.162
Erosion 0.289 Food −0.231
Natural hazard 0.034 Trees on property 0.048
Pollination −0.233 Neighborhood trees 0.767 **
Pest and disease 0.078 Tree health 0.704 **
Waste 0.158 Importance of trees −0.289
Recreation and tourism −0.037 TOSI 0.758 **
Aesthetics and inspiration 0.453 * Street trees 0.241
Knowledge 0.227 Trees in low income areas −0.27
Religious and spiritual values −0.149 Plant street trees −0.104
Cultural heritage −0.009 TMSI 0.005
* Level of significance = 0.05; ** Level of significance = 0.01.
3.4. How Do Neighborhood Trees and Socioeconomic Indicators Mediate the Public Perceptions ofEcosystem Services Availability?
Seven out of eight zip codes in Portland’s western sectors had a canopy rate higherthan the eastern sectors. The justification for the uneven distribution is associated withthe early conservation practices of urban forestry in the western zip code sectors [23], thehilly geological formation [26,27] and the higher income [8]. Tree canopy had a significantpositive relationship to TOSI indicators and cultural UES of aesthetics and inspiration(Table 8). However, the excessive canopy does not please everyone, as expressed in thefollowing statements from participants living in high canopy areas:
Too many trees already. While they have benefits, the trees need to be healthyand co-exist safely with residents. This requires regular, vigilant maintenance,
81
Land 2021, 10, 48
which a lot of people (...) fail to do. We’ve repeatedly witnessed the tragedy ofhuman deaths and property destructions, especially this last winter. Even onedeath is too many! We need to take better care of the existing trees before weconsider adding more. (97221—Southwest)
I don’t necessarily think the city should plant more trees. While the trees herecertainly help relieve heat we need to be mindful of how little sun we get here(in Portland rainy weather). I think the city needs to maintain a balance betweendensely wooded areas (e.g., Forest Park) and highly exposed areas (e.g., centraleastside). I think students and volunteers could plant lots of trees. (97221—Southwest)
(...) determine the most aesthetic and functional places to plant trees and thenonly plant trees that make logical sense for the conditions present in the chosenlocations. (97210—Northwest)
I think the city should plant fruit and nut trees when they plant trees. They growjust as easy as any other tree. Most have beautiful flowers and foliage. And betteryet they make healthy snacks especially in low income neighborhoods and fooddeserts. (97236—East)
(...) I can’t see cars coming at intersections because there are too many treesalready in my neighborhood. There is a near miss almost every day at my housebecause people can’t see the cars coming. (97212—Northeast)
East of the Willamette River, five zip codes stood out with more than 10% of canopycover. The zip code 97236 had 23.5% canopy cover in the Pleasant Valley area, an earlyincorporated neighborhood near an affluent suburb, Happy Valley. This zip code areaalso bears Powell Butte Natural Area, a remaining forest fragment. 97212 had 17% oftree coverage and the fourth largest average income citywide. 97202 had 13.8% of canopycover and a protected riparian zone in the eastbound of Willamette River. 97215 had13% of canopy cover and a preserved forest fragment on Mount Tabor Park. 97266 had12.4% of tree coverage and was the third-lowest income zip code. However, it bears aforest fragment on Kelly Butte Natural Area. These findings showed that tree canopyfollows income and geological formation features, such as riverbanks, forest fragments andhilly areas.
In low-income communities, trees’ maintenance is observed as a financial burden,which can be classified as an ecosystem disservice [43]. Two zip codes from the East sectoranswered that 8.3% and 7.7% of the increasing tree canopy strategies have financial burdenas a management challenge. The average answer mentions for financial burden was 4.5%per zip code. Seven out of eleven neighborhoods with answers above average are in theEast, the sector with the lowest income and low canopy (Table 4). The following statementsextracted from the open-ended question about strategies for increase tree canopy reflectthe concerns for financial burden within residents of low-income neighborhoods:
“Offer to plant them (trees), offer low income solutions to families” (97233—East)
(...) lots of trees (are) in bad places and they die so better planning would dojust fine and offering classes for ppl (people) who want to learn how to maintainthe trees better and if they have it why does low income not have access to theclasses and knowledge of them? (97233—East)
Don’t charge for leaf cleanup. Offer a small tax credit for trees planted andmaintained to property owner(s). Education regarding the importance of treesfor everyone. Offer education to grow trees in a pot. Then everyone can grow atree. (97220—East)
(...) more financial and volunteer support to groups like that (street tree plantingnonprofit). Also when Portland had the ice storm this past winter, many residen-tial trees came down. (...) people could bring downed trees and branches, maybe
82
Land 2021, 10, 48
even for a donation. Free mulch for the city and donations! Tree culture need(s)to be supported in more ways than just plantings (...) to make owning trees easy.(97220—East)
I’m sure a lot of people are scared away from that program (street tree plantingprogram) due to the need to care for the tree and the possible damage to sidewalksthat they will eventually be forced to repair at their expense later on down theline. (97220—East)
The answers for increasing canopy strategies also indicated concerns for other UES,such as climate change, knowledge systems, natural heritage and cultural heritage. Exclud-ing the answers about management challenges, responses about regulating and provision-ing UES represented 28% and cultural UES accounted for 72% of answers. We believed thatpeople highly value cultural benefits from trees in urban areas due to the “extinction ofexperience” [3]. Within cultural ecosystem services, we distinguished patterns in responsesthat seek environmental education, multiple ethnic values for forest biodiversity and con-servation of heritage trees. The answers associated with knowledge systems indicated thatbesides incentives for tree planting, people also need to know how to care for trees andtheir importance regarding ecosystem services. Public surveys assessing urban forestryand management of UES have suggested the enforcement of knowledge systems [44].As observed in the previous statements, the survey participants repetitively suggestedpartnerships with education institutions, urban forestry jobs, internships and free work-shops. The responses indicated that the residents expect more personal accountability forownership if they have access to knowledge, tools and technical support from municipalityand nonprofits.
In answers that mentioned cultural heritage, people requested more planting eventsto bond with neighbors and create a sense of community. The participants asked formultilingual tree support, public participation in urban forestry planning and access totrees with ethnic values regarding inclusion and diversity measures. Natural heritageanswers indicate the population’s willingness to perpetuate biodiversity, urban ecologyand centenary trees. Together, cultural and natural heritage are UES that reflect landscapeinterpretations, which are individual perspectives of the environment based on personalbackground, memories, experiences and expectations. In general, environmental plan-ning bears management tools that can perpetuate systemic racism by restricting access toecosystem services based on socioeconomic values, reducing maintenance costs in areaswith low-income and people of color and not acknowledging the diversity of behaviors inpublic space [45,46]. Surveys, interviews and focus groups can collect ideas, perspectivesand expectations from historically unheard voices and open a path for public participationin urban forestry planning.
Portland had a complex history of gentrification that burdened the black communitywith displacement, loss of sense of spatial identity and identity representation [21]. Theincrease in population promoted real estate development for housing, business and othercivic infrastructures. In Portland, there is an inverse relationship between canopy coverand urban development indicators, as water pipers [10]. The survey answers indicatedthat people are aware that new developments threaten trees, impacting their maintenanceand natural heritage. The following statements are from the zip codes with lower housingownership [Appendix B, Table A1] and most gentrified areas [32]:
“Yes, we need many more trees but (...) focus on protecting the most mature treesas they have been shown to provide the greatest benefits.” (97227—North)
Demolition review to ensure maintenance of entire tree canopy as developmentcan remove existing trees. The accelerated development in Portland has notbeen counterbalanced with a comprehensive plan to prevent tree removal andplant new trees. It has greatly reduced potential green spaces which could offsetsomewhat the unbridled concrete development. (97232—Northeast)
83
Land 2021, 10, 48
Trees are natural green infrastructures that support stormwater catchment, avoiderosion and improve air quality. Other forms of green infrastructure such as rain gardens,green roofs, artificial wetlands and parks can bring green gentrification—a gentrificationprocess caused by the implementation of green infrastructures. The following Discussionsection will explore how the results are associated with environmental justice and landscapemanagement.
4. Discussion and Conclusions
This study aimed to address questions about the relationship between the existingamounts of neighborhood tree canopy with sociodemographic data and community per-spectives. One of the explicit goals of the present study was to understand the relationshipbetween tree ownership, maintenance and the amount of tree canopy. We found that zipcodes with higher tree canopy were consistent with greater sense of ownership and qualityof trees, as measured by the TOSI. Specifically, the two TOSI questions about the number oftrees and the good condition of trees had a strong correlation and high significance valueswith tree canopy. This finding is consistent with a low Cronbach’s alpha, suggesting thatthis metric can be explored further, perhaps in a different setting.
Our findings also indicate that a sense of ownership comprises the importance andsatisfaction with the quantity and the quality of trees in the neighborhood, including treesin private property, public spaces and the right-of-way. Affluent zip codes had highercanopy cover had a higher correlation with public maintenance of street trees, as measuredby the TMSI. While earlier research suggests that tree canopy and income are correlated inthe U.S. [8–10], the perception of tree ownership is a new concept that brings accountabilityof ownership and maintenance in relation to urban ecosystem services. We observed alower correlation between the tree canopy and TMSI than with TOSI (Table 8). TMSI alsopresented a lower range of mean values on the Likert scale response (Table 6), suggestinga common concern about tree care citywide (Figure 3). In the question about increasingtree canopy strategies, the responses about tree maintenance represented about 18% of theanswers (Table 7).
Perhaps one of the most germane findings in our study is the fact that while a canon ofliterature describes the importance of trees in providing UES (e.g., pollination, air quality,climate regulation, etc.), our survey findings indicate that issues about management andcultural ecosystems services feature prominently among the respondents. This finding,while perhaps mundane, is significant for several reasons, including the fact that respon-dents seem to recognize the financial burden and maintenance when considering trees. Ifthis finding is consistent across the city, then municipal goals for expanding tree canopywill face formidable obstacles if they present trees an important for traditional regulatingecosystem services. Rather, recognizing that communities are considering, perhaps lessthese regulatory services, than those surrounding maintenance and financing, may providemore effective.
Suitable messaging may not be the only implication of this finding. If aesthetics,inspiration and level of ownership are correlated with the amount of neighborhood treecanopy (Table 8), then attempts to create distributional equity will require considerablerecognition of the maintenance costs involved. Maintenance often includes the plantingappropriate species, pruning of trees, watering and a host of other monitoring to ensurehealthy growth. Responses indicated the importance of maintenance and also suggestedthat municipalities provide support to those communities how may not have the financialresources to address maintenance concerns. Currently the City of Portland requires adjacentproperty owners to maintain all public trees, which increases the level of inequity alreadyexperienced by lower income communities. Perhaps the positive and significant correlationbetween income and presence of tree canopy is because lower income community maynot prefer trees due to the cost of maintenance, which the open-ended responses indicated.The development of trees in the right-of-way interacts with other infrastructure, such assidewalks, residences and transit features. Studies that observe the growth and health of
84
Land 2021, 10, 48
street trees [47], suggest regular monitoring and maintenance such as root pruning andinteraction with underground infrastructures [48–50] which can help to ensure a healthyand robust tree canopy.
While these findings offer a first step towards integrating community perspectives intourban forest management, the findings suggest the importance of engaging communitiesin the management of tree canopy. The open-ended results suggested that respondentsgenuinely understand the challenges facing urban forest management and the importanceof finding systematic ways to maintain canopy and provide equitable access to all residents.Our findings indicate, for example, that promoting financial solutions that optimize publicand private budgets toward urban forestry and cultural heritage practices that engage thecommunity in participatory planning and empowerment are the priority strategies forincreasing tree canopy. With the multiple goals for achieving environmental equity throughurban forestry, these strategies must also include raising awareness about the inequitabledistribution of existing tree canopy, planting more trees in vulnerable communities, ex-ploring diverse perspectives about climate resilience and exploring the role of trees amonghistorically marginalized communities [46].
This study offers a means for understanding the importance of ownership and main-tenance in addressing urban ecosystem services. While our survey can help to underscoresome of these priorities, we recognize that engaging communities about urban forestry maypose several challenges. If employed effectively, other data collection methods, includinglistening sessions, focus groups and interviews, can help to contextualize urban forestrywithin the broader set of community needs that may be priorities. The COVID-19 pandemichas made clear that priorities such has housing, food and medical care are often front-and-center among POC and lower income communities, which may pose several challenges fordiscussions about urban forestry. Since POC and low-income neighborhoods have beenexcluded from planning for a healthy and abundant urban forest [8], a pattern that may beassociated to redlining practices in the U.S. [51] perhaps the built and natural environmentin neighborhoods can be a direct means for understanding other pressing priorities. Byengaging historically disinvested communities and address distributional injustices thathave created current inequities in the distribution of tree canopy cover, municipal agenciesmay find creative solutions that ‘multi-solve’ the myriad pressing challenges.
Our study found that survey respondents seeks more measures and strategies toaddress cultural UES, such as cultural heritage, natural heritage, aesthetics and inspiration.The gap of systematic descriptions for these cultural UES within municipal plans may re-quire greater levels of public involvement, which would build on diverse perspectives [46].While government agencies are often responsible for the management of public spaces,the same agencies may not be trusted allies with communities that have been historicallydisinvested. As such, management options that engage community-based organization(CBOs) may be a more trusted and effective approach for soliciting plausible solutions.Such CBOs can work with community members to explore their expectations for land use,tree canopy, species selection, planting events, tree giveaways and volunteer workforce.
Examples of such cross-sectoral urban forestry management are emerging. In Toronto,CBOs had a more diverse species list than municipal agencies, landscape architects andnurseries [52]. In Detroit, interviews with CBO staff and recipients of giveaway treesinformed that the ability to choose the tree species is a fact that impacts the willingness ofresidents to care for private trees, as well as live in areas with lower canopy. In both cases,studies have found that the major challenges are concerns with maintenance practicesand costs, such as pruning, sidewalk damages and tree debris removal [53]. Both studiessuggested stewardships for a functioning and healthy urban forestry, where CBOs wouldhave the goal to promote understanding, while supporting cultural ecosystem services.
Author Contributions: L.A.C.N. have performed the analysis and wrote the manuscript. V.S. havecollected the survey data, coordinated the researched, and reviewed the manuscript. Both authorshave read and agreed to the published version of the manuscript.
85
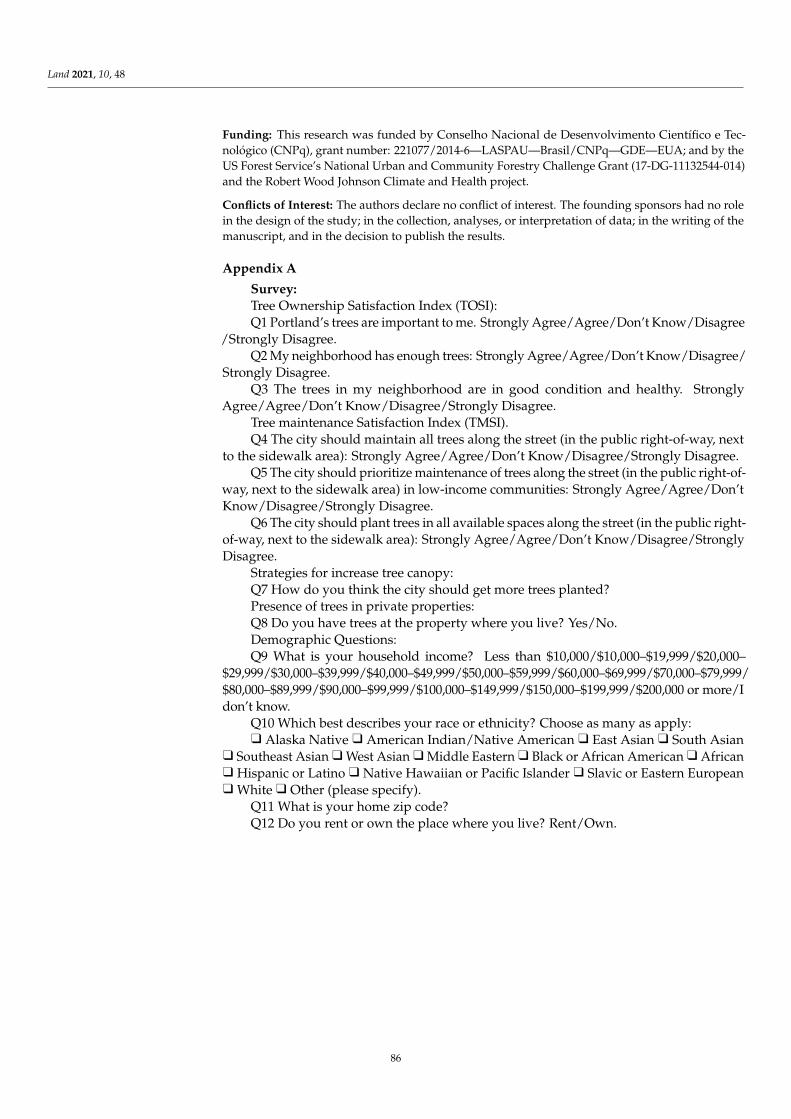
Land 2021, 10, 48
Funding: This research was funded by Conselho Nacional de Desenvolvimento Científico e Tec-nológico (CNPq), grant number: 221077/2014-6—LASPAU—Brasil/CNPq—GDE—EUA; and by theUS Forest Service’s National Urban and Community Forestry Challenge Grant (17-DG-11132544-014)and the Robert Wood Johnson Climate and Health project.
Conflicts of Interest: The authors declare no conflict of interest. The founding sponsors had no rolein the design of the study; in the collection, analyses, or interpretation of data; in the writing of themanuscript, and in the decision to publish the results.
Appendix A
Survey:Tree Ownership Satisfaction Index (TOSI):Q1 Portland’s trees are important to me. Strongly Agree/Agree/Don’t Know/Disagree
/Strongly Disagree.Q2 My neighborhood has enough trees: Strongly Agree/Agree/Don’t Know/Disagree/
Strongly Disagree.Q3 The trees in my neighborhood are in good condition and healthy. Strongly
Agree/Agree/Don’t Know/Disagree/Strongly Disagree.Tree maintenance Satisfaction Index (TMSI).Q4 The city should maintain all trees along the street (in the public right-of-way, next
to the sidewalk area): Strongly Agree/Agree/Don’t Know/Disagree/Strongly Disagree.Q5 The city should prioritize maintenance of trees along the street (in the public right-of-
way, next to the sidewalk area) in low-income communities: Strongly Agree/Agree/Don’tKnow/Disagree/Strongly Disagree.
Q6 The city should plant trees in all available spaces along the street (in the public right-of-way, next to the sidewalk area): Strongly Agree/Agree/Don’t Know/Disagree/StronglyDisagree.
Strategies for increase tree canopy:Q7 How do you think the city should get more trees planted?Presence of trees in private properties:Q8 Do you have trees at the property where you live? Yes/No.Demographic Questions:Q9 What is your household income? Less than $10,000/$10,000–$19,999/$20,000–
$29,999/$30,000–$39,999/$40,000–$49,999/$50,000–$59,999/$60,000–$69,999/$70,000–$79,999/$80,000–$89,999/$90,000–$99,999/$100,000–$149,999/$150,000–$199,999/$200,000 or more/Idon’t know.
Q10 Which best describes your race or ethnicity? Choose as many as apply:
Land 2021, 10, x FOR PEER REVIEW 18 of 24
Examples of such cross-sectoral urban forestry management are emerging. In To-
ronto, CBOs had a more diverse species list than municipal agencies, landscape architects
and nurseries [52]. In Detroit, interviews with CBO staff and recipients of giveaway trees
informed that the ability to choose the tree species is a fact that impacts the willingness of
residents to care for private trees, as well as live in areas with lower canopy. In both cases,
studies have found that the major challenges are concerns with maintenance practices and
costs, such as pruning, sidewalk damages and tree debris removal [53]. Both studies sug-
gested stewardships for a functioning and healthy urban forestry, where CBOs would
have the goal to promote understanding, while supporting cultural ecosystem services.
Author Contributions: L.A.C.N. have performed the analysis and wrote the manuscript. V.S. have
collected the survey data, coordinated the researched, and reviewed the manuscript. All authors
have read and agreed to the published version of the manuscript.
Funding: This research was funded by Conselho Nacional de Desenvolvimento Científico e Tecno-
lógico (CNPq), grant number: 221077/2014-6—LASPAU—Brasil/CNPq—GDE—EUA; and by the
US Forest Service’s National Urban and Community Forestry Challenge Grant (17-DG-11132544-
014) and the Robert Wood Johnson Climate and Health project.
Conflicts of Interest: The authors declare no conflict of interest. The founding sponsors had no role
in the design of the study; in the collection, analyses, or interpretation of data; in the writing of the
manuscript, and in the decision to publish the results.
Appendix A
Survey:
Tree Ownership Satisfaction Index (TOSI):
Q1 Portland’s trees are important to me. Strongly Agree/Agree/Don’t Know/Disagree
/Strongly Disagree.
Q2 My neighborhood has enough trees: Strongly Agree/Agree/Don’t Know/Disa-
gree/Strongly Disagree.
Q3 The trees in my neighborhood are in good condition and healthy. Strongly
Agree/Agree/Don’t Know/Disagree/Strongly Disagree.
Tree maintenance Satisfaction Index (TMSI).
Q4 The city should maintain all trees along the street (in the public right-of-way, next
to the sidewalk area): Strongly Agree/Agree/Don’t Know/Disagree/Strongly Disagree.
Q5 The city should prioritize maintenance of trees along the street (in the public right-
of-way, next to the sidewalk area) in low-income communities: Strongly
Agree/Agree/Don’t Know/Disagree/Strongly Disagree.
Q6 The city should plant trees in all available spaces along the street (in the public
right-of-way, next to the sidewalk area): Strongly Agree/Agree/Don’t Know/Disa-
gree/Strongly Disagree.
Strategies for increase tree canopy:
Q7 How do you think the city should get more trees planted?
Presence of trees in private properties:
Q8 Do you have trees at the property where you live? Yes/No.
Demographic Questions:
Q9 What is your household income? Less than $10,000/$10,000–$19,999/$20,000–
$29,999/$30,000–$39,999/$40,000–$49,999/$50,000–$59,999/$60,000–$69,999/$70,000–
$79,999/$80,000–$89,999/$90,000–$99,999/$100,000–$149,999/$150,000–$199,999/$200,000
or more/I don’t know.
Q10 Which best describes your race or ethnicity? Choose as many as apply:
❑ Alaska Native ❑ American Indian/Native American ❑ East Asian ❑ South Asian
❑ Southeast Asian ❑ West Asian ❑ Middle Eastern ❑ Black or African American ❑ Af-
rican ❑ Hispanic or Latino ❑ Native Hawaiian or Pacific Islander ❑ Slavic or Eastern
European ❑ White ❑ Other (please specify).
Q11 What is your home zip code?
Alaska Native
Land 2021, 10, x FOR PEER REVIEW 18 of 24
Examples of such cross-sectoral urban forestry management are emerging. In To-
ronto, CBOs had a more diverse species list than municipal agencies, landscape architects
and nurseries [52]. In Detroit, interviews with CBO staff and recipients of giveaway trees
informed that the ability to choose the tree species is a fact that impacts the willingness of
residents to care for private trees, as well as live in areas with lower canopy. In both cases,
studies have found that the major challenges are concerns with maintenance practices and
costs, such as pruning, sidewalk damages and tree debris removal [53]. Both studies sug-
gested stewardships for a functioning and healthy urban forestry, where CBOs would
have the goal to promote understanding, while supporting cultural ecosystem services.
Author Contributions: L.A.C.N. have performed the analysis and wrote the manuscript. V.S. have
collected the survey data, coordinated the researched, and reviewed the manuscript. All authors
have read and agreed to the published version of the manuscript.
Funding: This research was funded by Conselho Nacional de Desenvolvimento Científico e Tecno-
lógico (CNPq), grant number: 221077/2014-6—LASPAU—Brasil/CNPq—GDE—EUA; and by the
US Forest Service’s National Urban and Community Forestry Challenge Grant (17-DG-11132544-
014) and the Robert Wood Johnson Climate and Health project.
Conflicts of Interest: The authors declare no conflict of interest. The founding sponsors had no role
in the design of the study; in the collection, analyses, or interpretation of data; in the writing of the
manuscript, and in the decision to publish the results.
Appendix A
Survey:
Tree Ownership Satisfaction Index (TOSI):
Q1 Portland’s trees are important to me. Strongly Agree/Agree/Don’t Know/Disagree
/Strongly Disagree.
Q2 My neighborhood has enough trees: Strongly Agree/Agree/Don’t Know/Disa-
gree/Strongly Disagree.
Q3 The trees in my neighborhood are in good condition and healthy. Strongly
Agree/Agree/Don’t Know/Disagree/Strongly Disagree.
Tree maintenance Satisfaction Index (TMSI).
Q4 The city should maintain all trees along the street (in the public right-of-way, next
to the sidewalk area): Strongly Agree/Agree/Don’t Know/Disagree/Strongly Disagree.
Q5 The city should prioritize maintenance of trees along the street (in the public right-
of-way, next to the sidewalk area) in low-income communities: Strongly
Agree/Agree/Don’t Know/Disagree/Strongly Disagree.
Q6 The city should plant trees in all available spaces along the street (in the public
right-of-way, next to the sidewalk area): Strongly Agree/Agree/Don’t Know/Disa-
gree/Strongly Disagree.
Strategies for increase tree canopy:
Q7 How do you think the city should get more trees planted?
Presence of trees in private properties:
Q8 Do you have trees at the property where you live? Yes/No.
Demographic Questions:
Q9 What is your household income? Less than $10,000/$10,000–$19,999/$20,000–
$29,999/$30,000–$39,999/$40,000–$49,999/$50,000–$59,999/$60,000–$69,999/$70,000–
$79,999/$80,000–$89,999/$90,000–$99,999/$100,000–$149,999/$150,000–$199,999/$200,000
or more/I don’t know.
Q10 Which best describes your race or ethnicity? Choose as many as apply:
❑ Alaska Native ❑ American Indian/Native American ❑ East Asian ❑ South Asian
❑ Southeast Asian ❑ West Asian ❑ Middle Eastern ❑ Black or African American ❑ Af-
rican ❑ Hispanic or Latino ❑ Native Hawaiian or Pacific Islander ❑ Slavic or Eastern
European ❑ White ❑ Other (please specify).
Q11 What is your home zip code?
American Indian/Native American
Land 2021, 10, x FOR PEER REVIEW 18 of 24
Examples of such cross-sectoral urban forestry management are emerging. In To-
ronto, CBOs had a more diverse species list than municipal agencies, landscape architects
and nurseries [52]. In Detroit, interviews with CBO staff and recipients of giveaway trees
informed that the ability to choose the tree species is a fact that impacts the willingness of
residents to care for private trees, as well as live in areas with lower canopy. In both cases,
studies have found that the major challenges are concerns with maintenance practices and
costs, such as pruning, sidewalk damages and tree debris removal [53]. Both studies sug-
gested stewardships for a functioning and healthy urban forestry, where CBOs would
have the goal to promote understanding, while supporting cultural ecosystem services.
Author Contributions: L.A.C.N. have performed the analysis and wrote the manuscript. V.S. have
collected the survey data, coordinated the researched, and reviewed the manuscript. All authors
have read and agreed to the published version of the manuscript.
Funding: This research was funded by Conselho Nacional de Desenvolvimento Científico e Tecno-
lógico (CNPq), grant number: 221077/2014-6—LASPAU—Brasil/CNPq—GDE—EUA; and by the
US Forest Service’s National Urban and Community Forestry Challenge Grant (17-DG-11132544-
014) and the Robert Wood Johnson Climate and Health project.
Conflicts of Interest: The authors declare no conflict of interest. The founding sponsors had no role
in the design of the study; in the collection, analyses, or interpretation of data; in the writing of the
manuscript, and in the decision to publish the results.
Appendix A
Survey:
Tree Ownership Satisfaction Index (TOSI):
Q1 Portland’s trees are important to me. Strongly Agree/Agree/Don’t Know/Disagree
/Strongly Disagree.
Q2 My neighborhood has enough trees: Strongly Agree/Agree/Don’t Know/Disa-
gree/Strongly Disagree.
Q3 The trees in my neighborhood are in good condition and healthy. Strongly
Agree/Agree/Don’t Know/Disagree/Strongly Disagree.
Tree maintenance Satisfaction Index (TMSI).
Q4 The city should maintain all trees along the street (in the public right-of-way, next
to the sidewalk area): Strongly Agree/Agree/Don’t Know/Disagree/Strongly Disagree.
Q5 The city should prioritize maintenance of trees along the street (in the public right-
of-way, next to the sidewalk area) in low-income communities: Strongly
Agree/Agree/Don’t Know/Disagree/Strongly Disagree.
Q6 The city should plant trees in all available spaces along the street (in the public
right-of-way, next to the sidewalk area): Strongly Agree/Agree/Don’t Know/Disa-
gree/Strongly Disagree.
Strategies for increase tree canopy:
Q7 How do you think the city should get more trees planted?
Presence of trees in private properties:
Q8 Do you have trees at the property where you live? Yes/No.
Demographic Questions:
Q9 What is your household income? Less than $10,000/$10,000–$19,999/$20,000–
$29,999/$30,000–$39,999/$40,000–$49,999/$50,000–$59,999/$60,000–$69,999/$70,000–
$79,999/$80,000–$89,999/$90,000–$99,999/$100,000–$149,999/$150,000–$199,999/$200,000
or more/I don’t know.
Q10 Which best describes your race or ethnicity? Choose as many as apply:
❑ Alaska Native ❑ American Indian/Native American ❑ East Asian ❑ South Asian
❑ Southeast Asian ❑ West Asian ❑ Middle Eastern ❑ Black or African American ❑ Af-
rican ❑ Hispanic or Latino ❑ Native Hawaiian or Pacific Islander ❑ Slavic or Eastern
European ❑ White ❑ Other (please specify).
Q11 What is your home zip code?
East Asian
Land 2021, 10, x FOR PEER REVIEW 18 of 24
Examples of such cross-sectoral urban forestry management are emerging. In To-
ronto, CBOs had a more diverse species list than municipal agencies, landscape architects
and nurseries [52]. In Detroit, interviews with CBO staff and recipients of giveaway trees
informed that the ability to choose the tree species is a fact that impacts the willingness of
residents to care for private trees, as well as live in areas with lower canopy. In both cases,
studies have found that the major challenges are concerns with maintenance practices and
costs, such as pruning, sidewalk damages and tree debris removal [53]. Both studies sug-
gested stewardships for a functioning and healthy urban forestry, where CBOs would
have the goal to promote understanding, while supporting cultural ecosystem services.
Author Contributions: L.A.C.N. have performed the analysis and wrote the manuscript. V.S. have
collected the survey data, coordinated the researched, and reviewed the manuscript. All authors
have read and agreed to the published version of the manuscript.
Funding: This research was funded by Conselho Nacional de Desenvolvimento Científico e Tecno-
lógico (CNPq), grant number: 221077/2014-6—LASPAU—Brasil/CNPq—GDE—EUA; and by the
US Forest Service’s National Urban and Community Forestry Challenge Grant (17-DG-11132544-
014) and the Robert Wood Johnson Climate and Health project.
Conflicts of Interest: The authors declare no conflict of interest. The founding sponsors had no role
in the design of the study; in the collection, analyses, or interpretation of data; in the writing of the
manuscript, and in the decision to publish the results.
Appendix A
Survey:
Tree Ownership Satisfaction Index (TOSI):
Q1 Portland’s trees are important to me. Strongly Agree/Agree/Don’t Know/Disagree
/Strongly Disagree.
Q2 My neighborhood has enough trees: Strongly Agree/Agree/Don’t Know/Disa-
gree/Strongly Disagree.
Q3 The trees in my neighborhood are in good condition and healthy. Strongly
Agree/Agree/Don’t Know/Disagree/Strongly Disagree.
Tree maintenance Satisfaction Index (TMSI).
Q4 The city should maintain all trees along the street (in the public right-of-way, next
to the sidewalk area): Strongly Agree/Agree/Don’t Know/Disagree/Strongly Disagree.
Q5 The city should prioritize maintenance of trees along the street (in the public right-
of-way, next to the sidewalk area) in low-income communities: Strongly
Agree/Agree/Don’t Know/Disagree/Strongly Disagree.
Q6 The city should plant trees in all available spaces along the street (in the public
right-of-way, next to the sidewalk area): Strongly Agree/Agree/Don’t Know/Disa-
gree/Strongly Disagree.
Strategies for increase tree canopy:
Q7 How do you think the city should get more trees planted?
Presence of trees in private properties:
Q8 Do you have trees at the property where you live? Yes/No.
Demographic Questions:
Q9 What is your household income? Less than $10,000/$10,000–$19,999/$20,000–
$29,999/$30,000–$39,999/$40,000–$49,999/$50,000–$59,999/$60,000–$69,999/$70,000–
$79,999/$80,000–$89,999/$90,000–$99,999/$100,000–$149,999/$150,000–$199,999/$200,000
or more/I don’t know.
Q10 Which best describes your race or ethnicity? Choose as many as apply:
❑ Alaska Native ❑ American Indian/Native American ❑ East Asian ❑ South Asian
❑ Southeast Asian ❑ West Asian ❑ Middle Eastern ❑ Black or African American ❑ Af-
rican ❑ Hispanic or Latino ❑ Native Hawaiian or Pacific Islander ❑ Slavic or Eastern
European ❑ White ❑ Other (please specify).
Q11 What is your home zip code?
South Asian
Land 2021, 10, x FOR PEER REVIEW 18 of 24
Examples of such cross-sectoral urban forestry management are emerging. In To-
ronto, CBOs had a more diverse species list than municipal agencies, landscape architects
and nurseries [52]. In Detroit, interviews with CBO staff and recipients of giveaway trees
informed that the ability to choose the tree species is a fact that impacts the willingness of
residents to care for private trees, as well as live in areas with lower canopy. In both cases,
studies have found that the major challenges are concerns with maintenance practices and
costs, such as pruning, sidewalk damages and tree debris removal [53]. Both studies sug-
gested stewardships for a functioning and healthy urban forestry, where CBOs would
have the goal to promote understanding, while supporting cultural ecosystem services.
Author Contributions: L.A.C.N. have performed the analysis and wrote the manuscript. V.S. have
collected the survey data, coordinated the researched, and reviewed the manuscript. All authors
have read and agreed to the published version of the manuscript.
Funding: This research was funded by Conselho Nacional de Desenvolvimento Científico e Tecno-
lógico (CNPq), grant number: 221077/2014-6—LASPAU—Brasil/CNPq—GDE—EUA; and by the
US Forest Service’s National Urban and Community Forestry Challenge Grant (17-DG-11132544-
014) and the Robert Wood Johnson Climate and Health project.
Conflicts of Interest: The authors declare no conflict of interest. The founding sponsors had no role
in the design of the study; in the collection, analyses, or interpretation of data; in the writing of the
manuscript, and in the decision to publish the results.
Appendix A
Survey:
Tree Ownership Satisfaction Index (TOSI):
Q1 Portland’s trees are important to me. Strongly Agree/Agree/Don’t Know/Disagree
/Strongly Disagree.
Q2 My neighborhood has enough trees: Strongly Agree/Agree/Don’t Know/Disa-
gree/Strongly Disagree.
Q3 The trees in my neighborhood are in good condition and healthy. Strongly
Agree/Agree/Don’t Know/Disagree/Strongly Disagree.
Tree maintenance Satisfaction Index (TMSI).
Q4 The city should maintain all trees along the street (in the public right-of-way, next
to the sidewalk area): Strongly Agree/Agree/Don’t Know/Disagree/Strongly Disagree.
Q5 The city should prioritize maintenance of trees along the street (in the public right-
of-way, next to the sidewalk area) in low-income communities: Strongly
Agree/Agree/Don’t Know/Disagree/Strongly Disagree.
Q6 The city should plant trees in all available spaces along the street (in the public
right-of-way, next to the sidewalk area): Strongly Agree/Agree/Don’t Know/Disa-
gree/Strongly Disagree.
Strategies for increase tree canopy:
Q7 How do you think the city should get more trees planted?
Presence of trees in private properties:
Q8 Do you have trees at the property where you live? Yes/No.
Demographic Questions:
Q9 What is your household income? Less than $10,000/$10,000–$19,999/$20,000–
$29,999/$30,000–$39,999/$40,000–$49,999/$50,000–$59,999/$60,000–$69,999/$70,000–
$79,999/$80,000–$89,999/$90,000–$99,999/$100,000–$149,999/$150,000–$199,999/$200,000
or more/I don’t know.
Q10 Which best describes your race or ethnicity? Choose as many as apply:
❑ Alaska Native ❑ American Indian/Native American ❑ East Asian ❑ South Asian
❑ Southeast Asian ❑ West Asian ❑ Middle Eastern ❑ Black or African American ❑ Af-
rican ❑ Hispanic or Latino ❑ Native Hawaiian or Pacific Islander ❑ Slavic or Eastern
European ❑ White ❑ Other (please specify).
Q11 What is your home zip code?
Southeast Asian
Land 2021, 10, x FOR PEER REVIEW 18 of 24
Examples of such cross-sectoral urban forestry management are emerging. In To-
ronto, CBOs had a more diverse species list than municipal agencies, landscape architects
and nurseries [52]. In Detroit, interviews with CBO staff and recipients of giveaway trees
informed that the ability to choose the tree species is a fact that impacts the willingness of
residents to care for private trees, as well as live in areas with lower canopy. In both cases,
studies have found that the major challenges are concerns with maintenance practices and
costs, such as pruning, sidewalk damages and tree debris removal [53]. Both studies sug-
gested stewardships for a functioning and healthy urban forestry, where CBOs would
have the goal to promote understanding, while supporting cultural ecosystem services.
Author Contributions: L.A.C.N. have performed the analysis and wrote the manuscript. V.S. have
collected the survey data, coordinated the researched, and reviewed the manuscript. All authors
have read and agreed to the published version of the manuscript.
Funding: This research was funded by Conselho Nacional de Desenvolvimento Científico e Tecno-
lógico (CNPq), grant number: 221077/2014-6—LASPAU—Brasil/CNPq—GDE—EUA; and by the
US Forest Service’s National Urban and Community Forestry Challenge Grant (17-DG-11132544-
014) and the Robert Wood Johnson Climate and Health project.
Conflicts of Interest: The authors declare no conflict of interest. The founding sponsors had no role
in the design of the study; in the collection, analyses, or interpretation of data; in the writing of the
manuscript, and in the decision to publish the results.
Appendix A
Survey:
Tree Ownership Satisfaction Index (TOSI):
Q1 Portland’s trees are important to me. Strongly Agree/Agree/Don’t Know/Disagree
/Strongly Disagree.
Q2 My neighborhood has enough trees: Strongly Agree/Agree/Don’t Know/Disa-
gree/Strongly Disagree.
Q3 The trees in my neighborhood are in good condition and healthy. Strongly
Agree/Agree/Don’t Know/Disagree/Strongly Disagree.
Tree maintenance Satisfaction Index (TMSI).
Q4 The city should maintain all trees along the street (in the public right-of-way, next
to the sidewalk area): Strongly Agree/Agree/Don’t Know/Disagree/Strongly Disagree.
Q5 The city should prioritize maintenance of trees along the street (in the public right-
of-way, next to the sidewalk area) in low-income communities: Strongly
Agree/Agree/Don’t Know/Disagree/Strongly Disagree.
Q6 The city should plant trees in all available spaces along the street (in the public
right-of-way, next to the sidewalk area): Strongly Agree/Agree/Don’t Know/Disa-
gree/Strongly Disagree.
Strategies for increase tree canopy:
Q7 How do you think the city should get more trees planted?
Presence of trees in private properties:
Q8 Do you have trees at the property where you live? Yes/No.
Demographic Questions:
Q9 What is your household income? Less than $10,000/$10,000–$19,999/$20,000–
$29,999/$30,000–$39,999/$40,000–$49,999/$50,000–$59,999/$60,000–$69,999/$70,000–
$79,999/$80,000–$89,999/$90,000–$99,999/$100,000–$149,999/$150,000–$199,999/$200,000
or more/I don’t know.
Q10 Which best describes your race or ethnicity? Choose as many as apply:
❑ Alaska Native ❑ American Indian/Native American ❑ East Asian ❑ South Asian
❑ Southeast Asian ❑ West Asian ❑ Middle Eastern ❑ Black or African American ❑ Af-
rican ❑ Hispanic or Latino ❑ Native Hawaiian or Pacific Islander ❑ Slavic or Eastern
European ❑ White ❑ Other (please specify).
Q11 What is your home zip code?
West Asian
Land 2021, 10, x FOR PEER REVIEW 18 of 24
Examples of such cross-sectoral urban forestry management are emerging. In To-
ronto, CBOs had a more diverse species list than municipal agencies, landscape architects
and nurseries [52]. In Detroit, interviews with CBO staff and recipients of giveaway trees
informed that the ability to choose the tree species is a fact that impacts the willingness of
residents to care for private trees, as well as live in areas with lower canopy. In both cases,
studies have found that the major challenges are concerns with maintenance practices and
costs, such as pruning, sidewalk damages and tree debris removal [53]. Both studies sug-
gested stewardships for a functioning and healthy urban forestry, where CBOs would
have the goal to promote understanding, while supporting cultural ecosystem services.
Author Contributions: L.A.C.N. have performed the analysis and wrote the manuscript. V.S. have
collected the survey data, coordinated the researched, and reviewed the manuscript. All authors
have read and agreed to the published version of the manuscript.
Funding: This research was funded by Conselho Nacional de Desenvolvimento Científico e Tecno-
lógico (CNPq), grant number: 221077/2014-6—LASPAU—Brasil/CNPq—GDE—EUA; and by the
US Forest Service’s National Urban and Community Forestry Challenge Grant (17-DG-11132544-
014) and the Robert Wood Johnson Climate and Health project.
Conflicts of Interest: The authors declare no conflict of interest. The founding sponsors had no role
in the design of the study; in the collection, analyses, or interpretation of data; in the writing of the
manuscript, and in the decision to publish the results.
Appendix A
Survey:
Tree Ownership Satisfaction Index (TOSI):
Q1 Portland’s trees are important to me. Strongly Agree/Agree/Don’t Know/Disagree
/Strongly Disagree.
Q2 My neighborhood has enough trees: Strongly Agree/Agree/Don’t Know/Disa-
gree/Strongly Disagree.
Q3 The trees in my neighborhood are in good condition and healthy. Strongly
Agree/Agree/Don’t Know/Disagree/Strongly Disagree.
Tree maintenance Satisfaction Index (TMSI).
Q4 The city should maintain all trees along the street (in the public right-of-way, next
to the sidewalk area): Strongly Agree/Agree/Don’t Know/Disagree/Strongly Disagree.
Q5 The city should prioritize maintenance of trees along the street (in the public right-
of-way, next to the sidewalk area) in low-income communities: Strongly
Agree/Agree/Don’t Know/Disagree/Strongly Disagree.
Q6 The city should plant trees in all available spaces along the street (in the public
right-of-way, next to the sidewalk area): Strongly Agree/Agree/Don’t Know/Disa-
gree/Strongly Disagree.
Strategies for increase tree canopy:
Q7 How do you think the city should get more trees planted?
Presence of trees in private properties:
Q8 Do you have trees at the property where you live? Yes/No.
Demographic Questions:
Q9 What is your household income? Less than $10,000/$10,000–$19,999/$20,000–
$29,999/$30,000–$39,999/$40,000–$49,999/$50,000–$59,999/$60,000–$69,999/$70,000–
$79,999/$80,000–$89,999/$90,000–$99,999/$100,000–$149,999/$150,000–$199,999/$200,000
or more/I don’t know.
Q10 Which best describes your race or ethnicity? Choose as many as apply:
❑ Alaska Native ❑ American Indian/Native American ❑ East Asian ❑ South Asian
❑ Southeast Asian ❑ West Asian ❑ Middle Eastern ❑ Black or African American ❑ Af-
rican ❑ Hispanic or Latino ❑ Native Hawaiian or Pacific Islander ❑ Slavic or Eastern
European ❑ White ❑ Other (please specify).
Q11 What is your home zip code?
Middle Eastern
Land 2021, 10, x FOR PEER REVIEW 18 of 24
Examples of such cross-sectoral urban forestry management are emerging. In To-
ronto, CBOs had a more diverse species list than municipal agencies, landscape architects
and nurseries [52]. In Detroit, interviews with CBO staff and recipients of giveaway trees
informed that the ability to choose the tree species is a fact that impacts the willingness of
residents to care for private trees, as well as live in areas with lower canopy. In both cases,
studies have found that the major challenges are concerns with maintenance practices and
costs, such as pruning, sidewalk damages and tree debris removal [53]. Both studies sug-
gested stewardships for a functioning and healthy urban forestry, where CBOs would
have the goal to promote understanding, while supporting cultural ecosystem services.
Author Contributions: L.A.C.N. have performed the analysis and wrote the manuscript. V.S. have
collected the survey data, coordinated the researched, and reviewed the manuscript. All authors
have read and agreed to the published version of the manuscript.
Funding: This research was funded by Conselho Nacional de Desenvolvimento Científico e Tecno-
lógico (CNPq), grant number: 221077/2014-6—LASPAU—Brasil/CNPq—GDE—EUA; and by the
US Forest Service’s National Urban and Community Forestry Challenge Grant (17-DG-11132544-
014) and the Robert Wood Johnson Climate and Health project.
Conflicts of Interest: The authors declare no conflict of interest. The founding sponsors had no role
in the design of the study; in the collection, analyses, or interpretation of data; in the writing of the
manuscript, and in the decision to publish the results.
Appendix A
Survey:
Tree Ownership Satisfaction Index (TOSI):
Q1 Portland’s trees are important to me. Strongly Agree/Agree/Don’t Know/Disagree
/Strongly Disagree.
Q2 My neighborhood has enough trees: Strongly Agree/Agree/Don’t Know/Disa-
gree/Strongly Disagree.
Q3 The trees in my neighborhood are in good condition and healthy. Strongly
Agree/Agree/Don’t Know/Disagree/Strongly Disagree.
Tree maintenance Satisfaction Index (TMSI).
Q4 The city should maintain all trees along the street (in the public right-of-way, next
to the sidewalk area): Strongly Agree/Agree/Don’t Know/Disagree/Strongly Disagree.
Q5 The city should prioritize maintenance of trees along the street (in the public right-
of-way, next to the sidewalk area) in low-income communities: Strongly
Agree/Agree/Don’t Know/Disagree/Strongly Disagree.
Q6 The city should plant trees in all available spaces along the street (in the public
right-of-way, next to the sidewalk area): Strongly Agree/Agree/Don’t Know/Disa-
gree/Strongly Disagree.
Strategies for increase tree canopy:
Q7 How do you think the city should get more trees planted?
Presence of trees in private properties:
Q8 Do you have trees at the property where you live? Yes/No.
Demographic Questions:
Q9 What is your household income? Less than $10,000/$10,000–$19,999/$20,000–
$29,999/$30,000–$39,999/$40,000–$49,999/$50,000–$59,999/$60,000–$69,999/$70,000–
$79,999/$80,000–$89,999/$90,000–$99,999/$100,000–$149,999/$150,000–$199,999/$200,000
or more/I don’t know.
Q10 Which best describes your race or ethnicity? Choose as many as apply:
❑ Alaska Native ❑ American Indian/Native American ❑ East Asian ❑ South Asian
❑ Southeast Asian ❑ West Asian ❑ Middle Eastern ❑ Black or African American ❑ Af-
rican ❑ Hispanic or Latino ❑ Native Hawaiian or Pacific Islander ❑ Slavic or Eastern
European ❑ White ❑ Other (please specify).
Q11 What is your home zip code?
Black or African American
Land 2021, 10, x FOR PEER REVIEW 18 of 24
Examples of such cross-sectoral urban forestry management are emerging. In To-
ronto, CBOs had a more diverse species list than municipal agencies, landscape architects
and nurseries [52]. In Detroit, interviews with CBO staff and recipients of giveaway trees
informed that the ability to choose the tree species is a fact that impacts the willingness of
residents to care for private trees, as well as live in areas with lower canopy. In both cases,
studies have found that the major challenges are concerns with maintenance practices and
costs, such as pruning, sidewalk damages and tree debris removal [53]. Both studies sug-
gested stewardships for a functioning and healthy urban forestry, where CBOs would
have the goal to promote understanding, while supporting cultural ecosystem services.
Author Contributions: L.A.C.N. have performed the analysis and wrote the manuscript. V.S. have
collected the survey data, coordinated the researched, and reviewed the manuscript. All authors
have read and agreed to the published version of the manuscript.
Funding: This research was funded by Conselho Nacional de Desenvolvimento Científico e Tecno-
lógico (CNPq), grant number: 221077/2014-6—LASPAU—Brasil/CNPq—GDE—EUA; and by the
US Forest Service’s National Urban and Community Forestry Challenge Grant (17-DG-11132544-
014) and the Robert Wood Johnson Climate and Health project.
Conflicts of Interest: The authors declare no conflict of interest. The founding sponsors had no role
in the design of the study; in the collection, analyses, or interpretation of data; in the writing of the
manuscript, and in the decision to publish the results.
Appendix A
Survey:
Tree Ownership Satisfaction Index (TOSI):
Q1 Portland’s trees are important to me. Strongly Agree/Agree/Don’t Know/Disagree
/Strongly Disagree.
Q2 My neighborhood has enough trees: Strongly Agree/Agree/Don’t Know/Disa-
gree/Strongly Disagree.
Q3 The trees in my neighborhood are in good condition and healthy. Strongly
Agree/Agree/Don’t Know/Disagree/Strongly Disagree.
Tree maintenance Satisfaction Index (TMSI).
Q4 The city should maintain all trees along the street (in the public right-of-way, next
to the sidewalk area): Strongly Agree/Agree/Don’t Know/Disagree/Strongly Disagree.
Q5 The city should prioritize maintenance of trees along the street (in the public right-
of-way, next to the sidewalk area) in low-income communities: Strongly
Agree/Agree/Don’t Know/Disagree/Strongly Disagree.
Q6 The city should plant trees in all available spaces along the street (in the public
right-of-way, next to the sidewalk area): Strongly Agree/Agree/Don’t Know/Disa-
gree/Strongly Disagree.
Strategies for increase tree canopy:
Q7 How do you think the city should get more trees planted?
Presence of trees in private properties:
Q8 Do you have trees at the property where you live? Yes/No.
Demographic Questions:
Q9 What is your household income? Less than $10,000/$10,000–$19,999/$20,000–
$29,999/$30,000–$39,999/$40,000–$49,999/$50,000–$59,999/$60,000–$69,999/$70,000–
$79,999/$80,000–$89,999/$90,000–$99,999/$100,000–$149,999/$150,000–$199,999/$200,000
or more/I don’t know.
Q10 Which best describes your race or ethnicity? Choose as many as apply:
❑ Alaska Native ❑ American Indian/Native American ❑ East Asian ❑ South Asian
❑ Southeast Asian ❑ West Asian ❑ Middle Eastern ❑ Black or African American ❑ Af-
rican ❑ Hispanic or Latino ❑ Native Hawaiian or Pacific Islander ❑ Slavic or Eastern
European ❑ White ❑ Other (please specify).
Q11 What is your home zip code?
African
Land 2021, 10, x FOR PEER REVIEW 18 of 24
Examples of such cross-sectoral urban forestry management are emerging. In To-
ronto, CBOs had a more diverse species list than municipal agencies, landscape architects
and nurseries [52]. In Detroit, interviews with CBO staff and recipients of giveaway trees
informed that the ability to choose the tree species is a fact that impacts the willingness of
residents to care for private trees, as well as live in areas with lower canopy. In both cases,
studies have found that the major challenges are concerns with maintenance practices and
costs, such as pruning, sidewalk damages and tree debris removal [53]. Both studies sug-
gested stewardships for a functioning and healthy urban forestry, where CBOs would
have the goal to promote understanding, while supporting cultural ecosystem services.
Author Contributions: L.A.C.N. have performed the analysis and wrote the manuscript. V.S. have
collected the survey data, coordinated the researched, and reviewed the manuscript. All authors
have read and agreed to the published version of the manuscript.
Funding: This research was funded by Conselho Nacional de Desenvolvimento Científico e Tecno-
lógico (CNPq), grant number: 221077/2014-6—LASPAU—Brasil/CNPq—GDE—EUA; and by the
US Forest Service’s National Urban and Community Forestry Challenge Grant (17-DG-11132544-
014) and the Robert Wood Johnson Climate and Health project.
Conflicts of Interest: The authors declare no conflict of interest. The founding sponsors had no role
in the design of the study; in the collection, analyses, or interpretation of data; in the writing of the
manuscript, and in the decision to publish the results.
Appendix A
Survey:
Tree Ownership Satisfaction Index (TOSI):
Q1 Portland’s trees are important to me. Strongly Agree/Agree/Don’t Know/Disagree
/Strongly Disagree.
Q2 My neighborhood has enough trees: Strongly Agree/Agree/Don’t Know/Disa-
gree/Strongly Disagree.
Q3 The trees in my neighborhood are in good condition and healthy. Strongly
Agree/Agree/Don’t Know/Disagree/Strongly Disagree.
Tree maintenance Satisfaction Index (TMSI).
Q4 The city should maintain all trees along the street (in the public right-of-way, next
to the sidewalk area): Strongly Agree/Agree/Don’t Know/Disagree/Strongly Disagree.
Q5 The city should prioritize maintenance of trees along the street (in the public right-
of-way, next to the sidewalk area) in low-income communities: Strongly
Agree/Agree/Don’t Know/Disagree/Strongly Disagree.
Q6 The city should plant trees in all available spaces along the street (in the public
right-of-way, next to the sidewalk area): Strongly Agree/Agree/Don’t Know/Disa-
gree/Strongly Disagree.
Strategies for increase tree canopy:
Q7 How do you think the city should get more trees planted?
Presence of trees in private properties:
Q8 Do you have trees at the property where you live? Yes/No.
Demographic Questions:
Q9 What is your household income? Less than $10,000/$10,000–$19,999/$20,000–
$29,999/$30,000–$39,999/$40,000–$49,999/$50,000–$59,999/$60,000–$69,999/$70,000–
$79,999/$80,000–$89,999/$90,000–$99,999/$100,000–$149,999/$150,000–$199,999/$200,000
or more/I don’t know.
Q10 Which best describes your race or ethnicity? Choose as many as apply:
❑ Alaska Native ❑ American Indian/Native American ❑ East Asian ❑ South Asian
❑ Southeast Asian ❑ West Asian ❑ Middle Eastern ❑ Black or African American ❑ Af-
rican ❑ Hispanic or Latino ❑ Native Hawaiian or Pacific Islander ❑ Slavic or Eastern
European ❑ White ❑ Other (please specify).
Q11 What is your home zip code?
Hispanic or Latino
Land 2021, 10, x FOR PEER REVIEW 18 of 24
Examples of such cross-sectoral urban forestry management are emerging. In To-
ronto, CBOs had a more diverse species list than municipal agencies, landscape architects
and nurseries [52]. In Detroit, interviews with CBO staff and recipients of giveaway trees
informed that the ability to choose the tree species is a fact that impacts the willingness of
residents to care for private trees, as well as live in areas with lower canopy. In both cases,
studies have found that the major challenges are concerns with maintenance practices and
costs, such as pruning, sidewalk damages and tree debris removal [53]. Both studies sug-
gested stewardships for a functioning and healthy urban forestry, where CBOs would
have the goal to promote understanding, while supporting cultural ecosystem services.
Author Contributions: L.A.C.N. have performed the analysis and wrote the manuscript. V.S. have
collected the survey data, coordinated the researched, and reviewed the manuscript. All authors
have read and agreed to the published version of the manuscript.
Funding: This research was funded by Conselho Nacional de Desenvolvimento Científico e Tecno-
lógico (CNPq), grant number: 221077/2014-6—LASPAU—Brasil/CNPq—GDE—EUA; and by the
US Forest Service’s National Urban and Community Forestry Challenge Grant (17-DG-11132544-
014) and the Robert Wood Johnson Climate and Health project.
Conflicts of Interest: The authors declare no conflict of interest. The founding sponsors had no role
in the design of the study; in the collection, analyses, or interpretation of data; in the writing of the
manuscript, and in the decision to publish the results.
Appendix A
Survey:
Tree Ownership Satisfaction Index (TOSI):
Q1 Portland’s trees are important to me. Strongly Agree/Agree/Don’t Know/Disagree
/Strongly Disagree.
Q2 My neighborhood has enough trees: Strongly Agree/Agree/Don’t Know/Disa-
gree/Strongly Disagree.
Q3 The trees in my neighborhood are in good condition and healthy. Strongly
Agree/Agree/Don’t Know/Disagree/Strongly Disagree.
Tree maintenance Satisfaction Index (TMSI).
Q4 The city should maintain all trees along the street (in the public right-of-way, next
to the sidewalk area): Strongly Agree/Agree/Don’t Know/Disagree/Strongly Disagree.
Q5 The city should prioritize maintenance of trees along the street (in the public right-
of-way, next to the sidewalk area) in low-income communities: Strongly
Agree/Agree/Don’t Know/Disagree/Strongly Disagree.
Q6 The city should plant trees in all available spaces along the street (in the public
right-of-way, next to the sidewalk area): Strongly Agree/Agree/Don’t Know/Disa-
gree/Strongly Disagree.
Strategies for increase tree canopy:
Q7 How do you think the city should get more trees planted?
Presence of trees in private properties:
Q8 Do you have trees at the property where you live? Yes/No.
Demographic Questions:
Q9 What is your household income? Less than $10,000/$10,000–$19,999/$20,000–
$29,999/$30,000–$39,999/$40,000–$49,999/$50,000–$59,999/$60,000–$69,999/$70,000–
$79,999/$80,000–$89,999/$90,000–$99,999/$100,000–$149,999/$150,000–$199,999/$200,000
or more/I don’t know.
Q10 Which best describes your race or ethnicity? Choose as many as apply:
❑ Alaska Native ❑ American Indian/Native American ❑ East Asian ❑ South Asian
❑ Southeast Asian ❑ West Asian ❑ Middle Eastern ❑ Black or African American ❑ Af-
rican ❑ Hispanic or Latino ❑ Native Hawaiian or Pacific Islander ❑ Slavic or Eastern
European ❑ White ❑ Other (please specify).
Q11 What is your home zip code?
Native Hawaiian or Pacific Islander
Land 2021, 10, x FOR PEER REVIEW 18 of 24
Examples of such cross-sectoral urban forestry management are emerging. In To-
ronto, CBOs had a more diverse species list than municipal agencies, landscape architects
and nurseries [52]. In Detroit, interviews with CBO staff and recipients of giveaway trees
informed that the ability to choose the tree species is a fact that impacts the willingness of
residents to care for private trees, as well as live in areas with lower canopy. In both cases,
studies have found that the major challenges are concerns with maintenance practices and
costs, such as pruning, sidewalk damages and tree debris removal [53]. Both studies sug-
gested stewardships for a functioning and healthy urban forestry, where CBOs would
have the goal to promote understanding, while supporting cultural ecosystem services.
Author Contributions: L.A.C.N. have performed the analysis and wrote the manuscript. V.S. have
collected the survey data, coordinated the researched, and reviewed the manuscript. All authors
have read and agreed to the published version of the manuscript.
Funding: This research was funded by Conselho Nacional de Desenvolvimento Científico e Tecno-
lógico (CNPq), grant number: 221077/2014-6—LASPAU—Brasil/CNPq—GDE—EUA; and by the
US Forest Service’s National Urban and Community Forestry Challenge Grant (17-DG-11132544-
014) and the Robert Wood Johnson Climate and Health project.
Conflicts of Interest: The authors declare no conflict of interest. The founding sponsors had no role
in the design of the study; in the collection, analyses, or interpretation of data; in the writing of the
manuscript, and in the decision to publish the results.
Appendix A
Survey:
Tree Ownership Satisfaction Index (TOSI):
Q1 Portland’s trees are important to me. Strongly Agree/Agree/Don’t Know/Disagree
/Strongly Disagree.
Q2 My neighborhood has enough trees: Strongly Agree/Agree/Don’t Know/Disa-
gree/Strongly Disagree.
Q3 The trees in my neighborhood are in good condition and healthy. Strongly
Agree/Agree/Don’t Know/Disagree/Strongly Disagree.
Tree maintenance Satisfaction Index (TMSI).
Q4 The city should maintain all trees along the street (in the public right-of-way, next
to the sidewalk area): Strongly Agree/Agree/Don’t Know/Disagree/Strongly Disagree.
Q5 The city should prioritize maintenance of trees along the street (in the public right-
of-way, next to the sidewalk area) in low-income communities: Strongly
Agree/Agree/Don’t Know/Disagree/Strongly Disagree.
Q6 The city should plant trees in all available spaces along the street (in the public
right-of-way, next to the sidewalk area): Strongly Agree/Agree/Don’t Know/Disa-
gree/Strongly Disagree.
Strategies for increase tree canopy:
Q7 How do you think the city should get more trees planted?
Presence of trees in private properties:
Q8 Do you have trees at the property where you live? Yes/No.
Demographic Questions:
Q9 What is your household income? Less than $10,000/$10,000–$19,999/$20,000–
$29,999/$30,000–$39,999/$40,000–$49,999/$50,000–$59,999/$60,000–$69,999/$70,000–
$79,999/$80,000–$89,999/$90,000–$99,999/$100,000–$149,999/$150,000–$199,999/$200,000
or more/I don’t know.
Q10 Which best describes your race or ethnicity? Choose as many as apply:
❑ Alaska Native ❑ American Indian/Native American ❑ East Asian ❑ South Asian
❑ Southeast Asian ❑ West Asian ❑ Middle Eastern ❑ Black or African American ❑ Af-
rican ❑ Hispanic or Latino ❑ Native Hawaiian or Pacific Islander ❑ Slavic or Eastern
European ❑ White ❑ Other (please specify).
Q11 What is your home zip code?
Slavic or Eastern European
Land 2021, 10, x FOR PEER REVIEW 18 of 24
Examples of such cross-sectoral urban forestry management are emerging. In To-
ronto, CBOs had a more diverse species list than municipal agencies, landscape architects
and nurseries [52]. In Detroit, interviews with CBO staff and recipients of giveaway trees
informed that the ability to choose the tree species is a fact that impacts the willingness of
residents to care for private trees, as well as live in areas with lower canopy. In both cases,
studies have found that the major challenges are concerns with maintenance practices and
costs, such as pruning, sidewalk damages and tree debris removal [53]. Both studies sug-
gested stewardships for a functioning and healthy urban forestry, where CBOs would
have the goal to promote understanding, while supporting cultural ecosystem services.
Author Contributions: L.A.C.N. have performed the analysis and wrote the manuscript. V.S. have
collected the survey data, coordinated the researched, and reviewed the manuscript. All authors
have read and agreed to the published version of the manuscript.
Funding: This research was funded by Conselho Nacional de Desenvolvimento Científico e Tecno-
lógico (CNPq), grant number: 221077/2014-6—LASPAU—Brasil/CNPq—GDE—EUA; and by the
US Forest Service’s National Urban and Community Forestry Challenge Grant (17-DG-11132544-
014) and the Robert Wood Johnson Climate and Health project.
Conflicts of Interest: The authors declare no conflict of interest. The founding sponsors had no role
in the design of the study; in the collection, analyses, or interpretation of data; in the writing of the
manuscript, and in the decision to publish the results.
Appendix A
Survey:
Tree Ownership Satisfaction Index (TOSI):
Q1 Portland’s trees are important to me. Strongly Agree/Agree/Don’t Know/Disagree
/Strongly Disagree.
Q2 My neighborhood has enough trees: Strongly Agree/Agree/Don’t Know/Disa-
gree/Strongly Disagree.
Q3 The trees in my neighborhood are in good condition and healthy. Strongly
Agree/Agree/Don’t Know/Disagree/Strongly Disagree.
Tree maintenance Satisfaction Index (TMSI).
Q4 The city should maintain all trees along the street (in the public right-of-way, next
to the sidewalk area): Strongly Agree/Agree/Don’t Know/Disagree/Strongly Disagree.
Q5 The city should prioritize maintenance of trees along the street (in the public right-
of-way, next to the sidewalk area) in low-income communities: Strongly
Agree/Agree/Don’t Know/Disagree/Strongly Disagree.
Q6 The city should plant trees in all available spaces along the street (in the public
right-of-way, next to the sidewalk area): Strongly Agree/Agree/Don’t Know/Disa-
gree/Strongly Disagree.
Strategies for increase tree canopy:
Q7 How do you think the city should get more trees planted?
Presence of trees in private properties:
Q8 Do you have trees at the property where you live? Yes/No.
Demographic Questions:
Q9 What is your household income? Less than $10,000/$10,000–$19,999/$20,000–
$29,999/$30,000–$39,999/$40,000–$49,999/$50,000–$59,999/$60,000–$69,999/$70,000–
$79,999/$80,000–$89,999/$90,000–$99,999/$100,000–$149,999/$150,000–$199,999/$200,000
or more/I don’t know.
Q10 Which best describes your race or ethnicity? Choose as many as apply:
❑ Alaska Native ❑ American Indian/Native American ❑ East Asian ❑ South Asian
❑ Southeast Asian ❑ West Asian ❑ Middle Eastern ❑ Black or African American ❑ Af-
rican ❑ Hispanic or Latino ❑ Native Hawaiian or Pacific Islander ❑ Slavic or Eastern
European ❑ White ❑ Other (please specify).
Q11 What is your home zip code?
White
Land 2021, 10, x FOR PEER REVIEW 18 of 24
Examples of such cross-sectoral urban forestry management are emerging. In To-
ronto, CBOs had a more diverse species list than municipal agencies, landscape architects
and nurseries [52]. In Detroit, interviews with CBO staff and recipients of giveaway trees
informed that the ability to choose the tree species is a fact that impacts the willingness of
residents to care for private trees, as well as live in areas with lower canopy. In both cases,
studies have found that the major challenges are concerns with maintenance practices and
costs, such as pruning, sidewalk damages and tree debris removal [53]. Both studies sug-
gested stewardships for a functioning and healthy urban forestry, where CBOs would
have the goal to promote understanding, while supporting cultural ecosystem services.
Author Contributions: L.A.C.N. have performed the analysis and wrote the manuscript. V.S. have
collected the survey data, coordinated the researched, and reviewed the manuscript. All authors
have read and agreed to the published version of the manuscript.
Funding: This research was funded by Conselho Nacional de Desenvolvimento Científico e Tecno-
lógico (CNPq), grant number: 221077/2014-6—LASPAU—Brasil/CNPq—GDE—EUA; and by the
US Forest Service’s National Urban and Community Forestry Challenge Grant (17-DG-11132544-
014) and the Robert Wood Johnson Climate and Health project.
Conflicts of Interest: The authors declare no conflict of interest. The founding sponsors had no role
in the design of the study; in the collection, analyses, or interpretation of data; in the writing of the
manuscript, and in the decision to publish the results.
Appendix A
Survey:
Tree Ownership Satisfaction Index (TOSI):
Q1 Portland’s trees are important to me. Strongly Agree/Agree/Don’t Know/Disagree
/Strongly Disagree.
Q2 My neighborhood has enough trees: Strongly Agree/Agree/Don’t Know/Disa-
gree/Strongly Disagree.
Q3 The trees in my neighborhood are in good condition and healthy. Strongly
Agree/Agree/Don’t Know/Disagree/Strongly Disagree.
Tree maintenance Satisfaction Index (TMSI).
Q4 The city should maintain all trees along the street (in the public right-of-way, next
to the sidewalk area): Strongly Agree/Agree/Don’t Know/Disagree/Strongly Disagree.
Q5 The city should prioritize maintenance of trees along the street (in the public right-
of-way, next to the sidewalk area) in low-income communities: Strongly
Agree/Agree/Don’t Know/Disagree/Strongly Disagree.
Q6 The city should plant trees in all available spaces along the street (in the public
right-of-way, next to the sidewalk area): Strongly Agree/Agree/Don’t Know/Disa-
gree/Strongly Disagree.
Strategies for increase tree canopy:
Q7 How do you think the city should get more trees planted?
Presence of trees in private properties:
Q8 Do you have trees at the property where you live? Yes/No.
Demographic Questions:
Q9 What is your household income? Less than $10,000/$10,000–$19,999/$20,000–
$29,999/$30,000–$39,999/$40,000–$49,999/$50,000–$59,999/$60,000–$69,999/$70,000–
$79,999/$80,000–$89,999/$90,000–$99,999/$100,000–$149,999/$150,000–$199,999/$200,000
or more/I don’t know.
Q10 Which best describes your race or ethnicity? Choose as many as apply:
❑ Alaska Native ❑ American Indian/Native American ❑ East Asian ❑ South Asian
❑ Southeast Asian ❑ West Asian ❑ Middle Eastern ❑ Black or African American ❑ Af-
rican ❑ Hispanic or Latino ❑ Native Hawaiian or Pacific Islander ❑ Slavic or Eastern
European ❑ White ❑ Other (please specify).
Q11 What is your home zip code?
Other (please specify).Q11 What is your home zip code?Q12 Do you rent or own the place where you live? Rent/Own.
86
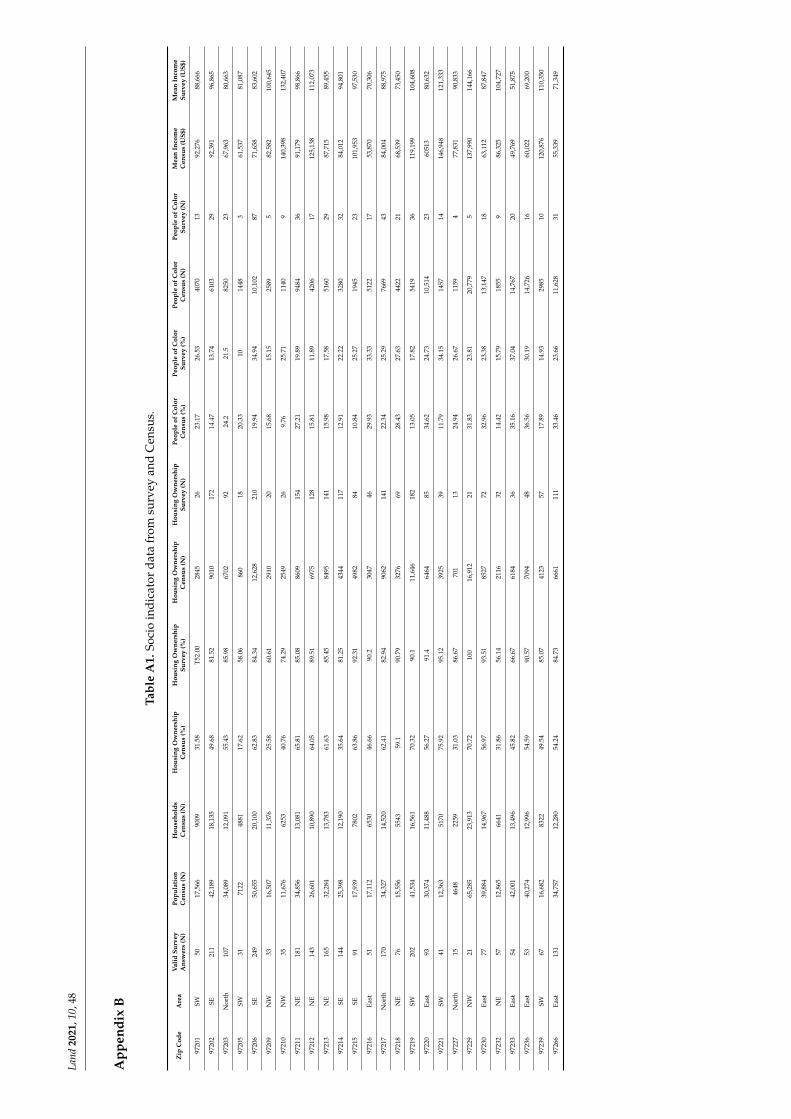
Land
2021
,10,
48
App
endi
xB
Tabl
eA
1.So
cio
indi
cato
rda
tafr
omsu
rvey
and
Cen
sus.
Zip
Cod
eA
rea
Val
idSu
rvey
Ans
wer
s(N
)Po
pula
tion
Cen
sus
(N)
Hou
seho
lds
Cen
sus
(N)
Hou
sing
Ow
ners
hip
Cen
sus
(%)
Hou
sing
Ow
ners
hip
Surv
ey(%
)H
ousi
ngO
wne
rshi
pC
ensu
s(N
)H
ousi
ngO
wne
rshi
pSu
rvey
(N)
Peop
leof
Col
orC
ensu
s(%
)Pe
ople
ofC
olor
Surv
ey(%
)Pe
ople
ofC
olor
Cen
sus
(N)
Peop
leof
Col
orSu
rvey
(N)
Mea
nIn
com
eC
ensu
s(U
S$)
Mea
nIn
com
eSu
rvey
(US$
)
9720
1SW
5017
,566
9009
31.5
8T5
2.00
2845
2623
.17
26.5
340
7013
92,2
7688
,666
9720
2SE
211
42,1
8918
,135
49.6
881
.52
9010
172
14.4
713
.74
6103
2992
,391
96,8
65
9720
3N
orth
107
34,0
8912
,091
55.4
385
.98
6702
9224
.221
.582
5023
67,9
6380
,663
9720
5SW
3171
2248
8117
.62
58.0
686
018
20.3
310
1448
361
,537
81,0
87
9720
6SE
249
50,6
5520
,100
62.8
384
.34
12,6
2821
019
.94
34.9
410
,102
8771
,658
83,6
02
9720
9N
W33
16,5
0711
,376
25.5
860
.61
2910
2015
.68
15.1
525
895
82,5
8210
0,64
5
9721
0N
W35
11,6
7662
5340
.76
74.2
925
4926
9.76
25.7
111
409
140,
398
132,
407
9721
1N
E18
134
,856
13,0
8165
.81
85.0
886
0915
427
.21
19.8
994
8436
91,1
7998
,866
9721
2N
E14
326
,601
10,8
9064
.05
89.5
169
7512
815
.81
11.8
942
0617
125,
138
112,
073
9721
3N
E16
532
,284
13,7
8361
.63
85.4
584
9514
115
.98
17.5
851
6029
87,7
1589
,455
9721
4SE
144
25,3
9812
,190
35.6
481
.25
4344
117
12.9
122
.22
3280
3284
,012
94,8
01
9721
5SE
9117
,939
7802
63.8
692
.31
4982
8410
.84
25.2
719
4523
101,
953
97,5
30
9721
6Ea
st51
17,1
1265
3046
.66
90.2
3047
4629
.93
33.3
351
2217
53,8
7070
,306
9721
7N
orth
170
34,3
2714
,520
62.4
182
.94
9062
141
22.3
425
.29
7669
4384
,004
88,9
75
9721
8N
E76
15,5
5655
4359
.190
.79
3276
6928
.43
27.6
344
2221
68,5
3973
,450
9721
9SW
202
41,5
3416
,561
70.3
290
.111
,646
182
13.0
517
.82
5419
3611
9,19
910
4,60
8
9722
0Ea
st93
30,3
7411
,488
56.2
791
.464
6485
34.6
224
.73
10,5
1423
6051
380
,632
9722
1SW
4112
,363
5170
75.9
295
.12
3925
3911
.79
34.1
514
5714
146,
948
121,
333
9722
7N
orth
1546
4822
5931
.03
86.6
770
113
24.9
426
.67
1159
477
,831
90,8
33
9722
9N
W21
65,2
8523
,913
70.7
210
016
,912
2131
.83
23.8
120
,779
513
7,99
014
4,16
6
9723
0Ea
st77
39,8
8414
,967
56.9
793
.51
8527
7232
.96
23.3
813
,147
1863
,112
87,8
47
9723
2N
E57
12,8
6566
4131
.86
56.1
421
1632
14.4
215
.79
1855
986
,325
104,
727
9723
3Ea
st54
42,0
0113
,496
45.8
266
.67
6184
3635
.16
37.0
414
,767
2049
,769
51,8
75
9723
6Ea
st53
40,2
7412
,996
54.5
990
.57
7094
4836
.56
30.1
914
,726
1660
,022
69,2
00
9723
9SW
6716
,682
8322
49.5
485
.07
4123
5717
.89
14.9
329
8510
120,
876
110,
350
9726
6Ea
st13
134
,757
12,2
8054
.24
84.7
366
6111
133
.46
23.6
611
,628
3155
,339
71,3
49
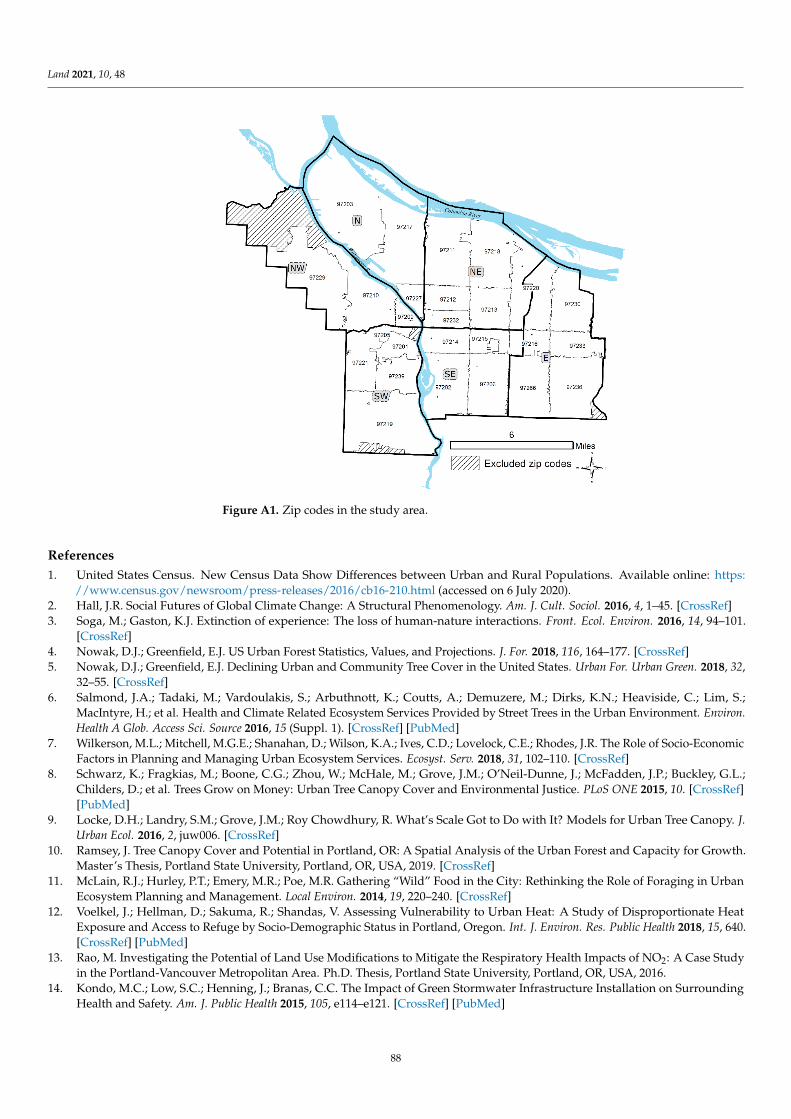
Land 2021, 10, 48
Land 2021, 10, x FOR PEER REVIEW 22 of 24
Figure A1. Zip codes in the study area.
References:
1. United States Census. New Census Data Show Differences Between Urban and Rural Populations. Available online:
https://www.census.gov/newsroom/press-releases/2016/cb16-210.html (accessed on 6 July 2020).
2. Hall, J.R. Social Futures of Global Climate Change: A Structural Phenomenology. Am. J. Cult. Sociol. 2016, 4, 1–45,
doi:10.1057/ajcs.2015.12.
3. Soga, M.; Gaston, K.J. Extinction of experience: The loss of human-nature interactions. Front. Ecol. Environ. 2016, 14, 94–101,
doi:10.1002/fee.1225.
4. Nowak, D.J.; Greenfield, E.J. US Urban Forest Statistics, Values, and Projections. J. For. 2018, 116, 164–177, doi:10.1093/jo-
fore/fvx004.
5. Nowak, D.J.; Greenfield, E.J. Declining Urban and Community Tree Cover in the United States. Urban For. Urban Green. 2018,
32, 32–55, doi:10.1016/j.ufug.2018.03.006.
6. Salmond, J.A.; Tadaki, M.; Vardoulakis, S.; Arbuthnott, K.; Coutts, A.; Demuzere, M.; Dirks, K.N.; Heaviside, C.; Lim, S.; Mac-
Intyre, H.; et al. Health and Climate Related Ecosystem Services Provided by Street Trees in the Urban Environment. Environ.
Heal. A Glob. Access Sci. Source 2016, 15 (Suppl. 1), doi:10.1186/s12940-016-0103-6.
7. Wilkerson, M.L.; Mitchell, M.G.E.; Shanahan, D.; Wilson, K.A.; Ives, C.D.; Lovelock, C.E.; Rhodes, J.R. The Role of Socio-Eco-
nomic Factors in Planning and Managing Urban Ecosystem Services. Ecosyst. Serv. 2018, 31, 102–110,
doi:10.1016/J.ECOSER.2018.02.017.
8. Schwarz, K.; Fragkias, M.; Boone, C.G.; Zhou, W.; McHale, M.; Grove, J.M.; O’Neil-Dunne, J.; McFadden, J.P.; Buckley, G.L.;
Childers, D.; et al. Trees Grow on Money: Urban Tree Canopy Cover and Environmental Justice. PLoS ONE 2015, 10,
doi:10.1371/journal.pone.0122051.
9. Locke, D.H.; Landry, S.M.; Grove, J.M.; Roy Chowdhury, R. What’s Scale Got to Do with It? Models for Urban Tree Canopy. J.
Urban Ecol. 2016, 2, juw006, doi:10.1093/jue/juw006.
10. Ramsey, J. Tree Canopy Cover and Potential in Portland, OR: A Spatial Analysis of the Urban Forest and Capacity for Growth.
Master’s Thesis, Portland State University, Portland, OR, USA, 2019, doi:10.15760/etd.6988.
11. McLain, R.J.; Hurley, P.T.; Emery, M.R.; Poe, M.R. Gathering “Wild” Food in the City: Rethinking the Role of Foraging in Urban
Ecosystem Planning and Management. Local Environ. 2014, 19, 220–240, doi:10.1080/13549839.2013.841659.
12. Voelkel, J.; Hellman, D.; Sakuma, R.; Shandas, V. Assessing Vulnerability to Urban Heat: A Study of Disproportionate Heat
Exposure and Access to Refuge by Socio-Demographic Status in Portland, Oregon. Int. J. Environ. Res. Public Health 2018, 15,
doi:10.3390/ijerph15040640.
Figure A1. Zip codes in the study area.
References1. United States Census. New Census Data Show Differences between Urban and Rural Populations. Available online: https:
//www.census.gov/newsroom/press-releases/2016/cb16-210.html (accessed on 6 July 2020).2. Hall, J.R. Social Futures of Global Climate Change: A Structural Phenomenology. Am. J. Cult. Sociol. 2016, 4, 1–45. [CrossRef]3. Soga, M.; Gaston, K.J. Extinction of experience: The loss of human-nature interactions. Front. Ecol. Environ. 2016, 14, 94–101.
[CrossRef]4. Nowak, D.J.; Greenfield, E.J. US Urban Forest Statistics, Values, and Projections. J. For. 2018, 116, 164–177. [CrossRef]5. Nowak, D.J.; Greenfield, E.J. Declining Urban and Community Tree Cover in the United States. Urban For. Urban Green. 2018, 32,
32–55. [CrossRef]6. Salmond, J.A.; Tadaki, M.; Vardoulakis, S.; Arbuthnott, K.; Coutts, A.; Demuzere, M.; Dirks, K.N.; Heaviside, C.; Lim, S.;
MacIntyre, H.; et al. Health and Climate Related Ecosystem Services Provided by Street Trees in the Urban Environment. Environ.Health A Glob. Access Sci. Source 2016, 15 (Suppl. 1). [CrossRef] [PubMed]
7. Wilkerson, M.L.; Mitchell, M.G.E.; Shanahan, D.; Wilson, K.A.; Ives, C.D.; Lovelock, C.E.; Rhodes, J.R. The Role of Socio-EconomicFactors in Planning and Managing Urban Ecosystem Services. Ecosyst. Serv. 2018, 31, 102–110. [CrossRef]
8. Schwarz, K.; Fragkias, M.; Boone, C.G.; Zhou, W.; McHale, M.; Grove, J.M.; O’Neil-Dunne, J.; McFadden, J.P.; Buckley, G.L.;Childers, D.; et al. Trees Grow on Money: Urban Tree Canopy Cover and Environmental Justice. PLoS ONE 2015, 10. [CrossRef][PubMed]
9. Locke, D.H.; Landry, S.M.; Grove, J.M.; Roy Chowdhury, R. What’s Scale Got to Do with It? Models for Urban Tree Canopy. J.Urban Ecol. 2016, 2, juw006. [CrossRef]
10. Ramsey, J. Tree Canopy Cover and Potential in Portland, OR: A Spatial Analysis of the Urban Forest and Capacity for Growth.Master’s Thesis, Portland State University, Portland, OR, USA, 2019. [CrossRef]
11. McLain, R.J.; Hurley, P.T.; Emery, M.R.; Poe, M.R. Gathering “Wild” Food in the City: Rethinking the Role of Foraging in UrbanEcosystem Planning and Management. Local Environ. 2014, 19, 220–240. [CrossRef]
12. Voelkel, J.; Hellman, D.; Sakuma, R.; Shandas, V. Assessing Vulnerability to Urban Heat: A Study of Disproportionate HeatExposure and Access to Refuge by Socio-Demographic Status in Portland, Oregon. Int. J. Environ. Res. Public Health 2018, 15, 640.[CrossRef] [PubMed]
13. Rao, M. Investigating the Potential of Land Use Modifications to Mitigate the Respiratory Health Impacts of NO2: A Case Studyin the Portland-Vancouver Metropolitan Area. Ph.D. Thesis, Portland State University, Portland, OR, USA, 2016.
14. Kondo, M.C.; Low, S.C.; Henning, J.; Branas, C.C. The Impact of Green Stormwater Infrastructure Installation on SurroundingHealth and Safety. Am. J. Public Health 2015, 105, e114–e121. [CrossRef] [PubMed]
88
Land 2021, 10, 48
15. Gaston, K.J.; Soga, M.; Duffy, J.P.; Garrett, J.K.; Gaston, S.; Cox, D.T.C. Personalised Ecology. Trends Ecol. Evol. 2018, 33, 916–925.[CrossRef] [PubMed]
16. Millennium Ecosystem Assessment. Ecosystems and Human Well-Being: Synthesis (Millennium Ecosystem Assessment Series); IslandPress: Washington, DC, USA, 2005.
17. Kuthy, D. Redlining and Greenlining: Olivia Robinson Investigates Root Causes of Racial Inequity. Art Educ. 2017, 70, 50–57.[CrossRef]
18. Mortimer-Sandilands, C.; Erickson, B. Queer Ecologies: Sex, Nature, Politics, Desire (Book Collections on Project MUSE); IndianaUniversity Press: Bloomington, IN, USA, 2010.
19. McPhearson, T.; Andersson, E.; Elmqvist, T.; Frantzeskaki, N. Resilience of and through Urban Ecosystem Services. Ecosyst. Serv.2015, 12, 152–156. [CrossRef]
20. Ortiz, M.S.O.; Geneletti, D. Assessing Mismatches in the Provision of Urban Ecosystem Services to Support Spatial Planning: ACase Study on Recreation and Food Supply in Havana, Cuba. Sustainability 2018, 10, 2165. [CrossRef]
21. Hern, M. What a City is for: Remaking the Politics of Displacement; MIT Press: Cambridge, CA, USA, 2016.22. Griffin-Valade, L.; Kahn, F.; Scott, J. East Portland: History of City Services Examined. Available online: https://www.
portlandoregon.gov/auditservices/article/488003 (accessed on 6 July 2020).23. Hawkins, W. The Legacy of Olmsted Brothers in Portland, Oregon; Priv Printed: Portland, OR, USA, 2014.24. Robertson, G.; Mason, A. Assessing the sustainability of agricultural and urban forests in the United States. 2016. Available
online: https://www.fs.usda.gov/treesearch/pubs/52278 (accessed on 6 July 2020).25. Gibson, K.; Abbott, C. Portland, Oregon. Cities 2002, 19, 425–436. [CrossRef]26. Alberti, M. Advances in Urban Ecology: Integrating Humans and Ecological Processes in Urban; Springer: New York, NY, USA, 2008.27. Turner, M.; Gardner, R.H.; Golley, F.B. Oak Ridge National Laboratory. In Landscape Ecology in Theory and Practice: Pattern and
Process, 2nd ed.; Springer: New York, NY, USA, 2015.28. Wherry, S.; Wood, T.; Moritz, H.; Duffy, K. Assessment of Columbia and Willamette River Flood Stage on the Columbia
Corridor Levee System at Portland, Oregon, in a Future Climate. Scientific Investigations Report, 1, 2018. Available online:https://pubs.usgs.gov/sir/2018/5161/sir20185161.pdf (accessed on 6 July 2020).
29. United States Census Data. Available online: https://data.census.gov/cedsci/ (accessed on 6 July 2020).30. Ause, C.W. Black and Green: How Disinvestment, Displacement and Segregation Created the Conditions for Eco-Gentrification
in Portland’s Albina District, 1940–2015. Bachelor’s Thesis, Portland State University, Portland, OR, USA, 2016.31. Hughes, J. Historical Content of Racist Planning: A history of how planning segregated Portland. In City of Portland; 2019.
Available online: https://www.portland.gov/sites/default/files/2019-12/portlandracistplanninghistoryreport.pdf (accessed on6 July 2020).
32. Bates, L.K. Gentrification and Displacement Study: Implementing an Equitable Inclusive Development Strategy in the Context ofGentrification; Portland State University Urban Studies and Planning Faculty Publications and Presentations: Portland, OR,USA, 2013.
33. Goodling, E.; Green, J.; McClintock, N. Uneven Development of the Sustainable City: Shifting Capital in Portland, Oregon. UrbanGeogr. 2015, 36, 504–527. [CrossRef]
34. City of Portland. Portland Maps-Open Data. Available online: https://gis-pdx.opendata.arcgis.com/ (accessed on 6 July 2020).35. Oregon State University, State of Oregon. Oregon Spatial Data Library. Available online: https://spatialdata.oregonexplorer.info/
geoportal/ (accessed on 6 July 2020).36. United States Geological Survey. Multi-Resolution Land Characteristics Consortium. Available online: https://www.mrlc.gov/
data (accessed on 6 July 2020).37. Coulston, J.W.; Moisen, G.G.; Wilson, B.T.; Finco, M.V.; Cohen, W.B.; Brewer, C.K. Modeling percent tree canopy cover: A pilot
study. Photogr. Eng. Remote Sens. 2012, 78, 715–727. [CrossRef]38. Shandas, V.; Boden, K.; Voelkel, J. Citywide Tree Planting Report. 2017. Available online: https://www.portlandoregon.gov/
parks/article/705823 (accessed on 6 July 2020).39. Atique, U.; An, K.G. Stream Health Evaluation Using a Combined Approach of Multi-Metric Chemical Pollution and Biological
Integrity Models. Water (Switzerland) 2018, 10, 661. [CrossRef]40. Yirigui, Y.; Lee, S.W.; Pouyan Nejadhashemi, A. Multi-Scale Assessment of Relationships between Fragmentation of Riparian
Forests and Biological Conditions in Streams. Sustainability 2019, 11, 5060. [CrossRef]41. Arifwidodo, S.D.; Chandrasiri, O. The Relationship between Housing Tenure, Sense of Place and Environmental Management
Practices: A Case Study of Two Private Land Rental Communities in Bangkok, Thailand. Sustain. Cities Soc. 2013, 8, 16–23.[CrossRef]
42. Donovan, G.H.; Prestemon, J.P. The Effect of Trees on Crime in Portland, Oregon. Environ. Behav. 2012, 44, 3–30. [CrossRef]43. Speak, A.; Escobedo, F.J.; Russo, A.; Zerbe, S. An Ecosystem Service-Disservice Ratio: Using Composite Indicators to Assess the
Net Benefits of Urban Trees. Ecol. Indic. 2018, 95, 544–553. [CrossRef]44. Young, R.F. Mainstreaming Urban Ecosystem Services: A National Survey of Municipal Foresters. Urban Ecosyst. 2013, 16,
703–722. [CrossRef]45. Brownlow, A. An Archaeology of Fear and Environmental Change in Philadelphia. Geoforum 2006, 37, 227–245. [CrossRef]
89
Land 2021, 10, 48
46. Schell, C.J.; Dyson, K.; Fuentes, T.L.; Des Roches, S.; Harris, N.C.; Miller, D.S.; Woelfle-Erskine, C.A.; Lambert, M.R. The Ecologicaland Evolutionary Consequences of Systemic Racism in Urban Environments. Science 2020, 4497, eaay4497. [CrossRef]
47. Batala, E.; Tsitsoni, T. Street Tree Health Assessment System: A Tool for Study of Urban Greenery. Int. J. Sustain. Dev. Plan. 2009,4, 345–356. [CrossRef]
48. Benson, A.R.; Morgenroth, J.; Koeser, A.K. The Effects of Root Pruning on Growth and Physiology of Two Acer Species in NewZealand. Urban For. Urban Green. 2019, 38, 64–73. [CrossRef]
49. Kuliczkowska, E.; Parka, A. Management of Risk of Environmental Failure Caused by Tree and Shrub Root Intrusion into Sewers.Urban For. Urban Green. 2017, 21, 1–10. [CrossRef]
50. Ordóñez Barona, C. Adopting Public Values and Climate Change Adaptation Strategies in Urban Forest Management: A Reviewand Analysis of the Relevant Literature. J. Environ. Manag. 2015, 164, 215–221. [CrossRef]
51. Hoffman, J.S.; Shandas, V.; Pendleton, N. The Effects of Historical Housing Policies on Resident Exposure to Intra-Urban Heat: AStudy of 108 US Urban Areas. Climate 2020, 8, 12. [CrossRef]
52. Conway, T.M.; Vander Vecht, J. Growing a Diverse Urban Forest: Species Selection Decisions by Practitioners Planting andSupplying Trees. Landsc. Urban Plan. 2015, 138, 1–10. [CrossRef]
53. Carmichael, C.E.; McDonough, M.H. Community Stories: Explaining Resistance to Street Tree-Planting Programs in Detroit,Michigan, USA. Soc. Nat. Resour. 2019, 32, 588–605. [CrossRef]
90
land
Article
Land-Based Financing Elements in Infrastructure PolicyFormulation: A Case of India
Raghu Dharmapuri Tirumala * and Piyush Tiwari
�����������������
Citation: Tirumala, R.D.; Tiwari, P.
Land-Based Financing Elements in
Infrastructure Policy Formulation: A
Case of India. Land 2021, 10, 133.
https://doi.org/10.3390/land10020133
Academic Editor: Alessio Russo
Received: 31 December 2020
Accepted: 27 January 2021
Published: 29 January 2021
Publisher’s Note: MDPI stays neutral
with regard to jurisdictional claims in
published maps and institutional affil-
iations.
Copyright: © 2021 by the authors.
Licensee MDPI, Basel, Switzerland.
This article is an open access article
distributed under the terms and
conditions of the Creative Commons
Attribution (CC BY) license (https://
creativecommons.org/licenses/by/
4.0/).
Faculty of Architecture, Building and Planning, Melbourne School of Design, The University of Melbourne,Melbourne 3010, Australia; [email protected]* Correspondence: [email protected]
Abstract: A rapid increase in land and property values has been one of the driving forces of ur-ban ecosystem development in many countries. This phenomenon has presented project propo-nents/policymakers with multiple options and associated challenges, nudging them to configureor incorporate elements of land-based financing in their policies and legislations. Specifically, theGovernment of India and various state governments have sought to monetize land through diverseinstruments, for augmenting the financial viability of infrastructure and area development projects.This paper compares Indian central and state infrastructure policies/acts with regard to land mon-etization strategies. The analysis indicates that policies and legislations are taking a turn towardspromoting land monetization mechanisms as a financing tool for cities and project implementationagencies. However, the approach is cautiously used and implementation is often seen to fall behindactual project timelines. Based on the findings, key determinants of a successful policy that capturesan increase in land values, are identified. The learnings provide useful inputs for states to strengthentheir policy documents and legislative/institutional frameworks, for ensuring the effectiveness ofland-based financing tools.
Keywords: land-based financing; land monetisation; policy; infrastructure; Sustainable Develop-ment Goals
1. Introduction
The infrastructure and urban development landscape across the world witnesseda substantial transformation in the last two decades, attributable to economic growth,internationalization, and greater expectations of citizens [1]. The developing world hasstruggled with wide-ranging systemic constraints that include technical, institutional, andfinancial aspects in managing this burgeoning change. The growing fiscal stress of cities(“urban local bodies” (ULBs)) is forcing nations and subnational entities across the worldto explore newer sources of finance—broadening the tax base and introducing differentcharges for utilities [2]. Land-based financing is increasingly seen as a tool for developinginfrastructure and providing ecosystem services, across the world. The success of Singaporeand Hong Kong in using these tools has spurred the interests of various governments theworld over, to explore various tools and instruments that capture the increased value ofland, and to finance infrastructure or area-based developments. Driven by speculation,these approaches have led to increased land prices and created more inequality in thedeveloping world. In developed markets such as Hong Kong, London, Paris, and Tokyo, itis estimated that a person earning a national average income would need to work for morethan 60 years to buy a residential property. Similar assessment for India ranges between100 years for property across Indian metros, and nearly 580 years for a property at thehighest rate in Mumbai [3].
Land is an important backbone for infrastructure development, which led to numerousstatutory interventions by governments, to ensure its availability for economic purposes.Land is conventionally seen as one of the factors of production, and the emphasis is on
91
Land 2021, 10, 133
making this increasingly scarce resource available for economic growth. The traditionalland acquisition acts in many countries were all premised on procuring land, in someinstances under the ambit of eminent domain, to propel economic and ecosystem growth.Further, to prevent runaway misuse of increasing land and property values, some countriesput in place, urban land ceiling acts, to cap the rentals that could be charged [4].
The prominence attached to land is very explicit in the Sustainable Development Goalswhen compared to the Millennium Development Goals (MDGs). In the MDGs, land (andproperty) is viewed as a resource under Goal 7 (Ensuring Environmental Sustainability) forimproving the lives of slum dwellers. In contrast, the importance of land as a contributingparameter has been featured in many SDGs. In SDG 1 (“Removing Poverty in all itsforms everywhere”), land features as a factor in Target 1.4 that describes rights to economicresources for all (particularly the poor and vulnerable) including control over land and otherforms of property. Access to land in a secure and equal manner is considered an importantdeterminant for improving the productivity and incomes of small-scale food producersin Target 2.3 of SDG 2 (“End hunger, achieve food security and improved nutrition, andpromote sustainable agriculture”). Having rights to ownership and control of land is alsoseen as an important feature for achieving SDG 5 (“Achieve gender equality and empowerall women and girls”—Target 5a). Access to land is also an important factor for achievingSDG 11 (“Make cities inclusive, safe, resilient and sustainable”), which addresses accessto the infrastructure [5]. Land has always been considered as a fundamental factor thatinfluences poverty, hunger, and sustainability [6]. The development path of the urbanecosystem will be influenced in some sense, by how land develops [7].
This innate relationship between land and development, coupled with the poorresources of the governments to raise finances for providing urban infrastructure facilitiesto an increasing urban population, gave rise to the concept of land-based financing tools.Land-based financing is modeled on the premise that land as a resource adjacent to aninfrastructure facility/service has a substantial increase in value, a part of which could beused for financing development projects in that area. Many countries including India andglobal forums such as Global Land Tool Network, Royal Institution of Chartered Surveyorshave adopted tools for this value capture in the form of area linked development charges,impact fees, transfer of development rights, urban land value tax, surcharges on stampduty, etc. [8–10].
The idea of levying a tax on increased land value due to the efforts of the governmentor the community was first stated by Henry George in his seminal book “Progress andPoverty” [11]. Since then the concept of land-based financing or variants of land valuecapture has been propagated through the years [2,12]. The instruments span across atransfer of development rights, impact fees, land leases and sale proceeds, property, andland tax variants, betterment charges, etc. [13]. The very steep increase in land values,particularly in the developing world, has presented project proponents and policymakerswith a range of opportunities to fund projects using land as one of the resources. [14].
While the benefits from land value capture are evident, land-based financing doeshave its share of criticisms. Leveraging the increased value of land distorts the land rightsregime and equity across various sections of the society. In India, for instance, manyinformal and slum settlements are situated on government-owned lands. The dwellersin these settlements do not own a legal title to the land but have perceived rights toreside. Attempts to gain from monetizing such land parcels might negatively impact thesehuman settlements [15]. The equitable benefits of land-based financing across all sectionsof the society are not conclusive, as there have been instances of the system bypassing thepoor [13] where the expected revenues do not subsidize the needy.
One of the major criticisms of land-based financing models is the intrinsic nature tofront end the investment that is recouped over a period, during which time the affordabilityof the land to the general public is constrained. Thus, lawmakers and policy actors needto assess policies against an equity framework that addresses aspects relating to wherethe economic value is being created and recovered from, to who is going to benefit from
92
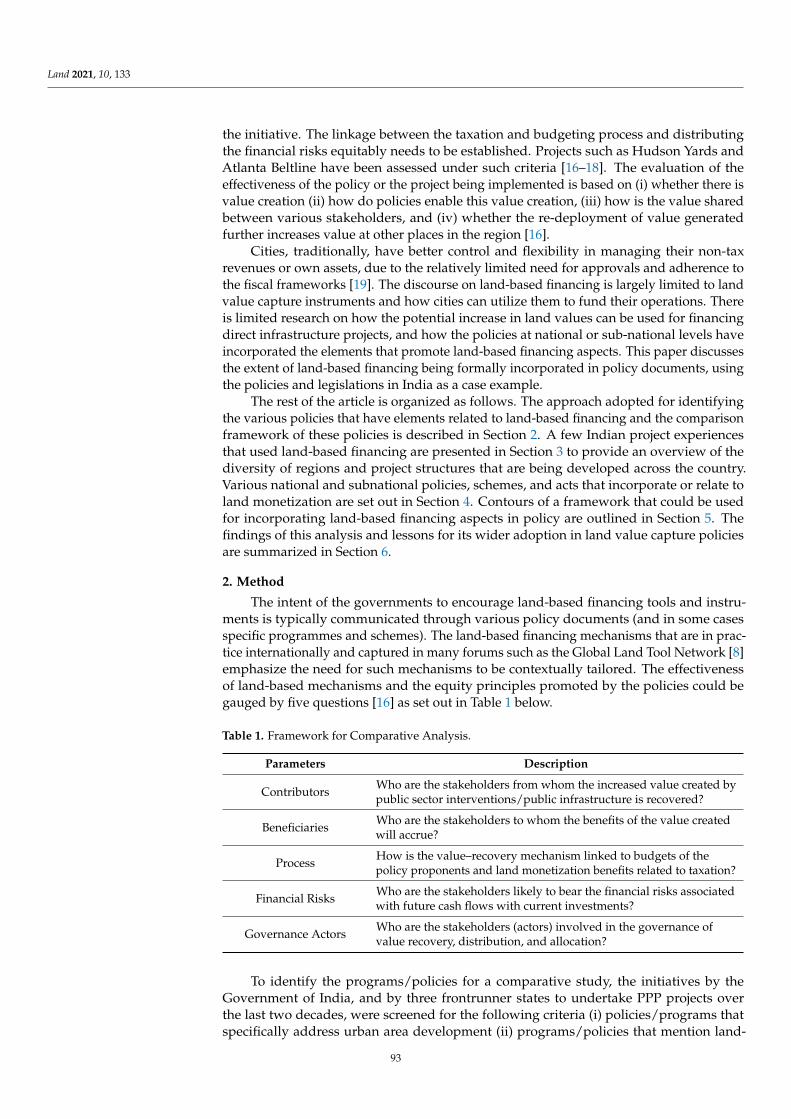
Land 2021, 10, 133
the initiative. The linkage between the taxation and budgeting process and distributingthe financial risks equitably needs to be established. Projects such as Hudson Yards andAtlanta Beltline have been assessed under such criteria [16–18]. The evaluation of theeffectiveness of the policy or the project being implemented is based on (i) whether there isvalue creation (ii) how do policies enable this value creation, (iii) how is the value sharedbetween various stakeholders, and (iv) whether the re-deployment of value generatedfurther increases value at other places in the region [16].
Cities, traditionally, have better control and flexibility in managing their non-taxrevenues or own assets, due to the relatively limited need for approvals and adherence tothe fiscal frameworks [19]. The discourse on land-based financing is largely limited to landvalue capture instruments and how cities can utilize them to fund their operations. Thereis limited research on how the potential increase in land values can be used for financingdirect infrastructure projects, and how the policies at national or sub-national levels haveincorporated the elements that promote land-based financing aspects. This paper discussesthe extent of land-based financing being formally incorporated in policy documents, usingthe policies and legislations in India as a case example.
The rest of the article is organized as follows. The approach adopted for identifyingthe various policies that have elements related to land-based financing and the comparisonframework of these policies is described in Section 2. A few Indian project experiencesthat used land-based financing are presented in Section 3 to provide an overview of thediversity of regions and project structures that are being developed across the country.Various national and subnational policies, schemes, and acts that incorporate or relate toland monetization are set out in Section 4. Contours of a framework that could be usedfor incorporating land-based financing aspects in policy are outlined in Section 5. Thefindings of this analysis and lessons for its wider adoption in land value capture policiesare summarized in Section 6.
2. Method
The intent of the governments to encourage land-based financing tools and instru-ments is typically communicated through various policy documents (and in some casesspecific programmes and schemes). The land-based financing mechanisms that are in prac-tice internationally and captured in many forums such as the Global Land Tool Network [8]emphasize the need for such mechanisms to be contextually tailored. The effectivenessof land-based mechanisms and the equity principles promoted by the policies could begauged by five questions [16] as set out in Table 1 below.
Table 1. Framework for Comparative Analysis.
Parameters Description
Contributors Who are the stakeholders from whom the increased value created bypublic sector interventions/public infrastructure is recovered?
Beneficiaries Who are the stakeholders to whom the benefits of the value createdwill accrue?
Process How is the value–recovery mechanism linked to budgets of thepolicy proponents and land monetization benefits related to taxation?
Financial Risks Who are the stakeholders likely to bear the financial risks associatedwith future cash flows with current investments?
Governance Actors Who are the stakeholders (actors) involved in the governance ofvalue recovery, distribution, and allocation?
To identify the programs/policies for a comparative study, the initiatives by theGovernment of India, and by three frontrunner states to undertake PPP projects overthe last two decades, were screened for the following criteria (i) policies/programs thatspecifically address urban area development (ii) programs/policies that mention land-
93
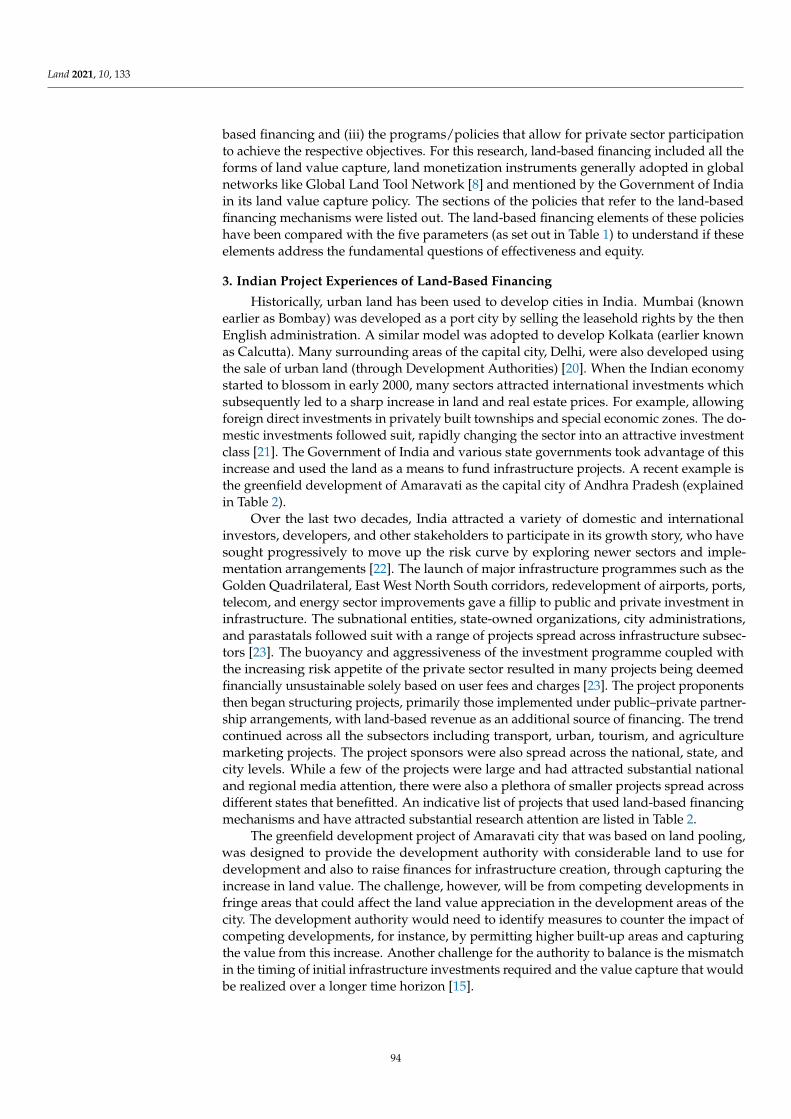
Land 2021, 10, 133
based financing and (iii) the programs/policies that allow for private sector participationto achieve the respective objectives. For this research, land-based financing included all theforms of land value capture, land monetization instruments generally adopted in globalnetworks like Global Land Tool Network [8] and mentioned by the Government of Indiain its land value capture policy. The sections of the policies that refer to the land-basedfinancing mechanisms were listed out. The land-based financing elements of these policieshave been compared with the five parameters (as set out in Table 1) to understand if theseelements address the fundamental questions of effectiveness and equity.
3. Indian Project Experiences of Land-Based Financing
Historically, urban land has been used to develop cities in India. Mumbai (knownearlier as Bombay) was developed as a port city by selling the leasehold rights by the thenEnglish administration. A similar model was adopted to develop Kolkata (earlier knownas Calcutta). Many surrounding areas of the capital city, Delhi, were also developed usingthe sale of urban land (through Development Authorities) [20]. When the Indian economystarted to blossom in early 2000, many sectors attracted international investments whichsubsequently led to a sharp increase in land and real estate prices. For example, allowingforeign direct investments in privately built townships and special economic zones. The do-mestic investments followed suit, rapidly changing the sector into an attractive investmentclass [21]. The Government of India and various state governments took advantage of thisincrease and used the land as a means to fund infrastructure projects. A recent example isthe greenfield development of Amaravati as the capital city of Andhra Pradesh (explainedin Table 2).
Over the last two decades, India attracted a variety of domestic and internationalinvestors, developers, and other stakeholders to participate in its growth story, who havesought progressively to move up the risk curve by exploring newer sectors and imple-mentation arrangements [22]. The launch of major infrastructure programmes such as theGolden Quadrilateral, East West North South corridors, redevelopment of airports, ports,telecom, and energy sector improvements gave a fillip to public and private investment ininfrastructure. The subnational entities, state-owned organizations, city administrations,and parastatals followed suit with a range of projects spread across infrastructure subsec-tors [23]. The buoyancy and aggressiveness of the investment programme coupled withthe increasing risk appetite of the private sector resulted in many projects being deemedfinancially unsustainable solely based on user fees and charges [23]. The project proponentsthen began structuring projects, primarily those implemented under public–private partner-ship arrangements, with land-based revenue as an additional source of financing. The trendcontinued across all the subsectors including transport, urban, tourism, and agriculturemarketing projects. The project sponsors were also spread across the national, state, andcity levels. While a few of the projects were large and had attracted substantial nationaland regional media attention, there were also a plethora of smaller projects spread acrossdifferent states that benefitted. An indicative list of projects that used land-based financingmechanisms and have attracted substantial research attention are listed in Table 2.
The greenfield development project of Amaravati city that was based on land pooling,was designed to provide the development authority with considerable land to use fordevelopment and also to raise finances for infrastructure creation, through capturing theincrease in land value. The challenge, however, will be from competing developments infringe areas that could affect the land value appreciation in the development areas of thecity. The development authority would need to identify measures to counter the impact ofcompeting developments, for instance, by permitting higher built-up areas and capturingthe value from this increase. Another challenge for the authority to balance is the mismatchin the timing of initial infrastructure investments required and the value capture that wouldbe realized over a longer time horizon [15].
94
Land 2021, 10, 133
Table 2. Illustrative projects that incorporated land-based financing elements.
Project Key Features
Amaravati City
Amaravati, city assumed importance in 2014 when it was designated as theadministrative capital of the newly carved state of Andhra Pradesh.Anticipating the challenges that would come from rapid urbanization,population increase, and the associated increase in the value of land in theurban area, the Government of Andhra Pradesh introduced the “LandPooling Scheme (LPS)” as an innovative land-use planning instrument tocapture the land value increases in a manner that is equitable and balancesdevelopment with urbanization. The unique feature of the LPS was toensure that landowners benefit directly from the increase in land valuewhen the capital city would be developed, by making them stakeholders inthe development process. The scheme encouraged landowners tocontribute their plot of land in return for a smaller plot of urban servicedland (returnable plot), expected to be higher in value and was alsopromised annuity payments (to support livelihoods) and skill upgradingprograms for setting up self-owned enterprises [15].
TheBangalore-Mysore
InfrastructureCorridor
The project was conceived in the 1980s as an expressway of about 111 kmconnecting the heritage city of Mysore to the capital city Bangalore. Theproject proposed by Nandi Infrastructure Corridor Enterprises Ltd. wasalso to include residential, industrial, and commercial facilities. Theobjective was to de-congest Bangalore city and attract people to shift to theupcoming townships along the corridor. The government of Karnatakaentered into a Framework Agreement with the developer in the year 1997agreeing to provide land for the project. However, several rounds oflitigation ensued, challenging the land acquisition process for the projectand refusal to grant permission by the Planning Authority for theconstruction of group housing [24].
Hyderabad MetroRail Project
The rail project comprising 66 stations in 72 km estimated at Rs. 14,132crores are being developed by L&T Hyderabad Metro Rail Private Limited,Hyderabad. Nearly, 40% of the revenues are estimated to come from realestate development and lease revenues therefrom [25].
Modernization ofDelhi International
Airport
Rajiv Gandhi International Airport was a greenfield airport built onapproximately 5000 acres of land. Nearly 45 acres were identified as phase1 development for commercial and hospitality facilities comprising about14 assets. Out of 5000 rooms, 3000 rooms were budget rooms and theremaining were categorized as luxurious rooms. The cost of constructionwas estimated to be Rs. 75 lakhs to Rs. 1 crore per room. The concessionagreement was signed on 4.4.2006 and construction completed on 31.3.2010.The other major components of the project included the renovation ofTerminals 1A, 1B, 1C, and Terminal 2 of the existing airport [26].
Dhamra Port,Odisha
Dhamra is a port close to the mineral-rich industrial states of Odisha,Jharkhand and Chattisgarh developed on a Build Own Operate ShareTransfer framework. The 25.0 MTPA project with a concession period of408 months was bid out on a revenue share basis. The concessionagreement was signed on 2.4.1998. Excess land allotted to the project wasmet with challenges [27].
Modern CentralBus Terminus cum
CommercialComplex, Haldia,
West Bengal
Eleven acres of land near HPL Township was identified for the project, outof which the private partner was to develop a modern Central BusTerminus on 7 acres of land and operate it for 20 years. The remaining4 acres of land was to be developed commercially by the PPP partner whowas also expected to operate and maintain the facilities for 50 years [28].
Construction ofcentral busterminal,
Makarpura,Vadodara
Constructed on 6.3 acres as a BOT project for a concession period of378 months. The concession agreement was signed in 2010 with Hubtown(Vadodara) Bus Terminal Ltd. at a project cost of Rs. 60.28 crores [28].
Source: Authors compilation based on a review of the literature.
95
Land 2021, 10, 133
The Bangalore Mysore Infrastructure Corridor, a road project that linked two majorcities Bangalore and Mysore in the southern state of Karnataka, had attracted significantpublic attention as a large quantum of land was promised to the project developer. Thebusiness case of the project hinged on making land available to the developer along thecorridor, for developing and maintaining townships for a defined period, which wouldoffset the costs for developing the road and associated infrastructure. While there wasopposition to the excessive land sought to be acquired for the project, the contours of thismodel served as a template for infrastructure projects in the country to use land-basedfinancing approaches. Therefore, whenever the business case of a project resulted insuboptimal revenues (from the user charges and associated cash flow streams), the projectsponsors, typically the public sector entities offered additional land or rights to use theland for shoring up the sources. For instance, in the case of Delhi International Airport(and other airports at Hyderabad, Bangalore, and Mumbai), the project sponsor offeredland surrounding the main airport for commercial development. The income arising fromsuch additional land development was expected to offset the capital and operations andmaintenance (O&M) expenditure being incurred on the project.
Similar models have also been adopted in port projects (Dhamra port) and metro trainprojects (Hyderabad metro). The viability of revenue streams was a risk that was sought tobe addressed using land and real estate as a sweetener in many instances. The approach,though, has not been a runaway success due to the limitations in monetizing the land value,especially after the global financial crisis and its aftermath [23]. Political controversies havealso stalled the progress of land acquisition and the implementation of projects in manycases as there were attempts to convert agricultural land to industrial and infrastructurepurposes [14]. However, the belief in such a model had nevertheless been seeded in manyproject sponsors.
4. Elements of Land Monetization in Key Legislation and Policies in India
There have been initiatives (though on a limited scale and fragmented) to reform theinstitutional, governance, and financial systems for encouraging private sector participationand coexisting with the social contexts surrounding land [14,29]. The policy and legislativeframework that enables land-based financing in India include Municipal Corporations Acts,Municipality Acts, Development Authority Acts, Town Planning Acts, Stamp Duty, andRegistration Acts, various schemes of the central and state government, national policies,and state policies. The powers to legislate different types of instruments varies by the typeof agency.
The proponents of infrastructure projects are mostly city administrations and thestate level parastatals, whose access to different sources of finances are limited by thepowers to influence the prevailing legislations. In most cases, they have very limited say inintroducing a new element or changing the base or the rate of a tax system, though theyhave better control over the administration of any tool once the same has been enacted.Moreover, the revisions to policies and legislations are not carried out regularly by centraland state governments, leading to a potential delay in accessing the upside in the land valueincreases. In the meantime, the expenditure for the infrastructure service provision keepsescalating. Another area of criticism is the lack of transparency that exists in the distributionof land and the direction of transfer (typically from public ownership to private control).Therefore, an effective institutional and governance framework is vital for conductingtransparent and equitable land-based financing transactions.
Various government constituted expert committees and interest groups have sug-gested mechanisms and instruments for utilizing unused land to finance infrastructurein India. One of the earlier initiatives was the report of the Committee on Roadmap forFiscal Consolidation that recommended the monetization of land resources for financingcivic infrastructure [30]. Instruments such as land pooling, monetization of underuti-lized/unutilized urban lands, land readjustment, land value capture were suggested aspart of land-based financing systems [31,32]. The levy of area-based development charges
96
Land 2021, 10, 133
was in vogue till 2010 in Mumbai, where the revenues were collected and retained by thecity municipal corporation. Ahmedabad city has been adopting the premium floor spaceindex tool on a stand-alone basis, and to supplement the transit-oriented developmentinitiatives in the city.
The design of recent government of India’s schemes and programmes reflect thisintent with sustainability as the centerpiece. Various urban development schemes werelaunched by the Government of India in mid-2000 to facilitate better infrastructure facilitiesand ecosystem services for citizens. The schemes were customized for different categoriesof towns and cities (based on population, characteristics, etc.). The prominent amongstthem being the Jawaharlal Nehru National Urban Renewal Mission (JnNURM) Scheme,Atal Mission for Rejuvenation and Urban Transformation (AMRUT), and the Smart CitiesMission. These schemes (and similar ones for different cities) aim to accelerate investmentsin city infrastructure while proposing to reform the governance, institutional, and financingsystems. These schemes seek to improve land registration and cadastral systems and makethe real estate available more freely for development projects through repealing land ceilingregulations.
Though direct methods of land monetization are not suggested in the JnNURMguidelines, it provided for legal and policy changes to be made by the States and simplifyrules related to the conversion of land from agriculture to non-agriculture purposes. Thisimplied that more land needs to be made available for the creation of assets meant forecosystem services. As a consequence of this mission, the State needed to earmark landalso for commercial use to serve the economically weaker sections (EWS) and low-incomegroups (LIG) allottees. This would include public markets, parks, schools, etc., that maygenerate continued revenues to the urban local bodies (ULB). As a result of the developmentof EWS and LIG housing projects, the land value in adjacent areas may increase due toadditional habitation. The Smart City Mission guidelines place the onus on State levelpublic agencies to create frameworks and policies for monetizing land and land-basedassets in a Smart City. Land is also recognized as a key resource for implementing theAMRUT scheme, even though the scheme stops short of suggesting that excess land can bemonetized for improving the sustainability of projects.
The primary legislation that enables the acquisition of land for infrastructure anddevelopment projects is the Land Acquisition Act, 2013 (which was promulgated replacingthe archaic act of 1894). The Act sets out compensations that are much more aligned tomarket values than its predecessor. Section 26(3)(c) of this Act envisages that a Companycan acquire land as equity and make landowners as its shareholders. It is possible, therefore,for a Government company to monetize land this way by acquiring it, developing necessarypublic infrastructure, and benefitting from the revenues that accrue.
The intention of various tiers of governments to provide direction for funding infras-tructure developments is set out in the respective infrastructure policies and acts. The threestates that are at the forefront are Gujarat, Andhra Pradesh, and Karnataka. While landmonetization is not specified in the Andhra Pradesh law, it may be construed that in theprocess of development of a project for carrying out the objects of the Act, the InfrastructureAuthority can suggest ways and means monetize land acquired for a project. Though thepowers to acquire land is not vested in the Infrastructure
Authority directly, however, in Schedule V of the law [under Section 2(rr)], it isenvisaged that the State Government will extend support to acquire land necessary for aproject. It also provides for asset-based support by the Government, whereby the projectproponent provides land at a subsidized lease for a predefined period (not exceeding33 years).
The Gujarat Infrastructure Development Act does not empower the project authorityto acquire land. However, in Chapter II—Infrastructure Projects (Section 6), the lawenvisages assistance by Government agencies for conferment of the right to develop anyland. It also provides for Government agencies to participate in the equity of a project(not exceeding 49% of total equity), extends senior or subordinated loans, and similar such
97
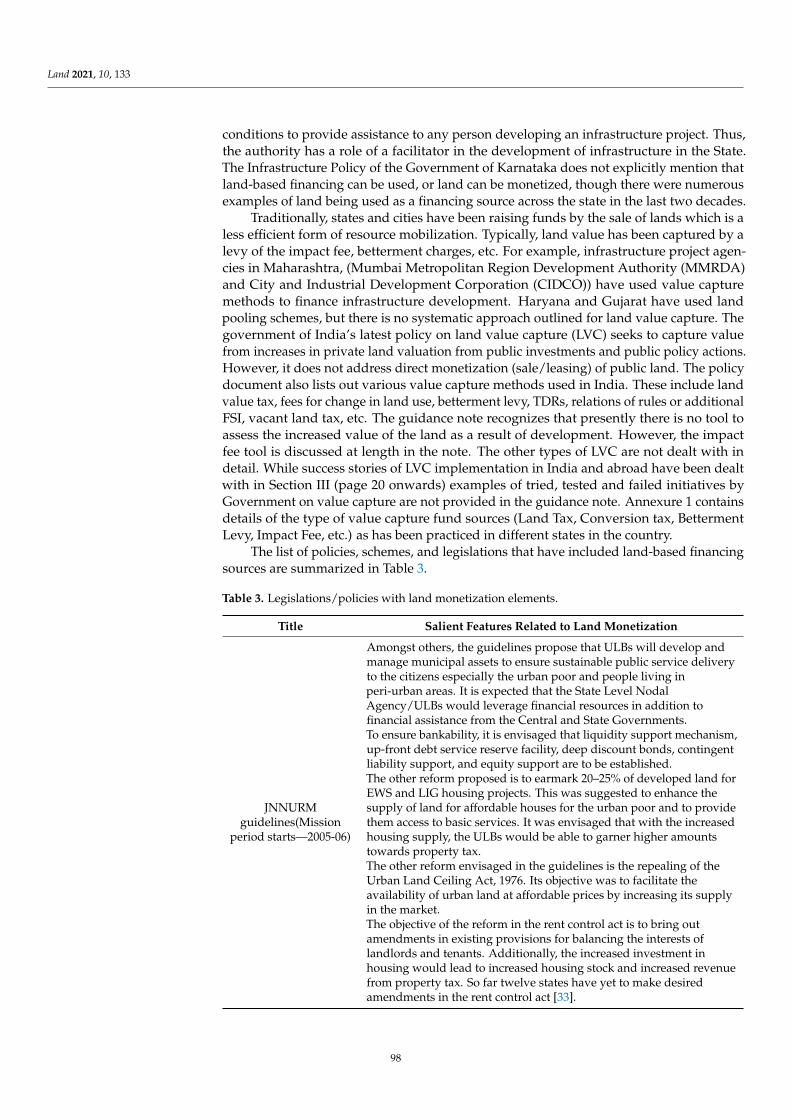
Land 2021, 10, 133
conditions to provide assistance to any person developing an infrastructure project. Thus,the authority has a role of a facilitator in the development of infrastructure in the State.The Infrastructure Policy of the Government of Karnataka does not explicitly mention thatland-based financing can be used, or land can be monetized, though there were numerousexamples of land being used as a financing source across the state in the last two decades.
Traditionally, states and cities have been raising funds by the sale of lands which is aless efficient form of resource mobilization. Typically, land value has been captured by alevy of the impact fee, betterment charges, etc. For example, infrastructure project agen-cies in Maharashtra, (Mumbai Metropolitan Region Development Authority (MMRDA)and City and Industrial Development Corporation (CIDCO)) have used value capturemethods to finance infrastructure development. Haryana and Gujarat have used landpooling schemes, but there is no systematic approach outlined for land value capture. Thegovernment of India’s latest policy on land value capture (LVC) seeks to capture valuefrom increases in private land valuation from public investments and public policy actions.However, it does not address direct monetization (sale/leasing) of public land. The policydocument also lists out various value capture methods used in India. These include landvalue tax, fees for change in land use, betterment levy, TDRs, relations of rules or additionalFSI, vacant land tax, etc. The guidance note recognizes that presently there is no tool toassess the increased value of the land as a result of development. However, the impactfee tool is discussed at length in the note. The other types of LVC are not dealt with indetail. While success stories of LVC implementation in India and abroad have been dealtwith in Section III (page 20 onwards) examples of tried, tested and failed initiatives byGovernment on value capture are not provided in the guidance note. Annexure 1 containsdetails of the type of value capture fund sources (Land Tax, Conversion tax, BettermentLevy, Impact Fee, etc.) as has been practiced in different states in the country.
The list of policies, schemes, and legislations that have included land-based financingsources are summarized in Table 3.
Table 3. Legislations/policies with land monetization elements.
Title Salient Features Related to Land Monetization
JNNURMguidelines(Mission
period starts—2005-06)
Amongst others, the guidelines propose that ULBs will develop andmanage municipal assets to ensure sustainable public service deliveryto the citizens especially the urban poor and people living inperi-urban areas. It is expected that the State Level NodalAgency/ULBs would leverage financial resources in addition tofinancial assistance from the Central and State Governments.To ensure bankability, it is envisaged that liquidity support mechanism,up-front debt service reserve facility, deep discount bonds, contingentliability support, and equity support are to be established.The other reform proposed is to earmark 20–25% of developed land forEWS and LIG housing projects. This was suggested to enhance thesupply of land for affordable houses for the urban poor and to providethem access to basic services. It was envisaged that with the increasedhousing supply, the ULBs would be able to garner higher amountstowards property tax.The other reform envisaged in the guidelines is the repealing of theUrban Land Ceiling Act, 1976. Its objective was to facilitate theavailability of urban land at affordable prices by increasing its supplyin the market.The objective of the reform in the rent control act is to bring outamendments in existing provisions for balancing the interests oflandlords and tenants. Additionally, the increased investment inhousing would lead to increased housing stock and increased revenuefrom property tax. So far twelve states have yet to make desiredamendments in the rent control act [33].
98
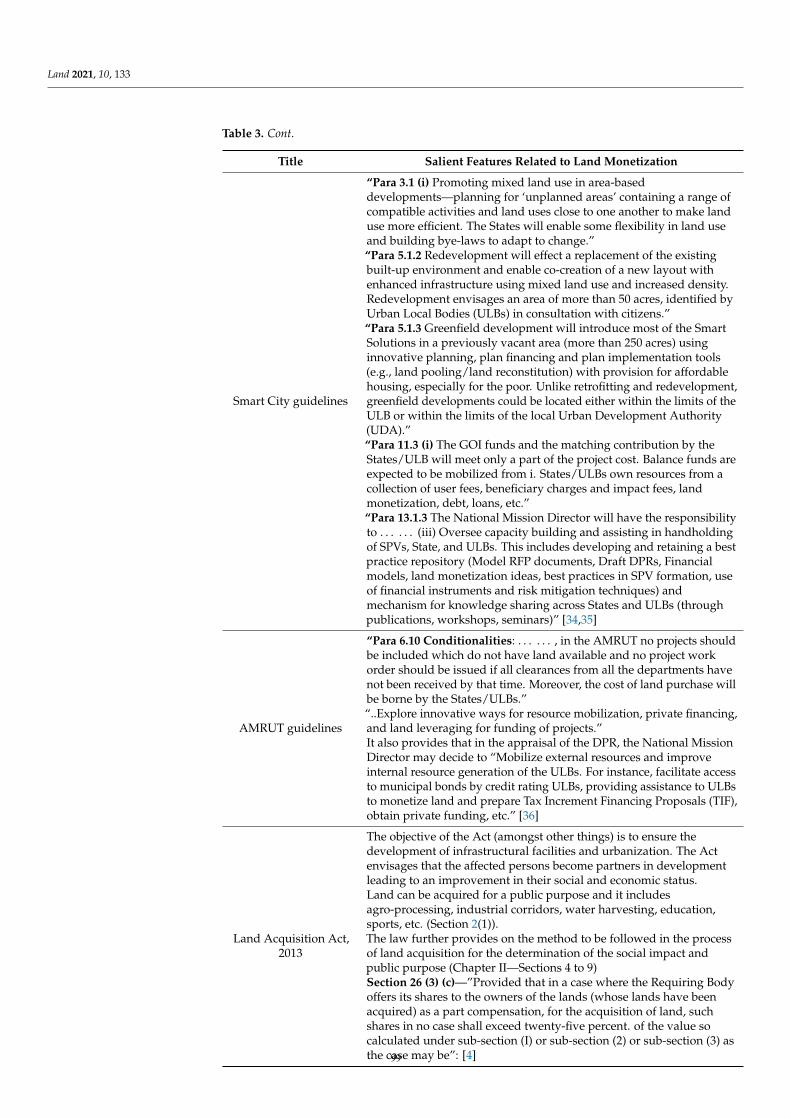
Land 2021, 10, 133
Table 3. Cont.
Title Salient Features Related to Land Monetization
Smart City guidelines
“Para 3.1 (i) Promoting mixed land use in area-baseddevelopments—planning for ‘unplanned areas’ containing a range ofcompatible activities and land uses close to one another to make landuse more efficient. The States will enable some flexibility in land useand building bye-laws to adapt to change.”“Para 5.1.2 Redevelopment will effect a replacement of the existingbuilt-up environment and enable co-creation of a new layout withenhanced infrastructure using mixed land use and increased density.Redevelopment envisages an area of more than 50 acres, identified byUrban Local Bodies (ULBs) in consultation with citizens.”“Para 5.1.3 Greenfield development will introduce most of the SmartSolutions in a previously vacant area (more than 250 acres) usinginnovative planning, plan financing and plan implementation tools(e.g., land pooling/land reconstitution) with provision for affordablehousing, especially for the poor. Unlike retrofitting and redevelopment,greenfield developments could be located either within the limits of theULB or within the limits of the local Urban Development Authority(UDA).”“Para 11.3 (i) The GOI funds and the matching contribution by theStates/ULB will meet only a part of the project cost. Balance funds areexpected to be mobilized from i. States/ULBs own resources from acollection of user fees, beneficiary charges and impact fees, landmonetization, debt, loans, etc.”“Para 13.1.3 The National Mission Director will have the responsibilityto . . . . . . (iii) Oversee capacity building and assisting in handholdingof SPVs, State, and ULBs. This includes developing and retaining a bestpractice repository (Model RFP documents, Draft DPRs, Financialmodels, land monetization ideas, best practices in SPV formation, useof financial instruments and risk mitigation techniques) andmechanism for knowledge sharing across States and ULBs (throughpublications, workshops, seminars)” [34,35]
AMRUT guidelines
“Para 6.10 Conditionalities: . . . . . . , in the AMRUT no projects shouldbe included which do not have land available and no project workorder should be issued if all clearances from all the departments havenot been received by that time. Moreover, the cost of land purchase willbe borne by the States/ULBs.”“..Explore innovative ways for resource mobilization, private financing,and land leveraging for funding of projects.”It also provides that in the appraisal of the DPR, the National MissionDirector may decide to “Mobilize external resources and improveinternal resource generation of the ULBs. For instance, facilitate accessto municipal bonds by credit rating ULBs, providing assistance to ULBsto monetize land and prepare Tax Increment Financing Proposals (TIF),obtain private funding, etc.” [36]
Land Acquisition Act,2013
The objective of the Act (amongst other things) is to ensure thedevelopment of infrastructural facilities and urbanization. The Actenvisages that the affected persons become partners in developmentleading to an improvement in their social and economic status.Land can be acquired for a public purpose and it includesagro-processing, industrial corridors, water harvesting, education,sports, etc. (Section 2(1)).The law further provides on the method to be followed in the processof land acquisition for the determination of the social impact andpublic purpose (Chapter II—Sections 4 to 9)Section 26 (3) (c)—”Provided that in a case where the Requiring Bodyoffers its shares to the owners of the lands (whose lands have beenacquired) as a part compensation, for the acquisition of land, suchshares in no case shall exceed twenty-five percent. of the value socalculated under sub-section (I) or sub-section (2) or sub-section (3) asthe case may be”: [4]99
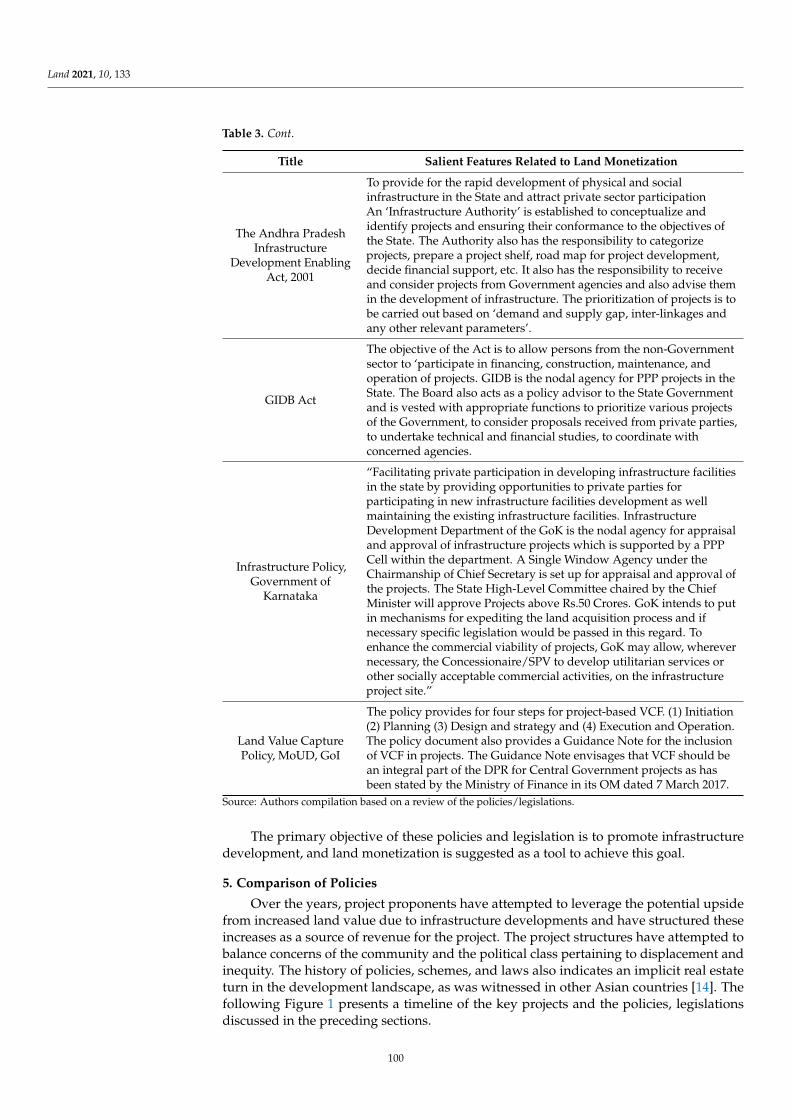
Land 2021, 10, 133
Table 3. Cont.
Title Salient Features Related to Land Monetization
The Andhra PradeshInfrastructure
Development EnablingAct, 2001
To provide for the rapid development of physical and socialinfrastructure in the State and attract private sector participationAn ‘Infrastructure Authority’ is established to conceptualize andidentify projects and ensuring their conformance to the objectives ofthe State. The Authority also has the responsibility to categorizeprojects, prepare a project shelf, road map for project development,decide financial support, etc. It also has the responsibility to receiveand consider projects from Government agencies and also advise themin the development of infrastructure. The prioritization of projects is tobe carried out based on ‘demand and supply gap, inter-linkages andany other relevant parameters’.
GIDB Act
The objective of the Act is to allow persons from the non-Governmentsector to ‘participate in financing, construction, maintenance, andoperation of projects. GIDB is the nodal agency for PPP projects in theState. The Board also acts as a policy advisor to the State Governmentand is vested with appropriate functions to prioritize various projectsof the Government, to consider proposals received from private parties,to undertake technical and financial studies, to coordinate withconcerned agencies.
Infrastructure Policy,Government of
Karnataka
“Facilitating private participation in developing infrastructure facilitiesin the state by providing opportunities to private parties forparticipating in new infrastructure facilities development as wellmaintaining the existing infrastructure facilities. InfrastructureDevelopment Department of the GoK is the nodal agency for appraisaland approval of infrastructure projects which is supported by a PPPCell within the department. A Single Window Agency under theChairmanship of Chief Secretary is set up for appraisal and approval ofthe projects. The State High-Level Committee chaired by the ChiefMinister will approve Projects above Rs.50 Crores. GoK intends to putin mechanisms for expediting the land acquisition process and ifnecessary specific legislation would be passed in this regard. Toenhance the commercial viability of projects, GoK may allow, wherevernecessary, the Concessionaire/SPV to develop utilitarian services orother socially acceptable commercial activities, on the infrastructureproject site.”
Land Value CapturePolicy, MoUD, GoI
The policy provides for four steps for project-based VCF. (1) Initiation(2) Planning (3) Design and strategy and (4) Execution and Operation.The policy document also provides a Guidance Note for the inclusionof VCF in projects. The Guidance Note envisages that VCF should bean integral part of the DPR for Central Government projects as hasbeen stated by the Ministry of Finance in its OM dated 7 March 2017.
Source: Authors compilation based on a review of the policies/legislations.
The primary objective of these policies and legislation is to promote infrastructuredevelopment, and land monetization is suggested as a tool to achieve this goal.
5. Comparison of Policies
Over the years, project proponents have attempted to leverage the potential upsidefrom increased land value due to infrastructure developments and have structured theseincreases as a source of revenue for the project. The project structures have attempted tobalance concerns of the community and the political class pertaining to displacement andinequity. The history of policies, schemes, and laws also indicates an implicit real estateturn in the development landscape, as was witnessed in other Asian countries [14]. Thefollowing Figure 1 presents a timeline of the key projects and the policies, legislationsdiscussed in the preceding sections.
100
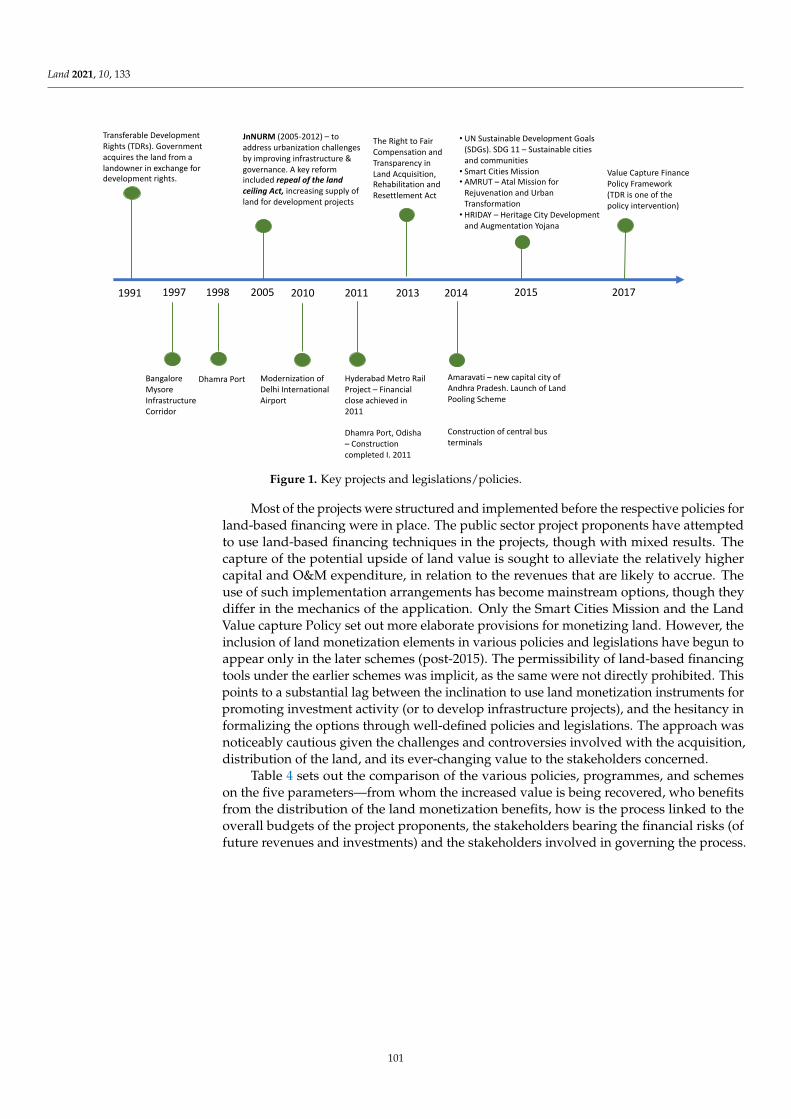
Land 2021, 10, 133Land 2021, 10, 133 12 of 18
Figure 1. Key projects and legislations/policies.
Most of the projects were structured and implemented before the respective policies
for land-based financing were in place. The public sector project proponents have at-
tempted to use land-based financing techniques in the projects, though with mixed re-
sults. The capture of the potential upside of land value is sought to alleviate the relatively
higher capital and O&M expenditure, in relation to the revenues that are likely to accrue.
The use of such implementation arrangements has become mainstream options, though
they differ in the mechanics of the application. Only the Smart Cities Mission and the Land
Value capture Policy set out more elaborate provisions for monetizing land. However, the
inclusion of land monetization elements in various policies and legislations have begun
to appear only in the later schemes (post-2015). The permissibility of land-based financing
tools under the earlier schemes was implicit, as the same were not directly prohibited.
This points to a substantial lag between the inclination to use land monetization instru-
ments for promoting investment activity (or to develop infrastructure projects), and the
hesitancy in formalizing the options through well-defined policies and legislations. The
approach was noticeably cautious given the challenges and controversies involved with
the acquisition, distribution of the land, and its ever-changing value to the stakeholders
concerned.
Table 4 sets out the comparison of the various policies, programmes, and schemes on
the five parameters—from whom the increased value is being recovered, who benefits
from the distribution of the land monetization benefits, how is the process linked to the
overall budgets of the project proponents, the stakeholders bearing the financial risks (of
future revenues and investments) and the stakeholders involved in governing the process.
2005
JnNURM (2005-2012) – to address urbanization challenges by improving infrastructure & governance. A key reform included repeal of the land ceiling Act, increasing supply of land for development projects
The Right to Fair Compensation and Transparency in Land Acquisition, Rehabilitation and Resettlement Act
2013 2015
• UN Sustainable Development Goals (SDGs). SDG 11 – Sustainable cities and communities
• Smart Cities Mission• AMRUT – Atal Mission for
Rejuvenation and Urban Transformation
• HRIDAY – Heritage City Development and Augmentation Yojana
1991
Transferable Development Rights (TDRs). Government acquires the land from a landowner in exchange for development rights.
2017
Value Capture Finance Policy Framework(TDR is one of the policy intervention)
2011
Hyderabad Metro Rail Project – Financial close achieved in 2011
Dhamra Port, Odisha – Construction completed I. 2011
2010
Modernization of Delhi International Airport
2014
Amaravati – new capital city of Andhra Pradesh. Launch of Land Pooling Scheme
Construction of central bus terminals
1997 1998
Dhamra PortBangalore Mysore Infrastructure Corridor
Figure 1. Key projects and legislations/policies.
Most of the projects were structured and implemented before the respective policies forland-based financing were in place. The public sector project proponents have attemptedto use land-based financing techniques in the projects, though with mixed results. Thecapture of the potential upside of land value is sought to alleviate the relatively highercapital and O&M expenditure, in relation to the revenues that are likely to accrue. Theuse of such implementation arrangements has become mainstream options, though theydiffer in the mechanics of the application. Only the Smart Cities Mission and the LandValue capture Policy set out more elaborate provisions for monetizing land. However, theinclusion of land monetization elements in various policies and legislations have begun toappear only in the later schemes (post-2015). The permissibility of land-based financingtools under the earlier schemes was implicit, as the same were not directly prohibited. Thispoints to a substantial lag between the inclination to use land monetization instruments forpromoting investment activity (or to develop infrastructure projects), and the hesitancy informalizing the options through well-defined policies and legislations. The approach wasnoticeably cautious given the challenges and controversies involved with the acquisition,distribution of the land, and its ever-changing value to the stakeholders concerned.
Table 4 sets out the comparison of the various policies, programmes, and schemeson the five parameters—from whom the increased value is being recovered, who benefitsfrom the distribution of the land monetization benefits, how is the process linked to theoverall budgets of the project proponents, the stakeholders bearing the financial risks (offuture revenues and investments) and the stakeholders involved in governing the process.
101
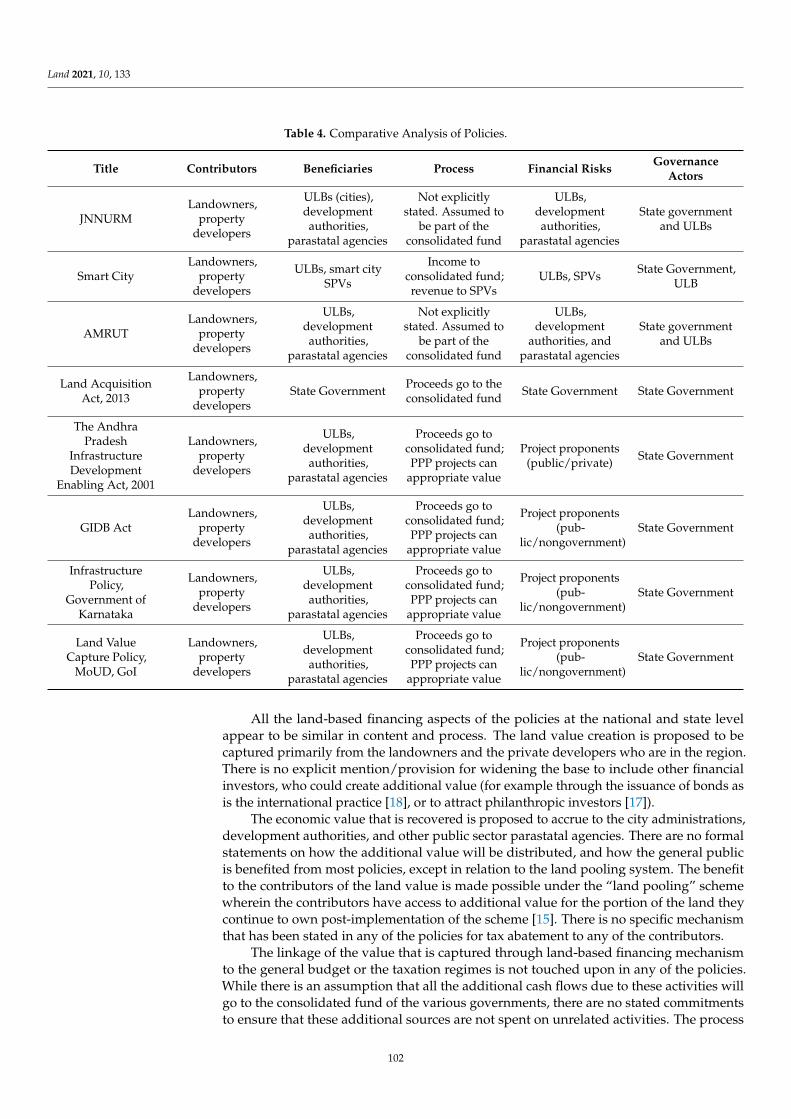
Land 2021, 10, 133
Table 4. Comparative Analysis of Policies.
Title Contributors Beneficiaries Process Financial Risks GovernanceActors
JNNURMLandowners,
propertydevelopers
ULBs (cities),developmentauthorities,
parastatal agencies
Not explicitlystated. Assumed to
be part of theconsolidated fund
ULBs,developmentauthorities,
parastatal agencies
State governmentand ULBs
Smart CityLandowners,
propertydevelopers
ULBs, smart citySPVs
Income toconsolidated fund;revenue to SPVs
ULBs, SPVs State Government,ULB
AMRUTLandowners,
propertydevelopers
ULBs,developmentauthorities,
parastatal agencies
Not explicitlystated. Assumed to
be part of theconsolidated fund
ULBs,development
authorities, andparastatal agencies
State governmentand ULBs
Land AcquisitionAct, 2013
Landowners,property
developersState Government Proceeds go to the
consolidated fund State Government State Government
The AndhraPradesh
InfrastructureDevelopment
Enabling Act, 2001
Landowners,property
developers
ULBs,developmentauthorities,
parastatal agencies
Proceeds go toconsolidated fund;PPP projects can
appropriate value
Project proponents(public/private) State Government
GIDB ActLandowners,
propertydevelopers
ULBs,developmentauthorities,
parastatal agencies
Proceeds go toconsolidated fund;PPP projects can
appropriate value
Project proponents(pub-
lic/nongovernment)State Government
InfrastructurePolicy,
Government ofKarnataka
Landowners,property
developers
ULBs,developmentauthorities,
parastatal agencies
Proceeds go toconsolidated fund;PPP projects can
appropriate value
Project proponents(pub-
lic/nongovernment)State Government
Land ValueCapture Policy,
MoUD, GoI
Landowners,property
developers
ULBs,developmentauthorities,
parastatal agencies
Proceeds go toconsolidated fund;PPP projects can
appropriate value
Project proponents(pub-
lic/nongovernment)State Government
All the land-based financing aspects of the policies at the national and state levelappear to be similar in content and process. The land value creation is proposed to becaptured primarily from the landowners and the private developers who are in the region.There is no explicit mention/provision for widening the base to include other financialinvestors, who could create additional value (for example through the issuance of bonds asis the international practice [18], or to attract philanthropic investors [17]).
The economic value that is recovered is proposed to accrue to the city administrations,development authorities, and other public sector parastatal agencies. There are no formalstatements on how the additional value will be distributed, and how the general publicis benefited from most policies, except in relation to the land pooling system. The benefitto the contributors of the land value is made possible under the “land pooling” schemewherein the contributors have access to additional value for the portion of the land theycontinue to own post-implementation of the scheme [15]. There is no specific mechanismthat has been stated in any of the policies for tax abatement to any of the contributors.
The linkage of the value that is captured through land-based financing mechanismto the general budget or the taxation regimes is not touched upon in any of the policies.While there is an assumption that all the additional cash flows due to these activities willgo to the consolidated fund of the various governments, there are no stated commitmentsto ensure that these additional sources are not spent on unrelated activities. The process
102
Land 2021, 10, 133
appears to be at a preliminary stage of evolution. The policymakers are yet to set out themechanism for investigating the relative advantages of land monetization options and toassess the impact of these choices on the wider society. Accordingly, the financial risksremain with the project proponents.
The governance of land-based financing structures has been retained by the govern-ment across all the policies. While there is no specific mention of region-specific urbandevelopment authorities to be created, such institutions exist across the country and havebeen used in the case of Amaravati city development [15]. Such institutional structures haveadded flexibility in raising capital, managing the project more efficiently, and insulatingfinancial expenditure from the influence of political exigencies.
There have been substantial gaps in policy and planning with respect to incorpo-rating land as a revenue source in the policy and legislative frameworks. Since urbandevelopment is a state subject, much of the federal schemes and guidelines highlight theneed for adopting innovative land monetization principles but do not set out the finerimplementation details. It is left to the states, to incorporate these principles based ontheir local context, relevance, and suitability. Many states have appropriately modified therelevant tax codes and other legislations to enable land value capture, though some areyet to initiate action. Therefore, at the state level, there is a wide disparity among states intheir readiness to adopt or integrate land monetization approaches in their planning andproject designs. While the value capture policy guidelines mention that land monetiza-tion principles should be an integral part of an assessment for all projects of the centralgovernment, the individual schemes under which projects are submitted (by individualstates/departments) to the central government, do not insist on the same being an integralpart. Therefore, there is some dissonance in the translation of a policy of the central gov-ernment with policies/schemes of other departments. The dissonance only increases at thestate level, where each state has different enabling mechanisms for promoting land-basedrevenue instruments.
In summary, the policies in India have lagged behind the projects in terms of incor-porating land-based financing aspects. Driven by fiscal constraints, most states are nowexploring various elements of land value capture to be included in their policies, thoughthe Government of India policy on land value capture is dedicated to this aspect. The policylandscape appears to be in the initial stages of evolution and is yet to reach a higher-orderprocess supported by appropriate legislations for mainstreaming land-based financingmechanisms in the design and planning processes. [8,16–18].
6. Policy Implications
For governments to use land-based financing tools effectively, it needs to be sup-ported with appropriate laws/legislations or executive orders permitting value capturemethods (through tax and non-tax revenues) and earmarking/distributing funds for spe-cific projects/developments. Further, policies need to be formulated to provide a clearroadmap for (a) capturing the value (b) collecting the fees or charges (deposited to theconsolidated funds of the state), (c) earmarking funds for specific projects/developments,and (d) ensuring timely disbursement of funds to project implementing agencies (throughbudgetary allocations or establishing project-specific funds/accounts) [8,16–18]. To enactthe policies requires a strong institutional framework and collaboration between differentstakeholders [2].
A reflection into the project structures and the elements of the national and sub-national policies in India, and in international markets brings to the fore the conflictsbetween incorporating the private sector motivation of profit maximization against thepublic sector responsibilities for equitable access to ecosystem services and weaving theseinto state planning and policy statements [13]. In the Atlanta Beltline project, the projectproponent has not made any provisions for reducing the negative effect of increases in taxesof low-income households or capping of any rents along the project influence area [17].The extent of the control that the project proponent has over the land markets and the
103
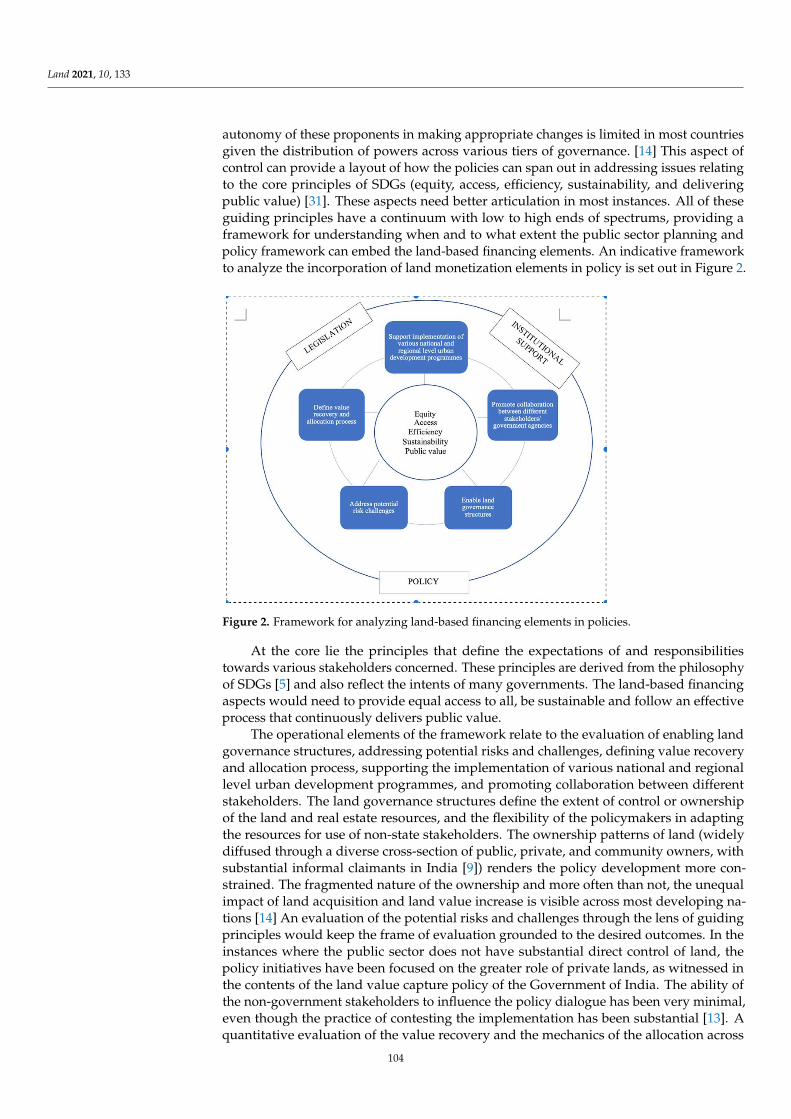
Land 2021, 10, 133
autonomy of these proponents in making appropriate changes is limited in most countriesgiven the distribution of powers across various tiers of governance. [14] This aspect ofcontrol can provide a layout of how the policies can span out in addressing issues relatingto the core principles of SDGs (equity, access, efficiency, sustainability, and deliveringpublic value) [31]. These aspects need better articulation in most instances. All of theseguiding principles have a continuum with low to high ends of spectrums, providing aframework for understanding when and to what extent the public sector planning andpolicy framework can embed the land-based financing elements. An indicative frameworkto analyze the incorporation of land monetization elements in policy is set out in Figure 2.
Land 2021, 10, 133 15 of 18
proponent has not made any provisions for reducing the negative effect of increases in
taxes of low-income households or capping of any rents along the project influence area
[17]. The extent of the control that the project proponent has over the land markets and
the autonomy of these proponents in making appropriate changes is limited in most coun-
tries given the distribution of powers across various tiers of governance. [14] This aspect
of control can provide a layout of how the policies can span out in addressing issues re-
lating to the core principles of SDGs (equity, access, efficiency, sustainability, and deliv-
ering public value) [31]. These aspects need better articulation in most instances. All of
these guiding principles have a continuum with low to high ends of spectrums, providing
a framework for understanding when and to what extent the public sector planning and
policy framework can embed the land-based financing elements. An indicative frame-
work to analyze the incorporation of land monetization elements in policy is set out in
Figure 2.
Figure 2. Framework for analyzing land-based financing elements in policies.
At the core lie the principles that define the expectations of and responsibilities to-
wards various stakeholders concerned. These principles are derived from the philosophy
of SDGs [5] and also reflect the intents of many governments. The land-based financing
aspects would need to provide equal access to all, be sustainable and follow an effective
process that continuously delivers public value.
The operational elements of the framework relate to the evaluation of enabling land
governance structures, addressing potential risks and challenges, defining value recovery
and allocation process, supporting the implementation of various national and regional
level urban development programmes, and promoting collaboration between different
stakeholders. The land governance structures define the extent of control or ownership of
the land and real estate resources, and the flexibility of the policymakers in adapting the
resources for use of non-state stakeholders. The ownership patterns of land (widely dif-
fused through a diverse cross-section of public, private, and community owners, with
substantial informal claimants in India [9]) renders the policy development more con-
strained. The fragmented nature of the ownership and more often than not, the unequal
impact of land acquisition and land value increase is visible across most developing na-
tions [14] An evaluation of the potential risks and challenges through the lens of guiding
principles would keep the frame of evaluation grounded to the desired outcomes. In the
instances where the public sector does not have substantial direct control of land, the pol-
icy initiatives have been focused on the greater role of private lands, as witnessed in the
Figure 2. Framework for analyzing land-based financing elements in policies.
At the core lie the principles that define the expectations of and responsibilitiestowards various stakeholders concerned. These principles are derived from the philosophyof SDGs [5] and also reflect the intents of many governments. The land-based financingaspects would need to provide equal access to all, be sustainable and follow an effectiveprocess that continuously delivers public value.
The operational elements of the framework relate to the evaluation of enabling landgovernance structures, addressing potential risks and challenges, defining value recoveryand allocation process, supporting the implementation of various national and regionallevel urban development programmes, and promoting collaboration between differentstakeholders. The land governance structures define the extent of control or ownershipof the land and real estate resources, and the flexibility of the policymakers in adaptingthe resources for use of non-state stakeholders. The ownership patterns of land (widelydiffused through a diverse cross-section of public, private, and community owners, withsubstantial informal claimants in India [9]) renders the policy development more con-strained. The fragmented nature of the ownership and more often than not, the unequalimpact of land acquisition and land value increase is visible across most developing na-tions [14] An evaluation of the potential risks and challenges through the lens of guidingprinciples would keep the frame of evaluation grounded to the desired outcomes. In theinstances where the public sector does not have substantial direct control of land, thepolicy initiatives have been focused on the greater role of private lands, as witnessed inthe contents of the land value capture policy of the Government of India. The ability ofthe non-government stakeholders to influence the policy dialogue has been very minimal,even though the practice of contesting the implementation has been substantial [13]. Aquantitative evaluation of the value recovery and the mechanics of the allocation across
104
Land 2021, 10, 133
various stakeholders is essential to understand and configure the project structures and topromote sustainability of the land-based financing mechanisms. A broader perspectiveof how these elements support collaboration with prevailing or anticipated governmentrejuvenation programmes indicates the inclusiveness of the policy. A proactive approachto governing the land monetization process, with supporting institutional and regulatoryaspects would provide a feedback overlay for the assessment.
7. Summary and Conclusions
The purpose of this research article is to sketch out the broad direction of how thevarious policies and legislations incorporate the land-based financing elements, giventhe projects being implemented are actively adopting such mechanisms. The increasein attention to land-based financing models and the adoption of land monetization in-struments generally coincided with the development of infrastructure projects under thepublic–private partnership arrangements. The stress on finances of the project proponentscoupled with the anticipation of upside in the land values post-implementation of infras-tructure projects has given way to consider land as a revenue source, rather than just afactor of production [9,13]. The viability assessment of the projects, particularly those inthe transport sector, improved substantially with the addition of a real estate component.
The institutional, governance, and policy formulation practices present in India are re-flective of similar structures prevalent in Asia and other developing regions. Developmentagendas of many countries are moving in a similar direction, so are the challenges thatthey encounter in accelerating political and administrative actions. The use of land-basedfinancing elements without appropriate structuring could lead to sub-optimal distributivejustice to all the stakeholders concerned. The policies need to strike a balance betweenincreasing the burden on the adversely affected landowners and users, while not exagger-ating the benefits derived by those who are advantageously placed to the intervention. Aframework that encompasses the generally accepted guiding principles for analyzing theextent to which the land-based financing elements could be incorporated in their respectivepolicies and legislations could provide the policymakers and public sector project propo-nents a tool to comprehensively assess their needs, opportunities, and constraints. Theproject proponents also need to be conscious of how the financial risks are identified andborne, which ecosystem services are receiving lower funding due to the land value increaseinterventions [16]. A holistic assessment needs to be undertaken before incorporatingland-based financing elements in policy to balance the realities of the contributors to theland value increments, and broad basing the beneficiaries pool (to include wider societywhere appropriate through lower taxes or better ecosystem services).
A reasoned discussion with stakeholders while framing the policies, supported by po-litical advocacy, will lead to a more efficient public investment process. With the increasingattractiveness of land monetization options for funding economic growth, many developingsocieties will need to balance value capture with the expectations of affected stakeholders.This research contributes to the ongoing discourse of systematically understanding theelements for formulating public policies on land management.
Author Contributions: Conceptualization, methodology, formal analysis, resources, writing–originaldraft preparataion and writing–review and editing–equally contributed by R.D.T. and P.T. All authorshave read and agreed to the published version of the manuscript.
Funding: This research received no external funding.
Institutional Review Board Statement: Not Applicable.
Informed Consent Statement: Not Applicable.
Data Availability Statement: The data presented in this study is contained within this article.
Conflicts of Interest: The authors declare no conflict of interest.
105
Land 2021, 10, 133
References1. Suzuki, H.; Cervero, R.; Iuchi, K. Transforming Cities with Transit. Transit and Land-Use Integration for Sustainable Urban Development,
1st ed.; World Bank: Washington, DC, USA, 2013.2. Bahl, R.W.; Linn, J.F.; Wetzel, D.L. Financing Metropolitan Governments in Developing Countries, 1st ed.; Lincoln Institute of Land
Policy: Washington, DC, USA, 2013.3. Chakravorty, S. A new price regime: Land markets in Urban and Rural India. Econ. Polit. Wkly. 2013, 48, 45–54.4. Singh, S. Land Acquisition in India: An Examination of the 2013 Act and Options. J. L. Rural Stud. 2016, 4, 1. [CrossRef]5. United Nations. SDG Indicators—SDG Indicators. 2017. Available online: https://unstats.un.org/sdgs/indicators/indicators-
list/ (accessed on 24 July 2020).6. Besley, T.; Burgess, R. Land reform, poverty reduction, and growth: Evidence from India. Q. J. Econ. 2000, 2, 389–430. [CrossRef]7. UN-Habitat. Affordable Land and Housing in Latin America and the Caribbean, 1st ed.; UN-Habitat: Nairobi, Kenya, 2011; Available on-
line: https://unhabitat.org/affordable-land-and-housing-in-latin-america-and-the-caribbean-2 (accessed on 20 January 2021).8. Munoz-Gielen, D. Improving Public-Value Capturing in Urban Development. Innov. L. Prop. Tax. 2011, 150–170. Available online:
https://www.researchgate.net/publication/285574748_Improving_public-value_capture_in_urban_development (accessed on15 December 2020).
9. Gandhi, S.; Phatak, V.K. Land-based Financing in Metropolitan Cities in India: The Case of Hyderabad and Mumbai. Urbanisation2016, 1, 31–52. [CrossRef]
10. Rics. RICS Valuation—Professional Standards (Red Book). Basis of Value; Royal Institution of Chartered Surveyors: London, UK, 2012.Available online: https://www.rics.org/globalassets/rics-website/media/upholding-professional-standards/sector-standards/valuation/rics-valuation--global-standards-jan.pdf (accessed on 15 December 2020).
11. George, H. Progress and Poverty (Edited and Abridged for Modern Readers by Bob Drake, 2006); Aziloth Books: London, UK, 1879.12. Smolka, M.O. Implementing Value Capture in Latin America: Policies and Tools for Urban Development Policy Focus Report Series;
Lincoln Institute of Land Policy: Cambridge, MA, USA, 2013.13. Berrisford, S.; Cirolia, L.R.; Palmer, I. Land-based financing in sub-Saharan African cities. Environ. Urban 2018, 1, 35–52. [CrossRef]14. Shatkin, G. The real estate turn in policy and planning: Land monetization and the political economy of peri-urbanization in Asia.
Cities 2016, 53, 141–149. [CrossRef]15. Ramachandraiah, C. Making of Amaravati. Econ. Polit. Wkly. 2016, 51, 68–75.16. Wolf-Powers, L. Reclaim Value Capture for Equitable Urban Development. Metropolitics 2019. Available online: https://
metropolitics.org/Reclaim-Value-Capture-for-Equitable-Urban-Development.html (accessed on 20 January 2021).17. Immergluck, D. Large redevelopment initiatives, housing values, and gentrification: The case of the Atlanta beltline. Urban Stud.
2009, 46, 1723–1745. [CrossRef]18. Van der Veen, M.; Altes, W.K.K. Urban development agreements: Do they meet guiding principles for a better deal? Cities 2011,
28, 310–319. [CrossRef]19. Peterson, G.E. Unlocking Land Values to Finance Urban Infrastructure; The World Bank: Washington, DC, USA, 2008.20. Nallathiga, R. Urban infrastructure development in India: Resource requirements and mobilization methods. IUP J. Infrastruct.
2010, 8, 26–37.21. RICS Research. Real Estate and Construction Professionals in India by 2020; RICS Research: London, UK, 2011.22. RICS Research. Bridging the Gap; RICS Research: London, UK, 2020.23. Kelkar, D.V. Report of the Committee on Revisiting and Revitalising Public Private Partnership model of Infrastructure; Government of
India: New Delhi, India, 2015.24. Balakrishnan, S. Highway urbanization and land conflicts: The challenges to decentralization in India. Pac. Aff. 2013, 86, 785–811.
[CrossRef]25. Kulshreshtha, R.; Kumar, A.; Tripathi, A.; Likhi, D.K. Critical Success Factors in Implementation of Urban Metro System on PPP:
A Case Study of Hyderabad Metro. Glob. J. Flex. Syst. Manag. 2017, 18, 303–320. [CrossRef]26. Chaudhuri, S. Impact of privatisation on performance of airport infrastructure projects in India: A preliminary study. Int. J. Aviat.
Manag. 2011, 1, 40. [CrossRef]27. Sahoo, K. Deregulation in development project: A case of Dhamra port project in Odisha. Ocean Coast. Manag. 2014, 100, 151–158.
[CrossRef]28. Sharma, K.K.; Misra, S.K.; Singla, A.K. Role of Public Private Partnership in Bus Terminals: A Case Study of Punjab. Think India
2019, 22, 116–128. [CrossRef]29. Germán, L.; Bernstein, A.E. Land value capture. Policy Br. 2018, 2016–2019. Available online: https://www.lincolninst.edu/sites/
default/files/pubfiles/land-value-capture-policy-brief.pdf (accessed on 15 December 2020).30. Kelkar, V.L.; Rajaraman, I.; Misra, S. Report of the Committee on Roadmap for Fiscal Consolidation; Government of India: New Delhi,
India, 2012.31. Kanuri, C.; Revi, A.; Espey, J.; Kuhle, H. Getting Started With the SDGs in Cities; Sustainable Development Solutions Network:
New York, NY, USA, 2016.32. Tiwari, P. India Habitat III, National Report, 2016. Minist. Hous. Urban Poverty Alleviation 2016, 32, 978–998.33. Kundu, D. Urban Development Programmes in India: A Critique of JnNURM. Soc. Chang. 2014, 44, 615–632. [CrossRef]
106

Land 2021, 10, 133
34. Government of India MHUA. Smart Cities Mission, Government of India. Resource Website. 2015. Available online: http://smartcities.gov.in/content/ (accessed on 15 December 2020).
35. Roy, S. The Smart City Paradigm in India: Issues and Challenges of Sustainability and Inclusiveness. Soc. Sci. 2016, 44, 29.36. Kundu, D.; Sietchiping, R.; Kinyanjui, M. Developing National Urban Policies; Springer: Singapore, 2020.
107

land
Article
Who Pays the Bill? Assessing Ecosystem Services Losses in anUrban Planning Context
Harald Zepp 1,* and Luis Inostroza 1,2
�����������������
Citation: Zepp, H.; Inostroza, L.
Who Pays the Bill? Assessing
Ecosystem Services Losses in an
Urban Planning Context. Land 2021,
10, 369. https://doi.org/10.3390/
land10040369
Academic Editor: Alessio Russo
Received: 8 March 2021
Accepted: 31 March 2021
Published: 2 April 2021
Publisher’s Note: MDPI stays neutral
with regard to jurisdictional claims in
published maps and institutional affil-
iations.
Copyright: © 2021 by the authors.
Licensee MDPI, Basel, Switzerland.
This article is an open access article
distributed under the terms and
conditions of the Creative Commons
Attribution (CC BY) license (https://
creativecommons.org/licenses/by/
4.0/).
1 Institute of Geography, The Ruhr-University Bochum, 44801 Bochum, Germany;[email protected]
2 Universidad Autonoma de Chile, 4810101 Temuco, Chile* Correspondence: [email protected]
Abstract: While Ecosystem Services (ES) are crucial for sustaining human wellbeing, urban devel-opment can threaten their sustainable supply. Following recent EU directives, many countries inEurope are implementing laws and regulations to protect and improve ES at local and regional levels.However, urban planning regulations already consider mandatory compensation for the loss ofnature, and this compensation is often restricted to replacing green with green in other locations.This situation might lead to the loss of ES in areas subject to urban development, a loss that wouldeventually be replaced elsewhere. Therefore, ES assessments should be included in urban planningto improve the environmental conditions of urban landscapes where development takes place. Usingan actual planning and development example that involves a proposed road to a restructured formerindustrial area in Bochum, Germany, we developed an ad-hoc assessment to compare a standardenvironmental compensation approach applying ES. We evaluated the impact of the planned con-struction alternatives with both approaches. In a second step, we selected the alternative with a lowerimpact and estimated the ES losses from the compensation measures. Our findings show that an ESassessment provides a solid basis for the selection of development alternatives, the identification ofcompensation areas, and the estimation of compensation amounts, with the benefit of improvingthe environmental quality of the affected areas. Our method was effective in strengthening urbanplanning, using ES science in the assessment and evaluation of urban development alternatives.
Keywords: compensation measures; urban resilience; urban development; impact assessment
1. Ecosystem Services for Cities
Ecosystem Services (ES) science has provided a framework and empirical evidence foranalysing, discussing and communicating environmental trade-offs arising from alternativedevelopment options in several planning contexts [1–3]. Resilience, sustainability andquality of life can be greatly improved in urban areas by including ES assessments [4,5].Urban planning can benefit from the adequate use of the ES framework. Urban areas needto improve the application of laws and regulations following EU-directives to protect andimprove the natural environment at local and regional levels [6,7].
This paper uses the ES concept in a practical way to illustrate its potential to supportdecision-making. The aim is to present a clear way to apply the ES framework in an actualurban development case to show the benefits of such an approach. We apply the ES conceptin a real planning case study using a procedure that is ready to implement and easy tounderstand, avoiding unnecessary conceptual and operational complexity. Our approachcan be used by a broader community of scholars and decision-makers who might notnecessarily be familiar with the ES concept. We present the ES concept, focusing on how itcan be implemented in practice for urban planning and the necessary steps to follow.
109
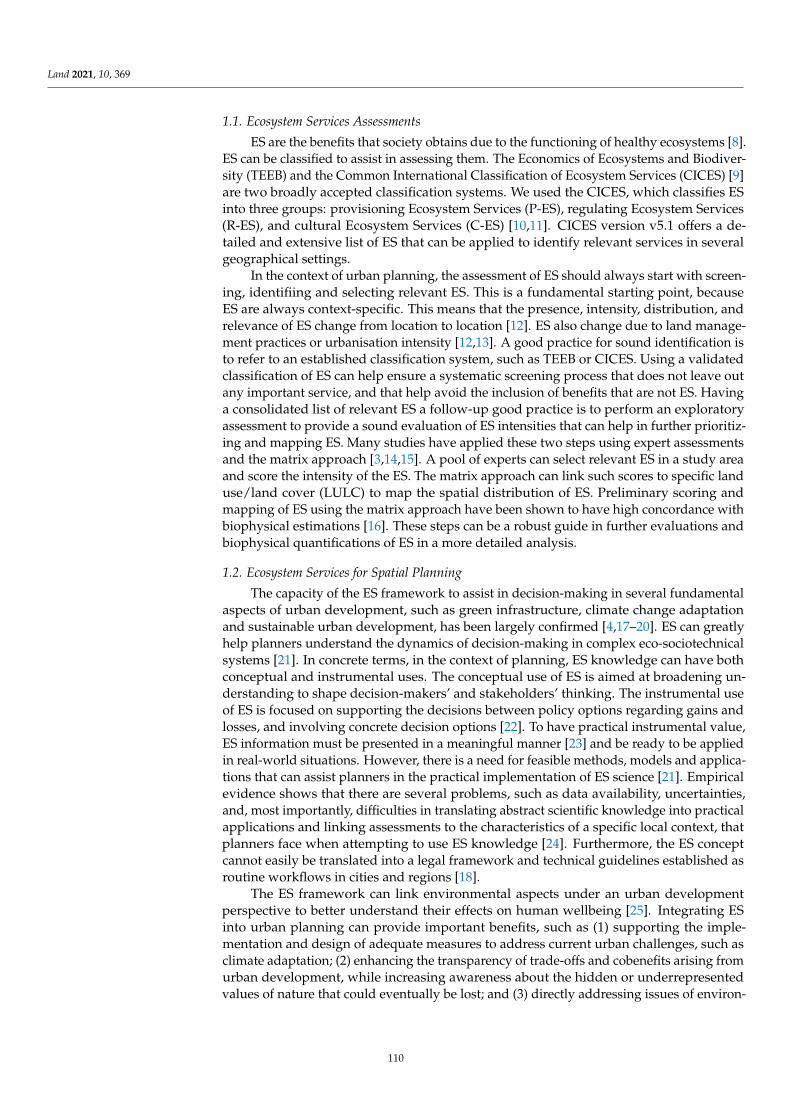
Land 2021, 10, 369
1.1. Ecosystem Services Assessments
ES are the benefits that society obtains due to the functioning of healthy ecosystems [8].ES can be classified to assist in assessing them. The Economics of Ecosystems and Biodiver-sity (TEEB) and the Common International Classification of Ecosystem Services (CICES) [9]are two broadly accepted classification systems. We used the CICES, which classifies ESinto three groups: provisioning Ecosystem Services (P-ES), regulating Ecosystem Services(R-ES), and cultural Ecosystem Services (C-ES) [10,11]. CICES version v5.1 offers a de-tailed and extensive list of ES that can be applied to identify relevant services in severalgeographical settings.
In the context of urban planning, the assessment of ES should always start with screen-ing, identifiing and selecting relevant ES. This is a fundamental starting point, becauseES are always context-specific. This means that the presence, intensity, distribution, andrelevance of ES change from location to location [12]. ES also change due to land manage-ment practices or urbanisation intensity [12,13]. A good practice for sound identification isto refer to an established classification system, such as TEEB or CICES. Using a validatedclassification of ES can help ensure a systematic screening process that does not leave outany important service, and that help avoid the inclusion of benefits that are not ES. Havinga consolidated list of relevant ES a follow-up good practice is to perform an exploratoryassessment to provide a sound evaluation of ES intensities that can help in further prioritiz-ing and mapping ES. Many studies have applied these two steps using expert assessmentsand the matrix approach [3,14,15]. A pool of experts can select relevant ES in a study areaand score the intensity of the ES. The matrix approach can link such scores to specific landuse/land cover (LULC) to map the spatial distribution of ES. Preliminary scoring andmapping of ES using the matrix approach have been shown to have high concordance withbiophysical estimations [16]. These steps can be a robust guide in further evaluations andbiophysical quantifications of ES in a more detailed analysis.
1.2. Ecosystem Services for Spatial Planning
The capacity of the ES framework to assist in decision-making in several fundamentalaspects of urban development, such as green infrastructure, climate change adaptationand sustainable urban development, has been largely confirmed [4,17–20]. ES can greatlyhelp planners understand the dynamics of decision-making in complex eco-sociotechnicalsystems [21]. In concrete terms, in the context of planning, ES knowledge can have bothconceptual and instrumental uses. The conceptual use of ES is aimed at broadening un-derstanding to shape decision-makers’ and stakeholders’ thinking. The instrumental useof ES is focused on supporting the decisions between policy options regarding gains andlosses, and involving concrete decision options [22]. To have practical instrumental value,ES information must be presented in a meaningful manner [23] and be ready to be appliedin real-world situations. However, there is a need for feasible methods, models and applica-tions that can assist planners in the practical implementation of ES science [21]. Empiricalevidence shows that there are several problems, such as data availability, uncertainties,and, most importantly, difficulties in translating abstract scientific knowledge into practicalapplications and linking assessments to the characteristics of a specific local context, thatplanners face when attempting to use ES knowledge [24]. Furthermore, the ES conceptcannot easily be translated into a legal framework and technical guidelines established asroutine workflows in cities and regions [18].
The ES framework can link environmental aspects under an urban developmentperspective to better understand their effects on human wellbeing [25]. Integrating ESinto urban planning can provide important benefits, such as (1) supporting the imple-mentation and design of adequate measures to address current urban challenges, such asclimate adaptation; (2) enhancing the transparency of trade-offs and cobenefits arising fromurban development, while increasing awareness about the hidden or underrepresentedvalues of nature that could eventually be lost; and (3) directly addressing issues of environ-
110
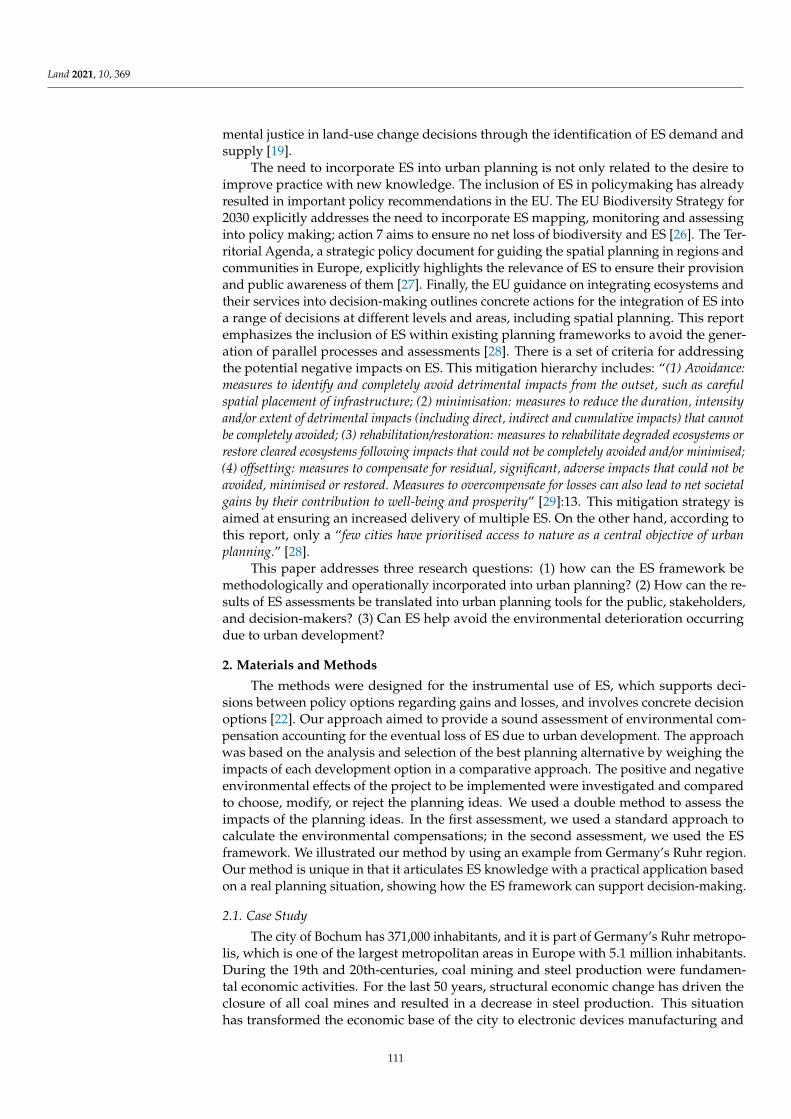
Land 2021, 10, 369
mental justice in land-use change decisions through the identification of ES demand andsupply [19].
The need to incorporate ES into urban planning is not only related to the desire toimprove practice with new knowledge. The inclusion of ES in policymaking has alreadyresulted in important policy recommendations in the EU. The EU Biodiversity Strategy for2030 explicitly addresses the need to incorporate ES mapping, monitoring and assessinginto policy making; action 7 aims to ensure no net loss of biodiversity and ES [26]. The Ter-ritorial Agenda, a strategic policy document for guiding the spatial planning in regions andcommunities in Europe, explicitly highlights the relevance of ES to ensure their provisionand public awareness of them [27]. Finally, the EU guidance on integrating ecosystems andtheir services into decision-making outlines concrete actions for the integration of ES intoa range of decisions at different levels and areas, including spatial planning. This reportemphasizes the inclusion of ES within existing planning frameworks to avoid the gener-ation of parallel processes and assessments [28]. There is a set of criteria for addressingthe potential negative impacts on ES. This mitigation hierarchy includes: “(1) Avoidance:measures to identify and completely avoid detrimental impacts from the outset, such as carefulspatial placement of infrastructure; (2) minimisation: measures to reduce the duration, intensityand/or extent of detrimental impacts (including direct, indirect and cumulative impacts) that cannotbe completely avoided; (3) rehabilitation/restoration: measures to rehabilitate degraded ecosystems orrestore cleared ecosystems following impacts that could not be completely avoided and/or minimised;(4) offsetting: measures to compensate for residual, significant, adverse impacts that could not beavoided, minimised or restored. Measures to overcompensate for losses can also lead to net societalgains by their contribution to well-being and prosperity” [29]:13. This mitigation strategy isaimed at ensuring an increased delivery of multiple ES. On the other hand, according tothis report, only a “few cities have prioritised access to nature as a central objective of urbanplanning.” [28].
This paper addresses three research questions: (1) how can the ES framework bemethodologically and operationally incorporated into urban planning? (2) How can the re-sults of ES assessments be translated into urban planning tools for the public, stakeholders,and decision-makers? (3) Can ES help avoid the environmental deterioration occurringdue to urban development?
2. Materials and Methods
The methods were designed for the instrumental use of ES, which supports deci-sions between policy options regarding gains and losses, and involves concrete decisionoptions [22]. Our approach aimed to provide a sound assessment of environmental com-pensation accounting for the eventual loss of ES due to urban development. The approachwas based on the analysis and selection of the best planning alternative by weighing theimpacts of each development option in a comparative approach. The positive and negativeenvironmental effects of the project to be implemented were investigated and comparedto choose, modify, or reject the planning ideas. We used a double method to assess theimpacts of the planning ideas. In the first assessment, we used a standard approach tocalculate the environmental compensations; in the second assessment, we used the ESframework. We illustrated our method by using an example from Germany’s Ruhr region.Our method is unique in that it articulates ES knowledge with a practical application basedon a real planning situation, showing how the ES framework can support decision-making.
2.1. Case Study
The city of Bochum has 371,000 inhabitants, and it is part of Germany’s Ruhr metropo-lis, which is one of the largest metropolitan areas in Europe with 5.1 million inhabitants.During the 19th and 20th-centuries, coal mining and steel production were fundamen-tal economic activities. For the last 50 years, structural economic change has driven theclosure of all coal mines and resulted in a decrease in steel production. This situationhas transformed the economic base of the city to electronic devices manufacturing and
111
Land 2021, 10, 369
car production, with a more diversified sectoral mix, including service industries anduniversities, as a part of the knowledge-based economy.
The study area is located in the eastern part of Bochum. It can be considered a typicalexample of “glocalisation” [30], depicting the local effects of economic globalisation. Themultinational GM/Opel car factory is located at two sites within the city of Bochum,covering an area of approximately 100 hectares. After the company decided to end carproduction at the end of 2015, one site was given up, and the other site was developedto serve as the European logistics centre for the distribution of spare car parts and anew industrial area. The existing access road connecting the site by the freeway crossesa residential area, and will become overloaded by increasing traffic. To ameliorate theenvironmental impacts, four alternative corridors have been discussed. The four planningalternatives for the access roads to the former factories are generally presented in Figure 1.
Land 2021, 10, x FOR PEER REVIEW 4 of 18
2.1. Case Study
The city of Bochum has 371,000 inhabitants, and it is part of Germany’s Ruhr
metropolis, which is one of the largest metropolitan areas in Europe with 5.1 million
inhabitants. During the 19th and 20th-centuries, coal mining and steel production were
fundamental economic activities. For the last 50 years, structural economic change has
driven the closure of all coal mines and resulted in a decrease in steel production. This
situation has transformed the economic base of the city to electronic devices
manufacturing and car production, with a more diversified sectoral mix, including service
industries and universities, as a part of the knowledge-based economy.
The study area is located in the eastern part of Bochum. It can be considered a typical
example of “glocalisation” [30], depicting the local effects of economic globalisation. The
multinational GM/Opel car factory is located at two sites within the city of Bochum,
covering an area of approximately 100 hectares. After the company decided to end car
production at the end of 2015, one site was given up, and the other site was developed to
serve as the European logistics centre for the distribution of spare car parts and a new
industrial area. The existing access road connecting the site by the freeway crosses a
residential area, and will become overloaded by increasing traffic. To ameliorate the
environmental impacts, four alternative corridors have been discussed. The four planning
alternatives for the access roads to the former factories are generally presented in
Figure 1.
Figure 1. Location of the study area in Germany and the Ruhr area, and main features. Four alternative access roads to the
GM/Opel European logistics centre are under discussion (A1, A2, A3 and A4). Satellite imagery: ESRI, DigitalGlobe, Geo-
Eye, Earthstar Geographics, CNES/Airbus DS, USDA, USGS, AeroGRID, IGN, and the GIS User Community.
2.2. Mapping Urban Structural Types
We delineated the area named Lagendreer-Werne with a total surface area of 1632
hectares. We mapped the entire area in several field campaigns. This detailed mapping
Figure 1. Location of the study area in Germany and the Ruhr area, and main features. Four alternative access roads tothe GM/Opel European logistics centre are under discussion (A1, A2, A3 and A4). Satellite imagery: ESRI, DigitalGlobe,GeoEye, Earthstar Geographics, CNES/Airbus DS, USDA, USGS, AeroGRID, IGN, and the GIS User Community.
2.2. Mapping Urban Structural Types
We delineated the area named Lagendreer-Werne with a total surface area of 1632hectares. We mapped the entire area in several field campaigns. This detailed mappingeffort yielded several LULC classes. We grouped the LULC according to 22 urban structuralsubtypes (USSs), representing urban morphological units that embody the characteristicsof the urban structure. The characteristics of urban structural types were related to factorssuch as the surface materials, the internal configuration of diverse open and sealed patches,the height of vegetation, and height [31]. We further differentiated the USSs listed inTable 1. A visual field survey was conducted after preparatory mapping based on aerialphotos. Among the USSs, we identified open space, which normally contains the highestenvironmental values (Table 1).
112
Land 2021, 10, 369
Table 1. List of USSs and ES values used in the assessment. P-ES: provisioning ES; R-ES: regulating ES; C-ES: cultural ES.Column p indicates USSs that are terrestrial open space on natural soils. Values for P-ES, R-ES and C-ES are the mean of thesingle ES in each of the P-ES, R-ES and C-ES groups. The range is 0 to 5. High values indicate high ES supply provided bythe USSs.
i Urban Structural Subtypes P-ES R-ES C-ES p
1 Allotment gardens 2.1 3.4 3.6 12 Arable field 2.0 2.8 2.3 13 Cemeteries 1.1 3.3 3.5 1
4 Commercial and industrial uses with a high degree ofsurface sealing 0.8 1.0 0.7
5 Detached and semi-detached houses 1.4 2.0 1.2
6 Housing complexes with green areas, e.g. row housessingle multi-story houses 1.2 1.6 0.8
7 Lakes ponds 2.1 2.5 3.8
8 Linear groves (including industrial & green buffers ofindustrial areas) 0.9 2.8 2.2
9 Mixed commercial and residential uses with a lowdegree of surface sealing 0.9 1.3 0.8
10 Parking lots and parking areas 0.2 0.4 0.311 Parks and green belts 1.4 3.8 4.1 112 Pasture and meadow 2.0 3.7 3.6 113 Places and squares 0.3 0.4 0.514 Playgrounds 0.6 1.5 2.315 Public buildings and public institutions 1.0 1.4 1.516 Railroad tracks 0.3 1.0 0.917 Roads 0.2 0.4 0.318 Sports grounds and leisure infrastructure 0.7 1.4 1.8
19 Technical infrastructure (e.g., power transformationareas) 0.4 0.5 0.6
20 Terrace houses 1.1 1.7 1.021 Urban forest of considerable size and compactness 2.0 4.5 4.7 122 Villas 1.5 2.1 1.4
2.3. Impact Assessment Using a Standard Approach
We analyzed the potential impacts of each of the four access roads using a parallelassessment. First, the impact assessment focused on three fundamental environmentalaspects to estimate the necessary compensation, based on the protected environmentalgoods in German legislation: soil, biotope and recreation. We defined a buffer area of 50 mfor each of the proposed access roads. We measured the high-quality soil, biotope andrecreation values that would eventually be lost within each of these buffer areas.
2.3.1. Biotope
A biotope is evaluated based on vegetation cover from the perspective of natureconservation (biotope value). The value of biotopes refers to the scheme to managecompensation used in landscape planning [32]. Biotope value depends on the degreeof naturalness, rareness, recoverability, and integrity. Biotope value is expressed on anordinal scale from 0 (the lowest) to 10 (the highest). Our assessment focused only on thehighest occurring biotope values (6–7 high and 8–9 very high), for which we calculated therespective hectares. We used the detailed biotope map provided by the cities of Bochumand Dortmund. The maps were prepared at a scale of 1:5000 and are regularly updated.We manually determined the values of empty areas by identifying equivalent biotopes.
2.3.2. Soil Values
Soil map units include soil quality based on a long-established assessment scheme [33],which assigns numbers according to a soil’s relative capacity to bear and sustain crop pro-duction. Soil quality is assessed on the basis of the soil texture, which reflects a soil’s
113
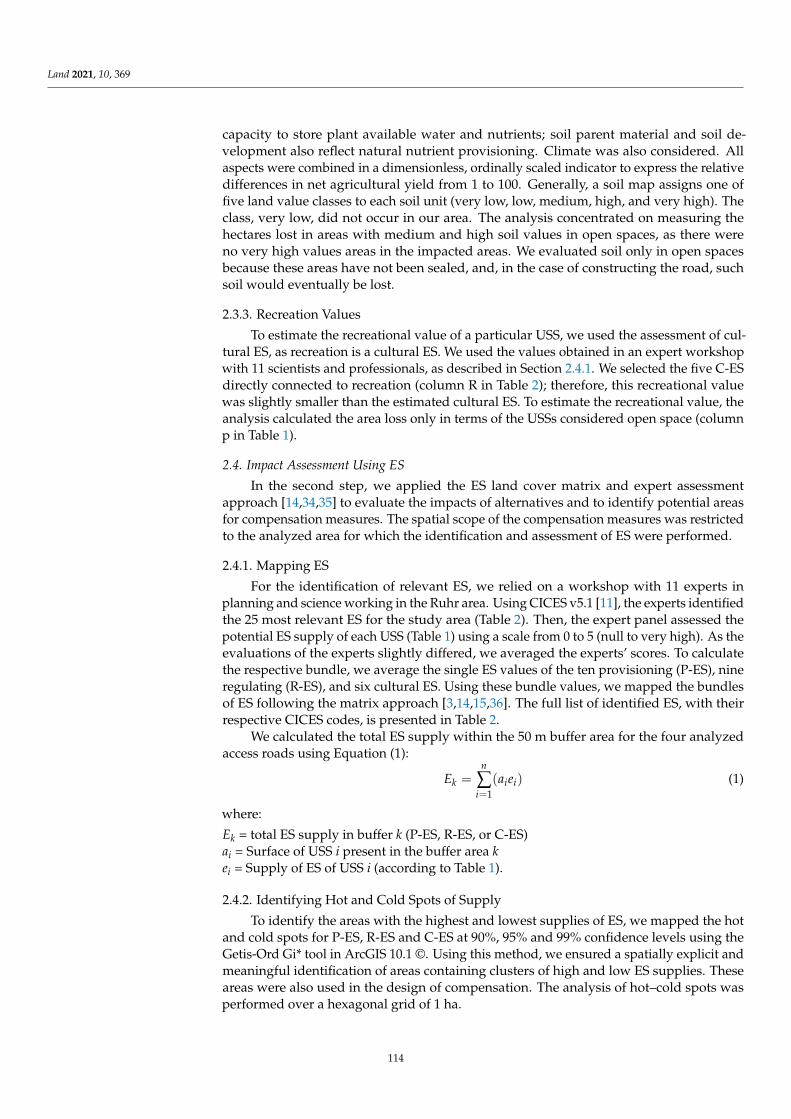
Land 2021, 10, 369
capacity to store plant available water and nutrients; soil parent material and soil de-velopment also reflect natural nutrient provisioning. Climate was also considered. Allaspects were combined in a dimensionless, ordinally scaled indicator to express the relativedifferences in net agricultural yield from 1 to 100. Generally, a soil map assigns one offive land value classes to each soil unit (very low, low, medium, high, and very high). Theclass, very low, did not occur in our area. The analysis concentrated on measuring thehectares lost in areas with medium and high soil values in open spaces, as there wereno very high values areas in the impacted areas. We evaluated soil only in open spacesbecause these areas have not been sealed, and, in the case of constructing the road, suchsoil would eventually be lost.
2.3.3. Recreation Values
To estimate the recreational value of a particular USS, we used the assessment of cul-tural ES, as recreation is a cultural ES. We used the values obtained in an expert workshopwith 11 scientists and professionals, as described in Section 2.4.1. We selected the five C-ESdirectly connected to recreation (column R in Table 2); therefore, this recreational valuewas slightly smaller than the estimated cultural ES. To estimate the recreational value, theanalysis calculated the area loss only in terms of the USSs considered open space (columnp in Table 1).
2.4. Impact Assessment Using ES
In the second step, we applied the ES land cover matrix and expert assessmentapproach [14,34,35] to evaluate the impacts of alternatives and to identify potential areasfor compensation measures. The spatial scope of the compensation measures was restrictedto the analyzed area for which the identification and assessment of ES were performed.
2.4.1. Mapping ES
For the identification of relevant ES, we relied on a workshop with 11 experts inplanning and science working in the Ruhr area. Using CICES v5.1 [11], the experts identifiedthe 25 most relevant ES for the study area (Table 2). Then, the expert panel assessed thepotential ES supply of each USS (Table 1) using a scale from 0 to 5 (null to very high). As theevaluations of the experts slightly differed, we averaged the experts’ scores. To calculatethe respective bundle, we average the single ES values of the ten provisioning (P-ES), nineregulating (R-ES), and six cultural ES. Using these bundle values, we mapped the bundlesof ES following the matrix approach [3,14,15,36]. The full list of identified ES, with theirrespective CICES codes, is presented in Table 2.
We calculated the total ES supply within the 50 m buffer area for the four analyzedaccess roads using Equation (1):
Ek =n
∑i=1
(aiei) (1)
where:
Ek = total ES supply in buffer k (P-ES, R-ES, or C-ES)ai = Surface of USS i present in the buffer area kei = Supply of ES of USS i (according to Table 1).
2.4.2. Identifying Hot and Cold Spots of Supply
To identify the areas with the highest and lowest supplies of ES, we mapped the hotand cold spots for P-ES, R-ES and C-ES at 90%, 95% and 99% confidence levels using theGetis-Ord Gi* tool in ArcGIS 10.1 ©. Using this method, we ensured a spatially explicit andmeaningful identification of areas containing clusters of high and low ES supplies. Theseareas were also used in the design of compensation. The analysis of hot–cold spots wasperformed over a hexagonal grid of 1 ha.
114
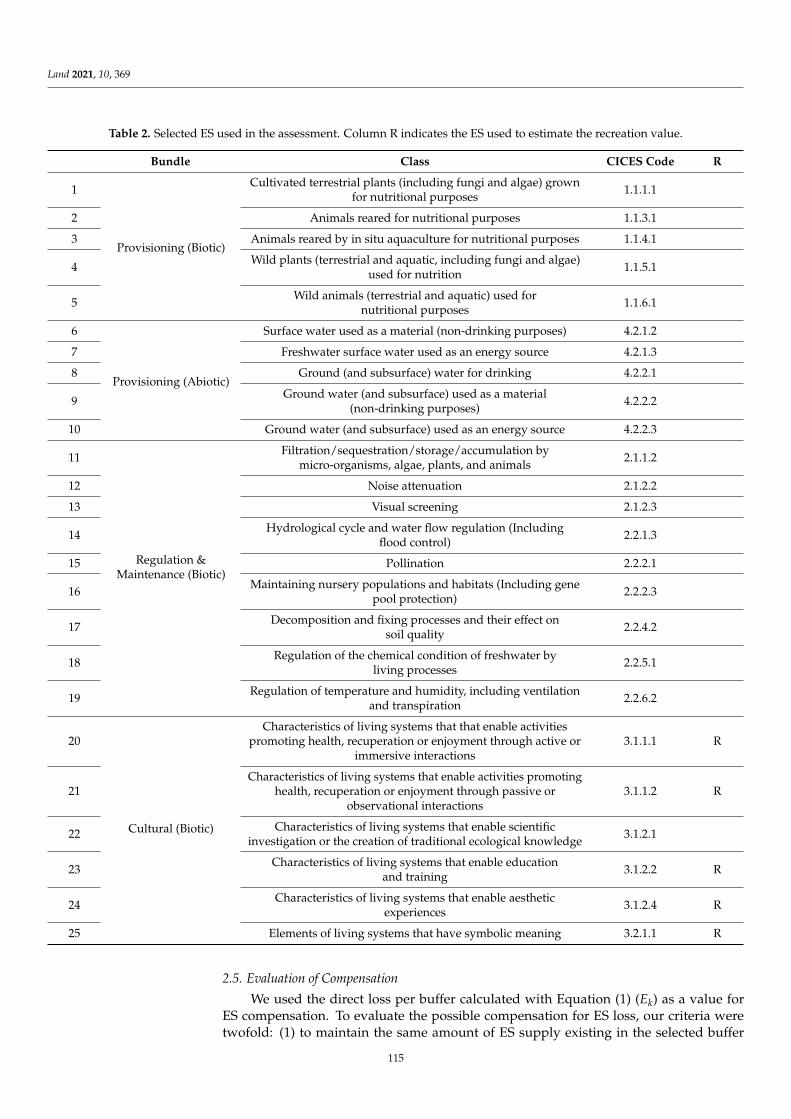
Land 2021, 10, 369
Table 2. Selected ES used in the assessment. Column R indicates the ES used to estimate the recreation value.
Bundle Class CICES Code R
1
Provisioning (Biotic)
Cultivated terrestrial plants (including fungi and algae) grownfor nutritional purposes 1.1.1.1
2 Animals reared for nutritional purposes 1.1.3.1
3 Animals reared by in situ aquaculture for nutritional purposes 1.1.4.1
4 Wild plants (terrestrial and aquatic, including fungi and algae)used for nutrition 1.1.5.1
5 Wild animals (terrestrial and aquatic) used fornutritional purposes 1.1.6.1
6
Provisioning (Abiotic)
Surface water used as a material (non-drinking purposes) 4.2.1.2
7 Freshwater surface water used as an energy source 4.2.1.3
8 Ground (and subsurface) water for drinking 4.2.2.1
9 Ground water (and subsurface) used as a material(non-drinking purposes) 4.2.2.2
10 Ground water (and subsurface) used as an energy source 4.2.2.3
11
Regulation &Maintenance (Biotic)
Filtration/sequestration/storage/accumulation bymicro-organisms, algae, plants, and animals 2.1.1.2
12 Noise attenuation 2.1.2.2
13 Visual screening 2.1.2.3
14 Hydrological cycle and water flow regulation (Includingflood control) 2.2.1.3
15 Pollination 2.2.2.1
16 Maintaining nursery populations and habitats (Including genepool protection) 2.2.2.3
17 Decomposition and fixing processes and their effect onsoil quality 2.2.4.2
18 Regulation of the chemical condition of freshwater byliving processes 2.2.5.1
19 Regulation of temperature and humidity, including ventilationand transpiration 2.2.6.2
20
Cultural (Biotic)
Characteristics of living systems that that enable activitiespromoting health, recuperation or enjoyment through active or
immersive interactions3.1.1.1 R
21Characteristics of living systems that enable activities promoting
health, recuperation or enjoyment through passive orobservational interactions
3.1.1.2 R
22 Characteristics of living systems that enable scientificinvestigation or the creation of traditional ecological knowledge 3.1.2.1
23 Characteristics of living systems that enable educationand training 3.1.2.2 R
24 Characteristics of living systems that enable aestheticexperiences 3.1.2.4 R
25 Elements of living systems that have symbolic meaning 3.2.1.1 R
2.5. Evaluation of Compensation
We used the direct loss per buffer calculated with Equation (1) (Ek) as a value forES compensation. To evaluate the possible compensation for ES loss, our criteria weretwofold: (1) to maintain the same amount of ES supply existing in the selected buffer
115
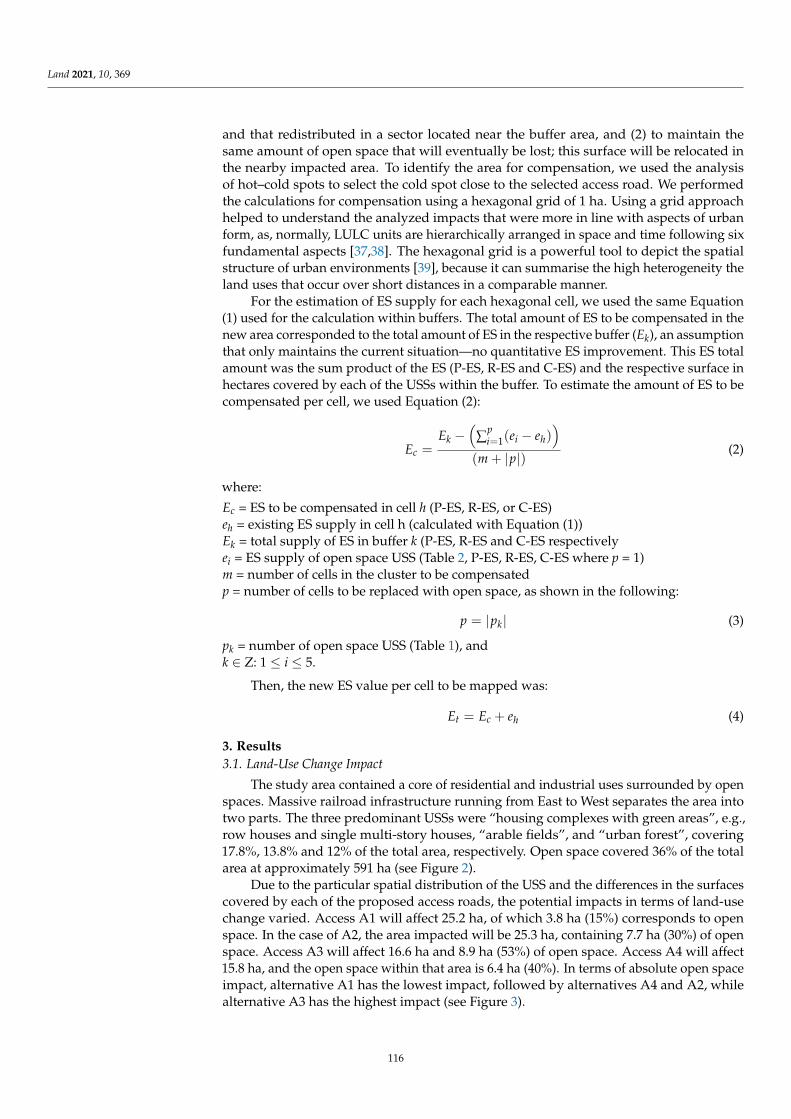
Land 2021, 10, 369
and that redistributed in a sector located near the buffer area, and (2) to maintain thesame amount of open space that will eventually be lost; this surface will be relocated inthe nearby impacted area. To identify the area for compensation, we used the analysisof hot–cold spots to select the cold spot close to the selected access road. We performedthe calculations for compensation using a hexagonal grid of 1 ha. Using a grid approachhelped to understand the analyzed impacts that were more in line with aspects of urbanform, as, normally, LULC units are hierarchically arranged in space and time following sixfundamental aspects [37,38]. The hexagonal grid is a powerful tool to depict the spatialstructure of urban environments [39], because it can summarise the high heterogeneity theland uses that occur over short distances in a comparable manner.
For the estimation of ES supply for each hexagonal cell, we used the same Equation(1) used for the calculation within buffers. The total amount of ES to be compensated in thenew area corresponded to the total amount of ES in the respective buffer (Ek), an assumptionthat only maintains the current situation—no quantitative ES improvement. This ES totalamount was the sum product of the ES (P-ES, R-ES and C-ES) and the respective surface inhectares covered by each of the USSs within the buffer. To estimate the amount of ES to becompensated per cell, we used Equation (2):
Ec =Ek −
(∑
pi=1(ei − eh)
)
(m + |p|) (2)
where:
Ec = ES to be compensated in cell h (P-ES, R-ES, or C-ES)eh = existing ES supply in cell h (calculated with Equation (1))Ek = total supply of ES in buffer k (P-ES, R-ES and C-ES respectivelyei = ES supply of open space USS (Table 2, P-ES, R-ES, C-ES where p = 1)m = number of cells in the cluster to be compensatedp = number of cells to be replaced with open space, as shown in the following:
p = |pk| (3)
pk = number of open space USS (Table 1), andk ∈ Z: 1 ≤ i ≤ 5.
Then, the new ES value per cell to be mapped was:
Et = Ec + eh (4)
3. Results3.1. Land-Use Change Impact
The study area contained a core of residential and industrial uses surrounded by openspaces. Massive railroad infrastructure running from East to West separates the area intotwo parts. The three predominant USSs were “housing complexes with green areas”, e.g.,row houses and single multi-story houses, “arable fields”, and “urban forest”, covering17.8%, 13.8% and 12% of the total area, respectively. Open space covered 36% of the totalarea at approximately 591 ha (see Figure 2).
Due to the particular spatial distribution of the USS and the differences in the surfacescovered by each of the proposed access roads, the potential impacts in terms of land-usechange varied. Access A1 will affect 25.2 ha, of which 3.8 ha (15%) corresponds to openspace. In the case of A2, the area impacted will be 25.3 ha, containing 7.7 ha (30%) of openspace. Access A3 will affect 16.6 ha and 8.9 ha (53%) of open space. Access A4 will affect15.8 ha, and the open space within that area is 6.4 ha (40%). In terms of absolute open spaceimpact, alternative A1 has the lowest impact, followed by alternatives A4 and A2, whilealternative A3 has the highest impact (see Figure 3).
116
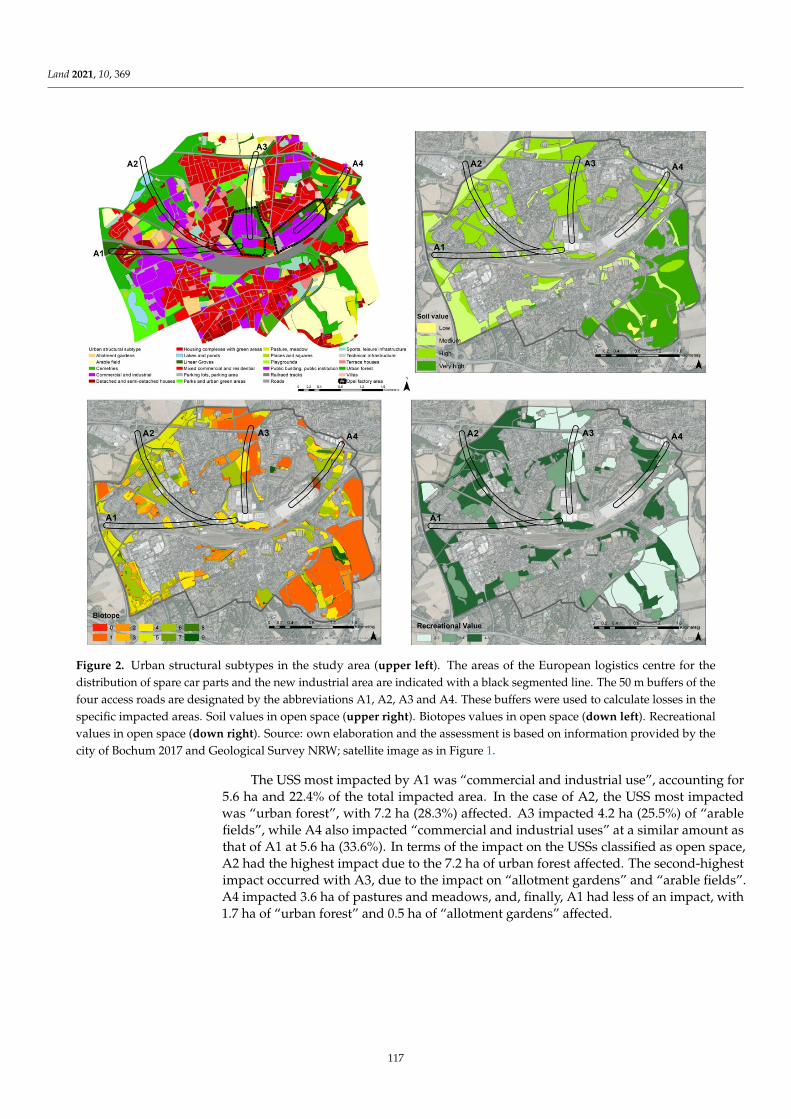
Land 2021, 10, 369
Land 2021, 10, x FOR PEER REVIEW 9 of 18
3. Results
3.1. Land-Use Change Impact
The study area contained a core of residential and industrial uses surrounded by
open spaces. Massive railroad infrastructure running from East to West separates the area
into two parts. The three predominant USSs were “housing complexes with green areas”,
e.g., row houses and single multi-story houses, “arable fields”, and “urban forest”, cover-
ing 17.8%, 13.8% and 12% of the total area, respectively. Open space covered 36% of the
total area at approximately 591 ha (see Figure 2).
Figure 2. Urban structural subtypes in the study area (upper left). The areas of the European logistics centre for the
distribution of spare car parts and the new industrial area are indicated with a black segmented line. The 50 m buffers of
the four access roads are designated by the abbreviations A1, A2, A3 and A4. These buffers were used to calculate losses
in the specific impacted areas. Soil values in open space (upper right). Biotopes values in open space (down left).
Recreational values in open space (down right). Source: own elaboration and the assessment is based on information
provided by the city of Bochum 2017 and Geological Survey NRW; satellite image as in Figure 1.
Due to the particular spatial distribution of the USS and the differences in the surfaces
covered by each of the proposed access roads, the potential impacts in terms of land-use
change varied. Access A1 will affect 25.2 ha, of which 3.8 ha (15%) corresponds to open
space. In the case of A2, the area impacted will be 25.3 ha, containing 7.7 ha (30%) of open
space. Access A3 will affect 16.6 ha and 8.9 ha (53%) of open space. Access A4 will affect
15.8 ha, and the open space within that area is 6.4 ha (40%). In terms of absolute open
space impact, alternative A1 has the lowest impact, followed by alternatives A4 and A2,
while alternative A3 has the highest impact (see Figure 3).
Figure 2. Urban structural subtypes in the study area (upper left). The areas of the European logistics centre for thedistribution of spare car parts and the new industrial area are indicated with a black segmented line. The 50 m buffers of thefour access roads are designated by the abbreviations A1, A2, A3 and A4. These buffers were used to calculate losses in thespecific impacted areas. Soil values in open space (upper right). Biotopes values in open space (down left). Recreationalvalues in open space (down right). Source: own elaboration and the assessment is based on information provided by thecity of Bochum 2017 and Geological Survey NRW; satellite image as in Figure 1.
The USS most impacted by A1 was “commercial and industrial use”, accounting for5.6 ha and 22.4% of the total impacted area. In the case of A2, the USS most impactedwas “urban forest”, with 7.2 ha (28.3%) affected. A3 impacted 4.2 ha (25.5%) of “arablefields”, while A4 also impacted “commercial and industrial uses” at a similar amount asthat of A1 at 5.6 ha (33.6%). In terms of the impact on the USSs classified as open space,A2 had the highest impact due to the 7.2 ha of urban forest affected. The second-highestimpact occurred with A3, due to the impact on “allotment gardens” and “arable fields”.A4 impacted 3.6 ha of pastures and meadows, and, finally, A1 had less of an impact, with1.7 ha of “urban forest” and 0.5 ha of “allotment gardens” affected.
117
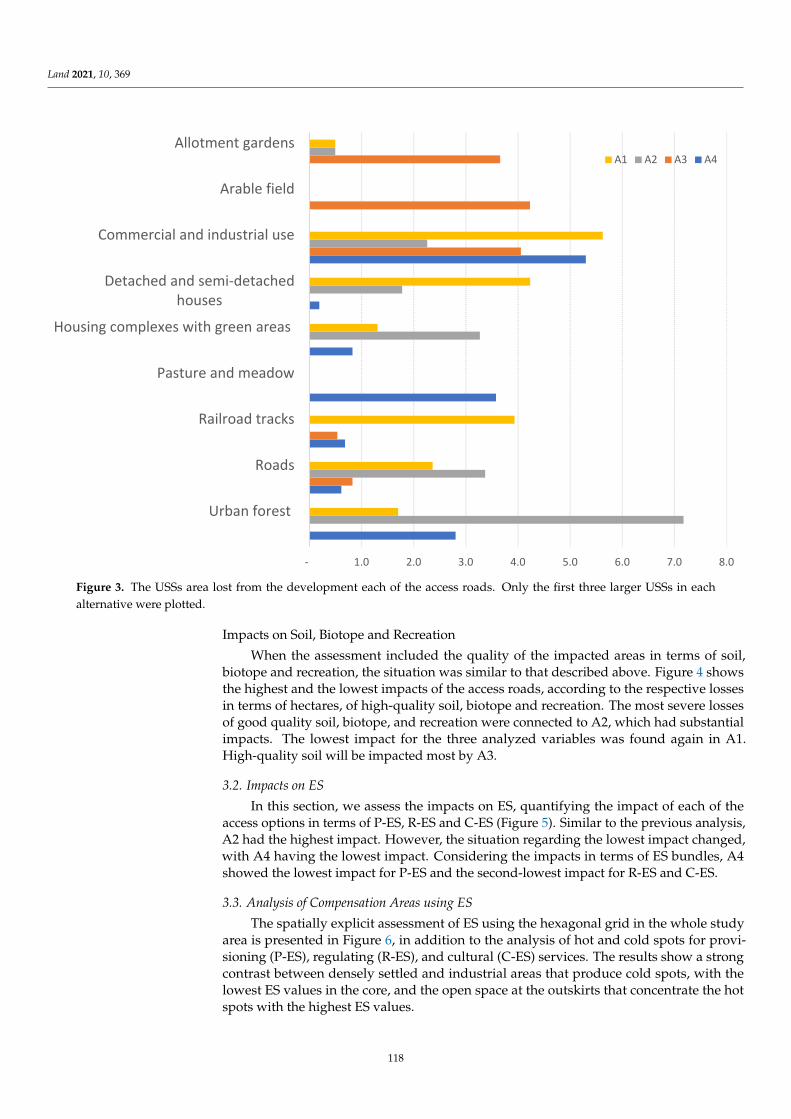
Land 2021, 10, 369Land 2021, 10, x FOR PEER REVIEW 10 of 18
Figure 3. The USSs area lost from the development each of the access roads. Only the first three larger USSs in each alter-
native were plotted.
The USS most impacted by A1 was “commercial and industrial use”, accounting for
5.6 ha and 22.4% of the total impacted area. In the case of A2, the USS most impacted was
“urban forest”, with 7.2 ha (28.3%) affected. A3 impacted 4.2 ha (25.5%) of “arable fields”,
while A4 also impacted “commercial and industrial uses” at a similar amount as that of
A1 at 5.6 ha (33.6%). In terms of the impact on the USSs classified as open space, A2 had
the highest impact due to the 7.2 ha of urban forest affected. The second-highest impact
occurred with A3, due to the impact on “allotment gardens” and “arable fields”. A4 im-
pacted 3.6 ha of pastures and meadows, and, finally, A1 had less of an impact, with 1.7 ha
of “urban forest” and 0.5 ha of “allotment gardens” affected.
3.1.1. Impacts on Soil, Biotope and Recreation
When the assessment included the quality of the impacted areas in terms of soil, bi-
otope and recreation, the situation was similar to that described above. Figure 4 shows the
highest and the lowest impacts of the access roads, according to the respective losses in
terms of hectares, of high-quality soil, biotope and recreation. The most severe losses of
good quality soil, biotope, and recreation were connected to A2, which had substantial
impacts. The lowest impact for the three analyzed variables was found again in A1. High-
quality soil will be impacted most by A3.
- 1.0 2.0 3.0 4.0 5.0 6.0 7.0 8.0
Urban forest
Roads
Railroad tracks
Pasture and meadow
Housing complexes with green areas
Detached and semi-detachedhouses
Commercial and industrial use
Arable field
Allotment gardensA1 A2 A3 A4
Figure 3. The USSs area lost from the development each of the access roads. Only the first three larger USSs in eachalternative were plotted.
Impacts on Soil, Biotope and Recreation
When the assessment included the quality of the impacted areas in terms of soil,biotope and recreation, the situation was similar to that described above. Figure 4 showsthe highest and the lowest impacts of the access roads, according to the respective lossesin terms of hectares, of high-quality soil, biotope and recreation. The most severe lossesof good quality soil, biotope, and recreation were connected to A2, which had substantialimpacts. The lowest impact for the three analyzed variables was found again in A1.High-quality soil will be impacted most by A3.
3.2. Impacts on ES
In this section, we assess the impacts on ES, quantifying the impact of each of theaccess options in terms of P-ES, R-ES and C-ES (Figure 5). Similar to the previous analysis,A2 had the highest impact. However, the situation regarding the lowest impact changed,with A4 having the lowest impact. Considering the impacts in terms of ES bundles, A4showed the lowest impact for P-ES and the second-lowest impact for R-ES and C-ES.
3.3. Analysis of Compensation Areas using ES
The spatially explicit assessment of ES using the hexagonal grid in the whole studyarea is presented in Figure 6, in addition to the analysis of hot and cold spots for provi-sioning (P-ES), regulating (R-ES), and cultural (C-ES) services. The results show a strongcontrast between densely settled and industrial areas that produce cold spots, with thelowest ES values in the core, and the open space at the outskirts that concentrate the hotspots with the highest ES values.
118
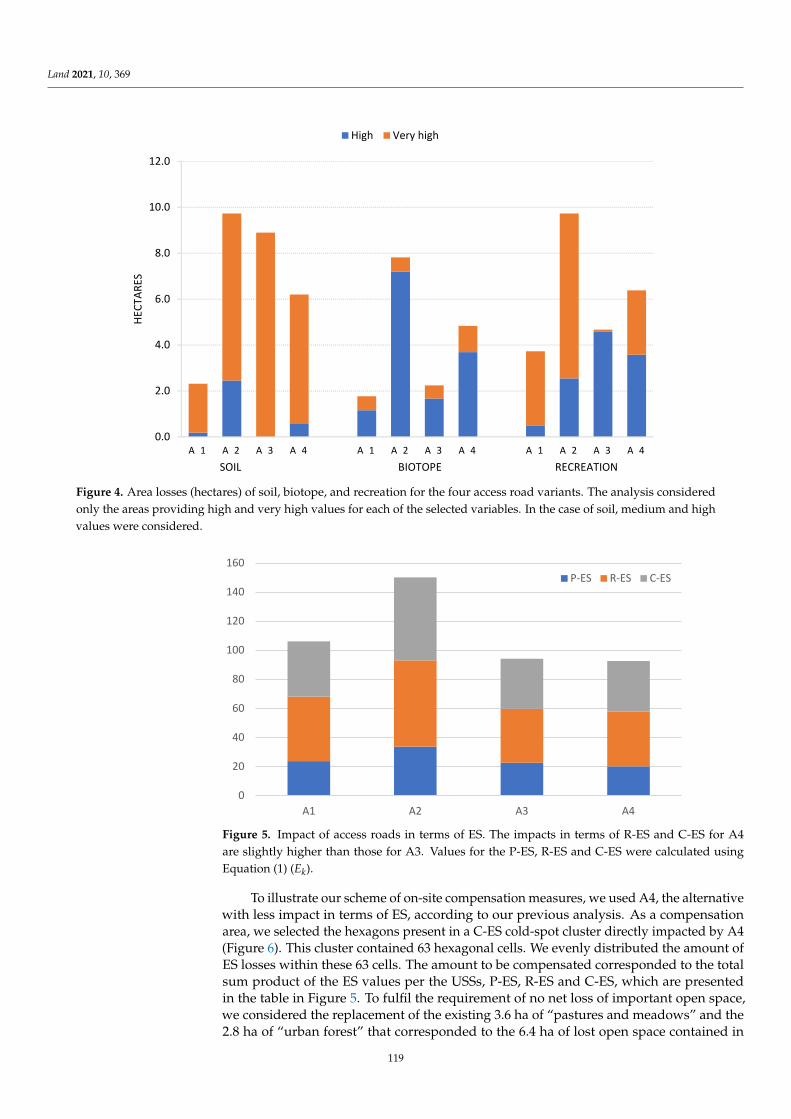
Land 2021, 10, 369Land 2021, 10, x FOR PEER REVIEW 11 of 18
Figure 4. Area losses (hectares) of soil, biotope, and recreation for the four access road variants. The analysis considered
only the areas providing high and very high values for each of the selected variables. In the case of soil, medium and high
values were considered.
3.2. Impacts on ES
In this section, we assess the impacts on ES, quantifying the impact of each of the
access options in terms of P-ES, R-ES and C-ES (Figure 5). Similar to the previous analysis,
A2 had the highest impact. However, the situation regarding the lowest impact changed,
with A4 having the lowest impact. Considering the impacts in terms of ES bundles, A4
showed the lowest impact for P-ES and the second-lowest impact for R-ES and C-ES.
Figure 5. Impact of access roads in terms of ES. The impacts in terms of R-ES and C-ES for A4 are
slightly higher than those for A3. Values for the P-ES, R-ES and C-ES were calculated using Equa-
tion 1 (Ek).
0.0
2.0
4.0
6.0
8.0
10.0
12.0
A 1 A 2 A 3 A 4 A 1 A 2 A 3 A 4 A 1 A 2 A 3 A 4
HEC
TAR
ES
SOIL BIOTOPE RECREATION
High Very high
0
20
40
60
80
100
120
140
160
A1 A2 A3 A4
P-ES R-ES C-ES
Figure 4. Area losses (hectares) of soil, biotope, and recreation for the four access road variants. The analysis consideredonly the areas providing high and very high values for each of the selected variables. In the case of soil, medium and highvalues were considered.
Land 2021, 10, x FOR PEER REVIEW 11 of 18
Figure 4. Area losses (hectares) of soil, biotope, and recreation for the four access road variants. The analysis considered
only the areas providing high and very high values for each of the selected variables. In the case of soil, medium and high
values were considered.
3.2. Impacts on ES
In this section, we assess the impacts on ES, quantifying the impact of each of the
access options in terms of P-ES, R-ES and C-ES (Figure 5). Similar to the previous analysis,
A2 had the highest impact. However, the situation regarding the lowest impact changed,
with A4 having the lowest impact. Considering the impacts in terms of ES bundles, A4
showed the lowest impact for P-ES and the second-lowest impact for R-ES and C-ES.
Figure 5. Impact of access roads in terms of ES. The impacts in terms of R-ES and C-ES for A4 are
slightly higher than those for A3. Values for the P-ES, R-ES and C-ES were calculated using Equa-
tion 1 (Ek).
0.0
2.0
4.0
6.0
8.0
10.0
12.0
A 1 A 2 A 3 A 4 A 1 A 2 A 3 A 4 A 1 A 2 A 3 A 4
HEC
TAR
ES
SOIL BIOTOPE RECREATION
High Very high
0
20
40
60
80
100
120
140
160
A1 A2 A3 A4
P-ES R-ES C-ES
Figure 5. Impact of access roads in terms of ES. The impacts in terms of R-ES and C-ES for A4are slightly higher than those for A3. Values for the P-ES, R-ES and C-ES were calculated usingEquation (1) (Ek).
To illustrate our scheme of on-site compensation measures, we used A4, the alternativewith less impact in terms of ES, according to our previous analysis. As a compensationarea, we selected the hexagons present in a C-ES cold-spot cluster directly impacted by A4(Figure 6). This cluster contained 63 hexagonal cells. We evenly distributed the amount ofES losses within these 63 cells. The amount to be compensated corresponded to the totalsum product of the ES values per the USSs, P-ES, R-ES and C-ES, which are presentedin the table in Figure 5. To fulfil the requirement of no net loss of important open space,we considered the replacement of the existing 3.6 ha of “pastures and meadows” and the2.8 ha of “urban forest” that corresponded to the 6.4 ha of lost open space contained in
119
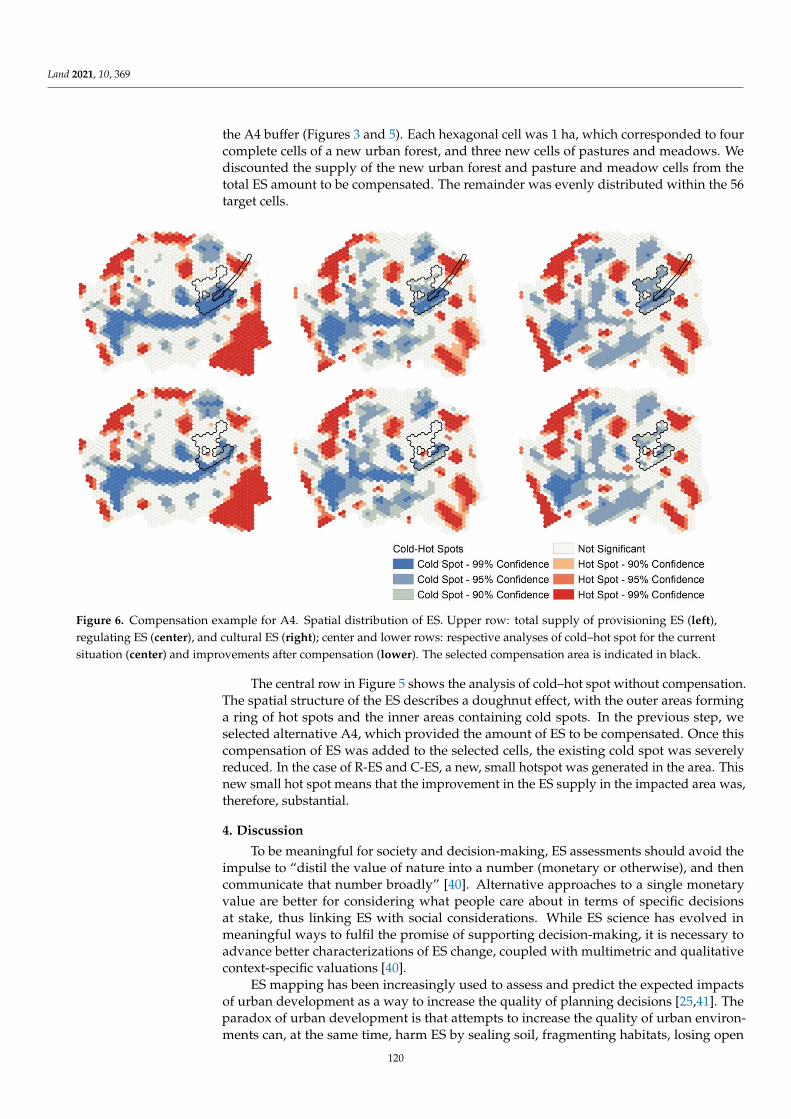
Land 2021, 10, 369
the A4 buffer (Figures 3 and 5). Each hexagonal cell was 1 ha, which corresponded to fourcomplete cells of a new urban forest, and three new cells of pastures and meadows. Wediscounted the supply of the new urban forest and pasture and meadow cells from thetotal ES amount to be compensated. The remainder was evenly distributed within the 56target cells.
Land 2021, 10, x FOR PEER REVIEW 12 of 18
3.3. Analysis of Compensation Areas using ES
The spatially explicit assessment of ES using the hexagonal grid in the whole study
area is presented in Figure 6, in addition to the analysis of hot and cold spots for
provisioning (P-ES), regulating (R-ES), and cultural (C-ES) services. The results show a
strong contrast between densely settled and industrial areas that produce cold spots, with
the lowest ES values in the core, and the open space at the outskirts that concentrate the
hot spots with the highest ES values.
Figure 6. Compensation example for A4. Spatial distribution of ES. Upper row: total supply of provisioning ES (left),
regulating ES (center), and cultural ES (right); center and lower rows: respective analyses of cold–hot spot for the current
situation (center) and improvements after compensation (lower). The selected compensation area is indicated in black.
To illustrate our scheme of on-site compensation measures, we used A4, the alterna-
tive with less impact in terms of ES, according to our previous analysis. As a compensation
area, we selected the hexagons present in a C-ES cold-spot cluster directly impacted by
A4 (Figure 6). This cluster contained 63 hexagonal cells. We evenly distributed the amount
of ES losses within these 63 cells. The amount to be compensated corresponded to the total
sum product of the ES values per the USSs, P-ES, R-ES and C-ES, which are presented in
the table in Figure 5. To fulfil the requirement of no net loss of important open space, we
considered the replacement of the existing 3.6 ha of “pastures and meadows” and the 2.8
ha of “urban forest” that corresponded to the 6.4 ha of lost open space contained in the A4
buffer (Figures 3 and 5). Each hexagonal cell was 1 ha, which corresponded to four com-
plete cells of a new urban forest, and three new cells of pastures and meadows. We dis-
counted the supply of the new urban forest and pasture and meadow cells from the total
ES amount to be compensated. The remainder was evenly distributed within the 56 target
cells.
The central row in Figure 5 shows the analysis of cold–hot spot without compensa-
tion. The spatial structure of the ES describes a doughnut effect, with the outer areas form-
ing a ring of hot spots and the inner areas containing cold spots. In the previous step, we
selected alternative A4, which provided the amount of ES to be compensated. Once this
compensation of ES was added to the selected cells, the existing cold spot was severely
Figure 6. Compensation example for A4. Spatial distribution of ES. Upper row: total supply of provisioning ES (left),regulating ES (center), and cultural ES (right); center and lower rows: respective analyses of cold–hot spot for the currentsituation (center) and improvements after compensation (lower). The selected compensation area is indicated in black.
The central row in Figure 5 shows the analysis of cold–hot spot without compensation.The spatial structure of the ES describes a doughnut effect, with the outer areas forminga ring of hot spots and the inner areas containing cold spots. In the previous step, weselected alternative A4, which provided the amount of ES to be compensated. Once thiscompensation of ES was added to the selected cells, the existing cold spot was severelyreduced. In the case of R-ES and C-ES, a new, small hotspot was generated in the area. Thisnew small hot spot means that the improvement in the ES supply in the impacted area was,therefore, substantial.
4. Discussion
To be meaningful for society and decision-making, ES assessments should avoid theimpulse to “distil the value of nature into a number (monetary or otherwise), and thencommunicate that number broadly” [40]. Alternative approaches to a single monetaryvalue are better for considering what people care about in terms of specific decisionsat stake, thus linking ES with social considerations. While ES science has evolved inmeaningful ways to fulfil the promise of supporting decision-making, it is necessary toadvance better characterizations of ES change, coupled with multimetric and qualitativecontext-specific valuations [40].
ES mapping has been increasingly used to assess and predict the expected impactsof urban development as a way to increase the quality of planning decisions [25,41]. Theparadox of urban development is that attempts to increase the quality of urban environ-ments can, at the same time, harm ES by sealing soil, fragmenting habitats, losing open
120
Land 2021, 10, 369
space, and diminishing important vegetation structures, and, therefore, threaten humanwell-being [25,42].
Our empirical, methodological approach can counteract urban development short-comings in a sound environmental compensation manner that accounts for the losses of ES.The proposed consideration of the spatial distribution of ES in a wider area surrounding asite that is affected by land-use change broadens the perspective. Our assessment gives anoverall picture of an area’s environmental situation, allowing multiple possible analyses ofenvironmental performances, risks and strengths. We illustrated only three environmentalaspects: soil, biotope and recreation. Similar studies have proven ES mapping a powerfulinput for scenario evaluation [3]. Here, we demonstrated that ES mapping using expertassessment can assist in evaluating possible impacts arising from urban developmentand in analyzing compensation. We presented two ways to analyze the impacts of urbandevelopment, with contrasting results. One way was based on the area-weighted loss ofprotected environmental goods, and the other way highlighted the impacts on ES. Themerit of an ES assessment, as analyzed in the introduction (Section 1.2), is that it integratesinto the decision-making process the hidden or underrepresented values of nature thatcould eventually be lost. Our analysis also included the full spectrum of USSs and therespective benefits that society receives from ecosystems in such areas. An analysis basedon expert assessments of ES and the LULC matrix is highly correlated with biophysicalmeasurements [16]. Therefore, our assessment is suitable for rapid preliminary evaluationsand can be complemented or improved with biophysical measurements of key ES for amore complex analysis.
4.1. Limitations
There are two general limitations to consider when using our approach. The firstlimitation is that we used a general delineation of the planned roads. A more detailedassessment should use the exact delineation as detailed in engineering plans. The secondlimitation is that we did not assess in detail the area compensated in terms of USSs. Ingeneral, it is always possible to increase the supply of ES by including NbS in existing urbanareas. However, a detailed estimation is necessary according to specific urban morphology.
4.2. The Role of Participatory Processes
Public participation can be greatly supported by using ES as a basis for guidingdiscussions and focusing on synergies and trade-offs between development options andstakeholder groups [1]. Our method allows the integration of civil society, a key aspect ofparticipatory planning [1]. In the participatory process held in urban planning, argumenta-tive lock-in-situations can block sustainable urban development. Environmentalists andenvironmental authorities remain in fierce opposition to municipal development agenciesand developers. The former focuses on protection; the latter favours using open spacefor urban development while offering new economic possibilities and jobs. As a conse-quence, and due to powerful lobbies, city councils often overrule environmental concerns.Consequently, there is progress for one group of stakeholders only, at the expense of theother groups. We illustrated the procedure with an actual case study, with results that canfeed a participatory process. Our method allows the use of participatory planning, wherestakeholders and experts can identify development alternatives that could be judged bycitizens assisting in a structured decision-making process that is value-focused, i.e., ableto express what matters to people, and analytic, i.e., ascertains trade-offs between alterna-tives, as suggested by Chan [40]. Such an approach, where ES “values drive alternativescenarios and spatial analysis of benefits and costs” [40] holds the potential for reducingthe social impacts brought on by urban development [1]. The theoretical basis of the ESframework is robust, but to put it into practice requires the involvement of key agents ofdevelopment [43].
121
Land 2021, 10, 369
4.3. Environmental Encroachment Paradox
The assessment of environmental impacts induced by land-use change, such as theconstruction of road infrastructure, requires the inclusion of neighbouring areas that arespatially and functionally related to the directly affected site, and the taking into accountof the urban context of urban transformations at larger scales. When ES are not assessed inareas where urban development takes place, the supply of ES might be reduced, affectingthe well-being of residents. This local loss of ES can occur even if the overall ES supplyremains equal or has been improved at larger scales.
The traditional approach of environmental impact assessments is to assess and judgepossible encroachment on the environment expected at specific development sites. Manda-tory compensation for the loss of nature (e.g., according to Directive 2011/92/EU) [44] isoften restricted to replacing urban green spaces by improving rural or peri-urban greenspaces, as in the case of German legislation [45]. According to the current legislationin Germany, compensation is restricted to the encroachment of legally protected goods(people and especially human health, animals, plants, biodiversity, soil, water, air, climateand landscape, cultural heritage and other properties, as well as interactions betweenprotected goods) and must be carried out by balancing the loss of biotopes by increasingthe quality of biotopes in other places. Typical compensation measures are planting trees,creating artificial wetlands, and transforming arable fields into species-rich meadows, orsimply compensating by setting aside money for nature conservation purposes withoutany direct localised effect. These sites do not necessarily need to be close to the areaof environmental encroachment. At the moment, even eco-accounting between distantlocations and monetary compensation is legally possible. The highly valued vegetationwill be placed far from the location of encroachment, making the compensation measuresfrom such assessments lead to an upgrade in the quality of already existing open and greenspaces elsewhere. Consequently, the environmental quality of the directly affected people,those living in the affected area, would not profit from such compensation. Thus, benefitsmay not be noticeable on or near the site impacted by the land-use change. Eventually,shifting compensation in distant areas means a deterioration of the supply of ES in theaffected area.
Such legally binding, mandatory compensation for the loss of nature has severalshortcomings: (i) compensation is carried out by replacing vegetation with vegetation;(ii) the loss of ES in areas to be developed is neglected; and (iii) the current environmentalstatus is not improved. Vegetation and protection of species serve as the main indicatorsof the value of green elements. The degree of compensation is usually calculated bymultiplying the biotope value with the area of the lost urban green space, neglecting otherES; and (iv) in practice, compensation is allowed to occur in distant areas, far from theaffected site. In contrast, we suggest that compensation should include measures thatmaintain or eventually improve the environmental and living conditions in the affected area.Such measures could include countermeasures against urban heat islands, the realisationof nature-based solutions (NbS) against urban flash floods, reclamation of brownfields,river restoration, and other NbS. Using an ES assessment, it is possible to improve existingenvironmental quality in the affected areas. Our method goes beyond the calculation ofimpacts for each variant. We show how urban development can contribute to improving theoverall environmental situation of areas subject to development, using the ES framework.
The consideration of the broad spectrum of NbS, along with ES supply, can open a vastrange of possibilities for compensation. Admittedly, regulations that define compensationmeasures might have to be diversified, and practice in municipal administrations andconsultancies needs to be adapted, for the ES concept to unfold its full advantage.
4.4. Estimating Urban Development Compensations with ES
To apply the ES framework in urban settings, it is necessary to include all types ofurban areas belonging to the urban ecosystem, to consider the full spectrum of land-usesand not restrict the analysis only to the urban green space, as normally occurs [37]. Dif-
122
Land 2021, 10, 369
ferent degrees of urbanisation will deliver ES at different intensities, which can be higherfor some bundles, such as cultural services, or lower for others, such as provisioningservices [12,31,36]. Restricting the analyses only to green areas is a conceptual and method-ological shortcoming which constrains the chances to ameliorate development alternativesin the places where it is needed. Furthermore, combining compensation measure deter-mination with an ES assessment can improve preexisting situations, as we have indicatedwith our analysis.
Our approach ensures that the supply of ES will be maintained in the impacted areas,considering the broad spectrum of USSs. This means that the benefits of nature can befound everywhere. The relevance lies in the amount of ES—to maintain or increase whenthe amount is too low. Nature is not restricted to open space.
In our approach we considered no net loss of ES, i.e., maintaining the existing supply.It is also possible to apply this procedure to improve an existing situation. This could berealized by introducing a coefficient defining a target for ES improvement in the specificcompensation area, or by targeting specific cold spots to transform them into hot spots.
4.5. ES and Urban Form: Spatial Distribution Matters
Enhancing the supply of ES in urban environments involves aspects of spatial distri-bution. In our approach, we maintained the same amount of preexisting ES that had beenrelocated to a nearby area previously identified as a cold spot for cultural ES. The analysisof cold and hot spots after the calculation of the compensation showed that the formercold spot was diminished in size, and partially transformed into a hot spot. This outcomeindicated a substantial change in the spatial structure of the ES supply. It also showed thatthe supply of ES can be enhanced, even when no explicit quantitative improvements areconsidered, because a spatial structural assessment was involved in the supply of ES. Ourresults are in line with those in a similar study by Thomas [46], which showed that onlyby changing the spatial distribution of ES supply areas can the overall supply be altered,enhanced or diminished.
5. Conclusions
Our findings are relevant to research on the spatial structure of urban ES and thechanges introduced by urban development. The peculiarities of the spatial structures foundin urban areas, high heterogeneity, and complexity over relatively short distances, makethe urban form a fundamental aspect to consider within ES assessments. Using USSs anda matrix-based approach for the assessment of ES allows the incorporation of the urbanspatial structure that underpins the supply of ES. In our assessment, we illustrated howthe selection of road alternatives can be improved by using an ES framework.
Our method illustrates how to improve planning procedures using an ES based ap-proach. The suggested methodology is meant to counteract some of the shortcomings oftraditional, legally binding regulations for environmental compensation due to urban de-velopment. Our method aims to strengthen urban resilience with a holistic understanding,using ES. The advantages of our method are the following: (i) not restricting compensationto merely accounting biotopes, but considering a wide range of ES; (ii) taking into accountthe overall spatial distribution of ES in the affected area in the search of legally manda-tory compensation; (iii) highlighting synergies and trade-offs and allowing for NbS andstrategic implementation of green infrastructure measures to leverage co-benefits [47]; and(iv) providing compensation near the affected locations.
Author Contributions: Conceptualization, H.Z. and L.I.; data curation, H.Z. and L.I.; formal analysis,L.I.; funding acquisition, H.Z. and L.I.; investigation, H.Z. and L.I.; methodology, H.Z. and L.I.;visualization, H.Z. and L.I.; writing—original draft, H.Z. and L.I.; writing—review and editing, H.Z.and L.I. All authors have read and agreed to the published version of the manuscript.
Funding: The finalization of this paper was supported by the research project, “Implementation of theConcept of Ecosystem Services in the Planning of Green Infrastructure to Strengthen the Resilience of
123
Land 2021, 10, 369
the Metropolis Ruhr and Shanghai—research grant 01LE1805A”, funded by the Bundesministeriumfür Bildung und Forschung (BMBF).
Data Availability Statement: Data available on request. The data presented in this study areavailable on request from the corresponding author.
Acknowledgments: Mapping was partly carried out in a transformation lab within the frameworkof the Double Degree Master Program, “Transformation of Urban Landscapes”, jointly offered byRuhr-Universität Bochum and Tongji-University, Shanghai.
Conflicts of Interest: The authors declare no conflict of interest.
References1. Fürst, C.; Opdam, P.; Inostroza, L.; Luque, S. Evaluating the role of ecosystem services in participatory land use planning:
Proposing a balanced score card. Landsc. Ecol. 2014, 29, 1435–1446. [CrossRef]2. La Rosa, D.; Spyra, M.; Inostroza, L. Indicators of Cultural Ecosystem Services for urban planning: A review. Ecol. Indic. 2016, 61,
74–89. [CrossRef]3. Mukul, S.A.; Sohel, M.S.I.; Herbohn, J.; Inostroza, L.; König, H. Integrating ecosystem services supply potential from future
land-use scenarios in protected area management: A Bangladesh case study. Ecosyst. Serv. 2017, 26, 355–364. [CrossRef]4. Gómez-Baggethun, E.; Barton, D.N. Classifying and valuing ecosystem services for urban planning. Ecol. Econ. 2013, 86, 235–245.
[CrossRef]5. Wolch, J.R.; Byrne, J.; Newell, J.P. Urban green space, public health, and environmental justice: The challenge of making cities
‘just green enough’. Landsc. Urban Plan. 2014, 125, 234–244. [CrossRef]6. Stepniewska, M.; Zwierzchowska, I.; Mizgajski, A. Capability of the Polish legal system to introduce the ecosystem services
approach into environmental management. Ecosyst. Serv. 2018, 29, 271–281. [CrossRef]7. European Union. Green Infrastructure (GI)—Enhancing Europe’s Natural Capital; EU: Brussels, Belgium, 2013.8. Costanza, R.; de Groot, R.; Braat, L.; Kubiszewski, I.; Fioramonti, L.; Sutton, P.; Farber, S.; Grasso, M. Twenty years of ecosystem
services: How far have we come and how far do we still need to go? Ecosyst. Serv. 2017, 28, 1–16. [CrossRef]9. Burkhard, B.; Maes, J. Mapping Ecosystem Services, 1st ed.; Burkhard, B., Maes, J., Eds.; PENSOFT Publishers: Sofia, Bulgaria, 2017.
[CrossRef]10. Haines-Young, R.; Potschin, M. Categorisation Systems: The Classification Challenge. 2016. Available online: https://www.
nottingham.ac.uk/cem/pdf/CEM_Report15.pdf (accessed on 9 February 2021).11. Haines-Young, R.; Potschin, M. Common International Classification of Ecosystem Services (CICES) V5. 1. Guidance on the Application
of the Revised Structure; Fabis Consulting: Nottingham, UK, 2018.12. Inostroza, L.; de la Barrera, F. Ecosystem Services and Urbanisation. A Spatially Explicit Assessment in Upper Silesia, Central
Europe. IOP Conf. Ser. Mater. Sci. Eng. 2019, 471, 092028. [CrossRef]13. Braat, L.C.; de Groot, R. The ecosystem services agenda: Bridging the worlds of natural science and economics, conservation and
development, and public and private policy. Ecosyst. Serv. 2012, 1, 4–15. [CrossRef]14. Montoya-Tangarife, C.; Barrera, F.D.e.; Salazar, A.; Inostroza, L.; de la Barrera, F.; Salazar, A.; Inostroza, L. Monitoring the Effects
of Land Cover Change on the Supply of Ecosystem Services in an Urban Region: A Study of Santiago-Valparaı Chile. PLoS ONE2017, 12, e0188117. [CrossRef]
15. Burkhard, B.; Kroll, F.; Nedkov, S.; Müller, F. Mapping ecosystem service supply, demand and budgets. Ecol. Indic. 2012, 21, 17–29.[CrossRef]
16. Roche, P.K.; Campagne, C.S. Are expert-based ecosystem services scores related to biophysical quantitative estimates? Ecol. Indic.2019, 106, 105421. [CrossRef]
17. Hansen, R.; Frantzeskaki, N.; McPhearson, T.; Rall, E.L.; Kabisch, N.; Kaczorowska, A.; Kain, J.-H.; Artmann, M.; Pauleit, S. Theuptake of the ecosystem services concept in planning discourses of European and American cities. Ecosyst. Serv. 2015, 12, 228–246.[CrossRef]
18. Cortinovis, C.; Geneletti, D. Ecosystem services in urban plans: What is there, and what is still needed for better decisions. LandUse Policy 2018, 70, 298–312. [CrossRef]
19. Geneletti, D.; Cortinovis, C.; Zardo, L.; Esmail, B.A. Planning for Ecosystem Services in Cities; Springer Nature: Cham, Switzerland,2020. [CrossRef]
20. Baró, F.; Haase, D.; Gómez-Baggethun, E.; Frantzeskaki, N. Mismatches between ecosystem services supply and demand in urbanareas: A quantitative assessment in five European cities. Ecol. Indic. 2015, 55, 146–158. [CrossRef]
21. Moore, S.A. Testing a Mature Hypothesis: Reflection on “Green Cities, Growing Cities, Just Cities: Urban Planning and theContradiction of Sustainable Development”. J. Am. Plan. Assoc. 2016, 82, 385–388. [CrossRef]
22. McKenzie, E.; Posner, S.; Tillmann, P.; Bernhardt, J.R.; Howard, K.; Rosenthal, A. Understanding the Use of Ecosystem ServiceKnowledge in Decision Making: Lessons from International Experiences of Spatial Planning. Environ. Plan. C Gov. Policy 2014, 32,320–340. [CrossRef]
124
Land 2021, 10, 369
23. Wright, W.C.; Eppink, F.V.; Greenhalgh, S. Are ecosystem service studies presenting the right information for decision making?Ecosyst. Serv. 2017, 25, 128–139. [CrossRef]
24. Kaczorowska, A.; Kain, J.-H.; Kronenberg, J.; Haase, D. Ecosystem services in urban land use planning: Integration challenges incomplex urban settings—Case of Stockholm. Ecosyst. Serv. 2016, 22, 204–212. [CrossRef]
25. Cortinovis, C.; Geneletti, D. A performance-based planning approach integrating supply and demand of urban ecosystemservices. Landsc. Urban Plan. 2020, 201, 103842. [CrossRef]
26. European Commission. EU Biodiversity Strategy for 2030 Bringing Nature Back into Our Lives; European Commission: Brussels,Belgium, 2020.
27. European Union. Territorial Agenda 2030. A Future for All Places; Informal meeting of Ministers responsible for Spatial Planningand Territorial Development and/or Territorial Cohesion; EU: Brussels, Belgium, 2020.
28. European Commission. EU Guidance on Integrating Ecosystems and Their Services into Decision—Part 1/3; European Commission:Brussels, Belgium, 2019.
29. European Commission. EU Guidance on Integrating Ecosystems and Their Services into Decision-Making—2/3; European Commission:Brussels, Belgium, 2019.
30. Robertson, R. Glocalization. In The International Encyclopedia of Anthropology; John Wiley & Sons, Ltd.: Hoboken, NJ, USA, 2018.[CrossRef]
31. Zepp, H.; Andrzej, M.; Mess, C.; Zwierzchowska, I. A Preliminary Assessment of Urban Ecosystem Services in Central EuropeanUrban Areas. A Methodological Outline with Examples from Bochum (Germany) and Poznan (Poland). Ber. Geogr. Landeskd.2016, 90, 67–84.
32. Bastian, O.L.A.F. Biotope Mapping and Evaluation as a Base of Nature Conservation and Landscape Planning. Ekologia 1996,15, 5–17.
33. Schrey, H.P. Bodenkarte von Nordrhein-Westfalen 1:50.000. Inhalt, Aufbau, Auswertung; Geologischer Dienst Nordrhein-Westfalen:Krefeld, Germany, 2014.
34. Kopperoinen, L.; Itkonen, P.; Niemelä, J. Using expert knowledge in combining green infrastructure and ecosystem services inland use planning: An insight into a new place-based methodology. Landsc. Ecol. 2014, 29, 1361–1375. [CrossRef]
35. Rozas-Vásquez, D.; Fürst, C.; Geneletti, D.; Muñoz, F. Multi-actor involvement for integrating ecosystem services in strategicenvironmental assessment of spatial plans. Environ. Impact Assess. Rev. 2017, 62, 135–146. [CrossRef]
36. Inostroza, L. Clustering Spatially Explicit Bundles of Ecosystem Services in A Central European Region. IOP Conf. Ser. Mater. Sci.Eng. 2019, 471, 092027. [CrossRef]
37. Zepp, H.; Inostroza, L.; Sutcliffe, R.; Ahmed, S.; Moebus, S. Neighbourhood Environmental Contribution and Health. A novelindicator integrating urban form and urban green. Chang. Adapt. Socio-Ecol. Syst. 2018, 4, 46–51. [CrossRef]
38. Wentz, E.A.; York, A.M.; Alberti, M.; Conrow, L.; Fischer, H.; Inostroza, L.; Jantz, C.; Pickett, S.T.; Seto, K.C.; Taubenböck, H. Sixfundamental aspects for conceptualizing multidimensional urban form: A spatial mapping perspective. Landsc. Urban Plan. 2018,179, 55–62. [CrossRef]
39. Spyra, M.; Inostroza, L.; Hamerla, A.; Bondaruk, J. Ecosystem services deficits in cross-boundary landscapes: Spatial mismatchesbetween green and grey systems. Urban Ecosyst. 2019, 22, 37–47. [CrossRef]
40. Chan, K.M.A.; Satterfield, T. The maturation of ecosystem services: Social and policy research expands, but whither biophysicallyinformed valuation? People Nat. 2020, 2, 1021–1060. [CrossRef]
41. Grêt-Regamey, A.; Altwegg, J.; Sirén, E.A.; van Strien, M.J.; Weibel, B. Integrating ecosystem services into spatial planning—Aspatial decision support tool. Landsc. Urban Plan. 2017, 165, 206–219. [CrossRef]
42. Alberti, M. The Effects of Urban Patterns on Ecosystem Function. Int. Reg. Sci. Rev. 2005, 28, 168–192. [CrossRef]43. Inostroza, L.; König, H.J.; Pickard, B.; Zhen, L. Putting ecosystem services into practice: Trade-off assessment tools, indicators and
decision support systems. Ecosyst. Serv. 2017, 26, 303–305. [CrossRef]44. European Union. Directive 2011/92/EU of the European Parliament and of the Council of 13 December 2011 on the Assessment of the
Effects of Certain Public and Private Projects on the Environment; European Union: Brussels, Belgium, 2011.45. Federal Ministry of the Environment, Nature Conservation and Nuclear Safety. Act on Nature Conservation and Landscape
Management; Federal Law Gazette [Bundesgesetzblatt] I p. 2542; Federal Ministry of the Environment, Nature Conservation andNuclear Safety: Berlin, Germany, 2009; p. 74. [CrossRef]
46. Thomas, A.; Masante, D.; Jackson, B.; Cosby, B.; Emmett, B.; Jones, L. Fragmentation and Thresholds in Hydrological Flow-BasedEcosystem Services. Ecol. Appl. 2020, 30, 1–14. [CrossRef]
47. Meerow, S.; Newell, J.P. Spatial planning for multifunctional green infrastructure: Growing resilience in Detroit. Landsc. UrbanPlan. 2017, 159, 62–75. [CrossRef]
125

land
Article
The Potential of Tram Networks in the Revitalization of theWarsaw Landscape
Jan Łukaszkiewicz 1 , Beata Fortuna-Antoszkiewicz 1, Łukasz Oleszczuk 2 and Jitka Fialová 3,*
�����������������
Citation: Łukaszkiewicz, J.;
Fortuna-Antoszkiewicz, B.;
Oleszczuk, Ł.; Fialová, J. The
Potential of Tram Networks in the
Revitalization of the Warsaw
Landscape. Land 2021, 10, 375.
https://doi.org/10.3390/
land10040375
Academic Editors: Alessio Russo and
Giuseppe T. Cirella
Received: 26 February 2021
Accepted: 1 April 2021
Published: 4 April 2021
Publisher’s Note: MDPI stays neutral
with regard to jurisdictional claims in
published maps and institutional affil-
iations.
Copyright: © 2021 by the authors.
Licensee MDPI, Basel, Switzerland.
This article is an open access article
distributed under the terms and
conditions of the Creative Commons
Attribution (CC BY) license (https://
creativecommons.org/licenses/by/
4.0/).
1 Department of Landscape Architecture, Institute of Environmental Engineering, Warsaw University of LifeSciences-SGGW, UL. Nowoursynowska 159, 02-776 Warszaw, Poland; [email protected] (J.Ł.);[email protected] (B.F.-A.)
2 Legal and Analytical Services Department, 02-776 Warsaw, Poland; [email protected] Department of Landscape Management, Faculty of Forestry and Wood Technology, Mendel University in
Brno, 613 00 Brno, Czech Republic* Correspondence: [email protected]; Tel.: +420-545134096
Abstract: The current crisis of worldwide agglomeration and economic, spatial, and ownershipfactors, among others, mean that there is usually a shortage of new green areas, which are sociallyvery beneficial. Therefore, various brownfields or degraded lands along public transport routes, e.g.,tram lanes, are effectively transformed for this purpose. The significant potential of tram systems isthat they can became a backbone of green corridors across the city. This case study of the Warsawtram system (total length over 300 km of single tracks in service in 2019) enables us to simulatethe potential growth of a biologically active area connected with an increasing share of greeneryaround tram lanes in Warsaw. Experience allows the authors to present the types of greenery systemsbased on existing and future tram corridors best suited for this city. The suggested usage of tramlanes as green corridors is in line with the generally-accepted concept of urban green infrastructure.Therefore, the aim of the authors is to present in a condensed fashion their views on a very importantissue within the program of the revitalization of the Warsaw landscape by converting where possiblethe existing tram lines, as well as planning new ones according to the “green point of view”.
Keywords: cityscape visual perception; green infrastructure; linear parks; sustainable landscapeplanning; tram lanes; Warsaw
1. Introduction
Warsaw, Poland’s capital, has a unique character as it was almost totally destroyedduring the German occupation (the World War II period). Reconstruction of its infras-tructure took decades and still is not complete. In addition, progression of the town’sgrowth could not be based on the development of the existing structure, including thetransportation system. The authors strongly believe that the growing demand for movingmasses of people around the city is best fulfilled by the modernization and construction ofthe tram lines.
In the last few decades, there has been a fundamental change in the concept of de-signing tramway networks all over the world [1–5]. Concerning trams, passenger andenvironmentally friendly solutions are introduced by increasing accessibility, improv-ing travel efficiency, and reducing energy consumption, thus reducing environmentalcosts [1–8]. The use of the multi-factor analysis method at each level of tram route planningand extensive promotional and information campaigns cause tramways to receive moreand more social attention, as does the involvement of future passengers in the open debateat the design analysis stage (e.g., [5,7–11]). In this context, it is no exaggeration to saythat the tramway as a form of public transport becomes a stimulus for developing andrevitalizing cities [4,12]. Despite the multitude of solutions used in different countries,there are some similarities between them. One worth noting is the adaptation of degraded,
127
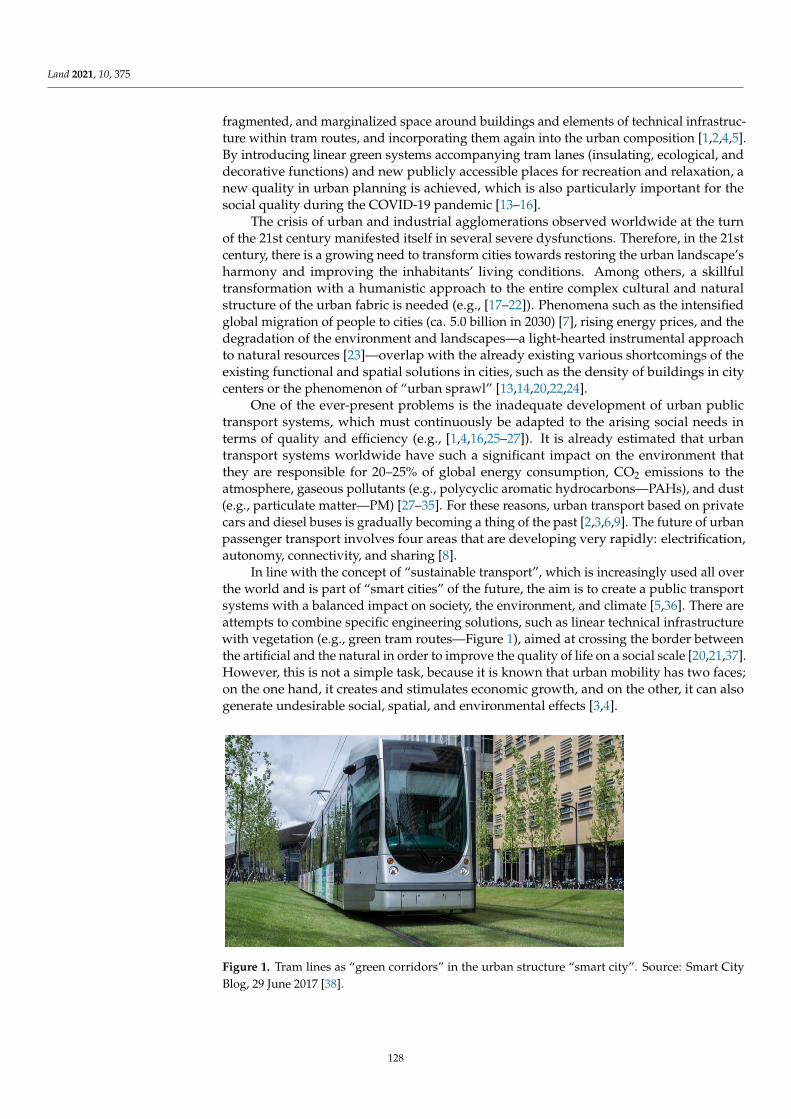
Land 2021, 10, 375
fragmented, and marginalized space around buildings and elements of technical infrastruc-ture within tram routes, and incorporating them again into the urban composition [1,2,4,5].By introducing linear green systems accompanying tram lanes (insulating, ecological, anddecorative functions) and new publicly accessible places for recreation and relaxation, anew quality in urban planning is achieved, which is also particularly important for thesocial quality during the COVID-19 pandemic [13–16].
The crisis of urban and industrial agglomerations observed worldwide at the turnof the 21st century manifested itself in several severe dysfunctions. Therefore, in the 21stcentury, there is a growing need to transform cities towards restoring the urban landscape’sharmony and improving the inhabitants’ living conditions. Among others, a skillfultransformation with a humanistic approach to the entire complex cultural and naturalstructure of the urban fabric is needed (e.g., [17–22]). Phenomena such as the intensifiedglobal migration of people to cities (ca. 5.0 billion in 2030) [7], rising energy prices, and thedegradation of the environment and landscapes—a light-hearted instrumental approachto natural resources [23]—overlap with the already existing various shortcomings of theexisting functional and spatial solutions in cities, such as the density of buildings in citycenters or the phenomenon of “urban sprawl” [13,14,20,22,24].
One of the ever-present problems is the inadequate development of urban publictransport systems, which must continuously be adapted to the arising social needs interms of quality and efficiency (e.g., [1,4,16,25–27]). It is already estimated that urbantransport systems worldwide have such a significant impact on the environment thatthey are responsible for 20–25% of global energy consumption, CO2 emissions to theatmosphere, gaseous pollutants (e.g., polycyclic aromatic hydrocarbons—PAHs), and dust(e.g., particulate matter—PM) [27–35]. For these reasons, urban transport based on privatecars and diesel buses is gradually becoming a thing of the past [2,3,6,9]. The future of urbanpassenger transport involves four areas that are developing very rapidly: electrification,autonomy, connectivity, and sharing [8].
In line with the concept of “sustainable transport”, which is increasingly used all overthe world and is part of “smart cities” of the future, the aim is to create a public transportsystems with a balanced impact on society, the environment, and climate [5,36]. There areattempts to combine specific engineering solutions, such as linear technical infrastructurewith vegetation (e.g., green tram routes—Figure 1), aimed at crossing the border betweenthe artificial and the natural in order to improve the quality of life on a social scale [20,21,37].However, this is not a simple task, because it is known that urban mobility has two faces;on the one hand, it creates and stimulates economic growth, and on the other, it can alsogenerate undesirable social, spatial, and environmental effects [3,4].
Land 2021, 10, x FOR PEER REVIEW 2 of 24
some similarities between them. One worth noting is the adaptation of degraded, frag-mented, and marginalized space around buildings and elements of technical infrastruc-ture within tram routes, and incorporating them again into the urban composition [1,2,4,5]. By introducing linear green systems accompanying tram lanes (insulating, eco-logical, and decorative functions) and new publicly accessible places for recreation and relaxation, a new quality in urban planning is achieved, which is also particularly im-portant for the social quality during the COVID-19 pandemic [13–16].
The crisis of urban and industrial agglomerations observed worldwide at the turn of the 21st century manifested itself in several severe dysfunctions. Therefore, in the 21st century, there is a growing need to transform cities towards restoring the urban land-scape’s harmony and improving the inhabitants’ living conditions. Among others, a skill-ful transformation with a humanistic approach to the entire complex cultural and natural structure of the urban fabric is needed (e.g., [17–22]). Phenomena such as the intensified global migration of people to cities (ca. 5.0 billion in 2030) [7], rising energy prices, and the degradation of the environment and landscapes—a light-hearted instrumental ap-proach to natural resources [23]—overlap with the already existing various shortcomings of the existing functional and spatial solutions in cities, such as the density of buildings in city centers or the phenomenon of “urban sprawl” [13,14,20,22,24].
One of the ever-present problems is the inadequate development of urban public transport systems, which must continuously be adapted to the arising social needs in terms of quality and efficiency (e.g., [1,4,16,25–27]). It is already estimated that urban transport systems worldwide have such a significant impact on the environment that they are responsible for 20–25% of global energy consumption, CO2 emissions to the atmos-phere, gaseous pollutants (e.g., polycyclic aromatic hydrocarbons—PAHs), and dust (e.g., particulate matter—PM) [27–35]. For these reasons, urban transport based on private cars and diesel buses is gradually becoming a thing of the past [2,3,6,9]. The future of urban passenger transport involves four areas that are developing very rapidly: electrification, autonomy, connectivity, and sharing [8].
In line with the concept of “sustainable transport”, which is increasingly used all over the world and is part of “smart cities” of the future, the aim is to create a public transport systems with a balanced impact on society, the environment, and climate [5,36]. There are attempts to combine specific engineering solutions, such as linear technical infrastructure with vegetation (e.g., green tram routes—Figure 1), aimed at crossing the border between the artificial and the natural in order to improve the quality of life on a social scale [20,21,37]. However, this is not a simple task, because it is known that urban mobility has two faces; on the one hand, it creates and stimulates economic growth, and on the other, it can also generate undesirable social, spatial, and environmental effects [3,4].
Figure 1. Tram lines as “green corridors” in the urban structure “smart city”. Source: Smart City Blog, 29 June 2017 [38]. Figure 1. Tram lines as “green corridors” in the urban structure “smart city”. Source: Smart CityBlog, 29 June 2017 [38].
128
Land 2021, 10, 375
Simultaneously, urban planning formulates hypotheses (which have been confirmedmany times in the past) that linear structures of public transport systems may support therevitalization of dysfunctional urban areas. Depending on the adopted priorities, strategies,and local spatial development policy, it is assumed that revitalizing activities will beconcentrated along selected linear structures, necessary for the city and with a wide spatialrange. It shall help connect the city’s internal districts and bind the peripheries closerwith the center [2,4,9,12,39]. For example, in the last several decades in urban planningin Europe and various regions of the world, a very positive, relatively new, and growingphenomenon has been observed, consisting of strengthening the integration of built-upareas thanks to the presence of tram systems [1,4,5,39].
Therefore, this publication makes a hypothesis that the tram—a necessary and envi-ronmentally friendly form of urban public transport—is a crucial urban tool enabling thesimultaneous integration of dysfunctional and dispersed parts of the city and—no lessimportant—an essential catalyst for a thorough restructuring of urban green systems andpublic urban spaces. This applies particularly to Warsaw, where very difficult and complexgeological conditions make development of an underground transport system a very costlyand time-consuming task.
This publication aims to present the importance and potential of a tram network forthe reconstruction and development of the transport infrastructure in Warsaw. At thesame time, based on the examples of other European cities that did not have as traumatica past as Warsaw and that have developed in an evolutionary way, this paper tries todelineate how—drawing on the contemporary canons of sustainable development—theright proportions can be achieved in the design of the urban tram route surroundings,taking into account functional (optimum connection), environmental (resource enrichment),and landscape (the city’s image) aspects.
2. Materials and Methods
The identification of the issues and the formulation of the main goals of the researchallowed us to starting the first stage of work. An extensive literature search was conductedto compile examples of tram systems playing a key role on transformation of urbanspace. Combinations of keywords including “urban”, “city”, “tram lanes”, “tramways”,“revitalization”, “green infrastructure”, and “linear parks” were used in searching threeonline literature databases, including Scopus, ISI Web of Knowledge, and Google Scholar.
Issues identified during the literature review were divided synthetically in two majorthematic groups:
• city policies (especially in Europe) concerning use of tram systems to stimulate urbandevelopment and revitalization of urban spaces;
• the importance of greenery used along tram routes for the urban environment and thequality of life.
The data collected at this stage of the research was from both the literature andthe authors’ own professional, scientific, and practical experience concerning the designand development of the tramway system in Warsaw. Such an example is the study anddevelopment concept of a tram route linking the Gocław and Saska Kepa districts inWarsaw, which consisted of elaboration of different initial variants of spatial solutions, andthen open social consultations and elaborations of the final design.
The analysis of collected data allowed us to state that tram systems are an extremelyvital tool for the revitalization of urbanized spaces, especially when they are combinedwith linear green systems (e.g., concerning remediation abilities of plants and the influenceof green structures on air filtration in the city). This fact is of great importance not only forurban environments but, what is more crucial, for the urban society and the quality of life.
At the final stage of the work, the data collected from the literature and as partof the authors’ own research formed the basis for the actual design work, enabling thedevelopment of a theoretical model for the transformation of the city tram system thatwould fit the specific conditions of Warsaw.
129
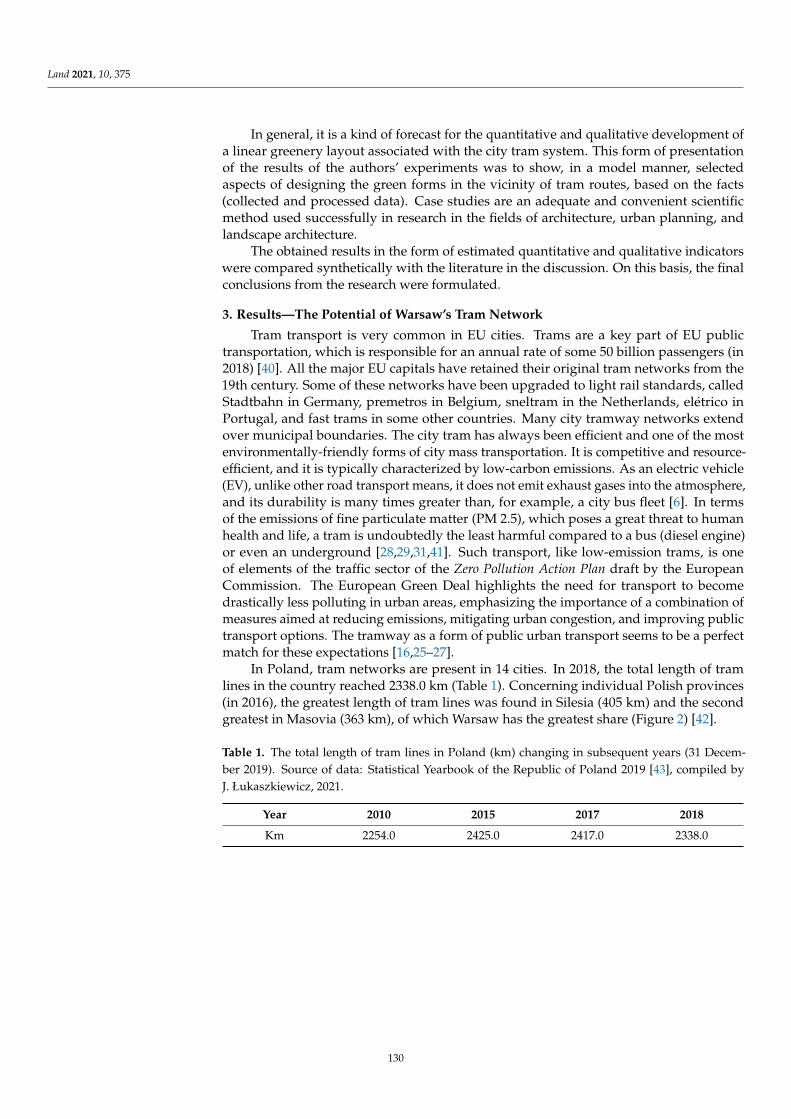
Land 2021, 10, 375
In general, it is a kind of forecast for the quantitative and qualitative development ofa linear greenery layout associated with the city tram system. This form of presentationof the results of the authors’ experiments was to show, in a model manner, selectedaspects of designing the green forms in the vicinity of tram routes, based on the facts(collected and processed data). Case studies are an adequate and convenient scientificmethod used successfully in research in the fields of architecture, urban planning, andlandscape architecture.
The obtained results in the form of estimated quantitative and qualitative indicatorswere compared synthetically with the literature in the discussion. On this basis, the finalconclusions from the research were formulated.
3. Results—The Potential of Warsaw’s Tram Network
Tram transport is very common in EU cities. Trams are a key part of EU publictransportation, which is responsible for an annual rate of some 50 billion passengers (in2018) [40]. All the major EU capitals have retained their original tram networks from the19th century. Some of these networks have been upgraded to light rail standards, calledStadtbahn in Germany, premetros in Belgium, sneltram in the Netherlands, elétrico inPortugal, and fast trams in some other countries. Many city tramway networks extendover municipal boundaries. The city tram has always been efficient and one of the mostenvironmentally-friendly forms of city mass transportation. It is competitive and resource-efficient, and it is typically characterized by low-carbon emissions. As an electric vehicle(EV), unlike other road transport means, it does not emit exhaust gases into the atmosphere,and its durability is many times greater than, for example, a city bus fleet [6]. In termsof the emissions of fine particulate matter (PM 2.5), which poses a great threat to humanhealth and life, a tram is undoubtedly the least harmful compared to a bus (diesel engine)or even an underground [28,29,31,41]. Such transport, like low-emission trams, is oneof elements of the traffic sector of the Zero Pollution Action Plan draft by the EuropeanCommission. The European Green Deal highlights the need for transport to becomedrastically less polluting in urban areas, emphasizing the importance of a combination ofmeasures aimed at reducing emissions, mitigating urban congestion, and improving publictransport options. The tramway as a form of public urban transport seems to be a perfectmatch for these expectations [16,25–27].
In Poland, tram networks are present in 14 cities. In 2018, the total length of tramlines in the country reached 2338.0 km (Table 1). Concerning individual Polish provinces(in 2016), the greatest length of tram lines was found in Silesia (405 km) and the secondgreatest in Masovia (363 km), of which Warsaw has the greatest share (Figure 2) [42].
Table 1. The total length of tram lines in Poland (km) changing in subsequent years (31 Decem-ber 2019). Source of data: Statistical Yearbook of the Republic of Poland 2019 [43], compiled byJ. Łukaszkiewicz, 2021.
Year 2010 2015 2017 2018
Km 2254.0 2425.0 2417.0 2338.0
130
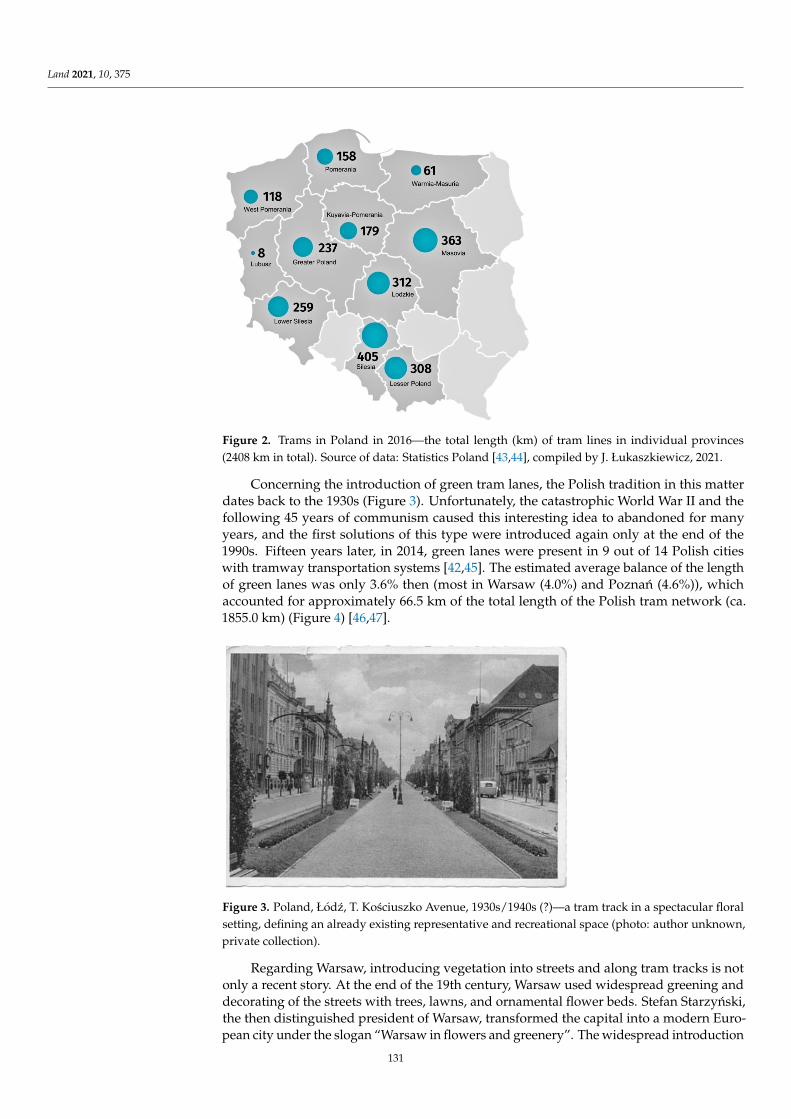
Land 2021, 10, 375Land 2021, 10, x FOR PEER REVIEW 5 of 24
Figure 2. Trams in Poland in 2016—the total length (km) of tram lines in individual provinces (2408 km in total). Source of data: Statistics Poland [43,44], compiled by J. Łukaszkiewicz, 2021.
Concerning the introduction of green tram lanes, the Polish tradition in this matter dates back to the 1930s (Figure 3). Unfortunately, the catastrophic World War II and the following 45 years of communism caused this interesting idea to abandoned for many years, and the first solutions of this type were introduced again only at the end of the 1990s. Fifteen years later, in 2014, green lanes were present in 9 out of 14 Polish cities with tramway transportation systems [42,45]. The estimated average balance of the length of green lanes was only 3.6% then (most in Warsaw (4.0%) and Poznań (4.6%)), which ac-counted for approximately 66.5 km of the total length of the Polish tram network (ca. 1855.0 km) (Figure 4) [46,47].
Figure 3. Poland, Łódź, T. Kościuszko Avenue, 1930s/1940s (?)—a tram track in a spectacular floral setting, defining an already existing representative and recreational space (photo: author un-known, private collection).
Figure 2. Trams in Poland in 2016—the total length (km) of tram lines in individual provinces(2408 km in total). Source of data: Statistics Poland [43,44], compiled by J. Łukaszkiewicz, 2021.
Concerning the introduction of green tram lanes, the Polish tradition in this matterdates back to the 1930s (Figure 3). Unfortunately, the catastrophic World War II and thefollowing 45 years of communism caused this interesting idea to abandoned for manyyears, and the first solutions of this type were introduced again only at the end of the1990s. Fifteen years later, in 2014, green lanes were present in 9 out of 14 Polish citieswith tramway transportation systems [42,45]. The estimated average balance of the lengthof green lanes was only 3.6% then (most in Warsaw (4.0%) and Poznan (4.6%)), whichaccounted for approximately 66.5 km of the total length of the Polish tram network (ca.1855.0 km) (Figure 4) [46,47].
Land 2021, 10, x FOR PEER REVIEW 5 of 24
Figure 2. Trams in Poland in 2016—the total length (km) of tram lines in individual provinces (2408 km in total). Source of data: Statistics Poland [43,44], compiled by J. Łukaszkiewicz, 2021.
Concerning the introduction of green tram lanes, the Polish tradition in this matter dates back to the 1930s (Figure 3). Unfortunately, the catastrophic World War II and the following 45 years of communism caused this interesting idea to abandoned for many years, and the first solutions of this type were introduced again only at the end of the 1990s. Fifteen years later, in 2014, green lanes were present in 9 out of 14 Polish cities with tramway transportation systems [42,45]. The estimated average balance of the length of green lanes was only 3.6% then (most in Warsaw (4.0%) and Poznań (4.6%)), which ac-counted for approximately 66.5 km of the total length of the Polish tram network (ca. 1855.0 km) (Figure 4) [46,47].
Figure 3. Poland, Łódź, T. Kościuszko Avenue, 1930s/1940s (?)—a tram track in a spectacular floral setting, defining an already existing representative and recreational space (photo: author un-known, private collection).
Figure 3. Poland, Łódz, T. Kosciuszko Avenue, 1930s/1940s (?)—a tram track in a spectacular floralsetting, defining an already existing representative and recreational space (photo: author unknown,private collection).
Regarding Warsaw, introducing vegetation into streets and along tram tracks is notonly a recent story. At the end of the 19th century, Warsaw used widespread greening anddecorating of the streets with trees, lawns, and ornamental flower beds. Stefan Starzynski,the then distinguished president of Warsaw, transformed the capital into a modern Euro-pean city under the slogan “Warsaw in flowers and greenery”. The widespread introduction
131
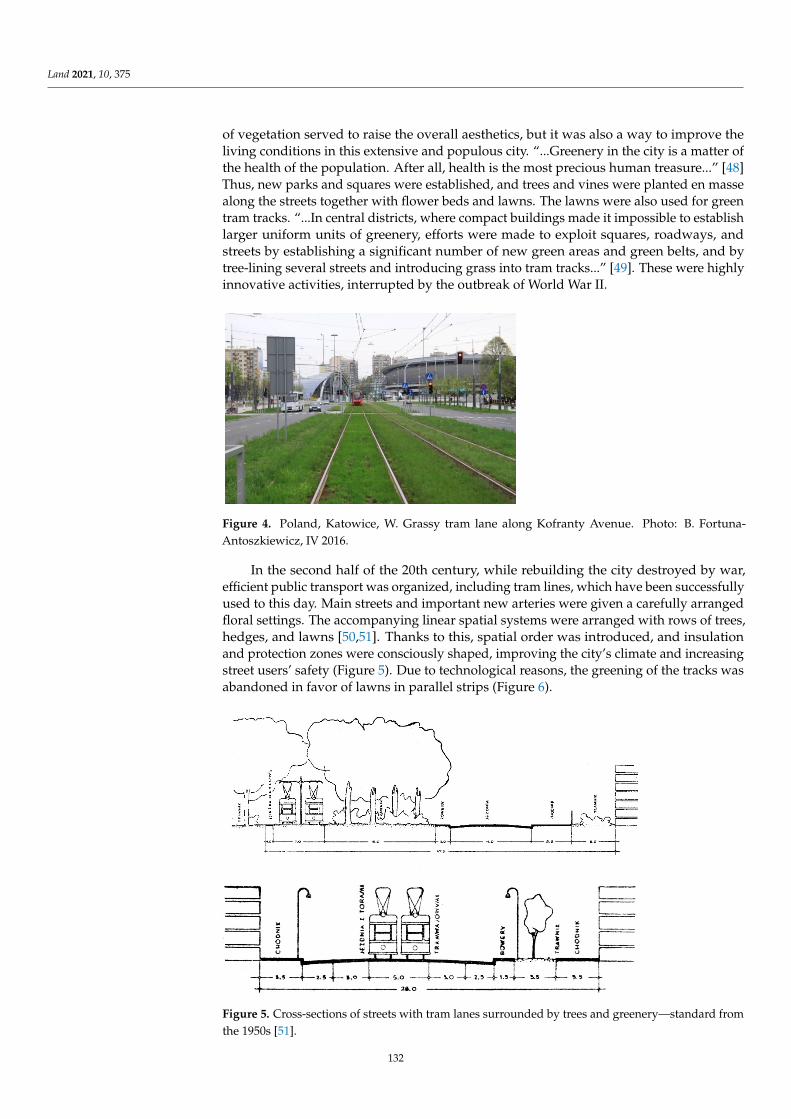
Land 2021, 10, 375
of vegetation served to raise the overall aesthetics, but it was also a way to improve theliving conditions in this extensive and populous city. “...Greenery in the city is a matter ofthe health of the population. After all, health is the most precious human treasure...” [48]Thus, new parks and squares were established, and trees and vines were planted en massealong the streets together with flower beds and lawns. The lawns were also used for greentram tracks. “...In central districts, where compact buildings made it impossible to establishlarger uniform units of greenery, efforts were made to exploit squares, roadways, andstreets by establishing a significant number of new green areas and green belts, and bytree-lining several streets and introducing grass into tram tracks...” [49]. These were highlyinnovative activities, interrupted by the outbreak of World War II.
Land 2021, 10, x FOR PEER REVIEW 6 of 24
Figure 4. Poland, Katowice, W. Grassy tram lane along Kofranty Avenue. Photo: B. Fortuna-An-toszkiewicz, IV 2016.
Regarding Warsaw, introducing vegetation into streets and along tram tracks is not only a recent story. At the end of the 19th century, Warsaw used widespread greening and decorating of the streets with trees, lawns, and ornamental flower beds. Stefan Starzyński, the then distinguished president of Warsaw, transformed the capital into a modern European city under the slogan “Warsaw in flowers and greenery”. The wide-spread introduction of vegetation served to raise the overall aesthetics, but it was also a way to improve the living conditions in this extensive and populous city. “...Greenery in the city is a matter of the health of the population. After all, health is the most precious human treasure...” [48] Thus, new parks and squares were established, and trees and vines were planted en masse along the streets together with flower beds and lawns. The lawns were also used for green tram tracks. “...In central districts, where compact buildings made it impossible to establish larger uniform units of greenery, efforts were made to exploit squares, roadways, and streets by establishing a significant number of new green areas and green belts, and by tree-lining several streets and introducing grass into tram tracks...” [49]. These were highly innovative activities, interrupted by the outbreak of World War II.
In the second half of the 20th century, while rebuilding the city destroyed by war, efficient public transport was organized, including tram lines, which have been success-fully used to this day. Main streets and important new arteries were given a carefully arranged floral settings. The accompanying linear spatial systems were arranged with rows of trees, hedges, and lawns [50,51]. Thanks to this, spatial order was introduced, and insulation and protection zones were consciously shaped, improving the city’s climate and increasing street users’ safety (Figure 5). Due to technological reasons, the greening of the tracks was abandoned in favor of lawns in parallel strips (Figure 6).
Figure 4. Poland, Katowice, W. Grassy tram lane along Kofranty Avenue. Photo: B. Fortuna-Antoszkiewicz, IV 2016.
In the second half of the 20th century, while rebuilding the city destroyed by war,efficient public transport was organized, including tram lines, which have been successfullyused to this day. Main streets and important new arteries were given a carefully arrangedfloral settings. The accompanying linear spatial systems were arranged with rows of trees,hedges, and lawns [50,51]. Thanks to this, spatial order was introduced, and insulationand protection zones were consciously shaped, improving the city’s climate and increasingstreet users’ safety (Figure 5). Due to technological reasons, the greening of the tracks wasabandoned in favor of lawns in parallel strips (Figure 6).
Land 2021, 10, x FOR PEER REVIEW 7 of 24
Figure 5. Cross-sections of streets with tram lanes surrounded by trees and greenery—standard from the 1950s [51].
Figure 6. Warsaw, 1950s. The newly arranged J. Marchlewskiego Avenue (currently Jana Pawła II Avenue)—a separate inner lane with a tram line surrounded by greenery (lawns with hedges) and regular rows of young trees on both sides of the road. Photo: Z. Siemaszko, collection: National Digital Archives [52].
Currently in Warsaw, around 70 years later, only fragmentary arrangements remain (dismal remnants !!!) of the old projects. Along with the development of car traffic, park-ing spaces appeared in place of gradually dying trees and degraded lawns in many cases. Such depletion of natural resources is particularly acute in the city center, where the pro-cess of building densification has been progressing over the last decades, often at the ex-pense of small green enclaves (squares, undeveloped areas), and there the green track becomes a solution. Tramlines penetrate the highly urbanized center, making it possible to introduce a collision-free network of linear greenery [42,46,53,54].
At present (data from 2019) the length of green tram lanes in Warsaw has reached 25.0 km with a total length of approx. 433.0 km of tracks [46]. When renovating and con-structing new tram routes, the Warsaw Trams have started to introduce green lanes as standard, implementing them both on concrete and ballast foundations [47] (Figures 7 and 8).
Figure 5. Cross-sections of streets with tram lanes surrounded by trees and greenery—standard fromthe 1950s [51].
132
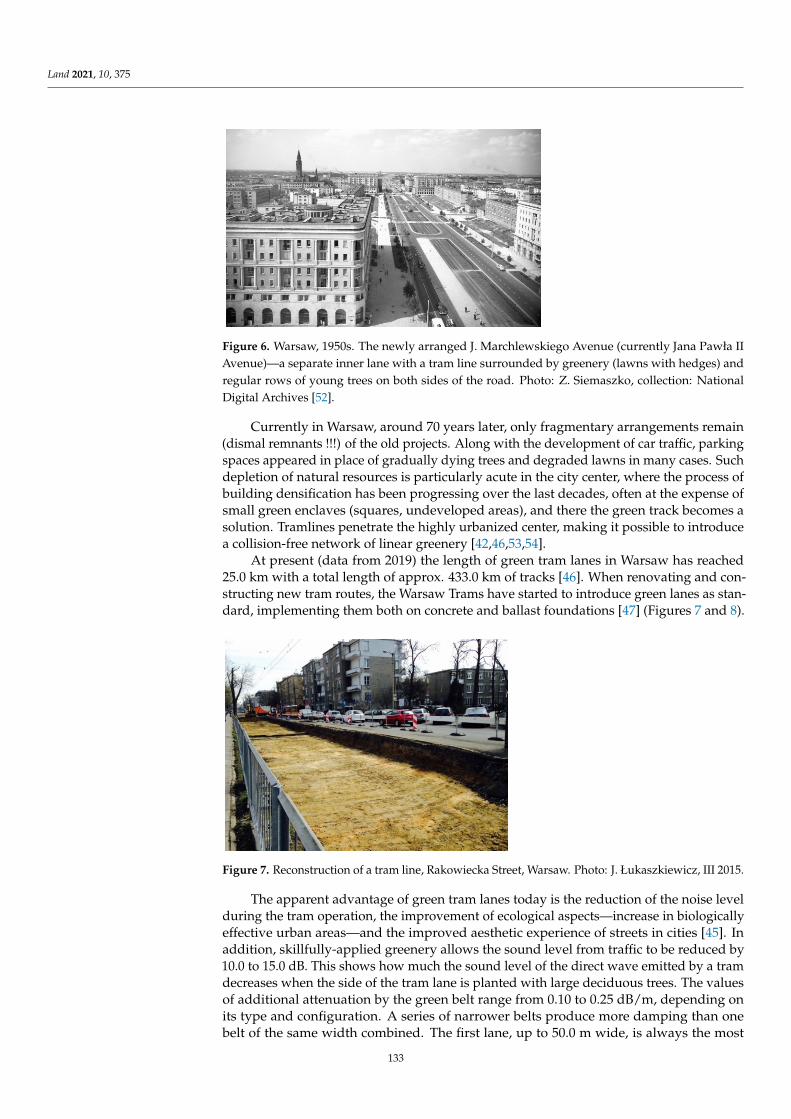
Land 2021, 10, 375
Land 2021, 10, x FOR PEER REVIEW 7 of 24
Figure 5. Cross-sections of streets with tram lanes surrounded by trees and greenery—standard from the 1950s [51].
Figure 6. Warsaw, 1950s. The newly arranged J. Marchlewskiego Avenue (currently Jana Pawła II Avenue)—a separate inner lane with a tram line surrounded by greenery (lawns with hedges) and regular rows of young trees on both sides of the road. Photo: Z. Siemaszko, collection: National Digital Archives [52].
Currently in Warsaw, around 70 years later, only fragmentary arrangements remain (dismal remnants !!!) of the old projects. Along with the development of car traffic, park-ing spaces appeared in place of gradually dying trees and degraded lawns in many cases. Such depletion of natural resources is particularly acute in the city center, where the pro-cess of building densification has been progressing over the last decades, often at the ex-pense of small green enclaves (squares, undeveloped areas), and there the green track becomes a solution. Tramlines penetrate the highly urbanized center, making it possible to introduce a collision-free network of linear greenery [42,46,53,54].
At present (data from 2019) the length of green tram lanes in Warsaw has reached 25.0 km with a total length of approx. 433.0 km of tracks [46]. When renovating and con-structing new tram routes, the Warsaw Trams have started to introduce green lanes as standard, implementing them both on concrete and ballast foundations [47] (Figures 7 and 8).
Figure 6. Warsaw, 1950s. The newly arranged J. Marchlewskiego Avenue (currently Jana Pawła IIAvenue)—a separate inner lane with a tram line surrounded by greenery (lawns with hedges) andregular rows of young trees on both sides of the road. Photo: Z. Siemaszko, collection: NationalDigital Archives [52].
Currently in Warsaw, around 70 years later, only fragmentary arrangements remain(dismal remnants !!!) of the old projects. Along with the development of car traffic, parkingspaces appeared in place of gradually dying trees and degraded lawns in many cases. Suchdepletion of natural resources is particularly acute in the city center, where the process ofbuilding densification has been progressing over the last decades, often at the expense ofsmall green enclaves (squares, undeveloped areas), and there the green track becomes asolution. Tramlines penetrate the highly urbanized center, making it possible to introducea collision-free network of linear greenery [42,46,53,54].
At present (data from 2019) the length of green tram lanes in Warsaw has reached25.0 km with a total length of approx. 433.0 km of tracks [46]. When renovating and con-structing new tram routes, the Warsaw Trams have started to introduce green lanes as stan-dard, implementing them both on concrete and ballast foundations [47] (Figures 7 and 8).
Land 2021, 10, x FOR PEER REVIEW 8 of 24
Figure 7. Reconstruction of a tram line, Rakowiecka Street, Warsaw. Photo: J. Łukaszkiewicz, III 2015.
Figure 8. Reconstruction of a tram line—laying a lawn, Rakowiecka Street, Warsaw. Photo: J. Łukaszkiewicz, V 2015.
The apparent advantage of green tram lanes today is the reduction of the noise level during the tram operation, the improvement of ecological aspects—increase in biologi-cally effective urban areas—and the improved aesthetic experience of streets in cities [45]. In addition, skillfully-applied greenery allows the sound level from traffic to be reduced by 10.0 to 15.0 dB. This shows how much the sound level of the direct wave emitted by a tram decreases when the side of the tram lane is planted with large deciduous trees. The values of additional attenuation by the green belt range from 0.10 to 0.25 dB/m, depending on its type and configuration. A series of narrower belts produce more damping than one belt of the same width combined. The first lane, up to 50.0 m wide, is always the most critical. Tree belts with dense shrubs suppress noise by approx. 3.0 dB for every 30.0 m of width. Even a band of vegetation with a negligible acoustic attenuation changes the noise spectrum shape by dispersing and absorbing high-frequency components [55–61].
Additionally, vegetation reduces the speed of rising and falling of the sound level, which reduces the annoyance of noise [62]. According to various studies carried out in different conditions, the scope of noise reduction varies, but the share of the vegetation itself, especially high vegetation, remains unchallenged in this process. Therefore, instead of building acoustic screens in every situation, it is better to plant dense trees, which are incomparably more favorable for environmental and aesthetic reasons [63] (Figures 9 and 10).
Figure 7. Reconstruction of a tram line, Rakowiecka Street, Warsaw. Photo: J. Łukaszkiewicz, III 2015.
The apparent advantage of green tram lanes today is the reduction of the noise levelduring the tram operation, the improvement of ecological aspects—increase in biologicallyeffective urban areas—and the improved aesthetic experience of streets in cities [45]. Inaddition, skillfully-applied greenery allows the sound level from traffic to be reduced by10.0 to 15.0 dB. This shows how much the sound level of the direct wave emitted by a tramdecreases when the side of the tram lane is planted with large deciduous trees. The valuesof additional attenuation by the green belt range from 0.10 to 0.25 dB/m, depending onits type and configuration. A series of narrower belts produce more damping than onebelt of the same width combined. The first lane, up to 50.0 m wide, is always the most
133
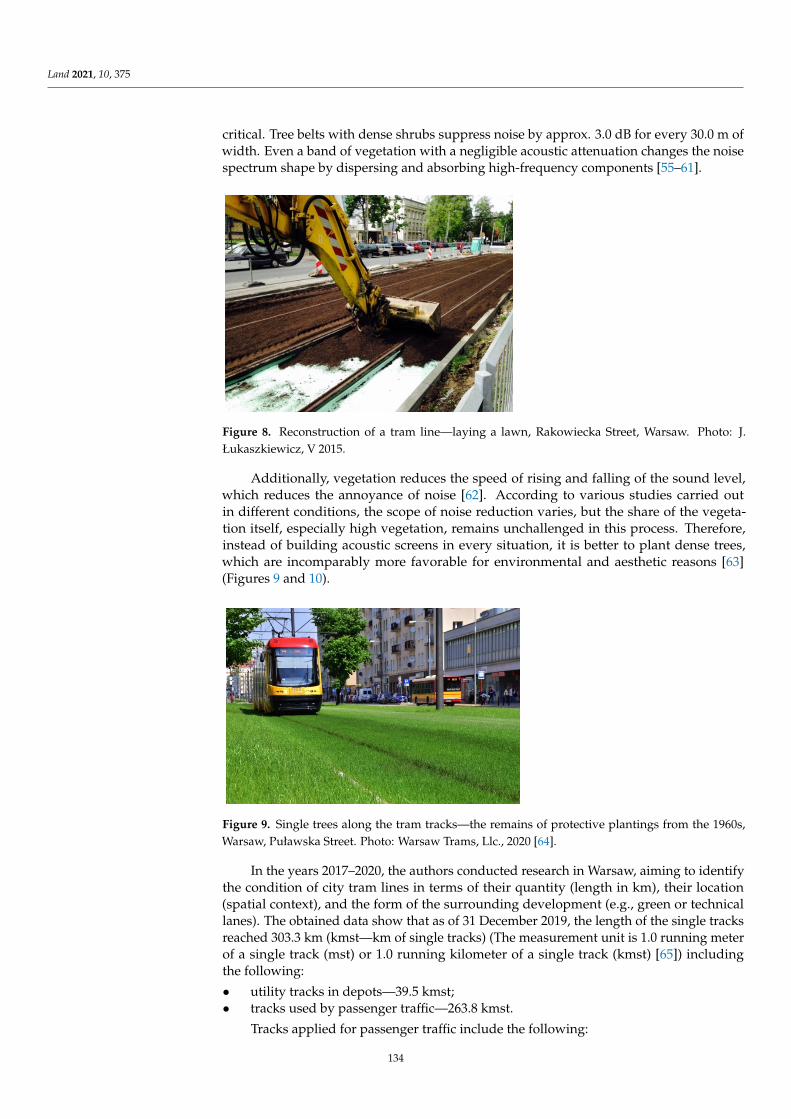
Land 2021, 10, 375
critical. Tree belts with dense shrubs suppress noise by approx. 3.0 dB for every 30.0 m ofwidth. Even a band of vegetation with a negligible acoustic attenuation changes the noisespectrum shape by dispersing and absorbing high-frequency components [55–61].
Land 2021, 10, x FOR PEER REVIEW 8 of 24
Figure 7. Reconstruction of a tram line, Rakowiecka Street, Warsaw. Photo: J. Łukaszkiewicz, III 2015.
Figure 8. Reconstruction of a tram line—laying a lawn, Rakowiecka Street, Warsaw. Photo: J. Łukaszkiewicz, V 2015.
The apparent advantage of green tram lanes today is the reduction of the noise level during the tram operation, the improvement of ecological aspects—increase in biologi-cally effective urban areas—and the improved aesthetic experience of streets in cities [45]. In addition, skillfully-applied greenery allows the sound level from traffic to be reduced by 10.0 to 15.0 dB. This shows how much the sound level of the direct wave emitted by a tram decreases when the side of the tram lane is planted with large deciduous trees. The values of additional attenuation by the green belt range from 0.10 to 0.25 dB/m, depending on its type and configuration. A series of narrower belts produce more damping than one belt of the same width combined. The first lane, up to 50.0 m wide, is always the most critical. Tree belts with dense shrubs suppress noise by approx. 3.0 dB for every 30.0 m of width. Even a band of vegetation with a negligible acoustic attenuation changes the noise spectrum shape by dispersing and absorbing high-frequency components [55–61].
Additionally, vegetation reduces the speed of rising and falling of the sound level, which reduces the annoyance of noise [62]. According to various studies carried out in different conditions, the scope of noise reduction varies, but the share of the vegetation itself, especially high vegetation, remains unchallenged in this process. Therefore, instead of building acoustic screens in every situation, it is better to plant dense trees, which are incomparably more favorable for environmental and aesthetic reasons [63] (Figures 9 and 10).
Figure 8. Reconstruction of a tram line—laying a lawn, Rakowiecka Street, Warsaw. Photo: J.Łukaszkiewicz, V 2015.
Additionally, vegetation reduces the speed of rising and falling of the sound level,which reduces the annoyance of noise [62]. According to various studies carried outin different conditions, the scope of noise reduction varies, but the share of the vegeta-tion itself, especially high vegetation, remains unchallenged in this process. Therefore,instead of building acoustic screens in every situation, it is better to plant dense trees,which are incomparably more favorable for environmental and aesthetic reasons [63](Figures 9 and 10).
Land 2021, 10, x FOR PEER REVIEW 9 of 24
Figure 9. Single trees along the tram tracks—the remains of protective plantings from the 1960s, Warsaw, Puławska Street. Photo: Warsaw Trams, Llc., 2020 [64].
Figure 10. Trees in a row at the tram-track, Warsaw, 2019. Photo: J. Bernacki [53].
In the years 2017–2020, the authors conducted research in Warsaw, aiming to identify the condition of city tram lines in terms of their quantity (length in km), their location (spatial context), and the form of the surrounding development (e.g., green or technical lanes). The obtained data show that as of 31 December 2019, the length of the single tracks reached 303.3 km (kmst—km of single tracks) (The measurement unit is 1.0 running meter of a single track (mst) or 1.0 running kilometer of a single track (kmst) [65]) including the following:
• utility tracks in depots—39.5 kmst; • tracks used by passenger traffic—263.8 kmst.
Tracks applied for passenger traffic include the following:
• separated tracks—211.2 kmst; including green lanes with vegetation cover—approx. 25.5 kmst;
• not separated tracks available for cars, busses, and emergency vehicles—52.6 kmst [65].
Tramlines in Warsaw connect distant districts, mainly on the north-south and east-west axes (on both sides of the Vistula river), and they are concentrated within the city center with a high density of high-rise buildings (Figure 11).
Figure 9. Single trees along the tram tracks—the remains of protective plantings from the 1960s,Warsaw, Puławska Street. Photo: Warsaw Trams, Llc., 2020 [64].
In the years 2017–2020, the authors conducted research in Warsaw, aiming to identifythe condition of city tram lines in terms of their quantity (length in km), their location(spatial context), and the form of the surrounding development (e.g., green or technicallanes). The obtained data show that as of 31 December 2019, the length of the single tracksreached 303.3 km (kmst—km of single tracks) (The measurement unit is 1.0 running meterof a single track (mst) or 1.0 running kilometer of a single track (kmst) [65]) includingthe following:
• utility tracks in depots—39.5 kmst;• tracks used by passenger traffic—263.8 kmst.
Tracks applied for passenger traffic include the following:
134
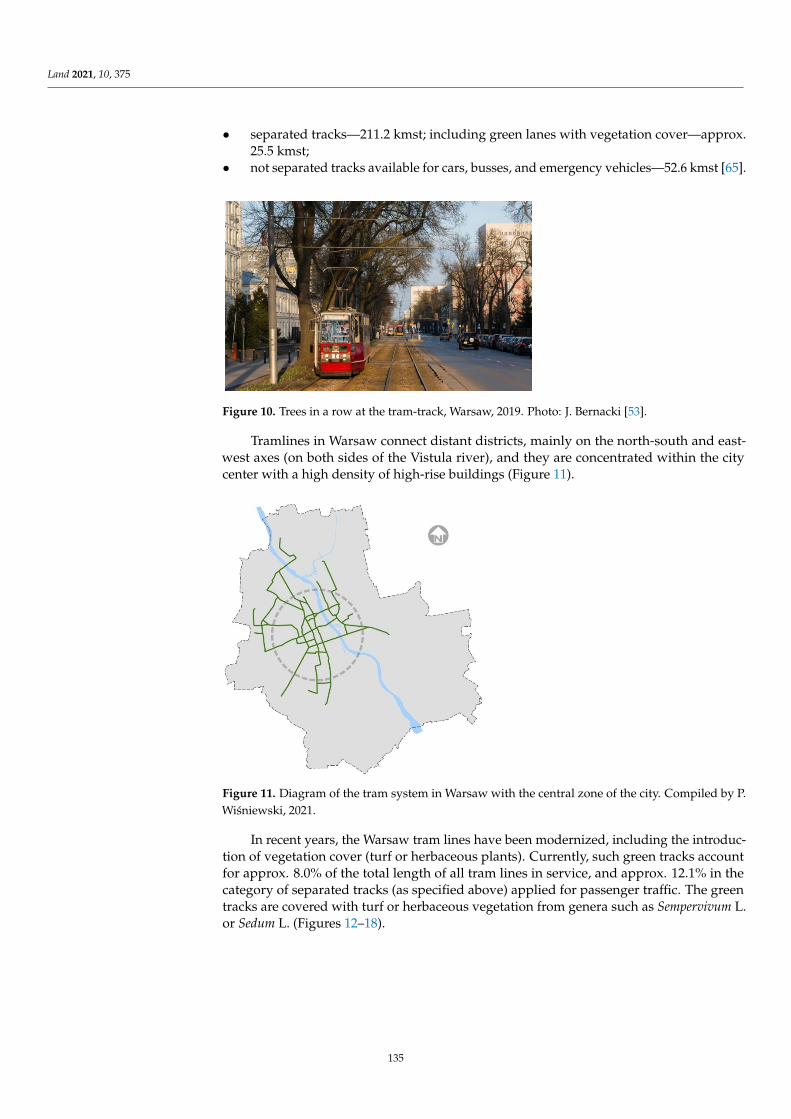
Land 2021, 10, 375
• separated tracks—211.2 kmst; including green lanes with vegetation cover—approx.25.5 kmst;
• not separated tracks available for cars, busses, and emergency vehicles—52.6 kmst [65].
Land 2021, 10, x FOR PEER REVIEW 9 of 24
Figure 9. Single trees along the tram tracks—the remains of protective plantings from the 1960s, Warsaw, Puławska Street. Photo: Warsaw Trams, Llc., 2020 [64].
Figure 10. Trees in a row at the tram-track, Warsaw, 2019. Photo: J. Bernacki [53].
In the years 2017–2020, the authors conducted research in Warsaw, aiming to identify the condition of city tram lines in terms of their quantity (length in km), their location (spatial context), and the form of the surrounding development (e.g., green or technical lanes). The obtained data show that as of 31 December 2019, the length of the single tracks reached 303.3 km (kmst—km of single tracks) (The measurement unit is 1.0 running meter of a single track (mst) or 1.0 running kilometer of a single track (kmst) [65]) including the following:
• utility tracks in depots—39.5 kmst; • tracks used by passenger traffic—263.8 kmst.
Tracks applied for passenger traffic include the following:
• separated tracks—211.2 kmst; including green lanes with vegetation cover—approx. 25.5 kmst;
• not separated tracks available for cars, busses, and emergency vehicles—52.6 kmst [65].
Tramlines in Warsaw connect distant districts, mainly on the north-south and east-west axes (on both sides of the Vistula river), and they are concentrated within the city center with a high density of high-rise buildings (Figure 11).
Figure 10. Trees in a row at the tram-track, Warsaw, 2019. Photo: J. Bernacki [53].
Tramlines in Warsaw connect distant districts, mainly on the north-south and east-west axes (on both sides of the Vistula river), and they are concentrated within the citycenter with a high density of high-rise buildings (Figure 11).
Land 2021, 10, x FOR PEER REVIEW 10 of 24
Figure 11. Diagram of the tram system in Warsaw with the central zone of the city. Compiled by P. Wiśniewski, 2021.
In recent years, the Warsaw tram lines have been modernized, including the intro-duction of vegetation cover (turf or herbaceous plants). Currently, such green tracks ac-count for approx. 8.0% of the total length of all tram lines in service, and approx. 12.1% in the category of separated tracks (as specified above) applied for passenger traffic. The green tracks are covered with turf or herbaceous vegetation from genera such as Semper-vivum L. or Sedum L. (Figures 12–18).
Figure 12. Warsaw: Grochowska Street, Praga district. The vegetation cover of tracks, mainly of Sempervivum L. and Sedum L. species—a very ornamental green carpet with extensive mainte-nance. Photo shared with permission: Warsaw Trams Llc., 2020 [65].
Figure 11. Diagram of the tram system in Warsaw with the central zone of the city. Compiled by P.Wisniewski, 2021.
In recent years, the Warsaw tram lines have been modernized, including the introduc-tion of vegetation cover (turf or herbaceous plants). Currently, such green tracks accountfor approx. 8.0% of the total length of all tram lines in service, and approx. 12.1% in thecategory of separated tracks (as specified above) applied for passenger traffic. The greentracks are covered with turf or herbaceous vegetation from genera such as Sempervivum L.or Sedum L. (Figures 12–18).
135
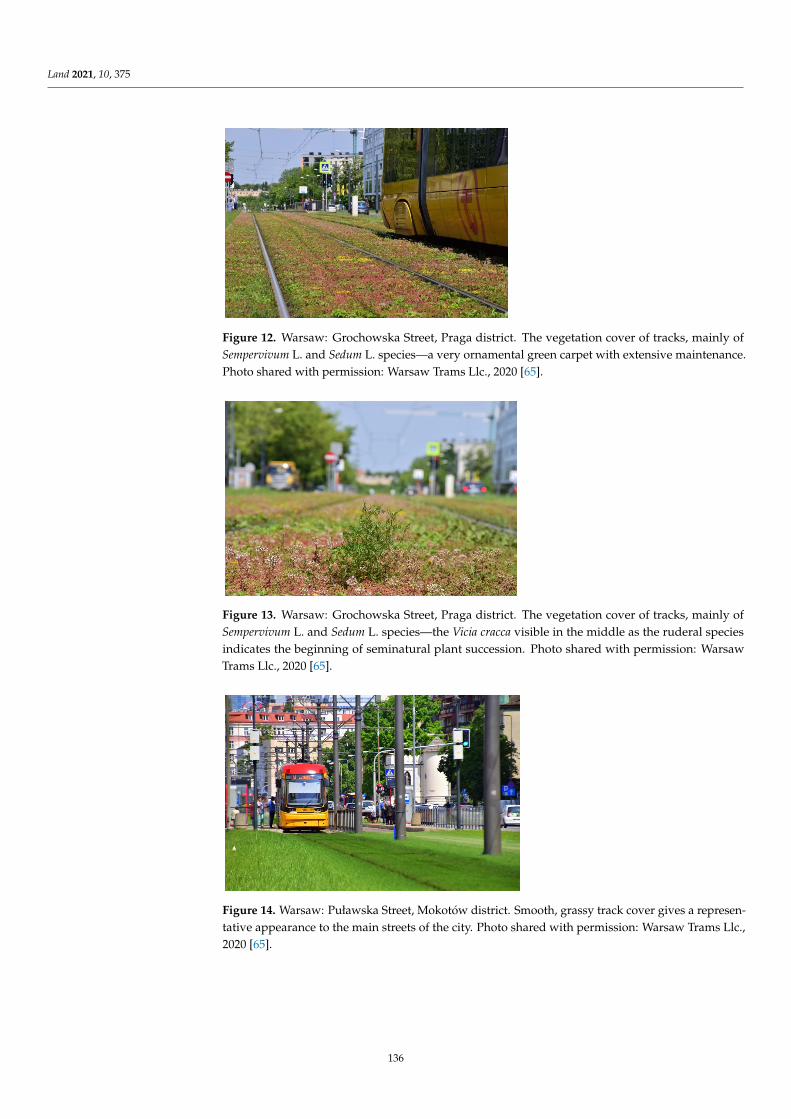
Land 2021, 10, 375
Land 2021, 10, x FOR PEER REVIEW 10 of 24
Figure 11. Diagram of the tram system in Warsaw with the central zone of the city. Compiled by P. Wiśniewski, 2021.
In recent years, the Warsaw tram lines have been modernized, including the intro-duction of vegetation cover (turf or herbaceous plants). Currently, such green tracks ac-count for approx. 8.0% of the total length of all tram lines in service, and approx. 12.1% in the category of separated tracks (as specified above) applied for passenger traffic. The green tracks are covered with turf or herbaceous vegetation from genera such as Semper-vivum L. or Sedum L. (Figures 12–18).
Figure 12. Warsaw: Grochowska Street, Praga district. The vegetation cover of tracks, mainly of Sempervivum L. and Sedum L. species—a very ornamental green carpet with extensive mainte-nance. Photo shared with permission: Warsaw Trams Llc., 2020 [65].
Figure 12. Warsaw: Grochowska Street, Praga district. The vegetation cover of tracks, mainly ofSempervivum L. and Sedum L. species—a very ornamental green carpet with extensive maintenance.Photo shared with permission: Warsaw Trams Llc., 2020 [65].
Land 2021, 10, x FOR PEER REVIEW 10 of 24
Figure 11. Diagram of the tram system in Warsaw with the central zone of the city. Compiled by P. Wiśniewski, 2021.
In recent years, the Warsaw tram lines have been modernized, including the intro-duction of vegetation cover (turf or herbaceous plants). Currently, such green tracks ac-count for approx. 8.0% of the total length of all tram lines in service, and approx. 12.1% in the category of separated tracks (as specified above) applied for passenger traffic. The green tracks are covered with turf or herbaceous vegetation from genera such as Semper-vivum L. or Sedum L. (Figures 12–18).
Figure 12. Warsaw: Grochowska Street, Praga district. The vegetation cover of tracks, mainly of Sempervivum L. and Sedum L. species—a very ornamental green carpet with extensive mainte-nance. Photo shared with permission: Warsaw Trams Llc., 2020 [65].
Figure 13. Warsaw: Grochowska Street, Praga district. The vegetation cover of tracks, mainly ofSempervivum L. and Sedum L. species—the Vicia cracca visible in the middle as the ruderal speciesindicates the beginning of seminatural plant succession. Photo shared with permission: WarsawTrams Llc., 2020 [65].
Land 2021, 10, x FOR PEER REVIEW 11 of 24
Figure 13. Warsaw: Grochowska Street, Praga district. The vegetation cover of tracks, mainly of Sempervivum L. and Sedum L. species—the Vicia cracca visible in the middle as the ruderal species indicates the beginning of seminatural plant succession. Photo shared with permission: Warsaw Trams Llc., 2020 [65].
Figure 14. Warsaw: Puławska Street, Mokotów district. Smooth, grassy track cover gives a repre-sentative appearance to the main streets of the city. Photo shared with permission: Warsaw Trams Llc., 2020 [65].
Figure 15. Warsaw: Puławska Street, Mokotów district. Smooth, grassy track cover gives a repre-sentative appearance to the main streets of the city. Photo shared with permission: Tramwaje War-szawskie Llc., 2020 [65].
Figure 16. Warsaw: Rakowiecka Street, Mokotów district. The grassy track cover after mowing during summer. Photo: J. Łukaszkiewicz, VIII 2016 [65].
Figure 14. Warsaw: Puławska Street, Mokotów district. Smooth, grassy track cover gives a represen-tative appearance to the main streets of the city. Photo shared with permission: Warsaw Trams Llc.,2020 [65].
136
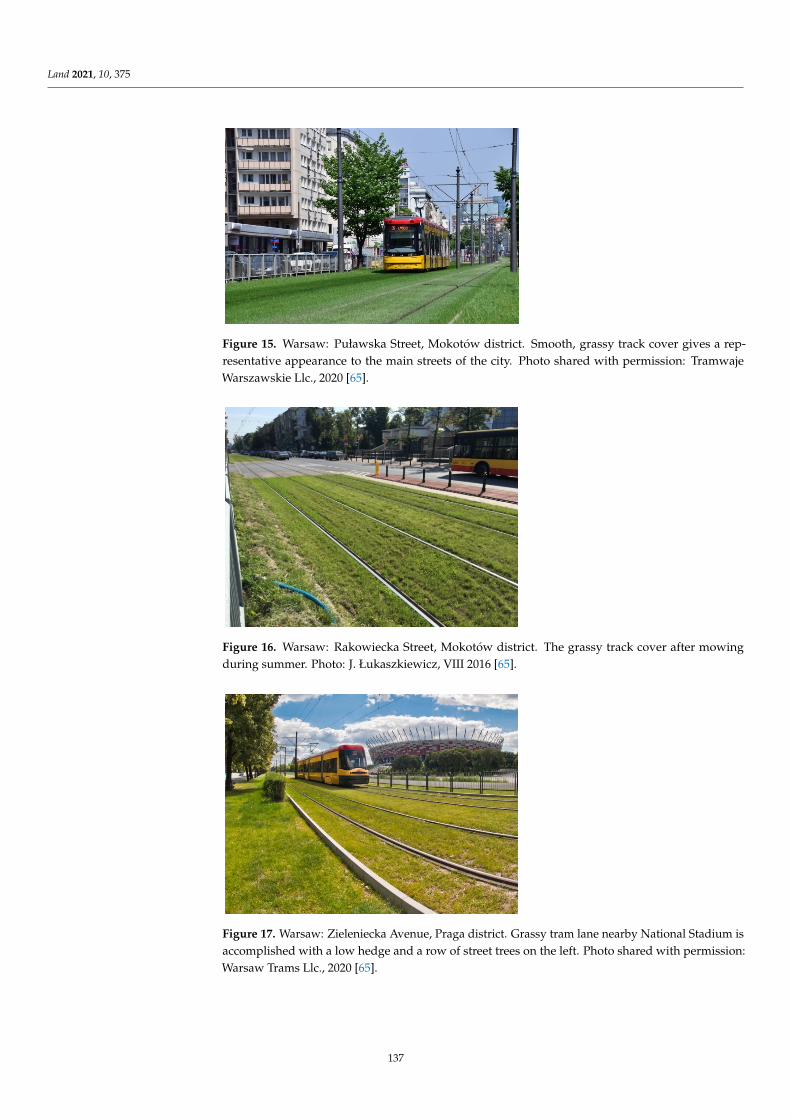
Land 2021, 10, 375
Land 2021, 10, x FOR PEER REVIEW 11 of 24
Figure 13. Warsaw: Grochowska Street, Praga district. The vegetation cover of tracks, mainly of Sempervivum L. and Sedum L. species—the Vicia cracca visible in the middle as the ruderal species indicates the beginning of seminatural plant succession. Photo shared with permission: Warsaw Trams Llc., 2020 [65].
Figure 14. Warsaw: Puławska Street, Mokotów district. Smooth, grassy track cover gives a repre-sentative appearance to the main streets of the city. Photo shared with permission: Warsaw Trams Llc., 2020 [65].
Figure 15. Warsaw: Puławska Street, Mokotów district. Smooth, grassy track cover gives a repre-sentative appearance to the main streets of the city. Photo shared with permission: Tramwaje War-szawskie Llc., 2020 [65].
Figure 16. Warsaw: Rakowiecka Street, Mokotów district. The grassy track cover after mowing during summer. Photo: J. Łukaszkiewicz, VIII 2016 [65].
Figure 15. Warsaw: Puławska Street, Mokotów district. Smooth, grassy track cover gives a rep-resentative appearance to the main streets of the city. Photo shared with permission: TramwajeWarszawskie Llc., 2020 [65].
Land 2021, 10, x FOR PEER REVIEW 11 of 24
Figure 13. Warsaw: Grochowska Street, Praga district. The vegetation cover of tracks, mainly of Sempervivum L. and Sedum L. species—the Vicia cracca visible in the middle as the ruderal species indicates the beginning of seminatural plant succession. Photo shared with permission: Warsaw Trams Llc., 2020 [65].
Figure 14. Warsaw: Puławska Street, Mokotów district. Smooth, grassy track cover gives a repre-sentative appearance to the main streets of the city. Photo shared with permission: Warsaw Trams Llc., 2020 [65].
Figure 15. Warsaw: Puławska Street, Mokotów district. Smooth, grassy track cover gives a repre-sentative appearance to the main streets of the city. Photo shared with permission: Tramwaje War-szawskie Llc., 2020 [65].
Figure 16. Warsaw: Rakowiecka Street, Mokotów district. The grassy track cover after mowing during summer. Photo: J. Łukaszkiewicz, VIII 2016 [65]. Figure 16. Warsaw: Rakowiecka Street, Mokotów district. The grassy track cover after mowingduring summer. Photo: J. Łukaszkiewicz, VIII 2016 [65].
Land 2021, 10, x FOR PEER REVIEW 12 of 24
Figure 17. Warsaw: Zieleniecka Avenue, Praga district. Grassy tram lane nearby National Stadium is accomplished with a low hedge and a row of street trees on the left. Photo shared with permis-sion: Warsaw Trams Llc., 2020 [65].
Figure 18. Warsaw: A. Mickiewicza Street, Żoliborz district. Grassy tram lane lined with rows of street trees on both sides. Photo shared with permission: Warsaw Trams Llc., 2020 [65].
The presented general data show that ca. 185.7 km of single tram tracks in Warsaw can be potentially transformed into a biologically active surface with turf or herbaceous vegetation cover. Some of these tracks run in separate corridors along the streets or inde-pendently across areas excluded for traffic, which offers the opportunity to introduce ad-ditional accompanying greenery (insulation and protective belts—one or double sided) of various widths.
Considering diverse spatial conditions and possible plant arrangements (different configurations of trees and shrubs connected with more or less extensive grassy areas), the authors introduced several model versions of natural protection zones (Figures 19–21). Linear vegetation belts make it possible to create insulation barriers of various densi-ties of trees and shrubs, and in the broadest version—even to create structures like linear parks, available for direct use (added recreational function).
3.1. The Model—Detailed Assumptions
1 The model assumes the hypothetical development of a track section, 100.0 m long, with a parallel linear strip of land of the same length; the purpose of developing the
Figure 17. Warsaw: Zieleniecka Avenue, Praga district. Grassy tram lane nearby National Stadium isaccomplished with a low hedge and a row of street trees on the left. Photo shared with permission:Warsaw Trams Llc., 2020 [65].
137
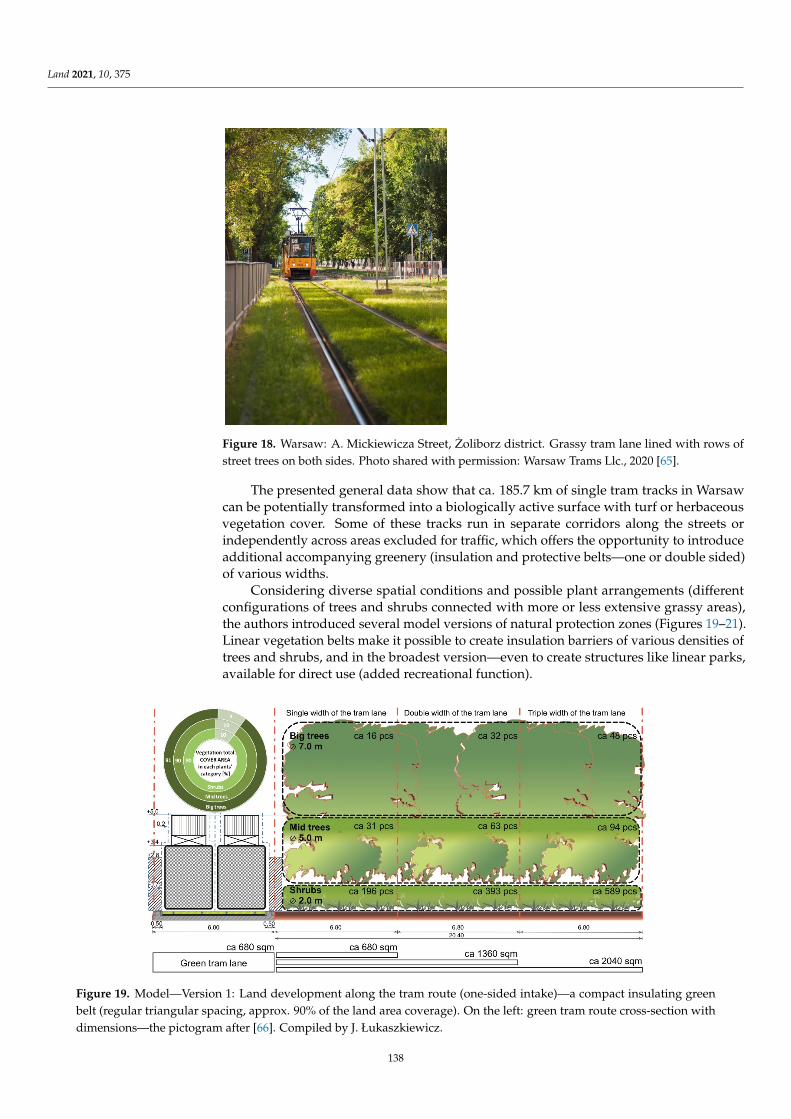
Land 2021, 10, 375
Land 2021, 10, x FOR PEER REVIEW 12 of 24
Figure 17. Warsaw: Zieleniecka Avenue, Praga district. Grassy tram lane nearby National Stadium is accomplished with a low hedge and a row of street trees on the left. Photo shared with permis-sion: Warsaw Trams Llc., 2020 [65].
Figure 18. Warsaw: A. Mickiewicza Street, Żoliborz district. Grassy tram lane lined with rows of street trees on both sides. Photo shared with permission: Warsaw Trams Llc., 2020 [65].
The presented general data show that ca. 185.7 km of single tram tracks in Warsaw can be potentially transformed into a biologically active surface with turf or herbaceous vegetation cover. Some of these tracks run in separate corridors along the streets or inde-pendently across areas excluded for traffic, which offers the opportunity to introduce ad-ditional accompanying greenery (insulation and protective belts—one or double sided) of various widths.
Considering diverse spatial conditions and possible plant arrangements (different configurations of trees and shrubs connected with more or less extensive grassy areas), the authors introduced several model versions of natural protection zones (Figures 19–21). Linear vegetation belts make it possible to create insulation barriers of various densi-ties of trees and shrubs, and in the broadest version—even to create structures like linear parks, available for direct use (added recreational function).
3.1. The Model—Detailed Assumptions
1 The model assumes the hypothetical development of a track section, 100.0 m long, with a parallel linear strip of land of the same length; the purpose of developing the
Figure 18. Warsaw: A. Mickiewicza Street, Zoliborz district. Grassy tram lane lined with rows ofstreet trees on both sides. Photo shared with permission: Warsaw Trams Llc., 2020 [65].
The presented general data show that ca. 185.7 km of single tram tracks in Warsawcan be potentially transformed into a biologically active surface with turf or herbaceousvegetation cover. Some of these tracks run in separate corridors along the streets orindependently across areas excluded for traffic, which offers the opportunity to introduceadditional accompanying greenery (insulation and protective belts—one or double sided)of various widths.
Considering diverse spatial conditions and possible plant arrangements (differentconfigurations of trees and shrubs connected with more or less extensive grassy areas),the authors introduced several model versions of natural protection zones (Figures 19–21).Linear vegetation belts make it possible to create insulation barriers of various densities oftrees and shrubs, and in the broadest version—even to create structures like linear parks,available for direct use (added recreational function).
Land 2021, 10, x FOR PEER REVIEW 13 of 24
model is to visualize the possibilities of enriching the surroundings of tram routes with greenery as an additional natural resource for the urban environment.
2 The conventional unit of the width applied in the model (urban unit) for the meas-urement of the strip of land parallel to the trackway corresponds to the basic width of the double tram track in Warsaw—6.8 m (track without additional space for elec-tric poles); the strip of land along the track may have a width of several times the width of the track; hence an additional strip of land with a width equal to a width of tracks lane (ca. 6.8 m) has a total area of ca. 680 m2; a strip of land with a width equal a double width of tracks lane (ca. 13.6 m) = an area of ca. 1360 m2; a strip of land with a width equal to 3 times the width of the double tracks lane (ca. 20.4 m) = an area of ca. 2040.0 m2
3 The model presents versions of vegetation cover for a strip of land with a total width equal to three times the track’s width, i.e., ca. 20.0 m; research shows that the insula-tion green belts of this width are the most effective in stopping volatile and solid air pollutants, and at the same time, this width is sufficient to introduce local urban lin-ear parks.
4 The model presents three versions of land development on one side of the tram dou-ble-track lane, assuming that the same development may occur on both sides or in a mosaic pattern.
5 It is assumed that the tram track itself has a green cover, i.e., grassy or herbaceous vegetation; the use of large trees (height > 10.0 m, Ø 7.0 m), smaller trees (height < 10.0 m, Ø 5.0 m), large shrubs (Ø 2.0 m), and lawns is assumed.
3.2. Model—Various Solutions Version 1. Development of the area along the tram route in the form of a green bar-
rier—a compact insulating green belt (regular triangular spacing, approx. 90% of the land area coverage); estimated numbers of plants in individual categories were calculated (large trees, h > 10.0 m/crown Ø approx. 7.0 m; smaller trees h < 10.0 m/crown Ø approx. 5.0 m; large shrubs Ø approx. 2.0 m) for a strip of land with a length of 100.0 m.
The width of the insulating green belt is a multiplication of the green double track width (Tr = 6.8 m); in the adopted version, the maximum width reaches the triple width of tracks lane exceeding 20.0 m and may be increased as far as possible and necessary, in accordance with the principle presented in the model (Figure 19).
Figure 19. Model—Version 1: Land development along the tram route (one-sided intake)—a com-pact insulating green belt (regular triangular spacing, approx. 90% of the land area coverage). On the left: green tram route cross-section with dimensions—the pictogram after [66]. Compiled by J. Łukaszkiewicz.
Figure 19. Model—Version 1: Land development along the tram route (one-sided intake)—a compact insulating greenbelt (regular triangular spacing, approx. 90% of the land area coverage). On the left: green tram route cross-section withdimensions—the pictogram after [66]. Compiled by J. Łukaszkiewicz.
138
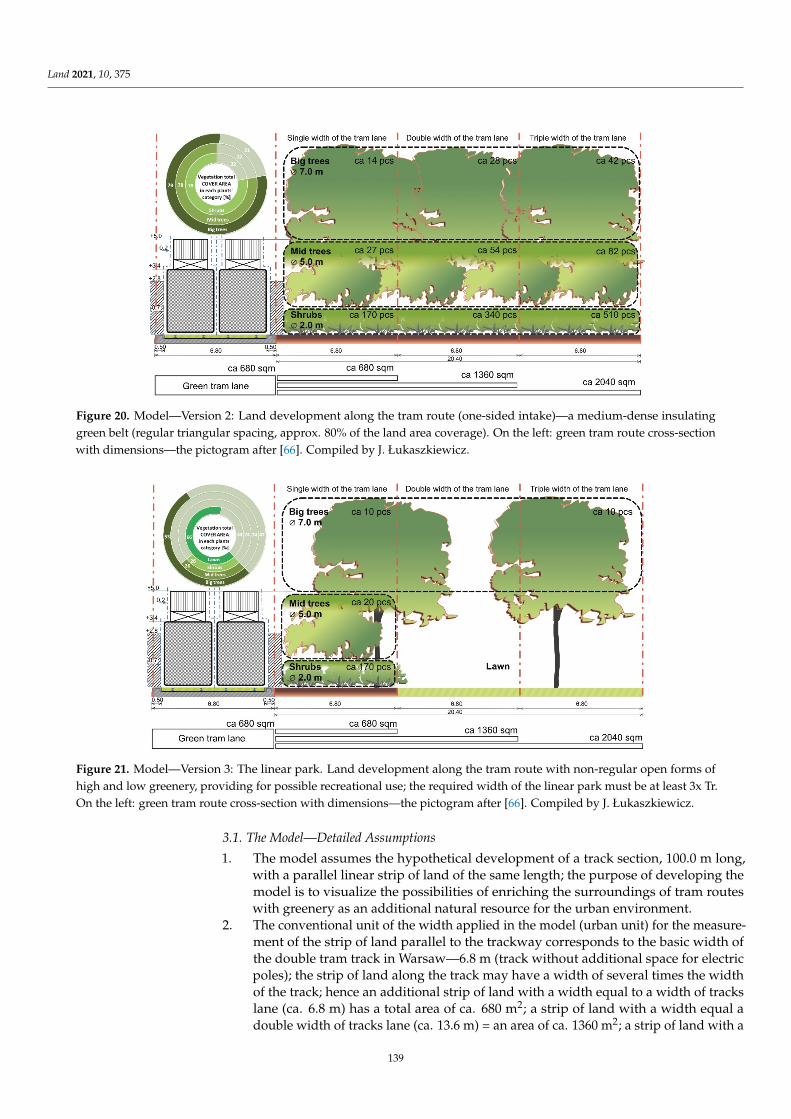
Land 2021, 10, 375
Land 2021, 10, x FOR PEER REVIEW 14 of 24
Version 2. Development of the area along the tram route in the form of a green bar-rier—a medium-dense insulating green belt (regular square spacing, approx. 80% of the land area coverage); estimated numbers of plants in individual categories were calculated (large trees, h > 10.0 m/crown Ø approx. 7.0 m; smaller trees h < 10.0 m/crown Ø approx. 5.0 m; large shrubs Ø approx. 2.0 m) for a strip of land with a length of 100.0 m.
The width of the insulating green belt is a multiplication of the green double track width (Tr = 6.8 m); in the adopted version, the maximum width reaches the triple width of tracks lane exceeding 20.0 m and may be increased as far as possible and necessary, in accordance with the principle presented in the model (Figure 20).
Figure 20. Model—Version 2: Land development along the tram route (one-sided intake)—a me-dium-dense insulating green belt (regular triangular spacing, approx. 80% of the land area cover-age). On the left: green tram route cross-section with dimensions—the pictogram after [66]. Com-piled by J. Łukaszkiewicz.
Version 3. The linear park—land development along the tram route with non-regular open forms of high and low greenery, providing high luminosity beneath the canopy, with a significant share of open grassy areas providing for possible recreational use (an implementation of path layout, equipment, etc.); on the edge of the green tram lane, the greenery of the diverse height creates a compact, insulating physical and optical green barrier. Estimated numbers of plants in individual categories (large trees, h> 10.0 m/crown Ø approx. 7.0 m; smaller trees h < 10.0 m/crown Ø approx. 5.0 m; large shrubs Ø approx. 2.0 m) were determined for a strip of land with a length of 100.0 m. The width of the green belt arranged as a linear park is a multiple of the width of the green tram lane (Tr = 6.8 m); … in the adopted version, the maximum width reaches the triple width of tracks lane exceeding 20.0 m (Figure 21).
Figure 20. Model—Version 2: Land development along the tram route (one-sided intake)—a medium-dense insulatinggreen belt (regular triangular spacing, approx. 80% of the land area coverage). On the left: green tram route cross-sectionwith dimensions—the pictogram after [66]. Compiled by J. Łukaszkiewicz.
Land 2021, 10, x FOR PEER REVIEW 15 of 24
Figure 21. Model—Version 3: The linear park. Land development along the tram route with non-regular open forms of high and low greenery, providing for possible recreational use; the required width of the linear park must be at least 3x Tr. On the left: green tram route cross-section with dimensions—the pictogram after [66]. Compiled by J. Łukaszkiewicz.
Currently, green tram lanes in Warsaw provide approx. 8.9 ha of biologically active area (a total length of approx. 25.5 km of a single track with the mean track width of ap-prox. 3.5 m), which is only approx. 1.78% of the total area of the ten largest parks in War-saw (Table 2).
Table 2. The area of the 10 largest parks in Warsaw.
No. Parks of Warsaw (10 Largest) Area (ha) 1 Natolin 105.00 2 Pole Mokotowskie 100.00 3 Łazienki Królewskie 76.00 4 Skaryszewski 58.00 5 Marszałka E. Rydza-Śmigłego 53.00 6 Bródnowski 25.40 7 Wilanów 24.00 8 Dolinka Służewiecka 23.00 9 Moczydło 19.94 10 Morskie Oko—Promenada 17.90
Total area of parks (ha) 502.24
There is still approx. a total length of 185.7 kmst (single tram tracks) in Warsaw po-tentially suitable for transformation into green lanes. If at least some of these resources are available for direct use (after excluding “technical” sections, i.e., intersections, viaducts, stops, pedestrian crossings, etc.), the following can be assumed:
• the introduction of low vegetation cover (lawns or herbaceous plants) using only 50% of the resources of available single track length (approx. 92.85 km) with the mean-narrow version of track spacing (width of approx. 3.5 m) allows obtaining approx. 32.5 ha of biologically active area in total; connecting it with the area of already ex-isting green tracks allows 41.4 ha of biologically active area to be obtained in the scale of the entire city’s tramway system;
• the possibility of introducing additional protection green belts along the tram lanes using only 20% of available 185.7 kmst of single track length (due to restrictions re-sulting from spatial or technical conditions), gives approx. 37.14 km length of tracks in total; green belts of such a length and approx. 6.8 m average width would allow
Figure 21. Model—Version 3: The linear park. Land development along the tram route with non-regular open forms ofhigh and low greenery, providing for possible recreational use; the required width of the linear park must be at least 3x Tr.On the left: green tram route cross-section with dimensions—the pictogram after [66]. Compiled by J. Łukaszkiewicz.
3.1. The Model—Detailed Assumptions
1. The model assumes the hypothetical development of a track section, 100.0 m long,with a parallel linear strip of land of the same length; the purpose of developing themodel is to visualize the possibilities of enriching the surroundings of tram routeswith greenery as an additional natural resource for the urban environment.
2. The conventional unit of the width applied in the model (urban unit) for the measure-ment of the strip of land parallel to the trackway corresponds to the basic width ofthe double tram track in Warsaw—6.8 m (track without additional space for electricpoles); the strip of land along the track may have a width of several times the widthof the track; hence an additional strip of land with a width equal to a width of trackslane (ca. 6.8 m) has a total area of ca. 680 m2; a strip of land with a width equal adouble width of tracks lane (ca. 13.6 m) = an area of ca. 1360 m2; a strip of land with a
139
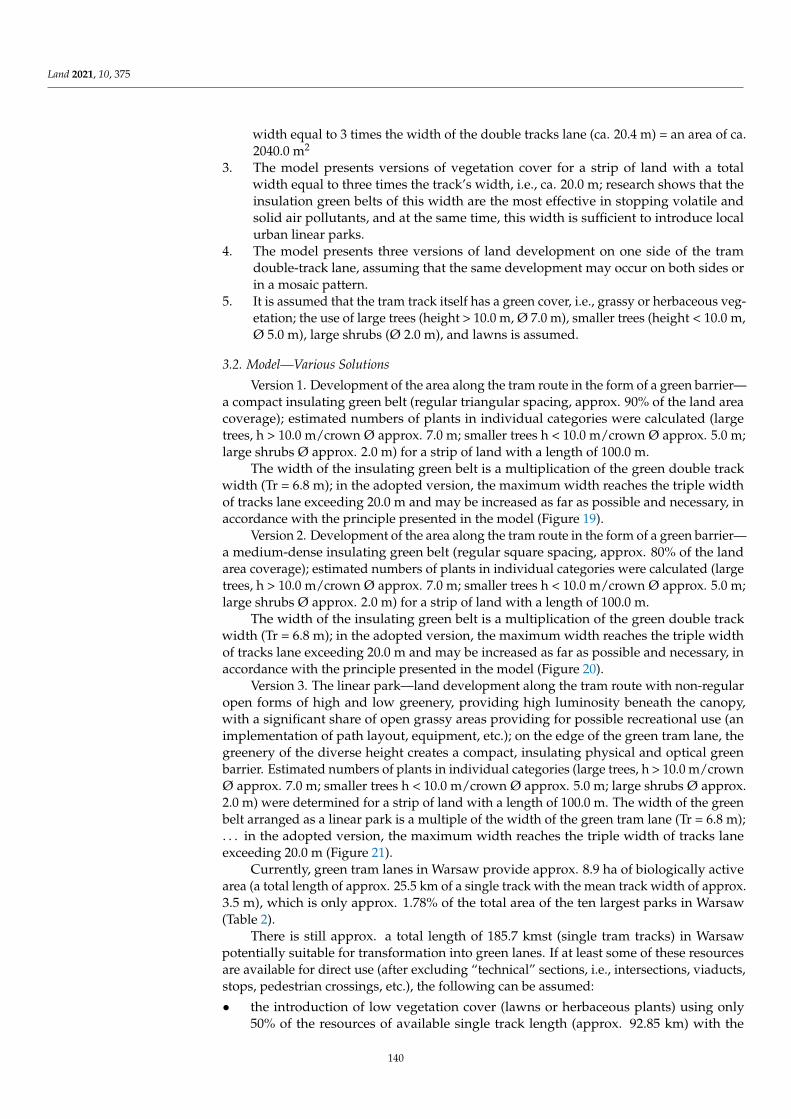
Land 2021, 10, 375
width equal to 3 times the width of the double tracks lane (ca. 20.4 m) = an area of ca.2040.0 m2
3. The model presents versions of vegetation cover for a strip of land with a totalwidth equal to three times the track’s width, i.e., ca. 20.0 m; research shows that theinsulation green belts of this width are the most effective in stopping volatile andsolid air pollutants, and at the same time, this width is sufficient to introduce localurban linear parks.
4. The model presents three versions of land development on one side of the tramdouble-track lane, assuming that the same development may occur on both sides orin a mosaic pattern.
5. It is assumed that the tram track itself has a green cover, i.e., grassy or herbaceous veg-etation; the use of large trees (height > 10.0 m, Ø 7.0 m), smaller trees (height < 10.0 m,Ø 5.0 m), large shrubs (Ø 2.0 m), and lawns is assumed.
3.2. Model—Various Solutions
Version 1. Development of the area along the tram route in the form of a green barrier—a compact insulating green belt (regular triangular spacing, approx. 90% of the land areacoverage); estimated numbers of plants in individual categories were calculated (largetrees, h > 10.0 m/crown Ø approx. 7.0 m; smaller trees h < 10.0 m/crown Ø approx. 5.0 m;large shrubs Ø approx. 2.0 m) for a strip of land with a length of 100.0 m.
The width of the insulating green belt is a multiplication of the green double trackwidth (Tr = 6.8 m); in the adopted version, the maximum width reaches the triple widthof tracks lane exceeding 20.0 m and may be increased as far as possible and necessary, inaccordance with the principle presented in the model (Figure 19).
Version 2. Development of the area along the tram route in the form of a green barrier—a medium-dense insulating green belt (regular square spacing, approx. 80% of the landarea coverage); estimated numbers of plants in individual categories were calculated (largetrees, h > 10.0 m/crown Ø approx. 7.0 m; smaller trees h < 10.0 m/crown Ø approx. 5.0 m;large shrubs Ø approx. 2.0 m) for a strip of land with a length of 100.0 m.
The width of the insulating green belt is a multiplication of the green double trackwidth (Tr = 6.8 m); in the adopted version, the maximum width reaches the triple widthof tracks lane exceeding 20.0 m and may be increased as far as possible and necessary, inaccordance with the principle presented in the model (Figure 20).
Version 3. The linear park—land development along the tram route with non-regularopen forms of high and low greenery, providing high luminosity beneath the canopy,with a significant share of open grassy areas providing for possible recreational use (animplementation of path layout, equipment, etc.); on the edge of the green tram lane, thegreenery of the diverse height creates a compact, insulating physical and optical greenbarrier. Estimated numbers of plants in individual categories (large trees, h > 10.0 m/crownØ approx. 7.0 m; smaller trees h < 10.0 m/crown Ø approx. 5.0 m; large shrubs Ø approx.2.0 m) were determined for a strip of land with a length of 100.0 m. The width of the greenbelt arranged as a linear park is a multiple of the width of the green tram lane (Tr = 6.8 m);. . . in the adopted version, the maximum width reaches the triple width of tracks laneexceeding 20.0 m (Figure 21).
Currently, green tram lanes in Warsaw provide approx. 8.9 ha of biologically activearea (a total length of approx. 25.5 km of a single track with the mean track width of approx.3.5 m), which is only approx. 1.78% of the total area of the ten largest parks in Warsaw(Table 2).
There is still approx. a total length of 185.7 kmst (single tram tracks) in Warsawpotentially suitable for transformation into green lanes. If at least some of these resourcesare available for direct use (after excluding “technical” sections, i.e., intersections, viaducts,stops, pedestrian crossings, etc.), the following can be assumed:
• the introduction of low vegetation cover (lawns or herbaceous plants) using only50% of the resources of available single track length (approx. 92.85 km) with the
140
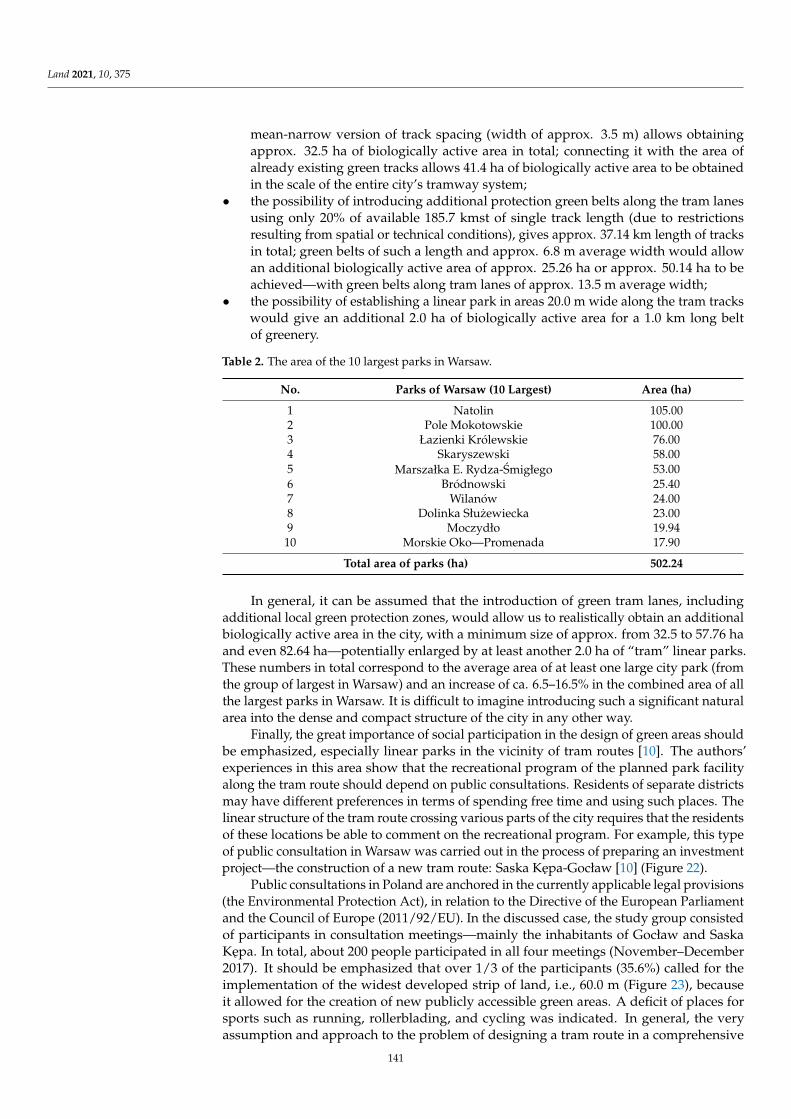
Land 2021, 10, 375
mean-narrow version of track spacing (width of approx. 3.5 m) allows obtainingapprox. 32.5 ha of biologically active area in total; connecting it with the area ofalready existing green tracks allows 41.4 ha of biologically active area to be obtainedin the scale of the entire city’s tramway system;
• the possibility of introducing additional protection green belts along the tram lanesusing only 20% of available 185.7 kmst of single track length (due to restrictionsresulting from spatial or technical conditions), gives approx. 37.14 km length of tracksin total; green belts of such a length and approx. 6.8 m average width would allowan additional biologically active area of approx. 25.26 ha or approx. 50.14 ha to beachieved—with green belts along tram lanes of approx. 13.5 m average width;
• the possibility of establishing a linear park in areas 20.0 m wide along the tram trackswould give an additional 2.0 ha of biologically active area for a 1.0 km long beltof greenery.
Table 2. The area of the 10 largest parks in Warsaw.
No. Parks of Warsaw (10 Largest) Area (ha)
1 Natolin 105.002 Pole Mokotowskie 100.003 Łazienki Królewskie 76.004 Skaryszewski 58.005 Marszałka E. Rydza-Smigłego 53.006 Bródnowski 25.407 Wilanów 24.008 Dolinka Słuzewiecka 23.009 Moczydło 19.9410 Morskie Oko—Promenada 17.90
Total area of parks (ha) 502.24
In general, it can be assumed that the introduction of green tram lanes, includingadditional local green protection zones, would allow us to realistically obtain an additionalbiologically active area in the city, with a minimum size of approx. from 32.5 to 57.76 haand even 82.64 ha—potentially enlarged by at least another 2.0 ha of “tram” linear parks.These numbers in total correspond to the average area of at least one large city park (fromthe group of largest in Warsaw) and an increase of ca. 6.5–16.5% in the combined area of allthe largest parks in Warsaw. It is difficult to imagine introducing such a significant naturalarea into the dense and compact structure of the city in any other way.
Finally, the great importance of social participation in the design of green areas shouldbe emphasized, especially linear parks in the vicinity of tram routes [10]. The authors’experiences in this area show that the recreational program of the planned park facilityalong the tram route should depend on public consultations. Residents of separate districtsmay have different preferences in terms of spending free time and using such places. Thelinear structure of the tram route crossing various parts of the city requires that the residentsof these locations be able to comment on the recreational program. For example, this typeof public consultation in Warsaw was carried out in the process of preparing an investmentproject—the construction of a new tram route: Saska Kepa-Gocław [10] (Figure 22).
Public consultations in Poland are anchored in the currently applicable legal provisions(the Environmental Protection Act), in relation to the Directive of the European Parliamentand the Council of Europe (2011/92/EU). In the discussed case, the study group consistedof participants in consultation meetings—mainly the inhabitants of Gocław and SaskaKepa. In total, about 200 people participated in all four meetings (November–December2017). It should be emphasized that over 1/3 of the participants (35.6%) called for theimplementation of the widest developed strip of land, i.e., 60.0 m (Figure 23), becauseit allowed for the creation of new publicly accessible green areas. A deficit of places forsports such as running, rollerblading, and cycling was indicated. In general, the veryassumption and approach to the problem of designing a tram route in a comprehensive
141
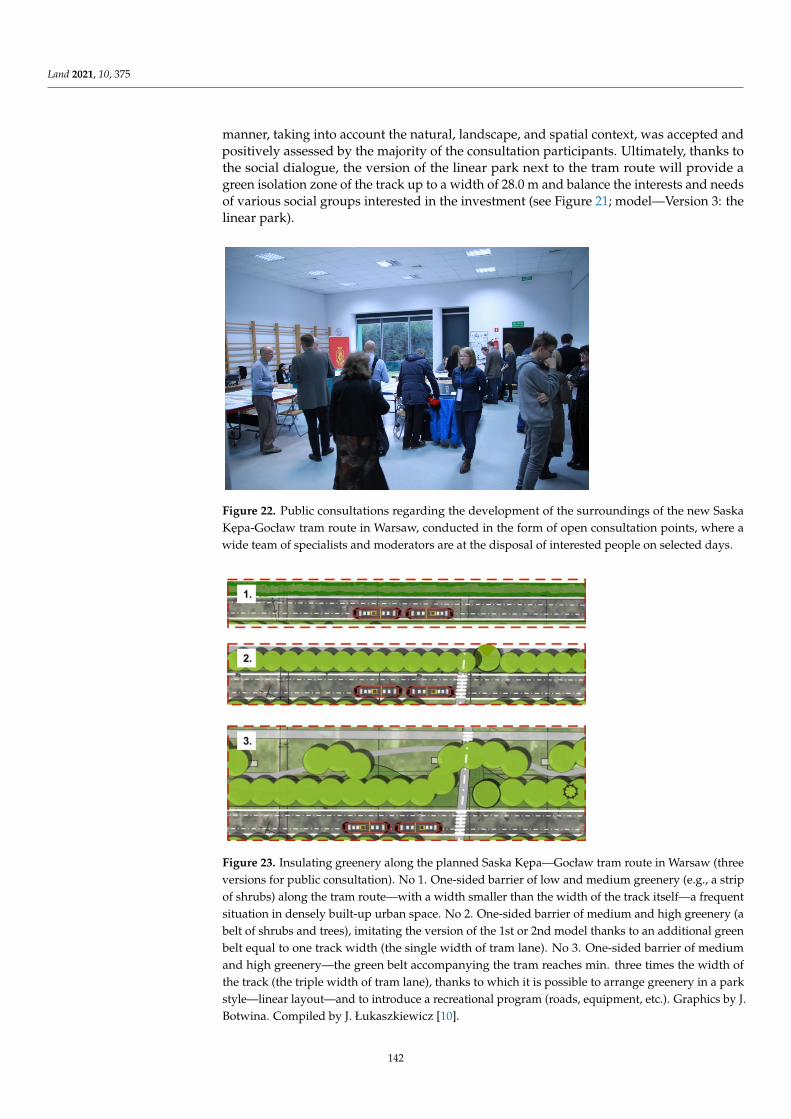
Land 2021, 10, 375
manner, taking into account the natural, landscape, and spatial context, was accepted andpositively assessed by the majority of the consultation participants. Ultimately, thanks tothe social dialogue, the version of the linear park next to the tram route will provide agreen isolation zone of the track up to a width of 28.0 m and balance the interests and needsof various social groups interested in the investment (see Figure 21; model—Version 3: thelinear park).
Land 2021, 10, x FOR PEER REVIEW 16 of 24
an additional biologically active area of approx. 25.26 ha or approx. 50.14 ha to be achieved—with green belts along tram lanes of approx. 13.5 m average width;
• the possibility of establishing a linear park in areas 20.0 m wide along the tram tracks would give an additional 2.0 ha of biologically active area for a 1.0 km long belt of greenery.
In general, it can be assumed that the introduction of green tram lanes, including additional local green protection zones, would allow us to realistically obtain an addi-tional biologically active area in the city, with a minimum size of approx. from 32.5 to 57.76 ha and even 82.64 ha—potentially enlarged by at least another 2.0 ha of “tram” linear parks. These numbers in total correspond to the average area of at least one large city park (from the group of largest in Warsaw) and an increase of ca. 6.5–16.5% in the combined area of all the largest parks in Warsaw. It is difficult to imagine introducing such a signif-icant natural area into the dense and compact structure of the city in any other way.
Finally, the great importance of social participation in the design of green areas should be emphasized, especially linear parks in the vicinity of tram routes [10]. The au-thors’ experiences in this area show that the recreational program of the planned park facility along the tram route should depend on public consultations. Residents of separate districts may have different preferences in terms of spending free time and using such places. The linear structure of the tram route crossing various parts of the city requires that the residents of these locations be able to comment on the recreational program. For example, this type of public consultation in Warsaw was carried out in the process of pre-paring an investment project—the construction of a new tram route: Saska Kępa-Gocław [10] (Figure 22).
Figure 22. Public consultations regarding the development of the surroundings of the new Saska Kępa-Gocław tram route in Warsaw, conducted in the form of open consultation points, where a wide team of specialists and moderators are at the disposal of interested people on selected days.
Public consultations in Poland are anchored in the currently applicable legal provi-sions (the Environmental Protection Act), in relation to the Directive of the European Par-liament and the Council of Europe (2011/92/EU). In the discussed case, the study group consisted of participants in consultation meetings—mainly the inhabitants of Gocław and Saska Kępa. In total, about 200 people participated in all four meetings (November–De-cember 2017). It should be emphasized that over 1/3 of the participants (35.6%) called for the implementation of the widest developed strip of land, i.e., 60.0 m (Figure 23), because it allowed for the creation of new publicly accessible green areas. A deficit of places for sports such as running, rollerblading, and cycling was indicated. In general, the very as-sumption and approach to the problem of designing a tram route in a comprehensive manner, taking into account the natural, landscape, and spatial context, was accepted and positively assessed by the majority of the consultation participants. Ultimately, thanks to the social dialogue, the version of the linear park next to the tram route will provide a green isolation zone of the track up to a width of 28.0 m and balance the interests and
Figure 22. Public consultations regarding the development of the surroundings of the new SaskaKepa-Gocław tram route in Warsaw, conducted in the form of open consultation points, where awide team of specialists and moderators are at the disposal of interested people on selected days.
Land 2021, 10, x FOR PEER REVIEW 17 of 24
needs of various social groups interested in the investment (see Figure 21; model—Ver-sion 3: the linear park).
Figure 23. Insulating greenery along the planned Saska Kępa—Gocław tram route in Warsaw (three versions for public consultation). No 1. One-sided barrier of low and medium greenery (e.g., a strip of shrubs) along the tram route—with a width smaller than the width of the track it-self—a frequent situation in densely built-up urban space. No 2. One-sided barrier of medium and high greenery (a belt of shrubs and trees), imitating the version of the 1st or 2nd model thanks to an additional green belt equal to one track width (the single width of tram lane). No 3. One-sided barrier of medium and high greenery—the green belt accompanying the tram reaches min. three times the width of the track (the triple width of tram lane), thanks to which it is possible to arrange greenery in a park style—linear layout—and to introduce a recreational program (roads, equip-ment, etc.). Graphics by J. Botwina. Compiled by J. Łukaszkiewicz [10].
4. Discussion Warsaw, the capital of Poland, is a rapidly growing urban organism badly needing a
general concept to organize this development to avoid city congestion and suffocation in the near future. One of the ideas seems to be the careful planning of the urban space growth along the tram lines as backbones of this development. The authors think that in light of the city’s traumatic past and subsequent rapid development, President Starzyński’s plan of building a radial structure has been lost, and now it is time to bring forward suitable plans before it is too late. Fortunately, there are examples to be followed, which are discussed here.
Sustainable development of the urban organisms involves the reduction of consump-tion of non-renewable spatial resources, assuming the reuse of wastelands or brownfields (e.g., [12,19–21]). Tram lines are often a perfect tool to integrate urban space, creating lin-ear systems (“urban corridors”). In fact, the concept of development based on linear struc-tures is not new in urban planning. The example is the idea of a linear city (“La Ciudad Lineal”, ca. 1885) by the Spanish urbanist Arturo Soria y Mata (1844–1920) or the idea of “La Ville Radieuse” (“The Radiant City”, 1920s) by Le Corbusier (1887–1965). Both theo-ries later found further followers (e.g., [9,39]). For example, the concept of a “linear city” was applied in Curitiba (Curitiba), Brazil (approx. 3.0 million inhabitants) or in Australian cities (e.g., Melbourne, Coburg, and Sydney), where the tram is often an essential element of “urban corridors” [2,5].
Many examples from around the world indicate that a tramway can contribute to the improvement of the visual quality of urban public space and the promotion of the image of the city itself. For example, tram lines in France (France now has 240 city tram networks) are a symbol of modernity and an expression of French cities’ pro-ecological aspirations: restoring the lost public spaces, rationalizing access to public transport, and limiting the traffic (e.g., Montpellier, Strasbourg or Bordeaux and many others) [1–5].
Figure 23. Insulating greenery along the planned Saska Kepa—Gocław tram route in Warsaw (threeversions for public consultation). No 1. One-sided barrier of low and medium greenery (e.g., a stripof shrubs) along the tram route—with a width smaller than the width of the track itself—a frequentsituation in densely built-up urban space. No 2. One-sided barrier of medium and high greenery (abelt of shrubs and trees), imitating the version of the 1st or 2nd model thanks to an additional greenbelt equal to one track width (the single width of tram lane). No 3. One-sided barrier of mediumand high greenery—the green belt accompanying the tram reaches min. three times the width ofthe track (the triple width of tram lane), thanks to which it is possible to arrange greenery in a parkstyle—linear layout—and to introduce a recreational program (roads, equipment, etc.). Graphics by J.Botwina. Compiled by J. Łukaszkiewicz [10].
142
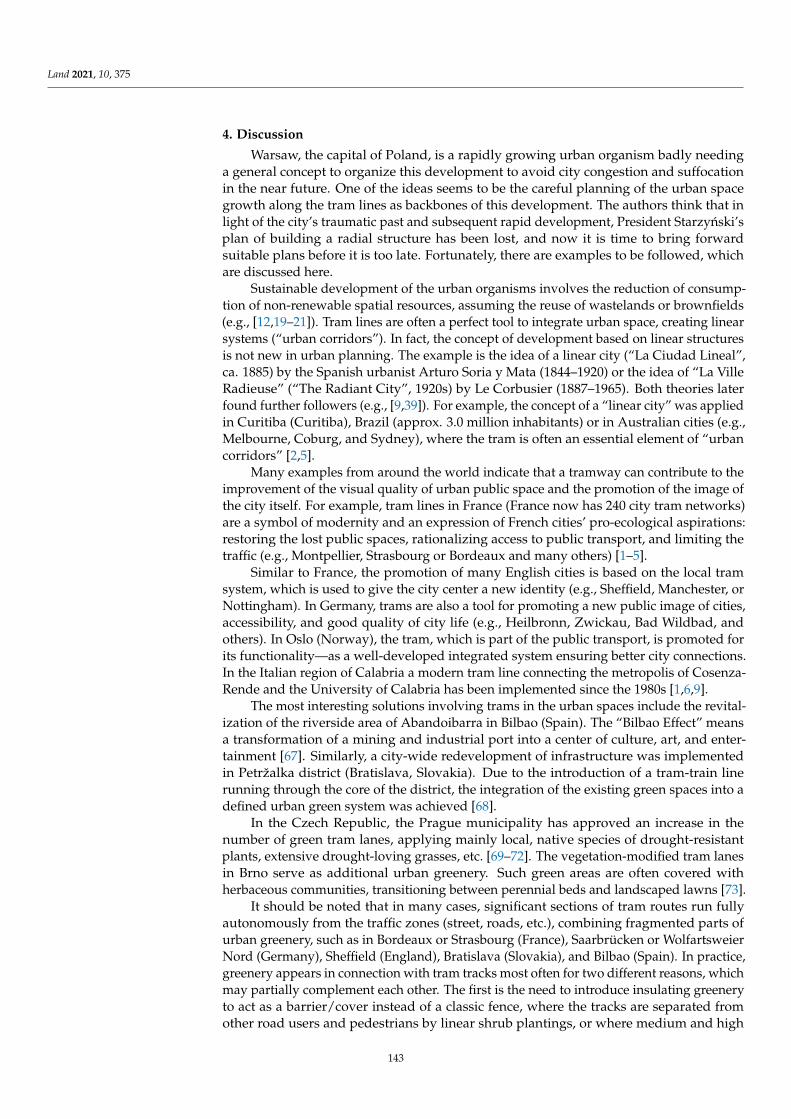
Land 2021, 10, 375
4. Discussion
Warsaw, the capital of Poland, is a rapidly growing urban organism badly needinga general concept to organize this development to avoid city congestion and suffocationin the near future. One of the ideas seems to be the careful planning of the urban spacegrowth along the tram lines as backbones of this development. The authors think that inlight of the city’s traumatic past and subsequent rapid development, President Starzynski’splan of building a radial structure has been lost, and now it is time to bring forwardsuitable plans before it is too late. Fortunately, there are examples to be followed, whichare discussed here.
Sustainable development of the urban organisms involves the reduction of consump-tion of non-renewable spatial resources, assuming the reuse of wastelands or brownfields(e.g., [12,19–21]). Tram lines are often a perfect tool to integrate urban space, creating linearsystems (“urban corridors”). In fact, the concept of development based on linear structuresis not new in urban planning. The example is the idea of a linear city (“La Ciudad Lineal”,ca. 1885) by the Spanish urbanist Arturo Soria y Mata (1844–1920) or the idea of “La VilleRadieuse” (“The Radiant City”, 1920s) by Le Corbusier (1887–1965). Both theories laterfound further followers (e.g., [9,39]). For example, the concept of a “linear city” was appliedin Curitiba (Curitiba), Brazil (approx. 3.0 million inhabitants) or in Australian cities (e.g.,Melbourne, Coburg, and Sydney), where the tram is often an essential element of “urbancorridors” [2,5].
Many examples from around the world indicate that a tramway can contribute to theimprovement of the visual quality of urban public space and the promotion of the image ofthe city itself. For example, tram lines in France (France now has 240 city tram networks)are a symbol of modernity and an expression of French cities’ pro-ecological aspirations:restoring the lost public spaces, rationalizing access to public transport, and limiting thetraffic (e.g., Montpellier, Strasbourg or Bordeaux and many others) [1–5].
Similar to France, the promotion of many English cities is based on the local tramsystem, which is used to give the city center a new identity (e.g., Sheffield, Manchester, orNottingham). In Germany, trams are also a tool for promoting a new public image of cities,accessibility, and good quality of city life (e.g., Heilbronn, Zwickau, Bad Wildbad, andothers). In Oslo (Norway), the tram, which is part of the public transport, is promoted forits functionality—as a well-developed integrated system ensuring better city connections.In the Italian region of Calabria a modern tram line connecting the metropolis of Cosenza-Rende and the University of Calabria has been implemented since the 1980s [1,6,9].
The most interesting solutions involving trams in the urban spaces include the revital-ization of the riverside area of Abandoibarra in Bilbao (Spain). The “Bilbao Effect” meansa transformation of a mining and industrial port into a center of culture, art, and enter-tainment [67]. Similarly, a city-wide redevelopment of infrastructure was implementedin Petržalka district (Bratislava, Slovakia). Due to the introduction of a tram-train linerunning through the core of the district, the integration of the existing green spaces into adefined urban green system was achieved [68].
In the Czech Republic, the Prague municipality has approved an increase in thenumber of green tram lanes, applying mainly local, native species of drought-resistantplants, extensive drought-loving grasses, etc. [69–72]. The vegetation-modified tram lanesin Brno serve as additional urban greenery. Such green areas are often covered withherbaceous communities, transitioning between perennial beds and landscaped lawns [73].
It should be noted that in many cases, significant sections of tram routes run fullyautonomously from the traffic zones (street, roads, etc.), combining fragmented parts ofurban greenery, such as in Bordeaux or Strasbourg (France), Saarbrücken or WolfartsweierNord (Germany), Sheffield (England), Bratislava (Slovakia), and Bilbao (Spain). In practice,greenery appears in connection with tram tracks most often for two different reasons, whichmay partially complement each other. The first is the need to introduce insulating greeneryto act as a barrier/cover instead of a classic fence, where the tracks are separated fromother road users and pedestrians by linear shrub plantings, or where medium and high
143
Land 2021, 10, 375
green plantings separate the entire length of the tracks from the traffic zone (e.g., Zwickau,Wolfartsweier, or Freiburg im Breisgau—Germany) (Figure 24). The second reason isthe integration of the tram routes with the urban greenery system (existing and newlydeveloped) thanks to coherent city-wide landscape strategies (e.g., Strasbourg, Bordeaux,and Montpellier—France, or Heilbronn—Germany) [1–3,12,20,21,67,68].
Land 2021, 10, x FOR PEER REVIEW 18 of 24
Similar to France, the promotion of many English cities is based on the local tram system, which is used to give the city center a new identity (e.g., Sheffield, Manchester, or Nottingham). In Germany, trams are also a tool for promoting a new public image of cit-ies, accessibility, and good quality of city life (e.g., Heilbronn, Zwickau, Bad Wildbad, and others). In Oslo (Norway), the tram, which is part of the public transport, is promoted for its functionality—as a well-developed integrated system ensuring better city connections. In the Italian region of Calabria a modern tram line connecting the metropolis of Cosenza-Rende and the University of Calabria has been implemented since the 1980s [1,6,9].
The most interesting solutions involving trams in the urban spaces include the revi-talization of the riverside area of Abandoibarra in Bilbao (Spain). The “Bilbao Effect” means a transformation of a mining and industrial port into a center of culture, art, and entertainment [67]. Similarly, a city-wide redevelopment of infrastructure was imple-mented in Petržalka district (Bratislava, Slovakia). Due to the introduction of a tram-train line running through the core of the district, the integration of the existing green spaces into a defined urban green system was achieved [68].
In the Czech Republic, the Prague municipality has approved an increase in the num-ber of green tram lanes, applying mainly local, native species of drought-resistant plants, extensive drought-loving grasses, etc. [69–72]. The vegetation-modified tram lanes in Brno serve as additional urban greenery. Such green areas are often covered with herbaceous communities, transitioning between perennial beds and landscaped lawns [73].
It should be noted that in many cases, significant sections of tram routes run fully autonomously from the traffic zones (street, roads, etc.), combining fragmented parts of urban greenery, such as in Bordeaux or Strasbourg (France), Saarbrücken or Wolfarts-weier Nord (Germany), Sheffield (England), Bratislava (Slovakia), and Bilbao (Spain). In practice, greenery appears in connection with tram tracks most often for two different reasons, which may partially complement each other. The first is the need to introduce insulating greenery to act as a barrier/cover instead of a classic fence, where the tracks are separated from other road users and pedestrians by linear shrub plantings, or where me-dium and high green plantings separate the entire length of the tracks from the traffic zone (e.g., Zwickau, Wolfartsweier, or Freiburg im Breisgau—Germany) (Figure 24). The second reason is the integration of the tram routes with the urban greenery system (exist-ing and newly developed) thanks to coherent city-wide landscape strategies (e.g., Stras-bourg, Bordeaux, and Montpellier—France, or Heilbronn—Germany) [1–3,12,20,21,67,68].
Figure 24. The tram train traveling in the “green corridor” consisting of grassy tracks, bordering trees, shrubs, and climbers attached to electric poles. Freiburg im Breisgau (Germany) has imple-mented numerous green tracks since 1980 [74].
Figure 24. The tram train traveling in the “green corridor” consisting of grassy tracks, bordering trees,shrubs, and climbers attached to electric poles. Freiburg im Breisgau (Germany) has implementednumerous green tracks since 1980 [74].
Due to their often favorable location in the compact urban structure, tram lanesare predisposed to be transformed into green areas of phytoremediation, climatic, andbiocenotic importance (e.g., [1–6,9,61,67–73,75]). For example, in Strasbourg, the skillfullyshaped and maintained coherent continuity of green communication lanes outside the citycenter has resulted in biodiversity corridors—migration routes for small animals and plantseeds [1,3].
The vegetation along tram lanes is very welcome to mitigate the city’s climate, e.g., thelevel of air pollution, the effects of climate change, etc. [23,28,61,75–79]. Naturally, the abilityof plants to absorb pollutants and clean the air (phytoremediation) depends on their size andvitality—trees play the most significant role in this process. In general, research shows thatthe appropriate structure and the maintenance of tall greenery—both its arrangement (forms,spatial arrangements) and internal structure—are of greater importance for air qualityimprovement. The highest efficiency in the accumulation of dust particles is achieved byisolating tall greenery forms located 3.0–15.0 m from the source of transport emissions. It isrelatively more than 2.5 times more than in the case of similar tree stands, but still growingfurther (e.g., [28–30,34,79,80]). Air purification of dust (PM) is optimal with a sufficientlyloose tree crown structure (40% of density), reaching the optimal canopy density of approx.35–70%. By increasing size or tree density of the smallest urban green spaces (e.g., aroundtram lanes), a real and most noticeable effect can be achieved in cleaning up the urbanatmosphere (e.g., [28–30,33–35,80,81]).
In Warsaw, the prospective opportunity for the rapid development of the tram networksystem is essential and dictated by the economy rules as the environmental burden issmaller than in the case of the underground (no need to make deep excavations, dealwith their negative effects on the hydro-groundwork conditions, use enormous amountsof building materials, transport masses of earth—an effect of earthmoving, disorganizedpublic transport, closed streets, construction sites, boreholes, etc.).
Increasing the biologically active area in the center zone of Warsaw is now a necessaryrequirement. Although greenery is introduced in every possible way (green roofs, green
144
Land 2021, 10, 375
walls, greenery on terraces, etc.), the main disadvantage of these forms of vegetation istheir limited or complete lack of access to all users of urban public spaces. Such personsbecome only passive viewers (often only from a considerable distance) of such isolatedarrangements. In terms of environmental advantages, forms such as green roofs, greenwalls, greenery on terraces, etc., undoubtedly play an important role—they serve to increasethe biologically active surface and help to reduce the urban “heat island” phenomenon;however, in terms of social values—apart from a positive aesthetic effect—they do not havea more significant impact.
The greenery which is in Warsaw associated with tram lanes is also, to some extent,excluded from direct use (especially green tracks), but it is still visually closer as it is on thestreet level. Undoubtedly, this has a positive effect on the reception of a given space, whichthus adopts a harmonious landscape appearance. In addition, the green tram lanes are realbiocenotic corridors—they allow for unhindered existence and movement of small fauna(e.g., birds, insects, earthworms). Adding the technical considerations discussed earlier(protective function), it can be concluded that the vegetation accompanying tram routes isthe simplest and most advantageous way of introducing greenery into the downtown area.
The model of the greenery version interrelated to tram tracks in Warsaw presentedherein carries plenty of resemblance to solutions applied in other cities and countries.This is a concise conceptualization allowing for a choice of a specific greenery version inrelation to the width of the lane of the accessible ground. In the widest version of the model(Version 3), the option to introduce linear parks along the tram tracks was also taken intoaccount. In this case, the greenery is also a recreational space, besides having the isolatingfunction. Such solutions are popular around the world [1–6,9,67–73], and this trend is alsoprovided for in the design of the environment of tram route Saska Kepa—Gocław, in whichthe authors participated [10]. Furthermore, the conceptual research concerning the greenerystructure accompanying the tram lines has shown great socioeconomic importance of thepublic consultations at the stage of the project preparation.
The presented case studies of cities show that a complex, coherent, and thoughtfulapproach to tramway lane design results in their successful integration with the urban sur-roundings [2,3,5,9,10,67]. The current world standard trams are environmentally friendly;they move almost noiselessly—often on surfaces covered with vegetation or in “greencorridors”—without degrading visually valuable, often historic downtown areas. Thetramways meet the expectations and carry out the communication tasks of modern cities,not only without generating adverse environmental effects but also positively influencingthe process of shaping public spaces [1–4,39].
Moreover, one cannot forget that every—even the smallest—fragment of visible urbangreenery is of great importance in relieving stress and mental disorders in city dwellersforced to stay in confinement during the global COVID-19 pandemic [13–15].
To sum up, those responsible for development of the future shape of a city andits public transport should take a leaf out of the book on other European cities, writtenby the decentralization and competition between cities across Europe and all over theworld, showing that the evolution of urban theories makes it necessary to combine publictransport with a high-standard multifunctional urban space. The tram system is a core ofsuch projects, implementing not only communication functions without adverse effectson the environment (compared to other means of public transport), but also positivelyinfluencing the process of shaping urban public spaces by using “green thinking” as a keyfactor [1–3,5].
5. Conclusions
Trams are a key part of EU public transportation. The great importance of urban tramsystems for the everyday transportation of masses of people is confirmed by the EU andPolish statistics data. The ecological advantages of trams are recognized in successiveEU strategies and policies related to urban development and environmental protection.Globally, trams seem to be a vital tool for the development of urban space, which allow
145
Land 2021, 10, 375
arranging and consolidating structures called “urban corridors”. As additional greenareas can be introduced into densely urbanized space through tramlines, the real social,environmental, and functional importance of this form of transport is finally tangible. TheWarsaw tram system case study (total length over 300 km of single tracks in service in 2019)was implemented in order to simulate the potential growth of a biologically active areaconnected with an increasing share of greenery around tram lanes in Warsaw.
The suggested revitalization of the existing and designing the future tram lanes asgreen corridors is in line with the generally accepted concept of urban green infrastructure.Therefore, the authors aim to present their views on this significant issue in a condensedfashion, within the program of the revitalization of Warsaw landscape by converting theexisting tram lines, where possible, and planning new ones according to the “green pointof view”.
The information used as a basis to analyze the relevant situation in Warsaw camefrom other studies, European as well as global, presenting the development of urbantram systems. The authors’ experience in designing of the tram lane surroundings inWarsaw was of key importance for the research presented, especially in terms of greeneryforms—their functionality, utility, and visual quality.
The synthesis of these issues is presented as a model with several versions, applied toWarsaw itself in the first place (as it is the case study of our research); however, the modelcould be applicable in other cities of the world. The development of such a model aimsto indicate a potential solution to a specific problem, namely the shaping of tram routesurroundings, especially with high greenery used. Our findings provide fundamental andvaluable, yet overlooked, guidelines for urban tram system managers, urban policymakers,and local planners. The authors do not claim that the presented model is the only and bestpossible solution to the principles of designing and revitalization of greenery along tramroutes. Nevertheless, it seems to be a viable overall proposition with which one can createdetailed solutions adapted to the conditions of the specific site.
The paper indicates that in Warsaw—similar to other capital cities—some selectedareas along the tram routes can be designed and arranged as linear parks with additionalrecreational functions, following the prevailing world trend. The linear park is, in a way,a contemporary approach to more traditional spatial linear forms such as a boulevard ora promenade. An excellent example of such a solution is the case of a planned tram linefrom Saska-Kepa to Gocław district in Warsaw. Moreover, also based on this example,this publication emphasizes the great importance of public consultations in planning newtram lines.
Taking into account all the results obtained so far, the main conclusions are as follows:(1) The presented case study (Warsaw) allows one to determine to what extent the introduc-tion of green tracks (i.e., covered with herbaceous vegetation or additionally surroundedby tall vegetation) would realistically increase the biologically active area in the scale ofthe entire city; (2) With the adoption of minimum area parameters, the introduction ofgreenery associated with tram lines allows one to generate a biologically active area equalto a size of at least one large city park; in the case of Warsaw, it is an additional severaldozen hectares of greenery in the densely built-up zone; (3) This is important especially inthe central area—with dense, high-rise buildings and extensive technical infrastructure—where there is a shortage of space available for the introduction of new natural objects(parks, squares, promenades, etc.). Often, green tram tracks are the only rational way ofintroducing “ground-layer” vegetation into this zone; (4) The plans of city developmentshould also consider the “green” tram lines leading to recreational areas on the outskirts,serving at the same time as “ventilation corridors”; (5) The case of Warsaw and the spatialsimulations presented in this paper seem to confirm that this kind of approach, alreadysuccessfully applied in many cities around the world, appears to be the best way of tacklingsome key environmental issues during the continuous development of Poland’s capital.
146
Land 2021, 10, 375
Author Contributions: Conceptualization, methodology, and formal analysis: J.Ł. and B.F.-A.; in-vestigation and resources: J.Ł., B.F.-A., and J.F.; data selection: J.Ł. and Ł.O.; writing—original draftpreparation: J.Ł.; writing—review and editing: J.Ł., B.F.-A., and J.F.; visualization: J.Ł., B.F.-A., andŁ.O.; supervision: J.Ł., B.F.-A., and J.F. All authors have read and agreed to the published version ofthe manuscript.
Funding: This research received no external funding.
Institutional Review Board Statement: Not applicable.
Informed Consent Statement: Not applicable.
Acknowledgments: We would like to thank Vera Kolárová for her extremely competent help inlanguage proofreading. We would like to thank our colleague Wisniewski for his help in preparinggraphic materials. The authors would like to thank the anonymous reviewers and editors for theirconstructive comments and suggestions.
Conflicts of Interest: The authors declare no conflict of interest.
References1. Burns, M. HiTrans Best Practice Guide 3. Public Transport & Urban Design. 2005. Available online: https://www.crow.nl/
downloads/documents/13360 (accessed on 15 January 2019).2. Adams, R.A.M. Transforming Australian Cities. For a More Financially Viable and Sustainable Future. Transportation and Urban
Design. City of Melbourne. 2009. Available online: http://www.transformingaustraliancities.com.au/wp-content/uploads/Transforming-Australian-Cities-Report.pdf (accessed on 21 September 2020).
3. Konopacki-Maciuk, Z. Trams as tools of urban transformation in French cities. Tech. Trans. Archit. 2014, 10, 61–79. [CrossRef]4. Stipcic, M. Transit System as a Project of Urbanity. Quad. Recer. Urban. 2017, 7. Available online: https://www.raco.cat/index.
php/QRU/article/view/321810 (accessed on 12 November 2020).5. Lu, K.; Han, B.; Zhou, X. Smart urban transit systems: From integrated framework to interdisciplinary perspective. Urban Rail
Transit 2018, 4, 49–67. [CrossRef]6. Air Quality News Magazine—May 2020 by Spacehouse—Issuu. Available online: https://issuu.com/spacehouse/docs/final.
_aqn._mag._issue3.may2020 (accessed on 15 February 2021).7. UNEP (United Nations Environmental Programme) Annual Report. 2007. Available online: http://wedocs.unep.org/bitstream/
handle/20.500.11822/7647/-UNEP%202007%20Annual%20Report-2008806.pdf?sequence=5&isAllowed=y (accessed on17 July 2018).
8. Bouton, S.; Hannon, E.; Haydamous, L.; Heid, B.; Knupfer, S.; Naucler, T.; Neuhaus, F.; Nijssen, J.T.; Ramanathan, S. AnIntegrated Perspective on the Future of Mobility. McKinsey Center for Business and Environment, September 2017. Availableonline: https://www.mckinsey.com/~{}/media/McKinsey/Business%20Functions/Sustainability/Our%20Insights/Urban%20commercial%20transport%20and%20the%20future%20of%20mobility/An-integrated-perspective-on-the-future-of-mobility.pdf (accessed on 20 January 2019).
9. Feudo, F.L.; Festa, C.D. A Tram-Train System to Connect the Urban Area of Cosenza to Its Province: A Simulation Model of Trans-port Demand Modal Split and a Territorial Analysis to Identify Adapted Transit Oriented Development Prospects. In Proceedingsof the Building the Urban Future and Transit Oriented Development (BUFTOD), Champs-sur-Marne, France, 17 April 2012; HALId: Hal-00734634. Available online: https://hal.archives-ouvertes.fr/hal-00734634 (accessed on 4 November 2020).
10. Łukaszkiewicz, J.; Fortuna-Antoszkiewicz, B.; Botwina, J.; Oleszczuk, Ł.; Wisniewski, P. Sustainable development of the city’stransport infrastructure—A project of a new tram line with a linear park along the Exhibition Channel in Warsaw. J. Environ. Sci.Eng. A 2018, 7, 285–300. [CrossRef]
11. Jakimavicius, M.; Burinskiene, M. Multiple criteria assessment of a new tram line development scenario in Vilnius City publictransport system. Transport 2013, 28, 431–437. [CrossRef]
12. Sas-Bojarska, A. Linear revitalization—Problems and challenges. Discursive article. Urban Dev. Issues 2017, 53, 5–19. [CrossRef]13. Frumkin, H. Urban sprawl and public health. Public Health Rep. 2002, 117, 201–217. [CrossRef]14. Ewing, R.; Meakins, G.; Hamidi, S.; Nelson, A.C. Relationship between urban sprawl and physical activity, obesity, and
morbidity—Update and refinement. Health Place 2014, 26, 118–126. [CrossRef] [PubMed]15. Soga, M.; Evans, M.J.; Tsuchiya, K.; Fukano, Y. A room with a green view: The importance of nearby nature for mental health
during the COVID-19 pandemic. Ecol. Appl. 2020, 31, e02248. [CrossRef] [PubMed]16. Althoff, J. The European Green Deal and the Future of Mobility. Available online: https://eu.boell.org/en/2020/07/20/european-
green-deal-and-future-mobility (accessed on 20 March 2021).17. Lynch, K. The Image of the City; MIT Press: Cambridge, MA, USA, 1960.18. Mumford, L. The City in History—Its Origins, Its Transformations, and Its Prospects; Harcourt Brace & World: New York, NY,
USA, 1961.19. Gehl, J. Cities for People; Island Press: Washington, DC, USA, 2010.
147
Land 2021, 10, 375
20. Pluta, K. Przestrzenie Publiczne Miast Europejskich Projektowanie Urbanistyczne [Public Spaces of European Urban Designs]; OficynaWydawnicza Politechniki Warszawskiej: Warsaw, Poland, 2014.
21. Nyka, L. Architectural Research Addressing Societal Challenges. In From Structures to Landscapes—Towards Re-Conceptualization ofthe Urban Condition; Rodrigues, M.J., da Costa, C., Roseta, F., Lages, J.P., da Costa, S.C., Eds.; Taylor & Francis Group: London,UK, 2017; pp. 509–515.
22. Feliciantonio, D.; Salvati, L.; Sarantakou, E.; Rontos, K. Class diversification, economic growth and urban sprawl: Evidences froma pre-crisis European city. Qual. Quant. 2018, 52, 1501–1522. [CrossRef]
23. UNEP/GRID-Warsaw Centre. Innovative Eco-City Conference 2018. COP24; UNEP/GRID-Warsaw Centre: Katowice, Poland, 2018;pp. 1–16. Available online: https://www.gridw.pl/innowacyjneecomiasto18?lang=en (accessed on 14 December 2020).
24. Johnson, M.P. Environmental impacts of urban sprawl: A survey of the literature and proposed research agenda. Environ. Plan. AEcon. Space 2001, 33, 717–735. [CrossRef]
25. EUdebates Team. Which European Capital Has the Best Tram System? 2020. Available online: https://eudebates.tv/debates/eu-policies/transport-and-travel/which-european-capital-has-the-best-tram-system/ (accessed on 20 March 2021).
26. City Logistics. Air Quality in Europe Is Improving. 24 November 2020. Available online: http://www.citylogistics.info/research/air-quality-in-europe-is-improving/ (accessed on 20 March 2021).
27. Smith Kevin. UITP: EU’s Green Deal Must Embrace Public Transport. 28 November 2019. Available online: https://www.railjournal.com/regions/europe/uitp-green-deal-embrace-public-transport/ (accessed on 20 March 2021).
28. Popek, R.; Gawronska, H.; Gawronski, S.W. The level of particulate matter on foliage depends on the distance from the source ofemission. Int. J. Phytoremediat. 2015, 17, 1262–1268. [CrossRef]
29. Gawronski, S.W. Fitoremediacyjna Rola Roslin na Terenach Zurbanizowanych (Phytoremediation Role of Plants in Urbanized Areas);Nowak, G., Kubus, M., Sobisz, Z., Eds.; Drzewa i Krzewy w Rekultywacji (Trees and Shrubs in Environmental Reclamation), Mat.IX Zjazdu Polskiego Towarzystwa Dendrologicznego. Konferencja Naukowa, Wirty-Ustka, 19-22 wrzesnia 2018 r. Wyd; PolskieTowarzystwo Dendrologiczne: Szczecin, Poland, 2018; pp. 19–27.
30. Sgrigna, G.; Sæbø, A.; Gawronski, S.; Popek, R.; Calfapietra, C. Particulate Matter deposition on Quercus ilex leaves in anindustrial city of central Italy. Environ. Pollut. 2015, 197, 187–194. [CrossRef]
31. Moreno, T.; Reche, C.; Rivas, I.; Minguill’on, M.C.; Martins, V.; Vargas, C.; Buonanno, G.; Parga, J.; Pandolfi, M.; Brines, M.; et al.Urban air quality comparison for bus, tram, subway and pedestrian commutes in Barcelona. Environ. Res. 2015, 142, 495–510.[CrossRef]
32. Canales, D.; Bouton, S.; Trimble, E.; Thayne, J.; Da Silva, L.; Shastry, S.; Knupfer, S.; Powell, M. Connected Urban Growth: Public-Private Collaborations for Transforming Urban Mobility; Coalition for Urban Transitions: London, UK; Washington, DC, USA, 2017;Available online: http://newclimateeconomy.net/content/cities-working-papers (accessed on 15 October 2018).
33. Matos, P.; Vieira, J.; Rocha, B.; Branquinho, C.; Pinho, P. Modeling the provision of air-quality regulation ecosystem serviceprovided by urban green spaces using lichens as ecological indicators. Sci. Total Environ. 2019, 665, 521–530. [CrossRef] [PubMed]
34. Jin, S.; Guo, J.; Wheeler, S.; Kan, L.; Che, S. Evaluation of impacts of trees on PM2.5 dispersion in urban streets. Atmos. Environ.2014, 99, 277–287. [CrossRef]
35. Yang, J.; Chang, Y.; Yan, P. Ranking the suitability of common urban tree species for controlling PM2.5 pollution. Atmos. Pollut.Res. 2015, 6, 267–277. [CrossRef]
36. Reksins, M. (Ed.) Strategy for the sustainable development of the Warsaw transport system until 2015 and for the following years.In Resolution No. LVIII/1749/2009 of the City Council of Warsaw of 9 July 2009; City Council of Warsaw: Warsaw, Poland. (In Polish)
37. Nyka, L. Przestrzen Miejska Jako Krajobraz [Urban Space as Landscape]; Czasopismo Techniczne 1-A; Architektura: Krakow, Poland,2012; pp. 49–59.
38. Smart City Blog. Kolejne Srodki Z Ue Na Transport Publiczny W Miastach [More Eu Funds for Public Transport in Cities].Available online: https://smartcityblog.pl/transport-publiczny-w-miastach/ (accessed on 20 November 2020). (In Polish).
39. Furundzic, D.S.; Furundzic, B.S. Infrastructure Corridor as Linear City. In Proceedings of the 1st International Conferenceon Architecture & Urban Design, Epoka Unversity, Triana, Albania, 19–21 April 2012; pp. 721–728. Available online: https://core.ac.uk/download/pdf/152488845.pdf (accessed on 19 December 2020).
40. RailwayPro. Public Transport is a Must under the EU’s Green Deal. 29 November 2019. Available online: https://www.railwaypro.com/wp/public-transport-is-a-must-under-the-eus-green-deal/ (accessed on 20 March 2021).
41. Quing, L.; Shinrin, Y. Pengiun Life. In The Art and Science of Forest Bathing; Insignis Media: Kraków, Poland, 2018.42. Beister, M.; Górny, J.; Połom, M. Rozwój Infrastruktury Tramwajowej w Polsce w Okresie Członkostwa w Unii Europejskiej [The
of the Publisherdevelopment of the Tramway Infrastructure in Poland during Accession to the European Union]. Tech. Transp.Szyn. 2015, 22, 20–36. Available online: http://www.tts.infotransport.pl/pl/ (accessed on 20 March 2021).
43. Statistics Poland. Statistical Products Department. Statistical Yearbook of the Republic of Poland 2019; Statistics Poland: Warsaw,Poland, 2019.
44. Statistics Poland. Tramways in Poland; Statistics Poland: Warsaw, Poland, 2018. Available online: https://stat.gov.pl/infografiki-widzety/infografiki/infografika-tramwaje,74,1.html (accessed on 20 March 2021).
45. Oleksiewicz, W.A. Rozwój Zielonych Torowisk Tramwajowych w Polsce (Development of Green Tram Tracks in Poland); X KonferencjaNaukowo-Techniczna “Miasto i Transport 2016”; Unpublished material-presentation.
46. Warsaw Trams, L. [Tramwaje Warszawskie sp. z o.o.]. Unpublished Report 2019. (In Polish).
148
Land 2021, 10, 375
47. Urbanowicz, W. Tramwaje Warszawskie Przetestuja Zielone Torowisko na Tłuczniu. 2019. Available online: https://www.transport-publiczny.pl/mobile/tramwaje-warszawskie-przetestuja-zielone-torowisko-na-tluczniu-63017.html (accessed on4 December 2020).
48. Starzynski, S. Rozwój Stolicy (Odczyt Wygłoszony w Dniu 10 Czerwca 1938 r. na Zebraniu Urzadzonym Przez Stołeczny Okreg ZwiazkuRezerwistów). [Development of the Capital (Lecture Delivered on 10 June 1938 at a Meeting Organized by the Capital District of the Unionof Reservists).]; Wyd. Przez Stołeczny Okreg Zwiazku Rezerwistów; [druk] Drukarnia Współczesna Sp. z o.o.: Warszawa, Poland,1938. (In Polish)
49. Starzynski, S. Sprawozdanie Prezydenta m. st. Warszawy Stefana Starzynskiego za Okres od 3 III 1934 do 23 II 1939 Wygłoszone na 50Posiedzeniu Tymczasowej Rady Miejskiej w Dniu 23 Lutego 1939 Roku. [The Report of the President of the Capital City of Warsaw, StefanStarzynski, for the Period from 3 March 1934 to 23 February 1939, Delivered at the 50th Session of the Provisional City Council on 23February 1939]; Wyd. Zarzad Miejski w m. st. Warszawie; [druk] Drukarnia Miejska: Warszawa, Poland, 1939. (In Polish)
50. Fortuna-Antoszkiewicz, B. Przemiany Formy Elementów I Układów Ogrodowych Wzdłuz Traktów Komunikacyjnych Na PrzykładzieTraktu Królewskiego W Warszawie [Form’s Transformations of Garden Elements and Arrangements Longwise Roads on the Example of RoyalRoad in Warsaw]; SGGW: Warsaw, Poland, 2012.
51. Ptaszycka, A. Przestrzenie Zielone W Miastach [Green Spaces in Cities]; Ludowa Spółdzielnia Wydawnicza: Oddział w Poznaniu,Poznan, 1950.
52. Co Pamieta Warszawa. Available online: https://culture.pl/pl/artykul/co-pamieta-warszawa (accessed on 15 February 2021).53. Klub Miłosników Komunikacji Miejskiej.Blog. 111 Lat Tramwaju Elektrycznego [111 Years of the Electric Tram] 10 April 2019.
Available online: https://kmkm.waw.pl/111-lat-tramwaju-elektrycznego/ (accessed on 20 November 2020). (In Polish)54. SISCOM. Available online: http://siskom.waw.pl/kp-tramwaje.htm (accessed on 20 March 2021).55. Woznicka, M.; Barszcz, P.; Janeczko, K.; Staniszewski, P.; Fortuna-Antoszkiewicz, B. Noise Level in Recreational Forest Manage-
ment Areas on a Selected Example. In Proceedings of the Public Recreation and Landscape Protection—With nature hand inhand! Krtiny, Czech Republic, 2–4 May 2018; Fialová, J., Ed.; Wyd. Mendel University in Brno: Brno, Czechia, 2018; pp. 267–271.
56. Piechowicz, J.; Ozga, A.; Mleczko, D.; Kasprzak, C.; Stryczniewicz, L. Ekologia Akustyczna na Obszarach Lesnych [Acoustic Ecology inForest Areas]; Wyd. Kat. Mechaniki i Wibroakustyki, Wydz. Inzynierii Mechanicznej i Robotyki, AGH im; Stanisława Staszica wKrakowie: Kraków, Poland, 2015. (In Polish)
57. Engel, Z. Ochrona Srodowiska Pracy Przed Drganiami i Hałasem [Environment Protection Against Vibration and Noise]; WydawnictwoNaukowe PWN: Warszawa, Poland, 1993. (In Polish)
58. Niemirski, W. Kształtowanie Terenów Zieleni; Arkady: Warszawa, Poland, 1973. (In Polish)59. Sadowski, J.; Wodzinski, L. Akustyka Miasta [City Acoustics]; z. 12.148: 1955; Architektura: Warsaw, Poland. (In Polish)60. Sadowski, J. Podstawy Akustyki Urbanistycznej [Basics of Urban Acoustics]; Arkady: Warszawa, Poland, 1982. (In Polish)61. Jakubcová, E.; Horváthová, E. Urban heat island mitigation—Microclimate regulation. Sci. Agric. Bohem. 2020, 51, 99–106.62. Makarewicz, R. Hałas w Srodowisku [Noise in the Environment]; Osrodek Wydawnictw Naukowych: Poznan, Poland, 1996.63. Fortuna-Antoszkiewicz, B. Roslinnosc W Kompozycji Przestrzennej—Wartosci i Zachowanie Dziedzictwa [Vegetation in Spatial
Composition—Values and Preservation of Heritage]; Wyd. SGGW: Warszawa, Poland, 2019. (In Polish)64. Single Trees by the Tram Tracks—The Remains of Protective Plantings from the 1960s; Warsaw Trams, LLC.: Warsaw, Poland, 2020.65. Granted Permission for Sahing Photos, 2020–2021; Warsaw Trams, LLC.: Warsaw, Poland, 2020.66. Neufert, E. Podrecznik Projektowania Architektoniczno—Budowlanego [Architectural and Construction Design Manual]; Arkady: Warsaw,
Poland, 1995.67. Taplin, M. Bilbao: First Line is Just the Beginning. Available online: http://www.lrta.org/mag/articles/art0403.html (accessed on
25 September 2018).68. Green Urban Axis—Petržalka Masterplan, Bratislava, Slovakia. Available online: http://markoandplacemakers.com/projects/
green-urban-axis-petr-alka-masterplan-bratislava-slovakia (accessed on 15 February 2021).69. Ozelenení Tramvajových Pásu—TZB-Info. Available online: https://stavba.tzb-info.cz/terasy-a-zpevnene-plochy/21444-
ozeleneni-tramvajovych-pasu (accessed on 15 February 2021).70. Záchranárum Vadí Tráva na Kolejích. Available online: https://prazsky.denik.cz/zpravy_region/zachranarum-vadi-trava-na-
kolejich-20160903.html (accessed on 15 February 2021).71. Harciník, J. Povrchy Tramvajových Tratí Hlavního Mesta Prahy; Institut Plánování a Rozvoje hl. m: Prahy, Czech Republic, 2016; p. 44.72. Zelené Tramvajové Pásy Oživí Prahu. Výzkumníci už Testují Nejvhodnejší Rostliny—Pražský Deník. Available online: https:
//prazsky.denik.cz/zpravy_region/zeleny-tramvajovy-pas-doprava-klima-ekologie-rostlina-chytre-mesto.html (accessed on15 February 2021).
73. Cejpková, K. Principy Tvorby Verejných Prostranství; Kancelár architekta mesta Brna: Brno, Czech Republic, 2019; pp. 110–150.74. Trams in Freiburg im Breisgau. Available online: https://en.wikipedia.org/wiki/Trams_in_Freiburg_im_Breisgau (accessed on
20 March 2021).75. Šeptunová, Z.; Rieger, V.; Kundrata, M.; Hollan, J.; Gaillyová., Y.; Sedlák, R. Adaptacní Opatrení na Zmírnování Vlivu Klimatickýxh
Zmen pro Mesto Brno; Nadace Partnerství: Brno, Czech Republic, 2017; p. 8. Available online: https://www.lifetreecheck.eu/getattachment/c3688a57-a8eb-4925-ada7-47f1ef66c675/attachment%22 (accessed on 15 February 2021).
76. McPherson, G.E. Benefit-based tree valuation. Arboric. Urban For. 2007, 33, 1–11.
149

Land 2021, 10, 375
77. McPherson, G.E.; Simpson, J.R.; Scott, K.I. Actualizing microclimate and air quality benefits with parking lot tree shade ordinances.Wetter Und Leben 2001, 50, 353–369.
78. Chee Keng Lee, A.; Jordan, H.C.; Horsley, J. Value of urban green spaces in promoting healthy living and wellbeing: Prospects forplanning. Risk Manag. Healthc. Policy 2015, 8, 131–137. [CrossRef]
79. Borowski, J.; Fortuna-Antoszkiewicz, B.; Łukaszkiewicz, J.; Rosłon-Szerynska, E. Conditions for the effective development andprotection of the resources of urban green infrastructure. E3S Web Conf. 2018, 45, 1–8. [CrossRef]
80. Sæbø, A.; Popek, R.; Nawrot, B.; Hanslin, H.M.; Gawronska, H.; Gawronski, S.W. Plant species differences in particulate matteraccumulation on leaf surfaces. Sci. Total Environ. 2012, 427–428, 347–354. [CrossRef]
81. Wang, X.; Teng, M.; Huang, C.; Zhou, Z.; Chen, X.; Xiang, Y. Canopy density effects on particulate matter attenuation coefficientsin street canyons during summer in the Wuhan metropolitan area. Atmos. Environ. 2020, 240, 117739. [CrossRef]
150
land
Article
Ecosystem Services Changes on Farmland in Response toUrbanization in the Guangdong–Hong Kong–Macao GreaterBay Area of China
Xuege Wang 1,2,3,4, Fengqin Yan 2,3,5, Yinwei Zeng 6, Ming Chen 2, Bin He 7, Lu Kang 2 and Fenzhen Su 1,2,3,7,*
�����������������
Citation: Wang, X.; Yan, F.; Zeng, Y.;
Chen, M.; He, B.; Kang, L.; Su, F.
Ecosystem Services Changes on
Farmland in Response to
Urbanization in the
Guangdong–Hong Kong–Macao
Greater Bay Area of China. Land 2021,
10, 501. https://doi.org/10.3390/
land10050501
Academic Editors: Alessio Russo and
Giuseppe T. Cirella
Received: 22 March 2021
Accepted: 4 May 2021
Published: 8 May 2021
Publisher’s Note: MDPI stays neutral
with regard to jurisdictional claims in
published maps and institutional affil-
iations.
Copyright: © 2021 by the authors.
Licensee MDPI, Basel, Switzerland.
This article is an open access article
distributed under the terms and
conditions of the Creative Commons
Attribution (CC BY) license (https://
creativecommons.org/licenses/by/
4.0/).
1 School of Geography and Ocean Sciences, Nanjing University, Nanjing 210023, China;[email protected]
2 State Key Laboratory of Resources and Environmental Information System, Institute of Geographic Sciencesand Natural Resources Research, Chinese Academy of Sciences, Beijing 100101, China; [email protected] (F.Y.);[email protected] (M.C.); [email protected] (L.K.)
3 Collaborative Innovation Center for the South China Sea Studies, Nanjing University, Nanjing 210023, China4 Department of Geography, Ghent University, 9000 Ghent, Belgium5 Innovation Academy of South China Sea Ecology and Environmental Engineering,
Chinese Academy of Sciences, Guangzhou 510301, China6 Department of Plants and Crops, Ghent University, 9000 Ghent, Belgium; [email protected] Faculty of Geomatics, Lanzhou Jiaotong University, Lanzhou 730070, China; [email protected]* Correspondence: [email protected]
Abstract: Extensive urbanization around the world has caused a great loss of farmland, whichsignificantly impacts the ecosystem services provided by farmland. This study investigated thefarmland loss due to urbanization in the Guangdong–Hong Kong–Macao Greater Bay Area (GBA) ofChina from 1980 to 2018 based on multiperiod datasets from the Land Use and Land Cover of Chinadatabases. Then, we calculated ecosystem service values (ESVs) of farmland using valuation methodsto estimate the ecosystem service variations caused by urbanization in the study area. The resultsshowed that 3711.3 km2 of farmland disappeared because of urbanization, and paddy fields sufferedmuch higher losses than dry farmland. Most of the farmland was converted to urban residentialland from 1980 to 2018. In the past 38 years, the ESV of farmland decreased by 5036.7 million yuandue to urbanization, with the highest loss of 2177.5 million yuan from 2000–2010. The hydrologicalregulation, food production and gas regulation of farmland decreased the most due to urbanization.The top five cities that had the largest total ESV loss of farmland caused by urbanization wereGuangzhou, Dongguan, Foshan, Shenzhen and Huizhou. This study revealed that urbanizationhas increasingly become the dominant reason for farmland loss in the GBA. Our study suggeststhat governments should increase the construction of ecological cities and attractive countryside toprotect farmland and improve the regional ESV.
Keywords: ecosystem service value; farmland loss; construction land expansion; remote sensing
1. Introduction
Unprecedented urbanization has been occurring worldwide, which has caused theurban population to currently account for more than half of the world′s population; thisproportion is expected to increase to nearly three-quarters by 2050 [1]. Considerable urbanexpansion has mostly taken place in developed countries in the past, but it will mainlyoccur in developing countries in the coming decades. It is estimated that the urban areain developing countries will increase to 1.2 million km2 by 2050, which is four times theurban area in 2000 [2]. As the largest developing country in the world, China has beenexperiencing unprecedented urban expansion after the implementation of the reform andopening up policy in 1978, with the increase of the urban population from 17.92% in 1978to 58.5% in 2017, and a projected rise to 70% by 2030 [3,4]. Urban agglomerations in China
151
Land 2021, 10, 501
are hotspots of urban expansion because of intensive anthropogenic activities and rapideconomic growth, such as the Jing-Jin-Ji urban agglomerations, the Yangtze River Deltaurban agglomerations, and the Pearl River Delta urban agglomerations [3,5,6].
Extensive urbanization has substantially encroached on farmland, wetlands andforestland, which has further led to decreases in the food supply, the loss of naturalhabitat, and the dramatic degradation of ecosystem services (ESs) [7–11]. Previous studiesproved that urban expansion mainly originates from the conversion of farmland, andhas also become the main source of farmland loss around the world [4,12–14]. In China,74% of the lost farmland was converted into 85% of the newly increased urban landin the past decades [15]. Farmland preservation and urban expansion has become ahot topic. Urbanization has not only encroached substantially on farmland, but alsoimpacted farmland quality and the intensity of agricultural activities [10,15,16]. Continuedurban expansion will accelerate agricultural land expansion, putting high pressure onthe natural ecosystems [10]. Moreover, urbanization has negative impacts on the ESssupported by farmland; e.g., food production ES, cultural heritage, wildlife habitat andopen space [17–20]. Narduccia et al. showed that urban areas have more negative impactson ESs than farmland [12]. The massive farmland loss due to urbanization is increasinglythreatening farmland preservation and relative ESs [10,21–23]. Previous studies put moreattention on the spatial and temporal relationship between urbanization and farmland,but they rarely explored the additional influences of urbanization on ESs and ecosystemfunctions supported by farmland. Therefore, it is necessary to explore the impacts ofurbanization on farmland and associated ESs.
Estimate ESs are significant and alert decision makers and the public to the importanceof these services. In 1997, Costanza et al. introduced the principle, methods and resultsof estimating the global ecosystem service value (ESV) by synthesizing previous studiesbased on a wide variety of methods, and they found that the global gross domestic productis much lower than the ESV [24]. In 2007, Xie et al. improved the valuation methods ofCostanza et al. and developed a unit value adapted to China, which can be applied toassess ESs in specific land use areas [25]. In 2015, Xie et al. modified their original approach,developing a method for evaluating the value equivalent factor in the per unit area, andproposed an integrated method for the dynamic evaluation of the Chinese terrestrialESV [26]. Xie et al.’s equivalent value per unit area method for the Chinese ESV has beenwidely adopted, but if it is directly applied to the regional scope, then the results will bebiased. Xu et al. proposed a regional revision method, which entails revising the averageES equivalent values of the entire country to that of the study area based on the data of foodproducts per unit area [27]. Xu et al.’s method has been widely implemented in differentregions and has increased the accuracy of change detection [8,9,28].
The Guangdong–Hong Kong–Macao Greater Bay Area (GBA) is one of the mosturbanized, industrialized and populous areas in China. However, the GBA used to be apredominantly agricultural region before 1980, was dominated by farms and rural villagesand was highly suitable for agricultural development [29,30]. Extensive urbanization in theGBA has led to a large area of farmland loss, but few studies have examined the farmlandloss in the GBA due to urbanization over recent decades. In previous studies, urbanizationmostly refers to the expansion of urban land or urban areas, but it also includes theexpansion of residential, road and industrial land [11,12,31,32]. To achieve a comprehensiveunderstanding of urbanization, this study defines urbanization as construction land sprawl;namely, the expansion of residential areas, industrial areas, mining areas, transportationland and other construction land. Therefore, the changes in farmland and its ESV becauseof urbanization were examined in the GBA from 1980 to 2018 in this study. The objectivesinclude the following: (1) to analyze the spatial and temporal changes in construction landin 1980, 1990, 2000, 2010 and 2018; (2) to examine the characteristics of farmland changesdue to urbanization during the past 38 years; and (3) to evaluate the ESV of farmland lossunder the effects of urbanization over the past four decades.
152
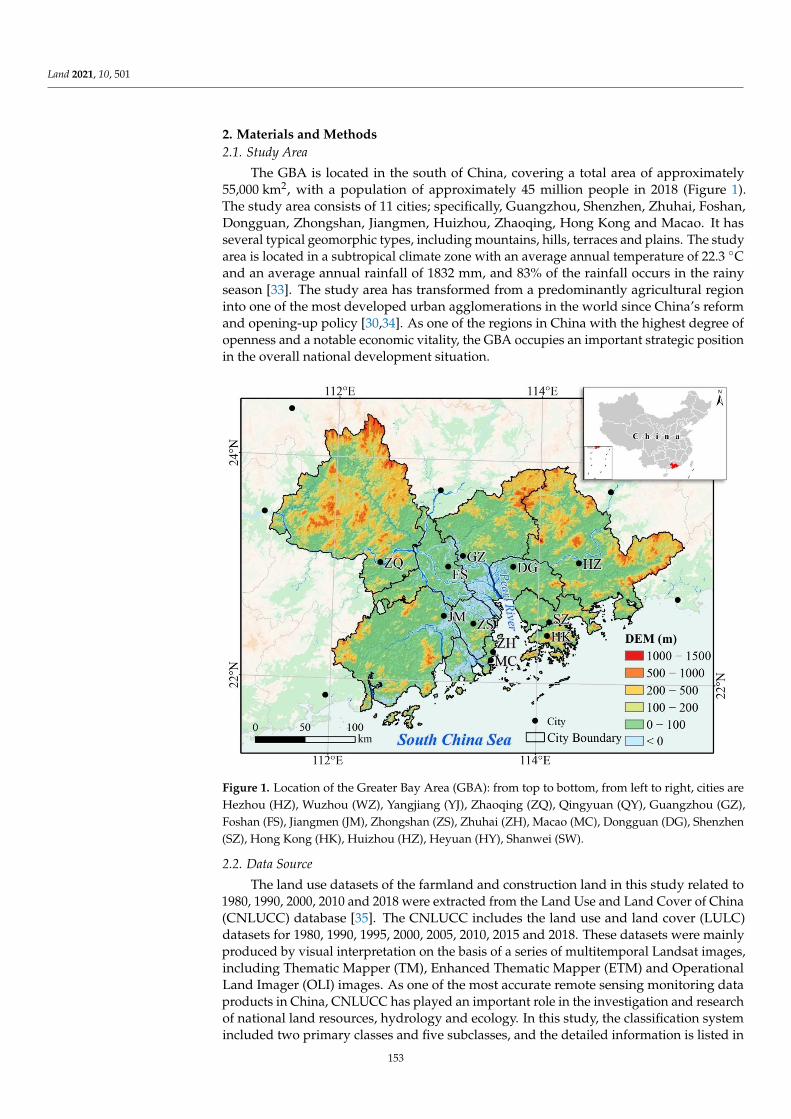
Land 2021, 10, 501
2. Materials and Methods2.1. Study Area
The GBA is located in the south of China, covering a total area of approximately55,000 km2, with a population of approximately 45 million people in 2018 (Figure 1).The study area consists of 11 cities; specifically, Guangzhou, Shenzhen, Zhuhai, Foshan,Dongguan, Zhongshan, Jiangmen, Huizhou, Zhaoqing, Hong Kong and Macao. It hasseveral typical geomorphic types, including mountains, hills, terraces and plains. The studyarea is located in a subtropical climate zone with an average annual temperature of 22.3 ◦Cand an average annual rainfall of 1832 mm, and 83% of the rainfall occurs in the rainyseason [33]. The study area has transformed from a predominantly agricultural regioninto one of the most developed urban agglomerations in the world since China’s reformand opening-up policy [30,34]. As one of the regions in China with the highest degree ofopenness and a notable economic vitality, the GBA occupies an important strategic positionin the overall national development situation.
Land 2021, 10, x FOR PEER REVIEW 3 of 18
farmland changes due to urbanization during the past 38 years; and (3) to evaluate the
ESV of farmland loss under the effects of urbanization over the past four decades.
2. Materials and Methods
2.1. Study Area
The GBA is located in the south of China, covering a total area of approximately
55,000 km2, with a population of approximately 45 million people in 2018 (Figure 1). The
study area consists of 11 cities; specifically, Guangzhou, Shenzhen, Zhuhai, Foshan,
Dongguan, Zhongshan, Jiangmen, Huizhou, Zhaoqing, Hong Kong and Macao. It has sev-
eral typical geomorphic types, including mountains, hills, terraces and plains. The study
area is located in a subtropical climate zone with an average annual temperature of 22.3
°C and an average annual rainfall of 1832 mm, and 83% of the rainfall occurs in the rainy
season [33]. The study area has transformed from a predominantly agricultural region
into one of the most developed urban agglomerations in the world since China’s reform
and opening-up policy [30,34]. As one of the regions in China with the highest degree of
openness and a notable economic vitality, the GBA occupies an important strategic posi-
tion in the overall national development situation.
Figure 1. Location of the Greater Bay Area (GBA): from top to bottom, from left to right, cities are
Hezhou (HZ), Wuzhou (WZ), Yangjiang (YJ), Zhaoqing (ZQ), Qingyuan (QY), Guangzhou (GZ),
Foshan (FS), Jiangmen (JM), Zhongshan (ZS), Zhuhai (ZH), Macao (MC), Dongguan (DG), Shen-
zhen (SZ), Hong Kong (HK), Huizhou (HZ), Heyuan (HY), Shanwei (SW).
2.2. Data Source
The land use datasets of the farmland and construction land in this study related to
1980, 1990, 2000, 2010 and 2018 were extracted from the Land Use and Land Cover of
China (CNLUCC) database [35]. The CNLUCC includes the land use and land cover
(LULC) datasets for 1980, 1990, 1995, 2000, 2005, 2010, 2015 and 2018. These datasets were
mainly produced by visual interpretation on the basis of a series of multitemporal Landsat
images, including Thematic Mapper (TM), Enhanced Thematic Mapper (ETM) and Oper-
ational Land Imager (OLI) images. As one of the most accurate remote sensing monitoring
Figure 1. Location of the Greater Bay Area (GBA): from top to bottom, from left to right, cities areHezhou (HZ), Wuzhou (WZ), Yangjiang (YJ), Zhaoqing (ZQ), Qingyuan (QY), Guangzhou (GZ),Foshan (FS), Jiangmen (JM), Zhongshan (ZS), Zhuhai (ZH), Macao (MC), Dongguan (DG), Shenzhen(SZ), Hong Kong (HK), Huizhou (HZ), Heyuan (HY), Shanwei (SW).
2.2. Data Source
The land use datasets of the farmland and construction land in this study related to1980, 1990, 2000, 2010 and 2018 were extracted from the Land Use and Land Cover of China(CNLUCC) database [35]. The CNLUCC includes the land use and land cover (LULC)datasets for 1980, 1990, 1995, 2000, 2005, 2010, 2015 and 2018. These datasets were mainlyproduced by visual interpretation on the basis of a series of multitemporal Landsat images,including Thematic Mapper (TM), Enhanced Thematic Mapper (ETM) and OperationalLand Imager (OLI) images. As one of the most accurate remote sensing monitoring dataproducts in China, CNLUCC has played an important role in the investigation and researchof national land resources, hydrology and ecology. In this study, the classification systemincluded two primary classes and five subclasses, and the detailed information is listed in
153
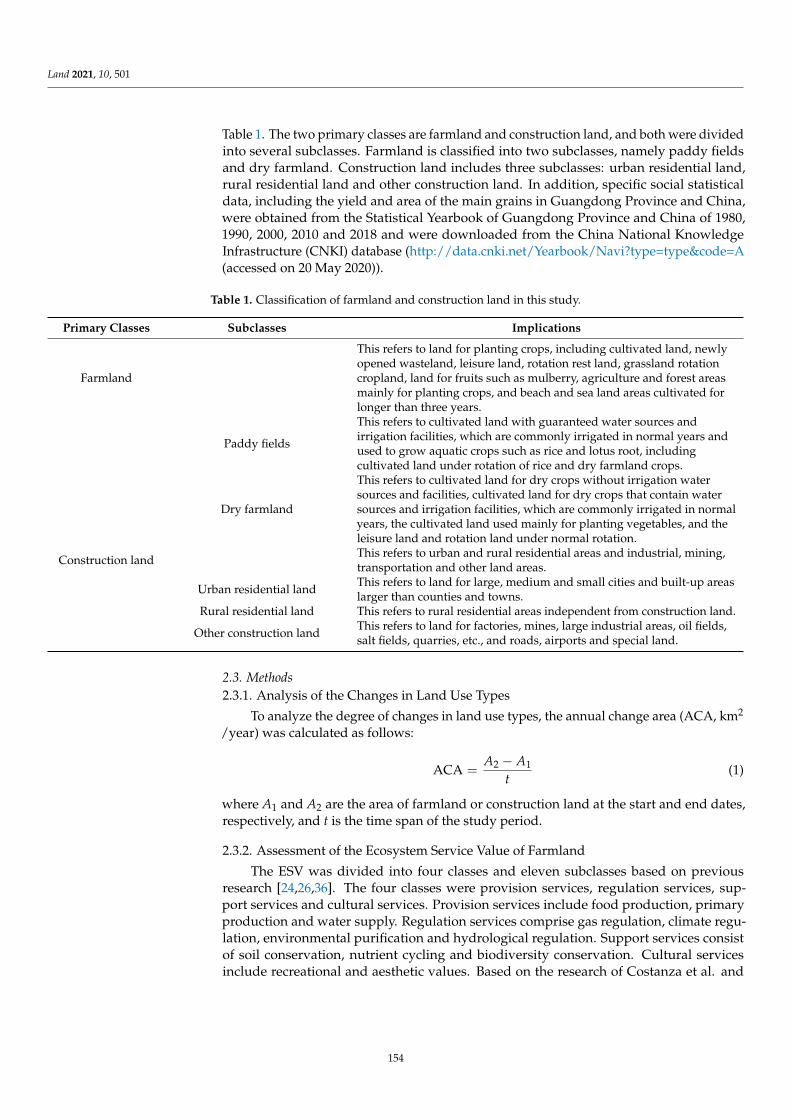
Land 2021, 10, 501
Table 1. The two primary classes are farmland and construction land, and both were dividedinto several subclasses. Farmland is classified into two subclasses, namely paddy fieldsand dry farmland. Construction land includes three subclasses: urban residential land,rural residential land and other construction land. In addition, specific social statisticaldata, including the yield and area of the main grains in Guangdong Province and China,were obtained from the Statistical Yearbook of Guangdong Province and China of 1980,1990, 2000, 2010 and 2018 and were downloaded from the China National KnowledgeInfrastructure (CNKI) database (http://data.cnki.net/Yearbook/Navi?type=type&code=A(accessed on 20 May 2020)).
Table 1. Classification of farmland and construction land in this study.
Primary Classes Subclasses Implications
Farmland
This refers to land for planting crops, including cultivated land, newlyopened wasteland, leisure land, rotation rest land, grassland rotationcropland, land for fruits such as mulberry, agriculture and forest areasmainly for planting crops, and beach and sea land areas cultivated forlonger than three years.
Paddy fields
This refers to cultivated land with guaranteed water sources andirrigation facilities, which are commonly irrigated in normal years andused to grow aquatic crops such as rice and lotus root, includingcultivated land under rotation of rice and dry farmland crops.
Dry farmland
This refers to cultivated land for dry crops without irrigation watersources and facilities, cultivated land for dry crops that contain watersources and irrigation facilities, which are commonly irrigated in normalyears, the cultivated land used mainly for planting vegetables, and theleisure land and rotation land under normal rotation.
Construction land This refers to urban and rural residential areas and industrial, mining,transportation and other land areas.
Urban residential land This refers to land for large, medium and small cities and built-up areaslarger than counties and towns.
Rural residential land This refers to rural residential areas independent from construction land.
Other construction land This refers to land for factories, mines, large industrial areas, oil fields,salt fields, quarries, etc., and roads, airports and special land.
2.3. Methods2.3.1. Analysis of the Changes in Land Use Types
To analyze the degree of changes in land use types, the annual change area (ACA, km2
/year) was calculated as follows:
ACA =A2 − A1
t(1)
where A1 and A2 are the area of farmland or construction land at the start and end dates,respectively, and t is the time span of the study period.
2.3.2. Assessment of the Ecosystem Service Value of Farmland
The ESV was divided into four classes and eleven subclasses based on previousresearch [24,26,36]. The four classes were provision services, regulation services, sup-port services and cultural services. Provision services include food production, primaryproduction and water supply. Regulation services comprise gas regulation, climate regu-lation, environmental purification and hydrological regulation. Support services consistof soil conservation, nutrient cycling and biodiversity conservation. Cultural servicesinclude recreational and aesthetic values. Based on the research of Costanza et al. and
154
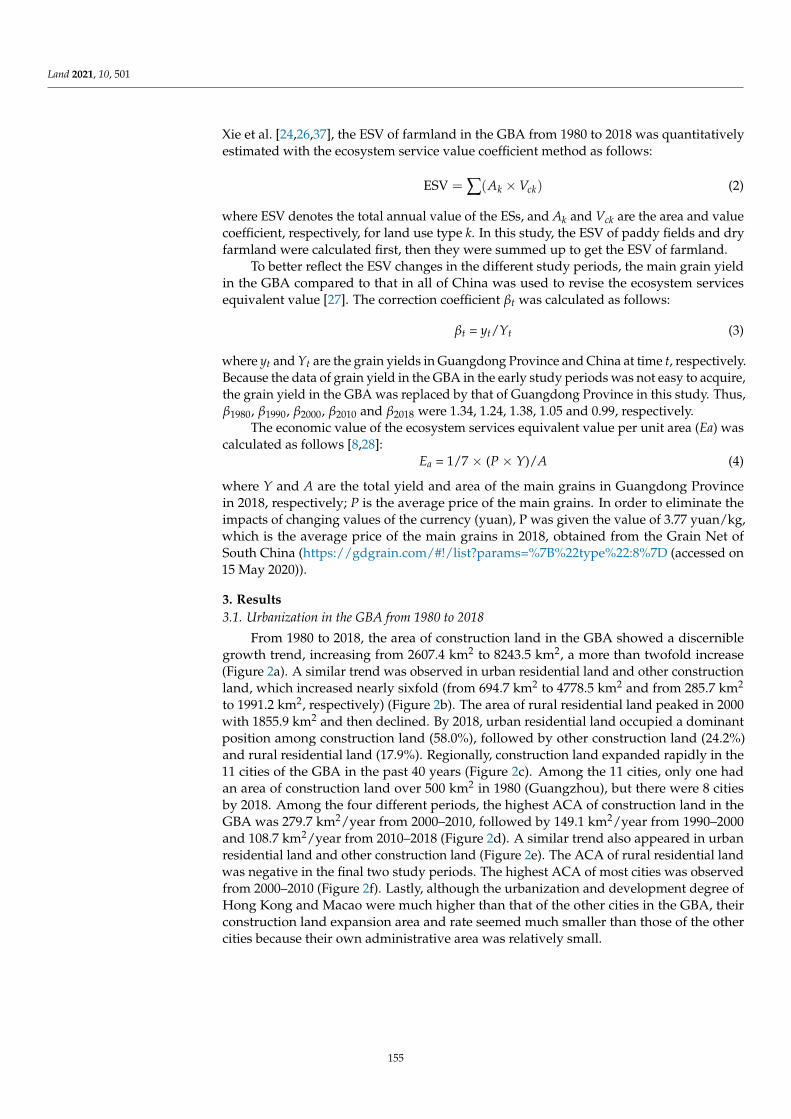
Land 2021, 10, 501
Xie et al. [24,26,37], the ESV of farmland in the GBA from 1980 to 2018 was quantitativelyestimated with the ecosystem service value coefficient method as follows:
ESV = ∑(Ak ×Vck) (2)
where ESV denotes the total annual value of the ESs, and Ak and Vck are the area and valuecoefficient, respectively, for land use type k. In this study, the ESV of paddy fields and dryfarmland were calculated first, then they were summed up to get the ESV of farmland.
To better reflect the ESV changes in the different study periods, the main grain yieldin the GBA compared to that in all of China was used to revise the ecosystem servicesequivalent value [27]. The correction coefficient βt was calculated as follows:
βt = yt/Yt (3)
where yt and Yt are the grain yields in Guangdong Province and China at time t, respectively.Because the data of grain yield in the GBA in the early study periods was not easy to acquire,the grain yield in the GBA was replaced by that of Guangdong Province in this study. Thus,β1980, β1990, β2000, β2010 and β2018 were 1.34, 1.24, 1.38, 1.05 and 0.99, respectively.
The economic value of the ecosystem services equivalent value per unit area (Ea) wascalculated as follows [8,28]:
Ea = 1/7 × (P × Y)/A (4)
where Y and A are the total yield and area of the main grains in Guangdong Provincein 2018, respectively; P is the average price of the main grains. In order to eliminate theimpacts of changing values of the currency (yuan), P was given the value of 3.77 yuan/kg,which is the average price of the main grains in 2018, obtained from the Grain Net ofSouth China (https://gdgrain.com/#!/list?params=%7B%22type%22:8%7D (accessed on15 May 2020)).
3. Results3.1. Urbanization in the GBA from 1980 to 2018
From 1980 to 2018, the area of construction land in the GBA showed a discerniblegrowth trend, increasing from 2607.4 km2 to 8243.5 km2, a more than twofold increase(Figure 2a). A similar trend was observed in urban residential land and other constructionland, which increased nearly sixfold (from 694.7 km2 to 4778.5 km2 and from 285.7 km2
to 1991.2 km2, respectively) (Figure 2b). The area of rural residential land peaked in 2000with 1855.9 km2 and then declined. By 2018, urban residential land occupied a dominantposition among construction land (58.0%), followed by other construction land (24.2%)and rural residential land (17.9%). Regionally, construction land expanded rapidly in the11 cities of the GBA in the past 40 years (Figure 2c). Among the 11 cities, only one hadan area of construction land over 500 km2 in 1980 (Guangzhou), but there were 8 citiesby 2018. Among the four different periods, the highest ACA of construction land in theGBA was 279.7 km2/year from 2000–2010, followed by 149.1 km2/year from 1990–2000and 108.7 km2/year from 2010–2018 (Figure 2d). A similar trend also appeared in urbanresidential land and other construction land (Figure 2e). The ACA of rural residential landwas negative in the final two study periods. The highest ACA of most cities was observedfrom 2000–2010 (Figure 2f). Lastly, although the urbanization and development degree ofHong Kong and Macao were much higher than that of the other cities in the GBA, theirconstruction land expansion area and rate seemed much smaller than those of the othercities because their own administrative area was relatively small.
155
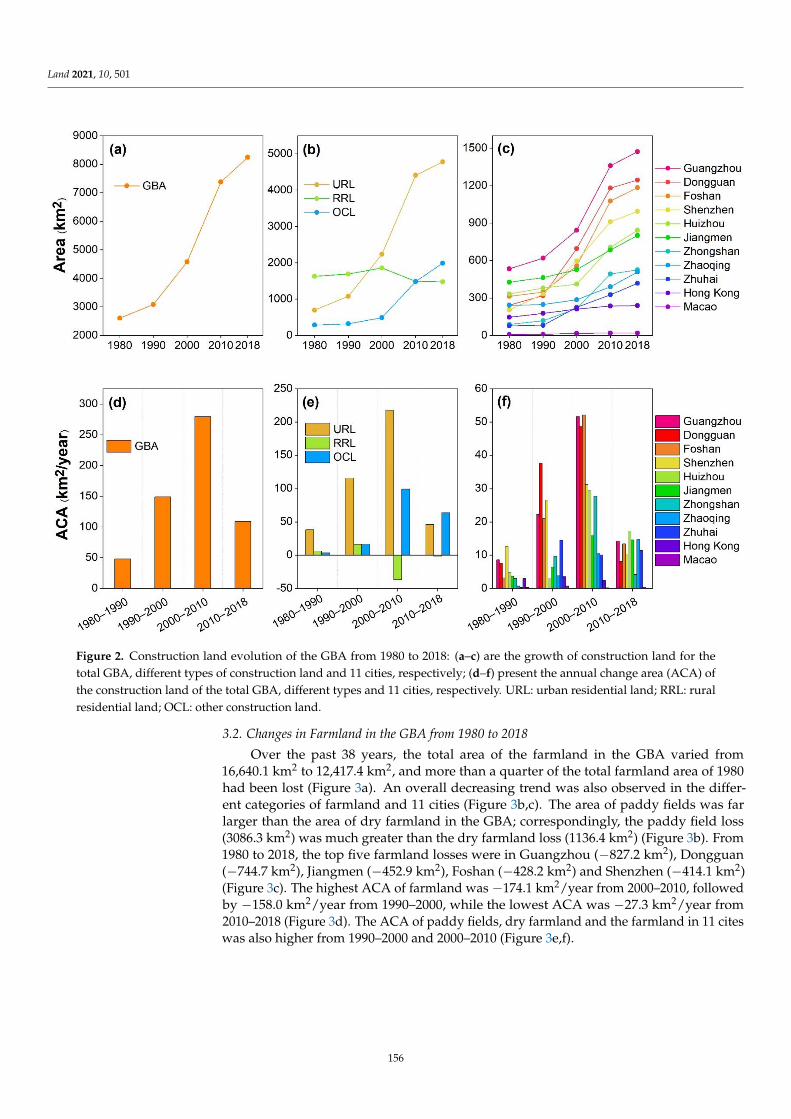
Land 2021, 10, 501Land 2021, 10, x FOR PEER REVIEW 6 of 18
Figure 2. Construction land evolution of the GBA from 1980 to 2018: (a–c) are the growth of construction land for the total
GBA, different types of construction land and 11 cities, respectively; (d–f) present the annual change area (ACA) of the
construction land of the total GBA, different types and 11 cities, respectively. URL: urban residential land; RRL: rural
residential land; OCL: other construction land.
3.2. Changes in Farmland in the GBA from 1980 to 2018
Over the past 38 years, the total area of the farmland in the GBA varied from 16,640.1
km2 to 12,417.4 km2, and more than a quarter of the total farmland area of 1980 had been
lost (Figure 3a). An overall decreasing trend was also observed in the different categories
of farmland and 11 cities (Figure 3b,c). The area of paddy fields was far larger than the
area of dry farmland in the GBA; correspondingly, the paddy field loss (3086.3 km2) was
much greater than the dry farmland loss (1136.4 km2) (Figure 3b). From 1980 to 2018, the
top five farmland losses were in Guangzhou (−827.2 km2), Dongguan (−744.7 km2), Jiang-
men (−452.9 km2), Foshan (−428.2 km2) and Shenzhen (−414.1 km2) (Figure 3c). The highest
ACA of farmland was −174.1 km2/year from 2000–2010, followed by −158.0 km2/year from
1990–2000, while the lowest ACA was −27.3 km2/year from 2010–2018 (Figure 3d). The
ACA of paddy fields, dry farmland and the farmland in 11 cites was also higher from
1990–2000 and 2000–2010 (Figure 3e,f).
Figure 2. Construction land evolution of the GBA from 1980 to 2018: (a–c) are the growth of construction land for thetotal GBA, different types of construction land and 11 cities, respectively; (d–f) present the annual change area (ACA) ofthe construction land of the total GBA, different types and 11 cities, respectively. URL: urban residential land; RRL: ruralresidential land; OCL: other construction land.
3.2. Changes in Farmland in the GBA from 1980 to 2018
Over the past 38 years, the total area of the farmland in the GBA varied from16,640.1 km2 to 12,417.4 km2, and more than a quarter of the total farmland area of 1980had been lost (Figure 3a). An overall decreasing trend was also observed in the differ-ent categories of farmland and 11 cities (Figure 3b,c). The area of paddy fields was farlarger than the area of dry farmland in the GBA; correspondingly, the paddy field loss(3086.3 km2) was much greater than the dry farmland loss (1136.4 km2) (Figure 3b). From1980 to 2018, the top five farmland losses were in Guangzhou (−827.2 km2), Dongguan(−744.7 km2), Jiangmen (−452.9 km2), Foshan (−428.2 km2) and Shenzhen (−414.1 km2)(Figure 3c). The highest ACA of farmland was −174.1 km2/year from 2000–2010, followedby −158.0 km2/year from 1990–2000, while the lowest ACA was −27.3 km2/year from2010–2018 (Figure 3d). The ACA of paddy fields, dry farmland and the farmland in 11 citeswas also higher from 1990–2000 and 2000–2010 (Figure 3e,f).
156
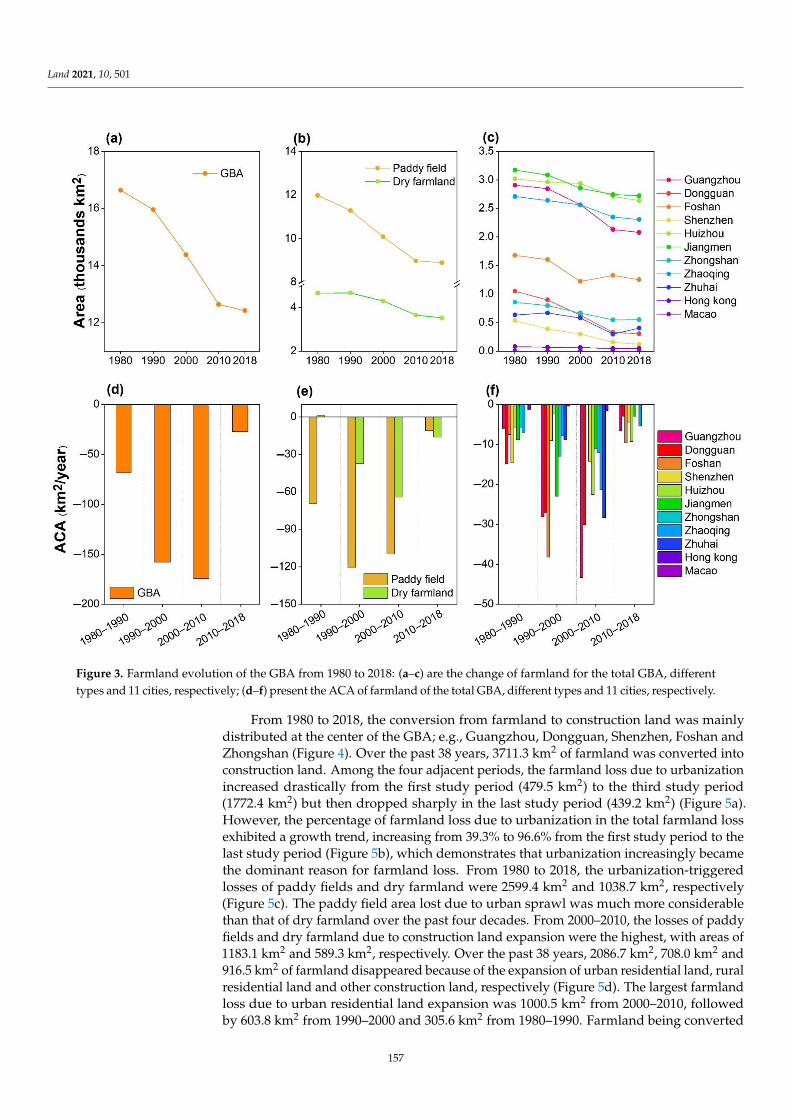
Land 2021, 10, 501Land 2021, 10, x FOR PEER REVIEW 7 of 18
Figure 3. Farmland evolution of the GBA from 1980 to 2018: (a–c) are the change of farmland for the total GBA, different
types and 11 cities, respectively; (d–f) present the ACA of farmland of the total GBA, different types and 11 cities, respec-
tively.
From 1980 to 2018, the conversion from farmland to construction land was mainly
distributed at the center of the GBA; e.g., Guangzhou, Dongguan, Shenzhen, Foshan and
Zhongshan (Figure 4). Over the past 38 years, 3711.3 km2 of farmland was converted into
construction land. Among the four adjacent periods, the farmland loss due to urbaniza-
tion increased drastically from the first study period (479.5 km2) to the third study period
(1772.4 km2) but then dropped sharply in the last study period (439.2 km2) (Figure 5a).
However, the percentage of farmland loss due to urbanization in the total farmland loss
exhibited a growth trend, increasing from 39.3% to 96.6% from the first study period to
the last study period (Figure 5b), which demonstrates that urbanization increasingly be-
came the dominant reason for farmland loss. From 1980 to 2018, the urbanization-trig-
gered losses of paddy fields and dry farmland were 2599.4 km2 and 1038.7 km2, respec-
tively (Figure 5c). The paddy field area lost due to urban sprawl was much more consid-
erable than that of dry farmland over the past four decades. From 2000–2010, the losses of
paddy fields and dry farmland due to construction land expansion were the highest, with
areas of 1183.1 km2 and 589.3 km2, respectively. Over the past 38 years, 2086.7 km2, 708.0
km2 and 916.5 km2 of farmland disappeared because of the expansion of urban residential
land, rural residential land and other construction land, respectively (Figure 5d). The larg-
est farmland loss due to urban residential land expansion was 1000.5 km2 from 2000–2010,
Figure 3. Farmland evolution of the GBA from 1980 to 2018: (a–c) are the change of farmland for the total GBA, differenttypes and 11 cities, respectively; (d–f) present the ACA of farmland of the total GBA, different types and 11 cities, respectively.
From 1980 to 2018, the conversion from farmland to construction land was mainlydistributed at the center of the GBA; e.g., Guangzhou, Dongguan, Shenzhen, Foshan andZhongshan (Figure 4). Over the past 38 years, 3711.3 km2 of farmland was converted intoconstruction land. Among the four adjacent periods, the farmland loss due to urbanizationincreased drastically from the first study period (479.5 km2) to the third study period(1772.4 km2) but then dropped sharply in the last study period (439.2 km2) (Figure 5a).However, the percentage of farmland loss due to urbanization in the total farmland lossexhibited a growth trend, increasing from 39.3% to 96.6% from the first study period to thelast study period (Figure 5b), which demonstrates that urbanization increasingly becamethe dominant reason for farmland loss. From 1980 to 2018, the urbanization-triggeredlosses of paddy fields and dry farmland were 2599.4 km2 and 1038.7 km2, respectively(Figure 5c). The paddy field area lost due to urban sprawl was much more considerablethan that of dry farmland over the past four decades. From 2000–2010, the losses of paddyfields and dry farmland due to construction land expansion were the highest, with areas of1183.1 km2 and 589.3 km2, respectively. Over the past 38 years, 2086.7 km2, 708.0 km2 and916.5 km2 of farmland disappeared because of the expansion of urban residential land, ruralresidential land and other construction land, respectively (Figure 5d). The largest farmlandloss due to urban residential land expansion was 1000.5 km2 from 2000–2010, followedby 603.8 km2 from 1990–2000 and 305.6 km2 from 1980–1990. Farmland being converted
157
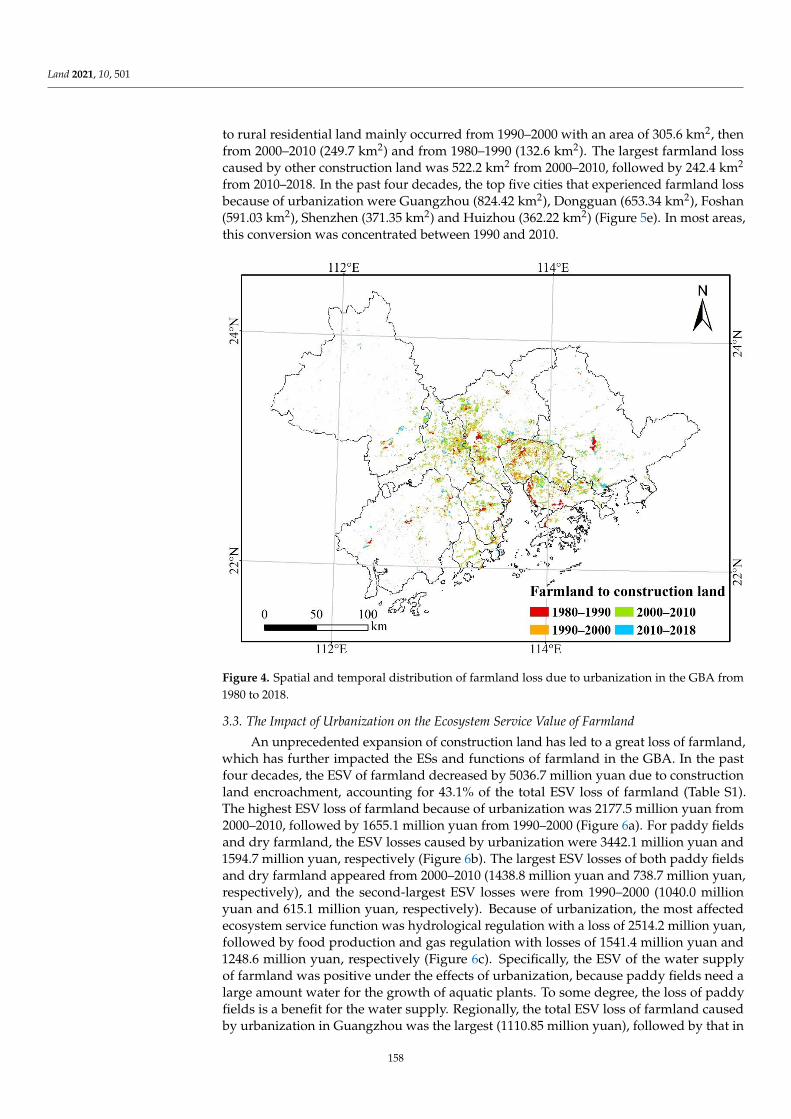
Land 2021, 10, 501
to rural residential land mainly occurred from 1990–2000 with an area of 305.6 km2, thenfrom 2000–2010 (249.7 km2) and from 1980–1990 (132.6 km2). The largest farmland losscaused by other construction land was 522.2 km2 from 2000–2010, followed by 242.4 km2
from 2010–2018. In the past four decades, the top five cities that experienced farmland lossbecause of urbanization were Guangzhou (824.42 km2), Dongguan (653.34 km2), Foshan(591.03 km2), Shenzhen (371.35 km2) and Huizhou (362.22 km2) (Figure 5e). In most areas,this conversion was concentrated between 1990 and 2010.
Land 2021, 10, x FOR PEER REVIEW 8 of 18
followed by 603.8 km2 from 1990–2000 and 305.6 km2 from 1980–1990. Farmland being
converted to rural residential land mainly occurred from 1990–2000 with an area of 305.6
km2, then from 2000–2010 (249.7 km2) and from 1980–1990 (132.6 km2). The largest farm-
land loss caused by other construction land was 522.2 km2 from 2000–2010, followed by
242.4 km2 from 2010–2018. In the past four decades, the top five cities that experienced
farmland loss because of urbanization were Guangzhou (824.42 km2), Dongguan (653.34
km2), Foshan (591.03 km2), Shenzhen (371.35 km2) and Huizhou (362.22 km2) (Figure 5e).
In most areas, this conversion was concentrated between 1990 and 2010.
Figure 4. Spatial and temporal distribution of farmland loss due to urbanization in the GBA from
1980 to 2018. Figure 4. Spatial and temporal distribution of farmland loss due to urbanization in the GBA from1980 to 2018.
3.3. The Impact of Urbanization on the Ecosystem Service Value of Farmland
An unprecedented expansion of construction land has led to a great loss of farmland,which has further impacted the ESs and functions of farmland in the GBA. In the pastfour decades, the ESV of farmland decreased by 5036.7 million yuan due to constructionland encroachment, accounting for 43.1% of the total ESV loss of farmland (Table S1).The highest ESV loss of farmland because of urbanization was 2177.5 million yuan from2000–2010, followed by 1655.1 million yuan from 1990–2000 (Figure 6a). For paddy fieldsand dry farmland, the ESV losses caused by urbanization were 3442.1 million yuan and1594.7 million yuan, respectively (Figure 6b). The largest ESV losses of both paddy fieldsand dry farmland appeared from 2000–2010 (1438.8 million yuan and 738.7 million yuan,respectively), and the second-largest ESV losses were from 1990–2000 (1040.0 millionyuan and 615.1 million yuan, respectively). Because of urbanization, the most affectedecosystem service function was hydrological regulation with a loss of 2514.2 million yuan,followed by food production and gas regulation with losses of 1541.4 million yuan and1248.6 million yuan, respectively (Figure 6c). Specifically, the ESV of the water supplyof farmland was positive under the effects of urbanization, because paddy fields need alarge amount water for the growth of aquatic plants. To some degree, the loss of paddyfields is a benefit for the water supply. Regionally, the total ESV loss of farmland causedby urbanization in Guangzhou was the largest (1110.85 million yuan), followed by that in
158
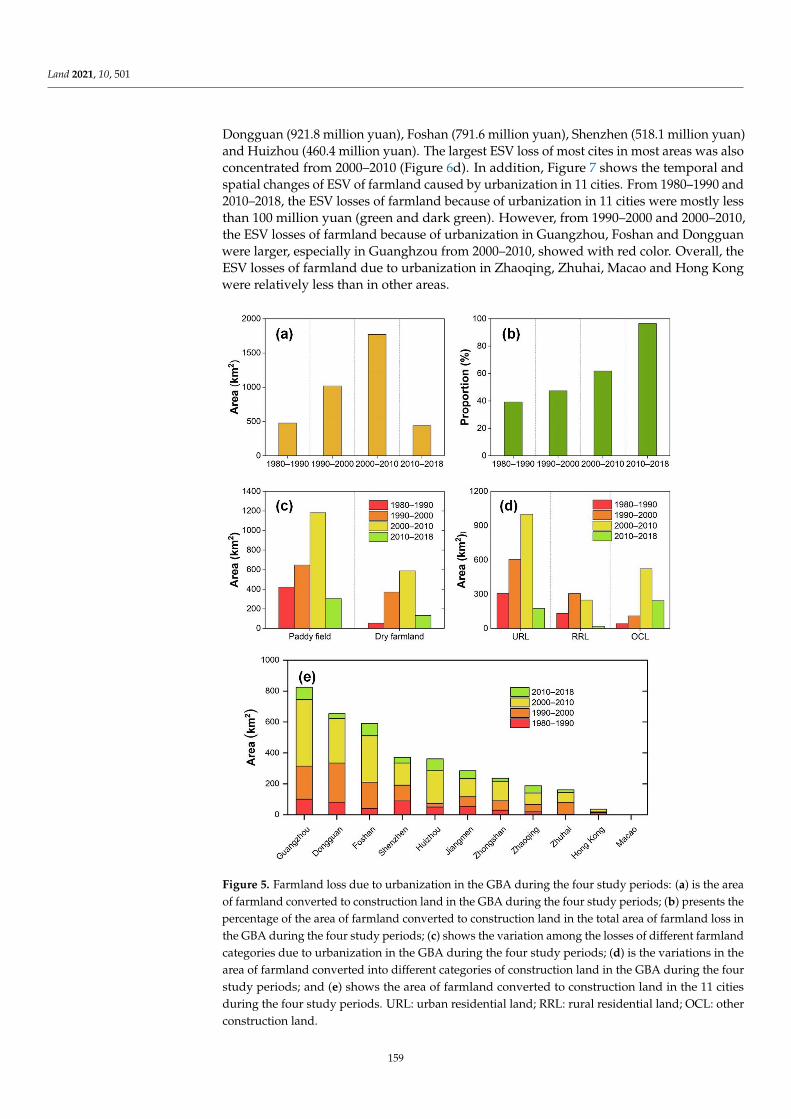
Land 2021, 10, 501
Dongguan (921.8 million yuan), Foshan (791.6 million yuan), Shenzhen (518.1 million yuan)and Huizhou (460.4 million yuan). The largest ESV loss of most cites in most areas was alsoconcentrated from 2000–2010 (Figure 6d). In addition, Figure 7 shows the temporal andspatial changes of ESV of farmland caused by urbanization in 11 cities. From 1980–1990 and2010–2018, the ESV losses of farmland because of urbanization in 11 cities were mostly lessthan 100 million yuan (green and dark green). However, from 1990–2000 and 2000–2010,the ESV losses of farmland because of urbanization in Guangzhou, Foshan and Dongguanwere larger, especially in Guanghzou from 2000–2010, showed with red color. Overall, theESV losses of farmland due to urbanization in Zhaoqing, Zhuhai, Macao and Hong Kongwere relatively less than in other areas.
Land 2021, 10, x FOR PEER REVIEW 9 of 18
Figure 5. Farmland loss due to urbanization in the GBA during the four study periods: (a) is the
area of farmland converted to construction land in the GBA during the four study periods; (b)
presents the percentage of the area of farmland converted to construction land in the total area of
farmland loss in the GBA during the four study periods; (c) shows the variation among the losses
of different farmland categories due to urbanization in the GBA during the four study periods; (d)
is the variations in the area of farmland converted into different categories of construction land in
the GBA during the four study periods; and (e) shows the area of farmland converted to construc-
tion land in the 11 cities during the four study periods. URL: urban residential land; RRL: rural
residential land; OCL: other construction land.
3.3. The Impact of Urbanization on the Ecosystem Service Value of Farmland
An unprecedented expansion of construction land has led to a great loss of farmland,
which has further impacted the ESs and functions of farmland in the GBA. In the past four
decades, the ESV of farmland decreased by 5036.7 million yuan due to construction land
encroachment, accounting for 43.1% of the total ESV loss of farmland (Table S1). The high-
est ESV loss of farmland because of urbanization was 2177.5 million yuan from 2000–2010,
followed by 1655.1 million yuan from 1990–2000 (Figure 6a). For paddy fields and dry
Figure 5. Farmland loss due to urbanization in the GBA during the four study periods: (a) is the areaof farmland converted to construction land in the GBA during the four study periods; (b) presents thepercentage of the area of farmland converted to construction land in the total area of farmland loss inthe GBA during the four study periods; (c) shows the variation among the losses of different farmlandcategories due to urbanization in the GBA during the four study periods; (d) is the variations in thearea of farmland converted into different categories of construction land in the GBA during the fourstudy periods; and (e) shows the area of farmland converted to construction land in the 11 citiesduring the four study periods. URL: urban residential land; RRL: rural residential land; OCL: otherconstruction land.
159
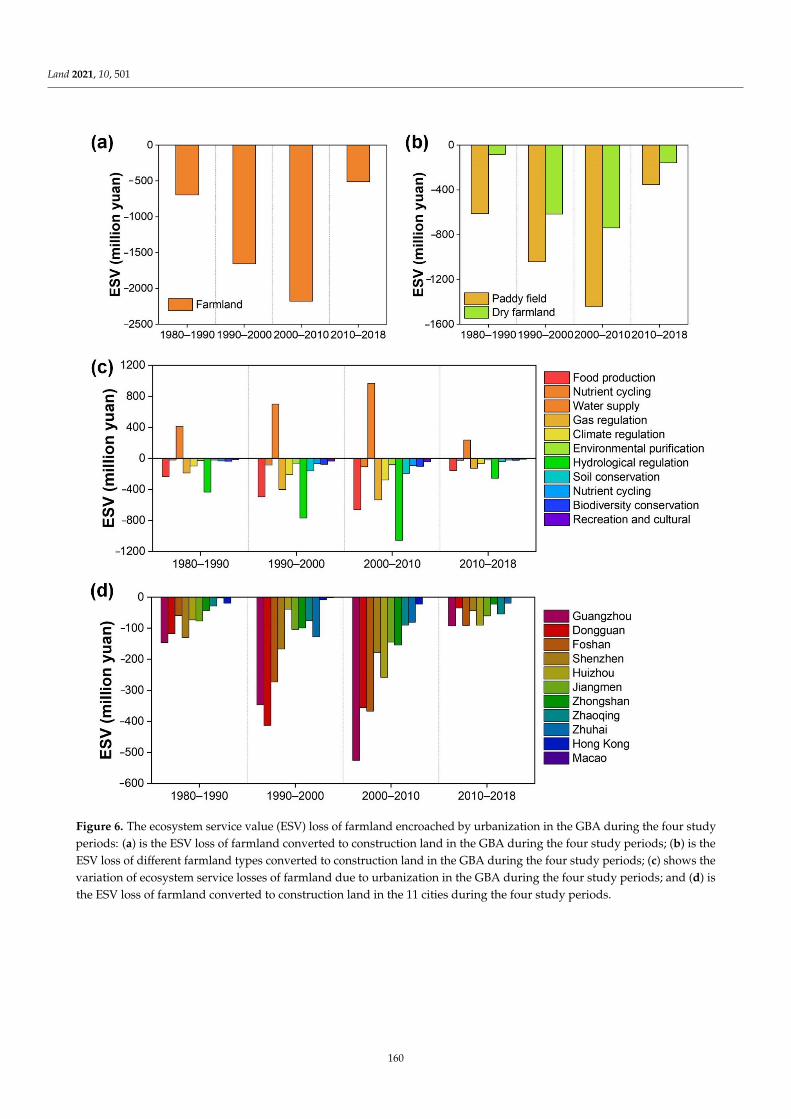
Land 2021, 10, 501Land 2021, 10, x FOR PEER REVIEW 11 of 18
Figure 6. The ecosystem service value (ESV) loss of farmland encroached by urbanization in the GBA during the four
study periods: (a) is the ESV loss of farmland converted to construction land in the GBA during the four study periods;
(b) is the ESV loss of different farmland types converted to construction land in the GBA during the four study periods;
(c) shows the variation of ecosystem service losses of farmland due to urbanization in the GBA during the four study
periods; and (d) is the ESV loss of farmland converted to construction land in the 11 cities during the four study periods.
Figure 6. The ecosystem service value (ESV) loss of farmland encroached by urbanization in the GBA during the four studyperiods: (a) is the ESV loss of farmland converted to construction land in the GBA during the four study periods; (b) is theESV loss of different farmland types converted to construction land in the GBA during the four study periods; (c) shows thevariation of ecosystem service losses of farmland due to urbanization in the GBA during the four study periods; and (d) isthe ESV loss of farmland converted to construction land in the 11 cities during the four study periods.
160
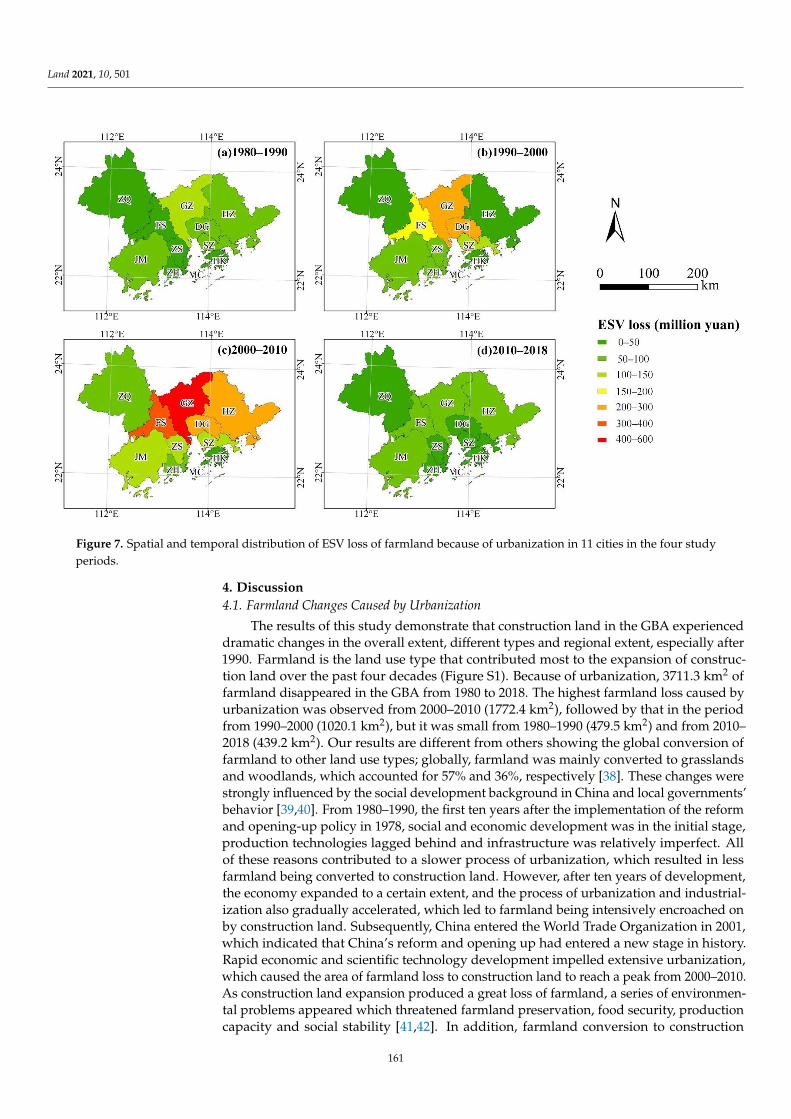
Land 2021, 10, 501Land 2021, 10, x FOR PEER REVIEW 12 of 18
Figure 7. Spatial and temporal distribution of ESV loss of farmland because of urbanization in 11 cities in the four study
periods.
4. Discussion
4.1. Farmland Changes Caused by Urbanization
The results of this study demonstrate that construction land in the GBA experienced
dramatic changes in the overall extent, different types and regional extent, especially after
1990. Farmland is the land use type that contributed most to the expansion of construction
land over the past four decades (Figure S1). Because of urbanization, 3711.3 km2 of farm-
land disappeared in the GBA from 1980 to 2018. The highest farmland loss caused by ur-
banization was observed from 2000–2010 (1772.4 km2), followed by that in the period from
1990–2000 (1020.1 km2), but it was small from 1980–1990 (479.5 km2) and from 2010–2018
(439.2 km2). Our results are different from others showing the global conversion of farm-
land to other land use types; globally, farmland was mainly converted to grasslands and
woodlands, which accounted for 57% and 36%, respectively [38]. These changes were
strongly influenced by the social development background in China and local govern-
ments’ behavior [39,40]. From 1980–1990, the first ten years after the implementation of
the reform and opening-up policy in 1978, social and economic development was in the
initial stage, production technologies lagged behind and infrastructure was relatively im-
perfect. All of these reasons contributed to a slower process of urbanization, which re-
sulted in less farmland being converted to construction land. However, after ten years of
development, the economy expanded to a certain extent, and the process of urbanization
and industrialization also gradually accelerated, which led to farmland being intensively
encroached on by construction land. Subsequently, China entered the World Trade Or-
ganization in 2001, which indicated that China’s reform and opening up had entered a
new stage in history. Rapid economic and scientific technology development impelled
extensive urbanization, which caused the area of farmland loss to construction land to
reach a peak from 2000–2010. As construction land expansion produced a great loss of
farmland, a series of environmental problems appeared which threatened farmland
preservation, food security, production capacity and social stability [41,42]. In addition,
Figure 7. Spatial and temporal distribution of ESV loss of farmland because of urbanization in 11 cities in the four studyperiods.
4. Discussion4.1. Farmland Changes Caused by Urbanization
The results of this study demonstrate that construction land in the GBA experienceddramatic changes in the overall extent, different types and regional extent, especially after1990. Farmland is the land use type that contributed most to the expansion of construc-tion land over the past four decades (Figure S1). Because of urbanization, 3711.3 km2 offarmland disappeared in the GBA from 1980 to 2018. The highest farmland loss caused byurbanization was observed from 2000–2010 (1772.4 km2), followed by that in the periodfrom 1990–2000 (1020.1 km2), but it was small from 1980–1990 (479.5 km2) and from 2010–2018 (439.2 km2). Our results are different from others showing the global conversion offarmland to other land use types; globally, farmland was mainly converted to grasslandsand woodlands, which accounted for 57% and 36%, respectively [38]. These changes werestrongly influenced by the social development background in China and local governments’behavior [39,40]. From 1980–1990, the first ten years after the implementation of the reformand opening-up policy in 1978, social and economic development was in the initial stage,production technologies lagged behind and infrastructure was relatively imperfect. Allof these reasons contributed to a slower process of urbanization, which resulted in lessfarmland being converted to construction land. However, after ten years of development,the economy expanded to a certain extent, and the process of urbanization and industrial-ization also gradually accelerated, which led to farmland being intensively encroached onby construction land. Subsequently, China entered the World Trade Organization in 2001,which indicated that China’s reform and opening up had entered a new stage in history.Rapid economic and scientific technology development impelled extensive urbanization,which caused the area of farmland loss to construction land to reach a peak from 2000–2010.As construction land expansion produced a great loss of farmland, a series of environmen-tal problems appeared which threatened farmland preservation, food security, productioncapacity and social stability [41,42]. In addition, farmland conversion to construction
161
Land 2021, 10, 501
land could also lead to intensification of farming, and abandonment and degradation offarmland [43,44]. Governments try their best to maintain a balance between urbanizationdevelopment and farmland preservation by implementing much stricter policies for farm-land conversion and ecological urbanization and construction [10,14]. As early as 2005,the central land policy for the preservation of 1.8 billion mu (1.2 million km2) farmlandwas established, which is a key environmental policy to cope with China’s land transfor-mation crisis since the 1990s [45]. In addition, to improve the urbanization quality and tostrengthen the protection of farmland and natural ecosystems, the National Plan on NewUrbanization and the Opinions on Accelerating the Construction of Ecological Civilizationwere promulgated in 2014 and 2015, respectively [39]. Under these policies, farmland lossdue to urbanization sharply declined after 2010. In addition, local governments’ behaviorhas vital impacts on the conversion of farmland to construction land [14,46,47]. Drivenby particular interests, local governments converted farmland to urban land at a lowcompensation and leased to developers at a much higher price [48], which significantlyaffected farmland change under rapid urbanization [14]. To preserve agricultural landand food security, a centralized fiscal reform in 1994 induced local governments’ land fi-nancing behavior to significantly influence farmland conversion [14]. Although the centralgovernment limits the total construction land quotas that local governments can lease todevelopers, local governments still have sufficient autonomy to determine which parcel ofland to lease out [14], and they resorted to land leasing to gain extra revenue to financeurban construction and balance fiscal expenditures [49]. This extra local revenue fromland leasing was approximately 33.7% of the local revenues from 2007 to 2012, whichmainly came from farmland conversion [50,51]. Lastly, the urbanization in Guangzhou,Dongguan, Foshan, Shenzhen and Huizhou was faster than in other cities over the pastfour decades (Figure 2); correspondingly, the area of farmland conversion to constructionland was greater in these cities than in the other cities (Figure 5). The same is observedin other developing counties, like India, where farmland conversion to construction landpredominantly occurred in the districts with high rates of economic growth and higheragricultural land suitability [22].
4.2. Ecosystem Service Value Changes due to Urbanization
Extensive urbanization has resulted in the degradation of farmland, which posesa great threat to food provision security, ecological environmental protection, ESs andregional sustainability [52–55]. In the past four decades, the ESV loss of farmland caused byurbanization was 5036.7 million yuan in the GBA, and the highest loss was 2177.5 millionyuan from 2000–2010, followed by 1655.1 million yuan from 1990–2000. The change trendof the ESV loss of farmland is similar to the change trend of farmland lost because ofurbanization, which is because the calculation of the ESV is based on area. In addition,our results indicate that ESs such as hydrological regulation, food production and gasregulation are particularly vulnerable to urbanization impacts (Figure 6c). As constructionland expands, a large area of farmland is converted to impermeable surfaces, which causesrain and runoff to not penetrate the ground in time and participate in the natural watercycle, which further heavily affects hydrological regulation [56]. For food production,urbanization has multiple effects. Rapid urbanization in the GBA has led to an increase inthe agricultural land use intensity, cropping frequency and chemical fertilizer use, a declinein the per capita availability of food grains, and soil and water pollution [10,22,57,58]. Inthis complex context, both food production and security are seriously influenced. Theprocess of urbanization and industrialization inevitably causes environmental problemssuch as air pollution [59], which predominantly originates from industry, transport, powergeneration and construction [60]. Air pollution could lead to air quality deterioration andthus influence regional gas regulation [59,60].
162
Land 2021, 10, 501
4.3. Farmland Conservation and Ecosystem Services Protection
Governments have been striving to maintain a balance between urbanization develop-ment and farmland preservation [10,14], and the results of this study show that farmlandloss due to urbanization sharply declined after 2010, but the results also indicate thatconstruction land expansion has increasingly become the dominant reason for the loss offarmland in the GBA over the past 40 years. Therefore, it is still vital for governments totake more effective steps to regulate construction land expansion and to develop trade-offsand synergies among urban development, agricultural production and ecosystem preser-vation [14,39]. Based on the results of this study, we provide several recommendations forfarmland preservation. First, to protect farmland and improve regional ESs, central andlocal governments should strictly control the area of new construction land and strengthenthe construction of ecological cities and beautify countryside. In urban areas, the gov-ernment could protect, plan and establish natural parks or green belts, including forests,grasses and wetlands. In rural areas, the government should promote reasonable planningfor farmland use or exploitation. Governments can also ‘green’ abandoned industrial andmining land with forests, grasses or water bodies to improve ESs. Second, governmentsmust strictly protect the red line of high-quality farmland and prohibit exploitation withoutrational reasons. Third, local governments should maintain the requisition–compensationbalance of farmland, including the quantity, quality and ecological balance. For example, ifthe quality of compensatory farmland is lower than the quality of requisitioned farmland,then governments should invest more money to improve the quality of medium- andlow-yield farmland or exploit new farmland rather than invest in urban construction [41].Fourth, local governments should take measures to prevent environmental pollution, suchas educating farmers to strictly control the use of agrochemicals and other soil additives toprevent soil pollution, and strictly prohibit the direct discharge of domestic sewage andindustrial wastewater into rivers without treatment. Finally, the public should respondto government policies and protect the environment. For example, to protect the waterand soil environment of farmland, enterprises and factories near farmland should strictlytreat sewage according to regulations, and discharge the sewage only after it reaches therequired standard. Farmers could reduce the use of pesticides and other chemicals toreduce the pollution of the farmland environment.
4.4. Limitations and Future Works
Estimates of ESV regionally and globally in monetary units play a critical role inheightening awareness and estimating the overall level of importance of ESs relative to andin combination with other contributors to sustainable human well-being [37]. Therefore, itis better for decision-makers and the public to consider the ESs as public goods or naturalresources, and take these values into account when scenarios and policies are changed.However, this valuation method could not be used to examine the spatial changes in ESV.In addition, the ESV of construction land in this study was considered as zero, which is notappropriate in some degree and probably led to errors in the results. In our future work,we would like to combine the valuation methods and other evaluation methods to acquiremore accurate results.
Farmland conservation and ecosystem services protection require cooperation in manyaspects, including from governments, experts and the public. Therefore, it is necessaryto build a system integrating geographic information system (GIS), spatial multicriteriaevaluation (SME) and participatory GIS (PGIS) approaches, where decision-makers, expertsand the public can participate and identify a range of ecosystem services [61–64]. Decisionmaker can easily collect and manage the results, which is useful for land use planning.That would be conducted in our future work.
5. Conclusions
This study explored the impacts of urbanization on farmland in the GBA from 1980to 2018 based on multiple temporal land use datasets of the CNLUCC database. The ESV
163
Land 2021, 10, 501
of farmland was also estimated by the valuation methods to study the ecosystem servicechanges caused by urbanization. Our results showed that the total area of farmland losscaused by urbanization was 3711.3 km2 over the past 38 years, leading to a direct declinein total ESVs by 5036.7 million yuan. Paddy fields suffered much more losses than dryfarmland because of urbanization. The expansion of construction land increasingly becamethe dominant reason for farmland loss in the GBA with the influence increasing from39.3% to 96.6%. The value of hydrological regulation, food production and gas regulationshowed much more decline. Guangzhou, Dongguan, Foshan, Shenzhen and Huizhou hadthe greatest total ESV loss of farmland caused by urbanization. The social developmentbackground in China and local governments’ behavior played a vital role in the farmlandconversion to construction land. To protect farmland and improve regional ESs, the centraland local governments should strengthen the construction of ecological cities and beautifycountryside by increasing capital investment, strengthening supervision, and raising publicawareness of environmental protection, and the public should respond to land use policiesand protect the environment.
Supplementary Materials: The following are available online at https://www.mdpi.com/article/10.3390/land10050501/s1, Figure S1: Conversion percentages of the different land use types intoconstruction land in the GBA from 1980 to 2018, Table S1: ESV changes of the farmland in the GBAfrom 1980 to 2018 (million yuan).
Author Contributions: Conceptualization, X.W., F.Y. and F.S.; methodology, X.W. and F.Y.; formalanalysis, X.W., M.C., B.H. and L.K.; writing—original draft preparation, X.W., Y.Z. and M.C.; writing—review and editing, X.W., F.Y., Y.Z. and F.S.; funding acquisition, X.W. and F.S. All authors have readand agreed to the published version of the manuscript.
Funding: This research was supported by the National Natural Science Foundation of China(41890854), the Program B for Outstanding Ph.D. Candidate of Nanjing University (No. 202002B087),and the China Scholarship Council (CSC) (No. 201906190120).
Institutional Review Board Statement: Not applicable.
Informed Consent Statement: Not applicable.
Data Availability Statement: Not applicable.
Acknowledgments: We appreciate critical and constructive comments and suggestions from thereviewers that helped improve the quality of this manuscript.
Conflicts of Interest: The authors declare no conflict of interest.
References1. Desa, U.N. World Urbanization Prospects: The 2014 Revision; United Nations Department of Economics and Social Affairs,
Population Division: New York, NY, USA, 2015.2. Angel, S.; Parent, J.; Civco, D.L.; Blei, A.; Potere, D. The dimensions of global urban expansion: Estimates and projections for all
countries, 2000–2050. Prog. Plan. 2011, 75, 53–107. [CrossRef]3. Lin, M.; Lin, T.; Sun, C.; Jones, L.; Sui, J.; Zhao, Y.; Liu, J.; Xing, L.; Ye, H.; Zhang, G.; et al. Using the Eco-Erosion Index to assess
regional ecological stress due to urbanization—A case study in the Yangtze River Delta urban agglomeration. Ecol. Indic. 2020,111, 106028. [CrossRef]
4. Bai, X.; Shi, P.; Liu, Y. Society: Realizing China’s urban dream. Nature 2014, 509, 158–160. [CrossRef] [PubMed]5. Sun, Y.; Zhao, S. Spatiotemporal dynamics of urban expansion in 13 cities across the Jing-Jin-Ji Urban Agglomeration from 1978
to 2015. Ecol. Indic. 2018, 87, 302–313. [CrossRef]6. Yang, C.; Li, Q.; Zhao, T.; Liu, H.; Gao, W.; Shi, T.; Guan, M.; Wu, G. Detecting Spatiotemporal Features and Rationalities of Urban
Expansions within the Guangdong–Hong Kong–Macau Greater Bay Area of China from 1987 to 2017 Using Time-Series LandsatImages and Socioeconomic Data. Remote Sens. 2019, 11, 2215. [CrossRef]
7. Yang, X.J. China’s Rapid Urbanization. Science 2013, 342, 310. [CrossRef] [PubMed]8. Xiao, R.; Lin, M.; Fei, X.; Li, Y.; Zhang, Z.; Meng, Q. Exploring the interactive coercing relationship between urbanization and
ecosystem service value in the Shanghai-Hangzhou Bay Metropolitan Region. J. Clean. Prod. 2020, 253, 119803. [CrossRef]9. Wang, X.; Yan, F.; Su, F. Impacts of Urbanization on the Ecosystem Services in the Guangdong-Hong Kong-Macao Greater Bay
Area, China. Remote Sens. 2020, 12, 3269. [CrossRef]
164
Land 2021, 10, 501
10. Jiang, L.; Deng, X.; Seto, K.C. The impact of urban expansion on agricultural land use intensity in China. Land Use Policy 2013, 35,33–39. [CrossRef]
11. Mao, D.; Wang, Z.; Wu, J.; Wu, B.; Zeng, Y.; Song, K.; Yi, K.; Luo, L. China’s wetlands loss to urban expansion. Land Degrad. Dev.2018, 29, 2644–2657. [CrossRef]
12. Narducci, J.; Quintas-Soriano, C.; Castro, A.; Som-Castellano, R.; Brandt, J.S. Implications of urban growth and farmland loss forecosystem services in the western United States. Land Use Policy 2019, 86, 1–11. [CrossRef]
13. Jones, N.; de Graaff, J.; Duarte, F.; Rodrigo, I.; Poortinga, A. Farming systems in two less favoured areas in Portugal: Theirdevelopment from 1989 to 2009 and the implications for sustainable land management. Land Degrad. Dev. 2014, 25, 29–44.[CrossRef]
14. Huang, Z.; Du, X.; Castillo, C.S.Z. How does urbanization affect farmland protection? Evidence from China. Resour. Conserv.Recycl. 2019, 145, 139–147. [CrossRef]
15. Tu, Y.; Chen, B.; Yu, L.; Xin, Q.; Gong, P.; Xu, B. How does urban expansion interact with cropland loss? A comparison of 14Chinese cities from 1980 to 2015. Landsc. Ecol. 2020. [CrossRef]
16. Song, W.; Pijanowski, B.C.; Tayyebi, A. Urban expansion and its consumption of high-quality farmland in Beijing, China. Ecol.Indic. 2015, 54, 60–70. [CrossRef]
17. Chapin Iii, F.S.; Zavaleta, E.S.; Eviner, V.T.; Naylor, R.L.; Vitousek, P.M.; Reynolds, H.L.; Hooper, D.U.; Lavorel, S.; Sala, O.E.;Hobbie, S.E.; et al. Consequences of changing biodiversity. Nature 2000, 405, 234–242. [CrossRef]
18. Butler, S.J.; Vickery, J.A.; Norris, K. Farmland Biodiversity and the Footprint of Agriculture. Science 2007, 315, 381. [CrossRef]19. Tilman, D.; Fargione, J.; Wolff, B.; Antonio, C.; Dobson, A.; Howarth, R.; Schindler, D.; Schlesinger, W.H.; Simberloff, D.;
Swackhamer, D. Forecasting Agriculturally Driven Global Environmental Change. Science 2001, 292, 281. [CrossRef] [PubMed]20. Gren, Å.; Andersson, E. Being efficient and green by rethinking the urban-rural divide—Combining urban expansion and food
production by integrating an ecosystem service perspective into urban planning. Sustain. Cities Soc. 2018, 40, 75–82. [CrossRef]21. Zhang, W.; Wang, W.; Li, X.; Ye, F. Economic development and farmland protection: An assessment of rewarded land conversion
quotas trading in Zhejiang, China. Land Use Policy 2014, 38, 467–476. [CrossRef]22. Pandey, B.; Seto, K.C. Urbanization and agricultural land loss in India: Comparing satellite estimates with census data. J. Environ.
Manag. 2015, 148, 53–66. [CrossRef] [PubMed]23. Sutton, M.A.; Oenema, O.; Erisman, J.W.; Leip, A.; van Grinsven, H.; Winiwarter, W. Too much of a good thing. Nature 2011, 472,
159–161. [CrossRef]24. Costanza, R.; d’Arge, R.; de Groot, R.; Farber, S.; Grasso, M.; Hannon, B.; Limburg, K.; Naeem, S.; O’Neill, R.V.; Paruelo, J.; et al.
The value of the world’s ecosystem services and natural capital. Nature 1997, 387, 253–260. [CrossRef]25. Xie, G.; Zhen, L.; Lu, C.; Xiao, Y.; Chen, C. Expert Knowledge Based Valua tion Method of Ecosystem Services in China. J. Nat.
Resour. 2008, 23, 911–919. [CrossRef]26. Xie, G.; Zhang, C.; Zhang, L.; Chen, W.; Li, S. Improvement of the Evaluation Method for Ecosystem Service Value Based on Per
Unit Area. J. Nat. Resour. 2015, 30, 1243–1254. [CrossRef]27. Xu, L.; Xu, X.; Luo, T.; Zhu, G.; Ma, Z. Services based on land use: A case study of Bohai Rim. Geogr. Res. 2012, 31, 1775–1784.28. Xiao, H.; Li, H.; Wang, L.; Chen, J.; Han, Y. Changes of Land Use and Ecosystem Service Value in the Guangdong-Hong
Kong-Macao Greater Bay Area-A Case Study of Guangdong-Foshan-Zhaoqing. Res. Soil. Water. Conserv. 2020, 27, 290–297.[CrossRef]
29. Kang, L.; Ma, L.; Liu, Y. Evaluation of farmland losses from sea level rise and storm surges in the Pearl River Delta region underglobal climate change. J. Geog. Sci. 2016, 26, 439–456. [CrossRef]
30. Deuskar, C.; Baker, J.L.; Mason, D. East Asia’s Changing Urban Landscape: Measuring a Decade of Spatial Growth; World BankPublications: Washington, DC, USA, 2015.
31. Seto, K.C.; Güneralp, B.; Hutyra, L.R. Global forecasts of urban expansion to 2030 and direct impacts on biodiversity and carbonpools. Proc. Natl. Acad. Sci. USA 2012, 109, 16083. [CrossRef]
32. Wu, W.; Zhao, S.; Zhu, C.; Jiang, J. A comparative study of urban expansion in Beijing, Tianjin and Shijiazhuang over the pastthree decades. Landsc. Urban Plan. 2015, 134, 93–106. [CrossRef]
33. Zhang, J.; Li, H.; Zhou, Y.; Dou, L.; Cai, L.; Mo, L.; You, J. Bioavailability and soil-to-crop transfer of heavy metals in farmlandsoils: A case study in the Pearl River Delta, South China. Environ. Pollut. 2018, 235, 710–719. [CrossRef] [PubMed]
34. Yang, C.; Li, Q.; Hu, Z.; Chen, J.; Shi, T.; Ding, K.; Wu, G. Spatiotemporal evolution of urban agglomerations in four major bayareas of US, China and Japan from 1987 to 2017: Evidence from remote sensing images. Sci. Total Environ. 2019, 671, 232–247.[CrossRef] [PubMed]
35. Xu, X.; Liu, J.; Zhang, S.; Li, R.; Yan, C.; Wu, S. China’s Multi-Period Land Use Land Cover Remote Sensing Monitoring Data Set(CNLUCC); Resource and Environment Data Science and Data Center, Institute of Geographic Sciences and Natural ResourcesResearch, Chinese Academy of Sciences: Beijing, China, 2018. [CrossRef]
36. Xie, G.; Li, W.; Xiao, Y.; Zhang, B.; Lu, C.; An, K.; Wang, J.; Xu, K.; Wang, J. Forest ecosystem services and their values in Beijing.Chin. Geogr. Sci. 2010, 20, 51–58. [CrossRef]
37. Costanza, R.; de Groot, R.; Sutton, P.; van der Ploeg, S.; Anderson, S.J.; Kubiszewski, I.; Farber, S.; Turner, R.K. Changes in theglobal value of ecosystem services. Glob. Environ. Chang. 2014, 26, 152–158. [CrossRef]
165
Land 2021, 10, 501
38. Yao, Z.; Zhang, L.; Tang, S.; Li, X.; Hao, T. The basic characteristics and spatial patterns of global cultivated land change since the1980s. J. Geog. Sci. 2017, 27, 771–785. [CrossRef]
39. Wang, J.; Lin, Y.; Glendinning, A.; Xu, Y. Land-use changes and land policies evolution in China’s urbanization processes. LandUse Policy 2018, 75, 375–387. [CrossRef]
40. Zhou, C.; Wang, Y.; Xu, Q.; Li, S. The new process of urbanization in the Pearl River Delta. Geogr. Res. 2019, 38, 45–63.41. Liu, L.; Liu, Z.; Gong, J.; Wang, L.; Hu, Y. Quantifying the amount, heterogeneity, and pattern of farmland: Implications for
China’s requisition-compensation balance of farmland policy. Land Use Policy 2019, 81, 256–266. [CrossRef]42. Cheng, L.; Jiang, P.; Chen, W.; Li, M.; Wang, L.; Gong, Y.; Pian, Y.; Xia, N.; Duan, Y.; Huang, Q. Farmland protection policies and
rapid urbanization in China: A case study for Changzhou City. Land Use Policy 2015, 48, 552–566. [CrossRef]43. Mishra, V. Population growth and intensification of land use in India. Int. J. Popul. Geogr. 2002, 8, 365–383. [CrossRef]44. Reddy, V.R.; Reddy, B.S. Land alienation and local communities: Case studies in Hyderabad- Secunderabad. Econ. Political Wkly.
2007, 42, 3233–3240.45. Chien, S. Local farmland loss and preservation in China—A perspective of quota territorialization. Land Use Policy 2015, 49, 65–74.
[CrossRef]46. Tian, L. Land use dynamics driven by rural industrialization and land finance in the peri-urban areas of China: “The examples of
Jiangyin and Shunde”. Land Use Policy 2015, 45, 117–127. [CrossRef]47. Huang, Z.; Cao, J. Ergodicity and bifurcations for stochastic logistic equation with non-Gaussian Lévy noise. Appl. Math. Comput.
2018, 330, 1–10. [CrossRef]48. Huang, Z.; Du, X. Government intervention and land misallocation: Evidence from China. Cities 2017, 60, 323–332. [CrossRef]49. Cao, G.; Feng, C.; Tao, R. Local “Land Finance” in China’s Urban Expansion: Challenges and Solutions. China World Econ. 2008,
16, 19–30. [CrossRef]50. Cheng, X.; Zheng, H.; Duan, W.; Hao, X.; Duan, W. Fault restoration based on the path analysis for distribution grid. In
Proceedings of the 2015 IEEE International Conference on Information and Automation, Beijing, China, 8–10 August 2015; pp.552–556.
51. Tao, R.; Su, F.; Liu, M.; Cao, G. Land leasing and local public finance in China’s regional development: Evidence from prefecture-level cities. Urban Stud. 2010, 47, 2217–2236. [CrossRef]
52. Jiang, L.; Deng, X.; Seto, K.C. Multi-level modeling of urban expansion and cultivated land conversion for urban hotspot countiesin China. Landsc. Urban Plan. 2012, 108, 131–139. [CrossRef]
53. Musinguzi, P.; Ebanyat, P.; Tenywa, J.; Basamba, T.; Tenywa, M.; Mubiru, D. Precision of farmerbased fertility ratings and soilorganic carbon for crop production on a Ferralsol. Solid Earth 2015, 6, 1063–1073. [CrossRef]
54. Kong, X. China must protect high-quality arable land. Nature 2014, 506, 7. [CrossRef]55. Su, S.; Jiang, Z.; Zhang, Q.; Zhang, Y. Transformation of agricultural landscapes under rapid urbanization: A threat to sustainability
in Hang-Jia-Hu region, China. Appl. Geogr. 2011, 31, 439–449. [CrossRef]56. Bai, X.; McPhearson, T.; Cleugh, H.; Nagendra, H.; Tong, X.; Zhu, T.; Zhu, Y.-G. Linking Urbanization and the Environment:
Conceptual and Empirical Advances. Annu. Rev. Environ. Resour. 2017, 42, 215–240. [CrossRef]57. Boserup, E. The Conditions of Agricultural Growth the Economics of Agrarian Change under Population Pressure; Routledge: London,
UK, 1965.58. Hu, Y.; Liu, X.; Bai, J.; Shih, K.; Zeng, E.Y.; Cheng, H. Assessing heavy metal pollution in the surface soils of a region that had
undergone three decades of intense industrialization and urbanization. Environ. Sci. Pollut. Res. 2013, 20, 6150–6159. [CrossRef][PubMed]
59. Deshpande, A.; Mishra, P. Urbanization, air pollution and human health. J. Environ. Res. Dev 2007, 1, 13.60. Xu, G.; Jiao, L.; Zhao, S.; Yuan, M.; Li, X.; Han, Y.; Zhang, B.; Dong, T. Examining the impacts of land use on air quality from a
spatio-temporal perspective in Wuhan, China. Atmosphere 2016, 7, 62. [CrossRef]61. Modica, G.; Zoccali, P.; Di Fazio, S. The e-Participation in Tranquillity Areas Identification as a Key Factor for Sustainable
Landscape Planning. In Computational Science and Its Applications—ICCSA 2013; Springer: Berlin, Germany, 27 June 2013; pp.550–565. [CrossRef]
62. Modica, G.; Pollino, M.; La Porta, L.; Di Fazio, S. Proposal of a Web-Based Multi-criteria Spatial Decision Support System(MC-SDSS) for Agriculture. In Innovative Biosystems Engineering for Sustainable Agriculture, Forestry and Food Production; SpringerNature: Cham, Switzerland, 2020; pp. 333–341. [CrossRef]
63. Jelokhani-Niaraki, M. Collaborative spatial multicriteria evaluation: A review and directions for future research. Int. J. Geog. Inf.Sci. 2020, 35, 9–42. [CrossRef]
64. Brown, G.; Fagerholm, N. Empirical PPGIS/PGIS mapping of ecosystem services: A review and evaluation. Ecosyst. Serv. 2015,13, 119–133. [CrossRef]
166
land
Article
Applying the Evaluation of Cultural Ecosystem Services inLandscape Architecture Design: Challenges and Opportunities
Xin Cheng 1,* , Sylvie Van Damme 2 and Pieter Uyttenhove 3
�����������������
Citation: Cheng, X.; Van Damme, S.;
Uyttenhove, P. Applying the
Evaluation of Cultural Ecosystem
Services in Landscape Architecture
Design: Challenges and
Opportunities. Land 2021, 10, 665.
https://doi.org/10.3390/land10070665
Academic Editors: Alessio Russo and
Giuseppe T. Cirella
Received: 18 May 2021
Accepted: 23 June 2021
Published: 24 June 2021
Publisher’s Note: MDPI stays neutral
with regard to jurisdictional claims in
published maps and institutional affil-
iations.
Copyright: © 2021 by the authors.
Licensee MDPI, Basel, Switzerland.
This article is an open access article
distributed under the terms and
conditions of the Creative Commons
Attribution (CC BY) license (https://
creativecommons.org/licenses/by/
4.0/).
1 Department of Urban Planning and Landscape Architecture, Xihua University, Chengdu 610039, China2 School of Arts, University College Ghent, 9000 Ghent, Belgium; [email protected] Department of Architecture and Urban Planning, Ghent University, 9000 Ghent, Belgium;
[email protected]* Correspondence: [email protected]; Tel.: +86-159-0814-2467
Abstract: Landscape architects play a significant role in safeguarding urban landscapes and humanwell-being by means of design and they call for practical knowledge, skills, and methods to addressincreasing environmental pressure. Cultural ecosystem services (CES) are recognized as highlyrelated to landscape architecture (LA) studies, and the outcomes of CES evaluations have the potentialto support LA practice. However, few efforts have focused on systematically investigating CES in LAstudies. Additionally, how CES evaluations are performed in LA studies is rarely researched. Thisstudy aims to identify the challenges and provide recommendations for applying CES evaluations toLA practice, focusing specifically on LA design. To conclude, three challenges are identified, namelya lack of consistent concepts (conceptual challenge); a lack of CES evaluation methods to informdesigns (methodological challenge); and practical issues of transferring CES evaluations to LA design(practical challenge). Based on our findings, we highlight using CES as a common term to refer tosocio-cultural values and encourage more CES evaluation methods to be developed and tested for LAdesign. In addition, we encourage more studies to explore the links of CES and landscape featuresand address other practical issues to better transfer CES evaluations onto LA designs.
Keywords: landscape architecture; cultural ecosystem services; design; evaluation
1. Introduction
Cities experience increasing environmental stress given the sharp rise of city popula-tions, and the consequent loss and degradation of urban green spaces. Landscape architectstherefore play a significant role in maintaining the human environment and well-being byplanning, design, and management of urban landscapes more than ever [1]. The Council ofEurope [2] defines landscape as an area that is perceived by people, and the character isthe result of the action and interaction of natural or human factors. Landscape architecture(LA), as a profession, provides site planning, design, and management advice to improvethe character, quality, and experience of the landscape [3]. Design is the core activity of theLA practice, considering many factors, such as the landscape itself, the intentions of theclients, the interaction of the users and the design setting, the materials, and the processesof creative expression. To do this effectively, landscape architects apply solid design pro-cesses and implementation methods, elaborated on and explained in an increasing amountof studies and publications on those topics. For example, Langley et al. [4] and Yue andShao [5] summarize the core knowledge domains of LA, including the evolution of analyti-cal methods for LA planning and design. Milburn and Brown [6] and Lenzholzer et al. [7]focus on incorporating research into the LA design process. Some scholars focus on newtools, such as Li and Milburn [8] and Gu et al. [9], who work on geodesign as a design tool.
LA primarily aims to organize the complexity of the landscape into comprehensible,productive, and beautiful places to improve the function, health, and experience of life.However, landscape architects increasingly face new challenges within today’s rapid
167
Land 2021, 10, 665
urbanization, such as designing resilient landscapes for adjusting to a changing climateand controlling natural disasters, creating a sense of place, and managing the growthof informal settlement [10,11]. Meanwhile, clients and the general public are no longeronly interested in the aesthetic value of landscape but also increasingly concerned aboutecological functions and environment conservation [12]. To achieve these multiple, often-competing objectives, landscape architects need a clear understanding of the relationshipsbetween humans and the environment and the interaction processes on how humans shapethe landscape they rely on and experience. Hence, there is an urgent call for practicalknowledge, skills, and methods to address these challenges within the LA profession [12].
The concept of ecosystem services (ES) refers to the benefits that people obtain fromecosystems [13]. They highlight the contributions that environments and landscapesprovide for society and the economy and, more generally, for human well-being. They aredivided into provisioning services, regulating services, supporting services, and culturalservices [13]. In the last decade, several researchers conducted studies on integratingES evaluation into spatial planning policies such as land use/cover to foster sustainabledevelopment. More recently, the relationship between ES and urban landscapes has alsobeen increasingly investigated. The outcomes of ES evaluations are recognized to have thepotential to support practical application and decision-making [14–19]. Among ES, culturalecosystem services (CES), namely the non-material benefits that people get from ecosystems,are regarded as directly influencing human-wellbeing and having the potential to motivatepeople’s willingness to protect urban greens [14,20]. Whether or not people are familiarwith the term, the concept resonates with nearly every human being, such as the experienceof recreational activities and scenery appreciations. Although different definitions havebeen developed so far, CES are generally defined as the non-material benefits people obtainfrom ecosystems [13], which was adopted by this study. CES evaluation is one of the biggestchallenges for further applying in practice. Evaluating what people obtain is a conciseway of disseminating the importance of ecosystems or landscapes [14]. Various evaluationmethods have been developed and they can generally be classified into monetary methodsand non-monetary methods, depending on whether the evaluation outcomes are expressedby money or not [14]. The classification can be further divided into revealed preferenceand stated preference methods. The revealed preference method means observing theactual markets or human behaviors related to the CES to assess CES. The stated preferencemethod means directly asking about one’s values to assess CES [14]. CES evaluation studiesand LA studies share many commonalities. First, they focus on the “human dimension” oflandscapes [21]. For example, LA has long been concerned with questions of the humanperception of and involvement with nature. Meanwhile, CES evaluations heavily dependon people’s perceptions and preferences. Second, both have a broad knowledge about theassessment of aesthetic values, place identity, and cultural heritage on-site and in specificcontexts [21]. Landscape architects may not be familiar with ES or CES; however, they arefamiliar with concepts such as aesthetics or heritage [22]. Third, both highlight the localscale of different landscape types, especially while studying urban green spaces like urbanparks, gardens, and forests, and, fourth, both are concerned with the benefits provided bylandscape features that can enhance the quality of the landscapes and the entire system [23].For example, parks are recognized as providing a range of CES, and, in many areas, theserelate to scientifically-assessed landscape features, such as the proportion of vegetation [24].Similarly, De Valck et al. [25] test the different degrees of high or low vegetation thatindicate outdoor recreation.
CES are highly related to LA studies, and the outcomes of CES evaluations have thepotential to guide LA practices. Although they share many commonalities, few efforts havefocused on systematically investigating CES in LA studies. Additionally, how CES evalua-tions are performed in LA studies is rarely investigated. This paper aims to identify thechallenges and opportunities of integrating CES evaluations into LA designs. Specifically, itdiscusses the problems and challenges of existing studies, the examined CES categories, the
168
Land 2021, 10, 665
implications and applications of evaluation methods, the links between CES and landscapefeatures, and opportunities for future study.
With this in mind, we specifically ask which CES are studied, what evaluation methodsare used, and how CES are connected to landscape features in LA studies. To achieve this,we focus on three areas:
1. First, we focus on the existing publications about CES within LA studies throughbibliographic research. Looking at the existing publications from a scientific databasehelps with understanding the status quo of the CES in LA studies. This approachallows for investigating a topic comprehensively and covering a large timespan [26].
2. Second, we focus on how landscape architects express their ideas in design proposalsrelated to CES through a systematic review of design proposals. Design proposalsdiffer in scale and complexity. They involve various constituent elements for a varietyof purposes and scales. They are often used to present design outcomes and commu-nicate with clients. Focusing on the design proposals helps with understanding whyCES are important, and how the abstract CES are expressed by the physical landscapefeatures, according to designers.
3. Third, we focus on how landscape architects state their ideas and values related toCES through interviews. Not all of the information is shown in design proposals. Thedesign process is complex, and the mechanisms behind the designs are unknown.Moreover, more practical issues can only be revealed by interviewing the designers asdealing with those issues is one of their daily tasks. Hence, we interviewed landscapearchitects directly to reveal more detailed information that might be missed, to revealthe real thoughts of designers and to get the primary data for further analysis.
Combining these three methods provided a comprehensive knowledge of CES evalua-tion in LA fields. In addition, this study focused on urban parks in China. As an importantcomponent of urban green spaces, urban parks are crucial for securing human well-beingby providing diverse benefits, and they have been studied by ES and LA fields. Urbanparks are important indicators used to estimate the quality of life in a city. Moreover,studying urban parks is vitally important for their design, planning, and management,especially in the case of China, which is experiencing increasing social and environmentalpressure caused by the rapid population growth in cities. Hence, it is an urgent call forvaluable tools to aid urban park design.
2. Methods
We combined three methods to investigate the challenges and opportunities of ap-plying CES evaluations in LA studies. Table 1 shows the study process. Specifically, wefirst reviewed existing scientific articles to have a general overview of the research onurban parks and identify items related to CES and the links between these terms. Then, weconducted a systematic review of selected park proposals based on a guideline (Table A1in Appendix A). Subsequently, we interviewed landscape architects directly to know theirthoughts about CES evaluations and other practical issues (Table A2).
Table 1. Overview of the study process.
Study Process Data Collection Data Analysis
(1) Review journal articles, dissertations, and conference papers from CNKI database 5273 publications Quantitative(2) Systematic review of park proposals 83 proposals Quantitative
(3) Interviews of landscape architects 12 interviewees Qualitative
CNKI is a key national information and knowledge database that includes journals, doctoral dissertations, master’s theses, proceedings,newspapers, yearbooks, statistical yearbooks, patents, standards, etc. in China.
2.1. Review of Keywords and Abstract of Scientific Publications
To review the existing publications about CES within LA studies, we used key termsand phrases based on reviewing the abstracts and keywords of scientific publications. Thistechnique can be used to quantify a large sample [26,27]. We first searched “landscape
169
Land 2021, 10, 665
architecture design*” and “urban park*” in the China National Knowledge Infrastructure(CNKI) database, including journals, dissertations, and conference papers. We set thetimespan up to November 2019, which resulted in 5273 items. Then, we screened thekey terms using CiteSpace.5.5.R2 (parameter settings: Years Per Slice: 2; Node Types:Keyword). The frequency of the keywords could reflect hot topics and core content over aset period [28]. Subsequently, we counted the occurrence frequency of key terms in relationto CES. There are different definitions and classifications of CES, and different authors usedifferent terms based on their study focus. Here, we recorded the terms that the authorsreported. Finally, other terms were also presented and counted if they were linked toCES terms.
2.2. Review of Design Proposals
A systematic review was conducted to review the design proposals of urban parks inChina. More specifically, we first collected park proposals from LA companies, governmentagents, and internet searches. A balance of park types and scales were also noticed, and,finally obtained, 83 items were obtained. Second, we asked a set of questions when wereviewed each park proposal and recorded the answers (Table A1), including the time, parkscales, park types, CES types, evaluation methods, and the relationships with landscapefeatures. More specifically, we set the classification of the answers of identified proposalsas shown in Table 2. There are several different classification mechanisms of urban parks,and it is beyond the scope of this study to give a comprehensive account of the variousclassifications. In this study, we based on the Standard for Classification of Urban GreenSpace of China.
Table 2. Review of design proposals.
Question Categories Answer Descriptions
(1) Time The year the design proposal came out.
(2) Scale The size of the park.
(3) Type
The urban park was classified into four major categories:comprehensive park, community park, topic park (children’s park, thecultural relics park, the commemorative park, zoological garden, sportspark, etc.), and belt-shaped park. Among them, comprehensive parks
include a large area of green land and numerous public servicefacilities, which are the main locations for residents to recreate, and a
significant public open space [29].
(4) CES types
We identified CES types by focusing on the non-material characteristics,meaning there was no pre-set classification before reviewing eachproposal. We recorded the original terms that authors reported in
proposals and similar terms were grouped.
(5) Evaluation of CES methods We recorded if the designers introduced CES evaluation methods intheir design proposals.
(6) The relationships with other landscapeelements/features (vegetation, benches, etc.)
The classifications of characteristics were selected from the literaturethat focused on the park characteristics, including Bertram and
Rehdanz [30], Campbell et al. [31], Chiesura [32], and Hegetschweileret al. [33]. Based on this classification, we recorded and grouped the
terms that the authors reported in their designs. For the detailed types,see Table A1.
2.3. Interviews of Landscape Architects
To reveal more detailed information from designers, 12 semi-structured phone inter-views were conducted between November, 2019 and January, 2020. The interviewees werelandscape architects with rich experience in park design in China and consisted of threegroups. The first group consisted of designers in the government’s LA design institute.The second group was made up of professors working at the university who were also
170
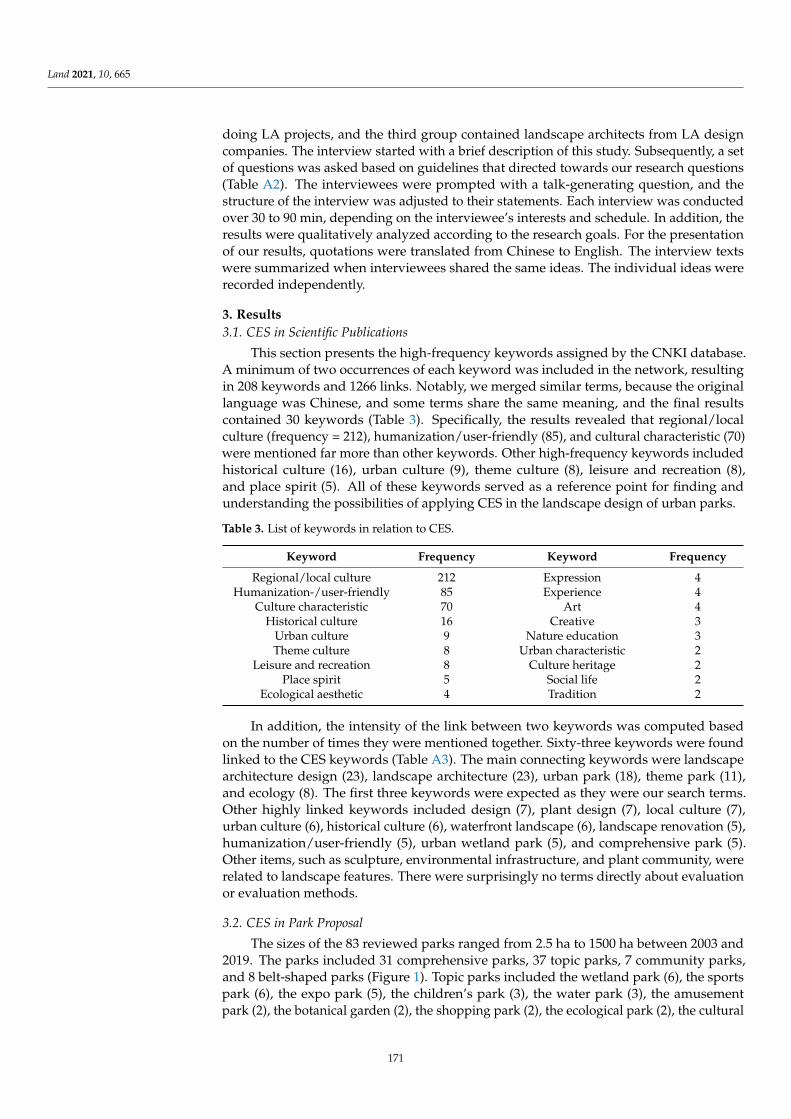
Land 2021, 10, 665
doing LA projects, and the third group contained landscape architects from LA designcompanies. The interview started with a brief description of this study. Subsequently, a setof questions was asked based on guidelines that directed towards our research questions(Table A2). The interviewees were prompted with a talk-generating question, and thestructure of the interview was adjusted to their statements. Each interview was conductedover 30 to 90 min, depending on the interviewee’s interests and schedule. In addition, theresults were qualitatively analyzed according to the research goals. For the presentationof our results, quotations were translated from Chinese to English. The interview textswere summarized when interviewees shared the same ideas. The individual ideas wererecorded independently.
3. Results3.1. CES in Scientific Publications
This section presents the high-frequency keywords assigned by the CNKI database.A minimum of two occurrences of each keyword was included in the network, resultingin 208 keywords and 1266 links. Notably, we merged similar terms, because the originallanguage was Chinese, and some terms share the same meaning, and the final resultscontained 30 keywords (Table 3). Specifically, the results revealed that regional/localculture (frequency = 212), humanization/user-friendly (85), and cultural characteristic (70)were mentioned far more than other keywords. Other high-frequency keywords includedhistorical culture (16), urban culture (9), theme culture (8), leisure and recreation (8),and place spirit (5). All of these keywords served as a reference point for finding andunderstanding the possibilities of applying CES in the landscape design of urban parks.
Table 3. List of keywords in relation to CES.
Keyword Frequency Keyword Frequency
Regional/local culture 212 Expression 4Humanization-/user-friendly 85 Experience 4
Culture characteristic 70 Art 4Historical culture 16 Creative 3
Urban culture 9 Nature education 3Theme culture 8 Urban characteristic 2
Leisure and recreation 8 Culture heritage 2Place spirit 5 Social life 2
Ecological aesthetic 4 Tradition 2
In addition, the intensity of the link between two keywords was computed basedon the number of times they were mentioned together. Sixty-three keywords were foundlinked to the CES keywords (Table A3). The main connecting keywords were landscapearchitecture design (23), landscape architecture (23), urban park (18), theme park (11),and ecology (8). The first three keywords were expected as they were our search terms.Other highly linked keywords included design (7), plant design (7), local culture (7),urban culture (6), historical culture (6), waterfront landscape (6), landscape renovation (5),humanization/user-friendly (5), urban wetland park (5), and comprehensive park (5).Other items, such as sculpture, environmental infrastructure, and plant community, wererelated to landscape features. There were surprisingly no terms directly about evaluationor evaluation methods.
3.2. CES in Park Proposal
The sizes of the 83 reviewed parks ranged from 2.5 ha to 1500 ha between 2003 and2019. The parks included 31 comprehensive parks, 37 topic parks, 7 community parks,and 8 belt-shaped parks (Figure 1). Topic parks included the wetland park (6), the sportspark (6), the expo park (5), the children’s park (3), the water park (3), the amusementpark (2), the botanical garden (2), the shopping park (2), the ecological park (2), the cultural
171
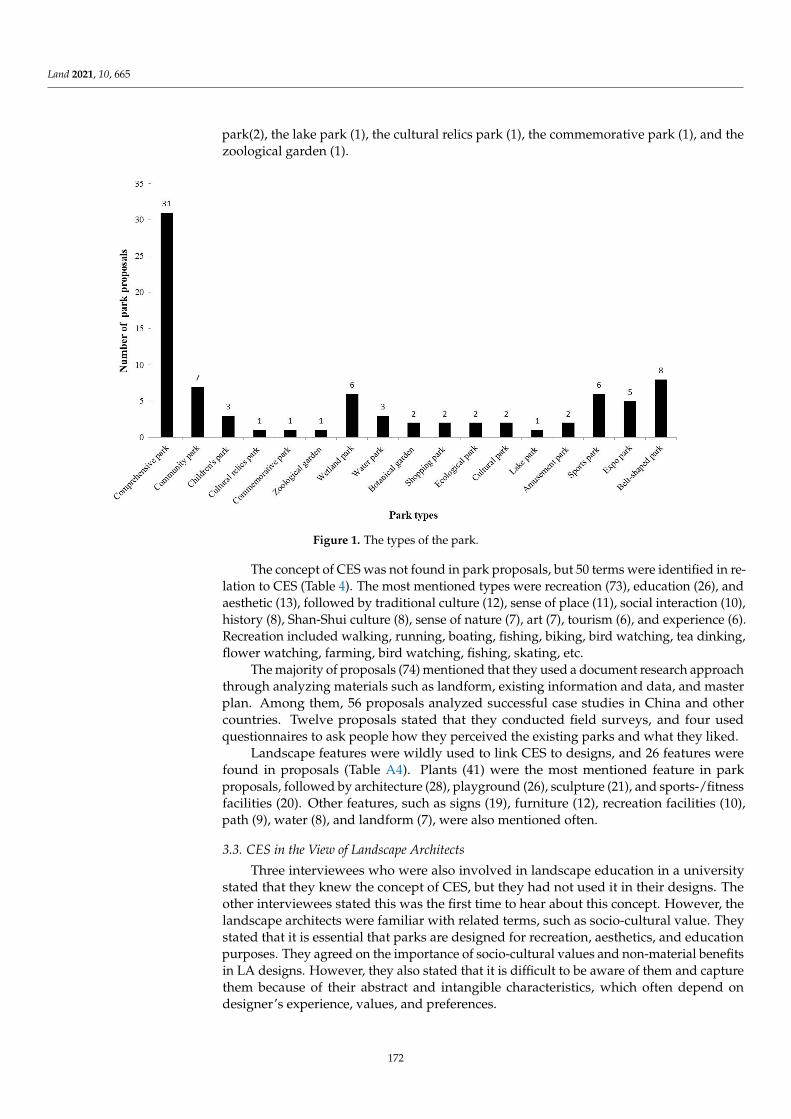
Land 2021, 10, 665
park(2), the lake park (1), the cultural relics park (1), the commemorative park (1), and thezoological garden (1).
Land 2021, 10, x FOR PEER REVIEW 6 of 15
Leisure and recreation 8 Culture heritage 2 Place spirit 5 Social life 2
Ecological aesthetic 4 Tradition 2
3.2. CES in Park Proposal The sizes of the 83 reviewed parks ranged from 2.5 ha to 1500 ha between 2003 and
2019. The parks included 31 comprehensive parks, 37 topic parks, 7 community parks, and 8 belt-shaped parks (Figure 1). Topic parks included the wetland park (6), the sports park (6), the expo park (5), the children’s park (3), the water park (3), the amusement park (2), the botanical garden (2), the shopping park (2), the ecological park (2), the cultural park(2), the lake park (1), the cultural relics park (1), the commemorative park (1), and the zoological garden (1).
Figure 1. The types of the park.
The concept of CES was not found in park proposals, but 50 terms were identified in relation to CES (Table 4). The most mentioned types were recreation (73), education (26), and aesthetic (13), followed by traditional culture (12), sense of place (11), social interac-tion (10), history (8), Shan-Shui culture (8), sense of nature (7), art (7), tourism (6), and experience (6). Recreation included walking, running, boating, fishing, biking, bird watching, tea dinking, flower watching, farming, bird watching, fishing, skating, etc.
Table 4. CES categories in park proposals.
CES Category Number CES Category Number Ethnic culture 1 Spiritual 4
Education 26 knowledge 1 Recreation 73 Tourism 6
Spiritual and religious value 3 Shopping experience 1 Cultural diversity 3 Identity 3 Traditional culture 12 Respect of nature 1
History 8 Love 2
Figure 1. The types of the park.
The concept of CES was not found in park proposals, but 50 terms were identified in re-lation to CES (Table 4). The most mentioned types were recreation (73), education (26), andaesthetic (13), followed by traditional culture (12), sense of place (11), social interaction (10),history (8), Shan-Shui culture (8), sense of nature (7), art (7), tourism (6), and experience (6).Recreation included walking, running, boating, fishing, biking, bird watching, tea dinking,flower watching, farming, bird watching, fishing, skating, etc.
The majority of proposals (74) mentioned that they used a document research approachthrough analyzing materials such as landform, existing information and data, and masterplan. Among them, 56 proposals analyzed successful case studies in China and othercountries. Twelve proposals stated that they conducted field surveys, and four usedquestionnaires to ask people how they perceived the existing parks and what they liked.
Landscape features were wildly used to link CES to designs, and 26 features werefound in proposals (Table A4). Plants (41) were the most mentioned feature in parkproposals, followed by architecture (28), playground (26), sculpture (21), and sports-/fitnessfacilities (20). Other features, such as signs (19), furniture (12), recreation facilities (10),path (9), water (8), and landform (7), were also mentioned often.
3.3. CES in the View of Landscape Architects
Three interviewees who were also involved in landscape education in a universitystated that they knew the concept of CES, but they had not used it in their designs. Theother interviewees stated this was the first time to hear about this concept. However, thelandscape architects were familiar with related terms, such as socio-cultural value. Theystated that it is essential that parks are designed for recreation, aesthetics, and educationpurposes. They agreed on the importance of socio-cultural values and non-material benefitsin LA designs. However, they also stated that it is difficult to be aware of them and capturethem because of their abstract and intangible characteristics, which often depend ondesigner’s experience, values, and preferences.
172
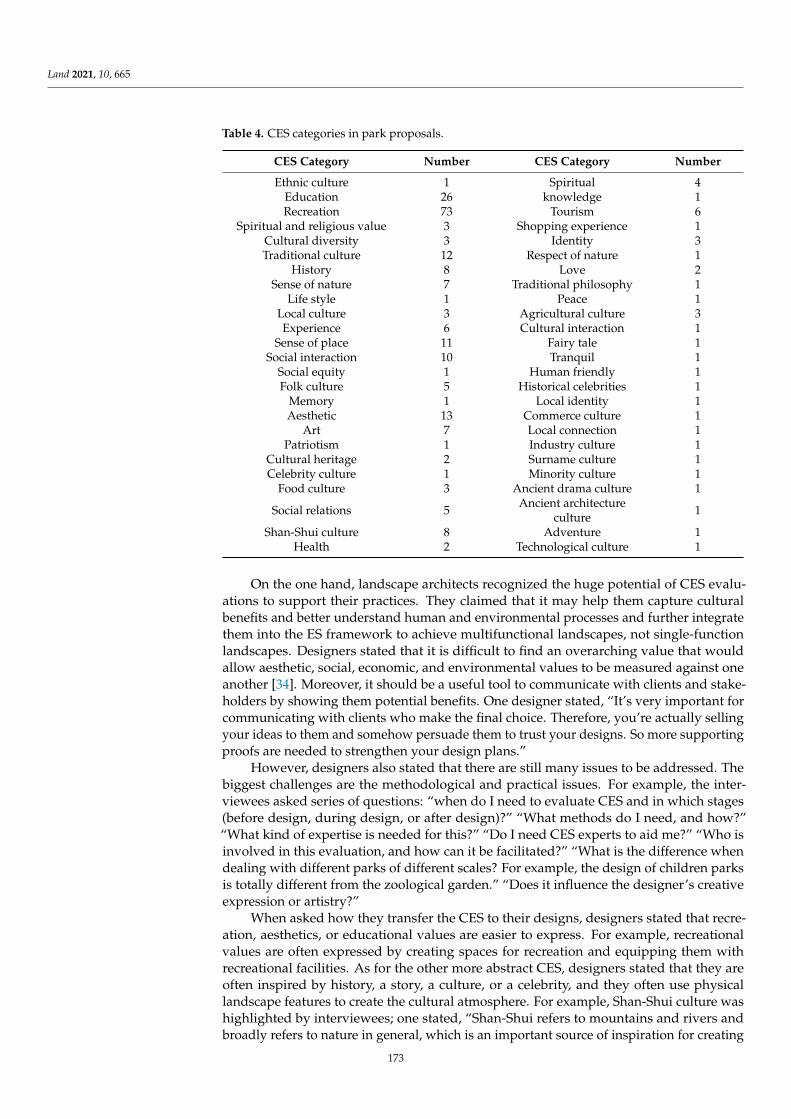
Land 2021, 10, 665
Table 4. CES categories in park proposals.
CES Category Number CES Category Number
Ethnic culture 1 Spiritual 4Education 26 knowledge 1Recreation 73 Tourism 6
Spiritual and religious value 3 Shopping experience 1Cultural diversity 3 Identity 3Traditional culture 12 Respect of nature 1
History 8 Love 2Sense of nature 7 Traditional philosophy 1
Life style 1 Peace 1Local culture 3 Agricultural culture 3Experience 6 Cultural interaction 1
Sense of place 11 Fairy tale 1Social interaction 10 Tranquil 1
Social equity 1 Human friendly 1Folk culture 5 Historical celebrities 1
Memory 1 Local identity 1Aesthetic 13 Commerce culture 1
Art 7 Local connection 1Patriotism 1 Industry culture 1
Cultural heritage 2 Surname culture 1Celebrity culture 1 Minority culture 1
Food culture 3 Ancient drama culture 1
Social relations 5 Ancient architectureculture 1
Shan-Shui culture 8 Adventure 1Health 2 Technological culture 1
On the one hand, landscape architects recognized the huge potential of CES evalu-ations to support their practices. They claimed that it may help them capture culturalbenefits and better understand human and environmental processes and further integratethem into the ES framework to achieve multifunctional landscapes, not single-functionlandscapes. Designers stated that it is difficult to find an overarching value that wouldallow aesthetic, social, economic, and environmental values to be measured against oneanother [34]. Moreover, it should be a useful tool to communicate with clients and stake-holders by showing them potential benefits. One designer stated, “It’s very important forcommunicating with clients who make the final choice. Therefore, you’re actually sellingyour ideas to them and somehow persuade them to trust your designs. So more supportingproofs are needed to strengthen your design plans.”
However, designers also stated that there are still many issues to be addressed. Thebiggest challenges are the methodological and practical issues. For example, the inter-viewees asked series of questions: “when do I need to evaluate CES and in which stages(before design, during design, or after design)?” “What methods do I need, and how?”“What kind of expertise is needed for this?” “Do I need CES experts to aid me?” “Who isinvolved in this evaluation, and how can it be facilitated?” “What is the difference whendealing with different parks of different scales? For example, the design of children parksis totally different from the zoological garden.” “Does it influence the designer’s creativeexpression or artistry?”
When asked how they transfer the CES to their designs, designers stated that recre-ation, aesthetics, or educational values are easier to express. For example, recreationalvalues are often expressed by creating spaces for recreation and equipping them withrecreational facilities. As for the other more abstract CES, designers stated that they areoften inspired by history, a story, a culture, or a celebrity, and they often use physicallandscape features to create the cultural atmosphere. For example, Shan-Shui culture washighlighted by interviewees; one stated, “Shan-Shui refers to mountains and rivers andbroadly refers to nature in general, which is an important source of inspiration for creating
173
Land 2021, 10, 665
places.” Another example is the use of plants: “Bamboo, for example, is often used indesigns to emphasize the elegance of the environment because, in Chinese culture, it is asymbol representing the character of moral integrity, modesty, and loyalty.” Sculptures arealso widely used to commemorate a celebrity or historical event or person. Designers alsostated that the process is complex and depends on sites and specific contexts.
4. Discussion: Challenges and Opportunities
This study focuses on which CES are studied, what evaluation methods are used, andhow the concepts connected to physical landscape featured in LA studies. In this section,we highlight three key challenges based on our findings and further discuss opportunitiesfor landscape architects to contribute to apply CES evaluations into LA studies in the future.
4.1. Conceptual Challenges: A Lack of Consistent Concepts
Although the term CES was not been used, various socio-cultural values were foundin the LA publications and design proposals. Local culture and historical culture werewidely highlighted, benefiting from the fruitful history and culture of China. Landscapearchitects did not use the term CES because the concept of CES is relatively new, proposedin recent decades. Chinese scholars seemed to be unaware of this progress until recentyears, and the number of studies focusing particularly on CES is still very limited [35]. Inaddition, some interviewees stated that they are unaware of the latest research trends ormethods because they do not read international research publications as their English ispoor. Another landscape architect stated that both CES and other terms he often uses suchas historical culture or Shan-Shui culture all refer to the social-cultural values, so it doesnot matter whether he uses the term CES or not. The landscape architects also highlightedthat the key is how to evaluate them and use them to guide the LA design practice.
Although CES have a range of definitions based on diverging views, leading toalternative classification schemes, they are generally described as socio-cultural values ornon-material benefits. There are several mainstream classifications of CES in ES studies,such as the Millennium Ecosystem Assessment classification, Economics of Ecosystems andBiodiversity, Common International Classification of Ecosystem Services, Final EcosystemGoods and Services Classification System, and, more recently, the IntergovernmentalPlatform on Biodiversity and Ecosystem Services. Diverse classifications were developedto clarify CES, and they are still in progress [36,37]. However, a consistent concept isnecessary as this gives an opportunity to organize a dialogue and cooperation betweenLA and CES studies [21]. CES have the potential to be a common term referring to socio-cultural benefits. The results show that many CES are referenced and studied in LA researchand design proposals but not by explicitly using the term CES. Hence, an opportunity ismissed by not highlighting the link between the environment and humans that implicitlyexists within the research and proposals. Given that this anthropocentric rationale can beeffective at generating support for environmental conservation [38], the explicit inclusionof the CES concept may also lead to better ecosystem protection in general [39]. Moreover,practitioners who lack basic knowledge about CES concepts may be less aware of whatcould benefit from their designs. Hence, the inclusion of a common term, concept, ordefinition for CES in the LA studies and design proposals and other similar documents isneeded to promote LA practice. Furthermore, the existing CES evaluation studies by manyother countries and their various methods and indicators can inspire LA studies in China.However, a concern about the use of CES evaluations by designers is that the applicationof CES as a scientific concept might cause a loss of creativity and artistic thinking. It is achallenge for designers to balance the evaluation and creativity, which requires designersto have a full understanding of the knowledge of CES and LA design.
4.2. Methodological Challenges: Lack of Evaluation Methods to Inform Designs
Most design proposals use document research, followed by questionnaires which arebased on people’s preferences and perceptions. In reality, expert-based methods are the
174
Land 2021, 10, 665
most used, even when this is not mentioned in the proposals. Indeed, the designs highlydepend on the experiences, skills, and values of the designers as experts, and evidence-based design is widely used for LA designs in China. An evidence-based design highlightsthe process of design by critically and appropriately integrating various aspects, such ascredible data, practitioner design expertise, client needs, and resources, in order to achieveproject objectives [40]. Although evidence-based design has been widely used, it hasbeen simultaneously critiqued for rigidity and misapplication in China. Hence, landscapearchitects gravitate to the support of research by integrating “research-informed design” asa broader term with concepts, fields, tools, or methods to support their practice. In thisstudy, CES is regarded as a research tool that has the potential to aid LA practices. It is clearthat, although CES are difficult to evaluate, a systematic evaluation of CES could guide thedesigners to capture and maximize them.
The diversity of CES study methods provides a rich inventory for scholars to assessCES. Instruments for assessing CES, including quantification, valuing, mapping, and mod-eling, are increasingly studied in CES and ES research. Many evaluation methods providean opportunity to evaluate CES in LA studies. The evaluation methods are generallydivided into monetary and non-monetary methods or revealed preference and stated pref-erence methods as introduced in the first section. Cheng et al. [14]; Hirons et al. [41]; andSpangenberg and Settele [42] summarize the evaluation methods. In urban green spacestudies, non-monetary methods were used more, especially questionnaires and interviews,which emphasize the preferences and perceptions of people. It highlights the importanceof the role that humans play in interaction with landscapes. Participatory mapping can beused to evaluate the crucial locations and settings for an urban park. Such assessments canprovide valuable information for designers to increase CES provisions in the urban land-scape. A social media-based method was used to reveal people’s preference of CES basedon the social media data from various resources such as Flickr or Instagram. Monetarymethods, such as willingness to pay (WTP), can be used to know people’s preferences forspecific park settings. Both monetary and non-monetary methods and their combinationsare encouraged to be used in LA studies. To achieve this, combing economics with otherdisciplines such as social or behavioral sciences is significant to know how to shift humanaspects to environment setting, which is encouraged in future studies.
4.3. Practical Challenges: Practical Issues of Transferring CES to LA Design
In addition to the conceptual and methodological challenges, there are also morepractical issues. They are: the relationships between CES and landscape features, theevaluation scopes (i.e., park types and size), data collection, and operation.
4.3.1. CES and Landscape Features
CES are highly related to landscape features. Sculpture, environmental infrastructure,and plant community were identified in the publications review. In addition, plants, archi-tecture, playground, sculpture, and sports-/fitness facilities were the features used most toindicate CES in the reviewed design proposals. Landscape architects also highlighted theimportance of the landscape features to express their ideas about CES. Linking the CES tophysical landscape features is regarded as an efficient way to ground the abstract conceptinto the designs. The link between CES and landscape features provided an opportunity tohelp designers easily grasp CES and create essential links between ecosystem processesand management actions [43]. For example, some studies have tried to link CES to alocation by means of participatory mapping, which allows people to mark the sites of CES(see Brown and Hausner [44]; Bryan et al. [45]; and Plieninger et al. [46]). Such studiesprovide designers with insight into the location of CES supplies and their correlations withspecific features [30]. De Valck et al. [25] test the influence of different degrees of highor low vegetation on recreation and how such specific connections have the potential tosupport the vegetation design and landscape management. Benches are also regardedas an indicator of aesthetic values that can guide LA designs [47]. However, the number
175
Land 2021, 10, 665
of studies linking CES and landscape features are still limited, and future studies shouldfocus more on the links between CES and landscape features to guide LA designs.
4.3.2. Scopes, Data Collection, and Implementation
Many other factors influence the transfer of the concept of CES into LA design. Thedesign process is complicated, and landscape architects need to coordinate a series of tasksto be performed by a number of people over a set period. They need to consider factorssuch as scale, types, layout, and features and organize the landscape to create a functional,comprehensible, and beautiful place. In addition, landscape architects need to consider thedata collection and operation process when integrating CES evaluation into this process.
Specifically, the first issue is the evaluation scope including park scales and types.Parks with different types and scales have different expressions. For instance, sports parksemphasize recreation more than commemorative parks, which highlight spiritual values asstated by designers, and, in this case, landscape architects often have to trade off differentCES. Meanwhile, different parks with different sizes add complexity. Hence, definingtypes and scales is crucial at the beginning to clarify the study scope and further selectevaluation methods.
The second issue is how to collect the data. Data collection is significant to supportpractices, and depends on what methods are selected. The data can be divided into primarydata or secondary data and quantitative data or qualitative data. For example, LA designsoften depend on the secondary data derived from the document research, and primarydata derived from the interviews. The primary data often engage stakeholders becauseCES evaluation is recognized to rely heavily on people’s preferences and perceptions.LA is a user-inspired and user-useful discipline that requires designers to achieve therequirements of the clients and collaborate with them, making it more complex. CESevaluation could contribute to the increased congruence between different stakeholders. Itis a useful tool for communicating with clients by showing what benefits they can havebased on design proposals.
The third issue is the operation of the CES evaluation, such as who is involved in theevaluation and how it can be implemented. There is often a lack of local research capacityto undertake valuation research [48], which requires designers to have the capacity to actas enumerators or facilitators. As most designers do not know about CES, training on howto evaluate CES is essential for designers. Additionally, the development of evaluationmethods, toolboxes, and practical guidelines is important to aid designers. Meanwhile,cooperation with ecologists or other experts is also highly encouraged at the beginning.
We take account of the complexity of practical issues and emphasize that there is notone simple and straightforward way to address practical issues. This study presentedassumptions and discussions for tackling the complexity of involving CES evaluation inlandscape design.
5. Conclusions
Landscape architects are facing increasing pressure due to rapid urbanization andcall for practical knowledge, skills, and methods, etc. to support their designs. This studyproposes that the concept of CES could have the potential to address their pressures byintegrating CES evaluation in LA designs. This study identified three challenges, includingconsistent concepts, methods for evaluating CES, and practical issues of transferring CES toLA design. We further provided recommendations about how to deal with these challengesby highlighting opportunities for designers to contribute to LA and CES research in thefuture. (1) We highlighted developing consistent concepts and highlighted using CES as acommon term to refer to socio-cultural values. (2) We encouraged using more evaluationmethods to assess CES in LA studies, including monetary and non-monetary methods,such as WTP, participatory mapping, and the social media-based method. In addition,(3) we encouraged more studies addressing various practical issues to better guide LAdesigns. The first issue is to define park types and scales, which is crucial at the beginning
176
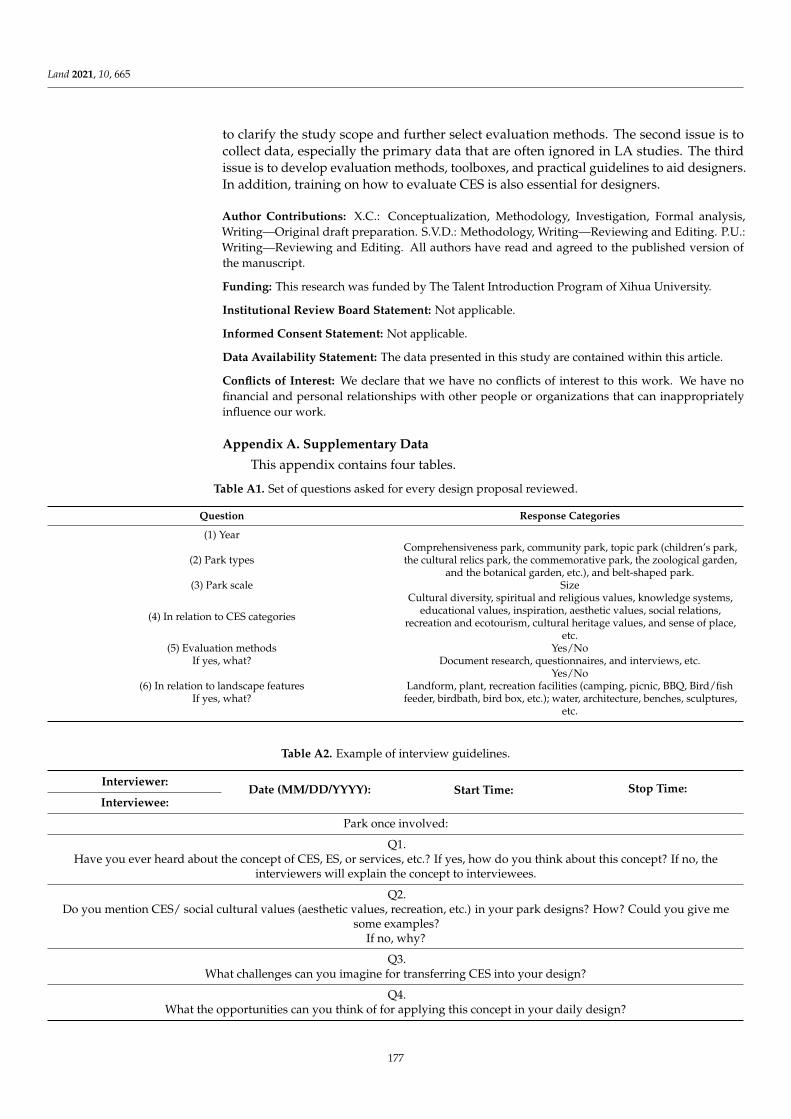
Land 2021, 10, 665
to clarify the study scope and further select evaluation methods. The second issue is tocollect data, especially the primary data that are often ignored in LA studies. The thirdissue is to develop evaluation methods, toolboxes, and practical guidelines to aid designers.In addition, training on how to evaluate CES is also essential for designers.
Author Contributions: X.C.: Conceptualization, Methodology, Investigation, Formal analysis,Writing—Original draft preparation. S.V.D.: Methodology, Writing—Reviewing and Editing. P.U.:Writing—Reviewing and Editing. All authors have read and agreed to the published version ofthe manuscript.
Funding: This research was funded by The Talent Introduction Program of Xihua University.
Institutional Review Board Statement: Not applicable.
Informed Consent Statement: Not applicable.
Data Availability Statement: The data presented in this study are contained within this article.
Conflicts of Interest: We declare that we have no conflicts of interest to this work. We have nofinancial and personal relationships with other people or organizations that can inappropriatelyinfluence our work.
Appendix A. Supplementary Data
This appendix contains four tables.
Table A1. Set of questions asked for every design proposal reviewed.
Question Response Categories
(1) Year
(2) Park typesComprehensiveness park, community park, topic park (children’s park,the cultural relics park, the commemorative park, the zoological garden,
and the botanical garden, etc.), and belt-shaped park.(3) Park scale Size
(4) In relation to CES categories
Cultural diversity, spiritual and religious values, knowledge systems,educational values, inspiration, aesthetic values, social relations,
recreation and ecotourism, cultural heritage values, and sense of place,etc.
(5) Evaluation methodsIf yes, what?
Yes/NoDocument research, questionnaires, and interviews, etc.
(6) In relation to landscape featuresIf yes, what?
Yes/NoLandform, plant, recreation facilities (camping, picnic, BBQ, Bird/fish
feeder, birdbath, bird box, etc.); water, architecture, benches, sculptures,etc.
Table A2. Example of interview guidelines.
Interviewer:Date (MM/DD/YYYY): Start Time: Stop Time:
Interviewee:
Park once involved:
Q1.Have you ever heard about the concept of CES, ES, or services, etc.? If yes, how do you think about this concept? If no, the
interviewers will explain the concept to interviewees.
Q2.Do you mention CES/ social cultural values (aesthetic values, recreation, etc.) in your park designs? How? Could you give me
some examples?If no, why?
Q3.What challenges can you imagine for transferring CES into your design?
Q4.What the opportunities can you think of for applying this concept in your daily design?
177
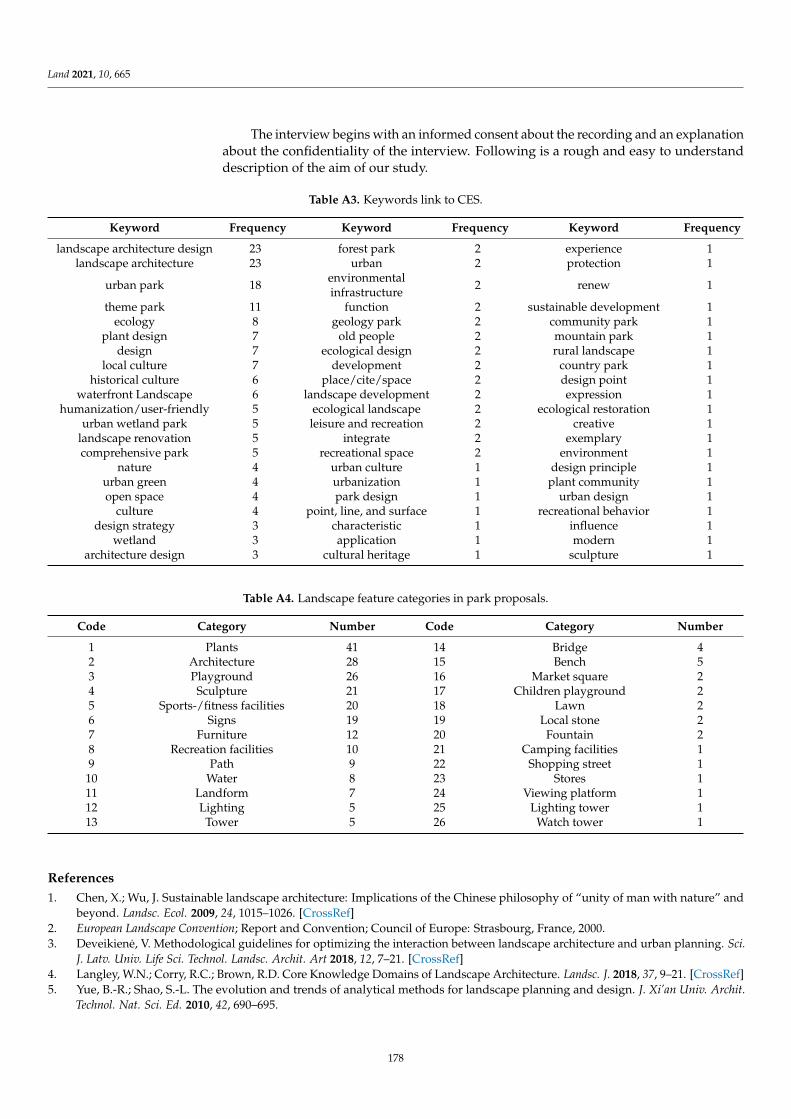
Land 2021, 10, 665
The interview begins with an informed consent about the recording and an explanationabout the confidentiality of the interview. Following is a rough and easy to understanddescription of the aim of our study.
Table A3. Keywords link to CES.
Keyword Frequency Keyword Frequency Keyword Frequency
landscape architecture design 23 forest park 2 experience 1landscape architecture 23 urban 2 protection 1
urban park 18 environmentalinfrastructure 2 renew 1
theme park 11 function 2 sustainable development 1ecology 8 geology park 2 community park 1
plant design 7 old people 2 mountain park 1design 7 ecological design 2 rural landscape 1
local culture 7 development 2 country park 1historical culture 6 place/cite/space 2 design point 1
waterfront Landscape 6 landscape development 2 expression 1humanization/user-friendly 5 ecological landscape 2 ecological restoration 1
urban wetland park 5 leisure and recreation 2 creative 1landscape renovation 5 integrate 2 exemplary 1comprehensive park 5 recreational space 2 environment 1
nature 4 urban culture 1 design principle 1urban green 4 urbanization 1 plant community 1open space 4 park design 1 urban design 1
culture 4 point, line, and surface 1 recreational behavior 1design strategy 3 characteristic 1 influence 1
wetland 3 application 1 modern 1architecture design 3 cultural heritage 1 sculpture 1
Table A4. Landscape feature categories in park proposals.
Code Category Number Code Category Number
1 Plants 41 14 Bridge 42 Architecture 28 15 Bench 53 Playground 26 16 Market square 24 Sculpture 21 17 Children playground 25 Sports-/fitness facilities 20 18 Lawn 26 Signs 19 19 Local stone 27 Furniture 12 20 Fountain 28 Recreation facilities 10 21 Camping facilities 19 Path 9 22 Shopping street 1
10 Water 8 23 Stores 111 Landform 7 24 Viewing platform 112 Lighting 5 25 Lighting tower 113 Tower 5 26 Watch tower 1
References1. Chen, X.; Wu, J. Sustainable landscape architecture: Implications of the Chinese philosophy of “unity of man with nature” and
beyond. Landsc. Ecol. 2009, 24, 1015–1026. [CrossRef]2. European Landscape Convention; Report and Convention; Council of Europe: Strasbourg, France, 2000.3. Deveikiene, V. Methodological guidelines for optimizing the interaction between landscape architecture and urban planning. Sci.
J. Latv. Univ. Life Sci. Technol. Landsc. Archit. Art 2018, 12, 7–21. [CrossRef]4. Langley, W.N.; Corry, R.C.; Brown, R.D. Core Knowledge Domains of Landscape Architecture. Landsc. J. 2018, 37, 9–21. [CrossRef]5. Yue, B.-R.; Shao, S.-L. The evolution and trends of analytical methods for landscape planning and design. J. Xi’an Univ. Archit.
Technol. Nat. Sci. Ed. 2010, 42, 690–695.
178
Land 2021, 10, 665
6. Milburn, L.-A.S.; Brown, R.D. The relationship between research and design in landscape architecture. Landsc. Urban Plan. 2003,64, 47–66. [CrossRef]
7. Lenzholzer, S.; Duchhart, I.; Koh, J. ‘Research through designing’in landscape architecture. Landsc. Urban Plan. 2013, 113, 120–127.[CrossRef]
8. Li, W.; Milburn, L.-A. The evolution of geodesign as a design and planning tool. Landsc. Urban Plan. 2016, 156, 5–8. [CrossRef]9. Gu, Y.; Deal, B.; Larsen, L. Geodesign processes and ecological systems thinking in a coupled human-environment context: An
integrated framework for landscape architecture. Sustainability 2018, 10, 3306. [CrossRef]10. Alizadeh, B.; Hitchmough, J. A review of urban landscape adaptation to the challenge of climate change. Int. J. Clim. Chang.
Strateg. Manag. 2019, 11, 178–194. [CrossRef]11. Steiner, F. Frontiers in urban ecological design and planning research. Landsc. Urban Plan. 2014, 125, 304–311. [CrossRef]12. Grose, M.; Frisby, M. Mixing ecological science into landscape architecture. Front. Ecol. Environ. 2019, 17, 296–297. [CrossRef]13. MEA. Millennium Ecosystem Assessment: Ecosystems and Human Well-being: Synthesis; Island Press: Washington, DC, USA, 2005.14. Cheng, X.; Van Damme, S.; Li, L.; Uyttenhove, P. Evaluation of cultural ecosystem services: A review of methods. Ecosyst. Serv.
2019, 37, 100925. [CrossRef]15. De Groot, R. Function-analysis and valuation as a tool to assess land use conflicts in planning for sustainable, multi-functional
landscapes. Landsc. Urban Plan. 2006, 75, 175–186. [CrossRef]16. De Groot, R.; Hein, L. Concept and Valuation of Landscape Functions at Different Scales, in Multifunctional Land Use; Springer:
Berlin/Heidelberg, Germany, 2007; pp. 15–36.17. Lautenbach, S.; Kugel, C.; Lausch, A.; Seppelt, R. Analysis of historic changes in regional ecosystem service provisioning using
land use data. Ecol. Indic. 2011, 11, 676–687. [CrossRef]18. Maes, J.; Egoh, B.; Willemen, L.; Liquete, C.; Vihervaara, P.; Schägner, J.P.; Grizzetti, B.; Drakou, E.; La Notte, A.; Zulian, G.; et al.
Mapping ecosystem services for policy support and decision making in the European Union. Ecosyst. Serv. 2012, 1, 31–39.[CrossRef]
19. Mooney, P. A systematic approach to incorporating multiple ecosystem services in landscape planning and design. Landsc. J.2014, 33, 141–171. [CrossRef]
20. Dickinson, D.C.; Hobbs, R.J. Cultural ecosystem services: Characteristics, challenges and lessons for urban green space research.Ecosyst. Serv. 2017, 25, 179–194. [CrossRef]
21. Schaich, H.; Bieling, C.; Plieninger, T. Linking Ecosystem Services with Cultural Landscape Research. GAIA Ecol. Perspect. Sci.Soc. 2010, 19, 269–277. [CrossRef]
22. Riechers, M.; Barkmann, J.; Tscharntke, T. Perceptions of cultural ecosystem services from urban green. Ecosyst. Serv. 2016, 17,33–39. [CrossRef]
23. Lovell, S.; Johnston, D.M. Designing landscapes for performance based on emerging principles in landscape ecology. Ecol. Soc.2009, 14, 44. [CrossRef]
24. Plieninger, T.; Bieling, C.; Fagerholm, N.; Byg, A.; Hartel, T.; Hurley, P.; López-Santiago, C.A.; Nagabhatla, N.; Oteros-Rozas,E.; Raymond, C.M.; et al. The role of cultural ecosystem services in landscape management and planning. Curr. Opin. Environ.Sustain. 2015, 14, 28–33. [CrossRef]
25. De Valck, J.; Landuyt, D.; Broekx, S.; Liekens, I.; De Nocker, L.; Vranken, L. Outdoor recreation in various landscapes: Which sitecharacteristics really matter? Land Use Policy 2017, 65, 186–197. [CrossRef]
26. Scholte, S.S.; van Teeffelen, A.J.; Verburg, P.H. Integrating socio-cultural perspectives into ecosystem service valuation: A reviewof concepts and methods. Ecol. Econ. 2015, 114 (Suppl. C), 67–78. [CrossRef]
27. Beck, A.C.; Campbell, D.; Shrives, P.J. Content analysis in environmental reporting research: Enrichment and rehearsal of themethod in a British–German context. Br. Account. Rev. 2010, 42, 207–222. [CrossRef]
28. Shrivastava, R.; Mahajan, P. Artificial intelligence research in India: A scientometric analysis. Sci. Technol. Libr. 2016, 35, 136–151.[CrossRef]
29. Li, H.M.; Jin, Y.M. A Construction of Landscape Evaluation Indicator System for the Urban Comprehensive Park Based on theTheory about Three Elements. Appl. Mech. Mater. 2011, 99–100, 496–500. [CrossRef]
30. Bertram, C.; Rehdanz, K. Preferences for cultural urban ecosystem services: Comparing attitudes, perception, and use. Ecosyst.Serv. 2015, 12, 187–199. [CrossRef]
31. Campbell, L.K.; Svendsen, E.S.; Sonti, N.F.; Johnson, M.L. A social assessment of urban parkland: Analyzing park use andmeaning to inform management and resilience planning. Environ. Sci. Policy 2016, 62, 34–44. [CrossRef]
32. Chiesura, A. The role of urban parks for the sustainable city. Landsc. Urban Plan. 2004, 68, 129–138. [CrossRef]33. Hegetschweiler, K.T.; de Vries, S.; Arnberger, A.; Bell, S.; Brennan, M.; Siter, N.; Olafsson, A.S.; Voigt, A.; Hunziker, M. Linking
demand and supply factors in identifying cultural ecosystem services of urban green infrastructures: A review of Europeanstudies. Urban For. Urban Green. 2017, 21, 48–59. [CrossRef]
34. Thompson, I. Aesthetic, social and ecological values in landscape architecture: A discourse analysis. Ethics Place Environ. 2000, 3,269–287. [CrossRef]
35. Jiang, W. Ecosystem services research in China: A critical review. Ecosyst. Serv. 2017, 26, 10–16. [CrossRef]36. Costanza, R.; De Groot, R.; Braat, L.; Kubiszewski, I.; Fioramonti, L.; Sutton, P.; Farber, S.; Grasso, M. Twenty years of ecosystem
services: How far have we come and how far do we still need to go? Ecosyst. Serv. 2017, 28, 1–16. [CrossRef]
179
Land 2021, 10, 665
37. Czúcz, B.; Arany, I.; Potschin-Young, M.; Bereczki, K.; Kertész, M.; Kiss, M.; Aszalós, R.; Haines-Young, R. Where concepts meetthe real world: A systematic review of ecosystem service indicators and their classification using CICES. Ecosyst. Serv. 2018, 29,145–157. [CrossRef]
38. Schröter, M.; Van Der Zanden, E.H.; van Oudenhoven, A.; Remme, R.; Serna-Chavez, H.M.; De Groot, R.S.; Opdam, P. Ecosystemservices as a contested concept: A synthesis of critique and counter-arguments. Conserv. Lett. 2014, 7, 514–523. [CrossRef]
39. Lam, S.T.; Conway, T.M. Ecosystem services in urban land use planning policies: A case study of Ontario municipalities. Land UsePolicy 2018, 77, 641–651. [CrossRef]
40. Peavey, E.; Vander Wyst, K.B. Evidence-based design and research-informed design: What’s the difference? Conceptual definitionsand comparative analysis. HERD Health Environ. Res. Des. J. 2017, 10, 143–156. [CrossRef]
41. Hirons, M.; Comberti, C.; Dunford, R. Valuing Cultural Ecosystem Services. Annu. Rev. Environ. Resour. 2016, 41, 545–574.[CrossRef]
42. Spangenberg, J.H.; Settele, J. Precisely incorrect? Monetising the value of ecosystem services. Ecol. Complex. 2010, 7, 327–337.[CrossRef]
43. Kupschus, S.; Schratzberger, M.; Righton, D. Practical implementation of ecosystem monitoring for the ecosystem approach tomanagement. J. Appl. Ecol. 2016, 53, 1236–1247. [CrossRef]
44. Brown, G.; Hausner, V.H. An empirical analysis of cultural ecosystem values in coastal landscapes. Ocean Coast. Manag. 2017, 142,49–60. [CrossRef]
45. Bryan, B.A.; Raymond, C.M.; Crossman, N.; MacDonald, D.H. Targeting the management of ecosystem services based on socialvalues: Where, what, and how? Landsc. Urban Plan. 2010, 97, 111–122. [CrossRef]
46. Plieninger, T.; Dijks, S.; Oteros-Rozas, E.; Bieling, C. Assessing, mapping, and quantifying cultural ecosystem services atcommunity level. Land Use Policy 2013, 33, 118–129. [CrossRef]
47. Bieling, C.; Plieninger, T. Recording Manifestations of Cultural Ecosystem Services in the Landscape. Landsc. Res. 2013, 38,649–667. [CrossRef]
48. Christie, M.; Fazey, I.; Cooper, R.; Hyde, T.; Kenter, J.O. An evaluation of monetary and non-monetary techniques for assessingthe importance of biodiversity and ecosystem services to people in countries with developing economies. Ecol. Econ. 2012, 83,67–78. [CrossRef]
180
land
Communication
Estimating Air Pollution Removal and Monetary Value forUrban Green Infrastructure Strategies UsingWeb-Based Applications
Alessio Russo 1,* , Wing Tung Chan 1 and Giuseppe T. Cirella 2
�����������������
Citation: Russo, A.; Chan, W.T.;
Cirella, G.T. Estimating Air Pollution
Removal and Monetary Value for
Urban Green Infrastructure Strategies
Using Web-Based Applications. Land
2021, 10, 788. https://doi.org/
10.3390/land10080788
Academic Editor:
Thomas Panagopoulos
Received: 22 June 2021
Accepted: 25 July 2021
Published: 27 July 2021
Publisher’s Note: MDPI stays neutral
with regard to jurisdictional claims in
published maps and institutional affil-
iations.
Copyright: © 2021 by the authors.
Licensee MDPI, Basel, Switzerland.
This article is an open access article
distributed under the terms and
conditions of the Creative Commons
Attribution (CC BY) license (https://
creativecommons.org/licenses/by/
4.0/).
1 School of Arts, Francis Close Hall Campus, University of Gloucestershire, Swindon Road,Cheltenham GL50 4AZ, UK; [email protected]
2 Faculty of Economics, University of Gdansk, 81-824 Sopot, Poland; [email protected]* Correspondence: [email protected]; Tel.: +44-(0)1242-714557
Abstract: More communities around the world are recognizing the benefits of green infrastructure(GI) and are planting millions of trees to improve air quality and overall well-being in cities. However,there is a need for accurate tools that can measure and value these benefits whilst also informingthe community and city managers. In recent years, several online tools have been developed toassess ecosystem services. However, the reliability of such tools depends on the incorporation oflocal or regional data and site-specific inputs. In this communication, we have reviewed two ofthe freely available tools (i.e., i-Tree Canopy and the United Kingdom Office for National Statistics)using Bristol City Centre as an example. We have also discussed strengths and weaknesses for theiruse and, as tree planting strategy tools, explored further developments of such tools in a Europeancontext. Results show that both tools can easily calculate ecosystem services such as air pollutantremoval and monetary values and at the same time be used to support GI strategies in compact cities.These tools, however, can only be partially utilized for tree planting design as they do not considersoil and root space, nor do they include drawing and painting futures. Our evaluation also highlightsmajor gaps in the current tools, suggesting areas where more research is needed.
Keywords: urban ecosystem services; urban tree planting; i-Tree Canopy; Office for NationalStatistics; health damage costs; United Kingdom
1. Introduction
Air pollution caused by the growth of urbanization and industrialization continues toplague societies in the twenty-first century [1]. Urbanization plays a major role in worsen-ing ventilation conditions and increases the emissions of pollutants [2]. The transformationof land use, caused by urbanization, reduces ventilation quality via building morphologyand, indirectly, the urban wind velocity [3]. Air pollution derived from human activitiescomes from both indoor and outdoor environments [4]. It causes harm to health, decreaseseconomic growth, and augments social problems (i.e., by way of knock-on societal ef-fects) [5]. In 2015, the World Health Organization [6] estimated 4.3 million deaths occurreddue to indoor air pollution and 3.7 million due to outdoor air pollution (i.e., 8 millionfor the year). Data published by the United Kingdom (UK) Royal College of Physiciansdemonstrates that there are around 40,000 fatalities each year due to air pollution [7].
Several studies show that green infrastructure (GI) can improve air quality in cities [8–11].In particular, urban vegetation provides several ecosystem services and plays a vital rolein air pollutant removal, heavy metal removal, rainwater interception, and microclimaticimprovements [12–14].
Planting millions, billions, or even trillions of trees as a simple solution to air pollutionand other major environmental problems is being proposed by an increasing numberof global, regional, and national projects [15]. Large tree planting can also improve life
181
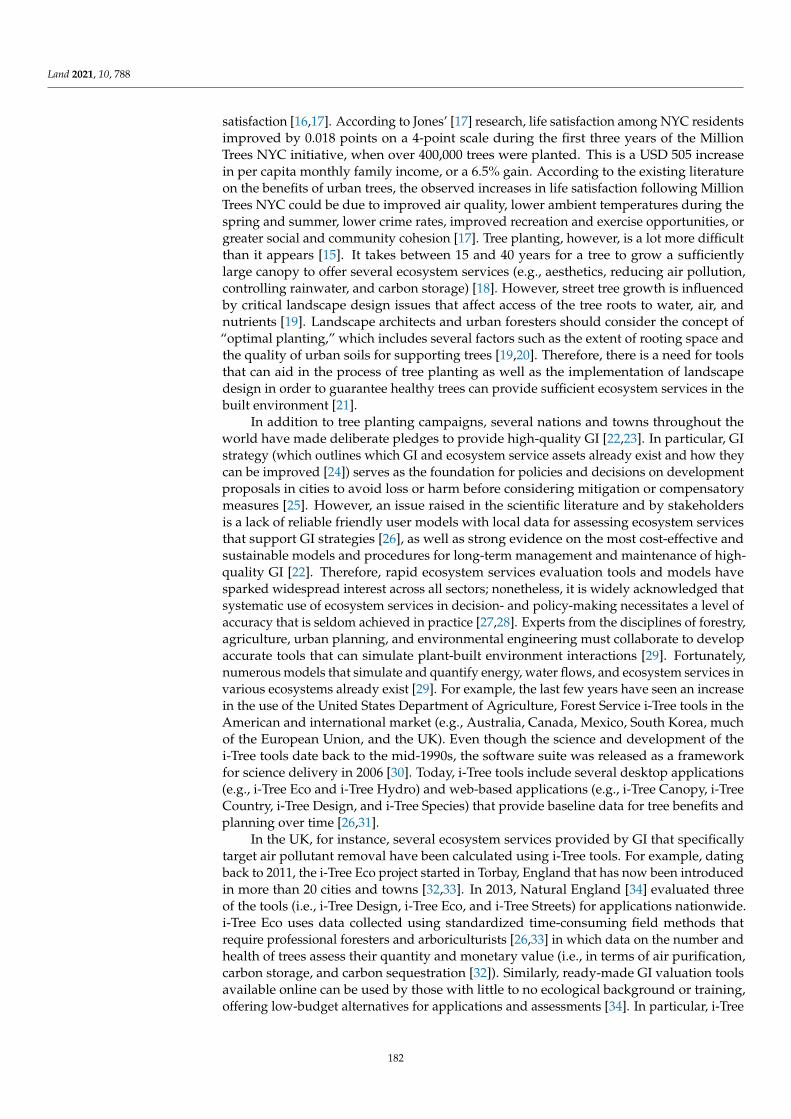
Land 2021, 10, 788
satisfaction [16,17]. According to Jones’ [17] research, life satisfaction among NYC residentsimproved by 0.018 points on a 4-point scale during the first three years of the MillionTrees NYC initiative, when over 400,000 trees were planted. This is a USD 505 increasein per capita monthly family income, or a 6.5% gain. According to the existing literatureon the benefits of urban trees, the observed increases in life satisfaction following MillionTrees NYC could be due to improved air quality, lower ambient temperatures during thespring and summer, lower crime rates, improved recreation and exercise opportunities, orgreater social and community cohesion [17]. Tree planting, however, is a lot more difficultthan it appears [15]. It takes between 15 and 40 years for a tree to grow a sufficientlylarge canopy to offer several ecosystem services (e.g., aesthetics, reducing air pollution,controlling rainwater, and carbon storage) [18]. However, street tree growth is influencedby critical landscape design issues that affect access of the tree roots to water, air, andnutrients [19]. Landscape architects and urban foresters should consider the concept of“optimal planting,” which includes several factors such as the extent of rooting space andthe quality of urban soils for supporting trees [19,20]. Therefore, there is a need for toolsthat can aid in the process of tree planting as well as the implementation of landscapedesign in order to guarantee healthy trees can provide sufficient ecosystem services in thebuilt environment [21].
In addition to tree planting campaigns, several nations and towns throughout theworld have made deliberate pledges to provide high-quality GI [22,23]. In particular, GIstrategy (which outlines which GI and ecosystem service assets already exist and how theycan be improved [24]) serves as the foundation for policies and decisions on developmentproposals in cities to avoid loss or harm before considering mitigation or compensatorymeasures [25]. However, an issue raised in the scientific literature and by stakeholdersis a lack of reliable friendly user models with local data for assessing ecosystem servicesthat support GI strategies [26], as well as strong evidence on the most cost-effective andsustainable models and procedures for long-term management and maintenance of high-quality GI [22]. Therefore, rapid ecosystem services evaluation tools and models havesparked widespread interest across all sectors; nonetheless, it is widely acknowledged thatsystematic use of ecosystem services in decision- and policy-making necessitates a level ofaccuracy that is seldom achieved in practice [27,28]. Experts from the disciplines of forestry,agriculture, urban planning, and environmental engineering must collaborate to developaccurate tools that can simulate plant-built environment interactions [29]. Fortunately,numerous models that simulate and quantify energy, water flows, and ecosystem services invarious ecosystems already exist [29]. For example, the last few years have seen an increasein the use of the United States Department of Agriculture, Forest Service i-Tree tools in theAmerican and international market (e.g., Australia, Canada, Mexico, South Korea, muchof the European Union, and the UK). Even though the science and development of thei-Tree tools date back to the mid-1990s, the software suite was released as a frameworkfor science delivery in 2006 [30]. Today, i-Tree tools include several desktop applications(e.g., i-Tree Eco and i-Tree Hydro) and web-based applications (e.g., i-Tree Canopy, i-TreeCountry, i-Tree Design, and i-Tree Species) that provide baseline data for tree benefits andplanning over time [26,31].
In the UK, for instance, several ecosystem services provided by GI that specificallytarget air pollutant removal have been calculated using i-Tree tools. For example, datingback to 2011, the i-Tree Eco project started in Torbay, England that has now been introducedin more than 20 cities and towns [32,33]. In 2013, Natural England [34] evaluated threeof the tools (i.e., i-Tree Design, i-Tree Eco, and i-Tree Streets) for applications nationwide.i-Tree Eco uses data collected using standardized time-consuming field methods thatrequire professional foresters and arboriculturists [26,33] in which data on the number andhealth of trees assess their quantity and monetary value (i.e., in terms of air purification,carbon storage, and carbon sequestration [32]). Similarly, ready-made GI valuation toolsavailable online can be used by those with little to no ecological background or training,offering low-budget alternatives for applications and assessments [34]. In particular, i-Tree
182
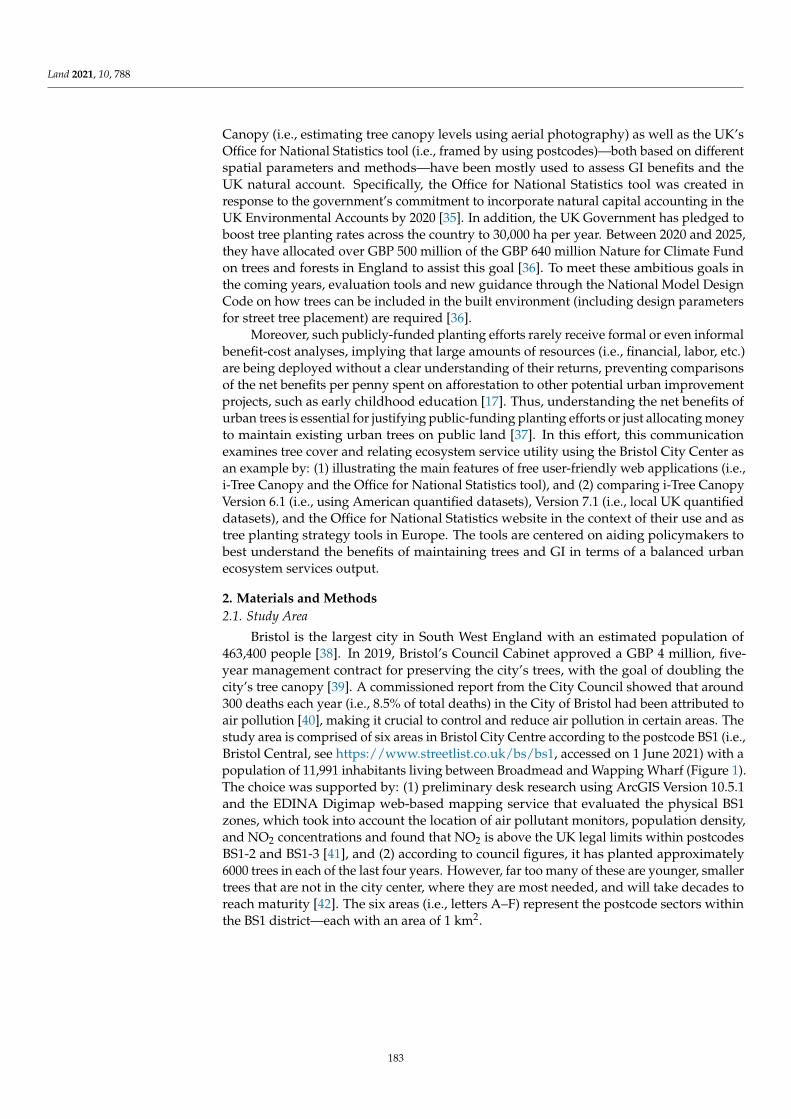
Land 2021, 10, 788
Canopy (i.e., estimating tree canopy levels using aerial photography) as well as the UK’sOffice for National Statistics tool (i.e., framed by using postcodes)—both based on differentspatial parameters and methods—have been mostly used to assess GI benefits and theUK natural account. Specifically, the Office for National Statistics tool was created inresponse to the government’s commitment to incorporate natural capital accounting in theUK Environmental Accounts by 2020 [35]. In addition, the UK Government has pledged toboost tree planting rates across the country to 30,000 ha per year. Between 2020 and 2025,they have allocated over GBP 500 million of the GBP 640 million Nature for Climate Fundon trees and forests in England to assist this goal [36]. To meet these ambitious goals inthe coming years, evaluation tools and new guidance through the National Model DesignCode on how trees can be included in the built environment (including design parametersfor street tree placement) are required [36].
Moreover, such publicly-funded planting efforts rarely receive formal or even informalbenefit-cost analyses, implying that large amounts of resources (i.e., financial, labor, etc.)are being deployed without a clear understanding of their returns, preventing comparisonsof the net benefits per penny spent on afforestation to other potential urban improvementprojects, such as early childhood education [17]. Thus, understanding the net benefits ofurban trees is essential for justifying public-funding planting efforts or just allocating moneyto maintain existing urban trees on public land [37]. In this effort, this communicationexamines tree cover and relating ecosystem service utility using the Bristol City Center asan example by: (1) illustrating the main features of free user-friendly web applications (i.e.,i-Tree Canopy and the Office for National Statistics tool), and (2) comparing i-Tree CanopyVersion 6.1 (i.e., using American quantified datasets), Version 7.1 (i.e., local UK quantifieddatasets), and the Office for National Statistics website in the context of their use and astree planting strategy tools in Europe. The tools are centered on aiding policymakers tobest understand the benefits of maintaining trees and GI in terms of a balanced urbanecosystem services output.
2. Materials and Methods2.1. Study Area
Bristol is the largest city in South West England with an estimated population of463,400 people [38]. In 2019, Bristol’s Council Cabinet approved a GBP 4 million, five-year management contract for preserving the city’s trees, with the goal of doubling thecity’s tree canopy [39]. A commissioned report from the City Council showed that around300 deaths each year (i.e., 8.5% of total deaths) in the City of Bristol had been attributed toair pollution [40], making it crucial to control and reduce air pollution in certain areas. Thestudy area is comprised of six areas in Bristol City Centre according to the postcode BS1 (i.e.,Bristol Central, see https://www.streetlist.co.uk/bs/bs1, accessed on 1 June 2021) with apopulation of 11,991 inhabitants living between Broadmead and Wapping Wharf (Figure 1).The choice was supported by: (1) preliminary desk research using ArcGIS Version 10.5.1and the EDINA Digimap web-based mapping service that evaluated the physical BS1zones, which took into account the location of air pollutant monitors, population density,and NO2 concentrations and found that NO2 is above the UK legal limits within postcodesBS1-2 and BS1-3 [41], and (2) according to council figures, it has planted approximately6000 trees in each of the last four years. However, far too many of these are younger, smallertrees that are not in the city center, where they are most needed, and will take decades toreach maturity [42]. The six areas (i.e., letters A–F) represent the postcode sectors withinthe BS1 district—each with an area of 1 km2.
183
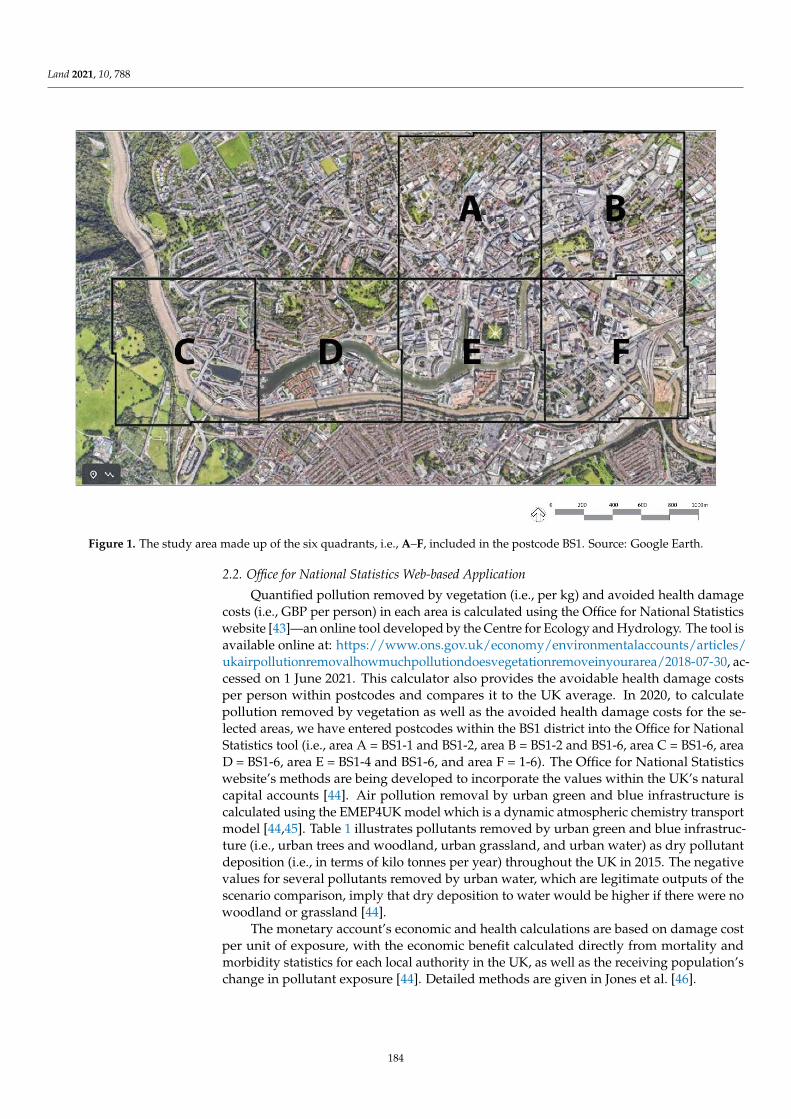
Land 2021, 10, 788Land 2021, 10, x FOR PEER REVIEW 4 of 18
Figure 1. The study area made up of the six quadrants, i.e., A–F, included in the postcode BS1. Source: Google Earth.
2.2. Office for National Statistics Web-based Application Quantified pollution removed by vegetation (i.e., per kg) and avoided health damage
costs (i.e., GBP per person) in each area is calculated using the Office for National Statistics website [43]—an online tool developed by the Centre for Ecology and Hydrology. The tool is available online at: https://www.ons.gov.uk/economy/environmentalaccounts/arti-cles/ukairpollutionremovalhowmuchpollutiondoesvegetationremoveinyourarea/2018-07-30, accessed on 1 June 2021. This calculator also provides the avoidable health damage costs per person within postcodes and compares it to the UK average. In 2020, to calculate pollution removed by vegetation as well as the avoided health damage costs for the se-lected areas, we have entered postcodes within the BS1 district into the Office for National Statistics tool (i.e., area A = BS1-1 and BS1-2, area B = BS1-2 and BS1-6, area C = BS1-6, area D = BS1-6, area E = BS1-4 and BS1-6, and area F =1-6). The Office for National Statistics website’s methods are being developed to incorporate the values within the UK’s natural capital accounts [44]. Air pollution removal by urban green and blue infrastructure is cal-culated using the EMEP4UK model which is a dynamic atmospheric chemistry transport model [44,45]. Table 1 illustrates pollutants removed by urban green and blue infrastruc-ture (i.e., urban trees and woodland, urban grassland, and urban water) as dry pollutant deposition (i.e., in terms of kilo tonnes per year) throughout the UK in 2015. The negative values for several pollutants removed by urban water, which are legitimate outputs of the scenario comparison, imply that dry deposition to water would be higher if there were no woodland or grassland [44].
Figure 1. The study area made up of the six quadrants, i.e., A–F, included in the postcode BS1. Source: Google Earth.
2.2. Office for National Statistics Web-based Application
Quantified pollution removed by vegetation (i.e., per kg) and avoided health damagecosts (i.e., GBP per person) in each area is calculated using the Office for National Statisticswebsite [43]—an online tool developed by the Centre for Ecology and Hydrology. The tool isavailable online at: https://www.ons.gov.uk/economy/environmentalaccounts/articles/ukairpollutionremovalhowmuchpollutiondoesvegetationremoveinyourarea/2018-07-30, ac-cessed on 1 June 2021. This calculator also provides the avoidable health damage costsper person within postcodes and compares it to the UK average. In 2020, to calculatepollution removed by vegetation as well as the avoided health damage costs for the se-lected areas, we have entered postcodes within the BS1 district into the Office for NationalStatistics tool (i.e., area A = BS1-1 and BS1-2, area B = BS1-2 and BS1-6, area C = BS1-6, areaD = BS1-6, area E = BS1-4 and BS1-6, and area F = 1-6). The Office for National Statisticswebsite’s methods are being developed to incorporate the values within the UK’s naturalcapital accounts [44]. Air pollution removal by urban green and blue infrastructure iscalculated using the EMEP4UK model which is a dynamic atmospheric chemistry transportmodel [44,45]. Table 1 illustrates pollutants removed by urban green and blue infrastruc-ture (i.e., urban trees and woodland, urban grassland, and urban water) as dry pollutantdeposition (i.e., in terms of kilo tonnes per year) throughout the UK in 2015. The negativevalues for several pollutants removed by urban water, which are legitimate outputs of thescenario comparison, imply that dry deposition to water would be higher if there were nowoodland or grassland [44].
The monetary account’s economic and health calculations are based on damage costper unit of exposure, with the economic benefit calculated directly from mortality andmorbidity statistics for each local authority in the UK, as well as the receiving population’schange in pollutant exposure [44]. Detailed methods are given in Jones et al. [46].
184
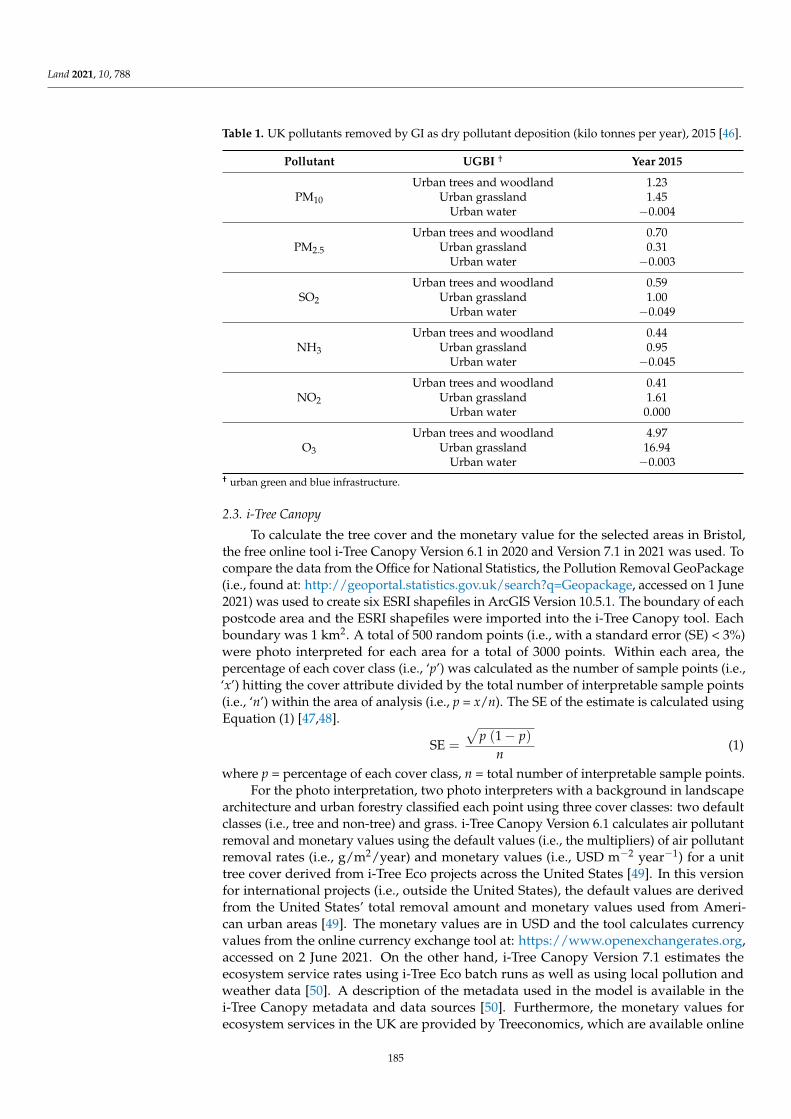
Land 2021, 10, 788
Table 1. UK pollutants removed by GI as dry pollutant deposition (kilo tonnes per year), 2015 [46].
Pollutant UGBI † Year 2015
Urban trees and woodland 1.23PM10 Urban grassland 1.45
Urban water −0.004
Urban trees and woodland 0.70PM2.5 Urban grassland 0.31
Urban water −0.003
Urban trees and woodland 0.59SO2 Urban grassland 1.00
Urban water −0.049
Urban trees and woodland 0.44NH3 Urban grassland 0.95
Urban water −0.045
Urban trees and woodland 0.41NO2 Urban grassland 1.61
Urban water 0.000
Urban trees and woodland 4.97O3 Urban grassland 16.94
Urban water −0.003† urban green and blue infrastructure.
2.3. i-Tree Canopy
To calculate the tree cover and the monetary value for the selected areas in Bristol,the free online tool i-Tree Canopy Version 6.1 in 2020 and Version 7.1 in 2021 was used. Tocompare the data from the Office for National Statistics, the Pollution Removal GeoPackage(i.e., found at: http://geoportal.statistics.gov.uk/search?q=Geopackage, accessed on 1 June2021) was used to create six ESRI shapefiles in ArcGIS Version 10.5.1. The boundary of eachpostcode area and the ESRI shapefiles were imported into the i-Tree Canopy tool. Eachboundary was 1 km2. A total of 500 random points (i.e., with a standard error (SE) < 3%)were photo interpreted for each area for a total of 3000 points. Within each area, thepercentage of each cover class (i.e., ‘p’) was calculated as the number of sample points (i.e.,‘x’) hitting the cover attribute divided by the total number of interpretable sample points(i.e., ‘n’) within the area of analysis (i.e., p = x/n). The SE of the estimate is calculated usingEquation (1) [47,48].
SE =
√p (1 − p)
n(1)
where p = percentage of each cover class, n = total number of interpretable sample points.For the photo interpretation, two photo interpreters with a background in landscape
architecture and urban forestry classified each point using three cover classes: two defaultclasses (i.e., tree and non-tree) and grass. i-Tree Canopy Version 6.1 calculates air pollutantremoval and monetary values using the default values (i.e., the multipliers) of air pollutantremoval rates (i.e., g/m2/year) and monetary values (i.e., USD m−2 year−1) for a unittree cover derived from i-Tree Eco projects across the United States [49]. In this versionfor international projects (i.e., outside the United States), the default values are derivedfrom the United States’ total removal amount and monetary values used from Ameri-can urban areas [49]. The monetary values are in USD and the tool calculates currencyvalues from the online currency exchange tool at: https://www.openexchangerates.org,accessed on 2 June 2021. On the other hand, i-Tree Canopy Version 7.1 estimates theecosystem service rates using i-Tree Eco batch runs as well as using local pollution andweather data [50]. A description of the metadata used in the model is available in thei-Tree Canopy metadata and data sources [50]. Furthermore, the monetary values forecosystem services in the UK are provided by Treeconomics, which are available online
185
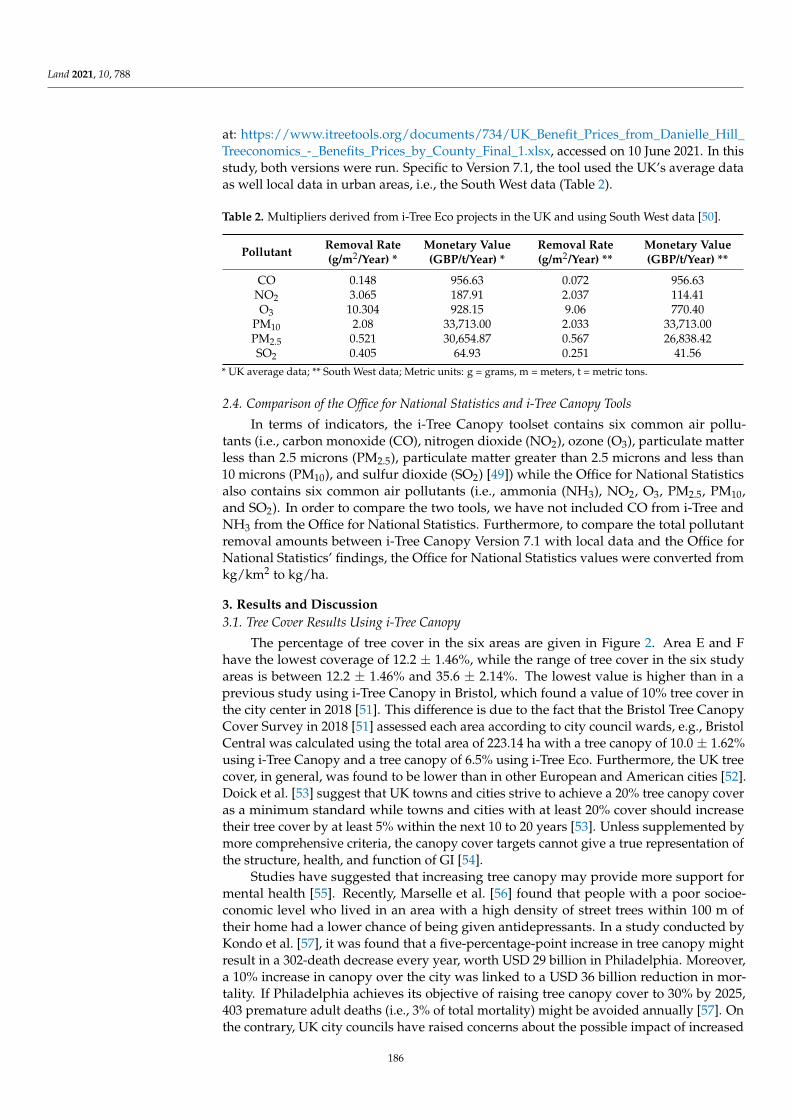
Land 2021, 10, 788
at: https://www.itreetools.org/documents/734/UK_Benefit_Prices_from_Danielle_Hill_Treeconomics_-_Benefits_Prices_by_County_Final_1.xlsx, accessed on 10 June 2021. In thisstudy, both versions were run. Specific to Version 7.1, the tool used the UK’s average dataas well local data in urban areas, i.e., the South West data (Table 2).
Table 2. Multipliers derived from i-Tree Eco projects in the UK and using South West data [50].
Pollutant Removal Rate(g/m2/Year) *
Monetary Value(GBP/t/Year) *
Removal Rate(g/m2/Year) **
Monetary Value(GBP/t/Year) **
CO 0.148 956.63 0.072 956.63NO2 3.065 187.91 2.037 114.41O3 10.304 928.15 9.06 770.40
PM10 2.08 33,713.00 2.033 33,713.00PM2.5 0.521 30,654.87 0.567 26,838.42SO2 0.405 64.93 0.251 41.56
* UK average data; ** South West data; Metric units: g = grams, m = meters, t = metric tons.
2.4. Comparison of the Office for National Statistics and i-Tree Canopy Tools
In terms of indicators, the i-Tree Canopy toolset contains six common air pollu-tants (i.e., carbon monoxide (CO), nitrogen dioxide (NO2), ozone (O3), particulate matterless than 2.5 microns (PM2.5), particulate matter greater than 2.5 microns and less than10 microns (PM10), and sulfur dioxide (SO2) [49]) while the Office for National Statisticsalso contains six common air pollutants (i.e., ammonia (NH3), NO2, O3, PM2.5, PM10,and SO2). In order to compare the two tools, we have not included CO from i-Tree andNH3 from the Office for National Statistics. Furthermore, to compare the total pollutantremoval amounts between i-Tree Canopy Version 7.1 with local data and the Office forNational Statistics’ findings, the Office for National Statistics values were converted fromkg/km2 to kg/ha.
3. Results and Discussion3.1. Tree Cover Results Using i-Tree Canopy
The percentage of tree cover in the six areas are given in Figure 2. Area E and Fhave the lowest coverage of 12.2 ± 1.46%, while the range of tree cover in the six studyareas is between 12.2 ± 1.46% and 35.6 ± 2.14%. The lowest value is higher than in aprevious study using i-Tree Canopy in Bristol, which found a value of 10% tree cover inthe city center in 2018 [51]. This difference is due to the fact that the Bristol Tree CanopyCover Survey in 2018 [51] assessed each area according to city council wards, e.g., BristolCentral was calculated using the total area of 223.14 ha with a tree canopy of 10.0 ± 1.62%using i-Tree Canopy and a tree canopy of 6.5% using i-Tree Eco. Furthermore, the UK treecover, in general, was found to be lower than in other European and American cities [52].Doick et al. [53] suggest that UK towns and cities strive to achieve a 20% tree canopy coveras a minimum standard while towns and cities with at least 20% cover should increasetheir tree cover by at least 5% within the next 10 to 20 years [53]. Unless supplemented bymore comprehensive criteria, the canopy cover targets cannot give a true representation ofthe structure, health, and function of GI [54].
Studies have suggested that increasing tree canopy may provide more support formental health [55]. Recently, Marselle et al. [56] found that people with a poor socioe-conomic level who lived in an area with a high density of street trees within 100 m oftheir home had a lower chance of being given antidepressants. In a study conducted byKondo et al. [57], it was found that a five-percentage-point increase in tree canopy mightresult in a 302-death decrease every year, worth USD 29 billion in Philadelphia. Moreover,a 10% increase in canopy over the city was linked to a USD 36 billion reduction in mor-tality. If Philadelphia achieves its objective of raising tree canopy cover to 30% by 2025,403 premature adult deaths (i.e., 3% of total mortality) might be avoided annually [57]. Onthe contrary, UK city councils have raised concerns about the possible impact of increased
186
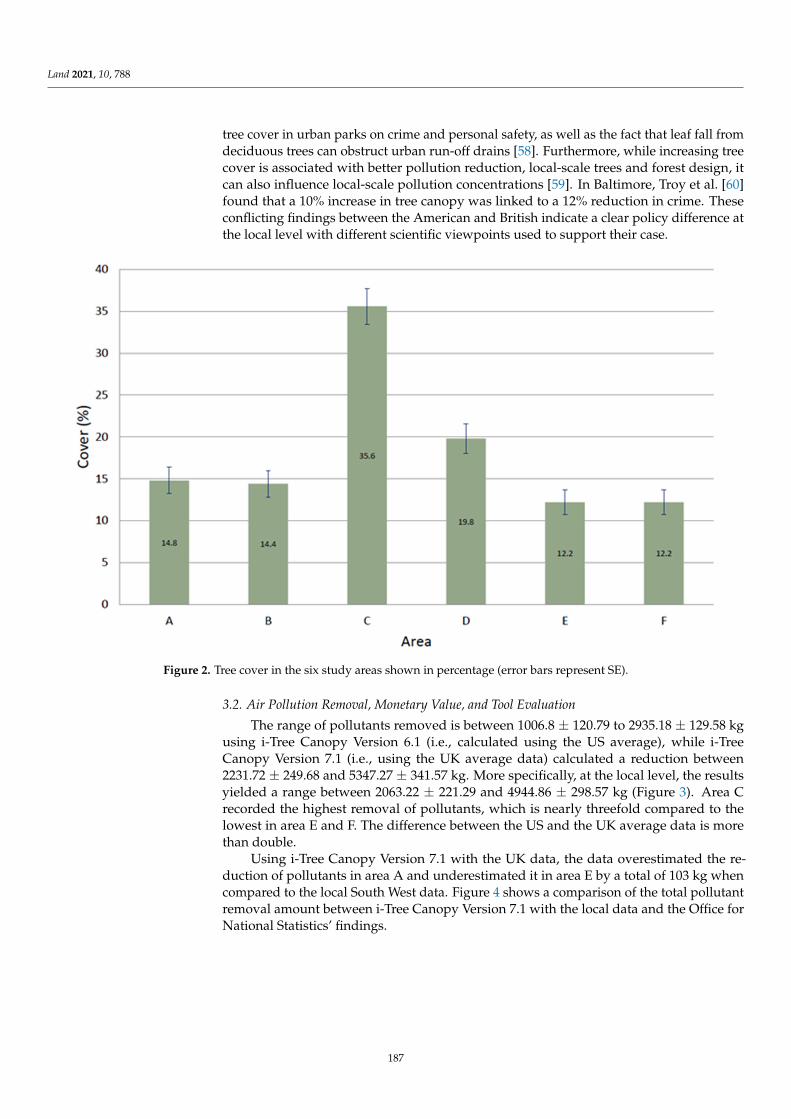
Land 2021, 10, 788
tree cover in urban parks on crime and personal safety, as well as the fact that leaf fall fromdeciduous trees can obstruct urban run-off drains [58]. Furthermore, while increasing treecover is associated with better pollution reduction, local-scale trees and forest design, itcan also influence local-scale pollution concentrations [59]. In Baltimore, Troy et al. [60]found that a 10% increase in tree canopy was linked to a 12% reduction in crime. Theseconflicting findings between the American and British indicate a clear policy difference atthe local level with different scientific viewpoints used to support their case.
Land 2021, 10, x FOR PEER REVIEW 7 of 18
Figure 2. Tree cover in the six study areas shown in percentage (error bars represent SE).
Studies have suggested that increasing tree canopy may provide more support for mental health [55]. Recently, Marselle et al. [56] found that people with a poor socioeco-nomic level who lived in an area with a high density of street trees within 100 m of their home had a lower chance of being given antidepressants. In a study conducted by Kondo et al. [57], it was found that a five-percentage-point increase in tree canopy might result in a 302-death decrease every year, worth USD 29 billion in Philadelphia. Moreover, a 10% increase in canopy over the city was linked to a USD 36 billion reduction in mortality. If Philadelphia achieves its objective of raising tree canopy cover to 30% by 2025, 403 prem-ature adult deaths (i.e., 3% of total mortality) might be avoided annually [57]. On the con-trary, UK city councils have raised concerns about the possible impact of increased tree cover in urban parks on crime and personal safety, as well as the fact that leaf fall from deciduous trees can obstruct urban run-off drains [58]. Furthermore, while increasing tree cover is associated with better pollution reduction, local-scale trees and forest design, it can also influence local-scale pollution concentrations [59]. In Baltimore, Troy et al. [60] found that a 10% increase in tree canopy was linked to a 12% reduction in crime. These conflicting findings between the American and British indicate a clear policy difference at the local level with different scientific viewpoints used to support their case.
3.2. Air Pollution Removal, Monetary Value, and Tool Evaluation The range of pollutants removed is between 1006.8 ± 120.79 to 2935.18 ± 129.58 kg
using i-Tree Canopy Version 6.1 (i.e., calculated using the US average), while i-Tree Can-opy Version 7.1 (i.e., using the UK average data) calculated a reduction between 2231.72 ± 249.68 and 5347.27 ± 341.57 kg. More specifically, at the local level, the results yielded a range between 2063.22 ± 221.29 and 4944.86 ± 298.57 kg (Figure 3). Area C recorded the highest removal of pollutants, which is nearly threefold compared to the lowest in area E and F. The difference between the US and the UK average data is more than double.
Using i-Tree Canopy Version 7.1 with the UK data, the data overestimated the reduc-tion of pollutants in area A and underestimated it in area E by a total of 103 kg when compared to the local South West data. Figure 4 shows a comparison of the total pollutant removal amount between i-Tree Canopy Version 7.1 with the local data and the Office for National Statistics’ findings.
Figure 2. Tree cover in the six study areas shown in percentage (error bars represent SE).
3.2. Air Pollution Removal, Monetary Value, and Tool Evaluation
The range of pollutants removed is between 1006.8 ± 120.79 to 2935.18 ± 129.58 kgusing i-Tree Canopy Version 6.1 (i.e., calculated using the US average), while i-TreeCanopy Version 7.1 (i.e., using the UK average data) calculated a reduction between2231.72 ± 249.68 and 5347.27 ± 341.57 kg. More specifically, at the local level, the resultsyielded a range between 2063.22 ± 221.29 and 4944.86 ± 298.57 kg (Figure 3). Area Crecorded the highest removal of pollutants, which is nearly threefold compared to thelowest in area E and F. The difference between the US and the UK average data is morethan double.
Using i-Tree Canopy Version 7.1 with the UK data, the data overestimated the re-duction of pollutants in area A and underestimated it in area E by a total of 103 kg whencompared to the local South West data. Figure 4 shows a comparison of the total pollutantremoval amount between i-Tree Canopy Version 7.1 with the local data and the Office forNational Statistics’ findings.
187
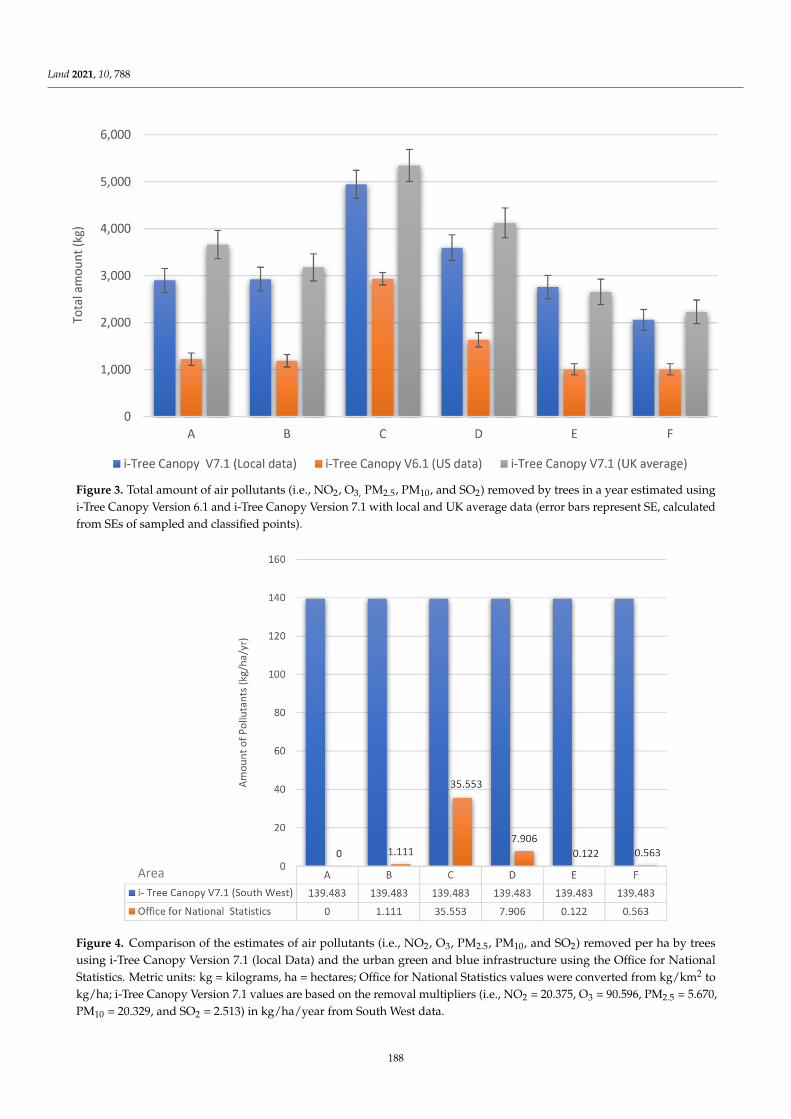
Land 2021, 10, 788Land 2021, 10, x FOR PEER REVIEW 8 of 18
Figure 3. Total amount of air pollutants (i.e., NO2, O3, PM2.5, PM10, and SO2) removed by trees in a year estimated using i-Tree Canopy Version 6.1 and i-Tree Canopy Version 7.1 with local and UK average data (error bars represent SE, calculated from SEs of sampled and classified points).
Figure 4. Comparison of the estimates of air pollutants (i.e., NO2, O3, PM2.5, PM10, and SO2) removed per ha by trees using i-Tree Canopy Version 7.1 (local Data) and the urban green and blue infrastructure using the Office for National Statistics. Metric units: kg = kilograms, ha = hectares; Office for National Statistics values were converted from kg/km2 to kg/ha; i-Tree Canopy Version 7.1 values are based on the removal multipliers (i.e., NO2 = 20.375, O3 = 90.596, PM2.5 = 5.670, PM10 = 20.329, and SO2 = 2.513) in kg/ha/year from South West data.
Figure 3. Total amount of air pollutants (i.e., NO2, O3, PM2.5, PM10, and SO2) removed by trees in a year estimated usingi-Tree Canopy Version 6.1 and i-Tree Canopy Version 7.1 with local and UK average data (error bars represent SE, calculatedfrom SEs of sampled and classified points).
Land 2021, 10, x FOR PEER REVIEW 8 of 18
Figure 3. Total amount of air pollutants (i.e., NO2, O3, PM2.5, PM10, and SO2) removed by trees in a year estimated using i-Tree Canopy Version 6.1 and i-Tree Canopy Version 7.1 with local and UK average data (error bars represent SE, calculated from SEs of sampled and classified points).
Figure 4. Comparison of the estimates of air pollutants (i.e., NO2, O3, PM2.5, PM10, and SO2) removed per ha by trees using i-Tree Canopy Version 7.1 (local Data) and the urban green and blue infrastructure using the Office for National Statistics. Metric units: kg = kilograms, ha = hectares; Office for National Statistics values were converted from kg/km2 to kg/ha; i-Tree Canopy Version 7.1 values are based on the removal multipliers (i.e., NO2 = 20.375, O3 = 90.596, PM2.5 = 5.670, PM10 = 20.329, and SO2 = 2.513) in kg/ha/year from South West data.
Figure 4. Comparison of the estimates of air pollutants (i.e., NO2, O3, PM2.5, PM10, and SO2) removed per ha by treesusing i-Tree Canopy Version 7.1 (local Data) and the urban green and blue infrastructure using the Office for NationalStatistics. Metric units: kg = kilograms, ha = hectares; Office for National Statistics values were converted from kg/km2 tokg/ha; i-Tree Canopy Version 7.1 values are based on the removal multipliers (i.e., NO2 = 20.375, O3 = 90.596, PM2.5 = 5.670,PM10 = 20.329, and SO2 = 2.513) in kg/ha/year from South West data.
188
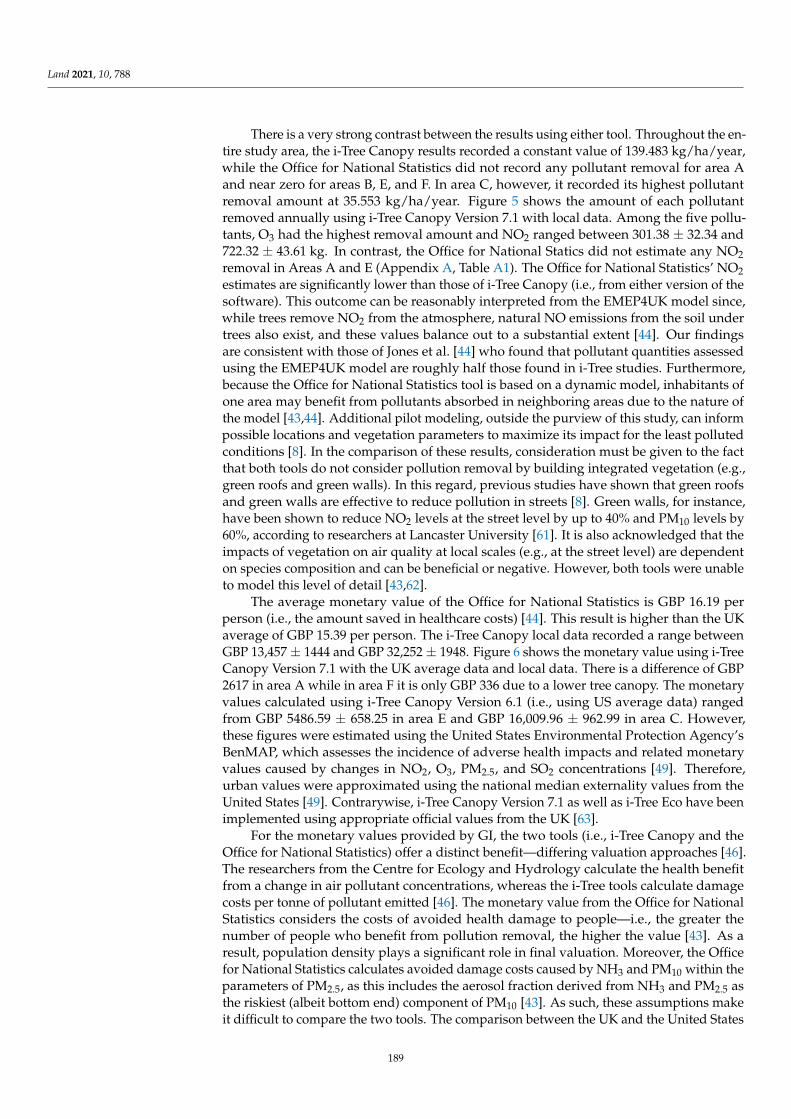
Land 2021, 10, 788
There is a very strong contrast between the results using either tool. Throughout the en-tire study area, the i-Tree Canopy results recorded a constant value of 139.483 kg/ha/year,while the Office for National Statistics did not record any pollutant removal for area Aand near zero for areas B, E, and F. In area C, however, it recorded its highest pollutantremoval amount at 35.553 kg/ha/year. Figure 5 shows the amount of each pollutantremoved annually using i-Tree Canopy Version 7.1 with local data. Among the five pollu-tants, O3 had the highest removal amount and NO2 ranged between 301.38 ± 32.34 and722.32 ± 43.61 kg. In contrast, the Office for National Statics did not estimate any NO2removal in Areas A and E (Appendix A, Table A1). The Office for National Statistics’ NO2estimates are significantly lower than those of i-Tree Canopy (i.e., from either version of thesoftware). This outcome can be reasonably interpreted from the EMEP4UK model since,while trees remove NO2 from the atmosphere, natural NO emissions from the soil undertrees also exist, and these values balance out to a substantial extent [44]. Our findingsare consistent with those of Jones et al. [44] who found that pollutant quantities assessedusing the EMEP4UK model are roughly half those found in i-Tree studies. Furthermore,because the Office for National Statistics tool is based on a dynamic model, inhabitants ofone area may benefit from pollutants absorbed in neighboring areas due to the nature ofthe model [43,44]. Additional pilot modeling, outside the purview of this study, can informpossible locations and vegetation parameters to maximize its impact for the least pollutedconditions [8]. In the comparison of these results, consideration must be given to the factthat both tools do not consider pollution removal by building integrated vegetation (e.g.,green roofs and green walls). In this regard, previous studies have shown that green roofsand green walls are effective to reduce pollution in streets [8]. Green walls, for instance,have been shown to reduce NO2 levels at the street level by up to 40% and PM10 levels by60%, according to researchers at Lancaster University [61]. It is also acknowledged that theimpacts of vegetation on air quality at local scales (e.g., at the street level) are dependenton species composition and can be beneficial or negative. However, both tools were unableto model this level of detail [43,62].
The average monetary value of the Office for National Statistics is GBP 16.19 perperson (i.e., the amount saved in healthcare costs) [44]. This result is higher than the UKaverage of GBP 15.39 per person. The i-Tree Canopy local data recorded a range betweenGBP 13,457 ± 1444 and GBP 32,252 ± 1948. Figure 6 shows the monetary value using i-TreeCanopy Version 7.1 with the UK average data and local data. There is a difference of GBP2617 in area A while in area F it is only GBP 336 due to a lower tree canopy. The monetaryvalues calculated using i-Tree Canopy Version 6.1 (i.e., using US average data) rangedfrom GBP 5486.59 ± 658.25 in area E and GBP 16,009.96 ± 962.99 in area C. However,these figures were estimated using the United States Environmental Protection Agency’sBenMAP, which assesses the incidence of adverse health impacts and related monetaryvalues caused by changes in NO2, O3, PM2.5, and SO2 concentrations [49]. Therefore,urban values were approximated using the national median externality values from theUnited States [49]. Contrarywise, i-Tree Canopy Version 7.1 as well as i-Tree Eco have beenimplemented using appropriate official values from the UK [63].
For the monetary values provided by GI, the two tools (i.e., i-Tree Canopy and theOffice for National Statistics) offer a distinct benefit—differing valuation approaches [46].The researchers from the Centre for Ecology and Hydrology calculate the health benefitfrom a change in air pollutant concentrations, whereas the i-Tree tools calculate damagecosts per tonne of pollutant emitted [46]. The monetary value from the Office for NationalStatistics considers the costs of avoided health damage to people—i.e., the greater thenumber of people who benefit from pollution removal, the higher the value [43]. As aresult, population density plays a significant role in final valuation. Moreover, the Officefor National Statistics calculates avoided damage costs caused by NH3 and PM10 within theparameters of PM2.5, as this includes the aerosol fraction derived from NH3 and PM2.5 asthe riskiest (albeit bottom end) component of PM10 [43]. As such, these assumptions makeit difficult to compare the two tools. The comparison between the UK and the United States
189
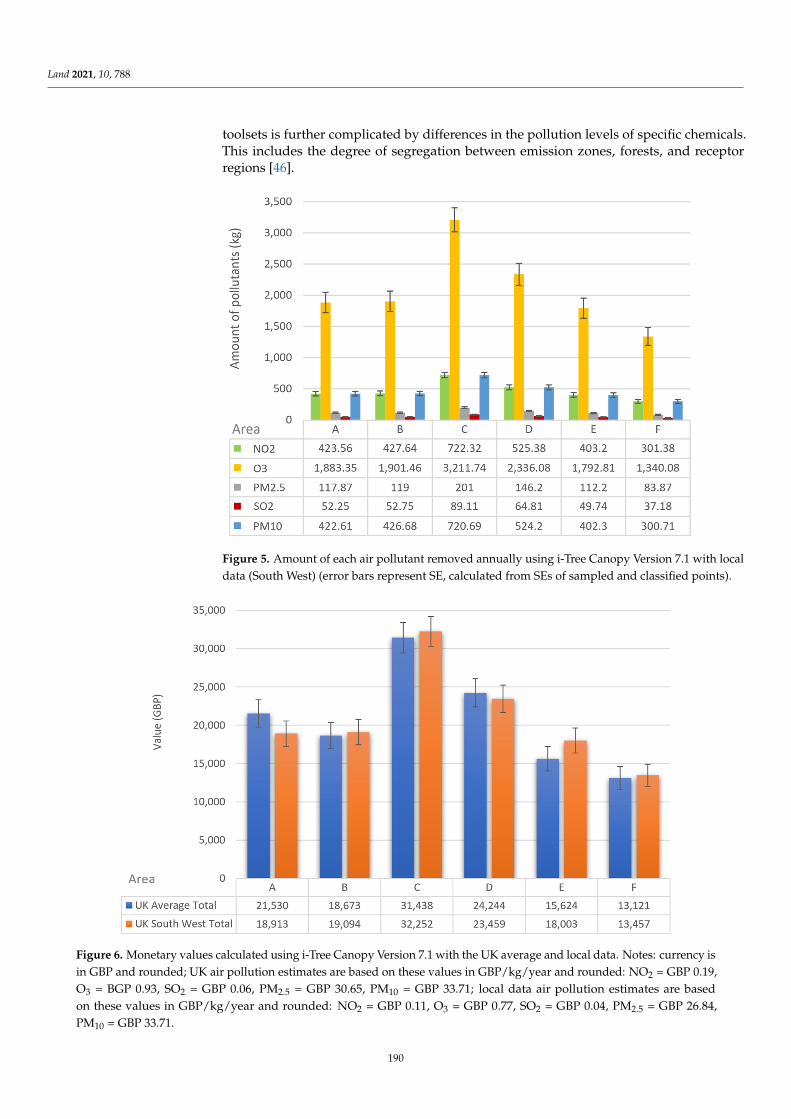
Land 2021, 10, 788
toolsets is further complicated by differences in the pollution levels of specific chemicals.This includes the degree of segregation between emission zones, forests, and receptorregions [46].
Land 2021, 10, x FOR PEER REVIEW 9 of 18
There is a very strong contrast between the results using either tool. Throughout the entire study area, the i-Tree Canopy results recorded a constant value of 139.483 kg/ha/year, while the Office for National Statistics did not record any pollutant removal for area A and near zero for areas B, E, and F. In area C, however, it recorded its highest pollutant removal amount at 35.553 kg/ha/year. Figure 5 shows the amount of each pollu-tant removed annually using i-Tree Canopy Version 7.1 with local data. Among the five pollutants, O3 had the highest removal amount and NO2 ranged between 301.38 ± 32.34 and 722.32 ± 43.61 kg. In contrast, the Office for National Statics did not estimate any NO2
removal in Areas A and E (Appendix A, Table A1). The Office for National Statistics’ NO2 estimates are significantly lower than those of i-Tree Canopy (i.e., from either version of the software). This outcome can be reasonably interpreted from the EMEP4UK model since, while trees remove NO2 from the atmosphere, natural NO emissions from the soil under trees also exist, and these values balance out to a substantial extent [44]. Our find-ings are consistent with those of Jones et al. [44] who found that pollutant quantities as-sessed using the EMEP4UK model are roughly half those found in i-Tree studies. Further-more, because the Office for National Statistics tool is based on a dynamic model, inhab-itants of one area may benefit from pollutants absorbed in neighboring areas due to the nature of the model [43,44]. Additional pilot modeling, outside the purview of this study, can inform possible locations and vegetation parameters to maximize its impact for the least polluted conditions [8]. In the comparison of these results, consideration must be given to the fact that both tools do not consider pollution removal by building integrated vegetation (e.g., green roofs and green walls). In this regard, previous studies have shown that green roofs and green walls are effective to reduce pollution in streets [8]. Green walls, for instance, have been shown to reduce NO2 levels at the street level by up to 40% and PM10 levels by 60%, according to researchers at Lancaster University [61]. It is also acknowledged that the impacts of vegetation on air quality at local scales (e.g., at the street level) are dependent on species composition and can be beneficial or negative. However, both tools were unable to model this level of detail [43,62].
Figure 5. Amount of each air pollutant removed annually using i-Tree Canopy Version 7.1 with local data (South West) (error bars represent SE, calculated from SEs of sampled and classified points).
Figure 5. Amount of each air pollutant removed annually using i-Tree Canopy Version 7.1 with localdata (South West) (error bars represent SE, calculated from SEs of sampled and classified points).
Land 2021, 10, x FOR PEER REVIEW 10 of 18
The average monetary value of the Office for National Statistics is GBP 16.19 per per-son (i.e., the amount saved in healthcare costs) [44]. This result is higher than the UK av-erage of GBP 15.39 per person. The i-Tree Canopy local data recorded a range between GBP 13,457 ± 1444 and GBP 32,252 ± 1948. Figure 6 shows the monetary value using i-Tree Canopy Version 7.1 with the UK average data and local data. There is a difference of GBP 2617 in area A while in area F it is only GBP 336 due to a lower tree canopy. The monetary values calculated using i-Tree Canopy Version 6.1 (i.e., using US average data) ranged from GBP 5486.59 ± 658.25 in area E and GBP 16,009.96 ± 962.99 in area C. However, these figures were estimated using the United States Environmental Protection Agency’s BenMAP, which assesses the incidence of adverse health impacts and related monetary values caused by changes in NO2, O3, PM2.5, and SO2 concentrations [49]. Therefore, urban values were approximated using the national median externality values from the United States [49]. Contrarywise, i-Tree Canopy Version 7.1 as well as i-Tree Eco have been im-plemented using appropriate official values from the UK [63].
Figure 6. Monetary values calculated using i-Tree Canopy Version 7.1 with the UK average and local data. Notes: currency is in GBP and rounded; UK air pollution estimates are based on these values in GBP/kg/year and rounded: NO2 = GBP 0.19, O3 = BGP 0.93, SO2 = GBP 0.06, PM2.5 = GBP 30.65, PM10 = GBP 33.71; local data air pollution estimates are based on these values in GBP/kg/year and rounded: NO2 = GBP 0.11, O3 = GBP 0.77, SO2 = GBP 0.04, PM2.5 = GBP 26.84, PM10 = GBP 33.71.
For the monetary values provided by GI, the two tools (i.e., i-Tree Canopy and the Office for National Statistics) offer a distinct benefit—differing valuation approaches [46]. The researchers from the Centre for Ecology and Hydrology calculate the health benefit from a change in air pollutant concentrations, whereas the i-Tree tools calculate damage costs per tonne of pollutant emitted [46]. The monetary value from the Office for National Statistics considers the costs of avoided health damage to people—i.e., the greater the number of people who benefit from pollution removal, the higher the value [43]. As a result, population density plays a significant role in final valuation. Moreover, the Office
Figure 6. Monetary values calculated using i-Tree Canopy Version 7.1 with the UK average and local data. Notes: currency isin GBP and rounded; UK air pollution estimates are based on these values in GBP/kg/year and rounded: NO2 = GBP 0.19,O3 = BGP 0.93, SO2 = GBP 0.06, PM2.5 = GBP 30.65, PM10 = GBP 33.71; local data air pollution estimates are basedon these values in GBP/kg/year and rounded: NO2 = GBP 0.11, O3 = GBP 0.77, SO2 = GBP 0.04, PM2.5 = GBP 26.84,PM10 = GBP 33.71.
190
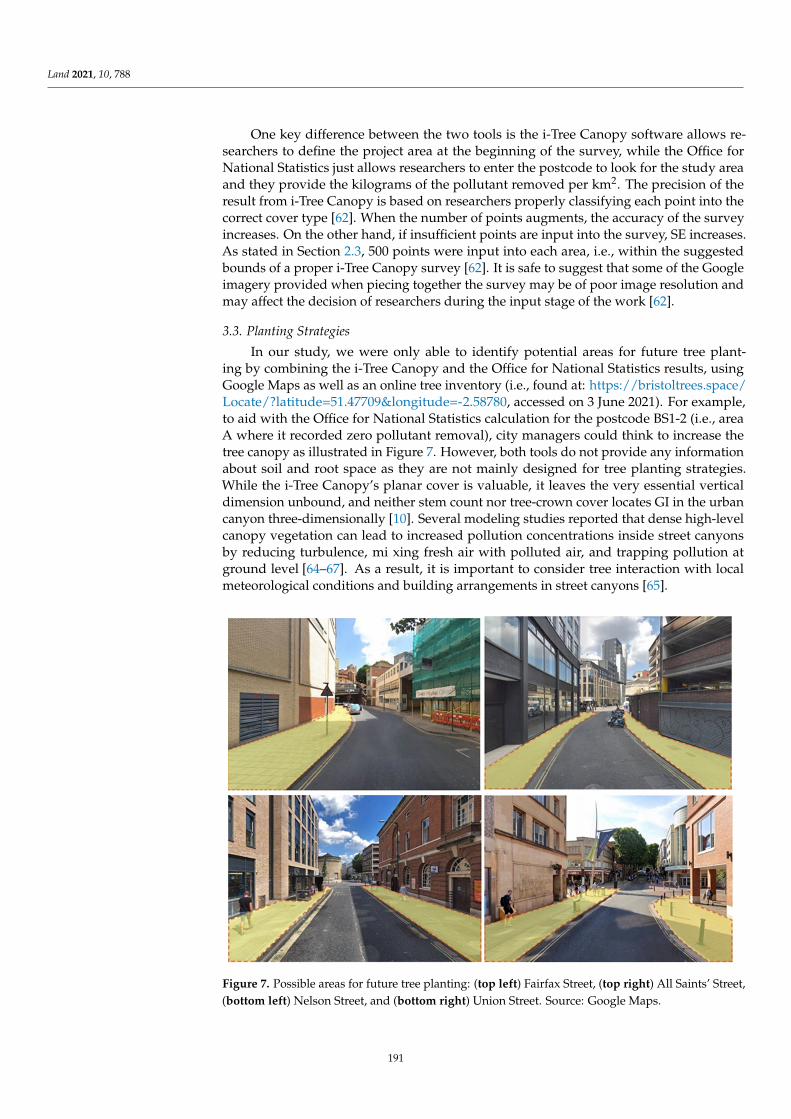
Land 2021, 10, 788
One key difference between the two tools is the i-Tree Canopy software allows re-searchers to define the project area at the beginning of the survey, while the Office forNational Statistics just allows researchers to enter the postcode to look for the study areaand they provide the kilograms of the pollutant removed per km2. The precision of theresult from i-Tree Canopy is based on researchers properly classifying each point into thecorrect cover type [62]. When the number of points augments, the accuracy of the surveyincreases. On the other hand, if insufficient points are input into the survey, SE increases.As stated in Section 2.3, 500 points were input into each area, i.e., within the suggestedbounds of a proper i-Tree Canopy survey [62]. It is safe to suggest that some of the Googleimagery provided when piecing together the survey may be of poor image resolution andmay affect the decision of researchers during the input stage of the work [62].
3.3. Planting Strategies
In our study, we were only able to identify potential areas for future tree plant-ing by combining the i-Tree Canopy and the Office for National Statistics results, usingGoogle Maps as well as an online tree inventory (i.e., found at: https://bristoltrees.space/Locate/?latitude=51.47709&longitude=-2.58780, accessed on 3 June 2021). For example,to aid with the Office for National Statistics calculation for the postcode BS1-2 (i.e., areaA where it recorded zero pollutant removal), city managers could think to increase thetree canopy as illustrated in Figure 7. However, both tools do not provide any informationabout soil and root space as they are not mainly designed for tree planting strategies.While the i-Tree Canopy’s planar cover is valuable, it leaves the very essential verticaldimension unbound, and neither stem count nor tree-crown cover locates GI in the urbancanyon three-dimensionally [10]. Several modeling studies reported that dense high-levelcanopy vegetation can lead to increased pollution concentrations inside street canyonsby reducing turbulence, mi xing fresh air with polluted air, and trapping pollution atground level [64–67]. As a result, it is important to consider tree interaction with localmeteorological conditions and building arrangements in street canyons [65].
Land 2021, 10, x FOR PEER REVIEW 12 of 18
Figure 7. Possible areas for future tree planting: (top left) Fairfax Street, (top right) All Saints’ Street, (bottom left) Nelson Street, and (bottom right) Union Street. Source: Google Maps.
The suitability of each plant for each location, including tolerance of relevant stress and projected growth form, must be carefully considered when implementing robust and effective GI [67]. Lack of growth space, poor soil quality, light heterogeneity, pollutants, diseases, and conflicts with human activities, constructions, and pavements are all key issues for vegetation and green spaces in compact cities like Bristol City Centre [70]. If trees are well-managed and the correct trees are planted in the right areas, the ecosystem services they provide can greatly exceed the disservices, contributing to a city’s or town’s long-term sustainability and livability [71]. Tree initiatives should include recommenda-tions on how to make public trees more resilient (e.g., promoting a broader species choice for public areas and ways to achieve greater size diversification) [71]. Recognizing that the potential for improving air quality through urban vegetation is limited, one important limitation to mitigating current air quality problems through vegetation is that the most polluted areas of cities have very limited space for planting, greatly limiting the potential for mitigation using these methods [72]. The benefits of an integrated policy that geo-graphically isolates people from major pollution sources as much as possible (i.e., partic-ularly transportation) and uses vegetation between the sources and the urban population are maximized [72].
4. Conclusions and Recommendations Many developed nations are beginning to reduce pollution emissions and deposition
through successful environmental policies [73–75]. At the same time, cities are implement-ing strategies to tackle air pollution; e.g., large scale urban afforestation projects are be-coming more popular as a strategy to improve urban sustainability and human health [76]. In order to design and plan sustainable cities, landscape architects and urban plan-ners need accurate metrics and indicators. In this communication, we have illustrated two free user-friendly online tools (i.e., the Office for National Statistics and i-Tree Canopy) using Bristol City Centre as an example. We found both tools are easy to use and com-municate ecosystem services and monetary values. However, they produce different re-
Figure 7. Possible areas for future tree planting: (top left) Fairfax Street, (top right) All Saints’ Street,(bottom left) Nelson Street, and (bottom right) Union Street. Source: Google Maps.
191
Land 2021, 10, 788
It should also be noted that both tools do not provide information about species.However, species selection tools are available via i-Tree Species software which was createdto assist urban foresters in choosing the best tree species for their needs (e.g., species’potential environmental services and geographic location). Using this additional toolset,users rank the importance of each desired environmental function provided by trees andthe tool estimates the appropriateness of the tree species based on weighted environmentaladvantages of tree species at maturity [50]. In addition, a tree selection guide is availableonline which provides nearly 300 potential species for GI [68]. Both tools do not design orintegrate tree planting applications; however, the i-Tree suite contains i-Tree Design andi-Tree Planting, but these only function in North America. In particular, i-Tree Plantingis an online tool that calculates the long-term environmental benefits of a tree-plantingproject with a variety of trees and species. Its methods are based on the i-Tree Design andi-Tree Forecast tools [30]. Future research could develop a similar tool for Europe or ageographic information system (GIS)-like tool similar to the one developed by Wu et al. [69]that identifies suitable tree-planting locations by simulating the planting of large, medium,and small trees on plantable areas, with large trees taking precedence because they areprojected to provide considerable benefits.
The suitability of each plant for each location, including tolerance of relevant stressand projected growth form, must be carefully considered when implementing robust andeffective GI [67]. Lack of growth space, poor soil quality, light heterogeneity, pollutants,diseases, and conflicts with human activities, constructions, and pavements are all keyissues for vegetation and green spaces in compact cities like Bristol City Centre [70]. If treesare well-managed and the correct trees are planted in the right areas, the ecosystem servicesthey provide can greatly exceed the disservices, contributing to a city’s or town’s long-termsustainability and livability [71]. Tree initiatives should include recommendations on howto make public trees more resilient (e.g., promoting a broader species choice for publicareas and ways to achieve greater size diversification) [71]. Recognizing that the potentialfor improving air quality through urban vegetation is limited, one important limitation tomitigating current air quality problems through vegetation is that the most polluted areasof cities have very limited space for planting, greatly limiting the potential for mitigationusing these methods [72]. The benefits of an integrated policy that geographically isolatespeople from major pollution sources as much as possible (i.e., particularly transportation)and uses vegetation between the sources and the urban population are maximized [72].
4. Conclusions and Recommendations
Many developed nations are beginning to reduce pollution emissions and depositionthrough successful environmental policies [73–75]. At the same time, cities are imple-menting strategies to tackle air pollution; e.g., large scale urban afforestation projectsare becoming more popular as a strategy to improve urban sustainability and humanhealth [76]. In order to design and plan sustainable cities, landscape architects and urbanplanners need accurate metrics and indicators. In this communication, we have illustratedtwo free user-friendly online tools (i.e., the Office for National Statistics and i-Tree Canopy)using Bristol City Centre as an example. We found both tools are easy to use and communi-cate ecosystem services and monetary values. However, they produce different results dueto the different methods that the tools incorporate. Our findings are in accordance withthe conclusions of Timilsina et al. [77], who reported that the disparity in predictions bygeneral models or average data have an impact on the estimation of ecosystem services.We also discussed the use of these tools for future tree planting strategies. According toKeith Sacre, co-founder of Treeconomics, the tree planting process should be strategizedinto several elements: “(1) creating a vision: what is wanted? (based on ‘What is therenow?’); (2) setting targets which are achievable and deliverable; (3) creating an action plan,comprising: where to plant, what to plant, how to plant, and what is needed to maintain?;and (4) monitoring and reviewing progress” [78]. This approach would potentially allowfor “realistic and achievable targets to be set [and] suitable species to be selected” [78].
192
Land 2021, 10, 788
In terms of a key strength of the i-Tree Canopy tool, it allows users to simply photo-interpret Google aerial images to obtain statistically valid estimates of tree and othercover types, as well as evaluations of their uncertainty [30]. Random point samplingapproaches such as i-Tree Canopy have the benefit of openly available data and softwarethat may be used by a wide range of people [79]. Users of any random point samplingmethod, on the other hand, should be cognizant of the uncertainties involved with anyurban tree cover estimate, especially if it is being used to track change [79]. i-Tree Canopy,as such, calculates several ecosystem services, e.g., avoided runoff, carbon storage andsequestration, and air pollutants removal; however, European users should be aware that i-Tree Canopy benefits (i.e., ecosystem services and monetary values) from selected locationsare available only in Sweden and the UK. Using the i-Tree suite software, one can identifylandscape features to predict other phenomena as well, e.g., wood tick presence [80]. Futureresearch could explore the use of i-Tree Canopy to map edible green infrastructure as wellas urban food provisioning ecosystem services [81]. The Office for National Statisticstool, on the other hand, provides meaningful urban metrics that highlight the linkagesbetween GI and health which can improve health impacts through urban policies [82].The Office for National Statistics website formulates its research from inputting postcodesand working from the preset-2015 dataset. The use of postcodes is a standard that manyepidemiological studies utilize when pinpointing or narrowing in on specific phenomena(e.g., pollutants) [83–85]. This, in turn, parallels the tool’s parameter structure and offers theprospect of measuring other performance or production elements via overlaid GIS. As anextension, we recommend the use of locals models for ecosystem services assessments [77].Therefore, the Office for National Statistics uses landcover maps that are more appropriatefor analyzing ecosystem services at the regional scale rather than the local scale sincemaps with limited resolution are unreliable for local studies unless additional data orfine-adjustments are supplied [86,87].
At length, both tools are excellent online resources which are easy to use, require littleto no expert knowledge, and parallel a bottom-up concept, i.e., they are simplistic, fast,and trackable. A key difference, however, is that the i-Tree Canopy software specificallytakes into account only tree (i.e., green) coverage while the Office for National Statisticsconsiders the total environment (e.g., water, vegetation, etc.). This methodological dif-ference would explain much of the discrepancy in results since Bristol is situated on theRiver Avon and water is considered a negative value in the Office for National Statisticsmethodology. However, results must be validated by fieldwork so future research couldcompare both tools using a stratified sample according to a rural-urban gradient [88–90].Further case research would aid in better explaining if the toolsets could be integratedsomehow (e.g., GIS) and if GI strategy can reliably be sought after if vast differences arepresent. Nonetheless, when factoring in an urban sustainable vision of designing green,urban-friendly cities, an uncertainty analysis should become a formal practice and neces-sary component of any modeling exercises, especially for models which aim to support“model transparency, model development, effective communication of model output, [ . . . ]decision-making” [91] and policy formation. To further improve or develop new tools,researchers should also account for ecosystem disservices in order to assess the net benefitsof GI [92,93]. To conclude, the results of this communication have updated the literatureon the evaluation of GI tools in the UK [34] as well as provide a basis for the future devel-opment of a comprehensive online design tool that is site-specific for GI strategy and forthe assessment of urban ecosystem services in Europe.
Author Contributions: Conceptualization, software, investigation, resources, data curation, writing—original draft preparation, methodology, validation, formal analysis, A.R. and W.T.C.; writing—review and editing, A.R. and G.T.C.; supervision, project administration, funding acquisition, A.R.All authors have read and agreed to the published version of the manuscript.
Funding: This research received no external funding.
Institutional Review Board Statement: Not applicable.
193
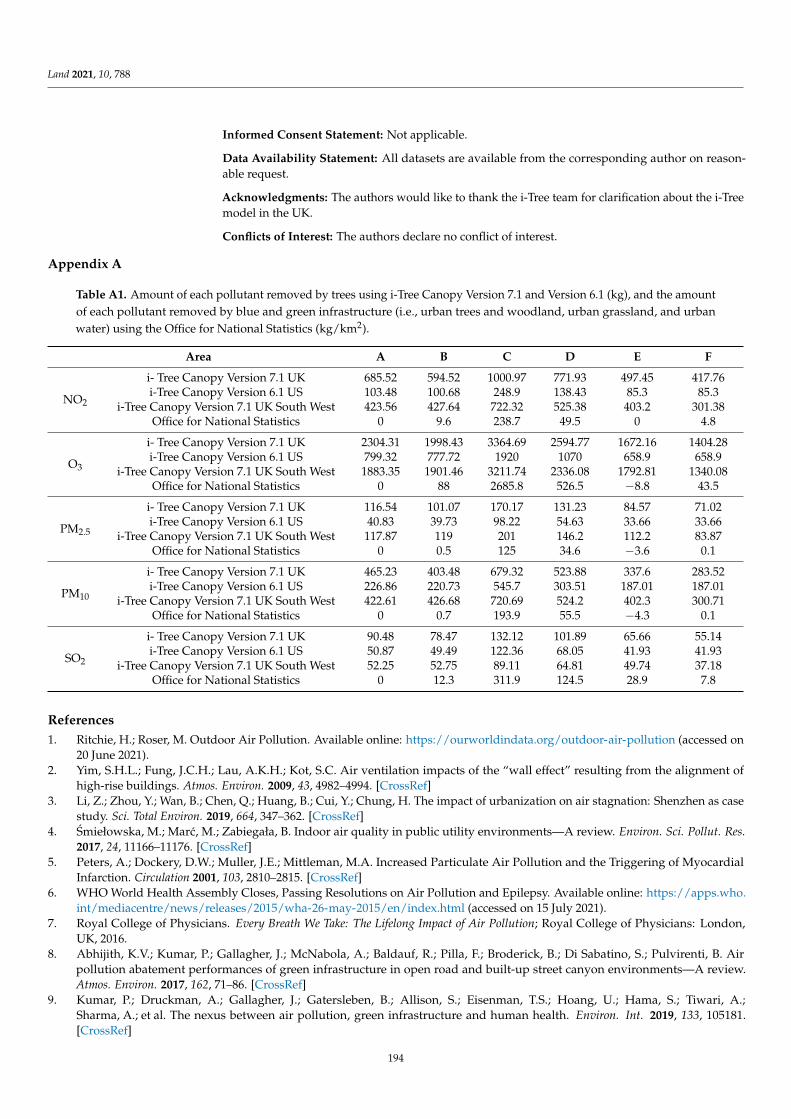
Land 2021, 10, 788
Informed Consent Statement: Not applicable.
Data Availability Statement: All datasets are available from the corresponding author on reason-able request.
Acknowledgments: The authors would like to thank the i-Tree team for clarification about the i-Treemodel in the UK.
Conflicts of Interest: The authors declare no conflict of interest.
Appendix A
Table A1. Amount of each pollutant removed by trees using i-Tree Canopy Version 7.1 and Version 6.1 (kg), and the amountof each pollutant removed by blue and green infrastructure (i.e., urban trees and woodland, urban grassland, and urbanwater) using the Office for National Statistics (kg/km2).
Area A B C D E F
NO2
i- Tree Canopy Version 7.1 UK 685.52 594.52 1000.97 771.93 497.45 417.76i-Tree Canopy Version 6.1 US 103.48 100.68 248.9 138.43 85.3 85.3
i-Tree Canopy Version 7.1 UK South West 423.56 427.64 722.32 525.38 403.2 301.38Office for National Statistics 0 9.6 238.7 49.5 0 4.8
O3
i- Tree Canopy Version 7.1 UK 2304.31 1998.43 3364.69 2594.77 1672.16 1404.28i-Tree Canopy Version 6.1 US 799.32 777.72 1920 1070 658.9 658.9
i-Tree Canopy Version 7.1 UK South West 1883.35 1901.46 3211.74 2336.08 1792.81 1340.08Office for National Statistics 0 88 2685.8 526.5 −8.8 43.5
PM2.5
i- Tree Canopy Version 7.1 UK 116.54 101.07 170.17 131.23 84.57 71.02i-Tree Canopy Version 6.1 US 40.83 39.73 98.22 54.63 33.66 33.66
i-Tree Canopy Version 7.1 UK South West 117.87 119 201 146.2 112.2 83.87Office for National Statistics 0 0.5 125 34.6 −3.6 0.1
PM10
i- Tree Canopy Version 7.1 UK 465.23 403.48 679.32 523.88 337.6 283.52i-Tree Canopy Version 6.1 US 226.86 220.73 545.7 303.51 187.01 187.01
i-Tree Canopy Version 7.1 UK South West 422.61 426.68 720.69 524.2 402.3 300.71Office for National Statistics 0 0.7 193.9 55.5 −4.3 0.1
SO2
i- Tree Canopy Version 7.1 UK 90.48 78.47 132.12 101.89 65.66 55.14i-Tree Canopy Version 6.1 US 50.87 49.49 122.36 68.05 41.93 41.93
i-Tree Canopy Version 7.1 UK South West 52.25 52.75 89.11 64.81 49.74 37.18Office for National Statistics 0 12.3 311.9 124.5 28.9 7.8
References1. Ritchie, H.; Roser, M. Outdoor Air Pollution. Available online: https://ourworldindata.org/outdoor-air-pollution (accessed on
20 June 2021).2. Yim, S.H.L.; Fung, J.C.H.; Lau, A.K.H.; Kot, S.C. Air ventilation impacts of the “wall effect” resulting from the alignment of
high-rise buildings. Atmos. Environ. 2009, 43, 4982–4994. [CrossRef]3. Li, Z.; Zhou, Y.; Wan, B.; Chen, Q.; Huang, B.; Cui, Y.; Chung, H. The impact of urbanization on air stagnation: Shenzhen as case
study. Sci. Total Environ. 2019, 664, 347–362. [CrossRef]4. Smiełowska, M.; Marc, M.; Zabiegała, B. Indoor air quality in public utility environments—A review. Environ. Sci. Pollut. Res.
2017, 24, 11166–11176. [CrossRef]5. Peters, A.; Dockery, D.W.; Muller, J.E.; Mittleman, M.A. Increased Particulate Air Pollution and the Triggering of Myocardial
Infarction. Circulation 2001, 103, 2810–2815. [CrossRef]6. WHO World Health Assembly Closes, Passing Resolutions on Air Pollution and Epilepsy. Available online: https://apps.who.
int/mediacentre/news/releases/2015/wha-26-may-2015/en/index.html (accessed on 15 July 2021).7. Royal College of Physicians. Every Breath We Take: The Lifelong Impact of Air Pollution; Royal College of Physicians: London,
UK, 2016.8. Abhijith, K.V.; Kumar, P.; Gallagher, J.; McNabola, A.; Baldauf, R.; Pilla, F.; Broderick, B.; Di Sabatino, S.; Pulvirenti, B. Air
pollution abatement performances of green infrastructure in open road and built-up street canyon environments—A review.Atmos. Environ. 2017, 162, 71–86. [CrossRef]
9. Kumar, P.; Druckman, A.; Gallagher, J.; Gatersleben, B.; Allison, S.; Eisenman, T.S.; Hoang, U.; Hama, S.; Tiwari, A.;Sharma, A.; et al. The nexus between air pollution, green infrastructure and human health. Environ. Int. 2019, 133, 105181.[CrossRef]
194
Land 2021, 10, 788
10. Hewitt, C.N.; Ashworth, K.; MacKenzie, A.R. Using green infrastructure to improve urban air quality (GI4AQ). Ambio 2020,49, 62–73. [CrossRef] [PubMed]
11. Russo, A.; Cirella, G.T. Urban Sustainability: Integrating Ecology in City Design and Planning. In Sustainable Human–NatureRelations: Environmental Scholarship, Economic Evaluation, Urban Strategies; Cirella, G.T., Ed.; Springer: Singapore, 2020; pp. 187–204.
12. Jim, C.Y.; Chen, W.Y. Assessing the ecosystem service of air pollutant removal by urban trees in Guangzhou (China). J. Environ.Manag. 2008, 88, 665–676. [CrossRef]
13. Cavanagh, J.-A.E.; Zawar-Reza, P.; Wilson, J.G. Spatial attenuation of ambient particulate matter air pollution within an urbanisednative forest patch. Urban For. Urban Green. 2009, 8, 21–30. [CrossRef]
14. Dadea, C.; Russo, A.; Tagliavini, M.; Mimmo, T.; Zerbe, S. Tree Species as Tools for Biomonitoring and Phytoremediation in UrbanEnvironments: A Review with Special Regard to Heavy Metals. Arboric. Urban For. 2017, 43, 155–167.
15. Brancalion, P.H.S.; Holl, K.D. Guidance for successful tree planting initiatives. J. Appl. Ecol. 2020, 57, 2349–2361. [CrossRef]16. Pynnönen, S.; Haltia, E.; Hujala, T. Digital forest information platform as service innovation: Finnish Metsaan.fi service use, users
and utilisation. For. Policy Econ. 2021, 125, 102404. [CrossRef]17. Jones, B.A. Planting urban trees to improve quality of life? The life satisfaction impacts of urban afforestation. For. Policy Econ.
2021, 125, 102408. [CrossRef]18. TDAG. Trees in the Townscape: A Guide for Decision Makers; Trees and Design Action Group: London, UK, 2012.19. Mullaney, J.; Lucke, T.; Trueman, S.J. A review of benefits and challenges in growing street trees in paved urban environments.
Landsc. Urban Plan. 2015, 134, 157–166. [CrossRef]20. Bodnaruk, E.W.; Kroll, C.N.; Yang, Y.; Hirabayashi, S.; Nowak, D.J.; Endreny, T.A. Where to plant urban trees? A spatially explicit
methodology to explore ecosystem service tradeoffs. Landsc. Urban Plan. 2017, 157, 457–467. [CrossRef]21. Urban, J. Up by Roots; ISA: New York, NY, USA, 2008; ISBN 1881956652.22. Jerome, G.; Sinnett, D.; Burgess, S.; Calvert, T.; Mortlock, R. A framework for assessing the quality of green infrastructure in the
built environment in the UK. Urban. For. Urban. Green. 2019, 40, 174–182. [CrossRef]23. Ellis, J.B. Sustainable surface water management and green infrastructure in UK urban catchment planning. J. Environ. Plan.
Manag. 2013, 56, 24–41. [CrossRef]24. Joint Core Strategy. Green Infrastructure Strategy; Joint Core Strategy: Gloucester, UK, 2014.25. Natural England. Green Infrastructure Strategies: An Introduction for Local Authorities and Their Partners; Natural England: London,
UK, 2008.26. Russo, A.; Escobedo, F.J.; Timilsina, N.; Schmitt, A.O.; Varela, S.; Zerbe, S. Assessing urban tree carbon storage and sequestration
in Bolzano, Italy. Int. J. Biodivers. Sci. Ecosyst. Serv. Manag. 2014, 10, 54–70. [CrossRef]27. Daily, G.; Polasky, S.; Goldstein, J.; Kareiva, P.; Mooney, H. Ecosystem services in decision making: Time to deliver. Front. Ecol.
Environ. 2009, 7, 21–28. [CrossRef]28. Villa, F.; Bagstad, K.J.; Voigt, B.; Johnson, G.W.; Portela, R.; Honzák, M.; Batker, D. A Methodology for Adaptable and Robust
Ecosystem Services Assessment. PLoS ONE 2014, 9, e91001. [CrossRef]29. Brown, M.E.; McGroddy, M.; Spence, C.; Flake, L.; Sarfraz, A.; Nowak, D.J.; Milesi, C. Modeling the Ecosystem Services Provided by
Trees in Urban Ecosystems: Using Biome-BGC to Improve i-Tree Eco; NASA: Washington, DC, USA, 2012.30. Nowak, D.J. Understanding i-Tree: Summary of Programs and Methods; General Technical Report NRS-200; Northern Research
Station, Forest Service, Department of Agriculture: Madison, WI, USA, 2020; 100p, [plus 14 appendices].31. Roy, S.; Byrne, J.; Pickering, C. A systematic quantitative review of urban tree benefits, costs, and assessment methods across
cities in different climatic zones. Urban For. Urban Green. 2012, 11, 351–363. [CrossRef]32. Rogers, K.; Hansford, D.; Sunderland, T.; Brunt, A.; Coish, N. Measuring the ecosystem services of Torbay’s trees: The Torbay i-
Tree Eco pilot project. In Proceedings of the Urban Trees Research Conference, London, UK, 26–27 July 2021; Forestry Commission:Edinburgh, UK, 2011; pp. 18–26.
33. Raum, S.; Hand, K.L.; Hall, C.; Edwards, D.M.; O’Brien, L.; Doick, K.J. Achieving impact from ecosystem assessment andvaluation of urban greenspace: The case of i-Tree Eco in Great Britain. Landsc. Urban Plan. 2019, 190, 103590. [CrossRef]
34. Natural England. Green Infrastructure—Valuation Tools Assessment; Natural England: Exeter, UK, 2013.35. Greater London Authority. A Natural Capital Account for Public Green Space in London: How It Can Shape Future Policy
and Decision-Making. Available online: https://www.london.gov.uk/sites/default/files/nca_supplementary_document.pdf(accessed on 14 July 2021).
36. UK Government. The England Trees Action Plan. 2021–2024; UK Government: London, UK, 2021.37. Pincetl, S.; Gillespie, T.; Pataki, D.E.; Saatchi, S.; Saphores, J.-D. Urban tree planting programs, function or fashion? Los Angeles
and urban tree planting campaigns. GeoJournal 2013, 78, 475–493. [CrossRef]38. Bristol City Council. The Population of Bristol; Bristol City Council: Bristol, UK, 2019.39. Climate Action. Friends of the Earth Bristol’s One City Plan to Create an Urban Forest. 2021. Available online: https://
takeclimateaction.uk/solutions/bristols-one-city-plan-create-urban-forest (accessed on 1 June 2021).40. Consultants Air Quality. Health Impacts of Air Pollution; Consultants Air Quality: Bristol, UK, 2017.41. Chan, W.T. The Benefit of Green Infrastructure on Air Quality in Bristol; University of Gloucestershire: Cheltenham, UK, 2019.
195
Land 2021, 10, 788
42. Garrett, J.; Connett, J. Campaigners Accuse Marvin Rees of Not Protecting Bristol’s Mature Trees. Available online:https://thebristolcable.org/2021/02/campaigners-accuse-marvin-rees-of-putting-housing-above-climate-by-not-protecting-bristols-mature-trees/ (accessed on 14 July 2021).
43. Office for National Statistics UK Air Pollution Removal: How Much Pollution Does Vegetation Remove in Your Area? Available on-line: https://www.ons.gov.uk/economy/environmentalaccounts/articles/ukairpollutionremovalhowmuchpollutiondoesvegeta-tionremoveinyourarea/2018-07-30 (accessed on 16 June 2021).
44. Jones, L.; Vieno, M.; Fitch, A.; Carnell, E.; Steadman, C.; Cryle, P.; Holland, M.; Nemitz, E.; Morton, D.; Hall, J.; et al. Urbannatural capital accounts: Developing a novel approach to quantify air pollution removal by vegetation. J. Environ. Econ. Policy2019, 8, 413–428. [CrossRef]
45. Vieno, M.; Heal, M.R.; Williams, M.L.; Carnell, E.J.; Nemitz, E.; Stedman, J.R.; Reis, S. The sensitivities of emissions reductions forthe mitigation of UK PM2.5. Atmos. Chem. Phys. 2016, 16, 265–276. [CrossRef]
46. Jones, L.; Vieno, M.; Morton, D.; Cryle, P.; Holland, M.; Carnell, E.; Nemitz, E.; Hall, J.; Beck, R.; Reis, S.; et al. Developing Estimatesfor the Valuation of Air Pollution Removal in Ecosystem Accounts: Final Report Office for National Statistics; Centre for Ecology andHydrology (CEH): Wallingford, UK, 2017.
47. Nowak, D.J.; Greenfield, E.J. Tree and impervious cover change in U.S. cities. Urban For. Urban Green. 2012, 11, 21–30. [CrossRef]48. Russo, A.; Escobedo, F.J.; Timilsina, N.; Zerbe, S. Transportation carbon dioxide emission offsets by public urban trees: A case
study in Bolzano, Italy. Urban For. Urban Green. 2015, 14, 398–403. [CrossRef]49. Hirabayashi, S. i-Tree Canopy Air Pollutant Removal and Monetary Value Model Descriptions. 2014, pp. 1–11. Available
online: https://www.itreetools.org/documents/560/i-Tree_Canopy_Air_Pollutant_Removal_and_Monetary_Value_Model_Descriptions.pdf (accessed on 10 June 2021).
50. Tree i-Tree Species. Available online: https://species.itreetools.org/ (accessed on 15 June 2021).51. Trees of Bristol Bristol Tree Canopy Cover Survey. 2018. Available online: https://bristoltrees.space/trees/treecover-map.xq?
fbclid=IwAR1QpV-CYSE6LYwZjd5yak_S3QZpoqBqILnj7_O3-SdzmTtBwwhbdg9dgcA (accessed on 16 June 2021).52. Rogers, K.; Jaluzot, A. Treeconomics Oxford i-Tree Canopy Cover Assessment; Treeconomics: Oxford, UK, 2015.53. Doick, K.J.; Davies, H.J.; Moss, J.; Coventry, R.; Handley, P.; VazMonteiro, M.; Rogers, K.; Simpkin, P. The Canopy Cover of
England’s Towns and Cities: Baselining and setting targets to improve human health and well-being. In Proceedings of the Trees,People and the Built Environment 3: Urban Trees Research Conference, Birmingham, UK, 5–6 April 2017.
54. Kenney, W.A.; Van Wassenaer, P.J.E.; Satel, A.L. Criteria and indicators for strategic urban forest planning and management.Arboric. Urban For. 2011, 37, 108–117.
55. Astell-Burt, T.; Feng, X. Association of Urban Green Space with Mental Health and General Health among Adults in Australia.JAMA Netw. Open 2019, 2, 1–22. [CrossRef]
56. Marselle, M.R.; Bowler, D.E.; Watzema, J.; Eichenberg, D.; Kirsten, T.; Bonn, A. Urban street tree biodiversity and antidepressantprescriptions. Sci. Rep. 2020, 10, 22445. [CrossRef]
57. Kondo, M.C.; Mueller, N.; Locke, D.H.; Roman, L.A.; Rojas-Rueda, D.; Schinasi, L.H.; Gascon, M.; Nieuwenhuijsen, M.J. Healthimpact assessment of Philadelphia’s 2025 tree canopy cover goals. Lancet Planet. Health 2020, 4, e149–e157. [CrossRef]
58. Nemitz, E.; Vieno, M.; Carnell, E.; Fitch, A.; Steadman, C.; Cryle, P.; Holland, M.; Morton, R.D.; Hall, J.; Mills, G.; et al. Potentialand limitation of air pollution mitigation by vegetation and uncertainties of deposition-based evaluations. Philos. Trans. R. Soc. AMath. Phys. Eng. Sci. 2020, 378, 20190320. [CrossRef] [PubMed]
59. Nowak, D.J.; Hirabayashi, S.; Bodine, A.; Greenfield, E. Tree and forest effects on air quality and human health in the UnitedStates. Environ. Pollut. 2014, 193, 119–129. [CrossRef]
60. Troy, A.; Morgan Grove, J.; O’Neil-Dunne, J. The relationship between tree canopy and crime rates across an urban–rural gradientin the greater Baltimore region. Landsc. Urban Plan. 2012, 106, 262–270. [CrossRef]
61. Pugh, T.A.M.; MacKenzie, A.R.; Whyatt, J.D.; Hewitt, C.N. Effectiveness of Green Infrastructure for Improvement of Air Qualityin Urban Street Canyons. Environ. Sci. Technol. 2012, 46, 7692–7699. [CrossRef] [PubMed]
62. Tree. i-Tree Canopy Technical Notes. Available online: https://canopy.itreetools.org/references (accessed on 16 June 2021).63. Sunderland, T.; Rogers, K.; Coish, N. What proportion of the costs of urban trees can be justified by the carbon sequestration and
air-quality benefits they provide? Arboric. J. 2012, 34, 62–82. [CrossRef]64. Janhäll, S. Review on urban vegetation and particle air pollution—Deposition and dispersion. Atmos. Environ. 2015, 105, 130–137.
[CrossRef]65. Jeanjean, A.P.R.; Buccolieri, R.; Eddy, J.; Monks, P.S.; Leigh, R.J. Air quality affected by trees in real street canyons: The case of
Marylebone neighbourhood in central London. Urban For. Urban Green. 2017, 22, 41–53. [CrossRef]66. Riondato, E.; Pilla, F.; Sarkar Basu, A.; Basu, B. Investigating the effect of trees on urban quality in Dublin by combining air
monitoring with i-Tree Eco model. Sustain. Cities Soc. 2020, 61, 102356. [CrossRef]67. Barwise, Y.; Kumar, P. Designing vegetation barriers for urban air pollution abatement: A practical review for appropriate plant
species selection. NPJ Clim. Atmos. Sci. 2020, 3, 12. [CrossRef]68. Hirons, A.; Sjöman, H. Tree Species Selection for Green Infrastructure: A Guide for Specifiers; Trees and Design Action Group: London,
UK, 2019; ISBN 978-0-9928686-4-2.69. Wu, C.; Xiao, Q.; McPherson, E.G. A method for locating potential tree-planting sites in urban areas: A case study of Los Angeles,
USA. Urban For. Urban Green. 2008, 7, 65–76. [CrossRef]
196
Land 2021, 10, 788
70. Jim, C.Y.; Konijnendijk van den Bosch, C.; Chen, W.Y. Acute Challenges and Solutions for Urban Forestry in Compact andDensifying Cities. J. Urban Plan. Dev. 2018, 144, 04018025. [CrossRef]
71. Vaz Monteiro, M.; Handley, P.; Morison, J.; Doick, K. The Role of Urban Trees and Greenspaces in Reducing Urban Air Temperatures;Forest Research: Surrey, UK, 2019; ISBN 978-0-85538-984-0.
72. Defra Air Quality Expert Group—Defra, UK. Available online: https://uk-air.defra.gov.uk/research/aqeg/ (accessed on 20June 2021).
73. Miranda, M.L.; Edwards, S.E.; Keating, M.H.; Paul, C.J. Making the environmental justice grade: The relative burden of airpollution exposure in the United States. Int. J. Environ. Res. Public Health 2011, 8, 1755–1771. [CrossRef] [PubMed]
74. Duvall, R.M.; Long, R.W.; Beaver, M.R.; Kronmiller, K.G.; Wheeler, M.L.; Szykman, J.J. Performance evaluation and communityapplication of low-cost sensors for ozone and nitrogen dioxide. Sensors 2016, 16, 1698. [CrossRef]
75. Stevens, K.A.; Bryer, T.A.; Yu, H. Air Quality Enhancement Districts: Democratizing data to improve respiratory health. J. Environ.Stud. Sci. 2021, 1–6. [CrossRef]
76. Yao, N.; Konijnendijk van den Bosch, C.C.; Yang, J.; Devisscher, T.; Wirtz, Z.; Jia, L.; Duan, J.; Ma, L. Beijing’s 50 million newurban trees: Strategic governance for large-scale urban afforestation. Urban For. Urban Green. 2019, 44, 126392. [CrossRef]
77. Timilsina, N.; Beck, J.L.; Eames, M.S.; Hauer, R.; Werner, L. A comparison of local and general models of leaf area and biomass ofurban trees in USA. Urban For. Urban Green. 2017, 24, 157–163. [CrossRef]
78. Sacre, K. i-Tree focus Tree planting strategies. ARB Mag. 2020, 190, 15–16.79. Parmehr, E.G.; Amati, M.; Taylor, E.J.; Livesley, S.J. Estimation of urban tree canopy cover using random point sampling and
remote sensing methods. Urban For. Urban Green. 2016, 20, 160–171. [CrossRef]80. Omodior, O.; Eze, P.; Anderson, K.R. Using i-tree canopy vegetation cover subtype classification to predict peri-domestic tick
presence. Ticks Tick Borne Dis. 2021, 12, 101684. [CrossRef]81. Russo, A.; Cirella, G.T. Edible urbanism 5.0. Palgrave Commun. 2019, 5, 1–9. [CrossRef]82. Prasad, A.; Gray, C.B.; Ross, A.; Kano, M. Metrics in Urban Health: Current Developments and Future Prospects. Annu. Rev.
Public Health 2016, 37, 113–133. [CrossRef]83. Grubesic, T.H.; Matisziw, T.C. On the use of ZIP codes and ZIP code tabulation areas (ZCTAs) for the spatial analysis of
epidemiological data. Int. J. Health Geogr. 2006, 5, 1–15. [CrossRef]84. Krieger, N.; Waterman, P.; Chen, J.T.; Soobader, M.J.; Subramanian, S.V.; Carson, R. Zip code caveat: Bias due to spatiotemporal
mismatches between zip codes and US census-defined geographic areas: The public health disparities geocoding project. Am. J.Public Health 2002, 92, 1100–1102. [CrossRef]
85. Acevedo-Garcia, D. Zip code-level risk factors for tuberculosis: Neighborhood environment and residential segregation in NewJersey, 1985–1992. Am. J. Public Health 2001, 91, 734–741. [CrossRef]
86. Liu, O.Y.; Russo, A. Assessing the contribution of urban green spaces in green infrastructure strategy planning for urbanecosystem conditions and services. Sustain. Cities Soc. 2021, 68, 102772. [CrossRef]
87. Dales, N.P.; Brown, N.J.; Lusardi, J. Assessing the Potential for Mapping Ecosystem Services in England Based on Existing Habitats;Natural England: Newcastle, UK, 2014.
88. Baró, F.; Gómez-Baggethun, E.; Haase, D. Ecosystem service bundles along the urban-rural gradient: Insights for landscapeplanning and management. Ecosyst. Serv. 2017, 24, 147–159. [CrossRef]
89. Zardo, L.; Geneletti, D.; Pérez-Soba, M.; Van Eupen, M. Estimating the cooling capacity of green infrastructures to support urbanplanning. Ecosyst. Serv. 2017, 26, 225–235. [CrossRef]
90. Larondelle, N.; Haase, D. Urban ecosystem services assessment along a rural–urban gradient: A cross-analysis of European cities.Ecol. Indic. 2013, 29, 179–190. [CrossRef]
91. Lin, J.; Kroll, C.N.; Nowak, D.J. An uncertainty framework for i-Tree eco: A comparative study of 15 cities across the UnitedStates. Urban For. Urban Green. 2021, 60, 127062. [CrossRef]
92. Russo, A.; Escobedo, F.J.; Cirella, G.T.; Zerbe, S. Edible green infrastructure: An approach and review of provisioning ecosystemservices and disservices in urban environments. Agric. Ecosyst. Environ. 2017, 242, 53–66. [CrossRef]
93. Von Döhren, P.; Haase, D. Ecosystem disservices research: A review of the state of the art with a focus on cities. Ecol. Indic. 2015,52, 490–497. [CrossRef]
197


MDPISt. Alban-Anlage 66
4052 BaselSwitzerland
Tel. +41 61 683 77 34Fax +41 61 302 89 18
www.mdpi.com
Land Editorial OfficeE-mail: [email protected]
www.mdpi.com/journal/land

MDPI St. Alban-Anlage 66 4052 Basel Switzerland
Tel: +41 61 683 77 34 Fax: +41 61 302 89 18
www.mdpi.com ISBN 978-3-0365-1837-4