valuation of ecosystem services of hindu kush
TRANSCRIPT
First
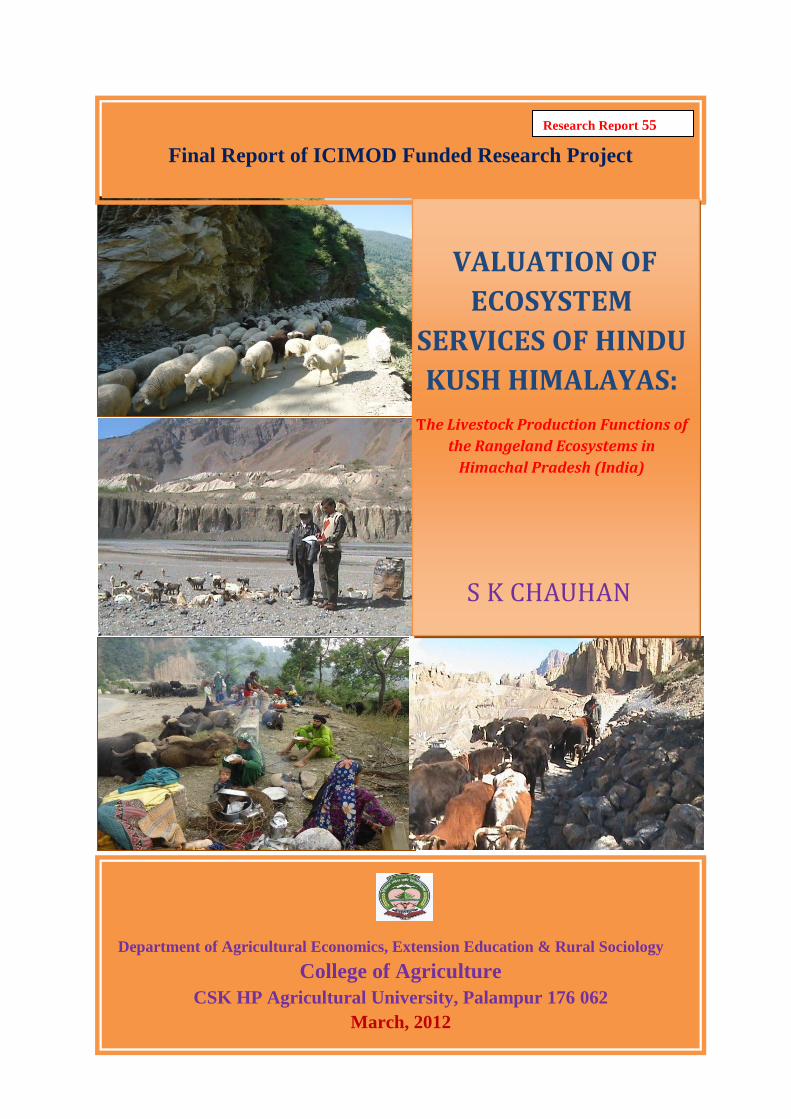
Final Report of ICIMOD Funded Research Project
VALUATION OF
ECOSYSTEM
SERVICES OF HINDU
KUSH HIMALAYAS:
The Livestock Production Functions of
the Rangeland Ecosystems in
Himachal Pradesh (India)
S K CHAUHAN
Department of Agricultural Economics, Extension Education & Rural Sociology
College of Agriculture
CSK HP Agricultural University, Palampur 176 062
March, 2012
Research Report 55
VALUATION OF ECOSYSTEM SERVICES
OF HINDU KUSH HIMALAYAS
The Livestock Production Functions of the Rangeland
Ecosystems in Himachal Pradesh (India)
S K CHAUHAN
DEPARTMENT OF AGRICULTURAL ECONOMICS
EXTENSION EDUCATION & RURAL SOCIOLOGY
COLLEGE OF AGRICULTURE
CSK HP AGRICULTURAL UNIVERSITY, PALAMPUR 176 062
March, 2012
RESEARCH TEAM
Principal Investigator
S K Chauhan Professor (Agricultural Economics), CSK HPKV, Palampur-176 062
Field Enumerator/Field Assistant
Arvind Kumar (Field Enumerator) 06.07.2011 to 04.02.2012
Kulbhushan (Field Assistant) 01.10.2011 to 07.12.2011
Sakshi Chauhan (Field Assistant) 08.02.2012 to 31.03.2012
ACRONYMS, ABBREVIATIONS
CMIE Centre for Monitoring of Indian Economy
GDP Gross Domestic Product
GSDP Gross State Domestic Product
HKH Hindu Kush Himalayas
Ha Hectare
HHs/hhs Households
IHR Indian Himalayan Region
NA Not Available
RMG Ready Made Garments
SMP Skimmed Milk Power
q Quintal
UNDP United Nations Development Programme
UP Uttar Pradesh
WISP World Initiative for Sustainable Pastoralism
ACKNOWLEDGEMENT
Himachal Pradesh is a small mountainous state in the western Himalayas with a total
geographical area of 55,673 sq km according to professional survey. The cultivable area is
just 11.57% of the total geographical area of 4389704 ha by village papers, four-fifths of
which is rainfed. A preponderant majority (over 86 per cent) of the farmers are small and
marginal. The rearing of livestock is an integral part of the farming system particularly in
zone three and four where livestock herders migrate and use the vast available rangelands.
The livestock not only provides milk, wool, mutton, hides, skin, manure and draught power
for agriculture production, but is a source of self employment to rural people. Studies have
shown that animal husbandry contributes 10 to 32 % of household’s income in different agro-
climatic zones of the state. The importance of livestock sector in the state is also evident from
the fact that 83 % of the households keep some bovine, 27 % rear goats and sheep (with goat
17% and sheep 10%) while the poultry is kept by 2 % of the households. The ad hoc project
entitled ‘Valuation of ecosystem services of Hindu Kush Himalayas: The livestock
production functions of the rangeland ecosystems in Himachal Pradesh (India)” was funded
by ICIMOD, Kathmandu (Nepal) for a period of seven to eight months. I take this
opportunity to put on record our sincere thanks to Dr Wahid Jasra and Dr Mohammad Ismail
of ICIMOD for providing funds (INR Rs 2.53 lakh) without which it would have not been
possible to complete the study.
My sincere thanks are to the Vice-Chancellor and Director of Research of CSK Himachal
Pradesh Agricultural University, Palampur and Head Department of Agricultural Economics,
Extension Education & Rural Sociology who provided all assistance and facilities to
accomplish the study.
I shall be failing in our duty if I do not place on record the assistance and hospitality provided
by the livestock herders of the study areas in Chamba and Lahaul - Spiti districts of Himachal
Pradesh. They not only spared their valuable time but also provided the required valuable
information which proved to be of immense use for accomplishing the objectives of study. I
also acknowledge the help and cooperation received from the officials particularly the
Conservators of forests and the staff working under them. The field enumerator and field
assistant namely Arvind Kumar and Kulbhushan, who worked in the project, deserve special
appreciations for their hard work, dedication and paying number of visits while collecting the
data from highland alpine pastures utilized by the migratory livestock herders despite many
odds in the prolonged rainy season. I am also very much indebted to all the administrative
and supporting staff of different offices in the University, especially to the staff of the
Department of Agricultural Economics, Extension Education & Rural Sociology. Last but not
the least, I remain thankful to all those who helped either directly or indirectly to bring out
this report in time.
S K Chauhan
March 31, 2012
Palampur
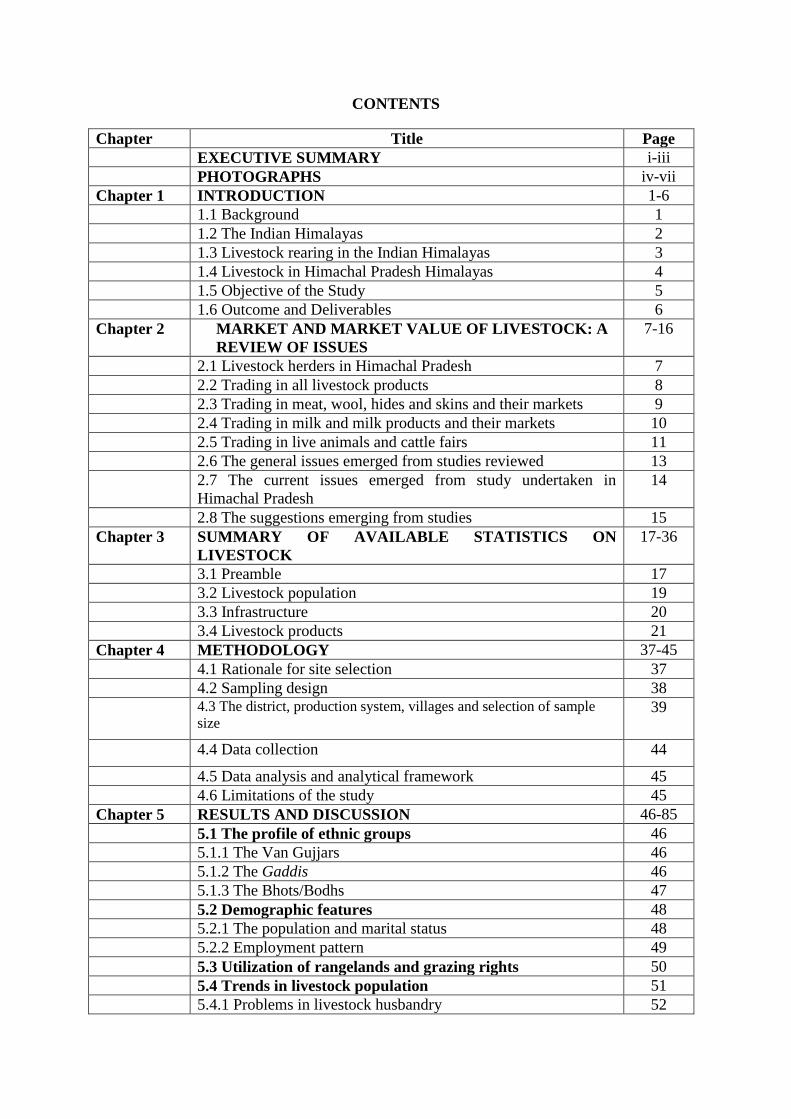
CONTENTS
Chapter Title Page
EXECUTIVE SUMMARY i-iii
PHOTOGRAPHS iv-vii
Chapter 1 INTRODUCTION 1-6
1.1 Background 1
1.2 The Indian Himalayas 2
1.3 Livestock rearing in the Indian Himalayas 3
1.4 Livestock in Himachal Pradesh Himalayas 4
1.5 Objective of the Study 5
1.6 Outcome and Deliverables 6
Chapter 2 MARKET AND MARKET VALUE OF LIVESTOCK: A
REVIEW OF ISSUES
7-16
2.1 Livestock herders in Himachal Pradesh 7
2.2 Trading in all livestock products 8
2.3 Trading in meat, wool, hides and skins and their markets 9
2.4 Trading in milk and milk products and their markets 10
2.5 Trading in live animals and cattle fairs 11
2.6 The general issues emerged from studies reviewed 13
2.7 The current issues emerged from study undertaken in
Himachal Pradesh
14
2.8 The suggestions emerging from studies 15
Chapter 3 SUMMARY OF AVAILABLE STATISTICS ON
LIVESTOCK
17-36
3.1 Preamble 17
3.2 Livestock population 19
3.3 Infrastructure 20
3.4 Livestock products 21
Chapter 4 METHODOLOGY 37-45
4.1 Rationale for site selection 37
4.2 Sampling design 38
4.3 The district, production system, villages and selection of sample
size 39
4.4 Data collection 44
4.5 Data analysis and analytical framework 45
4.6 Limitations of the study 45
Chapter 5 RESULTS AND DISCUSSION 46-85
5.1 The profile of ethnic groups 46
5.1.1 The Van Gujjars 46
5.1.2 The Gaddis 46
5.1.3 The Bhots/Bodhs 47
5.2 Demographic features 48
5.2.1 The population and marital status 48
5.2.2 Employment pattern 49
5.3 Utilization of rangelands and grazing rights 50
5.4 Trends in livestock population 51
5.4.1 Problems in livestock husbandry 52
5.4.2 Investment on additional livestock 53
5.4.3 Livestock production 53
5.4.4 Processing of animal products 54
5.4.5 Consumption and marketing problems of livestock products 55
5.4.6 Use of livestock for guests 55
5.4.7 Sale of live animals 56
5.4.8 Sale of livestock products 57
5.4.9 Gender involvement in sale of animals’ products 57
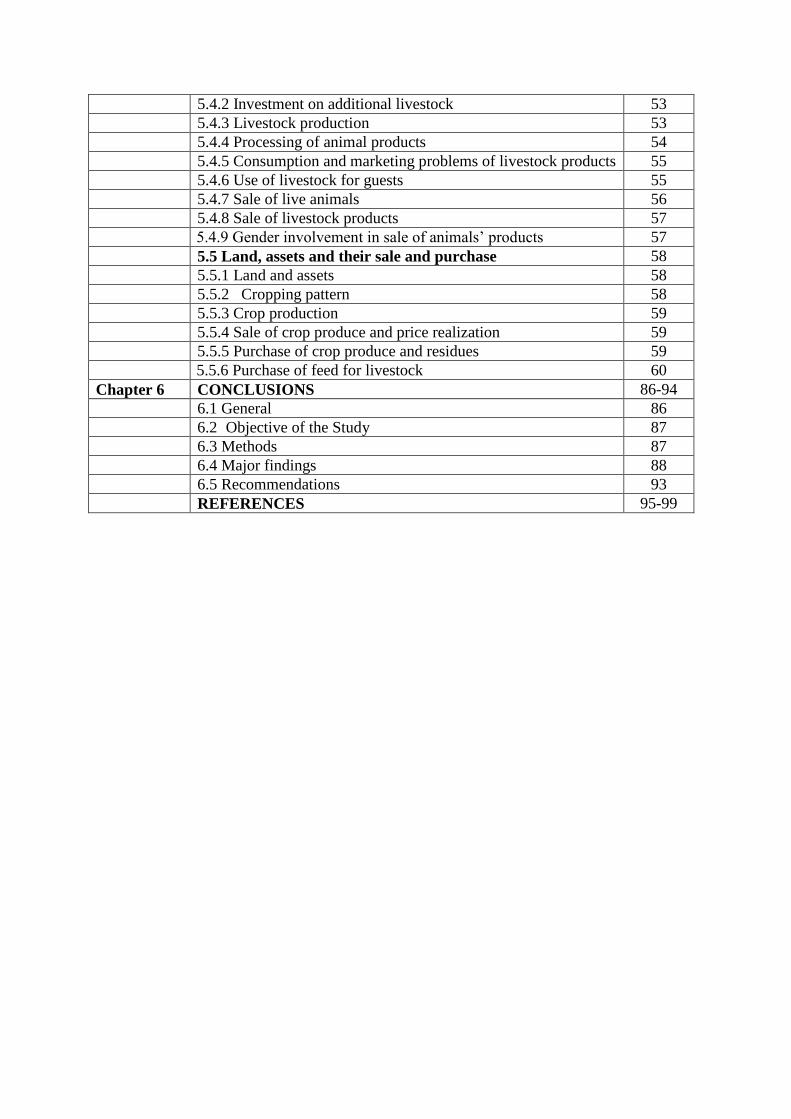
5.5 Land, assets and their sale and purchase 58
5.5.1 Land and assets 58
5.5.2 Cropping pattern 58
5.5.3 Crop production 59
5.5.4 Sale of crop produce and price realization 59
5.5.5 Purchase of crop produce and residues 59
5.5.6 Purchase of feed for livestock 60
Chapter 6 CONCLUSIONS 86-94
6.1 General 86
6.2 Objective of the Study 87
6.3 Methods 87
6.4 Major findings 88
6.5 Recommendations 93
REFERENCES 95-99
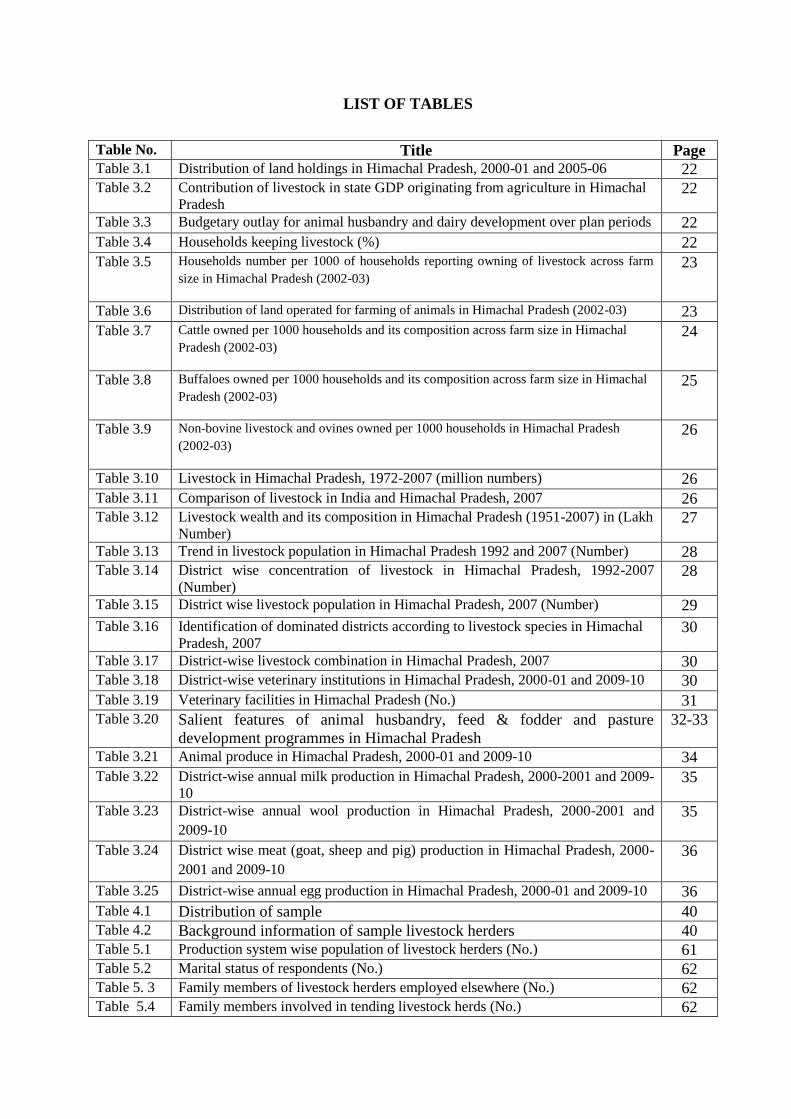
LIST OF TABLES
Table No. Title Page Table 3.1 Distribution of land holdings in Himachal Pradesh, 2000-01 and 2005-06 22 Table 3.2 Contribution of livestock in state GDP originating from agriculture in Himachal
Pradesh 22
Table 3.3 Budgetary outlay for animal husbandry and dairy development over plan periods 22
Table 3.4 Households keeping livestock (%) 22
Table 3.5 Households number per 1000 of households reporting owning of livestock across farm
size in Himachal Pradesh (2002-03)
23
Table 3.6 Distribution of land operated for farming of animals in Himachal Pradesh (2002-03) 23
Table 3.7 Cattle owned per 1000 households and its composition across farm size in Himachal
Pradesh (2002-03)
24
Table 3.8 Buffaloes owned per 1000 households and its composition across farm size in Himachal
Pradesh (2002-03)
25
Table 3.9 Non-bovine livestock and ovines owned per 1000 households in Himachal Pradesh
(2002-03)
26
Table 3.10 Livestock in Himachal Pradesh, 1972-2007 (million numbers) 26
Table 3.11 Comparison of livestock in India and Himachal Pradesh, 2007 26 Table 3.12 Livestock wealth and its composition in Himachal Pradesh (1951-2007) in (Lakh
Number) 27
Table 3.13 Trend in livestock population in Himachal Pradesh 1992 and 2007 (Number) 28 Table 3.14 District wise concentration of livestock in Himachal Pradesh, 1992-2007
(Number) 28
Table 3.15 District wise livestock population in Himachal Pradesh, 2007 (Number) 29
Table 3.16 Identification of dominated districts according to livestock species in Himachal
Pradesh, 2007 30
Table 3.17 District-wise livestock combination in Himachal Pradesh, 2007 30 Table 3.18 District-wise veterinary institutions in Himachal Pradesh, 2000-01 and 2009-10 30
Table 3.19 Veterinary facilities in Himachal Pradesh (No.) 31 Table 3.20 Salient features of animal husbandry, feed & fodder and pasture
development programmes in Himachal Pradesh
32-33
Table 3.21 Animal produce in Himachal Pradesh, 2000-01 and 2009-10 34
Table 3.22 District-wise annual milk production in Himachal Pradesh, 2000-2001 and 2009-
10 35
Table 3.23 District-wise annual wool production in Himachal Pradesh, 2000-2001 and
2009-10
35
Table 3.24 District wise meat (goat, sheep and pig) production in Himachal Pradesh, 2000-
2001 and 2009-10
36
Table 3.25 District-wise annual egg production in Himachal Pradesh, 2000-01 and 2009-10 36
Table 4.1 Distribution of sample 40 Table 4.2 Background information of sample livestock herders 40 Table 5.1 Production system wise population of livestock herders (No.) 61 Table 5.2 Marital status of respondents (No.) 62 Table 5. 3 Family members of livestock herders employed elsewhere (No.) 62 Table 5.4 Family members involved in tending livestock herds (No.) 62

Table 5.5 Utilization of rangelands for grazing livestock herds (multiple %) 63
Table 5.6 Area of rangelands with exclusive rights for daily grazing 63 Table 5.7 Livestock herders having own area of forest 63
Table 5.8 Livestock inventory (over one year) on sample herds in 2011 (No.) 64
Table 5.9 Livestock inventory (over one year) on sample herds in 2001 (No.) 64
Table 5.10 Change in overall livestock (over one year) in 2011 over 2001 (No.) 64
Table 5.11 Mean value of different type of livestock (over one year) in US $* 65 Table 5.12 Problems of livestock herders, 2011 (Multiple % response) 66 Table 5.13 Problems of livestock herders, 2001 (Multiple % response) 66
Table 5.14 Reasons for change in ownership since 2000 year (Multiple % response) 67
Table 5.15 Response of herders in making additional investment on livestock 67 Table 5.16 Type of animals for additional investment 68 Table 5.17 Basis of making additional investment on livestock 68
Table 5.18 Response of herders in meeting feed requirement for additional livestock 69
Table 5.19 Production of milk during last 12 months (kg) 69 Table 5.20 Annual estimates of animal products realized by livestock herders (kg) 70 Table 5.21 Processing of animal products (No.) 71 Table 5.22 Consumption pattern of animal products on livestock herding households (kg) 72 Table 5.23 Marketing problems in the sale of animal products (Multiple No. & % response) 73 Table 5.24 Use of livestock for guests, wedding, etc, 2010-11 (Number and value in US $) 74
Table 5.25 Sale of adult livestock during 2010-11 (No.) 75
Table 5.26 Sale of young stock, 2010-11 (No.) 75
Table 5.27 Sale of adult livestock, 2010-11(US $*) 76 Table 5.28 Sale of young stock, 2010-11 (US $*) 76 Table 5.29 Disposal/marketing of animal products, 2010-11 77
Table 5.30 Unit price received by livestock herders for different animal products, 2010-11
(US $)
77
Table 5.31 Processing of livestock products 78 Table 5.32 Marketing of value-added livestock products from animals’ fibre and skins/hides 79
Table 5.33 Unit price of value-added products made from animals’ fibre and skins/hides (US $) 79
Table 5.34 Persons involved in value added products from animals’ fibre and skins/hides 79 Table 5.35 Annual income from secondary uses of livestock (US $) 80
Table 5.36 Composition of annual gross household income, 2010-11 (US $) 81
Table 5.37 Land and durable assets on livestock herding households 82 Table 5.38 Cropping pattern of livestock herding households (ha) 83
Table 5.39 Production of grain and fodder on farms of livestock herding households (kg) 83 Table 5.40 Marketing of grains and fodder on farms of livestock herders (kg) 84 Table 5.41 Unit price of grain and fodder crops sold (US $/kg) 84
Table 5.42 Purchase of grain and fodder on livestock herding households (kg) 85
Table 5.43 Prices of crop residues during 2010-11 (US $/kg) 85
Table 5.44 Purchase of feed for livestock 85
LIST OF FIGURES
Figure
No.
Title Page
Fig 4.1 Map of Himachal Pradesh showing the selected districts 38
Fig 4.2 The sampling design 39
Fig 4.3 Map of Lahaul & Spiti district showing sample villages in Himachal Pradesh 41
Fig 4.4 Map of Chamba district showing sample villages in Himachal Pradesh 42
Fig 4.5 Routes followed by migratory livestock herders in the selected ecosystem of
H P
43
LIST OF PHOTOGRAPHS
Photo
No.
Title Page
Photo 1. Data collection in process iv
Photo 2 Livestock grazing in alpine pastures v
Photo 3 Livestock migration v
Photo 4 Livestock products and services vi
Photo 5 Livestock based and other crop activities vii
i
EXECUTIVE SUMMARY
The present study carried out in Lahual-Spiti and Chamba districts of Himachal Pradesh
mainly confined to three major livestock rearing ethnic groups namely the Gujjars producing
buffalos, the Gaddis producing sheep & goats and Bodhs producing chegu goats in addition
to other livestock. The corresponding livestock system followed by these communities
includes tranhumance-1, transhumance-2 and agro-pastoralism. A total sample of 100 (25
Gujjar households, 50 Gaddi households and 25 of Bodh households) was drawn through
proportional allocation following multistage random sampling. The primary data pertained to
2010-11 agricultural year. The findings emanated from secondary data reveals that livestock
accounted for 30% in the state agriculture GDP despite decline in the budget outlay from 10th
Five Year Plan to 11th
Five Year Plan. As far as the recent trend is concerned there has been
increase in cattle, buffaloes and goats population, and resultantly overall increase in total
livestock population, however, sheep, horses & ponies have shown declining trend in the
state.
Further the analysis of data collected from NSS report 493, reveals that in Himachal Pradesh,
upto 0.04 ha size class of operational holding 6 to 100 % of the area was operated for farming
of animals and it was entirely used for dairy animals, however, at the overall level, 0.41 % of
the operational land was used for farming of animals, out of which nearly 78 % meant for
dairying. The estimated number of cattle owned by 1000 households stood at 1398, that is,
more than one cattle per household in Himachal Pradesh and the estimated number of such
households was 5, 87,500 (48.09% of total). The number of cattle (8000 per 1000 households,
that is 8 per household) was the highest in the farm size group of 7.5 -10.0 ha followed by
6000 per 1000 household, that is, 6 per household in the farm size group of 10-20 ha. In case
of buffaloes their number per 1000 households was 617 on all sizes of operational holding
with a maximum of 3000 per 1000 household in the farm size category of 10-20 ha.
Buffaloes were not owned by any of the landless category household which clearly signifies
the strong land- livestock relationship in the state. As many as 3, 84,900 households (31.51%)
owned buffaloes in Himachal Pradesh. In all 2, 35,000 households (19.24%) possessed sheep
& goats in Himachal Pradesh. As many as 5000 sheep & goats per 1000 households, that is, 5
sheep & goats per household were owned by the households in Himachal Pradesh.
Based on primary data analysis, the study found that 1.38 men, 0.50 women and 0.70 children
with their total of 2.56 per household were engaged in tending livestock herds. However, the
number of persons involved in tending livestock herds per household was the highest (6.52)
on transhumant-1 (Gujjars) followed by 1.48 on transhumant-2 (Gaddis) and below one (0.76)
on agropastoralist (Bodh) households. The rangeland with exclusive right for grazing within a
walking distance from the village or place of residing/halting/transitory camp ranged from 36
ha on transhumant-1 group to 201 ha on transhumant-2 of livestock herders, with overall
average of 88 ha. None of the livestock herder had their own forest which could supply fuel
wood for human beings and grass & forage for the livestock maintained by such households.
At the individual level there has been a slight increase in the population of cattle, buffaloes,
horses and donkeys while sheep & goats declined in their number due to among other things,
shrinking of grazing areas and disliking of the profession by the younger generation
inasmuch as it involves migrating system throughout the year. As regards hurdles in livestock
rearing, the problems of shrinking grazing area and non-availability of veterinary aid were
less severe than nowadays. Similarly, the problem of infestation of grasslands by obnoxious
weeds has become more serious now as compared to a decade ago.
ii
As many as, 40 to 56% of livestock herders wanted to make investment on additional
livestock in order to earn more profits through increased production of milk and milk
products, wool and increased production of farm yard manure were important motivating
factors for making additional investment. To meet out the additional requirements of feed and
fodder, 14% were prepared to lease-in additional pasture land and in some cases by buying
hay, wheat and paddy straw from the local farmers and market.
The findings further reveals that yoghurt (curd), cheese, ghee, kurut (made from colostrums),
butter, wool and goat hair were the important livestock products harvested by livestock
herders. Milk was the most important item of household use; its per capita consumption
varied from 45 kg per annum on agropastoralist (Bodh) households to as high as 130 kg per
annum in case of transhumant-2 (Gaddis). The consumption of animals for meat purpose was
found only in respect of transhumant-2 (Gaddi) and agropastoralist (Bodh) livestock herding
households where it amounted to 22.72 kg and 15.60 kg per head per annum, respectively.
The role of women was more pronounced than their male counterparts; in case of
transhumant-1 (Gujjars), the processing of livestock products (the wool and sale of live
animals for meat) was mainly confined to men on transhumant-2 (Gaddis). In case of agro-
pastoralist (Bodh) households, both men and women were equally involved.
Non-remunerative price for wool was the most important problem being faced by majority of
transhumant-2 (Gaddis) sample households rearing sheep & goats. Non-remunerative price of
milk, lack of veterinary aid and no price for dead sheep & goat were some other problems
reported by around 21-22% of the livestock herders. Likewise, lack of transportation facility
in disposing of their animal products due to their migratory nature was yet another problem
which was reported by buffalo and sheep & goat herders. Small ruminants, sheep & goats
were used for meat purpose; however, large ruminants were not consumed as a tradition in
the area.
Only unproductive sheep & goat animals that had attained the age of maturity were sold for
meat/mutton to the traders. The overall sale proceeds from all animals including adults and
young stock was assessed at $ 2306.74 per household per annum in the study area. The
quantity of milk sold per household per annum amounted to 1322 kg priced at $ 0.47 per kg.
The amount of wool sold was 50.02 kg at an average price of $ 0.94 per kg. Similarly, the
amount of cheese and meat sold was 46.90 kg and 32.35 kg per household per annum at a
price of $ 3.90 and $ 3.38 per kg. None of the sample household prepared value-added
products from animal’s fibre like woolen yarn, cashmere, pullovers, socks, etc.
The fodder crops like hay and crop residues of wheat & paddy as straw were purchased only
by the transhumant-1 (Gujjar) buffalo herders and agro-pastoralist (Bodh) rearing cattle along
with chegu goats. Besides, barley as feed grain was also fed to chegu goats by the agro-
pastoralists in Spiti region of Himachal Pradesh. The transhumant-2 (Gaddis) group
producing sheep & goat herds did not purchase either of the fodder crops produce or crops
residue as fodder in that these small ruminants were fed only through grazing.
The policy implications invite the attention for iimprovement of support lands by employing
different measures for the control of invasive shrubs, weeds, etc. through enhanced public
investments for the establishment of high yielding varieties of grasses and legumes and for
the conservation of local nutritious grass species. Fodder crops can also be propagated
wherever possible e.g. on banks of small streams, bunds and wastelands. Forage crops
cultivation along with cereals is another possible option for increasing fodder supply.
Appropriate price support for livestock products particularly the milk & its products, the wool

iii
and live animals for meat, etc. In addition establishment of markets for milk, farm yard
manure of large ruminants and small ruminants’ droppings collected at the place of migration
is also essential.
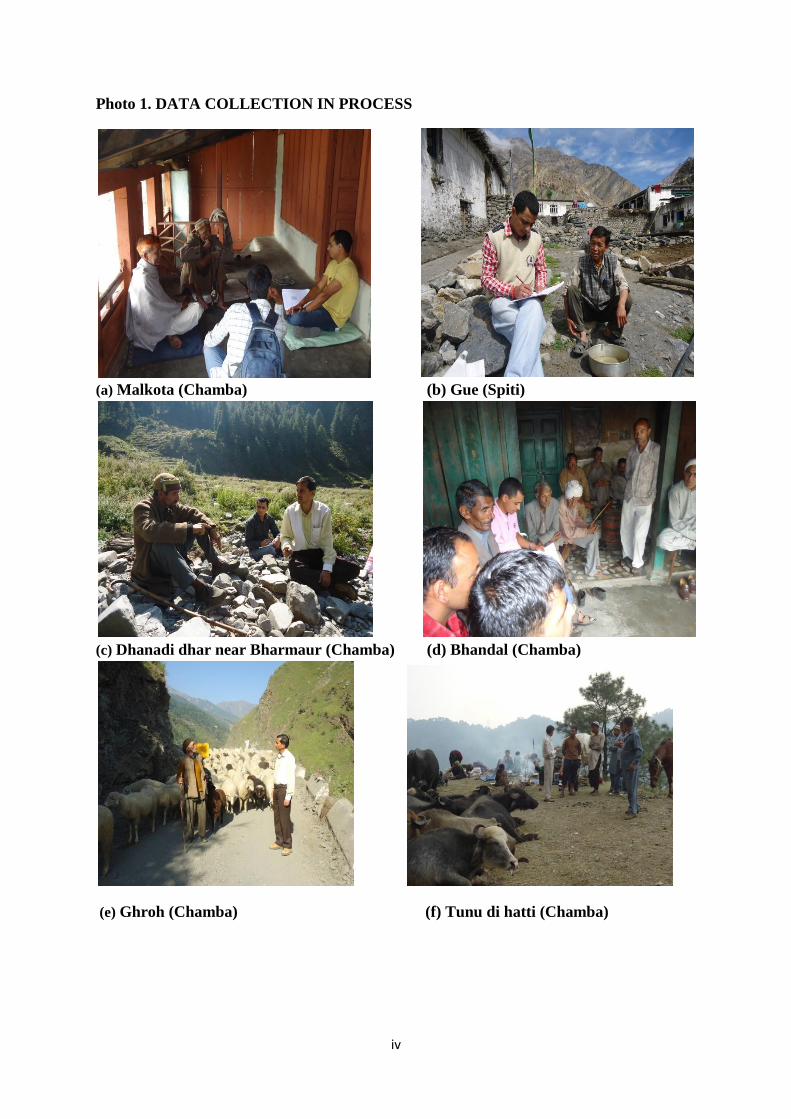
iv
Photo 1. DATA COLLECTION IN PROCESS
(a) Malkota (Chamba) (b) Gue (Spiti)
(c) Dhanadi dhar near Bharmaur (Chamba) (d) Bhandal (Chamba)
(e) Ghroh (Chamba) (f) Tunu di hatti (Chamba)
v
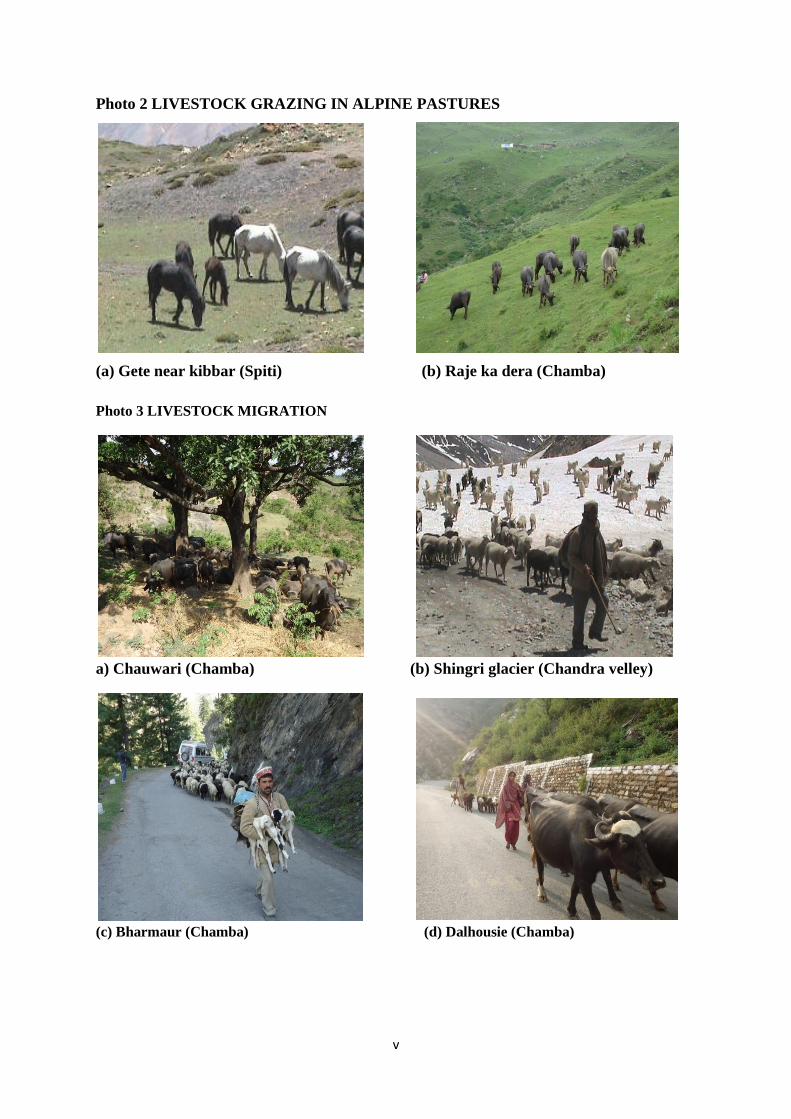
Photo 2 LIVESTOCK GRAZING IN ALPINE PASTURES
(a) Gete near kibbar (Spiti) (b) Raje ka dera (Chamba)
Photo 3 LIVESTOCK MIGRATION
a) Chauwari (Chamba) (b) Shingri glacier (Chandra velley)
(c) Bharmaur (Chamba) (d) Dalhousie (Chamba)
vi
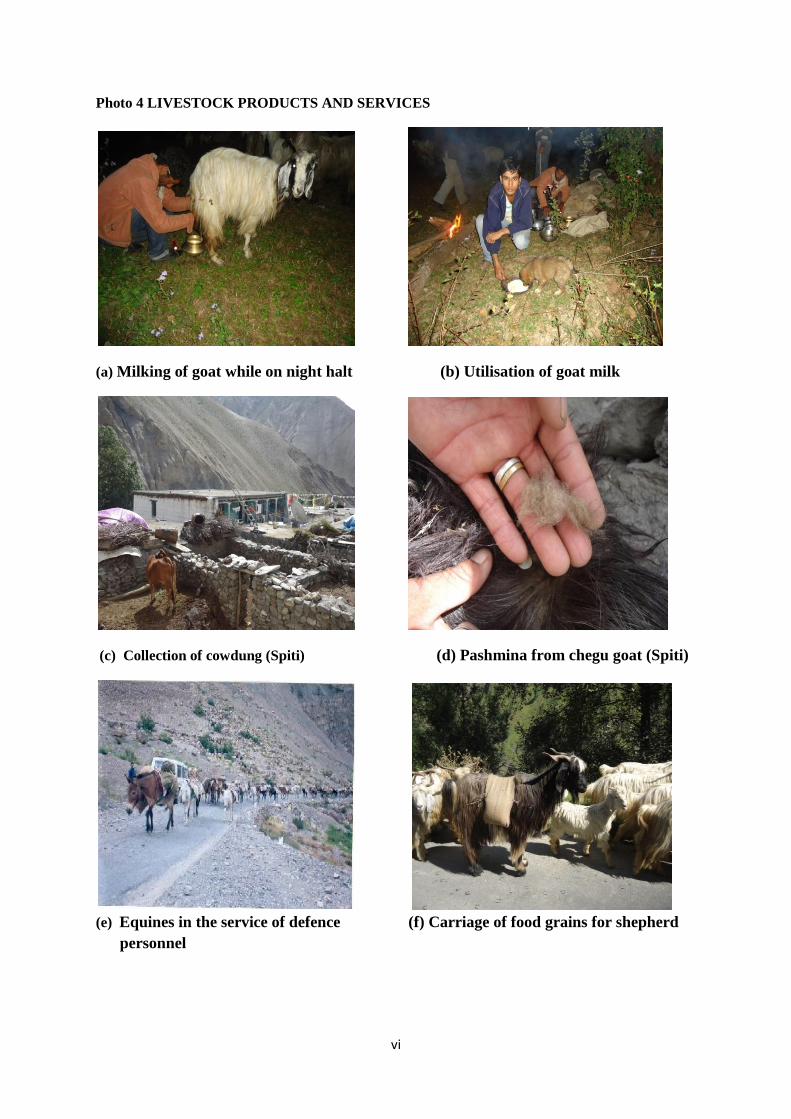
Photo 4 LIVESTOCK PRODUCTS AND SERVICES
(a) Milking of goat while on night halt (b) Utilisation of goat milk
(c) Collection of cowdung (Spiti) (d) Pashmina from chegu goat (Spiti)
(e) Equines in the service of defence (f) Carriage of food grains for shepherd
personnel
vii
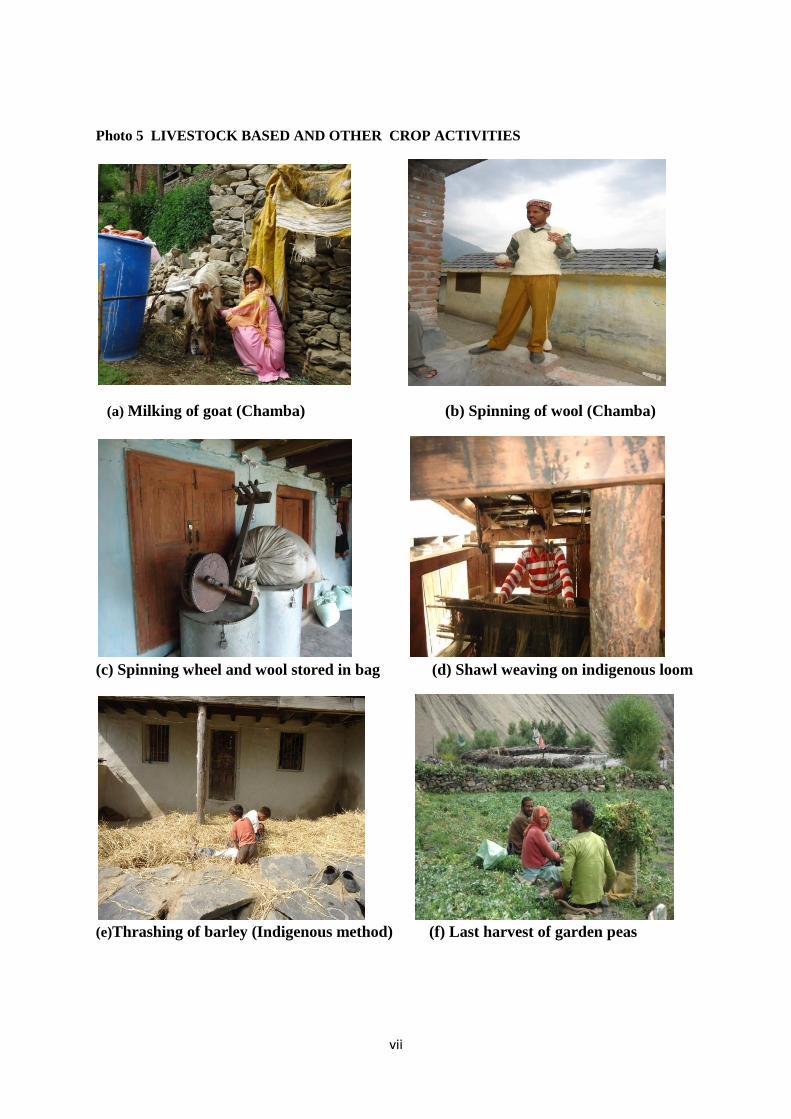
Photo 5 LIVESTOCK BASED AND OTHER CROP ACTIVITIES
(a) Milking of goat (Chamba) (b) Spinning of wool (Chamba)
(c) Spinning wheel and wool stored in bag (d) Shawl weaving on indigenous loom
(e)Thrashing of barley (Indigenous method) (f) Last harvest of garden peas
1
CHAPTER 1
INTRODUCTION
1.1 Background
Ecological systems play a fundamental role in supporting life on earth at all hierarchical scales. They
form the life support systems within which all economic development takes place. Ecosystem
functions have been defined as “the conditions and processes through which natural ecosystems, and
the species that make them up, sustain and fulfil human life” (Daily, 1997). Ecological services are
those ecosystem functions that are perceived to support human welfare (De Groot, 1992; 1994;
Barbier et al., 1994; Costanza et al., 1997b). They consist of flows of materials, energy and
information from natural capital stocks which combine with manufactures and human capital services
to produce human welfare (Costanza et al., 1998). As an ecosystem degrades it loses biodiversity
value and ability to optimally perform ecological functions and vice versa. Because of the direct use
of the structural value provided by these ecosystems and in most cases of free access to such
ecosystems they are under heavy utilization pressure and are rapidly disappearing. The harmful
effects of the degradation of ecosystem services are being borne disproportionately by the poor and
are sometimes the principal factor causing poverty and social conflict as well as impacts like
desertification, deforestation, global warming and food and water scarcity that could have profound
implications for traditional livelihoods, industry, biodiversity, soil and water resources, and hence,
agricultural productivity.
The Hindu Kush Himalayas (HKH) provides food, fuel, and fresh water-which are needed for
human survival and are fundamental resources for tourism and economic development.
However, anthropogenic factors including resource use, high rate of development and
construction and higher visitation rates have caused large scale degradation of natural
ecosystem of the Himalayas leading to reduced flow ecosystem service values affecting
human wellbeing.
Rangelands account for over 55% of terrestrial ecosystems of the Hindu Kush Himalayas
(HKH). Livestock production either through sedentary management or nomadic pastoralism
or a combination of both is the traditional and primary use of these rangelands. Livestock
production is not only a major livelihood means for the local pastoral or agropastoral
communities but also an important part of the national economies of HKH region. Even in
countries like China where the contribution of livestock production in the pastoral area to the
national GDP is very low, though for local communities living in Tibet, West Sichuan and
Qinghai, livestock production based on extensive rangelands is still a very important part of
2
their life and economic incomes. Livestock production in the HKH is multipurpose and its
real importance to local people is often underestimated or disguised by current accounting
methods based on market values. Holistically valuing such complex systems, although
always difficult, is extremely necessary to the formulation of right policies not only on
livestock production but also on rangeland resources management which has often been
ignored by the national governments. The necessity to value the livestock production has
been further felt with the recent realization and emphasis on the multifucntionalities of the
rangeland ecosystems. Knowing the true values of livestock production would be essential
for the debates and designing of payment of ecosystem services which has been a hot topic
for the HKH.
There have been some attempts made to review the economic importance of pastoralism,
such as the one supported by UNDP and conducted by World Initiative for Sustainable
Pastoralism (WISP) in 2006. These studies though very meaningful, their usefulness for HKH
is compromised for the following reasons: firstly, they were conducted at national level and
no analysis was given for the states, provinces, autonomous regions or districts of the
countries; secondly, the previous studies mostly focused only on pastoralism or agro
pasotralism and ignored the sedentary livestock management which is also an important part
of livestock production in HKH; thirdly, most of these studies were done by experts outside
the HKH through analyzing limited available published literature or country annals, and
could, therefore, not make a deep analysis to reflect the true picture. What is more, many
more similar studies were undertaken using data collected five years ago and thus could not
any more reflect the current situation considering fast development of the region.
1.2 The Indian Himalayas
The Indian Himalayas extending between east of Afghanistan and Pakistan to the west of
Myanmar cover approximately 5,91,000 km2 or 18% of the India's land surface and spread
over the states of Jammu and Kashmir, Himachal Pradesh, Uttarakhand, Sikkim, Arunachal
Pradesh and some parts of Assam and West Bengal. In the form of an arc it stretches over
2,800 km from arid Mediterranean 'areas' in the west, to wet Chinese Malayan 'areas' in the
east. The two extremes are very different both ecologically and socio-culturally. The Indian
Himalayas on the east-west axis can be divided broadly into two geographical divisions of
East and West Himalayas.
Approximately 51 million people (6% of India’s population) inhabit the Indian Himalayas.
The region is low in human density as compared to the rest of India (mean=123.7

3
persons/km2, as against 273.0 persons/km
2 for the rest of India). The region is
underdeveloped, the mean CMIE (Center for Monitoring of Indian Economy) Index of
development being 82.0 as against 100 for India. The most important aspect of the livelihood
of the Himalayan people is their high dependence on natural resources. The region, in general,
is characterized by rugged, undulating terrain, small isolated villages, an agro-pastoral
economy, small land holdings, dominance of dry farming and less area covered by irrigation.
Added to these are the multiple environmental hazards that have further jeopardized the
economic condition of the people (Badola & Hussain, 2003a). Thus the economy lacks
resilience and is highly vulnerable to shocks and stresses. From a public point of view that
aims to maximize social welfare (Merlo, 1995), evaluation becomes fundamental for
identifying socially acceptable solutions in management and planning decision-making
processes. It would help in generating information on the role of natural ecosystems in
sustaining the lives and livelihoods of local communities and the ways to address the
information, market and policy failures associated with these. Protecting and enhancing the
natural services that support livelihoods will have multiple benefits of reduced natural
hazards, diversified livelihood activities and enhanced productivity of agro ecosystems.
1.3 Livestock rearing in the Indian Himalayas
The four major linked modes of land production in the Indian Himalaya are agriculture,
pastoralism, production and sale of wool products and trade in medicinal herbs. Livestock
thus forms a regular source of income for these pastoralists, and hence, needs to be looked
into as a land-based production system. The nature and magnitude of these links between
various subsystems differ from place to place, depending upon the natural and environmental
conditions and the socio cultural traditions. The livestock rearing systems in the Indian
Himalayas can be broadly divided into three categories viz: nomadism, transhumance and
agro pastoralists. All the three categories can be found in the entire Indian Himalayan region
ranging from the Changpas of trans Himalayas in the Changthang region to the Bhutia’s,
Bakarwals, Gaddis, Jads and Marchas of Central Himalayas to the pastoralists and agro
pastoralists in the eastern Himalayan region.
The ecological, social, and economic potential is limited by the extremely inhospitable
conditions of high altitude settlement. Exploitation and mismanagement of alpine pastures
and forest degradation in the lower altitudes have been the focus of environmental
discussions in the region. Some of the best grazing areas have become protected after their
4
declaration as biospheres and sanctuaries causing a severe threat to survival of their livestock
while several forest areas have been encroached upon by individuals and brought under
cultivation, further denying these pastoralists their resources. A number of studies have
examined the changes in alpine grazing resources, their growth rate, consumption patterns,
and other parameters, however few studies have looked into the socio economic dimensions
of livestock rearing, the contribution of livestock to the household and local economy and the
trends of livestock holdings in the region during the more recent years.
As is well known, the mountain specificities namely, inaccessibility, marginality, fragility, niche and
human adaptation circumscribe development of these regions. While the first three specificities
constitute in varying degree, the constraints to development, the latter two like micro niches and
human adaptation mechanism suggest the potential available in these regions. The Indian Himalayan
Region (IHR) spreads over 2500 km from north western to north east Himalayas with a population of
over 30 million (highest among all the mountain regions). It encompasses 12 states of India including
Himachal Pradesh and Uttarakhand and is located between 210 57’ to 37
0 5’ N latitudes and 72
0 40’ to
970 25’ E longitudes. The climate is predominantly temperate; monthly mean temperature is around
100 C excluding the cold desert region while the annual rainfall ranges from 75 to 175 mm. The agro-
horti-livestock production system is followed by 90 % of the people living in the north western
Himalayas. Nearly 93 % of the farmers are marginal or small land owning families. The people
residing in all the mountain regions are disproportionately vulnerable, poor marginalized and do not
have adequate access to markets and social services leading to endemic poverty. They primarily
depend on the natural resources like land and forest for their livelihoods which in many cases are over
exploited manifested in deepening ecological crisis. The diversification of agriculture including
livestock is, therefore, suggested as a panacea for ameliorating economic conditions of the local
people and conserving the natural resources as well.
1.4 Livestock in Himachal Pradesh Himalayas
In Himachal Pradesh about 92 % of the population, mainly rural, is directly engaged in agriculture,
horticulture and animal husbandry. About 18% of the total Gross State Domestic Product (GSDP)
comes from agriculture and its allied sectors (2008-09). The state is divided into four agro-climatic
zones. The rearing of livestock is an integral part of the farming system particularly in zone three
(high hills temperate wet zone)) and four (high hills temperate dry) where livestock herders migrate
and use the vast available rangelands. The livestock not only provides milk, wool, mutton, hides, skin,
manure and draught power for agriculture production, but is a source of self employment to rural
people. Studies have shown that animal husbandry contributes 10 to 32 % of household’s income in
different agro-climatic zones of the state. The importance of livestock sector in the state is also
5
evident from the fact that 83 % of the households keep some bovine, 27 % rear goat (17% goat and
10% sheep) while the poultry is kept by 2 % of the households. The livestock population though
seems to have stabilized during the past three decades; its composition has undergone noticeable
changes, especially at the district or regional level. The studies have shown that livestock
composition is changing in favour of buffaloes and small ruminants particularly of goats
mainly guided by the market forces, i.e, increasing meat demand (Rathore and Jairth, 2002;
Kumar et al. (2004). These changes have important implications towards increased demand for the
livestock products, draught power availability and ecological pressure (Chand, 1995). It is against this
backdrop that the issues like changes in the composition and trends in the livestock population and
livestock products, the market and non market contribution of livestock to herders of varied ethnic
groups need to be investigated to arrive at the true value of the contributions of the vast rangelands to
mankind via livestock production systems. The quantification of these contributions would bring out
the importance of designing appropriate policies for the sustainable development of these rangelands.
Against this background, ICIMOD sponsored this study on the valuation of livestock
production in the HKH region by using the latest available data. The analysis focused on the
states, autonomous regions, provinces or districts of India, Pakistan, Bhutan, Nepal and China
which are the partner countries. The study was conducted by national agriculture economists
with collaboration of an international consultant. In India the study was jointly conducted by
the Wildlife Institute of India, Dehra Dun (Uttarakhand) and the Himachal Pradesh
Agricultural University, Palampur (Himachal Pradesh). The present report pertained to
Himachal Pradesh within the boundaries of the ICIMOD working areas in India. The states of
Jammu and Kashmir, Uttarakhand, Sikkim and Arunachal Pradesh have been covered by
Wildlife Institute of India, Dehra Dun (Uttarakhand).
1.5 Objective of the study
As alluded to above, the overall goal of the study was to understand both the market and non-
market values generated by livestock production in the HKH area so as to facilitate debates
on the importance of rangelands and adequate payment for Ecosystem Service Schemes. The
specific objectives of the study are as under:
To collect and analyze state and district wise data on livestock production and its
trends over the last two decades in Himachal Pradesh;
To analyze the market and non-market contribution of livestock production under
different farming systems followed by different ethnic groups;
6
To assess the contribution of livestock production to the local revenue and household
economy of different ethnic groups and estimate its contribution at the state level.
1.6 Outcome and deliverables
The main outcomes of the study are as under:
The trends in the composition of livestock population both at the state and district
levels;
Quantification of the contribution of livestock towards the livelihoods of different
ethnic groups/population in terms of household income and employment;
Quantification of the market and non-market contribution of livestock towards
household/state economy
The documentation of indigenous knowledge and imminent market and non market
threats faced by livestock herders such as the effect of climate change on the
ecological sustainability of the rangelands
Inputs for designing appropriate policies for improving the productivity of livestock
and protecting and conserving the rangelands on a sustainable basis;
Research gaps in the existing literature on livestock and rangelands
Insights for future R&D issues related to livestock production and ecological
sustainability of the vast rangelands available in the HKH especially in the context of
climate change
7
CHAPTER 2
MARKET AND MARKET VALUE OF LIVESTOCK: A REVIEW OF ISSUES
As livestock enterprise is interwoven with agriculture since ages, India possesses a great
genetic reservoir of livestock species which are reared to meet the domestic and international
demand for milk, meat, fibre and leather. With this in view, this chapter reviews the available
literature and brings out the major issues from findings of different studies undertaken on the
market and market value of livestock and its products in India in the succeeding paragraphs.
2.1 Livestock herders in Himachal Pradesh
There are a number of studies that have examined the socio-economic features of livestock
herders. These studies have shown that Gaddi and Gujjar communities are mainly confined
to Chamba district are following a transhumance livestock production system, whereas the
Bodhs residing in Lahual-Spiti district of Himachal Pradesh follow agro-pastoralism. The
Gaddis and Van Gujjars are traditionally and still predominantly buffalo and sheep & goats
breeders, respectively; however, Bodhs rear assorted livestock comprising cattle, chegu goats,
sheep and pack animals. Gaddis and Van Gujjars spend their summer in the high hills alpine
pastures located in Chamba district of Himachal Pradesh and winters in the low hills of
adjoining district of the state and boarder districts of other states like Punjab and Haryana.
Gaddis have their permanent home and land in Chamba district and they have also purchased
lands at the place of their migration in plain areas. The Van Gujjars (followers of Islam) who
were leading a nomadic life have been subjected to a cultural change and have become semi-
settled farmers as a result of getting bits of land (5 merla) during 1990s. The Bodh
community is permanent settler in Spiti valley of Lahual-Spiti distict where they grow barley,
garden peas, wheat and potato and rear animals. The animals are let loose in the alpine
pastures. The socio-economic life of Gaddis and Van Gujjars is the most pitiable due to their
migrating nature. Closure of pastures for the sake of forest development, biospheres,
sanctuaries and infestation of grasslands by obnoxious weeds were the major problems faced
by such communities. Not only this, the Van Gujjars were facing a major problem of
livelihood which they were eking out by selling milk in the cities (Negi, 1976; Singhal 1978;
Bhasin, 1988; Chauhan, 1990; Choudhary, 2002; Jaryal, 2005 and Pathania et.al, 2010). Most
of the areas along the Jammu border in Chamba district, which were the grazing pastures for
8
herds, have been sealed and their grazing permits also cancelled declaring those areas as
‘sensitive’ (Chaudhary, 2002). Yet another study reported that more than one-half Van Gujjar
dairymen households earned their income between Rs 10,000 to Rs 20,000 per year. Nearly
25% households earned more than Rs 10,000 annually. The living conditions of the Gujjars
were also pitiable as they lived in single room houses made from mud and thatches. Most of
them lived in a single room with their cattle and even cook their food in the same room. Only
3.5 % had separate toilets and 1% has separate sheds for cattle. Only 17 % of the Van Gujjars
listened to radio and 2% viewed television. Nearly 91 % of Van Gujjars did not have a cot to
sleep, 95 % did not have pressure cookers and only 1 % of them had telephone facility.
Literacy rate amongst the Gujjars community was the lowest in the state. Nearly 13 % males
had studied up to 5th
standard and only 1% have studied beyond matriculation (Jaryal, 2005).
2.2 Trading in all livestock products
With the WTO agreement in the early 1990s, India entered into the global market. Since then
trading of livestock products has progressed and it is, therefore, imperative to analyse the
changes in trade performance in the aftermath of WTO. The studies in this context have
shown that the livestock sector exported particularly of bovine meat, dairy products and eggs,
have registered a considerable rise and liberalization policies too seem to have further
augmented their growth. As a result of which the domestic price of exportable commodities
like meat has increased while that of importable commodities like milk has decreased. India
has the potential to significantly increase and expand the export of livestock products for
which domestic policy initiatives coupled with increased production and productivity are
important (Jha, 2004; and Kumar et al, 2007).
The share of milk products and eggs to total value of livestock sector export have gone up
considerably from 5 to 14 % and 3 to 10 % between 1992-94 and 2002-04, respectively
(Bardhan, 2007). At present India is a net exporter of all livestock products, except hairs and
wool as well as hides and skins. In dollar terms, only leather and leather products, meat and
meat products, dairy and dairy products, and readymade garments (RMG) of wool have
recorded significant increases (Raju (2007). Likewise in was observed that the export of dairy
products is limited to butter and ghee together with negligible quantities of skimmed milk
powder and whole milk powder. India possesses comparative advantage in dairy products due
to higher quantum and lesser cost of production over New Zealand, Australia and U.S.A.
(Kalamkar, 2007).
9
The major export destinations for Indian dairy products like cheese, whey based fermented
products, milk food for babies, other milk powder, butter and ghee are the Indian sub-
continent, gulf region and South-East Asia. The value added dairy products like butter and
ghee were more profitable than value added liquid milk varieties, viz., standardized milk,
toned milk and full cream milk (Hazra et al, 2007 and Rangasamy and Dhaka, 2007). The
growth in per capita income and shift in consumption pattern towards livestock products
would lead to acceleration in demand for livestock products and thus is expected to give a
fillip to this sector (Dastagiri, 2002).
2.3 Trading in meat, wool, hides and skins and their markets
India is the sixth largest meat producing country of the world by contributing 2.3% of the
global meat production after China (28.7 %), U.S.A. (14.9 %), Brazil (7.7 %), Germany (2.6
%) and France (2.4 %). The Indian economy is now poised for achieving the “Pink
Revolution”. Of the total meat production in the country bovine meat contributes the lion’s
share (about 60 %) followed by sheep and goat (15 %), poultry (12 %), pig (10 %) and other
(3 %). Furthermore, India is the major buffalo meat producing country of the world
contributing 48.6 % to global meat production. Wool and hair as well as raw hides and skins
are the basic raw materials for the woolen garments and leather industry, respectively. By and
large, the markets for these livestock products are organized.
The studies have shown that India possesses the potential to achieve number one position in
meat production and there by “Pink Revolution” through buffalo is not far behind to the other
revolutions such as green, white and blue which have already been achieved. India’s total
exports of meat and meat preparations have grown at the rate of 10 to 14 % and are exported
to UAE, Malaysia, Philippines, Iran and Saudi Arabia. However, its vast export potential
could not be tapped due to foot and mouth diseases, small holding of animals, inadequate
modern abattoirs facilities, lack of refrigerated trucks and cargo facility, difficulties in
traceability and quality enforcement, negative propaganda, lack of pragmatic policy, low pace
of modernization and establishment of slaughter houses, lack of value added products and
global competitiveness (Bhardwaj and Panwar, 2007; Prakash et al., 2007; Singh et al. 2007).
Likewise, it has been reported that about 68% of sample shepherds sold about 61% of wool in
village itself and the remaining in the nearby markets. One kilogram of wool had Rs. 3.4
marketing cost, of which labour charges accounted for about 91%, followed by transportation
cost, (about 5 %), however, the marketing cost per kilogram of wool declined with the
10
increase in size of flocks. The skins & hides markets were held weekly wherein butchers or
small rural and urban traders carry raw produce and pay market charges at the rate of Rs
1/skin and Rs.5/hide to the organizers. The buyers and hoarders (exclusive middlemen) of
raw skins and hides treated them and finally disposed off to the tanner’s agent/tanner unit
(Waghmare et al., 2007; Singh, 2007).
2.4 Trading in milk and milk products and their markets
Milk being precious but perishable commodity requires quick disposal so as to reach the
ultimate consumer. Likewise, most of its products do perish quickly and require safe handling
in order to reach the ultimate destination. Although milk marketing through co-operatives
along with butter and ghee are, by and large organized, their success and failure stories do
exist across Indian states/regions. Furthermore, private traders exist for milk, khoya, cheese,
butter and ghee trade thereby charging higher prices from the consumers. Milk and milk
products marketing has attracted the attention of following studies during the last decade.
The studies in this regard have found that crossbred cows had higher productivity than of
buffaloes and indigenous cows which led to marketed surplus as percentage of total
production in the range of 68 % in intermediate zone to 73 % in sub-tropical zone in Jammu
and Kashmir (Wani and Wani, 2010). And in spite of growing presence of modern milk
supply chains, the traditional milk supply chain is still dominant (Kumar, 2010). Some
studies on marketing of milk reported that major channels of milk marketing, found that of
the total milk produced over 95 % was marketed; and of the total milk marketed, about 40-55
% was sold directly to the rural and urban consumers while private agencies accounted for
the remaining quantity. Furthermore, the producer’s share in consumer’s rupee was inversely
proportional to the length of distribution (Banafar, 2007; Chaudhary, 2007; Gauraha, 2007;
and Singh et al. (2007). It has been found that the processing and marketing sectors in Indian
dairying have been suffering from high costs and lack of competitiveness, not the milk
production sector with India’s lowest milk yield in the world (Singh, 2007). Likewise, the
studies on the performance of milk marketing through co–operatives in India reported that the
western and northern region milk co-operatives have done well while they have lagged
behind in the eastern region. Yet, the milk co-operatives emerged to be a better option for
organized procurement of milk in the rural area also found that the milk producers had the
tendency to sell their milk through producer-co-operative-retailer-consumer channel even
though the producer’s share in consumer’s rupee was the highest in direct channel. Of the
11
total milk sold in the district, 32 % was procured through 450 primary village co-operatives.
Pali private sector dairy assured better milk price to the producers and also run a number of
welfare schemes to the members so as to enhance their living standards. On the other hand it
has been reported that marketing through ‘milk producers’ cooperative society’ was preferred
because of timely and assured payment, payment at small intervals and precise measurement.
The authors further suggested that there is a need to strengthen the cooperative marketing in
the district to reach the maximum milk producers so that this enterprise becomes more
profitable for them. The producer consumer channel was reported to be the most
remunerative due to the highest producer’s share in consumer’s rupee (Banafar, 2007; Chand,
2007; Kaul, 2007; Deokate et al. 2007; Singh and Joshi, 2007; Chand et al. (2009).
Besides, the co-operative plant revealed more efficiency in the manufacture of toned milk,
standardized milk, full cream milk and ghee whereas the private plant had an edge over co-
operative dairy plant in the manufacture of butter and skimmed milk powder (Babu and
Verma; 2010). Further, the net returns from milk processing and value- addition were
significantly higher than fresh milk marketing. However, since the value addition to milk
being capital intensive, it was often beyond the reach of the resource poor small milk market
agents indicating need for increasing access to formal micro or small–scale credit through
appropriate policy formulation of the financial institutions. With increasing awareness among
consumers regarding quality and safety of milk and its products, efforts should be made to
evolve some sort of licensing, regularization and legal control to link traditional milk market
agents with formal market agents without disturbing their enterprise in the state. It would
help maintain the quality and safety of milk and milk products (Kumar et al, 2010).
2.5 Trading in live animals and cattle fairs
Livestock development starts at the marketing end as it provides the necessary incentive to
the producers to adopt scientific methods of practicing animal husbandry. Marketing of
livestock such as milch cows and buffaloes, bullock, he buffaloes, camels, horses, donkeys
and mules, sheep and goats, pigs, yak, mithun, etc is not only a source of income to the
farmers and animal dealers to supplement their household income but it has even become a
big business to the rearers/farmers/dealers in some of the developed Indian states/regions. Yet,
livestock trading is mostly done through cattle fairs on unscientific lines. A plethora of
studies on the status and functioning of animal fairs found that holding of cattle fairs in
various states significantly contributes towards the income of livestock holders but
12
expenditure incurred by the Government in holding these fairs was not adequate. In Rajasthan
state alone 260 animal fairs were held during a year, of which 10 were the state level fairs.
Most of the markets operated only once in a year with a duration of one to four weeks. Of the
total 230 cattle fairs organized in UP state, 21 % were organized at municipality level, 27 %
at panchayat samiti level and the remaining 52 % at gram panchayat level. Sheep and goats
were marketed in separate markets mostly by Khatika and Kasai communities charging high
margins ranging from 24 to 42%. The organizers (mostly the private sector unorganised
machinery) provided the necessary facilities at the fair site and collected entry fee and
revenue while buyers from outside state also paid sales tax which varied from fair to fair. As
much as 95% of the animal’s transacted in cattle fairs included bullocks, calves (young male
stock of cows) and camel. Trading of buffaloes and small ruminants constituted only 1 %.
The farmer farmer channel was the most efficient marketing channel for both male and
female cattle and buffalo marketing and farmer middlemen wholesaler farmer
channel was the least efficient one (Burark and Jogi, 2007; Chauhan and Dogra, 2007; Jain
and Khan, 2007; Suhag et al., 2007; Shukla and Hussain, 2007; Singh and Verma, 2007;
Kumar et al., 2009; Gupta and Suresh, 2010; and Biswal and Kumar, 2011).
A study on the problems and constraints in cattle fairs, pointed out that 90% of the buyers
faced the problems of unauthorized involvement of intermediaries charging handsome
amount and controlling authority did not play their due role. Lack of funds, high marketing
charges, high intermediaries’ commission, high price of animals ranged between 50 and 70 %.
Lack of credit and insurance facilities, involvement of intermediaries together with
unlicensed intermediaries, non-co-operative role of local bodies were the other constraints
faced by buyers. The sellers faced non-availability of bank facility and have to carry huge
cash amount with them, as the transaction in cattle market took place in late hours. Similarly,
due to non-availability of cattle shed in the market area, sellers faced the problem to provide
drinking water and keeping their animal in safest place in rainy/summer days. The authors,
therefore, suggest the regulation of livestock markets together with the development of
proper market intelligence and market information system to acquaint about market arrivals,
prevailing market prices and other market information including market fee (Beohar et al.,
2007).

13
2.6 The general issues emerged from studies reviewed
The following major issues have been emerged from the studies reported in the preceding
sections:
Closure of pastures for the sake of forest development, creating wetlands,
biospheres, sanctuaries and infestation of grasslands by obnoxious weeds creating
severe problems to the livestock migrating communities.
Strict prohibition by sealing areas and cancellation of grazing permits for people
and livestock movement along the interstate and international bordering area on
account of defence activities.
Poor and pitiable living conditions of the Gujjar and Gaddi livestock herders while
on migration as they have to live in single room houses made from mud and
thatches. Most of Gujjars live in a single room with their buffaloes and even cook
their food in the same room. Low literacy due to non availability of schooling
facilities near migrating sights and lack of information and communication
network are other constraints in development.
Foot and mouth diseases, small holding of animals, inadequate modern
infrastructure for value addition and marketing facilities and global
competitiveness coming in the way of tapping huge export potential for meat.
Lack of access to formal micro or small–scale credit through appropriate policy
formulation of the financial institutions for the resource poor small milk market
agents.
Lack of awareness among consumers regarding quality and safety of milk and its
products, and poor linkages of traditional milk market agents with formal market
agents and non regulation of legal control through licensing.
Not low milk yield but high costs of processing and marketing in Indian dairying
affecting the competitiveness in the international market.
Holding of livestock trading on unscientific lines through cattle fairs mainly in the
absence of basic facilities viz; cattle shed in the market areas, provision of drinking
water and keeping the animal in safest place in rainy/summer days, banking facility
in the late hours as the transaction in cattle market take place in late hours, etc.
Besides, inadequate public (government) support and non-co-operative role of
local bodies in holding such fairs are the other issues.
14
2.7 The current issues emerged from study undertaken in Himachal Pradesh
The issues related to livestock herds maintained by major ethnic groups viz, the Gujjars, the
Gaddies and the Bhots residing in high land alpine pasture eco system are as under:
Shrinkage of grazing areas due to commissioning of hydroelectric projects;
development of sanctuaries, bio-spheres; creation of wetlands; the afforestation
programme; the defence activities, etc. Various multipurpose projects like Changar
project, the Kandi watershed and now mid Himalayan project has led to shrinkage of
grazing areas significantly utilized by the migrating livestock graziers.
Encroachment on migrating routes on account of construction of roads and some
buildings, that is, colonies for mega projects’ staff and labourers.
Non availabilities of basic facilities like schooling for children, electricity for
temporary huts. Paths leading to pastures made of cutting stones & boulders.
Infestation of grasslands by obnoxious weeds like lantana, azeratum, parthenium, etc
in the plain and now in high land alpine pastures as well.
Non availability of markets for milk, farm yard manure of large ruminants and small
ruminants’ droppings collected at the place of migration.
The climate change effecting the growth of grass as the now in the alpine pastures
melts before the migrating routes via high reaches known as passages become
operational. By the time the livestock herders reach there the grass grown there
becomes dry and unpalatable. More- over on the places of grazing the natural lakes
are drying up and facing difficulty in watering the animals. Earlier the grass grown
was rich in water contents and thus requirement of water for animal was less. But due
to changes in climate not only the natural lakes become dry but the dry grass also
lacks in water contents.
No parity in the price rise of wool in comparison to consumer price index. The price
of wool has not raised as in case of other animals products like milk, meat and eggs.
Due to available alternatives for wool and woolens in the market, the price of wool
has remained stagnant for many years. At one time the price of wool, desi ghee and
honey was same. But today honey is sold @ $ 2 per kg, desi ghee @ $6 per kg and the
wool fetches just one dollar per kg of wool. The milk produced by migrating Gujjars
do not get remunerative price. The milk sold by Gujjars fetches INR Rs 10 /kg less
price than the market price in the normal demand areas.
15
Ever rising income and better access to education has impacted negatively livestock
production in the production centres though the demand at every corner has almost
become double. In the minds of educated youth, livestock rearing is a low level
profession as one has to tolerate urine and dung smell. Besides animal rearing activity
is highly labour intensive and all the time needing personal attention. Not only this,
society do not give them respect despite their great contribution in maintaining supply
of essential food items and in the GDP of economy. Agriculture and horticulture
activities can wait for days together but not the livestock without reducing yield of
their produce.
The institutional and infrastructural support has not reached up to migratory herders
staying places. Lack of access to markets, credit, inputs, technology and services to
small scale livestock producers inhibit them to take advantage of the opportunities
resulting from the expanding demand for animal food products in the domestic and
global markets;
Reducing public investment in livestock sector and inadequate promotional avenues
especially amongst small-scale producers for value addition of livestock products
especially the milk, meat and wool.
2.8 The suggestions emerging from studies
The important suggestions that have been emerged from the past studies and recent field
experiences have been listed below:
Promoting and strengthening of markets for live animals to incentivise farmers to
scale up livestock production and adopt best production practices.
Improvements in value-addition of livestock products to meet the growing demand for
processed and value-added products and also to contain import threats from the
countries that heavily subsidize their livestock sector.
Strengthening and promoting institutions such as co-operatives, producers’
organizations and contract farming that link producers to markets and reduce
marketing and transaction costs.
Creating a level playing field for increased competition among various market
players and regulating them to prevent collusive oligopsony.
16
Developing mechanisms that enable farmers to share benefits of the institution driven
supply chains.
Encouraging and facilitating smallholders to collectivize as organizations to
effectively deal with agribusiness firms.
Development of a long term outlook for export of livestock products, which can
provide a continuum to the policy thrust. Tendency of adhocism should be avoided.
Promoting awareness about food safety issues among various stakeholders on the
supply chain, and strengthening quarantine and animal health delivery systems to
control spread of infectious diseases.
Creating awareness about the participatory grassland management strategy and its
incorporation as a component of livestock development programmes.
Improving feeding systems using local feed resources especially through food-feed
crop improvement and low-cost feed formulations.
Methods for the conservation and improvement of indigenous livestock.
Information and knowledge management, particularly for institutional capacity
building.

17
CHAPTER 3
SUMMARY OF AVAILABLE STATISTICS ON LIVESTOCK
3.1 Preamble
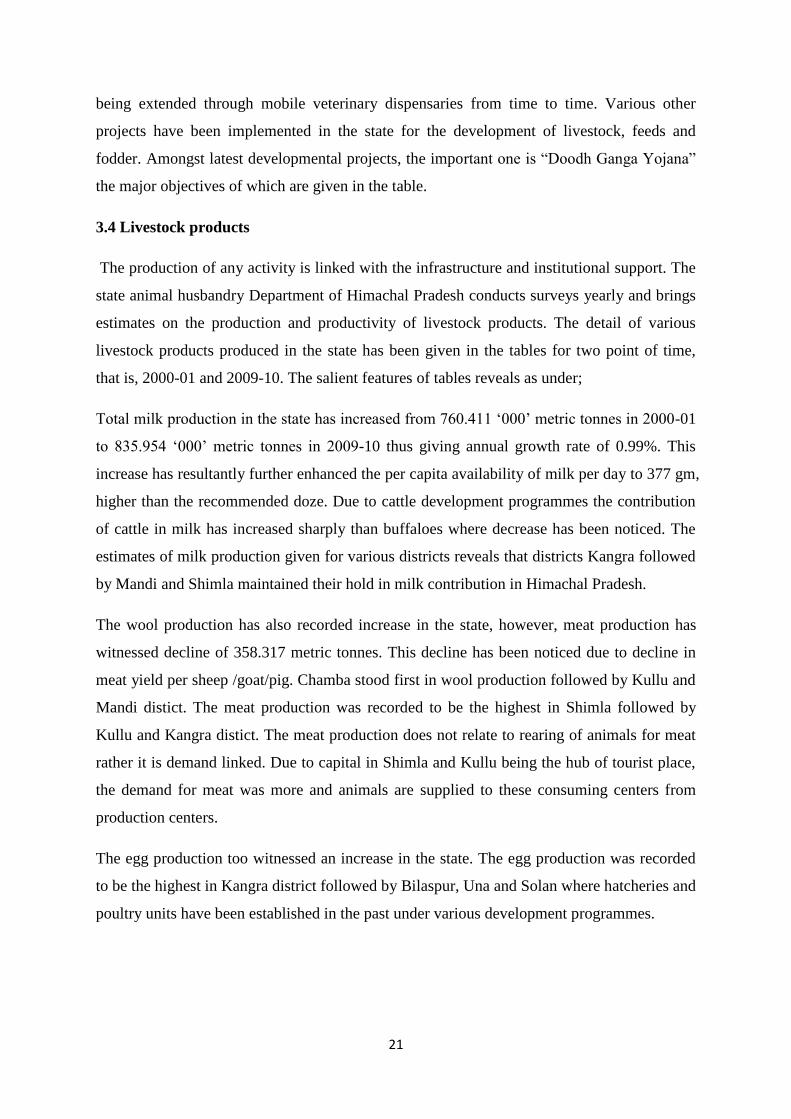
Himachal Pradesh is a small mountainous state in the western Himalayas with a total
geographical area of 55.67 lakh ha. Agriculture is the main occupation of the people of this
state as it provides direct employment to 70% of the total workers of the state. Out of the total
geographical area, the area of operational holdings is about 9.33 lakh ha and is operated by
9.68 lakh farmers. The average holding size comes to 1.04 ha. The distribution of land
holdings given over two agricultural census show that 87.15% of the total holdings are of
small and marginal farmers, 12.55% of holdings are owned by semi-medium/medium farmers
and only 0.30% by large farmers (Table 3.1). The cultivable area is just 11 % of the total
geographical area of which around four-fifths is rainfed. Agriculture happens to be the most
important source of livelihood. Agriculture and allied sectors account for about 17% of the
total gross domestic product. Rearing of livestock is an integral component of rural economy
which contributes about 30% in the state gross domestic product originating in agriculture
(Table 3.2). However, the animal husbandry and dairy development sector was allocated
about 1% of the total state outlay and nearly 8% of the total agricultural outlay during 11th
five year plan (Table 3.3). About 18 out of every 20 households keep at least one of the
species of livestock. Bovine (cattle and buffalo) is the most common species. Of the total
households in the state, 82.90 % have bovine. Goat is the next important livestock. Nearly
one-sixth of the total households keep goat. Similarly, one out of every ten households keeps
a sheep. Rearing of pigs is rare. And the households keeping poultry accounted for 2.15% of
the total households (Table 3.4). The conclusions derived from NSS survey report number
493 based on 2002-03 year data Table 3.21 reveals that cattle, buffalo, other large heads, and
sheep & goats are owned by all the large category farmers possessing operational land
holding size of 10-20 ha in Himachal Pradesh (Table 3.5). Sheep and goats were also
maintained by landless households and their number per 1000 households was just 8. While
considering all sizes of operational holdings cattle were maintained by 491 households,
(49.1%) buffalo by 322 households (32.20%) and sheep and goats by 196 (19.60%)
households out of 1000 households. Land- livestock has a very close relationship. Upto 0.04
ha size class of operational holding 6 to 100 % of the area was operated for farming of
18
animals and it was entirely used for dairy animals (Table 3.6). On the whole, 0.41 % of the
operational land was used for farming of animals, out of which nearly 78 % meant for
dairying. In the operational land holding size of 0.04 - 0.5 ha, there were maximum
households to the extent of 30500 using plots mainly for animal farming who operated 0.28%
their land comprising 40% for dairying, 41% for fishery and 19% for other animals in the
state of Himachal Pradesh. The number of households using plots mainly for animal farming
on all sizes was estimated at 67, 500.
It can also be noticed from the Table 3.7 that the estimated number of cattle owned by 1000
households stood at 1398, that is, more than one cattle per household in Himachal Pradesh
and the estimated number of such households was 5,87,500. The number of male cattle (493)
was slightly less than that of female cattle (549). The number of cattle (8000 per 1000
households, that is 8 per household) was the highest in the farm size group of 7.5 -10.0 ha
followed by 6000 per 1000 household, that is, 6 per household in the farm size group of 10-
20 ha.
In case of buffaloes their number per 1000 households was 617 on all sizes of operational
holding with a maximum of 3000 per 1000 household in the farm size category of 10-20 ha
(Table 3.8). Buffaloes were not owned by any of the landless category household in
Himachal Pradesh. As many as 3,84,900 households owned buffaloes in Himachal Pradesh.
One of the interesting features of Table 3.24 is that adult males were not liked by the
household which is clear from the very small number of just 8 per 1000 households in all
sizes of operational holdings. In all 2,35,000 households possessed sheep & goats in
Himachal Pradesh (Table 3.9). As many as 5000 sheep & goats per 1000 households, that is,
5 sheep & goats per household were owned by the households in Himachal Pradesh.
For enhancing the productivity of different species, a two- pronged strategy effort is being
implemented by involving both conservation and improvement of the indigenous breeds and
crossbreeding on a large scale. The government’s proposal to arrange veterinary services
through the private sector has not been economically viable, because of the topographic
conditions, scattered habitations and the practice of transhumance. Scientific research has
been conducted for upgrading the alpine pastures and the quality of grass in village common
lands. Training courses for proper management of livestock at the household level,
particularly for women are being organized through the local Panchayati Raj Institutions
(PRIs). These measures have been taken through co-ordination between different Research &
Development (R &D) institutions and government departments concerned, in particular the
19
Department of Animal Husbandry and College of Veterinary and Animal Sciences, HP
Agricultural University, Palampur institutions.
The first livestock census in Himachal Pradesh in its present form acquiring the status of full-
fledged statehood in 1971 was conducted in 1972. It completed its eighth count in 2007. A
total of 5.21 million livestock (0.98% of country's population) was estimated by the livestock
census of 2007 (Table 3.4). This number was less than that of human population; however, in
2003 it was close to that of human population in the state for 2001 population census. The
other important statistics on livestock population, the institutional set up and livestock
products over the last decade have been shown in subsequent tables numbering from 3.10 to
3.25. The salient findings under different heads have been given below:
3.2 Livestock population
Livestock rearing is an integral part of farming and hold the distinct complementary
relationship with crop production. The crop by-product on the one hand provides fodder to
livestock that in turn supply precious farm yard manure to crops and animal power for their
cultivation. Himachal Pradesh account for 0.98% of the country’s livestock population.
The livestock population of Himachal Pradesh accounting for 1.31% of India’s total
population in 1972 has increased to 5.21 million (0.98% of the country’s total population) in
2007.
In terms of livestock species, the share of cattle was 1.14% in country’s total cattle
population during 2007, however, buffaloes accounted for 0.72% of India’s total buffaloes.
Sheep & goats jointly accounted for 2.14% in country’s total population. Horses and ponies
too accounted for more than 2%.
After, reorganization of states and forming new districts in Himachal Pradesh with its present
number of 12 districts in 1970s and acquiring full statehood status in 1971, the share of cattle
has declined from 45.37% in 1972 to 43.45% while the population of buffaloes has increased
from just 11.76% in 1972 to 14.60% in 2007. The absolute number and proportion of sheep
population has declined while that of goats has increased over the same period. The
population of horses and ponies has also witnessed decline. On the whole the livestock
population in Himachal Pradesh recorded an increase from 4.62 million in 1972 to 5.21
million in 2007 giving annual growth rate of 036% p.a.
20
As far as the recent trend is concerned there has been increase in cattle, buffaloes and goats
population, and resultantly overall increase in total livestock population. Sheep, horses &
ponies have shown declining trend.
While viewing the trend in livestock population across districts, Chamba, Kinnaur, Kullu and
Sirmaur witnessed increased over 1992-2007 livestock census years while remaining districts
showed declining trend.
District wise livestock wealth in Himachal Pradesh depicted for 2007 census year and the
ranking of various species reveals that cattle is mainly concentrated in Mandi, Kangra,
Chamba, Shimla and Sirmaur districts with its proportion varying from 12 to 21% of the state
total. Not only this, Shimla followed by Mandi, Kullu and Sirmaur accounted for more than
50% of cattle in their total livestock population. Buffaloes were mainly confined to Kangra,
Una, Hamirpur, Bilaspur and Solan districts with their proportion varying from 21 to 11% in
the state population. In Una, Hamirpur and Bilaspur their proportion was much higher which
varied from 62 to 43% in the district population ranking at number one.
Sheep and goats population was mainly concentrated in the high altitude districts namely
Chamba followed by Mandi district in the state. In kinnaur and Lahual-Spiti districts, sheep
ranked at number one in the livestock population with its share of 56 to 60%. None of the
district ranked number one as far as goat population is concerned. On the whole it can be
concluded that cattle followed by goats and sheep were the important livestock species in
Himachal Pradesh. Besides, Shimla, Mandi, Kullu and Sirmour dominated in cattle
population. Buffaloes were more popular in low altitude areas in Una, Hamirpur and Bilaspur
district, whereas sheep alone mainly confined to Kinnaur and Lahual Spiti distict falling high
altitude temperate dry zone of the statet. Sheep and goats being small ruminants jointly
maintained their hold in Kinnaur, Lahual-Spiti and Chamba districts falling in the temperate
wet and dry region of Himachal Pradesh with their proportion ranging from 80% to 61% in
total population of the districts.
3.3 Infrastructure
From infrastructure point of view Himachal Pradesh has attained progress setting up various
veterinary institutions whose number increased from 1847 in 2000-01 to 2203 in 2009-10
thus adding 356 institutions at the rate of 1.93% p.a.. At present 360 veterinary hospitals and
1761 veterinary dispensaries are operational in the state. Facility to livestock rearers are also
21
being extended through mobile veterinary dispensaries from time to time. Various other
projects have been implemented in the state for the development of livestock, feeds and
fodder. Amongst latest developmental projects, the important one is “Doodh Ganga Yojana”
the major objectives of which are given in the table.
3.4 Livestock products
The production of any activity is linked with the infrastructure and institutional support. The
state animal husbandry Department of Himachal Pradesh conducts surveys yearly and brings
estimates on the production and productivity of livestock products. The detail of various
livestock products produced in the state has been given in the tables for two point of time,
that is, 2000-01 and 2009-10. The salient features of tables reveals as under;
Total milk production in the state has increased from 760.411 ‘000’ metric tonnes in 2000-01
to 835.954 ‘000’ metric tonnes in 2009-10 thus giving annual growth rate of 0.99%. This
increase has resultantly further enhanced the per capita availability of milk per day to 377 gm,
higher than the recommended doze. Due to cattle development programmes the contribution
of cattle in milk has increased sharply than buffaloes where decrease has been noticed. The
estimates of milk production given for various districts reveals that districts Kangra followed
by Mandi and Shimla maintained their hold in milk contribution in Himachal Pradesh.
The wool production has also recorded increase in the state, however, meat production has
witnessed decline of 358.317 metric tonnes. This decline has been noticed due to decline in
meat yield per sheep /goat/pig. Chamba stood first in wool production followed by Kullu and
Mandi distict. The meat production was recorded to be the highest in Shimla followed by
Kullu and Kangra distict. The meat production does not relate to rearing of animals for meat
rather it is demand linked. Due to capital in Shimla and Kullu being the hub of tourist place,
the demand for meat was more and animals are supplied to these consuming centers from
production centers.
The egg production too witnessed an increase in the state. The egg production was recorded
to be the highest in Kangra district followed by Bilaspur, Una and Solan where hatcheries and
poultry units have been established in the past under various development programmes.
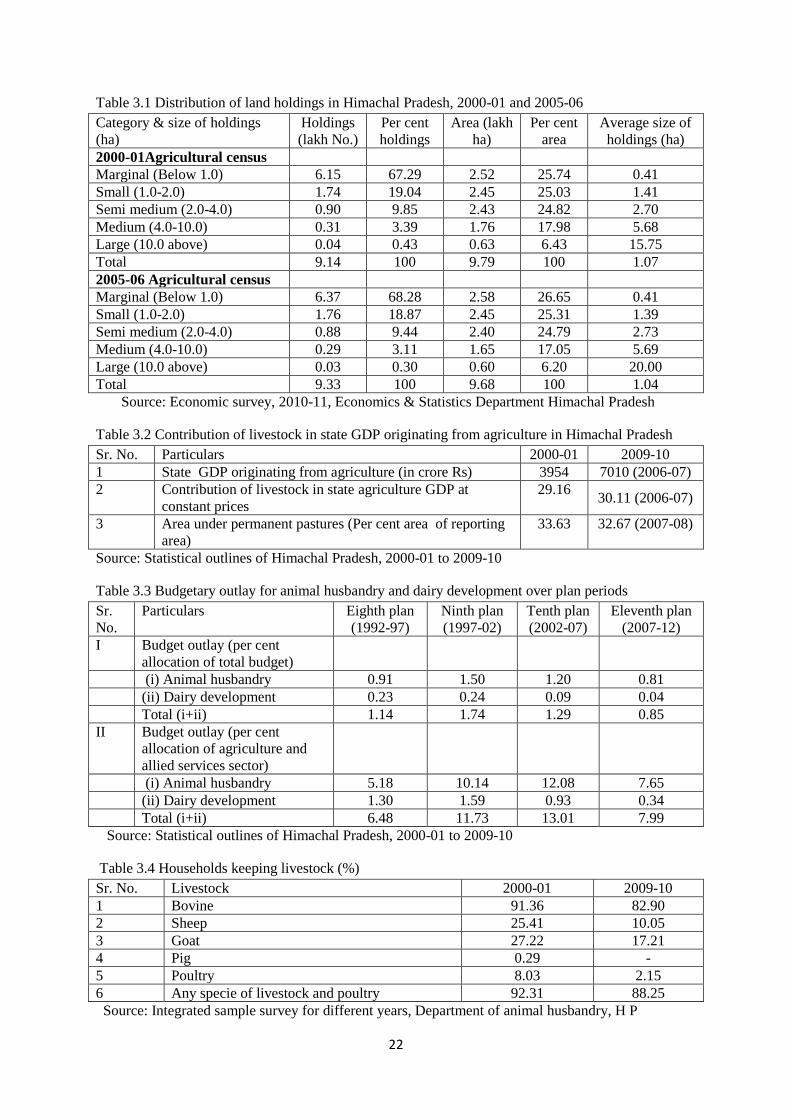
22
Table 3.1 Distribution of land holdings in Himachal Pradesh, 2000-01 and 2005-06
Category & size of holdings
(ha)
Holdings
(lakh No.)
Per cent
holdings
Area (lakh
ha)
Per cent
area
Average size of
holdings (ha)
2000-01Agricultural census
Marginal (Below 1.0) 6.15 67.29 2.52 25.74 0.41
Small (1.0-2.0) 1.74 19.04 2.45 25.03 1.41
Semi medium (2.0-4.0) 0.90 9.85 2.43 24.82 2.70
Medium (4.0-10.0) 0.31 3.39 1.76 17.98 5.68
Large (10.0 above) 0.04 0.43 0.63 6.43 15.75
Total 9.14 100 9.79 100 1.07
2005-06 Agricultural census
Marginal (Below 1.0) 6.37 68.28 2.58 26.65 0.41
Small (1.0-2.0) 1.76 18.87 2.45 25.31 1.39
Semi medium (2.0-4.0) 0.88 9.44 2.40 24.79 2.73
Medium (4.0-10.0) 0.29 3.11 1.65 17.05 5.69
Large (10.0 above) 0.03 0.30 0.60 6.20 20.00
Total 9.33 100 9.68 100 1.04
Source: Economic survey, 2010-11, Economics & Statistics Department Himachal Pradesh
Table 3.2 Contribution of livestock in state GDP originating from agriculture in Himachal Pradesh
Sr. No. Particulars 2000-01 2009-10
1 State GDP originating from agriculture (in crore Rs) 3954 7010 (2006-07)
2 Contribution of livestock in state agriculture GDP at
constant prices
29.16 30.11 (2006-07)
3 Area under permanent pastures (Per cent area of reporting
area)
33.63 32.67 (2007-08)
Source: Statistical outlines of Himachal Pradesh, 2000-01 to 2009-10
Table 3.3 Budgetary outlay for animal husbandry and dairy development over plan periods
Sr.
No.
Particulars Eighth plan
(1992-97)
Ninth plan
(1997-02)
Tenth plan
(2002-07)
Eleventh plan
(2007-12)
I Budget outlay (per cent
allocation of total budget)
(i) Animal husbandry 0.91 1.50 1.20 0.81
(ii) Dairy development 0.23 0.24 0.09 0.04
Total (i+ii) 1.14 1.74 1.29 0.85
II Budget outlay (per cent
allocation of agriculture and
allied services sector)
(i) Animal husbandry 5.18 10.14 12.08 7.65
(ii) Dairy development 1.30 1.59 0.93 0.34
Total (i+ii) 6.48 11.73 13.01 7.99
Source: Statistical outlines of Himachal Pradesh, 2000-01 to 2009-10
Table 3.4 Households keeping livestock (%)
Sr. No. Livestock 2000-01 2009-10
1 Bovine 91.36 82.90
2 Sheep 25.41 10.05
3 Goat 27.22 17.21
4 Pig 0.29 -
5 Poultry 8.03 2.15
6 Any specie of livestock and poultry 92.31 88.25
Source: Integrated sample survey for different years, Department of animal husbandry, H P
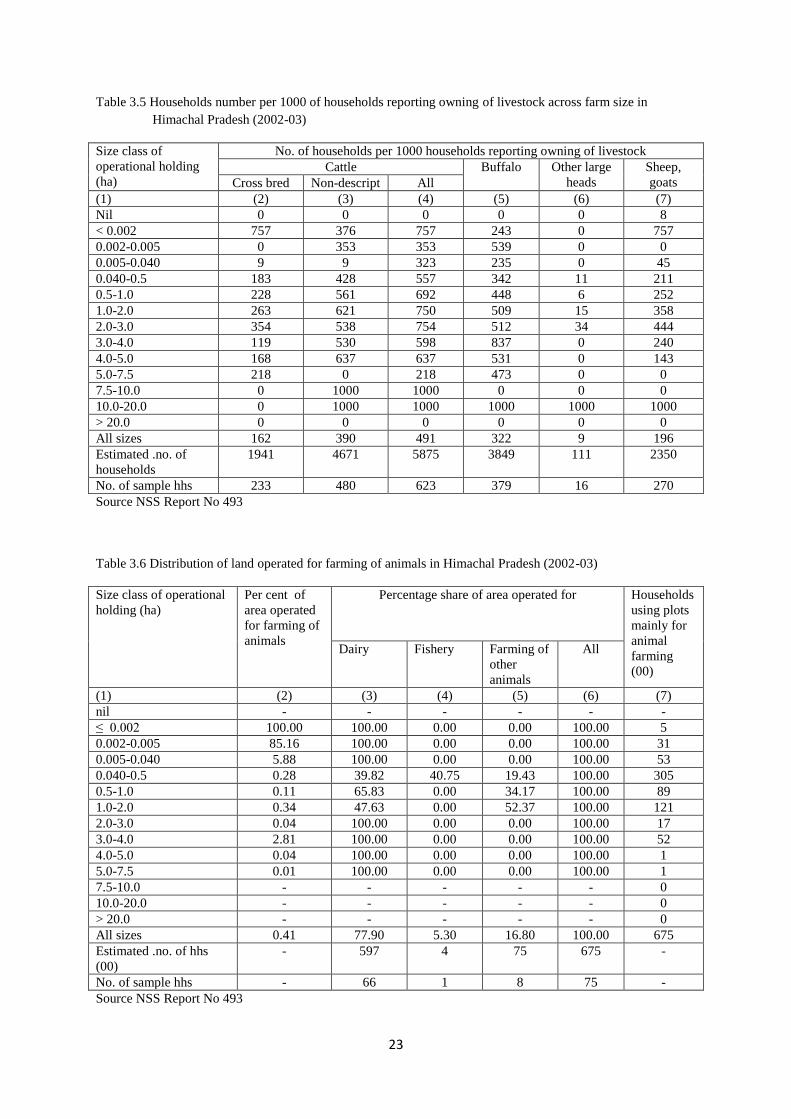
23
Table 3.5 Households number per 1000 of households reporting owning of livestock across farm size in
Himachal Pradesh (2002-03)
Size class of
operational holding
(ha)
No. of households per 1000 households reporting owning of livestock
Cattle Buffalo Other large
heads
Sheep,
goats Cross bred Non-descript All
(1) (2) (3) (4) (5) (6) (7)
Nil 0 0 0 0 0 8
< 0.002 757 376 757 243 0 757
0.002-0.005 0 353 353 539 0 0
0.005-0.040 9 9 323 235 0 45
0.040-0.5 183 428 557 342 11 211
0.5-1.0 228 561 692 448 6 252
1.0-2.0 263 621 750 509 15 358
2.0-3.0 354 538 754 512 34 444
3.0-4.0 119 530 598 837 0 240
4.0-5.0 168 637 637 531 0 143
5.0-7.5 218 0 218 473 0 0
7.5-10.0 0 1000 1000 0 0 0
10.0-20.0 0 1000 1000 1000 1000 1000
> 20.0 0 0 0 0 0 0
All sizes 162 390 491 322 9 196
Estimated .no. of
households
1941 4671 5875 3849 111 2350
No. of sample hhs 233 480 623 379 16 270
Source NSS Report No 493
Table 3.6 Distribution of land operated for farming of animals in Himachal Pradesh (2002-03)
Size class of operational
holding (ha)
Per cent of
area operated
for farming of
animals
Percentage share of area operated for Households
using plots
mainly for
animal
farming
(00)
Dairy Fishery Farming of
other
animals
All
(1) (2) (3) (4) (5) (6) (7)
nil - - - - - -
≤ 0.002 100.00 100.00 0.00 0.00 100.00 5
0.002-0.005 85.16 100.00 0.00 0.00 100.00 31
0.005-0.040 5.88 100.00 0.00 0.00 100.00 53
0.040-0.5 0.28 39.82 40.75 19.43 100.00 305
0.5-1.0 0.11 65.83 0.00 34.17 100.00 89
1.0-2.0 0.34 47.63 0.00 52.37 100.00 121
2.0-3.0 0.04 100.00 0.00 0.00 100.00 17
3.0-4.0 2.81 100.00 0.00 0.00 100.00 52
4.0-5.0 0.04 100.00 0.00 0.00 100.00 1
5.0-7.5 0.01 100.00 0.00 0.00 100.00 1
7.5-10.0 - - - - - 0
10.0-20.0 - - - - - 0
> 20.0 - - - - - 0
All sizes 0.41 77.90 5.30 16.80 100.00 675
Estimated .no. of hhs
(00)
- 597 4 75 675 -
No. of sample hhs - 66 1 8 75 -
Source NSS Report No 493
24
Table 3.7 Cattle owned per 1000 households and its composition across farm size in Himachal Pradesh (2002-03)
Size class of
operational
holding (ha)
Number of cattle owned per 1000 households
Adult males Adult females Young stock Total
For breeding
only
For
work
only
For
both
breed-
ing
and
work
Others All Not calved
once
In milk Dry Others All Male Female All
Cross-
bred
Others Cross-
bred
Others Cross-
bred
Others Cross-
bred
Others
(1) (2) (3) (4) (5) (6) (7) (8) (9) (10) (11) (12) (13) (14) (15) (16) (17) (18) (19)
nil 0 0 0 0 0 0 0 0 0 0 0 0 0 0 0 0 0 0
≤0.002 0 0 0 0 0 0 0 376 381 0 757 0 0 1514 381 0 381 1894
0.002-0.005 0 0 0 0 0 0 0 0 0 50 0 0 304 353 0 50 50 403
0.005-0.040 0 0 0 0 0 0 0 0 9 103 0 180 9 301 27 113 139 440
0.040-0.5 1 1 336 83 5 426 8 11 118 176 42 174 2 531 159 202 361 1318
0.5-1.0 6 8 658 70 0 743 2 19 174 271 80 273 20 841 224 216 440 2024
1.0-2.0 0 17 817 188 10 1033 1 7 219 376 59 234 30 925 390 349 739 2697
2.0-3.0 0 0 827 274 67 1168 4 0 340 327 201 244 10 1126 331 424 755 3049
3.0-4.0 0 206 566 323 0 1095 0 0 181 220 10 189 64 665 0 194 194 1954
4.0-5.0 0 0 1192 81 127 1401 0 0 168 937 0 937 0 2043 469 469 937 4381
5.0-7.5 0 0 0 0 0 0 23 0 413 0 0 0 0 436 280 304 585 1020
7.5-10.0 0 0 3000 0 0 3000 0 1000 0 2000 0 0 0 3000 1000 1000 2000 8000
10.0-20.0 0 0 0 0 0 0 0 0 0 2000 0 0 0 2000 2000 2000 4000 6000
>20.0 0 0 0 0 0 0 0 0 0 0 0 0 0 0 0 0 0 0
All sizes 2 7 398 81 5 493 4 11 121 190 46 167 10 549 169 187 356 1398
Estimated .no.
of hhs (00)
23 43 2575 495 55 3146 47 127 1290 1955 451 1626 123 4657 1519 1911 2944 5875
No. of sample
hhs
2 5 265 60 8 332 6 16 158 221 64 165 16 505 179 217 336 623
Source NSS Report No 493

25
Table 3.8 Buffaloes owned per 1000 households and its composition across farm size in Himachal Pradesh (2002-03)
Size class of
operational
holding(ha)
Number of buffalo owned per 1000 households
Adult males Adult females Young stock Total
For
breeding
only
For
work
only
For both
breed-
ing and
work
Others All Not
calved
once
In milk Dry Others
All Male Female All
(1) (2) (3) (4) (5) (6) (7) (8) (9) (10) (11) (12) (13) (14) (15)
nil 0 0 0 0 0 0 0 0 0 0 0 0 0 0
≤0.002 0 0 0 0 0 0 0 243 0 243 0 486 486 729
0.002-0.005 0 0 0 0 0 0 363 177 0 539 0 0 0 539
0.005-0.040 0 0 0 0 0 0 200 35 0 235 0 200 200 435
0.040-0.5 2 0 2 0 5 30 208 174 5 416 23 129 152 573
0.5-1.0 7 0 0 7 14 54 298 197 60 608 37 180 217 839
1.0-2.0 13 0 0 15 28 3 359 314 28 704 79 299 378 1110
2.0-3.0 0 0 0 22 22 9 681 241 40 971 98 457 555 1548
3.0-4.0 0 0 0 0 0 0 818 433 96 1347 103 728 831 2177
4.0-5.0 0 0 0 0 0 0 383 280 168 831 20 20 39 870
5.0-7.5 0 0 0 0 0 0 494 23 0 517 0 450 450 967
7.5-10.0 0 0 0 0 0 0 0 0 0 0 0 0 0 0
10.0-20.0 0 0 0 0 0 0 0 2000 0 2000 1000 0 1000 3000
>20.0 0 0 0 0 0 0 0 0 0 0 0 0 0 0
All sizes 4 0 1 4 8 23 222 162 20 428 31 151 181 617
Estimated .no.
of hhs (00)
45 0 10 34 90 227 2409 1684 212 3748 329 1475 1690 3849
No. of sample
hhs
6 0 1 5 12 175 247 166 20 370 34 151 175 379
Source NSS Report No 493
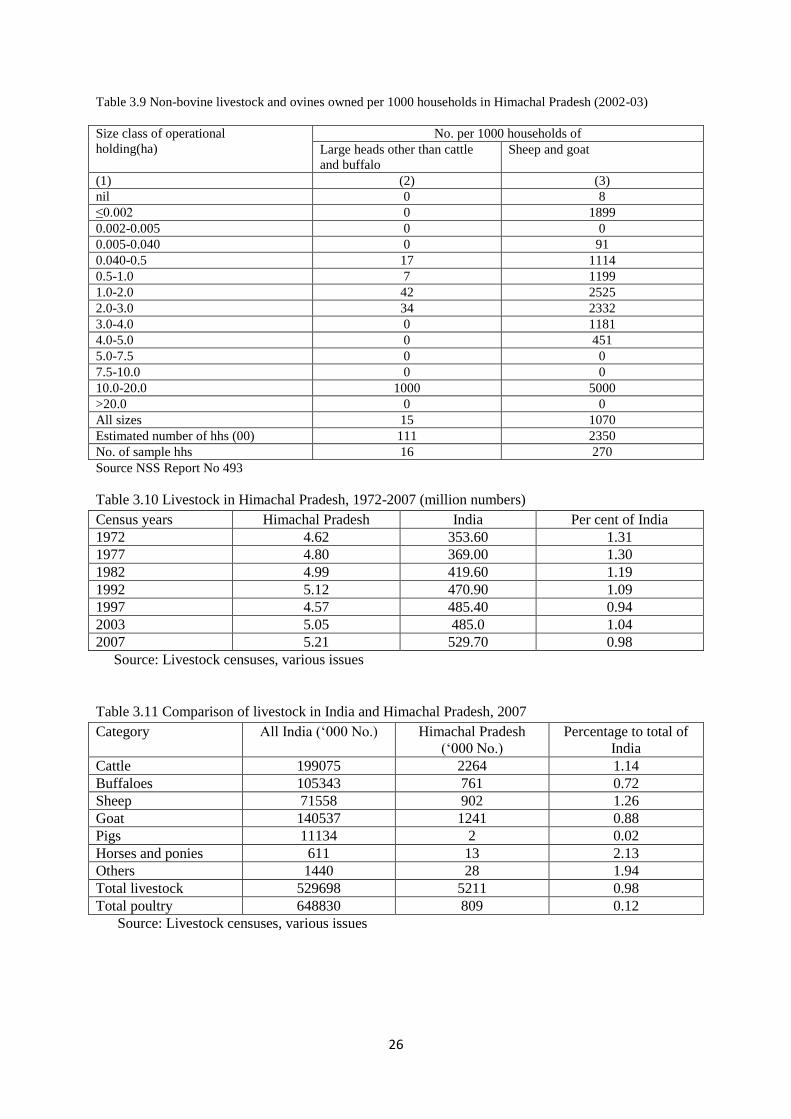
26
Table 3.9 Non-bovine livestock and ovines owned per 1000 households in Himachal Pradesh (2002-03)
Size class of operational
holding(ha)
No. per 1000 households of
Large heads other than cattle
and buffalo
Sheep and goat
(1) (2) (3)
nil 0 8
≤0.002 0 1899
0.002-0.005 0 0
0.005-0.040 0 91
0.040-0.5 17 1114
0.5-1.0 7 1199
1.0-2.0 42 2525
2.0-3.0 34 2332
3.0-4.0 0 1181
4.0-5.0 0 451
5.0-7.5 0 0
7.5-10.0 0 0
10.0-20.0 1000 5000
>20.0 0 0
All sizes 15 1070
Estimated number of hhs (00) 111 2350
No. of sample hhs 16 270
Source NSS Report No 493
Table 3.10 Livestock in Himachal Pradesh, 1972-2007 (million numbers)
Census years Himachal Pradesh India Per cent of India
1972 4.62 353.60 1.31
1977 4.80 369.00 1.30
1982 4.99 419.60 1.19
1992 5.12 470.90 1.09
1997 4.57 485.40 0.94
2003 5.05 485.0 1.04
2007 5.21 529.70 0.98
Source: Livestock censuses, various issues
Table 3.11 Comparison of livestock in India and Himachal Pradesh, 2007
Category All India (‘000 No.) Himachal Pradesh
(‘000 No.)
Percentage to total of
India
Cattle 199075 2264 1.14
Buffaloes 105343 761 0.72
Sheep 71558 902 1.26
Goat 140537 1241 0.88
Pigs 11134 2 0.02
Horses and ponies 611 13 2.13
Others 1440 28 1.94
Total livestock 529698 5211 0.98
Total poultry 648830 809 0.12
Source: Livestock censuses, various issues
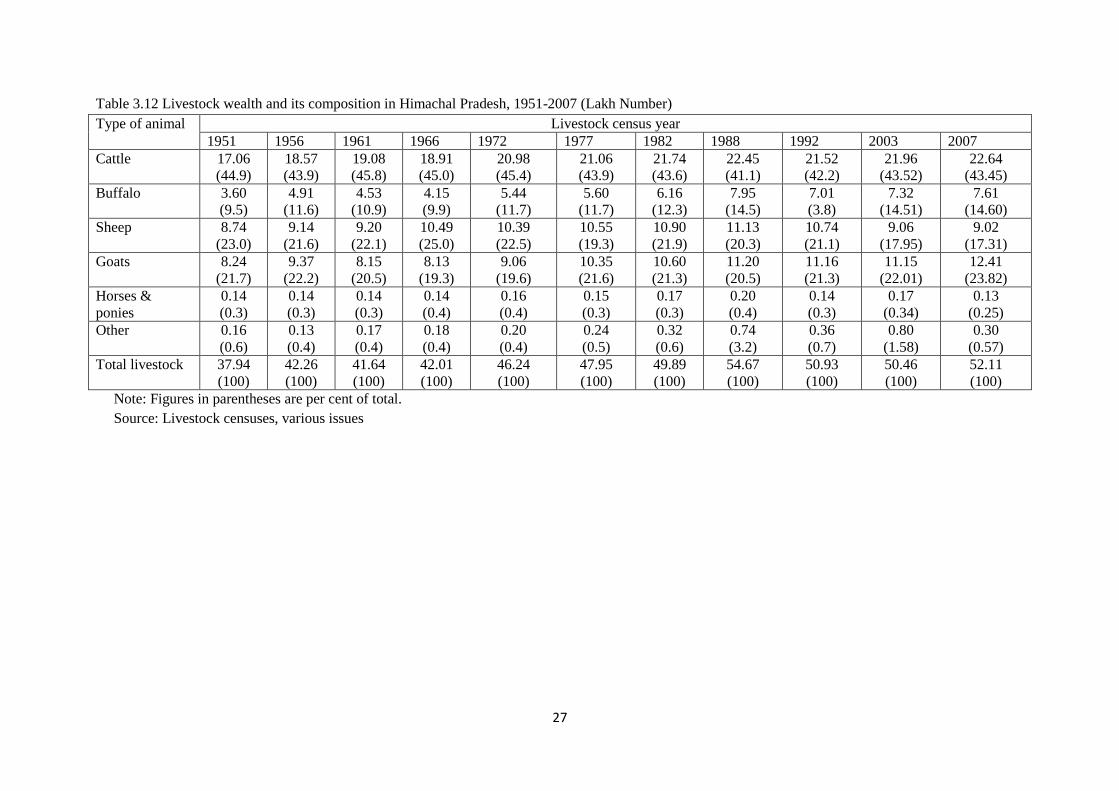
27
Table 3.12 Livestock wealth and its composition in Himachal Pradesh, 1951-2007 (Lakh Number)
Type of animal Livestock census year
1951 1956 1961 1966 1972 1977 1982 1988 1992 2003 2007
Cattle 17.06
(44.9)
18.57
(43.9)
19.08
(45.8)
18.91
(45.0)
20.98
(45.4)
21.06
(43.9)
21.74
(43.6)
22.45
(41.1)
21.52
(42.2)
21.96
(43.52)
22.64
(43.45)
Buffalo 3.60
(9.5)
4.91
(11.6)
4.53
(10.9)
4.15
(9.9)
5.44
(11.7)
5.60
(11.7)
6.16
(12.3)
7.95
(14.5)
7.01
(3.8)
7.32
(14.51)
7.61
(14.60)
Sheep 8.74
(23.0)
9.14
(21.6)
9.20
(22.1)
10.49
(25.0)
10.39
(22.5)
10.55
(19.3)
10.90
(21.9)
11.13
(20.3)
10.74
(21.1)
9.06
(17.95)
9.02
(17.31)
Goats 8.24
(21.7)
9.37
(22.2)
8.15
(20.5)
8.13
(19.3)
9.06
(19.6)
10.35
(21.6)
10.60
(21.3)
11.20
(20.5)
11.16
(21.3)
11.15
(22.01)
12.41
(23.82)
Horses &
ponies
0.14
(0.3)
0.14
(0.3)
0.14
(0.3)
0.14
(0.4)
0.16
(0.4)
0.15
(0.3)
0.17
(0.3)
0.20
(0.4)
0.14
(0.3)
0.17
(0.34)
0.13
(0.25)
Other 0.16
(0.6)
0.13
(0.4)
0.17
(0.4)
0.18
(0.4)
0.20
(0.4)
0.24
(0.5)
0.32
(0.6)
0.74
(3.2)
0.36
(0.7)
0.80
(1.58)
0.30
(0.57)
Total livestock 37.94
(100)
42.26
(100)
41.64
(100)
42.01
(100)
46.24
(100)
47.95
(100)
49.89
(100)
54.67
(100)
50.93
(100)
50.46
(100)
52.11
(100)
Note: Figures in parentheses are per cent of total.
Source: Livestock censuses, various issues
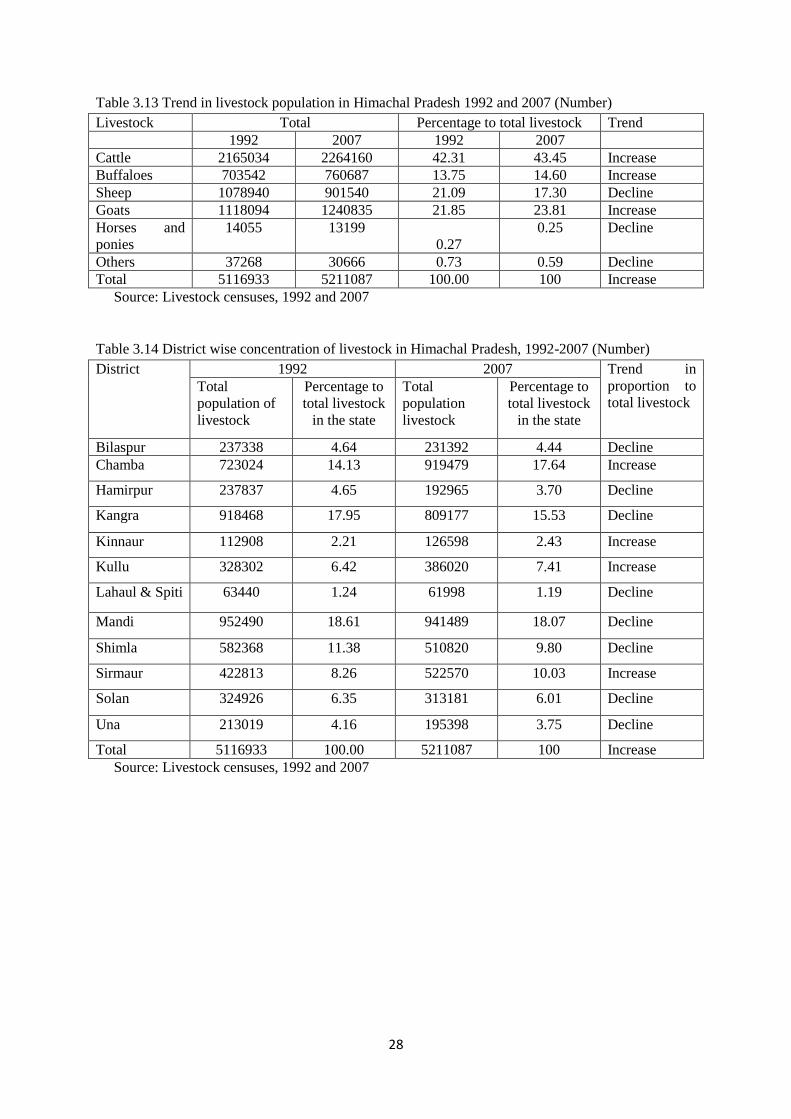
28
Table 3.13 Trend in livestock population in Himachal Pradesh 1992 and 2007 (Number)
Livestock Total Percentage to total livestock Trend
1992 2007 1992 2007
Cattle 2165034 2264160 42.31 43.45 Increase
Buffaloes 703542 760687 13.75 14.60 Increase
Sheep 1078940 901540 21.09 17.30 Decline
Goats 1118094 1240835 21.85 23.81 Increase
Horses and
ponies
14055 13199
0.27
0.25 Decline
Others 37268 30666 0.73 0.59 Decline
Total 5116933 5211087 100.00 100 Increase
Source: Livestock censuses, 1992 and 2007
Table 3.14 District wise concentration of livestock in Himachal Pradesh, 1992-2007 (Number)
District 1992 2007 Trend in
proportion to
total livestock Total
population of
livestock
Percentage to
total livestock
in the state
Total
population
livestock
Percentage to
total livestock
in the state
Bilaspur 237338 4.64 231392 4.44 Decline
Chamba 723024 14.13 919479 17.64 Increase
Hamirpur 237837 4.65 192965 3.70 Decline
Kangra 918468 17.95 809177 15.53 Decline
Kinnaur 112908 2.21 126598 2.43 Increase
Kullu 328302 6.42 386020 7.41 Increase
Lahaul & Spiti 63440 1.24 61998 1.19 Decline
Mandi 952490 18.61 941489 18.07 Decline
Shimla 582368 11.38 510820 9.80 Decline
Sirmaur 422813 8.26 522570 10.03 Increase
Solan 324926 6.35 313181 6.01 Decline
Una 213019 4.16 195398 3.75 Decline
Total 5116933 100.00 5211087 100 Increase
Source: Livestock censuses, 1992 and 2007
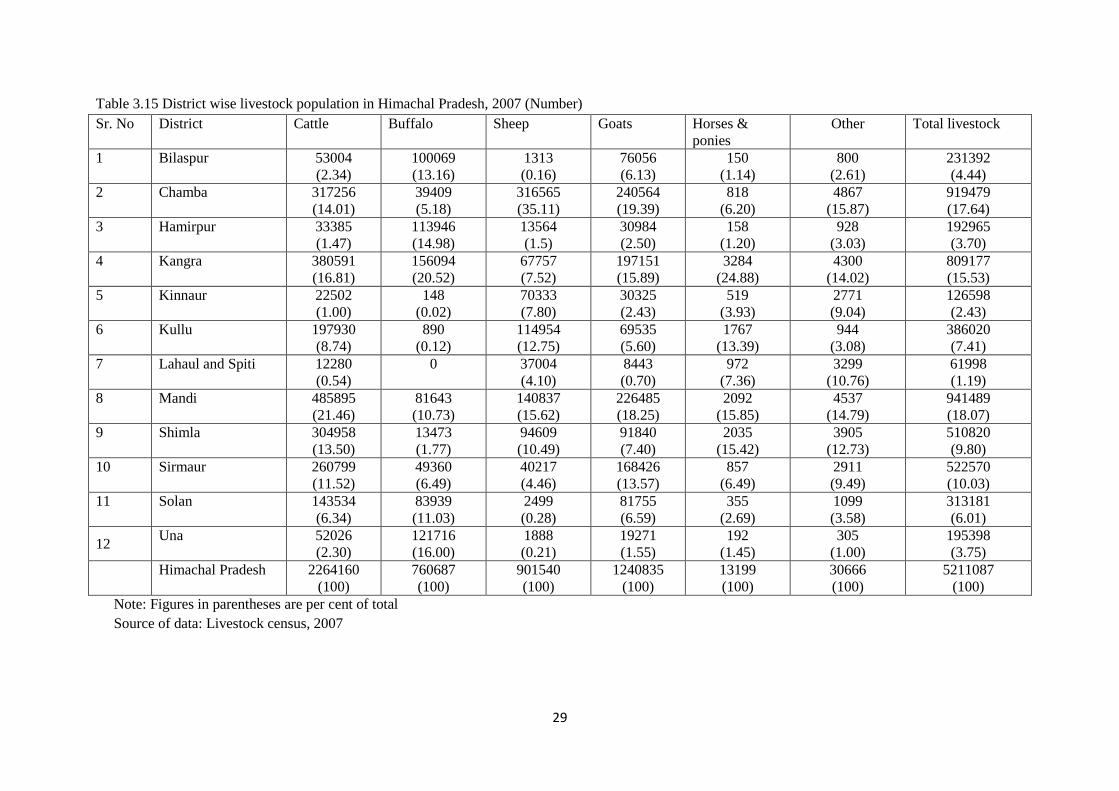
29
Table 3.15 District wise livestock population in Himachal Pradesh, 2007 (Number)
Sr. No District Cattle Buffalo Sheep Goats Horses &
ponies
Other Total livestock
1 Bilaspur 53004
(2.34)
100069
(13.16)
1313
(0.16)
76056
(6.13)
150
(1.14)
800
(2.61)
231392
(4.44)
2 Chamba 317256
(14.01)
39409
(5.18)
316565
(35.11)
240564
(19.39)
818
(6.20)
4867
(15.87)
919479
(17.64)
3 Hamirpur 33385
(1.47)
113946
(14.98)
13564
(1.5)
30984
(2.50)
158
(1.20)
928
(3.03)
192965
(3.70)
4 Kangra 380591
(16.81)
156094
(20.52)
67757
(7.52)
197151
(15.89)
3284
(24.88)
4300
(14.02)
809177
(15.53)
5 Kinnaur 22502
(1.00)
148
(0.02)
70333
(7.80)
30325
(2.43)
519
(3.93)
2771
(9.04)
126598
(2.43)
6 Kullu 197930
(8.74)
890
(0.12)
114954
(12.75)
69535
(5.60)
1767
(13.39)
944
(3.08)
386020
(7.41)
7 Lahaul and Spiti 12280
(0.54)
0
37004
(4.10)
8443
(0.70)
972
(7.36)
3299
(10.76)
61998
(1.19)
8 Mandi 485895
(21.46)
81643
(10.73)
140837
(15.62)
226485
(18.25)
2092
(15.85)
4537
(14.79)
941489
(18.07)
9 Shimla 304958
(13.50)
13473
(1.77)
94609
(10.49)
91840
(7.40)
2035
(15.42)
3905
(12.73)
510820
(9.80)
10 Sirmaur 260799
(11.52)
49360
(6.49)
40217
(4.46)
168426
(13.57)
857
(6.49)
2911
(9.49)
522570
(10.03)
11 Solan 143534
(6.34)
83939
(11.03)
2499
(0.28)
81755
(6.59)
355
(2.69)
1099
(3.58)
313181
(6.01)
12 Una 52026
(2.30)
121716
(16.00)
1888
(0.21)
19271
(1.55)
192
(1.45)
305
(1.00)
195398
(3.75)
Himachal Pradesh 2264160
(100)
760687
(100)
901540
(100)
1240835
(100)
13199
(100)
30666
(100)
5211087
(100)
Note: Figures in parentheses are per cent of total
Source of data: Livestock census, 2007
30
Table 3.16 Identification of dominated districts according to livestock species in Himachal Pradesh,
2007
Category Dominated districts in terms of population of livestock species
Cattle Mandi (21.46) Kangra (16.81) Shimla (13.50)
Buffaloes Kangra (20.52) Una (16.00) Bilaspur (13.16)
Sheep Chamba (35.11) Mandi (15.62) Kullu (12.75)
Goat Chamba (19.39) Mandi (18.25) Kangra (15.89)
Horses & ponies Kangra (24.88) Mandi (15.85) Shimla (15.42)
Total livestock Mandi (18.07) Chamba 17.64) Kangra (15.53)
Note: Figure in the parentheses indicate per cent to total animals in the state under respective category.
Table 3.17 District-wise livestock combination in Himachal Pradesh, 2007
Category Ranking of major species
Rank 1 Rank 2 Rank 3
Bilaspur Buffalo (43.25 %) Goat (32.87 %) Cattle (22.91 %)
Chamba Cattle (34.50 % Sheep (34.43 %) Goat (26.16 %)
Hamirpur Buffalo (59.05 %) Cattle (17.30 %) Goat (16.06 %)
Kangra Cattle (47.03 %) Goat (24.36 %) Buffalo ((19.20 %)
Kinnaur Sheep (55.56 %) Goat (23.95 %) Cattle (17.77 %)
Kullu Cattle (51.27 %) Sheep (29.78 %) Goat (18.01 %)
Lahaul & Spiti Sheep (59.69 %) Cattle (19.81 %) Goat (13.62 %),
Mandi Cattle (51.61 %) Goat (24.06 %) Sheep (14.96 %)
Shimla Cattle (59.70 %) Sheep (18.52 %) Goat (17.98 %)
Sirmaur Cattle (49.91 %) Goat (32.23 %) Buffalo (9.45 %)
Solan Cattle (45.83 %) Buffalo (26.80 %) Goat (26.10 %),
Una Buffalo (62.29 %) Cattle (26.63 %) Goat (9.86 %)
State Cattle (43.45 %) Goat (23.81 %) Sheep (17.30 %)
Note: Figure in the parentheses indicate per cent to total livestock in the respective district
Table 3.18 District-wise veterinary institutions in Himachal Pradesh, 2000-01 and 2009-10
District 2000-01
(Number)
2009-10
(Number)
Change in 2009-10 over 2000-
01
Bilaspur 92 125 33
Chamba 169 209 40
Hamirpur 115 140 25
Kangra 341 416 75
Kinnaur 58 64 6
Kullu 91 110 19
Lahaul & Spiti 53 60 7
Mandi 272 318 46
Shimla 241 312 71
Sirmaur 123 161 38
Solan 124 159 35
Una 97 129 32
Total 1847 2203 356
Source of data: Integrated sample survey for estimation of animal products for different years
Table 3.19 Veterinary facilities in Himachal Pradesh (No.)
31
Sr.
No.
Particulars 2000-01 2009-10 Change in 2009-
10 over 2000-01
1 Poly clinic 7 7 0
2 Veterinary hospital/CVD 302 360 58
3 Veterinary dispensaries 1460 1761 301
4 Mobile veterinary dispensaries 14 NA -
5 Quality control lab - 1 1
6 Veterinary check posts 4 6 2
7 Cattle breeding farms 5 3 -2
8 Sheep breeding farms 5 5 0
9 Sheep & wool extension centres 10 9 -1
10 Wool analysis lab 3 3 0
11 Disease investigation labs 2 2 0
12 Clinical labs 4 4 0
13 Poultry farms/centres 14 13 -1
14 Angora rabbit breeding farms 2 2 0
15 Horse breeding farms 1 1 0
16 Liquid nitrogen plants 7 NA
17 Semen processing labs - 2 2
18 Frozen semen banks 3 7 4
19 A I centres under ICDP,HCD and KVP 143 NA
20 Pool store - 11 11
21 Training centre 2 2 0
22 Go sadan 2 3 1
23 Epidemiology - 1 1
24 Total 1847 2203 356
25 Artificial insemination facility available
in existing veterinary hospitals &
dispensaries
1321 1910 589
Source of data: Integrated sample survey for estimation of animal products for different years
32
Table 3.20 Salient features of animal husbandry, feed & fodder and pasture development programmes in Himachal Pradesh
Sr No. Name of the programme Year of start Objectives
I State government executed programmes
1 Watershed development project for Himalayan hills (Kandi
Project)
1990 - 2005 To improve the socio economic conditions off farmers living along
Ghaggar, Swan, Sirsa Chakki and Markanda watersheds.
2 Setting up of horse breeding farm, Lari 2003-04 To preserve Spiti breed of horses
3 Setting up of yak breeding farm, Lari 2003-04 To preserve local breed of yaks
4 Hundred egger 2004-05 To assist poultry breeders in poultry farming
5 200 days old broiler chicks and backyard poultry scheme 2004-05 To provide self employment to the unemployed youth of SC/ST
category
6 World bank aided mid Himalayan watershed development
project
2005-06 To change the process of depletion of natural resources, to enhance
the productive potential of the natural resources and to enhance the
income of village people
7 Livestock insurance scheme 2006 To save livestock owners from loss in the event of death of high
yielding cattle and buffalo
8 Setting up of milk processing plant at Kafota and Nahan in
Sirmaur district
2007-08 To provide direct employment opportunities through village dairy
cooperatives
9
Livestock census, 2007 2007-08 To conduct livestock census and supply data for future policy frame
work
10 Shepherd insurance scheme 2007-08 To provide insurance coverage to shepherds
11 Setting up of cattle feed plant at Bhoranj in Hamirpur
district
2009-10 To supply quality feed ingredients to livestock rearers at reasonable
rates
12 Doodh Ganga Yojna 2009-10 To supply improved of milch animals to dairy farmers/self help
groups to increase milk production in the state.
13 National project on cattle and buffalo development NA Strengthening of liquid nitrogen storage, transport and distribution.
Strengthening of sperm stations, semen banks and A I centres.
Acquisition of high pedigree bulls for spern stations and for natural
service in remote areas and strengthening of training facilities, etc.
14 Centrally sponsored schemes in poultry sector NA To develop poultry sector in the state through backyard poultry
farming
15 Assistance to state for control of animal diseases NA To provide free vaccination to the livestock against FMD, BQ,
enteroloxaemia, PPR, ranikhet disease, Marek’s disease and rabies
due to poor nutrition and influx of interstate migratory livestock
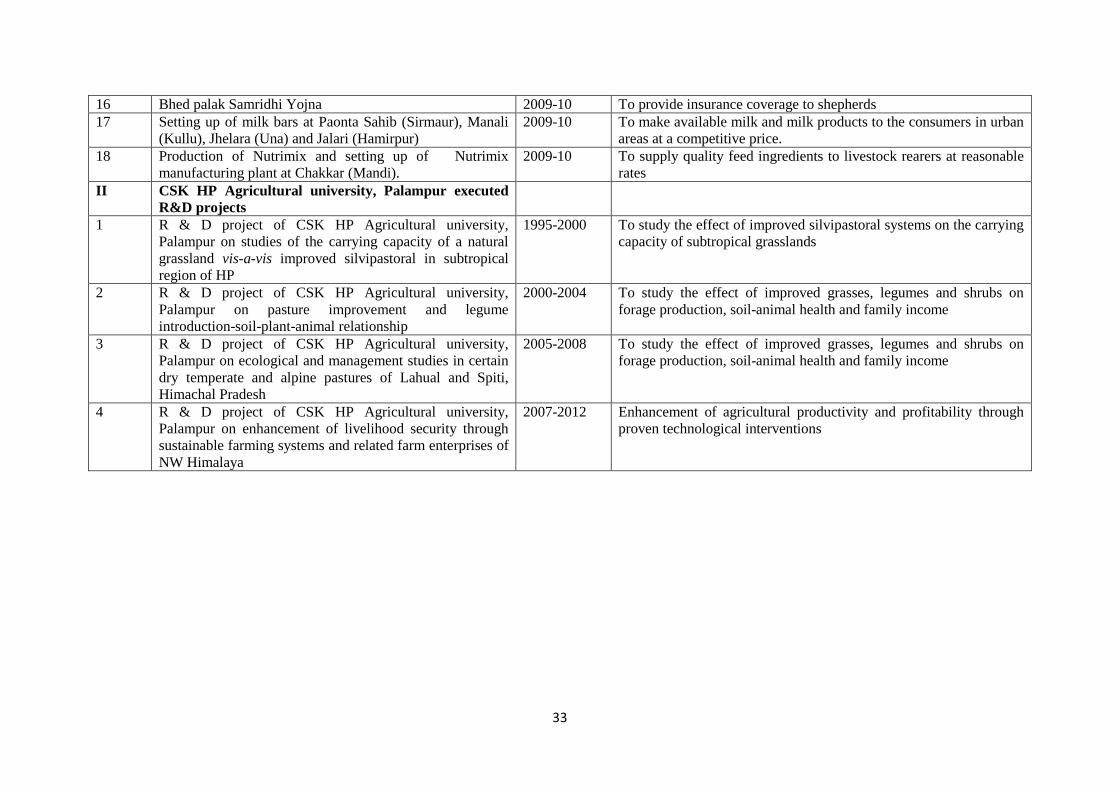
33
16 Bhed palak Samridhi Yojna 2009-10 To provide insurance coverage to shepherds
17 Setting up of milk bars at Paonta Sahib (Sirmaur), Manali
(Kullu), Jhelara (Una) and Jalari (Hamirpur)
2009-10 To make available milk and milk products to the consumers in urban
areas at a competitive price.
18 Production of Nutrimix and setting up of Nutrimix
manufacturing plant at Chakkar (Mandi).
2009-10 To supply quality feed ingredients to livestock rearers at reasonable
rates
II CSK HP Agricultural university, Palampur executed
R&D projects
1 R & D project of CSK HP Agricultural university,
Palampur on studies of the carrying capacity of a natural
grassland vis-a-vis improved silvipastoral in subtropical
region of HP
1995-2000 To study the effect of improved silvipastoral systems on the carrying
capacity of subtropical grasslands
2 R & D project of CSK HP Agricultural university,
Palampur on pasture improvement and legume
introduction-soil-plant-animal relationship
2000-2004 To study the effect of improved grasses, legumes and shrubs on
forage production, soil-animal health and family income
3 R & D project of CSK HP Agricultural university,
Palampur on ecological and management studies in certain
dry temperate and alpine pastures of Lahual and Spiti,
Himachal Pradesh
2005-2008 To study the effect of improved grasses, legumes and shrubs on
forage production, soil-animal health and family income
4 R & D project of CSK HP Agricultural university,
Palampur on enhancement of livelihood security through
sustainable farming systems and related farm enterprises of
NW Himalaya
2007-2012 Enhancement of agricultural productivity and profitability through
proven technological interventions
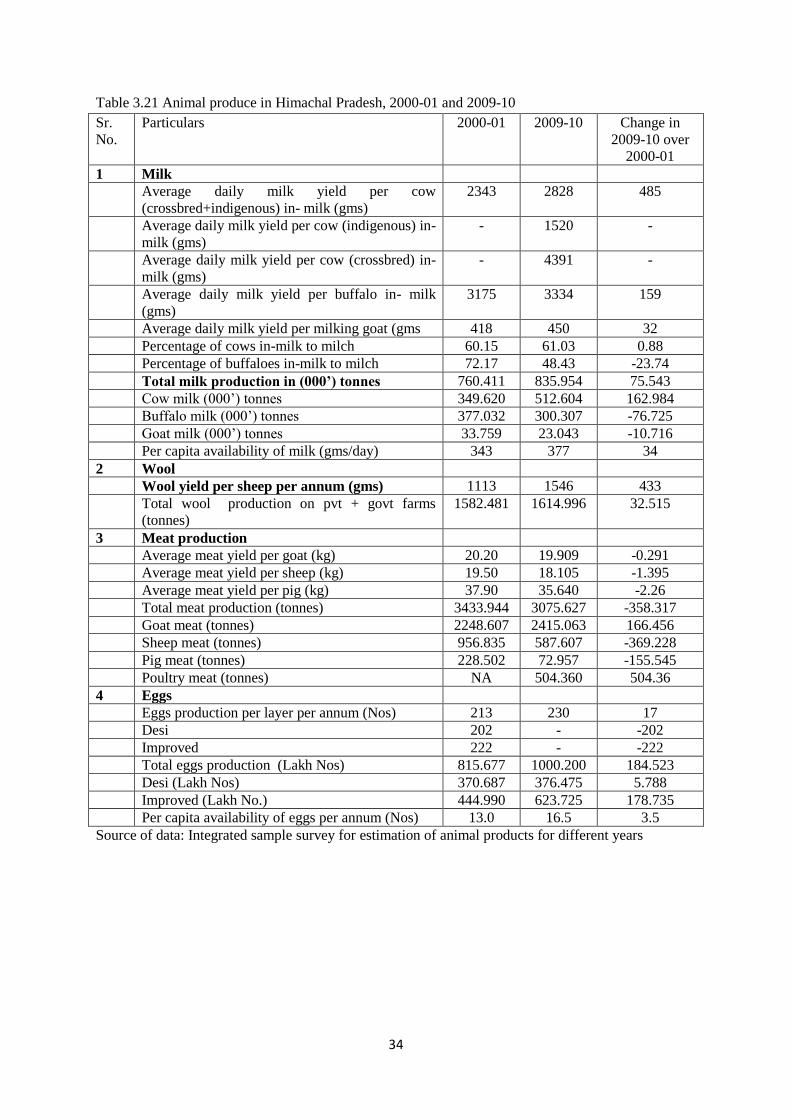
34
Table 3.21 Animal produce in Himachal Pradesh, 2000-01 and 2009-10
Sr.
No.
Particulars 2000-01 2009-10 Change in
2009-10 over
2000-01
1 Milk
Average daily milk yield per cow
(crossbred+indigenous) in- milk (gms)
2343 2828 485
Average daily milk yield per cow (indigenous) in-
milk (gms)
- 1520 -
Average daily milk yield per cow (crossbred) in-
milk (gms)
- 4391 -
Average daily milk yield per buffalo in- milk
(gms)
3175 3334 159
Average daily milk yield per milking goat (gms 418 450 32
Percentage of cows in-milk to milch 60.15 61.03 0.88
Percentage of buffaloes in-milk to milch 72.17 48.43 -23.74
Total milk production in (000’) tonnes 760.411 835.954 75.543
Cow milk (000’) tonnes 349.620 512.604 162.984
Buffalo milk (000’) tonnes 377.032 300.307 -76.725
Goat milk (000’) tonnes 33.759 23.043 -10.716
Per capita availability of milk (gms/day) 343 377 34
2 Wool
Wool yield per sheep per annum (gms) 1113 1546 433
Total wool production on pvt + govt farms
(tonnes)
1582.481 1614.996 32.515
3 Meat production
Average meat yield per goat (kg) 20.20 19.909 -0.291
Average meat yield per sheep (kg) 19.50 18.105 -1.395
Average meat yield per pig (kg) 37.90 35.640 -2.26
Total meat production (tonnes) 3433.944 3075.627 -358.317
Goat meat (tonnes) 2248.607 2415.063 166.456
Sheep meat (tonnes) 956.835 587.607 -369.228
Pig meat (tonnes) 228.502 72.957 -155.545
Poultry meat (tonnes) NA 504.360 504.36
4 Eggs
Eggs production per layer per annum (Nos) 213 230 17
Desi 202 - -202
Improved 222 - -222
Total eggs production (Lakh Nos) 815.677 1000.200 184.523
Desi (Lakh Nos) 370.687 376.475 5.788
Improved (Lakh No.) 444.990 623.725 178.735
Per capita availability of eggs per annum (Nos) 13.0 16.5 3.5
Source of data: Integrated sample survey for estimation of animal products for different years
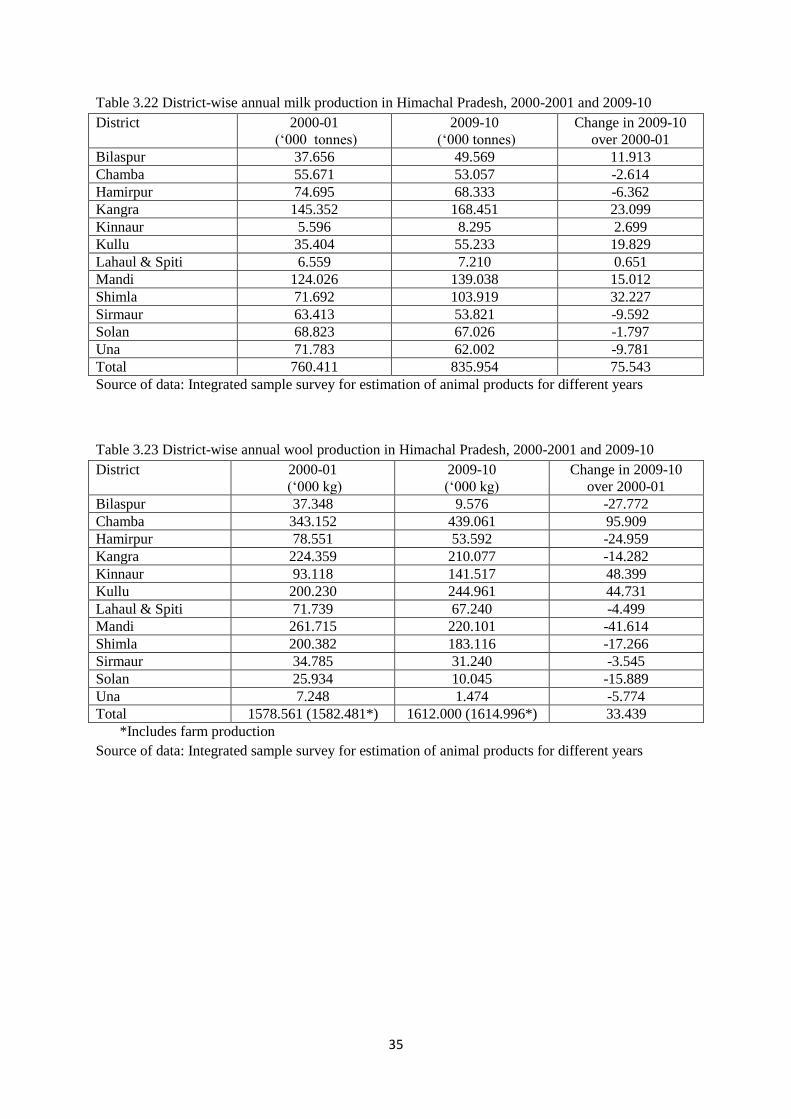
35
Table 3.22 District-wise annual milk production in Himachal Pradesh, 2000-2001 and 2009-10
District 2000-01
(‘000 tonnes)
2009-10
(‘000 tonnes)
Change in 2009-10
over 2000-01
Bilaspur 37.656 49.569 11.913
Chamba 55.671 53.057 -2.614
Hamirpur 74.695 68.333 -6.362
Kangra 145.352 168.451 23.099
Kinnaur 5.596 8.295 2.699
Kullu 35.404 55.233 19.829
Lahaul & Spiti 6.559 7.210 0.651
Mandi 124.026 139.038 15.012
Shimla 71.692 103.919 32.227
Sirmaur 63.413 53.821 -9.592
Solan 68.823 67.026 -1.797
Una 71.783 62.002 -9.781
Total 760.411 835.954 75.543
Source of data: Integrated sample survey for estimation of animal products for different years
Table 3.23 District-wise annual wool production in Himachal Pradesh, 2000-2001 and 2009-10
District 2000-01
(‘000 kg)
2009-10
(‘000 kg)
Change in 2009-10
over 2000-01
Bilaspur 37.348 9.576 -27.772
Chamba 343.152 439.061 95.909
Hamirpur 78.551 53.592 -24.959
Kangra 224.359 210.077 -14.282
Kinnaur 93.118 141.517 48.399
Kullu 200.230 244.961 44.731
Lahaul & Spiti 71.739 67.240 -4.499
Mandi 261.715 220.101 -41.614
Shimla 200.382 183.116 -17.266
Sirmaur 34.785 31.240 -3.545
Solan 25.934 10.045 -15.889
Una 7.248 1.474 -5.774
Total 1578.561 (1582.481*) 1612.000 (1614.996*) 33.439
*Includes farm production
Source of data: Integrated sample survey for estimation of animal products for different years
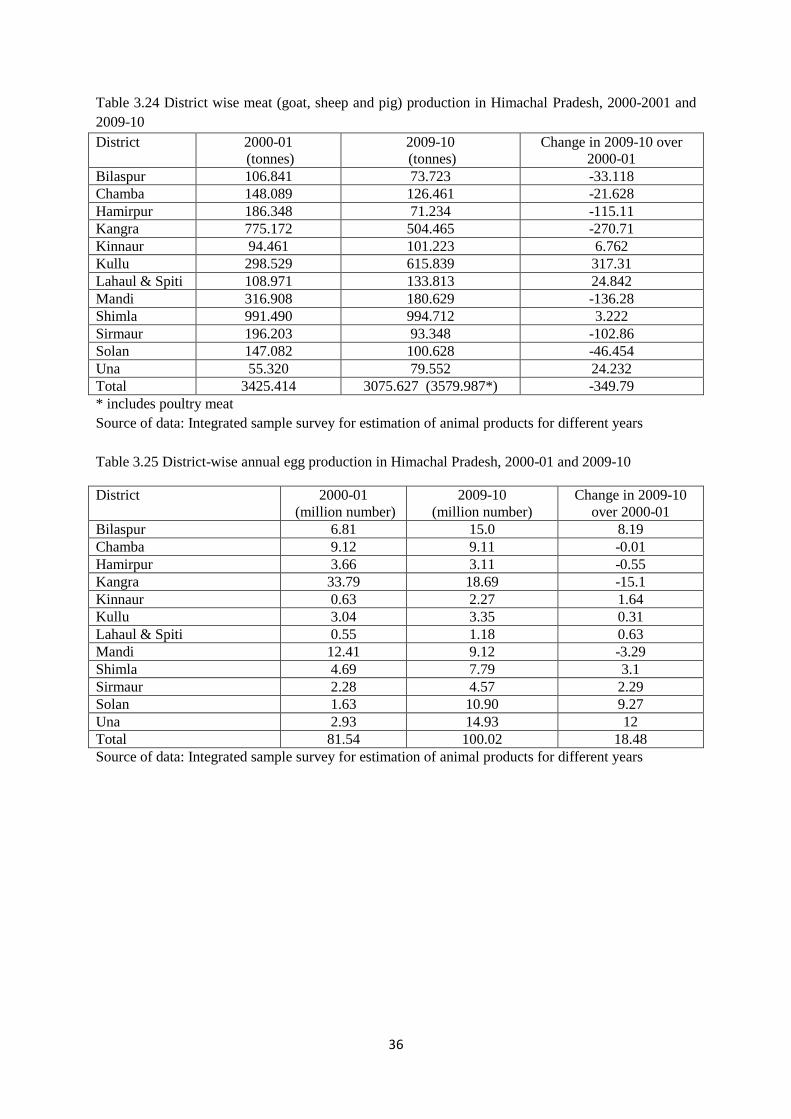
36
Table 3.24 District wise meat (goat, sheep and pig) production in Himachal Pradesh, 2000-2001 and
2009-10
District 2000-01
(tonnes)
2009-10
(tonnes)
Change in 2009-10 over
2000-01
Bilaspur 106.841 73.723 -33.118
Chamba 148.089 126.461 -21.628
Hamirpur 186.348 71.234 -115.11
Kangra 775.172 504.465 -270.71
Kinnaur 94.461 101.223 6.762
Kullu 298.529 615.839 317.31
Lahaul & Spiti 108.971 133.813 24.842
Mandi 316.908 180.629 -136.28
Shimla 991.490 994.712 3.222
Sirmaur 196.203 93.348 -102.86
Solan 147.082 100.628 -46.454
Una 55.320 79.552 24.232
Total 3425.414 3075.627 (3579.987*) -349.79
* includes poultry meat
Source of data: Integrated sample survey for estimation of animal products for different years
Table 3.25 District-wise annual egg production in Himachal Pradesh, 2000-01 and 2009-10
District 2000-01
(million number)
2009-10
(million number)
Change in 2009-10
over 2000-01
Bilaspur 6.81 15.0 8.19
Chamba 9.12 9.11 -0.01
Hamirpur 3.66 3.11 -0.55
Kangra 33.79 18.69 -15.1
Kinnaur 0.63 2.27 1.64
Kullu 3.04 3.35 0.31
Lahaul & Spiti 0.55 1.18 0.63
Mandi 12.41 9.12 -3.29
Shimla 4.69 7.79 3.1
Sirmaur 2.28 4.57 2.29
Solan 1.63 10.90 9.27
Una 2.93 14.93 12
Total 81.54 100.02 18.48
Source of data: Integrated sample survey for estimation of animal products for different years
37
CHAPTER 4
METHODOLOGY
The scientific and systematic methodology is an essential component of sound research
investigation. It directly influences the validity and generalisability of research findings. In
the field of social sciences, formulation of hypotheses, research design and techniques of
measurement of variables to test proposed hypotheses are integral components of a well
conceived/identified and formulated project proposal. In the literature on methodologies in
social sciences, there are five main approaches, namely, sample surveys, rapid appraisal,
participant observation, case studies and participatory learning and action to conduct a
scientific research inquiry. The adoption of a particular approach or amalgam of different
approaches, however, is contingent on a variety of factors most notably, the objectives of the
proposed research inquiry, the proposed use of the findings, the level of required reliability of
results, complexity of the research area/programme and, of course, the availability of
resources (budget outlay, human resource and time frame). The present chapter, therefore,
discusses the details of the research methodology in terms of research design, method of data
collection, analysis, measurement of selected variables and difficulties faced in conducting
study.
4.1 Rationale for site selection
Himachal Pradesh state of India in the western Himalayas was selected for sampling as it lies
within the ICIMOD defined HKH region. The broad criteria for selection of districts were
their maximum representation in terms of livestock rearing systems, livestock rearing
communities and logistics. In each of the selected district all the livestock rearing production
and land use systems were listed and final sites were selected based on random sampling. The
study covered two districts, namely, Chamba and Lahaul- Spiti out of the four districts in
which the rangelands are located (Fig 4.1). These two districts were purposively chosen to
ensure representation of both different ethnic groups depending on livestock husbandry and
also the types/quality of the rangelands that are available in the state.

38
Fig 4.1 Map of Himachal Pradesh showing the selected districts
4.2 Sampling design
Multistage stratified random sampling design was followed to select a sample district, the
production system, the villages and the livestock herders in consultation with different
stakeholders like officials of Directorate of Animal Husbandry, the scientists of the college of
veterinary and animal sciences CSK HP Agricultural University, Palampur, the district senior
veterinary/animal husbandry officers and social organizations like Himachal Gaddis union,
the Gujjars vikas sangh and tribal groups, etc. The study covered the three major livestock
rearing systems prevalent there viz. transhumance 1 (Gujjars), transhumance 2 (Gaddis) and
agro-pastoralist (Bhots/Bodhs). The first strata of the sample consisted of districts, second the
production systems, the third of villages and the fourth and final strata were of the households
(livestock herders). The number of households from each ethnic group/community/livestock
rearing system was selected based on total of household in each stratum. The number of
samples selected was adequate to ensure representativeness. The total sample size was 100
households depending on the number of households and homogeneity in demographic and
socioeconomic parameters within the production systems was derived using data from
Census of India.
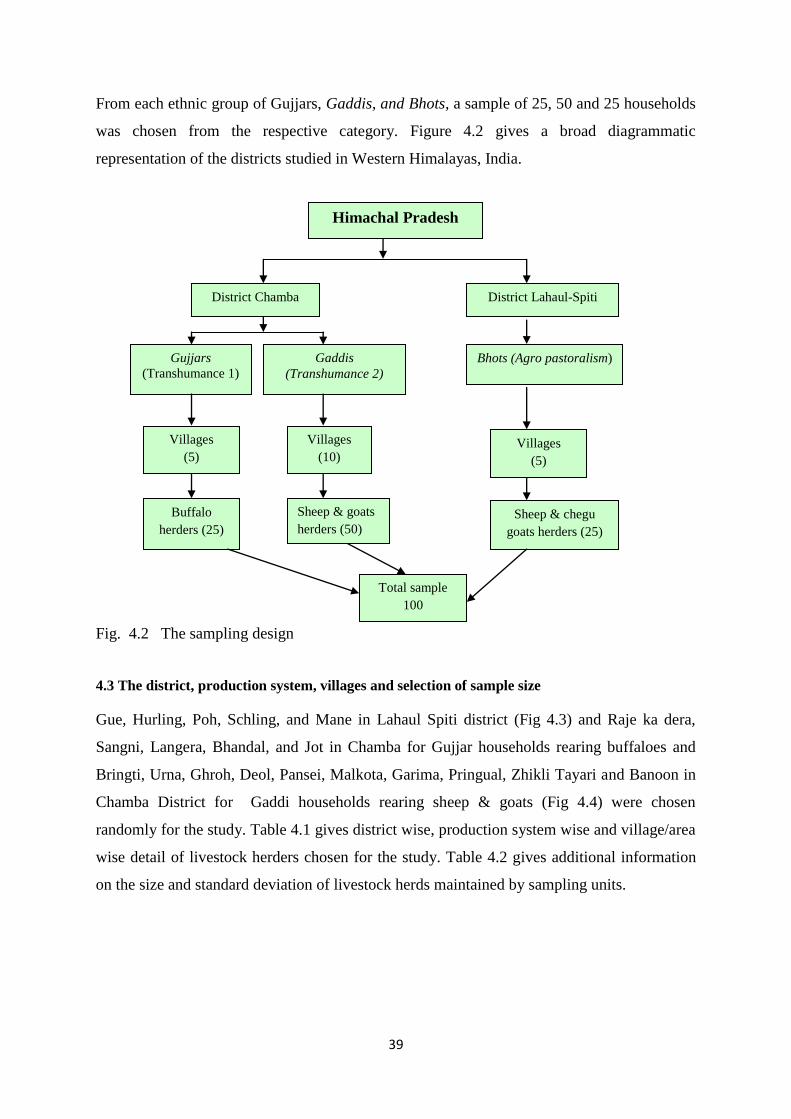
39
From each ethnic group of Gujjars, Gaddis, and Bhots, a sample of 25, 50 and 25 households
was chosen from the respective category. Figure 4.2 gives a broad diagrammatic
representation of the districts studied in Western Himalayas, India.
Fig. 4.2 The sampling design
4.3 The district, production system, villages and selection of sample size
Gue, Hurling, Poh, Schling, and Mane in Lahaul Spiti district (Fig 4.3) and Raje ka dera,
Sangni, Langera, Bhandal, and Jot in Chamba for Gujjar households rearing buffaloes and
Bringti, Urna, Ghroh, Deol, Pansei, Malkota, Garima, Pringual, Zhikli Tayari and Banoon in
Chamba District for Gaddi households rearing sheep & goats (Fig 4.4) were chosen
randomly for the study. Table 4.1 gives district wise, production system wise and village/area
wise detail of livestock herders chosen for the study. Table 4.2 gives additional information
on the size and standard deviation of livestock herds maintained by sampling units.
District Lahaul-Spiti
District Chamba
Gujjars
(Transhumance 1)
Buffalo
herders (25)
Sheep & goats
herders (50)
Gaddis
(Transhumance 2)
Villages
(5)
Villages
(10)
Sheep & chegu
goats herders (25)
Total sample
100
Villages
(5)
Bhots (Agro pastoralism)
Himachal Pradesh
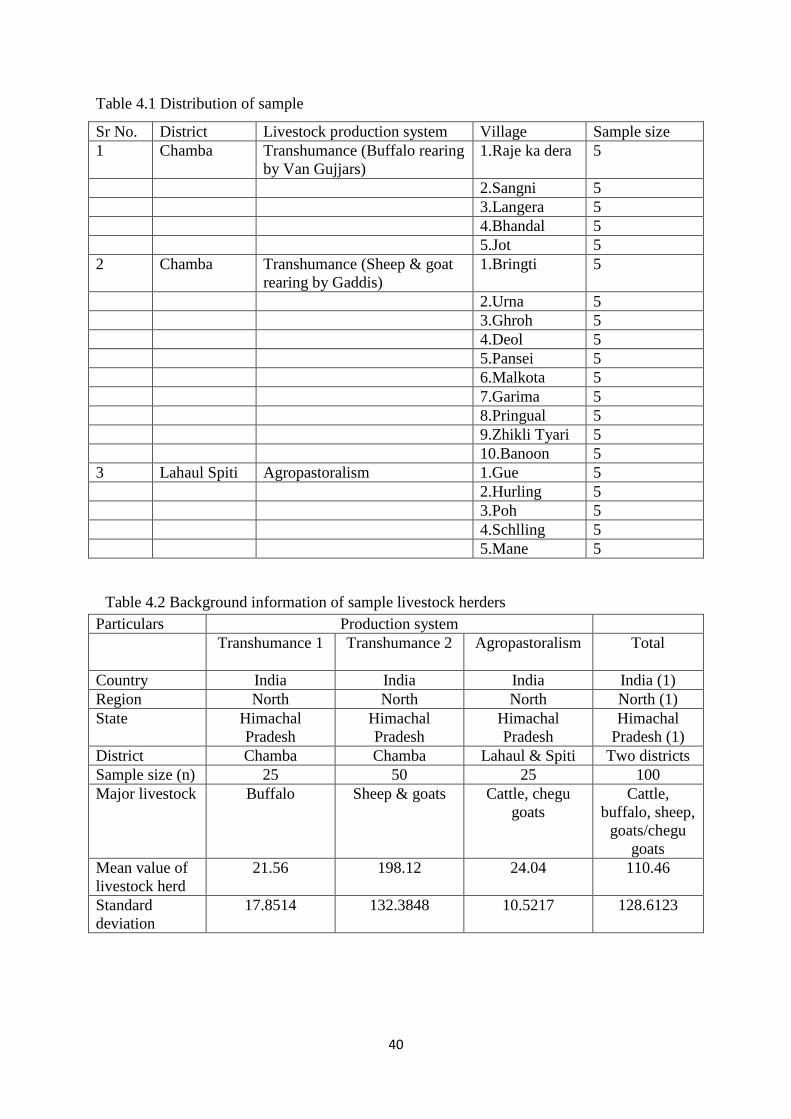
40
Table 4.1 Distribution of sample
Sr No. District Livestock production system Village Sample size
1 Chamba Transhumance (Buffalo rearing
by Van Gujjars)
1.Raje ka dera 5
2.Sangni 5
3.Langera 5
4.Bhandal 5
5.Jot 5
2 Chamba Transhumance (Sheep & goat
rearing by Gaddis)
1.Bringti 5
2.Urna 5
3.Ghroh 5
4.Deol 5
5.Pansei 5
6.Malkota 5
7.Garima 5
8.Pringual 5
9.Zhikli Tyari 5
10.Banoon 5
3 Lahaul Spiti Agropastoralism 1.Gue 5
2.Hurling 5
3.Poh 5
4.Schlling 5
5.Mane 5
Table 4.2 Background information of sample livestock herders
Particulars Production system
Transhumance 1
Transhumance 2
Agropastoralism Total
Country India India India India (1)
Region North North North North (1)
State Himachal
Pradesh
Himachal
Pradesh
Himachal
Pradesh
Himachal
Pradesh (1)
District Chamba Chamba Lahaul & Spiti Two districts
Sample size (n) 25 50 25 100
Major livestock Buffalo Sheep & goats Cattle, chegu
goats
Cattle,
buffalo, sheep,
goats/chegu
goats
Mean value of
livestock herd
21.56 198.12 24.04 110.46
Standard
deviation
17.8514 132.3848 10.5217 128.6123
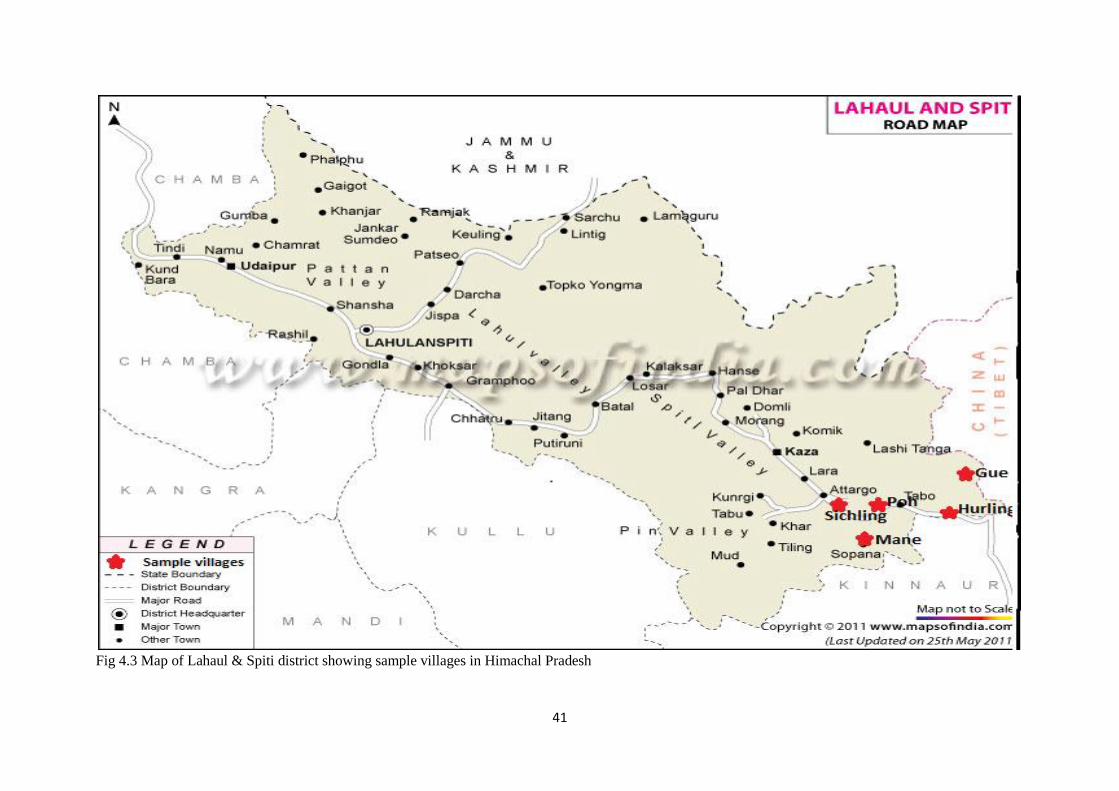
41
Fig 4.3 Map of Lahaul & Spiti district showing sample villages in Himachal Pradesh
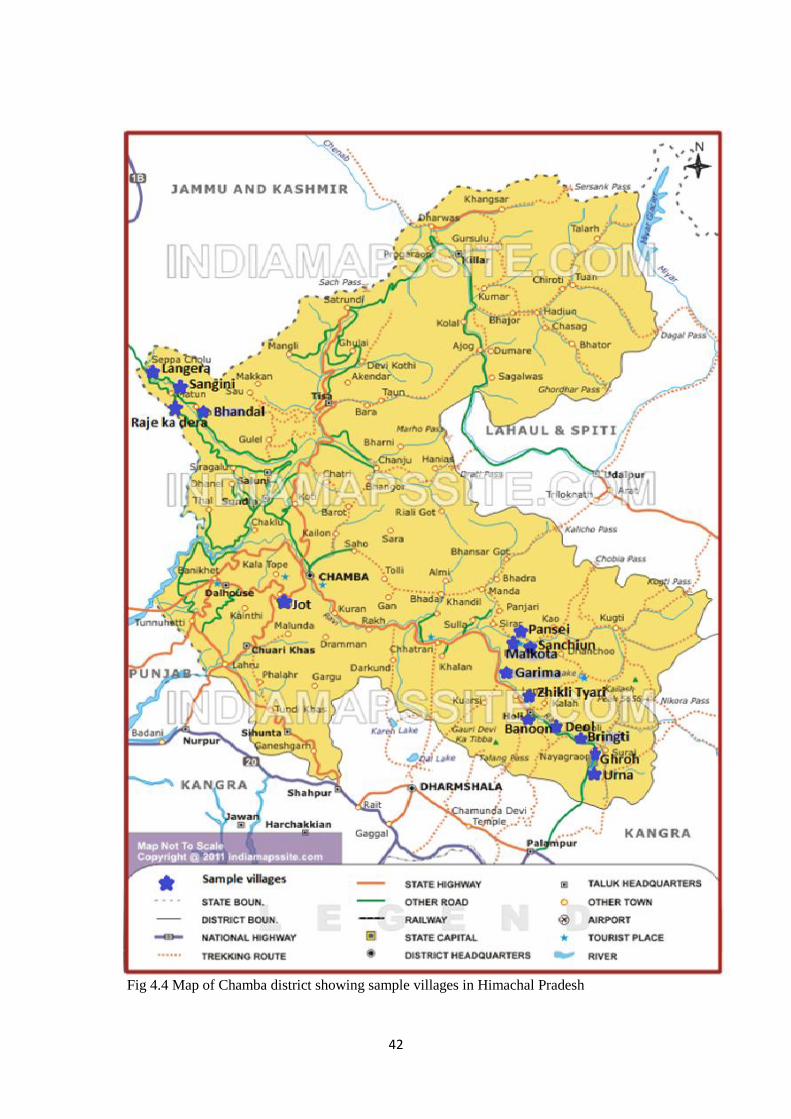
42
Fig 4.4 Map of Chamba district showing sample villages in Himachal Pradesh
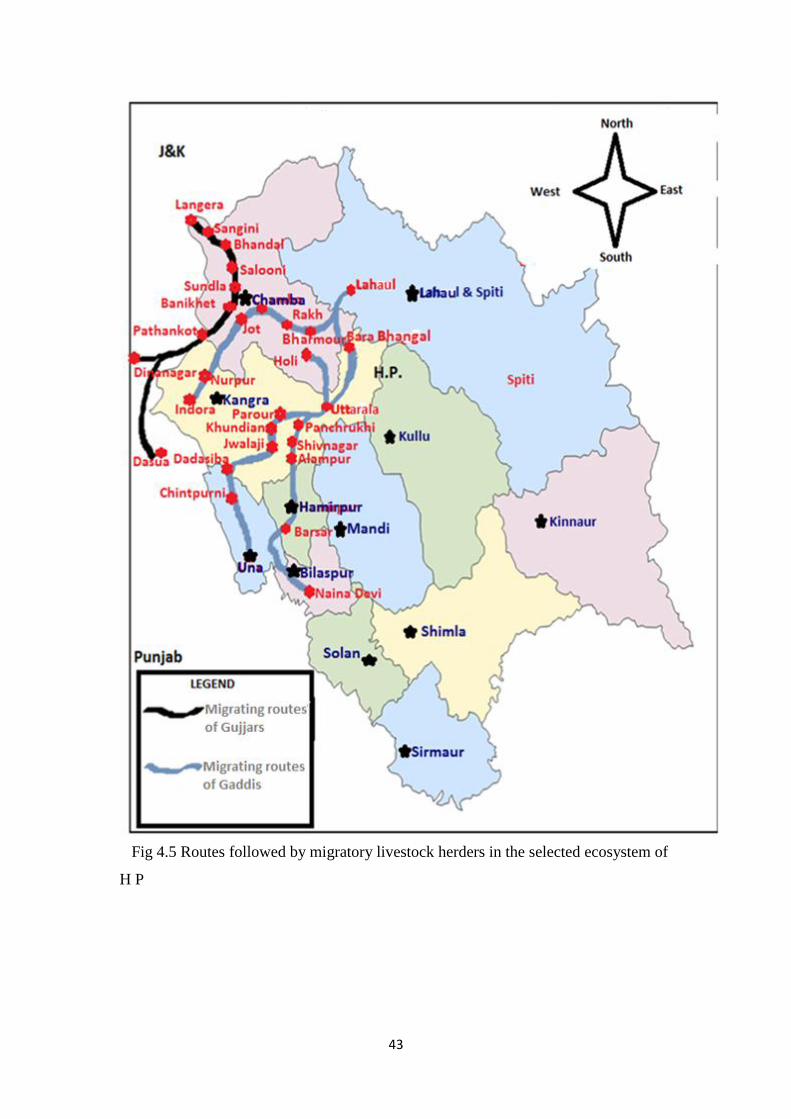
43
Fig 4.5 Routes followed by migratory livestock herders in the selected ecosystem of
H P
44
4.4 Data collection
The study is based on both secondary and primary data. The secondary data were
collected from different government departments like the Directorate of Animal
Husbandry, Directorate of Land Records, Directorate of Economics and Statistics and
Directorate of Forests. The secondary data on different parameters of livestock and
their products such as livestock composition, milk production, meat production, the
wool production and their finished products, the land use under forests cover,
permanent pastures and grazing lands, and so on were collected for such districts from
the following published and unpublished sources.
Annual reports like the quinquennial livestock census reports and the
estimation of results of sample surveys for animal products of the State
Animal Husbandry Directorate,
Statistical abstracts and economic surveys of department of Economics &
Statistics of Himachal Pradesh,
Annual reports and state forest policies of department of forest & environment,
Reports of woolfed and milkfed,
Reports of NBAGR (ICAR), Karnal on Pashmina goat of Himalayas
Crop annual season reports of the directorate of land records,
Research reports/studies available in Agricultural University
The primary data were collected from the sample households rearing livestock herds
using well-designed and pre-tested schedule provided by international consultant
through ICIMOD. The data on the following aspects were collected at the
household’s level through a personal interview method for the year 2010-11:
Background information
General information on demographic features
Ownership of land and assets
Livestock ownership and its dynamics and problems associated
Purchased feed for livestock and crop production and value of crop products
Production and processing of animal products
45
Marketing of livestock their value added products and associated marketing problems
Source wise annual household income realization
4.5 Data analysis and analytical framework
Data were entered and analysed using statistical packages such as excel and SPSS.
Statistical tools like averages, percentages and standard errors, etc were employed to
arrive at the objectives. For each production system the following statistics were
derived:
a. Mean livestock holding per house hold
b. Trends in live stock holdings
c. Productivity of livestock
d. Market and non market values of the livestock and products
e. Proportion of the total household income contributed by livestock
4.6 Limitations of the study
The study is based on the sample observations collected from 100 livestock
herders in the selected villages of Chamba and Lahaul Spiti districts of
Himachal Pradesh western Himalayan state, India. The sample size was fixed
keeping in view time and resource (money) constraints. The local language
spoken by the respondents and its tinge was difficult to understand with a
clear-cut meaning. Therefore, to overcome the language problem, one local
youth was employed in the project, but he too left the job in between.
Thereafter, the help of scientists/animal husbandry doctors working/posted in
study areas was sought in clarifying the doubts. As is the usual case, since no
farm records were maintained by the sample livestock herders, the data were
collected by survey method based on their memory and past experience. Thus
while due care was taken to extract accurate information, the possibility of a
few slips from the memory of the respondents could not be ruled out . Further,
though the results of study have been arrived at following scientific
methodology and have more applicability to the temperate wet and temperate
dry (cold desert) areas of trans-Himalayan region in Himachal Pradesh, the
results can be generalised to other similar regions/systems in HKH region
without any significant variations.
46
CHAPTER 5
RESULTS AND DISCUSSION
As alluded to above, the present study is mainly confined to three ethnic groups
rearing livestock whose economy is mainly based on buffaloes (The Gujjars), sheep &
goats (The Gaddis) and assorted type of livestock including chegu goats (The
Bhots/Bodhs) residing in Chamba and Lahaul Spiti districts of Himachal Pradesh
(India). The brief description of these ethnic groups is given below.
5.1 The profile of ethnic groups
5.1.1 The Van Gujjars
There are two types of Gujjars in Himachal Pradesh one the Hindus and other the
Muhammadans popularly known as Van Gujjars. Both rear buffaloes. However,
while the earlier lead a sedentary/stationary life, the latter follow a transhumance
system. Thus the economy of both Gujjar communities in Himachal Pradesh is mainly
based on buffalo husbandry. The Gujjars who are followers of Hindu religion rear 5-
10 buffaloes while those following Islam rear 10-25 buffaloes. The Van Gujjars move
up to the high mountain grazing places during summer and rainy seasons and come
down during the early winter. Both Gaddis and Gujjars spend same time in the
mountain pastures and plain grazing areas. The only difference is that Gujjars do not
graze their animals in the forests during winter and make halts in the open places near
Pathankot, Dassua, Dinanagar, Gurdaspur, etc where they are customarily invited by
the large farmers growing paddy and wheat. The paddy and wheat straw is fed to the
buffaloes. The buffaloes are also grazed in the nearby areas and Gujjars also help their
landlords in domestic chores. The farm yard manure is utilized by the landlords.
5.1.2 The Gaddis
The shepherds of western Himalayas rear sheep and goats and mostly belong to
Chamba, Kinnaur, Kangra, Kullu, Mandi, Shimla, and Sirmaur districts of Himachal
Pradesh (India). The shepherds of Chamba district are popularly known as Gaddis
who wander from high hills to plain areas in search of grass and water for their sheep
47
and goats. During summer and rainy seasons, they spend four months in the high
reaches of the mountains and make use of meadows and pastures which are highly
rich in nutritious grass. Similarly, during winter they move down to plains of the state
as well as to the neighbouring states and spend four months in the forests where they
have their grazing rights. While moving upward to high hills/mountains and coming
downward to plains, the shepherds spend four months (2 months in moving upwards
and 2 months coming downward). The major routes of migration followed by Gaddis
and Gujjars have been shown in the methodologies chapter (Fig 4.5). On an average a
one side distance of 350-500 kms is covered by the shepherds who lead not only very
harsh and difficult life but face many challenges like the hazards of transport vehicles
on their migrating routes, the attack of wild animals, the shrinkage of grazing areas on
the pretext of plantation in many wasteland areas, declaration of sanctuaries and
reduction in the supply of good grass due to infestation of weeds like lantana,
azeratum and congress grass (parthenium). Many places where shepherds used to
make their night halts have been occupied by hydroelectric project authorities or some
building have been constructed. Thus general development process along the
migrating routes has impacted the life of Gaddis. The same is true for Gujjars also.
5.1.3 The Bhots/Bodhs
The people of Spiti region of Lahaul Spiti district are mostly known as Bhots/Bodhs.
This region, resembling Ladakh and Tibet, is more desolate and barren than Lahaul
region of the district. There are three distinct geographic regions in Spiti; these are the
Spiti valley (the valley of the Spiti river), the Pin valley (the valley of the Pin river)
and high mountain regions in the north and east of Spiti tehsil. The region has always
remained a source of attraction to both adventurers and scholars. The people
inhabiting the area, their economy, religion, customs and rituals including family
structure and traditions have always attracted the attention of the scholars. The
economy of the Bodhs is agropastoral. People rear cattle, yak churu/churi sheep &
goats and equines mostly the horses and donkeys. The horses bred in the area are in
greater demand from other parts of the state and country. Similarly, the chegu goats
reared in the area are famous for pashmina. The Bodhs unlike Gujjars and Gaddis lead
a sedentary life. However, they move their livestock for grazing in the nearby and far
off pastures and collect grass from the grasslands and pastures. During summers after
48
melting of snow, all the animals except milking cows and churies are let loose for
months together in the pastures after sowing is over and some like donkeys are
engaged for carriage purpose besides ploughing. These animals are brought back
before the onset of the next snow fall season in September-October. The task of
looking after the animals is performed by one or two herdsmen of the entire village.
Farmers rear donkeys of short height and use them for transporting fuel, fodder and
other needy items for their use. During winter the livestock is confined to the pens and
sheds and fed on hay and willow bask. Scarcity of fodder is a major problem in the
area. It is collected from all available sources and stored to feed the animals in the
winter. And to economize fodder, the animals are let loose in the pastures. During
summer season, which lasts five to six months only, the farmers hurriedly collect cow
dung, grasses and fuel wood from quite far off places and transport using donkeys.
The donkeys are also used to transport FYM to the fields. In those villages where
donkeys are not reared, yaks are used for this purpose.
5.2 Demographic features
5.2.1 The population and marital status
Table 5.1 reveals production system wise population composition of livestock herders
in terms of adults and children. It can be observed from the table that on transhumant-
1 Gujjar households the average size of family was the largest (8.32) followed by
agropastoralist Bhots (6.76) and transhumant-2 Gaddis (5.46). The overall size of
family in the state for these groups was 6.50. In adult’s population, the female’s
composition was below 50% in all groups with overall percentage of 44%. In case of
children the population of females was higher than males in agro pastoralists and
transhumant-2 categories whereas in transhumant-1 group again the population of
female children was much lower than 50%. Likewise, at the overall level the
population of female children was marginally lower (47%) than the desired level of
50%. At the household level, the number of children was higher in transhumant-1
group followed by transhumant-2. The sex ratio was in favour of males in the entire
category of livestock herders which varied from 764 in transhumant-1 group to 870 in
agro pastoralists with overall average of 821. On the whole, average size of the family
varied from 5.46 in agro pastoralists group to 8.32 in transhumant-1 group with
49
overall size of 6.50. The number of adults per households was more than children in
all the cases. And the overall sex ratio was 821 females per 1000 males.
Table 5.2 shows the marital status of respondent livestock herders. As may be seen
from the table all the transhumant-1 respondents were married, whereas, in agro
pastoralists and transhumance-2 category, 90% and 96% respondents were married,
respectively. The widower and unmarried constituted 6 % and 4 %, respectively
among agro pastoralists. Considering the overall situation, 94% livestock herder
respondents were married while 3% each were unmarried and widows & widowers.
5.2.2 Employment pattern
Table 5.3 shows the status of employment in service sector outside the village in
another town of the country or abroad. The table shows that 25 persons (3 of
transhumant-1; 15 of agro pastoralist and 7 of transhumant-2 sample herder
households) were employed outside their villages. In other words, in transhumance-1,
agro pastoralist and transhumance-2 households 2.50%, 6.58%, and 5.26% of the total
men and women (adults) were employed outside, respectively. At the overall level,
5.20% of the men and women were employed in military and paramilitary forces. One
interesting feature of this table is that the number of men was more than their women
i.e. out of 25, 23 (92%) comprised men and 2 (8%) women (one each from
transhumance-1 and agro pastoralist group).
Table 5.4 depicts the family members’ involvement in tending livestock herds. The
table shows that among transhumance-1 (Gujjar) livestock rearing households
especially the buffalo herders, the proportion of children, women and men involved in
herding livestock was 62.50%, 67.86% and 93.75% of their respective population.
The average number of children, women and men involved in livestock rearing per
household was 2.60, 1.52 and 2.40 with total of 6.52 per household. In all, 163
persons were involved in herding livestock maintained by the transhumance-1
(Gujjars). On transhumant-2 (Gaddis) households, the involvement of children and
women was less in comparison to transhumant-1 (Gujjar) households. The average
number of men per household was even less (1.30) while in case of women and
children it was almost negligible (women 0.10 and children 0.08). In all, 74 persons
were involved in tending sheep and goat herds maintained by transhumant-2 (Gaddis)
50
and the number per household was 1.48. Among agropastoralist livestock herders, the
children were not involved in tending livestock herds. The number of men involved
per household was 0.52 while number of women involved was 0.24. Among
agropastoralist (Bodhs) communities who reside in Lahual Spiti district, 19 persons
who accounted for 11.24% of the total population were involved in tending livestock
herds which comprised mostly of goats (chegu goat), cattle and donkeys. Considering
all three systems of livestock rearing, 1.38 men, 0.50 women and 0.70 children with
their total of 2.56 per household were engaged in tending livestock herds.
In sum, the number of persons involved in tending livestock herds per household was
the highest (6.52) on transhumant-1 (Gujjars) followed by 1.48 on transhumant-2
(Gaddis) and below one (0.76) on agropastoralist (Bodh) households. Further, the
transhumant-1 (Gujjars) were cultivating crops just for the name sake; the Gaddis had
their land in two places one in Chamba (the higher hills) and other in lower parts of
the state where other family members were practicing agriculture. However, in Lahual
Spiti district majority of the agropastoralist (Bodh) households had herds of assorted
livestock breeds and practiced agriculture during summer commencing from April to
September.
5.3 Utilization of rangelands and grazing rights
Tables 5.5, 5.6 and 5.7 present data on the utilization of rangeland resources by the
livestock herders. It can be seen from Table 5.5 that both transhumant-1 (Gujjars) and
transhumant-2 (Gaddis) made use of open access community lands and land taken on
lease or of their own. The Gujjars and Gaddis had their rights for grazing livestock in
the pastures on higher hills. They are issued permits stating the number of animals to
be grazed by the department of forest, government of Himachal Pradesh which are
renewed every year. The agropastoralist (Bodhs) of Spiti region have their community
lands where the livestock herds reared by households are taken/sent after melting of
the snow. The milking animals are kept at home and rests including donkeys are
moved to pastures. These animals are brought back during September- October before
the commencement of fresh snow fall.
As may be seen from Table 5.6, the rangeland with exclusive right within a walking
distance from the village or place of residing/ halting ranged from 36 ha on
51
transhumant-1 group to 201 ha on transhumanct-2 of livestock herders. At the overall
level considering all systems of livestock grazing, it was 88 ha. Table 5.7 further
shows that none of the livestock herder had their own forest which could supply wood
and fuel for human beings and grass for the livestock maintained by such households.
5.4 Trends in livestock population
Table 5.8 and Table 5.9 present information about the existing adult livestock
maintained by herders during 2011 and about a decade ago in 2001. It can be seen
from Table 5.8 that the size of livestock, maintained by transhumant-1 (Gujjar),
transhumant-2 (Gaddi) and agropastoralist (Bodh) households in 2011 varied from
21.36 on Gujjar households to 31.01 on Gaddi households with an overall average of
22.37. The Gujjar livestock herders had higher number of buffaloes (19.60 per
household) followed by horses (1.36 per household). These households also reared
sheep and goat which numbered 0.20 per household. Among Gaddi households, sheep
and goats were the major livestock whose numbers were 98 and 99 per household
followed by cattle. The cattle were kept at home for milk and draft services at times of
cultivation of crops. The total number per household of all livestock was 198.12
which in terms of adult capital unit came to be 31.01. In a similar vein, among Bodh
households, sheep and goats were main animals whose averages size varied from 6.80
for sheep and 13.88 for goats. Cattle, horses and donkeys were also reared by these
households whose numbers per household were 2.16, 0.12 and 1.04, respectively. On
an average, more than 100 livestock of all types were maintained per household by the
sample herders which in terms of adult cattle units came to be 22.37. The sheep and
goats dominated the livestock herd.
In comparison, the size of livestock herd was less in the year of 2001 as compared to
2011 in case of transhumant-1 (Gujjar) and agropastoralist (Bodh) households (Table
5.9). However, among transhumant-2 (Gaddi) households, the herd size was larger
(41.98) in the former year as compared to what it exists in the latter year (31.01). The
trends in livestock inventory possessed by the livestock herders in 2011 over 2001
have been brought in Table 5.10. The table shows that while there has been a slight
increase in the population of cattle, buffaloes, horses and donkeys, there has been a
sharp decline in the number of sheep and goats. This decline may be attributed to,
52
among other things, shrinking of grazing areas and disliking of the profession by the
younger generation inasmuch as it involves migrating system throughout the year. On
the whole, it can be concluded that the size of livestock herds possessed by
transhumant-1 (Gujjars) and agro pastoralist (Bodhs) has increased whereas that
maintained by transhumant-2 (Gaddis) has reduced due to various reasons.
The average value of livestock species over one year of age possessed by various
category herders is presented in Table 5.11. The table reveals that cattle mostly the
cows were valued at average value of US $ 109 which varied from US $ 68 among
transhumant-2 (Gaddis) to US $ 150 among agropastoralist (Bodh) households.
Buffalo was valued at US $ 407 with its variability from US $ 206 on transhumant-2
(Gaddi) farms to US $ 408 on transhumant-1 (Gujjar) households. Horses used for
transport purpose were valued at US $ 466 with small variability from one group to
other. Donkeys were maintained by agropastoralist (Bodh) herders which were valued
at US $ 124. The average value of sheep (US $ 61) was slightly higher than goat (US
$ 60).
5.4.1 Problems in livestock husbandry
The problems faced by livestock herders are depicted in Table 5.12. It can be noticed
from the table that shrinking of grazing area was the foremost problem faced by
livestock herders followed by non availability of veterinary aid due to roaming life led
by the herders. Weeds infestation in the grasslands affecting the quantity and quality
of grass and causing deterioration in the quality of wool fibre and goats hair was
another problem being reported by 17% of herders. Many weeds even created skin
problems to the livestock and their flock masters. This problem was more severe
among sheep and goats rearing herders. Lack of remunerative prices for milk was
also reported by transhumant-1 (Gujjars) buffalo herders. Table 5.13 shows the
problems faced by livestock herder about a decade ago. It can be seen from the table
that the problems of shrinking grazing area and non-availability of veterinary aid were
less severe than nowadays. Similarly, the problem of infestation of grasslands by
obnoxious weeds has become more serious now as compared to a decade ago.
Table 5.14 spells out the reasons for change in livestock ownership among different
ethnic groups since 2000. The table shows that in all, there were 23% cases of change
53
in ownership. Among trandhumant-1 (Gujjars), the ownership changed in case of 28%
respondents while in case of transhumant-2 (Gaddis) 32% experienced change in
ownership. In agropastoralist (Bodh) group, none of the respondents reported change
in ownership. In a majority of the respondents where change in ownership happened,
it occurred following the death of their parents followed by old age of the parents. In
13% cases, the ownership changed due to division of family. Thus shrinkage of
grazing areas followed by non-availability of veterinary aid and weed infestation in
the grasslands were important problems being faced by livestock herders.
5.4.2 Investment on additional livestock
Table 5.15 gives information on the willingness of herders to make investment on
additional livestock. As may be seen from the table, 40 to 56% of livestock herders
wanted to make investment on additional livestock. All the 40% transhumant-1
(Gujjars) expressed their willingness to make investment on buffaloes, whereas, the
transhumant-2 (Gaddis) preferred to make investment on sheep (82%) and goat (46%).
Similarly, in case of agropastoralist (Bodh) group, those who expressed willingness
for making investment, it was again for acquiring sheep and goat (Table 5.16). The
desire to earn more profits through increased production of milk and milk products,
wool and increased production of farm yard manure were important motivating
factors for making additional investment (Table 5.17). While enquiring about the
sources from where the feed will be arranged for additional livestock holding; the
majority of respondents reported that they still have enough grazing land despite
shrinkage of areas. Likewise, 14% were prepared to lease-in additional pasture land.
In some cases, respondents also reported that they would meet the additional
requirement of feed by buying hay, wheat and paddy straw from the local farmers and
market (Table 5.18).
5.4.3 Livestock production
Table 5.19 gives data on production level of milk obtained from milch animals like
cow, buffalo and goat. The average yield of milk obtained from cow, buffalo and goat
was 381, 2699 and 614 kg per household per annum. The production on per day basis
was 1.04, 7.39 and 1.68 kg per household. Sheep were not milked by the herders. All
the milk of sheep was fed to lambs.
54
Table 5.20 shows different other livestock products that were being prepared by
livestock herders under different systems. The table reveals that yoghurt (curd),
cheese, ghee, kurut (made from colostrums), butter, wool and goat hair were the
important livestock products harvested by livestock herders. Among these products,
the production of yoghurt was the highest (141 kg per household per annum) followed
by cheese (63 kg per household per annum). Further, while in case of transhumant-1
(Gujjar) livestock herders, yoghurt was the most important livestock product followed
by cheese, however, wool followed by yoghurt was the main products realized by
transhumant-2 (Gaddis). Similarly, in case of agropastoralist (Bodhs) again yoghurt
was an important item of livestock product. The production of manure varied from
23.8 metric tonnes per household per annum on agropastoralist (Bodh) livestock
herders to 184.87 metric tonnes per household per annum on transhumant-1 (Gujjar)
households.
5.4.4 Processing of animal products
The processing of livestock products is highly gender specific. Table 5.21 shows that
in respect of transhumant-1 (Gujjar) livestock herders women processed most of the
livestock products barring cheese and manure. Cheese was prepared by 72 % of
herders and in all the cases it was processed by men. All other animal products were
processed by all the livestock herders. On transhumant-2 households, wool was
processed by 98% of the households followed by the processing of goat hair by 92%
households which was mostly processed by men. On agropastoralist (Bodh) livestock
herders group, wool and cashmere were processed by 88% and 84% of the livestock
herders. Goat hair was got sheared by 92% of herders where both men and women
were involved. Manure was the only livestock product harvested by cent per cent
livestock herders of various categories and in majority of cases (48% to 100%) this
was processed by men. In brief, while in case of transhumant-1 (Gujjar) livestock
herds the role of women was more pronounced than their male counterparts; in case of
transhumant-2 (Gaddis), the processing of livestock products was mainly confined to
men. In case of agropastoralist (Bodh) households, both men and women were
equally involved.
55
5.4.5 Consumption and marketing problems of livestock products
Table 5.22 gives information on the use of livestock products at home. Milk was the
most important item of household use; its per capita consumption varied from 45 kg
per annum on agropastoralist (Bodh) households to as high as 130 kg per annum in
case of transhumant-2 (Gaddis). In case of trandhumant-1 (Gujjar) households, the per
capita consumption of milk was assessed at 105 kg per annum. Similarly, the per
capita consumption of yoghurt varied from 11.65 kg per annum in case of Gaddi
households to 41.25 kg per annum in case of Gujjar livestock households. It can
further be seen from the table that the per capita consumption of other livestock
products like cheese, ghee, kurut and meat was below 10 kg per annum. The
consumption of animals for meat purpose was found only in respect of transhumant-2
(Gaddi) and agropastoralist (Bodh) livestock herding households where it amounted
to 22.72 kg and 15.60 kg per head per annum, respectively.
The main marketing problems being faced by sample livestock herders in the sale of
animals and their products have brought in Table 5.23. It can be seen from the table
that non-remunerative price for wool was the most important problem being faced by
majority of transhumant-2 (Gaddis) rearing sheep. Non-remunerative price of milk,
lack of veterinary aid and no price for dead sheep & goat were some other problems
reported by around 21-22% of the livestock herders. Likewise, lack of transportation
facility in disposing of their animal products due to their migratory livestock rearing
systems was yet another problem which was reported by buffalo and sheep & goat
herders.
5.4.6 Use of livestock for guests
The monetary value of the animals like sheep, goats and buffalo animals offered to
guests as gift and or consumed during wedding ceremony have been reported in Table
5.24. In the study area, while sheep and goat are offered as gift or slaughtered and
served as meat to guests during ceremonies as a tradition, buffaloes were offered in
the form of dowry (gift) by very few households. The large ruminants are not
slaughtered for meat by the livestock communities in the area. Table 5.24 shows that
the average value of buffalos given as gift by the transhumant-1 (Gujjar) graziers was
$ 277.53 per household per annum. Likewise, in case of transhumant-2 (Gaddi)
56
households, the value of sheep and goat gifted/consumed by them was assessed at $
5.70 and $ 88.95, respectively. In case of agropastoralist (Bodh) households, the use
of sheep and goat was valued at $ 8.84 to 87.10 per household per annum.
5.4.7 Sale of live animals
Table 5.25 and 5.26 show the sale proceeds of live adults and young stock of male
and female animals. Table 5.25 shows that sheep and goats were mainly kept for sale
as their number per household varied from 2.34 (male goats) to 2.84 (male sheep) in
case of transhumant-2 (Gaddis). Among agropastoralist (Bodhs), the number of male
sheep and goat sold per household was negligible, less than one. At the overall level,
while the number of male sheep and goat sold was 1.38 and 1.45, respectively, that of
female sheep and goat sold was 5.06 and 4.68, respectively. The number of adult
female sheep and goat sold by the sample transhumant-2 (Gaddi) households per year
was 10 per annum. In a like manner, 2.24 female buffaloes per household per year
were sold by transhumant-1 (Gujjar) households. Male buffaloes were not in great
demand; therefore, the younger males were not properly looked after leading to their
deaths. Naturally, the sale of these adults was quite low. Further, number of male
buffalo calves who survived despite neglect and poor management, were sold as a
young stock and number sold per household was one (Table 5.26). Young stock of
male sheep & goat was sold at the rate of 8 animals per household per annum,
whereas the females were sold at a rate of nearly one per household per annum. It is
thus clear that young stock of female buffalo as well as sheep & goat were not sold
and used instead for breeding purposes. Only unproductive animals that had attained
the age of maturity were sold for meat/mutton to the traders.
Table 5.27 and Table 5.28 show the sale value of animals being realized by the
sample livestock households. As may be seen from Table 5.27, while the value of
adult buffalo sold at the overall level was $ 199 per household per annum, the highest
value of a buffalo sold by a transhumant-1 (Gujjar) livestock herder was $ 796.40. In
a similar vein, the average value of adult sheep and goat sold was $ 396.77 while the
maximum value received was $1107.24. Inasmuch as adult goats were sold in large
number; the value realized was also higher; it was $ 2180.47 per household per annum
in case of agro pastoralist and $ 1107.24 at the overall level. In case of young stock,
57
the value of animal realized on account of sale was the highest for sheep which was $
568.44 per household per annum in respect of transhumant-2 (Gaddis) group and $
284.22 per household per annum at the overall level. The value realized on account of
sale of young stock of buffalo was $ 360.50 at the overall level and $ 144.20 per
household for transhumant-1 (Gujjar) livestock herders. The overall sale proceeds
from all animals including adults and young stock was assessed at $ 2306.74 per
household per annum in the study area.
5.4.8 Sale of livestock products
The sale of livestock products is shown in Table 5.29 and the unit price realized is
given in Table 5.30. As may be seen from these tables, the quantity of milk sold per
household per annum amounted to 1322 kg priced at $ 0.47 per kg. The amount of
wool sold was 50.02 kg at an average price of $ 0.94 per kg. Similarly, the amount of
cheese and meat sold was 46.90 kg and 32.35 kg per household per annum at a price
of $ 3.90 and $ 3.38 per kg. The average amount of manure sold was 1.68 tonnes at a
price of $ 22.67 per tonne. The amount of ghee sold by the sample households stood
at 3.25 kg per household which was priced at $ 7.18 per kg. Hides of animals were
other salable item though sold in very small number (0.05) priced at $ 0.91 per hide.
5.4.9 Gender involvement in sale of animals’ products
Table 5.31 gives details about the persons responsible for sale of livestock products. It
can be seen from the table that in most of the cases men were actively involved in the
sale of milk, cheese and manure. In case of transhumant-1 (Gujjars) rearing buffaloes,
women were also involved in the sale of milk. In comparison, all sale operations
pertaining to livestock products were performed by men in case of transhumant-2
(Gaddi) households. Again in agropastoralist group of livestock herders, most of sale
related activities confined to men though women also participated in sometimes.
It can be seen from Table 5.32 and Table 5.33 that none of the sample household
prepared value-added products from animal’s fibre like woolen yarn, cashmere,
pullovers, socks, etc and, therefore, the unit price charged for such items was nil.
Since no value added products like woolen yarn, cashmere, pullovers, socks, etc were
58
prepared by any of the sample household, therefore, there was no information/data on
the involvement of men, women and children (Table 5.34)
5.5 Land, assets and their sale and purchase
5.5.1 Land and assets
Table 5.37 gives information on the area of cropland and assets possessed by sample
livestock households. The table shows that on an average a sample household
possessed 0.44 ha of irrigated land and 0.25 ha of rainfed land. In all 10% of the
sample households possessed cars and 2% each had small trucks and tractors.
Motorcycle as means of transport was owned by 13% households. Television as the
means for recreation was possessed by 68% households. In all, 81% households
communicated through telephone and or cell phones. The number of residential
buildings owned by sample livestock herders exceeded the size of sample; there were
148 residential houses for 100 sample households thus giving an average of 1.48
houses per household. This could explained in terms of their migratory nature; since
majority of the households resort to seasonal migration they had to construct houses at
more than one place like the one in plains and other in the hills. The other assets
owned by sample households include refrigerator, solar panels and rooms for
handlooms, etc.
5.5.2 Cropping pattern
Table 5.38 gives detail of the allocation of cropland under different crops viz., wheat,
rice, potato, maize, pea and pulses. It can be noticed from the table that wheat was the
important crop grown by sample livestock herders at the overall level. On
transhumant-1 (Gujjar) households, wheat and maize were allocated to 0.053 and
0.051 ha per household. In case of transhumant-2 (Gaddis), wheat was the most
important crop followed by rice. The agropastoralisst (Bodh) grew garden peas which
has introduced as a cash crop recently in most of their crop land (0.33 ha/household)
followed by wheat. Among fodder crops, barley was an important crop. Hay was not
sown in the fields rather it was harvested from the grasslands by transhumant-2
(Gaddis) and agropastoralist (Bodh_ group livestock herders. The area under hay was
around 0.14 ha per household at the overall level while among different groups it was
59
higher in case of agropastoralist (Bodhs) to the tune of 0.48 ha/ household as
compared to ranshumant-1/Gaddis (0.048 ha/ household). Thus while wheat, maize,
rice and garden peas were the most important grain crops grown by livestock herders,
barley and hay were important fodder crops.
5.5.3 Crop production
The production of grains and fodder is depicted in Table 5.39. The table shows that
on the overall farm situation the production of wheat, rice, potato, maize, garden peas
and pulses was 2.12, 0.51, 0.91, 0.39, 5.38 and 0.23 q/household. The production of
barley used as grain was estimated to be 0.88 q/household while its production as
fodder was 2.72 q/ household. Similarly, the production of wheat straw was found to
be 5.16 and 1.38 q per household, respectively. The production of hay was estimated
to be 4.38 q/household.
5.5.4 Sale of crop produces and price realization
Table 5.40 and Table 5.41 show that sample livestock herders had surplus of grain
crops over above their family needs. Fodder crops produce was just enough to meet
their requirements. As far as quantity of market grain is concerned, on an average 5 kg
each of wheat and rice was sold. The quantity of pulses sold was 8 kg per household.
Rajmash was grown by transhumant-2 (Gaddis) in Chamba district and due to its
better yield, they had surplus to sell in the market. The green/garden pea was grown
by the agropastoralist (Bodh) group as a cash crop in Lahual-Spiti district of Himachal
Pradesh. The sale proceed of peas was estimated to be 3.74 q/ household. As far as
unit price of crop produce is concerned, wheat, rice, pulses and garden peas fetched $
0.34, 0.45, 1.13 and 0.70 prices per kg in the study area (Table 5.41).
5.5.5 Purchase of crop produce and residues
Table 5.42 shows the purchase of grain and fodder in the event of shortages to meet
out their requirements. Table 5.43 depicts the price of crop residues realized by the
sample livestock herders. It can be examined from the table that wheat and rice grains
were purchased to the extent of 3.53 and 3.32 q/household. Potato, maize and pulses
were purchased to the extent of 1.24, 0.53 and 0.53, respectively. Paddy straw (10.6 q),
wheat straw (3.75 q) and hay (2.49 q) were the important residues purchased by the
60
farmers at the household level for feeding their livestock. The unit price per quintal
paid for wheat straw and paddy straw was US $ 7.1 and 4.9, respectively. Alfalfa
fodder and barley as fodder were purchased to the extent of 2.19 and 1.53 q/
household, respectively. These fodder crops were purchased only by the transhumant-
1 (Gujjar) buffalo herders. Barley as grain was fed to goats by the agropastoralist
(Bodh) livestock herders who purchased 0.26 q/household. Hay and wheat & paddy
straws were also purchased by the sample livestock herders who mostly reared
buffaloes and cattle alonwith chegu goats in Chamba and Lahaul-Spiti districts,
respectively. Paddy straw as fodder was fed to buffaloes by Gujjar households. The
sheep and goat livestock herders did not purchase either of the fodder crops produce
or crops residue as fodder in that these small ruminants were fed only through grazing.
5.5.6 Purchase of feed for livestock
Table 5.44 reveals the status of sample households purchasing feed now and ten years
ago. It can be seem from the table that the use of feed per household has increased
significantly on agropastoralist (Bhodh) group than transhumant-2 (Gaddis). On
transhumant-1 (Gujjar) group, the use of feed has declined slightly which could be
due to the reduced number of animals reared by existing household.
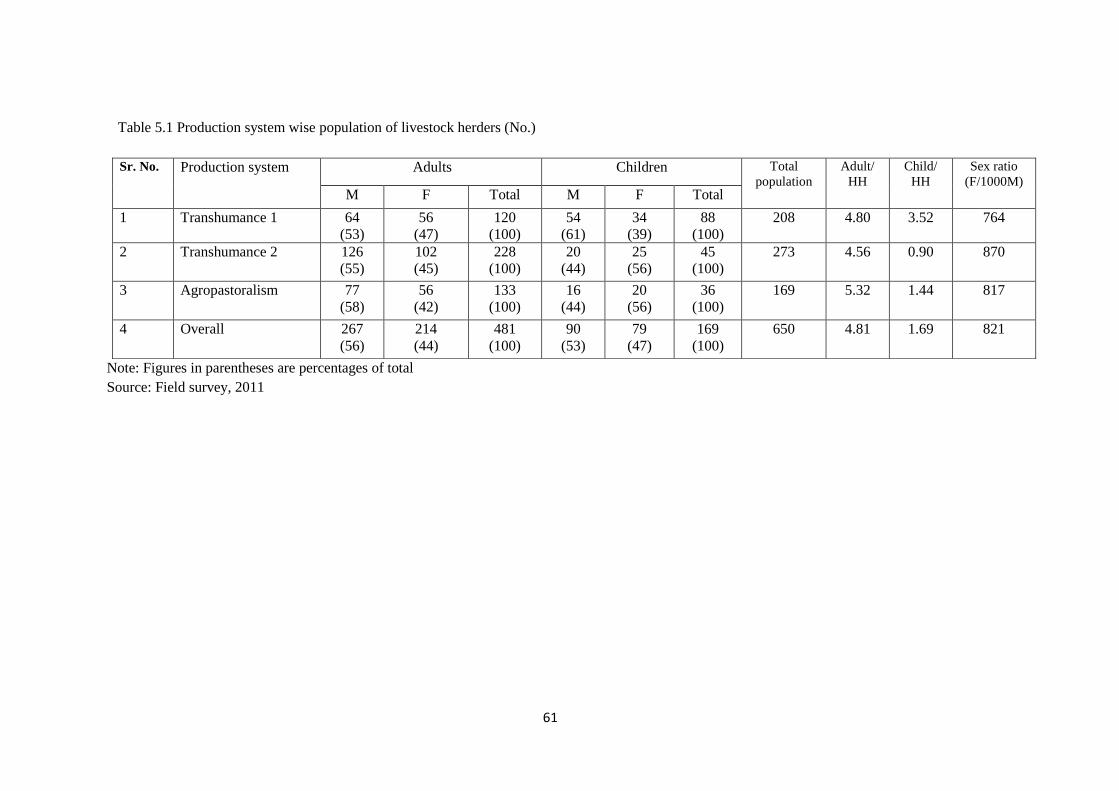
61
Table 5.1 Production system wise population of livestock herders (No.)
Note: Figures in parentheses are percentages of total
Source: Field survey, 2011
Sr. No. Production system Adults Children Total
population
Adult/
HH
Child/
HH
Sex ratio
(F/1000M) M F Total M F Total
1 Transhumance 1
64
(53)
56
(47)
120
(100)
54
(61)
34
(39)
88
(100)
208 4.80 3.52 764
2 Transhumance 2
126
(55)
102
(45)
228
(100)
20
(44)
25
(56)
45
(100)
273 4.56 0.90 870
3 Agropastoralism
77
(58)
56
(42)
133
(100)
16
(44)
20
(56)
36
(100)
169 5.32 1.44 817
4 Overall
267
(56)
214
(44)
481
(100)
90
(53)
79
(47)
169
(100)
650 4.81 1.69 821
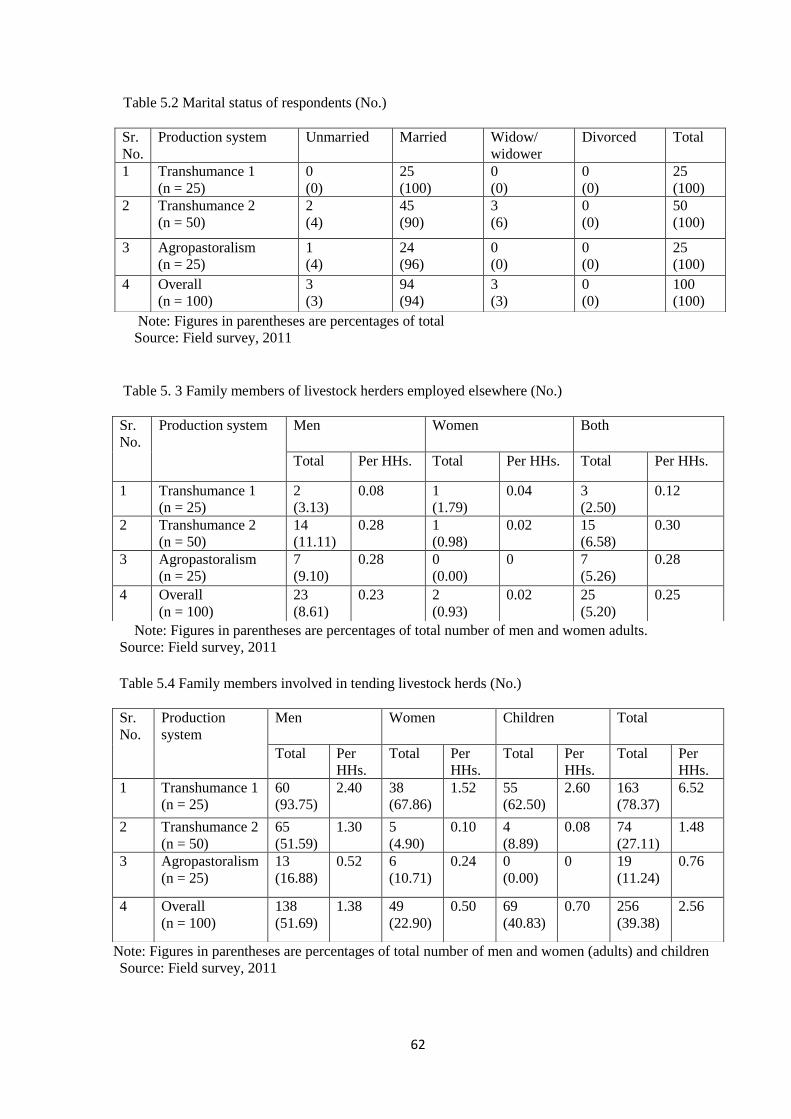
62
Table 5.2 Marital status of respondents (No.)
Note: Figures in parentheses are percentages of total
Source: Field survey, 2011
Table 5. 3 Family members of livestock herders employed elsewhere (No.)
Note: Figures in parentheses are percentages of total number of men and women adults.
Source: Field survey, 2011
Table 5.4 Family members involved in tending livestock herds (No.)
Note: Figures in parentheses are percentages of total number of men and women (adults) and children
Source: Field survey, 2011
Sr.
No.
Production system Unmarried Married Widow/
widower
Divorced Total
1 Transhumance 1
(n = 25)
0
(0)
25
(100)
0
(0)
0
(0)
25
(100)
2 Transhumance 2
(n = 50)
2
(4)
45
(90)
3
(6)
0
(0)
50
(100)
3 Agropastoralism
(n = 25)
1
(4)
24
(96)
0
(0)
0
(0)
25
(100)
4 Overall
(n = 100)
3
(3)
94
(94)
3
(3)
0
(0)
100
(100)
Sr.
No.
Production system
Men Women Both
Total Per HHs. Total Per HHs. Total Per HHs.
1 Transhumance 1
(n = 25)
2
(3.13)
0.08
1
(1.79)
0.04 3
(2.50)
0.12
2 Transhumance 2
(n = 50)
14
(11.11)
0.28
1
(0.98)
0.02 15
(6.58)
0.30
3 Agropastoralism
(n = 25)
7
(9.10)
0.28
0
(0.00)
0 7
(5.26)
0.28
4 Overall
(n = 100)
23
(8.61)
0.23 2
(0.93)
0.02 25
(5.20)
0.25
Sr.
No.
Production
system
Men Women Children Total
Total Per
HHs.
Total Per
HHs.
Total Per
HHs.
Total Per
HHs.
1 Transhumance 1
(n = 25)
60
(93.75)
2.40 38
(67.86)
1.52 55
(62.50)
2.60 163
(78.37)
6.52
2 Transhumance 2
(n = 50)
65
(51.59)
1.30 5
(4.90)
0.10 4
(8.89)
0.08 74
(27.11)
1.48
3 Agropastoralism
(n = 25)
13
(16.88)
0.52 6
(10.71)
0.24 0
(0.00)
0 19
(11.24)
0.76
4 Overall
(n = 100)
138
(51.69)
1.38 49
(22.90)
0.50 69
(40.83)
0.70 256
(39.38)
2.56
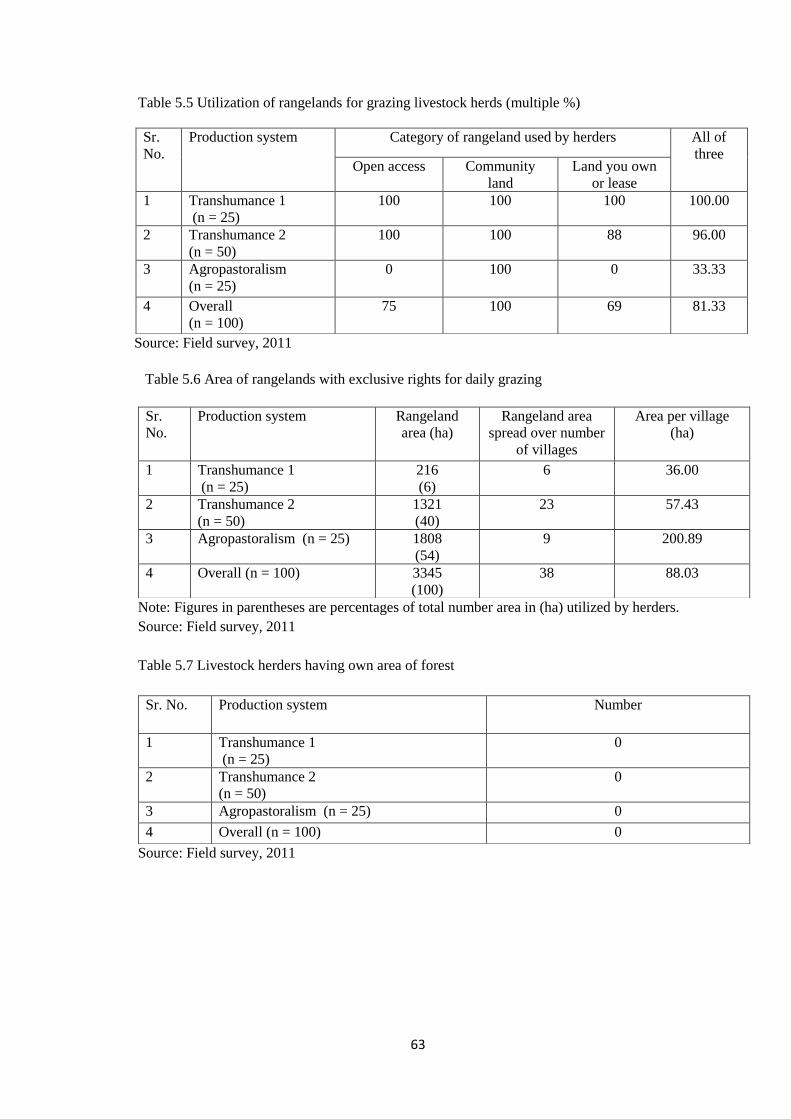
63
Table 5.5 Utilization of rangelands for grazing livestock herds (multiple %)
Source: Field survey, 2011
Table 5.6 Area of rangelands with exclusive rights for daily grazing
Note: Figures in parentheses are percentages of total number area in (ha) utilized by herders.
Source: Field survey, 2011
Table 5.7 Livestock herders having own area of forest
Source: Field survey, 2011
Sr.
No.
Production system Category of rangeland used by herders All of
three Open access Community
land
Land you own
or lease
1 Transhumance 1
(n = 25)
100 100 100 100.00
2 Transhumance 2
(n = 50)
100 100 88 96.00
3 Agropastoralism
(n = 25)
0 100 0 33.33
4 Overall
(n = 100)
75 100 69 81.33
Sr.
No.
Production system Rangeland
area (ha)
Rangeland area
spread over number
of villages
Area per village
(ha)
1 Transhumance 1
(n = 25)
216
(6)
6 36.00
2 Transhumance 2
(n = 50)
1321
(40)
23 57.43
3 Agropastoralism (n = 25) 1808
(54)
9 200.89
4 Overall (n = 100) 3345
(100)
38 88.03
Sr. No. Production system Number
1 Transhumance 1
(n = 25)
0
2 Transhumance 2
(n = 50)
0
3 Agropastoralism (n = 25) 0
4 Overall (n = 100) 0
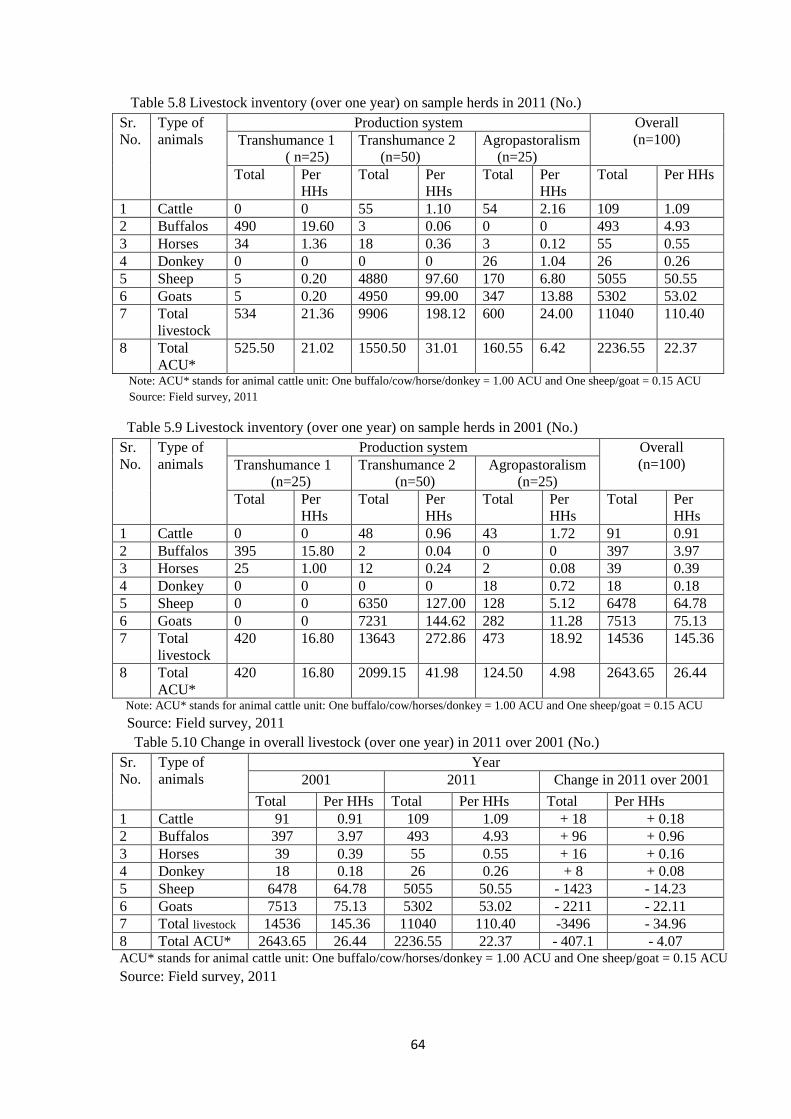
64
Table 5.8 Livestock inventory (over one year) on sample herds in 2011 (No.)
Sr.
No.
Type of
animals
Production system Overall
(n=100) Transhumance 1
( n=25)
Transhumance 2
(n=50)
Agropastoralism
(n=25)
Total Per
HHs
Total Per
HHs
Total Per
HHs
Total Per HHs
1 Cattle 0 0 55 1.10 54 2.16 109 1.09
2 Buffalos 490 19.60 3 0.06 0 0 493 4.93
3 Horses 34 1.36 18 0.36 3 0.12 55 0.55
4 Donkey 0 0 0 0 26 1.04 26 0.26
5 Sheep 5 0.20 4880 97.60 170 6.80 5055 50.55
6 Goats 5 0.20 4950 99.00 347 13.88 5302 53.02
7 Total
livestock
534 21.36 9906 198.12 600 24.00 11040 110.40
8 Total
ACU*
525.50 21.02 1550.50 31.01 160.55 6.42 2236.55 22.37
Note: ACU* stands for animal cattle unit: One buffalo/cow/horse/donkey = 1.00 ACU and One sheep/goat = 0.15 ACU
Source: Field survey, 2011
Table 5.9 Livestock inventory (over one year) on sample herds in 2001 (No.)
Sr.
No.
Type of
animals
Production system Overall
(n=100) Transhumance 1
(n=25)
Transhumance 2
(n=50)
Agropastoralism
(n=25)
Total Per
HHs
Total Per
HHs
Total Per
HHs
Total Per
HHs
1 Cattle 0 0 48 0.96 43 1.72 91 0.91
2 Buffalos 395 15.80 2 0.04 0 0 397 3.97
3 Horses 25 1.00 12 0.24 2 0.08 39 0.39
4 Donkey 0 0 0 0 18 0.72 18 0.18
5 Sheep 0 0 6350 127.00 128 5.12 6478 64.78
6 Goats 0 0 7231 144.62 282 11.28 7513 75.13
7 Total
livestock
420 16.80 13643 272.86 473 18.92 14536 145.36
8 Total
ACU*
420 16.80 2099.15 41.98 124.50 4.98 2643.65 26.44
Note: ACU* stands for animal cattle unit: One buffalo/cow/horses/donkey = 1.00 ACU and One sheep/goat = 0.15 ACU
Source: Field survey, 2011
Table 5.10 Change in overall livestock (over one year) in 2011 over 2001 (No.)
Sr.
No.
Type of
animals
Year
2001 2011 Change in 2011 over 2001
Total Per HHs Total Per HHs Total Per HHs
1 Cattle 91 0.91 109 1.09 + 18 + 0.18
2 Buffalos 397 3.97 493 4.93 + 96 + 0.96
3 Horses 39 0.39 55 0.55 + 16 + 0.16
4 Donkey 18 0.18 26 0.26 + 8 + 0.08
5 Sheep 6478 64.78 5055 50.55 - 1423 - 14.23
6 Goats 7513 75.13 5302 53.02 - 2211 - 22.11
7 Total livestock 14536 145.36 11040 110.40 -3496 - 34.96
8 Total ACU* 2643.65 26.44 2236.55 22.37 - 407.1 - 4.07 ACU* stands for animal cattle unit: One buffalo/cow/horses/donkey = 1.00 ACU and One sheep/goat = 0.15 ACU
Source: Field survey, 2011
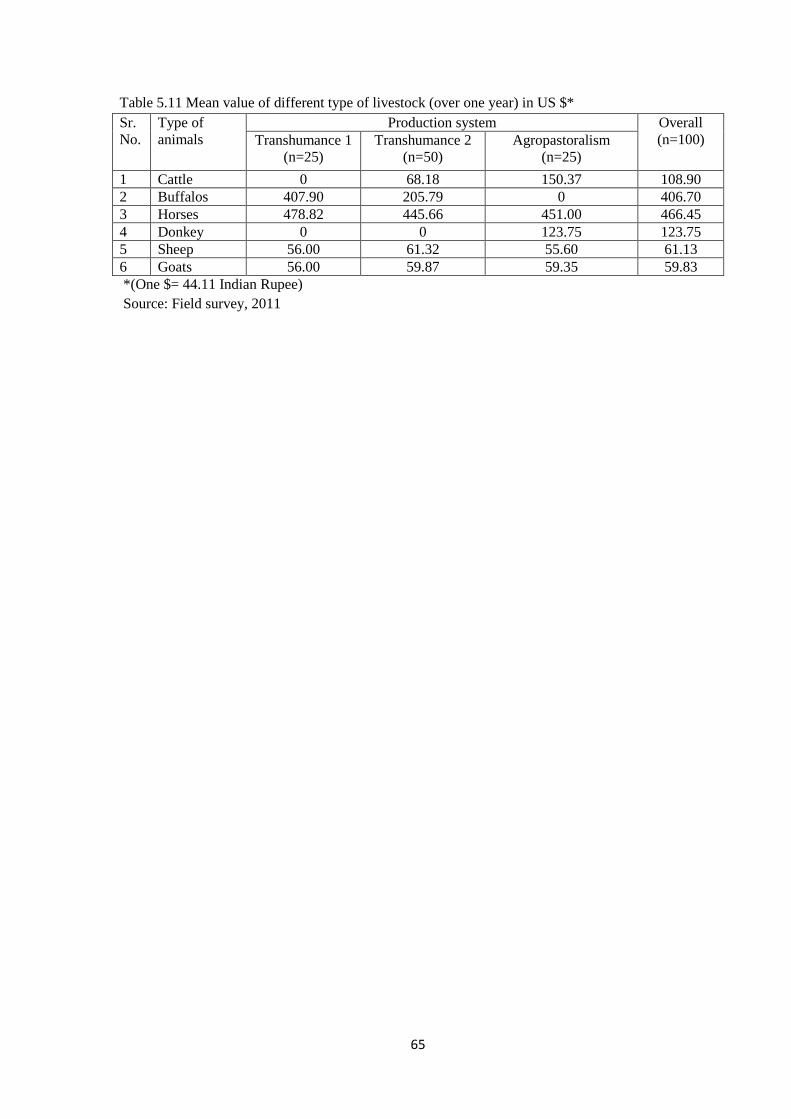
65
Table 5.11 Mean value of different type of livestock (over one year) in US $*
Sr.
No.
Type of
animals
Production system Overall
(n=100)
Transhumance 1
(n=25)
Transhumance 2
(n=50)
Agropastoralism
(n=25)
1 Cattle 0 68.18 150.37 108.90
2 Buffalos 407.90 205.79 0 406.70
3 Horses 478.82 445.66 451.00 466.45
4 Donkey 0 0 123.75 123.75
5 Sheep 56.00 61.32 55.60 61.13
6 Goats 56.00 59.87 59.35 59.83
*(One $= 44.11 Indian Rupee)
Source: Field survey, 2011
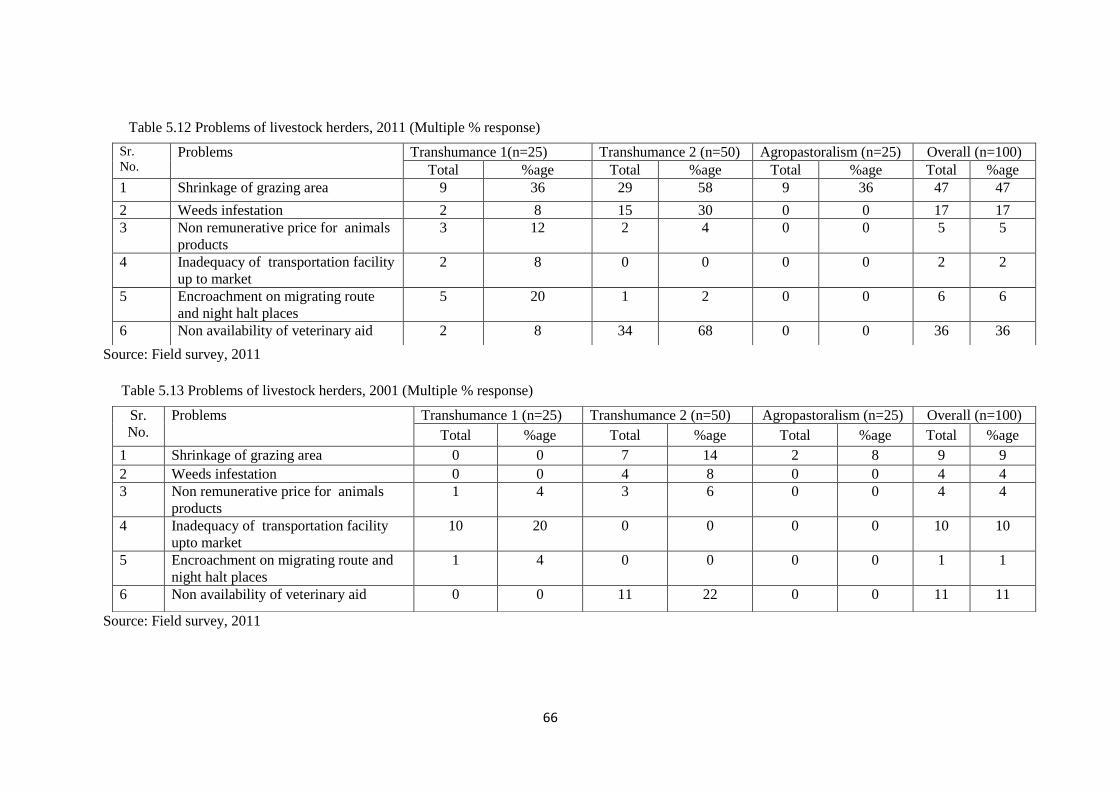
66
Table 5.12 Problems of livestock herders, 2011 (Multiple % response)
Source: Field survey, 2011
Table 5.13 Problems of livestock herders, 2001 (Multiple % response)
Source: Field survey, 2011
Sr.
No. Problems Transhumance 1(n=25) Transhumance 2 (n=50) Agropastoralism (n=25) Overall (n=100)
Total %age Total %age Total %age Total %age
1 Shrinkage of grazing area 9 36 29 58 9 36 47 47
2 Weeds infestation 2 8 15 30 0 0 17 17
3 Non remunerative price for animals
products
3 12 2 4 0 0 5 5
4 Inadequacy of transportation facility
up to market
2 8 0 0 0 0 2 2
5 Encroachment on migrating route
and night halt places
5 20 1 2 0 0 6 6
6 Non availability of veterinary aid 2 8 34 68 0 0 36 36
Sr.
No.
Problems Transhumance 1 (n=25) Transhumance 2 (n=50) Agropastoralism (n=25) Overall (n=100)
Total %age Total %age Total %age Total %age
1 Shrinkage of grazing area 0 0 7 14 2 8 9 9
2 Weeds infestation 0 0 4 8 0 0 4 4
3 Non remunerative price for animals
products
1 4 3 6 0 0 4 4
4 Inadequacy of transportation facility
upto market
10 20 0 0 0 0 10 10
5 Encroachment on migrating route and
night halt places
1 4 0 0 0 0 1 1
6 Non availability of veterinary aid 0 0 11 22 0 0 11 11
67
Table 5.14 Reasons for change in ownership since 2000 year (Multiple % response)
Note: Figures in [ ] are percentages of total sample and ( ) are percentages of reasons
Source: Field survey, 2011
Table 5.15 Response of herders in making additional investment on livestock
Source: Field survey, 2011
Sr.
No.
Reasons Transhumance 1
(n=25)
Transhumance
2
(n=50)
Agropastoralism
(n=25)
Overall
(n=100)
1 Total cases of
change in
ownership
7
[28.00]
16
[32.00]
0
[0]
23
[23.00]
2 Change due to
old age of
parents
4
(57.14)
4
(25.00)
0
(0)
8
(8.00)
3 Change due to
death of
parents
2
(28.57)
10
(62.50)
0
(0)
12
(12.00)
4
Change on
account of
division of
family
1
(14.29)
2
(12.50)
0
(0)
3
(3.00)
Sr.
No.
Production
system
Number of
herders
willing
to invest
%age of
herders
willing to
invest
Number of
herders
unwilling to
invest
%age of
herders
unwilling to
invest
1 Transhumance 1
(n = 25)
10 40.00 15 60.00
2 Transhumance 2
(n = 50)
28 56.00 22 44.00
3 Agropastoralism
(n = 25)
13 52.00 12 48.00
4 Overall
(n = 100)
51 51.00 49 49.00
68
Table 5.16 Type of animals for additional investment
Sr.
No.
Type of
animal
Transhumance
1
(n=25)
Transhumance 2
(n=50)
Agropastoralism
(n=25)
Overall
(n=100)
No. %age No. %age No. %age No. %age
1 Sheep 0 0 23 82.14 13 100 36 80.80
2 Goat 0 0 13 46.43 13 100 26 63.41
3 Buffaloes 10 100 0 0 0 0 10 100.00
Source: Field survey, 2011
Table 5.17 Basis of making additional investment on livestock
Sr.
No.
Reasons Transhumance
1
(n=25)
Transhumance
2
(n=50)
Agropastoralism
(n=25)
Overall
(n=100)
No. %age No. %age No. %age No. %age
1 Getting
enhanced
production of
wool
0 0 2 4 10 40 12 12
2 Getting
enhanced
production of
manure
0 0 0 0 11 44 11 11
3 Getting
enhanced milk
and its products
9 36 0 0 0 0 9 9
4 Enhancing
income by
selling more live
animals
0 0 11 22 0 0 11 11
5 To increase herd
for more profit,
also make warm
cloth
1 4 10 20 3 12 15 15
Source: Field survey, 2011
69
Table 5.18 Response of herders in meeting feed requirement for additional livestock
Sr.
No.
Response Transhumance 1
(n=25)
Transhumance
2
(n=50)
Agropastoralism
(n=25)
Overall
(n=100)
No. %age No. %age No. %age No. %age
1 Sufficient
grazing/leased
in land
3 12 25 50 13 52 41 41
2 More pasture
land will be
leased-in
4 16 10 20 0 0 14 14
3 Purchase of
hay in the
market
3 12 0 0 0 0 3 3
4 Purchasing
wheat and
paddy straw
in the market
4 16 0 0 0 0 4 4
Source: Field survey, 2011
Table 5.19 Production of milk during last 12 months (kg)
Sr.
No.
Milch
animal
Transhumance 1
(n=25)
Transhumance
2
(n=50)
Agropastoralism
(n=25)
Overall
(n=100)
Total Per HH Total Per HH Total Per HH Total Per HH
1 Cow 0 0 12140 243 25940 1038 38080 381
2 Buffalo 268280 10731 1620 32 0 0 269900 2699
3 Goats 0 0 58167 1163 3241 130 61408 614
Source: Field survey, 2011
70
Table 5.20 Annual estimates of animal products realized by livestock herders (kg)
Sr.
No.
Production
System
Transhumance 1
(n=25)
Transhumance 2
(n=50)
Agropastoralism
(n=25)
Overall
(n=100)
Total Per HH Total Per HH Total Per HH Total Per HH
1 Yoghurt 8750 350.00 3180 63.60 2150 86.00 14080 140.80
2 Cheese 6035 241.40 0 0 272 10.88 6307 63.07
3 Ghee 1419 56.76 166 3.32 332 13.28 1917 19.17
4 Kurut 742 29.68 0 0 0 0 742 7.42
5 Butter 1315 52.60 0 0 50 2.00 1365 13.65
6 Wool 0 0 5760 115.20 114.50 4.58 5874.5 58.75
7 Cashmere 0 0 0 0 21.80 0.87 21.8 0.22
8 Goat hair 0 0 53.8 1.07 126 5.04 179.8 1.80
9 Yak hair 0 0 0 0 0 0 0 0
10 Skins (No) 0 0 0 0 0 0 0 0
11 Hides (No) 0 0 5 0.10 1 0.04 6 0.06
12 Manure (tonnes) 4622 185 1898 38 595 24 7115 71
Source: Field survey, 2011
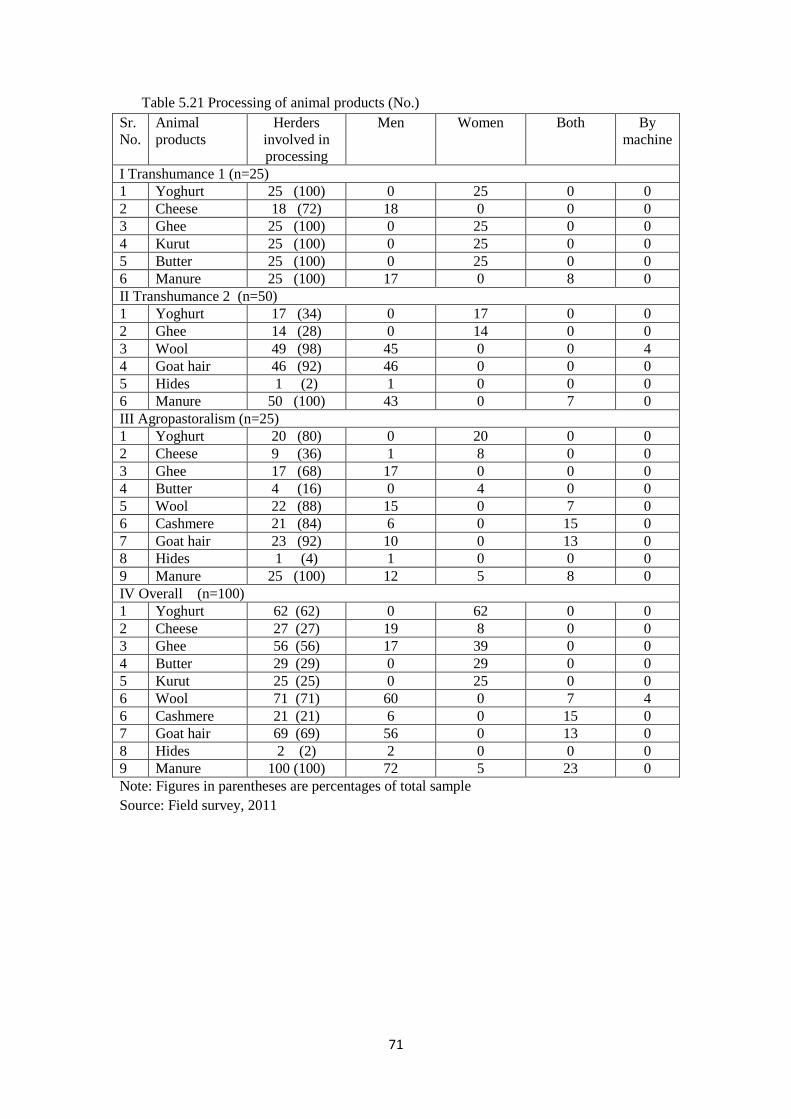
71
Table 5.21 Processing of animal products (No.)
Sr.
No.
Animal
products
Herders
involved in
processing
Men Women Both By
machine
I Transhumance 1 (n=25)
1 Yoghurt 25 (100) 0 25 0 0
2 Cheese 18 (72) 18 0 0 0
3 Ghee 25 (100) 0 25 0 0
4 Kurut 25 (100) 0 25 0 0
5 Butter 25 (100) 0 25 0 0
6 Manure 25 (100) 17 0 8 0
II Transhumance 2 (n=50)
1 Yoghurt 17 (34) 0 17 0 0
2 Ghee 14 (28) 0 14 0 0
3 Wool 49 (98) 45 0 0 4
4 Goat hair 46 (92) 46 0 0 0
5 Hides 1 (2) 1 0 0 0
6 Manure 50 (100) 43 0 7 0
III Agropastoralism (n=25)
1 Yoghurt 20 (80) 0 20 0 0
2 Cheese 9 (36) 1 8 0 0
3 Ghee 17 (68) 17 0 0 0
4 Butter 4 (16) 0 4 0 0
5 Wool 22 (88) 15 0 7 0
6 Cashmere 21 (84) 6 0 15 0
7 Goat hair 23 (92) 10 0 13 0
8 Hides 1 (4) 1 0 0 0
9 Manure 25 (100) 12 5 8 0
IV Overall (n=100)
1 Yoghurt 62 (62) 0 62 0 0
2 Cheese 27 (27) 19 8 0 0
3 Ghee 56 (56) 17 39 0 0
4 Butter 29 (29) 0 29 0 0
5 Kurut 25 (25) 0 25 0 0
6 Wool 71 (71) 60 0 7 4
6 Cashmere 21 (21) 6 0 15 0
7 Goat hair 69 (69) 56 0 13 0
8 Hides 2 (2) 2 0 0 0
9 Manure 100 (100) 72 5 23 0
Note: Figures in parentheses are percentages of total sample
Source: Field survey, 2011
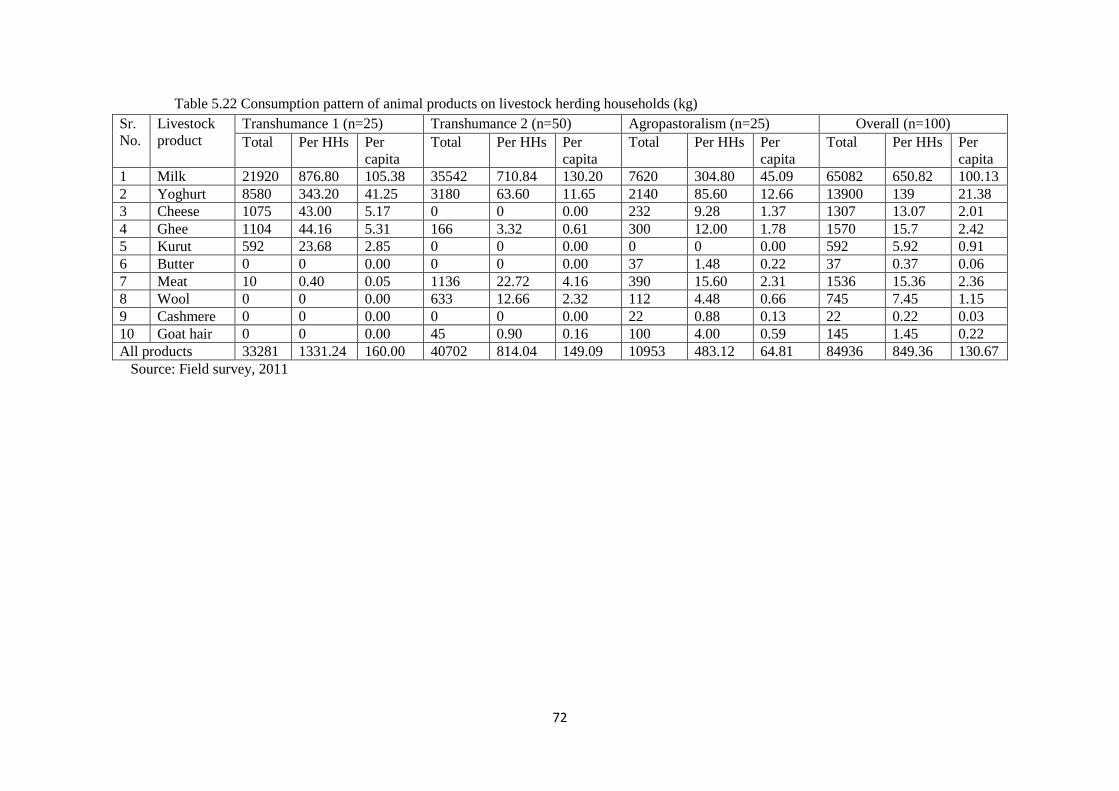
72
Table 5.22 Consumption pattern of animal products on livestock herding households (kg)
Sr.
No.
Livestock
product
Transhumance 1 (n=25) Transhumance 2 (n=50) Agropastoralism (n=25) Overall (n=100)
Total Per HHs Per
capita
Total Per HHs Per
capita
Total Per HHs Per
capita
Total Per HHs Per
capita
1 Milk 21920 876.80 105.38 35542 710.84 130.20 7620 304.80 45.09 65082 650.82 100.13
2 Yoghurt 8580 343.20 41.25 3180 63.60 11.65 2140 85.60 12.66 13900 139 21.38
3 Cheese 1075 43.00 5.17 0 0 0.00 232 9.28 1.37 1307 13.07 2.01
4 Ghee 1104 44.16 5.31 166 3.32 0.61 300 12.00 1.78 1570 15.7 2.42
5 Kurut 592 23.68 2.85 0 0 0.00 0 0 0.00 592 5.92 0.91
6 Butter 0 0 0.00 0 0 0.00 37 1.48 0.22 37 0.37 0.06
7 Meat 10 0.40 0.05 1136 22.72 4.16 390 15.60 2.31 1536 15.36 2.36
8 Wool 0 0 0.00 633 12.66 2.32 112 4.48 0.66 745 7.45 1.15
9 Cashmere 0 0 0.00 0 0 0.00 22 0.88 0.13 22 0.22 0.03
10 Goat hair 0 0 0.00 45 0.90 0.16 100 4.00 0.59 145 1.45 0.22
All products 33281 1331.24 160.00 40702 814.04 149.09 10953 483.12 64.81 84936 849.36 130.67
Source: Field survey, 2011
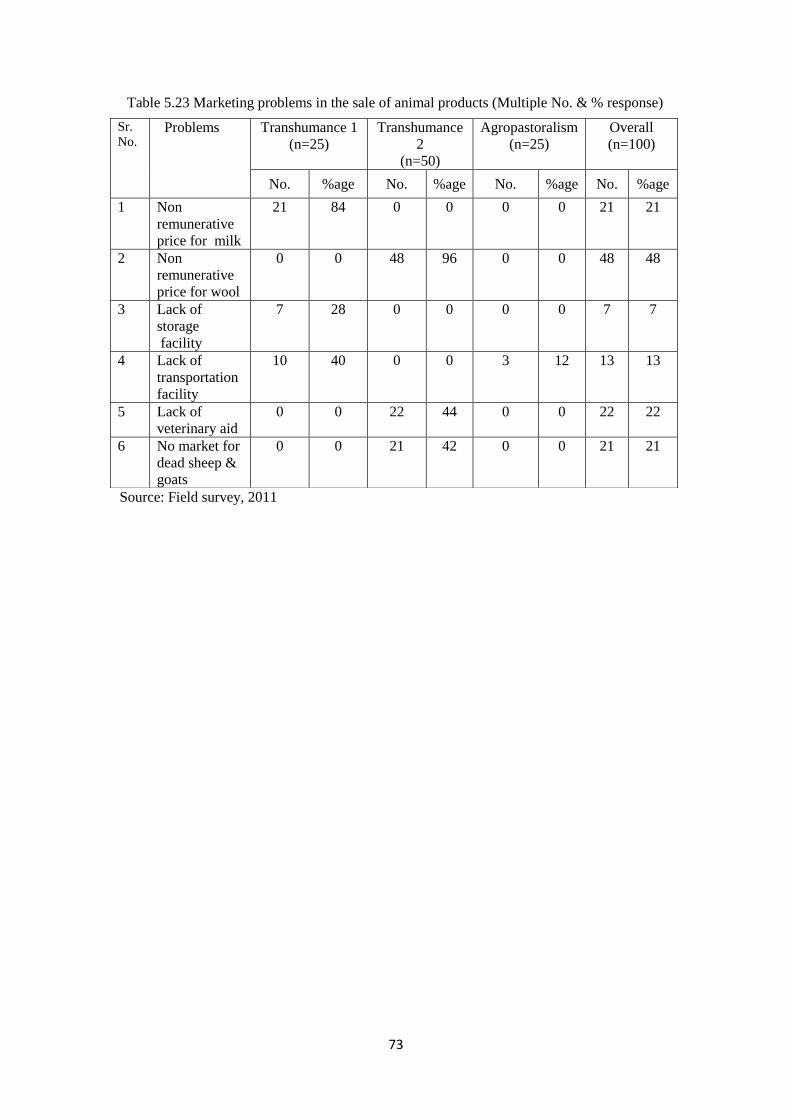
73
Table 5.23 Marketing problems in the sale of animal products (Multiple No. & % response)
Source: Field survey, 2011
Sr.
No. Problems Transhumance 1
(n=25)
Transhumance
2
(n=50)
Agropastoralism
(n=25)
Overall
(n=100)
No. %age No. %age No. %age No. %age
1 Non
remunerative
price for milk
21 84 0 0 0 0 21 21
2 Non
remunerative
price for wool
0 0 48 96 0 0 48 48
3 Lack of
storage
facility
7 28 0 0 0 0 7 7
4 Lack of
transportation
facility
10 40 0 0 3 12 13 13
5
Lack of
veterinary aid
0 0 22 44 0 0 22 22
6
No market for
dead sheep &
goats
0 0 21 42 0 0 21 21
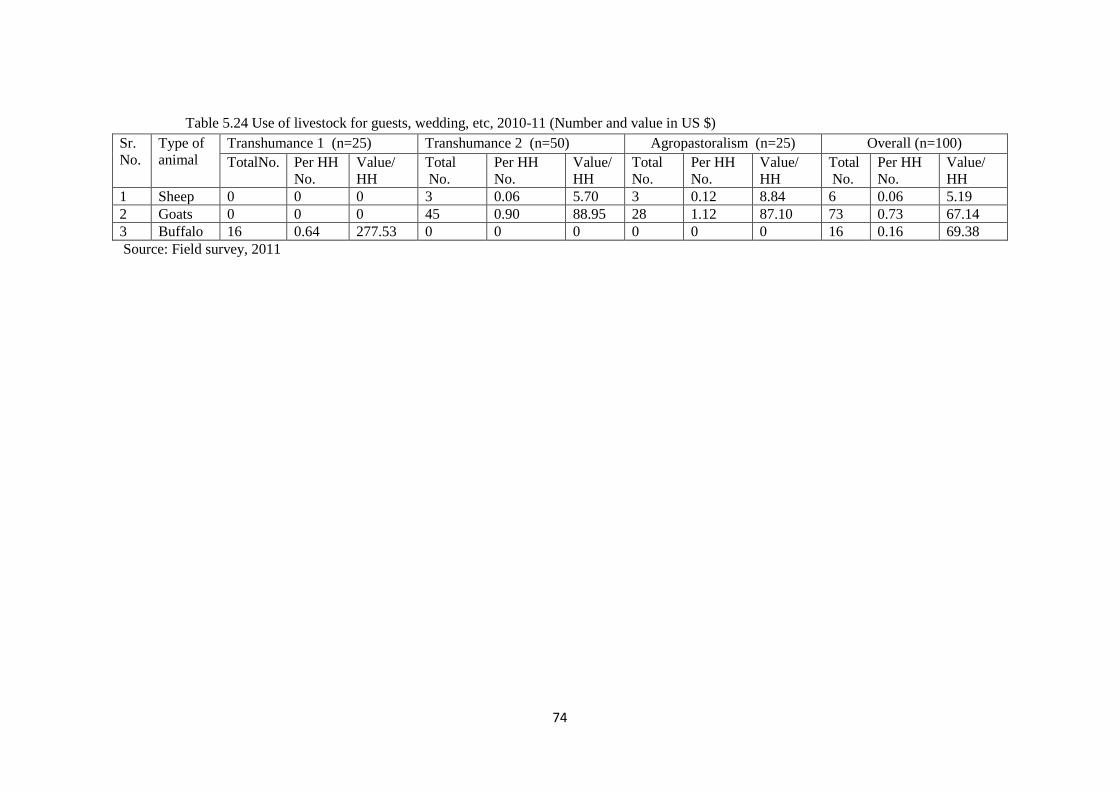
74
Table 5.24 Use of livestock for guests, wedding, etc, 2010-11 (Number and value in US $)
Sr.
No.
Type of
animal
Transhumance 1 (n=25) Transhumance 2 (n=50) Agropastoralism (n=25) Overall (n=100)
TotalNo. Per HH
No.
Value/
HH
Total
No.
Per HH
No.
Value/
HH
Total
No.
Per HH
No.
Value/
HH
Total
No.
Per HH
No.
Value/
HH
1 Sheep 0 0 0 3 0.06 5.70 3 0.12 8.84 6 0.06 5.19
2 Goats 0 0 0 45 0.90 88.95 28 1.12 87.10 73 0.73 67.14
3 Buffalo 16 0.64 277.53 0 0 0 0 0 0 16 0.16 69.38
Source: Field survey, 2011
75
Table 5.25 Sale of adult livestock during 2010-11 (No.)
Sr.
No.
Type
of
animal
Transhumance
1
(n=25)
Transhumance 2
(n=50)
Agropastoralism
(n=25)
Overall
(n=100)
Total Per HH Total Per HH Total Per
HH
Total Per HH
I Male
1 Buffalo 2 0.08 0 0 0 0 2 0.02
2 Goats 0 0 117 2.34 21 0.84 138 1.38
3 Sheep 0 0 142 2.84 3 0.12 145 1.45
4 Horses 0 0 0 0 0 0 0 0
II Female
1 Buffalo 56 2.24 0 0 0 0 56 0.56
2 Goats 0 0 502 10.04 4 0.16 506 5.06
3 Sheep 0 0 465 9.30 3 0.12 468 4.68
4 Horses 0 0 0 0 0 0 0 0
Source: Field survey, 2011
Table 5.26 Sale of young stock, 2010-11 (No.)
Sr.
No.
Type of
animal
Transhumance 1
(n=25)
Transhumance 2
(n=50)
Agropastoralism
(n=25)
Overall
(n=100)
Total Per
HH
Total Per
HH
Total Per
HH
Total Per
HH
I Male
1 Buffalo 100 4 0 0 0 0 100 1.00
2 Goats 0 0 836 16.72 0 0 836 8.36
3 Sheep 0 0 829 16.58 0 0 829 8.29
4 Horses 2 0.08 0 0 0 0 2 0.02
II Female
1 Buffalo 0 0 0 0 0 0 0 0
2 Goats 0 0 124 2.48 0 0 124 1.24
3 Sheep 0 0 121 2.42 0 0 121 1.21
4 Horses 1 0.04 0 0 0 0 1 0.01
Source: Field survey, 2011
76
Table 5.27 Sale of adult livestock, 2010-11(US $*)
Sr.
No.
Type of
animal
Transhumance 1 (n=25) Transhumance 2 (n=50) Agropastoralism (n=25) Overall (n=100)
Total value Value per HH Total value Value per HH Total value Value per HH Total value Value per HH
1 Buffalo 19910 796.40 0 0 0 0 19910 199.10
2 Goat 0 0 109023.60 2180.47 1700.20 68.01 110723.80 1107.24
3 Sheep 0 0 39169.30 783.39 408.02 16.32 39577.32 396.77
4 Horse 0 0 0 0 0 0 0 0
Total 19910 796.40 148192.90 2963.86 2108.22 84.33 170211.12 1702.11
*1$= Rs 44.11 Source: Field survey, 2011
Table 5.28 Sale of young stock, 2010-11 (US $*)
Sr.
No.
Type of
animal
Transhumance 1 (n=25) Transhumance 2 (n=50) Agropastoralism (n=25) Overall (n=100)
Total Per HH Total Per HH Total Per HH Total Per HH
1 Buffalo 3605 144.20 0 0 0 0 3605 360.50
2 Goats 0 0 27316.25 546.33 0 0 27316.25 273.16
3 Sheep 0 0 28422.08 568.44 0 0 28422.08 284.22
4 Horses 1120 44.80 0 0 0 0 1120 11.20
Total 4725 189.00 55738.33 1114.77 0 0 60463.33 604.63
*1$= Rs 44.11
Source: Field survey, 2011
77
Table 5.29 Disposal/marketing of animal products, 2010-11
Sr.
No.
Livestock
product
Transhumance
1
(n=25)
Transhumance 2
(n=50)
Agropastoralism
(n=25)
Overall
(n=100)
Total Per
HH
Total Per
HH
Total Per
HH
Total Per
HH
1 Milk (kg) 130500 5220 0 0 1700 68.00 132200 1322.00
2 Yoghurt
(kg)
0 0 0 0 0 0 0 0
3 Cheese
(kg)
4650 186 0 0 40 1.60 4690 46.90
4 Ghee (kg) 300 12 0 0 25 1.00 325 3.25
5 Kurut
(kg)
0 0 0 0 0 0 0 0
6 Butter
(kg)
0 0 0 0 10 0.40 10 0.10
7 Meat (kg) 0 0 3220 64.40 15 0.60 3235 32.35
8 Wool (kg) 0 0 5002 100.04 0 0 5002 50.02
9 Cashmere
(kg)
0 0 0 0 0 0 0 0
10 Goat hair
(kg)
0 0 0 0 0 0 0 0
11 Yak hair
(kg)
0 0 0 0 0 0 0 0
12 Skins
(No.)
0 0 0 0 0 0 0 0
13 Hides
(No.)
0 0 5 0.10 0 0 5 0.05
14 Manure
(t)
168 6.72 0 0 0 0 168 1.68
Source: Field survey, 2011
Table 5.30 Unit price received by livestock herders for different animal products, 2010-11 (US $)
Sr.
No.
Livestock
product
Transhumance 1
(n=25)
Transhumance 2
(n=50)
Agropastoralism
(n=25)
Overall
(n=100)
1 Milk (/kg) 0.36 0 0.57 0.47
2 Yoghurt (/kg) 0 0 0 0.00
3 Cheese (/kg) 2.12 0 5.67 3.90
4 Ghee (/kg) 6.80 0 7.55 7.18
5 Kurut (/kg) 0 0 0 0.00
6 Butter (/kg) 0 0 5.67 5.67
7 Meat (/kg) 0 2.22 4.53 3.38
8 Wool (/kg) 0 0.94 0 0.94
9 Cashmere (/kg) 0 0 0 0.00
10 Goat hair (/kg) 0 0 0 0.00
11 Yak hair (/kg) 0 0 0 0.00
12 Skins (/Piece) 0 0 0 0.00
13 Hides (/Piece) 0 0.91 0 0.91
14 Manure
(/tonne)
22.67 0 0 22.67
Source: Field survey, 2011
78
Table 5.31 Processing of livestock products
Sr.
No.
products Number of herders
involved in
processing
Men Women Both By machine
I Transhumance 1 (n=25)
1 Milk 19 (76) 14 0 5 0
2 Yoghurt 0 (0) 0 0 0 0
3 Cheese 15 (60) 15 0 0 0
4 Ghee 5 (20) 0 5 0 0
5 Kurut 0 (0) 0 0 0 0
6 Butter 0 (0) 0 0 0 0
7 Meat 0 (0) 0 0 0 0
8 Wool 0 (0) 0 0 0 0
9 Cashmere 0 (0) 0 0 0 0
10 Goat Hair 0 (0) 0 0 0 0
11 Skins 0 (0) 0 0 0 0
12 Hides 0 (0) 0 0 0 0
13 Manure 22 (88) 22 0 0 0
II Transhumance 2 (n=50)
1 Milk 0 (0) 0 0 0 0
2 Yoghurt 0 (0) 0 0 0 0
3 Cheese 0 (0) 0 0 0 0
4 Ghee 0 (0) 0 0 0 0
5 Kurut 0 (0) 0 0 0 0
6 Butter 0 (0) 0 0 0 0
7 Meat 49 (98) 49 0 0 0
8 Wool 47 (94) 41 0 0 6
9 Cashmere 0 (0) 0 0 0 0
10 Goat Hair 0 (0) 0 0 0 0
11 Skins 0 (0) 0 0 0 0
12 Hides 1 (2) 1 0 0 0
13 Manure 0 (0) 0 0 0 0
III Agropastoralism (n=25)
1 Milk 2 (8) 0 2 0 0
2 Yoghurt 0 (0) 0 0 0 0
3 Cheese 3 (12) 3 0 0 0
4 Ghee 3 (12) 3 0 0 0
5 Kurut 0 (0) 0 0 0 0
6 Butter 1 (4) 0 1 0 0
7 Meat 1 (4) 1 0 0 0
8 Wool 0 (0) 0 0 0 0
9 Cashmere 0 (0) 0 0 0 0
10 Goat Hair 0 (0) 0 0 0 0
11 Skins 0 (0) 0 0 0 0
12 Hides 0 (0) 0 0 0 0
13 Manure 0 (0) 0 0 0 0
Note: Figures in parentheses are percentages of total sample
Source: Field survey, 2011
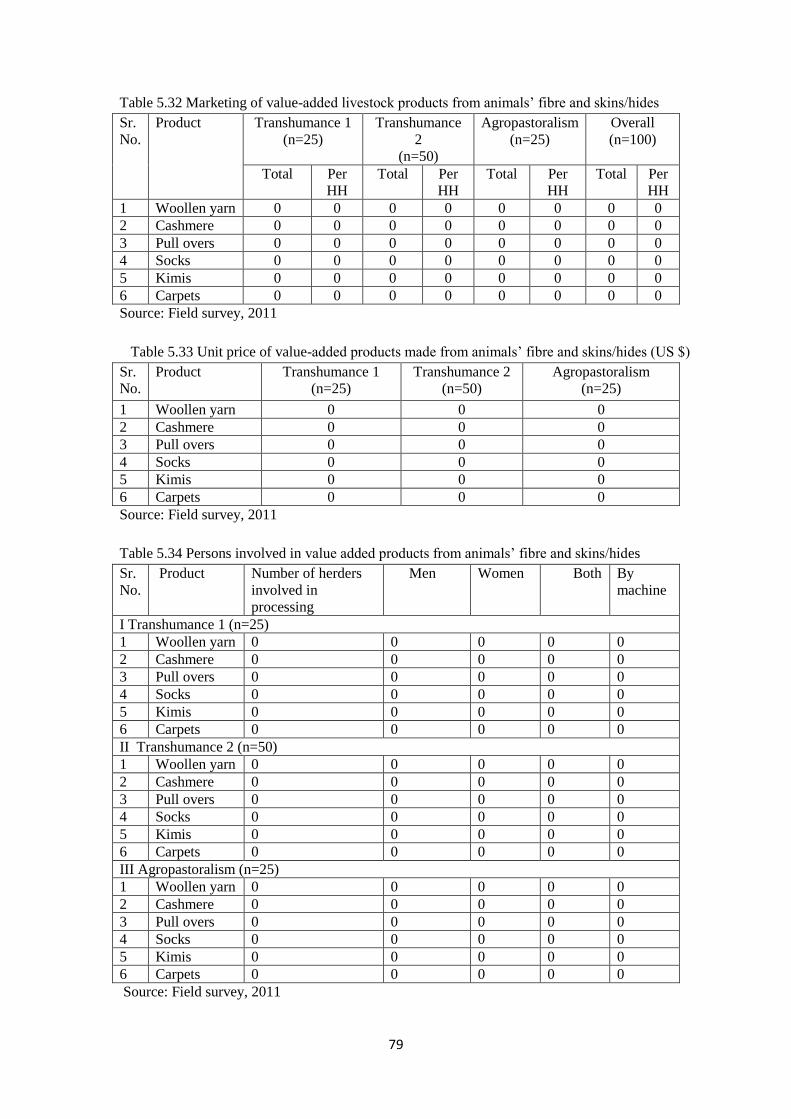
79
Table 5.32 Marketing of value-added livestock products from animals’ fibre and skins/hides
Sr.
No.
Product Transhumance 1
(n=25)
Transhumance
2
(n=50)
Agropastoralism
(n=25)
Overall
(n=100)
Total Per
HH
Total Per
HH
Total Per
HH
Total Per
HH
1 Woollen yarn 0 0 0 0 0 0 0 0
2 Cashmere 0 0 0 0 0 0 0 0
3 Pull overs 0 0 0 0 0 0 0 0
4 Socks 0 0 0 0 0 0 0 0
5 Kimis 0 0 0 0 0 0 0 0
6 Carpets 0 0 0 0 0 0 0 0
Source: Field survey, 2011
Table 5.33 Unit price of value-added products made from animals’ fibre and skins/hides (US $)
Sr.
No.
Product Transhumance 1
(n=25)
Transhumance 2
(n=50)
Agropastoralism
(n=25)
1 Woollen yarn 0 0 0
2 Cashmere 0 0 0
3 Pull overs 0 0 0
4 Socks 0 0 0
5 Kimis 0 0 0
6 Carpets 0 0 0
Source: Field survey, 2011
Table 5.34 Persons involved in value added products from animals’ fibre and skins/hides
Sr.
No.
Product
Number of herders
involved in
processing
Men Women Both By
machine
I Transhumance 1 (n=25)
1 Woollen yarn 0 0 0 0 0
2 Cashmere 0 0 0 0 0
3 Pull overs 0 0 0 0 0
4 Socks 0 0 0 0 0
5 Kimis 0 0 0 0 0
6 Carpets 0 0 0 0 0
II Transhumance 2 (n=50)
1 Woollen yarn 0 0 0 0 0
2 Cashmere 0 0 0 0 0
3 Pull overs 0 0 0 0 0
4 Socks 0 0 0 0 0
5 Kimis 0 0 0 0 0
6 Carpets 0 0 0 0 0
III Agropastoralism (n=25)
1 Woollen yarn 0 0 0 0 0
2 Cashmere 0 0 0 0 0
3 Pull overs 0 0 0 0 0
4 Socks 0 0 0 0 0
5 Kimis 0 0 0 0 0
6 Carpets 0 0 0 0 0
Source: Field survey, 2011
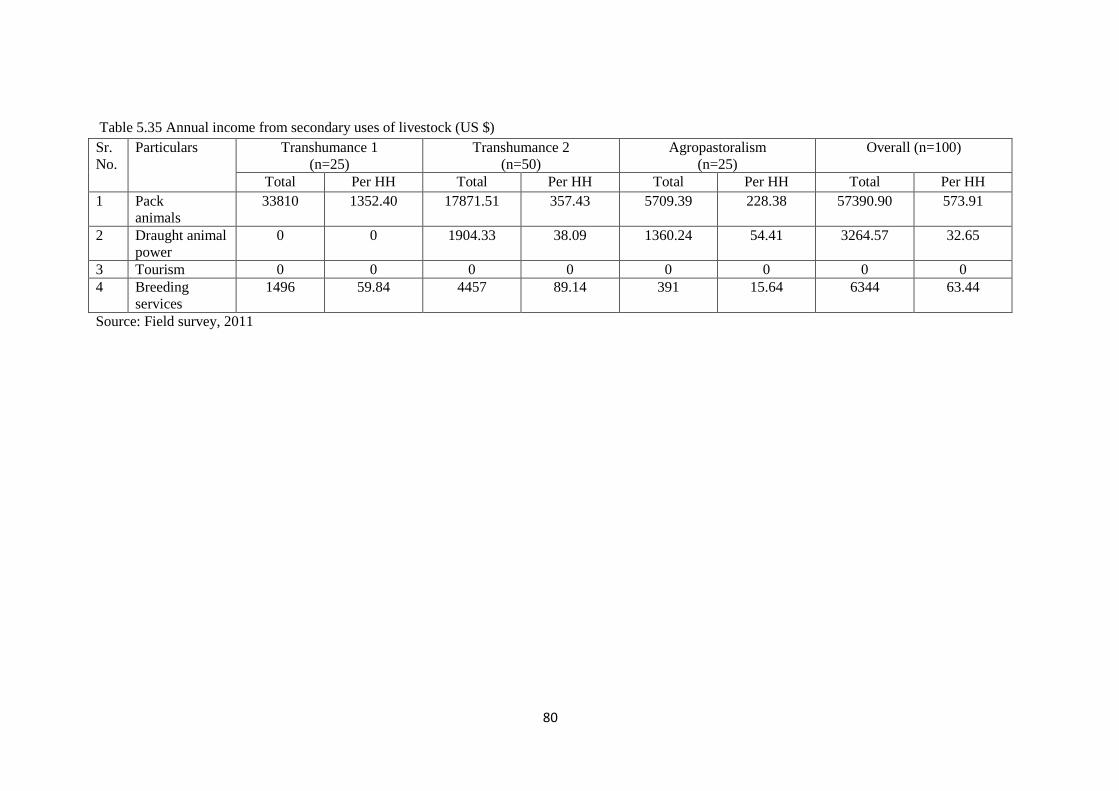
80
Table 5.35 Annual income from secondary uses of livestock (US $)
Sr.
No.
Particulars Transhumance 1
(n=25)
Transhumance 2
(n=50)
Agropastoralism
(n=25)
Overall (n=100)
Total Per HH Total Per HH Total Per HH Total Per HH
1 Pack
animals
33810 1352.40 17871.51 357.43 5709.39 228.38 57390.90 573.91
2 Draught animal
power
0 0 1904.33 38.09 1360.24 54.41 3264.57 32.65
3 Tourism 0 0 0 0 0 0 0 0
4 Breeding
services
1496 59.84 4457 89.14 391 15.64 6344 63.44
Source: Field survey, 2011
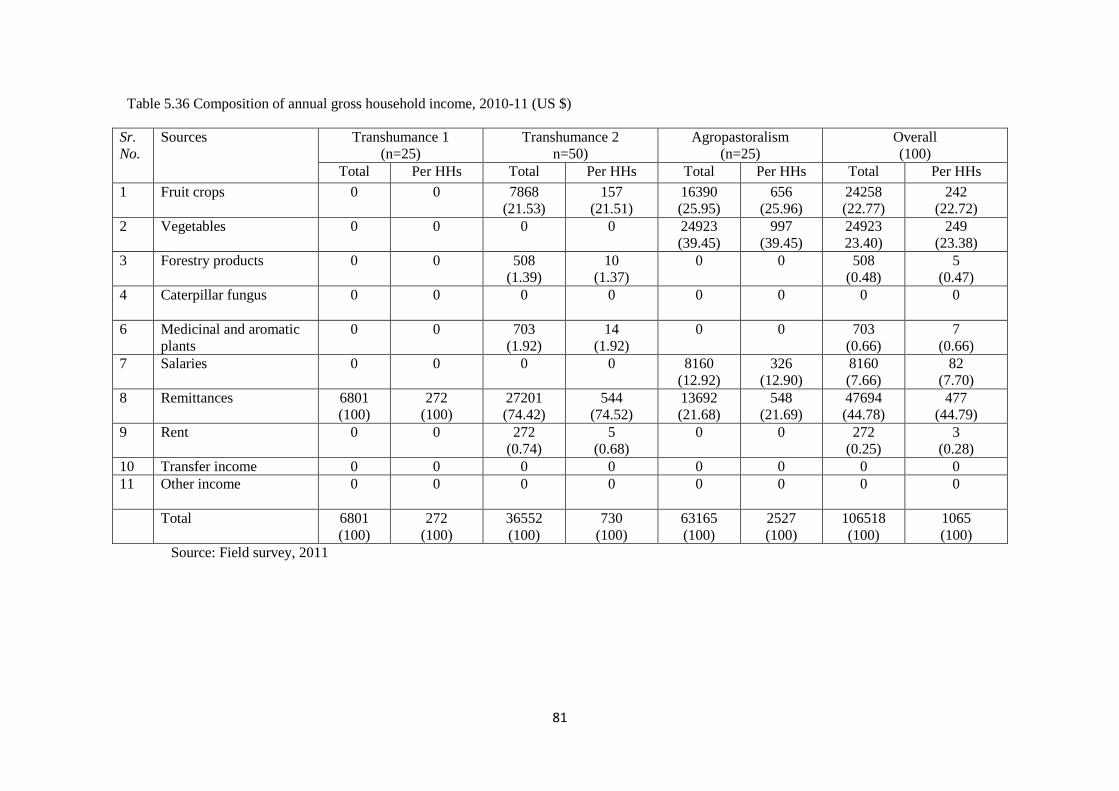
81
Table 5.36 Composition of annual gross household income, 2010-11 (US $)
Sr.
No.
Sources Transhumance 1
(n=25)
Transhumance 2
n=50)
Agropastoralism
(n=25)
Overall
(100)
Total Per HHs Total Per HHs Total Per HHs Total Per HHs
1 Fruit crops
0 0 7868
(21.53)
157
(21.51)
16390
(25.95)
656
(25.96)
24258
(22.77)
242
(22.72)
2 Vegetables
0 0 0 0 24923
(39.45)
997
(39.45)
24923
23.40)
249
(23.38)
3 Forestry products
0 0 508
(1.39)
10
(1.37)
0 0 508
(0.48)
5
(0.47)
4 Caterpillar fungus 0 0 0 0 0 0 0 0
6 Medicinal and aromatic
plants
0 0 703
(1.92)
14
(1.92)
0 0 703
(0.66)
7
(0.66)
7 Salaries
0 0 0 0 8160
(12.92)
326
(12.90)
8160
(7.66)
82
(7.70)
8 Remittances
6801
(100)
272
(100)
27201
(74.42)
544
(74.52)
13692
(21.68)
548
(21.69)
47694
(44.78)
477
(44.79)
9 Rent
0 0 272
(0.74)
5
(0.68)
0 0 272
(0.25)
3
(0.28)
10 Transfer income 0 0 0 0 0 0 0 0
11 Other income
0 0 0 0 0 0 0 0
Total 6801
(100)
272
(100)
36552
(100)
730
(100)
63165
(100)
2527
(100)
106518
(100)
1065
(100)
Source: Field survey, 2011
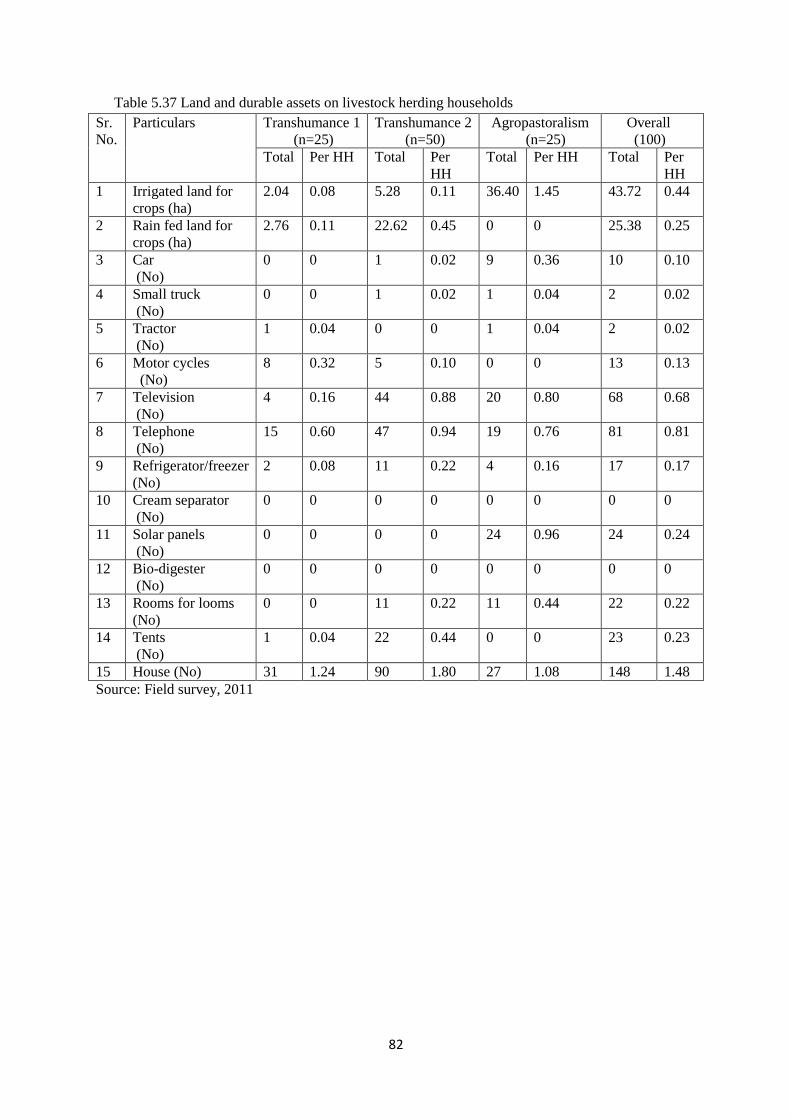
82
Table 5.37 Land and durable assets on livestock herding households
Sr.
No.
Particulars Transhumance 1
(n=25)
Transhumance 2
(n=50)
Agropastoralism
(n=25)
Overall
(100)
Total Per HH Total Per
HH
Total Per HH Total Per
HH
1 Irrigated land for
crops (ha)
2.04 0.08 5.28 0.11 36.40 1.45 43.72 0.44
2 Rain fed land for
crops (ha)
2.76 0.11 22.62 0.45 0 0 25.38 0.25
3 Car
(No)
0 0 1 0.02 9 0.36 10 0.10
4 Small truck
(No)
0 0 1 0.02 1 0.04 2 0.02
5 Tractor
(No)
1 0.04 0 0 1 0.04 2 0.02
6 Motor cycles
(No)
8 0.32 5 0.10 0 0 13 0.13
7 Television
(No)
4 0.16 44 0.88 20 0.80 68 0.68
8 Telephone
(No)
15 0.60 47 0.94 19 0.76 81 0.81
9 Refrigerator/freezer
(No)
2 0.08 11 0.22 4 0.16 17 0.17
10 Cream separator
(No)
0 0 0 0 0 0 0 0
11 Solar panels
(No)
0 0 0 0 24 0.96 24 0.24
12 Bio-digester
(No)
0 0 0 0 0 0 0 0
13 Rooms for looms
(No)
0 0 11 0.22 11 0.44 22 0.22
14 Tents
(No)
1 0.04 22 0.44 0 0 23 0.23
15 House (No) 31 1.24 90 1.80 27 1.08 148 1.48
Source: Field survey, 2011
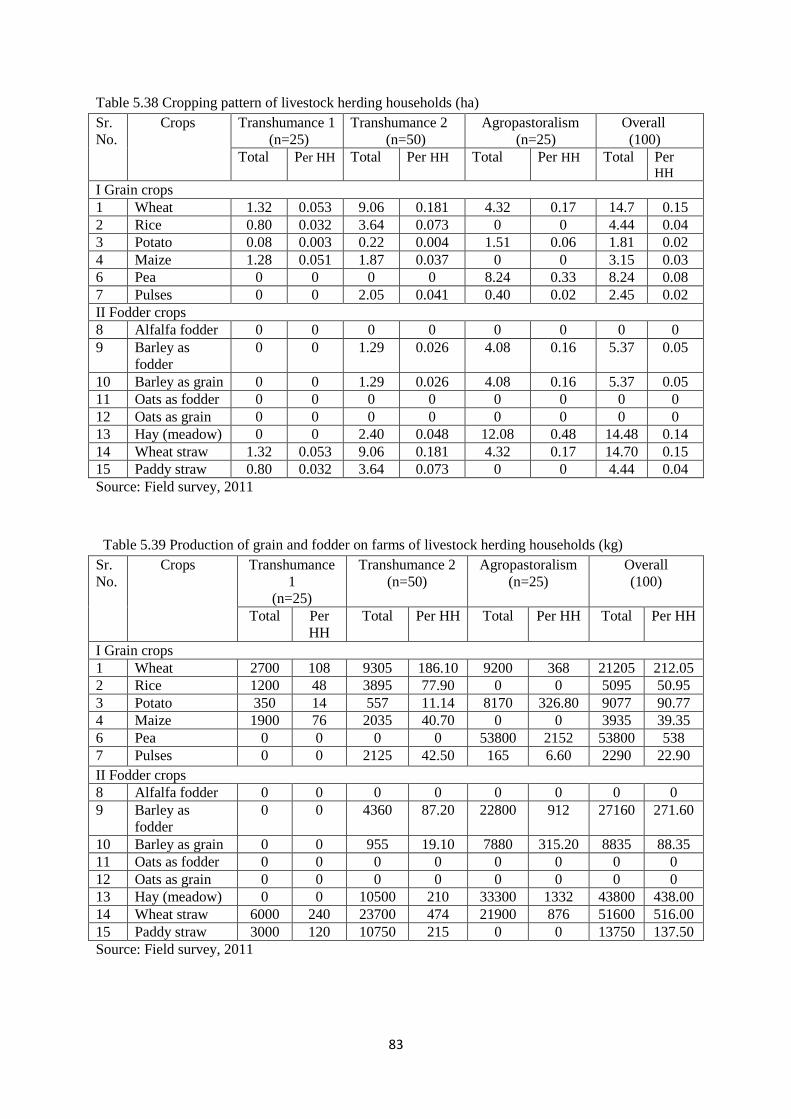
83
Table 5.38 Cropping pattern of livestock herding households (ha)
Sr.
No.
Crops Transhumance 1
(n=25)
Transhumance 2
(n=50)
Agropastoralism
(n=25)
Overall
(100)
Total Per HH Total Per HH Total Per HH Total Per HH
I Grain crops
1 Wheat 1.32 0.053 9.06 0.181 4.32 0.17 14.7 0.15
2 Rice 0.80 0.032 3.64 0.073 0 0 4.44 0.04
3 Potato 0.08 0.003 0.22 0.004 1.51 0.06 1.81 0.02
4 Maize 1.28 0.051 1.87 0.037 0 0 3.15 0.03
6 Pea 0 0 0 0 8.24 0.33 8.24 0.08
7 Pulses 0 0 2.05 0.041 0.40 0.02 2.45 0.02
II Fodder crops
8 Alfalfa fodder 0 0 0 0 0 0 0 0
9 Barley as
fodder
0 0 1.29 0.026 4.08 0.16 5.37 0.05
10 Barley as grain 0 0 1.29 0.026 4.08 0.16 5.37 0.05
11 Oats as fodder 0 0 0 0 0 0 0 0
12 Oats as grain 0 0 0 0 0 0 0 0
13 Hay (meadow) 0 0 2.40 0.048 12.08 0.48 14.48 0.14
14 Wheat straw 1.32 0.053 9.06 0.181 4.32 0.17 14.70 0.15
15 Paddy straw 0.80 0.032 3.64 0.073 0 0 4.44 0.04
Source: Field survey, 2011
Table 5.39 Production of grain and fodder on farms of livestock herding households (kg)
Sr.
No.
Crops
Transhumance
1
(n=25)
Transhumance 2
(n=50)
Agropastoralism
(n=25)
Overall
(100)
Total Per
HH
Total Per HH Total Per HH Total Per HH
I Grain crops
1 Wheat 2700 108 9305 186.10 9200 368 21205 212.05
2 Rice 1200 48 3895 77.90 0 0 5095 50.95
3 Potato 350 14 557 11.14 8170 326.80 9077 90.77
4 Maize 1900 76 2035 40.70 0 0 3935 39.35
6 Pea 0 0 0 0 53800 2152 53800 538
7 Pulses 0 0 2125 42.50 165 6.60 2290 22.90
II Fodder crops
8 Alfalfa fodder 0 0 0 0 0 0 0 0
9 Barley as
fodder
0 0 4360 87.20 22800 912 27160 271.60
10 Barley as grain 0 0 955 19.10 7880 315.20 8835 88.35
11 Oats as fodder 0 0 0 0 0 0 0 0
12 Oats as grain 0 0 0 0 0 0 0 0
13 Hay (meadow) 0 0 10500 210 33300 1332 43800 438.00
14 Wheat straw 6000 240 23700 474 21900 876 51600 516.00
15 Paddy straw 3000 120 10750 215 0 0 13750 137.50
Source: Field survey, 2011
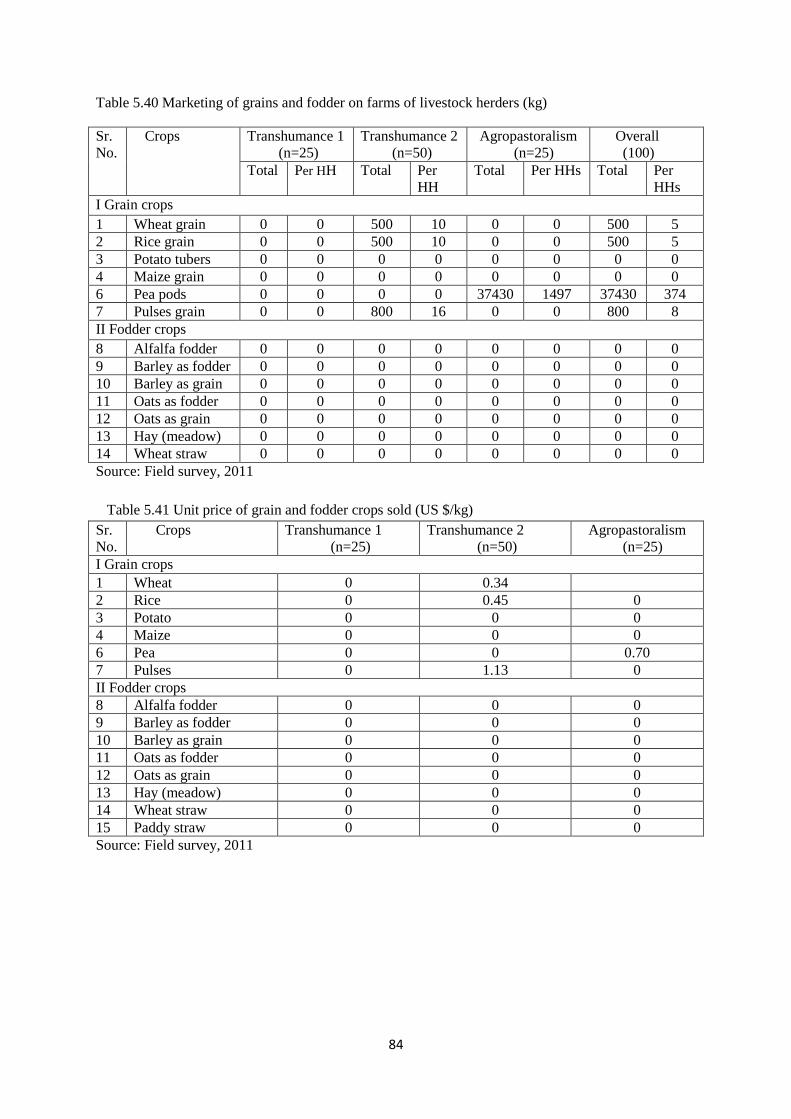
84
Table 5.40 Marketing of grains and fodder on farms of livestock herders (kg)
Sr.
No.
Crops Transhumance 1
(n=25)
Transhumance 2
(n=50)
Agropastoralism
(n=25)
Overall
(100)
Total Per HH Total Per
HH
Total Per HHs Total Per
HHs
I Grain crops
1 Wheat grain 0 0 500 10 0 0 500 5
2 Rice grain 0 0 500 10 0 0 500 5
3 Potato tubers 0 0 0 0 0 0 0 0
4 Maize grain 0 0 0 0 0 0 0 0
6 Pea pods 0 0 0 0 37430 1497 37430 374
7 Pulses grain 0 0 800 16 0 0 800 8
II Fodder crops
8 Alfalfa fodder 0 0 0 0 0 0 0 0
9 Barley as fodder 0 0 0 0 0 0 0 0
10 Barley as grain 0 0 0 0 0 0 0 0
11 Oats as fodder 0 0 0 0 0 0 0 0
12 Oats as grain 0 0 0 0 0 0 0 0
13 Hay (meadow) 0 0 0 0 0 0 0 0
14 Wheat straw 0 0 0 0 0 0 0 0
Source: Field survey, 2011
Table 5.41 Unit price of grain and fodder crops sold (US $/kg)
Sr.
No.
Crops Transhumance 1
(n=25)
Transhumance 2
(n=50)
Agropastoralism
(n=25)
I Grain crops
1 Wheat 0 0.34
2 Rice 0 0.45 0
3 Potato 0 0 0
4 Maize 0 0 0
6 Pea 0 0 0.70
7 Pulses 0 1.13 0
II Fodder crops
8 Alfalfa fodder 0 0 0
9 Barley as fodder 0 0 0
10 Barley as grain 0 0 0
11 Oats as fodder 0 0 0
12 Oats as grain 0 0 0
13 Hay (meadow) 0 0 0
14 Wheat straw 0 0 0
15 Paddy straw 0 0 0
Source: Field survey, 2011
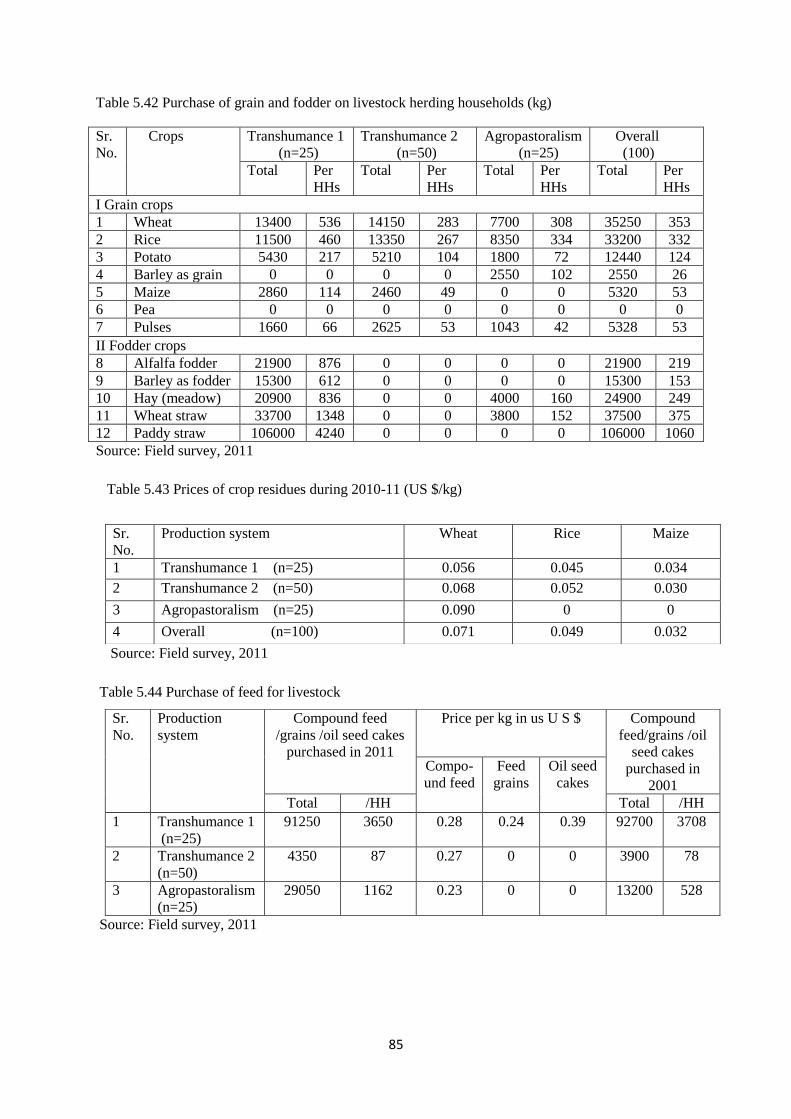
85
Table 5.42 Purchase of grain and fodder on livestock herding households (kg)
Sr.
No.
Crops Transhumance 1
(n=25)
Transhumance 2
(n=50)
Agropastoralism
(n=25)
Overall
(100)
Total Per
HHs
Total Per
HHs
Total Per
HHs
Total Per
HHs
I Grain crops
1 Wheat 13400 536 14150 283 7700 308 35250 353
2 Rice 11500 460 13350 267 8350 334 33200 332
3 Potato 5430 217 5210 104 1800 72 12440 124
4 Barley as grain 0 0 0 0 2550 102 2550 26
5 Maize 2860 114 2460 49 0 0 5320 53
6 Pea 0 0 0 0 0 0 0 0
7 Pulses 1660 66 2625 53 1043 42 5328 53
II Fodder crops
8 Alfalfa fodder 21900 876 0 0 0 0 21900 219
9 Barley as fodder 15300 612 0 0 0 0 15300 153
10 Hay (meadow) 20900 836 0 0 4000 160 24900 249
11 Wheat straw 33700 1348 0 0 3800 152 37500 375
12 Paddy straw 106000 4240 0 0 0 0 106000 1060
Source: Field survey, 2011
Table 5.43 Prices of crop residues during 2010-11 (US $/kg)
Source: Field survey, 2011
Table 5.44 Purchase of feed for livestock
Source: Field survey, 2011
Sr.
No.
Production system Wheat Rice Maize
1 Transhumance 1 (n=25) 0.056 0.045 0.034
2 Transhumance 2 (n=50) 0.068 0.052 0.030
3 Agropastoralism (n=25) 0.090 0 0
4 Overall (n=100) 0.071 0.049 0.032
Sr.
No.
Production
system
Compound feed
/grains /oil seed cakes
purchased in 2011
Price per kg in us U S $ Compound
feed/grains /oil
seed cakes
purchased in
2001
Compo-
und feed
Feed
grains
Oil seed
cakes
Total /HH Total /HH
1 Transhumance 1
(n=25)
91250 3650 0.28 0.24 0.39 92700 3708
2 Transhumance 2
(n=50)
4350 87 0.27 0 0 3900 78
3 Agropastoralism
(n=25)
29050 1162 0.23 0 0 13200 528
86
CHAPTER 6
CONCLUSIONS
6.1 General
Hill areas in India constitute 21% of total geographical area and 9 % of total population of the
country. The hill areas hold basic life support system and natural resources. A large part of
population in the plains is dependent on hill resources especially of Himalayan region. Most
of the perennial rivers in the country originate and have their watershed in the Himalayas.
Out of 13 hill states and regions, Himachal Pradesh is observed to be the most progressive
state, which has made remarkable achievements in socio-economic development of its people.
The state is being viewed as a model for development of Hindu-Kush Himalayan region. The
state has created a new concept in the development of the hill economy through
transformation brought about in agriculture, horticulture and animal husbandry (Verma and
Pratap, 1992). Himachal Pradesh is located in the northern part of the country. It has an
international border with Tibet in the east, Indian states of Jammu & Kashmir in the north,
Punjab in the west & south west and Haryana and Uttarakhand in the south. The state forms
part of western Himalayan zone. It has a hilly terrain, mountainous and undulating
topography with altitude ranging from 350 to 6975 metres above mean sea level. About 92 %
of the population, mainly rural in the state, is directly engaged in agriculture, horticulture and
animal husbandry. About 18% of the total Gross State Domestic Product (GSDP) comes from
agriculture and its allied sectors (2008-09). The state is divided into four agro-climatic zones.
The rearing of livestock is an integral part of the farming system particularly in zone three
and four where livestock herders migrate and use the vast available rangelands. The livestock
not only provides milk, wool, mutton, hides, skin, manure and draught power for agriculture
production, but is a source of self employment to rural people. Studies have shown that
animal husbandry contributes 10 to 32 % of household’s income in different agro-climatic
zones of the state. The importance of livestock sector in the state is also evident from the fact
that 83 % of the households keep some bovine, 27 % rear goat (17%) and sheep (10%) while
the poultry is kept by 2 % of the households. The livestock population though seems to have
stabilized during the past three decades; its composition has undergone noticeable changes,
especially at the district or regional level. These changes have important implications towards
increased demand for the livestock products, draught power availability and ecological
pressure (Chand, 1995). Against the above background, the issues like changes in the
87
composition and trends in the livestock population and livestock products, the market and
non market contribution of livestock to herders of varied ethnic groups need to be
investigated to arrive at the true value of the contributions of the vast rangelands to mankind
via livestock production systems. The quantification of these contributions would bring out
the importance of designing appropriate policies for the sustainable development of these
rangelands.
Against this background, ICIMOD proposed to conduct a study on the valuation of livestock
production in the HKH region by using the latest available data. The analysis focused on the
states, autonomous regions, provinces or districts of India, Pakistan, Bhutan, Nepal and China
which are the partner countries. The study was conducted by national agriculture economists
with collaboration of an international consultant. In India the study was jointly conducted by
the Wildlife Institute of India, Dehra Dun (Uttarakhand) and the Himachal Pradesh
Agricultural University, Palampur (Himachal Pradesh). The present report pertained to
Himachal Pradesh within the boundaries of the ICIMOD working areas in India. The states of
Jammu and Kashmir, Uttarakhand, Sikkim and Arunachal Pradesh would be covered by
Wildlife Institute of India, Dehra Dun (Uttarakhand).
6.2 Objective of the Study
To collect and analyze state and district wise data on livestock production and its
trends over the last two decades in Himachal Pradesh;
To analyze the market and non-market contribution of livestock production under
different farming systems followed by different ethnic groups;
To assess the contribution of livestock production to the local revenue and household
economy of different ethnic groups and estimate its contribution at the state level.
6.3 Methods
For field sampling two representative districts namely Lahaul-Spiti and Chamba were
selected mainly based on their maximum representation in terms of livestock rearing systems,
livestock rearing communities represented in the state, the logistics and location of
rangelands frequently visited by livestock herders of different ethnic groups. Multistage
stratified random sampling design was followed to select a sample of district, the production
system, the villages and the livestock herders in consultation with the officials of Directorate
of Animal Husbandry, the scientists of the college of veterinary and animal sciences CSK HP
Agricultural University, Palampur, the district senior veterinary/animal husbandry officers
88
and social organizations like Himachal Gaddis union, the Gujjars vikas sangh and tribal
groups, etc. The study covered the two major livestock rearing systems prevalent there viz.
transhumance-1 (Gujjars), transhumance-2 (Gaddis) and agro-pastoralist (Bodhs/Bhots). The
first strata of the sample consisted of districts, second the production systems, the third of
villages and the fourth and final strata were of the households (livestock herders). The
number of households from each ethnic group/community/livestock rearing system was
selected based on total of household in each stratum. The number of samples selected was
adequate to ensure representativeness. The total number of sample size was 100 depending on
the number of households and homogeneity in demographic and socio-economic parameters
within the production systems was derived using data from Census of India. From each ethnic
group of Gujjars, Gaddis, and Bhots, a sample of 25, 50, and 25 households from the
respective categories was chosen for the study. Gue, Hurling, Poh, Schling, and Mane in
Lahaul Spiti district and Raje-ka-dera, Sangni, Langera, Bhandal, and Jot in Chamba for
Gujjar households rearing buffaloes and Bringti, Urna, Ghroh, Deol, Pansei, Malkota, Garima,
Pringual, Zhikli Tayari and Banoon in Chamba District for Gaddi households rearing sheep
& goats were chosen randomly for the study.
6.4 Major findings
The analysis of data collected from secondary sources reveals that livestock accounted for
30% in Himachal Pradesh agriculture GDP despite decline in the budget outlay from 10th
Five Year Plan to 11th
Five Year Plan. As far as the recent trend is concerned there has been
increase in cattle, buffaloes and goats population, and resultantly overall increase in total
livestock population, however, sheep, horses & ponies have shown declining trend in the
state.
Further the analysis of data collected from NSS report 493, reveals that in Himachal Pradesh,
upto 0.04 ha size class of operational holding 6 to 100 % of the area was operated for farming
of animals and it was entirely used for dairy animals, however, at the overall level, 0.41 % of
the operational land was used for farming of animals, out of which nearly 78 % meant for
dairying. The estimated number of cattle owned by 1000 households stood at 1398, that is,
more than one cattle per household in Himachal Pradesh and the estimated number of such
households was 5, 87,500 (48.09% of total). The number of cattle (8000 per 1000 households,
that is 8 per household) was the highest in the farm size group of 7.5 -10.0 ha followed by
6000 per 1000 household, that is, 6 per household in the farm size group of 10-20 ha. In case
of buffaloes their number per 1000 households was 617 on all sizes of operational holding
with a maximum of 3000 per 1000 household in the farm size category of 10-20 ha.
89
Buffaloes were not owned by any of the landless category household which clearly signifies
the strong land- livestock relationship in the state. As many as 3, 84,900 households (31.51%)
owned buffaloes in Himachal Pradesh. In all 2, 35,000 households (19.24%) possessed sheep
& goats in Himachal Pradesh. As many as 5000 sheep & goats per 1000 households, that is, 5
sheep & goats per household were owned by the households in Himachal Pradesh.
The average size of family varied from 5.46 in transhumant-2 (Gaddis) group to 8.32 in
transhumant-1 (Gujjars) group with overall size of 6.50. The number of adults per households
was greater than children in all the cases. The overall sex ratio was 821 females per 1000
males. Considering the overall situation, 94% livestock herder respondents were married
while 3% each were unmarried and widows & widowers.
Amongst working population, 5.20% of the men and women at the overall level were
employed in military and paramilitary forces where the number of men was more than their
women i.e. out of 25, 23 (92%) comprised men and 2 (8%) women (one each from
transhumance-1 and agro pastoralist group).
Considering all three systems of livestock rearing, 1.38 men, 0.50 women and 0.70 children
with their total of 2.56 per household were engaged in tending livestock herds. However, the
number of persons involved in tending livestock herds per household was the highest (6.52)
on transhumant-1 (Gujjars) followed by 1.48 on transhumant-2 (Gaddis) and below one (0.76)
on agropastoralist (Bodh) households. Further, the transhumant-1 (Gujjars) were cultivating
crops just for the name sake; the Gaddis had their land in two places one in Chamba (the
higher hills) and other in lower parts of the state where other family members were practicing
agriculture. However, in Lahual Spiti district majority of the agropastoralist (Bodh)
households had herds of assorted livestock breeds and practiced agriculture during summer
commencing from April to September.
The rangeland with exclusive right for grazing within a walking distance from the village or
place of residing/halting/transitory camp ranged from 36 ha on transhumant-1 group to 201
ha on transhumant-2 of livestock herders, with overall average of 88 ha. None of the
livestock herder had their own forest which could supply fuel wood for human beings and
grass & forage for the livestock maintained by such households.
The trends in livestock inventory possessed by the livestock herders in 2011 over 2001 shows
that while there has been a slight increase in the population of cattle, buffaloes, horses and
donkeys, there has been a sharp decline in the number of sheep and goats. This decline may
90
be attributed to, among other things, shrinking of grazing areas and disliking of the profession
by the younger generation inasmuch as it involves migrating system throughout the year. On
the whole, it can be concluded that the size of livestock herds possessed by transhumant-1
(Gujjars) and agro pastoralist (Bodhs) has increased whereas that maintained by transhumant-
2 (Gaddis) has reduced due to various reasons. As regards hurdles in livestock rearing, the
problems of shrinking grazing area and non-availability of veterinary aid were less severe
than nowadays. Similarly, the problem of infestation of grasslands by obnoxious weeds has
become more serious now as compared to a decade ago.
In a majority of the livestock herding respondents where change in ownership happened, it
occurred following the death of their parents followed by old age of the parents. In 13% cases,
the ownership changed due to division of family.
As many as, 40 to 56% of livestock herders wanted to make investment on additional
livestock. The desire to earn more profits through increased production of milk and milk
products, wool and increased production of farm yard manure were important motivating
factors for making additional investment. While enquiring about the sources from where the
fodder & feed will be arranged for additional livestock holding; the majority of respondents
reported that they still have enough grazing land despite shrinkage of areas. Likewise, 14%
were prepared to lease-in additional pasture land. In some cases, respondents also reported
that they would meet the additional requirement of feed & fodder by buying hay, wheat and
paddy straw from the local farmers and market.
The findings further reveals that yoghurt (curd), cheese, ghee, kurut (made from colostrums),
butter, wool and goat hair were the important livestock products harvested by livestock
herders. Milk was the most important item of household use; its per capita consumption
varied from 45 kg per annum on agropastoralist (Bodh) households to as high as 130 kg per
annum in case of transhumant-2 (Gaddis). The consumption of animals for meat purpose was
found only in respect of transhumant-2 (Gaddi) and agropastoralist (Bodh) livestock herding
households where it amounted to 22.72 kg and 15.60 kg per head per annum, respectively.
While in case of transhumant-1 (Gujjar) livestock herds the role of women was more
pronounced than their male counterparts; in case of transhumant-2 (Gaddis), the processing
of livestock products (the wool and sale of live animals for meat) was mainly confined to
men. In case of agropastoralist (Bodh) households, both men and women were equally
involved.
91
Non-remunerative price for wool was the most important problem being faced by majority of
transhumant-2 (Gaddis) sample households rearing sheep & goats. Non-remunerative price of
milk, lack of veterinary aid and no price for dead sheep & goat were some other problems
reported by around 21-22% of the livestock herders. Likewise, lack of transportation facility
in disposing of their animal products due to their migratory nature was yet another problem
which was reported by buffalo and sheep & goat herders.
In the study area, while sheep and goat are offered as gift or slaughtered and served as meat
to guests during ceremonies as a tradition, buffaloes were offered in the form of dowry (gift)
by very few households. The large ruminants are not slaughtered for meat by the livestock
communities in the area. The average value of buffalo given as gift by the transhumant-1
(Gujjar) group was $ 277.53 per household per annum. Likewise, in case of transhumant-2
(Gaddi) households, the value of sheep and goat gifted/consumed by them was assessed at $
5.70 and $ 88.95, respectively. In case of agro pastoralist (Bodh) households, the use of sheep
and goat was valued at $ 8.84 to 87.10 per household per annum.
At the overall level, while the number of male sheep and goat sold was 1.38 and 1.45,
respectively, that of female sheep and goat sold was 5.06 and 4.68, respectively. The number
of adult female sheep and goat sold by the sample transhumant-2 (Gaddi) households per year
was 10 per annum. In a like manner, 2.24 female buffaloes per household per year were sold
by transhumant-1 (Gujjar) households. Male buffaloes were not in great demand; therefore,
the younger males were not properly looked after leading to their deaths. Naturally, the sale
of these adults was quite low. Further, number of male buffalo calves who survived despite
neglect and poor management, were sold as a young stock and number sold per household
was one. The young stock of female buffalo as well as of sheep & goat was not sold and used
instead for breeding purposes. Only unproductive sheep & goat animals that had attained the
age of maturity were sold for meat/mutton to the traders. The overall sale proceeds from all
animals including adults and young stock was assessed at $ 2306.74 per household per
annum in the study area.
The quantity of milk sold per household per annum amounted to 1322 kg priced at $ 0.47 per
kg. The amount of wool sold was 50.02 kg at an average price of $ 0.94 per kg. Similarly, the
amount of cheese and meat sold was 46.90 kg and 32.35 kg per household per annum at a
price of $ 3.90 and $ 3.38 per kg.
92
None of the sample household prepared value-added products from animal’s fibre like
woolen yarn, cashmere, pullovers, socks, etc and, therefore, the unit price charged for such
items was nil. Since no value added products like woolen yarn, cashmere, pullovers, socks,
etc were prepared by any of the sample household; therefore, there was no information/data
on the involvement of men, women and children.
The number of residential buildings owned by sample livestock herders exceeded the size of
sample; there were 148 residential houses for 100 sample households thus giving an average
of 1.48 houses per household. This could explained in terms of their migratory nature; since
majority of the households resort to seasonal migration they had to construct houses at more
than one place like the one in plains and other in the hills.
Regarding land assets, on an average a sample household possessed 0.44 ha of irrigated land
and 0.25 ha of rain-fed land. The agropastoralist (Bodh) grew garden pea which has
introduced as a cash crop recently in most of their crop land (0.33 ha/household) followed by
wheat. While wheat, maize, rice and garden peas were the most important grain crops grown
by livestock herders, barley and hay were important fodder crops. On the overall farm
situation the production of wheat, rice, potato, maize, garden peas and pulses was 2.12, 0.51,
0.91, 0.39, 5.38 and 0.23 q/household. As far as unit price of crop produce is concerned,
wheat, rice, pulses and garden peas fetched $ 0.34, 0.45, 1.13 and 0.70 prices per kg in the
study area.
Hay was harvested from grasslands. Wheat, rice and maize were purchased to the extent of
3.53, 3.32 and 0.53 q per household, respectively. Alfalfa fodder and barley as fodder were
purchased to the extent of 2.19 and 1.53 q per household, respectively. These fodder crops
were purchased by only the Gujjar buffalo herders. Barley as grain to the extent of 0.26 q per
household purchased from the market was fed to goats by the Bodh livestock herders.
The fodder crops like hay and crop residues of wheat & paddy as straw were purchased only
by the transhumant-1 (Gujjar) buffalo herders and agro-pastoralist (Bodh) rearing cattle along
with chegu goats. Besides, barley as feed grain was also fed to chegu goats by the agro-
pastoralists in Spiti region of Himachal Pradesh. The transhumant-2 (Gaddis) group
producing sheep & goat herds did not purchase either of the fodder crops produce or crops
residue as fodder in that these small ruminants were fed only through grazing.
93
6.5 Recommendations
Creation of basic facilities like schooling for children, electricity for temporary huts
and pucca paths leading to pastures made of cutting stones & boulders and
rejuvenation of drinking water sources.
Improvement of support lands (private grasslands) by employing different measures
for the control of invasive shrubs, weeds, etc. through enhanced public investments
for the establishment of high yielding varieties of grasses and legumes and for the
conservation of local nutritious grass species which at present are at the verge of
elimination due to infestation of pastures and grasslands with obnoxious weeds like
lantana, azeratum, parthenium, etc in large chunks of the state. This problem has put
question mark on the livestock rearing profession for subsistence and commercial
farming. Fodder crops can also be propagated wherever possible e.g. on banks of
small streams, bunds and wastelands. Forage crops cultivation along with cereals is
another possible option for increasing fodder supply. Attempts at conservation and
better utilization of forage should be linked to the efforts of increasing feed and
fodder production. In this context, hay making and silage making, could be effective
operational measures among others.
Appropriate price support for livestock products particularly the milk & its products,
the wool and live animals for meat, etc. In addition establishment of marketsfor milk,
farm yard manure of large ruminants and small ruminants’ droppings collected at the
place of migration is also essential. For the last three decades there is no parity in the
price rise of wool in comparison to consumer price index as it has not raised as in case
of other animal products like milk, meat and eggs. Due to available alternatives for
wool and woolens in the market, the price of wool has remained stagnant for many
years. New milk and wool shearing/collection centres should be established in areas
which are accessible to the producers especially the migratory livestock herders.
Adequate promotional avenues especially amongst small-scale producers for value
addition of livestock products for the milk, meat and wool are urgently needed
offering opportunities for the educated youth who at present dislike the livestock
profession.
Better outreach of institutional and infrastructural support like markets, credit, inputs,
technology and services to small scale livestock producers particularly at the places of
94
migration may encourage them to take advantage of the opportunities resulting from
the expanding demand for animal food products in the domestic and global markets;
Efforts to enhance research and extension investments on livestock related issues like
the menace of stray cattle, provision of better animal health services etc; are equally
important for overall livestock development in the state of Himachal Pradesh.The
uneconomic cattle are abandoned by their rearers and these animals roam in the fields
and come to roads in the evening for night halts creating lot of inconvenience for the
vehicle users.
95
REFERENCES
Kumar Anjani.(2010). Milk marketing chains in Bihar: Implication for Diary Farmers and Traders.
Agricultural Economics Research Review. (23):469-477.
Babu D and Verma N.K. (2010). Value Chains of Milk and Milk products in Organised Sector of
Tamil Nadu- A Comparative Analysis. Agricultural Economics Research Review
(23):479-486.
Badola, R. & Hussain S.A. (2003a). Conflict in paradise: Women and Protected Areas in the
Indian Himalayas. Mountain Research and Development 23 (3).
Barbier, E.B. Burgess, J.C., Folke, C., (1994). Paradise lost? The Ecological Economics of
Biodiversity
Bardhan D. (2007). India’s Trade Performance in Livestock and Livestock Products. Ind. Jn. of Agri.
Econ. (62)(3): 411-425
Banafar K.N.S. (2007). Production and Marketing of Milk in Raipur District of Chhattisgarh: An
Economics Analysis. Ind. Jn. of Agri. Econ. (62)(3): 478
Beohar B.B., Mishra P.K. and Nahatkar S.B.(2007). Livestock Marketing Problems in Madhya
Pradesh. Ind. Jn. of Agri. Econ. (62)(3):471
Bhardwaj S.P. and Panwar Sanjeev.(2007). A study of Livestock Marketing in India. Ind. Jn. of Agri.
Econ. (62)(3):468
Birthal P S, Taneja and Thorpe W (2006). Smallholder livestock production in India.
Proceedings, NCAP. New Delhi.
Biswal Anirudha and Kumar Sanjay. (2011). Economics of Livestock Marketing in Orissa.
Ind. Jour. Agril.Mktg. 25 (1): 54-63.
Burark S.S. and Jogi R.L.(2007). Market Infrastructure for Livestock Marketing in Rajasthan. Ind. Jn.
of Agri. Econ. (62)(3):469
Chand Khem, Jangid B.L. and Rohilla P.P. (2009). Milk Marketing Channels in Arid Region
of Rajasthan. Ind. Jour of Agril.Mktg. 23 (3): 140-149
Chand Ramesh (1995). Livestock in Himachal Pradesh: factors affecting growth, composition
and intensity, Ind. Jn. of Agri. Econ , 50(3):299-310.
Chauhan, S K. (2005). Equine Husbandry in the Mountains. Mittal Publication, New Delhi.
Chauhan S.K. and Dogra P.K.(2007). Economic Rationale and Marketing of Equine in Mountain
Areas. Ind. Jn. of Agri. Econ. (62)(3):462
96
Choudhary Vijay K.(2007). Economics, Marketing and Constraints of Milk Production in Progressive
Diary Farms. Ind. Jn. of Agri. Econ. (62)(3):482
Costanza, R., Cumberland, Daly, J., Goodland, H. & Norgaard, R. (1997) An Introduction to
Ecological Economics. Florida, U.S.A: International Society for Ecological
Economics.
Costanza, R., d’Arge, R., de Groot, R., Farber, S., Grasso, M., Hannon, B., Limburg, K.,
Naeem, S., O’Neill, R.V., Paruelo, J., Raskin, R.G., Sutton, P. & Belt, M.
(1998). The value of the world’s ecosystem services and natural capital. Nature.
Vol. 387.
Daily, G.C., Alexander, S., Ehrlich, P.R., Goulder, L., Lubchenco, J., Matson, P.A., Mooney,
H.A., Postel, S., Schneider, S.H., Tilman, D., & Woodwell, G.M. (1997).
Dastagiri, M.B. (2002). Demand for livestock products in india: Current status and
projections for 2020. In Livestock in different farming system in India.
Agricultural Economics Research Association (India). National Centre for
Agricultural Economics and Policy Research, New Delhi. :176-182
De Groot, R.S., (1992). "Functions of Nature: evaluation of nature in environmental planning,
management and decision-making". Wolters Noordhoff BV, Groningen,the Neth.
(345 pp).
De Groot, R.S., (1994). Environmental Functions and the Economic Value of Natural
Ecosystems (pp:151-168), in: Jansson et al. (eds), "Investing in Natural Capital:
the ecological economics approach to sustainability", Island Press, International
Society for Ecological Economics
Deokate T.B., Shendage P.N. and Jadhav K.L.(2007). Marketing of Milk in Amarvati District of
Maharastra. Ind. Jn. of Agri. Econ. (62)(3):453
Dev I, Misri B and Pathania M S (2006). Forage demand and supply in Western Himalaya: A
balance sheet for Himachal Pradesh. Indian Journal of Animal Sciences 76(9):
720-726.
Dikshit A.K. and Birthal P.S. (2010). India’s Livestock Feed Demand: Estimates and
Projections. Agricultural Economics Research Review, (23)(1):15-28
Ecosystem Services: Benefits supplied to human socities by natural ecosystems. Nature’s
Services: Societal Dependence on Natural Ecosystems. Island press, Washington,
D.C.
Elumalai K and Pandey uk (2004). Technological Change in Livestock Sector of Haryana.
Indian Journal of Agricultural Economics, 59(2):-
Gaurakha A.K. (2007). Economics of Milk Marketing in Chhattigarh. Ind. Jn. of Agri. Econ.
(62)(3):463
97
Govt. of H P (1992). The State Report on Livestock Census. Directorate of Land Records,
Shimla.
Govt. of H.P (2000-01-2010-10). Integrated Sample Survey for Estimation of Animal
Products. Directorate of Animal Husbandry, Shimla.
Govt. of H P (2007). 18 th Livestock Census Himachal Pradesh. Directorate of Animal
Husbandry, Shimla.
Gupta D.C. and Suresh A.(2010). Marketing Practices of Small Ruminant Farmers In semi-arid
Region of Rajasthan. Ind. Jour of Agril.Mktg.(24) (1) : 49-60
Hazra Pralay, Sirohi Smita and Goswani Snehangshu.(2007). Capitalising on Trade Prospects in
Asian Markets for Exports of Indian Dairy Products. Ind. Jn. of Agri. Econ. (62)(3): 472
Jain Bhag Chandra and Khan M.A.(2007). Structure and Working of Cattle Markets and Fairs in
Chhattisgarh. Ind. Jn. of Agri. Econ. (62)(3):464
Jha Brajesh (2004). Implications of Trade Liberalisation for the Livestock Sector. Ind.Jn.of
Agri.Econ,59(3):566-577.
Kalamakar S.S. (2007). Export Marketing of Dairy Products: Problems and Perspectives. Ind. Jn. of
Agri. Econ. (62)(3): 459
Kaul Sushila. (2007). Analytical Study of Marketing of Milk through co-operative in India. Ind. Jn. of
Agri. Econ. (62)(3): 458
Kumar Anjani. (2010) Exports of livestock Products from India: Performance,
Competitiveness and Determinants. Agricultural Economics Research Review, (23)
(1):57-67.
Kumar Anjani (2010). Milk Marketing Chains in Bihar: Implications for Dairy Farmers and
Traders. Agricultural Economics Research Review, (23):469-477
Kumar Anjani, Staal Steven J. and Singh K. Dhiraj. (2011). Smallholder Diary Farmers’
Access to Modern Milk Marketing Chains in India. Agricultural Economics
Research Review ,(24): 243-253
Kumar Anjani, Staal Steven J., Baltenweck and L. Lapar Lucy. (2010). Traditional milk
market in Assam: Potential for Income and Employment Generation. Ind. Jn. of
Agril. Econ. (65) (4): 747-759
Kumar Anjani, Staal Steven J., Singh N.P. and K. Singh Dhiraj.(2007). Livestock Sector Trade of
India: Surging Momentum in the new Liberalised Regime. Ind. Jn. of Agri. Econ. (62)(3):
395-410
Kumar Sanjay, Mirajkar P.P., Singh Y.P. and Singh R. (2011). Analysis of willingness to pay
for Veterinary Services of the Livestock owners of Sangli District of Maharastra.
Agricultural Economics Research Review, (24): 149-153
98
Kumar Shalander, Kareemulla K. and Rama Rao C.A.(2009). Goat Marketing System in Rajasthan
Ind. Jour. Agril.Mktg., 23 (3): 150-167
Kumar V, Sharma H.R., and Sharma R.K.2004. Livestock Economy of Himachal Pradesh:
Growth pattern, ecological implications and state policy. Agricultural Economics
Research Review 17(2):57-76.
Merlo, M., 1995. Non-market Environmental Values in Forest Management Accounting.
Proceedings of XX IUFRO World Congress, Session 4.04–02, Tampere, Finland
Prakash Brahm Sharma D.K. and Singh D.S., (2007). Meat Exports from India: Current Trends,
Constraints and Prospects. Ind. Jn. of Agri. Econ. (62)(3): 458
Rathore M S and Jairth M S (2002). Livestock Development in Hilly Areas: Case of Himachal
Pradesh. In Livestock in different systems in India (Eds PS Birthal, Anjani Kumar and
Laxmi Tewari). NCAP, New Delhi.
Raju S.S. (2007). Trade in Indian Livestock Products and Its Competitiveness. Ind. Jn. of Agri. Econ.
(62)(3): 461
Rangasamy N. and Dhaka J.P.(2007). Economics of Value-added Dairy Products Manufacturing by
Co-operative Dairy in Tamil Nadu. Ind. Jn. of Agri. Econ. (62)(3):454
Shukla A.N. and Hussain Nasir.(2007).Live Animals Marketing Pattern in Western Uttar Pradesh. Ind.
Jn. of Agri. Econ. (62)(3):455
Shukla Archana (2007). Trade Scenario of Cattle Fairs and Future Prospects of Livestock Markets in
Uttar Pradesh. Ind. Jn. of Agri. Econ. (62)(3):466
Singh A.K. Singh and Joshi Seema (2007). Milk and Milk Product Marketing in Western Uttar
Pradesh. Ind. Jn. of Agri. Econ. (62)(3):466
Singh Babu, Singh Rakesh Kumar, Kumar and Bhupender(2007). Marketing Efficiency of Goats for
Meat in Uttar Pradesh. Ind. Jn. of Agri. Econ. (62)(3):477
Singh C.P. and Sharma J.D.(2007). Growth of Goat Population and Problems of Rearing Goat in
Rajasthan. Ind. Jn. of Agri. Econ. (62)(3): 467
Singh Jitendra, Bhargava Hargovind and Kishor Raj.(2007). Marketing System of Private Milk
Collection and Distribution Agencies in Lucknow City of Uttar Pradesh. Ind. Jn. of Agri.
Econ. (62)(3):479
Singh J.P. (2007). Structure, Regulatory Mechanism and Constraints in Skins and Hides in
Chaurichaura Market of Eastern Uttar Pradesh. Ind. Jn. of Agri. Econ. (62)(3):475
Singh Shiv Raj and Datta K.K.(2010). Understanding Value Addition in Indian Diary Sector:
Some perspectives. Agricultural Economics Research Review, (23):487-493
Singh Sukhpal.(2007). Marketing of Liquid Milk: A Case Study of Ahmedabad Milk Market. Ind. Jn.
of Agri. Econ. (62)(3):440-447
99
Suhag K.S., Goyal S.K. and Bhatia Jitender.(2007). Marketing of Livestock through Cattle Fairs in
Hisar (Haryana). Ind. Jn. of Agri. Econ. (62)(3):474
Suresh A. and Gupta D.C. (2010). Production and Trade in Wool and Woollen Products in
India. Ind. Jour of Agril. Mktg., 24 (2): 58-65.
Suresh A.,Gupta D.C.and Mann J.S.(2010) Degradation of Common Pastures: An Economics
Perspective of its Impact on Livestock Farming and Coping strategies.(23)(1).:47-
56
Pathania M.S., Sharma S.K., Vashist G.D., Sharma K.D., Katock Anup.(2010) Socio-economic
Analysis of Migrating Gujjars of Himachal Pradesh. Himachal Journal of Agricultural
Research (36).(1):72-78
Rao Radhakrishna.(2004). Role of Goat and Sheep in Rural Economy. Kurukshetra . (51)(4).
Taneja V K (2008). Goats and Sheep: Semi-intensive and Intensive Systems, the Future. In
The Hindu Survey of Indian Agriculture. National press, Kasturi building,
Chennai
Waghmare M.N., Tilekar S.N. and Rajput S.R.(2007). Marketing of Wool in Dhule District of
Western Maharashtra. Ind. Jn. of Agri. Econ. (62)(3):456
Wani S.A. and Wani M.H.(2010) Marketing of Milk in Various Agro-climate Zones of
Jammu and Kashmir (23)(1):83-90

100