islamic valuation premium
TRANSCRIPT
Journal of Business Valuation andEconomic Loss Analysis
Manuscript 1095
The valuation premium of the common stocksof Islamic financial institutions
M. F. Omran, Nile University
©2011 Berkeley Electronic Press. All rights reserved.
The valuation premium of the common stocksof Islamic financial institutions
M. F. Omran
Abstract
The study examines the valuation premiums paid by investors for the common stocks ofIslamic financial institutions in the United Arab Emirates (UAE). The UAE stock markets, duringthe period 2001-2005, were dominated by financial institutions which counted for 58% of all listedstocks. The study employs the price to book and the price to sales valuation multiples. Valuationby price to book value is more relevant and accurate for financial firms due to the high liquidity oftheir assets. It is found that there is a strong clientele preference for Islamic stocks despite themodest financial performance achieved in comparison with other financial institutions andinsurance companies. The clientele preference in the UAE, measured by higher valuationpremium, is for Islamic financial institutions first followed by commercial banks and last bytraditional insurance companies and financial services companies.
KEYWORDS: Islamic Financial Institutions, Valuation, Clientele Preference
Author Notes: The author would like to thank Jim Hoffman and two anonymous referees for theirvery helpful comments and suggestions that led to a better presentation of the paper’s ideas. Anearlier draft of this paper was presented at the research symposium in business and economics,American University of Sharjah, February 11th, 2010 and the tenth Islamic countries conferenceon statistical sciences, Cairo, Egypt, December 20-23, 2009. The author would like to thank allparticipants for their useful feedbacks.
1. INTRODUCTION
The interest in Islamic finance has been growing for several years. The interesting
trend in the last few years is the growing interest of non-Muslims in Islamic
financial products and institutions. The interests of non Muslims is obviously not
due to religion but it is rooted in the fact that many of the high risk endeavors
taken by traditional financial institutions are not allowed at all under Islamic
finance. However, the variety of Islamic financial products failed to grow at the
same rate as the growth in interest in Islamic finance. The fact remains that there
are not many products that comply with Islamic laws that can absorb the massive
flow of funds. That could have an impact on profitability of Islamic financial
institutions since they have to accept deposits that they may not have use for.
There is very little written on how Islamic financial institutions perform in
comparison with traditional financial institutions.
Omran (2009) was the first study to examine the financial performance of
Islamic financial institutions compared with traditional financial institutions in the
United Arab Emirates. His results indicate that the return on equity of Islamic
financial institutions lagged behind the UAE stock markets for the period from
2001 to 2005. However, Islamic financial institutions price to earnings multiples
were the highest in the market despite of the poor financial performance. This can
only be attributed to the clientele effect of the UAE investors. They prefer to pay
a premium for their faith namely for the comfort of knowing that their money is in
full compliance with Islamic laws and regulations. The most probable reason for
the low return on equity is the lack of financial products that comply with Islamic
regulations. Therefore, most of the funds lie idle which in turn reduces the return
on equity. Return on equity has three drivers. The first is the net profit margin
which is net profit after taxes divided by sales. Sales in case of financial
institutions are revenues from loans and revenues from other services. The second
driver is assets turnover which is sales divided by total assets. High assets
turnover will certainly lead to higher return on equity. The last driver is the
financial leverage which is total assets divided by equity. It is the second driver
which is the problem in Islamic financial institutions. Total liabilities (and
therefore total assets) are not limited since no financial institution can refuse
deposits. However, the assets’ product mix available for Islamic financial
institutions is still limited which leads to a very low assets turnover and
subsequently lower return on equity. The limited mix of products is due mainly to
the insufficient academic research carried out on how to create innovative
products that comply with Islamic laws and can utilize the idle funds available to
Islamic financial institutions.
1
Omran: Valuation Premium

The objective of the current study is to determine if the results of Omran
(2009) remain valid if different measures of valuation multiples are used. In other
words, is the clientele effect still there if we use different measures of valuation
multiples? We also improve on Omran’s (2009) results by eliminating the
potential bias that could result from using some correlated accounting variables
on both sides of regression. Also, the bootstrapping method is used to drive the
empirical distributions of the extra valuation premiums’ estimates.
The study employs the price to book value and price to sales multiples
instead of the price to earnings multiple used in Omran (2009). The study
confirms the results of Omran (2009) that there is a strong clientele preference for
Islamic financial institutions in the UAE regardless of which measure of valuation
is adopted.
The study is divided into 5 sections with the introduction in the first
section. Section 2 discusses the composition and drivers of values for the price to
book value and price to sales multiples. Section 3 describes the data set. Section 4
examines the significance of the Islamic valuation premiums using the price to
book value and price to sales multiples. Section 5 concludes the study.
2. VALUATION MODELS
Common stocks valuation can mainly be done by one of two methods: discounted
cash flows and price multiples. The discounted cash flows method requires
forecasting future cash flows, dividends payout, growth in dividends, and
discount rates. It also requires the estimation of the growth periods in the case of
supernormal growth when a company is expected to grow at above average
growth rate before it reaches the constant growth stage. A fundamental price is
then reached by discounting all future dividends expected from the stock. Fund
managers may then use that fundamental price to compare it with market price in
order for them to reach a buy, hold, or sell decision. While theoretically sound,
empirically it is quite difficult to apply because of the many estimates of future
variables required. It is even a more difficult method to use in emerging and
developing economies because of unavailable data and lack of transparency. In
sharp contrast to developed economies, emerging markets do not have long
history of data which makes it difficult to compute historical cost of capital and
risk premiums. For example, estimation of historical betas, which are measures of
non diversifiable risk in common stocks, requires a relatively long time series
which are often not available in many emerging markets. Also, emerging stock
markets suffer from illiquidity which leads to stall prices and possible downside
bias in risk measures.
The price multiple approaches to valuation are much simpler and easier to
compute. The multiples relate the price to some fundamental values of the firm
such as earnings per share, book value of equity, sales per share, and cash flows
2
Submission to Journal of Business Valuation and Economic Loss Analysis
http://www.bepress.com/jbvela
per share. The multiples can be taken as a vote of confidence from the market in
case of high multiple and vice versa. It simply means that investors are valuing
the future prospects of the stock fundamentals so much that they are willing to
pay a higher multiple to buy it. The approach is cross sectional in nature since it
compares the price multiple of the company in a specific industry to that industry
average price multiple. For example, an average price to book value multiple of
3.43 for a particular Islamic bank means that investors are willing to pay a price
equivalent to 3.43 times the book value per share of that bank. The average price
to book value multiple along with its standard deviation can be used to judge if a
particular Islamic bank is significantly under or overvalued in comparison to its
peers. Significant deviations from the average should be explained by changes in
important economic variables. An overvalued bank in terms of price to book
value multiple compared with its peer’s average should be explained by some
economic variables such as higher potential growth due to new markets, specific
competitive advantage, or lower cost of capital that led investors to bidding up the
price of the bank’s stock.
The most widely used multiple is the price to earnings per share (PE)
multiple. The PE multiple is used by security analysts to identify mispriced stocks
in addition to corporate finance analysts who are interested in mergers or
acquisitions. However, the multiple suffers from accounting manipulation of
earnings and its ambiguity in case of companies with negative earnings. A
negative PE multiple is hard to explain. The situation becomes more critical in
case of an economy in recession or an economy slowing down as many more
companies can have negative earnings. Alternative multiples such as price to book
value (PBV) and price to sales (PS) can prove more valuable in general in case of
profits recession. They are also more relevant for financial institutions due to the
high liquidity of their assets. Lie and Lie (2002) found that PBV multiple
valuations seem to be more accurate for financial firms in the USA. Tseng and
Lee (2007) found that PS multiple is the most appropriate model for evaluating
financial firms in Taiwan’s commercial banking industry.
The price to book value multiple, PBV, for a stable firm that is growing at
a constant growth rate, g, can be derived as follows. Let P0 represent the common
stock price for a stable company that is growing at a constant growth rate, g, at
time zero. Gordon (1962) showed that the price, P0, is gK
DP
−= 1
0 , where D1 is the
expected dividends at time one, K is the common stockholders’ required rate of
return (cost of equity) and g is the constant growth rate. Since expected dividends
at time one are basically equal to the part of the expected net income that is going
to be distributed to common stockholders, the price, P0, becomes gK
bNIP
−
−=
)1(10
,
where NI1 is the net income per share expected at time one, (1-b) is the dividends
payout ratio, and b is the retention ratio. The formula can be divided further into
3
Omran: Valuation Premium
its principal components when NI1 is replaced by, BV0 multiplied by ROE1, where
BV0 is the book value at time zero and ROE1 is the return on equity expected at
time 1. The price, P0, becomesgK
bROEBVP
−
−=
)1)(( 100
. To reach at the price to book
value multiple, we divide both sides by BV0. The price to book value multiple,
PBV, isgK
bROE
BV
P
−
−=
)1)(( 1
0
0 . The PBV is an increasing function of return on equity and
the constant growth rate and a decreasing function of the retention ratio and the
required rate of return.
The above analysis assumes that the firm has reached maturity and that its
fundamentals can only grow at a constant rate. However, the analysis also applies
to companies experiencing supernormal growth in its early years although the
formulas have to be adjusted to take into account the extra future earnings for the
supernormal growth years. Since no company can keep growing at higher than
average economic growth forever, otherwise the company will be bigger than the
economy itself, the PBV of the supernormal growing company will be higher than
an equivalently priced stable company to take into account the present value of
future growth opportunities.
The most influential variable to affect the PBV multiple is the ROE. ROE
is an indicator of the firm’s overall performance because it provides an indication
of how well the company is creating value to its shareholders. The value of the
firm’s common stocks is determined by the relationship between the firm’s ROE
and its cost of equity, K. Those firms that are creating value by earning higher
returns on equity than their costs of equity will be rewarded by higher market
prices compared to their book values (PBV>1). Those firms that are expected to
just earn their costs of equity capital should be traded at equity prices that are
close to their book values (PBV=1). Those firms that are destroying value by
earning lower ROE than their costs of equity will be trading at lower equity prices
than their book values (PBV<1).
Industries with higher ROE compared with the equity cost of capital will
attract new entrants which will lead to an eventual reduction of the ROE to the
cost of equity capital in the long run. Companies with a competitive advantage
will be rewarded with higher ROE and consequently higher PBV multiples in the
short term. In the long term and with the new entrants into the market the ROE
will reverse towards the equity cost of capital and the value of the stock price will
reverse to the stable constant growth model.
The price to sales (PS) multiple for a stable firm that is growing at a
constant growth rate, g, can be derived as follows. Let P0 represent the common
stock price at time zero for a stable company that is growing at a constant growth
rate, g. The Gordon’s (1962) constant growth model stock price, P0, is gK
DP
−= 1
0 ,
where D1 is the expected dividends at time one, K is the common stockholders
4
Submission to Journal of Business Valuation and Economic Loss Analysis
http://www.bepress.com/jbvela
required rate of return (cost of equity) and g is the constant growth rate. Since the
dividends expected to be paid at time one are basically equal to the part of the net
income at time one that is going to be distributed to common stockholders, the
price becomes gK
bNIP
−
−=
)1(10
, where NI1 is the net income per share expected at time
one, (1-b) is the dividends payout ratio, and b is the retention ratio. The formula
can be divided further into its principal components when NI1 is replaced by, S1
multiplied by NPM1, where S1 is the company’s sales per share at time one and
NPM1 is net profit margin expected at time one. The price at time zero
becomesgK
bNPMSP
−
−=
)1)(( 110
. Since the company is stable and growing at a constant
growth g, S1 can be replaced by its components which are S0 multiplied by (1+g).
The price becomesgK
bNPMgSP
−
−+=
)1)()(1( 100 . To reach at the price to sales multiple, we
divide both sides by S0. The price to sales multiple, PS, isgK
bNPMg
S
P
−
−+=
)1)()(1( 1
0
0 . The
PS is an increasing function of net profit margin and the constant growth rate, and
a decreasing function of the retention ratio and the required rate of return (cost of
equity).
The above analysis assumes that the firm has reached maturity and that its
sales can only grow at a constant rate. However, the analysis also applies to
companies experiencing supernormal growth in sales in its early years although
the formulas have to be adjusted to take into account the extra future sales for the
supernormal growth years. Since no company can keep growing at higher than
average economic growth forever, the price of the company will eventually
reverse towards the stable growth price over time. In the short term, the PS of the
supernormal growing company will be higher than an equivalently priced stable
company to take into account the present value of future growth opportunities.
The most important driver for the PS multiple is the net profit margin,
NPM. A firm’s net profit margin shows the profitability of the company’s
operating activities. An analysis of NPM can indicate the efficiency of the firm’s
operating management. If we assume that the company is as efficient as its
industry in controlling its expenses, the NPM will then reflect the ability of the
firm to charge a premium on its products. Companies with superior products and
higher sales will achieve higher net profit margins due to their ability of dictating
prices. However, in a perfectly competitive environment, new entrants will be
attracted to those industries with higher net profit margins which will eventually
reduce net profit margins to their the long run equilibrium.
3. DATA
The study is a regression analysis of the panel data for the firms listed in the local
share directory in the United Arab Emirates (UAE) from 2001 to 2005. The local
share directory is published by the national bank of Abu Dhabi. The sample has
5
Omran: Valuation Premium
88 companies that are traded in at least one of the two major stock markets in the
UAE, the Abu Dhabi Stock Market or Dubai Financial Market. The sample
includes 8 financial services companies, 18 banks, 19 insurance companies, 6
Islamic financial institutions (3 banks and 3 insurance companies), and 37 non
financial firms in other sectors of the economy. The UAE stock market in the
period of study was dominated by financial institutions. There were 51 financial
firms among the 88 companies listed. The percentage of financial firms is 58% of
all listed companies. The pooled data approach is used in the study. There are 308
observations in the sample. The data are end of year values and pooled in time
series and cross section directions. For example, for each company in the sample
the end of year results are included and pooled with the rest of the companies in
the cross section sample. Since the study is covering a period of 4 years for 88
companies, one should expect 352 observations. However, some companies were
not listed during the whole sample period which led to the 308 observations
collected. Dummies will be added in next section to take into account different
intercepts per industry.
4. ISLAMIC VALUATION PREMIUM
The objective of the paper is to test for the existence of significant valuation
premiums in case of Islamic financial institutions in the UAE. Islamic and
traditional financial institutions count for 58% of all listed companies in the UAE.
Traditional financial institutions include commercial banks, insurance companies,
and finance companies that deal with mortgages and other credit related activities.
The analysis in this section is based on the price to book value (PBV) and price to
sales (PS) multiples.
The analysis in section 2 indicated that return on equity (ROE) is the most
influential value driver for the price to book value multiple (PBV). PBV is
expected to be positively related to ROE. Figure 1.a shows the PBV on the y-axis
versus ROE on the x-axis together with the fitted ordinary least squares (OLS)
line. Figure 1.b has the logarithmic transformation of the PBV to the base ten on
the y-axis versus ROE on the x-axis together with the OLS line. The logarithmic
transformation is used to test whether influential outliers affect significantly the
fitted OLS line. The figures confirm the previously discussed economic theory
prediction that there is a positive relationship between the two variables. The
logarithmic transformation is not needed in the case of PBV since the fitted OLS
line seems not to be affected much by influential outliers.
The analysis in section 2 indicated that net profit (NPM) is the most
influential value driver for the price to sales multiple (PS). PS is expected to be
positively related to NPM. Figure 1.c shows the PS on the y-axis versus NPM on
the x-axis together with the fitted ordinary least squares (OLS) line. Figure 1.d
has the logarithmic transformation of the PS to the base ten on the y-axis versus
6
Submission to Journal of Business Valuation and Economic Loss Analysis
http://www.bepress.com/jbvela
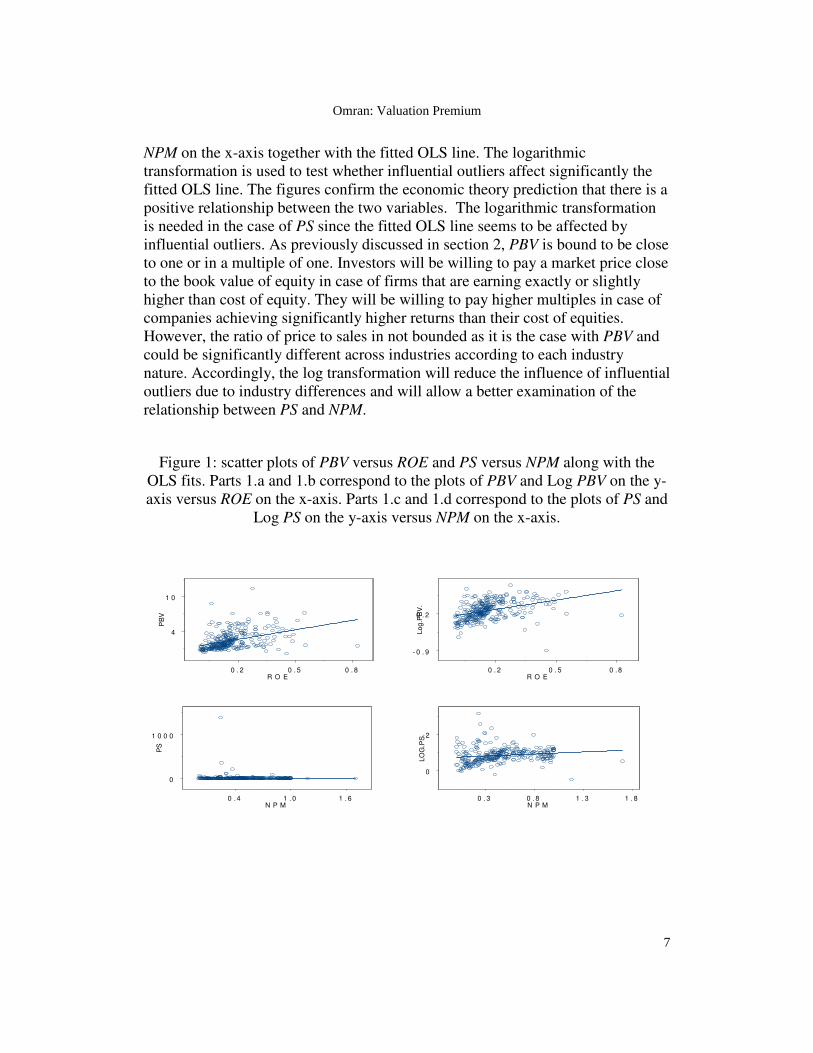
NPM on the x-axis together with the fitted OLS line. The logarithmic
transformation is used to test whether influential outliers affect significantly the
fitted OLS line. The figures confirm the economic theory prediction that there is a
positive relationship between the two variables. The logarithmic transformation
is needed in the case of PS since the fitted OLS line seems to be affected by
influential outliers. As previously discussed in section 2, PBV is bound to be close
to one or in a multiple of one. Investors will be willing to pay a market price close
to the book value of equity in case of firms that are earning exactly or slightly
higher than cost of equity. They will be willing to pay higher multiples in case of
companies achieving significantly higher returns than their cost of equities.
However, the ratio of price to sales in not bounded as it is the case with PBV and
could be significantly different across industries according to each industry
nature. Accordingly, the log transformation will reduce the influence of influential
outliers due to industry differences and will allow a better examination of the
relationship between PS and NPM.
Figure 1: scatter plots of PBV versus ROE and PS versus NPM along with the
OLS fits. Parts 1.a and 1.b correspond to the plots of PBV and Log PBV on the y-
axis versus ROE on the x-axis. Parts 1.c and 1.d correspond to the plots of PS and
Log PS on the y-axis versus NPM on the x-axis.
0 . 2 0 . 5 0 . 8R O E
4
1 0
PB
V
0 . 2 0 . 5 0 . 8R O E
- 0 . 9
0 . 2
Lo
g.P
BV
.
0 . 4 1 . 0 1 . 6N P M
0
1 0 0 0
PS
0 . 3 0 . 8 1 . 3 1 . 8N P M
0
2
LO
G.P
S.
7
Omran: Valuation Premium
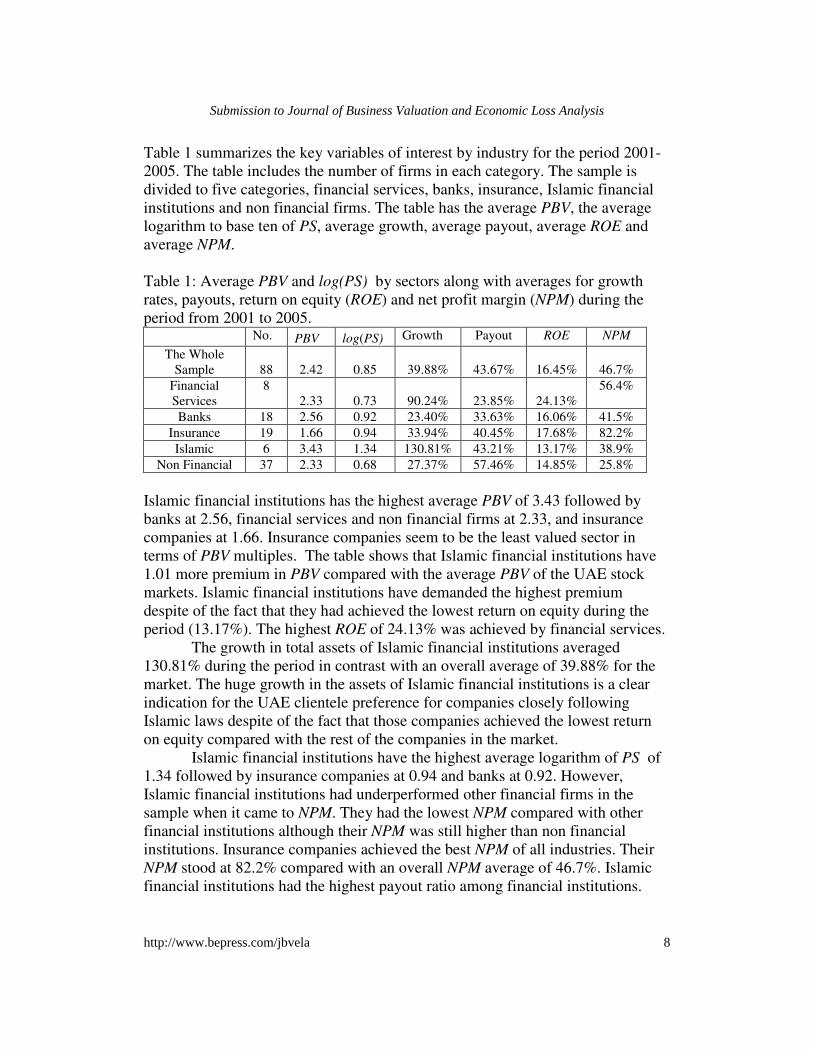
Table 1 summarizes the key variables of interest by industry for the period 2001-
2005. The table includes the number of firms in each category. The sample is
divided to five categories, financial services, banks, insurance, Islamic financial
institutions and non financial firms. The table has the average PBV, the average
logarithm to base ten of PS, average growth, average payout, average ROE and
average NPM.
Table 1: Average PBV and log(PS) by sectors along with averages for growth
rates, payouts, return on equity (ROE) and net profit margin (NPM) during the
period from 2001 to 2005.
No. PBV log(PS) Growth Payout ROE NPM
The Whole
Sample
88 2.42 0.85 39.88% 43.67% 16.45%
46.7%
Financial
Services
8
2.33 0.73 90.24% 23.85% 24.13%
56.4%
Banks 18 2.56 0.92 23.40% 33.63% 16.06% 41.5%
Insurance 19 1.66 0.94 33.94% 40.45% 17.68% 82.2%
Islamic 6 3.43 1.34 130.81% 43.21% 13.17% 38.9%
Non Financial 37 2.33 0.68 27.37% 57.46% 14.85% 25.8%
Islamic financial institutions has the highest average PBV of 3.43 followed by
banks at 2.56, financial services and non financial firms at 2.33, and insurance
companies at 1.66. Insurance companies seem to be the least valued sector in
terms of PBV multiples. The table shows that Islamic financial institutions have
1.01 more premium in PBV compared with the average PBV of the UAE stock
markets. Islamic financial institutions have demanded the highest premium
despite of the fact that they had achieved the lowest return on equity during the
period (13.17%). The highest ROE of 24.13% was achieved by financial services.
The growth in total assets of Islamic financial institutions averaged
130.81% during the period in contrast with an overall average of 39.88% for the
market. The huge growth in the assets of Islamic financial institutions is a clear
indication for the UAE clientele preference for companies closely following
Islamic laws despite of the fact that those companies achieved the lowest return
on equity compared with the rest of the companies in the market.
Islamic financial institutions have the highest average logarithm of PS of
1.34 followed by insurance companies at 0.94 and banks at 0.92. However,
Islamic financial institutions had underperformed other financial firms in the
sample when it came to NPM. They had the lowest NPM compared with other
financial institutions although their NPM was still higher than non financial
institutions. Insurance companies achieved the best NPM of all industries. Their
NPM stood at 82.2% compared with an overall NPM average of 46.7%. Islamic
financial institutions had the highest payout ratio among financial institutions.
8
Submission to Journal of Business Valuation and Economic Loss Analysis
http://www.bepress.com/jbvela
They distributed 43.21% of profits. However, their payout was lower than that of
the non financial institutions which was 57.46%.
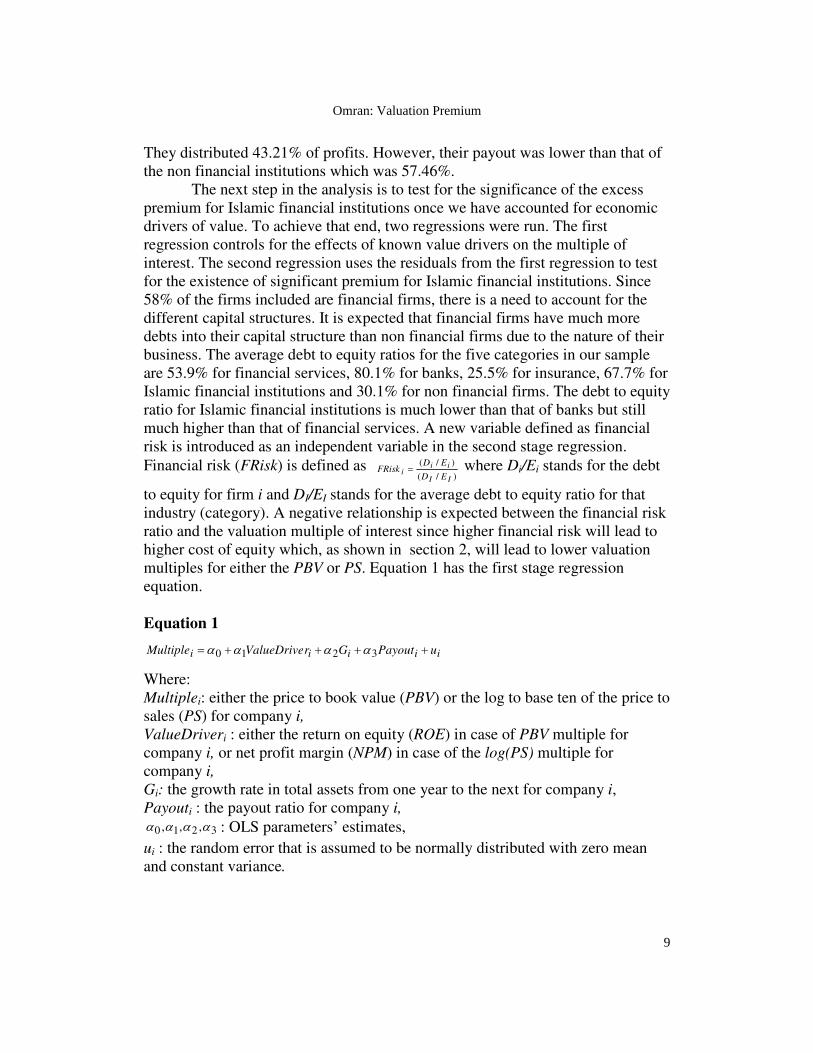
The next step in the analysis is to test for the significance of the excess
premium for Islamic financial institutions once we have accounted for economic
drivers of value. To achieve that end, two regressions were run. The first
regression controls for the effects of known value drivers on the multiple of
interest. The second regression uses the residuals from the first regression to test
for the existence of significant premium for Islamic financial institutions. Since
58% of the firms included are financial firms, there is a need to account for the
different capital structures. It is expected that financial firms have much more
debts into their capital structure than non financial firms due to the nature of their
business. The average debt to equity ratios for the five categories in our sample
are 53.9% for financial services, 80.1% for banks, 25.5% for insurance, 67.7% for
Islamic financial institutions and 30.1% for non financial firms. The debt to equity
ratio for Islamic financial institutions is much lower than that of banks but still
much higher than that of financial services. A new variable defined as financial
risk is introduced as an independent variable in the second stage regression.
Financial risk (FRisk) is defined as )/(
)/(
II
iii
ED
EDFRisk = where Di/Ei stands for the debt
to equity for firm i and DI/EI stands for the average debt to equity ratio for that
industry (category). A negative relationship is expected between the financial risk
ratio and the valuation multiple of interest since higher financial risk will lead to
higher cost of equity which, as shown in section 2, will lead to lower valuation
multiples for either the PBV or PS. Equation 1 has the first stage regression
equation.
Equation 1
iiiii uPayoutGrValueDriveMultiple ++++= 3210 αααα
Where:
Multiplei: either the price to book value (PBV) or the log to base ten of the price to
sales (PS) for company i,
ValueDriveri : either the return on equity (ROE) in case of PBV multiple for
company i, or net profit margin (NPM) in case of the log(PS) multiple for
company i,
Gi: the growth rate in total assets from one year to the next for company i,
Payouti : the payout ratio for company i,
3210 ,,, αααα : OLS parameters’ estimates,
ui : the random error that is assumed to be normally distributed with zero mean
and constant variance.
9
Omran: Valuation Premium
Equation 1 models PBV multiple or the log(PS) multiple as a dependent variable.
The independent variables are either ROE in case of the PBV multiple or NPM in
case of the log(PS) multiple, growth (G), and payout ratio. The error terms (u) in
equation 1 are assumed to follow the normal distribution with a mean of zero and
constant variance. It is important to state that the objectives behind the first stage
regression are to control for the effects of the independent variables. The
dependent and independent variables on both sides of regression 1 are accounting
variables that are correlated with each other. However, while the accounting
variables correlation may bias the parameters’ estimates of the OLS of equation 1,
the residuals of the regression will still represent information independent from
the accounting variables controlled for by the regression line. The error terms (u)
are used as the dependent variable in the second stage regression. The
independent variables are financial risk, and four dummy variables to represent
financial services, banks, insurance and Islamic financial institutions. The
constant in the second stage regression represents non-financial firms. Financial
risk is used in the second stage regression rather than the first stage since it is a
ratio that is dependent on the firm and its industry. Therefore, it does not suffer
from the same correlation with other accounting variables as other independent
variables used in equation 1. The second stage regression is presented in equation
2.
Equation 2
iii eDIslamicDInsuranceDBanksDFServicesFRisku ++++++= 543210 ββββββ
Where:
ui: the residuals obtained from the first stage regression,
FRiski : the ratio of debt/equity for each company divided by the relevant industry
debt/equity ratio,
DFService: a dummy variable that takes a value of one for financial services such
as mortgages and credit firms, and zero otherwise,
DBanks: a dummy variable that takes a value of one for a bank, and zero
otherwise.
DInsurance: a dummy variable that takes a value of one for insurance companies,
and zero otherwise.
DIslamic: a dummy variable that takes a value of one for an Islamic financial
institution (whether it is a bank or insurance company), and zero otherwise.
543210 ,,,,, ββββββ : OLS parameters’ estimates,
ei : the random error that is assumed to be normally distributed with zero mean
and constant variance.
10
Submission to Journal of Business Valuation and Economic Loss Analysis
http://www.bepress.com/jbvela
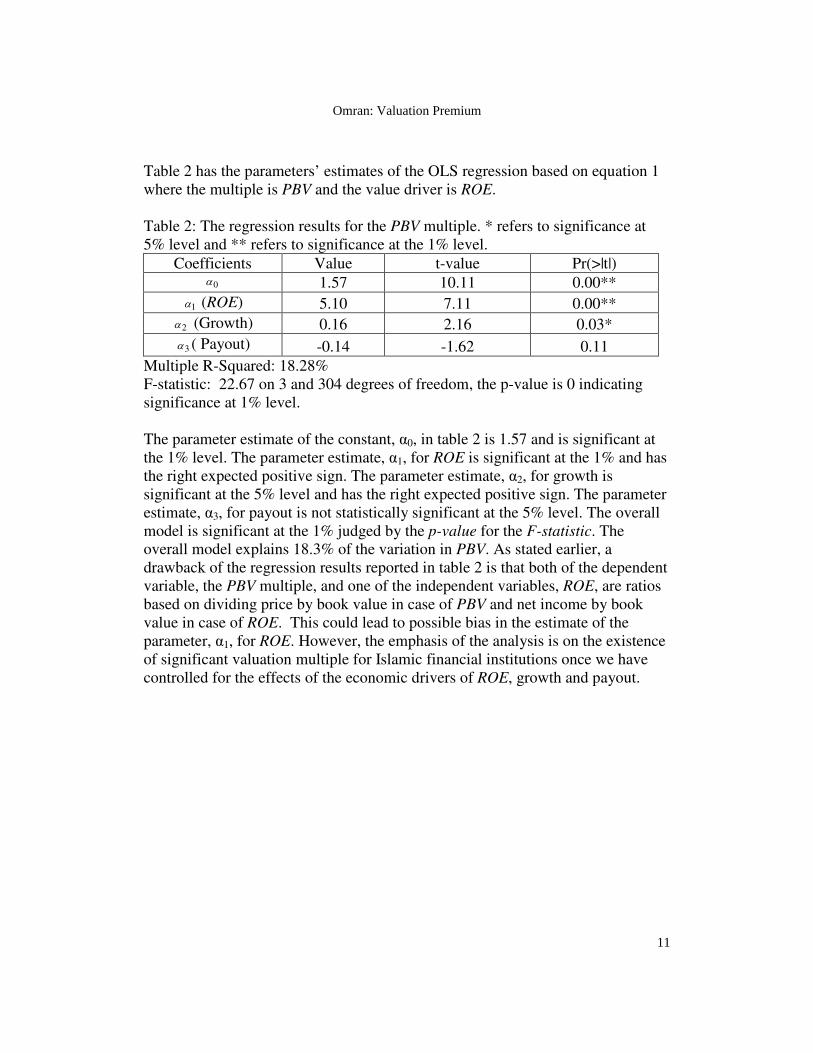
Table 2 has the parameters’ estimates of the OLS regression based on equation 1
where the multiple is PBV and the value driver is ROE.
Table 2: The regression results for the PBV multiple. * refers to significance at
5% level and ** refers to significance at the 1% level.
Coefficients Value t-value Pr(>|t|)
0α 1.57 10.11 0.00**
1α (ROE) 5.10 7.11 0.00**
2α (Growth) 0.16 2.16 0.03*
3α ( Payout) -0.14 -1.62 0.11
Multiple R-Squared: 18.28%
F-statistic: 22.67 on 3 and 304 degrees of freedom, the p-value is 0 indicating
significance at 1% level.
The parameter estimate of the constant, α0, in table 2 is 1.57 and is significant at
the 1% level. The parameter estimate, α1, for ROE is significant at the 1% and has
the right expected positive sign. The parameter estimate, α2, for growth is
significant at the 5% level and has the right expected positive sign. The parameter
estimate, α3, for payout is not statistically significant at the 5% level. The overall
model is significant at the 1% judged by the p-value for the F-statistic. The
overall model explains 18.3% of the variation in PBV. As stated earlier, a
drawback of the regression results reported in table 2 is that both of the dependent
variable, the PBV multiple, and one of the independent variables, ROE, are ratios
based on dividing price by book value in case of PBV and net income by book
value in case of ROE. This could lead to possible bias in the estimate of the
parameter, α1, for ROE. However, the emphasis of the analysis is on the existence
of significant valuation multiple for Islamic financial institutions once we have
controlled for the effects of the economic drivers of ROE, growth and payout.
11
Omran: Valuation Premium
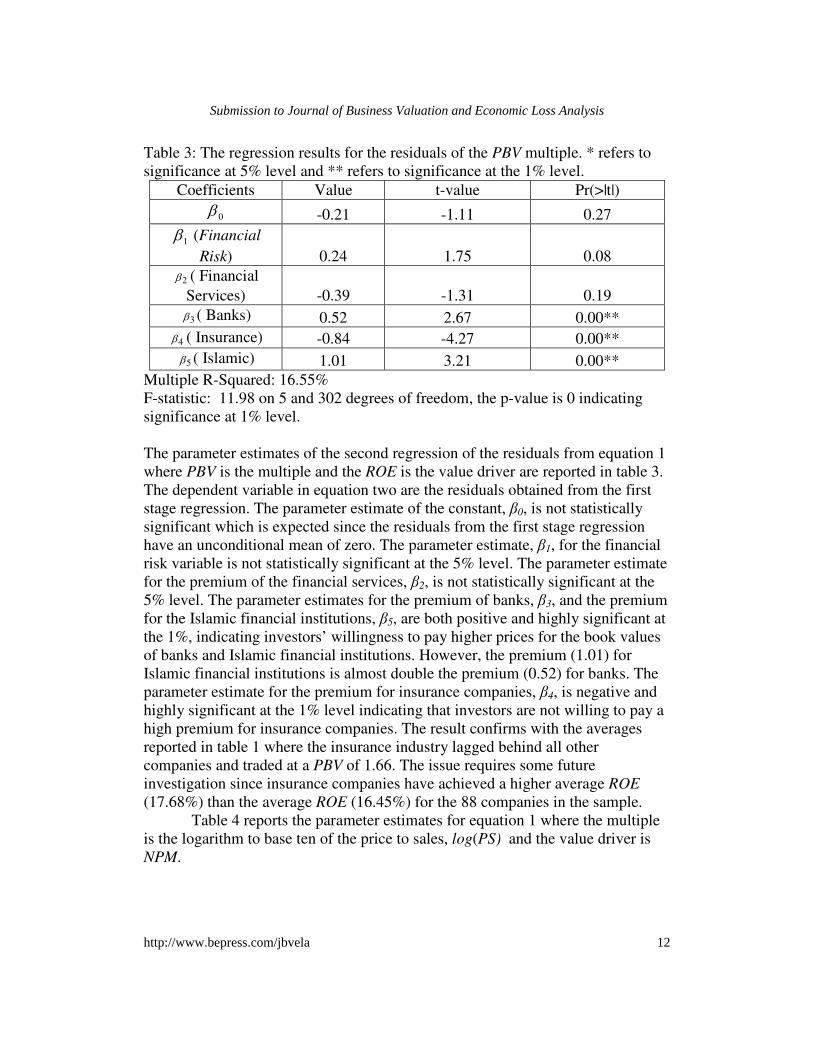
Table 3: The regression results for the residuals of the PBV multiple. * refers to
significance at 5% level and ** refers to significance at the 1% level.
Coefficients Value t-value Pr(>|t|)
0β -0.21 -1.11 0.27
1β (Financial
Risk) 0.24 1.75 0.08
2β ( Financial
Services) -0.39 -1.31 0.19
3β ( Banks) 0.52 2.67 0.00**
4β ( Insurance) -0.84 -4.27 0.00**
5β ( Islamic) 1.01 3.21 0.00**
Multiple R-Squared: 16.55%
F-statistic: 11.98 on 5 and 302 degrees of freedom, the p-value is 0 indicating
significance at 1% level.
The parameter estimates of the second regression of the residuals from equation 1
where PBV is the multiple and the ROE is the value driver are reported in table 3.
The dependent variable in equation two are the residuals obtained from the first
stage regression. The parameter estimate of the constant, β0, is not statistically
significant which is expected since the residuals from the first stage regression
have an unconditional mean of zero. The parameter estimate, β1, for the financial
risk variable is not statistically significant at the 5% level. The parameter estimate
for the premium of the financial services, β2, is not statistically significant at the
5% level. The parameter estimates for the premium of banks, β3, and the premium
for the Islamic financial institutions, β5, are both positive and highly significant at
the 1%, indicating investors’ willingness to pay higher prices for the book values
of banks and Islamic financial institutions. However, the premium (1.01) for
Islamic financial institutions is almost double the premium (0.52) for banks. The
parameter estimate for the premium for insurance companies, β4, is negative and
highly significant at the 1% level indicating that investors are not willing to pay a
high premium for insurance companies. The result confirms with the averages
reported in table 1 where the insurance industry lagged behind all other
companies and traded at a PBV of 1.66. The issue requires some future
investigation since insurance companies have achieved a higher average ROE
(17.68%) than the average ROE (16.45%) for the 88 companies in the sample.
Table 4 reports the parameter estimates for equation 1 where the multiple
is the logarithm to base ten of the price to sales, log(PS) and the value driver is
NPM.
12
Submission to Journal of Business Valuation and Economic Loss Analysis
http://www.bepress.com/jbvela
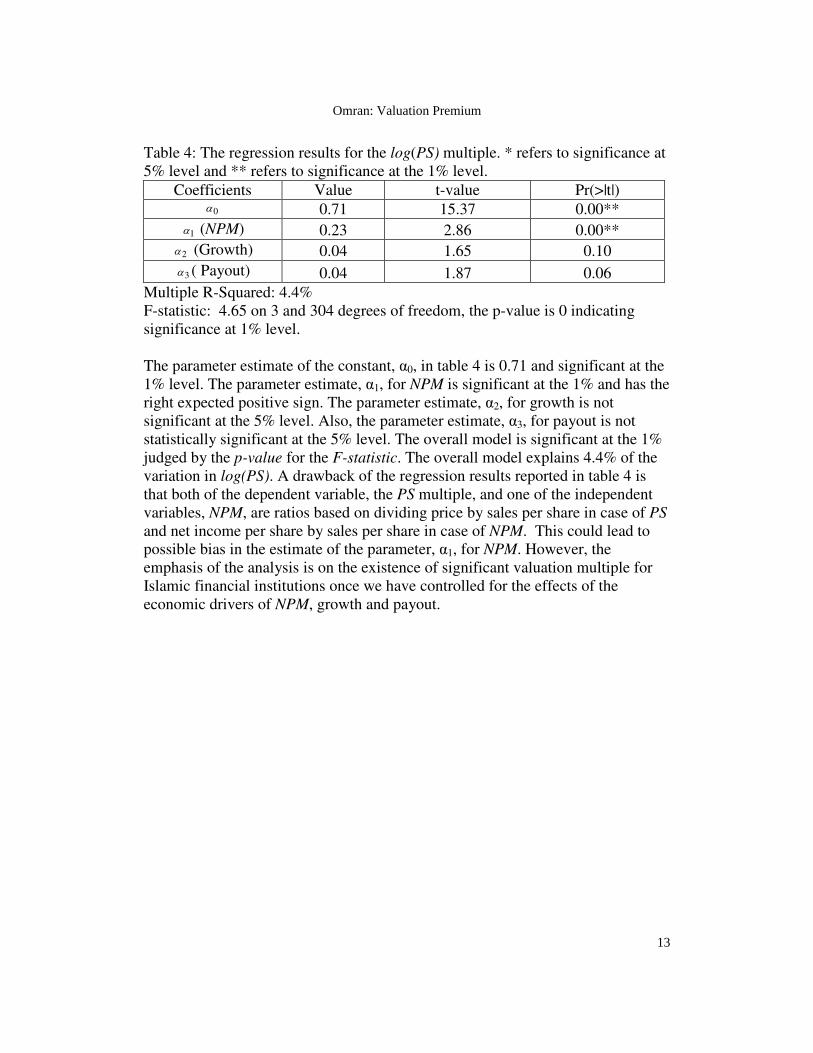
Table 4: The regression results for the log(PS) multiple. * refers to significance at
5% level and ** refers to significance at the 1% level.
Coefficients Value t-value Pr(>|t|)
0α 0.71 15.37 0.00**
1α (NPM) 0.23 2.86 0.00**
2α (Growth) 0.04 1.65 0.10
3α ( Payout) 0.04 1.87 0.06
Multiple R-Squared: 4.4%
F-statistic: 4.65 on 3 and 304 degrees of freedom, the p-value is 0 indicating
significance at 1% level.
The parameter estimate of the constant, α0, in table 4 is 0.71 and significant at the
1% level. The parameter estimate, α1, for NPM is significant at the 1% and has the
right expected positive sign. The parameter estimate, α2, for growth is not
significant at the 5% level. Also, the parameter estimate, α3, for payout is not
statistically significant at the 5% level. The overall model is significant at the 1%
judged by the p-value for the F-statistic. The overall model explains 4.4% of the
variation in log(PS). A drawback of the regression results reported in table 4 is
that both of the dependent variable, the PS multiple, and one of the independent
variables, NPM, are ratios based on dividing price by sales per share in case of PS
and net income per share by sales per share in case of NPM. This could lead to
possible bias in the estimate of the parameter, α1, for NPM. However, the
emphasis of the analysis is on the existence of significant valuation multiple for
Islamic financial institutions once we have controlled for the effects of the
economic drivers of NPM, growth and payout.
13
Omran: Valuation Premium
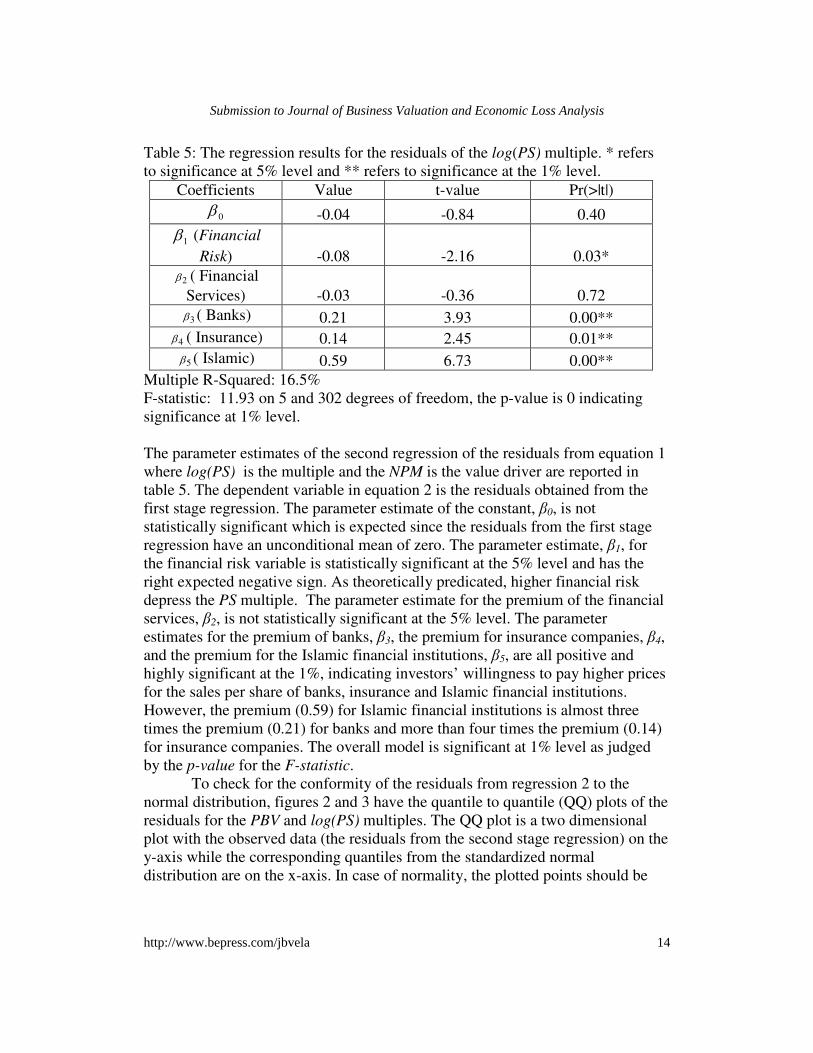
Table 5: The regression results for the residuals of the log(PS) multiple. * refers
to significance at 5% level and ** refers to significance at the 1% level.
Coefficients Value t-value Pr(>|t|)
0β -0.04 -0.84 0.40
1β (Financial
Risk) -0.08 -2.16 0.03*
2β ( Financial
Services) -0.03 -0.36 0.72
3β ( Banks) 0.21 3.93 0.00**
4β ( Insurance) 0.14 2.45 0.01**
5β ( Islamic) 0.59 6.73 0.00**
Multiple R-Squared: 16.5%
F-statistic: 11.93 on 5 and 302 degrees of freedom, the p-value is 0 indicating
significance at 1% level.
The parameter estimates of the second regression of the residuals from equation 1
where log(PS) is the multiple and the NPM is the value driver are reported in
table 5. The dependent variable in equation 2 is the residuals obtained from the
first stage regression. The parameter estimate of the constant, β0, is not
statistically significant which is expected since the residuals from the first stage
regression have an unconditional mean of zero. The parameter estimate, β1, for
the financial risk variable is statistically significant at the 5% level and has the
right expected negative sign. As theoretically predicated, higher financial risk
depress the PS multiple. The parameter estimate for the premium of the financial
services, β2, is not statistically significant at the 5% level. The parameter
estimates for the premium of banks, β3, the premium for insurance companies, β4,
and the premium for the Islamic financial institutions, β5, are all positive and
highly significant at the 1%, indicating investors’ willingness to pay higher prices
for the sales per share of banks, insurance and Islamic financial institutions.
However, the premium (0.59) for Islamic financial institutions is almost three
times the premium (0.21) for banks and more than four times the premium (0.14)
for insurance companies. The overall model is significant at 1% level as judged
by the p-value for the F-statistic.
To check for the conformity of the residuals from regression 2 to the
normal distribution, figures 2 and 3 have the quantile to quantile (QQ) plots of the
residuals for the PBV and log(PS) multiples. The QQ plot is a two dimensional
plot with the observed data (the residuals from the second stage regression) on the
y-axis while the corresponding quantiles from the standardized normal
distribution are on the x-axis. In case of normality, the plotted points should be
14
Submission to Journal of Business Valuation and Economic Loss Analysis
http://www.bepress.com/jbvela
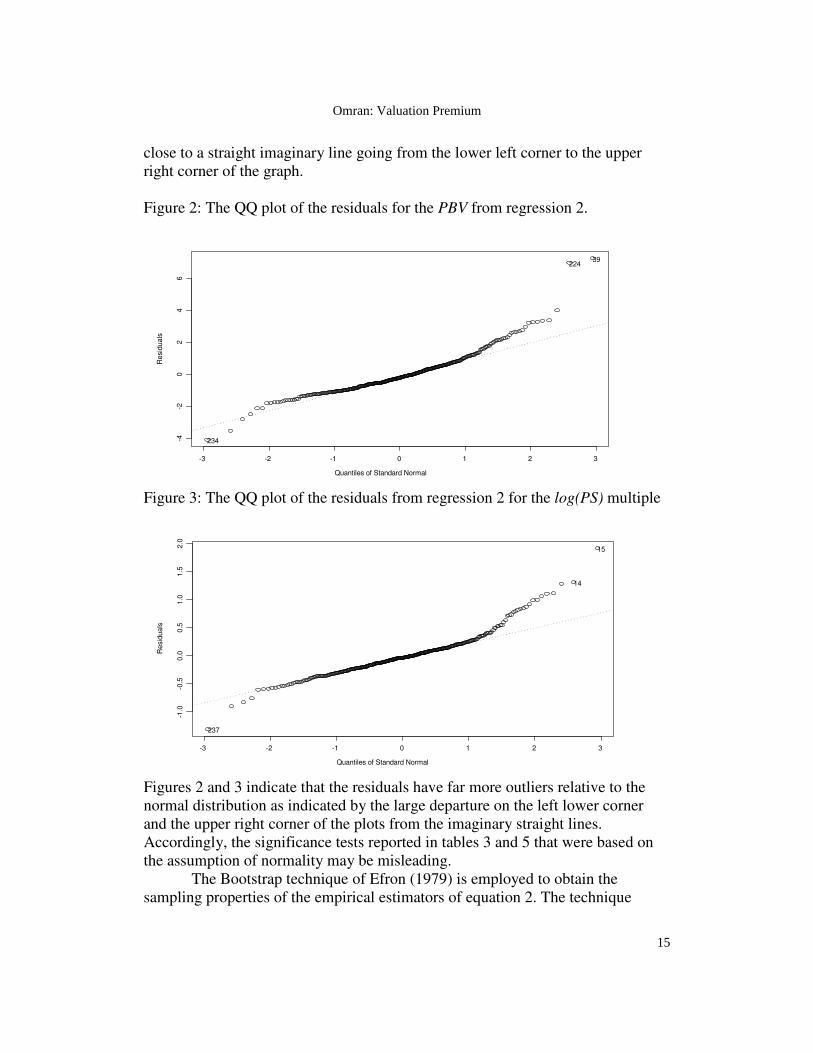
close to a straight imaginary line going from the lower left corner to the upper
right corner of the graph.
Figure 2: The QQ plot of the residuals for the PBV from regression 2.
Quantiles of Standard Normal
Re
sid
ua
ls
-3 -2 -1 0 1 2 3
-4-2
02
46
234
22439
Figure 3: The QQ plot of the residuals from regression 2 for the log(PS) multiple
Quantiles of Standard Normal
Re
sid
ua
ls
-3 -2 -1 0 1 2 3
-1.0
-0.5
0.0
0.5
1.0
1.5
2.0
237
14
15
Figures 2 and 3 indicate that the residuals have far more outliers relative to the
normal distribution as indicated by the large departure on the left lower corner
and the upper right corner of the plots from the imaginary straight lines.
Accordingly, the significance tests reported in tables 3 and 5 that were based on
the assumption of normality may be misleading.
The Bootstrap technique of Efron (1979) is employed to obtain the
sampling properties of the empirical estimators of equation 2. The technique
15
Omran: Valuation Premium
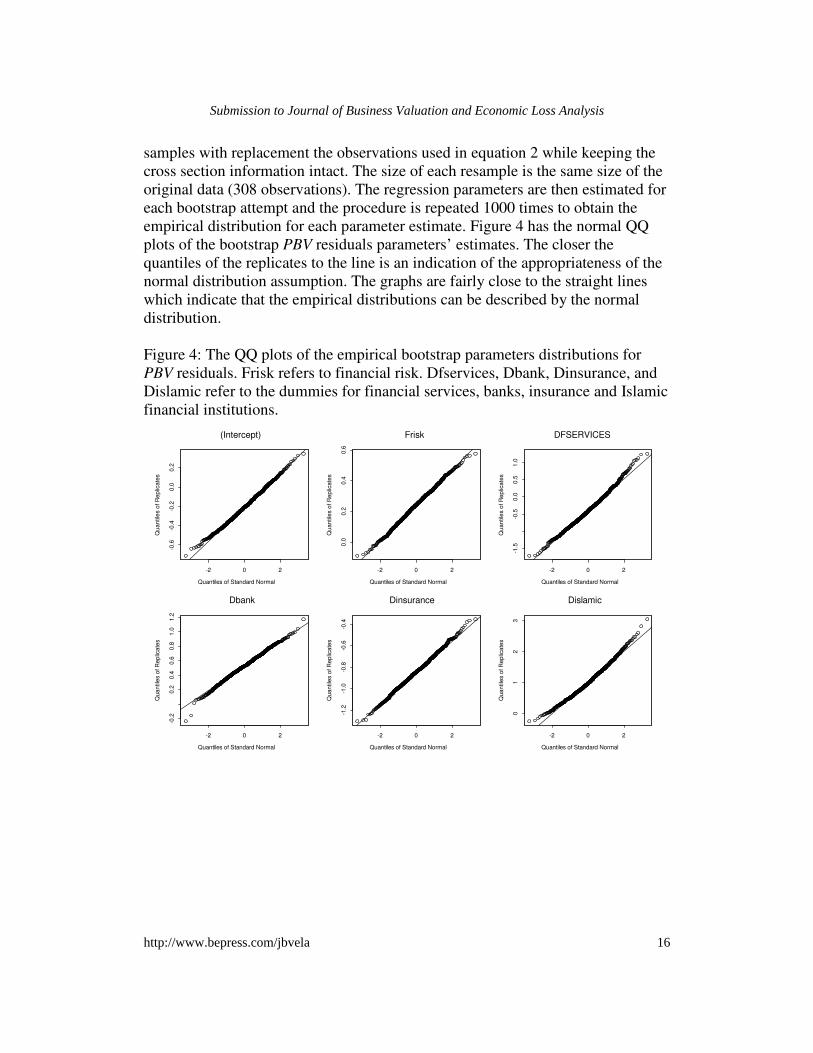
samples with replacement the observations used in equation 2 while keeping the
cross section information intact. The size of each resample is the same size of the
original data (308 observations). The regression parameters are then estimated for
each bootstrap attempt and the procedure is repeated 1000 times to obtain the
empirical distribution for each parameter estimate. Figure 4 has the normal QQ
plots of the bootstrap PBV residuals parameters’ estimates. The closer the
quantiles of the replicates to the line is an indication of the appropriateness of the
normal distribution assumption. The graphs are fairly close to the straight lines
which indicate that the empirical distributions can be described by the normal
distribution.
Figure 4: The QQ plots of the empirical bootstrap parameters distributions for
PBV residuals. Frisk refers to financial risk. Dfservices, Dbank, Dinsurance, and
Dislamic refer to the dummies for financial services, banks, insurance and Islamic
financial institutions.
Quantiles of Standard Normal
Qu
an
tile
s o
f R
ep
lica
tes
-2 0 2
-0.6
-0.4
-0.2
0.0
0.2
(Intercept)
Quantiles of Standard Normal
Qu
an
tile
s o
f R
ep
lica
tes
-2 0 2
0.0
0.2
0.4
0.6
Frisk
Quantiles of Standard Normal
Qu
an
tile
s o
f R
ep
lica
tes
-2 0 2
-1.5
-0.5
0.0
0.5
1.0
DFSERVICES
Quantiles of Standard Normal
Qu
an
tile
s o
f R
ep
lica
tes
-2 0 2
-0.2
0.2
0.4
0.6
0.8
1.0
1.2
Dbank
Quantiles of Standard Normal
Qu
an
tile
s o
f R
ep
lica
tes
-2 0 2
-1.2
-1.0
-0.8
-0.6
-0.4
Dinsurance
Quantiles of Standard Normal
Qu
an
tile
s o
f R
ep
lica
tes
-2 0 2
01
23
Dislamic
16
Submission to Journal of Business Valuation and Economic Loss Analysis
http://www.bepress.com/jbvela
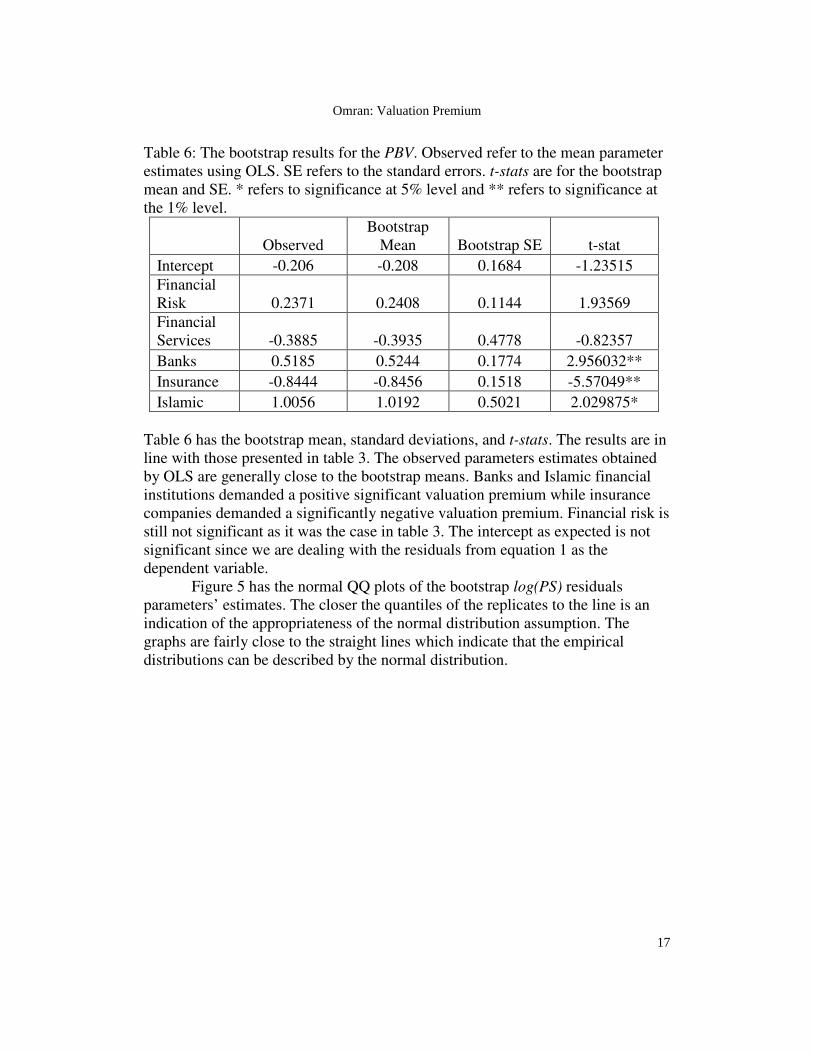
Table 6: The bootstrap results for the PBV. Observed refer to the mean parameter
estimates using OLS. SE refers to the standard errors. t-stats are for the bootstrap
mean and SE. * refers to significance at 5% level and ** refers to significance at
the 1% level.
Observed
Bootstrap
Mean Bootstrap SE t-stat
Intercept -0.206 -0.208 0.1684 -1.23515
Financial
Risk 0.2371 0.2408 0.1144 1.93569
Financial
Services -0.3885 -0.3935 0.4778 -0.82357
Banks 0.5185 0.5244 0.1774 2.956032**
Insurance -0.8444 -0.8456 0.1518 -5.57049**
Islamic 1.0056 1.0192 0.5021 2.029875*
Table 6 has the bootstrap mean, standard deviations, and t-stats. The results are in
line with those presented in table 3. The observed parameters estimates obtained
by OLS are generally close to the bootstrap means. Banks and Islamic financial
institutions demanded a positive significant valuation premium while insurance
companies demanded a significantly negative valuation premium. Financial risk is
still not significant as it was the case in table 3. The intercept as expected is not
significant since we are dealing with the residuals from equation 1 as the
dependent variable.
Figure 5 has the normal QQ plots of the bootstrap log(PS) residuals
parameters’ estimates. The closer the quantiles of the replicates to the line is an
indication of the appropriateness of the normal distribution assumption. The
graphs are fairly close to the straight lines which indicate that the empirical
distributions can be described by the normal distribution.
17
Omran: Valuation Premium
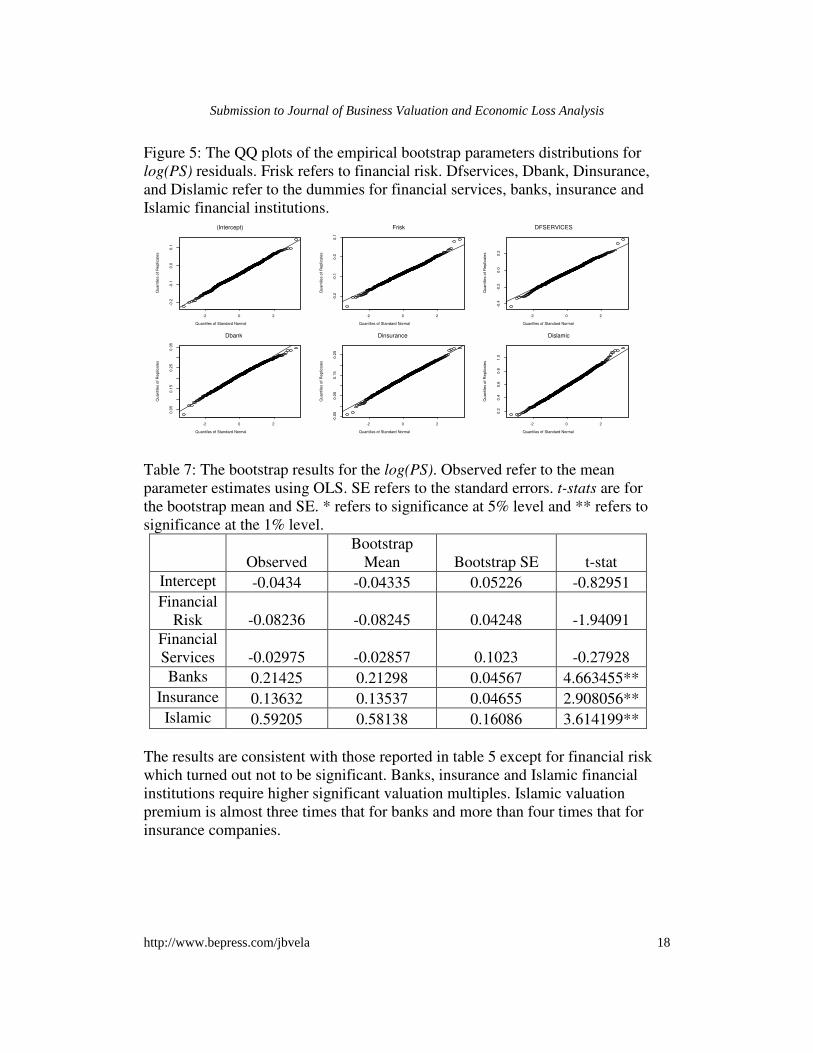
Figure 5: The QQ plots of the empirical bootstrap parameters distributions for
log(PS) residuals. Frisk refers to financial risk. Dfservices, Dbank, Dinsurance,
and Dislamic refer to the dummies for financial services, banks, insurance and
Islamic financial institutions.
Quantiles of Standard Normal
Qu
an
tile
s o
f R
ep
lica
tes
-2 0 2
-0.2
-0.1
0.0
0.1
(Intercept)
Quantiles of Standard NormalQ
ua
ntile
s o
f R
ep
lica
tes
-2 0 2
-0.2
-0.1
0.0
0.1
Frisk
Quantiles of Standard Normal
Qu
an
tile
s o
f R
ep
lica
tes
-2 0 2
-0.4
-0.2
0.0
0.2
DFSERVICES
Quantiles of Standard Normal
Qu
an
tile
s o
f R
ep
lica
tes
-2 0 2
0.0
50
.15
0.2
50
.35
Dbank
Quantiles of Standard Normal
Qu
an
tile
s o
f R
ep
lica
tes
-2 0 2
-0.0
50
.05
0.1
50
.25
Dinsurance
Quantiles of Standard Normal
Qu
an
tile
s o
f R
ep
lica
tes
-2 0 2
0.2
0.4
0.6
0.8
1.0
Dislamic
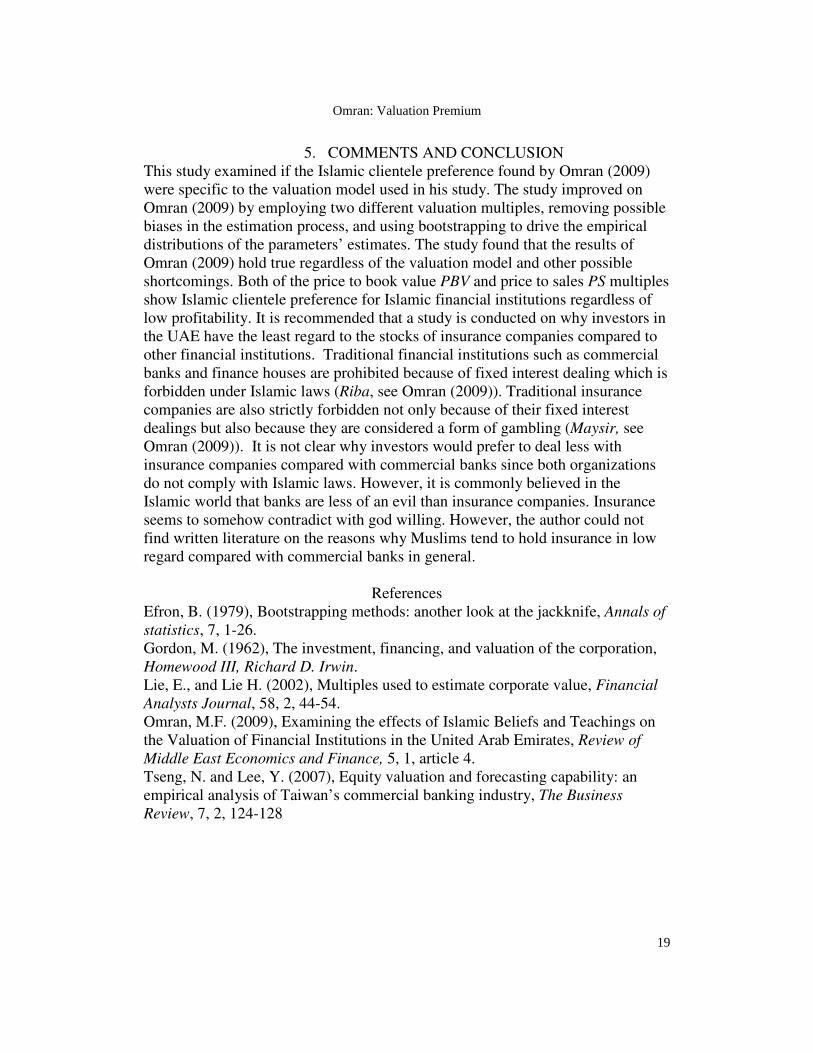
Table 7: The bootstrap results for the log(PS). Observed refer to the mean
parameter estimates using OLS. SE refers to the standard errors. t-stats are for
the bootstrap mean and SE. * refers to significance at 5% level and ** refers to
significance at the 1% level.
Observed
Bootstrap
Mean Bootstrap SE t-stat
Intercept -0.0434 -0.04335 0.05226 -0.82951
Financial
Risk -0.08236 -0.08245 0.04248 -1.94091
Financial
Services -0.02975 -0.02857 0.1023 -0.27928
Banks 0.21425 0.21298 0.04567 4.663455**
Insurance 0.13632 0.13537 0.04655 2.908056**
Islamic 0.59205 0.58138 0.16086 3.614199**
The results are consistent with those reported in table 5 except for financial risk
which turned out not to be significant. Banks, insurance and Islamic financial
institutions require higher significant valuation multiples. Islamic valuation
premium is almost three times that for banks and more than four times that for
insurance companies.
18
Submission to Journal of Business Valuation and Economic Loss Analysis
http://www.bepress.com/jbvela
5. COMMENTS AND CONCLUSION
This study examined if the Islamic clientele preference found by Omran (2009)
were specific to the valuation model used in his study. The study improved on
Omran (2009) by employing two different valuation multiples, removing possible
biases in the estimation process, and using bootstrapping to drive the empirical
distributions of the parameters’ estimates. The study found that the results of
Omran (2009) hold true regardless of the valuation model and other possible
shortcomings. Both of the price to book value PBV and price to sales PS multiples
show Islamic clientele preference for Islamic financial institutions regardless of
low profitability. It is recommended that a study is conducted on why investors in
the UAE have the least regard to the stocks of insurance companies compared to
other financial institutions. Traditional financial institutions such as commercial
banks and finance houses are prohibited because of fixed interest dealing which is
forbidden under Islamic laws (Riba, see Omran (2009)). Traditional insurance
companies are also strictly forbidden not only because of their fixed interest
dealings but also because they are considered a form of gambling (Maysir, see
Omran (2009)). It is not clear why investors would prefer to deal less with
insurance companies compared with commercial banks since both organizations
do not comply with Islamic laws. However, it is commonly believed in the
Islamic world that banks are less of an evil than insurance companies. Insurance
seems to somehow contradict with god willing. However, the author could not
find written literature on the reasons why Muslims tend to hold insurance in low
regard compared with commercial banks in general.
References
Efron, B. (1979), Bootstrapping methods: another look at the jackknife, Annals of
statistics, 7, 1-26.
Gordon, M. (1962), The investment, financing, and valuation of the corporation,
Homewood III, Richard D. Irwin.
Lie, E., and Lie H. (2002), Multiples used to estimate corporate value, Financial
Analysts Journal, 58, 2, 44-54.
Omran, M.F. (2009), Examining the effects of Islamic Beliefs and Teachings on
the Valuation of Financial Institutions in the United Arab Emirates, Review of
Middle East Economics and Finance, 5, 1, article 4.
Tseng, N. and Lee, Y. (2007), Equity valuation and forecasting capability: an
empirical analysis of Taiwan’s commercial banking industry, The Business
Review, 7, 2, 124-128
19
Omran: Valuation Premium