urban badger setts: characteristics, patterns of use and management implications
TRANSCRIPT
Urban badger setts: characteristics, patterns of use andmanagement implications
J. Davison1, M. Huck1, R. J. Delahay2 & T. J. Roper1
1 Department of Biology and Environmental Science, University of Sussex, Brighton, UK
2 Central Science Laboratory, Sand Hutton, York, UK
Keywords
burrow; den; Meles meles; radio tracking;
resting site; sett survey; wildlife damage.
Correspondence
Tim Roper, Department of Biology and
Environmental Science, University of
Sussex, Brighton BN1 9QG, UK.
Fax: +44 1273 678433
Email: [email protected]
Editor: Nigel Bennett
Received 20 September 2007; revised 16
January 2008; accepted 29 January 2008
doi:10.1111/j.1469-7998.2008.00424.x
Abstract
Damage caused by badger setts is an important source of human–carnivore
conflict in urban areas of the UK, yet little is known about the spatial distribution
of urban badger setts or their pattern of occupation. We compared the density,
spatial distribution and size of setts in four urban and two rural study areas in the
UK and assessed the applicability to urban systems of distinguishing between
‘main’ and ‘outlier’ setts. In addition, we used radio-telemetry to investigate
diurnal patterns of sett use in one urban area (Brighton). It was possible to
distinguish between main and outlier setts in urban environments, and local sett
densities were comparable in urban and rural areas. However, urban badgers used
substantially fewer setts than did a nearby rural population, and they spent a
smaller proportion of days in outlier setts. Social groups with larger ranges had
more setts available to them and, within groups, individuals with larger ranges
used more setts. Outliers appeared to serve multiple functions, including allowing
efficient and safe travel to important parts of the home range. We conclude that
sett densities can be high in urban habitats, suggesting significant potential for sett-
related problems to arise. The fact that urban main setts can be distinguished from
outliers enables management actions to be tailored accordingly. In particular,
because main setts seem to represent a particularly valuable resource to urban
badgers, alternatives to the closure of problem main setts need to be considered.
Introduction
The presence of carnivores in urban areas can result in
conflict with humans in a number of ways, including direct
attacks (Gomper, 2002), disease transmission (Jenkins &
Craig, 1992) and damage to property (Harris, 1984). In the
case of badgers Meles meles, Natural England currently
receives c. 200 applications per year from householders or
other urban landowners for licences to interfere with bad-
gers or their setts for purposes of damage prevention (Ward,
2007). Most of these applications relate to setts being
excavated in gardens or in proximity to buildings or other
structures such as roads or waterways. Management of such
problems usually involves destroying all or part of a pro-
blem sett if it is considered that other setts are available to
the resident badgers.
Typically, a group of badgers has multiple setts within its
territory (Kruuk, 1978; Roper, 1992) but makes greatest use
of a single large ‘main’ sett. Smaller setts, used occasionally,
are termed ‘outlier’ setts (Kruuk, 1978). While the benefits
to badgers of using a main sett are believed to include
thermoregulatory advantage and predator avoidance (Neal
& Roper, 1991), it is less clear why they use outlier setts.
Existing evidence suggests that outlier use has multiple
functions including enabling animals to reduce their ecto-
parasite load (Roper et al., 2001), avoid harassment or
breeding suppression (Neal, 1977), minimize the costs of
travelling between resting and foraging areas (Kruuk, 1978)
or take emergency refuge (Butler & Roper, 1995; see
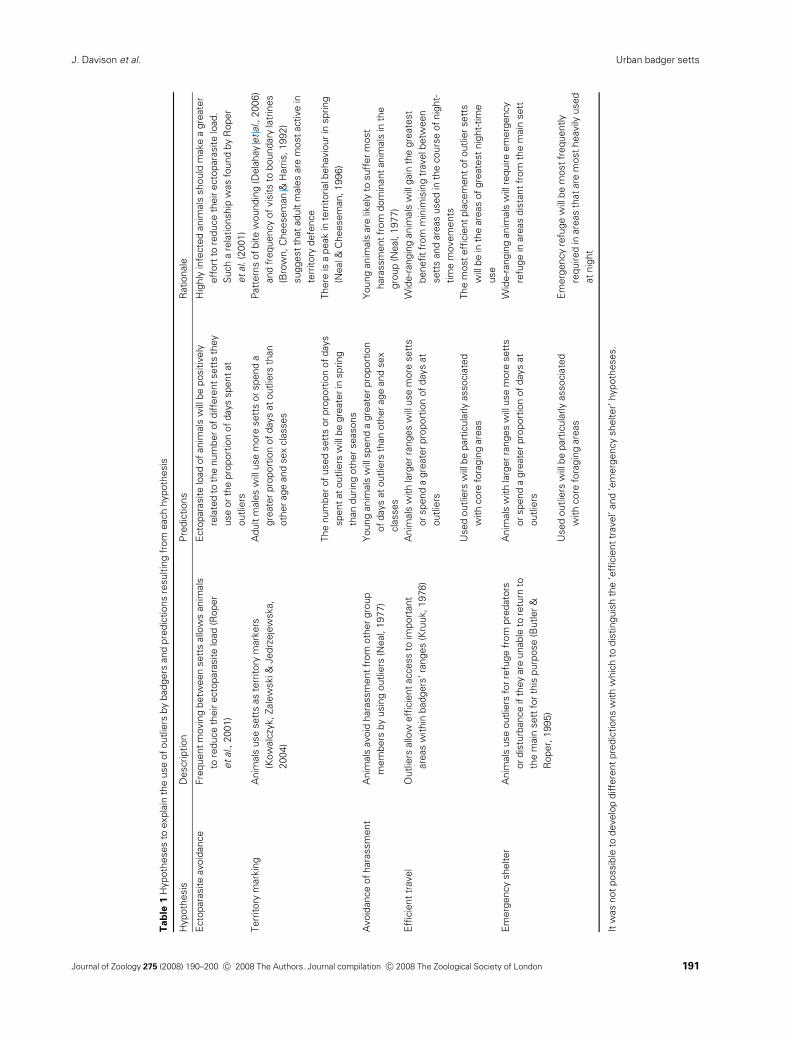
summary of hypotheses in Table 1).
The distinction between main setts and outliers is crucial
in the application of damage mitigation procedures because
destruction of a main sett is likely to have more serious
consequences for the resident badgers than destruction of an
outlier. Yet, main setts are more likely to cause problems
because of their larger size and because they are perma-
nently occupied by an entire social group of badgers. While
the characteristics of setts and their use have been relatively
well studied in rural environments, no detailed information
is available from urban areas. It cannot be assumed that sett
use is similar for both urban and rural badgers, because
there is evidence that ranging, territorial and social beha-
viour differ between the two environments (Harris, 1984;
Cresswell & Harris, 1988; Davison, 2007).
We aimed to collect data on the characteristics and use of
urban badger setts in order to aid the development of a
management strategy for dealing with urban badger pro-
blems. We analysed sett data from four urban and two rural
study areas in order to compare the density, spatial distribu-
tion and external characteristics of setts. In addition, we
Journal of Zoology
Journal of Zoology 275 (2008) 190–200 c� 2008 The Authors. Journal compilation c� 2008 The Zoological Society of London190
Journal of Zoology. Print ISSN 0952-8369
Tab
le1
Hypoth
eses
toexpla
inth
euse
of
outlie
rsby
badgers
and
pre
dic
tions
resultin
gfr
om
each
hypoth
esis
Hypoth
esis
Description
Pre
dic
tions
Rationale
Ecto
para
site
avoid
ance
Fre
quent
movin
gbetw
een
sett
sallo
ws
anim
als
tore
duce
their
ecto
para
site
load
(Roper
et
al.,2001)
Ecto
para
site
load
of
anim
als
will
be
positiv
ely
rela
ted
toth
enum
ber
of
diffe
rent
sett
sth
ey
use
or
the
pro
port
ion
of
days
spent
at
outlie
rs
Hig
hly
infe
cte
danim
als
should
make
agre
ate
r
eff
ort
tore
duce
their
ecto
para
site
load.
Such
are
lationship
was
found
by
Roper
et
al.
(2001)
Terr
itory
mark
ing
Anim
als
use
sett
sas
terr
itory
mark
ers
(Kow
alc
zyk,Zale
wski&
Jedrz
eje
wska,
2004)
Adult
male
sw
illuse
more
sett
sor
spend
a
gre
ate
rpro
port
ion
of
days
at
outlie
rsth
an
oth
er
age
and
sex
cla
sses
Patt
ern
sof
bite
woundin
g(D
ela
hay
et
al.,2006)
and
frequency
of
vis
its
toboundary
latr
ines
(Bro
wn,C
heesem
an
&H
arr
is,1992)
suggest
that
adult
male
sare
most
active
in
terr
itory
defe
nce
The
num
ber
of
used
sett
sor
pro
port
ion
of
days
spent
at
outlie
rsw
illbe
gre
ate
rin
spring
than
during
oth
er
seasons
There
isa
peak
inte
rritorialbehavio
ur
inspring
(Neal&
Cheesem
an,1996)
Avoid
ance
of
hara
ssm
ent
Anim
als
avoid
hara
ssm
ent
from
oth
er
gro
up
mem
bers
by
usin
goutlie
rs(N
eal,
1977)
Young
anim
als
will
spend
agre
ate
rpro
port
ion
of
days
at
outlie
rsth
an
oth
er
age
and
sex
cla
sses
Young
anim
als
are
likely
tosuff
er
most
hara
ssm
ent
from
dom
inant
anim
als
inth
e
gro
up
(Neal,
1977)
Effi
cie
nt
travel
Outlie
rsallo
weffi
cie
nt
access
toim
port
ant
are
as
within
badgers
’ra
nges
(Kru
uk,1978)
Anim
als
with
larg
er
ranges
will
use
more
sett
s
or
spend
agre
ate
rpro
port
ion
of
days
at
outlie
rs
Wid
e-r
angin
ganim
als
will
gain
the
gre
ate
st
benefit
from
min
imis
ing
travelbetw
een
sett
sand
are
as
used
inth
ecours
eof
nig
ht-
tim
em
ovem
ents
Used
outlie
rsw
illbe
part
icula
rly
associa
ted
with
core
fora
gin
gare
as
The
most
effi
cie
nt
pla
cem
ent
of
outlie
rsett
s
will
be
inth
eare
as
of
gre
ate
st
nig
ht-
tim
e
use
Em
erg
ency
shelter
Anim
als
use
outlie
rsfo
rre
fuge
from
pre
dato
rs
or
dis
turb
ance
ifth
ey
are
unable
tore
turn
to
the
main
sett
for
this
purp
ose
(Butler
&
Roper,
1995)
Anim
als
with
larg
er
ranges
will
use
more
sett
s
or
spend
agre
ate
rpro
port
ion
of
days
at
outlie
rs
Wid
e-r
angin
ganim
als
will
require
em
erg
ency
refu
ge
inare
as
dis
tant
from
the
main
sett
Used
outlie
rsw
illbe
part
icula
rly
associa
ted
with
core
fora
gin
gare
as
Em
erg
ency
refu
ge
will
be
most
frequently
required
inare
as
that
are
most
heavily
used
at
nig
ht
Itw
as
not
possib
leto
develo
pdiffe
rent
pre
dic
tions
with
whic
hto
dis
tinguis
hth
e‘e
fficie
nt
travel’
and
‘em
erg
ency
shelter’
hypoth
eses.
Journal of Zoology 275 (2008) 190–200 c� 2008 The Authors. Journal compilation c� 2008 The Zoological Society of London 191
Urban badger settsJ. Davison et al.
described patterns of sett use in a single intensively studied
urban badger population. Our main aims were to determine
(1) whether main setts can be meaningfully distinguished
from outlier setts in urban environments; (2) whether these
two types of sett are spatially distributed in the samemanner in
urban and rural environments; and (3) whether urban badgers
use these two types of sett in the same way as rural badgers. In
addition, we discuss the results in relation to various hypoth-
eses concerning the function of outlier setts (Table 1).
Methods
Urban badger sett characteristics
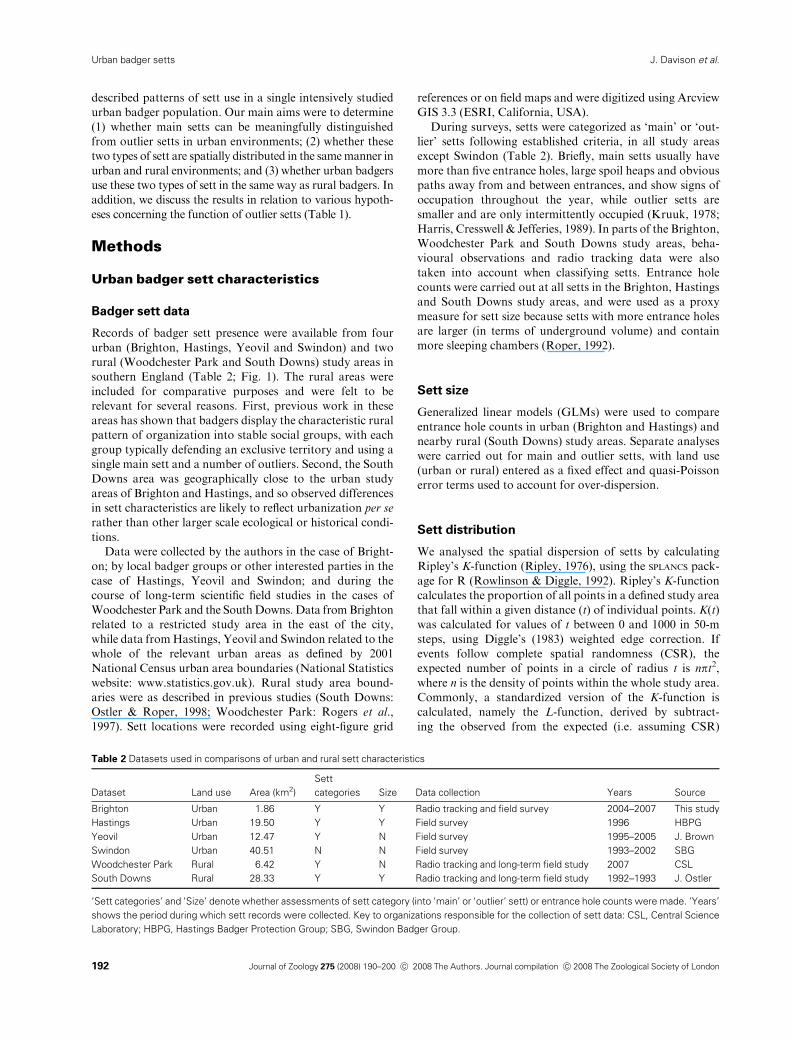
Badger sett data
Records of badger sett presence were available from four
urban (Brighton, Hastings, Yeovil and Swindon) and two
rural (Woodchester Park and South Downs) study areas in
southern England (Table 2; Fig. 1). The rural areas were
included for comparative purposes and were felt to be
relevant for several reasons. First, previous work in these
areas has shown that badgers display the characteristic rural
pattern of organization into stable social groups, with each
group typically defending an exclusive territory and using a
single main sett and a number of outliers. Second, the South
Downs area was geographically close to the urban study
areas of Brighton and Hastings, and so observed differences
in sett characteristics are likely to reflect urbanization per se
rather than other larger scale ecological or historical condi-
tions.
Data were collected by the authors in the case of Bright-
on; by local badger groups or other interested parties in the
case of Hastings, Yeovil and Swindon; and during the
course of long-term scientific field studies in the cases of
Woodchester Park and the SouthDowns. Data fromBrighton
related to a restricted study area in the east of the city,
while data fromHastings, Yeovil and Swindon related to the
whole of the relevant urban areas as defined by 2001
National Census urban area boundaries (National Statistics
website: www.statistics.gov.uk). Rural study area bound-
aries were as described in previous studies (South Downs:
Ostler & Roper, 1998; Woodchester Park: Rogers et al.,
1997). Sett locations were recorded using eight-figure grid
references or on field maps and were digitized using Arcview
GIS 3.3 (ESRI, California, USA).
During surveys, setts were categorized as ‘main’ or ‘out-
lier’ setts following established criteria, in all study areas
except Swindon (Table 2). Briefly, main setts usually have
more than five entrance holes, large spoil heaps and obvious
paths away from and between entrances, and show signs of
occupation throughout the year, while outlier setts are
smaller and are only intermittently occupied (Kruuk, 1978;
Harris, Cresswell & Jefferies, 1989). In parts of the Brighton,
Woodchester Park and South Downs study areas, beha-
vioural observations and radio tracking data were also
taken into account when classifying setts. Entrance hole
counts were carried out at all setts in the Brighton, Hastings
and South Downs study areas, and were used as a proxy
measure for sett size because setts with more entrance holes
are larger (in terms of underground volume) and contain
more sleeping chambers (Roper, 1992).
Sett size
Generalized linear models (GLMs) were used to compare
entrance hole counts in urban (Brighton and Hastings) and
nearby rural (South Downs) study areas. Separate analyses
were carried out for main and outlier setts, with land use
(urban or rural) entered as a fixed effect and quasi-Poisson
error terms used to account for over-dispersion.
Sett distribution
We analysed the spatial dispersion of setts by calculating
Ripley’s K-function (Ripley, 1976), using the SPLANCS pack-
age for R (Rowlinson & Diggle, 1992). Ripley’s K-function
calculates the proportion of all points in a defined study area
that fall within a given distance (t) of individual points. K(t)
was calculated for values of t between 0 and 1000 in 50-m
steps, using Diggle’s (1983) weighted edge correction. If
events follow complete spatial randomness (CSR), the
expected number of points in a circle of radius t is npt2,where n is the density of points within the whole study area.
Commonly, a standardized version of the K-function is
calculated, namely the L-function, derived by subtract-
ing the observed from the expected (i.e. assuming CSR)
Table 2 Datasets used in comparisons of urban and rural sett characteristics
Dataset Land use Area (km2)
Sett
categories Size Data collection Years Source
Brighton Urban 1.86 Y Y Radio tracking and field survey 2004–2007 This study
Hastings Urban 19.50 Y Y Field survey 1996 HBPG
Yeovil Urban 12.47 Y N Field survey 1995–2005 J. Brown
Swindon Urban 40.51 N N Field survey 1993–2002 SBG
Woodchester Park Rural 6.42 Y N Radio tracking and long-term field study 2007 CSL
South Downs Rural 28.33 Y Y Radio tracking and long-term field study 1992–1993 J. Ostler
‘Sett categories’ and ‘Size’ denote whether assessments of sett category (into ‘main’ or ‘outlier’ sett) or entrance hole counts were made. ‘Years’
shows the period during which sett records were collected. Key to organizations responsible for the collection of sett data: CSL, Central Science
Laboratory; HBPG, Hastings Badger Protection Group; SBG, Swindon Badger Group.
Journal of Zoology 275 (2008) 190–200 c� 2008 The Authors. Journal compilation c� 2008 The Zoological Society of London192
Urban badger setts J. Davison et al.
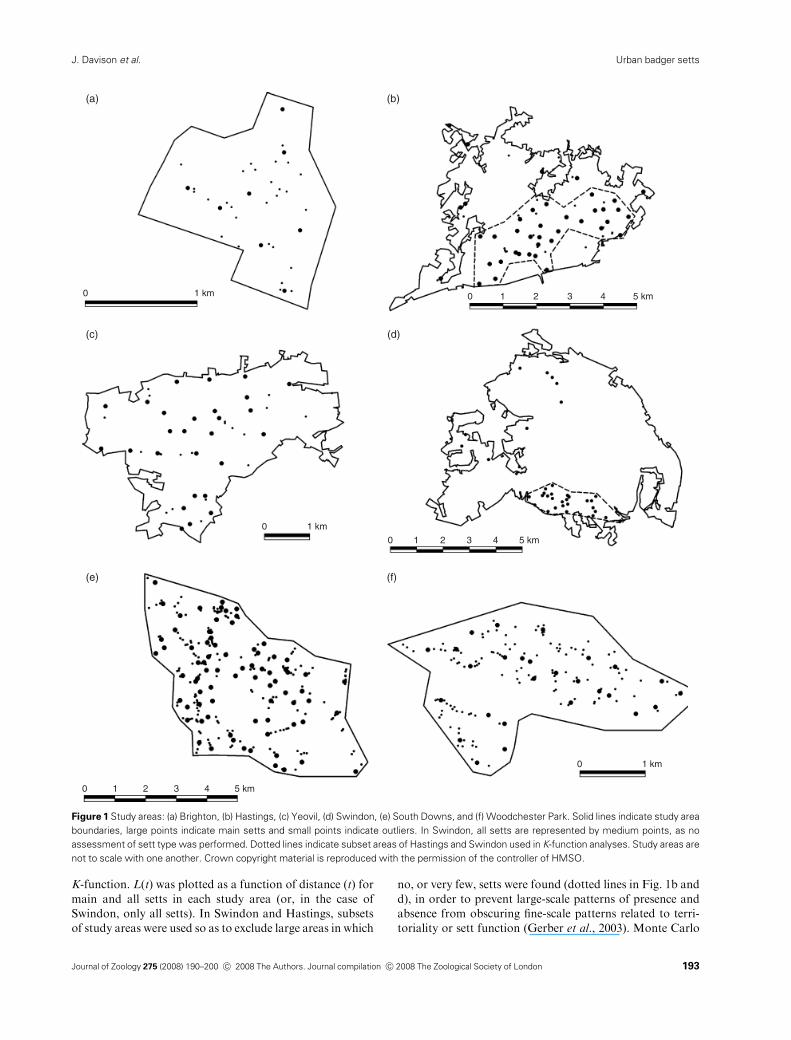
K-function. L(t) was plotted as a function of distance (t) for
main and all setts in each study area (or, in the case of
Swindon, only all setts). In Swindon and Hastings, subsets
of study areas were used so as to exclude large areas in which
no, or very few, setts were found (dotted lines in Fig. 1b and
d), in order to prevent large-scale patterns of presence and
absence from obscuring fine-scale patterns related to terri-
toriality or sett function (Gerber et al., 2003). Monte Carlo
0 1 km 0 1 2 3 4 5 km
0
0 1 km
0 1 km
0 1 2 3 4 5 km
1 2 3 4 5 km
(a)
(c)
(e) (f)
(d)
(b)
Figure 1 Study areas: (a) Brighton, (b) Hastings, (c) Yeovil, (d) Swindon, (e) South Downs, and (f) Woodchester Park. Solid lines indicate study area
boundaries, large points indicate main setts and small points indicate outliers. In Swindon, all setts are represented by medium points, as no
assessment of sett type was performed. Dotted lines indicate subset areas of Hastings and Swindon used in K-function analyses. Study areas are
not to scale with one another. Crown copyright material is reproduced with the permission of the controller of HMSO.
Journal of Zoology 275 (2008) 190–200 c� 2008 The Authors. Journal compilation c� 2008 The Zoological Society of London 193
Urban badger settsJ. Davison et al.
simulations were used to construct 95% confidence envel-
opes around L=0, based on 1000 simulations of random
distributions. An observed L-function below the confidence
envelope at a given distance indicated over-dispersion at
that scale (spatial lag), while a value above it indicated
under-dispersion.
Sett use
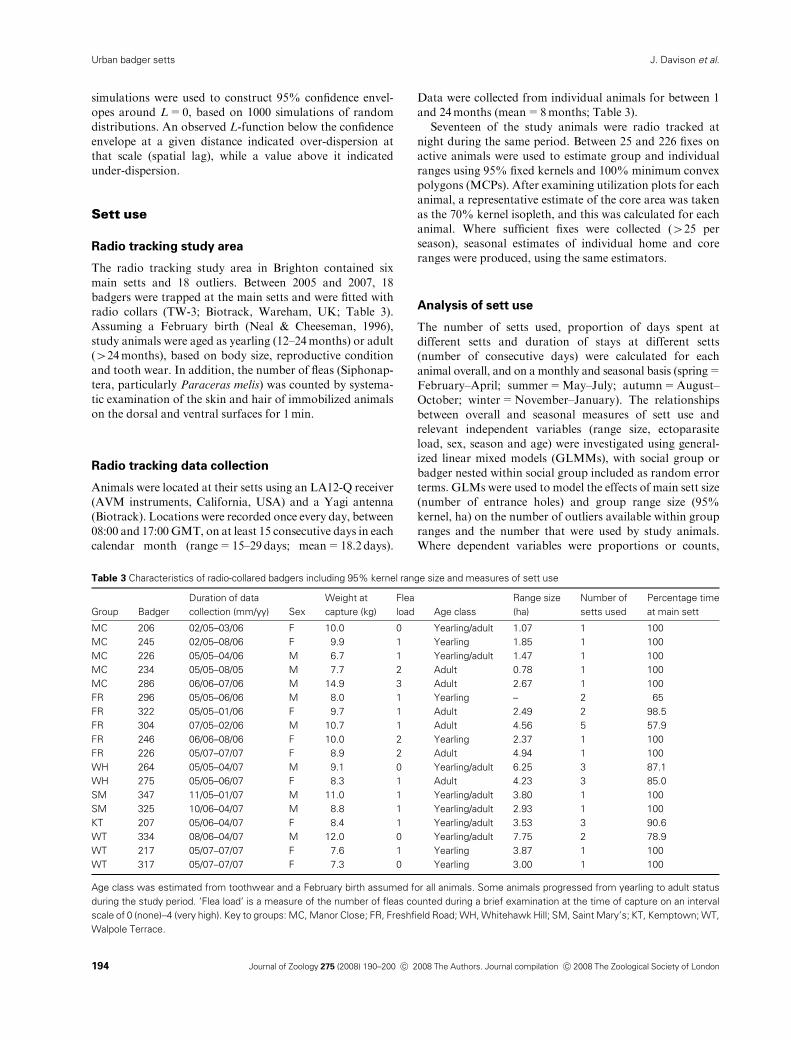
Radio tracking study area
The radio tracking study area in Brighton contained six
main setts and 18 outliers. Between 2005 and 2007, 18
badgers were trapped at the main setts and were fitted with
radio collars (TW-3; Biotrack, Wareham, UK; Table 3).
Assuming a February birth (Neal & Cheeseman, 1996),
study animals were aged as yearling (12–24months) or adult
(424months), based on body size, reproductive condition
and tooth wear. In addition, the number of fleas (Siphonap-
tera, particularly Paraceras melis) was counted by systema-
tic examination of the skin and hair of immobilized animals
on the dorsal and ventral surfaces for 1min.
Radio tracking data collection
Animals were located at their setts using an LA12-Q receiver
(AVM instruments, California, USA) and a Yagi antenna
(Biotrack). Locations were recorded once every day, between
08:00 and 17:00 GMT, on at least 15 consecutive days in each
calendar month (range=15–29days; mean=18.2 days).
Data were collected from individual animals for between 1
and 24months (mean=8months; Table 3).
Seventeen of the study animals were radio tracked at
night during the same period. Between 25 and 226 fixes on
active animals were used to estimate group and individual
ranges using 95% fixed kernels and 100% minimum convex
polygons (MCPs). After examining utilization plots for each
animal, a representative estimate of the core area was taken
as the 70% kernel isopleth, and this was calculated for each
animal. Where sufficient fixes were collected (425 per
season), seasonal estimates of individual home and core
ranges were produced, using the same estimators.
Analysis of sett use
The number of setts used, proportion of days spent at
different setts and duration of stays at different setts
(number of consecutive days) were calculated for each
animal overall, and on a monthly and seasonal basis (spring=
February–April; summer=May–July; autumn=August–
October; winter=November–January). The relationships
between overall and seasonal measures of sett use and
relevant independent variables (range size, ectoparasite
load, sex, season and age) were investigated using general-
ized linear mixed models (GLMMs), with social group or
badger nested within social group included as random error
terms. GLMs were used to model the effects of main sett size
(number of entrance holes) and group range size (95%
kernel, ha) on the number of outliers available within group
ranges and the number that were used by study animals.
Where dependent variables were proportions or counts,
Table 3 Characteristics of radio-collared badgers including 95% kernel range size and measures of sett use
Group Badger
Duration of data
collection (mm/yy) Sex
Weight at
capture (kg)
Flea
load Age class
Range size
(ha)
Number of
setts used
Percentage time
at main sett
MC 206 02/05–03/06 F 10.0 0 Yearling/adult 1.07 1 100
MC 245 02/05–08/06 F 9.9 1 Yearling 1.85 1 100
MC 226 05/05–04/06 M 6.7 1 Yearling/adult 1.47 1 100
MC 234 05/05–08/05 M 7.7 2 Adult 0.78 1 100
MC 286 06/06–07/06 M 14.9 3 Adult 2.67 1 100
FR 296 05/05–06/06 M 8.0 1 Yearling – 2 65
FR 322 05/05–01/06 F 9.7 1 Adult 2.49 2 98.5
FR 304 07/05–02/06 M 10.7 1 Adult 4.56 5 57.9
FR 246 06/06–08/06 F 10.0 2 Yearling 2.37 1 100
FR 226 05/07–07/07 F 8.9 2 Adult 4.94 1 100
WH 264 05/05–04/07 M 9.1 0 Yearling/adult 6.25 3 87.1
WH 275 05/05–06/07 F 8.3 1 Adult 4.23 3 85.0
SM 347 11/05–01/07 M 11.0 1 Yearling/adult 3.80 1 100
SM 325 10/06–04/07 M 8.8 1 Yearling/adult 2.93 1 100
KT 207 05/06–04/07 F 8.4 1 Yearling/adult 3.53 3 90.6
WT 334 08/06–04/07 M 12.0 0 Yearling/adult 7.75 2 78.9
WT 217 05/07–07/07 F 7.6 1 Yearling 3.87 1 100
WT 317 05/07–07/07 F 7.3 0 Yearling 3.00 1 100
Age class was estimated from toothwear and a February birth assumed for all animals. Some animals progressed from yearling to adult status
during the study period. ‘Flea load’ is a measure of the number of fleas counted during a brief examination at the time of capture on an interval
scale of 0 (none)–4 (very high). Key to groups: MC, Manor Close; FR, Freshfield Road; WH, Whitehawk Hill; SM, Saint Mary’s; KT, Kemptown; WT,
Walpole Terrace.
Journal of Zoology 275 (2008) 190–200 c� 2008 The Authors. Journal compilation c� 2008 The Zoological Society of London194
Urban badger setts J. Davison et al.
binomial or Poisson error distributions were used, respec-
tively, and models were checked for over-dispersion (Craw-
ley, 2002). In each case, a minimum adequate model was
constructed by retaining or deleting the least significant
terms from a maximal model on the basis of likelihood ratio
tests (LRTs; Crawley, 2002).
The location of outliers with respect to individual core
ranges was also assessed by comparing the proportion of
setts falling within animals’ core ranges with the proportion
expected, assuming that sett location was random within
95% kernel ranges. A w2-test for given proportions was
carried out using data from six animals where outlier sett use
and ranging data were available.
Results
Badger sett data
Urban main setts had significantly fewer entrance holes than
rural main setts (mean urban=12.8, rural=19.8; GLM:
parameter estimate area (urban)=�0.44, SE=0.13,
t=�3.49, Po0.001) whereas urban and rural outliers were
not significantly different in size (mean urban=3.0,
rural=3.8; GLM: parameter estimate area (urban)=�0.24,SE=0.16, t=�1.53, P=0.13).
The ratio of main setts to outliers was significantly
different between study areas (main:outlier ratio: Bright-
on=3.5, Hastings=0.8, Yeovil=0.8, Woodchester
Park=4.6, South Downs=2.5; test for equality of propor-
tions: w2=47.74, d.f.=4, Po0.001). However, there was no
significant difference in sett size distributions between
Brighton, Hastings and South Downs (pairwise G-tests,
P=0.52–0.75) or between the pooled urban distribution
and the rural distribution from the South Downs area
(G=27.24, d.f.=36, P=0.85; Fig. 2).
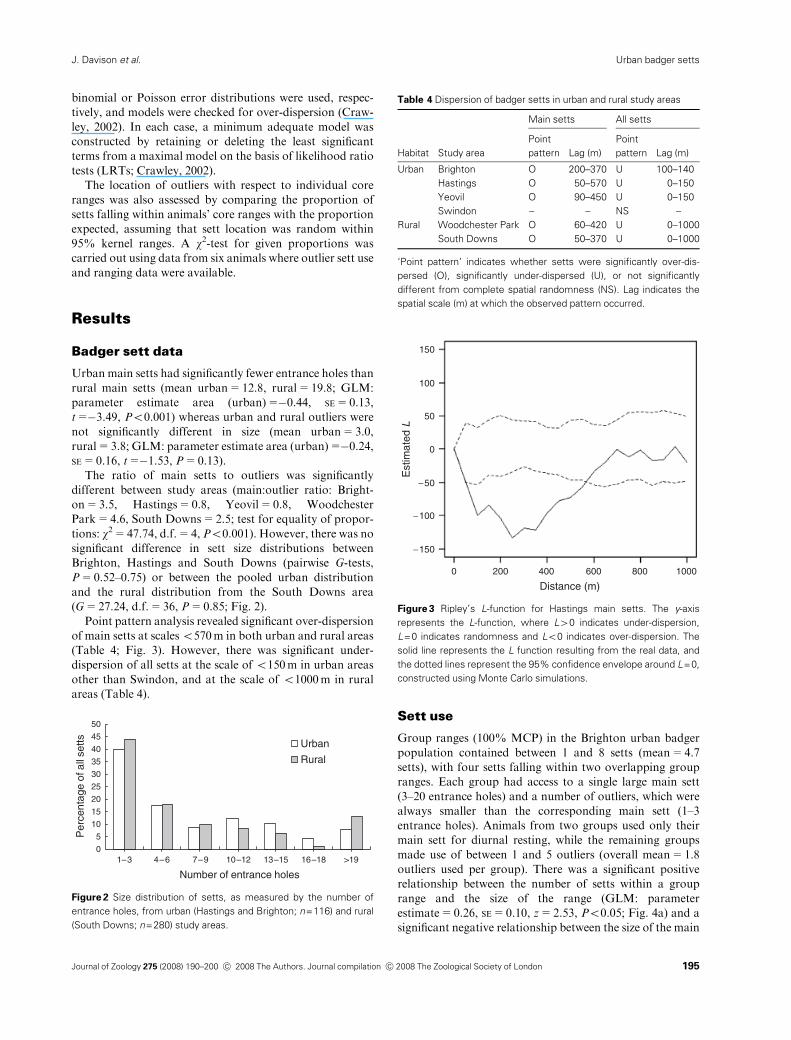
Point pattern analysis revealed significant over-dispersion
of main setts at scaleso570m in both urban and rural areas
(Table 4; Fig. 3). However, there was significant under-
dispersion of all setts at the scale of o150m in urban areas
other than Swindon, and at the scale of o1000m in rural
areas (Table 4).
Sett use
Group ranges (100% MCP) in the Brighton urban badger
population contained between 1 and 8 setts (mean=4.7
setts), with four setts falling within two overlapping group
ranges. Each group had access to a single large main sett
(3–20 entrance holes) and a number of outliers, which were
always smaller than the corresponding main sett (1–3
entrance holes). Animals from two groups used only their
main sett for diurnal resting, while the remaining groups
made use of between 1 and 5 outliers (overall mean=1.8
outliers used per group). There was a significant positive
relationship between the number of setts within a group
range and the size of the range (GLM: parameter
estimate=0.26, SE=0.10, z=2.53, Po0.05; Fig. 4a) and a
significant negative relationship between the size of the main
0
5
10
15
20
25
30
35
40
45
50
1–3 4–6 7–9 10–12 13–15 16–18 >19
Number of entrance holes
Per
cent
age
of a
ll se
tts Urban
Rural
Figure 2 Size distribution of setts, as measured by the number of
entrance holes, from urban (Hastings and Brighton; n=116) and rural
(South Downs; n=280) study areas.
Table 4 Dispersion of badger setts in urban and rural study areas
Habitat Study area
Main setts All setts
Point
pattern Lag (m)
Point
pattern Lag (m)
Urban Brighton O 200–370 U 100–140
Hastings O 50–570 U 0–150
Yeovil O 90–450 U 0–150
Swindon – – NS –
Rural Woodchester Park O 60–420 U 0–1000
South Downs O 50–370 U 0–1000
‘Point pattern’ indicates whether setts were significantly over-dis-
persed (O), significantly under-dispersed (U), or not significantly
different from complete spatial randomness (NS). Lag indicates the
spatial scale (m) at which the observed pattern occurred.
150
100
50
0
−50
−100
−150
0 200 400 600 800 1000
Distance (m)
Est
imat
ed L
Figure 3 Ripley’s L-function for Hastings main setts. The y-axis
represents the L-function, where L40 indicates under-dispersion,
L=0 indicates randomness and Lo0 indicates over-dispersion. The
solid line represents the L function resulting from the real data, and
the dotted lines represent the 95% confidence envelope around L=0,
constructed using Monte Carlo simulations.
Journal of Zoology 275 (2008) 190–200 c� 2008 The Authors. Journal compilation c� 2008 The Zoological Society of London 195
Urban badger settsJ. Davison et al.
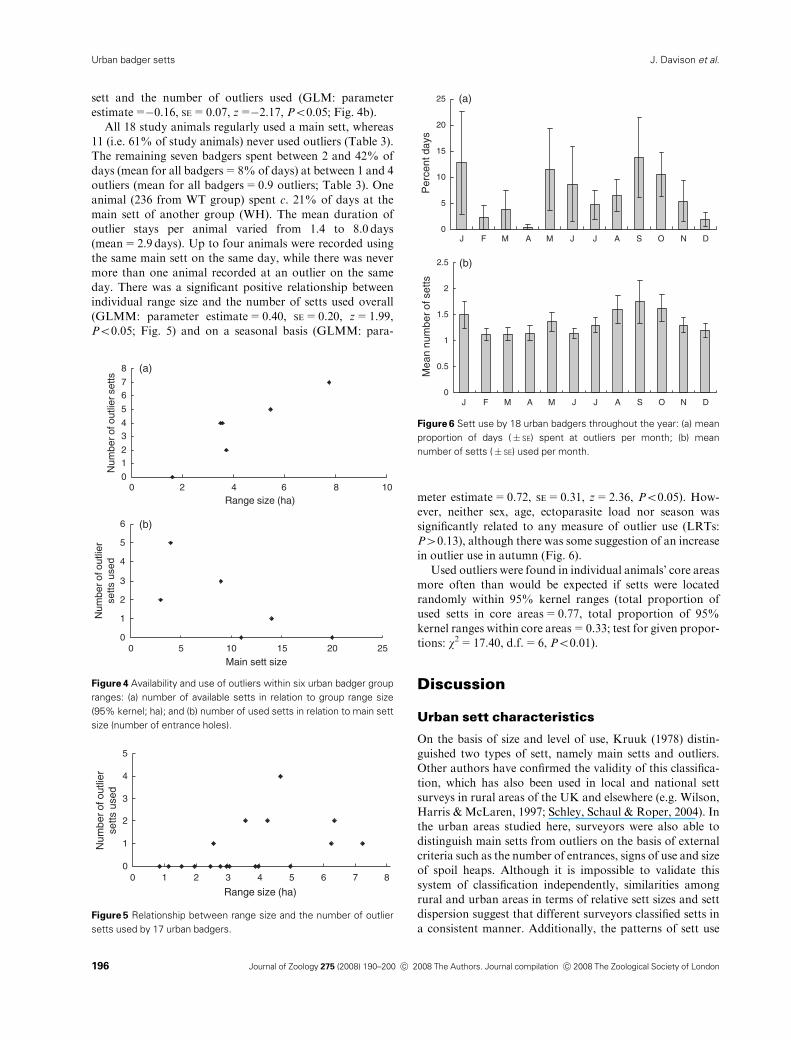
sett and the number of outliers used (GLM: parameter
estimate=�0.16, SE=0.07, z=�2.17, Po0.05; Fig. 4b).
All 18 study animals regularly used a main sett, whereas
11 (i.e. 61% of study animals) never used outliers (Table 3).
The remaining seven badgers spent between 2 and 42% of
days (mean for all badgers=8% of days) at between 1 and 4
outliers (mean for all badgers=0.9 outliers; Table 3). One
animal (236 from WT group) spent c. 21% of days at the
main sett of another group (WH). The mean duration of
outlier stays per animal varied from 1.4 to 8.0 days
(mean=2.9 days). Up to four animals were recorded using
the same main sett on the same day, while there was never
more than one animal recorded at an outlier on the same
day. There was a significant positive relationship between
individual range size and the number of setts used overall
(GLMM: parameter estimate=0.40, SE=0.20, z=1.99,
Po0.05; Fig. 5) and on a seasonal basis (GLMM: para-
meter estimate=0.72, SE=0.31, z=2.36, Po0.05). How-
ever, neither sex, age, ectoparasite load nor season was
significantly related to any measure of outlier use (LRTs:
P40.13), although there was some suggestion of an increase
in outlier use in autumn (Fig. 6).
Used outliers were found in individual animals’ core areas
more often than would be expected if setts were located
randomly within 95% kernel ranges (total proportion of
used setts in core areas=0.77, total proportion of 95%
kernel ranges within core areas=0.33; test for given propor-
tions: w2=17.40, d.f.=6, Po0.01).
Discussion
Urban sett characteristics
On the basis of size and level of use, Kruuk (1978) distin-
guished two types of sett, namely main setts and outliers.
Other authors have confirmed the validity of this classifica-
tion, which has also been used in local and national sett
surveys in rural areas of the UK and elsewhere (e.g. Wilson,
Harris & McLaren, 1997; Schley, Schaul & Roper, 2004). In
the urban areas studied here, surveyors were also able to
distinguish main setts from outliers on the basis of external
criteria such as the number of entrances, signs of use and size
of spoil heaps. Although it is impossible to validate this
system of classification independently, similarities among
rural and urban areas in terms of relative sett sizes and sett
dispersion suggest that different surveyors classified setts in
a consistent manner. Additionally, the patterns of sett use
(a)
(b)
0
1
2
3
4
5
6
0 5 10 15 20 25
Main sett size
Num
ber o
f out
lier
setts
use
d
0
12
34
5
67
8
0 2 4 6 8 10Range size (ha)
Num
ber o
f out
lier s
etts
Figure 4 Availability and use of outliers within six urban badger group
ranges: (a) number of available setts in relation to group range size
(95% kernel; ha); and (b) number of used setts in relation to main sett
size (number of entrance holes).
0
1
2
3
4
5
0 1 2 3 4 5 6 7
Range size (ha)
Num
ber o
f out
lier
setts
use
d
8
Figure 5 Relationship between range size and the number of outlier
setts used by 17 urban badgers.
(a)
(b)
0
5
10
15
20
25
J F M A M J J A S O N D
Per
cent
day
s
0
0.5
1
1.5
2
2.5
J F M A M J J A S O N D
Mea
n nu
mbe
r of
set
tsFigure 6 Sett use by 18 urban badgers throughout the year: (a) mean
proportion of days (� SE) spent at outliers per month; (b) mean
number of setts (� SE) used per month.
Journal of Zoology 275 (2008) 190–200 c� 2008 The Authors. Journal compilation c� 2008 The Zoological Society of London196
Urban badger setts J. Davison et al.
revealed by radio tracking in the Brighton study area
support a functional distinction between main and outlier
setts: that is, setts that were classified as main setts on the
basis of their external appearance were found to be con-
tinuously occupied by entire social groups, whereas setts
classified as outliers were only intermittently occupied by
single animals . We conclude, therefore, that the classifica-
tion of setts based on survey data is as valid in urban
environments as it is in rural ones.
However, urban main setts were significantly smaller than
rural main setts, perhaps reflecting a limit on space for sett
construction in urban areas. Alternatively, because setts
tend to increase in size through time as a result of digging
by successive generations of animals (Roper, 1992; Ostler &
Roper, 1998), the smaller size of urban main setts may
reflect their more recent origin or a lower average social
group size in urban badgers.
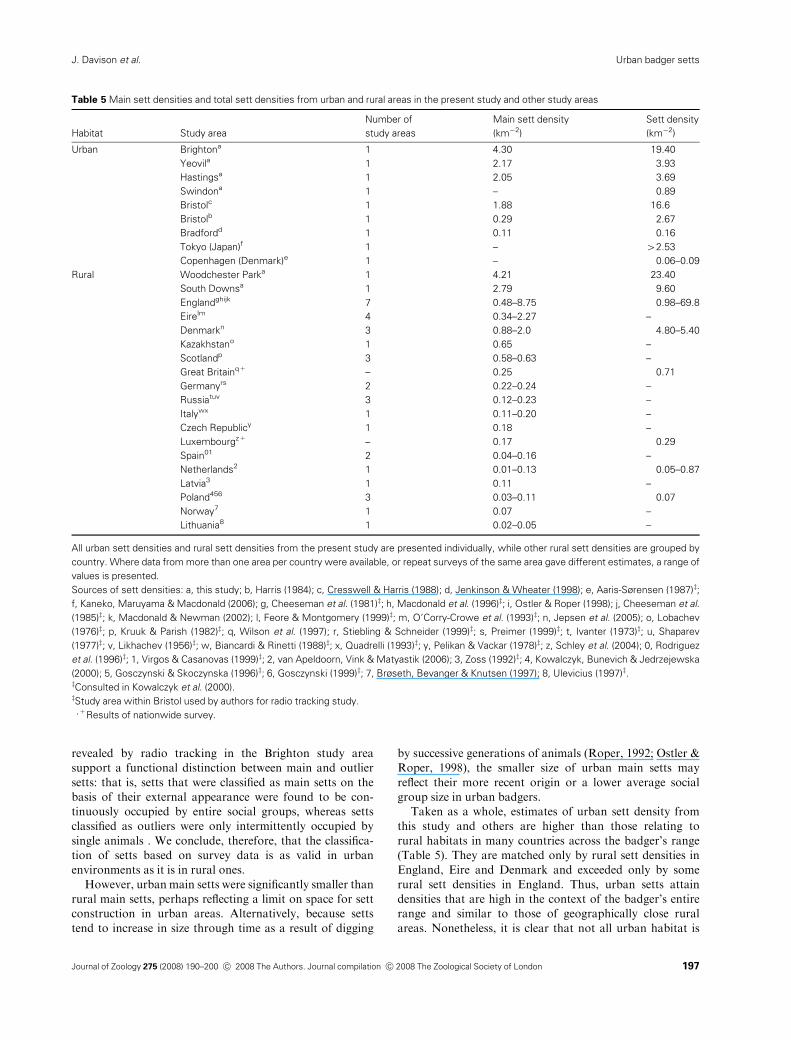
Taken as a whole, estimates of urban sett density from
this study and others are higher than those relating to
rural habitats in many countries across the badger’s range
(Table 5). They are matched only by rural sett densities in
England, Eire and Denmark and exceeded only by some
rural sett densities in England. Thus, urban setts attain
densities that are high in the context of the badger’s entire
range and similar to those of geographically close rural
areas. Nonetheless, it is clear that not all urban habitat is
Table 5 Main sett densities and total sett densities from urban and rural areas in the present study and other study areas
Habitat Study area
Number of
study areas
Main sett density
(km�2)
Sett density
(km�2)
Urban Brightona 1 4.30 19.40
Yeovila 1 2.17 3.93
Hastingsa 1 2.05 3.69
Swindona 1 – 0.89
Bristolc� 1 1.88 16.6
Bristolb 1 0.29 2.67
Bradfordd 1 0.11 0.16
Tokyo (Japan)f 1 – 42.53
Copenhagen (Denmark)e 1 – 0.06–0.09
Rural Woodchester Parka 1 4.21 23.40
South Downsa 1 2.79 9.60
Englandghijk 7 0.48–8.75 0.98–69.8
Eirelm 4 0.34–2.27 –
Denmarkn 3 0.88–2.0 4.80–5.40
Kazakhstano 1 0.65 –
Scotlandp 3 0.58–0.63 –
Great Britainq+ – 0.25 0.71
Germanyrs 2 0.22–0.24 –
Russiatuv 3 0.12–0.23 –
Italywx 1 0.11–0.20 –
Czech Republicy 1 0.18 –
Luxembourgz+ – 0.17 0.29
Spain01 2 0.04–0.16 –
Netherlands2 1 0.01–0.13 0.05–0.87
Latvia3 1 0.11 –
Poland456 3 0.03–0.11 0.07
Norway7 1 0.07 –
Lithuania8 1 0.02–0.05 –
All urban sett densities and rural sett densities from the present study are presented individually, while other rural sett densities are grouped by
country. Where data from more than one area per country were available, or repeat surveys of the same area gave different estimates, a range of
values is presented.
Sources of sett densities: a, this study; b, Harris (1984); c, Cresswell & Harris (1988); d, Jenkinson & Wheater (1998); e, Aaris-Sørensen (1987)z;
f, Kaneko, Maruyama & Macdonald (2006); g, Cheeseman et al. (1981)z; h, Macdonald et al. (1996)z; i, Ostler & Roper (1998); j, Cheeseman et al.
(1985)z; k, Macdonald & Newman (2002); l, Feore & Montgomery (1999)z; m, O’Corry-Crowe et al. (1993)z; n, Jepsen et al. (2005); o, Lobachev
(1976)z; p, Kruuk & Parish (1982)z; q, Wilson et al. (1997); r, Stiebling & Schneider (1999)z; s, Preimer (1999)z; t, Ivanter (1973)z; u, Shaparev
(1977)z; v, Likhachev (1956)z; w, Biancardi & Rinetti (1988)z; x, Quadrelli (1993)z; y, Pelikan & Vackar (1978)z; z, Schley et al. (2004); 0, Rodriguez
et al. (1996)z; 1, Virgos & Casanovas (1999)z; 2, van Apeldoorn, Vink & Matyastik (2006); 3, Zoss (1992)z; 4, Kowalczyk, Bunevich & Jedrzejewska
(2000); 5, Gosczynski & Skoczynska (1996)z; 6, Gosczynski (1999)z; 7, Brøseth, Bevanger & Knutsen (1997); 8, Ulevicius (1997)z.zConsulted in Kowalczyk et al. (2000).zStudy area within Bristol used by authors for radio tracking study.�,+Results of nationwide survey.
Journal of Zoology 275 (2008) 190–200 c� 2008 The Authors. Journal compilation c� 2008 The Zoological Society of London 197
Urban badger settsJ. Davison et al.
suitable for badgers, because setts were absent from large
parts of Swindon and Hastings (Fig. 1b and d).
Patterns of main sett dispersion were very similar for
urban and rural areas, with over-dispersion at a spatial lag
of o570m in all areas. In rural areas, over-dispersion of
main setts has been attributed to territoriality, because there
is typically only one main sett per territory (Kruuk, 1978;
Neal & Cheeseman, 1996). However, previous research in
urban Bristol and ongoing research in our own Brighton
study area suggest that urban badgers lack clear territorial
behaviour (Harris, 1984; Cresswell & Harris, 1988; Davison,
2007). The distribution of main setts in urban areas may
therefore represent a more subtle system of exclusivity,
resulting from less obvious defensive behaviour or competi-
tive exclusion. Alternatively, current urban main sett dis-
tribution may be a relic from a time when the areas in
question were effectively rural and the badger population
was territorial (Harris, 1982, 1984).
Sett use
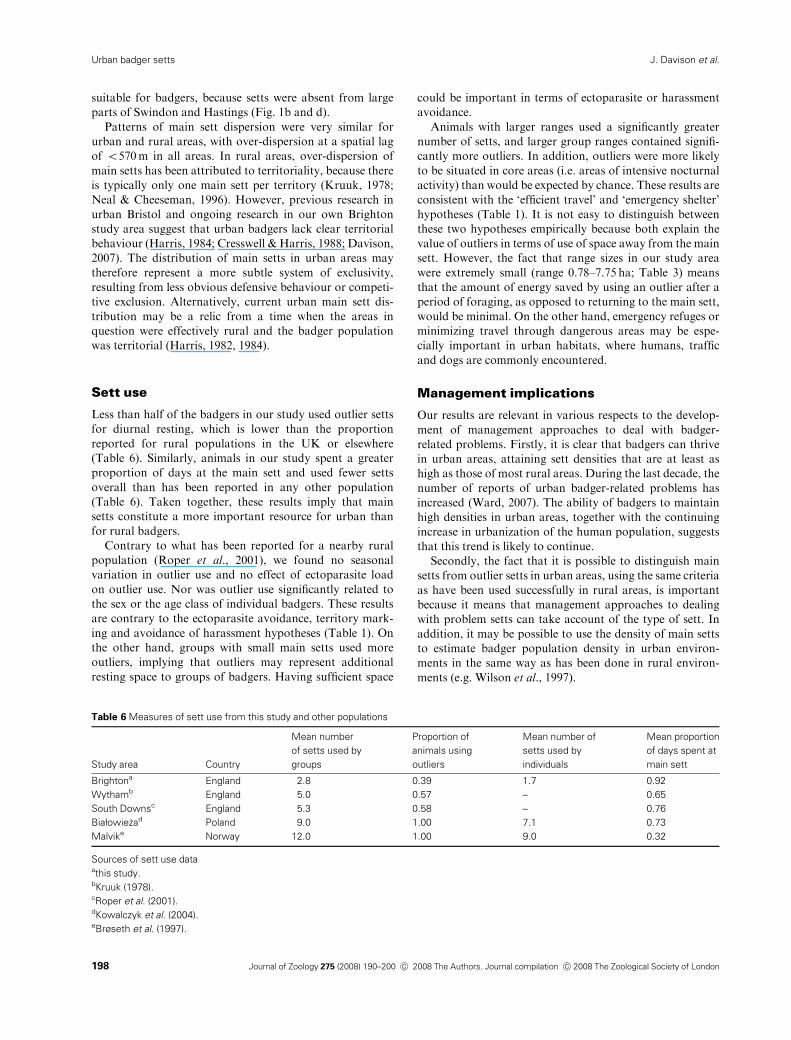
Less than half of the badgers in our study used outlier setts
for diurnal resting, which is lower than the proportion
reported for rural populations in the UK or elsewhere
(Table 6). Similarly, animals in our study spent a greater
proportion of days at the main sett and used fewer setts
overall than has been reported in any other population
(Table 6). Taken together, these results imply that main
setts constitute a more important resource for urban than
for rural badgers.
Contrary to what has been reported for a nearby rural
population (Roper et al., 2001), we found no seasonal
variation in outlier use and no effect of ectoparasite load
on outlier use. Nor was outlier use significantly related to
the sex or the age class of individual badgers. These results
are contrary to the ectoparasite avoidance, territory mark-
ing and avoidance of harassment hypotheses (Table 1). On
the other hand, groups with small main setts used more
outliers, implying that outliers may represent additional
resting space to groups of badgers. Having sufficient space
could be important in terms of ectoparasite or harassment
avoidance.
Animals with larger ranges used a significantly greater
number of setts, and larger group ranges contained signifi-
cantly more outliers. In addition, outliers were more likely
to be situated in core areas (i.e. areas of intensive nocturnal
activity) than would be expected by chance. These results are
consistent with the ‘efficient travel’ and ‘emergency shelter’
hypotheses (Table 1). It is not easy to distinguish between
these two hypotheses empirically because both explain the
value of outliers in terms of use of space away from the main
sett. However, the fact that range sizes in our study area
were extremely small (range 0.78–7.75 ha; Table 3) means
that the amount of energy saved by using an outlier after a
period of foraging, as opposed to returning to the main sett,
would be minimal. On the other hand, emergency refuges or
minimizing travel through dangerous areas may be espe-
cially important in urban habitats, where humans, traffic
and dogs are commonly encountered.
Management implications
Our results are relevant in various respects to the develop-
ment of management approaches to deal with badger-
related problems. Firstly, it is clear that badgers can thrive
in urban areas, attaining sett densities that are at least as
high as those of most rural areas. During the last decade, the
number of reports of urban badger-related problems has
increased (Ward, 2007). The ability of badgers to maintain
high densities in urban areas, together with the continuing
increase in urbanization of the human population, suggests
that this trend is likely to continue.
Secondly, the fact that it is possible to distinguish main
setts from outlier setts in urban areas, using the same criteria
as have been used successfully in rural areas, is important
because it means that management approaches to dealing
with problem setts can take account of the type of sett. In
addition, it may be possible to use the density of main setts
to estimate badger population density in urban environ-
ments in the same way as has been done in rural environ-
ments (e.g. Wilson et al., 1997).
Table 6 Measures of sett use from this study and other populations
Study area Country
Mean number
of setts used by
groups
Proportion of
animals using
outliers
Mean number of
setts used by
individuals
Mean proportion
of days spent at
main sett
Brightona England 2.8 0.39 1.7 0.92
Wythamb England 5.0 0.57 – 0.65
South Downsc England 5.3 0.58 – 0.76
Białowiezad Poland 9.0 1.00 7.1 0.73
Malvike Norway 12.0 1.00 9.0 0.32
Sources of sett use dataathis study.bKruuk (1978).cRoper et al. (2001).dKowalczyk et al. (2004).eBrøseth et al. (1997).
Journal of Zoology 275 (2008) 190–200 c� 2008 The Authors. Journal compilation c� 2008 The Zoological Society of London198
Urban badger setts J. Davison et al.
Thirdly, our results show that urban badgers have fewer
outliers available and spend less time at them, which
suggests that main setts represent a particularly important
resource. Consequently, in cases where a main sett is causing
a problem, its closure may not be a realistic option because
resident badgers may not have adequate alternative setts
within their existing home range. This is consistent with
evidence that badgers sometimes make vigorous attempts to
regain access to a closed sett, and that closure of main setts
has a poorer record of success in urban than in rural areas
(Ward, 2007). Alternatives to main sett closure therefore
need to be considered.
In a wider context, our results demonstrate the impor-
tance of ecological and behavioural data in explaining
patterns of urban wildlife damage and in informing manage-
ment policies. On the one hand, the basic aspects of the
behaviour and ecology of urban populations may resemble
those of rural populations, as is the case with the common
use of main and outlier setts by badgers in both types of
environment. On the other hand, adaptation to urban
habitat may involve detailed changes in behaviour, as is
exemplified by the less frequent use of outliers in urban
badgers. Management of urban wildlife problems can be
improved by taking account of such differences.
Acknowledgements
We thank Julian Brown, Swindon Badger Group and
Hastings Badger Protection Society for supplying badger
sett data, and the CSL Woodchester Park field team for
assistance with badger trapping. This project was funded by
Defra WSC under contract WM0304. M.H. was supported
by a Marie Curie Intra-European Postdoctoral Fellowship.
We also thank Alastair Ward, Richard Brand-Hardy and
two anonymous referees, whose comments greatly improved
the paper.
References
van Apeldoorn, R.C., Vink, J. & Matyastik, T. (2006).
Dynamics of a local badger (Meles meles) population in the
Netherlands over the years 1983–2001. Mammal. Biol. 71,
25–38.
Brøseth, H., Bevanger, K. & Knutsen, B. (1997). Function of
multiple badgerMeles meles setts: distribution and utilisa-
tion.Wildl. Biol. 3, 89–96.
Brown, J.A., Cheeseman, C.L. & Harris, S. (1992). Studies on
the spread of bovine tuberculosis from badgers to cattle.
J. Zool. (Lond.) 227, 694–696.
Butler, J.M. & Roper, T.J. (1995). Escape tactics and alarm
responses in badgers Meles meles – a field experiment.
Ethology 99, 313–322.
Crawley, M. (2002). Statistical computing: an introduction to
data analysis using S-plus. New York, USA: John Wiley &
Sons.
Cresswell, W.J. & Harris, S. (1988). Foraging behavior and
home-range utilization in a suburban badger (Meles meles)
population.Mammal. Rev. 18, 37–49.
Davison, J. (2007) The ecology and behaviour of urban badgers
Meles meles. DPhil thesis, School of Life Sciences, Uni-
versity of Sussex.
Delahay, R.J., Walker, N., Forrester, G.J., Harmsen, B.,
Riordan, P., Macdonald, D.W., Newman, C. & Cheese-
man, C.L. (2006). Demographic correlates of bite wound-
ing in European badgers (Meles meles L.) in stable and
perturbed populations. Anim. Behav. 71, 1047–1055.
Diggle, P.J. (1983). Statistical analysis of spatial point pattern.
New York: Academic Press.
Gerber, L.R., Seabloom, E.W., Burton, R.S. & Reichman,
O.J. (2003). Translocation of an imperilled woodrat popu-
lation: integrating spatial and habitat patterns. Anim.
Conserv. 6, 309–316.
Gomper, M.E. (2002). Top carnivores in the suburbs? Ecologi-
cal and conservation issues raised by colonization of north-
eastern North America by coyotes. Bioscience 52, 185–190.
Harris, S. (1982). Activity patterns and habitat utilization of
badgers (Meles meles) in suburban Bristol: a radio tracking
study. Symp. Zool. Soc. Lond. 49, 301–323.
Harris, S. (1984). Ecology of urban badgers Meles meles –
distribution in Britain and habitat selection, persecution,
food and damage in the city of Bristol. Biol. Conserv. 28,
349–375.
Harris, S., Cresswell, P. & Jefferies, D. (1989). Surveying for
badgers. Occasional Publication of the Mammal Society No.
9. Bristol, UK: Mammal Society.
Jenkins, D.J. & Craig, N.A. (1992). The role of foxes Vulpes
vulpes in the epidemiology of Echinococcus granulosus in
urban environments. Med. J. Aust. 157, 754–756.
Jenkinson, S. & Wheater, C.P. (1998). The influence of public
access and sett visibility on badger (Meles meles) sett
disturbance and persistence. J. Zool. (Lond.) 246, 478–482.
Jepsen, J.U., Madsen, A.B., Karlsson, M. &Groth, D. (2005).
Predicting distribution and density of European badger
(Meles meles) setts in Denmark. Biodivers. Conserv. 14,
3235–3253.
Kaneko, Y., Maruyama, N. & Macdonald, D.W. (2006).
Food habits and habitat selection of suburban badgers
(Meles meles) in Japan. J. Zool. (Lond.) 270, 78–89.
Kowalczyk, R., Bunevich, A.N. & Jedrzejewska, B. (2000).
Badger density and distribution of setts in Białowiez’a
Primeval Forest (Poland and Belarus) compared to other
Eurasian populations. Acta Theriol. 45, 395–408.
Kowalczyk, R., Zalewski, A. & Jedrzejewska, B. (2004).
Seasonal and spatial pattern of shelter use by badgers
Meles meles in Białowiez’a Primeval Forest (Poland). Acta
Theriol. 49, 75–92.
Kruuk, H. (1978). Spatial organization and territorial beha-
vior of European badgerMeles meles. J. Zool. (Lond.) 184,
1–19.
Macdonald, D.W. & Newman, C. (2002). Population dy-
namics of badgers (Meles meles) in Oxfordshire, UK:
Journal of Zoology 275 (2008) 190–200 c� 2008 The Authors. Journal compilation c� 2008 The Zoological Society of London 199
Urban badger settsJ. Davison et al.
numbers, density and cohort life histories, and a possible
role of climate change in population growth. J. Zool.
(Lond.) 256, 121–138.
Neal, E. (1977). Badgers. Poole, UK: Blandford Press.
Neal, E. & Cheeseman, C.L. (1996). Badgers. London, UK: T
& A. D. Poyser Ltd.
Neal, E. & Roper, T.J. (1991). The environmental impact
of badgers and their setts. Symp. Zool. Soc. Lond. 61,
89–106.
Ostler, J.R. & Roper, T.J. (1998). Changes in size, status, and
distribution of badgerMeles meles L. setts during a 20-year
period. Mammal. Biol. 63, 200–209.
Ripley, B.D. (1976). The second-order analysis of stationary
point processes. J. Appl. Prob. 13, 255–266.
Rogers, L.M., Cheeseman, C.L., Mallinson, P.J. & Clifton-
Hadley, R. (1997). The demography of a high density
badger (Meles meles) population in the west of England.
J. Zool. (Lond.) 242, 705–728.
Roper, T.J. (1992). Badger Meles meles sett architecture,
internal environment and function. Mammal. Rev. 22,
43–53.
Roper, T.J., Ostler, J.R., Schmid, T.K. & Christian, S.F.
(2001). Sett use in European badgers Meles meles. Beha-
viour 138, 173–187.
Rowlinson, B.S. & Diggle, P.J. (1992) Splancs: Spatial Point
Pattern Analysis Code in S-Plus, Technical Report 92/63,
Lancaster University, UK.
Schley, L., Schaul, M. & Roper, T.J. (2004). Distribution and
population density of badgersMeles meles in Luxembourg.
Mammal. Rev. 34, 233–240.
Ward, A. (2007) Project WM0304. Development of a strategy
for resolving urban badger damage problems. CSL Final
Report. www.defra.gov.uk.
Wilson, G., Harris, S. & McLaren, G. (1997). Changes in the
British badger population, 1988 to 1997. London, UK:
Peoples Trust for Endangered Species.
Journal of Zoology 275 (2008) 190–200 c� 2008 The Authors. Journal compilation c� 2008 The Zoological Society of London200
Urban badger setts J. Davison et al.