untitled - investor relations
TRANSCRIPT

Table of Contents
UNITED STATES SECURITIES AND EXCHANGE COMMISSION
Washington, D.C. 20549
Form 10-K
☑ ANNUAL REPORT PURSUANT TO SECTION 13 OR 15(d) OF THE SECURITIES EXCHANGE ACT OF 1934 For the fiscal year ended June 27, 2003
or
o TRANSITION REPORT PURSUANT TO SECTION 13 OR 15(d) OF THE SECURITIES EXCHANGE ACT OF 1934 For the transition period from to
Commission file number 1-4224
Avnet, Inc.(Exact name of registrant as specified in its charter)
New York 11-1890605
(State or other jurisdiction ofincorporation or organization) (I.R.S. Employer
Identification No.)
2211 South 47th Street, Phoenix, Arizona(Address of principal executive offices) 85034
(Zip Code)
Registrant’s telephone number, including area code
(480) 643-2000
Securities registered pursuant to Section 12(b) of the Act:
Title of each class Name of each exchange on which registered
Common Stock New York Stock Exchange and Pacific Exchange
Securities registered pursuant to Section 12(g) of the Act:
None
Indicate by check mark whether the registrant (1) has filed all reports required to be filed by Section 13 or 15(d) of the Securities Exchange Act of 1934during the preceding 12 months (or for such shorter period that the registrant was required to file such reports), and (2) has been subject to such filingrequirements for the past 90 days. Yes ☑ No o
Indicate by check mark if disclosure of delinquent filers pursuant to Item 405 of Regulation S-K is not contained herein, and will not be contained, to thebest of registrant’s knowledge, in definitive proxy or information statements incorporated by reference in Part III of this Form 10-K or any amendment to thisForm 10-K. ☑
Indicate by check mark whether the registrant is an accelerated filer (as defined in Rule 12b-2 of the Exchange Act. Yes ☑ No o
The aggregate market value (approximate) of the registrant’s common equity held by non-affiliates based on the closing price of
a share of the registrant’s common stock for New York Stock Exchange composite transactions on September 8, 2003 $2,235,676,736
The number of shares of the registrant’s Common Stock (net of treasury shares) outstanding at September 8, 2003 119,618,873
DOCUMENTS INCORPORATED BY REFERENCE
Certain portions of the registrant’s definitive proxy statement (to be filed pursuant to Reg. 14A) relating to the Annual Meeting of Shareholders anticipatedto be held on November 6, 2003 are incorporated herein by reference in Part III of this Report.

TABLE OF CONTENTS
FORWARD-LOOKING STATEMENTSPART I
Item 1. BusinessItem 2. PropertiesItem 3. Legal ProceedingsItem 4. Submission of Matters to a Vote of Security Holders
PART IIItem 5. Market for Registrant’s Common Equity and Related Stockholder MattersItem 6. Selected Financial DataItem 7. Management’s Discussion and Analysis of Financial Condition and Results of OperationsItem 7A. Quantitative and Qualitative Disclosures About Market RiskItem 8. Financial Statements and Supplementary DataItem 9. Changes in and Disagreements with Accountants on Accounting and Financial DisclosuresItem 9A. Controls and Procedures
PART IIIItem 10. Directors and Executive OfficersItem 11. Executive CompensationItem 12. Security Ownership of Certain Beneficial Owners and ManagementItem 13. Certain Relationships and Related TransactionsItem 14. Principal Accountant Fees and Services
PART IVItem 15. Exhibits, Financial Statement Schedules and Reports on Form 8-K
EX-23.1EX-23.2EX-31.1EX-31.2EX-32.1EX-32.2
Table of Contents
TABLE OF CONTENTS
Page
PART I Forward-Looking Statements 2 Item 1. Business 3 Item 2. Properties 10 Item 3. Legal Proceedings 10 Item 4. Submission of Matters to a Vote of Security Holders 11
PART IIItem 5. Market for Registrant’s Common Equity and Related Stockholder Matters 12 Item 6. Selected Financial Data 13 Item 7. Management’s Discussion and Analysis of Financial Condition and Results of
Operations 15
Item 7A. Quantitative and Qualitative Disclosures About Market Risk 31 Item 8. Financial Statements and Supplementary Data 32 Item 9.
Changes in and Disagreements with Accountants on Accounting and FinancialDisclosures 32
Item 9A. Controls and Procedures 33 PART III
Item 10. Directors and Executive Officers 34 Item 11. Executive Compensation 34 Item 12. Security Ownership of Certain Beneficial Owners and Management 34 Item 13. Certain Relationships and Related Transactions 34 Item 14. Principal Accountant Fees and Services 34
PART IVItem 15. Exhibits, Financial Statement Schedules and Reports on Form 8-K 35
1
Table of Contents
FORWARD-LOOKING STATEMENTS
This Report contains forward-looking statements with respect to the financial condition, results of operations and business of Avnet, Inc. and subsidiaries(“Avnet” or the “Company”). You can find many of these statements by looking for words like “believes,” “expects,” “anticipates,” “estimates” or similarexpressions in this Report or in documents incorporated by reference in this Report.
These forward-looking statements are subject to numerous assumptions, risks and uncertainties. Factors that may cause actual results to differ materiallyfrom those contemplated by the forward-looking statements include the following:
• Continuation or worsening of the current technology industry down-cycle, particularly the semiconductor sector, would adversely affect Avnet’s expectedoperating results.
• Competitive pressures among distributors of electronic components and computer products may increase significantly through entry of new competitors or
otherwise. • General economic or business conditions, domestic and foreign, may be less favorable than management expected, resulting in lower sales and declining
operating results which can, in turn, impact the Company’s credit ratings, debt covenant compliance and liquidity, as well as the Company’s ability tomaintain existing unsecured financing or to obtain new financing.
• Legislative or regulatory changes may adversely affect the businesses in which Avnet is engaged. • Adverse changes may occur in the securities markets. • Changes in interest rates and currency fluctuations may reduce Avnet’s profit margins. • Avnet may be adversely affected by the allocation of products by suppliers.
Because forward-looking statements are subject to risks and uncertainties, actual results may differ materially from those expressed or implied by them.Management cautions you not to place undue reliance on these statements, which speak only as of the date of this Report.
Avnet does not undertake any obligation to update publicly or revise any forward-looking statements, whether as a result of new information, future events orotherwise.
2
Table of Contents
PART I
Item 1. Business*
Avnet, Inc., incorporated in New York in 1955, together with its subsidiaries (the “Company” or “Avnet”), is one of the world’s largest industrial distributors,based on sales, of electronic components, enterprise network and computer equipment and embedded subsystems, with sales in 2003 of $9.05 billion. Avnetcreates a vital link in the technology supply chain that connects over 250 of the world’s leading electronic component and computer product manufacturers to aglobal customer base of over 100,000 original equipment manufacturers (“OEMs”), contract manufacturers, value-added resellers (“VARs”) and end-users. Avnetdistributes electronic components and computer products as received from its suppliers or with assembly or other value added by Avnet. Additionally, Avnetprovides engineering design, materials management and logistics services, system integration and configuration, and supply chain advisory services.
Organizational Structure
As of the end of 2003, the Company was comprised of three global operating groups: Electronics Marketing (“EM”), Computer Marketing (“CM”) andApplied Computing (“AC”). Under the operating group structure as of the end of 2003 and in the current structure discussed below, each operating group has itsown senior management team that is led by a group president and includes other senior executives within the group that manage the group’s accounting andfinance, information systems, facilities, warehousing and other administrative tasks for each group as a whole. Each operating group also has distinct financialreporting that is evaluated at the corporate level and on which operating decisions and strategic planning for the Company as a whole are made. EM, CM and ACwere the overall segments upon which Avnet’s management primarily evaluated the operations of the Company and upon which it based its operating decisionsthrough the end of fiscal 2003. Divisions exist within each operating group that serve primarily as sales and marketing units to further streamline the sales andmarketing efforts within each operating group and to enhance each operating group’s ability to work with its customers and suppliers, generally along morespecific product lines or based upon geography. However, each division relies heavily on the support services that are provided centrally within each operatinggroup and by centralized support at the corporate level. These divisions are specifically discussed in the operating group discussions below.
Subsequent to 2003, management announced plans to combine CM and AC into one computer products and services operating group called AvnetTechnology Solutions (“ATS”). This combination will continue to bring to market all value propositions contained within the two former operating groups and ispart of Avnet’s continued efforts to strengthen its market leadership position, streamline operations and produce further cost savings. The rationalization of certainoperating facilities, equipment and processes is expected to yield significant cost savings while also stimulating new marketing opportunities for the combinedgroup by selling from a broader, shared line card of products and services to customers that will be served by the larger, combined operating group. See“Restructuring and Other Charges” appearing in Item 7 of this Report for further discussion of the restructuring efforts surrounding the combination of these twooperating groups as well as the benefits and cost savings that management expects will result.
A summary of each operating group, based on the three-group structure in place as of June 27, 2003, is included below. Further financial information bysegment and geography are also contained in Note 16 to the consolidated financial statements appearing in Item 15 of this Report.
* Unless otherwise specifically indicated, references in this Report to any particular year or quarter generally are to the Company’s fiscal year period. TheCompany’s fiscal year ends on the Friday closest to June 30th (Saturday closest to June 30th commencing in 2004).
3
Table of Contents
Electronics Marketing (“EM”)
EM markets and sells semiconductors, interconnect, passive and electromechanical devices (“IP&E”), and radio frequency (“RF”)/microwave components.EM markets and sells its products and services to customers spread across end-markets including communications, computer hardware and peripheral, industrialand manufacturing, medical equipment, and military and aerospace. EM also offers an array of value-added services to its customers, such as supply-chainmanagement, engineering design, inventory replenishment systems, connector and cable assembly, and semiconductor programming.
EM markets and sells products on behalf of over 250 of the world’s leading electronic component manufacturers. Suppliers of components to EM includeAnalog Devices, Infineon Technologies, Intel, Motorola, National Semiconductor, ON Semiconductor, Philips Components, Texas Instruments, Tyco and Xilinx.EM sells to multinational, regional and local OEMs and contract manufacturers including Benchmark, Celestica, Flextronics, General Electric, Plexus, Sanmina-SCI, Siemens and Solectron.
EM is Avnet’s largest operating group, with sales in 2003 of $4.99 billion, representing 55.1% of Avnet’s consolidated sales. EM is comprised of threeregional operations: EM Americas, which had sales of $2.38 billion in 2003, or 26.3% of Avnet’s consolidated sales; EM EMEA (Europe, Middle East andAfrica), which had sales of $1.74 billion in 2003, or 19.2% of Avnet’s consolidated sales; and EM Asia, which had sales of $868.3 million in 2003, or 9.6% ofAvnet’s consolidated sales.
Each EM sales division is generally focused on a specific customer segment, particular product lines provided by a limited group of suppliers or on a specificgeography. The various divisions collectively focus on the transactional needs of the traditional global electronic components distribution market, and therebyoffer one of the industry’s broadest line cards and convenient one-stop shopping with an emphasis on responsiveness, on-time delivery and quality. Certainspecialty services are made available to the individual divisions through common support service units.
EM’s sales division structure is as follows:
Americas
• Avnet Cilicon: Avnet’s semiconductor division in the Americas focuses on the semiconductor requirements of both customers and suppliers. To achievethis focus, Avnet Cilicon has channels focused on different customers’ needs, including dedicated channels to service small to medium customers, largecustomer engagements, defense and aerospace customers, emerging customers and contract manufacturers. Avnet Cilicon also provides an array ofengineering design and supply chain management services. Avnet Cilicon contains the former Avnet RF & Microwave sales division which was combinedwith Avnet Cilicon during 2003.
• Avnet IP&E: This division was rebranded during 2003 from the sales division formerly named Avnet Kent. Avnet IP&E distributes electronic connectors,
electronic wire and cable, and other passive and electromechanical products and interconnect assemblies used in assembling and manufacturing electronicproducts. Avnet IP&E also provides a wide array of value-added services including hi-reliability processing, parametric assembly, RF cable assembly, fanassembly, taping and reeling and component modification.
EMEA
• In EMEA, EM goes to market with seven sales divisions: EBV and WBC, based in Germany, which specialize in demand creation and logistics services forselect semiconductor suppliers; Silica, based in the United Kingdom, a semiconductor marketer; Avnet Time, based in the United Kingdom, a marketer ofIP&E components; BFI-Optilas, based in France, a marketer of specialty components and devices across Europe; Avnet Israel, based in Tel Aviv, one of thelargest value-added electronic components distributors in Israel; and Avnet Kopp, one of South Africa’s largest distributors of electronic and electricalcomponents. EM EMEA does business in 30 western and eastern European countries, South Africa, Turkey, Egypt and Israel.
4
Table of Contents
Asia
• EM Asia is a value-added distributor of electronic components and services in 10 Asian countries and Australia and New Zealand. All of EM Asia’soperations have access to the products and services provided by EM globally. The 2001 acquisition of Sunrise Technology Ltd. (“Sunrise”) significantlyenhanced EM’s presence in Asia, especially in the Peoples’ Republic of China (“PRC”). Avnet goes to market in China with three focused sales andmarketing divisions — Sunrise, ChinaTronic and Avnet Technology.
Computer Marketing (“CM”)
CM markets and sells enterprise computing systems, system configuration and integration, communications, software and storage. CM provides mid- tohigh-end servers, data storage, software and networking solutions, and the services required to implement these solutions. CM is a leading partner for systemvendors such as IBM and HP. Other key suppliers CM serves include Cisco Systems, EMC, Oracle, StorageTek and VERITAS. CM markets and sells its productsand services to the VAR channel and enterprise computing customers, which include AdviseX Technologies, ASAP Software, Key Information Systems, SiriusComputer Systems, Software Spectrum and Venture Systemsource.
CM’s 2003 sales were $2.43 billion, representing 26.8% of Avnet’s consolidated sales. CM’s 2003 global sales consisted of the following regional results:CM North America sales of $2.01 billion, or 22.2% of Avnet’s consolidated sales; CM EMEA sales of $371.2 million, or 4.1% of Avnet’s consolidated sales; andCM Asia/ Pacific sales of $45.0 million, or 0.5% of Avnet’s consolidated sales.
CM consists of three primary sales divisions as follows:
• Avnet Hall-Mark, based in North America, concentrates on sales of enterprise computer systems and software, including servers, storage and software,exclusively to the reseller channel in North America. Avnet Hall-Mark is one of the industry’s leading value-added distributors in the enterprise computingspace in support of a limited line card of the foremost systems, storage and software manufacturers. Avnet Hall-Mark provides those manufacturers’products to value-added resellers, along with complementary value-added services. Avnet Hall-Mark also provides logistics, financial, marketing, sales andtechnical services, including in-house engineering support, complex systems integration and configuration services.
• Avnet Enterprise Solutions provides end-user customers with information technology solutions that include hardware, software, maintenance, financial and
professional services. Avnet Enterprise Solutions is a solutions integrator specializing in enterprise server storage and network solutions. Avnet EnterpriseSolutions leverages its unique suite of technical and financial strategies and services to minimize risk, maximize flexibility and optimize the use of capitalon IT infrastructures, and thus brings value to businesses intent on managing their total cost of technology infrastructure — from the data center, throughthe network, to the desktop.
• Avnet Partner Solutions, based in Europe, is an industry leading, value-added distributor of enterprise computing systems, software, storage and services,
marketing exclusively to the reseller channel. Avnet Partner Solutions has European offices in Austria, Czech Republic, Germany, Hungary, Italy, Poland,Switzerland and the United Kingdom. Avnet Partner Solutions also operates a division in Australia, serving resellers and end-users.
Applied Computing (“AC”)
AC focuses on the worldwide OEM market for computing technology, system integrators and non-PC OEMs that require embedded systems and solutionsincluding engineering, product prototyping, integration and other value-added services. AC markets and sells subsystem products such as microprocessors, single-board computers, server building blocks, storage products, peripherals, flat panel displays, networking software, embedded software, wireless products andembedded operating systems. AC suppliers include Advanced Micro Devices, EIZO, IBM, Intel, LG.Philips, Maxtor, Micron Technologies, Motorola, Sharp,
5
Table of Contents
Toshiba and Western Digital. AC’s customers include ABS Computer Technologies, Astra Detentechnik, Avatar Technology, Avaya, Boldata, CC Compunet, ECSTrading Co. Ltd., GE Medical Systems, MA Laboratories, Xala Informatica and Western Scientific.
AC’s 2003 sales were approximately $1.63 billion, representing 18.0% of Avnet’s consolidated sales. AC’s 2003 global sales consisted of the followingregional results: AC North America sales of $633.1 million, or 7.0% of Avnet’s consolidated sales; AC EMEA sales of $888.2 million, or 9.8% of Avnet’sconsolidated sales; and AC Asia/ Pacific sales of $109.4 million, or 1.2% of Avnet’s consolidated sales.
AC’s sales divisions include the following:
• Applied Computing Components serves the needs of manufacturers of general-purpose computers by providing them with the latest technologies such asmicroprocessors, DRAM modules and motherboards.
• Applied Computing Solutions provides technical design, integration, marketing and financing to developers of application specific computer solutions in
the non-PC market place. Examples of these types of customers are OEMs in the medical, telecommunications, industrial control and digital creationmarket segments.
• Applied Computing Market Development concentrates on specialized displays, network products and storage solutions, while targeting mainly VARs and
system integrators with its wireless switch and wireless standalone solutions.
AC’s coverage of Europe as of the end of 2003 includes the United Kingdom, Germany, Spain, Italy, Austria (also services eastern Europe), the Nordicregion, the Benelux region, France and Switzerland.
Avnet Technology Solutions (“ATS”)
As discussed above, ATS was formed subsequent to 2003 through the combination of CM and AC. The sales divisions, product offerings and customer andsupplier relationships of CM and AC discussed above are expected to continue under ATS, while overall costs should decrease from the rationalization of variousfacilities, equipment and processes. ATS would have accounted for sales of $4.06 billion, or 44.9% of Avnet’s consolidated 2003 sales, had the new operatinggroup structure been in place during 2003. Regionally, ATS’s sales were spread across the Americas ($2.65 billion, or 29.3% of consolidated sales), EMEA($1.26 billion, or 13.9% of consolidated sales) and Asia ($154.4 million, or 1.7% of consolidated sales).
Foreign Operations
As noted in the operating group discussions, Avnet’s operations are deployed globally with significant operations in the three major regions of the world: theAmericas, EMEA, and Asia. Historically, Avnet’s operations in the Americas region (primarily the United States) have contributed the largest percentage ofconsolidated sales. During 2003, 2002 and 2001, the percentage of the Company’s business based in the Americas has been 56%, 60% and 68%, respectively. TheEMEA region’s contribution to Avnet’s consolidated sales has remained relatively flat over the same three-year period. The Asia region has been continuouslygrowing as a percentage of consolidated sales with 11%, 8% and 4%, respectively, of consolidated sales being generated there. This growth in Asia is a result ofAvnet’s continued investment in the PRC, which was recently admitted into the World Trade Organization, as well as investment in other countries throughoutthis rapidly growing region. Management expects the Asia region to continue this growth trend and to contribute a growing percentage of consolidated sales inthe future.
Avnet’s foreign operations are subject to a variety of risks including potential restrictions on transfers of funds, foreign currency fluctuations, import andexport duties, import and export regulations that could erode profit margins, changing foreign tax laws and regulations, potential military conflicts, less flexibleemployee contracts in the event of business downturns, and the burden and cost of compliance with foreign laws. The most significant of these risks is theCompany’s exposure to foreign currency fluctuations, which are hedged
6
Table of Contents
regularly as part of Avnet’s treasury and cash management operations. These risks are discussed further at “Quantitative and Qualitative Disclosures AboutMarket Risk” appearing in Item 7A of this Report. Additionally, discussion of specific impacts of foreign currency fluctuations, most notably the Euro, on theCompany’s consolidated financial statements are further discussed in “Management’s Discussion and Analysis of Financial Condition and Results of Operations”appearing in Item 7 of this Report.
Significant Acquisitions
Avnet made no significant acquisitions during 2003 or 2002. Avnet has historically pursued a strategic acquisition program to grow its presence in worldmarkets for electronic components and computer products. This growth strategy was a significant factor in Avnet becoming one of the largest industrialdistributors of electronic components and computer equipment worldwide. Having achieved this scale, management has focused in the Company’s most recenttwo fiscal years on its existing lines of business and strategies to help those businesses grow organically. For instance, since the acquisition of Sunrise TechnologyLtd. in 2001, Avnet has continued to establish an infrastructure throughout the Asia/ Pacific region to accommodate the significant growth in this part of theworld. Largely as a result of these efforts, sales in this region have increased from $556.4 million in 2000 to $1.02 billion in 2003. Further, the limited number ofacquisition targets has changed the focus of the Company’s acquisition strategy to a relatively smaller scale, which would likely be directed at geographies wherethe Company is seeking to increase its scale and scope if any acquisition targets are pursued. Management currently does not anticipate making any materialacquisitions in the near term.
During the last three years, the Company has completed six acquisitions — two in North America, two in Europe, one in the Asia/ Pacific region and one inthe Middle East — as highlighted in the table below:
Sales
Acquisition Date Acquired Company Base of Operations (Millions)(A)
March 2002 Gamma Optronik AB France $ 8 June 2001 Kent Electronics Corporation North America 942 May 2001 Sunrise Technology Ltd. China 230 February 2001 RDT Technologies Ltd. Israel 90 October 2000 VEBA Electronics Group Germany 1,800 July 2000 Savoir Technology Group, Inc. North America 767
(A) Represents the acquired company’s approximate sales in its most recent fiscal year prior to its acquisition by Avnet.
During 2001, the Company acquired a number of businesses that had a substantial positive impact on the sales and scale of operations of the Company. Inaddition to enhanced scale, as discussed above, another goal of the Company’s acquisition strategy is to recognize certain cost savings once the acquired companyis merged with Avnet. In order to achieve such cost savings, certain reduction efforts often must take place in the form of headcount reductions, facilityconsolidation and other reorganization efforts. See “Restructuring and Other Charges” appearing in Item 7 of this Report for further discussion of the Company’srestructuring efforts, including those associated with recent acquisitions. Below is a discussion of the Company’s significant acquisitions (those acquisitionswhere the acquired company had sales in excess of $150 million in its most recent fiscal year prior to acquisition). With the exception of the acquisition of KentElectronics Corporation (“Kent”), all of the acquisitions discussed below were accounted for using the purchase method of accounting.
On June 8, 2001, Avnet completed its acquisition of Kent, a specialty distributor and network integrator, following approval of the Amended and RestatedMerger Agreement and Plan of Merger dated as of March 21, 2001 (the “Merger Agreement”) by Avnet and Kent shareholders on June 6, 2001. Pursuant to theMerger Agreement, Kent was merged into Avnet and its separate existence ceased. Kent shareholders received 0.87 of a share of Avnet common stock for eachshare of Kent common stock held, with cash paid in
7
Table of Contents
lieu of any fractional shares based on $25.84 per Avnet share. Avnet issued approximately 25.3 million shares of its common stock to Kent shareholders and anadditional 1.7 million shares were reserved for issuance upon the exercise of outstanding warrants and stock options assumed in the transaction.
The accompanying consolidated financial statements and notes for years prior to 2002 have been restated to reflect the acquisition of Kent, which has beenaccounted for as a “pooling-of-interests.” The periods combined are more fully discussed in Note 2 to the consolidated financial statements appearing in Item 15of this Report. As discussed in Item 7 of this Report and in the notes to the consolidated financial statements, the Company recorded certain charges in the fourthquarters of 2002 and 2001, a significant portion of which resulted from the Kent acquisition being accounted for as a “pooling-of-interests.” Thus, these chargeswere recorded to the Company’s consolidated statements of operations as opposed to being reflected as opening balance sheet adjustments recorded as part ofpurchase accounting.
In May 2001, Avnet acquired Sunrise, a privately held electronic components distribution company serving indigenous and multinational OEMs and contractmanufacturers in the PRC and Hong Kong. The Sunrise acquisition has substantially strengthened the Company’s operations in the PRC and Asia overall andprovides an important strategic foothold for continued expansion in this important region of the world.
In October 2000, the Company completed the acquisition of certain European operations of the VEBA Electronics Group consisting of (a) the Germany-headquartered EBV Group, including EBV Electronik and WBC, both pan-European semiconductor distributors, and Atlas Services Europe, a logistics providerfor EBV and WBC; and (b) the Germany-based RKE Systems, a computer products and services distributor. The amount paid at closing of $740.0 million,subject to the resolution of certain purchase price contingencies, included the payoff of substantially all of the debt on the books of the companies acquired.During 2003, the Company and the seller of the VEBA Electronics Group resolved all remaining purchase price contingencies related to this acquisition, resultingin a refund to Avnet of a portion of the amount paid at closing totaling approximately $6.5 million.
In July 2000, the Company acquired Savoir Technology Group, Inc. (“Savoir”), a leading distributor of IBM mid-range server products in the Americas. Thisacquisition has benefited the Company, particularly CM, by contributing substantially to making Avnet one of the largest distributors of IBM Enterprise productsglobally. In the Savoir merger, holders of Savoir common stock received 0.11452 of a share of Avnet common stock for each share of Savoir common stock, andcash in lieu of fractional Avnet shares. Holders of Savoir series A preferred shares received 0.16098 of a share of Avnet common stock for each share they heldand cash in lieu of fractional Avnet shares. The total cost of the acquisition of Savoir including estimated expenses was approximately $145.8 million, consistingof the cost for the Savoir shares of $111.1 million in Avnet stock and $0.7 million in Avnet stock options (net of related tax benefits of $0.5 million) as well as$1.8 million for transaction expenses and $32.2 million for the payoff of pre-existing Savoir debt. The above dollar value of Avnet stock includes the issuance of3,736,954 shares of Avnet stock valued at the assumed price of $29.66 per share.
Major Products
One of Avnet’s competitive strengths is the breadth and quality of the suppliers whose products it distributes. IBM represents the only supplier from whichsales exceed 10% of the Company’s consolidated sales. During 2003, IBM products accounted for approximately 17.5% of the Company’s sales. Listed in the
8
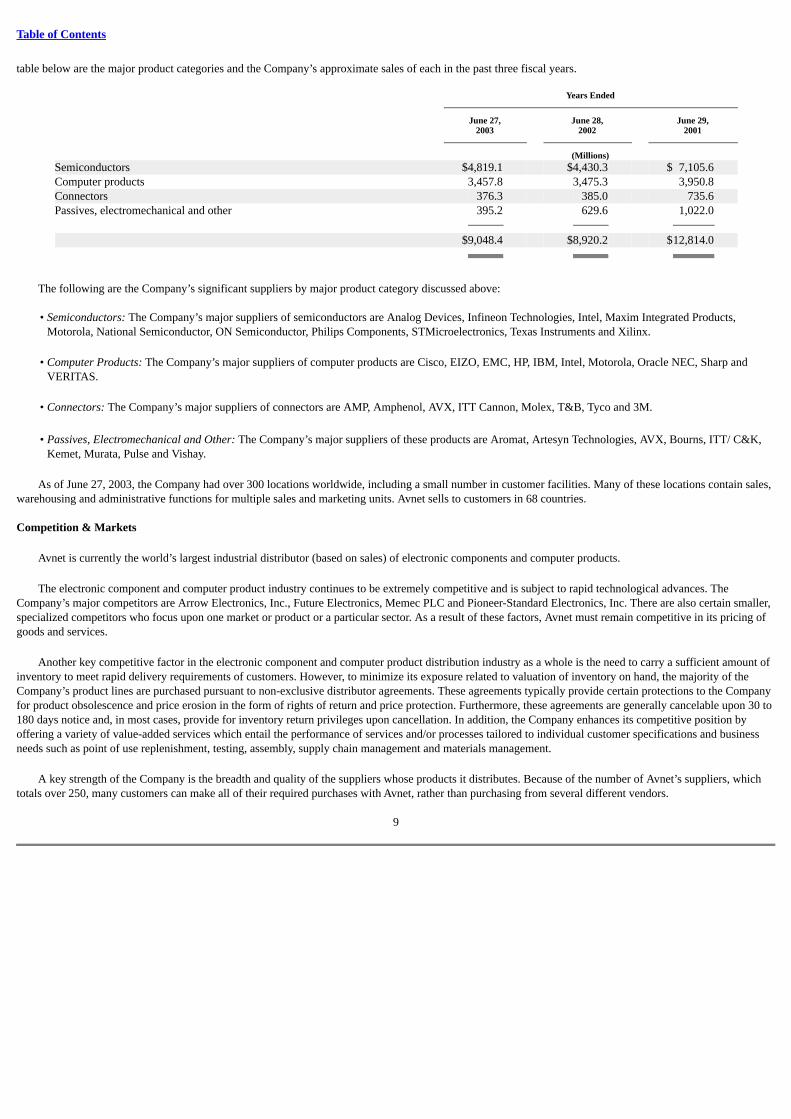
Table of Contents
table below are the major product categories and the Company’s approximate sales of each in the past three fiscal years.
Years Ended
June 27, June 28, June 29,2003 2002 2001
(Millions)Semiconductors $4,819.1 $4,430.3 $ 7,105.6 Computer products 3,457.8 3,475.3 3,950.8 Connectors 376.3 385.0 735.6 Passives, electromechanical and other 395.2 629.6 1,022.0 $9,048.4 $8,920.2 $12,814.0
The following are the Company’s significant suppliers by major product category discussed above:
• Semiconductors: The Company’s major suppliers of semiconductors are Analog Devices, Infineon Technologies, Intel, Maxim Integrated Products,Motorola, National Semiconductor, ON Semiconductor, Philips Components, STMicroelectronics, Texas Instruments and Xilinx.
• Computer Products: The Company’s major suppliers of computer products are Cisco, EIZO, EMC, HP, IBM, Intel, Motorola, Oracle NEC, Sharp and
VERITAS. • Connectors: The Company’s major suppliers of connectors are AMP, Amphenol, AVX, ITT Cannon, Molex, T&B, Tyco and 3M. • Passives, Electromechanical and Other: The Company’s major suppliers of these products are Aromat, Artesyn Technologies, AVX, Bourns, ITT/ C&K,
Kemet, Murata, Pulse and Vishay.
As of June 27, 2003, the Company had over 300 locations worldwide, including a small number in customer facilities. Many of these locations contain sales,warehousing and administrative functions for multiple sales and marketing units. Avnet sells to customers in 68 countries.
Competition & Markets
Avnet is currently the world’s largest industrial distributor (based on sales) of electronic components and computer products.
The electronic component and computer product industry continues to be extremely competitive and is subject to rapid technological advances. TheCompany’s major competitors are Arrow Electronics, Inc., Future Electronics, Memec PLC and Pioneer-Standard Electronics, Inc. There are also certain smaller,specialized competitors who focus upon one market or product or a particular sector. As a result of these factors, Avnet must remain competitive in its pricing ofgoods and services.
Another key competitive factor in the electronic component and computer product distribution industry as a whole is the need to carry a sufficient amount ofinventory to meet rapid delivery requirements of customers. However, to minimize its exposure related to valuation of inventory on hand, the majority of theCompany’s product lines are purchased pursuant to non-exclusive distributor agreements. These agreements typically provide certain protections to the Companyfor product obsolescence and price erosion in the form of rights of return and price protection. Furthermore, these agreements are generally cancelable upon 30 to180 days notice and, in most cases, provide for inventory return privileges upon cancellation. In addition, the Company enhances its competitive position byoffering a variety of value-added services which entail the performance of services and/or processes tailored to individual customer specifications and businessneeds such as point of use replenishment, testing, assembly, supply chain management and materials management.
A key strength of the Company is the breadth and quality of the suppliers whose products it distributes. Because of the number of Avnet’s suppliers, whichtotals over 250, many customers can make all of their required purchases with Avnet, rather than purchasing from several different vendors.
9
Table of Contents
Seasonality
With the exception of a relatively minor impact on consolidated results from the growth in revenues in the computer-related businesses (CM and AC) duringAvnet’s fiscal quarter ending in December, Avnet’s business is not materially impacted by seasonality.
Number of Employees
At June 27, 2003, Avnet had approximately 10,100 employees.
Avnet Website
The Company’s Annual Report on Form 10-K, Quarterly Reports on Form 10-Q, Current Reports on Form 8-K and amendments to those Reports, if any,filed or furnished pursuant to Section 13(a) or 15(d) of the Securities Exchange Act of 1934 are available on the Company’s website (avnet.com under the“Investor Relations — SEC Filings” captions) as soon as reasonably practicable after the Company electronically files such material with, or furnishes it to, theSecurities and Exchange Commission.
Item 2. Properties
At June 27, 2003, the Company owned and leased approximately 748,000 and 3,727,000 square feet of space, respectively, of which approximately 53% islocated in the United States. EM’s principal facilities for warehousing and value-added operations are located in Chandler, AZ; Poing, Germany; Tongeren,Belgium; and Grapevine, TX, where EM has approximately 395,000, 230,000, 167,000 and 181,000 square feet of space, respectively. CM’s principal facilitiesfor warehousing and value-added operations are located in Chandler, AZ where CM has approximately 196,000 square feet of space. CM also utilizes a portion ofthe Tongeren, Belgium facility discussed above for warehousing and value added operations. CM leases a 132,000 square foot building in Tempe, AZ for use asthe CM headquarters and EM and CM share leased office facilities of approximately 48,000 square feet in Diegem, Belgium as the administrative headquartersfor their respective European operations. AC’s principal facilities for integration and warehousing are located in Phoenix, AZ and Nettetal, Germany, where AChas approximately 87,000 and 177,000 square feet of space, respectively. AC leases approximately 35,000 square feet of space in Phoenix, AZ for use as the ACheadquarters. The Company leases a 176,000 square foot building in Phoenix, AZ for use as the EM headquarters as well as the Company’s corporateheadquarters.
As part of the planned restructuring activity in the first and second quarters of 2004, as discussed in Item 7 of this Report, the Company is in the process ofcombining the CM and AC operations as well as identifying additional properties for consolidation throughout Avnet’s global operations. As a result, theCompany’s total leased and owned facilities, including certain of the more significant facilities discussed above, may be impacted by these forthcomingrestructuring efforts.
Item 3. Legal Proceedings
As a result primarily of certain former manufacturing operations, Avnet may have liability under various federal, state and local environmental laws andregulations, including those governing pollution and exposure to and the handling, storage and disposal of hazardous substances. For example, under theComprehensive Environmental Response, Compensation and Liability Act of 1980, as amended (“CERCLA”) and similar state laws, Avnet may be liable for thecosts of cleaning up environmental contamination on or from its current or former properties, and at off-site locations where the Company disposed of wastes inthe past. Such laws may impose joint and several liability. Typically, however, the costs for cleanup at such sites are allocated among potentially responsibleparties (“PRPs”) based upon each party’s relative contribution to the contamination, and other factors.
In May 1993, the Company and the former owners of a Company-owned site in Oxford, North Carolina entered into a Settlement Agreement in which theformer owners agreed to bear 100% of all costs associated with investigation and cleanup of soils and sludges remaining on the site and 70% of all costsassociated with
10
Table of Contents
investigation and cleanup of groundwater. The Company agreed to be responsible for 30% of the groundwater investigation and cleanup costs. In October 1993,the Company and the former owners entered into a Consent Decree and Court Order with the Environmental Protection Agency (the “EPA”) for theenvironmental clean-up of the site, the cost of which, according to the EPA’s remedial investigation and feasibility study, was estimated to be approximately$6.3 million, exclusive of the approximately $1.5 million in EPA past costs paid by the potentially responsible parties (“PRPs”).
In September 2002, the Company’s subsidiary, Sterling Electronics, Inc. (“Sterling”), was added as a defendant in an existing lawsuit filed in the SuperiorCourt of California, County of Los Angeles, by property owners and residents in or near the San Gabriel Valley Superfund Site. This master case is aconsolidation of six different matters filed during the period from July 1997 through November 2001. Sterling once owned 92.46% of the capital stock ofPhaostron, Inc., which has been named as a PRP for contamination at the site. In March 2003, the court dismissed all six cases on technical grounds, but allowedthe plaintiffs the opportunity to properly serve newly-added industrial defendants, including Sterling, in any case not yet outside the mandatory service period. Infour of the six cases, the applicable service period has expired. Sterling, therefore, cannot be re-added to those cases as a defendant. In the remaining two cases,the plaintiffs have until January 1, 2004 and November 30, 2004, respectively, to re-add Sterling as a defendant in the master case and properly perfect service ofprocess on Sterling. Those plaintiffs have not indicated a monetary amount sought in this matter. The Company believes that Sterling has meritorious defenses toliability, and, although the ultimate outcome is uncertain, based on current information, the Company does not believe that its liability for this matter, if any, willbe material to its financial position, cash flow or results of operations.
The Company is a PRP at a manufacturing site in Huguenot, New York currently under investigation by the New York State Department of EnvironmentalConservation (“NYSDEC”), which site the Company owned from the mid-1960s until the early-1970s. The estimated cost of the first phase of the environmentalclean-up (to remediate contaminated soils), is approximately $2.4 million based on a NYSDEC cost estimate. The Company is currently engaged in litigation toapportion these costs among it and the current and former owners and operators of the site. Based on current information, Avnet does not anticipate its liability inthe matter will be material to its financial position, cash flow or results of operations.
Based on the information known to date, management believes that the Company has appropriately accrued in its consolidated financial statements for itsshare of the costs associated with these environmental clean-up sites.
The Company and/or its subsidiaries are also parties to various other legal proceedings arising from time to time in the normal course of business. Whilelitigation is subject to inherent uncertainties, management currently believes that the ultimate outcome of these proceedings, individually and in the aggregate,will not have a material adverse effect on the Company’s financial position, cash flow or overall results of operations.
Item 4. Submission of Matters to a Vote of Security Holders
Not applicable.
11
Table of Contents
PART II
Item 5. Market for Registrant’s Common Equity and Related Stockholder Matters
Market price per share
The Company’s common stock is listed on the New York Stock Exchange and the Pacific Exchange. Quarterly market prices (as reported for the New YorkStock Exchange composite transactions) for the last two fiscal years were:
2003 2002
Fiscal Quarters High Low High Low
1st $21.60 $11.28 $25.72 $17.55 2nd 14.15 5.96 26.38 17.54 3rd 12.55 9.61 29.06 22.98 4th 14.02 10.44 28.42 18.95
Record Holders
As of September 8, 2003 there were approximately 6,067 holders of record of Avnet’s common stock.
Dividends
The cash dividend paid on common stock was 7.5 cents per share during the first two quarters in fiscal 2002. Avnet announced on August 15, 2001 that itwould look to more effectively deploy its cash to fuel future earnings growth by discontinuing the payment of its cash dividend effective after its dividendpayment made on January 2, 2002.
12
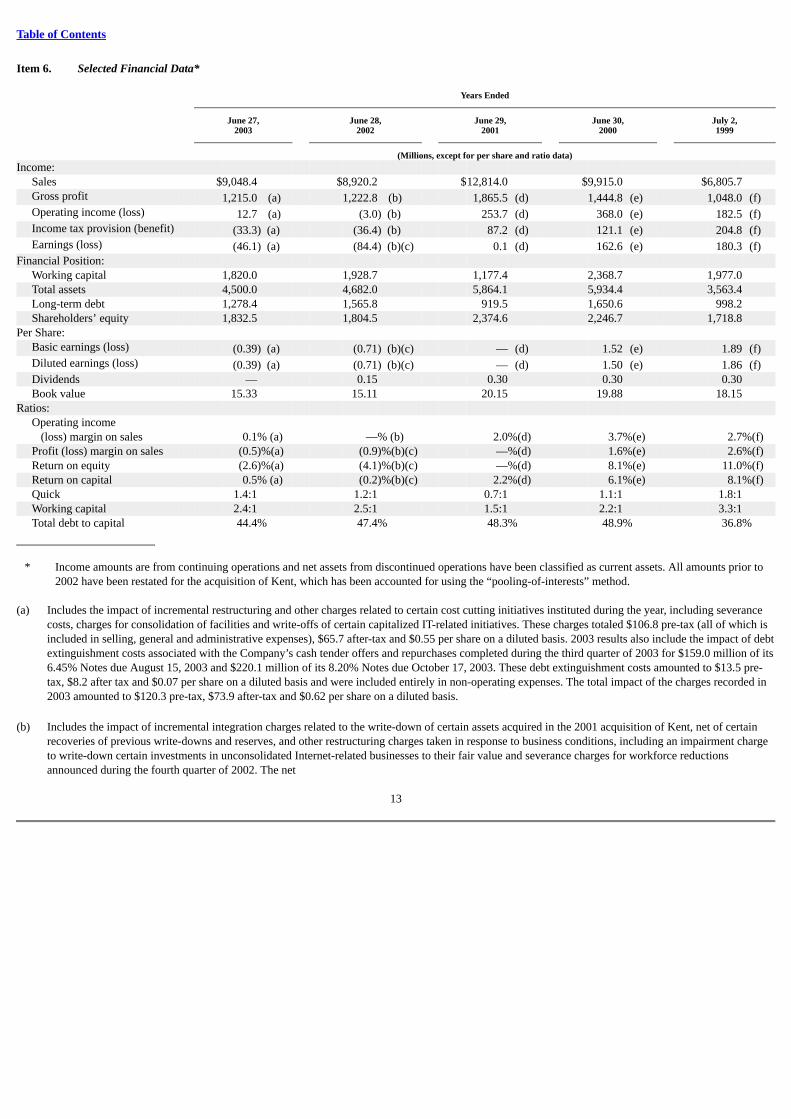
Table of Contents
Item 6. Selected Financial Data*
Years Ended
June 27, June 28, June 29, June 30, July 2,2003 2002 2001 2000 1999
(Millions, except for per share and ratio data)Income: Sales $9,048.4 $8,920.2 $12,814.0 $9,915.0 $6,805.7 Gross profit 1,215.0 (a) 1,222.8 (b) 1,865.5 (d) 1,444.8 (e) 1,048.0 (f) Operating income (loss) 12.7 (a) (3.0) (b) 253.7 (d) 368.0 (e) 182.5 (f) Income tax provision (benefit) (33.3) (a) (36.4) (b) 87.2 (d) 121.1 (e) 204.8 (f) Earnings (loss) (46.1) (a) (84.4) (b)(c) 0.1 (d) 162.6 (e) 180.3 (f)Financial Position: Working capital 1,820.0 1,928.7 1,177.4 2,368.7 1,977.0 Total assets 4,500.0 4,682.0 5,864.1 5,934.4 3,563.4 Long-term debt 1,278.4 1,565.8 919.5 1,650.6 998.2 Shareholders’ equity 1,832.5 1,804.5 2,374.6 2,246.7 1,718.8 Per Share: Basic earnings (loss) (0.39) (a) (0.71) (b)(c) — (d) 1.52 (e) 1.89 (f) Diluted earnings (loss) (0.39) (a) (0.71) (b)(c) — (d) 1.50 (e) 1.86 (f) Dividends — 0.15 0.30 0.30 0.30 Book value 15.33 15.11 20.15 19.88 18.15 Ratios:
Operating income(loss) margin on sales 0.1% (a) —% (b) 2.0%(d) 3.7%(e) 2.7%(f)
Profit (loss) margin on sales (0.5)%(a) (0.9)%(b)(c) —%(d) 1.6%(e) 2.6%(f) Return on equity (2.6)%(a) (4.1)%(b)(c) —%(d) 8.1%(e) 11.0%(f) Return on capital 0.5% (a) (0.2)%(b)(c) 2.2%(d) 6.1%(e) 8.1%(f) Quick 1.4:1 1.2:1 0.7:1 1.1:1 1.8:1 Working capital 2.4:1 2.5:1 1.5:1 2.2:1 3.3:1 Total debt to capital 44.4% 47.4% 48.3% 48.9% 36.8%
* Income amounts are from continuing operations and net assets from discontinued operations have been classified as current assets. All amounts prior to2002 have been restated for the acquisition of Kent, which has been accounted for using the “pooling-of-interests” method.
(a) Includes the impact of incremental restructuring and other charges related to certain cost cutting initiatives instituted during the year, including severancecosts, charges for consolidation of facilities and write-offs of certain capitalized IT-related initiatives. These charges totaled $106.8 pre-tax (all of which isincluded in selling, general and administrative expenses), $65.7 after-tax and $0.55 per share on a diluted basis. 2003 results also include the impact of debtextinguishment costs associated with the Company’s cash tender offers and repurchases completed during the third quarter of 2003 for $159.0 million of its6.45% Notes due August 15, 2003 and $220.1 million of its 8.20% Notes due October 17, 2003. These debt extinguishment costs amounted to $13.5 pre-tax, $8.2 after tax and $0.07 per share on a diluted basis and were included entirely in non-operating expenses. The total impact of the charges recorded in2003 amounted to $120.3 pre-tax, $73.9 after-tax and $0.62 per share on a diluted basis.
(b) Includes the impact of incremental integration charges related to the write-down of certain assets acquired in the 2001 acquisition of Kent, net of certain
recoveries of previous write-downs and reserves, and other restructuring charges taken in response to business conditions, including an impairment chargeto write-down certain investments in unconsolidated Internet-related businesses to their fair value and severance charges for workforce reductionsannounced during the fourth quarter of 2002. The net
13
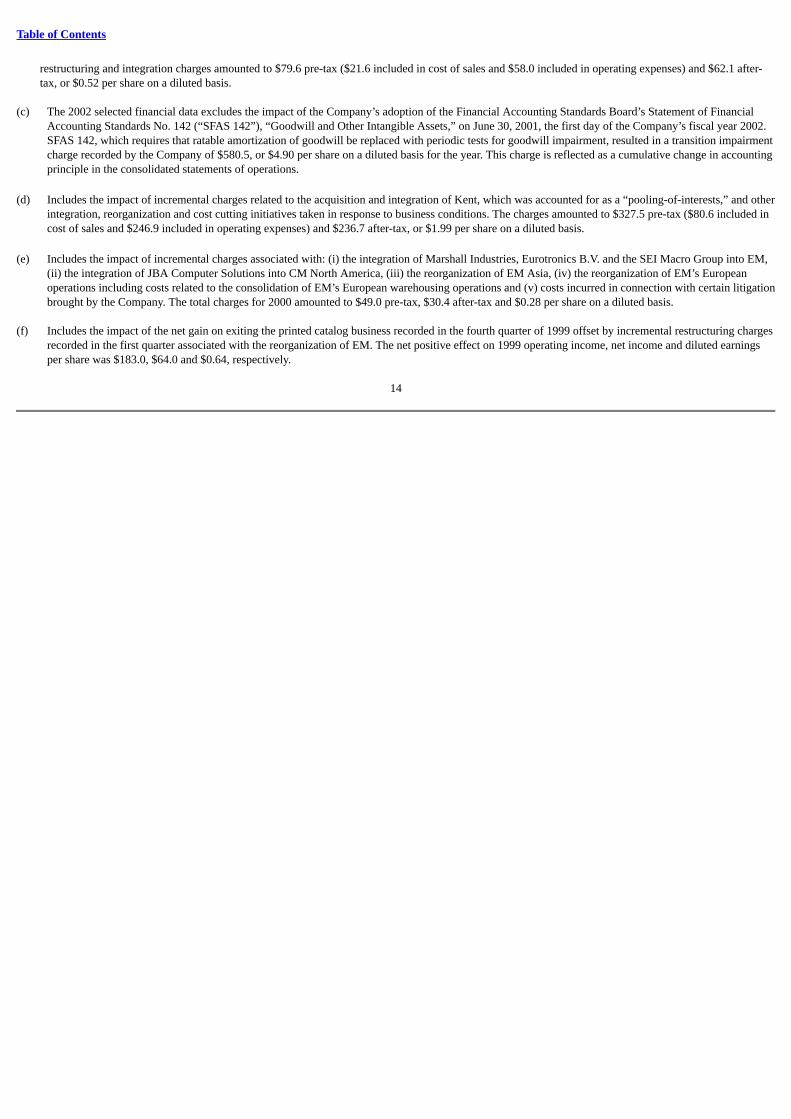
Table of Contents
restructuring and integration charges amounted to $79.6 pre-tax ($21.6 included in cost of sales and $58.0 included in operating expenses) and $62.1 after-tax, or $0.52 per share on a diluted basis.
(c) The 2002 selected financial data excludes the impact of the Company’s adoption of the Financial Accounting Standards Board’s Statement of FinancialAccounting Standards No. 142 (“SFAS 142”), “Goodwill and Other Intangible Assets,” on June 30, 2001, the first day of the Company’s fiscal year 2002.SFAS 142, which requires that ratable amortization of goodwill be replaced with periodic tests for goodwill impairment, resulted in a transition impairmentcharge recorded by the Company of $580.5, or $4.90 per share on a diluted basis for the year. This charge is reflected as a cumulative change in accountingprinciple in the consolidated statements of operations.
(d) Includes the impact of incremental charges related to the acquisition and integration of Kent, which was accounted for as a “pooling-of-interests,” and other
integration, reorganization and cost cutting initiatives taken in response to business conditions. The charges amounted to $327.5 pre-tax ($80.6 included incost of sales and $246.9 included in operating expenses) and $236.7 after-tax, or $1.99 per share on a diluted basis.
(e) Includes the impact of incremental charges associated with: (i) the integration of Marshall Industries, Eurotronics B.V. and the SEI Macro Group into EM,
(ii) the integration of JBA Computer Solutions into CM North America, (iii) the reorganization of EM Asia, (iv) the reorganization of EM’s Europeanoperations including costs related to the consolidation of EM’s European warehousing operations and (v) costs incurred in connection with certain litigationbrought by the Company. The total charges for 2000 amounted to $49.0 pre-tax, $30.4 after-tax and $0.28 per share on a diluted basis.
(f) Includes the impact of the net gain on exiting the printed catalog business recorded in the fourth quarter of 1999 offset by incremental restructuring chargesrecorded in the first quarter associated with the reorganization of EM. The net positive effect on 1999 operating income, net income and diluted earningsper share was $183.0, $64.0 and $0.64, respectively.
14
Table of Contents
Item 7. Management’s Discussion and Analysis of Financial Condition and Results of Operations
For an understanding of the significant factors that influenced the Company’s performance during the past three fiscal years, the following discussion shouldbe read in conjunction with the consolidated financial statements, including the related notes, and other information appearing elsewhere in this Report. Thesevere economic downturn in the technology markets in which the Company competes is a material contributor to the financial results discussed in this“Management’s Discussion and Analysis of Financial Condition and Results of Operations” (“MD&A”).
Due to the severity and length of the downturn in the electronic component and computer product industry and in the global economy as a whole, theCompany has recorded numerous charges in recent years that are discussed more fully in “Restructuring and Other Charges” in this MD&A. These charges havehad a significant impact on the Company’s results of operations in each of the years presented in this Report as discussed further below.
In addition to disclosing financial results that are determined in accordance with accounting principles generally accepted in the United States (“GAAP”), theCompany also discloses pro forma or non-GAAP measures that may exclude certain items. Management believes that providing this additional information isuseful to the reader to better assess and understand operating performance, especially when comparing results with previous periods or forecasting performancefor future periods. Management believes the pro forma measures also help indicate underlying trends in the business. Management also uses pro formainformation to establish operational goals and, in some cases, for measuring performance for compensation purposes. However, analysis of results and outlook ona pro forma or non-GAAP basis should be used as a complement to, and in conjunction with, data presented in accordance with GAAP.
Please note that unless otherwise specifically indicated, references herein to any particular year or quarter generally are to the Company’s fiscal year periods.The Company’s fiscal year ends on the Friday closest to June 30 (Saturday closest to June 30 commencing in 2004).
Critical Accounting Policies
The Company’s consolidated financial statements have been prepared in accordance with GAAP. The preparation of these consolidated financial statementsrequires the Company to make estimates and assumptions that affect the reported amounts of assets, liabilities, revenues and expenses during the reporting period.These estimates and assumptions are based upon the Company’s continuous evaluation of historical results and anticipated future events. Actual results may differfrom these estimates under different assumptions or conditions.
The Securities and Exchange Commission defines critical accounting polices as those that are, in management’s view, most important to the portrayal of theCompany’s financial condition and results of operations and those that require significant judgments and estimates. Management believes the Company’s mostcritical accounting policies relate to:
Valuation of Receivables: The Company maintains an allowance for doubtful accounts for estimated losses resulting from customer defaults. Bad debtreserves are recorded based upon historic default averages as well as the Company’s regular assessment of the financial condition of its customers
Valuation of Inventories: Inventories are recorded at the lower of cost (first in — first out) or estimated market value. The Company’s inventories includehigh-technology components, embedded systems and computing technologies sold into rapidly changing, cyclical and competitive markets whereby suchinventories may be subject to early technological obsolescence.
The Company regularly evaluates inventories for excess, obsolescence or other factors that may render inventories less marketable. Write-downs arerecorded so that inventories reflect the approximate net realizable value and take into account the Company’s contractual provisions with its suppliers, whichprovide certain protections to the Company for product obsolescence and price erosion in the form of rights of return and price protection. Because of the largenumber of transactions and the complexity of managing the process
15
Table of Contents
around price protections and stock rotations, estimates are made regarding adjustments to the carrying amount of inventories. Additionally, assumptions aboutfuture demand, market conditions and decisions to discontinue certain product lines can impact the decision to write down inventories. If assumptions aboutfuture demand change or actual market conditions are less favorable than those projected by management, management would evaluate whether additional write-downs of inventories are required. In any case, actual values could be different from those estimated.
Accounting for Income Taxes: Management judgment is required in determining the provision for income taxes, deferred tax assets and liabilities and thevaluation allowance recorded against net deferred tax assets. The carrying value of the Company’s net foreign operating loss carry-forwards is dependent upon itsability to generate sufficient future taxable income in certain tax jurisdictions. In addition, the Company considers historic levels of income, expectations and riskassociated with estimates of future taxable income and ongoing prudent and feasible tax planning strategies in assessing a tax valuation allowance. Should theCompany determine that it is not able to realize all or part of its deferred tax assets in the future, an additional valuation allowance may be recorded against thedeferred tax assets with a corresponding charge to income in the period such determination is made.
Restructuring and Integration Charges: The Company has been subject to the financial impact of integrating acquired businesses and charges related tobusiness reorganizations. In connection with such events, management is required to make estimates about the financial impact of such matters that are inherentlyuncertain. Accrued liabilities and reserves are established to cover the cost of severance, facility consolidation and closure, lease termination fees, inventoryadjustments based upon acquisition-related termination of supplier agreements and/or the re-evaluation of the acquired working capital assets (inventory andaccounts receivable), change-in-control expenses, and write-down of other acquired assets including goodwill. Actual amounts incurred could be different fromthose estimated.
Additionally, in assessing the Company’s goodwill for impairment in accordance with the Financial Accounting Standards Board’s (“FASB”) Statement ofFinancial Accounting Standards No. 142 (“SFAS 142”), “Goodwill and Other Intangible Assets,” the Company is required to make significant assumptions aboutthe future cash flows and overall performance of its reporting units. Should these assumptions or the structure of the reporting units change in the future basedupon market conditions or changes in business strategy, the Company may be required to record additional impairment charges to its remaining goodwill. See“Change in Accounting Principle — Goodwill” in this MD&A for further discussion of SFAS 142 and the Company’s transitional and annual impairment tests.
Contingencies and Litigation: The Company is involved in various legal proceedings and other claims related to environmental, labor, product and othermatters, all of which arise in the normal course of business. The Company is required to assess the likelihood of any adverse judgment or outcome to thesematters, as well as the range of potential losses. A determination of the reserves required, if any, is made after careful analysis by management and internal and,when necessary, external counsel. The required reserves may change in the future due to developments or a change in circumstances. Changes to reserves couldincrease or decrease earnings in the period the changes are effective.
The Company does not consider revenue recognition to be a critical accounting policy due to the nature of its business in which revenues are generallyrecognized when persuasive evidence of an arrangement exists, delivery has occurred or services have been rendered, the sales price is fixed or determinable andcollectibility is reasonably assured. Generally these criteria are met upon the actual shipment of product to the customer. Accordingly, other than for estimatesrelated to possible returns of products from customers, discounts or rebates, the recording of revenue does not require significant judgments or estimates.Furthermore, revenues from maintenance contracts, which are deferred and recognized to income over the life of the agreement, and revenues and anticipatedprofits from long-term contracts, which are recorded on a percentage of completion basis, are not material to the consolidated results of operations of theCompany.
16
Table of Contents
Recently Issued Accounting Pronouncements
In November 2002, the Emerging Issues Task Force reached a consensus on EITF Issue No. 02-16 (“EITF 02-16”), “Accounting by a Customer (Including aReseller) for Certain Consideration Received from a Vendor.” EITF 02-16 provides guidance as to the classification and timing of recognition of supplier rebatesin the results of operations of the customer or reseller receiving the rebate. Substantially all of Avnet’s rebates are dependent on the resale of the product toAvnet’s customers and the rebates are typically not awarded until Avnet completes this sale. Avnet has historically accounted for these rebates as a reduction ofcost of sales and, therefore, EITF 02-16 did not have a material impact on the Company.
In January 2003, the FASB issued FASB Interpretation No. 46 (“FIN 46”), “Consolidation of Variable Interest Entities,” which requires the consolidation ofvariable interest entities (“VIEs”), as defined, based upon an assessment of a company’s investment interests in the VIE as it relates to the interests of otherinvestors in the VIE. FIN 46 also includes certain disclosure requirements related to any VIEs. The consolidation requirements apply to any VIEs created afterJanuary 31, 2003 and, for any VIEs that existed prior to that date, the consolidation requirements are effective with Avnet’s first quarter of fiscal 2004 to theextent Avnet continues to hold an investment interest in any such VIEs as of the first day of that quarter. The adoption of FIN 46 is not expected to have amaterial impact on the Company’s consolidated financial statements.
In April 2003, the FASB issued Statement of Financial Accounting Standards No. 149 (“SFAS 149”), “Amendment of Statement 133 on DerivativeInstruments and Hedging Activities,” which amends and clarifies financial accounting and reporting for derivative instruments, including certain derivativeinstruments embedded in other contracts. SFAS 149 is effective for contracts entered into or modified after June 30, 2003 and for hedging relationshipsdesignated after June 30, 2003. The provisions of SFAS 149 are to be applied prospectively and, therefore, will have no impact on pre-existing hedgingtransactions.
In May 2003, the FASB issued Statement of Financial Accounting Standards No. 150 (“SFAS 150”), “Accounting for Certain Financial Instruments withCharacteristics of both Liabilities and Equity.” SFAS 150 establishes standards for classification and measurement of certain financial instruments. SFAS 150 iseffective for any financial instruments entered into or modified after May 31, 2003 and Avnet adopted SFAS 150, as required, for any previously existingfinancial instruments as of June 28, 2003. The adoption of SFAS 150 did not have a material effect on the Company’s consolidated financial statements.
Acquisitions and Investments
For an overview of the Company’s acquisitions over the past three years, see Item 1, “Business,” and see Note 2 to the consolidated financial statementsappearing in Item 15 of this Report. Management currently does not anticipate making any material acquisitions in the near term.
See Note 2 to the consolidated financial statements for further discussion of the impact of certain material acquisitions on the financial results of theCompany.
Results from Operations
The results for 2003 reflect a relatively stable but continuing weak technology market as the electronic components and computer products industry, and theglobal economy in general, continue to try to recover from the downturn that commenced after the Company’s second quarter of 2001. This downturn has had asignificant impact on the Company’s results from operations in all periods presented herein. The downturn is primarily a consequence of several economic andgeopolitical forces: weakened financial markets following the collapse of the dot com industry and other recent significant business failures; weak global demandfor IT capital equipment following the Y2K and dot com infrastructure buildup; a severe oversupply of electronic components; and an uncertain geopoliticalclimate. These events have impacted, to varying degrees, all facets of the technology markets in which the Company competes, resulting in suppressed demandwhich has been compounded by pricing pressures within the supply chain, a common effect to the industry in a downturn such
17
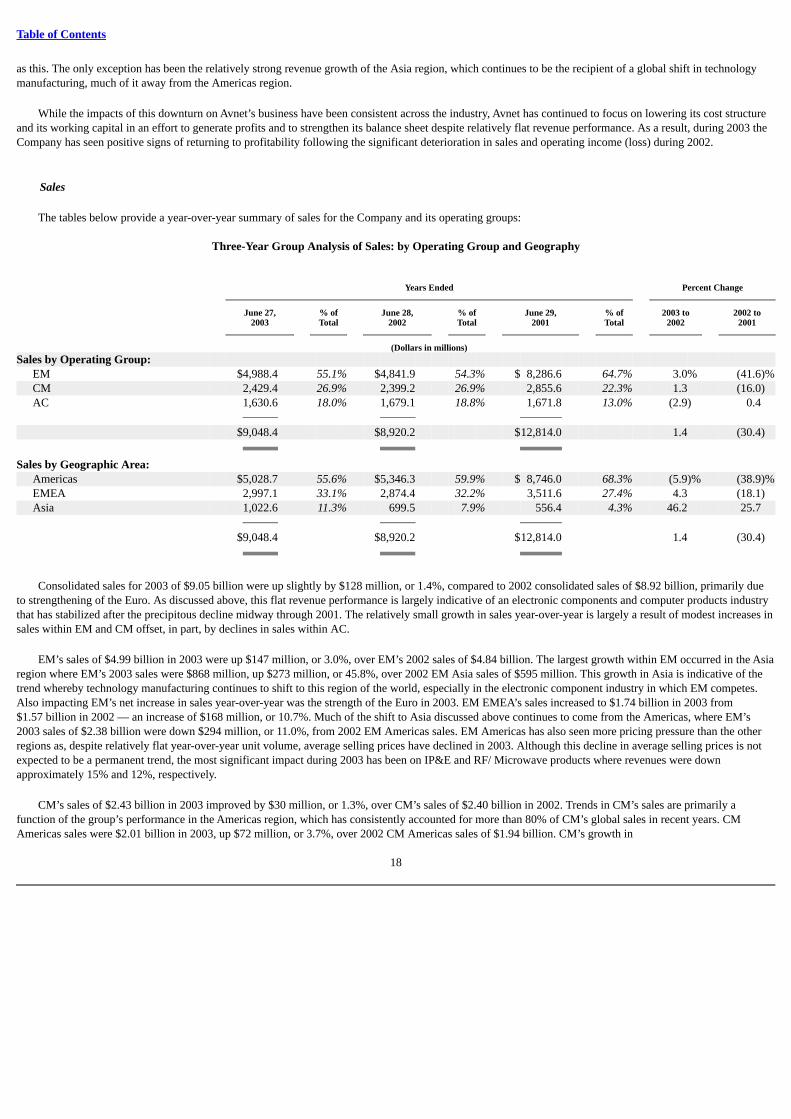
Table of Contents
as this. The only exception has been the relatively strong revenue growth of the Asia region, which continues to be the recipient of a global shift in technologymanufacturing, much of it away from the Americas region.
While the impacts of this downturn on Avnet’s business have been consistent across the industry, Avnet has continued to focus on lowering its cost structureand its working capital in an effort to generate profits and to strengthen its balance sheet despite relatively flat revenue performance. As a result, during 2003 theCompany has seen positive signs of returning to profitability following the significant deterioration in sales and operating income (loss) during 2002.
Sales
The tables below provide a year-over-year summary of sales for the Company and its operating groups:
Three-Year Group Analysis of Sales: by Operating Group and Geography
Years Ended Percent Change
June 27, % of June 28, % of June 29, % of 2003 to 2002 to2003 Total 2002 Total 2001 Total 2002 2001
(Dollars in millions)Sales by Operating Group: EM $4,988.4 55.1% $4,841.9 54.3% $ 8,286.6 64.7% 3.0% (41.6)% CM 2,429.4 26.9% 2,399.2 26.9% 2,855.6 22.3% 1.3 (16.0) AC 1,630.6 18.0% 1,679.1 18.8% 1,671.8 13.0% (2.9) 0.4 $9,048.4 $8,920.2 $12,814.0 1.4 (30.4) Sales by Geographic Area: Americas $5,028.7 55.6% $5,346.3 59.9% $ 8,746.0 68.3% (5.9)% (38.9)% EMEA 2,997.1 33.1% 2,874.4 32.2% 3,511.6 27.4% 4.3 (18.1) Asia 1,022.6 11.3% 699.5 7.9% 556.4 4.3% 46.2 25.7 $9,048.4 $8,920.2 $12,814.0 1.4 (30.4)
Consolidated sales for 2003 of $9.05 billion were up slightly by $128 million, or 1.4%, compared to 2002 consolidated sales of $8.92 billion, primarily dueto strengthening of the Euro. As discussed above, this flat revenue performance is largely indicative of an electronic components and computer products industrythat has stabilized after the precipitous decline midway through 2001. The relatively small growth in sales year-over-year is largely a result of modest increases insales within EM and CM offset, in part, by declines in sales within AC.
EM’s sales of $4.99 billion in 2003 were up $147 million, or 3.0%, over EM’s 2002 sales of $4.84 billion. The largest growth within EM occurred in the Asiaregion where EM’s 2003 sales were $868 million, up $273 million, or 45.8%, over 2002 EM Asia sales of $595 million. This growth in Asia is indicative of thetrend whereby technology manufacturing continues to shift to this region of the world, especially in the electronic component industry in which EM competes.Also impacting EM’s net increase in sales year-over-year was the strength of the Euro in 2003. EM EMEA’s sales increased to $1.74 billion in 2003 from$1.57 billion in 2002 — an increase of $168 million, or 10.7%. Much of the shift to Asia discussed above continues to come from the Americas, where EM’s2003 sales of $2.38 billion were down $294 million, or 11.0%, from 2002 EM Americas sales. EM Americas has also seen more pricing pressure than the otherregions as, despite relatively flat year-over-year unit volume, average selling prices have declined in 2003. Although this decline in average selling prices is notexpected to be a permanent trend, the most significant impact during 2003 has been on IP&E and RF/ Microwave products where revenues were downapproximately 15% and 12%, respectively.
CM’s sales of $2.43 billion in 2003 improved by $30 million, or 1.3%, over CM’s sales of $2.40 billion in 2002. Trends in CM’s sales are primarily afunction of the group’s performance in the Americas region, which has consistently accounted for more than 80% of CM’s global sales in recent years. CMAmericas sales were $2.01 billion in 2003, up $72 million, or 3.7%, over 2002 CM Americas sales of $1.94 billion. CM’s growth in
18
Table of Contents
the Americas is driven in large part by growth in the enterprise computing and storage markets offset, in part, by continued reduced activity in thetelecommunications and networking sectors. CM’s EMEA and Asia sales of $371 million and $45 million, respectively, were down 12.9% and up 38.1% incomparison to 2002 results.
AC’s 2003 sales were $1.63 billion, down $48 million, or 2.9%, from 2002 sales of $1.68 billion. This reduction is primarily a result of AC’s continued focuson higher margin OEMs while reducing its customer relationships in the highly competitive, low margin PC Builder market in all regions. AC Americas’ sales of$633 million in 2003 were down $96 million, or 13.2%, from 2002. This decline was somewhat offset by sales within AC EMEA of $888 million, which were up1.1% over 2002, primarily on the strength of the Euro, and sales within AC Asia of $109 million, which were up 52.9% over 2002 sales, primarily due to themigration of some business to the Asia region, similar to the effect on EM’s business discussed above.
As discussed further in “Restructuring and Other Charges,” the Company announced subsequent to 2003 that it would combine the CM and AC operationson a global basis, which is expected to result in the elimination of certain duplicative executive and support functions (no material eliminations in sales andmarketing positions are anticipated), the closing of certain logistics operations in the Americas and EMEA and the elimination of certain duplicative IT platforms.This combination is not expected to result in any material reduction in sales for the combined enterprises. CM and AC combined generated revenues in 2003 of$4.06 billion, or 45% of consolidated sales as compared to combined revenues of $4.08 billion, or 46% of consolidated sales, in 2002.
The Company completed 2002 with sales of $8.92 billion, down 30.4%, or $3.89 billion, from the record sales of $12.81 billion recorded in 2001. Asdiscussed above, the decrease in consolidated sales was due primarily to the confluence of global and domestic economic forces that caused the severe downturnin the technology markets the Company serves. EM sales were most significantly impacted as this group reported sales of $4.84 billion in 2002, down$3.44 billion, or 42%, from 2001 sales of $8.29 billion. The drop within EM is directly attributable to the global decline in semiconductor sales in 2002 consistentwith the semiconductor industry as a whole, which experienced its worst performance in annual revenue trends in calendar 2001. CM sales of $2.40 billion weredown $456 million, or 16%, from 2001 levels primarily due to similar macro-economic factors as discussed above. AC sales of $1.68 billion in 2002 increasedmarginally by 0.4% from 2001 due primarily to growth in its European operations (affected, in part, by a full year of operations of RKE Systems in 2002,acquired as part of the VEBA Group acquisition discussed in Item 1 of this Report) as well as marginally positive growth in Asia.
Restructuring and Other Charges
The Company recorded a number of restructuring and other charges during the last three fiscal years. These charges relate primarily to three items:(1) charges stemming from acquisition and integration of newly acquired businesses; (2) charges to record impairment in the Company’s Internet-relatedinvestments and (3) the reorganization of operations in each of the three major regions of the world in which the Company operates, generally taken in responseto business conditions at the time of the charge. The Company also recorded a charge for the cumulative effect of change in accounting principle, which is furtherdiscussed in “Change in Accounting Principle — Goodwill” in this MD&A, and debt extinguishment costs associated with the Company’s redemption of certainoutstanding debt obligations, which is further discussed in “Liquidity and Capital Resources.”
19
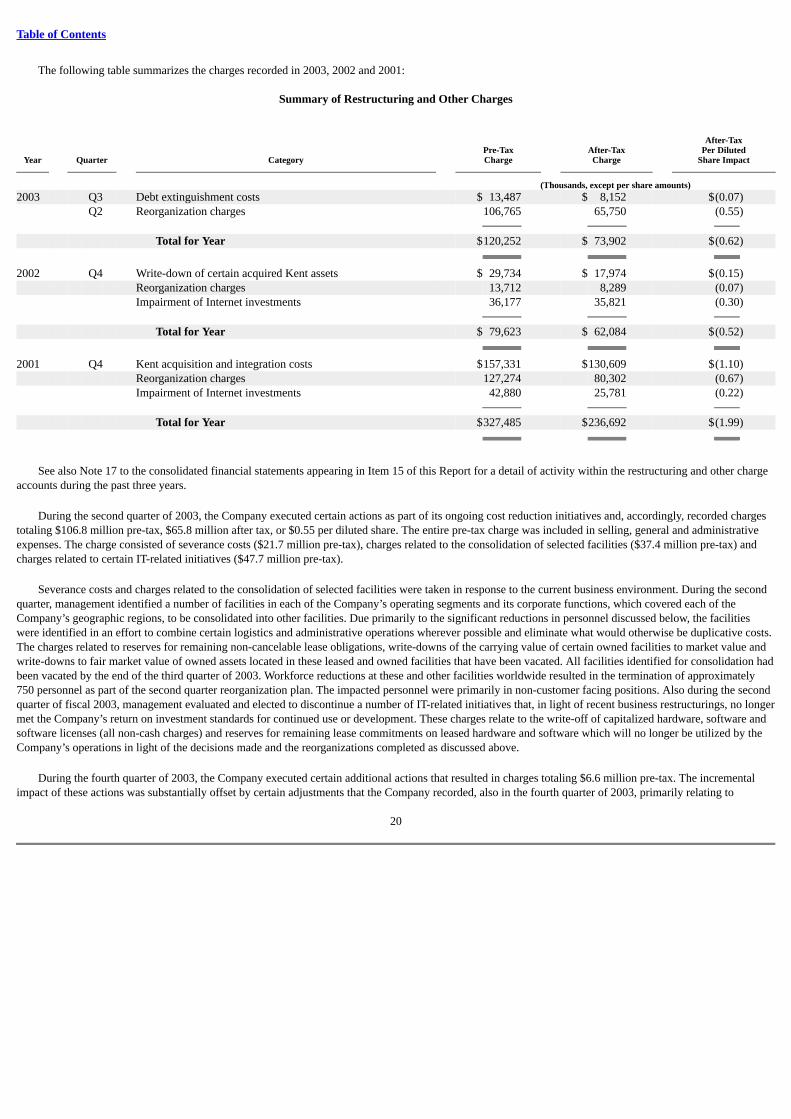
Table of Contents
The following table summarizes the charges recorded in 2003, 2002 and 2001:
Summary of Restructuring and Other Charges
After-Tax
Pre-Tax After-Tax Per DilutedYear Quarter Category Charge Charge Share Impact
(Thousands, except per share amounts)2003 Q3 Debt extinguishment costs $ 13,487 $ 8,152 $(0.07) Q2 Reorganization charges 106,765 65,750 (0.55) Total for Year $120,252 $ 73,902 $(0.62) 2002 Q4 Write-down of certain acquired Kent assets $ 29,734 $ 17,974 $(0.15) Reorganization charges 13,712 8,289 (0.07) Impairment of Internet investments 36,177 35,821 (0.30) Total for Year $ 79,623 $ 62,084 $(0.52) 2001 Q4 Kent acquisition and integration costs $157,331 $130,609 $(1.10) Reorganization charges 127,274 80,302 (0.67) Impairment of Internet investments 42,880 25,781 (0.22) Total for Year $327,485 $236,692 $(1.99)
See also Note 17 to the consolidated financial statements appearing in Item 15 of this Report for a detail of activity within the restructuring and other chargeaccounts during the past three years.
During the second quarter of 2003, the Company executed certain actions as part of its ongoing cost reduction initiatives and, accordingly, recorded chargestotaling $106.8 million pre-tax, $65.8 million after tax, or $0.55 per diluted share. The entire pre-tax charge was included in selling, general and administrativeexpenses. The charge consisted of severance costs ($21.7 million pre-tax), charges related to the consolidation of selected facilities ($37.4 million pre-tax) andcharges related to certain IT-related initiatives ($47.7 million pre-tax).
Severance costs and charges related to the consolidation of selected facilities were taken in response to the current business environment. During the secondquarter, management identified a number of facilities in each of the Company’s operating segments and its corporate functions, which covered each of theCompany’s geographic regions, to be consolidated into other facilities. Due primarily to the significant reductions in personnel discussed below, the facilitieswere identified in an effort to combine certain logistics and administrative operations wherever possible and eliminate what would otherwise be duplicative costs.The charges related to reserves for remaining non-cancelable lease obligations, write-downs of the carrying value of certain owned facilities to market value andwrite-downs to fair market value of owned assets located in these leased and owned facilities that have been vacated. All facilities identified for consolidation hadbeen vacated by the end of the third quarter of 2003. Workforce reductions at these and other facilities worldwide resulted in the termination of approximately750 personnel as part of the second quarter reorganization plan. The impacted personnel were primarily in non-customer facing positions. Also during the secondquarter of fiscal 2003, management evaluated and elected to discontinue a number of IT-related initiatives that, in light of recent business restructurings, no longermet the Company’s return on investment standards for continued use or development. These charges relate to the write-off of capitalized hardware, software andsoftware licenses (all non-cash charges) and reserves for remaining lease commitments on leased hardware and software which will no longer be utilized by theCompany’s operations in light of the decisions made and the reorganizations completed as discussed above.
During the fourth quarter of 2003, the Company executed certain additional actions that resulted in charges totaling $6.6 million pre-tax. The incrementalimpact of these actions was substantially offset by certain adjustments that the Company recorded, also in the fourth quarter of 2003, primarily relating to
20
Table of Contents
certain of the charges recorded in the second quarter of 2003. The new charge activity, mostly for severance and consolidation of selected facilities, related toeach of the Company’s three operating groups and its corporate functions in the Americas and EMEA regions. The additional census reductions totaledapproximately 175 and resulted primarily from: (1) EM’s decision to combine its Cilicon and RF and Microwave sales divisions; and (2) AC’s decision to reduceits participation in certain market segments where profitability of the products in question have not yielded acceptable economic returns to the Company. Thefourth quarter adjustments to prior restructuring and other charges reflect changes in estimates from the time the charges and applicable reserves were initiallyrecorded, relating to: (1) reserves for severance and for leases and other contractual commitments that were determined to be excessive during the fourth quarterbased upon payments made or still to be made and/or based upon more favorable than anticipated sublease or lease buyout arrangements; and (2) an adjustment,based upon estimated sales price net of costs to sell as derived from current market studies and comparable sales, of a portion of a write-down that was recordedin the second quarter of 2003 related to an owned facility that was vacated and classified as held for sale during that quarter.
Of the 2003 charges, $29.5 million remains unexpended at June 27, 2003 relating primarily to severance costs, substantially all of which is expected to beutilized during the first quarter of 2004, contractual lease commitments, substantially all of which is expected to be utilized by the end of 2007, and remainingpayments on the IT-related contracts discussed above, substantially all of which is expected to be utilized during the first quarter of 2004.
The 2003 restructuring charges discussed above are expected to yield annualized cost reductions of approximately $90 million. Substantially all of thesecosts have been removed from the business as of the end of 2003 so the full impact of these efforts should be felt in the results of operations for 2004.
Subsequent to 2003, the Company announced certain additional restructuring and cost cutting initiatives in response to the ongoing downturn in thetechnology industry. The resulting anticipated charges can be broken into three categories: (1) the combination of CM and AC, which the Company announced inJuly 2003 (see Note 16 to the consolidated financial statements appearing in Item 15 of this Report), which is expected to result in the elimination of certainduplicative executive and support functions (no material eliminations in sales and marketing positions are anticipated), the closing of certain warehousing andlogistics operations in the Americas and EMEA and the elimination of certain duplicative IT platforms; (2) the reorganization of the Company’s global ITresources, which are currently administered generally on a separate basis within each of the Company’s operating groups, which is expected to result inelimination of certain IT-related positions globally in addition to the write-off of certain IT-related assets; and (3) various other reductions within EM and withincentralized support functions, which are expected to include certain census reductions, primarily in non-customer facing positions, and the consolidation ofcertain administrative facilities. These reduction efforts, most of which are expected to be completed during 2004, are expected to result in additional charges ofapproximately $50 million, roughly half of which are expected to be cash charges. Management anticipates cost savings to the Company from these reductionefforts will be approximately $90 million annually, most of which should be completed by the end of the third quarter of 2004.
In the fourth quarter of 2002, the Company recorded charges representing a write-down in value of certain assets acquired in the 2001 acquisition of Kentand certain other charges taken in response to business conditions. The charge totaled $79.6 million pre-tax ($21.6 million included in cost of sales and$58.0 million included in operating expenses) and $62.1 million after tax, or $0.52 per share on a diluted basis.
The Kent-related items resulted from the acquisition of Kent being accounted for using the “pooling-of-interests” method of accounting for the acquisition.These items relate specifically to assets or obligations that were on the books of Kent at the acquisition and, therefore, under the “pooling-of-interests” method,these items that normally would have been reflected as adjustments to goodwill if the purchase method of accounting could have been used were instead recordedto the Company’s consolidated statement of operations. These items amounted to $29.7 million pre-tax and relate primarily to: (1) write-downs to the value ofreceivables considered uncollectible after the Company had exhausted efforts of collecting these
21
Table of Contents
amounts from Kent’s pre-acquisition customers ($8.2 million pre-tax); (2) excess and obsolete inventory, primarily for customer-specific inventory held by Kentat the acquisition date that was subsequently determined, through ongoing negotiations with the customers, to require a write-down to net realizable value($21.6 million pre-tax); and (3) charges to record additional write-downs to approximate fair market value on held-for-sale properties acquired in the Kentacquisition or to record lease reserves for non-cancelable lease obligations on properties the Company committed to exit ($15.9 million pre-tax);(4) approximately $16.0 million pre-tax in cash recoveries of certain charges recorded as part of the restructuring and integration charges taken in the fourthquarter of 2001.
The remaining pre-tax charge recorded in the fourth quarter of 2002, which amounted to $49.9 million, included an impairment charge of $36.2 million pre-tax to write-down certain of the Company’s investments in unconsolidated Internet-related businesses to their fair market value and $13.7 million pre-tax forseverance charges taken for workforce reductions, primarily in the Americas region, with more limited reductions in EMEA and Asia, totaling approximately 850individuals. The impairments recorded to the Company’s Internet-related investments are considered capital losses for tax purposes and are therefore onlydeductible to the extent the Company has available capital gains. At that time, there were no capital gains, available or forecasted in the foreseeable future, tooffset these losses. Therefore, the Company generally did not record a tax benefit for these losses.
In the fourth quarter of 2001, the Company recorded restructuring and integration charges in connection with the acquisition and integration of Kent and forcosts related to actions taken in response to business conditions and other restructuring activity. The charge amounted to $327.5 million pre-tax ($80.6 millionincluded in cost of sales and $246.9 million included in operating expenses) and $236.7 million after-tax, or $1.99 per share on a diluted basis. Approximately$157.3 million of the pre-tax charge resulted from the acquisition of Kent having been accounted for using the “pooling-of-interests” method as discussed above.These items consisted of costs incurred in completing the acquisition including significant change-in-control and other executive benefit-related payments madeas a result of the acquisition ($68.3 million pre-tax), professional fees for investment banking, legal and accounting services rendered to both Avnet and Kent($12.7 million pre-tax), as well as adjustments to the assets acquired and liabilities assumed ($76.3 million pre-tax). The adjustments to the assets acquired andliabilities assumed were primarily recorded as a result of the Company’s efforts to realize certain synergies of the combined Kent-Avnet operations. In order toachieve such cost savings in the combined enterprise, elimination of certain duplicative positions, facilities and inventory was required. These charges includedaccruals for severance for approximately 130 employees terminated ($4.6 million pre-tax), write-downs of receivables considered uncollectible ($8.0 million pre-tax), inventory write-downs related to termination of non-strategic product lines ($20.5 million pre-tax), write-downs associated with the disposal of fixed assets($25.1 million pre-tax), lease terminations ($8.5 million pre-tax) and other items ($9.6 million pre-tax).
The balance of the pre-tax charge recorded in the fourth quarter of 2001, amounting to $170.2 million, related to a number of actions taken to cope withmarket conditions and to strengthen Avnet’s operations. These actions included cost reductions associated with the reorganization of the Company’s business, theintegration of recent acquisitions, as well as cost-cutting actions taken in response to business conditions. These charges fall into a number of categories includingseverance for the elimination of approximately 880 employees, related to the Company’s EM, CM and corporate operations in all three global regions($28.5 million pre-tax), inventory write-downs related to terminations of non-strategic product lines ($9.4 million pre-tax), inventory valuation adjustments forspecial inventory purchases to meet customer requirements which are in excess of what is anticipated to be sold or returned ($50.7 million pre-tax), write-downsassociated with the disposal of fixed assets ($15.2 million pre-tax), lease terminations ($21.1 million pre-tax), adjustments to the book value of investments inunconsolidated entities ($42.9 million pre-tax) and other items ($2.4 million pre-tax). The unusually large impact on after-tax income related to this charge is dueprimarily to the non-deductibility of certain acquisition-related costs and the impact of tax rates in foreign jurisdictions.
22
Table of Contents
Of the 2002 and 2001 charges, which totaled $407.1 million pre-tax, $16.0 million remains unexpended at June 27, 2003 which relates primarily toseverance, substantially all of which is scheduled to be utilized by the end of the second quarter of 2004, and contractual lease commitments, substantially all ofwhich is expected to be utilized by the end of 2007.
Gross Profit and Gross Profit Margins
Consolidated gross profit for 2003 was $1.21 billion, representing a gross profit margin of 13.43%, down from $1.22 billion in 2002, or 13.71%. Gross profitin 2002 includes $21.6 million of restructuring charges discussed above which reduced the reported gross profit margin in that year by 24 basis points (0.24%).
The decline in consolidated gross profit margins year-over-year was primarily attributable to the mix of business amongst the Company’s operating groups,including the negative impact of lower gross profit margin computer product sales in 2003, as well as the mix of product sales within the operating groups,especially a greater volume of software sales within CM which yield a lower margin (while also bearing a low cost of capital thus making software sales anattractive market to the Company despite the lower margins). EM’s gross profit margins improved in 2003 even with the previously discussed migration oftechnology manufacturing to the Asia region, where margins have traditionally been lower than in other regions of the world. CM experienced continued changesin product mix and competitive pricing, most notably in the computer hardware and storage markets (markets that also bear a low cost of capital, similar tosoftware discussed above), which exacerbated the decline in gross profit margins within this business. Additionally, as discussed in “Restructuring and OtherCharges” above, AC continued to exit customer relationships in the low-margin PC Builder segment which resulted in improved gross profit margins for thisoperating group in the fourth quarter of 2003. Nevertheless, the group still experienced depressed margins on a year-over-year comparison. AC’s efforts in thisarea yielded gross profit margin improvement to a high for the year of 8.60% in the fourth quarter of 2003.
Consolidated gross profit margins were 13.71% in 2002 as compared to 14.56% in 2001. Cost of sales in these years included the impact of restructuring andother charges totaling $21.6 million and $80.6 million, respectively, which negatively impacted gross profit margins by 24 basis points (0.24%) in 2002 and 63basis points (0.63%) in 2001. The decline in gross profit margin in 2002 from the prior year illustrated the difficult market environment and pressure on averageselling prices across the operating groups. The downward trend also included the effect of product mix: increased sales of computer products (includingmicroprocessors, DRAMS, disk drives, etc.) that generally have lower gross profit margins than other products in the Company’s product lines. The impact ofthese factors on the Company’s gross profit margins was mitigated in part by the Company’s efforts, beginning in late 2001, to expand its presence withcustomers who utilize more of the Company’s value-added services and in end-market segments that provide generally higher gross profit margins.
Selling, General and Administrative Expenses and Operating Income (Loss)
Selling, general and administrative expenses were $1.20 billion, or 13.3% of sales, in 2003 as compared to $1.23 billion, or 13.7% of sales, in 2002. Includedin 2003 and 2002 operating expenses are restructuring and other charges discussed above totaling $106.8 million (1.2% of sales) in 2003 and $58.0 million (0.7%of sales) in 2002. The $23.6 million improvement in operating expenses year-over-year, despite also recording $48.8 million more of restructuring and othercharges in 2003 compared to 2002, is a function of the Company’s extensive cost reduction efforts in all facets of its business. This improvement is offset in partby the value of the Euro, which strengthened compared to the US Dollar throughout the majority of 2003.
23
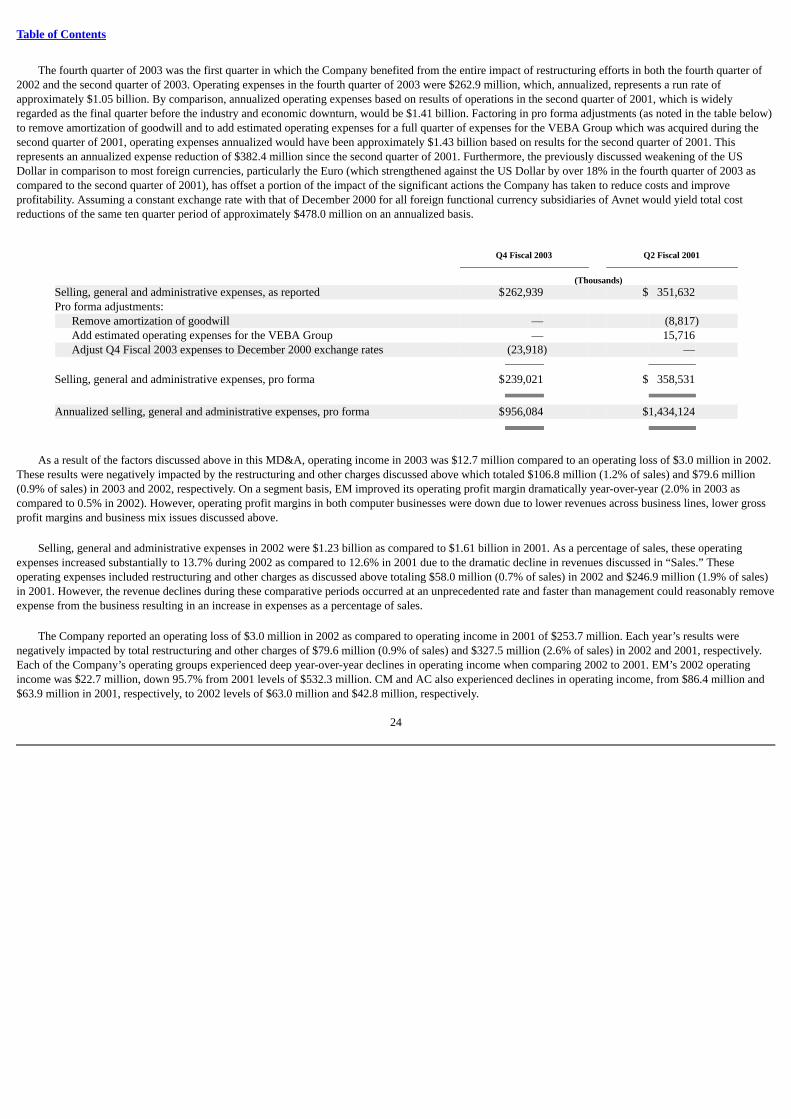
Table of Contents
The fourth quarter of 2003 was the first quarter in which the Company benefited from the entire impact of restructuring efforts in both the fourth quarter of2002 and the second quarter of 2003. Operating expenses in the fourth quarter of 2003 were $262.9 million, which, annualized, represents a run rate ofapproximately $1.05 billion. By comparison, annualized operating expenses based on results of operations in the second quarter of 2001, which is widelyregarded as the final quarter before the industry and economic downturn, would be $1.41 billion. Factoring in pro forma adjustments (as noted in the table below)to remove amortization of goodwill and to add estimated operating expenses for a full quarter of expenses for the VEBA Group which was acquired during thesecond quarter of 2001, operating expenses annualized would have been approximately $1.43 billion based on results for the second quarter of 2001. Thisrepresents an annualized expense reduction of $382.4 million since the second quarter of 2001. Furthermore, the previously discussed weakening of the USDollar in comparison to most foreign currencies, particularly the Euro (which strengthened against the US Dollar by over 18% in the fourth quarter of 2003 ascompared to the second quarter of 2001), has offset a portion of the impact of the significant actions the Company has taken to reduce costs and improveprofitability. Assuming a constant exchange rate with that of December 2000 for all foreign functional currency subsidiaries of Avnet would yield total costreductions of the same ten quarter period of approximately $478.0 million on an annualized basis.
Q4 Fiscal 2003 Q2 Fiscal 2001
(Thousands)Selling, general and administrative expenses, as reported $262,939 $ 351,632 Pro forma adjustments: Remove amortization of goodwill — (8,817) Add estimated operating expenses for the VEBA Group — 15,716 Adjust Q4 Fiscal 2003 expenses to December 2000 exchange rates (23,918) — Selling, general and administrative expenses, pro forma $239,021 $ 358,531 Annualized selling, general and administrative expenses, pro forma $956,084 $1,434,124
As a result of the factors discussed above in this MD&A, operating income in 2003 was $12.7 million compared to an operating loss of $3.0 million in 2002.These results were negatively impacted by the restructuring and other charges discussed above which totaled $106.8 million (1.2% of sales) and $79.6 million(0.9% of sales) in 2003 and 2002, respectively. On a segment basis, EM improved its operating profit margin dramatically year-over-year (2.0% in 2003 ascompared to 0.5% in 2002). However, operating profit margins in both computer businesses were down due to lower revenues across business lines, lower grossprofit margins and business mix issues discussed above.
Selling, general and administrative expenses in 2002 were $1.23 billion as compared to $1.61 billion in 2001. As a percentage of sales, these operatingexpenses increased substantially to 13.7% during 2002 as compared to 12.6% in 2001 due to the dramatic decline in revenues discussed in “Sales.” Theseoperating expenses included restructuring and other charges as discussed above totaling $58.0 million (0.7% of sales) in 2002 and $246.9 million (1.9% of sales)in 2001. However, the revenue declines during these comparative periods occurred at an unprecedented rate and faster than management could reasonably removeexpense from the business resulting in an increase in expenses as a percentage of sales.
The Company reported an operating loss of $3.0 million in 2002 as compared to operating income in 2001 of $253.7 million. Each year’s results werenegatively impacted by total restructuring and other charges of $79.6 million (0.9% of sales) and $327.5 million (2.6% of sales) in 2002 and 2001, respectively.Each of the Company’s operating groups experienced deep year-over-year declines in operating income when comparing 2002 to 2001. EM’s 2002 operatingincome was $22.7 million, down 95.7% from 2001 levels of $532.3 million. CM and AC also experienced declines in operating income, from $86.4 million and$63.9 million in 2001, respectively, to 2002 levels of $63.0 million and $42.8 million, respectively.
24
Table of Contents
Interest Expense and Other Income (Expense)
Interest expense was $104.9 million in 2003 as compared with $124.6 million in 2002, representing a 15.8% decline year-over-year. This decrease is dueprimarily to the ongoing debt reductions and reduced drawings under the accounts receivable securitization program (hereafter referred to as the “Program” —see “Liquidity and Capital Resources — Financing Transactions”) during 2003. Consolidated debt balances at June 27, 2003 were $1.47 billion as compared to$1.63 billion at June 28, 2002 ($1.83 billion including drawings under the Program), representing a decrease of $159 million, or $359 million including thereduced drawings under the Program. The reductions in debt are a result of the positive operating cash flows and reductions in working capital over the course of2003. Through similar efforts in 2002 as well, the Company has reduced its total outstanding debt by $1.85 billion, or approximately 56%, since December 2000.
Other income, net, was $26.2 million in 2003 as compared to $6.8 million in 2002. The increase in other income, net, was primarily a result of favorableforeign currency translation impacts during 2003.
Also during 2003, the Company incurred $13.5 million of debt extinguishment costs associated with the redemption of a portion of its 6.45% Notes dueAugust 15, 2003 and its 8.20% Notes due October 17, 2003 as is further discussed in “Liquidity and Capital Resources.”
Interest expense was $124.6 million in 2002 as compared with $191.9 million in 2001, declining by 35.1%. The decrease was due primarily to the reductionof debt and reduced drawings under the Program as a result of cash generated by reductions in working capital and, to a lesser extent, as a result of lower interestrates on the Company’s variable rate debt. The Company reduced its total debt and its drawings under the Program by approximately $740 million from June2001 to June 2002 and $1.5 billion from the end of December 2000 to June 2002.
Income Tax Provision (Benefit)
The Company’s effective tax rate on its loss from continuing operations was a benefit of 41.9% in 2003 as compared to a benefit of 30.1% in 2002. The mixof profits globally at varying statutory rates impacts the Company’s consolidated tax rate. The Company also benefited in 2003 from the favorable impact ofcertain tax planning initiatives put in place over the course of the prior year.
Avnet’s effective tax rate on its loss from continuing operations was a benefit of 30.1% in 2002 as compared to a provision rate of 99.9% in 2001. The highrate in 2001 is primarily a result of certain non-deductible costs incurred associated with the Kent acquisition as well as the non-deductibility of goodwillamortization, which was ceased in accordance with SFAS 142 at the beginning of 2002 (see “Change in Accounting Principle — Goodwill”).
Net Income (Loss) from Continuing Operations
As a result of the factors described in the preceding sections of this MD&A, the consolidated loss from continuing operations was $46.1 million ($0.39 pershare on a diluted basis) in 2003 as compared to $84.4 million ($0.71 per share on a diluted basis) in 2002. These results include the negative after tax impact ofrestructuring and other charges (including the debt extinguishment costs in 2003) of $73.9 million ($0.62 per share on a diluted basis) and $62.1 million ($0.52per share on a diluted basis) in 2003 and 2002, respectively.
The Company recorded a net loss from continuing operations of $84.4 million in 2002, or $0.71 per share on a diluted basis, as compared to net income fromcontinuing operations of $0.1 million, or breakeven on a per share basis, in 2001. These results included the after tax impact of restructuring and other chargestotaling $62.1 million ($0.52 per share on a diluted basis) in 2002 and $236.7 million ($1.99 per share on a diluted basis) in 2001. The decline in profitability is aresult of the confluence of the various factors discussed above in this MD&A.
25
Table of Contents
Change in Accounting Principle — Goodwill
In June 2001, the FASB issued Statement of Financial Accounting Standards No. 142 (“SFAS 142”), “Goodwill and Other Intangible Assets,” whichestablishes financial accounting and reporting for acquired goodwill and other intangible assets. SFAS 142 requires that ratable amortization of goodwill bereplaced with periodic tests for goodwill impairment and that intangible assets with finite lives be amortized over their useful lives. The Company elected earlyadoption of the provisions of SFAS 142 effective June 30, 2001, the first day of the Company’s fiscal year 2002.
Therefore, the amortization of goodwill was suspended effective on that date. Under the required transitional provisions of SFAS 142, the Companyidentified and evaluated its reporting units for impairment as of June 30, 2001 using a two-step process. The Company engaged an outside valuation consultant toassist in this process. The first step was to ascertain whether there was an indication that any of the Company’s goodwill was impaired. This was accomplished byidentifying the Company’s reporting units pursuant to the guidelines set out in SFAS 142 and then determining the carrying value of each of those reporting unitsby assigning the Company’s assets and liabilities, including existing goodwill, to each of those reporting units as of June 30, 2001. For the purpose of thisprocess, the reporting unit structure was defined as each of the three regional businesses (Americas, EMEA and Asia) within each of the Company’s threeoperating groups. The fair value of each reporting unit was determined by using a combination of present value and multiple of earnings valuation techniques.Such fair value was then compared to the carrying value of each reporting unit. As a result of completing the first step of the process, it was determined that therewas an impairment of goodwill related to the Company’s EM and CM operations in both EMEA and Asia. The Company identified no impairment of goodwill inthe Americas region. In the second step of the process, the implied fair value of the affected reporting unit’s goodwill was compared to its carrying value. Thiswas done in order to determine the amount of impairment; that is, the amount by which the carrying amount exceeded the fair value. As a result of the valuationprocess, the Company recorded an impairment charge of $580.5 million, which was recorded as a cumulative effect of a change in accounting principle in the firstquarter of 2002. As reflected in the accompanying consolidated statement of cash flows for 2002, the charge resulting from the cumulative effect of change inaccounting principle did not impact cash flow.
The magnitude of the transition impairment charge was significantly impacted by the timing of the effective date of when the fair value analysis wasperformed and the designation of the reporting unit structure. Since the Company adopted SFAS 142 on June 30, 2001, the fair value analysis was required to becompleted as of that date. Due to the difficult business and economic conditions at that date, which severely impacted the market sectors in which the Companyoperates, and the uncertainty as to when such conditions would materially improve, the fair value of the Company’s businesses was significantly less than it mighthave been at other times. In other words, in a cyclical business, the timing of a valuation such as this may be an important factor in the outcome of the valuationexercise. The reporting units with the most significant impairment of goodwill are in Europe where the Company has not yet generated an acceptable level ofprofits and cash flows. In addition, the defined reporting unit structure has resulted in an impairment of goodwill which includes goodwill related to certain recentacquisitions that otherwise might not have been impaired.
The Company conducts its periodic test for goodwill impairment annually, on the first day of the fiscal fourth quarter. The Company’s annual impairmenttests in 2003 and 2002 have yielded no additional impairments to the carrying value of the Company’s goodwill.
Liquidity and Capital Resources
Cash Flows
In 2003, cash flow of $169.5 million was generated from continuing operations before depreciation, amortization, deferred taxes and other non-cash itemsand $482.4 million was generated by reductions in working capital (excluding cash and cash equivalents), thus generating net cash flow from operations of$651.9 million. The positive cash flow generated from working capital reductions is a result of the Company’s continued efforts to improve its asset utilizationand efficiency, primarily through reductions of receivables (cash inflow of $140.7 million) and inventories (cash inflow of $387.1 million), in what continues tobe a
26
Table of Contents
stable but weak electronic components and computer products distribution industry. Cash flows from working capital reductions were $824.8 million in 2002. Thecash flow impact of working capital was more significant in 2002 as this year represented the first full fiscal year of the economic downturn and, thus, a periodwhen more significant cost cutting and balance sheet management initiatives were put in place in order to return the business to profitability despite minimalrevenue growth. In addition to cash flow from operating activities in 2003, $5.1 million was needed for other normal business operations including purchases ofproperty, plant and equipment ($34.2 million), net of cash proceeds from sales of property, plant and equipment ($16.4 million) and cash generated from otheritems ($12.7 million). In light of the ongoing economic environment and the Company’s more stringent return on investment criteria, the Company hassignificantly curbed its level of capital expenditures in comparison to prior years. Combined, the Company generated $646.8 million in net cash and cashequivalents from normal business operations in 2003. Deducting from this amount the Company’s use of $9.2 million for acquisitions of operations andinvestments during 2003, the combined net proceeds of $637.6 million along with $465.3 million of cash generated from new long-term debt financing were usedto reduce drawings under the accounts receivable securitization program by $200.0 million, to repay other debt balances of $666.7 million and to generateadditional cash and cash equivalents of $236.2 million during 2003.
In 2002, cash flow from operating activities totaled $976.3 million. During this period, $151.5 million was generated from continuing operations beforedepreciation, amortization, deferred taxes and other non-cash items and $824.8 million was generated by reductions in working capital (excluding cash and cashequivalents). In addition, the Company used $73.2 million for normal business operations including dividend payments ($26.5 million), purchases of propertyplant and equipment ($87.2 million), offset in part by cash proceeds on sale of property plant and equipment ($3.4 million) and net cash generated from otheritems ($37.1 million). Combined, the Company generated $903.1 million in net cash and cash equivalents from normal business operations. The Company alsoused $34.1 million for acquisitions of operations and investments during 2002 (see Item 1 of this Report). The combined net cash generated, as discussed above,of $869.0 million along with $394.3 million of cash proceeds from long-term debt financing were used to reduce drawings under the accounts receivablesecuritization program by $150.0 million and to, net, repay debt balances of $1.051 billion. Finally, cash and cash equivalents increased by $62.0 million for theyear.
In 2001, the Company generated $336.3 million from income from continuing operations before depreciation, amortization, deferred taxes and other non-cash items (including transaction costs associated with the acquisition of Kent). This was offset by $150.1 million of cash used for working capital (excludingcash and cash equivalents), resulting in $186.2 million of net cash flows provided from operations. In addition, the Company used $142.6 million for othernormal business operations including purchases of property, plant and equipment ($147.3 million) and dividends ($27.4 million), offset by cash proceeds on salesof property, plant and equipment ($28.7 million) and cash generated from other items ($3.4 million). This resulted in $43.6 million being generated from normalbusiness operations. The Company also used $667.3 million for acquisitions, net of cash received from dispositions and the net cash used for discontinuedoperations. This overall use of cash of $623.7 million was financed by a $119.2 million net increase in debt, $350.0 million of proceeds from the sale ofreceivables under the asset securitization program and the utilization of $154.5 million of available cash.
Over the past three years, cash generated from continuing operations before depreciation, amortization, deferred taxes, cash payments for the acquisition ofKent and other non-cash items totaled $657.3 million. During the same period, $1.16 billion was generated from reductions in working capital (excluding cashand cash equivalents), reflective of the typical nature of the Company’s industry where cash is generated by normal working capital reductions during a downturn,as well as through specific working capital management initiatives put in place by the Company since the downturn began during 2001. This has resulted in$1.81 billion in net cash flow from operations. Cash of $220.8 million was needed for other normal business operations including purchases of property, plant andequipment ($268.6 million) and payment of dividends ($53.9 million), offset in part by cash proceeds from sales of property, plant and equipment ($48.5 million)and net cash generated by other items ($53.2 million). This resulted in a net generation of cash from normal business operations totaling $1.59 billion during thelast three years. During the same three-year period, the
27
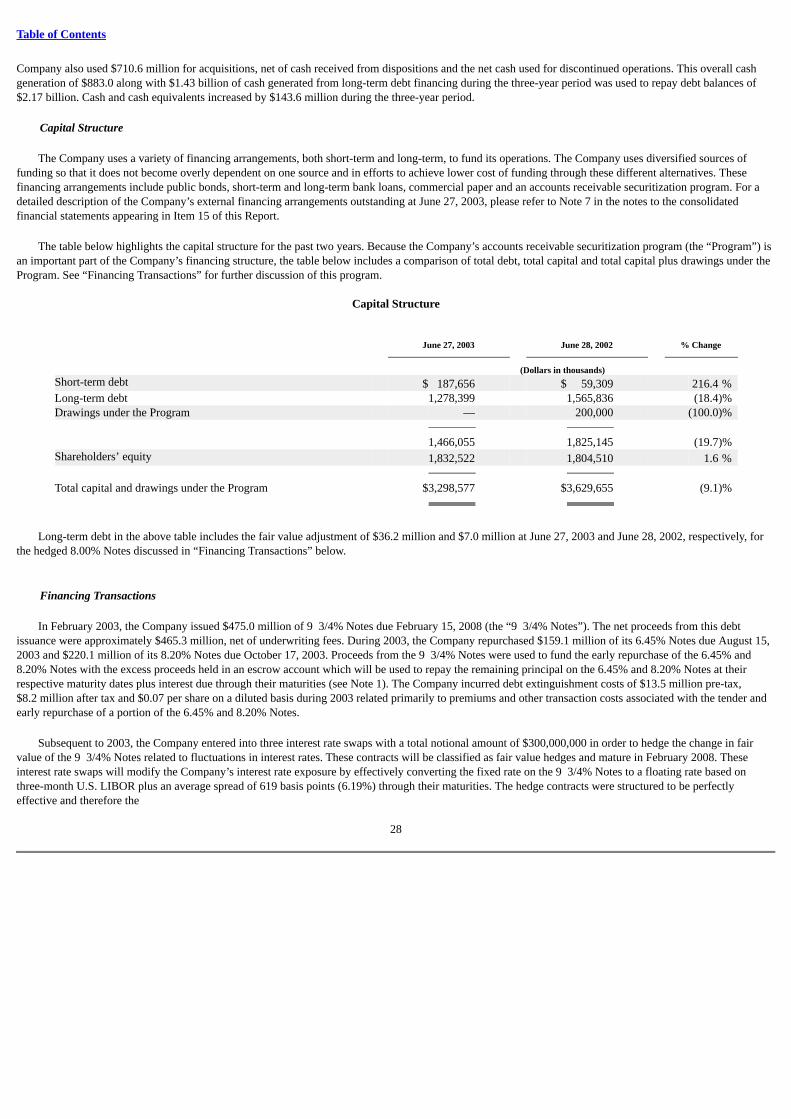
Table of Contents
Company also used $710.6 million for acquisitions, net of cash received from dispositions and the net cash used for discontinued operations. This overall cashgeneration of $883.0 along with $1.43 billion of cash generated from long-term debt financing during the three-year period was used to repay debt balances of$2.17 billion. Cash and cash equivalents increased by $143.6 million during the three-year period.
Capital Structure
The Company uses a variety of financing arrangements, both short-term and long-term, to fund its operations. The Company uses diversified sources offunding so that it does not become overly dependent on one source and in efforts to achieve lower cost of funding through these different alternatives. Thesefinancing arrangements include public bonds, short-term and long-term bank loans, commercial paper and an accounts receivable securitization program. For adetailed description of the Company’s external financing arrangements outstanding at June 27, 2003, please refer to Note 7 in the notes to the consolidatedfinancial statements appearing in Item 15 of this Report.
The table below highlights the capital structure for the past two years. Because the Company’s accounts receivable securitization program (the “Program”) isan important part of the Company’s financing structure, the table below includes a comparison of total debt, total capital and total capital plus drawings under theProgram. See “Financing Transactions” for further discussion of this program.
Capital Structure
June 27, 2003 June 28, 2002 % Change
(Dollars in thousands)Short-term debt $ 187,656 $ 59,309 216.4 %Long-term debt 1,278,399 1,565,836 (18.4)%Drawings under the Program — 200,000 (100.0)% 1,466,055 1,825,145 (19.7)%Shareholders’ equity 1,832,522 1,804,510 1.6 % Total capital and drawings under the Program $3,298,577 $3,629,655 (9.1)%
Long-term debt in the above table includes the fair value adjustment of $36.2 million and $7.0 million at June 27, 2003 and June 28, 2002, respectively, forthe hedged 8.00% Notes discussed in “Financing Transactions” below.
Financing Transactions
In February 2003, the Company issued $475.0 million of 9 3/4% Notes due February 15, 2008 (the “9 3/4% Notes”). The net proceeds from this debtissuance were approximately $465.3 million, net of underwriting fees. During 2003, the Company repurchased $159.1 million of its 6.45% Notes due August 15,2003 and $220.1 million of its 8.20% Notes due October 17, 2003. Proceeds from the 9 3/4% Notes were used to fund the early repurchase of the 6.45% and8.20% Notes with the excess proceeds held in an escrow account which will be used to repay the remaining principal on the 6.45% and 8.20% Notes at theirrespective maturity dates plus interest due through their maturities (see Note 1). The Company incurred debt extinguishment costs of $13.5 million pre-tax,$8.2 million after tax and $0.07 per share on a diluted basis during 2003 related primarily to premiums and other transaction costs associated with the tender andearly repurchase of a portion of the 6.45% and 8.20% Notes.
Subsequent to 2003, the Company entered into three interest rate swaps with a total notional amount of $300,000,000 in order to hedge the change in fairvalue of the 9 3/4% Notes related to fluctuations in interest rates. These contracts will be classified as fair value hedges and mature in February 2008. Theseinterest rate swaps will modify the Company’s interest rate exposure by effectively converting the fixed rate on the 9 3/4% Notes to a floating rate based onthree-month U.S. LIBOR plus an average spread of 619 basis points (6.19%) through their maturities. The hedge contracts were structured to be perfectlyeffective and therefore the
28
Table of Contents
Company will account for them using the shortcut method as defined by Statement of Financial Accounting Standards No. 133 (“SFAS 133”), “Accounting forDerivative Instruments and Hedging Activities,” as amended by Statement of Financial Accounting Standards No. 138, “Accounting for Certain Derivative andHedging Activities.”
During 2003, the Company amended its syndicated bank credit facilities. Prior to the 2003 amendments, the bank credit facilities included a multi-year creditfacility with a syndicate of banks that provided up to $428.8 million in financing and a 364-day credit facility providing up to $488.7 in financing (the originalsyndicated bank credit facility also included a $82.5 million term loan facility that matured in November 2001). The multi-year credit facility was a three-yearrevolving, multi-currency facility that was to mature on October 25, 2004. The Company was able to select from various interest rate options and maturities underthis facility.
The amended terms of the multi-year credit facility reduced the available borrowings under the facility to $350.0 million. Additionally, the 364-day creditfacility was terminated as part of the 2003 amendments. These amendments also modified certain covenants to the agreement. The Company was in compliancewith all of the covenants at June 27, 2003.
The amended agreement also contained a “springing lien” provision whereby borrowings under the amended multi-year credit facility would become securedby various assets of the Company if (a) Avnet received a debt rating of Ba1 or lower by Moody’s or BB+ or lower by S&P or (b) if Avnet terminated its currentaccounts receivable securitization program (see below) without simultaneously entering into another securitization with similar terms.
On September 8, 2003, Moody’s adjusted the Company’s debt rating to Ba2. Management believed it was in the Company’s best interests to terminate thefacility rather than allow the liens to spring when no amounts were outstanding or expected to be drawn prior to the facility’s October 2004 expiration. See“Liquidity” for further discussion of the Company’s borrowing capacity and expected financing needs.
In addition to its primary financing arrangements, the Company has several small lines of credit in various locations to fund the short-term working capital,foreign exchange, overdraft and letter of credit needs of its wholly owned subsidiaries in Europe and Asia. Avnet generally guarantees its subsidiaries’ debt underthese facilities.
Off-Balance Sheet Arrangements
The Company has a $350 million accounts receivable securitization program (the “Program”) with two financial institutions whereby it may sell, on arevolving basis, an undivided interest in a pool of its trade accounts receivable. Under the Program, the Company may sell receivables in securitizationtransactions and retain a subordinated interest and servicing rights to those receivables. Receivables sold under the Program are sold without legal recourse tothird party conduits through a wholly-owned bankruptcy-remote special purpose entity that is consolidated for financial reporting purposes. The Programqualifies for sale treatment under Statement of Financial Accounting Standards No. 140, “Accounting for Transfer and Servicing of Financial Assets andExtinguishment of Liabilities.” The availability for financing under the Program is dependent on the level of the Company’s trade receivables from month tomonth. There were no receivables sold under the Program at June 27, 2003. At June 28, 2002, the Company had sold $200.0 million of receivables under theProgram, which is reflected as a reduction of receivables in the consolidated balance sheets. The cash received from the sale of receivables was used primarily topay down outstanding debt. The purpose of the Program is to provide the Company with an additional source of liquidity at interest rates more favorable than itcould receive through other forms of financing. The Program was amended during 2003 to adjust certain minimum senior unsecured credit ratings that theCompany must maintain in order to continue using the Program in its current form. These minimum credit ratings were again amended subsequent to 2003. Underthe Program, as amended in 2004, the minimum credit rating triggers are Ba3 by Moody’s Investor Services (“Moody’s”) and BB- by Standard & Poors (“S&P”).This most recent amendment effectively extended the term of the Program to August 2005.
29
Table of Contents
Covenants and Conditions
The Program contains certain covenants relating to the quality of the receivables sold under the Program in addition to the minimum unsecured ratingstriggers discussed in “Off-Balance Sheet Arrangements” above. If these conditions are not met, the Company may not be able to borrow any additional fundsunder the Program and the financial institutions generally have the right to accelerate any amounts outstanding. Circumstances that could affect the Company’sability to meet the required covenants and conditions of the Program include the duration and depth of the current economic downturn and the impact onprofitability, perceived financial strength or weakness by credit rating agencies and various other economic, market and industry factors. The Company was incompliance with all covenants, including the minimum unsecured credit ratings triggers, for the Program at June 27, 2003.
In the case of any default, the Company would either have to negotiate with the lenders to modify the Program or pay off all amounts outstanding, terminatethe Program and, if necessary, seek alternative financing. As of June 27, 2003, there were no drawings under the Program.
See “Liquidity” for further discussion of the Company’s availability under these various facilities.
Liquidity
Under its current financing arrangements discussed in “Financing Transactions” above, the Company had an aggregate of approximately $700.0 million inadditional borrowing capacity at June 27, 2003 ($350.0 million after the termination of the multi-year facility subsequent to 2003, as discussed in “FinancingTransactions”). The Company also had an additional $395.5 million of cash and cash equivalents at June 27, 2003, although $78.5 million of that cash on handwas held in an escrow account that is restricted to repay the remaining principal and interest obligations on the 6.45% and 8.20% Notes. Management believes itsborrowing capacity, before and after the termination of the multi-year facility, its current cash availability and its ability to generate cash from normal operationsare sufficient to meet its projected working capital requirements and debt obligations maturing in the upcoming year.
The following table highlights the Company’s liquidity and related ratios for the past two years:
Comparative Analysis — Liquidity
Years Ended Percentage
ChangeJune 27, 2003(1) June 28, 2002(2) 2003 to 2002
(Dollars in millions)Current Assets $3,126.1 $3,205.5 (2.5)%Quick Assets 1,867.3 1,533.2 21.8 Current Liabilities 1,306.1 1,276.8 2.3 Working Capital 1,820.0 1,928.7 (5.6)Total Debt 1,466.1 1,625.1 (9.8)Total Capital 3,298.6 3,429.7 (3.8)Quick Ratio 1.4:1 1.2:1 Working Capital Ratio 2.4:1 2.5:1 Debt to Total Capital 44.4% 47.4%
(1) Ratios that include cash and cash equivalents include $78.5 million of restricted cash held in escrow at June 27, 2003 to fund remaining principal and interestpayments on the 6.45% and 8.20% Notes (see “Financing Transactions” for further discussion).
(2) The Company had $200.0 million of accounts receivable sold under the accounts receivable securitization program at June 28, 2002 (there were no drawings
under this program at June 27, 2003). The receivables sold are excluded from accounts receivable and drawings under this program are excluded from debtfor the purpose of the balances and ratios in the table above.
30
Table of Contents
The Company’s quick assets at June 27, 2003 totaled $1.87 billion as compared with $1.53 billion at June 28, 2002. At June 27, 2003, quick assets weregreater than the Company’s current liabilities by $561.2 million as compared to $256.4 million at June 28, 2002. This increase in quick assets is due in part to theincrease in cash and cash equivalents resulting from the Company’s positive cash flows and financing transactions completed during 2003 (see “Cash Flow” and“Financing Transactions” above) as well as the increase in receivables in the June 28, 2003 consolidated balance sheet which resulted in part from the reduceddrawings under the Company’s accounts receivable securitization program during 2003. Working capital at June 27, 2003 was $1.82 billion as compared with$1.93 billion at June 28, 2002. This decrease is primarily a result of the previously discussed inventory reductions since 2002, offset in part by the increase inquick assets. At June 28, 2003, to support each dollar of current liabilities, the Company had $1.43 of quick assets and $0.96 of other current assets for a total of$2.39 as compared with $2.51 at June 28, 2002.
The Company does not currently have any material commitments for capital expenditures.
Long-Term Contractual Obligations
The Company has the following contractual obligations outstanding as of June 27, 2003 (in millions):
Due in Less Due in Due in Due After
Total than 1 Year 1-3 Years 4-5 Years 5 Years
Long-term debt, including amounts due withinone year $1,429.9 $187.7 $360.6 $876.1 $ 5.5
Operating leases 186.0 51.8 69.5 35.4 29.3 $1,615.9 $239.5 $430.1 $911.5 $34.8
At June 27, 2003, the Company has two interest rate swaps outstanding on one of its fixed rate debt instruments which have yielded, in accordance withSFAS 133, as amended, a fair value adjustment of $36.2 million to the Company’s long-term debt included in the consolidated balance sheet at June 27, 2003.
In connection with the Company’s January 2000 acquisition of 84% of the stock of Eurotronics B.V., which went to market as SEI, the Company entered intoa share purchase agreement with the sellers that called for an additional payment of cash or common stock of the Company if the Company’s share price does notreach $45.25 per share by January 2004. This guarantee would result in an additional payment to the sellers of approximately $77.0 million based on theCompany’s stock price as of June 27, 2003.
Item 7A. Quantitative and Qualitative Disclosures About Market Risk
The Company seeks to reduce earnings and cash flow volatility associated with changes in interest rates and foreign currency exchange rates by entering intofinancial arrangements intended to provide a hedge against a portion of the risks associated with such volatility. The Company continues to have exposure to suchrisks to the extent they are not hedged.
The Company has used interest rate swaps that convert certain fixed rate debt to variable rate debt, effectively hedging the change in fair value of the fixedrate debt resulting from fluctuations in interest rates. At June 27, 2003, the Company has two interest rate swaps outstanding under which the Company pays avariable interest rate and receives a fixed interest rate. Subsequent to 2003, the Company entered into three additional interest rate swaps on $300.0 million of theCompany’s 9 3/4% Notes, in order to hedge the change in fair value of this fixed rate debt resulting from fluctuations in interest rates. The following table setsforth the
31
Table of Contents
scheduled maturities and the total fair value (generally based on quoted market prices) of the Company’s debt outstanding at June 27, 2003 (dollars in millions):
There- Total at Fair Value at2004 2005 2006 2007 2008 after June 27, 2003 June 27, 2003
Liabilities: Fixed rate debt $176 $360 $ — $400 $476 $ 6 $ 1,418 $1,526 Average interest rate 8.4% Floating rate debt $ 12 $ — $ — $ — $ — $ — $ 12 $ 12 Average interest rate 4.4% Interest Rate Swaps: Fixed to variable $ — $ — $ — $400 $ — $ — $ 400 Average pay rate LIBOR+2.9% Average receive rate 8.0%
Many of the Company’s subsidiaries, on occasion, purchase and sell products in currencies other than their functional currencies. This subjects the Companyto the risks associated with the fluctuations of foreign currency exchange rates. The Company reduces this risk by utilizing natural hedging (offsetting receivablesand payables) as well as by creating offsetting positions through the use of derivative financial instruments, primarily forward foreign exchange contracts withmaturities of less than sixty days. The Company adjusts all foreign denominated balances and any outstanding foreign exchange contracts to fair market valuethrough the consolidated statements of operations. Therefore, the market risk related to foreign exchange contracts is offset by changes in valuation of theunderlying items being hedged. The asset or liability representing the fair value of foreign exchange contracts is classified in the captions “other current assets” or“accrued expenses and other,” as applicable, in the accompanying consolidated balance sheets. A hypothetical 10% change in currency exchange rates under thecontracts outstanding at June 27, 2003 would result in an increase or decrease of approximately $15.7 million to the fair value of the forward foreign exchangecontracts, which would generally be offset by an opposite effect on the related hedged positions.
Item 8. Financial Statements and Supplementary Data
The financial statements and supplementary data are listed under Item 15 of this Report.
Item 9. Changes in and Disagreements with Accountants on Accounting and Financial Disclosures
As previously reported in the Company’s Current Report on Form 8-K filed on April 23, 2002, on April 17, 2002 the Company dismissed its independentauditor, Arthur Andersen LLP (“Arthur Andersen”) and appointed KPMG LLP (“KPMG”) as its new independent auditor, effective immediately. These actionswere approved by the Company’s Board of Directors upon the recommendation of its Audit Committee. KPMG audited the consolidated financial statements ofthe Company for the fiscal years ending June 27, 2003 and June 28, 2002.
During the fiscal year ended June 29, 2001, and the subsequent interim periods through the date of Arthur Andersen’s dismissal, there was no disagreementbetween the Company and Arthur Andersen, as defined in Item 304 of Regulation S-K, on any matter of accounting principles or practices, financial statementdisclosure, or auditing scope or procedure, which disagreement, if not resolved to Arthur Andersen’s satisfaction, would have caused Arthur Andersen to makereference to the subject matter of such disagreement in connection with its reports, and there occurred no reportable events as defined in Item 304(a)(1)(v) ofRegulation S-K.
The audit report of Arthur Andersen on the consolidated financial statements of Avnet for the fiscal year ended June 29, 2001 did not contain an adverseopinion or disclaimer of opinion, nor was it qualified or modified as to uncertainty, audit scope or accounting principles. During the fiscal years of Avnet endedJune 28, 2002 and June 29, 2001, through the date of Arthur Andersen’s dismissal, neither the Company nor
32

Table of Contents
anyone on its behalf consulted with KPMG regarding any of the matters or events set forth in Item 304(a)(2)(i) and (ii) of Regulation S-K.
Avnet provided Arthur Andersen with a copy of the foregoing statements. Attached as Exhibit 16 to this Form 10-K is a copy of Andersen’s letter stating itsagreement with such statements.
Item 9A. Controls and Procedures
The Company’s management, including its Chief Executive Officer and Chief Financial Officer, have evaluated the effectiveness of the Company’sdisclosure controls and procedures (as such term is defined in Rules 13a-15(e) and 15d-15(e) under the Securities Exchange Act of 1934 (the “Exchange Act”)) asof the end of the reporting period covered by this Annual Report on Form 10-K. Based on such evaluation, the Chief Executive Officer and Chief FinancialOfficer have concluded that, as of the end of the period covered by this Annual Report on Form 10-K, the Company’s disclosure controls and procedures areeffective such that material information required to be disclosed by the Company in the reports that it files or submits under the Exchange Act is recorded,processed, summarized and reported, within the time periods specified by the Securities and Exchange Commission’s rules and forms relating to the Company.
During the last quarter of 2003, there have been no changes to the Company’s internal control over financial reporting that have materially affected, or arereasonably likely to materially affect, the Company’s internal control over financial reporting.
33
Table of Contents
PART III
Item 10. Directors and Executive Officers
The information called for by Item 10 is incorporated in this Report by reference to the Company’s definitive proxy statement relating to the Annual Meetingof Stockholders anticipated to be held on November 6, 2003.
Item 11. Executive Compensation
The information called for by Item 11 is incorporated in this Report by reference to the Company’s definitive proxy statement relating to the Annual Meetingof Stockholders anticipated to be held on November 6, 2003.
Item 12. Security Ownership of Certain Beneficial Owners and Management
The information called for by Item 12 is incorporated in this Report by reference to the Company’s definitive proxy statement relating to the Annual Meetingof Stockholders anticipated to be held on November 6, 2003.
Item 13. Certain Relationships and Related Transactions
The information called for by Item 13 is incorporated in this Report by reference to the Company’s definitive proxy statement relating to the Annual Meetingof Stockholders anticipated to be held on November 6, 2003.
Item 14. Principal Accountant Fees and Services
The information called for by Item 14 is incorporated in this Report by reference to the Company’s definitive proxy statement relating to the Annual Meetingof Stockholders anticipated to be held on November 6, 2003.
34
Table of Contents
PART IV
Item 15. Exhibits, Financial Statement Schedules and Reports on Form 8-K
a. The following documents are filed as part of this Report:
Page
1. Consolidated Financial Statements: Independent Auditors’ Reports 38 Avnet, Inc. and Subsidiaries Consolidated Financial Statements: Consolidated Balance Sheets at June 27, 2003 and June 28, 2002 42
Consolidated Statements of Operations for the years ended June 27, 2003,
June 28, 2002 and June 29, 2001 43
Consolidated Statements of Shareholders’ Equity for the years ended June 27,2003, June 28, 2002 and June 29, 2001 44
Consolidated Statements of Cash Flows for the years ended June 27, 2003,
June 28, 2002 and June 29, 2001 45 Notes to Consolidated Financial Statements 46 2. Financial Statement Schedules:
Schedule II (Valuation and Qualifying Accounts) for the years ended June 27, 2003,June 28, 2002 and June 29, 2001 75
Schedules other than that above have been omitted because they are not applicable orthe required information is shown in the financial statements or notes thereto. 3. Exhibits — The exhibit index for this Report can be found on pages 76 to 80.
b. Reports on Form 8-K
During the fourth quarter of 2003, the Company filed the following Current Reports on Form 8-K: (1) Current Report on Form 8-K bearing cover date ofApril 3, 2003 in which the Company reported under Item 9 that it had issued a press release announcing that the third quarter of fiscal 2003 corporate updateconference call would be held on April 24, 2003; (2) Current Report on Form 8-K bearing cover date of April 24, 2003 in which the Company furnished, pursuantto Items 9 and 12, its press release announcing the third quarter of 2003 financial results; (3) Current Report on Form 8-K bearing cover date of April 30, 2003 inwhich the Company reported under Item 9 that it had issued a press release announcing its presentation at the upcoming 31st Annual JPMorgan Technology &Telecom Conference; and (4) Current Report on Form 8-K bearing cover date of June 9, 2003 in which the Company reported under Item 9 that it had issued apress release announcing its presentation at the upcoming Thomas Weisel Partners Growth Forum 5.0.
35
Table of Contents
SIGNATURES
Pursuant to the requirements of Section 13 or 15(d) of the Securities Exchange Act of 1934, the Registrant has duly caused this Report to be signed on itsbehalf by the undersigned, thereunto duly authorized.
AVNET, INC. (Registrant)
By: /s/ ROY VALLEE Roy Vallee, Chairman of the Board, Chief Executive Officer and Director
Date: September 15, 2003
Pursuant to the requirements of the Securities Exchange Act of 1934, this Report has been signed below by the following persons on behalf of the Registrantand in the capacities indicated on September 15, 2003.
Signature Title
/s/ ROY VALLEE
Roy Vallee
Chairman of the Board,Chief Executive Officer and Director
/s/ ELEANOR BAUM
Eleanor Baum
Director
/s/ J. VERONICA BIGGINS
J. Veronica Biggins
Director
/s/ LAWRENCE W. CLARKSON
Lawrence W. Clarkson
Director
/s/ EHUD HOUMINER
Ehud Houminer
Director
/s/ JAMES A. LAWRENCE
James A. Lawrence
Director
/s/ SALVATORE J. NUZZO
Salvatore J. Nuzzo
Director
/s/ RAY M. ROBINSON
Ray M. Robinson
Director
/s/ FREDERIC SALERNO
Frederic Salerno
Director
/s/ GARY L. TOOKER
Gary L. Tooker
Director
36

Table of Contents
Signature Title
/s/ RAYMOND SADOWSKI
Raymond Sadowski
Senior Vice President, Chief FinancialOfficer and Assistant Secretary
/s/ JOHN F. COLE
John F. Cole
Controller and Principal Accounting Officer
37
Table of Contents
INDEPENDENT AUDITORS’ REPORT
The Board of Directors
Avnet, Inc.
We have audited the accompanying consolidated balance sheets of Avnet, Inc. and subsidiaries (the Company) as of June 27, 2003 and June 28, 2002, and therelated consolidated statements of operations, shareholders’ equity and cash flows for the years then ended. In connection with our audits of the consolidatedfinancial statements, we have also audited the financial statement schedule for the years ended June 27, 2003 and June 28, 2002 listed in the accompanying index.These consolidated financial statements and financial statement schedule are the responsibility of the Company’s management. Our responsibility is to express anopinion on these consolidated financial statements and financial statement schedule based on our audits. The consolidated financial statements and financialstatement schedule of Avnet, Inc. and subsidiaries for the year ended June 29, 2001 were audited by other auditors who have ceased operations. Those auditorsexpressed an unqualified opinion on those consolidated financial statements and financial statement schedule, before the revisions described in Notes 6 and 16 tothe consolidated financial statements, in their report dated August 14, 2001 based upon their audit and upon the report of other auditors.
We conducted our audits in accordance with auditing standards generally accepted in the United States of America. Those standards require that we plan andperform the audit to obtain reasonable assurance about whether the financial statements are free of material misstatement. An audit includes examining, on a testbasis, evidence supporting the amounts and disclosures in the financial statements. An audit also includes assessing the accounting principles used and significantestimates made by management, as well as evaluating the overall financial statement presentation. We believe that our audits provide a reasonable basis for ouropinion.
In our opinion, the consolidated financial statements referred to above present fairly, in all material respects, the financial position of Avnet, Inc. andsubsidiaries as of June 27, 2003 and June 28, 2002, and the results of their operations and their cash flows for the years then ended in conformity with accountingprinciples generally accepted in the United States of America. Also, in our opinion, the related financial statement schedule for the years ended June 27, 2003 andJune 28, 2002, when considered in relation to the basic consolidated financial statements taken as a whole, presents fairly, in all material respects, the informationset forth therein.
As discussed above, the consolidated financial statements and financial statement schedule of Avnet, Inc. and subsidiaries for the year ended June 29, 2001were audited by other auditors who have ceased operations. As described in Note 6, these consolidated financial statements have been revised to include thetransitional disclosures required by Statement of Financial Accounting Standards (SFAS) No. 142, Goodwill and Other Intangible Assets, which was adopted bythe Company as of June 30, 2001. In our opinion, the disclosures for fiscal year 2001 in Note 6 are appropriate. As described in Note 16, the Company allocatedgoodwill to its reportable segments previously presented as corporate assets during the year ended June 27, 2003, and accordingly, the amounts relating to thefiscal years ending 2002 and 2001 segment financial information have been restated to conform to the fiscal year 2003 presentation. We audited the adjustmentsthat were applied to restate the disclosures for reportable segments reflected in the fiscal year 2001 consolidated financial statements. In our opinion, suchadjustments are appropriate and have been properly applied. However, we were not engaged to audit, review, or apply any procedures to the fiscal year 2001consolidated financial statements of Avnet, Inc. and subsidiaries other than with respect to such disclosures and, accordingly, we do not express an opinion or anyother form of assurance on the fiscal year 2001 consolidated financial statements taken as a whole.
/s/ KPMG LLP
Phoenix, Arizona
August 7, 2003
38
Table of Contents
NOTICE REGARDING CONSENT OF ARTHUR ANDERSEN LLP
Section 11(a) of the Securities Act of 1933 provides that in case any part of a registration statement, when such part became effective, contained an untruestatement of a material fact, or omitted to state a material fact required to be stated therein or necessary to make the statements therein not misleading, any personacquiring a security pursuant to such registration statement (unless it is proved that at the time of such acquisition such person knew of such untruth or omission)may sue, among others, an accountant who has with his consent been named as having certified any part of the registration statement, or as having prepared anyreport which is used in connection with the registration statement.
On April 17, 2002, we dismissed Arthur Andersen LLP (“Arthur Andersen”) as our independent auditors. After reasonable efforts, we have been unable toobtain Arthur Andersen’s written consent to the incorporation by reference of Arthur Andersen’s audit report with respect to our financial statements as ofJune 29, 2001 and for the years ended June 29, 2001 and June 30, 2000 into our registration statements on Forms S-3 No. 333-39530 relating to shelf offerings ofsecurities of Avnet on a delayed or continuous basis under Rule 415, No. 333-94957 relating to the resale of common stock of Avnet issued in connection with theacquisition of Eurotronics B.V., and No. 333-107474 relating to shelf offerings of securities of Avnet on a delayed or continuous basis under Rule 415; Forms S-4No. 333-58852 relating to common stock of Avnet issuable upon exercise of options and warrants originally granted by Kent Electronics Corporation, 333-36970relating to common stock of Avnet issuable upon exercise of options and warrants originally granted by Savoir Technology Group, Inc. and No. 333-86721relating to common stock of Avnet issuable upon exercise of options and warrants originally granted by Marshall Industries, and Forms S-8 No. 2-96800, No. 33-29475, No. 33-43855, No. 033-64765, No. 333-45735, No. 333-55806, No. 333-00129, No. 333-17271, No. 333-45267, No. 333-89297 and No. 333-101039relating to common stock of Avnet issuable under the 1984, 1988, 1990, 1995, 1997 and 1999 Stock Option Plans, the 1994 and 1996 Avnet Incentive StockPrograms, the Avnet Deferred Compensation Plan, the Marshall Industries Stock Option Plans and the Avnet Employee Stock Purchase Plan, respectively. Suchaudit report is included in this Form 10-K.
Under these circumstances, Rule 437a under the Securities Act of 1933 permits Avnet to file this Form 10-K, which is incorporated by reference into theabove listed registration statements, without a written consent from Arthur Andersen. However, as a result, Arthur Andersen will not have any liability underSection 11(a) of the Securities Act for any untrue statements of a material fact contained in the financial statements audited by Arthur Andersen or any omissionsof a material fact required to be stated therein. Accordingly, you would be unable to assert a claim against Arthur Andersen under Section 11(a) of the SecuritiesAct.
39
Table of Contents
THE REPORT PRESENTED BELOW IS A COPY OF THE INDEPENDENT AUDITORS’ REPORT OF ARTHUR ANDERSEN LLP, THE FORMERAUDITOR FOR AVNET, INC., ISSUED ON AUGUST 14, 2001. ARTHUR ANDERSEN LLP HAS BEEN UNABLE TO ISSUE AN UPDATED REPORT.ADDITIONALLY, THE OPINION PRESENTED BELOW COVERS THE BALANCE SHEET AS OF JUNE 29, 2001 AND JUNE 30, 2000 AND THESTATEMENTS OF OPERATIONS, SHAREHOLDERS’ EQUITY AND CASH FLOWS FOR THE YEARS ENDED JUNE 30, 2000 AND JULY 2, 1999,WHICH STATEMENTS ARE NOT INCLUDED IN THIS REPORT ON FORM 10-K.
REPORT OF INDEPENDENT PUBLIC ACCOUNTANTS
To Avnet, Inc.
We have audited the accompanying consolidated balance sheets of Avnet, Inc. (a New York corporation) and Subsidiaries as of June 29, 2001 and June 30,2000, and the related consolidated statements of income, shareholders’ equity and cash flows for each of the three years in the period ended June 29, 2001. Thesefinancial statements and the schedule referred to below are the responsibility of the Company’s management. Our responsibility is to express an opinion on thesefinancial statements based on our audits. We did not audit the financial statements of Kent Electronics Corporation and Subsidiaries, a company acquired during2001 in a transaction accounted for as a pooling-of-interests, as discussed in Note 1. Such statements are included in the consolidated financial statements ofAvnet, Inc. and reflect 12 percent of total consolidated assets as of June 30, 2000 and 6 percent, 7 percent and 7 percent of total consolidated revenues for theyears ended June 29, 2001, June 30, 2000 and July 2, 1999, respectively. These statements were audited by other auditors whose report has been furnished to us,and our opinion, insofar as it relates to amounts included for Kent Electronics Corporation and Subsidiaries, is based solely upon the report of the other auditors.
We conducted our audits in accordance with auditing standards generally accepted in the United States. Those standards require that we plan and perform theaudit to obtain reasonable assurance about whether the financial statements are free of material misstatement. An audit includes examining, on a test basis,evidence supporting the amounts and disclosures in the financial statements. An audit also includes assessing the accounting principles used and significantestimates made by management, as well as evaluating the overall financial statement presentation. We believe that our audits and the report of the other auditorsprovide a reasonable basis for our opinion.
In our opinion, based on our audits and the report of the other auditors, the financial statements referred to above present fairly, in all material respects, thefinancial position of Avnet, Inc. and Subsidiaries as of June 29, 2001 and June 30, 2000, and the results of their operations and their cash flows for each of thethree years in the period ended June 29, 2001 in conformity with accounting principles generally accepted in the United States.
Our audits were made for the purpose of forming an opinion on the basic financial statements taken as a whole. The schedule listed in the index of financialstatement schedules is presented for purposes of complying with the Securities and Exchange Commission’s rules and is not part of the basic financial statements.This schedule has been subjected to the auditing procedures applied in the audits of the basic financial statements and, in our opinion, based on our audits and thereport of the other auditors, fairly states in all material respects the financial data required to be set forth therein in relation to the basic financial statements takenas a whole.
/s/ ARTHUR ANDERSEN LLP
Phoenix, Arizona
August 14, 2001
40
Table of Contents
REPORT OF INDEPENDENT CERTIFIED PUBLIC ACCOUNTANTS
Board of Directors and Stockholders
Kent Electronics Corporation
We have audited the consolidated statements of earnings, cash flows and stockholders’ equity of Kent Electronics Corporation and Subsidiaries for the yearended March 31, 2001. These financial statements are the responsibility of the Company’s management. Our responsibility is to express an opinion on thesefinancial statements based on our audit.
We conducted our audit in accordance with auditing standards generally accepted in the United States of America. Those standards require that we plan andperform the audit to obtain reasonable assurance about whether the financial statements are free of material misstatement. An audit includes examining, on a testbasis, evidence supporting the amounts and disclosures in the financial statements. An audit also includes assessing the accounting principles used and significantestimates made by management, as well as evaluating the overall financial statement presentation. We believe that our audit provides a reasonable basis for ouropinion.
In our opinion, the financial statements referred to above present fairly, in all material respects, the consolidated results of operations, cash flows and changesin stockholders’ equity of Kent Electronics Corporation and Subsidiaries for the year ended March 31, 2001, in conformity with accounting principles generallyaccepted in the United States of America.
/s/ GRANT THORNTON LLP
Houston, Texas
May 8, 2001
41
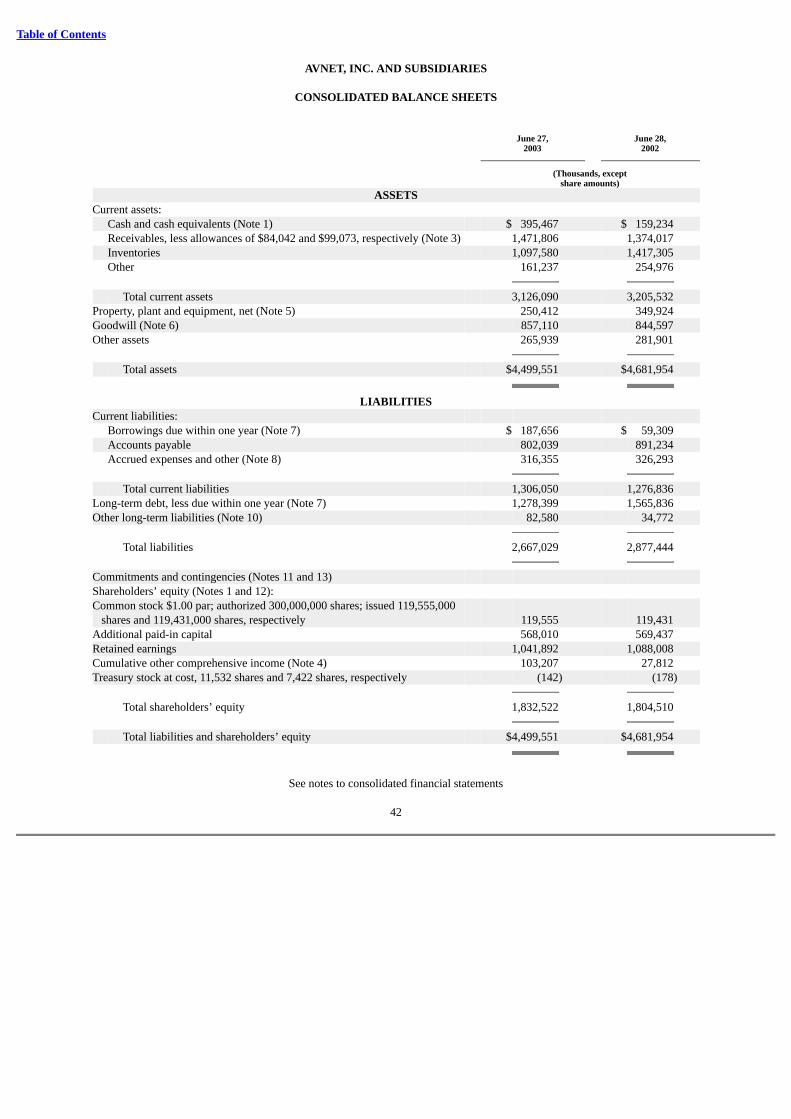
Table of Contents
AVNET, INC. AND SUBSIDIARIES
CONSOLIDATED BALANCE SHEETS
June 27, June 28,
2003 2002
(Thousands, exceptshare amounts)
ASSETSCurrent assets: Cash and cash equivalents (Note 1) $ 395,467 $ 159,234 Receivables, less allowances of $84,042 and $99,073, respectively (Note 3) 1,471,806 1,374,017 Inventories 1,097,580 1,417,305 Other 161,237 254,976 Total current assets 3,126,090 3,205,532 Property, plant and equipment, net (Note 5) 250,412 349,924 Goodwill (Note 6) 857,110 844,597 Other assets 265,939 281,901 Total assets $4,499,551 $4,681,954
LIABILITIESCurrent liabilities: Borrowings due within one year (Note 7) $ 187,656 $ 59,309 Accounts payable 802,039 891,234 Accrued expenses and other (Note 8) 316,355 326,293 Total current liabilities 1,306,050 1,276,836 Long-term debt, less due within one year (Note 7) 1,278,399 1,565,836 Other long-term liabilities (Note 10) 82,580 34,772 Total liabilities 2,667,029 2,877,444 Commitments and contingencies (Notes 11 and 13) Shareholders’ equity (Notes 1 and 12): Common stock $1.00 par; authorized 300,000,000 shares; issued 119,555,000
shares and 119,431,000 shares, respectively 119,555 119,431 Additional paid-in capital 568,010 569,437 Retained earnings 1,041,892 1,088,008 Cumulative other comprehensive income (Note 4) 103,207 27,812 Treasury stock at cost, 11,532 shares and 7,422 shares, respectively (142) (178) Total shareholders’ equity 1,832,522 1,804,510 Total liabilities and shareholders’ equity $4,499,551 $4,681,954
See notes to consolidated financial statements
42
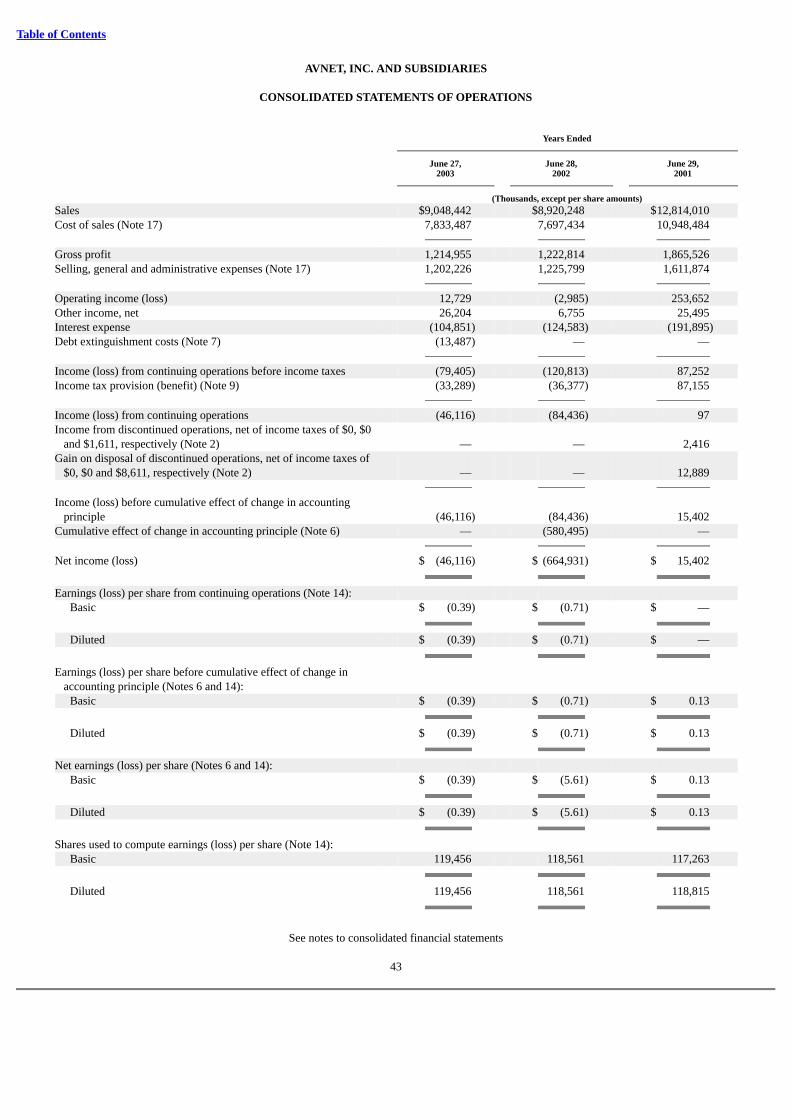
Table of Contents
AVNET, INC. AND SUBSIDIARIES
CONSOLIDATED STATEMENTS OF OPERATIONS
Years Ended
June 27, June 28, June 29,2003 2002 2001
(Thousands, except per share amounts)Sales $9,048,442 $8,920,248 $12,814,010 Cost of sales (Note 17) 7,833,487 7,697,434 10,948,484 Gross profit 1,214,955 1,222,814 1,865,526 Selling, general and administrative expenses (Note 17) 1,202,226 1,225,799 1,611,874 Operating income (loss) 12,729 (2,985) 253,652 Other income, net 26,204 6,755 25,495 Interest expense (104,851) (124,583) (191,895)Debt extinguishment costs (Note 7) (13,487) — — Income (loss) from continuing operations before income taxes (79,405) (120,813) 87,252 Income tax provision (benefit) (Note 9) (33,289) (36,377) 87,155 Income (loss) from continuing operations (46,116) (84,436) 97 Income from discontinued operations, net of income taxes of $0, $0
and $1,611, respectively (Note 2) — — 2,416
Gain on disposal of discontinued operations, net of income taxes of$0, $0 and $8,611, respectively (Note 2) — — 12,889
Income (loss) before cumulative effect of change in accounting
principle (46,116) (84,436) 15,402
Cumulative effect of change in accounting principle (Note 6) — (580,495) — Net income (loss) $ (46,116) $ (664,931) $ 15,402 Earnings (loss) per share from continuing operations (Note 14): Basic $ (0.39) $ (0.71) $ — Diluted $ (0.39) $ (0.71) $ — Earnings (loss) per share before cumulative effect of change in
accounting principle (Notes 6 and 14):
Basic $ (0.39) $ (0.71) $ 0.13 Diluted $ (0.39) $ (0.71) $ 0.13 Net earnings (loss) per share (Notes 6 and 14): Basic $ (0.39) $ (5.61) $ 0.13 Diluted $ (0.39) $ (5.61) $ 0.13 Shares used to compute earnings (loss) per share (Note 14): Basic 119,456 118,561 117,263 Diluted 119,456 118,561 118,815
See notes to consolidated financial statements
43
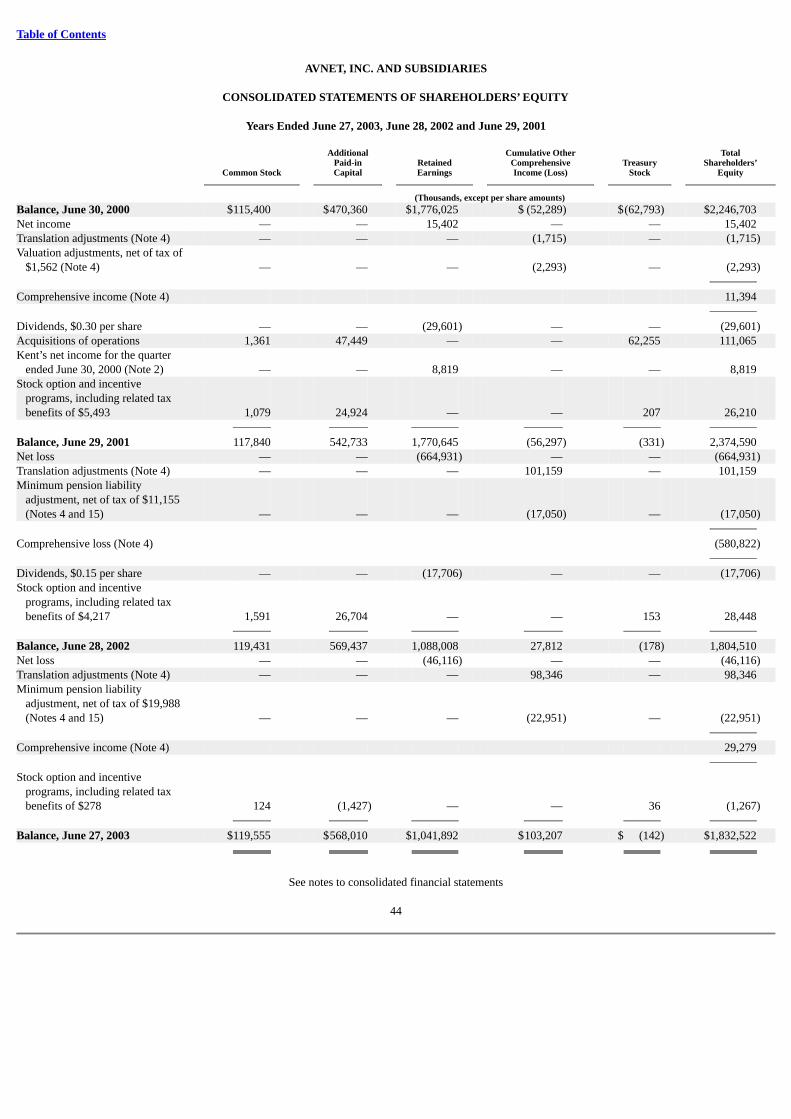
Table of Contents
AVNET, INC. AND SUBSIDIARIES
CONSOLIDATED STATEMENTS OF SHAREHOLDERS’ EQUITY
Years Ended June 27, 2003, June 28, 2002 and June 29, 2001
Additional Cumulative Other TotalPaid-in Retained Comprehensive Treasury Shareholders’
Common Stock Capital Earnings Income (Loss) Stock Equity
(Thousands, except per share amounts)Balance, June 30, 2000 $115,400 $470,360 $1,776,025 $ (52,289) $(62,793) $2,246,703 Net income — — 15,402 — — 15,402 Translation adjustments (Note 4) — — — (1,715) — (1,715)Valuation adjustments, net of tax of
$1,562 (Note 4) — — — (2,293) — (2,293) Comprehensive income (Note 4) 11,394 Dividends, $0.30 per share — — (29,601) — — (29,601)Acquisitions of operations 1,361 47,449 — — 62,255 111,065 Kent’s net income for the quarter
ended June 30, 2000 (Note 2) — — 8,819 — — 8,819
Stock option and incentiveprograms, including related taxbenefits of $5,493 1,079 24,924 — — 207 26,210
Balance, June 29, 2001 117,840 542,733 1,770,645 (56,297) (331) 2,374,590 Net loss — — (664,931) — — (664,931)Translation adjustments (Note 4) — — — 101,159 — 101,159 Minimum pension liability
adjustment, net of tax of $11,155(Notes 4 and 15) — — — (17,050) — (17,050)
Comprehensive loss (Note 4) (580,822) Dividends, $0.15 per share — — (17,706) — — (17,706)Stock option and incentive
programs, including related taxbenefits of $4,217
1,591
26,704
—
—
153
28,448
Balance, June 28, 2002 119,431 569,437 1,088,008 27,812 (178) 1,804,510 Net loss — — (46,116) — — (46,116)Translation adjustments (Note 4) — — — 98,346 — 98,346 Minimum pension liability
adjustment, net of tax of $19,988(Notes 4 and 15)
—
—
—
(22,951)
—
(22,951)
Comprehensive income (Note 4) 29,279 Stock option and incentive
programs, including related taxbenefits of $278
124
(1,427)
—
—
36
(1,267)
Balance, June 27, 2003 $119,555 $568,010 $1,041,892 $103,207 $ (142) $1,832,522
See notes to consolidated financial statements
44
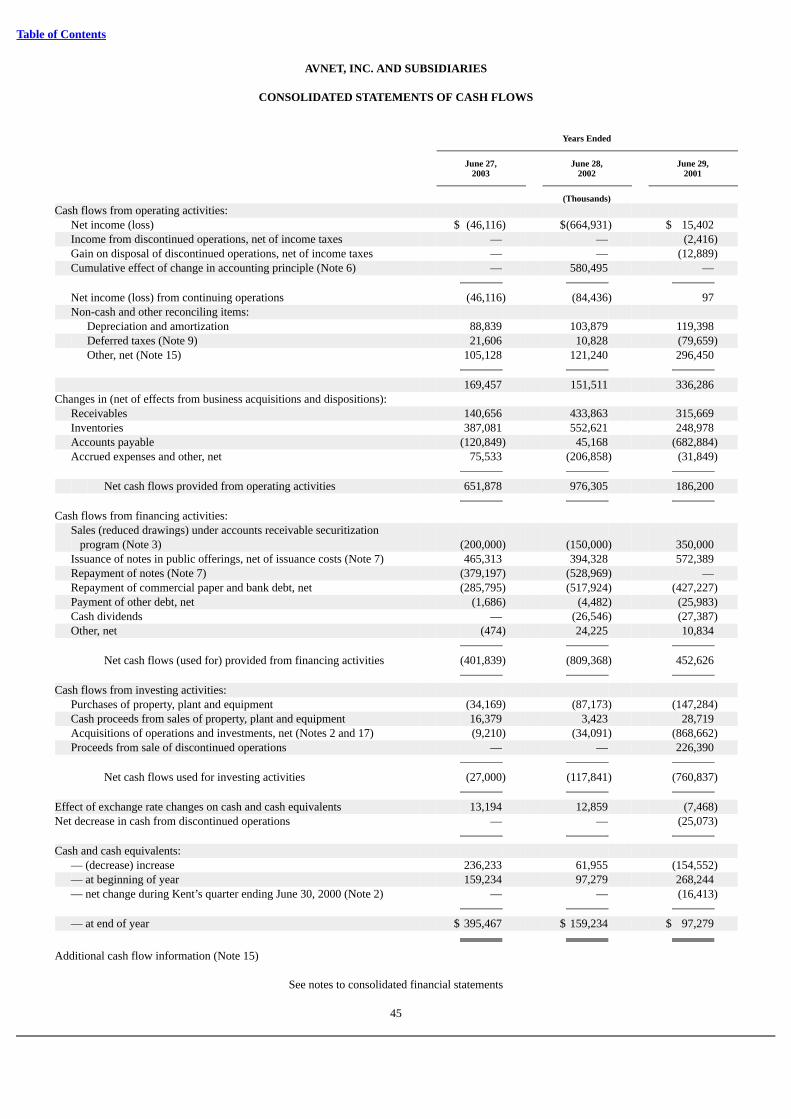
Table of Contents
AVNET, INC. AND SUBSIDIARIES
CONSOLIDATED STATEMENTS OF CASH FLOWS
Years Ended
June 27, June 28, June 29,2003 2002 2001
(Thousands)Cash flows from operating activities: Net income (loss) $ (46,116) $(664,931) $ 15,402 Income from discontinued operations, net of income taxes — — (2,416) Gain on disposal of discontinued operations, net of income taxes — — (12,889) Cumulative effect of change in accounting principle (Note 6) — 580,495 — Net income (loss) from continuing operations (46,116) (84,436) 97 Non-cash and other reconciling items: Depreciation and amortization 88,839 103,879 119,398 Deferred taxes (Note 9) 21,606 10,828 (79,659) Other, net (Note 15) 105,128 121,240 296,450 169,457 151,511 336,286 Changes in (net of effects from business acquisitions and dispositions): Receivables 140,656 433,863 315,669 Inventories 387,081 552,621 248,978 Accounts payable (120,849) 45,168 (682,884) Accrued expenses and other, net 75,533 (206,858) (31,849) Net cash flows provided from operating activities 651,878 976,305 186,200 Cash flows from financing activities:
Sales (reduced drawings) under accounts receivable securitization
program (Note 3) (200,000) (150,000) 350,000 Issuance of notes in public offerings, net of issuance costs (Note 7) 465,313 394,328 572,389 Repayment of notes (Note 7) (379,197) (528,969) — Repayment of commercial paper and bank debt, net (285,795) (517,924) (427,227) Payment of other debt, net (1,686) (4,482) (25,983) Cash dividends — (26,546) (27,387) Other, net (474) 24,225 10,834 Net cash flows (used for) provided from financing activities (401,839) (809,368) 452,626 Cash flows from investing activities: Purchases of property, plant and equipment (34,169) (87,173) (147,284) Cash proceeds from sales of property, plant and equipment 16,379 3,423 28,719 Acquisitions of operations and investments, net (Notes 2 and 17) (9,210) (34,091) (868,662) Proceeds from sale of discontinued operations — — 226,390 Net cash flows used for investing activities (27,000) (117,841) (760,837) Effect of exchange rate changes on cash and cash equivalents 13,194 12,859 (7,468)Net decrease in cash from discontinued operations — — (25,073) Cash and cash equivalents: — (decrease) increase 236,233 61,955 (154,552) — at beginning of year 159,234 97,279 268,244 — net change during Kent’s quarter ending June 30, 2000 (Note 2) — — (16,413) — at end of year $ 395,467 $ 159,234 $ 97,279 Additional cash flow information (Note 15)
See notes to consolidated financial statements
45
Table of Contents
AVNET, INC. AND SUBSIDIARIES
NOTES TO CONSOLIDATED FINANCIAL STATEMENTS
1. Summary of significant accounting policies:
Principles of consolidation — The accompanying consolidated financial statements include the accounts of the Company and all of its subsidiaries. Allintercompany accounts and transactions have been eliminated.
Effective June 8, 2001, the Company acquired Kent Electronics Corporation (“Kent”) in a transaction accounted for as a “pooling-of-interests.” Accordingly,the accompanying consolidated financial statements and notes for periods prior to the acquisition have been restated to reflect the acquisition of Kent (seeNote 2).
Cash and cash equivalents — The Company considers all highly liquid investments with an original maturity of three months or less to be cash equivalents.At June 27, 2003, cash and cash equivalents include $78,543,000 of cash restricted and held in an escrow account. This escrow balance consists of a portion ofthe proceeds from the Company’s issuance in February 2003 of $475,000,000 of 9 3/4% Notes due February 15, 2008, which will be used to repay the remainingprincipal on the 6.45% Notes due August 15, 2003 and the 8.20% Notes due October 17, 2003 at their respective maturity dates plus interest due through theirmaturities (see Note 7).
Inventories — Inventories, comprised principally of finished goods, are stated at cost (first-in, first-out) or market, whichever is lower.
Investments — Investments in joint ventures and entities in which the Company has an ownership interest greater than 50% and exercises control over theventure are consolidated in the accompanying consolidated financial statements. Minority interests in the years presented, which amounts are not material, areincluded in the caption “accrued expenses and other” in the accompanying consolidated balance sheets. The Company invests from time to time in ventures inwhich the Company’s ownership interest is less than 20% and over which the Company does not exercise significant influence. Such investments are accountedfor under the cost method. The fair values for investments not traded on a quoted exchange are estimated based upon the performance of the ventures historically,the ventures’ forecasted financial performance and management’s evaluation of the ventures’ viability and business models. To the extent the book value of aninvestment exceeds its assessed fair value, the Company will record an appropriate impairment charge (see Note 17). Thus, the carrying value of the Company’sinvestments approximates fair value.
Depreciation and amortization — Depreciation and amortization is generally provided for by the straight-line method over the estimated useful lives of theassets. The estimated useful lives for depreciation and amortization are typically as follows: buildings — 30 years; machinery, fixtures and equipment — 2-10 years; and leasehold improvements — over the applicable remaining lease term or useful life if shorter. Internal use software costs are expensed or capitalizeddepending upon the stage of the project, in accordance with the AICPA’s Statement of Position 98-1, “Accounting for the Costs of Computer Software Developedor Obtained for Internal Use.” Amortization of internal use software costs commences upon the project’s completion and extends over the estimated useful life,typically ranging from 5-7 years.
Long-lived assets — Long-lived assets are reviewed for impairment whenever events or changes in circumstances indicate that the carrying amount of theassets may not be recoverable. The Company continually evaluates the carrying value and the remaining economic useful life of all long-lived assets and willadjust the carrying value and the related depreciation and amortization period if and when appropriate.
Goodwill — Goodwill represents the excess of the purchase price over the fair value of net assets acquired. Except for an immaterial amount of goodwillapplicable to purchases made before October 31, 1970, goodwill was amortized on a straight-line basis over 40 years through June 29, 2001. The Company hasadopted the Financial Accounting Standards Board’s (“FASB”) Statement of Financial Accounting Standards No. 141 (“SFAS 141”), “Business Combinations,”which requires that all business combinations initiated after June 30, 2001 be accounted for under the purchase method and that certain identifiable intangibleassets be recognized as assets apart from goodwill. The Company has no other material identifiable
46
Table of Contents
AVNET, INC. AND SUBSIDIARIES
NOTES TO CONSOLIDATED FINANCIAL STATEMENTS — Continued
intangible assets besides goodwill. The Company also elected to early adopt the provisions of the FASB’s Statement of Financial Accounting Standards No. 142(“SFAS 142”), “Goodwill and Other Intangible Assets,” effective June 30, 2001, the first day of the Company’s fiscal year 2002. SFAS 142 requires that ratableamortization of goodwill be replaced with periodic tests for goodwill impairment (see Note 6). The Company conducts its periodic test for goodwill impairmentannually, on the first day of the fiscal fourth quarter.
Foreign currency translation — The assets and liabilities of foreign operations are translated into U.S. dollars at the exchange rates in effect at the balancesheet date, with the related translation gains and losses reported as a separate component of shareholders’ equity and comprehensive income. Results ofoperations are translated using the average exchange rates prevailing throughout the period. Transactions denominated in currencies other than the functionalcurrency of the Avnet business unit that is party to the transaction (primarily trade receivables and payables) are translated at exchange rates in effect at thebalance sheet date or upon settlement of the transaction. Gains and losses from such translation are recorded to the consolidated statements of operations as acomponent of “other income, net.”
Income taxes — The Company follows the asset and liability method of accounting for income taxes. Deferred tax assets and liabilities are recognized for theestimated future tax impact of differences between the financial statement carrying amounts of assets and liabilities and their respective tax bases. Deferred taxassets and liabilities are measured using enacted tax rates in effect for the year in which those temporary differences are expected to be recovered or settled. Theeffect on deferred tax assets and liabilities of a change in tax rates is recognized in earnings in the period in which the new rate is enacted.
No provision for U.S. income taxes has been made for approximately $290,740,000 of cumulative unremitted earnings of foreign subsidiaries at June 27,2003 because those earnings are expected to be permanently reinvested outside the U.S.
Self-insurance — The Company is primarily self-insured for workers’ compensation, and general, product and automobile liability costs; however, theCompany also has a stop-loss insurance policy in place to limit the Company’s exposure to individual and aggregate claims made. Liabilities for these programsare estimated based upon outstanding claims and claims estimated to have been incurred but not yet reported based upon historical loss experience. Theseestimates are subject to variability due to changes in trends of losses for outstanding claims and incurred but not recorded claims, including external factors suchas future inflation rates, benefit level changes and claim settlement patterns.
Revenue recognition — Revenue from product sales is recognized when persuasive evidence of an arrangement exists, delivery has occurred or services havebeen rendered, the sales price is fixed or determinable and collectibility is reasonably assured. Generally, these criteria are met upon shipment to customers. Mostof the Company’s product sales come from product Avnet purchases from a supplier and holds in inventory. A portion of the Company’s sales are shipments ofproduct directly from its suppliers to its customers. In such circumstances, Avnet negotiates the price with the customer, pays the supplier directly for the productshipped and bears credit risk of collecting payment from its customers. Furthermore, in such drop-shipment arrangements, Avnet bears responsibility foraccepting returns of product from the customer even if Avnet, in turn, has a right to return the product to the original supplier if the product is defective. Underthese terms, the Company serves as the principal with the customer, as defined under SEC Staff Accounting Bulletin No. 101 and Emerging Issues Task ForceIssue No. 99-19 (“EITF 99-19”), Reporting Revenue Gross as a Principal versus Net as an Agent,” and therefore recognizes the sale and cost of sale of theproduct upon receiving notification from the supplier that the product has shipped.
In addition, the Company has more limited contractual relationships with certain of its customers and suppliers whereby Avnet assumes an agencyrelationship in the transaction as defined by EITF 99-19. In such
47
Table of Contents
AVNET, INC. AND SUBSIDIARIES
NOTES TO CONSOLIDATED FINANCIAL STATEMENTS — Continued
arrangements, the Company recognizes the fee associated with serving as an agent in sales with no associated cost of sales.
Revenues and anticipated profits under long-term contracts are recorded on the percentage of completion basis, under which a portion of the total contractprice is accrued based on the ratio of costs incurred to estimated costs at completion. Revenues from maintenance contracts are recognized ratably over the life ofthe contracts, ranging from one to three years. Revenues are recorded net of discounts, rebates and estimated returns.
Shipping and handling fees and costs — The Company recognizes amounts billed to a customer in a sale transaction related to shipping and handling asrevenue. The costs incurred by the Company for shipping and handling are classified as cost of sales.
Comprehensive income (loss) — Comprehensive income (loss) represents net income (loss) for the year adjusted for changes in shareholders’ equity fromnon-shareholder sources. Cumulative comprehensive income (loss) items consist of currency translation, valuation adjustments for marketable securities and theimpact of the Company’s additional minimum pension liability, net of tax (see Note 4).
Stock-based compensation — The Company accounts for its stock based compensation plans using the intrinsic value method initially prescribed byAccounting Principles Board Opinion No. 25 (“APB 25”), “Accounting for Stock Issued to Employees.” In applying APB 25, no expense is recognized upongrant of stock under the Company’s various stock option plans, except in the rare circumstances where the exercise price is less than the fair market value on thegrant date, nor is expense recognized in connection with shares purchased by employees under the Employee Stock Purchase Plan (see Note 12).
No expense was recognized for options granted under the various stock option plans as the options granted during the periods presented had exercise pricesequal to the market value of the underlying stock on the date of the grants. Statement of Financial Accounting Standards No. 148, “Accounting for Stock-BasedCompensation — Transition and Disclosure — An Amendment of FASB Statement No. 123,” requires certain disclosures of the pro forma impact on net income(loss) and earnings (loss) per share as if a fair value-based method of measuring stock-based compensation, as defined by Statement of Financial AccountingStandards No. 123, “Accounting for Stock-Based Compensation,” had been applied.
Reported and pro forma net income (loss) and earnings (loss) per share are as follows:
Years Ended
June 27, June 28, June 29,2003 2002 2001
(Thousands, except per share amounts)Net income (loss), as reported $(46,116) $(664,931) $15,402 Less: Fair value impact of employee stock compensation, net of tax (8,953) (10,459) (8,452) Pro forma net income (loss) $(55,069) $(675,390) $ 6,950 Earnings (loss) per share: Basic — as reported $ (0.39) $ (5.61) $ 0.13 Basic — pro forma $ (0.46) $ (5.70) $ 0.06 Diluted — as reported $ (0.39) $ (5.61) $ 0.13 Diluted — pro forma $ (0.46) $ (5.70) $ 0.06
48
Table of Contents
AVNET, INC. AND SUBSIDIARIES
NOTES TO CONSOLIDATED FINANCIAL STATEMENTS — Continued
The fair value of the stock options granted is estimated on the date of grant using the Black-Scholes option-pricing model. The weighted average assumptionsused and the weighted average estimated fair values of an option granted are as follows:
Years Ended
June 27, June 28, June 29,2003 2002 2001
Expected life (years) 6.0 6.0 5.5 Risk-free interest rate 3.2% 4.3% 6.0%Volatility 41.8% 40.7% 37.0%Dividend yield — 0.4% 1.1%Weighted average fair value $5.77 $8.34 $11.33
Concentration of credit risk — Financial instruments that potentially subject the Company to a concentration of credit risk principally consist of cash andcash equivalents and trade accounts receivable. The Company invests its excess cash primarily in overnight Eurodollar time deposits and institutional moneymarket funds with quality financial institutions. The Company sells electronic components and computer products primarily to original equipment and contractmanufacturers, including the military and military contractors, throughout the world. To reduce credit risk, management performs ongoing credit evaluations of itscustomers’ financial condition and, in some instances, has obtained insurance coverage to reduce such risk. The Company maintains reserves for potential creditlosses, but has not experienced any material losses related to individual customers or groups of customers in any particular industry or geographic area.
Fair value of financial instruments — The carrying amounts of the Company’s financial instruments, including cash and cash equivalents, receivables andaccounts payable approximate their fair values at June 27, 2003 due to the short-term nature of these instruments. See Note 7 for further discussion of the fairvalue of the Company’s fixed rate long-term debt instruments and see Investments in this Note 1 for further discussion of the fair value of the Company’sinvestments in unconsolidated entities.
Accounts receivable securitization — The Company has an accounts receivable securitization program whereby the Company may sell receivables insecuritization transactions and retain a subordinated interest and servicing rights to those receivables. The Company accounts for the program under the FASB’sStatement of Financial Accounting Standards No. 140 (“SFAS 140”), “Accounting for Transfers and Servicing of Financial Assets and Extinguishment ofLiabilities.” The gain or loss on sales of receivables is determined at the date of transfer based upon the relative fair value of the assets sold and the interestsretained. The Company estimates fair value based on the present value of future expected cash flows using management’s best estimates of the key assumptions,including collection period and discount rates (see Note 3).
Derivative financial instruments — The Company accounts for derivative financial instruments in accordance with the FASB’s Statement of FinancialAccounting Standards No. 133 (“SFAS 133”), “Accounting for Derivative Instruments and Hedging Activities,” as amended by Statement of FinancialAccounting Standards No. 138, “Accounting for Certain Derivative Instruments and Hedging Activities.”
Many of the Company’s subsidiaries, on occasion, purchase and sell products in currencies other than their functional currencies. This subjects the Companyto the risks associated with the fluctuations of foreign currency exchange rates. The Company reduces this risk by utilizing natural hedging (offsetting receivablesand payables) as well as by creating offsetting positions through the use of derivative financial instruments, primarily forward foreign exchange contracts withmaturities of less than sixty days. The Company adjusts all foreign denominated balances and any outstanding foreign exchange contracts to fair market valuethrough the consolidated statements of operations. Therefore, the market risk related to the foreign exchange contracts is offset by the changes in valuation of theunderlying items being hedged. The asset or liability representing the
49
Table of Contents
AVNET, INC. AND SUBSIDIARIES
NOTES TO CONSOLIDATED FINANCIAL STATEMENTS — Continued
fair value of foreign exchange contracts is classified in the captions “other current assets” or “accrued expenses and other,” as applicable, in the accompanyingconsolidated balance sheets.
The Company has also entered into hedge transactions that convert certain fixed rate debt to variable rate debt, effectively hedging the change in fair value ofthe fixed rate debt resulting from fluctuations in interest rates. Those fair value hedges and the hedged debt are adjusted to current market values through interestexpense in accordance with SFAS 133, as amended (see Note 7).
The Company does not hedge its investment in its foreign operations nor its floating interest rate exposures. The Company does not enter into derivativefinancial instruments for trading or speculative purposes and monitors the financial stability and credit standing of its counter parties.
Fiscal year — The Company operates on a “52/53 week” fiscal year, which ends on the Friday closest to June 30th (Saturday closest to June 30thcommencing in 2004). Fiscal years 2003, 2002 and 2001 all contained 52 weeks. Unless otherwise noted, all references to the “year 2003” or any other “year”shall mean the Company’s fiscal year.
Management estimates — The preparation of financial statements in conformity with accounting principles generally accepted in the United States requiresmanagement to make estimates and assumptions that affect certain reported amounts of assets and liabilities, disclosure of contingent assets and liabilities at thedate of the financial statements and the reported amounts of revenues and expenses during the reporting period. Actual results could differ from those estimates.
Reclassifications — Certain reclassifications have been made to the prior years’ consolidated financial statements and notes thereto to conform to the currentyear presentation.
New accounting standards — In November 2002, the Emerging Issues Task Force reached a consensus on EITF Issue No. 02-16 (“EITF 02-16”),“Accounting by a Customer (Including a Reseller) for Certain Consideration Received from a Vendor.” EITF 02-16 provides guidance as to the classification andtiming of recognition of supplier rebates in the results of operations of the customer or reseller receiving the rebate. Substantially all of Avnet’s rebates aredependent on the resale of the product to Avnet’s customers and the rebates are typically not awarded until Avnet completes this sale. Avnet has historicallyaccounted for these rebates as a reduction of cost of sales and, therefore, EITF 02-16 did not have a material impact on the Company.
In January 2003, the FASB issued FASB Interpretation No. 46 (“FIN 46”), “Consolidation of Variable Interest Entities,” which requires the consolidation ofvariable interest entities (“VIEs”), as defined, based upon an assessment of a company’s investment interests in the VIE as it relates to the interests of otherinvestors in the VIE. FIN 46 also includes certain disclosure requirements related to any VIEs. The consolidation requirements apply to any VIEs created afterJanuary 31, 2003 and, for any VIEs that existed prior to that date, the consolidation requirements are effective with Avnet’s first quarter of fiscal 2004 to theextent Avnet continues to hold an investment interest in any such VIEs as of the first day of that quarter. The adoption of FIN 46 is not expected to have amaterial impact on the Company’s consolidated financial statements.
In April 2003, the FASB issued Statement of Financial Accounting Standards No. 149 (“SFAS 149”), “Amendment of Statement 133 on DerivativeInstruments and Hedging Activities,” which amends and clarifies financial accounting and reporting for derivative instruments, including certain derivativeinstruments embedded in other contracts. SFAS 149 is effective for contracts entered into or modified after June 30, 2003 and for hedging relationshipsdesignated after June 30, 2003. The provisions of SFAS 149 are to be applied prospectively and therefore will have no impact on pre-existing hedgingtransactions.
In May 2003, the FASB issued Statement of Financial Accounting Standards No. 150 (“SFAS 150”), “Accounting for Certain Financial Instruments withCharacteristics of both Liabilities and Equity.”
50
Table of Contents
AVNET, INC. AND SUBSIDIARIES
NOTES TO CONSOLIDATED FINANCIAL STATEMENTS — Continued
SFAS 150 establishes standards for classification and measurement of certain financial instruments. SFAS 150 is effective for any financial instruments enteredinto or modified after May 31, 2003 and Avnet adopted SFAS 150, as required, for any previously existing financial instruments as of June 28, 2003. Theadoption of SFAS 150 did not have a material effect on the Company’s consolidated financial statements.
2. Acquisitions and dispositions:
During the last three fiscal years, the Company has completed six acquisitions — two in North America, two in Europe, one in the Asia/ Pacific region andone in the Middle East. One of the acquisitions was completed in 2002 and five of the acquisitions were completed in 2001. All acquisitions, except for theacquisition of Kent discussed below and in Note 1, have been accounted for as purchases.
During 2003, the Company acquired the remaining 40% interest in Max India Ltd. as well as the remaining interests in various Israeli subsidiaries of AvnetComponents Israel Ltd. The Company also completed contingent purchase price payments associated with companies acquired in previous years includingSunrise Technology Ltd. and Avnet Italy. The acquisitions of these remaining minority interests and the contingent purchase price payments required a totalinvestment of $9,210,000, all of which was paid in cash.
In 2002, the Company completed the acquisition of Gamma Optronik AB, as well as certain contingent purchase price payments associated with businessesacquired in prior fiscal years (principally, Sunrise Technology Ltd., RDT Technologies Ltd., PCD Italia S.r.l. and Matica S.p.A. and Savoir Technology Group,Inc.), the acquisition of the remaining 20% interest in Kopp Electronics Limited and further investment in an unconsolidated business. These transactions requireda total investment of $34,091,000 (net of $1,462,000 of cash on the books of Gamma Optronik AB at its acquisition date), all of which was paid in cash. GammaOptronik AB had sales totaling approximately $7,534,000 during its fiscal year immediately preceding its acquisition. The historical results of operations of theacquired company would not have had a material effect on the Company’s consolidated results of operations and therefore no unaudited pro forma results arepresented herein.
The acquisitions completed during 2001 consisted principally of Kent, Sunrise Technology Ltd., RDT Technologies Ltd., certain European operations of theVEBA Electronics Group (consisting of EBV, WBC, Atlas Logistics and RKE Systems, collectively, the “VEBA Group”) and Savoir Technology Group, Inc.These acquisitions, excluding the Kent acquisition which was accounted for as a “pooling-of-interests,” required a total investment of $876,079,000 (net of$74,423,000 of cash on the books of the companies acquired), of which $789,599,000 was paid in cash (excluding $32,200,000 to pay off pre-existing debt),$111,065,000 was paid in Avnet stock and $714,000 was paid in Avnet stock options (net of related tax benefits of $454,000), less a receivable of $25,299,000 forincome tax credits related to the acquisition of the VEBA Group. In addition, the Company paid $79,063,000 of Kent acquisition-related costs, consistingprimarily of change-in-control and other executive benefit-related payments and professional fees for investment banking, legal and accounting services renderedto both Avnet and Kent. In the aggregate, the operations acquired during 2001, excluding Kent, had sales totaling approximately $2,887,000,000 during the fiscalyear of each such operation immediately preceding its acquisition. The historical results of operations of the companies other than Kent that were acquired during2001 would not have had a material effect on the Company’s results of operations and therefore no unaudited pro forma results are presented herein. TheCompany also sold certain small non-core operations during 2001, the impact of which was not material.
During 2003, the Company and the seller of the VEBA Group resolved certain purchase price contingencies related to this acquisition. This resolutionresulted in a refund to Avnet, totaling approximately $6,486,000, of a portion of the amount paid by Avnet at the closing of the acquisition. The refunded purchaseprice was recorded as a reduction of operating expenses in the 2003 consolidated statement of operations as the goodwill related to the VEBA Group had beenwritten off as a result of the transition impairment test performed upon the adoption of SFAS 142 (see Note 6).
51
Table of Contents
AVNET, INC. AND SUBSIDIARIES
NOTES TO CONSOLIDATED FINANCIAL STATEMENTS — Continued
As discussed in Note 1, the accompanying consolidated financial statements and notes have been restated to reflect the acquisition of Kent, which wasaccounted for as a “pooling-of-interests.” Each share of Kent common stock was converted into 0.87 shares of Avnet common stock. A total of approximately25.3 million Avnet common shares were issued for the outstanding stock of Kent and an additional 1.7 million shares were reserved for issuance upon theexercise of outstanding warrants and stock options assumed in the transaction.
Kent’s results of operations for the period from July 1, 2000 to June 8, 2001 and for its fiscal year ended April 1, 2000 were combined with Avnet’s results ofoperations for the years ended June 29, 2001 and June 30, 2000, respectively. In addition, Kent’s balance sheet as of April 1, 2000 was combined with Avnet’sbalance sheet as of June 30, 2000. Therefore, an adjustment was made to retained earnings to include $8,819,000 of net income for Kent for the three monthsended June 30, 2000 as these earnings were not included in any of the statements of operations otherwise presented. For the same three months, Kent’s sales of$223,313,000 and Kent’s cash flows (used for) provided from operating, financing and investing activities of ($26,644,000), $1,443,000 and $8,788,000,respectively, have been excluded from the consolidated statements of operations and cash flows, respectively. The restated financial information includes certainreclassifications to conform Kent’s financial statement presentation to that of Avnet. Intercompany transactions between the combined companies were notmaterial.
The following table is a reconciliation of the results of operations of the previously separate Avnet and Kent companies to reported combined results ofoperations for the most recent interim period preceding the acquisition:
Avnet Before Kent Before Avnet as
Pooling Pooling Restated
(Thousands)Nine months ended March 30, 2001 Sales $9,557,204 $719,051 $10,276,255 Income from continuing operations 205,596 25,536 231,132 Net income 205,596 45,952 251,548
Disposition of discontinued operations:
On October 10, 2000, Kent sold K*TEC Electronics Corporation (“K*TEC”), its contract manufacturing operation, for $237,200,000, consisting of$175,000,000 in cash, a $50,000,000 senior secured note which was redeemed on January 26, 2001 and a $12,200,000 unsecured note which was settled during2002. A gain on the sale of K*TEC of approximately $21,500,000 pre-tax, $12,889,000 after-tax, or $0.11 per diluted share, was recorded in 2001. The net assetsand operations of K*TEC are reflected as discontinued operations in the accompanying consolidated financial statements for 2001. Corporate and shared generaland administrative costs of the Company were not allocated to discontinued operations. The net assets and results of operations of K*TEC were not material in2001 and therefore the condensed financial information of the discontinued operations has not been presented herein.
3. Accounts receivable securitization:
The Company has an accounts receivable securitization program (the “Program”) with two financial institutions that allows the Company to sell, on arevolving basis, an undivided interest of up to $350,000,000 in eligible U.S. receivables while retaining a subordinated interest in a portion of the receivables. Theeligible receivables are sold without legal recourse to third party conduits through a wholly owned bankruptcy-remote special purpose entity that is consolidatedfor financial reporting purposes. The Company continues servicing the sold receivables and charges the third party conduits a monthly servicing fee at marketrates; accordingly, no servicing asset or liability has been recorded. Cash received from the Program has been used primarily to pay down outstanding externalfinancing.
52
Table of Contents
AVNET, INC. AND SUBSIDIARIES
NOTES TO CONSOLIDATED FINANCIAL STATEMENTS — Continued
The Program qualifies for sale treatment under SFAS 140. As of June 27, 2003, the Company had no drawings outstanding under the Program and thereforethere are no securitized accounts receivable held by the third party conduits. As of June 28, 2002, the outstanding balance of securitized accounts receivable heldby the third party conduits, net of applicable allowances, totaled $324,570,000, of which the Company’s subordinated retained interest was $124,570,000.Accordingly, $200,000,000 of accounts receivable balances were removed from the consolidated balance sheet at June 28, 2002, with those funds used to reduceoutstanding debt. Cash outflows for reduced drawings under the Program in the consolidated statements of cash flows for 2003 and 2002 reflect the impact of alower amount of accounts receivable being sold, on a revolving basis, into the third party conduits.
Expenses associated with the Program are as follows:
Years Ended
June 27, June 28, June 29,2003 2002 2001
(Thousands)Losses on sales of receivables and discount on retained interest, net of
servicing revenues $1,244 $ 8,511 $ — Program, facility and professional fees 1,864 1,619 200 Loss on sale of receivables at inception — — 3,696 Total $3,108 $10,130 $3,896
Losses on sales of receivables and discount on retained interest, net of related servicing revenues, are recorded in interest expense while the other costsassociated with the Program are recorded in selling, general and administrative expenses in the accompanying consolidated statements of operations. To the extentthere have been drawings under the Program, the Company has historically measured the fair value of its retained interests at the time of a securitization using apresent value model incorporating two key assumptions: (1) a weighted average life of trade accounts receivable of 45 days and (2) a discount rate of 6.75% perannum.
The Program agreement requires the Company to maintain minimum senior unsecured credit ratings in order to continue utilizing the Program in its currentform. In December 2002, the Company amended the Program agreement to lower the minimum ratings triggers to Ba2 by Moody’s Investor Services(“Moody’s”) or BB by Standard & Poors (“S&P”). Subsequent to 2003, the Company amended the Program agreement to lower the minimum ratings triggers toBa3 by Moody’s or BB- by S&P. This most recent amendment effectively extended the term of the Program to August 2005.
4. Comprehensive income (loss):
The following table illustrates the cumulative balances of comprehensive income (loss) items at June 27, 2003, June 28, 2002 and June 29, 2001:
June 27, June 28, June 29,
2003 2002 2001
(Thousands)Cumulative translation adjustments $143,208 $ 44,862 $(56,297)Cumulative minimum pension liability adjustments, net (40,001) (17,050) — Total $103,207 $ 27,812 $(56,297)
53
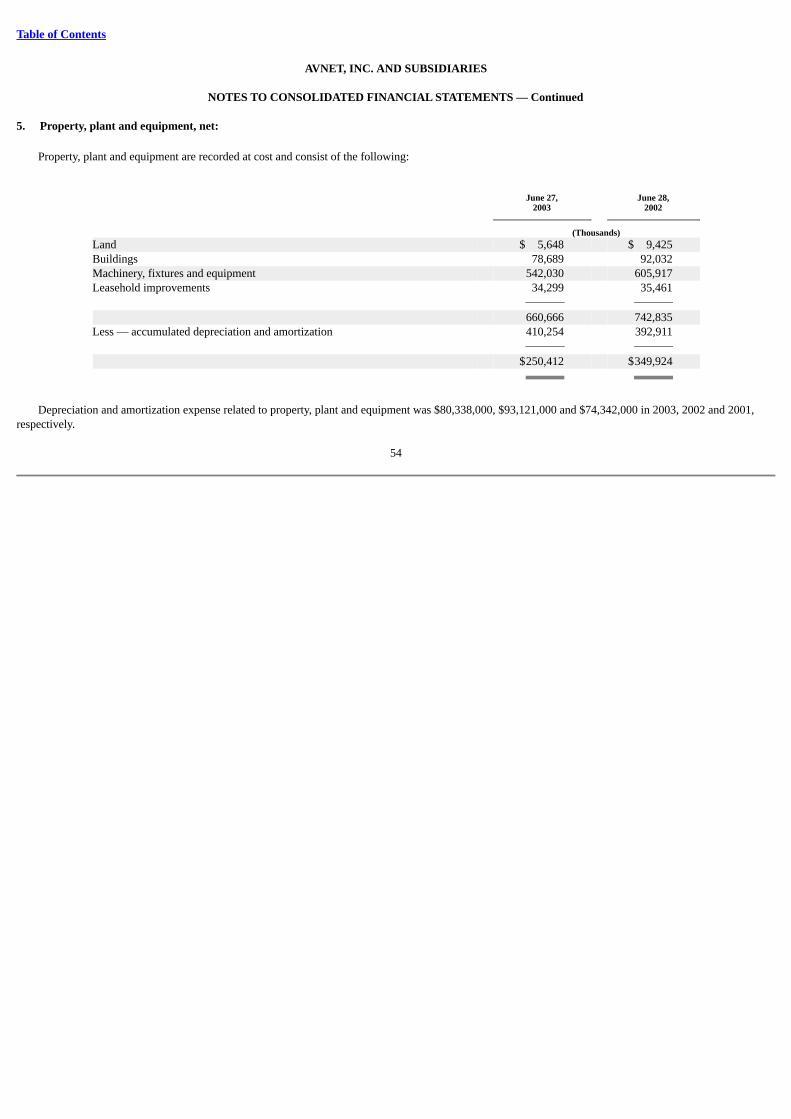
Table of Contents
AVNET, INC. AND SUBSIDIARIES
NOTES TO CONSOLIDATED FINANCIAL STATEMENTS — Continued
5. Property, plant and equipment, net:
Property, plant and equipment are recorded at cost and consist of the following:
June 27, June 28,
2003 2002
(Thousands)Land $ 5,648 $ 9,425 Buildings 78,689 92,032 Machinery, fixtures and equipment 542,030 605,917 Leasehold improvements 34,299 35,461 660,666 742,835 Less — accumulated depreciation and amortization 410,254 392,911 $250,412 $349,924
Depreciation and amortization expense related to property, plant and equipment was $80,338,000, $93,121,000 and $74,342,000 in 2003, 2002 and 2001,respectively.
54
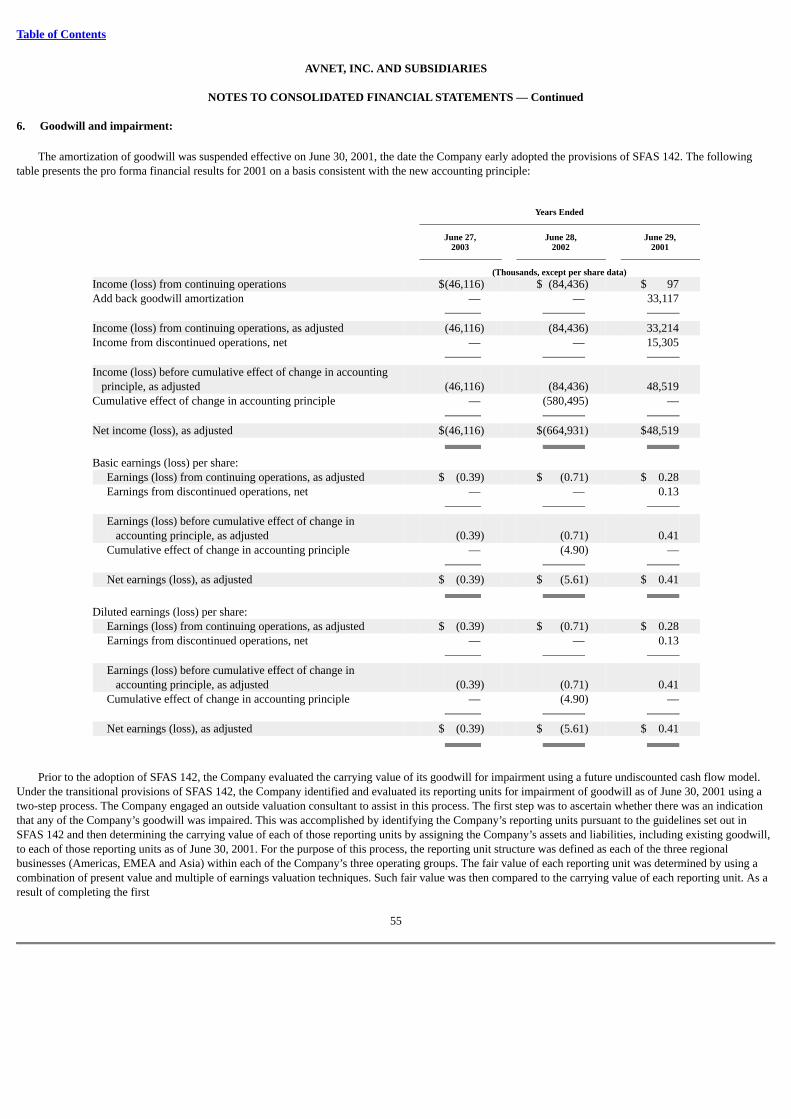
Table of Contents
AVNET, INC. AND SUBSIDIARIES
NOTES TO CONSOLIDATED FINANCIAL STATEMENTS — Continued
6. Goodwill and impairment:
The amortization of goodwill was suspended effective on June 30, 2001, the date the Company early adopted the provisions of SFAS 142. The followingtable presents the pro forma financial results for 2001 on a basis consistent with the new accounting principle:
Years Ended
June 27, June 28, June 29,2003 2002 2001
(Thousands, except per share data)Income (loss) from continuing operations $(46,116) $ (84,436) $ 97 Add back goodwill amortization — — 33,117 Income (loss) from continuing operations, as adjusted (46,116) (84,436) 33,214 Income from discontinued operations, net — — 15,305 Income (loss) before cumulative effect of change in accounting
principle, as adjusted (46,116) (84,436) 48,519 Cumulative effect of change in accounting principle — (580,495) — Net income (loss), as adjusted $(46,116) $(664,931) $48,519 Basic earnings (loss) per share: Earnings (loss) from continuing operations, as adjusted $ (0.39) $ (0.71) $ 0.28 Earnings from discontinued operations, net — — 0.13
Earnings (loss) before cumulative effect of change in
accounting principle, as adjusted (0.39) (0.71) 0.41 Cumulative effect of change in accounting principle — (4.90) — Net earnings (loss), as adjusted $ (0.39) $ (5.61) $ 0.41 Diluted earnings (loss) per share: Earnings (loss) from continuing operations, as adjusted $ (0.39) $ (0.71) $ 0.28 Earnings from discontinued operations, net — — 0.13
Earnings (loss) before cumulative effect of change in
accounting principle, as adjusted (0.39) (0.71) 0.41 Cumulative effect of change in accounting principle — (4.90) — Net earnings (loss), as adjusted $ (0.39) $ (5.61) $ 0.41
Prior to the adoption of SFAS 142, the Company evaluated the carrying value of its goodwill for impairment using a future undiscounted cash flow model.Under the transitional provisions of SFAS 142, the Company identified and evaluated its reporting units for impairment of goodwill as of June 30, 2001 using atwo-step process. The Company engaged an outside valuation consultant to assist in this process. The first step was to ascertain whether there was an indicationthat any of the Company’s goodwill was impaired. This was accomplished by identifying the Company’s reporting units pursuant to the guidelines set out inSFAS 142 and then determining the carrying value of each of those reporting units by assigning the Company’s assets and liabilities, including existing goodwill,to each of those reporting units as of June 30, 2001. For the purpose of this process, the reporting unit structure was defined as each of the three regionalbusinesses (Americas, EMEA and Asia) within each of the Company’s three operating groups. The fair value of each reporting unit was determined by using acombination of present value and multiple of earnings valuation techniques. Such fair value was then compared to the carrying value of each reporting unit. As aresult of completing the first
55
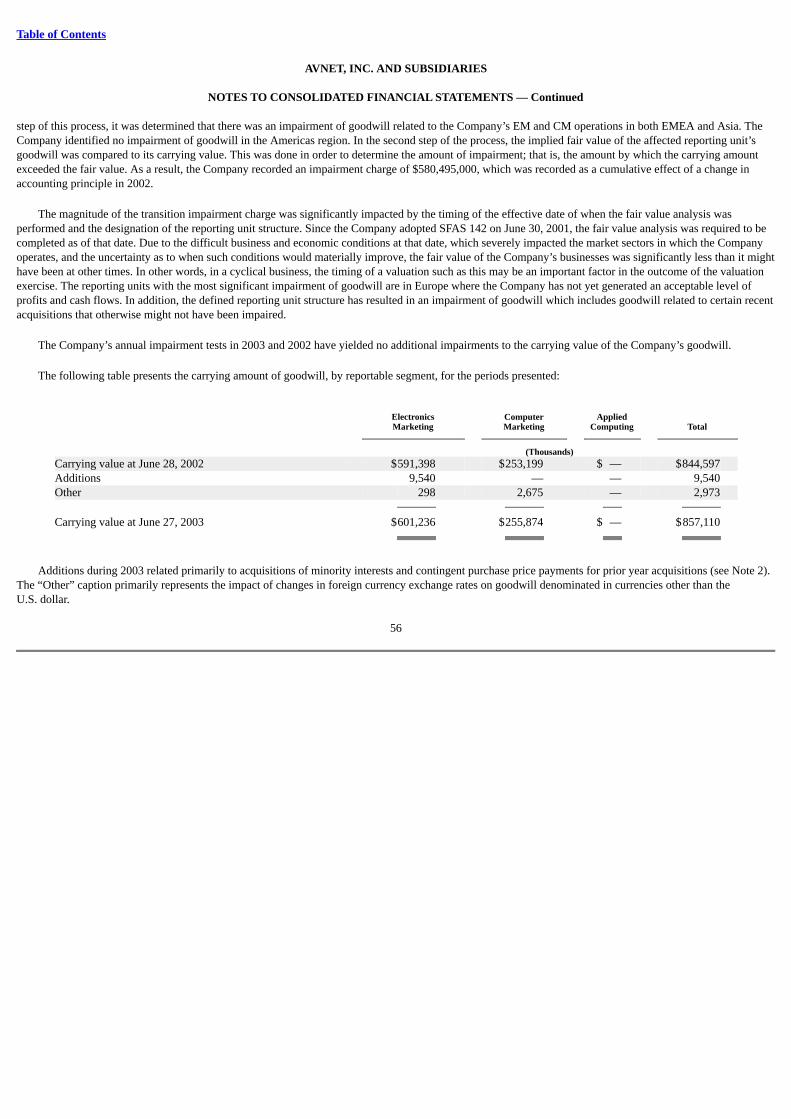
Table of Contents
AVNET, INC. AND SUBSIDIARIES
NOTES TO CONSOLIDATED FINANCIAL STATEMENTS — Continued
step of this process, it was determined that there was an impairment of goodwill related to the Company’s EM and CM operations in both EMEA and Asia. TheCompany identified no impairment of goodwill in the Americas region. In the second step of the process, the implied fair value of the affected reporting unit’sgoodwill was compared to its carrying value. This was done in order to determine the amount of impairment; that is, the amount by which the carrying amountexceeded the fair value. As a result, the Company recorded an impairment charge of $580,495,000, which was recorded as a cumulative effect of a change inaccounting principle in 2002.
The magnitude of the transition impairment charge was significantly impacted by the timing of the effective date of when the fair value analysis wasperformed and the designation of the reporting unit structure. Since the Company adopted SFAS 142 on June 30, 2001, the fair value analysis was required to becompleted as of that date. Due to the difficult business and economic conditions at that date, which severely impacted the market sectors in which the Companyoperates, and the uncertainty as to when such conditions would materially improve, the fair value of the Company’s businesses was significantly less than it mighthave been at other times. In other words, in a cyclical business, the timing of a valuation such as this may be an important factor in the outcome of the valuationexercise. The reporting units with the most significant impairment of goodwill are in Europe where the Company has not yet generated an acceptable level ofprofits and cash flows. In addition, the defined reporting unit structure has resulted in an impairment of goodwill which includes goodwill related to certain recentacquisitions that otherwise might not have been impaired.
The Company’s annual impairment tests in 2003 and 2002 have yielded no additional impairments to the carrying value of the Company’s goodwill.
The following table presents the carrying amount of goodwill, by reportable segment, for the periods presented:
Electronics Computer AppliedMarketing Marketing Computing Total
(Thousands)Carrying value at June 28, 2002 $591,398 $253,199 $ — $844,597 Additions 9,540 — — 9,540 Other 298 2,675 — 2,973 Carrying value at June 27, 2003 $601,236 $255,874 $ — $857,110
Additions during 2003 related primarily to acquisitions of minority interests and contingent purchase price payments for prior year acquisitions (see Note 2).The “Other” caption primarily represents the impact of changes in foreign currency exchange rates on goodwill denominated in currencies other than theU.S. dollar.
56
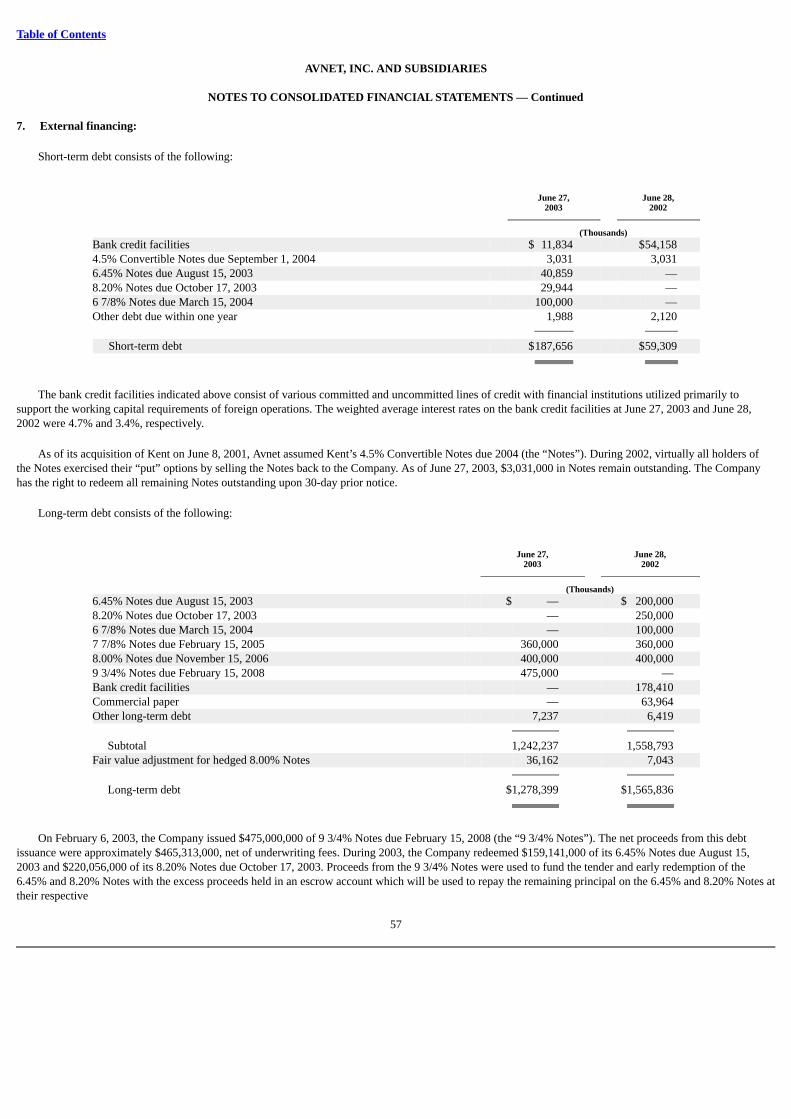
Table of Contents
AVNET, INC. AND SUBSIDIARIES
NOTES TO CONSOLIDATED FINANCIAL STATEMENTS — Continued
7. External financing:
Short-term debt consists of the following:
June 27, June 28,
2003 2002
(Thousands)Bank credit facilities $ 11,834 $54,158 4.5% Convertible Notes due September 1, 2004 3,031 3,031 6.45% Notes due August 15, 2003 40,859 — 8.20% Notes due October 17, 2003 29,944 — 6 7/8% Notes due March 15, 2004 100,000 — Other debt due within one year 1,988 2,120 Short-term debt $187,656 $59,309
The bank credit facilities indicated above consist of various committed and uncommitted lines of credit with financial institutions utilized primarily tosupport the working capital requirements of foreign operations. The weighted average interest rates on the bank credit facilities at June 27, 2003 and June 28,2002 were 4.7% and 3.4%, respectively.
As of its acquisition of Kent on June 8, 2001, Avnet assumed Kent’s 4.5% Convertible Notes due 2004 (the “Notes”). During 2002, virtually all holders ofthe Notes exercised their “put” options by selling the Notes back to the Company. As of June 27, 2003, $3,031,000 in Notes remain outstanding. The Companyhas the right to redeem all remaining Notes outstanding upon 30-day prior notice.
Long-term debt consists of the following:
June 27, June 28,
2003 2002
(Thousands)6.45% Notes due August 15, 2003 $ — $ 200,000 8.20% Notes due October 17, 2003 — 250,000 6 7/8% Notes due March 15, 2004 — 100,000 7 7/8% Notes due February 15, 2005 360,000 360,000 8.00% Notes due November 15, 2006 400,000 400,000 9 3/4% Notes due February 15, 2008 475,000 — Bank credit facilities — 178,410 Commercial paper — 63,964 Other long-term debt 7,237 6,419 Subtotal 1,242,237 1,558,793 Fair value adjustment for hedged 8.00% Notes 36,162 7,043 Long-term debt $1,278,399 $1,565,836
On February 6, 2003, the Company issued $475,000,000 of 9 3/4% Notes due February 15, 2008 (the “9 3/4% Notes”). The net proceeds from this debtissuance were approximately $465,313,000, net of underwriting fees. During 2003, the Company redeemed $159,141,000 of its 6.45% Notes due August 15,2003 and $220,056,000 of its 8.20% Notes due October 17, 2003. Proceeds from the 9 3/4% Notes were used to fund the tender and early redemption of the6.45% and 8.20% Notes with the excess proceeds held in an escrow account which will be used to repay the remaining principal on the 6.45% and 8.20% Notes attheir respective
57
Table of Contents
AVNET, INC. AND SUBSIDIARIES
NOTES TO CONSOLIDATED FINANCIAL STATEMENTS — Continued
maturity dates plus interest due through their maturities (see Note 1). The Company incurred debt extinguishment costs of $13,487,000 pre-tax, $8,152,000 aftertax and $0.07 per share on a diluted basis during 2003 related primarily to premiums and other transaction costs associated with the tender and early redemptionof a portion of the 6.45% and 8.20% Notes.
During 2003, the Company amended its syndicated bank credit facilities. Prior to the 2003 amendments, the bank credit facilities included a multi-year creditfacility with a syndicate of banks that provided up to $428,750,000 in financing and a 364-day credit facility providing up to $488,750,000 in financing (theoriginal syndicated bank credit facility also included a $82,500,000 term loan facility that matured in November 2001). The multi-year credit facility was a three-year revolving, multi-currency facility that was to mature on October 25, 2004. The Company was able to select from various interest rate options and maturitiesunder this facility.
The amended terms of the multi-year credit facility reduced the available borrowings under the facility to $350,000,000. Additionally, the 364-day creditfacility was terminated as part of the 2003 amendments. These amendments also modified certain covenants to the agreement. The Company was in compliancewith all of the covenants at June 27, 2003.
The amended agreement also contained a “springing lien” provision whereby borrowings under the amended multi-year credit facility would become securedby various assets of the Company if (a) Avnet received a debt rating of Ba1 or lower by Moody’s or BB+ or lower by S&P or (b) if Avnet terminated its currentaccounts receivable securitization program (see Note 3) without simultaneously entering into another securitization with similar terms.
There were no outstanding balances under the amended bank credit facilities at June 27, 2003. Outstanding balances under the bank credit facilities atJune 28, 2002, which totaled $178,410,000, consisted primarily of foreign currency borrowings under the multi-year credit facility described above with aweighted average interest rate of 4.4%. The weighted average interest rate on the commercial paper program was 3.7% at June 28, 2002. The Company classifiedborrowings under its commercial paper program as long-term based on its intention and ability to refinance such borrowings under its multi-year borrowingfacility.
See Note 19 for further discussion of the multi-year credit facility.
In November 2001, the Company entered into two interest rate swaps (the “Swaps”) with a total notional amount of $400,000,000 in order to hedge thechange in fair value of the 8.00% Notes due November 2006 (the “8% Notes”) related to fluctuations in interest rates. These contracts are classified as fair valuehedges and mature in November 2006. The Swaps modify the Company’s interest rate exposure by effectively converting the fixed rate on the 8% Notes to afloating rate based on three-month U.S. LIBOR plus a spread through their maturities (4.2% at June 27, 2003). The hedged fixed rate debt and the Swaps areadjusted to current market values through interest expense in the accompanying consolidated statements of operations. The Company accounts for the hedgesusing the shortcut method as defined under SFAS 133, as amended. Due to the effectiveness of the hedges since inception, the market value adjustments for thehedged debt and the Swaps directly offset one another. The fair value of the Swaps at June 27, 2003 and June 28, 2002 was $36,162,000 and $7,043,000,respectively, and is included in other long-term assets in the accompanying consolidated balance sheets. Additionally, included in long-term debt is a comparablefair value adjustment increasing the total liability by these same amounts.
Subsequent to 2003, the Company entered into three interest rate swaps with a total notional amount of $300,000,000 in order to hedge the change in fairvalue of the 9 3/4% Notes related to fluctuations in interest rates. These contracts will be classified as fair value hedges and mature in February 2008. Theseinterest rate swaps will modify the Company’s interest rate exposure by effectively converting the fixed rate on the 9 3/4% Notes to a floating rate based on three-month U.S. LIBOR plus an average spread of 619 basis points (6.19%) through their maturities. Similar to the Swaps discussed above, the hedge contracts werestructured to be
58
Table of Contents
AVNET, INC. AND SUBSIDIARIES
NOTES TO CONSOLIDATED FINANCIAL STATEMENTS — Continued
perfectly effective and therefore the Company will account for them using the shortcut method as defined by SFAS 133, as amended.
The Company had borrowing capacity of approximately $657,158,000 ($307,158,000 giving effect to the subsequent termination of the multi-year facilitydiscussed in Note 19) at June 27, 2003 under its bank financing and credit facilities and the asset securitization program (see Note 3). This borrowing capacityincludes $42,842,000 in letters of credit issued at June 27, 2003, all of which are issued under the multi-year facility. Although these issued letters of credit arenot actually drawn upon at June 27, 2003, they utilize borrowing capacity under the Company’s credit facility and are considered in the overall borrowingcapacity noted above.
Aggregate debt maturities for 2004 through 2008 and thereafter are as follows (in thousands):
2004 $ 187,656 2005 360,166 2006 437 2007 400,186 2008 475,893 Thereafter 5,555 Total debt $1,429,893
At June 27, 2003, the fair value, generally based on quoted market prices, of the 4.5% Convertible Notes due 2004, the 6.45% Notes due August 15, 2003,the 8.20% Notes due October 17, 2003, the 6 7/8% Notes due March 15, 2004, the 7 7/8% Notes due February 15, 2005 and the 9 3/4% Notes due February 15,2008 are $3,131,000, $40,859,000, $30,019,000, $101,000,000, $369,000,000 and $534,375,000, respectively.
8. Accrued expenses and other:
Accrued expenses and other consist of the following:
June 27, June 28,
2003 2002
(Thousands)Payroll, commissions and related $126,126 $117,221 Insurance 11,373 14,654 Income taxes 31,640 14,983 Other 147,216 179,435 $316,355 $326,293
59
Table of Contents
AVNET, INC. AND SUBSIDIARIES
NOTES TO CONSOLIDATED FINANCIAL STATEMENTS — Continued
9. Income taxes:
The components of the provision for (benefit from) income taxes are indicated in the table below. The future tax provision (benefit) for deferred income taxesresults from temporary differences arising principally from inventory valuation, accounts receivable valuation, net operating losses related to foreign operations,certain accruals and depreciation, net of any changes to the valuation allowance.
Years Ended
June 27, June 28, June 29,2003 2002 2001
(Thousands)Current: Federal $(60,425) $(77,608) $ 93,646 State and local (7,855) (10,396) 15,271 Foreign 13,385 40,799 57,897 Total current taxes (54,895) (47,205) 166,814 Deferred: Federal 18,607 25,595 (31,491) State and local 2,419 6,193 (6,047) Foreign 580 (20,960) (42,121) Total deferred taxes 21,606 10,828 (79,659) Provision for (benefit from) income taxes $(33,289) $(36,377) $ 87,155
A reconciliation between the federal statutory tax rate and the effective tax rate is as follows:
Years Ended
June 27, June 28, June 29,2003 2002 2001
Federal statutory rate (35.0)% (35.0)% 35.0%State and local income taxes, net of federal benefit (4.5) (2.8) 8.9 Amortization and disposition of goodwill — — 11.4 Non-deductible costs related to the acquisition of Kent (Note 17) — — 36.8 Impairment of investments in unconsolidated entities (Note 17) 0.7 10.2 — Foreign tax rates, including impact of valuation allowances (4.1) (3.3) 7.9 Other, net 1.0 0.8 (0.1) Effective tax rate (41.9)% (30.1)% 99.9%
Foreign tax rates generally consist of the impact of the difference between foreign and federal statutory rates applied to foreign income (losses) and alsoinclude the impact of valuation allowances placed against the Company’s otherwise realizable foreign loss carry-forwards. The additional valuation allowancerecorded during 2003 is substantially offset by a tax benefit related to certain foreign losses that are deductible in the United States. The Company determines itsvaluation allowance through an evaluation of relevant factors used to assess the likelihood of recoverability of the Company’s deferred tax assets.
60
Table of Contents
AVNET, INC. AND SUBSIDIARIES
NOTES TO CONSOLIDATED FINANCIAL STATEMENTS — Continued
The significant components of deferred tax assets and liabilities, included primarily in other long-term assets on the consolidated balance sheets, are asfollows:
June 27, June 28,
2003 2002
(Thousands)Deferred tax assets: Inventory valuation $ 25,370 $ 25,900 Accounts receivable valuation 18,963 28,299 Foreign tax loss carry-forwards 218,217 188,808 Various accrued liabilities and other 78,682 80,346 341,232 323,353 Less — valuation allowance (148,382) (120,671) 192,850 202,682 Deferred tax liabilities: Depreciation and amortization of property, plant and equipment 9,051 12,474 Net deferred tax assets $ 183,799 $ 190,208
As of June 27, 2003, the Company has foreign net operating loss carryforwards of approximately $735,020,000, approximately $168,318,000 of which haveexpiration dates ranging from 2004 to 2016 and the remaining $566,702,000 of which have no expiration date.
10. Pension and profit sharing plans:
The Company’s noncontributory defined benefit pension plan (the “Plan”) and its 401(k) plan cover substantially all domestic employees. Kent also had a401(k) plan covering all of its eligible employees which, in September 2001, was merged into the Avnet 401(k) plan. The expense relating to the 401(k) plans for2003, 2002 and 2001 amounted to $17,900, $23,000 and $4,281,000, respectively. During 2003 and 2002, the Company did not make any material matchingcontributions. The noncontributory pension plan provides defined benefits pursuant to a cash balance feature whereby a participant accumulates a benefit basedupon a percentage of current salary, which varies with age, and interest credits. At June 27, 2003, the market value of the pension plan assets was $132,764,000.These assets were comprised of common stocks (56%), corporate debt obligations (25%), U.S. Government securities (14%) and money market funds (5%). Thepension plan assets do not include any material investments in Avnet common stock.
61
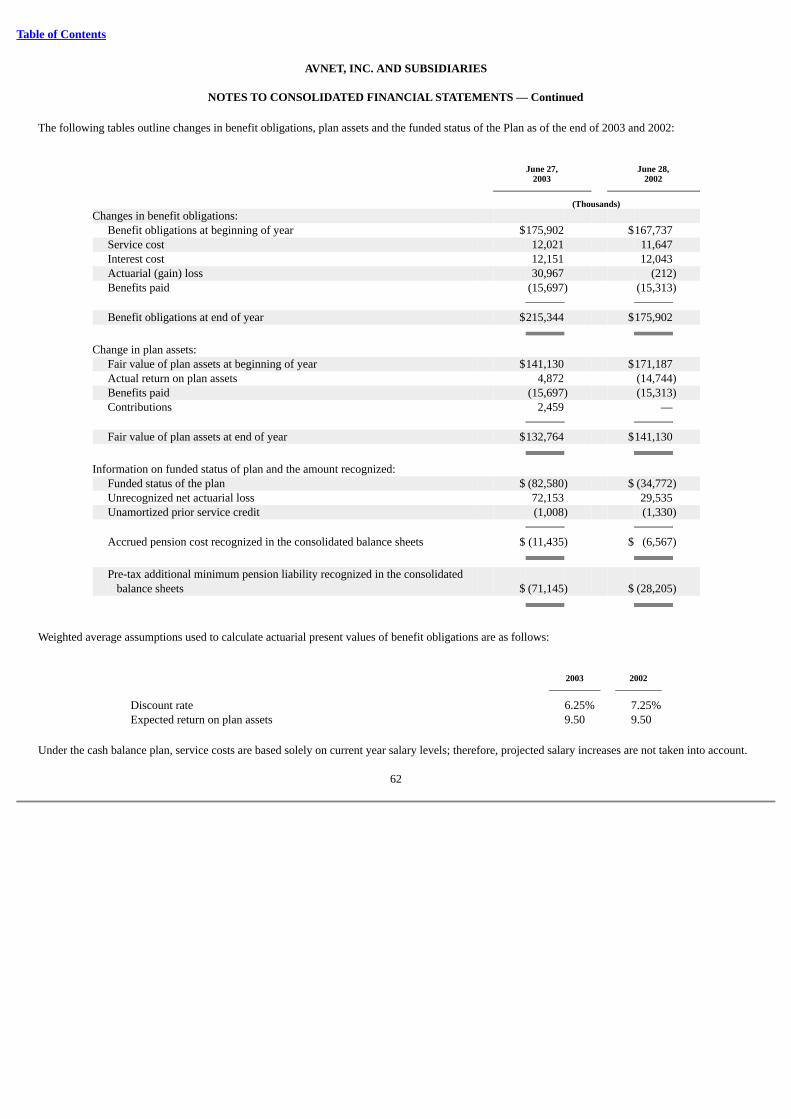
Table of Contents
AVNET, INC. AND SUBSIDIARIES
NOTES TO CONSOLIDATED FINANCIAL STATEMENTS — Continued
The following tables outline changes in benefit obligations, plan assets and the funded status of the Plan as of the end of 2003 and 2002:
June 27, June 28,
2003 2002
(Thousands)Changes in benefit obligations: Benefit obligations at beginning of year $175,902 $167,737 Service cost 12,021 11,647 Interest cost 12,151 12,043 Actuarial (gain) loss 30,967 (212) Benefits paid (15,697) (15,313) Benefit obligations at end of year $215,344 $175,902 Change in plan assets: Fair value of plan assets at beginning of year $141,130 $171,187 Actual return on plan assets 4,872 (14,744) Benefits paid (15,697) (15,313) Contributions 2,459 — Fair value of plan assets at end of year $132,764 $141,130 Information on funded status of plan and the amount recognized: Funded status of the plan $ (82,580) $ (34,772) Unrecognized net actuarial loss 72,153 29,535 Unamortized prior service credit (1,008) (1,330) Accrued pension cost recognized in the consolidated balance sheets $ (11,435) $ (6,567)
Pre-tax additional minimum pension liability recognized in the consolidated
balance sheets $ (71,145) $ (28,205)
Weighted average assumptions used to calculate actuarial present values of benefit obligations are as follows:
2003 2002
Discount rate 6.25% 7.25%Expected return on plan assets 9.50 9.50
Under the cash balance plan, service costs are based solely on current year salary levels; therefore, projected salary increases are not taken into account.
62
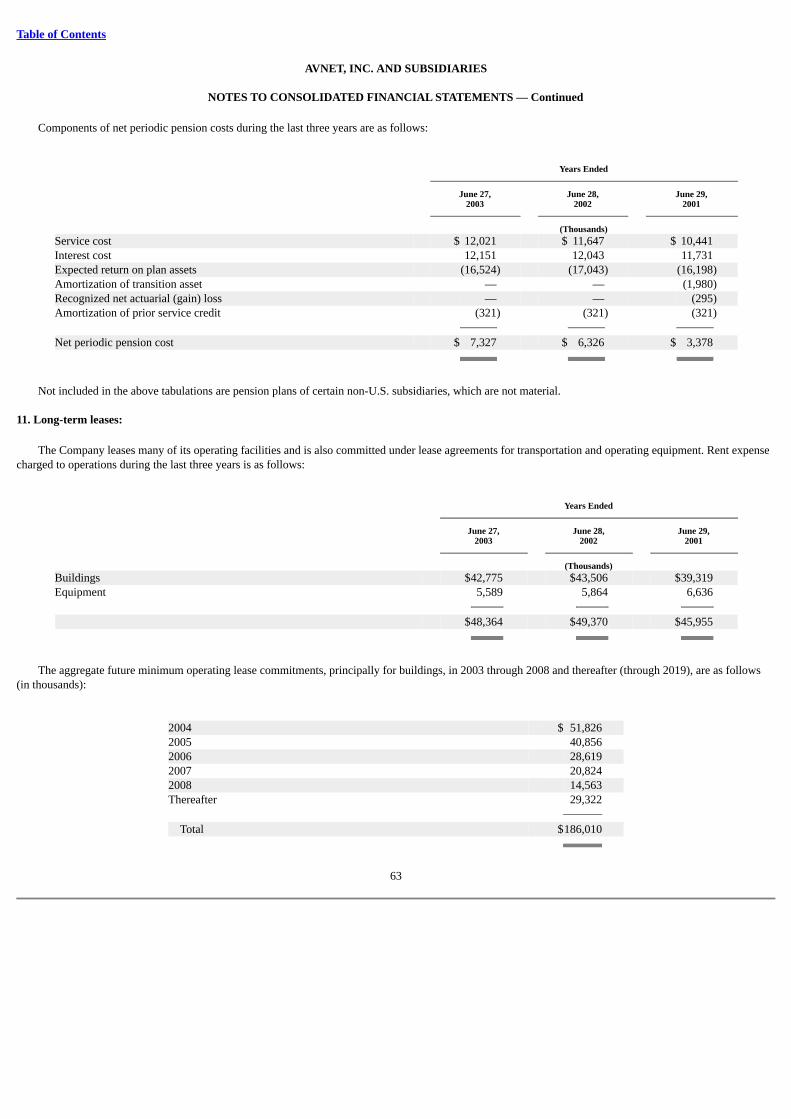
Table of Contents
AVNET, INC. AND SUBSIDIARIES
NOTES TO CONSOLIDATED FINANCIAL STATEMENTS — Continued
Components of net periodic pension costs during the last three years are as follows:
Years Ended
June 27, June 28, June 29,2003 2002 2001
(Thousands)Service cost $ 12,021 $ 11,647 $ 10,441 Interest cost 12,151 12,043 11,731 Expected return on plan assets (16,524) (17,043) (16,198)Amortization of transition asset — — (1,980)Recognized net actuarial (gain) loss — — (295)Amortization of prior service credit (321) (321) (321) Net periodic pension cost $ 7,327 $ 6,326 $ 3,378
Not included in the above tabulations are pension plans of certain non-U.S. subsidiaries, which are not material.
11. Long-term leases:
The Company leases many of its operating facilities and is also committed under lease agreements for transportation and operating equipment. Rent expensecharged to operations during the last three years is as follows:
Years Ended
June 27, June 28, June 29,2003 2002 2001
(Thousands)Buildings $42,775 $43,506 $39,319 Equipment 5,589 5,864 6,636 $48,364 $49,370 $45,955
The aggregate future minimum operating lease commitments, principally for buildings, in 2003 through 2008 and thereafter (through 2019), are as follows(in thousands):
2004 $ 51,826 2005 40,856 2006 28,619 2007 20,824 2008 14,563 Thereafter 29,322 Total $186,010
63
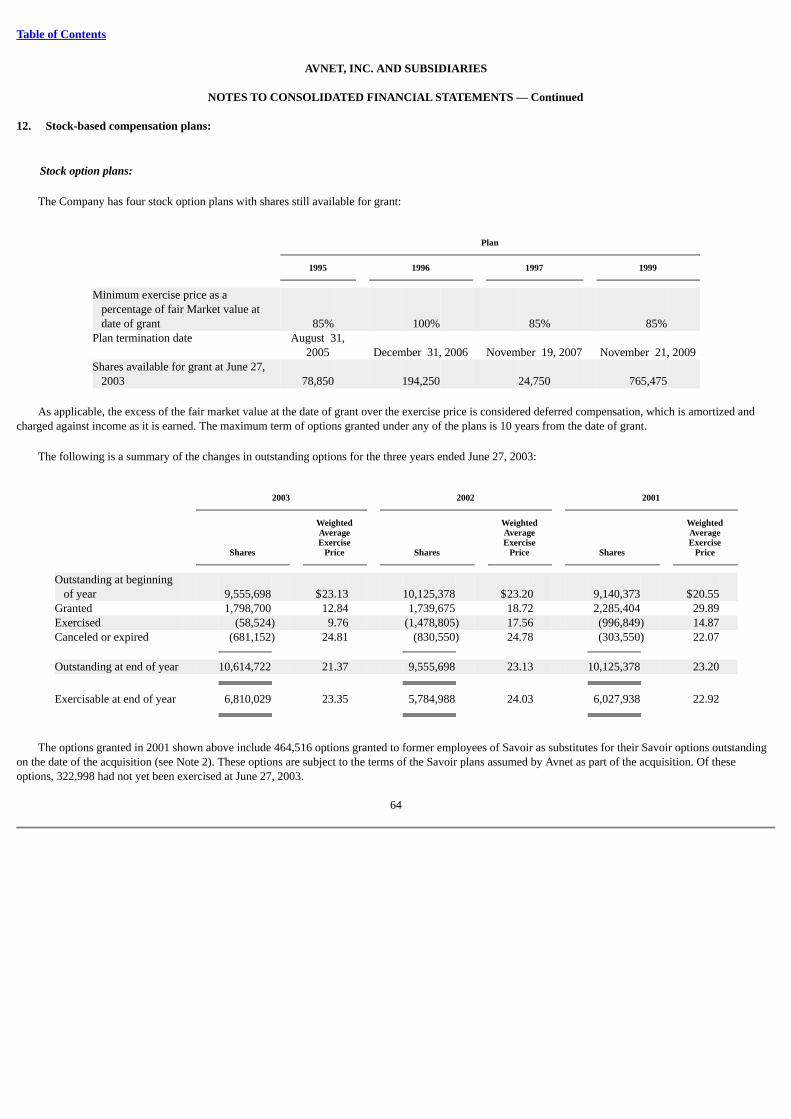
Table of Contents
AVNET, INC. AND SUBSIDIARIES
NOTES TO CONSOLIDATED FINANCIAL STATEMENTS — Continued
12. Stock-based compensation plans:
Stock option plans:
The Company has four stock option plans with shares still available for grant:
Plan
1995 1996 1997 1999
Minimum exercise price as apercentage of fair Market value atdate of grant 85% 100% 85% 85%
Plan termination date August 31,2005 December 31, 2006 November 19, 2007 November 21, 2009
Shares available for grant at June 27,2003 78,850 194,250 24,750 765,475
As applicable, the excess of the fair market value at the date of grant over the exercise price is considered deferred compensation, which is amortized andcharged against income as it is earned. The maximum term of options granted under any of the plans is 10 years from the date of grant.
The following is a summary of the changes in outstanding options for the three years ended June 27, 2003:
2003 2002 2001
Weighted Weighted WeightedAverage Average AverageExercise Exercise Exercise
Shares Price Shares Price Shares Price
Outstanding at beginningof year 9,555,698 $23.13 10,125,378 $23.20 9,140,373 $20.55
Granted 1,798,700 12.84 1,739,675 18.72 2,285,404 29.89 Exercised (58,524) 9.76 (1,478,805) 17.56 (996,849) 14.87 Canceled or expired (681,152) 24.81 (830,550) 24.78 (303,550) 22.07 Outstanding at end of year 10,614,722 21.37 9,555,698 23.13 10,125,378 23.20 Exercisable at end of year 6,810,029 23.35 5,784,988 24.03 6,027,938 22.92
The options granted in 2001 shown above include 464,516 options granted to former employees of Savoir as substitutes for their Savoir options outstandingon the date of the acquisition (see Note 2). These options are subject to the terms of the Savoir plans assumed by Avnet as part of the acquisition. Of theseoptions, 322,998 had not yet been exercised at June 27, 2003.
64
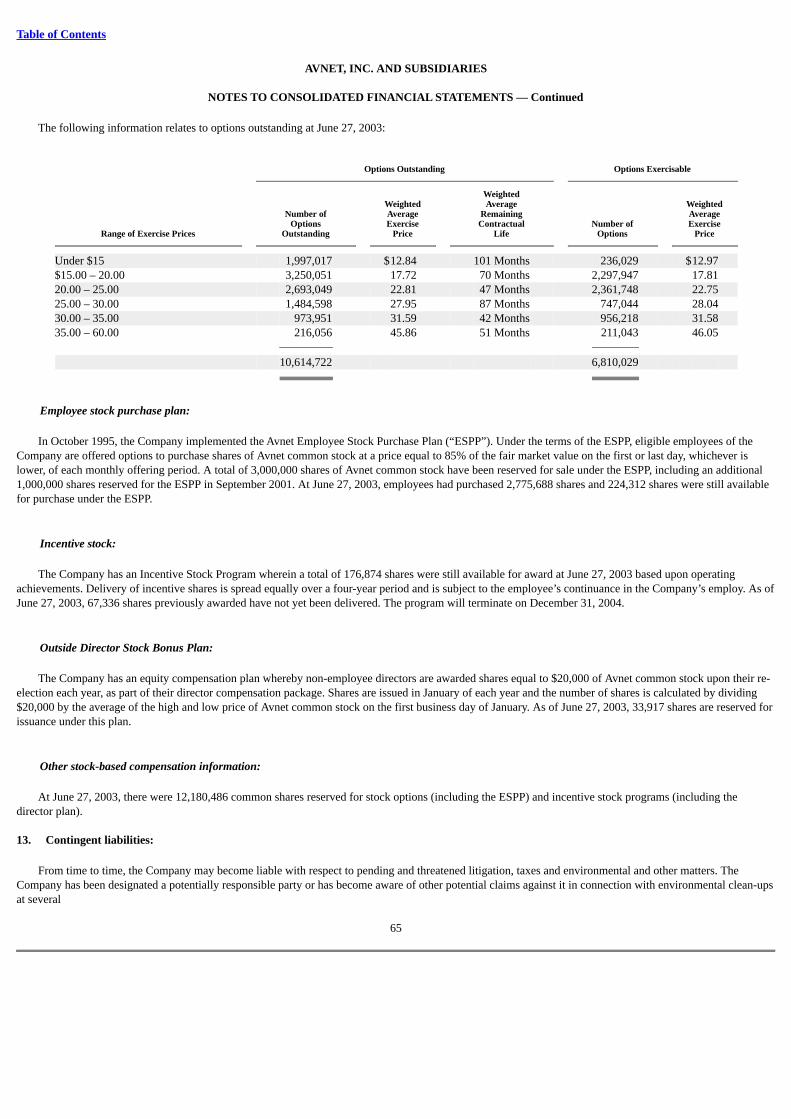
Table of Contents
AVNET, INC. AND SUBSIDIARIES
NOTES TO CONSOLIDATED FINANCIAL STATEMENTS — Continued
The following information relates to options outstanding at June 27, 2003:
Options Outstanding Options Exercisable
WeightedWeighted Average Weighted
Number of Average Remaining AverageOptions Exercise Contractual Number of Exercise
Range of Exercise Prices Outstanding Price Life Options Price
Under $15 1,997,017 $12.84 101 Months 236,029 $12.97 $15.00 – 20.00 3,250,051 17.72 70 Months 2,297,947 17.81 20.00 – 25.00 2,693,049 22.81 47 Months 2,361,748 22.75 25.00 – 30.00 1,484,598 27.95 87 Months 747,044 28.04 30.00 – 35.00 973,951 31.59 42 Months 956,218 31.58 35.00 – 60.00 216,056 45.86 51 Months 211,043 46.05 10,614,722 6,810,029
Employee stock purchase plan:
In October 1995, the Company implemented the Avnet Employee Stock Purchase Plan (“ESPP”). Under the terms of the ESPP, eligible employees of theCompany are offered options to purchase shares of Avnet common stock at a price equal to 85% of the fair market value on the first or last day, whichever islower, of each monthly offering period. A total of 3,000,000 shares of Avnet common stock have been reserved for sale under the ESPP, including an additional1,000,000 shares reserved for the ESPP in September 2001. At June 27, 2003, employees had purchased 2,775,688 shares and 224,312 shares were still availablefor purchase under the ESPP.
Incentive stock:
The Company has an Incentive Stock Program wherein a total of 176,874 shares were still available for award at June 27, 2003 based upon operatingachievements. Delivery of incentive shares is spread equally over a four-year period and is subject to the employee’s continuance in the Company’s employ. As ofJune 27, 2003, 67,336 shares previously awarded have not yet been delivered. The program will terminate on December 31, 2004.
Outside Director Stock Bonus Plan:
The Company has an equity compensation plan whereby non-employee directors are awarded shares equal to $20,000 of Avnet common stock upon their re-election each year, as part of their director compensation package. Shares are issued in January of each year and the number of shares is calculated by dividing$20,000 by the average of the high and low price of Avnet common stock on the first business day of January. As of June 27, 2003, 33,917 shares are reserved forissuance under this plan.
Other stock-based compensation information:
At June 27, 2003, there were 12,180,486 common shares reserved for stock options (including the ESPP) and incentive stock programs (including thedirector plan).
13. Contingent liabilities:
From time to time, the Company may become liable with respect to pending and threatened litigation, taxes and environmental and other matters. TheCompany has been designated a potentially responsible party or has become aware of other potential claims against it in connection with environmental clean-upsat several
65
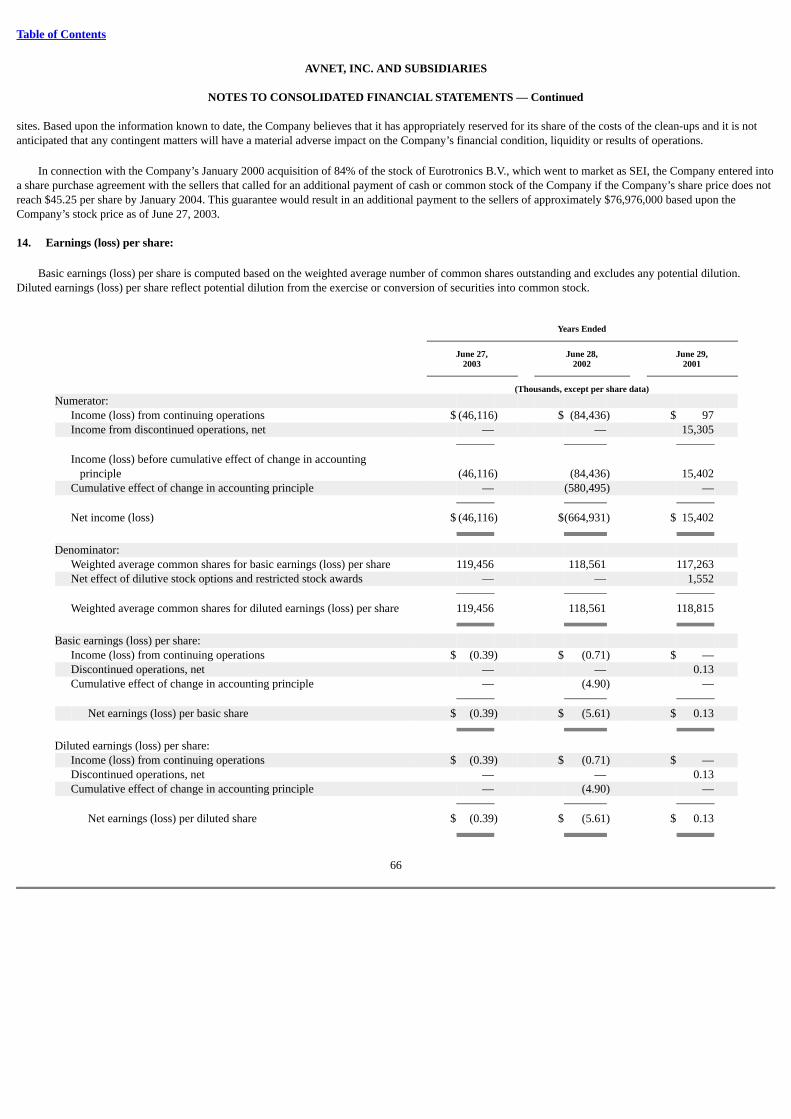
Table of Contents
AVNET, INC. AND SUBSIDIARIES
NOTES TO CONSOLIDATED FINANCIAL STATEMENTS — Continued
sites. Based upon the information known to date, the Company believes that it has appropriately reserved for its share of the costs of the clean-ups and it is notanticipated that any contingent matters will have a material adverse impact on the Company’s financial condition, liquidity or results of operations.
In connection with the Company’s January 2000 acquisition of 84% of the stock of Eurotronics B.V., which went to market as SEI, the Company entered intoa share purchase agreement with the sellers that called for an additional payment of cash or common stock of the Company if the Company’s share price does notreach $45.25 per share by January 2004. This guarantee would result in an additional payment to the sellers of approximately $76,976,000 based upon theCompany’s stock price as of June 27, 2003.
14. Earnings (loss) per share:
Basic earnings (loss) per share is computed based on the weighted average number of common shares outstanding and excludes any potential dilution.Diluted earnings (loss) per share reflect potential dilution from the exercise or conversion of securities into common stock.
Years Ended
June 27, June 28, June 29,2003 2002 2001
(Thousands, except per share data)Numerator: Income (loss) from continuing operations $ (46,116) $ (84,436) $ 97 Income from discontinued operations, net — — 15,305
Income (loss) before cumulative effect of change in accountingprinciple (46,116) (84,436) 15,402
Cumulative effect of change in accounting principle — (580,495) — Net income (loss) $ (46,116) $(664,931) $ 15,402 Denominator: Weighted average common shares for basic earnings (loss) per share 119,456 118,561 117,263 Net effect of dilutive stock options and restricted stock awards — — 1,552 Weighted average common shares for diluted earnings (loss) per share 119,456 118,561 118,815 Basic earnings (loss) per share: Income (loss) from continuing operations $ (0.39) $ (0.71) $ — Discontinued operations, net — — 0.13 Cumulative effect of change in accounting principle — (4.90) — Net earnings (loss) per basic share $ (0.39) $ (5.61) $ 0.13 Diluted earnings (loss) per share: Income (loss) from continuing operations $ (0.39) $ (0.71) $ — Discontinued operations, net — — 0.13 Cumulative effect of change in accounting principle — (4.90) — Net earnings (loss) per diluted share $ (0.39) $ (5.61) $ 0.13
66
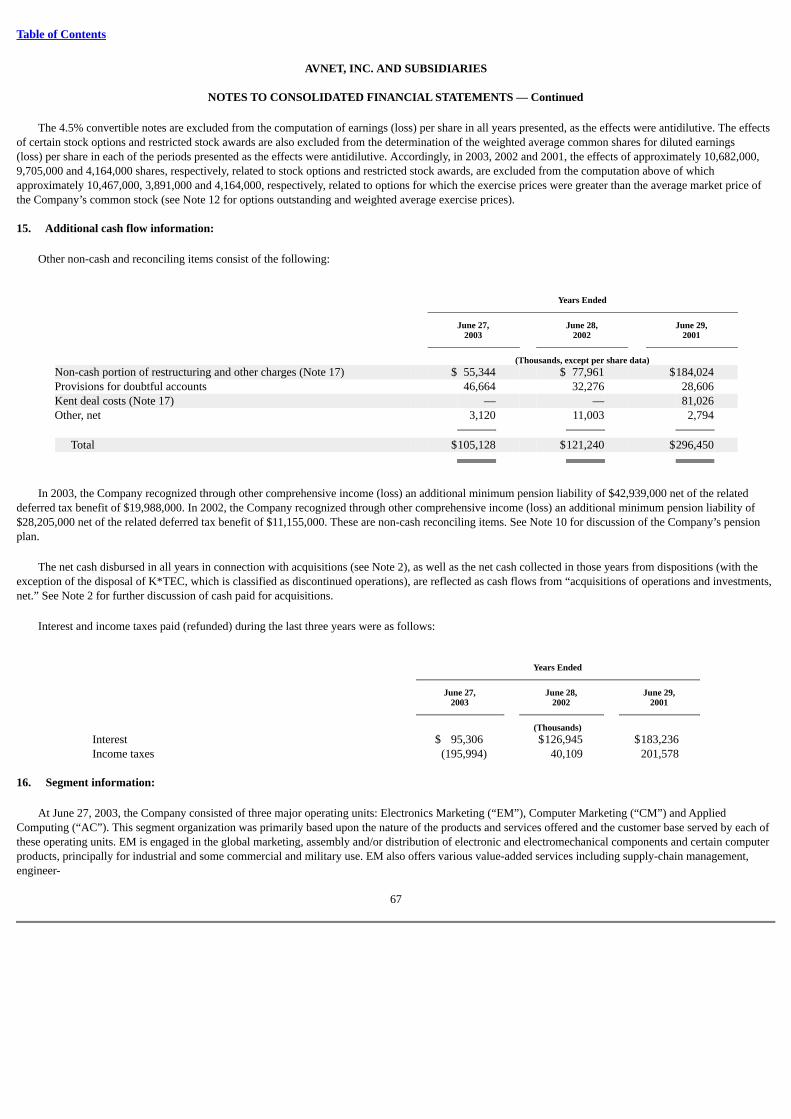
Table of Contents
AVNET, INC. AND SUBSIDIARIES
NOTES TO CONSOLIDATED FINANCIAL STATEMENTS — Continued
The 4.5% convertible notes are excluded from the computation of earnings (loss) per share in all years presented, as the effects were antidilutive. The effectsof certain stock options and restricted stock awards are also excluded from the determination of the weighted average common shares for diluted earnings(loss) per share in each of the periods presented as the effects were antidilutive. Accordingly, in 2003, 2002 and 2001, the effects of approximately 10,682,000,9,705,000 and 4,164,000 shares, respectively, related to stock options and restricted stock awards, are excluded from the computation above of whichapproximately 10,467,000, 3,891,000 and 4,164,000, respectively, related to options for which the exercise prices were greater than the average market price ofthe Company’s common stock (see Note 12 for options outstanding and weighted average exercise prices).
15. Additional cash flow information:
Other non-cash and reconciling items consist of the following:
Years Ended
June 27, June 28, June 29,2003 2002 2001
(Thousands, except per share data)Non-cash portion of restructuring and other charges (Note 17) $ 55,344 $ 77,961 $184,024 Provisions for doubtful accounts 46,664 32,276 28,606 Kent deal costs (Note 17) — — 81,026 Other, net 3,120 11,003 2,794 Total $105,128 $121,240 $296,450
In 2003, the Company recognized through other comprehensive income (loss) an additional minimum pension liability of $42,939,000 net of the relateddeferred tax benefit of $19,988,000. In 2002, the Company recognized through other comprehensive income (loss) an additional minimum pension liability of$28,205,000 net of the related deferred tax benefit of $11,155,000. These are non-cash reconciling items. See Note 10 for discussion of the Company’s pensionplan.
The net cash disbursed in all years in connection with acquisitions (see Note 2), as well as the net cash collected in those years from dispositions (with theexception of the disposal of K*TEC, which is classified as discontinued operations), are reflected as cash flows from “acquisitions of operations and investments,net.” See Note 2 for further discussion of cash paid for acquisitions.
Interest and income taxes paid (refunded) during the last three years were as follows:
Years Ended
June 27, June 28, June 29,2003 2002 2001
(Thousands)Interest $ 95,306 $126,945 $183,236 Income taxes (195,994) 40,109 201,578
16. Segment information:
At June 27, 2003, the Company consisted of three major operating units: Electronics Marketing (“EM”), Computer Marketing (“CM”) and AppliedComputing (“AC”). This segment organization was primarily based upon the nature of the products and services offered and the customer base served by each ofthese operating units. EM is engaged in the global marketing, assembly and/or distribution of electronic and electromechanical components and certain computerproducts, principally for industrial and some commercial and military use. EM also offers various value-added services including supply-chain management,engineer-
67
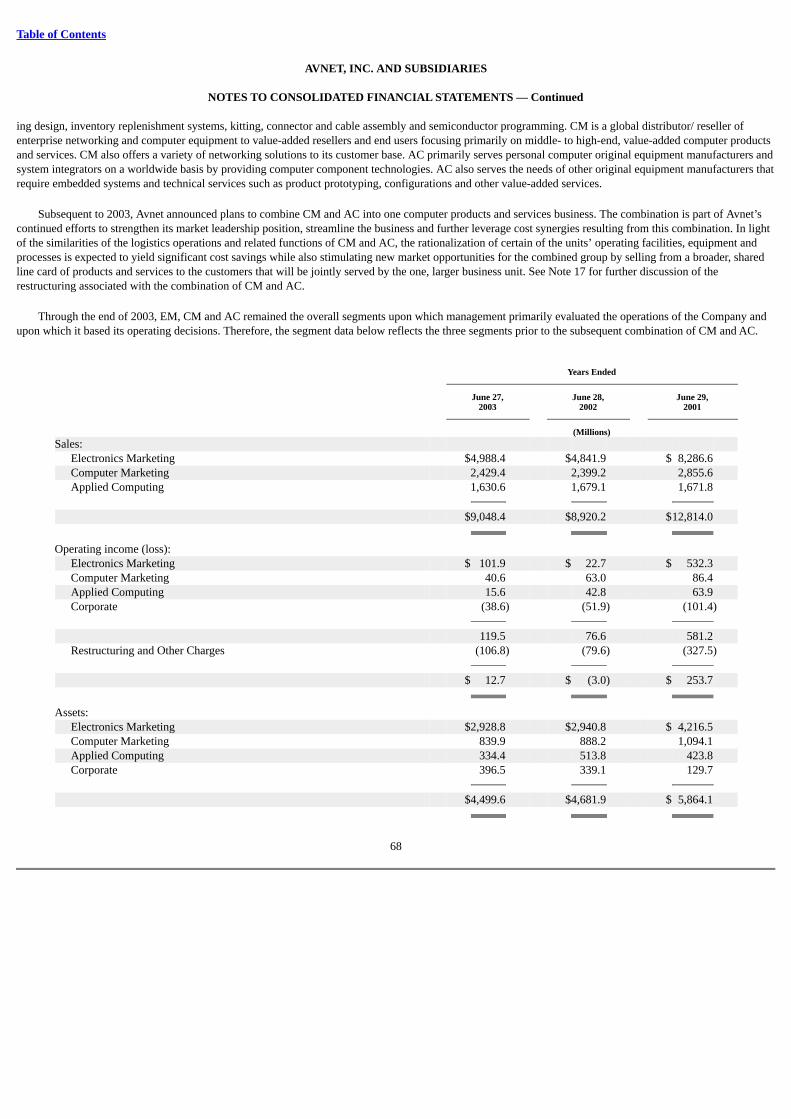
Table of Contents
AVNET, INC. AND SUBSIDIARIES
NOTES TO CONSOLIDATED FINANCIAL STATEMENTS — Continued
ing design, inventory replenishment systems, kitting, connector and cable assembly and semiconductor programming. CM is a global distributor/ reseller ofenterprise networking and computer equipment to value-added resellers and end users focusing primarily on middle- to high-end, value-added computer productsand services. CM also offers a variety of networking solutions to its customer base. AC primarily serves personal computer original equipment manufacturers andsystem integrators on a worldwide basis by providing computer component technologies. AC also serves the needs of other original equipment manufacturers thatrequire embedded systems and technical services such as product prototyping, configurations and other value-added services.
Subsequent to 2003, Avnet announced plans to combine CM and AC into one computer products and services business. The combination is part of Avnet’scontinued efforts to strengthen its market leadership position, streamline the business and further leverage cost synergies resulting from this combination. In lightof the similarities of the logistics operations and related functions of CM and AC, the rationalization of certain of the units’ operating facilities, equipment andprocesses is expected to yield significant cost savings while also stimulating new market opportunities for the combined group by selling from a broader, sharedline card of products and services to the customers that will be jointly served by the one, larger business unit. See Note 17 for further discussion of therestructuring associated with the combination of CM and AC.
Through the end of 2003, EM, CM and AC remained the overall segments upon which management primarily evaluated the operations of the Company andupon which it based its operating decisions. Therefore, the segment data below reflects the three segments prior to the subsequent combination of CM and AC.
Years Ended
June 27, June 28, June 29,2003 2002 2001
(Millions)Sales: Electronics Marketing $4,988.4 $4,841.9 $ 8,286.6 Computer Marketing 2,429.4 2,399.2 2,855.6 Applied Computing 1,630.6 1,679.1 1,671.8 $9,048.4 $8,920.2 $12,814.0 Operating income (loss): Electronics Marketing $ 101.9 $ 22.7 $ 532.3 Computer Marketing 40.6 63.0 86.4 Applied Computing 15.6 42.8 63.9 Corporate (38.6) (51.9) (101.4) 119.5 76.6 581.2 Restructuring and Other Charges (106.8) (79.6) (327.5) $ 12.7 $ (3.0) $ 253.7 Assets: Electronics Marketing $2,928.8 $2,940.8 $ 4,216.5 Computer Marketing 839.9 888.2 1,094.1 Applied Computing 334.4 513.8 423.8 Corporate 396.5 339.1 129.7 $4,499.6 $4,681.9 $ 5,864.1
68
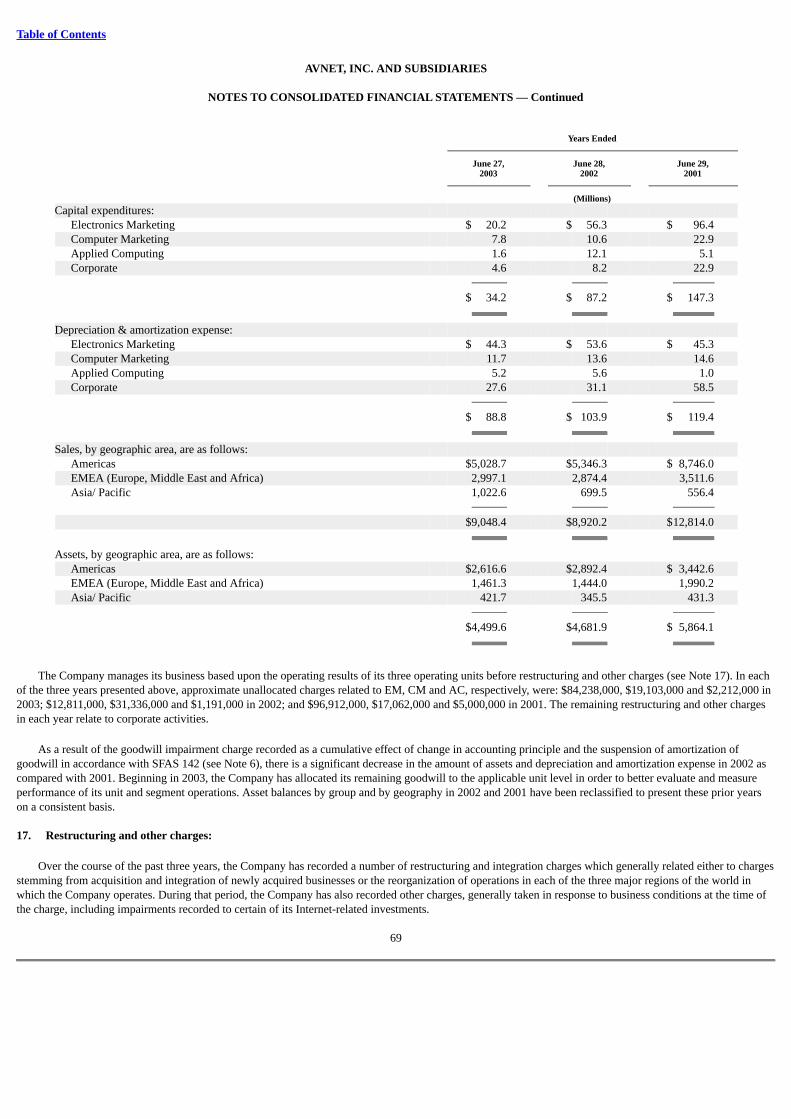
Table of Contents
AVNET, INC. AND SUBSIDIARIES
NOTES TO CONSOLIDATED FINANCIAL STATEMENTS — Continued
Years Ended
June 27, June 28, June 29,2003 2002 2001
(Millions)Capital expenditures: Electronics Marketing $ 20.2 $ 56.3 $ 96.4 Computer Marketing 7.8 10.6 22.9 Applied Computing 1.6 12.1 5.1 Corporate 4.6 8.2 22.9 $ 34.2 $ 87.2 $ 147.3 Depreciation & amortization expense: Electronics Marketing $ 44.3 $ 53.6 $ 45.3 Computer Marketing 11.7 13.6 14.6 Applied Computing 5.2 5.6 1.0 Corporate 27.6 31.1 58.5 $ 88.8 $ 103.9 $ 119.4 Sales, by geographic area, are as follows: Americas $5,028.7 $5,346.3 $ 8,746.0 EMEA (Europe, Middle East and Africa) 2,997.1 2,874.4 3,511.6 Asia/ Pacific 1,022.6 699.5 556.4 $9,048.4 $8,920.2 $12,814.0 Assets, by geographic area, are as follows: Americas $2,616.6 $2,892.4 $ 3,442.6 EMEA (Europe, Middle East and Africa) 1,461.3 1,444.0 1,990.2 Asia/ Pacific 421.7 345.5 431.3 $4,499.6 $4,681.9 $ 5,864.1
The Company manages its business based upon the operating results of its three operating units before restructuring and other charges (see Note 17). In eachof the three years presented above, approximate unallocated charges related to EM, CM and AC, respectively, were: $84,238,000, $19,103,000 and $2,212,000 in2003; $12,811,000, $31,336,000 and $1,191,000 in 2002; and $96,912,000, $17,062,000 and $5,000,000 in 2001. The remaining restructuring and other chargesin each year relate to corporate activities.
As a result of the goodwill impairment charge recorded as a cumulative effect of change in accounting principle and the suspension of amortization ofgoodwill in accordance with SFAS 142 (see Note 6), there is a significant decrease in the amount of assets and depreciation and amortization expense in 2002 ascompared with 2001. Beginning in 2003, the Company has allocated its remaining goodwill to the applicable unit level in order to better evaluate and measureperformance of its unit and segment operations. Asset balances by group and by geography in 2002 and 2001 have been reclassified to present these prior yearson a consistent basis.
17. Restructuring and other charges:
Over the course of the past three years, the Company has recorded a number of restructuring and integration charges which generally related either to chargesstemming from acquisition and integration of newly acquired businesses or the reorganization of operations in each of the three major regions of the world inwhich the Company operates. During that period, the Company has also recorded other charges, generally taken in response to business conditions at the time ofthe charge, including impairments recorded to certain of its Internet-related investments.
69
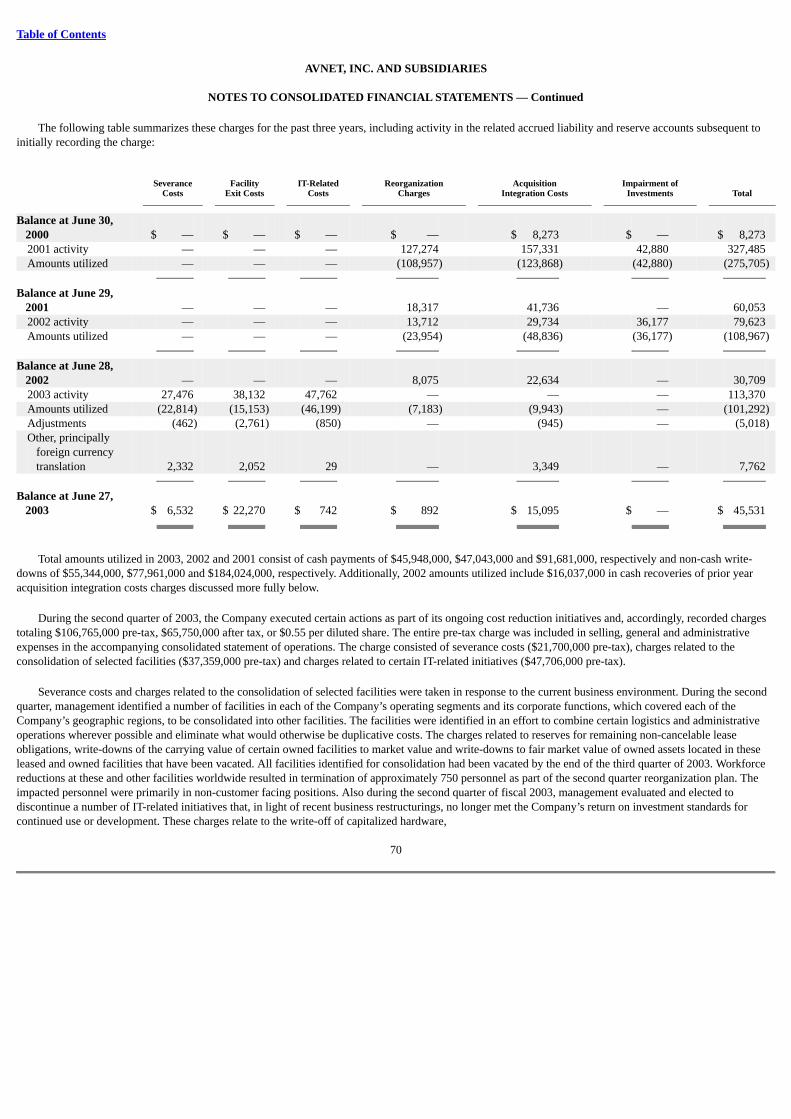
Table of Contents
AVNET, INC. AND SUBSIDIARIES
NOTES TO CONSOLIDATED FINANCIAL STATEMENTS — Continued
The following table summarizes these charges for the past three years, including activity in the related accrued liability and reserve accounts subsequent toinitially recording the charge:
Severance Facility IT-Related Reorganization Acquisition Impairment of
Costs Exit Costs Costs Charges Integration Costs Investments Total
Balance at June 30,2000 $ — $ — $ — $ — $ 8,273 $ — $ 8,273
2001 activity — — — 127,274 157,331 42,880 327,485 Amounts utilized — — — (108,957) (123,868) (42,880) (275,705) Balance at June 29,
2001 — — — 18,317 41,736 — 60,053
2002 activity — — — 13,712 29,734 36,177 79,623 Amounts utilized — — — (23,954) (48,836) (36,177) (108,967) Balance at June 28,
2002 — — — 8,075 22,634 — 30,709 2003 activity 27,476 38,132 47,762 — — — 113,370 Amounts utilized (22,814) (15,153) (46,199) (7,183) (9,943) — (101,292) Adjustments (462) (2,761) (850) — (945) — (5,018)
Other, principallyforeign currencytranslation 2,332 2,052 29 — 3,349 — 7,762
Balance at June 27,
2003 $ 6,532 $ 22,270 $ 742 $ 892 $ 15,095 $ — $ 45,531
Total amounts utilized in 2003, 2002 and 2001 consist of cash payments of $45,948,000, $47,043,000 and $91,681,000, respectively and non-cash write-downs of $55,344,000, $77,961,000 and $184,024,000, respectively. Additionally, 2002 amounts utilized include $16,037,000 in cash recoveries of prior yearacquisition integration costs charges discussed more fully below.
During the second quarter of 2003, the Company executed certain actions as part of its ongoing cost reduction initiatives and, accordingly, recorded chargestotaling $106,765,000 pre-tax, $65,750,000 after tax, or $0.55 per diluted share. The entire pre-tax charge was included in selling, general and administrativeexpenses in the accompanying consolidated statement of operations. The charge consisted of severance costs ($21,700,000 pre-tax), charges related to theconsolidation of selected facilities ($37,359,000 pre-tax) and charges related to certain IT-related initiatives ($47,706,000 pre-tax).
Severance costs and charges related to the consolidation of selected facilities were taken in response to the current business environment. During the secondquarter, management identified a number of facilities in each of the Company’s operating segments and its corporate functions, which covered each of theCompany’s geographic regions, to be consolidated into other facilities. The facilities were identified in an effort to combine certain logistics and administrativeoperations wherever possible and eliminate what would otherwise be duplicative costs. The charges related to reserves for remaining non-cancelable leaseobligations, write-downs of the carrying value of certain owned facilities to market value and write-downs to fair market value of owned assets located in theseleased and owned facilities that have been vacated. All facilities identified for consolidation had been vacated by the end of the third quarter of 2003. Workforcereductions at these and other facilities worldwide resulted in termination of approximately 750 personnel as part of the second quarter reorganization plan. Theimpacted personnel were primarily in non-customer facing positions. Also during the second quarter of fiscal 2003, management evaluated and elected todiscontinue a number of IT-related initiatives that, in light of recent business restructurings, no longer met the Company’s return on investment standards forcontinued use or development. These charges relate to the write-off of capitalized hardware,
70
Table of Contents
AVNET, INC. AND SUBSIDIARIES
NOTES TO CONSOLIDATED FINANCIAL STATEMENTS — Continued
software and software licenses (all non-cash charges) and reserves for remaining lease commitments on leased hardware and software which will no longer beutilized by the Company’s operations in light of the decisions made and the reorganizations completed as discussed above.
During the fourth quarter of 2003, the Company executed certain additional actions that resulted in charges totaling $6,605,000 pre-tax. The incrementalimpact of these actions was substantially offset by certain adjustments that the Company recorded, also in the fourth quarter of 2003, primarily relating to certainof the charges recorded in the second quarter of 2003. The new charge activity, mostly for severance and consolidation of selected facilities, related to each of theCompany’s three operating groups and its corporate functions in the Americas and EMEA regions. The additional census reductions totaled approximately 175and resulted primarily from: (1) EM’s decision to combine its Cilicon and RF and Microwave sales divisions; and (2) AC’s decision to reduce its participation incertain market segments where profitability of the products in question have not yielded acceptable economic returns to the Company. The fourth quarteradjustments to prior restructuring and other charges reflect changes in estimates from the time the charges and applicable reserves were initially recorded, relatingto: (1) reserves for severance and for leases and other contractual commitments that were determined to be excessive during the fourth quarter based uponpayments made or still to be made and/or based upon more favorable than anticipated sublease or lease buyout arrangements; and (2) an adjustment, based uponestimated sales price net of costs to sell as derived from current market studies and comparable sales, of a portion of a write-down that was recorded in the secondquarter of 2003 related to an owned facility that was vacated and classified as held for sale during that quarter.
Of the 2003 charges, $29,544,000 remains unexpended at June 27, 2003 relating primarily to severance costs, substantially all of which is expected to beutilized during the first quarter of 2004, contractual lease commitments, substantially all of which is expected to be utilized by the end of 2007, and remainingpayments on the IT-related contracts discussed above, substantially all of which is expected to be utilized during the first quarter of 2004.
Subsequent to 2003, the Company announced certain additional restructuring and cost cutting initiatives in response to the ongoing downturn in thetechnology industry. The resulting anticipated charges can be broken into three categories: (1) the combination of CM and AC, which the Company announced inJuly 2004 (see Note 16), is expected to result in the elimination of certain duplicative executive and support functions (no material eliminations in sales andmarketing positions are anticipated), the closing of certain warehousing and logistics operations in the Americas and EMEA and the elimination of certainduplicative IT platforms; (2) the reorganization of the Company’s global IT resources, which are currently administered generally on a separate basis within eachof the Company’s operating groups, is expected to result in elimination of certain IT-related positions globally in addition to write-off of certain IT-related assets;and (3) various other reductions within EM and corporate functions, which are expected to include certain census reductions, primarily in non-customer facingpositions, and the consolidation of certain administrative facilities. These reduction efforts, most of which are expected to be completed during 2004, are expectedto result in additional charges of approximately $50,000,000, roughly half of which are expected to be cash changes. Management anticipates cost savings to theCompany from these reduction efforts will be approximately $90,000,000 annually, most of which should be completed from the business by the end of the thirdquarter of 2004.
In the fourth quarter of 2002, the Company recorded charges representing a write-down in value of certain assets acquired in the 2001 acquisition of Kentand certain other charges taken in response to business conditions. The charge totaled $79,623,000 pre-tax ($21,600,000 included in cost of sales and $58,023,000included in operating expenses) and $62,084,000 after tax, or $0.52 per share on a diluted basis.
The Kent-related items resulted from the acquisition of Kent being accounted for using the “pooling-of-interests” method of accounting for the acquisition.These items relate specifically to assets or obligations that
71
Table of Contents
AVNET, INC. AND SUBSIDIARIES
NOTES TO CONSOLIDATED FINANCIAL STATEMENTS — Continued
were on the books of Kent at the acquisition and, therefore, under the “pooling-of-interests” method, these items that normally would have been reflected asadjustments to goodwill if the purchase method of accounting could have been used were instead recorded to the Company’s consolidated statement ofoperations. These items amounted to $29,734,000 pre-tax and relate primarily to: (1) write-downs to the value of receivables considered uncollectible after theCompany had exhausted efforts of collecting these amounts from Kent’s pre-acquisition customers ($8,200,000 pre-tax); (2) excess and obsolete inventory,primarily for customer-specific inventory held by Kent at the acquisition date that was subsequently determined, through ongoing negotiations with the customer,to require a write-down to net realizable value ($21,600,000 pre-tax); and (3) charges to record additional write-downs to approximate fair market value on held-for-sale properties acquired in the Kent acquisition or to record lease reserves for non-cancelable lease obligations on properties the Company committed to exit($15,971,000 pre-tax); (4) net of approximately $16,037,000 pre-tax in cash recoveries of certain charges recorded as part of the restructuring and integrationcharges taken in the fourth quarter of 2001.
The remaining pre-tax charge recorded in the fourth quarter of 2002, which amounted to $49,889,000, included an impairment charge of $36,177,000 pre-taxto write-down certain of the Company’s investments in unconsolidated Internet-related businesses to their fair market value and $13,712,000 pre-tax forseverance charges taken for workforce reductions, primarily in the Americas region, with more limited reductions in EMEA and Asia, totaling approximately 850individuals announced during the fourth quarter. The impairments recorded to the Company’s Internet-related investments are considered capital losses for taxpurposes and are therefore only deductible to the extent the Company has available capital gains. At that time, there were no capital gains, available or forecastedin the foreseeable future, to offset these losses. Therefore, the Company generally did not record a tax benefit for these losses.
In the fourth quarter of 2001, the Company recorded restructuring and integration charges in connection with the acquisition and integration of Kent and forcosts related to actions taken in response to business conditions and other restructuring activity. The charge amounted to $327,485,000 pre-tax ($80,596,000included in cost of sales and $246,889,000 included in selling, general and administrative expenses) and $236,692,000 after-tax, or $1.99 per share on a dilutedbasis. Approximately $157,331,000 of the pre-tax charge resulted from the acquisition of Kent having been accounted for using the “pooling-of-interests” methodas discussed above. These items consisted of costs incurred in completing the acquisition including significant change-in-control and other executive benefit-related payments made as a result of the acquisition ($68,343,000 pre-tax), professional fees for investment banking, legal and accounting services rendered toboth Avnet and Kent ($12,683,000 pre-tax), as well as adjustments to the assets acquired and liabilities assumed ($76,305,000 pre-tax). The adjustments to theassets acquired and liabilities assumed were primarily recorded as a result of the Company’s efforts to realize certain synergies of the combined Kent-Avnetoperations. In order to achieve such cost savings in the combined enterprise, elimination of certain duplicative positions, facilities and inventory was required.These charges included accruals for severance for approximately 130 employees terminated ($4,650,000 pre-tax), write-downs of receivables considereduncollectible ($7,988,000 pre-tax), inventory write-downs related to termination of non-strategic product lines ($20,488,000 pre-tax), write-downs associated withthe disposal of fixed assets ($25,081,000 pre-tax), lease terminations ($8,462,000 pre-tax) and other items ($9,636,000 pre-tax).
The balance of the pre-tax charge recorded in the fourth quarter of 2001, amounting to $170,154,000, related to a number of actions taken to cope withmarket conditions and to strengthen Avnet’s operations. These actions included cost reductions associated with the reorganization of the Company’s business, theintegration of recent acquisitions, as well as important cost-cutting actions taken in response to business conditions. These charges fall into a number of categoriesincluding severance for the elimination of approximately 880 employees, related to the Company’s EM, CM and corporate operations in all three global regions($28,531,000 pre-tax), inventory write-downs related to terminations of non-strategic product lines ($9,440,000 pre-tax), inventory valuation adjustments forspecial inventory purchases to meet customer
72
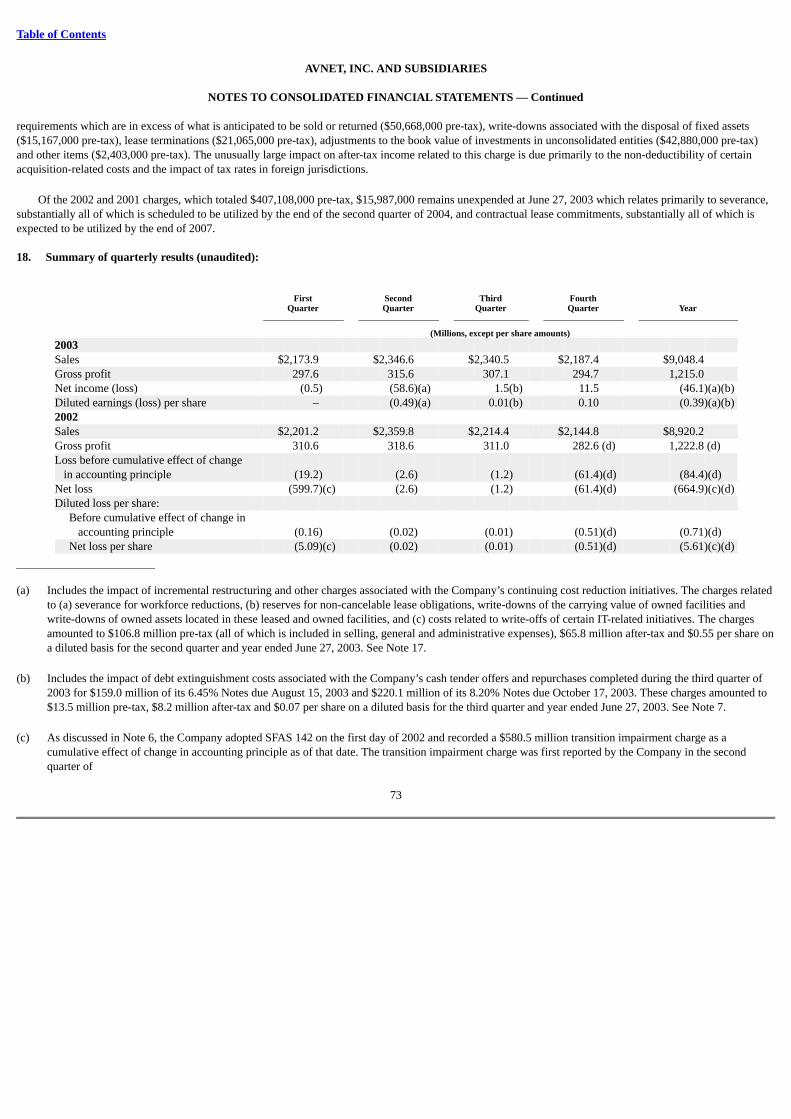
Table of Contents
AVNET, INC. AND SUBSIDIARIES
NOTES TO CONSOLIDATED FINANCIAL STATEMENTS — Continued
requirements which are in excess of what is anticipated to be sold or returned ($50,668,000 pre-tax), write-downs associated with the disposal of fixed assets($15,167,000 pre-tax), lease terminations ($21,065,000 pre-tax), adjustments to the book value of investments in unconsolidated entities ($42,880,000 pre-tax)and other items ($2,403,000 pre-tax). The unusually large impact on after-tax income related to this charge is due primarily to the non-deductibility of certainacquisition-related costs and the impact of tax rates in foreign jurisdictions.
Of the 2002 and 2001 charges, which totaled $407,108,000 pre-tax, $15,987,000 remains unexpended at June 27, 2003 which relates primarily to severance,substantially all of which is scheduled to be utilized by the end of the second quarter of 2004, and contractual lease commitments, substantially all of which isexpected to be utilized by the end of 2007.
18. Summary of quarterly results (unaudited):
First Second Third Fourth
Quarter Quarter Quarter Quarter Year
(Millions, except per share amounts)2003 Sales $2,173.9 $2,346.6 $2,340.5 $2,187.4 $9,048.4 Gross profit 297.6 315.6 307.1 294.7 1,215.0 Net income (loss) (0.5) (58.6)(a) 1.5(b) 11.5 (46.1)(a)(b)Diluted earnings (loss) per share – (0.49)(a) 0.01(b) 0.10 (0.39)(a)(b)2002 Sales $2,201.2 $2,359.8 $2,214.4 $2,144.8 $8,920.2 Gross profit 310.6 318.6 311.0 282.6 (d) 1,222.8 (d)Loss before cumulative effect of change
in accounting principle (19.2) (2.6) (1.2) (61.4)(d) (84.4)(d)Net loss (599.7)(c) (2.6) (1.2) (61.4)(d) (664.9)(c)(d)Diluted loss per share:
Before cumulative effect of change inaccounting principle (0.16) (0.02) (0.01) (0.51)(d) (0.71)(d)
Net loss per share (5.09)(c) (0.02) (0.01) (0.51)(d) (5.61)(c)(d)
(a) Includes the impact of incremental restructuring and other charges associated with the Company’s continuing cost reduction initiatives. The charges relatedto (a) severance for workforce reductions, (b) reserves for non-cancelable lease obligations, write-downs of the carrying value of owned facilities andwrite-downs of owned assets located in these leased and owned facilities, and (c) costs related to write-offs of certain IT-related initiatives. The chargesamounted to $106.8 million pre-tax (all of which is included in selling, general and administrative expenses), $65.8 million after-tax and $0.55 per share ona diluted basis for the second quarter and year ended June 27, 2003. See Note 17.
(b) Includes the impact of debt extinguishment costs associated with the Company’s cash tender offers and repurchases completed during the third quarter of
2003 for $159.0 million of its 6.45% Notes due August 15, 2003 and $220.1 million of its 8.20% Notes due October 17, 2003. These charges amounted to$13.5 million pre-tax, $8.2 million after-tax and $0.07 per share on a diluted basis for the third quarter and year ended June 27, 2003. See Note 7.
(c) As discussed in Note 6, the Company adopted SFAS 142 on the first day of 2002 and recorded a $580.5 million transition impairment charge as a
cumulative effect of change in accounting principle as of that date. The transition impairment charge was first reported by the Company in the secondquarter of
73

Table of Contents
AVNET, INC. AND SUBSIDIARIES
NOTES TO CONSOLIDATED FINANCIAL STATEMENTS — Continued
2002. However, in accordance with the provisions of SFAS 142, the charge has been properly reflected in the first quarter in the table above. (d) Includes the impact of incremental reorganization and integration charges associated with the write-down in value of certain assets acquired in the Kent
acquisition and certain other charges taken in response to current business conditions. The charge amounted to $79.6 million pre-tax ($21.6 millionincluded in cost of sales and $58.0 million included in operating expenses) and $62.1 million after-tax, or $0.52 per share on a diluted basis for the fourthquarter and year ended June 28, 2002. See Note 17.
19. Subsequent event (unaudited)
As there were no amounts outstanding under the Company’s multi-year credit facility (see Note 7) and because the Company did not expect to draw on thefacility prior to its October 2004 expiration, the Company terminated the facility on September 8, 2003.
74
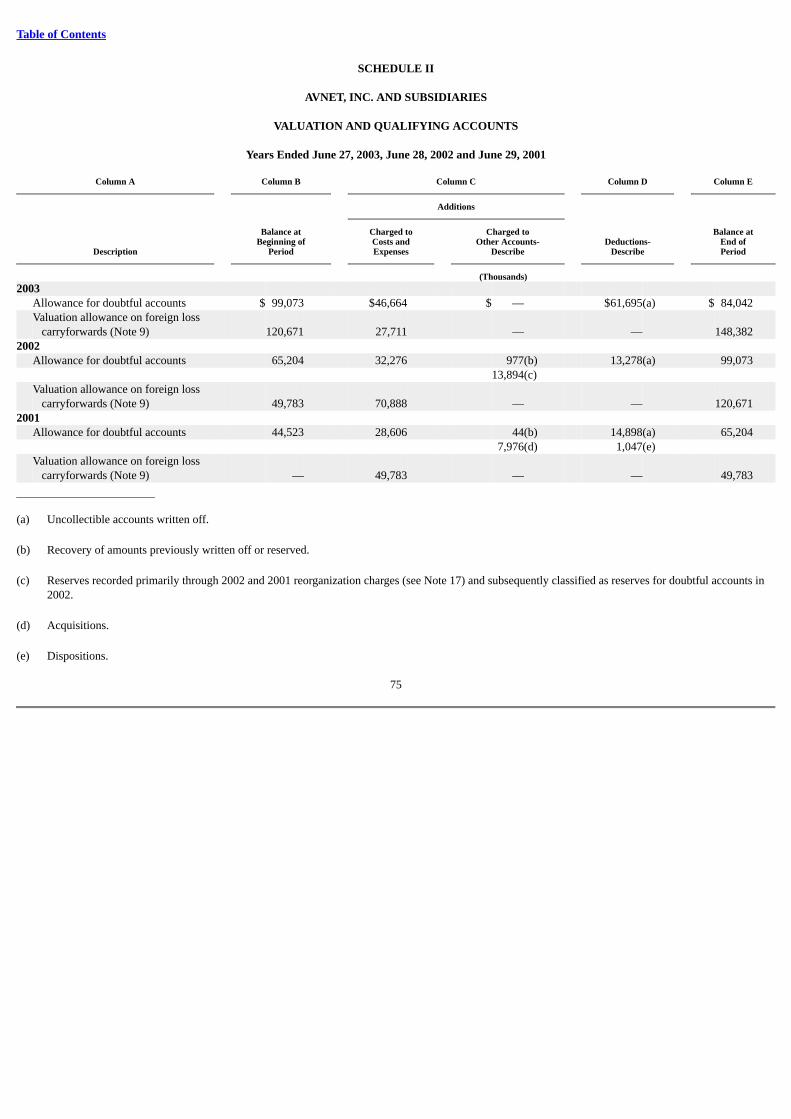
Table of Contents
SCHEDULE II
AVNET, INC. AND SUBSIDIARIES
VALUATION AND QUALIFYING ACCOUNTS
Years Ended June 27, 2003, June 28, 2002 and June 29, 2001
Column A Column B Column C Column D Column E
Additions
Balance at Charged to Charged to Balance atBeginning of Costs and Other Accounts- Deductions- End of
Description Period Expenses Describe Describe Period
(Thousands)2003 Allowance for doubtful accounts $ 99,073 $46,664 $ — $61,695(a) $ 84,042
Valuation allowance on foreign loss
carryforwards (Note 9) 120,671 27,711 — — 148,382 2002 Allowance for doubtful accounts 65,204 32,276 977(b) 13,278(a) 99,073 13,894(c)
Valuation allowance on foreign loss
carryforwards (Note 9) 49,783 70,888 — — 120,671 2001 Allowance for doubtful accounts 44,523 28,606 44(b) 14,898(a) 65,204 7,976(d) 1,047(e)
Valuation allowance on foreign loss
carryforwards (Note 9) — 49,783 — — 49,783
(a) Uncollectible accounts written off. (b) Recovery of amounts previously written off or reserved. (c) Reserves recorded primarily through 2002 and 2001 reorganization charges (see Note 17) and subsequently classified as reserves for doubtful accounts in
2002. (d) Acquisitions. (e) Dispositions.
75
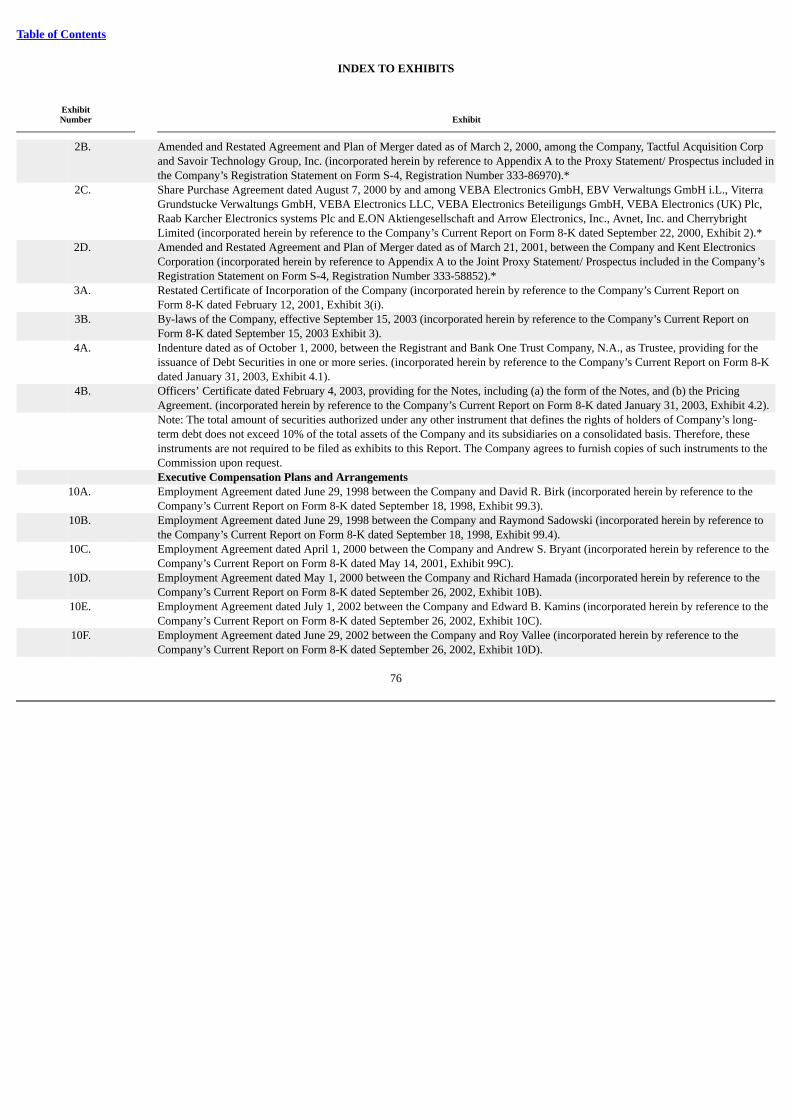
Table of Contents
INDEX TO EXHIBITS
ExhibitNumber Exhibit
2B.
Amended and Restated Agreement and Plan of Merger dated as of March 2, 2000, among the Company, Tactful Acquisition Corpand Savoir Technology Group, Inc. (incorporated herein by reference to Appendix A to the Proxy Statement/ Prospectus included inthe Company’s Registration Statement on Form S-4, Registration Number 333-86970).*
2C.
Share Purchase Agreement dated August 7, 2000 by and among VEBA Electronics GmbH, EBV Verwaltungs GmbH i.L., ViterraGrundstucke Verwaltungs GmbH, VEBA Electronics LLC, VEBA Electronics Beteiligungs GmbH, VEBA Electronics (UK) Plc,Raab Karcher Electronics systems Plc and E.ON Aktiengesellschaft and Arrow Electronics, Inc., Avnet, Inc. and CherrybrightLimited (incorporated herein by reference to the Company’s Current Report on Form 8-K dated September 22, 2000, Exhibit 2).*
2D.
Amended and Restated Agreement and Plan of Merger dated as of March 21, 2001, between the Company and Kent ElectronicsCorporation (incorporated herein by reference to Appendix A to the Joint Proxy Statement/ Prospectus included in the Company’sRegistration Statement on Form S-4, Registration Number 333-58852).*
3A. Restated Certificate of Incorporation of the Company (incorporated herein by reference to the Company’s Current Report onForm 8-K dated February 12, 2001, Exhibit 3(i).
3B.
By-laws of the Company, effective September 15, 2003 (incorporated herein by reference to the Company’s Current Report onForm 8-K dated September 15, 2003 Exhibit 3).
4A.
Indenture dated as of October 1, 2000, between the Registrant and Bank One Trust Company, N.A., as Trustee, providing for theissuance of Debt Securities in one or more series. (incorporated herein by reference to the Company’s Current Report on Form 8-Kdated January 31, 2003, Exhibit 4.1).
4B.
Officers’ Certificate dated February 4, 2003, providing for the Notes, including (a) the form of the Notes, and (b) the PricingAgreement. (incorporated herein by reference to the Company’s Current Report on Form 8-K dated January 31, 2003, Exhibit 4.2).
Note: The total amount of securities authorized under any other instrument that defines the rights of holders of Company’s long-term debt does not exceed 10% of the total assets of the Company and its subsidiaries on a consolidated basis. Therefore, theseinstruments are not required to be filed as exhibits to this Report. The Company agrees to furnish copies of such instruments to theCommission upon request.
Executive Compensation Plans and Arrangements
10A. Employment Agreement dated June 29, 1998 between the Company and David R. Birk (incorporated herein by reference to theCompany’s Current Report on Form 8-K dated September 18, 1998, Exhibit 99.3).
10B.
Employment Agreement dated June 29, 1998 between the Company and Raymond Sadowski (incorporated herein by reference tothe Company’s Current Report on Form 8-K dated September 18, 1998, Exhibit 99.4).
10C. Employment Agreement dated April 1, 2000 between the Company and Andrew S. Bryant (incorporated herein by reference to theCompany’s Current Report on Form 8-K dated May 14, 2001, Exhibit 99C).
10D.
Employment Agreement dated May 1, 2000 between the Company and Richard Hamada (incorporated herein by reference to theCompany’s Current Report on Form 8-K dated September 26, 2002, Exhibit 10B).
10E. Employment Agreement dated July 1, 2002 between the Company and Edward B. Kamins (incorporated herein by reference to theCompany’s Current Report on Form 8-K dated September 26, 2002, Exhibit 10C).
10F.
Employment Agreement dated June 29, 2002 between the Company and Roy Vallee (incorporated herein by reference to theCompany’s Current Report on Form 8-K dated September 26, 2002, Exhibit 10D).
76
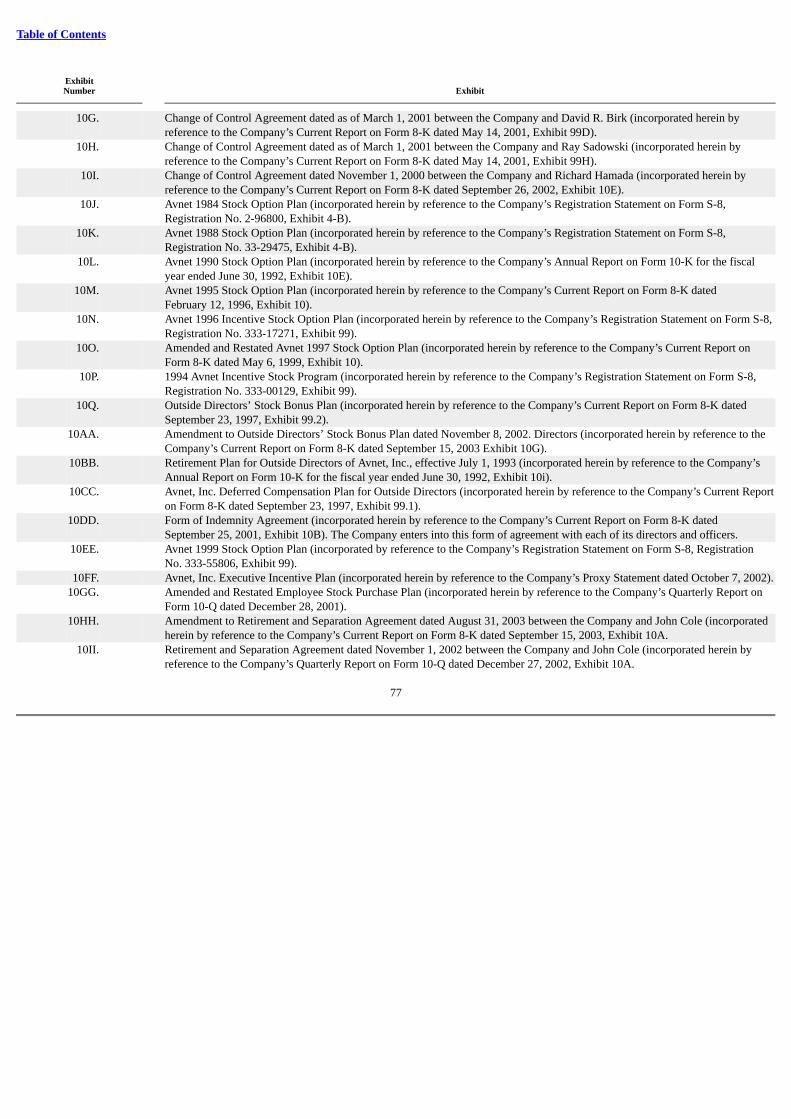
Table of Contents
ExhibitNumber Exhibit
10G.
Change of Control Agreement dated as of March 1, 2001 between the Company and David R. Birk (incorporated herein byreference to the Company’s Current Report on Form 8-K dated May 14, 2001, Exhibit 99D).
10H. Change of Control Agreement dated as of March 1, 2001 between the Company and Ray Sadowski (incorporated herein byreference to the Company’s Current Report on Form 8-K dated May 14, 2001, Exhibit 99H).
10I.
Change of Control Agreement dated November 1, 2000 between the Company and Richard Hamada (incorporated herein byreference to the Company’s Current Report on Form 8-K dated September 26, 2002, Exhibit 10E).
10J. Avnet 1984 Stock Option Plan (incorporated herein by reference to the Company’s Registration Statement on Form S-8,Registration No. 2-96800, Exhibit 4-B).
10K.
Avnet 1988 Stock Option Plan (incorporated herein by reference to the Company’s Registration Statement on Form S-8,Registration No. 33-29475, Exhibit 4-B).
10L. Avnet 1990 Stock Option Plan (incorporated herein by reference to the Company’s Annual Report on Form 10-K for the fiscalyear ended June 30, 1992, Exhibit 10E).
10M.
Avnet 1995 Stock Option Plan (incorporated herein by reference to the Company’s Current Report on Form 8-K datedFebruary 12, 1996, Exhibit 10).
10N. Avnet 1996 Incentive Stock Option Plan (incorporated herein by reference to the Company’s Registration Statement on Form S-8,Registration No. 333-17271, Exhibit 99).
10O.
Amended and Restated Avnet 1997 Stock Option Plan (incorporated herein by reference to the Company’s Current Report onForm 8-K dated May 6, 1999, Exhibit 10).
10P. 1994 Avnet Incentive Stock Program (incorporated herein by reference to the Company’s Registration Statement on Form S-8,Registration No. 333-00129, Exhibit 99).
10Q.
Outside Directors’ Stock Bonus Plan (incorporated herein by reference to the Company’s Current Report on Form 8-K datedSeptember 23, 1997, Exhibit 99.2).
10AA. Amendment to Outside Directors’ Stock Bonus Plan dated November 8, 2002. Directors (incorporated herein by reference to theCompany’s Current Report on Form 8-K dated September 15, 2003 Exhibit 10G).
10BB.
Retirement Plan for Outside Directors of Avnet, Inc., effective July 1, 1993 (incorporated herein by reference to the Company’sAnnual Report on Form 10-K for the fiscal year ended June 30, 1992, Exhibit 10i).
10CC. Avnet, Inc. Deferred Compensation Plan for Outside Directors (incorporated herein by reference to the Company’s Current Reporton Form 8-K dated September 23, 1997, Exhibit 99.1).
10DD.
Form of Indemnity Agreement (incorporated herein by reference to the Company’s Current Report on Form 8-K datedSeptember 25, 2001, Exhibit 10B). The Company enters into this form of agreement with each of its directors and officers.
10EE. Avnet 1999 Stock Option Plan (incorporated by reference to the Company’s Registration Statement on Form S-8, RegistrationNo. 333-55806, Exhibit 99).
10FF. Avnet, Inc. Executive Incentive Plan (incorporated herein by reference to the Company’s Proxy Statement dated October 7, 2002).
10GG. Amended and Restated Employee Stock Purchase Plan (incorporated herein by reference to the Company’s Quarterly Report onForm 10-Q dated December 28, 2001).
10HH.
Amendment to Retirement and Separation Agreement dated August 31, 2003 between the Company and John Cole (incorporatedherein by reference to the Company’s Current Report on Form 8-K dated September 15, 2003, Exhibit 10A.
10II. Retirement and Separation Agreement dated November 1, 2002 between the Company and John Cole (incorporated herein byreference to the Company’s Quarterly Report on Form 10-Q dated December 27, 2002, Exhibit 10A.
77
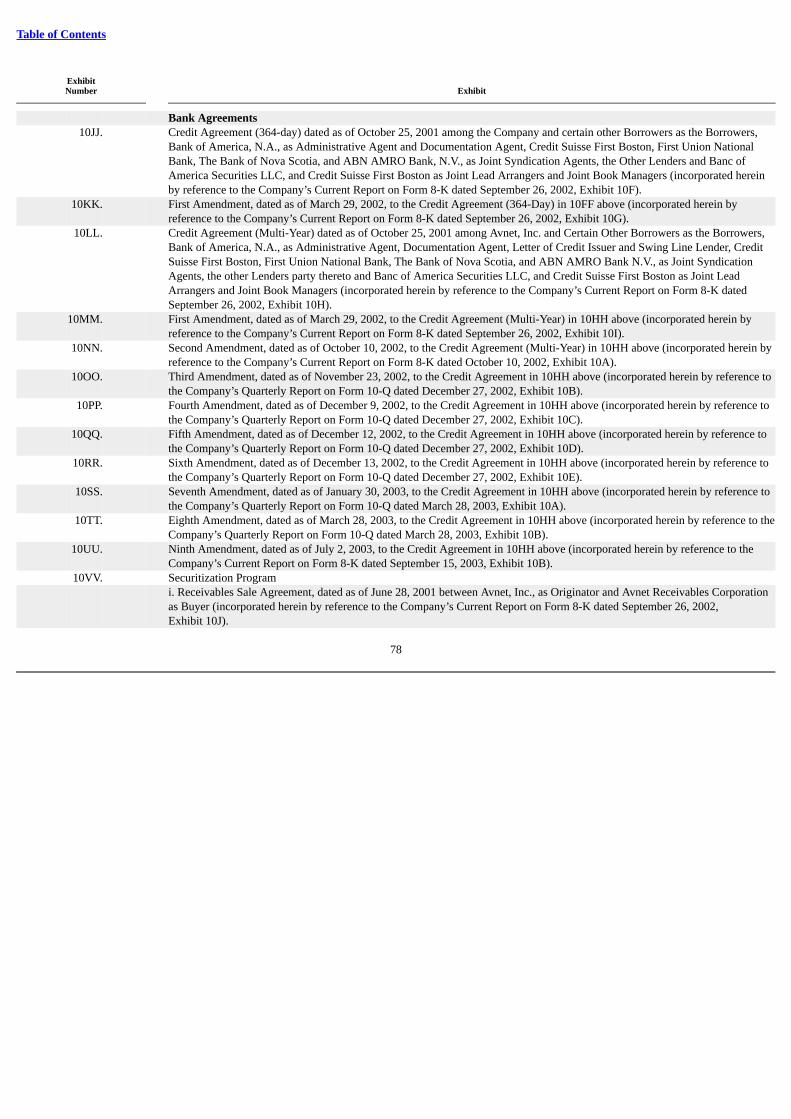
Table of Contents
ExhibitNumber Exhibit
Bank Agreements
10JJ.
Credit Agreement (364-day) dated as of October 25, 2001 among the Company and certain other Borrowers as the Borrowers,Bank of America, N.A., as Administrative Agent and Documentation Agent, Credit Suisse First Boston, First Union NationalBank, The Bank of Nova Scotia, and ABN AMRO Bank, N.V., as Joint Syndication Agents, the Other Lenders and Banc ofAmerica Securities LLC, and Credit Suisse First Boston as Joint Lead Arrangers and Joint Book Managers (incorporated hereinby reference to the Company’s Current Report on Form 8-K dated September 26, 2002, Exhibit 10F).
10KK.
First Amendment, dated as of March 29, 2002, to the Credit Agreement (364-Day) in 10FF above (incorporated herein byreference to the Company’s Current Report on Form 8-K dated September 26, 2002, Exhibit 10G).
10LL.
Credit Agreement (Multi-Year) dated as of October 25, 2001 among Avnet, Inc. and Certain Other Borrowers as the Borrowers,Bank of America, N.A., as Administrative Agent, Documentation Agent, Letter of Credit Issuer and Swing Line Lender, CreditSuisse First Boston, First Union National Bank, The Bank of Nova Scotia, and ABN AMRO Bank N.V., as Joint SyndicationAgents, the other Lenders party thereto and Banc of America Securities LLC, and Credit Suisse First Boston as Joint LeadArrangers and Joint Book Managers (incorporated herein by reference to the Company’s Current Report on Form 8-K datedSeptember 26, 2002, Exhibit 10H).
10MM.
First Amendment, dated as of March 29, 2002, to the Credit Agreement (Multi-Year) in 10HH above (incorporated herein byreference to the Company’s Current Report on Form 8-K dated September 26, 2002, Exhibit 10I).
10NN. Second Amendment, dated as of October 10, 2002, to the Credit Agreement (Multi-Year) in 10HH above (incorporated herein byreference to the Company’s Current Report on Form 8-K dated October 10, 2002, Exhibit 10A).
10OO.
Third Amendment, dated as of November 23, 2002, to the Credit Agreement in 10HH above (incorporated herein by reference tothe Company’s Quarterly Report on Form 10-Q dated December 27, 2002, Exhibit 10B).
10PP. Fourth Amendment, dated as of December 9, 2002, to the Credit Agreement in 10HH above (incorporated herein by reference tothe Company’s Quarterly Report on Form 10-Q dated December 27, 2002, Exhibit 10C).
10QQ.
Fifth Amendment, dated as of December 12, 2002, to the Credit Agreement in 10HH above (incorporated herein by reference tothe Company’s Quarterly Report on Form 10-Q dated December 27, 2002, Exhibit 10D).
10RR. Sixth Amendment, dated as of December 13, 2002, to the Credit Agreement in 10HH above (incorporated herein by reference tothe Company’s Quarterly Report on Form 10-Q dated December 27, 2002, Exhibit 10E).
10SS.
Seventh Amendment, dated as of January 30, 2003, to the Credit Agreement in 10HH above (incorporated herein by reference tothe Company’s Quarterly Report on Form 10-Q dated March 28, 2003, Exhibit 10A).
10TT. Eighth Amendment, dated as of March 28, 2003, to the Credit Agreement in 10HH above (incorporated herein by reference to theCompany’s Quarterly Report on Form 10-Q dated March 28, 2003, Exhibit 10B).
10UU.
Ninth Amendment, dated as of July 2, 2003, to the Credit Agreement in 10HH above (incorporated herein by reference to theCompany’s Current Report on Form 8-K dated September 15, 2003, Exhibit 10B).
10VV. Securitization Program
i. Receivables Sale Agreement, dated as of June 28, 2001 between Avnet, Inc., as Originator and Avnet Receivables Corporationas Buyer (incorporated herein by reference to the Company’s Current Report on Form 8-K dated September 26, 2002,Exhibit 10J).
78
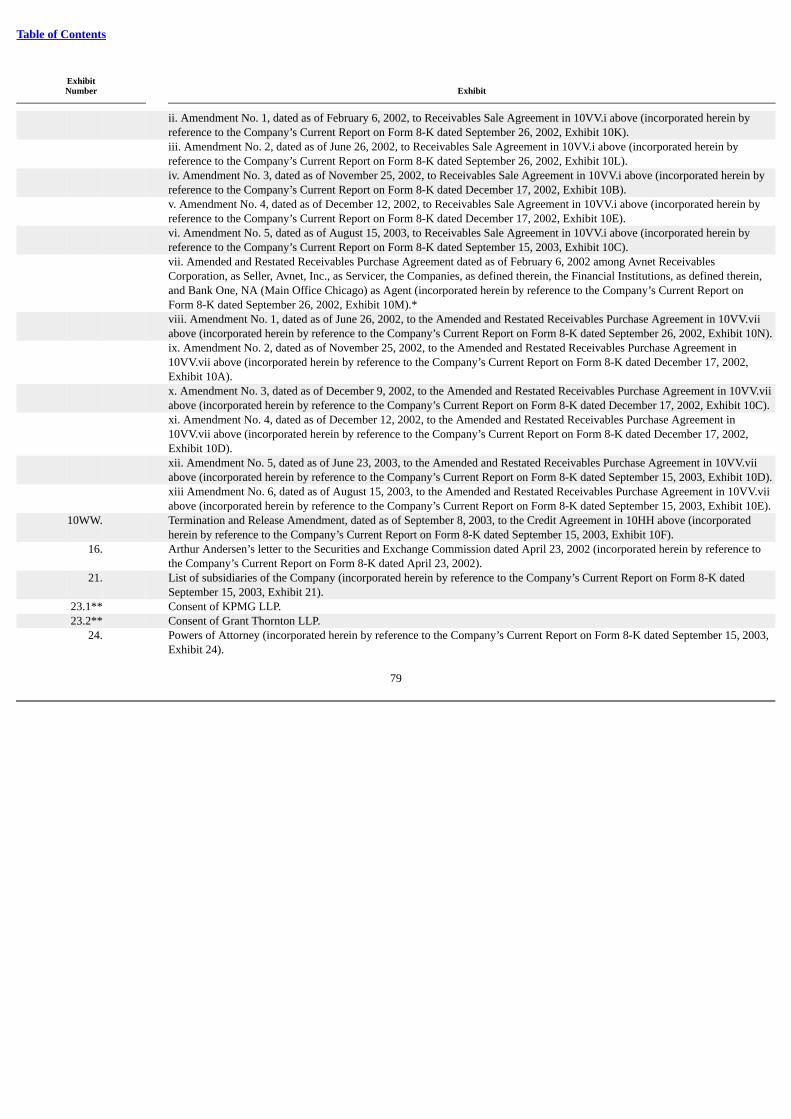
Table of Contents
ExhibitNumber Exhibit
ii. Amendment No. 1, dated as of February 6, 2002, to Receivables Sale Agreement in 10VV.i above (incorporated herein byreference to the Company’s Current Report on Form 8-K dated September 26, 2002, Exhibit 10K).
iii. Amendment No. 2, dated as of June 26, 2002, to Receivables Sale Agreement in 10VV.i above (incorporated herein byreference to the Company’s Current Report on Form 8-K dated September 26, 2002, Exhibit 10L).
iv. Amendment No. 3, dated as of November 25, 2002, to Receivables Sale Agreement in 10VV.i above (incorporated herein byreference to the Company’s Current Report on Form 8-K dated December 17, 2002, Exhibit 10B).
v. Amendment No. 4, dated as of December 12, 2002, to Receivables Sale Agreement in 10VV.i above (incorporated herein byreference to the Company’s Current Report on Form 8-K dated December 17, 2002, Exhibit 10E).
vi. Amendment No. 5, dated as of August 15, 2003, to Receivables Sale Agreement in 10VV.i above (incorporated herein byreference to the Company’s Current Report on Form 8-K dated September 15, 2003, Exhibit 10C).
vii. Amended and Restated Receivables Purchase Agreement dated as of February 6, 2002 among Avnet ReceivablesCorporation, as Seller, Avnet, Inc., as Servicer, the Companies, as defined therein, the Financial Institutions, as defined therein,and Bank One, NA (Main Office Chicago) as Agent (incorporated herein by reference to the Company’s Current Report onForm 8-K dated September 26, 2002, Exhibit 10M).*
viii. Amendment No. 1, dated as of June 26, 2002, to the Amended and Restated Receivables Purchase Agreement in 10VV.viiabove (incorporated herein by reference to the Company’s Current Report on Form 8-K dated September 26, 2002, Exhibit 10N).
ix. Amendment No. 2, dated as of November 25, 2002, to the Amended and Restated Receivables Purchase Agreement in10VV.vii above (incorporated herein by reference to the Company’s Current Report on Form 8-K dated December 17, 2002,Exhibit 10A).
x. Amendment No. 3, dated as of December 9, 2002, to the Amended and Restated Receivables Purchase Agreement in 10VV.viiabove (incorporated herein by reference to the Company’s Current Report on Form 8-K dated December 17, 2002, Exhibit 10C).
xi. Amendment No. 4, dated as of December 12, 2002, to the Amended and Restated Receivables Purchase Agreement in10VV.vii above (incorporated herein by reference to the Company’s Current Report on Form 8-K dated December 17, 2002,Exhibit 10D).
xii. Amendment No. 5, dated as of June 23, 2003, to the Amended and Restated Receivables Purchase Agreement in 10VV.viiabove (incorporated herein by reference to the Company’s Current Report on Form 8-K dated September 15, 2003, Exhibit 10D).
xiii Amendment No. 6, dated as of August 15, 2003, to the Amended and Restated Receivables Purchase Agreement in 10VV.viiabove (incorporated herein by reference to the Company’s Current Report on Form 8-K dated September 15, 2003, Exhibit 10E).
10WW.
Termination and Release Amendment, dated as of September 8, 2003, to the Credit Agreement in 10HH above (incorporatedherein by reference to the Company’s Current Report on Form 8-K dated September 15, 2003, Exhibit 10F).
16. Arthur Andersen’s letter to the Securities and Exchange Commission dated April 23, 2002 (incorporated herein by reference tothe Company’s Current Report on Form 8-K dated April 23, 2002).
21.
List of subsidiaries of the Company (incorporated herein by reference to the Company’s Current Report on Form 8-K datedSeptember 15, 2003, Exhibit 21).
23.1** Consent of KPMG LLP. 23.2** Consent of Grant Thornton LLP.
24. Powers of Attorney (incorporated herein by reference to the Company’s Current Report on Form 8-K dated September 15, 2003,Exhibit 24).
79

Table of Contents
ExhibitNumber Exhibit
31.1** Certification by Roy Vallee, Chief Executive Officer, under Section 302 of the Sarbanes-Oxley Act of 2002. 31.2** Certification by Raymond Sadowski, Chief Financial Officer, under Section 302 of the Sarbanes-Oxley Act of 2002. 32.1*** Certification by Roy Vallee, Chief Executive Officer, under Section 906 of the Sarbanes-Oxley Act of 2002. 32.2*** Certification by Raymond Sadowski, Chief Financial Officer, under Section 906 of the Sarbanes-Oxley Act of 2002.
* This Exhibit does not include the Exhibits and Schedules thereto as listed in its table of contents. The Company undertakes to furnish any such Exhibits andSchedules to the Securities and Exchange Commission upon its request.
** Filed herewith.
*** Furnished herewith.
80
Exhibit 23.1
Independent Auditors’ Consent
The Board of DirectorsAvnet, Inc.:
We consent to the incorporation by reference in the registration statements Nos. 333-39530, 333-94957 and 333-107474 on Form S-3, Nos. 333-58852, 333-36970 and 333-86721 on Form S-4, and Nos. 2-96800, 33-29475, 33-43855, 033-64765, 333-17271, 333-45735, 333-55806, 333-00129, 333-45267, 333-89297and 333-101039 on Form S-8, of Avnet, Inc. of our report dated August 7, 2003, with respect to the consolidated balance sheets of Avnet, Inc. and subsidiaries asof June 27, 2003 and June 28, 2002, and the related consolidated statements of operations, shareholders’ equity and cash flows for the years then ended, and therelated financial statement schedule for the years ended June 27, 2003 and June 28, 2002, which report appears in the June 27, 2003 annual report on Form 10-Kof Avnet, Inc.
Our report dated August 7, 2003 states that the consolidated financial statements and financial statement schedule of Avnet, Inc. and subsidiaries for the yearended June 29, 2001 were audited by other auditors who have ceased operations. Those auditors expressed an unqualified opinion on those consolidated financialstatements and financial statement schedule, before the revisions described in Notes 6 and 16 to the consolidated financial statements in their report datedAugust 14, 2001. As described in Note 6, these consolidated financial statements have been revised to include the transitional disclosures required by Statementof Financial Accounting Standards (SFAS) No. 142, Goodwill and Other Intangible Assets, which was adopted by the Company as of June 30, 2001. In ouropinion, the disclosures for fiscal year 2001 in Note 6 are appropriate. As described in Note 16, the Company allocated goodwill to its reportable segmentspreviously presented as corporate assets during the year ended June 27, 2003, and accordingly, the amounts relating to the fiscal years ending 2002 and 2001segment financial information have been restated to conform to the fiscal year 2003 presentation. We audited the adjustments that were applied to restate thedisclosures for reportable segments reflected in the fiscal year 2001 financial statements. In our opinion, such adjustments are appropriate and have been properlyapplied. However, we were not engaged to audit, review, or apply any procedures to the fiscal year 2001 consolidated financial statements of Avnet, Inc. andsubsidiaries other than with respect to such adjustments.
/s/ KPMG LLP
Phoenix, ArizonaSeptember 11, 2003

Exhibit 23.2
CONSENT OF INDEPENDENT CERTIFIED PUBLIC ACCOUNTANTS
We have issued our report dated May 8, 2001, accompanying the consolidated statements of earnings, cash flows and stockholders’ equity of Kent ElectronicsCorporation and Subsidiaries for the year ended March 31, 2001, which is included in the Annual Report of Avnet, Inc. and Subsidiaries on Form 10-K for theyear ended June 27, 2003. We hereby consent to the incorporation by reference of said report into Avnet, Inc.’s previously filed Registration Statements on FormsS-3 No. 333-39530 relating to a shelf offering of securities of Avnet, Inc., No. 333-94957 relating to common stock of Avnet, Inc. issuable in connection with theacquisition of Eurotronics B.V., No. 333-107474 relating to a shelf offering of securities of Avnet, Inc.; Forms S-4 No. 333-58852 relating to common stock ofAvnet, Inc. issuable in connection with the acquisition of Kent Electronics Corporation, No. 333-36970 relating to common stock of Avnet, Inc. issuable inconnection with the acquisition of Savoir, No. 333-86721 relating to common stock of Avnet, Inc. issuable in connection with the acquisition of MarshallIndustries; and Forms S-8 No. 2-96800, No. 33-29475, No. 33-43855, No. 033-64765, No. 333-45735, No. 333-55806, No. 333-00129, No. 333-17271, No. 333-45267, No. 333-89297 and No. 333-101039 relating to common stock of Avnet, Inc. issuable under the 1984, 1988, 1990, 1995, 1997 and 1999 Stock OptionPlans, the 1994 and 1996 Avnet Incentive Stock Option Plans, the Avnet Deferred Compensation Plan, the Marshall Industries Stock Option Plans and the AvnetEmployee Stock Purchase Plan, respectively.
/s/ GRANT THORNTON LLP
Houston, TexasSeptember 12, 2003
Exhibit 31.1
CERTIFICATION OF CHIEF EXECUTIVE OFFICER
I, Roy Vallee, Chief Executive Officer of Avnet, Inc., certify that:
1. I have reviewed this annual report on Form 10-K of Avnet, Inc.; 2. Based on my knowledge, this report does not contain any untrue statement of a material fact or omit to state a material fact necessary to make the
statements made, in light of the circumstances under which such statements were made, not misleading with respect to the period covered by thisreport;
3. Based on my knowledge, the financial statements, and other financial information included in this report, fairly present in all material respects the
financial condition, results of operations and cash flows of the registrant as of, and for, the periods presented in this report; 4. The registrant’s other certifying officer(s) and I are responsible for establishing and maintaining disclosure controls and procedures (as defined in
Exchange Act Rules 13a-15(e) and 15d-15(e)) for the registrant and have: a. designed such disclosure controls and procedures, or caused such disclosure controls and procedures to be designed under our supervision,
to ensure that material information relating to the registrant, including its consolidated subsidiaries, is made known to us by others withinthose entities, particularly during the period in which this report is being prepared;
b. evaluated the effectiveness of the registrant’s disclosure controls and procedures and presented in this report our conclusions about the
effectiveness of the disclosure controls and procedures, as of the end of the period covered by this report based on such evaluation; and c. disclosed in this report any change in the registrant’s internal control over financial reporting that occurred during the registrant’s most
recent fiscal quarter (the registrant’s fourth fiscal quarter in the case of an annual report) that has materially affected, or is reasonably likelyto materially affect, the registrant’s internal control over financial reporting; and
5. The registrant’s other certifying officer(s) and I have disclosed, based on our most recent evaluation of internal control over financial reporting, to the
registrant’s auditors and the audit committee of the registrant’s board of directors (or persons performing equivalent functions): a. all significant deficiencies and material weaknesses in the design or operation of internal control over financial reporting which are
reasonably likely to adversely affect the registrant’s ability to record, process, summarize and report financial information; and b. any fraud, whether or not material, that involves management or other employees who have a significant role in the registrant’s internal
control over financial reporting.
Date: September 15, 2003
/s/ ROY VALLEE
Roy ValleeChief Executive Officer
Exhibit 31.2
CERTIFICATION OF CHIEF FINANCIAL OFFICER
I, Raymond Sadowski, Chief Financial Officer of Avnet, Inc., certify that:
1. I have reviewed this annual report on Form 10-K of Avnet, Inc.; 2. Based on my knowledge, this report does not contain any untrue statement of a material fact or omit to state a material fact necessary to make the
statements made, in light of the circumstances under which such statements were made, not misleading with respect to the period covered by thisreport;
3. Based on my knowledge, the financial statements, and other financial information included in this report, fairly present in all material respects the
financial condition, results of operations and cash flows of the registrant as of, and for, the periods presented in this report; 4. The registrant’s other certifying officer(s) and I are responsible for establishing and maintaining disclosure controls and procedures (as such term is
defined in Exchange Act Rules 13a-15(e) and 15d-15(e)) for the registrant and have:
a. designed such disclosure controls and procedures, or caused such disclosure controls and procedures to be designed under our supervision,to ensure that material information relating to the registrant, including its consolidated subsidiaries, is made known to us by others withinthose entities, particularly during the period in which this report is being prepared;
b. evaluated the effectiveness of the registrant’s disclosure controls and procedures and presented in this report our conclusions about the
effectiveness of the disclosure controls and procedures, as of the end of the period covered by this report based on such evaluation; and c. disclosed in this report any change in the registrant’s internal control over financial reporting that occurred during the registrant’s most
recent fiscal quarter (the registrant’s fourth fiscal quarter in the case of an annual report) that has materially affected, or is reasonably likelyto materially affect, the registrant’s internal control over financial reporting; and
5. The registrant’s other certifying officer(s) and I have disclosed, based on our most recent evaluation of internal control over financial reporting, to theregistrant’s auditors and the audit committee of the registrant’s board of directors (or persons performing equivalent functions):
a. all significant deficiencies and material weaknesses in the design or operation of internal control over financial reporting which arereasonably likely to adversely affect the registrant’s ability to record, process, summarize and report financial information; and
b. any fraud, whether or not material, that involves management or other employees who have a significant role in the registrant’s internal
control over financial reporting.
Date: September 15, 2003
/s/ RAYMOND SADOWSKI
Raymond SadowskiChief Financial Officer
Exhibit 32.1
CERTIFICATION PURSUANT TO 18 U.S.C. SECTION 1350(AS ADOPTED PURSUANT TO SECTION 906 OF THE SARBANES-OXLEY ACT OF 2002)
Pursuant to 18 U.S.C. §1350, the undersigned Chief Executive Officer of Avnet, Inc. (the “Company”) hereby certifies that the Company’s Annual Report onForm 10-K for the year ended June 27, 2003 (the “Report”) fully complies with the requirements of Section 13(a) or 15(d), as applicable, of the SecuritiesExchange Act of 1934 and that the information contained in the Report fairly presents, in all material respects, the financial condition and results of operations ofthe Company.
Dated: September 15, 2003
/s/ Roy Vallee
Roy ValleeChief Executive Officer
The foregoing certification is being furnished pursuant to 18 U.S.C. §1350 and Section 906 of the Sarbanes-Oxley Act of 2002 and is not being filed as part ofthe Report or as a separate disclosure document.
Exhibit 32.2
CERTIFICATION PURSUANT TO 18 U.S.C. SECTION 1350(AS ADOPTED PURSUANT TO SECTION 906 OF THE SARBANES-OXLEY ACT OF 2002)
Pursuant to 18 U.S.C. §1350, the undersigned Chief Financial Officer of Avnet, Inc. (the “Company”) hereby certifies that the Company’s Annual Report onForm 10-K for the year ended June 27, 2003 (the “Report”) fully complies with the requirements of Section 13(a) or 15(d), as applicable, of the SecuritiesExchange Act of 1934 and that the information contained in the Report fairly presents, in all material respects, the financial condition and results of operations ofthe Company.
Dated: September 15, 2003
/s/ Raymond Sadowski
Raymond SadowskiChief Financial Officer
The foregoing certification is being furnished pursuant to 18 U.S.C. §1350 and Section 906 of the Sarbanes-Oxley Act of 2002 and is not being filed as part ofthe Report or as a separate disclosure document.