parker drilling investor relations presentation - cloudfront.net
TRANSCRIPT
1
Investor Presentation June 2019
PKD (NYSE)Rig 273 Alaska
2
Forward-Looking Statements Caution
The following presentation contains certain statements that may be deemed to be “forward-looking statements” within themeaning of the securities laws of the United States.
All statements, other than statements of historical facts, addressing activities, events or developments that the Companyexpects, projects, believes or anticipates will or may occur in the future, the outlook for equipment and utilization and dayrates, general industry conditions including bidding activity, future results of the Company’s operations, capital expenditures,income tax matters, expansion and growth opportunities, financing activities, debt repayment, returns on capital, cash flowsand other such matters, are forward-looking statements.
Although the Company believes its expectations stated in this presentation are based on reasonable assumptions, actual resultsmay differ materially from those expressed or implied in the forward-looking statements.
For a more detailed discussion of risk factors, please refer to the Company’s reports filed with the SEC, including reports onForms 10-K and 10-Q. Each forward-looking statement speaks only as of the date of this presentation, and the Companyundertakes no obligation to publically update or revise any forward-looking statement.
Non-GAAP Measures: Included in this presentation are certain non‐GAAP financial measures as defined under SEC RegulationG. Investors are urged to consider closely the disclosure in Company’s Annual Report on Form 10‐K, Quarterly Reports on Form10‐Q and Current Reports on Form 8‐K and any reconciliation to GAAP measures provided in this presentation.

3
Parker Drilling
A service-driven company, we offer “operational execution” services and products to mitigate risk and
control costs so our customers can deliver safe and profitable wells.
• Drives a motivated and educated workforce
• Promotes enterprise alignment
• Serves in the best interest of stakeholders
• Maximize return on capital
• Enhance flexibility in a cyclical industry
• Reliable partner, trusted advisor
• Key role in customer success
• Known for operational execution
• Enhances operating leverage and economies of scale
• Optimizes resource allocation
• Enrich market intelligence • Absorbs industry volatility
• Delivers share appreciation
• Facilitates the return of capital
StrongBrand Equity
Team Oriented and
Continual Improvement
Culture
Capital Efficient Business Model
Scale in Key Geographies and Product
Lines
ROC Company
4
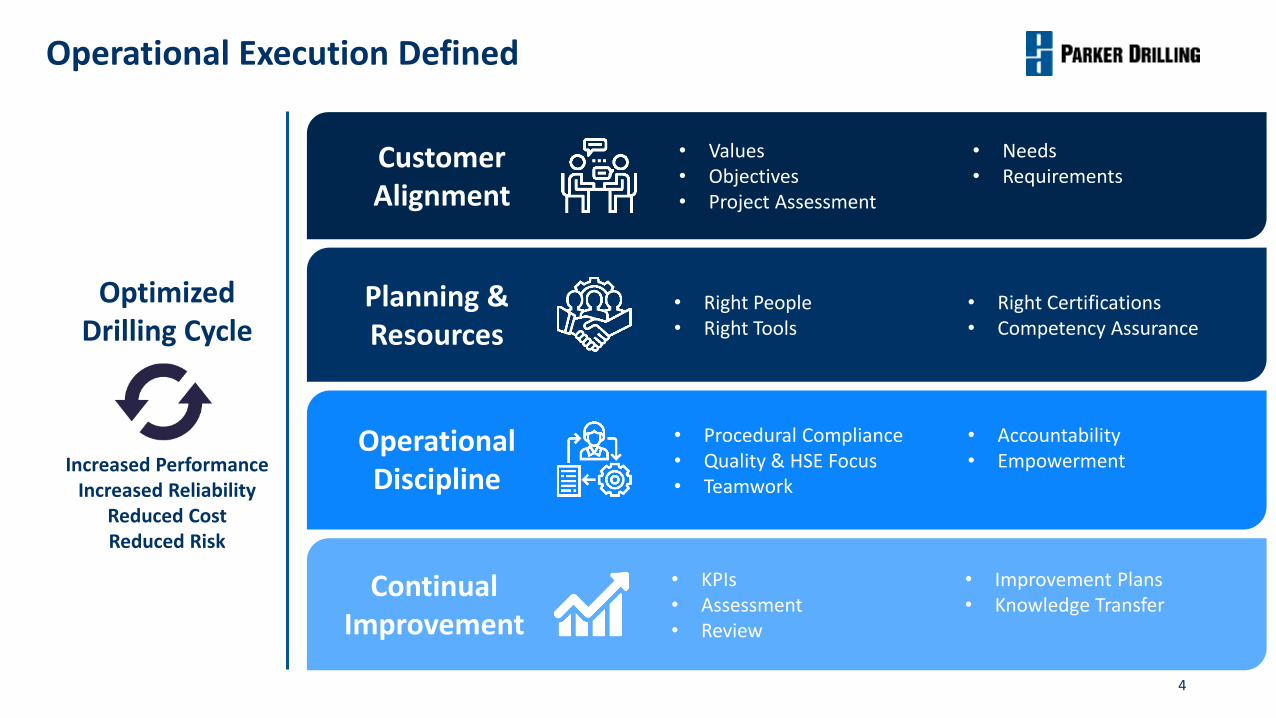
Operational Execution Defined
Optimized Drilling Cycle
Increased PerformanceIncreased Reliability
Reduced CostReduced Risk
• Procedural Compliance• Quality & HSE Focus• Teamwork
• Accountability• Empowerment
Operational Discipline
• Values• Objectives• Project Assessment
• Needs• Requirements
Customer Alignment
• KPIs• Assessment• Review
• Improvement Plans• Knowledge Transfer
Continual Improvement
• Right People• Right Tools
• Right Certifications• Competency Assurance
Planning & Resources

5
Where We’re Heading
Total Rentals O&M Owned Rigs
36%
18%
46%
2012
Revenue $678 M
Rebalanced revenue mix by investment bias toward capital
efficient opportunities53%
33%
14%
Revenue $528 M
Current 1
Grow scale in target geographies and product lines based upon capital
efficient platform
1 LTM as of 1Q’19
6
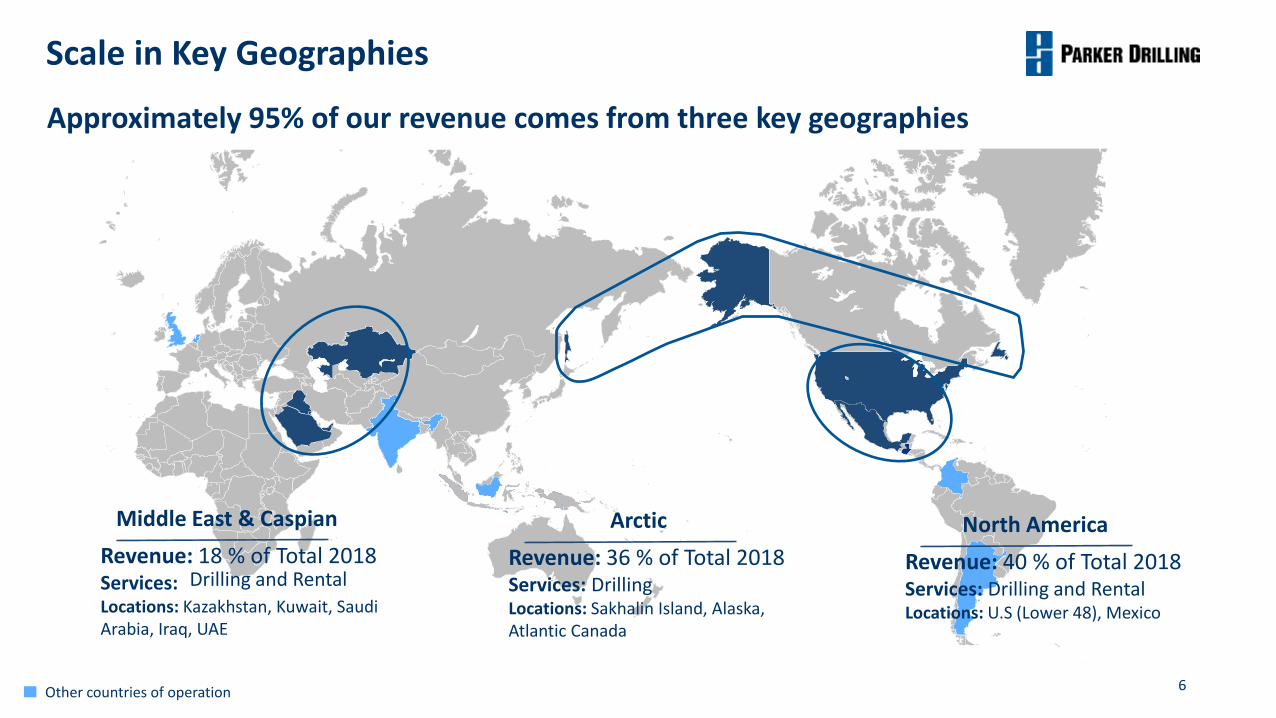
Scale in Key Geographies
Approximately 95% of our revenue comes from three key geographies
Middle East & Caspian
Revenue: 18 % of Total 2018 Services: Locations: Kazakhstan, Kuwait, Saudi Arabia, Iraq, UAE
Arctic
Revenue: 36 % of Total 2018 Services: Drilling Locations: Sakhalin Island, Alaska, Atlantic Canada
North America
Revenue: 40 % of Total 2018 Services: Drilling and Rental Locations: U.S (Lower 48), Mexico
Drilling and Rental
Other countries of operation

7
United States43%
International57%
Offshore33%
Onshore67%
621 465
293 260 225 251
348
247
134 183 256 277
-
200
400
600
800
1,000
1,200
2014 2015 2016 2017 2018 LTM
Revenue by Business
Drilling Rentals
$ millions
161
104
51 37 6 11
134
82
14 53 97
110
-
50
100
150
200
250
300
350
2014 2015 2016 2017 2018 LTM
Adjusted EBITDA excluding G&A2 by Business
Drilling Rentals
$ millions
1LTM as of 1Q’192Adjusted EBITDA excluding G&A is a non-GAAP measure. Please refer to the appendix for the definition and reconciliation
Company Overview
• 85-year history of delivering operational excellence tothe oil and gas industry
• Operated in 65 countries, currently active in 20
• Headquartered in Houston, Texas
• Dedicated global workforce totaling ~2400 employees
1 1

8
Rental Tools & Well Services Overview
Well Intervention1%
1 LTM as of 1Q’19
Middle East / Caspian
17%
Revenues by Geography 1
North Sea5%
Other7%
North America
71%
Revenues by Product Offering 1
Surface & Tubular
84%
• High return, quick payback investment opportunities
• Diversified product offerings across core geographies• Surface & Tubulars – drill pipe, tubing, drill collars,
pressure control equipment, and more• Well Construction – tubular running services and
downhole tool rentals• Well Intervention – fishing and related services and
whipstocks
• A leading supplier in U.S. land and offshore Gulf of Mexico markets
• A solid international platform with major presence in the Middle East
• Opportunities to expand by leveraging existing infrastructure and resources
Well Construction15%

9
U.S. Rentals – Leading U.S. Supplier
Parker U.S. Rentals Growth vs. US Rig Count 3
U.S. Rental Revenues by Market 1
25%
75%
U.S. Offshore
U.S. Land
• Well developed infrastructure – presence in every major U.S. basin
• Diverse mix of customers and outstanding customer service
• Engineering and QHSE capabilities for servicing offshore and high-profile projects
• Leading supplier of premium drill pipe
Unique Operating Strengths
1 LTM as of 1Q’192 The Parker U.S. Tubular Goods Utilization Index represents the proportion of tubular goods (drill pipe and related products) that were on rental compared to the total inventory of tubular goods, and indexed to a base level of tubular goods inventory on rental. Tubular goods rentals do not account for all the U.S. Rental Tools segment’s revenues.3 Source Baker Hughes-GE rig data
130%
140%
150%
160%
170%
180%
Q2 ‘16 vs Q1 ‘19
% Δ Avg US Rig Count % Δ Tubular Utilization Index % Δ US Rental Revenue2

10
Leader in New Drill Pipe TechnologyEarly adoption of new drill pipe technology, coupled with our focus on operational execution, helps our customers deliver increasingly complex wells more efficiently
Benefits
Performance• High strength tool joints• Higher torque rating • Improved hydraulic• Better fatigue resistance
Ease of Use• Faster make up times• Minimizes stabbing damages• Improved tong gripping
Lower Maintenance Cost• Reduced repair frequency• Increased refacing amount• Less recut loss
U.S. Land Well Lateral Lengths & Efficiencies
6,683
7,627
6,489
7,056
6,452
5,704
8,505
6,588
10,100
8,660
9,714
8,236
8,881
7,498
6,798
9,735
8,947
10,510
Anadarko 2014-2018
Appalachian 2014-2018
Delaware 2014-2018
DJ 2014-2018
Gulf Coast 2014-2018
Mid-Con 2014-2018
Midland 2014-2018
PRB 2014-2018
Williston 2014-2018
2018+ Avg. Lat Length (ft) 2014-2018 Avg. Lat Length (ft)
536
931
610
1,334
984
611
762
453
1,009
651
1,102
711
1,565
1,137
774
833
596
1,348
Anadarko 2014-2018
Appalachian 2014-2018
Delaware 2014-2018
DJ 2014-2018
Gulf Coast 2014-2018
Mid-Con 2014-2018
Midland 2014-2018
PRB 2014-2018
Williston 2014-2018
2018+ Avg. ft/d 2014-2018 Avg. ft/d
Source: DrillingInfo DI Rig Analytics

11
International Rentals - Improving Performance
Forward Plan
• Focusing on scale in core markets with sustainable activity
• Automated Casing Running Tool (CRT) performance exceeding competitive technologies
• Leverage Well Construction success to pull through additional product lines
6.1 6.37.6
8.5 8.610.4 10.0 9.9 10.6
1Q'17 2Q'17 3Q'17 4Q'17 1Q'18 2Q'18 3Q'18 4Q'18 1Q'19
Well Construction Revenues Growth
$ millions
Revenue Scale in Core Markets
2014A
Saudi Arabia UAE Iraq Other
Current 1
Saudi Arabia UAE Iraq Other
Revenues by Product Offering 1
Surface & Tubular45%
Well Construction
51%
Well Intervention4%
1 LTM as of through 1Q’19

12
1 LTM as of 1Q’192 Excluding reimbursable revenue3 Rig count as of March 31, 2019
Drilling Services Overview
56%44%
Revenues1,2 by Arena
Land
Offshore
Revenues by Geography 1,2,3
Middle East / Caspian: 23%
Owned Rigs: 8O&M Rigs: 37
North America: 11%Owned Rigs: 16
O&M Rigs: 1
Arctic: 65%Owned Rigs: 3
O&M Rigs:6
Other: 1%Owned Rigs: 2O&M Rigs: 2
•Expand capital efficient O&M through technical service and operational resources
•Onshore, offshore, remote and harsh-environment expertise
•Highly capable fleet to meet complex drilling requirements
•Developing scale in large and growing international markets

13
Expanding O&M Business
$32 $43 $42
$161
2019 2020 2021 2022+
O&M Revenue
O&M Contracted Backlog 1
Total backlog of $278 million as of June 2019
$ millions
Recent Notable O&M Project Awards
• Holly Platform – ExxonMobil Offshore California
• West White Rose Project – Husky Energy Offshore Atlantic Canada
1 O&M revenue backlog is an estimate of O&M drilling revenues from drilling contracts. It does not include owned–asset drilling revenues, rental revenues and all other revenues we may earn, including those for added services, reimbursables, mobilization or demobilization; nor does it anticipate revenue reductions that may be due to conditions that would lead to reduced dayrates or early terminations.2 Rig count as of March 31, 2019
31
41
3
5
0
10
20
30
40
50
2012 Current
Rig
Co
un
t
O&M by Arena 2
Land Offshore

14
International vs. US Volatility 1
International & Alaska Drilling Services
• International markets have historically provided better value and less volatility compared to the U.S.
• Recovery in many international markets is beginning to take shape in earnest
• Opportunities to restart idle assets with minimal capital expenditure requirements (i.e. Alaska and Kazakhstan)
Highlights
928
7 14 13
'08 '09 - '11 '14 '16 - 17 '17 - 18
15% 117% 7% 129% 16%
United States
Average change in rig count: 57%
Average bull market length: 14 months
InternationalAverage change in rig count: 20% Average bull market length: 33 months
Bear Market
… while the US market is prone to more volatility during downturnsAverage change in rig count: (31%)Average bear market length: 12 months
United States
Average change in rig count: (21%) Average bear market length: 17 months
Change in rig count
International
Bull Market
International rig counts have seen longer periods of expansion in bull markets…
4
5930
'08 '9 - 14 '16 - 19
5% 40% 15%
9
24 20
4 4
'08 - '09 '11 - '13 '14 - '16 '17 '19
(55%) (13%) (79%) (4%) (5%)
7
27
'08 - '09 '14 - '16
(10%) (31%)
1Source: Deutsche Bank, FactSet, Baker Hughes-GE rig data. Note: Market data as of May 20, 2019.

15
U.S Drilling Services
2 2
4
2
1
3
1
1 1
Light Bay Deep Bay Deep Posted High-Spec Posted
Competitor B
Competitor A
Parker
Barge Rig Diversity 4
• Leverage resources and experience to expand O&M business (i.e. California & GOM offshore)
• Dominant market share in GOM inland waters with only fleet capable of drilling all projects
• Parker-owned rigs breakeven gross margin3 projected at approx. 30% utilization
Unique Operating Strengths
1 LTM as of 1Q’192 Excluding reimbursables3 Excluding depreciation and amortization4 Rigs classes are defined as follows:
• Light Bay: Drawworks rating < 1500hp with bay barge design• Deep Bay: Drawworks rating > 1500hp with 2 mud pumps with bay barge design• Deep Posted : Drawworks rating > 1500hp with 2 mud pumps with posted barge design• High-Spec Posted: Drawworks rating > 3000hp with 3 mud pump 7500psi system and posted barge design
90%
10%
60%
40%ParkerOwned
RigsO&M + Project Services
Drilling Revenues 2 by Service Type
ParkerOwned
Rigs
O&M + Project Services
2014 Current1

16
Continuing to progress in 2019…
US Drilling
Intl. / AK Drilling
Executed O&M drilling contract with Husky Energy for their new
platform project offshore Atlantic Canada
Opening new U.S. Rental Tools facility
in Odessa, TX
Completed rig reactivation phase on offshore
California O&M project
Extended tubular running services contract for an additional 3 years with key client in Abu Dhabi
Intl. Rentals
USRentals
17
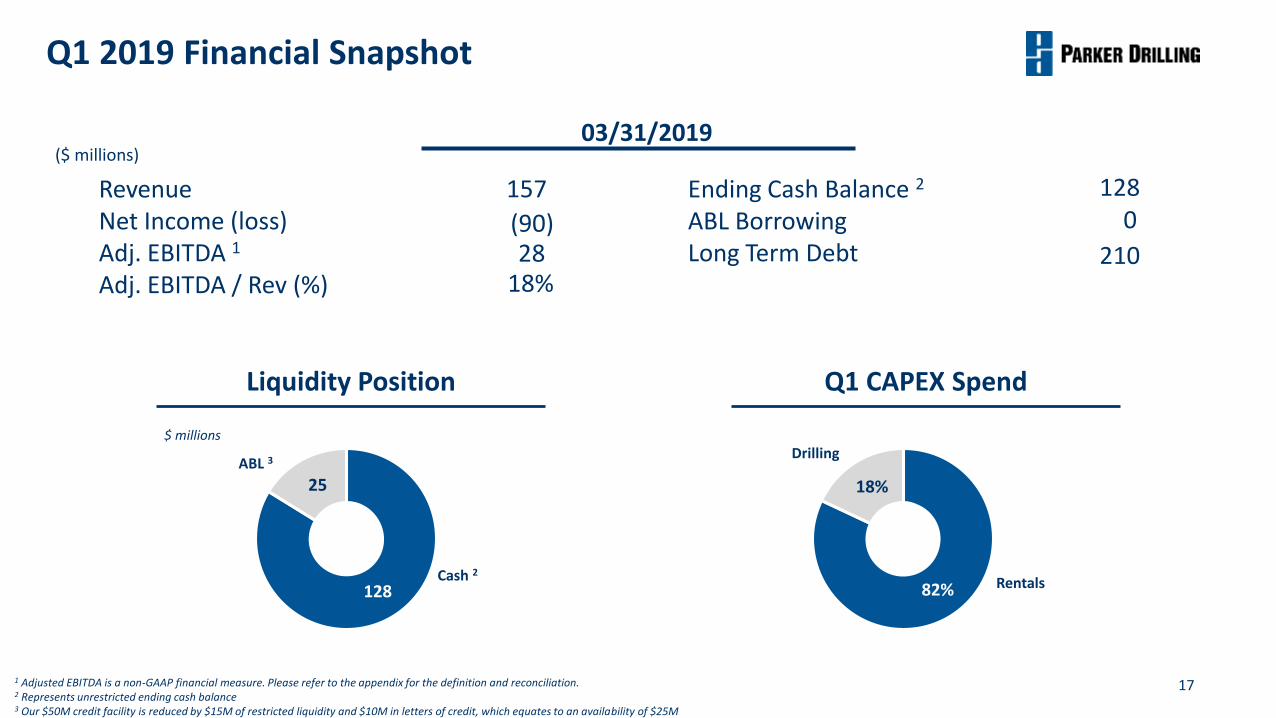
Q1 2019 Financial Snapshot
1 Adjusted EBITDA is a non-GAAP financial measure. Please refer to the appendix for the definition and reconciliation.2 Represents unrestricted ending cash balance3 Our $50M credit facility is reduced by $15M of restricted liquidity and $10M in letters of credit, which equates to an availability of $25M
7 ½
%
$ millions
128
25
Cash 2
ABL 3
Liquidity Position Q1 CAPEX Spend
82%
18%
Rentals
Drilling
($ millions)03/31/2019
Ending Cash Balance 2
ABL BorrowingLong Term Debt
1280
210
RevenueNet Income (loss) Adj. EBITDA 1
Adj. EBITDA / Rev (%)
157
2818%
(90)
18
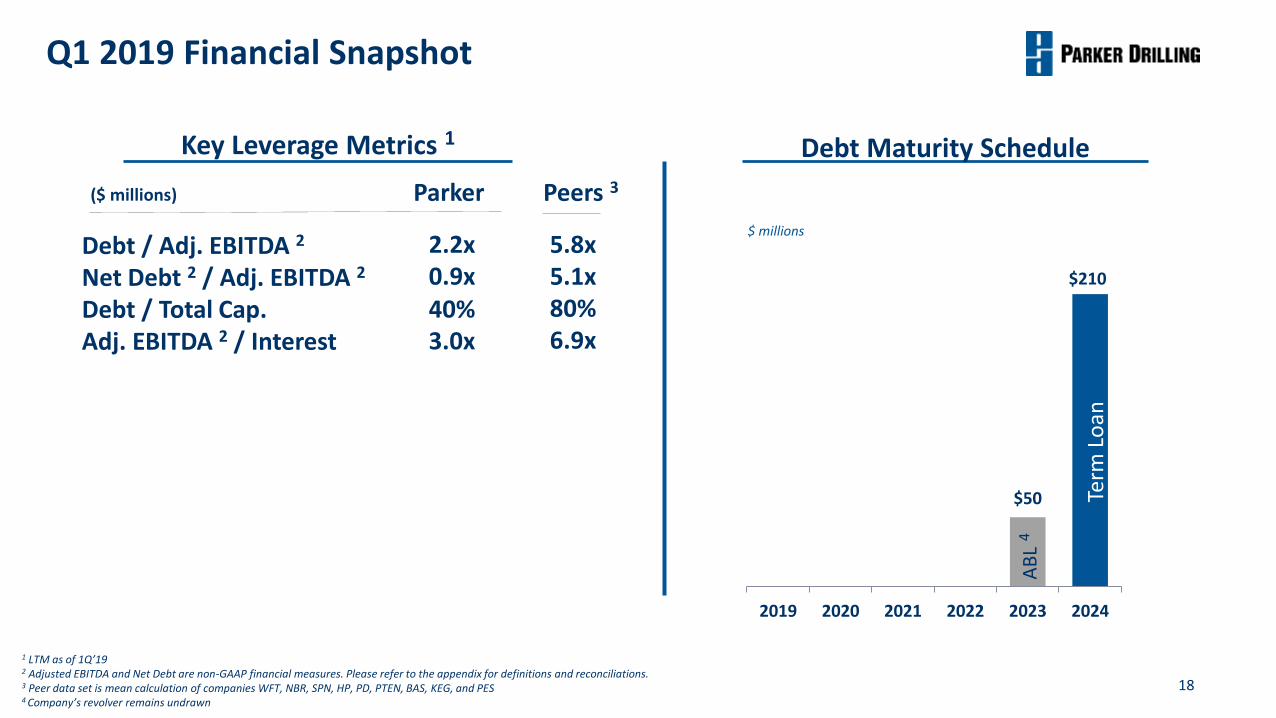
1 LTM as of 1Q’192 Adjusted EBITDA and Net Debt are non-GAAP financial measures. Please refer to the appendix for definitions and reconciliations.3 Peer data set is mean calculation of companies WFT, NBR, SPN, HP, PD, PTEN, BAS, KEG, and PES4 Company’s revolver remains undrawn
$210
$50
2019 2020 2021 2022 2023 2024
Debt Maturity Schedule
$ millionsDebt / Adj. EBITDA 2
Net Debt 2 / Adj. EBITDA 2
Debt / Total Cap.Adj. EBITDA 2 / Interest
2.2x0.9x
($ millions) Parker
Key Leverage Metrics 1
Peers 3
3.0x40%
5.8x5.1x80%6.9x
AB
L4
Term
Lo
an
Q1 2019 Financial Snapshot


20
Reconciliation of Adjusted EBITDA to Net Income (loss)
1 We believe Adjusted EBITDA is an important measure of operating performance because it allows management, investors and others to evaluate and compare our core operating results from period to period by removing the impact of our capital structure (interest expense from our outstanding debt), asset base (depreciation and amortization), remeasurement of foreign currency transactions, tax consequences, impairment and other special items. Special items include items impacting operating expenses that management believes detract from an understanding of normal operating performance. Management uses Adjusted EBITDA as a supplemental measure to review current period operating performance and period to period comparisons. Our Adjusted EBITDA may not be comparable to a similarly titled measure of another company because other entities may not calculate EBITDA in the same manner. EBITDA and Adjusted EBITDA are not measures of financial performance under U.S. Generally Accepted Accounting Principles (GAAP), and should not be considered in isolation or as an alternative to operating income or loss, net income or loss, cash flows provided by or used in operating, investing and financing activities, or other income or cash flow statement data prepared in accordance with GAAP.
$ in millions LTM FY 2018 FY 2017 FY 2016 FY 2015 FY 2014
Net income (loss) (227) (166) (119) (231) (95) 23
Interest expense 32 43 44 46 45 44
Income tax expense (benefit) 6 7 10 74 23 24
Depreciation and amortization 104 108 122 140 156 145
EBITDA (85) (8) 57 29 129 236
Adjustments:
Loss on impairment 51 51 - - - -
Provision for reduction in carrying value of certain assets - - 2 - 12 -
(Gain) loss on disposition of assets, net 2 2 2 1 (2) (1)
Pre-petition restructuring charges 22 22 - - - -
Reorganization items 103 9 - - - -
Interest income (0) (0) (0) (0) (0) (0)
Other 2 2 (0) (0) 10 28
Special items - - 3 1 1 -
Non-routine items - - - - - (3)
Adjusted EBITDA 195 78 64 31 150 260
G&A 26 25 26 34 36 35
Adjusted EBITDA excluding G&A 121 103 90 65 186 295
Parker Drilling Company and Subsidiaries
Adj. EBITDA and Adj. EBITDA excluding G&A
(Unaudited)

21
Reconciliation of Net Debt to Total Debt
1 Net debt is computed by subtracting the sum of cash & cash equivalents from total debt. This non-GAAP measure has limitations and therefore should not be used in isolation or as a substitute for the amounts reported in accordance with GAAP. However, management evaluates the performance of the consolidated Company based on several criteria, including net debt, because it believes that this financial measure accurately measures the Company’s liquidity. In addition, securities analysts and investors use this measure as one of the metrics on which they analyze the company’s performance. Other companies in this industry may compute this measure differently.
$ in millions March 31, 2019
Long Term Debt $210
Current Debt 0
Total Debt $210
Cash & Cash Equivalents 128
Net Debt 1 $82

22
Parker Drilling Services
• O&M requires skills that enable the drilling contractor to run unique equipment under special circumstances
Operations & ManagementDaywork Drilling Services
Drilling Services
Unique CapabilityCost EfficiencyRisk Management
• Development requires processes & procedures which maximize efficiency & minimizes clients cost per BOE
• Exploration requires the drilling contractor to provide contingency equipment & skilled multifaceted personnel

23
Parker Rental & Services
• Impact and Stabilization• Hole Openers , Reamers• ROP enhancers, Motors
Well ConstructionWell Intervention Surface & Tubular
Rental & Services
• Cased & Open Hole• P&A• Through Tubing
Tubular Running ServicesRe-entry Services Machines Shops
BHA Tools RentalFishing & Remedial PCE & Tubular Rental
• Conventional TRS• CRT – 2M-TEK
• Hydro-Mechanical Whipstocks
• Fabrication & Repair• Inspection
• BOPs• Drill Pipe, HWDP• Drill Collar

24
Parker Drilling HistoryFor over 85 years, the Parker Drilling team has provided premier drilling and rental tools products and services in some of the world’s most remote
and challenging environments.; Parker Drilling has engineered a history of record setting, pioneering the way for new innovative, reliable, and efficient ways of drilling for more than 80 years
1934: Parker Drilling founded in Oklahoma
1969: Parker enters Alaska
1980: Parker becomes first U.S. drilling contractor to provide specialized services and drilling expertise to China
1999: Parker exits the U.S. land drilling market
2007: Parker named one of America’s Safest Companies for 2007 by Occupational Hazards magazine
2013: Parker named “Drilling Contractor of the Year” by Exxon Neftegas, Ltd.
2016: Parker enters Canadian Offshore Market
1945: Company enters the international drilling market with first rigs working in Venezuela and Canada
1991: Parker becomes the first Western drilling company to work in the Siberian Arctic
2009:Parker celebrates 75th year of operations and opens Anchorage, Alaska Regional Office
2014: Parker celebrates 80th year of operations
1967: Parker patents Heli-Hoist rig design, opening new international and arctic frontiers
1972:Company sets drilling depth record – 28,500 ft at Ralph Lowe Estate, TX
1991: Company introduces new era of arctic drilling technology with an innovative, powerful and self-propelled rig
1999: Parker designs and constructs world’s first and only arctic-class drilling barge, the Sunkar, to explore the Caspian Sea
2002:Company designs, constructs and operates “Yastreb”, the world’s most technologically advanced ERD land rig, for the Sakhalin-1 Project in Russia
2011:Total measured depth of 12,345 meters
2015: Parker acquires 2M-Tek and commercializes Top Tek Tool (Automated Casing Running Tool)
1934 1945 1969 1980 1991 1999 2007 2009 2012 2014 20151967 1972 2002 2008 2011 2013 2016
2008:Company breaks ERD record at Sakhalin Island, reaching out over seven miles under the sea floor with “Yastreb”
2012:Total measured depth of 12,450 meters
2013: Total measured depth of 12,700 meters
Yastreb Rig sets new world records for extended-reach drilling with the world's longest well from Sakhalin Island, Russia.