investor presentation - hyundai
TRANSCRIPT

Investor Presentation

Cautionary Statement with Respect to Forward-Looking Statements
1
In the presentation that follows and in related comments by Hyundai Motor’s management, our use of the
words “expect,” “anticipate,” “project,” “estimate,” “forecast,” “objective,” “plan,” “goal,” “outlook,” “target,”
“pursue” and similar expressions is intended to identify forward looking statements.
The financial data discussed herein are presented on a preliminary basis before the audit from our Independent
Auditor; final data will be included in HMC’s Independent auditor’s report. While these statements represent our
current judgment on what the future may hold, and we believe these judgments are reasonable, actual results
may differ materially due to numerous important factors. Such factors include, among others, the following :
changes in economic conditions, currency exchange rates or political stability; shortages of fuel, labor strikes
or work stoppages; market acceptance of the corporation’s new products; significant changes in the
competitive environment; changes in laws, regulations and tax rates; and the ability of the corporation to
achieve reductions in cost and employment levels to realize production efficiencies and implement capital
expenditures at levels and times planned by management.
We do not intend or assume any obligation to update any forward-looking statement, which speaks only as of
the date on which it is made.
Ver. 2019-01-31

Current Status of HMC
G90

3
4,099 4,392
4,621 4,835 4,844 4,920
4,532 4,499
2011 2012 2013 2014 2015 2016 2017 2018
Global Sales Trend (Unit: 1,000 vehicles)
Brand Value Growth (Unit: US$ in Billions)
Source : Company data (Retail sales excluding CKD sales)
Initial Quality Study (Unit: number of problems per unit)
Vehicle Dependability Study (Unit: number of problems per unit)
Source : J.D. Power
169 188
158 133 124
16 15 9
3 3
2014 2015 2016 2017 2018
(Ranks among non-premium)
Source : Interbrand
Focus on Value Growth Strategy
(U$ 5B in ‘10 → 13.5B in ’18, 125.4%↑)
Balanced Growth
(Ranks among Non-Premium)
Source : J.D. Power
95 92
88
74 68
2 2 4 2
50
90
2015 2016 2017 2018 2018
1st
(Ranks among Premium)
6.0 7.5 9.0 10.4 11.3 12.5 13.2 13.5
19.3% 24.4%
20.5% 15.6%
8.5% 11.1%
5.1% 2.6%
-10%
0%
10%
20%
30%
0
5
10
15
20
25
2011 2012 2013 2014 2015 2016 2017 2018
HMC Brand Value (Billion US$) HMC Value Growth (%)

4
Balanced Sales Growth through Global Plants
(Unit: 1,000 vehicles) ‘17. 4Q ‘18. 4Q
Turkey Plant India Plant China Plant US Plant Czech Plant Russia Plant
US
176 174
Korea
195 170
W.Europe
127 128
India
152 153
China
221 267
9 manufacturing plants ( ), 6 R&D facilities ( ), 15 direct sales subsidiaries ( ), sales in more than 200 countries globally
Source: Company data (Retail sales excluding CKD and CVs for each region)
Brazil Plant
+14.7%
△17.5% △0.3%
△0.2%
+1.4%
Brazil
49 46
+4.5%
Others (MEA, APAC, Turkey)
142 142
+0.1%
Russia
47 46
+2.3%
Global
‘17. 4Q ’18. 4Q
1,215 1,196
△1.6%
Global (ex-China)
’17. 4Q ’18. 4Q
943 973
+3.2%
(Global Retail Sales including CVs)

Balanced Sales Growth by Diversified Business Portfolio
5
Geographically Diversified Portfolio (%) Marketable Product Mix* (%)
13.6
22.4
35.3
12.6
34.7
26.4
3.5
7.1
3.2
9.6
0.7
29.4
27.6
13.5
45.0
39.4
14.3
16.8
3.4
3.0
6.5
11.2
12.1
8.5
0 20 40 60 80 100
Honda
Toyota
GM
VW
Domestic North America Europe China Asia (ex-China) Others
Source: Company data for HMC 2017 Global Retail Sales, Competitor information from IHS (CY2017 data)
*A+B+C=Mini+Sub Compact+Compact; D+E+F=Mid-Size+Large+Luxury; RV=SUV+MPV; Others=PUP and others; excluding HCVs
15.2 18.0 16.8 18.6 16.0 15.4 Hyundai
40.9
37.5
27.4
56.7
11.1
10.4
11.1
16.6
46.7
39.1
35.0
21.4
1.3
13.0
26.5
5.3
0 20 40 60 80 100
Honda
Toyota
GM
VW
A+B+C D+E+F RV Others
49.1 14.5 29.7 6.6 Hyundai

Key Strengths for HMC

7
Value Growth (Product Competitiveness)
Kona and New Santa Fe with outstanding specification received excellent remarks from customers
Kona (Entry CUV – B segment)
New Santa Fe (Compact SUV – D segment)
Specification Hyundai Santa Fe (19MY) Ford Edge (19MY) Jeep Cherokee
Displacement 2.4L 2.0L 2.0L
Max. Power 235 @ 6000 245 @ 5500 180 @ 6400
Mileage (City/Highway) 22mpg / 29mpg 21mpg / 29mpg 21mpg / 29mpg
Safety (Small Overlap) Top Safety Pick Plus (Good) - - (Moderate)
MSRP USD 25,000 ~ 36,600 USD 29,315 ~ 36,025 USD 25,495 ~ 37,775
Expected Release Date Aug. 2018 Oct. 2018 Aug. 2018
Source: Autodata
Specification Hyundai Kona (18MY) Chevrolet Trax (18MY) Honda HR-V (18MY)
Displacement 2.0L 1.4L 1.8L
Max. Power 175 @ 5,500 138 @ 4,900 141 @ 6,500
Mileage (City/Highway) 27mpg / 33mpg 25mpg / 33mpg 28mpg / 34mpg
Safety (Small Overlap) - (Good) - (Good) - (Acceptable)
MSRP USD 19,000 ~ 26,400 USD 21,000 ~ 27,295 USD 19,670 ~ 25,140
1H18 US Sales Volume 15,193 (released Mar. 2018) 46,989 45,555

8
6,005
7,473
9,004
10,409
11,293
12,547
13,193 13,535
61
53
43
40
39
35 35 36
2011 2012 2013 2014 2015 2016 2017 2018
Enhancement in Brand Value
(Ranks) (Unit: US$ in Millions)
Brand value has increased an average of 12.3% each year, since the implementation of Modern Premium in 2011.
Awards and Accolades
+20%
+24%
+16%
+8%
+11%
Date Titles Regions Models
’18.11 The North American Car and
Truck of the Year U.S KONA
’18.11 Motor Trend Car of the Year U.S G70
’18.09 TOP SAFETY PICK+ U.S. Santa Fe
’18.09 2018 International Design
Excellence Awards U.S. Santa Fe
’18.07 Auto Express New Car Awards
2018 U.K KONA, KONA EV
’18.06 Green Car of the Year U.K KONA EV
’18.06 Vehicle Satisfaction Awards U.S. Accent, Elantra, Sonata
’18.06 Best in Class Mid-Size SUV U.K Santa Fe
’18.05 Good Design Award Australia KONA
’18.05 Game Changer Award U.K i30 N
’18.05 Auto Trader New Car Awards
2018 U.K Tucson
’18.04 Red Dot Design Awards Germany NEXO, KONA
’18.02 ‘18 Consumer Report (Top Auto Brands)
U.S. Genesis
’18.02 iF Design Award 2018 Germany G70, KONA, i30, Solati
‘17.12 ’17 Good Design Award U.S. Sonata
‘17.09 ’17 J.D. Power
(Driver Experience in Compact) U.S. Elantra
Source: Interbrand
+5%
Value Growth (Brand Enhancement)
+3%

9
Volume Growth
HMC’s global sales plan
Source: Company data * Above figures in sales plan are based on wholesales
Sales Growth by country
(Unit: 1,000 vehicles) 2017 2018 2019 (P)
YoY(%)
Korea 689 721 712 △1.3
US 702 693 705 +1.7
Canada 131 129 131 +1.8
W. Europe 530 545 540 △0.9
Turkey 52 33 22 △32.9
India 527 550 580 +5.5
Russia only 166 183 181 △1.2
Brazil 181 189 204 +8.2
China 785 790 860 +8.8
Total 4,506 4,589 4,680 +2.0
2019 Sales Plan (Regional Wholesales)
(Unit: 1,000 vehicles) 2018 2019 (P)
Korea 721 712
Overseas 3,868 3,968
North America 872 886
Europe 589 573
India 550 580
Russia 196 195
South America 320 336
China 790 860
Total 4,589 4,680
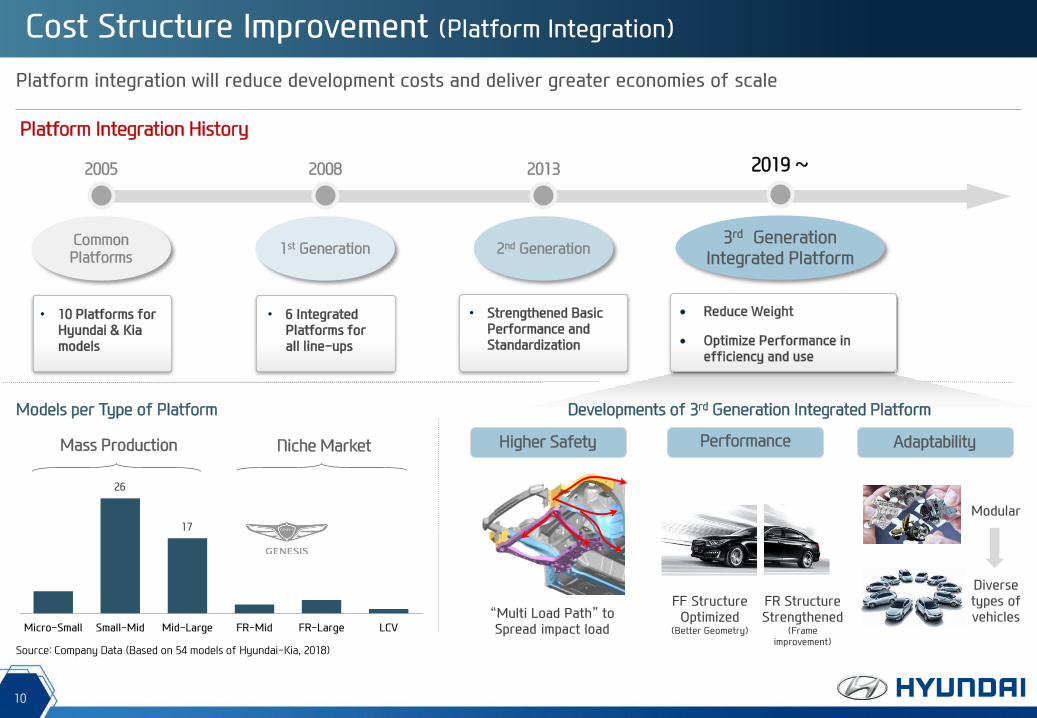
Micro-Small Small-Mid Mid-Large FR-Mid FR-Large LCV
26
17
10
Platform integration will reduce development costs and deliver greater economies of scale
Models per Type of Platform
Source: Company Data (Based on 54 models of Hyundai-Kia, 2018)
Mass Production
Cost Structure Improvement (Platform Integration)
Niche Market
Platform Integration History
Higher Safety
“Multi Load Path” to Spread impact load
Developments of 3rd Generation Integrated Platform
Performance Adaptability
FF Structure Optimized
(Better Geometry)
FR Structure Strengthened
(Frame improvement)
Modular
Diverse types of vehicles
1st Generation
2008
• 6 Integrated Platforms for all line-ups
2013
2nd Generation
• Strengthened Basic Performance and Standardization
• 10 Platforms for Hyundai & Kia models
2005
Common Platforms
2019 ~

Future Technology Hyundai Motor’s Vision for Future Mobility
“Clean Mobility, Freedom in Mobility, Connected Mobility”

12
By 2020, HMC will Improve fuel efficiency by 25% on average, securing the product competitiveness in the market
2020 Fuel Efficiency improvement Roadmap
Improve powertrains
Reduce weight
Expand Green Car line-ups
Refresh 70% of the current powertrains (7 out of 10 P/T line-ups to be replaced)
Improve performance of 「Nu」 for mid-seg and 「Kappa」 engines for small-seg sedan
Expand engine lineups with turbo-charger
Improve current 6-speed and 8-speed transmission
Increase portion of advanced strength steel for the chassis of platform to make vehicles safer and lighter
Apply more lightweight materials such as aluminum, foamed plastic and etc.
Increase green car line-up to 31 models by 2020 and 44 models by 2025
Introduce new green car technologies
Aiming to be the 2nd largest manufacturer in green car market
Category 2014 By 2020
Gasoline Kappa, Gamma, Nu,
Theta II, Lambda II, Tau
New engines
Performance
Turbo Charger
Diesel U, R, A, S New engines
Transmission
4 spd : Kappa, CVT
6 spd : Gamma, Theta, Lambda DCT
7 spd : Gamma DCT
8 spd : Lambda
Increase number of transmissions
Improve transfer efficiency
Category 2014 By 2018
Advanced
strength
steel
33% ~ 52% 48% ~ 62%
Category 2018 2020 2025
HEV 6 Models 10 Models -
PHEV 4 Models 11 Models -
EV 3 Models 8 Models -
FCEV 1 Model 2 Models -
Total 14 Models 31 Models 44 Models
*Including Kia models
Future Technology (Clean Mobility)
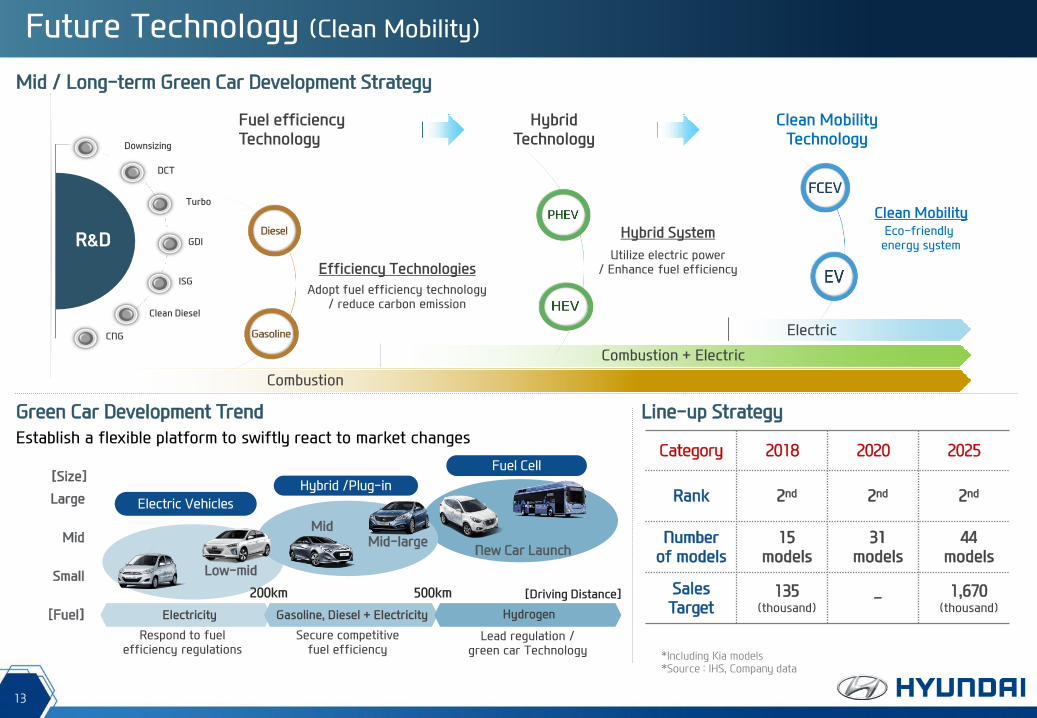
13
Mid / Long-term Green Car Development Strategy
Combustion
Electric
Combustion + Electric
Green Car Development Trend
Establish a flexible platform to swiftly react to market changes
[Fuel]
Respond to fuel efficiency regulations
Secure competitive fuel efficiency
Lead regulation / green car Technology
[Size]
Small
Mid
Large
Line-up Strategy
Low-mid
Mid
New Car Launch Mid-large
*Including Kia models *Source : IHS, Company data
Future Technology (Clean Mobility)
Category 2018 2020 2025
Rank 2nd 2nd 2nd
Number of models
15 models
31 models
44 models
Sales Target
135 (thousand)
- 1,670 (thousand)

14
Maintain our global green car sales ranking (No.2) and leading positon in EV and FCEV technology
Source: Company data
Fuel Cell Electric Vehicle FCEV Development
HMC Toyota Honda
Production year 2013 2015 2016
Assuring ‘FCEV Leading Maker’ position by producing the most efficient FCEV model, NEXO
Major components are independently developed, e.g. FCEV stack
The first auto maker to successfully begin commercial production several years ahead of competitors
NEXO
Max. distance: 609 km (Korea) 378.4 mile (US)
Max. speed: 177 km/h
Fuel efficiency: 96.2km/kg
More than 600km with a 700-bar hydrogen tank can be fully charged in 5 minutes
Future Technology (Clean Mobility)
Electric Vehicle EV Performance Comparison
KONA EV
Battery capacity : 64 kWh
Max. distance : 482 km (WLTP) 546 km (NEDC)
Max. speed : 167 km/h
Fast Charging : 54 min
Normal Charging : 9h 35 min
Specification Hyundai Kona EV Chevrolet BOLT EV
VW e-Golf 2017
Battery 64 kWh 60 kWh 35.8 kWh
Motor 150 kW 150 kW 100 kW
Fuel Efficiency (combined)
143 MPGe 135.6 MPGe 119 MPGe
Driving Distance 241 miles 238 miles 125 miles · WLTP (Worldwide harmonized Light vehicle Test Procedure)
· NEDC (New European Driving Cycle)

15
Electric Motor
Powered by advanced lithium-ion battery
HMC independently developed and obtained distinctive technology on hybrid system
Parallel Hybrid Drive System
Simpler in structure compare with other
types of hybrid
Specification Hyundai IONIQ
(Blue) Toyota Prius
(Eco) Ford C-Max
Net Power 141 ps 121 ps 141 ps
Battery 1.56 kWh 0.75 kWh 1.40 kWh
Fuel Efficiency (combined)
58 MPG 56 MPG 39 MPG
System Parallel System Power Split
System Power Split
System
IONIQ HEV
Displacement : 1.6ℓ
Net Power : 141 ps
Fuel Efficiency : 58 mpg
Launched in 2016
Hybrid Vehicle HEV Performance Comparison
Source: Company data
Future Technology (Clean Mobility)
Plug-in Hybrid Vehicle PHEV Performance Comparison
IONIQ PHEV
Displacement : 1.6ℓ
Net Power : 141 ps
Launched in 2017
Specification Hyundai IONIQ
PHEV Toyota Prius
Prime Chevrolet Volt
Battery 8.9 kWh 8.8 kWh 18.4 kWh
Motor 44.5 kW 90 kW 111 kW
Fuel Efficiency (combined)
20.5 km/ℓ(Gas)
5.5km/kWh(Elec)
21.4 km/ℓ(Gas)
6.4km/kWh(Elec)
17.8 km/ℓ(Gas)
5.3km/kWh(Elec)
Driving Distance (Korea)
46 km 40 km 89 km

16
HMC targets to bring level 4 autonomous driving in smart cities by 2021 and fully autonomous driving by 2030
Development Philosophy
Level 1 & Level 2
Development status Levels of Driving Automation (SAE)
“Intelligent Safety Vehicle”
Automated Lane Change
Intersection Entry/Exit
Highway TG Entry/Exit
HDA (Highway Driving Assist)
TJA (Traffic Jam Assistance)
Advanced Driver Assistance
System
Level 3
Provide ultimate safety not only to the driver but also to the passengers / pedestrians / other drivers, by having vehicle proactively analyzing driving environments and assist driver when necessary
Lev. Definition Note
5 Full Automation In advanced research
4 High Automation First show in CES 2017
3 Conditional Automation Completed advanced
development
2 Partial Automation Partially in market (HDA, etc.)
1 Driver Assistance In market (LKAS, SCC, AEB, etc.)
*SAE : Society of Automotive Engineers
Future Technology (Freedom in Mobility)

HMC targets to bring level 4 autonomous driving in smart cities by 2021 and fully autonomous driving by 2030
Future Technology (Freedom in Mobility)
Five base for Open Innovation Mid-to Long-term Directions
Partial Level 4
Partial Level 4
Complete Level 4
Company Cooperation Core Area
CVs
Beijing • AI • ICT Cooperation
Berlin • Smart City • Mobility Solution
Tel Aviv • Autonomous Driving • Start-up Investment
Seoul • Tech Directions • Future Strategy
Silicon Valley • Innovation CRADLE • Corporate & Colleague
Strategic Partnership Current Achievements • Installed partial Autonomous driving features (Level 1 ~ 3) in new model
• Partial Level 4 Autonomous Driving in highway
Level 4 Autonomous Driving in 200 km From Seoul to PyeongChang
17
• Autonomous Driving Platform
• Sound Recognition, IoT, Connected Car
• Autonomous Driving Software
• Cloud System, Sensor & Controller
• Radar & AI
• Sensor based Recognition

18
HMC has concentrated on R&D and increased investment for future technologies
Remote Support Fully Autonomous Smart Traffic Mobility Hub
Major areas
Remotely connect cars to prevent or solve problems
Fully autonomous using V2X (V2X : Vehicle to Everything)
Locate vehicles and analyze traffic to navigate the car
Vehicles become center of our lives
Car Network Tele Network Cloud Big Data
■ ‘Open Innovation’ partnership with global companies (Cisco partnership established in April 2016)
■ Integrated infrastructure combining network, cloud, big data and security solutions
4 Core Technologies
“ Vehicles become information hubs connecting cars to life ”
Future Technology (Connected Mobility)

19
Bring our customers the most efficient, convenient, economical mobility solution
Future Technology (Connected Mobility)
Major Advanced Technologies
User Interface
Smart Traffic Assist
By monitoring the road ahead, keep a safe distance around the car
IoT
Augmented Reality
Connecting with road, integration of real camera & footage gives 3D navigation
Remote Control
With automated steering, braking and changing direction aid system
Protecting the driver from any situations by monitoring driver state
Driver Monitoring
Interactive voice recognition through AVN system and IT tech
Monitor Recognition
Greater control of multiple features With 3D hand gesture recognition
Voice Recognition

New Brand Genesis

21
HMC introduced new global luxury brand ‘Genesis’ as a driver for growth
Why Genesis?
Unlock the untapped profit opportunity Elevate entire brand and organization
10.0
7.6 7.1
6.5
5.0
6.9
5.6 6.0
3.1
BMW Toyota Daimler Renault Nissan GM Honda VW Ford
Penetrating fast growing premium market Establish virtuous business circle
7.2 7.9 8.6
9.3 10.0 10.5 11.0 11.5 11.8 12.0 12.2
2012 2013 2014 2015 2016 2017 2018 2019 2020 2021 2022
(Unit : millions)
Source: IHS, Company data
New Brand (Introduction of Genesis)

Line-up
22
Genesis Brand to achieve full line-up of 6 models by 2021
Phase 3 (‘21 ~ ) Phase 2 ( ~ ‘20) Phase 1 ( ~ ‘17)
Sales Channel Share existing sales network
and resources
Line-up
Sales Channel Selectively open exclusive dealers and operate online sales channel
Line-up : Diversify powertrain
Sales Channel Separately operate exclusive dealers
History
Roadmap
New Brand (Strategy of Genesis)
Genesis 1st gen. (Hyundai)
Launched Genesis brand & EQ900 (G90)
G80
2008 2015 2016
G70
2017
G90 Facelift
2018

Brand

24
N offers race track-capable vehicles to customers who truly love cars
New Brand (High Performance Vehicle, N Brand)
Three DNA of N Brand Concept Cars
RM16
Powertrain: 2.0T GDI
Max. Power: 300 PS
Max. Torque: 39kg.m
N 2025 Vision Gran Turismo
Powertrain: Hydrogen Fuel Cell
Max. Power: 884 PS
Corner Rascal Unique carving feel when cornering
Everyday Sports Car
Performance for everyone
Race Track Capability
Technology originated from motor sport
Vision Gran Turismo
Introduce N Brand
2014 2015 2012 -
RM14 Concept
2016
RM 16 Concept
Project RM (Racing Midship)
Inception of R&D ‘i30 N’ launch
1st N Brand model ‘i30 N’ launched in Europe
2017 2018
‘Veloster N’ launch
2nd N Brand model ‘Veloster N’ launched in Korea

25
New Brand (High Performance Vehicle, N Brand)
i30 N
Max. speed: 250 km/h
Max. power: 275 ps / 6,000 rpm
Max. Torque: 36 kg·m / 1450-4700 rpm
Acceleration (0 – 100 kph) : 6.1 sec
Internalized the motor sport technology and then applied it to road going cars to make it fun-to-drive
Source: Company data
Max. speed: 250 km/h
Max. power: 275 ps / 6,000 rpm
Max. Torque: 36 kg·m / 1450-4700 rpm
Acceleration (0 – 100 kph) : 6.1 sec
Veloster N
High Power Output High Strength High Technology Lightweight Aerodynamic Design
Models
Core Tech
N High-performance engine
N 6-Speed Manual Transmission
N Special Chassis
Durability completed over 10,000km of testing
Use of lighter materials and an optimized frame structure
Aerodynamic design which increases downforce such as the front splitter, side skirts, and double-deck rear spoiler
Rev Match (Automatically Synchronize engine and transmission)
N Electronic Control Suspension

Shareholder Value

27
Shareholder Value
HMC has increased shareholder return, enhanced communication with shareholders, and improved transparency
Key Activities
Mid-long Term Dividend Policy
Allocate 30 to 50% of annual Free Cash Flow for shareholder returns
Aim to lift its payout ratio to the average of global automakers 1,950 3,000 4,000 4,000 4,000
6% 11%
17% 20%
27%
-20%
0%
20%
0
2000
4000
6000
2013 2014 2015 2016 2017
DPS (KRW) Payout Ratio (%)
*DPS for ordinary shares including interim dividend
Established Corporate Governance and
Communication Committee
Posted Corporate Governance Charter
Announced Mid-long Term Dividend Policy
Apr. 2015 Mar. 2016 Jan. 2017
*Free Cash Flow from non-finance division
Will appoint An Outside Director* based on
Recommendation of Shareholders * In charge of Shareholder’s Rights protection
Jan. 2018

Appendix

2017. 4Q 2018. 4Q (Thousand units)
Source: Company Data (excluding CKD, excluding CVs for each region except Korea)
Sales Results (Regional Wholesales)
29
Europe
△5.3%
146 155
India
Russia
Korea China N.America
S.America
+7.3%
82 76 52 49
+4.7%
195 170
+14.7%
232 198
+16.7%
229 296
△22.5%
138 134
+3.0%
1,226 1,234
Global
△0.6%
Global(ex-China)
994 934
+6.4%
Others
△2.5%
139 142
(MEA, APAC) (Global Wholesales including CVs)

30
Balance Sheet (K-IFRS Consolidated)
(Billion KRW) End-2017 End-2018 Diff. % chg.
Asset 178,199 180,656 +2,456 +1.4%
Current Asset(a) 73,976 72,760 △1,256 △1.6%
Liabilities(b) 103,442 106,760 +3,318 +3.2%
Current Liability(c) 43,161 48,557 +5,397 +12.5%
Debt(d) 72,001 73,296 +1,296 +1.8%
Provision 6,654 6,800 +145 +2.2%
Equity(e) 74,757 73,896 △861 △1.2%
Capital Stock 1,489 1,489 0 0.0%
Capital Surplus 4,201 4,201 0 0.0%
Retained Earnings 67,332 66,490 △842 △1.3%
Current Ratio(a/c) 171.4% 149.8%
Liability to Equity(b/e) 138.4% 144.5%
Debt to Equity(d/e) 96.3% 99.2%
EBITDA/Interest Exp. 24.3x 20.1x

31
Income Statement (K-IFRS Consolidated)
(Billion KRW) ‘17. 4Q ‘18. 1Q ‘18. 2Q ‘18. 3Q ‘18. 4Q YoY QoQ
Revenue 24,501 22,437 24,712 24,434 25,670 +4.8% +5.1%
Gross Profit 4,218 3,468 3,926 3,693 4,057 △3.9% +9.8%
Margin (%) 17.2 15.5 15.9 15.1 15.8
SG&A 3,443 2,786 2,976 3,404 3,555 +3.2% +4.4%
Portion (%) 14.1 12.4 12.0 13.9 13.8
Operating Income 775 681 951 289 501 △35.4% +73.4%
Margin (%) 3.2 3.0 3.8 1.2 2.0
Income before tax 416 926 1,129 362 113 △72.9% △68.9%
Margin (%) 1.7 4.1 4.6 1.5 0.4
Net Income 1,288 732 811 306 △203 △115.8% △166.4%
Margin (%) 5.3 3.3 3.3 1.3 △0.8
Depreciation 589 571 576 600 611
Amortization 341 344 352 364 343
EBITDA 1,705 1,596 1,879 1,254 1,455