investor presentation - zydus wellness
TRANSCRIPT
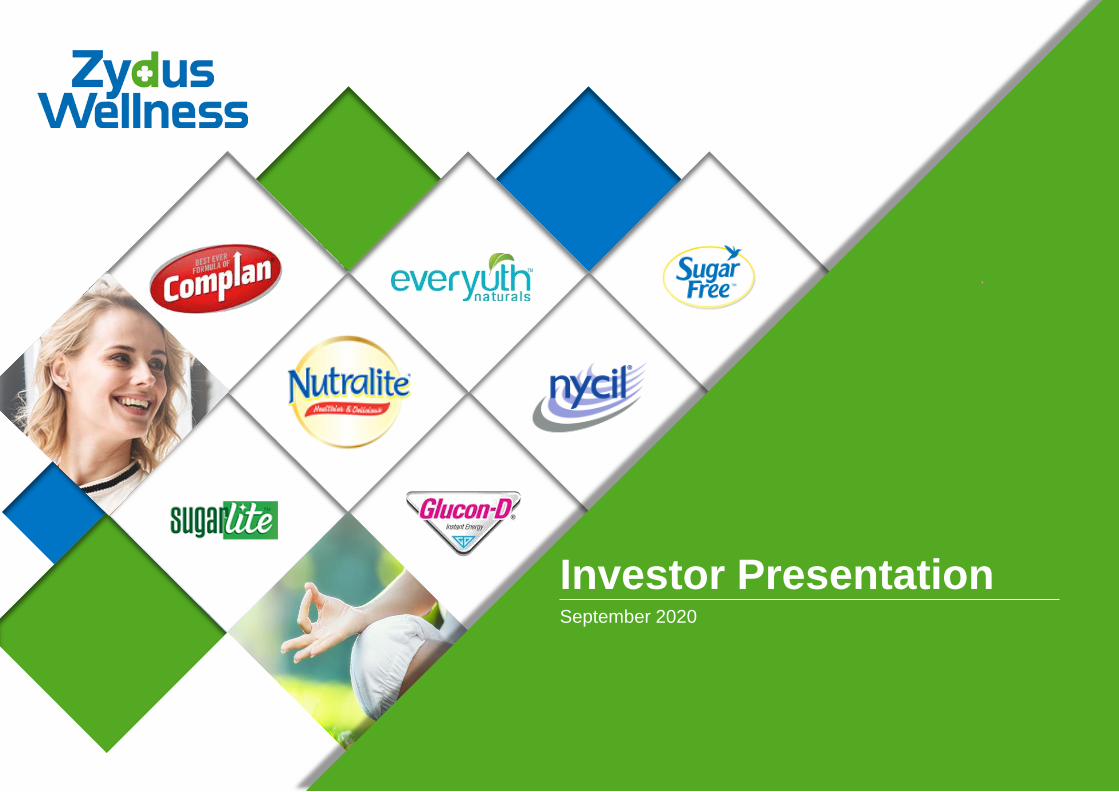
Investor PresentationSeptember 2020
Disclaimer
1
This presentation and the accompanying slides (the “presentation”) contains selected information about the activities of Zydus Wellness Limited (the “Company”) and its subsidiaries and affiliates (together, the “Group”) as at
the date of the presentation. It does not purport to present a comprehensive overview of the Group or contain all the information necessary to evaluate an investment in the Company. This presentation should be read in
conjunction with the Company’s other periodic and continuous disclosure announcements, which are available at www.zyduswellness.in.
This presentation is for information purposes only and is not a prospectus, disclosure document or other offering document under any law, nor does it form part of any present or future invitation, recommendation or offer to
purchase or sell securities of the Group in any jurisdiction. No part of this presentation, nor the fact of its distribution, should form the basis of, or be relied on in connection with any contract or commitment or investment
decision whatsoever.
If there is any subsequent offering of any security of the Company, it will be made pursuant to separate and distinct offering documentation, and in such case the information in this presentation will be superseded in its entirety
by any such offering documentation in final form. In addition, as this presentation only contains general, summary and selected information about the Group, it may omit material information about the Group and is not a
complete description of the Group’s business and the risks relating to it. Therefore, this presentation should not form the basis of any investment decision to purchase or sell the Group’s securities. Any decision to purchase
securities in the context of an offering of securities (if any) should be made solely on the basis of information contained in the offering documentation published in relation to such offering.
This presentation is being communicated to selected persons who have professional experience in matters relating to investments for information purposes only and does not constitute a recommendation regarding any
securities of the Company. Other persons should not rely or act upon this presentation or any of its contents.
The contents of this presentation are strictly confidential. This presentation is being provided solely for the information of the attendees and may not be copied, reproduced or redistributed, in whole or in part, to any other
person in any manner without the Company’s written consent. The distribution of this presentation in certain jurisdictions may be restricted by law and recipients should inform themselves about and observe any such
restrictions. In particular, this presentation may not be transmitted or distributed, directly or indirectly, in the United States, Canada or Japan.
This document does not constitute or form part of, and should not be construed as, an offer to sell or issue or the solicitation of an offer to purchase securities of the Company or any member of the Group or an inducement to
enter into investment activity, in any jurisdiction. In particular, this document and the information contained herein do not constitute or form part of any offer of securities for sale in the United States and are not for publication or
distribution in the United States. No securities of the Company have been or will be registered under the U.S. Securities Act of 1933, as amended, and may not be offered or sold in the United States, except pursuant to
registration or an exemption from the registration requirements of the U.S. Securities Act of 1933, as amended. No public offering of securities will be made into the United States.
This presentation has been prepared by the Company based on information and data which the Company considers reliable, but the Company makes no representation or warranty, express or implied, as to and no reliance
should be placed on, the fairness, accuracy, completeness or correctness of the information contained herein or any statement made in this presentation. The presentation has not been independently verified.
The Company, each member of the Group and their respective directors, advisers and representatives do not accept any liability for any facts made in or omitted from this presentation. To the maximum extent permitted by law,
the Company, each member of the Group and their respective directors, advisers and representatives disclaim all liability and responsibility (including without limitation any liability arising from negligence or otherwise) for any
direct or indirect loss or damage, howsoever arising, which may be suffered by any recipient through use of or reliance on anything contained in or omitted from or otherwise arising in connection with this presentation.
The information contained in and the statements made in this presentation should be considered in the context of the circumstances prevailing at the time. There is no obligation to update, modify or amend such information or
statements or to otherwise notify any recipient if any information or statement set forth herein, changes or subsequently becomes inaccurate or outdated. The information contained in this document is provided as at the date of
this document and is subject to change without notice.
Any investor that intends to deal in any existing or prospective securities of the Company is required to make its own independent investigation and appraisal of the business and financial condition of the Group and the nature
of the securities at the time of such dealing. Attendees are deemed to represent that they possess, either individually or through their advisers, sufficient investment expertise to understand the risks involved in dealing in any
such securities.
No one has been authorised to give any information or to make any representations other than those contained in this presentation, and if given or made, such information or representations must not be relied upon as having
been authorised by the Company or its affiliates.
The information in this presentation does not constitute financial advice (nor investment, tax, accounting or legal advice) and does not take into account an investor’s individual investment objectives, including the merits and
risks involved in an investment in the Company or its securities, or an investor’s financial situation, tax position or particular needs. No recommendation is made as to how investors should exercise any investment decision.
Past performance information in this presentation should not be relied upon as an indication of (and is not an indicator of) future performance.
This presentation contains “forward-looking statements”. Such forward-looking statements involve known and unknown risks, uncertainties and other important factors beyond the Company’s control that could cause the actual
results, performance or achievements of any member of the Group to be materially different from future results, performance or achievements expressed or implied by such forward-looking statements. Similarly, statements
about market and industry trends are based on interpretations of current market conditions which are also subject to change. These statements may also assume the success of the Group’s business strategies. The success of
any of these strategies is subject to uncertainties and contingencies beyond the Group’s control, and no assurance can be given that any of the strategies will be effective or that the anticipated benefits from the strategies will
be realised in the period for which the forward looking statements may have been prepared or otherwise. Attendees are cautioned not to place undue reliance on forward looking statements. No representation, warranty or
assurance (express or implied) is given that the occurrence of the events expressed or implied in any forward-looking statements in this presentation will actually occur.
This document contains data sourced from and the views of independent third parties. In replicating such data in this document, the Company makes no representation, whether express or implied, as to the accuracy of such
data. The replication of any third party views in this document should not necessarily be treated as an indication that the Company agrees with or concurs with such views.
By attending this Presentation and/or accepting a copy of this document, you agree to be bound by the foregoing limitations and conditions and, in particular, will be taken to have represented, warranted and undertaken that: (i)
you have read and agree to comply with the contents of this notice including, without limitation, the obligation to keep this document and its contents confidential; (ii) you will not at any time have any discussion, correspondence
or contact concerning the information in this document with any of the directors or employees of the Company or its subsidiaries nor with any of their customers or suppliers, or any governmental or regulatory body without the
prior written consent of the Company; and (iii) you agree not to remove or copy this document, or any materials provided in connection herewith
Agenda
1 Company overview
2 Key highlights
3 Recent updates
4 Appendix
2

Company overview
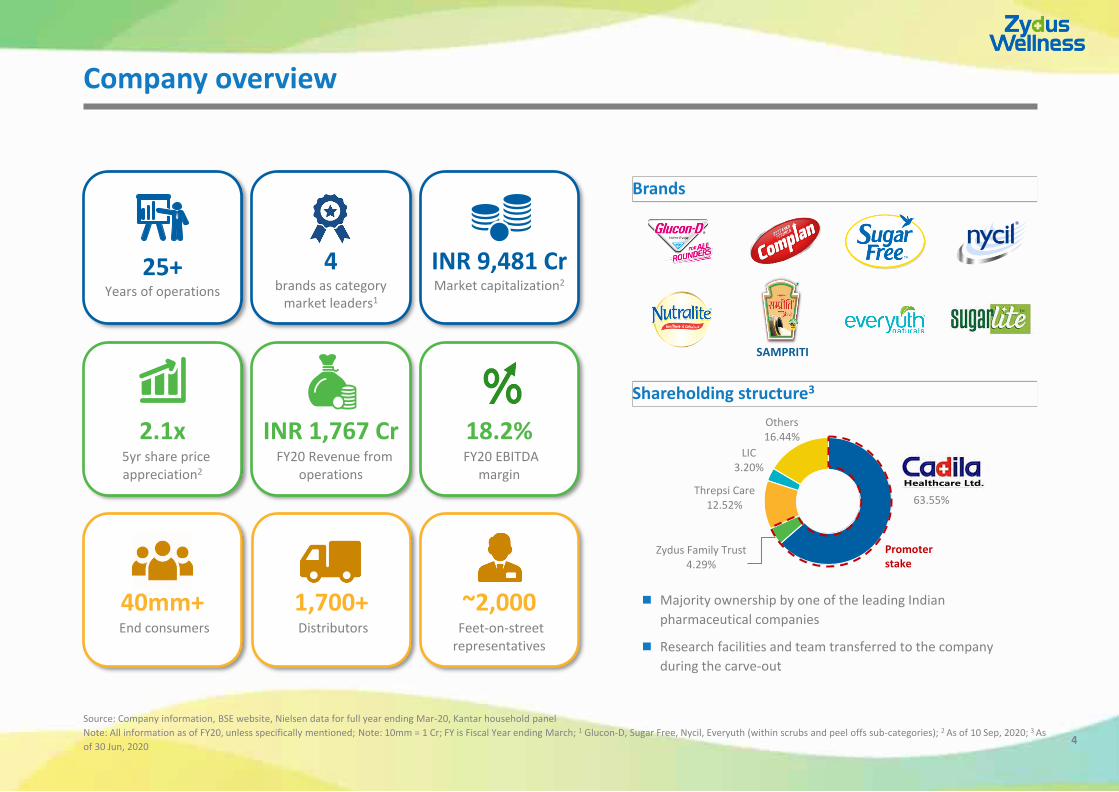
25+Years of operations
Company overview
4brands as category
market leaders1
2.1x5yr share price appreciation2
40mm+End consumers
INR 9,481 CrMarket capitalization2
INR 1,767 CrFY20 Revenue from
operations
18.2%FY20 EBITDA
margin
1,700+Distributors
~2,000Feet-on-street
representatives
Source: Company information, BSE website, Nielsen data for full year ending Mar-20, Kantar household panel
Note: All information as of FY20, unless specifically mentioned; Note: 10mm = 1 Cr; FY is Fiscal Year ending March; 1 Glucon-D, Sugar Free, Nycil, Everyuth (within scrubs and peel offs sub-categories); 2 As of 10 Sep, 2020; 3 As
of 30 Jun, 20204
Shareholding structure3
63.55%
Zydus Family Trust4.29%
Threpsi Care12.52%
LIC3.20%
Others16.44%
Majority ownership by one of the leading Indian
pharmaceutical companies
Research facilities and team transferred to the company
during the carve-out
Brands
SAMPRITI
Promoter stake
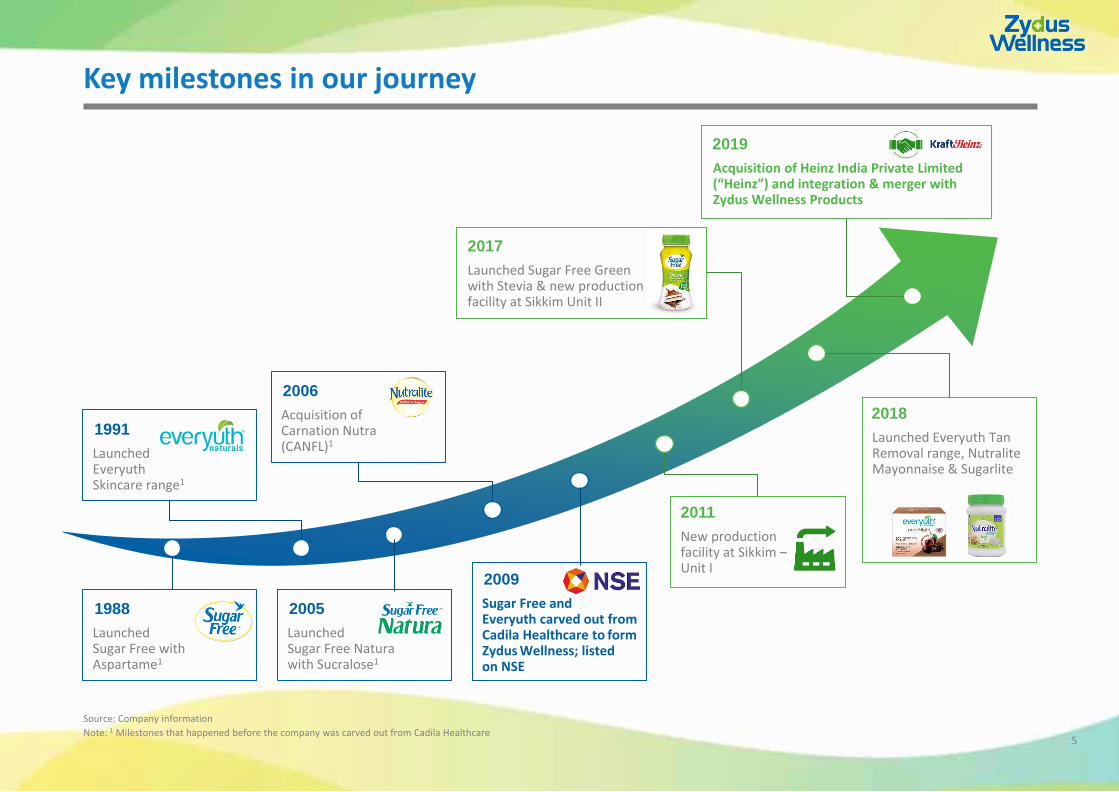
Key milestones in our journey
5
Source: Company information
Note: 1 Milestones that happened before the company was carved out from Cadila Healthcare
Launched Sugar Free with Aspartame1
1988
Launched Sugar Free Natura with Sucralose1
2005
Launched Everyuth Skincare range1
1991
Sugar Free and Everyuth carved out from Cadila Healthcare to formZydus Wellness; listed on NSE
2009
Launched Everyuth Tan Removal range, Nutralite Mayonnaise & Sugarlite
2018 Acquisition of Carnation Nutra (CANFL)1
2006
New production facility at Sikkim –Unit I
2011
Launched Sugar Free Green with Stevia & new production facility at Sikkim Unit II
2017
Acquisition of Heinz India Private Limited (“Heinz”) and integration & merger with Zydus Wellness Products
2019

Key Highlights
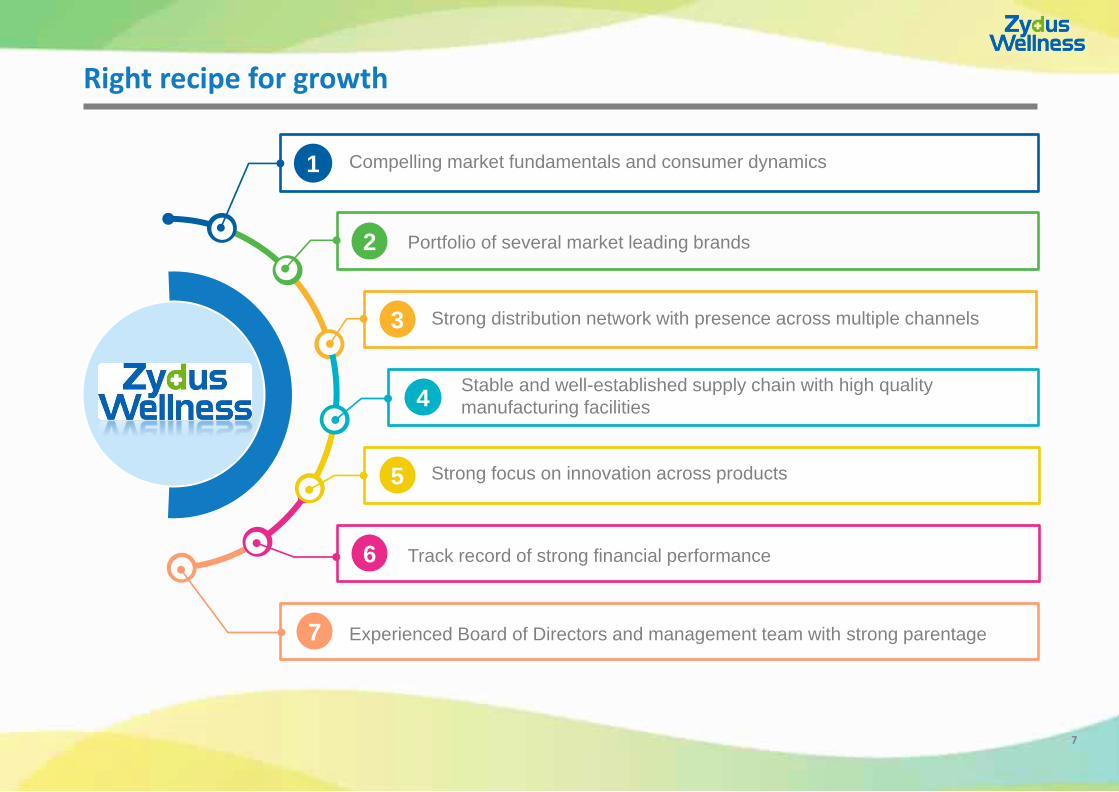
Right recipe for growth
1
6
2
3
4
5
7
Compelling market fundamentals and consumer dynamics
Portfolio of several market leading brands
Strong distribution network with presence across multiple channels
Stable and well-established supply chain with high quality
manufacturing facilities
Strong focus on innovation across products
Track record of strong financial performance
Experienced Board of Directors and management team with strong parentage
7
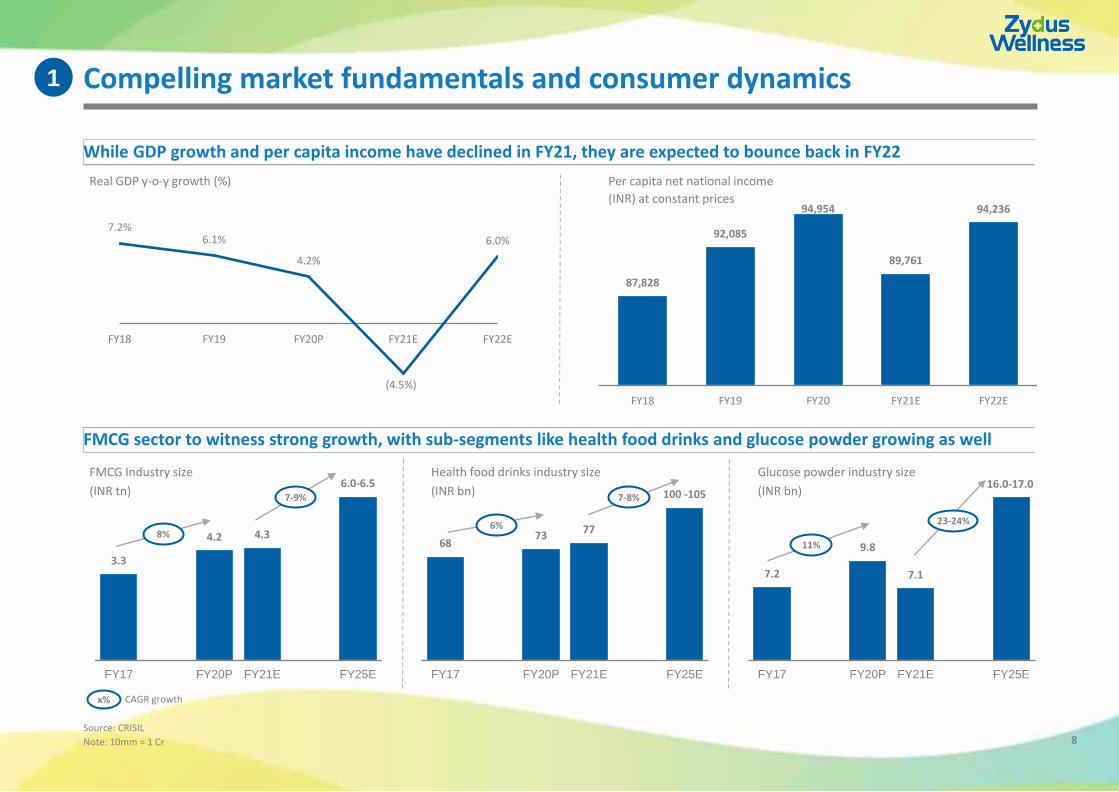
Compelling market fundamentals and consumer dynamics1
8
While GDP growth and per capita income have declined in FY21, they are expected to bounce back in FY22
87,828
92,085
94,954
89,761
94,236
FY18 FY19 FY20 FY21E FY22E
3.3
4.2 4.3
6.0-6.5
FY17 FY20P FY21E FY25E
FMCG sector to witness strong growth, with sub-segments like health food drinks and glucose powder growing as well
Source: CRISIL
Note: 10mm = 1 Cr
Real GDP y-o-y growth (%) Per capita net national income
(INR) at constant prices
7.2% 6.1%
4.2%
(4.5%)
6.0%
FY18 FY19 FY20P FY21E FY22E
68 73
77
100 -105
FY17 FY20P FY21E FY25E
7.2
9.8
7.1
16.0-17.0
FY17 FY20P FY21E FY25E
FMCG Industry size
(INR tn)
Health food drinks industry size
(INR bn)
Glucose powder industry size
(INR bn)
8%
7-9%
6%
7-8%
11%
23-24%
x% CAGR growth
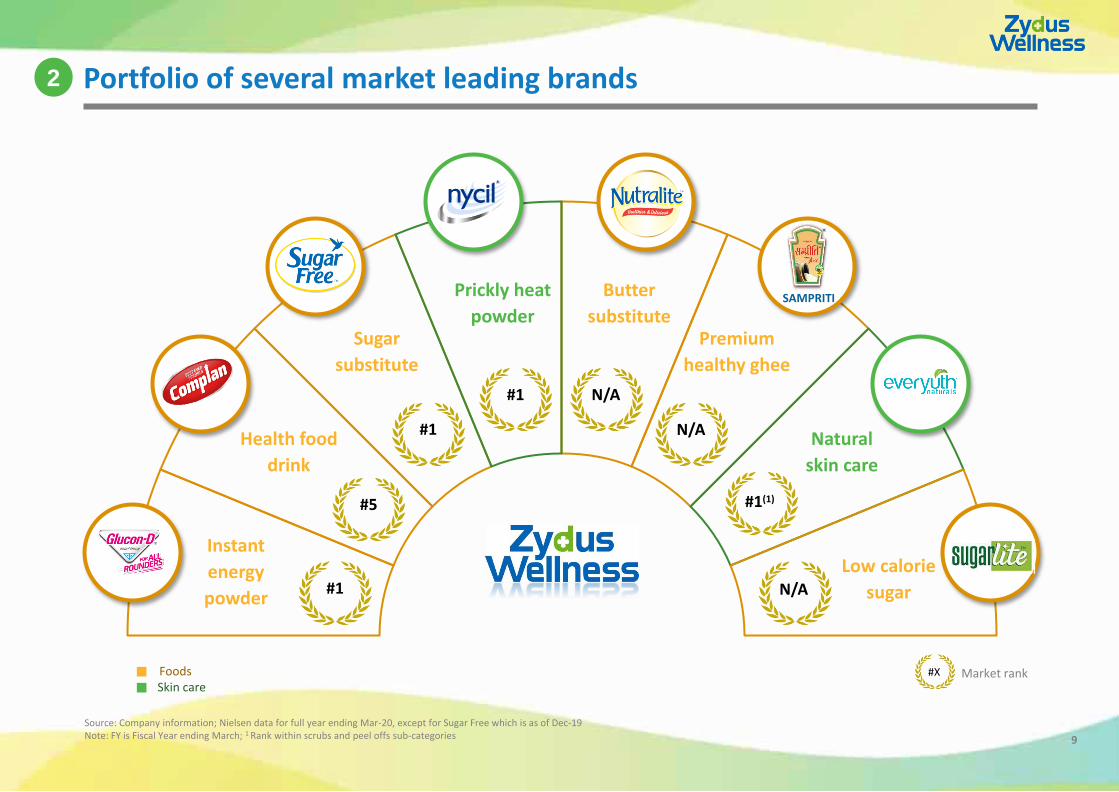
Portfolio of several market leading brands
Source: Company information; Nielsen data for full year ending Mar-20, except for Sugar Free which is as of Dec-19Note: FY is Fiscal Year ending March; 1 Rank within scrubs and peel offs sub-categories
#X Market rank
Butter
substitutePremium
healthy ghee
Natural
skin care
Low calorie
sugar
Instant
energy
powder
Health food
drink
Sugar
substitute
Prickly heat
powder
#1
#5
#1
#1
N/A
#1(1)
FoodsSkin care
SAMPRITI
2
9
N/A
N/A
Portfolio of several market leading brands(cont’d.)
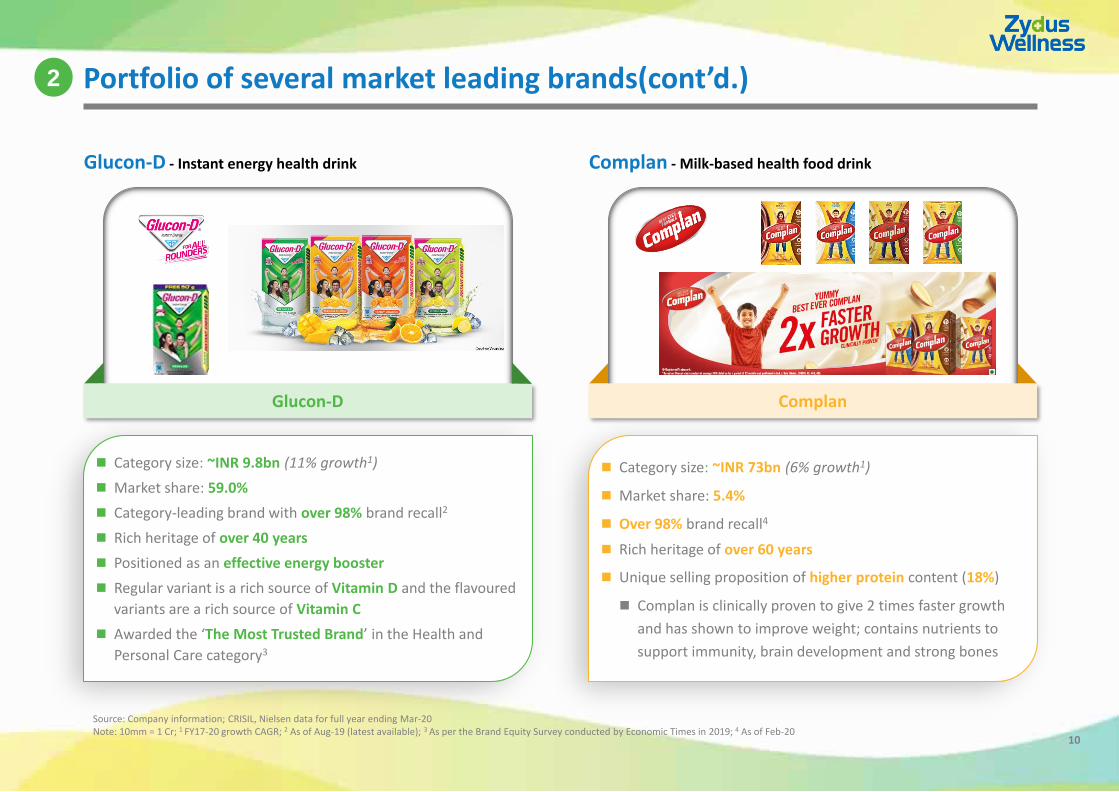
Glucon-D - Instant energy health drink
Glucon-D
Category size: ~INR 73bn (6% growth1)
Market share: 5.4%
Over 98% brand recall4
Rich heritage of over 60 years
Unique selling proposition of higher protein content (18%)
Complan is clinically proven to give 2 times faster growth
and has shown to improve weight; contains nutrients to
support immunity, brain development and strong bones
Complan
Complan - Milk-based health food drink
10
Category size: ~INR 9.8bn (11% growth1)
Market share: 59.0%
Category-leading brand with over 98% brand recall2
Rich heritage of over 40 years
Positioned as an effective energy booster
Regular variant is a rich source of Vitamin D and the flavoured
variants are a rich source of Vitamin C
Awarded the ‘The Most Trusted Brand’ in the Health and
Personal Care category3
Source: Company information; CRISIL, Nielsen data for full year ending Mar-20 Note: 10mm = 1 Cr; 1 FY17-20 growth CAGR; 2 As of Aug-19 (latest available); 3 As per the Brand Equity Survey conducted by Economic Times in 2019; 4 As of Feb-20
2
Portfolio of several market leading brands(cont’d.)
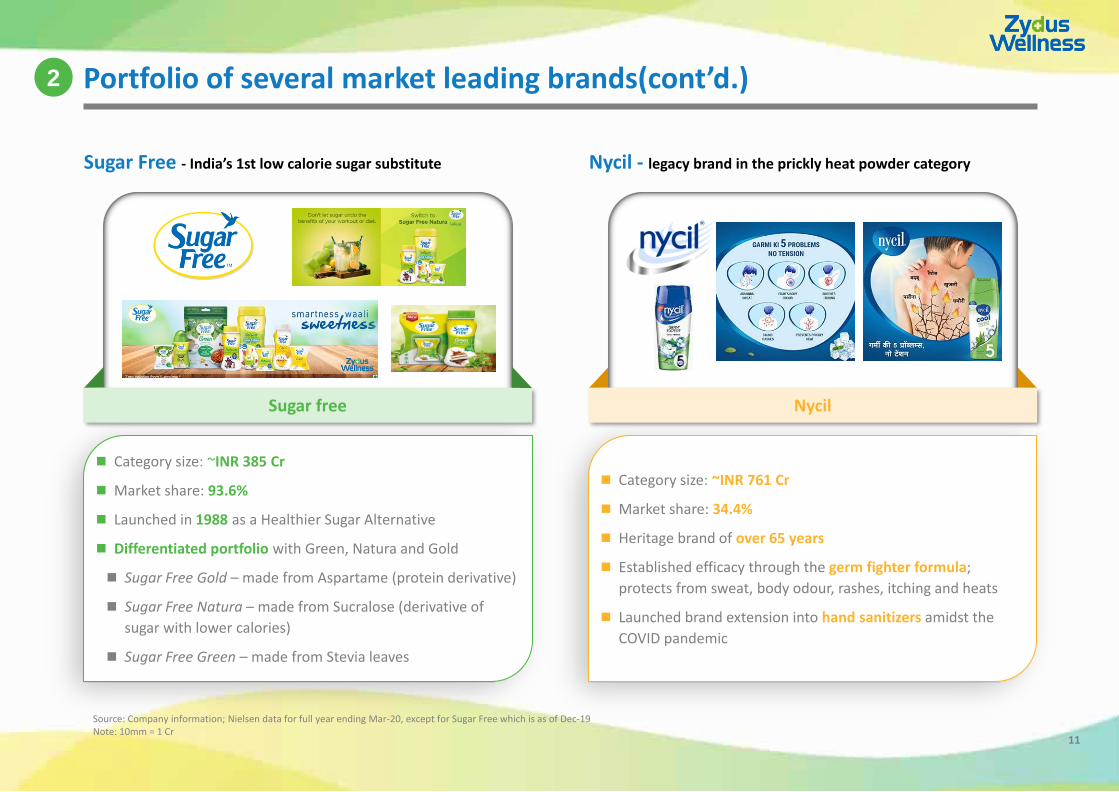
Sugar Free - India’s 1st low calorie sugar substitute
Category size: ~INR 385 Cr
Market share: 93.6%
Launched in 1988 as a Healthier Sugar Alternative
Differentiated portfolio with Green, Natura and Gold
Sugar Free Gold – made from Aspartame (protein derivative)
Sugar Free Natura – made from Sucralose (derivative of
sugar with lower calories)
Sugar Free Green – made from Stevia leaves
Sugar free
11
Source: Company information; Nielsen data for full year ending Mar-20, except for Sugar Free which is as of Dec-19Note: 10mm = 1 Cr
2
Category size: ~INR 761 Cr
Market share: 34.4%
Heritage brand of over 65 years
Established efficacy through the germ fighter formula;
protects from sweat, body odour, rashes, itching and heats
Launched brand extension into hand sanitizers amidst the
COVID pandemic
Nycil - legacy brand in the prickly heat powder category
Nycil
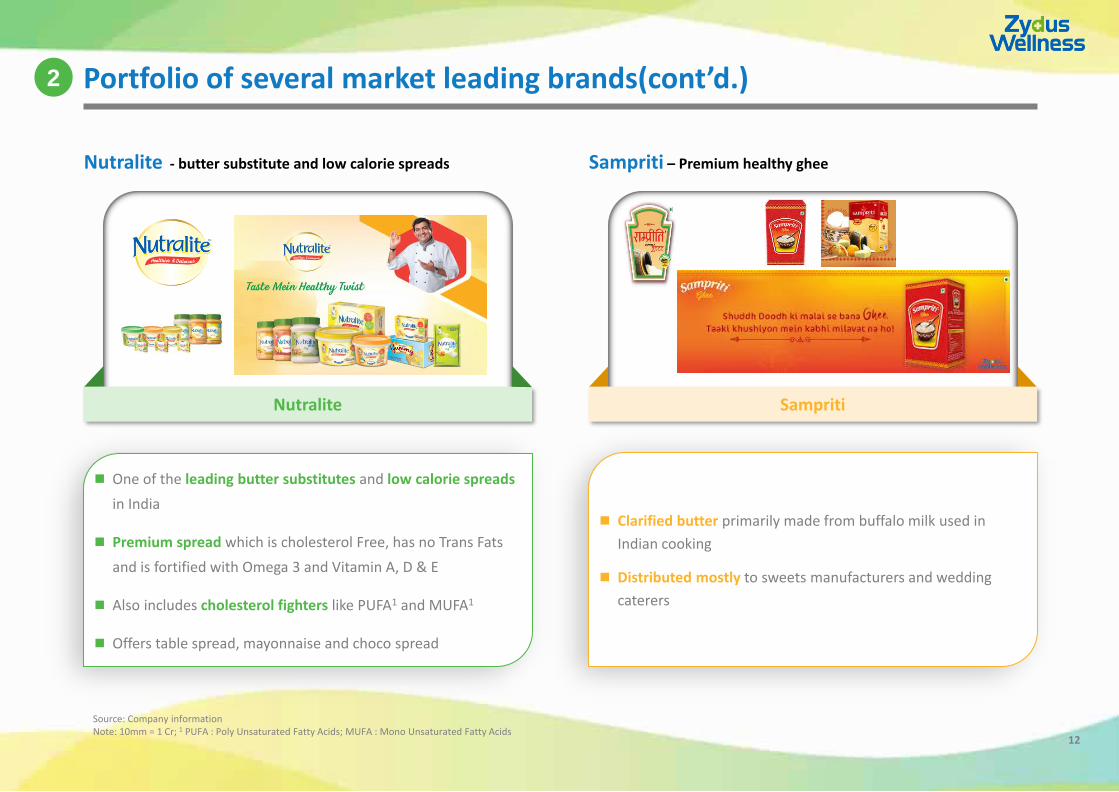
One of the leading butter substitutes and low calorie spreads
in India
Premium spread which is cholesterol Free, has no Trans Fats
and is fortified with Omega 3 and Vitamin A, D & E
Also includes cholesterol fighters like PUFA1 and MUFA1
Offers table spread, mayonnaise and choco spread
Portfolio of several market leading brands(cont’d.)
Nutralite - butter substitute and low calorie spreads
Nutralite
Clarified butter primarily made from buffalo milk used in
Indian cooking
Distributed mostly to sweets manufacturers and wedding
caterers
Sampriti
Sampriti – Premium healthy ghee
12
Source: Company informationNote: 10mm = 1 Cr; 1 PUFA : Poly Unsaturated Fatty Acids; MUFA : Mono Unsaturated Fatty Acids
2
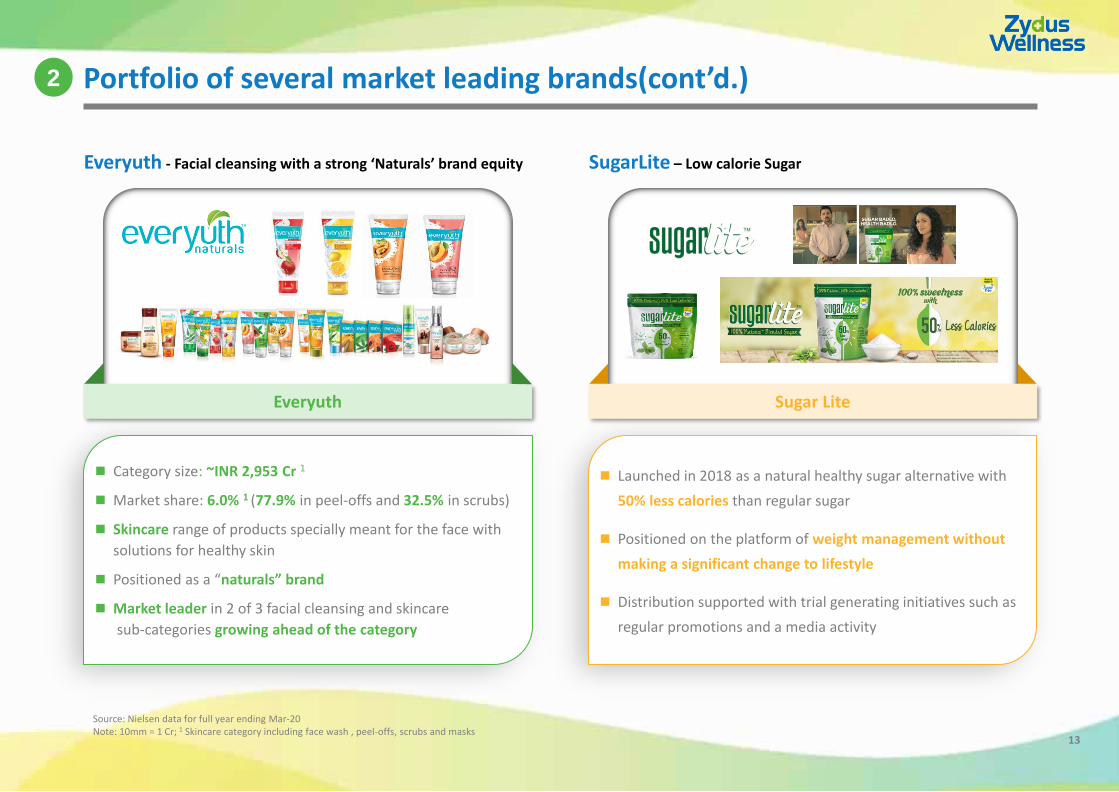
Category size: ~INR 2,953 Cr 1
Market share: 6.0% 1 (77.9% in peel-offs and 32.5% in scrubs)
Skincare range of products specially meant for the face with
solutions for healthy skin
Positioned as a “naturals” brand
Market leader in 2 of 3 facial cleansing and skincare
sub-categories growing ahead of the category
Portfolio of several market leading brands(cont’d.)
Everyuth - Facial cleansing with a strong ‘Naturals’ brand equity
Everyuth
13
Source: Nielsen data for full year ending Mar-20Note: 10mm = 1 Cr; 1 Skincare category including face wash , peel-offs, scrubs and masks
2
Launched in 2018 as a natural healthy sugar alternative with
50% less calories than regular sugar
Positioned on the platform of weight management without
making a significant change to lifestyle
Distribution supported with trial generating initiatives such as
regular promotions and a media activity
SugarLite – Low calorie Sugar
Sugar Lite
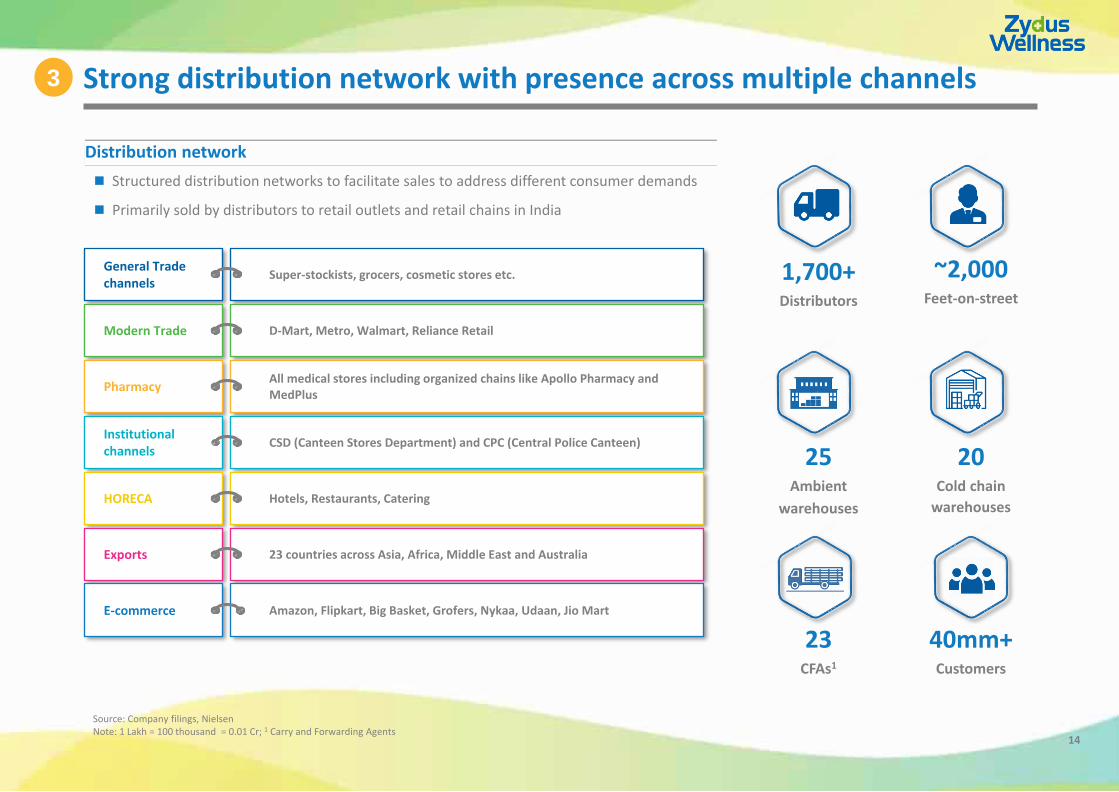
Strong distribution network with presence across multiple channels
14
Source: Company Information.
20Cold chain
warehouses
25Ambient
warehouses
1,700+Distributors
~2,000Feet-on-street
23CFAs1
Distribution network
3
Source: Company filings, NielsenNote: 1 Lakh = 100 thousand = 0.01 Cr; 1 Carry and Forwarding Agents
40mm+Customers
Structured distribution networks to facilitate sales to address different consumer demands
Primarily sold by distributors to retail outlets and retail chains in India
General Trade channels
Super-stockists, grocers, cosmetic stores etc.
Modern Trade D-Mart, Metro, Walmart, Reliance Retail
PharmacyAll medical stores including organized chains like Apollo Pharmacy and MedPlus
Institutional channels
CSD (Canteen Stores Department) and CPC (Central Police Canteen)
HORECA Hotels, Restaurants, Catering
Exports 23 countries across Asia, Africa, Middle East and Australia
E-commerce Amazon, Flipkart, Big Basket, Grofers, Nykaa, Udaan, Jio Mart
Stable and well established supply chain with high quality manufacturing facilities4
15
Manufacturing footprint
Owned manufacturing plants
Glucon-D and Complan
Sitarganj
Nycil
Sampriti Ghee and Milk
processing
Aligarh
Nycil
Silvassa
1 3
Supply chain efficiency
Sugar Free and Everyuth
Sikkim4
Haridwar
5 manufacturing facilities across 4 states
37Bulk milk vendors
36Milk collection centers
205Raw material vendors
124Packaging material vendors
CFA1 consolidation to help reduce logistics cost through
warehouse optimization and freight lane consolidation
Efficient and cost-effective procurement plan
Integrated planning and fulfilment process to reduce inventory
Awarded “India lead 25 (next) supply chains in 2020” at the 12th
Inflection Supply chain Logistics Innovation2
Source: Company filingsNote: 1 Carry and Forwarding Agents; 2 People’s choice award amongst top supply chains; 3 NAMC - National Awards for Manufacturing Competitiveness, IMEA - Indian Manufacturing Excellence Awards
Nutralite
Ahmedabad2
5
Co-packers
Both plants awarded Gold Medal in the NAMC 2019 Audit; Sikkim Plant won Gold and Ahmedabad Plant won Silver at IMEA 2019 3
1
2
Strong focus on innovation across products 5
16
● Track record on launching new products, with continued focus on innovation
Source: Company filings
January 2020 March 2020 June 2020 July 2020
Sugar Free Green re-launch
New formulation
developed using a
new, better
tasting stevia
For consumers who
seek weight
management
Nycil Hand Sanitizers
Decision to execute
and launch the
product within a
fortnight
Complan Nutrigro
Complan enters the
toddler health food
drink segment
Marketed and
distributed leveraging
doctor's
recommendation and
prescription
Complan sachets
Targeted at
northern and
western regions
of India to
participate in
sachet market
Nutralite Choco Spread
Initially launched
through e-
Commerce;
other channels
to follow
Glucon D ImmunoVolt
Energy bites
that boost
immunity
October 2018
Launched Sugarlite
100% natural blended
sugar but with 50%
less calories than
normal sugar
March 2018
Everyuth tan removal range
Launched Tan
Removal Scrub & Tan
Removal Face Pack
Enriched with
detoxifying chocolate
and vitamin-rich
cherries
January 2018
Nutralite Mayonnaise
Launched in three
flavors – Cheesy
garlic, Classic veg and
Achari
Rich in Vitamin A, D
and E to meet 30% of
the daily requirement
of these essential
nutrients
Track record of strong financial performance6
17
52,114
84,282
176,682
62,02553,737
FY18 FY19 FY20 Q1 FY20 Q1 FY21
Revenue from operations
Margin
Source: Company filings
Note: The numbers of FY20 are not comparable with the corresponding previous years since the consolidated financial results of the acquired business of Heinz India Private Limited (“Heinz”) was incorporated from the fourth
quarter of FY 19; EBITDA is before exceptional items; 1mm = 0.1 Cr = 10 Lakhs; FY is Fiscal Year ending March
In INR Lakhs
xx%
Profit after tax
13,651
17,124
14,172
8,0408,920
FY18 FY19 FY20 Q1 FY20 Q1 FY21
26% 20% 8% 13% 17%
In INR Lakhs
EBITDA
12,526
18,480
32,106
14,87112,235
FY18 FY19 FY20 Q1 FY20 Q1 FY21
24% 22% 18% 24% 23%
In INR Lakhs
Gross margin
35,173
54,445
98,805
36,73029,907
FY18 FY19 FY20 Q1 FY20 Q1 FY21
67% 65% 56% 59% 56%
In INR Lakhs
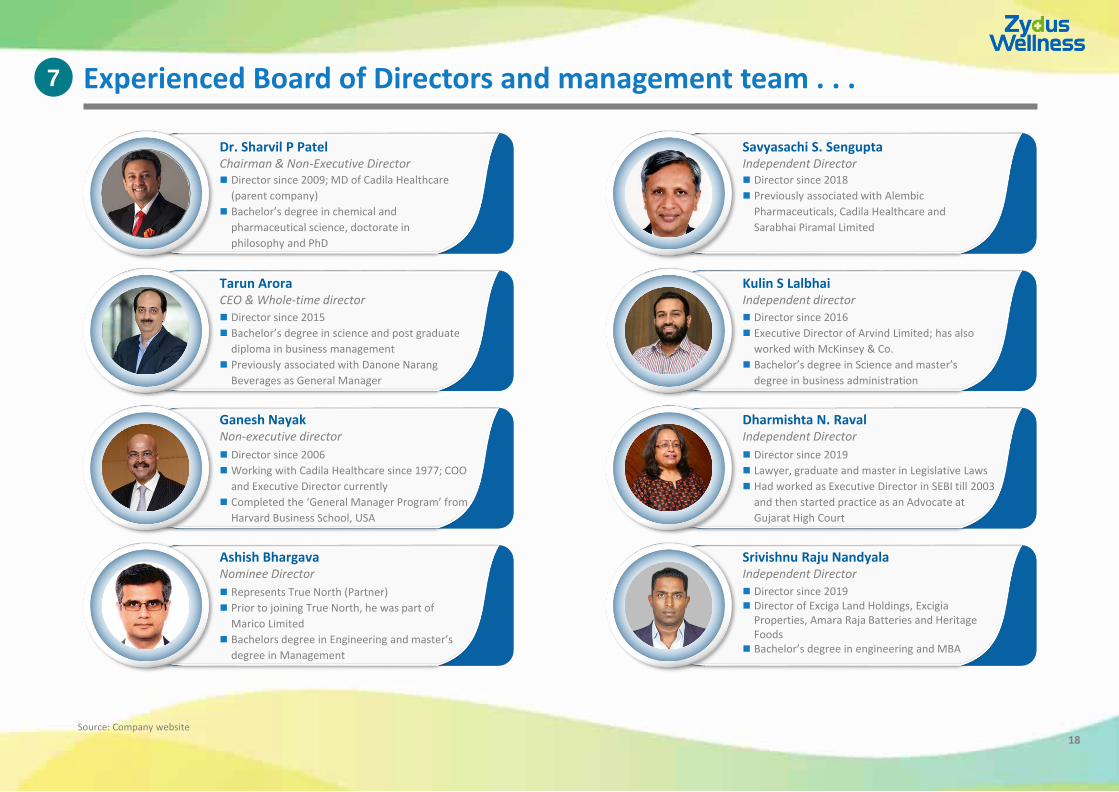
Experienced Board of Directors and management team . . .7
18
Dr. Sharvil P PatelChairman & Non-Executive Director Director since 2009; MD of Cadila Healthcare
(parent company)
Bachelor’s degree in chemical and
pharmaceutical science, doctorate in
philosophy and PhD
Tarun AroraCEO & Whole-time director
Director since 2015
Bachelor’s degree in science and post graduate
diploma in business management
Previously associated with Danone Narang
Beverages as General Manager
Ganesh NayakNon-executive director
Director since 2006
Working with Cadila Healthcare since 1977; COO
and Executive Director currently
Completed the ‘General Manager Program’ from
Harvard Business School, USA
Ashish BhargavaNominee Director
Represents True North (Partner)
Prior to joining True North, he was part of
Marico Limited
Bachelors degree in Engineering and master’s
degree in Management
Savyasachi S. SenguptaIndependent Director Director since 2018
Previously associated with Alembic
Pharmaceuticals, Cadila Healthcare and
Sarabhai Piramal Limited
Kulin S LalbhaiIndependent director
Director since 2016
Executive Director of Arvind Limited; has also
worked with McKinsey & Co.
Bachelor’s degree in Science and master’s
degree in business administration
Dharmishta N. RavalIndependent Director
Director since 2019
Lawyer, graduate and master in Legislative Laws
Had worked as Executive Director in SEBI till 2003
and then started practice as an Advocate at
Gujarat High Court
Srivishnu Raju Nandyala Independent Director
Director since 2019 Director of Exciga Land Holdings, Excigia
Properties, Amara Raja Batteries and Heritage Foods
Bachelor’s degree in engineering and MBA
Source: Company website
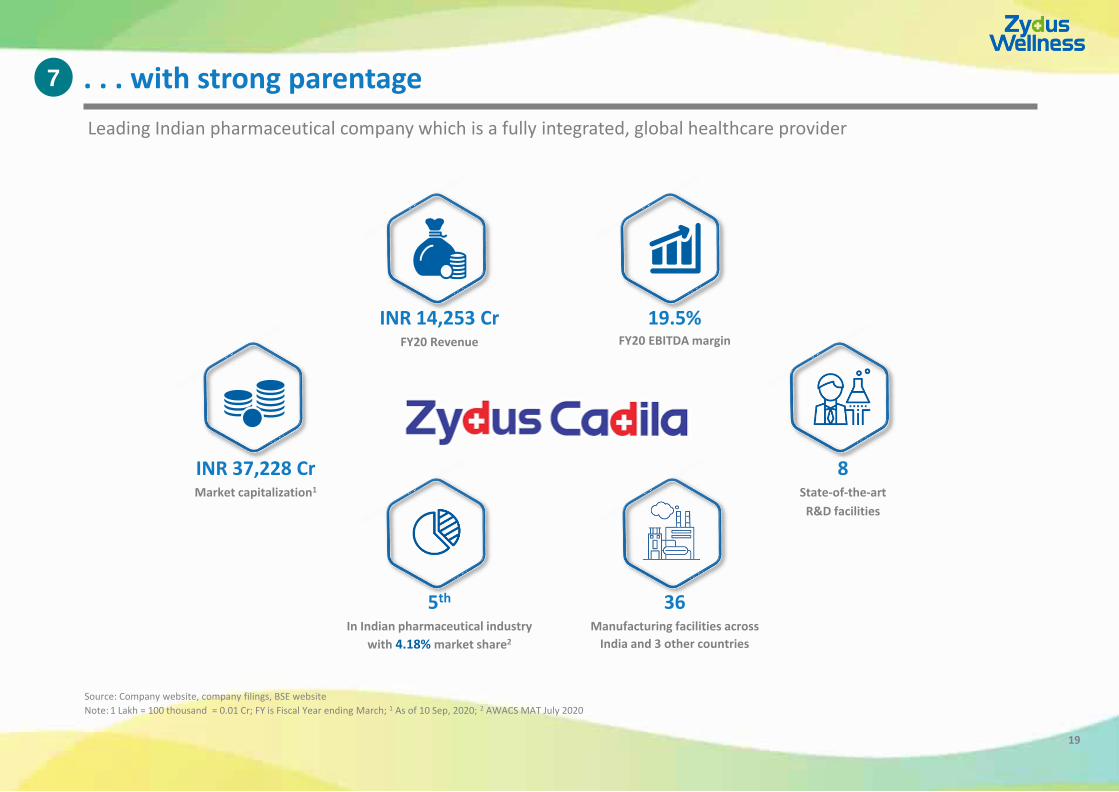
. . . with strong parentage
19
7
Leading Indian pharmaceutical company which is a fully integrated, global healthcare provider
Source: Company website, company filings, BSE website
Note: 1 Lakh = 100 thousand = 0.01 Cr; FY is Fiscal Year ending March; 1 As of 10 Sep, 2020; 2 AWACS MAT July 2020
INR 14,253 CrFY20 Revenue
19.5%FY20 EBITDA margin
INR 37,228 CrMarket capitalization1
5th
In Indian pharmaceutical industry
with 4.18% market share2
36Manufacturing facilities across
India and 3 other countries
8State-of-the-art
R&D facilities
Leverage M&A
to significantly
grow scale
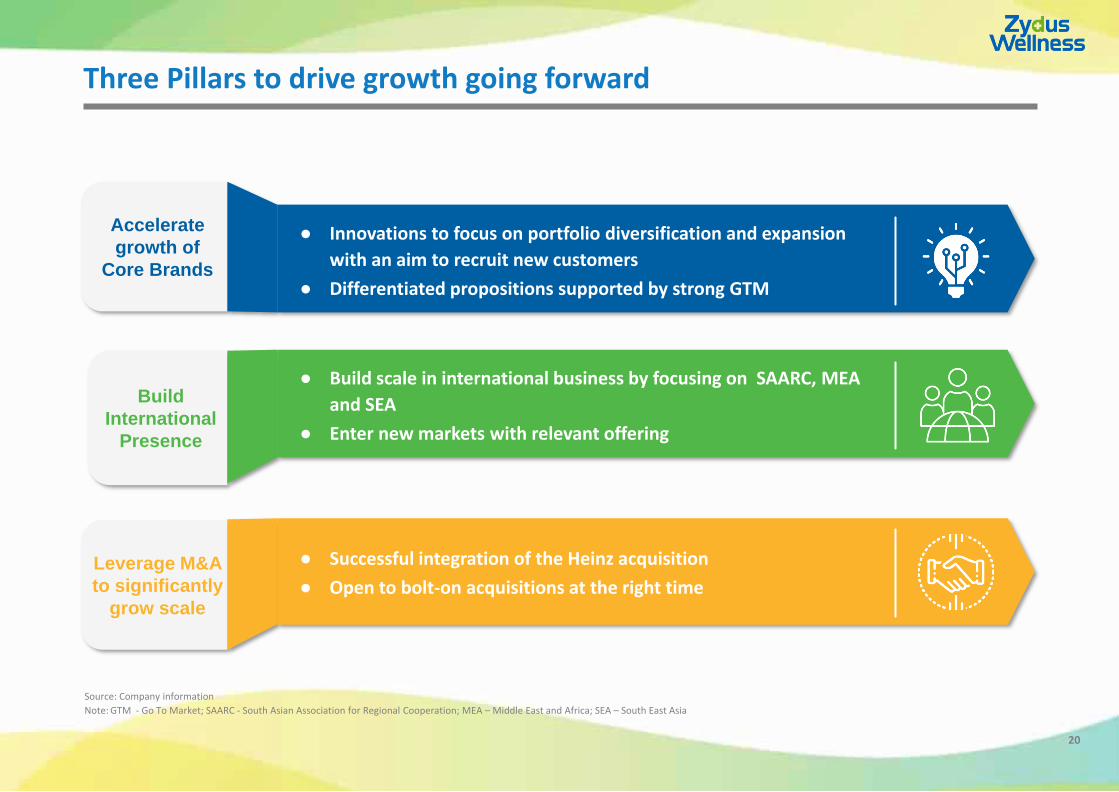
Three Pillars to drive growth going forward
20
● Successful integration of the Heinz acquisition
● Open to bolt-on acquisitions at the right time
Accelerate
growth of
Core Brands
● Innovations to focus on portfolio diversification and expansion
with an aim to recruit new customers
● Differentiated propositions supported by strong GTM
Build
International
Presence
● Build scale in international business by focusing on SAARC, MEA
and SEA
● Enter new markets with relevant offering
Source: Company information
Note: GTM - Go To Market; SAARC - South Asian Association for Regional Cooperation; MEA – Middle East and Africa; SEA – South East Asia
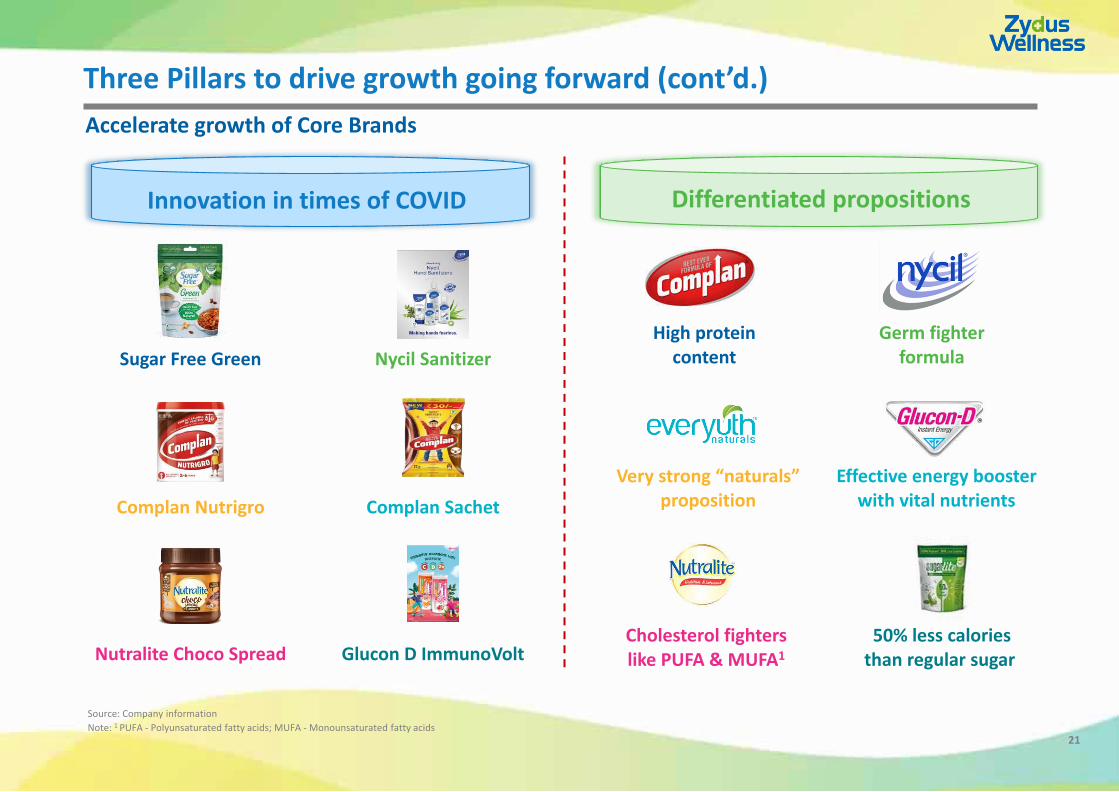
Three Pillars to drive growth going forward (cont’d.)
21
Accelerate growth of Core Brands
Innovation in times of COVID Differentiated propositions
High protein content
Germ fighter formula
Very strong “naturals” proposition
Sugar Free Green Nycil Sanitizer
Complan Nutrigro Complan Sachet
Nutralite Choco Spread Glucon D ImmunoVolt
Effective energy booster with vital nutrients
Cholesterol fighters like PUFA & MUFA1
50% less calories than regular sugar
Source: Company information
Note: 1 PUFA - Polyunsaturated fatty acids; MUFA - Monounsaturated fatty acids
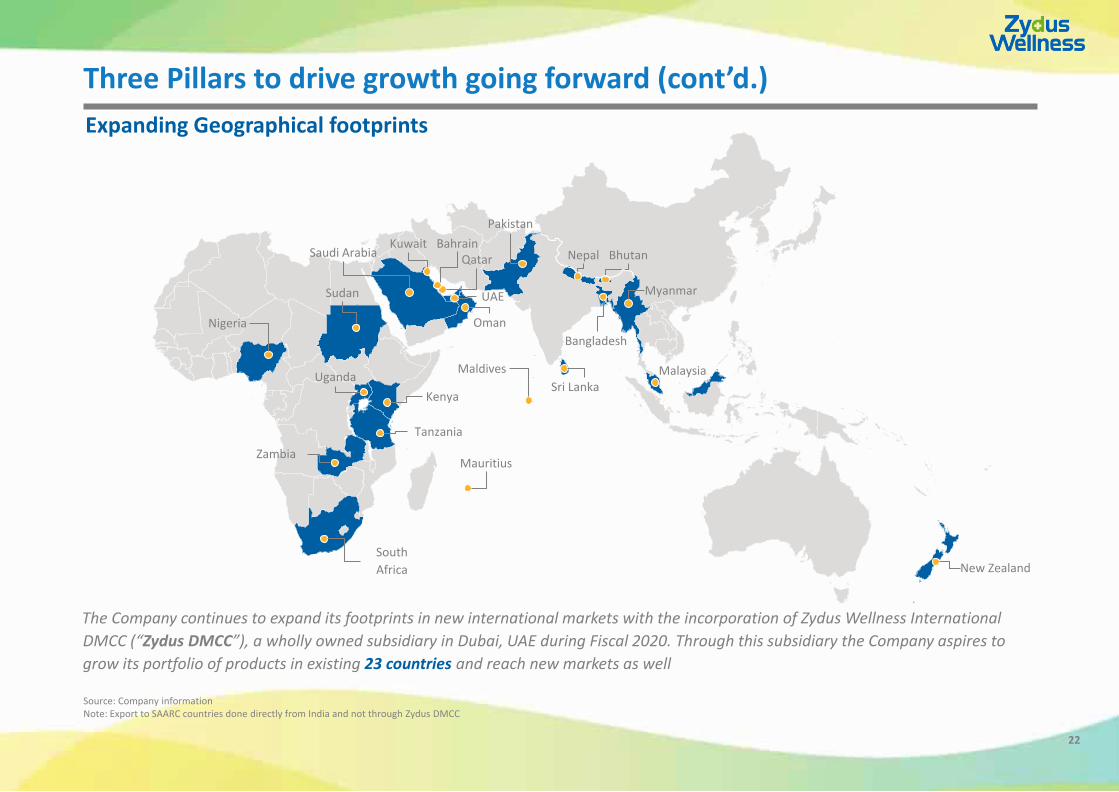
Three Pillars to drive growth going forward (cont’d.)
22
The Company continues to expand its footprints in new international markets with the incorporation of Zydus Wellness International
DMCC (“Zydus DMCC”), a wholly owned subsidiary in Dubai, UAE during Fiscal 2020. Through this subsidiary the Company aspires to
grow its portfolio of products in existing 23 countries and reach new markets as well
Expanding Geographical footprints
Source: Company informationNote: Export to SAARC countries done directly from India and not through Zydus DMCC
Nigeria
Bangladesh
Sri LankaMalaysia
Myanmar
BhutanNepal
Pakistan
Oman
UAE
QatarBahrainKuwait
Saudi Arabia
Sudan
New Zealand
Maldives
Mauritius
Kenya
Uganda
South
Africa
Zambia
Tanzania
Three Pillars to drive growth going forward (cont’d.)
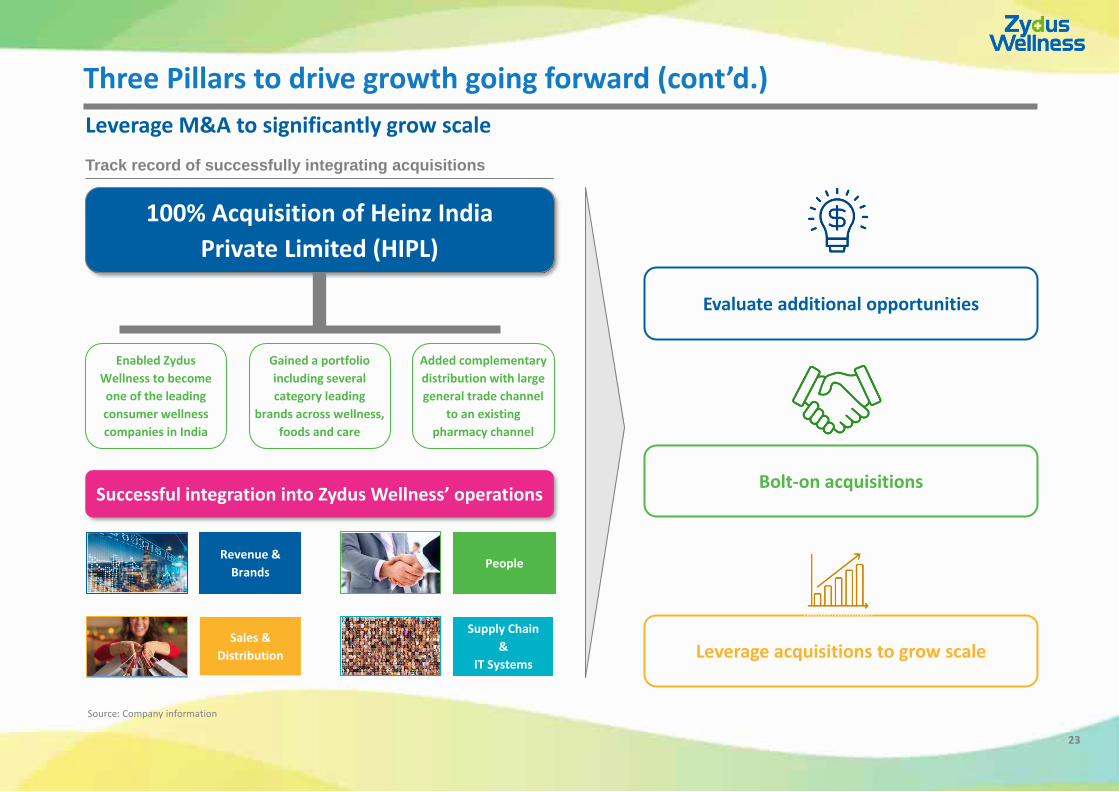
23
Leverage M&A to significantly grow scale
Track record of successfully integrating acquisitions
100% Acquisition of Heinz India
Private Limited (HIPL)
Enabled Zydus
Wellness to become
one of the leading
consumer wellness
companies in India
Gained a portfolio
including several
category leading
brands across wellness,
foods and care
Added complementary
distribution with large
general trade channel
to an existing
pharmacy channel
Successful integration into Zydus Wellness’ operations
Revenue &
BrandsPeople
Sales &
Distribution
Supply Chain
&
IT Systems
Evaluate additional opportunities
Bolt-on acquisitions
Leverage acquisitions to grow scale
Source: Company information

Recent updates
24
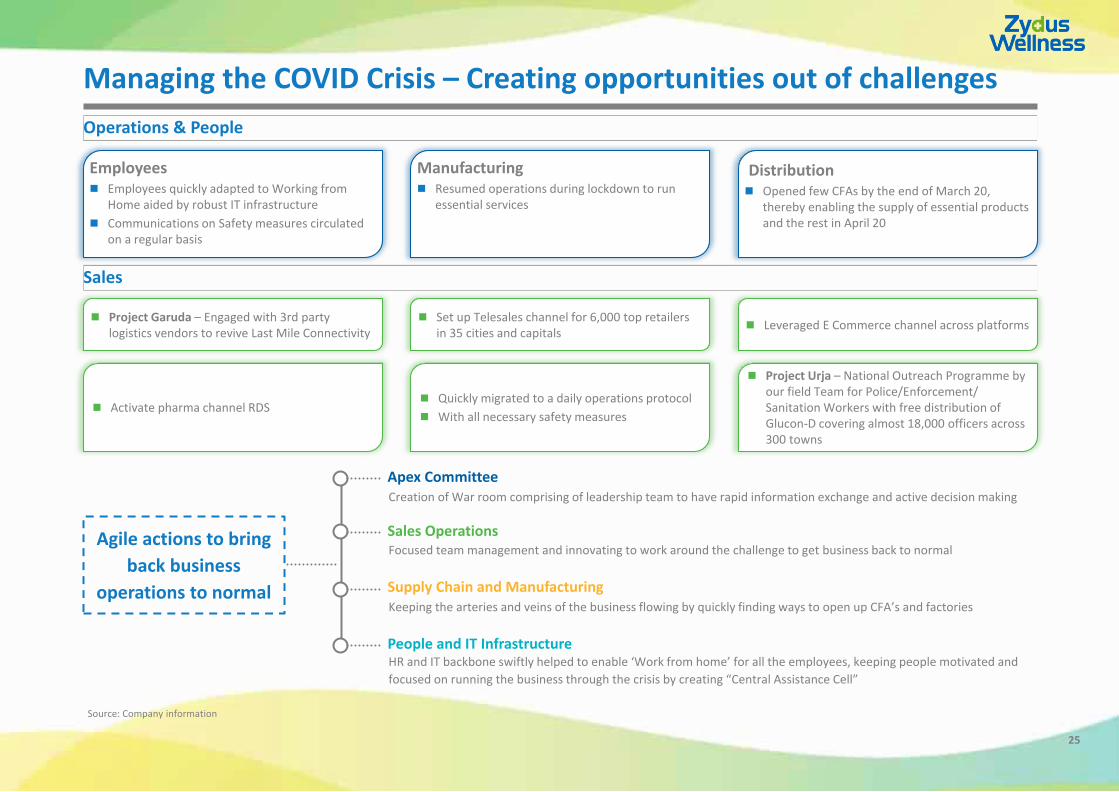
Managing the COVID Crisis – Creating opportunities out of challenges
25
Manufacturing Resumed operations during lockdown to run
essential services
Distribution Opened few CFAs by the end of March 20,
thereby enabling the supply of essential products and the rest in April 20
Employees Employees quickly adapted to Working from
Home aided by robust IT infrastructure
Communications on Safety measures circulated on a regular basis
Operations & People
Sales
Project Garuda – Engaged with 3rd party logistics vendors to revive Last Mile Connectivity
Set up Telesales channel for 6,000 top retailers in 35 cities and capitals
Leveraged E Commerce channel across platforms
Activate pharma channel RDS Quickly migrated to a daily operations protocol
With all necessary safety measures
Project Urja – National Outreach Programme by our field Team for Police/Enforcement/Sanitation Workers with free distribution of Glucon-D covering almost 18,000 officers across 300 towns
Agile actions to bring
back business
operations to normal
Creation of War room comprising of leadership team to have rapid information exchange and active decision making
Apex Committee
Focused team management and innovating to work around the challenge to get business back to normal
Sales Operations
Keeping the arteries and veins of the business flowing by quickly finding ways to open up CFA’s and factories
Supply Chain and Manufacturing
HR and IT backbone swiftly helped to enable ‘Work from home’ for all the employees, keeping people motivated and
focused on running the business through the crisis by creating “Central Assistance Cell”
People and IT Infrastructure
Source: Company information
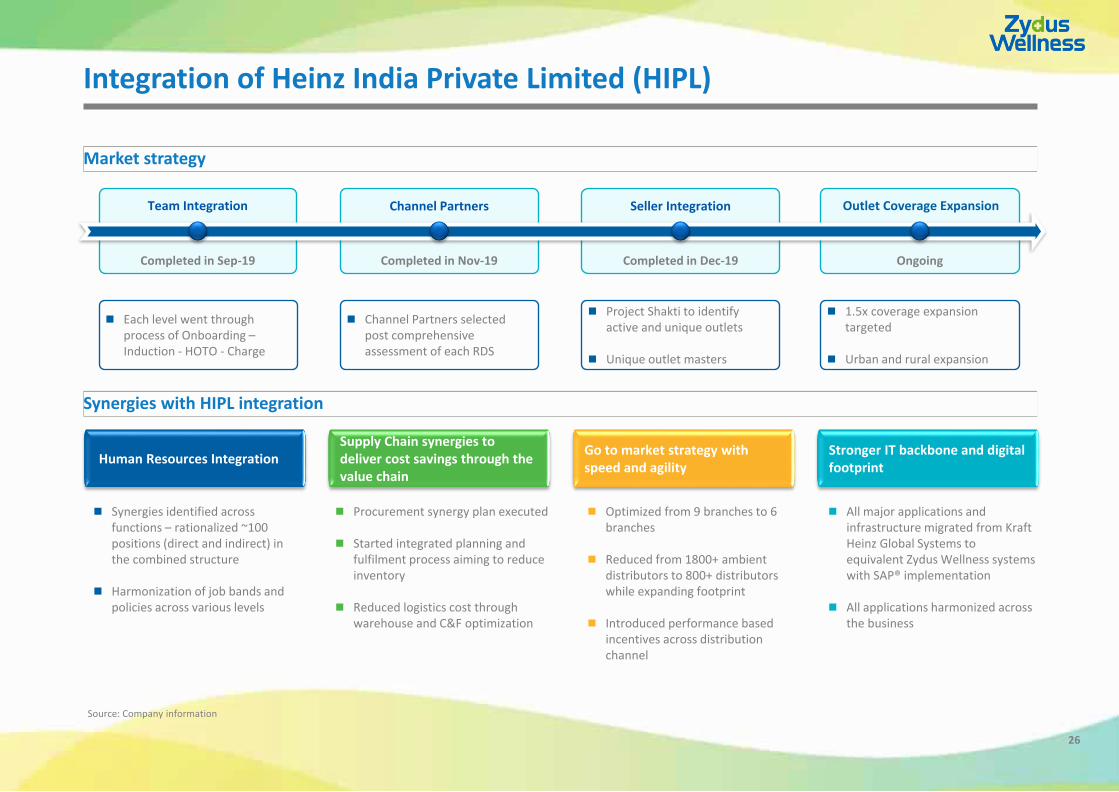
Integration of Heinz India Private Limited (HIPL)
26
Synergies with HIPL integration
Human Resources IntegrationSupply Chain synergies to deliver cost savings through the value chain
Go to market strategy with speed and agility
Stronger IT backbone and digital footprint
Synergies identified across functions – rationalized ~100 positions (direct and indirect) in the combined structure
Harmonization of job bands and policies across various levels
Procurement synergy plan executed
Started integrated planning and fulfilment process aiming to reduce inventory
Reduced logistics cost through warehouse and C&F optimization
Optimized from 9 branches to 6 branches
Reduced from 1800+ ambient distributors to 800+ distributors while expanding footprint
Introduced performance based incentives across distribution channel
All major applications and infrastructure migrated from Kraft Heinz Global Systems to equivalent Zydus Wellness systems with SAP® implementation
All applications harmonized across the business
Market strategy
Team Integration Channel Partners Seller Integration Outlet Coverage Expansion
Completed in Sep-19 Completed in Nov-19 Completed in Dec-19 Ongoing
Each level went through process of Onboarding –Induction - HOTO - Charge
Channel Partners selected post comprehensive assessment of each RDS
Project Shakti to identify active and unique outlets
Unique outlet masters
1.5x coverage expansion targeted
Urban and rural expansion
Source: Company information

Appendix
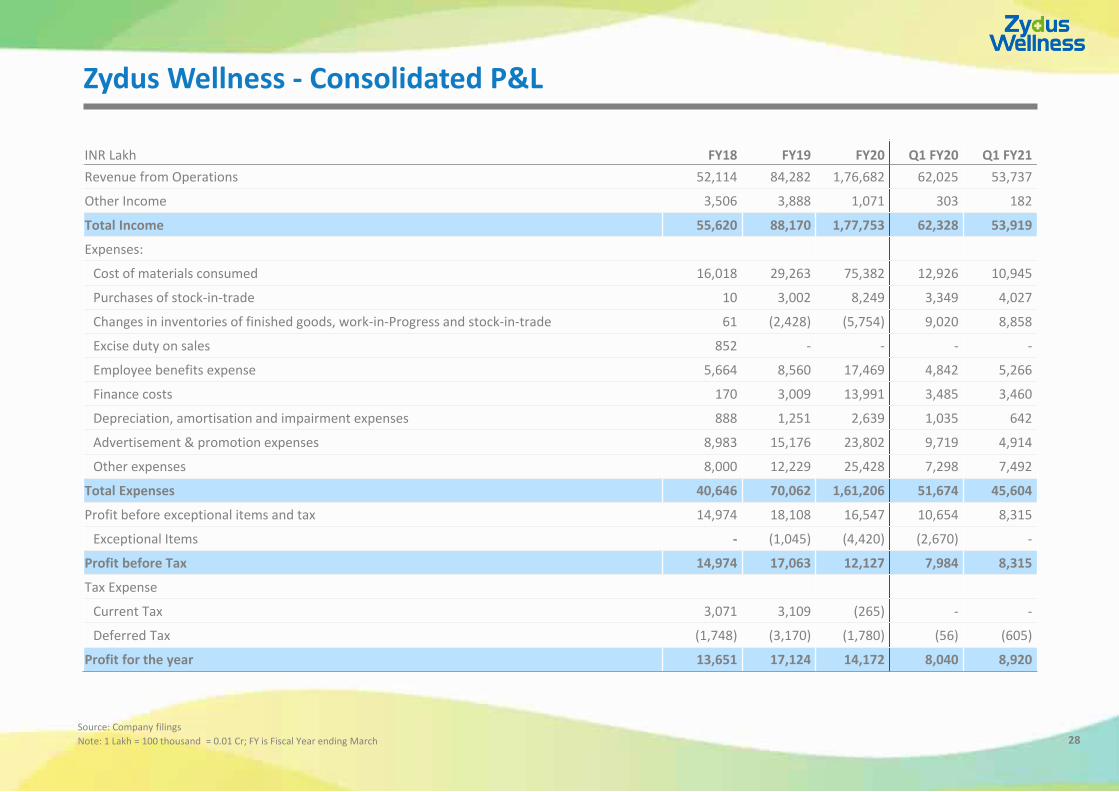
Zydus Wellness - Consolidated P&L
28
INR Lakh FY18 FY19 FY20 Q1 FY20 Q1 FY21
Revenue from Operations 52,114 84,282 1,76,682 62,025 53,737
Other Income 3,506 3,888 1,071 303 182
Total Income 55,620 88,170 1,77,753 62,328 53,919
Expenses:
Cost of materials consumed 16,018 29,263 75,382 12,926 10,945
Purchases of stock-in-trade 10 3,002 8,249 3,349 4,027
Changes in inventories of finished goods, work-in-Progress and stock-in-trade 61 (2,428) (5,754) 9,020 8,858
Excise duty on sales 852 - - - -
Employee benefits expense 5,664 8,560 17,469 4,842 5,266
Finance costs 170 3,009 13,991 3,485 3,460
Depreciation, amortisation and impairment expenses 888 1,251 2,639 1,035 642
Advertisement & promotion expenses 8,983 15,176 23,802 9,719 4,914
Other expenses 8,000 12,229 25,428 7,298 7,492
Total Expenses 40,646 70,062 1,61,206 51,674 45,604
Profit before exceptional items and tax 14,974 18,108 16,547 10,654 8,315
Exceptional Items - (1,045) (4,420) (2,670) -
Profit before Tax 14,974 17,063 12,127 7,984 8,315
Tax Expense
Current Tax 3,071 3,109 (265) - -
Deferred Tax (1,748) (3,170) (1,780) (56) (605)
Profit for the year 13,651 17,124 14,172 8,040 8,920
Source: Company filings
Note: 1 Lakh = 100 thousand = 0.01 Cr; FY is Fiscal Year ending March
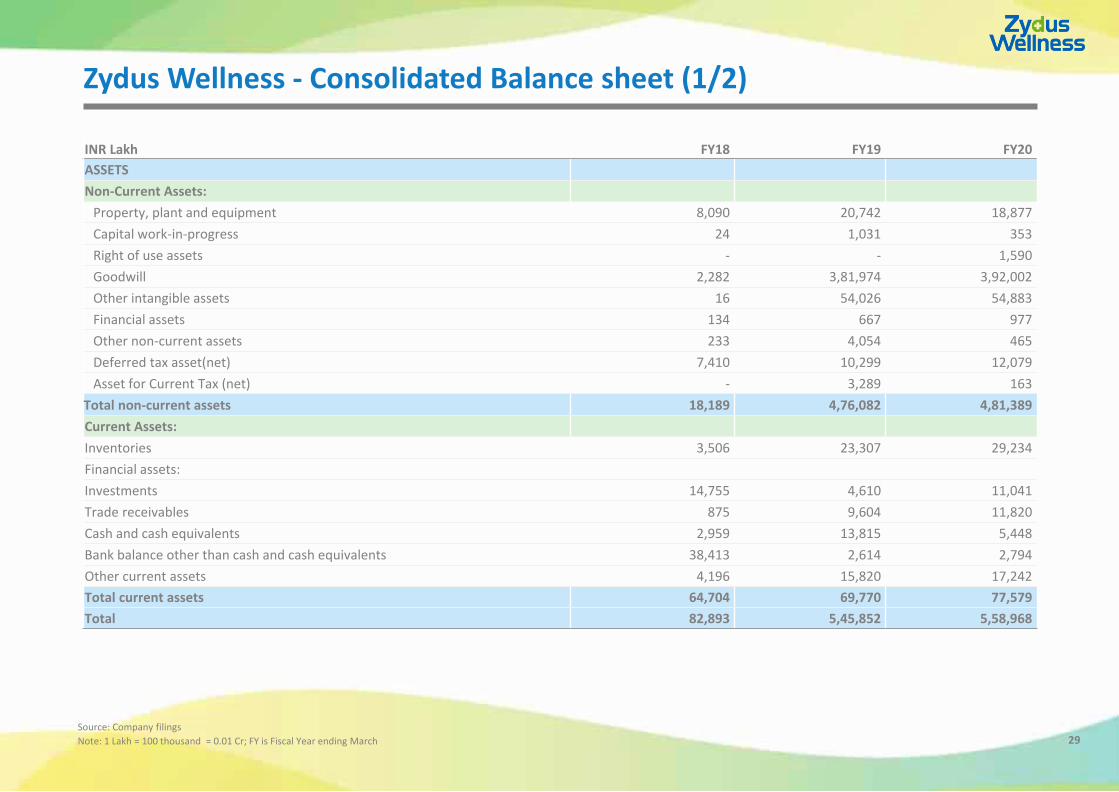
Zydus Wellness - Consolidated Balance sheet (1/2)
29
INR Lakh FY18 FY19 FY20
ASSETS
Non-Current Assets:
Property, plant and equipment 8,090 20,742 18,877
Capital work-in-progress 24 1,031 353
Right of use assets - - 1,590
Goodwill 2,282 3,81,974 3,92,002
Other intangible assets 16 54,026 54,883
Financial assets 134 667 977
Other non-current assets 233 4,054 465
Deferred tax asset(net) 7,410 10,299 12,079
Asset for Current Tax (net) - 3,289 163
Total non-current assets 18,189 4,76,082 4,81,389
Current Assets:
Inventories 3,506 23,307 29,234
Financial assets:
Investments 14,755 4,610 11,041
Trade receivables 875 9,604 11,820
Cash and cash equivalents 2,959 13,815 5,448
Bank balance other than cash and cash equivalents 38,413 2,614 2,794
Other current assets 4,196 15,820 17,242
Total current assets 64,704 69,770 77,579
Total 82,893 5,45,852 5,58,968
Source: Company filings
Note: 1 Lakh = 100 thousand = 0.01 Cr; FY is Fiscal Year ending March
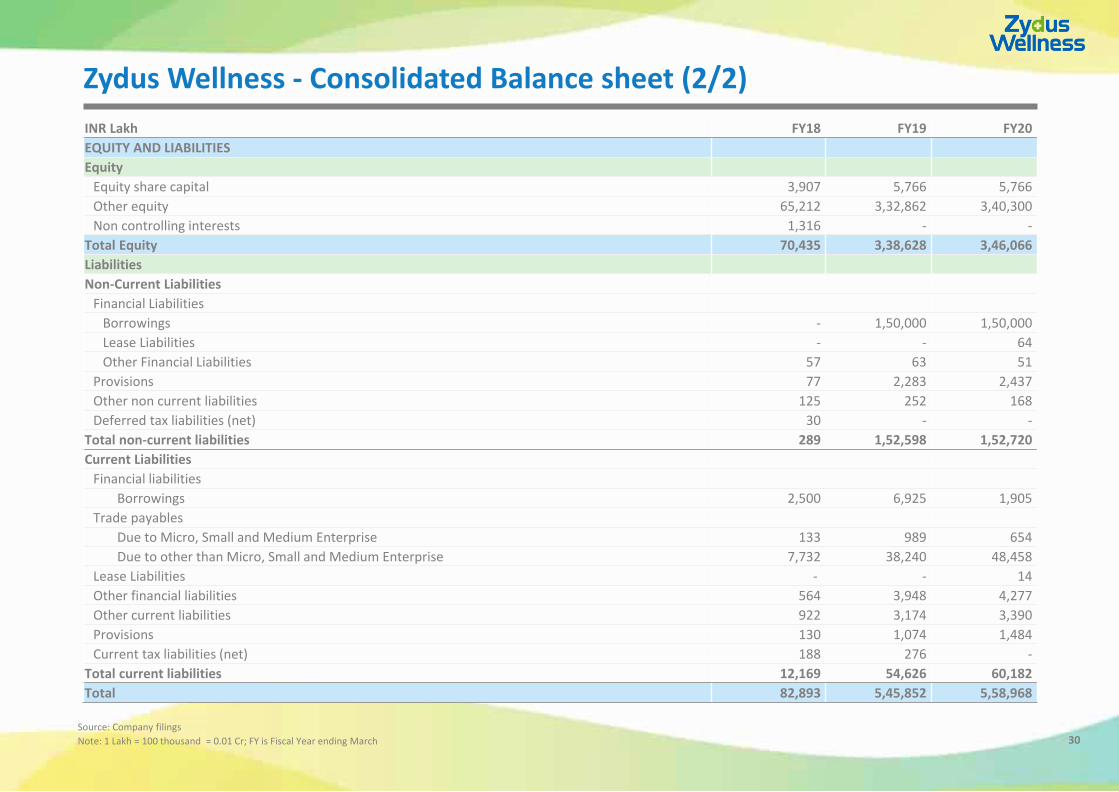
Zydus Wellness - Consolidated Balance sheet (2/2)
30
INR Lakh FY18 FY19 FY20
EQUITY AND LIABILITIES
Equity
Equity share capital 3,907 5,766 5,766
Other equity 65,212 3,32,862 3,40,300
Non controlling interests 1,316 - -
Total Equity 70,435 3,38,628 3,46,066
Liabilities
Non-Current Liabilities
Financial Liabilities
Borrowings - 1,50,000 1,50,000
Lease Liabilities - - 64
Other Financial Liabilities 57 63 51
Provisions 77 2,283 2,437
Other non current liabilities 125 252 168
Deferred tax liabilities (net) 30 - -
Total non-current liabilities 289 1,52,598 1,52,720
Current Liabilities
Financial liabilities
Borrowings 2,500 6,925 1,905
Trade payables
Due to Micro, Small and Medium Enterprise 133 989 654
Due to other than Micro, Small and Medium Enterprise 7,732 38,240 48,458
Lease Liabilities - - 14
Other financial liabilities 564 3,948 4,277
Other current liabilities 922 3,174 3,390
Provisions 130 1,074 1,484
Current tax liabilities (net) 188 276 -
Total current liabilities 12,169 54,626 60,182
Total 82,893 5,45,852 5,58,968
Source: Company filings
Note: 1 Lakh = 100 thousand = 0.01 Cr; FY is Fiscal Year ending March