nhpc investor presentation
TRANSCRIPT
8/28/2017
1
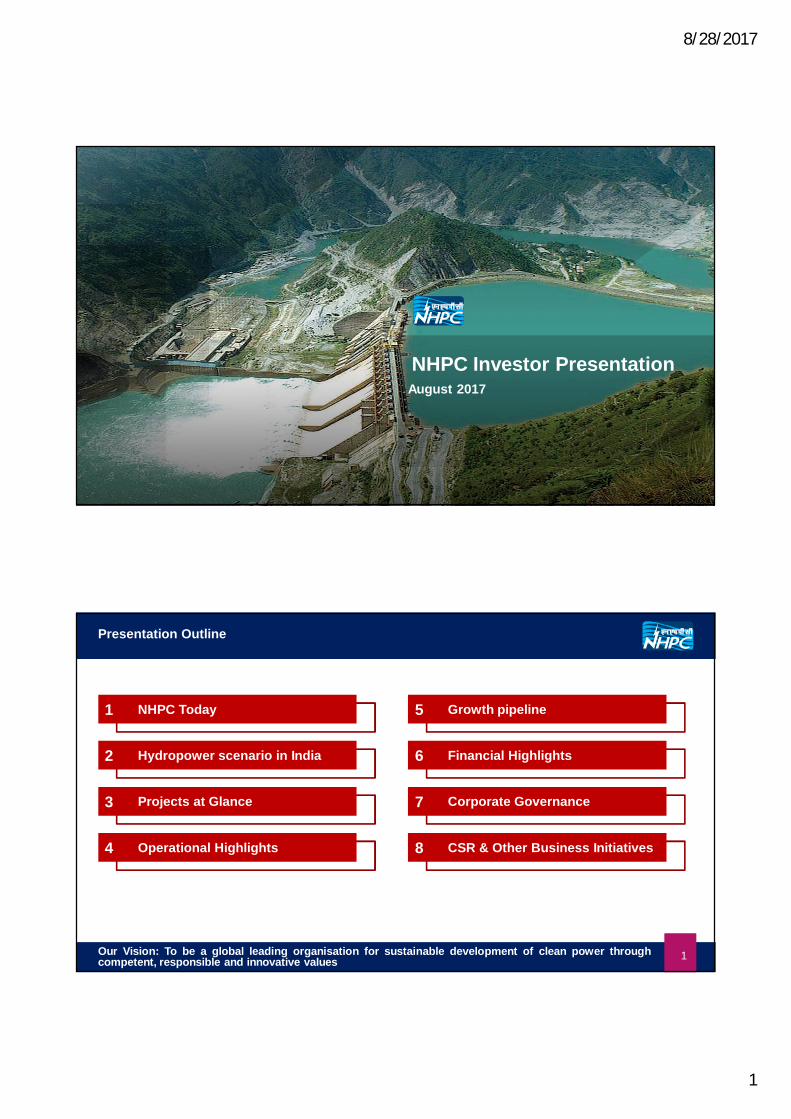
NHPC Investor PresentationAugust 2017
Confidential
NHPC Today
Projects at Glance
Our Vision: To be a global leading organisation for sustainable development of clean power throughcompetent, responsible and innovative values
Hydropower scenario in India
Operational Highlights
Growth pipeline
CSR & Other Business Initiatives
Corporate Governance
Financial Highlights
Presentation Outline
1
2
3
4
5
5
6
7
8
1
8/28/2017
2
Confidential
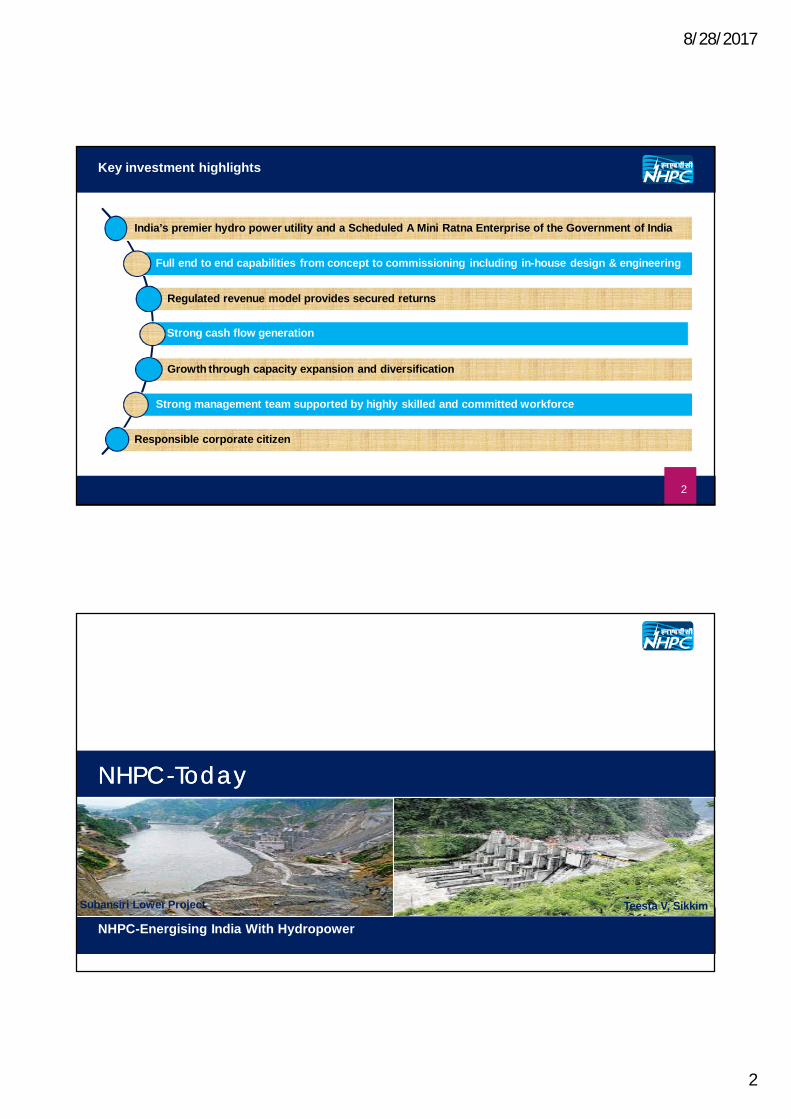
Key investment highlights
India’s premier hydro power utility and a Scheduled A Mini Ratna Enterprise of the Government of India
Full end to end capabilities from concept to commissioning including in-house design & engineering
Regulated revenue model provides secured returns
Strong cash flow generation
Growth through capacity expansion and diversification
Strong management team supported by highly skilled and committed workforce
Responsible corporate citizen
2
NHPCNHPC--Today Today
Subansiri Lower Project Teesta V, Sikkim
NHPC-Energising India With Hydropower
8/28/2017
3
Confidential
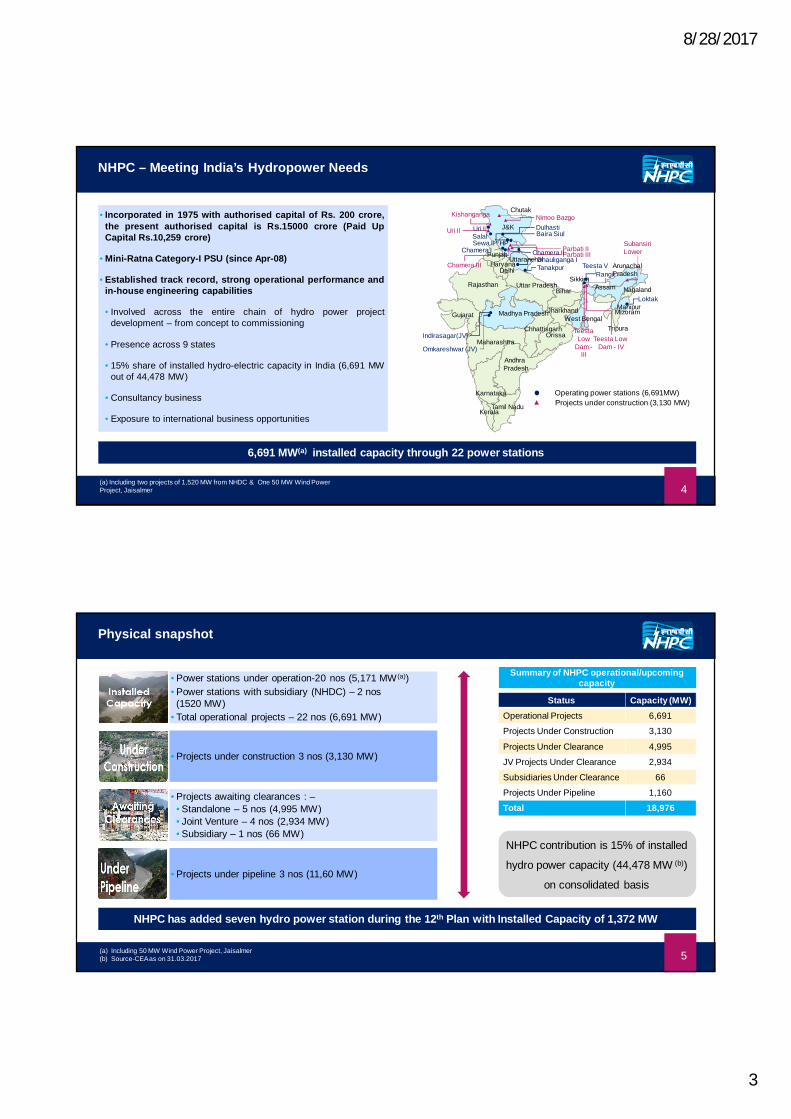
NHPC – Meeting India’s Hydropower Needs
(a) Including two projects of 1,520 MW from NHDC & One 50 MW Wind Power Project, Jaisalmer
6,691 MW(a) installed capacity through 22 power stations
• Incorporated in 1975 with authorised capital of Rs. 200 crore,the present authorised capital is Rs.15000 crore (Paid UpCapital Rs.10,259 crore)
• Mini-Ratna Category-I PSU (since Apr-08)
• Established track record, strong operational performance andin-house engineering capabilities
• Involved across the entire chain of hydro power projectdevelopment – from concept to commissioning
• Presence across 9 states
• 15% share of installed hydro-electric capacity in India (6,691 MWout of 44,478 MW)
• Consultancy business
• Exposure to international business opportunities
Operating power stations (6,691MW)Projects under construction (3,130 MW)
J&K
HP
PunjabHaryana
Rajasthan
Uttaranchal
Uttar Pradesh
Gujarat Madhya Pradesh
Orissa
Bihar
Maharashtra
Andhra Pradesh
Karnataka
Tamil NaduKerala
Chhattisgarh
Jharkhand
Sikkim
ArunachalPradesh
Assam Nagaland
ManipurMizoram
Tripura
Delhi
Loktak
Teesta Low Dam - IV
Teesta Low
Dam -III
West Bengal
Indirasagar(JV)
Omkareshwar (JV)
Chamera III
Chamera ISewa IISalalUri IUri II
Kishanganga ChutakNimoo BazgoDulhastiBaira Siul
Parbati IIParbati III
SubansiriLowerChamera II
Dhauliganga ITanakpur Teesta V
Rangit
4
Confidential
Summary of NHPC operational/upcoming capacity
Status Capacity (MW)Operational Projects 6,691
Projects Under Construction 3,130
Projects Under Clearance 4,995
JV Projects Under Clearance 2,934
Subsidiaries Under Clearance 66
Projects Under Pipeline 1,160
Total 18,976
Physical snapshot
NHPC contribution is 15% of installed
hydro power capacity (44,478 MW (b))
on consolidated basis
• Power stations under operation-20 nos (5,171 MW (a))• Power stations with subsidiary (NHDC) – 2 nos (1520 MW)
• Total operational projects – 22 nos (6,691 MW)
• Projects under construction 3 nos (3,130 MW)
• Projects awaiting clearances : –• Standalone – 5 nos (4,995 MW)• Joint Venture – 4 nos (2,934 MW)• Subsidiary – 1 nos (66 MW)
• Projects under pipeline 3 nos (11,60 MW)
(a) Including 50 MW Wind Power Project, Jaisalmer(b) Source-CEA as on 31.03.2017
NHPC has added seven hydro power station during the 12th Plan with Installed Capacity of 1,372 MW
5
8/28/2017
4
Confidential
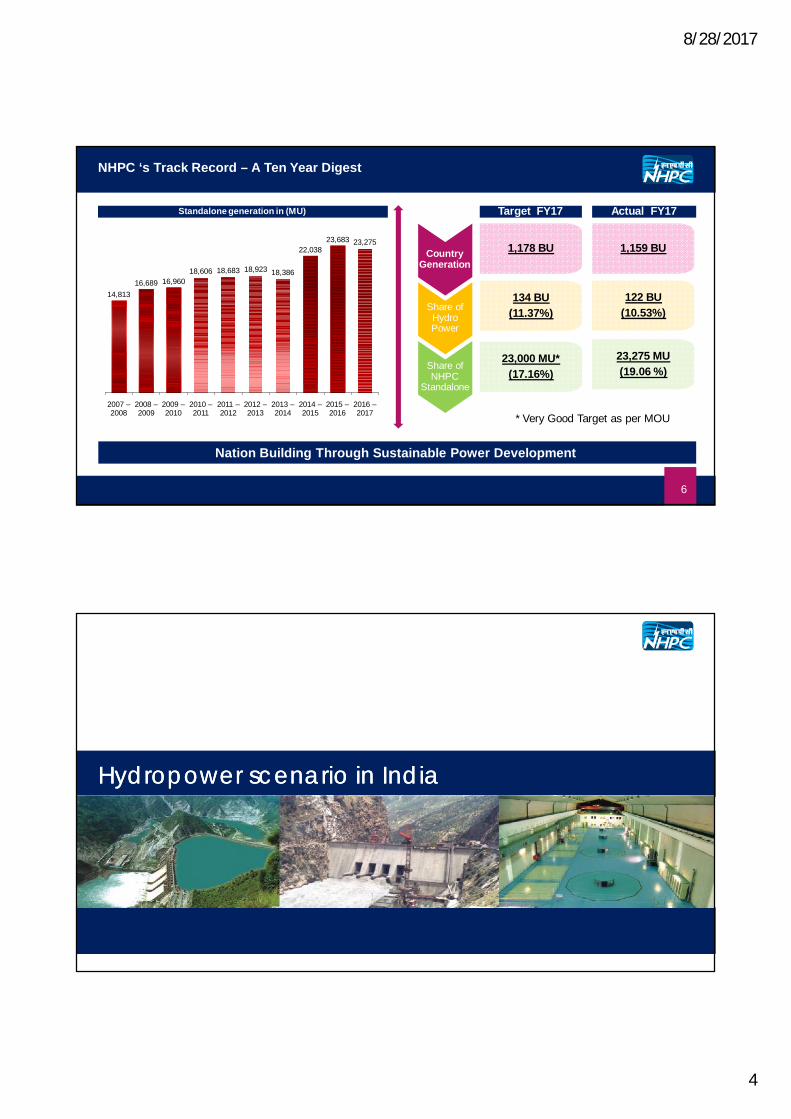
Standalone generation in (MU)
Country Generation
Share of Hydro Power
Share of NHPC
Standalone
1,178 BU
134 BU(11.37%)
23,000 MU*(17.16%)
Target FY17 Actual FY17
1,159 BU
122 BU(10.53%)
23,275 MU(19.06 %)
NHPC ‘s Track Record – A Ten Year Digest
Nation Building Through Sustainable Power Development
14,81316,689 16,960
18,606 18,683 18,923 18,386
22,03823,683 23,275
2007 –2008
2008 –2009
2009 –2010
2010 –2011
2011 –2012
2012 –2013
2013 –2014
2014 –2015
2015 –2016
2016 –2017
6
* Very Good Target as per MOU
Hydropower scenario in IndiaHydropower scenario in India
8/28/2017
5
Confidential
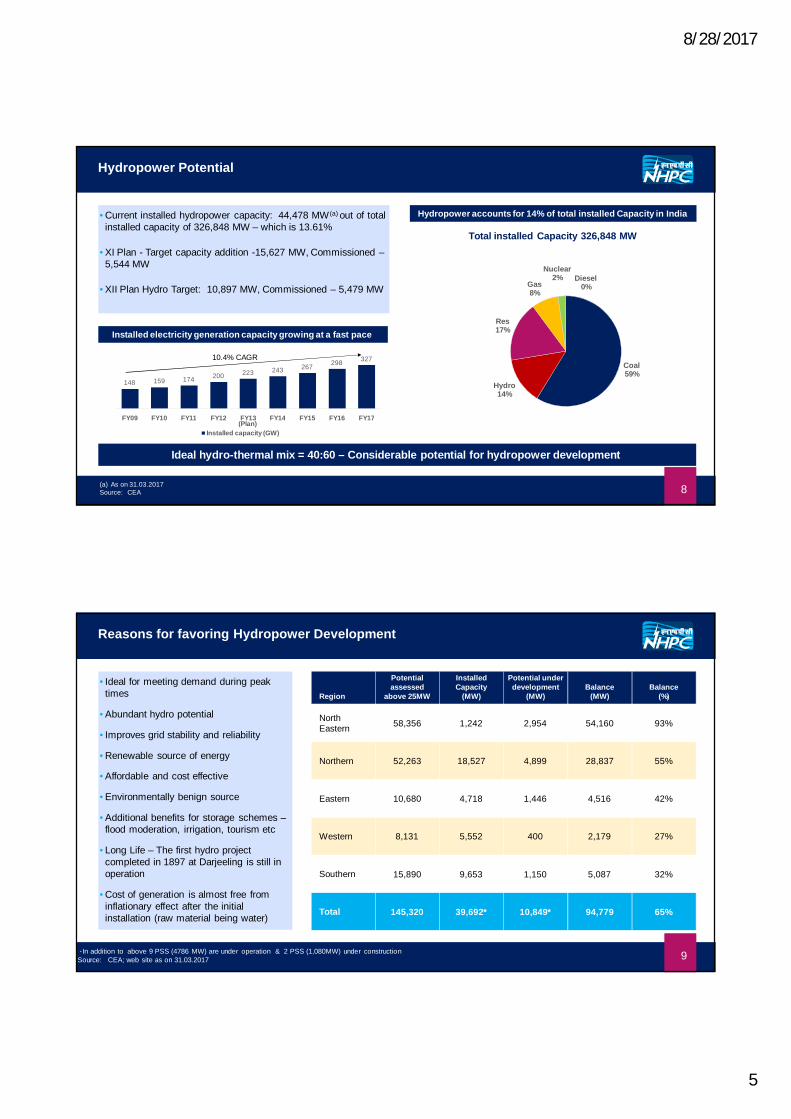
Hydropower Potential
(a) As on 31.03.2017 Source: CEA
Ideal hydro-thermal mix = 40:60 – Considerable potential for hydropower development
Installed electricity generation capacity growing at a fast pace
Hydropower accounts for 14% of total installed Capacity in India
Coal59%
Hydro14%
Res17%
Gas8%
Nuclear2% Diesel
0%
• Current installed hydropower capacity: 44,478 MW (a) out of total installed capacity of 326,848 MW – which is 13.61%
• XI Plan - Target capacity addition -15,627 MW, Commissioned –5,544 MW
• XII Plan Hydro Target: 10,897 MW, Commissioned – 5,479 MW
8
Total installed Capacity 326,848 MW
10.4% CAGR
148 159 174 200 223 243 267 298 327
FY09 FY10 FY11 FY12 FY13 FY14 FY15 FY16 FY17(Plan)
Installed capacity (GW)
Confidential
Reasons for favoring Hydropower Development
• Ideal for meeting demand during peak times
• Abundant hydro potential
• Improves grid stability and reliability
• Renewable source of energy
• Affordable and cost effective
• Environmentally benign source
• Additional benefits for storage schemes –flood moderation, irrigation, tourism etc
• Long Life – The first hydro project completed in 1897 at Darjeeling is still in operation
• Cost of generation is almost free from inflationary effect after the initial installation (raw material being water)
Region
Potential assessed
above 25MW
Installed Capacity
(MW)
Potential under development
(MW)Balance
(MW)Balance
(%)
North Eastern 58,356 1,242 2,954 54,160 93%
Northern 52,263 18,527 4,899 28,837 55%
Eastern 10,680 4,718 1,446 4,516 42%
Western 8,131 5,552 400 2,179 27%
Southern 15,890 9,653 1,150 5,087 32%
Total 145,320 39,692* 10,849* 94,779 65%
* In addition to above 9 PSS (4786 MW) are under operation & 2 PSS (1,080MW) under constructionSource: CEA; web site as on 31.03.2017 9
8/28/2017
6
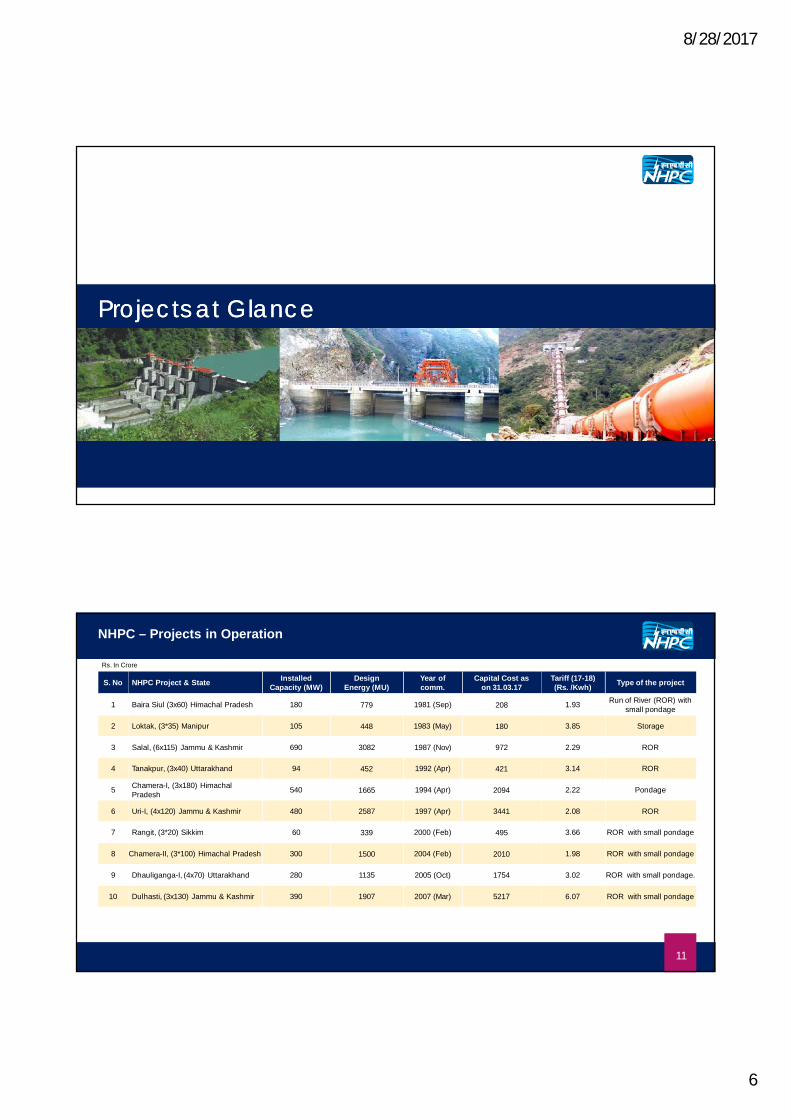
Projects at GlanceProjects at Glance
Confidential
S. No NHPC Project & State Installed Capacity (MW)
Design Energy (MU)
Year of comm.
Capital Cost as on 31.03.17
Tariff (17-18) (Rs. /Kwh) Type of the project
1 Baira Siul (3x60) Himachal Pradesh 180 779 1981 (Sep) 208 1.93 Run of River (ROR) with small pondage
2 Loktak, (3*35) Manipur 105 448 1983 (May) 180 3.85 Storage
3 Salal, (6x115) Jammu & Kashmir 690 3082 1987 (Nov) 972 2.29 ROR
4 Tanakpur, (3x40) Uttarakhand 94 452 1992 (Apr) 421 3.14 ROR
5 Chamera-I, (3x180) Himachal Pradesh 540 1665 1994 (Apr) 2094 2.22 Pondage
6 Uri-I, (4x120) Jammu & Kashmir 480 2587 1997 (Apr) 3441 2.08 ROR
7 Rangit, (3*20) Sikkim 60 339 2000 (Feb) 495 3.66 ROR with small pondage
8 Chamera-II, (3*100) Himachal Pradesh 300 1500 2004 (Feb) 2010 1.98 ROR with small pondage
9 Dhauliganga-I, (4x70) Uttarakhand 280 1135 2005 (Oct) 1754 3.02 ROR with small pondage.
10 Dulhasti, (3x130) Jammu & Kashmir 390 1907 2007 (Mar) 5217 6.07 ROR with small pondage
NHPC – Projects in Operation
11
Rs. In Crore
8/28/2017
7
Confidential
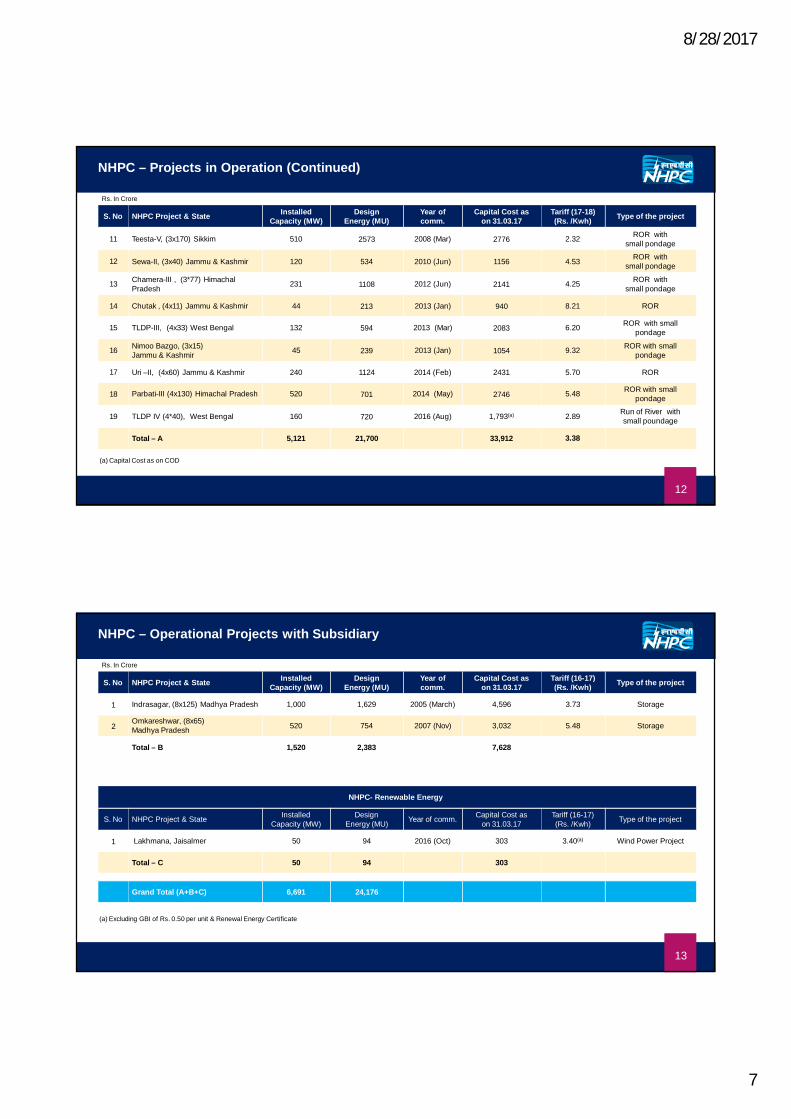
S. No NHPC Project & State Installed Capacity (MW)
Design Energy (MU)
Year of comm.
Capital Cost as on 31.03.17
Tariff (17-18) (Rs. /Kwh) Type of the project
11 Teesta-V, (3x170) Sikkim 510 2573 2008 (Mar) 2776 2.32 ROR with small pondage
12 Sewa-II, (3x40) Jammu & Kashmir 120 534 2010 (Jun) 1156 4.53 ROR with small pondage
13 Chamera-III , (3*77) Himachal Pradesh 231 1108 2012 (Jun) 2141 4.25 ROR with
small pondage
14 Chutak , (4x11) Jammu & Kashmir 44 213 2013 (Jan) 940 8.21 ROR
15 TLDP-III, (4x33) West Bengal 132 594 2013 (Mar) 2083 6.20 ROR with small pondage
16 Nimoo Bazgo, (3x15) Jammu & Kashmir 45 239 2013 (Jan) 1054 9.32 ROR with small
pondage
17 Uri –II, (4x60) Jammu & Kashmir 240 1124 2014 (Feb) 2431 5.70 ROR
18 Parbati-III (4x130) Himachal Pradesh 520 701 2014 (May) 2746 5.48 ROR with small pondage
19 TLDP IV (4*40), West Bengal 160 720 2016 (Aug) 1,793(a) 2.89 Run of River with small poundage
Total – A 5,121 21,700 33,912 3.38
NHPC – Projects in Operation (Continued)
(a) Capital Cost as on COD
12
Rs. In Crore
Confidential
S. No NHPC Project & State Installed Capacity (MW)
Design Energy (MU)
Year of comm.
Capital Cost as on 31.03.17
Tariff (16-17) (Rs. /Kwh) Type of the project
1 Indrasagar, (8x125) Madhya Pradesh 1,000 1,629 2005 (March) 4,596 3.73 Storage
2Omkareshwar, (8x65)Madhya Pradesh 520 754 2007 (Nov) 3,032 5.48 Storage
Total – B 1,520 2,383 7,628
NHPC – Operational Projects with Subsidiary
NHPC- Renewable Energy
S. No NHPC Project & State Installed Capacity (MW)
Design Energy (MU) Year of comm. Capital Cost as
on 31.03.17Tariff (16-17) (Rs. /Kwh) Type of the project
1 Lakhmana, Jaisalmer 50 94 2016 (Oct) 303 3.40(a) Wind Power Project
Total – C 50 94 303
Grand Total (A+B+C) 6,691 24,176
(a) Excluding GBI of Rs. 0.50 per unit & Renewal Energy Certificate
13
Rs. In Crore
8/28/2017
8
Operational HighlightsOperational Highlights
Confidential
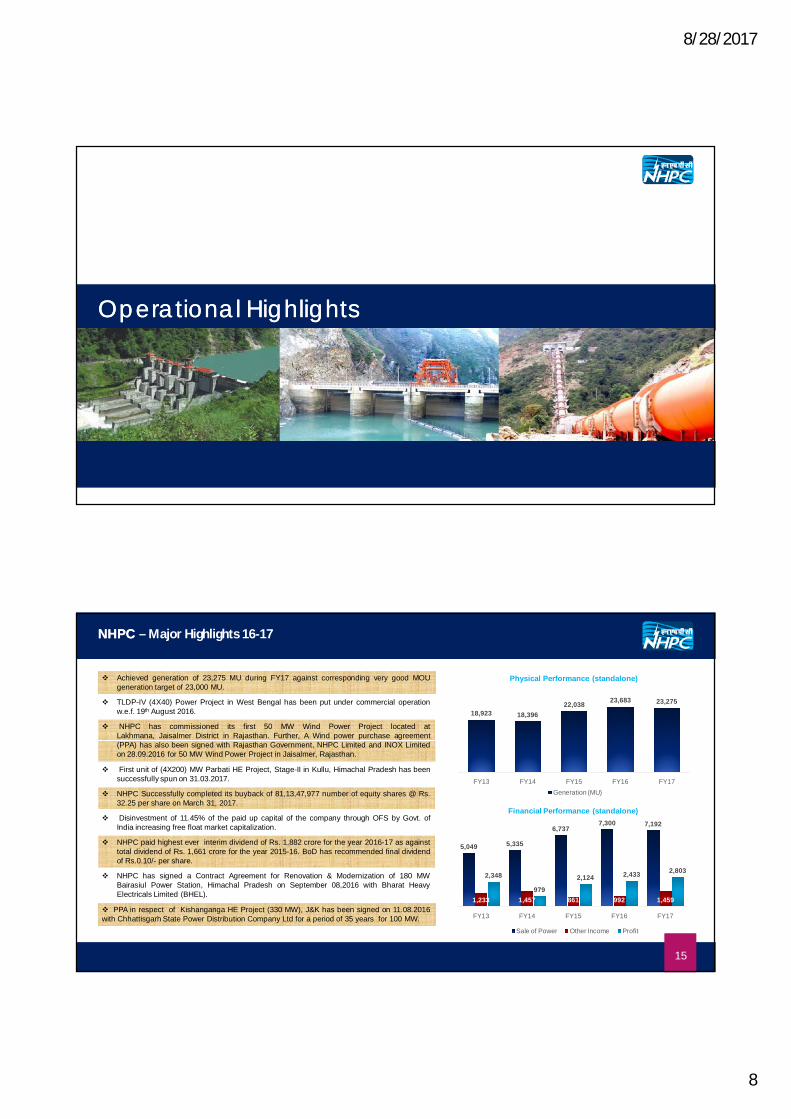
NHPC NHPC – Major Highlights 16-17
Achieved generation of 23,275 MU during FY17 against corresponding very good MOUgeneration target of 23,000 MU.
TLDP-IV (4X40) Power Project in West Bengal has been put under commercial operationw.e.f. 19th August 2016.
NHPC has commissioned its first 50 MW Wind Power Project located atLakhmana, Jaisalmer District in Rajasthan. Further, A Wind power purchase agreement(PPA) has also been signed with Rajasthan Government, NHPC Limited and INOX Limitedon 28.09.2016 for 50 MW Wind Power Project in Jaisalmer, Rajasthan.
NHPC Successfully completed its buyback of 81,13,47,977 number of equity shares @ Rs.32.25 per share on March 31, 2017.
First unit of (4X200) MW Parbati HE Project, Stage-II in Kullu, Himachal Pradesh has beensuccessfully spun on 31.03.2017.
Disinvestment of 11.45% of the paid up capital of the company through OFS by Govt. ofIndia increasing free float market capitalization.
NHPC paid highest ever interim dividend of Rs. 1,882 crore for the year 2016-17 as againsttotal dividend of Rs. 1,661 crore for the year 2015-16. BoD has recommended final dividendof Rs.0.10/- per share.
NHPC has signed a Contract Agreement for Renovation & Modernization of 180 MWBairasiul Power Station, Himachal Pradesh on September 08,2016 with Bharat HeavyElectricals Limited (BHEL).
PPA in respect of Kishanganga HE Project (330 MW), J&K has been signed on 11.08.2016with Chhattisgarh State Power Distribution Company Ltd for a period of 35 years for 100 MW.
15
18,923 18,39622,038 23,683 23,275
FY13 FY14 FY15 FY16 FY17
Physical Performance (standalone)
Generation (MU)
5,049 5,335
6,7377,300 7,192
1,233 1,457 861 992 1,459
2,348
979
2,124 2,433 2,803
FY13 FY14 FY15 FY16 FY17
Financial Performance (standalone)
Sale of Power Other Income Profit
8/28/2017
9
Confidential
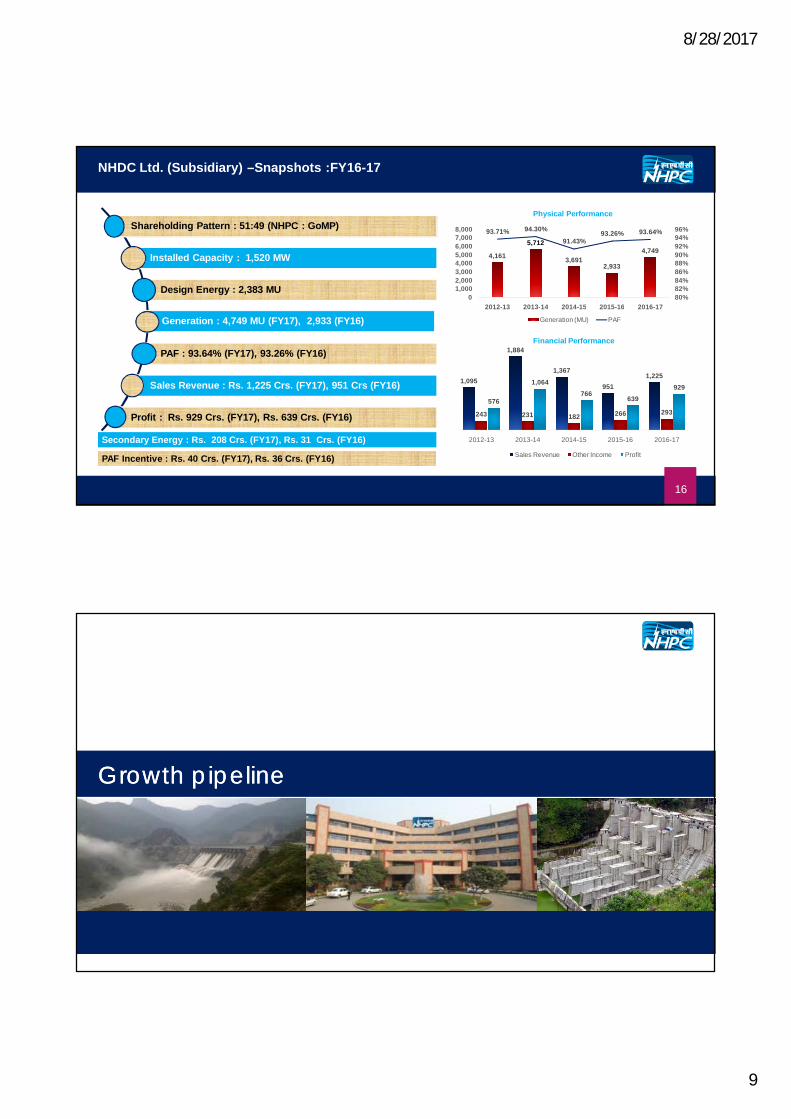
Shareholding Pattern : 51:49 (NHPC : GoMP)
Installed Capacity : 1,520 MW
Design Energy : 2,383 MU
Generation : 4,749 MU (FY17), 2,933 (FY16)
PAF : 93.64% (FY17), 93.26% (FY16)
Sales Revenue : Rs. 1,225 Crs. (FY17), 951 Crs (FY16)
Profit : Rs. 929 Crs. (FY17), Rs. 639 Crs. (FY16)
1,095
1,884
1,367
9511,225
243 231 182 266 293576
1,064766
639929
2012-13 2013-14 2014-15 2015-16 2016-17
Financial Performance
Sales Revenue Other Income Profit
4,161
5,712
3,6912,933
4,749
93.71% 94.30%
91.43%93.26% 93.64%
80%82%84%86%88%90%92%94%96%
01,0002,0003,0004,0005,0006,0007,0008,000
2012-13 2013-14 2014-15 2015-16 2016-17
Physical Performance
Generation (MU) PAF
Secondary Energy : Rs. 208 Crs. (FY17), Rs. 31 Crs. (FY16)
PAF Incentive : Rs. 40 Crs. (FY17), Rs. 36 Crs. (FY16)
NHDC Ltd. (Subsidiary) –Snapshots :FY16-17
16
Growth pipelineGrowth pipeline
8/28/2017
10
Confidential
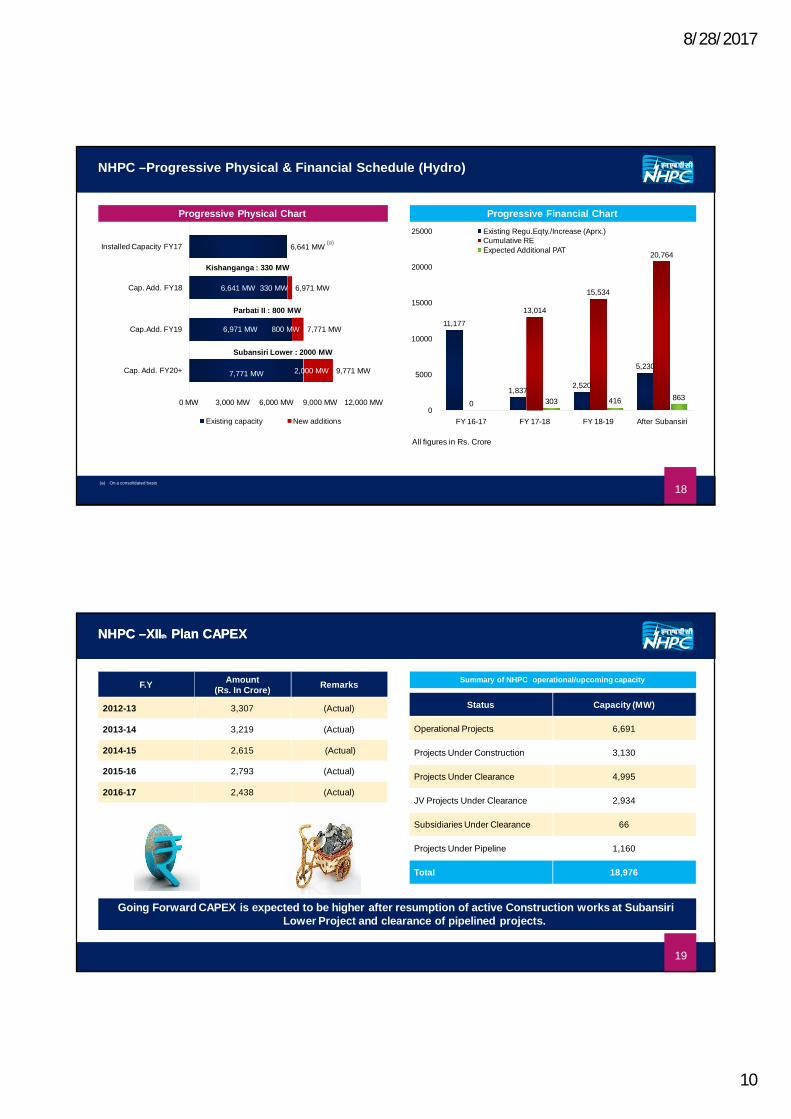
7,771 MW
6,971 MW
6,641 MW
2,000 MW
800 MW
330 MW
9,771 MW
7,771 MW
6,971 MW
6,641 MW
0 MW 3,000 MW 6,000 MW 9,000 MW 12,000 MW
Cap. Add. FY20+
Cap.Add. FY19
Cap. Add. FY18
Installed Capacity FY17
Existing capacity New additions
NHPC –Progressive Physical & Financial Schedule (Hydro)
8,251 MW
Subansiri Lower : 2000 MW
11,177
1,837 2,520
5,230
0
13,014
15,534
20,764
303 416 8630
5000
10000
15000
20000
25000
FY 16-17 FY 17-18 FY 18-19 After Subansiri
Existing Regu.Eqty./Increase (Aprx.)Cumulative REExpected Additional PAT
All figures in Rs. Crore
Parbati II : 800 MW
Progressive Physical Chart Progressive Financial Chart
18
Kishanganga : 330 MW
(a) On a consolidated basis
(a)
Confidential
F.Y Amount (Rs. In Crore) Remarks
2012-13 3,307 (Actual)
2013-14 3,219 (Actual)
2014-15 2,615 (Actual)
2015-16 2,793 (Actual)
2016-17 2,438 (Actual)
Going Forward CAPEX is expected to be higher after resumption of active Construction works at Subansiri Lower Project and clearance of pipelined projects.
NHPC NHPC ––XIIXIIthth Plan Plan CAPEXCAPEX
Summary of NHPC operational/upcoming capacity
Status Capacity (MW)
Operational Projects 6,691
Projects Under Construction 3,130
Projects Under Clearance 4,995
JV Projects Under Clearance 2,934
Subsidiaries Under Clearance 66
Projects Under Pipeline 1,160
Total 18,976
19
8/28/2017
11
Confidential
NHPC ProjectInstalled Capacity
(MW)
Design Energy (MU)
Type of the project
CCEA Estimated Cost
(Rs. Crore) (Price Level)
AnticipatedProject Cost (Rs. Crore)
Provisional Project Expenditure till –March’17
(Rs. Crore)
ExpectedCommissioning
Schedule
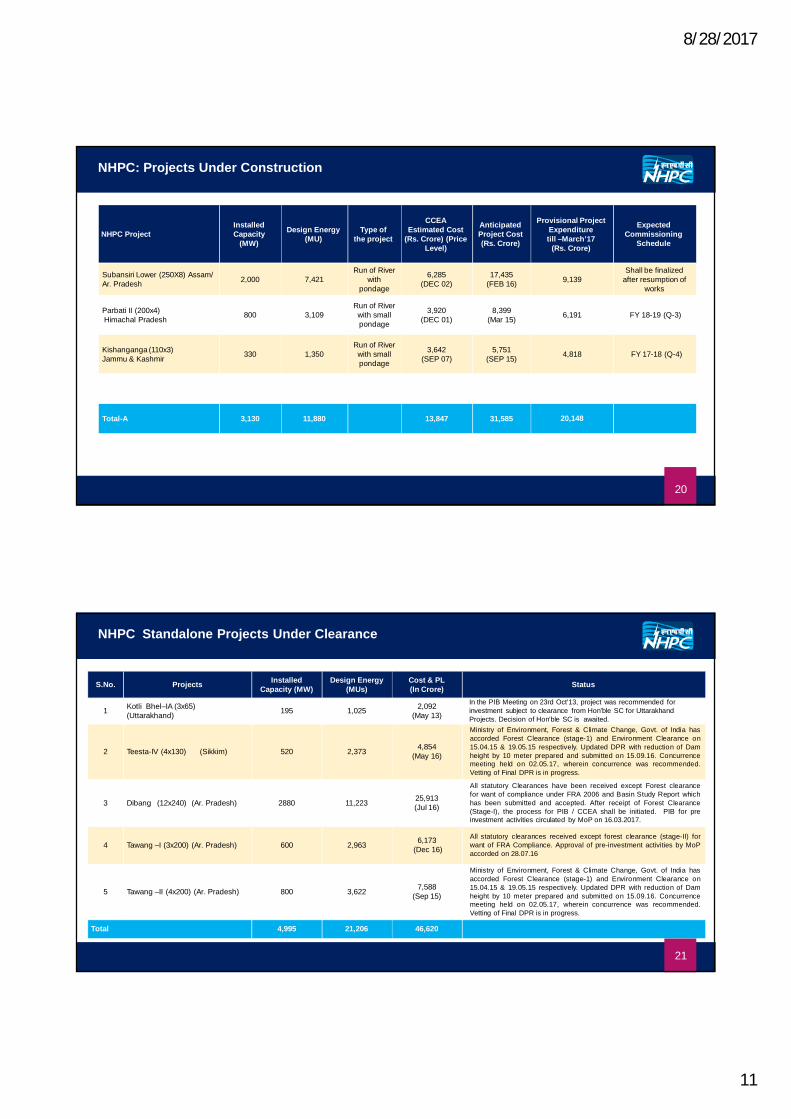
Subansiri Lower (250X8) Assam/ Ar. Pradesh 2,000 7,421
Run of River with
pondage
6,285(DEC 02)
17,435(FEB 16) 9,139
Shall be finalized after resumption of
works
Parbati II (200x4)Himachal Pradesh 800 3,109
Run of River with small pondage
3,920(DEC 01)
8,399(Mar 15) 6,191 FY 18-19 (Q-3)
Kishanganga (110x3) Jammu & Kashmir 330 1,350
Run of River with small pondage
3,642(SEP 07)
5,751(SEP 15) 4,818 FY 17-18 (Q-4)
Total-A 3,130 11,880 13,847 31,585 20,148
NHPC: Projects Under Construction
20
Confidential
S.No. Projects Installed Capacity (MW)
Design Energy (MUs)
Cost & PL(In Crore) Status
1 Kotli Bhel–IA (3x65) (Uttarakhand) 195 1,025 2,092
(May 13)
In the PIB Meeting on 23rd Oct’13, project was recommended for investment subject to clearance from Hon’ble SC for Uttarakhand Projects. Decision of Hon’ble SC is awaited.
2 Teesta-IV (4x130) (Sikkim) 520 2,373 4,854 (May 16)
Ministry of Environment, Forest & Climate Change, Govt. of India hasaccorded Forest Clearance (stage-1) and Environment Clearance on15.04.15 & 19.05.15 respectively. Updated DPR with reduction of Damheight by 10 meter prepared and submitted on 15.09.16. Concurrencemeeting held on 02.05.17, wherein concurrence was recommended.Vetting of Final DPR is in progress.
3 Dibang (12x240) (Ar. Pradesh) 2880 11,223 25,913(Jul 16)
All statutory Clearances have been received except Forest clearancefor want of compliance under FRA 2006 and Basin Study Report whichhas been submitted and accepted. After receipt of Forest Clearance(Stage-I), the process for PIB / CCEA shall be initiated. PIB for preinvestment activities circulated by MoP on 16.03.2017.
4 Tawang –I (3x200) (Ar. Pradesh) 600 2,963 6,173(Dec 16)
All statutory clearances received except forest clearance (stage-II) forwant of FRA Compliance. Approval of pre-investment activities by MoPaccorded on 28.07.16
5 Tawang –II (4x200) (Ar. Pradesh) 800 3,622 7,588(Sep 15)
Ministry of Environment, Forest & Climate Change, Govt. of India hasaccorded Forest Clearance (stage-1) and Environment Clearance on15.04.15 & 19.05.15 respectively. Updated DPR with reduction of Damheight by 10 meter prepared and submitted on 15.09.16. Concurrencemeeting held on 02.05.17, wherein concurrence was recommended.Vetting of Final DPR is in progress.
Total 4,995 21,206 46,620
NHPC Standalone Projects Under Clearance
21
8/28/2017
12
Confidential
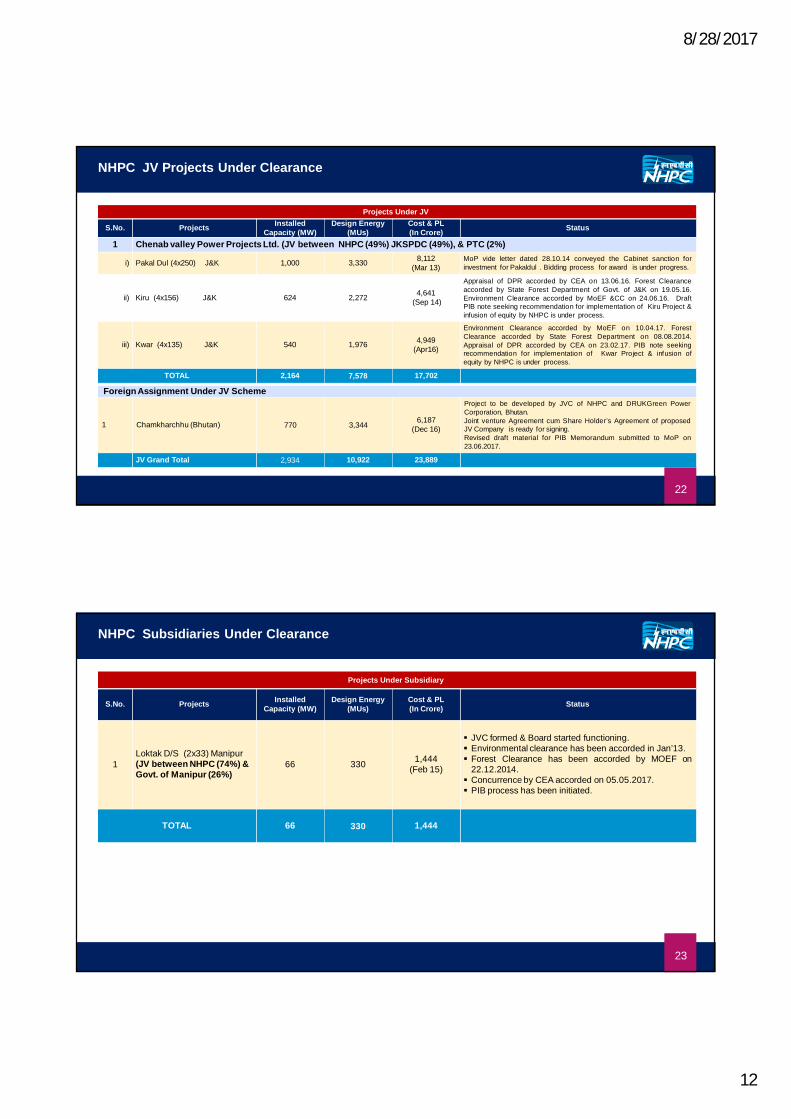
NHPC JV Projects Under Clearance
Projects Under JV
S.No. Projects Installed Capacity (MW)
Design Energy (MUs)
Cost & PL(In Crore) Status
1 Chenab valley Power Projects Ltd. (JV between NHPC (49%) JKSPDC (49%), & PTC (2%)
i) Pakal Dul (4x250) J&K 1,000 3,330 8,112(Mar 13)
MoP vide letter dated 28.10.14 conveyed the Cabinet sanction forinvestment for Pakaldul . Bidding process for award is under progress.
ii) Kiru (4x156) J&K 624 2,272 4,641(Sep 14)
Appraisal of DPR accorded by CEA on 13.06.16. Forest Clearanceaccorded by State Forest Department of Govt. of J&K on 19.05.16.Environment Clearance accorded by MoEF &CC on 24.06.16. DraftPIB note seeking recommendation for implementation of Kiru Project &infusion of equity by NHPC is under process.
iii) Kwar (4x135) J&K 540 1,976 4,949(Apr16)
Environment Clearance accorded by MoEF on 10.04.17. ForestClearance accorded by State Forest Department on 08.08.2014.Appraisal of DPR accorded by CEA on 23.02.17. PIB note seekingrecommendation for implementation of Kwar Project & infusion ofequity by NHPC is under process.
TOTAL 2,164 7,578 17,702
Foreign Assignment Under JV Scheme
1 Chamkharchhu (Bhutan) 770 3,344 6,187(Dec 16)
Project to be developed by JVC of NHPC and DRUKGreen PowerCorporation, Bhutan.Joint venture Agreement cum Share Holder’s Agreement of proposedJV Company is ready for signing.Revised draft material for PIB Memorandum submitted to MoP on23.06.2017.
JV Grand Total 2,934 10,922 23,889
22
Confidential
NHPC Subsidiaries Under Clearance
Projects Under Subsidiary
S.No. Projects Installed Capacity (MW)
Design Energy (MUs)
Cost & PL(In Crore) Status
1Loktak D/S (2x33) Manipur (JV between NHPC (74%) & Govt. of Manipur (26%)
66 330 1,444(Feb 15)
JVC formed & Board started functioning. Environmental clearance has been accorded in Jan’13. Forest Clearance has been accorded by MOEF on
22.12.2014. Concurrence by CEA accorded on 05.05.2017. PIB process has been initiated.
TOTAL 66 330 1,444
23

8/28/2017
13
Confidential
S.No. Projects State Installed Capacity (MW)
Projects Under FR/DPR Preparation
1 Bursar Jammu & Kashmir 800
2 Dhauliganga Intermediate Uttarakhand 210
3 Gauriganga-III A Uttarakhand 150
Total-A 1,160
NHPC: Projects Under PipelineProjects Under Pipeline
24
Financial HighlightsFinancial Highlights
Subansiri Lower Project Teesta V, Sikkim
8/28/2017
14
Confidential
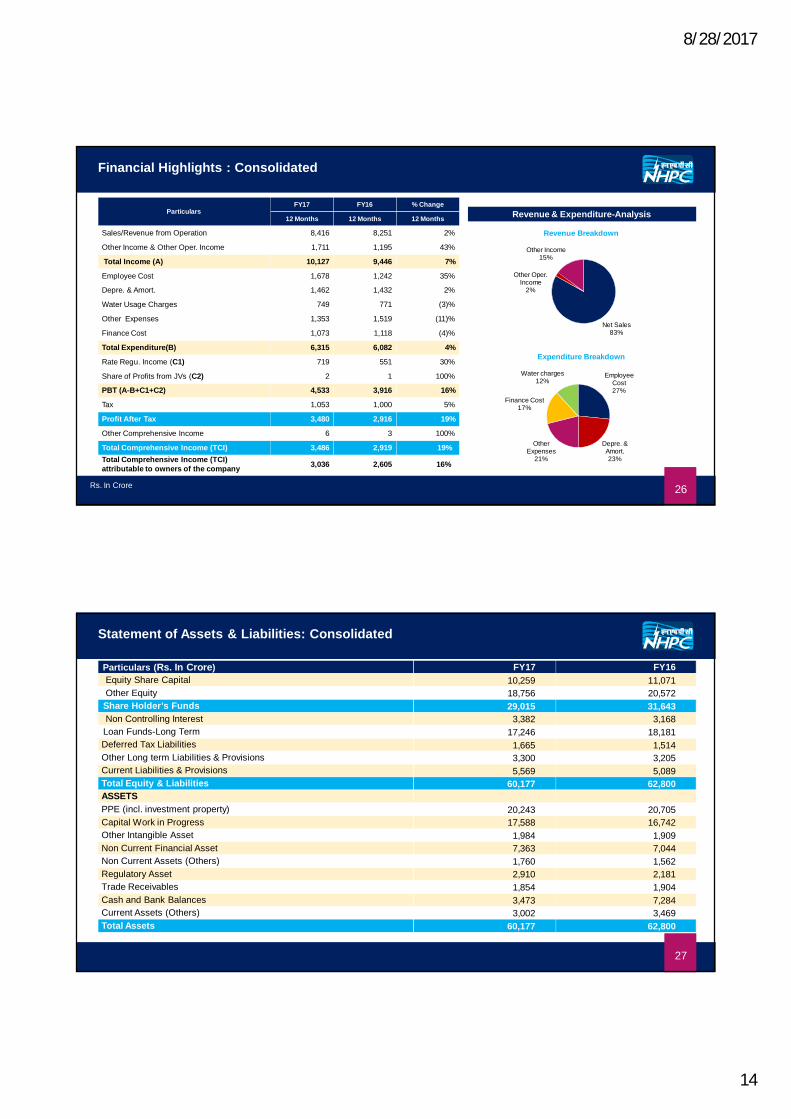
Financial Highlights : Consolidated
Awaiting Clearances
Revenue & Expenditure-Analysis
Rs. In Crore
ParticularsFY17 FY16 % Change
12 Months 12 Months 12 Months
Sales/Revenue from Operation 8,416 8,251 2%
Other Income & Other Oper. Income 1,711 1,195 43%
Total Income (A) 10,127 9,446 7%
Employee Cost 1,678 1,242 35%
Depre. & Amort. 1,462 1,432 2%
Water Usage Charges 749 771 (3)%
Other Expenses 1,353 1,519 (11)%
Finance Cost 1,073 1,118 (4)%
Total Expenditure(B) 6,315 6,082 4%
Rate Regu. Income (C1) 719 551 30%
Share of Profits from JVs (C2) 2 1 100%
PBT (A-B+C1+C2) 4,533 3,916 16%
Tax 1,053 1,000 5%
Profit After Tax 3,480 2,916 19%
Other Comprehensive Income 6 3 100%
Total Comprehensive Income (TCI) 3,486 2,919 19%Total Comprehensive Income (TCI) attributable to owners of the company 3,036 2,605 16%
26
Net Sales 83%
Other Oper. Income
2%
Other Income15%
Revenue Breakdown
Expenditure Breakdown
Employee Cost 27%
Depre. & Amort. 23%
Other Expenses
21%
Finance Cost 17%
Water charges 12%
Confidential
Statement of Assets & Liabilities: Consolidated
Awaiting Clearances
Particulars (Rs. In Crore) FY17 FY16Equity Share Capital 10,259 11,071 Other Equity 18,756 20,572 Share Holder’s Funds 29,015 31,643 Non Controlling Interest 3,382 3,168 Loan Funds-Long Term 17,246 18,181 Deferred Tax Liabilities 1,665 1,514 Other Long term Liabilities & Provisions 3,300 3,205 Current Liabilities & Provisions 5,569 5,089 Total Equity & Liabilities 60,177 62,800 ASSETSPPE (incl. investment property) 20,243 20,705 Capital Work in Progress 17,588 16,742 Other Intangible Asset 1,984 1,909 Non Current Financial Asset 7,363 7,044 Non Current Assets (Others) 1,760 1,562Regulatory Asset 2,910 2,181 Trade Receivables 1,854 1,904 Cash and Bank Balances 3,473 7,284 Current Assets (Others) 3,002 3,469 Total Assets 60,177 62,800
27
8/28/2017
15
Confidential
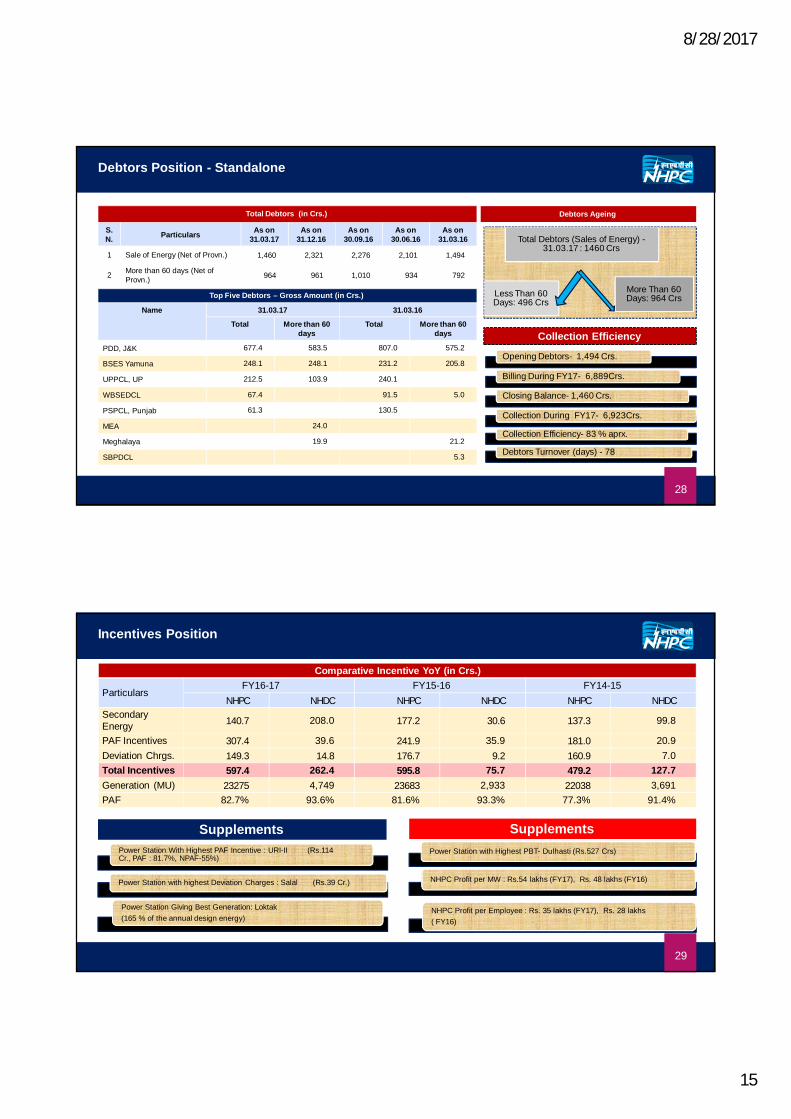
Debtors Position - Standalone
Awaiting Clearances
Pipelined Projects
Total Debtors (in Crs.)
S. N. Particulars As on
31.03.17As on
31.12.16As on
30.09.16As on
30.06.16As on
31.03.16
1 Sale of Energy (Net of Provn.) 1,460 2,321 2,276 2,101 1,494
2 More than 60 days (Net of Provn.) 964 961 1,010 934 792
Top Five Debtors – Gross Amount (in Crs.)
Name 31.03.17 31.03.16
Total More than 60 days
Total More than 60 days
PDD, J&K 677.4 583.5 807.0 575.2
BSES Yamuna 248.1 248.1 231.2 205.8
UPPCL, UP 212.5 103.9 240.1
WBSEDCL 67.4 91.5 5.0
PSPCL, Punjab 61.3 130.5
MEA 24.0
Meghalaya 19.9 21.2
SBPDCL 5.3
Total Debtors (Sales of Energy) -31.03.17 : 1460 Crs
More Than 60 Days: 964 CrsLess Than 60
Days: 496 Crs
Debtors Ageing
Opening Debtors- 1,494 Crs.
Billing During FY17- 6,889Crs.
Closing Balance- 1,460 Crs.
Collection During FY17- 6,923Crs.
Collection Efficiency- 83 % aprx.
Debtors Turnover (days) - 78
Collection Efficiency
28
Confidential
Incentives Position
Awaiting Clearances
Pipelined Projects
Supplements SupplementsPower Station with Highest PBT- Dulhasti (Rs.527 Crs)
NHPC Profit per MW : Rs.54 lakhs (FY17), Rs. 48 lakhs (FY16)
NHPC Profit per Employee : Rs. 35 lakhs (FY17), Rs. 28 lakhs( FY16)
Power Station With Highest PAF Incentive : URI-II (Rs.114 Cr., PAF : 81.7%, NPAF-55%)
Power Station with highest Deviation Charges : Salal (Rs.39 Cr.)
Power Station Giving Best Generation: Loktak(165 % of the annual design energy)
29
Comparative Incentive YoY (in Crs.)
ParticularsFY16-17 FY15-16 FY14-15
NHPC NHDC NHPC NHDC NHPC NHDCSecondary Energy 140.7 208.0 177.2 30.6 137.3 99.8
PAF Incentives 307.4 39.6 241.9 35.9 181.0 20.9 Deviation Chrgs. 149.3 14.8 176.7 9.2 160.9 7.0 Total Incentives 597.4 262.4 595.8 75.7 479.2 127.7 Generation (MU) 23275 4,749 23683 2,933 22038 3,691 PAF 82.7% 93.6% 81.6% 93.3% 77.3% 91.4%
8/28/2017
16
Confidential
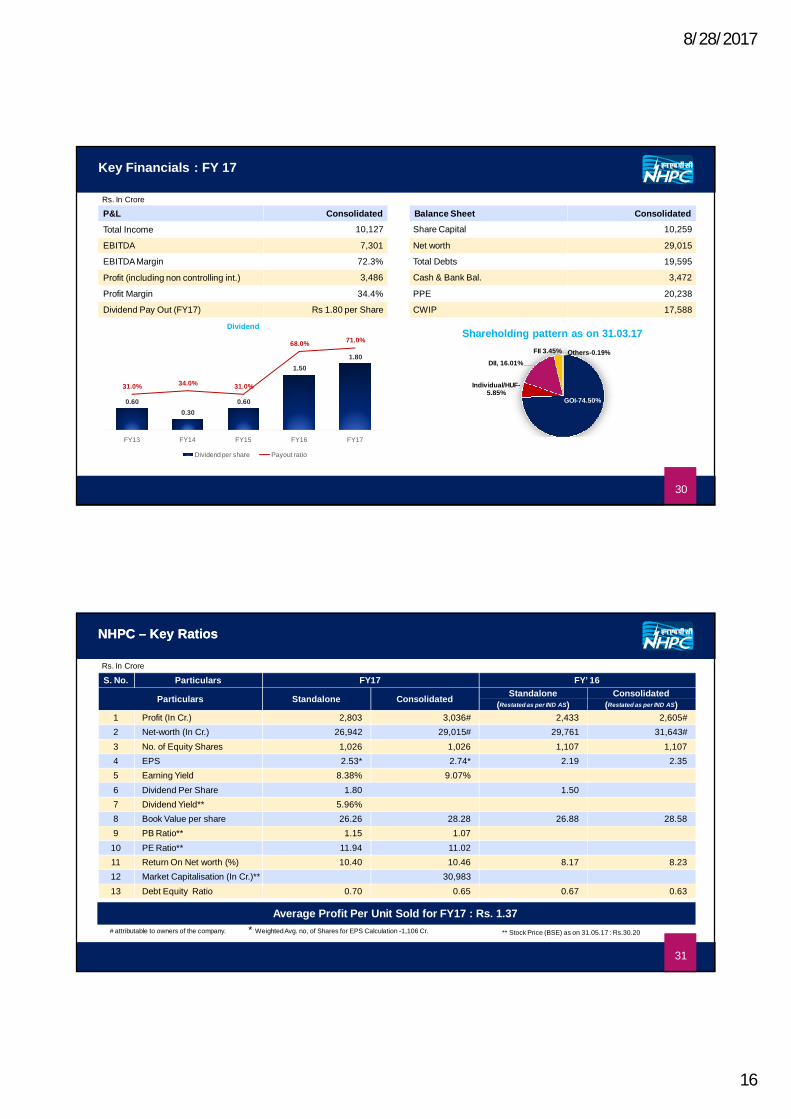
Key Financials : FY 17
Pipelined Projects
P&L ConsolidatedTotal Income 10,127
EBITDA 7,301
EBITDA Margin 72.3%
Profit (including non controlling int.) 3,486
Profit Margin 34.4%
Dividend Pay Out (FY17) Rs 1.80 per Share
Balance Sheet ConsolidatedShare Capital 10,259
Net worth 29,015
Total Debts 19,595
Cash & Bank Bal. 3,472
PPE 20,238
CWIP 17,588
Shareholding pattern as on 31.03.17FII 3.45%
GOI-74.50%
Individual/HUF-5.85%
DII, 16.01%Others-0.19%
Rs. In Crore
30
0.600.30
0.60
1.501.80
31.0% 34.0% 31.0%
68.0% 71.0%
FY13 FY14 FY15 FY16 FY17
Dividend
Dividend per share Payout ratio
Confidential
NHPC NHPC –– Key Key RatiosRatios
** Stock Price (BSE) as on 31.05.17 : Rs.30.20# attributable to owners of the company. * Weighted Avg. no, of Shares for EPS Calculation -1,106 Cr.
Average Profit Per Unit Sold for FY17 : Rs. 1.37
Rs. In Crore
31
S. No. Particulars FY17 FY’ 16
Particulars Standalone Consolidated Standalone Consolidated(Restated as per IND AS) (Restated as per IND AS)
1 Profit (In Cr.) 2,803 3,036# 2,433 2,605#2 Net-worth (In Cr.) 26,942 29,015# 29,761 31,643#3 No. of Equity Shares 1,026 1,026 1,107 1,1074 EPS 2.53* 2.74* 2.19 2.355 Earning Yield 8.38% 9.07%6 Dividend Per Share 1.80 1.507 Dividend Yield** 5.96%8 Book Value per share 26.26 28.28 26.88 28.589 PB Ratio** 1.15 1.07
10 PE Ratio** 11.94 11.0211 Return On Net worth (%) 10.40 10.46 8.17 8.2312 Market Capitalisation (In Cr.)** 30,98313 Debt Equity Ratio 0.70 0.65 0.67 0.63
8/28/2017
17
Corporate GovernanceCorporate Governance
Confidential
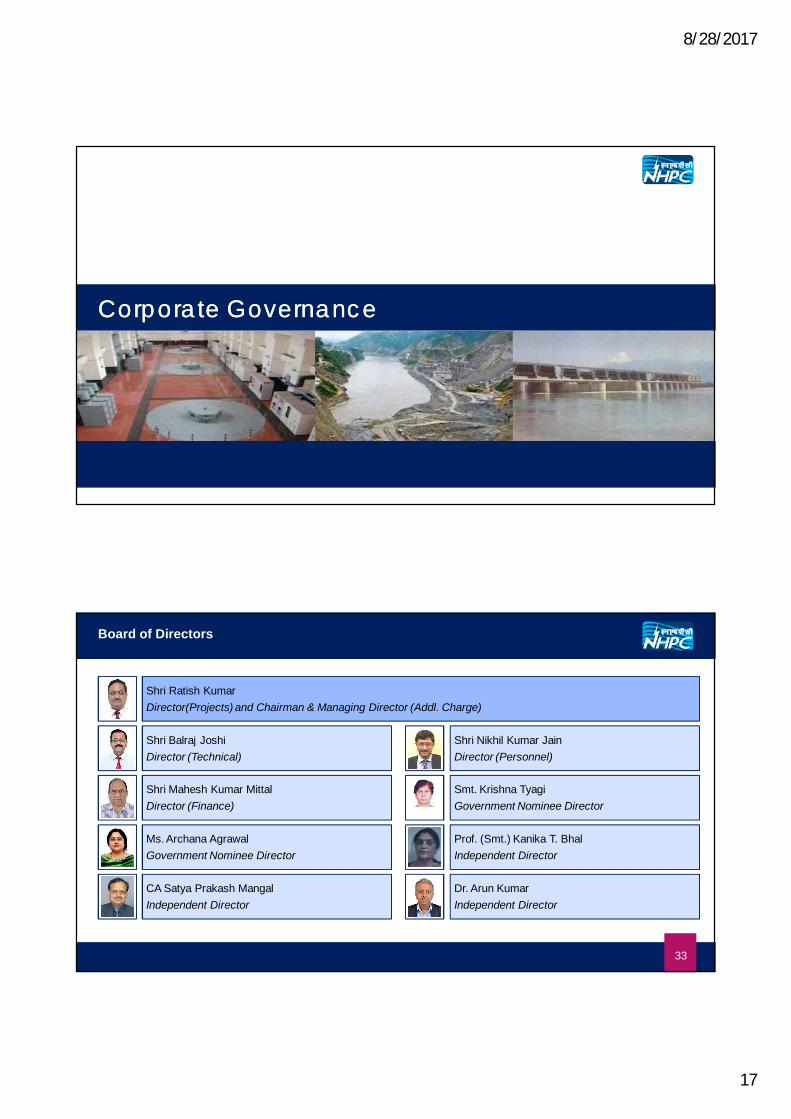
Board of Directors
Shri Ratish KumarDirector(Projects) and Chairman & Managing Director (Addl. Charge)
Shri Balraj JoshiDirector (Technical)
Shri Nikhil Kumar JainDirector (Personnel)
CA Satya Prakash MangalIndependent Director
Dr. Arun KumarIndependent Director
Shri Mahesh Kumar MittalDirector (Finance)
Smt. Krishna TyagiGovernment Nominee Director
Ms. Archana AgrawalGovernment Nominee Director
Prof. (Smt.) Kanika T. BhalIndependent Director
33
8/28/2017
18
CSR & Other initiativesCSR & Other initiatives
Confidential
Corporate Social Responsibility (Corporate Social Responsibility (CSR)CSR)
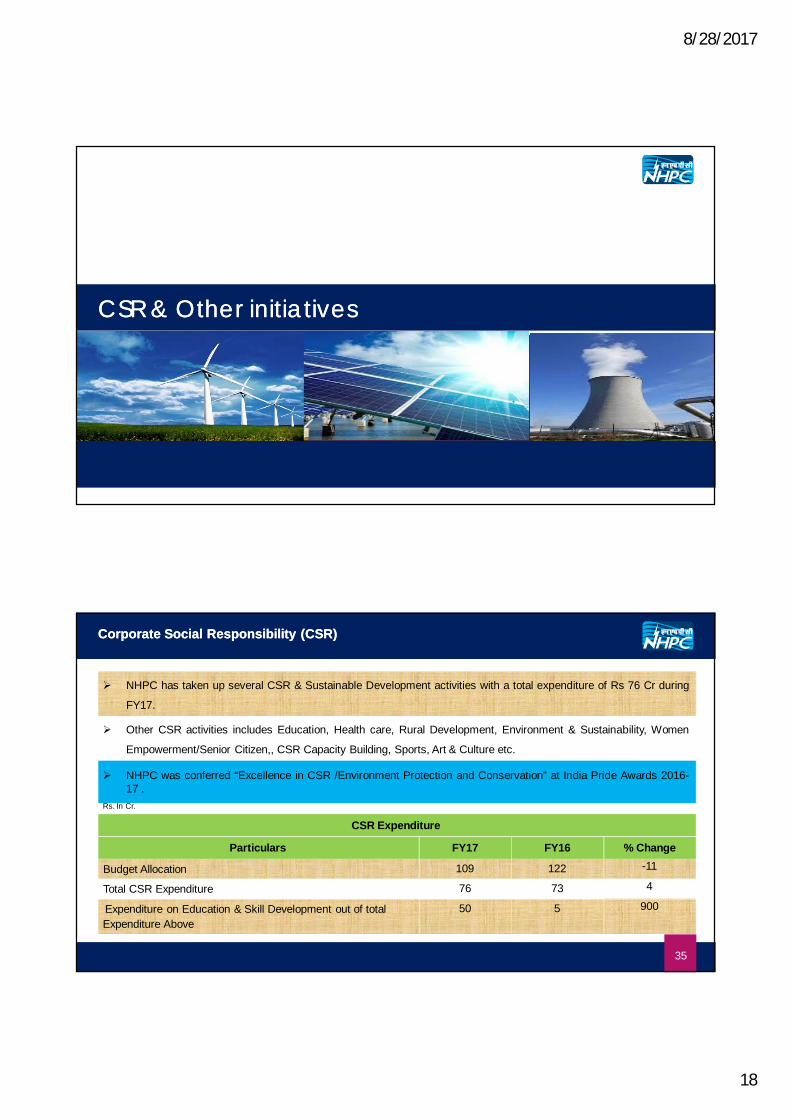
NHPC has taken up several CSR & Sustainable Development activities with a total expenditure of Rs 76 Cr during
FY17.
Other CSR activities includes Education, Health care, Rural Development, Environment & Sustainability, Women
Empowerment/Senior Citizen,, CSR Capacity Building, Sports, Art & Culture etc.
NHPC was conferred “Excellence in CSR /Environment Protection and Conservation” at India Pride Awards 2016-17 .
CSR Expenditure
Particulars FY17 FY16 % Change
Budget Allocation 109 122 -11
Total CSR Expenditure 76 73 4
Expenditure on Education & Skill Development out of total Expenditure Above
50 5 900
Rs. In Cr.
35
8/28/2017
19
Confidential
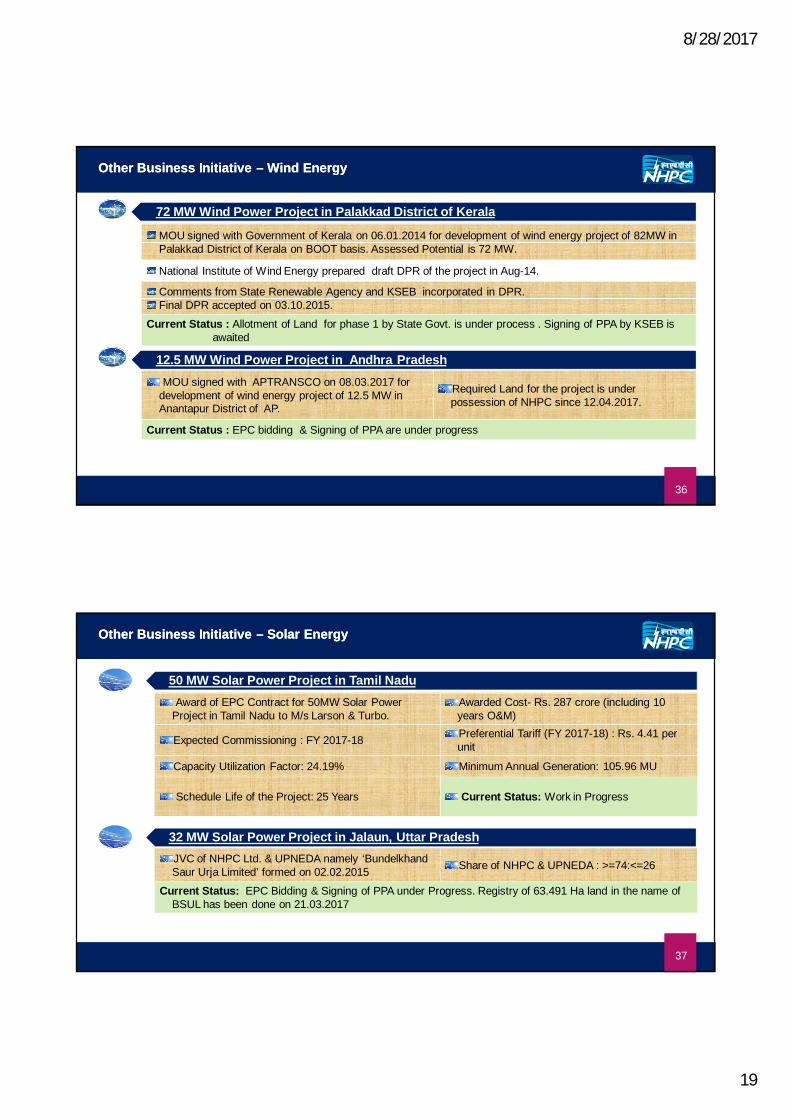
Other Business Initiative Other Business Initiative –– Wind Wind EnergyEnergy
MOU signed with Government of Kerala on 06.01.2014 for development of wind energy project of 82MW in Palakkad District of Kerala on BOOT basis. Assessed Potential is 72 MW.
National Institute of Wind Energy prepared draft DPR of the project in Aug-14.
Comments from State Renewable Agency and KSEB incorporated in DPR. Final DPR accepted on 03.10.2015.
Current Status : Allotment of Land for phase 1 by State Govt. is under process . Signing of PPA by KSEB is awaited
12.5 MW Wind Power Project in Andhra PradeshMOU signed with APTRANSCO on 08.03.2017 for
development of wind energy project of 12.5 MW in Anantapur District of AP.
Required Land for the project is under possession of NHPC since 12.04.2017.
Current Status : EPC bidding & Signing of PPA are under progress
72 MW Wind Power Project in Palakkad District of Kerala
36
Confidential
Other Business Initiative Other Business Initiative –– Solar Solar EnergyEnergy
50 MW Solar Power Project in Tamil NaduAward of EPC Contract for 50MW Solar Power
Project in Tamil Nadu to M/s Larson & Turbo.Awarded Cost- Rs. 287 crore (including 10 years O&M)
Expected Commissioning : FY 2017-18 Preferential Tariff (FY 2017-18) : Rs. 4.41 per unit
Capacity Utilization Factor: 24.19% Minimum Annual Generation: 105.96 MU
Schedule Life of the Project: 25 Years Current Status: Work in Progress
JVC of NHPC Ltd. & UPNEDA namely ‘Bundelkhand Saur Urja Limited’ formed on 02.02.2015 Share of NHPC & UPNEDA : >=74:<=26
Current Status: EPC Bidding & Signing of PPA under Progress. Registry of 63.491 Ha land in the name of BSUL has been done on 21.03.2017
32 MW Solar Power Project in Jalaun, Uttar Pradesh
37
8/28/2017
20
Confidential
Other Business Other Business InitiativeInitiative –– Thermal PowerThermal Power
MOU With BSPGCL & PIRPAINTI BIJLEE COMPANY 1,320 MW (660x2)
Supercritical Thermal Power Plant with installed capacity of 1,320 MW (2*660) to be developed through JVC in Pirpainti, Bhagalpur, Bihar.
MoU has been signed on 22.02.2014 amongst NHPC Ltd, Bihar State Power Generation Company Limited (BSPGCL) and Pirpainti Bijlee Company Pvt Limited (PBCPL).
NHPC will acquire 74% stake in PBCPL.
Current Status : PIB is under examination by Ministry of Power. Govt. of Bihar has applied for allocation of separate coal blocks to Pirpainti Project on 21.10.2016 to Ministry of Coal.
Power Station Having Best PAF during FY17 : URI II (81.70 % against NAPAF of 55%)
38
Confidential
39