presentation_2223_q1.pdf - lenovo investor relations
TRANSCRIPT
2022 Lenovo Internal. All rights reserved.
Q1FY23 Earnings AnnouncementAugust 10, 2022
Forward-Looking Statement
This presentation contains “forward-looking statements”, which are statements that refer to the expectations and plans for the future and include, without limitation, statements regarding Lenovo’s future results of operations, financial condition or business prospects as well as other statements based on projections, estimates and assumptions. In some cases, these statements can be identified by terms such as "expect," "intend," "plan," "believe," "estimate," "may," "will," "should" and comparable words (including negative variants of such words). These forward-looking statements, reflect the current expectations and plans of the directors and management of Lenovo, which may not materialize or may change. Many risks, uncertainties and other factors, some of which are unpredictable and beyond Lenovo’s control, could affect the matters discussed in these forward-looking statements. These factors include, without limitation, economic and business conditions globally and in the countries where we operate, Lenovo’s ability to predict and respond quickly to market developments, consumer demand, pricing trends and competition; changes in applicable laws and regulations (including applicable tax and tariff rates). Any variance from the expectations or plans on which theseforward-looking statements are based could cause Lenovo’s actual results or actions to differ materially from those expressed orimplied in these statements. These forward-looking statements are not guarantees of future performance and you are cautioned not to place undue reliance on these statements. Lenovo undertakes no obligation to update any forward-looking statements in this presentation, whether as a result of new information or any subsequent change, development or event. All forward-looking statements in this presentation are qualified by reference to this paragraph.
22022 Lenovo Internal. All rights reserved.
2022 Lenovo Internal. All rights reserved.
Yuanqing YangChairman & CEO
August 10, 2022

2022 Lenovo Internal. All rights reserved.2022 Lenovo Internal. All rights reserved.
• 9 consecutive quarters of
revenue & profitability
improvement
• 37% revenue mix of Non-PC
4
Group:New Engines Driving Growth & Profitability
Source: Internal
2022 Lenovo Internal. All rights reserved.2022 Lenovo Internal. All rights reserved.
Opportunities
Accelerated Digital/Intelligent
transformations:
• Hybrid work model to stay
• Strong, sustainable demand for:
• Smart devices/IoT
• Smart infrastructure
• Intelligent applications and
services
5
Group:New Engines Driving Growth & Profitability
Source: Industry Research

2022 Lenovo Internal. All rights reserved.2022 Lenovo Internal. All rights reserved.Source: Internal
Group Net Income ($M)
Group Revenue ($M)
Q1 21/22 Q2 21/22 Q3 21/22 Q4 21/22 Q1 22/23
• Net income $516 million, up
11% YTY; Non-HKFRS net
income1 $556 million, up 35%
YTY
• Revenue $17 billion, up 0.2%
YTY, up 5% in constant
currency
6
Performance
16,929 16,956
+0.2%
Group:New Engines Driving Growth & Profitability
1 Adjusted net income is not prepared in accordance with the Hong
Kong Financial Reporting Standards
9.6%
+11%
466516
0
0.2
0.4
0.6
0.8
1
1.2
0
100
200
300
400
500
600
Q1 21/22 Q1 22/23
+35%
413
556
0
0.2
0.4
0.6
0.8
1
1.2
0
100
200
300
400
500
600
Q1 21/22 Q1 22/23
Non-HKFRS Net Income1 ($M)

2022 Lenovo Internal. All rights reserved.2022 Lenovo Internal. All rights reserved.Source: Internal
• New growth engines all saw
double-digit revenue YTY growth
• SSG1: up 23% YTY
• ISG2: up 14% YTY
• MBG3: up 21% YTY
7
PerformanceGroup:New Engines Driving Growth & Profitability MBG Revenue($M)SSG Revenue($M)
23%
1,184
1,456
ISG Revenue($M)
Q1 21/22 Q1 22/23
14%
1,835
2,086
Q1 21/22 Q1 22/23 Q1 21/22 Q1 22/23
21%
1,797
2,175
1 SSG:Solutions & Services Group; 2 ISG : Infrastructure Solutions Group; 3 MBG:Mobile Business Group

2022 Lenovo Internal. All rights reserved.2022 Lenovo Internal. All rights reserved.
⚫ R&D investment up 10% YTY,
headcount up 29% YTY
⚫ Realizing ESG goals
⚫ Strengthen One Lenovo platform
Sustainable growth
8
Group:New Engines Driving Growth & Profitability
Source: Internal

2022 Lenovo Internal. All rights reserved.2022 Lenovo Internal. All rights reserved.
Trillion-dollar IT services market
keeps expanding
• Hybrid work model drives Premier &
Custom fulfillment services demand
• Digital workplace drives as-a-Service
demand
• Smart vertical solutions grow at
double-digit CAGR through 2025
Lenovo’s strategic intent:
Drive high growth in 3 high margin
service segments:
• Support Services
• Managed Services
• Project & Solution Services
Source: Industry Research
OpportunitiesSSGSolutions & Services Group:
Strong Growth, Higher Margin
9
2022 Lenovo Internal. All rights reserved.2022 Lenovo Internal. All rights reserved.
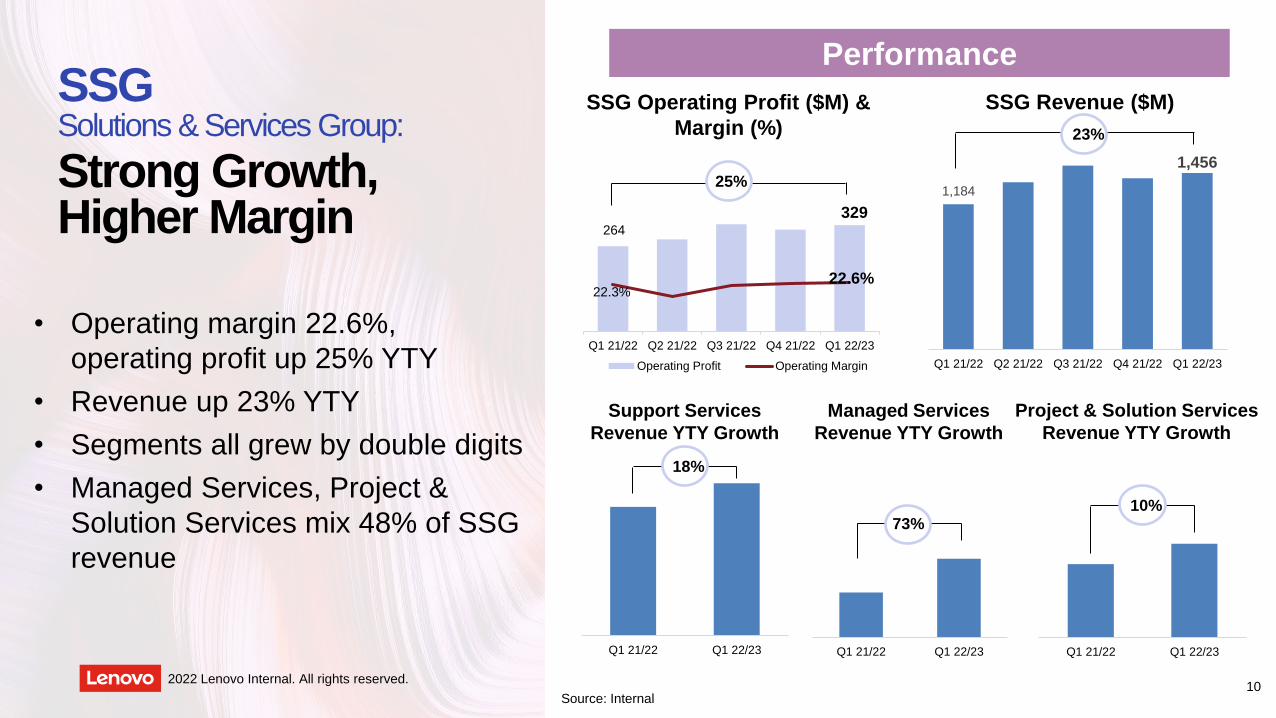
SSG Operating Profit ($M) &
Margin (%)
SSG Revenue ($M)
0.15
0.17
0.19
0.21
0.23
0.25
0.27
0.29
-50
50
150
250
350
Q1 21/22 Q2 21/22 Q3 21/22 Q4 21/22 Q1 22/23
Operating Profit Operating Margin
329
22.6%22.3%
264
1,184
1,456
Q1 21/22 Q2 21/22 Q3 21/22 Q4 21/22 Q1 22/23
Managed Services
Revenue YTY Growth
Project & Solution Services
Revenue YTY Growth
• Operating margin 22.6%,
operating profit up 25% YTY
• Revenue up 23% YTY
• Segments all grew by double digits
• Managed Services, Project &
Solution Services mix 48% of SSG
revenue
Source: Internal
Q1 21/22 Q1 22/23 Q1 21/22 Q1 22/23
10%73%
Support Services
Revenue YTY Growth
Q1 21/22 Q1 22/23
18%
23%
25%
SSGSolutions & Services Group:
Strong Growth, Higher Margin
Performance
10

2022 Lenovo Internal. All rights reserved.2022 Lenovo Internal. All rights reserved.
• Invest in software tools, platforms and
vertical solutions
• Expand TruScale portfolio to Digital
Workplace solutions market
• Launch hybrid/multi-cloud solutions
• Develop sustainability offerings
• Expand footprint with PCCW strategic
partnership
SSGSolutions & Services Group:
Strong Growth, Higher Margin
Sustainable growth
11

2022 Lenovo Internal. All rights reserved.2022 Lenovo Internal. All rights reserved.
ICT Infrastructure upgrade continues
By 2025:
• Server growth at double-digit CAGR
• Edge infrastructure to exceed $41 billion
• Storage to reach $36 billion
Lenovo’s strategic intent:
Full-stack infrastructure provider from
edge to cloud including hardware,
software & services
Sources: IDC, Industry research
Opportunities
12
ISGInfrastructure Solutions Group:
Record Revenue, Steady Profit Improvement
2022 Lenovo Internal. All rights reserved.2022 Lenovo Internal. All rights reserved.
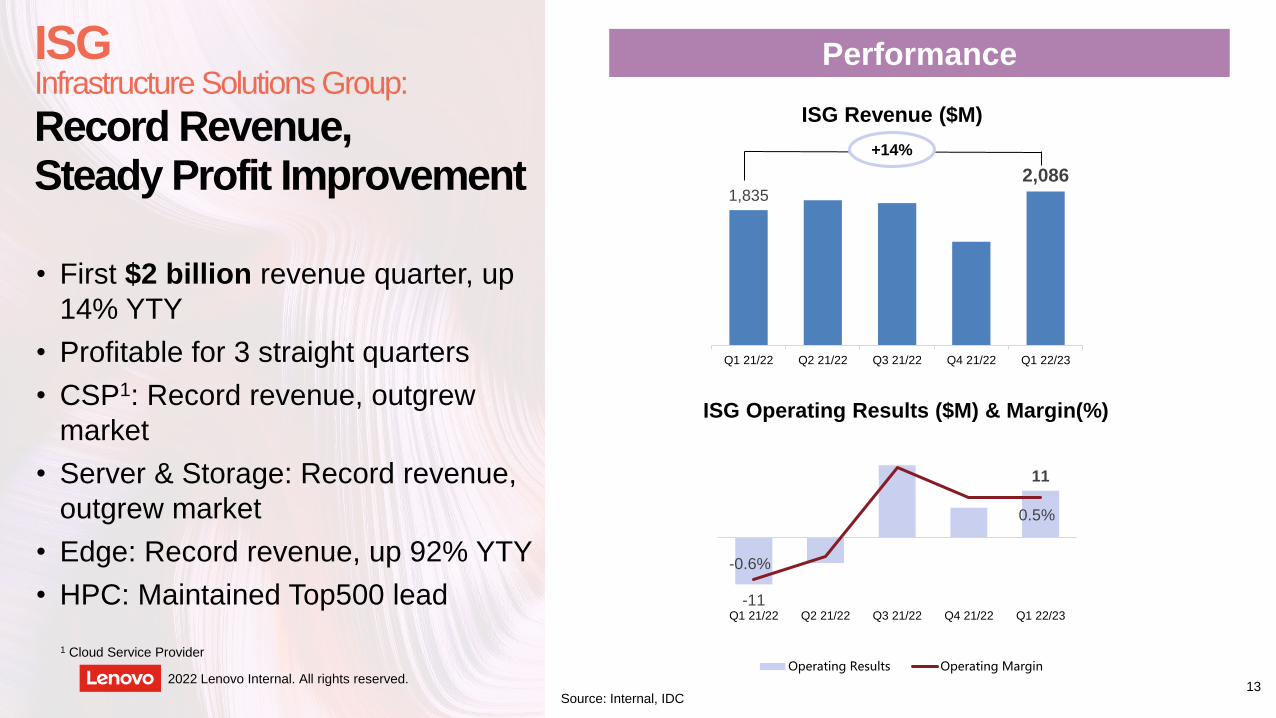
ISG Operating Results ($M) & Margin(%)
1 Cloud Service Provider
Source: Internal, IDC
• First $2 billion revenue quarter, up
14% YTY
• Profitable for 3 straight quarters
• CSP1: Record revenue, outgrew
market
• Server & Storage: Record revenue,
outgrew market
• Edge: Record revenue, up 92% YTY
• HPC: Maintained Top500 lead
ISG Revenue ($M)
1,835
2,086
Q1 21/22 Q2 21/22 Q3 21/22 Q4 21/22 Q1 22/23
+14%
-11
11
-0.6%
0.5%
-0.009
-0.007
-0.005
-0.003
-0.001
0.001
0.003
0.005
0.007
0.009
0.011
-15
-10
-5
0
5
10
15
20
Q1 21/22 Q2 21/22 Q3 21/22 Q4 21/22 Q1 22/23
Operating Results Operating Margin
ISGInfrastructure Solutions Group:
Record Revenue, Steady Profit Improvement
Performance
13
2022 Lenovo Internal. All rights reserved.2022 Lenovo Internal. All rights reserved.
• End-to-end infrastructure provider
• Invest in portfolio & innovation,
particularly in Edge & Services
• Drive in-house motherboard design &
manufacturing
• Balance scale & profitability
Sustainable growth
14
ISGInfrastructure Solutions Group:
Record Revenue, Steady Profit Improvement

2022 Lenovo Internal. All rights reserved.2022 Lenovo Internal. All rights reserved.
Hybrid work model brings growth
opportunities
• PC: TAM to be higher than pre-
pandemic level in longer term
• Smartphone/Tablet: Expansion
opportunity
• Smart Collaboration: expected to
exceed $80 billion by 2025
Source: Industry Research
IDGIntelligent Devices Group:
Market Leader Driven by Innovation
Opportunities
15
Lenovo’s strategic intent:
• Invest in innovation & premium
segments
• Expand business beyond PCs

2022 Lenovo Internal. All rights reserved.2022 Lenovo Internal. All rights reserved.
IDG Operating Profit ($M)
& Margin(%)
• Operating profit over $1 billion,
maintained leading profitability
• PC: solid #1, enlarged gap with
#2, premium segment revenue
grew 8% YTY
• Beyond-PC: revenue mix 22% of
IDG revenue
Source: Internal, IDC
1,095 1,070
7.5% 7.5%
3.0%
4.0%
5.0%
6.0%
7.0%
8.0%
9.0%
10.0%
-200
0
200
400
600
800
1000
1200
1400
Q1 21/22 Q2 21/22 Q3 21/22 Q4 21/22 Q1 22/23
Operating Profit Operating Margin
IDGIntelligent Devices Group:
Market Leader Driven by Innovation
Performance
14,666 14,274
Q1 21/22 Q2 21/22 Q3 21/22 Q4 21/22 Q1 22/23
IDG Revenue ($M)
PC Market Share(%)
78%
22%
PC
PC & Beyond-PC Revenue Mix (%)
Beyond-PC
Q1 21/22 Q2 21/22 Q3 21/22 Q4 21/22 Q1 22/23
Lenovo HP Dell Acer Apple
24.4%
16

2022 Lenovo Internal. All rights reserved.2022 Lenovo Internal. All rights reserved.
• Mobile: revenue up 21% YTY
• NA: up 14% YTY
• LA: up 21% YTY
• EMEA: up 24% YTY
• AP: up 56% YTY
Source: Internal
IDGIntelligent Devices Group:
Market Leader Driven by Innovation
Performance
17
NA MBG Revenue
YTY growth
EMEA MBG Revenue
YTY growth
LA MBG Revenue
YTY growth
AP MBG Revenue
YTY growth
Q1 21/22 Q1 22/23
14%
Q1 21/22 Q1 22/23
21%
Q1 21/22 Q1 22/23
24%
Q1 21/22 Q1 22/23
56%

2022 Lenovo Internal. All rights reserved.2022 Lenovo Internal. All rights reserved.
• Invest in innovation from smart
devices to smart collaboration to
smart spaces
• Focused on innovative form-factors,
extreme performance, adaptive
intelligence, security, etc.
• Provide seamless connection &
collaboration for digital workspace
IDGIntelligent Devices Group:
Market Leader Driven by Innovation
Sustainable growth
18
2022 Lenovo Internal. All rights reserved.
19
Based on New IT architecture of
“Client-Edge-Cloud-Network-Intelligence”
• Smart Devices to Smart Spaces
• Computer to Computing
• Traditional IT to Digital Industries
• Human to Planet

2022 Lenovo Internal. All rights reserved. 20
Transcend
the Cycle
• Right Strategy &
Strong Execution
• Agility & Resilience

2022 Lenovo Internal. All rights reserved.
Wong Wai MingChief Financial OfficerAugust 10, 2022
*all figures in the following slides are in million US$ unless otherwise stated

25
35
16
24
Q3 21/22
Revenue Contribution (%) & Growth by Geography
466 512
640
412
516
0.0%
20.0%
40.0%
60.0%
80.0%
100.0%
120.0%
100
200
300
400
500
600
700
800
900
1,000
Q121/22
Q221/22
Q321/22
Q421/22
Q122/23
Net Income1
Resilient Growth Amid Challenges
22
Performance
• Digital Transformation was a strong
driver for structural growth despite short-
term headwinds; revenue remained
stable – 5% YTY growth in constant
currency
• Record net income1 for Q1; non-HKFRS2
net income up 35% on robust profitability
• Net margin continued to improve YTY for
the 9th consecutive quarter, thanks to
operational excellence
• Strong expansion beyond PC; non-PC
businesses made up over 1/3 of Group
sales
2022 Lenovo Internal. All rights reserved.
16,929 17,869
20,127
16,694 16,956
Q121/22
Q221/22
Q321/22
Q421/22
Q122/23
Revenue
1 Profit attributable to equity holders; 2 Non-HKFRS measure was adjusted by adding
back (i) net fair value changes on financial assets at fair value through profit or loss,
(ii) amortization of intangible assets resulting from mergers and acquisitions, and (iii)
mergers and acquisitions related charges; and the corresponding income tax effects,
if any
+11% YTY
China
Asia Pacific
Americas
EMEA
-11% YTY
+1% YTY
+8% YTY
+1% YTY
Flat YTY
413
556
0.0%
20.0%
40.0%
60.0%
80.0%
100.0%
120.0%
-
100
200
300
400
500
600
Q121/22
Q122/23
Non-HKFRS2 Net Income
675
813
0.0%
20.0%
40.0%
60.0%
80.0%
100.0%
120.0%
- 100 200 300 400 500 600 700 800 900
Q121/22
Q122/23
Non-HKFRS2 Group Operating Profit
+21% YTY +35% YTY
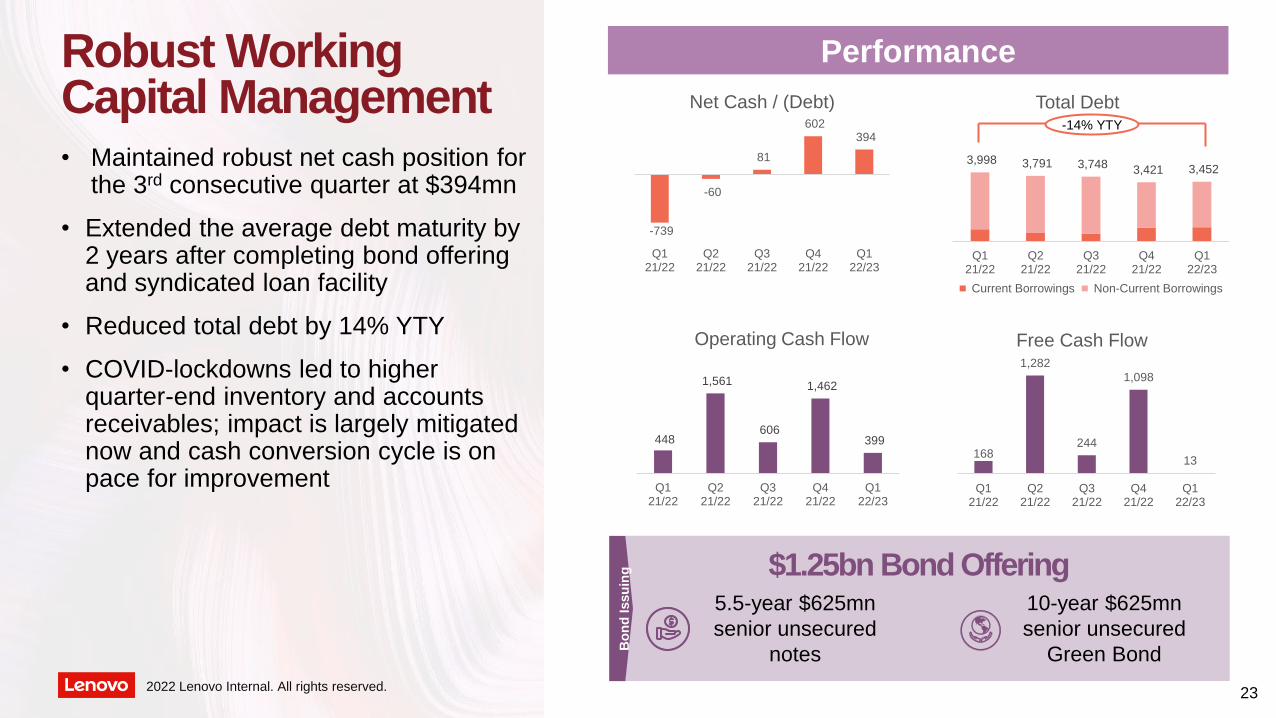
Robust Working Capital Management
23
• Maintained robust net cash position for the 3rd consecutive quarter at $394mn
• Extended the average debt maturity by 2 years after completing bond offering and syndicated loan facility
• Reduced total debt by 14% YTY
• COVID-lockdowns led to higher quarter-end inventory and accounts receivables; impact is largely mitigated now and cash conversion cycle is on pace for improvement
2022 Lenovo Internal. All rights reserved.
448
1,561
606
1,462
399
Q121/22
Q221/22
Q321/22
Q421/22
Q122/23
Operating Cash Flow
-739
-60
81
602 394
Q121/22
Q221/22
Q321/22
Q421/22
Q122/23
Net Cash / (Debt)
168
1,282
244
1,098
13
Q121/22
Q221/22
Q321/22
Q421/22
Q122/23
Free Cash Flow
Bo
nd
Issu
ing
$1.25bn Bond Offering5.5-year $625mn
senior unsecured
notes
10-year $625mn
senior unsecured
Green Bond
3,998 3,791 3,748 3,421 3,452
-
1,000
2,000
3,000
4,000
5,000
6,000
Q121/22
Q221/22
Q321/22
Q421/22
Q122/23
Total Debt
Current Borrowings Non-Current Borrowings
-14% YTY
Performance

242022 Lenovo Internal. All rights reserved.
SSGSolutions & Services Group
• Revenue and operating profit maintained
strong growth above 20% YTY; double-
digit YTY revenue growth for all three
services segments
• Record operating profit margin
showcases resilience and robust
profitability
• Deferred revenue up 20% YTY
• Strategic partnership with PCCW to
accelerate market penetration and
growth potential
264 285 332 315 329
22.3%
20.9%
22.2% 22.5% 22.6%
14.0%
16.0%
18.0%
20.0%
22.0%
24.0%
-
100
200
300
400
500
600
700
Q1 21/22 Q2 21/22 Q3 21/22 Q4 21/22 Q1 22/23
Operating Profit and Margin
Operating profit Operating margin
+25% YTY
2,430 2,571 2,777 2,900 2,918
Q121/22
Q221/22
Q321/22
Q421/22
Q122/23
Deferred Revenue
+20% YTY
1,184 1,363
1,498 1,396 1,456
-
500
1,000
1,500
2,000
2,500
Q121/22
Q221/22
Q321/22
Q421/22
Q122/23
Revenue
+23% YTY
Managed Services achieved
73%hypergrowth YTY thanks to
strong as-a-Service
momentum
Rising Rate
of penetration in Support
Services
& enhanced portfolio
Double
DigitYTY growth in
total contract value
for Vertical Solutions
Performance
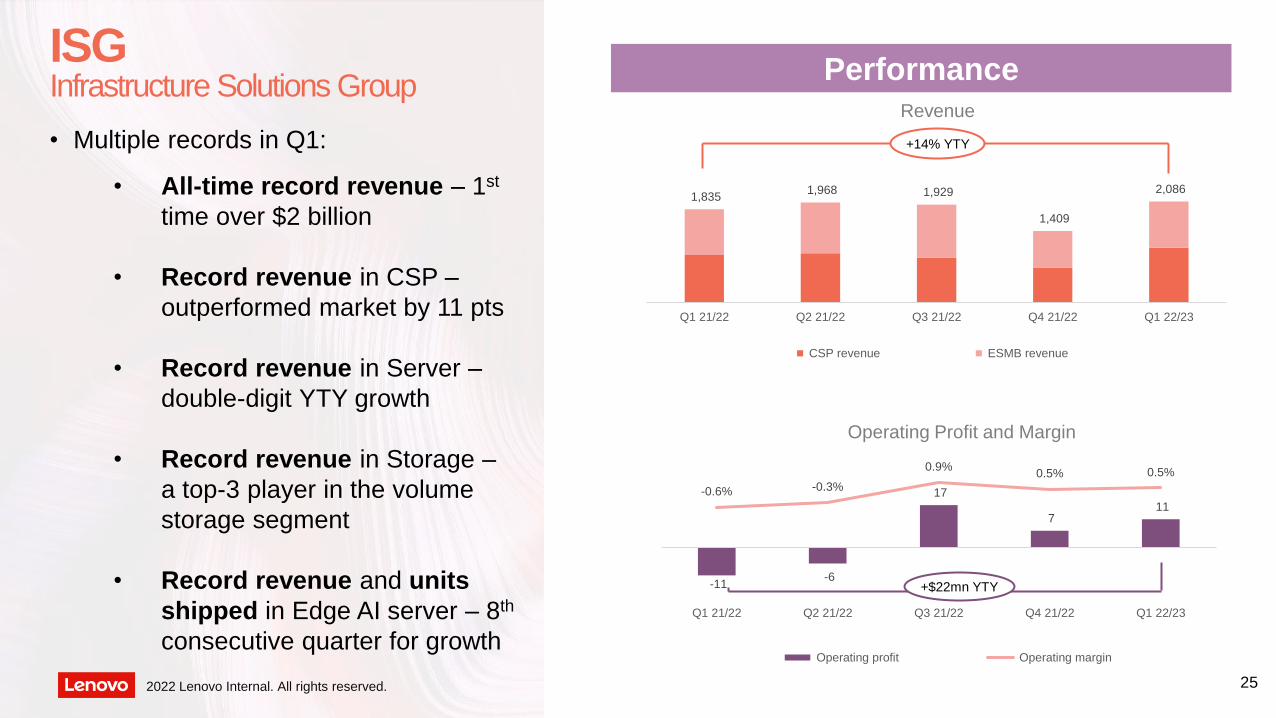
1,835 1,968 1,929
1,409
2,086
-
500
1,000
1,500
2,000
2,500
3,000
Q1 21/22 Q2 21/22 Q3 21/22 Q4 21/22 Q1 22/23
CSP revenue ESMB revenue
ISGInfrastructure Solutions Group
252022 Lenovo Internal. All rights reserved.
Revenue
-11 -6
17
7 11
-0.6% -0.3%
0.9%0.5% 0.5%
-6.0%
-5.0%
-4.0%
-3.0%
-2.0%
-1.0%
0.0%
1.0%
-20 -15 -10
-5 - 5
10 15 20 25 30
Q1 21/22 Q2 21/22 Q3 21/22 Q4 21/22 Q1 22/23
Operating profit Operating margin
Operating Profit and Margin
+14% YTY
+$22mn YTY
Performance
• Multiple records in Q1:
• All-time record revenue – 1st
time over $2 billion
• Record revenue in CSP –
outperformed market by 11 pts
• Record revenue in Server –
double-digit YTY growth
• Record revenue in Storage –
a top-3 player in the volume
storage segment
• Record revenue and units
shipped in Edge AI server – 8th
consecutive quarter for growth

14,666 15,339
17,610
14,696 14,274
-
2,000
4,000
6,000
8,000
10,000
12,000
14,000
16,000
18,000
20,000
Q1 21/22 Q2 21/22 Q3 21/22 Q4 21/22 Q1 22/23
IDG Revenue
PC revenue Non-PC revenue
IDGIntelligent Devices Group1
262022 Lenovo Internal. All rights reserved.
• Premium-to-market growth for the PC
segment despite challenges in supply
and consumer demand
• Operating profit margin remained
robust, thanks to an enriched
commercial and premium sales mix
• Non-PC sales grew 12% YTY to
contribute 22% of the IDG mix, based
on its strength in
smartphone, accessories, visual and
Smart Collaboration Solutions
• Mobile revenue grew 21% YTY
• Smart Collaboration Solutions grew by
high double-digits, securing key wins
across all regions
1 IDG mainly consists of PC, tablet, smartphone, and smart devices business 2 Non-PC includes other
smart devices, smartphones, tablets, embedded computing/IoT, and scenario-based solutions such as
Small Collaboration, Smart Home and Smart Office
1,095 1,165 1,352
1,126 1,070
7.5%7.6% 7.7% 7.7%
7.5%
5.00%
5.50%
6.00%
6.50%
7.00%
7.50%
8.00%
-
500
1,000
1,500
2,000
2,500
Q1 21/22 Q2 21/22 Q3 21/22 Q4 21/22 Q1 22/23
Operating profit Operating margin
Operating Profit and Margin
-3% YTY
-2% YTY
Performance
1,797 1,931
2,217 1,957
2,175
-
500
1,000
1,500
2,000
2,500
Q1 21/22 Q2 21/22 Q3 21/22 Q4 21/22 Q1 22/23
Mobile Revenue
+21% YTY

743 817
932
589
777
4.4%4.6% 4.6%
3.5%
4.6%
-1.0%
0.0%
1.0%
2.0%
3.0%
4.0%
5.0%
-100
100
300
500
700
900
1,100
1,300
1,500
Q1 21/22 Q2 21/22 Q3 21/22 Q4 21/22 Q1 22/23
Group Operating Profit & Margin
Operating profit Operating margin
466 482 549 576
511
2.8% 2.7% 2.7%
3.4%
3.0%
0.0%
0.5%
1.0%
1.5%
2.0%
2.5%
3.0%
3.5%
4.0%
-100
100
300
500
700
900
1,100
1,300
1,500
Q1 21/22 Q2 21/22 Q3 21/22 Q4 21/22 Q1 22/23
R&D Expenses and Ratio to Revenue
R&D expense R&D ratio
Continuous R&D Spending to Drive Innovation and Margin Improvement
27
• R&D spending grew 10%, contributing to
operating margin improvement
• R&D spending areas:
• High-value added products and
key components
• Edge, Multi-Cloud and Cloud-
related software and hardware
• 5G networking capabilities
• AI enabled solutions and service
offerings
2022 Lenovo Internal. All rights reserved.
+10% YTY
+5% YTY
Performance
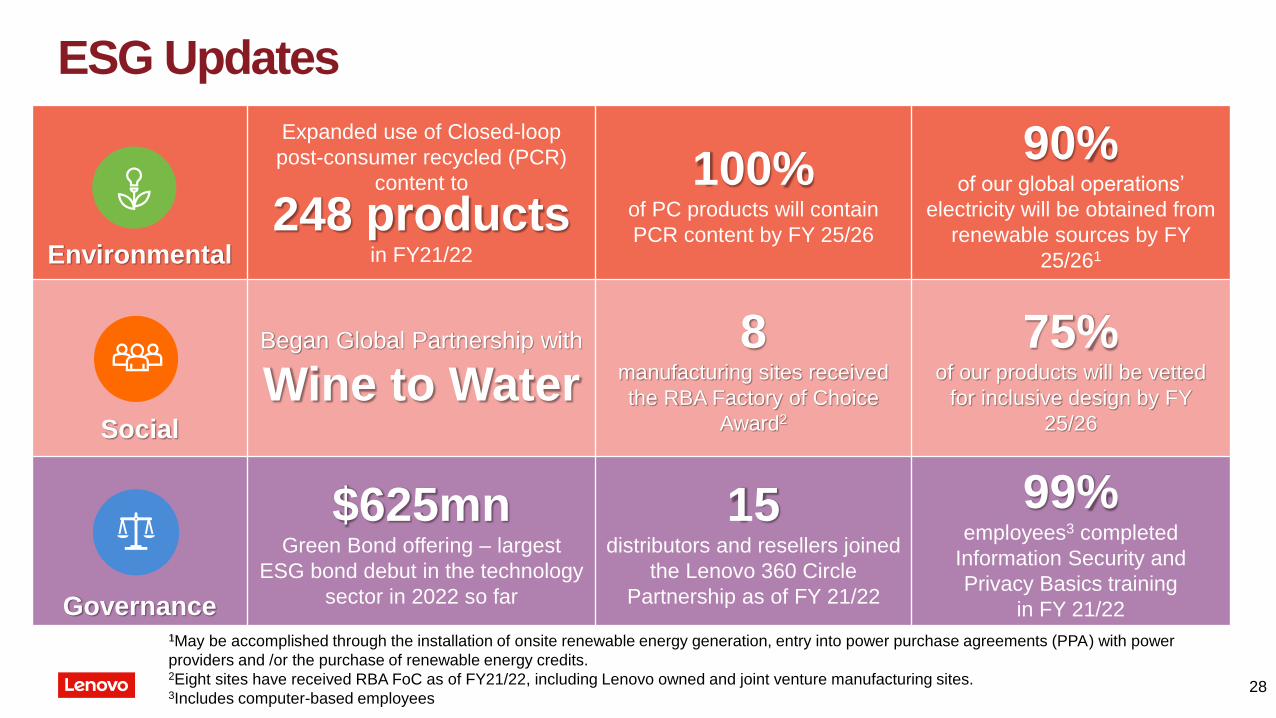
ESG Updates
28
Environmental
Expanded use of Closed-loop
post-consumer recycled (PCR)
content to
248 products in FY21/22
100%of PC products will contain
PCR content by FY 25/26
90% of our global operations’
electricity will be obtained from
renewable sources by FY
25/261
Social
Began Global Partnership with
Wine to Water8
manufacturing sites received
the RBA Factory of Choice
Award2
75%of our products will be vetted
for inclusive design by FY
25/26
Governance
$625mn Green Bond offering – largest
ESG bond debut in the technology
sector in 2022 so far
15distributors and resellers joined
the Lenovo 360 Circle
Partnership as of FY 21/22
99%employees3 completed
Information Security and
Privacy Basics training
in FY 21/22
1May be accomplished through the installation of onsite renewable energy generation, entry into power purchase agreements (PPA) with power
providers and /or the purchase of renewable energy credits.2Eight sites have received RBA FoC as of FY21/22, including Lenovo owned and joint venture manufacturing sites. 3Includes computer-based employees
2022 Lenovo Internal. All rights reserved.
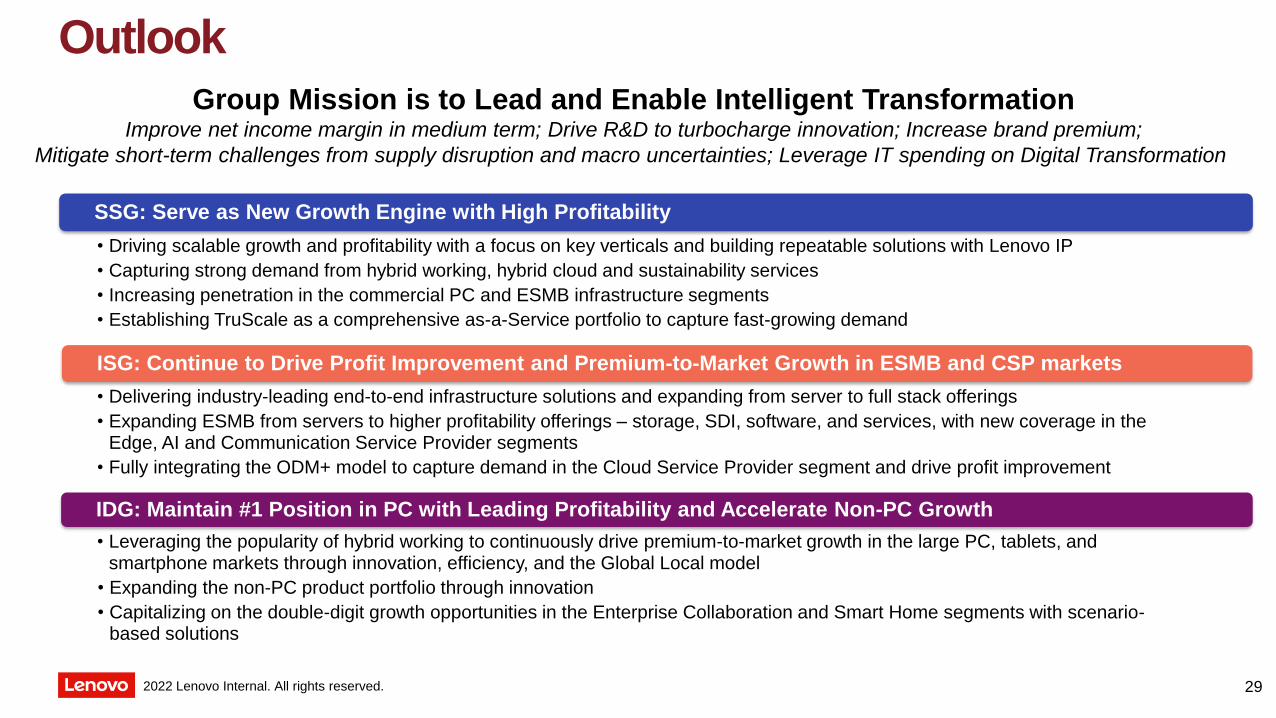
• Driving scalable growth and profitability with a focus on key verticals and building repeatable solutions with Lenovo IP
• Capturing strong demand from hybrid working, hybrid cloud and sustainability services
• Increasing penetration in the commercial PC and ESMB infrastructure segments
• Establishing TruScale as a comprehensive as-a-Service portfolio to capture fast-growing demand
SSG: Serve as New Growth Engine with High Profitability
• Delivering industry-leading end-to-end infrastructure solutions and expanding from server to full stack offerings
• Expanding ESMB from servers to higher profitability offerings – storage, SDI, software, and services, with new coverage in the Edge, AI and Communication Service Provider segments
• Fully integrating the ODM+ model to capture demand in the Cloud Service Provider segment and drive profit improvement
ISG: Continue to Drive Profit Improvement and Premium-to-Market Growth in ESMB and CSP markets
• Leveraging the popularity of hybrid working to continuously drive premium-to-market growth in the large PC, tablets, and smartphone markets through innovation, efficiency, and the Global Local model
• Expanding the non-PC product portfolio through innovation
• Capitalizing on the double-digit growth opportunities in the Enterprise Collaboration and Smart Home segments with scenario-based solutions
IDG: Maintain #1 Position in PC with Leading Profitability and Accelerate Non-PC Growth
Outlook
29
Group Mission is to Lead and Enable Intelligent TransformationImprove net income margin in medium term; Drive R&D to turbocharge innovation; Increase brand premium;
Mitigate short-term challenges from supply disruption and macro uncertainties; Leverage IT spending on Digital Transformation

Supplemental Financial Materials
302022 Lenovo Internal. All rights reserved.
- Financial Summary
- Condensed Consolidated Income Statement- Condensed Consolidated Balance Sheet- Condensed Consolidated Cash Flow Statement- Supplemental Non-HKRFS Measures

2022 Lenovo Internal. All rights reserved.
Financial Summary
31
US$ Million Q1 21/22 Q1 22/23 Y/Y%
Revenue 16,929 16,956 0%
Gross profit 2,824 2,869 2%
Operating expenses (2,081) (2,092) 1%
Operating profit 743 777 5%
Operating profit (non-HKRFS) 675 813 21%
Other non-operating expenses (93) (86) -8%
Profit before taxation 650 691 6%
Profit before taxation (non-HKRFS) 585 729 25%
Taxation (165) (152) -8%
Profit for the period 485 539 11%
Profit for the period (non-HKRFS) 428 569 33%
Profit attributable to
Other non-controlling interests 19 23 24%
Equity holders of the Company 466 516 11%
Equity holders of the Company (non-HKRFS) 413 556 35%
EPS (US cents)
Basic 4.02 4.39 9%
Diluted 3.53 4.01 14%
Q1 21/22 Q1 22/23
Gross margin 16.7% 16.9%
Operating margin 4.4% 4.6%
E/R ratio 12.3% 12.3%
PTI margin 3.8% 4.1%
Net margin 2.8% 3.0%

Condensed Consolidated Income Statement
32
US$ Million Q1 21/22 Q1 22/23
Revenue 16,929 16,956
Cost of sales (14,105) (14,087)
Gross profit 2,824 2,869
Selling and distribution expenses (847) (879)
Administrative expenses (812) (688)
Research and development expenses (466) (511)
Other operating income/(expenses) – net 44 (14)
Operating profit 743 777
Finance income 9 19
Finance costs (101) (100)
Share of losses of associates and joint venture (1) (5)
Profit before taxation (PTI) 650 691
Taxation (165) (152)
Profit for the period 485 539
Profit attributable to
Other non-controlling interests 19 23
Equity holders of the Company 466 516
Per share data
Earnings per share (US cents) – Basic 4.02 4.39
Earnings per share (US cents) – Diluted 3.53 4.01
2022 Lenovo Internal. All rights reserved.
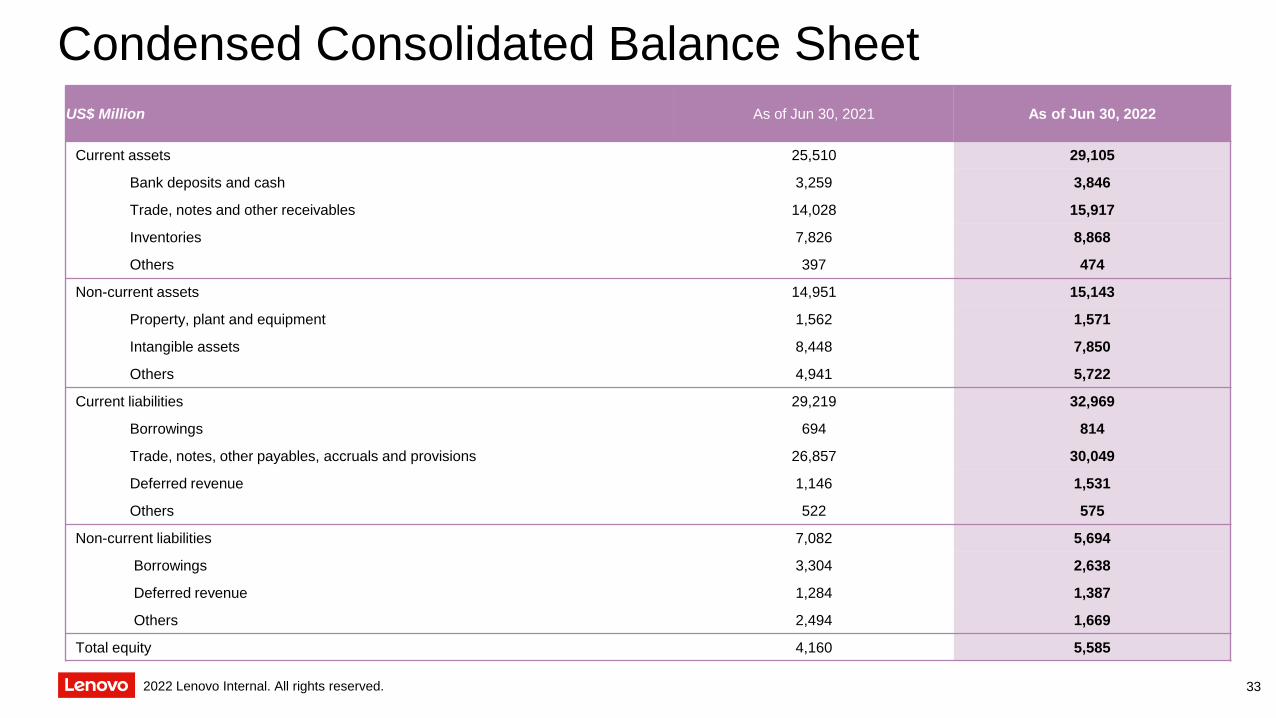
Condensed Consolidated Balance Sheet
332022 Lenovo Internal. All rights reserved.
US$ Million As of Jun 30, 2021 As of Jun 30, 2022
Current assets 25,510 29,105
Bank deposits and cash 3,259 3,846
Trade, notes and other receivables 14,028 15,917
Inventories 7,826 8,868
Others 397 474
Non-current assets 14,951 15,143
Property, plant and equipment 1,562 1,571
Intangible assets 8,448 7,850
Others 4,941 5,722
Current liabilities 29,219 32,969
Borrowings 694 814
Trade, notes, other payables, accruals and provisions 26,857 30,049
Deferred revenue 1,146 1,531
Others 522 575
Non-current liabilities 7,082 5,694
Borrowings 3,304 2,638
Deferred revenue 1,284 1,387
Others 2,494 1,669
Total equity 4,160 5,585

Condensed Consolidated Cash Flow Statement
34
US$ Million Q1 21/22 Q1 22/23
Net cash generated from operating activities 448 399
Net cash used in investing activities (192) (388)
Net cash used in financing activities (180) (8)
Increase in cash and cash equivalents 76 3
Effect of foreign exchange rate changes 32 (145)
Cash and cash equivalents at the beginning of the period 3,068 3,930
Cash and cash equivalents at the end of the period 3,176 3,788
2022 Lenovo Internal. All rights reserved.
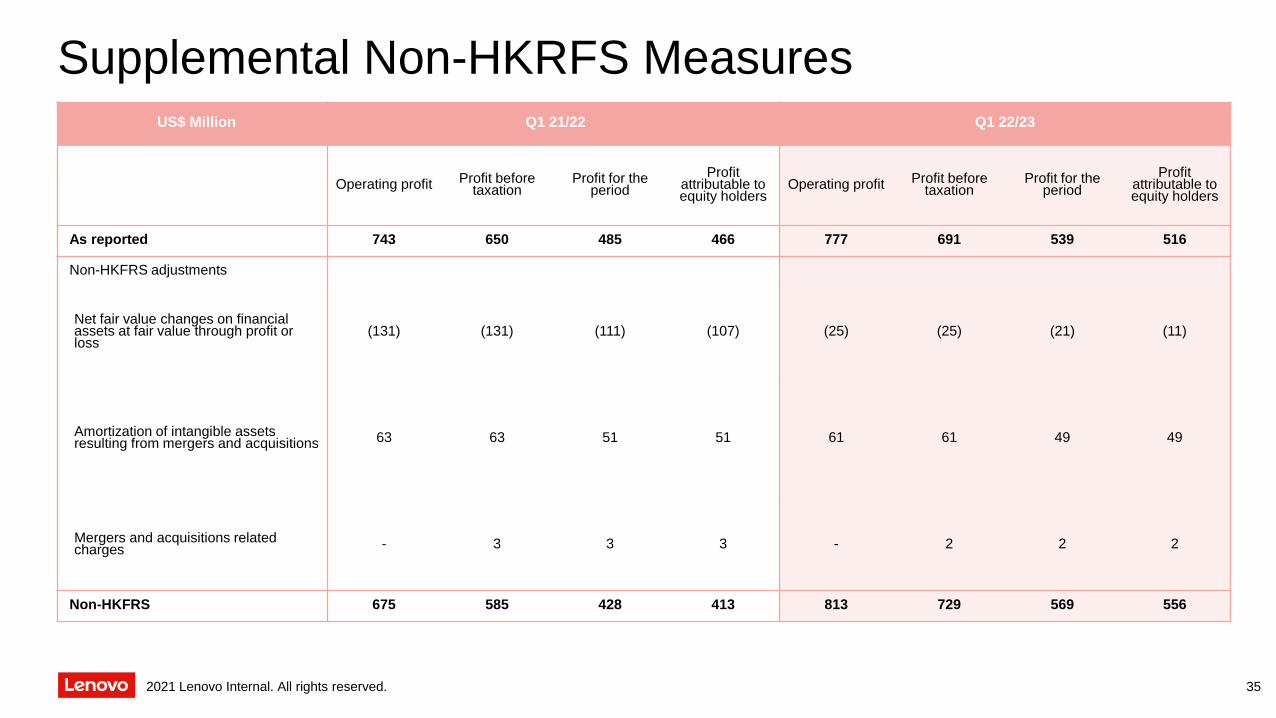
Supplemental Non-HKRFS Measures
2021 Lenovo Internal. All rights reserved. 35
US$ Million Q1 21/22 Q1 22/23
Operating profit Profit before taxation
Profit for the period
Profit attributable to equity holders
Operating profit Profit before taxation
Profit for the period
Profit attributable to equity holders
As reported 743 650 485 466 777 691 539 516
Non-HKFRS adjustments
Net fair value changes on financial assets at fair value through profit or loss
(131) (131) (111) (107) (25) (25) (21) (11)
Amortization of intangible assets resulting from mergers and acquisitions 63 63 51 51 61 61 49 49
Mergers and acquisitions related charges - 3 3 3 - 2 2 2
Non-HKFRS 675 585 428 413 813 729 569 556