unique responses of midbrain cart neurons in macaques to ovarian steroids
TRANSCRIPT
Unique Responses of Midbrain CART Neurons in Macaques toOvarian Steroids
F.B. Limaa, J.A. Hendersona, A.P. Reddya, Y. Tokuyamaa, G. W. Hubertc, M.J. Kuharc, andC.L. Betheaa,b
aDivision of Reproductive Sciences, Oregon National Primate Research Center, Beaverton, Oregon, 97006,USA
bDivision of Neuroscience, Oregon National Primate Research Center, Beaverton, Oregon, 97006, USA
cDivision of Neuroscience, Yerkes National Primate Research Center of Emory University, Atlanta, Georgia,30329, USA
AbstractCART (cocaine and amphetamine regulated transcript) is a neuropeptide involved in the control ofseveral physiological processes, such as response to psychostimulants, food intake, depressivediseases and neuroprotection. It is robustly expressed in the brain, mainly in regions that controlemotional and stress responses and it is regulated by estrogen in the hypothalamus. There is a distinctpopulation of CART neurons located in the vicinity of the Edinger-Westphal nucleus of the midbrainthat also colocalize urocortin-1. The aims of this study were 1) to determine the distribution of CARTimmunoreactive neurons in the monkey midbrain, 2) to examine the effects of estrogen (E) andprogesterone (P) on midbrain CART mRNA and peptide expression and 3) to determine whethermidbrain CART neurons contain steroid receptors. Adult female rhesus monkeys (Macacamulatta) were spayed and either treated with placebo (OVX), estrogen alone (E), progesterone alone(P) or E + P. Animals were prepared (a) for RNA extraction followed by microarray analysis andquantitative (q) RT-PCR (n=3/group); (b) for immunohistochemical analysis of CART and CART+tryptophan hydroxylase (TPH), CART+estrogen receptors (ER) or CART+progesterone receptors(n=5/group) and (c) for western blots (n=3/group). Both E− and E+P-administration decreased CARTgene expression on the microarray and with qRT-PCR. Stereological analysis of CARTimmunostaining at five levels of the Edinger-Westphal nucleus indicated little effect of E or E + Padministration on the area of CART immunostaining. However, P administration increased CART-immunopositive area in comparison to the OVX control group with Student’s t-test, but not withANOVA. CART 55–102 detection on western blot was unchanged by hormone administration.ERβand PR were detected in CART neurons and CART fibers appeared to innervate TPH-positiveserotonin neurons in the dorsal raphe. In summary, E decreased CART mRNA, but this effect didnot translate to the protein level. Moreover, P administration alone had a variable effect on CARTmRNA, but it caused an increase in CART immunostaining. Together, the data suggest that CARTneurons in the midbrain have a unique steroid response, which may be mediated by nuclear receptors,neuroactive steroids or interneurons.
Corresponding author: Cynthia L. Bethea, Division of Reproductive Sciences, Oregon National Primate Research Center, 505 NW185th Avenue Beaverton, OR 97006, USA. Fax: +1 503 690 5384. E-mail addresses: [email protected]'s Disclaimer: This is a PDF file of an unedited manuscript that has been accepted for publication. As a service to our customerswe are providing this early version of the manuscript. The manuscript will undergo copyediting, typesetting, and review of the resultingproof before it is published in its final citable form. Please note that during the production process errors may be discovered which couldaffect the content, and all legal disclaimers that apply to the journal pertain.
NIH Public AccessAuthor ManuscriptBrain Res. Author manuscript; available in PMC 2009 August 28.
Published in final edited form as:Brain Res. 2008 August 28; 1227: 76–88. doi:10.1016/j.brainres.2008.05.078.
NIH
-PA Author Manuscript
NIH
-PA Author Manuscript
NIH
-PA Author Manuscript
KeywordsCocaine and amphetamine regulated transcript (CART); estrogen; progesterone; serotonin; Edinger-Westphal nucleus
INTRODUCTIONCocaine and amphetamine regulated transcript (CART) is a novel peptide which was originallydescribed by Douglass et al. (1995) in the rat striatum as a transcript regulated by acute cocaineand amphetamine administration. CART mRNA and protein are expressed in various areas ofthe brain of humans, monkeys and rats, including hypothalamus, pituitary and adrenal(Douglass et al. 1995; Vrang 2006; Koylu et al. 1997; Valera et al. 2006); limbic system (Hurd& Fagergren 2000), and sensory cortex (Hurd & Fagergren 2000). CART is modified by post-translational processing and several CART peptide fragments exist in the brain (Dylag et al.,2006; Thim et al. 1999; Kuhar & Yoho 1999). However, CART- (55–102) is the best describedfragment and it shows the most diverse profile of biological actions (Kristensen et al. 1998;Bannon et al. 2001).
CART is robustly expressed in the hypothalamic paraventricular nucleus (PVN) and in thelocus coeruleus, both of which control stress responses (Koylu et al. 2006). Moreover in PVN,the CRH-immunoreactive neurons are activated by i.c.v. injection of CART-(55–102) (Vranget al. 2000). Also, CART- (55–102) markedly induces plasma adrenocorticotropic hormone(ACTH) and corticosterone levels in male rats (Stanley et al. 2001). In vitro, CART- (55–102)increases release of CRH from hypothalamic explants (Stanley et al. 2001). Together, thesedata suggest that CART-(55–102) may activate the hypothalamus–pituitary–adrenal axis,possibly by interacting with the CRH system, thereby controlling emotional and stressresponses (Chaki et al. 2003).
CART mRNA is robustly expressed in the Edinger-Westphal nucleus in humans (Hurd &Fagergren 2000) and rats (Kozicz 2003). Moreover in rats, CART colocalizes with urocortin-1in the Edinger-Westphal nucleus (Kozicz 2003) and urocortin-1 expressed the Edinger-Westphal nucleus plays a role in the regulation of the hypothalamus-pituitary-axis in responseto stress (Weninger et al. 1999; Skelton et al. 2000; Gaszner et al. 2004; Kozicz 2007). CARTand urocortins-1 are present in fiber terminals that project to the lateral septal nucleus (LS) aswell. However, the anatomy of the Edinger-Westphal nucleus in monkeys differs from that ofhumans. In monkey, the Edinger-Westphal nucleus contains choline acetyltransferase-positive,presumed pre-ganglionic neurons of the ciliary ganglion whereas the human Edinger-Westphalconsists of noncholingeric urocortin-positive neurons (Horn et al., 2008). We found that theanatomical distribution of the midbrain CART neurons in the monkey is identical to that of themidbrain urocortins-1 neurons as recently described (May et al., 2008). Hence in monkey,midbrain CART neurons are located between the Edinger-Westphal nucleus and theocculomotor (III) nucleus.
We previously conducted a microarray analysis on a small block of tissue that contained thedorsal raphe nucleus from ovariectomized (OVX) monkeys treated with placebo or ovariansteroids (Reddy & Bethea 2005). Data from the human Affymetrix chip indicated that CARTmRNA was present in the block and that it was significantly decreased by estrogen (E) and E+ progesterone (E+P). These data suggested that the Edinger-Westphal region might be partof the block and that midbrain CART may be regulated by ovarian steroids. We sought toconfirm the data from the human array and re-probed new Rhesus Affymetrix gene chips withthe same RNA from the midbrain blocks. In addition, we characterized CART mRNAexpression with quantitative (q) RT-PCR.
Lima et al. Page 2
Brain Res. Author manuscript; available in PMC 2009 August 28.
NIH
-PA Author Manuscript
NIH
-PA Author Manuscript
NIH
-PA Author Manuscript

Based upon the expression of CART mRNA, we then examined the distribution of CARTimmunoreactive neurons in the monkey midbrain and determined the effects of steroidadministration on CART protein expression. In addition, we determined whether CARTneurons express estrogen and/or progesterone receptors (ERα, ERβ and PR, respectively) andwhether CART neurons project to serotonin neurons of the dorsal raphe nucleus.
RESULTS1. CART microarray in blocks from dorsal raphe nucleus in macaques
RNA extracted from midbrain tissue blocks was hybridized to Affymetrix Rhesus Gene Chipsand analyzed with GeneSifter software (n=3 animals/group). The results of the analysis ofCART gene expression are shown in Figure 1. The P group was elevated compared to the Ovxgroup, but it was highly variable. There was a significant difference between the treated groupswhen the P group was omitted (ANOVA, p<0.05). Post-hoc comparison indicated that both Eand E+P-administration decreased CART gene expression in the midbrain significantlycompared with OVX animals (Student Newman-Keuls post hoc, p<0.05).
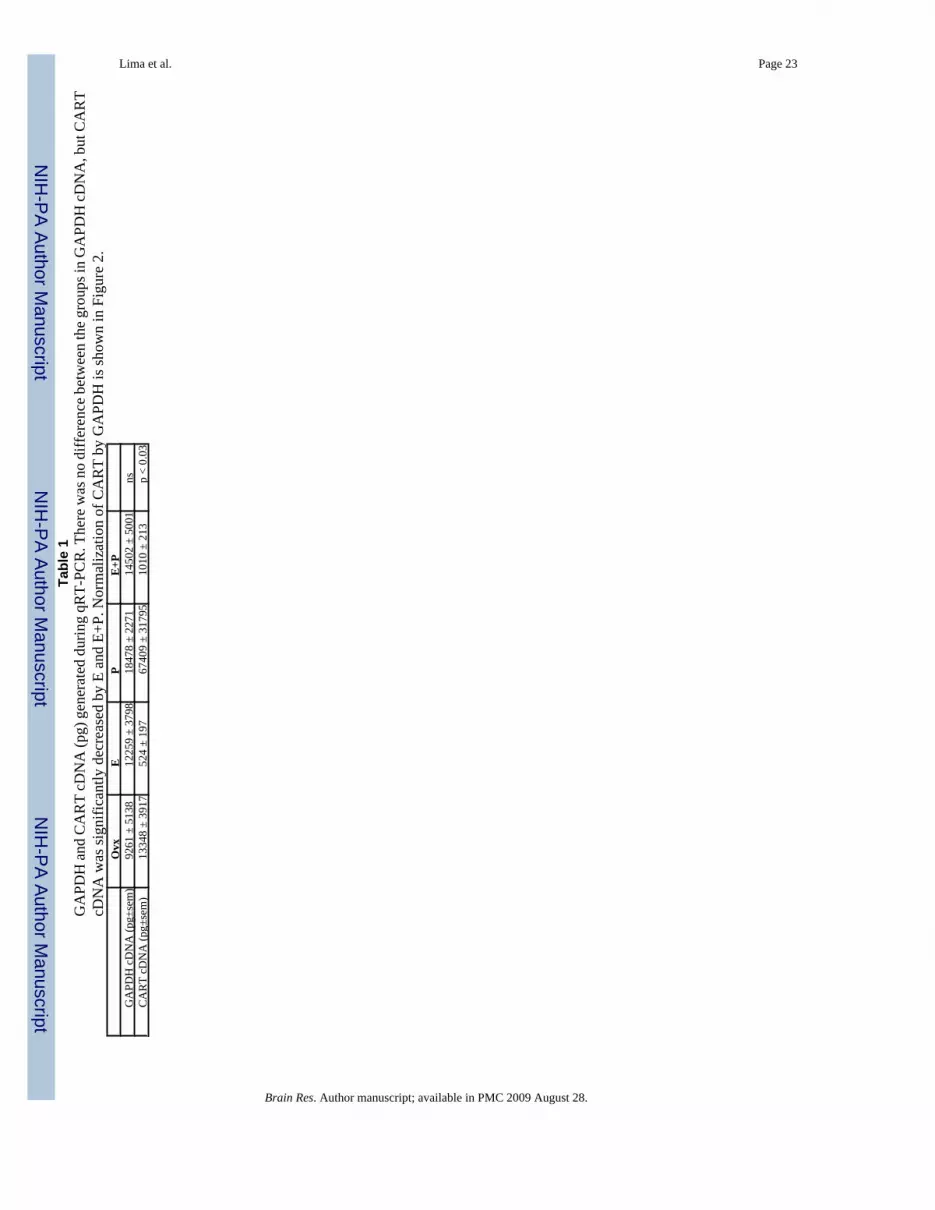
2. CART mRNA expression – (q) RT-PCRRNA extracted from the midbrain tissue blocks (n=3 animals/group) was subjected to qRT-PCR for CART mRNA and GAPDH, a housekeeping gene. The pg of cDNA produced forGAPDH and for CART is shown in Table 1. There was no difference between the groups inGAPDH cDNA, but CART cDNA was significantly decreased by E and E+P. CART geneexpression was normalized by GAPDH and the results are shown in Figure 2. There was asignificant difference between all of the treatment groups (Kruskal-Wallace, p=0.04), butDunn’s post hoc comparisons yielded no differences. When the P group was omitted, therewas a significant difference between the treated groups (ANOVA, p<0.05). Post-hoccomparison indicated that both E and E+P-administration decreased CART gene expressionin the midbrain significantly compared with OVX animals (Student Newman-Keuls post hoc,p<0.05).
3. CART immunostaining near the Edinger-Westphal nucleus3.1. CART single staining quantification—Figure 3 contains the montages ofrepresentative sections from a P-treated animal that were immunohistochemically stained forCART at 5 levels of the Edinger-Westphal nucleus, which were 250µ apart in a rostral to caudaldirection. CART immunoreactive neurons were prominent at each level. CARTimmunoreactivity was abolished by omission of the primary antibody and byimmunoneutralization of primary antibody with the corresponding immunizing peptide (resultsnot shown).
Figure 4 illustrates the immunostaining for CART at level 3 of one animal from each treatmentgroup. Visually, there was an obvious and robust increase in CART immunostaining in the P-treated animals. Yet, there was no difference in the positive pixel area, in the percentage of thetotal area that was positive, or in the number of CART neurons by ANOVA. However,comparison of individual groups with the OVX group by Students t-test indicated that P alonecaused a significant increase both in the positive pixel area for CART (Figure 5A) and in thepercentage of the total area that was positive for CART (Figure 5B). The total examined areadid not differ between groups (Figure 5C). Also, in the direct comparison with Student’s t-test,there was a significant increase in the total number of CART neurons in the P treated animalscompared with the OVX group, both in the absolute number of cells (Figure 6A) and in thenumber of cells/mm3 (Figure 6B).
Lima et al. Page 3
Brain Res. Author manuscript; available in PMC 2009 August 28.
NIH
-PA Author Manuscript
NIH
-PA Author Manuscript
NIH
-PA Author Manuscript
3.2. Double immunofluorescence for CART plus TPH and CART plus ERα—Sections from a P-treated animal were examined for CART plus TPH and CART plus ERα.Double-label immunofluorescence revealed that CART neurons (red-Figure 7A) did notexpress TPH (green-Figure 7B; overlay-Figure 7C) although TPH positive neurons wereobserved in the dorsal raphe nucleus, which is caudal to the Edinger-Westphal nucleus (Figure7D). Moreover, CART fibers (red) were present in the vicinity of TPH positive neurons (green)in the dorsal raphe nucleus. Although we cannot conclude that these fibers are in synapticcontact with the serotonin neurons, they appear to be juxtaposed (Figure 7E and 7F). ERα wasundetectable (not shown).
3.3. Double peroxidase staining for CART and ERβ—Sections from a P-treatedmonkey were examined for CART plus ERβ. In double-labeled neurons, CART stained brownin the cytoplasm and ERβ stained black in the nucleus (Figure 8, panels A–E, double headarrows). ER positive neurons that are not CART expressing were present as well (single headarrows). Omission of only the ERβ antibody resulted in CART labeled neurons with no nuclearstaining (Figure 8, panels F–H). There was no staining when the primary antibodies for CARTand ERβ were omitted (results not shown).
3.4. Double peroxidase staining for CART and PR—Sections from an E+P treatedanimal were examined for CART plus PR. In double-labeled neurons, CART stained brownin the cytoplasm and PR stained black in the nucleus. PR was undetectable in the absence ofthe primary antibody for PR (Figure 9, panels A, B). Numerous CART neurons contained PR(double head arrows, Figure 9, panels C–H). Figures 9F and 9G also show PR positive neuronsthat do not contain CART (single head arrows).
4. Western BlotsThere was no difference between the groups (n=3/group) in cytosolic CART protein levels(Figure 10).
5. Hormone AssaysSerum estradiol concentrations (pg/ml±SEM) equaled 18.42±3.35, 108.05±14.05, 21.02±3.97and 112.83±10.82 in the placebo, E, P and E+P treated groups, respectively (n=11/treatment).Serum progesterone concentrations (ng/ml±SEM) equaled 0.11±0.02, 0.39±0.11, 6.99±0.63and 6.16±0.63 in the placebo, E, P and E+P treated groups (n=11/treatment), respectively.
DISCUSSIONThe present work showed that in monkeys, CART protein is expressed in midbrain neuronsadjacent to the Edinger-Westphal nucleus and that CART fibers project to serotonin neuronsin the dorsal raphe nucleus. CART neurons contain ERβ, thus corroborating previous workshowing that urocortin-1 cells, which colocalize CART, contain ERβ but not ERα in the mousebrain (Derks et al. 2007). We also demonstrated that CART neurons colocalize PR and together,these findings implicate a direct regulation of CART gene expression by steroids. Although Edecreased CART mRNA expression in the midbrain, this was not reflected in the peptideexpression, perhaps due to post-transcriptional regulatory mechanisms. However, P aloneincreased CART immunostaining in the cell bodies in the midbrain, but there was no changein total protein. The mechanism by which P exerts this effect requires further investigation.
Gene Expression versus Protein ExpressionCART mRNA expression in the midbrain population was significantly suppressed by E and E+P administration as determined with microarray and qRT-PCR. Since the E+P treated groupwas similar to the E group, we attribute the decrease in both groups to E action. CART mRNA
Lima et al. Page 4
Brain Res. Author manuscript; available in PMC 2009 August 28.
NIH
-PA Author Manuscript
NIH
-PA Author Manuscript
NIH
-PA Author Manuscript

was slightly but not significantly elevated by P only administration. Thus, it appeared that Eregulated CART gene expression in the midbrain. However, in the immunohistochemistryassay, neither E nor E+P had any effect, but there was an indication that P increasedimmunostaining. Thus, changes in CART mRNA did not translate to changes inimmunostaining. Finally, there was no regulation of CART on the western blots. CART isheavily edited by post-transcriptional events yielding numerous slice variants (Dylag et al.,2006; Thim et al. 1999; Kuhar & Yoho 1999). These data suggest that even though RNA copynumber decreases, there may be adjustments in translational efficiency, or peptide turnoverand degradation, which maintain CART peptide expression within a narrow range. Likewise,if there is decreased release of CART along with decreased transcription of CART in the E andE+P treatment groups, then protein levels may not change significantly.
Effects of E and P administrationIn rats, a sexually dimorphic modulation of CART expression was observed in the PVN andARC nuclei with the forced swim test (Gozen et al. 2007). Another study in rats showed thatE administration reduced the elevated CART expression due to reoccurring insulinhypoglycemia. However, E did not regulate basal CART expression in that area (Nedungadi& Briski 2007). During pregnancy, when serum P is elevated, rats show increased CARTexpression in the anteroventral periventricular nucleus (AVPV), a nucleus governing maternalbehavior and GnRH release (Valera et al. 2006). The latter data are consistent with ourobservation that P increased CART immunostained area, as well as the number of detectableneurons in the midbrain.
The effect of P alone on CART immunostaining is unusual. Visually, there is an obvious androbust increase in CART immunostaining density with P administration, which was notadequately portrayed by the stereological analysis. P could increase CART peptide by an actionthrough nuclear PR; but without E, nuclear PR may be scarce, although P tended to increaseCART gene expression. Alternatively, the action of P on CART expression may depend uponits metabolite, allopregnanolone, interacting with potential GABA-A receptors on CARTneurons (Barbaccia et al. 2001). However, this is thought to be an inhibitory “GABA-like”action, so it is difficult to understand how this mechanism could increase CART translation orstability. Yet, if activation of GABA receptors inhibited cell firing and CART release from theterminals and/or trafficking of CART to the terminal regions, then CART may accumulate inthe cell bodies thereby producing more immunostaining. Allopregnanolone could also act viastimulatory interneurons. Immunohistochemistry is more sensitive than the western blots,which did not detect any difference in total CART protein in the midbrain region.
Gender and Sensitivity to CocaineIt is attractive to speculate that gender differences in the sensitivity to cocaine may involveCART. Women are more sensitive to cocaine effects than men (Festa & Quinones-Jenab2004) and studies during the menstrual cycle have reported an increased effect of cocaineduring the follicular phase. Since the luteal phase of the cycle is characterized by the highestlevels of P, it was suggested that P attenuated the subjective effects of cocaine (Evans et al.2002; Evans & Foltin 2006). In this study, CART accumulated in cell bodies with Padministration. Although we are not sure if this represents increased CART synthesis ordecreased CART trafficking, perhaps this response plays a role in the attenuated effects ofcocaine during the luteal phase. Further studies to determine the effect of E and P on the densityof CART fibers in the dorsal raphe nucleus could be informative regarding CART trafficking.
CART, Stress and the HPA axisCART stimulates CRF and ACTH, and responds to glucocorticoids, indicating that CARTimpacts activity of the HPA axis. Hypothalamic nuclei involved with the control of stress, like
Lima et al. Page 5
Brain Res. Author manuscript; available in PMC 2009 August 28.
NIH
-PA Author Manuscript
NIH
-PA Author Manuscript
NIH
-PA Author Manuscript
PVN, ARC and supraoptic nuclei (SON) display high CART expression and there is a bodyof evidence indicating that CART plays a role in the stress response (Koylu et al. 1997; Vranget al. 1999; Smith et al. 2004). Of note, the Edinger-Westphal region is one of the areas whereCART regulates CRH release [for review see (Kuhar et al. 2000)]. Although CART is widelyexpressed, in the rat brain the Edinger-Westphal region demonstrates robust CART mRNAexpression (Douglass et al. 1995). In macaques, the neurons expressing CART are outside ofthe Edinger-Westphal nucleus. Initially, neurons from the Edinger-Westphal nucleus weredescribed in rats as a parasympathetic component of the oculomotor complex, projecting tothe ciliary ganglion and leading to pupilloconstriction (Klooster et al. 1993). The Edinger-Westphal nucleus receives input from the spinal cord and the hypothalamus and sendsprojections to different areas expressing the CRH type I (Potter et al. 1994) and type II receptors(Bittencourt et al. 1999; Van Pett et al. 2000; Korosi et al. 2007), suggesting a role in autonomicregulation. Recently the Edinger-Westphal region has been postulated to exert a regulatorycontrol over stress responses. Neurons colocalizing CART and urocortins located adjacent toEdinger-Westphal, respond to acute stress and can modulate several physiological functions(Kozicz 2003). Since E and P regulate CART expression in the midbrain near the Edinger-Westphal nucleus, it is possible that steroids are modulating the stress response by an actionin this area.
CART and SerotoninIt has been reported in rats that CART may have an antidepressant effect through increases inextracellular serotonin (Ma et al. 2007). Specifically, a CART infusion in the dorsal raphenucleus leads to a significant increase of serotonin efflux in the nucleus accumbens, a majortarget of dorsal raphe serotonergic projections. This work is consistent with our demonstrationthat CART terminals are in close apposition with serotonergic cell bodies in the dorsal raphenucleus. Clearly, evidence of CART receptors on serotonin neurons is needed.
CART, Estrogen and NeuroprotectionCART is also involved in neuroprotection mechanisms. A recent study showed that CART ishighly induced by E in the cerebral cortex during ischemia, suggesting that the up-regulationof this neuropeptide by E may play a role in neuroprotection (Xu et al. 2006). In our studywithout insult, CART mRNA was decreased by E administration but there was no effect onthe peptide. Thus, the CART gene may react to E differently under different condition (ischemiaversus normal) or in different areas of the brain.
In summary, we found that in monkeys CART is expressed in midbrain neurons adjacent tothe Edinger-Westphal nucleus and that CART fibers project to serotonin neurons in the dorsalraphe nucleus. CART neurons contain ERβ and PR, which may act to regulate gene expression.However, peptide expression did not reflect gene expression. P alone increased CARTimmunostaining in the cell bodies in the midbrain, but there was no change in total protein.The mechanism by which P exerts this effect requires further investigation. Nonetheless, CARTneurons exhibit a unique steroid response profile, which may play a role in stress sensitivityand subjective affects of cocaine.
EXPERIMENTAL PROCEDURESThe Oregon National Primate Research Center Institutional Animal Care and Use Committeeapproved this study.
1- Animals and treatmentsAdult female rhesus monkeys (Macaca mulatta) were ovariectomized by the surgical personnelof ONPRC according to accepted veterinary surgical protocol. All animals were born in China
Lima et al. Page 6
Brain Res. Author manuscript; available in PMC 2009 August 28.
NIH
-PA Author Manuscript
NIH
-PA Author Manuscript
NIH
-PA Author Manuscript
and were aged between 7 and 14 years by dental exam. They weighed between 4 and 8 kg, andwere in good health. Steroid hormone treatments were initiated 3–8 months after ovariectomy.Animals were either treated with placebo (Ovx control group; n=11), or treated with E for 28days (E group; n=11), or with E for 28 days and then supplemented with P for the final 14 ofthe 28 days (E+P group; n=11), or with placebo for 14 days and then treated with P for 14 days(P group; n=11). The spayed control monkeys received empty Silastic capsules (s.c.). The E-treated monkeys were implanted with a 4.5-cm E-filled Silastic capsules (i.d. 0.132 in.; o.d.0.183 in.; Dow Corning, Midland, MI) filled with crystalline estradiol [1,3,5(10)-estratrien-3,17-b-diol; Steraloids, Wilton, NH]. The E+P-treated monkeys received an E-filledcapsule and days later, received one 6-cm capsule filled with crystalline P (4-pregnen-3,20dione; Steraloids). The P treated monkeys received a placebo capsule and 12 then one 6-cmcapsule filled with crystalline P on day 14. All capsules were placed in the periscapular areaunder ketamine anesthesia (ketamine HCl, 10 mg/kg, s.c.; Fort Dodge Laboratories, FortDodge, IA). The monkeys were euthanized at the end of the treatment periods according toprocedures recommended by the Panel on Euthanasia of the American Veterinary Association.Each animal was sedated with ketamine, given an overdose of pentobarbital (25 mg/kg, i.v.),and exsanguinated by severance of the descending aorta. Twenty animals (n=5/group) wereprocessed for immunohistochemistry. Twelve animals were perfused with RNA later andprocessed for mRNA extraction (n=3/group). Twelve animals were processed for subcellularfractionation of the dorsal raphe region and western blotting (n=3/group). The animals wereprocessed in consecutive sets containing one Ovx control animal and one animal from eachhormone treatment group.
2- Tissue preparation for microarray analysis and (q) RT-PCRThe left ventricle of the heart was cannulated, and the head of each animal was perfused with3 l of 1X cold RNA-later buffer (Ambion Inc., Austin, TX). The brain was removed from thecranium and blocked. The midbrain block was dissected as previously described (Reddy &Bethea 2005), and extends from the Edinger-Westphal nucleus through the dorsal raphenucleus (5 mm wide, 6 mm high and 3 mm thick). The tissue was immediately frozen in liquidnitrogen. For RNA extraction, the frozen block was dropped directly into TriReagent (Sigma,St. Louis, MO).
2.1- RNA extraction, analysis and Affymetrix Hybridization—RNA was extractedfrom the microdisected blocks of midbrain, cleaned, quality tested, labeled and hybridized toAffymetrix Rhesus Gene Chips by the Affymetrix Microarray Core of the OHSU GeneMicroarray Shared Resource as previously described (Reddy & Bethea 2005; Bethea & Reddy2008). The data was processed with Affymetrix GCOS interface software, compressed intoCHP files and uploaded to GeneSifter (VisX Labs, Seattle, WA)
2.2- Quantitative (q) RT-PCR—The RNA from the microdissected midbrain blocks wassubjected to qRT-PCR for CART. Glyceraldehyde 3 phosphate dehydrogenase (GAPDH) wasused as the internal reference gene, as the array hybridization data indicated that this gene wasnot regulated (data not shown). Complementary DNA (cDNA) synthesis and quantitativepolymerase chain reaction (qRT-PCR) was conducted as previously described with Sybr green(Bethea and Reddy, 2008). Fluorescence was detected with the ABI 7900 thermal cycler duringforty cycles. The reaction (final volume 20 µl) contained 1–10,000 ng of pool cDNA (standardcurve) or 250 ng of sample cDNA, 100 nM of forward and reverse primers and 1X PlatinumSybr green PCR mix. The amount of cDNA added to the reaction mix was approximated fromthe amount of RNA used for reverse transcriptase and Nanodrop quantitation of single strandcDNA. The slope of the standard curve was used to calculate the relative pg of each transcriptin the RNA extracted from the raphe blocks. The primers were obtained from Invitrogen:
CART—Accession # L26318
Lima et al. Page 7
Brain Res. Author manuscript; available in PMC 2009 August 28.
NIH
-PA Author Manuscript
NIH
-PA Author Manuscript
NIH
-PA Author Manuscript

Forward primer (284–302 bp)— CTG ATC GAA GCG CTG CAA G
Reverse primer (494–475 bp)— GAG AAT GGA CGC CCC TTC AT
GAPDH
Forward primer (348–369bp)—CTG ACA CTG AGT ACG TCG TGG A
Reverse primer (615–595 bp)—TGG ACT GTG GTC ATG AGT CCT T
3- Tissue Preparation for immunohistochemistryFollowing euthanasia, the left ventricle of the heart was cannulated and the head of each animalwas perfused with 1 liter of saline followed by 7 liters of 4% paraformaldehyde in 3.8% borate,pH 9.5 (both solutions made with DEPC-treated water (0.1% diethyl pyrocarbonate) tominimize RNase contamination). The brains were removed and dissected. Tissue blocks werepost-fixed in 4% paraformaldehyde for 3 h, then transferred to 0.02M potassium phosphate-buffered saline (KPBS) containing 10%, followed by 20% glycerol and 2% dimethyl sulfoxideat 4°C for 3 days to cryoprotect the tissue. After infiltration, the block was frozen in isopentenecooled to −55°C, and stored at −80°C until sectioning. Sections (25 µm) were cut on a slidingmicrotome, and serial sections were collected in a cryoprotection buffer (30% ethylene glycol,20% glycerol in 0.05 M PBS) and then frozen at − 20°C until processing for ICC.
3.1- CART single immunostaining—The polyclonal antiserum was generated againstCART peptide fragment 55–102 (a gift of Dr Michael J. Kuhar, Emory University, Atlanta,Georgia). The immunohistochemical characteristics of the antibody to CART have beenpublished (Koylu et al., 1997). Sections of midbrain were removed from cryoprotectant andimmediately washed 4 times with 0.02 M KPBS (15 min each). Then, they were immersed in0.6% H2O2 for 30 min, washed 4 times in KPBS buffer (15 min each) and then incubated withthe following blocking solutions: normal goat serum (0.6% NGS, Vector Laboratories,Burlingame, CA) for 1 hour; bovine serum albumin (3% BSA, Sigma, St. Louis, MO) for 1hour; avidin for 20 min and biotin for 20 min (Vector Laboratories, Burlingame, CA). Sectionswere then incubated at 4°C for 48 h in antibody to CART diluted 1/15,000 in 0.6% NGS, 0.4%triton and KPBS. Sections were rinsed 4 times in KPBS buffer (15 min each), incubated inbiotylinated goat anti-rabbit serum for 1 hour (Vector Laboratories, Burlingame, CA), washed4 times in KPBS buffer (15 min each), incubated with ABC reagent (Vector Laboratories,Burlingame, CA) for 1 hour, washed 4 times in KPBS buffer (15 min each), incubated with0.05% 3,3’diaminobenzidine tetrahydrochloride (DAB, Dojindo Laboratories, Kumamoto,Japan)-KPBS plus 3% hydrogen peroxide for approximately 2 min, washed 4 times in KPBSbuffer (15 min each). Sections were mounted on Superfrost Plus slides (Fischer, Santa Clara,CA) and dehydrated through a graded series of ethanols, xylene, and Histoclear. Sections weremounted under glass with DPX.
The sections were processed in consecutive assays containing one Ovx control animal and oneanimal from each hormone treatment group. The animals were previously treated withhormones and processed together. Thus, 5 assays were conducted on 5 matched sets of animals.A covariance analysis for differences between the assays was not necessary.
3.2- Double immunostainingCART + tryptophan hydroxylase (TPH) and CART + ERα: Sections of midbrain wereincubated with the rabbit anti-CART (1:5000) and sheep anti-TPH antibody (Chemicon,Temecula, CA) or mouse anti-ERα 1D5 (1:25, Neomarkers, Fremont, CA). The TPH antibodyintensely labels serotonin neurons in the monkey midbrain (Bethea et al., 2000) and intenselylabels embryonic stem cell derived serotonin neurons (Salli et al., 2004). The ERα antibodyprovides intense nuclear staining in the ERα-positive human breast cancer cell line T-47D
Lima et al. Page 8
Brain Res. Author manuscript; available in PMC 2009 August 28.
NIH
-PA Author Manuscript
NIH
-PA Author Manuscript
NIH
-PA Author Manuscript
(Bethea et al., 2003). The staining was visualized by incubating with fluorescence-conjugatedsecondary antibodies. To visualize CART neurons a donkey anti-rabbit IgG conjugated toAlexa Fluor 555 (Molecular Probes, Eugene, OR, USA) was used. For visualization of TPHpositive neurons a donkey anti-sheep IgG conjugated to Alexa Fluor 488 was used (MolecularProbes, Eugene, OR, USA). For visualization of ERα positive neurons, a donkey anti-mouseIgG conjugated to Alexa Fluor 488 was used.
First, sections were mounted on slides, incubated at room temperature for 20 minutes in anautofluorescence eliminator reagent (Chemicon, Temecula, CA) and rinsed for 1 minute in70% ethanol. Then sections were incubated at 4°C for 48 h in a cocktail containing both primaryantibodies in 2% normal donkey serum (NDS-Jackson Immunoresearch Laboratories, WestGrove, PA) and KPBS. They were then rinsed in KPBS buffer four times for 15 min each,incubated for 1 hour in a cocktail of fluorescent secondary antibodies and washed again fourtimes for 15 min each. Then, a drop of a solution containing 4',6-diamidino-2-phenylindole,dihydrochloride (DAPI, SlowFade Gold, Molecular Probes) was applied in each section,followed by the coverslip. To determine the relationship between serotonin neurons (TPHpositive) and CART neurons, the sections were examined with a Marianas stereologyworkstation (Intelligent Imaging Innovations, Denver, CO, USA) and images were acquiredwith Slidebook 4.2 (Olympus Imaging Systems, Center Valley, PA).
CART + ERβ and CART +PR: Double peroxidase immunohistochemistry was performedto determine if CART neurons contained ERβ or PR. Sections were first immunostained forthe nuclear steroid receptor and developed with DAB + nickel (0.05% DAB-KPBS plus 8%nickel and 3% hydrogen peroxide) yielding black nuclei, and then subsequently immunostainedfor CART yielding a brown cytoplasm, as described in section 3.1. The antibody used againstPR was diluted to 2.5 µg/ml in 0.6% NGS, 0.4% triton and KPBS. B39 (a gift of Dr GeoffreyGreen, University of Chicago) was raised against PR isolated from the human breast carcinomacell line T-47D (Press and Greene, 1988) and cross-reacts with monkey PR (Bethea et al.,1992). ERβ was detected with a mouse anti-ERβ (1:200; Neomarkers). The antibody to ERβintensely stains the nucleus of the ERβ-positive human breast cancer cell line T47D (Salli etal., 2004). After the dehydration process, sections were mounted under glass with DPX.Sections were examined and photographed with direct optical microscopy (Zeiss microscopewith Olympus digital camera).
3.3- Quantitative Tissue Analysis—Sections were anatomically matched betweenanimals using anatomical reference points. The Marianas stereological workstation withSlidebook 4.2 was used for analysis. Each section was examined through the rostro-caudalextent of the Edinger-Westphal nucleus (five levels, 250 µm interval between sections). Amontage of the entire area containing CART positive neurons was built by the workstation.The area containing the CART positive neurons was defined and measured (µ2 total area).Then, the image was segmented into positive and negative pixels with Slidebook 4.2. Thepositive pixel area was reported in square microns (µ2 positive area). The percent of the totalarea that was positively stained for CART was also computed.
For cell counting, the area of interest was outlined on the montage and detectable CART-immunoreactive cells were identified and counted by hand. All cell counts refer to detectableneurons only. The number of CART-immunoreactive neurons in the designated area of the fivesections was summed, generating one value for each animal. The individual sums wereaveraged to obtain the group mean. In addition, Slidebook 4.2 provides the square microns ofthe outlined area. The thickness of each section (25 µm × 5 sections = 125 µm) plus the intervalsbetween the sections (250 µm × 4 intervals= 1000 µm) in microns was used as the length ofthe region (125 + 1000= 1125 µm). The average area of the region for each animal (µ2 outlinedby Slidebook 4.2), was multiplied by the length to obtain the volume of the region (µ3/109 =
Lima et al. Page 9
Brain Res. Author manuscript; available in PMC 2009 August 28.
NIH
-PA Author Manuscript
NIH
-PA Author Manuscript
NIH
-PA Author Manuscript
mm3). The total number of CART-immunoreactive neurones in each animal was divided bythe volume of the area examined to obtain the number of CART neurons per cubic millimeterfor each animal. The individual numbers of CART neurons /mm3 were then averaged to obtainthe group means. Differences in cell numbers between the groups were determined by ANOVAfollowed by Newman-Keuls post-test or by Student’s t-test using Prism Statistical software(Graph-Pad Software, Inc., San Diego, CA, USA). P < 0.05 was considered statisticallysignificant.
4- Western BlotsThe midbrain raphe region was obtained and subjected to subcellular fractionation aspreviously described (Tokuyama et al. 2008). Cytosolic samples containing 50 µg of proteinwere run on a 16% nongradient Tris-Tricine gel (Jule, Inc., Milford, CT) as previouslydescribed (Kuhar & Yoho 1999). The antibody to CART was generated against the 55–102fragment and was previously characterized (Kuhar & Yoho 1999). In this study, CART 55–102 was subjected to densitometric analysis with NIH Image. The area under the curve inarbitrary units was analyzed with ANOVA.
5- Hormone AssaysAssays for E and P were performed utilizing a Roche Diagnostics 2010 Elecsys assayinstrument. Before these analyses, measurements of E and P on this platform were comparedto traditional RIAs as reported previously (Bethea et al. 2005).
AcknowledgmentsWe are deeply grateful to the dedicated staff of the Division of Animal Resources including the staff of the Departmentsof Surgery and Pathology for their expertise and helpfulness in all aspects of monkey management.
This research was supported by NIH-Grants MH 62677 to CLB, DA15162 to MJK, the NIH Fogarty InternationalCenter grant TW/HD-00668 to P. Michael Conn, the Eunice Kennedy Shriver NICHD through cooperative agreementU54-HD18185 as part of the Specialized Cooperative Centers Program in Reproduction and Infertility Research,RR00165 for Support of Yerkes National Primate Research Center and RR00163 for Support of the Oregon NationalPrimate Research Center
ReferencesBannon AW, Seda J, Carmouche M, Francis JM, Jarosinski MA, Douglass J. Multiple behavioral effects
of cocaine- and amphetamine-regulated transcript (CART) peptides in mice: CART 42–89 and CART49–89 differ in potency and activity. J. Pharmacol. Exp. Ther 2001;299:1021–1026. [PubMed:11714891]
Barbaccia ML, Serra M, Purdy RH, Biggio G. Stress and neuroactive steroids. Int Rev Neurobiol2001;46:243–272. [PubMed: 11599302]
Bethea CL, Fahrenbach WH, Sprangers SA, Freesh F. Immunocytochemical localization of progestinreceptors in monkey hypothalamus: effect of estrogen and progestin. Endocrinology 1992;130:895–905. [PubMed: 1733733]
Bethea CL, Lu NZ, Reddy A, Shlaes T, Streicher JM, Whittemore SR. Characterization of reproductivesteroid receptors and response to estrogen in a rat serotonergic cell line. J Neurosci Methods2003;127:31–41. [PubMed: 12865146]
Bethea CL, Mirkes SJ, Shively CA, Adams MR. Steroid regulation of tryptophan hydroxylase protein inthe dorsal raphe of macaques. Biol Psychiatry 2000;47:562–576. [PubMed: 10715363]
Bethea CL, Reddy AP. Effect of ovarian hormones on survival genes in laser captured serotonin neuronsfrom macaques. J. Neurochem 2008;105:1129–1143. [PubMed: 18182058]
Bethea CL, Streicher JM, Mirkes SJ, Sanchez RL, Reddy AP, Cameron JL. Serotonin-related geneexpression in female monkeys with individual sensitivity to stress. Neuroscience 2005;132:151–166.[PubMed: 15780474]
Lima et al. Page 10
Brain Res. Author manuscript; available in PMC 2009 August 28.
NIH
-PA Author Manuscript
NIH
-PA Author Manuscript
NIH
-PA Author Manuscript
Bittencourt JC, Vaughan J, Arias C, Rissman RA, Vale WW, Sawchenko PE. Urocortin expression inthe rat brain: evidence against a pervasive relationship of urocortincontaining projections with targetsbearing type 2 CRF receptors. J Comp Neurol 1999;415:285–312. [PubMed: 10553117]
Chaki S, Kawashima N, Suzuki Y, Shimazaki T, Okuyama S. Cocaine- and amphetamine-regulatedtranscript peptide produces anxiety-like behavior in rodents. Eur. J. Pharmacol 2003;464:49–54.[PubMed: 12600694]
Derks NM, Roubos EW, Kozicz T. Presence of estrogen receptor beta in urocortin-1 neurons in the mousenon-preganglionic Edinger-Westphal. Gen Comp Endocrinol 2007;153:228–234. [PubMed:17632108]
Douglass J, McKinzie AA, Couceyro P. PCR differential display identifies a rat brain mRNA that istranscriptionally regulated by cocaine and amphetamine. J. Neurosci 1995;15:2471–2481. [PubMed:7891182]
Dylag T, Kotlinska J, Rafalski P, Rachuta A, Silberring J. The activity of CART peptide fragments.Peptides 2006;27:1926–1933. [PubMed: 16730858]
Evans SM, Foltin RW. Exogenous progesterone attenuates the subjective effects of smoked cocaine inwomen, but not in men. Neuropsychopharmacology 2006;31:659–674. [PubMed: 16160708]
Evans SM, Haney M, Foltin RW. The effects of smoked cocaine during the follicular and luteal phasesof the menstrual cycle in women. Psychopharmacology (Berl) 2002;159:397–406. [PubMed:11823892]
Festa ED, Quinones-Jenab V. Gonadal hormones provide the biological basis for sex differences inbehavioral responses to cocaine. Horm. Behav 2004;46:509–519. [PubMed: 15555492]
Gaszner B, Csernus V, Kozicz T. Urocortin neurons respond in a differentiated manner to various acutestressors in the Edinger-Westphal nucleus in the rat. J Comp Neurol 2004;480:170–179. [PubMed:15514930]
Gozen O, Balkan B, Yararbas G, Koylu EO, Kuhar MJ, Pogun S. Sex differences in the regulation ofcocaine and amphetamine-regulated transcript expression in hypothalamic nuclei of rats by forcedswim stress. Synapse 2007;61:561–568. [PubMed: 17447258]
Hurd YL, Fagergren P. Human cocaine- and amphetamine-regulated transcript (CART) mRNA is highlyexpressed in limbic and sensory-related brain regions. J. Comp Neurol 2000;425:583–598. [PubMed:10975881]
Horn AK, Eberhorn A, Hartig W, Ardeleanu P, Messoudi A, Buttner-Ennever JA. Perioculomotor cellgroups in monkey and man defined by their histochemical and functional properties: reappraisal ofthe Edinger-Westphal nucleus. J Comp Neurol 2008;507:1317–1335. [PubMed: 18186030]
Klooster J, Beckers HJ, Vrensen GF, Van der Want JJ. The peripheral and central projections of theEdinger-Westphal nucleus in the rat. A light and electron microscopic tracing study. Brain Res1993;632:260–273. [PubMed: 7511978]
Korosi A, Kozicz T, Richter J, Veening JC, Olivier B, Roubos EW. Corticotropin-releasing factor,urocortin-1 and their receptors in the mouse spinal cord. J Comp Neurol 2007;502:973–989.[PubMed: 17444496]
Koylu EO, Balkan B, Kuhar MJ, Pogun S. Cocaine and amphetamine regulated transcript (CART) andthe stress response. Peptides 2006;27:1956–1969. [PubMed: 16822586]
Koylu EO, Couceyro PR, Lambert PD, Ling NC, DeSouza EB, Kuhar MJ. Immunohistochemicallocalization of novel CART peptides in rat hypothalamus, pituitary and adrenal gland. J.Neuroendocrinol 1997;9:823–833. [PubMed: 9419833]
Kozicz T. CRF and CRF-related peptides in stress adaptation: from invertebrates to man. Gen CompEndocrinol 2007;153:198–199. [PubMed: 17666206]
Kozicz T. Neurons colocalizing urocortin and cocaine and amphetamine-regulated transcriptimmunoreactivities are induced by acute lipopolysaccharide stress in the Edinger-Westphal nucleusin the rat. Neuroscience 2003;116:315–320. [PubMed: 12559087]
Kristensen P, Judge ME, Thim L, Ribel U, Christjansen KN, Wulff BS, Clausen JT, Jensen PB, MadsenOD, Vrang N, Larsen PJ, Hastrup S. Hypothalamic CART is a new anorectic peptide regulated byleptin. Nature 1998;393:72–76. [PubMed: 9590691]
Kuhar MJ, Adams LD, Hunter RG, Vechia SD, Smith Y. CART peptides. Regul. Pept 2000;89:1–6.[PubMed: 10771306]
Lima et al. Page 11
Brain Res. Author manuscript; available in PMC 2009 August 28.
NIH
-PA Author Manuscript
NIH
-PA Author Manuscript
NIH
-PA Author Manuscript

Kuhar MJ, Yoho LL. CART peptide analysis by Western blotting. Synapse 1999;33:163–171. [PubMed:10420164]
Ma Z, Pearson E, Tao R. CART peptides increase 5-hydroxytryptamine in the dorsal raphe and nucleusaccumbens of freely behaving rats. Neurosci. Lett 2007;417:303–307. [PubMed: 17346884]
May PJ, Reiner AJ, Ryabinin AE. Comparison of the distributions of urocortin-containing and cholinergicneurons in the perioculomotor midbrain of the cat and macaque. J Comp Neurol 2008;507:1300–1316. [PubMed: 18186029]
Nedungadi TP, Briski KP. Effects of estradiol on acute and recurrent insulin-induced hypoglycemia-associated patterns of arcuate neuropeptide Y, proopiomelanocortin, and cocaine-and amphetamine-related transcript gene expression in the ovariectomized rat. Neuroendocrinology 2007;86:270–276.[PubMed: 17934251]
Potter E, Sutton S, Donaldson C, Chen R, Perrin M, Lewis K, Sawchenko PE, Vale W. Distribution ofcorticotropin-releasing factor receptor mRNA expression in the rat brain and pituitary. Proc. Natl.Acad. Sci. U. S. A 1994;91:8777–8781. [PubMed: 8090722]
Reddy AP, Bethea CL. Preliminary array analysis reveals novel genes regulated by ovarian steroids inthe monkey raphe region. Psychopharmacology (Berl) 2005;180:125–140. [PubMed: 15731897]
Salli U, Reddy AP, Salli N, Lu NZ, Kuo H-C, Pau FK-Y, Wolf DP, Bethea CL. Serotonin neurons derivedfrom rhesus monkey embryonic stem cells: similarities to CNS serotonin neurons. Exp Neurol2004;188:351–364. [PubMed: 15246835]
Skelton KH, Nemeroff CB, Knight DL, Owens MJ. Chronic administration of the triazolobenzodiazepinealprazolam produces opposite effects on corticotropin-releasing factor and urocortin neuronalsystems. J. Neurosci 2000;20:1240–1248. [PubMed: 10648728]
Smith SM, Vaughan JM, Donaldson CJ, Rivier J, Li C, Chen A, Vale WW. Cocaine-and amphetamine-regulated transcript activates the hypothalamic-pituitary-adrenal axis through a corticotropin-releasing factor receptor-dependent mechanism. Endocrinology 2004;145:5202–5209. [PubMed:15271883]
Stanley SA, Small CJ, Murphy KG, Rayes E, Abbott CR, Seal LJ, Morgan DG, Sunter D, Dakin CL,Kim MS, Hunter R, Kuhar M, Ghatei MA, Bloom SR. Actions of cocaine and amphetamine-regulatedtranscript (CART) peptide on regulation of appetite and hypothalamo-pituitary axes in vitro and invivo in male rats. Brain Res 2001;893:186–194. [PubMed: 11223006]
Thim L, Kristensen P, Nielsen PF, Wulff BS, Clausen JT. Tissue-specific processing of cocaine- andamphetamine-regulated transcript peptides in the rat. Proc. Natl. Acad. Sci. U.S.A 1999;96:2722–2727. [PubMed: 10077578]
Tokuyama Y, Reddy AP, Bethea CL. Neuroprotective actions of ovarian hormones without insult in theraphe region of rhesus macaques. Neuroscience. 2008in press
Valera AG, Cavalcante JC, Elias CF, Felicio LF. Cocaine- and amphetamine-regulated transcript isoverexpressed in the anteroventral periventricular nucleus of pregnant rats. J. Neuroendocrinol2006;18:711–714. [PubMed: 16879170]
Van Pett K, Viau V, Bittencourt JC, Chan RK, Li HY, Arias C, Prins GS, Perrin M, Vale W, SawchenkoPE. Distribution of mRNAs encoding CRF receptors in brain and pituitary of rat and mouse. J CompNeurol 2000;428:191–212. [PubMed: 11064361]
Vrang N. Anatomy of hypothalamic CART neurons. Peptides 2006;27:1970–1980. [PubMed: 16765484]Vrang N, Larsen PJ, Clausen JT, Kristensen P. Neurochemical characterization of hypothalamic cocaine-
amphetamine-regulated transcript neurons. J. Neurosci 1999;19:RC5. [PubMed: 10234051]Vrang N, Larsen PJ, Kristensen P, Tang-Christensen M. Central administration of cocaine-amphetamine-
regulated transcript activates hypothalamic neuroendocrine neurons in the rat. Endocrinology2000;141:794–801. [PubMed: 10650962]
Weninger SC, Dunn AJ, Muglia LJ, Dikkes P, Miczek KA, Swiergiel AH, Berridge CW, Majzoub JA.Stress-induced behaviors require the corticotropin-releasing hormone (CRH) receptor, but not CRH.Proc. Natl. Acad. Sci. U.S.A 1999;96:8283–8288. [PubMed: 10393986]
Xu Y, Zhang W, Klaus J, Young J, Koerner I, Sheldahl LC, Hurn PD, Martinez-Murillo F, Alkayed NJ.Role of cocaine- and amphetamine-regulated transcript in estradiol-mediated neuroprotection. Proc.Natl. Acad. Sci. U.S.A 2006;103:14489–14494. [PubMed: 16971488]
Lima et al. Page 12
Brain Res. Author manuscript; available in PMC 2009 August 28.
NIH
-PA Author Manuscript
NIH
-PA Author Manuscript
NIH
-PA Author Manuscript
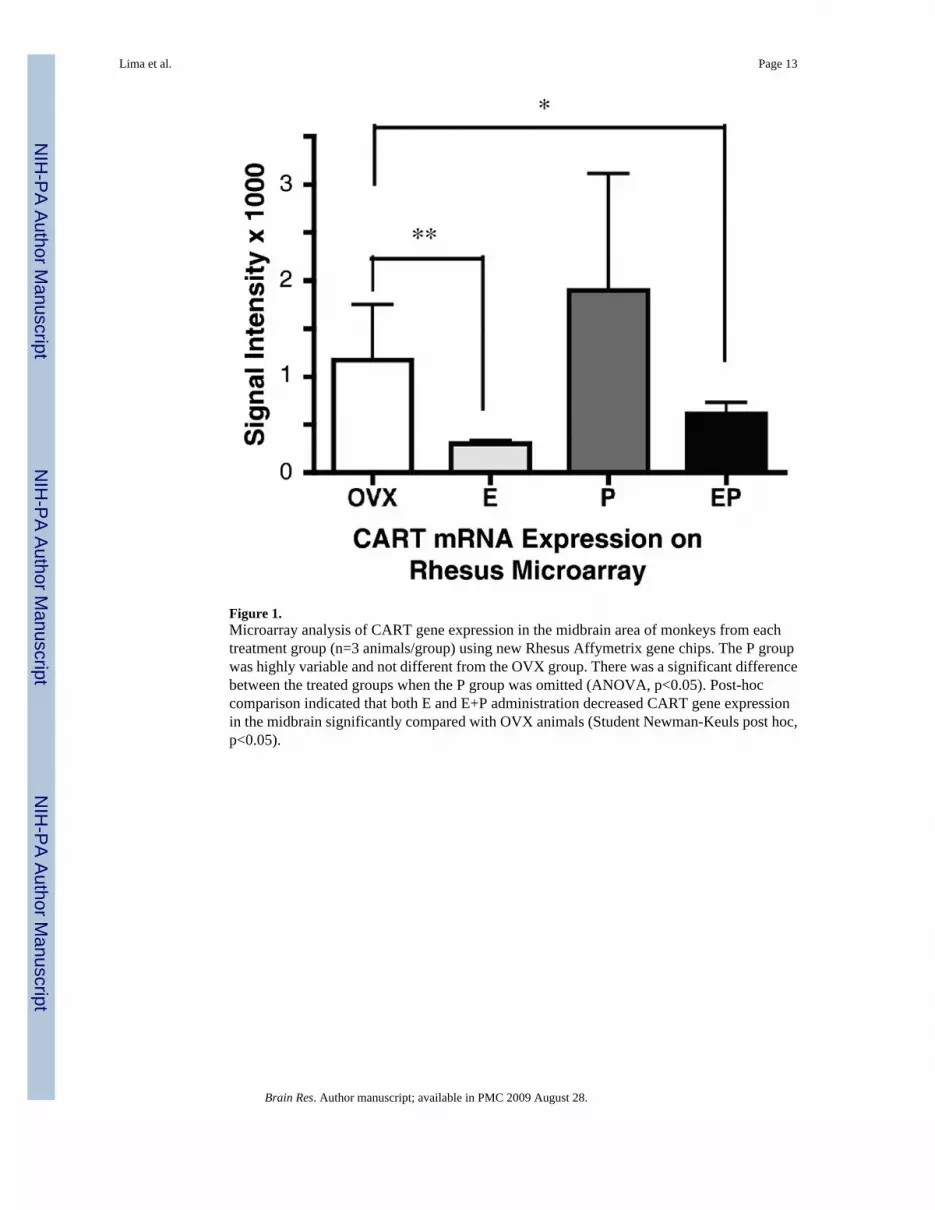
Figure 1.Microarray analysis of CART gene expression in the midbrain area of monkeys from eachtreatment group (n=3 animals/group) using new Rhesus Affymetrix gene chips. The P groupwas highly variable and not different from the OVX group. There was a significant differencebetween the treated groups when the P group was omitted (ANOVA, p<0.05). Post-hoccomparison indicated that both E and E+P administration decreased CART gene expressionin the midbrain significantly compared with OVX animals (Student Newman-Keuls post hoc,p<0.05).
Lima et al. Page 13
Brain Res. Author manuscript; available in PMC 2009 August 28.
NIH
-PA Author Manuscript
NIH
-PA Author Manuscript
NIH
-PA Author Manuscript
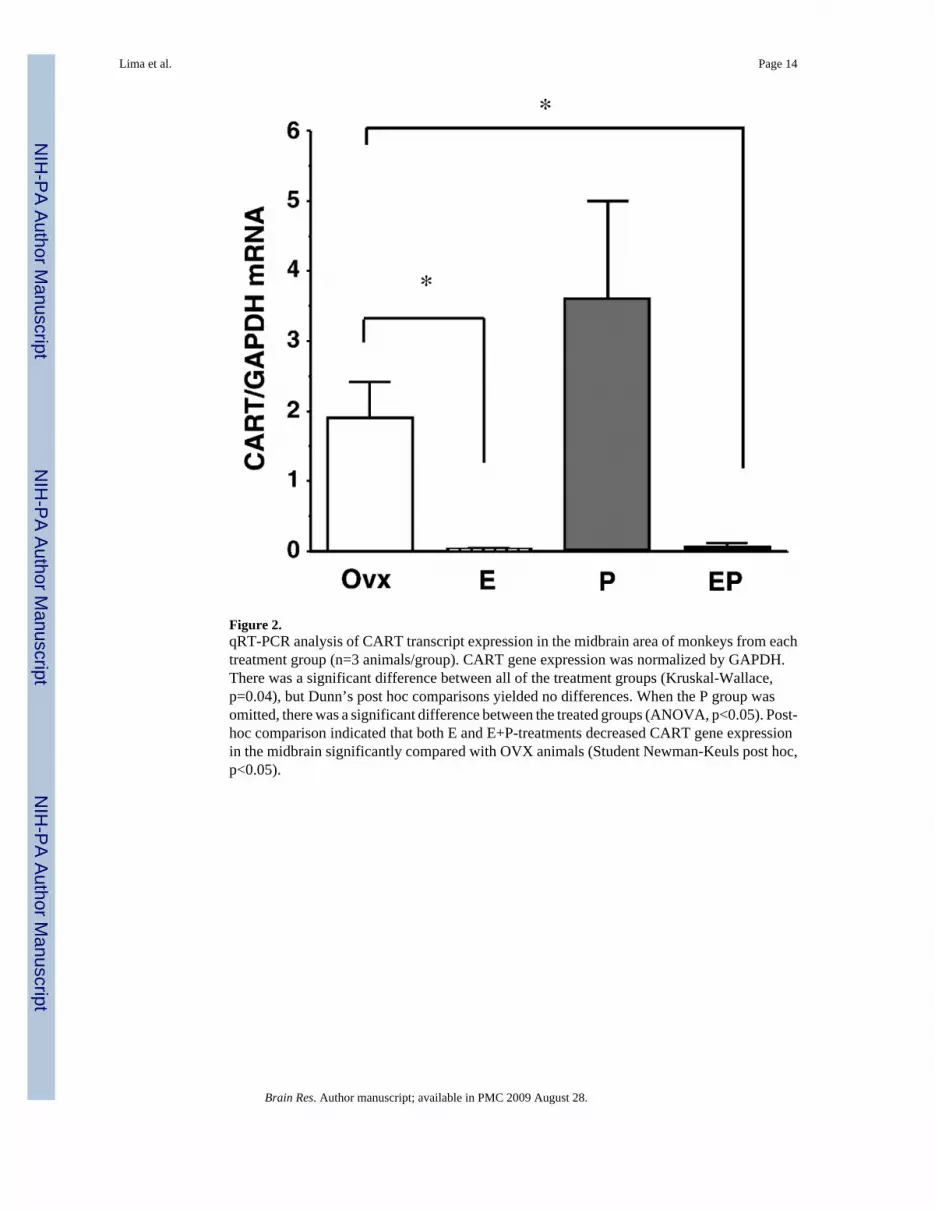
Figure 2.qRT-PCR analysis of CART transcript expression in the midbrain area of monkeys from eachtreatment group (n=3 animals/group). CART gene expression was normalized by GAPDH.There was a significant difference between all of the treatment groups (Kruskal-Wallace,p=0.04), but Dunn’s post hoc comparisons yielded no differences. When the P group wasomitted, there was a significant difference between the treated groups (ANOVA, p<0.05). Post-hoc comparison indicated that both E and E+P-treatments decreased CART gene expressionin the midbrain significantly compared with OVX animals (Student Newman-Keuls post hoc,p<0.05).
Lima et al. Page 14
Brain Res. Author manuscript; available in PMC 2009 August 28.
NIH
-PA Author Manuscript
NIH
-PA Author Manuscript
NIH
-PA Author Manuscript
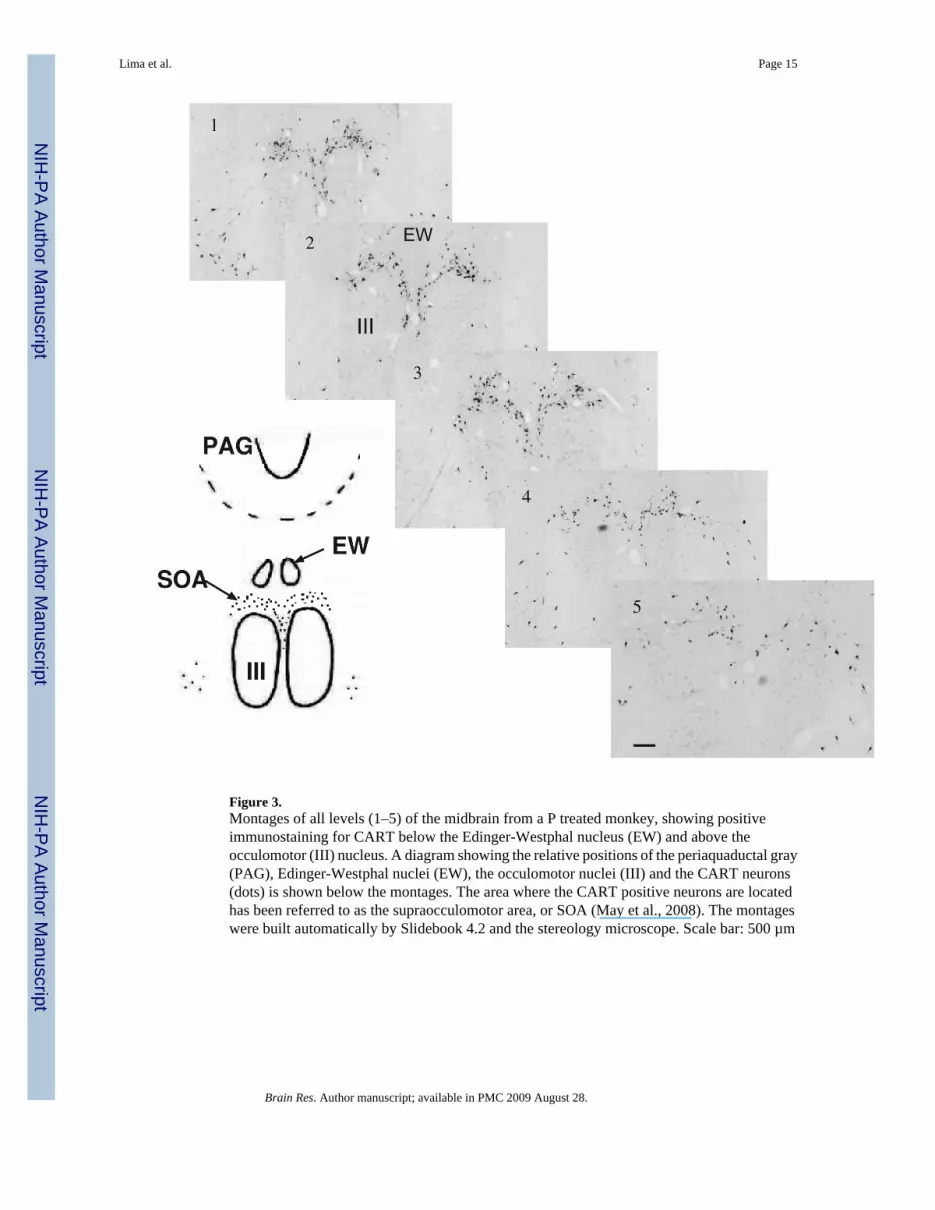
Figure 3.Montages of all levels (1–5) of the midbrain from a P treated monkey, showing positiveimmunostaining for CART below the Edinger-Westphal nucleus (EW) and above theocculomotor (III) nucleus. A diagram showing the relative positions of the periaquaductal gray(PAG), Edinger-Westphal nuclei (EW), the occulomotor nuclei (III) and the CART neurons(dots) is shown below the montages. The area where the CART positive neurons are locatedhas been referred to as the supraocculomotor area, or SOA (May et al., 2008). The montageswere built automatically by Slidebook 4.2 and the stereology microscope. Scale bar: 500 µm
Lima et al. Page 15
Brain Res. Author manuscript; available in PMC 2009 August 28.
NIH
-PA Author Manuscript
NIH
-PA Author Manuscript
NIH
-PA Author Manuscript

Figure 4.Comparison of immunohistochemical staining for CART at level 3 of the Edinger-Westphalnucleus from representative animals in each treatment group. Scale bar: 500 µm
Lima et al. Page 16
Brain Res. Author manuscript; available in PMC 2009 August 28.
NIH
-PA Author Manuscript
NIH
-PA Author Manuscript
NIH
-PA Author Manuscript
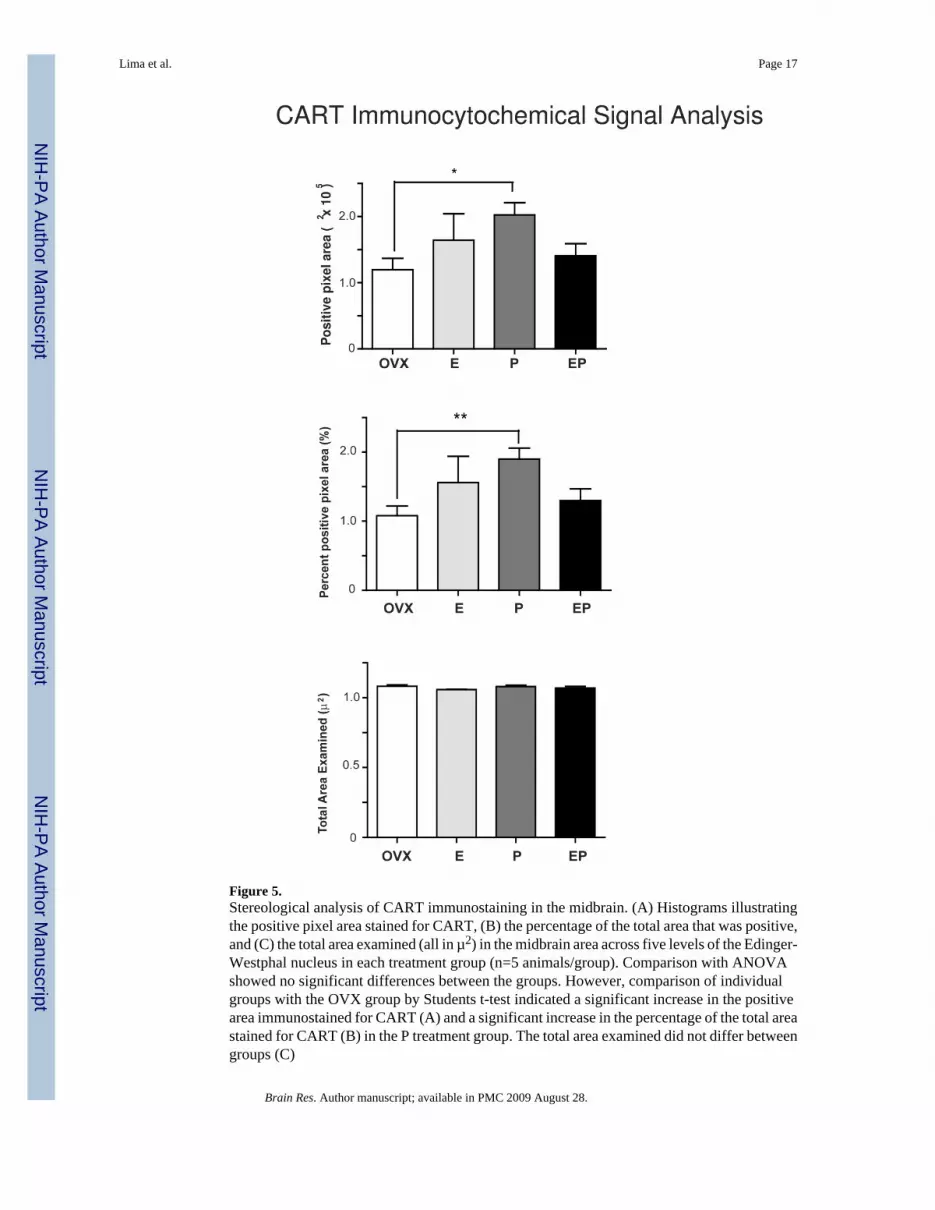
Figure 5.Stereological analysis of CART immunostaining in the midbrain. (A) Histograms illustratingthe positive pixel area stained for CART, (B) the percentage of the total area that was positive,and (C) the total area examined (all in µ2) in the midbrain area across five levels of the Edinger-Westphal nucleus in each treatment group (n=5 animals/group). Comparison with ANOVAshowed no significant differences between the groups. However, comparison of individualgroups with the OVX group by Students t-test indicated a significant increase in the positivearea immunostained for CART (A) and a significant increase in the percentage of the total areastained for CART (B) in the P treatment group. The total area examined did not differ betweengroups (C)
Lima et al. Page 17
Brain Res. Author manuscript; available in PMC 2009 August 28.
NIH
-PA Author Manuscript
NIH
-PA Author Manuscript
NIH
-PA Author Manuscript
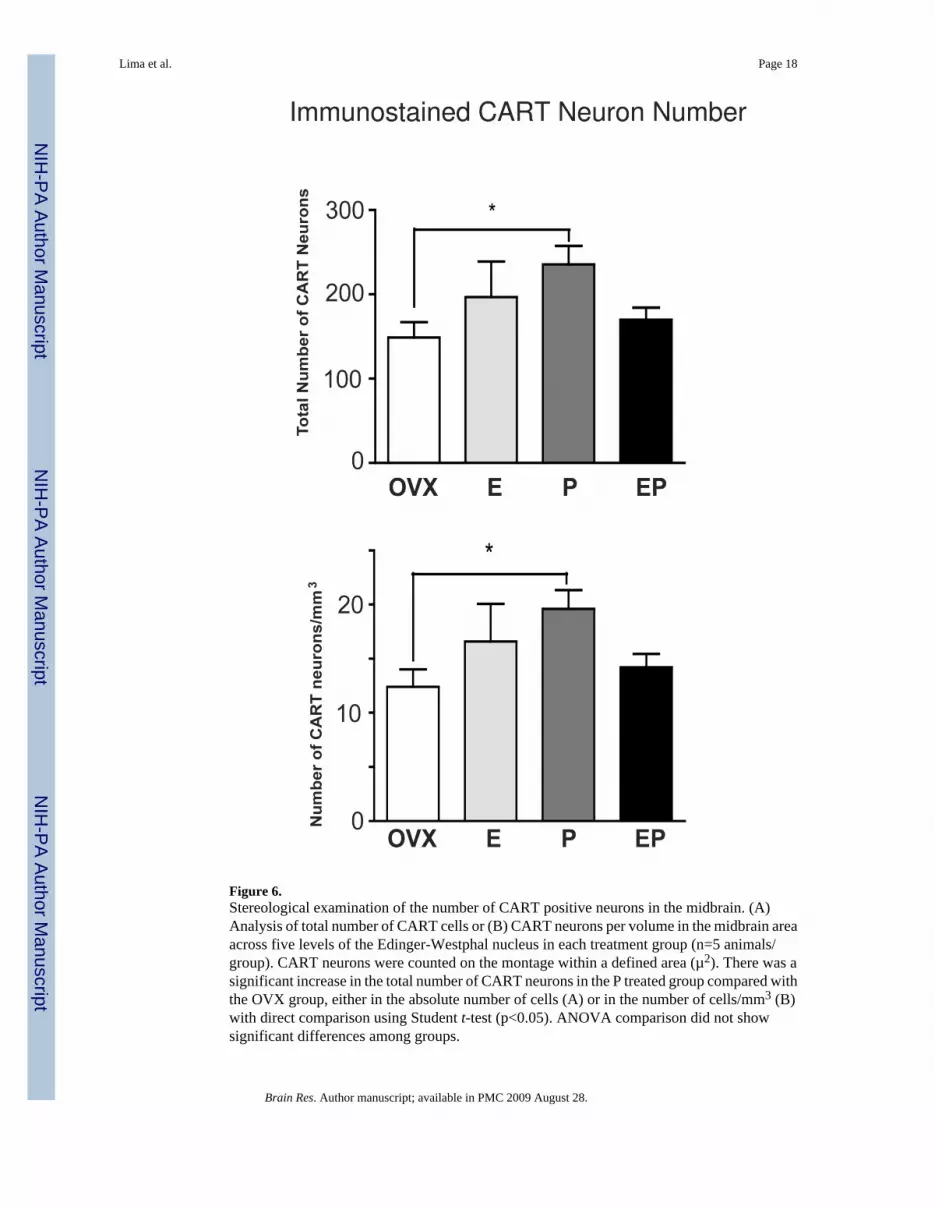
Figure 6.Stereological examination of the number of CART positive neurons in the midbrain. (A)Analysis of total number of CART cells or (B) CART neurons per volume in the midbrain areaacross five levels of the Edinger-Westphal nucleus in each treatment group (n=5 animals/group). CART neurons were counted on the montage within a defined area (µ2). There was asignificant increase in the total number of CART neurons in the P treated group compared withthe OVX group, either in the absolute number of cells (A) or in the number of cells/mm3 (B)with direct comparison using Student t-test (p<0.05). ANOVA comparison did not showsignificant differences among groups.
Lima et al. Page 18
Brain Res. Author manuscript; available in PMC 2009 August 28.
NIH
-PA Author Manuscript
NIH
-PA Author Manuscript
NIH
-PA Author Manuscript
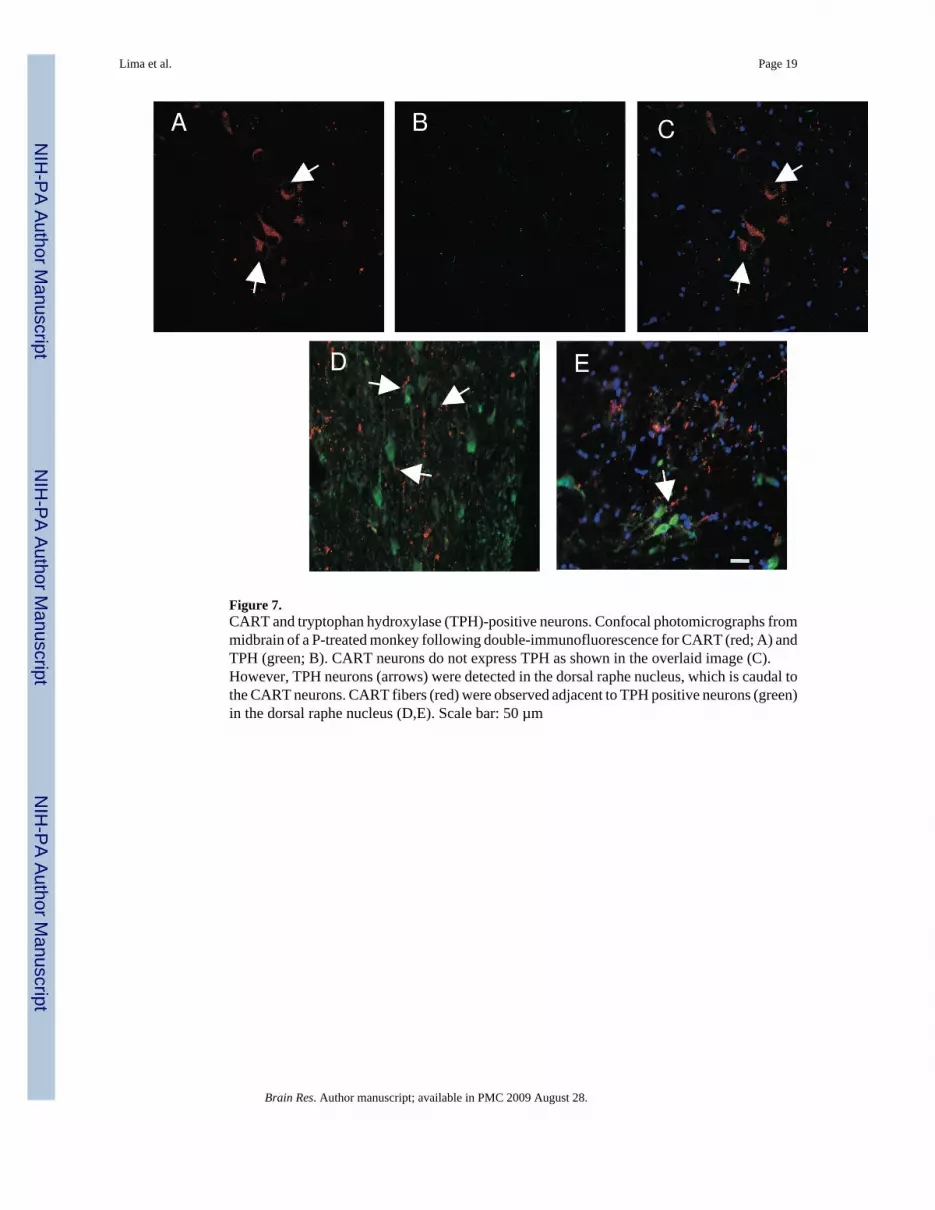
Figure 7.CART and tryptophan hydroxylase (TPH)-positive neurons. Confocal photomicrographs frommidbrain of a P-treated monkey following double-immunofluorescence for CART (red; A) andTPH (green; B). CART neurons do not express TPH as shown in the overlaid image (C).However, TPH neurons (arrows) were detected in the dorsal raphe nucleus, which is caudal tothe CART neurons. CART fibers (red) were observed adjacent to TPH positive neurons (green)in the dorsal raphe nucleus (D,E). Scale bar: 50 µm
Lima et al. Page 19
Brain Res. Author manuscript; available in PMC 2009 August 28.
NIH
-PA Author Manuscript
NIH
-PA Author Manuscript
NIH
-PA Author Manuscript
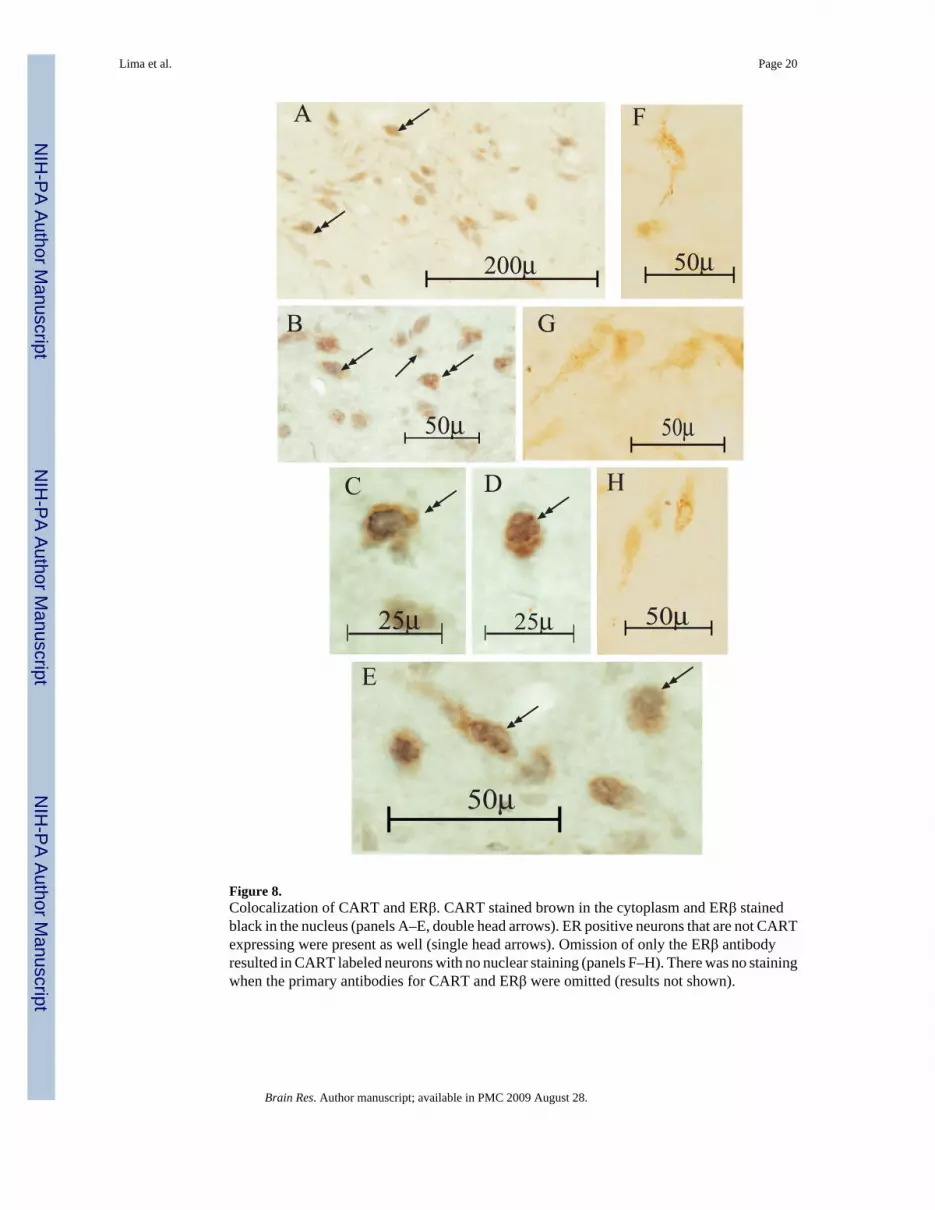
Figure 8.Colocalization of CART and ERβ. CART stained brown in the cytoplasm and ERβ stainedblack in the nucleus (panels A–E, double head arrows). ER positive neurons that are not CARTexpressing were present as well (single head arrows). Omission of only the ERβ antibodyresulted in CART labeled neurons with no nuclear staining (panels F–H). There was no stainingwhen the primary antibodies for CART and ERβ were omitted (results not shown).
Lima et al. Page 20
Brain Res. Author manuscript; available in PMC 2009 August 28.
NIH
-PA Author Manuscript
NIH
-PA Author Manuscript
NIH
-PA Author Manuscript

Figure 9.Colocalization of CART and PR. CART stained brown in the cytoplasm and PR stained blackin the nucleus. PR was undetectable in the absence of the primary antibody for PR (panels A,B). Numerous CART neurons contained PR (double head arrows, panels C–H). Figures 9Fand 9G also show PR positive neurons that do not contain CART (single head arrows).
Lima et al. Page 21
Brain Res. Author manuscript; available in PMC 2009 August 28.
NIH
-PA Author Manuscript
NIH
-PA Author Manuscript
NIH
-PA Author Manuscript

Figure 10.Top. Representative western blot showing CART signal at 9kD and the same blot reprobed foractin. Three sets of the 4 treatment groups were run on one gel and the band density wasobtained with NIH Image as area under the curve in arbitrary units. The density of the CARTband was normalized by the actin band and the results expressed as the mean±SEM are shownin the bottom panel. There was no difference between the treatment groups with ANOVA.
Lima et al. Page 22
Brain Res. Author manuscript; available in PMC 2009 August 28.
NIH
-PA Author Manuscript
NIH
-PA Author Manuscript
NIH
-PA Author Manuscript
NIH
-PA Author Manuscript
NIH
-PA Author Manuscript
NIH
-PA Author Manuscript
Lima et al. Page 23Ta
ble
1G
APD
H a
nd C
AR
T cD
NA
(pg)
gen
erat
ed d
urin
g qR
T-PC
R. T
here
was
no
diff
eren
ce b
etw
een
the
grou
ps in
GA
PDH
cD
NA
, but
CA
RT
cDN
A w
as si
gnifi
cant
ly d
ecre
ased
by
E an
d E+
P. N
orm
aliz
atio
n of
CA
RT
by G
APD
H is
show
n in
Fig
ure
2.O
vxE
PE
+PG
APD
H c
DN
A (p
g±se
m)
9261
± 5
138
1225
9 ±
3798
1847
8 ±
2271
1450
2 ±
5001
nsC
AR
T cD
NA
(pg±
sem
)13
348
± 39
1752
4 ±
197
6740
9 ±
3179
510
10 ±
213
p <
0.03
Brain Res. Author manuscript; available in PMC 2009 August 28.