understanding the effect of harvester speed on subsequent
TRANSCRIPT
SRA Grower Group Innovation Project
Understanding the effect of harvester speed on subsequent ratoon performance in the Burdekin: final report 2014/092
SRA Project Code 2014/092
Project Title Understanding the effect of harvester speed on subsequent ratoon
performance in the Burdekin
Group name Burdekin Productivity Services Ltd
Chief Investigator(s) Rob Milla
Project Objectives
Quantify the effect of various harvester speeds on ratoonability and subsequent yield through shoot and stool counts and crop yield
Provide growers and industry with information on the cost benefit or penalty of a range of harvester speeds between 6 and 12 km/hr
Engage with grower groups and harvesting contractors to discuss the implications of a change in speed of harvesters – ensure that growers are present during project activities such as harvesting, shoot and stool counts.
Explore how harvester speed affects the subsequent crop performance on different soil types and varieties
Milestone Number 8
Milestone Due Date 30 May 2017 Date submitted 30/5/2017
Reason for delay
(if relevant)
Milestone Title Third year data analysis and final report
Success in achieving the
milestone
☒ Completely Achieved
☐ Partially Achieved
☐ Not Achieved
Will the project be
completed on the current
milestone timetable?
☒ YES
☐ NO
(If NO, provide an explanation on how the project will be delivered within
Section 6)
© Sugar Research Australia Limited 2017
Copyright in this document is owned by Sugar Research Australia Limited (SRA) or by one or more other parties which have provided it to SRA, as indicated in the document. With the exception of any material protected by a trade mark, this document is licensed under a Creative Commons Attribution-NonCommercial 4.0 International licence (as described through this link). Any use of this publication, other than as authorised under this licence or copyright law, is prohibited.
http://creativecommons.org/licenses/by-nc/4.0/legalcode - This link takes you to the relevant licence conditions, including the full legal code.
In referencing this document, please use the citation identified in the document.
Disclaimer:
In this disclaimer a reference to “SRA” means Sugar Research Australia Ltd and its directors, officers, employees, contractors and agents.
This document has been prepared in good faith by the organisation or individual named in the document on the basis of information available to them at the date of publication without any independent verification. Although SRA does its best to present information that is correct and accurate, to the full extent permitted by law SRA makes no warranties, guarantees or representations about the suitability, reliability, currency or accuracy of the information in this document, for any purposes.
The information contained in this document (including tests, inspections and recommendations) is produced for general information only. It is not intended as professional advice on any particular matter. No person should act or fail to act on the basis of any information contained in this document without first conducting independent inquiries and obtaining specific and independent professional advice as appropriate.
To the full extent permitted by law, SRA expressly disclaims all and any liability to any persons in respect of anything done by any such person in reliance (whether in whole or in part) on any information contained in this document, including any loss, damage, cost or expense incurred by any such persons as a result of the use of, or reliance on, any information in this document.
The views expressed in this publication are not necessarily those of SRA.
Any copies made of this document or any part of it must incorporate this disclaimer.
Please cite as: Milla R. 2017. Understanding the effect of harvester speed on subsequent ratoon
performance in the Burdekin: final report project 2014/092. Sugar Research Australia Limited,
Brisbane.
PART A
Section 1: Abstract
In 2014 six harvester speed trials were established in the Burdekin to investigate the effect of harvester speed
on crop yields and subsequent ratooning, and the economics associated with harvesting at different speeds.
These trials came about after discussions with growers identified harvester damage as a major cause of yield
loss in ratoons. The trials compared the recommended best practice harvesting speed of 7-8 km/h to lower
speeds (5-6 km/h) and higher speeds (9 km/h or higher).
The trials commenced in plant cane blocks, and concluded with the second ratoon harvest in 2016. Statistical
analysis of the crop yields and changes in yield generally found no correlation between harvester speed and
yield or the changes in yield from one year to the next. The only significant effects were noted in the change in
yield in between the first and second ratoon crops, at sites 1 and 5. However, at both of these sites there were
issues with the irrigation management which have affected the overall yield and potentially compromised the
results.
The economic analysis showed that harvesting costs initially decrease as speed increases from a very low
speed (5-6 km/h) up to around 9 km/h. Above 9 km/h the costs increased in some cases and decreased in
others.
At the conclusion of the project there has been no obvious effect of harvester speed on crop yield or
ratooning. There are some trends in the economic analyses, but these are not consistent when the harvesting
speed is greater than 9 km/h. This suggests that while growers perceive harvesting speed to be the major
factor affecting yields and ratooning, other components of the farming system can have as great an, or
greater, effect than harvesting. It also demonstrates the difficulty of isolating and testing the influence of one
part of the farming system on yield.
Section 2: Milestone Achievement
Collation of data and statistical analyses
The infield data collection has been completed for the five sites that were harvested in 2016. This included
harvest data – yield and ccs – economic data, and post-harvest shoot, stool and gap counts at four weeks after
harvest.
In the second ratoon harvest the treatment speeds were the same as the first ratoon harvest which will allow
direct comparisons to be made, unlike between plant and first ratoon where some treatment changes were
made. To account for changes in the treatment speeds between the plant and first ratoon crops the
treatments have been grouped as Low (5-6 km/h), BMP (7-8 km/h), Moderate (9-10 km/h) and High (11 km/h).
At sites 4 and 5, the lowest speed in the plant crop became the highest speed in the next crop.
Harvester speed had no effect on the crop yield in either the plant or first ratoon crops. In the second ratoon
the different harvester speeds again had no obvious impact on crop yield with minimal variation in yields
between treatments (Table 1). Where variation is obvious, it is mostly related to infield variability and has
been noticed in the previous two harvests. Figure 1 shows the yield for each plot at site 2 over the three years
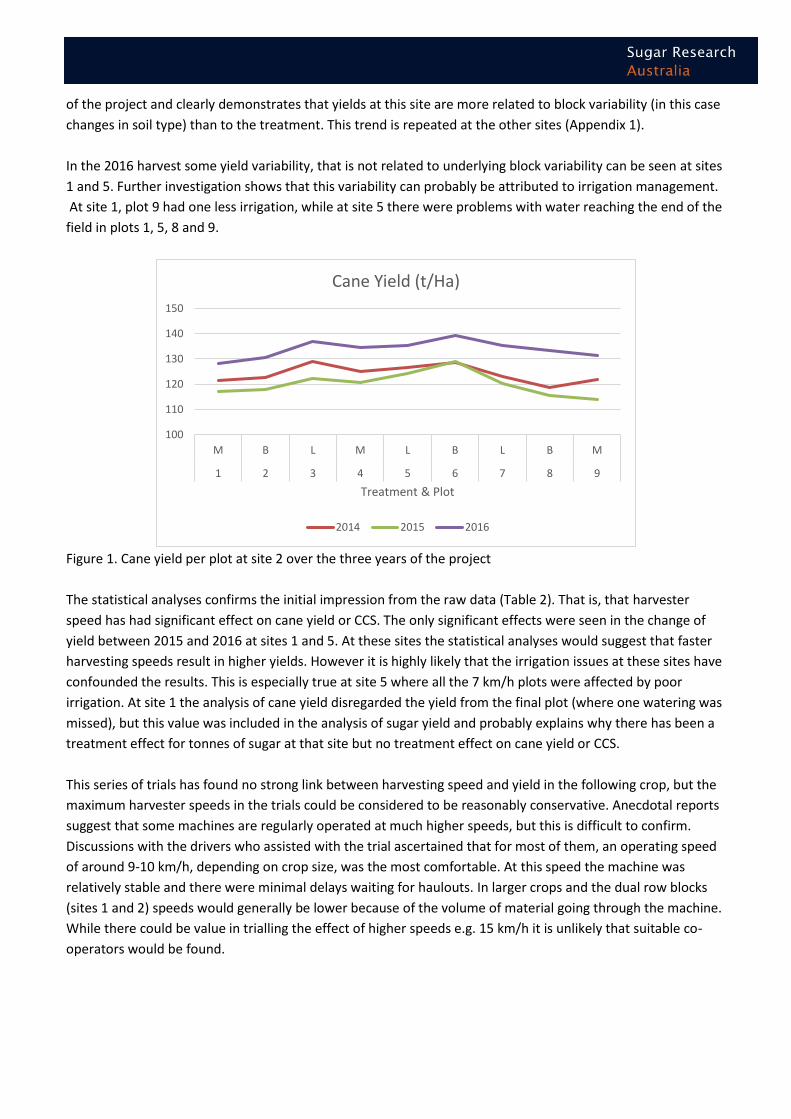
of the project and clearly demonstrates that yields at this site are more related to block variability (in this case
changes in soil type) than to the treatment. This trend is repeated at the other sites (Appendix 1).
In the 2016 harvest some yield variability, that is not related to underlying block variability can be seen at sites
1 and 5. Further investigation shows that this variability can probably be attributed to irrigation management.
At site 1, plot 9 had one less irrigation, while at site 5 there were problems with water reaching the end of the
field in plots 1, 5, 8 and 9.
Figure 1. Cane yield per plot at site 2 over the three years of the project
The statistical analyses confirms the initial impression from the raw data (Table 2). That is, that harvester
speed has had significant effect on cane yield or CCS. The only significant effects were seen in the change of
yield between 2015 and 2016 at sites 1 and 5. At these sites the statistical analyses would suggest that faster
harvesting speeds result in higher yields. However it is highly likely that the irrigation issues at these sites have
confounded the results. This is especially true at site 5 where all the 7 km/h plots were affected by poor
irrigation. At site 1 the analysis of cane yield disregarded the yield from the final plot (where one watering was
missed), but this value was included in the analysis of sugar yield and probably explains why there has been a
treatment effect for tonnes of sugar at that site but no treatment effect on cane yield or CCS.
This series of trials has found no strong link between harvesting speed and yield in the following crop, but the
maximum harvester speeds in the trials could be considered to be reasonably conservative. Anecdotal reports
suggest that some machines are regularly operated at much higher speeds, but this is difficult to confirm.
Discussions with the drivers who assisted with the trial ascertained that for most of them, an operating speed
of around 9-10 km/h, depending on crop size, was the most comfortable. At this speed the machine was
relatively stable and there were minimal delays waiting for haulouts. In larger crops and the dual row blocks
(sites 1 and 2) speeds would generally be lower because of the volume of material going through the machine.
While there could be value in trialling the effect of higher speeds e.g. 15 km/h it is unlikely that suitable co-
operators would be found.
100
110
120
130
140
150
M B L M L B L B M
1 2 3 4 5 6 7 8 9
Treatment & Plot
Cane Yield (t/Ha)
2014 2015 2016
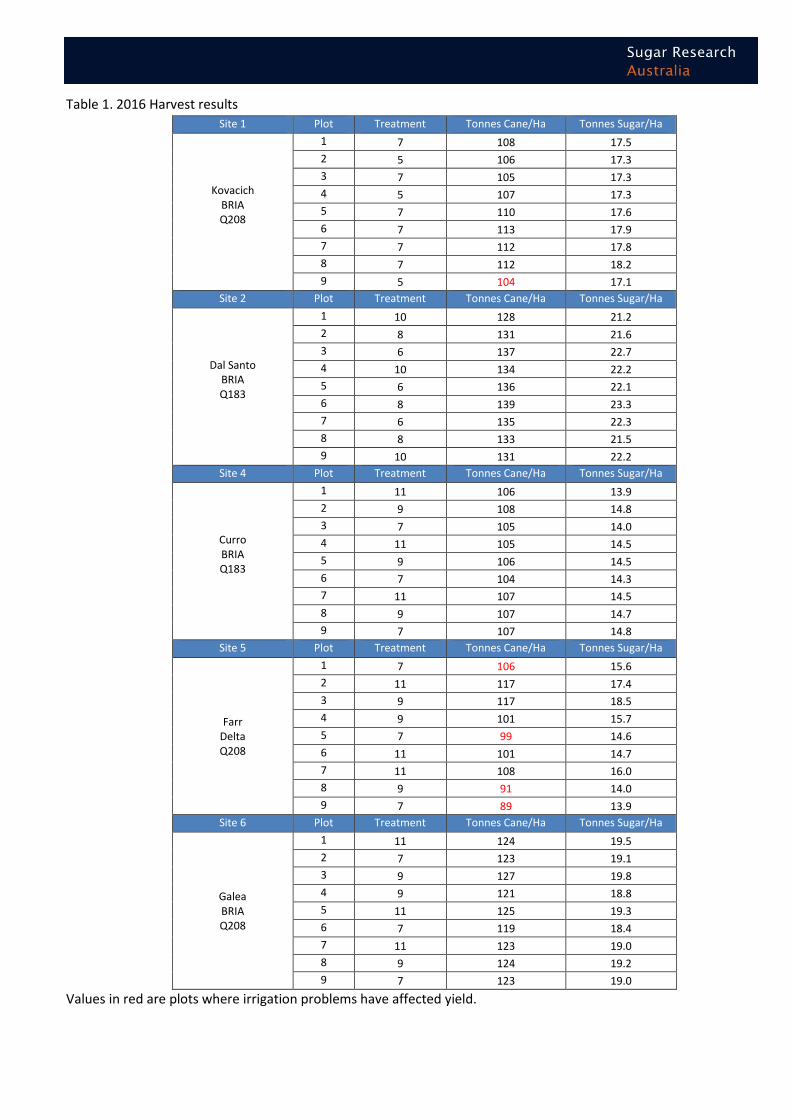
Table 1. 2016 Harvest results
Site 1 Plot Treatment Tonnes Cane/Ha Tonnes Sugar/Ha
Kovacich BRIA Q208
1 7 108 17.5
2 5 106 17.3
3 7 105 17.3
4 5 107 17.3
5 7 110 17.6
6 7 113 17.9
7 7 112 17.8
8 7 112 18.2
9 5 104 17.1
Site 2 Plot Treatment Tonnes Cane/Ha Tonnes Sugar/Ha
Dal Santo BRIA Q183
1 10 128 21.2
2 8 131 21.6
3 6 137 22.7
4 10 134 22.2
5 6 136 22.1
6 8 139 23.3
7 6 135 22.3
8 8 133 21.5
9 10 131 22.2
Site 4 Plot Treatment Tonnes Cane/Ha Tonnes Sugar/Ha
Curro BRIA Q183
1 11 106 13.9
2 9 108 14.8
3 7 105 14.0
4 11 105 14.5
5 9 106 14.5
6 7 104 14.3
7 11 107 14.5
8 9 107 14.7
9 7 107 14.8
Site 5 Plot Treatment Tonnes Cane/Ha Tonnes Sugar/Ha
Farr Delta Q208
1 7 106 15.6
2 11 117 17.4
3 9 117 18.5
4 9 101 15.7
5 7 99 14.6
6 11 101 14.7
7 11 108 16.0
8 9 91 14.0
9 7 89 13.9
Site 6 Plot Treatment Tonnes Cane/Ha Tonnes Sugar/Ha
Galea BRIA Q208
1 11 124 19.5
2 7 123 19.1
3 9 127 19.8
4 9 121 18.8
5 11 125 19.3
6 7 119 18.4
7 11 123 19.0
8 9 124 19.2
9 7 123 19.0
Values in red are plots where irrigation problems have affected yield.
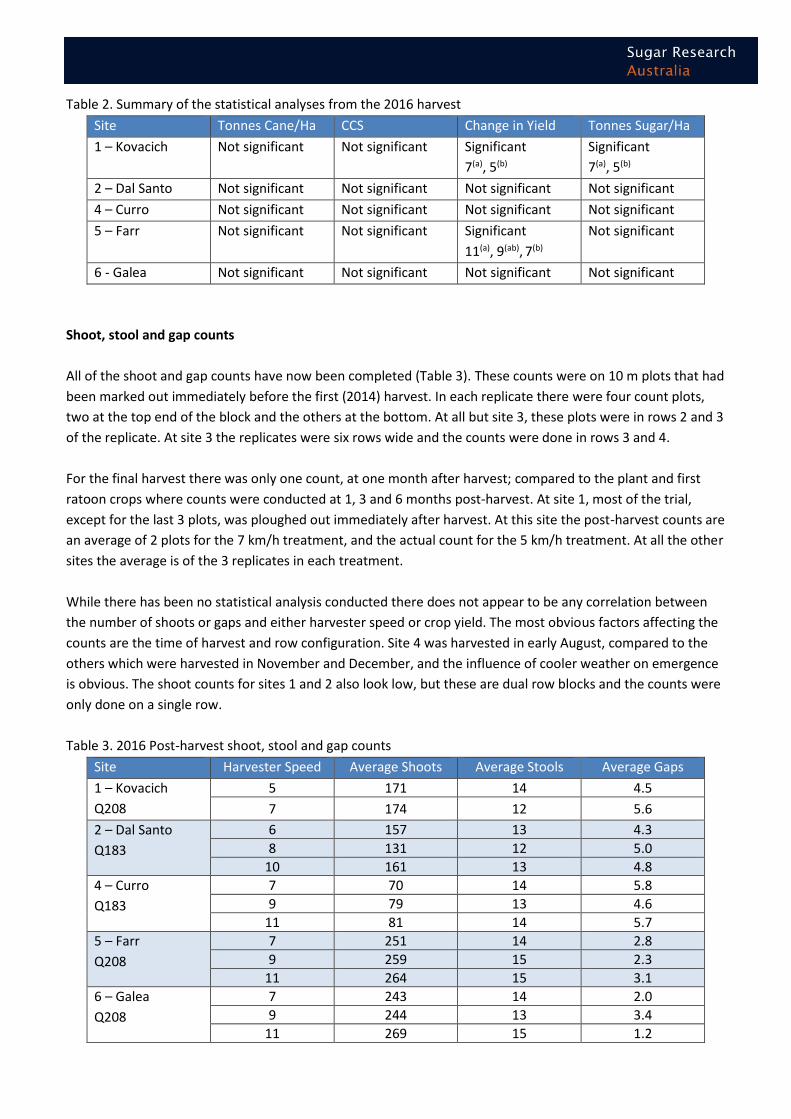
Table 2. Summary of the statistical analyses from the 2016 harvest
Site Tonnes Cane/Ha CCS Change in Yield Tonnes Sugar/Ha
1 – Kovacich Not significant Not significant Significant
7(a), 5(b)
Significant
7(a), 5(b)
2 – Dal Santo Not significant Not significant Not significant Not significant
4 – Curro Not significant Not significant Not significant Not significant
5 – Farr Not significant Not significant Significant
11(a), 9(ab), 7(b)
Not significant
6 - Galea Not significant Not significant Not significant Not significant
Shoot, stool and gap counts
All of the shoot and gap counts have now been completed (Table 3). These counts were on 10 m plots that had
been marked out immediately before the first (2014) harvest. In each replicate there were four count plots,
two at the top end of the block and the others at the bottom. At all but site 3, these plots were in rows 2 and 3
of the replicate. At site 3 the replicates were six rows wide and the counts were done in rows 3 and 4.
For the final harvest there was only one count, at one month after harvest; compared to the plant and first
ratoon crops where counts were conducted at 1, 3 and 6 months post-harvest. At site 1, most of the trial,
except for the last 3 plots, was ploughed out immediately after harvest. At this site the post-harvest counts are
an average of 2 plots for the 7 km/h treatment, and the actual count for the 5 km/h treatment. At all the other
sites the average is of the 3 replicates in each treatment.
While there has been no statistical analysis conducted there does not appear to be any correlation between
the number of shoots or gaps and either harvester speed or crop yield. The most obvious factors affecting the
counts are the time of harvest and row configuration. Site 4 was harvested in early August, compared to the
others which were harvested in November and December, and the influence of cooler weather on emergence
is obvious. The shoot counts for sites 1 and 2 also look low, but these are dual row blocks and the counts were
only done on a single row.
Table 3. 2016 Post-harvest shoot, stool and gap counts
Site Harvester Speed Average Shoots Average Stools Average Gaps
1 – Kovacich
Q208
5 171 14 4.5
7 174 12 5.6
2 – Dal Santo
Q183
6 157 13 4.3
8 131 12 5.0
10 161 13 4.8
4 – Curro
Q183
7 70 14 5.8
9 79 13 4.6
11 81 14 5.7
5 – Farr
Q208
7 251 14 2.8
9 259 15 2.3
11 264 15 3.1
6 – Galea
Q208
7 243 14 2.0
9 244 13 3.4
11 269 15 1.2
Over the term of the project the stool counts have been considered to be the least accurate because they
relied the most on the assessor’s interpretation of where one stool ended and the next started. The shoot and
gap counts were more quantitative and should be more accurate. The shoot counts are not considered to be
particularly useful measure of harvester damage as they appear to be more influenced by variety and time of
year than by treatment.
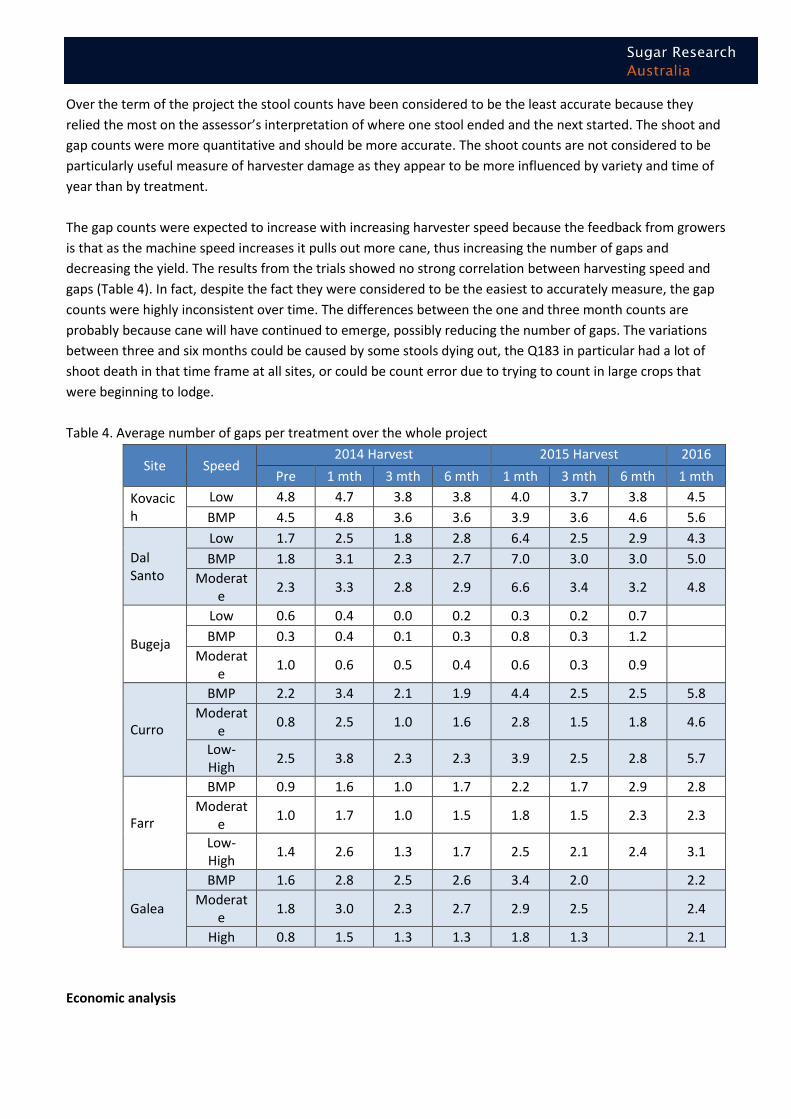
The gap counts were expected to increase with increasing harvester speed because the feedback from growers
is that as the machine speed increases it pulls out more cane, thus increasing the number of gaps and
decreasing the yield. The results from the trials showed no strong correlation between harvesting speed and
gaps (Table 4). In fact, despite the fact they were considered to be the easiest to accurately measure, the gap
counts were highly inconsistent over time. The differences between the one and three month counts are
probably because cane will have continued to emerge, possibly reducing the number of gaps. The variations
between three and six months could be caused by some stools dying out, the Q183 in particular had a lot of
shoot death in that time frame at all sites, or could be count error due to trying to count in large crops that
were beginning to lodge.
Table 4. Average number of gaps per treatment over the whole project
Site Speed 2014 Harvest 2015 Harvest 2016
Pre 1 mth 3 mth 6 mth 1 mth 3 mth 6 mth 1 mth
Kovacich
Low 4.8 4.7 3.8 3.8 4.0 3.7 3.8 4.5
BMP 4.5 4.8 3.6 3.6 3.9 3.6 4.6 5.6
Dal Santo
Low 1.7 2.5 1.8 2.8 6.4 2.5 2.9 4.3
BMP 1.8 3.1 2.3 2.7 7.0 3.0 3.0 5.0
Moderate
2.3 3.3 2.8 2.9 6.6 3.4 3.2 4.8
Bugeja
Low 0.6 0.4 0.0 0.2 0.3 0.2 0.7
BMP 0.3 0.4 0.1 0.3 0.8 0.3 1.2
Moderate
1.0 0.6 0.5 0.4 0.6 0.3 0.9
Curro
BMP 2.2 3.4 2.1 1.9 4.4 2.5 2.5 5.8
Moderate
0.8 2.5 1.0 1.6 2.8 1.5 1.8 4.6
Low-High
2.5 3.8 2.3 2.3 3.9 2.5 2.8 5.7
Farr
BMP 0.9 1.6 1.0 1.7 2.2 1.7 2.9 2.8
Moderate
1.0 1.7 1.0 1.5 1.8 1.5 2.3 2.3
Low-High
1.4 2.6 1.3 1.7 2.5 2.1 2.4 3.1
Galea
BMP 1.6 2.8 2.5 2.6 3.4 2.0 2.2
Moderate
1.8 3.0 2.3 2.7 2.9 2.5 2.4
High 0.8 1.5 1.3 1.3 1.8 1.3 2.1
Economic analysis
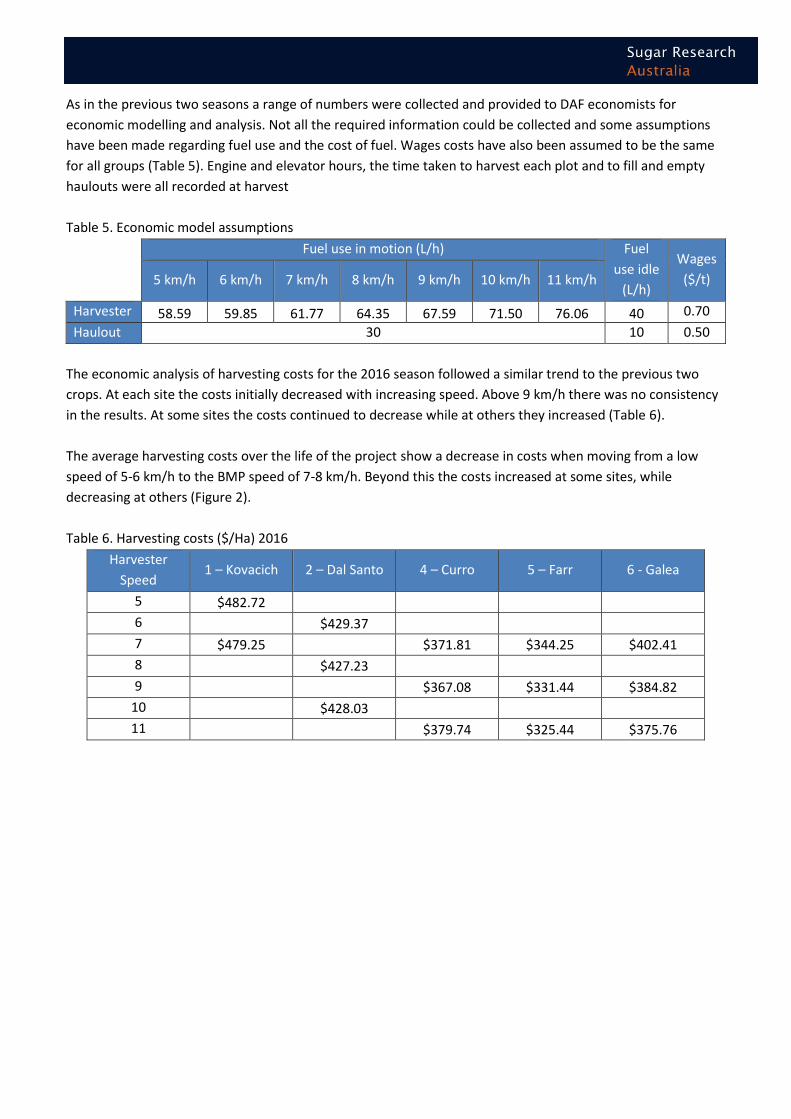
As in the previous two seasons a range of numbers were collected and provided to DAF economists for
economic modelling and analysis. Not all the required information could be collected and some assumptions
have been made regarding fuel use and the cost of fuel. Wages costs have also been assumed to be the same
for all groups (Table 5). Engine and elevator hours, the time taken to harvest each plot and to fill and empty
haulouts were all recorded at harvest
Table 5. Economic model assumptions
Fuel use in motion (L/h) Fuel
use idle
(L/h)
Wages
($/t)
5 km/h 6 km/h 7 km/h 8 km/h 9 km/h 10 km/h 11 km/h
Harvester 58.59 59.85 61.77 64.35 67.59 71.50 76.06 40 0.70
Haulout 30 10 0.50
The economic analysis of harvesting costs for the 2016 season followed a similar trend to the previous two
crops. At each site the costs initially decreased with increasing speed. Above 9 km/h there was no consistency
in the results. At some sites the costs continued to decrease while at others they increased (Table 6).
The average harvesting costs over the life of the project show a decrease in costs when moving from a low
speed of 5-6 km/h to the BMP speed of 7-8 km/h. Beyond this the costs increased at some sites, while
decreasing at others (Figure 2).
Table 6. Harvesting costs ($/Ha) 2016
Harvester
Speed 1 – Kovacich 2 – Dal Santo 4 – Curro 5 – Farr 6 - Galea
5 $482.72
6 $429.37
7 $479.25 $371.81 $344.25 $402.41
8 $427.23
9 $367.08 $331.44 $384.82
10 $428.03
11 $379.74 $325.44 $375.76
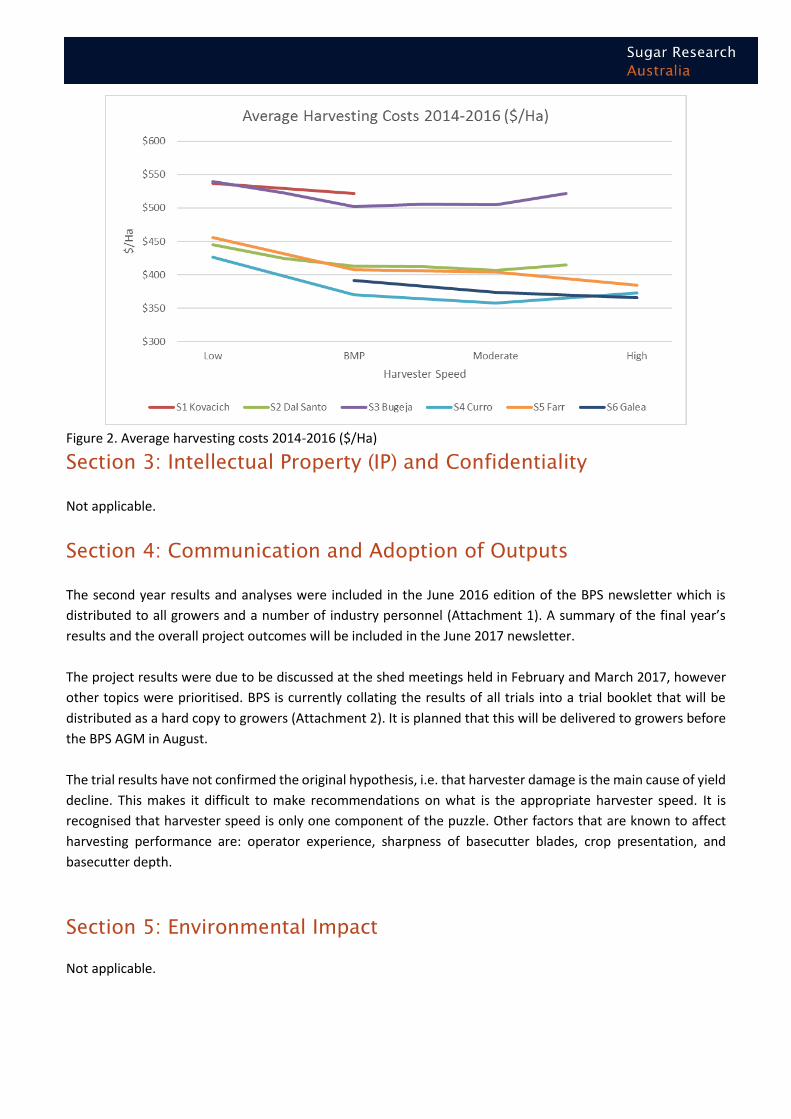
Figure 2. Average harvesting costs 2014-2016 ($/Ha)
Section 3: Intellectual Property (IP) and Confidentiality
Not applicable.
Section 4: Communication and Adoption of Outputs
The second year results and analyses were included in the June 2016 edition of the BPS newsletter which is
distributed to all growers and a number of industry personnel (Attachment 1). A summary of the final year’s
results and the overall project outcomes will be included in the June 2017 newsletter.
The project results were due to be discussed at the shed meetings held in February and March 2017, however
other topics were prioritised. BPS is currently collating the results of all trials into a trial booklet that will be
distributed as a hard copy to growers (Attachment 2). It is planned that this will be delivered to growers before
the BPS AGM in August.
The trial results have not confirmed the original hypothesis, i.e. that harvester damage is the main cause of yield
decline. This makes it difficult to make recommendations on what is the appropriate harvester speed. It is
recognised that harvester speed is only one component of the puzzle. Other factors that are known to affect
harvesting performance are: operator experience, sharpness of basecutter blades, crop presentation, and
basecutter depth.
Section 5: Environmental Impact
Not applicable.
Section 6: Project Variations
Personnel Changes
Not applicable
Proposed variations
Not applicable
Other Matters
Not applicable
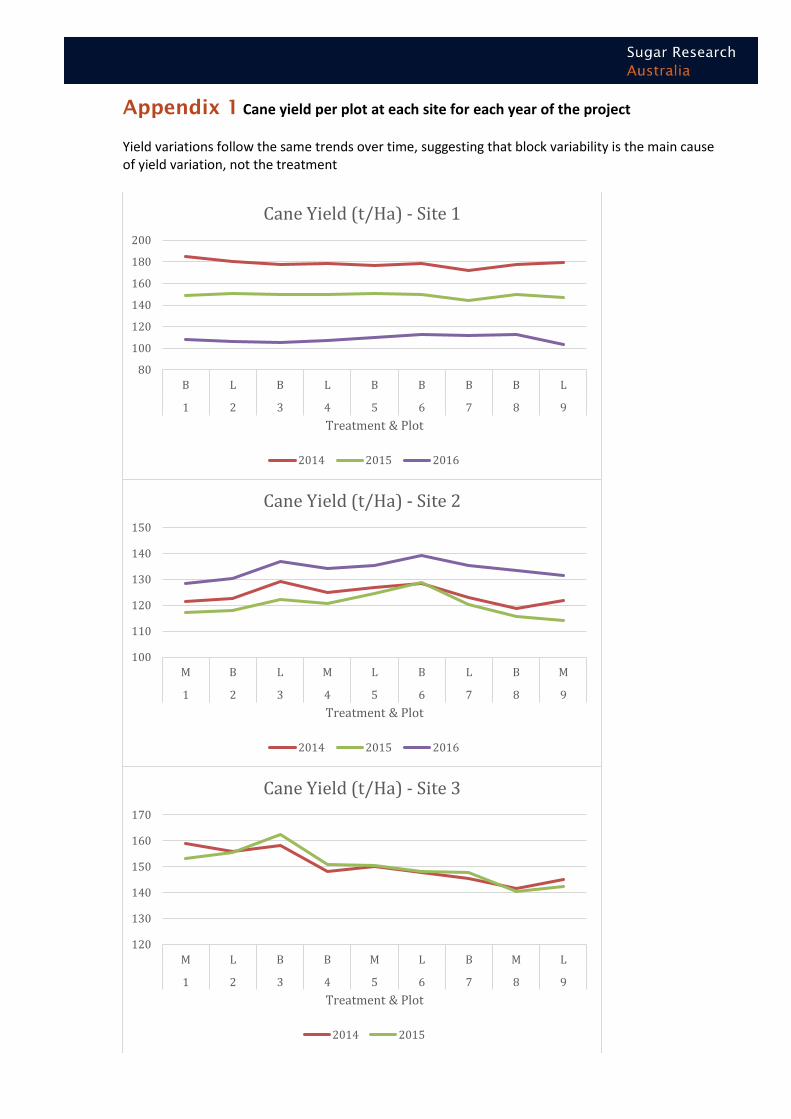
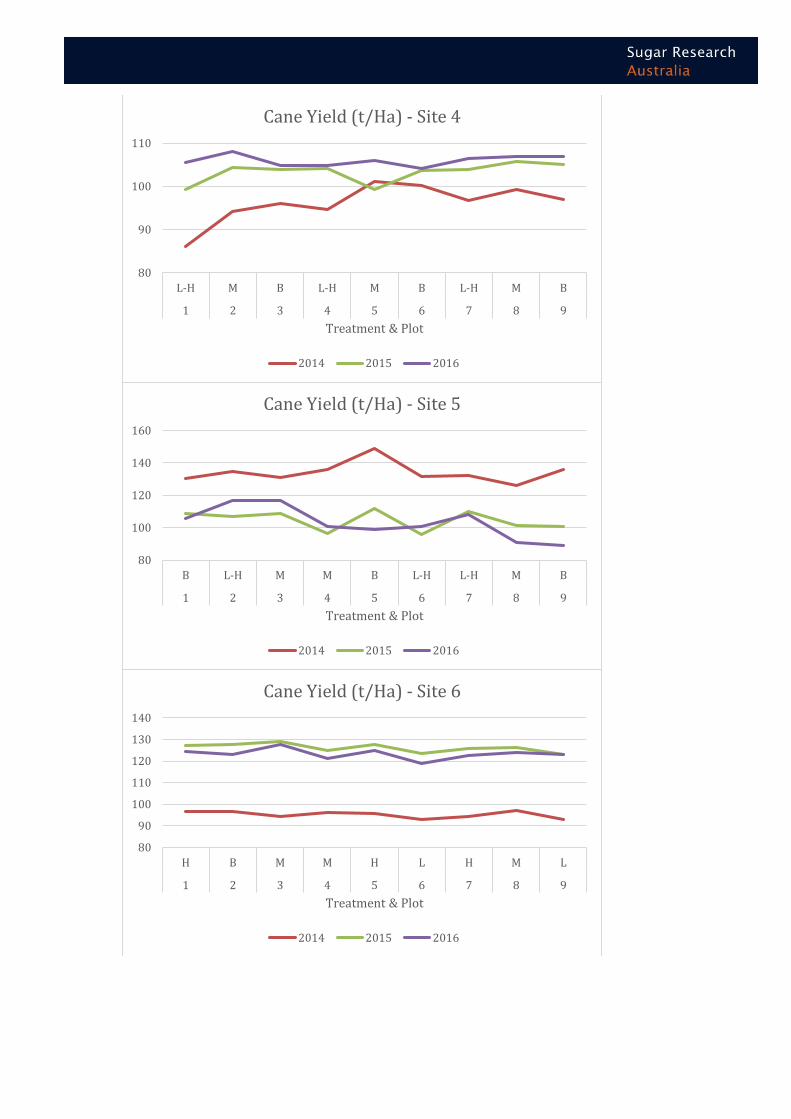
Appendix 1 Cane yield per plot at each site for each year of the project
Yield variations follow the same trends over time, suggesting that block variability is the main cause of yield variation, not the treatment
80
100
120
140
160
180
200
B L B L B B B B L
1 2 3 4 5 6 7 8 9
Treatment & Plot
Cane Yield (t/Ha) - Site 1
2014 2015 2016
100
110
120
130
140
150
M B L M L B L B M
1 2 3 4 5 6 7 8 9
Treatment & Plot
Cane Yield (t/Ha) - Site 2
2014 2015 2016
120
130
140
150
160
170
M L B B M L B M L
1 2 3 4 5 6 7 8 9
Treatment & Plot
Cane Yield (t/Ha) - Site 3
2014 2015
80
90
100
110
L-H M B L-H M B L-H M B
1 2 3 4 5 6 7 8 9
Treatment & Plot
Cane Yield (t/Ha) - Site 4
2014 2015 2016
80
100
120
140
160
B L-H M M B L-H L-H M B
1 2 3 4 5 6 7 8 9
Treatment & Plot
Cane Yield (t/Ha) - Site 5
2014 2015 2016
80
90
100
110
120
130
140
H B M M H L H M L
1 2 3 4 5 6 7 8 9
Treatment & Plot
Cane Yield (t/Ha) - Site 6
2014 2015 2016