understanding the basic knowledge of the measurements
TRANSCRIPT

− 31 −
Sysmex Journal International Vol.9 No.1 (1999)
FOREWORD In this article the principles of measurement used in theSysmex hematology analyzers available on the marketare described. Because of the wide application of mea-surement principles in Sysmex products, a general expla-nation of the measurement principles will be presentedfirst. Then each measurement parameter such as RBC,WBC, PLT, immature WBC, NRBC, reticulocyte andhemoglobin, is explained.
UNDERSTANDINGTHE BASIC KNOWLEDGE OFTHE MEASUREMENTS
In this section, basic but important knowledge for under-standing the measurement principles in biological cellanalysis is described.
Cell counting by electric capacitance method
Around 1960, when Sysmex first tried to develop ahematology analyzer, the founder of the CoulterCompany (now Beckman-Coulter Co.), Mr. Wallace H.Coulter1), took out a technical patent for the electric resis-tance method he had developed. Due to the risk ofinfringement of this patent, Sysmex could not apply thismethod to its product.
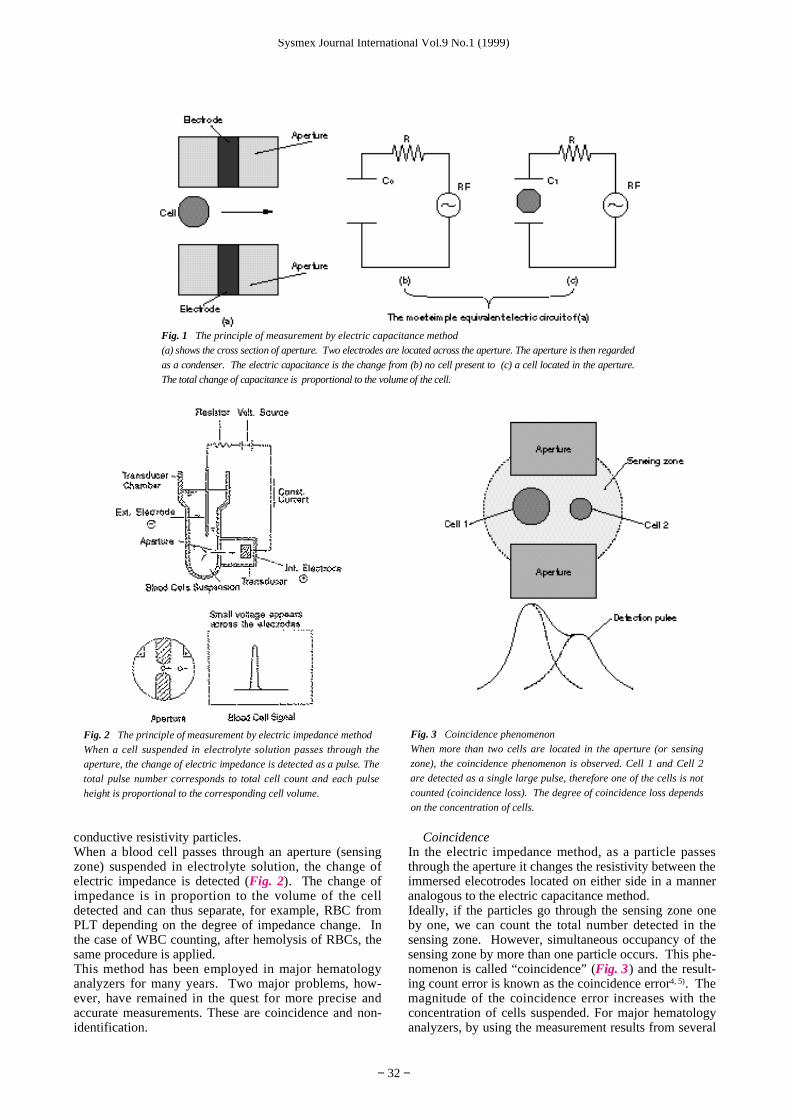
To avoid this technical patent, Sysmex developed thecapacitance method rather than the resistance method.As shown in Fig. 1, when a particle is located in thedetection area, a change in electric capacitance occursand this is in proportion to the volume of the particle.Applying this method, we can count the total number ofcells as they pass through the detection area (a smallaperture). A detailed description of this method is givenin the article by Tatsumi2) and Okada3), in this issue.This method has not been directly applied in our recentproducts alone. The technology is, however, still used insome of our products as a part of the high energy electricimpedance method for the purpose of detection and dif-ferentiation of WBCs, which will be described in a latersection in this article.
Cell counting by electric impedance method
(Note : The word “Impedance” used here has almost the same meaningas “Resistance”. Theoretically, impedance contains resistance, capaci-tance and reactance. In electric impedance method, electric resistancedoes major contribution. As then in this article, electric impedancemethod and electric resistance method are almost the same.)
This is the most popular method applied in hematologyanalyzers manufactured not only by Sysmex but also byother companies. In this method, biological cells such asWBC, RBC and PLT are regarded as completely non-
Principles of Measurement in Hematology Analyzers Manufactured by Sysmex Corporation
Keiji FUJIMOTO
Scientific Division, Sysmex Corporation, 4-4-4 Takatsukadai, Nishi-ku, Kobe 651-2271, Japan.
This article describes the measurement principles found in hematology analyzers manufactured by Sysmex Corporation and currently available on the market. To aid in understanding, a brief historical background of the analytical principles involved is presented. This isfollowed by general descriptions of particle behavior in an electric field and coincidence. The details of the measurement principles ofindividual parameters, RBC, WBC, PLT, reticulocytes, immature WBC and NRBC are presented together with the relevant reagentreactions.
As technology advances, so does the availability of new analyzers to satisfy customer needs. Sysmex Corporation will continue to develop innovative and user friendly products of high clinical utility.
(Sysmex J Int 9 : 31 − 44, 1999)
Automated Hematology Analyzer, RBC, WBC
− 32 −
Sysmex Journal International Vol.9 No.1 (1999)
conductive resistivity particles. When a blood cell passes through an aperture (sensingzone) suspended in electrolyte solution, the change ofelectric impedance is detected (Fig. 2). The change ofimpedance is in proportion to the volume of the celldetected and can thus separate, for example, RBC fromPLT depending on the degree of impedance change. Inthe case of WBC counting, after hemolysis of RBCs, thesame procedure is applied.This method has been employed in major hematologyanalyzers for many years. Two major problems, how-ever, have remained in the quest for more precise andaccurate measurements. These are coincidence and non-identification.
CoincidenceIn the electric impedance method, as a particle passesthrough the aperture it changes the resistivity between theimmersed elecotrodes located on either side in a manneranalogous to the electric capacitance method.Ideally, if the particles go through the sensing zone oneby one, we can count the total number detected in thesensing zone. However, simultaneous occupancy of thesensing zone by more than one particle occurs. This phe-nomenon is called “coincidence” (Fig. 3) and the result-ing count error is known as the coincidence error4, 5). Themagnitude of the coincidence error increases with theconcentration of cells suspended. For major hematologyanalyzers, by using the measurement results from several
Fig. 1 The principle of measurement by electric capacitance method(a) shows the cross section of aperture. Two electrodes are located across the aperture. The aperture is then regardedas a condenser. The electric capacitance is the change from (b) no cell present to (c) a cell located in the aperture.The total change of capacitance is proportional to the volume of the cell.
Fig. 2 The principle of measurement by electric impedance methodWhen a cell suspended in electrolyte solution passes through theaperture, the change of electric impedance is detected as a pulse. Thetotal pulse number corresponds to total cell count and each pulseheight is proportional to the corresponding cell volume.
Fig. 3 Coincidence phenomenonWhen more than two cells are located in the aperture (or sensingzone), the coincidence phenomenon is observed. Cell 1 and Cell 2are detected as a single large pulse, therefore one of the cells is notcounted (coincidence loss). The degree of coincidence loss dependson the concentration of cells.

− 33 −
Sysmex Journal International Vol.9 No.1 (1999)
samples of different concentration, the coincidence cor-rection formula can be established. This correction for-mula may be integrated into the analyzer’s computer andthe coincidence corrected result reported (Fig. 4).Two simple models of coincidence are illustrated in Fig. 5and will help to analyze the coincidence phenomena andother problems described below.In order to minimize coincidence physically, the hydro-dynamic focusing method has been developed andassembled in some analyzers.
Hydrodynamic focusing methodThe coincidence phenomenon is simplified into two mod-els, namely horizontal interaction and vertical interaction(Fig. 5).When the vertical interaction occurs, a large single signalis observed even although two cells pass through thesensing zone simultaneously (Fig. 5b). The count resultitself may be corrected by the coincidence correction for-mula described previously. However, from the singlelarge pulse generated, it is not possible to decide if thisarises from one large cell or two small cells. In case ofhorizontal interaction, sometimes an M-shaped signaloccurs as a result of two cells located near each passinghorizontally through the sensing zone (Fig. 5a).
Fig. 4 Coincidence correction formulaThe dotted line represents the actual measurement results.The higher concentrations of suspended cells produce highercoincidence loss. This actual measurement curve depends onthe type of instrument. The solid line is the count correctedby the coincidence correction formula.
Fig. 5 Simplified representation of the two types of coincidence In the case of horizontal interaction (a), one wide M-shaped pulse is produced; in the case of verticalinteraction (b), one large pulse is observed. From the observed pulse, inversely, we can not identify theexistence of two cells in the aperture.

− 34 −
Sysmex Journal International Vol.9 No.1 (1999)
In 1969, Thom, et al. (Photo 1) using a large scale modelinvestigated the effect of axial and non-axial particleflow through the electrical field both at the entrance andsides of the sensing zone. In this study single particlespassing close to the wall of the sensing zone also pro-duced M-shaped pulses similar to that illustrated in Fig.5a. This M-shaped signal was produced by only one par-ticle and was completely independent of the coincidencephenomenon. It was due to the passage of the cell closeto the wall of the sensing zone where high current densityexists6,7) (Fig. 6). This observation indicated the impossi-bility of determining the cause of the M-shaped pulse,non-axial passage through the sensing zone or horizontalinteraction of a couple of cells. While the count resultmay be valid because of coincidence correction, there isno way to correct the measurement of cell volume.Thom, by using an hydrodynamic focusing method (Fig. 7) ,attempted to resolve this problem8). In hydrodynamic focusing a steady flow of diluent, thesheath is drawn through the aperture and the cell suspen-sion is injected into this moving body of liquid in a finestream close to the aperture entrance. Using this principle the vertical interaction coincidencephenomenon described above is dramatically reduced. In a hydrodynamically focused system, no particle there-fore goes near the wall or the entrance angle of the sens-ing zone (aperture), where high current density exists. Asa result all M-shaped signals detected are due to the hori-zontal interaction coincidence phenomenon.The horizontal interaction coincidence phenomenon maybe further decreased by the choice of a suitable dilutionratio of measurement sample.As described above, there is much merit in the applica-tion of hydrodynamic focusing for cell analysis.However it took time to develop this method for com-mercial hematology analyzers because of the need forprecision components and a highly sophisticated fluidcircuit design.In 1980, TOA Medical Electronics Co., Ltd. (the corpo-rate name was changed to Sysmex Co.) in Japan releaseda fully automated hematology analyzer, the E Series,was the first fully automated hydrodynamically focusedelectric impedance system worldwide. This measurementtechnology is incorporated in other recent systems suchas NE Series9-11), SE Series and XE-2100TM.One of the major practical merits of this method forhematology laboratories is the dramatic improvement inthe resolution of the cell volume distribution curves. Fig. 8shows the comparison of distribution curves from a mix-ture of three different monosized latex particles with andwithout hydrodynamic focusing. A much clearer volumedistribution histogram is obtained by the hydrodynami-cally focused analyzer.Hydrodynamic focusing when applied to RBC measure-ments produces a clear disrimination between PLT andRBC. It enables subtle change in the RBC volume distri-bution curves in patients with iron deficiency undergoing treatment to be recognized. It permits recognitionof multiple RBC populations in, for example, patientswith iron deficiency who have received blood transfu-sion. A major disadvantage of the electric impedance methodis the difficulty in distinguishing large platelets from
Photo 1 Prof. Dr. Reinhard Thom and the author This photo was taken in his home in July, 1998. Heinvented the hydrodynamic focusing method as appliedto electric impedance detection in the Free Universityof Berlin.
Fig. 6 The effect of inhomogeneity of the electrical fieldwithin the sensing zone6)
When a cell passes axially though the sensing zone, aGaussian style pulse is observed. When a cell passesthrough the sensing zone non-axially the signal producedis M-shaped.
Fig. 7 Schematic diagram of hydrodynamic focusingmethodThe cell stream is sheathed by cell free reagent. As aresult, all cells are directed through the centre of the sens-ing zone (axial flow). As a result the vertical interactioncoincidence can be ignored (Fig. 5b).

extremely microcytic or fragmented RBC even usinghydrodynamic focusing method. This capability is betterwith light scattering methods as will be described in alater section. The electric impedance method, however,can estimate cell volume more precisely than the lightscattering method. In both methods, morphologicalabnormality of RBCs, for example spherocytosis, orelliptocytosis is not detected unless the MCH or MCHCis out of normal range. Morphological abnormality isbest detect by image analysis technology.
Shape factorThom, et al. challenged the accurate measurement of thevolume of latex particles by analyzer using an electricimpedance instrument even with hydrodynamic focusing.During this investigation, it was found that different sig-nal heights were produced by different shaped cells withthe same theoretical volume6, 7, 12). Since the system was hydrodynamically focused, thisphenomenon cannot be explained by vertical interactioncoincidence and/or non-axial particle flow. Using a large scale model, these workers demonstratedthat when a spherical cell goes through the sensing zone,
the signal height of this cell corresponds to a larger ellip-soid cell. This is illustrated by the dashed line in Fig. 9.This is an example of the “shape factor” phenomenon.When a fresh or non-stabilized RBC passes through thesensing zone, its shape is transformed into an ellipsoidcreating an ellipsoid electronic shadow. Thus the volumeof the electronic shadow conforms very closely to thephysical volume of the cell. If, on the other hand, a latexparticle is passed through the sensing zone it retains itsspherical shape but produces a fusiform electronicshadow equivalent to 1.3-1.5 times of the actual volumeof the sphere. Particles with other shapes produce evenmore complex electronic shadows. Experimentally, theshape factor of spherical cells such as latex particlescompared with fresh RBC is 1.3-1.5. This means that alatex particle having the same theoretical volume as afresh RBC produces a signal which is 1.3-1.5 times larger. Understanding this phenomenon and the use of shapefactor will help the calibration of the distribution curvesusing latex particles.
RF/DC methodDuring the early evolution of technology for hematologyanalyzers, the measurement parameters expanded fromonly WBC and RBC to PLT, and then to WBC 3 part dif-ferential (lymphocyte, neutrophil, and other cells).Sysmex paralleled this development with many then“state of the art” analyzers.To progress further, however, and develop the WBC 5part differential count required additional technologies.In the electric resistance method, detection pulses corre-spond to cell volume. As described above, Sysmexdeveloped the electric capacitance method for cell count-ing originally for the purpose of avoiding the Coulterpatent. Electric capacitance signals depend not only onthe volume of cells but also on their internal contentssuch as granules and nuclei. So long as the integrity ofWBC could be maintained, measurement of electricresistance and capacitance simultaneously would result incell volume and internal information for the differentcells. This suggested that it might be possible to achievefurther differentiation of WBC using this combination oft e c h n o l o g i e s1 3 ). This became a reality when Sysmexdeveloped the WBC 5 part differential count using such acombination.
Sysmex Journal International Vol.9 No.1 (1999)
− 35 −
Fig. 8 A comparison of resolving power with and without hydrodynamic focusing methodMixed latex particles of 4.3 fL, 12 fL and 19 fL are measured. The distribution curve by E Series withthe hydrodynamic focusing method (the histogram on the left) is superior to the non-focused system.
Fig. 9 Actual measurement volume of a spherical cellBy the electric impedance method, a spherical cell produces an ellip-tical shadow in the electric field as indicated by the dashed line. Thevolume of this spherical cell is overestimated by 30 to 50 % or alter-natively the shape factor is 1.3 to 1.5.

Cell counting by the light scattering method
When light reaches the surface of any material, scatter-ing occurs. The detailed theory of the light scatteringmechanism is very complex. Basically, there are twomajor light scattering theories depending upon the rela-tive relationship between the wave length (λ) of incidentlight and the diameter of objective (D);
D << 2λ / π Rayleigh theories2λ / π < D < 10λ / π Mie theories
The Mie theory provides a solution to the way in whichlight is spread as its component fields act on a smallsphere suspended in some background medium andapplies particularly to the case of blood cells.More details of the light scattering method can be foundin the article by Groner, et al. in this issue. The lightscattering method only as applied in Sysmex productswill be discribed here.In Sysmex products, we have applied the light scatteringmethod by using an argon ion laser (488 nm wave lengthand 7.5 mW output power) in the fully automated reticu-locyte analyzer, the R-10001 6 ). Cell size is determinedusing forward light scatter and simultaneously RNA con-tent by fluorescence after automated staining with thefluorochrome Auramine O. At the time of its introduc-tion, only the argon laser possessed sufficient power anda suitable wavelength for the small amount of RNA ineach reticulocyte1 7 ). From the cell volume and fluores-cence, a scattergram was produced from which it waspossible to discriminate and count mature RBC, reticulo-cytes and PLT (Figs 10 and 11).
Sysmex Journal International Vol.9 No.1 (1999)
− 36 −
Fig.10 The principle of measurement of automated reticulocyte analyzer R-1000The R-1000 analyzes reticulocytes by flow cytometry, using an argon laser as the light source. Whole blood sam-ples are stained with a fluorescent dye and passed through a laser beam in the sheathed flow cell. The fluorescentlylabeled cells are irradiated using an argon laser beam and the forward scatter and the side fluorescence emittedfrom each cell in the sheath flow are detected. While the former is used as an indicator of relative cell size, the lat-ter is used as an indicator of RNA content. Combining these two parameters, reticulocyte count and reticulocyteratio are determined.
Fig. 11 An example of scattergram produced by the R-1000Vertical axis indicates cell volume and horizontal axis indi-cates the intensity of fluorescence. The scattergram is dividedinto PLT area, mature RBC area and reticulocyte area.

In general, the light scattering method is constructed bycomplex formulae with many parameters of size, shape,and surface condition of the cell, which are not simplelinear functions between the scattered light intensity andthe cell volume. This means, for example, that twice thelight intensity does not imply twice the volume. This isinconvenient for the precise detection of cell volume, thephenomenon however works well in the discriminationbetween large PLT and small RBC which have the samevolume but different surface characteristics.The argon gas laser has a life span of several thousandhours. The price of the argon laser is around US$ 2,000 -3,000 and partly accounts for the high production cost ofthe analyzer.Sysmex has now studied the application of an alternativelaser light source. A semi-conductor laser (excitationwave length 650 nm, power output 2 mW) developed byTOSHIBA ELECTRIC Co. was used in studies on cellanalysis. Building on experience obtained during devel-opment of the R-1000, we achieved a new application ofthis semi-conductor laser for WBC differential, resultingin the development of a fully automated hematology ana-lyzer, the SF-300018).
THE MEASUREMENT PRINCIPLES IN EACH PARAMETER
In this section, the measurement principle for each para-meter generated in Sysmex hematology analyzers isdescribed.
Red blood cells (RBC) and platelets (PLT)
Currently, RBC and PLT are counted in a single mea-surement channel and unit with the same sample prepara-tion procedure.
Electric impedance methodAs described above, in this method, all cells are assumedto be non-conducting particles. The change of imped-ance is detected when cells suspended in electrolyte solu-tion pass through the sensing zone, normally 70-100 µmdiameter and depth (Fig. 2). In whole blood, there areapproximately 5 × 1 01 2/L. To avoid or minimize thecoincidence phenomenon, whole blood is prediluted25,000 to 50,000 times with electrolyte solution, calledthe diluent.Predilution may be performed manually or automaticallyin the instrument. The composition of the diluent is care-fully designed to maintain the suspended cells in goodcondition interms of shape and size by controlling theosmotic pressure, pH, etc. and the addition of somepreservatives. As stated previously, M-shaped signals are produced bynon-axial cell flow in the sensing zone and can result inmisleading measurements unless corrected. Some recentSysmex products such as KX-21T M, K-4500T M and SF-3 0 0 0T M do not have hydrodynamic focusing but candetect and eliminate such M-shaped signals automaticallyby means of editing circuitry. Coincidence loss is alsoa u t o m a t i c a l l y corrected. The frequency and exact shapesof these M-shaped signals depends on the deformability
of the cells. Fresh blood cells and stabilized blood cellssuch as control materials exhibit very different degrees ofdeformability.
Electric impedance method-hydrodynamic focusing method
In high end analyzers (XE-2100, SE Series, NE Series),the presence of hydrodynamic focusing method removesthe need for editing circuitry (Fig. 7). This method mini-mizes coincidence and the occurrence of M-shaped sig-nals producing very reliable distribution curves and countresults.Accurate focusing of the sheathed flow in the sensingzone requires precision component and sophisticatedfluid control technology. Any small air babbles producednear the sensing zone will disturb accurate focusing andproduce electric noise.We add a special surfactant in the sheath reagent, whichproduces few bubbles and any formed are rapidlyremoved from the sensing zone.
Light scattering methodBasically, Sysmex Corporation relies upon electricimpedance as the primary measurement method becauseit can estimate the volume of each cell exactly.However, in some abnormal samples, such as those withlarge PLTs and small RBCs or fragments of them, theimpedance method can have difficulty in discriminatingbetween RBCs and PLTs.In such cases this discrimination is much better with thelight scattering method. In the XE-2100, however, bothimpedance and scattered light methods co-exist. ThePLT counts by impedance are presented as the primaryresults. In the above-mentioned abnormal samples, inwhich the PLT counts by the two measurement methodsfail to agree, a computer algorithm is applied and thereported result is switched to that produced by scatteredlight19).
WBC counts and differential
Electric impedance methodWBC can be categorized into lymphocytes, neutrophils,eosinophils, basophils and monocytes in normal samples.Early hematology analyzers were unable to differentiatethe different WBC types and therefore only a total countwas provided. The population ratio between WBC and RBC is around1 : 1,000 even in normal samples, which means that RBCinterference during estimation of WBCs may occur. Toincrease accuracy and precision of WBC count it is nec-essary to hemolyze the RBCs. The development of lysing reagents for RBCs but notfor WBC was difficult. In the early developmentalstages of hematology analyzers, saponin was used as alysing reagent for RBCs, but this also affected WBCswhich were stripped of their cytoplasm, and theirnuclei shrunk more or less uniformly. As a result ofmany investigations, more sophisticated lysing r e a g e n twere developed, by which the WBC cytoplasm wasstill stripped and the nuclei shrunk but the degree ofshrinkage depended on the cell type. The differingdegrees of shrinkage made possible the WBC 3 part
Sysmex Journal International Vol.9 No.1 (1999)
− 37 −

differential, separating lymphocytes, neutrophils andother cells (Fig. 12, Photo 2). This method is stillused in the K Series instruments. In some semi-auto-mated analyzers, a WBC 2-part differential count (orlymphocytes and other WBC) is provided.
Electric impedance method -RF/DC methodDuring developmental work on lysing reagents, we pro-duced a highly sophisticated reagent which hemolyzesRBCs but not WBCs (Photo 3).WBCs, although of different sizes, comprise a nucleus,cytoplasm and frequently granules. The nature of thesecomponents varies with the type of cell. These character-istics can be used for differentiating the types of whitecell : therefore, it becomes possible to differentiateWBCs by detecting volume and internal information.As mentioned above, by applying both of the electricimpedance (DC) method and electric capacitance (RF)method, we can estimate the cell volume and its internalcontent (nucleus, granules etc.). Even if two cell typeshave the same volume, they can be differentiated if theyhave different internal contents (Fig. 13).No reagents are available which can maintain the originalshape of WBCs over a prolonged period and at the sametime hemolyze the RBCs completely. In fully automatedhematology analyzers, sample preparation proceduressuch as dilution, mixing, reaction with reagents, tempera-ture and timing are perfectly standardised by computercontrolled sequences. Thus in a short, fixed time, whichis sufficient for the lysing reagents to act, measurementdata with good precision is obtained by fully automatedanalyzers. However, with manual sample preparationusing those reagents, as is necessary in semi-automatedinstruments, it is difficult to achieve good 3- and 5- partdifferentiation.Basophil and eosinophil absolute numbers are muchlower than other WBC types in normal samples. In someanalyzers, independent channels for those cells areassembled and use the impedance method of measure-ment (Fig. 14).
Light scattering methodThe impedance method detects volume and internal con-tent of cells. The optical method achieves 5 part differ-entiation by using light scatter and fluorescence withstaining of organelles, granules and nuclei.Fig. 15 illustrates the principle of measurement of theWBC differential in the SF-3000 by means of a semi-conductor laser. The scattered light from the surface ofthe cell provides information on its size. Some incidentlight penetrates the inside of cell and produces scatteredlight from cytoplasmic granules and the nucleus. The information gleaned from light scatter depends onthe angle of scatter. Generally, lower angle scatteredlight contains information on cell size and higher anglescattered light contains information on the internal com-position of the cell.The simultaneous observation of such different angles ofscattered light can provide a scattergram producing inde-pendent parameters (Fig. 16) .The detection devices for the different scattered lightangles are assembled on the same electronic board,which permits a simple and reliable optical design. In
Sysmex Journal International Vol.9 No.1 (1999)
− 38 −
Fig. 12 An example of WBC 3 part differentialAll RBCs are hemolysed. The WBCs are de-nucleated andtheir nuclei are shrunk. The degree of shrinkage of the nucleiis dependent upon the type of WBC. A WBC 3 part differentialthen becomes possible (left to right are the lymphocytes, the so-called mixed cells comprising mainly monocytes and finally theneutrophils).
Photo 2 Morphological change of a WBC and some RBCsbefore and after reaction with lysing reagent
Before reaction : a single WBC and three RBCsare clearly observed
After reaction : the WBC has been de-nucleatedand three RBCs have disappeared

Sysmex Journal International Vol.9 No.1 (1999)
− 39 −
Photo 3 Morphological appearance of WBCs in the lysing reagent for the 5 part differential
Fig. 13 Schematic model of RF (Radio Frequency) and DC (Direct Current) detection methodSimultaneous application of RF and DC in the sensing zone, produces information on cell sizeand internal composition as the cell goes through the sensing zone.
a : neutrophil
c : monocyte
d : eosinophil e : basophil
b : lymphocyte
Radio frequency method
Direct current method

Sysmex Journal International Vol.9 No.1 (1999)
− 40 −
In the eosinophil detection channel, a specific alka-line lysing reagent hemolyses RBCs and all WBCsexcept eosinophils. Such residual eosinophils aredetected by the electric impedance method.
In the basophil detection channel, a specific acidiclysing reagent hemolyses RBCs and all WBCs exceptbasophils. Such residual basophils are detected bythe electric impedance method.
Fig. 14 The measurement principle for eosinophil and basophil detectionIn the SE-9000, two independent channels are constructed to detect those cells.
Fig. 15 The principle of measurement of WBC differentiation in SF-3000 using thelight scattering methodWhen hydrodynamically focused cells pass through the flow cell, a focused semi-conduc-tor laser light beam illuminates the cells. Each cell produces scattered light of low angleand high angle. Low angle scattered light provides cell size information, and high anglescattered light contains information on the internal composition of the cell.For more clear discrimination of eosinophils from other granulocytic cells, a specificstain dyes eosinophils granules clearly separating them from other cell types.
Low angle scattered light detection model
High angle scattered light detection model High angle scattered light detection principle
Low angle scattered light detection principle

t h e SF-3000, for the purpose of clear discrimination ofeosinophils from other granulocytic cells, a special stainexclusively dyes eosinophils and changes their scatteringcharacteristics. In the standard scattergram the locationof basophils coincides with that of the neutrophils. TheSF-3000 therefore first performs a WBC 4 part differenti-ation (lymphocytes, monocytes, eosinophils and neu-trophils) and then in the next sequence uses a specificlysing reagent to count basophils.The XE-2100 uses almost the same method. In XE-2100,
however, we detect side scatter intensity (90° s c a t t e r )rather than high angle scattered light for information oncell content. At the same time, all cells are stained by afluorescence dye and the side fluorescence intensity pro-duced by RNA/DNA derived from organelle and nucleiis measured. This information provides 4 part differenti-ation (Fig. 17). Basophils are counted using low angleforward scatter and side scatter (90° scatter) (Fig. 18)after lysis of other WBCs.
Sysmex Journal International Vol.9 No.1 (1999)
− 41 −
Fig. 16 Example of the scattergram produced by the SF-3000
DIFF WBC/BASO
Side scattered light intensity
Fig. 17 Example of the scattergram produced by the XE-2100 (WBC 4 part differental)
Fig. 18 Example of the scattergram produced by the XE-2100 (basophil detection)
Side scattered light intensity
Side scattered light intensity
Immature WBC
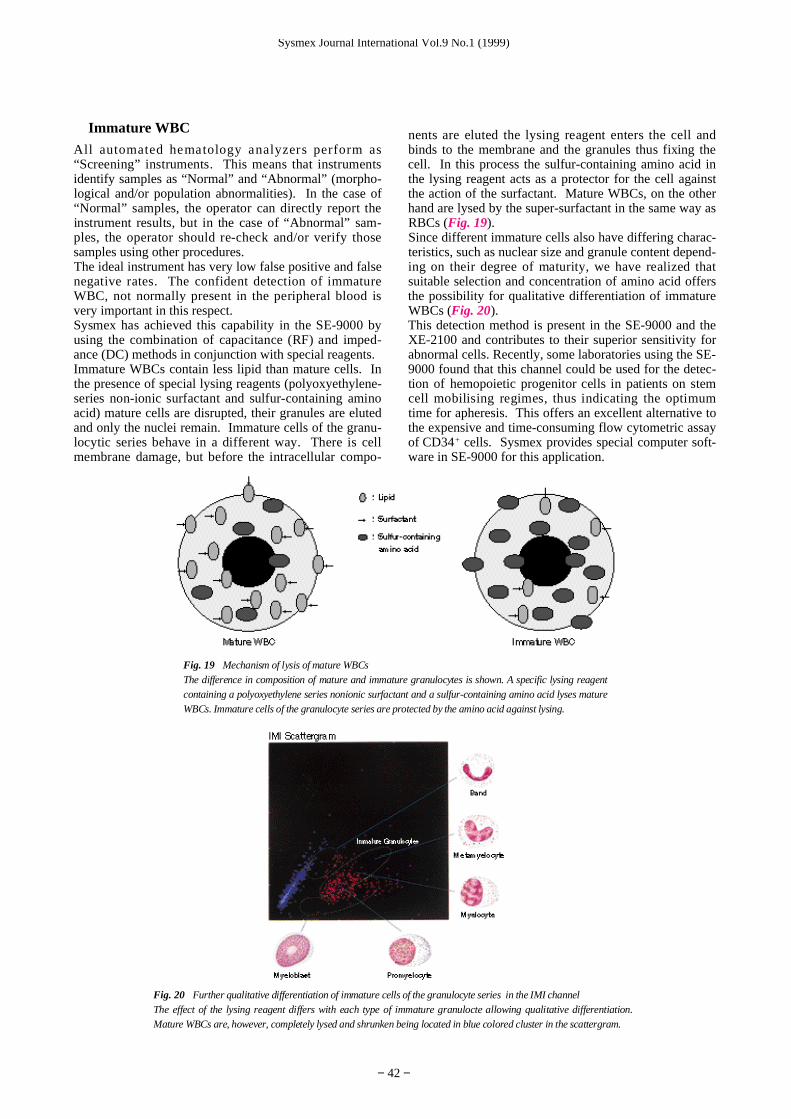
All automated hematology analyzers perform as“Screening” instruments. This means that instrumentsidentify samples as “Normal” and “Abnormal” (morpho-logical and/or population abnormalities). In the case of“Normal” samples, the operator can directly report theinstrument results, but in the case of “Abnormal” sam-ples, the operator should re-check and/or verify thosesamples using other procedures.The ideal instrument has very low false positive and falsenegative rates. The confident detection of immatureWBC, not normally present in the peripheral blood isvery important in this respect. Sysmex has achieved this capability in the SE-9000 byusing the combination of capacitance (RF) and imped-ance (DC) methods in conjunction with special reagents.Immature WBCs contain less lipid than mature cells. Inthe presence of special lysing reagents (polyoxyethylene-series non-ionic surfactant and sulfur-containing aminoacid) mature cells are disrupted, their granules are elutedand only the nuclei remain. Immature cells of the granu-locytic series behave in a different way. There is cellmembrane damage, but before the intracellular compo-
nents are eluted the lysing reagent enters the cell andbinds to the membrane and the granules thus fixing thecell. In this process the sulfur-containing amino acid inthe lysing reagent acts as a protector for the cell againstthe action of the surfactant. Mature WBCs, on the otherhand are lysed by the super-surfactant in the same way asRBCs (Fig. 19).Since different immature cells also have differing charac-teristics, such as nuclear size and granule content depend-ing on their degree of maturity, we have realized thatsuitable selection and concentration of amino acid offersthe possibility for qualitative differentiation of immatureWBCs (Fig. 20).This detection method is present in the SE-9000 and theXE-2100 and contributes to their superior sensitivity forabnormal cells. Recently, some laboratories using the SE-9000 found that this channel could be used for the detec-tion of hemopoietic progenitor cells in patients on stemcell mobilising regimes, thus indicating the optimumtime for apheresis. This offers an excellent alternative tothe expensive and time-consuming flow cytometric assayof CD34+ cells. Sysmex provides special computer soft-ware in SE-9000 for this application.
Sysmex Journal International Vol.9 No.1 (1999)
− 42 −
Fig. 19 Mechanism of lysis of mature WBCsThe difference in composition of mature and immature granulocytes is shown. A specific lysing reagentcontaining a polyoxyethylene series nonionic surfactant and a sulfur-containing amino acid lyses matureWBCs. Immature cells of the granulocyte series are protected by the amino acid against lysing.
Fig. 20 Further qualitative differentiation of immature cells of the granulocyte series in the IMI channelThe effect of the lysing reagent differs with each type of immature granulocte allowing qualitative differentiation.Mature WBCs are, however, completely lysed and shrunken being located in blue colored cluster in the scattergram.

Nucleated red blood cell (NRBC)
The detection of NRBC has clinical significance. In almost hematology analyzers, some or all of nucleatedRBCs have been recognized as lymphocytes due to theirsimilar nuclear size. This results in overestimation ofthe total WBC count. Hitherto it has been difficult tocount NRBC by automated methods. During the devel-opment of WBC differential from 3 part to 5 part, thedetection capability of NRBC have been has improved.Today, most sophisticated hematology analyzers have aflagging system to indicate the presence of NRBC in asample. This flagging system, however, can not producean NRBC count.
Sysmex has established NRBC quantitative estimation inaddition to qualitative flagging in XE-2100. In this ana-lyzer, first, complete hemolysis of RBCs is produced by aspecific lysing reagent, which simultaneously denucle-ates, shrinks and slightly stains the nuclei of NRBCs. Atthe same time, this lysing reagent maintains the shape
of the WBCs and stains their intracytoplasmic organellesand nuclei. The different degrees of staining between NRBCs andWBCs can be detected by semi-conductor laser, the fluo-rescence intensity of the WBCs being much stronger thanfor NRBCs. This permits easy differentiation and quanti-tative estimation (Figs 21 and 22).
Reticulocyte counting
Until recently, reticulocyte counting has been performedby visual microscopy of supravitally stained preparations.A fully automated method was first realized in 1988 bySysmex, the R-1000, which has proven to be a popularmethod worldwide. This capability is adopted in the XE-2100 and also as an optional attachment (RAM-1) for theSE-9000. In these devices, RBCs are stained by fluorescence dyeand activated by an argon or a semi-conductor laser.Fluorescence mainly from DNA and RNA in WBCs,
Sysmex Journal International Vol.9 No.1 (1999)
− 43 −
Fig. 21 The method principle for NRBC detection in the XE-2100 - the mechanism of lysis-A new reagent has been developed for NRBC detection in the XE-2100. The RBCs are completely lysed. The WBCs,however, retain their original shape. The NRBC are de-nucleated and shrunken. The specific dye contained in the reagentstains the cytoplasm and nucleus of the WBCs quite strongly while the staining of the NRBC is comparatively weak.
Fig. 22 The principle for NRBC detection in the XE-2100 - the detection method-The reaction with the new reagent is explained in Fig. 21. The cell stream is focused hydrodynamically in the flow cell.Individual cells are activated in the flow cell by a semi-conductor laser and produce forward scatter and fluorescence. Thedifferent staining characteristics between WBCs and NRBCs achieves clear discrimination of those cells and makes NRBCcounting possible.

reticulocytes and PLTs is detected by scattering of light.Fluorescence intensity (RNA/DNA concentration) andscattered light (cell size) are expressed in a scattergram,in which mature RBCs, reticulocytes, PLTs and WBCsare discriminated (Fig. 11).The fluorescent dye in the instruments stains RNA andDNA simultaneously. The concentration of DNA inWBC exceeds that of RNA in reticulocytes, therefore thefluorescence intensity of the WBC far exceeds that of thereticulocytes.Large PLTs and RBCs including reticulocytes are dis-criminated by curve threshold set by a computer algo-rithm rather than straight line. Moreover, as describedabove, in the light scattering method, the discriminationcapability between large PLTs and RBCs is superior tothe electric impedance method. With normal samples,discrimination and enumeration of reticulocyte are doneperfectly.In some abnormal cases with poor discrimination, theinstrument gives a flag as an alarm and suggests re-checking by an alternative method.In these analyzers, reticulocytes are differentiated intothree categories, the most immature (youngest) reticulo-cyte, moderately mature reticulocytes and most maturereticulocyte. This classification provides sensitive para-meters to indicate bone marrow activity.
Hemoglobin measurement
Hemoglobin concentration measurement is regarded asone of the most important parameters produced by hema-tology analyzers. In Sysmex hematology analyzers,RBCs are first hemolysed, and the hemoglobin releasedis converted to a single stable form such as oxyhemoglo-bin, cyanmethemoglobin or SLS hemoglobin.Those stabilized hemoglobins are measured by spec-trophotometric methods. The details are described in aseparate article in this issue.
CONCLUSIONThis article has described the measurement principlesemployed in Sysmex hematology analyzers. Since thetime we released our first analyzer to the market, we havecontinued to develop innovative technologies for ourproducts in order to produce reliable measurementresults. We are, however, not satisfied that even ournewest products are the perfect or ultimate machine. Wein order promise to continue basic investigation anddevelopment in order to provide improved and/or innova-tive products.The rate of development of technical innovations contin-ues unabated. We, Sysmex Corporation would like tocontinue to provide customer oriented products by listen-ing to customer opinions.
References1 ) Coulter WH : Means for counting particles suspended in a fluid.
USP No. 2656508.2) Tatsumi N, et al. : Principle of blood cell counter -development of
electric impedance method. Sysmex J Int, 9 (1) : 8-20, 1999.3) Okada T : Development and problem of automated hematology
analyzer. Sysmex J Int, 9 (1) : 52-57, 1999.4) Bader, et al. : Theory of coincidence counts and simple practical
methods of coincidence count correction for optical and resistivepulse particle counters. Rev Sci Instrum, 42 (10) : 1407, 1972.
5) Helleman PW : Investigation on the fundamental assumptionsunderlying coincidence loss theories. Chapter 8 of the CoulterElectronic Particle Counter, De Bilt Holland, 1972.
6) Thom R, et al. :Die elektronische Volumenbestimmung vonBlutkörperchen und ihre Fehlerquellen. Z Ges Exp Med, 151 :331-349, 1969.
7) Kachel V : Sizing of cells by the electrical resistance pulse tech-nique. Chapter 7 of Cell Analysis 1, Plenum Press, New York,1982.
8) Thom R, Kachel V : Fortschritte fuer die elektronishe Grössenbes-timmung von Blutkörperchen. Blut, 21 : 48-50, 1970.
9) Tatsumi N, et al. : Evaluation of a new blood cell counter withsheath flow system. Cytometry, 6 : 395-400, 1985.
10) Rowan RM : Blood cell volume analysis. pp.16-17, Albert Clarkand Company Ltd., London, 1983.
11) Okada T : Performance of automated hematology analyzersE Series. Sysmex J, 6 (3) : 148-157, 1 9 8 3 .
12) Thom R : Einfluß von Reagenzien und Materialien auf hämatolo-gische Meßergebnisse und Probleme der Standardisierung mitKalibriermaterial. Lab Med, 9 : 98-108, 1985
13) Fujimoto K : A basic theory in clinical laboratory -white bloodcell differentiation by hematology analyzers-. Kensa to gijutsu,7 (12) : 1472-1476, 1989.
14) Mullaney PF, Dean PN : The small angle light scattering of bio-logical cells. Biophysical J, 10:764-772, 1970.
15) Groner W : Optical technology in blood cell counting. Sysmex JInt, 9 (1) : 21-30, 1999.
16) Kojima K, et al. : An automated optoelectronic reticulocyte counter.Am J Clin Pathol, 92 : 57-61, 1989.
17) Takami T, et al. : Outline of automated reticulocyte analyzer R-1000, Sysmex J, 11 (Suppl.II) : 18-26, 1988.
18) TOA Medical Electronics Co., Ltd. : Evaluation of the automatedhematology analyzer SF-3000. Sysmex J Int, 6 : 4-15, 1996.
19) Inoue H : Overview of automated hematology analyzer XE-2100.Sysmex J Int, 9 (1) : 58-64, 1999.
20) Hamaguchi Y, et al. : A reagent for three part differenticial inWBCs. Sysmex J, 8 (11) : 12-22, 1985. (in Japanese)
21) Yamane T, et al. : Determination of hematopoietic stem cells inperipheral blood by automated hematology analyzer, SE-9000.Sysmex J Int, 7 : 57-62, 1997.
22) TOA Medical Electronics Co., Ltd. : Introduction of the hematopoi-etic progenitor cell (HPC) screening module. Sysmex J, 20 (2) :142-149, 1997.
23) Chang CC, Kass L : Clinical significance of immature reticulocytefraction determined by automated reticulocyte counting. Am J ClinPathol, 108 : 69-73, 1997.
24) Watanabe K, et al. : Reticulocyte maturity as an indicator for esti-mating qualitative abnormality of erythropoiesis. J Clin Pathol,47 : 736-739, 1994.
25) Oshiro I, et al. : New method for hemoglobin determination by usingsodium lauryl sulfate (SLS). Clin Biochem, 15 (1) : 83-88, 1982.
26) Hamaguchi Y : Overview of the principle of Sysmex's hemoglobino-m e t r y . Sysmex J Int, 9 (1) : 45-51, 1999.
Sysmex Journal International Vol.9 No.1 (1999)
− 44 −