unclassified dsti/iccp/ie(2004)16/final - oecd
TRANSCRIPT
Unclassified DSTI/ICCP/IE(2004)16/FINAL Organisation de Coopération et de Développement Economiques Organisation for Economic Co-operation and Development 30-Mar-2005 ________________________________________________________________________________________________________ English - Or. English DIRECTORATE FOR SCIENCE, TECHNOLOGY AND INDUSTRY COMMITTEE FOR INFORMATION, COMPUTER AND COMMUNICATIONS POLICY
Working Party on the Information Economy
ICT DIFFUSION TO BUSINESS: Peer review: Denmark Country report
JT00181297 Document complet disponible sur OLIS dans son format d'origine Complete document available on OLIS in its original format
DST
I/ICC
P/IE
(2004)16/FIN
AL
U
nclassified
English - O
r. English
DSTI/ICCP/IE(2004)16/FINAL
2
FOREWORD
In December 2004 this report was presented to the Working Party on the Information Economy (IE), as part of the peer review of ICT diffusion to business in Denmark. It was recommended to be made public by the Committee for Information, Computer and Communications Policy in March 2005.
The report was prepared by Kasper Ovesen (Rambøll Management) and Graham Vickery of the OECD Secretariat. The series of peer reviews of ICT diffusion to business has been co-ordinated by Graham Vickery. It is published under the responsibility of the Secretary-General of the OECD.
Copyright OECD, 2005.
Applications for permission to reproduce or translate all or part of this material should be made to:
Head of Publications Service, OECD, 2 rue André-Pascal, 75775 Paris Cedex 16, France.
DSTI/ICCP/IE(2004)16/FINAL
3
TABLE OF CONTENTS
SUMMARY..................................................................................................................................................... 4
ICT DIFFUSION TO BUSINESS IN DENMARK......................................................................................... 5
Introduction .................................................................................................................................................. 5 ICT diffusion to business ............................................................................................................................. 6 ICT diffusion and business use .................................................................................................................... 7
Indicators and composite measures .......................................................................................................... 7 The ICT sector .......................................................................................................................................... 8 Total ICT spending................................................................................................................................. 10 Telecommunications............................................................................................................................... 12 ICT use in general................................................................................................................................... 14 Broadband prices .................................................................................................................................... 14 ICT skills ................................................................................................................................................ 16 ICT education ......................................................................................................................................... 16 ICT occupations...................................................................................................................................... 17 ICT use in enterprises ............................................................................................................................. 19 E-business and e-commerce ................................................................................................................... 21 Digital signatures.................................................................................................................................... 22
Summary .................................................................................................................................................... 25 General approach to ICT policy ................................................................................................................. 25
Strategy for an information society ........................................................................................................ 25 Focus of government policies and programmes ..................................................................................... 27
Policy co-ordination ................................................................................................................................... 27 Specific initiatives ...................................................................................................................................... 29
Infrastructure: telecommunication markets ............................................................................................ 29 R&D ....................................................................................................................................................... 30 Equipment, software, and services ......................................................................................................... 32 Skills ....................................................................................................................................................... 33 Digital content ........................................................................................................................................ 33 E-government ......................................................................................................................................... 34 E-procurement ........................................................................................................................................ 34 Trust and security ................................................................................................................................... 35 Demonstration and awareness ................................................................................................................ 36 Small firms ............................................................................................................................................. 37
Policy evaluation........................................................................................................................................ 38 Conclusion.................................................................................................................................................. 39
General remarks...................................................................................................................................... 39 Strengths ................................................................................................................................................. 39 Weaknesses............................................................................................................................................. 40 Recommendations .................................................................................................................................. 41
BIBLIOGRAPHY.......................................................................................................................................... 44
NOTES .......................................................................................................................................................... 47
DSTI/ICCP/IE(2004)16/FINAL
4
SUMMARY
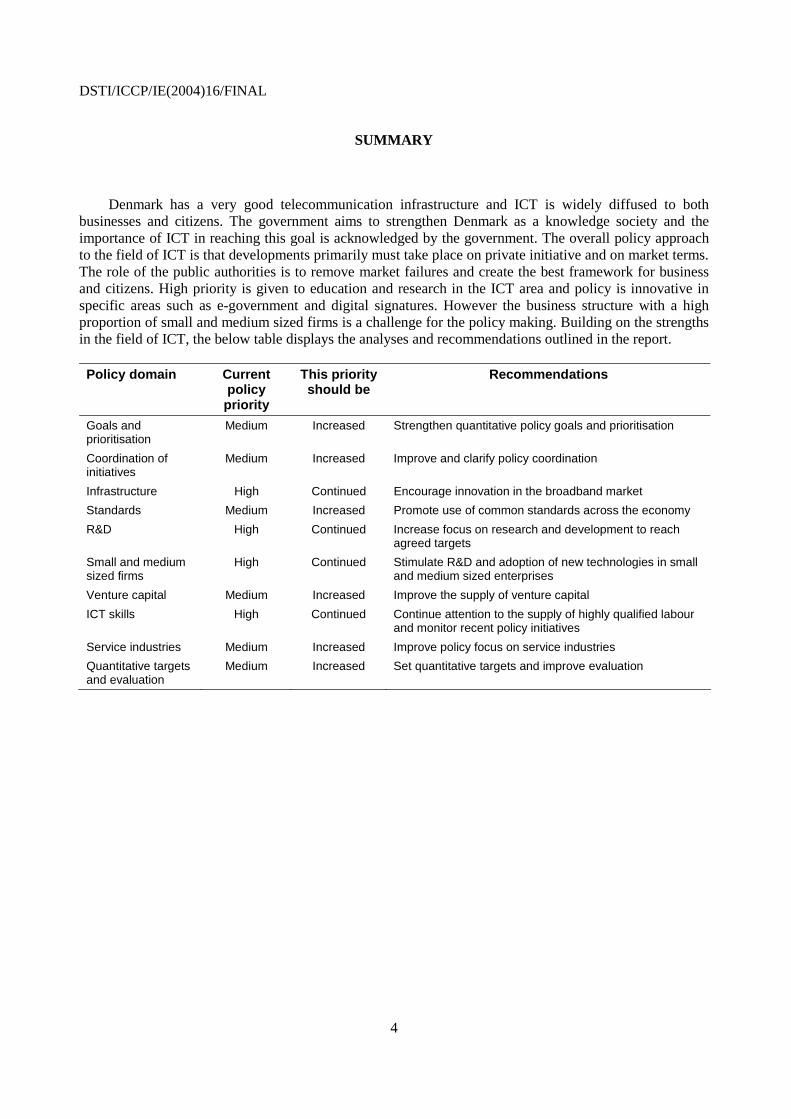
Denmark has a very good telecommunication infrastructure and ICT is widely diffused to both businesses and citizens. The government aims to strengthen Denmark as a knowledge society and the importance of ICT in reaching this goal is acknowledged by the government. The overall policy approach to the field of ICT is that developments primarily must take place on private initiative and on market terms. The role of the public authorities is to remove market failures and create the best framework for business and citizens. High priority is given to education and research in the ICT area and policy is innovative in specific areas such as e-government and digital signatures. However the business structure with a high proportion of small and medium sized firms is a challenge for the policy making. Building on the strengths in the field of ICT, the below table displays the analyses and recommendations outlined in the report.
Policy domain Current policy priority
This priority should be
Recommendations
Goals and prioritisation
Medium Increased Strengthen quantitative policy goals and prioritisation
Coordination of initiatives
Medium Increased Improve and clarify policy coordination
Infrastructure High Continued Encourage innovation in the broadband market
Standards Medium Increased Promote use of common standards across the economy
R&D High Continued Increase focus on research and development to reach agreed targets
Small and medium sized firms
High Continued Stimulate R&D and adoption of new technologies in small and medium sized enterprises
Venture capital Medium Increased Improve the supply of venture capital
ICT skills High Continued Continue attention to the supply of highly qualified labour and monitor recent policy initiatives
Service industries Medium Increased Improve policy focus on service industries
Quantitative targets and evaluation
Medium Increased Set quantitative targets and improve evaluation
DSTI/ICCP/IE(2004)16/FINAL
5
ICT DIFFUSION TO BUSINESS IN DENMARK
Introduction
The OECD Growth Study concluded that information and communications technology (ICT) is a key input to productivity and growth performance (OECD, 2001a, 2001b, 2003a). In 2001 the OECD Council Ministerial urged the OECD to strengthen its peer review of structural reforms. The 2002 Council Ministerial requested “the OECD to increase its monitoring of member countries’ implementation of the recommendations of the OECD Growth Study”.
This report is part of the peer review process of policies promoting ICT diffusion to business, designed to respond to the two Ministerial requests as part of the Growth Follow-up project. OECD peer reviews are used as a method to bring together peers from member countries to discuss the policy experience and its main challenges in an individual country. Once a critical mass of countries has been reviewed, a cross-country comparative synthesis report will be prepared with a view to identifying common good policy practices. Following a first round of reviews conducted in the Working Party on the Information Economy (WPIE) in December 2003, and a second round in June 2004, the present report is background for the third round of reviews in December 2004. The discussion and comments made at the meeting will be reflected in the final version of this report.
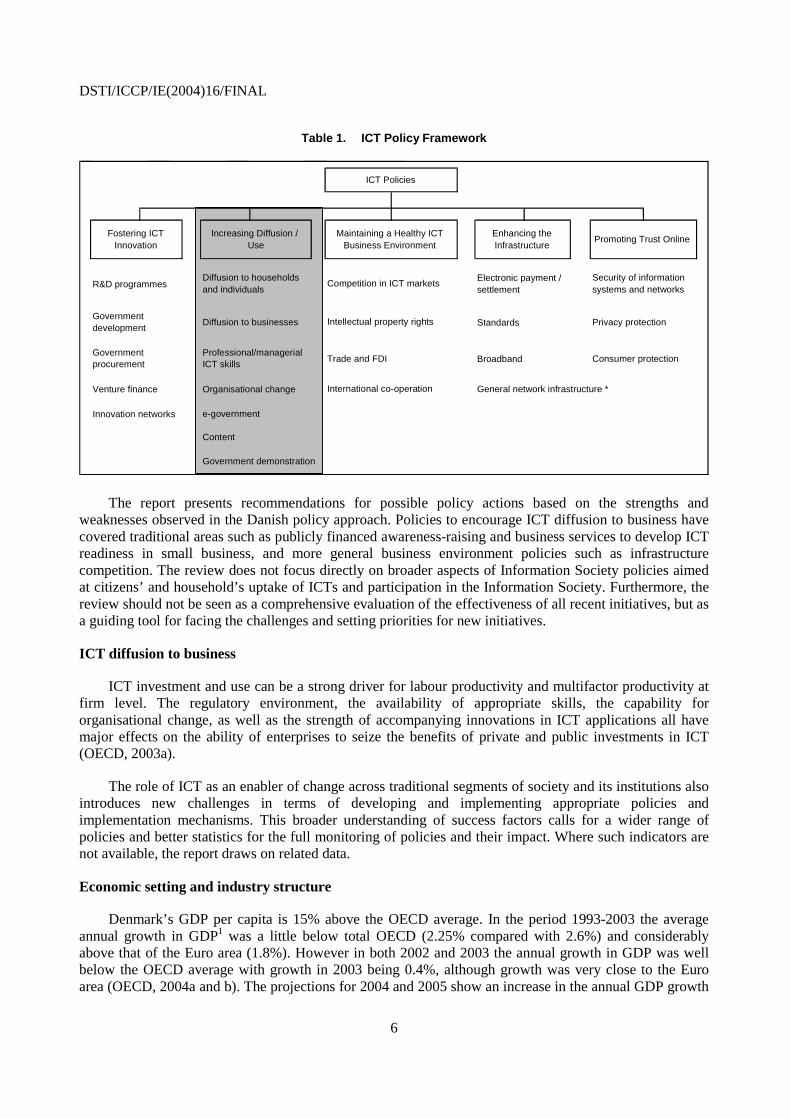
The report reviews the status of diffusion of ICT to business in Denmark and describes current and previous policies aimed at ICT uptake in firms. ICT diffusion to business is one of the five pillars of the ICT policy framework used in the Information Technology Outlook 2004 Policy Questionnaire, shown in Table 1. Given the complexity of the ICT diffusion process and the central role of a number of the other factors, attention is also given to the other parts of the framework (including R&D, public procurement, standards, broadband, and trust and security issues) that are important elements in the diffusion of ICT to business.
DSTI/ICCP/IE(2004)16/FINAL
6
Table 1. ICT Policy Framework
R&D programmes
Diffusion to businesses Standards Privacy protection
Trade and FDI Broadband Consumer protection
Venture finance Organisational change General network infrastructure *
Innovation networks e-government
Content
Government demonstration
ICT Policies
Fostering ICT Innovation
Increasing Diffusion / Use
Maintaining a Healthy ICT Business Environment Promoting Trust Online
Diffusion to households and individuals
Professional/managerial ICT skills
Security of information systems and networks
Electronic payment / settlement
Enhancing the Infrastructure
International co-operation
Government development
Government procurement
Competition in ICT markets
Intellectual property rights
The report presents recommendations for possible policy actions based on the strengths and weaknesses observed in the Danish policy approach. Policies to encourage ICT diffusion to business have covered traditional areas such as publicly financed awareness-raising and business services to develop ICT readiness in small business, and more general business environment policies such as infrastructure competition. The review does not focus directly on broader aspects of Information Society policies aimed at citizens’ and household’s uptake of ICTs and participation in the Information Society. Furthermore, the review should not be seen as a comprehensive evaluation of the effectiveness of all recent initiatives, but as a guiding tool for facing the challenges and setting priorities for new initiatives.
ICT diffusion to business
ICT investment and use can be a strong driver for labour productivity and multifactor productivity at firm level. The regulatory environment, the availability of appropriate skills, the capability for organisational change, as well as the strength of accompanying innovations in ICT applications all have major effects on the ability of enterprises to seize the benefits of private and public investments in ICT (OECD, 2003a).
The role of ICT as an enabler of change across traditional segments of society and its institutions also introduces new challenges in terms of developing and implementing appropriate policies and implementation mechanisms. This broader understanding of success factors calls for a wider range of policies and better statistics for the full monitoring of policies and their impact. Where such indicators are not available, the report draws on related data.
Economic setting and industry structure
Denmark’s GDP per capita is 15% above the OECD average. In the period 1993-2003 the average annual growth in GDP1 was a little below total OECD (2.25% compared with 2.6%) and considerably above that of the Euro area (1.8%). However in both 2002 and 2003 the annual growth in GDP was well below the OECD average with growth in 2003 being 0.4%, although growth was very close to the Euro area (OECD, 2004a and b). The projections for 2004 and 2005 show an increase in the annual GDP growth
DSTI/ICCP/IE(2004)16/FINAL
7
of 1.9% and 2.6% respectively, above the Euro area but below those for the OECD total. The contribution of ICT investment to GDP growth has been high particularly in the 1995-2002 period, and ICT-using services have been a steady contributor to labour productivity. In the short term, a cut in interest rates is projected followed by a gradual monetary tightening in 2005. The unemployment rate has risen steadily from 4.3% in 2001 and is expected to peak at 6% in 2004. Additionally, a weak labour market has led to a moderation of wage increases in the private sector (OECD, 2004b).
Since 1987 exports as a percentage of GDP exceeded imports and there was a surplus on the balance of trade. Denmark’s export revenues derive primarily from manufactured goods (excluding canned meat, milk and ships) which take up 76% of the total. Agricultural products of animal origin make up 8%, and fuels, lubricant and electric current take around 7%. Among the different industries there is a great variety in the share of exports, but major areas are machinery and instruments and medicinal and other pharmaceutical products, which make up 35% and 10% of all exported manufactured goods respectively (Statistics Denmark, 2004a).
According to population projections, the working part of the population (25-64 years) will decline 13% over the next four decades, while the population aged 65+ will increase rapidly from 15% of the total population in 2004 to 23% in 2050 (Statistics Denmark, 2004b). Retired persons make up 23.3% of the population aged 18+. Of the population aged 18-66, 7.4% have retired early (i.e. before the age of 66) (Statistics Denmark, 2004c). The demographic changes challenges the present form of the welfare state, with less people participating in the labour force and a relatively high percentage of elderly people.
The private sector accounts for two-third of all jobs (1.4 million people) and the remaining one-third of jobs are found in the public sector (0.8 million) (Statistics Denmark, 2004a). Almost three in four of all employed persons work in the service sector, where public services make up a large share of 33% of all jobs. Of all employed persons, less than 5% work within agriculture and fishing and less than 25% within manufacturing and construction. Over the last few decades, Denmark has changed from being an agricultural/industrial society to becoming a service society (Statistics Denmark, 2004a, p. 249). Both the private and the public sector are major users of innovations in the ICT field.
In 2002, there was about 280 000 active2 enterprises in Denmark. Small and medium sized enterprises (SMEs) are dominant: 55% of the enterprises had no employees, 36% had 1-9 employees, almost 8% had 10-99 employees and only 2 200 (0.8%) had 100 employees or more. However the latter category represents 62% of the total employment (Statistics Denmark, 2004d).
The current liberal-conservative government is emphasizing the importance of economic growth and national competitiveness, and the means adopted has been lower taxes on labour, reduction of administrative burdens and promoting research (Ministry of Economic and Business Affairs, 2003, p. 5). As regards the field of ICT, the Danish government states that: “The development of IT and telecommunications in Denmark should preferably take place within the framework of private enterprise and on market terms” (Ministry of Science, Technology and Innovation, 2003a).
ICT diffusion and business use
Indicators and composite measures
The Economist’s e-readiness rankings, published since 2000, rank the world’s 60 largest economies’ e-readiness. The ranking is based on nearly 100 criteria, organized into six categories: connectivity and technology infrastructure, business environment, consumer and business adoption, legal and policy environment, social and cultural environment and supporting e-services (The Economist, 2004). Since 2000 Denmark has moved up nine places to first position in 2004, followed by the United Kingdom,
DSTI/ICCP/IE(2004)16/FINAL
8
Sweden, Norway and Finland. Denmark is number one in the category legal and policy environment, second in connectivity and technology infrastructure and third in the category supporting e-services. In the business environment category, Denmark ranks fifth suggesting that despite an encouraging regulatory environment and very widespread ICT diffusion and use across the population, business use lags and could be further enhanced.
Statistics Denmark in co-operation with The Danish Ministry of Science, Technology and Innovation conducts surveys of development in the field of ICT. “Information Society Denmark. ICT status” gathers most ICT statistics and covers the population’s use of ICT, business use of ICT, the public sector’s use of ICT, ICT security, ICT competences, the ICT sector and ICT products. In addition, the National IT and Telecom Agency publishes half-yearly and annual statistics on telecommunications and diffusion of cable modem and DSL in Denmark compared to other countries. Rambøll Management in co-operation with Danish IT (membership organisation for IT professionals and those interested in IT) publishes “IT in Practice”, covering the development and use of ICT in Denmark. Other sources are “E-business Nordic” (Rambøll Management) which deals with the use of e-business in Finland, Sweden, Norway and Denmark. As in the other peer reviews, this report also draws on the internationally comparable data from the OECD and other sources.
The ICT sector
In 2002, the share of value added in the ICT sector3 was 10.3% of the total value added in the business sector (Statistics Denmark, 2004i). Exports of ICT commodities and ICT consultancy services exceeded USD 8.3 bn4 (corresponding to DKK 51 bn) in 2002, constituting around 12% of total exports (Statistics Denmark, 2004e). Imports of ICT commodities5 took up 15% of the total imports in 2002 and were around 1.2 times ICT commodities exports (not including ICT services) (Statistics Denmark, 2003).
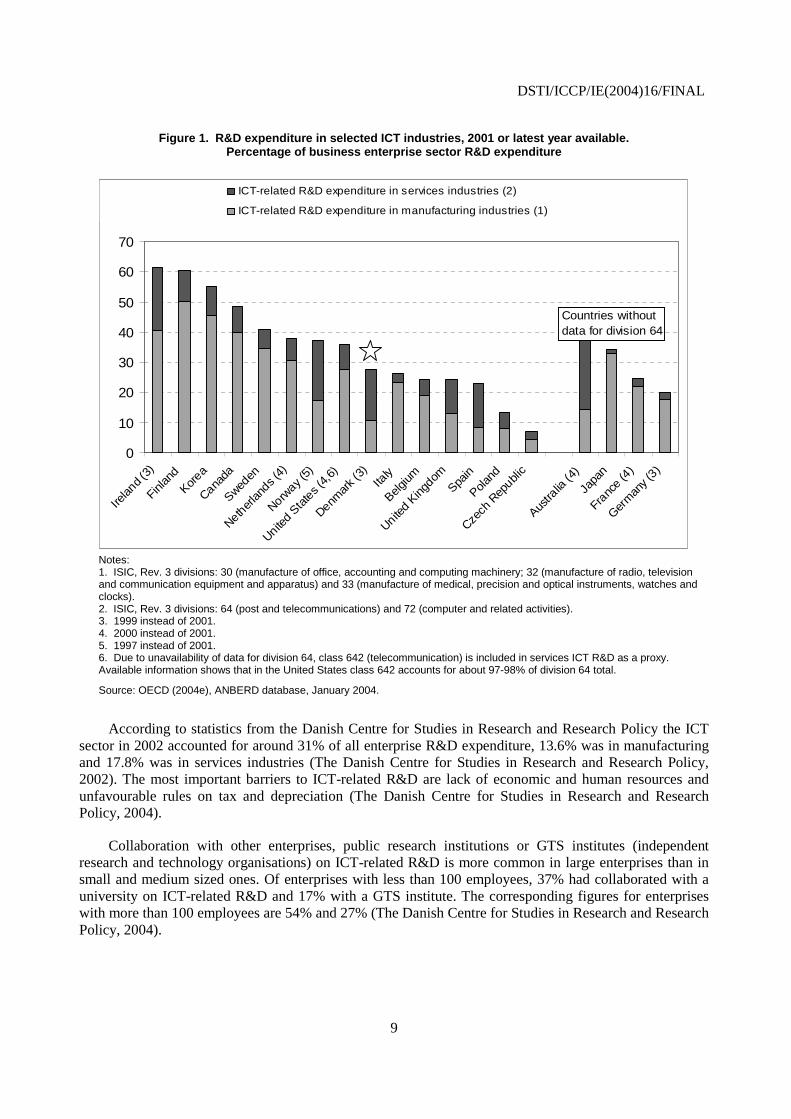
Research and development. Figure 1 shows the share of R&D in ICT manufacturing and services in total R&D for selected OECD countries. Compared to other countries the Danish ICT manufacturing industries’ share of total R&D is low. However the ICT services’ share ranks high, making up a greater percentage of the total R&D than ICT manufacturing. Together this places Denmark at the middle of the list (See Figure 1).
DSTI/ICCP/IE(2004)16/FINAL
9
Figure 1. R&D expenditure in selected ICT industries, 2001 or latest year available. Percentage of business enterprise sector R&D expenditure
0
10
20
30
40
50
60
70
Irelan
d (3)
Finlan
d
Korea
Canada
Sweden
Nether
lands (
4)
Norway (
5)
United S
tate
s (4,
6)
Denmar
k (3)
Italy
Belgium
United K
ingdo
mSpa
in
Poland
Czech
Rep
ublic
Austra
lia (4
)
Japa
n
Franc
e (4)
Germ
any (
3)
ICT-related R&D expenditure in services industries (2)
ICT-related R&D expenditure in manufacturing industries (1)
Countries without data for division 64
Notes: 1. ISIC, Rev. 3 divisions: 30 (manufacture of office, accounting and computing machinery; 32 (manufacture of radio, television and communication equipment and apparatus) and 33 (manufacture of medical, precision and optical instruments, watches and clocks). 2. ISIC, Rev. 3 divisions: 64 (post and telecommunications) and 72 (computer and related activities). 3. 1999 instead of 2001. 4. 2000 instead of 2001. 5. 1997 instead of 2001. 6. Due to unavailability of data for division 64, class 642 (telecommunication) is included in services ICT R&D as a proxy. Available information shows that in the United States class 642 accounts for about 97-98% of division 64 total.
Source: OECD (2004e), ANBERD database, January 2004.
According to statistics from the Danish Centre for Studies in Research and Research Policy the ICT sector in 2002 accounted for around 31% of all enterprise R&D expenditure, 13.6% was in manufacturing and 17.8% was in services industries (The Danish Centre for Studies in Research and Research Policy, 2002). The most important barriers to ICT-related R&D are lack of economic and human resources and unfavourable rules on tax and depreciation (The Danish Centre for Studies in Research and Research Policy, 2004).
Collaboration with other enterprises, public research institutions or GTS institutes (independent research and technology organisations) on ICT-related R&D is more common in large enterprises than in small and medium sized ones. Of enterprises with less than 100 employees, 37% had collaborated with a university on ICT-related R&D and 17% with a GTS institute. The corresponding figures for enterprises with more than 100 employees are 54% and 27% (The Danish Centre for Studies in Research and Research Policy, 2004).
DSTI/ICCP/IE(2004)16/FINAL
10
In 2001, R&D in the ICT sector was primarily funded by the firms themselves. The foreign funding of ICT R&D took up 9% of the total R&D investments compared to 8% in the entire business sector.6 Direct public funding of firm ICT R&D investments amounted to 1% of total R&D investments, whereas for the remaining business sector it was 3% (Statistics Denmark, 2003).
In the ICT sector, R&D expenditures as a share of turnover are higher than in the business sector overall. In 2002 R&D in the ICT sector made up 3.5% of the turnover whereas R&D in the business sector amounted to 1.1% of the turnover (Statistics Denmark, 2004h).
Enterprise formation. The relative share of the ICT sector in new enterprises peaked in 2000, where the ICT sector took up 14.2% of the total number of new enterprises in the business sector, and in 2001 the ICT sector accounted for 12.6% of new enterprises (Statistics Denmark, 2003). According to statistics including eleven European countries, business birth rates in the ICT sector are noticeably higher than in the whole business economy.7 Denmark had the second highest business birth rates in 2001 at 17%, following Norway at 18.4%. However Denmark also had the highest business death rates at 14.9% in 2000 and survival rates for ICT enterprises in Denmark were the second lowest among the European countries (Eurostat Statistics in Focus, 2004). This is confirmed by analysis conducted by FORA (Ministry of Economic and Business Affairs, Centre for Economic and Business Research). This analysis shows that Denmark performs relatively well in the establishment of new enterprises, but is far behind the best countries regarding their growth.8 In terms of conditions for entrepreneurial activity Denmark is number 14 out of 21 countries. The conclusion is that policy can be improved in different areas for instance modification of the restrictive rules on bankruptcy,9 counselling for entrepreneurs and development of a well functioning venture capital market (FORA, 2003).
Venture capital. The Danish state-backed investment company VaekstFonden (The Danish Investment Fund) carries out studies of the Danish venture capital market (VaekstFonden, 2001-2003, 2004). According to one of these studies Denmark ranks fifth in venture capital investments as a percentage of GDP. In the period 2001-2003 Danish venture capital investments made up 0.13% of GDP. Ahead of Denmark were United Kingdom, Finland and the Netherlands (all around 0.17%) and Sweden (0.24%). Danish investment activity declined in both 2002 and 2003, with the Danish investors making venture investments of DKK 2.1 and 1.8 billion respectively. However the decline in Danish investments (14%) corresponds to the decline found in the international investment activity (15%). In 2003, initial investments made up 31% of the total investments and follow-on investments took the remaining 69%. The distribution between new and existing portfolio companies has changed significantly since 2001 where 62% went to initial investments and 38% to follow-on investments. According to this study, the decline in the number of new investments implies that it has been harder to raise capital for new start-ups. In the ICT sector investments declined from 38% of all investments in 2002 to 25% in 2003, and the share of the total number of initial investments decreased from 28% in 2002 to 20% in 2003. Thus the report indicates that the raising venture capital for start-ups in the ICT sector has become more difficult. The new venture fund announced in November 2004 may go some way towards improving the supply of start-up venture capital
Total ICT spending
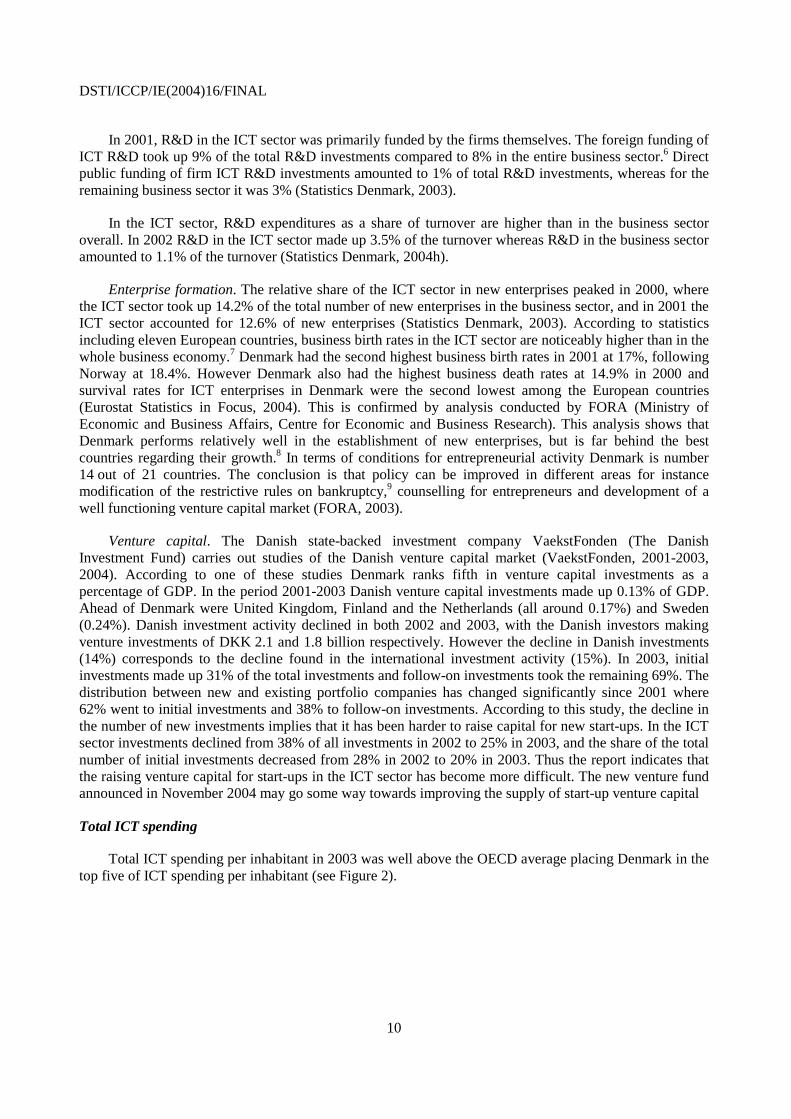
Total ICT spending per inhabitant in 2003 was well above the OECD average placing Denmark in the top five of ICT spending per inhabitant (see Figure 2).
DSTI/ICCP/IE(2004)16/FINAL
11
Figure 2. Total ICT spending per inhabitant, 2003. USD
0
500
1000
1500
2000
2500
3000
Switzer
land
United
Stat
es
Sweden
Norway
Denmark
Finlan
d
Nether
lands
Japa
n
United
King
dom
Austra
lia
Austria
Belgium
Canad
a
German
y
Franc
eOECD
New Z
ealan
dIre
land
Italy
Spain
Korea
Portug
al
Greece
Czech
Rep
ublic
Hunga
ry
Slovak R
epub
lic
Poland
Mexico
Turke
y
Telecommunications IT
Source: OECD 2004e, based on data from International Data Corporation (IDC).
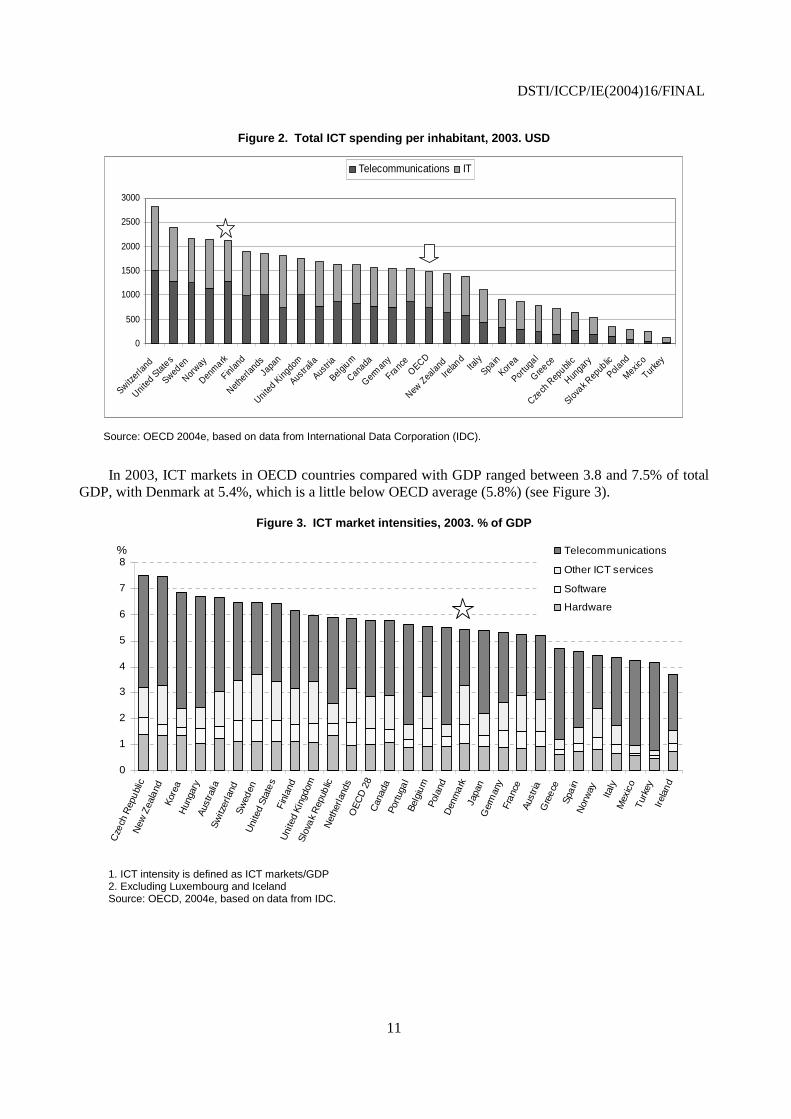
In 2003, ICT markets in OECD countries compared with GDP ranged between 3.8 and 7.5% of total GDP, with Denmark at 5.4%, which is a little below OECD average (5.8%) (see Figure 3).
Figure 3. ICT market intensities, 2003. % of GDP
0
1
2
3
4
5
6
7
8
Cze
ch R
epu
blic
New
Zea
land
Kor
eaH
unga
ryA
ustra
liaS
witz
erla
ndS
wed
enU
nite
d S
tate
sF
inla
ndU
nite
d K
ingd
omS
lova
k R
epub
licN
ethe
rlan
dsO
EC
D 2
8C
anad
aPo
rtug
al
Belg
ium
Pol
and
Den
mar
kJa
pan
Ger
man
yF
ranc
eAu
stria
Gre
ece
Spa
inN
orw
ay Italy
Mex
ico
Tur
key
Irel
and
Telecommunications
Other ICT services
Software
Hardware
%
1. ICT intensity is defined as ICT markets/GDP 2. Excluding Luxembourg and Iceland Source: OECD, 2004e, based on data from IDC.
DSTI/ICCP/IE(2004)16/FINAL
12
PCs
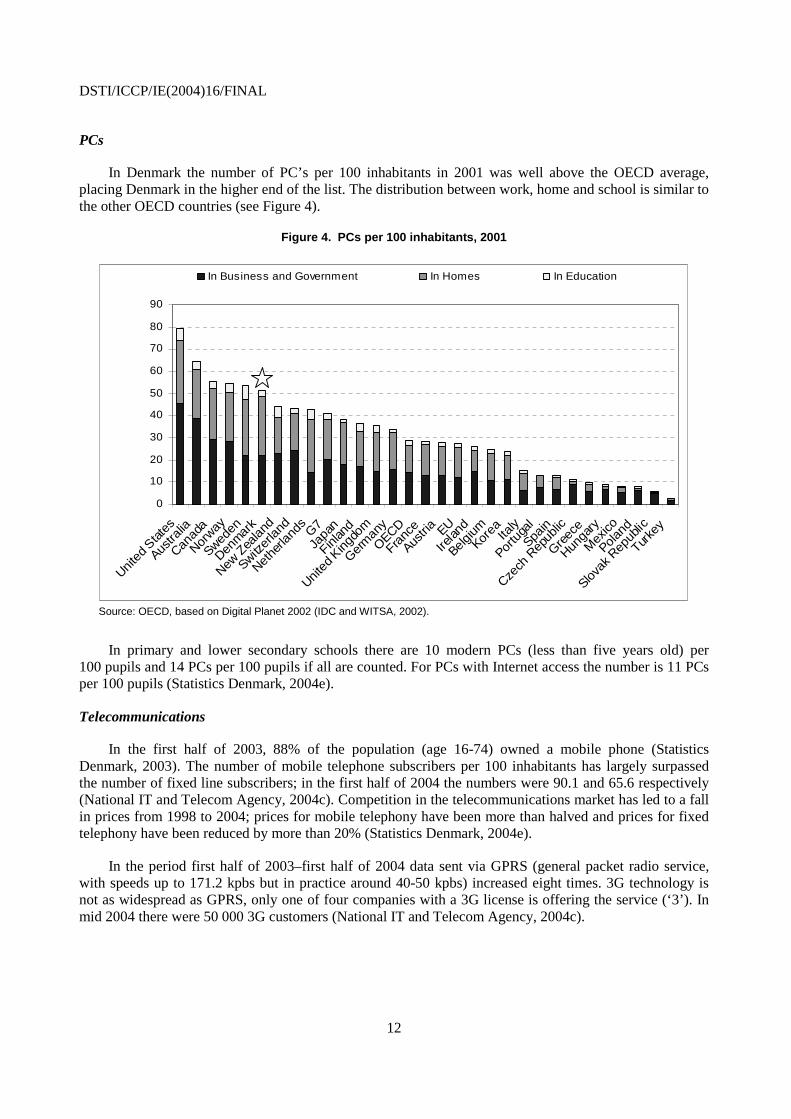
In Denmark the number of PC’s per 100 inhabitants in 2001 was well above the OECD average, placing Denmark in the higher end of the list. The distribution between work, home and school is similar to the other OECD countries (see Figure 4).
Figure 4. PCs per 100 inhabitants, 2001
0
10
20
30
40
50
60
70
80
90
United
Stat
es
Austra
lia
Canad
a
Norway
Sweden
Denmar
k
New Z
ealan
d
Switzer
land
Nethe
rland
sG7
Japa
n
Finlan
d
United
King
dom
Germ
any
OECD
Franc
e
Austri
a EU
Irelan
d
BelgiumKor
ea Italy
Portu
gal
Spain
Czech
Rep
ublic
Greec
e
Hunga
ry
Mex
ico
Poland
Slovak
Rep
ublic
Turke
y
In Business and Government In Homes In Education
Source: OECD, based on Digital Planet 2002 (IDC and WITSA, 2002).
In primary and lower secondary schools there are 10 modern PCs (less than five years old) per 100 pupils and 14 PCs per 100 pupils if all are counted. For PCs with Internet access the number is 11 PCs per 100 pupils (Statistics Denmark, 2004e).
Telecommunications
In the first half of 2003, 88% of the population (age 16-74) owned a mobile phone (Statistics Denmark, 2003). The number of mobile telephone subscribers per 100 inhabitants has largely surpassed the number of fixed line subscribers; in the first half of 2004 the numbers were 90.1 and 65.6 respectively (National IT and Telecom Agency, 2004c). Competition in the telecommunications market has led to a fall in prices from 1998 to 2004; prices for mobile telephony have been more than halved and prices for fixed telephony have been reduced by more than 20% (Statistics Denmark, 2004e).
In the period first half of 2003–first half of 2004 data sent via GPRS (general packet radio service, with speeds up to 171.2 kpbs but in practice around 40-50 kpbs) increased eight times. 3G technology is not as widespread as GPRS, only one of four companies with a 3G license is offering the service (‘3’). In mid 2004 there were 50 000 3G customers (National IT and Telecom Agency, 2004c).
DSTI/ICCP/IE(2004)16/FINAL
13
According to Statistics Denmark access to the Internet via telephone connections is available to everyone in Denmark (Statistics Denmark, 2003). Thus the availability and penetration of more advanced and fast Internet connections is of more policy interest. In broadband markets development has been rapid. From mid 2001 to October 2004 the availability of ADSL increased from 69% to 96% of all households and enterprises and mid-2004 cable modem was available to 60% of all households (Statistics Denmark, 2004h). Additionally the incumbent telecommunications operator TDC has undertaken to increase the availability of ADSL to 98% by October 2005. In most parts of the country there are alternative Internet access platforms available (ADSL, cable modem, FWA and WIFI). ADSL, cable modem and to a lesser extent FWA, are the most widespread. In 54% of all local authority areas, these three alternatives are available, while two kinds of Internet access are available in 33% and one, in form of ADSL, in 13%. Furthermore, in almost all areas there are four ADSL providers (Statistics Denmark, 2004h).
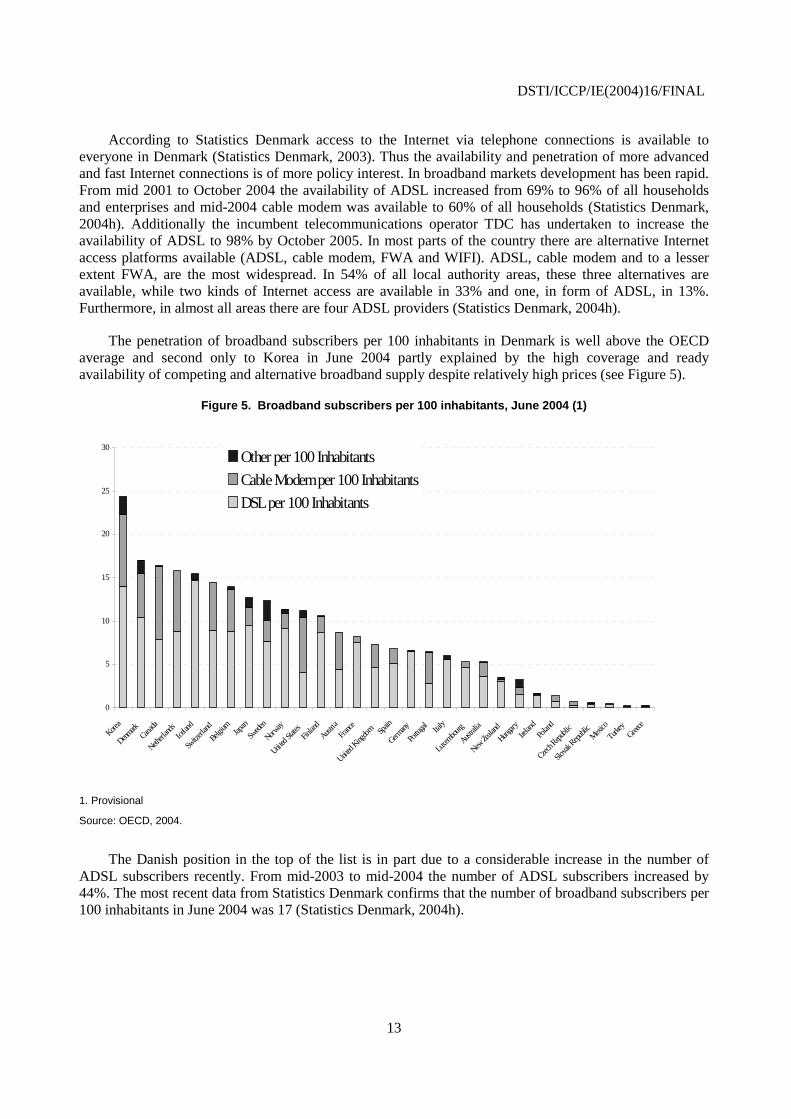
The penetration of broadband subscribers per 100 inhabitants in Denmark is well above the OECD average and second only to Korea in June 2004 partly explained by the high coverage and ready availability of competing and alternative broadband supply despite relatively high prices (see Figure 5).
Figure 5. Broadband subscribers per 100 inhabitants, June 2004 (1)
0
5
10
15
20
25
30
Korea
Denmark
Canada
Netherl
ands
Icelan
d
Switz
erland
Belgium
Japan
Swede
n
Norway
United
States
Finlan
d
Austria
France
United
Kingdo
m Sp
ain
Germany
Portu
gal
Italy
Luxe
mbourg
Austral
ia
New Ze
aland
Hungar
y
Irelan
d
Polan
d
Czech
Repu
blic
Slovak
Republi
cMexi
co
Turkey
Greece
Other per 100 Inhabitants
Cable Modem per 100 Inhabitants
DSL per 100 Inhabitants
1. Provisional
Source: OECD, 2004.
The Danish position in the top of the list is in part due to a considerable increase in the number of ADSL subscribers recently. From mid-2003 to mid-2004 the number of ADSL subscribers increased by 44%. The most recent data from Statistics Denmark confirms that the number of broadband subscribers per 100 inhabitants in June 2004 was 17 (Statistics Denmark, 2004h).
DSTI/ICCP/IE(2004)16/FINAL
14
ICT use in general
In 2004 the part of the population with access to the Internet via broadband (i.e. a transmission speed towards the user higher than 128 kbps10) surpassed the part with access via ISDN or analogue modem: 48% of the population had access via some kind of broadband and 41% had access via ISDN or analogue modem (Statistics Denmark, 2004h). The share of enterprises with broadband access in 2004 was very high at 84% (Statistics Denmark, 2004f).
In 2004, 75% of the population aged 16-74, had access to the Internet at home and 53% of the population used the Internet every day. 68% of the population used the Internet at home and 42% at work. As regards access to a PC, 84% of the population had access at home. The most common private purposes for using the Internet are to search for information and use online services (70%) and to communicate (65%). Purchases/sales and banking (55%) and contact to public authorities (43%) are common purposes for using the Internet. However 29% stated that security in connection with payment is still a concern (Statistics Denmark, 2004h).
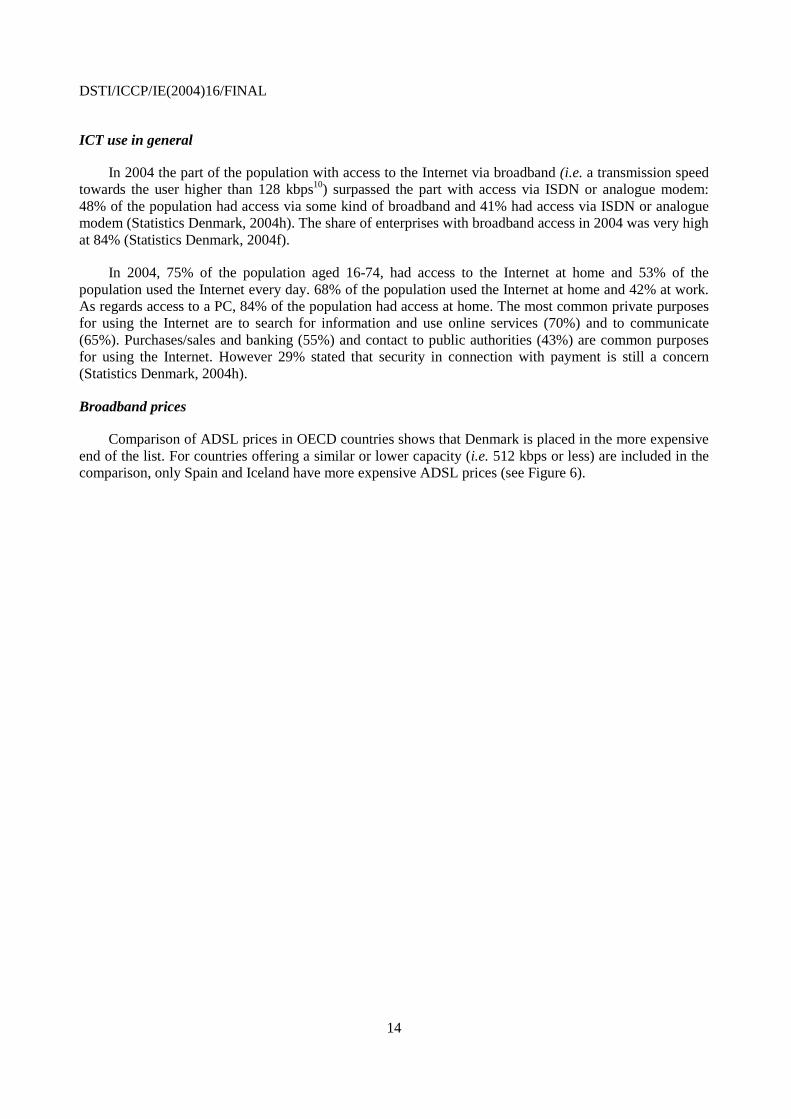
Broadband prices
Comparison of ADSL prices in OECD countries shows that Denmark is placed in the more expensive end of the list. For countries offering a similar or lower capacity (i.e. 512 kbps or less) are included in the comparison, only Spain and Iceland have more expensive ADSL prices (see Figure 6).
DSTI/ICCP/IE(2004)16/FINAL
15
Figure 6. Comparison of ADSL prices, January 2004
558
495
483
409
405
376
359
357
351
351
335
308
297
285
260
260
236
205
201
0 100 200 300 400 500 600
Spain (512 kbit/s)
Germany (768 kbit/s)
Iceland (256 kbit/s)*
Italy (640 kbit/s)
Belgium (3 Mbit/s)*
Sw itzerland (600 kbit/s)
Denmark (512 kbit/s)
Finland (512 kbit/s)
Luxembourg (512 kbit/s)
Norw ay (704 kbit/s)*
Greece (512 kbit/s)
Sw eden (512 kbit/s)*
Austria (768 kbit/s)*
UK (512 kbit/s)
France (512 kbit/s)
Portugal (512 kbit/s)*
US - SBC(384 kbit/s)
Canada (1.5 Mbit/s)
Netherlands (384 kbit/s)*
DKK
Note: Represented by the cheapest of the major providers in each country. Prices are not adjusted for differences in purchasing power. A comparison of ADSL prices is difficult due to different speeds in different countries. Furthermore, in the countries marked *, a variable traffic charge is payable if the subscriber exceeds a specified monthly volume of traffic.
Source: Broadband Market Tariffwatch, www.baskerville.telecoms.com, January 2004
The OECD benchmarking of broadband prices from incumbents in 2003 showed only four of the countries were more expensive than TDC in Denmark: Turk Telecom (Turkey), P&T (Luxembourg), OTE (Greece) and Telmex (Mexico). The benchmarking included offers from the incumbents which included at least 1 Gigabyte data. Danish ADSL services are either relatively slow speed or expensive (OECD, 2004c).
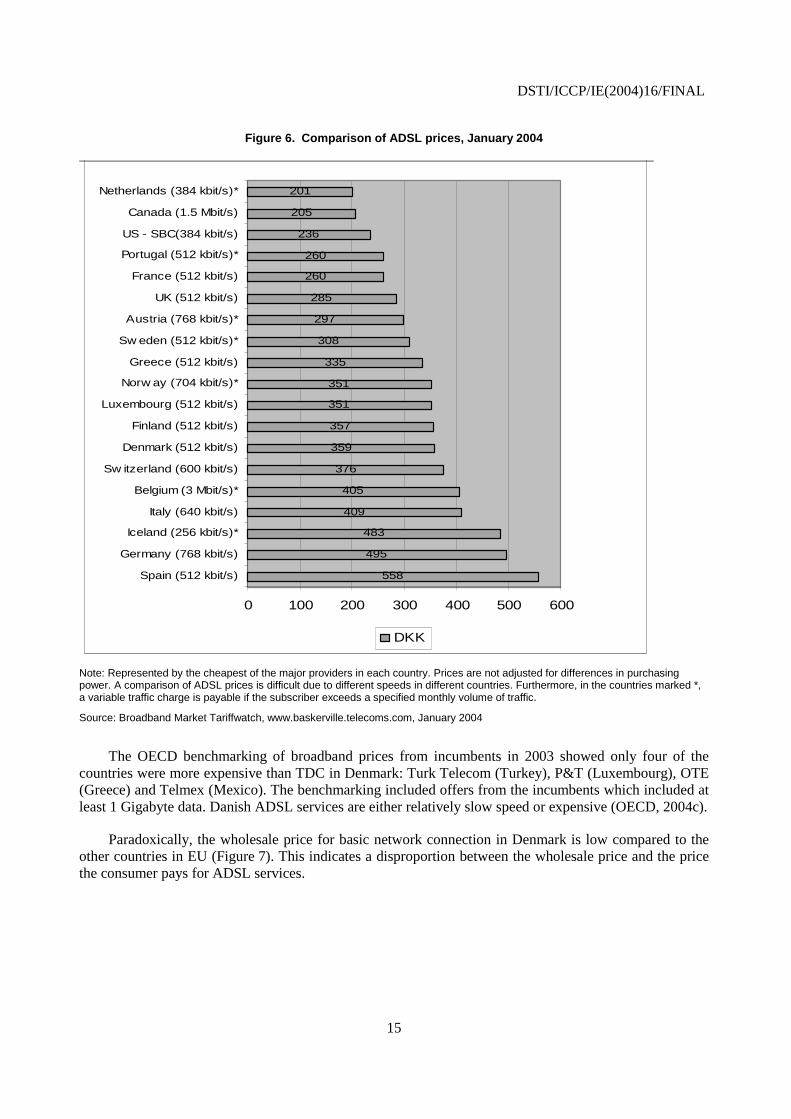
Paradoxically, the wholesale price for basic network connection in Denmark is low compared to the other countries in EU (Figure 7). This indicates a disproportion between the wholesale price and the price the consumer pays for ADSL services.
DSTI/ICCP/IE(2004)16/FINAL
16
Figure 7. Wholesale prices, raw copper and shared use, August 2003
0
5
10
15
20
25
Denmar
k
Nether
lands
Italy
Greec
e
Austri
a
Franc
eSpa
in
Germ
any
EU
Belgium
Portu
gal
Sweden UK
Finlan
d
Irelan
d
Luxe
mbo
urg
€ per monthRaw copper
Shared use
Note: costs of establishment are distributed over 36 months.
Note: costs of establishment are distributed over 36 months.
Source: Commission of the European Communities: Commission Staff/Working Paper. Technical Annexes of the Ninth Report on the Implementation of the Telecommunications Regulatory Package.
ICT skills
Statistics Denmark publishes data on the computer skills of the total population showing a relatively high rate of computer literacy. In 2004, 85% of the Danish population had used a computer, 83% had opened a program, 69% had copied a file, 66% had used the “copy – paste” function and 54% had used a spreadsheet. The share of the population who had made a homepage and who had programmed was 15% and 13% respectively (Statistics Denmark, 2004g).
In Denmark, the first computer driving license was issued in 1997 and in 2004 the number of computer driving licenses issued was 230 000 (5% of the population). An educational IT driving license has been initiated in order to ensure the technical skills of teachers. About 36 000 primary and lower secondary schools teachers had obtained the IT driving license (60% of teachers) (Statistics Denmark, 2004h).
ICT education
Across the Nordic countries there are similarities in the distribution of tertiary graduates among the different fields of study, e.g. 21-24% of tertiary graduates in Nordic countries in 2001/2002 were in social sciences, business and law. On average one third of OECD tertiary graduates are in this area. In Denmark the share of tertiary graduates in humanities and arts are above the OECD average at 11.6% and well above Sweden and Norway: the shares are 14.4% in Denmark, 7.2% in Norway, 5.5% in Sweden and 11.4% in Finland. As regards the share of tertiary graduates in engineering, manufacturing and construction fields of study, Sweden and Finland are in front of the Nordic countries with around 21% of all tertiary graduates in this area, whereas both Denmark and Norway are well below with 8.9% and 7.4% respectively. Furthermore, the share in Denmark is below the OECD average of 13.3% (OECD, 2004d). Compared to the OECD average, Denmark has a majority of graduates in humanities and arts and fewer graduates in engineering, manufacturing and construction. However Denmark also has a well-developed dual system of vocational education which could also partly explain some of the differences with other Nordic countries and the OECD average.
DSTI/ICCP/IE(2004)16/FINAL
17
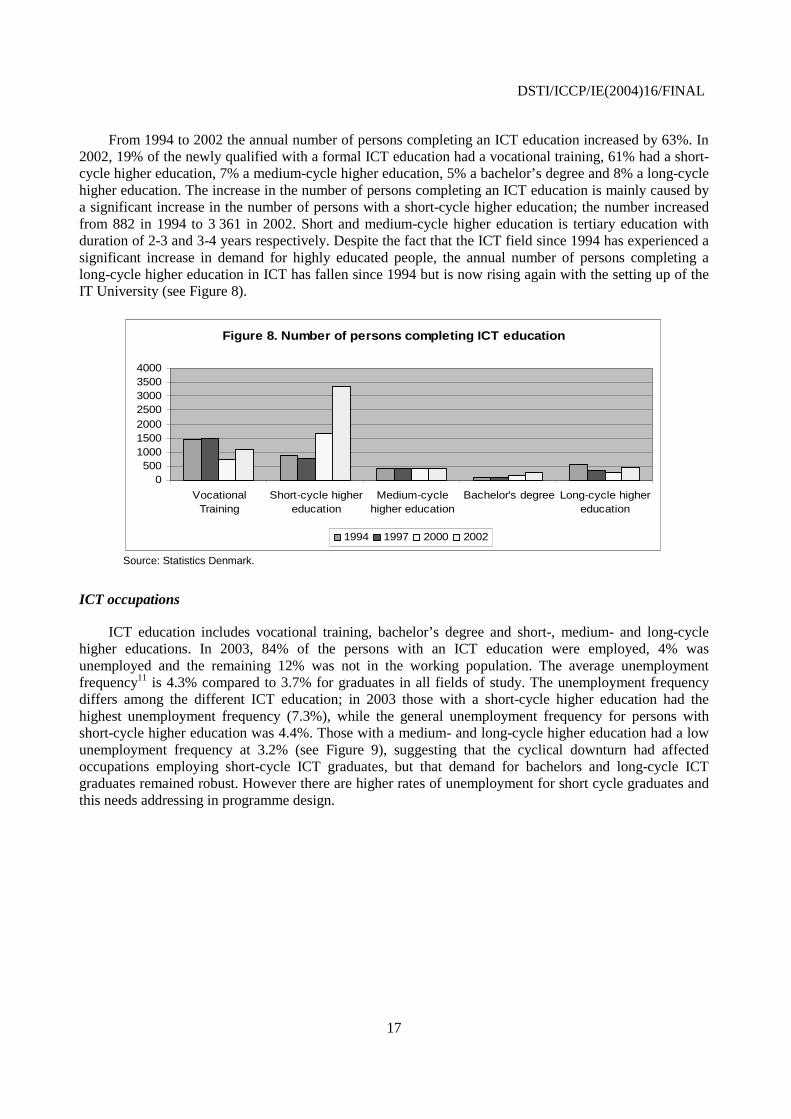
From 1994 to 2002 the annual number of persons completing an ICT education increased by 63%. In 2002, 19% of the newly qualified with a formal ICT education had a vocational training, 61% had a short-cycle higher education, 7% a medium-cycle higher education, 5% a bachelor’s degree and 8% a long-cycle higher education. The increase in the number of persons completing an ICT education is mainly caused by a significant increase in the number of persons with a short-cycle higher education; the number increased from 882 in 1994 to 3 361 in 2002. Short and medium-cycle higher education is tertiary education with duration of 2-3 and 3-4 years respectively. Despite the fact that the ICT field since 1994 has experienced a significant increase in demand for highly educated people, the annual number of persons completing a long-cycle higher education in ICT has fallen since 1994 but is now rising again with the setting up of the IT University (see Figure 8).
Figure 8. Number of persons completing ICT education
0500
1000150020002500300035004000
VocationalTraining
Short-cycle highereducation
Medium-cyclehigher education
Bachelor's degree Long-cycle highereducation
1994 1997 2000 2002
Source: Statistics Denmark.
ICT occupations
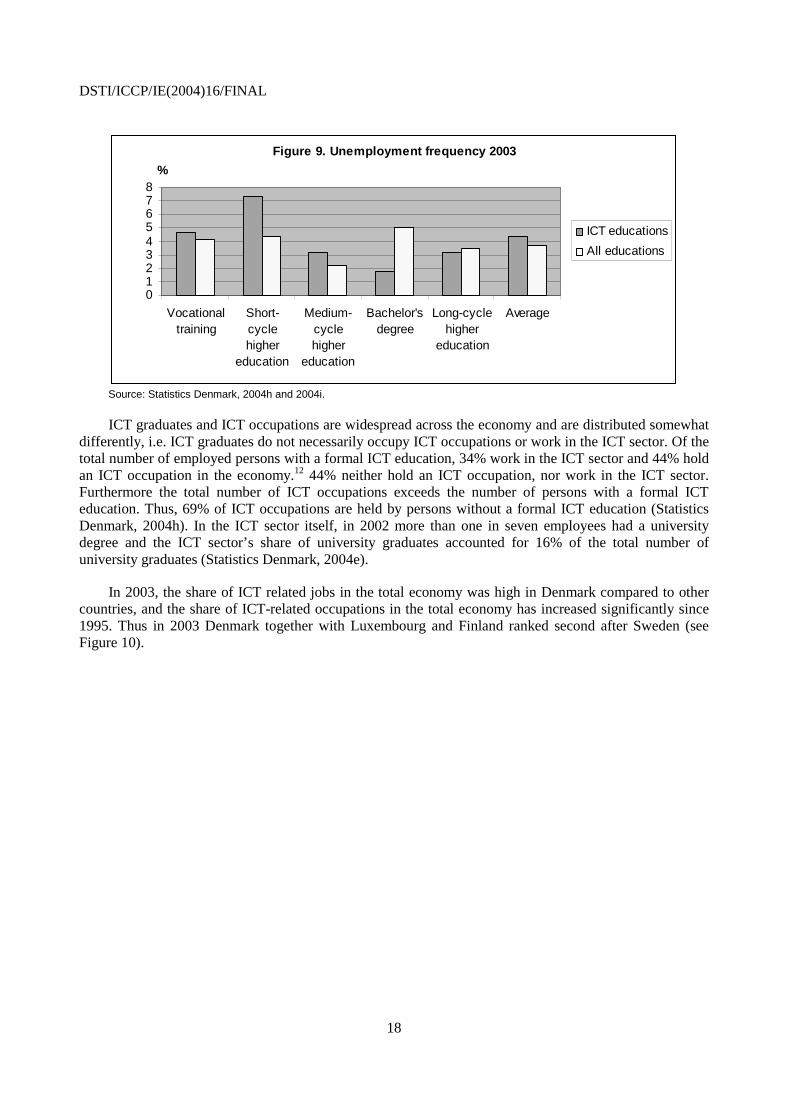
ICT education includes vocational training, bachelor’s degree and short-, medium- and long-cycle higher educations. In 2003, 84% of the persons with an ICT education were employed, 4% was unemployed and the remaining 12% was not in the working population. The average unemployment frequency11 is 4.3% compared to 3.7% for graduates in all fields of study. The unemployment frequency differs among the different ICT education; in 2003 those with a short-cycle higher education had the highest unemployment frequency (7.3%), while the general unemployment frequency for persons with short-cycle higher education was 4.4%. Those with a medium- and long-cycle higher education had a low unemployment frequency at 3.2% (see Figure 9), suggesting that the cyclical downturn had affected occupations employing short-cycle ICT graduates, but that demand for bachelors and long-cycle ICT graduates remained robust. However there are higher rates of unemployment for short cycle graduates and this needs addressing in programme design.
DSTI/ICCP/IE(2004)16/FINAL
18
Figure 9. Unemployment frequency 2003
012345678
Vocationaltraining
Short-cyclehigher
education
Medium-cyclehigher
education
Bachelor'sdegree
Long-cyclehigher
education
Average
%
ICT educations
All educations
Source: Statistics Denmark, 2004h and 2004i.
ICT graduates and ICT occupations are widespread across the economy and are distributed somewhat differently, i.e. ICT graduates do not necessarily occupy ICT occupations or work in the ICT sector. Of the total number of employed persons with a formal ICT education, 34% work in the ICT sector and 44% hold an ICT occupation in the economy.12 44% neither hold an ICT occupation, nor work in the ICT sector. Furthermore the total number of ICT occupations exceeds the number of persons with a formal ICT education. Thus, 69% of ICT occupations are held by persons without a formal ICT education (Statistics Denmark, 2004h). In the ICT sector itself, in 2002 more than one in seven employees had a university degree and the ICT sector’s share of university graduates accounted for 16% of the total number of university graduates (Statistics Denmark, 2004e).
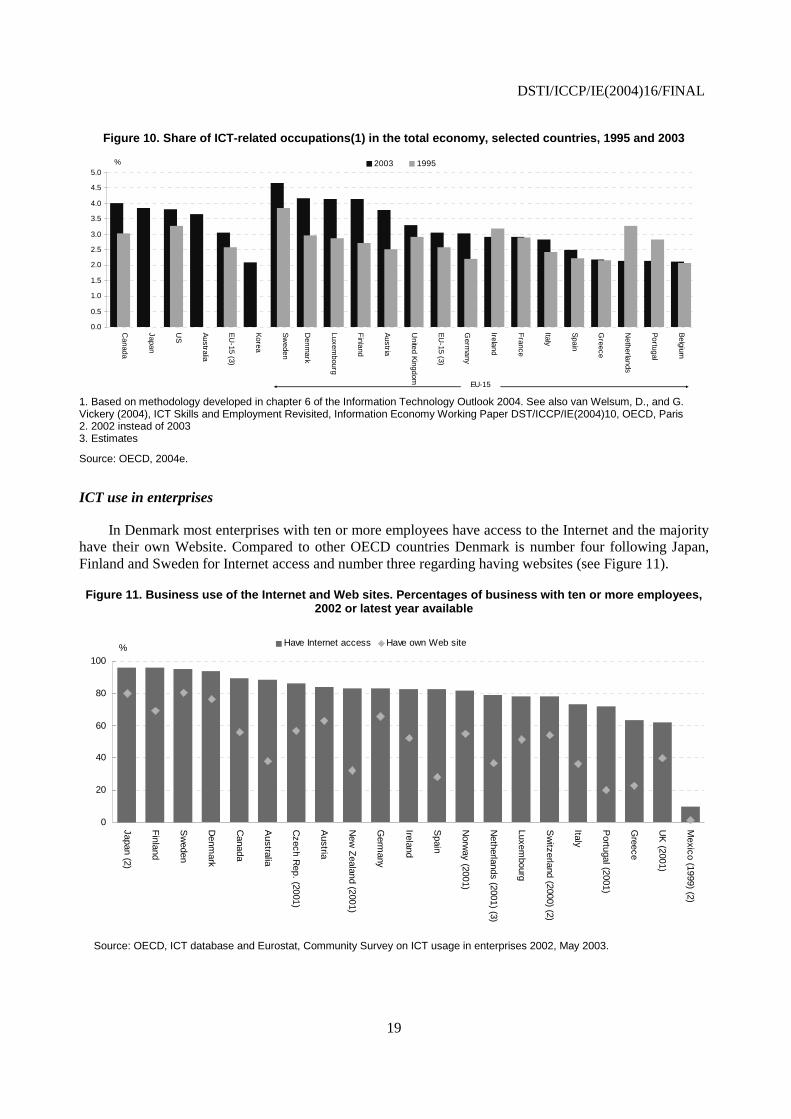
In 2003, the share of ICT related jobs in the total economy was high in Denmark compared to other countries, and the share of ICT-related occupations in the total economy has increased significantly since 1995. Thus in 2003 Denmark together with Luxembourg and Finland ranked second after Sweden (see Figure 10).
DSTI/ICCP/IE(2004)16/FINAL
19
Figure 10. Share of ICT-related occupations(1) in the total economy, selected countries, 1995 and 2003
0.0
0.5
1.0
1.5
2.0
2.5
3.0
3.5
4.0
4.5
5.0
Canada
Japan
US Australia
EU
-15 (3)
Korea
Sw
eden
Denm
ark
Luxembourg
Finland
Austria
United K
ingdom
EU
-15 (3)
Germ
any
Ireland
France
Italy
Spain
Greece
Netherlands
Portugal
Belgium
2003 1995%
EU-15
1. Based on methodology developed in chapter 6 of the Information Technology Outlook 2004. See also van Welsum, D., and G. Vickery (2004), ICT Skills and Employment Revisited, Information Economy Working Paper DST/ICCP/IE(2004)10, OECD, Paris 2. 2002 instead of 2003 3. Estimates
Source: OECD, 2004e.
ICT use in enterprises
In Denmark most enterprises with ten or more employees have access to the Internet and the majority have their own Website. Compared to other OECD countries Denmark is number four following Japan, Finland and Sweden for Internet access and number three regarding having websites (see Figure 11).
Figure 11. Business use of the Internet and Web sites. Percentages of business with ten or more employees, 2002 or latest year available
0
20
40
60
80
100Japan (2)
Finland
Sw
eden
Denm
ark
Canada
Australia
Czech R
ep. (2001)
Austria
New
Zealand (2001)
Germ
any
Ireland
Spain
Norw
ay (2001)
Netherlands (2001) (3)
Luxembourg
Sw
itzerland (2000) (2)
Italy
Portugal (2001)
Greece
UK
(2001)
Mexico (1999) (2)
% Have Internet access Have own Web site
Source: OECD, ICT database and Eurostat, Community Survey on ICT usage in enterprises 2002, May 2003.
DSTI/ICCP/IE(2004)16/FINAL
20
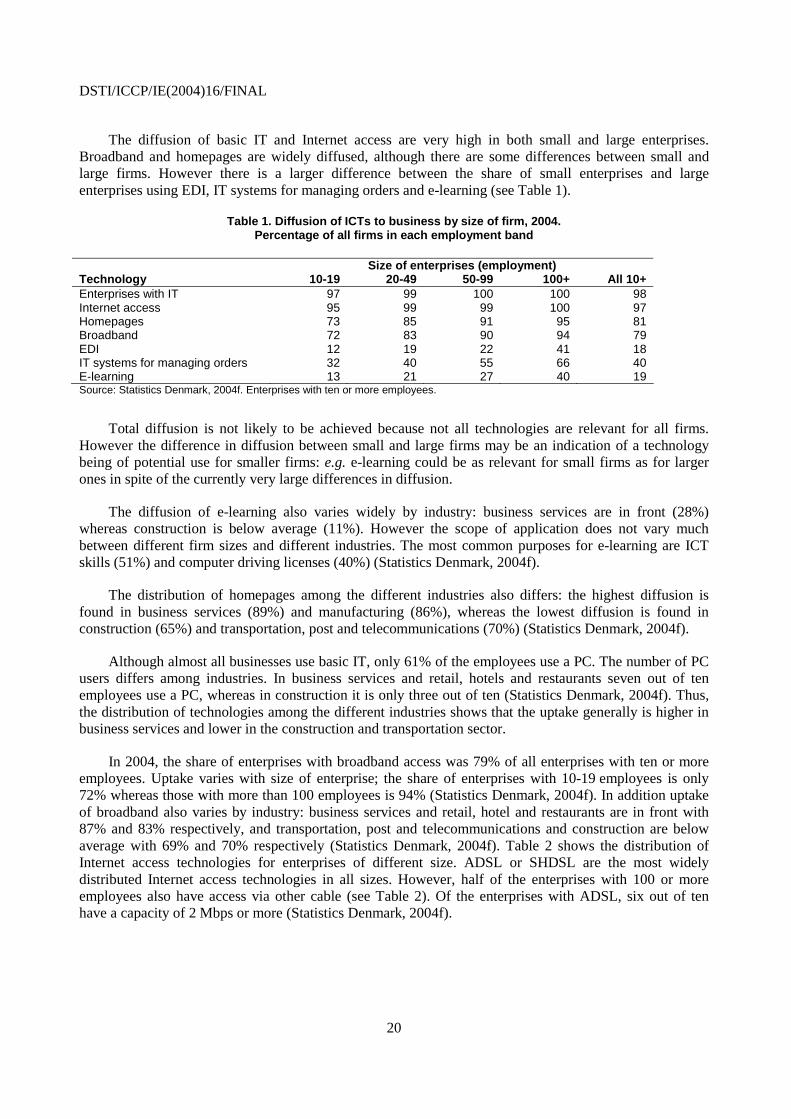
The diffusion of basic IT and Internet access are very high in both small and large enterprises. Broadband and homepages are widely diffused, although there are some differences between small and large firms. However there is a larger difference between the share of small enterprises and large enterprises using EDI, IT systems for managing orders and e-learning (see Table 1).
Table 1. Diffusion of ICTs to business by size of firm, 2004. Percentage of all firms in each employment band
Size of enterprises (employment) Technology 10-19 20-49 50-99 100+ All 10+ Enterprises with IT 97 99 100 100 98 Internet access 95 99 99 100 97 Homepages 73 85 91 95 81 Broadband 72 83 90 94 79 EDI 12 19 22 41 18 IT systems for managing orders 32 40 55 66 40 E-learning 13 21 27 40 19 Source: Statistics Denmark, 2004f. Enterprises with ten or more employees.
Total diffusion is not likely to be achieved because not all technologies are relevant for all firms. However the difference in diffusion between small and large firms may be an indication of a technology being of potential use for smaller firms: e.g. e-learning could be as relevant for small firms as for larger ones in spite of the currently very large differences in diffusion.
The diffusion of e-learning also varies widely by industry: business services are in front (28%) whereas construction is below average (11%). However the scope of application does not vary much between different firm sizes and different industries. The most common purposes for e-learning are ICT skills (51%) and computer driving licenses (40%) (Statistics Denmark, 2004f).
The distribution of homepages among the different industries also differs: the highest diffusion is found in business services (89%) and manufacturing (86%), whereas the lowest diffusion is found in construction (65%) and transportation, post and telecommunications (70%) (Statistics Denmark, 2004f).
Although almost all businesses use basic IT, only 61% of the employees use a PC. The number of PC users differs among industries. In business services and retail, hotels and restaurants seven out of ten employees use a PC, whereas in construction it is only three out of ten (Statistics Denmark, 2004f). Thus, the distribution of technologies among the different industries shows that the uptake generally is higher in business services and lower in the construction and transportation sector.
In 2004, the share of enterprises with broadband access was 79% of all enterprises with ten or more employees. Uptake varies with size of enterprise; the share of enterprises with 10-19 employees is only 72% whereas those with more than 100 employees is 94% (Statistics Denmark, 2004f). In addition uptake of broadband also varies by industry: business services and retail, hotel and restaurants are in front with 87% and 83% respectively, and transportation, post and telecommunications and construction are below average with 69% and 70% respectively (Statistics Denmark, 2004f). Table 2 shows the distribution of Internet access technologies for enterprises of different size. ADSL or SHDSL are the most widely distributed Internet access technologies in all sizes. However, half of the enterprises with 100 or more employees also have access via other cable (see Table 2). Of the enterprises with ADSL, six out of ten have a capacity of 2 Mbps or more (Statistics Denmark, 2004f).
DSTI/ICCP/IE(2004)16/FINAL
21
Table 2. Internet access technology by enterprise size, 2004 Percentage of all firms in each employment band (multiple technologies possible)
Size of enterprises (employment) Technology 10-19 20-49 50-99 100 All 10 Analogue modem 11 6 6 8 9 ISDN 18 16 11 13 16 ADSL or SHDSL 65 74 72 59 68 Other cable 9 14 24 50 16 Wireless 5 9 11 19 8
Source: Statistics Denmark, 2004f. All enterprises with ten or more employees.
E-business and e-commerce
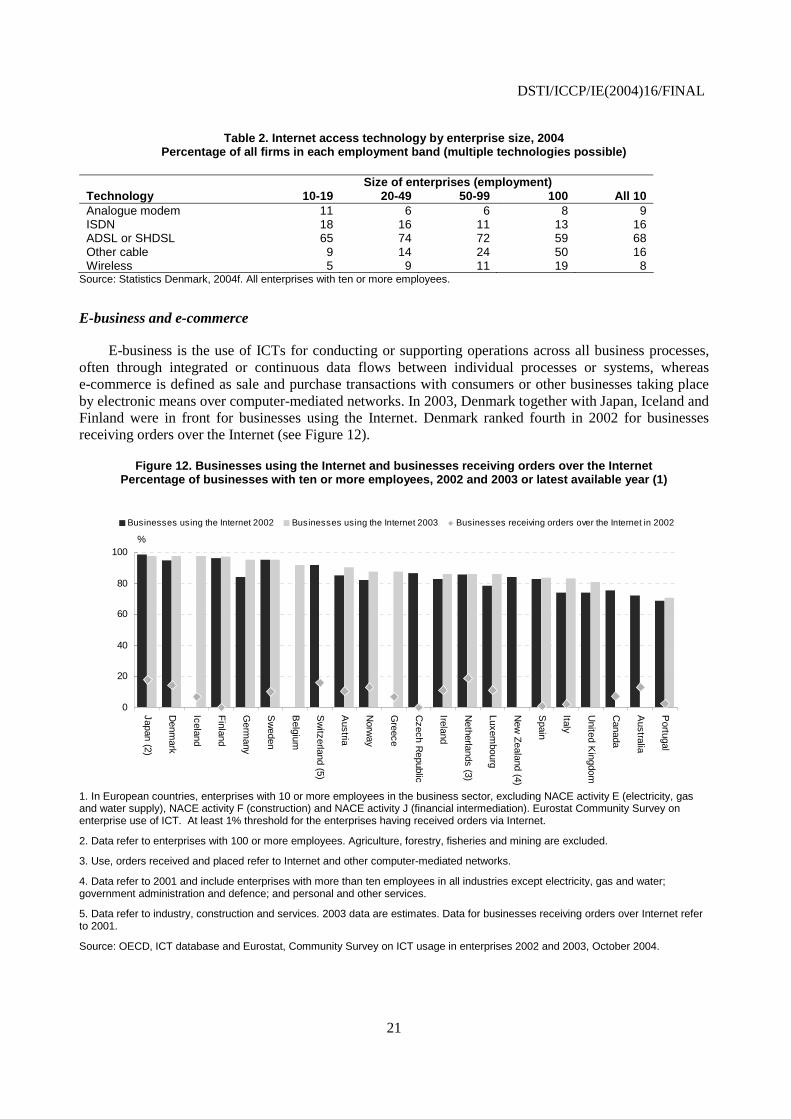
E-business is the use of ICTs for conducting or supporting operations across all business processes, often through integrated or continuous data flows between individual processes or systems, whereas e-commerce is defined as sale and purchase transactions with consumers or other businesses taking place by electronic means over computer-mediated networks. In 2003, Denmark together with Japan, Iceland and Finland were in front for businesses using the Internet. Denmark ranked fourth in 2002 for businesses receiving orders over the Internet (see Figure 12).
Figure 12. Businesses using the Internet and businesses receiving orders over the Internet Percentage of businesses with ten or more employees, 2002 and 2003 or latest available year (1)
0
20
40
60
80
100
Japan (2)
Denm
ark
Iceland
Finland
Germ
any
Sw
eden
Belgium
Sw
itzerland (5)
Austria
Norw
ay
Greece
Czech R
epublic
Ireland
Netherlands (3)
Luxembourg
New
Zealand (4)
Spain
Italy
United K
ingdom
Canada
Australia
Portugal
%
Businesses using the Internet 2002 Businesses using the Internet 2003 Businesses receiving orders over the Internet in 2002
1. In European countries, enterprises with 10 or more employees in the business sector, excluding NACE activity E (electricity, gas and water supply), NACE activity F (construction) and NACE activity J (financial intermediation). Eurostat Community Survey on enterprise use of ICT. At least 1% threshold for the enterprises having received orders via Internet.
2. Data refer to enterprises with 100 or more employees. Agriculture, forestry, fisheries and mining are excluded.
3. Use, orders received and placed refer to Internet and other computer-mediated networks.
4. Data refer to 2001 and include enterprises with more than ten employees in all industries except electricity, gas and water; government administration and defence; and personal and other services.
5. Data refer to industry, construction and services. 2003 data are estimates. Data for businesses receiving orders over Internet refer to 2001.
Source: OECD, ICT database and Eurostat, Community Survey on ICT usage in enterprises 2002 and 2003, October 2004.
DSTI/ICCP/IE(2004)16/FINAL
22
Due to differences in methods the data in Figure 12 are not directly comparable to data from Statistics Denmark. The latest data for 2003 from Statistics Denmark shows that the share of businesses with ten or more employees receiving orders over the Internet was 27%. As regards placing orders, the number was 57% (Statistics Denmark, 2004f).
The major part of sales on the Internet is business to business and business to government, which takes up 86% of total sales. The remaining 14% is sold to private consumers (Statistics Denmark, 2004f). The most common private purchases are commodities related to entertainment (e.g. tickets for theatre, concerts, cinema and sport) (36%), travelling (32%), books, magazines and newspapers (24%) and movies and music (22%) (Statistics Denmark, 2004g).
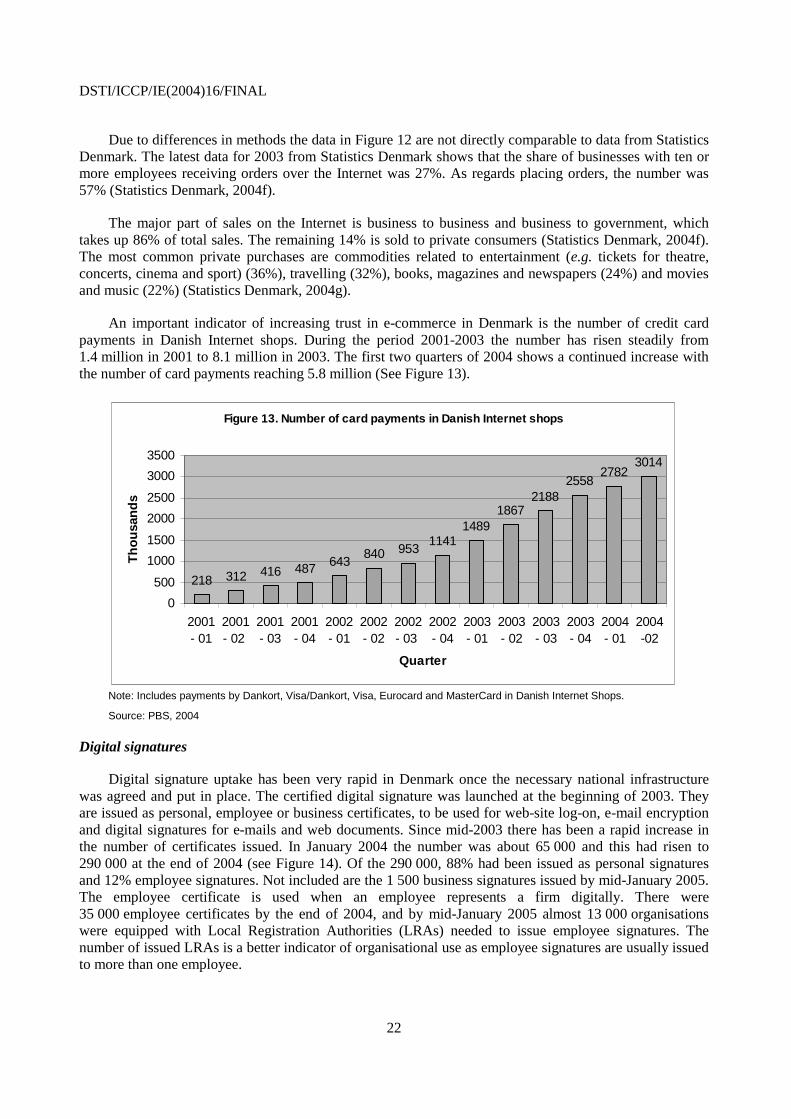
An important indicator of increasing trust in e-commerce in Denmark is the number of credit card payments in Danish Internet shops. During the period 2001-2003 the number has risen steadily from 1.4 million in 2001 to 8.1 million in 2003. The first two quarters of 2004 shows a continued increase with the number of card payments reaching 5.8 million (See Figure 13).
Figure 13. Number of card payments in Danish Internet shops
218 312 416 487 643840 953
11411489
18672188
25582782
3014
0
500
1000
1500
2000
2500
3000
3500
2001- 01
2001- 02
2001- 03
2001- 04
2002- 01
2002- 02
2002- 03
2002- 04
2003- 01
2003- 02
2003- 03
2003- 04
2004- 01
2004-02
Quarter
Th
ou
san
ds
Note: Includes payments by Dankort, Visa/Dankort, Visa, Eurocard and MasterCard in Danish Internet Shops.
Source: PBS, 2004
Digital signatures
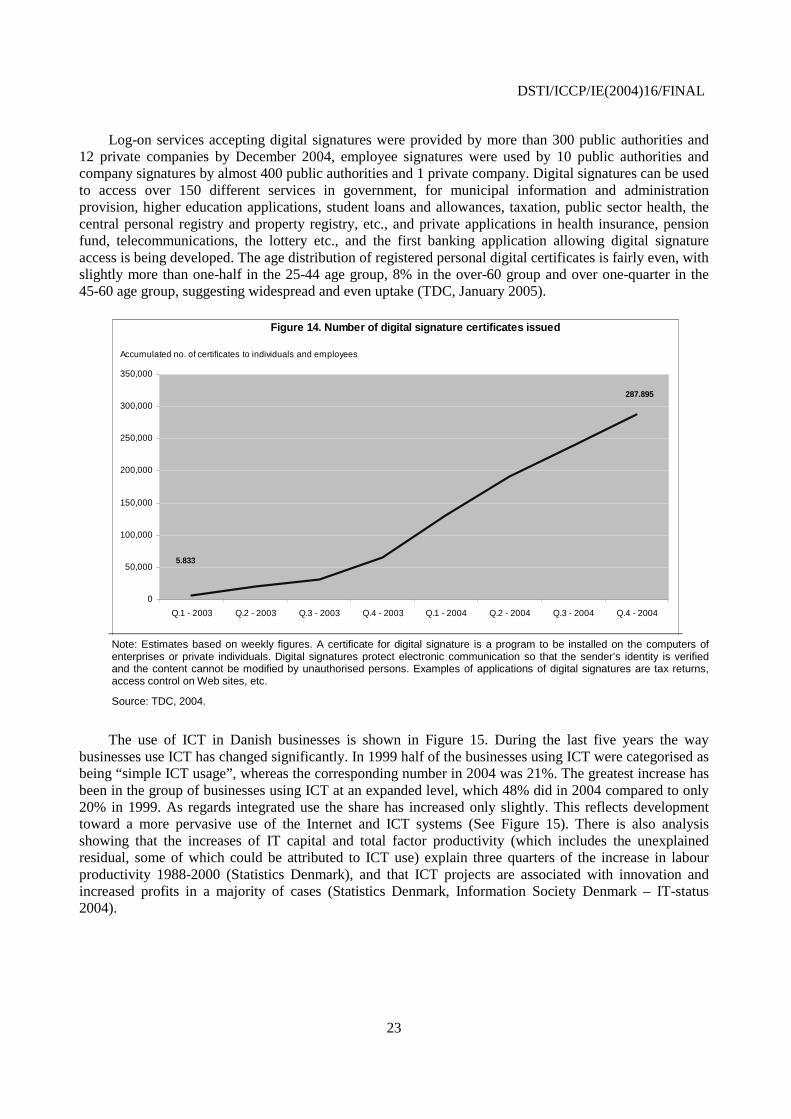
Digital signature uptake has been very rapid in Denmark once the necessary national infrastructure was agreed and put in place. The certified digital signature was launched at the beginning of 2003. They are issued as personal, employee or business certificates, to be used for web-site log-on, e-mail encryption and digital signatures for e-mails and web documents. Since mid-2003 there has been a rapid increase in the number of certificates issued. In January 2004 the number was about 65 000 and this had risen to 290 000 at the end of 2004 (see Figure 14). Of the 290 000, 88% had been issued as personal signatures and 12% employee signatures. Not included are the 1 500 business signatures issued by mid-January 2005. The employee certificate is used when an employee represents a firm digitally. There were 35 000 employee certificates by the end of 2004, and by mid-January 2005 almost 13 000 organisations were equipped with Local Registration Authorities (LRAs) needed to issue employee signatures. The number of issued LRAs is a better indicator of organisational use as employee signatures are usually issued to more than one employee.
DSTI/ICCP/IE(2004)16/FINAL
23
Log-on services accepting digital signatures were provided by more than 300 public authorities and 12 private companies by December 2004, employee signatures were used by 10 public authorities and company signatures by almost 400 public authorities and 1 private company. Digital signatures can be used to access over 150 different services in government, for municipal information and administration provision, higher education applications, student loans and allowances, taxation, public sector health, the central personal registry and property registry, etc., and private applications in health insurance, pension fund, telecommunications, the lottery etc., and the first banking application allowing digital signature access is being developed. The age distribution of registered personal digital certificates is fairly even, with slightly more than one-half in the 25-44 age group, 8% in the over-60 group and over one-quarter in the 45-60 age group, suggesting widespread and even uptake (TDC, January 2005).
0
50,000
100,000
150,000
200,000
250,000
300,000
350,000
Q.1 - 2003 Q.2 - 2003 Q.3 - 2003 Q.4 - 2003 Q.1 - 2004 Q.2 - 2004 Q.3 - 2004 Q.4 - 2004
Figure 14. Number of digital signature certificates issued
5.833
287.895
Accumulated no. of certificates to individuals and employees
Note: Estimates based on weekly figures. A certificate for digital signature is a program to be installed on the computers of enterprises or private individuals. Digital signatures protect electronic communication so that the sender’s identity is verified and the content cannot be modified by unauthorised persons. Examples of applications of digital signatures are tax returns, access control on Web sites, etc.
Source: TDC, 2004.
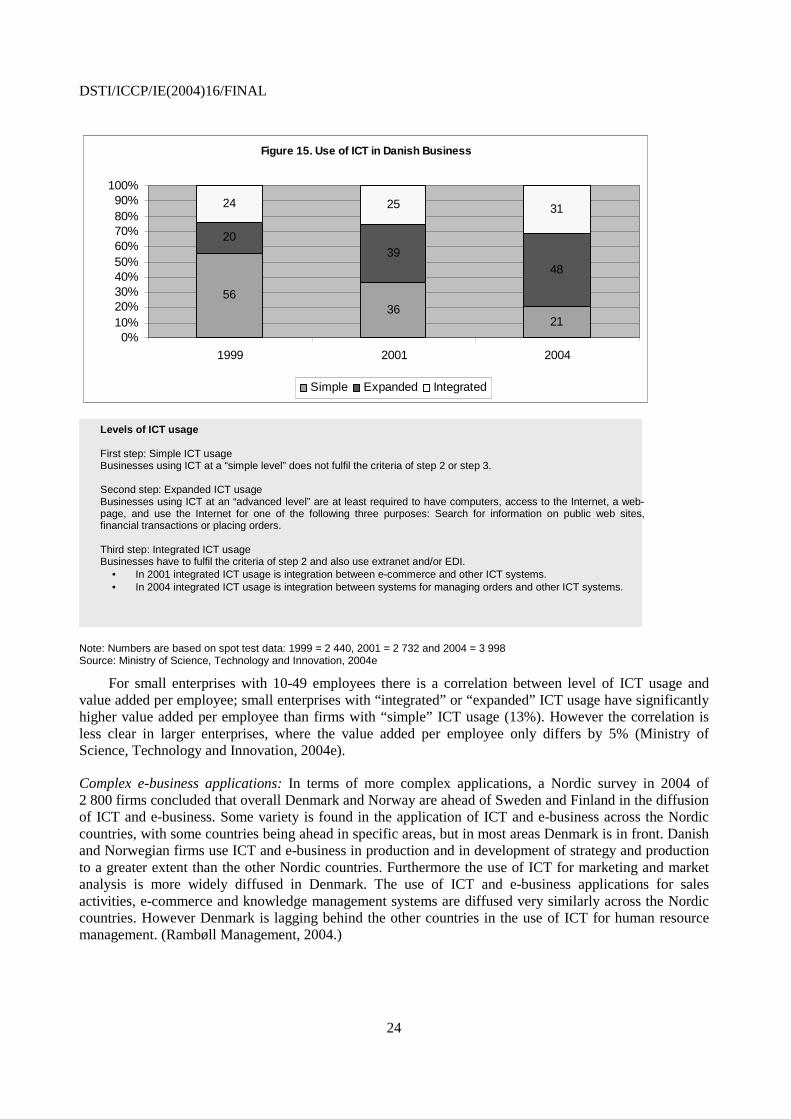
The use of ICT in Danish businesses is shown in Figure 15. During the last five years the way businesses use ICT has changed significantly. In 1999 half of the businesses using ICT were categorised as being “simple ICT usage”, whereas the corresponding number in 2004 was 21%. The greatest increase has been in the group of businesses using ICT at an expanded level, which 48% did in 2004 compared to only 20% in 1999. As regards integrated use the share has increased only slightly. This reflects development toward a more pervasive use of the Internet and ICT systems (See Figure 15). There is also analysis showing that the increases of IT capital and total factor productivity (which includes the unexplained residual, some of which could be attributed to ICT use) explain three quarters of the increase in labour productivity 1988-2000 (Statistics Denmark), and that ICT projects are associated with innovation and increased profits in a majority of cases (Statistics Denmark, Information Society Denmark – IT-status 2004).
DSTI/ICCP/IE(2004)16/FINAL
24
Figure 15. Use of ICT in Danish Business
5636
21
2039
48
24 25 31
0%10%20%30%40%50%60%70%80%90%
100%
1999 2001 2004
Simple Expanded Integrated
Levels of ICT usage First step: Simple ICT usage Businesses using ICT at a “simple level” does not fulfil the criteria of step 2 or step 3. Second step: Expanded ICT usage Businesses using ICT at an “advanced level” are at least required to have computers, access to the Internet, a web-page, and use the Internet for one of the following three purposes: Search for information on public web sites, financial transactions or placing orders. Third step: Integrated ICT usage Businesses have to fulfil the criteria of step 2 and also use extranet and/or EDI.
• In 2001 integrated ICT usage is integration between e-commerce and other ICT systems. • In 2004 integrated ICT usage is integration between systems for managing orders and other ICT systems.
Note: Numbers are based on spot test data: 1999 = 2 440, 2001 = 2 732 and 2004 = 3 998 Source: Ministry of Science, Technology and Innovation, 2004e
For small enterprises with 10-49 employees there is a correlation between level of ICT usage and value added per employee; small enterprises with “integrated” or “expanded” ICT usage have significantly higher value added per employee than firms with “simple” ICT usage (13%). However the correlation is less clear in larger enterprises, where the value added per employee only differs by 5% (Ministry of Science, Technology and Innovation, 2004e).
Complex e-business applications: In terms of more complex applications, a Nordic survey in 2004 of 2 800 firms concluded that overall Denmark and Norway are ahead of Sweden and Finland in the diffusion of ICT and e-business. Some variety is found in the application of ICT and e-business across the Nordic countries, with some countries being ahead in specific areas, but in most areas Denmark is in front. Danish and Norwegian firms use ICT and e-business in production and in development of strategy and production to a greater extent than the other Nordic countries. Furthermore the use of ICT for marketing and market analysis is more widely diffused in Denmark. The use of ICT and e-business applications for sales activities, e-commerce and knowledge management systems are diffused very similarly across the Nordic countries. However Denmark is lagging behind the other countries in the use of ICT for human resource management. (Rambøll Management, 2004.)
DSTI/ICCP/IE(2004)16/FINAL
25
Summary
Denmark has performed well economically in recent years with high levels of ICT access and use contributing to high GDP levels and GDP growth which has been considerably above the Euro area, although somewhat below the OECD total. Denmark ranks highly on almost all relevant parameters for the diffusion of ICT. Total ICT spending per inhabitant in 2003 was well above the OECD average placing Denmark in the top five of ICT spending. In Denmark the number of PC’s per 100 inhabitants is well above the OECD average. In 2004 access to the Internet via telephone connections is available to everyone, ADSL is available to 96% of all households and enterprises and high speed internet via cable modem available to 60% of all households. The penetration of broadband subscribers per 100 inhabitants in Denmark is well above the OECD average and was second only to Korea in June 2004. Comparison of ADSL retail prices in OECD countries shows that Denmark is placed in the more expensive end of the list.
Most enterprises with ten or more employees have access to the Internet and the majority have their own Website. The diffusion of basic IT and Internet access are very high in both small and large enterprises. Broadband and homepages are widely diffused, although there are some differences between small and large firms. Businesses with simple use of ICT made up 21% of the total in 2004, those using ICT at an expanded level represented 48%, and the most advanced businesses (“integrated use”) made up 31% of the total
From 1994 to 2002 the number of people completing an ICT education increased by 23%, but this is mainly due to increases in the number with a short-cycle higher ICT education. Despite growing demand for highly educated people in the ICT field since 1994 the annual number completing a long-cycle higher education in ICT has fallen slightly. ICT-related R&D is moderately high but considerably behind the leading countries. The most important barriers to ICT-related R&D are lack of economic and human resources and unfavourable rules on tax and depreciation.
General approach to ICT policy
Strategy for an information society
In Denmark ICT policy is a high priority area. The Danish Ministry of Science, Technology and Innovation, with technical assistance from the Danish National IT and Telecom Agency, is responsible for the co-ordination of the government’s ICT policies. ICT policy is part of an overall strategy to enhance R&D, innovation and higher education in Denmark and is an important part of the government’s overarching objective of Denmark ranking among the leading high technology societies (Ministry of Science, Technology and Innovation, 2004d).
Policies are generally in line with European recommendations. In the area of R&D and innovation, Denmark has adopted the Barcelona objectives of R&D and innovation to reach 3% of GDP in 2010 (Ministry of Science, Technology and Innovation, 2003b). The Barcelona objectives state that private R&D investments should make up 2% and public R&D investments 1% of GDP. In 2003 aggregate R&D investments in Denmark were equivalent to 2.61% of GDP (DKK 36.5 billion), of which private investments represented 1.8% (DKK 25.2 billion) and public investments 0.8% (DKK 11.2 billion) (http://www.cfa.au.dk/Presse/FoU_03.pdf). Denmark is above the OECD average at 2.26% of GDP, however the leading countries are well above Denmark: the share in Sweden and Finland is 4.27% and 3.46% respectively (OECD, 2004a). In the field of ICT, the action plan eEurope 2005 sets the framework for the European ICT policy. The eEurope plan also includes a benchmarking program in order to target the efforts (Ministry of Science, Technology and Innovation, 2004d).
DSTI/ICCP/IE(2004)16/FINAL
26
In 1994 one of the first ICT plans was submitted in the report “Information Society 2000” and in 1995 a related “IT action plan 95” was published. Since then, a number of ICT action plans and publications have been issued (www.vtu.dk). The general approach was outlined in the action plan “From Hardware to Content. Strategy for Fast, Cheap and Secure Internet to all of Denmark” in 2001. The current objectives of ICT policy are contained in the action plan “IT for All” from 2002. The action plan in 2003 (Using IT Wisely) and the ICT policy review in 2004 (Ministry of Science, Technology and Innovation, 2004d) are based on objectives outlined in the 2002 plan. In 1999, a political accord on telecommunications initiated an annual review; in 2002 an annual review of the ICT status in Denmark was initiated in “IT for All”. As the title of the 2001 action plan indicates, it initiated a shift from hardware to content, which has been followed-up in the annual reports on ICT status in Denmark. The report from 2003 “Using IT Wisely” focuses on effective utilisation of ICT by business, the public sector and citizens.
ICT policy is based on two main principles. The government believes that driven by demand, the market will develop in the right direction. Thus developments in the field of ICT should take place within private enterprises and on market terms. The government’s primary task is to identify and remove market failures. However, the Danish business structure has a very high proportion of small businesses, and the public sector also has a key role in promoting IT development by using its influence as a large consumer and by offering digital services to citizens and the business sector. Additionally, the public sector may contribute to the development of ICT security (Ministry of Science, Technology and Innovation, 2003a).
Based on these two main principles, the government’s ICT policy has three expressed objectives (Ministry of Science, Technology and Innovation, 2003a), the first of which focuses on ICT supply and use in the business sector:
• Creating growth in Danish business and industry. This should be accomplished by making the use of IT in the Danish business sector more advanced and profitable; ensuring that the Danish IT industry has beneficial conditions for generating value; and creating the best possible framework for a well-functioning telecommunications market.
• Reforming the public sector. This should be accomplished by IT and digital services promoting efficiency and productivity in the public sector; by public services being supplied on a coherent basis focusing on the user; and by the public sector working and communicating digitally in its internal routines and when contacting citizens and businesses.
• Qualifying Danes for the future knowledge society. This should be accomplished by citizens having access to, and skills for using IT; by a wider range of relevant and useful services being offered via the Internet by public authorities; by increased transparency in the IT society; and by the citizens being aware of their own IT rights.
The government has designated ten yardsticks for ICT policy which is assessed by its contribution to these areas (Ministry of Science, Technology and Innovation, 2002b). The first three areas are directly relevant to aspects of change in the business sector:
• Strengthening collaboration between research, education, and business and industry.
• Generating knowledge and innovation to the benefit of business and industrial enterprises.
• Attracting investment and enhancing the competitiveness of Danish business and industry.
• Improving the quality of education and ensuring that instruction is targeted at the individual student.
DSTI/ICCP/IE(2004)16/FINAL
27
• Achieving better value for money in public systems.
• Making it easier for the individual to have an overall picture of the system of public services, so that free choice is facilitated.
• Easing the burdens of Danes’ busy everyday life.
• Providing help to persons with special needs.
• Furthering individuals’ opportunities for active participation and co-influence.
• Preserving, communicating and creating new Danish cultural experiences.
Although this defines a set of areas to which ICT policy should contribute, it does not offer quantitative objectives for each area.
The impacts of ICT policy are also assessed in the annual reports of the status of ICT initiated as part of the 2002 action plan (Ministry of Science, Technology and Innovation, 2002). Two reports have been published: Using IT Wisely (2003) and the ICT policy review IT og telepolitisk redegørelse (2004). These reports provide an overall picture of the development of selected ICT indicators and a status report on current initiatives.
Focus of government policies and programmes
Danish ICT policy focuses on three main areas: the business sector, the public sector and citizens. Specific initiatives to strengthen the field of ICT in Denmark are found in each area. The government focuses on creating framework conditions for both business and citizens to meet the objective of effective and profitable use of ICT. This includes promoting competition in the telecommunications market to ensure the best and cheapest infrastructure and by promoting innovation and research in the ICT sector. Furthermore, the government attaches importance to ensuring a highly skilled ICT workforce and promoting supplementary training via e-learning. Additionally, emphasis is on promoting the skills of the population at large, ensuring that everybody can participate in the high technology society. In the public sector the focus is on creating an efficient and coherent public sector which is readily accessible to both businesses and citizens (Ministry of Science, Technology and Innovation, 2003a).
There is a wide range of analysis and initiatives in the field of ICT. The advanced national statistical base provides a good starting point to identify market failures and areas suitable for government intervention on the basis of a systematic framework for analysis. In a number of areas specific quantitative policy goals have been identified, for example in the telecommunications area the availability of DSL (see below) and goals for online government services to business including digital signatures and e-invoicing (see The Danish eGovernment Strategy 2004-06), and to the extent possible these approaches should be expanded and applied systematically in further areas of ICT policy.
Policy co-ordination
Coordination of ICT policies involves a large number of ministries. ICT policy affects different ministries and responsibilities for the execution of initiatives in their own field are spread among the various ministries (for example health-related ICT is located in the Ministry of Health). The following section describes the most important ICT-related responsibilities of the larger Ministries, and the key roles of the Ministry of Science, Technology and Innovation and the Ministry of Finance.
DSTI/ICCP/IE(2004)16/FINAL
28
Ministry of Science, Technology and Innovation: The Ministry of Science, Technology and Innovation has overall responsibility and coordinating responsibility for ICT policy. The Ministry of Science, Technology and Innovation was created in 2001 by enlargement of the then Ministry of Information Technology and Research. The Ministry covers the universities (research and education), industrial research and Denmark's policy on technology and innovation. The reorganisation of the Ministry was part of the government’s overall mission to strengthen Denmark’s growth potential and competitiveness in the knowledge economy. The object of the Ministry is to promote the interaction of trade and industry, centres of research and education and to strengthen coordination of industry and research policy (www.vtu.dk). One of the responsibilities of the Ministry is standard setting: e.g. the XML committee, which is part of the project eGovernment (see below), is located in the Ministry of Science, Technology and Innovation and the Ministry chairs the committee (www.e.gov.dk).
The National IT and Telecom Agency is located under the Ministry of Science, Technology and Innovation. Its principal task is to develop and implement initiatives within key areas of the government's IT policy strategy and to contribute actively to creating the best possible framework for businesses, citizens and the public sector to realize the network society. The Agency also assists and provides input to the Minister (www.itst.dk). The Council for IT Security cooperates with the IT Security division of the National IT and Telecom Agency to strengthen IT security in Denmark (www.itst.dk).
Ministry of Finance: The Ministry of Finance is home to the project eGovernment to promote and coordinate the transition to eGovernment in the public sector. The Digital Taskforce is located in the Ministry of Finance and the permanent secretary of the Ministry is chairman of the Taskforce. The objective of the Digital Taskforce is to promote the digitization process across different levels of the public sector and to work as a catalyst in solving problems of coordination and cooperation. The Digital Taskforce assists the joint board of the project eGovernment in carrying out adopted projects. The employees of the Taskforce are seconded from different ministries and from Local Government Denmark and the Association of County Councils in Denmark (www.e.gov.dk).
The Agency for Governmental Management is located under the Ministry of Finance, and is responsible for ensuring the quality of the central electronic public procurement portal (DOIP) and the integration of DOIP in the finance and accounting system of state institutions (DOIPEI). The actual operation of the public procurement portal is handled by the private company, Consolidated Holdings A/S (www.doip.dk, www.oes.dk).
Other initiatives: The advisory group E-kredsen (E-group) is a co-operation among the Ministry of Science, Technology and Innovation, the Ministry of Economics and Business Affairs and commercial- and special interest organisations to promote the development of e-commerce (www.e-fokus.dk). The president of the group is the senior manager of the Ministry of Science, Technology and Innovation.
The Danish Commerce and Companies Agency located under the Ministry of Economics and Business Affairs, plays a central role in the development of e-government in Denmark. The Agency is responsible for the development of the public-private portal Virk.dk, which is a combined portal for businesses to access public and private services (www.eogs.dk/sw863.asp). Furthermore, the Central Customs and Tax Administration (Told og Skat), which is located under the Ministry of Taxation, has also been a driving force in the development of e-government. The Central Customs and Tax Administration offers business and citizens digital services, for instance digital reporting on tax etc. (www.toldogskat.dk).
The Ministry of Education is responsible for the use of ICT in the primary and secondary schools, for example an IT initiative in primary and lower secondary schools which includes computer driving licences for both pupils and teachers. The initiative aims at promoting the use of IT at all levels of education (www.uvm.dk).
DSTI/ICCP/IE(2004)16/FINAL
29
To coordinate ICT in the public sector, the various ministries have prepared a joint policy, initiated in the action plan “IT for All” in 2002. Two cross ministerial councils have been established to promote coordination of government ICT policy. The IT Council of the State (Statens IT råd), in which all Ministries are represented at management level, contributes ICT policy initiatives and debates ICT policy and ensures joint cooperation. Technical, organisational and administrative issues in relation to purchase and use of ICT are discussed in the IT Forum of the State (Statens IT forum), a subdivision of the IT Council. IT managers of the various Ministries are members of this forum (www.vtu.dk).
Most of the issues addressed at ministerial level also concern the local and regional administrations. Thus, the cross-level cooperation in the public sector takes place in the Coordinated Information Committee (Det Koordinerende Informationsudvalg) and the Joint Board of the Project eGovernment (Bestyrelsen for projekt digital forvaltning) (www.vtu.dk, www.e.gov.dk).
This selection of initiatives is not exhaustive as the following section on specific initiatives shows; other Ministries are also involved in the execution of ICT policy and initiatives.
Specific initiatives
The following section presents selected ICT initiatives in Denmark. A majority of the initiatives are in the current Government IT action plan (“IT for All”). Since progress in the area of ICT has high priority in Denmark, and there are numerous initiatives, those selected are all directly or indirectly relevant to ICT diffusion to business.
Infrastructure: telecommunication markets
In general, Denmark has a well developed ICT infrastructure, the share of businesses and households with access to an ADSL connection to the Internet is relatively high and the ADSL coverage was 96% in October 2004 (Statistics Denmark, 2004h). See the section “Telecommunications” above.
The market for telecommunications is expanding rapidly and this is an important policy area. The Danish telecommunication market has with success undergone a liberalization process throughout the 1990s in some areas following and in some areas being ahead of the regulation from the European Union. From 1992 until 2003 DKK 69 billion13 has been invested in the telecommunications sector (National IT and Telecom Agency, 2003), the number of operators has increased and the turnover in the sector has doubled. The means was the introduction of competition under the headline “best and cheapest”14. However, some telecommunication operators in Denmark have experienced significant difficulties as a result of the market dominance of the largest operator, TDC. If this continues, the result could be that some of the larger operators will leave the Danish market, which would mean less technological innovation and less competition, and thereby a higher user price (Danish Competition Authority, 2004).
The liberalisation process which the Danish market has undergone follows the underlying idea that a competitive market will be best and most effective in ensuring optimal facilities for the consumers and industry, both in terms of product range and price. This market-based strategy has proved successful for instance in relation to the availability and penetration of fast Internet access (Ministry of Science, Technology and Innovation, 2003a).
The liberalisation of the telecommunications market in Denmark does not imply an end to regulation, but it has changed both the role of government and the nature of telecommunications regulation. In December 2002 a deregulation of the interconnection area was implemented on the basis of the National IT and Telecom Agency’s analysis of competitive conditions in the wholesale market of the telecommunications sector. Hence, interconnection rules for international traffic were significantly relaxed,
DSTI/ICCP/IE(2004)16/FINAL
30
and for certain parts of the basic ICT infrastructure (the back bone network) interconnection rules were simplified (Ministry of Science, Technology and Innovation, 2003a).
In May 2003 the National IT and Telecom Agency issued a competition report to identify possible barriers to a well-functioning telecommunications market. The report found that the existing regulation is sufficient for handling the identified barriers in general. However, a need for strengthening or amending current legislation was identified particularly regarding improving competitive terms in the ADSL market. As a consequence, three amendments concerning interconnection and the incumbent’s non-discrimination obligation were implemented in Danish law on 1 April 2004. Furthermore, these changes are to be seen in the light of the incumbent undertaking to extend the availability of DSL from 95% to 98% of the population within two years.
Overall, the spread of mobile technologies has been improved through a number of tender procedures in recent years, among these a 3G auction, competition on frequencies for 2G, competition on frequencies for TETRA, and two separate competitions on licences for FWA (www.itst.dk).
It is a clear objective for the Danish Government to maintain strong competition in the telecommunications market to reach the goal of the best and cheapest solutions. While “cheapest” is measurable, it is more difficult to define and measure the objective of “best”. The concept expresses the telecommunications policy aim of ensuring a market that offers the newest and most advanced communications solutions to businesses and citizens with a product range that provides products both to the users who are primarily interested in price and to those who ask for advanced and tailored high quality solutions. Effective and real competition in the telecommunications market is the means to ensure a wide and varied range of services. For the government it is a condition that the telecommunications sector invests in innovation and development, and it is high-priority to ensure the right framework conditions for a well-functioning IT and telecommunications sector that will support development and growth (Ministry of Science, Technology and Innovation, 2003a).
R&D
ICT R&D takes up 22% of all R&D expenditures in Denmark (DKK 8.1 billion in 2003) mostly financed by the private sector (DKK 7.4 billion, 92% of the total) which benefits from general R&D incentives, and a much smaller share by the public sector (DKK 650 million, 8% of the total). Direct public funding of business ICT R&D investments is only around 1% of the total. The focus areas with around one-fifth each are business systems and communications. ICT and biotechnology are the largest areas of R&D expenditures in Denmark, with around one-quarter each, but their funding structures are quite different. ICT R&D is predominantly funded by the private sector and only 8% by the public sector, whereas 25% of biotechnology R&D is financed from public sources. (See also “ICT sector” above.)
In general, the government approach is to promote applications-orientated research and research in businesses including SMEs. In the past few years funding for ICT research has gone to projects and initiatives at the interface between universities and businesses, although this has in many cases still tended to focus on technological development rather than at wider business use and organisational issues, something now being addressed in several small business programmes described below.
The government recognises that advanced technology is an increasingly important competitive factor as a consequence of globalisation and internationalisation (Ministry of Science, Technology and Innovation, 2002c). The objective is that Denmark should be a leading country in the high-tech society within the next 10-20 years (Ministry of Science, Technology and Innovation, 2002c). As a direct follow-up to this primary objective the government is establishing the “High Technology Fund” in 2005. This fund will invest strategically in high-tech research and innovation in three core areas: biotechnology,
DSTI/ICCP/IE(2004)16/FINAL
31
nanotechnology and information and communications technology. Additionally the fund will focus on advancing research initiatives in SMEs and large scale projects. The amount invested in research and innovation every year will be the interest on the fund’s capital. From 2005 to 2012 at least DKK 2 billion will be added to the Fund every year and the aggregated capital will add up to at least DKK 16 billion (www.vtu.dk).
The number of ICT-related PhD graduates in Denmark is estimated to be 30-40 a year and this number has increased with the setting up of the IT University. This number should be compared with total PhD graduates: in 2002 there were 929 PhD graduates of which 9% were in the humanities, 11% in social sciences, 21% in natural science, 29% in health care, 8% in agriculture and 22% in technical science (Kurt Johannesen, Ministry of Science, Technology and Innovation). Compared to other OECD countries the graduation rate15 at advanced research level (PhDs) in Denmark in 2002 was below the OECD average of 1.2%. According to this benchmark both Sweden and Finland were well above the OECD average and Norway was close to the OECD average (OECD, 2004d). In order to promote research, the government has decided to increase the number of PhDs by 50% during the next 4 years, i.e. from the current number of around 1 000 PhDs annually to 1 500 in 2008. The funding of the increase of PhDs presupposes co-funding from the business sector (Ministry of Finance, 2004b).
In 1992 a tax reduction scheme for foreign scientists and key employees was implemented in order to attract qualified employees to Danish enterprises and research institutions. Scientists and other key employees who are recruited abroad during the first three years in Denmark only pay 25% income tax. In order to obtain the tax reduction, a list of criteria has to be met, e.g. the monthly salary must exceed DKK 56 000. On 1st January 2004, 1 503 persons in 537 enterprises were using the scheme. At 1 January 2003 one-third of the persons using the scheme were researchers (Ministry of Taxation, 2004).
To promote R&D in businesses, a pilot scheme for a 150% tax deduction on research was implemented in 2002. To be able to deduct the expenditures the research has to be conducted in cooperation with a public research institution and the firm can only deduct the amount paid directly to the institution. The amount which can be deducted must be between DKK 0.5 - 5 million, with DKK 5 million being the annual upper limit. In 2004 the scheme was prolonged until 2006. In addition SMEs are able to deduct their expenditures on wages, which considerably expands the value of this initiative for them. The annual budget is around DKK 167 million (www.forsk.dk/shf/opslag/vejl_skema7.htm).
ICT research became a political priority in 1996, when the first draft for an ICT Research strategy was introduced. In the period 1996-1999 the Danish National Centre for IT Research16 spent DKK 90 million on cooperative projects. The projects were prolonged in 1999 and another DKK 61 million was allocated to the centre for development of research competences and innovation in businesses17 (www.cit.dk). The Centre was closed in 2002, but the initiative was continued in a national scheme for IT Research in 2003. In 2002 the government allocated DKK 115 million to finance IT research over the period 2003-2005. Among other things, this allocation may contribute to better interaction between research institutions and the business sector. A major portion of the funds is set aside for an increased production of PhDs (Ministry of Science, Technology and Innovation, 2003a).
The Ministry of Science, Technology and Innovation funds initiatives that promotes and supports innovation. The budget for 2005 allocates DKK 616 million to various innovation grants, of which two are aimed directly at ICT innovation18 with DKK 2.5 and 35.3 million respectively. Despite the fact that the remaining grants are not directly awarded to the ICT field, they may indirectly promote ICT innovation as they focus for instance on innovation in SMEs, cooperation among businesses and universities, cooperation among public and private research and funding of innovative environments (Ministry of Finance, 2004a).
DSTI/ICCP/IE(2004)16/FINAL
32
Another R&D initiative is the Jutland-Funen IT drive, which is a cross regional initiative launched in 2002 with the aim of disseminating knowledge about IT and the use of IT in the business community in Jutland and Funen. The government has allocated DKK 175 million over a period of four years19. The initiative has two overall objectives: 1) to develop and strengthen co-operation between businesses and regional ICT-environments within R&D; and 2) to strengthen the dissemination of advanced knowledge on ICT from the regional ICT-environments. These objectives are being realised through the establishment of four ICT R&D centres at universities20 (www.vtu.dk).
A new government regional development action plan from September 2004 will integrate all Danish regions in the “advanced technological society”21. A branch under the Jutland-Funen IT drive, known as the IT Corridor, is part of this. The purpose is to create direct access to new best practice ICT knowledge through cross-regional projects between business and research and knowledge institutions with competences in the ICT field. From 2002-2005 DKK 82.5 million has been allocated22 for projects under the IT Corridor, and since mid-2002 a number of application rounds have had widespread response (www.videnflytterud.dk).
ICT is a national research priority and one of the strategic areas under the “High Technology Fund” above. Several specific projects are a part of this priority, among them Pervasive Computing. ‘Pervasive computing’ refers to the insertion of small chips into any kind of objects such as clothing, furniture, houses, cars, etc. Specific initiatives and projects are still being developed, but the Katrinebjerg research environment in Aarhus, has a strong international position in the field (Ministry of Science, Technology and Innovation, 2004c).
Equipment, software, and services
A home PC tax reduction scheme has been in effect since 1997, but has been changed several times, most recently in 2002. The purpose of the scheme is to ensure widespread regular use of home work stations, including fast Internet access (http://www.skat.dk/publikationer/ notater/570.html). The scheme offers a number of models for financing a home PC and broadband access, e.g. the employer can pay all expenditures on the PC and broadband access or the employee can pay a part of the expenditures and deduct an annual amount from taxable income. The general scheme is that the home PC and Internet access is in part paid for by a tax reductions (http://www.tax.dk/pjecer/hjemmepc.htm).
Digitisation of government services and communication between the public and the private sector has high priority and the government has initiated a number of projects with relevance for e-business and e-procurement.
In order to enhance flexible communication the Danish Ministry of Science, Technology and Innovation has chosen XML as the core communication standard in the public sector and a XML project has been started (Ministry of Science, Technology and Innovation, 2002a). An important part of the work in the field will be to evaluate and approve standards, undertaken by the Danish e-Government IT-architecture and XML committees (National IT and Telecom agency, 2004a / http://isb.oio.dk/info). It is expected that the XML initiative will contribute to a more transparent and open marketplace for businesses23. Furthermore, in January 2004 Denmark became one of the first countries to adopt a standard for e-commerce in the public sector, the OASIS Universal Business Language (UBL). Another project on establishing standards for e-commerce in Denmark is translation of the international UNSPEC.
DSTI/ICCP/IE(2004)16/FINAL
33
Skills
In Denmark the focus has been on improvement of basic IT-skills (Ministry of Science, Technology and Innovation, 2002c). The ambition of the Danish government is to: i) increase the number of people with access to and who actually use the Internet, ii) increase the number of home PC work places, iii) increase use of ICT in the education system, and 4) reduce the lack of ICT personnel/manpower. According to the action plan from 2002, “IT for All” the aim is that ICT will contribute to: i) everybody participating in education if they want to; ii) all teaching will be structured according to individual circumstances and needs; iii) full development of individual potential; and iv) continuous improvement of the welfare society (Ministry of Science, Technology and Innovation, 2002b). These schemes apply across the whole population, as there is little difference in ICT uptake and use between males and females and in general, and older people are catching up rapidly (in 2002 38% of the 60-74 age group had an Internet connection and this increased to 54% in 2004).
In 1999, a special IT-university, the IT University of Copenhagen (ITU), was established to strengthen research and knowledge in the area of ICT. It was funded to undertake both theoretical research and applied research into the interaction and growing importance of information technology. The university is a teaching and research-based institution focusing on ICT and ICT-related opportunities. In 2003 ITU received DKK 118.3 million from the state budget and the university had 1 375 master students enrolled. See www.itu.dk. This new university is results and output-orientated and more effort could be made in this direction.
A project on IT, media and schools aims to promote the educational use of IT in school teaching and make IT and media a co-player and driving force in day-to-day school activities. Initiatives have been started in four areas: “Educational facilities”, “Teacher qualifications”, “Connection to Sectornet” and “Buying educational TV programmes“. The Government’s policy on developing an IT licence for students and developing additional Internet-based teaching aids for subjects such as Danish and mathematics will be implemented within the IT, media and schools project (Ministry of Science, Technology and Innovation, 2003a).
Improved education paths have been introduced for IT staff with short-cycle higher education. The universities of Aalborg, Århus, Odense and Roskilde have offered education programmes where IT technicians receive between 11/2 and 2 years’ merit when admitted to bachelor programmes in computer science, enabling them to obtain the bachelor degree after 1 or 11/2 years’ additional studies. From summer 2002 the University of Copenhagen has offered a similar programme where IT technicians receive merit equal to 11/4 person-years, and the University of Aalborg has offered programmes for multimedia designers to obtain the bachelor degree after 11/2 or 2 years of study (Ministry of Science, Technology and Innovation, 2003a).
Digital content
The strategy for digital content is part of the overall ICT action plan from 2002; “IT for All”. The policy approach includes reduction of barriers for new digital content services and an increase of user assessment of public websites. Widespread availability of fast Internet services in Denmark is a core strength to be utilised; the challenge for the future is to stimulate demand for example by promoting content production, but so far policy has not specifically addressed this issue.
DSTI/ICCP/IE(2004)16/FINAL
34
E-government
The Ministry of Taxation (www.erhverv.toldskat.dk) has started an extensive modernisation of IT systems. A new modernised IT architecture offers citizens and business digital services in a number of areas, including digital reporting on tax, toll, duty and annual reports. This modernisation will pave the way for added efficiency in the public sector, facilitating contact with citizens and businesses as well as developing public sector digital content and services (Ministry of Science, Technology and Innovation, 2003a).
Virk.dk (www.virk.dk) is a private-public business portal offering businesses one combined portal for content, services and news from public authorities and private players operating since May 2003. The Danish Commerce and Companies Agency is responsible for its development. Virk.dk is developing digital solutions designed to reduce the administrative burdens for the Danish business sector and increase efficiency. Currently more than 50 governmental authorities are part of the portal and the objective is that Virk.dk should include all public authorities at central, regional and local level. The portal is customer orientated and gathers forms, information and tools relevant to business. To registered users, the portal offers individualised services tailored to business needs, e.g. by offering pre-filled forms and relevant news. In addition all data on Virk.dk are in XML in order to make it reusable. The portal’s goal was to reach 12 000 registered users in 2004. However, the portal had difficulties reaching this number due to technical problems and a delay in marketing as the technical platform did not work. The portal had approximately 15 000 ‘unique users’24 a week in May 200425, or around 60 000 unique users for the month.26 AC Nielsen data for March 2004 show that 45% of the users are very satisfied or satisfied with the portal at a whole, 38% are neutral, 7% are unsatisfied or very unsatisfied and 10% do not know (Danish Commerce and Companies Agency, 2004; Pelle Oeby, Danish Commerce and Companies Agency).
The Ministry of Employment has initiated a project on digitisation of sickness benefits administration. Businesses can report absence due to sickness and request refunding electronically on Virk.dk, which makes the administration of sickness benefits easier for them. The Ministry of Employment has appointed a steering group with representatives of all stakeholders in the sickness benefit project, and agreement is currently being sought with stakeholders for coming phases (Ministry of Science, Technology and Innovation, 2003a).
SMV-portalen (www.smv-portalen.dk) is a web-portal under the Danish Trade Council. The portal facilitates small and medium-sized companies when they want to start exporting. It was started in 2001 and has been extended to a large degree since. The primary idea with the portal is to deliver advice and tools which can make it easier for SMEs to export their goods or services. In the first 7 months of 2004 almost 30 000 ‘unique users’ visited the portal.
E-procurement
The central electronic public procurement portal (DOIP, www.doip.dk) has been operating since 2002. DOIP is an electronic market place to which both private and public purchasers and their suppliers have access, and whose functionality, interface, security and transaction costs are regulated by the public sector. The Agency for Governmental Management has developed full integration of DOIP into the finance and accounting system of state institutions (DOIPEI) automating the entire procurement process from finding a product to invoice, and this is expected to increase the use of electronic procurement significantly. In the first eight months of 2004 DOIP had a turnover of DKK 50 million, a significant increase compared to the turnover in 2003 (www.doip.dk). However, it is still well below original expectations. The initial owner Gatetrade sold the operation in July 2004 after significant investments over the previous 4 years without achieving sufficient transactions and procurement volume. According to a press release from the board of directors in July 2004 the users, particularly the public contracting
DSTI/ICCP/IE(2004)16/FINAL
35
authorities, have not sufficiently changed practices and mentality of their procurement departments for e-procurement to succeed. The former owner was of the opinion that after 2 years of operation the marketplace was far from reaching a critical mass and a balance between income and expenses.
The National Agency for Enterprise and Construction has in collaboration with Local Government Denmark (KL) initiated a procurement-portal (www.udbudsportalen.dk). The portal offers public tenders and private supplier’s guidance, in-depth knowledge and extensive tools and information on procurement of public services. Among other things the portal has a comprehensive guide on legal aspects of Public Private Cooperation, and a manual for starting a Public Private Partnership (PPP). The portal was started in 2002, and the number of visitors has increased consistently since. Thus, in the first five month of 2004 the portal had more than 530 000 hits or page references – summing up to around 5 000 page references per day. Furthermore, the portal is extended with more information and tools continually (Jakob Scharff, Local Government Denmark). Additionally, a portal where all Danish and foreign procurements, smaller purchases and tenders can be found, is hosted by the National IT and Telecom Agency. In order to get access to the portal, the user has to pay an annual fee (www.udbudsavisen.dk).
E-invoicing. The Danish Parliament has passed a law on public payments aimed at making public payment administration easier for citizens, businesses and authorities. As part of this new law, all public authorities must be able to receive and send electronic invoices from 1 February 2005 and e-invoicing will be mandatory for all public entities and their suppliers, covering ordering through to invoicing (the initiative is run by the Agency for Governmental Management – see above). Three options are offered to suppliers: i) invoice scanning service (Laes Ind) which is free for suppliers with turnover less than DKK 15 million otherwise approximately DKK 7 per invoice, where firms mail their invoices to the service which scans the invoice and sends it in OIOXML to the public buyer electronically; ii) invoice homepage for supplier data entry; iii) electronic invoicing generated in OIOXML by the supplier and forwarded to the public buyer. Public authorities are obliged to receive invoices in the OIOXML format, which is the common public standard (http://www.oes.dk/sw22324.asp).
Trust and security
Different initiatives in the area of security and trust have been launched. The main objectives are i) to increase the spread of ICT security solutions, ii) to improve organisation of ICT security, and iii) to reduce the barriers for use of electronic communication. A skills environment for IT security has been established in the Ministry of Science, Technology and Innovation across divisions and agencies, and an office for IT-security has been established within the ministry.
The Council for IT Security (www.rfits.dk) was appointed on 1 January 2003.27 The Ministry of Science, Technology and Innovation is working together with the Council on public IT security matters. Through its activities, the Council for IT Security will contribute to ensure that the highest professional knowledge is available in the area of IT security to public authorities, the private sector and citizens in general. A number of initiatives are underway, including developing a security strategy. The Council is responsible for launching campaigns, and prescribing norms and standards for ICT security.
From 2006 it will be obligatory for government institutions to implement a common ICT security standard after a three-year running-in period. The DS 484 standard has been chosen as frame of reference due to its clear structure, and all public institutions will match the requirements of this standard by the end of 2006 (National IT and Telecom Agency, 2004b). The Ministry of Science, Technology and Innovation will establish a program for implementation.
DSTI/ICCP/IE(2004)16/FINAL
36
Digital signatures. A coherent system of Public Key Infrastructure (PKI) for digital signatures was implemented throughout the private and public sector in 2003 allowing for secure electronic exchange of communication and encoding digital messages (see uptake section above). The reliable third-party responsible for establishing, issuing and maintaining digital signatures is the telecommunications operator TDC A/S. The initiative includes a homepage with information on background, technology, security and new possibilities relating to digital signatures (www.digitalsignatur.dk). It was clearly recognised that one signature is enough for all purposes, but also that public sector use alone (e.g. once a year tax payments) are not enough to justify use.
Software-based digital signatures (with mandatory password and based on the social security number) are provided free to individuals to install and use on their PC. The issuing and acquisition of employee signatures is more complex. To ensure the relation between the employee and the organisation the acquisition of an application called a “Local Registration Authority” (LRA) and a statement from the management is necessary. Public institutions pay for the LRA and for each employee signature they issue; private businesses can use an LRA and up to 10 employee signatures for free but have to pay for the LRA if they want to issue additional signatures. Digital signatures are free to use by individuals, there is unlimited reception of personal and employee digital signatures in public institutions and businesses pay for solutions receiving digital signatures except for employee signatures from public institutions.
Challenges in implementing digital signature systems include long time scales needed to establish an open large scale infrastructure, very little experience in other countries to draw on, the necessity of establishing electronic services to drive use (signatures are not an end in themselves), and getting businesses and citizens to use them. Issues raised in implementation so far include the procedures for acquisition and issuing of employee signatures; the choice between employee and business signatures in secure e-mail solutions; and how to provide solutions that allow mobility and are not to expensive.
A consumer related initiative called the e-commerce trust mark (“E-mærket”) has been initiated recently. The trust mark is created as a safety and security approval to certify businesses for the consumer when buying products on the Internet (www.e-maerket.dk).
Demonstration and awareness
Digital North Denmark (www.detdigitalenordjylland.dk) is a four-year regional ICT pilot project with 89 sub-projects in the fields of digital administration, competences and education, art and culture, IT-business, and IT-infrastructure. The main objective of the initiative is to explore the possibilities of the network society in North Denmark and to enhance the use of existing information and communications technologies. The Ministry of Science, Technology and Innovation provided DKK 170 million for the initiative. The model of finance for the sub-projects under the Digital North Denmark has been with one third State funding and two thirds local co-funding. The projects have been selected through five project contests over the period 2000-2002. A great element of variation is a significant feature of the projects. The vast majority have been joint projects, and 60 of these include participation from both the public and the private sector. In 43 of the projects a private enterprise was in charge of the project, and private enterprises were represented in 76 projects (Digital North Denmark, 2002). Many small scale projects were included, where the implementation was decentralised, and no overall measures were set for the projects (Thomas Kibak, Danish Technological Institute).
One of the sub-projects of Digital North Denmark concerned establishment of a network for SMEs to strengthen their use of ICT. The project was VUR-IKON (www.vur-ikon.dk) and included 40 SMEs from the northernmost part of Denmark. The companies received consultancy in all fields of ICT from the VUR-IKON centre, including ICT strategies, feasibility studies, education, networking etc. The project ran from 2002 and until December 2003 and also received EU-funding. Generally, such projects have
DSTI/ICCP/IE(2004)16/FINAL
37
increased technological knowledge and ICT competences in the northern part of Denmark, and according to some of the employees in businesses involved, the project matched their needs to a large extent (Digital North Denmark, 2003). However, overall documentation of impacts has been impossible to carry out, because of the difficulties in isolating the impact of the various projects.
Digital Construction is an initiative within the framework of the National Agency for Enterprise and Construction to promote productivity in the building and construction sector by means of digital technology. Among other things, the target areas of the initiative are intended to create/disseminate knowledge about the effect of IT investments in the construction industry. Initial studies have identified six central areas for development: standardisation of classifications, descriptions and formats; common solutions for contracting, project web, 3D models and FM-data; and best practice cases. For each area a joint venture of architects, consulting engineers, knowledge centres etc. have contracted to develop common solutions. The project aims at the construction industry which has until now been a minor use of ICT. The focus is on the application of existing information and communication technologies in the construction sector rather than technological innovation. A learning network will be established to collect and communicate experience gained during the project. The initiative will run for three years from 2003 and a total allocation of DKK 40 million. See www.detdigitalebyggeri.dk. This kind of initiative could be extended to other mature sectors which are economically important.
Raising awareness in the government sector: The vision in the area of e-government is to systematically use digital technologies to introduce new ways of thinking and transform organisations and work processes to improve the quality of service and efficiency. The so-called ‘eDay’ initiative is part of the digitalization of the public sector. Together with local and regional authorities, the Government decided that from 1 September 2003, eDay, all public authorities in central government, regional and local administrations have a right to send and receive letters, documents and other information not containing personal data on a fully electronic basis via e-mail and websites. The goal is for digital communication to become the principal rule when public authorities are communicating with each other, while paper is used only as an exception.
To ensure that everyone has access to updated e-mail addresses in the public sector, the Ministry of Science, Technology and Innovation has established a common public database with the addresses of all public authorities. Several lessons have been learned from the eDay initiative. The strengths of the initiative has been: 1) establishment of a direct line from the e-Government board through their strategy combining IT and business; 2) eDay is a simple and easily understandable business case that supports and explains the initiative; 3) in order to enact initiatives on a voluntary basis, the eDay initiative proves that it is well worth the effort to establish contact with a named person in all authorities, and use them as local ambassadors; 4) by replacing the normal central enforcement with the local collaborator’s right to communicate electronically, the pressure towards complying is generated and amplified locally, partly making success a question of a critical mass of authorities supporting the initiative (www.e.gov.dk).
The first eDay only involved public administration. A second eDay will be held on 1 February 2005. The public sector must be able to handle secure e-mail by that date and citizens and businesses will have a right to send and receive e-mail from public authorities using digital signatures. Similarly, public authorities can be allowed to exchange documents with sensitive and confidential information after eDay 2.
Small firms
The “Implementation of e-commerce” project involves 60 SMEs. The project is initiated by the Ministry of Science, Technology and Innovation, and is part of the governmental objectives on increase of e-commerce in Denmark. The objective of the project was development of e-business strategies and implementation of e-business. The project was based on six regional "development groups" each with ten
DSTI/ICCP/IE(2004)16/FINAL
38
companies. The participating SMEs received courses, individual consultations and participated in experience sharing work-hops. The project also included dissemination of results and marketing of e-business for SMEs through conferences, PR, communications campaigns etc. An evaluation of the project has been conducted, including a survey among all participants. The results were very positive, both in terms of an increase of implementation of e-business in the participating companies and an increased knowledge about the ICT-solution and the possibilities provided by e-commerce (Rambøll Management, 2004).
The Government has launched an initiative to spread e-learning among SMEs and the public sector. DKK 10 million was allocated for a tendering pool in 2004 and projects were selected via an open tender with five specified issues. The initiative supports and initiates e-learning projects based on cooperation between public authorities, private enterprises, educational institutions and organizations. More details are at www.e-kompetencer.dk.
As a part of the government’s measures to promote the diffusion of e-business in SMEs the Ministry of Science, Technology and Innovation has analysed the use of IT in SMEs in Denmark compared to other countries. The study shows four major barriers to uptake: i) management is not aware of the potential advantages in using IT, and changes in SMEs use of IT are often caused by customers’ demands and not by management acting proactively, ii) there is a lack of IT competences in SMEs which impedes full exploitation of the opportunities of IT, iii) SMEs do not understand their own IT needs and suitable IT solutions; iv) customers of SMEs have different demands, e.g. as regards the design of an electronic invoice, and there is a lack of common solutions across businesses. This analysis identified two main areas for further effort: create understanding and attention of the possibilities and solutions of IT, and strengthen IT competences in businesses. DKK 10 million has been allocated for projects, focusing on businesses with less than 50 employees. In order to receive funding, local authorities, regional authorities or business associations have to take an active part in the project, e.g. in diffusion of knowledge or gathering of experience (Ministry of Science, Technology and Innovation, 2004e).
Policy evaluation
The annual reviews of the ICT status in Denmark are valuable tools for monitoring and measuring ICT policy in Denmark. The reviews have been a driving force in developing new areas for statistics on the field of ICT and the reviews ensure that a status of the different initiatives are available. The annual reviews show a status on various indicators which makes it possible to monitor development in these areas. Objectives of ICT policy have been quantified in areas such as availability of DSL and the goals for eGovernment services and these approaches could be expanded to take advantage of the advanced national ICT statistical base and greater importance attached to evaluation.
Evaluation of the various initiatives varies as the responsibility for the execution of the initiatives is decentralised. Thus, there is great difference in the way initiatives are evaluated and the way the experiences are shared among different players. The advanced national statistical base provides a good starting point to further extend analysis into policy areas to the extent that they have not yet been rigorously evaluated.
DSTI/ICCP/IE(2004)16/FINAL
39
Conclusion
General remarks
Denmark has performed well economically in recent years with high levels of ICT access and use contributing to high GDP levels and GDP growth which has been considerably above the Euro area, although somewhat below the OECD total. The Danish government has clearly acknowledged that effective utilisation of IT and network infrastructure is important to further strengthen Denmark as a knowledge society, and it has identified the ability to convert information into useful knowledge and to build bridges between research, education and business as essential to enhance Denmark’s competitiveness. The government has the ambition that Denmark should rank among the world’s leading IT nations, and it ranks highly by most ICT diffusion and use criteria. The challenge for the Danish government is to maintain and enhance Denmark’s strong position which has so far contributed significantly to economic performance and to move into more research and knowledge-intensive economic activities. So far the structural attributes of the Danish economy have not been major barriers to high levels of ICT diffusion and use contributing to good economic performance, but the major question is how to build on the current base to move into new more knowledge-intensive activities. New questions of how to achieve “critical mass” and continued momentum need to be addressed to help underpin the necessary structural transformation of the Danish economy.
The government’s approach is that the development of IT and communication networks must take place primarily on private initiative and market terms. The role of the public authorities is to address market failures and create the best framework for business and citizens. Furthermore, the government has stated that to achieve this goal, targeted efforts in the areas of education, research, innovation and IT are needed. This market-led approach calls for systematic analysis to identify market failures and areas suitable for government intervention. In particular, as ICTs are mainstreamed, policy priorities for effective ICT diffusion and use should not be diluted. Policy will need continued focus and prioritisation, and the overall policy stance that has attached great importance to equity considerations may need to be reviewed to prioritise resources for the most promising areas.
Strengths
Denmark has a very good telecommunication infrastructure and ICT is widely diffused both to business and to citizens. The importance of ICT to economic growth is recognised and ICT policy is a high priority area. Policy has been innovative in specific areas such as e-government, digital signatures and e-invoicing. Strengths of government policies in the area of ICT diffusion to business include:
• There is a strong telecommunication infrastructure with very high coverage. Everyone can access the Internet via fixed telephone lines, ADSL access is available to almost all, and there is more than one supplier of broadband in many parts of the country.
• Business access (e.g. Internet access, web pages and broadband) and use of ICT is high (e.g. e-commerce) compared with other countries.
• Individual access to ICT is high for both PCs and Internet, and broadband access is increasing steadily with Denmark in the top two OECD countries for broadband penetration. Internet use is relatively high for banking, electronic payments, buying and search for information. ICT spending per inhabitant is among the highest in the world.
• IT education has been strengthened with the establishment of the IT University and the planned 50% increase in the number of PhDs (all areas).
DSTI/ICCP/IE(2004)16/FINAL
40
• The establishment of the high-technology fund represents an increased focus and greater funding in the area of IT research as well as in other key areas relevant for future growth.
• Government policy has been innovative in specific areas, for instance promotion of ICT accessibility (the home PC/broadband scheme), stimulation of ICT skills at all levels of the education system, and using e-government as a tool to increase accessibility of government information, reduce business costs and spread the use of digital signatures.
• Programmes to improve ICT diffusion (e.g. Digital North) have proved useful, although clearer goals, greater focus on building networks and encouraging spillovers, and embedded assessment and evaluation could have increased impacts.
• Denmark has a relatively high number of ICT start up companies, which contributes to innovation and job creation in the ICT sector.
• E-government is relatively widespread and Denmark is seen to be a leader in providing on-demand government services compared with other OECD countries. Many government institutions offer information and services on-line, and e-government is used pro-actively to reduce administrative burdens on business (for example the Virk.dk portal), as well as increase use of digital signatures.
Weaknesses
Despite the high priority given to ICT, policy implementation is constrained by relatively limited resources allocated to promotion of ICT. The business structure with a high proportion of small and medium sized enterprises is a challenge for policy making, and implies that government and other institutions (e.g. GTS institutes, business associations) have to assume some of the technology development and diffusion roles taken by large leading firms in other countries. Even where goals are articulated, the process of converting policy goals into action is not based on clear, quantifiable goals, and systematic monitoring and evaluation of policies and programmes has not been established. The points below list some of the challenges that Denmark is facing:
• Policy goals and prioritisation. Policy goals are relatively broad and vague, and clearer prioritisation of the different fields of ICT policy would provide a better basis for more targeted efforts.
• Policy coordination. An important step has been taken towards improving ICT policy coordination with the grouping of ICT related policies in the Ministry of Science, Technology and Innovation. However, a number of ministries and agencies are responsible for various parts of ICT policy and for its execution, for example the e-procurement initiative and the Digital Taskforce led by the Ministry of Finance, leading to confusion of roles and dilution of effort. In particular the area of e-procurement have suffered in the current setup and needs rethinking and reorganising.
• Competition in the broadband market. Broadband prices are high relative to other countries, although broadband uptake has been relatively high. Market dominance by the incumbent may however impede innovation and development of new services and products in the broadband market that are essential for further rounds of broadband uptake and use.
DSTI/ICCP/IE(2004)16/FINAL
41
• Research and development. Despite initiatives to promote R&D, both public and private sector R&D are lagging relative to the government’s aim of Denmark reaching the Barcelona objectives in 2010. The business structure with a high proportion of small and medium sized enterprises means that business R&D, use of advanced technological applications and transfer of knowledge between R&D and technological institutions and business may lag compared with other countries. This requires continued attention and renewed focus in the context of the government policy objectives to move to more research and knowledge-intensive activities.
• Access to venture capital. Despite the relatively high share of ICT start ups, the survival rate of new companies is low partly due to difficulties in raising venture capital for new companies. Additionally the tight rules on bankruptcy and debt relief are an impediment to entrepreneurial activity during crucial early expansion stages.
• Supply of qualified labour. In addition to the initiatives to promote ICT skills at both basic and advanced level, further effort is needed to ensure an adequate number of candidates, PhDs and specialists in the field of ICT to underpin the shift of Denmark’s economic activities towards higher value and more advanced segments. Currently the share of tertiary graduates in engineering, manufacturing and construction is well below the Nordic and OECD averages. This will require much greater focus on outputs and results from the education system, in the university sector in particular, but also in the compulsory public education system, to get improved performance and greater public and private benefits from public investments in education.
• Use of more advanced technologies. There is evidence to suggest that although small businesses have performed well compared with other countries, they are lagging in the strategic use of more advanced ICT applications and may lack the information, management resources, skills and organisational capabilities to efficiently use more advanced technologies.
• Weakness in the distribution of institutional support. The business supporting services and public R&D is still focusing on traditional industry instead services industries and the ICT sector. The research and technology organisations (GTS institutes) reflect earlier industrial and business structures and priorities, and more effort is needed to adjust priorities and respond to market signals from new and emerging economic activities.
• Diffusing common standards. Various initiatives have been initiated to encourage widespread adoption of common standards, including the Danish XML project and the central website OIO.dk. However there is a need to develop and increase the use of common standards further to provide positive externalities in the small business sector.
• Quantitative targets and evaluation. Quantitative objectives and monitoring targets for ICT policy are lacking in some areas, making it difficult to measure whether ICT policy is meeting the broad policy objectives laid out for policy in these areas.
Recommendations
The strengths of Denmark in terms of its recognition of the importance of the knowledge society, the need to strengthen links between research, education and business and its strong position in diffusion and use of ICT means that it is well-placed for the next steps forward. However, the structure of the Danish economy, the preponderance of the small firm sector, the relatively low-R&D intensity and poor outputs of the education system present major challenges for future government policy. The characteristics of the Danish economy and the fact that it is a leader by many diffusion and use criteria means that there are
DSTI/ICCP/IE(2004)16/FINAL
42
major challenges to devise new policies and build a new critical mass of innovative effort that builds on current ICT diffusion and encourages further development. The recommendations that follow identify priority actions that should help Denmark devise new solutions to these emerging challenges.
• Strengthen policy goals and prioritisation: ICT policies need to be focused on Danish competences and strengths in order to increase policy effectiveness. Clear enunciation of the long-term goals of ICT policy to improve growth and employment performance is needed to formulate overall strategy, prioritise different areas of ICT policy, and focus future initiatives.
• Improve policy coordination: Policies for universities, business research, technology and innovation are grouped in the Ministry of Science, Technology and Innovation and the Digital Taskforce has been established, but better coordination is needed to ensure cooperation across different ministries for the execution of ICT-related policy. Clarification of the responsibilities among the different ministries will help set a common focus for ICT policy and improve development of the general institutional framework within which more focused policies operate.
• Promote innovation in the network communication market: Despite liberalisation of the telecommunication market, one operator still dominates the market. Further competition is needed in order to ensure innovation in new services and products, e.g. higher capacity and new digital content products.
• Increase focus on research and development: It is necessary to maintain increased public support for ICT R&D. The High Technology Fund and the planned increase in production of Ph.D. graduates are steps in the right direction. However, to reach the target of becoming a knowledge society, higher level funding and support is necessary to R&D in general, paying attention to ICT-related R&D and R&D in small and medium sized enterprises.
• Improve the supply of venture capital: Further attention is needed to enhance the supply of venture capital for new and small firms taking into account the barriers that firms have to grow to medium size.
• Promote the supply of qualified labour: An increase of the general level of ICT-related education is needed, increasing the numbers taking higher education, particularly mixed courses, as well as more advanced PhD-level education. It is necessary to increase the level of output- and results-based competition in tertiary education and research institutions to raise standards and increase benefits.
• Use of more advanced technologies. Policies should be strengthened to the extent that there are market failures in the strategic adoption of more advanced technologies by small firms. To be effective such initiatives should build on the lessons from evaluation of previous programmes (e.g. Digital North) to improve focus and increase spread, and assessment of benefits and costs of current sector initiatives (e.g. construction) involving business associations and large numbers of small businesses to build and extend common approaches to digitisation of work methods in mature sectors.
• Improve policy focus on services industries: Government programmes and initiatives need to be directed at improving the efficiency of services industries and providing the framework for new service development. Measures include redirecting and reprioritising resources currently going to research and technology organisations (GTS institutes) and similar institutions to improve support services for established services firms, and focused support for new growth areas including digital content and software.

DSTI/ICCP/IE(2004)16/FINAL
43
• Standard setting: The government needs to promote the use of common standards to lower cost of implementing ICT and integrated ICT solutions, especially in small and medium sized companies. The experience with the Virk.dk business services portal in using common XML protocols should be further exploited and used as an example to encourage the adoption of common international standards.
• Quantitative targets and evaluation: The current action plans need to set clearer policy objectives and quantitative targets, and improved monitoring and evaluation mechanisms need to be built into policy initiatives.
DSTI/ICCP/IE(2004)16/FINAL
44
BIBLIOGRAPHY
Danish Centre for Studies in Research and Research Policy (2002), Erhvervslivets forsknings og udviklings arbejde - Forskningsstatistik 2002.
Danish Commerce and Companies Agency (2004), Fakta vedrørende erhvervspotalen Virk.dk Web site http://www.eogs.dk/sw863.asp.
Danish Competition Authority (2004), Udfordringer for den danske telesektor, kapitel 3 i Konkurrenceredegørelse 2004 http://www.ks.dk/publikationer/konkurrenceredegoerelsen/kr2004/kap03.htm/.
Digital North Denmark (2002), Annual report 2002.
Digital North Denmark (2003), Project of the Month March 2003: The VUR-IKON Project http://www.detdigitalenordjylland.dk/en/themes/project_of_the_month/project_of_the_month_march_2004.htm.
Economist (2004), The 2004 e-readiness rankings. A white paper from the Economist Intelligence Unit, London, Economist Intelligence Unit and IBM.
Eurostat Statistics in focus (2004), Industry, Trade and Services, 32/2004.
FORA (2003), Et benchmark studie af iværksætteraktivitet – hvad kan Danmark lære? http://www.foranet.dk/upload/fora_indhold.pdf.
Ministry of Economic and Business Affairs (2003), Regeringens Vækstredegørelse, 2003 http://www.oem.dk/Publikationer/vaekstredegor03/vaekstrede03.pdf.
Ministry of Finance (2003), Vækst, viden og investeringer – de næste skridt.
Ministry of Finance (2004a), Finanslovforslag 2005.
Ministry of Finance (2004b), Særlige emner på Finanslovsforslaget 2005 http://www.fm.dk/1024/visPublikation.asp?artikelID=6733.
Ministry of Science, Technology and Innovation (The then Ministry of Information Technology and Research) (2001), From Hardware to Content. Strategy for Fast, Cheap and Secure Internet to all of Denmar. http://www.videnskabsministeriet.dk/fsk/publ/2001/broadband/FromHardvaretoContent.pdf.
Ministry of Science, Technology and Innovation (2002a), Handlingsplan for e-handel – fra udbredelse til anvendelse. http://www.vtu.dk/fsk/publ/2002/ehandel/pdf/handlingsplan_for_e-handel_2002.pdf.
Ministry of Science, Technology and Innovation (2002b), It for alle – Danmarks fremtid. IT- og telepolitisk redegørelse og handlingsplan 2002 (IT for all) http://www.videnskabsministeriet.dk/fsk/publ/2002/itforalle/itforalle.pdf.
DSTI/ICCP/IE(2004)16/FINAL
45
Ministry of Science, Technology and Innovation (2002c), IT Research and development in Denmark.
Ministry of Science, Technology and Innovation (2003a), IT med omtanke. It- og telepolitisk handlingsplan 2003 (Using IT Wisely) http://www.videnskabsministeriet.dk/cgi-bin/doc-show.cgi?doc_id=183990&leftmenu=PUBLIKATIONER.
Ministry of Science, Technology and Innovation (2003b), Regeringens videnstrategi – viden i vækst, Redegørelse til Folketinget, januar 2003. http://www.vtu.dk/fsk/publ/2003/videnstrategi/viden_redegoerelse.pdf.
Ministry of Science, Technology and Innovation (2004a), Hovedpointer i It- og telepolitisk redegørelse 2004 & Nøgletal om informationssamfundet Danmark 2004 (memo). http://www.videnskabsministeriet.dk/fsk/Hovedpointer.pdf.
Ministry of Science, Technology and Innovation (2004b), Viden flytter ud (website). www.videnflytterud.dk.
Ministry of Science, Technology and Innovation (2004c), Fokus på fremtiden: Visioner for bioteknologi, nanoteknologi og informations- og kommunikationsteknologi. http://www.vtu.dk/fsk/publ/2004/forcus_paa_fremtiden/pdf/fremtiden.pdf.
Ministry of Science, Technology and Innovation (2004d), It- og telepolitisk redegørelse 2004.
Ministry of Science, Technology and Innovation (2004e), IT på rette tid og sted - IT-anvendelse i danske virksomheder og indsatser i andre lande – oktober 2004 (forthcoming).
Ministry of Taxation (2000), Den skattemæssige behandling af pc m.v. stillet til rådighed af arbejdsgiveren, kapitel 3 i Betænkning om den skattemæssige behandling af pc-hjemmearbejdspladser og hjemme-pc-ordninger. http://www.skat.dk/publikationer/udgivelser/1740/.
Ministry of Taxation (2004), Tax scheme for researchers and key employees http://www.skat.dk/tal_statistik/skatter_og_afgifter/671.html.
National IT and Telecom Agency (2003), Tele Yearbook 2003.
National IT and Telecom Agency (2004a), Infostructurebase on Offentlig Information Online (www.oio.dk). http://isb.oio.dk/info.
National IT and Telecom Agency (2004b), Standard for it-sikkerhedsprocesser i staten on Offentlig Information Online (www.oio.dk). http://www.oio.dk/itsikkerhed/standard_it_sikkerhed.
National IT and Telecom Agency (2004c), Telecom Statistics – first half of 2004.
OECD, Main Science and Technology Indicators Database.
OECD (2001a), Drivers of growth: Information technology, innovation and entrepreneurship, Science, Technology and Industry Outlook Special edition, Paris, OECD.
OECD (2001b), The new economy: Beyond the hype, Paris, OECD.
OECD (2003a), ICT and economic growth: Evidence from OECD countries, industries and firm. Paris, OECD.
OECD (2003b), OECD Communications Outlook 2003, Paris, OECD.
DSTI/ICCP/IE(2004)16/FINAL
46
OECD (2004a), OECD in Figures 2004 edition. Statistics on the member countries. Paris, OECD.
OECD (2004b), OECD Economic Outlook 2004, Number 75, Paris, OECD.
OECD (2004c), Benchmarking broadband prices in the OECD, Paris, OECD.
OECD (2004d), Education at a glance. OECD indicators 2004, Paris, OECD.
OECD (2004e), Information Technology Outlook 2004, Paris, OECD.
Rambøll Management (2004), Genvej til e-handel. Evaluering.
Rambøll Management (2004), E-business Nordic 2004.
Statistics Denmark (2003), Information Society Denmark. ICT Status 2003.
Statistics Denmark (2004a), Statistical Yearbook 2004.
Statistics Denmark (2004b), Nyt fra Danmarks Statistik, nr. 254, 2004.
Statistics Denmark (2004c), Nyt fra Danmarks Statistik, nr. 202, 2004.
Statistics Denmark (2004d), Generel Erhvervsstatistik, 2004:16, 2004.
Statistics Denmark (2004e), Key Figures on Information Society Denmark 2004.
Statistics Denmark (2004f), Danske virksomheders brug af IT 2004, Serviceerhverv 2004:53.
Statistics Denmark (2004g), Befolkningens brug af Internettet 2004, Serviceerhverv 2004:27.
Statistics Denmark (2004h), Information Society Denmark 2004 (forthcoming).
Statistics Denmark (2004i), Statistikbanken.
VaekstFonden (2001-2003), Benchmarking af markedet for innovationsinvestering (2001-2003) http://www.vaekstfonden.dk/download_media.asp?media_id=1952.
VaekstFonden (2004), The Danish market for venture capital and buy-out (2004) http://www.vf.dk/download_media.asp?media_id=1951 http://www.vf.dk/download_media.asp?media_id=1957 (English summary).
DSTI/ICCP/IE(2004)16/FINAL
47
NOTES
1 Measured as annual volume change in GDP.
2 Enterprises with a real activity are defined as enterprises performing work corresponding to at least a half man-year.
3 The Danish definition of the ICT sector includes ICT manufacturing (ISIC divisions 3001 office machinery, 3002 computers and other information processing equipment, 3130 insulated wire and cable, 3210 electronic valves and tubes and other electronic components, 3220 TV and radio transmitters and apparatus for line telephony, 3230 TV and radio receivers, sound or video recording apparatus, 3320 instruments and appliances for measuring, checking and testing, 3330 industrial process control equipment), ICT wholesale (ISIC 514320 radio and TV goods, 516410 office machinery and equipment, 516520 electric installation material, 516520 electronic components), ISIC 6420 telecommunications and ICT consultancy, ISIC 7133 renting of office machinery and equipment including computers, 7210 hardware consultancy, 7220 software consultancy and supply, 7230 data processing, 7240 data base activities, 7250 maintenance and repair of office, accounting and computing machinery, 7260 other computer related activities (Statistics Denmark, 2003, p.198).
4 Calculated at the current rate 611.84.
5 The Danish definition of ICT commodities includes telecommunications equipment, consumer electronics, computers, electronic components, office machinery and measuring instruments (Statistics Denmark, 2003).
6 The business sector includes manufacturing (15-37), construction (45), wholesale, retail trade and repair (50-52), hotels and restaurants (55), transport, post and telecommunications (60-64), finance (65-67), business services (70-74), recreational, cultural, sporting activities (92), other service activities (93), driving schools (804100), education (804290), veterinarians (852000) and activity not stated (980000). The classification is based on the Danish Industrial Classification 1993, 2nd edition (1996).
7 Business economy includes NACE Rev 1 sections C-K: Mining and quarrying (C), Manufacturing (D), Energy (E), Construction (F), Wholesale (G), Hotels and restaurants (H), Transport, storage and communication (I), Financial intermediation (J), Real estate, renting and business activities (K).
8 This is also the conclusion of a report made by The National Agency for Enterprise and Construction: De nye virksomheder - 4. statistiske protræt af iværksættere. http://www.ebst.dk/publikationer/rapporter/denye/index.htm.
9 The government has stated that it will adjust the rules on bankruptcy in order to increase the incentive to start new enterprises and to create a more entrepreneurial culture in Denmark (Ministry of Finance, 2003).
10 Broadband access is defined as Internet access with a transmission speed towards the user faster than an ordinary modem or an ISDN connection, i.e. a transmission speed over 128kbit/s (Statistics Denmark, 2003). In the most recent Statistics Denmark publications (e.g. Statistics Denmark, 2004f) the term “broadband access” has replaced the term “fast Internet access”. However the definition is the same.
DSTI/ICCP/IE(2004)16/FINAL
48
11 The unemployment frequency estimates the percentage of the number of persons with a formal ICT
education, unemployed at a given time.
12 The classification of occupations is based on DISCO-88, which is the Danish version of the international standard classification of occupations (ISCO-88). The definition of ICT occupations are divided into two groups: primary ICT occupations, which includes 1236 (Computing services department managers), 2131 (Computer systems designers and analysts), 2132 (Computer programmers), 2139 (Computing professionals not elsewhere classified), 3114 (Electronics and telecommunications engineering technicians), 3121 (Computer assistants), 3122 (Computer equipment operators), 3123 (Industrial robot controllers), 4113 (Data entry operators), 7242 (Electronics fitters), 7243 (Electronics mechanics and servicers), 7244 (Telegraph and telephone installers and servicers), 7245 (Electrical line installers, repairers and cable jointers), 8170 (Automated-assembly-line and industrial-robot operators), 8283 (Electronic-equipment assemblers). Secondary ICT occupations which includes 2143 (Electrical engineers), 2144 (Electronics and telecommunications engineers), 3113 (Electrical engineering technicians), 3119 (Physical and engineering science technicians not elsewhere classified), 3131 (Photographers and image and sound recording equipment operators), 3132 (Broadcasting and telecommunications equipment operators), 4112 (Word-processor and related operators), 4114 (Calculating-machine operators), 7241 (Electrical mechanics and fitters).
13 Not including posted investments in UMTS licenses.
14 In 1994 the government introduced an action plan for telecommunications. This implied that Denmark should be “best and cheapest” for telecommunications services and products by 2000. This should happen through competition. In 1996 the liberalisation process started. The method was inspired by a EU-directive from 1990 and involved gradually introducing liberalisation in a number of different markets. The liberalisation broke the monopoly of “Tele Danmark” (Today TDC) – the Danish telecommunications supplier. Source: Danish Competition Authority 2004.
15 Graduation rates represent the number of persons receiving a Ph.D.-level degree as a percentage of the population at the age of graduation.
16 In Danish “Center for IT-forskning”.
17 ”Partnerskaber til udvikling af forskningskompetencer og erhvervslivets innovationsevne” www.cit.dk. 18 The initiatives are the Crossroads Copenhagen scheme (www.crossroadscopenhagen.com), which is a
network of public and private enterprises working to develop Ørestad Nord into an international centre of research in, and development of, culture, media and communication technology, and the Jutland-Funen IT drive (www.vtu.dk), described in the following section.
19 In 2002, DKK 50 milllion, in 2003, DKK 50 million, in 2004, DKK 40 million, and in 2005 DKK 35 million www.vtu.dk.
20 The ICT R&D centres are located in Århus, Sønderborg, Odense and Aalborg (Ministry of Science, Technology and Innovation, 2003).
21 The action plan is called “Viden flytter ud”. www.vtu.dk.
22 As a part of the DKK 175 million for the whole Jutland-Funen IT drive initiative.
23 For example: i) FESD (The Joint Electronic Document Management System (JEDMS)), ii) Standards forms, iii) Enterprise architecture incl. EA repository.
24 A unique user is an individual that has visited a Web site or received specific content, such as ads, e-mail, or newsletters. For a unique user on a Web site, unique user information consists of, at least, the IP address

DSTI/ICCP/IE(2004)16/FINAL
49
associated with their computer and a further ID such as a browser ID. Since more than one person may use a computer, other information, such as a user ID and password may be required to ensure that each unique user is being counted. www.whatis.com.
25 Or approximately a little more than 200 000 hits per month (Information from Pelle Øby, Danish Commerce and Companies Agency).
26 Users who appear in these figures are not necessarily registered.
27 The Council for IT Security replaced another ICT security council working from 1995–2002.