umversify microfilins international - shareok
TRANSCRIPT
Umversify Microfilins
International
1.0 12.5
LI
1.25 1.4
12.0
1.8
1.6
M ICROCOPY RESO LU TIO N T E S T CH ART NATIONAL BUREAU O F STA N D A RD S
STANDA RD R E FE R E N C E M ATERIA L 1010a (ANSI a n d ISO T E S T C H A R T N o . 2)
University Microfilms Inc.300 N. Zeeb Road, Ann Arbor, MI 48106

INFORMATION TO USERS
This reproduction was made from a copy of a manuscript sent to us for publication and microfilming. While the most advanced technology has been used to photograph and reproduce this manuscript, the quality of the reproduction is heavily dependent upon the quality of the material submitted. Pages in any manuscript may have indistinct print. In all cases the best available copy has been filmed.
The following explanation of techniques is provided to help clarify notations which may appear on this reproduction.
1. Manuscripts may not always be complete. When it is not possible to obtain missing pages, a note appears to indicate this.
2. When copyrighted materials are removed from the manuscript, a note appears to indicate this.
3. Oversize materials (maps, drawings, and charts) are photographed by sectioning the original, beginning at the upper left hand comer and continuing from left to right in equal sections with small overlaps. Each oversize page is also filmed as one exposure and is available, for an additional charge, as a standard 35mm slide or in black and white paper format.*
4. Most photographs reproduce acceptably on positive microfilm or microfiche but lack clarify on xerographic copies made from the microfilm. For an additional charge, all photographs are available in black and white standard 35mm slide format. *
*For more information about black and white slides or enlarged paper reproductions, please contact the Dissertations Customer Services Department.
U’IMvBTsity
IVJîcrônlms . International

8603517
Olowin, Ronald P au l
PROBING THE LARGE-SCALE STRUCTURE OF THE UNIVERSE: AN ANALYSIS OF 55 BRIGHT SOUTHERN CLUSTERS OF GALAXIES
The University of Oklahom a Ph.D. 1985
UniversityMicrofilms
Internstionsi so o n , zeeb Roaa, Ann Arbor, Ml 48106


PLEASE NOTE:
In all cases this material has been filmed in the best possible way from the available copy. Problems encountered with this docum ent have been identified here with a check mark V
1. Glossy photographs or p ag es .
2. Colored illustrations, paper or print______
3. Photographs with dark background_____
4. Illustrations are poor copy
5. Pages with black marks, not original copy
6. Print shows through as there is text on both sides of p a g e
7. Indistinct, broken or small print on several pages
8. Print exceeds margin requirem ents______
9. Tightly bound copy with print lost in sp in e_______
10. Computer printout pages with indistinct print
11. Page(s)____________ lacking when material received, and not available from school orauthor.
12. P age(s)____________ seem to be missing in numbering only as text follows.
13. Two pages num bered . Text follows.
14. Curling and wrinkled p ag es_______
15. Dissertation contains pages with print a t a slant, filmed a s received__________
16. Other
UniversityMicrofilms
International

T H E U N IV E R S IT Y O F O K L A H O M A
G R A D U A T E C O L L E G E
P R O B IN G T H E L A R G E -S C A L E S T R U C T U R E
O F T H E U N IV E R S E : A N A N A LY SIS O F 55
B R IG H T S O U T H E R N C L U S T E R S O F G A L A X IE S
A DISSERTATION
SUBMITTED TO THE GRADUATE FACULTY
in partial fulfillment of the requirements for the
degree of
D octor of Philosophy
by
Ronald Paul Olowin
Norman, Oklahoma
P R O B IN G T H E L A R G E -S C A L E S T R U C T U R E
O F T H E U N IV E R S E : A N A N A LY SIS O F 55
B R IG H T S O U T H E R N C L U ST E R S O F G A L A X IE S
A DISSERTATION APPROVED FOR THE DEPARTMENT OF
PHYSICS AND ASTRONOMY
By
I Gnldo L. Chincarinl, Chair
---David R. Branch
Tibor J . H^rcVeg
R onald Kantowski
Thom as M. Smith
D E D IC A T IO N
This thesis is dedicated to m y family:
in levins rnemory of my parents
Clement Jan and Sophia Ann Olowin
a n i with grateful appreciation of
Mary Dreisbach, Aaron Benjamin and Frederick Alexander.
m
D E S ID E R A T U M
Melius est enim in via clauiicare quam praeter viam fortiter ambulare.
Nam qui in via claudicat, etiam si parum proficiscatur, appropinquat ad
terminum; qui vero extra viam ambulat, quanto fortius currit, tanto magis
a termina elongatur.— Aquinas
In laonnem
IV
A C K N O W L E D G E M E N T S
Financial support for this work came from the Department of Physics and As
tronomy and the Associates of The University of Oklahoma. W ithout their generous
infusion of funds, resources and equipment this effort would have been impossible.
In particular, I would like to thank the Departmental Chairs during my tenure,
David Golden and David Branch, for making so many facilities available so readily.
Special thanks for the valuable and continued aid are given to A1 Schwarzkopf of the
Statistical Consulting Laboratory of the Energy Resources Institute of the Univer
sity of Oklahoma and Lynn Wellborn of the Physics and Astronomy Branch of the
University of Oklahoma Libraries. My gratitude is also extended to Russell Cannon
of the U. K. Schmidt Telescope Unit of the Royal Observatory, Edinburgh, Scotland
for providing survey plates of the Virgo Cluster of Galaxies and to Wayne H. War
ren of the National Space Science D ata Center for providing a machine-readable
version of the Smithsonian Astrophysical Observatory Star Catalogue.
My Professors have been patient and tolerant individuals. In particular, I have
been privUedged to work under the guidance of David Branch, Guido Chincarini,
John Cowan, Tibor Herczeg, Ronald Kantowski, Michael Morrison, Gregory Parker,
Stan Robertson and Deborah Watson all of whom have made lasting contributions
to my academic development.
During the production of this thesis the special assistance of Judith Tucker at
Printing Concepts, Inc. has been extremely helpful. Likewise, my thanks go to
Richard Henry and, in particular, to Michael Morrison who unraveled the mysteries
of for me.
My close friends have been invaluable. Sherman and Laura Kent have been
steadfast, robust and nourishing allies. Lome Thomas and John Schiff have been
marvelous role models of genuine scholarship in the highest academic tradition; they
have rescued me innumenrable times from the arms of ignorance. I greatly appre
ciate their unselfish support. Klaus Rossberg quietly maintained me throughout.
The special help and encouragement of Tibor Herczeg has been sustaining.
His deep grasp of the History of Astronomy and his impeccable scholarship will
always be an influence. The expert guidance and help from Harold Corwin has
been immeasurable. The eager and generous support and advice he has given has
illuminated for me what it means to do professional astronomy.
To Doris Jane Chediak I owe a sincere debt of gratitude and thanks. She has
made a living and deep contribution to my growth and development and has been
an invaluable asset to my family.
The advice and guidance of ray thesis advisor, Guido Chincarini, has been in
dispensable. He has provided my first exposure to research on clusters of galaxies
and throughout this effort has given me encouragement and unencumbered oppor
tunities to broaden my astronomical experience. For this, for his sometimes painful
honesty, and for his deep scientific integrity, I give Professor Chincarini my great
and sincere thanks. I am extremely grateful for his time and friendship.
Finally, I wish to express my deepest appreciation to my family. That they
tolerated this eff’ort and suffered my neglect with patience, unselfishness and wit is
remarkable.
V I
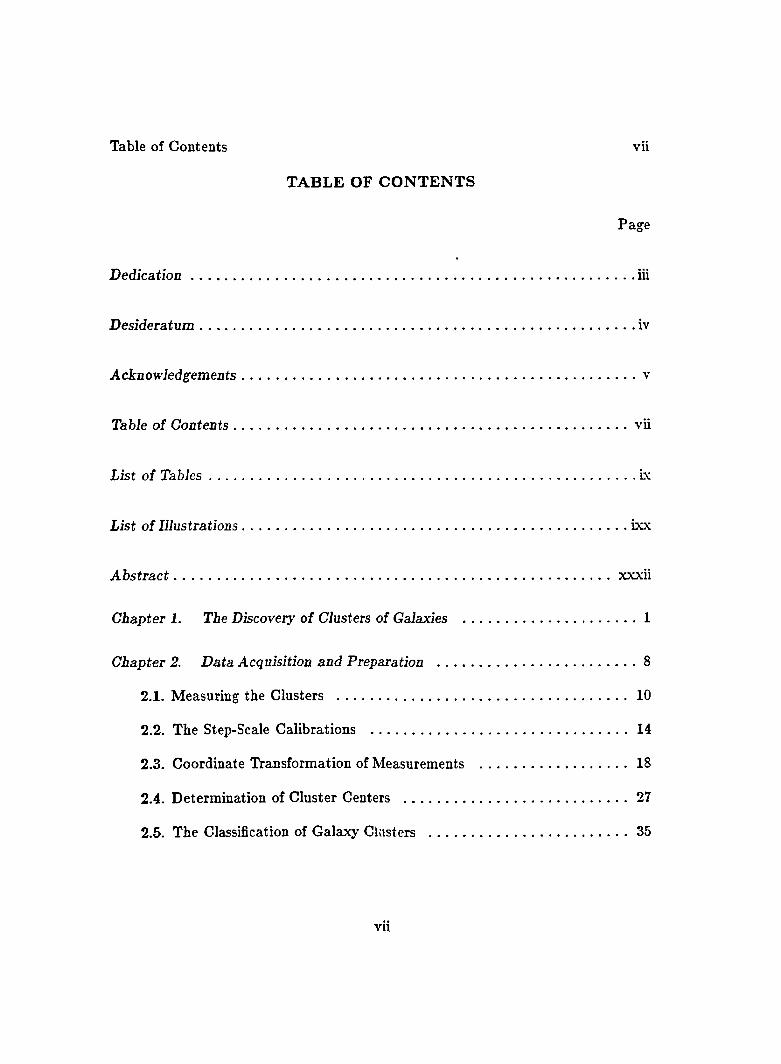
Table of Contents vii
T A B L E OF C O N T E N T S
Page
D ed ica tio n ..........................................................................................................................iii
D esideratum ....................................................................................................................... iv
Acknowledgem ents............................................................................................................. v
Table o f C ontents ............................................................................................................. vii
List o f T ab les ..................................................................................................................... ix
List o f Illustrations.......................................................................................................... ixx
A b s tra c t ......................................................................................................................... xxxii
Chapter 1. The Discovery o f Clusters of Galaxies ................................................. 1
Chapter 2. Data Acquisition and Preparation ........................................................ 8
2.1. Measuring the Clusters ..................................................................................10
2.2. The Step-Scale Calibrations ........................................................................ 14
2.3. Coordinate Transformation of Measurements .......................................... 18
2.4. Determination of Cluster Centers ............................................................... 27
2.5. The Classification of Galaxy Clusters ........................................................ 35
vu
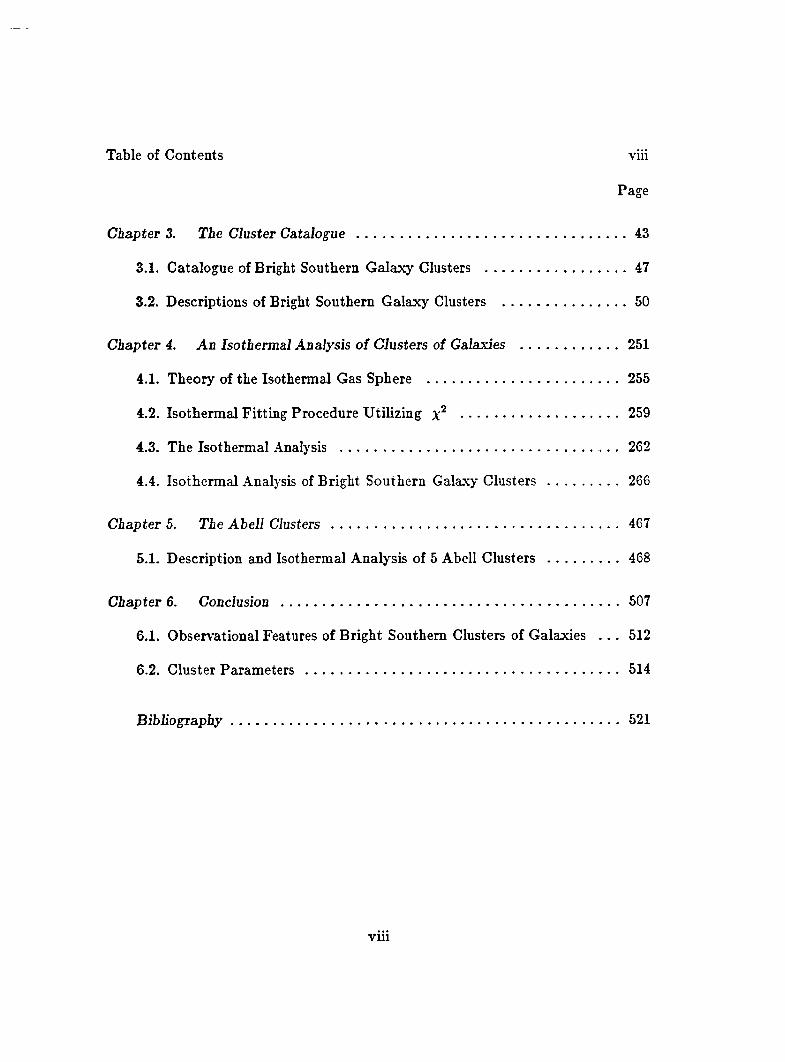
Table of Contents viii
Page
Chapter 3. The Cluster Catalogue ............................................................................43
3.1. Catalogue of Bright Southern Galaxy Clusters .........................................47
3.2. Descriptions of Bright Southern Galaxy Clusters ....................................50
Chapter 4. An Isothermal Analysis o f Clusters of Galaxies..... ............................251
4.1. Theory of the Isothermal Gas Sphere ...................................................... 255
4.2. Isothermal Fitting Procedure Utilizing ............................................. 259
4.3. The Isothermal Analysis .............................................................................. 262
4.4. Isothermal Analysis of Bright Southern Galaxy Clusters ......................266
Chapter 5. The Abell Clusters .................................................................................467
5.1. Description and Isothermal Analysis of 5 Abell Clusters ......................468
Chapter 6. Conclusion ...............................................................................................507
6.1. Observational Features of Bright Southern Clusters of Galaxies . . . 512
6.2. Cluster Parameters ........................................................................................ 514
B ibliography ............................................................................................................ 521
vm
List of Tables
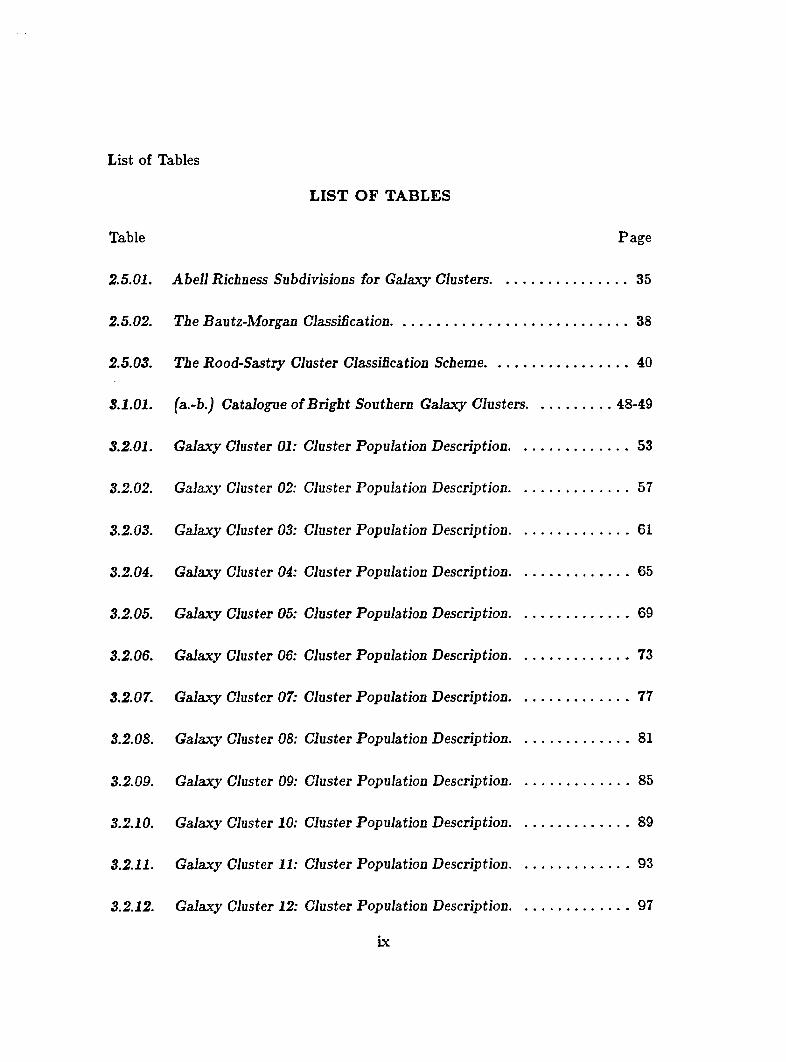
L IS T O F TA BLES
Table Page
2.5.01. Abell Richness Subdivisions for Galaxy Clusters....................... ..............35
2.5.02. The Bautz-Morgan ClassiBcation................................................ .............. 38
2.5.03. T ie Rood-Sastry Cluster ClassiScation Scheme....................... .............. 40
3.1.01. (a.-b.) Catalogue of Bright Soutieru Galaxy Clusters........... 48-49
3.2.01. Galaxy Cluster 01: Cluster Population Description................ .............. 53
3.2.02. Galaxy Cluster 02: Cluster Population Description.................. ................57
3.2.03. Galaxy Cluster 03: Cluster Population Description.................. ................61
3.2.04. Galaxy Cluster 04: Cluster Population Description................ ................65
3.2.05. Galaxy Cluster 05: Cluster Population Description.................. .............. 69
3.2.06. Galaxy Cluster 06: Cluster Population Description.................. .............. 73
3.2.07. Galaxy Cluster 07: Cluster Population Description................ .............. 77
3.2.08. Galaxy Cluster OS: Cluster Population Description................ .............. 81
3.2.09. Galaxy Cluster 09: Cluster Population Description................ .............. 85
3.2.10. Galaxy Cluster 10: Cluster Population Description................ ................89
3.2.11. Galaxy Cluster 11: Cluster Population Description.................. ................93
3.2.12. Galaxy Cluster 12: Cluster Population Description..................
ix
................97
List of Tables
3.2.13. Galaxy Cluster 13: Cluster Population Description................ ............101
3.2.14. Galaxy Cluster 14: Cluster Population Description................ ............105
3.2.15. Galaxy Cluster 15: Cluster Population Description................ ............109
3.2.16. Galaxy Cluster 16: Cluster Population Description................ ............113
3.2.17. Galaxy Cluster 17: Cluster Population Description................ ............117
3.2.18. Galaxy Cluster 18: Cluster Population Description................ ............121
3.2.19. Galaxy Cluster 19: Cluster Population Description................ ............125
3.2.20. Galaxy Cluster 20: Cluster Population Description................ ............129
3.2.21. Galaxy Cluster 21: Cluster Population Description................ ............133
3.2.22. Galaxy Cluster 22: Cluster Population Description................ ............137
3.2.23. Galaxy Cluster 23: Cluster Population Description................ ............141
3.2.24. Galaxy Cluster 24: Cluster Population Description................ ............145
3.2.25. Galaxy Cluster 25: Cluster Population Description................ ............149
3.2.26. Galaxy Cluster 26: Cluster Population Description................ ............153
3.2.27. Galaxy Cluster 27: Cluster Population Description................ ............157
3.2.28. Galaxy Cluster 28: Cluster Population Description................ ............161
3.2.29. Galaxy Cluster 29: Cluster Population Description................ ............165
3.2.30. Galaxy Cluster 30: Cluster Population Description................ ............169
List of Tables
3.2.31. Galaxy Cluster 31: Cluster Population Description................ ............173
3.2.32. Galaxy Cluster 32: Cluster Population Description................ ............177
3.2.33. Galaxy Cluster 33: Cluster Population Description................ ............181
3.2.34. Galaxy Cluster 34: Cluster Population Description................ ............185
3.2.35. Galaxy Cluster 35: Cluster Population Description................ ............189
3.2.36. Galaxy Cluster 36: Cluster Population Description................ ............193
3.2.37. Galaxy Cluster 37: Cluster Population Description................ ............197
3.2.38. Galaxy Cluster 38: Cluster Population Description................ ............201
3.2.39. Galaxy Cluster 39: Cluster Population Description................ ............205
3.2.40. Galaxy Cluster 40: Cluster Population Description................ ............209
3.2.41. Galaxy Cluster 41: Cluster Population Description................ ............213
3.2.42. Galaxy Cluster 42: Cluster Population Description................ ............217
3.2.43. Galaxy Cluster 43: Cluster Population Description................ ............221
3.2.44. Galaxy Cluster 44: Cluster Population Description................ ............225
3.2.45. Galaxy Cluster 45: Cluster Population Description................ ............229
3.2.46. Galaxy Cluster 46: Cluster Population Description................ ............233
3.2.47. Galaxy Cluster 47: Cluster Population Description................ ............237
3.2.48. Galaxy Cluster 48: Cluster Population Description................ ............241
XI
List of Tables
2.2.49. Galaxy Cluster 49: Cluster Population Description................................245
3.2.50. Galaxy Cluster 50: Cluster Population Description................ ..............249
4.4.01. (a.) Ring Count Data for Galaxy Cluster 01..........................................268
4.4.01. (h.) Cluster Parameters for Galaxy Cluster 01...................... ................270
4.4.02. (a.) Ring Count Data for Galaxy Cluster 02...........................................272
4.4.02. (b.) Cluster Parameters for Galaxy Cluster 02. ...................................274
4.4.03. (a.J Ring Count Data for Galaxy Cluster 03............................ ................276
4.4.02. (b.) Cluster Parameters for Galaxy Cluster 03........................ ................278
4.4.04. (a.) Ring Count Data for Galaxy Cluster 04..........................................280
4.4.04. (b.) Cluster Parameters for Galaxy Cluster 04........................ ..............282
4.4.05. (a.) Ring Count Data for Galaxy Cluster 05.........................................284
4.4.05. (b.) Cluster Parameters for Galaxy Cluster 05........................ ...............286
4.4.06. (a.) Ring Count Data for Galaxy Cluster 06..............................................288
4.4.06. (b.) Cluster Parameters for Galaxy Cluster 06. .................................... 290
4.4.07. (a.) Ring Count Data for Galaxy Cluster 07. ......................................292
4.4.07. (b.) Cluster Parameters for Galaxy Cluster 07. .................................... 294
4.4.08. (a.) Ring Count Data for Galaxy Cluster 08............................ ............. 296
4.4.08. (b.) Cluster Parameters for Galaxy Cluster 08. ................... ............. 298
Xll
List of Tables
4.4.09. (a.) Riag Count Data for Galaxy Cluster 09.......................... ................ 300
4.4.09. (b.) Cluster Parameters for Galaxy Cluster 09.................... ................ 302
4.4.10. (a.J R ing Count Data for Galaxy Cluster 10....................... ................ 304
4.4.10. (b.) Cluster Parameters for Galaxy Cluster 10.................... ................ 306
4.4.11. (a.) Ring Count Data for Galaxy Cluster 11.......................... ..................308
4.4.11. (b.) Cluster Parameters for Galaxy Cluster 11...................... ..................310
4.4.12. (a.) R ing Count Data for Galaxy Cluster 12. ................... ..................312
4.4.12. (b.) Cluster Parameters for Galaxy Cluster 12.................... ................ 314
4.4.13. (a.) Ring Count Data for Galaxy Cluster 13....................... ................ 316
4.4.13. (b.) Cluster Parameters for Galaxy Cluster 13.................... ................ 318
4.4.14. (a.) Ring Count Data for Galaxy Cluster 14....................... ................ 320
4.4.14. (b.) Cluster Parameters for Galaxy Cluster 14.................... ................ 322
4.4.15. (a.) Ring Count Data for Galaxy Cluster 15....................... ..................324
4.4.15. (b.) Cluster Parameters for Galaxy Cluster 15...................... ..................326
4.4.16. (a.) Ring Count Data for Galaxy Cluster 16.......................... ..................328
4.4.16. (b.) Cluster Parameters for Galaxy Cluster 16.................... ................ 330
4.4.17. (a.) Ring Count Data for Galaxy Cluster 17. ..................... ..................332
4.4.17. (b.) Cluster Parameters for Galaxy Cluster 17. ................ ................ 334
xm
List of Tables
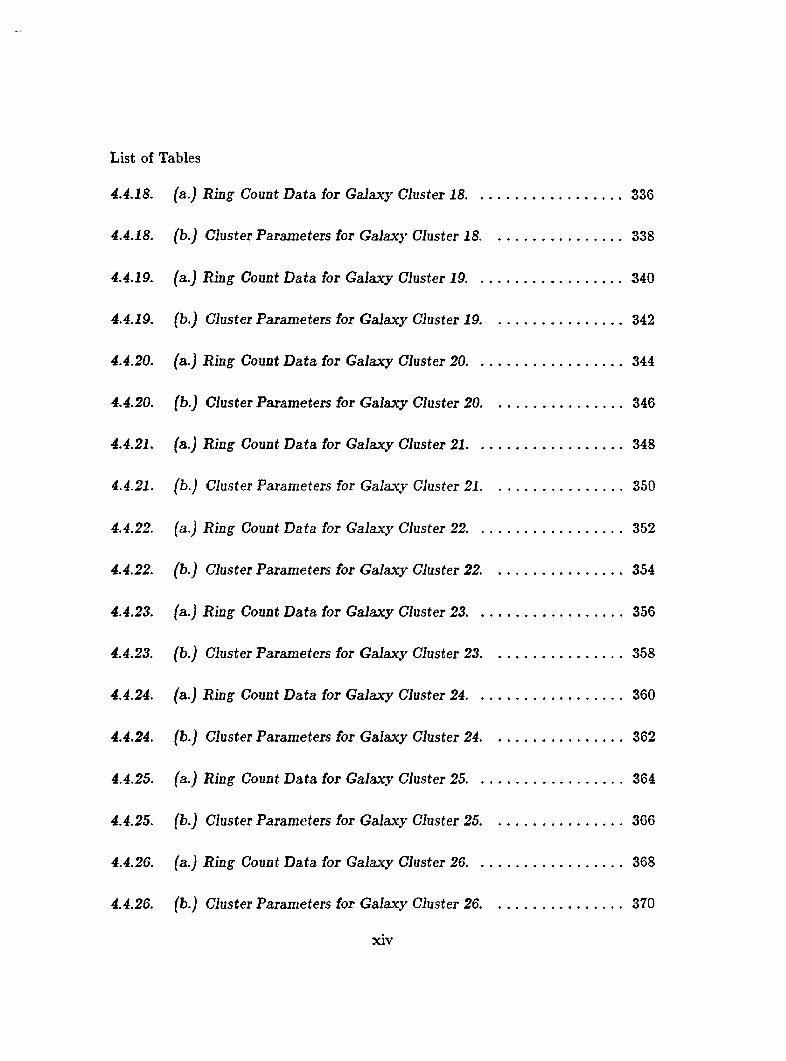
4.4.18. (a.) Ring Count Data for Galaxy Cluster IS.
4.4.18.
4.4.19.
4.4.19.
4.4.20.
4.4.20.
4.4.21.
4.4.21.
4.4.22.
4.4.22.
4.4.22.
4.4.23.
4.4.24.
4.4.24.
4.4.25.
4.4.25.
4.4.26.
4.4.26.
336
b.) Cluster Parameters for Galaxy Cluster 18......................................... 338
I.) Ring Count Data for Galaxy Cluster 19............................................. 340
b.) Cluster Parameters for Galaxy Cluster 19......................................... 342
a.J Ring Count Data for Galaxy Cluster 20.......................................... 344
b.) Cluster Parameters for Galaxy Cluster 20....................................... 346
a.) Ring Count Data for Galaxy Cluster 21............................................. 348
b.J Cluster Parameters for Galaxy Cluster 21......................................... 350
a.) Ring Count Data for Galaxy Cluster 22.......................................... 352
b.) Cluster Parameters for Galaxy Cluster 22. 354
a.) Ring Count Data for Galaxy Cluster 23.......................................... 356
b.) Cluster Parameters for Galaxy Cluster 23....................................... 358
a.) Ring Count Data for Galaxy Cluster 24. 360
b.) Cluster Parameters for Galaxy Cluster 24....................................... 362
a.) Ring Count Data for Galaxy Cluster 25.......................................... 364
b.) Cluster Parameters for Galaxy Cluster 25....................................... 366
a.) Ring Count Data for Galaxy Cluster 26.......................................... 368
b.) Cluster Parameters for Galaxy Cluster 26...................................... 370
XIV
List of Tables
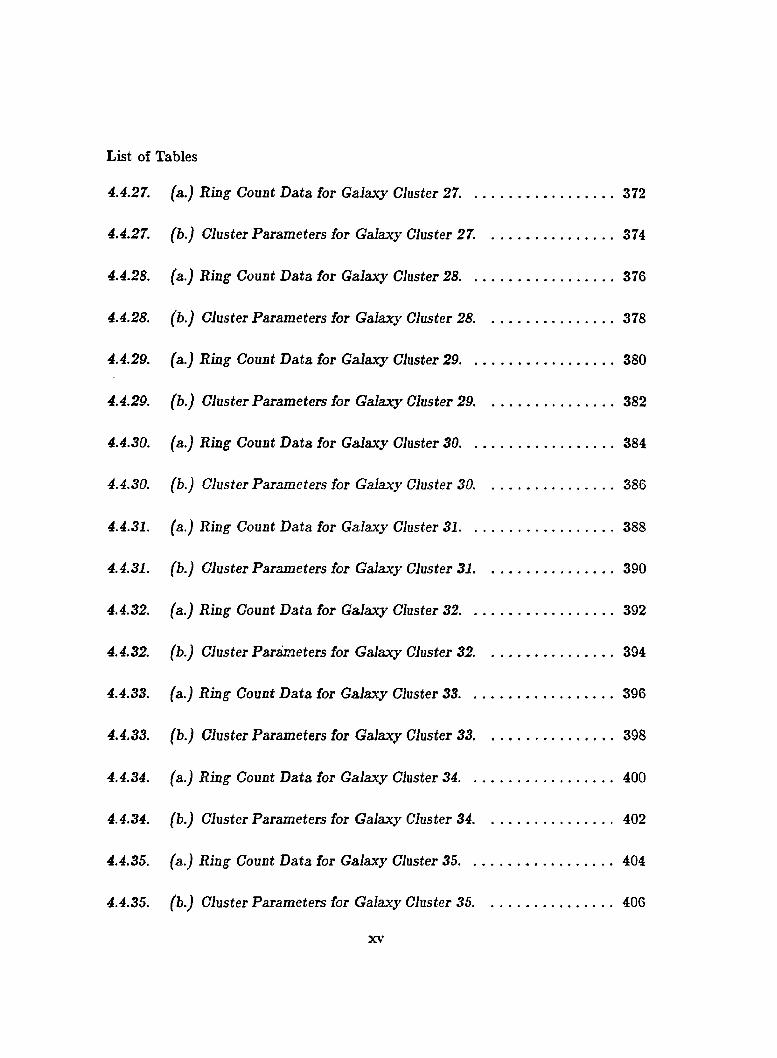
4.4.27. (a.) Ring Count Data for Galaxy Cluster 27. ..................... ................ 372
4.4.27. (b.) Cluster Parameters for Galaxy Cluster 27. ............... ................ 374
4.4.28. (a.) Ring Count Data for Galaxy Cluster 28........................ ................ 376
4.4.28. (b.) Cluster Parameters for Galaxy Cluster 28.................... ................ 378
4.4.29. (a.) Ring Count Data for Galaxy Cluster 29........................ ..................380
4.4.29. (b.) Cluster Parameters for Galaxy Cluster 29. ................ ................ 382
4.4.30. (a.) Ring Count Data for Galaxy Cluster 30.......................... ..................384
4.4.30. (b.) Cluster Parameters for Galaxy Cluster 30.................... ................ 386
4.4.31. (a.) Ring Count Data for Galaxy Cluster 31........................ ................ 388
4.4.31. (b.) Cluster Parameters for Galaxy Cluster 31.................... ................ 390
4.4.32. (a.) Ring Count Data for Galaxy Cluster 32. ................... ................ 392
4.4.32. (b.) Cluster Parameters for Galaxy Cluster 32. ............... ................ 394
4.4.33. (a.) Ring Count Data for Galaxy Cluster 33........................ ................ 396
4.4.33. (b.) Cluster Parameters for Galaxy Cluster 33...................... ..................398
4.4.34. (a.) Ring Count Data for Galaxy Cluster 34.......................... ..................400
4.4.34. (b.) Cluster Parameters for Galaxy Cluster 34.................... ..................402
4.4.35. (a.) Ring Count Data for Galaxy Cluster 35........................ ..................404
4.4.35. (b.J Cluster Parameters for Galaxy Cluster 35....................
XV
................ 406
List of Tables
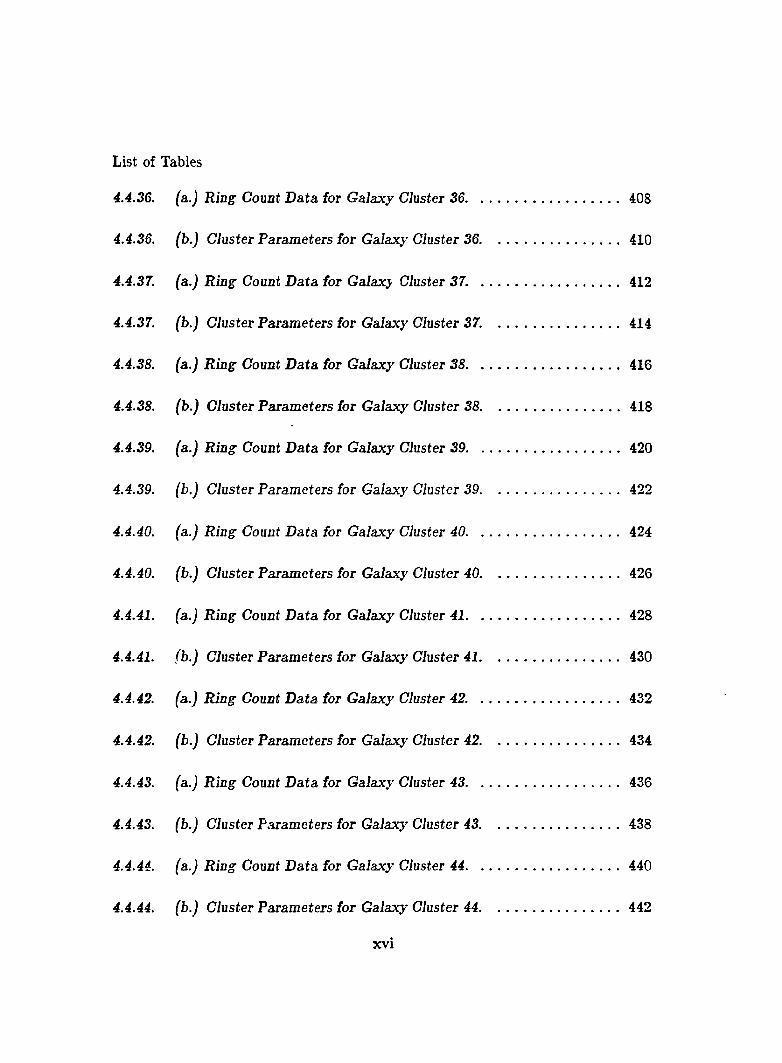
4.4.36. (a.) Riag Count Data for Galaxy Cluster 36.......................... ................ 408
4.4.36. (b.) Cluster Parameters for Galaxy Cluster 36.................... ................ 410
4.4.37. (a.) Ring Count Data for Galaxy Cluster 37. ................... ................ 412
4.4.37. (b.J Cluster Parameters for Galaxy Cluster 37. .............. ................ 414
4.4.38. (a.j R ing Count Data for Galaxy Cluster 38.......................... ..................416
4.4.38. (b.J Cluster Parameters for Galaxy Cluster 38...................... ................ 418
4.4.39. (a.) R ing Count Data for Galaxy Cluster 39.......................... ................ 420
4.4.39. (b.J Cluster Parameters for Galaxy Cluster 39................... ................ 422
4.4.40. (a.) R ing Count Data for Galaxy Cluster 40....................... ................ 424
4.4.40. (b.J Cluster Parameters for Galaxy Cluster 40.................... ................ 426
4.4.41. (a.) Ring Count Data for Galaxy Cluster 41....................... ................ 428
4.4.41. fb.) Cluster Parameters for Galaxy Cluster 41.................... ................ 430
4.4.42. (a.) R ing Count Data for Galaxy Cluster 42. ................... ................ 432
4.4.42. (b.) Cluster Parameters for Galaxy Cluster 42. ................ ..................434
4.4.43. (a.) Ring Count Data for Galaxy Cluster 43.......................... ................ 436
4.4.43. (b.J Cluster Parameters for Galaxy Cluster 43..................... ..................438
4.4.44. (a.) Ring Count Data for Galaxy Cluster 44.......................... ................ 440
4.4.44. (b.) Cluster Parameters for Galaxy Cluster 44...................
xvi
................ 442
List of Tables
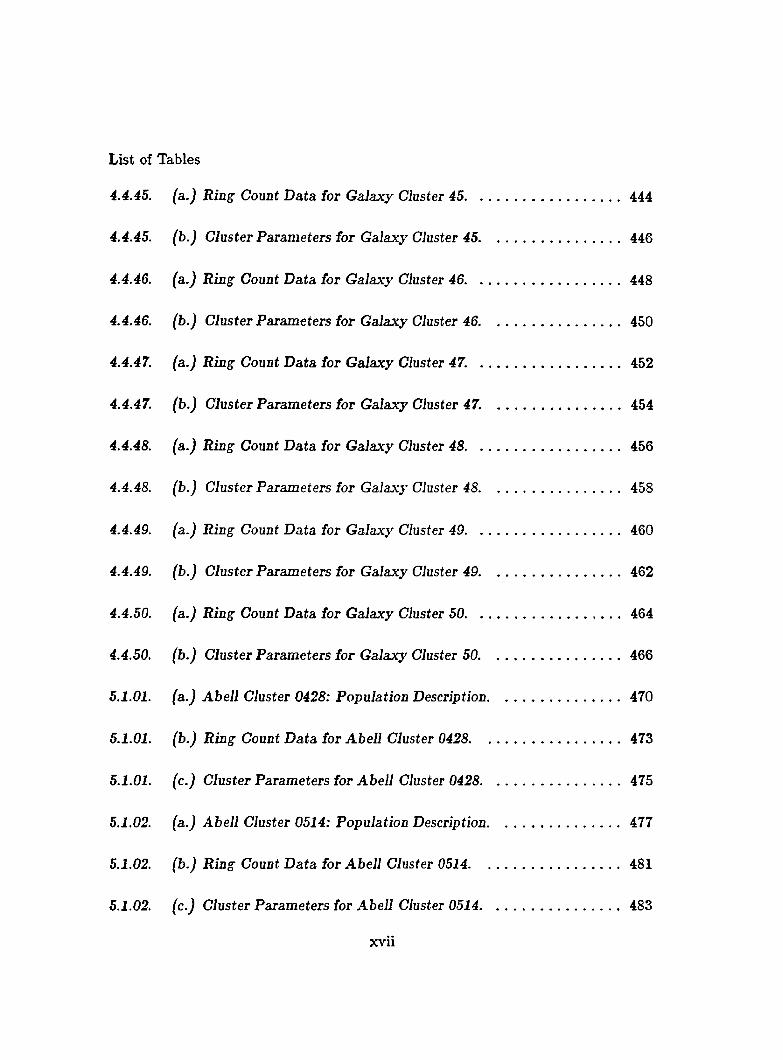
4.4.45. (a.) Ring Count Data for Galaxy Cluster 45.......................... ................ 444
4.4.45. (b.J Cluster Parameters for Galaxy Cluster 45.................... ................ 446
4.4.46. (a.) Ring Count Data for Galaxy Cluster 46........................ ................ 448
4.4.46. (b.) Cluster Parameters for Galaxy Cluster 46.................... ................ 450
4.4.47. (a.) Ring Count Data for Galaxy Cluster 47. ................... ................ 452
4.4.47. (b.J Cluster Parameters for Galaxy Cluster 47. ................ ................ 454
4.4.48. (a.j Ring Count Data for Galaxy Cluster 48.......................... ..................456
4.4.48. (b.J Cluster Parameters for Galaxy Cluster 48.................... ................ 458
4.4.49. (a.j Ring Count Data for Galaxy Cluster 49........................ ................ 460
4.4.49. (b.J Cluster Parameters for Galaxy Cluster 49.................... ................ 462
4.4.50. (a.J Ring Count Data for Galaxy Cluster 50........................ ................ 464
4.4.50. (b.J Cluster Parameters for Galaxy Cluster 50. ............... ................ 466
5.1.01. (a.j Abell Cluster 0428: Population Description................. ................ 470
5.1.01. (b.J Ring Count Data for Abell Cluster 0428......................... ..................473
5.1.01. (c.J Cluster Parameters for Abell Cluster 0428..................... ................ 475
5.1.02. (a.j Abell Cluster 0514: Population Description................... ................ 477
5.1.02. (b.J R ing Count Data for Abell Cluster 0514...................... ................ 481
5.1.02. (c.J Cluster Parameters for Abell Cluster 0514...................
xvii
................ 483
List of Tables
5.1.03. (a.) Abell Cluster 0533: Population Description....................................... 485
5.1.03. (b.) Ring’ Count Data for Abell Cluster 0533.......................................... 489
5.1.03. (c.) Cluster Parameters for Abell Cluster 0533....................................... 491
5.1.04. (a.) Abell Cluster 1736: Population Description....................................... 493
5.1.04. (b.) Ring Count Data for Abell Cluster 1736.......................................... 497
5.1.04. (c.) Cluster Parameters for Abell Cluster 1736....................................... 499
5.1.05. (a.) Abell Cluster 2538: Population Description....................................... 501
5.1.05. (b.) Ring Count Data for Abell Cluster 2538.......................................... 504
5.1.05. (c.) Cluster Parameters for Abell Cluster 2538....................................... 506
6.1.01. (a.-b.) Catalogue of Bright Southern Clusters o f Galaxies 509-510
XVlIl
List of Illustrations
L IS T O F IL L U ST R A T IO N S
Figure Page
2.1.1. Schematic o f X -Y Digitizer.................................................................................11
2.1.2. Circle Counting Mask Divided Into Abell-radii and Sectors........................13
2.2.1. Typical Step-Scales for Magnitude Determination.........................................14
2.2.2. Step-Scale Calibration Curve.............................................................................17
2.3.1. Plane Coordinates. Cross Section o f the Celestial Sphere........................... 19
2.3.2. Tangential or Standard Coordinate System .................................................... 20
2.3.3. 0 -C Diagram for Standard Star Reductions................................................... 23
2.3.4. Spherical Triangle GTP. ...................................................................................24
2.4.1. Isolines Representing a Bivariate Normal Distribution................................ 33
2.4.2. N -S and E -W Strip Counts for Galaxy Clusters............................................ 34
3.2.01. (a.) Field of Galaxy Cluster 01: 00 00 46 -36 19....................................... 51
3.2.01. (b.-h.) Cluster Morphology and Statistical Distributions..................... 52-53
3.2.02. (a.) Field of Galaxy Cluster 02: 00 03 14 -35 04....................................... 55
3.2.02. (b.-h.) Cluster Morphology and Statistical Distributions..................... 56-57
3.2.03. (a.) Field o f Galaxy Cluster 03: 00 06 49 -35 44....................................... 59
3.2.03. (b.-b.) Cluster Morphology and Statistical Distributions..................... 60-61
xix
List of Illustrations
3.2.04. (a.) Field o f Galaxy Cluster 04: 00 0 7 29 -57 15...................................... 63
3.2.04. (b.-b.) Cluster Morphology’ and Statistical Distributions....................64-65
3.2.05. (a.) Field o f Galaxy Cluster 05: 00 18 08 -49 32...................................... 67
3.2.05. (b.-h.) Cluster Morphology and Statistical Distributions....................68-69
3.2.06. (a.) Field o f Galaxy Cluster 06: 00 22 50 -33 1 7. .................................. 71
3.2.06. (b.-h.) Cluster Morphology and Statistical Distributions.................... 72-73
3.2.07. (a.) Field o f Galaxy Cluster 07: 01 29 34 -51 33....................................... 75
3.2.07. (b.-h.) Cluster Morphology and Statistical Distributions.................... 76-77
3.2.08. (a.) Field o f Galaxy Cluster 08: 01 39 50 -42 24....................................... 79
3.2.08. (b.-h.) Cluster Morphology and Statistical Distributions.................... 80-81
3.2.09. (a.) Field o f Galaxy Cluster 09: 02 55 44 -52 56....................................... 83
3.2.09. (b.-h.) Cluster Morphology and Statistical Distributions.................... 84-85
3.2.10. (a.) Field o f Galaxy Cluster 10: 03 44 05 -41 21....................................... 87
3.2.10. (b.-h.) Cluster Morphology and Statistical Distributions.................... 88-89
3.2.11. (a.) Field o f Galaxy Cluster 11: 04 04 04 -39 00....................................... 91
3.2.11. (b.-h.) Cluster Morphology and Statistical Distributions.................... 92-93
3.2.12. (a.) Field o f Galaxy Cluster 12: 05 24 00 -45 01....................................... 95
3.2.12. (b.-b.) Cluster Morphology and Statistical Distributions.................... 96-97
XX
List of Illustrations
3.2.13. (a.) Field o f Galaxy Cluster 13: 06 21 39 -64 56..................... ..............99
3.2.13. (b.-h.) Cluster Morphology and Statistical Distributions. . . 100-101
3.2.14. (a.) Field o f Galaxy Cluster 14: 06 25 02 -53 39..................... ............103
3.2.14. (b.-h.) Cluster Morphology and Statistical Distributions. . . , 104-105
3.2.15. (a.) Field o f Galaxy Cluster 15: 06 26 25 -54 22..................... ............107
3.2.15. (b.-h.) Cluster Morphology and Statistical Distributions. . . 108-109
3.2.16. (a.) Field o f Galaxv Cluster 16: 12 51 41 -28 44..................... ............I l l
3.2.16. (b.-h.) Cluster Morphology and Statistical Distributions. . . , , 112-113
3.2.17. (a.) Field of Galaxy Cluster 17: 13 03 25 -37 18..................... ............115
3.2.17. (b.-h.) Cluster Morphology and Statistical Distributions. . . , . . 116-117
3.2.18. (a.) Field o f Galaxy Cluster 18: 14 00 41 -33 44..................... ............119
3.2.18. (b.-h.) Cluster Morphology and Statistical Distributions. . . . . . 120-121
3.2.19. (a.) Field o f Galaxy Cluster 19: 14 09 18 -32 50..................... ............123
3.2.19. (b.-h.) Cluster Morphology and Statistical Distributions. . . . . . 124-125
3.2.20. (a.) Field o f Galaxy Cluster 20: 14 09 28 -34 01..................... ............127
3.2.20. (b.-h.) Cluster Morphology and Statistical Distributions. . . 128-129
3.2.21. (a.) Field o f Galaxy Cluster 21: 14 30 26 -31 33..................... ............131
3.2.21. (b.-h.) Cluster Morphology and Statistical Distributions. . .
xxi
132-133
List of Illustrations
3.2.22. (a..) Field o f Galaxy Cluster 22: 19 56 35 -38 33..................... ............135
3.2.22. (b.-b.) Cluster M orpholep and Statistical Distributions. . . , ,, 136-137
3.2.23. (a.) Field o f Galaxy Cluster 23: 20 38 34 -35 24..................... ............139
3.2.23. (b.-h.) Cluster Morphology and Statistical Distributions. . . . . . 140-141
3.2.24. (a.) Field o f Galaxy Cluster 24: 20 48 41 -52 08..................... ............143
3.2.24. (b.-h.) Cluster Morphology and Statistical Distributions. . . , , , 144-145
3.2.25. (a.) Field o f Galaxy Cluster 25: 2113 10 -59 36. ................. ............147
3.2.25. (b.-h.) Cluster Morphology and Statistical Distributions. . . 148-149
3.2.26. (a.) Field o f Galaxy Cluster 26: 21 22 58 -35 00. ................. ............151
3.2.26. (b.-h.) Cluster Morphology and Statistical Distributions. . . 152-153
3.2.27. (a.) Field o f Galaxy Cluster 27: 21 26 10 -51 04..................... ............155
3.2.27. (b.-h.) Cluster Morphology and Statistical Distributions. . . 156-157
3.2.28. (a.) Field o f Galaxy Cluster 28: 21 29 13 -35 23..................... ............159
3.2.28. (b.-h.) Cluster Morphology and Statistical Distributions. . . 160-161
3.2.29. (a.) Field o f Galaxy Cluster 29: 21 31 14 -62 15..................... ............ 163
3.2.29. (b.-h.) Cluster Morphology and Statistical Distributions. . . 164-165
3.2.30. (a.) Field o f Galaxy Cluster 30: 21 31 06 -53 50..................... ............167
3.2.30. (b.-h.) Cluster Morphology and Statistical Distributions. . .
xxii
168-169
List of Illustrations
3.2.31. (a.) Field of Galaxy Cluster 31: 21 32 18 -52 44...................... ............171
3.2.31. (b.-b.) Cluster Morphology and Statistical Distributions. . . . . , 172-173
3.2.32. (a.) Field of Galaxy Cluster 32: 21 41 46 -51 44...................... ............175
3.2.32. (b.-h.) Cluster Morphology and Statistical Distributions. . . . . . 176-177
3.2.33. (a.) Field o f Galaxy Cluster 33: 21 42 51 -57 30...................... ............179
3.2.33. (b.-h.) Cluster Morphology and Statistical Distributions. . . 180-181
3.2.34. (a.) Field o f Galaxy Cluster 34: 21 43 46 -44 06...................... ............183
3.2.34. (b.-h.) Cluster Morpholog}'and Statistical Distributions. . . 184-185
3.2.35. (a.) Field o f Galaxy Cluster 35: 21 44 41 -46 13...................... ............187
3.2.35. (b.-h.) Cluster Morphology and Statistical Distributions. . . 188-189
3.2.36. (a.) Field o f Galaxy Cluster 36: 21 50 32 -58 04...................... ............ 191
3.2.36. (b.-h.) Cluster Morphology and Statistical Distributions. . . 192-193
3.2.37. (a.) Field o f Galaxy Cluster 37: 21 55 17 -60 35...................... ............195
3.2.37. (b.-h.) Cluster Morphology and Statistical Distributions. . . . , , 196-197
3.2.38. (a.) Field o f Galaxy Cluster 38: 21 58 08 -60 11...................... ............199
3.2.38. (b.-h.) Cluster Morphology and Statistical Distributions. . . , 2 0 0 - 2 0 1
3.2.39. (a.) Field o f Galaxy Cluster 39: 22 01 11 -58 18...................... ............203
3.2.39. (b.-h.) Cluster Morphology and Statistical Distributions. . . . . . 204-205
XXlll
List of Illustrations
3.2.40. (a.) Field o f Galaxy Cluster 40: 22 01 07 -50 18..................... ............207
3.2.40. (b.-b.) Cluster Morpbology and Statistical Distributions. . . , , , 208-209
3.2.41. (a.) Field o f Galaxy Cluster 41: 2219 59 -50 23..................... ............2 1 1
3.2.41. (b.-b.) Cluster Morpbology and Statistical Distributions. . . , . 212-213
3.2.42. (a.) Field o f Galaxy Cluster 42: 22 21 25 -56 38. ................. ........... 215
3.2.42. (b.-b.) Cluster Morpbology and Statistical Distributions. . . , , , 216-217
3.2.43. (a.) Field o f Galaxy Cluster 43: 22 22 36 -56 06..................... ........... 219
3.2.43. (b.-b.) Cluster Morpbology and Statistical Distributions. . . 2 2 0 - 2 2 1
3.2.44. (a.) Field of Galaxy Cluster 44: 22 24 46 -30 52..................... ........... 223
3.2.44. (b.-b.) Cluster Morpbology and Statistical Distributions. . . 224-225
3.2.45. (a.) Field o f Galaxy Cluster 45: 23 16 35 -42 22. ................. ............227
3.2.45. (b.-b.) Cluster Morpbology and Statistical Distributions. . . 228-229
3.2.46. (a.) Field of Galaxy Cluster 46: 23 27 36 -39 37. ................. ............231
3.2.46. (b.-b.) Cluster Morpbology and Statistical Distributions. . . 232-233
3.2.47. (a.) Field o f Galaxy Cluster 47: 23 34 24 -69 35..................... ............235
3.2.47. (b.-b.) Cluster Morpbology' and Statistical Distributions. . . 236-237
3.2.48. (a.) Field o f Galaxy Cluster 48: 23 38 42 -30 30..................... ............239
3.2.48. (b.-b.) Cluster Morpbology and Statistical Distributions. . .
xxiv
,, , 240-241
List of Illustrations
3.2.49. (a.) Field o f Galaxy Cluster 49: 23 44 55 -28 25....................... ............243
3.2.49. (b.-b.) Cluster Morphology and Statistical Distributions. . . , . 244-245
3.2.50. (a.) Field o f Galaxy Cluster 50: 23 59 06 -44 07. ................. ............247
3.2.50. (b.-b.) Cluster Morpbology and Statistical Distributions. . . 248-249
4.1.1. Idealized Isothermal Sphere of Galaxies...................................... ............255
4.1.2. Coordinate Projections on the Celestial Sphere............................ .............257
4.2.1. Function in an n-Dimensional Hvperspace.............................. ............260
4.4.01. (a.-d.) Galaxy Cluster 01: Surface Density Statistics............... .............267
4.4.01. (e.) Isothermal Fit for Galaxy Cluster 01.................................... ............269
4.4.02. (a.-d.) Galaxy Cluster 02: Surface Density Statistics............... .............271
4.4.02. (e.) Isothermal Fit for Galaxy Cluster 02.................................... ............273
4.4.03. (a.-d.) Galaxy Cluster 03: Surface Density Statistics............. ............275
4.4.03. (e.) Isothermal Fit for Galaxy Cluster 03................................. ............277
4.4.04. (a.-d.) Galaxy Cluster 04: Surface Density Statistics............. ............279
4.4.04. (e.) Isothermal Fit for Galaxy Cluster 04................................. ............281
4.4.05. (a.-d.) Galaxy Cluster 05: Surface Density Statistics............. ............283
4.4.05. (e.) Isothermal Fit for Galaxy Cluster 05................................. ............285
4.4.06. (a.-d.) Galaxy Cluster 06: Surface Density Statistics.............
XXV
............287
List of Illustrations
4.4.06. (e.) Isothermal Fit for Galaxy Cluster 06................................................ 289
4.4.07. (a.-d.) Galaxy Cluster 07: Surface Density Statistics...............................291
4.4.07. (e . ) Isothermal Fit for Galaxy Cluster 07. ........................................... 293
4.4.08. (a.-d.) Galaxy Cluster 08: Surface Density Statistics...............................295
4.4.08. (e . ) Isothermal Fit for Galaxy Cluster 08................................................ 297
4.4.09. (a.-d.) Galaxy Cluster 09: Surface Density Statistics............................... 299
4.4.09. (e . ) Isothermal Fit for Galaxy Cluster 09................................................. 301
4.4.10. (a.-d.) Galaxy Cluster 10: Surface Density Statistics............................... 303
4.4.10. (e.) Isothermal Fit for Galaxy Cluster 10................................................... 305
4.4.11. (a.-d.) Galaxy Cluster 11: Surface Density Statistics............................... 307
4.4.11. (e . ) Isothermal Fit for Galaxy Cluster 11....................................................309
4.4.12. (a.-d.) Galaxy Cluster 12: Surface Density Statistics............................... 311
4.4.12. (e . ) Isothermal Fit for Galaxy Cluster 12. 313
4.4.13. (a.-d.) Galaxy Cluster 13: Surface Density Statistics............................... 315
4.4.13. (e.) Isothermal Fit for Galaxy Cluster 13....................................................317
4.4.14. (a.-d.) Galaxy Cluster 14: Surface Density Statistics................................319
4.4.14. (e.) Isothermal Fit for Galaxy Cluster 14....................................................321
4.4.15. (a.-d.) Galaxy Cluster 15: Surface Density Statistics................................323
xxvi
List of Illustrations
4.4.15. (e.) Isothermal Fit for Galaxy Cluster 15................................................... 325
4.4.16. (a.-d.) Galaxy Cluster 16: Surface Density Statistics.............................. 327
4.4.16. (e.) Isothermal Fit for Galaxy Cluster 16....................................................329
4.4.17. (a.-d.) Galaxy Cluster 17: Surface Density Statistics...............................331
4.4.17. (e.) Isothermal Fit for Galaxy Cluster 17. ............................................... 333
4.4.18. (a.-d.) Galaxy Cluster 18: Surface Density Statistics...............................335
4.4.18. (e.) Isothermal Fit for Galaxy Cluster 18....................................................337
4.4.19. (a.-d.) Galaxy Cluster 19: Surface Density Statistics...............................339
4.4.19. (e.) Isothermal Fit for Galaxy Cluster 19.................................................... 341
4.4.20. (a.-d.) Galaxy Cluster 20: Surface Density Statistics...............................343
4.4.20. (e.) Isothermal Fit for Galaxy Cluster 20................................................. 345
4.4.21. (a.-d.) Galaxy Cluster 21: Surface Density Statistics...............................347
4.4.21. (e . ) Isothermal Fit for Galaxy Cluster 21.................................................... 349
4.4.22. (a.-d.) Galaxy Cluster 22: Surface Density Statistics...............................351
4.4.22. (e . ) Isothermal Fit for Galaxy Cluster 22. ............................................ 353
4.4.23. (a.-d.) Galaxy Cluster 23: Surface Density Statistics...............................355
4.4.23. (e . ) Isothermal Fit for Galaxy Cluster 23................................................. 357
4.4.24. (a.-d.) Galaxy Cluster 24: Surface Density Statistics............................... 359
xxvii
List of Illustrations
4.4.24. (e.) Isothermal Fit for Galaxy Cluster 24................................................ 361
4.4.25. (a.-d.) Galaxy Cluster 25: Surface Density Statistics...............................363
4.4.25. (e.) Isothermal Fit for Galaxy Cluster 25................................................ 365
4.4.26. (a.-d.) Galaxy Cluster 26: Surface Density Statistics...............................367
4.4.26. (e.) Isothermal F it for Galaxy Cluster 26................................................ 369
4.4.27. (a.-d.) Galaxy Cluster 27: Surface Density Statistics............................... 371
4.4.27. (e.) Isothermal Fit for Galaxy Cluster 27. ........................................... 373
4.4.28. (a.-d.) Galaxy Cluster 28: Surface Density Statistics............................... 375
4.4.28. (e.) Isothermal Fit for Galaxy Cluster 28................................................ 377
4.4.29. (a.-d.) Galaxy Cluster 29: Surface Density Statistics............................... 379
4.4.29. (e.) Isothermal Fit for Galaxy Cluster 29................................................ 381
4.4.30. (a.-d.) Galaxy Cluster 30: Surface Density Statistics............................... 383
4.4.30. (e.) Isothermal Fit for Galaxy Cluster 30................................................ 385
4.4.31. (a.-d.) Galaxy Cluster 31: Surface Density Statistics............................... 387
4.4.31. (e.) Isothermal F it for Galaxy Cluster 31................................................... 389
4.4.32. (a.-d.) Galaxy Cluster 32: Surface Density Statistics............................... 391
4.4.32. (e.) Isothermal Fit for Galaxy Cluster 32................................................. 393
4.4.33. (a.-d.) Galax}’ Cluster 33: Surface Density Statistics................................395
xxviii
List of Illustrations
4.4.32. (e.) Isothermal Fit for Galaxy Cluster 33................................................ 397
4.4.34. (a.-d.) Galaxy Cluster 34: Surface Density Statistics.............................. 399
4.4.34. (e.) Isothermal Fit for Galaxy Cluster 34................................................ 401
4.4.35. (a.-d.) Galaxy Cluster 35: Surface Density Statistics.............................. 403
4.4.35. (e.) Isothermal Fit for Galaxy Cluster 35................................................ 405
4.4.36. (a.-d.) Galaxy Cluster 36: Surface Density Statistics...............................407
4.4.36. (e.) Isothermal Fit for Galaxy Cluster 36................................................ 409
4.4.37. (a.-d.) Galaxy Cluster 37: Surface Density Statistics...............................411
4.4.37. (e.) Isothermal Fit for Galaxy Cluster 27. ............................................ 413
4.4.38. (a.-d.) Galaxy Cluster 38: Surface Density Statistics...............................415
4.4.38. (e.) Isothermal Fit for Galaxy Cluster 38................................................... 417
4.4.39. (a.-d.) Galaxy Cluster 39: Surface Density Statistics...............................419
4.4.39. (e.) Isothermal Fit for Galaxy Cluster 39................................................ 421
4.4.40. (a.-d.) Galaxy Cluster 40: Surface Density Statistics...............................423
4.4.40. (e.) Isothermal Fit for Galaxy Cluster 40................................................ 425
4.4.41. (a.-d.) Galaxy Cluster 41: Surface Density Statistics...............................427
4.4.41. (e.) Isothermal Fit for Galaxy Cluster 41................................................... 429
4.4.42. (a.-d.) Galaxy Cluster 42: Surface Density Statistics...............................431
xxix

List of Illustrations
4.4.42. (e.) Isothermal Fit for Galaxy Cluster 42.............................. .............. 433
4.4.43. (a.-d.) Galaxy Cluster 43: Surface Density Statistics. .............. 435
4.4.43. (e.) Isothermal Fit for Galaxy Cluster 43.............................. .............. 437
4.4.44. (a.-d.) Galaxy Cluster 44: Surface Density Statistics. .............. 439
4.4.44. (e.) Isothermal Fit for Galaxy Cluster 44.............................. .............. 441
4.4.45. (a.-d.) Galaxy Cluster 45: Surface Density Statistics. . . . .............. 443
4.4.45. (e.) Isothermal Fit for Galaxy Cluster 45.............................. .............. 445
4.4.46. (a.-d.) Galaxy Cluster 46: Surface Density Statistics. . , . .............. 447
4.4.46. (e.) Isothermal Fit for Galaxy Cluster 46.............................. .............. 449
4.4.47. (a.-d.) Galaxy Cluster 47: Surface Density Statistics. .............. 451
4.4.47. (e.) Isothermal Fit for Galaxy Cluster 47. ......................... .............. 453
4.4.48. (a.-d.) Galaxy Cluster 48: Surface Density Statistics. .............. 455
4.4.48. (e.) Isothermal Fit for Galaxy Cluster 48.............................. .............. 457
4.4.49. (a.-d.) Galaxy Cluster 49: Surface Density Statistics. . . . .............. 459
4.4.49. (e.) Isothermal Fit for Galaxy Cluster 49.............................. .............. 461
4.4.50. (a.-d.) Galaxy Cluster 50: Surface Density Statistics. .............. 463
4.4.50. (e.) Isothermal Fit for Galaxy Cluster 50. ......................... .............. 464
5.1.01. (a.-g.) Abell Cluster 0428: Morphology' and Distributions.
X X X
___ 469-470
List of Illustrations
5.1.01. (b.-k.) Abell Cluster 0428: Surface Density Statistics..............................472
5.1.01. (1.) Isothermal Fit for Abell Cluster 0428................................................ 474
5.1.02. (a..-g.) Abell Cluster 0514: Morpbology and Distributions 476-477
5.1.02. (b.-k.) Abell Cluster 0514: Surface Density Statistics.............................. 480
5.1.02. (1.) Isothermal Fit for Abell Cluster 0514................................................ 482
5.1.03. Abell Cluster 0533: Morpbology and Distributions 484-485
5.1.03. (b.-k.) Abell Cluster 0533: Surface Density Statistics.............................. 488
5.1.03. (1.) Isothermal Fit for Abell Cluster 0533................................................. 490
5.1.04. ^a.-gj Abell Cluster 1736: Morpbology and Distributions 492-493
5.1.04. (b.-k.) Abell Cluster 1736: Surface Density Statistics.............................. 496
5.1.04. (1.) Isothermal Fit for Abell Cluster 1736................................................. 498
5.1.05. (s.-g.) Abell Cluster 2538: Morpbology and Distributions 500-501
5.1.05. (b.-k.) Abell Cluster 2538: Surface Density Statistics.............................. 503
5.1.05. (1.) Isothermal Fit for Abell Cluster 2538................................................. 505
6.0.01. Galaxy Cluster Locations on the Celestial Sphere..................................... 511
6.2.01. Core Population from Dispersion Ellipse Calculations..............................514
6.2.02. Luminosity Function for 55 Bright Southern Clusters o f Galaxies. . 518
XXXI
A B S T R A C T
Here was very fine discourses— and experiments;but I do lack philosophy enoughto understand them,and so cannot remember them.— Samuel Pepys
Diary, 1 march 1666
This dissertation presents the description of 55 bright, close [z < 0.1) clusters
of galaxies as a homogeneous sample taken from a new effort to catalogue galaxy
clusters in the Southern Hemisphere. The positions of some 21,000 galaxies in
clusters have been catalogued along with visual magnitudes, morphological types,
position angles of extended objects and pertinent remarks. For all of the clusters,
various cluster parameters have been determined and form the basis of comparative
studies for these fundamental aggregates of m atter in the universe.
The aims of this study are to produce a homogeneous sample of galaxy clusters
measured to a uniform limiting magnitude of m„=19.0; catalogued with accurate
positions relative to nearby astrometric standard stars; morphologically classified
and population typed; and statistically analysed in a uniform fashion to deduce
certain cluster parameters. The cluster parameters of interest include an estimate
of cluster distance, center and richness; galaxy distributions as a function of mor
phological type, magnitude distribution and core radius. The core radius has been
determined by fitting surface density information to an Isothermal Model by means
of a minimization procedure.
xxxii
P R O B IN G T H E L A R G E -SC A L E S T R U C T U R E
O F T H E U N IV E R S E : A N A N A LY SIS O F 55
B R IG H T S O U T H E R N C L U ST ER S O F G A L A X IE S
C H A P T E R I
T H E D ISC O V E R Y O F C L U ST ER S O F G A L A X IE S
Nothing can astound the stars. They have long lived.And you are not the first To come to such a place seeking the most difficult knowledge.— Robert Penn Warren
The history of the studies of the physical properties of clusters of galaxies is
short by the standards of many other astronomical topics, but it has been elaborated
in the service of the history of astronomy with many interesting and varied lines of
development-
In the great flurry of astronomical cataloguing during the eighteenth and nine
teenth centuries astronomers not only busied themselves with the positions of stars,
but also with the mysterious “nebulae” as well. In 1755 de la Caille published a cat
alogue of 42 southern nebulae which was followed in 1781 by the famous catalogue
of Charles Messier of 104 nebulae used by comet hunters to avoid spurious identi
fications (Landmark (1927), Jones: (1968)). Thirty-three of the objects identified
by Messier (1781) in his third and last catalogue are now recognized to be extra-
galactic, but even at the time the catalogue was published, these objects served
Discovery o f Clusters of Galaxies 2 §1.0
to illustrate an unusual concentration of nebulae in the constellations of Coma
Berenices and Virgo. In 1784 William Herschel (Herschel, 1784) published an even
larger catalogue of stars and nebulae of which over a thousand are extra-galactic ob
jects. He further confirmed the concentration of these objects in the region modern
astronomers regard as the galactic poles (Herschel, 1785). Sir William Herschel’s
catalogue was extended to the Southern Hemisphere by Sir John Herschel during
his residence in the Cape Province in South Africa. Here he published his Gen
eral Catalogue of Nebulae and S tar Clusters in 1864 which contains 5079 entries
(Herschel, 1864). The distribution of the nebulae found in this catalogue was in
vestigated by Proctor (1869) who confirmed their striking avoidance of the Milky
Way and used this information to prove the connection of our galaxy with the neb
ulae as independent stellar systems. Probable multiple clustering (Waters, 1873)
and the appearance of “nebular spots” (von Humboldt, 1866) were noticed in these
catalogues as well as being more clearly detectable in the later catalogues of Dreyer
(1888,1895, 1908) by Waters (1894).
W ith the advent of astronomical photography, the structures of the spiral neb
ulae were catalogued and studied in large numbers. A photographic catalogue
was compiled by Isaac Roberts in 1885-1904 and later published by his wife in
1922 (see Lundmark (1927), p. 15). A similar catalogue was published by James
Keeler in 1908 (Keeler (1908)). A whole-sky photographic survey was undertaken
by Franklin-Adams at this time, obtaining 206 overlapping plates at a scale of
approximately 30 arcmin/cm (Hardcastle (1914)).
O ther distinct groupings located in the constellations Ursa Major, Virgo and
Fornax were noticed in the distribution of nebulae found in the first widely used
catalogue of galaxies compiled by Shapley and Ames (1932a,b) which listed a total
of 1249 objects and claimed to be complete to the 13th magnitude. This important
work gleaned its source material from several existing catalogues including the NGC
Discovery of Clusters of Galaxies 3 §1.0
of Dreyer, the Path list (1914), the Reinmuth catalogues (1926,1928) and those of
the Harvard Observatorj’, and was put to use in later years with investigations by
de Vaucouleurs (1953) and Humason, Mayall and Sandage (1956). Here, the most
im portant work is the catalogue by Sandage and Tammann (1974a,b,c,d; 1975a,b)
- the Revised Shapley-Ames Catalogue - and the resulting analysis by Sandage,
Tammann and Yahil (1979).
I t is now known that these concentrations can be treated as isolated entities,
as nearby clusters of galaxies, their whole-sky distribution masked to some extent
by obscuration by the plane of our Galaxy. It was in the early part of this century
that astronomers paid them serious scrutiny within the larger context of the whole-
sky distribution of the nebulae (Hinks, 1911). Lundmark (1927) compiled a list of
55 concentrations of galaxies from various sources as did Shapley (1933). Galaxy
counts by Holmberg (1937, p.52) using the apparent magnitude of galaxies as an
indication of their distance and allowing for any dispersion in luminosity, indicated
the existence of a local metagalactic cloud with a density of more than five times
tha t of the surrounding background. But by 1934, only about twenty great clusters
of galaxies were known within 40 million light-years (on the old distance scale)
(Zwicky, 1938). Not so surprisingly, this caused Hubble (1934,1936) to comment
that rich clusters of galaxies were “relatively rare.”
Subsequently, the rate of discovery of clusters of galaxies soon overtook the
abilities of astronomers to study them in detail and it was Hubble himself who
declared that an estimated 1 % of all visible galaxies are members of rich clusters
which are distributed on the average of one per 50 square degrees of the celestial
sphere. Zwicky (1952) likened the cosmos as divided into cluster cells of a given
volume; something similar to a bubble-raft of soap suds. At the time, Zwicky
(1957a) estimated these cells to average 37.5/h M pc in diam eter and 440,000/(h*)
cubic Mpc in volume (h = Ro/lOO Am/aec/Mpc) with a cluster membership on the
Discovery of Clusters of Galaxies 4 §1.0
order of two to four thousand galaxies.
The belief of many that the universe was homogeneous and smooth prompted
astronomers to suggest that given a large enough volume of space, these irregulari
ties would tend to average out, and the overall distribution of galaxies would tend
towards randomness. But tests of this Cosmological Principle were impossible at
that time since the volume of space sampled till then were actually quite limited.
W ith the appearance of extensive sky surveys, most notably those made by
Shapley and colleagues (Shapley, 1933,1938,1947) and in particular the deep pho
tographic plates of the Lick Observatory and the National Geographic Society-
Palom ar Observatory Sky Survey, there was recognized the truly vast numbers of
clusters of galaxies. Shapley and, later, Shane and Wirtanen (1954), were inter
ested in the distribution of galaxies at large. Shapley’s main point was the irregular
distribution of the galaxies he surveyed. This conclusion was in contrast to the
idea of Hubble who, a t that time, considered clusters rare. As a result, we may
consider Shapley a precursor to the modern studies of the large-scale structure of
the universe.
The continued search for and the description of the properties of galaxies
showed a general hierarchy of organization indicating a smooth transition between
double galaxies, multiple galaxies, groups of galaxies and clusters of galaxies. In
other words, there seemed to be clustering at all observable levels. Pioneering work
on clustering was taken up by Zwicky a t the California Institute of Technology
using plates taken with various Schmidt telescopes. Not only did he discover new
clusters such as Pisces (Zwicky (1937)) but also he reinvestigated those clusters
already known (Cancer Zwicky (1950ab); Coma: Zwicky (1937a, 1951); Hydra:
Zwicky (1941); Pegasus; Edson and Zwicky (1941); Perseus: Zwicky (I942cd)). He
deduced that clusters, not galaxies, constituted the fundamental building blocks of
Discover}’ of Clusters of Galaxies 5 §1.0
the universe.
Zwicky believed that clusters represented very large entities and that they were
physically connected to each other and superposed onto a uniform background of
galaxies. This concept, however, has recently been modified. Clusters of galaxies
are in fact imbedded in large structures which characterize the distribution of visible
m atter in the universe (Chincarini and Martins, (1975); Chincarini, (1984)), and a
background of galaxies is not observed (Vettolani, de Sousa and Chincarini (1985)).
Further, large regions with a literal absence of galaxies, called voids, have now been
observed between large structures or superclusters (Chincarini (1978); Vettolani et
al. (1985)).
The conclusion that clustering is a fact urged the introduction of statistical
methods to interpret the data being amassed from galaxy counts made from pho
tographic plates (Neyman and Scott ,1952,1955; Neyman, Scott and Shane, 1953,
1954; Scott, Shane and Swanson, 1954). These investigations indicated that clusters
of galaxies may be fundamental units of m atter and are far more numerous than
formerly thought. In a major survey, Abell (1958) compiled a catalogue of 2712
rich clusters of galaxies discovered on the National Geographic-Palomar Observa
tory Sky Survey (POSS) and selected a homogeneous sample of 1682 clusters for
statistical study.
In the catalogue, a cluster was defined operationally as an association of galax
ies containing at least 50 members not more than two magnitudes fainter than the
third brightest member. The so-defined cluster must be compact enough for the
galaxies to be counted to within an arbitrary distance r from the center of the clus
ter where r = 4.6 x 10®/cz mm on the plate which transplates into a linear distance
of 1.5/h Mpc (h = JIo/100] at the scale of the POSS. The object of these efi’orts
was to study the distribution of the clusters as a function of depth in space, the
Discovery o f Clusters of Galaxies 6 §1.0
isotropy of the distribution of clusters and the evidence available for second-order
clustering, tha t is, for the existence of clusters of clusters of galaxies. We must
stress tha t this is the most fundamental survey work to date on the clustering of
galaxies because of its and completeness and homogeneity.
Extensions of these surveys and catalogues are continuing with lists of Southern
clusters of galaxies made by Klemola (1969), Snow (1970), Sersic (1974), Rose
(1976) and Braid and MacGillivray (1977). More recently, new cataloguing efforts
to include a homogeneous sample of clusters of galaxies in the Southern hemisphere
have begun. Before his untimely death in 1984, Abell had planned and organized a
large Southern effort as an all-sky completion of his work carried out in the Northern
hemisphere. The project (in progress) will be carried out by his successors (Abell et
al. (1985)) and initially analysed for the distribution of rich clusters by Chincarini
et al. (1985).
In general, the limit of most previous and current surveys has been z < 0.5, but
various groups are now searching for clusters at z > 0.5. Deep surveys giving counts
of galaxies have been undertaken by Kron and colleagues (Kron, et al. (1977)) as
well as by Tyson and Jarvis (1980) and Gunn et al. (1985) in an effort to detect
clusters at redshifts z > 0.4 — 0.5. This is the extreme limit of Abell’s effort which
was essentially imposed by limitations of the Schmidt telescope.
These fundamental surveys and studies have been undertaken with the aim of
understanding the distribution of galaxies as fundamental aggregates of m atter in
the universe. Current findings suggest tha t galaxies and clusters of galaxies are
parts of very large structures. In addition, regions devoid of galaxies have been
detected (Chincarini and Rood (1976); Gregory and Thompson (1978); Tarenghi
et al. (1979); Kirshner et al. 1983)) as well as large irregular structures. Using
this material, Peebles (1980) has developed the powerful statistical methods of
D iscovery o f Clusters of Galaxies 7 §1.0
the autocorrelation function directed at understanding the distribution of m atter
in the universe a t large and its implications, as well as opening the possibility of
discriminating between various cosmological models.
The observed distribution of galaxies appears at this time to be very clumpy.
These agglomerations define very large structures (Chincarini (1984)) of which no
boundary has been found. These very irregular forms have density peaks which
coincide with the observed clusters of galaxies, and such structures seem to be
connected to each other and never seem to be isolated. This model was spawned on
the basis of early observational evidence gathered by Chincarini and Rood (1978),
m otivated by the theories of Zel’dovich and colleagues (1978) and Einasto et al.
(1978), in which it would appear unlikely to detect an isolated cluster of galaxies.
Indeed, if positive density fluctuations form, as we see with clusters of galaxies, one
can also expect negative density fluctuations where the density of galaxies is very
low. And these regions have been observed. For instance, a particularly large void
has been detected by Kishner et al. (1981,1983) in the direction of the constellation
Bootes. The perhaps unexpected result of the observations (Chincarini, (1984)) is
tha t no galaxy has been seen in such voids. W hat is less clear, as pointed out
by Peebles (1983), is whether these voids have some physical significance or are a
natural by-product of a hierarchical clustering of galaxies.
I t is now seen that the distribution of galaxies in space is characterized in
various surveys by clustering on a large scale, observed as superclusters or chains,
and by voids, regions of space where galaxies have not been detected (Oort, (1983);
Vettolani et al. (1984)). There is general agreement on the fact that a uniform
background of galaxies upon which clusters and groups of galaxies are superposed
as conceived by the pioneering efforts of Hubble and Zwicky does not exist.
C H A P T E R II
D A T A A C Q U IS IT IO N A N D P R E P A R A T IO N
The explorations o f space end on a note of uncertainty... tpe measure shadows... we search among the ghostly errors of measurement...- Edwin Hubble, 1935
The most recent collection of positions of clusters of galaxies is the data gleaned
by Abell and Corwin (unpublished). This im portant body of information will be
incorporated into a new Southern Galaxy Cluster Survey (Abell et al. (1986)) and
will be consistent throughout with the Northern Survey of Abell (1957). It is from
this preliminary data that we have acquired the cooordinates of the positions of 50
clusters of galaxies found in the Southern Hemisphere. These were chosen for their
proximity {z < 0 .1 ) and their richness, with the intent to measure the clusters in a
consistent fashion and produce a homogeneous sample.
We are interested in the extent of the clusters on the sky; the accurate positions
and orientations of the cluster members; the morphological types of the galaxies in
the clusters and their total mix and the brightness of each of the cluster galaxies
8
D ata Acquisition 9 §2.0
measured consistently to some limiting magnitude. The result of this effort is a ho
mogeneous catalogue of data for 50 clusters of galaxies in the Southern Hemisphere.
We have also chosen to measure 5 Abell clusters of galaxies located in the Equa
torial Region to serve as a basis of comparison and provide a link of compatability
with earlier work.
In the following sections we address the acquisition of the data and the prepa
ration of the catalogue. We begin with the digitization of the position of galaxies
in a selected cluster. Once accurate positions have been measured, estimates are
made of position angle and individual morphological type as well as magnitude.
The positions as measured conform to the standard astrometric conventions of East
preceding, West following; and position angles adhere to the convention of angles
being measured from the N orth, positive Eastwards. Similarly, magnitudes are
measured as visual magnitudes, m„, by virtue of a step-scale calibrated against
photoelectric magnitudes of Virgo Cluster and Indus Supercluster galaxies as well
as AT87 globular clusters. The morphological classification is based on the coding of
revised morphological types by de Vaucouleurs and de Vaucouleurs (1964), but due
to the small size of the images of cluster galaxies on the photographic plates, only
a general classification of E , SO , SA , S B , or P are given. Relevant comments
complete the entry, the comments being a coded visual appearance of the observed
galaxies. W ith the completion of the measurements of a given cluster, the positional
d a ta recovered from the plates are transformed to celestial coordinates to assist in
later observations of the cluster members.
From the final form of the catalogued data we obtain several important cluster
param eters that are useful in comparing cluster information from other sources. Of
the many schemes that we will describe, we select the Abell type and Abell richness
classifications as well as the Bautz-Moryap. Classification as most compatible with
and representative of earlier work.
Data Acquisition 10 §2.1
t . l M ea su rin g th e C lusters
The data are contained on photographic film negative copies of the ESO/SERC
Southern Sky Atlas. The 606 J plates were taken on the UK 1.2m Schmidt Telescope
on Siding Spring Mountain, near Coonabarabran in New South Wales, Australia.
The basic optical parameters of the telescope are very similar to the Palomar 48-
inch Schmidt: aperture 1.24m, focal length 3.07m, giving a plate scale of 67.2
arcsec/mm, /-ratio of f/2.5, and a fuU field of 6.4® x 6.4®, with an unvingnetted field
of 5.4® diameter. The J refers to the Eastman-Kodak type IH aJ emulsion used for
the atlas survey; the plates were hypersensitised before exposure by a combination
of nitrogen and hydrogen gas soaking techniques. All exposures were done through
a 2mm-thick Schott (Jena) GG395 glass filter. The elective bandpass is thus from
about 3950A to 5400A
Measurements of the positions of galaxies on the ESO/SERC J Plates were
made using a Houston Instrument Series 7000 precision microprocessor-based Digi
tizer for converting plate positions into Cartesian (X — P ) digital data, which then
inputs the data to a VAX 11/780 host computer for analysis. The digitizer employs
a translucent active digitizing surface (including a 30mm wide perimeter set aside
as a Menu area) which allows backlighting and provides uniform high resolution
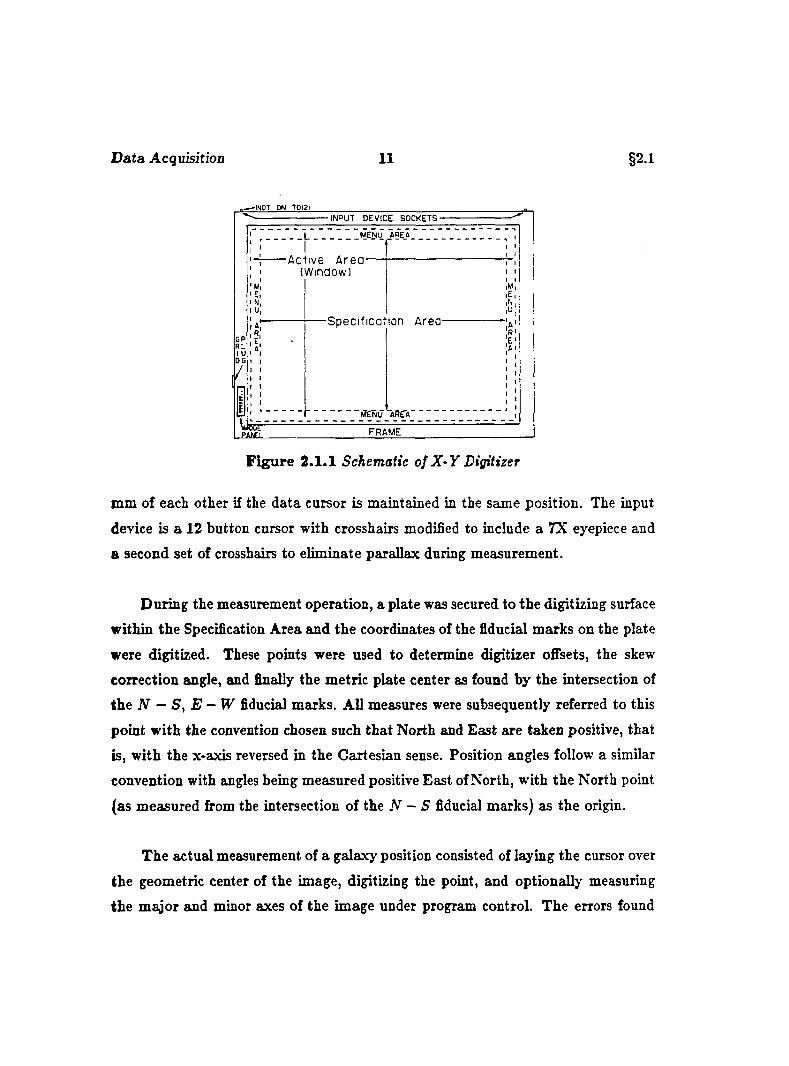
and accuracy over the entire Specification Area (see F igure 2.1.1).
The resolution setting was fixed at 0.025 mm (0.001” ) with a maximum digi
tization rate of one X - P coordinate point per second. A serial single coordinate
record format was chosen for the data in which the X and P magnitudes are repre
sented by seven characters in millimeter scale, plus a sign character, field delimiters
and a tag character. The digitizer was set to automatically average eight consec
utive strobe-scans per reading with the resultant Coordinate output to the host
computer. This averaging yields coordinate values deviating none or only ±0.025
D ata Acquisition 11 §2.1
-IN O T ON 7012)
■INPUT DEVICE SOCKETS-
MENU AREA
-Act i ve Area- (Window)
-Spec if ica t ion Area
■flENU "area"ÜC
PAÆL FRAME
F igu re 2.1.1 Schematic of X -Y Digitizer
mm of each other if the data cursor is maintained in the same position. The input
device is a 12 button cursor with crosshairs modified to include a 7X eyepiece and
a second set of crosshairs to eliminate parallax during measurement.
During the measurement operation, a plate was secured to the digitizing surface
within the Specification Area and the coordinates of the fiducial marks on the plate
were digitized. These points were used to determine digitizer offsets, the skew
correction angle, and finally the metric plate center as found by the intersection of
the N — S, E — W fiducial marks. All measures were subsequently referred to this
point with the convention chosen such tha t North and East are taken positive, that
is, with the x-axis reversed in the Cartesian sense. Position angles follow a similar
convention with angles being measured positive East of North, with the North point
(as measured from the intersection of the N — S fiducial marks) as the origin.
The actual measurement of a galaxy position consisted of laying the cursor over
the geometric center of the image, digitizing the point, and optionally measuring
the m ajor and minor axes of the image under program control. The errors found
D ata Acquisition 12 §2.1
in determining the geometric center of the image have been estimated by repeat
edly measuring the same point on differing occasions and combining the results to
assess our ability to recover a given object from a given field. We find that the
measurements are repeatable in this fashion to erx,j; = 0.286 mm or approximately
19.4 arcseconds for the worst case on the ESO/SERC fields. This virtually excludes
misidentifications of galaxies in the field, in particular if morphological information
is available.
For extended objects, the procedure was generally to measure along the as
sumed m ajor and minor axes of the object until the image faded into the background
density. A word of caution, however, is tha t although the major axis measurements
are repeatable to within = 0.06 mm, the minor axis measurement fiuctuates as a
result of the inability to bisect the major axis readily. Similarly, the construction of
position angles is such that the poles of the major axis are projected to intersect the
line connecting the N — S fiducial marks with a = 6.08 degrees. In general, major
and minor axes and position angles were not measured for objects whose diameter
was less than 0 . 1 mm or did not display an obvious ellipticity.
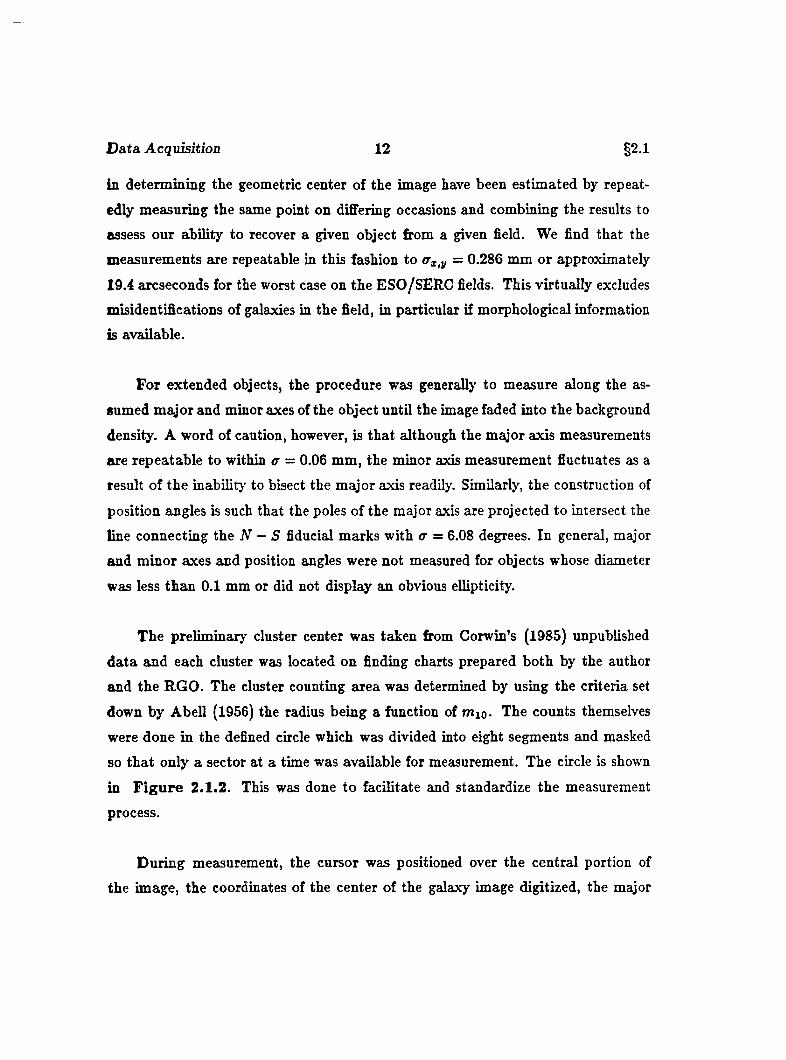
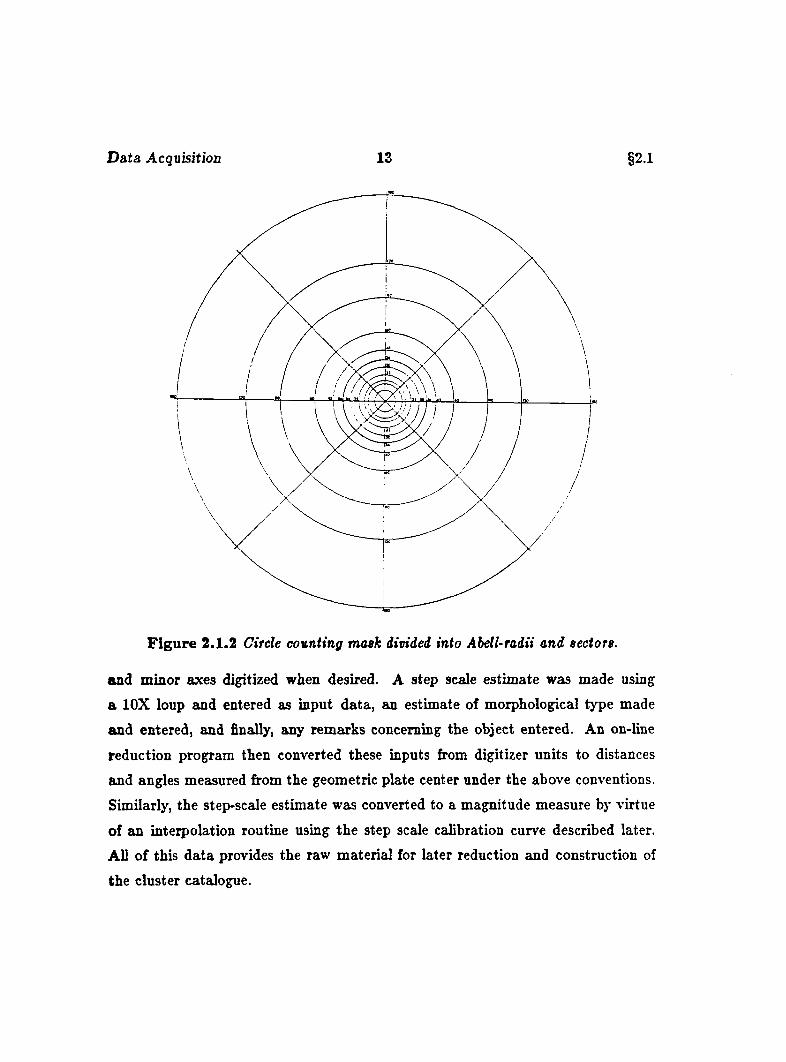
The preliminary cluster center was taken from Corwin’s (1985) unpublished
da ta and each cluster was located on finding charts prepared both by the author
and the RGO. The cluster counting area was determined by using the criteria set
down by Abell (1956) the radius being a function of mio- The counts themselves
were done in the defined circle which was divided into eight segments and masked
so tha t only a sector at a time was available for measurement. The circle is shown
in F ig u re 2.1.2. This was done to facilitate and standardize the measurement
process.
During measurement, the cursor was positioned over the central portion of
the image, the coordinates of the center of the galaxy image digitized, the major
D ata Acquisition 13 §2.1
F ig u re 2.1.2 Circle counting mask divided into Abell-radii and sectors.
and minor axes digitized when desired. A step scale estimate was made using
a lOX loup and entered as input data, an estimate of morphological type made
and entered, and finally, any remarks concerning the object entered. An on-line
reduction program then converted these inputs from digitizer units to distances
and angles measured from the geometric plate center under the above conventions.
Similarly, the step-scale estimate was converted to a magnitude measure by virtue
of an interpolation routine using the step scale calibration curve described later.
All of this da ta provides the raw material for later reduction and construction of
the cluster catalogue.
D a ta Acquisition 14
8.2 The Step-Scale Calibrations
§2.2
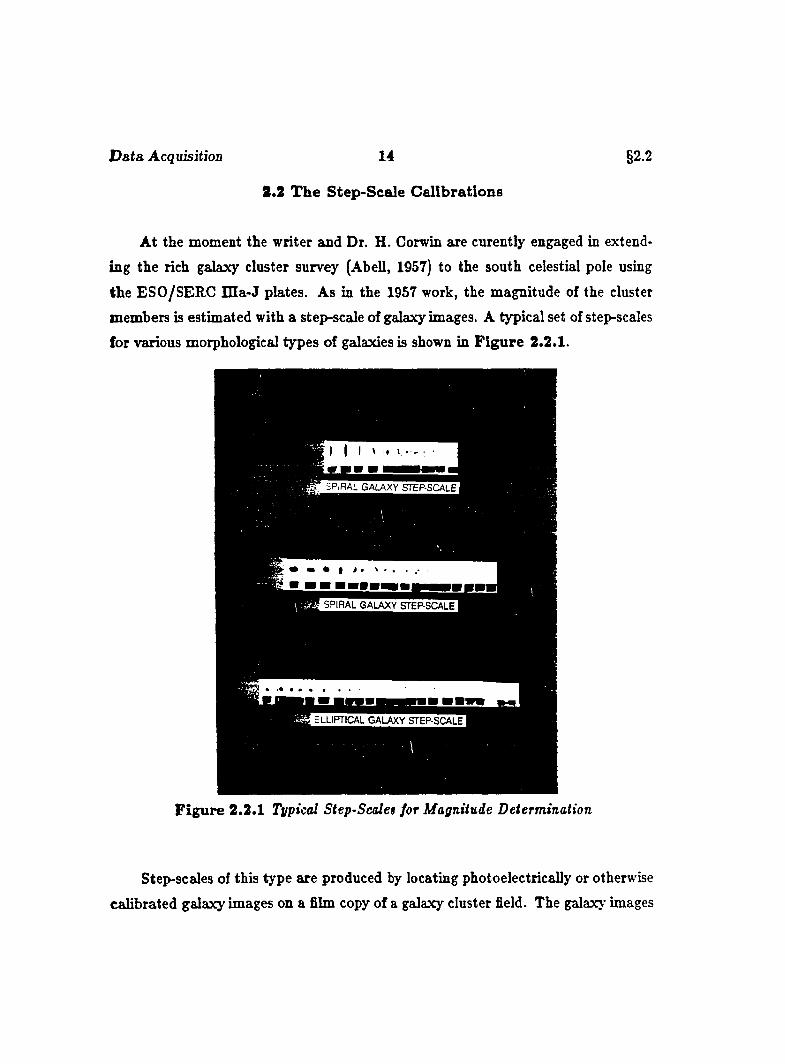
A t the moment the writer and Dr. H. Corwin are curently engaged in extend
ing the rich galaxy cluster survey (Abell, 1957) to the south celestial pole using
the ESO/SERC H la-J plates. As in the 1957 work, the magnitude of the cluster
members is estimated with a step-scale of galaxy images. A typical set of step-scales
for various morphological types of galaxies is shown in F ig u re 2.2.1
PIRAL GALAXY ST E P -SC A LE
bPIRAL GALAXY STEP-SCALE
ELLIPTICAL GALAXY STEP-SCALE
F ig u re 2.2.1 Typical Step-Scaleg for Magnitude Determination
Step-scales of this type are produced by locating photoelectrically or otherwise
calibrated galaxy images on a film copy of a galaxy cluster field. The galaxy images
D ata Acquisition 15 §2.2
are then excised from the film and mounted in a sequential array of increasing
magnitude. This template is then compared to images on program plates and the
magnitudes estimated by direct comparison.
The step scale used in this work is entirely composed of elliptical galaxy images.
A calibration curve for this step scale was generated by estimating step readings
to one tenth of a step for galaxies in the central thirty-six square degrees of the
Virgo Cluster as seen on UK Schmidt plate J2137. Many galaxies to my ~ 14.0 in
this field have well determined total magnitudes listed by de Vaucouleurs and Head
(1978). These are in the system of RC2, but with the addition of data from other
sources and with a small systematic error depending on inclination removed (see de
Vaucouleurs and Corwin, 1977 and de Vaucouleurs et al., 1977).
In the poorly observed range 14.0 < m j < 17.0, a large portion of the photo
electric calibrating data come from Corwin (1980). The data for the 19 Indus area
galaxies plus one galaxy in A2670 act as secondary standards in this range.
The calibration at fainter levels rests on photoelectric observations of three
galaxies in the galaxy cluster A1553 by Sandage (1972), and on photoelectrically
calibrated photographic photometry of galaxies, stars and globular clusters around
M87 by Hanes (1975,1977). Hanes’ work verifies earlier photographic photometry
of objects around M87 by Racine(1968) and Abies et al. (1974).
The mean errors in the calibrating data a t all magnitude levels are better than
Cb .v ~ ±0.15. However, systematic errors in estimating step-scale readings de
pend on surface brightness. Low surface brightness galaxies are generally estimated
too faint because ” integration” by eye of the light in the object’s image is difficult
(this is the prim ary reason for surface brightness errors in the survey photometry of
Shapley and Ames 1932 and in the CGCG. See Holmberg (1958), de Vaulcouleurs
D a ta Acquisition 16 §2.2
(1957), de Vaucouleurs and Pence (1979), and Corwin (1979) for details.) Similarly,
compact high surface brightness objects have their magnitudes underestimated be
cause their light is concentrated in overexposed star-like "dots” and the eye has
only the diameter of these objects to use as a clue to luminosity.
In both cases - high and low surface brightness - the luminosity profile of the
unknown object generally does not match that of the elliptical galaxies on the step
scale. A t faint levels, the effects cannot yet be quantified with any certainty because
of a lack of precise photometry for comparison. However, preliminary indications of
order-of-magnitude reliability come from the studies of Pickup (1979) and Hawkins
(1981). These seem to indicate that systematic errors are indeed present, but that
they do not exceed ±0.5 magnitudes. Another indication of systematic error is
related to magnitude determinations of difi'erent morphological types, but for the
moment the reliability of the step scale is taken as being able to provide total
m agnitudes of about ±0.5 magnitude accuracy.
The step scale calibration curve is shown in F ig u re 2 . 2 . 2 .
Prim e calibrators are photoelectrically {step < 12) or photographically {step >
12) observed galaxies in the Virgo Cluster area; secondary calibrators are photoelec
trically observed galaxies in the Indus area; in addition there is a photoelectrically
observed galaxy in A2670, and photo graphically observed globular clusters and
stars around M87. The step scale has been calibrated using both originals and film
copies of the ESO/SERC J plates. We then calibrate our measurements against
those made by Abell and Corwin by remeasuring those same galaxies, recording the
appropriate step-scale readings and comparing the two. The results are in quite
good agreement and once more suggest the ±0.5 magnitude accuracy. An indepen
dent source of comparison comes from our measurements of m i,m s and mio which
do not deviate by more than a few tenths of calculated magnitudes from estimates
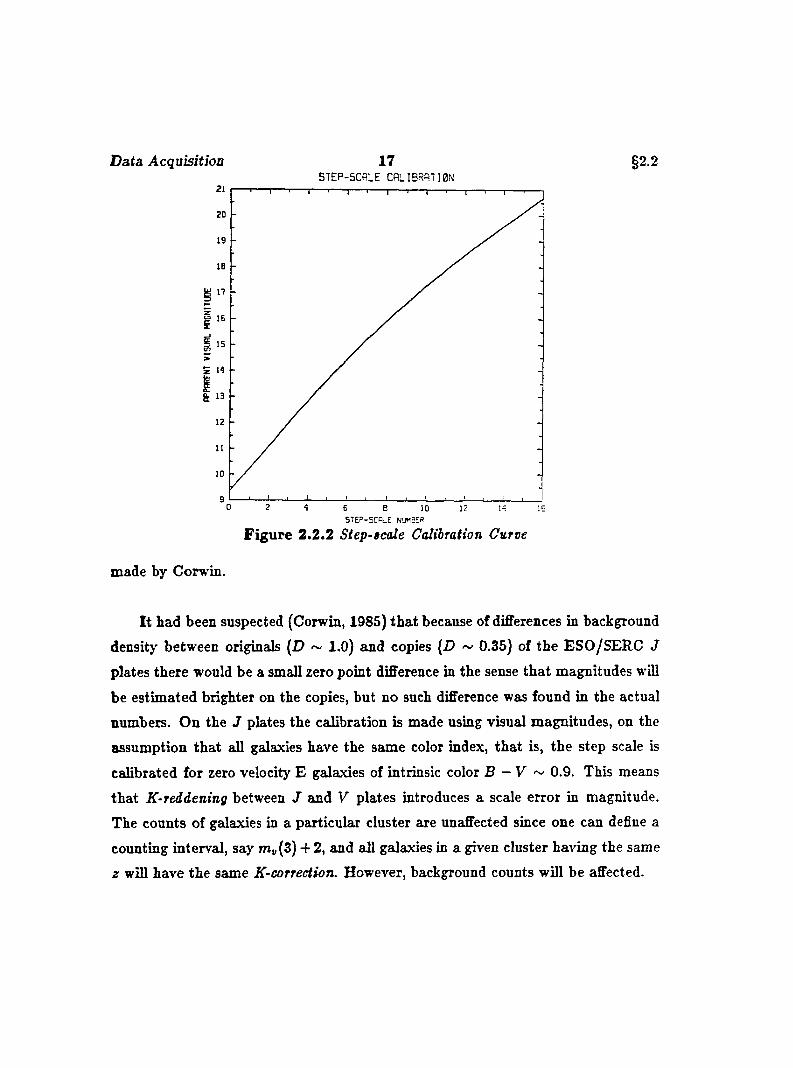
D ata Acquisition 17S T E P - S C A L E CALIBRATION
§2.2
0 2 4 6 e 10 12 14 15
S T £ P -S C fl;.E NUMBER
F igu re 2 .2 .2 Siep-scate Calibration Curve
made by Corwin.
I t had been suspected (Corwin, 1985) th a t because of difFerences in background
density between originals [D ~ 1.0) and copies {D ~ 0.35) of the ESO/SERC J
plates there would be a small zero point difference in the sense tha t magnitudes will
be estim ated brighter on the copies, but no such difference was found in the actual
numbers. On the J plates the calibration is made using visual magnitudes, on the
assumption tha t all galaxies have the same color index, tha t is, the step scale is
calibrated for zero velocity E galaxies of intrinsic color B — V ~ 0.9. This means
tha t K-reddening between J and V plates introduces a scale error in magnitude.
The counts of galaxies in a particular cluster are unaffected since one can define a
counting interval, say m„(3) 4-2, and all galaxies in a given cluster having the same
z will have the same K-correction. However, background counts will be affected.
D ata Acquisition 18 §2.3
3 .3 C o o rd in a te T ran s fo rm a tio n o f M easu rem en ts
Once a given plate has been measured, the resulting rectangular plate coordi
nates must be transformed to the celestial sphere in order to provide positions of
objects for telescopic observations. These positions form an important subgroup of
d a ta in the cluster catalogue and constitute the main spacial representation of the
projected surface density of clusters of galaxies.
Since the earliest days of astronomy stellar positions have been determined by
measuring absolute right ascensions and declinations. This fundamental approach
to spherical astrometry has been extended to fainter stars and galaxies by mea
suring their positions on photograpic plates with respect to a set of standard stars
such as those found in the Smithsonian Astrophysical Observatory Star Catalog
which gives the positions and proper motions of a large number of stars for the
epoch and equinox of 1950.0. Measurements on wide-angle photographs such as
the ESO/SERC J plates yield plane coordinates, which are then reduced to spher
ical (equatorial) coordinates in accordance with the SAO positions. The procedure
requires our ability to project a portion of the celestial sphere onto a plane and re
late the resulting ideal standard coordinates to the measured standard coordinates.
The underlying projective geometry assumes that the telescope is equivalent to a
pinhole camera for which the gnomic projection is appropriate. The ideal standard
coordinates ( , q comprise a rectangular coordinate system on the photographic
plate which is assumed to be planar. For Schmidt plate astrometry this assumption
breaks down and one must introduce the effects of plate curvature in the analysis,
but over small enough regions it is thought that the gnomic projection is adequate
(Eichorn, 1985). The measured standard coordinates x, y are approximations to
the ideal coordinates. Our first task is to relate the ideal standard coordinates to
the corresponding equatorial coordinates.
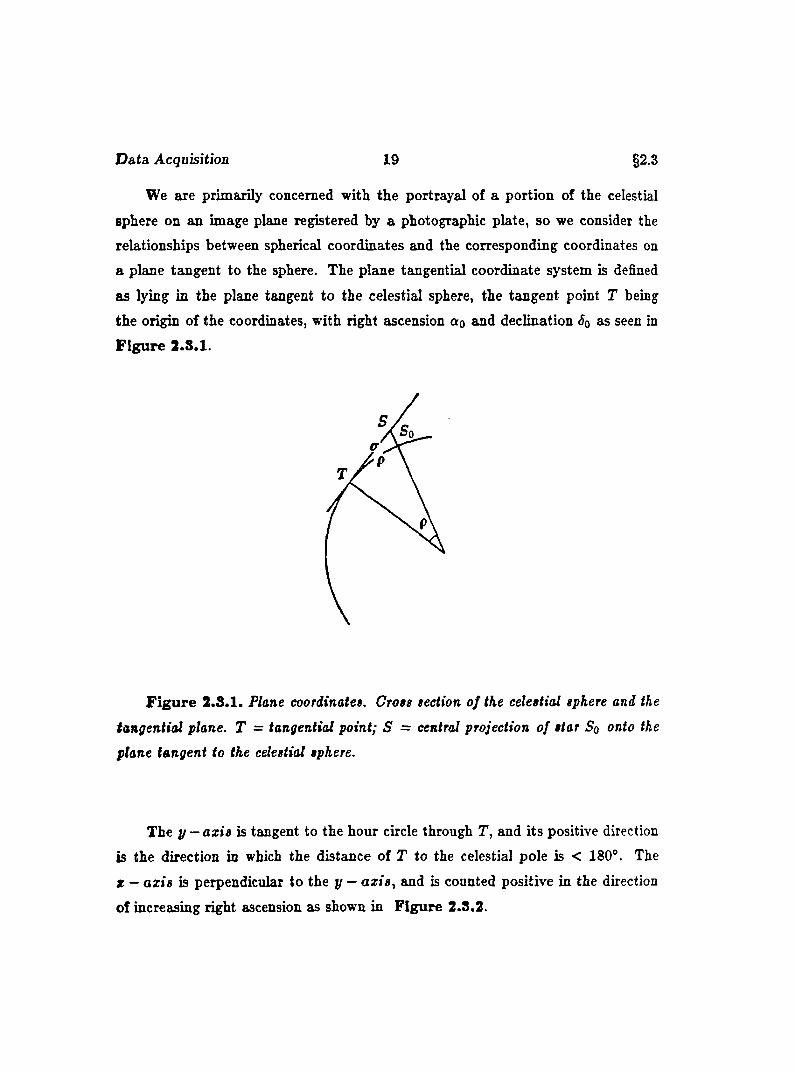
D ata Acquisition 19 §2.3
We are primarily concerned with the portrayal of a portion of the celestial
sphere on an image plane registered by a photographic plate, so we consider the
relationships between spherical coordinates and the corresponding coordinates on
a plane tangent to the sphere. The plane tangential coordinate system is defined
as lying in the plane tangent to the celestial sphere, the tangent point T being
the origin of the coordinates, with right ascension oq and declination Sq as seen in
F ig u re 2.3.1.
F ig u re 2 .3 .1 . Plane coordinates. Cross section of the celestial sphere and the
tangential plane. T = tangential point; S = central projection o f star Sq onto the
plane tangent to the celestial sphere.
The y — axis is tangent to the hour circle through T, and its positive direction
is the direction in which the distance of T to the celestial pole is < 180®. The
z — axis is perpendicular to the y — axis, and is counted positive in the direction
of increasing right ascension as shown in F igure 2.3.2
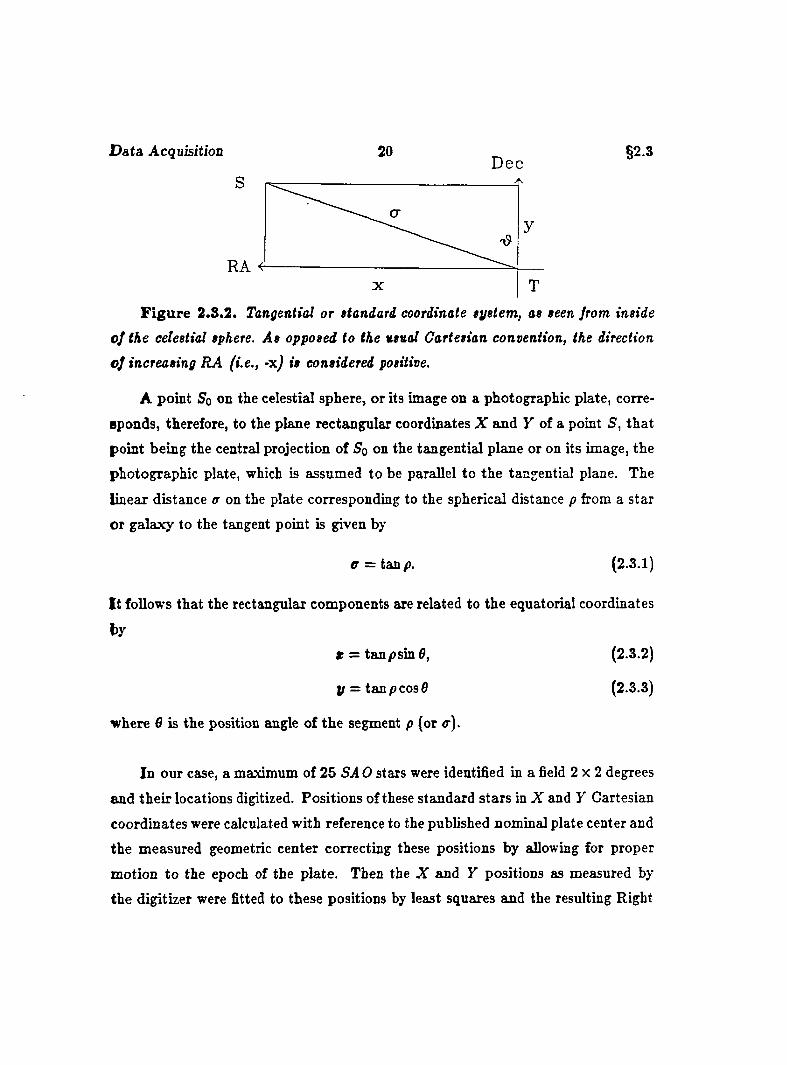
Data. Acquisition 2 0Dec
§2.3
S
RA
F ig u re 2.3.2. Tangential or ftandard coordinate Bystem, as seen from inside
o f the celestial sphere. As opposed to the usual Cartesian convention, the direction
o f increasing R A (i.e., -x) is considered positive.
A point So on the celestial sphere, or its image on a photographic plate, corre
sponds, therefore, to the plane rectangular coordinates X and F of a point 5, tha t
point being the central projection of So on the tangential plane or on its image, the
photographic plate, which is assumed to be parallel to the tangential plane. The
linear distance <r on the plate corresponding to the spherical distance p from a star
or galaxy to the tangent point is given by
c — tan p. (2.3.1)
I t follows that the rectangular components are related to the equatorial coordinates
l>yr = tanpsind, (2.3.2)
y = tan p cos 6 (2.3.3)
where 6 is the position angle of the segment p (or <r).
In our case, a maximum of 25 SAO stars were identified in a field 2 x 2 degrees
and their locations digitized. Positions of these standard stars in X and Y Cartesian
coordinates were calculated with reference to the published nominal plate center and
the measured geometric center correcting these positions by allowing for proper
motion to the epoch of the plate. Then the X and Y positions as measured by
the digitizer were fitted to these positions by least squares and the resulting Right
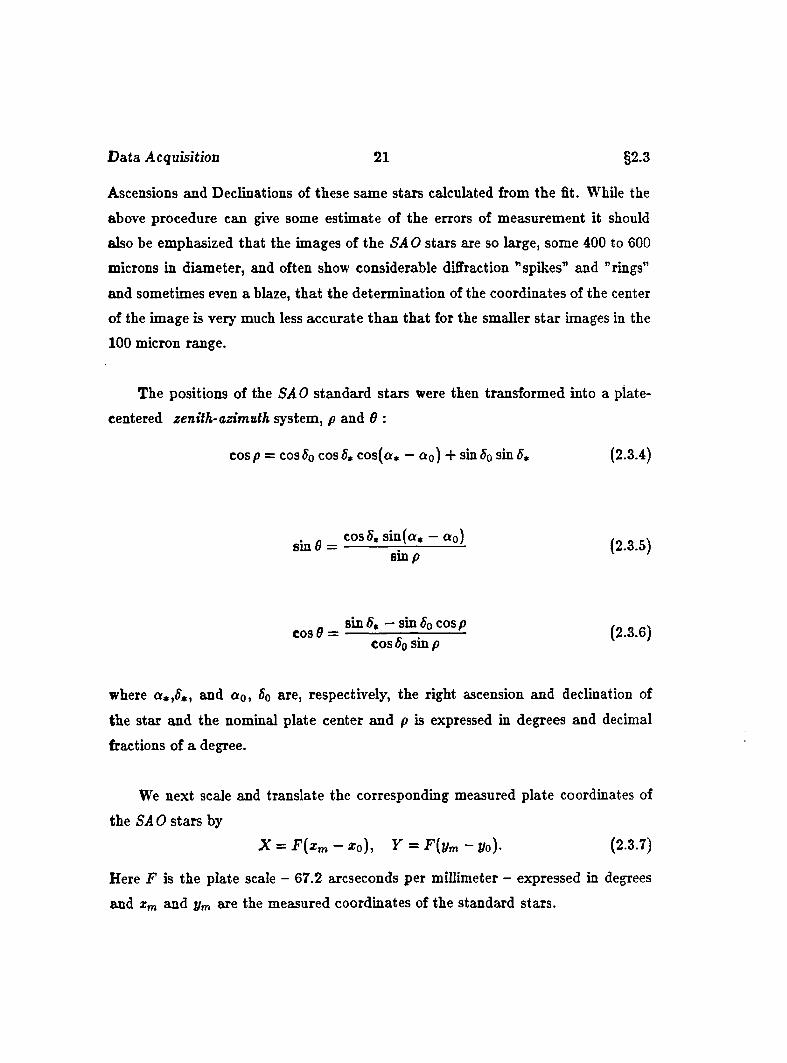
D ata Acquisition 21 §2.3
Ascensions and Declinations of these same stars calculated from the fit. While the
above procedure can give some estimate of the errors of measurement it should
also be emphasized that the images of the SA O stars are so large, some 400 to 600
microns in diameter, and often show considerable diffraction ”spikes” and "rings”
and sometimes even a blaze, tha t the determination of the coordinates of the center
of the image is very much less accurate than that for the smaller s tar images in the
1 0 0 micron range.
The positions of the SAO standard stars were then transformed into a plate-
centered zenith-azimuth system, p and 6 :
cos p = cos So cos St cos(a* — Oq ) + sin sin (2.3.4)
^ i ^ ^ ^ co sg .sm (a . -ao ) (2.3.5)amp
(2.3.6)COS Oo s m p
where and ao. So are, respectively, the right ascension and declination of
the star and the nominal plate center and p is expressed in degrees and decimal
fractions of a degree.
We next scale and translate the corresponding measured plate coordinates of
the SAO stars by
X = F { x m - x o ) , Y = F (y m -y o )- (2.3.7)
Here F is the plate scale - 67.2 arcseconds per millimeter - expressed in degrees
and Xm and y ^ are the measured coordinates of the standard stars.
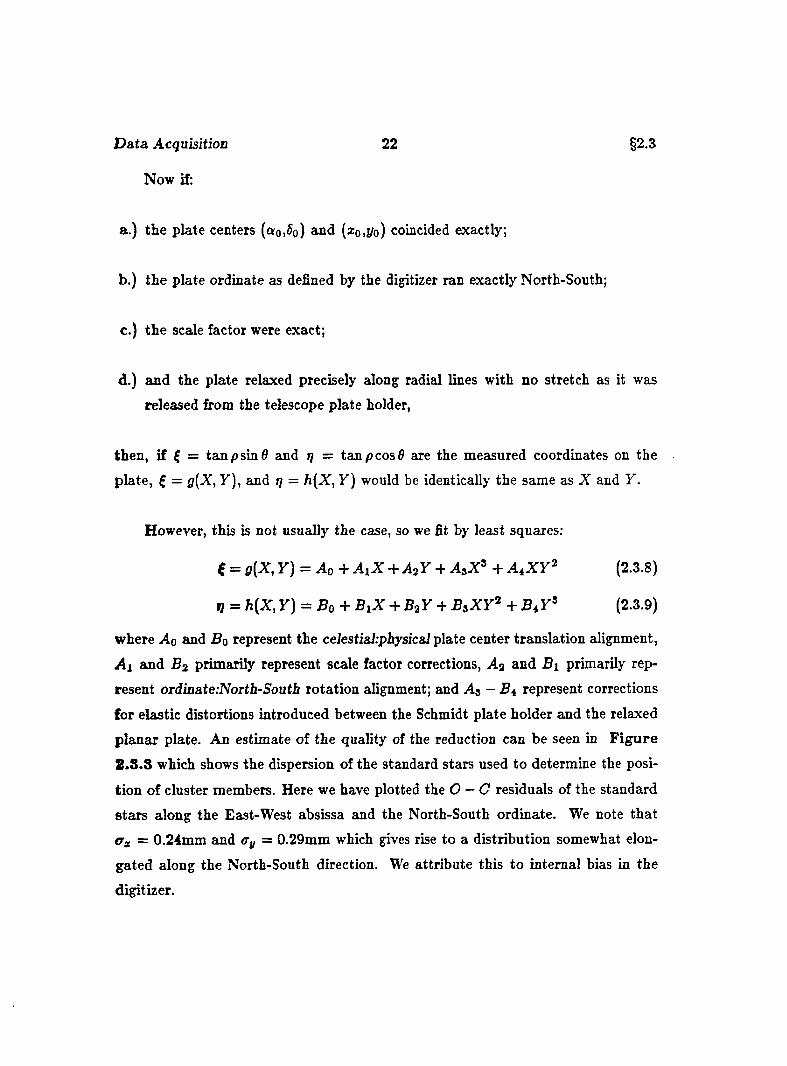
D ata Acquisition 22 §2.3
Now if:
a.) the plate centers (ao,5o) and (ïoiÎ/o) coincided exactly;
b.) the plate ordinate as defined by the digitizer ran exactly North-South;
c.) the scale factor were exact;
d.) and the plate relaxed precisely along radial lines with no stretch as it was
released from the telescope plate holder,
then, if ( = tan p sin d and tj = tan p cos 0 are the measured coordinates on the
plate, ( = g(X, Y) , and r/ = h (X , Y) would be identically the same as X and Y .
However, this is not usually the case, so we fit by least squares:
e = g{X, Y ) = A o + A iX + A 2 Y-i- A ^X ^ + A ^ X Y ^ (2.3.8)
q = h{X, y ) = Bo + B iX + B 2 Y + B iX Y ^ + B ^Y ^ (2.3.9)
where A q and Bo represent the celestial:pbysical plate center translation alignment,
A i and primarily represent scale factor corrections, Aa and B% primarily rep
resent ordinate:Nortb-Soutb rotation alignment; and A3 — B 4 represent corrections
for elastic distortions introduced between the Schmidt plate holder and the relaxed
planar plate. An estimate of the quality of the reduction can be seen in F igu re
2 .3 .3 which shows the dispersion of the standard stars used to determine the posi
tion of cluster members. Here we have plotted the O — G residuals of the standard
stars along the East-West absissa and the North-South ordinate. We note that
tTx = 0.24mm and Cy = 0.29mm which gives rise to a distribution somewhat elon
gated along the North-South direction. We attribute this to internal bias in the
digitizer.
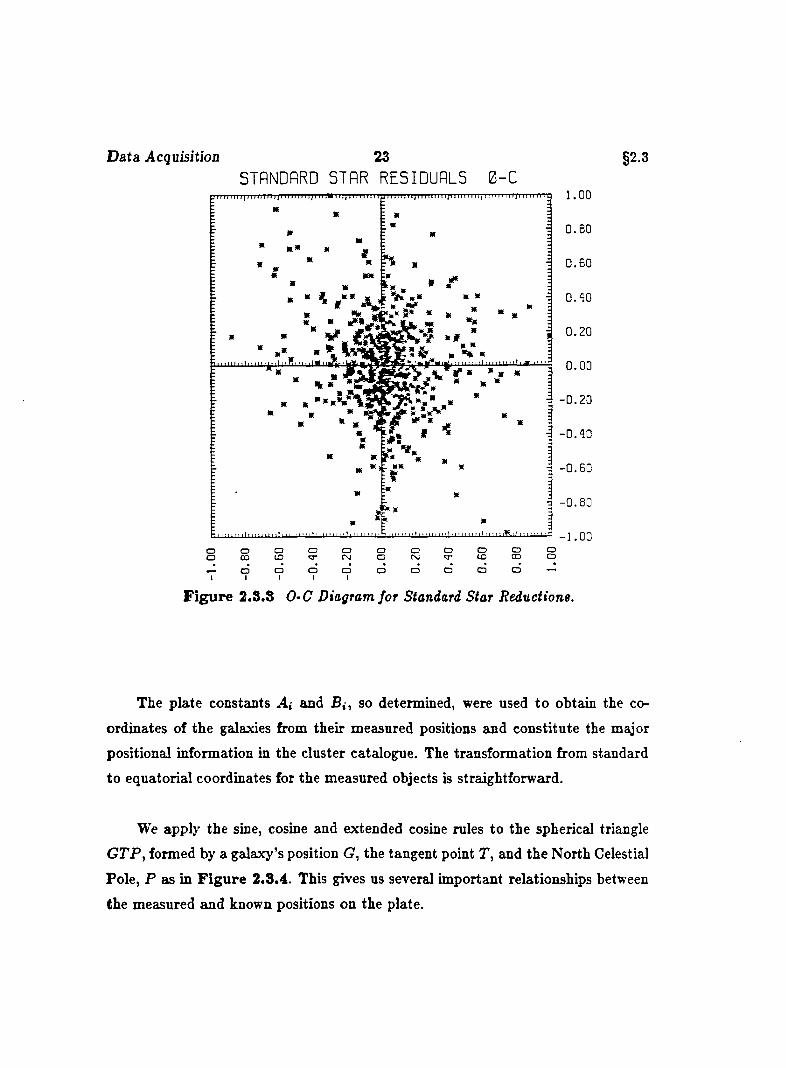
D ata Acquisition 23ST ANDARD S T A R R E S I D U A L S 0 - C
§2.3
1.00
0 . 6 0
0 . 5 0
MK•L* 0 .20
0 .00
0 .20
0 . 4 0
• 0 . 5 0
- 0 . 8 0
- 3 . 0 0CDCD
CDCD
OCD
CDCDCO
of \ l
oo o(NJCDCD
O00^ CD
I IO
ICD ~
F ig u re 2.8.3 0-C Diagram for Standard Star Reductions.
The plate constants Ai and B,-, so determined, were used to obtain the co
ordinates of the galaxies from their measured positions and constitute the major
positional information in the cluster catalogue. The transformation from standard
to equatorial coordinates for the measured objects is straightforward.
We apply the sine, cosine and extended cosine rules to the spherical triangle
G TP , formed by a galaxy’s position G, the tangent point T , and the North Celestial
Pole, P as in F ig u re 2.3.4 This gives us several important relationships between
the measured and known positions on the plate.
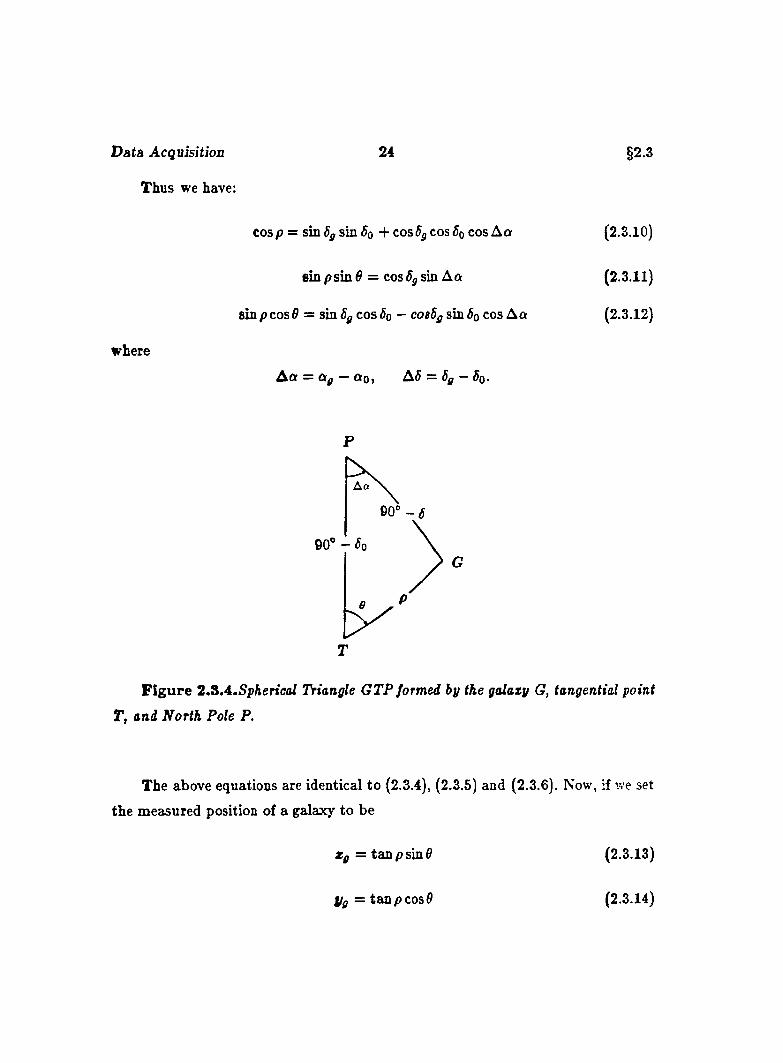
Data Acquisition
Thus we have;
24
where
cos p = sin Sff sin So + cos 6g cos Sq cos A a
BinpsinG = cos 6g sin A a
sin p cos 6 = sin cos — cosSg sin So cos A a
A a = Qg — tto, A f = fg — So.
§2.3
(2.3.10)
(2.3.11)
(2.3.12)
Ao
T
G
F ig u re 2.SA.Spherieal Triangle GTP formed by the galaxy G, tangential point
T, and North Pole P.
The above equations are identical to (2.3.4), (2.3.5) and (2.3.6). Now, if we set
the measured position of a galaxy to be
Xg = tan p sin 0
Pg = tan p cos 6
(2.3.13)
(2.3.14)
D ata Acquisition 25 §2.3
a n d d iv id e ( 2 .3 .1 1 ) a n d ( 2 .3 .1 2 ) b y ( 2 .3 .1 0 ) , r e s p e c t iv e ly , a n d s u b s t i t u t in g in ( 2 .3 .1 3 )
a n d ( 2 .3 .1 4 ) w e o b t a in
------ ( 2 .3 .1 5 )s i n 0 s m Ô0 + c o s 5 c o s Oq c o s A a
andsin 5 cos 5o ~ cos 5 sin ^ 0 cos A a
% = : J-----r ------- (2.3.16)sin 0 sin Oo + cos 0 cos Oo cos Aa
We can now express A a and 6g for a measured galaxy in terms of the measured
positions Xg and jjg and the celestial coordinates of the nominal plate center (ao, ^o).
Equation ( 2 .3 .1 6 ) can be written
yg (sin Sg sin So + cos 5g cos Sq c o s A a) = sin 5g cos Sq — cos Sg sin Sq cos A a
o r
s in Sg(cosSo - yg s in 5o ) = cos6g{yg c o s^ o + s in 5o) c o s A a,
f r o m w h ic h w e f in d
I fisn -i- «J Ic o s A a. ( 2 .3 .1 7 )
. c fs in ^o + î/oCOs5q' tân Oÿ — I ,
[cos So - t/g sm So,
The quantity A a may be found by writing ( 2 .3 .1 5 ) as
sin A a = (sin Sg sin + cos Sg cos So cos A a)
= Xg{iasiSg sin^o + c o s 5q c o s A a).
Since from ( 2 .3 .1 7 ) we have
|_sinoo + yg cos Sol(2.3.18)
we can write
[ , c . r c ^ cosfo - % sin go]tan Sn sin do + tan Sg cos do -i—:-------t"" " smdo + î/y cosdoj
- r sin^ do + Vo sin do cos do + cos* do - y g sin do cos do— X g t& D S g I : % J- BUlSo + ygCOsSo
sin A a = Xg
Data Acquisition 26 §2.3
from which
sin A a = . . (2.3.19)sm So + Vg cos So
Also, by dividing (2.3.19) by (2.3.18), we finally obtain:
tan A a = ----- . (2.3.20)cosSo - VgSmSo
The catalogued positions of both cluster centers and positions of galaxies are
determined by applying the plate constants A,- and Bi to the measured galaxy
positions and substituting the resulting quantities in equations (2.3.17) and (2.3.20).
This yields the equatorial coordinates and Sg which are reduced to the epoch
1950. We assume the errors in position are similar to those of the standard star
positions.
I t is also of interest to transform the equatorial coordinates of the cluster
centers to new galactic coordinates. This is useful to give estimates of galactic
extinction which effects the determination of mio and hence, the cluster redshift.
The conversion formulae to galactic latitude, 6 , and galactic longitude, I, are given
by:
b = sin” {cos Sg cos Sq cos(a^ — og) + sin Sg sin gg } , (2.3.21)
and
( cos Sg sin(ag - a g ) cos Sg J
where the epoch 1950 coordinates of the North Galactic Pole are given by a g =
192® 15' and Sa = +27® 24' with the ascending node of the galactic plane on the
equator as Ig = 33®.
Data Acquisition 27 §2.4
2.4 D e te rm in a tio n o f C lu s te r C en ters
Once we obtain a set of coordinate values for the position of galaxies in a
cluster, an im portant parameter to be derived is the center of the cluster. We have
determined the center of each cluster by various means. Here we accept the fact
tha t we are merely displaying our ignorance of just what constitutes a cluster and
our inability to determine other than operationally the nature of such an ensemble
of objects. Up to this point the term cluster has been used in an intuitive sense
without attem pting any formal definition, such as a group of contiguous elements
in a statistical population.
A discription of what constitutes a cluster which probably agrees with our
intuitive understanding of the term is given by considering our galaxies as points in
Euclidean space. Clusters may now be described as continuous regions of this space
containing a relatively high density of points, separated from other such regions by
regions contmning a relatively low density of points. Care must be taken, however,
not to restrict the definition. For example, there is no a priori reason for believing
tha t any clusters present in the data are of one particular shape and we must guard
against imposing a particular structure on the data, rather than finding the actual
structure present.
So to determine the center of a clusters depends on just what we think a cluster
is. In the case of clusters of galaxies, the notion of cluster center at its simplest
refers to the geometric centre of a bivariate distribution of points projected onto the
plane; the notion can be further compounded by the realization that in actuality
we are dealing with a multivariate population of objects of different morphological
classes or sub-populations, effected by selection and possible mass segregations. For
the sake of simplicity' and homogeneity, we choose a geometric approach.
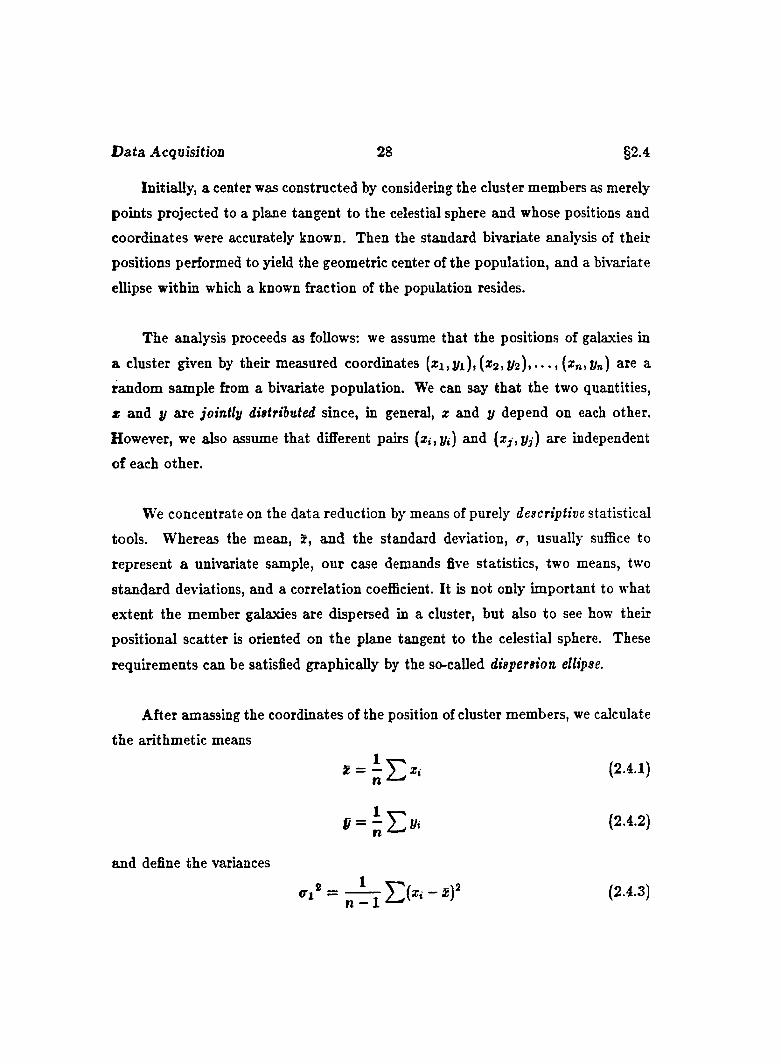
Data Acquisition 28 §2.4
Initially, a center was constructed by considering the cluster members as merely
points projected to a plane tangent to the celestial sphere and whose positions and
coordinates were accurately known. Then the standard bivariate analysis of their
positions performed to yield the geometric center of the population, and a bivariate
ellipse within which a known fraction of the population resides.
The analysis proceeds as follows: we assume that the positions of galaxies in
a cluster pven by their measured coordinates (z»,*/») are a
random sample from a bivariate population. We can say that the two quantities,
r and j/ are jointly distribated since, in general, x and y depend on each other.
However, we also assume that different pairs and (zy, are independent
of each other.
We concentrate on the data reduction by means of purely descriptive statistical
tools. Whereas the mean, x, and the standard deviation, usually suffice to
represent a univariate sample, our case demands five statistics, two means, two
standard deviations, and a correlation coefficient. It is not only important to what
extent the member galaxies are dispersed in a cluster, but also to see how their
positional scatter is oriented on the plane tangent to the celestial sphere. These
requirements can be satisfied graphically by the so-called dispersion ellipse.
After amassing the coordinates of the position of cluster members, we calculate
the arithmetic means
and define the variances
(2.4.2)
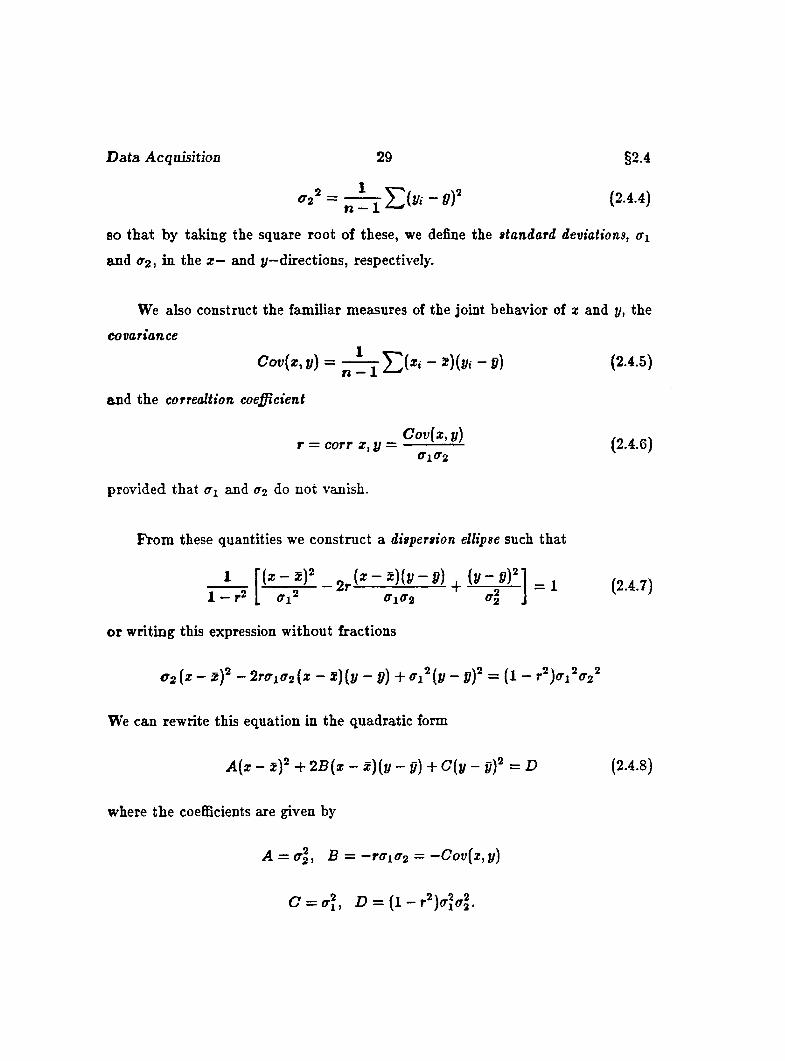
Data Acquisition 29 §2.4
- e f (2.4.4)
so tha t by taking the square root of these, we define the standard deviations, Oi
and <T2 , in the x — and y—directions, respectively.
We also construct the familiar measures of the joint behavior of x and y, the
covariance
Cov[x, y) = % ](zi - ï)(y, - s) (2.4.5)
and the cor reaction coefficient
r = o o T r x . y = ^ ^ a i ^ (2.4,6)
provided that Oi and 0 2 do not vanish.
From these quantities we construct a dispersion ellipse such that
1 (z - _ „ ^ ( g - g ) ( y - p ) ( y - g )1 - r* [ <7-i<T2 ' O’!
or writing this expression without fractions
f 2 (z - - 2 ro-i(r2 {x - i){ y - g) +o" i^ (y-g)^ = ( l - r*)o’i^o’2 ^
We can rewrite this equation in the quadratic form
A{x - i f + 2B{x - x){y - g) + C{y - ÿ f = D (2.4.8)
where the coefficients are given by
A = (rl, B = —TOitTz = —Cov{z, y]
C = (Ti, D = {l-r'^)a\(T\.
= 1 (2.4.7)
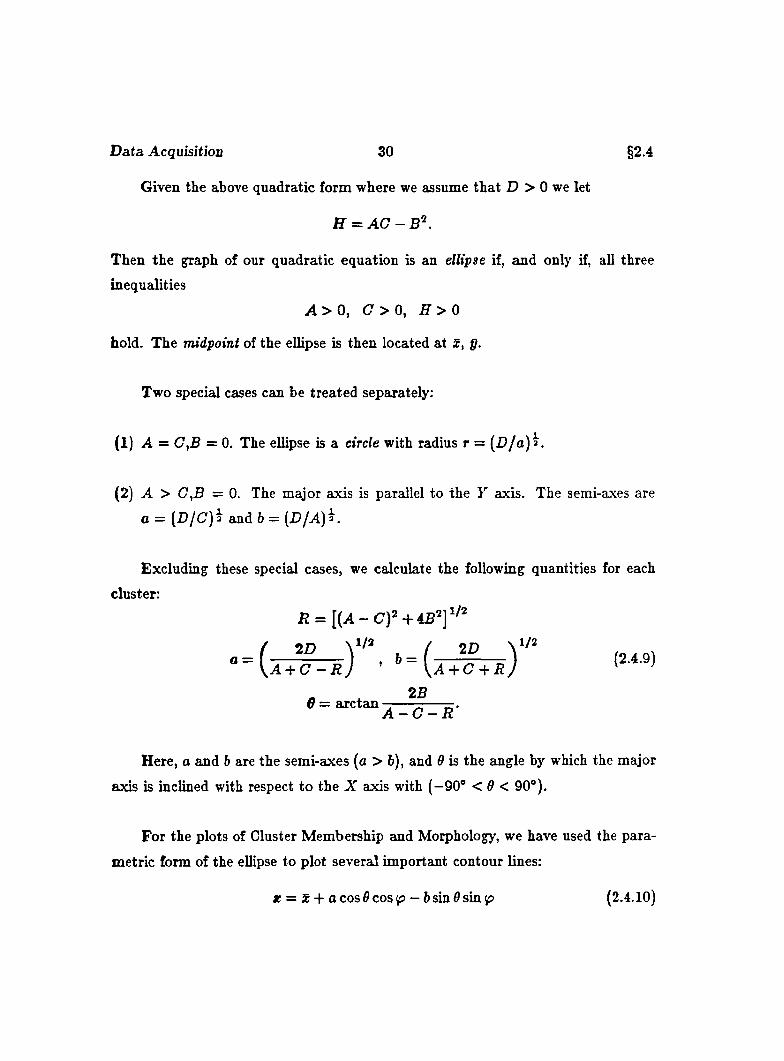
Data Acquisition 30 §2.4
Given the above quadratic form where we assume that D > 0 we let
f f = A C - B^.
Then the graph of our quadratic equation is an ellipse if, and only if, all three
inequalities
A > 0 , G > 0 , H > 0
hold. The midpoint of the ellipse is then located at î , ÿ.
Two special cases can be treated separately:
(1) A = C7,B = 0. The ellipse is a circle with radius r = (D/a )a .
(2) A > = 0. The major axis is parallel to the Y axis. The semi-axes are
a = ( D / C ) 3 and b — [DJA)^ .
Excluding these special cases, we calculate the following quantities for each
cluster:
R = [ { A - C Ÿ
2BG = arctanA — C — R
Here, a and b are the semi-axes (a > 6 ), and 0 is the angle by which the major
axis is inclined with respect to the X axis with (—90° < 0 < 90°).
For the plots of Cluster Membership and Morphology, we have used the para
metric form of the ellipse to plot several important contour lines:
a: = 3c-I-a cos 0 cos — 6 sin 0 sin 4P (2.4.10)
D ata Acquisition 31 §2.4
1 / = Ç + osin0cosÿ5 + 6cos6sin 4 5 (2.4.11)
with p a variable angle increasing from 0 to
It is of some interest to inquire what fraction of the cluster population de
termined by their positions z,, y, fall inside of the dispersion ellipse. We have
designated these as the core population. Following Trumpler and Weaver (1953)
we note tha t if /ix is the expectation and a i the standard deviation of the random
positional variable, X , then the probability density is given by:
f i ( x ) = (2ir)~^f^<rî^exp [-(a : - /ii)^ /2 ffi^ ] . (2.4.12)
Correspondingly, if is the expectation and the standard deviation of the
random positional variable Y , the probability density is
/2 (y ) = {2n)~^^'^(T2^exp [ - ( y - ^ 2 ^ ■ (2.4.13)
If we assume tha t x and y are independent of each other we can multiply f i {x ) and
/ 2 (y) hi order to obtain the probability of the joint distribution:
/ ( z , y) = f i { x ) • / 2 (y) = (2;r<Ti<7-2)“ ^ezp |^ -^g(z, y) . (2.4.14)
Here, the auxiliary function g{x, y) is
= , 2 .,.15)a l <r|
To study the density function f{x, y) we consider the contour lines or isolines
with equations
f {x ,y) = constant.
Since the variables x and y only occur in g{x,y), it suffices to study the lines
g(x, y) = COT
+ = (2.4.ie)
D ata Acquisition 32 §2.4
where each isollne is associated with a particular constant e.
A comparison of equation (2.4.16) with
= (2.4.17)
reveals that the isoline represents an ellipse with its center a t the point (pi, P2 ) and
with semi-axes
a = c^CTx,b = caffj.
In general,
o : 6 = <Tj ; <ra
Hence, given <Ti and <ra, the isolines are timilar in the geometric sense. f {x , y )
reaches its highest value at the central point {(1 1 , ^ 2 ) where c = 0 and f {x ,y) =
(2s-<Ti(T2)“ . An example is shown in F igure 2.4.1. Here, as in the plots of
Cluster Membership and Morphology, c takes on the values 0,1,2 . The parameter
c indicates the size of the ellipse; and all those galaxies inside the dispersion ellipse
th a t comprise the core population have c < 1.
Now the area of an ellipse defined by the above parameters is ro-jo-gc^. The
element of area dA corresponding to the change of c from c — d | to c -h d | is
2 Ta‘iO’2 cdc the frequency along such an infinitesimal ring is constant and equals
12ff<ri(T2
The fraction of the population du contained within the ring is thus ce % do and
the fraction u of the galaxy population contained within the dispersion ellipse is
therefore
- j :1 - e-2 = 0.39347. (2.4.18)
a
The dispersion ellipse thus encloses some 39 percent of the to ta l galaxy population
and can be used to estimate cluster density and richness.
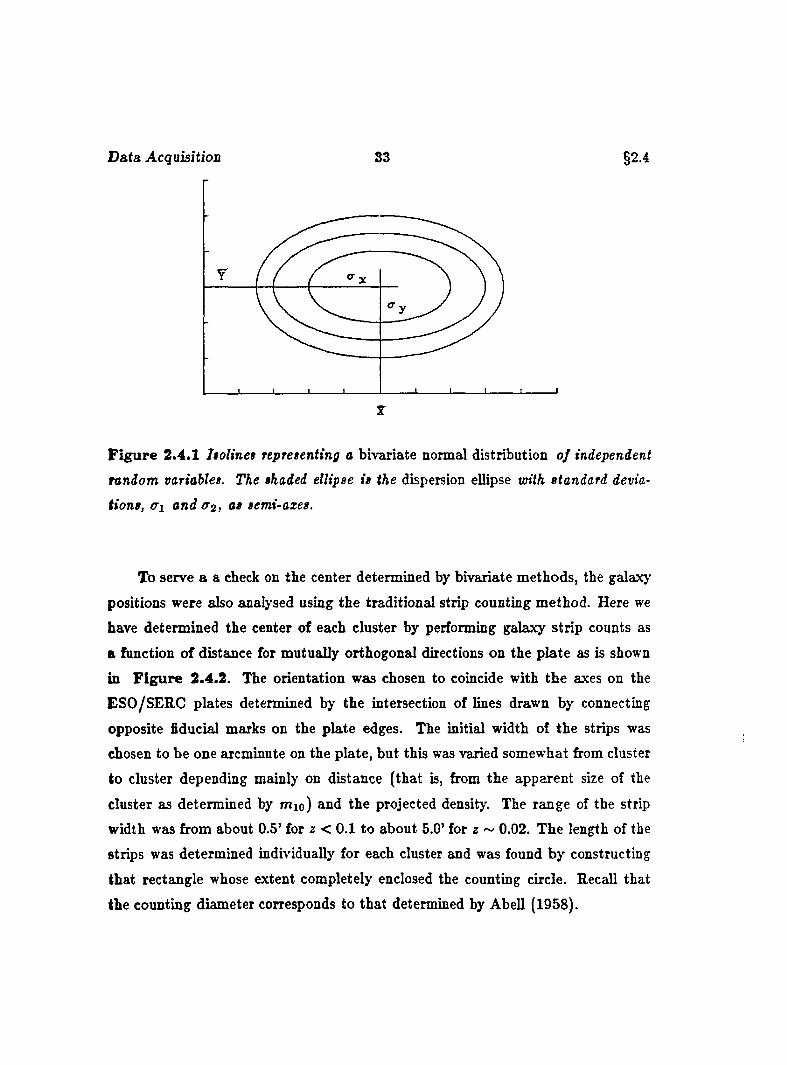
D ata Acquisition 33 §2.4
r
F ig u re 2 .4 .1 Itolinet representing a bivariate normal distribution o f independent
random variables. The shaded ellipse is the dispersion ellipse with standard devia
tions, Cl and 0 2 , as semi-axes.
To serve a a check on the center determined by bivariate methods, the galaxy
positions were also analysed using the traditional strip counting method. Here we
have determined the center of each cluster by performing galaxy strip counts as
a function of distance for mutually orthogonal directions on the plate as is shown
in F ig u re 2.4.2. The orientation was chosen to coincide with the axes on the
ESO/SERC plates determined by the intersection of lines drawn by connecting
opposite fiducial marks on the plate edges. The initial width of the strips was
chosen to be one arcminute on the plate, but this was varied somewhat from cluster
to cluster depending mainly on distance (that is, from the apparent size of the
cluster as determined by mio) and the projected density. The range of the strip
width was from about 0.5’ for z < 0.1 to about 5.0’ for z ~ 0.02. The length of the
strips was determined individually for each cluster and was found by constructing
that rectangle whose extent completely enclosed the counting circle. Recall that
the counting diameter corresponds to tha t determined by Abell (1958).
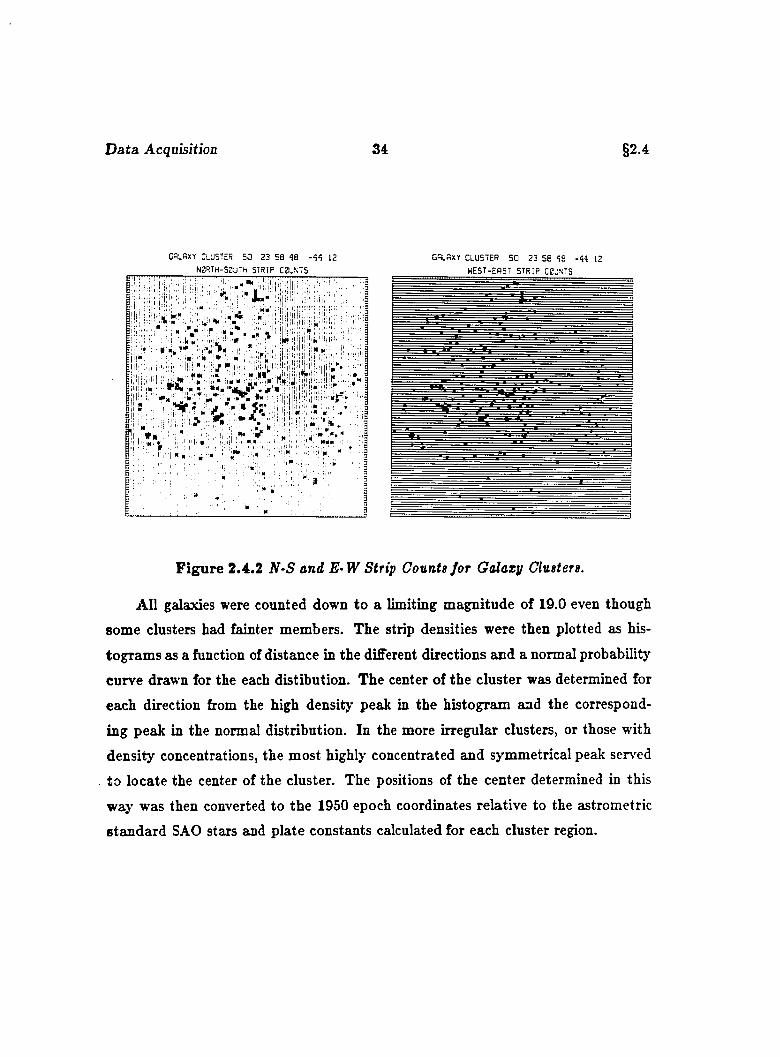
D ata AcquisitioD 34 §2.4
CflLR XY CLUSTER 5 0 2 3 5 8 4 8 - 4 4 12
NZRTH-SBUTH s t r ip C2UM S________________
I l i S i l f '
m m *■»f.*.I « ■ » • »
"''I:,!"''!'']'!"
G fiLB X Y C LU STER 5 0 2 3 5 8 4 3 - 4 4 12
W E S T -E A S T S T R IP c e u M S
F igu re 2.4.2 N -S and E -W Strip Gounte fo r Galaxy Clusters.
All galaxies were counted down to a limiting magnitude of 19.0 even though
some clusters had fainter members. The strip densities were then plotted as his
togram s as a function of distance in the different directions and a normal probability'
curve drawn for the each distibution. The center of the cluster was determined for
each direction from the high density peak in the histogram and the correspond
ing peak in the normal distribution. In the more irregular clusters, or those with
density concentrations, the most highly concentrated and symmetrical peak served
to locate the center of the cluster. The positions of the center determined in this
way was then converted to the 1950 epoch coordinates relative to the astrometric
standard SAO stars and plate constants calculated for each cluster region.
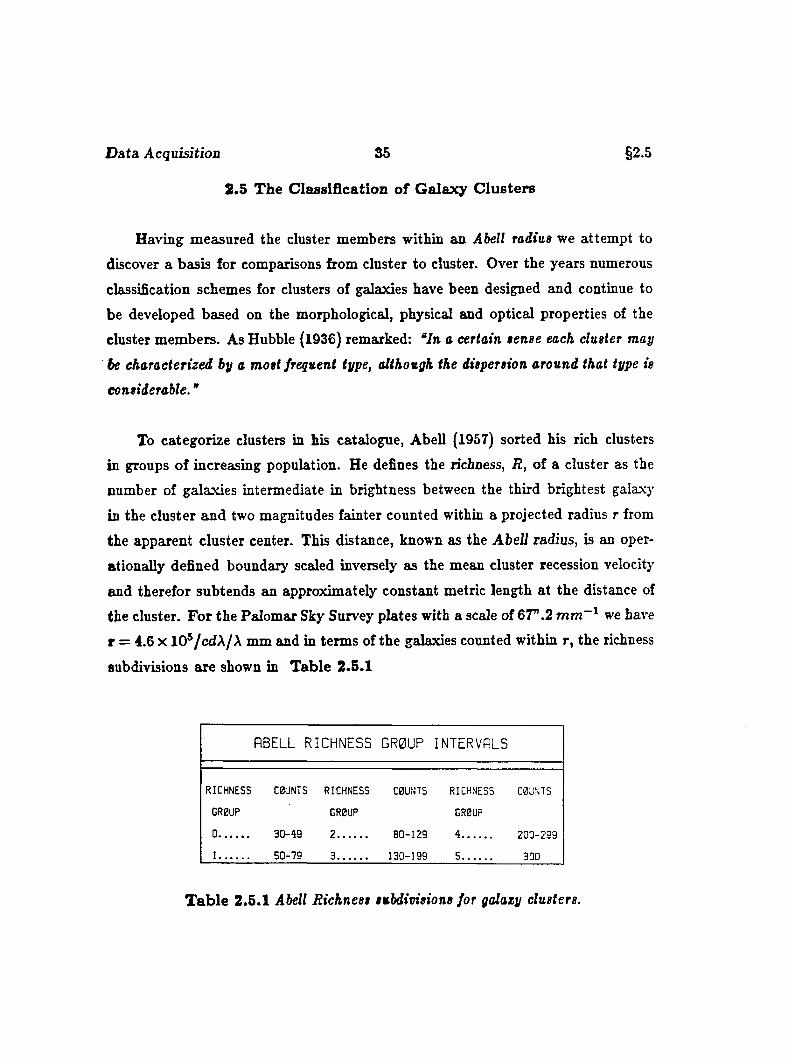
D ata Acquisition 35 §2.5
2.5 T he C lassifica tion o f G alaxy C lu s te rs
Having measured the cluster members within an Abell radius we attem pt to
discover a basis for comparisons from cluster to cluster. Over the years numerous
classification schemes for clusters of galaxies have been designed and continue to
be developed based on the morphological, physical and optical properties of the
cluster members. As Hubble (1936) remarked: “In a certain sense each cluster may
be characterized by a m ost frequent type, although the dispersion around that type is
considerable. ”
To categorize clusters in his catalogue, Abell (1957) sorted his rich clusters
in groups of increasing population. He defines the richness, R , of a cluster as the
number of galaxies intermediate in brightness between the third brightest galaxy
in the cluster and two magnitudes fainter counted within a projected radius r from
the apparent cluster center. This distance, known as the A b ell radius, is an oper
ationally defined boundary scaled inversely as the mean cluster recession velocity
and therefor subtends an approximately constant metric length a t the distance of
the cluster. For the Palom ar Sky Survey plates with a scale of 67^.2 we have
r = 4.6 X 10*/cdA/A mm and in term s of the galaxies counted within r, the richness
subdivisions are shown in T able 2.5.1
ABELL R I C H N E S S G R 0 U P I NTERVALS
RICHNESS C0UNTS RICHNESS C0UNTS RICHNESS C0LINTS
GR0UP GR0UP GR0UP
0.......... 30-49 2 .......... 80-129 4.............. 200-299
1 50-79 3 130-199 5............... 300
T a b le 2.5.1 Abell Richness subdivisions for galazy clusters.
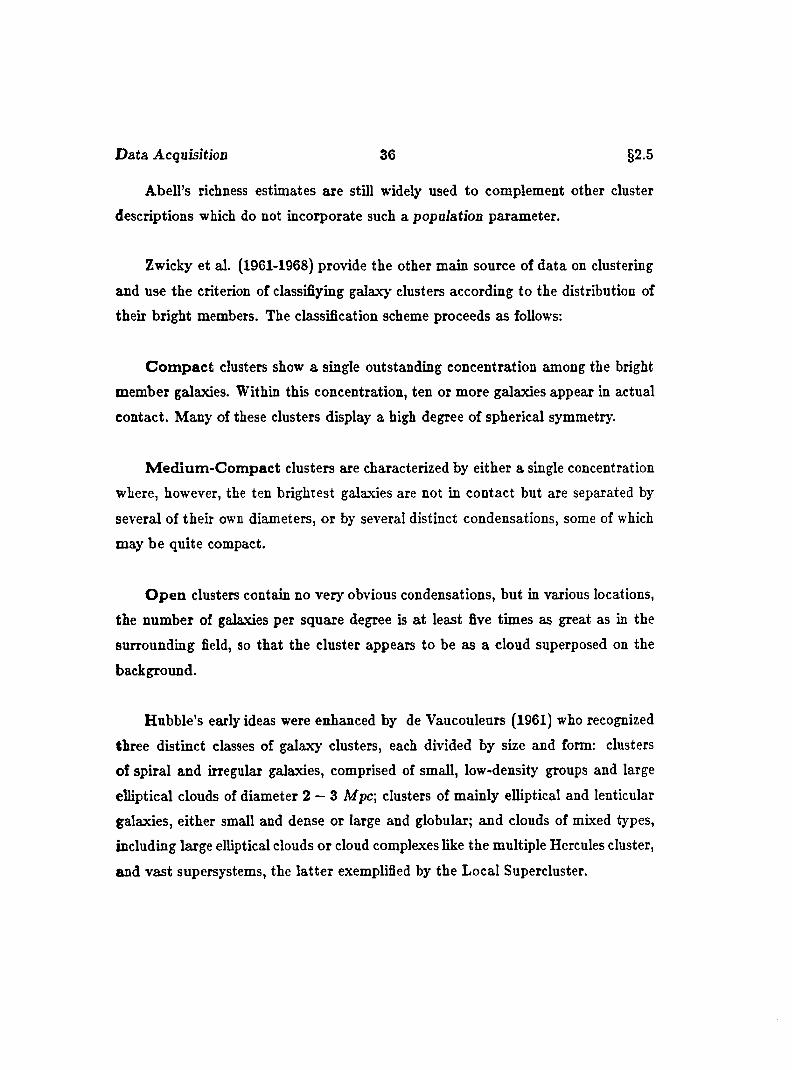
D ata Acquisition 36 §2.5
Abell’s richness estimates are still widely used to complement other cluster
descriptions which do not incorporate such a population parameter.
Zwicky et al. (1961-1968) provide the other main source of data on clustering
and use the criterion of classifîying galaxy clusters according to the distribution of
their bright members. The classification scheme proceeds as follows:
C o m p a c t clusters show a single outstanding concentration among the bright
member galaxies. Within this concentration, ten or more galaxies appear in actual
contact. Many of these clusters display a high degree of spherical symmetry.
M ed iu m -C o m p ac t clusters are characterized by either a single concentration
where, however, the ten brightest galaxies are not in contact but are separated by
several of their own diameters, or by several distinct condensations, some of which
may be quite compact.
O p e n clusters contain no very obvious condensations, but in various locations,
the number of galaxies per square degree is a t least five times as great as in the
surrounding field, so that the cluster appears to be as a cloud superposed on the
background.
Hubble’s early ideas were enhanced by de Vaucouleurs (1961) who recognized
three distinct classes of galaxy clusters, each divided by size and form: clusters
of spiral and irregular galaxies, comprised of small, low-density groups and large
elliptical clouds of diameter 2 — 3 Mpc; clusters of mainly elliptical and lenticular
galaxies, either small and dense or large and globular; and clouds of mixed types,
including large elliptical clouds or cloud complexes like the multiple Hercules cluster,
and vast supersystems, the la tte r exemplified by the Local Supercluster.
D ata Acquisition 37 §2.5
After examining the 20 nearest clusters in Abell’s (1957) catalogue, Morgan
(1961, 1962) suggested that the Coma and Virgo (and Ursa Major) clusters could
be considered as prototypes for a cluster morphology that paralleled that of open
star clusters in the Galaxy. In Virgo-type clusters, appreciable numbers of galaxies
of low central light concentration (in eflFect, spirals and irregulars) appear 1/2”*
to 1”* fainter than the brightest members, whereas Coma-type clusters are popu
lated in the range of the brightest two magnitudes exclusively by galaxies of high
light concentration. Incidental mention was afforded Ursa Major-type clouds which
represent ill-defined physical groups of exceedingly low volume density.
The de Vaucouleures and Morgan systems, based as they are on the morphol
ogy of the brighter galaxies of a cluster, suffer from the disadvantage that only the
nearby clusters of galaxies can be so classified. However on a first order approach,
there are marked correlations between these systems and the system of Zwicky.
Their main features are preserved in the two-part classification scheme of Abell
(1965, 1966);
R e g u la r clusters show strong central concentration and tend to be spherically
symétrie. All are rich, containing > 10* galaxies in the range of the brightest seven
magnitudes, the first S'" — 4'" of which are populated entirely or almost entirely by
E and SO galaxies. One or two giant elliptical galaxies are often centrally located,
and there is no strong evidence of subclustering. Most of Zwicky’s compact clusters
and Morgan’s si Coma-type clusters are regular; examples are the Coma cluster
[Abell 1656) and the Corona Borealis cluster (Abell 2065).
I r re g u la r clusters exhibit little or no spherical symmetry and no marked cen
tral condensation; often multiple nuclei exist indicating some substructuring. Clus
ter populations vary widely and galaxies of all types are normally present, although
poor groups may not contain giant elliptical galaxies. To this classification belong
D a ta Acquisition 38 §2.5
M organ’s Virgo-type clusters and Zwicky’s Medium compact and Open clusters.
Examples are the Local and M SI groups, the Virgo cluster, and Abell 2151, the
Hercules cluster.
The particular advantage of Abell’s classification is tha t it can be applied to
clusters over a great range of distances.
A five-part classification scheme depending on the relative optical contrast of
the brightest galaxy in a cluster to other cluster members was devised by Bautz
and Morgan (1970). To the initial list of types for 76 rich clusters were added the
classification for a further 111 by B autz (1972). Their scheme is shown in T ab le
2 . 5 . 2 . ____________________________________BAUTZ-M0RGAN CLRS5IFICATI0N SYSTEM
T Y P E ! THE a U S T E R JS D B M IN fiT E D B Y A S IN G E E . CENTRALLY LBGATED, CD G A .A X Y .
TYPE I I THE BRIGHTEST MEMBERS ARE INTERM EDIATE IN APPEARANCE BETWEEN CO
G A LA X IE S (W HICH HAVE EXTENDED ENVEL0PES) AND NORMAL G IANT E l L IP T IC A .S
TYPE I I I THE CLUSTER C 0 N T A IN S N 0 DOMINANT G ALAXIES
AND TH0 IN TE R M E D IA TE TY P E S . TYPE I - I I AND TYPE I I - I I I .
T ab le 3 .5 .2 The Bautz-Morgan Classification.
There are three main diflBculties encountered with the practical use of Bautz
and Morgan’s brightest galaxy morphology (van den Bergh, 1977). Initially, the
classification scheme is extremely vulnerable— to contamination by foreground field
galaxies; for example, missassigning cluster membership to a forground galaxy can
change a cluster’s classification from HI to I. Conversely, a dominant cD galaxy in
a distant cluster might be regarded as a member of a sparse clustering of brighter
foreground objects. Secondly, the K-dimming effect will reduce the surface bright
ness of the faint outer envelopes of distance cD galaxies and hence systematically
reduce the contrast between the cD and normal giant elliptical galaxies in the clus
D ata Acquisition 39 §2.5
ter. Finally, clusters in which three or more bright galaxies obviously dominate
the remaining members do not fit naturally into the Bautz-Morgan classification
system.
Rood and Sastry (1971) introduced a scheme strongly reminiscent of Hubble’s
early aingle-galaxy classification system which is based on the distribution of the
ten brightest cluster members:
cD (super giant): These clusters contain an outstandingly bright member, a cD
galaxy. As an operational definition, the size of the cD galaxy (i.e. semimajor axis
plus semiminor axis) is > 3 times that of any other member. If the main body is
multiple or shows any peculiarity, a subscript p is added to the type designation.
Prototypical examples include Abell 0401 (cD) and Abell 2199 (cDp).
B(binary): Here, two supergiant galaxies are separated by < 10 diameters of
the larger galaxy, with combined size > 3 times that of any other cluster member.
A subscript b indicates a connecting bridge between the subergiant binary or the
components of one or both of its members. Examples include Abell 1656 (b) and
AbeU 0154 (Bb).
L(line): In this case, > 3 brightest galaxies among the top ten members are
arreanged with comparable separations in a line, with numerous fainter members
distibuted around them. A typical example includes Abell 0426 (L).
C(coTe-balo): Here, > 4 of the ten brightest members are located near the
center of the cluster with comparable separations as well as being surrounded by
fainter galaxies. An example is Abell 2065 (G).
F (Bat): In this case, several of the ten brightest members and a large fraction
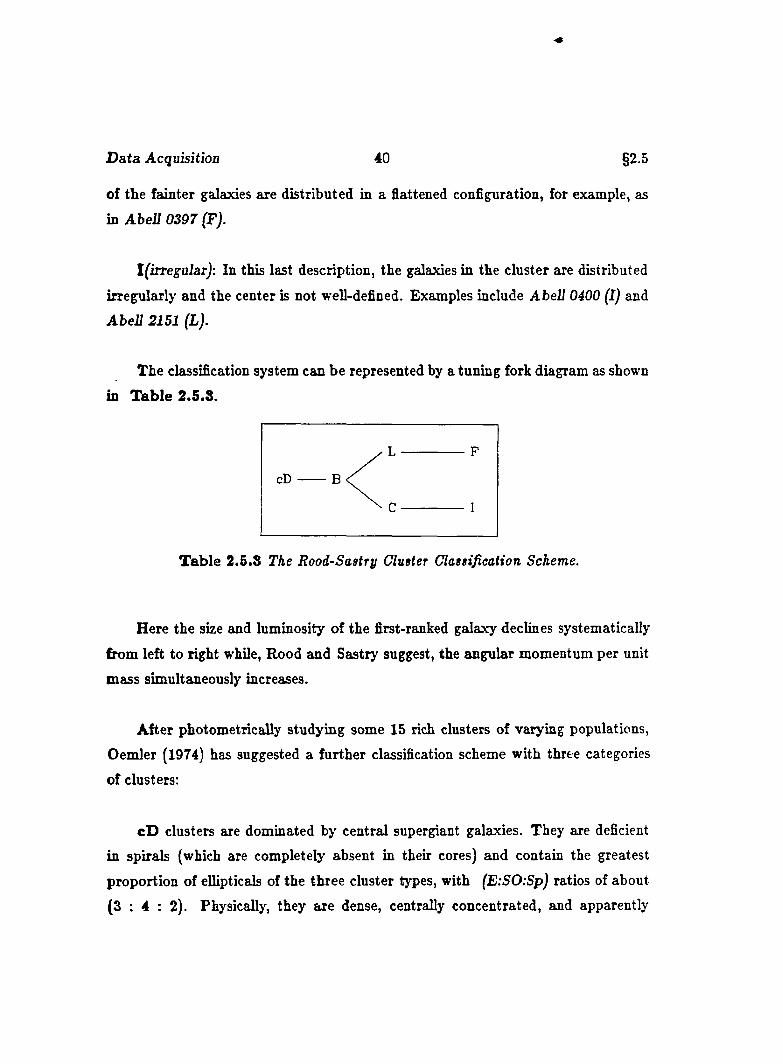
D ata Acquisition 40 §2.5
of the fainter galaxies are distributed in a flattened conflguration, for example, as
in Abell 0297 (F).
l(iiT€gvlar): In this last description, the galaxies in the cluster are distributed
irregularly and the center is not well-defined. Examples include Abell 0400 (I) and
AbeU 2151 (L).
The classification system can be represented by a tuning fork diagram as shown
in T ab le 2.5.3.
/ > ■ ------ F
cD —
^ C ------ ------ I
T ab le 2.5.8 The Rood-Sastry Cluster Classification Scheme.
Here the size and luminosity of the first-ranked galaxy declines systematically
from left to right while, Rood and Sastry suggest, the angular momentum per unit
mass simultaneously increases.
After photometrically studying some 15 rich clusters of varying populations,
Oemler (1974) has suggested a further classification scheme with three categories
of clusters:
cD clusters are dominated by central supergiant galaxies. They are deficient
in spirals (which are completely absent in their cores) and contain the greatest
proportion of ellipticals of the three cluster types, with (E:SO:Sp) ratios of about
( 3 : 4 : 2 ) . Physically, they are dense, centrally concentrated, and apparently
D ata Acquisition 41 §2.5
spherical. They also exhibit segregation by mass and morphological type of galaxy,
although the observational evidence for the former is marginal. Examples are Abell
1656, AbeU 2199 and AbeU 2670.
S p ira l-p o o r clusters are intermediate in type and are dominated by SO galax
ies, with (E:SO:Sp) ratios of about ( 1 : 2 : l) . These, too according to Oemler,
are segregated clusters, but they are less regular, compact, and centrally condensed
than the cD clusters. Examples include AbeU 0400 and AbeU 1214.
S p ira l-r ic h clusters are irregular in appearance, possess a low mean density
and have no tendency toward central condensation. Their composition is fairly
homogeneous, without perceptible segregation by morphological type, and they
show no evidence of dynamical relaxation or mass segregation. Spiral galaxies
predominate and the (E:SO:Sp) ratios are typically ( 1 : 2 : 3). Examples include
AbeU 1367, AbeU 2151 and AbeU 2197.
Oemler finds his system to relate most closely to that of Morgan, although the
dividing lines between the types do not precisely coincide.
The most recent proposals regarding classification have been advanced by Mel-
nick and Sargent (1977). From a study of six X-ray clusters they suggest subdivi
sion according to the relative radial distributions of different morphological types
of member galaxies in each cluster:
S p ira l or Sp clusters have a flat integral distribution of ellipticals but steep
cumulative distributions of spirals and lenticulars; the SO ’s dominate in the cluster
cores and the spirals in the outer regions, so that the integral radial frequency
distributions cross. Examples are the Hydra I (AbeU 1060) and Virgo clusters.
D ata Acquisition 42 §2.5
SO clusters have less flat E distributions, although the cumulative radial SO
and Sp profiles are again steep. Here, however, the lenticulars dominate the galaxy
populations throughout the clusters, and the integral distributions of SO and Sp
galaxies do not cross. To this class belong the clusters Abell 0376 and Abell 0576.
A b e ll 0426 (the Perseus cluster] appears to be unique in Melnick and Sargent’s
sample. Here it is the few spirals which exhibit a flat integral distribution, whereas
the SO’s and the E’s show steep parallel distributions at all radii. The number of
ellipticals remains larger than the number of SO’s throughout the cluster.
Comparison with the system of Oemler suggests similarities between SO and Sp
clusters described above and Oemler’s spiral-rieh an i tpiral-poor chisteis. Moreover
the distribution for the Perseus cluster resembles that of Oemler’s cD clusters, with
almost no spiral galaxies and with a somewhat larger number of ellipticals.
An im portant and desirable attribute for any cluster clasification system is that
it should be applicable to aggregates a t large distances, as is Abell’s simple two-part
scheme. Ultimately, however, the usefuUness of any system must depend on how
well it elucidates the nature of clusters by correlating their many varying traits.
For our purposes, however, we shall conform to the Abell Two-Part Clas-
tification and the Bautz-Morgan Classification schemes. We do this primarily
to be consistent with the Abell catalogue of galaxy clusters made for the North
ern Hemisphere, and the forthcoming catalogue of galaxy clusters of the Southern
Hemisphere.
C H A PT E R III
T H E C L U S T E R C A T A L O G U E
But by measure and number and weight,
Thou didst order all things.- Solomon
A catalogue of the positions of the galaxy clusters is given in T able 8.1.1.
The initial tabular data consists of a galaxy cluster identification number. Next
the rectangular coordinates of the cluster center as determined by the dispersion
ellipse analysis and measured from the geometric center of the plate; we note the use
of the standard astrometric conventions with z directed positively in the Eastward
direction, contrary to the Cartesian sense. The next two entries are the celestial and
new-galactic coordinates of the cluster center for the epoch 1950. These coordinates
are determined by applying the plate constants derived from the least-squares fitting
of the standard SAO stars to the cluster center rectangular position. Appropriate
transformations (see S ec tio n 2.3) convert the rectangular coordinates to Right
Ascension and Declination and these to new-galactic longitude and latitude. Finally,
an estimate of the cluster distance derived from mio is given to complete the table.
43
The Cluster Catalogue 44 §3.0
The measured positions of cluster members, magnitude estimates, and position
angle measurements are collected in the following descriptive sections. In Section
8 .1 we present the cluster catalogue. The catalogue is in tabular form and gives
the locations of the cluster centers for the epoch 1950 as well as their locations on
the ESO/SERC J plates. In addition, an estimate of redshift by virtue of mio is
pven as a distance indicator.
In S ec tion S.2 we pve in both graphical form and narrative the following
information:
1. Cluster Field. We present an enlargement of the field of every galaxy cluster
taken from film copies of the ESO/SERC survey plates. The print scale is typically
10 arcsec/mm and shows the galaxy cluster and its environs.
2. Cluster Membership and Morphology. Here, the measured positions of the
cluster members are plotted as they occur on the ESO/SERC Fields alligned with
the standard convention of orientation. The plotting grid is based on locations
determined from the plate center derived from extending and intersecting the four
fiducial marks found on the plate edges. Following this convention. East is located
in the Cartesian —x direction. The grids have been prepared in uniform size so as
to facilitate intercluster comparisons. The member galaxies have been plotted with
various symbols to indicate their morphological type as specified by the legend on
the plot.
S. Surface Density Distribution. In this plot, the cluster surface density is
plotted as increasingly dense tones and isopleths corresponding to the number of
galaxies counted per unit area. The extent of the plots is determined by the actual
extreme positions of the member galaxies and so the scale of the plot will vary from
cluster to cluster. The central portions of the cluster are emphasized in this case
Tie Cluster Catalane 45 §3.0
and thus the plot gives an intuitive, albeit qualitative, impression of the projected
surface density of the cluster.
4. Cluster Magnitude Distribution. Here, the estimated magnitudes of the
cluster members has been plotted as a histogram in bins corresponding to a change
in magnitude of 0.5 as determined by step-scale readings which were converted to
visual magnitudes by the appropriate transformations. The data has been smoothed
and a “smoothed version” of the data is plotted as a curve over the binned data.
This information extends to the limiting magnitude m„ = 19.0 uniformly for all
clusters and is useful in determining the Luminosity Function of the cluster.
5. Position Angle Distribution. As an attem pt was made to measure the
physical extent of galaxies tha t were larger than 10 microns, a body of data was
acquired for each cluster that included an estimate of the major and minor axes of
the appropriate galaxy images as well as their position angles. We use the standard
convention for the sense of orientation with angles measured in degrees positive
Eastward of North. The data is then tabulated in ten degree bins and plotted in
histogram form with a smoothed curve of the same data over the histogram. We
also present a sector plot which shows by means of a radial vector whose magnitude
is directly proportional to the number of galaxies in a given ten degree sector, the
position angle distribution of the cluster members.
6. Cluster Membership by Morphological Type. In similar fashion to the initial
figure, we plot a to-scale version of the cluster members but sorted by morphological
type. The original dispersion ellipse is maintained to assist comparative studies by
virtue of location while the cluster members have been separated into elliptical, SO
and spiral galaxies and plotted. The center of the cluster is marked and refers to
the center of the dispersion ellipse as determined by bivariate methods described
elsewhere.
The Cluster Catalogue 46 §3.0
7. Cluster Data Table. The data table consolidates the general body of infor
mation about the cluster. We indicate the cluster number designated by increasing
Right Ascension as weU as the position of the cluster center as determined by the
dispersion analysis in coordinates of Right Ascension and Declination of epoch 1950.
These coordinates are derived from least-squares fitting to the set of standard SAO
stars used in the measuring analysis. For each cluster we give the appropriate
ESO/SERC Plate and Field number to assist in locating the given cluster. In ad
dition, the table lists the x and y coordinates of the cluster center in the usual
convention as measured from the derived plate center, the epoch 1950 ecliptic and
new galactic coordinates, and the cluster redshift as determined by the visual mag
nitude of the tenth brightest cluster member. Several subtables show the cluster
morphology separated and counted to give the number of Elliptical, SO, normal and
barred Spiral and Peculiar galaxies; parameters of the calculated dispersion ellipse
to include major and minor axes measures in millimeters on the plate and position
angle, this time referred to the E-W absissa, with angles measured West to North
as positive in the Cartesian convention; and finally some population statistics to
include the number of galaxies in the sample, the core population, or the number
of galaxies found in the primary dispersion ellipse, and the limiting magnitude of
the sample.
8. Cluster Discriptiou. Here, we note individual discriptions of the galaxy clus
ters. General features of the cluster and its environs are noted along with estimates
of cluster Richness and Type. Special attention is paid to unique properties of the
cluster, peculiarities discovered and items of special interest.
T ie Cluster Catalogue 47 §3.1
8.1 C a ta lo g u e o f S o u th e rn G alaxy C lu s te rs
In this section we present a uniform catalogue of the clusters of galaxies in our
sample. For each of the clusters, we present the position of the cluster center as
determined by the dispersion ellipse analysis. In this case we give the Cartesian
coordinates of the cluster center as found on the ESO/SERC J plates, measured
from the plate center found by orthogonal extension of the plate fiducial marks; the
Right Ascension and Declination for the epoch 1950 found by the plate transforma
tion equations developed in S ec tio n 2.3; and the galactic latitude and longitude
of the cluster center for the epoch 1950. In addition, we give a value of the cluster
redshift as determined by mio. Finally, we present the ESO/SERC J plate location
of the clusters for quick identification of observation fields.
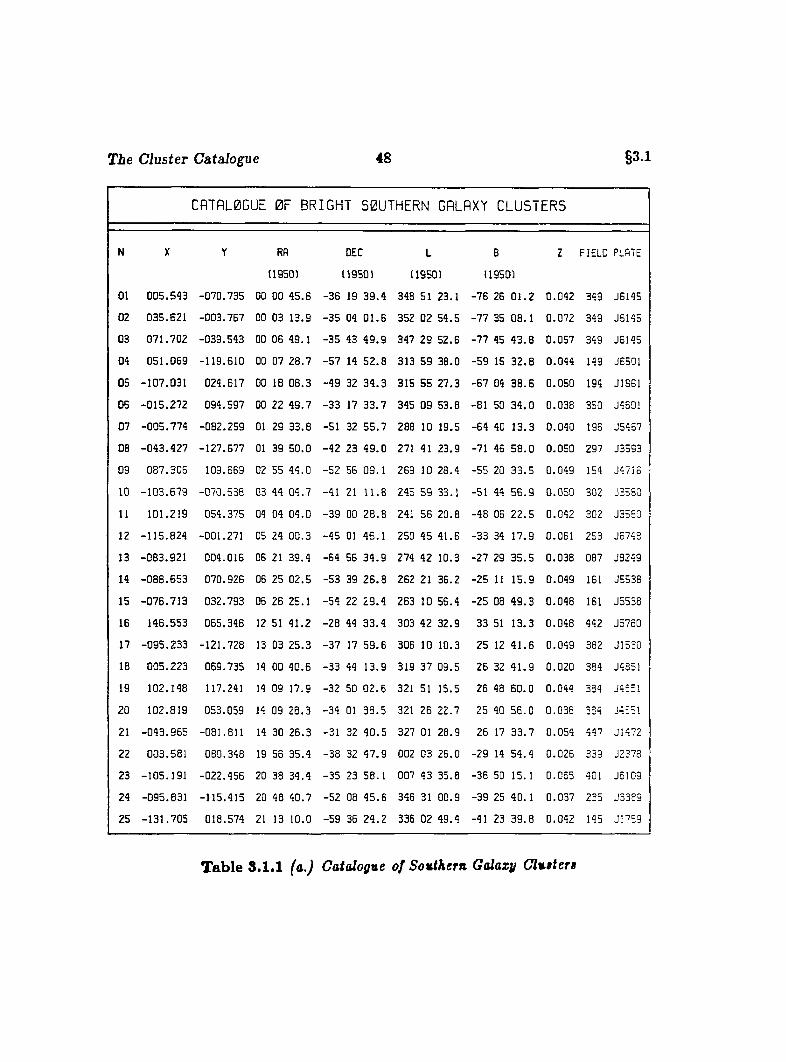
T ie Cluster Catalogue 48 §3.1
CRTRL0GUE 0 F B R I G H T SOUTHERN GRLRXY C L U S T E R S
N X Y RA DEC L B Z FIELD PLATE
(1950) (1950) (1950) 11950)
01 005.543 -070.735 00 00 45.6 -36 19 39.4 348 51 23.1 -76 26 01.2 0.042 349 J6145
02 035.621 -003.767 00 03 13.9 -35 04 01.6 352 02 54.5 -77 35 08.1 0.072 349 J6145
03 071.702 -039.543 00 06 49.1 -35 43 49.9 347 29 52.6 -77 45 43.8 0.057 349 J5146
04 051.069 -119.610 00 07 28.7 -57 14 52.8 313 59 38.0 -59 15 32.8 0.044 149 JS501
05 -107.031 024.617 00 18 08.3 -49 32 34.3 315 55 27.3 -67 04 38.6 0.050 194 J1861
OS -015.272 094.597 00 22 49.7 -33 17 33.7 345 09 53.8 -81 50 34.0 0.038 350 J4601
07 -005.774 -082.259 01 29 33.8 -51 32 55.7 288 10 19.5 -64 40 13.3 0.040 196 J5467
08 -043.427 -127.677 01 39 50.0 -42 23 49.0 271 41 23.9 -71 46 58.0 0.050 297 J3593
09 087.306 109.659 02 55 44.0 -52 56 09.1 269 10 28.4 -55 20 33.5 0.049 154 J4715
10 -103.679 -070.538 03 44 04.7 -41 21 11.8 245 59 33.1 -51 44 56.9 0.050 302 J3580
11 101.219 054.375 04 04 04.0 -39 00 28.8 241 56 20.8 -48 06 22.5 0.042 302 J35S0
12 -115.824 -001.271 05 24 00.3 -45 01 46.1 250 45 41.6 -33 34 17.9 0.061 253 J6743
13 -083.921 004.016 06 21 39.4 -64 56 34.9 274 42 10.3 -27 29 35.5 0.038 087 J8249
14 -088.653 070.926 06 25 02.5 -53 39 26.8 262 21 36.2 -25 11 15.9 0.049 161 J5538
15 -076.713 032.793 06 26 25.1 -54 22 29.4 263 10 56.4 -25 08 49.3 0.048 161 J5538
16 146.553 065.348 12 51 41.2 -28 44 33.4 303 42 32.9 33 51 13.3 0.048 442 J5750
17 -095.233 -121.728 13 03 25.3 -37 17 59.6 306 10 10.3 25 12 41.6 0.049 382 JI530
18 005.223 069.735 14 00 40.6 -33 44 13.9 319 37 09.5 26 32 41.9 0.020 384 J485!
19 102.148 117.241 14 09 17.9 -32 50 02.6 321 51 15.5 26 48 60.0 0.044 384 J4551
20 102.819 053.059 14 09 28.3 -34 01 36.5 321 26 22.7 25 40 56.0 0.038 384 J455I
21 -043.965 -081.811 14 30 26.3 -31 32 40.5 327 01 28.9 26 17 33.7 0.054 447 J1472
22 003.581 080.348 19 56 35.4 -38 32 47.9 002 03 26.0 -29 14 54.4 0.025 339 J2378
23 -105.191 -022.456 20 38 34.4 -35 23 58.1 007 43 35.8 -36 50 15. 1 0.055 401 J6I09
24 -095.831 -115.415 20 48 40.7 -52 08 45.6 346 31 00.9 -39 25 40.1 0.037 235 J3389
25 -131.705 018.574 21 13 10.0 -59 36 24.2 336 02 49.4 -41 23 39.8 0.042 145 J1759
T ab le 3.1.1 (a.) Catalogue o f Southern Galaxy C lu tters
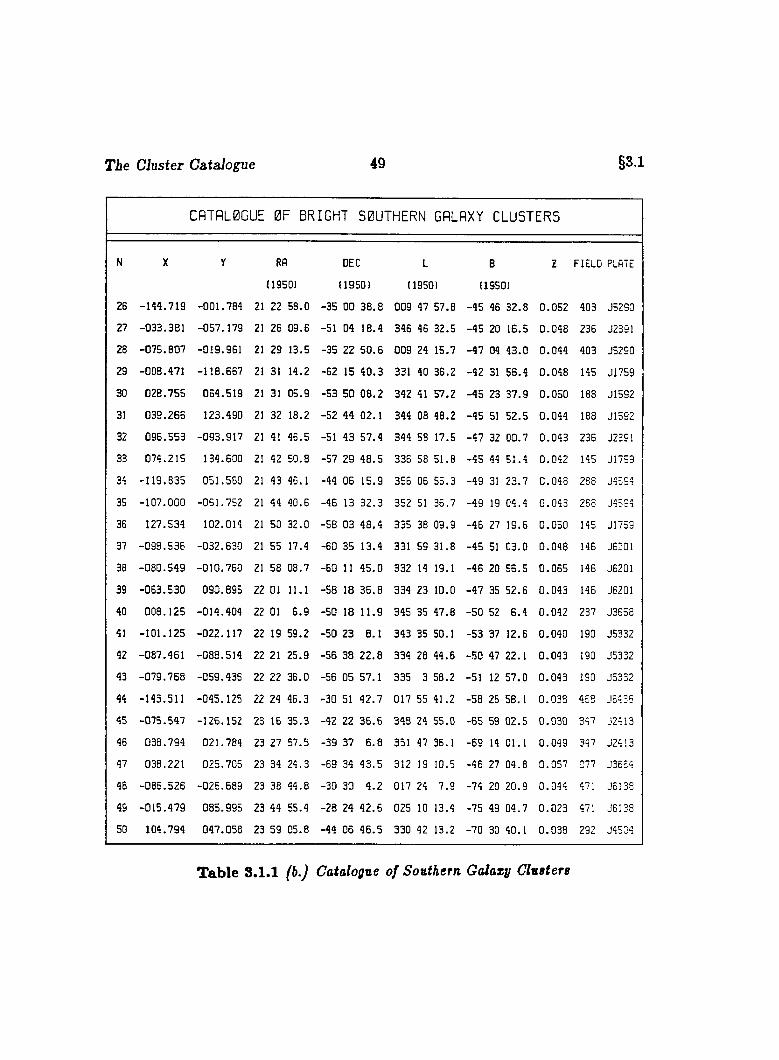
T ie Cluster Catalogue 49 §3.1
CATALOGUE OF BRIGHT SOUTHERN GALAXY C L U S T ER S
N }( f RA DEC L 8 z FIELD PLATE
(19501 (19501 ( 19501 (19501
26 -144..719 -001,.784 21 22 58,.0 -35 00 38.8 009 47 57,.8 -45 46 32.8 0.,052 403 J5290
27 -033,.381 -057,.179 21 26 09,.6 -51 04 18.4 346 46 32,.5 -45 20 18.5 0.,048 236 J2391
28 -075,.807 -019,.961 21 29 13,.5 -35 22 50.6 009 24 15,.7 -47 04 43.0 0..044 403 J5290
29 -008,.471 - l ie . .667 21 31 14,.2 -62 15 40.3 331 40 36,.2 -42 31 56.4 0..048 145 J1759
30 028,.755 064..519 21 31 05,.9 -53 50 08.2 342 41 57,.2 -45 23 37.9 0..050 188 J1592
31 039,.266 123..490 21 32 18,.2 -52 44 02.1 344 08 48,.2 -45 51 52.5 0.,044 188 J1592
32 096,.553 -093..917 21 41 46,.5 -51 43 57.4 344 58 17,.5 -47 32 00.7 0.,043 236 J2391
33 074,.215 134.,600 21 42 50,.8 -57 29 48.5 336 58 51,.8 -45 44 51.4 0..042 145 J1759
34 -119,.635 051.,550 21 43 46,.1 -44 05 15.9 356 06 55,.3 -49 31 23.7 0.,048 288 J4594
35 -107.,000 -061.,752 21 44 40,.6 -46 13 32.3 352 51 36,.7 -49 19 04.4 0..043 288 J4594
36 127.,534 102.,014 21 50 32,.0 -58 03 48.4 335 38 09,.9 -46 27 19.6 0.,050 145 JI753
37 -098.,536 -032.,630 21 55 17,.4 -60 35 13.4 331 59 31,.8 -45 51 03.0 0.,048 145 J6201
38 -080.,549 -010.,760 21 58 08,.7 -60 11 45.0 332 14 19,.1 -46 20 56.5 0. 065 145 J62D1
39 -053.,530 090.,895 22 01 11..1 -58 18 35.8 334 23 10,.0 -47 35 52.6 0. 043 146 J5201
40 008.,125 -014..404 22 01 6..9 -50 18 11.9 345 35 47..8 -50 52 6.4 0. 042 237 J3658
41 -101..125 -022. 117 22 19 59..2 -50 23 8.1 343 35 50..1 -53 37 12.6 0. 040 190 J5332
42 -087..461 -088.,514 22 21 25..9 -56 38 22.8 334 28 44..6 -50 47 22.1 0. 043 190 J5332
43 -079.,768 -059..435 22 22 36.,0 -56 05 57.1 335 3 58.,2 -51 12 57.0 0. 043 190 J5332
44 -143.,511 -045.,125 22 24 46.,3 -30 51 42.7 017 55 41.,2 -58 26 58.1 0. 038 468 J5435
45 -075..547 -126.,152 23 16 35..3 -42 22 36.6 348 24 55..0 -65 59 02.5 0. 030 347 J2413
46 038..794 021.,784 23 27 57..5 -39 37 6.8 351 47 36..1 -69 14 01.1 0. 049 347 J2413
47 038..221 025.,705 23 34 24.,3 -69 34 43.5 312 19 10,,5 -46 27 04.8 0. 057 077 J3664
48 -066..526 -028.,689 23 38 44..8 -30 30 4.2 017 24 7..9 -74 20 20.9 0. 044 471 J6138
49 -015,,479 085.,995 23 44 55..4 -28 24 42.6 025 10 13,,4 -75 49 04.7 0. 023 471 J5I38
50 104..794 047.,058 23 59 05..8 -44 06 46.5 330 42 13.,2 -70 30 40.1 0. 038 292 J45C4
T ab le 8.1.1 (b.) Catalogue of Southern Galaxy Clusters
The Cluster Catalogue 50 §3.2
8.2 D escrip tio n s o f S o u th e rn G alax y C lu ste rs
In this section we present a uniform description of the clusters of galaxies in our
sample. R ather than publish the data in numerical form, we choose a graphical and
tabular format for ease of comparison between cluster and cluster. Although nearly
21,000 individual galaxies have been measured the final sample is magnitude-limited
and uniform to = 19.0.
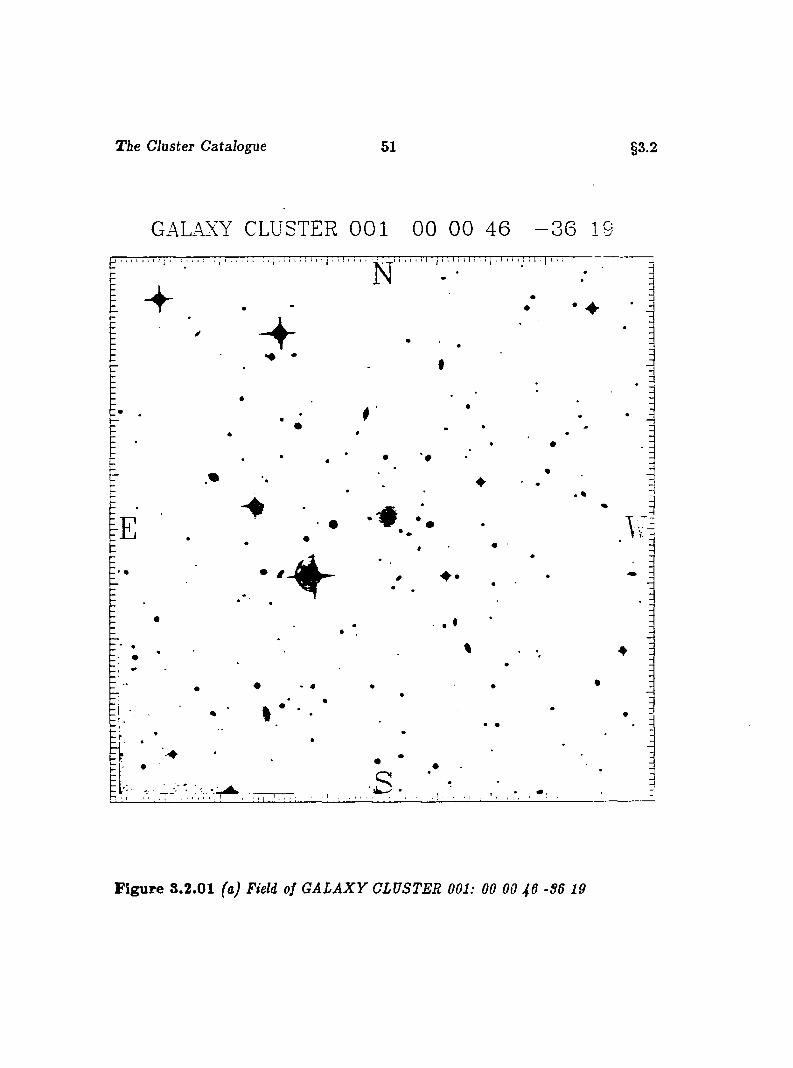
T ie Cluster Catalogue 51 §3.2
GALAXY CLUSTER 0 0 1 00 00 46 - 3 6 19
F ig u re 8 .2.01 faj Field of G A L A X Y CLUSTER 001: 00 00 46 -S6 19
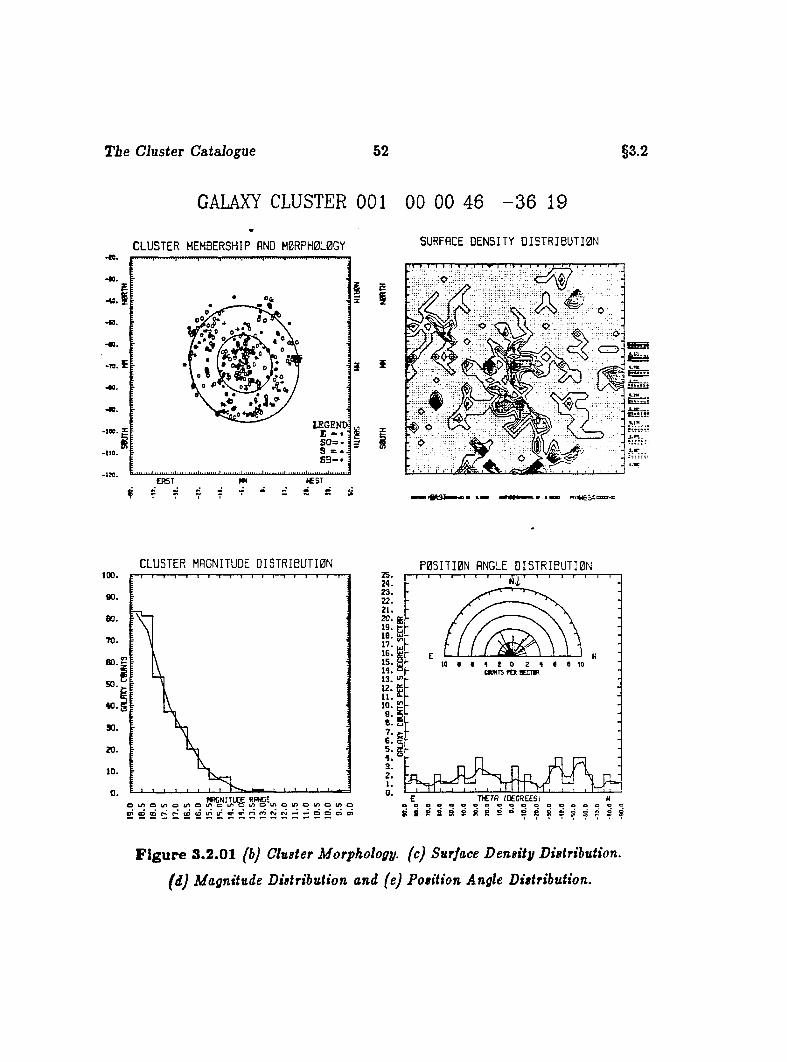
The Cluster Catalogue 52
GALAXY CLUSTER 001 00 00 46 - 3 6 19
C L U S T E R MEMBERSHIP AND H 0R P H 0 L 0 G Y
§3.2
SURFACE D E N S IT Y O I S T R I B U T I 0 N
-49.
-B.
- 70 . Ï
legend;E - . 1so= -
l£ S T
= s r s£BST t *
# ? ? Ç =
3
£I
# O
C L U S T E R MAGNITUDE D I S T R I B U T I 0 N
00.
80.
T O .
60.
50.
40.
SO.
20.
10.
o u, o u, o u, o 5.^^ oor ri m fO fO
25.24.23.22.21.20.19.16.17.16.15.14.13.12.11.10.6 .6.7.6.5.4 .3.2.I.0.
P 0 5 I T I 0 N ANGLE D I S T R I B U T I 0 N-T— I— I— I— I— I— I— I— T -r-l— I— I 1— I— I— I— r-
£-
H. 1 0 e « 4 S O 2 4 6 6 10MÜNT5 POl 8ECTIR
I < 1 I -I I » IT ïC T f l (OECREESj
UI ‘ '
F ig u re S .2.01 (b) Cluster Morphology, (c) Surface Density Distribution,
(d) Magnitude Distribution and (e) Position Angle Distribution.
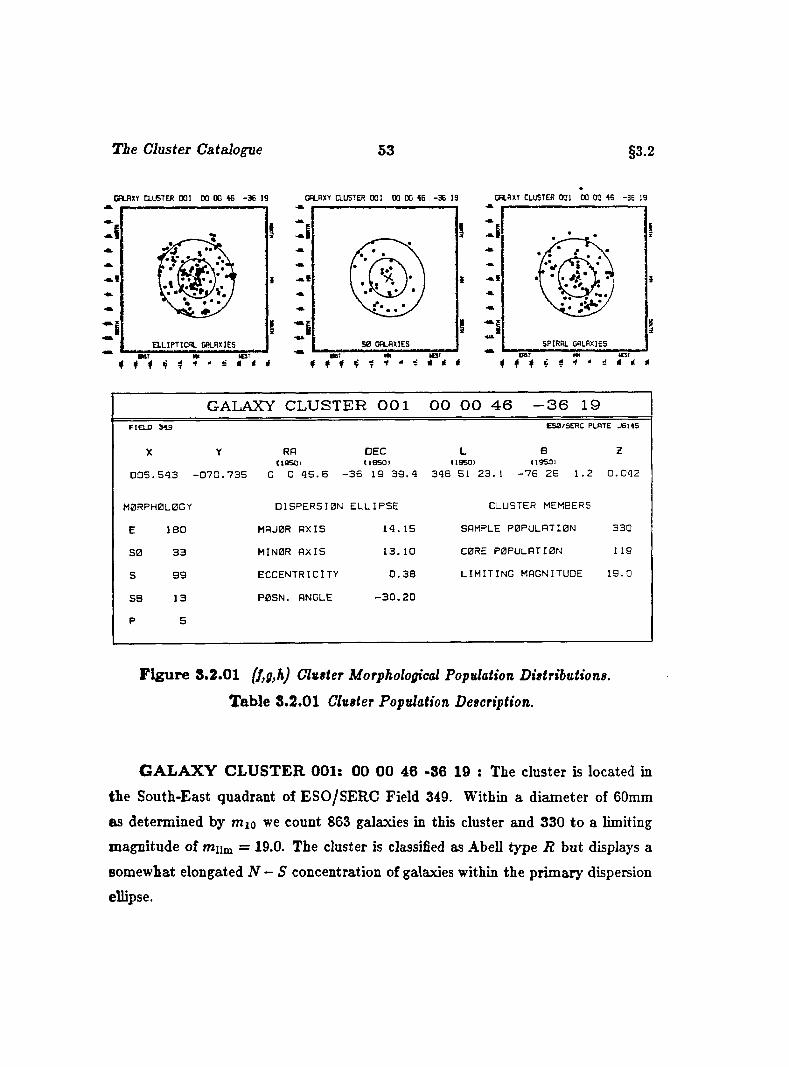
The Cluster Catalogue 53 §3.2
C R J X Y CLUSTER 001 00 0 0 46 - 3 6 19 GR-RXY [LUSTER 0 0 1 00 00 46 -3 6 19 CM. A XT CLUSTER 001 00 00 46 -3 6 19
E L L IP T IC A L GALAXIES
i
SP IR A L GALAXIESS 0 GALAXIES
i £ * * t
GALAXY CLUSTER 001 00 00 46 -36 19F IE L D 3 4 9
X
ES0/SERC PLATE J6145
zY RA DEC L B( t a s o i U 9 S 0 I ( I9 S 0 I (19S0I
0 0 5 . 5 4 3 - 0 7 0 . 7 3 5 0 0 4 5 . 6 - 3 6 19 3 9 . 4 3 4 8 51 2 3 . 1 - 7 6 2 6 1 . 2 0 . 0 4 2
MORPHOLOGY
E 1 8 0
8 0 3 3
S 9 9
SB 1 3
P 5
D IS P E R S IO N E L L IP S E
MAJOR A X IS 1 4 . 15
MINOR A X IS 1 3 . 1 0
E C C E N T R IC IT Y 0 . 3 8
P 0S N . ANGLE - 3 0 . 2 0
CLUSTER MEMBERS
SAMPLE P OPULATION 3 3 0
CORE P OPULA TION 119
L I M I T I N G MAGNITUDE 1 9 . 0
F ig u re 8.2.01 (J,g,h) Cluster Morphological Population D istributions.
Table 8.2.01 Cluster Population Description.
G A L A X Y C L U S T E R 001; 00 00 46 -86 19 : The cluster is located in
the South-East quadrant of ESO/SERC Field 349. Within a diameter of 60mm
as determined by mio we count 863 galaxies in this cluster and 330 to a limiting
magnitude of m nm = 19.0. The cluster is classihed as Abell type R but displays a
somewhat elongated N — S concentration of galaxies within the prim ary dispersion
ellipse.
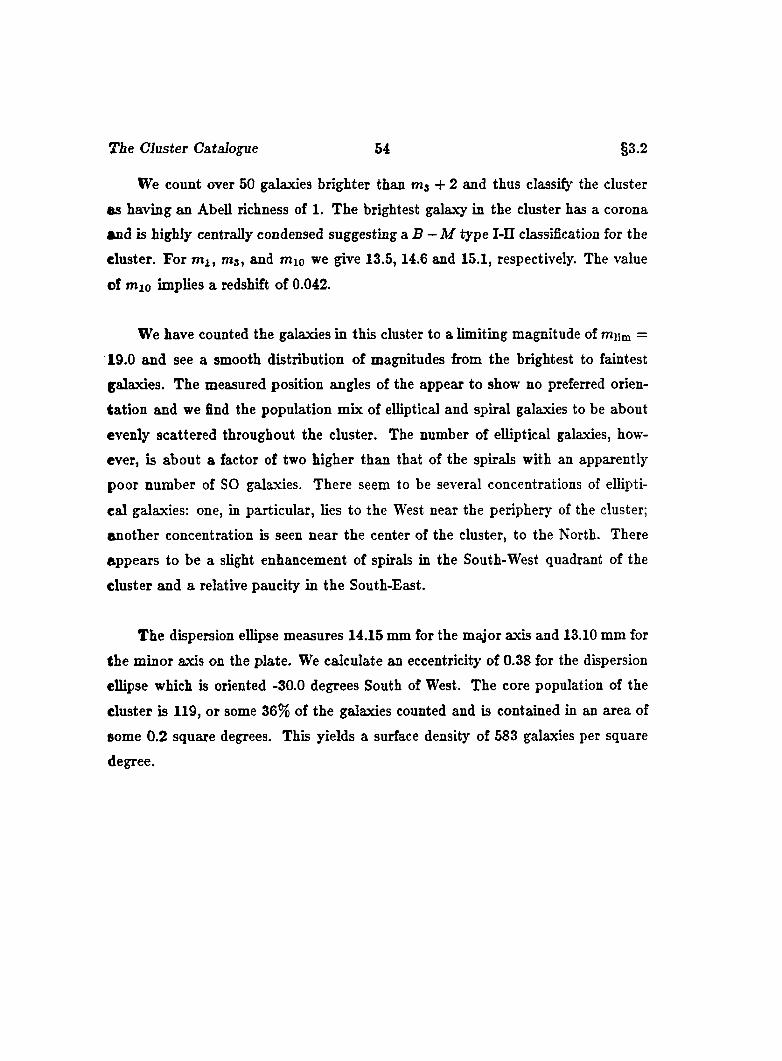
The Cluster Catalogue 54 §3.2
We count over 50 galaxies brighter than m 3 + 2 and thus classify the cluster
as having an Abell richness of 1 . The brightest galaxy in the cluster has a corona
and is highly centrally condensed suggesting a B —M type I-II classification for the
cluster. For m i, m3 , and mio we ^ v e 13.5, 14.6 and 15.1, respectively. The value
of mio implies a redshift of 0.042.
We have counted the galaxies in this cluster to a limiting magnitude of mnm =
19.0 and see a smooth distribution of magnitudes from the brightest to faintest
galaxies. The measured position angles of the appear to show no preferred orien
tation and we find the population mix of elliptical and spiral galaxies to be about
evenly scattered throughout the cluster. The number of elliptical galaxies, how
ever, is about a factor of two higher than that of the spirals with an apparently
poor number of SO galaxies. There seem to be several concentrations of ellipti
cal galaxies; one, in particular, lies to the West near the periphery of the cluster;
another concentration is seen near the center of the cluster, to the North. There
appears to be a slight enhancement of spirals in the South-West quadrant of the
cluster and a relative paucity in the South-East.
The dispersion ellipse measures 14.15 mm for the major axis and 13.10 mm for
the minor axis on the plate. We calculate an eccentricity of 0.38 for the dispersion
ellipse which is oriented -30.0 degrees South of West. The core population of the
cluster is 119, or some 36% of the galaxies counted and is contained in an area of
some 0.2 square degrees. This yields a surface density of 583 galaxies per square
degree.
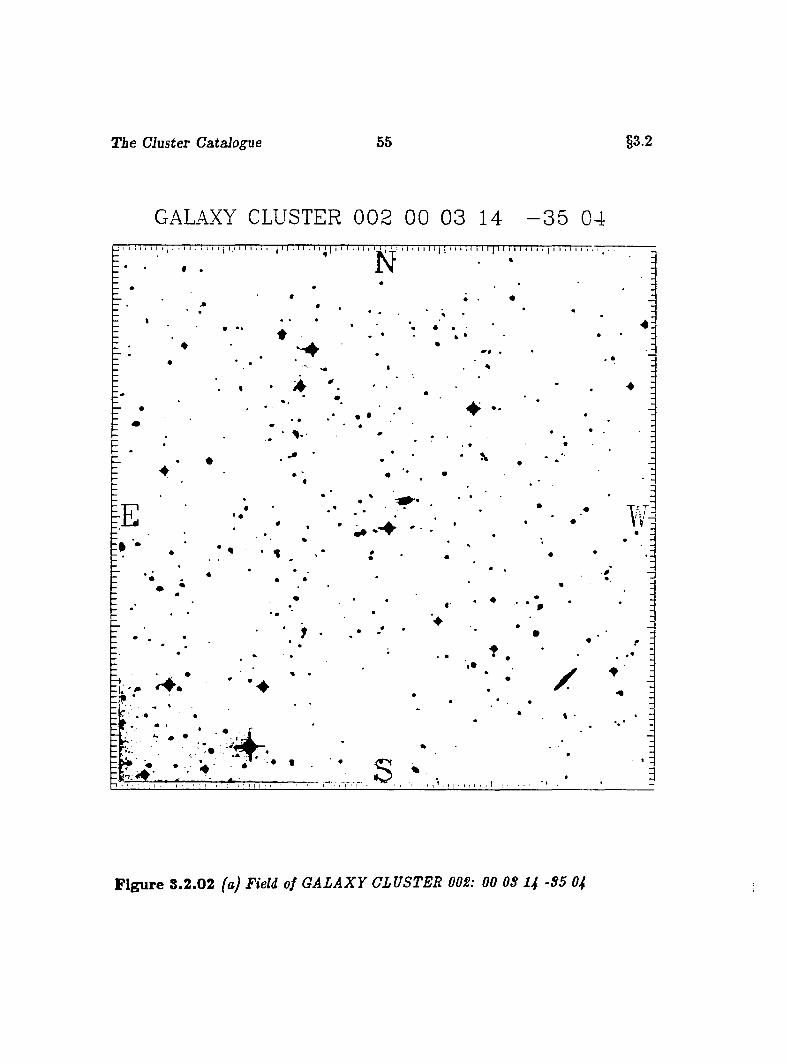
The Cluster Catalogue 55 §3.2
GALAXY CLUSTER 0 02 00 03 14 - 3 5 04
F ig u re 3 .2 .02 (a) Field of G A LA X Y CLUSTER DOS: 00 OS U -S5 04
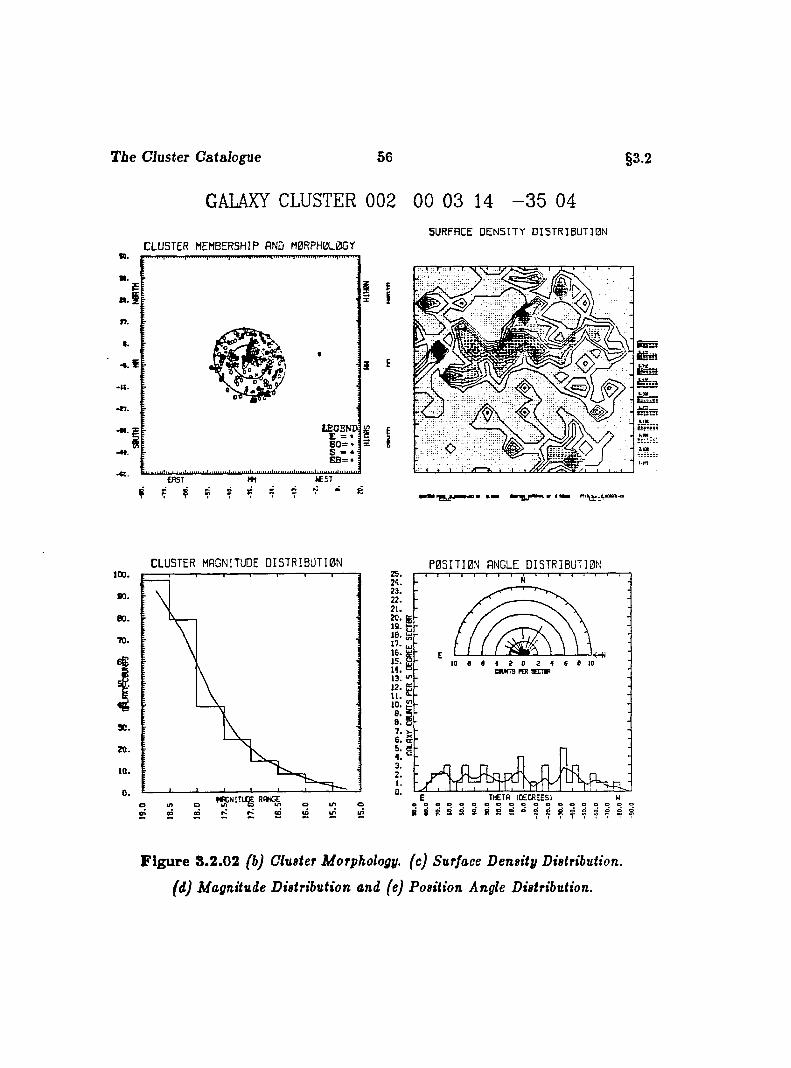
T ie Cluster Catalogue 56 §3.2
GALAXY CLUSTER 002 00 03 14 - 3 5 04SURFACE D ENSITY D I5T R 1B Ü TÎ0N
a.
n.
9 .
•9 .
•IS .
•17.
CLUSTER MEMBERSHIP AND M0RPH0L0GYI " I ............. .............................. .................................................................................................
CRsr
Ç ? *
LEGEND C = • SO-*S " * S B = «
iC S T
i
EI
i
CLUSTER MAGNITUDE DISTRIBUTI0N P05ITI0N ANGLE DISTRIBUTI0Nloo,fio. 22.
|ieo.TO.
15.
13. "
10.
90.
20.
E T Æ T P (DECREES) Woooeeoeoeooeooeooooi Î 8 ë S S S t i S 5 ° S S S ! S S S ^ S S
10.
0o rsNiTug o
F ig u re 3.2.02 (b) Cluster Morphology, (c) Surface Density Distribution,
(d) Magnitude Distribution and (e) Position Angle Distribution.
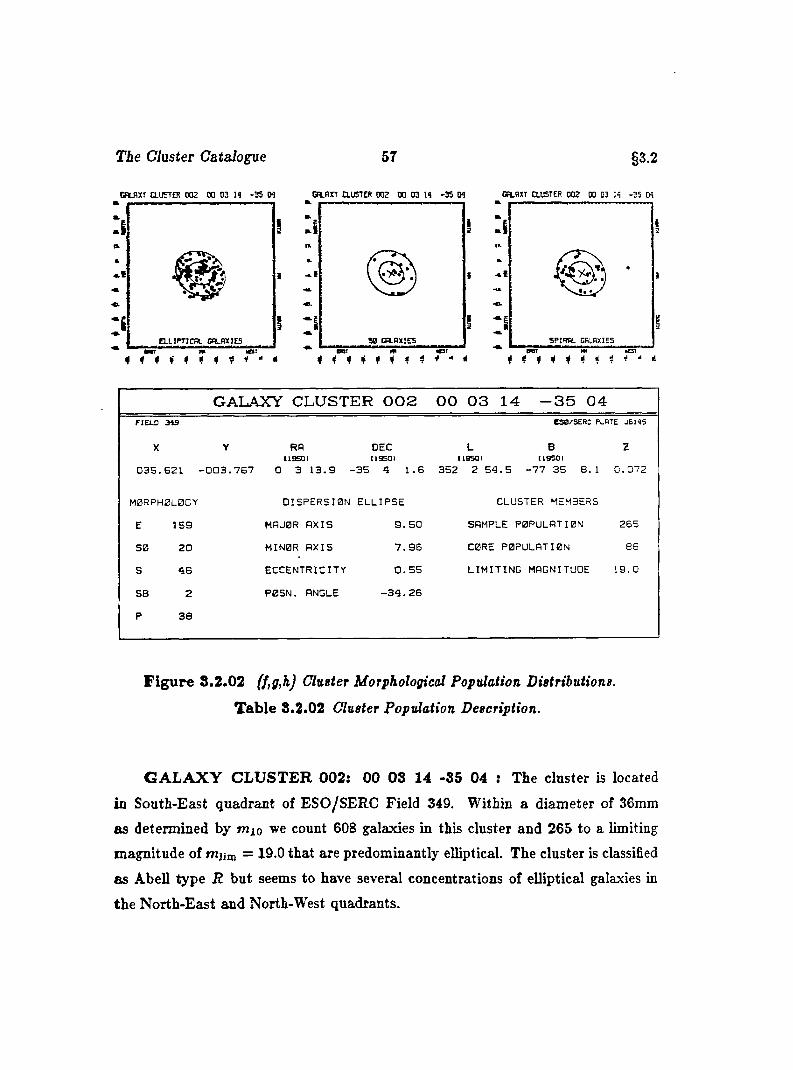
The Cluster Catalogue 57 §3.2
C nLflXT CLUSTER 0 0 2 0 0 0 3 H - 3 5 M CRLRXT CLUSTER 0 0 2 0 0 0 3 14 -3 5 0 4 CRLRXT CLUSTER 0 0 2 00 03 H -2 5 04
5 0 CRLPXIES SPIRAL GALAXIESELLIPTICAL GALAXIESM r
< t f * 4* l e r BBT m* 1 ^ " * 4 * 4 * 1 * 4 i f - *
BBT IB4 4 4 4 4 4 * i * é
GALAXY CLUSTER 002 00 03 14 -35 04FIEJLD 3*9 C sa /S E R C PLRTE JB 1 4 5
X
0 3 5 . 6 2 1
Y RA DECC19SQI n a s o i
- 0 0 3 . 7 6 7 0 3 1 3 . 9 - 3 5 4 1 . 6
LI lS S Q I
3 5 2 2 54
B(1 9 5 0 1
. 5 - 7 7 3 5 8 . 1
Z
0 . 0 7 2
M0RPHBL0GY D IS P E R S IO N E L L IP S E CLUSTER MEMBERS
E 1 5 9 HRJ0R A X IS 9 . 5 0 SAMPLE P 0 P U L A T I0 N 2 6 5
5 0 2 0 M IN 0 R A X IS 7 . 9 6 C0RE P OPULATION 8 5
S 4 6 E C C E N T R IC IT Y 0 . 5 5 L I M I T I N G MAGNITUDE 1 9 . 0
SB 2 P 0S N . ANGLE - 3 4 . 2 6
P 3 0
F ig u re 3 .2 .02 (f,g,h) Cluster M orphological Population Distributions.
T ab le 3.2.02 Cluster Population Description.
G A L A X Y C L U S T E R 002: 00 03 14 -35 04 : The cluster is located
in South-East quadrant of ESO/SERC Field 349. Within a diameter of 36mm
as determined by mio we count 608 galaxies in this cluster and 265 to a limiting
magnitude of mjim = 19.0 that are predominantly elliptical. The cluster is classified
as Abell type R but seems to have several concentrations of elliptical galaxies in
the N orth-East and North-West quadrants.
T ie Cluster Catalogue 58 §3.2
We count over 80 galaxies brighter than ms + 2 and thus classify the cluster
as having an Abell richness of 2. The brightest galaxy in the cluster has a corona
and is intermediate in appearance between the class cD and normal giant elliptical
galaxies suggesting a B — M type II classification for the cluster. For m i, m 3 , and
mio we give 15.6, 15.8 and 16.3, respectively. The value of mio implies a redshift
of 0.072.
The surface density distribution of this cluster shows several concentrations,
one running almost lineeirly East-West across the cluster, two East of center, and
another to the South-Southwest. The magnitude distribution is somewhat steep
from mv = 15 to m„ = 19 albeit smooth. There appear to be no unusual irregulari
ties in the position angle distribution with perhaps a very slightly higher of galaxies
measured with a position angle near —30°.
The dispersion ellipse holds nearly a third of the cluster population located
in an area of some 0.08 square degrees. With a core membership of 8 6 galaxies
this repersents a surface density of 1033 galaxies per square degree. The dispersion
ellipse is inclined 34 degrees South of West and is somewhat eccentric.
The cluster is rich in elliptical galaxies with nearly four times as many ellipticals
as spirals. The few SO galaxies identified appear to be loosely scattered throughout
the Western portion of the cluster. The spirals in the cluster appear somewhat
evenly divided East and West, but there appears to be a region perpendicular to the
dispersion ellipse major axis tha t is devoid of this type of galaxy. There are several
superposed faint pairs of galaxies, often pairs with an early and late type elliptical.
In addition, there are several subgroups dominated by a bright elliptical with fainter
elliptical attendants as, for example, one located at x = 52.39, y = 2.87. We also
note the appearance of severed faint "chains” of galaxies, comprised of four or more
galaxies in what looks like a line, such as those found a t z = 31.15,^ = —7.02.
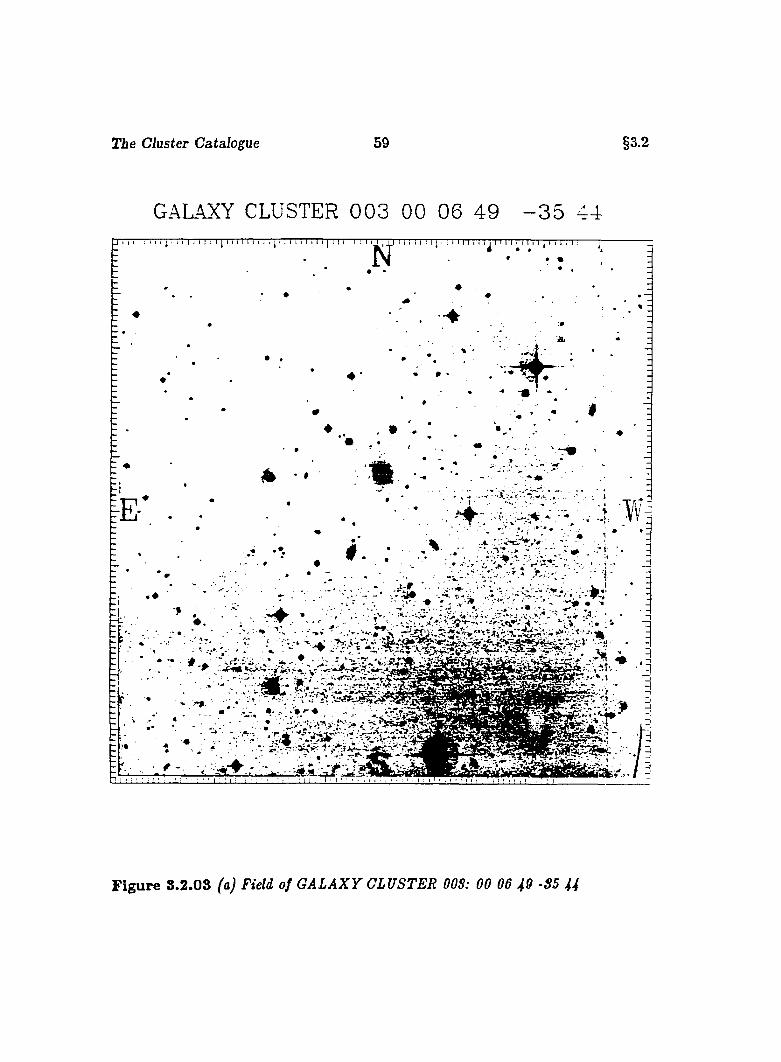
T ie Cluster Catalogue 59 §3.2
GALAXY CLUSTER 0 0 3 00 06 49 - 3 5 44“l j M t i I 1 I M j I 1 1 . 1 1 I 1 I j . : I I 1 I I ; I I I I I I I I I I I
N«
vt *
- i
B .
- r-
4 ' : " L ;
F ig u re 8.2 .03 /'oj F*eW 0/ G A LA X Y CLUSTER OOS: 00 06 49 -S5 44
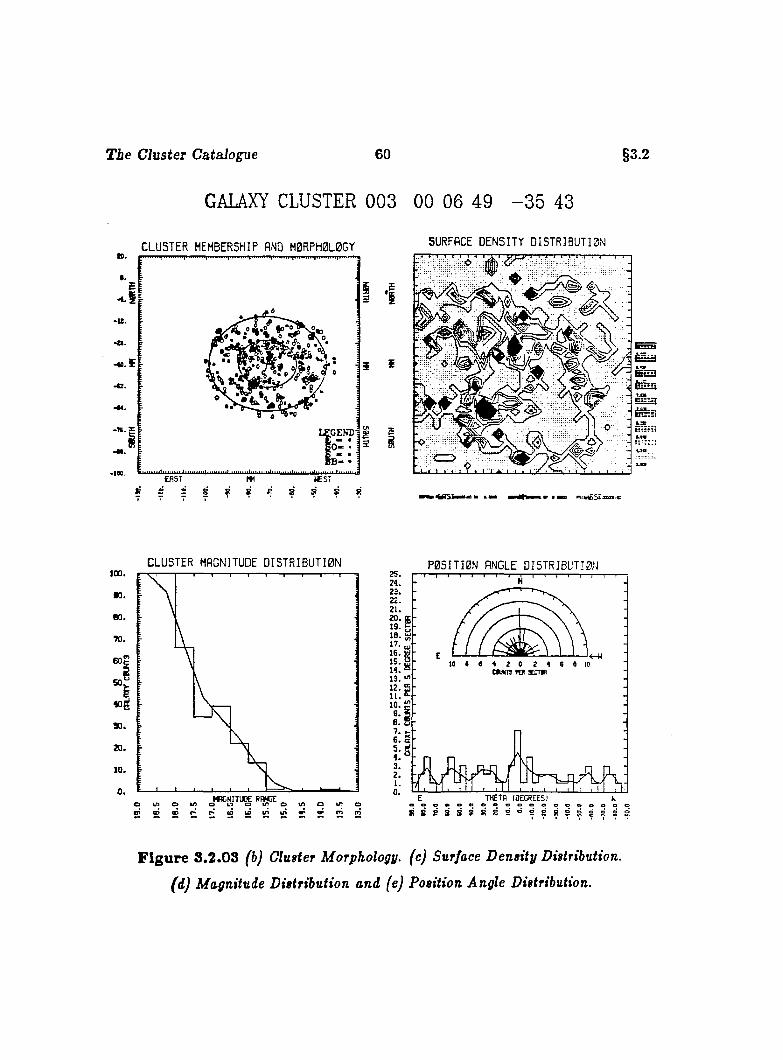
T ie Cluster Catalogue 60
GALAXY CLUSTER 003 00 06 49 - 3 5 43
C L U S T E R MEMBERSHIP AND M 0 R P H 0 L 0 G Y SURFACE D E N S IT Y D I S T R I B U T I 0 NT-TT-r-r-r-rr-r-
§3.2
i 1
GENE
C L U S T E R MAGNITUDE D I S T R I B U T I 0 N100.
mo.
eo.
TO.
“ I«g90.
20.
10.
0.
P 0 5 I T I 0 N ANGLE D I 5 T R I B U T I 0 N
ei CD CD r»* r>* CO ifi u) inw ^ w w
cn cn
25.24.
22.
li15.
13.
6. a
E THETR (DEGREES) k
; : ; ; : : : : : ; : : : : : :
F ig u re 3.2 .03 (b) Cluster Morphology, (c) Surface Density Distribution,
(d) Magnitude Distribution and (e) Position Angle Distribution.
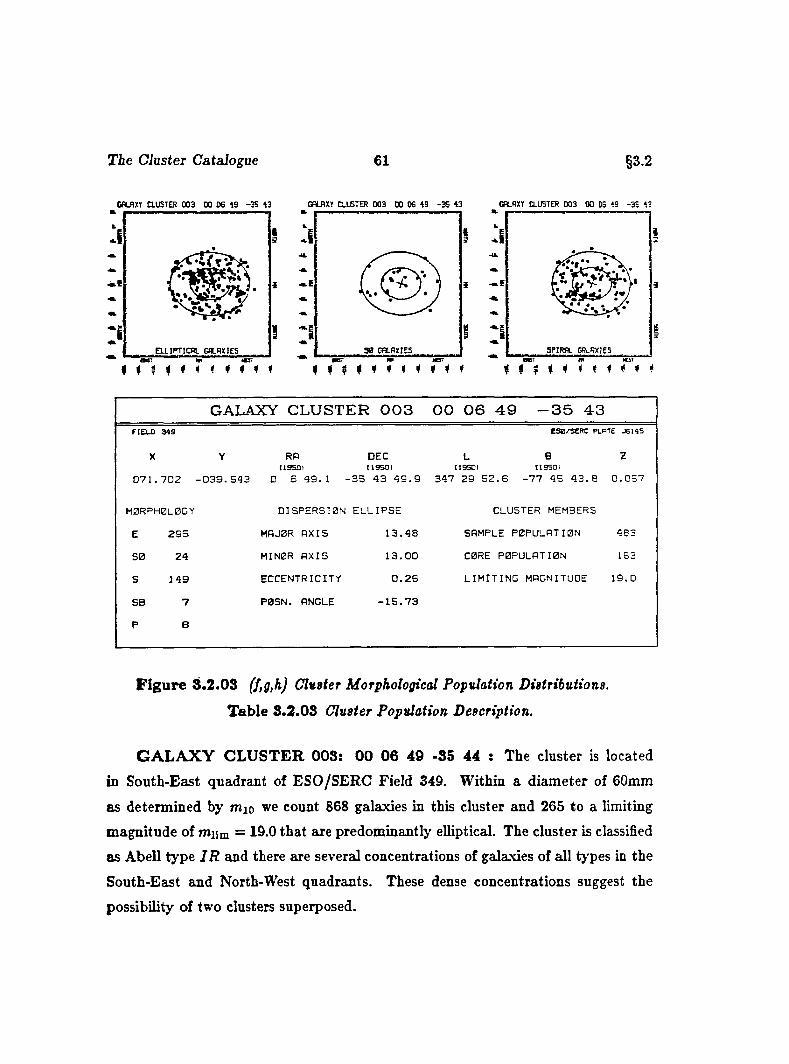
The Cluster Catalogue 61 §3.2
CflLflXT CLUSTER 0 0 3 DO 0 6 4 9 -3 S « G flL flXT CLUSTER 0 0 3 0 0 06 43 - 3 5 43 GALAXY CLUSTER 0 0 3 DO 06 *9 -3 5 43
I
i3
E L L I P T I C B L C f lL flX IE S
# ; ; * 4 f f ft f 4 f * 1 * * * *
GALAXY CLUSTER 003 00 06 49 -35 43FIELD 34 9
X
ESB/SERC PLBTE J514S
zY R B DEC L B( IS S n i 119501 119501 119501
0 7 1 . 7 0 2 - 0 3 9 . 5 4 3 0 6 4 9 . 1 - 3 5 4 3 4 9 . 9 347 29 5 2 . 6 - 7 7 45 4 3 . 5 0 . 0 5 7
M0RPH0L0GY
E 2 9 5
8 0 2 4
S 1 4 9
SB 7
P 6
D IS P E R S IO N E L L IP S E
MBJ0R A X IS 1 3 . 4 8
MINOR A X IS 1 3 . 0 0
E C C E N T R IC IT Y 0 . 2 6
P 0S N . ANGLE - 1 5 . 7 3
CLUSTER MEMBERS
SAMPLE P O P UL A TIO N 463
C0RE P 0 P U L A T I0 N 153
L I M I T I N G MAGNITUDE 1 9 .0
F ig u re 8 .2 .03 f/,ff,hj Giddier Morphological Population Distributions.
T able 8.2.03 Cluster Population Description.
G A L A X Y C L U S T E R 003: 00 06 49 -35 44 : The cluster is located
in South-East quadrant of ESO/SERC Field 349. Within a diam eter of 60mm
as determined by mio we count 868 galaxies in this cluster and 265 to a limiting
magnitude of miim = 19.0 tha t are predominantly elliptical. The cluster is classified
as Abell type I R and there are several concentrations of galaxies of all types in the
South-East and North-West quadrants. These dense concentrations suggest the
possibility of two clusters superposed.
The Cluster Catalogue 62 §3.2
We count over 1 0 0 galaxies brighter than m3 + 2 and thus classify the cluster as
having an Abell richness of 2. Since the brightest galaxy in the cluster has a corona
and is intermediate in appearance between the class cD and normal giant elliptical
galaxies, it suggests perhaps a B — M type I i m classification for the cluster. For
m i, m s, and mio we give 13.9,15.6 and 16.3, respectively. The value of mio implies
a redshift of 0.057.
The brightest galaxy in the cluster has a halo, whilst the third brightest appears
to be a spindle. The Northern portion of the cluster is more densly populated than
the Southern, yet there appears to be a relatively high concentration of galaxies
in a small region Southeast of the cluster center. This concentration is located
a t z = 77.87, y = —52.15, is dominated by a bright elliptical (m„ = 15.8), and
appears to be populated equally with both ellipticals and spirals, although the
main cluster has nearly twice the number of ellipticals as spirals. There are a few
obvious barred-spirals, several displaying rings around a dense nucleus, as the one
located at * = 89.46, y = —27.24. A small faint group predominately composed of
spirals is located at z = 57.35, y = —35.85 and there are several elliptical galaxies
apparently surrounded by a constellation of very faint attendants. Several galaxies
are termed peculiar because of possible superposition or irregularities and there are
a number of very low surface brightness galaxies with very f ^ t but distinguishable
nucleii.
The dispersion ellipse has a core population of 163, or some 34% of the sample
with a limiting magnitude of = 19.0. With an eccentricity of 0.26 and a position
angle of 15.73° South of West, the dispersion ellipse spans 0.19 square degrees and
gives a core surface density of 845 galaxies per square degree on the sky.
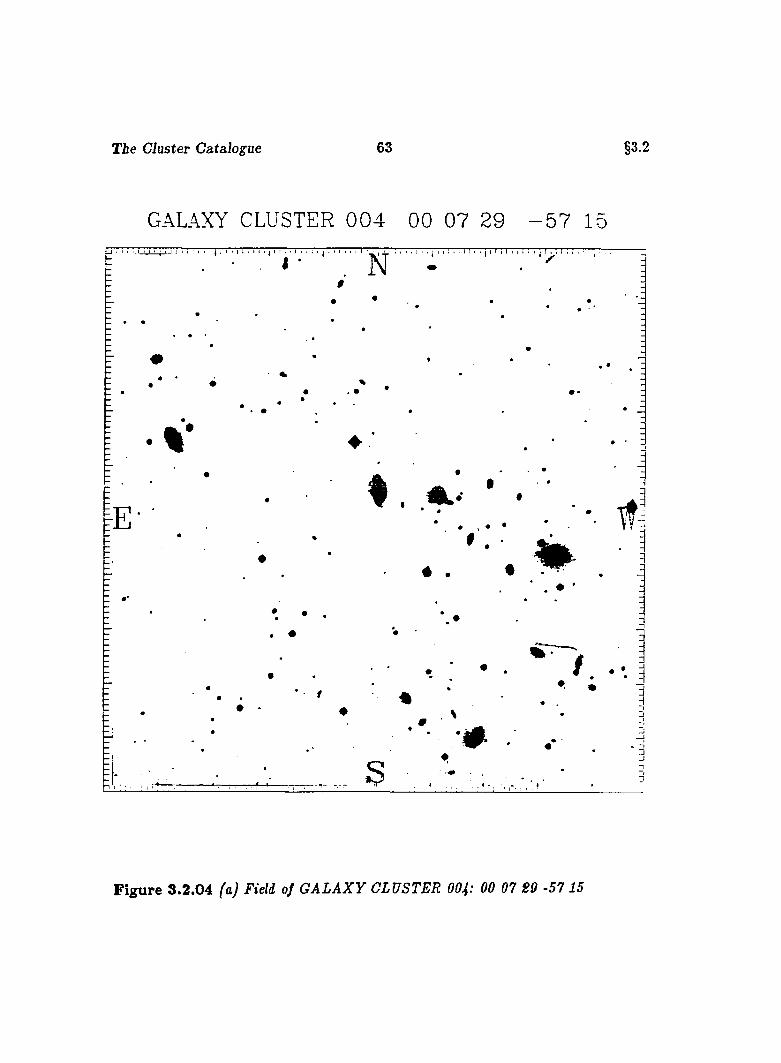
T ie Cluster Catalogue 63 §3.2
GALAXY CLUSTER 0 0 4 00 07 29 - 5 7 15
F ig u re 3 .2 .04 fa) Field of G A L A X Y CLUSTER OO4: 00 07 29 -57 15
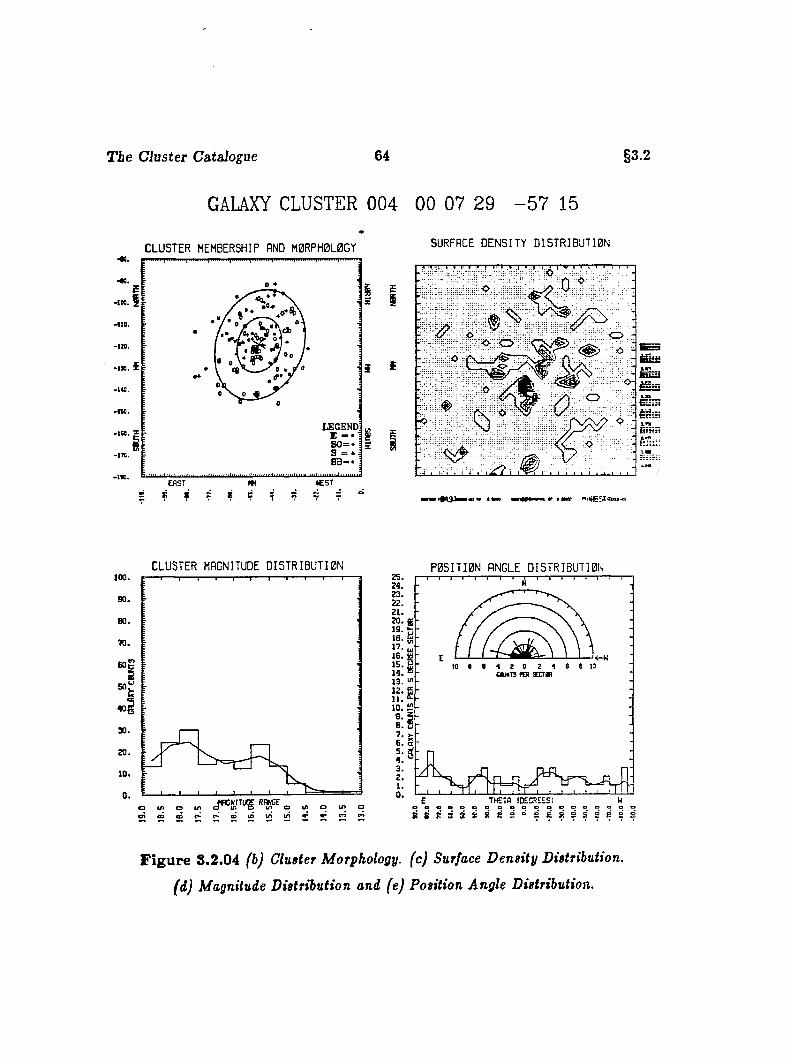
T ie Cluster Catalogue 64
GALAXY CLUSTER 004 00 07 29 - 5 7 15
§3.2
C L U S T E R MEMBERSHIP AND M 0R PH 0L 0G Y SURFACE D E N S I T Y D I S T R I B Ü T I 0 N
• I DO.
Oo
•1 9 0 . £
LEGEND•Its. z
-170 .
•110.EAST
? 4 4 «T
I
i
S
o
o-.:iO
• « mm
C L U S T E R MAGNITUDE D I S T R I B U T I 0 N100.
90.
80.
70.
50:40 ,
30.
20.
10.
0
25.24.23.22.2 1 .20.19.16.17.16.15.14.13.12.I I .10.9.6.7.6.5.4 .3.2.i.0.
P 0 5 I T I 0 N ANGLE D Î 5 T R I B U T I 0 N-T — I— :— I— r— T-
10 e 6 4 2 0 2 4 6 6 10C6UNT3 fCR SECrm
E T Æ T A (DECREES)eeaooe o o eo o oeeo ooR 8 P S S S R S 2 ® 2 g R 5 a s e
F ig u re 3.2.04 (b) Cluster Morphology, (c) Surface D ensity Distribution,
(d) Magnitude Distribution and (e) Position Angle Distribution.
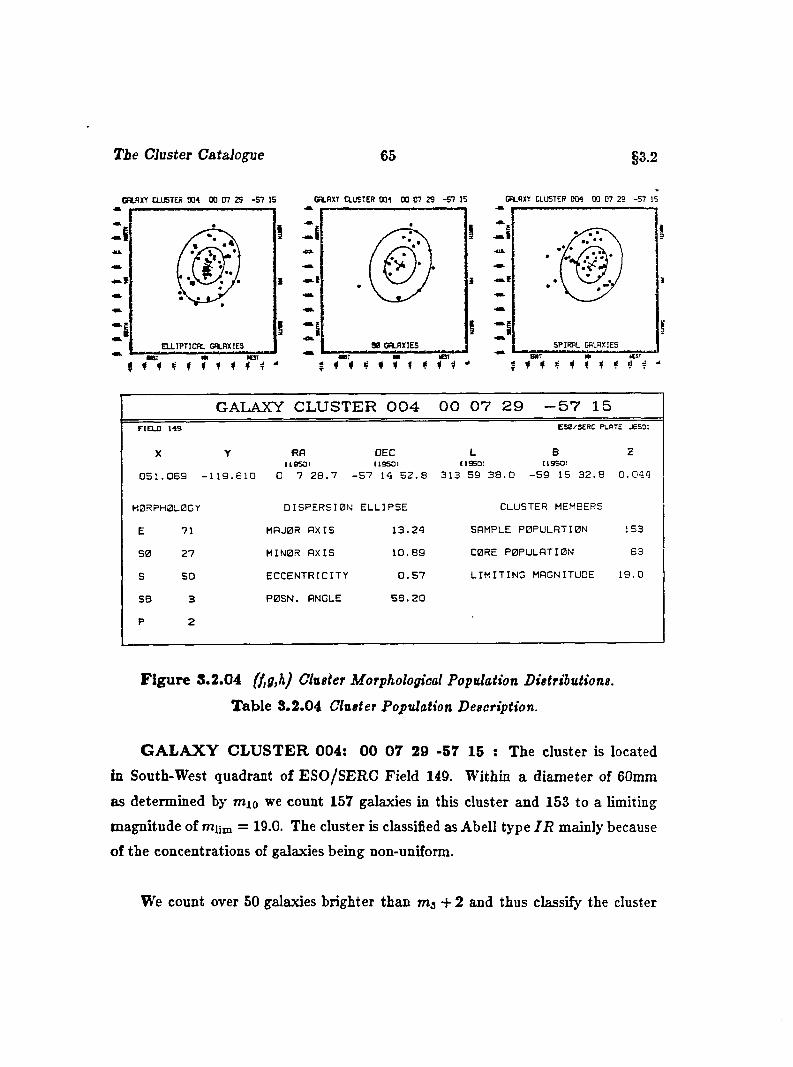
T ie Cluster Catalogue 65 §3.2
GBLfIXY CLUSTER OtM 0 0 07 25 - 5 7 15 CRLBXT CLUSTER 00 1 0 0 07 29 - 5 7 15 CRLfiXT CLUSTER 0 0 1 00 07 29 - 5 7 15
ii
S P IR A L GALAXIESE L L IP T IC A L g a l a x ie s
ICSTBBT < * # f f ^4 -*
GALAXY CLUSTER 004 00 07 29 -57 15FIELD 119 ESB/SERC PLATE J6S0I
X
0 5 1 . 0 6 9 -
Y
1 1 9 . 6 1 0
RA (lesoi
0 7 2 8 . 7 -
DEC119501
5 7 14 5 2 . 8
L B119501 (19501
3 1 3 5 9 3 8 . 0 - 5 9 15 3 2 . 8
Z
0 . 0 4 4
M0RPH0L0GY D IS P E R S IO N E L L IP S E CLUSTER MEMBERS
E V I MAJOR A X IS 1 3 . 2 4 SAMPLE PO P ULATIO N 153
5 0 2 7 MINOR A X IS 1 0 . 8 9 CORE P O P U L A TIO N 6 3
5 5 0 E C C E N T R IC IT Y 0 . 5 7 L I M I T I N G MAGNITUDE 1 9 . 0
SB 3 P 0 S N . ANGLE 5 8 . 2 0
P 2
F ig u re 3 .2 .04 (f,g,h) Cluster Morphological Population Distributions.
T able 8.2.04 Cluster Population Description.
G A L A X Y C L U S T E R 004: 00 07 29 -57 15 : The cluster is located
in South-West quadrant of ESO/SERC Field 149. Within a diameter of 60mm
as determined by mjo we count 157 galaxies in this cluster and 153 to a limiting
magnitude of miim = 19.0. The cluster is classified as Abell type I R mainly because
of the concentrations of galaxies being non-uniform.
We count over 50 galaxies brighter than mj + 2 and thus classify the cluster
The Cluster Catalogue 66 §3.2
as having an Abell richness of 1. We suggest a B —M type HI classification for the
cluster which has several normal giant ellipticals, the brightest of which appears to
be superposition of an early and a late elliptical. For m j, m j, and mio we give
13.2, 14.3 and 15.1, respectively. The value of mio implies a redshift of 0.044.
The cluster magnitude distribution is depressed near m„ = 16.5 and tapers
off after m„ = 18.5 suggesting several populations making up the cluster. We also
note a very slight excess of galaxies with orientation of 75 — 80° but do not deem it
significant.
We find a slight concentration of predominately elliptical galaxies just South
of the cluster center and there is a large region, comprising nearly half of the
Southern portion of the dispersion ellipse that is practically devoid of spirals. The
third brightest galaxy appears to be a spindle. The morphological distribution
{E : SO : 5) goes as ( 3 : 1 : 2 ) while the core population represents 41% of the
to ta l magnitude limited sample. The dispersion ellipse spans some 0.16 of a square
degree which implies a surface density of some 397 galaxies per square degree. The
position angle of the dispersion ellipse is inclined some 58 degrees North of West.
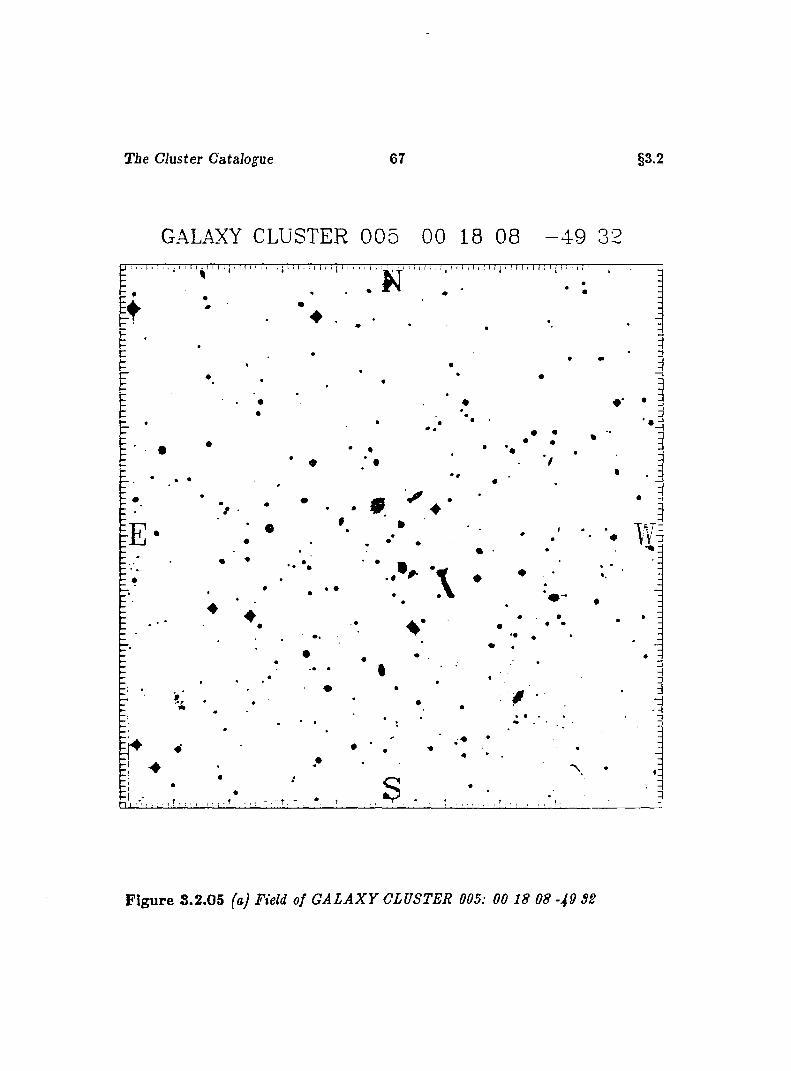
The Cluster Catalogue 67 §3.2
GALAXY CLUSTER 0 0 5 00 18 08 - 4 9 32
F ig u re S.2.05 faj Field of G A L A X Y CLUSTER 005: 00 18 08 -49 S2
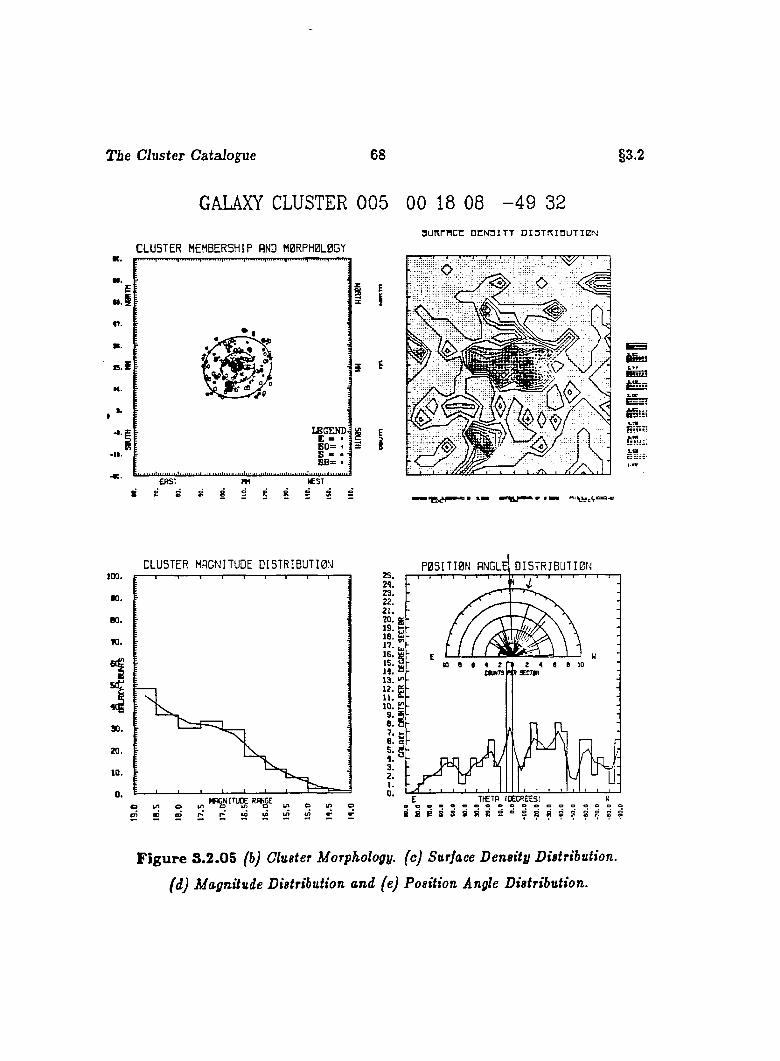
The Cluster Catalogue 68 §3.2
GALAXY CLUSTER 005 00 18 06 - 4 9 32sunrncc dcn3 I tt Disrr^iDUTiBN
C L U S T E R MEMBERSHIP AND M0RPH0L0GY•0.
LEGEND. E = ' :B 0 = » :S V « 1Sfis • i
• I I .
s e
I
i
!
I
CL U ST E R MAGNITUDE D I S T R I B U T I O N
K .
BQ.
TO.
3 0 .
20.
10.
„ o u> o r : œ m u i u i «" V
P O S I T I O N ANGLE) D I S T R I B U T I O N
FI I sn m
4
T « T P (DECREES)
F ig u re S.2.05 (b) Cluster Morphology, (c) Surface Density Distribution,
(d) Magnitude Distribution and (e) Position Angle Distribution.
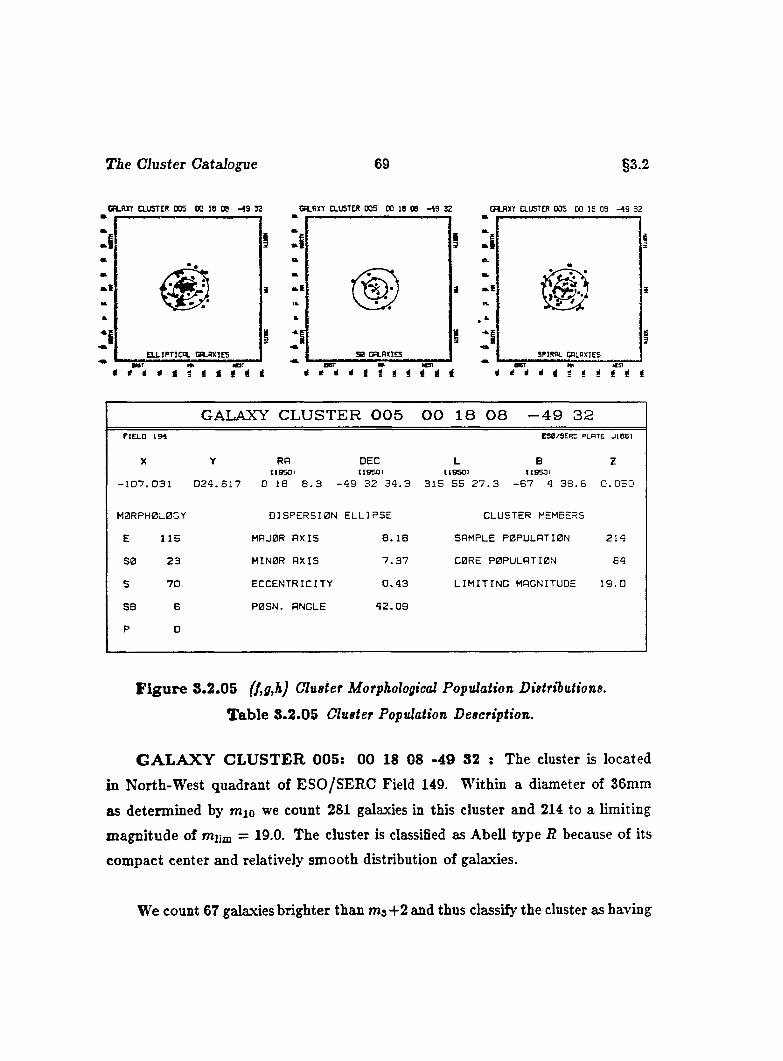
The Cluster Catalogue 69 §3.2
C R LB la a U S T E R 0 0 5 0 0 18 08 - M 32 CRLBXT CLUSTER 0 0 5 00 18 08 - 4 9 32 CRLBXT CLUSTER 0 0 5 00 18 OS - 4 9 32
.....
I III I l i ^
3 m:
. *•i :
50 GR.AXIE5ELLIPTICAL GALAXIES SPIRAL W L R X IE S
* * * * tm K31 BBT IBi i t t t i * * * * * * * * t *
*■ BBT IBi * * * * * * * « * * (
GALAXY C L U S T E R 0 0 5 0 0 1 8 0 8 - 4 9 3 2F IE L D 1 9 4 E S0/SE R C PLATE J IB B l
X
- 1 0 7 . 0 3 1
Y RR DEC119501 119501
0 2 4 . 6 1 7 0 18 8 . 3 - 4 9 3 2 3 4 . 3 3 1 5
L B19501 119501
5 5 2 7 . 3 - 6 7 4 3 8 . 8
z0 . 0 5 0
M0RPH0L0GY D IS P E R S IO N E L L IP S E CLUSTER MEMBERS
E 1 1 5 MAJOR A X IS 8 . 1 8 s a m p l e POPULATION 2 1 4
S0 2 3 MINOR A X IS 7 . 3 7 CORE POPULATION 84
s 7 0 E C C E N T R IC IT Y 0 . 4 3 L I M I T I N G MAGNITUDE 1 9 . 0
SB 6 P 0S N . ANGLE 4 2 . 0 9
P 0
F ig u re S.2.05 (f,g,h) Cluster Morphological Population Distributions.
T ab le 8.2.05 Cluster Population Description.
G A L A X Y C L U S T E R 005: 00 18 08 -49 32 : The cluster is located
in North-West quadrant of ESO/SERC Field 149. Within a diameter of 36mm
as determined by mio we count 281 galaxies in this cluster and 214 to a limiting
m agnitude of rnjim = 19.0. The cluster is classified as Abell type R because of its
compact center and relatively smooth distribution of galaxies.
We count 67 galaxies brighter than m a+2 and thus classify the cluster as having
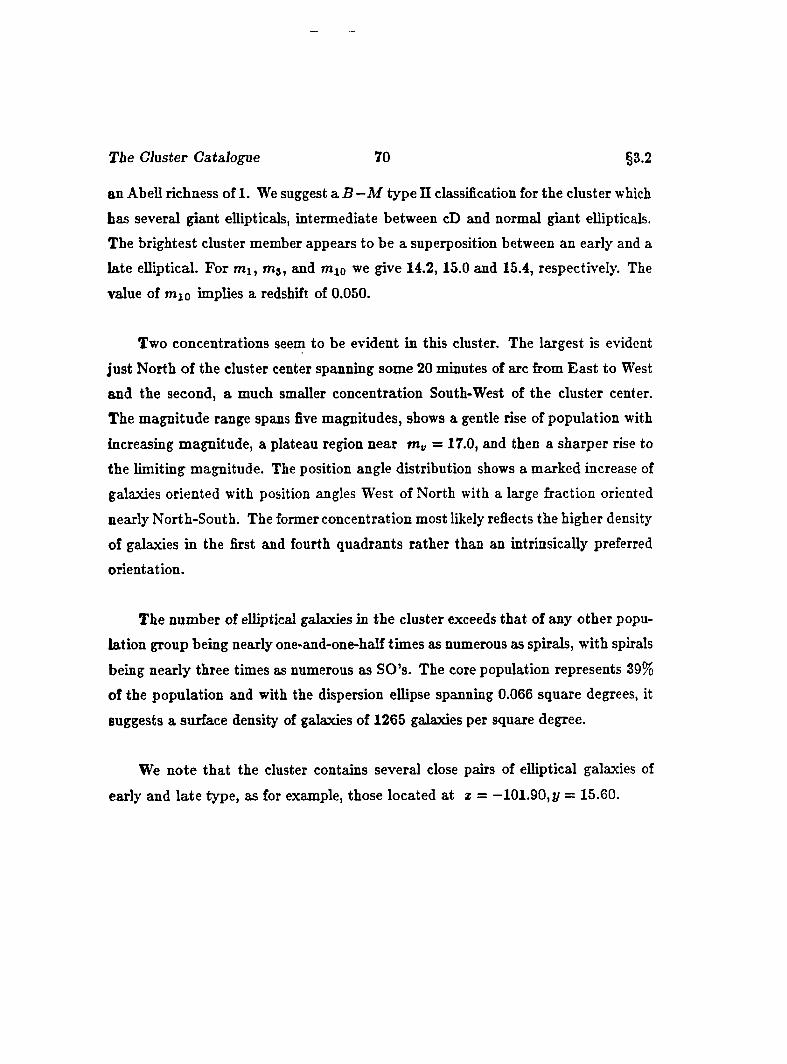
The Cluster Catalogue 70 §3.2
an Abell richness of 1. We suggest a B —M type II classification for the cluster which
has several giant ellipticals, intermediate between cD and normal giant ellipticals.
The brightest cluster member appears to be a superposition between an early and a
late elliptical. For m i, m j, and mio we give 14.2, 15.0 and 15.4, respectively. The
value of mio implies a redshift of 0.050.
Two concentrations seem to be evident in this cluster. The largest is evident
ju st North of the cluster center spanning some 20 minutes of arc from East to West
and the second, a much smaller concentration South-West of the cluster center.
The magnitude range spans five magnitudes, shows a gentle rise of population with
increasing magnitude, a plateau region near m„ = 17.0, and then a sharper rise to
the limiting magnitude. The position angle distribution shows a marked increase of
galaxies oriented with position angles West of North with a large fraction oriented
nearly North-South. The former concentration most likely refiects the higher density
of galaxies in the first and fourth quadrants rather than an intrinsically preferred
orientation.
The number of elliptical galaxies in the cluster exceeds that of any other popu
lation group being nearly one-and-one-half times as numerous as spirals, with spirals
being nearly three times as numerous as SO’s. The core population represents 39%
of the population and with the dispersion ellipse spanning 0.066 square degrees, it
suggests a surface density of galaxies of 1265 galaxies per square degree.
We note tha t the cluster contains several close pairs of elliptical galaxies of
early and late type, as for example, those located at z = —101.90, y = 15.60.
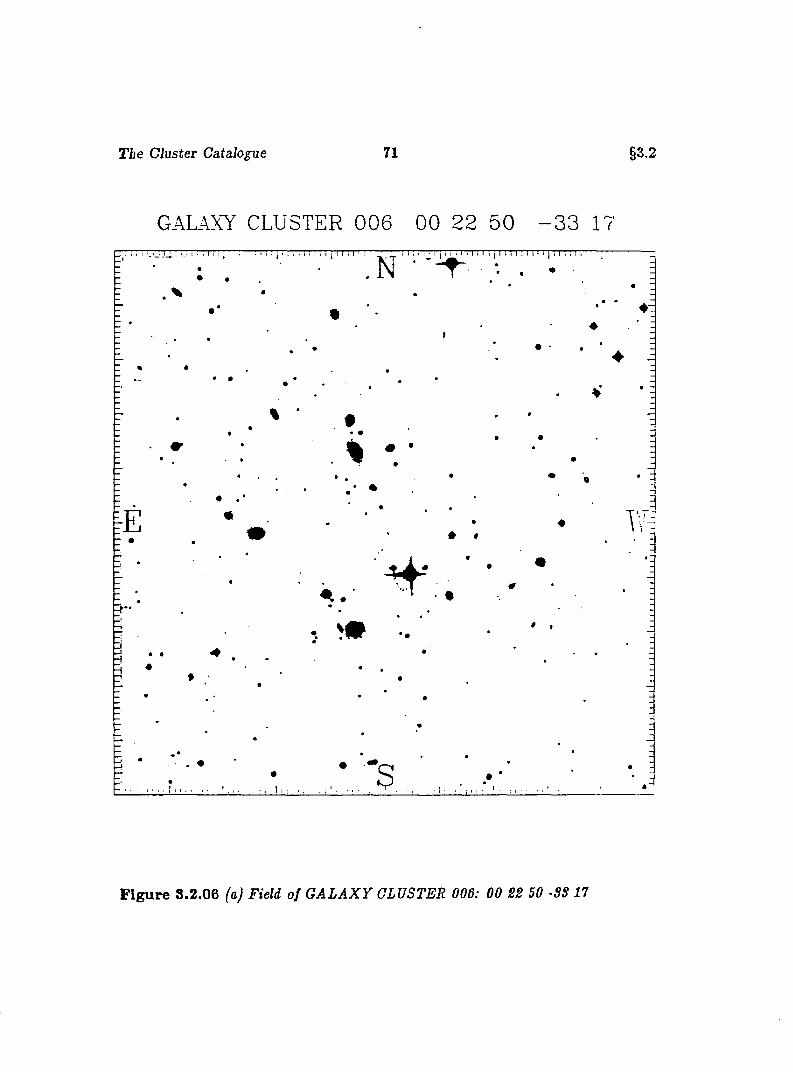
T ie Cluster Catalogue 71 §3.2
(:luij 5)TE:];t c ) o e ; ()C) 5>() -- 3 c ) I ' z
#
F ig u re 3.2.06 (a) Field of G A L A X Y CLUSTER 006: 00 22 50 -SS 17
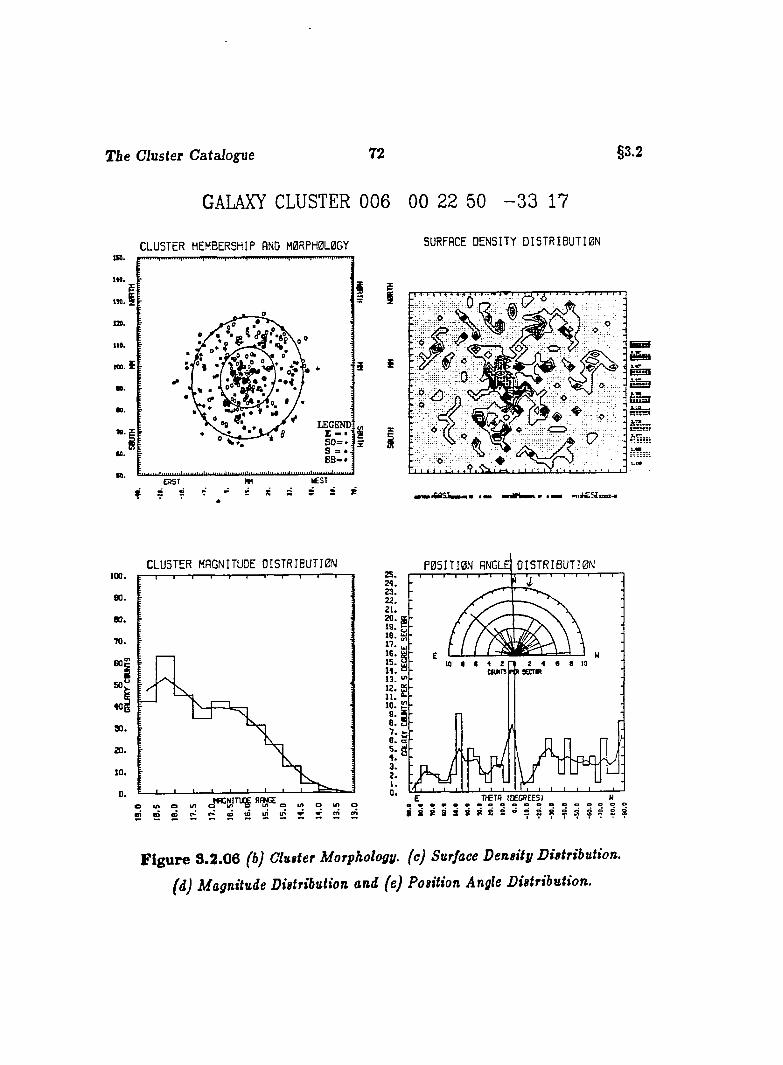
Tie Cluster C atalane 72
GALAXY CLUSTER 006 00 22 50 - 3 3 17
CL U ST E R MEMBERSHIP AND M0RPH0L0GY
§3.2
SURFACE D E N S IT Y D I S T R I B U T I O Ntn.
140.
IM.
no.
110.
too.
«0.
to.
to.I£ S TE R S T
P? ?
liU
C L U S T E R MAGNITUDE D I S T R I B U T I O N P O S I T I O N ANGLE D I S T R I B U T I O N100.
90.
T O .
50:«I90.
6. S20.
10.
0.o
F ig u re 3.2 .06 (b) Ghsier Morphology, (c) Surface Density Distribution,
(d) Magnitude Distribution and (e) Position Angle Distribution.
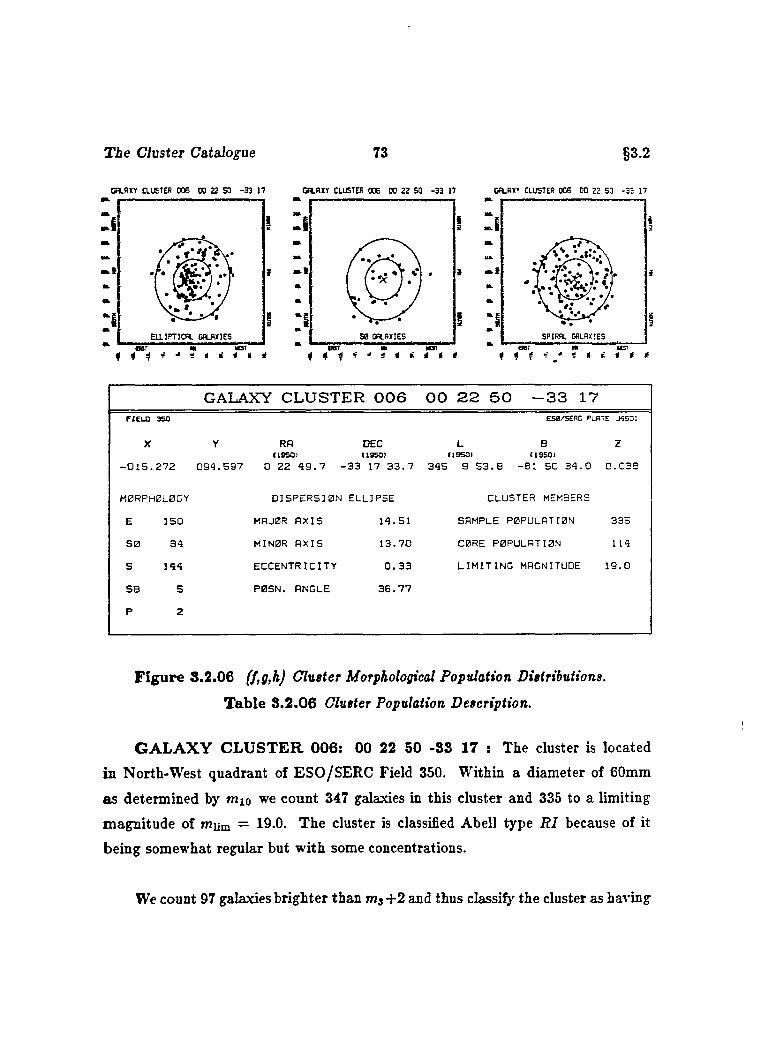
T ie Cluster Catalogue 73 §3.2
CRLflXY CLUSTER 0 0 6 00 22 SO - 3 3 17 GALAXY CLUSTER 006 00 2 2 50 33 17 GALAXY CLUSTER 0 0 6 0 0 22 50 - 3 3 17
E L L IP T IC A L GALAXIES
BBT BBTSPIRAL GALAXIES
f < ? a W R ^
GALAXY CLUSTER 006 0 0 22 50 -33 17FIELD 350 ESO/SERC PLATE J 5531
X Y RR DEC L B Z(19501 (19501 (19501 (19501
- 0 1 5 . 2 7 2 0 9 4 . 5 9 7 0 2 2 4 9 . 7 - 3 3 17 3 3 . 7 3 4 5 9 5 3 . 8 - 8 1 5 0 3 4 . 0 0 . 0 3 8
M0RPH0L0GY D IS P E R S IO N E L L IP S E CLUSTER MEMBERS
E 1 5 0 MRJ0R A X I S 1 4 . 5 1 s a m p l e POPULATION 3 3 5
5 0 3 4 MINOR A X I S 1 3 . 7 0 CORE POPULATION 114
S 14 4 E C C E N T R IC IT Y 0 . 3 3 L I M I T I N G MAGNITUDE 1 9 . 0
SB 5 P 0S N . ANGLE 3 6 . 7 7
P 2
F ig u re 3.2.06 (f,g,h) Cluster Morphological Population Distributions.
T ab le S.2 .06 Cluster Population Description.
G A L A X Y C L U S T E R 006; 00 22 50 -33 17 : The cluster is located
in North-West quadrant of ESO/SERC Field 350. Within a diameter of 60mm
as determined by mio we count 347 galaxies in this cluster and 335 to a limiting
magnitude of mum = 19 0. The cluster is classified Abell type R I because of it
being somewhat regular but with some concentrations.
We count 97 galaxies brighter than mj +2 and thus classify the cluster as having
The Cluster Catalogue 74 §3.2
an Abell richness of 2. We suggest a. B — M type II classification for the cluster
which has a mild core-halo configuration with the brightest galaxies intermediate
between the class cD and normal giant ellipticals. For and mio we give
13.9,14.3 and 14.9,respectively. The value of mio implies a redshift of 0.038.
As mentioned above the cluster displays a mile core halo configuration with a
somewhat diagonal concentration of cluster members running South- West to North-
East about 20mm long on the plate located just South-East of the cluster center.
There appears to be a small concentration of galaxies slightly more South-East of
this structure.
The brightest galaxy in the cluster appears to have a corona; likewise, othe
bright members are seen to possess extended envelopes and halos. The cluster
magnitude distribution displays a gentle rise from thirteenth to about sixteenth
magnitude where it appears to flatten off somewhat. An enhancement of the number
of faint galaxies appears to occur in the eighteenth magnitude range.
The position angle distribution for the brighter galaxies seems dominated by
inclinations West of North with two other noticable peaks occurring near 0.0 degrees
and 50.0 degrees East of North.
We notice a heavier concentration of elliptical galaxies near the center of the
cluster and within the dispersion ellipse, whereas the spirals appear to be more
uniformly distributed. The elliptical-spiral ratio appears to be nearly 1 : 1 with a
relative paucity of SO galaxies, which may be due to selection.
The core population of the cluster represents nearly 34% of the sample in an
area of nearly 0.22 square degrees yielding a surface density of 521 galaxies per
square degree in the dispersion ellipse.
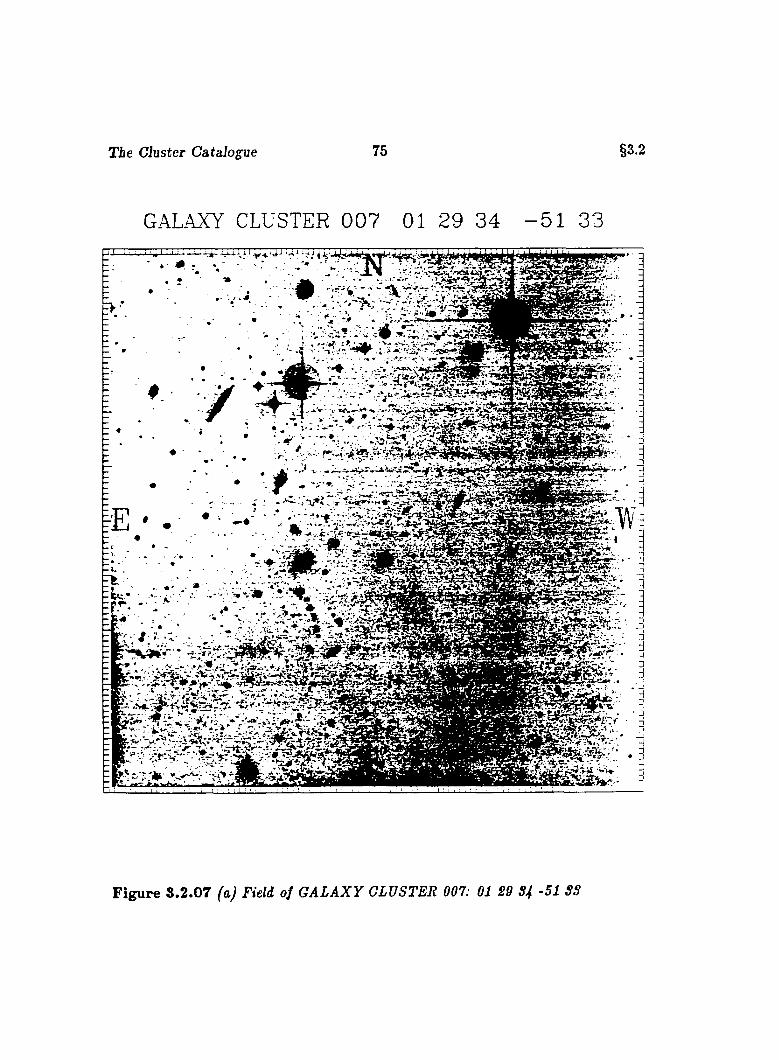
T ie Cluster Catalogue 75 §3.2
GALAXY CLUSTER 0 0 7 01 29 34 - 5 1 33
. . .. -1.
JsSs^SiiS■J ' '-'r /. • . . . - V f w . ' . / - " m f . . ' ^ ' %•- • f 4 •■''■'•V.-.’'-^ s jr-■’’ ■ ■„
"..? • V0K . .,• -j
;5 & # %m
I ft
%'r.' HjsSt.''" . 3
# % 2CsK)* .
F igure 3 .2 .07 faJ Field of G A LA X Y CLUSTER 007: 01 SO S4 -51 SS
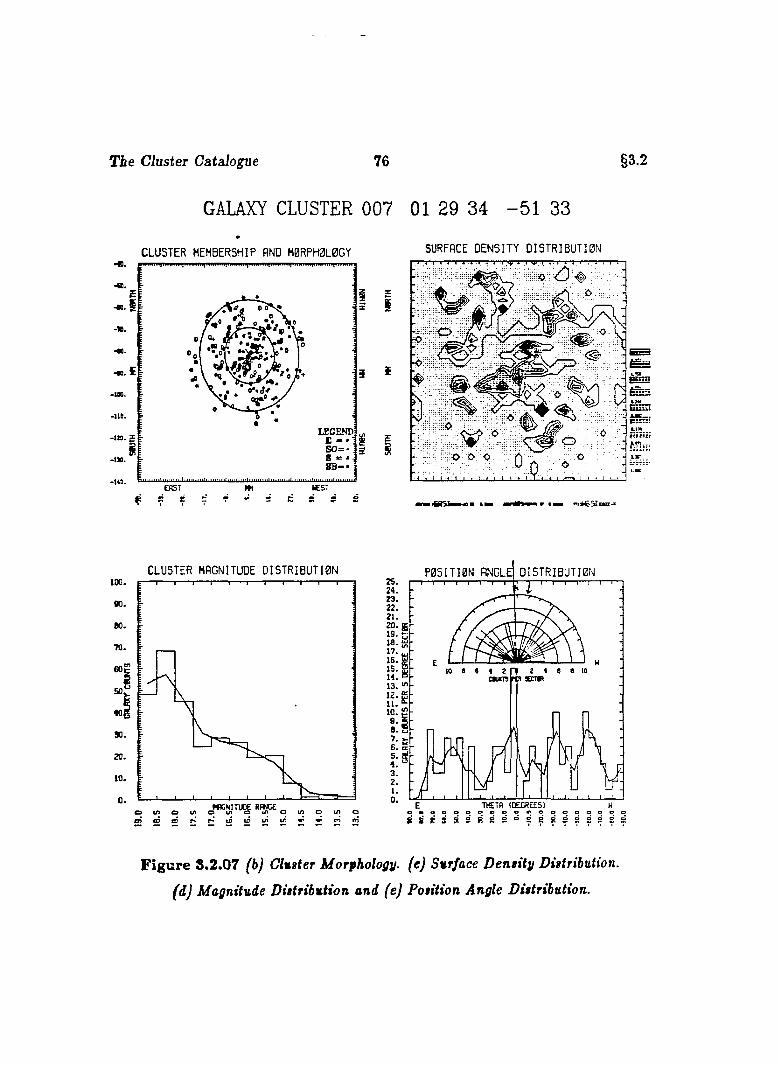
T ie Cluster Catalogue 76
GALAXY CLUSTER 007 01 29 34 - 5 1 33
§3.2
C L U ST E R MEMBERSHIP AND M 0RPH0L0GY•B.
-a.
•uo.
•iifi.
so=
•148.EAST
f ? C?
3 Ï
SURFACE D E N S IT Y D I S T R I B U T 1 0 N1 - x ' i i T n r " 4 4 "I I 4 I 4 I V 4 I 1 I' '% r - r r t i r-
j < I I ' ' I i i \ I : )
t v «.MB
CLU STER MAGNITUDE D I S T R I B U T I 0 NIX .
X .
N.70.
XSO.
«0,s .
za.10.
0 ,
o u. o u, «'ÏF o u> .
P O S I T I O N ANGLE D I S T R I B U T I O N
22.
15.
1:1
E TtETA IÜECREES1eeoeoeoeeocsi l i i P s a s R S 2 ® s S g g E S
F ig u re 8.2.07 (b) Cluster Morphology, (e) Surface D ensity Distribution,
(d j Magnitude Distribution and (e) Position Angle Distribution.
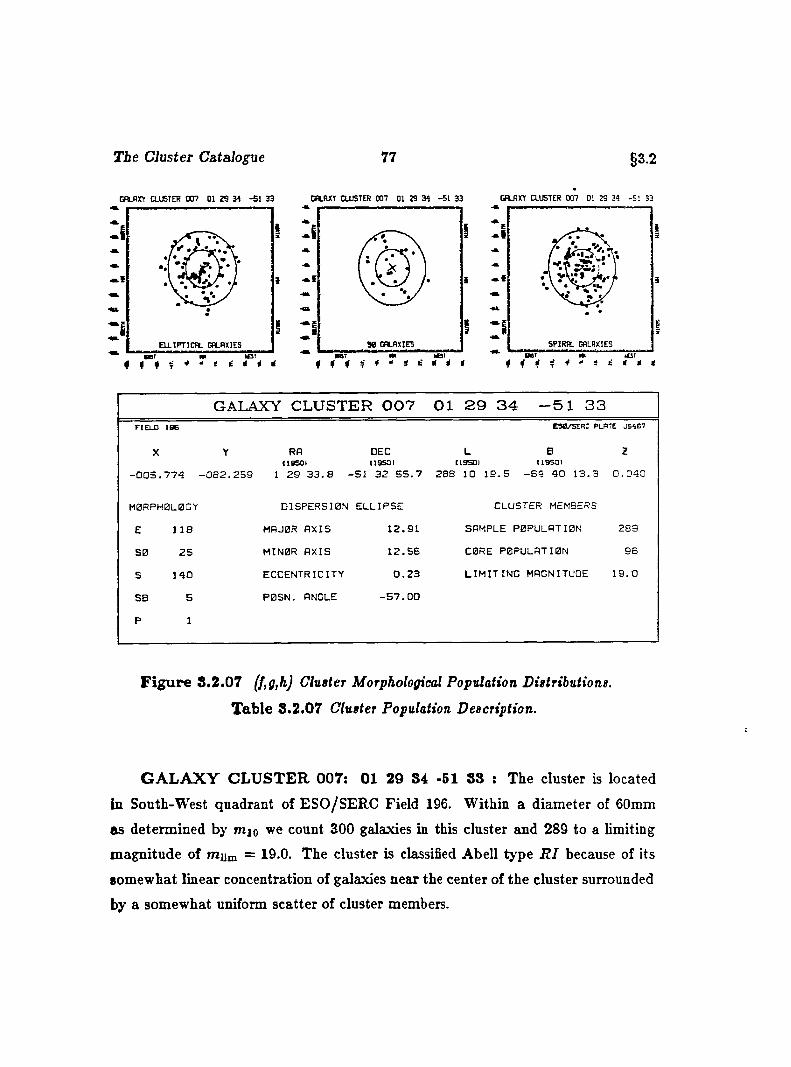
T ie Cluster Catalogue 77 §3.2
C A L A n CLUSTER 0 0 7 01 2 9 31 -5 1 3 3 CALRXT CLUSTER 0 07 01 29 31 -5 1 3 3 GALA XT CLUSTER 0 0 7 01 29 31 - S I 33
i
S P IR A L GALAXIES
GALAXY CLUSTER 007 01 29 34 -51 33F IE L D ID E
X
CSa/SERC PLATE J 5 4 S7
ZY RA DEC L B(19501 ( 19S0 I ( 195DJ ( I 9 S0 I
0 0 5 . 7 7 4 - 0 8 2 . 2 5 9 1 29 3 3 . 8 - 5 1 3 2 5 5 . 7 288 10 1 9 .5 - 6 4 4 0 1 3 .3 0 . 0 4 0
M O R P H O L O G Y
E 1 1 8
S 0 2 5
S 1 4 0
SB 5
P 1
DISPERSION ELLIP SE
MAJOR AXIS 1 2 .9 1
MINOR AXIS 1 2 .5 6
ECCENTRICITY 0 . 2 3
P0SN. ANGLE - 5 7 . 0 0
CLUSTER MEMBERS
SAMPLE POPULATION 2 89
CORE POPULATION 96
L IM IT IN G MAGNITUDE 1 9 .0
F ig u re 8 .2 .07 (f,g,h) Cluster Morphological Population Distributions.
T ab le 8 .2 .07 Cluster Population Description.
G A L A X Y C L U S T E R 007: 01 29 84 -51 88 : The cluster is located
in South-West quadrant of ESO/SERC Field 196. Within a diameter of 60mm
as determined by mio we count 300 galaxies in this cluster and 289 to a limiting
magnitude of mum = 19.0. The cluster is cleissified Abell type R I because of its
somewhat linear concentration of galaxies near the center of the cluster surrounded
by a somewhat uniform scatter of cluster members.
The Cluster Catalogue 78 §3.2
We count 37 galaxies brighter than m 3 +2 and thus classify the cluster as having
an Abell richness of 0. We suggest a B — M type IH classification for the cluster
which has no really dominant galaxies other than what appears to be a superposed
field spiral. For m i,m 3 , and mio we give 14.0,14.7 and 15.1,respectively. The value
of mio implies a redshift of 0.040.
We note a concentration of galaxies South-East of the cluster center with a
few small very dense concentrations such as the one a t z = 10.0, y = -93.0.
There is a slow increase in fainter populations with increasing magnitude reaching
a plateau near m^ = 17.0 and then a dramatic increase of members in the next
magnitude range. Position angles show a slight concentration of brighter galaxies
with inclinations West of North with an apparent enhancement near zero degrees.
The cluster population appears somewhat spiral enhanced with a E : S ratio of
1 :1 .2 with apparently fewer SO galaxies noted in the population. We notice a con
centration of elliptical galaxies South-East of the cluster center and a concentration
of spiral galaxies North-West of center.
The core population comprises slightly over a third of the galaxies in the sample
and resides in an area of nearly 0.18 square degrees, giving a core surface density
of 538 galaxies per square degree.
We find several superposed galaxies in this cluster such as the centrally con
densed diffuse ovoid superposed a t its pole with a faint elliptical galaxy at z =
—2 2 .2 , 1/ = —79.41. In addition, we discover another elliptical spiral combina
tion apparently superposed with (or possibly connected by) a luminous bridge
a t z = —6.52, y = -95.01. Another luminous bridge combination is found at
X — —18.26, y = —88.56. Finally, several superposed pairs are seen such as the set
a t z = —22.03, y = —91.31.
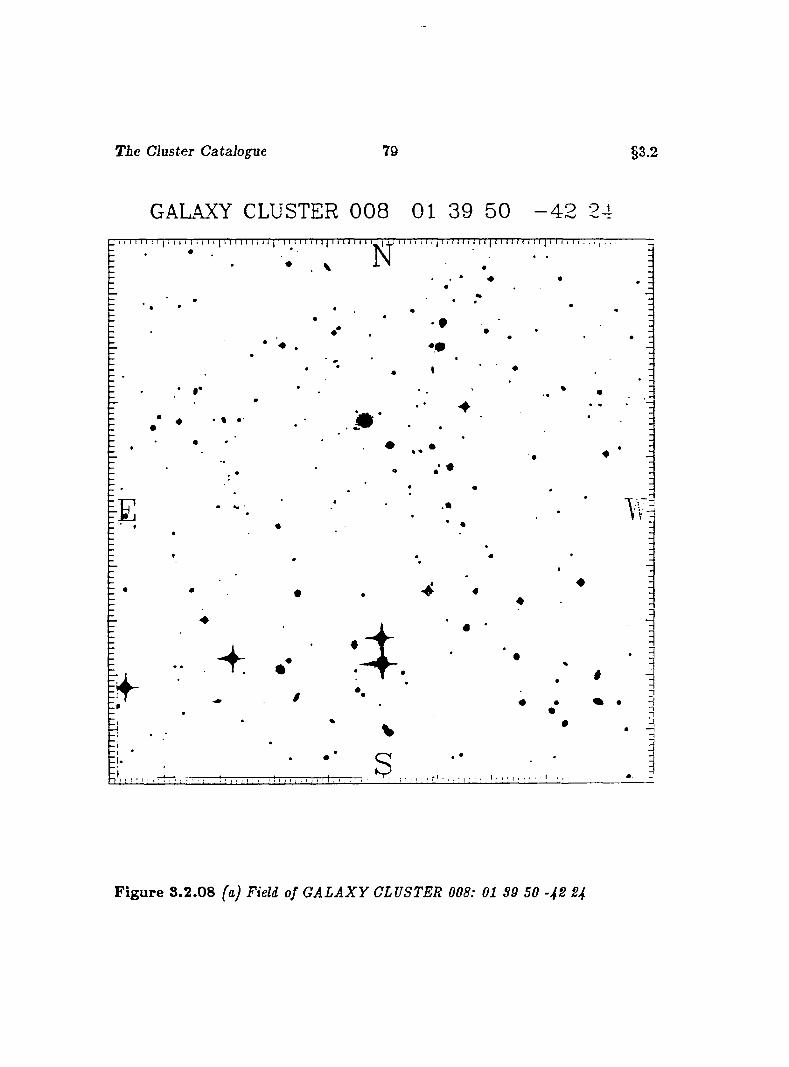
T ie Cluster Catalogue 79 §3.2
GALAXY CLUSTER 0 0 8 01 39 50 - 4 2 24
F ig u re 3 .2 .08 (a) Field of G A L A X Y CLUSTER 008: 01 SO 50 -42 24
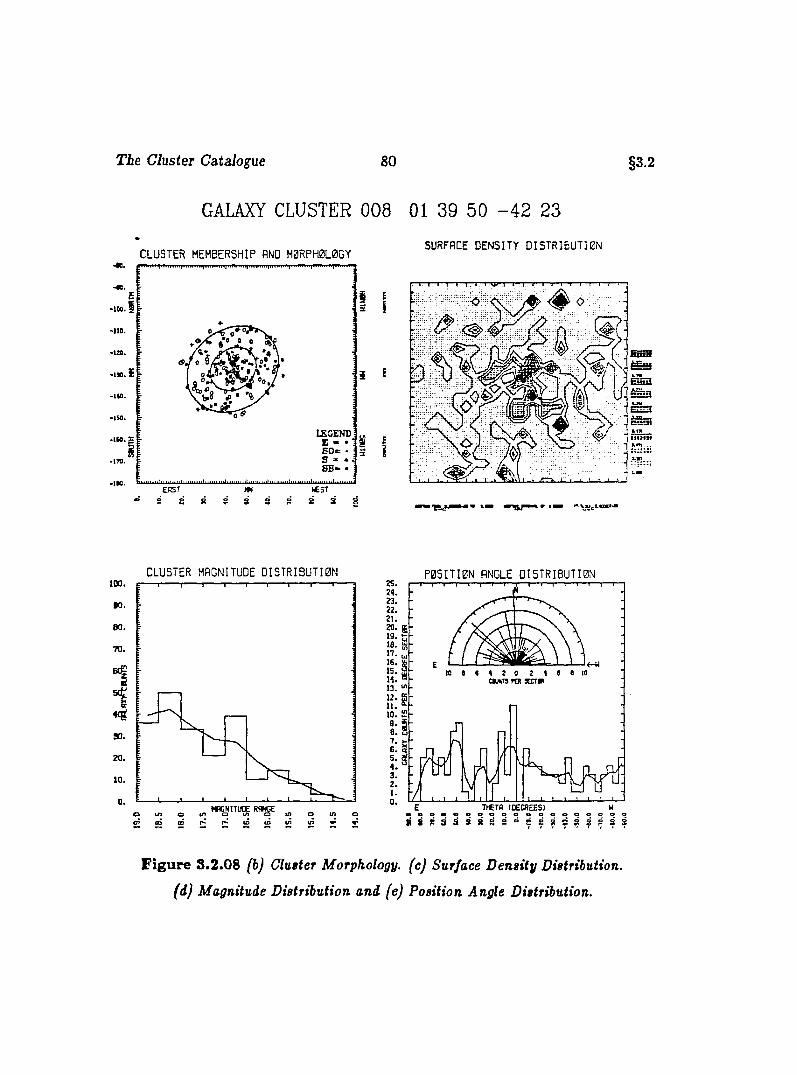
The Cluster Catalogue 80 §3.2
GALAXY CLUSTER 008 01 39 50 -4 2 23
SURFACE D E N S IT Y D I S T R I E U T I 0 NC L U S T E R MEMBERSHIP AND M 0RPH 0L0G Y
•190. 1
• IS O .
LEGEND
-170 .
• I K .
i I
i i
8 8 S 3 8 3 8
CL U ST E R MAGNITUDE D I S T R I B U T I O N P O S I T I O N ANGLE D I S T R I B U T I O N100.
•0 .
80.70.
90.
20.
10.
^ MflGNITOGI R»g€ ^ ^r- t*. ID to m to
25.24.
15.
13. "
l:s
5 3 3 2 S S
F ig u re 3.2.08 (b) Cluster Morphology, (c) Surface Density Distribution,
(d) Magnitude Distribution and (e) Position Angle Distribution.
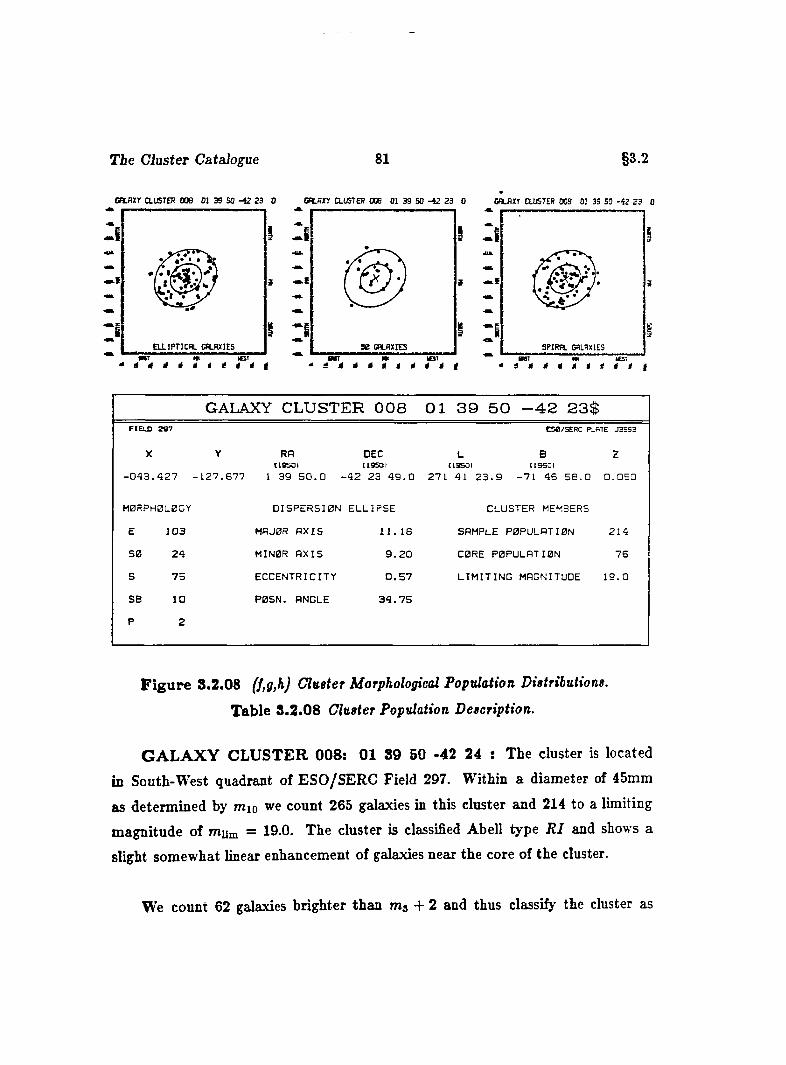
The Cluster Catalogue 81 §3.2
cn.nxr aiSTER oos oi 39 so -12 23 0 cn.nxr CLUSTER oœ 01 39 so -42 23 0 cfuixT ausiE R ooe o: as so -42 23 0
i 9
IE L L IP T IC B L c a jW IE S 3 0 GALAXIES SP IR A L GALAXIES
GALAXY CLUSTER 008 01 39 50 -42 23$f ie l d 2 9 7
X
ES0/SERC PLATE J3SS3
2Y RR DEC L BUS5DI I19S0I (1950J [195QJ
0 4 3 . 4 2 7 - 1 2 7 . 6 7 7 1 3 9 5 0 . 0 - 4 2 2 3 4 9 . 0 2 7 1 41 2 3 . 9 - 7 1 4 6 5 8 . 0 0 . 0 5 0
M0RPHBLBGY
E 1 0 3
SB 2 4
S 7 5
SB 10
P 2
D IS P E R S IO N E L L IP S E
MRJ0R A X I S 1 1 . 1 6
M IN 0 R A X IS 9 . 2 0
E C C E N T R IC IT Y 0 . 5 7
P 0S N . ANGLE 3 4 . 7 5
CLUSTER MEMBERS
SAMPLE P 0 P U L R T I0 N 2 1 4
C0RE P 0 P U L R T I0 N 7 6
L I M I T I N G MAGNITUDE 1 9 . 0
F ig u re 8.2.08 (f,g,h) Cluster Morphological Population Distributions.
Table 8 .2.08 Cluster Population Description.
G A L A X Y C L U S T E R 008: 01 89 50 -42 24 : The cluster is located
in South-West quadrant of ESO/SERC Field 297. Within a diameter of 45mm
as determined by mio we count 265 galaxies in this cluster and 214 to a limiting
magnitude of rrium = 19.0. The cluster is classified Abell type R I and shows a
slight somewhat linear enhancement of galaxies near the core of the cluster.
We count 62 galaxies brighter than + 2 and thus classify the cluster as
T ie Cluster Catalogue 82 §3.2
having an Abell richness of 1 . We suggest a B — M type I I I classification for the
cluster which lies somewhat intermediate between those clusters domimated by a
single cD galaxy and those with several giant ellipticals. For m i,m 3 , and mio we
give 14.5,14.8 and 15.4,respectively. The value of mio implies a redshift of 0.050.
We notice a nearly North-South linear concentration of galaxies near the clus
ter center as well as several regions of slight enhancement of numbers. This cluster
is found to be somewhat centrally condensed as shown in the surface density dis
tribution plot.
The cluster magnitude distribution shows a ramp-like increase in the population
form m„ = 14.5 to m„ = 18.5 with two enhancements in the range 16.5 — 17.0 and
18.0 — 18.5. For the brighter members of the cluster, we find position angles more
positive in the sense East of North and slightly more inclined at zero and near fifty
degrees than average.
The population is dominated by elliptical galaxies with a [E : SO : S) ratio
of ( 4 : 1 : 3 ) . The ellipticals are scattered throughout the dispersion ellipses, but
somewhat concentrated in the core. SO galaxies seem to be concentrated in the
Northerly portions of the clusters whereas the spirals show little concentration at
all, but a more uniform scatter. The core population represents nearly thirty-five
percent of the sample in an area of 0 . 1 1 square degees giving a cluster core surface
density of 672 galaxies per square degree.
We note several superposed or very close pairs of galaxies (of which we find
seven ) which seem consistently to be composed of an early elliptical and a later
one which is usually fainter. Examples can be found at the following locations:
* = —51.76, y = —115.22; x = —38.19, y — —145.40 and x = —29.41, y = —145.09.
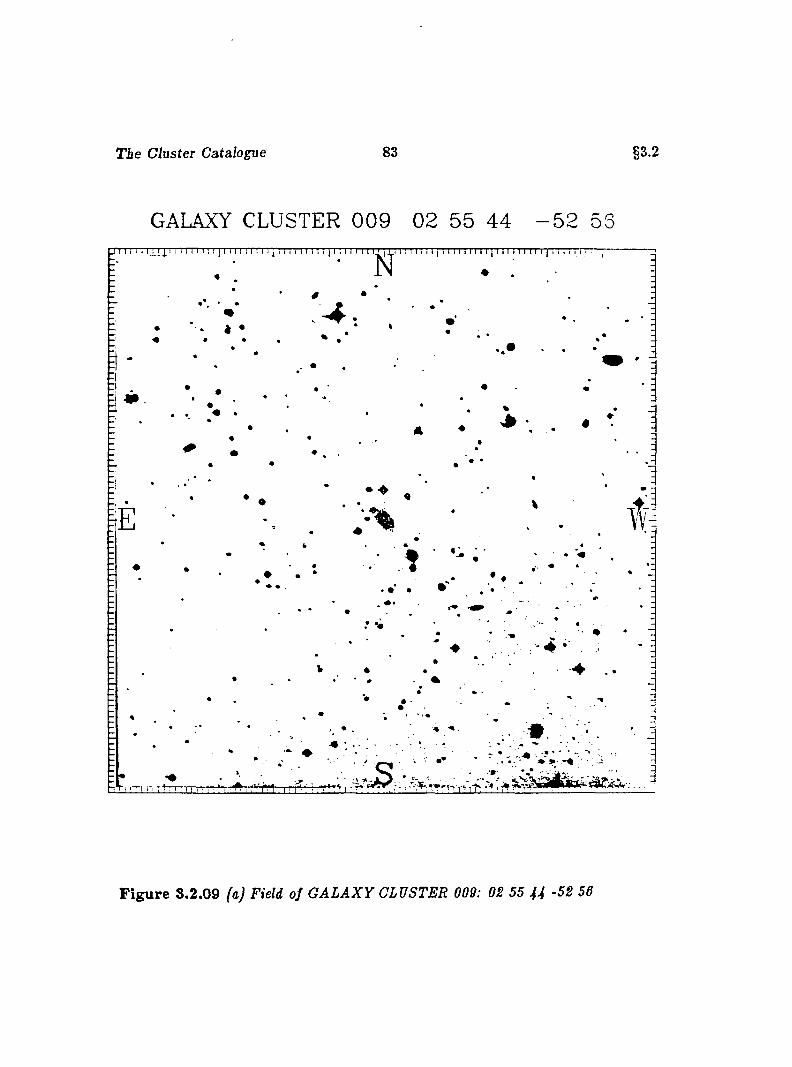
T ie Cluster Catalogue 83 §3.2
GALAXY CLUSTER 0 0 9 02 55 44 - 5 2 53
• ♦
F ig u re 3.2.09 faj Field of G A L A X Y CLUSTER 009: OS 55 44 -52 56
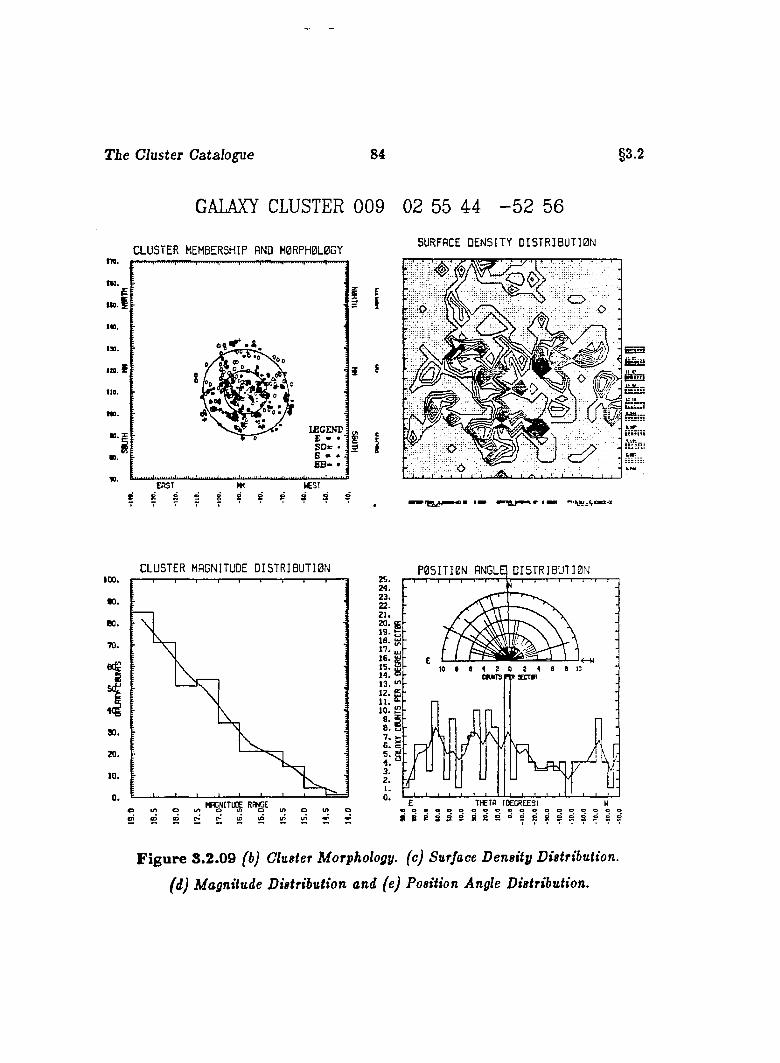
T ie Cluster Catalogue 84 §3.2
GALAXY CLUSTER 009 02 55 44 - 5 2 56
SURFACE D E N S I T Y D I S T R I B U T I 0 NC L U S T E R MEMBERSHIP AND H 0R PH 0L 0G Y
I
i i
! < Z >
1
C L U S T E R MAGNITUDE D I 5 T R I B U T I 0 N100.
n.eo.
70.
90.
Z O .
10.
o in o in in o ui oo i m m r J ^ i n m i n i n ^ ^
2 5 .2 4 .2 3 .22.21.Ii16.
1,: I1 3 . '
: : I 10. !
9 . j 8. ! 7. :6 . i5. ; 4. ' 3.2 . 1. 0.
P 0 5 I T I 0 N ANGLE! D I 5 T R I B U T Î 0 N
10 # e 4 2 0 2 4 6 0 10oiMTrn 3Ecrm
: r- r
T H E T fl lO E G R E E S )
F ig u re 3.2.09 (b) Cluster Morphology, (c) Surface D ensity Distribution,
(d) Magnitude Distribution and (e) Position Angle Distribution.
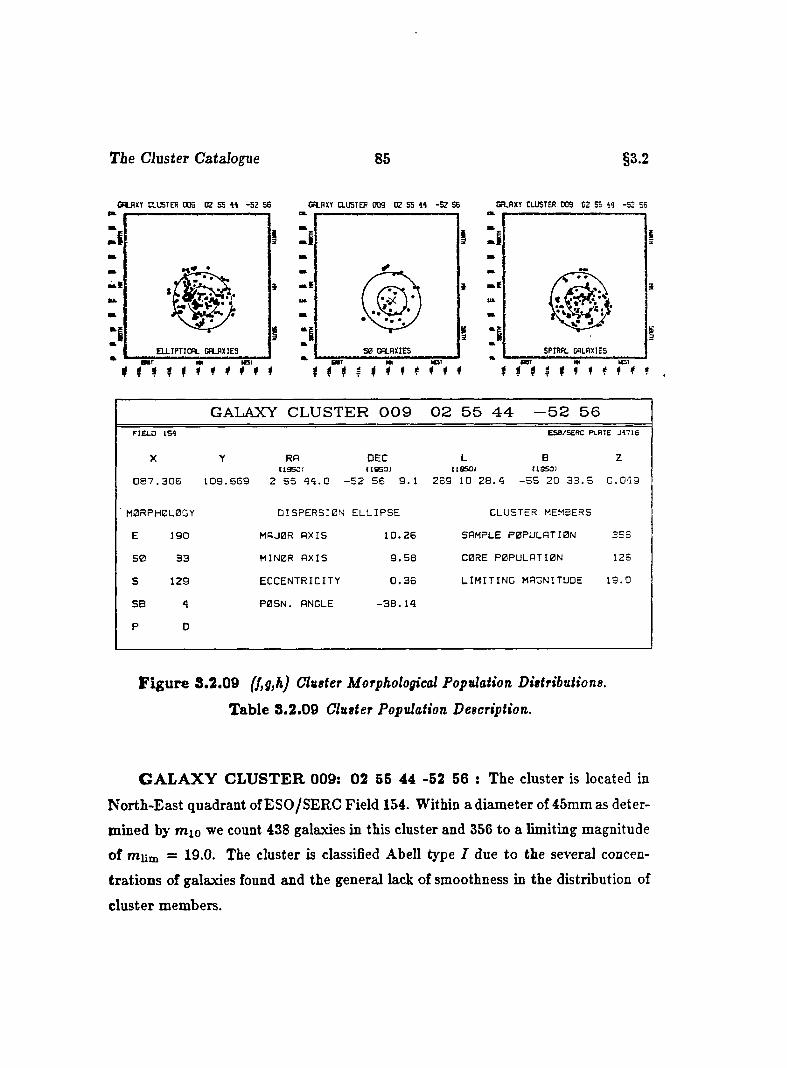
T ie Cluster C ata lan e 85 §3.2
CRLflXT CLUSTER 0 0 9 02 SS -5 2 56 CHLflXT CLUSTER 0 0 9 02 55 45 -5 2 58 CALRXT CLUSTER 0 0 9 0 2 55 44 -5 2 56
I
i
SPIR AL GALAXIESE U - IP T IC n . GALAXIES
B B T m IC 9 I
t t f f t * t * * * f f # f # f » f f
GALAXY CLUSTER 009 02 55 44 -52 56FIELD154 ESB/SERC PLATE J4716
X
0 8 7 . 3 0 5
Y
1 0 9 . 5 6 9
RR(19501
2 5 5 4 9 . 0 -
DEC (lasoi 5 2 5 5 9 . I
L B(18501 I1S50I
2 5 9 10 2 8 . 4 - 5 5 2 0 3 3 . 5
Z
0 . 0 4 9
■ M0RPHBL0GY D IS P E R S IO N E L L IP S E CLUSTER MEMBERS
E ISO MAJOR A X IS 1 0 . 2 5 SAMPLE P 0 P U L R T I0 N 3 5 5
S 0 3 3 M IN 0 R A X IS 9 . 5 8 C0RE P 0 P Ü L A T I0 N 125
s 1 2 9 E C C E N T R IC IT Y 0 . 3 6 L I M I T I N G MAGNITUDE 1 9 . 0
SB 4 P 0 S N . ANGLE - 3 8 . 1 4
P 0
F ig u re 8.2.09 f/,g,hj Cluster Morphological Population Distributions.
Table 8.2.09 Cluster Population Description.
G A L A X Y C L U ST E R 009; 02 55 44 -52 56 : The cluster is located in
N orth-East quadrant of ESO/SERC Field 154. Within a diameter of 45mm as deter
mined by mio we count 438 galaxies in this cluster and 356 to a limiting magnitude
of mutn = 19.0. The cluster is classified Abell type I due to the several concen
trations of galaxies found and the general lack of smoothness in the distribution of
cluster members.
T ie Cluster Catalogue 86 §3.2
We count 8 6 galaxies brighter than m 3 + 2 and thus classify the cluster as
having an Abell richness of 2. We suggest a B — M type II classification for the
cluster which has as its first brightest member an elliptical galaxy with a corona.
The third brightest object in the cluster is a spiral. For m i,m 3 , and mio we give
14 4 ,14.8 and 15.4,respectively. The value of mio implies a redshift of 0.049.
The distribution of cluster membership shows several small concentrations of
galaxies within the cluster. The main subgroup consists of a knotty chain of galaxies
running North-East to South-West, South-East of the cluster center. A relatively
dense region is located at z = —82, y = 1 0 1 where several galaxies form a subgroup
dominated by a bright pair.
The magnitude distribution exhibits a somewhat uniform increase in brightness
a t all magnitudes although a slight change of slope occurs near m„ = 16.5. We
find tha t the position angle distribution of the brighter galaxies shows a preference
for those galaxies aligned in projection to the direction of the major axis of the
dispersion ellipse, that is. East of North.
We note an [E : SO : 5) ratio of ( 1 : 0.17 : 0.68) with the ellipticals occuring
scattered throughout the cluster as well as being in present in several clumps. The
spirals are located predominantly in the Southern quadrants of the cluster, with a
relative paucity in the Northern quadrants. We find similar behavior with the SO
galaxies but are aware of possible misidentifications tha t might arise with confusion
of this class with that of the ellipticals a t large distances.
The core population contains some 35% of the galaxies in the sample within an
area of nearly 0.11 square degrees. This provides some 1164 galaxies per square de
gree for the core population, which resides in a somewhat eccentric (0.36) dispersion
ellipse aligned nearly forty degrees South of West.
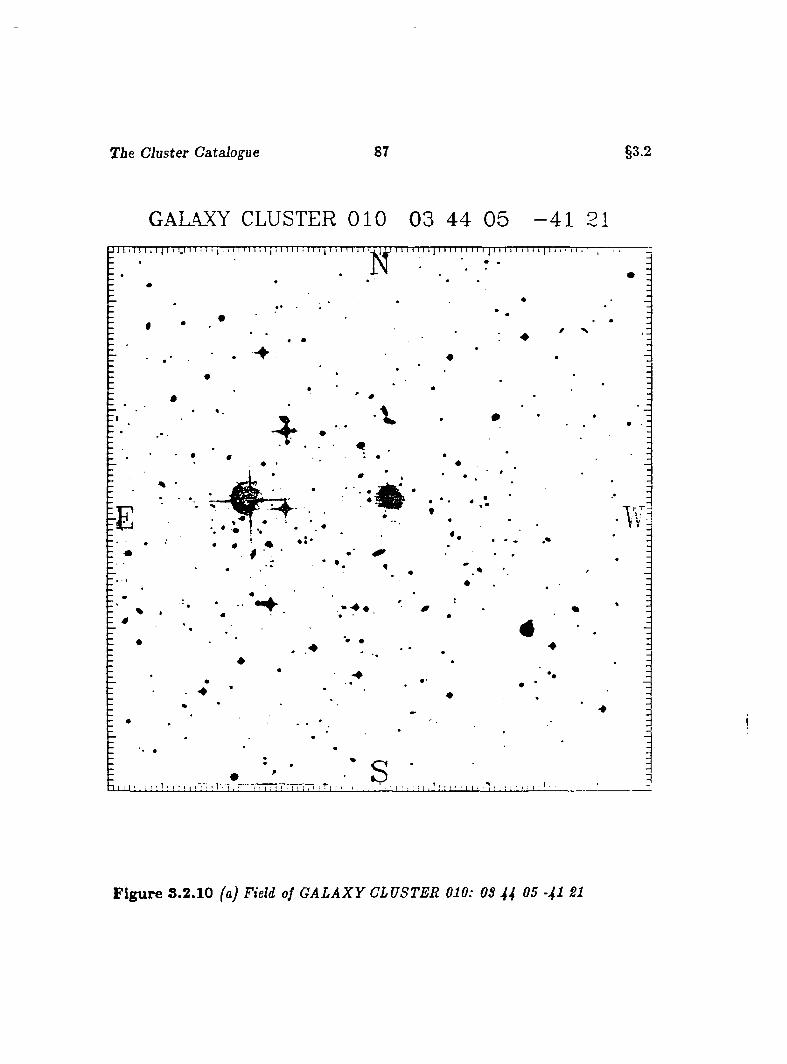
T ie Cluster Catalogue 87 §3.2
GALAXY CLUSTER 0 1 0 03 44 0 5 - 4 1 21
Ii
F ig u re 3 .2 .10 (a) Field of G A LA X Y CLUSTER 010: OS U 05 -4I 21
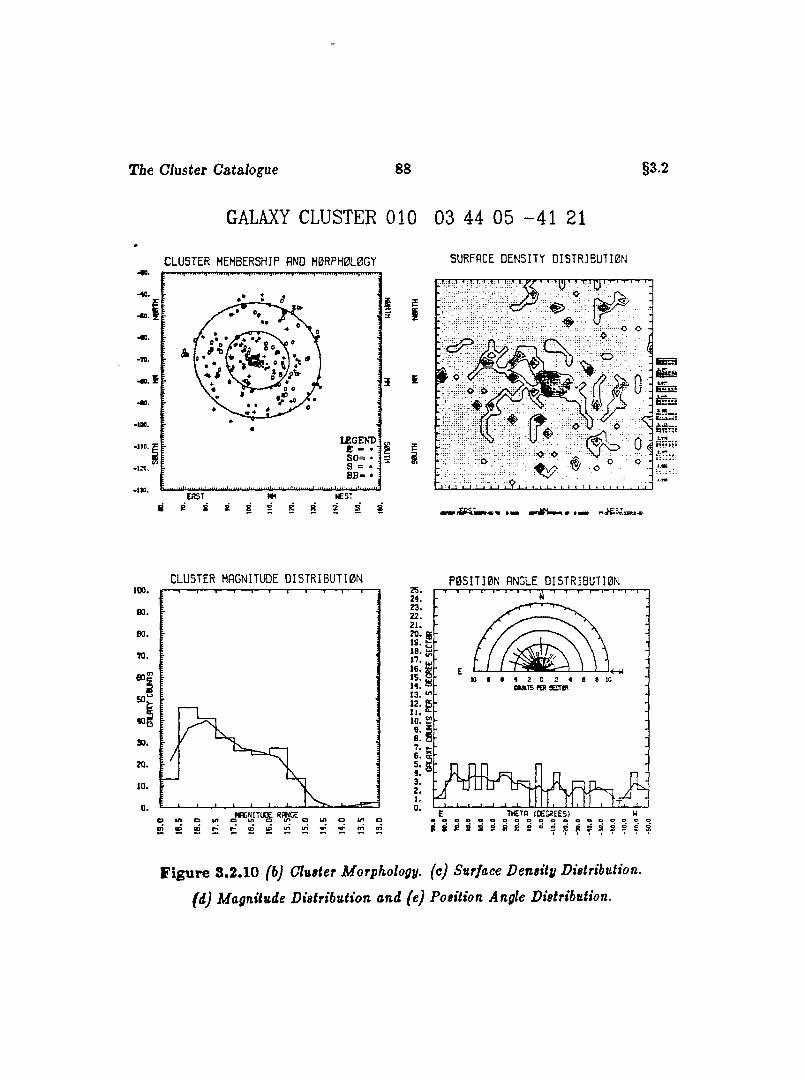
The Cluster Catalogue 88
GALAXY CLUSTER 010 03 44 05 - 4 1 21
§3.2
CLUSTER MEMBERSHIP AND M0RPH0L0GY SURFACE DENSITY DISTRIBUTION
so=86- $
E R S T
fi P 8 sWEST
R R S 8
gI
Os
CLUSTER MAGNITUDE DISTRIBUTI0Nsoo.ea.60.
70.
40,
90.
10.
0,o i n o u , i n o
ZS.24.23.22.21.20.19.16.17.16.15.14.13.12.11.10.6.8.7.6.5.4.3.2.1.0.
P05ITI0N ANGLE DISTRIBUTION-I—I—I—I—I—1—I—i—j—I—I—I—I—I—I—I—r-
K-
*0 # e 4 2 D 2 4 6 6 10CMTB W SEnm
1 - 1—' I I _i_ LM 11 M i l l I [t_ j_THETfl (DECREES)• oeeoeeeeoooeoooooo8 8 P 8 8 ^ R R 2 « 2 E R 8 8 S R S 8
F ig u re 3.2.10 (b) Cluster Morphology, (c) Surface Density Distribution,
(d) Magnitude Distribution and (e) Position Angle Distribution.
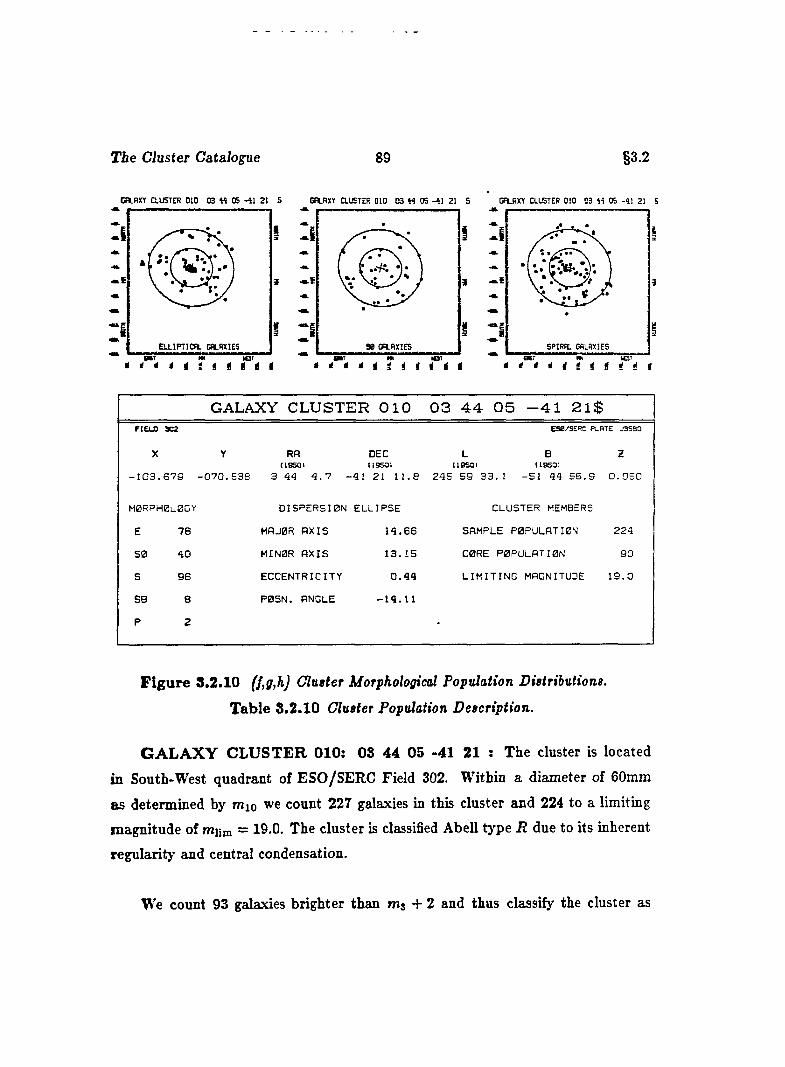
T ie Cluster Catahgue 89 §3.2
C r i M T f CLUSTER 0 1 0 03 44 05 <41 21 5 CRJ4XY CLUSTER 0 1 0 0 3 44 05 -4 1 21 5 G tA X T CLUSTER 0 10 03 44 05 -4 1 21 5
I
i
E L L IP T IC A L GALAXIES
■■r m lot i i i i tSPIRAL GALAXIES
GALAXY CLUSTER 010 03 44 05 -41 21:FIEUn 3C2
X
ESB/SERC PLATE J3SB0
2Y RR DEC L BIIBSOI 119501 I18S 0I (19501
1 0 3 . 6 7 9 - 0 7 0 . 5 3 6 3 4 4 4 . 7 - 4 1 21 1 1 . 8 2 4 5 5 9 3 3 . 1 - 5 1 4 4 5 5 . 9 0 . 0 5 0
M0RPH0L0GY
E 7 8
5 0 4 0
5 9 6
SB 8
P 2
D IS P E R S IO N E L L IP S E
HRJ0R A X IS 1 4 . 6 6
M IN 0 R A X IS 1 3 . 1 5
E C C E N T R IC IT Y 0 . 4 4
P 0S N . ANCLE - 1 4 . 1 1
CLUSTER MEMBERS
SAMPLE P 0 P U L A T I0 N 2 2 4
C0RE P 0 P U L A T I0 N 9 0
L I M I T I N G MAGNITUDE 1 9 . 0
F ig u re 3.2.10 (f,g,h) Clutter Morphological Population Distributions.
Table 8.2.10 Cluster Population Description.
G A L A X Y C L U S T E R 010: 08 44 05 -41 21 : The cluster is located
in South-West quadrant of ESO/SERC Field 302. Within a diameter of 60mm
as determined by mio we count 227 galaxies in this cluster and 224 to a limiting
magnitude of mum - 19.0. The cluster is classified Abell type R due to its inherent
regularity and central condensation.
We count 93 galaxies brighter than m j + 2 and thus classify the cluster as
The Cluster Catalogue 90 §3.2
having an Abell richness of 2. We suggest a B — M type I classification for the
cluster which has a dominant cD galaxy near the cluster center. We notice also,
th a t the third brightest galaxy has a corona For m i,m s, and mio we give 13.5, 15.1
and 15.4,respectively. The value of mio implies a redshift of 0.050.
The central cD galaxy is surrounded by faint attendants and dominates the
cluster. This central condensation provides the highest surface density in the cluster.
We find a rapid rise of population with magnitude to a plateau near m„ = 16.5
a quick jum p to m» = 18.0 and then a sudden fall at fainter magnitudes. The
distribution of bright galaxy position angles is practically uniform and appears to
■how no preferential position angle.
In this cluster we find the spiral galaxies more numerous with an (E:SO:S)
ratio of (l.0:0.5:1.2). The ellipticals seem to be concentrated near the center of the
cluster with an obvious enrichment near the central cD. SO galaxies are scattered
throughout the cluster as are the spirals, which have a slight preference for the
Eastern portions of the cluster.
The core population represents some 40% of the sample in an area of 0.21
square degrees. This represents a core surface density of 424 galaxies per square
degree.
We notice the occurence of several close pairs and groups of galaxies in the
cluster. For instance a pair of superposed and somewhat peculiar dense ovoid
galaxies w ith extended envelopes is located a t x = —130.26, y = —88.78. In
addition there are many low surface brightness galaxies with bright nucleii and
a few concentrations of galaxies above the general field, notably tha t located at
X = —91.06, y = -68.77. The latter is composed primarily of spiral-type galaxies.
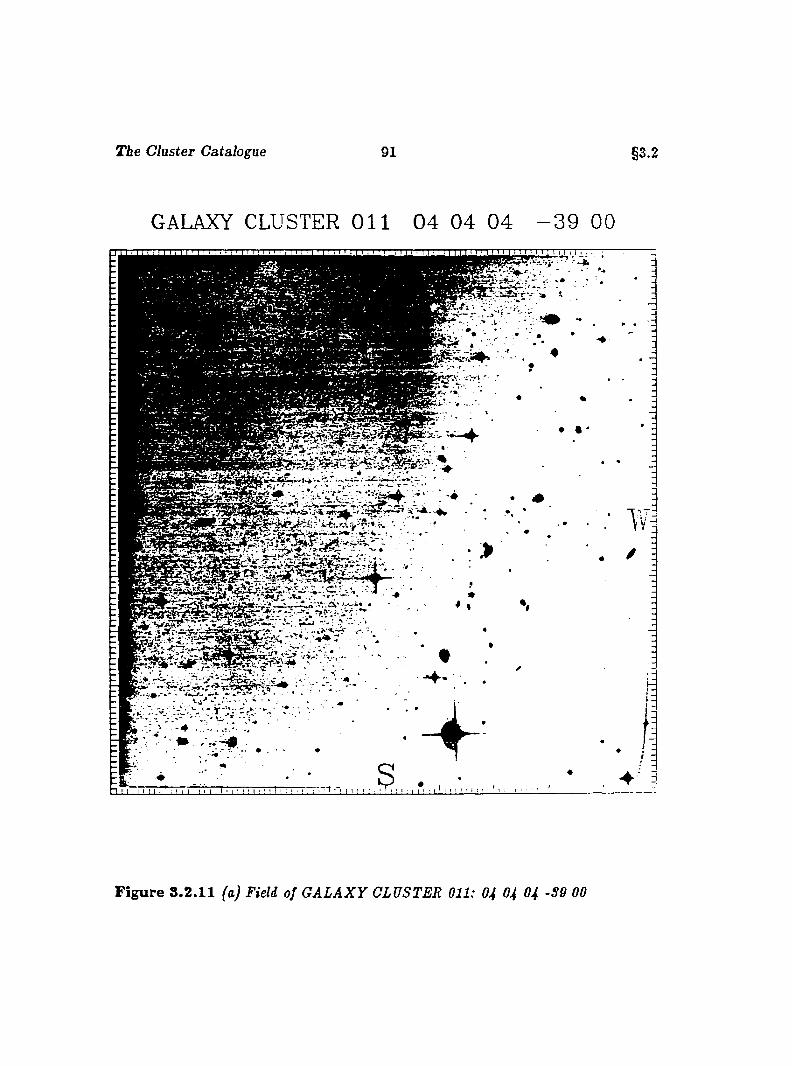
The Cluster Catalogue 91 §3.2
GALAXY CLUSTER O i l 0 4 04 0 4 - 3 9 00
F ig u re S .2 .H (a) Field of G A LA X Y CLUSTER O il: Of Of 04 -SO 00
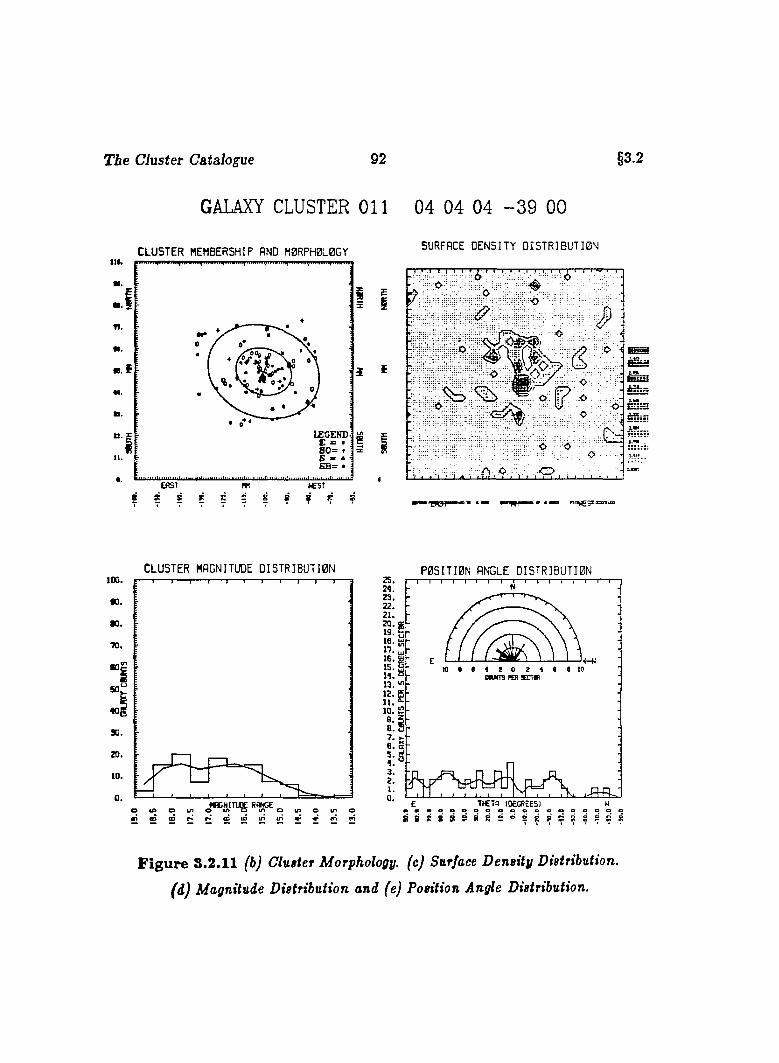
T ie Cluster Catalogue 92
GALAXY CLUSTER O il 04 04 04 - 3 9 00
§3.2
C L U S T E R MEMBERSHIP AND M 0RPH0L0GY110.
H.
TÎ.
s im.
IfGEND C = • : 80= * : B ■ * iEB= • :
I I .
E A ST m WEST
S £ 8 8 ? P S8 S 9
I I ?
1 f :
SURFACE D E N S IT Y D I S T R I B U T I O N
I .* I I...I .1. I 4 ^ 1 t I. i t ! f . 1 . 1 y r r i r - v f r
I * * ') ' '
■ a w " ' 4 4 5 5 ? = - =
C L U S T E R MAGNITUDE D I S T R I B U T I 0 Ntoo.•0.■ Q .
70.
50,
40|
90.
20.
to.a. «NITUg ^ „
2 5 .M.23.22.21.20.19.16.n .IE .IS .11.13.12.11.10.6.а.7.б. 5 . 1.3.2.I.0.
P O S I T I O N ANGLE D I S T R I B U T I O NT—I—1—I—I—I—r-
n . e i t o z i e e i o Mwm PEx s n v
è:
E t i c t b i d e c r e e s i woe «eaooe eoo oaoe eoeo8 8 £ 8 8 9 8 S £ » S £ 8 S 8 S £ S 8
F ig u re 3.2.11 (b) Cluster Morphology, (c) Surface D ensity Distribution,
(d) Magnitude Distribution and (e) Position Angle Distribution.
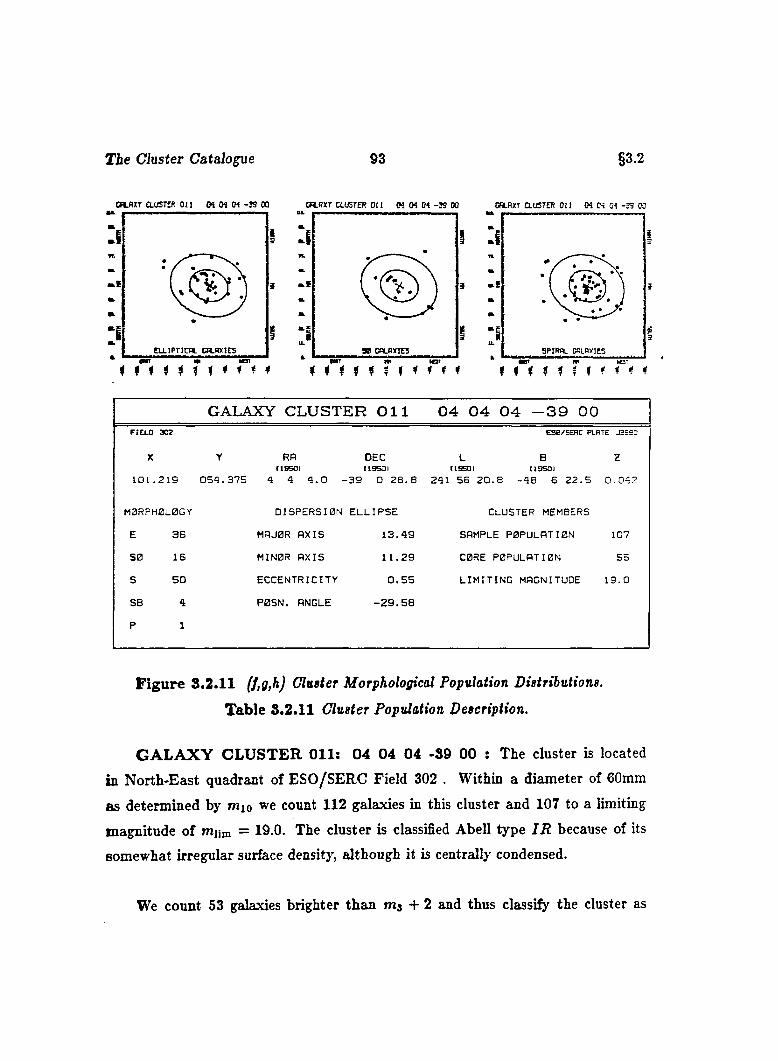
T ie Cluster Catalogue 93 §3.2
CHLHXT a U S T K o n M CM O'! - 3 9 OQ O R .flX T CLUSTER O i l CM CM 0 4 - 3 9 00 C n.B )(T CLUSTER O i l 0 4 0-5 0 4 - 3 9 00
«I3 3
# f $ ( f $ * f < # # # f f ; $ $ f f f f * * ( f f f f f
GALAXY CLUSTER O il 04 04 04 -39 00FIELD 302 ES0/SERC PLATE J3560
X
1 0 1 . 2 1 9
Y
0 5 4 . 3 7 5
RRI I9 S 0 I
4 4 4 . 0 -
DEC119501
3 9 0 2 8 . 8
L B(ISSOI 119501
241 5 6 2 0 . 8 - 4 8 6 2 2 . 5
H
0 . 0 4 2
M0RPH0L0GY O IS P E R S I0 N E L L IP S E CLUSTER MEMBERS
E 3 6 MRJ0R A X IS 1 3 . 4 9 SAMPLE POPULATION 107
S 0 1 6 M IN 0 R A X IS 1 1 . 2 9 C0RE POPULATION 5 5
S 5 0 E C C E N T R IC IT Y 0 . 5 5 L I M I T I N G MAGNITUDE 1 9 . 0
SB 4 P 0S N . ANGLE - 2 9 . 5 8
P 1
F ig u re 8.2.11 f/,ff,hj Cluster Morphological Population Distributions.
T able 8.2.11 Cluster Population Description.
G A L A X Y C L U S T E R O il : 04 04 04 -89 00 : The cluster is located
in North-East quadrant of ESO/SERC Field 302 . Within a diameter of 60mm
as determined by mio we count 112 galaxies in this cluster and 107 to a limiting
magnitude of mum = 19.0. The cluster is classified Abell type I R because of its
somewhat irregular surface density, although it is centrally condensed.
We count 53 galaxies brighter than m3 + 2 and thus classify the cluster as
The Cluster Catalogue 94 §3.2
having an Abell richness of 1. We suggest a possible B — M type II classification
for the cluster which displays a number of bright elliptical galaxies of intermediate
appearance. For m ijtn j, and mxo we give 13.4, 14.7 and 15.1,respectively. The
value of mio implies a redshift of 0.042.
The cluster membership is widely scattered save for the central portions of
the dispersion ellipse. We note a high concentration of galaxies just South of the
cluster center and a more dispersed collection of members distributed Northward
of the cluster center.
The to tal cluster membership is somewhat small, and the magnitude distribu
tion shows a gentle rise to a plateau at m„ = 16.0. There apears to be an isolated
group of faint galaxies from seventeenth to nineteenth magnitude. The position
angle distribution appears to be concentrated in the positive sense, that is. East of
North with a zone of avoidance of large angles of the opposite sense.
We find an [E : SO : 5) ratio of (1.0 : 0.44 : 1.39) and thus a relatively
spiral-rich cluster. Both the ellipticals and spirals are somewhat uniform in their
distribution with a higher concentration of spirals in the core population than el
lipticals. The cluster core contains over 51% of the sample population within an
area of nearly 0.17 square degrees. This yields a surface density of 328 galaxies per
square degree.
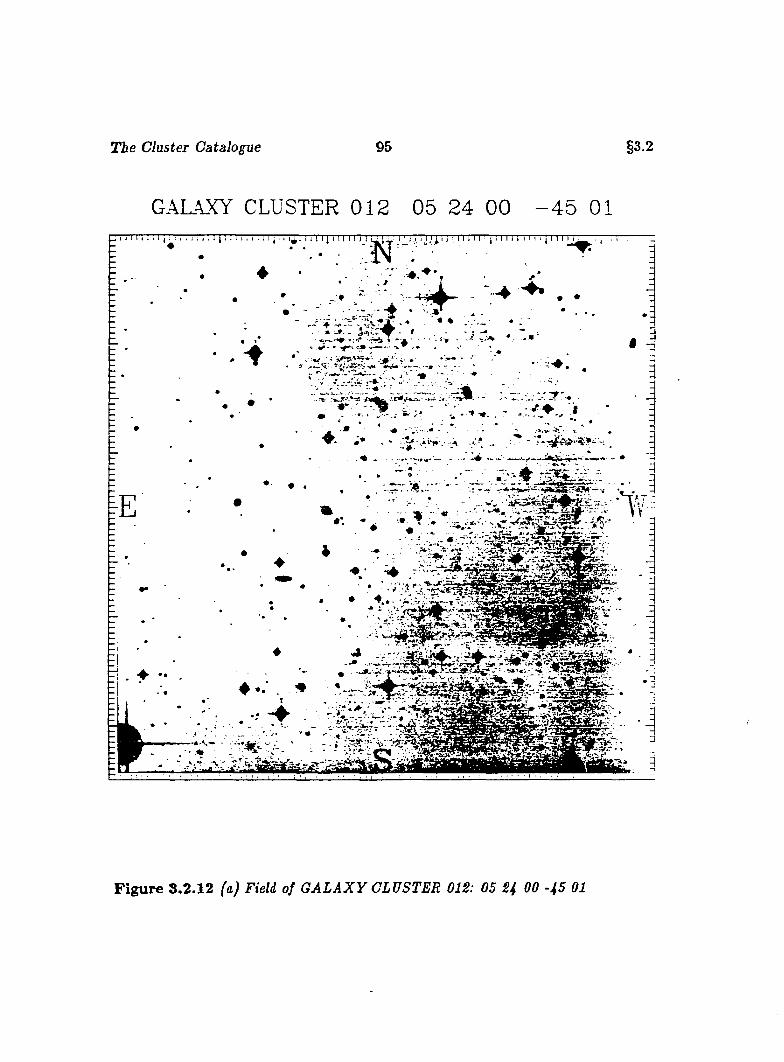
The Cluster Catalogue 95 §3.2
GALAXY CLUSTER 0 1 2 05 24 00 - 4 5 01i j i I I'r 111 ! 11 n 1 i i i 11M 11 ! j 11111111 ■ 11r r p
W l
■ . I
-m.
-A .t-
.- v-«-- «
■•• • ■ . .
. 1 - • V',»., ••V'^'vyi•.
F ig u re 8.2.12 (a) Field of G A L A X Y CLUSTER 012: 05 24 00 -45 01
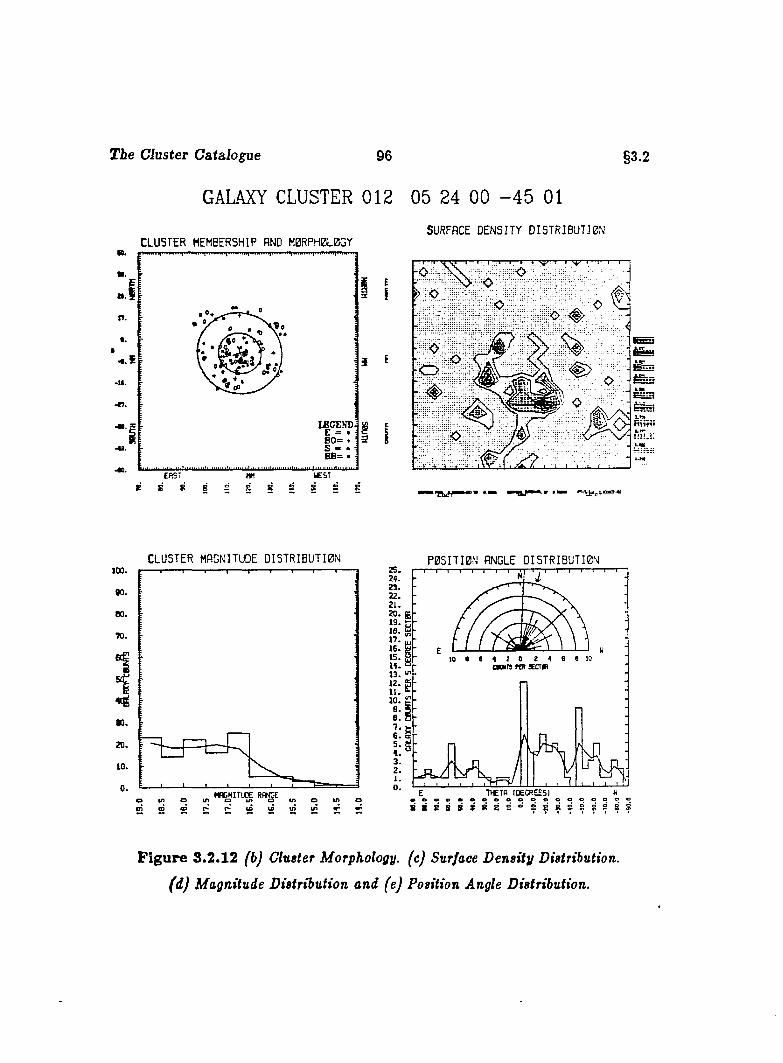
The Cluster Catalogue 96 §3.2
GALAXY CLUSTER 012 05 24 GO - 4 5 01
SURFACE D E N S IT Y D I S T R I B U T I 0 NC L U S T E R MEMBERSHIP AND M 0RPH 0L0G Y8.
a.n.
0*
E A S T MMRg 8 S PS s
E• I ' i V J W 4 I I I I i -l \ p r ' . r I V ‘- --- 1“
- 4>
C L U S T E R MAGNITUDE D I S T R I B U T I 0 N P 0 S I T I 0 N ANGLE D I S T R I B U T I 0 N
22.
6 . a
S S
F ig u re 3.2 .12 fbj Cluster Morphology, (c) Surface D ensity Distribution,
(d ) Magnitude Distribution and (e) Position Angle Distribution.
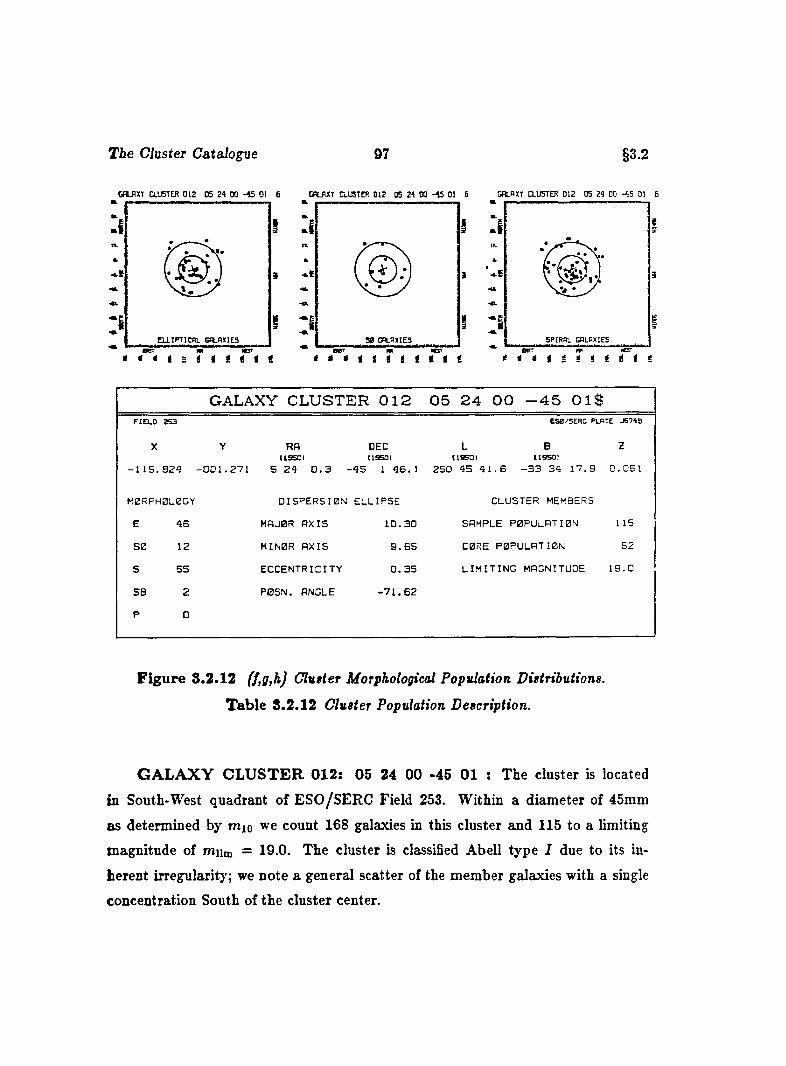
The Cluster Catalogue 97 §3.2
C flL flX T CLUSTER 0 1 2 0 5 24 00 -4 5 01 5 CRLflXT CLUSTER 0 1 2 05 24 00 - 4 5 01 6 GALAXY CLUSTER 0 1 2 05 24 00 -4 5 01 6
i i
IEU-IPTICn. CSLflK IES SPIRAL GALAXIES
t * * t â i i t t t t
GALAXY CLUSTER 012 05 24 00 -45 01!F IE L D ZS 3
X
E S e/S E R C PLATE J6 7 4 S
ZY RR DEC L BI lS S O J 119501 IIBSOI 119501
1 1 5 . 8 2 4 - 0 0 1 . 2 7 1 5 2 4 0 . 3 - 4 5 1 4 6 . 1 2 5 0 4 5 4 1 . 6 - 3 3 3 4 1 7 . 9 0 . 0 5 1
M0RPH0L0GY
E 4 5
SB 12
S 5 5
SB 2
P 0
D IS P E R S IO N E L L IP S E
HRJBR A X IS 1 0 . 3 0
MINOR A X IS 9 . 6 5
E C C E N T R IC IT Y 0 . 3 5
P 0S N . ANGLE - 7 1 , 6 2
CLUSTER MEMBERS
SAMPLE P O P ULA TIO N 115
CORE P O P U L A TIO N 52
L I M I T I N G MAGNITUDE 1 9 . 0
F ig u re 3.2.12 (J,g,h) Cluster Morphological Population Distributions.
Table 8.2 .12 Cluster Population D escription.
G A L A X Y C L U S T E R 012; 05 24 00 -45 01 : The cluster is located
IB South-West quadrant of ESO/SERC Field 253. Within a diameter of 45mm
as determined by mio we count 168 galaxies in this cluster and 115 to a limiting
magnitude of mum = 19.0. The cluster is classified Abell type I due to its in
herent irregularity; we note a general scatter of the member galaxies with a single
concentration South of the cluster center.
The Cluster Catalogue 98 §3.2
We count 38 galaxies brighter than + 2 and thus classify the cluster as
having an Abell richness of 0. We suggest a B — M type HI classification for the
cluster which has no dominant galaxies in the field, but just an enhancement of
the number of galaxies over and above the nominal field density. For mi,mg, and
fWio we give 14.1, 15.1 and 15.2,respectively. The value of mio implies a redshift of
0.061.
The cluster member galaxies are scattered throughout the measured region
with a concentration South of the cluster center and an enhancement in the third
quadrant. The cluster density distribution suggests a ’’U-shaped” grouping in the
region of highest galaxy surface density.
The cluster magnitude distribution is practically flat, with a few bright galaxies
in the tail of the range rising in number to a plateau after m^ = 16.5 and continuing
to the faint limit. The position angles of the brighter galaxies appears to be con
centrated in the negative sense with the majority of the population having position
angles West of North. We note two peaks in the distribution, one at zero degrees,
tha t is, running North-South, and another at fifty degrees, or to the North-West.
We find the cluster to be somewhat spiral rich with an {E : SO : S) ratio of
(l.O : 0.3 :1 .2). Whereas the elliptical galaxies appear to be concentrated in an area
South and East of the cluster center, the spirals appear in greater numbers South
of center with relatively few North of center. The core population, where 45% of
the galaxies reside, is located in an area of some 0.11 square degrees. This yields a
surface density of 475 galaxies per square degree within the dispersion ellipse.
We notice several pairs of elliptical galaxies composed of an early and late
member such as found at z == —99.4, y = —3.9 and x = —109.4, y = —2.9.
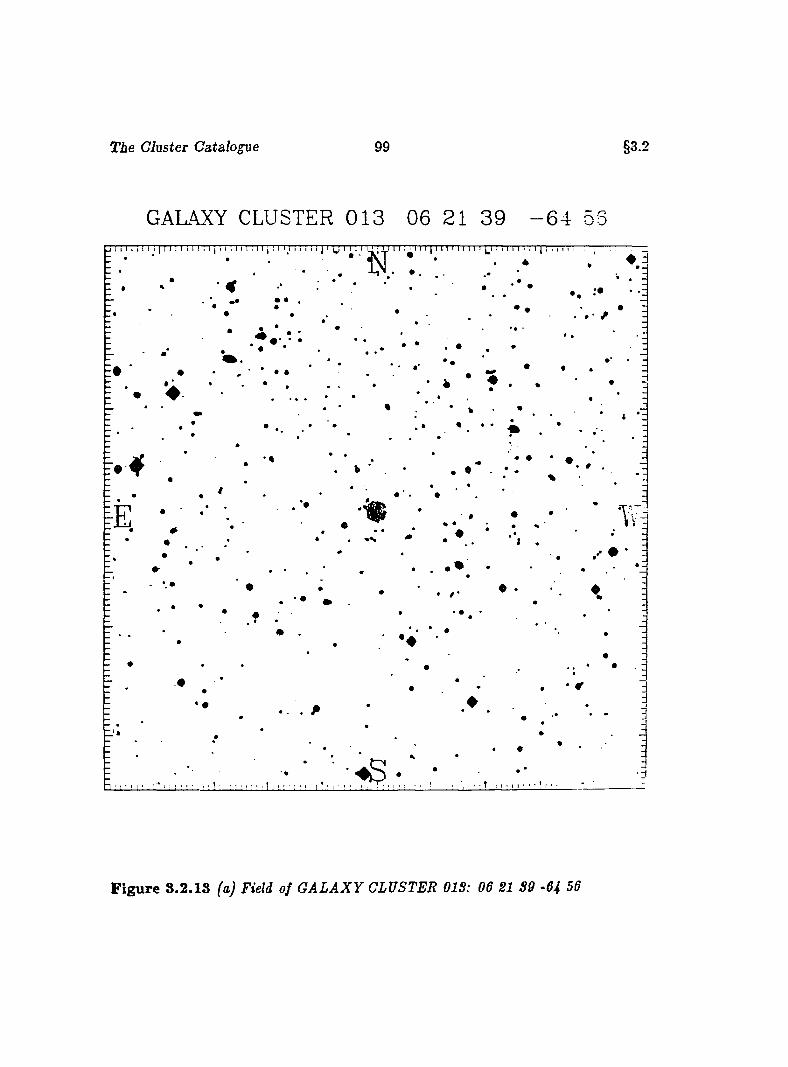
The Cluster Catalogue 99 §3.3
GALAXY CLUSTER 0 1 3 06 21 39 - 6 4 56
/ *
F ig u re 8 .2 .18 (a) Field of G A L A X Y CLUSTER OIS: 06 21 SQ -64 56
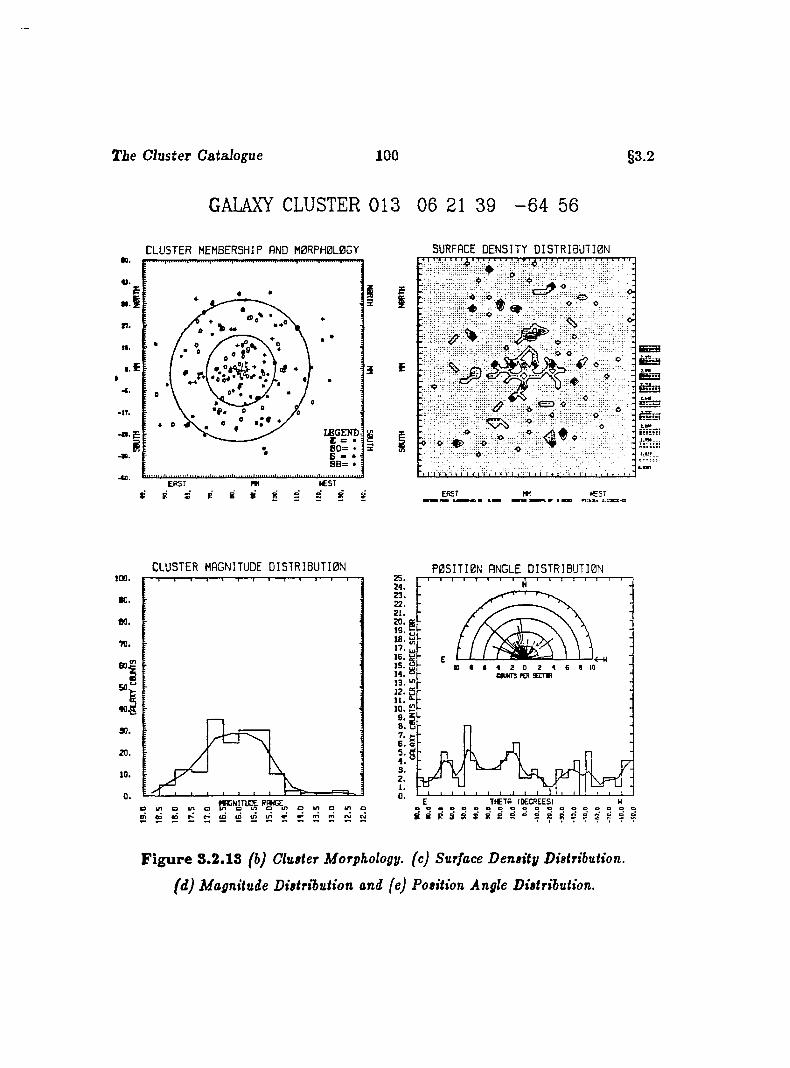
T ie Cluster Catalogue 100
GALAXY CLUSTER 013 06 21 39 - 6 4 56
§3.2
C L U S T E R MEMBERSHIP AND M 0R PH 0L 0G Y•0.41.
m.
It.
, E-4 .
•4X1.E A S T
IBGENVi c = ■ ; 80= •6 — * iSB= • ;
SURFACE D E N S I T Y O I S T R 1 B U T I 0 N
8 e p e g 8 2
I o
£
EAST WESTMML # # mikm. i.ssa^s
C L U S T E R MAGNITUDE D I S T R I B U T I O N P O S I T I O N ANGLE D I S T R I B U T I O N100.
•0.eo.■w.
t
40,
30.
20 .
10.
0,o m o u, o o u, o
22.
19.18.
I S .CfUNT9 PER irrm
13. ^
6. a
T Æ T A (D E C R E E S )
S 8 i S S @8 2 2 2 2 8 2 22 2 ?
F ig u re 3 .2 .IS (b) Cluster Morphology, (c) Surface D ensity Distribution,
(d ) Magnitude Distribution and (e) Position Angle Distribution.
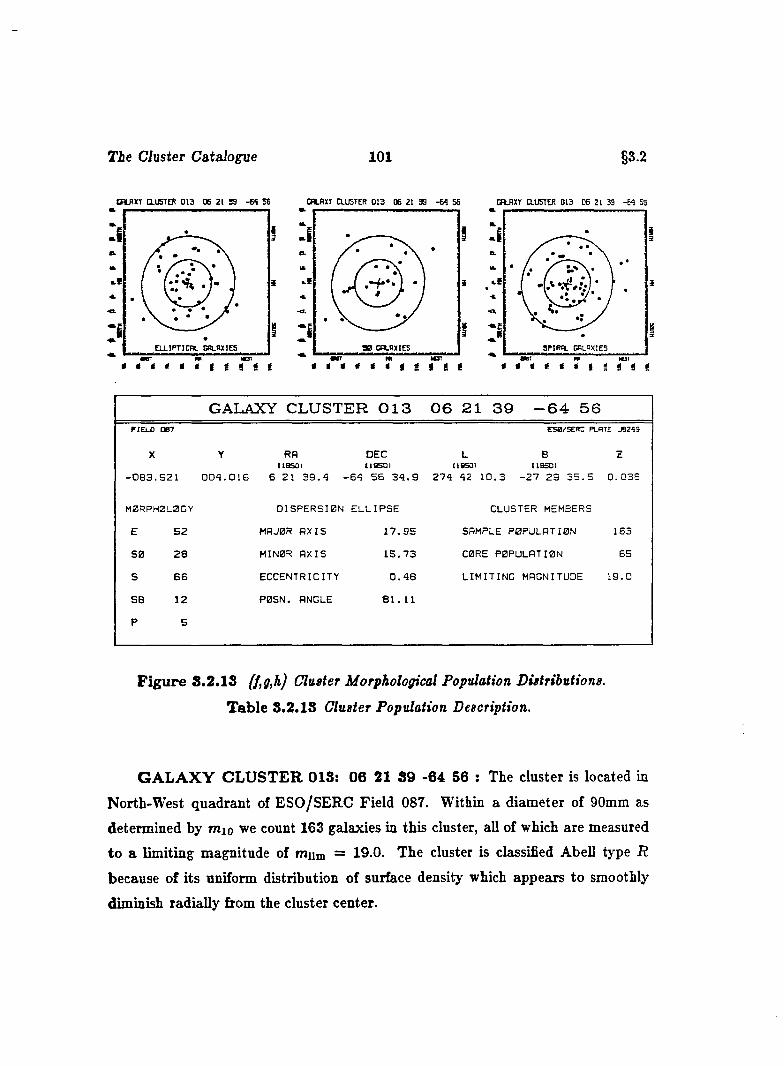
T ie Cluster Catalogue 101 §3.2
CnuHXT CLU5TQI D 13 06 21 S3 - M 56 C BLBXÏ CLUSTER 0 1 3 06 21 39 - 6 9 56 C F lflX T CLUSTER 0 13 05 21 39 - 6 9 55
i i
ELLIRTICRL GSLBXIES 9B CPLPXIES
GALAXY CLUSTER 013 06 21 39 -64 56FIELD 0B7
X
ESB/SERC PLATE J9299
zY RA DEC L Bl ia s o i (IB 5D I IIBSOI i ia s o i
0 8 3 .9 2 1 0 0 9 . 0 1 6 6 21 3 9 . 4 - 6 4 5 6 3 4 . 9 274 42 1 0 .3 - 2 7 2 9 3 5 . 5 0 .0 3 8
M0RPH0L0GY
E 5 2
8 0 2 8
S 6 6
SB 12
P 5
DISPERSION EL LIP S E
MAJ0R A X IS 1 7 .9 5
MINOR A XIS 1 5 .7 3
ECCENTRICITY 0 . 4 8
P0SN. ANGLE 8 1 . 1 1
CLUSTER MEMBERS
SAMPLE P0PULATI0N 163
CORE P0PULATI0N 65
L IM IT IN G MAGNITUDE 1 9 .0
F ig u re 3 .2 .13 Cluster Morphological Population Distributions.
T able 8.2.13 Cluster Population Description.
G A L A X Y C L U S T E R 018: 06 21 39 -64 56 : The cluster is located in
North-West quadrant of ESO/SERC Field 087. Within a diameter of 90mm as
determined by mio we count 163 galaxies in this cluster, all of which are measured
to a limiting magnitude of mum = 19.0. The cluster is classified Abell type R
because of its uniform distribution of surface density which appears to smoothly
diminish radially from the cluster center.
The Cluster Catalogue 102 §3.2
We count only 25 galaxies brighter than ms + 2 and thus classify the cluster as
having an Abell richness of 0. We suggest a B — M type Ü-III classification for the
cluster which has an intermediate population with only a single dominant galaxy
which appears to be a normal giant elliptical. For m i,m3 , and mio we give 12.9,
13.2 and 14.7,respectively. The value of mio implies a redshift of 0.038.
The cluster appears to be relatively smooth in its distribution with few con
centrations, the density gradually decreasing radially form the cluster center. The
■urface density has a few spots where galaxies congregate in shghtly higher num
bers, but this is due in part to what appears to be, for example, an elliptical galaxy
lurrounded by faint attendants as we find at z = -103.6, y = 3.8.
We find a somewhat symmetrical distribution of magnitudes in the cluster
reminiscent of a “bell-shaped” spread rising from the brightest cluster members to
a peak near m„ = 16.0 and tapering off to m„ = 18.5 with very few measured
faint galaxies near the magnitude limit. The position angle distribution shows a
preference for the brighter galaxies to lie inclined to the North-East whereas there
is a relative sparsity found to be inclined to the West of North. The positions of
elliptical galaxies are scattered throughout the cluster but with a preference for
the second and third quadrants. The spirals, on the other hand appear to have a
slightly larger population in the third and fourth quadrants. The cluster is spiral
rich with an {E : SO : S) ratio of (1.0 : 0.5 : 1.5). We find a core population
representing nearly 40% of the membership within an area of 0.31 square degrees.
On the sky, this represents a surface density of 209 galaxies per square degree.
Several pairs of superposed galaxies are noted with an early and a late elliptical
as that found at z = —65.5, y = 23.9. Some of the spirals appear distressed and/or
superposed and we note a peculiar galaxy at z = —81.7, y = —25.4 which displays
a thin diffuse bar with concentrations at its poles.
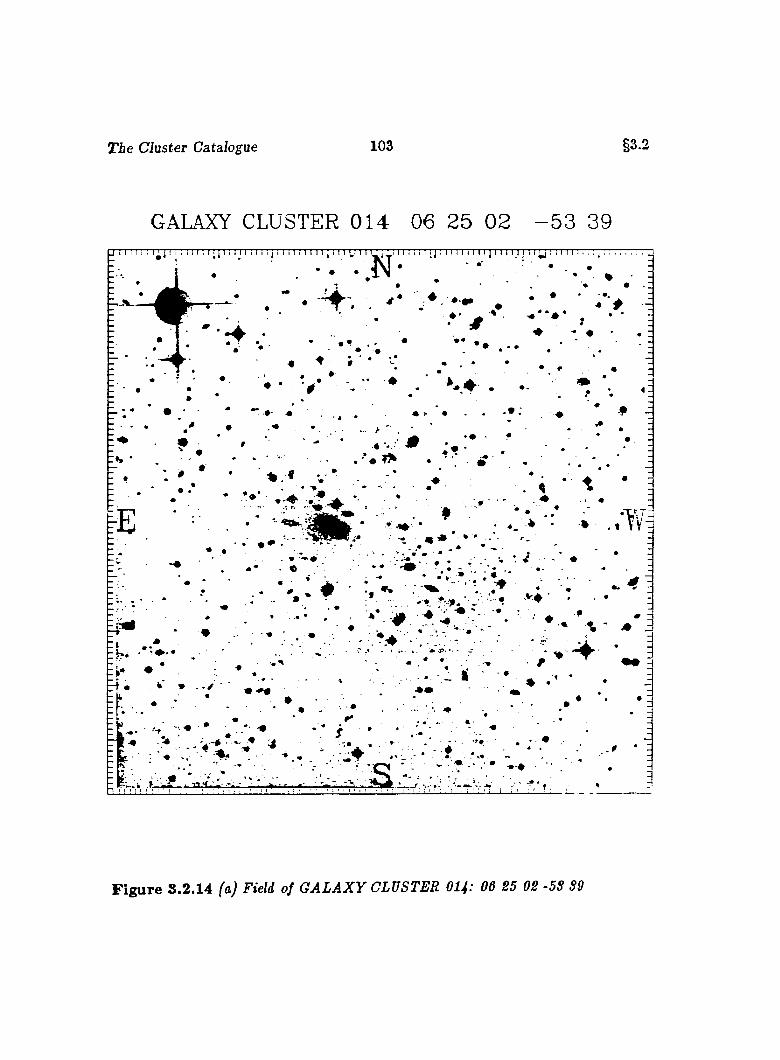
The Cluster Catalogue 103 §3.2
GALAXY CLUSTER 0 1 4 06 25 02 - 5 3 39M I : : 1 t I 1 I , I 1 j 1 I I I 1 1 M 1 j I 11 1 I I I 1 I I I I I 1 ! I I 1 ' M l 1 I I ! I N ] i * I 1 I i JT 'r [ ' l 1 I I J j I I y 1 11 I 1 I
•
m
♦• . *: ' . W . .» » .
♦ •» - *• * , - . ♦ . •
; •• * ■ ' . . ' , , . - w
T» . : . .
-tik:
54! L
• 'fc * /
:>■ i J . :
. T-• r . . 0
• * *
F ig u re S.2.14 (a) Field of G A L A X Y CLUSTER 014: 06 25 02 -5S S9
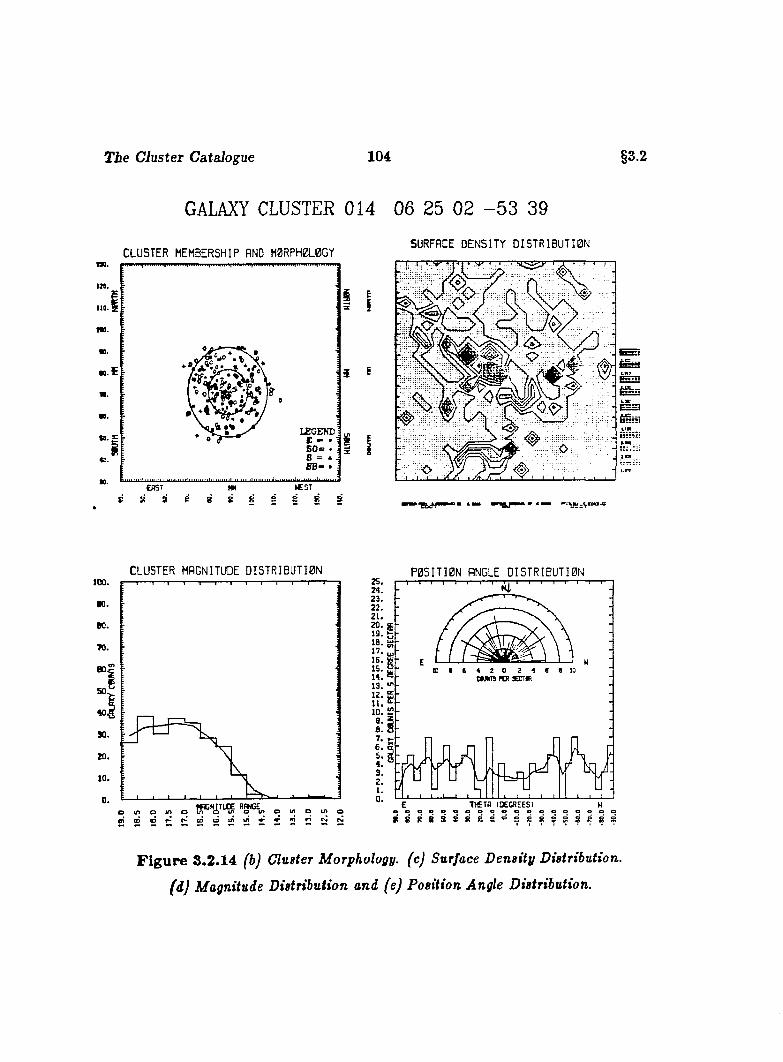
T ie Cluster Catalogue 104
GALAXY CLUSTER 014 06 25 02 - 5 3 39
§3.2
C L U S T E R M EM BERSHIP AND H 0R P H 0L 0G Y
t».110.
m.
#0.LEGEND
S 0 = • i4C.
m.MM &EST
8 S I = S R Seg
SURFACE D E N S IT Y D I S T R I B U T I O N
C L U S T E R MAGNITUDE D I S T R I B U T I O N P O S I T I O N ANGLE D I S T R I B U T I O N
•0.eo.TO.
90.
20.10.
25.24.
15.dUMrS f t? 3ECT#R
13.
TÆTfi (DECREES); : 3 :
F ig u re 8.2.14 (b) Cluster Morphology, (c) Surface Density Distribution,
(d) Magnitude Distribution and (e) Position Angle Distribution.

T ie CJuster Catalogue 105 §3.2
GALAXY a U S T E R O H 06 2 5 02 -5 3 3 9 6 GALAXY CLUSTER O H 06 25 0 2 -5 3 39 6 GALAXY CLUSTER O H 06 25 02 -S 3 39 B
ii
% • •
S P IR A L GALAXIES
< < < < < < I i i it t
GALAXY CLUSTER 014 06 25 02 -53 39$FIELD 161
X
ESB/SERC PLATE JES3B
zY RA DEC L B(19S 0I tISS O I (taSOI [195DI
0 8 8 . 6 5 3 0 7 0 . 9 2 6 6 2 5 2 . 5 - 5 3 3 9 2 6 . 8 2 5 2 21 3 6 . 2 - 2 5 11 1 5 . 9 0 . 0 9 9
MORPHOLOGY
E 1 0 9
5 0 2 0
5 9 8
SB 4
P 1
D IS P E R S I0 N E L L IP S E
MAJOR A X IS 1 0 . 3 0
MINOR A X IS 9 . 1 3
E C C E N T R IC IT Y 0 . 4 6
P 0S N . ANGLE - 8 6 . 7 2
CLUSTER MEMBERS
SAMPLE P OPULATION 2 3 2
CORE POPULATION 7 9
L I M I T I N G MAGNITUDE 1 9 . 0
F ig u re 3.2.14 (f,g,h) Cluster Morphological Population Distributions.
T able 8.2 .14 Cluster Population Description.
G A L A X Y C L U S T E R 014; 06 25 02 -53 39 : The cluster is located
in North-West quadrant of ESO/SERC Field 161. Within a diameter of 45mm
as determined by mxo we count 239 galaxies in this cluster and 232 to a limiting
magnitude of miim = 19.0. The cluster is classified Abell type R because of its
fairly uniform distribution of galaxies.
We count over 100 galaxies brighter than m 3 + 2 and thus classify the cluster
The Cluster Catalogue 106 §3.2
as having an Abell richness of 2. We suggest a, B — M type I classification for the
cluster which has a dominant centrally located cD galaxy with an apparent double
nucleus and a corona. For m i,m s, and mio we give 12.9,15.0 and 15.4, respectively.
The value of mio implies a redshift of 0.049.
The cluster appears centrally condensed with a smooth distribution decreasing
radially from the center. There is, however, a slight concentration North-East of
center where we find a slightly enhanced group of elliptical galaxies.
The magnitude distribution rises gradually from about m„ = 14.5 to m„ = 17.0
where it tapers off to a nearly flat plateau. For the position angle distribution, we
find no aparent preference for orientation and have nearly the same number of
galaxies oriented North-East as we have oriented North-West.
We find the positional distribution of elliptical and spiral galaxies to be similar
and somewhat oriented North-South. The {E : SO : S) ratio is (1.0 ; 0.2 ; 0.9)
giving a somewhat similar population of ellipticals and spirals. The core population
holds 34% of the cluster membership in an area of some 0.10 square degrees. This
yields a surface density of 763 galaxies per square degree. We note tha t the dis
persion ellipse is nearly oriented North-South which agrees well with the apparent
distribution of elliptical and spiral galaxies.
Aside from the remarkable cD galaxy with an apparent double nucleus and
corona, we note several complicated spiral galaxies that are centrally condensed
and have ring-like structures as, for example, one found at z == —79.3, y = 66.9.
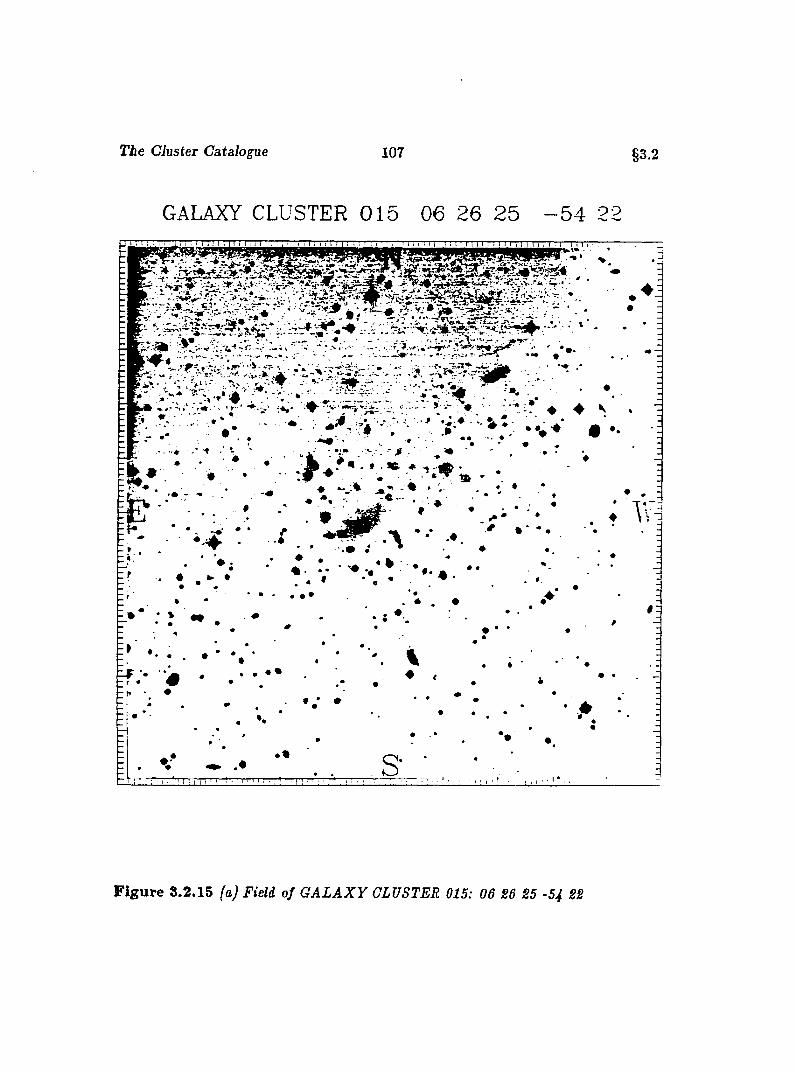
The Cluster Catalogue 107 §3.2
GALAXY CLUSTER 0 1 5 06 26 2 5 - 5 4 22I I t I i I 1 1 I 1 1 I I
: ...
, r - ^ : V - - - . V . . .
% # " ' * ' " - - ^ %
- ¥I*:If
. ■
. # *
:♦ .
* . v
* .
' » .
#
♦.
. • • %♦ «
• * •
Ï ; T 's - ■
F ig u re 8.2.15 (a) Field of G A L A X Y CLUSTER 015: 06 86 85 -54 88
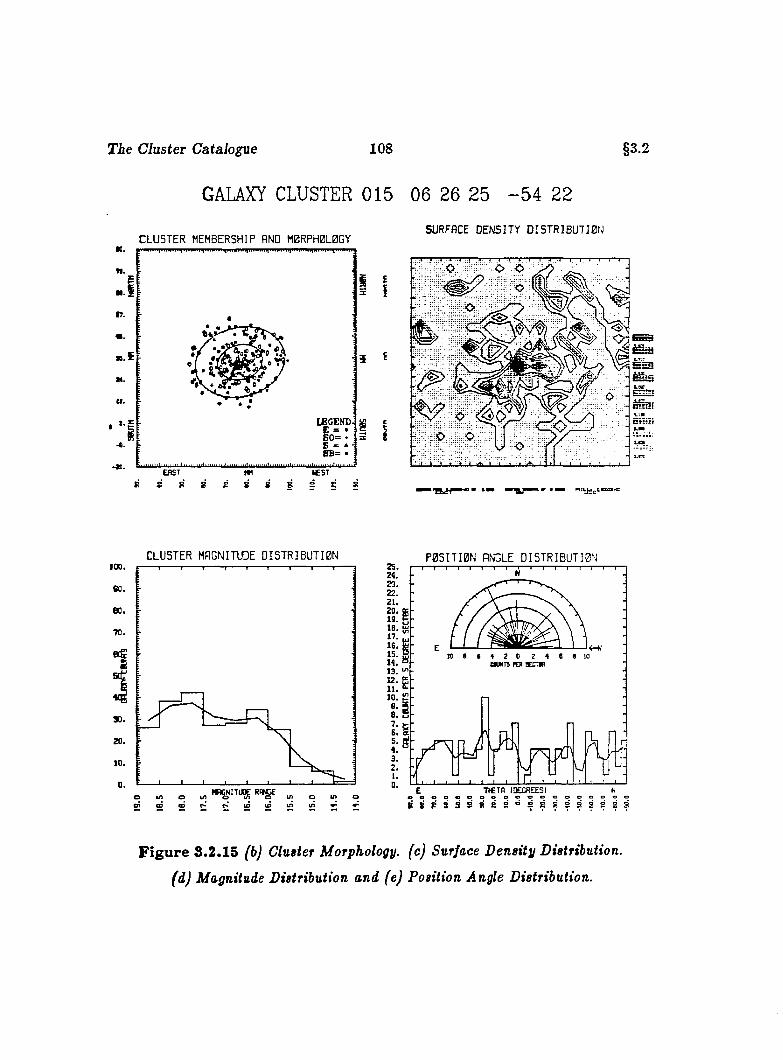
T ie Cluster Catalogue 108 §3.2
GALAXY CLUSTER 015 06 26 25 - 5 4 22
SURFACE D E N S IT Y D I S I R I B U T I 0 N•0.tl.
C L U S T E R MEMBERSHIP AND M 0RPH0L0GY .
. 1r.m.
= E
M.
(f.
X.
-e ." I
L£GEND-I = •S 0 = ♦B * * 8B= »
EAST m NEST
'"Ifcc'-"
C L U S T E R MAGNITUDE D I S T R I B U T I O N P O S I T I O N ANGLE D I S T R I B U T I O N100.
eo.80.
70.
90.
ZD.
10.
o w . = ^ „
Z5.
22.
!S: % :16. g - 15. S - 11. = - 13.12. E -I I . E .
6 . a
F ig u re 8.2.15 (b) Cluster Morphology, (c) Surface D ensity Distribution,
(d) Magnitude Distribution and (e) Position Angle Distribution.
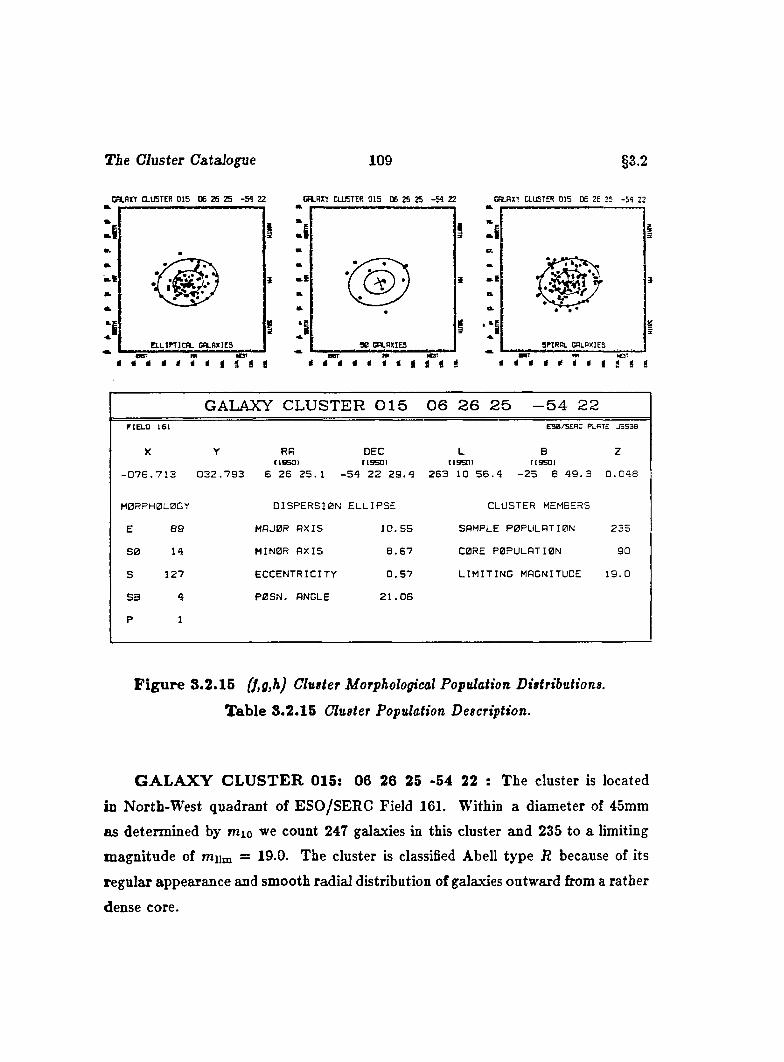
T ie Cluster Catalogue 109 §3.2
c a .n rr ausTER dis os zs zs -54 zz Cn.RTT CLUSTER 0 1 5 06 Z6 Z5 - 5 4 ZZ GBLRXT CLUSTER 0 1 5 OS Z6 25 -5 4 22
I
ii
IELLIPTIC». CR.BXIES
t
GALAXY CLUSTER 015 06 26 25 -54 22PIELO 161
X
ESe/SERC PLB7E JSS3S
ZY RA DEC L Bt lB S a i (19501 (19501 (19501
0 7 6 . 7 1 3 0 3 2 . 7 9 3 6 2 6 2 5 . 1 - 5 4 2 2 2 9 . 4 2 6 3 10 5 6 . 4 - 2 5 8 4 9 . 3 0 . 0 4 8
MORPHOLOGY
E 8 9
SO 14
S 1 2 7
SB 4
P 1
D IS P E R S IO N E L L IP S E
MAJOR A X IS 1 0 . 5 5
MINOR A X IS 8 . 6 7
E C C E N T R IC IT Y 0 . 5 7
P 0 S N . ANGLE 2 1 . 0 6
CLUSTER MEMBERS
SAMPLE PO P U L A TIO N 2 3 5
CORE P O P ULA TIO N 90
L I M I T I N G MAGNITUDE 1 9 . 0
F ig u re 8.2 .15 (f,g,h) Cluster Morphological Population Distributions.
T ab le 8 .2 .15 Cluster Population Description.
G A L A X Y C L U S T E R 015; 06 26 25 -54 22 : The cluster is located
in North-West quadrant of ESO/SERC Field 161. Within a diameter of 45mm
as determined by mio we count 247 galaxies in this cluster and 235 to a limiting
m agnitude of mum = 19.0. The cluster is classified Abell type R because of its
regular appearance and smooth radial distribution of galaxies outward from a rather
dense core.
The CJuster Catalogue 110 §3.2
We count 85 galaxies brighter than m3 + 2 and thus classify the cluster as
having an Abell richness of 2. We suggest a B — M type II classification for the
cluster which has a dominant elliptical galaxy somewhat intermediate between a cD
class galaxy and a normal giant elliptical. For m i,m 3 , and mio we give 14.3, 14.7
and 15.3, respectively. The value of mio implies a redshift of 0.048.
The cluster membership form a dense, rich and diverse cluster. There is an
obvious central condensation to the cluster with several concentrations South-East
of the cluster center. The core of the cluster appears somewhat elongated and
"dum beir shaped.
The magnitude distribution rises rapidly from the relatively few very bright
galaxies to a plateau near m„ = 16.0 then rises to another peak near m„ = 18.0
after which it falls off.
Position angles for the brighter galaxies are distributed about equally in both
the positive and negative sense, with a slight peak near +30°, tha t is to the North
North-East.
We find the cluster center dominated by elliptical galaxies, with the spirals, on
the other hand, scattered throughout the cluster-at-large. The [E : SO : 5) ratio
is (1.0 : 0.2 :1.5) making this a spiral-rich cluster. The core population represents
some 38% of the sample population and is located in an area of 0.10 square degrees.
This yields a core surface density of 894 galaxies per square degree.
We note that the m i,m 3 , and miO brightest galaxies are elliptical galaxies,
all possessing a corona. Other ellipticals are seen with coronae as well. Several
superpositions occur, for example at z = —84.1, y = 45.6, where we find a spiral-
elliptical combination.
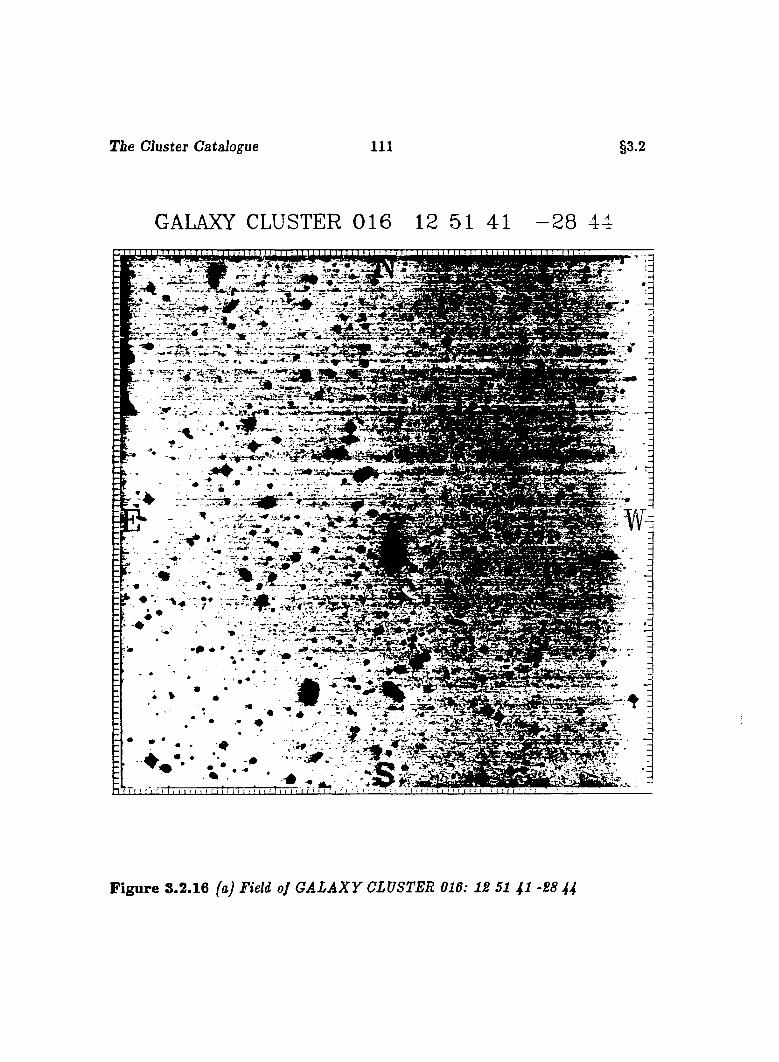
Tie Cluster Catalogue 111 §3.2
GALAXY CLUSTER 0 1 6 12 51 41 - 2 8 44
lL‘J mmmMm
1 I ! I ! - ! ± - ‘ ! , t t
F ig u re 3.2.16 faj Field of G A L A X Y CLUSTER 016: IS 51 41 -28 44
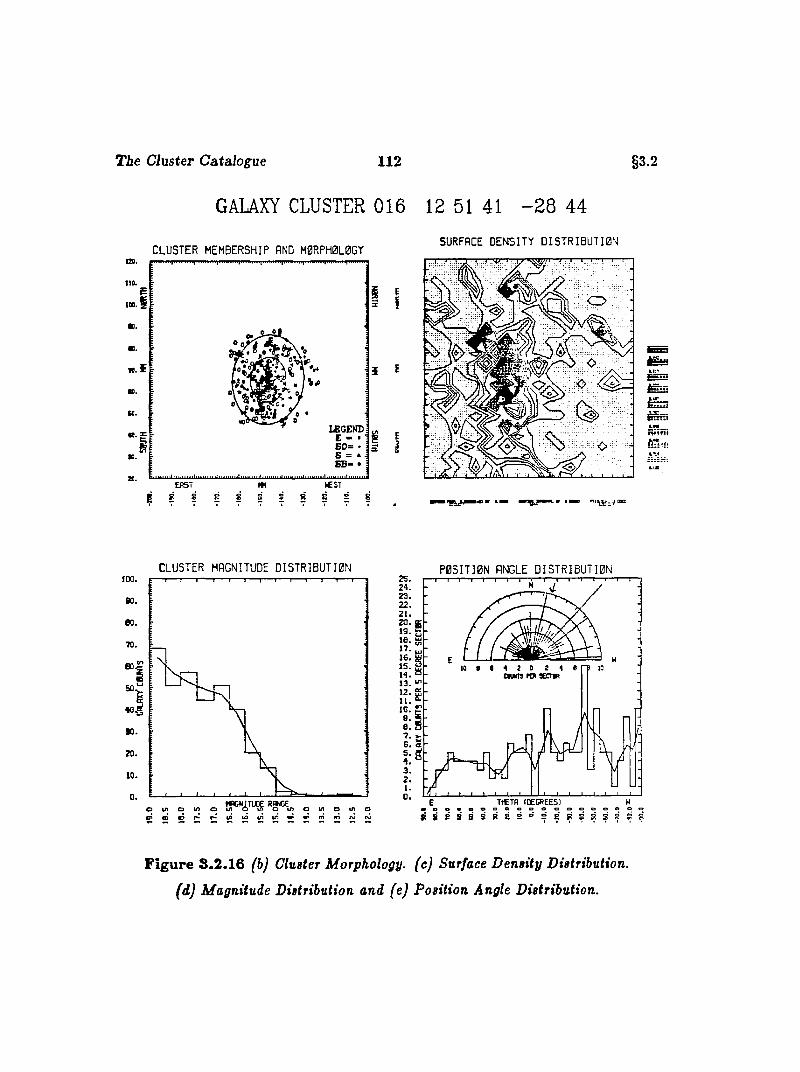
T ie Cluster Catalogue 112
GALAXY CLUSTER 016 12 51 41 - 2 8 44
§3.2
C L U S T E R M EM BERSHIP AND M0RPH0L0GYSURFACE DENSITY DI5TRIBUTI0N
C L U S T E R MAGNITUDE D I S T R I B U T I O N P O S I T I O N ANGLE D I S T R I B U T I O N
BO.
8 0 .
7 0 .
10.
o in o in a ÜP 'W '% o in o in o
2 S .2 9 .
22.
1 9 .1 6 .1 7 .
1 5 . cwira ftp SECin
T tE T fi I DEGREES]
{ 5 : 5 : 5
F ig u re 8 .2 .16 (b) Cluster Morphology, (e) Surface D ensity Distribution,
(d) Magnitude Distribution and (e) Position Angle Distribution.
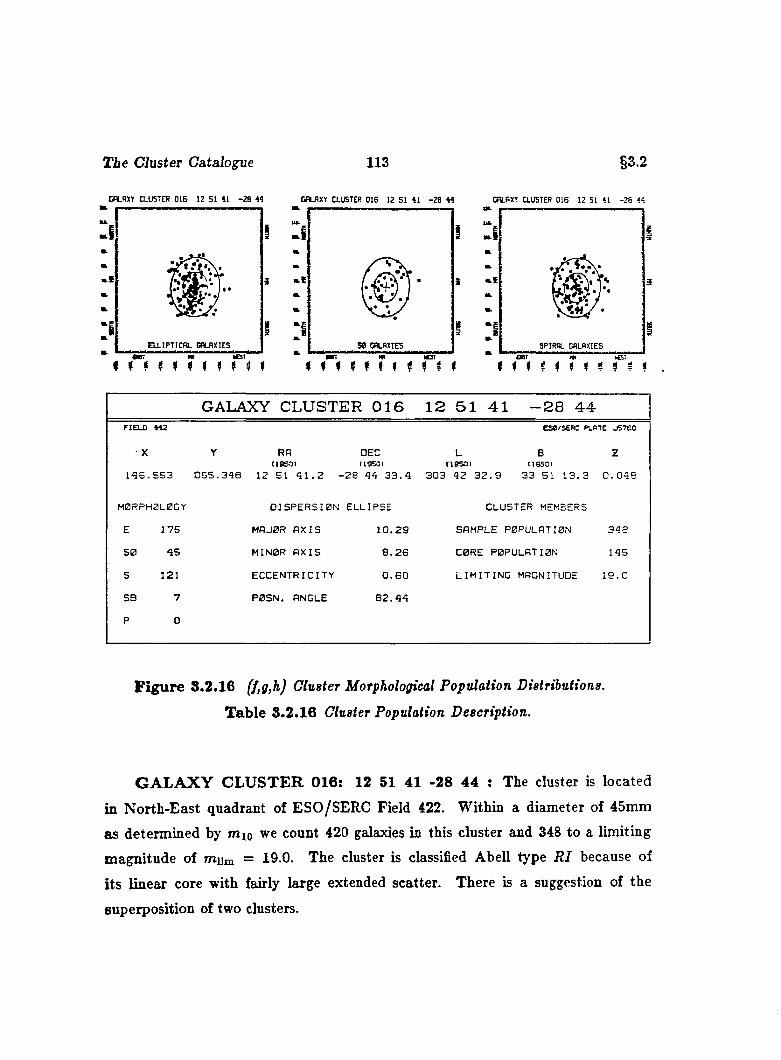
T ie Cluster Catalogue 113 §3.2
COLHXY CLUSTER 0 1 6 12 51 41 - 2 8 « GfUXY CLUSTER 016 12 51 41 -28 44 (SLBXY CLUSTER 016 12 51 41 -26 44
3
SPIRflL GALAXIES
< ♦ * ? f < < M ? » < ♦ ♦ Ç < ? » ? ? I I .
GALAXY CLUSTER 016 12 51 41 -28 44FIELD 442 ESe/SERC PLBTE J5 7 6 0
ZX Y RH DEC L BI1S 53I (I9SQ I CIBSDI (ISSCl
I Q G . 5 5 3 0 5 5 . 3 4 8 12 51 4 1 . 2 - 2 8 44 3 3 . 4 3 0 3 4 2 3 2 . 9 3 3 51 1 3 . 3 0 . 0 4 8
MORPHOLOGY
E 1 7 5
S 0 4 5
5 121
SB 7
P 0
D IS P E R S IO N E LL IP S E
MAJOR A X I S 1 0 . 2 9
MINOR A X I S 6 . 2 6
E C C E N T R IC IT Y 0 . 6 0
P 0 S N . ANGLE 8 2 . 4 4
CLUSTER MEMBERS
SAMPLE POPULATION 3 4 8
CORE POPULATION 14 5
L I M I T I N G MAGNITUDE 1 9 . 0
F ig u re 3 .2.16 (f,g,h) Cluster Morphological Population Distributions.
T ab le 3 .2 .16 Cluster Population Description.
G A L A X Y C L U S T E R 016: 12 51 41 -28 44 : The cluster is located
in N orth-East quadrant of ESO/SERC Field 422. Within a diameter of 45mm
as determined by mio we count 420 galaxies in this cluster and 348 to a limiting
magnitude of mum = 19 0. The cluster is classified Abell type R I because of
its linear core with fairly large extended scatter. There is a suggestion of the
superposition of two clusters.
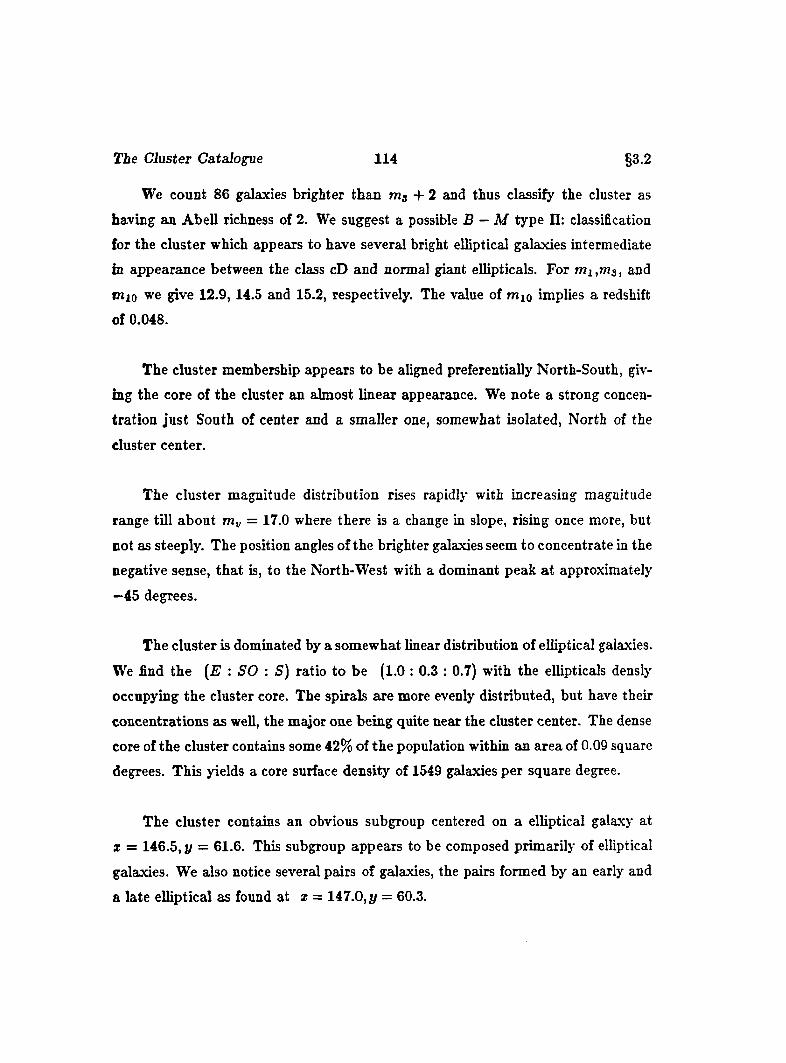
The Cluster Catalogue 114 §3.2
We count 8 6 galaxies brighter than m3 + 2 and thus classify the cluster as
having an Abell richness of 2. We suggest a possible B — M type II: classification
for the cluster which appears to have several bright elliptical galaxies intermediate
in appearance between the class cD and normal giant ellipticals. For m i,m 3 , and
Wio we give 12.9, 14.5 and 15.2, respectively. The value of mio implies a redshift
of 0.048.
The cluster membership appears to be aligned preferentially North-South, giv
ing the core of the cluster an almost linear appearance. We note a strong concen
tration just South of center and a smaller one, somewhat isolated, North of the
cluster center.
The cluster magnitude distribution rises rapidly with increasing magnitude
range till about = 17.0 where there is a change in slope, rising once more, but
not as steeply. The position angles of the brighter galaxies seem to concentrate in the
negative sense, that is, to the North-West with a dominant peak a t approximately
—45 degrees.
The cluster is dominated by a somewhat linear distribution of elliptical galaxies.
We find the [E : SO : S) ratio to be (1.0 : 0.3 : 0.7) with the ellipticals densly
occupying the cluster core. The spirals are more evenly distributed, but have their
concentrations as well, the major one being quite near the cluster center. The dense
core of the cluster contains some 42% of the population within an area of 0.09 square
degrees. This yields a core surface density of 1549 galaxies per square degree.
The cluster contains an obvious subgroup centered on a elliptical galaxy at
X = 146.5, p = 61.6. This subgroup appears to be composed primarily of elliptical
galaxies. We also notice several pairs of galaxies, the pairs formed by an early and
a late elliptical as found at z = 147.0, y = 60.3.
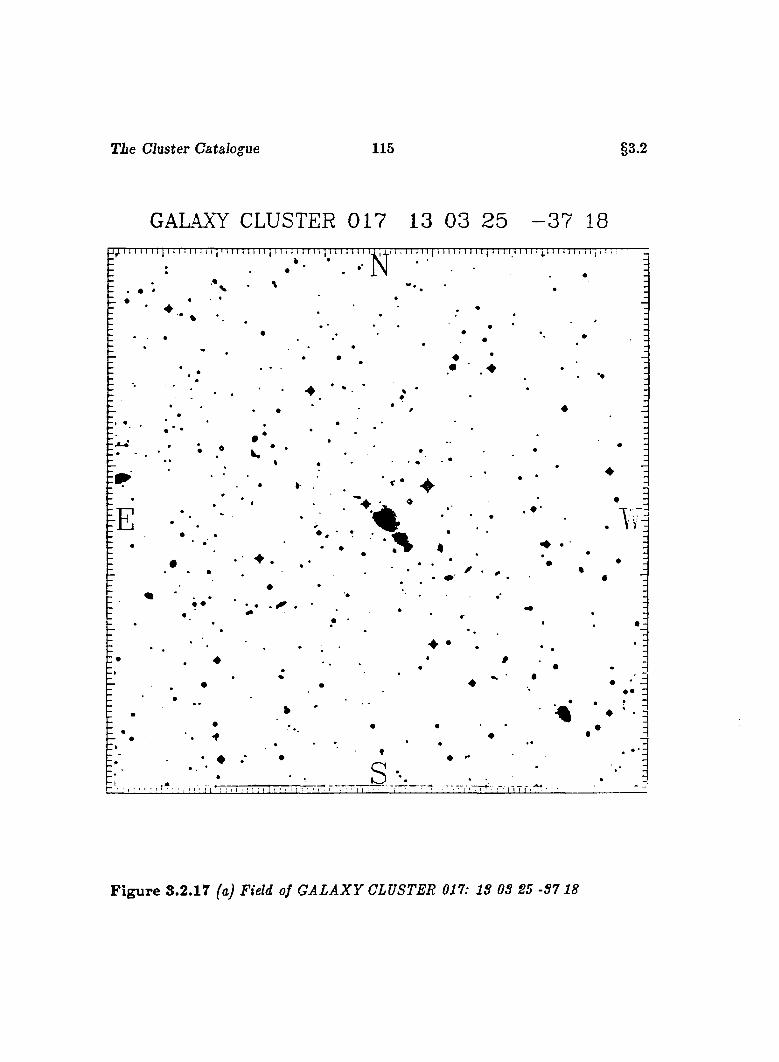
T ie Cluster Catalogue 115 §3.2
GALAXY CLUSTER 0 1 7 13 03 2 5 - 3 7 18
F ig u re 8.2 .17 (a) Field of G A L A X Y CLUSTER 017: IS OS 25 -57 18
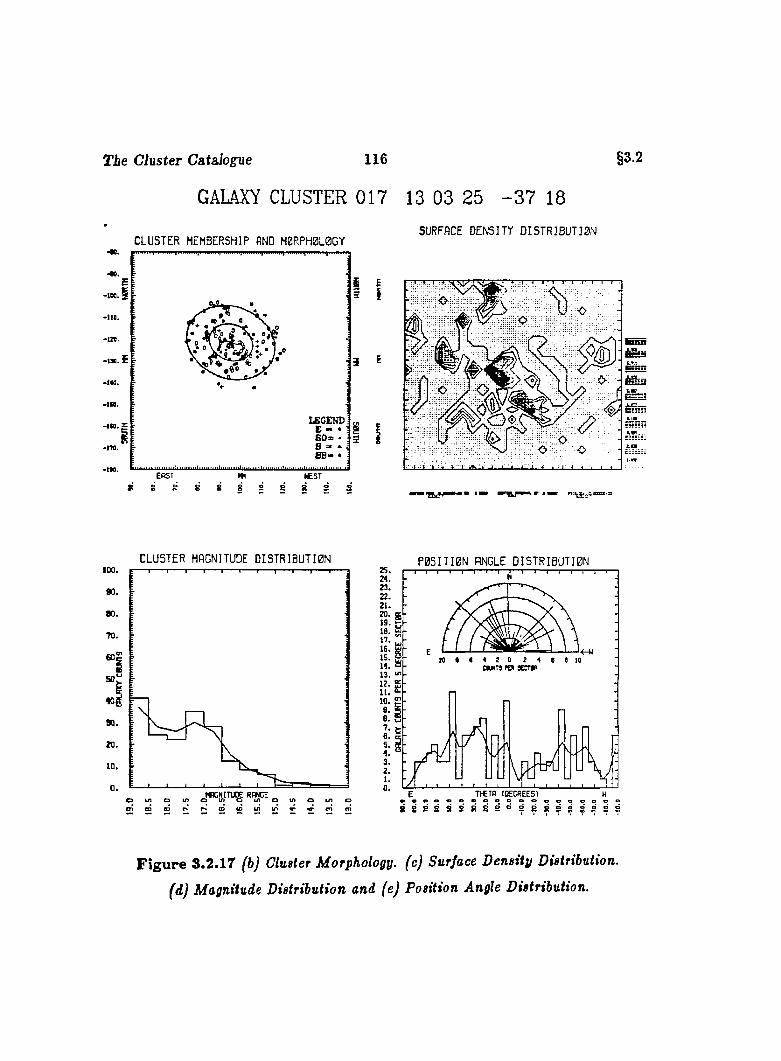
T ie Cluster Catalogue 116
GALAXY CLUSTER 017 13 03 25 - 3 7 18
SURFACE D E N S IT Y D I 5 T R I B U T 1 0 NC L U S T E R MEMBERSHIP AND M 0R PH 0L0G Y
§3.2
-1 9 0 . E
6 0 =
EAST I C S T6 8 S8 8 8 8
èinr!
C L U S T E R MAGNITUDE D I S T R I B U T I 0 N100.
so.80.
T O .
80.
2 0 .10.
H C N I T U D E RANGE o I /) O 1/1 o
P 0 5 I T I 0 N ANGLE D I 5 T R I B U T I 0 N
!Q # # 4 2 0 2 4 6 0 10CfUNTS fO 9 C W
o i C D o r » r “ { c i £ i i / i i n « * « * c n c n
E T tC T f l fO E C R E E S l W• eeooeeoooeooooooeo8 SRS 9 8 8 8 2 ^ 5 8 8 8 8 8 ^ 8 8
F ig u re 3.2.17 (b) Cluster Morphology, (c) Surface Density Distribution,
(d) Magnitude Distribution and (e) Position Angle Distribution.
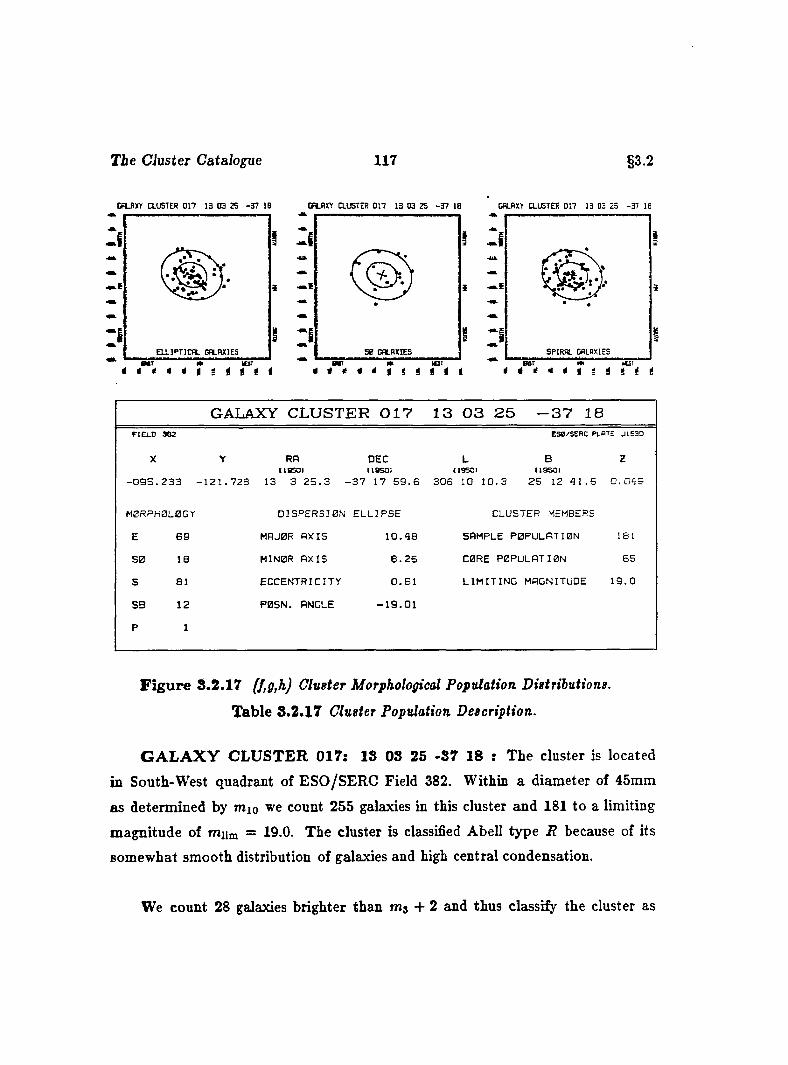
T ie Cluster Catalogue 117 §3.2
CHJXY ausTER on 13 03 2S -37 10 g h lrxy ausTER on 13 03 2s -3 7 is CBLRXY CLUSTER 017 13 03 25 -37 18
i i
SPIRBL CfiLRXlESSB GALAXIESear
« I
GALAXY CLUSTER 017 13 03 25 -37 18r iE L O 362
X
ESB/SERC PLATE J1 5 3 3
zY RH DEC L B( tss a i IlSS O I (19501 (19S 0I
□ 9 5 . 2 3 3 - 1 2 1 . 7 2 8 13 3 2 5 . 3 - 3 7 17 5 9 . G 3 0 6 10 1 0 . 3 2 5 12 4 1 . 6 0 . 0 4 9
MORPHOLOGY
E 6 9
S 0 I B
S 81
SB 1 2
P 1
D IS P E R S IO N E L L IP S E
MAJOR A X IS 1 0 . 4 8
MINOR A X IS 8 . 2 6
E C C E N T R IC IT Y 0 . 6 1
P 0 S N . ANGLE - 1 9 . 0 1
CLUSTER MEMBERS
SAMPLE P B P U L R T IB N 181
C0RE P 0 P U L O T I0 N 6 5
L I M I T I N G MAGNITUDE 1 9 . 0
F ig u re 3 .2 .17 (f,g,h) Cluster Morphological Population Distributions.
T able 3 .2 .17 Cluster Population Description.
G A L A X Y C L U S T E R 017: 13 03 25 -37 18 : The cluster is located
in South-West quadrant of ESO/SERC Field 382. Within a diameter of 45mm
as determined by mio we count 255 galaxies in this cluster and 181 to a limiting
magnitude of mum = 19.0. The cluster is classified Abell type i? because of its
somewhat smooth distribution of galaxies and high central condensation.
We count 28 galaxies brighter than m3 + 2 and thus classify the cluster as
The Cluster Catalogue 118 §3.2
having an Abell richness of 0. We suggest & B - M type II classification for the
cluster which has several bright elliptical galaxies with coronae tha t are intermediate
between the class cD and normal giant elliptical galaxies. For and mio we
give 13.2, 14.2 and 15.4, respectively. The value of mio implies a redshift of 0.049.
The cluster members form a distribution with several surface density concen
trations. The highest concentration exists at the cluster center with less dense
regions located South-West of center and North of center.
The magnitude distribution gently rises to an initial maximum at m„ = 17.0
then falls some thirty percent to a plateau near m„ = 18.5 and then rises once
more to the limiting magnitude. The position angle distribution shows an enhance
ment towards the North-East with peaks to the North-East, North and North-West
respectively.
In the core of the cluster we find the elliptical galaxies somewhat aligned along
the major axis of the dispersion ellipse and then scattered about the cluster with
a diminished number towards the Western end of the cluster. Similar behavoir is
found with the spiral galaxies which have a tendency to congregate in their greatest
numbers South of the cluster center. We find an (E ; SO : 5) ratio of (1.0:0.3:1.3)
making this a slightly spiral enriched cluster. The core population amounts to
some 36% of the sample located in an area of 0.09 square degrees. This represents
a surface density of 682 galaxies per square degree on the sky.
We note that the brightest five galaxies are classed as ellipticals having a corona.
At least two of these brightest galaxies appear superposed. Also found in this cluster
are several pairs of galaxies composed of an early and a late elliptical such as the
one located at z = —Q8 .8 ,y = —126.9.
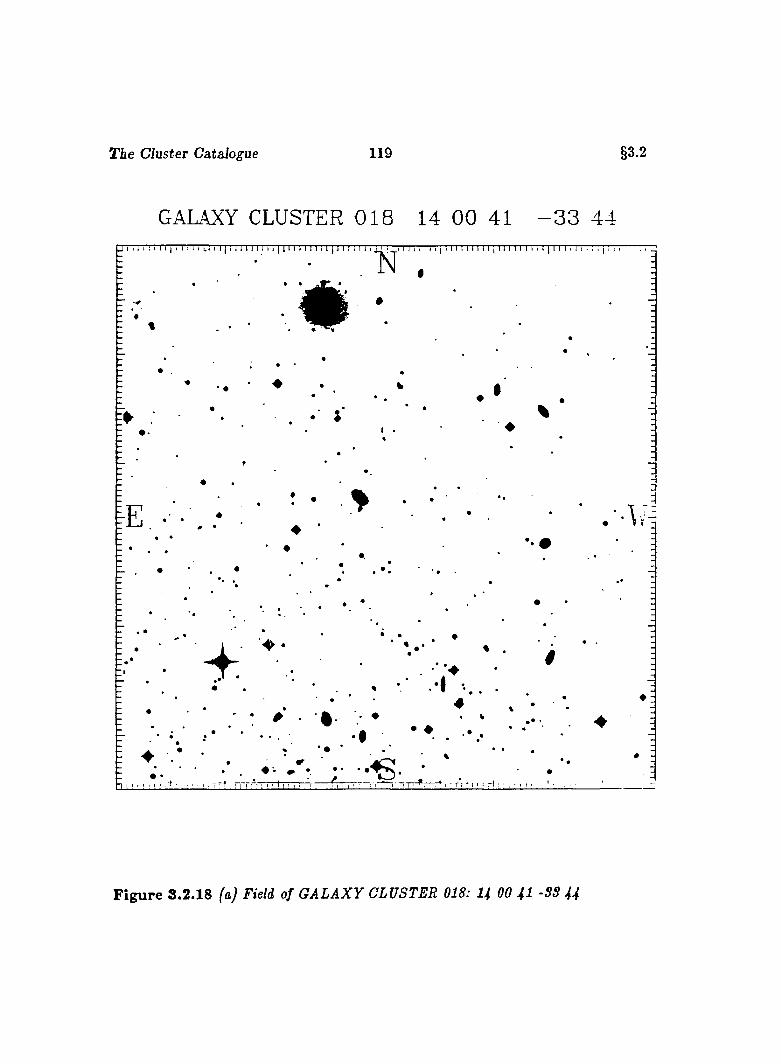
The Cluster Catalogue 119 §3.2
GALAXY CLUSTER 0 1 8 14 GO 41 - 3 3 44
F ig u re 3.2 .18 (a) Field of G A LA X Y CLUSTER 018: I4 00 4I -SS U
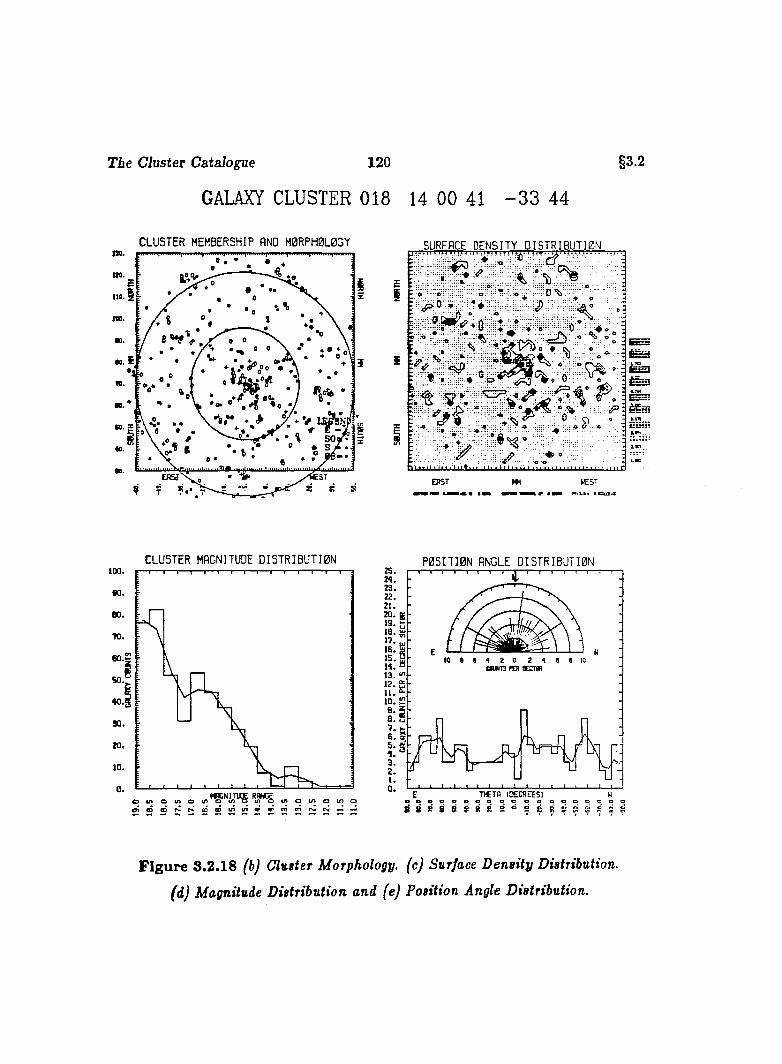
T ie Cluster Catalogue 120
GALAXY CLUSTER 018 14 00 41 - 3 3 44
§3.2
C L U S T E R MEMBERSHIP AND M 0R PH 0L 0G Ymm . •9
110.
m.
00.
0n.
m.
SO;«0 . .o*
£ R S j
SURFACE D E N S IT Y D I S T R I B U T I 0 Nt . . .
E ;
♦ <5>- ?
lUiltiliM.Hi.i.H 111o'
EPST WEST
C L U S T E R MAGNITUDE D I S T R I B U T I 0 N100.
so.!
o i n o l A o i n o m o u i o
25.M.23.22.21.
I!IE.
II; i13. ‘
IÎ;!10. Ig;il:\l;ia.2.1.0.
P 0 5 I T I 0 N ANGLE D I S T R I B Ü T 1 0 N
10 « « 1 2 0 2 4 « « tot«JNT3 K K m i R
S B B S B g R B S7>£TR I DECREES: W> o o o o e e o o e o oE R S S g g g
F ig u re 3.2.18 (b) Clurter Morphology, (c) Surface D ensity Distribution,
(d) Magnitude Distribution and (e) Position Angle Distribution.
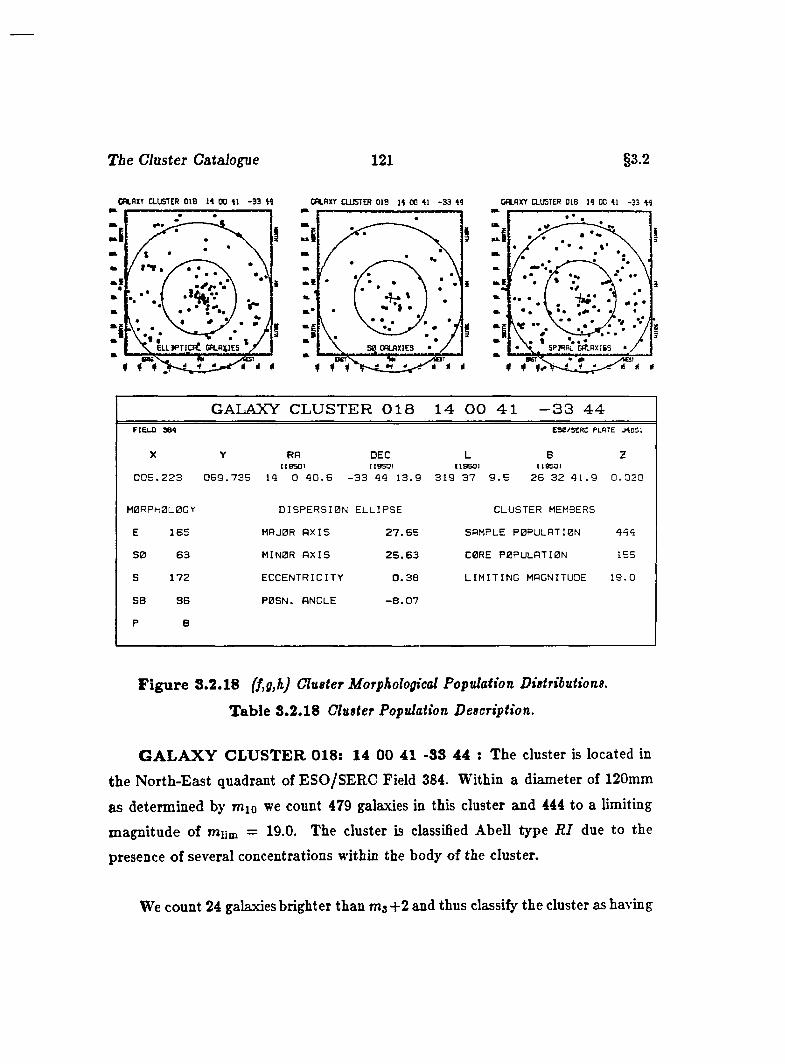
T ie Ciuster Catalogue 121 §3.2
Ca.flXY CLUSTER 018 H 00 41 -33 44 CFlflXY CLUSTER 018 14 00 41 -33 44 CflflXY CLUSTER 018 14 00 41 -33 44
V-#*
a H P T l C n t G A L A X IE S
i# f
S 0 G A L A X IE S
GALAXY CLUSTER 018 14 00 41 -33 44FIELD 3 8 4 ESO/SERC PLATE J4BSI
X Y RR DEC L B Zi t e s o i i i 9 s a i 119501 (18501
0 0 5 . 2 2 3 0 6 9 . 7 3 5 14 0 4 0 . 6 - 3 3 4 4 1 3 . 9 3 1 9 3 7 9 . 5 2 6 3 2 4 1 . 9 0 . 0 2 0
M 0RPH0L0GV D IS P E R S IO N E L L IP S E CLUSTER MEMBERS
E 1 6 5 HRJ0R A X IS 2 7 . 6 5 SAMPLE POPULATION 4 4 4
S0 6 3 M IN 0R A X IS 2 5 . 6 3 C0RE P 0 P U L A T I0 N 155
S 1 7 2 E C C E N T R IC IT Y 0 . 3 8 L I M I T I N G MAGNITUDE 1 9 . 0
SB SB P 0S N . ANGLE - 8 . 0 7
P 8
F ig u re 3.2 .18 (f,gjh) Cluster Morphological Population Distributions.
T able 8.2.18 Cluster Population Description.
G A L A X Y C L U S T E R 018: 14 00 41 -S3 44 : The cluster is located in
the N orth-East quadrant of ESO/SERC Field 384. Within a diameter of 120mm
as determined by mio we count 479 galaxies in this cluster and 444 to a limiting
magnitude of mum = 19.0. The cluster is classified Abell type R I due to the
presence of several concentrations within the body of the cluster.
We count 24 galaxies brighter than m s+ 2 and thus classify the cluster as having
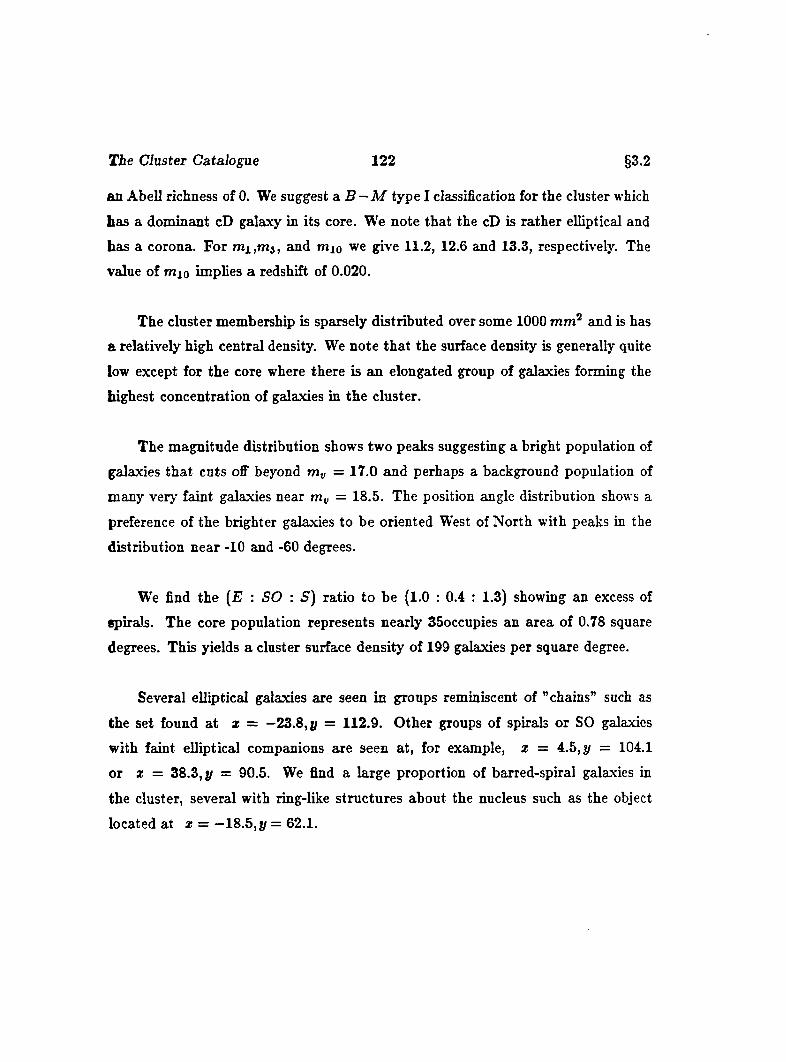
T ie Cluster Catalogue 122 §3.2
an Abell richness of 0. We suggest a B —M type I classification for the cluster which
has a dominant cD galaxy in its core. We note that the cD is rather elliptical and
has a corona. For m i,m s, and mio we give 11.2, 12.6 and 13.3, respectively. The
value of mio implies a redshift of 0 .0 2 0 .
The cluster membership is sparsely distributed over some 1000 mm^ and is has
a relatively high central density. We note th a t the surface density is generally quite
low except for the core where there is an elongated group of galaxies forming the
highest concentration of galaxies in the cluster.
The magnitude distribution shows two peaks suggesting a bright population of
galaxies tha t cuts off beyond m„ = 17.0 and perhaps a background population of
many very faint galaxies near = 18.5. The position angle distribution shows a
preference of the brighter galaxies to be oriented West of North with peaks in the
distribution near - 1 0 and -60 degrees.
We find the {E : SO : S ) ratio to be (1 . 0 ; 0.4 : 1.3) showing an excess of
spirals. The core population represents nearly SSoccupies an area of 0.78 square
degrees. This yields a cluster surface density of 199 galaxies per square degree.
Several elliptical galaxies are seen in groups reminiscent of "chains” such as
the set found a t a: = —23.8, y = 112.9. Other groups of spirals or SO galaxies
with faint elliptical companions are seen at, for example, x = 4.5, y = 104.1
or X = 38.3, y = 90.5. We find a large proportion of barred-spiral galaxies in
the cluster, several with ring-like structures about the nucleus such as the object
located at x = —18.5, y = 62.1.
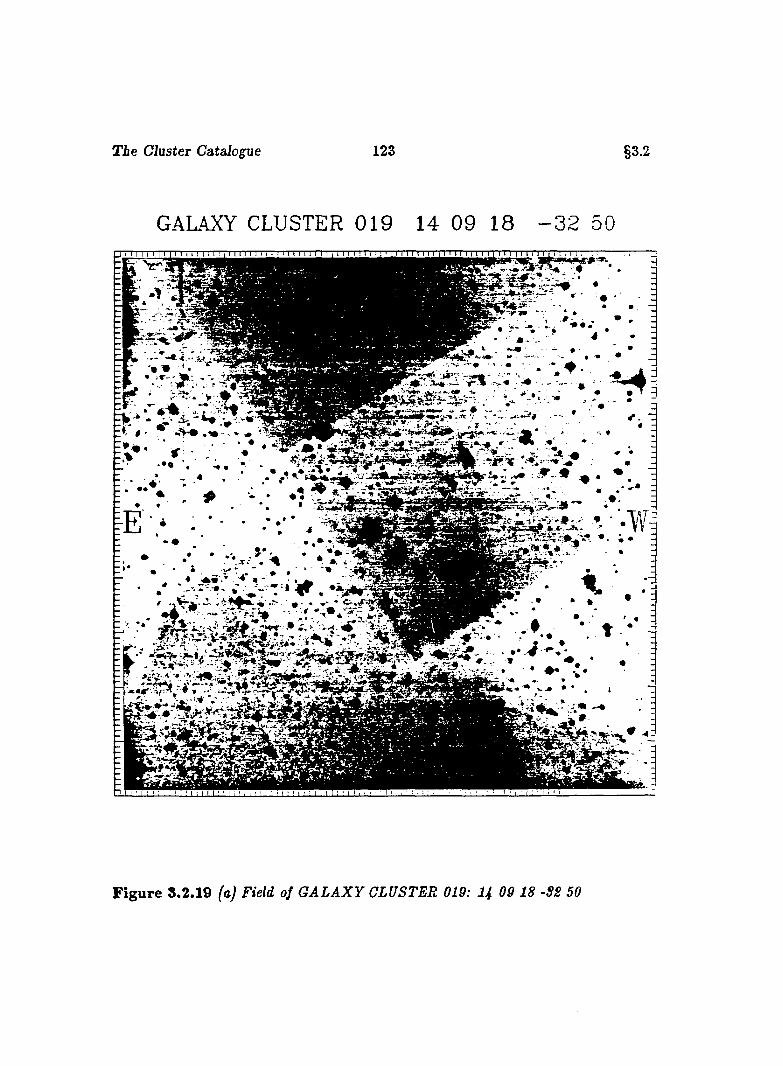
T ie Cluster Catalogue 123 §3.2
GALAXY CLUSTER 0 1 9 14 09 18 - 3 2 50
F ig u re 8.2.19 (a) Field of G A L A X Y CLUSTER 019: U 09 18 -SS 50
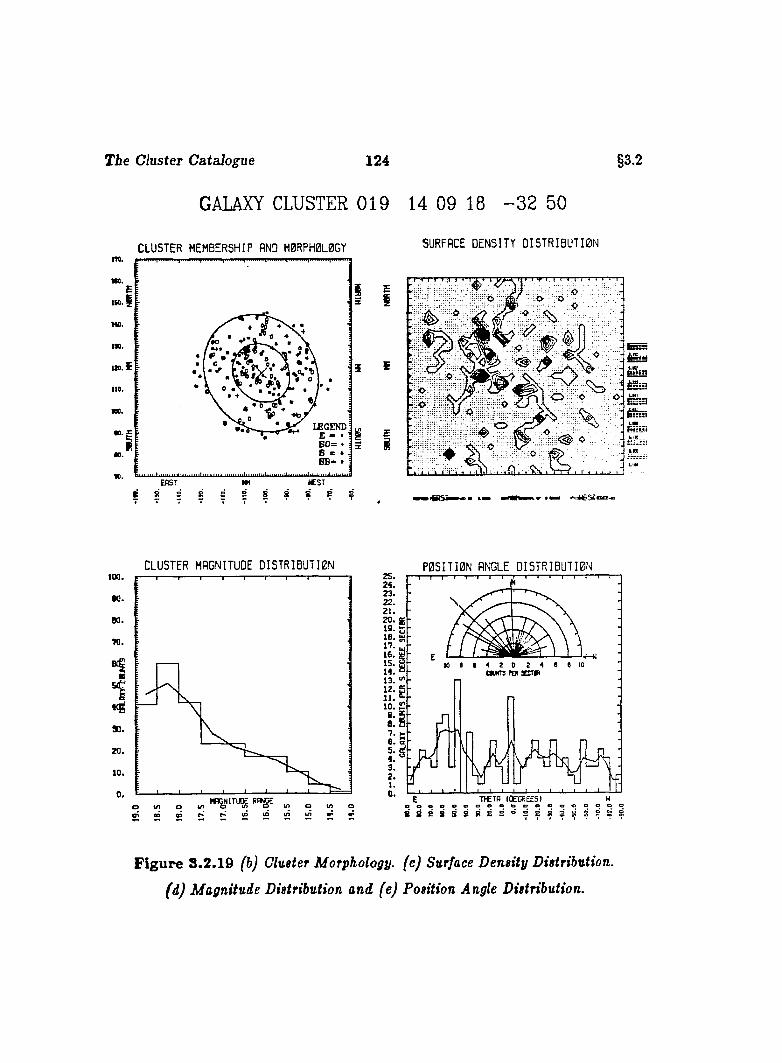
T ie Cluster Catalogue 124
GALAXY CLUSTER 019 14 09 18 - 3 2 50
§3.2
C L U ST E R MEMBERSHIP AND M0RPH0L0GYIW.m.
IK .
MO.
no.
no. E
n o .
000.
t r LEGEND E - • 8 0 = •
• •#0.
«0.
E A S T MH
SURFACE D E N S IT Y D I 5 T R I B U T I 0 N
C 9 R 5 2 8 8 : P
5I
£
K ^- . o
oI
i«3Ti— ■ -
é«!!l
C LUSTER MAGNITUDE D I S T R I B U T I 0 N P 0 S I T I 0 N ANGLE D I 5 T R I B U T I 0 N100.
■0 .80.
«I90.
2 0 .10.
0.„ WglTUDE ROtgE
22.
1 5 .d u n j r a s n m
13.
E THETfl (OeCREES) Hooooceoeoeeeoooooo8 8 2 8 8 8 8 2 2 = 2 8 8 3 8 8 2 2 8
F ig u re 8 .2 .19 (b) Cluster Morphology, (c) Surface Density Distribution,
(d) Magnitude Distribution and (e) Position Angle Distribution.
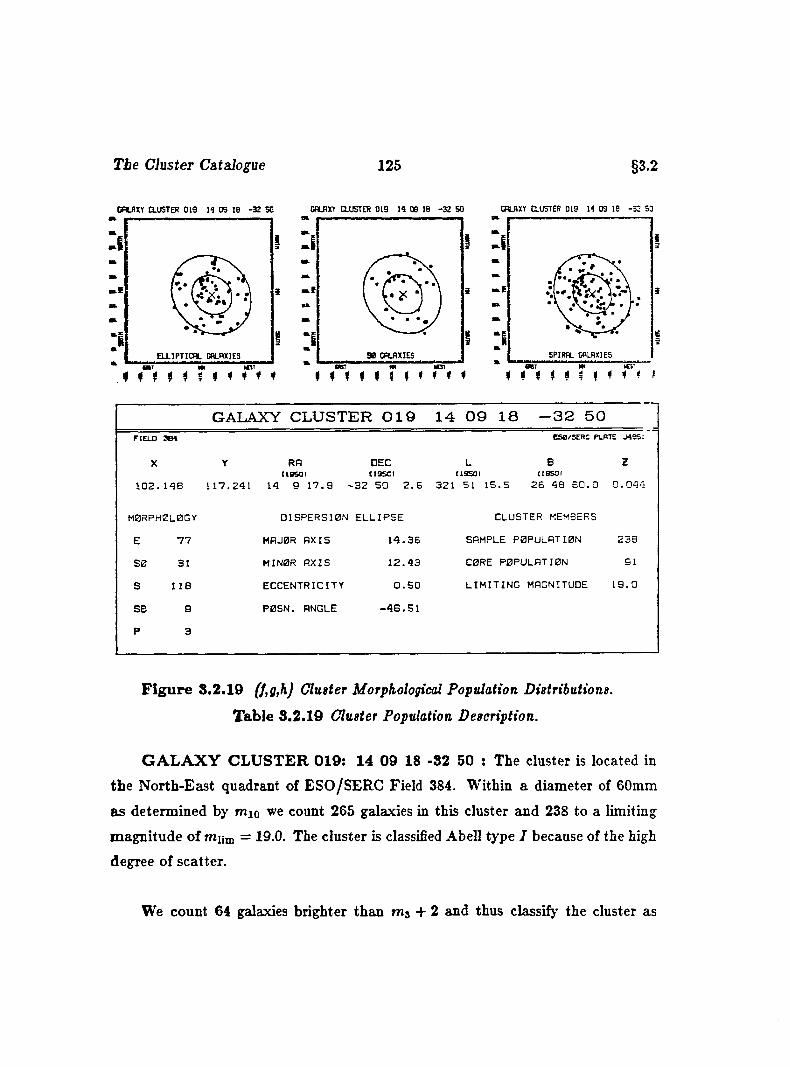
r i e Cluster Catalogue 125 §3.2
CHLflXT CLUSTER 019 H 09 18 -32 SO CRLRXY CLUSTER 019 H 09 18 -32 50 CBLfiXT CLUSTER 019 11 09 10 -32 SO
ii
SPIR BL GALAXIESGALAXIES
WST
GALAXY CLUSTER 019 14 09 18 -32 50FIELD 3B4
X
1 0 2 . 1 4 8
M0RPH0L0GY
E 7 7
S 0 31
S 1 1 8
SB g
P 3
ES0/5EHC PLATE J4B51
Y RA DEC L B ZItgSD I (19SDI H S 5 0 I (ISSOI
1 1 7 . 2 4 1 14 9 1 7 . 9 - 3 2 5 0 2 . 6 3 2 1 51 1 5 . 5 2 6 4 8 6 0 . 0 0 . 0 4 4
D IS P E R S IO N E L L IP S E
MAJOR A X IS 1 4 . 3 6
MIN ER A X IS 1 2 . 4 3
E C C E N T R IC IT Y 0 . 5 0
P 0 S N . ANGLE - 4 6 . 5 1
CLUSTER MEMBERS
SAMPLE P OPULATION 2 3 8
C0RE P OPULATION 91
L I M I T I N G MAGNITUDE 1 9 . 0
F ig u re 8.2.19 (f,g,h) Cluster Morphological Population Distributions.
T able 8 .2.19 Cluster Population Description.
G A L A X Y C L U S T E R 019; 14 09 18 -82 50 : The cluster is located in
the N orth-East quadrant of ESO/SERC Field 384. Within a diameter of 60mm
as determined by mxo we count 265 galaxies in this cluster and 238 to a limiting
m agnitude of mum = 19.0. The cluster is classified Abell type I because of the high
degree of scatter.
We count 64 galaxies brighter than m 3 + 2 and thus classify the cluster as
The Cluster Catalogue 126 §3.2
having an Abell richness of 1 . We suggest a B — M type III classification for the
cluster which has no significantly dominant galaxies. For m i,m 3 , and mio we give
14.3,14.8 and 15.2, respectively. The value of mio implies a redshift of 0.044.
The cluster appears to have several concentrations not located near the cluster
center: the most dense lies East of center while another lies North-East of center.
There are other smaller condensations scattered throughout the cluster.
The magnitude distribution rises slowly from the brightest galaxies to those
a t m„ = 17.5 after which the slope changes, rapidly rising to fainter magnitudes.
Position angles seem to be concentrated East of North, in the positive sense, with
peaks in the distribution near zero and forty-five degrees.
The elliptical galaxies appear to be scattered throughout the cluster with a
slight concentration in the core, especially in the second quadrant. Likewise, the
spirals concentrate in the core with a similar enhancement towards the North-East.
We find the {E : SO : S) ratio to be (1.0 : 0.4 : 1 .6 ) suggesting a spiral-rich cluster.
We note th a t the core population comprises some 38% of the sample within an
area of 0.19 square degrees. This yields a core surface density of 463 galaxies per
square degree.
The great diversity of spiral galaxies in the cluster gives rise to the discovery of
several peculiar members. W hat appears to be a barred- spiral with concentrations
a t the poles of the bar can be found at z = 84.7, y = 122.1. Another peculiar
object lies a t z = 79.3, y = 104.9, and appears as an “exclamation point” with a
fine whisp.
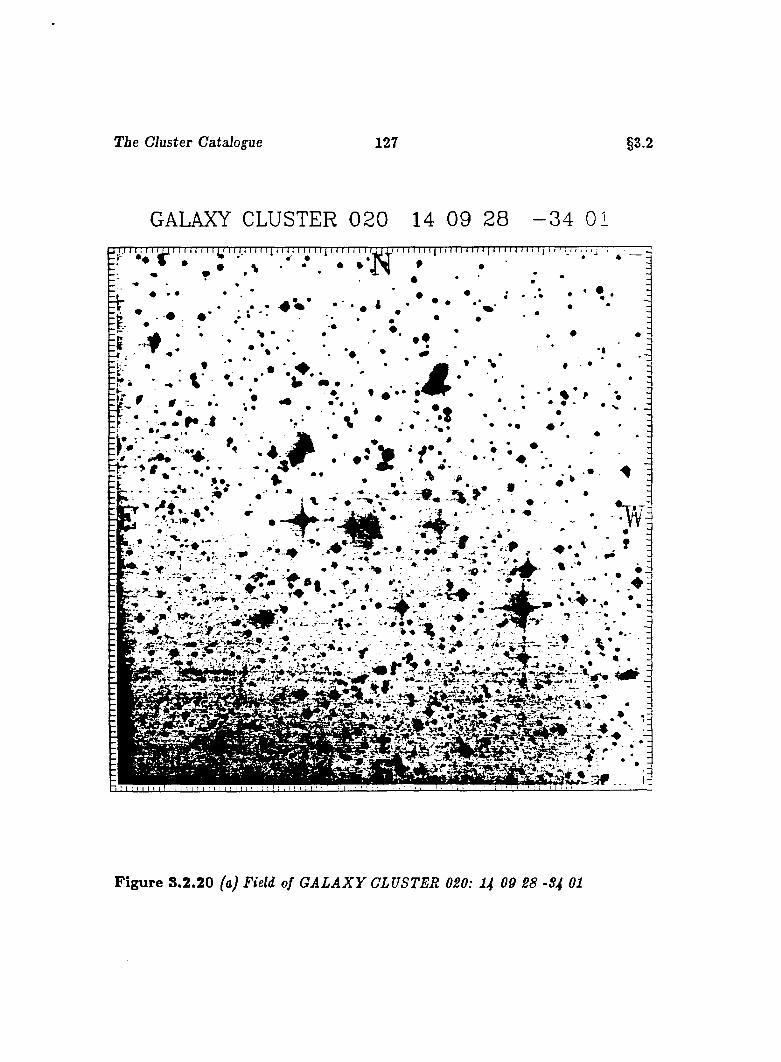
T ie Cluster Catalogue 127 §3.2
GALAXY CLUSTER 0 2 0 14 09 28 - 3 4 01J I I I I ! I M I I i I I I I i I I I n I I I I I I I I i I I I I I I I I I I I I I I i I I I I 1 I I I I 1 I I I I I I I I I I I I I I I I I I I M W I I ( I M I I ; n —
E ^ ^ • • • : • _
#
m m m L W . : 1 -1.1:
i
F ig u re 3 .2 .20 faJ Field of G A L A X Y CLUSTER 020: U 09 28 -S4 01
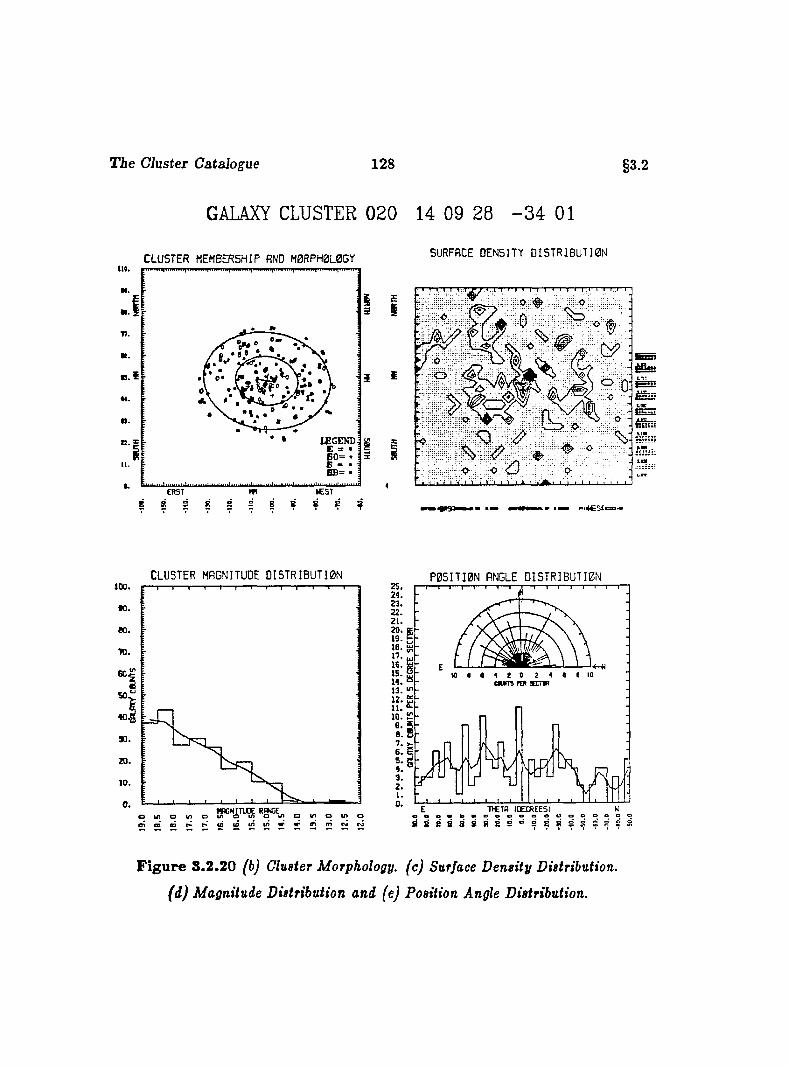
T ie Cluster Catalogue 128
GALAXY CLUSTER 020 14 09 28 - 3 4 01
§3.2
C L U S T E R MEMBERSHIP AND M 0R PH 0L0G Yl ie .
M.
M.
V .
0 ««4.
e .
ÆSTg ? # P ?
E R S T
S 8 S.
SURFACE D E N S IT Y D I S T R I B U T I 0 N
5I
i o o
C L U S T E R MAGNITUDE D I S T R I B U T I 0 N100.
n .
so.TO.
'I
40,
90.
20.
10.
0 .
P 0 5 I T I 0 N ANGLE D I S T R I B U T I 0 N
{JRGNnœ RgCEo i m D t . ^ r . ' i o t o u i i n . ' i n ir i cO rO
25.2 4 .
22.
20.1 9 .10.1 7 .
1 5 .CWdS rtn SC TB
13. " -
7. ».
THE TP lOECREES)
F ig u re 3.2 .20 (b) Cluster Morphology, (c) Surface Density Distribution,
(d) Magnitude Distribution and (e) Position Angle Distribution.
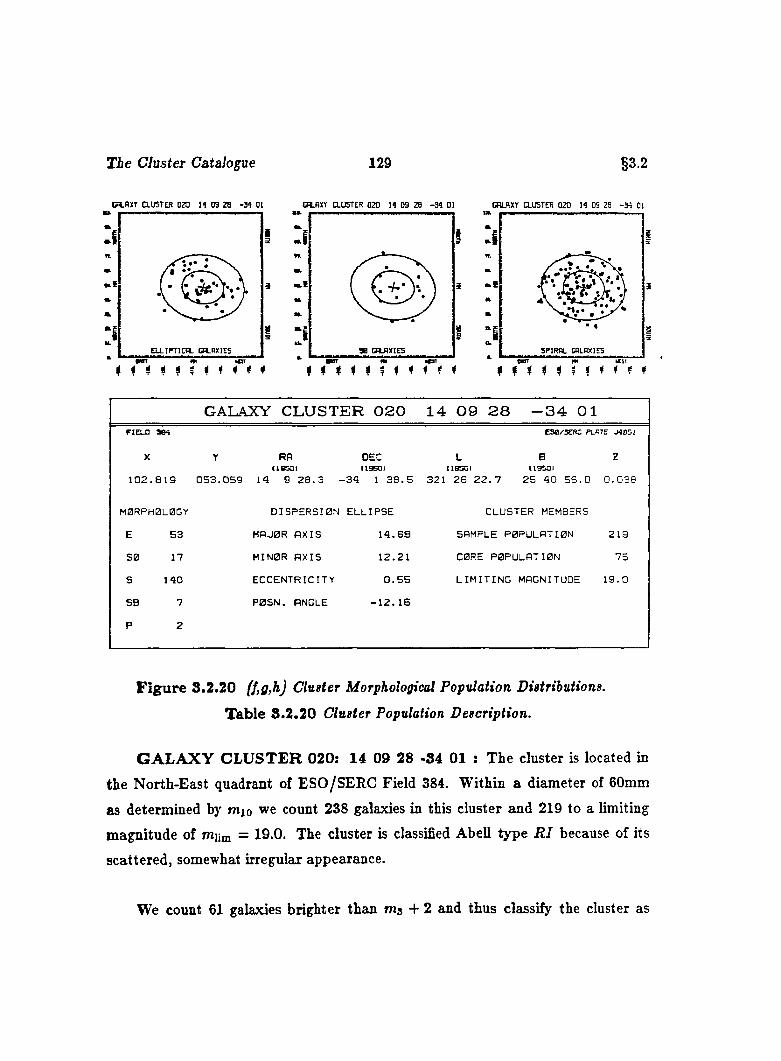
T ie Cluster Catalogue 129 §3.2
Cn.RXT CLUSTER 020 H 09 28 -34 01 CRLflXY CLUSTER 020 14 09 28 -34 01 CRLflXT CLUSTER 020 14 09 29 -34 01
3
a i
I
# # $ # f ; I f * f # $ f f I f f f f f 4 ( i 1 f f *
GALAXY C L U S T E R 0 2 0 1 4 0 9 2 8 ■34 0 1FIELD 36 4
X
tS e /S E K C PLATE J4SS1
ZY RR DEC L B(ISSO I 119561 IIBSO! 119501
1 0 2 . 8 1 9 0 5 3 . 0 5 9 14 9 2 8 . 3 - 3 4 1 3 8 . 5 3 2 1 2 6 2 2 . 7 2 5 4 0 5 6 . 0 0 . 0 3 8
M0RPH0L0GY
E 5 3
3 0 17
S 1 4 0
SB 7
P 2
d : s p e r s ] 0 n e l l i p s e
MBJ0R A X IS 1 4 . 6 8
M IN 0 R A X IS 1 2 . 2 1
e c c e n t r i c i t y 0 . 5 5
P 0 S N . ANGLE - 1 2 . 1 6
CLUSTER MEMBERS
SAMPLE P 0 P U L A T I0 N 2 1 9
C0RE P 0 P U L A T I0 N 7 5
L I M I T I N G MAGNITUDE 1 9 . 0
F ig u re 3.2.20 (f,g,h) Cluster Morpkological Population Distributions.
T able 3 .2 .20 Cluster Population Description.
G A L A X Y C L U S T E R 020: 14 09 28 -34 01 : The cluster is located in
the North-East quadrant of ESO/SERC Field 384. Within a diameter of 60mm
as determined by mio we count 238 galaxies in this cluster and 219 to a limiting
magnitude of miim = 19.0. The cluster is classified Abell type R I because of its
scattered, somewhat irregular appearance.
We count 61 galaxies brighter than m s + 2 and thus classify the cluster as
The Cluster C a ta lan e 130 §3.2
having an Abell richness of 1 . We suggest a B — M type II classification for the
cluster which has a number of bright galaxies intermediate between the type cD
and normal giant elliptical galaxies. For and mio we give 12.7, 14.5 and
14.8, respectively. The value of mio implies a redshift of 0.038.
The cluster shows a slight central condensation of the core with several small
concentrations, somewhat less dense than that found West of center. We find the
magnitude distribution to be ramp-like from brightest to faintest in a practically
uniform rise. Position angles tend to lean East of North with a few concentrations
a t 0, 30 and 50 degrees, respectively.
The elliptical galaxies appear more frequently in the Southern portions of the
cluster with a slight enchancement in the core. On the other hand, the spirals are
fairly uniformly scattered throughout the cluster. We find an (E : SO : S) ratio of
(l.O : 0.3 : 2.8) giving a spiral-rich cluster.
The core population comprises some 34% of the sample in an area of 0 . 2 square
degrees. This gives a surface density of 380 galaxies per square degree on the sky.
We call attention to a peculiar triplet of galaxies located a t z = 98.7, y = 53.6
th a t appear to be superposed. Another superposition reminiscent of an "exclama
tion point” , of a lenticular and an elliptical, is found at x = 108.4,y = 46.3. Also
noted are pairs of galaxies consisting of an early and a late elliptical, such as the
set residing at z = 82.0, y = 46.1.
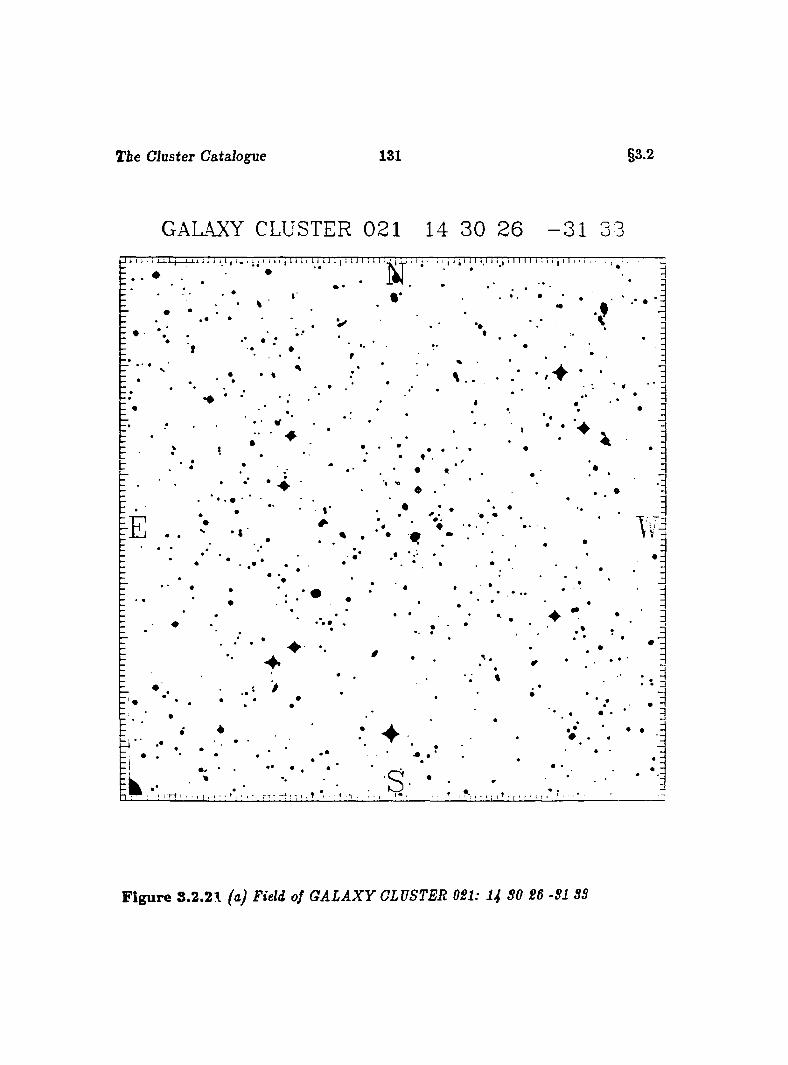
The Cluster Catalogue 131 §3.2
GALAXY CLUSTER 021 14 30 2 6 - 3 1 33TTTTTT
F ig u re S.2.21 (aj Field of G A LA X Y CLUSTER 021: U SO 26 -SI SS
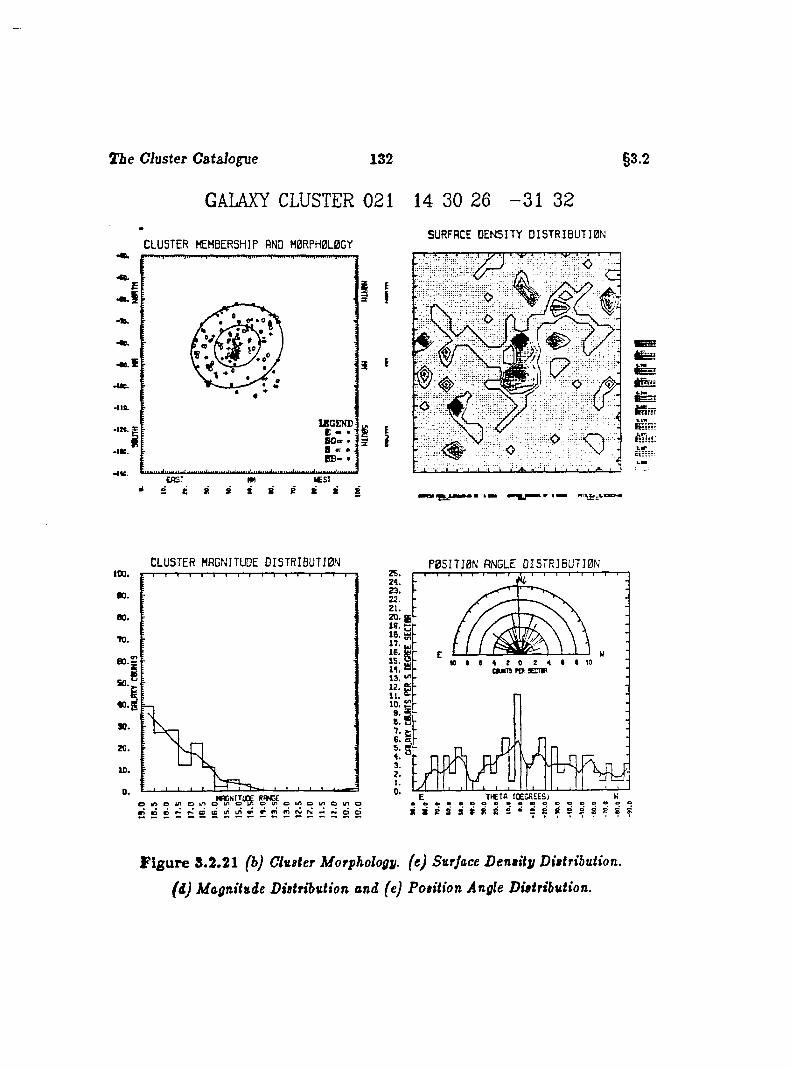
T ie Ciuster Catalogue 132
GALAXY CLUSTER 021 14 30 26 - 3 1 32
§3.2
C L U S T E R MEMBERSHIP AND M0RPH0L0GY
•uo.
•ÎK.
£RST «CST Ê 8 S8 8e 8 8 S
SURFACE D E N S IT Y D I S T R I B U T I 0 N
-O
@ 2
tëï£e stml?.
C L U S T E R MAGNITUDE O I S T R I B U T I 0 N P 0 5 I T I 0 N ANGLE D I S T R I B U T I 0 N100.
M.80 .
TO.
50.
90.
20.
10.
0 . •«GNITUE RfMGC0 « 9 0 ( / > o i n o i ^ o i n o u i o i / ) o m o m o
22 .
15.2 ■n. = ■13.12, S
o m rr? h k s u m
IQ .
B. S *
T « T f l !0ECR££SJ
e 8
F ig u re 8.2.21 (b) CluBter Morphology, (e) Surface D en tity Distribution,
( i ) Magnitude Distribution and (e) Position Angle Distribution.
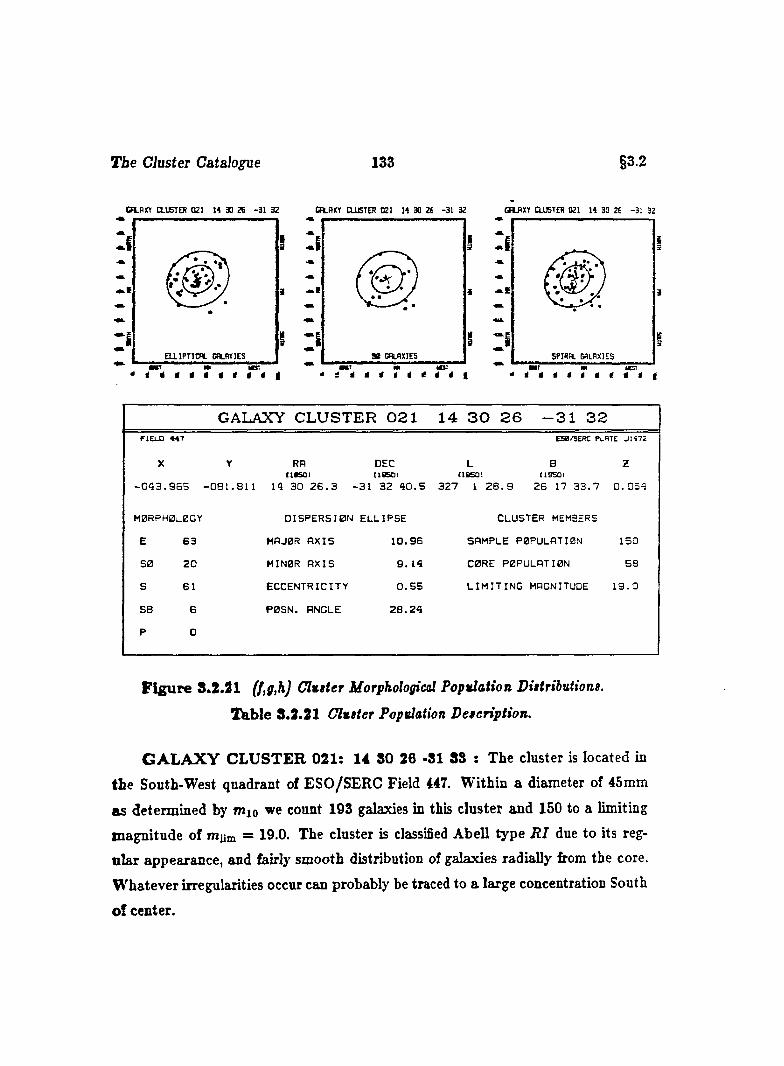
T ie Cluster C ata lane 133 §3.2
C T .R « [LUSTER 021 » 30 26 -31 32 CB.BXT OUSTER 021 11 30 26 -31 32 CRLflXT OUSTER 021 11 30 26 -31 32
3
i
GALAXY CLUSTER 0 2 1 14 3 0 2 6 - 3 1 3 2riELO ♦ 47 ES0/SERC PLBTE J H 7 Z
X
- 0 4 3 . 9SS
Y RAItCSOJ
- 0 8 1 . 8 1 1 14 3 0 2 6 . 3 -
DECiiesQi
31 3 2 4 0 . 5
L (iBsai
3 2 7 1 2 8 . 9
B119501
2 6 17 3 3 . 7
Z
0 . 0 5 4
M0RPH0L0GY D IS P E R S I0 N E L L IP S E CLUSTER MEMBERS
E 6 3 HAJ0R A X IS 1 0 . 9 6 SAMPLE P 0P U L A T I0 N 1 5 0
S0 2 0 M IN 0 R A X IS 8 . 14 CBRE P 0 P U L A T I0 N 5 8
s 61 E C C E N T R IC IT Y 0 . 5 5 L I M I T I N G MAGNITUDE 1 9 . 0
SB 6 P 0 S N . ANGLE 2 8 . 2 4
P 0
F ig u re 8.2.21 f/,ff,hj Clutter Morphological Population Dittributions.
Tkble 8.3.31 Clutter Population Deteription.
G A L A X Y C L U S T E R 021; 14 80 26 -81 8 8 : The cluster is located in
the South-West quadrant of ESO/SERC Field 447. W ithin a diameter of 45mm
as determined by fn%o we count 193 galaxies in this cluster and 150 to a limiting
magnitude of muni = 19.0. The cluster is classified Abell type R I due to its reg
ular appearance, and fairly smooth distribution of galaxies radially from the core.
W hatever irregularities occur can probably be traced to a large concentration South
o f center.
The Cluster C&tsJogue 134 §3.2
We count 13 galaxies brighter than ms + 2 and thus classify the cluster as
having an Abell richness of 0. We suggest & B — M type E - in classification for the
cluster which has no really dominant galaxies albeit several bright ellipticals which
could not be considered giant. For m i,m 3 , and mio we give 12.1, 12.6 and 13.9,
respectively. The value of mio implies a redshift of 0.054.
We find the cluster smooth with the exception of the fourth quadrant which
has a paucity of galaxies. There is a strong concentration of cluster members just
South of center, and a smaller group N orth of this. At the South-East extremity of
the cluster we find another small concentration.
The cluster magnitude distribution rises somewhat linearly from brightest to
faintest galaxies, with a noticable drop in population in the range m„ = 17.0 to
niv = 17.5. The position angle distribution shows no preference for sense other
than perhaps the peak a t zero degrees indicating a North-South orientation.
We note the concentration of elliptical galaxies in the core, their scatter else
where and their avoidance of the fourth quadrant. The spirals, on the other hand,
Are more uniform in their distribution, are somewhat concentrated towards the cen
te r of the cluster, and are also found a t its periphery. The {E : SO : S ) ratio
is (1.0 : 0.3 : 1.0) suggesting a nearly evenly divided population of ellipticals and
spirals. The core population comprises nearly 89% of the sample and is found in
an area of 0.11 square degrees. The core surface density is thus some 526 galaxies
per square degree on the sky.
We notice five pairs of elliptical galaxies comprised of an early and late member,
the brightest of which is located at z = —42.3, y = —67.9. The dense galaxy
concentration South of center has an unusual elliptical galaxy, centrally condensed
and supporting a halo, that is surrounded by a very faint population of attendants.
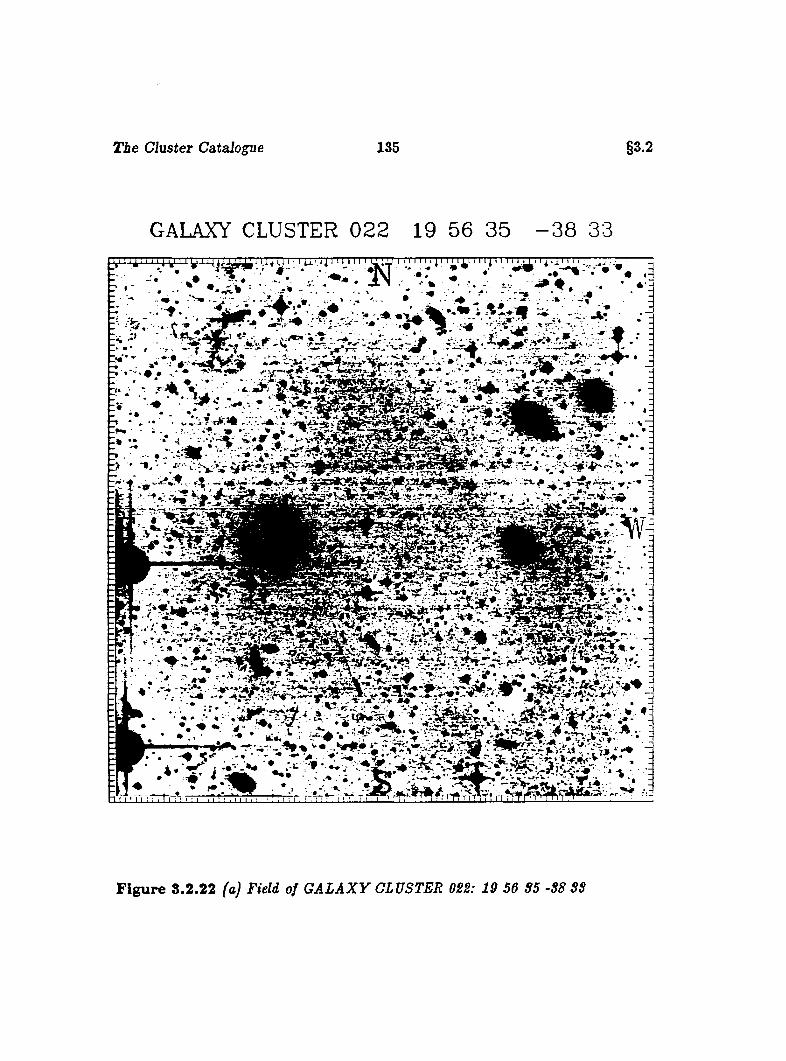
The Cluster Catalogue 135 §3.2
GALAXY CLUSTER 0 2 2 19 56 35 - 3 8 331,, 1 U' l i I n j 111 m u 111 n u 11 u i ^ r r r r ^ i :
; V J N T , : . • .» » ij ■ • ' ‘ ^ ® . .* ' j# . . • . .% - a
, .......
î s m ï f
F ig u re 3.2 .22 FieW of G A L A X Y CLUSTER 022: 19 56 S5 -S8 SS
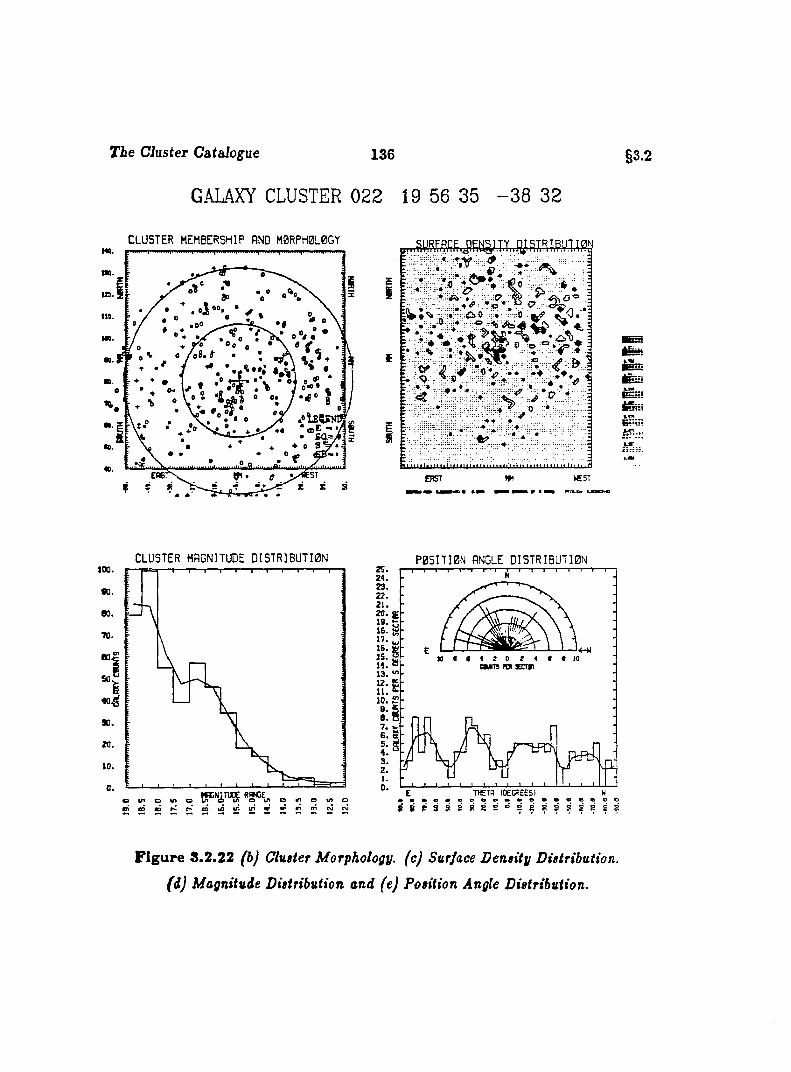
T ie Cluster Catalogue 136
GALAXY CLUSTER 022 19 56 35 - 3 8 32
C L U S T E R M EM BERSHIP AND M 0RPH0L0GY
tao.
I2B.
MO.
Ot
to.
m.
EI
0 ”o
<3®*XL"
n- -=s_^. - ^■■ft
0
* .
. 1 l U t N i l t U U m u i < i i i i « H . n l ^ i n l « t t i m i i M 111 II
E n S T W NEST
§3.2
muiis3
Kkii&!«.hr:::}■*:..
CL U ST E R MAGNITUDE D I S T R I B U T I 0 N P 0 5 I T I 0 N ANGLE D I S T R I B U T I 0 N100
90.
o i n o « o e > m o u > o
22.
2 0 . e
15.
13. “>
< n .
F ig u re 3.2.22 (b) Clutter Morphology, (c) Surface D en tity Distribution,
(d) Magnitude Distribution and (e) Position Angle Distribution.
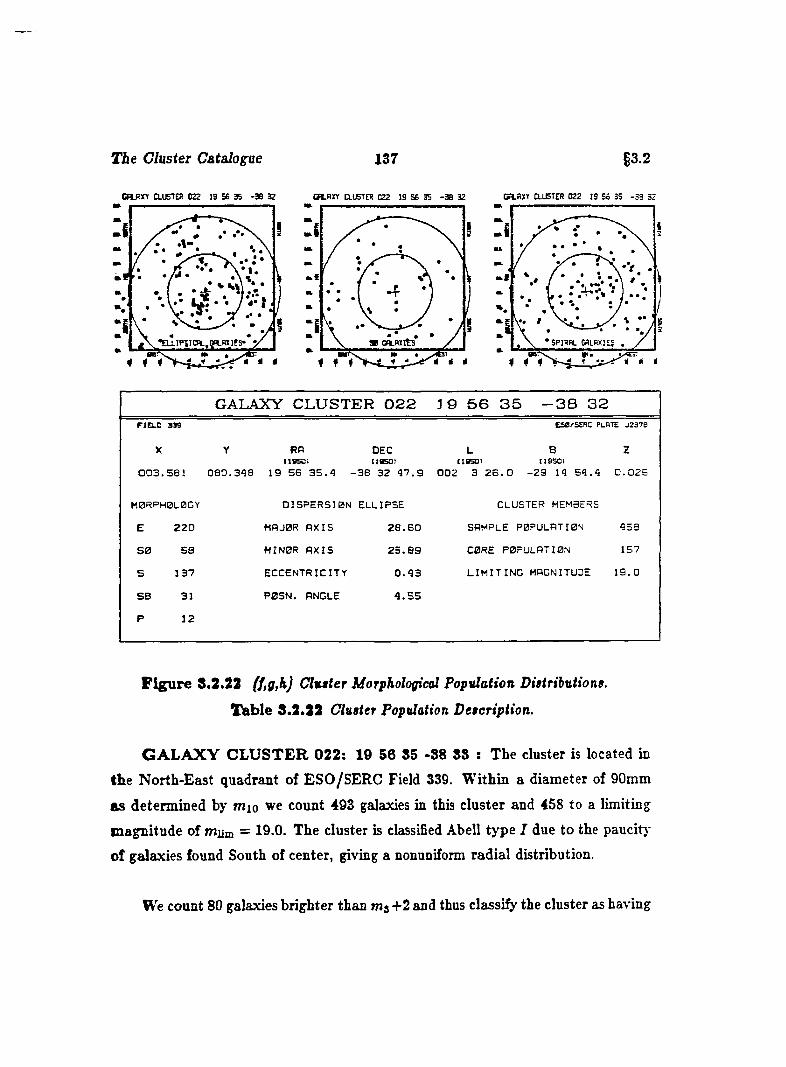
T ie Cluster CaWogTie 137 §3.2
omn ausTER ozz 19 ss 35 -as 3z CHJXY aUSTER 022 19 56 35 -38 32 CBLBxr CLUSTER 02 2 19 56 35 -3 9 32
*EmPïicw..g3Li«its»
m*
S P IR R L G A L A X IE S
*
GALAXY CLUSTER 0 2 2 3 9 5 6 3 5 - 3 8 3 2FIELD 339
X
ESa/SERC PLATE J2 3 7 6
HY RP DEC L B( tS S O l (19501 I105DI (19SDI
0 0 3 . 5 8 1 0 8 0 . 3 9 8 1 9 5 6 3 5 . 4 - 3 8 3 2 4 7 . 9 0 0 2 3 2 6 . 0 - 2 9 14 5 4 . 4 0 . 0 2 5
M 0RPH0L0GY
E 2 2 0
S 0 5 8
S 1 3 7
SB 31
P 1 2
D IS P E R S IO N E L L IP S E
MPJ0R A X IS 2 8 . 6 0
M IN 0 R A X I S 2 5 . 8 9
E C C E N T R IC IT Y 0 . 4 3
P 0 S N . ANGLE 4 . 5 5
CLUSTER MEMBERS
s a m p l e POPULATION 4 5 8
C0RE P OPULATION 157
L I M I T I N G MAGNITUDE 1 9 . 0
F ig u re S.2.22 (f,g,h) Cl%tter MorpkologieaJ Population Diftrihutions.
T ab le 8.3 .32 Cluater Population Detcription.
G A L A X Y C L U S T E R 022; 19 56 85 - 8 8 8 8 : The cluster is located in
the North-East quadrant of ESO/SERC Field 339. W ithin a diameter of 90mm
as determined by mio we count 493 galaxies in this cluster and 458 to a limiting
m agnitude of m y.m = 19.0. The cluster is classified Abell type I due to the paucity
of galaxies found South of center, giving a nonuniform radial distribution.
We count 80 galaxies brighter than ms +2 and thus classify the cluster as having
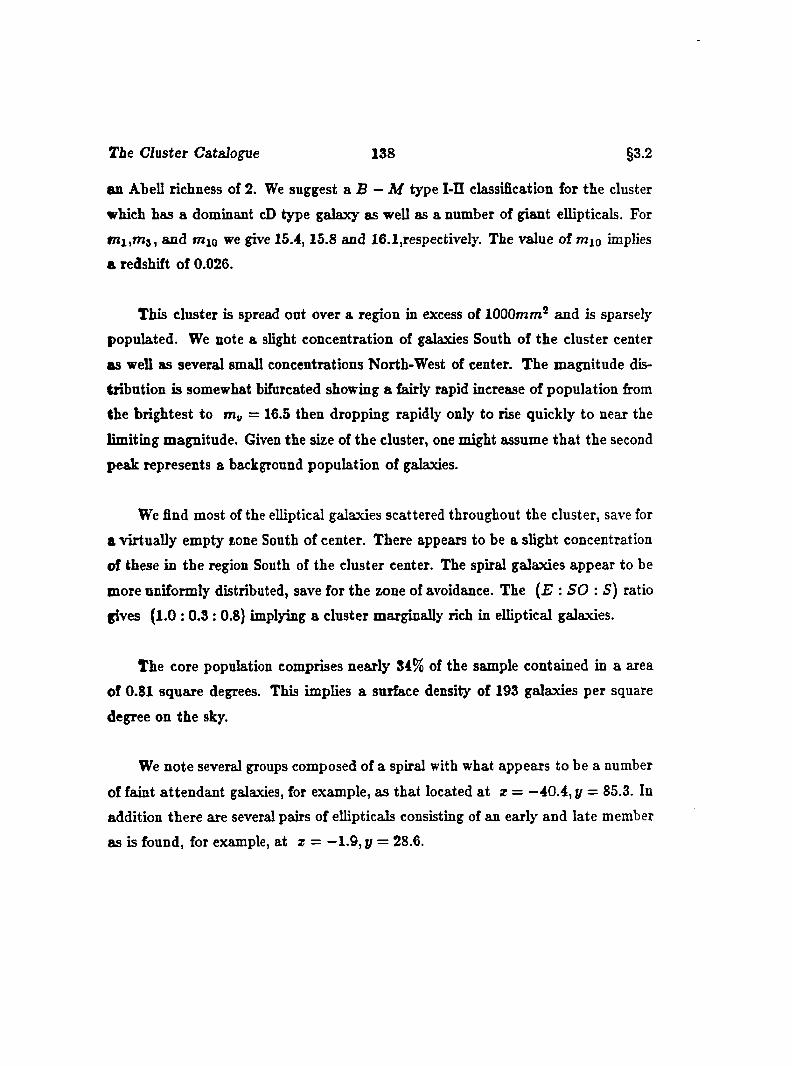
T ie Cluster Catalogue 138 §3.2
en Abell richness of 2. We suggest a B — M type I-II classification for the cluster
which has a dominant cD type galaxy as well as a number of giant ellipticals. For
and mjo we give 15.4,15.8 and 16.1,respectively. The value of mxo implies
a redshift of 0.026.
This cluster is spread out over a region in excess of lOOOmm^ and is sparsely
populated. We note a slight concentration of galaxies South of the cluster center
as well as several small concentrations North-West of center. The magnitude dis
tribution is somewhat bifurcated showing a fairly rapid increase of population from
the brightest to = 16.5 then dropping rapidly only to rise quickly to near the
limiting magnitude. Given the size of the cluster, one might assume th a t the second
peak represents a background population of galaxies.
We find most of the elliptical galaxies scattered throughout the cluster, save for
a virtually empty zone South of center. There appears to be a slight concentration
of these in the region South of the cluster center. The spiral galaxies appear to be
more uniformly distributed, save for the zone of avoidance. The {E : SO : S) ratio
fives (1.0 : 0.3 : 0.8) implying a cluster marginally rich in elliptical galaxies.
The core population comprises nearly 34% of the sample contained in a area
of 0.81 square degrees. This implies a surface density of 193 galaxies per square
degree on the sky.
We note several groups composed of a spiral with what appears to be a number
of faint attendant galaxies, for example, as that located at z = —40.4, y = 85.3. In
addition there are several pairs of ellipticals consisting of an early and late member
as is found, for example, a t x = —1.9, y = 28.6.
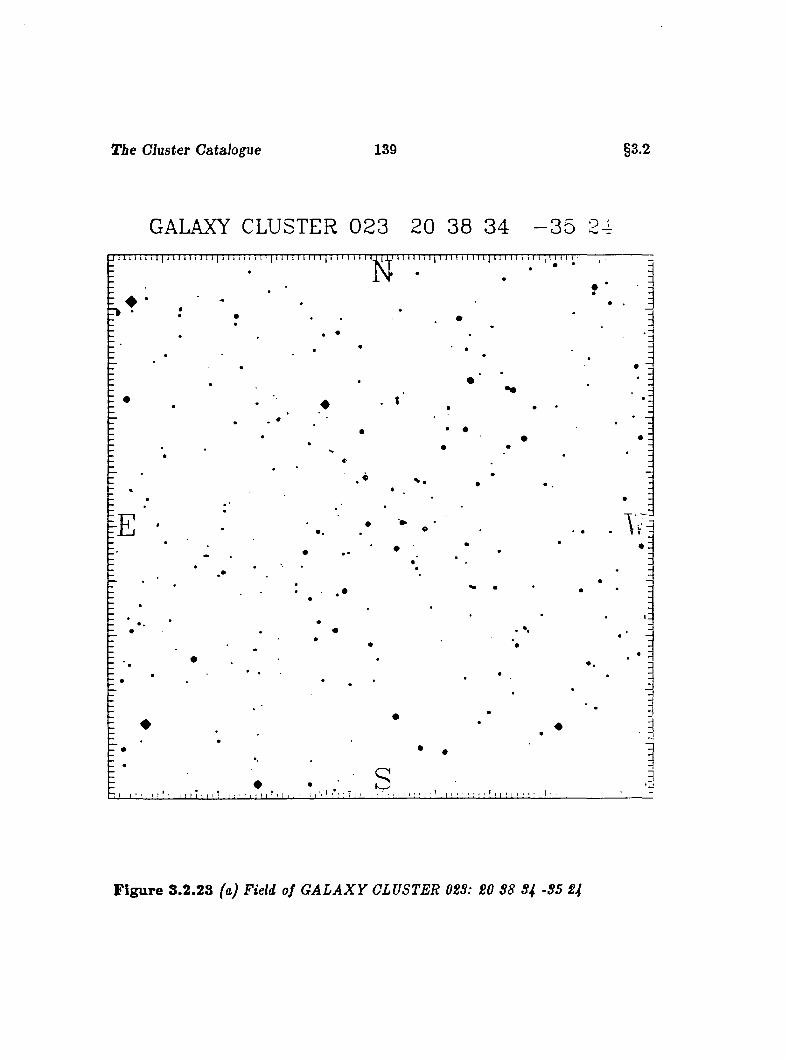
The Cluster Catalogue 139 §3.2
GALAXY CLUSTER 0 2 3 20 38 34 - 3 5 24
F ig u re 3 .2.28 (a) Field of G A L A X Y CLUSTER OSS: SO S8 S4 -S5 Sf
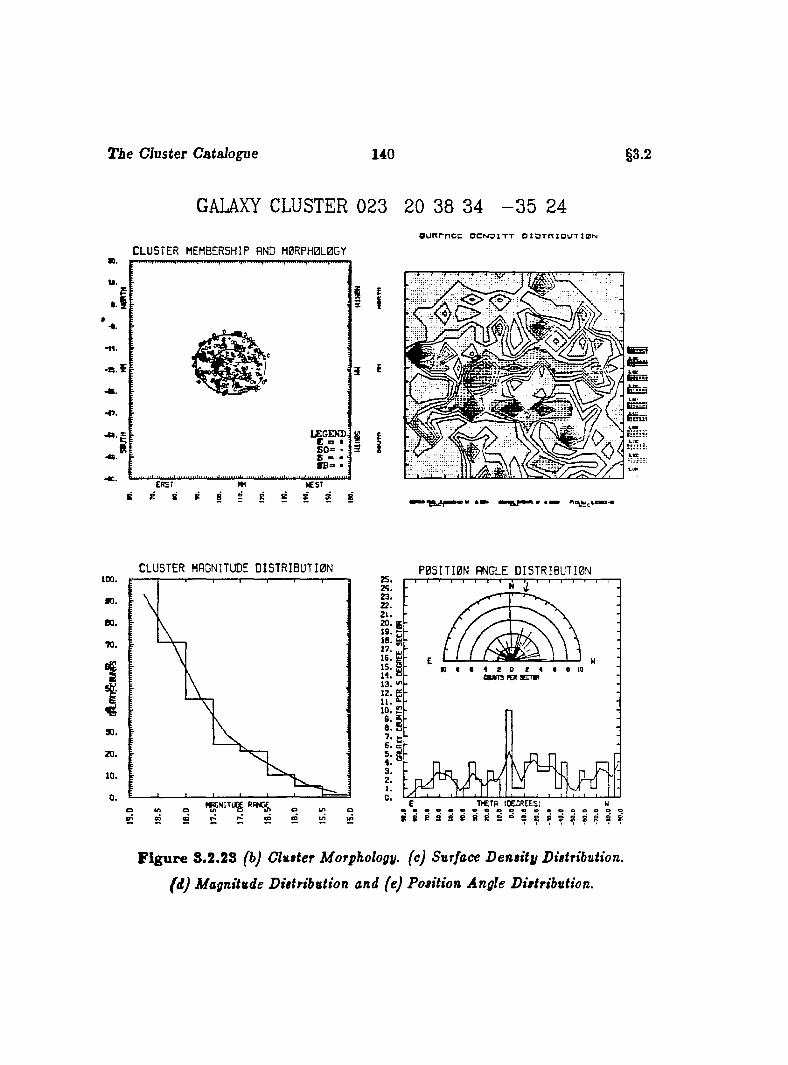
T ie Cluster Cataiogue 140
GALAXY CLUSTER 023 20 38 34 - 3 5 24
§3.2
C L U S T E R MEMBERSHIP AND M 0R PH 0L0G Y
LEGEND
3
o u r r r n c c o c n ^ x t t o x o t r x o u t j b n
I
""iScV"
C L U S T E R MAGNITUDE D I S T R I B U T I 0 N100.
flO.
eo.TO.
90.
2 0 .10.
•ÇN IT l^ RRN% ^
P B S I T I 0 N ANGLE D I S T R I B U T I O N
c n iT s rex s a »
V,E THETB IDEOREES) H
; 2 ; d ; ; ; : : : H H ; H : ;
F ig u re 8.2.23 fbj Clutter Morphology, (c) Surface D en tity Distribution,
(d) Magnitude Distribution and (e) Position Angle Distribution.
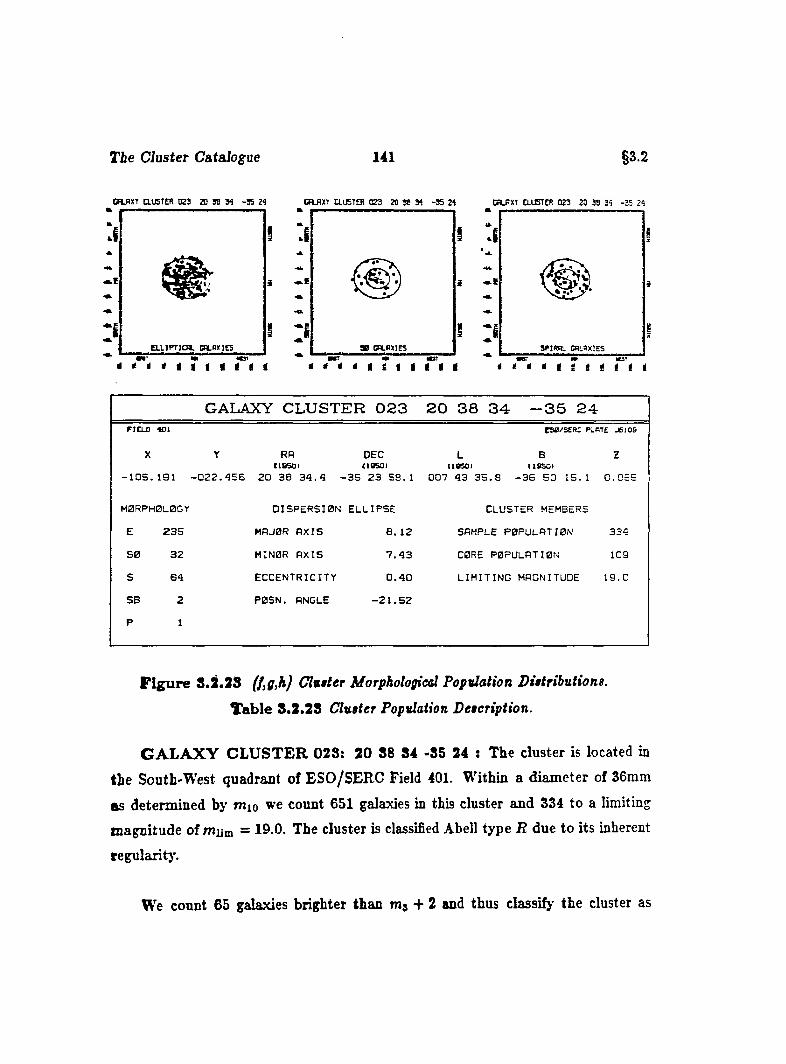
T ie Cluster Catalogue 141 §3.2
C anX T aUSTER 0Z3 ZD S8 M 24 C U X I auS T E R t e a 20 38 M -35 24 c a p x t aU S lE R 0Z3 20 38 34 -35 24
I A
i * 1
E L L l P T J C a . C f lL R X m S P IR A L G A L A X IE S•BT
* t i < i## mv mmr mt i t i t i » t
OBT mt * * * » i Î t i t t i
G A L A X Y C L U S T E R 0 2 3 2 0 3 8 3 4 - 3 5 2 4FIELD 401 Cse/SERC PLATE J61D9
X
- ID S . 191
Y RR DECI1D 50I (lasoi
- 0 2 2 .45B 20 38 3 4 .4 -3 5 23 58 .1
L BIIBSOJ (ISSOI
007 43 3 5 .8 -3 6 50 15.1
z
0 .0 6 5
M0RPH0L0GY DISPERSIO N ELLIP SE CLUSTER MEMBERS
E 2 3 5 MRJ0R A X IS 8 .1 2 SAMPLE POPULATION 334
80 32 MIN0R A X IS 7 .4 3 CORE p o p u l a t io n 109
S 6 4 ECC ENTRIC ITY 0 .4 0 L IM IT IN G MAGNITUDE 1 9 .0
SB 2 P0SN. ANGLE - 2 1 .5 2
P 1
F ig u re 8 .2 .38 (f,g,h) Clatter Morphologicd Population Dittrihutiont.
T ab le 8 .2.28 Cluster Population Description.
G A L A X Y C L U S T E R 028: 20 8 8 84 -85 24 : The cluster is located ia
the South-West quadrant of ESO/SERC Field 401. Within a diameter of 36mm
as determined by rtiio we count 651 galaxies in this cluster and 334 to a limiting
magnitude of rniim = 19.0. The cluster is classified Abell type R due to its inherent
regularity.
We count 65 galaxies brighter than m , + 2 and thus classify the cluster as
T ie Cluster C ata lan e 142 §3.2
having an Abell richness of 1. We suggest a B — M type H I classification for the
cluster which has no dominant galaxies in the field. For and nj^o we give
15.3,15.8 and 16.1, respectively. The value of mio implies a redshift of 0.065.
This rich cluster shows a dense concentration of galaxies with a radial popula
tion fall-off and several dense subgroups. The main subgroup is located somewhat
East of the cluster center with another concentration lying South of it. A similar
group is found just South of center. We note also the presence of another very dense
n bgroup to the East North-East a t the periphery of the cluster.
The magnitude distribution rises nearly exponentially from the brightest galax
ies to the magnitude limit with the majority of the cluster members being fainter
than = 17.5. We note that the position angle distribution displays a greater
number of bright galaxies oriented W est of North in the negative sense, with a not-
icable excess at zero degrees. We note the heavy concentration of elliptical galaxies
distributed throughout the cluster, whereas the spirals are fewer in number and
riiow no obvious grouping. The (E : SO : S) ratio favors the elliptical galaxies and
fives (1.0 : 0.1: 0.3).
The core population represents some 33% of the sample population but since
this cluster is so rich with faint galaxies, we must view this number with caution.
The dispersion ellipse spans 0.07 square degrees on the sky giving a core density of
1641 galaxies per square degree.
The rich core density may be further enhanced if we count the faint galaxies
th a t comprise the population fainter than = 19.0. We note 16 pairs of galaxies
in very close proximity or superposed, the brightest of which is located at z =
—99.7, y = —13.2. These are generally pairs of elliptical galaxies with an early and
a late member.
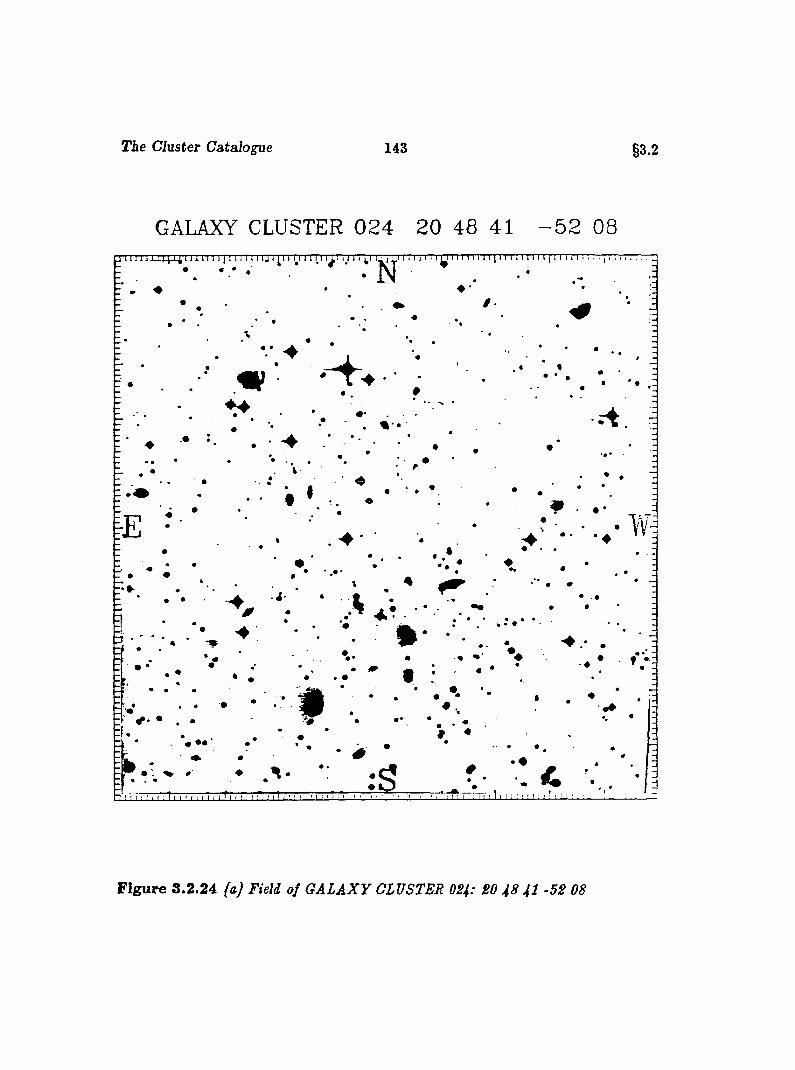
T ie Cluster C a ta la n e 143 §3.2
GALAXY CLUSTER 0 2 4 20 48 41 - 5 2 08j i i i u i x i 4 _ 4 i 1 1 I I 1 ly i 1 iTi 1 r jT jT
••
• ••
F ig u re 3 .2 .24 {aj Field of G A L A X Y CLUSTER 0S4: SO 48 4I -58 08
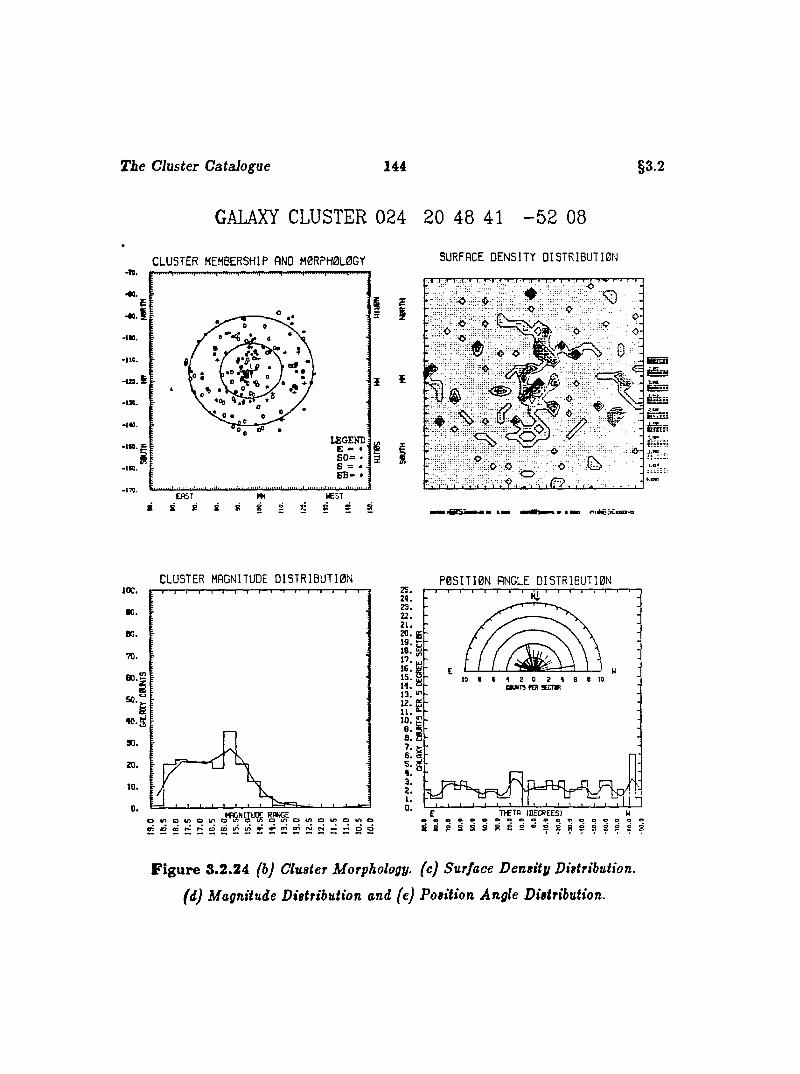
The Cluster Catalogue 144 §3.2
GALAXY CLUSTER 024 20 48 41 - 5 2 08
C L U S T E R MEMBERSHIP AND M 0 R P H 0 L 0 G Y SURFACE D E N S I T Y D I S T R I B U T I 0 N-TO,
410.
o f
WESTE PST 8 8 8 S s9m 8
Î Ï
0
C L U S T E R MAGNITUDE O I S T R 1 B U T I 0 NlOO,
70.
f f C N IT U O E RANGEO V ) O V > O i P O i n O i A O < n O 4A O in O (T> O
25.24.23.22.21.2 0 . g|-I1 5 . L
H. =13. '
l?;i10. I 8 . ;8. :
i;Sa.2.I.
P 0 5 I T I 0 N ANGLE D I S T R I B U T I O N
to « 4 4 2 0 2 4 6 0 10 COUNT? fOt XCTV
± i— 1 I I I- 1 ]
8 8 P 8 S 8 RBT H E T A (D E C R E E S ) Wtoooooeoeooo‘ 2 S R S S S P 2
F ig u re 8.2.24 (b) Cluster Morphology, (c) Surface D ensity Distribution,
(d) Magnitude Distribution and (e) Position Angle Distribution.
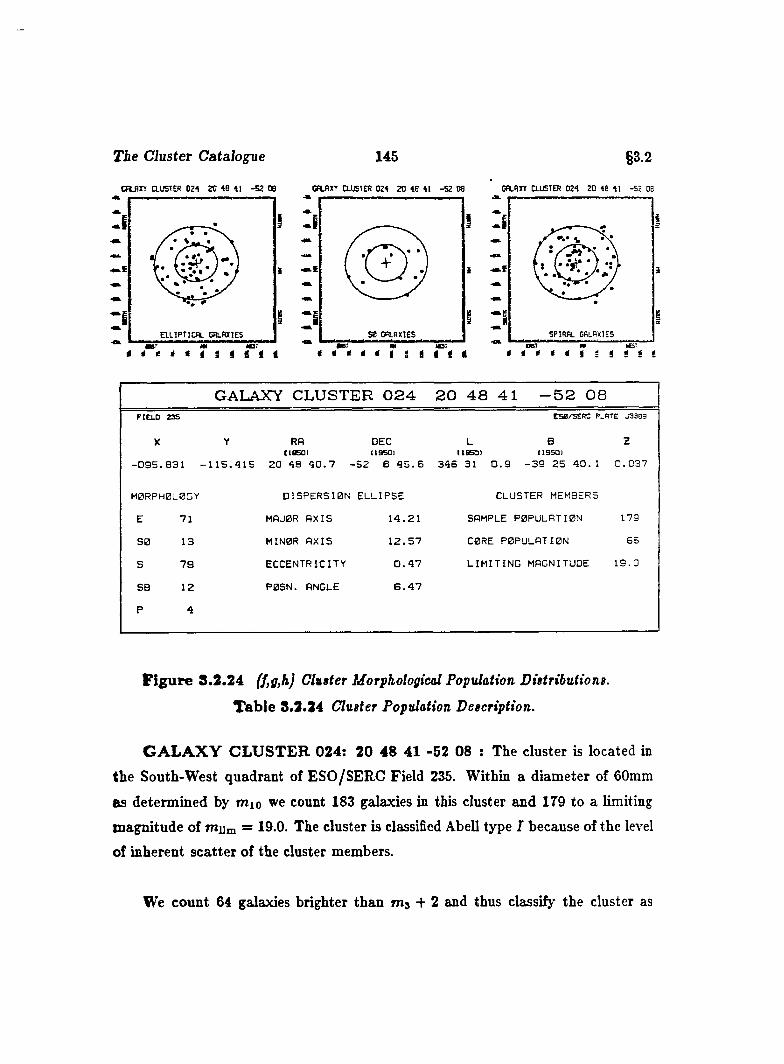
The Cluster C atalane
COflXT CLUSTER 024 20 48 41 -52 08
145
CPLRXT CLUSTER 024 20 48 41 -5 2 08
§3.2
C n L R IT CLUSTER 024 20 48 41 -52 08
1i
SPIRAL GALAXIESE L L I P T I C A L G A L A X IE S GALAXIES
B B T m K 3 It é t é t i s i i i tt
GALAXY CLUSTER 0 2 4 2 0 4 8 4 1 ■52 08FIELD 235
X
- 0 9 5 . 8 3 1
MORPHOLOGY
E 71
SO 13
S 7 9
SB 12
P 4
ESB/SERC PLATE J33B5
Y RR DEC L B ZCIOSOI 119501 IIB 5 D I I19SQI
- 1 1 5 . 4 1 5 2 0 48 4 0 . 7 - 5 2 8 4 5 . 6 3 4 6 31 0 . 9 - 3 9 2 5 4 0 . 1 0 . 0 3 7
D IS P E R S IO N E L L IP S E
MAJOR A X IS 1 4 . 2 1
MINOR A X IS 1 2 . 5 7
E C C E N T R IC IT Y 0 . 4 7
P0S N. ANGLE 6 . 4 7
CLUSTER MEMBERS
SAMPLE P OPULA TION 179
CORE P OPULATION 65
L I M I T I N G MAGNITUDE 1 9 . 0
F ig u re 8 .2 .24 Clutter Morphological Population Dittrihutions.
T ab le 8.2.24 Cluster Population Description.
G A L A X Y C L U S T E R 024: 20 48 41 -52 08 ; The cluster is located in
the South-West quadrant of ESO/SERC Field 235. Within a diameter of 60mm
as determined by mio we count 183 galaxies in this cluster and 179 to a limiting
magnitude of mum = 19.0. The cluster is classified Abell type I because of the level
of inherent scatter of the cluster members.
We count 64 galaxies brighter than + 2 and thus claissify the cluster as
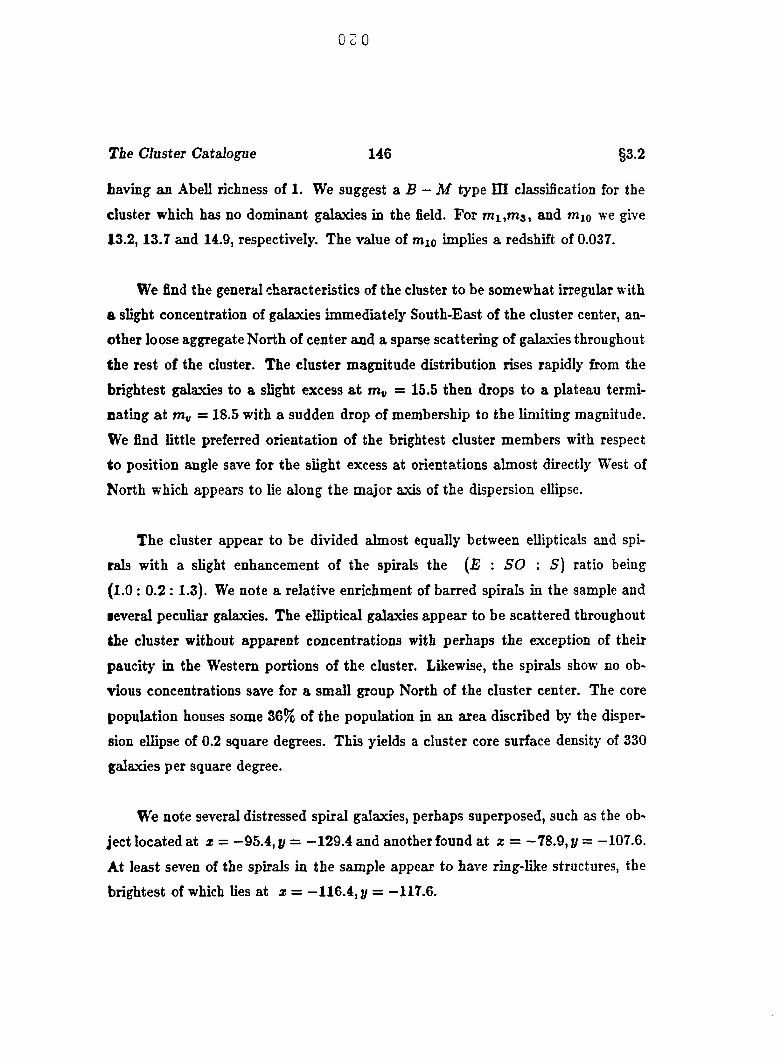
O c O
T ie Cluster Cataiogue 146 §3.2
having an Abell richness of 1. We suggest a B — M type III classification for the
cluster which has no dominant galaxies in the field. For m i,m s, and mio we give
13.2, 13.7 and 14.9, respectively. The value of mio implies a redshift of 0.037.
We find the general characteristics of the cluster to be somewhat irregular with
a slight concentration of galaxies immediately South-East of the cluster center, an
other loose aggregate North of center and a sparse scattering of galaxies throughout
the rest of the cluster. The cluster magnitude distribution rises rapidly from the
brightest galaxies to a slight excess a t m„ = 15.5 then drops to a plateau termi
nating a t TTiv = 18.5 with a sudden drop of membership to the limiting magnitude.
We find little preferred orientation of the brightest cluster members with respect
to position angle save for the slight excess at orientations almost directly West of
North which appears to lie zilong the major axis of the dispersion ellipse.
The cluster appear to be divided almost equally between ellipticals and spi
rals with a slight enhancement of the spirals the (JE : 5 0 : 5) ratio being
(1.0 : 0.2 : 1.3). We note a relative enrichment of barred spirals in the sample and
■everal peculiar galaxies. The elliptical galaxies appear to be scattered throughout
the cluster without apparent concentrations with perhaps the exception of their
paucity in the Western portions of the cluster. Likewise, the spirals show no ob
vious concentrations save for a small group North of the cluster center. The core
population houses some 36% of the population in an area discribed by the disper
sion ellipse of 0.2 square degrees. This yields a cluster core surface density of 330
galaxies per square degree.
We note several distressed spiral galaxies, perhaps superposed, such as the ob
ject located at X = —95.4, y = —129.4 and another found at x = —78.9, y = —107.6.
At least seven of the spirals in the sample appear to have ring-like structures, the
brightest of which lies at z = —116.4, y = —117.6.
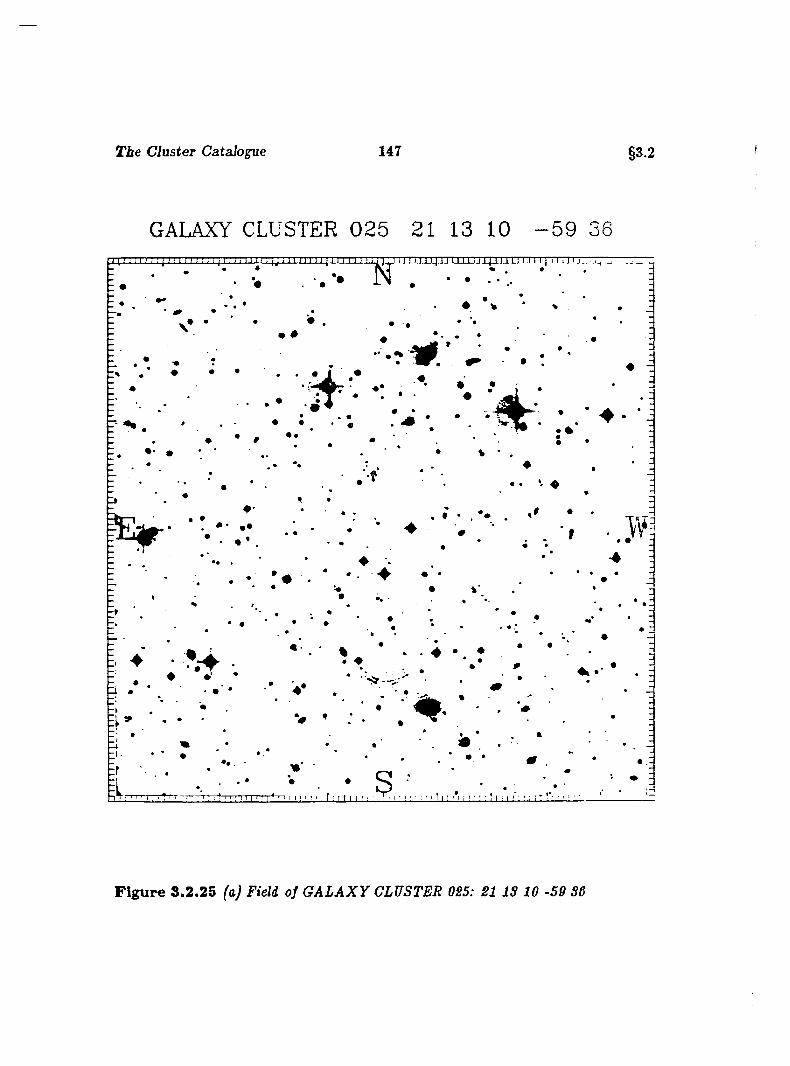
The Cluster Catalogue 147 §3.2
GALAXY CLUSTER 0 2 5 21 13 10 - 5 9 36I J — ; jÿT,
F ig u re 3 .2 .25 (a) Field of G A L A X Y CLUSTER 025: 21 IS 10 -59 SO
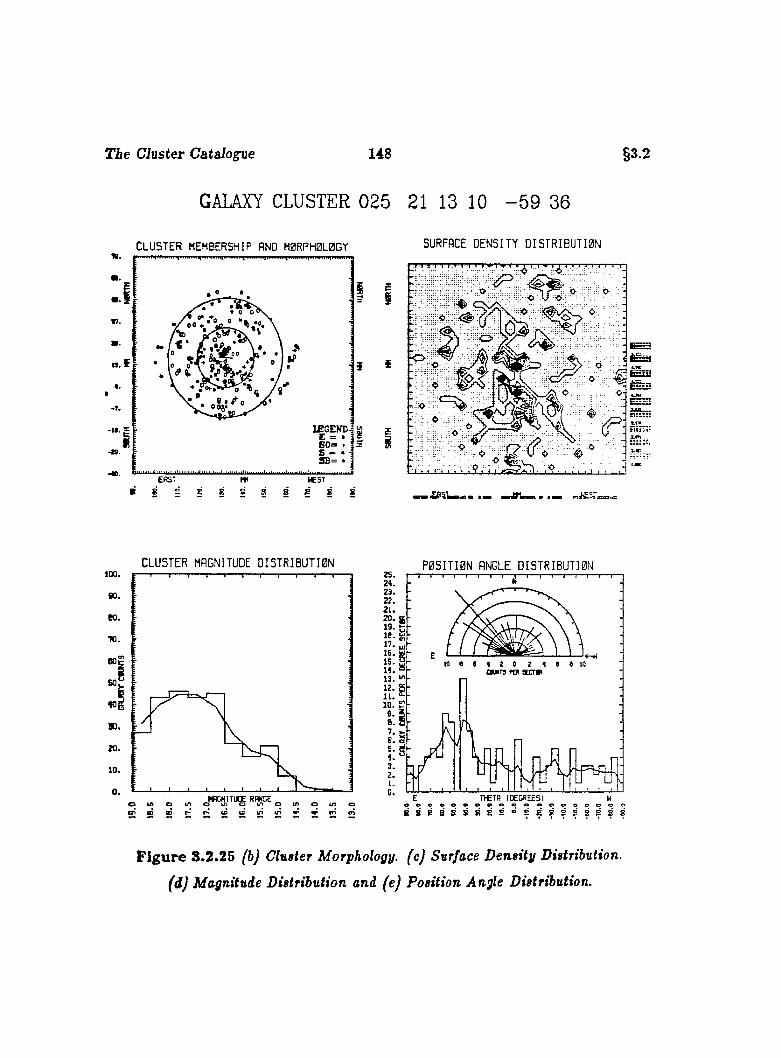
The Cluster Catalogue 148
GALAXY CLUSTER 025 21 13 10 - 5 9 36
§3.2
C L U S T E R MEMBERSHIP AND M 0RPH 0L0G Y
I£GEND-i E = »B0 = « ! S * • iS B = • :
EAST
« g ?E S 8 8
SURFACE D E N S IT Y D I S T R I B U T I 0 N
EI
O•oi
C L U S T E R MAGNITUDE D I S T R I B U T I 0 N100.
80.
80.
e a |
“ i«gso.
2 0 .10.
0 .
„ ..........................................c o i f l u ^ t n v v t n c n
P 0 S I T I 0 N ANGLE D I S T R I B U T I O N24.
22.
15.t tü M T 9 fC P S E T T * )
13. ^
eooooeooooooooeooo
F ig u re 8.2.25 (b) Cluster Morphology, (c) Surface D ensity Distribution,
(d) Magnitude Distribution and (e) Position Angle Distribution.
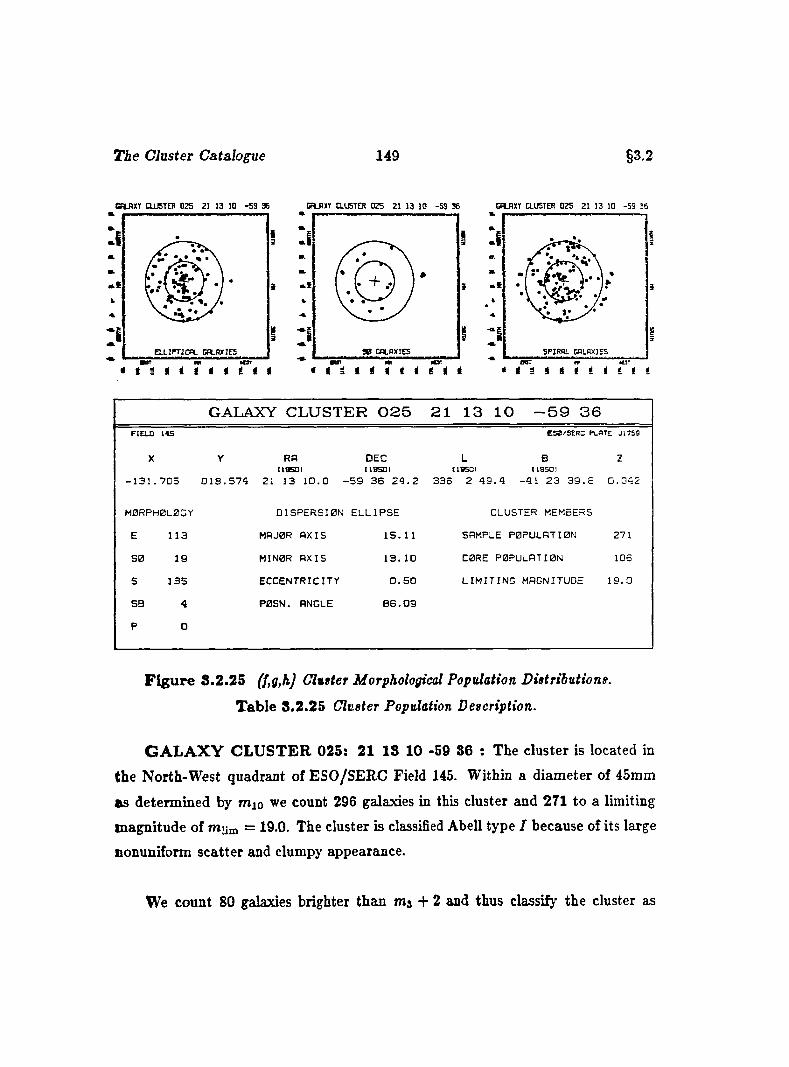
The Cluster Ca.talogue 149 §3.2
CH LBX T C L U S T E R 0 2 S 2 1 1 3 1 0 - 5 3 3 6 C n j X T C L U STER 025 21 13 10 - S 3 36 CfLBXT CLUSTER 025 21 13 10 -53 36
i i
GALAXY CLUSTER 025 21 13 10 -59 36FIELD 14S ESa/SERD PLATE J17S9
X
- 1 3 1 . 7 0 5
Y
0 1 8 . 5 7 4
RACIOSDI
21 13 1 0 . 0 -
DECIIBSDJ
-5 9 3 6 2 4 . 2
L BI1S50I 119501
3 3 6 2 4 9 . 4 - 4 1 2 3 3 9 . 8
Z
0 . 0 42
M 0RPH0L0CY D IS P E R S IO N E L L IP S E CLUSTER MEMBERS
E 1 1 3 MAJOR A X IS 1 5 . 11 SAMPLE POPULATION 271
8 0 1 9 MINOR A X IS 1 3 . 10 CORE POPULATION 106
S 1 3 5 E C C E N T R IC IT Y 0 . 5 0 L I M I T I N G MAGNITUDE 1 9 . 0
SB 4 P0S N. ANGLE 8 8 . 0 9
P 0
F ig u re 8.2 .25 (J,g,h) Clutter Morphological Population Distributiont.
Table 8.2.25 Cluster Population Description.
G A L A X Y C L U S T E R 025: 21 IS 10 -59 8 6 : The cluster is located in
the North-W est quadrant of ESO/SERC Field 145. Within a diameter of 45mm
as determined by mjo we count 296 galaxies in this cluster and 271 to a limiting
magnitude of mijm = 19.0. The cluster is classified Abell type I because of its large
nonuniform scatter and clumpy appearance.
We count 80 galaxies brighter than mj + 2 and thus classify the cluster as
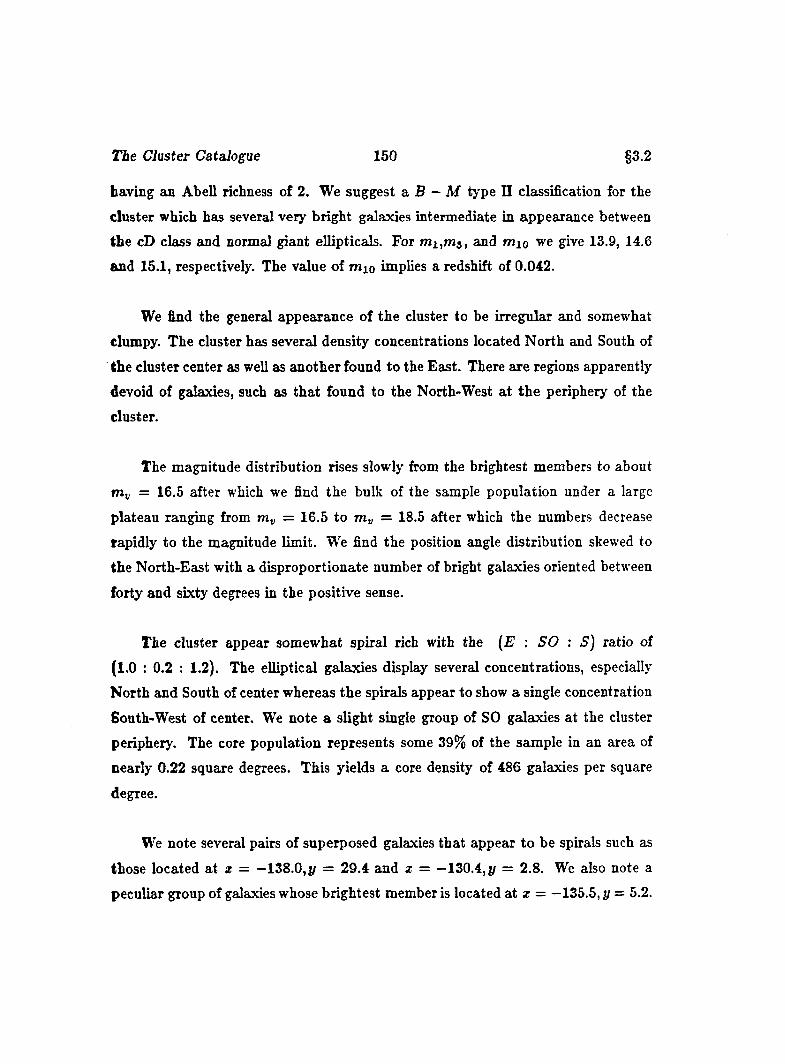
r i e Cluster Catalogue 150 §3.2
having an Abell richness of 2. We suggest a B — M type II classification for the
cluster which has several very bright galaxies intermediate in appearance between
the cD class and normal giant ellipticals. For and mio we give 13.9, 14.6
and 15.1, respectively. The value of mio implies a redshift of 0.042.
We find the general appearance of the cluster to be irregular and somewhat
clumpy. The cluster has several density concentrations located North and South of
the cluster center as well as another found to the East. There are regions apparently
devoid of galaxies, such as that found to the North-West at the periphery of the
cluster.
The magnitude distribution rises slowly from the brightest members to about
= 16.5 after which we find the bulk of the sample population under a large
plateau ranging from m„ = 16.5 to nty = 18.5 after which the numbers decrease
rapidly to the magnitude limit. We find the position angle distribution skewed to
the North-East with a disproportionate number of bright galaxies oriented between
forty and sixty degrees in the positive sense.
The cluster appear somewhat spiral rich with the (E : SO : S) ratio of
(1.0 : 0.2 ; 1.2). The elliptical galaxies display several concentrations, especially
North and South of center whereas the spirals appear to show a single concentration
South-West of center. We note a slight single group of SO galaxies at the cluster
periphery. The core population represents some 39% of the sample in an area of
nearly 0.22 square degrees. This yields a core density of 486 galaxies per square
degree.
We note several pairs of superposed galaxies that appear to be spirals such as
those located at z = —138.0, y = 29.4 and x = —130.4, y = 2.8. We also note a
peculiar group of galaxies whose brightest member is located at z = —135.5, y = 5.2.
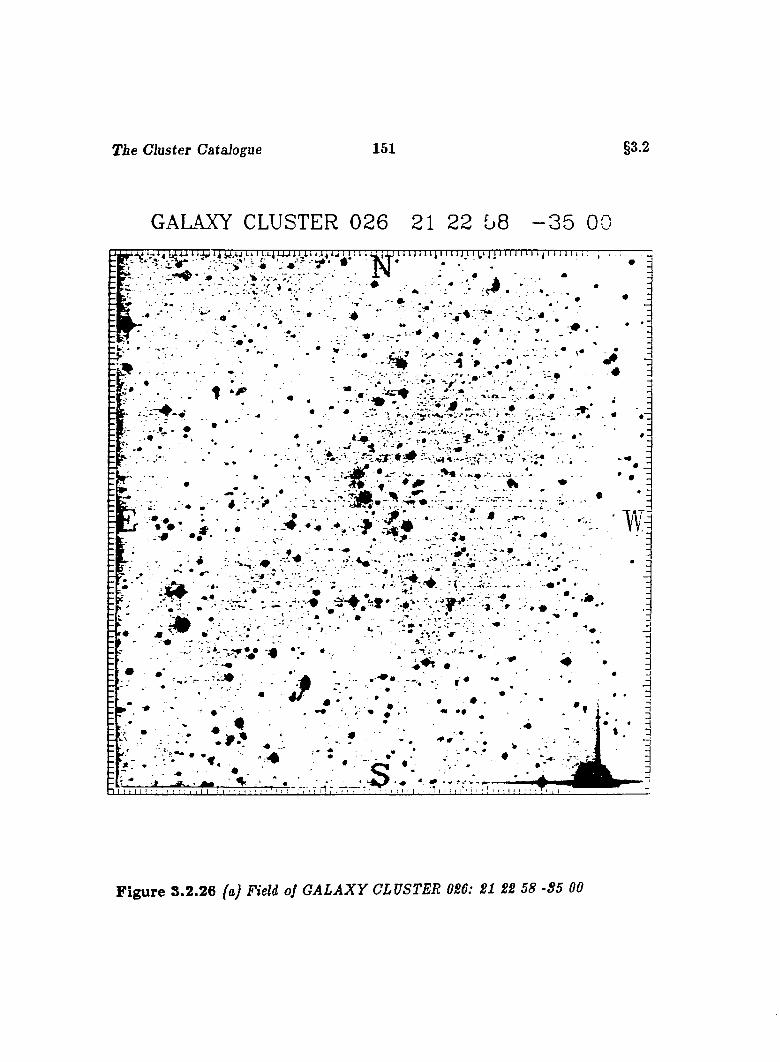
T ie Cluster Catalogue 151 §3.2
GALAXY CLUSTER 0 2 6 21 22 58 - 3 5 00l i 1 i . q L U i u i n j u 1 1 1 x u 11 i i i i i j 1 1 1 i j i ‘ jT r n r n r n , '! 1 1 1 1 , , , . , ................ _
% /.-v V/'v’' '.• ■ ~: . - ' . . - • • ■ v ’. v » V. - - ■• • . : - :
: ^ ■ / . . . ■ ; V . . - * ■. V - • ' • ■ ■ ■ -
. t' *■
‘ ■ ■■• ■ 0
1 f .i- • .-r' .. .m - :... .* ..' .# .•-- -ii'.
>
• V # .%
. . • fb . •
.0 ' . '
V -# ' •1-J#O f : y # r . " ' -i- **- ** .
E . • ^ • . . • .
I I I I I I ! ■ ; : 1 I I : ■ I I I I I ! ' ! I I I I rirrrrnTii; S ’* ' ' É
F ig u re 3 .2 .26 F»eW of G A LA X Y CLUSTER 086: 81 88 58 -S5 00
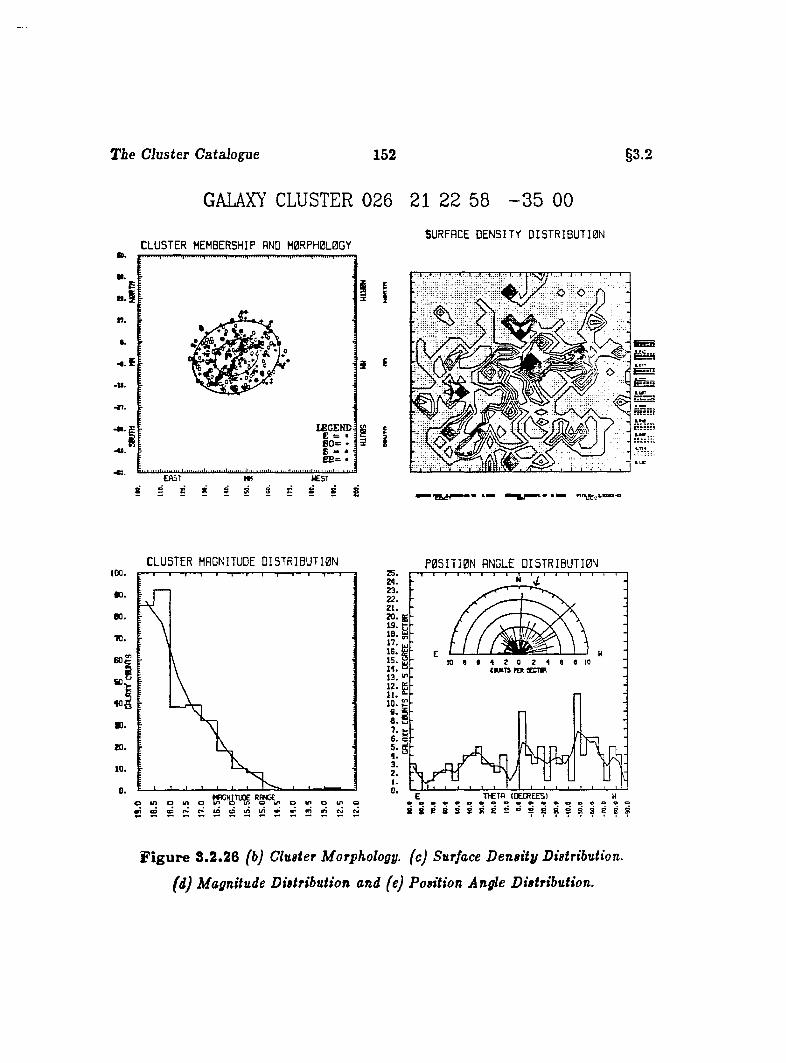
T ie Cluster Catalogue 152 §3.2
GALAXY CLUSTER 026 21 22 58 - 3 5 00
SURFACE D E N S I T Y D I S T R I B U T I 0 NC L U S T E R MEMBERSHIP AND M 0RPH 0L0G Y
lEGEKDS0 =: •
E\
t
C L U S T E R MAGNITUDE D I S T R I B U T I 0 N100.
#0 .
eo.
».».10.
c „ o „ o o .n o u . o
P 0 5 I T I 0 N ANGLE D I 5 T R I B U T I 0 N» .» .
22. 21. 20. g «.h
15. iiwra MX
T lC T f l (DECREES)
H : : : ;
F ig u re 3.2.26 (b) Cluster Morphology, (c) Surface D ensity Distribution,
( i ) Magnitude Distribution and (e) Position Angle Distribution.
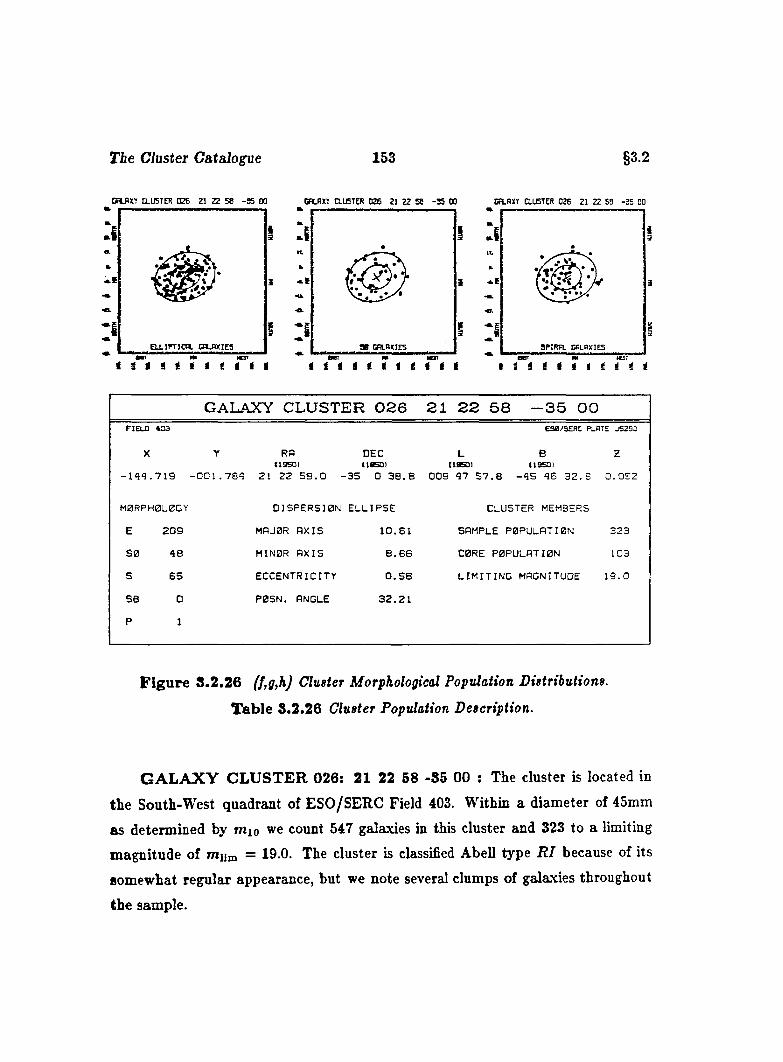
T ie Cluster Catalogue 153 §3.2
CRLAXY CLUSTER 026 21 22 58 -35 00 CfiLRXT CLUSTER 025 21 22 58 -3 5 00 CFLflXY CLUSTER 026 21 22 58 -3 5 00
ELLIPTIC^. CflLPXIES SPIRPL GALAXIES
t i t i im t e n * BBT mt * t i i i t i i i t t t t i t
“ B c r wt t i i t i t t t i i t
GALAXY CLUSTER 0 2 6 2 1 2 2 6 8 - 3 5 0 0FIELD 4 D 3 ESa/SERC Pl BTE JS293
X Y RP DEC L B zC1950I (18501 (ISSOI (ISSOI
- M 9 . 7 1 9 - 0 0 1 . 7 8 4 21 2 2 5 8 . 0 - 3 5 0 3 8 . 8 0 0 9 4 7 5 7 . 8 - 4 5 4 6 3 2 . 8 0 . 0 5 2
MBRPH0L0GY D IS P E R S IO N E L L IP S E CLUSTER MEMBERS
E 2 0 9 MPJ0R R X IS 1 0 . 6 1 s a m p l e P B PU L A T IB N 323
SB 4 8 MINER A X IS 8 . 6 6 C0RE P 0 P Ü L R T I0 N 103
S 6 5 E C C E N T R IC IT Y 0 . 5 8 L I M I T I N G MAGNITUDE 1 9 . 0
SB 0 P 0S N . ANGLE 3 2 . 2 1
P 1
F ig u re 8 .2 .26 Cluster Morphological Population Distributions.
T ab le 3.2.26 Cluster Population Description.
G A L A X Y C L U S T E R 026: 21 22 58 -85 00 : The cluster is located in
the South-West quadrant of ESO/SERC Field 403. Within a diameter of 45mm
as determined by mio we count 547 galaxies in this cluster and 323 to a limiting
magnitude of mum = 19.0. The cluster is classified Abell type R I because of its
somewhat regular appearance, but we note several clumps of galaxies throughout
the sample.
The Cluster Catalogue 154 §3.2
We count 81 galaxies brighter than ms + 2 and thus classify the cluster as
having an Abell richness of 2. We suggest a B - M type HI classification for the
cluster which has no really dominant galaxies save for a few bright members near
the cluster center. For m i,m s, and mio we give 15,1, 15,3 and 15,5, respectively.
The value of mio implies a redshift of 0,052,
We find the cluster somewhat elongated with several concentrations, the main
ones located North-West of center and South-East of center. The cluster appears
to reside in a sea of faint galaxies below the sample magnitude limit. We find
the magnitude distribution gently rising from the brightest members to a plateau
terminating at m„ = 18,0 after which there is an extremely rapid rise to the mag
nitude limit. This may suggest the cluster is a cloud of galaxies superposed on a
fmnt background. We find the position angle distribution somewhat skewed with
a preference of the brighter galaxies to be oriented West of North with an obvious
peak located at 45 degrees in the negative sense.
The elliptical galaxies in the sample are scattered throughout the cluster with
m, major concentration to the North-West of cluster center along the major axis of
the dispersion ellipse. The spirals appear to be located more to the periphery of
the cluster with some avoidance of the Western portions. The [E : SO : S) ratio
greatly favors the elliptical galaxies with divisions distributed as (1,0 : 0,2 : 0,3),
We find nearly 32% of the galaxies in the core of the dispersion ellipse which
spans an area of 0,1 square degrees. This yields a core surface density of 1018
galaxies per square degree.
We note nine pairs of elliptical galaxies in very close proximity that consist of an
early and a late member, the brightest of which is located at x = —158,2, y = 10,3,
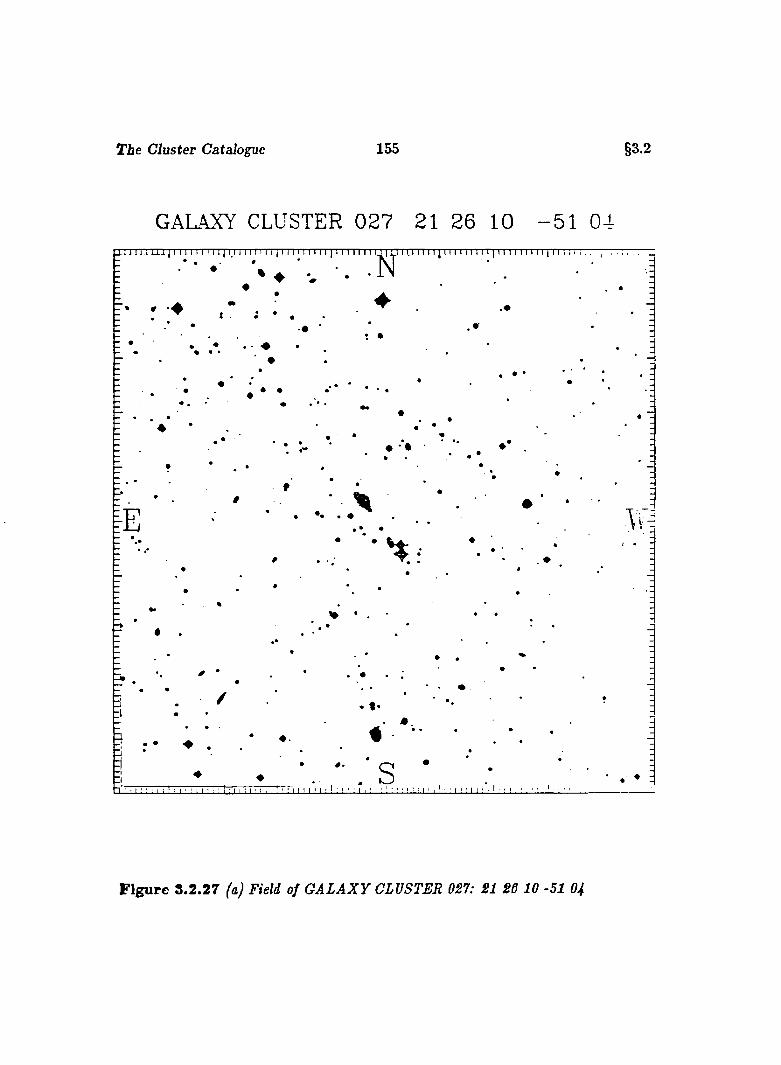
The Cluster Catalogue 155 §3.2
GALAXY CLUSTER 027 21 26 10 - 5 1 04
F ig u re 3 .2 .27 faj Field of G A LA X Y CLUSTER 027: 21 26 1 0 -51 04
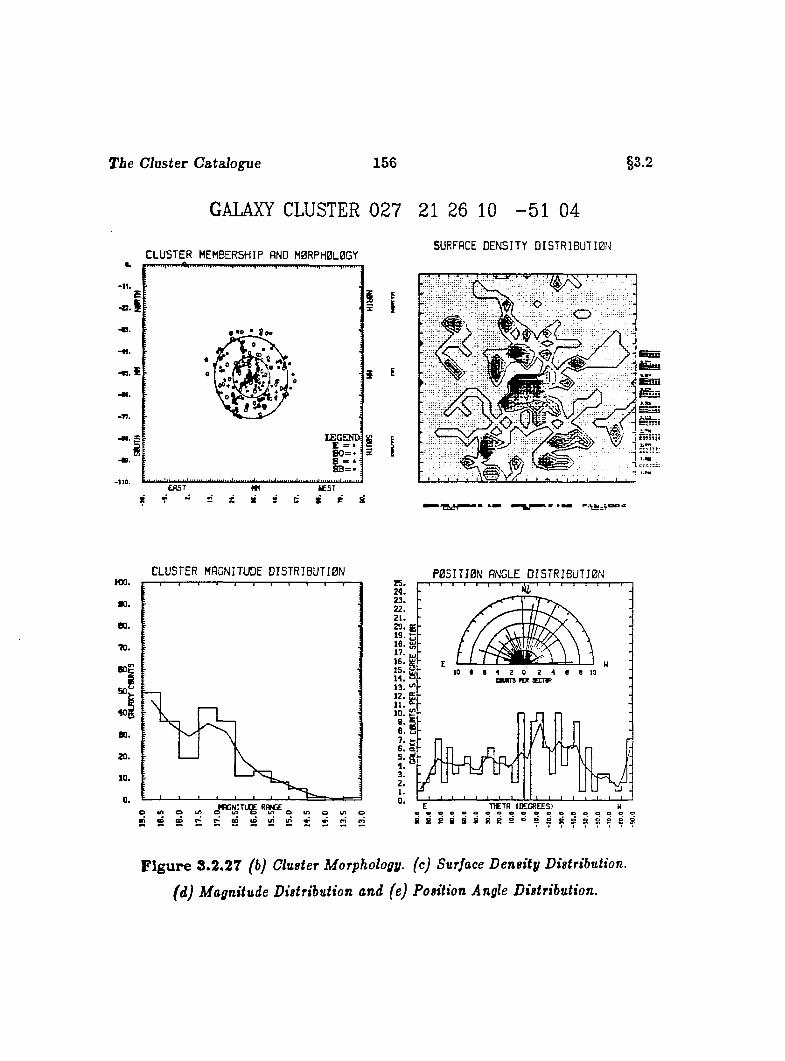
The Cluster C ataJo^e 156 §3.2
GALAXY CLUSTER 027 21 26 10 - 5 1 04
SURFACE D E N S IT Y D I S I R I B U T 1 0 NC L U S T E R MEM BERSHIP AND M 0RPH0L0GY
•11.
«T7.
S 5 S
i :
i I
Kuni
C L U S T E R MAGNITUDE D I S T R I B Ü T I 0 NK » .
•0.eo.
7 0 .
40j
80.
20.
10.
0 .
V) CD CD f ' r*>'q P C N i n g R fiN K
25.24.23.22.21.20.19.16.17.16.15.14.13.12.11.10.9.6 .7.6 .S .43 .2 ,I.0 .
P 0 5 I T I 0 N ANGLE D I 5 T R I B U T J 0 NI I I I I I I I A , I I I— :— !— I— 1
K.
Ï-
C M T S rot 9ECTP
j W l f f I ftfV;
j I I » I
o m o b n ou i i/i » m m
E THETA (DECREES) W«•eoooeoeeeooooaooo
F ig u re 8 .2 .27 (b) Cluster Morphology, (c) Surface D ensity Distribution,
(d) Magnitude Distribution and (e) Position Angle Distribution.
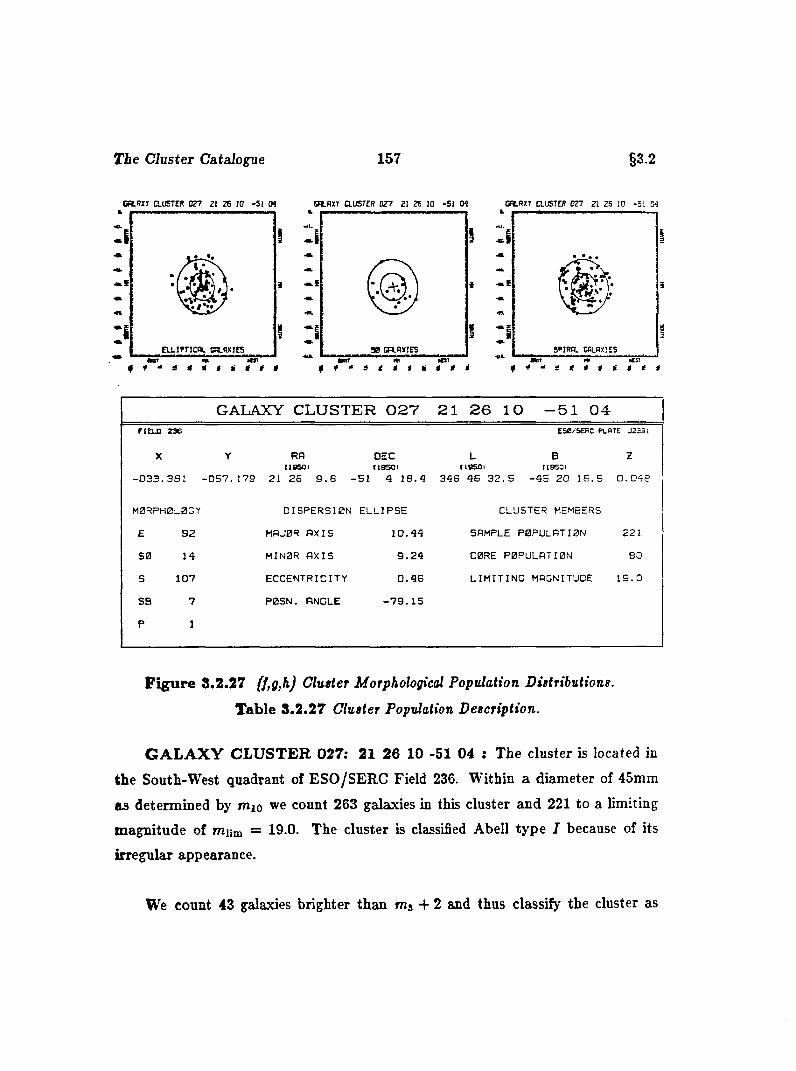
T ie Cluster Catalogue 157 §3.2
C flL R X r CLUSTER C ?7 21 2S JO -5 1 M GFLflXT CLUSTER 027 21 26 30 -51 M GALAX7 CLUSTER 027 21 25 10 -51 04
I
GALAXY CLUSTER 027 21 26 10 -51 04FIELD 2 3 6
X
ESO/SEBC PLR7E J2 3 3 I
zY RA DEC L BIiaS O I (19501 (19501 [[9501
0 3 3 . 3 8 1 - 0 5 7 . 1 7 9 21 2 6 9 . 6 - 5 1 4 1 8 . 4 3 4 6 4 8 3 2 . 5 - 4 5 2 0 1 6 . 5 0 . 0 4 8
M0RPH0L0GY
E 9 2
5 0 14
S 1 0 7
SB 7
P 1
D IS P E R S IO N E L L IP S E
MAJ0R A X IS 1 0 . 4 4
M IN 0 R A X IS 9 . 2 4
e c c e n t r i c i t y 0 . 4 6
P 0 S N . ANGLE - 7 9 . 1 5
CLUSTER MEMBERS
SAMPLE P OPULATION 221
C0RE P OPULA TION 8 0
L I M I T I N G MAGNITUDE 1 9 . 0
F ig u re 8.2.27 (f,g,h) Clutter Morphological Population Distributions.
T able 8 .2 .27 Clutter Population Description.
G A L A X Y C L U S T E R 027: 21 26 10 -51 04 : The cluster is located in
the South-West quadrant of ESO/SERC Field 236. Within a diameter of 45mm
as determined by mio we count 263 galaxies in this cluster and 221 to a limiting
magnitude of mum = 19.0. The cluster is classified Abell type I because of its
irregular appearance.
We count 43 galaxies brighter than mj + 2 and thus classify the cluster as
The Cluster Catalogue 158 §3.2
having an Abell richness of 0 . We suggest a B — M type IH classification for the
cluster which lacks any dominant galaxy. For and mio we give 13.5, 14.5
and 15.3, respectively. The value of mio implies a redshift of 0.048.
We find tha t the cluster contains several major concentrations, in particular,
those located near the cluster center, N orth of center and South-East of center.
These appear to be other smaller groups scattered throughout the sample.
The magnitude distribution is far from smooth, with a gentle rise from the
brightest galaxies to about rriy = 16.5 where a sharp rise in membership occurs.
The distribution then drops rapidly and rises again to the magnitude limit. Position
angles are irratic as well with the suggestion of a larger number of bright galaxies
oriented West of North, with a greater population having position angles less than
forty-five degrees.
We find a high concentration of elliptical galaxies near the center of the cluster
with the spirals somewhat less concentrated and away from center. The {E : SO :
S) ratio suggests a slighly spriral enriched cluster with a distribution of (l.O : 0.2 :
1.2). Those galaxies identified as SO appear to be located in the Southern portion
of the cluster.
We note that the core population comprises some 36% of the sample within an
area of 0.11 square degrees giving a core surface density of 753 galaxies per square
degree.
We find four pairs of elliptical galaxies in the cluster which appear to be com
prised of two early type ellipticals, the brightest of which is located at z = —32.3, y =
—55.5. The majority of the spirals are noticed to be lens-like in appearance with
central condensations.
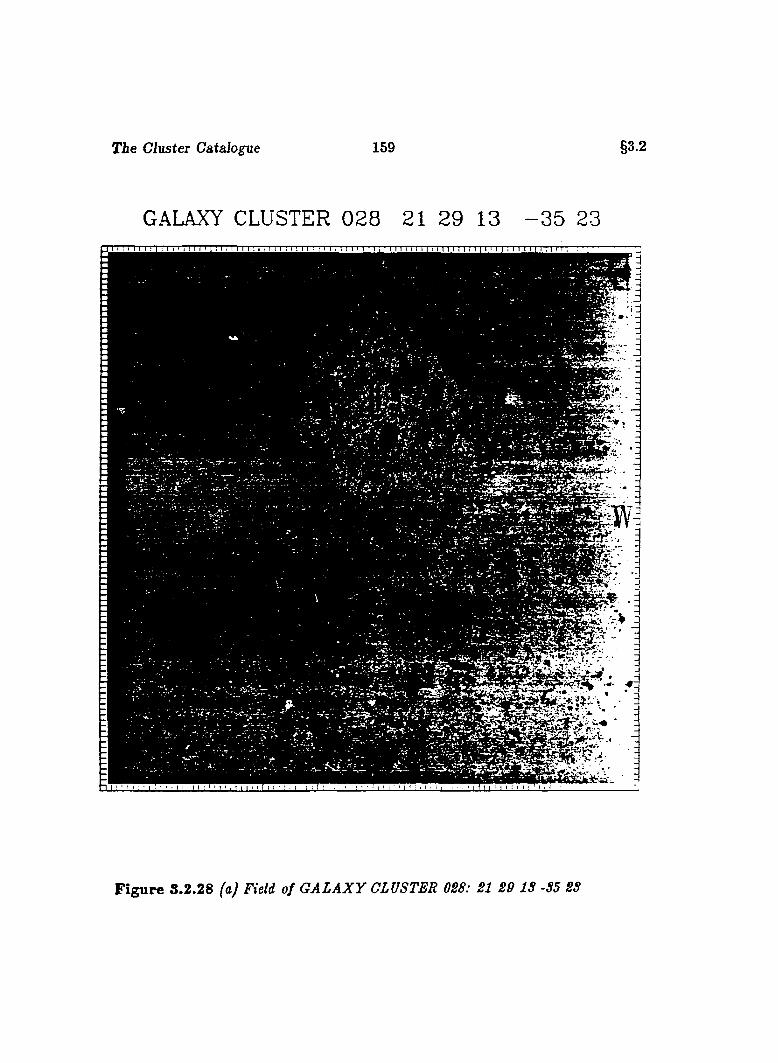
The Cluster Catalogue 159 §3.2
GALAXY CLUSTER 0 2 8 21 29 13 - 3 5 23
' " # Y '
F ig u re 3.2.28 faJ Field of G A L A X Y CLUSTER 028: 21 29 IS -S5 2S
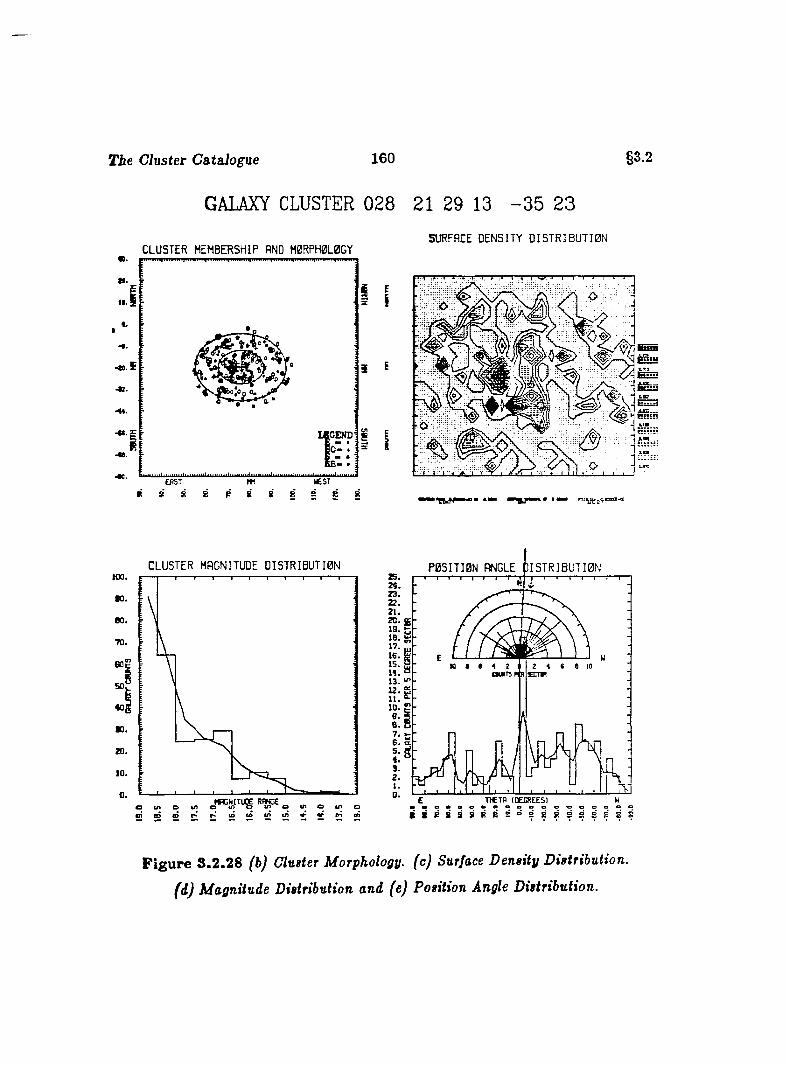
T ie Cluster Catalogue 160
GALAXY CLUSTER 028 21 29 13 - 3 5 23
SURFACE D E N S IT Y D I S T R I B U T I O NC L U S T E R MEM BERSHIP AND M0RPH0L0GY
§3.2
-».î
C L U S T E R MAGNITUDE D I S T R I B U T I O Ntoo.•0 .B O ,
70.
50.
40j
2 0 .10.
0 .
P 0 5 I T I 0 N ANGLE D I S T R I B U T I O N
15.
13. ^
E T J C T R (D E C R E E S )
;
F ig u re 3 .2 .28 (b) Cluster Morphology, (c) Surface Density Distribution,
(d) Magnitude Distribution and (e) Position Angle Distribution.
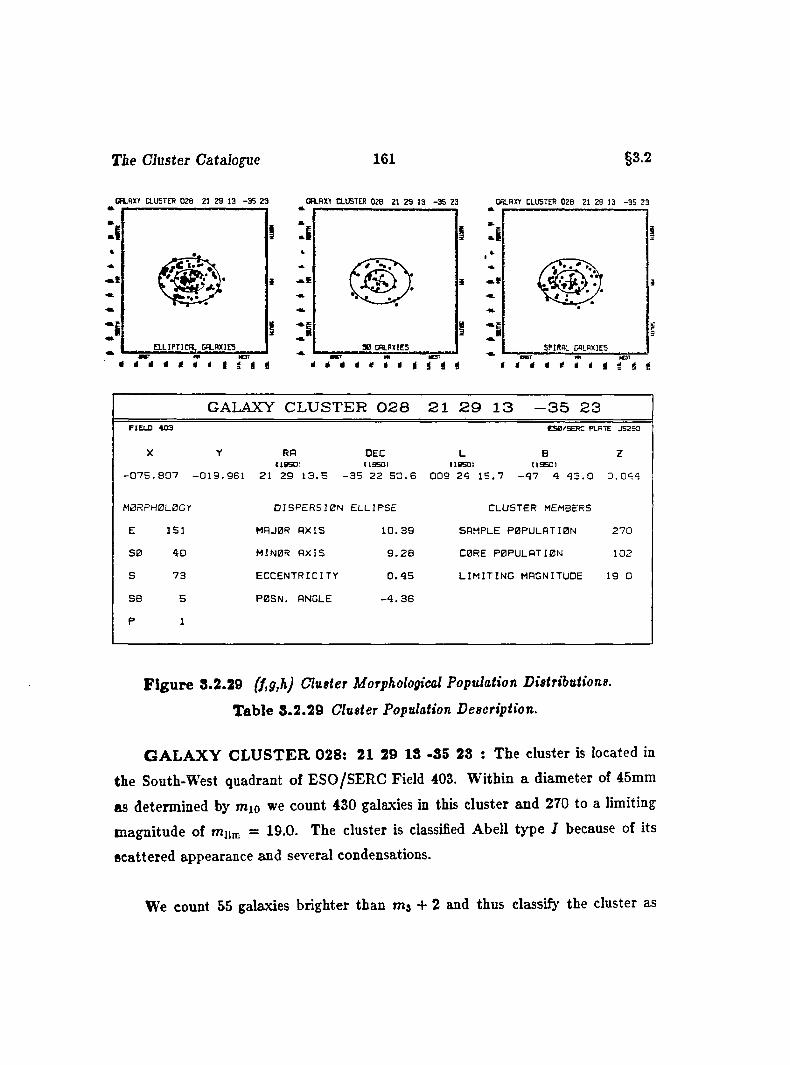
T ie Cluster Catalogue 161 §3.2
C a H X T C L U S T E R 0 2 8 2 1 2 9 1 3 - 3 S 2 3 GALAXY CLUSTER 028 21 29 13 35 23 GALAXY CLUSTER 028 21 29 13 -3 5 23
* 1
I a 1 J.* ■
*
i . a E i
*
____ E L L I P T I C A L D A .A X 1 C 5 . 3 0 G A L A X IE S S P IR A L G A L A X IE S
I â g < i i i « t t ë i t t t i t i i
GALAXY CLUSTER 028 21 29 13 -35 23FIELD 4D3 ESO/SERC PLATE JS230
X Y RA DEC L B ZI195DI CI950J I185DI (19501
- 0 7 5 . 8 0 7 - 0 1 9 . 9 6 1 21 2 9 1 3 . 5 - 3 5 2 2 5 0 . 6 0 0 9 2 4 1 5 . 7 - 4 7 4 4 3 . 0 0 . 0 4 4
M 0RPH0L0GY D IS P E R S IO N E L L IP S E CLUSTER MEMBERS
E 3S1 MAJOR A X IS 1 0 . 3 9 SAMPLE p o p u l a t i o n 2 7 0
5 0 4 0 M IN 0 R A X IS 9 . 2 B CORE P O P ULATIO N 10 2
5 7 3 E C C E N T R IC IT Y 0 . 4 5 L I M I T I N G MAGNITUDE 19 0
SB 5 P 0 S N . ANGLE - 4 . 3 6
P 1
F ig u re 8.2.29 (f,g,h) Cluster Morphological Population Distributions.
T able 8.2 .29 Cluster Population Description.
G A L A X Y C L U S T E R 028; 21 29 18 -85 23 : The cluster is located in
the South-West quadrant of ESO/SERC Field 403. W ithin a diameter of 45mm
as determined by mio we count 430 galaxies in this cluster and 270 to a limiting
magnitude of miim = 19.0. The cluster is classified Abell type I because of its
scattered appearance and several condensations.
We count 55 galaxies brighter than m j + 2 and thus classify the cluster as
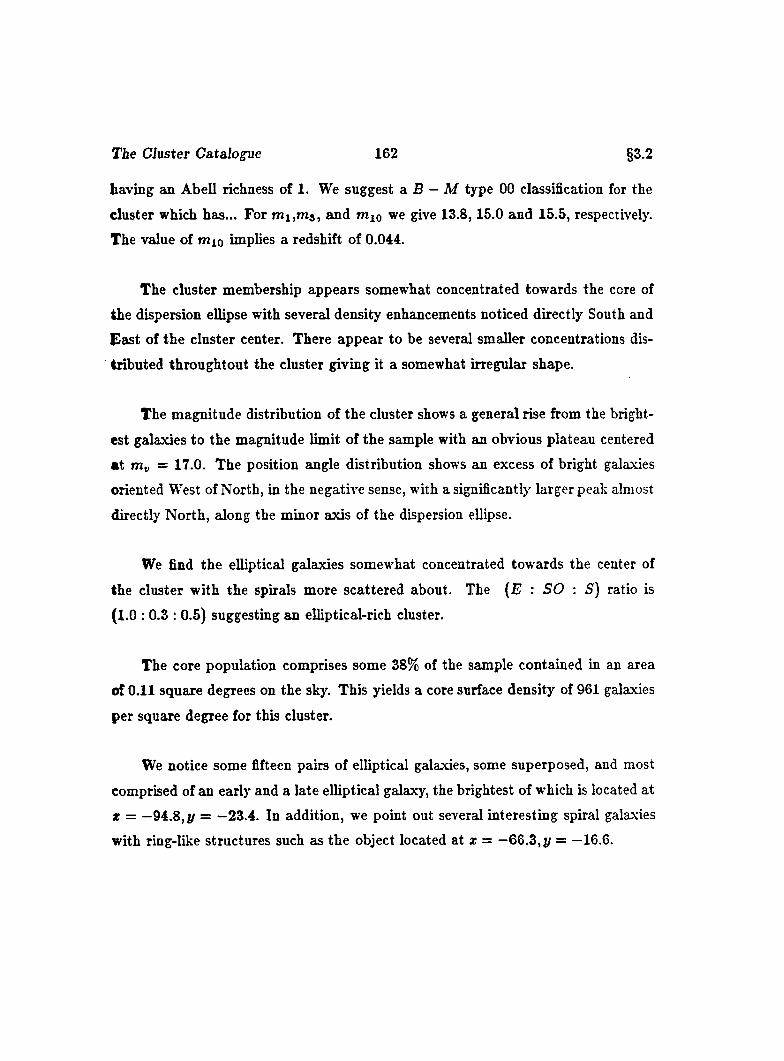
The Cluster Catalogue 162 §3.2
having an Abell richness of 1. We suggest a B — M type 00 classification for the
cluster which has... For m i,m 3 , and rriio we give 13.8, 15.0 and 15.5, respectively.
The value of mio implies a redshift of 0.044.
The cluster membership appears somewhat concentrated towards the core of
the dispersion ellipse with several density enhancements noticed directly South and
East of the cluster center. There appear to be several smaller concentrations dis
tributed throughtout the cluster giving it a somewhat irregular shape.
The magnitude distribution of the cluster shows a general rise from the bright
est galaxies to the magnitude limit of the sample with an obvious plateau centered
a t m„ = 17.0. The position angle distribution shows an excess of bright galaxies
oriented West of North, in the negative sense, with a significantly larger peak almost
directly North, along the minor axis of the dispersion ellipse.
We find the elliptical galaxies somewhat concentrated towards the center of
the cluster with the spirals more scattered about. The (E : SO : S) ratio is
(1.0 : 0.3 : 0.5) suggesting an elliptical-rich cluster.
The core population comprises some 38% of the sample contained in an area
of 0.11 square degrees on the sky. This yields a core surface density of 961 galaxies
per square degree for this cluster.
We notice some fifteen pairs of elliptical galaxies, some superposed, and most
comprised of an early and a late elliptical galaxy, the brightest of which is located at
X = —94.8, y = —23.4. In addition, we point out several interesting spiral galaxies
with ring-like structures such as the object located at x = —66.3, y = —16.6.
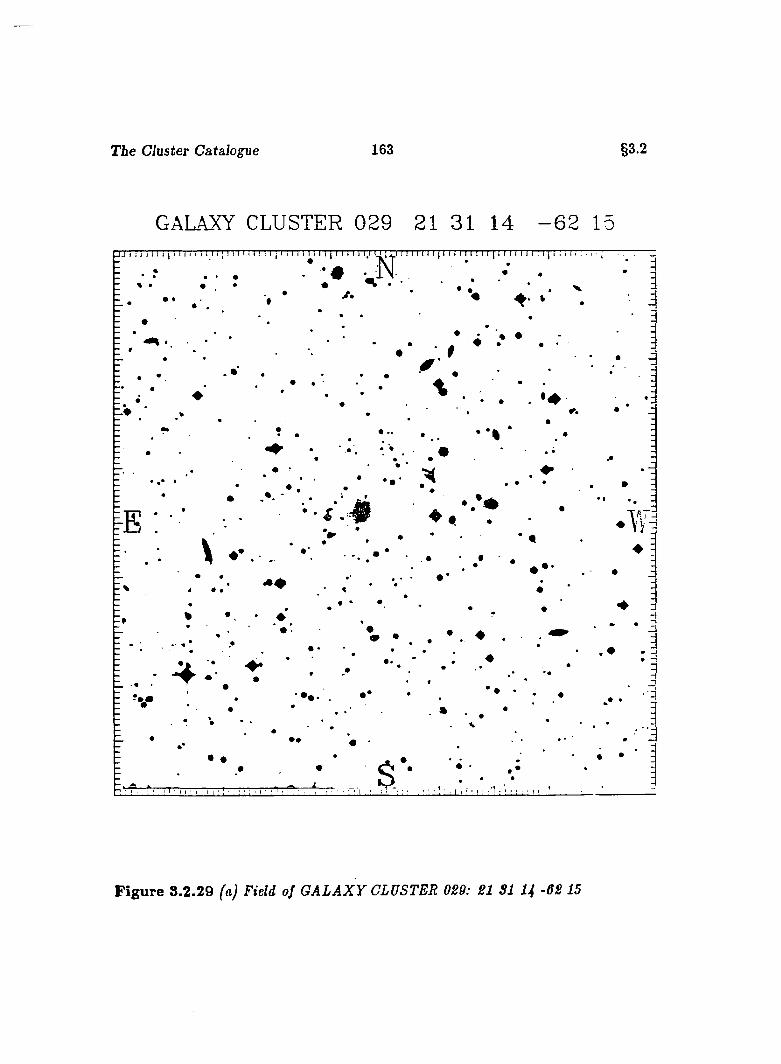
T ie Cluster Catalogue 163 §3.2
GALAXY CLUSTER 029 21 31 14 - 6 2 L
•#
F ig u re 3.2.29 (a) Field of G A L A X Y CLUSTER 029: 21 SI U -62 15
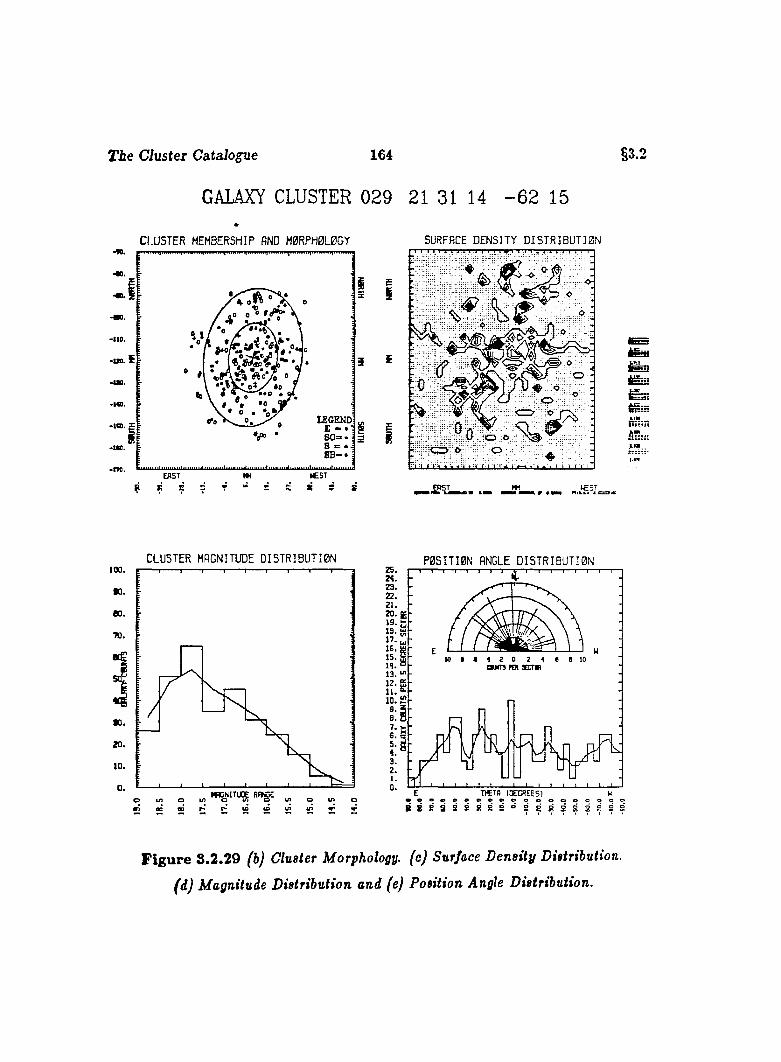
T ie Cluster C a ta lan e 164
GALAXY CLUSTER 029 21 31 14 - 6 2 15
C L U S T E R MEMBERSHIP AND M 0RPH0L0GY
§3.2
•110.
-1» . Ï
LEGEND"
E A ST m
SURFACE D E N S IT Y D I S T R I B U T I B N
I I
i S
I I
L r
^jn
f tn ! F
AT.
ç r s = ? “ = c 8 r s
C L U ST E R MAGNITUDE D I S T R I B U T I O N P O S I T I O N ANGLE D I S T R I B U T I O N
■0 .eo.
10.
20 .
10.
^ « N I T l ^ R f l G E „ ^
20. g19. C;s: :16. U 15. g
o u r s m SECT»13. 12. E 1 1 . C
7.*:
E T « T f l I D E C R E E S ) k• OBoeeeeeeooooooooo8 8 e S S i Ji S S ° S s' !! ? s s s s s
F ig u re 3.2.29 (b) Cluster Morphology, (c) Surface D ensity Distribution.
(d) Magnitude Distribution and (e) Position Angle Distribution.
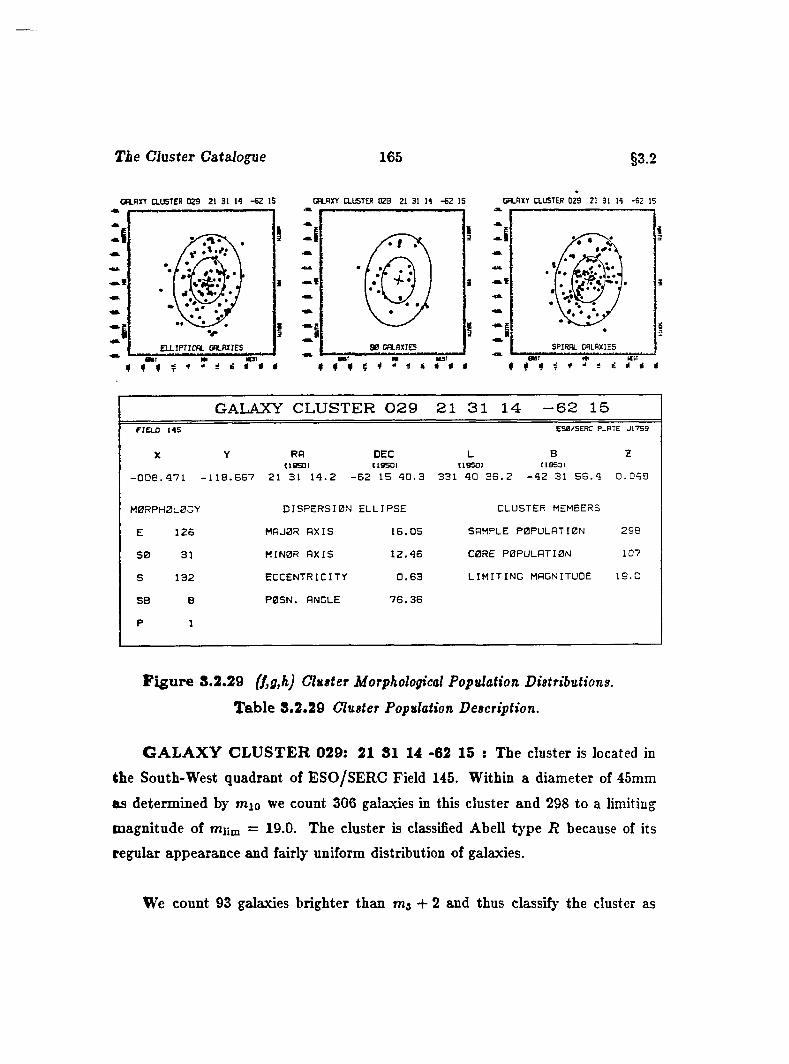
The Cluster Catalogue 165 §3.2
CBLRXY CLUSTER 029 21 31 14 -6 2 IS GALAXY CLUSTER 029 21 31 14 -6 2 15 GR.AXY CLUSTER 029 21 31 14 -62 15
ii
SPIRAL GALAXIESELLIPTICAL GALAXIESwrwr # ié
GALAXY CLUSTER 0 2 9 2 1 3 1 1 4 - 6 2 15F tE U J 145
X
- 0 0 8 . 4 7 1
MORPHOLOGY
E 125
SB 31
S 132
SB 8
P 1
Esa/SERC PLATE J17S9
Y RA DEC L B ZIIS 5Q ] 119501 119501 119501
. 1 1 8 . 6 6 7 21 31 1 4 . 2 - 5 2 15 4 0 . 3 3 3 1 4 0 3 6 . 2 - 4 2 31 5 6 . 4 0 . 0 4 3
D IS P E R S I0 N E L L IP S E
MRJ0R A X IS 1 6 . 0 5
M IN 0 R A X IS 1 2 . 4 6
E C C E N T R IC IT Y 0 . 6 3
P 0 S N . a n c l e 7 6 . 3 6
CLUSTER MEMBERS
SAMPLE P O P ULATIO N 2 9 8
CORE P O P UL A TIO N 107
L I M I T I N G MAGNITUDE 1 9 . 0
F ig u re 8.2.29 (f,g,h) Clugter Morphological Population Distributions.
T able 8.2 .29 Cluster Population Description.
G A L A X Y C L U S T E R 029; 21 81 14 -62 15 : The cluster is located in
the South-West quadrant of ESO/SERC Field 145. Within a diameter of 45mm
as determined by mio we count 306 galaxies in this cluster and 298 to a limiting
magnitude of miim = 19.0. The cluster is classified Abell type R because of its
regular appearance and fairly uniform distribution of galaxies.
We count 93 galaxies brighter than m j + 2 and thus classify the cluster as
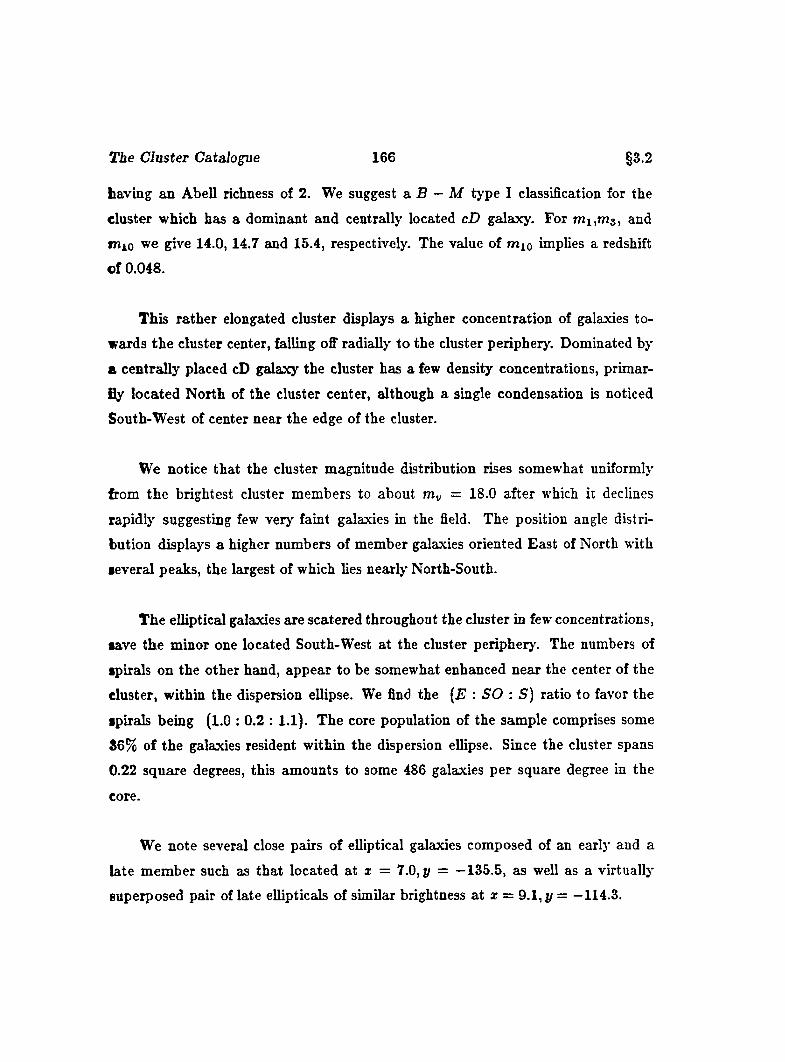
T ie Cluster C a ta lan e 166 §3.2
having an Abell richness of 2. We suggest a J5 — M type I classification for the
cluster which has a dominant and centrally located cD galaxy. For m i,m 3 , and
mio we give 14.0, 14.7 and 15.4, respectively. The value of mio implies a redshift
of 0.048.
This rather elongated cluster displays a higher concentration of galaxies to
wards the cluster center, falling ofi" radially to the cluster periphery. Dominated by
a centrally placed cD galaxy the cluster has a few density concentrations, primar
ily located North of the cluster center, although a single condensation is noticed
South-West of center near the edge of the cluster.
We notice that the cluster magnitude distribution rises somewhat uniformly
from the brightest cluster members to about niv = 18.0 after which it declines
rapidly suggesting few very faint galaxies in the field. The position angle distri
bution displays a higher numbers of member galaxies oriented East of North with
ieveral peaks, the largest of which lies nearly North-South.
The elliptical galaxies are scatered throughout the cluster in few concentrations,
mave the minor one located South-West at the cluster periphery. The numbers of
spirals on the other hand, appear to be somewhat enhanced near the center of the
cluster, within the dispersion ellipse. We find the [E : SO : S ) ratio to favor the
spirals being (l.O : 0.2 : 1.1). The core population of the sample comprises some
8 6 % of the galaxies resident within the dispersion ellipse. Since the cluster spans
0.22 square degrees, this amounts to some 486 galaxies per square degree in the
core.
We note several close pairs of elliptical galaxies composed of an early and a
late member such as that located at * = 7.0, y = —135.5, as well as a virtually
superposed pair of late ellipticals of similar brightness at z = 9.1, y = —114.3.
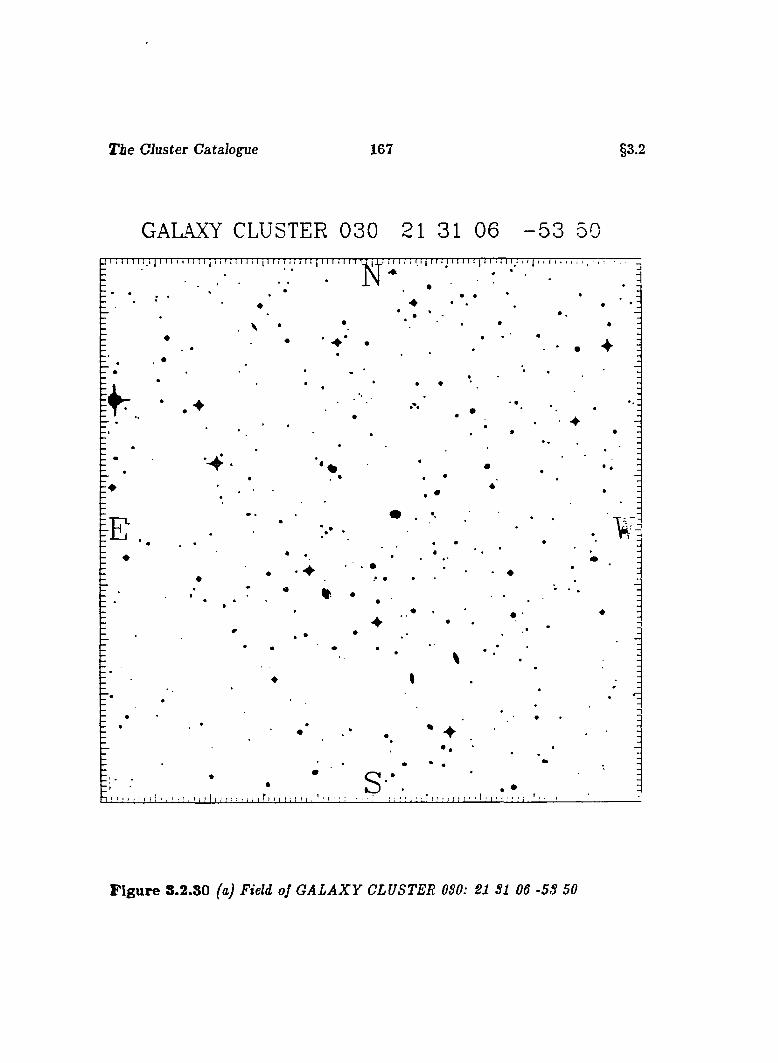
The Cluster Catalogue 167 §3.2
GALAXY CLUSTER 0 3 0 21 31 06 - 5 3 50
F ig u re 8.2.80 faj Field of G A L A X Y CLUSTER OSO: SI SI 06 -5S 50

The Cluster Catalogue 168
GALAXY CLUSTER 030 21 31 06 - 5 3 50
§3.2
C L U S T E R MEMBERSHIP AND M 0R PH 0L0G Yt s .
t ie .
m.
90.
90.
90.
e.
m .
m.WESTE A S T W
S
Î E
SURFACE D E N S IT Y D I S T R I B U T I B N
E 2
# 3
ëïîsi65A.n
C L U S T E R MAGNITUDE D I S T R I B U T I O N]0Q.90.
0 0 .70.
90.
20.
10.
M B g irT lB E RANGE
P 0 5 I T I 0 N ANCLE D I S T R I B U T I O N25.24.
22.
19. &
15.CKMT3 p m g C T W
13. ^
E THETA (DECREES) HoeevoeeoODo oeoeooeo
F ig u re 3.2.30 (b) Cluster Morphology, (c) Surface D ensity Distribution,
( i ) Magnitude Distribution and (e) Position Angle Distribution.
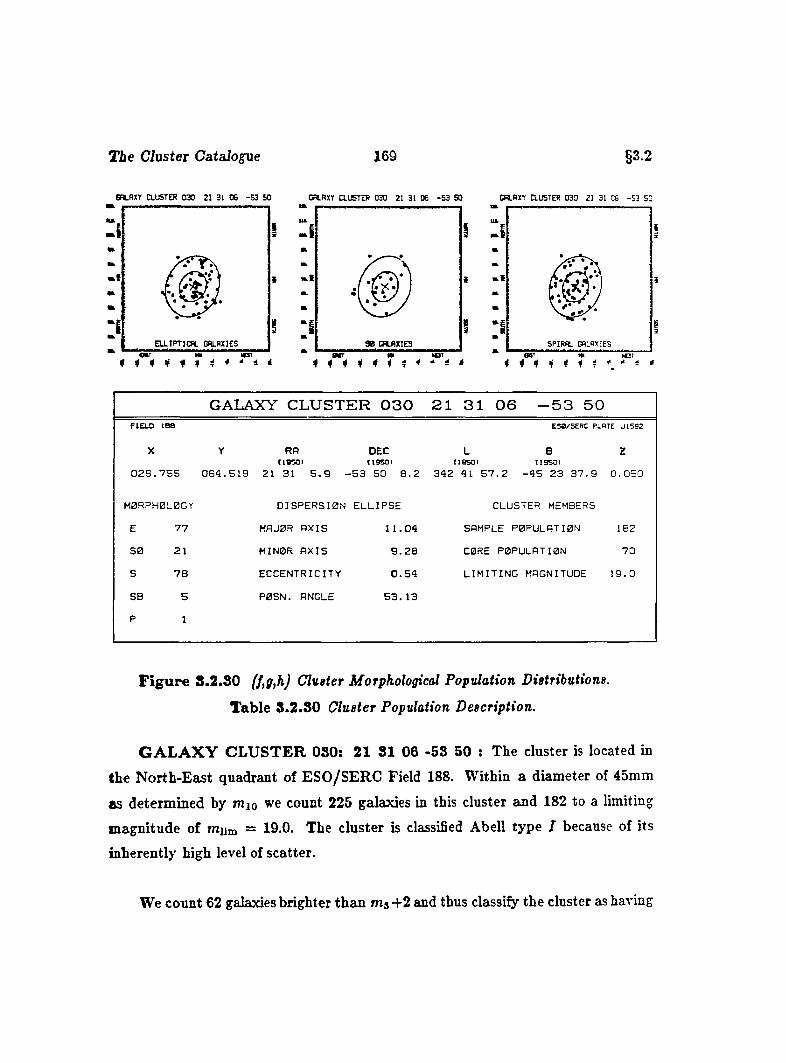
T ie Cluster Catalogue 169 §3.2
GRLfln CLUSTER 030 21 31 06 -5 3 50 CFLRXY CLUSTER 030 21 31 06 -S 3 50 CafiX T CLUSTER 030 21 31 05 -5 3 50
e # r
I
Ü S Ti 4 4 i 4 i 1 i ^
I
i
* # # f f "
GALAXY CLUSTER 0 3 0 2 1 31 0 6 —5 3 5 0FIELD IBS ESa/SERC PLATE J1 5 9 2
X
0 2 8 . 7 5 5
Y RA(19501
0 6 4 . 5 1 9 21 31 5 . 9 -
DEC(19501
■53 SO 8 . 2
L B(IB 50I (19501
3 4 2 41 5 7 . 2 - 4 5 2 3 3 7 . 9
Z
0 . 0 5 0
MORPHOLOGY D IS P E R S IO N E L L IP S E CLUSTER MEMBERS
E 7 7 MAJOR A X IS 1 1 . 0 4 SAMPLE POPULA TION 182
S 0 21 MINOR A X IS 9 . 2 8 CORE P OPULA TION 7 0
s 7 8 E C C E N T R IC IT Y 0 . 5 4 L I M I T I N G MAGNITUDE 1 9 . 0
SB 5 P 0 S N . ANGLE 5 3 . 13
P 1
F ig u re 8.2 .30 (f,g,h) Cluster Morphological Population Distributions.
T able 8.2.30 Cluster Population Description.
G A L A X Y C L U S T E R 030: 21 31 06 -53 50 : The cluster is located in
the N orth-East quadrant of ESO/SERC Field 188. Within a diameter of 45mm
as determined by mio we count 225 galaxies in this cluster and 182 to a limiting
magnitude of mjim = 19.0. The cluster is classified Abell type I because of its
inherently high level of scatter.
We count 62 galaxies brighter than m@ +2 and thus classify the cluster as having
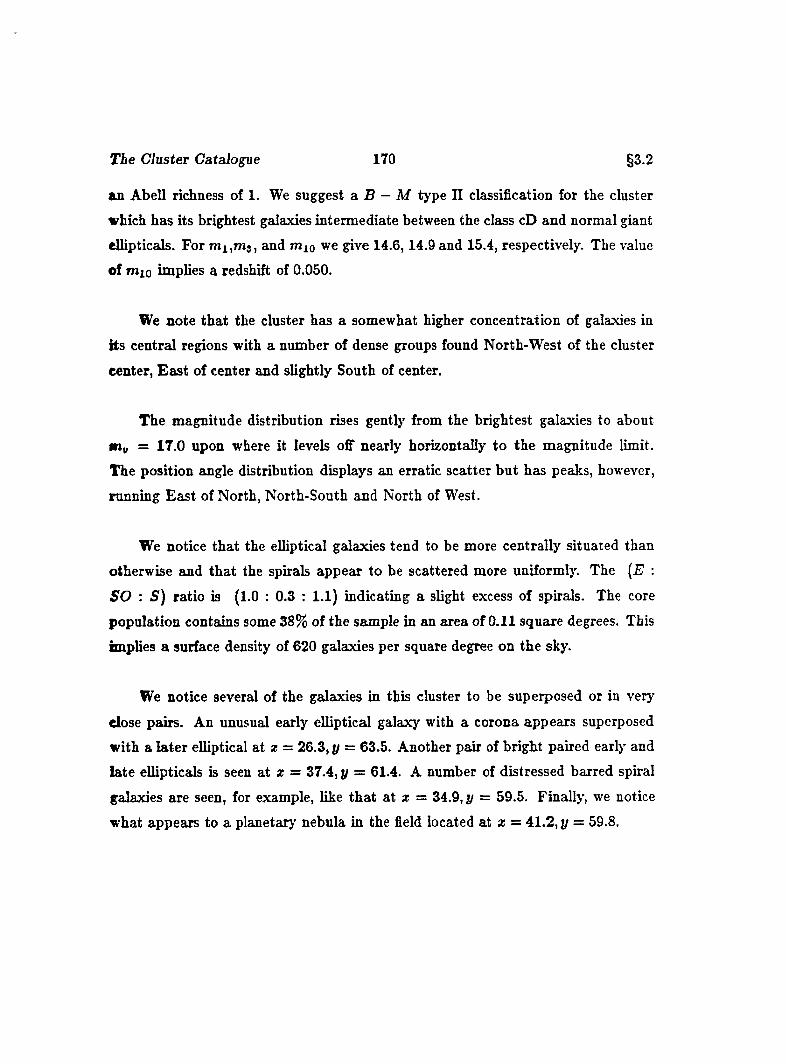
The Cluster Catalogue 170 §3.2
an Abell richness of 1. We suggest a B — M type II classification for the cluster
which has its brightest galaxies intermediate between the class cD and normal giant
ellipticals. For m i,m s, and mio we give 14.6,14.9 and 15.4, respectively. The value
of mio implies a redshift of 0.050.
We note tha t the cluster has a somewhat higher concentration of galaxies in
its central regions with a number of dense groups found North-West of the cluster
center. E ast of center and slightly South of center.
The magnitude distribution rises gently from the brightest galaxies to about
«V = 17 0 upon where it levels off nearly horizontally to the magnitude limit.
The position angle distribution displays an erratic scatter but has peaks, however,
running East of North, North-South and North of West.
We notice that the elliptical galaxies tend to be more centrally situated than
otherwise and tha t the spirals appear to be scattered more uniformly. The (E :
SO : S) ratio is (1.0 : 0.3 : 1.1) indicating a slight excess of spirals. The core
population contains some 38% of the sample in an area of 0.11 square degrees. This
implies a surface density of 620 galaxies per square degree on the sky.
We notice several of the galaxies in this cluster to be superposed or in very
close pairs. An unusual early elliptical galaxy with a corona appears superposed
with a later elliptical at z = 26.3, y — 63.5. Another pair of bright paired early and
late ellipticals is seen at z = 37.4, y = 61.4. A number of distressed barred spiral
galaxies are seen, for example, like tha t at z = 34.9, j/ = 59.5. Finally, we notice
what appears to a planetary nebula in the field located at z = 41.2, y = 59.8.
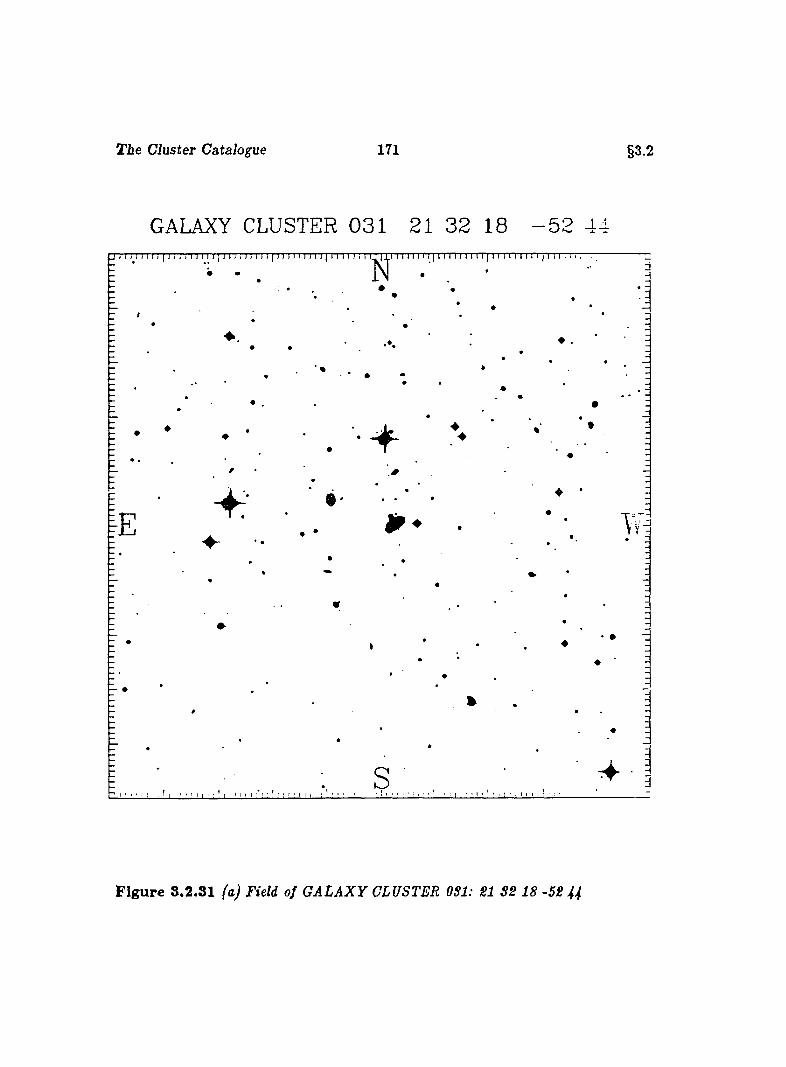
The Cluster Catalogue 171 §3.2
GALAXY CLUSTER 031 21 32 18 - 5 2 44i i ) 1 1 I I 1 1 1 1 ; 111 ri ] 11 j'; 1 1 1 1 1 1 1 1 1 1 1 1 1 1 1 1 1 1 1 1 1 : 1 I I I H 11111 ( 111 i'll 111 i t | 11 i"n 11 ri )'i 11 > i . , . ,
. N •
*
♦
♦ *# '
♦ •
F ig u re 3.2.81 fa) Field of G A LA X Y CLUSTER OSl: SI S2 18 -5S 44
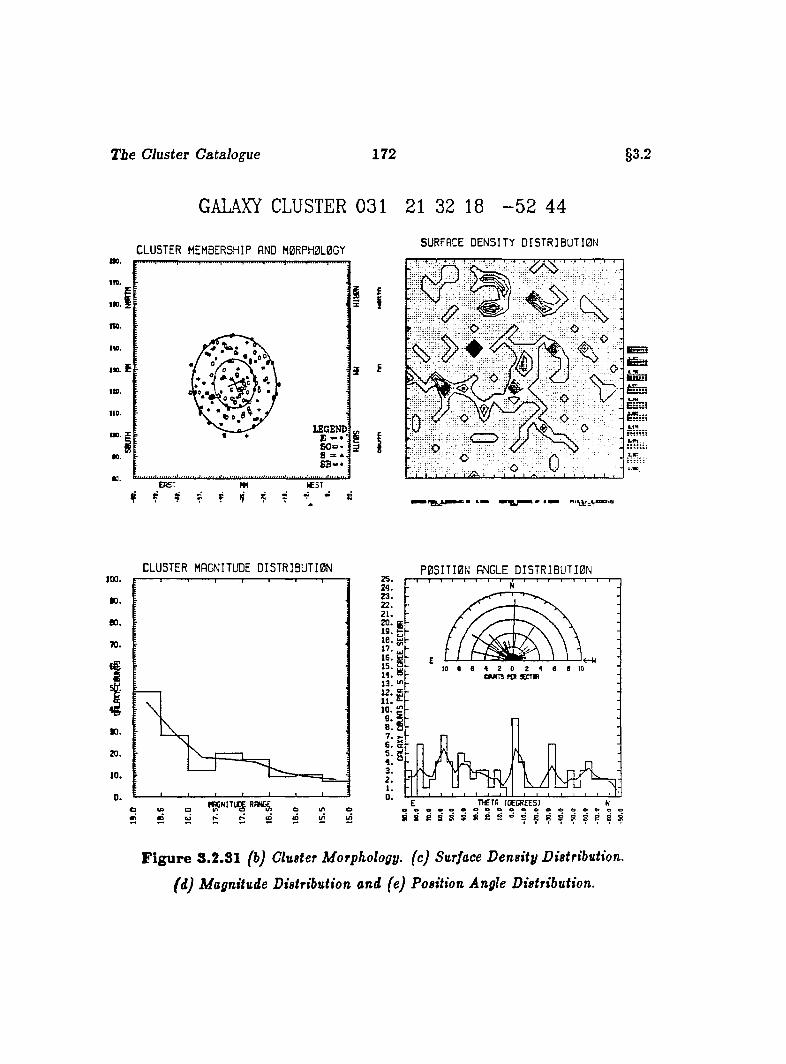
The Cluster Catalogue 172
GALAXY CLUSTER 031 21 32 18 - 5 2 44
§3.2
C L U S T E R MEMBERSHIP AND M0RPH0L0GYffO.
IfQ.in .
no.
tio.
no.
LEGENDin. =
60=n .
m .ERST
? ? ? £
i f
SURFACE D E N S IT Y D I S T R I B U T I B NI- I I 4 ' j ■ j ' I j I— r
I ; ' 4 • r I
' • mm
C LU STER MAGNITUDE D I S T R I B U T I B N P B S I T I 0 N ANGLE D I S T R I B U T I B N
WCNITUg RAN%
zs.24.
22.
H15.
CfUKTS fO 3ECm13. ^ 1 2 . 5
6. S
THETA (DECREES)eoeoooeoeeeeg « S 2 ® 2 £ R g g g p6 8 R S S
F ig u re 8.2.81 (b) Cluster Morphology, (c) Surface Density Distribution,
(d) Magnitude Distribution and (e) Position Angle Distribution.
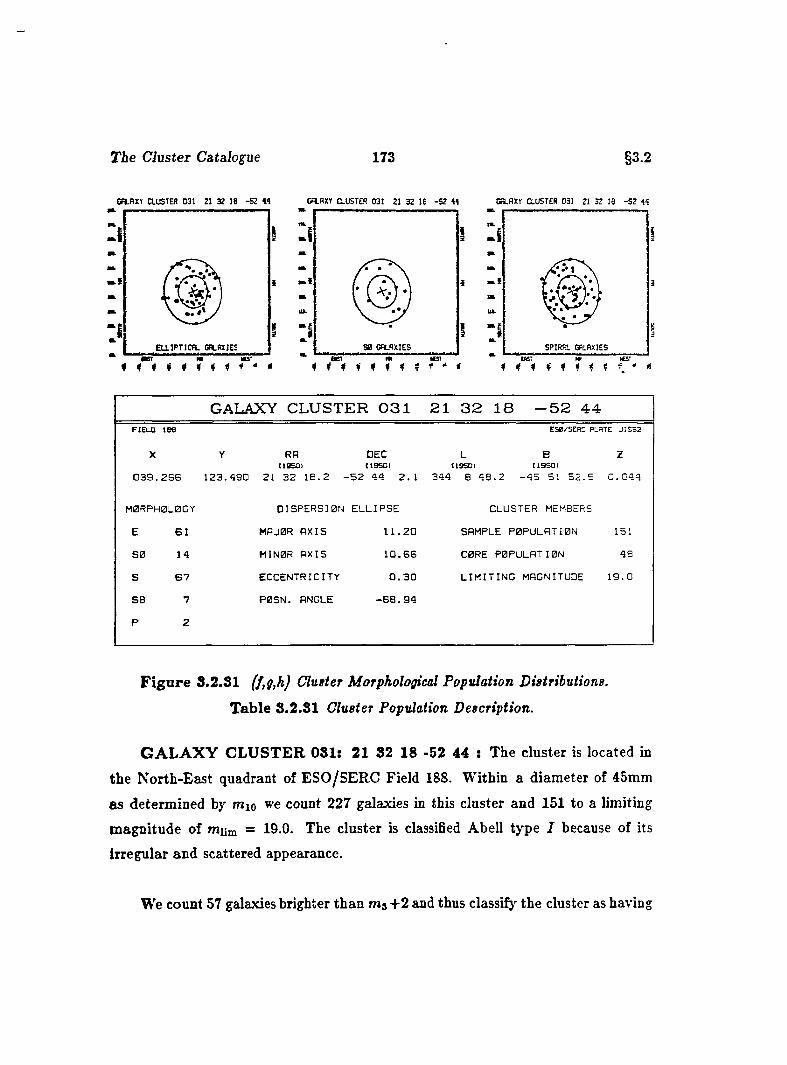
T ie Cluster Catalogue 173 §3.2
CRLHXT auST E R 031 21 32 IB -52 M CflflXT CLUSTER 031 21 32 18 -5 2 45 Cft-HXr CLUSTER 031 21 32 10 -5 2 44
ELLIPTICAL ta.HXJES
* t 1 i i i t 4 * ” *
Î
S0 GALAXIESB B T
I
S P IR A L G A L A X IE S
I t
GALAXY CLUSTER 0 3 1 2 1 3 2 1 8 - 5 2 4 4FIELO IBB
X
ES0/SERC PLATE J1ES2
zY RA DEC L BIIBSOI (19501 (19501 (19501
0 3 9 . 2 6 6 1 2 3 . 4 9 0 21 3 2 1 8 . 2 - 5 2 4 4 2 . 1 3 4 4 8 4 8 . 2 - 4 5 51 5 2 . 5 0 . 0 4 4
M0RPH0LBGY
E 6 1
S 0 1 4
S 6 7
SB 7
P 2
D I5 P E R S 1 0 N E L L IP S E
MHJ0R A X IS 1 1 . 2 0
M IN 0 R A X IS 1 0 . 6 6
e c c e n t r i c i t y 0 . 3 0
P 0 S N . ANGLE - 6 8 . 9 4
CLUSTER MEMBERS
SAMPLE P 0 P Ü L A T I0 N 151
C0RE P O P U L A TIO N 4 8
L I M I T I N G MAGNITUDE 1 9 . 0
F ig u re 8.2.31 (f,g,k) Cluster Morphological Population Distributions.
T able 8.2.81 Cluster Population Description.
G A L A X Y C L U S T E R 081: 21 82 18 -52 44 : The cluster is located in
the North-East quadrant of ESO/SERC Field 188. Within a diameter of 45mm
as determined by mio we count 227 galaxies in this cluster and 151 to a limiting
magnitude of mum = 19.0. The cluster is classified Abell type I because of its
irregular and scattered appearance.
We count 57 galaxies brighter than m s+ 2 and thus classify the cluster as having
The Cluster Catalogue 174 §3.2
an Abell richness of 1. We suggest a B — M type III classification for the cluster
which has no major dominant galaxies save the first brightest tha t appears to be
an edgewise spiral. For m i,m s, and mjo we give 15.0, 15.4 and 15.5, respectively.
The value of mio implies a redshift of 0.044.
We find this cluster possessing a rather scattered appearance, with few concen
trations, except for two small density enhancements, the greater located somewhat
East of center, the lesser located E ast South-East.
The cluster magnitude distribution shows a very slow rise from the brightest
galaxies with a greater change of slope occurring near m„ = 18.0 to the magnitude
limit. The position angle distribution appears to have a slight concentration of
galaxies oriented East of North and a peak running North-South.
We find the elliptical galaxies slightly more concentrated in the third and fourth
quadrants, whereas the spirals occur more frequently in the second and third quad
rants. The cluster appears somewhat spiral enhanced with an (E : SO : 5) ratio
of (1.0 : 0.2: 1.2). This scattered cluster has a core population comprising nearly
52% of the sample in a region spanning 0.13 square degrees. This represents a core
surface density of 365 galaxies per square degree on the sky.
We notice six close pairs of elliptical galaxies consisting of an early and a late
elliptical, the brightest occurring a t z = 40.5, y = 133.9. There are also a number
of spiral galaxies with ring-like structures or ansae such as the object located at
X = 52.4, y = 136.7. Several rather peculiar galaxies are also noted, such as that
residing a t z = 56.7, y = 110.0 which appears to possess a double nucleus within a
diffuse ovoid mass.
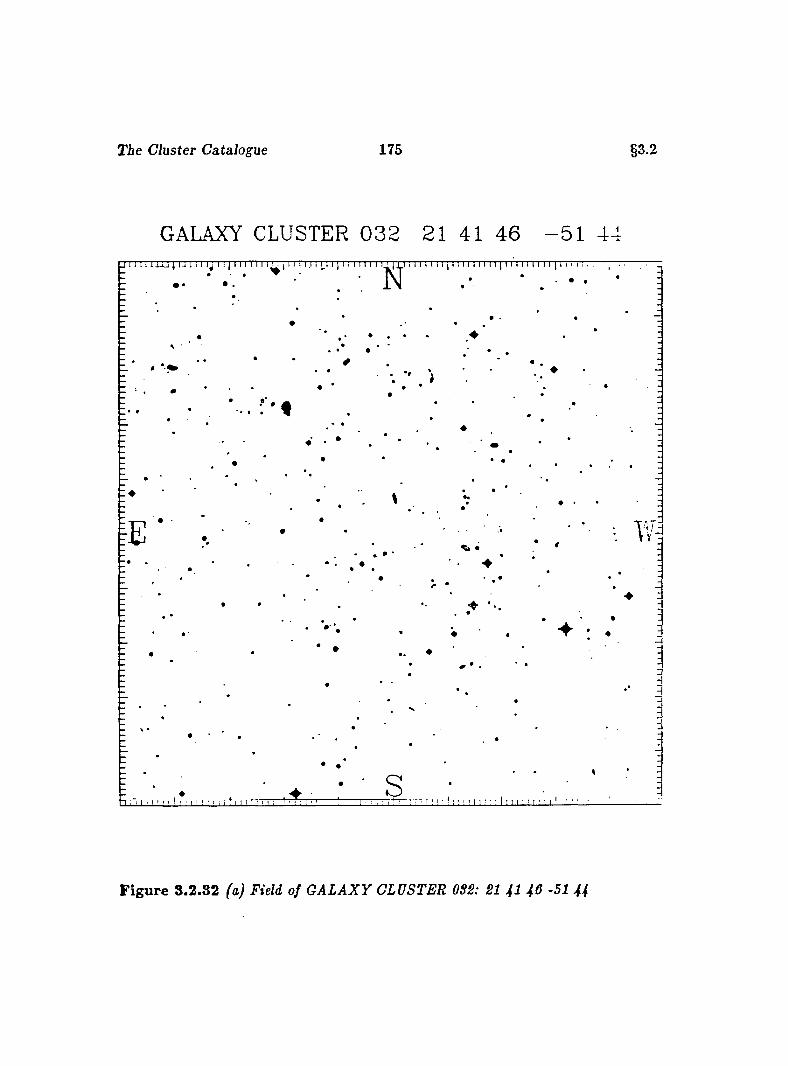
T ie Cluster Catalogue 175 §3.2
GALAXY CLUSTER 0 3 2 21 41 46 - 5 1 44
s
F ig u re 3.2.82 faJ Field of G A LA X Y CLUSTER OSS: 21 i l i 6 -51 U
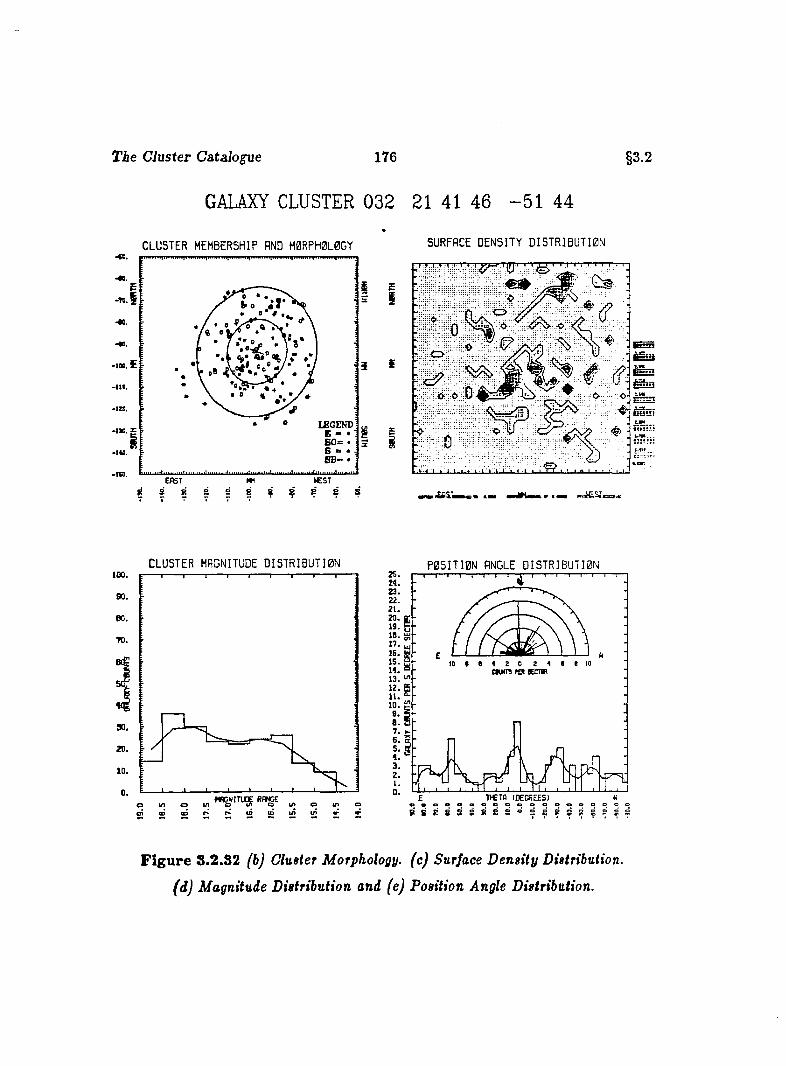
T ie Cluster Catalogue 176
GALAXY CLUSTER 032 21 41 46 - 5 1 44
§3.2
C L U S T E R MEMBERSHIP AND M 0RPH0L0GY
- • 0 .
-TO. h 0
• •
LEGEND
GO;
MM *C ST
2 8 Ç g S SERST
fl 9 R e
I
SURFACE D E N S IT Y D I S T R I B U T I B N
fO
£
IC5U!
îiîî'H
CL U S T E R MAGNITUDE D I S T R I B U T I B N P 0 5 I T I 0 N ANGLE D I S T R I B U T I B N100.
90.
80.
70.
20.
10.
o „ u, o
2S.24.
22.
15.
13.
a. S
E ■nCTO IDECREESJ0 0 0 0 0 0 0 0 0 0 0 0 0 0 0 0 0 S
F ig u re 3.2.82 (b) CluBter Morphology, (c) Surface Density Distribution.
(d) Magnitude Distribution and (e) Position Angle Distribution.
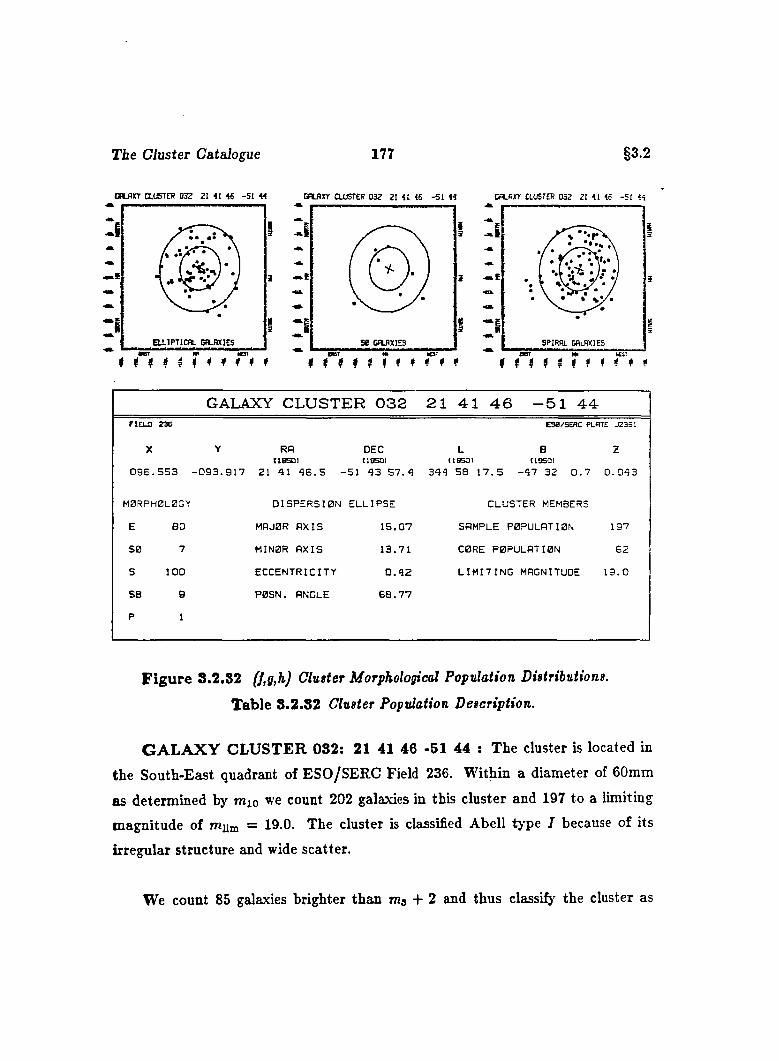
T ie Cluster Catalogue 177 §3.2
OWXT aUSTER 032 21 i l K -Si Ü CFlflXr CLUSTER 032 21 <l 46 -51 « CflB X r CLUSTER 032 2! 41 46 -51 44
3 3
E U lP T IC n L CflLRXIES S P IR A L G A L A X IE S
I I # 3 ; f # # , * f f f
GALAXY CLUSTER 032 21 41 46 -51 44FIELD 236 ES0/SERC PLATE J2331
X
0 9 6 . 5 5 3
Y
- 0 9 3 . 9 1 7
RA tlB SD I
21 41 4 6 . 5 -
DEC118501
51 4 3 5 7 . 4
L B118501 (18501
3 4 4 5 8 1 7 . 5 - 4 7 3 2 0 . 7
Z
0 . 0 4 3
M0RPH0L0GY D I S P E R S I0 N E L L IP S E CLUSTER MEMBERS
E BO MOJ0R A X IS 1 5 . 0 7 SAMPLE POPULATION 1 9 7
8 0 7 M IN 0 R A X IS 1 3 . 7 1 CORE POPULATION 6 2
S 1 0 0 E C C E N T R IC IT Y 0 . 4 2 L I M I T I N G MAGNITUDE 1 9 . 0
SB 8 P 0S N . ANGLE 6 8 . 7 7
P 1
F ig u re 3.2.82 (},g,h) Clutter Morphological Population Distributions.
Table 3.2.32 Cluster Population Description.
G A L A X Y C L U ST E R 032; 21 41 46 -51 44 : The cluster is located in
the South-East quadrant of ESO/SERC Field 236. W ithin a diameter of 60mm
as determined by mio we count 202 galaxies in this cluster and 197 to a limiting
magnitude of mum = 19.0. The cluster is classified Abell t>’pe I because of its
irregular structure and wide scatter.
We count 85 galaxies brighter than ms + 2 and thus classify the cluster as
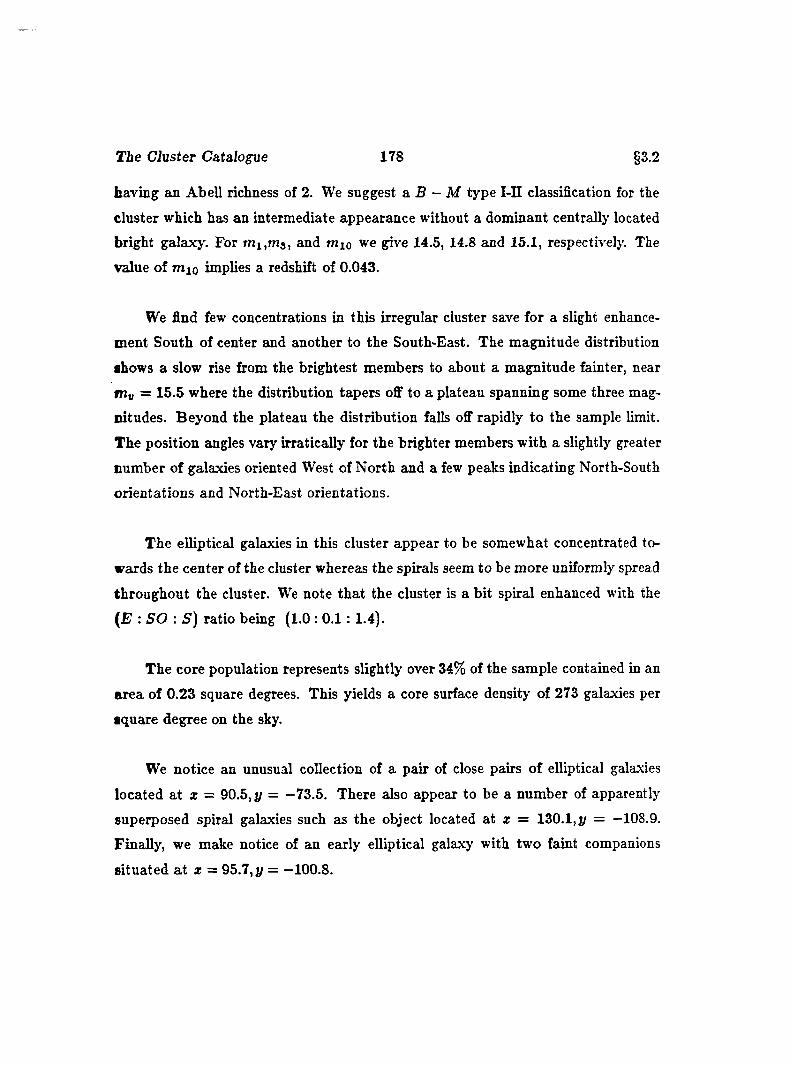
The Cluster Catalopie 178 §3.2
having an Abell richness of 2. We suggest a B ~ M type I I I classification for the
cluster which has an intermediate appearance without a dominant centrally located
bright galaxy. For mi,mg, and mio we give 14.5, 14.8 and 15.1, respectively. The
value of mio implies a redshift of 0.043.
We find few concentrations in this irregular cluster save for a slight enhance
ment South of center and another to the South-East. The magnitude distribution
shows a slow rise from the brightest members to about a magnitude fainter, near
niv = 15.5 where the distribution tapers off to a plateau spanning some three mag
nitudes. Beyond the plateau the distribution falls off rapidly to the sample limit.
The position angles vary irratically for the brighter members with a slightly greater
number of galaxies oriented West of North and a few peaks indicating North-South
orientations and North-East orientations.
The elliptical galaxies in this cluster appear to be somewhat concentrated to
wards the center of the cluster whereas the spirals seem to be more uniformly spread
throughout the cluster. We note tha t the cluster is a bit spiral enhanced with the
(E : SO : S ) ratio being (1.0 : 0 .1 : 1.4).
The core population represents slightly over 34% of the sample contained in an
area of 0.23 square degrees. This yields a core surface density of 273 galaxies per
square degree on the sky.
We notice an unusual collection of a pair of close pairs of elliptical galaxies
located a t z = 90.5, j/ = -73.5 . There also appear to be a number of apparently
superposed spiral galaxies such as the object located at z = 130.1,p = —108.9.
Finally, we make notice of an early elliptical galaxy with two faint companions
situated a t z = 95.7, y = —100.8.
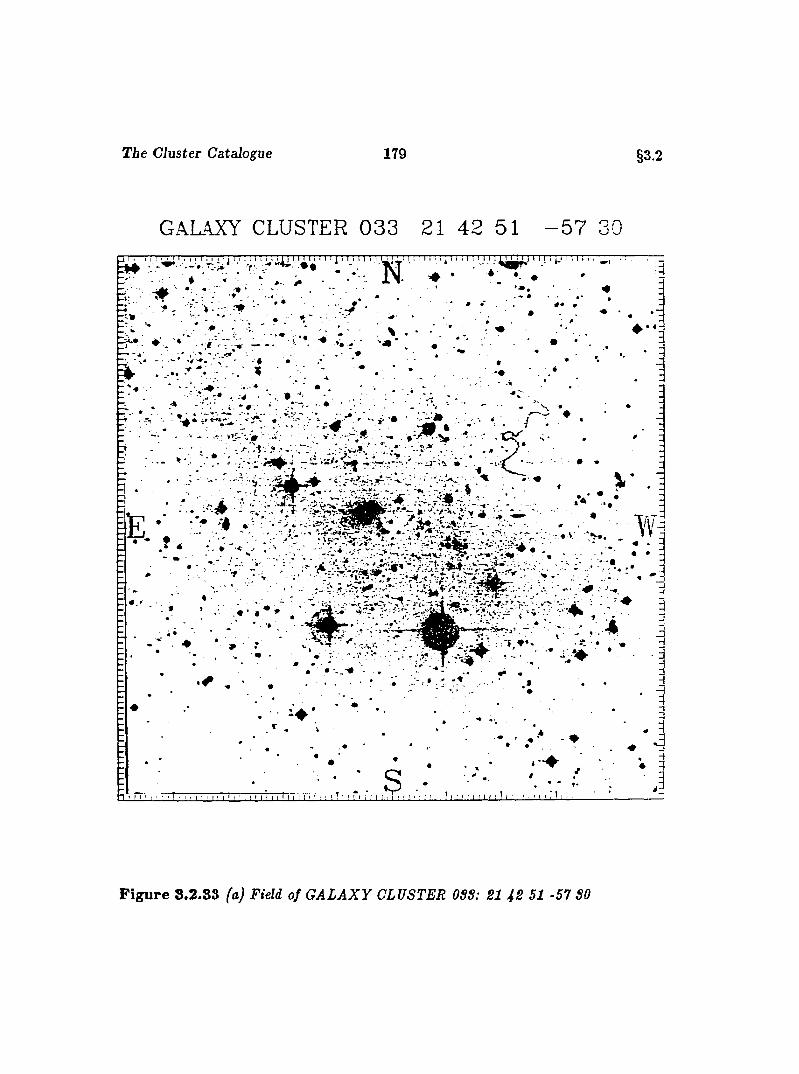
The Cluster Catalogue 179 §3.2
GALAXY CLUSTER 0 3 3 21 42 51 - 5 7 30I T ! i ^ ! T ; ; I ' TM i I J [ I 11 Vi i p y ; i i T ] 11 t t i : ‘ ‘ ‘ ‘ ‘ ‘ ‘ l ‘ L* ' ‘ ‘ ‘ ^
- . - ^ r ^ . ’’■ • t #
I:'t . - V ; ; . : ,
5^». *• s y#
*V . • > . .
Y .
Y ' . >• .: ; . . » : , v ■■■ ^ . ••*
n_u* I I I I I • 1 1 . M I I t • I ! M I ? I l l I I I ' ' ' ! I T I ' ' I i ! ( f ' I ' ■■ M ) j L M t L L ■' !
F ig u re 3.2 .83 fa) Field of G A L A X Y CLUSTER OSS: 21 42 51 -57 SO
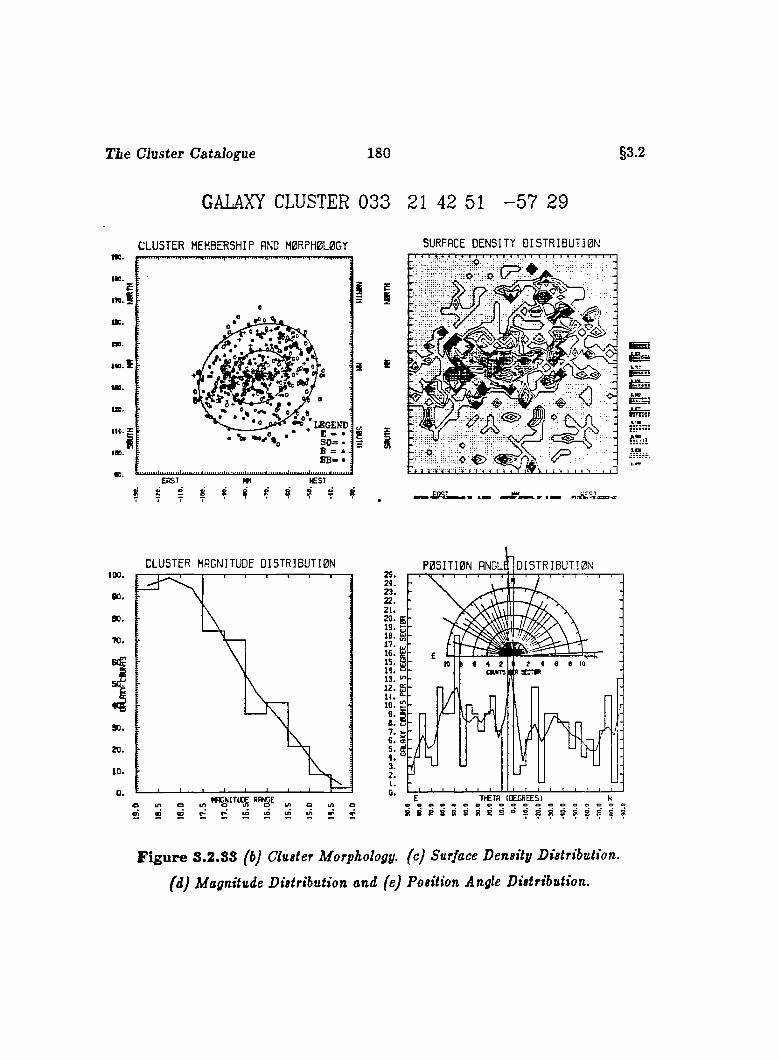
T ie Cluster Catalogue 180
GALAXY CLUSTER 033 21 42 51 - 5 7 29
§3.2
C L U S T E R MEMBERSHIP AND M0RPH0L0GY .
IfGEKDn o . z
SURFACE D E N S IT Y D I S T R 1 B Ü T I 0 N
I
: g a
:n ? ! ; i
— .£PL— ■ » LM «. # mm
C L U S T E R MAGNITUDE D I S T R I B U T I O N100.
so.eo.70.
1
90.
ZD.
10.
0o ^ «W u, o
P O S I T I O N ANGLE
‘i
n / 1r i I
V1 .
D I S T R I B U T I O N
E THETA I CECA EES Ieeevveeeooo oe
F ig u re S.2.8S (bj Cluster Morphology, (c) Surface Density Distribution,
(d) Magnitude Distribution and (e) Position Angle Distribution.
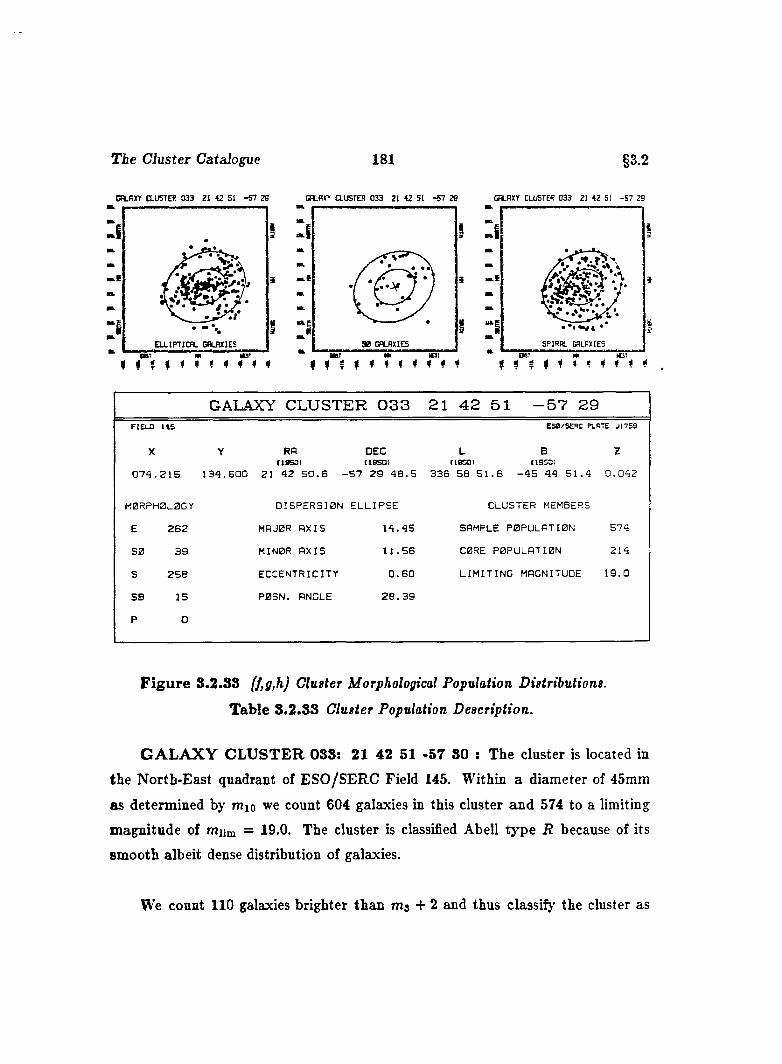
The Cluster Catalogue 181 §3.2
CH.RXY CLUSTER 033 21 C S I -5 7 23 CBLBXY CLUSTER 033 21 42 51 -5 7 29 GBLRXY CLUSTER 033 2! 42 5! -5 7 29
9 0 GALAXIES S P IR A L GALAX E SE L L I P T I C A L G A L A X IE S
# * * $ » * # f f
GALAXY CLUSTER 033 2 1 42 51 -57 29FIELD 145 ESO/SERC PLATE J1759
X
0 7 4 . 2 1 5
Y
1 3 4 . 6 0 0
RA(10501
21 4 2 5 0 . B -
DEC(IBSOI
5 7 2 9 4 8 . 5
L B(10501 (ISSOI
3 3 6 5 8 5 1 . 8 - 4 5 4 4 5 1 . 4
Z
0 . 0 4 2
M0RPH0L0GY D IS P E R S IO N E L L IP S E CLUSTER MEMBERS
E 2 6 2 MAJ0R A X IS 1 4 . 4 5 SAMPLE P 0 P U L A T I0 N 5 7 4
S 0 3 9 M IN 0R A X IS 1 1 . 5 6 CBRE POPULATION 2 1 4
3 2 5 8 E C C E N T R IC IT Y 0 . 6 0 L I M I T I N G MAGNITUDE 1 9 . 0
SB 3 5 P 0S N . ANGLE 2 6 . 3 9
P 0
F ig u re 8.2.33 ff,g,hj Cluster Morphological Population Distributions.
T able 3 .2.33 Cluster Population Description.
G A L A X Y C L U ST E R 033: 21 42 51 -57 30 : The cluster is located in
the North-East quadrant of ESO/SERC Field 145. Within a diameter of 45mm
as determined by mio we count 604 galaxies in this cluster and 574 to a limiting
magnitude of mum = 19.0. The cluster is classified Abell type R because of its
smooth albeit dense distribution of galaxies.
We count 110 galaxies brighter than m3 + 2 and thus classify the cluster as
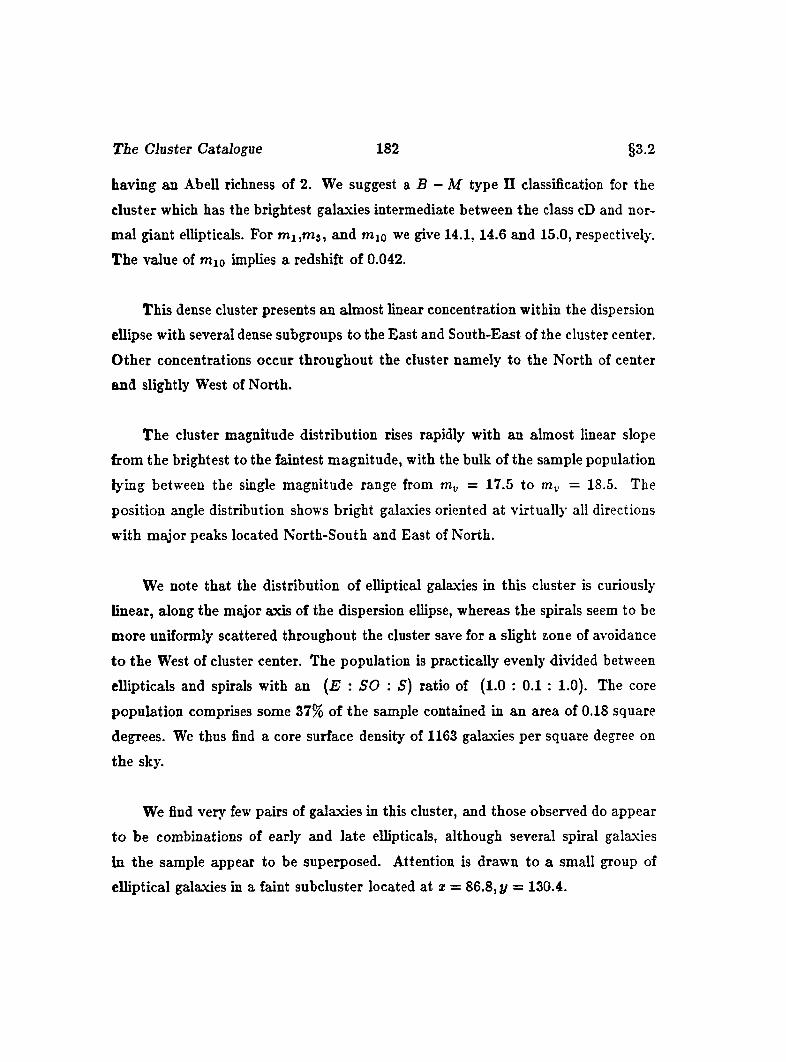
The Cluster Catalogue 182 §3.2
having an Abell richness of 2. We suggest a B - M type II classification for the
cluster which has the brightest galaxies intermediate between the class cD and nor
mal giant ellipticals. For m i,m 3 , and mio we give 14.1, 14.6 and 15.0, respectively.
The value of mio implies a redshift of 0.042.
This dense cluster presents an almost linear concentration within the dispersion
ellipse with several dense subgroups to the East and South-East of the cluster center.
O ther concentrations occur throughout the cluster namely to the North of center
and slightly West of North.
The cluster magnitude distribution rises rapidly with an almost linear slope
from the brightest to the faintest magnitude, with the bulk of the sample population
lying between the single magnitude range from m„ = 17.5 to = 18.5. The
position angle distribution shows bright galaxies oriented a t virtually all directions
with major peaks located North-South and East of North.
We note that the distribution of elliptical galaxies in this cluster is curiously
linear, along the major axis of the dispersion ellipse, whereas the spirals seem to be
more uniformly scattered throughout the cluster save for a slight zone of avoidance
to the West of cluster center. The population is practically evenly divided between
ellipticals and spirals with an {E SO : S) ratio of (1.0 : 0.1 : 1.0). The core
population comprises some 37% of the sample contained in an area of 0.18 square
degrees. We thus find a core surface density of 1163 galaxies per square degree on
the sky.
We find very few pairs of galaxies in this cluster, and those observed do appear
to be combinations of early and late ellipticals, although several spiral galaxies
in the sample appear to be superposed. Attention is drawn to a small group of
elhptical galaxies in a faint subcluster located at a; = 8 6 .8 , y — 130.4.
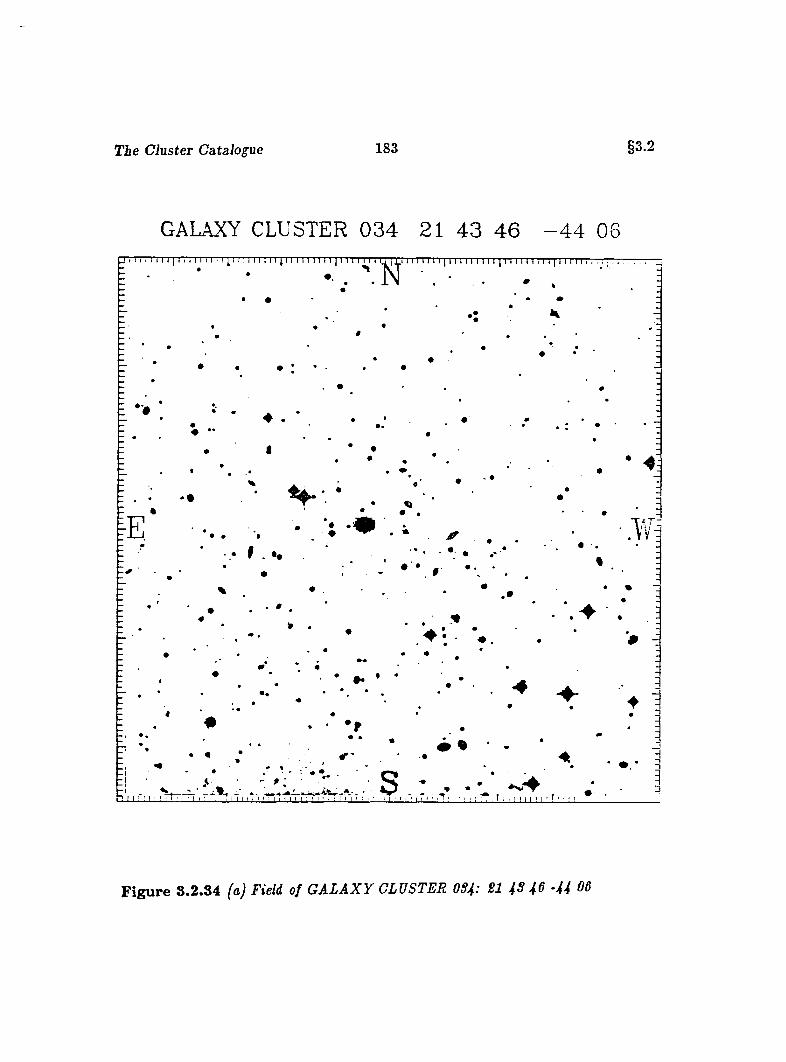
T ie Cluster Catalogue 183 §3.2
GALAXY CLUSTER 0 3 4 21 4 3 4 6 - 4 4 06
#
F ig u re 3.2.34 (a) Field of G A L A X Y CLUSTER OSJ : U \ S - U 06
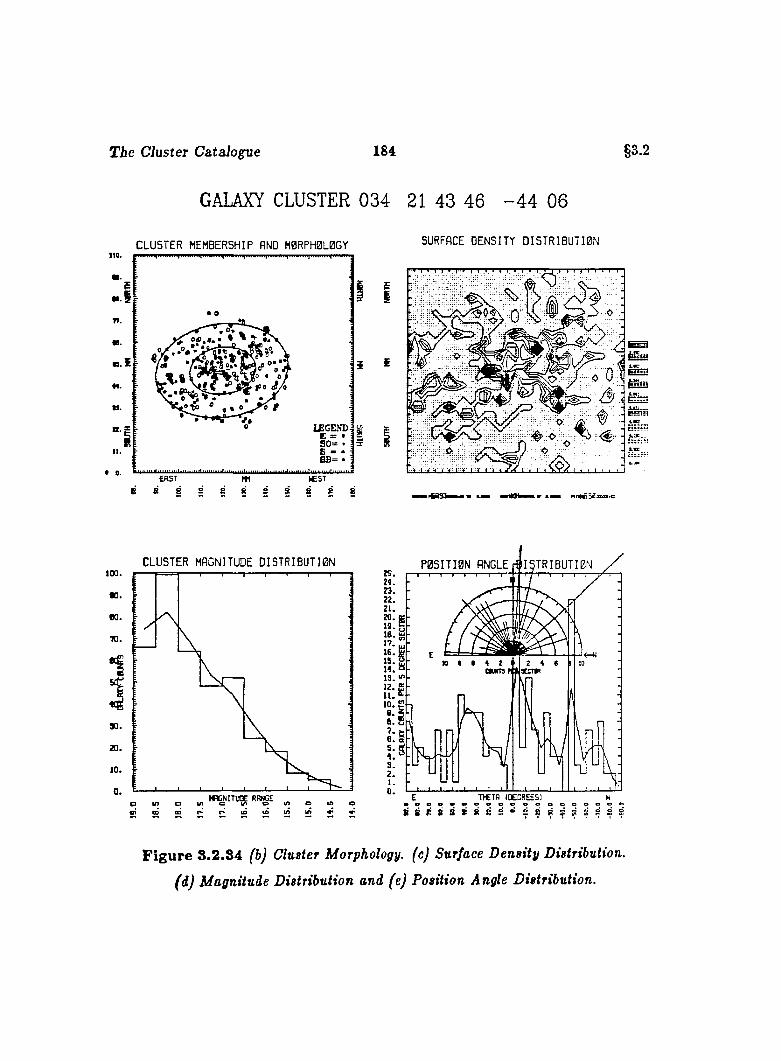
T ie Cluster C a ta lan e 184
GALAXY CLUSTER 034 21 43 46 - 4 4 06
§3.2
CLUSTER MEMBERSHIP AND M0RPH0L0GY110.
m.
m.
rr.e.
«5. 1 0»0«*
LEGEND E = # 5 0 = ♦ G - * 6B= •I I .
EAST
B S 2 8 S*CST
S 8
SURFACE D E N S IT Y D I 5 T R I B U T I 0 N
ë :n'TTi.' i I
$ esi!i
. .......... ..
CLUSTER MAGNITUDE DISTRIBUTI0N100.
to.eo.70.
30.
o u, «. oo
P0SITI0N flNGLErfllSTRIBUTIDN24.
10. g - ,
7 . >-
E ■nC Tfi (DECREES) M• o o e « « e e e e e o e o o o o o e
S 82 8 S B B 2 2 » S 8 R 2 2 S 2 2S
F ig u re 3 .2 .84 (b) Cluster Morphology, (c) Surface Density Distribution,
(d) Magnitude Distribution and (e) Position Angle Distribution.
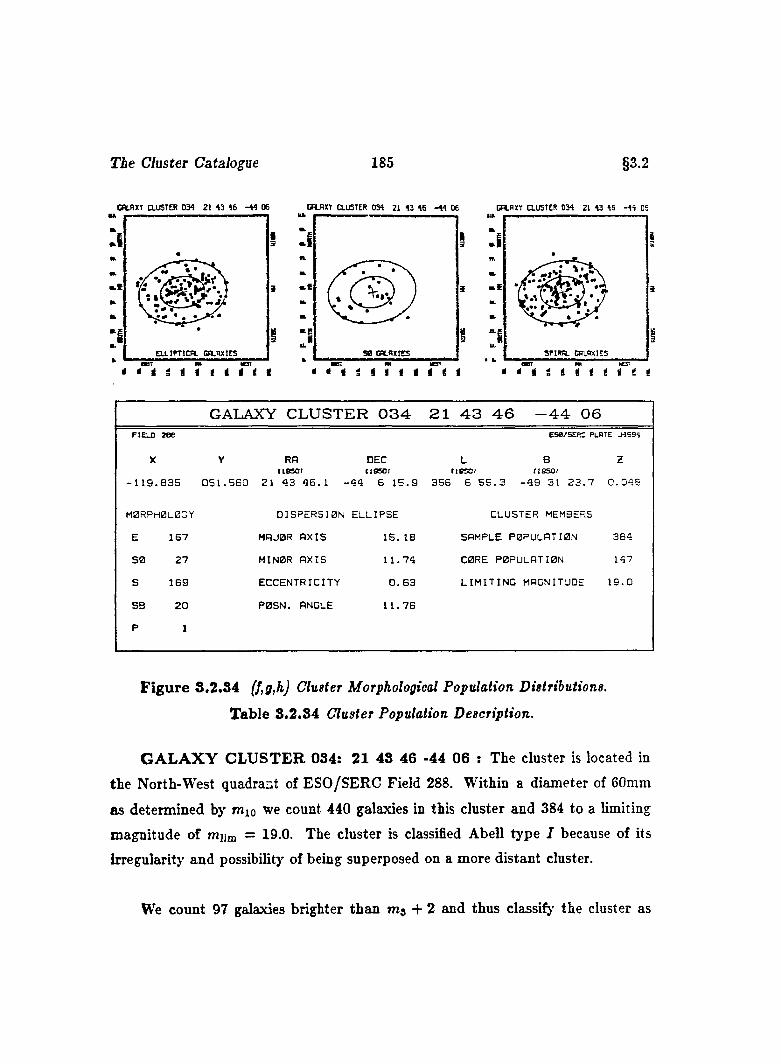
The Cluster Catalogue 185 §3.2
C a n x T Q.U5TER 0 3 4 21 4 3 46 -4 4 06 CRLRXT CLUSTER 034 21 43 46 -4 4 06 GR.BXT CLUSTER 034 21 43 46 -44 05
3
I
GALAXY CLUSTER 034 2 1 43 46 -44 06FIELD z e e ESB/SERC PLB 'E J4S 94
X
- 1 1 9 . 8 3 5
Y RA IIBSOI
0 5 1 . 5 6 0 21 4 3 4 6 . 1 -
DEC(IBSOI
4 9 6 1 5 . 9
L BIIBSOI IIBSOI
3 5 6 6 5 5 . 3 - 4 9 31 2 3 . 7
z
0 . 0 4 9
M0RPH0L0GY D IS P E R S IO N E L L IP S E CLUSTER MEMBERS
E 1 6 7 MAJOR A X IS 1 5 . 18 SAMPLE P OPULATION 3 8 4
SB 2 7 MINOR A X IS 1 1 . 7 4 CORE P OPULATION 147
S 1 6 9 E C C E N T R IC IT Y 0 . 6 3 L I M I T I N G MAGNITUDE 1 9 . 0
SB 2 0 P 0 S N . ANGLE 1 1 . 7 6
P 1
F ig u re 8.2 .34 (f,g,h) Cluster Morphological Population Distributions.
Table 3.2.84 Cluster Population Description.
G A L A X Y C L U S T E R 034: 21 43 46 -44 06 : The cluster is located in
the North-West quadrant of ESO/SERC Field 288. Within a diameter of 60mm
as determined by mio we count 440 galaxies in this cluster and 384 to a limiting
magnitude of mjim = 19.0. The cluster is classified Abell type I because of its
irregularity and possibility of being superposed on a more distant cluster.
We count 97 galaxies brighter than m j -f 2 and thus classify the cluster as
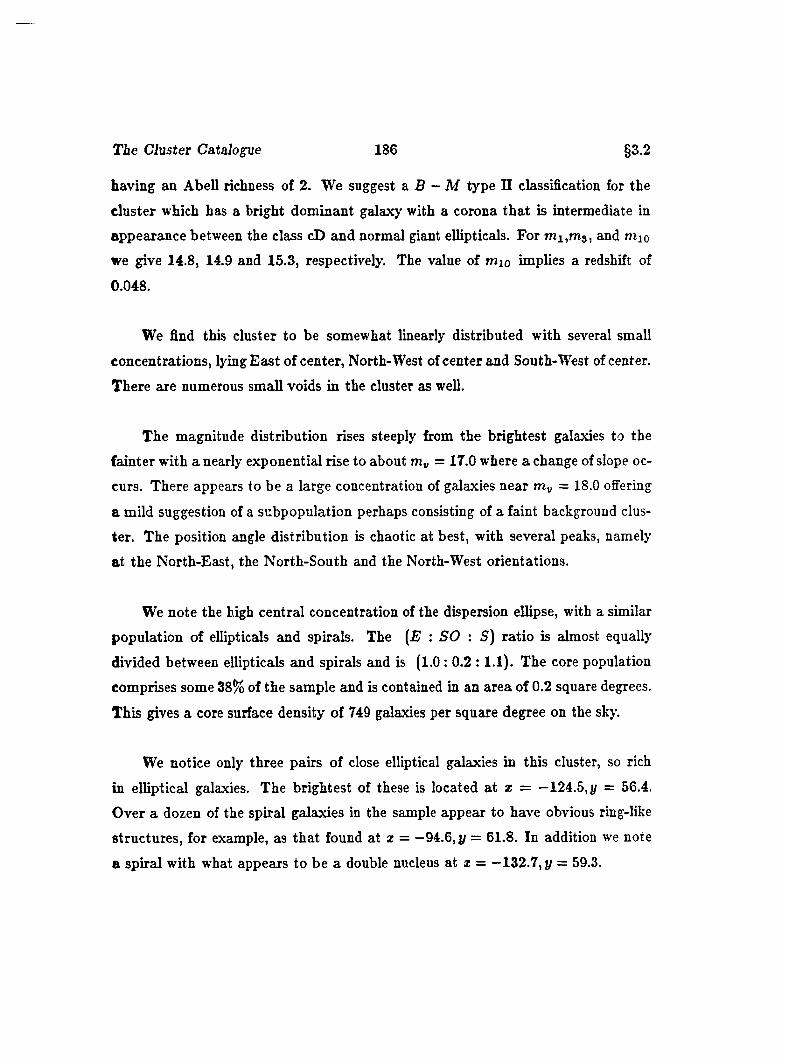
The Cluster Cata lane 186 §3.2
having an Abell richness of 2. We suggest a B — M type II classification for the
cluster which has a bright dominant galaxy with a corona tha t is intermediate in
appearance between the class cD and normal giant ellipticals. For m i,m 3 , and mio
we give 14.8, 14.9 and 15.3, respectively. The value of mio implies a redshift of
0.048.
We find this cluster to be somewhat linearly distributed with several small
concentrations, lying East of center, North-West of center and South-West of center.
There are numerous small voids in the cluster as well.
The magnitude distribution rises steeply from the brightest galaxies to the
fainter with a nearly exponential rise to about m„ = 17.0 where a change of slope oc
curs. There appears to be a large concentration of galaxies near m„ = 18.0 ofi’ering
a mild suggestion of a subpopulation perhaps consisting of a faint background clus
ter. The position angle distribution is chaotic at best, with several peaks, namely
at the North-East, the North-South and the North-West orientations.
We note the high central concentration of the dispersion ellipse, with a similar
population of ellipticals and spirals. The [E : SO : 5) ratio is almost equally
divided between ellipticals and spirals and is (1.0 : 0.2 : 1.1). The core population
comprises some 38% of the sample and is contained in an area of 0.2 square degrees.
This gives a core surface density of 749 galaxies per square degree on the sky.
We notice only three pairs of close elliptical galaxies in this cluster, so rich
in elliptical galaxies. The brightest of these is located at z = —124.5, j/ = 56.4.
Over a dozen of the spiral galaxies in the sample appear to have obvious ring-like
structures, for example, as tha t found at z = —94.6, y = 61.8. In addition we note
a spiral with what appears to be a double nucleus at z = —132.7, y = 59.3.
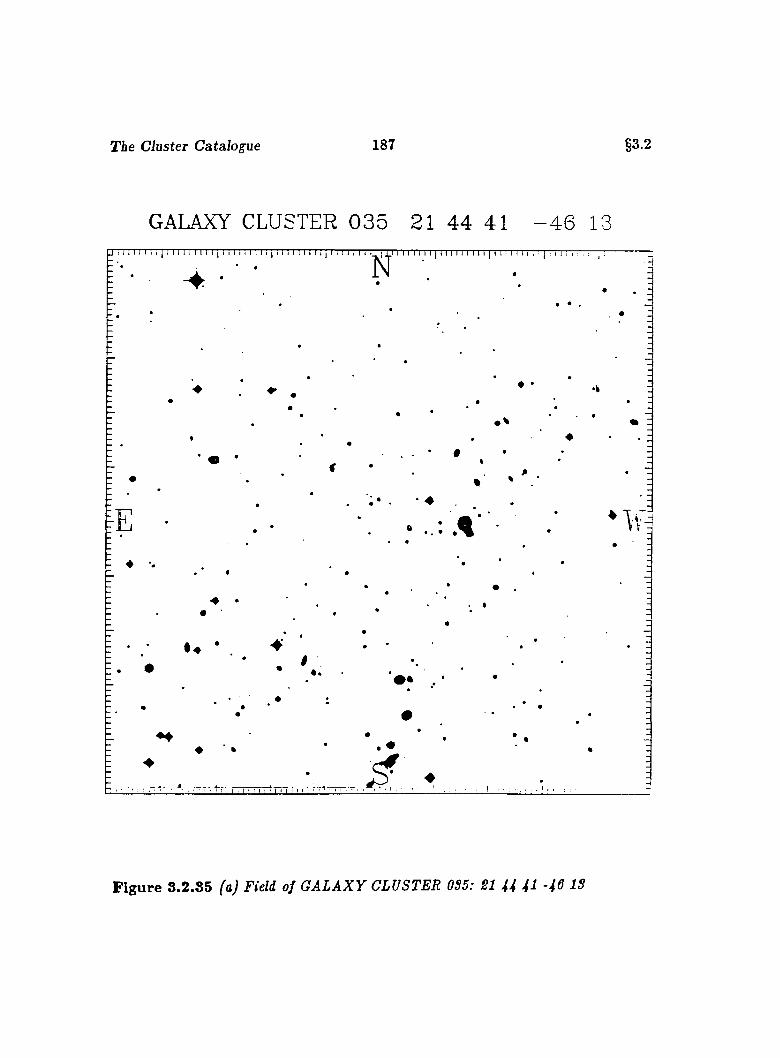
The Cluster Catalogue 187 §3.2
GALAXY CLUSTER 0 3 5 21 44 41 - 4 6 13
F ig u re 3 .2.35 (a) Field of G A LA X Y CLUSTER 0S5: 21 U 4I -46 IS
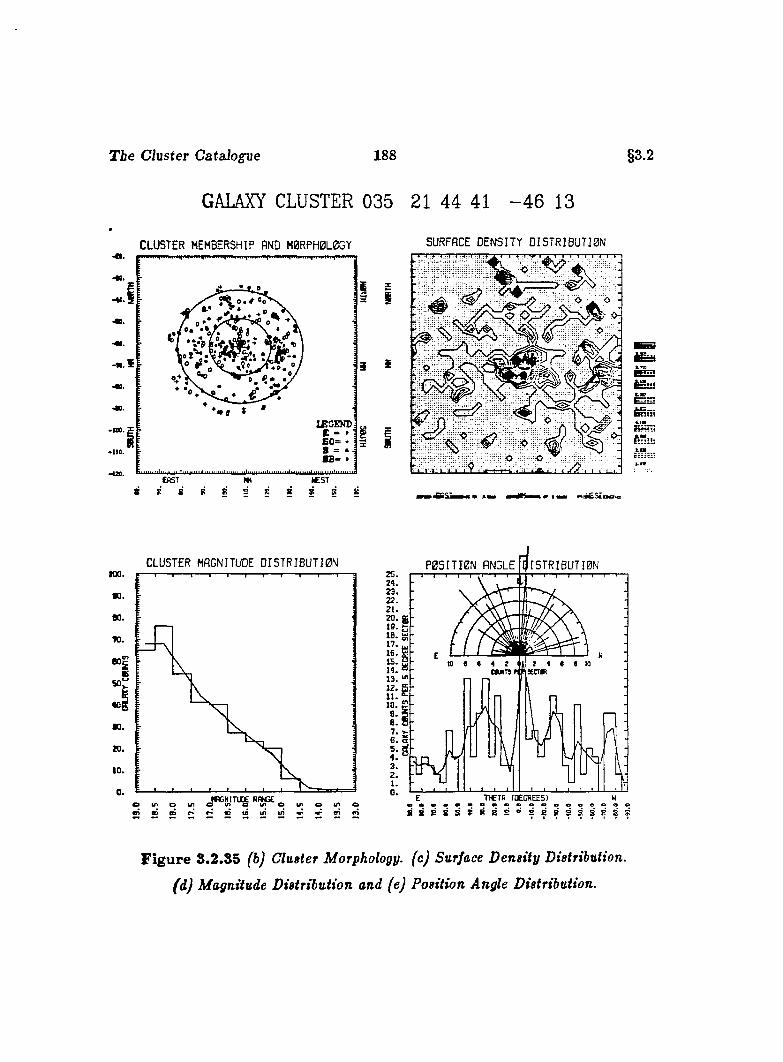
The Cluster Catalogue 188
GALAXY CLUSTER 035 21 44 41 - 4 6 13
§3.2
C L U S T E R MEMBERSHIP AND M 0R P H 0L 0G Y
-40
IfGEND E - ' 60= « S = *. SB* •
>no
•110
8 « $ 88 8 S
SURFACE D E N S I T Y D I S T R I B U T 2 0 N
3
5I
p o>
3%5%
.«Sh—«
fâïMë sëcüi5?5?!î
ïï;
C LU STER MAGNITUDE D I S T R I B U T I 0 NMO I 5 T R I B U T I 0 NP 0 S I T I 0 N ANGLE
22.21.3: g
15.
T îC T fl (DECREES)
F ig u re S.2.S5 (b) Cluster Morphology, (c) Surface Density Distribution,
(d) Magnitude Distribution and (e) Position Angle Distribution.
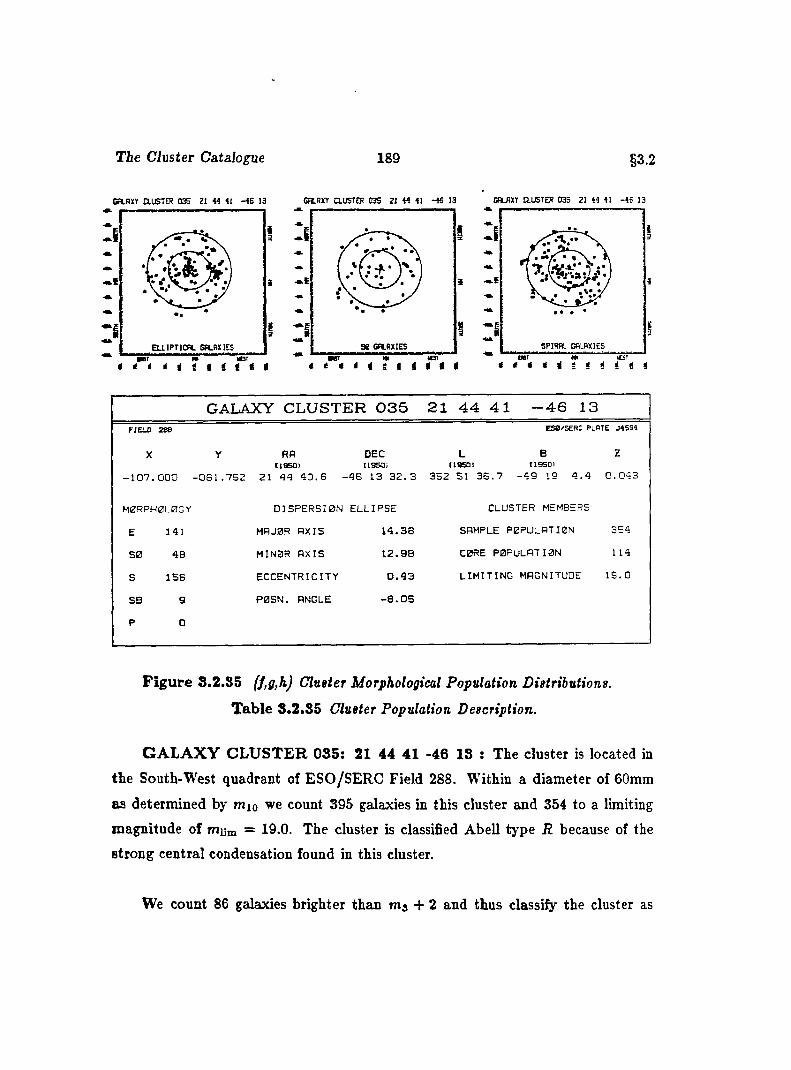
T ie Cluster Catalogue 189 §3.2
CALHXY a u S T O ? 0 3 5 Z 1 M 4 I - 4 6 13 CRLAXT CLUSTER 035 21 44 41 -4 6 13 CALAXT CLUSTER 035 21 44 41 -4 6 13
I
33
S P IR A L GALAXIESE L L IP T IC A L GALAXIESmmmt■er
i ii
GALAXY C L U S T E R 0 3 5 2 1 4 4 4 1 - 4 6 13FIE L D 2 8 8 E S 0/S E R C PLATE J 4 5 9 4
X
- 1 0 7 . 0 0 0
Y RAI lS S D I
- 0 6 1 . 7 5 2 21 4 4 4 0 . 6 -
DECI195Q I
4 6 13 3 2 . 3
L B( IS S D I (1 9 5 0 1
3 5 2 51 3 6 . 7 - 4 9 19 4 . 4
Z
0 . 0 4 3
M0RPH0L0GY D IS P E R S IO N E L L IP S E CLUSTER MEMBERS
E 141 MRJ0R A X IS 1 4 .3 8 SAMPLE P 0 P U L A T I0 N 3 5 4
SO 48 M INBR A X IS 1 2 .9 8 C0RE P 0 P U L A T I0 N 114
s 1 5 6 E C C E N T R IC IT Y 0 . 4 3 L I M I T I N G MAGNITUDE 1 9 . 0
SB 9 P0SN. ANGLE - 8 . 0 5
P D
F ig u re 8.2.35 (f,g,h) Cluster Morphological Population Distributions.
T able 3.2.35 Cluster Population Description.
G A L A X Y C L U S T E R 035; 21 44 41 -46 IS : The cluster is located in
the South-West quadrant of ESO/SERC Field 288. Within a diameter of 60mm
as determined by mio we count 395 galaxies in this cluster and 354 to a limiting
magnitude of mum = 19.0. The cluster is classified Abell type R because of the
strong central condensation found in this cluster.
We count 86 galaxies brighter than m j + 2 and thus classify the cluster as
Tie Cluster C atalogs 190 §3.2
having an Abell richness of 2. We suggest a B — M type II-III classification for the
cluster which appears to have bright and dominant galaxies but no strikingly giant
ellipticals. For mx,ms, and mio we give 13.4,14.6 and 15.1, respectively. The value
of mxo implies a redshift of 0.043.
We notice that the cluster is centrally condensed with several density enhance
ments, most notably near the cluster center. Slight groupings are also apparent
N orth of center and West of center.
The cluster magnitude distribution is nearly linear from the brightest galaxies
to the faintest, with a slight falloff near the magnitude limit. We find the position
angle distribution for the brighter galaxies to be generally non-preferential, but with
an excess running North-South and a relative depletion at small angles oriented
Eastward.
We find the elliptical galaxies somewhat concentrated towards the center of
the cluster with another slight concentration West of center near the periphery of
the dispersion ellipse. The spirals appear more dispersed and are found without
significant concentration throughout the cluster. The morphological distribution
is somewhat skewed towards the spiral galaxies with an {E : SO : S ) ratio of
(1.0 : 0.3 : 1.2). The core population comprises some 32% of the sample and spans
0.2 square degrees. The core surface density thus derived is 555 galaxies per square
degree on the sky.
We find several bright elliptical galaxies to posses a corona. There are very few
pairs of galaxies seen in this cluster. Those that are seen are pairs of ellipticals with
a curious group of three faint pairs located near x = —125.3, y = —62.7. We also
note several spiral galaxies wkh ring-like structures, for example, as that located at
X — —104.1,y = —67.7.
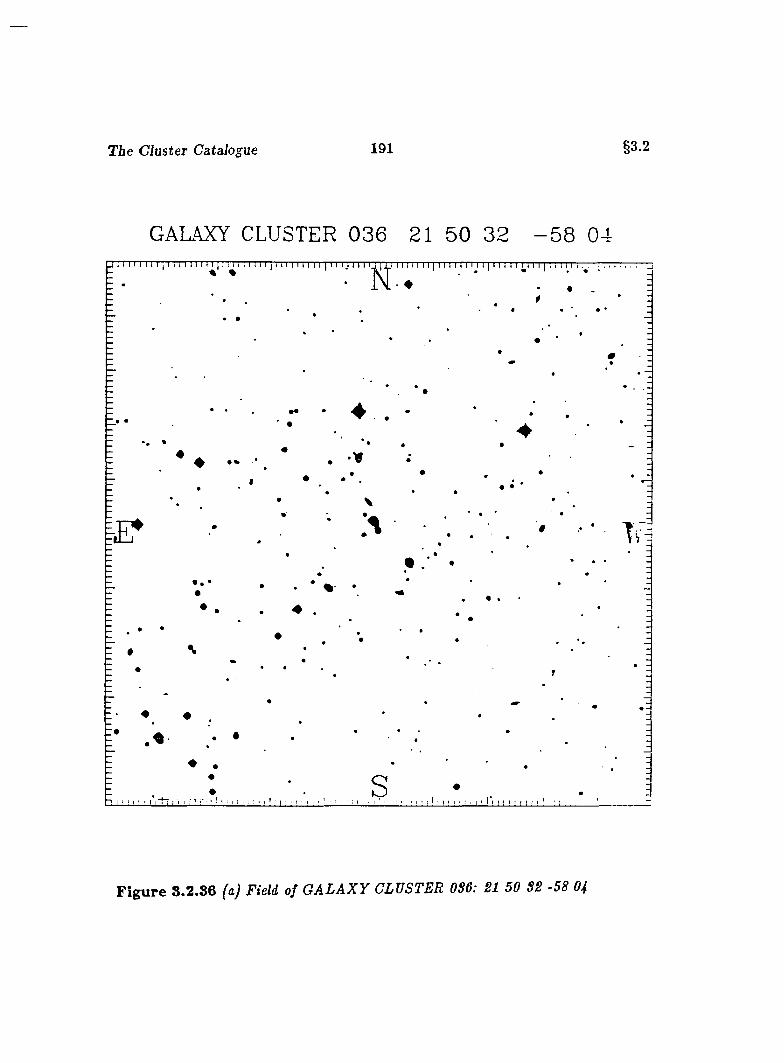
T ie Cluster Catalogue 191 §3.2
GALAXY CLUSTER 0 3 6 21 50 3 2 - 5 8 04
F ig u re S.2.S6 (a) Field of G A L A X Y OLVSTER 0S6: SI 50 SS -5S Of
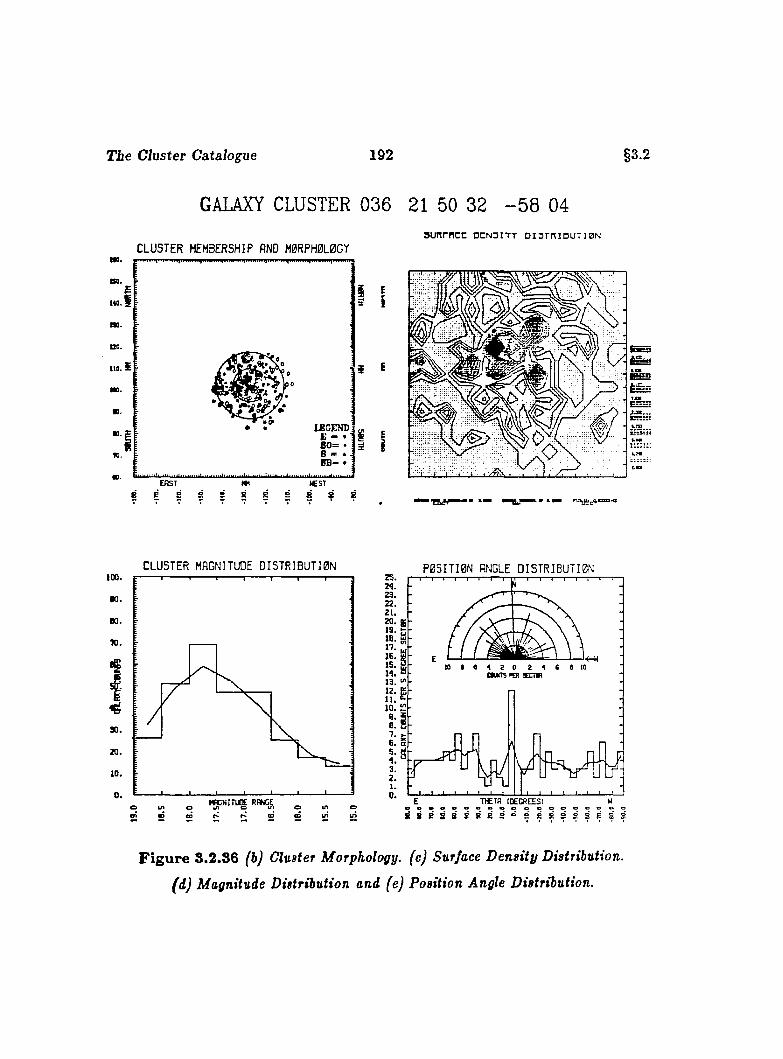
The Cluster Catalogue 192 §3.2
GALAXY CLUSTER 036 21 50 32 - 5 8 04
no.
no.^140.1
110. £
HD.
m.
m. ;fO.
C L U S T E R MEMBERSHIP AND H 0 R P H 0 L 0 G Y
âf!
EAST
LEGEND K - • 1 8 0 = •8 * * 8B" •
EST
3 H
auwrncr d c n s i t t D i s T n i o u T i B N
-'Wc'
C L U S T E R MAGNITUDE D I S T R I B U T I O N
_ l ________ I________ I________ L .
■n CD aiI K N I T i r e RANGE
2 £ S 5 5 ici ui
P O S I T I O N ANGLE D I S T R I B U T I O N29.23.22.21.20.IS .IS .n .IE .15.19.13.12.11.10.a.8.7.G.5.9.3.2.1.0.
*0 # e 4 2 0 2 4 6 0 10nUKTS fOl 9EnW
r - f t r
TÆTfl (DECREES)
F ig u re 3.2.36 fbj Cluster Morphology, (c) Surface Density Distribution,
(d) Magnitude Distribution and (e) Position Angle Distribution.
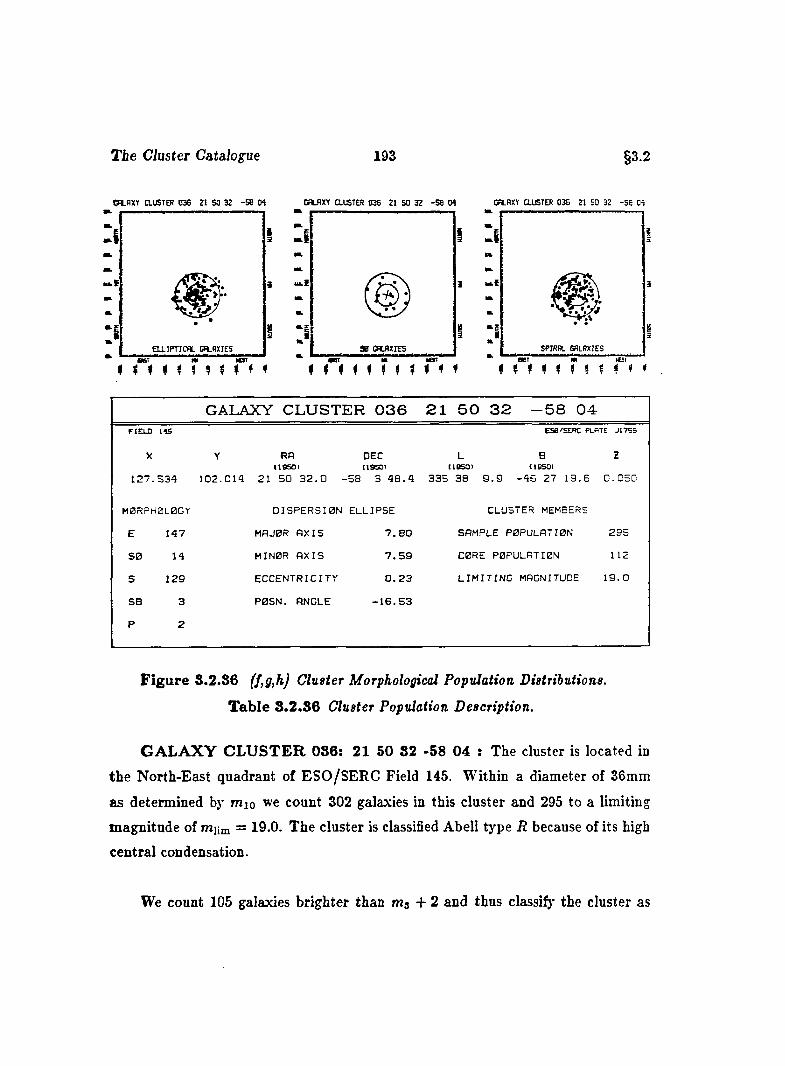
T ie Cluster Catalogue 193 §3.2
WLfiXY CLUSTER 036 21 50 32 -5 6 (M CHLflXY CLUSTER 036 21 SO 32 -5 8 M CBLBXY CLUSTER 036 21 50 32 -SB OS
S O f W X I E S S P IR A L G A L A X IE SE L L I P T IC A L G A L A X IE S
f f i 1 i 1
IBT SBT Ml
1 ? M ♦ ( 1 M M ?IBP
t 1BBT m
? M f ? ?ICSI
; ! < <
GALAXY C L U S T E R 0 3 6 2 1 5 0 3 2 - 5 8 0 4F IE L D 14S E S e/SE R C PLATE J 1 7 S 9
X Y RA DEC L B z1 1 9 5 0 1 (19501 I1 9 S 0 I (IS S O I
127. 534 1 0 2 .0 1 4 21 5 0 3 2 . 0 - 5 8 3 4 8 . 4 335 38 9 . 9 - 4 6 27 1 9 .6 0 . 0 5 0
MORPHOLOGY DISP ERS ION ELLIPSE CLUSTER MEMBERS
E 147 MPJ0R A X IS 7 . 8 0 SAMPLE POPULATION 2 9 5
5 0 14 MINOR A X IS 7 . 5 9 C0RE POPULATION 112
S 129 ECC ENTRIC ITY 0 . 2 3 L IM IT IN G MAGNITUDE 1 9 . 0
SB 3 P0SN. ANCLE - 1 6 . 5 3
P 2
F ig u re 8.2.36 (f,g,h) Gluater Morphological Population Distributions.
T ab le 3 .2 .86 Cluster Population Description.
G A L A X Y C L U S T E R 036; 21 50 32 -58 04 : The cluster is located in
the North-East quadrant of ESO/SERC Field 145. Within a diameter of 36mm
as determined by mio we count 302 galaxies in this cluster and 295 to a limiting
magnitude of miim = 19.0. The cluster is classified Abell type R because of its high
central condensation.
We count 105 galaxies brighter than m3 + 2 and thus classify the cluster as
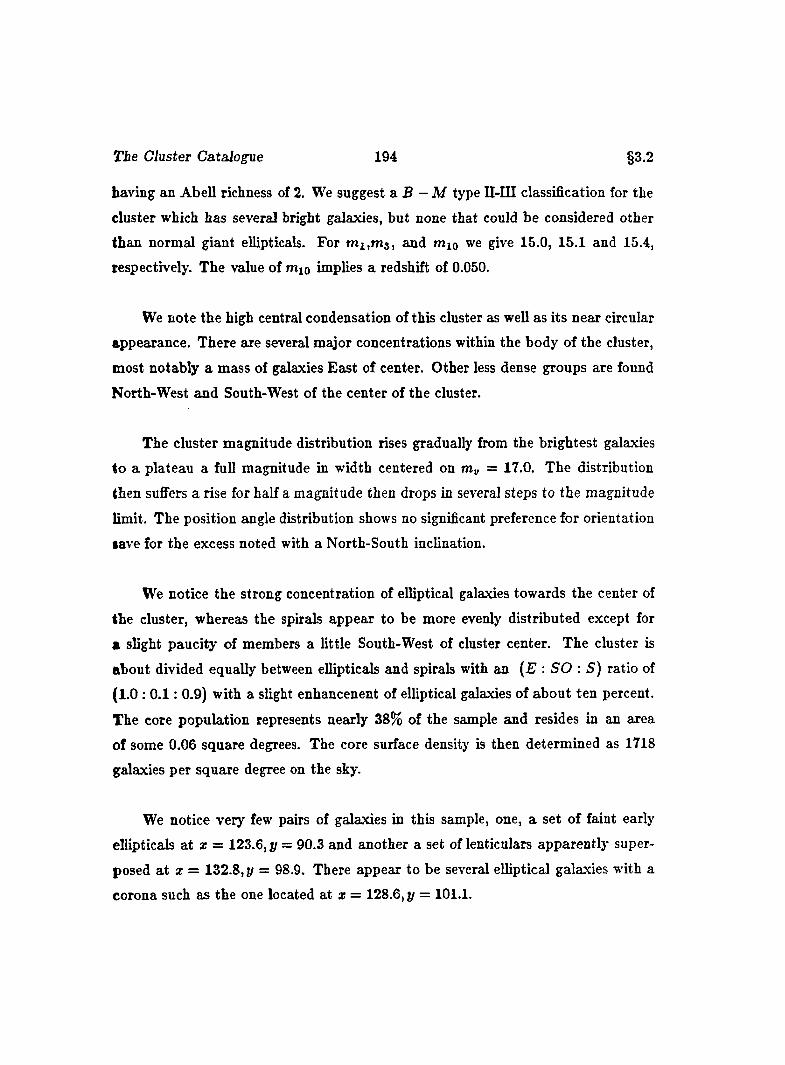
T ie Cluster Catalogue 194 §3.2
having an Abell richness of 2. We suggest a B — M type II-III classification for the
cluster which has several bright galaxies, but none that could be considered other
than normal giant ellipticals. For m i.m j, and mio we give 15.0, 15.1 and 15.4,
respectively. The value of mio implies a redshift of 0.050.
We note the high central condensation of this cluster as well as its near circular
appearance. There are several major concentrations within the body of the cluster,
most notably a mass of galaxies East of center. Other less dense groups are found
North-West and South-West of the center of the cluster.
The cluster magnitude distribution rises gradually from the brightest galaxies
to a plateau a full magnitude in width centered on = 17.0. The distribution
then suffers a rise for half a magnitude then drops in several steps to the magnitude
limit. The position angle distribution shows no significant preference for orientation
save for the excess noted with a North-South inclination.
We notice the strong concentration of elliptical galaxies towards the center of
the cluster, whereas the spirals appear to be more evenly distributed except for
* slight paucity of members a little South-West of cluster center. The cluster is
about divided equally between ellipticals and spirals with an {E : SO : S) ratio of
(1.0 : 0 .1 : 0.9) with a slight enhancenent of elliptical galaxies of about ten percent.
The core population represents nearly 38% of the sample and resides in an area
of some 0.06 square degrees. The core surface density is then determined as 1718
galaxies per square degree on the sky.
We notice very few pairs of galaxies in this sample, one, a set of faint early
ellipticals at z = 123.6, y = 90.3 and another a set of lenticulars apparently super
posed a t z = 132.8, y = 98.9. There appear to be several elliptical galaxies with a
corona such as the one located at z = 128.6, y = 101.1.
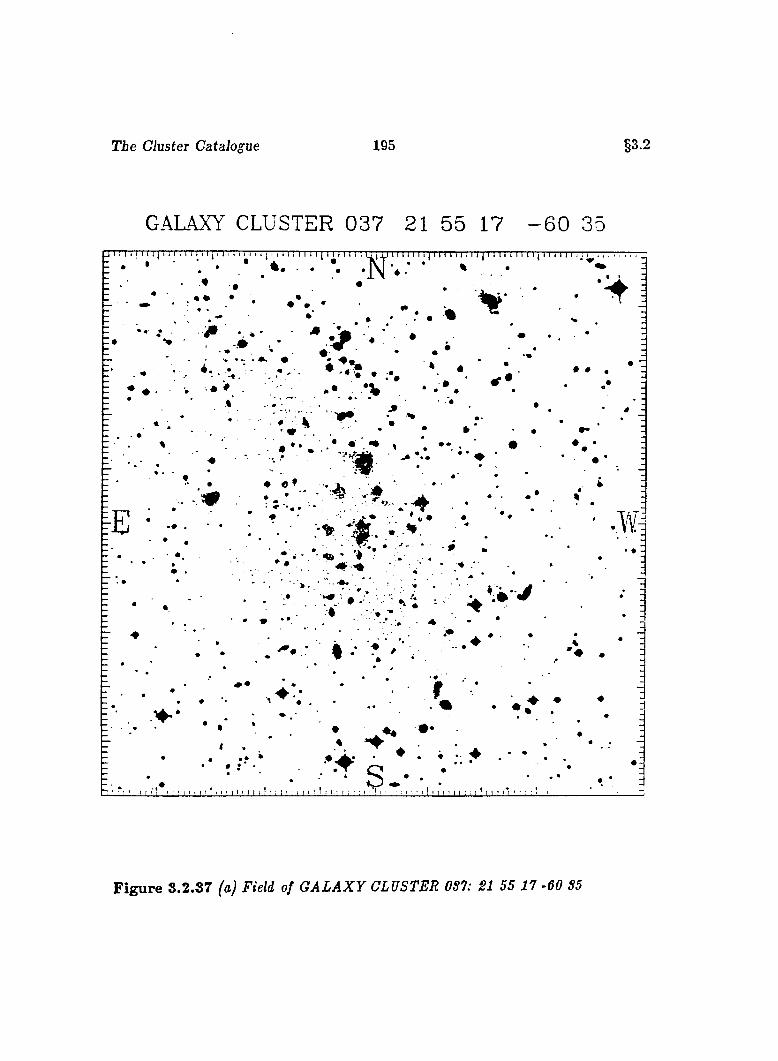
The Cluster Catalogue 195 §3.2
GALAXY CLUSTER 0 37 21 55 17 - 6 0 35
« •
♦ « f
F ig u re S.2.S7 (aj Field of G A L A X Y CLUSTER 057: SI 55 17 -60 S3
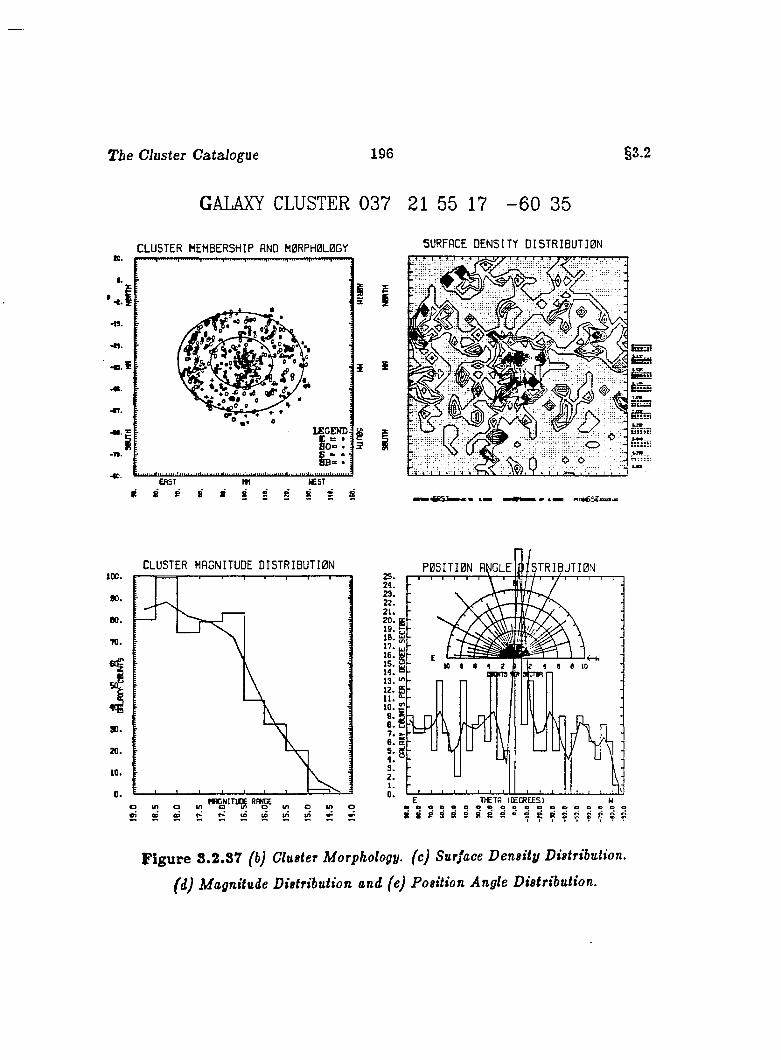
The Cluster Catalogue 196
GALAXY CLUSTER 037 21 55 17 - 6 0 35
§3.2
ft.
•-tj
• n .
C L U S T E R M EM B ER SH IP AND M 0RPH0L0GY 1 .
LEGEND; io= ’
SURFACE D E N S IT Y D I S T R I B U T I 0 N
i
EI
C LUSTER MAGNITUDE D I S T R I B U T I 0 N100.
to.
80.
TO.
SO.
20.
10.
c u. oE E S E S S S i S i S S r
P 0 5 T I 0 N A T R I B U T I 0 N
1
E T Æ T A (D E C R E E S ] M
: 3 : ; 5 ; n : H 5 H H H :
F ig u re 3 .2 .37 (b) Cluster Morphology, (c) Surface Density Distribution,
(d) Magnitude Distribution and (e) Position Angle Distribution.
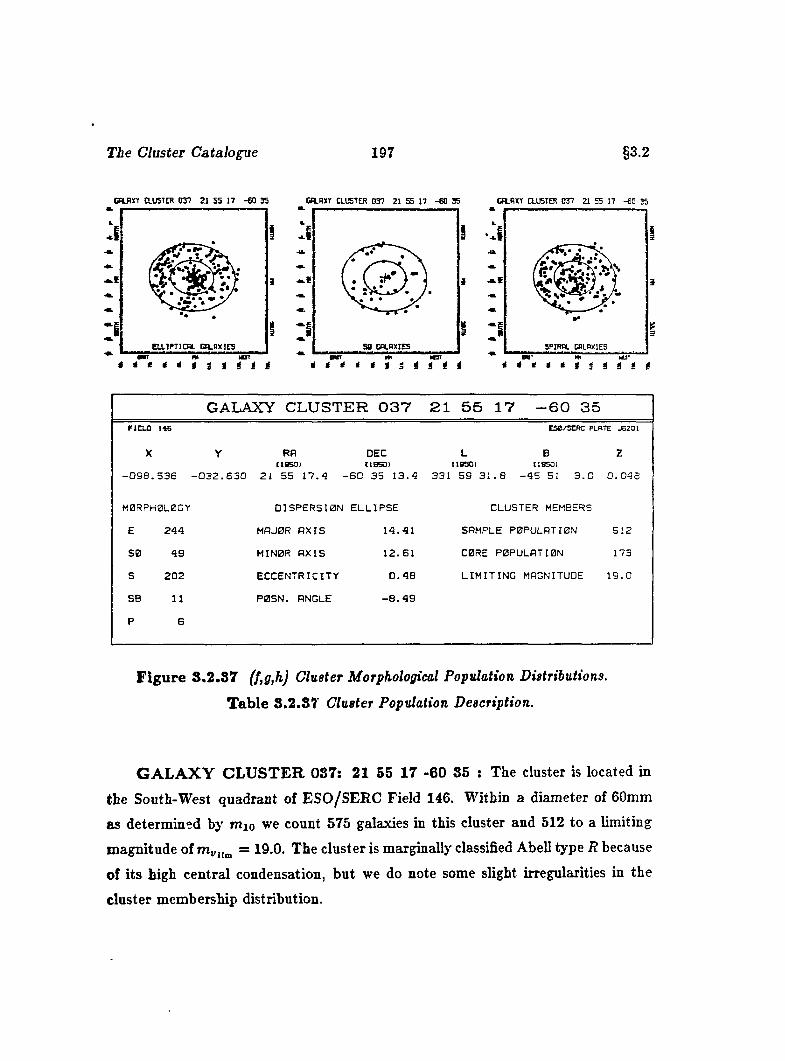
The Cluster Catalogue 197 §3.2
(smrr ausTER 037 21 55 i? -ea as CflHXT CLUSTER 037 21 55 17 -6 0 35 CflLflXT CLUSTER 037 21 55 17 -SO 35
3 i
GALAXY CLUSTER 0 3 7 2 1 5 5 1 7 - 6 0 3 5FIELD 148
X
ES0/SERC PLATE JE201
zY RA DEC L B■18501 119501 tlBSO l IISSOI
0 9 8 . 5 3 6 - 0 3 2 . 8 3 0 21 5 5 1 7 . 4 - 6 0 3 5 1 3 . 4 3 3 1 5 9 3 1 . 8 - 4 5 51 3 . 0 0 . 0 4 8
M0RPH0L0GY
E 2 4 4
3 0 4 9
S 2 0 2
SB nP 6
D 1 S P E R S I0 N E L L IP S E
MAJ0R A X I S 1 4 . 4 1
M IN 0 R A X IS 1 2 . 6 1
E C C E N T R IC IT Y 0 . 4 8
P 0 S N . ANGLE - 8 . 4 9
CLUSTER MEMBERS
SAMPLE P 0 P U L A T IB N 5 1 2
C0RE P 0 P U L A T I0 N 173
L I M I T I N G MAGNITUDE 1 9 . 0
F ig u re 3 .2 .8 7 (f,g,h) Cluster Morphological Population Distributions.
T ab le 3 .2 .37 Cluster Population Description.
G A L A X Y C L U S T E R 087: 21 55 17 -60 85 : The cluster is located in
the South-West quadrant of ESO/SERC Field 146. Within a diameter of 60mm
as determined by mio we count 575 galaxies in this cluster and 512 to a limiting
magnitude of = 19.0. The cluster is marginally classified Abell type R because
of its high central condensation, but we do note some slight irregularities in the
cluster membership distribution.
T ie Cluster Catalogue 198 §3.2
We count 112 galaxies brighter than m 3 + 2 and thus classify the cluster as
having an Abell richness of 2. We suggest a B — M type III classification for the
cluster which has no major dominant galaxies, although several bright ellipticals
are noted. For and mio we give 14.6,15.0 and 15.3, respectively. The value
of mio implies a redshift of 0.048.
The cluster membership displays a somewhat extended distribution with high
central condensation. The dense core of the cluster appears elongated and aligned
with the minor axis of the dispersion ellipse. Several concentrations are noted near
the cluster center and to the West as well as North of center. lu addition, we find
a few concentrations at the North-East periphery of the cluster. The magnitude
distribution rises rapidly from the brightest galaxies to a near plateau spanning
almost two magnitudes. The bulk of the population resides in this range and may
fuggest the possibility of a bright cluster superposed on a faint background. The
position angle varies wildly with an excess noted in the number of galaxies West of
North primarily caused by the peak indicating the North-South orientation.
We note the high concentration of elliptical galaxies in the sample, many of
which are concentrated towards the center of the cluster. A large number of spiral
galaxies are scattered throughout the cluster but without as high a central conden-
lation as the ellipticals. The {E : SO : S ) ratio is (1.0: 0.2 : 0.9) indicating some
ten percent more ellipticals than spirals. The core population comprises nearly
84% of the sample and resides in an area of 0.2 square degrees. This yields a core
surface density of 865 galaxies per square degree on the sky. Five bright elliptical
galaxies in the sample appear to have coronas. The brightest of these is located at
X = —101.2, p = —36.8, and we find an interesting pair with a faint elliptical galaxy
imbedded in the corona of a brighter one a t x = —96.5, y = —51.8. Of the several
peculiar galaxies seen we note an unusual barred spiral with a ring-like structure
and a large spur or luminous bridge located a t x = —91.7, y = —39.2.
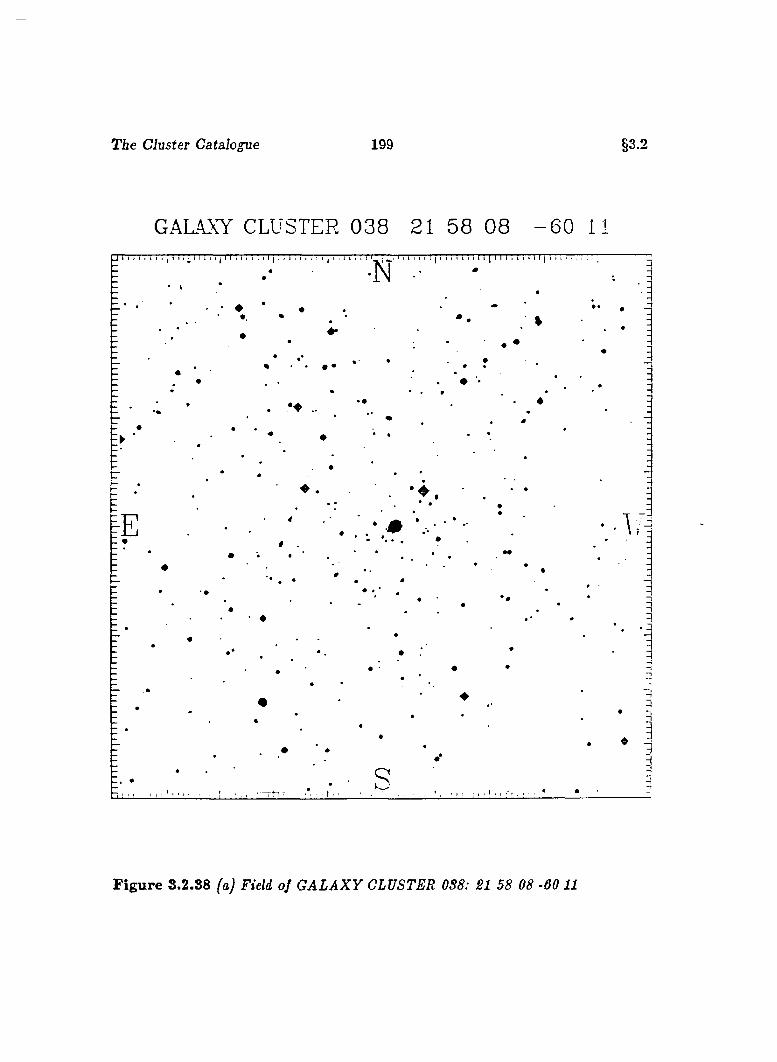
The Cluster Catalogue 199 §3.2
GALAXY CLUSTER 038 21 58 08 - 6 0 11
F ig u re S.2.S8 (a) Field of G A L A X Y CLUSTER 0S8: 21 58 08 -60 11
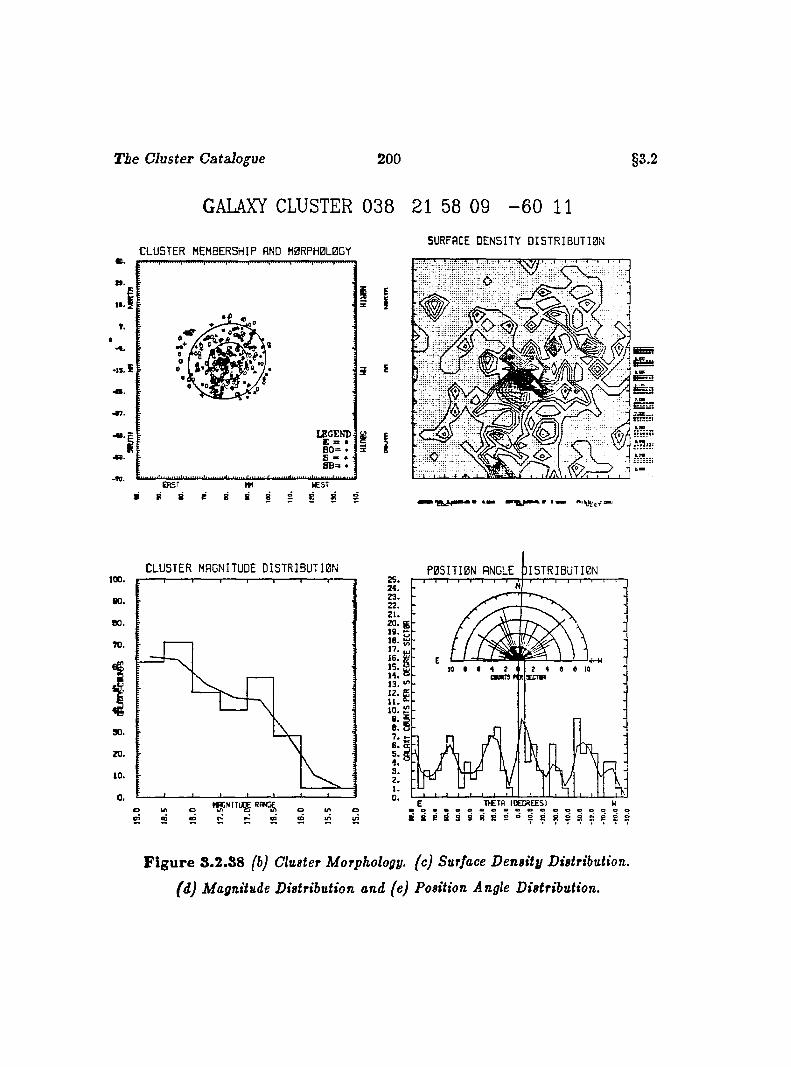
The Cluster Catalogue 200 §3.2
GALAXY CLUSTER 038 21 58 09 - 6 0 11
SURFACE D E N S IT Y D I S T R I B U T I 0 NC L U S T E R M EM BERSHIP AND M 0RPH0L0GY
# .
tt. II . f
».#
-4.
•j5,i
........................ .
W
■
L
LEGEND E = • : B0= • ■ 5 * * iSB^ •
a
ERST m WEST* R 8 P 8 6 g 2 ê R
I
C L U S T E R MAGNITUDE D I S T R I B U T I 0 N P I 3 5 I T Î 0 N ANCLE 3 I 5 T R I B U T I 0 N25.24.
5:518. %
13.
ë R s s B e s
F ig u re S .2.88 (b) Cluster Morphology, (c) Surface Density Distribution,
(d) Magnitude Distribution and (e) Position Angle Distribution.
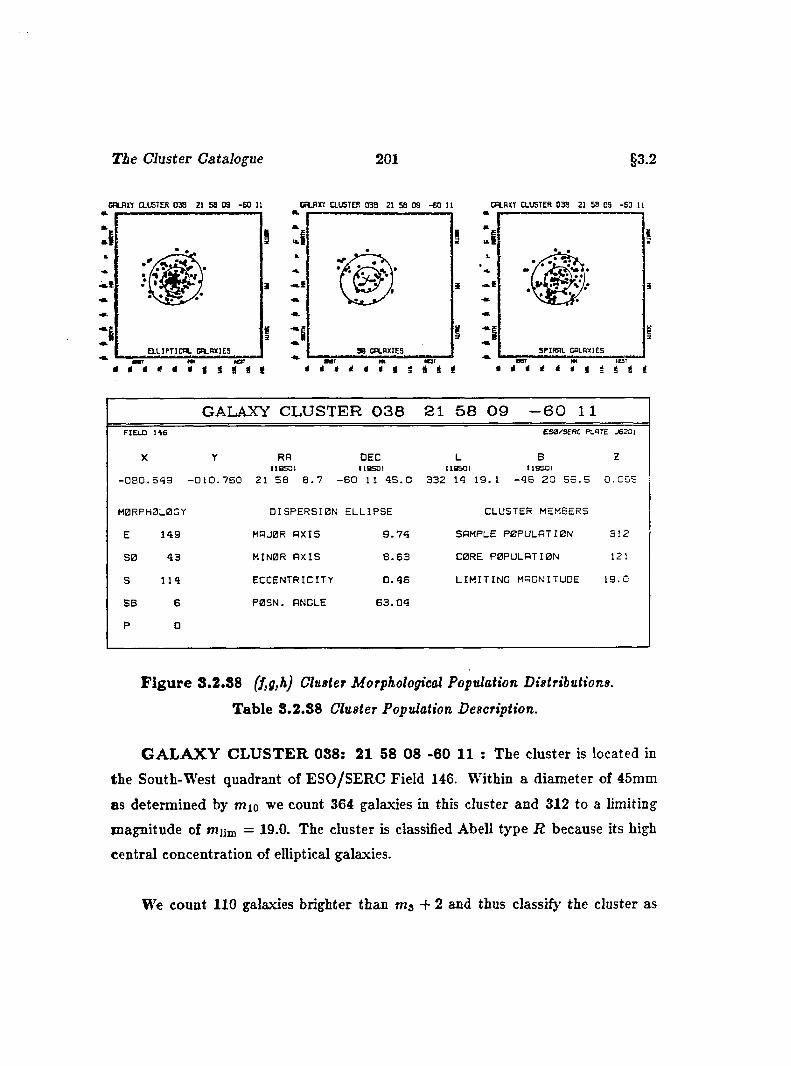
The Cluster Catalopie 201 §3.2
c a j n CLUSTER 038 21 58 09 -6 0 11 OaflXT CLUSTER 038 21 58 09 -6 0 11 CRLHXT CLUSTER 038 21 58 09 -6 0 11
1
ii
I
GALAXY CLUSTER 038 21 58 09 -6 0 11FIELD 146
X
ESB/SERC PLATE J6 2 0 I
zY RA DEC L B( l e s o i IlS S D I (18501 119501
0 8 0 . 5 4 9 - 0 1 0 . 7 6 0 21 5 8 8 . 7 - 6 0 11 4 5 . 0 3 3 2 14 1 9 . 1 - 4 6 2 0 5 5 . 5 0 . 0 5 5
MORPHOLOGY
E 1 4 9
SO 4 3
S 1 1 4
SB 6
P 0
D IS P E R S IO N E L L IP S E
MAJOR A X I S 9 . 7 4
MINOR A X IS 8 . 6 3
e c c e n t r i c i t y 0 . 4 8
P 0S N . ANGLE 6 3 . 0 4
CLUSTER MEMBERS
SAMPLE p o p u l a t i o n 3 1 2
CORE PO P UL A TIO N 121
L I M I T I N G MAGNITUDE 1 9 . 0
F ig u re 8.2.S8 (f,g,h) Cluster Morphological Population Distributions.
T able S.2.S8 Cluster Population Description.
G A L A X Y C L U S T E R 088: 21 58 08 -60 11 : The cluster is located in
the South-West quadrant of ESO/SERC Field 146. Within a diameter of 45mm
as determined by mxo we count 364 galaxies in this cluster and 312 to a limiting
magnitude of miim = 19.0. The cluster is classified Abell type R because its high
central concentration of elliptical galaxies.
We count 110 galaxies brighter than m3 4- 2 and thus classify the cluster as
T ie Cluster Catalogue 202 §3.2
having an Abell richness of 2. We suggest a B — M type I classification for the
cluster which has a multiple cD type galaxy as its brightest member. For
and mio we give 15.0, 15.4 and 16.0, respectively. The value of mio implies a
redshift of 0.065.
We note the high central condensation of this cluster displaying a complicated
density distribution. In addition we notice a concentration South of cluster center
near the periphery of the dispersion ellipse.
The cluster magnitude distribution can be described as a rapid rise in the
numbers of galaxies fainter thanm„ = 16.0 and then a gentler rise beyond m„ = 17.0
to the magnitude limit. The position angle distribution is somewhat chaotic and
appears to show a slight preference for orientations West of North although this is
motivated strongly by the peak near zero degrees.
We find the elliptical galaxies in this cluster strongly concentrated towards
the center of the cluster. The spirals, on the other hand, appear less concentrated
although there is a small group located South South-East of the cluster center. W e
find an {E : SO : S) ratio of (1.0 : 0.3 : 0.8) indicating an increase of ellipticals
over spirals of about twenty percent. The core population of this cluster represents
nearly 39% of the sample residing in an area of 0.09 square degrees. This yields a
cluster core surface density of 1307 galaxies per square degree.
We note a peculiar grouping of galaxies in the center of this cluster which
is dominated by a bright cD type galaxy. The cD is apparently surrounded by
several much fainter elliptical attendant galaxies in a tight group located at z =
—79.1, y = —10.4. We also notice a very close pair of lenticular galaxies found at
X = —77.7, y = —27.1, and a pair of ellipticals at z = —80.3, y = —9.6.
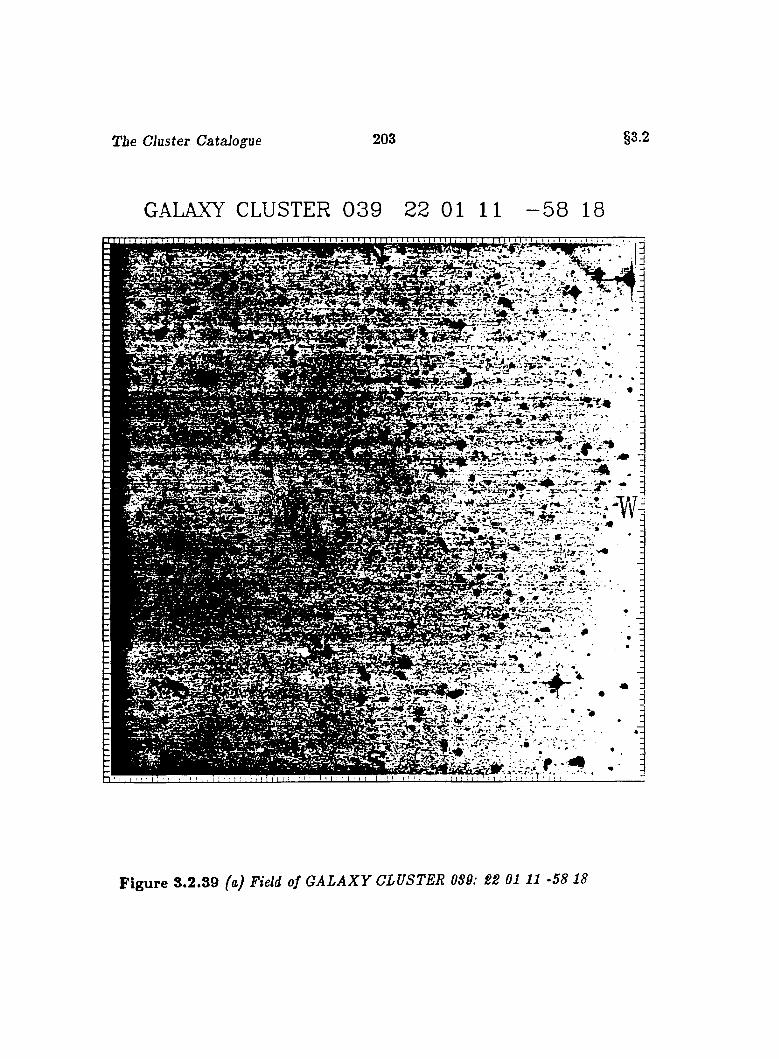
The Cluster Catalogue 203 §3.2
GALAXY CLUSTER 0 3 9 22 01 11 - 5 8 18
«Vîÿie sSs:?.'/
#'L-yr5T%?r.')r.T!l '. .
f . . '
F ig u re 3 .2 .39 (a) Field of G A L A X Y CLUSTER 0S9: SS 01 11 -58 18
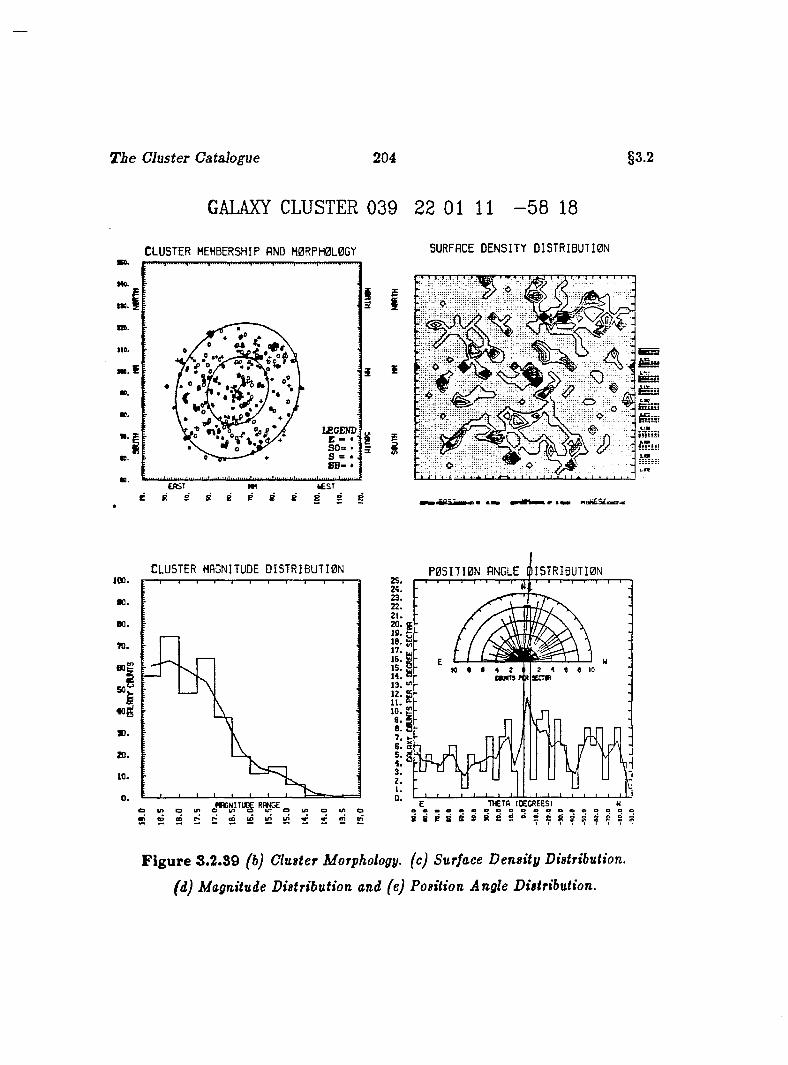
The Cluster Catalogue 204 §3.2
GALAXY CLUSTER 039 22 01 11 - 5 8 16
C L U S T E R MEMBERSHIP AND M 0R P H 0L 0G Y SURFACE D E N S I T Y D I S T R 1 B U T I 0 N
MO.
«D.
l ie .
m.
#0.
S 0 =
S B " •
m .WESTm
éc g g p e e s
5i
o .S
■o
I
C L U ST E R MAGNITUDE D I S T R I B U T I 0 N100.
n.eo.70.
eo,
1«gso.zo.10.
0 .
2S24.23.22.21.20.29.18.17.16.15.14.13.12.11.10.8.8 .7.6.5.4.3.2.1.0.
P 0 5 I T I 0 N ANGLE t t H 5 T R I B U T I 0 NT f I— I r —%— I I I I— r ' I I— r -
S'
C#m3 n R
« » '_ I_I_u y t—t * • I
e D P * p “ f f i U J i n m ^ « " e n t nE T IC T A (DECREES) Weoao*oooeeoaeooeoe
F ig u re 3.2.89 (b) Cluster Morphology, (c) Surface Density Distribution,
(d) Magnitude Distribution and (e) Position Angle Distribution.
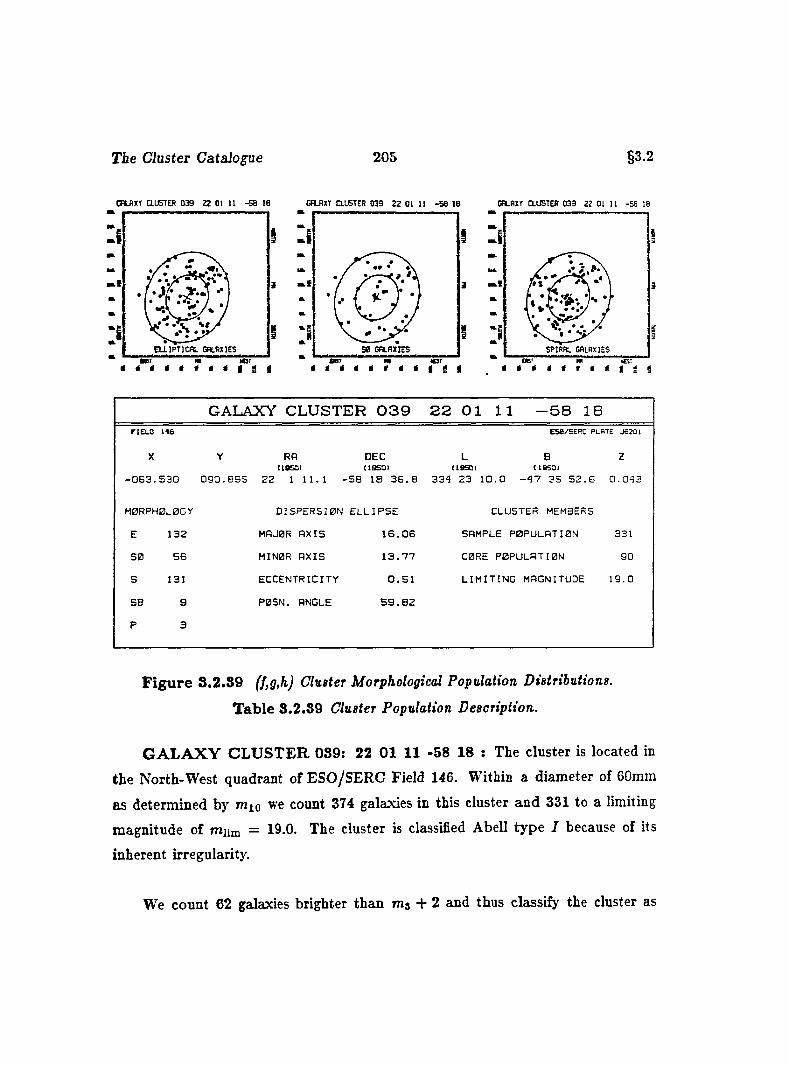
T ie Cluster Catalogue 205 §3.2
CPLAXY auSTER 039 2Z 01 11 -5 8 IB CFLflXT CLUSTER 033 22 01 11 -5 8 18 CHLRXY CLUSTER 039 22 01 11 -58 18
i 1
I IE L L I P T I C A L G A L A X IE S GALAXIES
■er ■ori
GALAXY CLUSTER 0 3 9 2 2 0 1 11 - 5 8 18FIE LD 146
X
ESB/SERC PLATE J62D I
2Y RA DEC L B(IB SD I (1 S 5 0 I ( le S Q I (19501
0 6 3 . 5 3 0 0 9 0 . 8 9 5 2 2 1 1 1 . 1 - 5 8 18 3 6 . 8 3 3 4 2 3 1 0 . 0 - 4 7 3 5 5 2 . 6 0 . 0 4 3
M0RPHBL0GY
E 1 3 2
SB 5 6
S 131
SB g
P 3
D IS P E R S IB N E L L IP S E
MRJ0R A X IS 1 6 . 0 6
MINBR A X IS 1 3 . 7 7
E C C E N T R IC IT Y 0 . 5 1
P 0S N . ANGLE 5 9 . 8 2
CLUSTER MEMBERS
SAMPLE P 0 P U L R T I0 N 331
C0RE P B P U L R T I0 N 90
L I M I T I N G MAGNITUDE 1 9 . 0
F ig u re 3 .2 .39 (f,g,h) Cluster Morphological Population Distributions.
T ab le 3.2.89 Cluster Population Description.
G A L A X Y C L U S T E R 039; 22 01 11 -58 18 : The cluster is located in
the North-West quadrant of ESO/SERC Field 146. Within a diameter of 60mm
as determined by ruio we count 374 galaxies in this cluster and 331 to a limiting
magnitude of miim = 19.0. The cluster is classified Abell type I because of its
inherent irregularity.
We count 62 galaxies brighter than + 2 and thus classify the cluster as
The Cluster Catalane 206 §3.2
having an Abell richness of 1. We suggest a B — M type I II classification for the
cluster which appears intermediate between prototypical cD dominated clusters and
those with normal giant ellipticals. For m i,m s, and mjo we give 13.5,14.6 and 15.1,
respectively. The value of mio implies a redshift of 0.043.
We find this irregular appearing cluster loosely bound and with numerous small
condensations. The largest group lies just South of the cluster center, whereas other
smaller groups are located to the East, South-East and North of the cluster center.
The cluster magnitude distribution rises slowly at first from the brightest galax
ies through a span of over two magnitudes. From = 16.0 there is a steeper rise
for another two magnitudes and then a gradual tapering of the distribution to the
magnitude limit. The position angle distribution, although erratic, suggests a pref
erence of the brighter galaxies to be oriented West of North with a peak near zero
degrees. This direction is consistent with the direction of the major axis of the
dispersion ellipse. We find the elliptical galaxies in this cluster to be widely scat
tered with only few concentrations. The spirals are distributed similarly with the
exceptions of a centrally located concentration and a zone of avoidance North of
the cluster center. We note an [E : SO : S) ratio of (1.0 : 0.4 : 1.1) indicating a
ten percent increase of spirals over ellipticals. The core population comprises only
27% of the sample and resides in an area of 0.24 square degrees. This yields a core
surface density of 370 galaxies per square degree.
We notice several elliptical galaxies with coronas, in particular, a bright early
elliptical with a fainter elliptical located in its corona found at z = —47.8, y = 95.3.
We also note the diversity of spiral galaxies: several are found to possess ring-like
structures such as the one located at z = —62.9, y = 114.4; and several are seen to
be superposed as we find at z = —45.2, y = 82.8. We note a very peculiar galaxy
a t z = —61.7, y = 78.3.
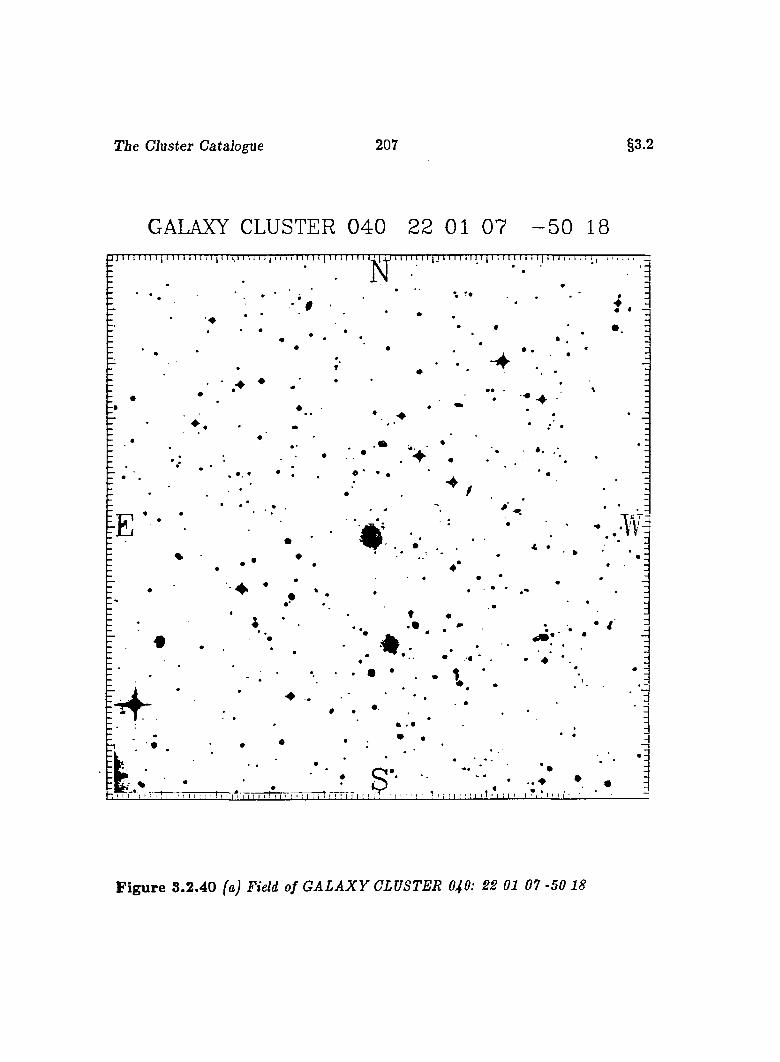
The Cluster Catalogue 207 §3.2
GALAXY CLUSTER 0 4 0 22 01 07 - 5 0 18
“1
F ig u re 8.2.40 (a) Field of G A L A X Y CLUSTER O4O: 22 01 07 -50 18
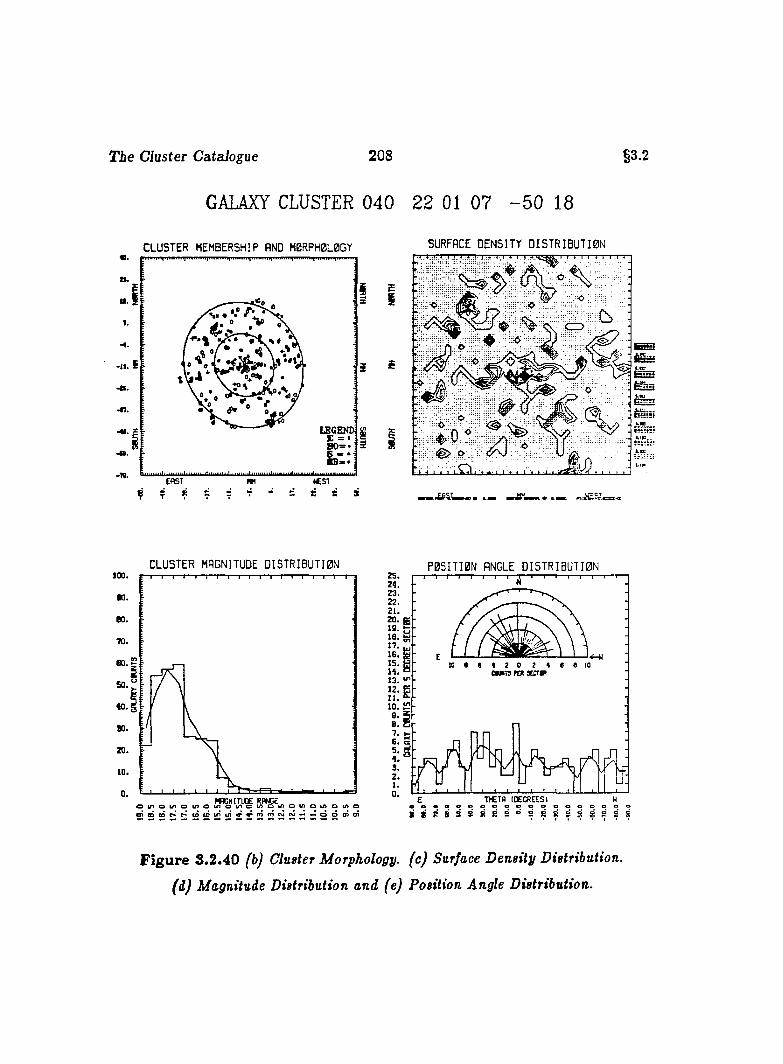
T ie Cluster Catsdogue 208
GALAXY CLUSTER 040 22 01 07 - 5 0 18
§3.2
C L U S T E R MEMBERSHIP AND M0RPH0L0GY
«a
•w.EAST
S
SURFACE D E N S IT Y D I S T R I B U T I 0 N
3
EI
:
;
C L U S T E R MAGNITUDE O I S T R I B U T I 0 N100.
n.BO,
■JO.
90.
20.
10.
0 .
P 0 5 I T I 0 N ANGLE D I 5 T R I B U T I 0 N
M C N ITU O E RRtCEO l / ) O W 9 0 l / ) O i n O t / Y O i / ) O l A O I A O U > O I / > 0O)S0DC*‘ r^tDC&inul«V*rT)fY)fM(^2'^*«OO0)(7)
24.
22.
7.5:
T>CTfl lOECREES)
s si s S 8 5 s s8 8
F ig u re 8.2 .40 fbJ Cluster Morphology, (c) Surface Density Distribution,
(d) Magnitude Distribution and (e) Position Angle Distribution.
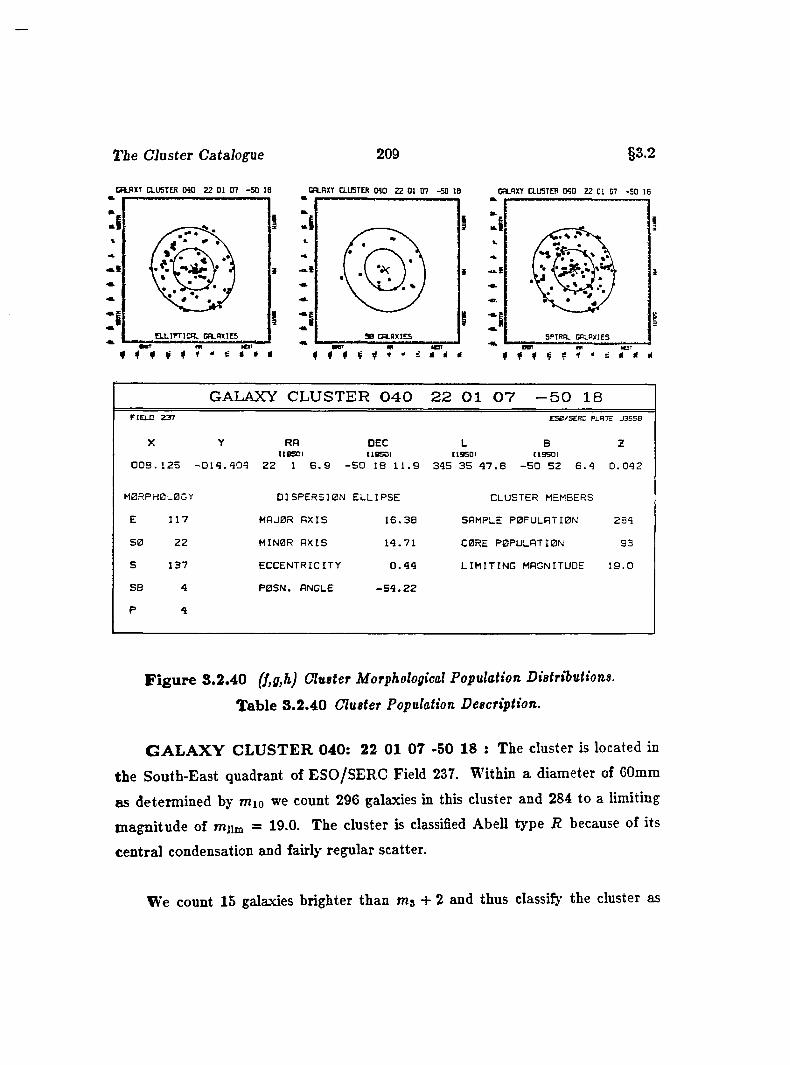
The Cluster Catalogue 209 §3.2
CRJ^XT CLUSTER MO 22 01 07 -50 16 CR.RXY CLUSTER MO 22 01 07 -50 18
i 4 ^
GALAXY CLUSTER MO 22 01 07 -5 0 18
i
9 0 GALAXIES
H H 4 4 4 4 4
GALAXY CLUSTER 040 2 2 01 07 -50 18FIELD 237 ESB/SERC PLATE J36SB
X
0 0 8 . 1 2 5
Y
- 0 1 4 . 4 0 4
RAIIBSOI
2 2 1 6 . 9 -
DECtlBSOI
-5 0 18 1 1 . 9
L BIISSOI IISSOI
3 4 5 3 5 4 7 . 8 - 5 0 5 2 6 . 4
Z
0 . 0 4 2
M0RPH0L0GY D IS P E R S IO N E L L IP S E CLUSTER MEMBERS
E 1 1 7 MAJOR A X IS 1 6 . 3 8 SAMPLE P OPULATION 2 8 4
S 0 2 2 MINBR A X IS 1 4 . 7 1 CORE P OPULATION 93
s 1 3 7 E C C E N T R IC IT Y 0 . 4 4 L I M I T I N G MAGNITUDE 1 9 . 0
SB 4 P 0 S N . ANGLE - 5 4 . 2 2
P 4
F ig u re 8.2 .40 (f,g,h) Cluster Morphological Population Distributions.
T able 3.2 .40 Cluster Population Description.
G A L A X Y C L U S T E R 040: 22 01 07 -50 18 : The cluster is located in
the South-East quadrant of ESO/SERC Field 237. Within a diameter of 60mm
as determined by mio we count 296 galaxies in this cluster and 284 to a limiting
m agnitude of mum = 19.0. The cluster is classified Abell t>'pe R because of its
central condensation and fairly regular scatter.
W e count 15 galaxies brighter than ms + 2 and thus classify the cluster as
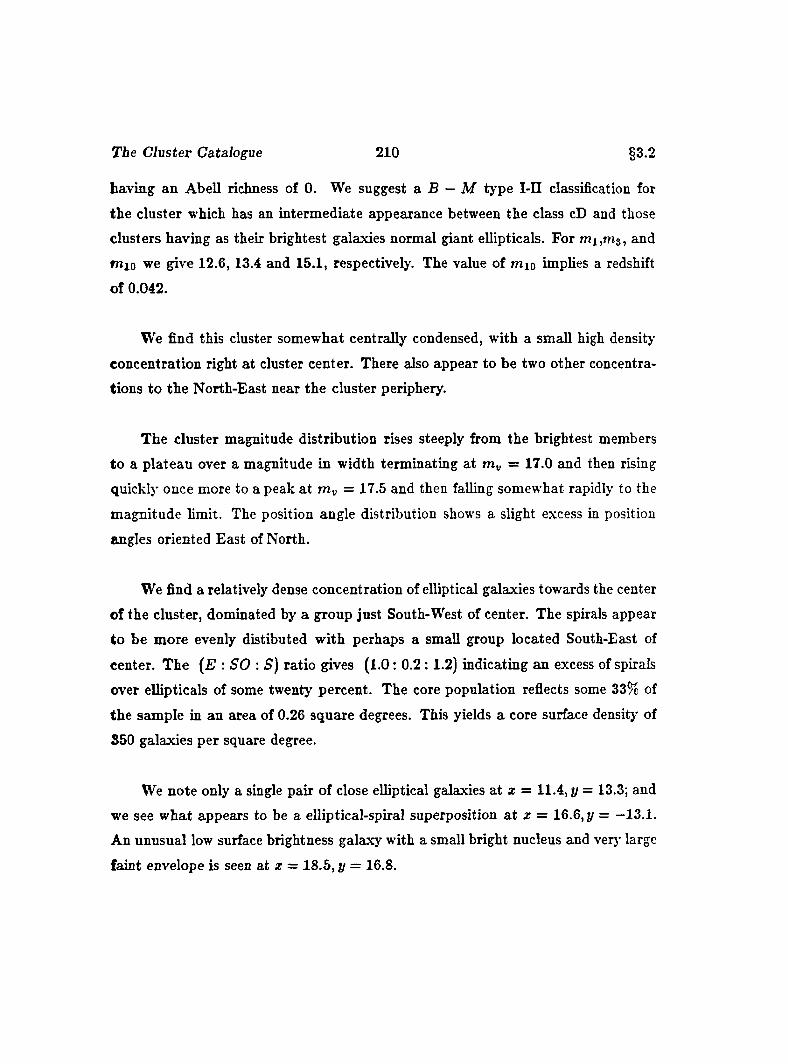
T ie Cluster Catalogue 210 §3.2
having an Abell richness of 0. We suggest a B — M type I II classification for
the cluster which has an intermediate appearance between the class cD and those
clusters having as their brightest galaxies normal giant ellipticals. For m i,m 3 , and
mio we give 12.6, 13.4 and 15.1, respectively. The value of mio implies a redshift
of 0.042.
We find this cluster somewhat centrally condensed, with a small high density
concentration right at cluster center. There also appear to be two other concentra
tions to the North-East near the cluster periphery.
The cluster magnitude distribution rises steeply from the brightest members
to a plateau over a magnitude in width terminating at m„ = 17.0 and then rising
quickly once more to a peak at m„ = 17.5 and then falling somewhat rapidly to the
magnitude limit. The position angle distribution shows a slight excess in position
angles oriented East of North.
We find a relatively dense concentration of elliptical galaxies towards the center
of the cluster, dominated by a group just South-West of center. The spirals appear
to be more evenly distibuted with perhaps a small group located South-East of
center. The {E : SO : S) ratio gives (1.0: 0.2 :1.2) indicating an excess of spirals
over ellipticals of some twenty percent. The core population reflects some 33% of
the sample in an area of 0.26 square degrees. This yields a core surface density of
350 galaxies per square degree.
We note only a single pair of close elliptical galaxies at z = 11.4, y = 13.3; and
we see what appears to be a elliptical-spiral superposition at x = 16.6, y = —13.1.
An unusual low surface brightness galaxy with a small bright nucleus and verj’ large
faint envelope is seen at x = 18.5, y = 16.8.
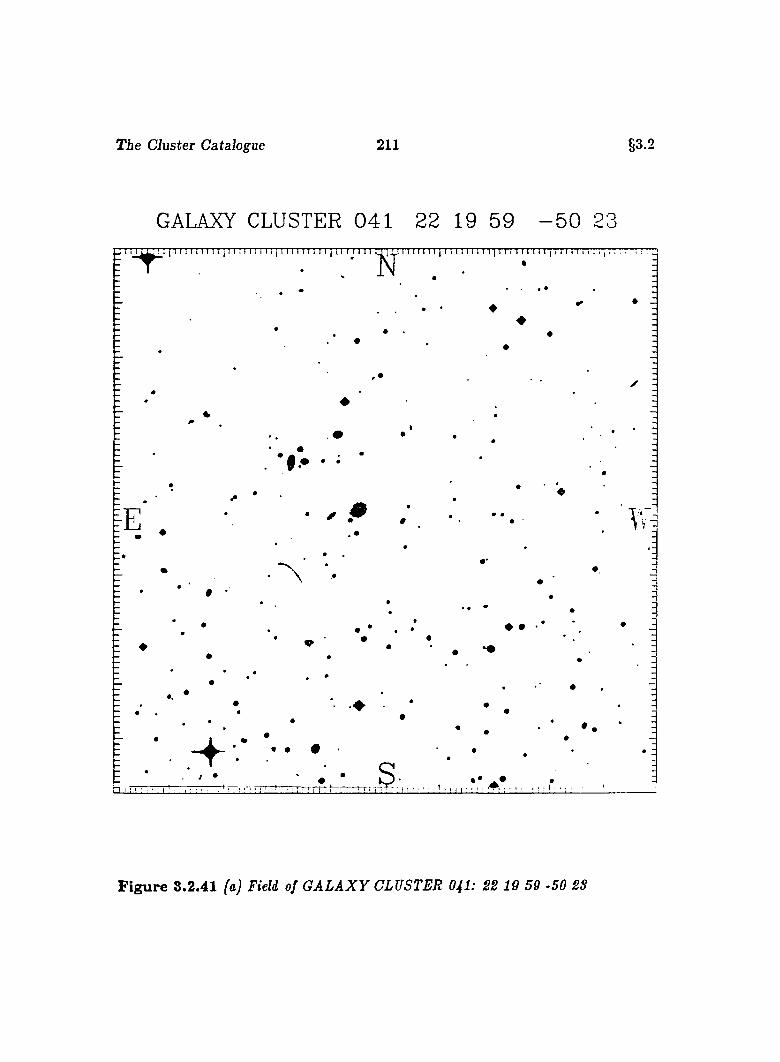
The Cluster Catalogue 211 53.2
GALAXY CLUSTER 041 22 19 59 - 5 0 23
♦ •
F ig u re 3.2.41 (a) Field of G A L A X Y CLUSTER 04I: 22 19 59 -50 2S
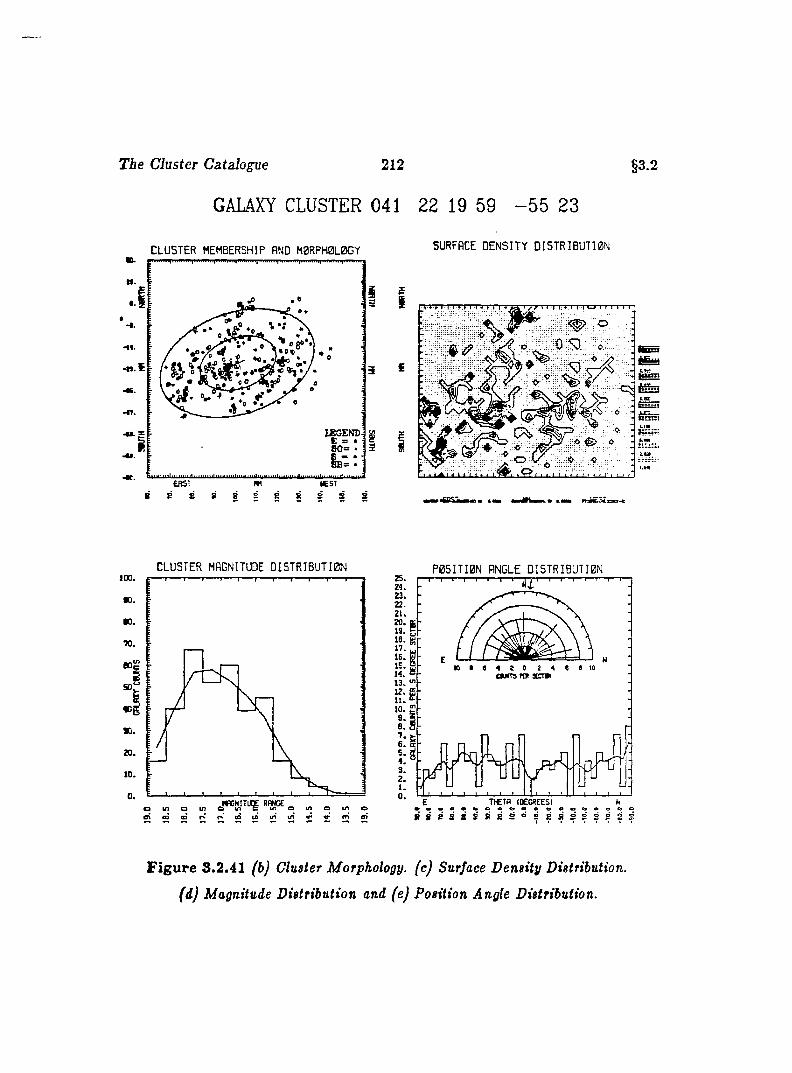
The Cluster Catalogue 212
GALAXY CLUSTER 041 22 19 59 - 5 5 23
SURFACE D E N S I T Y D I S T R 1 B U T I 0 N
§3.2
C L U S T E R MEMBERSHIP AND M 0RPH0L0GY
H7.
1£GEKD- C = • i80= ♦ ;
WEST
g RS 9 s 3
I f 1 1 1 I I I M M I J f e i I >^7 t i t 1:4.1 j T W n
wié£3iaap««
C L U S T E R MAGNITUDE D I S T R I B U T I 0 N
■0 .
o u, =
P O S I T I O N ANGLE D I S T R I B U T I O N
Ti€Tfl icecsresi8 E 2 “ S3 3 3 ;g 8 e s
F ig u re 8.2.41 (b) Cluster Morphology, (c) Surface Density Distribution,
(d) Magnitude Distribution and (e) Position Angle Distribution.
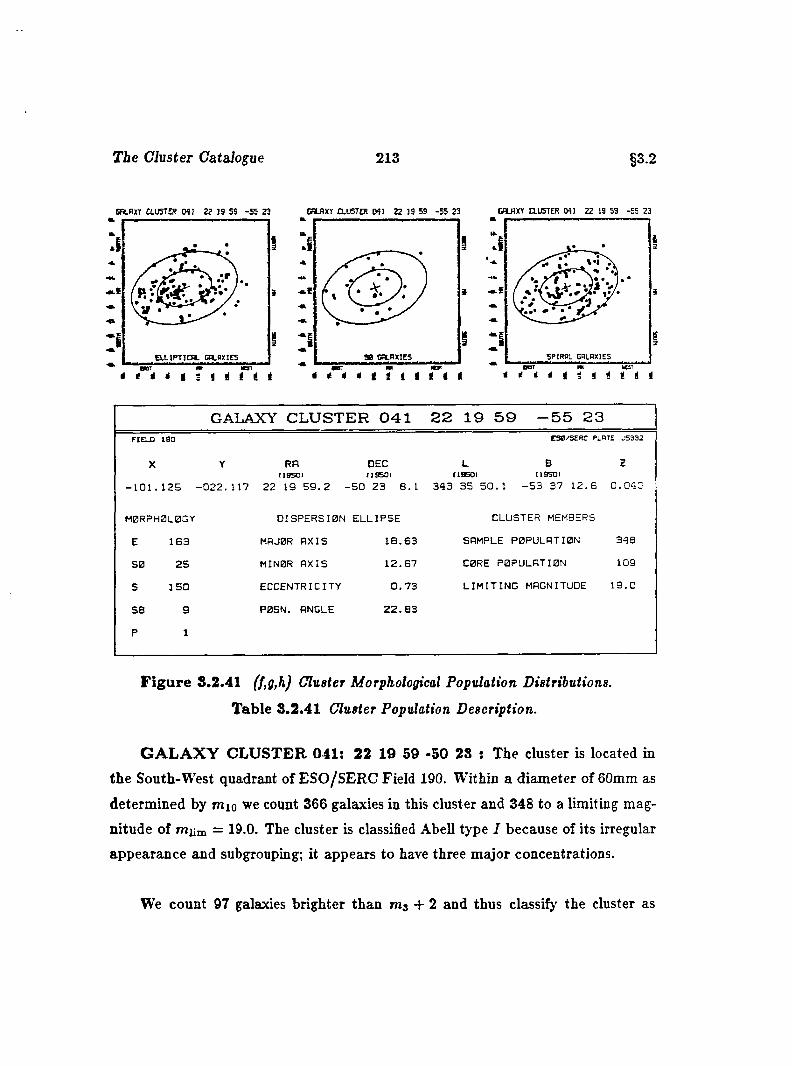
T ie CJuster Catalogue 213 §3.2
C a .f iX T C L U S T E R 04% 2 2 1 9 5 9 - 5 5 2 3 CRLRXT CLUSTER M l 22 19 59 55 23 GALAXY [LUSTER M l 22 19 59 -55 23
•rii
Ii i
GALAXY CLUSTER 0 4 1 2 2 1 9 5 9 ■55 2 3FIELD ISO
X
ES0/SERC PLATE JS 332
zY RA DEC L BfIBSDI 1 :3501 (1B50I (19501
1 0 1 . 1 2 5 - 0 2 2 . 1 1 7 2 2 19 5 9 . 2 - 5 0 2 3 6 . 1 3 4 3 3 5 5 0 . 1 - 5 3 3 7 1 2 . 6 0 . 0 4
M0RP H 0L 0G Y
E 1 6 3
5 0 2 5
5 1 5 0
SB 9
P 1
D IS P E R S IO N E L L IP S E
MHJ0R A X IS I B . 6 3
M IN 0R A X IS 1 2 . 6 7
E C C E N T R IC IT Y 0 . 7 3
P0SN. ANGLE 2 2 . 8 3
CLUSTER MEMBERS
SAMPLE P O P U L A TIO N 3 4 8
CORE PO P U L A TIO N 109
L I M I T I N G MAGNITUDE 1 9 . 0
F ig u re 8.2.41 (f,g,h) Cluster Morphological Population Distributions.
T able 3.2.41 Cluster Population Description.
G A L A X Y C L U S T E R 041; 22 19 59 -50 28 ; The cluster is located in
the South-West quadrant of ESO/SERC Field 190. Within a diameter of 60mm as
determined by mio we count 366 galaxies in this cluster and 348 to a limiting mag
nitude of miim = 19.0. The cluster is classified Abell type I because of its irregular
appearance and subgrouping; it appears to have three major concentrations.
We count 97 galaxies brighter than + 2 and thus classify the cluster as
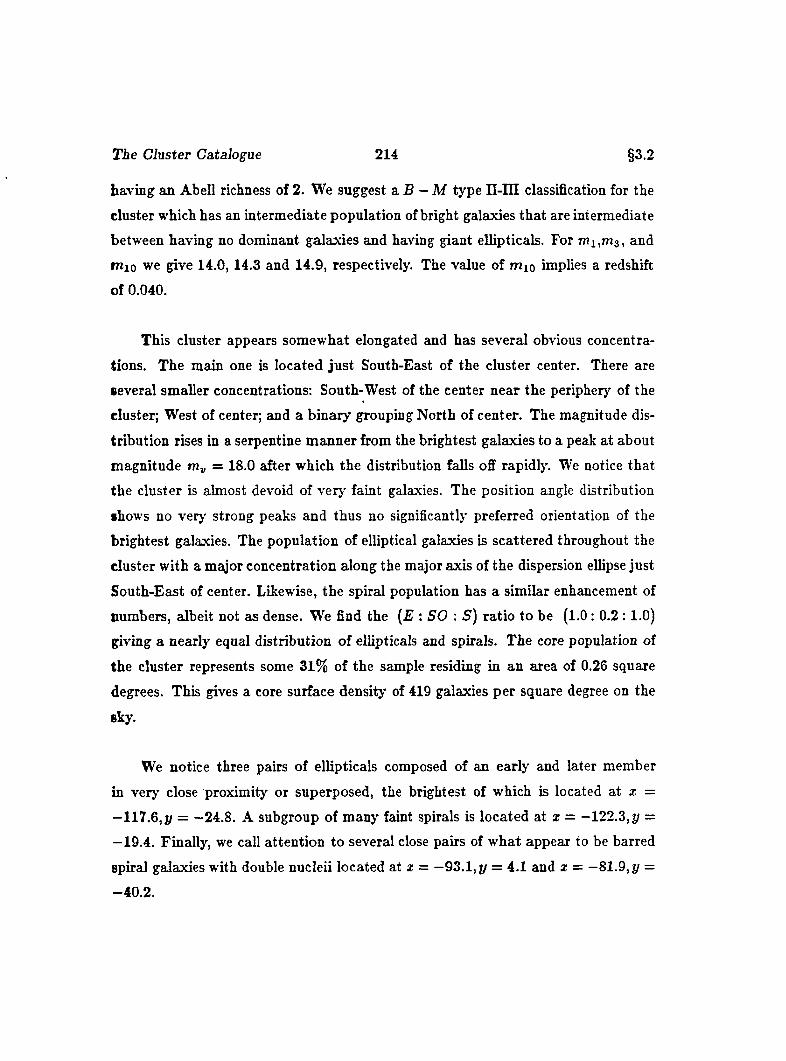
T ie Cluster Catalogue 214 §3.2
having an Abell richness of 2. We suggest a B —M type II-III classification for the
cluster which has an intermediate population of bright galaxies that are intermediate
between having no dominant galaxies and having giant ellipticals. For m i,m 3 , and
mio we give 14.0, 14.3 and 14.9, respectively. The value of mio implies a redshift
of 0.040.
This cluster appears somewhat elongated and has several obvious concentra
tions. The main one is located just South-East of the cluster center. There are
several smaller concentrations: South-West of the center near the periphery of the
cluster; West of center; and a binary grouping North of center. The magnitude dis
tribution rises in a serpentine manner from the brightest galaxies to a peak at about
magnitude = 18.0 after which the distribution falls off rapidly. We notice that
the cluster is almost devoid of verj' faint galaxies. The position angle distribution
shows no very strong peaks and thus no significantly preferred orientation of the
brightest galaxies. The population of elliptical galaxies is scattered throughout the
cluster with a major concentration along the major axis of the dispersion ellipse just
South-East of center. Likewise, the spiral population has a similar enhancement of
numbers, albeit not as dense. We find the (E : SO : S) ratio to be (l.O : 0.2 : 1.0)
giving a nearly equal distribution of ellipticals and spirals. The core population of
the cluster represents some 31% of the sample residing in an area of 0.26 square
degrees. This gives a core surface density of 419 galaxies per square degree on the
sky.
We notice three pairs of ellipticals composed of an early and later member
in very close proximity or superposed, the brightest of which is located at x =
—117.6,ÿ = —24.8. A subgroup of many faint spirals is located at x = -122.3, y =
—19.4. Finally, we call attention to several close pairs of what appear to be barred
spiral galaxies with double nucleii located at x = —93.1, y = 4.1 and x = —81.9, y =
-40.2 .
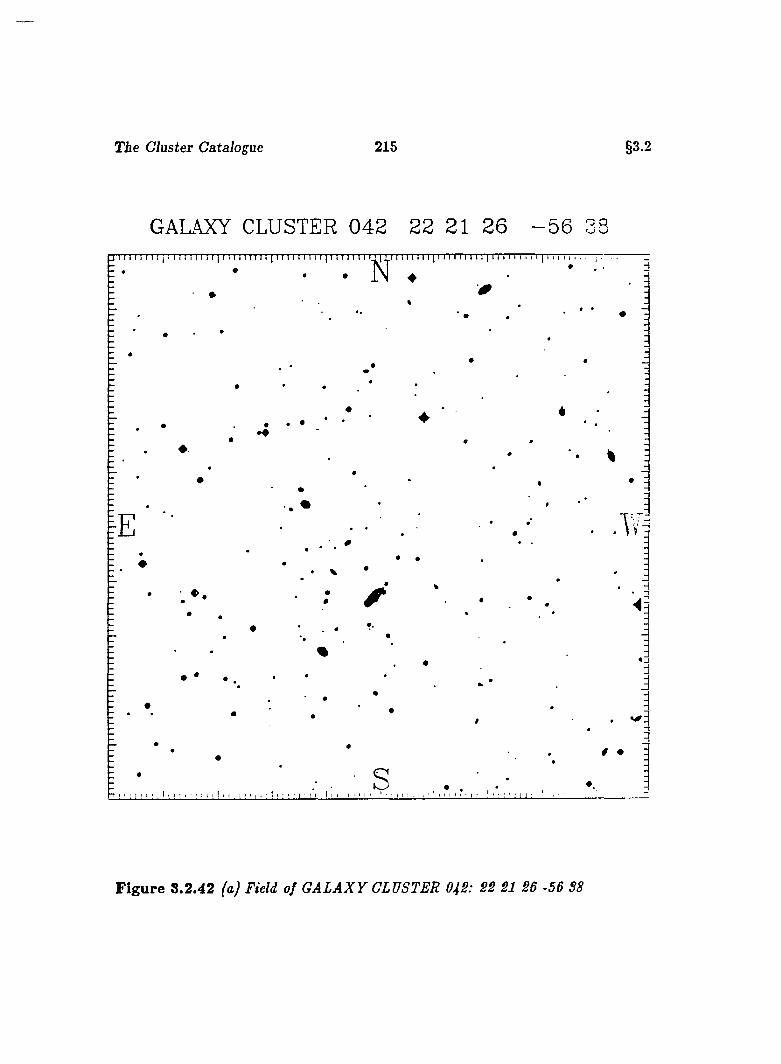
Tie Cluster Catalogue 215 §3.2
GALAXY CLUSTER 042 22 21 26 - 5 6 33
F ig u re 8.2.42 (a) Field of G A L A X Y CLUSTER Of2: 22 21 26 -56 S8
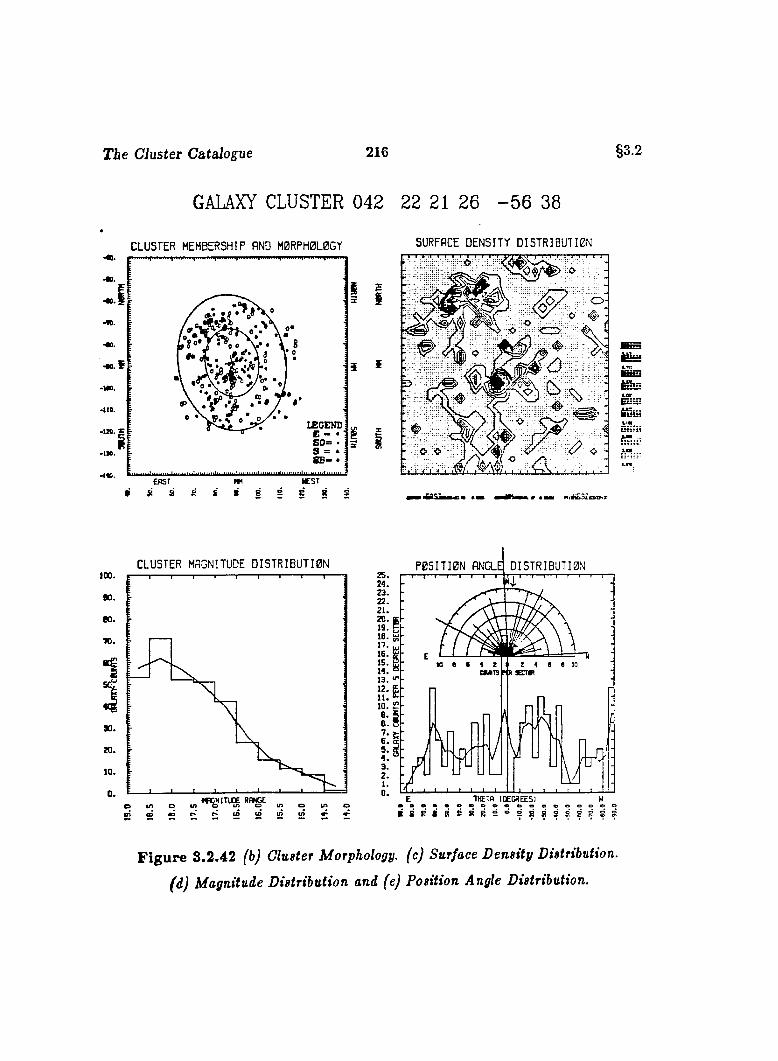
T ie Cluster Catalogue 216
GALAXY CLUSTER 042 22 21 26 - 5 6 38
§3.2
C L U S T E R MEMBERSHIP AND M 0 R P H 0L 0G Y
O*
•MO.
.#• I to .
LEGENDG 0 =
8 B - •
WESTEAST m
3
SURFACE D E N S IT Y D I S T R I B U T I 0 N
5I O-
:o
i( £Sânar.a:
C LUSTER MAGNITUDE D I S T R I B U T I 0 N D I S T R I B U T I 0 Ntoo.
60.
60 .
70.
90.20.
10.
o U, o m
P 0 5 I T I 0 N ANGLE
2 4 e 0 w m aECT*
E THETA (DECREES) W
: 3 ; : 5 : ; g : 5 H H ; H- H
F ig u re 3.2.42 (b) Cluster Morphology, (c) Surface Density Distribution,
(d) Magnitude Distribution and (e) Position Angle Distribution.
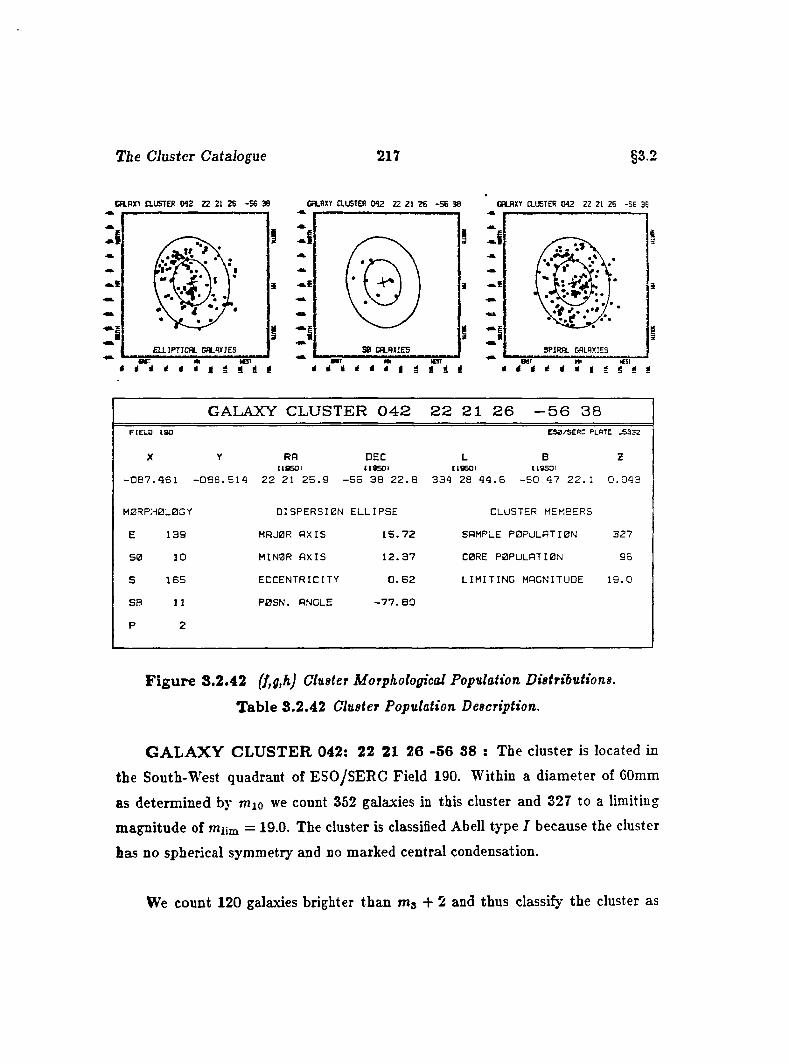
Tie CJuster Catalogue 217 §3.2
C O .R X 1 aUSTER 042 22 21 2S -56 38 Ca.nXY auSTER 042 22 21 26 -5 6 38 CflLRXT CLUSTER 042 22 21 26 -56 36
i
58 C aS X IE S
i i i t
GALAXY CLUSTER 042 22 21 26 -56 38FIELO ISO
X
ESB/SERC PLATE JS332
zY RA DEC L BI i a s o i U 9 5 0 I I1950I ( tasoi
0 B 7 . 9 6 1 - 0 8 8 . 5 1 4 2 2 21 2 5 . 9 - 5 6 3 8 2 2 . 8 3 3 4 28 4 4 . 6 - 5 0 4 7 2 2 . 1 0 . 0 4 3
MORPHOLOGY
E 1 3 9
5 0 10
S 1 6 5
SB 11
P 2
D IS P E R S IO N E L L IP S E
MRJ0R A X IS 1 5 . 7 2
MINOR A X IS 1 2 . 3 7
E C C E N T R IC IT Y 0 . 6 2
P 0S N . ANGLE - 7 7 . BO
CLUSTER MEMBERS
SAMPLE p o p u l a t i o n 3 2 7
C0RE POPULATION 96
L I M I T I N G MAGNITUDE 1 9 . 0
F ig u re 8.2.42 f/,g,hj Cluster Morphological Population Distributions.
T able S.2.42 Cluster Population Description.
G A L A X Y C L U S T E R 042; 22 21 26 -56 38 ; The cluster is located in
the South-West quadrant of ESO/SERC Field 190. Within a diameter of 60mm
as determined by mio we count 352 galaxies in this cluster and 327 to a limiting
magnitude of miim = 19.0. The cluster is classified Abell type [ because the cluster
has no spherical symmetry and no marked central condensation.
We count 120 galaxies brighter than m j + 2 and thus classify the cluster as
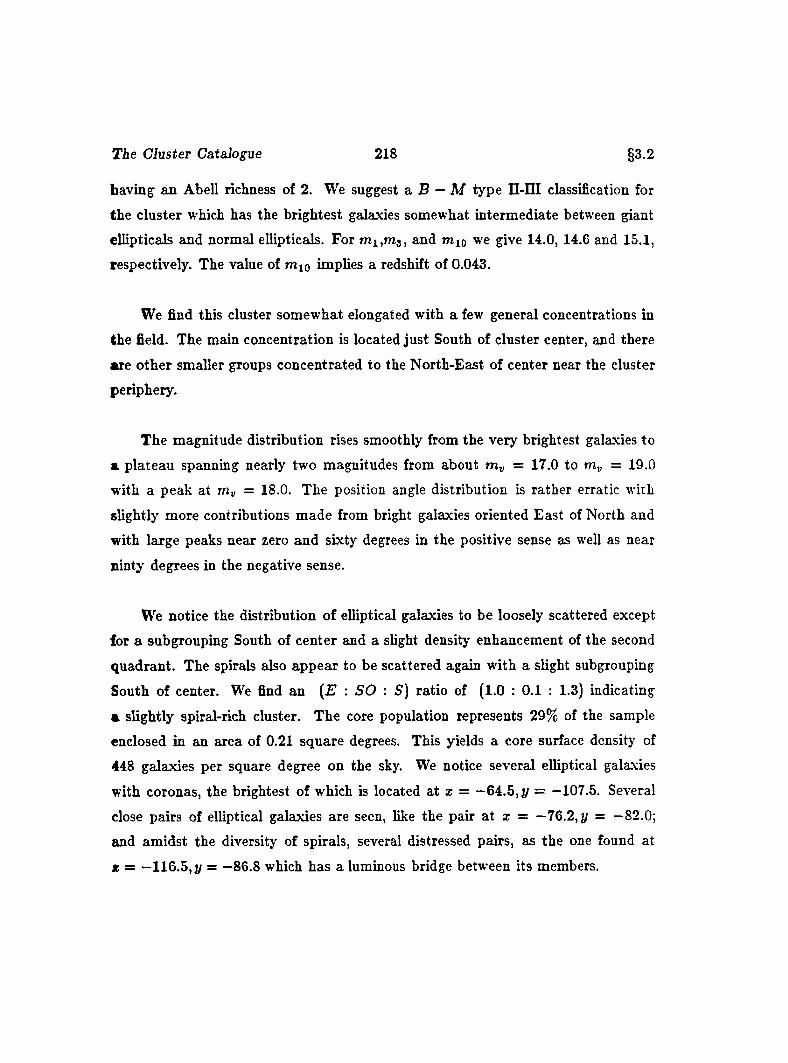
Tie CJuster Catalogue 218 §3.2
having an Abell richness of 2. We suggest a B — M type II-III classification for
the cluster which has the brightest galaxies somewhat intermediate between giant
ellipticals and normal ellipticals. For m i,m 3 , and mio we give 14.0, 14.6 and 15.1,
respectively. The value of mio implies a redshift of 0.043.
We find this cluster somewhat elongated with a few general concentrations in
the field. The main concentration is located just South of cluster center, and there
are other smaller groups concentrated to the North-East of center near the cluster
periphery.
The magnitude distribution rises smoothly from the very brightest galaxies to
a plateau spanning nearly two magnitudes from about m„ = 17.0 to m„ = 19.0
with a peak at m^ = 18.0. The position angle distribution is rather erratic with
slightly more contributions made from bright galaxies oriented East of North and
with large peaks near zero and sixty degrees in the positive sense as well as near
ninty degrees in the negative sense.
We notice the distribution of elliptical galaxies to be loosely scattered except
for a subgrouping South of center and a slight density enhancement of the second
quadrant. The spirals also appear to be scattered again with a slight subgrouping
South of center. We find an (E : SO : S) ratio of (1.0 : 0.1 ; 1.3) indicating
«. slightly spiral-rich cluster. The core population represents 29% of the sample
enclosed in an area of 0.21 square degrees. This yields a core surface density of
448 galaxies per square degree on the sky. We notice several elliptical galaxies
with coronas, the brightest of which is located at z = —64.5, y = —107.5. Several
close pairs of elliptical galaxies are seen, like the pair a t z = —76.2, y = —82.0;
and amidst the diversity of spirals, several distressed pairs, as the one found at
z = —116.5, y = —86.8 which has a luminous bridge between its members.
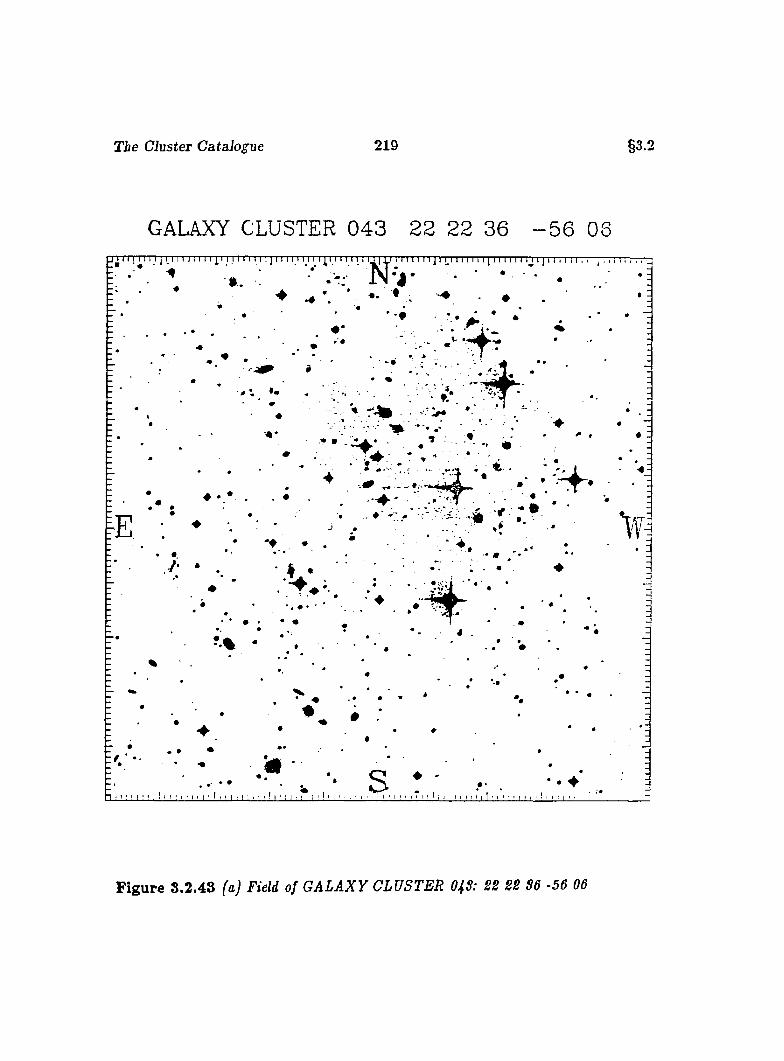
Tie Cluster Catalogue 219 §3.2
GALAXY CLUSTER 0 4 3 22 22 36 - 5 6 OS
F ig u re 3.3.43 faj Field of G A LA X Y CLUSTER 04S: 22 22 36 -56 06
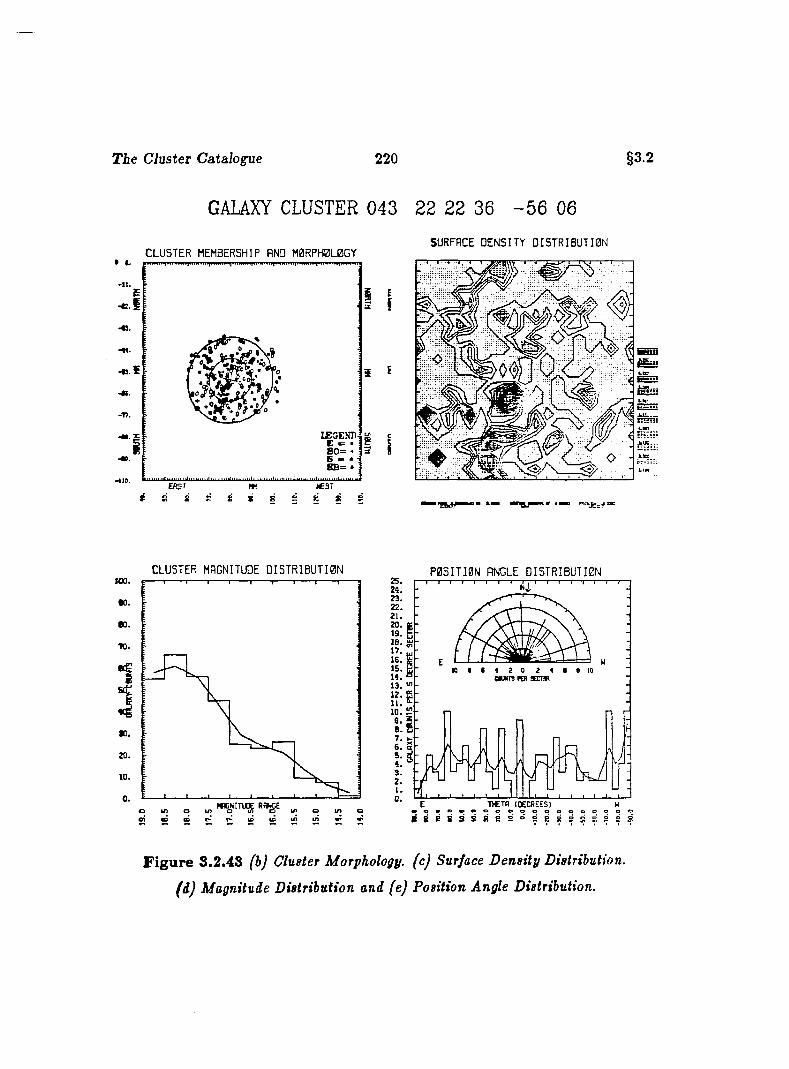
The Cluster Catalogue 220 §3.2
GALAXY CLUSTER 043 22 22 36 - 5 6 06
SURFACE D E N S I T Y O I S T R I B Ü T I 0 N» ft.
• f l .
-«.Ï
C L U S T E R MEMBERSHIP AND M 0R PH 0L 0G Y
-
IfGEND. 8 0 = '
Ib=:
I I
3 i
E A S T m I C 9 T
, m m
CLU STER MAGNITUDE D I S T R I B U T I 0 Ntoo.
•0.80.70.
20.
10.
0 .
P 0 S I T I 0 N ANGLE D I S T R Î B U T I 0 N2 5 .24.
22.
19.
1 7 .
1 3 . ^
E T Æ T f l (D E C R E E S )
; ;
F ig u re 3.2.48 (b) Cluster Morphology, (c) Surface Density Distribution,
(d) Magnitude Distribution and (e) Position Angle Distribution.
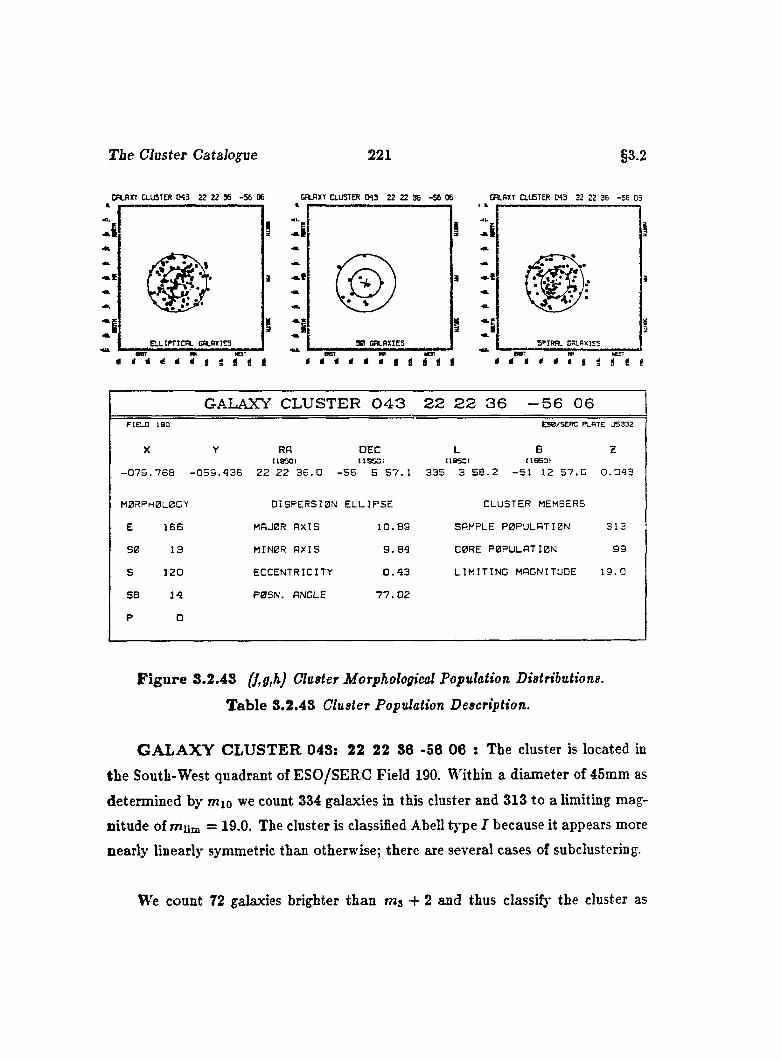
The CJuster Cata lane 221 §3.2
C a f lïT CLUSTER 04 3 22 22 36 -5 6 06 GH.RXT CLUSTER 043 22 22 36 -58 06 CRLRXT CLUSTER 043 22 22 36 -5 6 05
i
30 G A L A X IE S
GALAXY CLUSTER 043 22 22 36 -56 06FIELD ISO
X
ESO/SERC PLATE JS 332
zY RA DEC L B( l a s o i U S 5 C I (1S5DI (19S 0I
0 7 9 . 7 6 8 - 0 5 9 . 4 3 6 2 2 2 2 3 6 . 0 - 5 6 5 5 7 . 1 3 3 5 3 5 8 . 2 - 5 1 12 5 7 . 0 0 . 0 4 3
MORPHOLOGY
E IB B
SO 1 3
S 1 2 0
SB 1 4
P O
D IS P E R S IO N E L L IP S E
MAJOR A X IS 1 0 . 8 9
MINOR A X IS 9 . 8 4
E C C E N T R IC IT Y 0 . 4 3
P0S N. ANGLE 7 7 . 0 2
CLUSTER MEMBERS
SAMPLE P OPULATION 3 1 3
CORE P O P ULA TIO N 9 9
L I M I T I N G MAGNITUDE 1 9 . 0
F ig u re 3.2.43 (f,g,h) CluBter Morphological Population Distributions.
Table 3.2.43 Cluster Population Description.
G A L A X Y C L U S T E R 043: 22 22 36 -56 06 : The cluster is located in
the South-West quadrant of ESO/SERC Field 190. Within a diameter of 45mm as
determined by mio we count 334 galaxies in this cluster and 313 to a limiting mag
nitude of mum = 19-0. The cluster is classified Abell type I because it appears more
nearly linearly symmetric than otherwise; there are several cases of subclustering.
W'e count 72 galaxies brighter than -t- 2 and thus classi^’ the cluster as
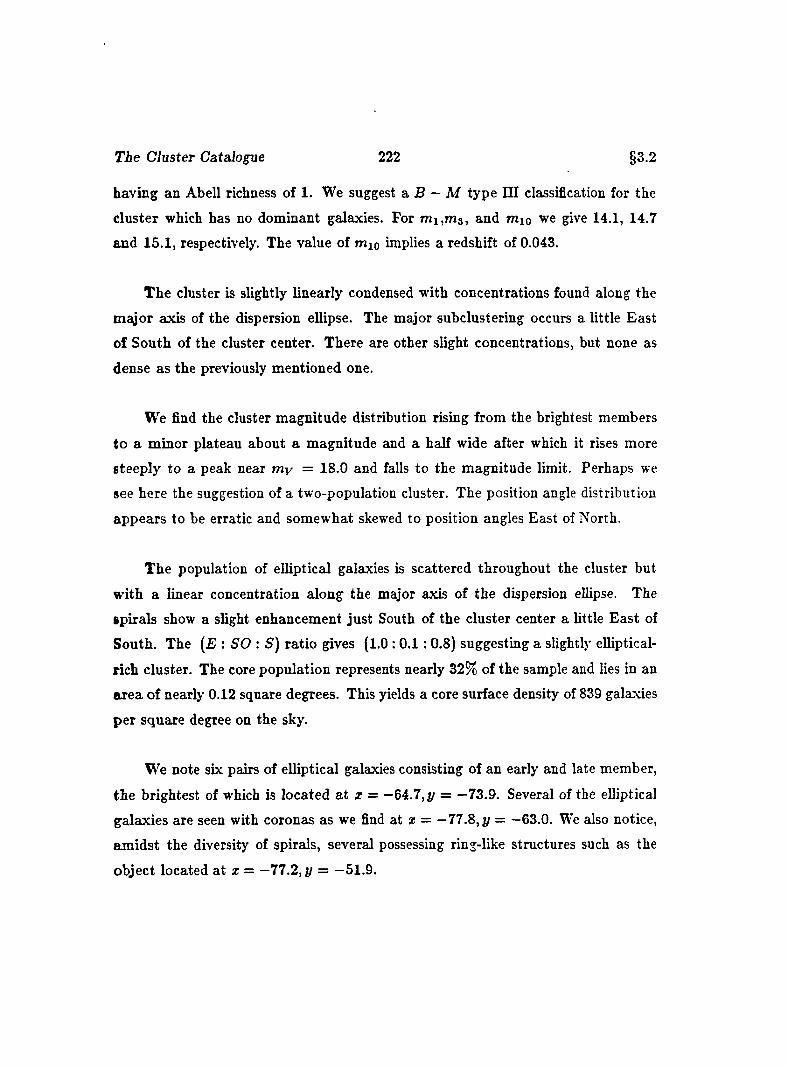
The CJuster Catalogue 222 §3.2
having an Abell richness of 1. We suggest a B — M type HI classification for the
cluster which has no dominant galaxies. For 7ni,ms, and mio we give 14.1, 14.7
and 15.1, respectively. The value of mio implies a redshift of 0.043.
The cluster is slightly linearly condensed with concentrations found along the
m ajor axis of the dispersion ellipse. The major subclustering occurs a little East
of South of the cluster center. There are other slight concentrations, but none as
dense as the previously mentioned one.
We find the cluster magnitude distribution rising from the brightest members
to a minor plateau about a magnitude and a half wide after which it rises more
steeply to a peak near my = 18.0 and falls to the magnitude limit. Perhaps we
see here the suggestion of a two-population cluster. The position angle distribution
appears to be erratic and somewhat skewed to position angles East of North.
The population of elliptical galaxies is scattered throughout the cluster but
with a linear concentration along the major axis of the dispersion ellipse. The
spirals show a slight enhancement just South of the cluster center a little East of
South. The {E : SO : 5) ratio gives (1.0 : 0.1: 0.8) suggesting a slightly elliptical-
rich cluster. The core population represents nearly 32% of the sample and lies in an
area of nearly 0.12 square degrees. This yields a core surface density of 839 galaxies
per square degree on the sky.
We note six pairs of elliptical galaxies consisting of an early and late member,
the brightest of which is located at x = —64.7,y = —73.9. Several of the elliptical
galaxies are seen with coronas as we find at z = —77.8,%/ = —63.0. We also notice,
am idst the diversity of spirals, several possessing ring-like structures such as the
object located at z = —77.2, y = —51.9.
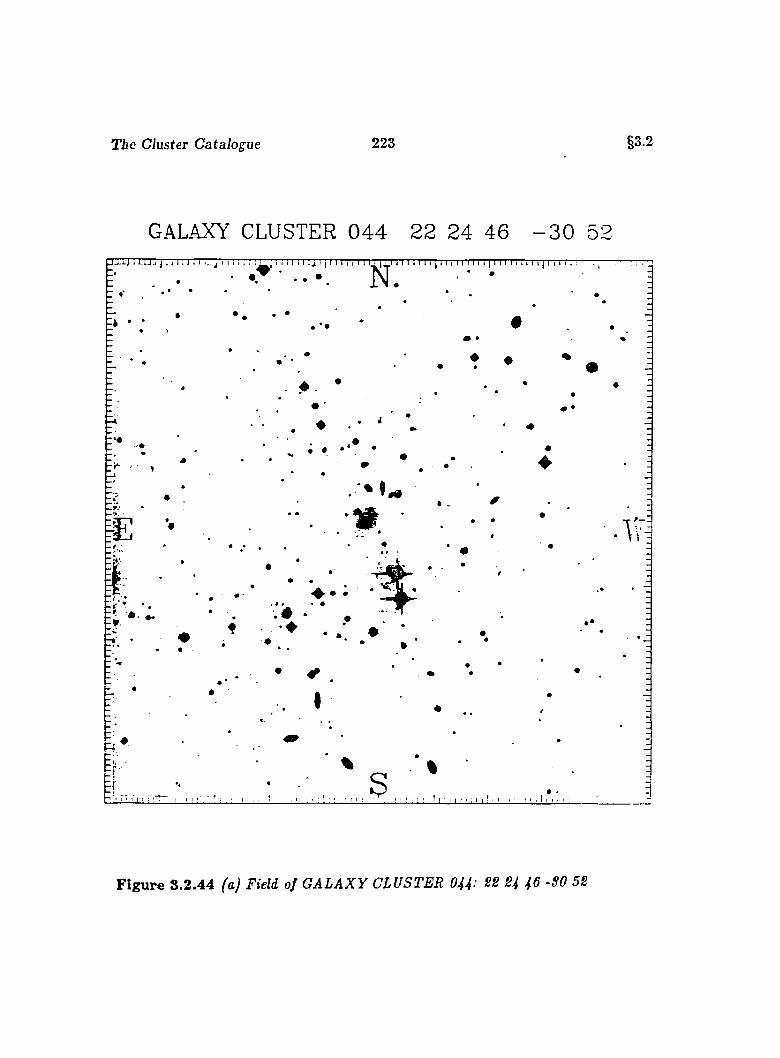
Tie CJuster Catalogue 223 §3.2
GALAXY CLUSTER 0 4 4 22 24 46 - 3 0 52
F ig u re 8.2 .44 fa) Field of G A LA X Y CLUSTER 044: 22 24 4 6 -SO 52
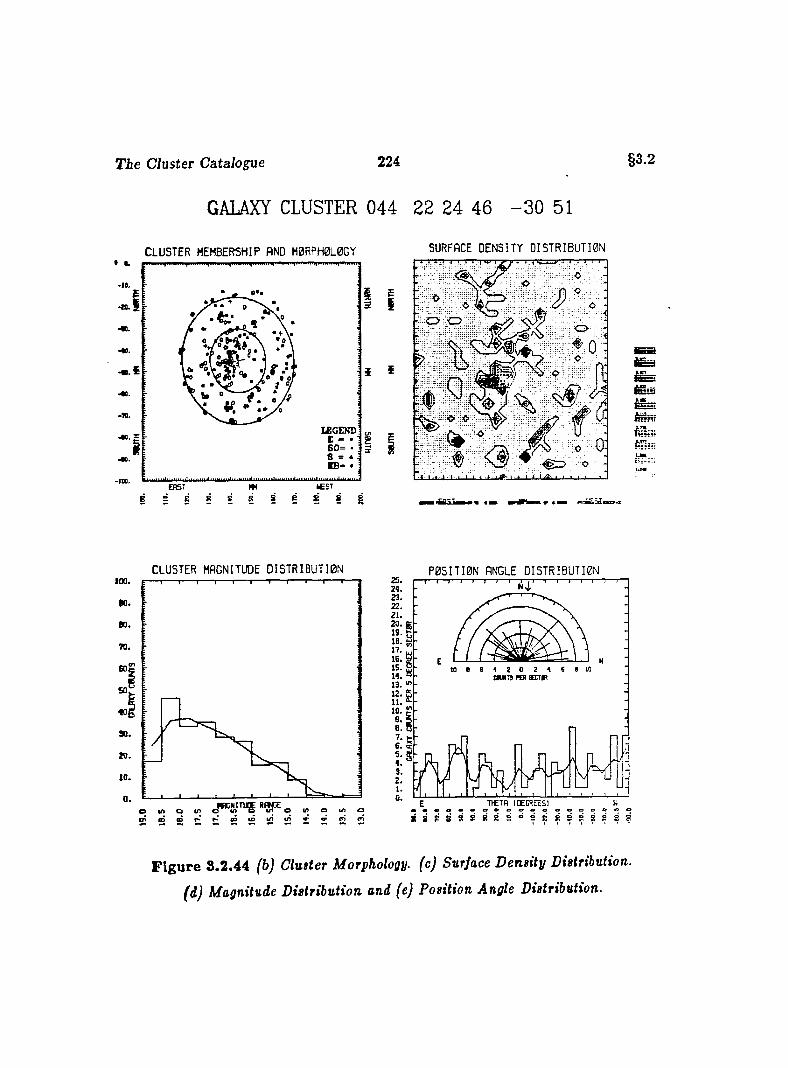
T ie Cluster Catalogue 224
GALAXY CLUSTER 044 22 24 46 - 3 0 51
C L U S T E R MEMBERSHIP AND M 0RPH 0L0G Y
§3.2
SURFACE D E N S IT Y D I S T R I B U T I O N
•le
•ô
S 0 =
WEST
é S 8ERST
8 §8 8 S sG
5I
■ O CD o
i tÉmtSssËiÿ
èraSi
CLU STER MAGNITUDE D I S T R I B U T I 0 N P O S I T I O N ANGLE D I S T R I B U T I O Ntoo.
•0.eo.70.
90.
» .
10.
IS .IB .n.15.
TtETfl IDECREESl
S S 2 g
F ig u re 8.2.44 (b) Clutter Morphology, (c) Surface Density Distribution,
(d) Magnitude Distribution and (e) Position Angle Distribution.
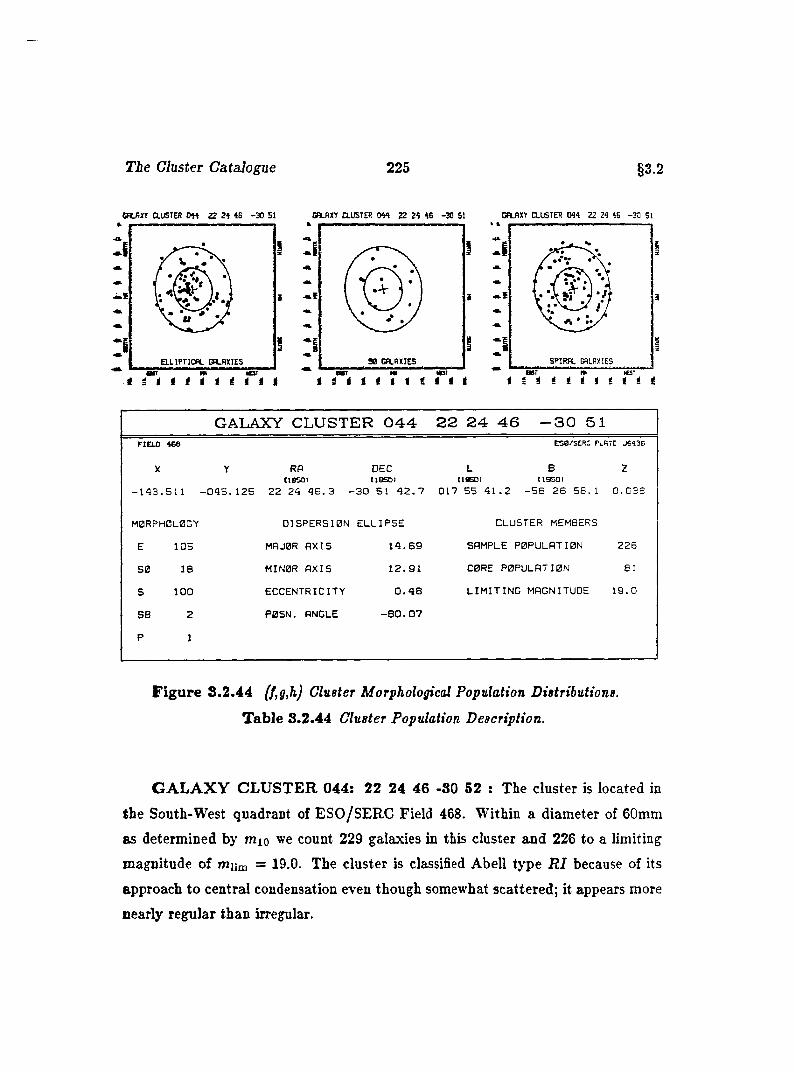
The Cluster Catalogue 225 §3.2
CfVlxr auSTER o n ZZ 24 46 -3 0 51 Ca.BX'r aUSTER d m ZZ 29 46 -30 51 CnjlXY CLUSTER 044 22 24 46 -3 0 51
i i
E L L IP T IC » - GALAXIESn r
i i i i i i t i i i i ii i i i i i i i i i t
GALAXY CLUSTER 044 22 24 46 -30 51r iE L D 466 ES0/SEFÎC PlR •E J6 4 3 6
X
- 1 4 3 . 5 1 1
Y
- 0 4 5 . 1 2 5
RB ciBsai 2 2 24 4 6 . 3 -
DEC iiesoi 3 0 51 4 2 . 7
L B119E0I (19501
0 1 7 5 5 4 1 . 2 - 5 8 2 6 5 6 . 1
H
0 . 0 3 8
M0RPHBL0CY D IS P E R S IO N E L L IP S E CLUSTER MEMBERS
E 1 0 5 MBJ0R A X IS 1 4 . 6 9 SAMPLE POPULATION 2 2 6
S 0 18 M IN 0R A X IS 1 2 . 9 1 C0RE P OPULATION 81
S 1 0 0 E C C E N T R IC IT Y 0 . 4 8 L I M I T I N G MAGNITUDE 1 9 . 0
SB 2 P0S N. ANGLE - 8 0 . 0 7
P 1
F ig u re S .2.44 Cluster Morphological Population Distributions.
Table 3.2.44 Cluster Population Description.
G A L A X Y C L U ST E R 044: 22 24 46 -80 52 : The cluster is located in
the South-West quadrant of ESO/SERC Field 468. Within a diameter of 60mm
as determined by mio we count 229 galaxies in this cluster and 226 to a limiting
magnitude of rnnm = 19.0. The cluster is classified Abell type R I because of its
approach to central condensation even though somewhat scattered; it appears more
nearly regular than irregular.
The Cluster Gatalog'ue 226 §3.2
We count 73 galaxies brighter than ms + 2 and thus classify the cluster as
having an Abell richness of 1. We suggest a B — M type II classification for the
cluster which has as its brightest member a galaxy intermediate between the class
cD and normal giant ellipticals. For m i,m 3 , and mio we give 13.5, 14.7 and 14.8,
respectively. The value of mio implies a redshift of 0.038.
The cluster appears somewhat scattered, but has several density concentra
tions the main one of which lies slightly East of the cluster center. Several smaller
concentrations are noted, most of them lying North of center whilst a single small
high density region lies South-East of the center of the cluster.
The cluster magnitude distribution rises in ramp-like fashion from the brightest
galaxies in the cluster to a maximum near m„ = 18.0 and drops off rapidly half a
magnitude later. The position angle distribution of the brighter galaxies shows no
obvious trend; but a slight peak is found at orientations West of North.
We find the elliptical galaxies somewhat more concentrated towards the center
of the cluster with their highest density in a region East of center. The spirals appear
to have a similar distribution, albeit more sparsely scattered. The {E : SO : S :)
ra tio is ( 1 . 0 : 0 . 2 : 1 .0 ) giving a similar number of ellipticals and spirals in the
cluster. The core population comprises nearly 36% of the sample contained in 0.21
square degrees. This yields a core surface density of 388 galaxies per square degree.
We note that the brightest galaxy in the cluster has a corona. There appears
to be a small subgroup of elliptical galaxies located at 2 = —159.5,y = —50.3. Of
the myriad and diverse spirals, we find several superposed such as those found at
* = —140.3,1/ = —66.7 and at z = —136.1, y = —19.6. Several peculiar galaxies are
seen such as the object located at 2 = -131.6, y = —17.9 which boasts a broken
ring-like structure.
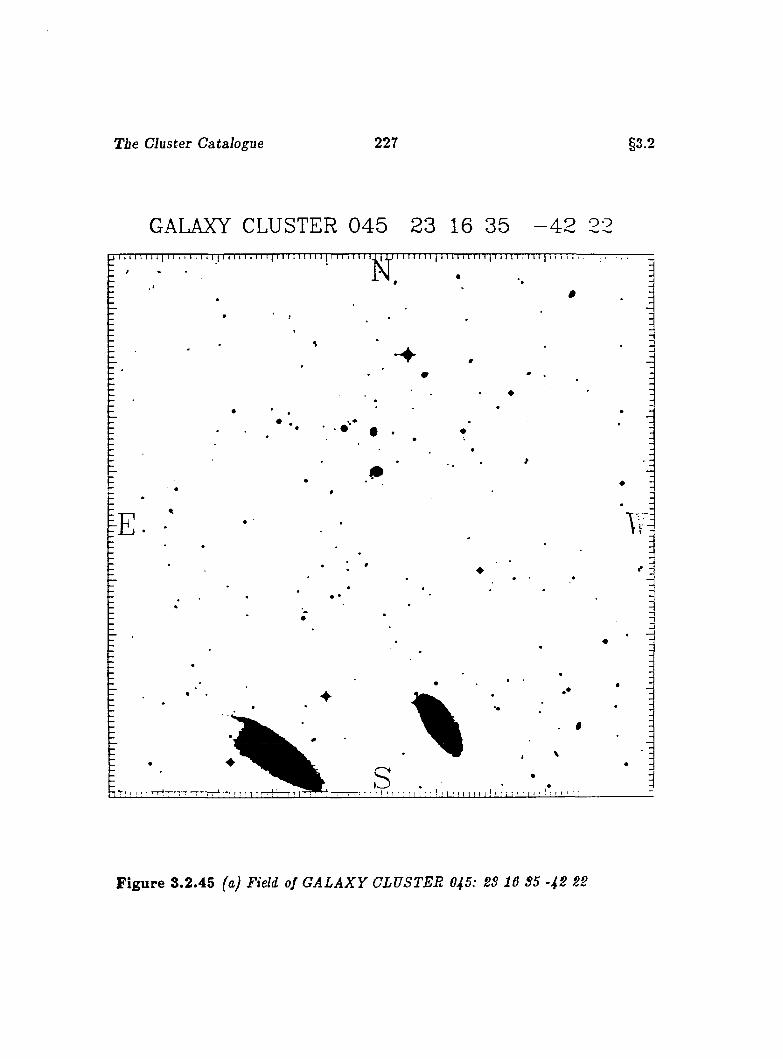
The Cluster Catalogue 227 §3.2
GALAXY CLUSTER 0 4 5 23 16 35 - 4 2 22j j 11 M 1 11 j 11 ; 1 i 1 1 1 1 i 1 1 1 1 1 M 11 1 1 1 1 1 1 1 1 1 1 1'l 111 i 11 u I JL I 11 11 111 i 1 1 M 1 1 1 M I n r i r n \t \-\ . i r . ; :— - r —
♦ .
s
■ \ ï 1
%
F ig u re 3.2.45 (a) Field of G A LA X Y CLUSTER 045: 2S 16 S5 -42 22
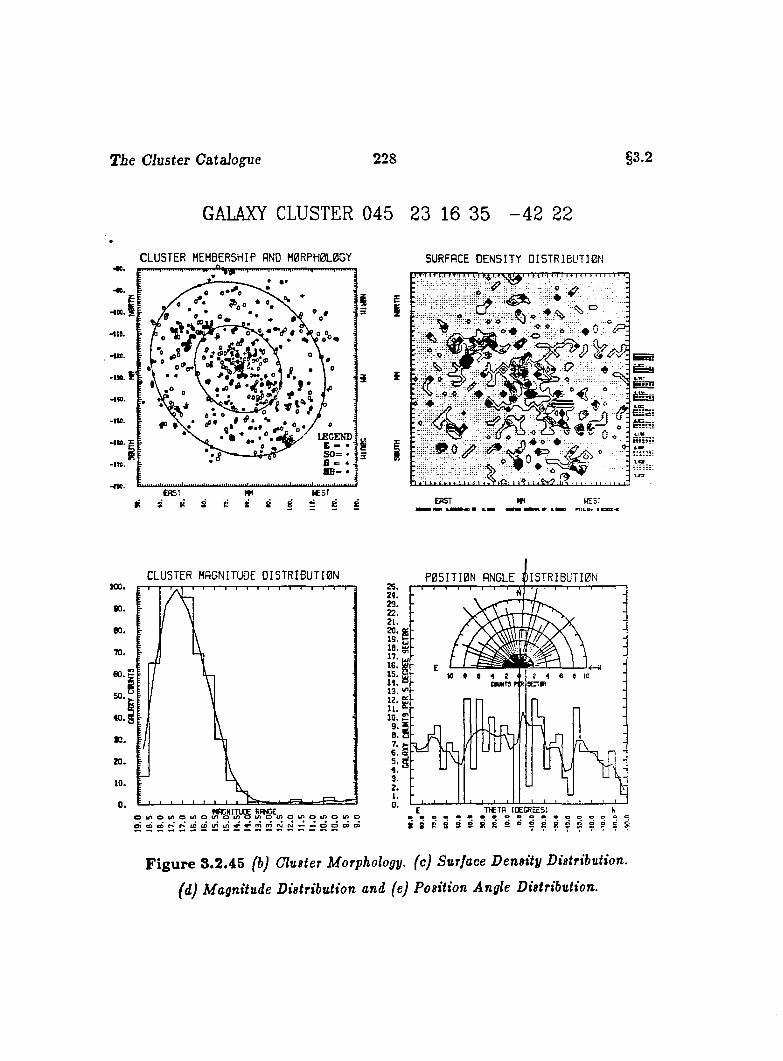
T ie Cluster Catalogue 228
GALAXY CLUSTER 045 23 16 35 - 4 2 22
§3.2
C L U S T E R MEMBERSHIP AND M 0R PH 0L0G Y
- 110.
L £ G £ N D
SURFACE D E N S I T Y D I S T R I B U T I 0 N■ r y T ir T T T .»:! I I n i 'M ' tt t t t I h 11 > h I n n :
I
ERST WESTiiim. <nB3>c
C L U S T E R MAGNITUDE O I 5 T R I B U T I 0 Ntoo.
6 0 .
5 0 .
M R C H IT U D E RANGEo i / ) 0 i n o i / i o i n o i / ) o ( / > 0 4 f î 0 i / )
P 0 5 I T I 0 N ANGLE D I S T R I B U T I B N
22.
19.16.
16.15.
13. 12. E
6 . a
ê:i : p s 3 s E S
F ig u re 3.2.45 (b) Cluster Morphology, (c) Surface Density Distribution,
(d) Magnitude Distribution and (e) Position Angle Distribution.
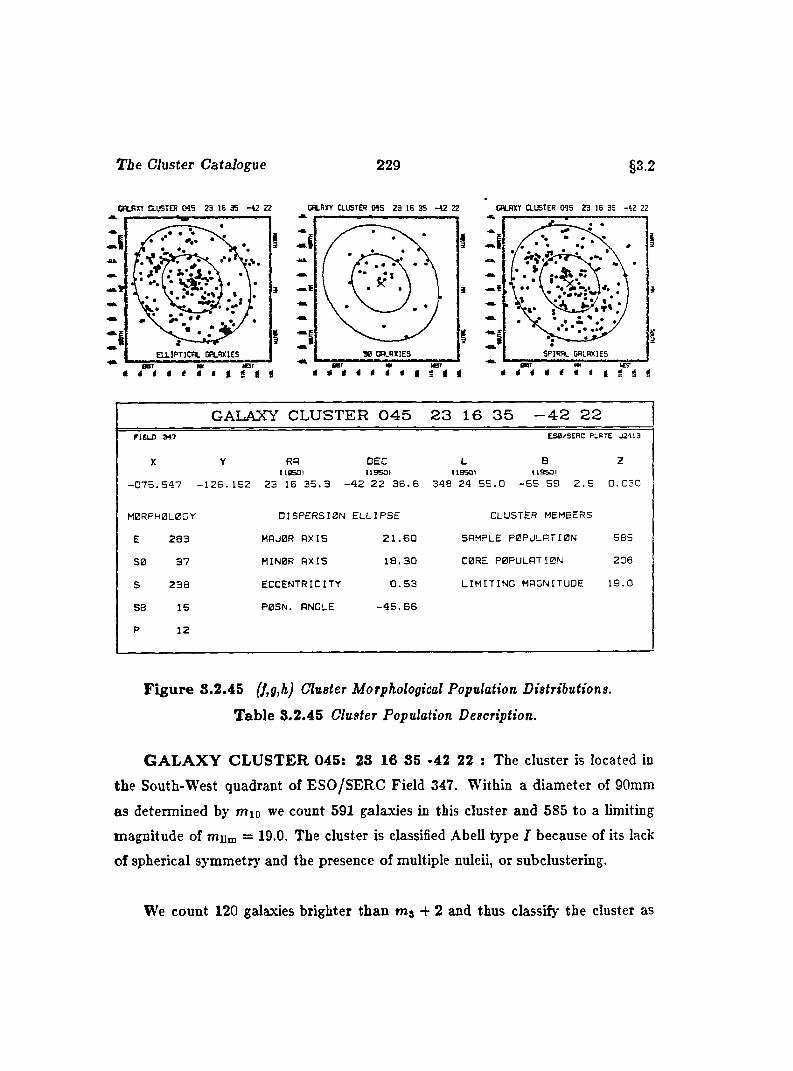
The Cluster Catalogue 229 §3.2
e n j w CLUSTER m s 23 le as -42 22 GRLRXY CLUSTER M S 23 16 35 -4 2 22 CfiLBXT CLUSTER M S 23 16 3S -42 22
I
3 3
« •
S P IR A L GALAXIES» G ALAXIESE L L IP T IC A L GALAXIES
nr ti
GALAXY CLUSTER 045 23 16 35 -42 22FIELD 347
X
- 0 7 5 . 5 4 7
M0RPH0L0GY
E 2 8 3
S0 3 7
S 2 3 8
SB 15
P 1 2
ESB/SERC PLATE J2413
Y RA DEC L B 2ItBSCI 119501 (19501 (19501
- 1 2 6 . 1 5 2 2 3 16 3 5 . 3 - 4 2 2 2 3 6 . 6 34 8 24 5 5 . 0 - 6 5 5 9 2 . 5 0 .030
D IS P E R S IO N E L L IP S E
MRJ0R A X IS 2 1 . 6 0
MIN0R A X IS 1 8 . 3 0
E C C E N T R IC IT Y 0 . 5 3
P0SN. ANGLE - 4 5 . 6 6
CLUSTER MEMBERS
SAMPLE P O P ULATIO N 5 6 5
C0RE POPULATION 2 0 8
L I M I T I N G MAGNITUDE 1 9 . 0
F ig u re 3.2.45 (f,g,h) Cluster Morphological Population Distributions.
T able 8.2.45 Cluster Population Description.
G A L A X Y C L U S T E R 045: 23 16 35 -42 22 : The cluster is located in
the South-West quadrant of ESO/SERC Field 347. Within a diameter of 90mm
as determined by mio we count 591 galaxies in this cluster and 585 to a limiting
magnitude of rrium = 19.0. The cluster is classified Abell type I because of its lack
of spherical symmetrj’ and the presence of multiple nuleii, or sub clustering.
We count 120 galaxies brighter than m j + 2 and thus classify the cluster as
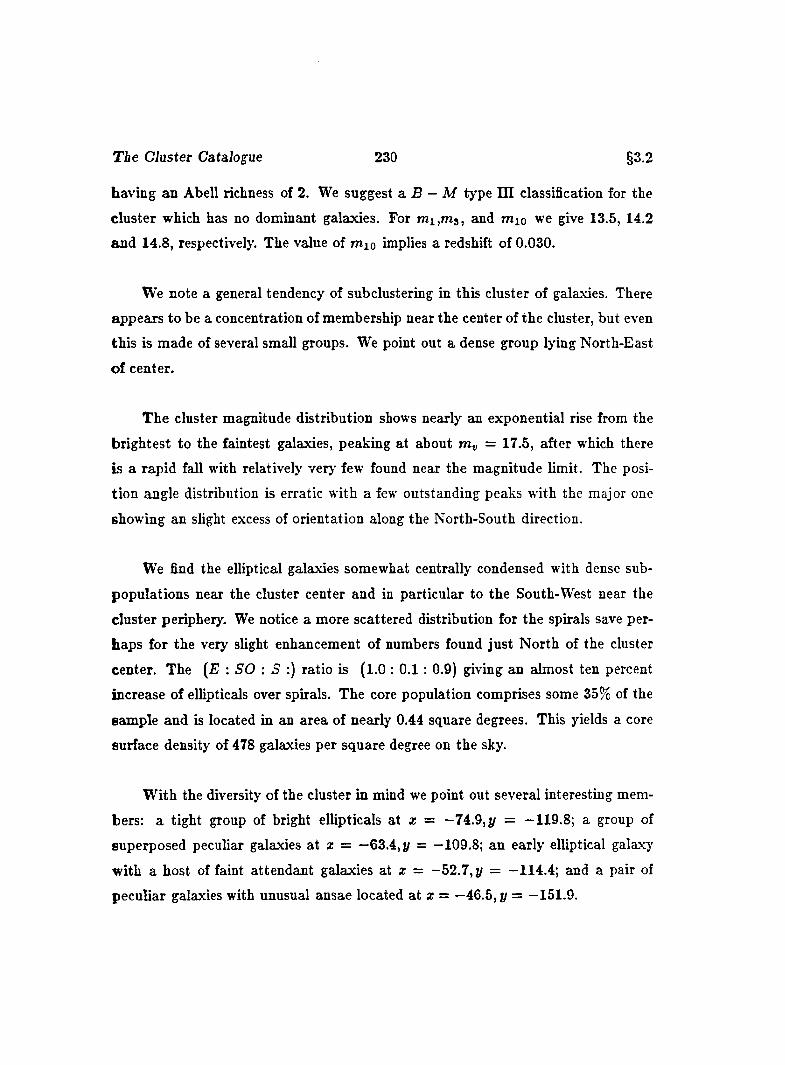
T ie CJuster Catalogue 230 §3.2
having an Abell richness of 2. We suggest a B — M type HI classification for the
cluster which has no dominant galaxies. For m i,m 3 , and mio we give 13.5, 14.2
and 14.8, respectively. The value of mio implies a redshift of 0.030.
We note a general tendency of subclustering in this cluster of galaxies. There
appears to be a concentration of membership near the center of the cluster, but even
this is made of several small groups. We point out a dense group lying North-East
of center.
The cluster magnitude distribution shows nearly an exponential rise from the
brightest to the faintest galaxies, peaking at about m„ = 17.5, after which there
is a rapid fall with relatively very few found near the magnitude limit. The posi
tion angle distribution is erratic with a few outstanding peaks with the major one
showing an slight excess of orientation along the North-South direction.
We find the elliptical galaxies somewhat centrally condensed with dense sub
populations near the cluster center and in particular to the South-West near the
cluster periphery. We notice a more scattered distribution for the spirals save per
haps for the very slight enhancement of numbers found just North of the cluster
center. The {E : SO : S ;) ratio is (1.0 : 0.1 ; 0.9) giving an almost ten percent
increase of ellipticals over spirals. The core population comprises some 35% of the
sample and is located in an area of nearly 0.44 square degrees. This yields a core
surface density of 478 galaxies per square degree on the sky.
W ith the diversity of the cluster in mind we point out several interesting mem
bers; a tight group of bright ellipticals at * = -74.9, y = —119.8; a group of
superposed peculiar galaxies at z = —63.4, y = —109.8; an early elliptical galaxy
with a host of faint attendant galaxies at z = -52.7, y = —114.4; and a pair of
peculiar galaxies with unusual ansae located at z = —46.5, y = —151.9.
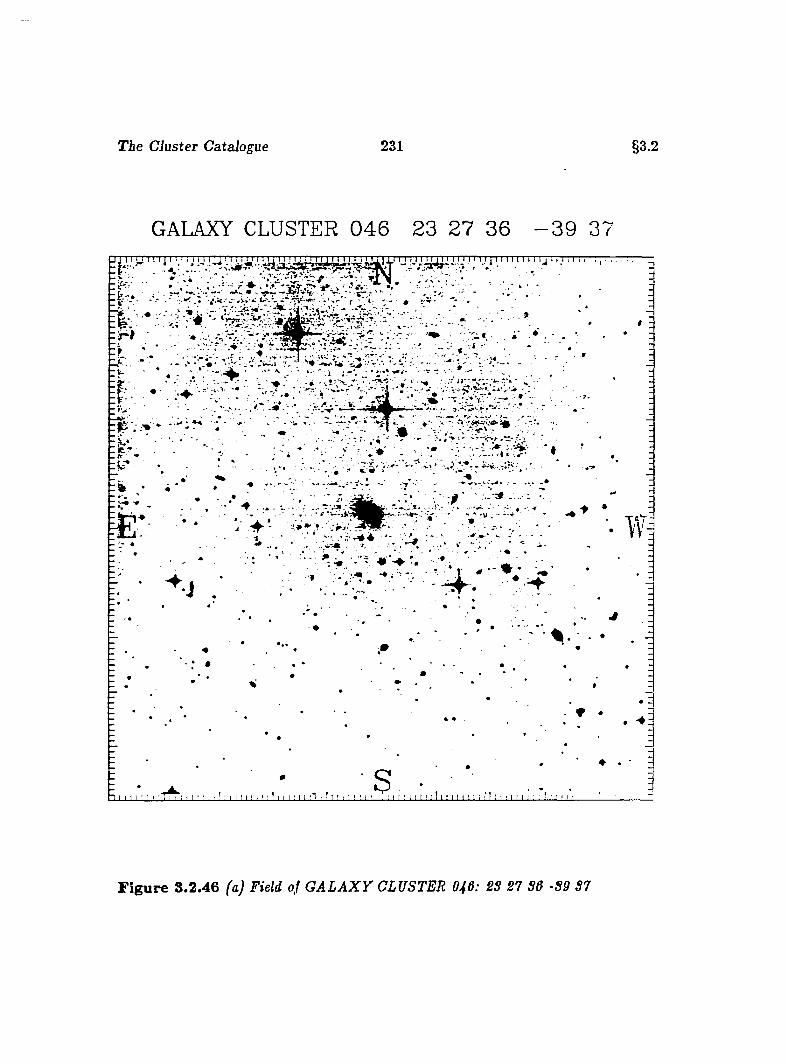
The Cluster Catalogue 231 §3.2
GALAXY CLUSTER 0 4 6 23 27 36 - 3 9 37m i l r r i 1 1 1 1 ; i i i 1 1 r n ; I m 111 1 1111 i" r i 1 1 1 1 1 1 1 1 1 1 ij -| . l i i i i i i i i i 'i i i i t i t i i i i i i i m . i i u i l i i , , , , ............ — ::
| : r , '
- r^ •* i' ' ' '* " *• 'A Ip " ■ ‘
i l - ,=F ' & •
\T rcr.ji,-.-- \ . . .
r j . , . . . y . •;' » I# ;--i*' "T - r -
. ^ ' # * ■ * I *
' 2 - 5' 3 r ' ■ •-»♦ ■.
V > ■
1 ■ ' ....• •■| < .• » f ^ ®
. --•• ' «« ~ _-y - - - r ' - ^
J
Y* -... % • T il
#
. 4 :
I I ! I I I I ’ M [ I ■ I 1 - 1 t t 1 ' I IS •
t I I M I M I I M t I I I I ; ' I : I I I I I : ■ '
F ig u re S.2.46 (a) Field of G A L A X Y CLUSTER O46: 8S 27 S5 -S9 S7
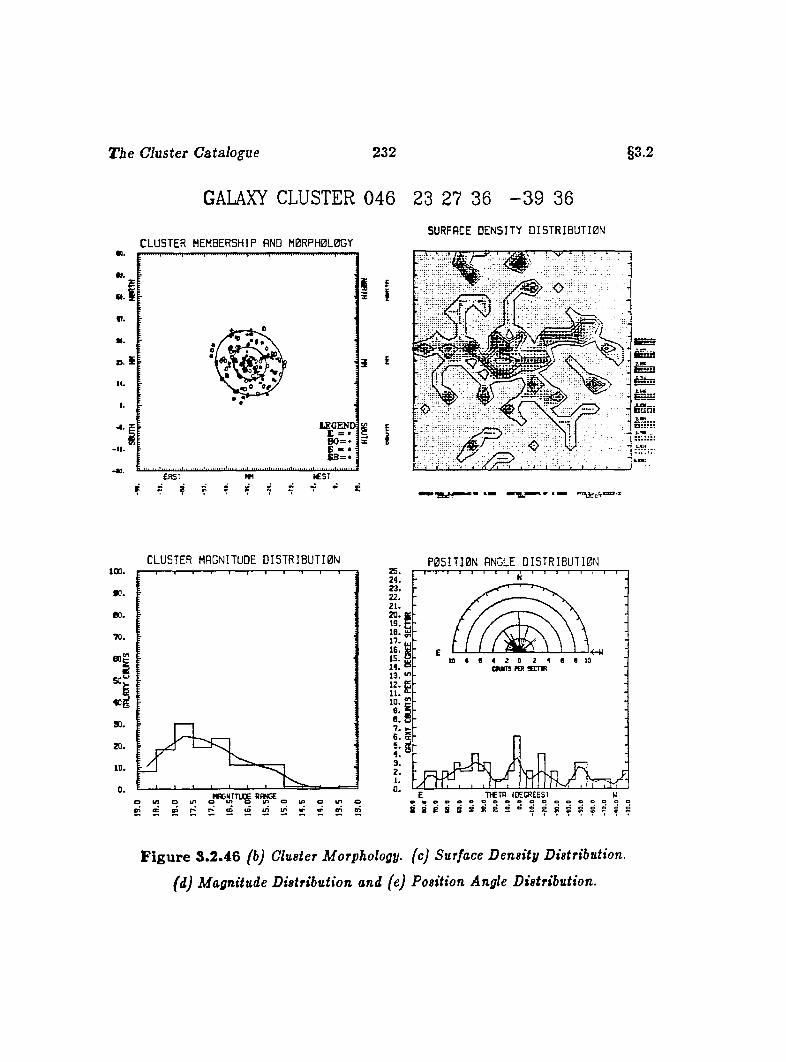
The Cluster Catalogue 232 §3.2
GALAXY CLUSTER 046 23 27 36 - 3 9 36
SURFACE D E N S IT Y D I S T R I B U T I O NC L U S T E R MEMBERSHIP AND MORPHOLOGY•Q.
tf.
m.
H.
• t l .
EAST
S» ? ?
I I
i E
.O
CLU STER MAGNITUDE D I S T R I B U T I O N P O S I T I O N ANGLE D I S T R I B U T I O NlOO.
RBNGE
28.17.16.15.
C M T S m 9ECTW
TÆ TR IDECREESleoeooooo8 8 P 8 S 8 S 8 8 8 S S
F ig u re 3.2.46 (b) Cluster Morphology, (c) Surface D ensity Distribution,
(d) Magnitude Distribution and (e) Position Angle Distribution.
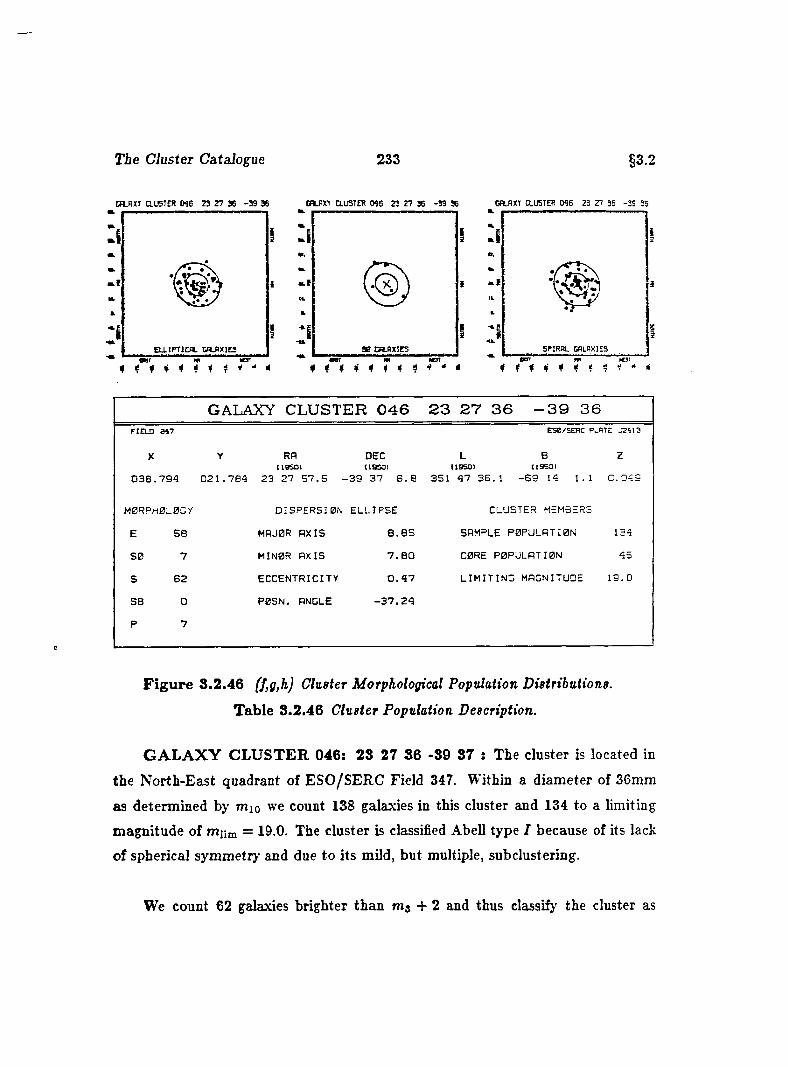
The CJuster Catalogue 233 §3.2
C flLH X r CLUSTER M G 23 2 7 3 6 - 3 9 36 C a J X T CLUSTER M G 23 2 7 36 - 3 9 36 CHLAXT CLUSTER M 6 23 27 35 - 3 9 35
I
4 i 4 i i 1 4 *4 4 4 i i * 4 4 * *S P IR A L G A L A X IE S
G A L A X Y C L U S T E R 0 4 6 2 3 2 7 3 6 - 3 9 3 6
F IE L D 3 4 7 E se/S E R C PLATE J 2 4 1 3
X
0 3 8 . 7 9 4
Y RA c i a s o i
0 2 1 . 7 8 4 2 3 2 7 5 7 . 5 -
DEC ( l a s o i
-3 9 3 7 6 . 8
L 8I1B50I t i s s a i
3 5 1 4 7 3 6 . 1 - 6 9 14 1 . 1
Z
0 . 0 4 3
M0RPH0L0GY D IS P E R S IO N E L L IP S E CLUSTER MEMBERS
E 5 8 HRJ0R A X IS 8 . 8 5 SAMPLE P 0 P U L A T I0 N 134
SB 7 MINOR A X IS 7 . 8 0 C0RE P 0 P U L R T I0 N 45
S 6 2 E C C E N T R IC IT Y 0 . 4 7 L I M I T I N G MAGNITUDE 1 9 . 0
SB 0 P 0S N . ANGLE - 3 7 . 2 9
P 7
F ig u re S.2.46 (f,g,h) Cluster Morphological Population Distributions.
T able S.2.46 Cluster Population Description.
G A L A X Y C L U S T E R 046: 2S 27 S6 -S9 ST : The cluster is located in
the North-East quadrant of ESO/SERC Field 347. Within a diameter of 36mm
as determined by mio we count 138 galaxies in this cluster and 134 to a limiting
magnitude of mum = 19.0. The cluster is classified Abell type I because of its lack
of spherical symmetry and due to its mild, but multiple, subclustering.
We count 62 galaxies brighter than m j 2 and thus classify the cluster as
The Cluster Catalogue 234 §3.2
having an Abell richness of 1. We suggest a B — M type I classification for the
cluster which has a dominant cD type galaxy located near the cluster center. For
n il,m s, and mio we give 13.4,15.1 and 15.3, respectively. The value of mio implies
a redshift of 0.049.
We notice that the cluster is mildly centrally condensed with slight condensa
tions immediately surrounding the center. A somewhat high density grouping lies
North of the center of the cluster near its periphery.
The cluster magnitude distribution shows a gentle rise from the brightest galax
ies to a maximum near m„ = 17.5 afer which it rapidly falls off. The position angle
distribution shows little preference for orientation save for the slight excess in the
North-South direction.
W e find the elliptical galaxies in the cluster to be slightly more concentrated
in the Southern portions of the cluster with a preference for the third and fourth
quadrants. The spirals, on the other hand, appear to be slightly more concentrated
towards the center of the cluster. The [E : SO : S) ratio is (1.0 : 0.1 : 1.2)
suggesting a slightly spiral enriched cluster.
The core population comprises almost 34% of the sample, and resides in an
area of nearly 0.08 square degrees. This yields a core surface density of 592 galaxies
per square degree on the sky.
We note several galaxies in this cluster that possess ring-like structures such
as the objects located at x = 35.4, y = 7.8 and x = 50.9, y = 24.4. In addition
we point out that there are several peculiar galaxies in the cluster such as the one
found a t X = 24.9, y = 27.7.
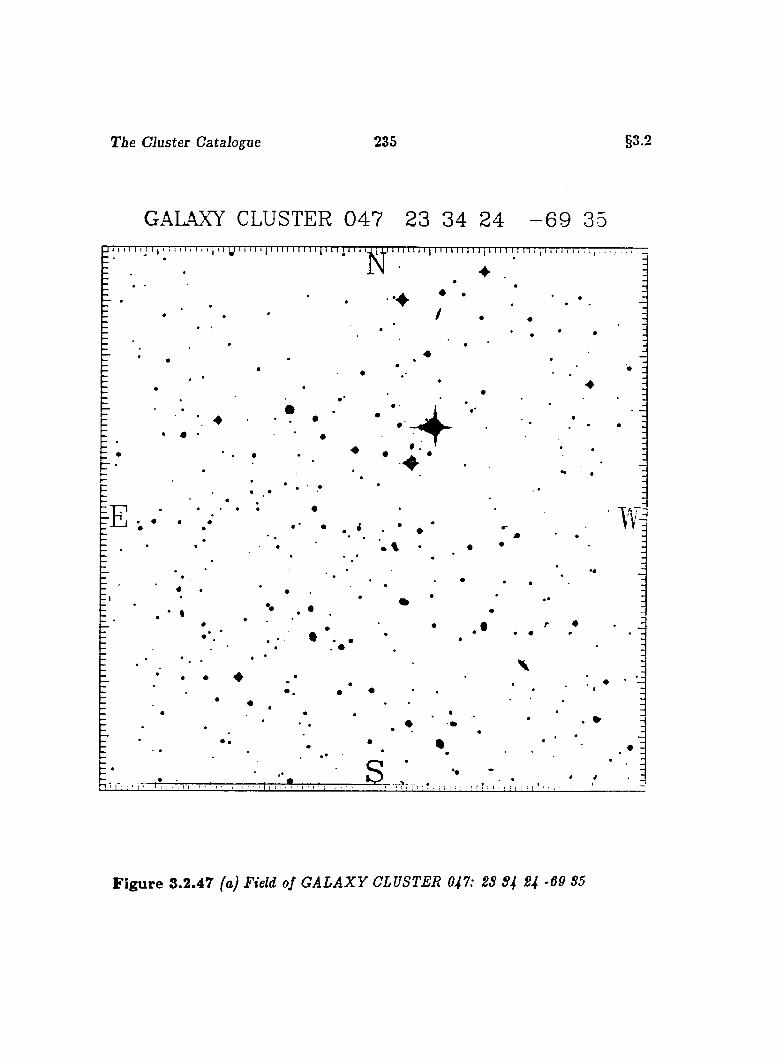
The Cluster Catalogue 235 §3.2
GALAXY CLUSTER 0 4 7 23 34 24 - 6 9 35
• #
F ig u re 3 .2 .47 (a) Field of G A L A X Y CLUSTER 047: 2S S4 24 - 69 S5
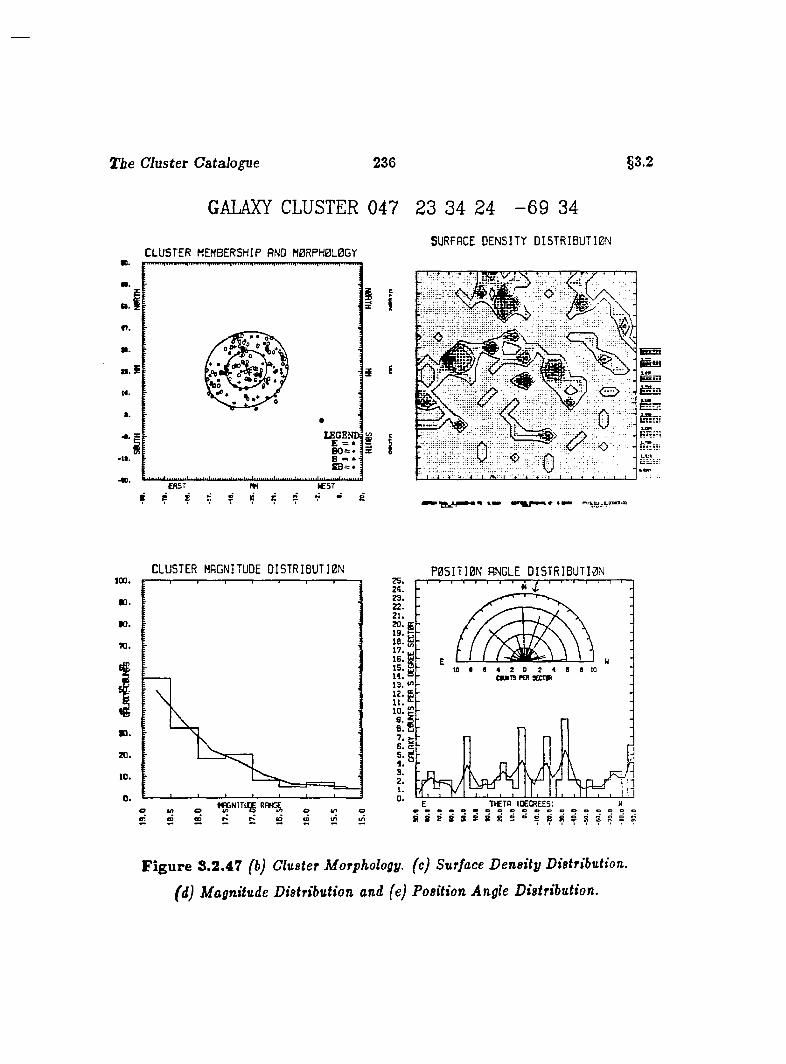
The Cluster Catalogue 236 §3.2
GALAXY CLUSTER 047 23 34 24 - 6 9 34
SURFACE D E N S I T Y D I 5 T R I B U T I 0 NC L U S T E R M EM BERSHIP AND M 0RPH 0L0G Ym.
«7.
t4.
(A S T IC S T
t S
3
Jl----I
CL U S T E R MAGNITUDE D I S T R I B U T 1 0 N100.
to.
•0.w.
n.
zc.10.
0 . o RAN% ^
P 0 S I T I 0 N ANGLE D I S T R I B U T I 0 N
e s r> r*> (o CD tn tn
25.24.
20. g -
m
T IC T B I DECREES:o v e e e o e o o e o o 2 I
F ig u re 3.2 .47 (b) Cluster Morphology, (c) Surface D ensity Distribution,
(d) Magnitude Distribution and (e) Position Angle Distribution.

The Cluster Catalogue 237 §3.2
C fU X T CLUSTER M 7 ZS 34 24 -S 3 34 Cftflxr CLUSTER 047 23 34 24 -6 9 34 CHLflXT CLUSTER 047 23 34 24 -6 3 34
ii
ELLIPTICAL Ca-PXI£S
# f # * f 4 $ f '
GALAXY CLUSTER 047 23 34 24 -69 34FIELD 077 ESa/SERC PLATE J3564
X
0 3 8 . 221
Y RR(1S50J
0 2 5 .7 0 5 2 3 34 2 4 . 3 -
DEC UBSOI
6 9 34 4 3 . 5
L BtISSOI (13531
312 19 1 0 . 5 - 4 6 27 4 . 8
Z
0 . 0 5 7
M0RPH0LBGY D15PERSI0N ELLIPSE CLUSTER MEMBERS
E 7 6 MRJ0R AXIS 1 0 .7 7 SAMPLE P0PULRTI0N 149
5 0 20 MIN0R AXIS 9 . 3 0 C0RE P0PULATI0N 43
S 47 ECCENTRICITY O .S l L IM IT IN G MAGNITUDE 19. 0
SB 6 P0SN. ANGLE 2 5 . 4 9
P 0
F ig u re S .2.47 (f,g,h) Glueter Morphological Population Distributions.
T able 8.2 .47 Cluster Population Description.
G A L A X Y C L U S T E R 047: 28 84 24 -69 85 : The cluster is located in
the North-East quadrant of ESO/SERC Field 077. Within a diameter of 45mm
as determined by mio we count 258 galaxies in this cluster and 149 to a limiting
magnitude of miim = 19.0. The cluster is classified Abell type I because of its lack
of spherical symmetry and the presence of multiple subclustering.
We count 42 galaxies brighter than m j -f 2 and thus classifj' the cluster as
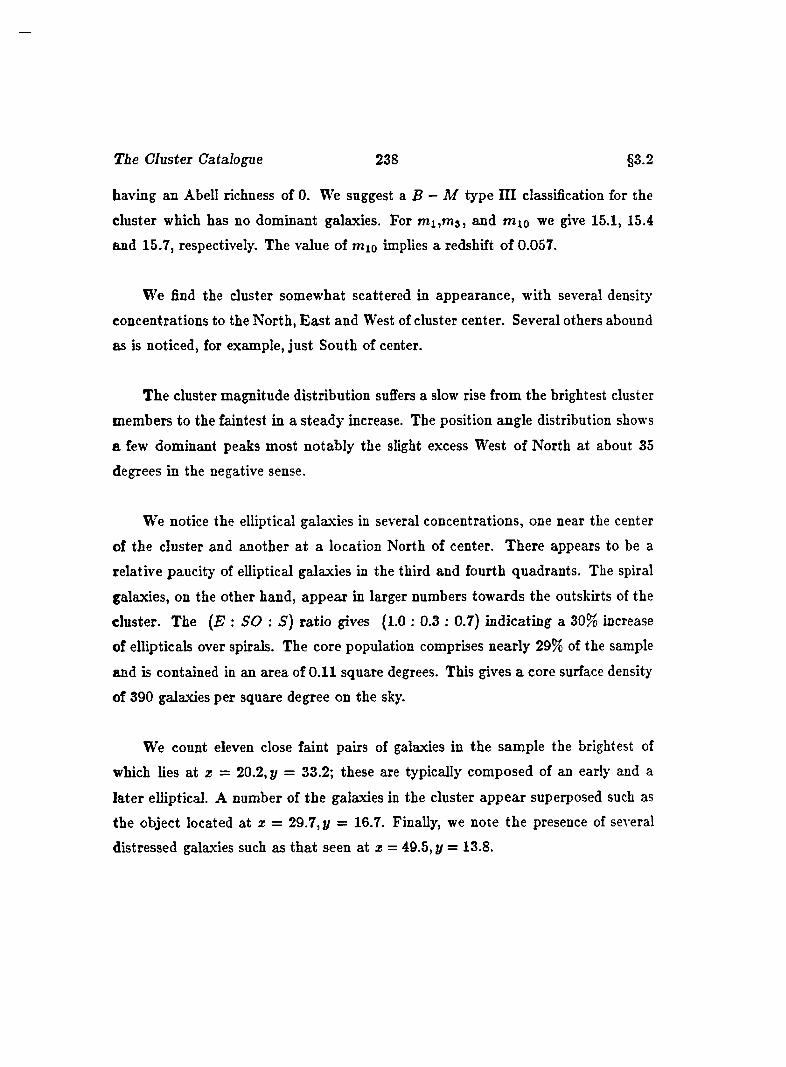
The Cluster Catalogue 238 §3.2
having an Abell richness of 0. We suggest a B — M type HI classification for the
cluster which has no dominant galaxies. For m i,m s, and m io we give 15.1, 15.4
and 15.7, respectively. The value of mio implies a redshift of 0.057.
We find the cluster somewhat scattered in appearance, with several density
concentrations to the North, East and West of cluster center. Several others abound
as is noticed, for example, just South of center.
The cluster magnitude distribution suffers a slow rise from the brightest cluster
members to the faintest in a steady increase. The position angle distribution shows
a few dominant peaks most notably the slight excess West of North at about 35
degrees in the negative sense.
We notice the elliptical galaxies in several concentrations, one near the center
of the cluster and another a t a location North of center. There appears to be a
relative paucity of elliptical galaxies in the third and fourth quadrants. The spiral
galaxies, on the other hand, appear in larger numbers towards the outskirts of the
cluster. The (E : SO : S ) ratio gives (1.0 : 0.3 : 0.7) indicating a 30% increase
of ellipticals over spirals. The core population comprises nearly 29% of the sample
and is contained in an area of 0.11 square degrees. This gives a core surface density
of 390 galaxies per square degree on the sky.
We count eleven close faint pairs of galaxies in the sample the brightest of
which lies at z = 20.2, y = 33.2; these are typically composed of an early and a
later elliptical. A number of the galaxies in the cluster appear superposed such as
the object located at z = 29.7, y = 16.7. Finally, we note the presence of several
distressed galaxies such as that seen at z = 49.5, y = 13.8.
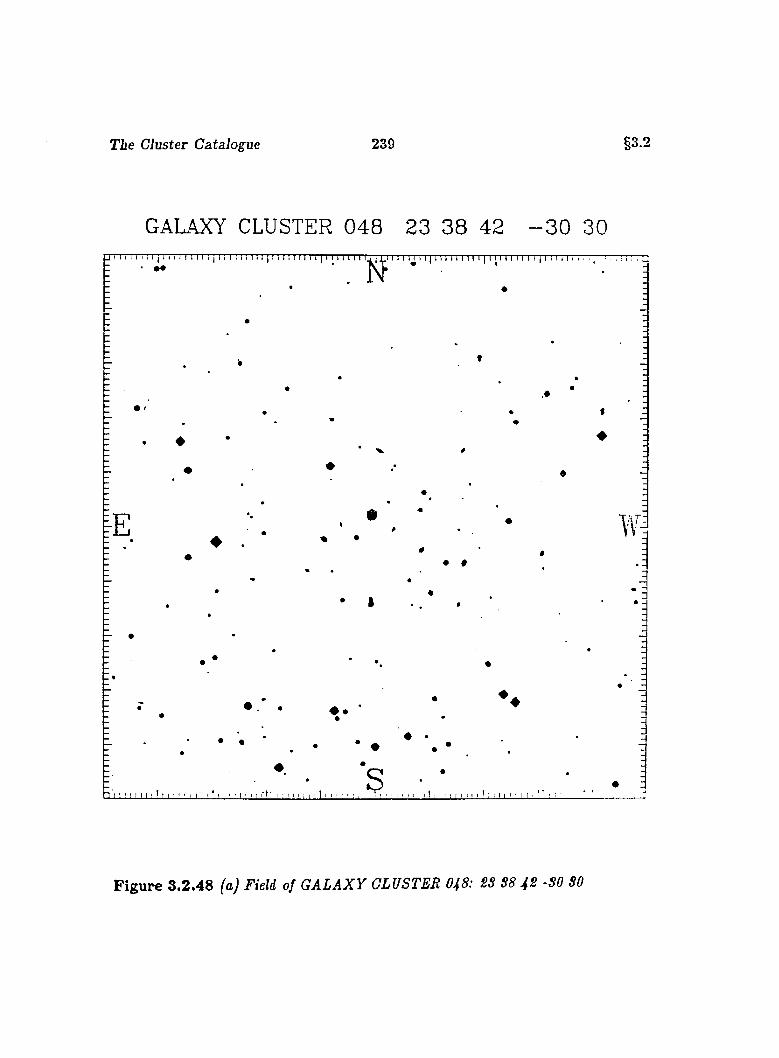
Tie Cluster Catalogue 239 §3.2
GALAXY CLUSTER 0 4 8 23 3 8 42 - 3 0 30
##
F ig u re 3 .2 .48 (a) Field of G A LA X Y CLUSTER O48: SS S8 42 -SO SO
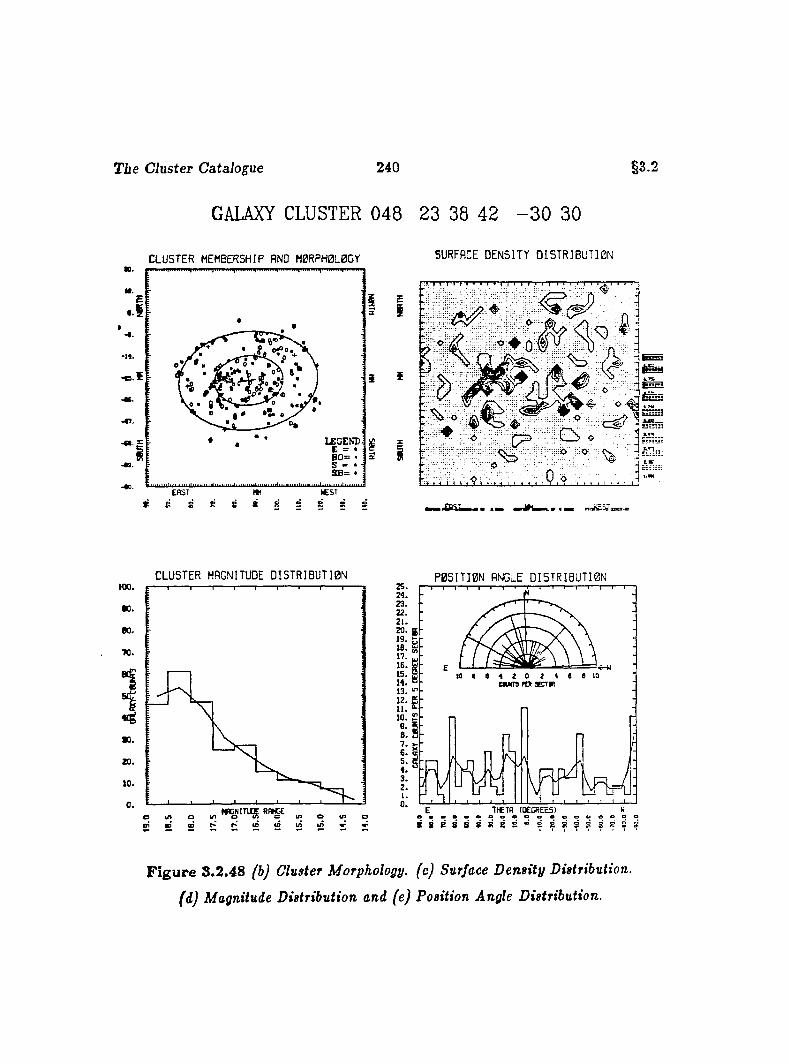
T ie Cluster Catalogue 240
GALAXY CLUSTER 048 23 38 42 - 3 0 30
§3.2
C L U S T E R MEMBERSHIP AND M 0R PH 0L 0G YmMIi
-II1-e
LBGEKD C = • i8 0 = • i S » * IS B = • :
IEAST m
s s s9 n e s
SURFACE D E N S IT Y D I S T R I B U T I O N
i Î
:
A
%
.JaSJm
C L U S T E R MAGNITUDE D I 5 T R I B U T I 0 N P 0 S I T I 0 N ANGLE D I 5 T R I B U T I B Ntoo.00.
BO.
1100.
20.10.
0 .
22.
20. g1 9 . X
1 5 . 2 - H . ® - 1 3 .12. E-i r . E .
2 . t
■n
ThCTfi (DEGREES:ooeo o eooo e2 8 R S 8 S
F ig u re 3.2.48 (b) Cluster Morphology, (c) Surface D ensity Distribution,
(d) Magnitude Distribution and (e) Position Angle Distribution.
Tie Cluster Catalogue 241 §3.2
C f m x r n-lB T C T M B 2 3 38 42 - 3 0 30 C a jX T CLUSTER M B 2 3 3 8 42 - 3 0 30 CRLHXT CLUSTER 04B 23 38 42 -3 0 30
I
99
I
GALAXY CLUSTER 048 2 3 38 42 -30 30FJE U J 471 ESa/SERC PLHTE J613B
X Y RR DEC L B ZriB so j 119501 I19S0I tlS S O I
- 0 8 6 . 52B - 0 2 6 . 6 3 9 2 3 3 8 4 4 . 8 - 3 0 3 0 4 . 2 0 1 7 2 4 7 . 9 - 7 4 2 0 2 0 . 9 0 . 0 4 4
M0RPH0L0GY D IS P E R S 1 0 N E L L IP S E CLUSTER MEMBERS
E 1 1 3 MRJ0R A X IS 1 6 . 0 3 SAMPLE P O P ULA TIO N 2 4 9
3 0 1 5 M IN 0 R A X IS 1 2 . 4 5 C0RE P 0 P U L R T IB N ■ 9 5
S 1 1 3 E C C E N T R IC IT Y 0 . 6 3 L I M I T I N G MAGNITUDE 1 9 . 0
SB 4 P 0 S N . ANGLE 7 . 1 2
P 4
F ig u re 8.2 .48 (f,g,h) Cluster Morphological Population Distributions.
Table 8.2.48 Cluster Population Description.
G A L A X Y C L U S T E R 048; 23 8 8 42 -80 80 : The cluster is located in
the South-West quadrant of ESO/SERC Field 471. Within a diameter of OOnim
as determined by mio we count 266 galaxies in this cluster and 249 to a limiting
magnitude of rniim = 19.0. The cluster is classified Abell type I because of its lack
of spherical symmetry and the presence of several concentrations in the body of the
cluster.
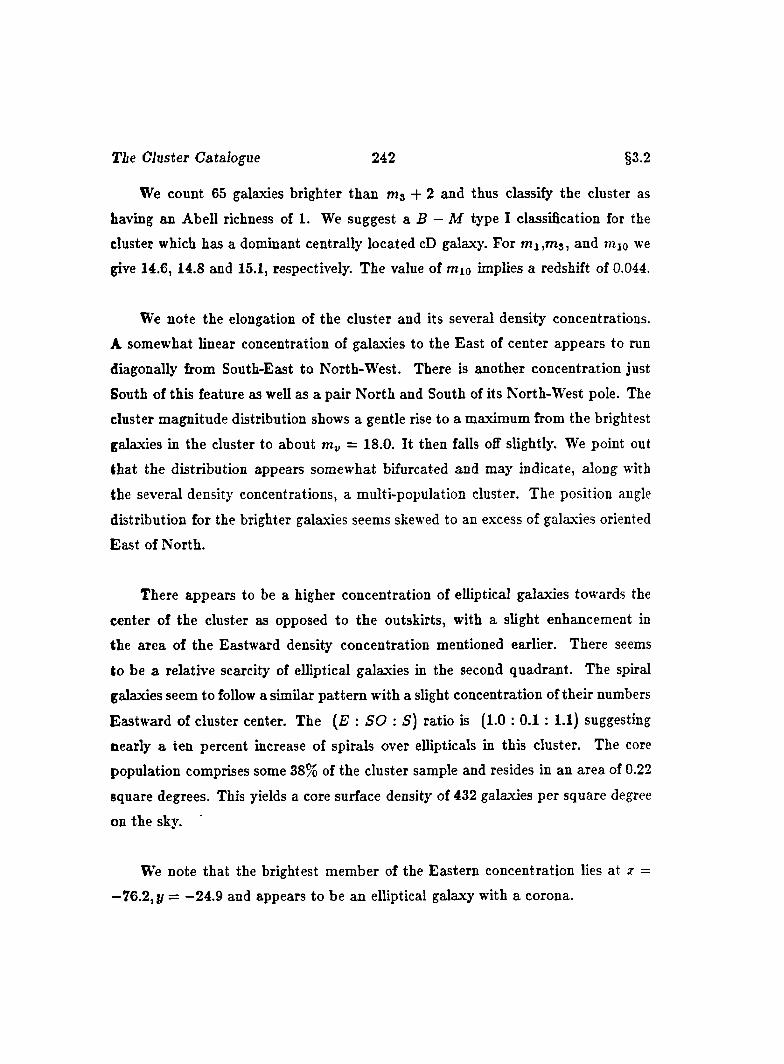
The Cluster Catalogue 242 §3.2
We count 65 galaxies brighter than m j + 2 and thus classify the cluster as
having an Abell richness of 1 . We suggest a B — M type I classification for the
cluster which has a dominant centrally located cD galaxy. For m i,m 3 , and mio we
give 14.6, 14.8 and 15.1, respectively. The value of mio implies a redshift of 0.044.
We note the elongation of the cluster and its several density concentrations.
A somewhat linear concentration of galaxies to the East of center appears to run
diagonally from South-East to North-West. There is another concentration just
South of this feature as well as a pair North and South of its North-West pole. The
cluster magnitude distribution shows a gentle rise to a maximum from the brightest
galaxies in the cluster to about m„ = 18.0. It then falls off slightly. We point out
that the distribution appears somewhat bifurcated and may indicate, along with
the several density concentrations, a multi-population cluster. The position angle
distribution for the brighter galaxies seems skewed to an excess of galaxies oriented
East of North.
There appears to be a higher concentration of elliptical galaxies towards the
center of the cluster as opposed to the outskirts, with a slight enhancement in
the area of the Eastward density concentration mentioned earlier. There seems
to be a relative scarcity of elliptical galaxies in the second quadrant. The spiral
galaxies seem to follow a similar pattern with a slight concentration of their numbers
Eastward of cluster center. The (E : SO : S) ratio is (1.0 : 0.1 : 1.1) suggesting
nearly a ten percent increase of spirals over ellipticals in this cluster. The core
population comprises some 38% of the cluster sample and resides in an area of 0.22
square degrees. This yields a core surface density of 432 galaxies per square degree
on the sky.
We note that the brightest member of the Eastern concentration lies at z =
—76.2, y = —24.9 and appears to be an elliptical galaxy with a corona.
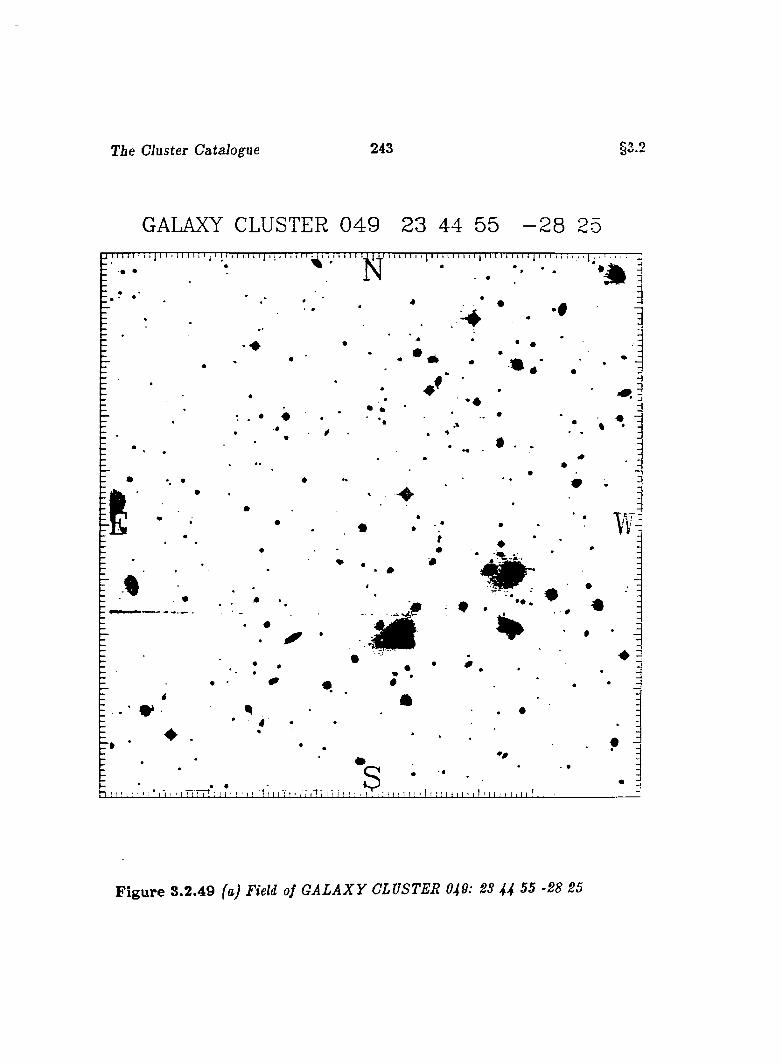
Tie Cluster Catalogue 243 §3.'
GALAXY CLUSTER 0 4 9 23 44 55 - 2 8 25j 1 1 1 1 M 1 1 ] 1 1 ■ 1T) T. I j T I’l l 1 1111 j 111 1 , 1 11 1 , 1 1 1 1 1 1 1 1 1 1 1 1 1 1111111 ; 1 1111 r p ' i T 1 1 1 i r r j 111 i 1 1 . . . [ . ,u ILi 1111111 ) 11111111 r p ' r r i 111 r r j 1 1 1 1 1 1 i ;
N
• •
*
II ♦
w . ■- 0 •
— %♦
: T I ' l I ' I ■ I ' T T i : I ! 1 ' ' I I ' t 1 I I I t ■ i T i 4 i I I i I I ■ , , i > n i i i t t : i i t t i i * i I ' i i : i i . i i '$ ........
F ig u re 8.2.49 (a) Field of G A LA X Y CLUSTER 049: SS 44 55 -28 25
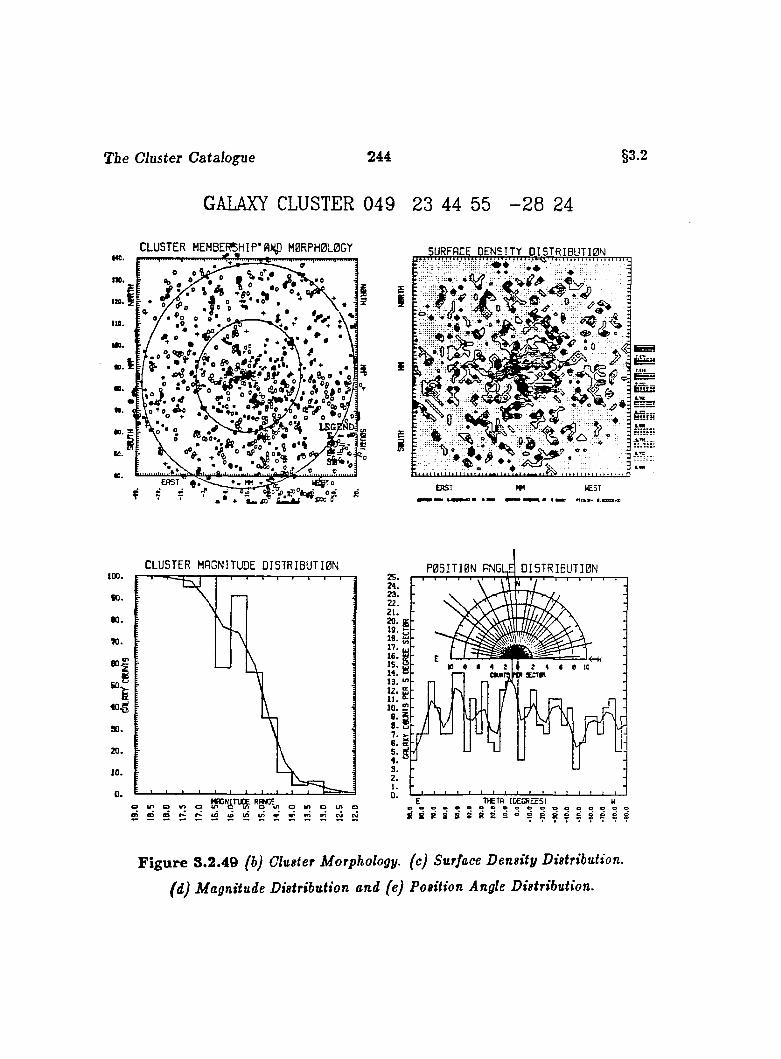
The Cluster Catalogue 244
GALAXY CLUSTER 049 23 44 55 - 2 8 24
§3.2
C L U S T E R M E M B E R S H IP 'm iÿ ) M 0R PH 0L0G Y .
***»9 S ° °i e g e n d ;
SURFACE D E N S IT Y D I S T R I B U T I O N
It m i« t I !♦ n I Kt 1 t*' Î
I I * t . i . i . i t i 11 f , I t , '
ERST WEST
C L U S T E R MAGNITUDE D I 5 T R 1 B U T I 0 Ntoo.00.
to.
TO.
: iX.n .10.
0 ,
m . « . RgKE . . . . . .
P O S I T I O N RNG D I S T R I B U T I O N
•n C T fl I DECREES!
E 2 5 D C ; S ! 2 ! 2 ï i S Ï 2 2 S î i
F ig u re 3 .2 .49 (b) Cltister Morphology, (c) Surface D ensity Distribution,
(d) Magnitude Distribution and (e) Position Angle Distribution.
T ie Cluster Catalogue 245 §3.2
CHLRXr CLUSTER 0 4 9 23 44 55 - 2 8 24
i
I
GALAXY CLUSTER 049 23 44 55 -28 24FIELD 471 ES0/SEFC Pl BTE J613B
X
- 0 1 5 . 4 7 9
Y
0 8 5 . 9 9 5
RPC1850I
2 3 4 4 5 5 . 4 -
□EC(19501
2 8 2 4 4 2 . 6
L B(19501 (ISSOI
0 2 5 10 1 3 . 4 - 7 5 4 9 4 . 7
Z
0 . 0 2 3
MORPHOLOGY D IS P E R S IO N E L L IP S E CLUSTER MEMBERS
E 6 2 6 MAJOR A X I S 2 7 . 0 3 SAMPLE POPULATION 1 1 4 0
5 0 9 7 MINOR A X I S 2 5 . 3 4 CORE POPULATION 4 0 9
S 3 2 4 E C C E N T R IC IT Y 0 . 3 5 L I M I T I N G MAGNITUDE 1 9 . 0
SB 6 6 P 0 S N . ANGLE 3 2 . 8 1
P 2 7
F ig u re 3 .2 .49 (f,g,h) Cluster Morphological Population Distributions.
T ab le 3 .2 .49 Cluster Population Description.
G A L A X Y C L U S T E R 049: 28 44 55 -28 25 : The cluster is located in
the North-West quadrant of ESO/SERC Field 471. Within a diameter of 120mm
as determined by mjo we count 1260 galaxies in this cluster and 1140 to a limiting
magnitude of rnnm = 19.0. The cluster is classified Abell tj'pe R because of its
strong central concentration and tendency to be sphericall symmetric.
We count 68 galaxies brighter than m j + 2 and thus classify the cluster as
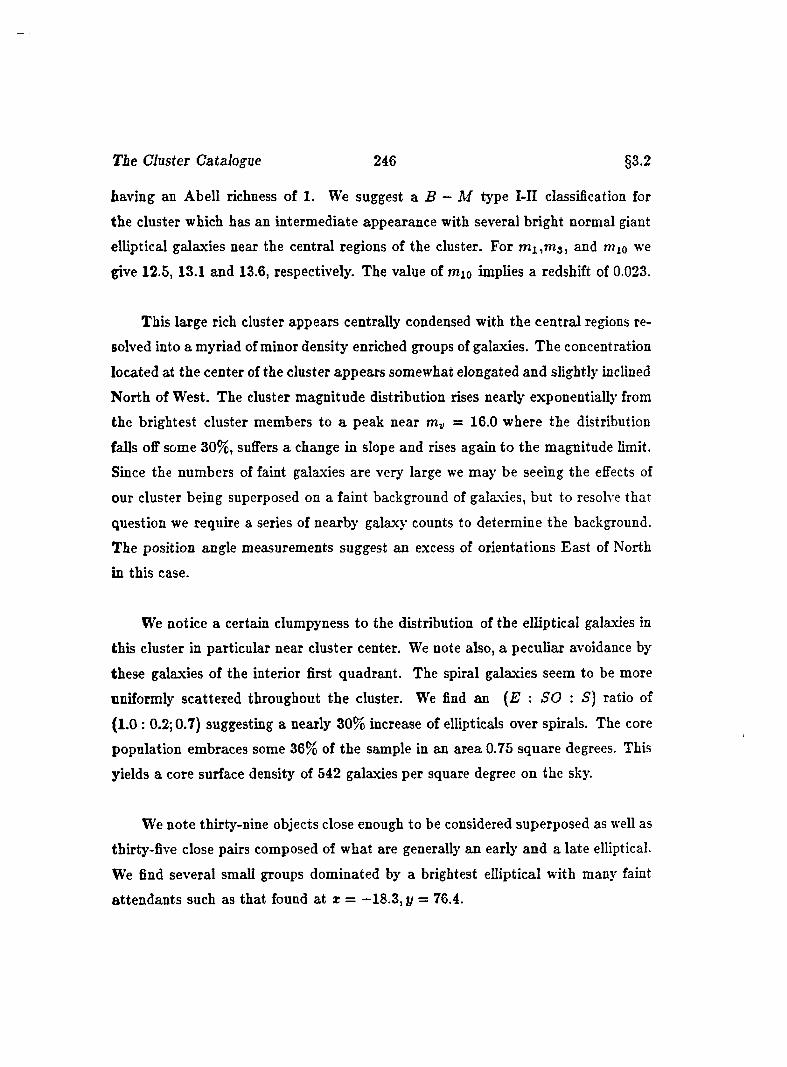
The Cluster Catalogue 246 §3.2
having an Abell richness of 1 . We suggest a B — M type I-II classification for
the cluster which has an intermediate appearance with several bright normal giant
elliptical galaxies near the central regions of the cluster. For m i,m 3 , and mio we
give 12.5, 13.1 and 13.6, respectively. The value of mio implies a redshift of 0.023.
This large rich cluster appears centrally condensed with the central regions re
solved into a myriad of minor density enriched groups of galaxies. The concentration
located at the center of the cluster appears somewhat elongated and slightly inclined
North of West. The cluster magnitude distribution rises nearly exponentially from
the brightest cluster members to a peak near m^ = 16.0 where the distribution
falls oflf some 30%, suffers a change in slope and rises again to the magnitude limit.
Since the numbers of faint galaxies are very large we may be seeing the effects of
our cluster being superposed on a faint background of galaxies, but to resolve that
question we require a series of nearby galaxy counts to determine the background.
The position angle measurements suggest an excess of orientations East of North
in this case.
We notice a certain clumpyness to the distribution of the elliptical galaxies in
this cluster in particular near cluster center. We note also, a peculiar avoidance by
these galaxies of the interior first quadrant. The spiral galaxies seem to be more
uniformly scattered throughout the cluster. We find an {E : SO : 5) ratio of
(1.0 : 0.2; 0.7) suggesting a nearly 30% increase of ellipticals over spirals. The core
population embraces some 36% of the sample in an area 0.75 square degrees. This
yields a core surface density of 542 galaxies per square degree on the sky.
We note thirty-nine objects close enough to be considered superposed as well as
thirty-five close pairs composed of what are generally an early and a late elliptical.
We find several small groups dominated by a brightest elliptical with many faint
attendants such as that found at z == —18.3, y = 76.4.
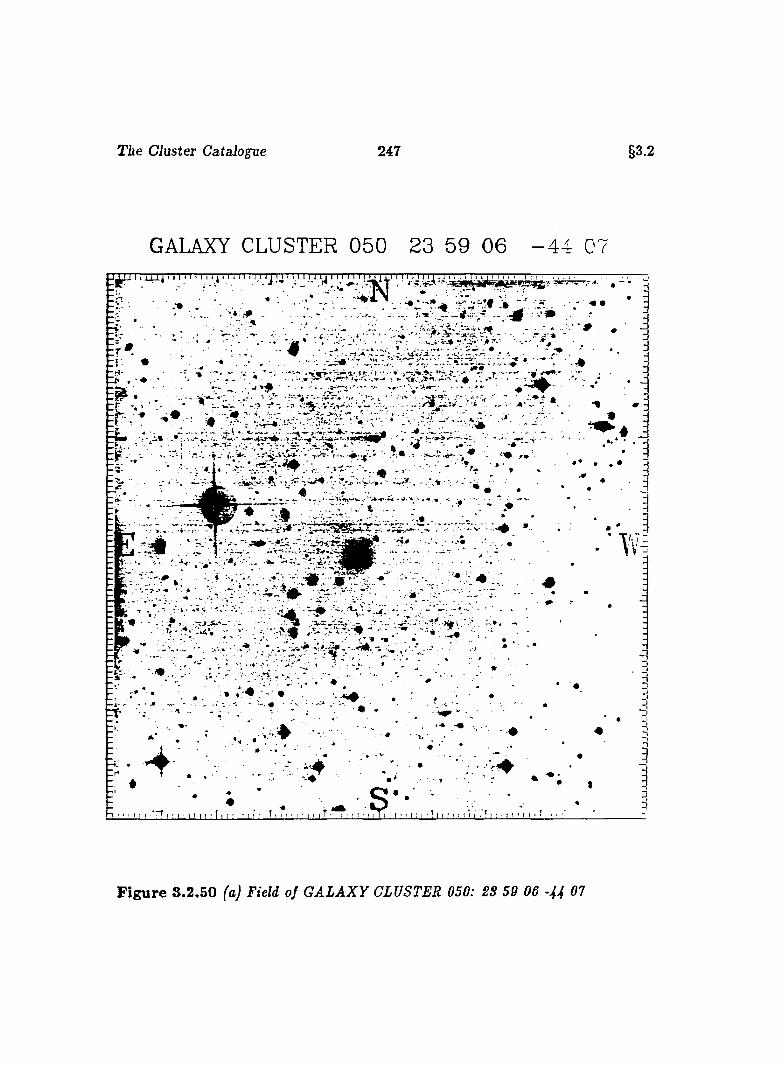
The Cluster Catalogue 247 §3.2
GALAXY CLUSTER 050 23 59 06 - 4 4 07J 1 1 1 1 1 i 1 1 1 1 1 1 1 1 1 1 1 i 111 i 1111 M 1 1 1 1 1 1 1 1 1 1 1 1 1 rn~n 1111' r r i T n i i i 11 ri r m 111 1 11 i . i : : . : r r r r
- r f -
. . . . ' , * - . .V ' • ' s . 1 ^ - • •• • - - « ' r# .. . _ ; _ V - - r , ' . . y : V * .
- . j i ' . -JV.*.:- • ■ ■■. • • - . W . . . . r 4 .A S K ' \ Z . , , . L / . . . - . . . T .. . • - - V— - ■« 4 - • ■ • * Jk
. . ..I T 'A ■ ' - î - - ^ . * .» • - -j- - . f * -■ .....................
" " P . * L . W U. ’ , 7 * % .«13 V ** »• ■ i* .. . . . I ' A «.• r . 4
“ t . 4 ' . *., t . . * • , . . . . « 4 .»«. * - # .« ..w . . .w . , .• - _ , . - .k . » “
ET. - ' • ' .••*••“"k . •- ■ V-I'm "T- i’.-*. : '
E #
t . :
' I * «. 4 v » *17 f/. ••'t' -.'•■• ' ' -•-
' i - i » ' «. • .
7 .7 v '7 ^ :
. ' T V i
E f ' 4 ""
t - r t«
.'I/'- # L.
U ! : M ! t ' t t ) I I I I I ! ' I !I ' I 1 1 I r ■ ' t I ' I I I I ■ ' i , ' n ■ I I I ! Î M I ; I : !
■ ■■'•■' - . 4
■■' •
I I I I ? I I I U I : I t I ■ t <
1
F ig u re S.2.50 (a) Field of G A LA X Y CLUSTER 050: 2S 59 06 -U 07
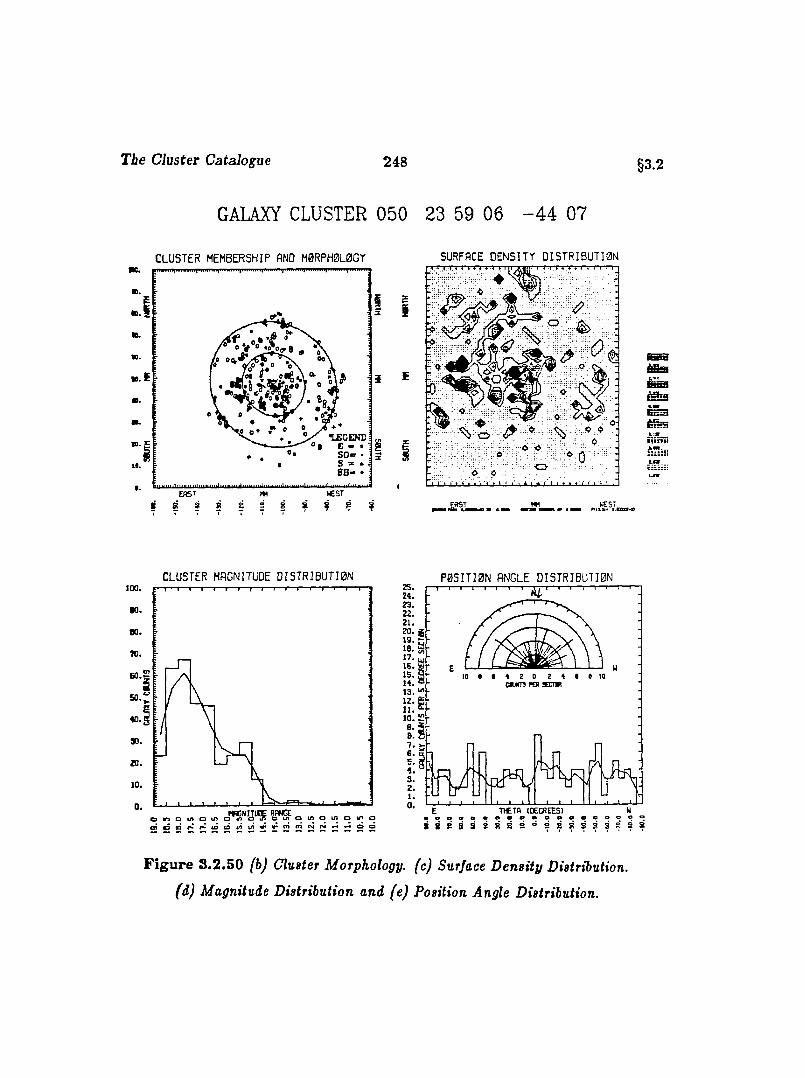
The Cluster Catalogue 248
GALAXY CLUSTER 050 23 59 06 - 4 4 07
C L U S T E R MEMBERSHIP AND M 0RPH 0L0G Y
m.«V
m. 00
S 0 =
* E S T
? ? ? ?ERST
! 8 S 8
SURFACE D E N S I T Y D I S T R I B U T I 0 N
3
§3.2
£i o
■o
.WESTMM
ÊhîÏI
C LU STER MAGNITUDE D I S T R I B U T I O N100.
K.8 0 .
7 0 .
3 0 .
20.
10.
0 ,
P 0 5 I T I 0 N ANGLE D I S T R I B U T I O N2 4 .
1 3 . h
1 5 .
TH ETfl (DECREES)eeeeeoooeeooÎR S 8 S3 3 ^ 3 2 B 8 9 8 3 8
F ig u re S.2.50 (b) Cluster Morphology, (c) Surface D ensity Distribution,
(d) Magnitude Distribution and (e) Position Angle Distribution.
T ie Cluster Catalogue 249 §3.2
CRLflXY CLUSTER 0 5 0 2 3 59 06 -4 9 07 CaJXY CLUSTER 050 23 59 06 -4 4 07 GRLRXY CLUSTER 050 23 59 06 -4 4 07
I
ia
SP IR B L GRLflXIES
fier Ml ICIfier1
GALAXY CLUSTER 050 23 59 06 -4-4 07FIELD 2 9 2 ESB/SEBC PLATE J4 5 0 4
X
1 0 4 . 7 9 4
Y
0 4 7 . 0 5 8
RR(195D1
2 3 5 9 5 . 8 -
DEC119501
4 4 6 4 8 . 5
L B119501 119501
3 3 0 4 2 1 3 . 2 - 7 0 3 0 4 0 . 1
Z
0 . 0 3 8
MBRPH0L0GY D IS P E R S IO N E L L IP S E CLUSTER MEMBERS
E 2 2 4 MBJ0R A X IS 1 5 . 18 SAMPLE P 0 P U L R T I0 N 33 4
SB 3 0 M IN 0 R A X IS 1 3 . 8 9 C0RE P 0 P U L R T I0 N 123
S 7 7 E C C E N T R IC IT Y 0 . 4 0 L I M I T I N G MRGNITUOE 1 9 . 0
SB 2 P 0 S N . ANGLE - 4 0 . 0 6
P 1
F ig u re S.2.50 (f,g,h) Clugter Morphological Population Distributions.
T ab le S.2.50 Cluster Population Description.
G A L A X Y C L U S T E R 050; 28 59 06 -44 07 : The cluster is located in
the North-East quadrant of ESO/SERC Field 292. Within a diameter of 60mm
as determined by mio we count 342 galaxies in this cluster and 334 to a limiting
magnitude of mum = 19.0. The cluster is classified Abell type I because of its lack of
spherical symmetry and presence of several concentrations indicating subclustering.
We count 43 galaxies brighter than m j -f 2 and thus classify the cluster as
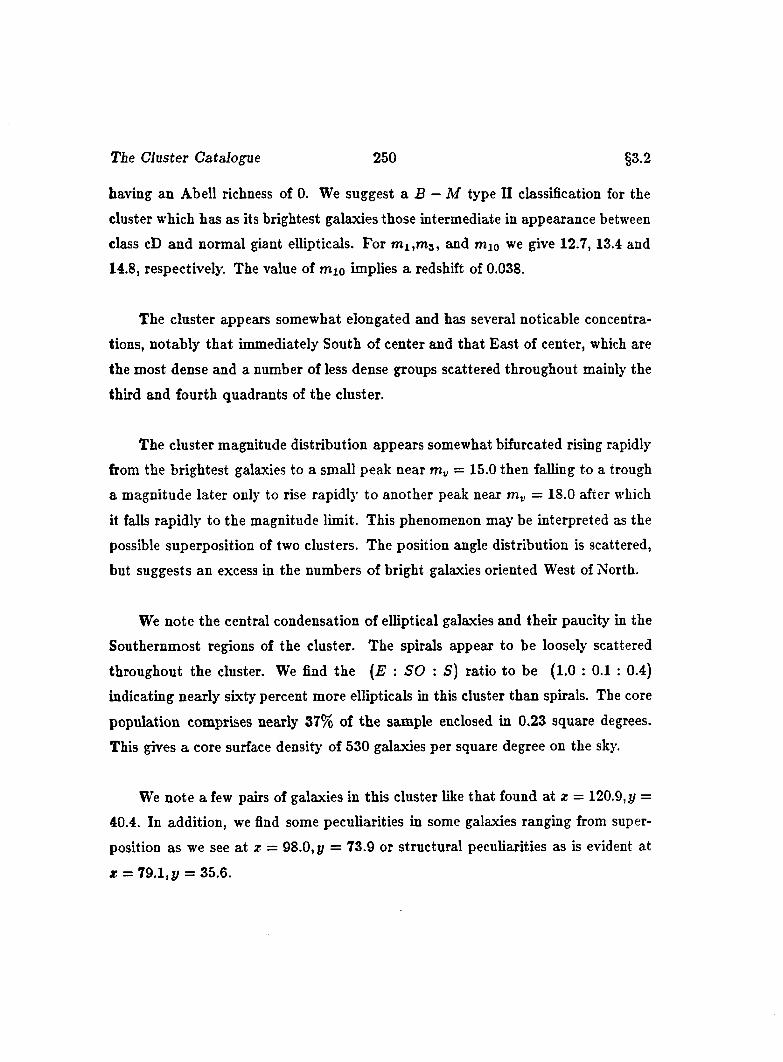
The Cluster Catalogue 250 §3.2
having an Abell richness of 0. We suggest a B — M type II classification for the
cluster which has as its brightest galaxies those intermediate in appearance between
class cD and normal giant ellipticals. For m i,m3 , and mio we give 12.7, 13.4 and
14.8, respectively. The value of mio implies a redshift of 0.038.
The cluster appears somewhat elongated and has several noticable concentra
tions, notably tha t immediately South of center and that East of center, which are
the most dense and a number of less dense groups scattered throughout mainly the
third and fourth quadrants of the cluster.
The cluster magnitude distribution appears somewhat bifurcated rising rapidly
from the brightest galaxies to a small peak near m„ = 15.0 then falling to a trough
a magnitude later only to rise rapidly to another peak near m„ = 18.0 after which
it falls rapidly to the magnitude limit. This phenomenon may be interpreted as the
possible superposition of two clusters. The position angle distribution is scattered,
but suggests an excess in the numbers of bright galaxies oriented West of North.
We note the central condensation of elliptical galaxies and their paucity in the
Southernmost regions of the cluster. The spirals appear to be loosely scattered
throughout the cluster. We find the (E : SO : 5) ratio to be (1 . 0 : 0 . 1 : 0.4)
indicating nearly sixty percent more ellipticals in this cluster than spirals. The core
population comprises nearly 37% of the sample enclosed in 0.23 square degrees.
This gives a core surface density of 530 galaxies per square degree on the sky.
We note a few pairs of galaxies in this cluster like that found at z = 120.9, y =
40.4. In addition, we find some peculiarities in some galaxies ranging from super
position as we see at z = 98.0, y = 73.9 or structural peculiarities as is evident at
X = 79.1, y = 35.6.
C H A PTER IV
A N IS O T H E R M A L A N A LY SIS O F C L U ST E R S O F G A L A X IE S
Although the myriad things are many,
their order is one.- Chuang-Tzu
One of the earliest attempts to determine the extent and population character
istics of rich clusters of the “nebulae” , but excluding the Virgo Group of galaxies,
was done by d’Arrest (1865) when he visually observed some twenty-five of the
brightest nebulae in what is now known as the Coma cluster. Some time later
nearly thirty such nebulae were catalogued in this area by Dreyer (1888) in his New
General Catalogue with an additional twenty listed in his Index Catalogues.
Some time later. Wolf (1901) photographed a minimally obscured region of
the North Galactic Pole in the Constellation Coma Berenices and identified 108
nebulae within a circle of half a degree. This aggregate of galaxies, the Coma
cluster, is considered a cluster prototype because of its richness, closeness and lack of
obscuration. He continued his research and catalogued the positions of 1528 nebulae
in the Coma field and described them in terms of Herschel’s system. Working in the
251
Isothermal Analysis 252 §4.0
same area with the 36-inch Crossley reflector at the Lick Observatory, Curtis (1918)
counted some 304 galaxies in an area of only 40 x 50 minutes of arc and remarked
tha t the region contained “the most remarkable aggregate of closely packed small
nebulae known to me.”
While discussing the velocity-distance relation for galaxies Hubble and Huma-
8 on (1931) commented on the “sizes” of several clusters discovered till that time.
These included the Perseus cluster studied by Wolf (1906), the Ursa Major cluster
observed by Baade (1928), the Leo cluster by Christie (1929) and the well-known
clusters in Corona Borealis, Gemini and Cancer. The Perseus cluster was said to
have some 500 nebulae within a radius of nearly one degree; the Coma cluster to
have nearly 800 within a radius somewhat less than a degree; and the Leo and Ursa
Major groups some 300 galaxies within radii corresponding to nearly 0.3 degrees.
The Coma cluster was given preliminary study by Lundmark (1927) to deter
mine the distance and dimensions of the group and later, using Wolf’s material,
Wallenquist (1933) gave the first study of the volume structure of the cluster. He
discovered a strongly peaked number density profile common to member galaxies
of differing luminosities. During the next decade Zwicky (1937c, 1941,1942a,b,c,d)
carried out a systematic study of the distribution of galaxies in clusters which was to
be the prototype of such analyses. For example, his examination of the Coma clus
te r (Zwicky, 1937c) revealed 670 galaxies brighter than 16.5m within 160 arcminutes
of the cluster center. He extended the total cluster membership to 1500 galaxies
while noting tha t even 4.5 degrees from the cluster center the average projected
number of galaxies still exceeded th a t of the surrounding field. He later claimed
th a t as a result of studies to fainter limiting magnitudes (Zwicky, 1951) that the
true population brighter than the limiting magnitude of 19.0 was detectable to a di
am eter of nearly twelve degrees and contained some ten thousand galaxies. Zwicky
maintained this point until 1972, in spite of the study by Oemler, Page and Wilson
Isotberm al Analysis 253 §4.0
(1965) who assigned a diameter of about 100 minutes of arc to the cluster. It was to
solve this dichotomy and after discussions with Zwicky in 1971 tha t Chincarini and
Rood (1971) decided to study the extent of the Coma cluster by using redshifts.
The hallmark result is the paper in Nature by Chincarini and Rood (1975) in which
the first evidence of superclustering was discovered using the space distribution (i.e.
R A , D and redsh ift) of galaxies.
The definition, however, of what is meant by cluster radii is not clear. Sim
ilar to the distribution of light in globular clusters of stars, the projected surface
density distribution of galaxies in clusters falls ofi" gradually and some realistic op
erational definition should be agreed on. The observational situation is much more
complicated because of the presence of an optically indistinguishable background
population of galaxies and early size measurements were governed in part as to how
conspicuously a cluster of galaxies stood out from its environment.
An a ttem pt at modeling the distribution of galaxies in clusters was undertaken
by Zwicky in 1937 when he noticed th a t the projected density distribution of the
Coma cluster was similar to the luminosity distributions previously seen in elliptical
galaxies by Hubble (1930). These approximated the distribution of mass in an
isothermal gas sphere which refer to a self-gravitating assembly of mass points in
hydrostatic equilibrium (Emden 1907). Subsequently, Zwicky (1957) found that the
distributions of galaxies in Cancer, H ydra I and Perseus could likewise be interpreted
by a bounded isothermal gas sphere model. The model was further extended by
Bah call (1972,1973a,b,c, 1974a, 1975), Austin and Peach (1974a), MacGillivray et
al. (1976), and others more recently. We mention in passing tha t the analysis of
Zwicky of the Virial mass of the Coma cluster uncovered for the first time the mass
discrepancy problem (or missing mass) in clusters of galaxies.
The isothermal procedures are based on the following relation (Bahcall 1972):
Isothermal Analysis 254 §4.0
^(obs)(f) = or • J ? ( „ o ) ( r / ; 3 ) + 7
where: H(cbs) and i 2 (t*o) are the observed and theoretical projected density
distrbutions and or is a density normalization factor. ^ is a scaling factor in dis
tance which relates the linear distance r from the center of the cluster to Emden’s
dimensionless radius ( such that r = The term has been named the structural
index of the cluster and is one of the primary cluster parameters. Values of i?(,so)
as a function of ( have been tabulated by Chandrasekhar (1942) and Zwicky (1957,
Table XXXV).
The values of ^ found by Zwicky (1957) were 22.4, 39.2, 40.5 and 52.3 jh
kpc for the Cancer, Coma, Hydra I and Perseus clusters respectively and took this
rather small spread as evidence tha t all regular clusters are similar in size and
structure. Abell (1966), however, notes tha t the spread is practically over a factor
of two. Nevertheless, the possibility of a consistent measure is attractive, and the
idea was pursued further by Bahcall (1973a, 1975) who introduced the notion of the
cluster core radius, Rc, as the angular radius at which the observed surface density
of galaxies falls to one-half of its central value a t which r = Zfi. For a t least four
of the five clusters Bahcall studied in 1973, the linear core radii were found to be
within 15 percent of an average value even though their redshifts ranged over a
factor of twenty. Later, in a fairly homogeneous sample of 15 low-redshift clusters
she found similar agreement with the isothermal gas sphere model and an average
linear core radius of Rc = (126 ± 23) Jh kpc. However, the m atter is not clear; but
the model is useful as a first approximation. We must point out tha t all clusters
may not be stable and that in the final analysis. X-ray observations may be a better
way to estim ate the cluster potential. Nevertheless, it is this model tha t we have
adapted to our analysis and is explained in detail in the next section.
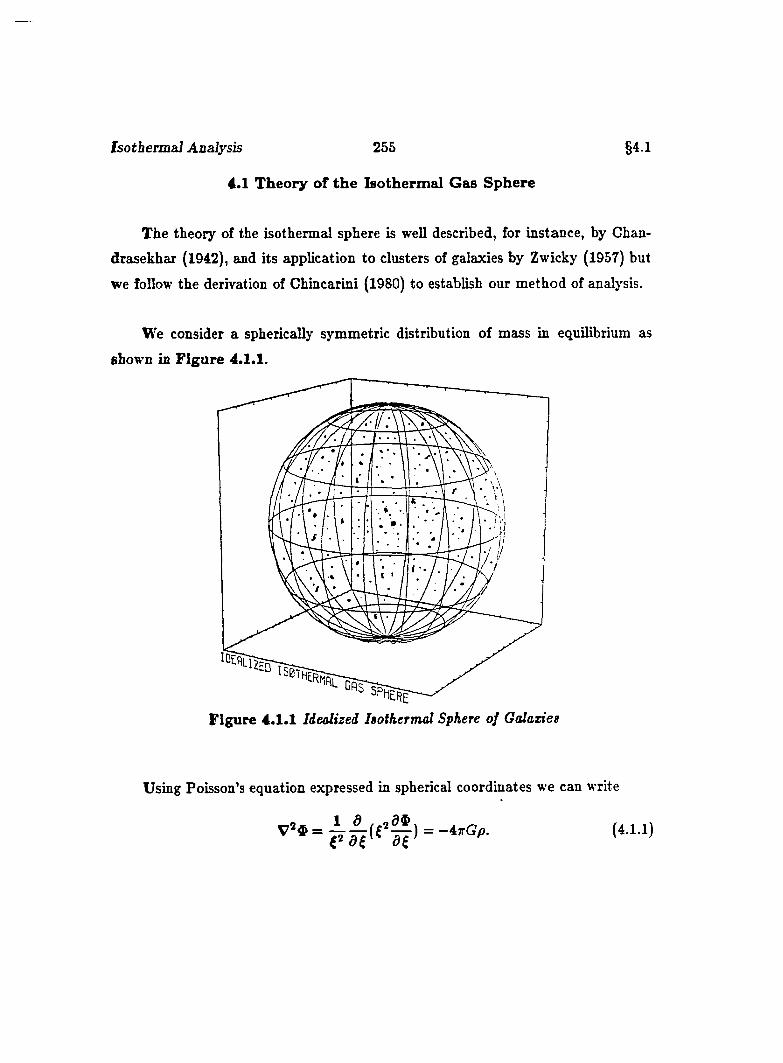
Isotberm al Analysis 255
4.1 T h eo ry o f th e Iso th e rm a l G as S p h ere
§4.1
The theory of the isothermal sphere is well described, for instance, by Chan
drasekhar (1942), and its application to clusters of galaxies by Zwicky (1957) but
we follow the derivation of Chincarini (1980) to establish our method of analysis.
We consider a spherically symmetric distribution of mass in equilibrium as
shown in F ig u re 4.1.1.
F igure 4.1.1 Idealized Isothermal Sphere of Galaxies
Using Poisson’s equation expressed in spherical coordinates we can write
" -4 ;rG f. (4 11)t C7Ç aÇ
Isotberm al Analysis 256 §4.1
Because of spherical symmetry the radial part remains while the polar and
azim uthal components vanish. We assume that the potential is entirely determined
by the mass distribution and tha t the system is in hydrostatic equilibrium, so that
~ = -ffP- (4.1.2)
From the equation of state of an ideal gas we have
P = p y (4.1.3)
and we derive , in terms of the density, the relation
Using dimensionless quantities we can write:
from which we obtain
P i(^0 j + — 0. (4.1.6)
Tables exist for the solution of the above equation and we use that of Zwicky
(1957) giving both the numerical solution and its projection on the celestial sphere.
For small radii, however. King (1972) has shown that a good approximation is given
by the relation
P-s/2
(4.1.7)
where J2 e = 3^ with beta being a structural length.
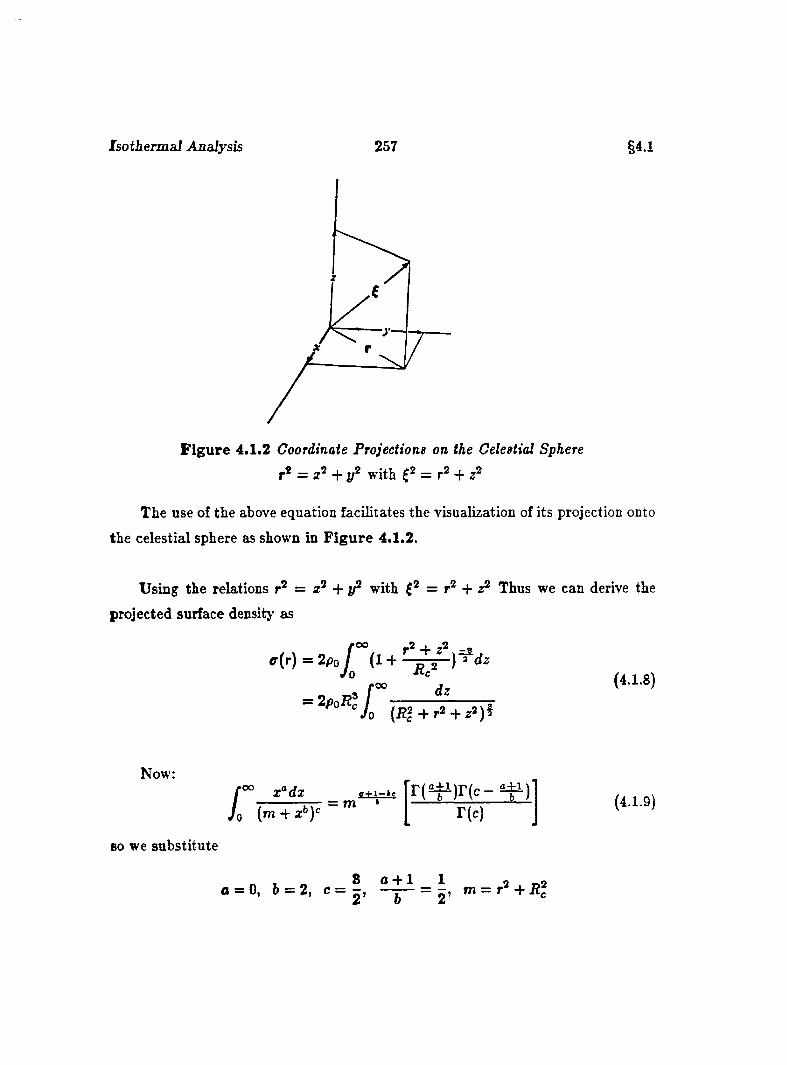
Isotherm al Analysis 257 §4.1
F ig u re 4.1.2 Coordinate Projections on the Celestial Sphere
r* = with + 2 ®
The use of the above equation facilitates the visualization of its projection onto
the celestial sphere as shown in F ig u re 4.1.2.
Using the relations + j/^ with Thus we can derive the
projected surface density as
{i22 + r2 + z2)ï
(4.1.8)
Now;
BO we substitute
L
oo «a c+i->c= m * r(c) (4 .1 .9 )
0 = 0, 0 = 2, c = | , = 1, m = r’ +
Isotberm al Analysis 258 §4.1
to obtain
(4.1.10)
where (r is the projected density.
A special case of interest occurs when
g (r = Jig) _ 1
<r(r = 0 ) ~ 2 ‘
. Here, is called the core radius and is defined as the distance from the center
of the cluster a t which the projected density is 50% that of the central density. We
use the isothermal formula to fit the observational data. The da ta are derived from
ring counts which yield the number of galaxies per square degree as a function of
the distance from the cluster center in minutes of arc.
In fitting the isothermal function we have several free param eters which need
to be optimized. In particular, we write the density as:
p(r) = a» g (r/i9 ) + 7 (4.1.12)
with q{rfP) the non-dimensional tabulated projected density, a a normalization
constant which depends on the population in the cluster, and 7 , a quantity which
is a function of the “background” and eventual cut-off radius. Once a ,^ and 7 have
been determined by minmizing the function we can estimate various cluster
param eters.
Isotherm al Analysis 259 §4.2
4.2 Iso th e rm a l F i t t in g P ro ced u re U tiliz ing
We choose a non-linear technique for fitting the surface density data to the
required function
p(r) = a • g(r//3)-h 7 . (4.2.1)
Now, we can define a measure of goodness of fit
(4.2.2)
According to the method of least squares, the optimum values of the param
eters Oj are obtained by minimizing x* with respect to each of the parameters
simultaneously. That is,
-<>('■■11'} = “■ (4.2.3)
In our case, the parameters a j to be applied to the fitting function are a , the
normalization constant; a core radius modification constant; and 7 , a “back
ground” constant.
I t is generally not convenient to derive an analytical expression for calculating
the parameters of a non-linear function, so we consider x^ to be a continuous
function if the n parameters oy describing a hypersurface in n-dimensional space
where we search for the appropriate minimum value of x^ as shown in F igu re 4.2.1.
One of the difiiculties of such a search is that for a given function there may
be more than one local minimum for x* within a reasonable range of values for the
param eters oy. Nevertheless, we begin by determining the variation of in the
neighborhood of the starting point Xo>
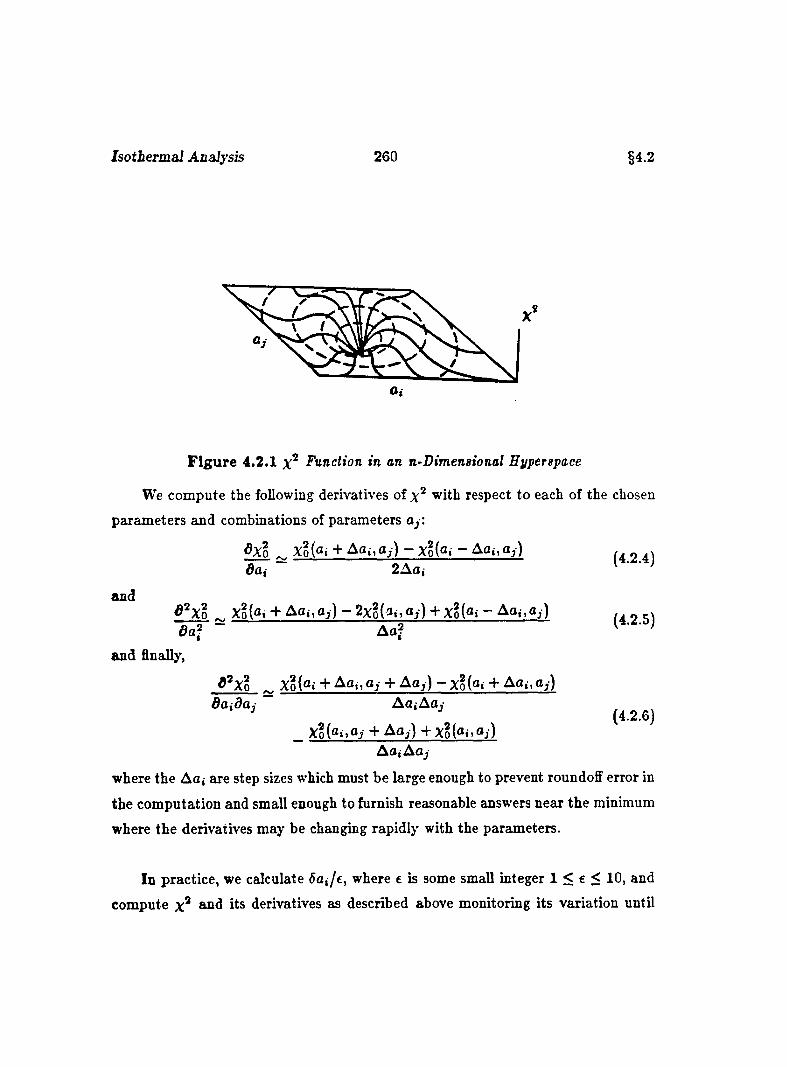
Isotbermal Analysis 260 §4.2
F ig u re 4.2.1 Function in an n-Dimensional Hyperspace
We compute the following derivatives of with respect to each of the chosen
parameters and combinations of parameters oy:
dxo _ Xo(qt + Afl i .gj) - Xq(q. - Aai ,gy)dai 2 A a ,
and^ ^ X o ^ X o (o , + A a i , g y ) - 2 x g ( 3 . , a j ) + X o ( q . ~ A a . , a y ) ôa? Ao?
( 4 .2 .4 )
( 4 .2 .5 )
and finally,
doidajg^Xo ^ Xo(q.- + A o „ g y + A cy) - Xo(aj + A o „ o y )
AOiAOy
_ Xo(a..Qj + Aoy) 4- Xo(o..Qj)Aa,-Aay
( 4 .2 .6 )
where the Aoj are step sizes which must be large enough to prevent roundoff error in
the computation and small enough to furnish reasonable answers near the minimum
where the derivatives may be changing rapidly with the parameters.
In practice, we calculate doi/e, where c is some small integer 1 < e < 1 0 , and
compute X* and its derivatives as described above monitoring its variation until
Isotierm al Analysis 261 §4.2
X® begins to increase. The size of the increments is decreased still further if the
first increment in a, does not yield a decrease in The last three points of the
search are used to locate the minimum x^ by parabolic interpolation, provided
uncertainties in the interpolation do not yield a higher value of than the lowest
already found.
Since the solution of our fit is the result of a search along the x^ hypersurface
rather than an exact analytical solution, there is no analytical form for the uncer
tainties in the final values of the parameters. Following Bevington (1969) we use
an algorithm which gives a reasonable definition of this uncertainty to approximate
our error such tha t
and
Pi - (*"' )]3= 0
(4.2.7)
(4.2.8)
where ir® is the sample varaiance for the fit and u = N — n — 1 is the number of
degrees of freedom after fitting N points with n + 1 parameters. Combining the
above two equations, the uncertainty in the coeflBcient Oj is given by
= 1 ) (1.2.9)
where Cjj(o’,- = 1 ) is the error m atrix evaluated with Ci = 1 .
Isotherm al Analysis 262 §4.3
4.3 T h e Iso th e rm a l A nalysis
This section is concerned with the Isothermal Fitting of the surface density dis
tribution of galaxy clusters. The general approach initially demands the calculation
of a cluster’s surface density on the sky. We achieve this by the traditional means of
ring counts, that is, by constructing a series of concentric annuli outwards from the
cluster center and counting the number of galaxies found within the bounds of each
annulus. The cluster center is th a t determined by the dispersion ellipse analysis.
Once the counts have been performed the surface density is derived as the number
of galaxies found per unit area of the annulus in question. The observed surface
density is then corrected for “background” contamination from data derived from
the predicted “field” count of galaxies on the ESO/SERC J-plates corresponding
to limiting magnitudes calibrated on the assumption of z = 0 colors for elliptical
galaxies as determined by Corwin (1985) and Rainey (1977).
Given the corrected surface density as a radial function of distance we can then
apply our isothermal fitting function to the data. As a test of our procedure, we
applied our analysis to Zwicky’s (1957) study of the Coma cluster of galaxies. Our
results, particularly that of the core radius as determined by the parameter yield
P = 1.579 ±0.316.
In comparison, we quote the values obtained by Bahcall (1973) and Austin and
Peach (1974) for the Coma cluster:
P - 2.0 Bahcall (1973)
P = 1.75 ± 0 .2 4 A ustin and Peach (1974),
and find our values in reasonable agreement.
In practice, however, we must point out that our method of analysis appears to
be quite sensitive to starting values of the initial parameters and the non-uniform
Isothermal Analysis 263 §4.3
radial distribution of surface density as a result of the effects of subclustering seen
in a number of clusters in our sample. We also note that the x* fitting procedure
experiences severe difficulty when test values of P are iterated to very small quan
tities forcing a near divide-by-zero condition that is catastrophic to the calculating
algorithm.
To offer the results of the Isothermal Fitting calculations, we present several
informative plots of the data as an aid to understanding the observations and the
scope of the analysis. The data are given in the following form:
1. Cluster Ring Counts. W ith the proper orientation of the positions of the
cluster members, we locate the center of the cluster and proceed to draw concentric
rings outward from the center of the cluster. The center is determined from the
dispersion ellipse computations and the rings are drawn at two arcminute intervals
to describe a counting annulus. The number of rings is derived from the average
range along both the ordinate and absissa calculated from the positions of the most
extended galaxies measured in the field. The resulting, generally rectangular shape,
is then measured for both major and minor axes which are averaged to give a length
which is then used as our maximum counting radius. Using this technique, we will
often miss the outermost galaxies in our ring counts as can be seen in the plots.
2. Quadrant Counts. Given the positions of the cluster members and their
relation to the cluster center we construct Cartesian axes with ordinate running
North-South and absissa running East-West. Then, with the usual convention, we
define the four quadrants in such a way that I:North-West, H:North-East, III:South-
E ast, and IV:South-West. Once the orientations are set, we begin to construct in
each quadrant an annulus that is t>'pically 2 . 0 minutes of arc in width and continue
doing so to the maximum counting radius. We count all galaxies that fall within
the bounds of each annulus terminating with the intersection of the annulus with
Isothermal Analysis 264 §4.3
the ordinate and absissa defining the quadrant of interest. Given the number of
galaxies within each annulus, or ring, we then plot a histogram and a smoothed
curve through the data and this is displayed as four plots, one for each quadrant.
S. Cluster Strip Counts. As a qualitative tool, this plot is essentially a pair of
orthogonal histograms that assist in determining the horizontal and vertical sym-
m etrj' of the cluster. The range of the plot is determined by the extrema of the data
as described above and the observations are then segregated into 1 . 0 millimeter bins
and counted. Once the counts have been performed, we plot a histogram of the data
and using the observed count frequency and given bin width, determine the mean
value and standard deviation of the mean. These values are used to plot a normally
distributed probability curve through the data to give the eye a qualitative appre
ciation of the distribution of the galaxy positions along each of the orthogonal axes.
And by noticing peaks in the data, one can easily find, for instance, the location of
concentrations in the cluster and also get some idea of the dispersion of the cluster
members from the center of the cluster.
4. Cluster Surface Density. This histogram is a composite of the data found in
the Quadrant Counts. For a given annulus, we count all galaxies found within its
bounds and for all quadrants. The total count is then plotted as a histogram, the
ordinate being the number of galaxies counted per annulus, and the absissa being
the annulus number with each succeeding annulus extending radially away from the
cluster center by increments of 2 . 0 minutes of arc.
5. Table of Data. The data table presents in numerical form the results of
the preceeding operations. We give the ring, or annulus number, the to tal count
of galaxies in that annulus, and the location of those counts in their respective
quadrants. Next, we determine the counting radius as the one which, for a given
annulus, divides it into sub-annuli of equal area. We then calculate the density
Isothermal Analysis 265 §4.3
of galaxies within the annulus and express tha t density as the number of galaxies
per square degree found in that circumscribed region. We also repeat the latter
two da ta with the values of their logarithms. Finally, the total number of galaxies
counted and the magnitude cutoff are given along with the coordinates of the cluster
center and the ring width used for counting.
6 . The h o th erm d Fit. This plot uses the data from the preceeding table as the
input to the Isothermal Fitting Procedure. This procedure attempts to minimize
while independently varying three parameters. We plot the observations consisting
of the cluster surface density as measured in units of galaxies per square degree
agmnst the radial distance from the center of the cluster as measured in minutes of
arc. The observed data is plotted as a broken line on a log-log scale. We then plot
with a solid line the best fit from the isothermal analysis for the same input data,
also on a log-log scale. Finally, we give the calculated value of the core radius in
units of Mpc.
7. Cluster Parameters. The last table gives the calculated values of the cluster
parameters and their variance. Beginning with the cluster identification, we display
the isothermal fitting equation
p(r) = a « g ( r / ; 9 ) + 7
and the values and variance of the free parameters a , and 7 . We then print the
best fit values of the parameters in equation form. Finally, we give the calulated
core radius, Rc, of the cluster as determined by the isothermal fit in units of Mpc
{H = 100/h km fsecjM pc) and the cluster redshift, z, as determined by mio-
IsotbermaJ Analysis 266 §4.4
4 .4 Iso th e rm a l A n a ly sis o f S o u th e rn G a lax y C lu s te rs
In this section we present a uniform description of the Isothermal Analysis
of galaxies in our sample. R ather than publish the data in numerical form, we
choose a graphical and tabular form at for ease of comparison between cluster and
cluster. The sample is magnitude-limited and uniform to = 19.0, In addition,
ring-counts were performed uniformly with annulae of 2 . 0 arcminute widths.
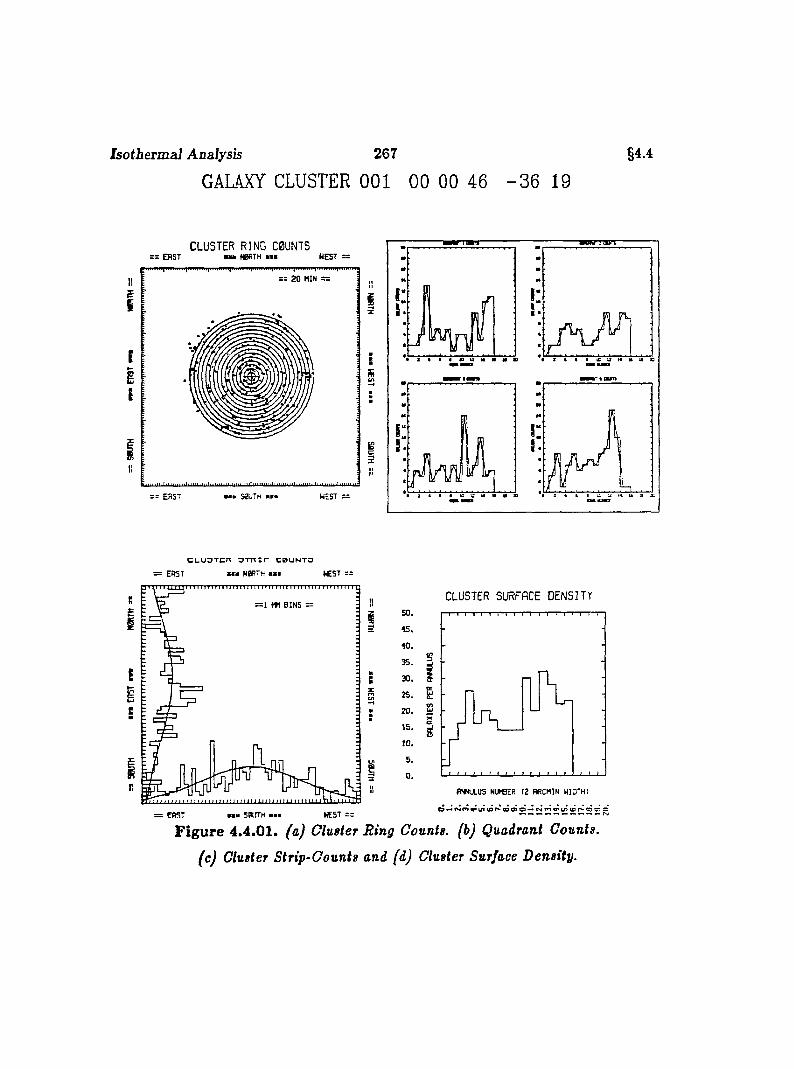
Isothermal Analysis 267
GALAXY CLUSTER 001 00 00 46 - 3 6 19
§4.4
CLUSTER RING C0ÜNTS= = EAST mmM N0RTH n i WEST :
== 2 0 MIN = z
= = E A S T S0Ü TH I W EST =
I
:*:
!!
C U U O T C f T O T H i r C 0 U N T O
EAST I » north m i &CST ==
R
IB I N S = =
E
E
n
= CRST I SBirTH mm. NEST = :
CLUSTER SURFACE DENSITY5 0 .
40 .
<s3 0 . S
2 5 . ë
20 . “
fl l f W L U S NUMBER 1 2 R R C M IN W ID TH )
F ig u re 4.4.01. (a) Cluster Ring Counts, (b) Quadrant Counts,
(c) Cluster Strip-Counts and (d) Cluster Surface Density.
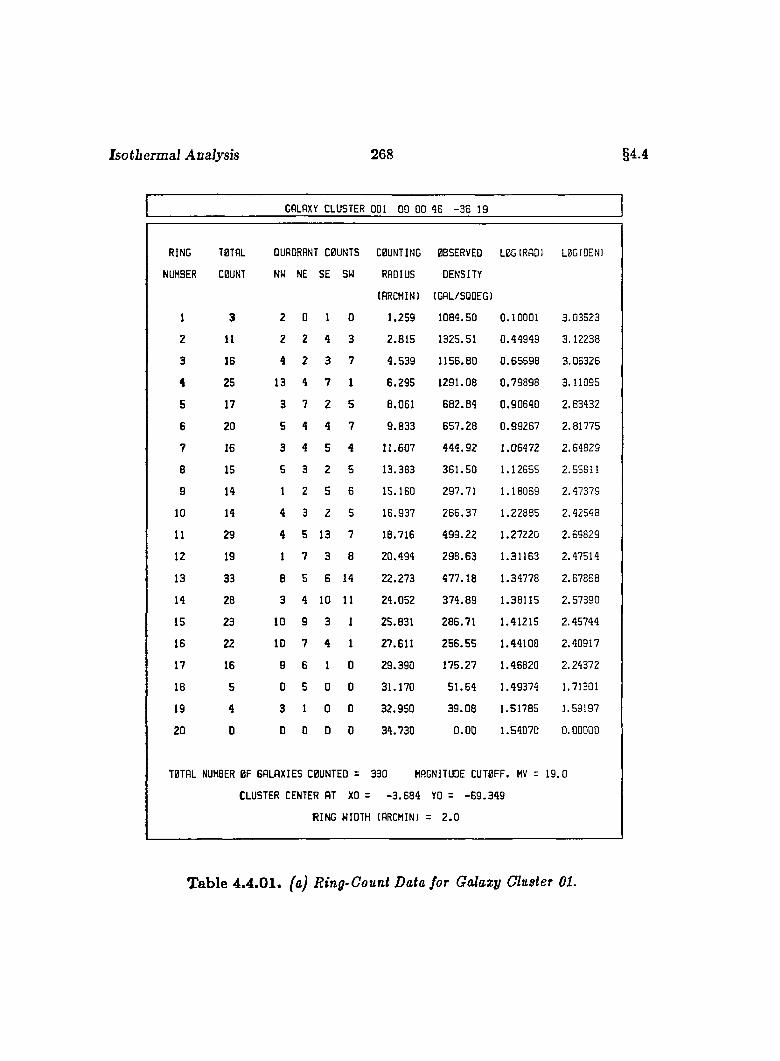
Isothermal Analysis 268 §4.4
GALAXY CLUSTER 001 00 00 46 -38 19
RING
NUMBER
TOTAL
COUNT
QUADRANT COUNTS
NW NE SE SW
COUNTING
RADIUS
(RRCMIN)
OBSERVED
DENSITY
IGRL/SQOEG)
LOG(RAO) LOGfOEN)
1 3 2 D 1 D 1 .2 5 9 1 08 4 .5 0 0 .10001 3 .03523
2 11 2 2 4 3 2 .8 1 5 1325.51 0 .4 4 9 4 9 3 .12238
3 16 4 2 3 7 4 .5 3 9 1 1 5 5 .8 0 0 .6 5 6 9 8 3 .06326
4 25 13 4 7 1 6 .2 9 5 1 2 9 1 .0 8 0 .7 9 8 9 8 3 .11095
5 17 3 7 2 5 8 .061 6 8 2 .8 4 0 .9 0 6 4 0 2 .83432
6 20 5 4 4 7 9 .8 3 3 6 5 7 .2 8 0 .9 9 2 6 7 2 .81775
7 16 3 4 5 4 11 .6 0 7 4 4 4 .9 2 1 .06 4 7 2 2 .64829
8 15 5 3 2 5 13 .383 3 6 1 .5 0 1 .12655 2.55811
9 14 1 2 5 6 15 .160 2 9 7 .7 1 1 .18069 2 .47379
10 14 4 3 2 5 16 .937 2 6 6 .3 7 1 .22 8 8 5 2 .42548
11 29 4 5 13 7 18 .716 4 9 9 .2 2 1 .27220 2 .69829
12 19 1 7 3 8 2 0 .4 9 4 2 9 8 .6 3 1.31163 2 .47514
13 33 8 5 6 14 2 2 .2 7 3 4 7 7 .1 8 1 .34778 2 .67868
14 28 3 4 10 11 2 4 .0 5 2 3 7 4 .8 9 1.38115 2 .57390
15 23 10 9 3 1 25 .831 2 8 6 .7 1 1 .41215 2 .45744
16 22 ID 7 4 1 27 .611 2 5 6 .5 5 1 .44108 2.40917
17 16 9 6 1 0 2 9 .3 9 0 1 7 5 .2 7 1 .46820 2.24372
18 5 0 5 0 0 3 1 .1 7 0 5 1 .6 4 1 .49374 1.71301
19 4 3 1 0 0 3 2 .9 5 0 3 9 .0 8 1 .51785 1.59197
20 0 0 0 0 0 3 4 .7 3 0 0 .0 0 1 .54 0 7 0 0 .00000
TOTAL NUMBER OF GALAXIES COUNTED =
CLUSTER CENTER AT XO =
RING WIDTH
330 MAGNITUDE CUTOFF. MV = 1 9 .0
- 3 .6 8 4 YO = - 6 9 .3 4 9
(RRCMIN) = 2 .0
T able 4.4.01. (a) Ring-Count Data Jar Galaxy Cluster 01.
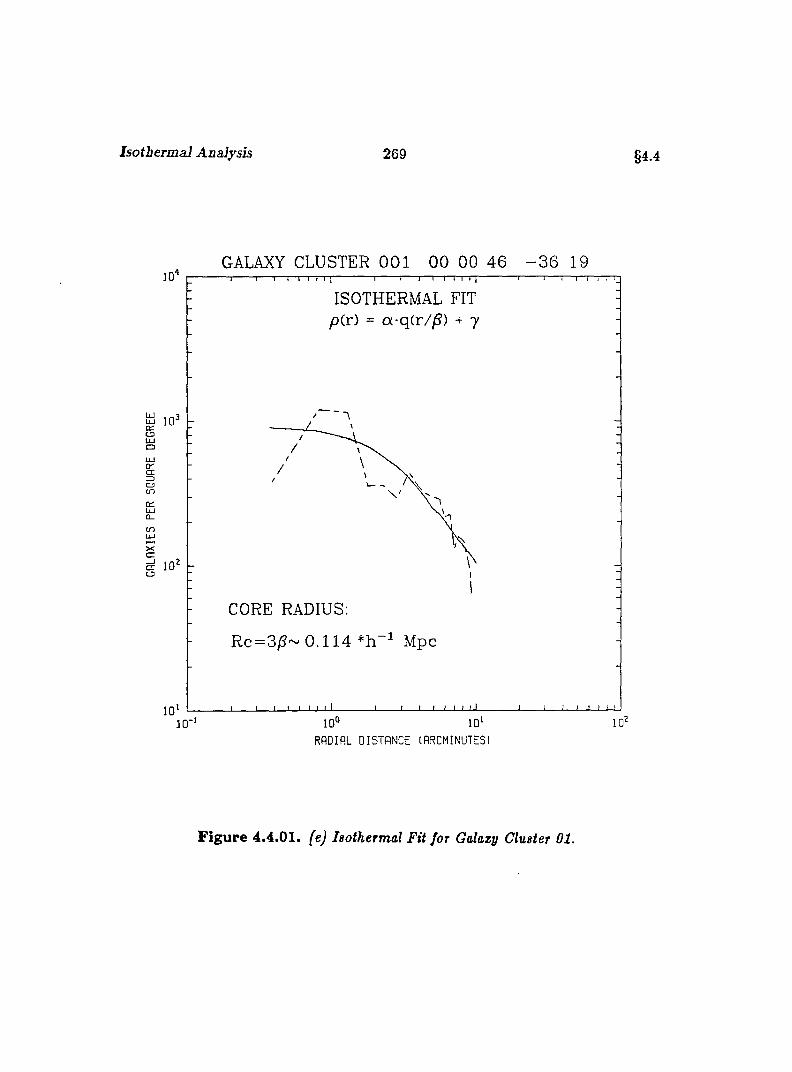
Isotbermal Analysis 269 §4.4
GALAXY CLUSTER 0 01 00 00 46 - 3 6 19
ISOTHERMAL FIT pir) = a-q(r//5) + y
a 1 0
OU Jo
0 0
Ù1U J0 _
c n
ŒŒ 10 ' L3
CORE RADIUS:
Rc=3jg- 0.114 Mpc
RADIAL DISTANCE tARCMINUTES)
F ig u re 4.4.01. (e) h o th erm d Fit for Gdaxy Cluster 01.
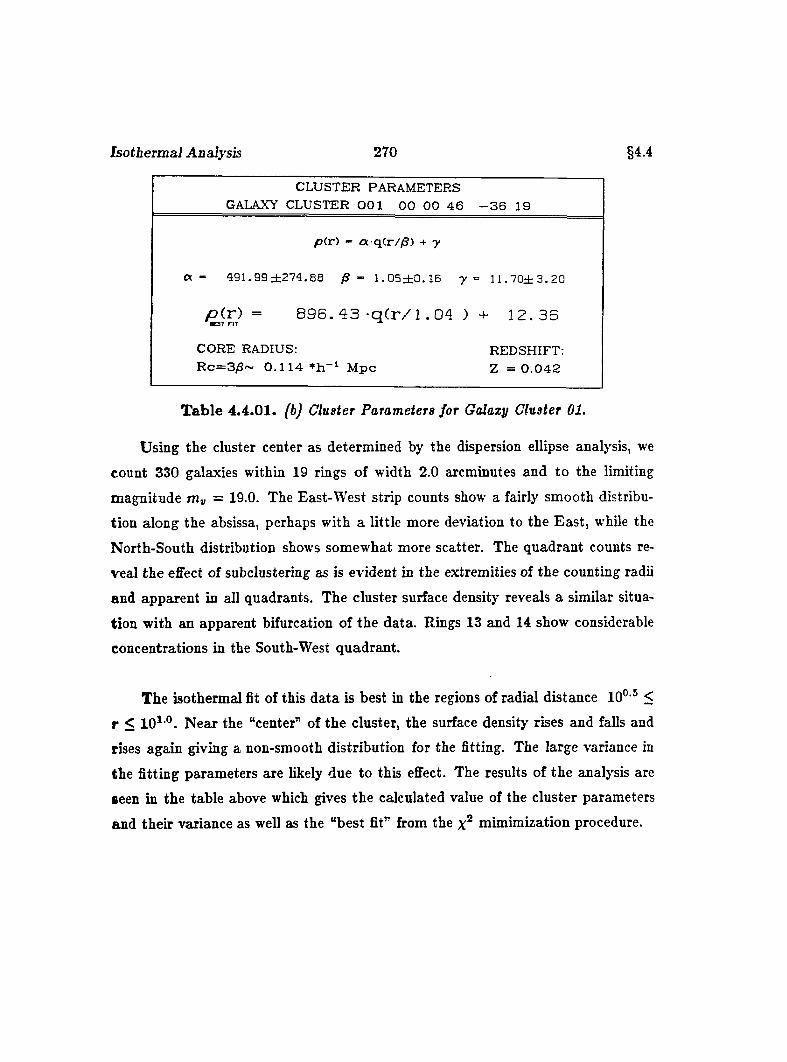
Isotbermal Analysis 270 §4.4
CLUSTER PARAMETERS GALAXY CLUSTER 0 0 1 0 0 0 0 4 6 - 3 6 19
p(r) - a q(r / /3) + y
a - 4 9 1 . 9 9 ± 2 7 4 . 8 8 /S - l . G 5 ± 0 . 1 6 7 = 1 1 . 7 0 ± 3 . 2 0
/ O ( r ) = 896. 4 3 - q ( r / l .04 ) + 12.36
CORE RADIUS:Rc=3/S~ 0.114 Mpc
REDSHIFT: Z = 0 .0 4 2
T ab le 4.4.01. (b) Cluster Parameters for Galaxy Cluster 01.
Using the cluster center as determined by the dispersion ellipse analysis, we
count 330 galaxies within 19 rings of width 2.0 arcminutes and to the limiting
magnitude ruv = 19.0. The East-West strip counts show a fairly smooth distribu
tion along the absissa, perhaps with a little more deviation to the East, while the
North-South distribution shows somewhat more scatter. The quadrant counts re
veal the effect of subclustering as is evident in the extremities of the counting radii
and apparent in all quadrants. The cluster surface density reveals a similar situa
tion with an apparent bifurcation of the data. Rings 13 and 14 show considerable
concentrations in the South-West quadrant.
The isothermal fit of this data is best in the regions of radial distance 1 0 ° ® <
r < 10'-°. Near the “center" of the cluster, the surface density rises and falls and
rises again giving a non-smooth distribution for the fitting. The large variance in
the fitting parameters are likely due to this effect. The results of the analysis are
seen in the table above which gives the calculated value of the cluster parameters
and their variance as well as the “best fit” from the mimimization procedure.
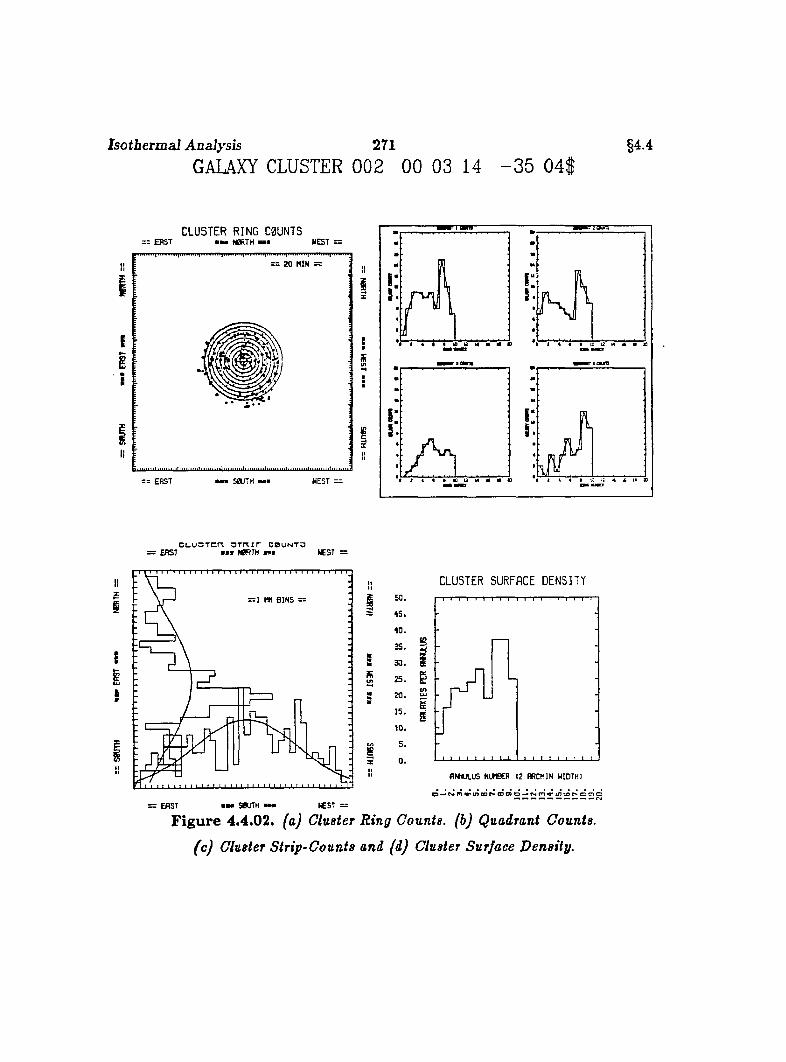
Isotberm al Analysis 271GALAXY CLUSTER 002 00 03 14 - 3 5 04$
§4.4
CLUSTER RING C0UNTS: E R S T mmm N 0R T H w W EST —
:= 2 0 M IN =Î!
II
II
W EST == = E R S T
ram rsn
r N
C l _ U 3 T C n 3 T R i r C 0 U N T 3 EAST m w N0RTH »»■ »C5T =
II
I
{I
= EAST mmm S8U T H « 5 T = =
CLUSTER SURFACE DENSITY
2 5 . g
i
A NN ULUS N U fB E R 12 B R W I N W ID TH )
F ig u re 4.4.02. (a) Cluster Ring Counts, (b) Quadrant Counts,
(c) Cluster Strip-Counts and (d) Cluster Surface Density.
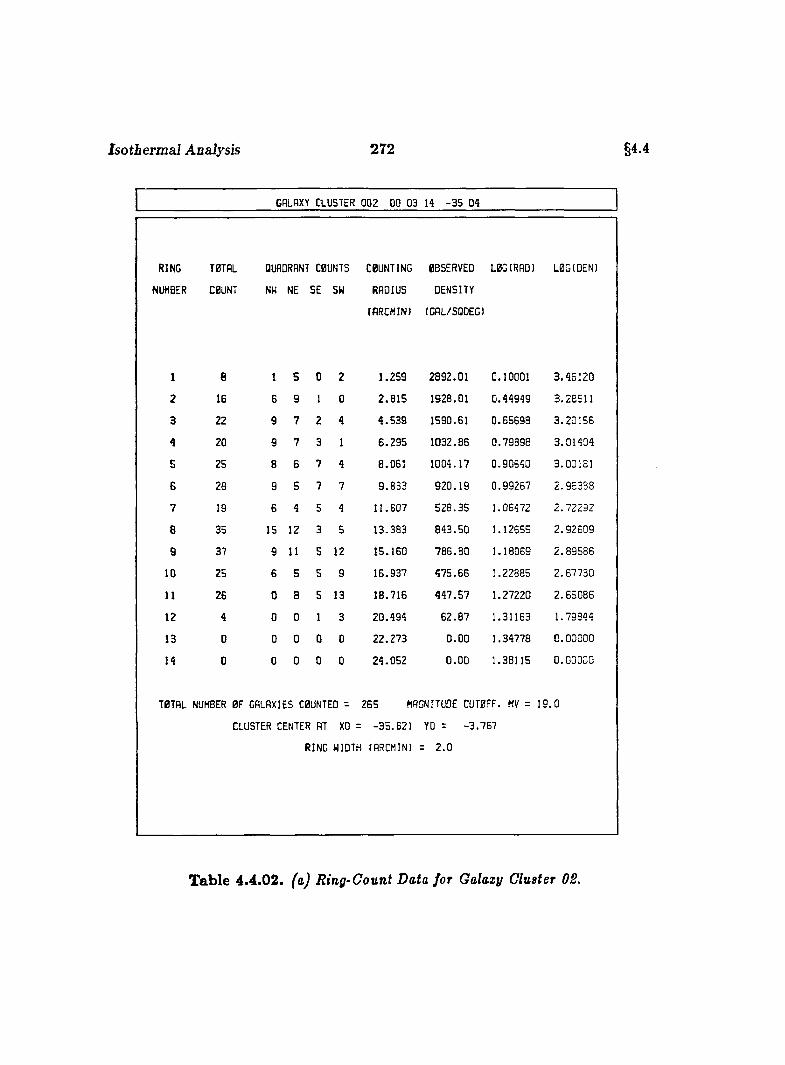
Isotbermal Analysis 272 §4.4
GALAXY CLUSTER 002 00 03 14 -35 04
HNG T0TAL QUADRANT C0UNTS C0UNTING 0BSERVED L0CIRAO) L0GIOEN)
JMBER C0UNT NW NE SE SW RADIUS DENSITY
(fiRCMIN) (GRL/SODEG)
1 8 1 5 0 2 1 .2 5 9 2 8 9 2 .0 1 0 .10001 3 .4 6 1 2 0
2 16 6 9 1 0 2 .8 1 5 1928 .01 0 .4 4 9 4 9 3 .2 8 5 1 1
3 22 9 7 2 4 4 .5 3 9 1590.61 0 .6 5 6 9 8 3 .2 0 1 5 6
4 20 9 7 3 1 6 .2 9 5 1 0 3 2 .8 6 0 .7 9 8 9 8 3 .0 1 4 0 4
5 25 8 6 7 4 8 .0 6 1 1D 04.I7 0 .9 0 6 4 0 3 .0 0 1 8 1
6 28 9 5 7 7 9 .8 3 3 9 2 0 .1 9 0 .9 9 2 6 7 2 .9 5 3 8 8
7 19 6 4 5 4 1 1 .6 0 7 5 2 8 .3 5 1 .06472 2 .7 2 2 9 2
8 35 15 12 3 5 1 3 .3 8 3 8 4 3 .5 0 1 .12655 2 .9 2 6 0 9
9 37 9 11 5 12 1 5 .1 6 0 7 8 6 .8 0 I . 18069 2 .8 9 5 8 6
10 25 6 5 5 g 1 6 .9 3 7 4 7 5 .6 6 1 .22885 2 .6 7 7 3 0
11 26 0 8 5 13 1 8 .7 1 6 4 4 7 .5 7 1 .2 7 2 2 0 2 .6 5 0 8 8
12 4 0 0 1 3 2 0 .4 9 4 6 2 .8 7 1 .31163 1 .79 8 4 4
13 0 0 0 D 0 2 2 .2 7 3 0 .0 0 1 .3 4 7 7 8 0 .0 0 0 0 0
14 0 0 0 0 0 2 4 .0 5 2 0 .0 0 1 .38 1 1 5 0 .0 0 0 0 0
T0TAL NUMBER 0F GALAXIES C0UNTEO = 265 MAGNITUDE CUT0FF. HV = 1 9 .0
CLUSTER CENTER AT XO = -3 5 .B 2 1 YO = -3 .7 6 7
RING WIDTH fARCHINl = 2 .0
T able 4.4.02. (a) Ring-Count Data for Qalazy Cluster 08.
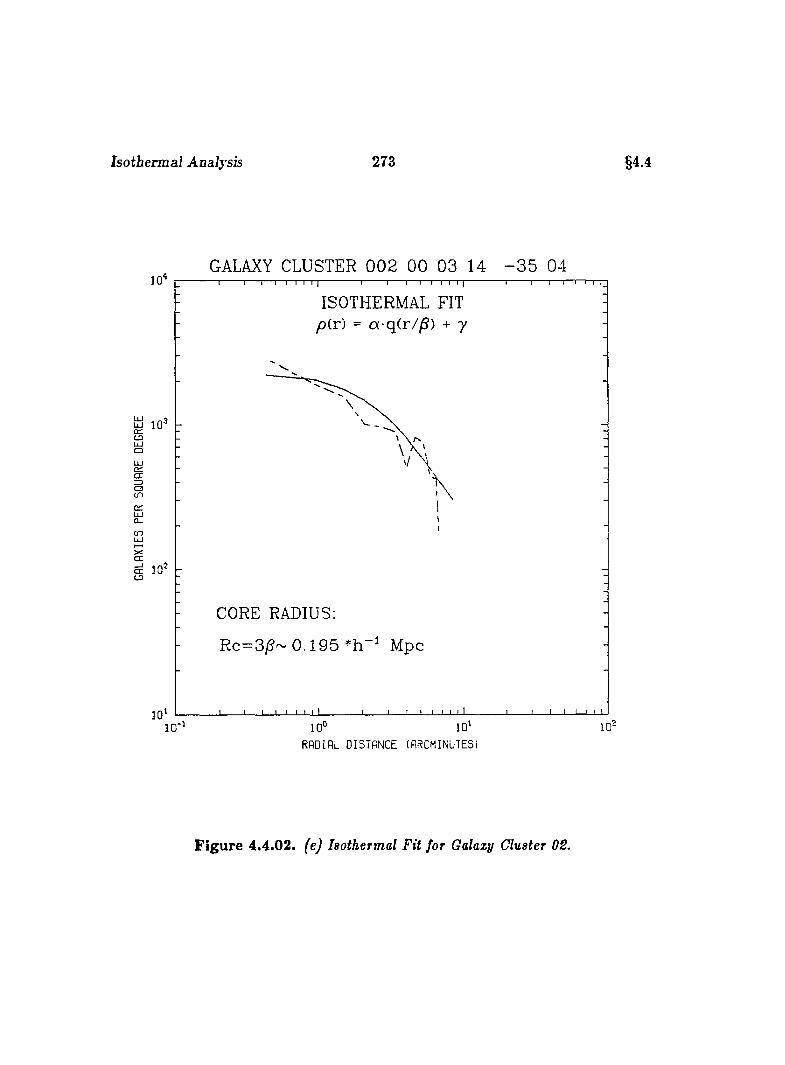
Isotbermal Analysis 273 §4.4
GALAXY CLUSTER 0 0 2 GO 03 14 - 3 5 041 0 '
ISOTHERMAL FIT p(r) = a-q(r//S) + y
OU Jor:exaCO
Û -
C OU J
ccΠ1 0 L3
CORE RADIUS:
Rc=3/?~ 0.195 *h Mpc
10*1 0 °
RADIAL DISTANCE (RRCMINUTESl
F ig u re 4.4.02. (e) Isothermal Fit for Galaxy Cluster OS.
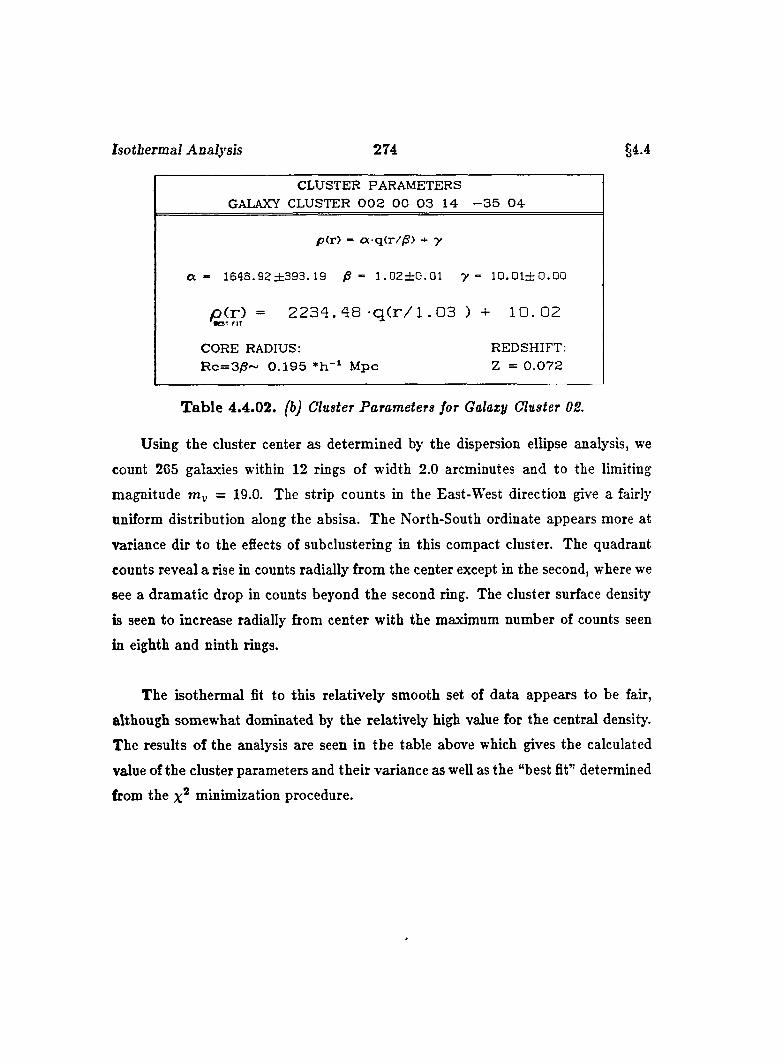
Isotbermal Analysis 274 §4.4
tx
CLUSTER PARAMETERS GALAXY CLUSTER 0 0 2 0 0 0 3 14 - 3 5 0 4
p(r) - a-q(r//S) + y
- 1 6 4 8 . 9 2 ± 3 9 3 . 1 9 /S - 1 . 0 2 ± 0 . 0 1 7 “ 1 0 . 0 1 ± 0 . 0 0
p ( r ) = 2 2 3 4 . 4 8 - q ( r / l .03 ) + 10.02
CORE RADIUS:R c= 3 /S ~ 0 .1 9 5 M pc
REDSHIFT: Z = 0 .0 7 2
T ab le 4.4.02. (b) Cluster Parameters for Galaxy Cluster OS.
Using the cluster center as determined by the dispersion ellipse analysis, we
count 265 galaxies within 12 rings of width 2.0 arcminutes and to the limiting
magnitude = 19.0. The strip counts in the East-West direction give a fairly
uniform distribution along the absisa. The North-South ordinate appears more at
variance dir to the effects of subclustering in this compact cluster. The quadrant
counts reveal a rise in counts radially from the center except in the second, where we
see a dramatic drop in counts beyond the second ring. The cluster surface density
is seen to increase radially from center with the maximum number of counts seen
in eighth and ninth rings.
The isothermal fit to this relatively smooth set of data appears to be fair,
although somewhat dominated by the relatively high value for the central density.
The results of the analysis are seen in the table above which gives the calculated
value of the cluster parameters and their variance as well as the “best fit” determined
from the minimization procedure.

Isotberm al Analysis 275
GALAXY CLUSTER 003 00 06 49 - 3 5 43§4.4
CLUSTER RING COUNTS= = ERST ■■■ N0RTH ■■■ WEST
ran
= 2 0 M IN =
SajTH WEST =
C L U 3T C H 3 T f T i r C0UNT3 : C P 5 T mmu NBRTM w frC S T = =
: B I N S =
III
= EBST
CLUSTER SURFACE DENSITY5 0 .
35. g
25. Ë
m W J L U S NUMBER 12 R R C M IN W ID TH !
— « M fn ^ m tD c * * c o o o
F ig u re 4.4.08. (a) Cluster Ring Counts, (b) Quadrant Counts,
(c) Cluster Strip-Counts and (d) Cluster Surface Density.
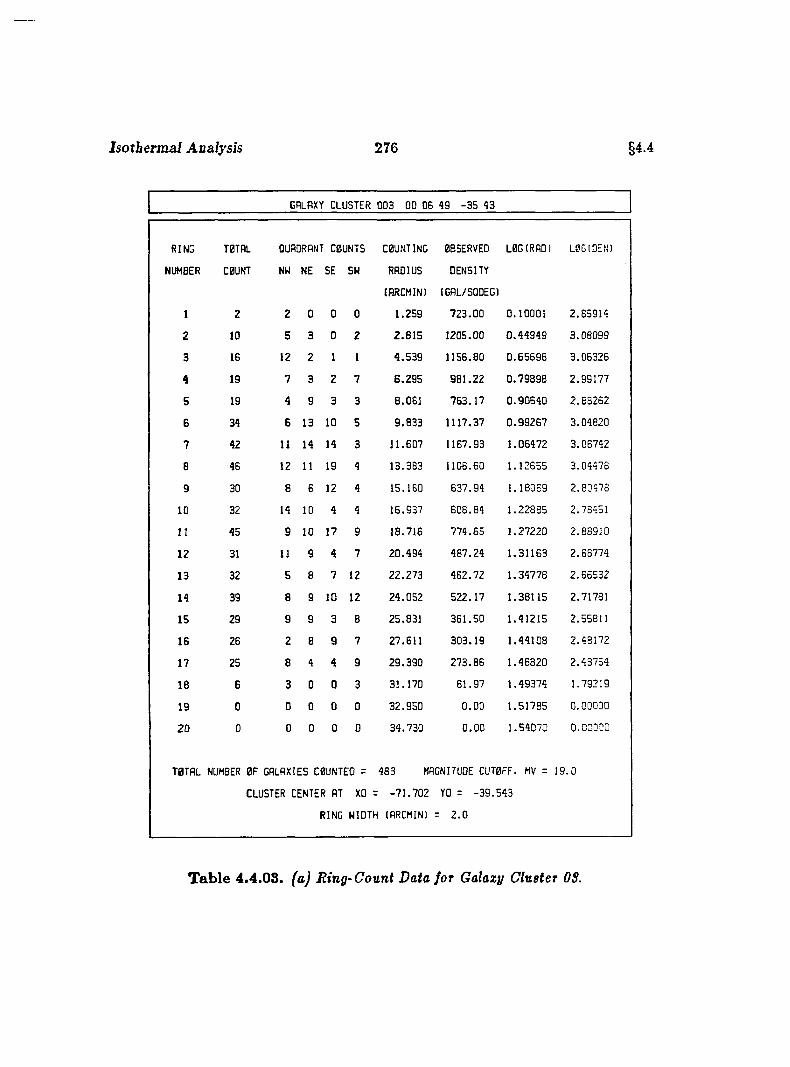
IsotbermaJ Analysis 276 §4.4
GRLRXY CLUSTER 003 00 06 49 -35 43
RING
NUMBER
T0TAL
C0UNT
QUADRANT C0UNTS
NW NE SE SW
COUNTING
RADIUS
(ARCHIN)
0BSERVEO
DENSITY
IGRL/SODEG)
L0G(RRD) L0GIDEN)
1 2 2 0 0 0 1 .2 5 9 7 2 3 .0 0 0 .1 0 0 0 1 2 .8 5 9 1 4
2 10 5 3 0 2 2 .8 1 5 120 5 .0 0 0 .4 4 9 4 9 3 .0 8 0 9 9
3 16 12 2 1 1 4 .5 3 9 1156 .80 0 .6 5 6 9 8 3 .0 6 3 2 6
4 19 7 3 2 7 6 .2 9 5 9 8 1 .2 2 0 .7 9 8 9 8 2 .9 9 1 7 7
5 19 4 9 3 3 8 .0 6 1 7 6 3 .1 7 0 .9 0 6 4 0 2 .8 8 2 6 2
6 34 6 13 10 5 9 .8 3 3 1117 ,37 0 .9 9 2 6 7 3 .04 8 2 0
7 42 11 14 14 3 11 .6 0 7 1167 .93 1 .0 6 4 7 2 3 .0 6 7 4 2
8 46 12 11 19 4 13 .383 1108 .60 1 .1 2 6 5 5 3 .0 4 4 7 8
9 30 8 6 12 4 15 .160 6 3 7 .9 4 1 .1 8 0 6 9 2 .8 0 4 7 8
10 32 14 10 4 4 16 .937 6 0 8 .8 4 1 .2 2 8 8 5 2 .78451
11 45 9 10 17 9 18 .7 1 6 7 7 4 .6 5 1 .2 7 2 2 0 2 .8 8 9 1 0
12 31 11 9 4 7 2 0 .4 9 4 4 8 7 .2 4 1 .3 1 1 6 3 2 .68 7 7 4
13 32 5 8 7 12 2 2 .2 7 3 4 6 2 .7 2 1 .3 4 7 7 8 2 .6 5 5 3 2
14 39 8 9 10 12 2 4 .0 5 2 5 2 2 .1 7 1 .3 8 1 1 5 2.71781
15 29 9 9 3 8 25 .831 3 6 1 .5 0 1 .4 1 2 1 5 2 .5 5 8 )1
16 26 2 8 9 7 27 .6 1 1 3 0 3 .1 9 1 .4 4 1 0 8 2 .4 8 1 7 2
17 25 8 4 4 9 2 9 .3 9 0 2 7 3 .8 6 1 .4 6 8 2 0 2 .43 7 5 4
18 6 3 0 0 3 3 1 .1 7 0 6 1 .9 7 1 .4 9 3 7 4 1.79219
19 0 0 0 0 0 3 2 .9 5 0 0 .0 0 1 .5 1 7 8 5 0.00000
2 0 0 0 0 0 0 3 4 .7 3 0 0 .0 0 1 .5 4 0 7 0 0.00000
T0TAL NUMBER 0F GALAXIES C0UNTEO =
CLUSTER CENTER AT XO =
RING WIDTH
483 MAGNITUDE CUT0FF, MV =
-7 1 .7 0 2 YO = -3 9 .5 4 3
(RRCMIN) = 2 .0
1 9 .0
T ab le 4.4.08. (a) Ring-Count Data for Galazy Cluster OS.

Isotbermal Analysis 277 §4 4
GALAXY CLUSTER 003 00 06 49 - 3 5 44
ISOTHERMAL FIT p(T) = a-q(r//3) + y
a iq3CDLUO
l i
e n
CORE RADIUS;
Rc=3jS~ 0 .154 *h Mpc
1 0 °RADIAL DISTANCE (ARCMINUTES)
F igure 4.4.03. (e) Isothermal Fit for Galaxy Cluster OS.
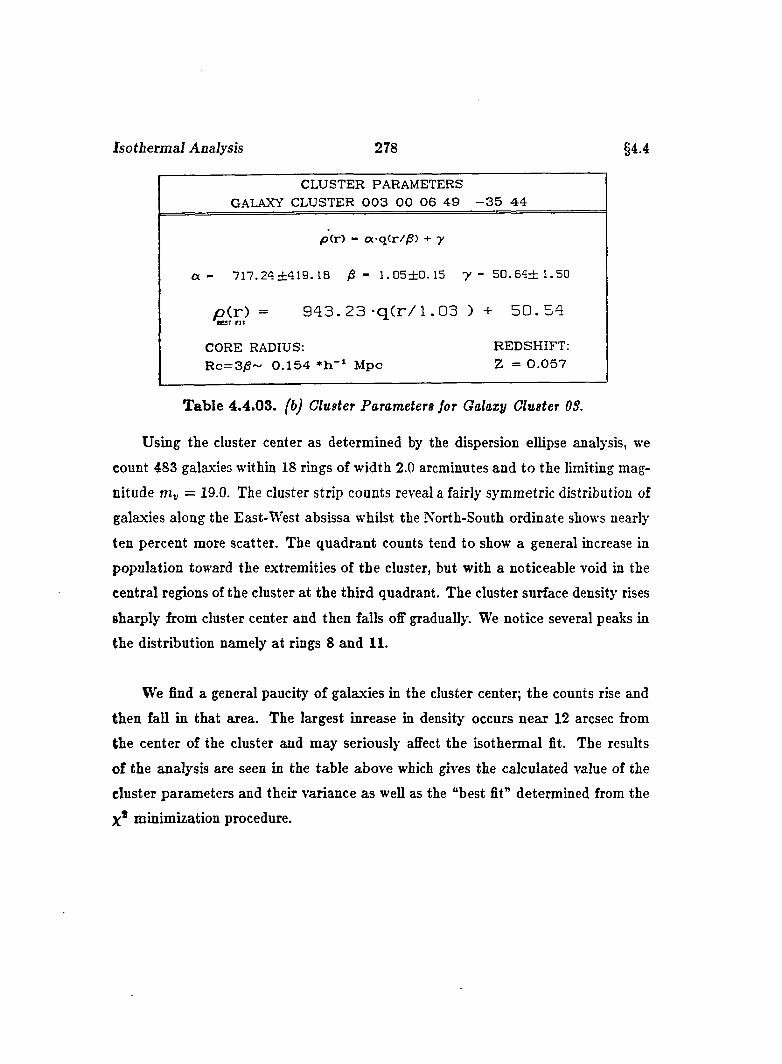
Isotbermal Analysis 278 §4.4
CLUSTER PARAMETERSGALAXY CLUSTER 0 0 3 0 0 0 6 4 9 - 3 5 4 4
/D(r) “ ofq<r//S) + y
a - 7 1 7 . 2 4 ± 4 1 9 . 1 8 /S - 1 . 0 5 ± 0 . 1 5 y “ 5 0 . 6 4 j : 1 . 5 0
p( r ) = 943. 2 3 - q ( r / l .03 ) + 50 .54
CORE RADIUS;R c= 3 /S ~ 0 .1 5 4 M pc
REDSHIFT: Z = 0 .0 5 7
T able 4.4.03. (b) Cluster Parameters for Galaxy Cluster OS.
Using the cluster center as determined by the dispersion ellipse analysis, we
count 483 galaxies within 18 rings of width 2.0 arcminutes and to the limiting mag
nitude niv = 19.0. The cluster strip counts reveal a fairly symmetric distribution of
galaxies along the East-West absissa whilst the North-South ordinate shows nearly
ten percent more scatter. The quadrant counts tend to show a general increase in
population toward the extremities of the cluster, but with a noticeable void in the
central regions of the cluster at the third quadrant. The cluster surface density rises
sharply from cluster center and then falls off gradually. We notice several peaks in
the distribution namely at rings 8 and 1 1 .
We find a general paucity of galaxies in the cluster center; the counts rise and
then fall in that area. The largest inrease in density occurs near 1 2 arcsec from
the center of the cluster and may seriously affect the isothermal fit. The results
of the analysis are seen in the table above which gives the calculated value of the
cluster parameters and their variance as well as the “best fit” determined from the
X* minimization procedure.
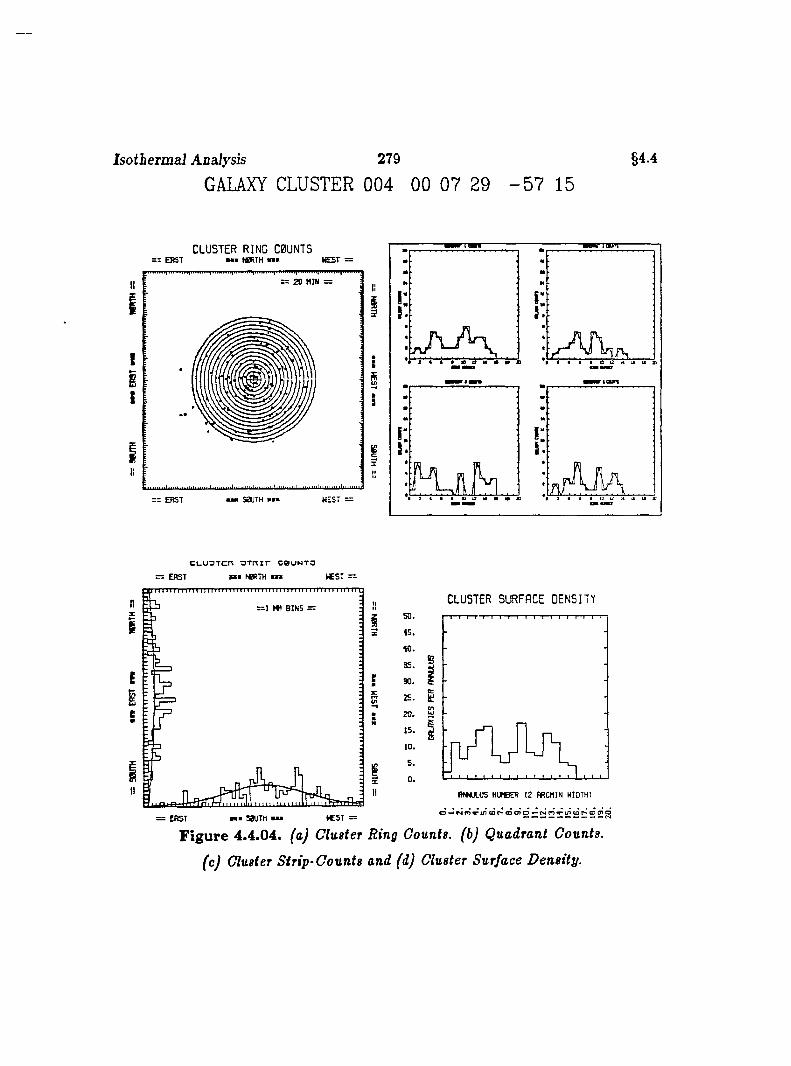
Isotherm al Analysis 279
GALAXY CLUSTER 004 00 07 29 - 5 7 15§4.4
CLUSTER RING C0UNTS== EAST ■ » N0RTH ■■■ WEST '
s= 2 0 MIN =
III
II
W E S T == = E R S T
Tuar
II
I
:
i
I
C t - U D T C n O T R i r C 0 U N T O
ERST B I NORTH n « ^ S T :
n BINS =
I
E
e
= ERST mm" SOUTH mm*
CLUSTER SURFACE DENSITY
F ig u re 4.4.04. (a) Cluster Ring Counts, (b) Quadrant Counts,
(c) Cluster Strip-Counts and (d) Cluster Surface Density.
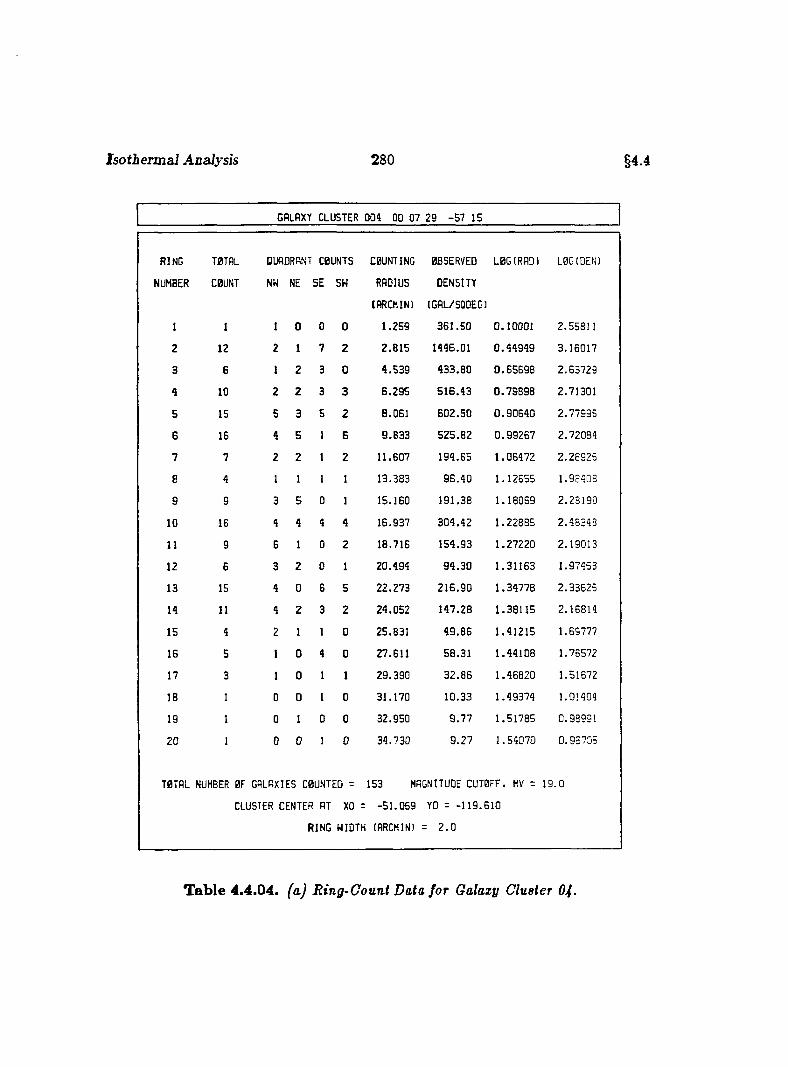
Isothermal Analysis 280 §4.4
GALAXY CLUSTER 004 00 07 29 -57 15
RING
NUMBER
T0TAL
C0UNT
QUADRANT C0UNTS
NW NE SE SW
COUNTING
RADIUS
(ARCMINl
0BSERVED
DENSITY
IGAL/SQDEG)
L0G(RRD) LBG(DEN)
1 1 1 0 0 0 1 .2 5 9 3 6 1 .5 0 0 .1 0 0 0 1 2 .55811
2 12 2 1 7 2 2 .8 1 5 1446 .01 0 .4 4 9 4 9 3 .1 6 0 1 7
3 8 1 2 3 0 4 .5 3 9 4 3 3 .8 0 0 .6 5 6 9 8 2 .6 3 7 2 9
4 10 2 2 3 3 6 ,2 9 5 5 1 6 .4 3 0 .7 9 8 9 8 2 .71301
5 15 5 3 5 2 8 .0 6 1 6 0 2 .5 0 0 .9 0 6 4 0 2 .7 7 9 9 6
6 16 4 5 1 E 9 .8 3 3 5 2 5 .8 2 0 .9 9 2 6 7 2 .7 2 0 8 4
7 7 2 2 1 2 11 .607 1 9 4 .6 5 1 .0 6 4 7 2 2 .2 8 9 2 6
8 4 1 1 1 1 13 .383 9 6 .4 0 1 .1 2 6 5 5 1 .9 8 4 0 8
9 9 3 5 0 1 15 .160 1 9 1 .3 8 1 .1 8 0 6 9 2 .2 8 1 9 0
10 16 4 4 4 4 16 .937 3 0 4 .4 2 1 .2 2 8 8 5 2 .4 8 3 4 3
11 9 6 1 0 2 18 .716 1 5 4 .9 3 1 .2 7 2 2 0 2 .1 9 0 1 3
12 6 3 2 0 1 20 .4 9 4 9 4 .3 0 1 .3 1 1 6 3 1 .97 4 5 3
13 15 4 0 6 5 22 .2 7 3 2 1 6 .9 0 1 .3 4 7 7 8 2 .3 3 5 2 6
14 11 4 2 3 2 24 .0 5 2 14 7 .2 8 1 .3 8 1 1 5 2 .1 6 8 1 4
15 4 2 1 1 0 25.831 4 9 .8 6 1 .4 1 2 1 5 1 .59777
16 5 1 0 4 Q 27.611 5 8 .3 1 1 .4 4 1 0 8 1 .76572
17 3 1 0 1 1 29 .3 9 0 3 2 .8 6 1 .4 6 8 2 0 1 .51672
18 1 0 0 1 0 31 .1 7 0 1 0 .3 3 1 .4 9 3 7 4 1.01404
19 1 0 1 0 0 32 .9 5 0 9 .7 7 1 .5 1 7 8 5 0 .98991
20 1 0 0 I 0 34 .7 3 0 9 .2 7 1 .5 4 0 7 0 0 .9 5 7 0 5
T0TAL NUMBER 0F GALAXIES C0UNTEO =
CLUSTER CENTER AT XO =
RING WIDTH
153 MAGNITUDE CUT0FF. MV =
-5 1 .0 6 9 YO = -1 1 9 .6 1 0
(RRCMIN) = 2 .0
1 9 .0
T ab le 4.4.04. faj Ring-Count Data for Galazy Cluster 04.
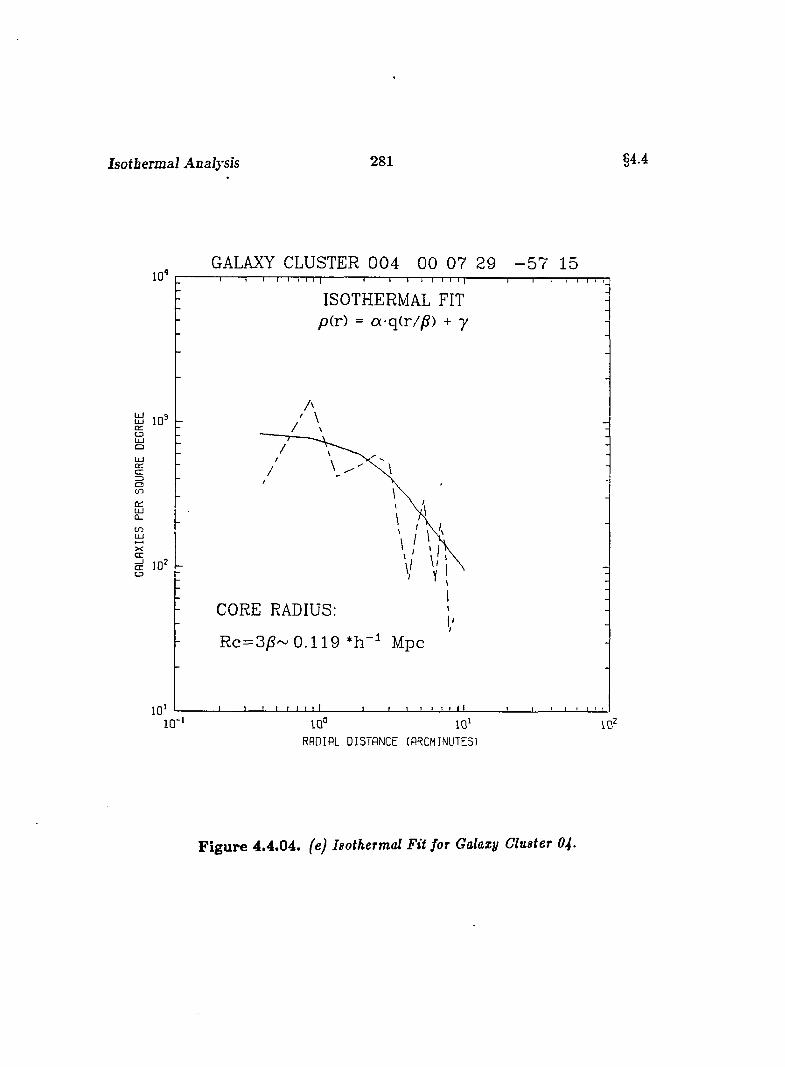
Isotbermal Analysis 281 §4.4
neCD
LUceŒ=3C3(nOfLUû_
XCE
CEL3
GALAXY CLUSTER 0 0 4 00 07 29 - 5 7 1510 '
ISOTHERMAL FIT p(r) = a-q(r//S) + y
CORE RADIUS:
Rc = 3 ^ ~ 0 .1 1 9 * h Mpc
10 '
RADIAL DISTANCE (ARCMINUTES)
F ig u re 4.4.04. fej Isothermal Fit for Galazy Cluster 04.
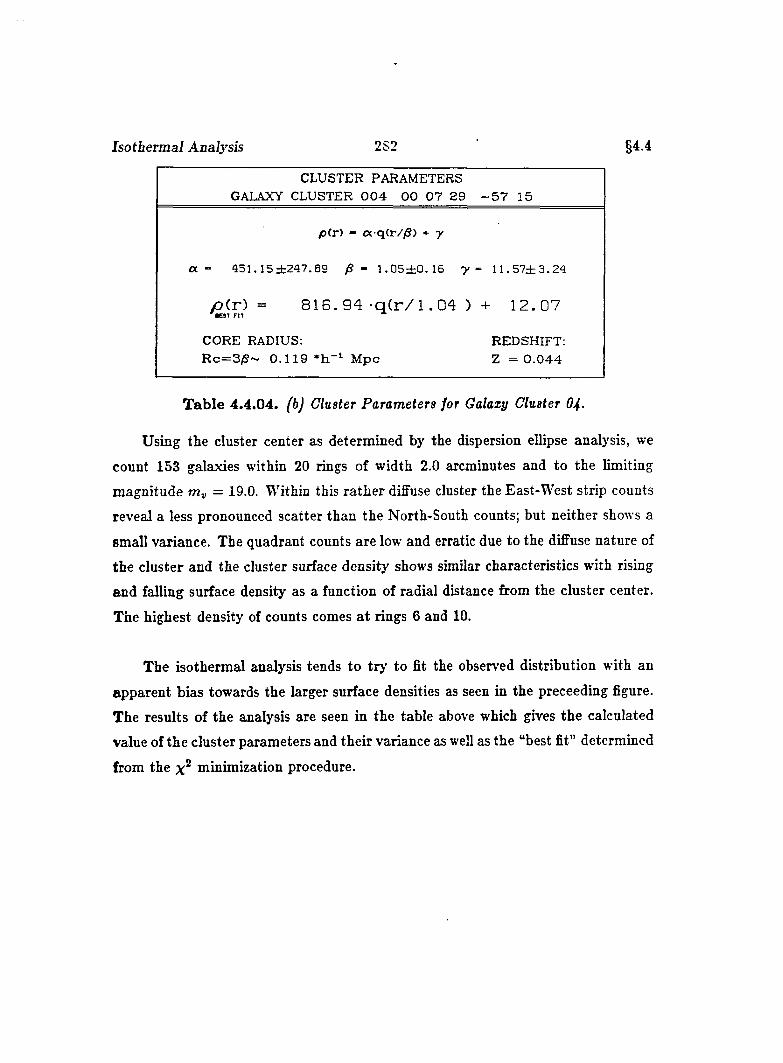
Isotbermal Analysis 282 §4.4
CLUSTER PARAMETERS GALAXY CLUSTER 0 0 4 0 0 0 7 29 - 5 7 15
p(r) - £x q(r//S) + y
a ~ 451. 15±247 .89 /S - 1 .0 5 ± 0 .1 6 y - 1 1 .5 7 ± 3 .2 4
p ( r ) = 8 1 6 . 9 4 - q C r / l .04 )•EST FIT * + 12.07
CORE RADIUS: REDSHIFT:R c= 3 /S ~ 0 .1 1 9 M pc Z = 0 .0 4 4
T ab le 4.4.04. (b) Cluster Parameters for Galaxy Cluster 04-
Using the cluster center as determined by the dispersion ellipse analysis, we
count 153 galaxies within 20 rings of width 2.0 arcminutes and to the limiting
magnitude = 19.0. Within this ra ther diffuse cluster the East-West strip counts
reveal a less pronounced scatter than the North-South counts; but neither shows a
small variance. The quadrant counts are low and erratic due to the diffuse nature of
the cluster and the cluster surface density shows similar characteristics with rising
and falling surface density as a function of radial distance from the cluster center.
The highest density of counts comes a t rings 6 and 10.
The isothermal analysis tends to try to fit the observed distribution with an
apparent bias towards the larger surface densities as seen in the preceeding figure.
The results of the analysis are seen in the table above which gives the calculated
value of the cluster parameters and their variance as well as the “best fit” determined
from the minimization procedure.
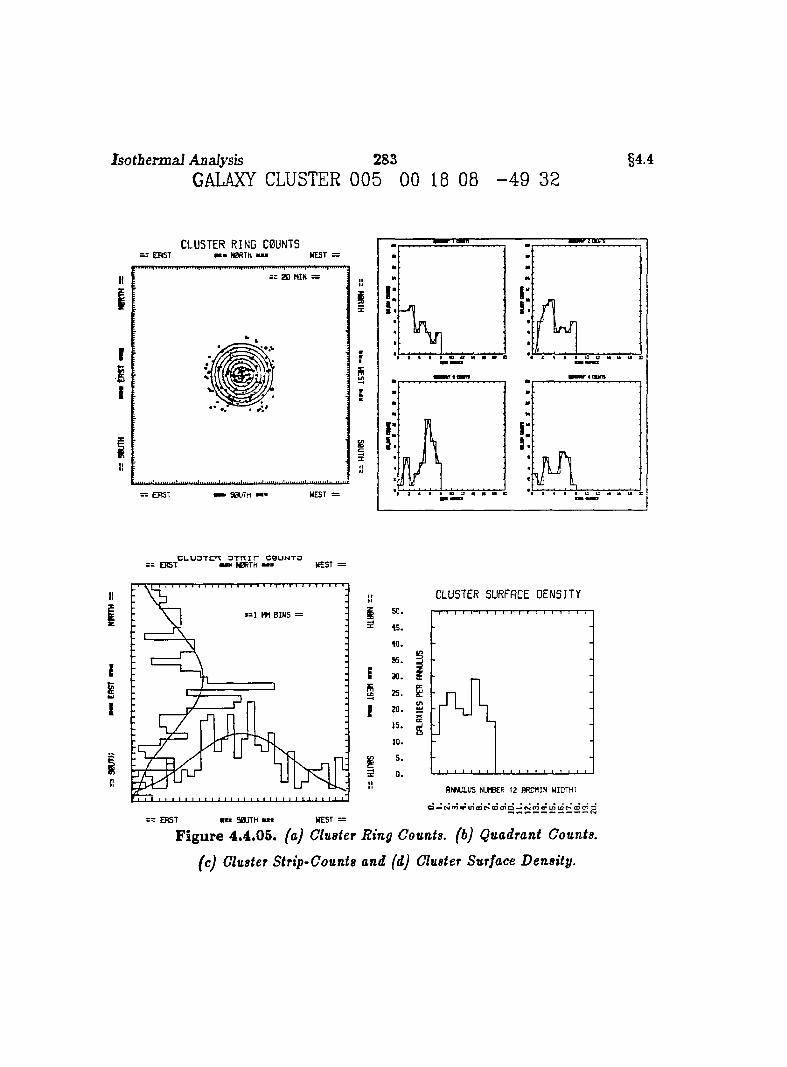
Isotbermal Analysis 283GALAXY CLUSTER 005 00 18 08 - 4 9 32
§4.4
CLUSTER RING COUNTS% = £ R S 7 m m N0R TH mmm WEST
= = 2 0 M IN =
E R S T ■ S0UTM WEST =
Tasrr
Iin i
s
s1
C L U S T c r ^ 3 T m r c b u n t o E R S T m m » £ R T H — " W EST =
= 1 MM B IN S —
{II
III LP-^
E
== ERST n > S O JTN m
5 0 .
1 5 .
M.5 5 .
3 0 .
35.20.
1 5 .
10.5 .
0 .
CLUSTER SURFACE DENSITY
S
Ë
f lW W L llS NUMBER 12 H R C M IN W ID T H ;
F ig u re 4.4.05. (a) Cluster Ring Counts, (b) Quadrant Counts,
(c) Cluster Strip-Counts and (d) Cluster Surface Density.
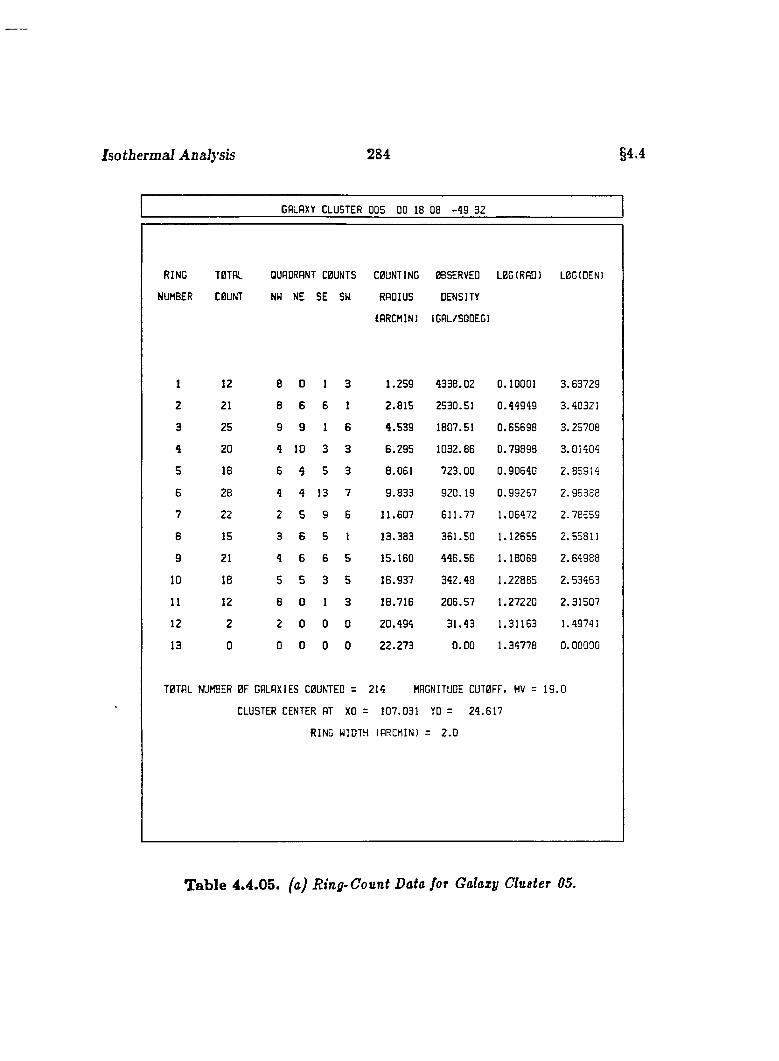
Isotbermal Analysis 284 §4.4
GALAXY CLUSTER 005 00 18 08 -49 32
RING
NUMBER
TOTAL
COUNT
QUADRANT COUNTS COUNTING OBSERVED LOGIRAD) LOG(DEN)
NW NE SE SW RADIUS DENSITY
(ARCMINl IGAL/SOOEG)
1 12 8 0 1 3 1 .2 5 9 4 3 3 8 .0 2 0 .1 0 0 0 1 3 .6 3 7 2 9
2 21 8 6 6 1 2 .8 1 5 2530.51 0 .4 4 9 4 9 3 .40321
3 25 9 9 1 6 4 .5 3 9 1807.51 0 .6 5 6 9 8 3 .2 5 7 0 8
4 20 4 10 3 3 6 .2 9 5 1032 .86 0 .7 9 8 9 3 3 .0 1 4 0 4
5 18 6 4 5 3 8 .0 6 1 7 2 3 .0 0 0 .9 0 6 4 0 2 .8 5 9 1 4
6 28 4 4 13 7 9 .8 3 3 9 2 0 .1 9 0 .9 9 2 6 7 2 .9 6 3 8 8
7 22 2 5 9 6 11 .6 0 7 6 1 1 .7 7 1 .06 4 7 2 2 .7 8 5 5 9
8 15 3 6 5 1 13 .3 8 3 3 6 1 .5 0 1 .12 6 5 5 2 .55811
9 21 4 6 6 5 15 .1 6 0 4 4 5 .5 6 1 .18 0 6 9 2 .6 4 9 8 8
10 18 5 5 3 5 16 .9 3 7 3 4 2 .4 8 1 .2 2 8 8 5 2 .5 3 4 6 3
11 12 8 0 1 3 1 8 .7 1 6 2 0 6 .5 7 1 .2 7 2 2 0 2 .3 1 5 0 7
12 2 2 0 0 0 2 0 .4 9 4 3 1 .4 3 1 .31 1 6 3 1.49741
13 0 0 0 0 0 2 2 .2 7 3 0 .0 0 1 .34 7 7 8 0 .0 0 0 0 0
TOTAL NUMBER OF GALAXIES COUNTED = 214 MAGNITUDE CUTOFF, MV = 1 9 .0
CLUSTER CENTER AT XO = 107.031 YO = 2 4 .6 1 7
RING WIDTH lARCMIN) = 2 .0
T ab le 4.4.05. (a) Ring-Count Data for Galazy Cluster 05.
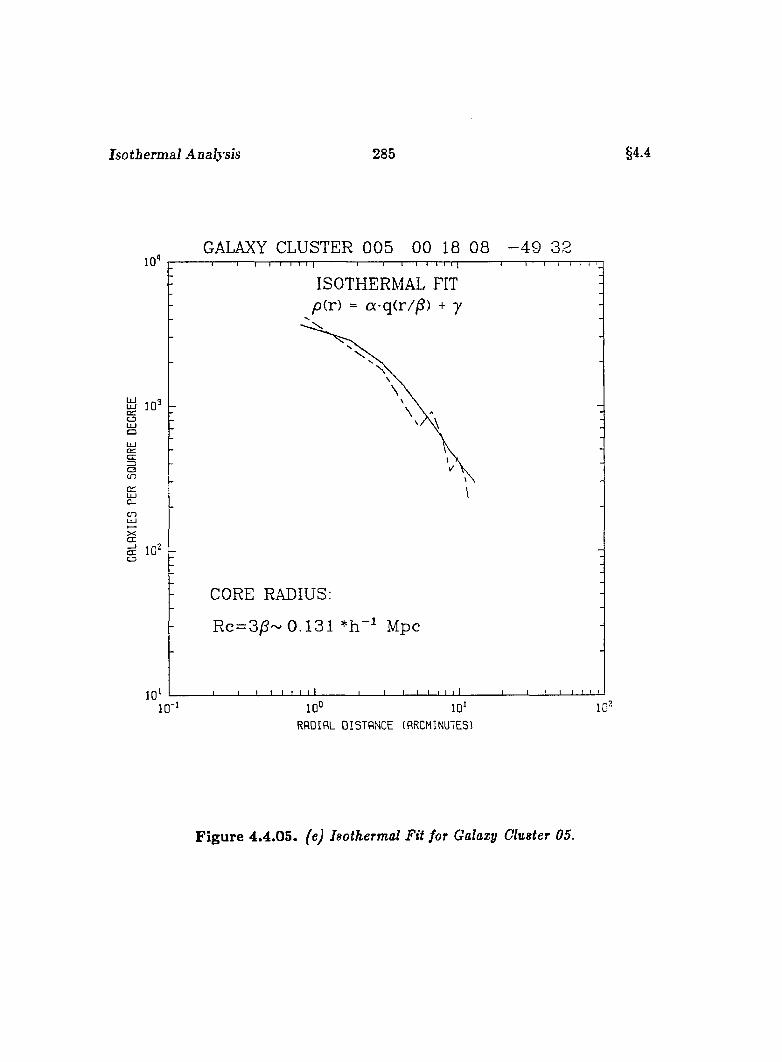
Isotbermal Analysis 285 §4^
GALAXY CLUSTER 0 0 5 00 18 08 - 4 9 32
cnCD
onŒ=3Oc n
U Jo _
c n
c xCD
10 '
ISOTHERMAL FIT p(r) = a-q(r/^) + y
CORE RADIUS:
Rc=3)S~ 0.131 Mpc
10 '10°
RADIAL DISTA NCE (ARCMINUTES!
F igu re 4.4.05. feJ Isothermal Fit for Galaxy Cluster 05.
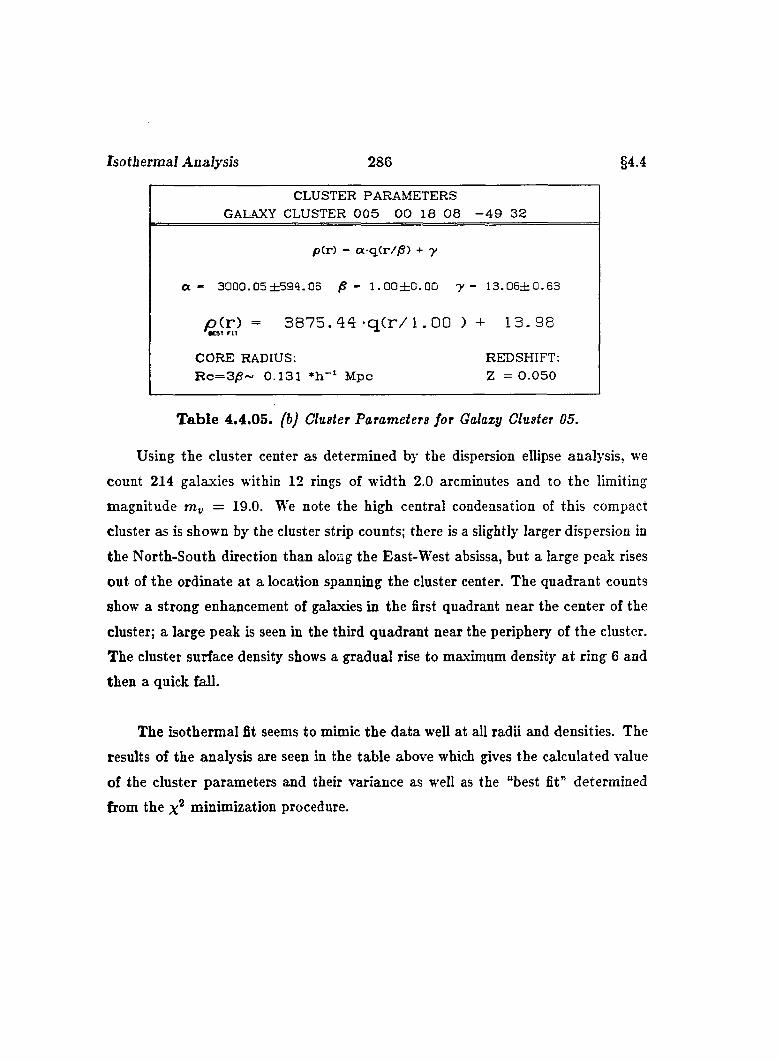
Isothermal Analysis 286 §4 4
CLUSTER PARAMETERS GALAXY CLUSTER 0 0 5 0 0 18 0 8 - 4 9 32
pCr) - a q(r//S) + y
CL - 3000.05 ±594.06 /S - 1 .00 ± 0 .0 0 y - 1 3 .0 6 ± 0 .6 3
p ( r ) = 3 8 7 5 . 4 4 -q ( r / l .GO ) + 13.98
CORE RADIUS:R c = 3 /S ~ 0 .1 3 1 Mpc
RED SHIFT: Z - 0 .0 5 0
T ab le 4.4.05. (b) Cluster Parameters for Galaxy Cluster 05.
Using the cluster center as determined by the dispersion ellipse analysis, we
count 214 galaxies within 12 rings of width 2.0 arcminutes and to the limiting
magnitude m„ = 19.0. We note the high central condensation of this compact
cluster as is shown by the cluster strip counts; there is a slightly larger dispersion in
the North-South direction than along the East-West absissa, but a large peak rises
out of the ordinate at a location spanning the cluster center. The quadrant counts
show a strong enhancement of galaxies in the first quadrant near the center of the
cluster; a large peak is seen in the third quadrant near the periphery of the cluster.
The cluster surface density shows a gradual rise to maximum density a t ring 6 and
then a quick fall.
The isothermal fit seems to mimic the data well at all radii and densities. The
results of the analysis are seen in the table above which gives the calculated value
of the cluster parameters and their variance as well as the “best fit” determined
firom the minimization procedure.

Isothermal Analysis 287
GALAXY CLUSTER 006 00 22 50 - 3 3 17§4.4
CLUSTER RING C0UNTS: E R S T mmm N 0RTM — W EST :
z = 2 0 M IN —
= E R ST S0UTM I
:I
:
i
CLU3TCR 3TKir C0UNT5 E A S T N0RTH mmm tC S T ==
I: B I N S s =
E
■■■ S0UTH nmc = ERST
CLUSTER SURFACE DENSITY
35. S
2 5 . ë
- X
F ig u re 4.4.06. fa) Cluster Ring Counts, (b) Quadrant Counts,
(c) Cluster Strip-Counts and (d) Cluster Surface Density.
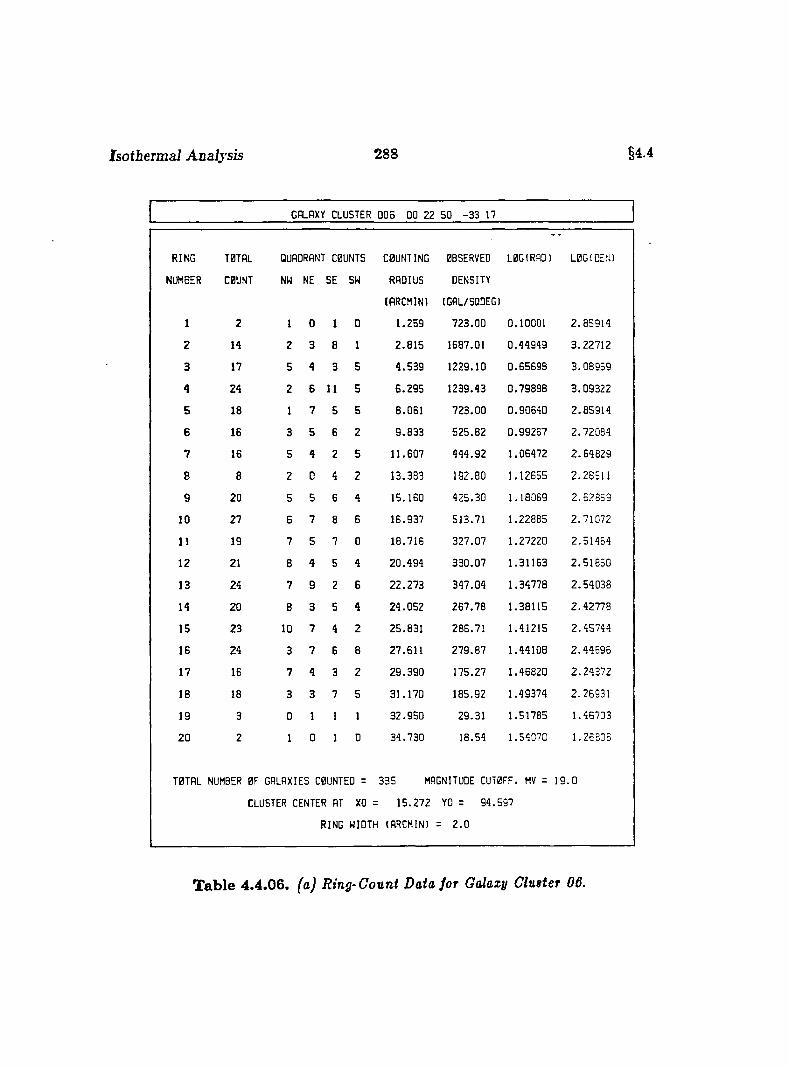
Isothermal Analysis 288 §4.4
GALAXY CLUSTER 006 00 22 50 -33 17
RING TOTAL QUADRANT COUNTS COUNTING OBSERVED LOG(RADI L0G!DEfJ)
NUMBER COUNT NW NE SE SW RADIUS DENSITY
(ARCMINl (GAL/SQOEG)
1 2 1 0 1 0 1 .2 5 9 7 2 3 .0 0 0 .10001 2 .8 5 9 1 4
2 14 2 3 8 1 2 .8 1 5 1687.01 0 .4 4 9 4 9 3 .2 2 7 1 2
3 17 5 4 3 5 4 .5 3 9 1229 .10 0 .6 5 6 9 3 3 .0 8 9 5 9
4 24 2 6 11 5 6 .2 9 5 1239 .43 0 .7 9 8 9 8 3 .0 9 3 2 2
5 18 1 7 5 5 8 .0 6 1 7 2 3 .0 0 0 .9 0 6 4 0 2 .8 5 9 1 4
6 16 3 5 6 2 9 .8 3 3 5 2 5 .8 2 0 .9 9 2 6 7 2 .7 2 0 8 4
7 16 5 4 2 5 1 1 .6 0 7 4 4 4 .9 2 1 .0 6 4 7 2 2 .6 4 8 2 9
8 8 2 0 4 2 1 3 .3 8 3 19 2 .8 0 1 .1 2 6 5 5 2 .2 8 5 1 1
9 20 5 5 G 4 1 5 .1 6 0 4 2 5 .3 0 1 .1 8 0 6 9 2.62869
10 27 6 7 8 6 1 6 .9 3 7 513 .71 1 .2 2 8 8 5 2 .7 1 0 7 2
11 19 7 5 7 0 1 8 .7 1 6 3 2 7 .0 7 1 .2 7 2 2 0 2 .5 1 4 6 4
12 21 8 4 5 4 2 0 .4 9 4 3 3 0 .0 7 1 .3 1 1 6 3 2 .5 1 8 6 0
13 24 7 9 2 6 2 2 .2 7 3 3 4 7 .0 4 1 .3 4 7 7 8 2 .5 4 0 3 8
14 20 8 3 5 4 2 4 .0 5 2 2 6 7 .7 8 1 .3 8 1 1 5 2 .4 2 7 7 8
15 23 10 7 4 2 2 5 .8 3 1 28 6 .7 1 1 .4 1 2 1 5 2 .4 5 7 4 4
16 24 3 7 6 8 27 .6 1 1 2 7 9 .8 7 1 .4 4 1 0 8 2 .4 4 6 9 6
17 16 7 4 3 2 2 9 .3 9 0 17 5 .2 7 1 .4 6 8 2 0 2 .2 4 3 7 2
18 18 3 3 7 5 3 1 .1 7 0 185 .92 1 .4 9 3 7 4 2 .2 6 9 3 1
19 3 0 1 1 1 3 2 .9 5 0 29 .31 1 .5 1 7 8 5 1 .46 7 0 3
2 0 2 1 0 1 0 3 4 .7 3 0 18 .54 1 .5 4 0 7 0 1 .2 6 8 0 8
TOTAL NUMBER OF GALAXIES COUNTED = 335 MAGNITUDE CUTOFF, MY = 1 9 0
CLUSTER CENTER AT xo = 1 5 .2 7 2 YO = 9 4 .5 9 7
RING WIDTH (ARCMIN) = 2 .0
T ab le 4.4.06. faj Ring-Count Data for Galaxy Cluster 06.
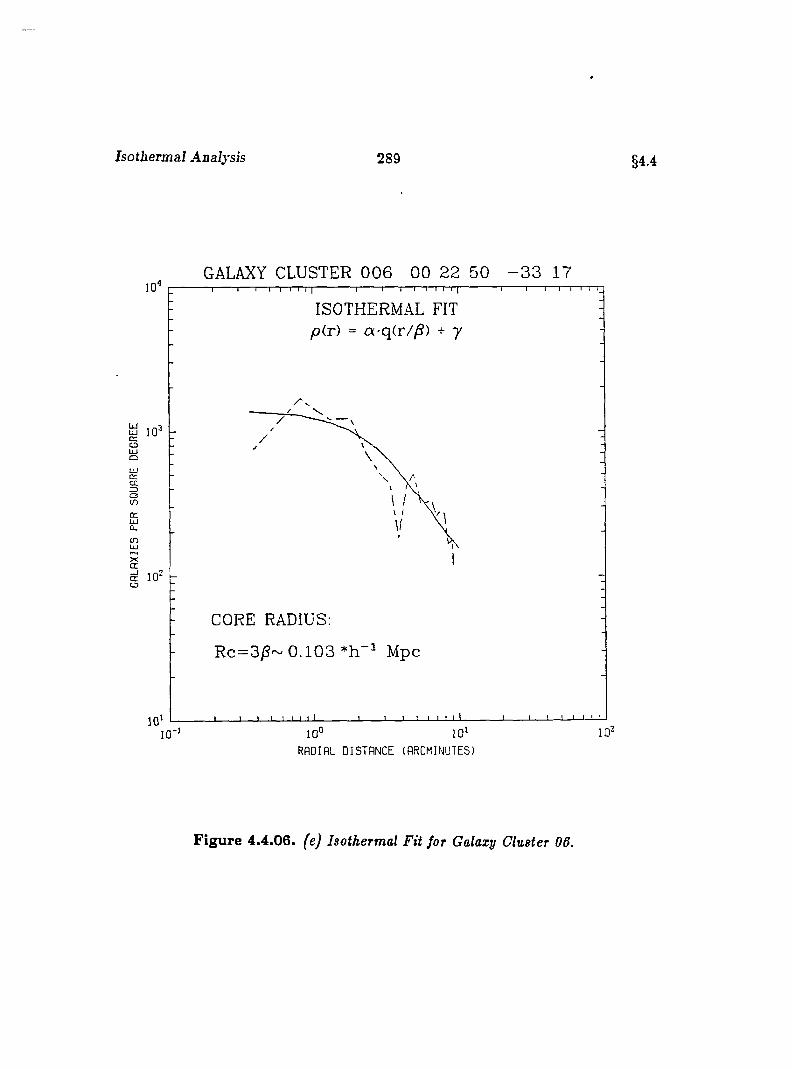
Isothermal Analysis 289 §4.4
GALAXY CLUSTER 0 0 6 00 22 50 - 3 3 17
ISOTHERMAL FIT pir) = a-q(r//S) + 7
OëccŒQCO
lUCO
CORE RADIUS:
Rc = 3^~ 0.103 Mpc
RADIAL DISTANCE (ARCMINUTES)
F ig u re 4.4.06. (e) Isothermal Fit for Galaxy Cluster 06.
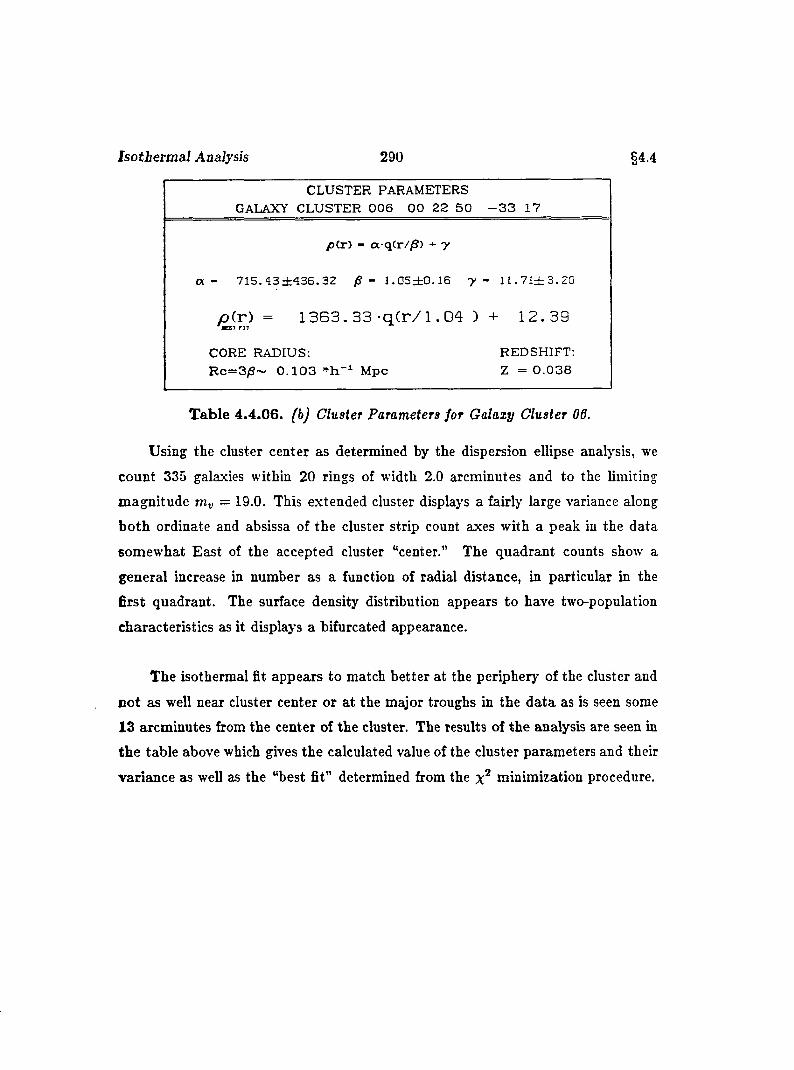
Isothermal Analysis 290 §4.4
CLUSTER PARAMETERSGALAXY CLUSTER 0 0 6 0 0 22 50 - 3 3 17
a
pCr) - a q(r//S) + y
- 7 1 5 . 4 3 ± 4 3 6 . 3 2 /? - 1 . 0 5 ± 0 . 1 6 y ~ 1 1 . 7 1 ± 3 . 2 0
yO(r) = 13B3. 33 •q ( r / l .G 4 ) + 12.39
CORE RADIUS:R c = 3 /S ~ 0 .1 0 3 Mpc
REDSHIFT: Z = 0 .0 3 8
T able 4.4.06. [h] Cluster Parameters for Galaxy Cluster 06.
Using the cluster center as determined by the dispersion ellipse analysis, we
count 335 galaxies within 20 rings of width 2.0 arcminutes and to the limiting
magnitude = 19.0. This extended cluster displays a fairly large variance along
both ordinate and absissa of the cluster strip count axes with a peak in the data
somewhat East of the accepted cluster “center.” The quadrant counts show a
general increase in number as a function of radial distance, in particular in the
first quadrant. The surface density distribution appears to have two-population
characteristics as it displays a bifurcated appearance.
The isothermal fit appears to match better at the periphery of the cluster and
not as well near cluster center or at the major troughs in the data as is seen some
13 arcminutes from the center of the cluster. The results of the analysis are seen in
the table above which gives the calculated value of the cluster parameters and their
variance as well as the “best fit” determined from the minimization procedure.

Isothermal Analysis 291
GALAXY CLUSTER 007 01 29 34 -5 1 33§4.4
C LU STER RIN G C0UNTS: e r s t b m N 0R TH — W EST = =
= 2 0 M IN =
== EAST 3 01/T H I W EST :
I
:
III
C L U S T E R S T R i r C 0 U N T S
: t o t — • N 0fiT H N E S T = =
c = 1 m B I N S =
I
_TL:
mmm S0U T H ■ ■■ N E S T = == ERST
CLUSTER SURFACE D E N S IT Yso.4 5 .
4 0 .
3 5 .
3 0 .
2 5 .
20.
1 5 .
10.
5 .
0 .
5
i
ANNUL u s NUMBER (2 A RCM IN K ID T H J
Figure 4.4.07. faJ Cluster Ring Counts, (b) Quadrant Counts,
(c) Cluster Strip-Counts and (d) Cluster Surface Density.
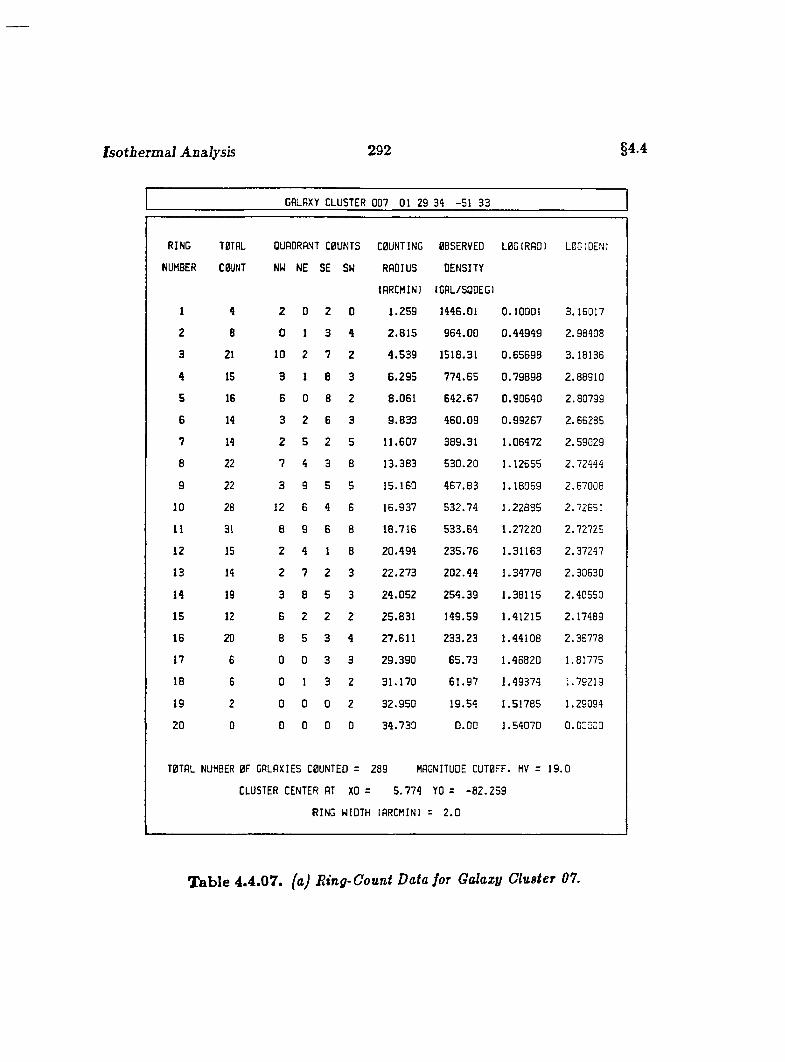
Isothermal Analysis 292 §4.4
GALAXY CLUSTER 007 01 29 34 -5 1 33
RING TOTAL QUADRANT COUNTS COUNTING OBSERVED LOG(RAD) LOG 1 DENI
NUMBER COUNT NW NE SE SW RADIUS DENSITY
(ARCMIN) (GAL/SQDEGl
1 4 2 0 2 0 1 . 2 5 9 1 4 4 5 . 0 1 0 . 1 0 0 0 1 3 . 1 5 0 1 7
2 8 0 1 3 4 2 . 8 1 5 9 6 4 . 0 0 0 . 4 4 9 4 9 2 . 9 8 4 0 8
3 21 ID 2 7 2 4 . 5 3 9 1 5 1 8 . 3 1 0 . 6 5 6 9 8 3 . 1 8 1 3 6
4 15 3 1 8 3 6 . 2 9 5 7 7 4 . 6 5 0 . 7 9 8 9 8 2 . 8 8 9 1 0
5 16 6 0 8 2 8 . 0 6 1 6 4 2 . 6 7 0 . 9 0 6 4 0 2 . 8 0 7 9 9
6 14 3 2 6 3 9 . 6 3 3 4 6 0 . 0 9 0 . 9 9 2 5 7 2 . 6 6 2 8 5
7 14 2 5 2 5 1 1 . 6 0 7 3 8 9 . 3 1 1 . 0 6 4 7 2 2 . 5 9 0 2 9
8 22 7 4 3 8 1 3 . 3 8 3 5 3 0 . 2 0 1 . 1 2 6 5 5 2 . 7 2 4 4 4
g 22 3 9 5 5 1 5 . 1 6 0 4 6 7 . 8 3 1 . 1 8 0 6 9 2 . 6 7 0 0 8
10 28 12 6 4 6 1 6 . 9 3 7 5 3 2 . 7 4 1 . 2 2 8 8 5 2 . 7 2 6 5 1
11 31 8 9 6 8 1 8 . 7 1 6 5 3 3 . 6 4 1 . 2 7 2 2 0 2 . 7 2 7 2 5
12 15 2 4 1 8 2 0 . 4 9 4 2 3 5 . 7 6 1 . 3 1 1 6 3 2 . 3 7 2 4 7
13 14 2 7 2 3 2 2 . 2 7 3 2 0 2 . 4 4 1 . 3 4 7 7 8 2 . 3 0 6 3 0
14 19 3 8 5 3 2 4 . 0 5 2 2 5 4 . 3 9 1 . 3 8 1 1 5 2 . 4 0 5 5 0
15 12 6 2 2 2 2 5 . 8 3 1 1 4 9 . 5 9 1 . 4 1 2 1 5 2 . 1 7 4 8 9
16 20 8 5 3 4 2 7 . 6 1 1 2 3 3 . 2 3 1 . 4 4 1 0 8 2 . 3 6 7 7 8
17 6 0 0 3 3 2 9 . 3 9 0 6 5 . 7 3 1 . 4 6 8 2 0 1 . 8 1 7 7 5
18 6 0 1 3 2 3 1 . 1 7 0 6 1 . 9 7 1 . 4 9 3 7 4 : . 7 9 2 1 9
19 2 0 0 0 2 3 2 . 9 5 0 1 9 . 5 4 1 . 5 1 7 8 5 1 .2 9 0 9 4
2 0 0 0 0 0 0 3 4 . 7 3 0 D.OD 1 . 5 4 0 7 0 0.00000
TOTAL NUMBER OF GALAXIES COUNTED = 2 8 9 MAGNITUDE CUTOFF. MV = 19 0
CLUSTER CENTER AT XO = 5 . 7 7 4 YO = - 8 2 . 2 5 9
RING WIDTH lARCHIN) = 2 . 0
Table 4.4.07. (aj Ring-Count Data for Galaxy Cluster 07.
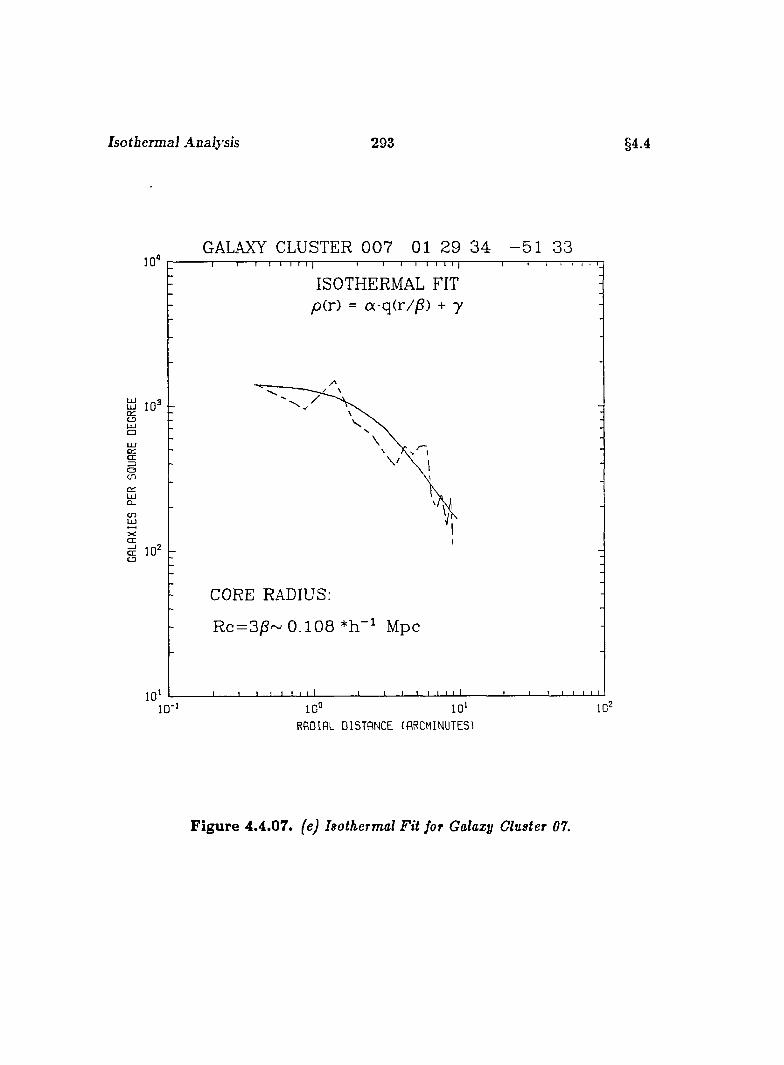
Isothermal Analysis 293 § 4 . 4
GALAXY CLUSTER 0 0 7 01 29 3 4 - 5 1 33
ISOTHERMAL FIT yo(r) = a-q(r//3) + 7
a
c n
CORE RADIUS;
Rc=3jS~ 0 .1 0 8 Mpc
10'
RflDIRL DISTANCE (ARCMINUTES)
Figure 4.4.07. fej Isothermal Fit for Galaxy Cluster 07.
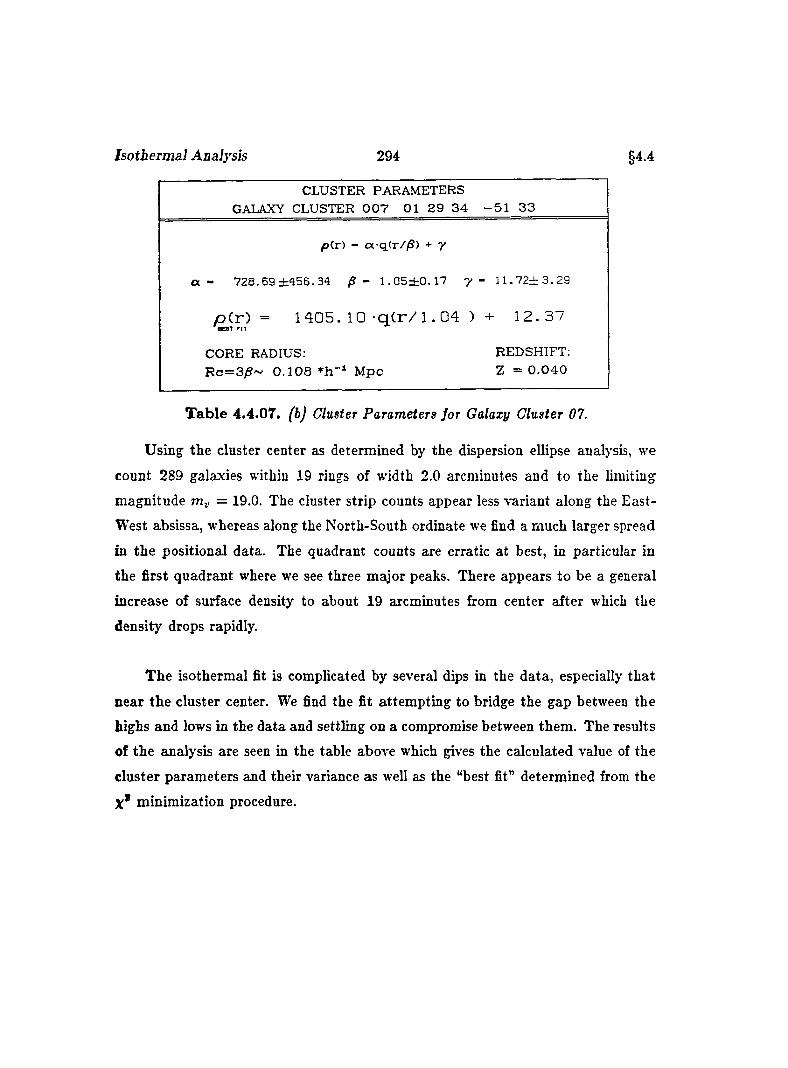
Isotbermaî Analysis 294 §4.4
CLUSTER PARAMETERSGALAXY CLUSTER 0 0 7 01 29 3 4 - 5 1 3 3
pCr) - a q(r//S) + y
a - 728. 6 9 ± 4 5 6 . 3 4 /S - 1 . 0 5 ± Q . 1 7 y - 1 1 . 7 2 ± 3 . 2 9
p ( r ) = 1 405 . I G - q ( r / 1 . 0 4 ) + 12.37
CORE RADIUS;R c= 3 /S ~ 0 .1 0 8 + h -i M pc
REDSHIFT: Z = 0 .0 4 0
Table 4.4.07. (b) Cluster Parameters for Galaxy Cluster 07.
Using the cluster center as determined by the dispersion ellipse analysis, we
count 289 galaxies within 19 rings of width 2.0 arcminutes and to the limiting
magnitude = 19.0. The cluster strip counts appear less variant along the East-
West absissa, whereas along the North-South ordinate we find a much larger spread
in the positional data. The quadrant counts are erratic at best, in particular in
the first quadrant where we see three major peaks. There appears to be a general
increase of surface density to about 19 arcminutes from center after which the
density drops rapidly.
The isothermal fit is complicated by several dips in the data, especially that
near the cluster center. We find the fit attempting to bridge the gap between the
highs and lows in the data and settling on a compromise between them. The results
of the analysis are seen in the table above which gives the calculated value of the
cluster parameters and their variance as well as the “best fit” determined from the
X* minimization procedure.
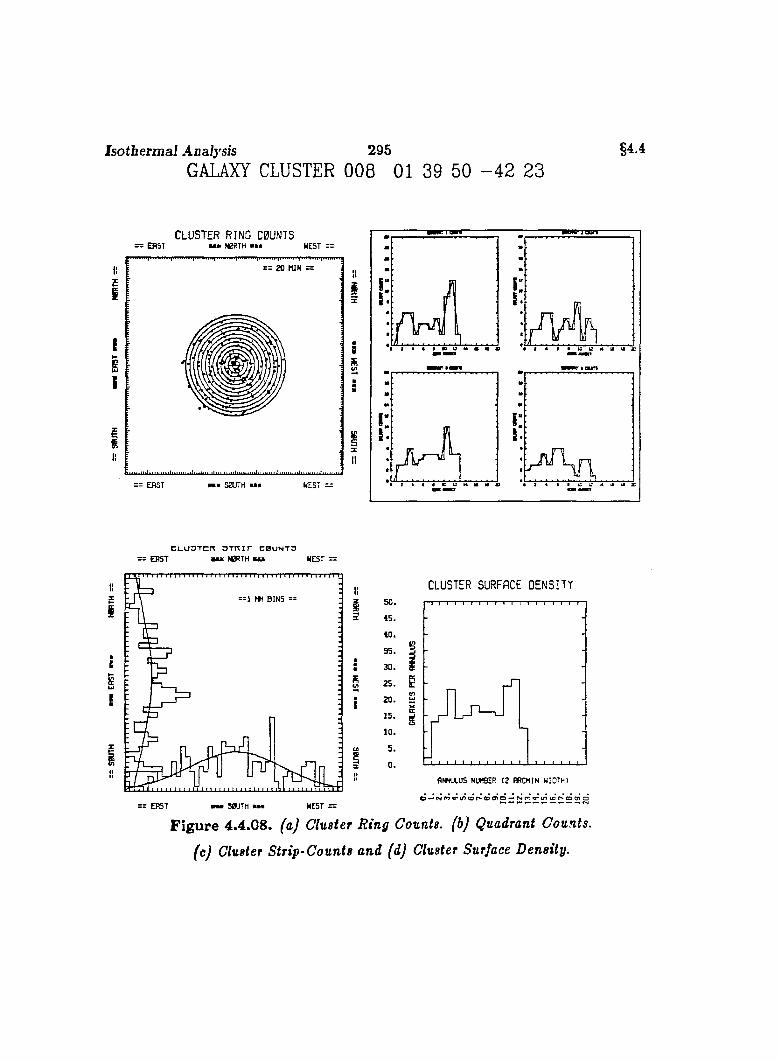
Isotbermaî Analysis 295GALAXY CLUSTER 008 01 39 50 - 4 2 23
§4.4
C L U S T E R R IN G C0UNT5: E f lS T mmm N 0RTH mmm W EST =
s = 2 0 HIN =
= = E A S T mm S0U T H mmm WEST —
III
C L U O T c rç D T n i r c b u n t o — E B S T miM M W r H > u N E S T =
IIEI
ÈI
= : E R S T — 30U TM *mm N E S T =
CLUSTER SURFACE D E N S IT Y
e3 5 .
΃
f lW M .U S NUMBER 1 2 R R CM IN W ID TH )
Figure 4.4.08. (aj Cluster Ring Counts, (b) Quadrant Counts,
(c) Cluster Strip-Counts and (d) Cluster Surface Density.
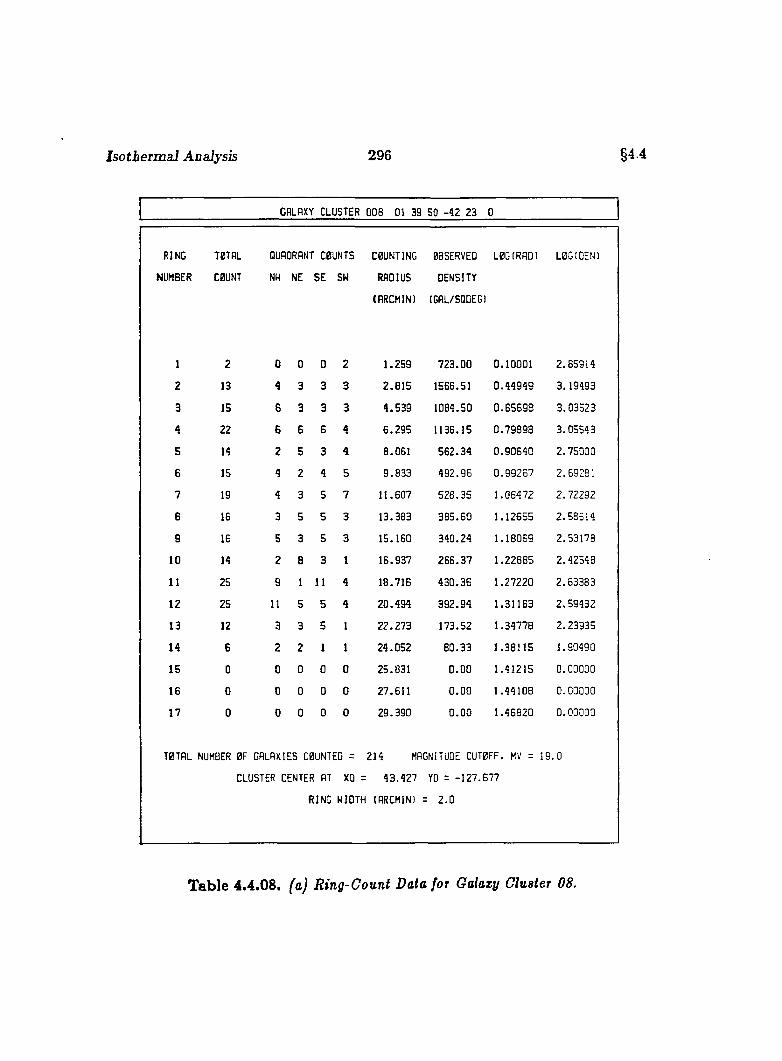
Isothermal Analysis 296 §4.4
GALAXY CLUSTER 008 01 39 50 -4 2 23 0
RING T0TAL QUADRANT C0UNTS COUNTING OBSERVED L0G(RAD) L8GIDEN1
JMBER C0UNT NW NE SE SW RADIUS DENSITY
(ARCMIN) (GAL/SQDEGl
1 2 0 0 D 2 1.259 723.00 0.10001 2.85914
2 13 4 3 3 3 2.815 1566.51 0.44949 3.19493
3 15 6 3 3 3 4.539 1084.50 0.65698 3.03523
4 22 6 6 6 4 6.295 1136.15 0.79898 3.05543
5 14 2 5 3 4 8.061 562.34 0.90640 2.75000
6 15 4 2 4 5 9.833 492.96 0.99267 2.69281
7 19 4 3 5 7 11.607 528.35 1.06472 2.72292
e 16 3 5 5 3 13.383 385.60 1.12655 2.58614
9 16 5 3 5 3 15.160 340.24 1.18069 2.53178
10 14 2 8 3 1 16.937 266.37 1.22885 2.42548
11 25 S 1 11 4 18.716 430.36 1.27220 2.63383
12 25 11 5 5 4 20.494 392.94 1.31163 2.59432
13 12 3 3 5 1 22.273 173.52 1.34778 2.23935
14 6 2 2 1 1 24.052 80.33 1.38115 1.90490
15 0 0 0 0 0 25.031 0.00 1.41215 0.00000
16 0 0 0 0 0 27.611 0.00 1.44108 0.00030
17 0 0 0 0 0 29.390 0.00 1.46820 0.00000
T0TRL NUMBER 0F GALAXIES C0ÜNTED = 214 MAGNITUDE CUT0FF, MV
CLUSTER CENTER AT XO = 43.427 YO = -127.677
RING WIDTH (ARCMIN) = 2.0
19.0
Table 4.4.08. (a) Ring-Count Data for Galaxy Cluster 08.
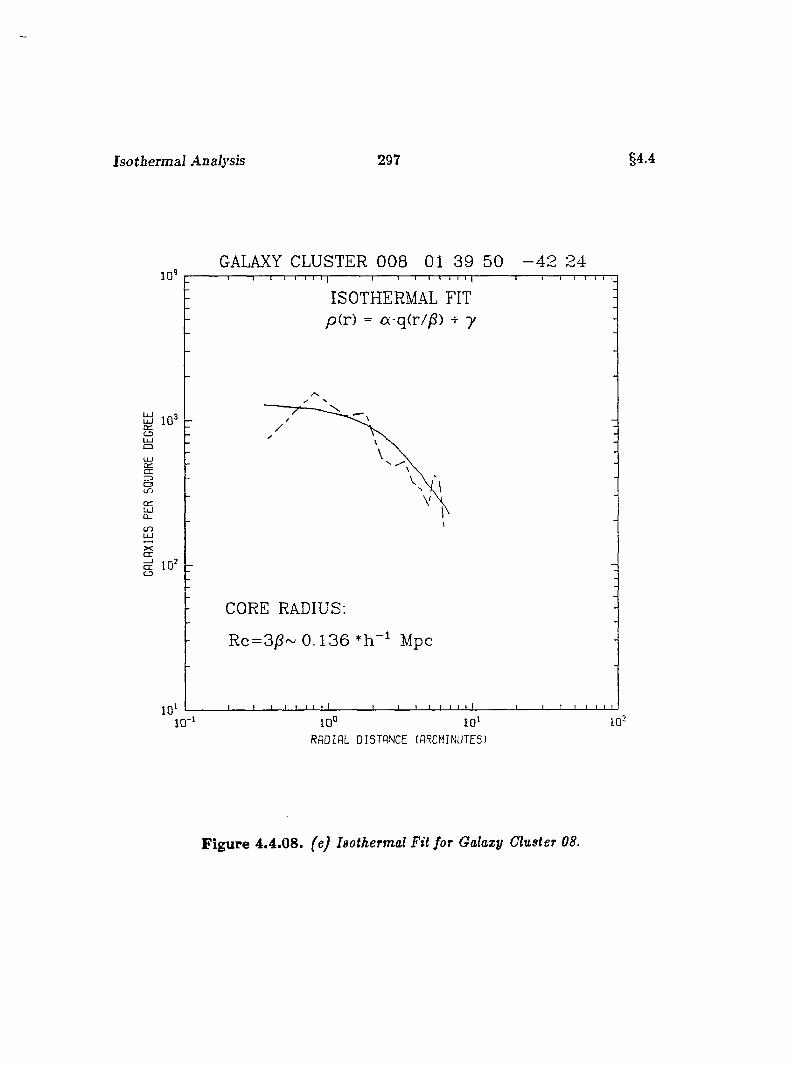
Isothermal Analysis 297 §4.4
GALAXY CLUSTER 0 0 8 01 39 50 - 4 2 2410 '
ISOTHERMAL FIT p(r) = oc-q(r/p) + 7
Q
Ü Jû _
c n
Π10^ 0
CORE RADIUS:
Rc = 3)S~ 0 .1 3 6 Mpc
10'10 ’10° 10*
R A D IA L D IS T A N C E (ARCMINUTES)
Figure 4.4.08. feJ Isothermal Fit for Galaxy Cluster 08.
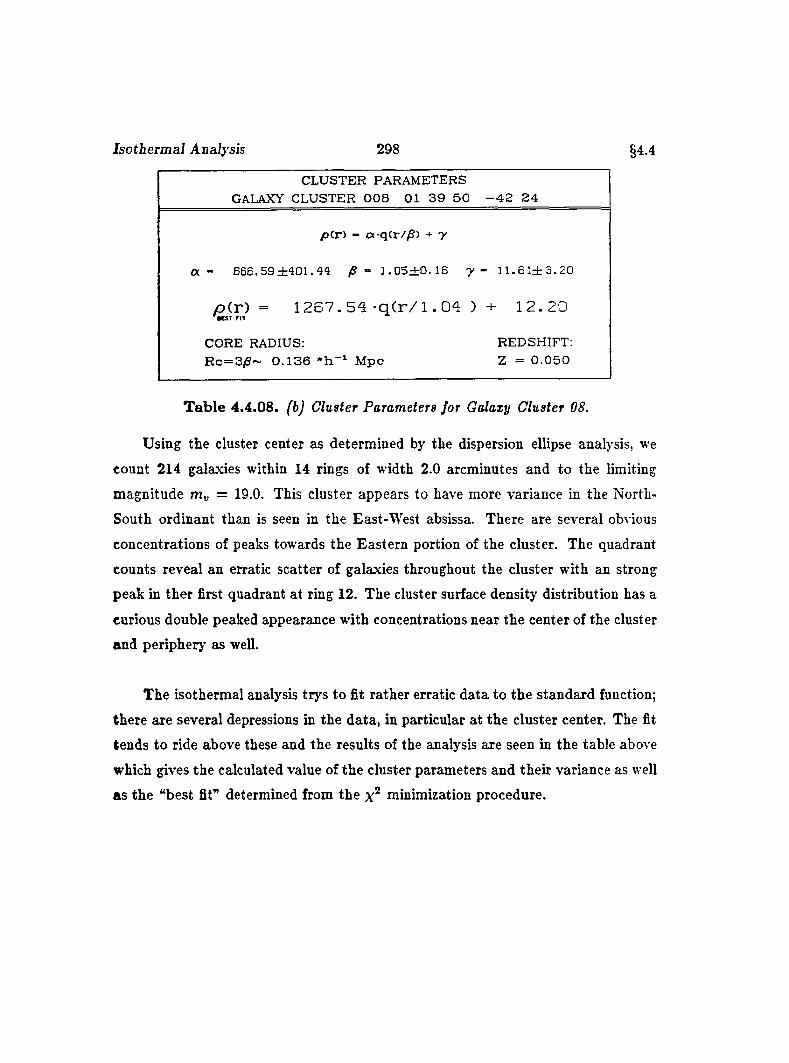
Isothermal Analysis 298 §4.4
CLUSTER PARAMETERSGALAXY CLUSTER 0 0 8 01 3 9 5 0 - 4 2 2 4
pC r) - a q ( r / /S ) + y
a - 6 6 6 .59 ± 4 0 1 .4 4 /S - ] . 0 5 ± 0 . 1 B y - 1 1 . 6 1 ± 3 . 2 0
p ( r ) = 1267. 5 4 - q C r / l . 04 ) + 12.20B D T r i 7
CORE RADIUS: REDSHIFT:R c= 3 /S ~ 0 .1 3 6 M pc Z = 0 .0 5 0
Table 4.4.08. (b) Cluster Parameters for Galaxy Cluster 08.
Using the cluster center as determined by the dispersion ellipse analysis, we
count 214 galaxies within 14 rings of width 2.0 arcminutes and to the limiting
magnitude m„ = 19.0. This cluster appears to have more variance in the North-
South ordinant than is seen in the East-West absissa. There are several obvious
concentrations of peaks towards the Eastern portion of the cluster. The quadrant
counts reveal an erratic scatter of galaxies throughout the cluster with an strong
peak in ther first quadrant at ring 12. The cluster surface density distribution has a
curious double peaked appearance with concentrations near the center of the cluster
and periphery' as well.
The isothermal analysis trys to fit rather erratic data to the standard function;
there are several depressions in the data, in particular at the cluster center. The fit
tends to ride above these and the results of the analysis are seen in the table above
which gives the calculated value of the cluster parameters and their variance as well
as the “best fit” determined from the minimization procedure.
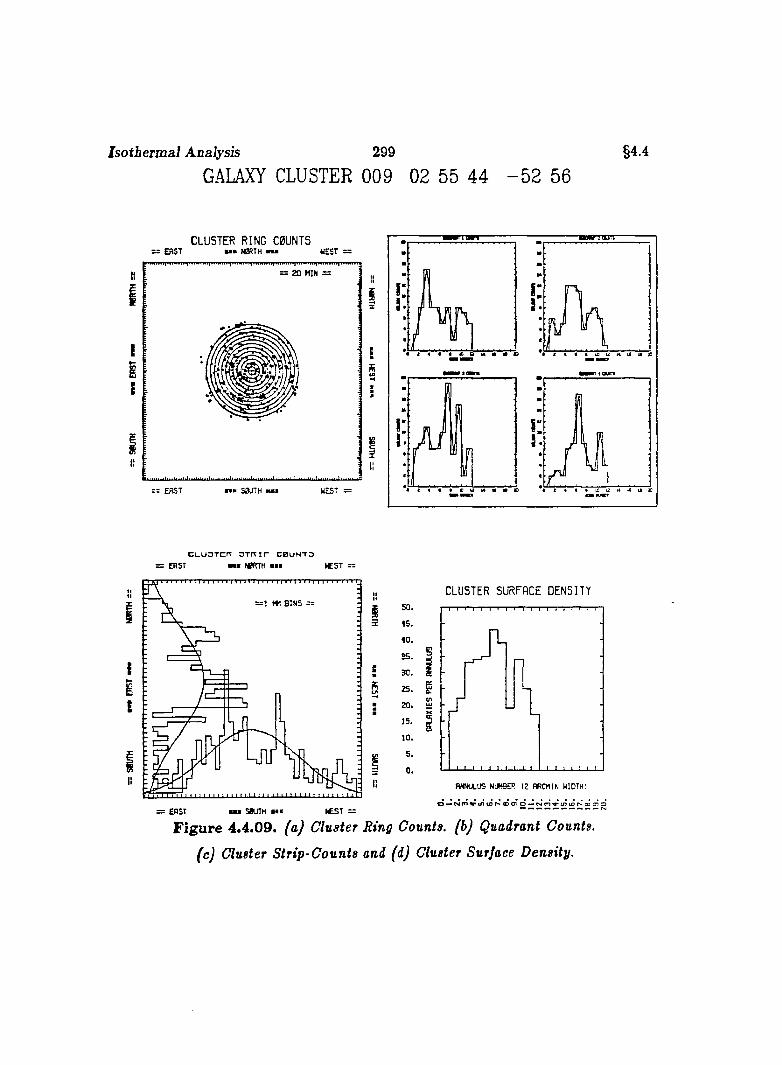
Isothermal Analysis 299
GALAXY CLUSTER 009 02 55 44 - 5 2 56§4 4
CL U ST E R RIN G C0ÜNTSE A S T M # N 0RTH W E ST =
2 0 M IN =
S0JTH
; J V |
AC L U O T c r r 3 T n i r c b u n t o
C A ST mmm NBRTH — N E S T :
iI!
rjV Kk n r
II
= E A S T I S ftJT H « S T —
CLUSTER SU R FA C E DENSITY
35. §30. S
25. g
i
0 .
Figure 4.4.09. {aJ Cluster Bing Counts, (b) Quadrant Counts,
(c) Cluster Strip-Counts and (d) Cluster Surface Density.
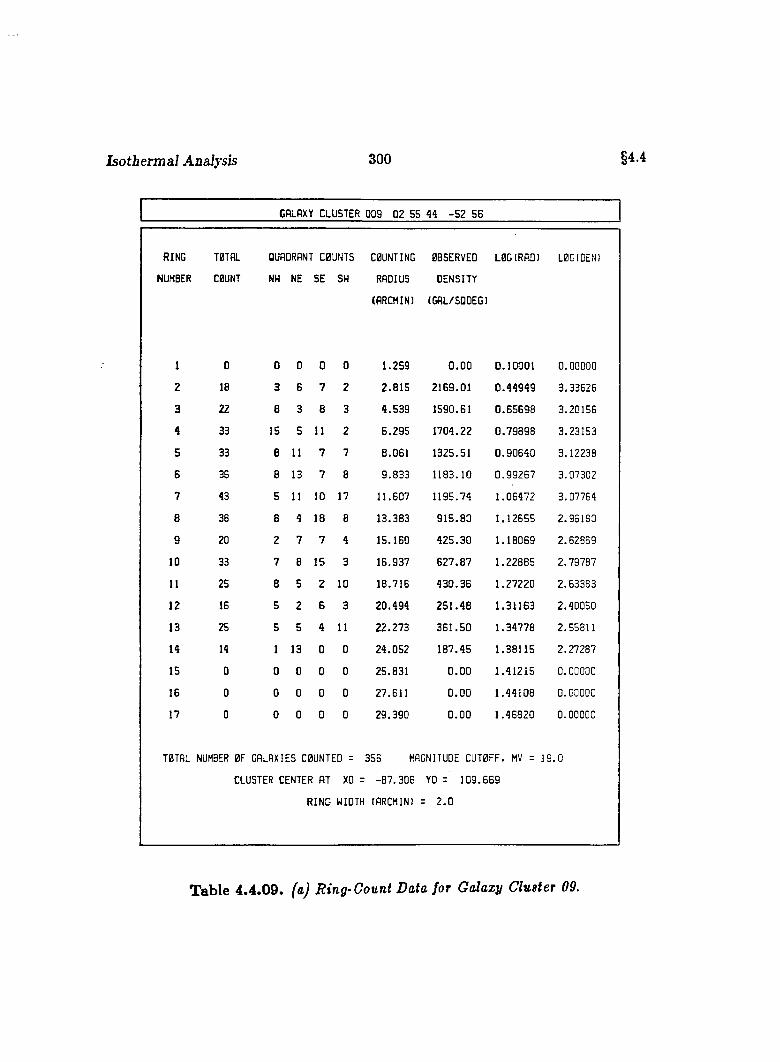
Isothermal Analysis 300 §4.4
GALAXY CLUSTER 009 02 55 44 -5 2 56
RING TOTAL QUADRANT COUNTS COUNTING OBSERVED LOG IRAQI L0GIDEN1
JMBER COUNT NW NE SE SW RADIUS DENSITY
(ARCMIN) (GAL/SQDEGl
1 0 0 0 0 0 1.259 0.00 0.10001 0.00000
2 18 3 6 7 2 2.815 2169.01 0.44949 3.33626
3 22 8 3 8 3 4.539 1590.61 0.65698 3.20156
4 33 15 5 11 2 6.295 1704.22 0.79898 3.23153
5 33 8 11 7 7 8.D61 1325.51 0.90640 3.12238
6 36 8 13 7 8 9.833 1183.10 0.99267 3.07302
7 43 5 11 10 17 11.607 1195.74 1.06472 3.07764
8 38 8 4 18 8 13.383 915.80 1.12655 2.96180
9 20 2 7 7 4 15.160 425.30 1.18069 2.62869
10 33 7 8 15 3 16.937 627.87 1.22885 2.79787
11 25 8 5 2 10 18.716 430.36 1.27220 2.63383
12 16 5 2 6 3 20.494 251.48 1.31163 2.40050
13 25 5 5 4 11 22.273 361.50 1.34778 2.55811
14 14 1 13 0 0 24.052 187.45 1,38115 2.27287
15 0 0 0 0 0 25.831 0.00 1.41215 0.00000
16 0 0 0 0 0 27.611 0.00 1.44108 0.00000
17 0 0 0 0 0 29.390 0.00 1.46820 0.00000
TOTAL NUMBER OF GALAXIES COUNTED = 3SB MAGNITUDE CUTOFF. MV = 19.0
CLUSTER CENTER AT XO = -B7.306 YO = 109.669
RING WIDTH tORCMINI = 2.0
Table 4.4.09. faj Ring-Count Data for Galaxy Cluster 09.
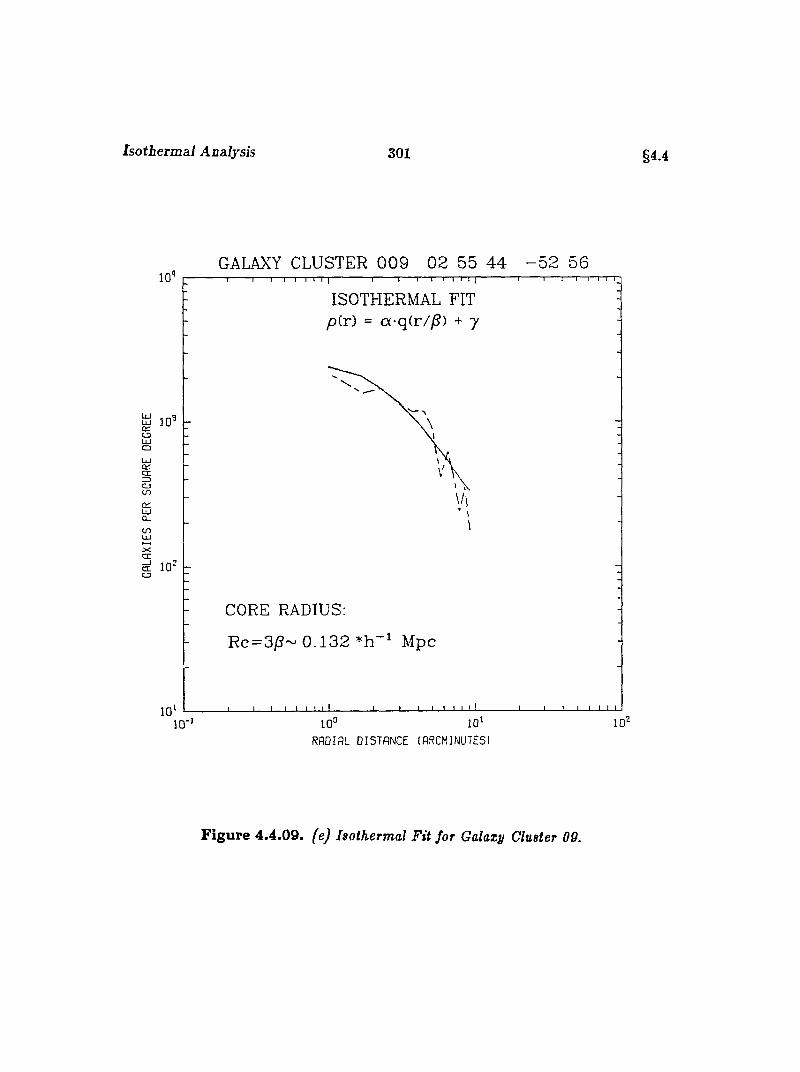
Isothermal Analysis 301 §4 4
GALAXY CLUSTER 0 0 9 02 55 4 4 - 5 2 56
IQ
Or:c rZDa(T)
XCEŒO
ISOTHERMAL FIT yo(r) = a-q(r//S) + y
CORE RADIUS;
Rc = 3jS~ 0 .1 3 2 Mpc
10 '10°
RA D IA L D IS T A N C E (ARCM INUTES)
Figure 4.4.09. (e) Isothermal Fit for Galaxy Cluster 09.
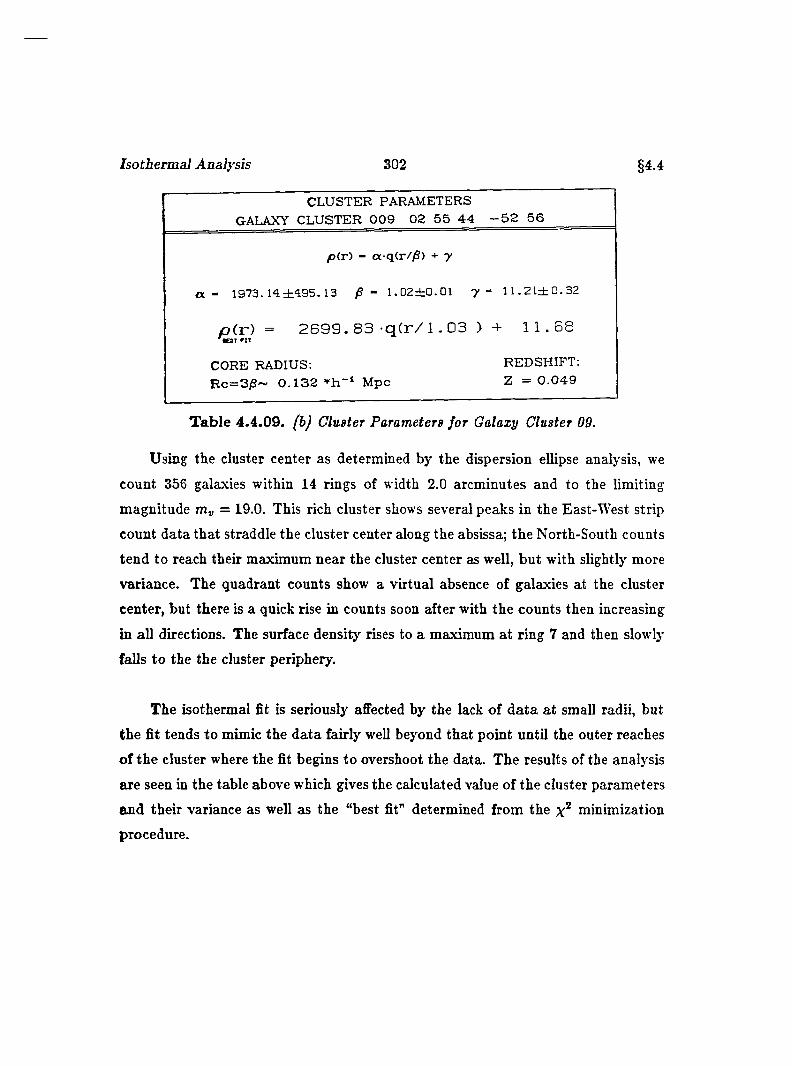
Isothermal Analysis 302 §4.4
CLUSTER PARAMETERSGALAXY CLUSTER 0 0 9 0 2 5 5 4 4 - 5 2 5 6
p(r) - a q(r//S) + y
a - 1973. M ± 4 9 5 . 13 /S - 1 .02 ± 0 .0 1 7 = 1 1 . 2 1 ± 0 . 3 2
p( r ) = 2699. 8 3 - q ( r / 1. 03 ) + 11.68'•E3T r n
CORE RADIUS: REDSHIFT:R c= 3 /S ~ 0 .1 3 2 M pc Z = 0 .0 4 9
Table 4.4.09. (h) Cluster Parameters for Galaxy Cluster 09.
Using the cluster center as determined by the dispersion ellipse analysis, we
count 356 galaxies within 14 rings of width 2.0 arcminutes and to the limiting
magnitude = 19.0. This rich cluster shows several peaks in the East-West strip
count data that straddle the cluster center along the absissa; the North-South counts
tend to reach their maximum near the cluster center as well, but with slightly more
variance. The quadrant counts show a virtual absence of galaxies at the cluster
center, but there is a quick rise in counts soon after with the counts then increasing
in all directions. The surface density rises to a maximum at ring 7 and then slowly
falls to the the cluster periphery.
The isothermal fit is seriously affected by the lack of data at small radii, but
the fit tends to mimic the data fairly well beyond that point until the outer reaches
of the cluster where the fit begins to overshoot the data. The results of the analysis
are seen in the table above which gives the calculated value of the cluster parameters
and their variance as well as the “best fit” determined from the minimization
procedure.
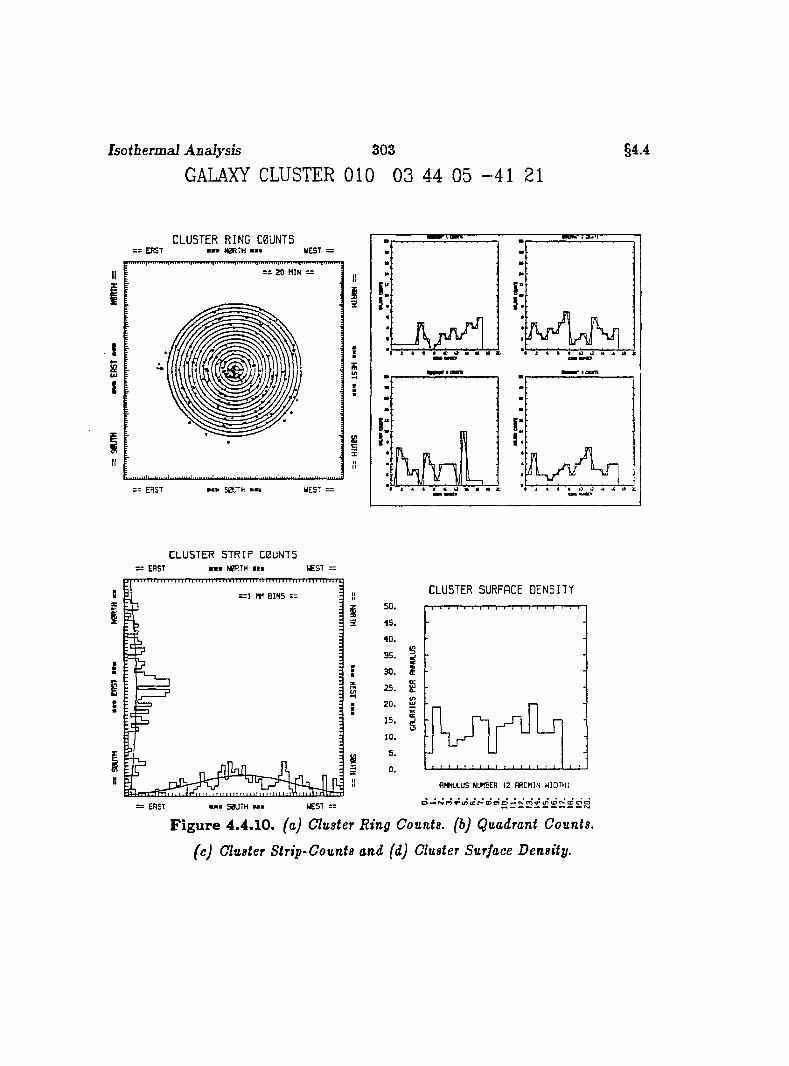
Isothermal Analysis 303
GALAXY CLUSTER 010 03 44 05 -4 1 21§4 4
CL U S T E R R IN G C0UNTS; e r s t # * N 0R T H W EST =
s s 2 0 M IN =
SBLITH I
II
I
!
a
3
CLUSTER STRIP C0ÜNT5: E A S T « ■ N 0RTH III t £ S T =
: B I N S = =
E
II
= EAST W EST =
CLUSTER SURFACE D E N S IT Y
4 5 .
2 5 . g
20 . 2sÉ
Figure 4.4.10. (a) Cluster Ring Counts, (b) Quadrant Counts,
(c) Cluster Strip-Counts and (d) Cluster Surface Density.
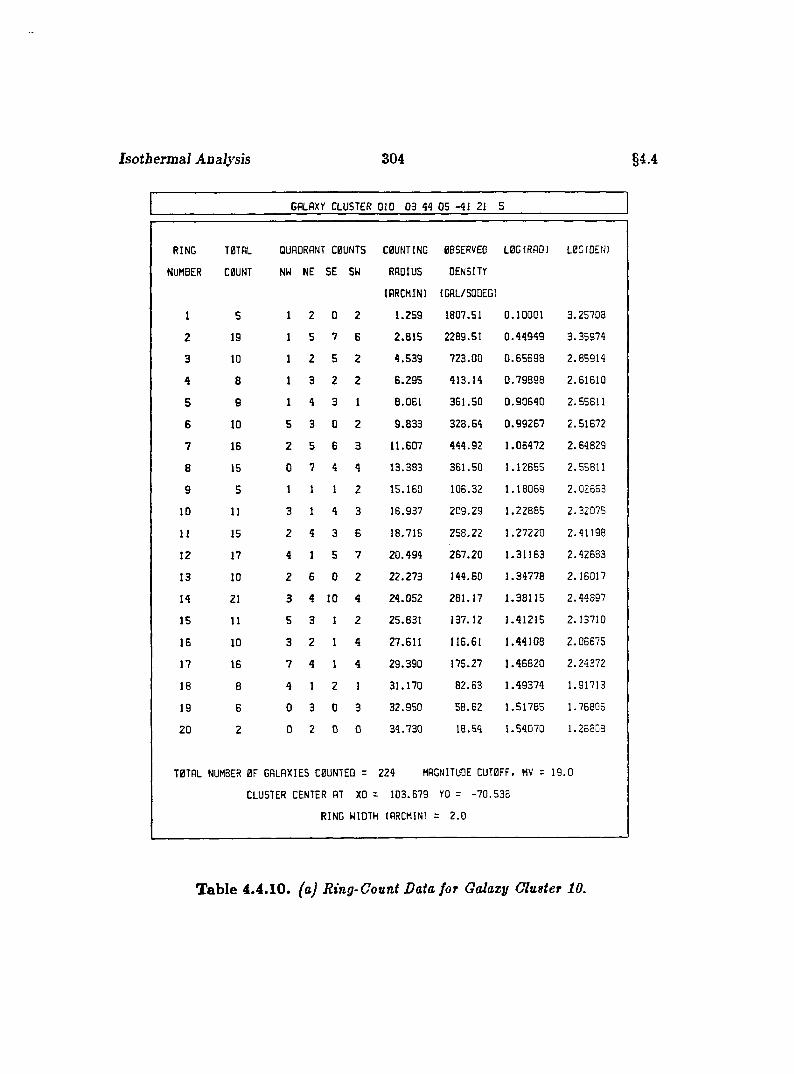
Isothermal Analysis 304 §4.4
GALAXY CLUSTER 010 03 44 05 -41 21 5
RING
NUMBER
TOTAL
COUNT
QUADRANT COUNTS
NW NE SE SW
COUNTING
RADIUS
lARCMIN)
OBSERVED
DENSITY
(GAL/SQOEG)
LOG(RAD) LOCtOENI
1 5 1 2 0 2 1.259 1807.51 0.10001 3.25708
2 19 1 5 7 6 2.815 2289.51 0.44949 3.35974
3 10 1 2 5 2 4.539 723.00 0.65698 2.85914
4 8 1 3 2 2 6.295 413.14 0.79898 2.61610
5 9 1 4 3 1 8.061 361.50 0.90640 2.55611
E 10 5 3 0 2 9.833 328.64 0.99267 2.51672
7 16 2 5 6 3 11.607 444.92 1.06472 2.64829
8 15 0 7 4 4 13.383 361.50 1.12655 2.55811
9 5 1 1 1 2 15.160 106.32 1.18069 2.02663
10 11 3 1 4 3 16.937 209.29 1.22885 2.32075
11 15 2 4 3 6 18.716 258.22 1.27220 2.41198
12 17 4 1 5 7 20.494 267.20 1.31163 2.42683
13 10 2 6 0 2 22.273 144.60 1.34778 2.16017
14 21 3 4 10 4 24.052 281.17 1.38115 2.44897
15 11 5 3 1 2 25.831 137.12 1.41215 2.13710
16 10 3 2 1 4 27.611 116.61 1.44106 2.05675
17 16 7 4 1 4 29.390 175.27 1.46820 2.24372
18 8 4 1 2 1 31.170 82.63 1.49374 1.91713
19 6 0 3 0 3 32.950 58.62 1.51785 1.76805
20 2 0 2 0 0 34.730 18.54 1.54070 1.26803
TOTAL NUMBER OF GALAXIES COUNTED =
CLUSTER CENTER AT XO =
RING WIDTH
224 MAGNITUDE CUTOFF, MV = 19.0
103.679 YO = -70.538
(arcmin; = 2.0
Table 4.4.10. {aJ Ring-Connt Data for Galaxy Ghister 10.
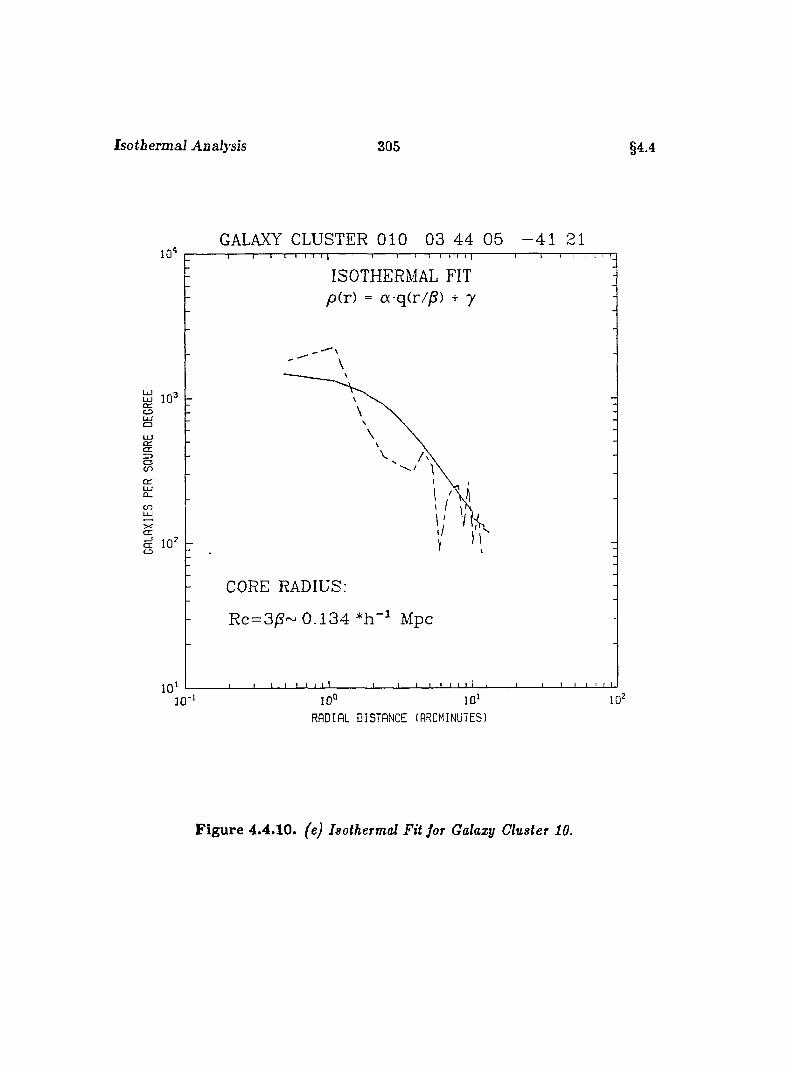
Isotbermaî Analysis 305 §4.4
GALAXY CLUSTER 010 03 44 05 - 4 1 21
ISOTHERMAL FIT p(r) = a-q(r/^) + 7
acn
Û_c n
CORE RADIUS:
R c = 3 /S - 0 .1 3 4 Mpc
10 '10°
R A O IA L D IS T A N C E (ARCMINUTES)
Figure 4.4.10. (e) Isothermal Fit for Galaxy Cluster 10.
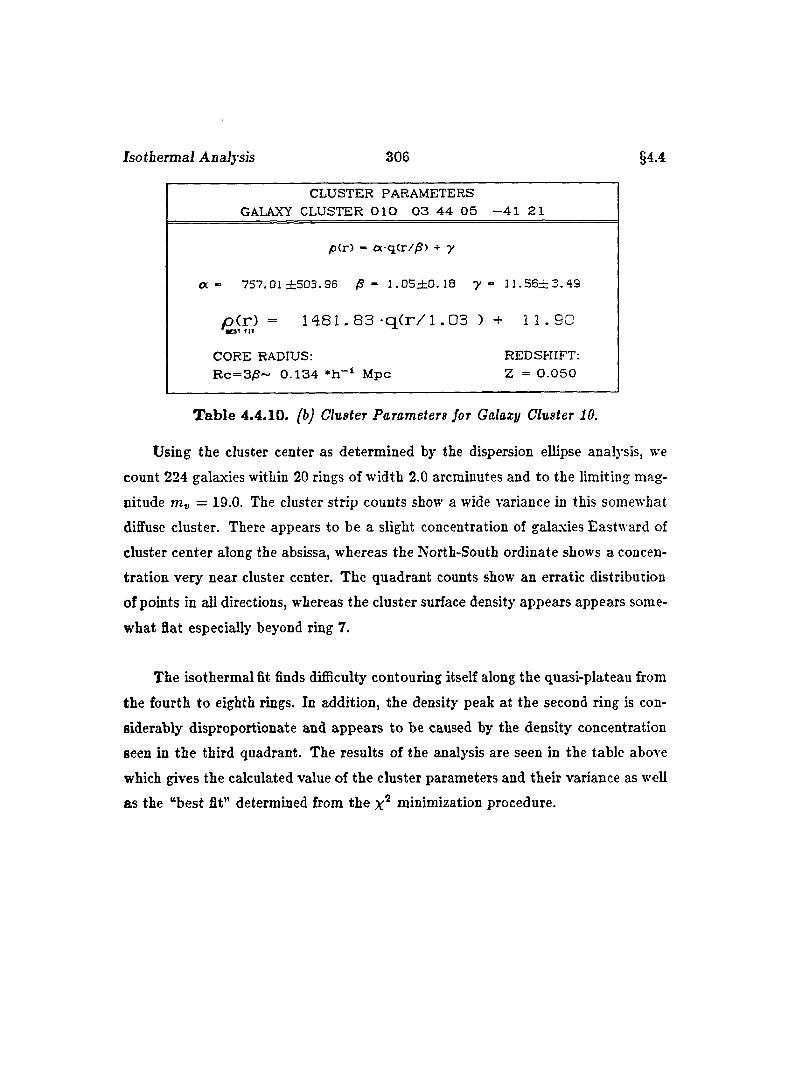
Isothermal Analysis 306 §4.4
CLUSTER PARAMETERS GALAXY CLUSTER 0 1 0 0 3 4 4 05 - 4 1 21
/oCr) - ot q(r/y5) + y
a ~ 757.01 ± 5 0 3 . 9 6 /S - 1 . 0 5 ± 0 . 18 y = n . 5 6 ± 3 . 4 9
p ( r ) = 1 4 8 1 . 8 3 - q C r / l . 0 3 )« 3 T f I T
+ 1 1 . 9 0
CORE RADIUS; REDSHIFT:R c= 3 /S ~ 0 .1 3 4 * h - i M pc Z = 0 . 0 5 0
Table 4.4.10. {bj Cluster Parameters for Galaxy Cluster 10.
Using the cluster center as determined by the dispersion ellipse analysis, we
count 224 galaxies within 20 rings of width 2.0 arcminutes and to the limiting mag
nitude mt, = 19.0. The cluster strip counts show a wide variance in this somewhat
diffuse cluster. There appears to be a slight concentration of galaxies Eastward of
cluster center along the absissa, whereas the North-South ordinate shows a concen
tration very near cluster center. The quadrant counts show an erratic distribution
of points in all directions, whereas the cluster surface density appears appears some
what flat especially beyond ring 7.
The isothermal fit finds difficulty contouring itself along the quasi-plateau from
the fourth to eighth rings. In addition, the density peak at the second ring is con
siderably disproportionate and appears to be caused by the density concentration
seen in the third quadrant. The results of the analysis are seen in the table above
which gives the calculated value of the cluster parameters and their variance as well
as the “best fit” determined from the minimization procedure.
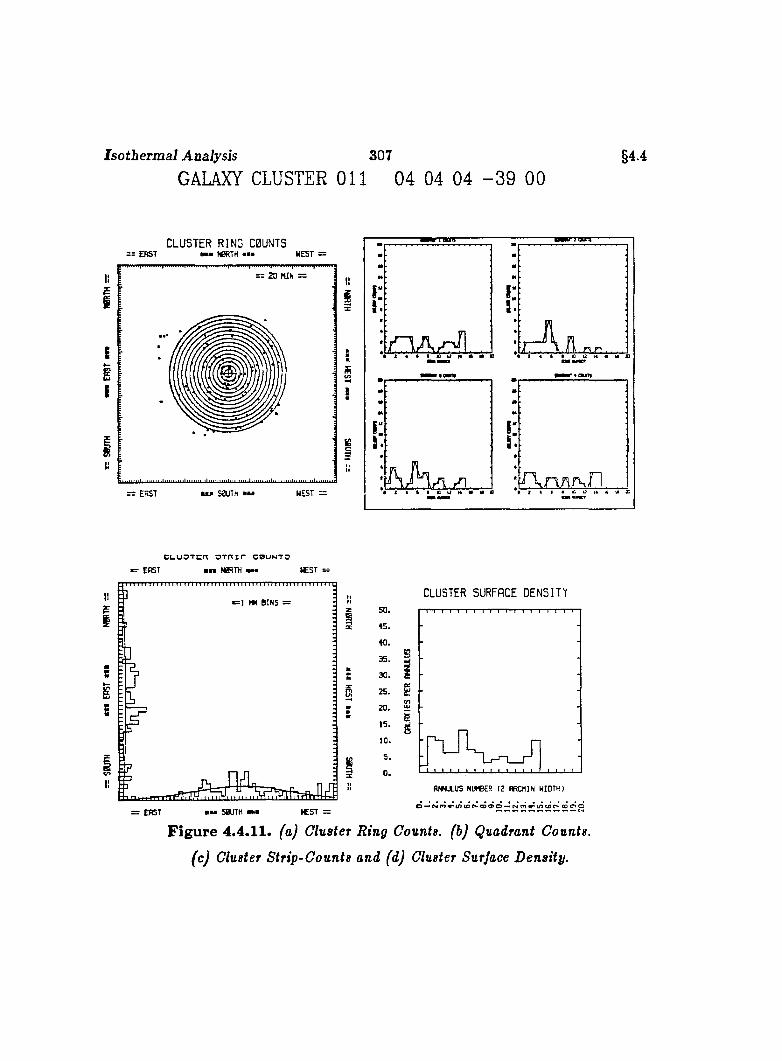
Isothermal Analysis 307GALAXY CLUSTER O il 04 04 04 - 3 9 00
§4.4
C L U S T E R R IN G C0UNTS: E B S T w N 0R TH W EST =
— 2 0 M IN =11
IEIE
W EST =
-------------------- — 1 I IM I I --------
:s. :. . . r - & . n . 7 T n . . .
I i :s. :
1 « « I C U M M B 2 4 1 « i C U K l t t l X
c i _ u 3 T c f \ o x n i r c b u n t o
E A S T a n N 0RTH mmm * E S T —
II
IB I N S =e=l
SiE
II
S a jT H= ERST
CLUSTER SURFACE D E N S IT Y
35. §
I
o -^N (n « * iD (c r^C D 9 > 0 '~N (n « * Ln u c* * co cT O
Figure 4.4.11. {aJ Cluster Ring Counts, (b) Quadrant Counts,
(c) Cluster Strip-Counts and (d) Cluster Surjace Density.
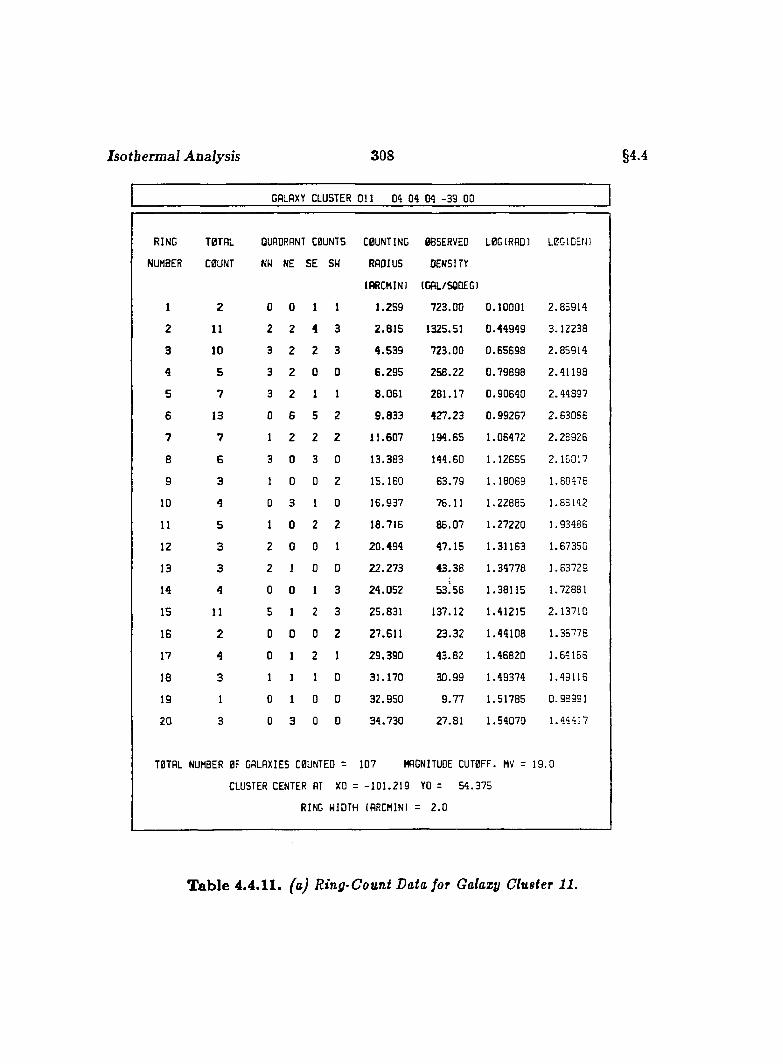
Isotbermaî Analysis 3 0 8 § 4 . 4
GALAXY CLUSTER O il 04 04 04 -3 9 00
RING TOTAL QUADRANT COUNTS COUNTING OBSERVED LOG(RAD) LEGIDENI
NUMBER COUNT NW NE SE SW RADIUS DENSITY
(ARCMIN) (GAL/SQOEG)
1 2 0 0 1 1 1 .2 5 9 7 2 3 .0 0 0 .1 0 0 0 1 2 .8 5 9 1 4
2 11 2 2 4 3 2 .8 1 5 1325.51 0 .4 4 9 4 9 3 .1 2 2 3 8
3 10 3 2 2 3 4 .5 3 9 7 2 3 .0 0 0 .6 5 6 9 8 2 .8 5 9 1 4
4 5 3 2 0 0 6 .2 9 5 2 5 8 .2 2 0 .7 9 8 9 8 2 .4 1 1 9 8
5 7 3 2 1 1 8 .0 6 1 2 8 1 .1 7 0 .9 0 6 4 0 2 .4 4 8 9 7
6 13 0 6 5 2 9 .8 3 3 4 2 7 .2 3 0 .9 9 2 6 7 2 .6 3 0 5 8
7 7 1 2 2 2 1 1 .6 0 7 194 .65 1 .0 6 4 7 2 2 .2 8 9 2 6
8 E 3 0 3 0 1 3 .3 8 3 144 .60 1 .12 6 5 5 2 .1 6 0 1 7
9 3 1 0 D 2 15 .1 6 0 6 3 .7 9 1 .18 0 6 9 1 .80478
10 4 0 3 1 0 1 6 .9 3 7 76 .11 1 .2 2 8 8 5 1 .88142
11 5 1 0 2 2 1 8 .7 1 6 8 6 .0 7 1 .27 2 2 0 1 .93486
12 3 2 0 0 1 2 0 .4 9 4 4 7 .1 5 1 .3 1 1 6 3 1 .67 3 5 0
13 3 2 1 0 0 2 2 .2 7 3 4 3 .3 8 1 .3 4 7 7 8 1 .6 3 7 2 9
14 4 0 0 1 3 2 4 .0 5 2 5 3 l5 6 1 .3 8 1 1 5 1 .72881
15 11 5 1 2 3 25 .8 3 1 137 .12 1 .4 1 2 1 5 2 .1 3 7 1 0
16 2 0 0 0 2 27 .6 1 1 2 3 .3 2 1 .4 4 1 0 8 1 .38 7 7 8
17 4 0 1 2 1 2 9 .3 9 0 4 3 .8 2 1 .4 6 8 2 0 1 .64 1 6 6
18 3 1 1 1 0 3 1 .1 7 0 3 0 .9 9 1 .4 9 3 7 4 1 .49116
19 1 0 1 0 0 3 2 .9 5 0 9 .7 7 1 .5 1 7 8 5 0 .98991
20 3 0 3 0 0 3 4 .7 3 0 2 7 .8 1 1 .5 4 0 7 0 1 .44417
T0TAL NUMBER OF GALAXIES COUNTED = 107 MAGNITUDE CUTOFF. MV = 1 9 .0
CLUSTER CENTER AT xo = - 1 0 1 .2 1 9 YO = 5 4 .3 7 5
RING WIDTH (ARCMIN) = 2 .0
Table 4.4.11. (a) Ring-Count Data for Galaxy Cluster 11.
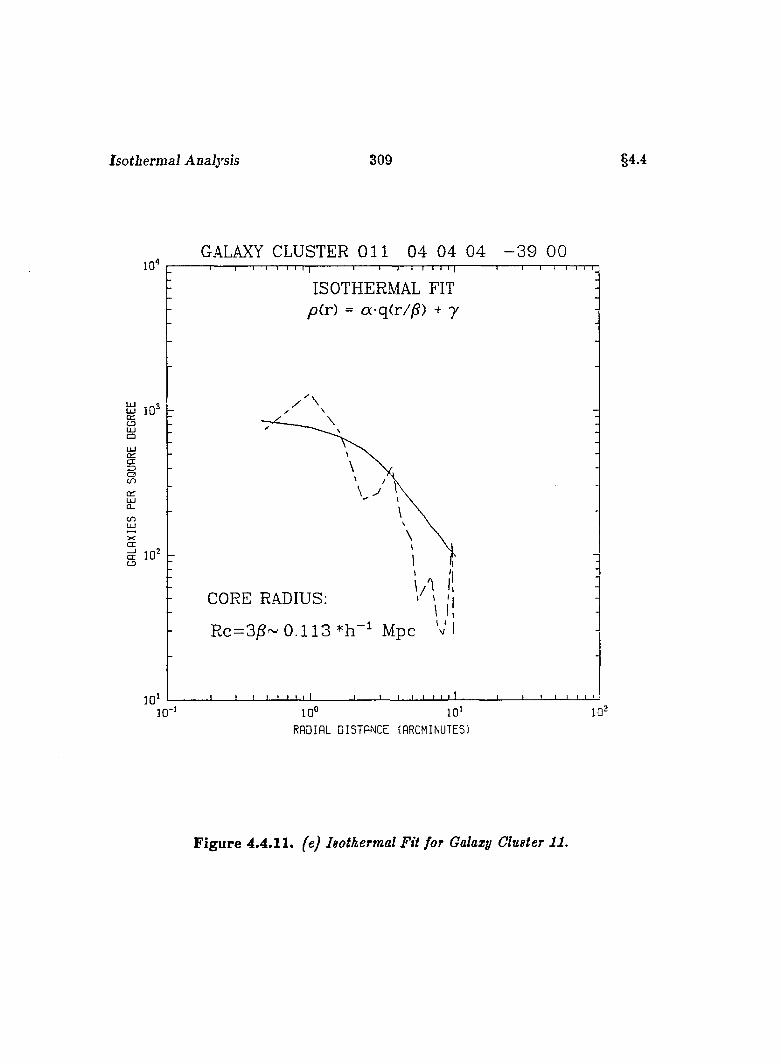
Isotbermaî Analysis 309 §4.4
GALAXY CLUSTER O i l 04 04 04 - 3 9 0010 '
ISOTHERMAL FIT p(r) = a-q(r//S) + 7
aCO
Û_CO
CORE RADIUS;
R c= 3jg- 0 .1 1 3 Mpc
i o ‘1 0 *10°
RADIAL DISTANCE (ARCMINUTES)
Figure 4.4.11. ^ej Isothermal Fit for Galaxy Cluster 11.
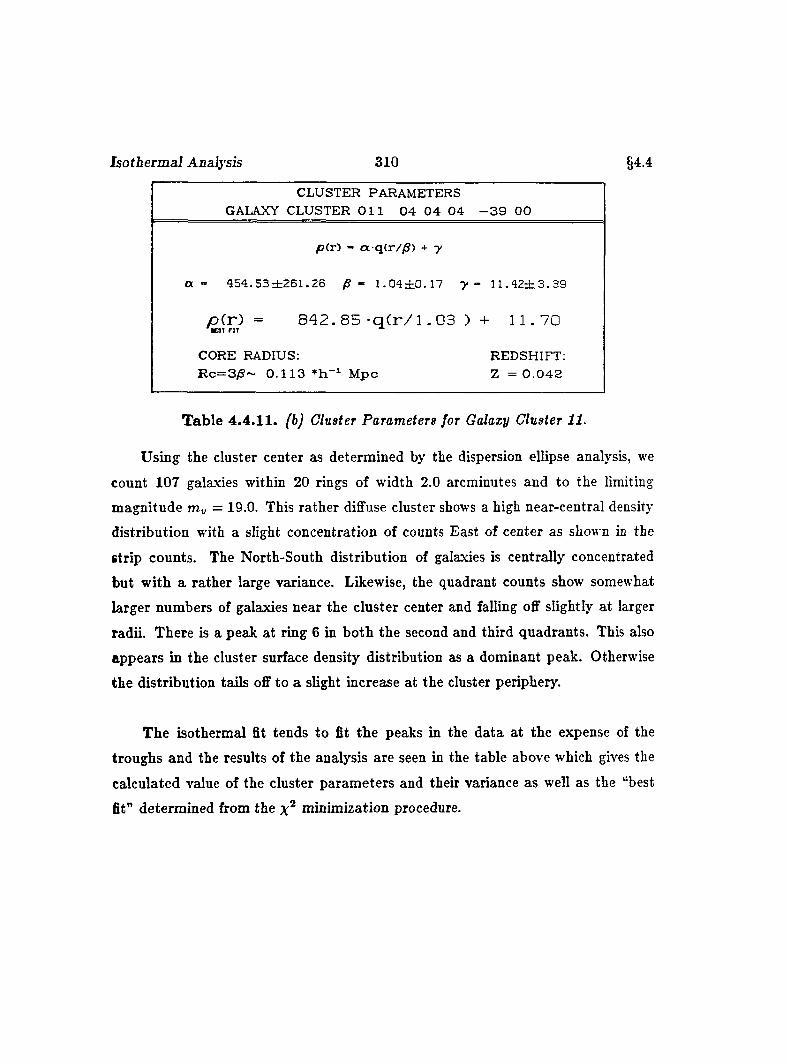
Isothermal Analysis 310
CORE RADIUS:R c= 3 /S ~ 0 . 1 1 3 Mpc
REDSHIFT: Z = 0 .0 4 2
§4.4
CLUSTER PARAMETERS _______GALAXY CLUSTER O i l 0 4 0 4 0 4 - 3 9 0 0
p(r) - a q(r//3) + y
a - 4 5 4 .5 3 ± 2 6 1 . 2 6 /S - 1 . 0 4 ± 0 . 1 7 y - 1 1 . 4 2 ± 3 . 3 9
p ( r ) = 842. 8 5 - q ( r / l . 03 ) + 11.70
Table 4.4 .11. (b) Cluster Parameters for Galaxy Cluster 11.
Using the cluster center as determined by the dispersion ellipse analysis, we
count 107 galaxies within 20 rings of width 2.0 arcminutes and to the limiting
magnitude = 19.0. This rather diffuse cluster shows a high near-central density
distribution with a slight concentration of counts East of center as shown in the
strip counts. The North-South distribution of galaxies is centrally concentrated
but with a rather large variance. Likewise, the quadrant counts show somewhat
larger numbers of galaxies near the cluster center and falling off slightly at larger
radii. There is a peak at ring 6 in both the second and third quadrants. This also
appears in the cluster surface density distribution as a dominant peak. Otherwise
the distribution tails off to a slight increase at the cluster periphery.
The isothermal fit tends to fit the peaks in the data at the expense of the
troughs and the results of the analysis are seen in the table above which gives the
calculated value of the cluster parameters and their variance as well as the “best
fit” determined from the minimization procedure.
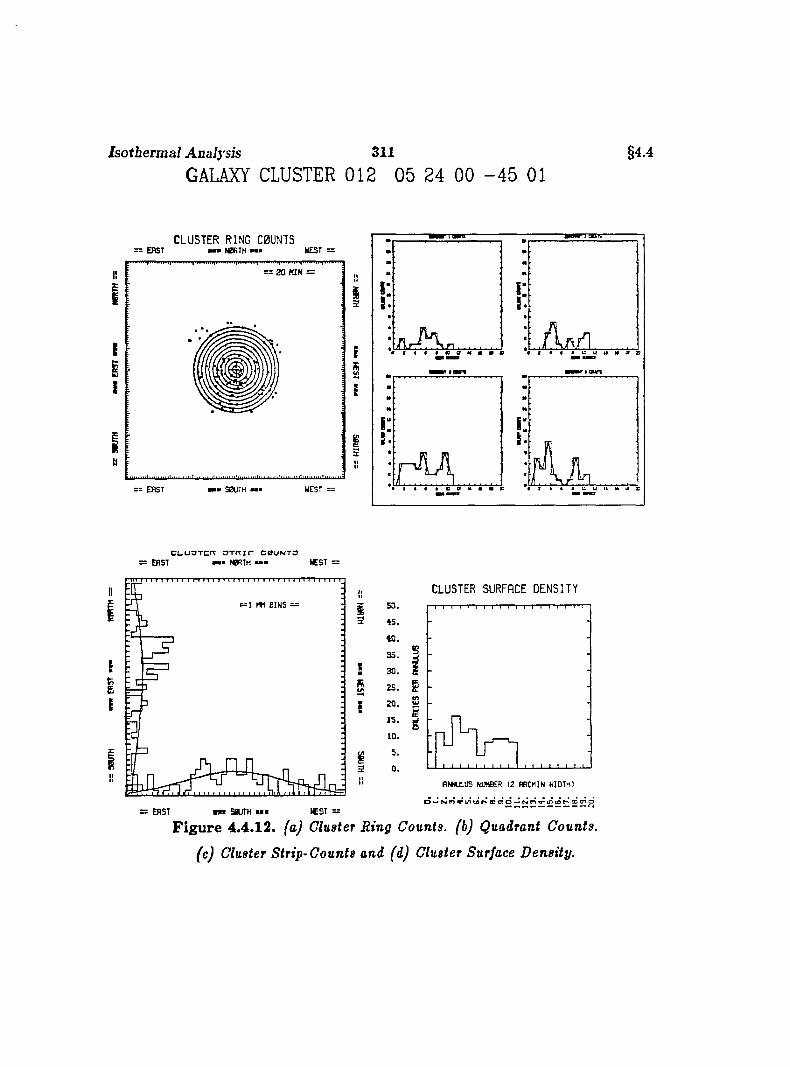
Isothermal Analysb 311GALAXY CLUSTER 012 05 24 GO - 4 5 01
§4.4
C L U S T E R RIN G C0UNTS: E R S T mmm NOiTH WEST =
= = 2 0 M IN —
I
u
W EST =— E R S T ■> S0UTH —
Î3
:I
83II
C Lu oT ca O T n ir c b u n to EA ST M l HBRTH WEST =
II= 1 MM B I N S =
II
— EAST U I SajTH U I W EST =
I
CLUSTER SURFACE DENSITY
a s . §
A W W L U S NUMBER 12 A RCM IN W ID TH )
0 > ^ r 4 r > v i / i t o r > C D 0 9 0 » « < N t n v m ( c r ~ o o ^ o
Figure 4.4.12. (a) Cluster Ring Counts, (b) Quadrant Counts,
(c) Cluster Strip-Counts and (d) Cluster Surface Density.
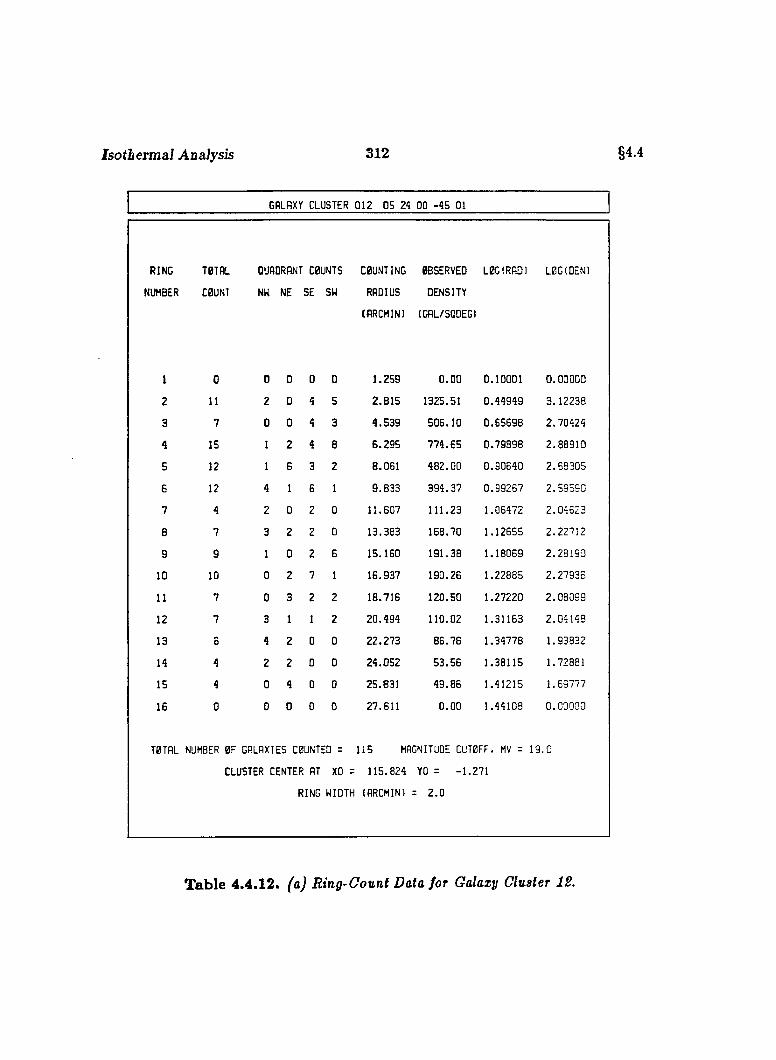
Isotbermal Analysis 312 §4.4
GALAXY CLUSTER 01 2 05 24 00 -4 5 01
RING TOTAL QUADRANT COUNTS COUNTING OBSERVED LOGIRADI LBC(DEN)
JHBER COUNT NU NE SE sw RADIUS DENSITY
(ARCMIN) (GAL/SQDEG)
I 0 0 0 0 0 1 .2 5 9 0 .0 0 0 .10 0 0 1 0 .0 0 0 0 0
2 11 2 0 4 5 2 .8 1 5 1325.51 0 .4 4 9 4 9 3 .1 2 2 3 8
3 7 0 0 4 3 4 .5 3 9 5 0 8 .1 0 0 .6 5 6 9 8 2 .7 0 4 2 4
4 15 1 2 4 8 6 .2 9 5 7 7 4 .6 5 0 .7 9 8 9 8 2 .8 8 9 1 0
5 12 1 6 3 2 8 .061 4 8 2 .0 0 0 .9 0 6 4 0 2 .6 8 3 0 5
6 12 4 1 G 1 9 .8 3 3 3 9 4 .3 7 0 .9 9 2 6 7 2 .5 9 5 9 0
7 4 2 0 2 0 1 1 .607 1 1 1 .2 3 1 .06 4 7 2 2 .0 4 6 2 3
8 7 3 2 2 0 13 .383 1 6 8 .7 0 1 .12 6 5 5 2 .2 2 7 1 2
9 9 1 0 2 G 15 .160 1 9 1 .3 8 1 .18 0 6 9 2 .2 8 1 9 0
10 10 0 2 7 1 1 6 .9 3 7 1 9 0 .2 6 1 .22 8 8 5 2 .2 7 9 3 6
11 7 0 3 2 2 18 .716 1 2 0 .5 0 1 .27 2 2 0 2 .0 8 0 9 9
12 7 3 1 1 2 2 0 .4 9 4 11 0 .0 2 1 .31 1 6 3 2 .0 4 1 4 8
13 5 4 2 0 0 2 2 .2 7 3 8 6 .7 6 1 .34 7 7 8 1 .9 3 8 3 2
14 4 2 2 0 0 2 4 .0 5 2 5 3 .5 6 1 .3 8 1 1 5 1 .72881
15 4 0 4 0 0 2 5 .831 4 9 .8 6 1 .41 2 1 5 1 .6 9 7 7 7
16 0 0 0 0 0 27 .611 0 .0 0 1 .44108 0 .0 0 0 0 0
TOTAL NUMBER OF GALAXIES COUNTED = 115 MAGNITUDE CUTOFF. MV = 19.0
CLUSTER CENTER AT XD = 115 .8 2 4 YD = -1 .2 7 1
RING WIDTH (ARCMIN) = 2 .0
Table 4.4.12. (a) Ring-Count Data for Galaxy Cluster 12.
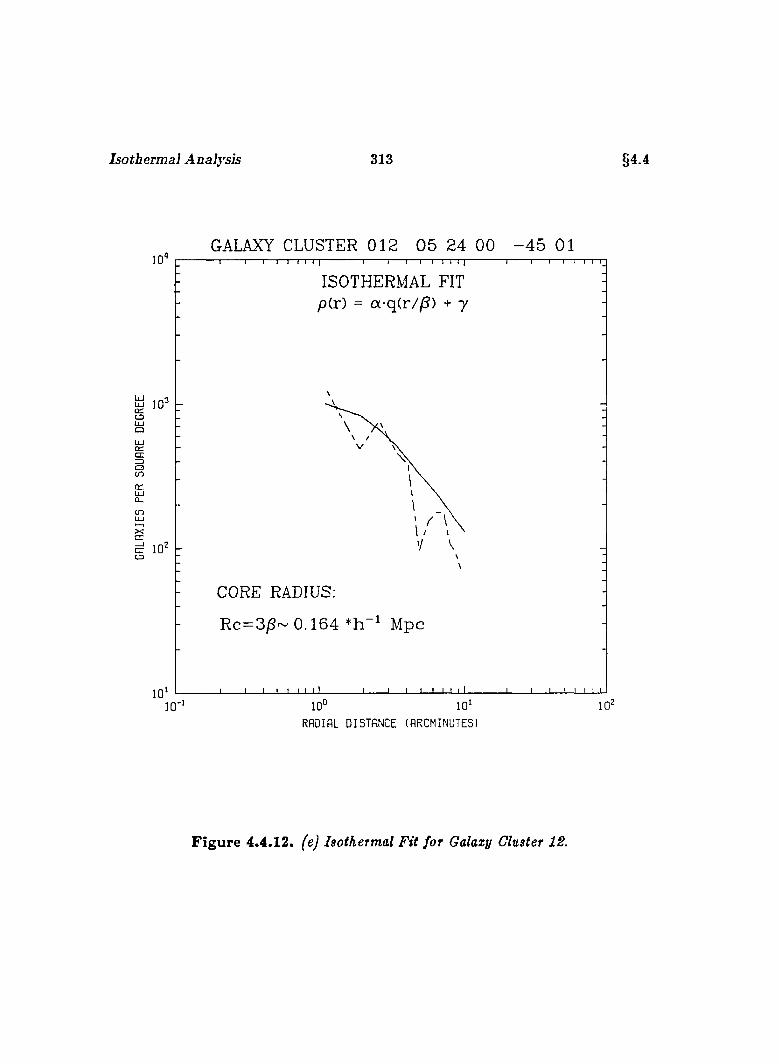
Isotbermal Analysis 313 §4.4
GALAXY CLUSTER 0 12 0 5 24 GO - 4 5 0110
ISOTHERMAL FIT pir) = aq (r //3 ) + 7
LDÜJO
Œ
Q_c n
c r
CORE RADIUS;
R c=3/3~ 0 .164 *h Mpc
10°
RADIAL DISTANCE (ARCMINUTES)
Figure 4.4.12. (e) Isothermal Fit for Galaxy Cluster 12.
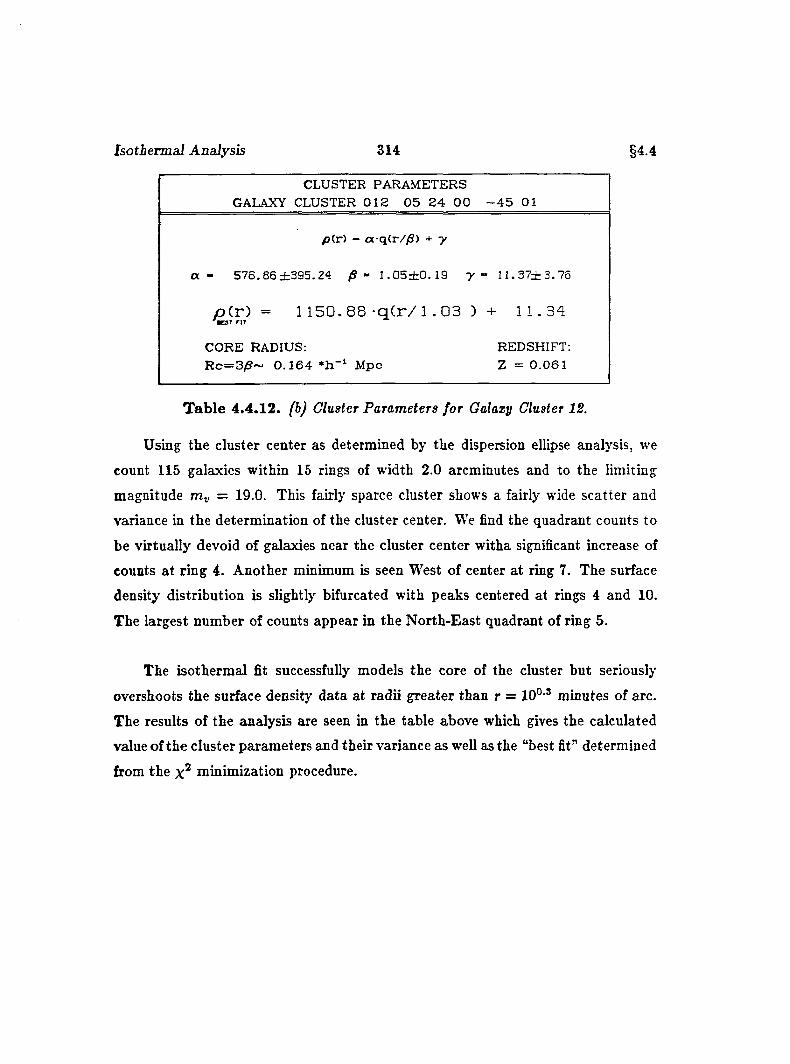
Isotbermal Analysis 314
CORE RADIUS:R c = 3 /S ~ 0 .1 6 4 Mpc
R E D S H IF T ;
Z = 0 .0 6 1
§4.4
CLUSTER PARAMETERS GALAXY CLUSTER 0 1 2 0 5 2 4 0 0 - 4 5 01
p ( r ) - a - q ( r / /S ) + y
a - 5 7 6 .6 6 ± 3 9 5 .2 4 /S - 1 . 0 5 ± 0 . 1 9 I 1 . 3 7 ± 3 . 7 6
p ( r ) = 1 15Q. 8 8 - q ( r / 1. 03 ) + 11.34
T able 4 .4.12. (b) Cluster Parameters for Galaxy Cluster IS.
Using the cluster center as determined by the dispersion ellipse analysis, we
count 115 galaxies within 15 rings of width 2.0 arcminutes and to the limiting
magnitude m-u = 19.0. This fairly sparce cluster shows a fairly wide scatter and
variance in the determination of the cluster center. We find the quadrant counts to
be virtually devoid of galaxies near the cluster center witha significant increase of
counts at ring 4. Another minimum is seen W'est of center at ring 7. The surface
density distribution is slightly bifurcated with peaks centered at rings 4 and 10.
The largest number of counts appear in the North-East quadrant of ring 5.
The isothermal fit successfully models the core of the cluster but seriously
overshoots the surface density data at radii greater than r = 10' -* minutes of arc.
The results of the analysis are seen in the table above which gives the calculated
value of the cluster parameters and their variance as well as the “best fit” determined
from the minimization procedure.
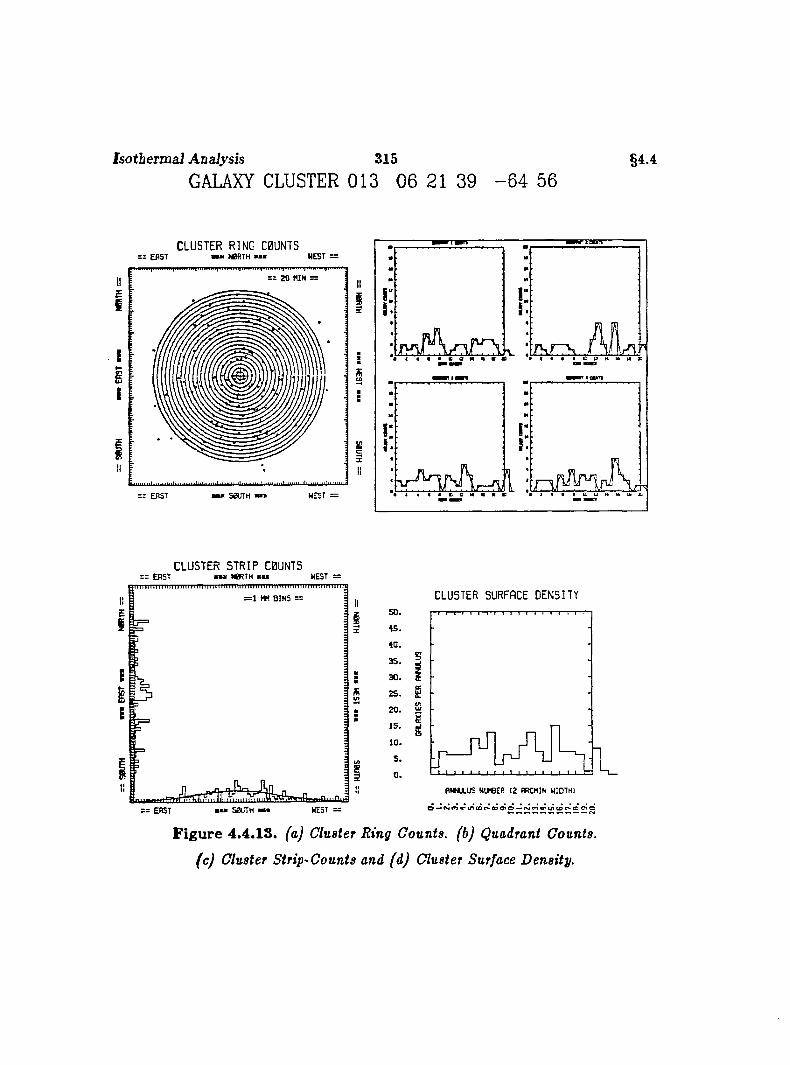
Isotbermal Analysis 315GALAXY CLUSTER 013 06 21 39 - 6 4 56
§4 4
C L U S T E R R IN G C0UNTSE A S T N 0A T H u > N E S T :
rw i
= = 2 0 M IN =
S0inH mmm
CLUSTER S T R IP C0ÜNT5: z E B S T • » N 0R T H « u N E S T —
= J MM B I N SIIEI
I
E
^ j,! [niiiHp.= = E R S T WEST =mmm S 0 J T H mm#
S O .
4 5 . -
4 0 . -
3 5 . I ■3 0 . 1 -
2 5 . g -
2 0 .P
l b .i -
1 0 . ■
5 .
0 .
CLUSTER SURFACE D EN SITYI I 1 I 1 » *7 ■ 1 I I I I I I n - i I I
rA IM J L U S NUMBER tZ ARCM IN W ID TH )
Figure 4.4.13. (a) Cluster Ring Counts, (b) Quadrant Counts,
(c) Cluster Strip-Counts and (d) Cluster Surface Density.
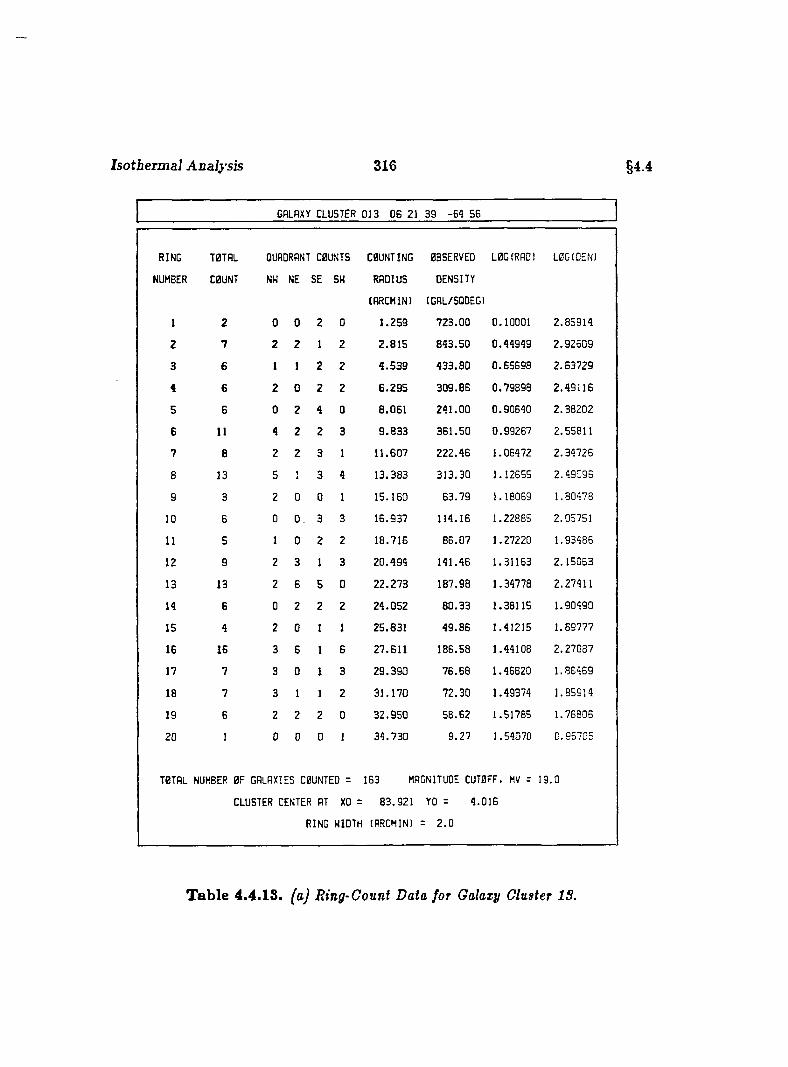
Isotbermal Analysis 316 §4 4
GALAXY CLUSTER 0 1 3 0 6 21 3 9 -6 4 5 6
RING TOTAL QUADRANT COUNTS COUNTING OBSERVED LOG (RAO) LOG(DEN)
NUMBER COUNT NW NE SE SU RADIUS DENSITY
(ARCMIN) (GAL/SQDEG)
1 2 0 0 2 0 1 .2 5 9 7 2 3 .0 0 0 .10 0 0 1 2 .8 5 9 1 4
2 7 2 2 1 2 2 .8 1 5 8 4 3 .5 0 0 .4 4 9 4 9 2 .9 2 5 0 9
3 £ 1 1 2 2 4 .5 3 9 4 3 3 .8 0 0 .6 5 6 9 8 2 .6 3 7 2 9
4 6 2 0 2 2 6 .2 9 5 3 0 9 .8 6 0 .7 9 8 9 8 2 .4 9 1 1 6
5 6 0 2 4 0 8 .0 6 1 2 4 1 .0 0 0 .9 0 6 4 0 2 .3 8 2 0 2
6 11 4 2 2 3 9 .8 3 3 3 6 1 .5 0 0 .9 9 2 6 7 2 .55811
7 8 2 2 3 1 1 1 .6 0 7 2 2 2 .4 6 1 .06472 2 .3 4 7 2 6
8 13 5 1 3 4 1 3 .3 8 3 3 1 3 .3 0 1 .12655 2 .4 9 5 9 6
9 3 2 0 0 1 1 5 .1 6 0 6 3 .7 9 1 .18069 1 .80 4 7 8
10 6 0 0 3 3 1 6 .9 3 7 11 4 .1 6 1 .22885 2 .05751
11 5 1 0 2 2 1 8 .7 1 6 8 6 .0 7 1 .27220 1 .93 4 8 6
12 9 2 3 1 3 2 0 .4 9 4 14 1 .4 6 1 .31163 2 .1 5 0 6 3
13 13 2 6 5 0 2 2 .2 7 3 18 7 .9 8 1 .34 7 7 8 2 .27 4 1 1
14 6 0 2 2 2 2 4 .0 5 2 8 0 .3 3 1 .38115 1 .90 4 9 0
15 4 2 0 1 1 2 5 .8 3 1 4 9 .8 6 1 .41215 1 .69 7 7 7
16 16 3 6 1 6 2 7 .6 1 1 18 6 .5 8 1 .44108 2 .2 7 0 8 7
17 7 3 0 1 3 2 9 .3 9 0 7 6 .6 8 1 .46820 1 .88 4 6 9
18 7 3 1 1 2 3 1 .1 7 0 7 2 .3 0 1 .49374 1 .85914
19 6 2 2 2 0 3 2 .9 5 0 5 8 .6 2 1 .51785 1 .76 8 0 5
20 1 0 0 0 1 3 4 .7 3 0 9 .2 7 1.54070 0 ,9 5 7 0 5
TBTAL NUMBER OF GALAXIES COUNTED = 163 MAGNITUDE CUTOFF, MV = 1 9 .0
CLUSTER CENTER AT xo = 8 3 .9 2 1 YO = 4 .0 1 6
RING WIDTH (ARCMIN) = 2 .0
Table 4.4.18. (a) Ring-Count Data for Galaxy Cluster IS.
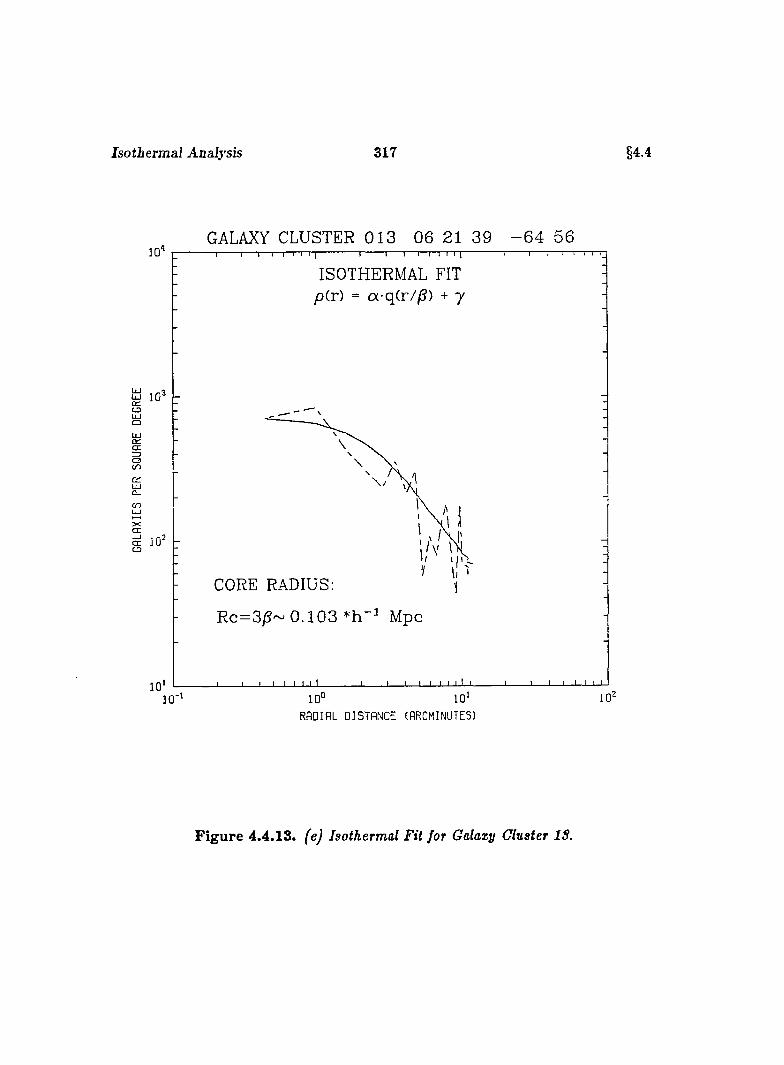
Isothermal Analysis 317 §4.4
GALAXY CLUSTER 0 1 3 06 21 39 - 6 4 56
ISOTHERMAL FIT pCr) = a-q(r//S) + 7
aO'Œacn
û _
c n
CORE RADIUS:
Rc=3)5~ 0 .1 0 3 Mpc
1010 ’10°
RADIAL DISTANCE (ARCMINUTES!
Figure 4.4.13. (e) Isothermal Fit for Galaxy Cluster IS.
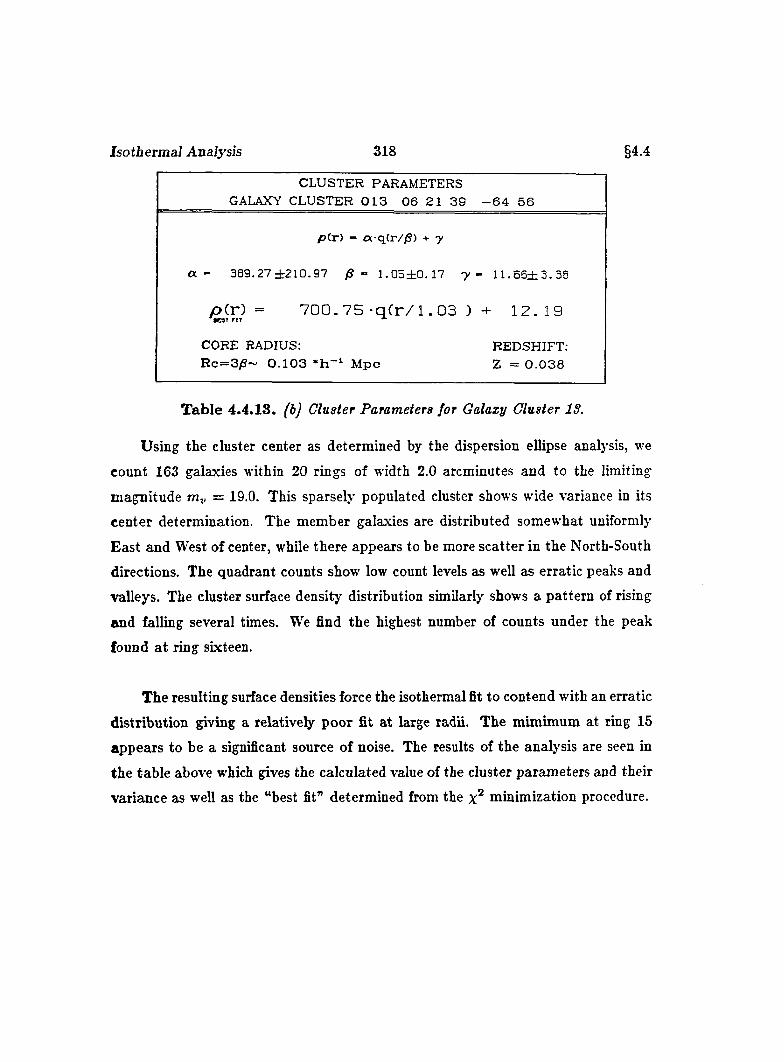
Isotbermal Analysis 318 §4.4
CLUSTER PARAMETERSGALAXY CLUSTER 0 1 3 0 6 21 3 9 - 6 4 5 6
p (r) - a-q(r//S) + y
a - 389.27 ± 2 1 0 .97 /S ~ 1 .05±G .17 -y - 1 I . 5 5 ± 3 . 3 8
p( r ) = 70G.75-qCr /1 .03 ) + 12.19
CORE RADIUS:R c= 3 /S ~ 0 .1 0 3 M pc
REDSHIFT: Z = 0 .0 3 8
Table 4.4.13. ^bj Cluster Parameters for Galaxy Cluster IS.
Using the cluster center as determined by the dispersion ellipse analysis, we
count 163 galaxies within 20 rings of width 2.0 arcminutes and to the limiting
magnitude rriy = 19.0. This sparsely populated cluster shows wide variance in its
center determination. The member galaxies are distributed somewhat uniformly
East and West of center, while there appears to be more scatter in the North-South
directions. The quadrant counts show low count levels as well as erratic peaks and
valleys. The cluster surface density distribution similarly shows a pattern of rising
and falling several times. We find the highest number of counts under the peak
found at ring sixteen.
The resulting surface densities force the isothermal fit to contend with an erratic
distribution giving a relatively poor fit at large radii. The mimimum at ring 15
appears to be a significant source of noise. The results of the analysis are seen in
the table above which gives the calculated value of the cluster parameters and their
variance as well as the “best fit” determined from the minimization procedure.
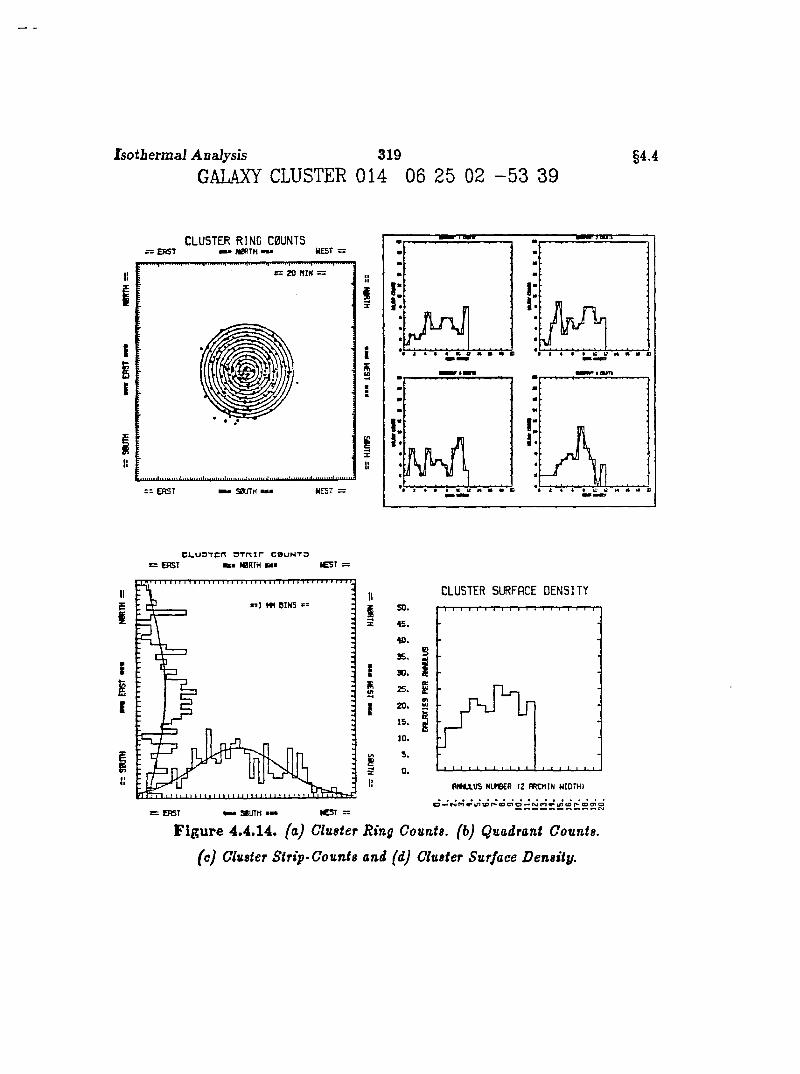
Isotbermal Analysis 319GALAXY CLUSTER 014 06 25 02 - 5 3 39
54.4
TBBTC L U S T E R R IN G C0ÜNTSw M R T H — W EST =
:
is
:= ERST Sa/TH
C L U O T C n 3 T K i r c b u n t o
= E R S T ■ » W R T H mm« t £ S T =
IISI
» = J MM B I N S =
E
E
!l
E
CLUSTER SURFACE D E N S IT Y
S
— ERST M MUTM W 3T =
Figure 4.4.14. (a) Cluster Ring Counts, (b) Quadrant Counts,
(c) Cluster Strip-Counts and (d) Cluster Surface Density.
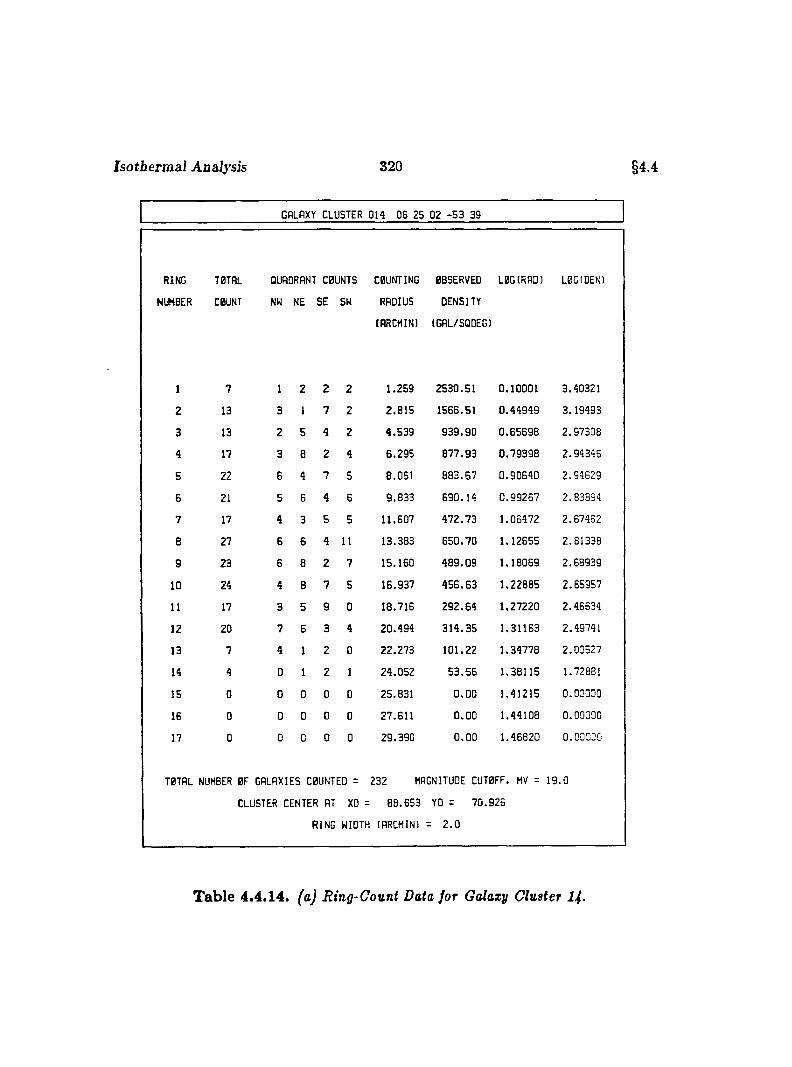
Isotbermal Analysis 320 §4.4
GALAXY CLUSTER 014 06 25 02 -5 3 39
iING T0TAL QUADRANT C0UNTS COUNTING OBSERVED LOGIRAO) L0GIOENI
JMBER C0UNT NW NE SE SW RADIUS DENSITY
(ARCMIN) (GAL/SQOEG)
1 7 1 2 2 2 1.259 2530.51 0.10001 3.40321
2 13 3 1 7 2 2.815 1566.51 0.44949 3.19493
3 13 2 5 4 2 4.539 939.90 0.65698 2.97308
4 17 3 8 2 4 6.295 877.93 0.79898 2.94346
5 22 6 4 7 5 8.061 883.67 0.90640 2.94629
6 21 5 6 4 6 9.833 690.14 0.99267 2.83894
7 17 4 3 5 5 11.607 472.73 1.06472 2.67462
8 27 6 6 4 11 13.383 650.70 1.12655 2.81338
9 23 6 8 2 7 15.160 489.09 1.18069 2.68939
10 24 4 8 7 5 16.937 456.63 1.22885 2.65957
11 17 3 5 5 0 18.716 292.64 1.27220 2.46534
12 20 7 6 3 4 20.494 314.35 1.31163 2.49741
13 7 4 1 2 0 22.273 101.22 1.34778 2.00527
14 4 0 1 2 1 24.052 53.56 1.38115 1.72881
15 0 0 D 0 D 25.831 0.00 1.41215 0.00000
16 0 D 0 0 D 27.611 0.00 1.44108 0.00000
17 0 0 D 0 0 29.390 0.00 1.46820 0.00000
TBTAL NUMBER 0F GALAXIES COUNTED = 232 MAGNITUDE CUT0FF. MV = 19.0
CLUSTER CENTER AT XD = 88.653 YO = 70.926
RING WIDTH (ARCMINl = 2.0
Table 4.4.14. (a) Ring-Count Data for Galazy Cluster I4.
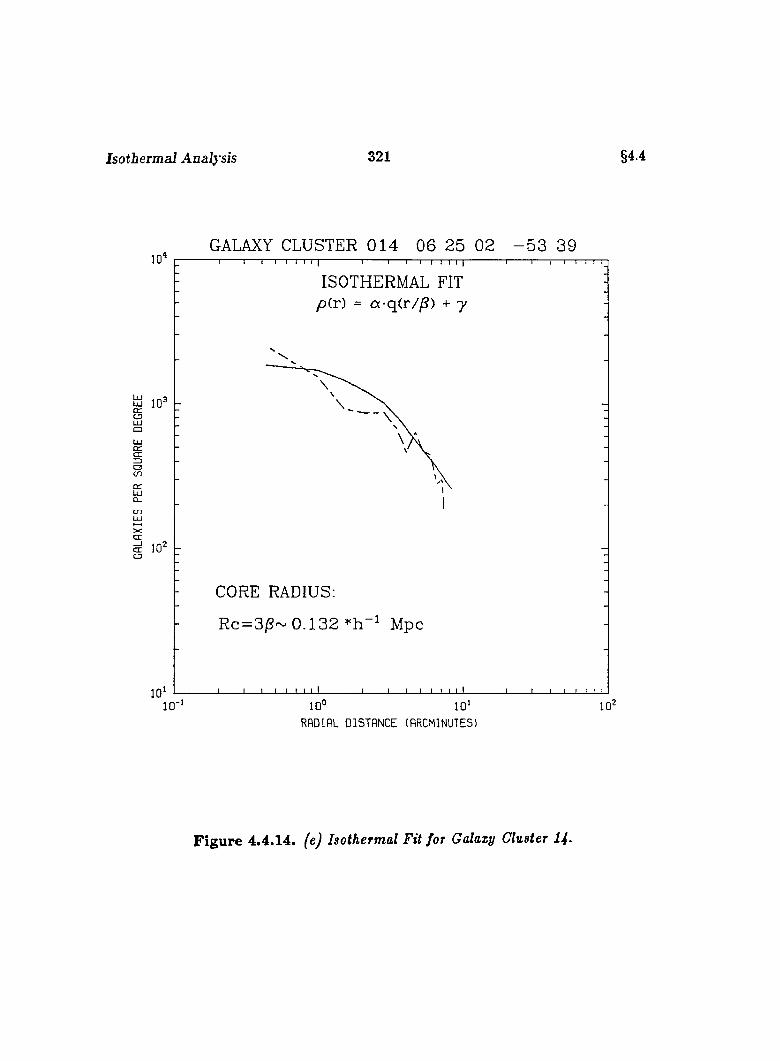
Isotbermal Analysis 321 §4.4
GALAXY CLUSTER 0 1 4 06 25 02 - 5 3 39
QlOLUOQiŒC3cn
LUÛ-
XŒŒCJ
10 '
ISOTHERMAL FIT p(.r) = a-q(r/^) + 7
' ■ — V
CORE RADIUS;
Rc=3jS~ 0 .1 3 2 Mpc
10'10°
RADIAL DISTANCE (ARCMINUTES)
Figure 4.4.14. (e) Isothermal Fit for Galaxy Cluster 14-
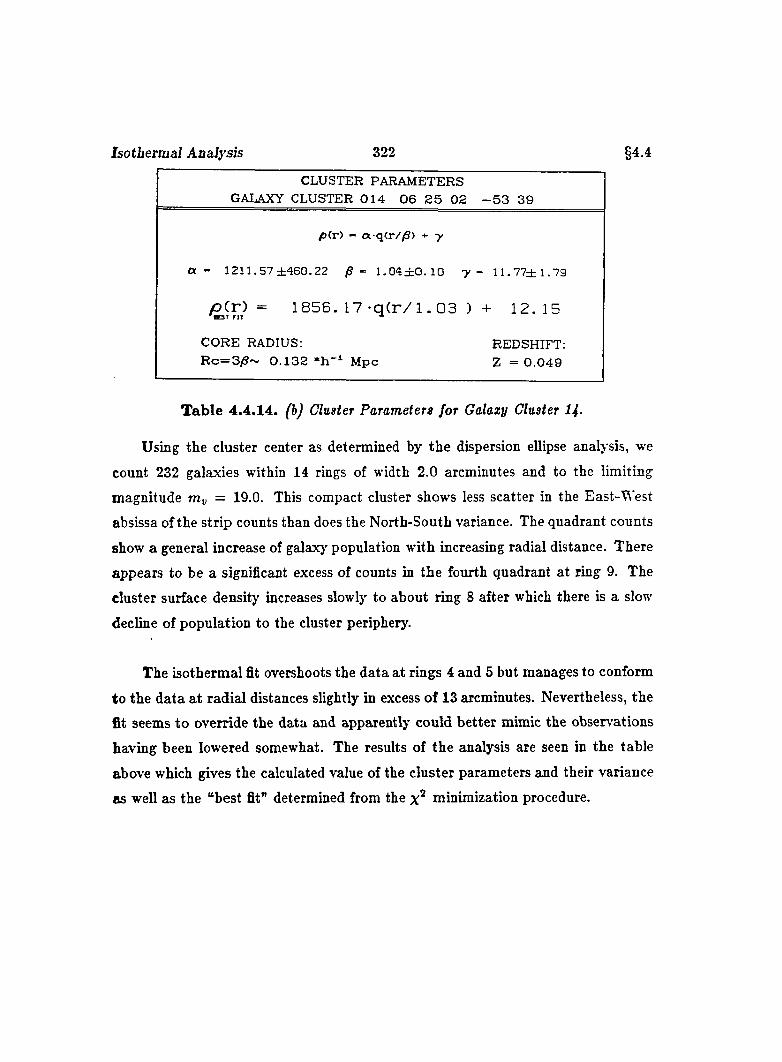
Isotbermal Analysis 322 §4.4
CLUSTER PARAMETERS GALAXY CLUSTER 0 1 4 0 6 2 5 02 - 5 3 39
pCr) - a-q(r//S) + y
a - 1211.57 ±460.22 /S - 1 .04±Q .10 y - 1 1 .7 7 ± 1.79
p C r ) = 1 8 5 6 . 1 7 - q C r / l . 03 )B O T F IT
+ 1 2 .1 5
CORE RADIUS: REDSHIFT;R c = 3 /S ~ 0 .1 3 2 Mpc Z = 0 .0 4 9
T ab le 4 .4 .14. (b) Cluster Parameters for Galaxy Cluster 14-
Using the cluster center as determined by the dispersion ellipse analysis, we
count 232 galaxies within 14 rings of width 2.0 arcminutes and to the limiting
magnitude = 19.0. This compact cluster shows less scatter in the East-West
absissa of the strip counts than does the North-South variance. The quadrant counts
show a general increase of galaxy population with increasing radial distance. There
appears to be a significant excess of counts in the fourth quadrant at ring 9. The
cluster surface density increases slowly to about ring 8 after which there is a slow
decline of population to the cluster periphery.
The isothermal fit overshoots the data a t rings 4 and 5 but manages to conform
to the data a t radial distances slightly in excess of 13 arcminutes. Nevertheless, the
fit seems to override the data and apparently could better mimic the obser\’’ations
having been lowered somewhat. The results of the analysis are seen in the table
above which gives the calculated value of the cluster parameters and their variance
as well as the “best fit” determined from the minimization procedure.
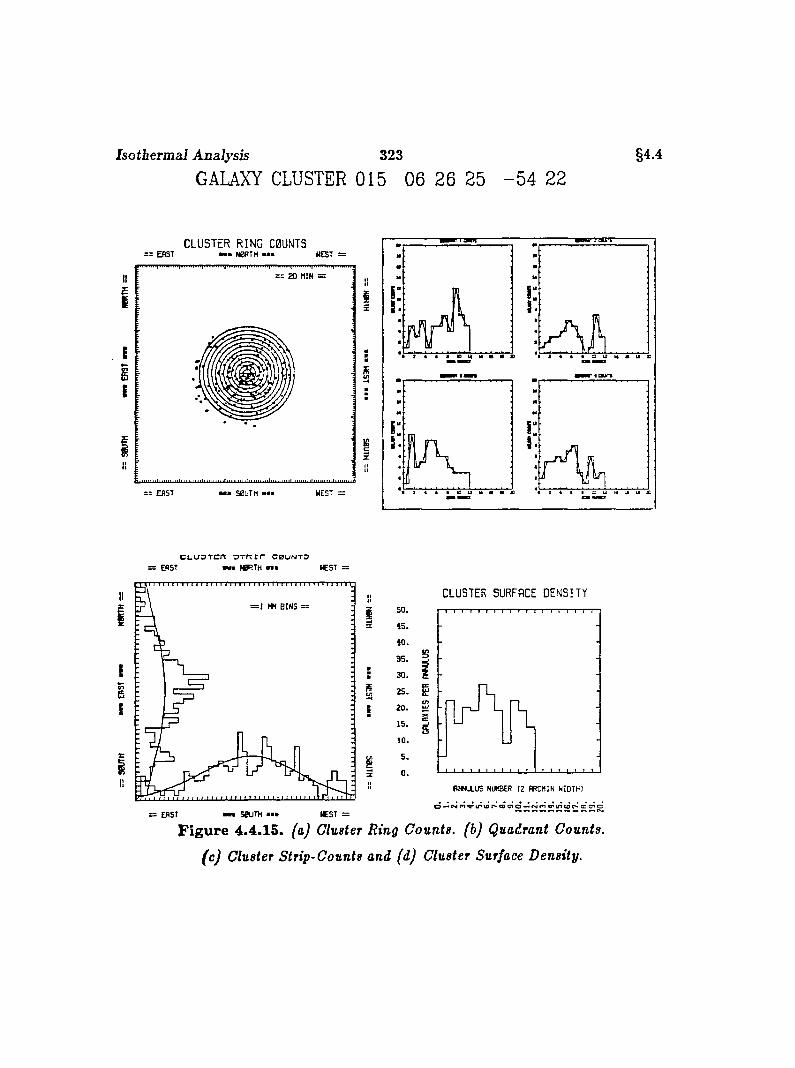
Isothermal Analysis 323
GALAXY CLUSTER 015 06 26 25 - 5 4 22§4.4
CLUSTER RING COUNTS: E A S T mmu N 0A T H ■ ■ ■ W EST =
ranrw
2 0 M IN =
W EST z =» » S 0 U T H ■■■
C t.U 3T C rC 3 T f T i r C 0 U N T 3
EA ST warn N BRTH i £ S T =
= 1 MM B I N S = =
IE
III
= EA ST m m S0U TM I t S T =
CLUSTER SURFACE DENSITY
3 5 . §
i
RN NU LU S NUMBER 12 RRCM IN W ID TH ]
Figure 4.4.15. (a) Cluster Ring Counts, (b) Quadrant Counts,
(c) Cluster Strip-Counts and (d) Cluster Surface Density.
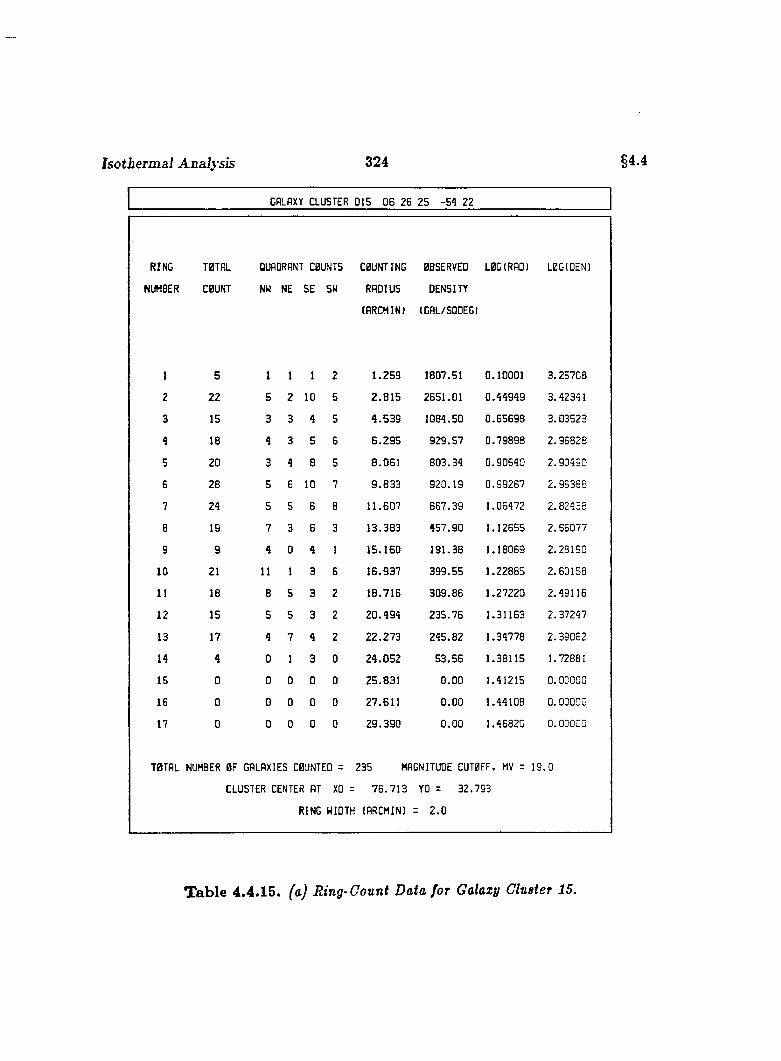
Isotbermal Analysis 324 §4.4
GALAXY CLUSTER 015 06 26 25 -54 22
RING TBTAL QUADRANT COUNTS COUNTING OBSERVED LOG(RAD) LOG(DEN)
JMBER COUNT NW NE SE SW RADIUS DENSITY
(ARCMIN) (GAL/SQDEG)
1 5 1 1 1 2 1 .2 5 9 1807.51 0 .1 0 0 0 1 3 .2 5 7 0 8
2 2 2 5 2 10 5 2 .8 1 5 2 651 .0 1 0 .4 4 9 4 9 3 .42341
3 15 3 3 4 5 4 .5 3 9 1084 .50 0 .6 5 6 9 8 3 .0 3 5 2 3
4 18 4 3 5 6 6 .2 9 5 9 2 9 .5 7 0 .7 9 8 9 8 2 .9 6 8 2 8
5 20 3 4 8 5 8 .0 6 1 8 0 3 .3 4 0 .9 0 6 4 0 2 .9 0 4 9 0
6 28 5 6 10 7 9 .8 3 3 9 2 0 .1 9 0 .9 9 2 6 7 2 .9 6 3 8 8
7 24 5 5 6 8 1 1 .6 0 7 6 5 7 .3 9 1 .06472 2 .8 2 4 3 8
8 19 7 3 6 3 1 3 .3 8 3 4 5 7 .9 0 1 .12 6 5 5 2 .6 6 0 7 7
9 9 4 0 4 1 1 5 .1 6 0 1 9 1 .3 8 1 .18 0 6 9 2 .2 8 1 9 0
10 21 11 1 3 6 1 6 .9 3 7 3 9 9 .5 5 1 .2 2 8 8 5 2 .6 0 1 5 8
11 18 8 5 3 2 1 8 .7 1 6 3 0 9 .8 6 1 .2 7 2 2 0 2 .4 9 1 1 6
12 15 5 5 3 2 2 0 .4 9 4 2 3 5 .7 6 1 .31 1 6 3 2 .3 7 2 4 7
13 17 4 7 4 2 2 2 .2 7 3 2 4 5 .8 2 1 .34778 2 .3 9 0 6 2
14 4 0 1 3 0 2 4 .0 5 2 5 3 .5 6 1 .3 8 1 1 5 1.72881
15 0 0 0 0 0 2 5 .8 3 1 0 .0 0 1 .41215 0 .0 0 0 0 0
16 0 0 0 0 0 2 7 .6 1 1 0 .0 0 1 .44 1 0 8 0 .0 0 0 0 0
17 0 0 0 0 0 2 9 .3 9 0 0 .0 0 1 .46 8 2 0 0 .0 0 0 0 0
TBTAL NUMBER OF GALAXIES COUNTED = 235 MAGNITUDE CUTOFF, MV = 1 9 .0
CLUSTER CENTER AT XO = 7 6 .7 1 3 YO = 32 .7 9 3
RING WIDTH (ARCMIN) = 2 .0
Table 4.4.15. (a) Ring-Count Data for Galaxy Cluster 15.

Isotbermal Analysis 325 §4 4
GALAXY CLUSTER 0 1 5 06 26 25 - 5 4 2210
ISOTHERMAL FIT yO(r) = a-q(r//S) + 7
CCC3COcmLUÛ _
cn
CORE RADIUS:
Rc = 3/?~ 0 .1 3 0 Mpc
10°RADIAL DISTANCE (ARCMINUTES)
Figure 4.4.15. (e) Isothermal Fit for Galaxy Cluster 15.
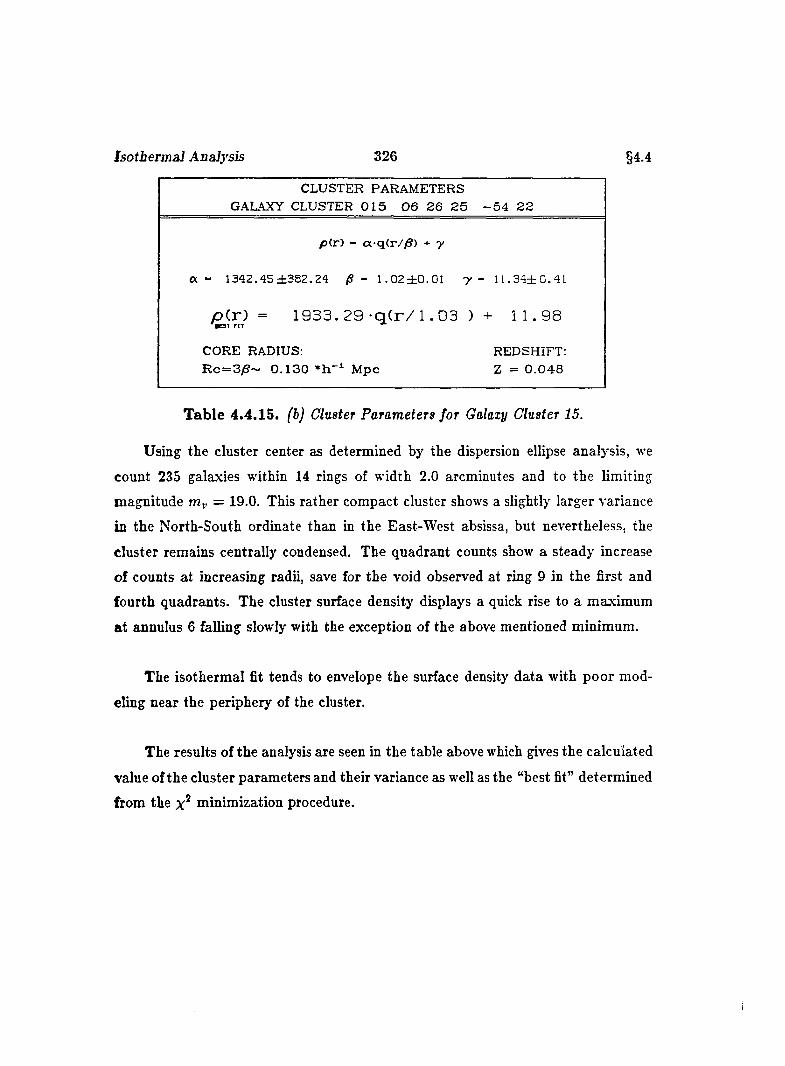
Isotbermal Analysis 326 §4.4
CLUSTER PARAMETERS GALAXY CLUSTER 0 1 5 0 6 26 2 5 - 5 4 2 2
p(r) - a-q(r//S) + y
1 3 4 2 . 4 5 ± 3 8 2 . 2 4 /S - 1 . 0 2 ± 0 . 0 1 y - 1 1 . 3 4 ± G . 4 1
pCr) = 193 3 .2 9 - q ( r / l .03 ) + 11.98
CORE RADIUS:R c = 3 /g ~ 0 .1 3 0 * h - i M pc
REDSHIFT: Z = 0 .0 4 8
T able 4.4.15. (b) Cluster Parameters for Galaxy Cluster 15.
Using the cluster center as determined by the dispersion ellipse analysis, we
count 235 galaxies within 14 rings of width 2.0 arcminutes and to the limiting
magnitude = 19.0. This rather compact cluster shows a slightly larger variance
in the North-South ordinate than in the East-West absissa, but nevertheless, the
cluster remains centrally condensed. The quadrant counts show a steady increase
of counts at increasing radii, save for the void observed at ring 9 in the first and
fourth quadrants. The cluster surface density displays a quick rise to a maximum
at annulus 6 falling slowly with the exception of the above mentioned minimum.
The isothermal fit tends to envelope the surface density data with poor mod
eling near the periphery of the cluster.
The results of the analysis are seen in the table above which gives the calculated
value of the cluster parameters and their variance as well as the “best fit” determined
from the x* minimization procedure.
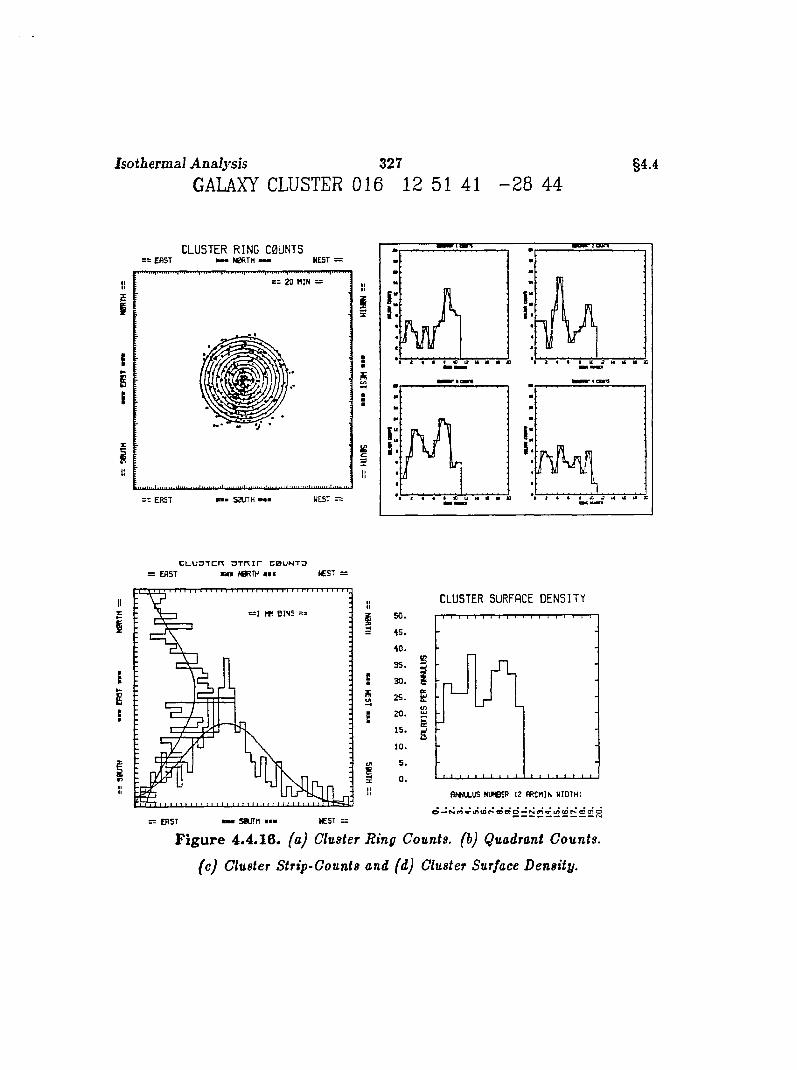
Isotbermal Analysis 327GALAXY CLUSTER 016 12 51 41 - 2 8 44
§4.4
CLUSTER RING C0UNTS: E A S T m e # N 0 R T H m m . N E ST :
= = 2 0 M IN —
= = E A S T p m * S 0U T H WEST =
I:
:
:
N W3
C L u u T c n 3 T m r c b u n t o : E A S T m i NBRTH tC S T —
II= 1 f t t B I N S = =E
I
It
= CAST ' S S U r n mmm NEST =
CLUSTER SURFACE DENSITY
r-TL
É
Figure 4.4.16. (a) Cluster Ring Counts, (b) Quadrant Counts,
(c) Cluster Strip-Counts and (d) Cluster Surface Density.
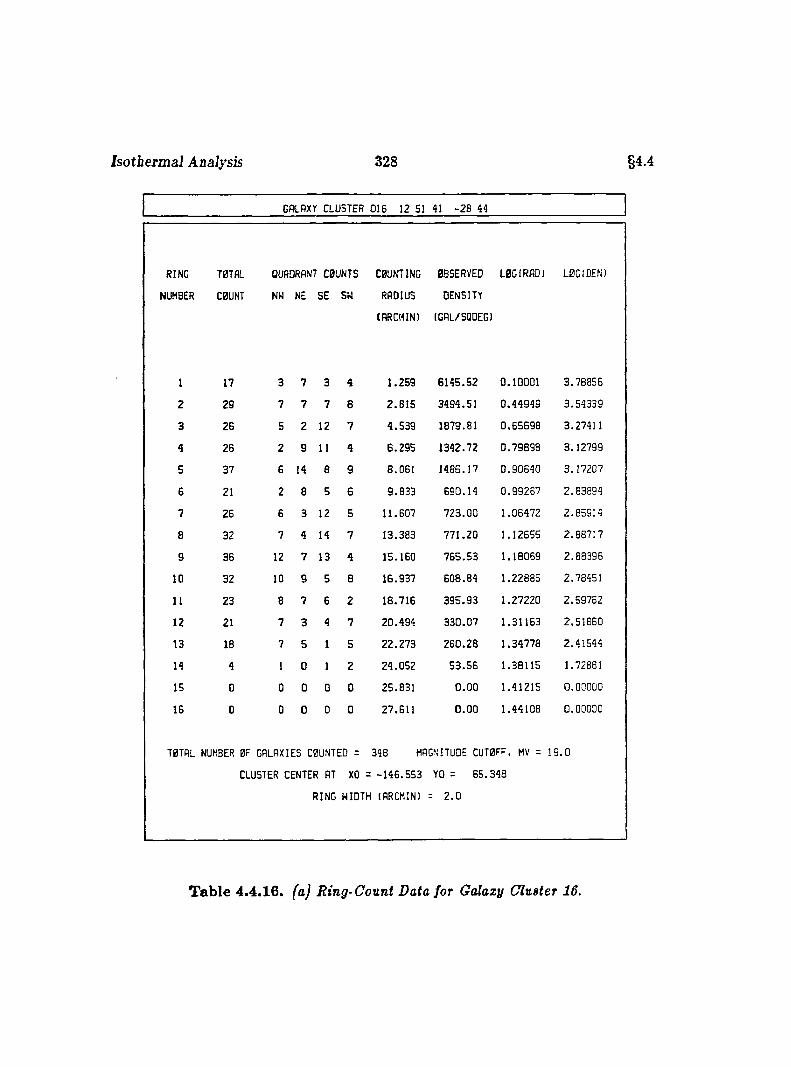
Isotbermal Analysis 328 544
GALAXY CLUSTER 016 12 51 41 -28 44
JING TOTAL QUADRANT COUNTS COUNTING OBSERVED LOG(RAD) L0GIDEN)
JHBER COUNT NW NE SE SW RADIUS DENSITY
(RRCMIN) (GAL/SQDEG)
I 17 3 7 3 4 1 .2 5 9 6 1 4 5 .5 2 0 .1 0 0 0 1 3 .7 8 8 5 6
2 29 7 7 7 8 2 .8 1 5 349 4 .5 1 0 .4 4 9 4 9 3 .5 4 3 3 9
3 26 5 2 12 7 4 .5 3 9 1879 .81 0 .6 5 6 9 8 3 .27411
4 26 2 9 11 4 6 .2 9 5 1 3 4 2 .7 2 0 .7 9 8 9 8 3 .1 2 7 9 9
5 37 6 14 e 9 8 .0 6 1 1 4 8 5 .1 7 0 .9 0 6 4 0 3 .1 7 2 0 7
6 21 2 8 5 S 9 .8 3 3 6 9 0 .1 4 0 .9 9 2 5 7 2 .8 3 8 9 4
7 26 6 3 12 5 11 .6 0 7 7 2 3 .0 0 1 .0 8 4 7 2 2 .8 5 9 1 4
8 32 7 4 14 7 1 3 .3 8 3 7 7 1 .2 0 1 .1 2 6 5 5 2 .8 8 7 1 7
g 35 12 7 13 4 15 .1 6 0 7 6 5 .5 3 1 .1 8 0 6 9 2 .8 8 3 9 5
10 32 10 9 5 8 1 6 .9 3 7 6 0 8 .8 4 1 .2 2 8 8 5 2 .78451
11 23 8 7 6 2 18 .7 1 6 3 9 5 .9 3 1 .2 7 2 2 0 2 .5 9 7 5 2
12 21 7 3 4 7 2 0 .4 9 4 3 3 0 .0 7 1 .3 1 1 6 3 2 .5 1 8 6 0
13 18 7 5 1 5 2 2 .2 7 3 2 6 0 .2 8 1 .3 4 7 7 8 2 .4 1 5 4 4
14 4 1 0 1 2 2 4 .0 5 2 5 3 .5 6 1 .3 8 1 1 5 1.72881
15 0 0 0 G 0 25 .8 3 1 0 .0 0 1 .4 1 2 1 5 0 .0 0 0 0 0
16 0 0 0 0 0 27 .6 1 1 0 .0 0 1 .4 4 1 0 8 0 .0 0 0 0 0
TBTAL NUMBER BF GALAXIES COUNTED = 348 MAGNITUDE CUTOFF. MV = 1 9 .0
CLUSTER CENTER AT XO = -1 4 6 .5 5 3 YO = 6 5 .3 4 8
RING WIDTH (ARCMIN) = 2 .0
Table 4.4.16. (a) Ring-Count Data for Galaxy Cluster 16.
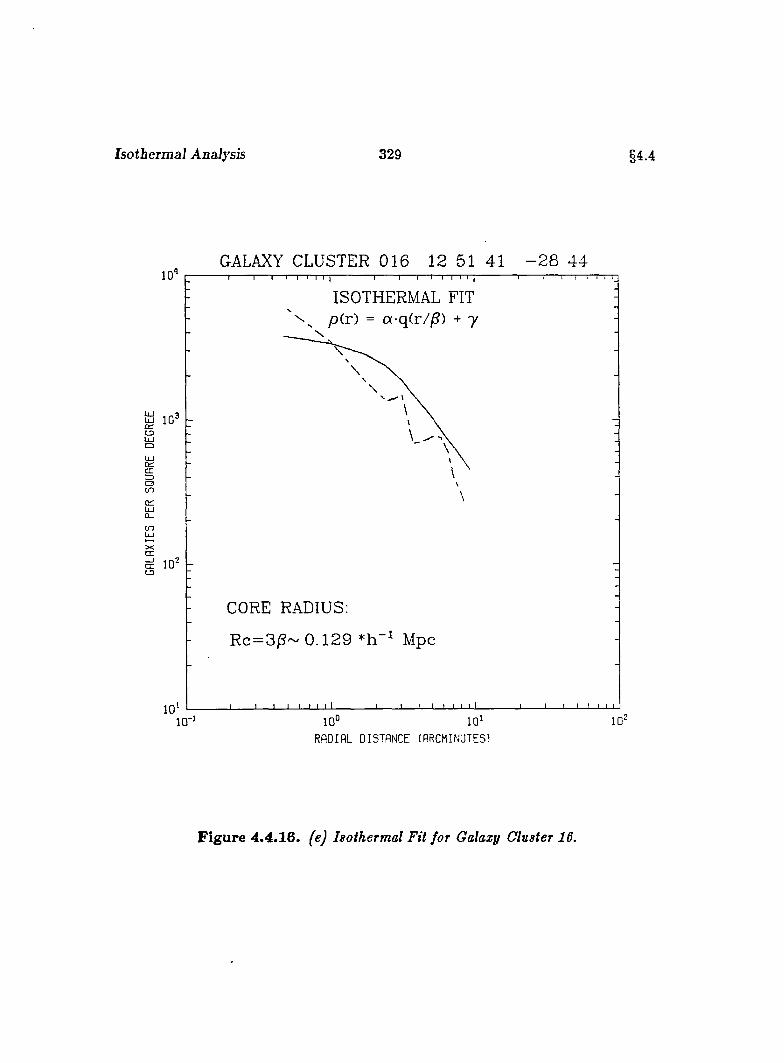
Isotbermal Analysis 329 §4 4
GALAXY CLUSTER 016 12 51 41 - 2 8 4410 '
ISOTHERMAL FIT pir) = aq(r//S) + 7
ŒC3cn
tn
CORE RADIUS:
Rc = 3jS~ 0 .1 2 9 t h - i Mpc
1 0 '10°
RADIAL DISTANCE (ARCMINUTES)
Figure 4.4.16. (e) Isothermal Fit for Galaxy Cluster 16.
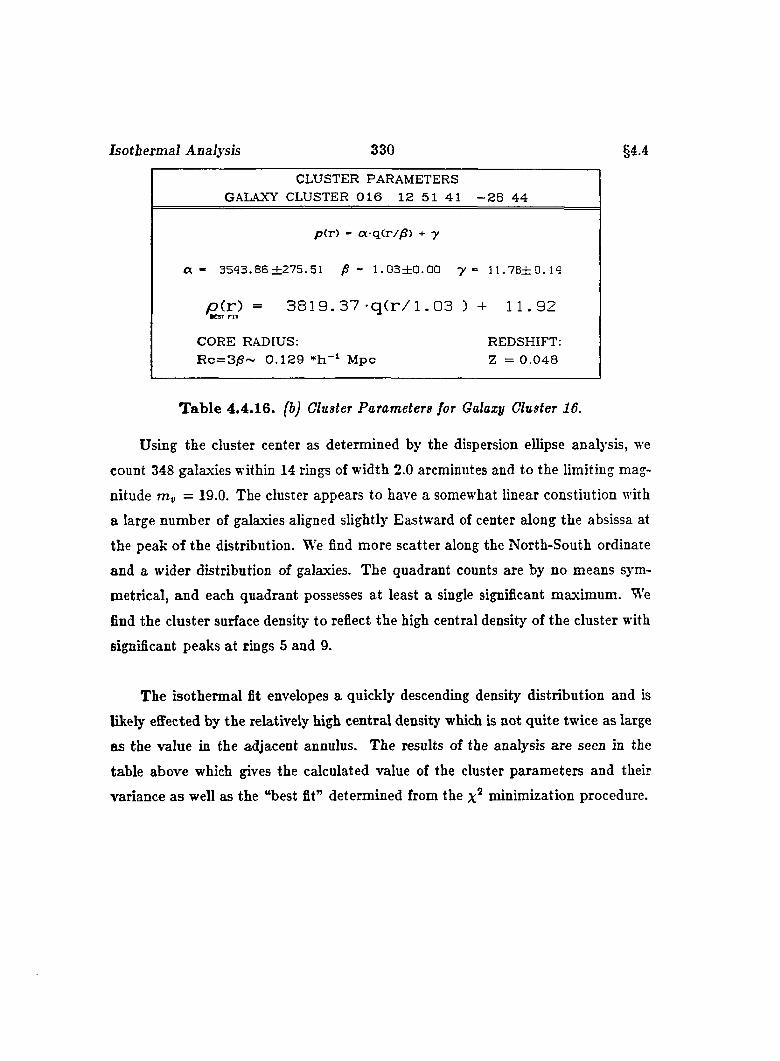
Isotbermal Analysis 330 §4.4
CLUSTER PARAMETERSGALAXY CLUSTER 0 1 6 12 51 41 - 2 8 4 4
pCr) - a-q(r//S) + y
a - 3543 .8 6 ±275 .51 /S = 1 .0 3 ± 0 .0 0 7 11. 78± 0.14
iO (r ) = 3819.37 * q ( r / l . 03 )■E JT F IT
+ 11.92
CORE RADIUS; REDSHIFT:R c = 3 /S ~ 0 .1 2 9 * h - i M pc Z = 0 .0 4 8
T ab le 4.4.16. (b) Cluster Parameters for Galaxy Cluster 16.
Using the cluster center as determined by the dispersion ellipse analysis, we
count 348 galaxies within 14 rings of width 2.0 arcminutes and to the limiting mag
nitude m-u = 19.0. The cluster appears to have a somewhat linear constiution with
a large number of galaxies aligned slightly Eastward of center along the absissa at
the peak of the distribution. We find more scatter along the North-South ordinate
and a wider distribution of galaxies. The quadrant counts are by no means sym
metrical, and each quadrant possesses at least a single significant maximum. We
find the cluster surface density to reflect the high central density of the cluster with
significant peaks a t rings 5 and 9.
The isothermal fit envelopes a quickly descending density distribution and is
likely effected by the relatively high central density which is not quite twice as large
as the value in the adjacent annulus. The results of the analysis are seen in the
table above which gives the calculated value of the cluster parameters and their
variance as well as the “best fit” determined from the minimization procedure.
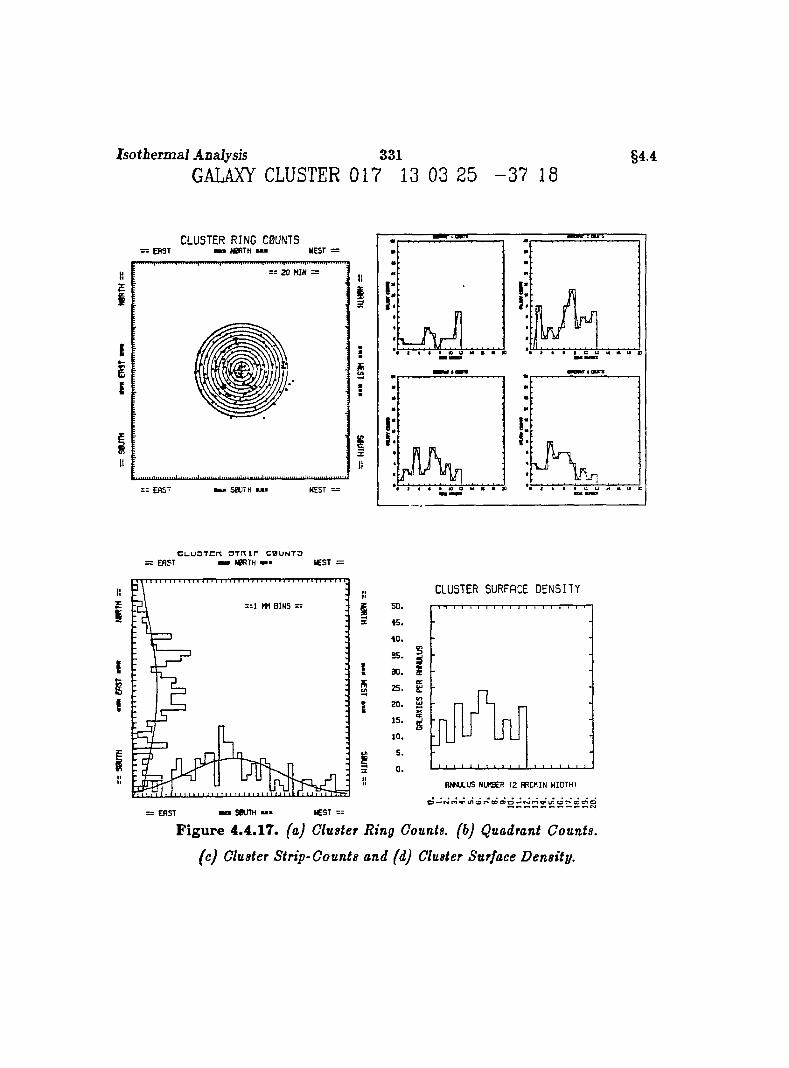
Isotbermal Analysis 331GALAXY CLUSTER 017 13 03 25 - 3 7 18
§4.4
CLUSTER RING COUNTS== EPST m u N0RTH *#« WEST =
20 MIN =
== EftST i S0UTH I WEST —
III
C U U O T C n 3 T m r C B U N T O : E A S T — W R T H — I C S T =
EI
Uhi
Ea
CLUSTER SURFACE DENSITY
S
2 S .
i
B IW X U S NUMBER 12 URCHIN WIDTH]
: EAST wmt SRJTH — l£S T ==
Figure 4.4.17. (a) Cluster Ring Counts, (b) Quadrant Counts,
(c) Cluster Strip-Counts and (d) Cluster Surface Density.
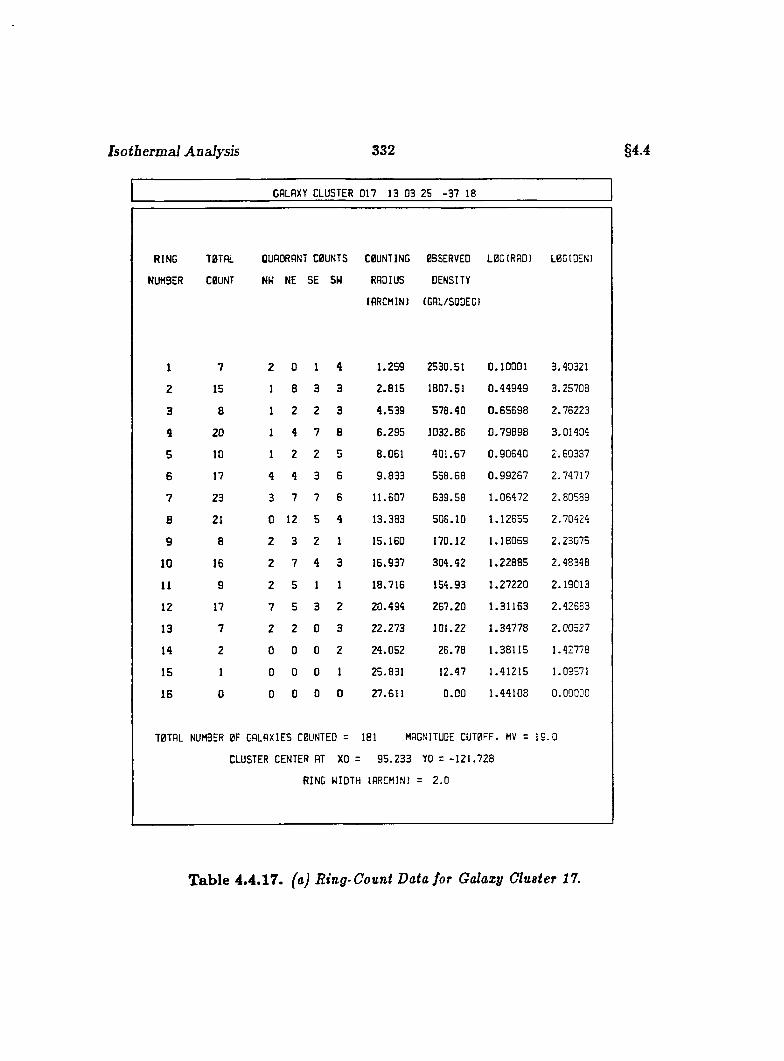
Isothermal Analysis 332 §4.4
GALAXY CLUSTER 017 13 03 25 -37 18
UNO T0TAL QUADRANT COUNTS COUNTING OBSERVED LOG (RAD) LOG(DEN)
IMBER COUNT NW NE SE SW RADIUS DENSITY
(RRCMIN) (GAL/SQDEG)
1 7 2 0 1 4 1 .2 5 9 253D.51 O.lDOOl 3.40321
2 15 1 8 3 3 2 .8 1 5 1807.51 0 .4 4 9 4 9 3 .25708
3 8 1 2 2 3 4 .5 3 9 5 7 8 .4 0 0 .6 5 6 9 8 2 .76223
4 20 1 4 7 8 6 .2 9 5 1032 .86 0 .7 9 8 9 8 3 .01404
5 10 1 2 2 5 8 .0 6 1 4 0 1 .6 7 0 .9 0 6 4 0 2 .60387
6 17 4 4 3 6 9 .8 3 3 5 5 8 .6 8 0 .9 9 2 6 7 2 .74 7 1 7
7 23 3 7 7 6 11 .607 6 3 3 .5 8 1 .0 6 4 7 2 2 .80 5 8 9
8 21 0 12 5 4 13 .383 5 0 8 .1 0 1 .1 2 6 5 5 2 .70424
9 8 2 3 2 1 15 .160 170 .12 1 .1 8 0 6 9 2 .23075
10 16 2 7 4 3 16 .937 3 0 4 .4 2 1 .2 2 8 8 5 2 .48 3 4 8
11 9 2 5 1 1 18 .716 154 .93 1 .2 7 2 2 0 2 .19013
12 17 7 5 3 2 2 0 .4 9 4 2 6 7 .2 0 1 .3 1 1 6 3 2 .42 6 8 3
13 7 2 2 0 3 2 2 .2 7 3 10 1 .2 2 1 .3 4 7 7 8 2 .00 5 2 7
14 2 0 0 0 2 2 4 .0 5 2 2 8 .7 8 1 .3 8 1 1 5 1.42778
15 1 0 0 0 1 25.831 12 .47 1 .4 1 2 1 5 1.09571
16 0 0 0 0 0 27 .611 0 .0 0 1 .4 4 1 0 8 0 .00000
TBTAL NUMBER 0F GALAXIES COUNTED = 181 MAGNITUDE CUT0FF, MV = 1 9 .0
CLUSTER CENTER AT XO = 9 5 .2 3 3 YO = -1 2 1 .7 2 8
RING WIDTH (ARCMIN) = 2 .0
Table 4.4.17. (a) Ring-Count Data for Galaxy Cluster 17.
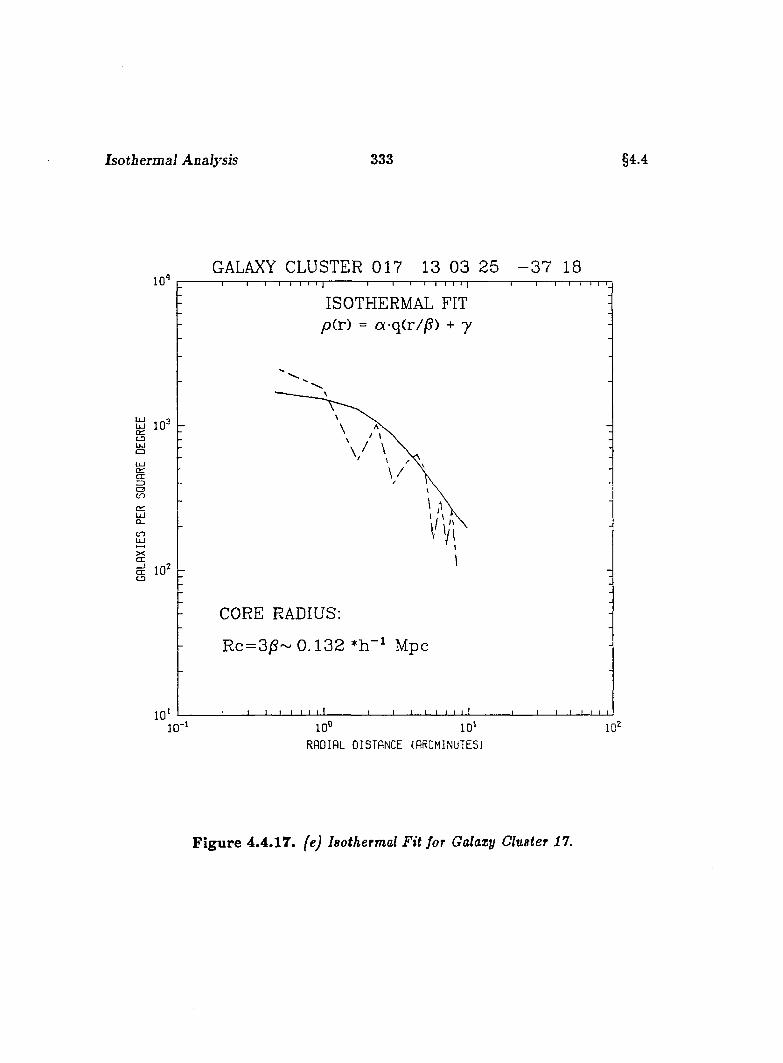
Isothermal Analysis 333 §4 4
GALAXY CLUSTER 017 13 03 25 - 3 7 1810 '
ISOTHERMAL FIT pCr) = aq(r//S) + y
a ioo
CL.
cnU J
l . 0 >CD
CORE RADIUS:
Rc = 3 ^ ~ 0 .1 3 2 *h Mpc
io‘10° 10 '
RADIAL DISTANCE (ARCMINUTES)
Figure 4.4.17. (e) Isothermal Fit for Galaxy Cluster 17.
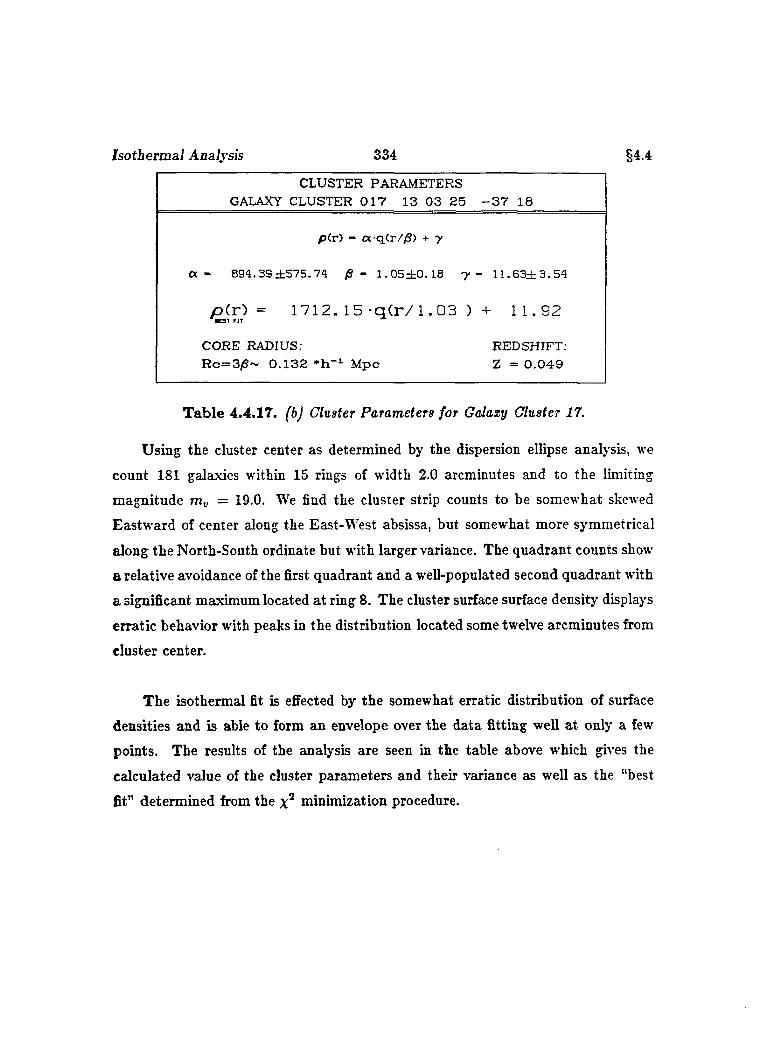
Isotbermal Analysis 334 §4.4
CLUSTER PARAMETERS GALAXY CLUSTER 0 1 7 13 0 3 25 - 3 7 18
p(r) - a q(r//S) + y
a - 894.39 ± 5 7 5 .7 4 /S - 1 .0 5 ± 0 .1 8 y - 1 1 .6 3 ± 3 .5 4
p ( r ) = 1712.15 - q ( r / 1 . 0 3 )K 3 T FIT
+ 1 1 . 9 2
CORE RADIUS: REDSHIFT:R c= 3 /8 ~ 0 .1 3 2 M pc Z = 0 .0 4 9
T ab le 4.4.17. (bj Cluster Parameters for Galaxy Cluster 17.
Using the cluster center as determined by the dispersion ellipse analysis, we
count 181 galaxies within 15 rings of width 2.0 arcminutes and to the limiting
magnitude = 19.0. We find the cluster strip counts to be somewhat skewed
Eastward of center along the East-West absissa, but somewhat more symmetrical
along the North-South ordinate but wüh larger variance. The quadrant counts show
a relative avoidance of the first quadrant and a well-populated second quadrant with
a significant maximum located a t ring 8. The cluster surface surface density displays
erratic behavior with peaks in the distribution located some twelve arcminutes from
cluster center.
The isothermal fit is effected by the somewhat erratic distribution of surface
densities and is able to form an envelope over the data fitting well at only a few
points. The results of the analysis are seen in the table above which gives the
calculated value of the cluster parameters and their variance as well as the “best
fit” determined from the minimization procedure.
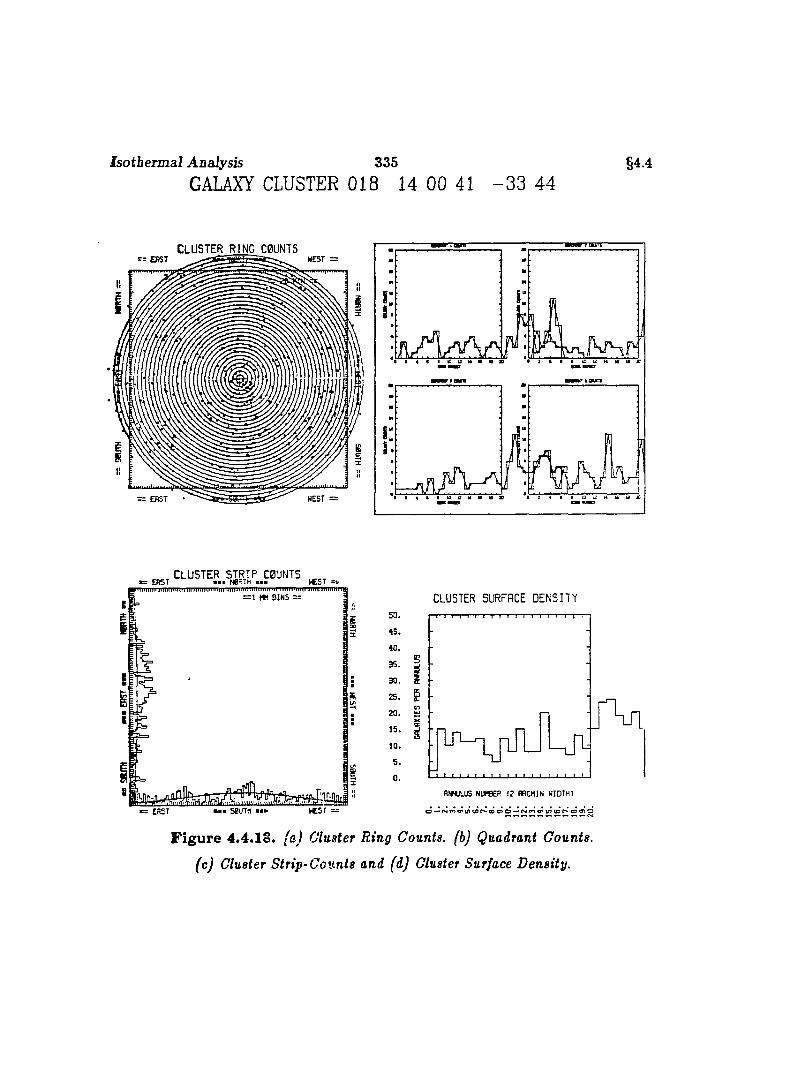
Isotbermal Analysis 335GALAXY CLUSTER 018 14 00 41 - 3 3 44
§4.4
CLUST ER RI NG COUNTS: EBST WEST =
W EST ==% ERST
EPST c l u s t e r .STRIP.COUNTS „
«= ERST
CLUSTER SURFACE DENSITY
s
ANNULUS NUtBER 12 URCHIN WIDTH)
Figure 4.4.18. faj Cluster Ring Counts, (b) Quadrant Counts,
(c) Cluster Strip-Counts and (d) Cluster Surface Density.
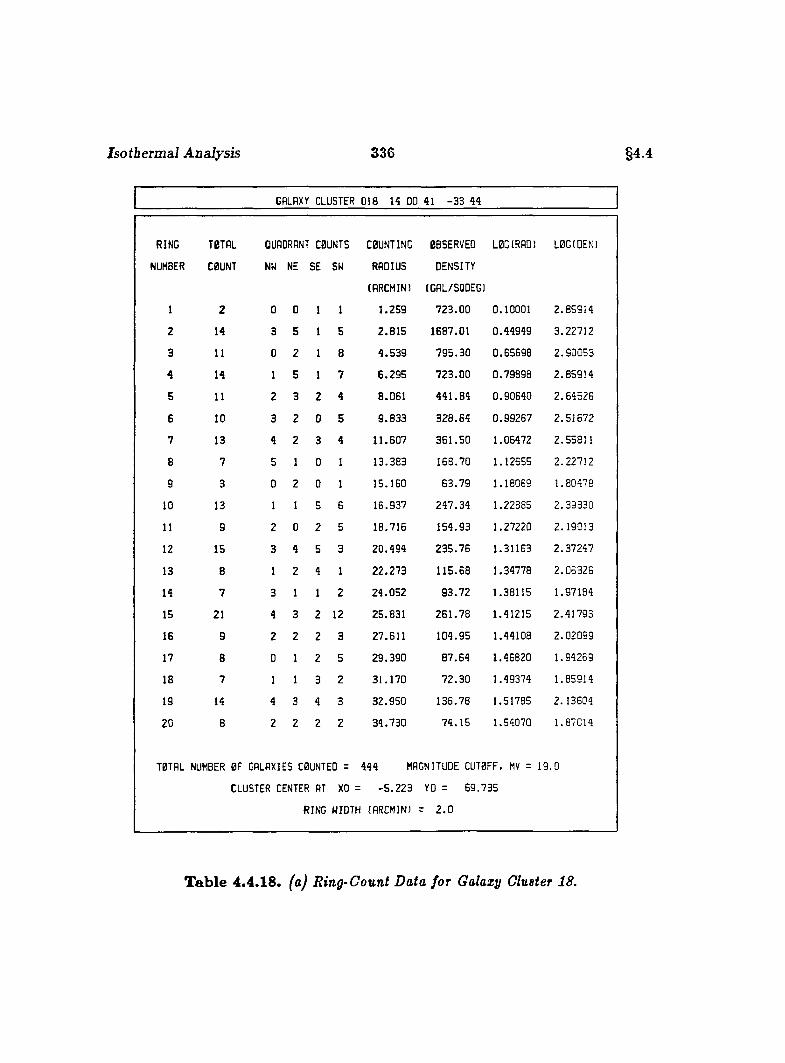
Isothermal Analysis 336 §4.4
GALAXY CLUSTER 018 H 00 41 -33 44
RING TOTAL QUADRANT COUNTS COUNTING OBSERVED LOGIRAD) LBGIDENl
NUMBER COUNT NW NE SE SW RADIUS DENSITY
(ARCMIN) IGAL/SQDEG)
1 2 0 0 1 1 1 .2 5 9 7 2 3 .0 0 0 .10001 2 .8 5 9 1 4
2 14 3 5 1 5 2 .8 1 5 168 7 .0 1 0 .4 4 9 4 9 3 .2 2 7 1 2
3 11 0 2 1 8 4 .5 3 9 7 9 5 .3 0 0 .6 5 6 9 8 2 .9 0 0 5 3
4 14 1 5 1 7 6 .2 9 5 7 2 3 .0 0 0 .7 9 8 9 8 2 .8 5 9 1 4
5 11 2 3 2 4 8 .0 6 1 4 4 1 .8 4 0 .9 0 6 4 0 2 .6 4 5 2 6
6 10 3 2 0 5 9 .8 3 3 3 2 8 .6 4 0 .9 9 2 6 7 2 .5 1 6 7 2
7 13 4 2 3 4 1 1 .6 0 7 3 6 1 .5 0 1 .06472 2 .55 8 1 1
8 7 5 1 0 1 1 3 .3 8 3 1 6 8 .7 0 1 .12855 2 .2 2 7 1 2
9 3 0 2 0 1 1 5 .1 6 0 6 3 .7 9 1 .18069 1 .80478
10 13 1 1 5 6 16 .9 3 7 2 4 7 .3 4 1 .22885 2 .3 9 3 3 0
11 9 2 0 2 5 1 8 .7 1 6 1 5 4 .9 3 1 .27220 2 .1 9 0 1 3
12 15 3 4 5 3 2 0 .4 9 4 2 3 5 .7 6 1 .31163 2 .3 7 2 4 7
13 8 1 2 4 1 2 2 .2 7 3 1 1 5 .6 8 1.34778 2 .0 5 3 2 6
14 7 3 1 1 2 2 4 .0 5 2 9 3 .7 2 1 .38115 1 .97 1 8 4
15 21 4 3 2 12 2 5 .8 3 1 2 6 1 .7 8 1 .41215 2 .4 1 7 9 3
16 9 2 2 2 3 2 7 .6 1 1 1 0 4 .9 5 1 .44108 2 .0 2 0 9 9
17 8 0 1 2 5 2 9 .3 9 0 8 7 .6 4 1 .46820 1 .9 4 2 6 9
18 7 1 1 3 2 3 1 .1 7 0 7 2 .3 0 1 .49374 1 .85914
19 14 4 3 4 3 3 2 .9 5 0 1 3 6 .7 6 1 .51785 2 .1 3 6 0 4
20 8 2 2 2 2 3 4 .7 3 0 7 4 .1 5 1 .54070 1.87C 14
TOTAL NUMBER OF GALAXIES COUNTED = 444 MAGNITUDE CUTOFF. MV = 19 0
CLUSTER CENTER AT XO = - 5 .2 2 3 YO = 6 9 .7 3 5
RING WIDTH (RRCMIN) = 2 .0
Table 4.4.18. (a) Ring-Count Data for Galaxy Cluster 18.
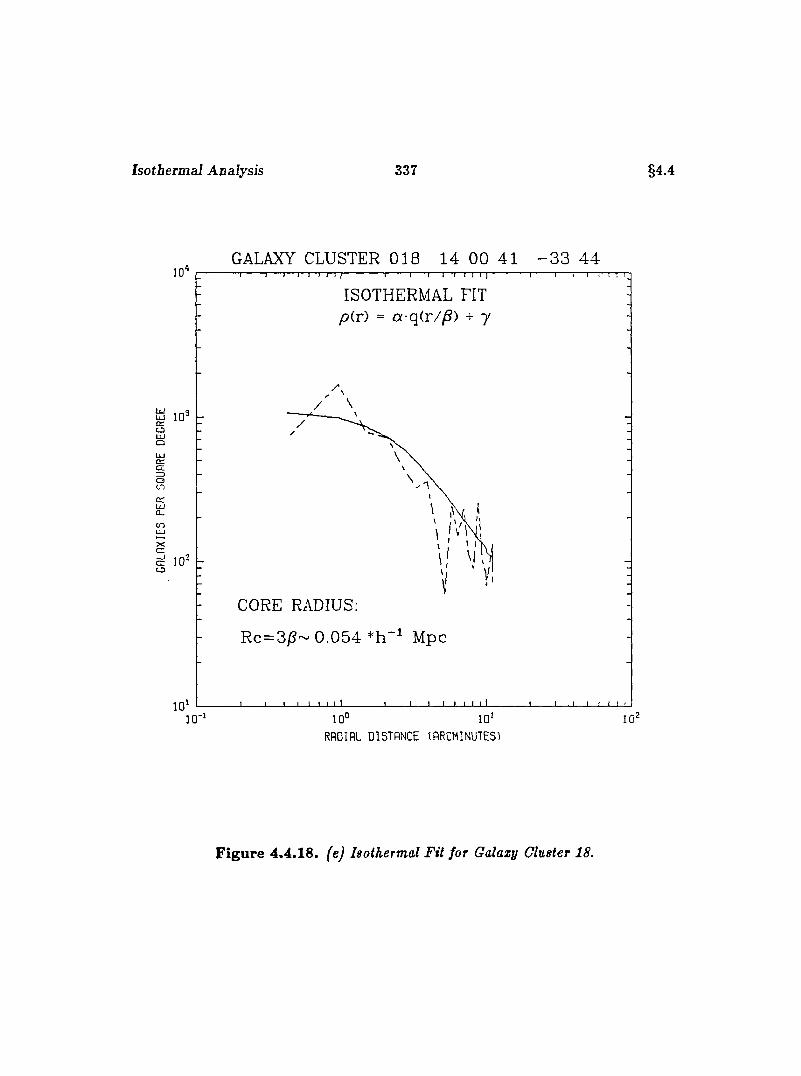
Isothermal Analysis 337 §4.4
GALAXY CLUSTER 018 14 00 41 - 3 3 4 410 '
ISOTHERMAL FIT p(r) = a-q(r/^) + 7
OU JoLU
goCOCdLUCL
CO
CORE RADIUS;
Rc=3jS~ 0 .0 5 4 *h Mpc
10‘
RADIAL DISTANCE (RRCM1NUTE51
Figure 4.4.18. (e) Isothermal Fit Jot Galaxy Cluster 18.
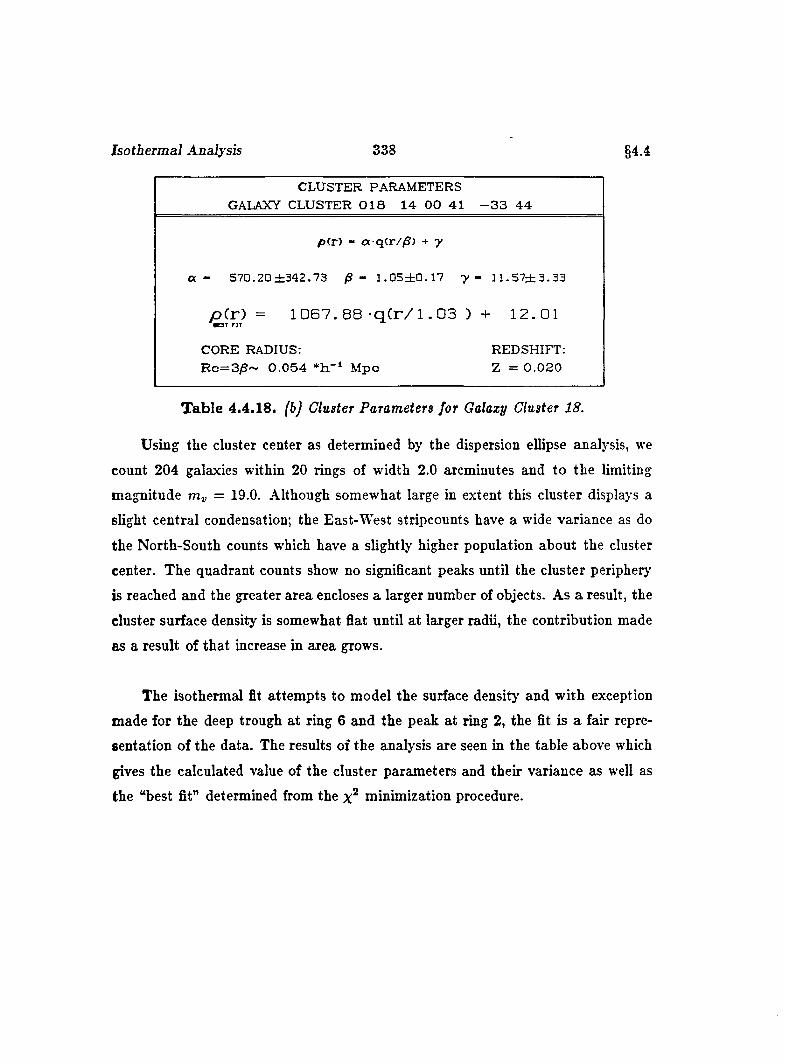
Isothermal Analysis 338 §4.4
CLUSTER PARAMETERS _______GALAXY CLUSTER 0 1 8 14 0 0 41 - 3 3 4 4
p(r) - oc q(r//S) + y
a - 570.20 ± 3 4 2 .7 3 /S - 1 .0 5 ± 0 .1 7 y - 1 1 .5 7 ± 3 .3 3
p(r) = 1 0 6 7 . 8 8 - q ( r / 1.03 ) + 12.01
CORE RADIUS;R c= 3 /S ~ 0 .0 5 4 * h ”‘ M pc
REDSHIFT: Z = 0 .0 2 0
T ab le 4.4.18. (b) Cluster Parameters for Galaxy Cluster 18.
Using the cluster center as determined by the dispersion ellipse analysis, we
count 204 galaxies within 20 rings of width 2.0 arcminutes and to the limiting
magnitude = 19.0. Although somewhat large in extent this cluster displays a
slight central condensation; the East-West stripcounts have a wide variance as do
the North-South counts which have a slightly higher population about the cluster
center. The quadrant counts show no significant peaks until the cluster periphery
is reached and the greater area encloses a larger number of objects. As a result, the
cluster surface density is somewhat flat until at larger radii, the contribution made
as a result of that increase in area grows.
The isothermal fit attem pts to model the surface density and with exception
made for the deep trough at ring 6 and the peak at ring 2, the fit is a fair repre
sentation of the data. The results of the analysis are seen in the table above which
gives the calculated value of the cluster parameters and their variance as well as
the “best fit” determined from the minimization procedure.
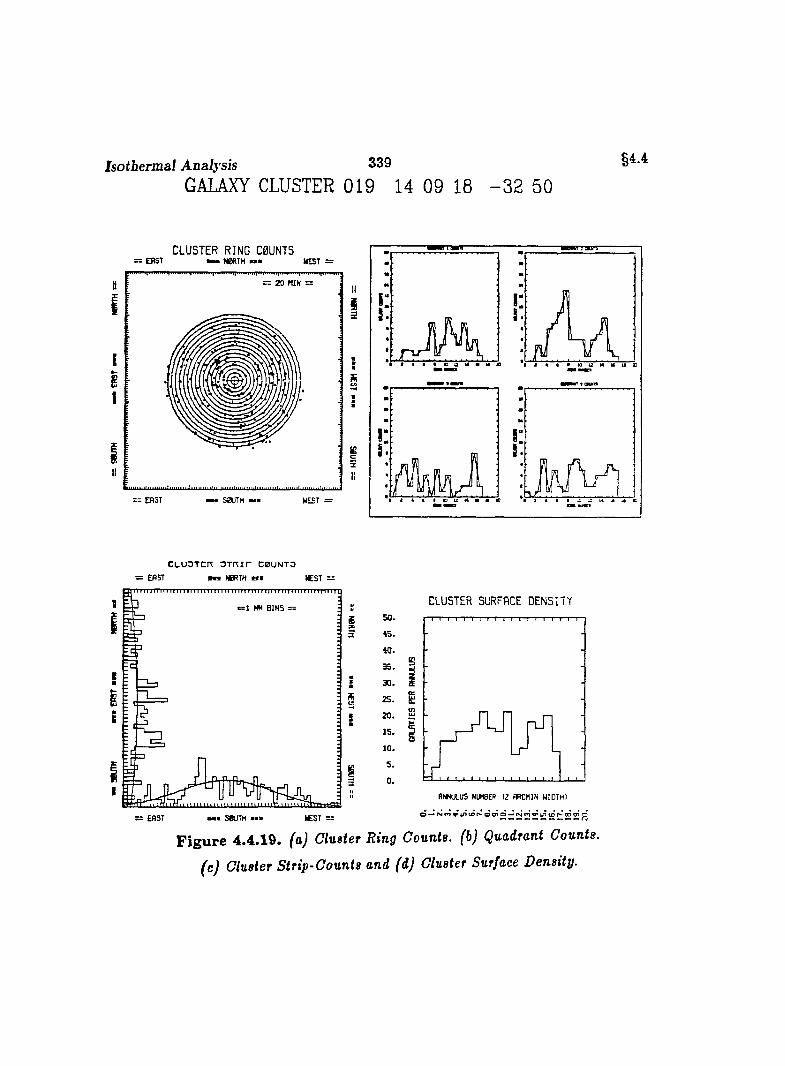
Isothermal Analysis 339GALAXY CLUSTER 019 14 09 18 - 3 2 50
§4 4
CLUSTER RI NG C0UNT5: ERST mmm N0RTH m»m WEST =
raw
“ 2 0 M IN =
S0UTH M B N E S T == - ERST
C L U 3 T C T T O T m r C 0 U N T O
EAST m N0RTH M t IC S T —
B B IN S =
!Ii
I
= EAST m m # S0UTH ■■■
5 0 .
45.4 0 .
3 5 ,
3 0 .
2 5 .
20.1 5 .
10.5 .
0 .
CLUSTER SURFACE DENSITY
S
n T l
Figure 4.4.19. (a) Cluster Ring Counts, (b) Quadrant Counts,
(c) Cluster Strip-Counts and (d) Cluster Surface Density.
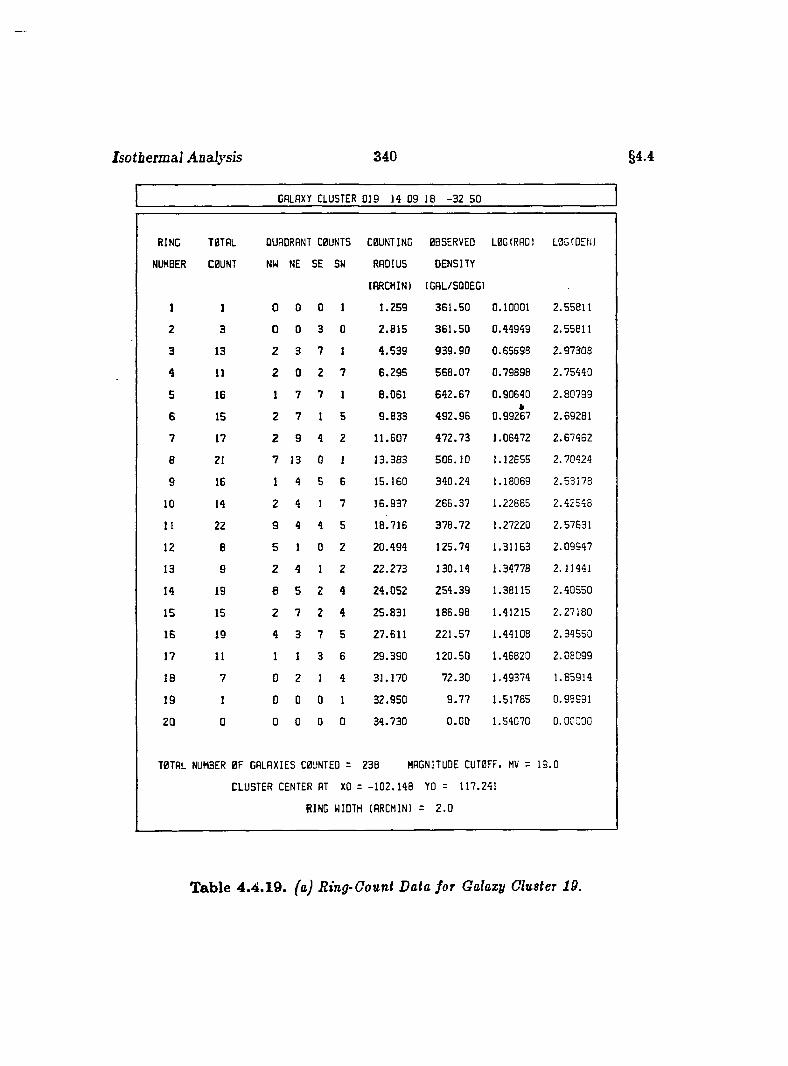
Isotheimàl Analysis 340 §4 4
GALAXY CLUSTER 019 14 09 18 -32 50
RING T0TAL QUAORANT COUNTS COUNTING OBSERVED L0G(RAD) L06CDEN)
NUMBER C0UNT NW NE SE SW RADIUS DENSITY
(ARCHIN) (GAL/SQDEG)
1 1 0 0 0 1 1 .2 5 9 3 6 1 .5 0 0.10001 2 .55811
2 3 0 0 3 0 2 .8 1 5 3 6 1 .5 0 0 .44 9 4 9 2 .55811
3 13 2 3 7 1 4 .5 3 9 9 3 9 .9 0 0 .65 5 9 8 2 .9 7 3 0 8
4 11 2 0 2 7 6 .2 9 5 5 6 8 .0 7 0 .79898 2 .7 5 4 4 0
5 16 1 7 7 1 8 .0 6 1 6 4 2 .6 7 0 .90640 2 .8 0 7 9 9
6 15 2 7 1 5 9 .8 3 3 4 9 2 .9 6 0 .99 2 6 7 2 .69281
7 17 2 9 4 2 11 .6 0 7 4 7 2 .7 3 1.06472 2 .6 7 4 6 2
8 21 7 13 0 1 1 3 .3 8 3 5 0 6 .1 0 1.12655 2 .7 0 4 2 4
9 16 1 4 5 6 15 .1 6 0 3 4 0 .2 4 1.18069 2 .53 1 7 8
10 14 2 4 1 7 1 6 .9 3 7 2 6 5 .3 7 1.22885 2 .4 2 5 4 8
11 22 9 4 4 5 18 .7 1 6 3 7 8 .7 2 1.27220 2 .57831
12 8 5 1 0 2 2 0 .4 9 4 1 2 5 .7 4 1.31163 2 .0 9 9 4 7
13 9 2 4 1 2 2 2 .2 7 3 1 3 0 .1 4 1 .34778 2 .11441
14 19 6 5 2 4 2 4 .0 5 2 2 5 4 .3 9 1.38115 2 .4 0 5 5 0
15 15 2 7 2 4 2 5 .8 3 1 1 8 6 .9 8 1.41215 2 .2 7 1 8 0
16 19 4 3 7 5 2 7 .6 1 1 2 2 1 .5 7 1.44108 2 .3 4 5 5 0
17 11 1 1 3 6 2 9 .3 9 0 1 2 0 .5 0 1.46820 2 .0 8 0 9 9
18 7 0 2 1 4 3 1 .1 7 0 7 2 .3 0 1.49374 1 .85914
19 1 0 0 0 1 3 2 .9 5 0 9 .7 7 1.51785 0 .93991
20 0 0 0 0 0 3 4 .7 3 0 0 .0 0 1.54070 o .o c c o o
T0TAL NUMBER 0F GALAXIES C0UNTEO = 238 MAGNITUDE CUT0FF. MV = 1 9 .0
CLUSTER CENTER AT XO = -1 0 2 .1 4 8 YO = 117.241
RING WIDTH (ARCMIN) = 2 .0
Table 4.4.19. faj Ring-Gount Data for Galaxy Chster 19.
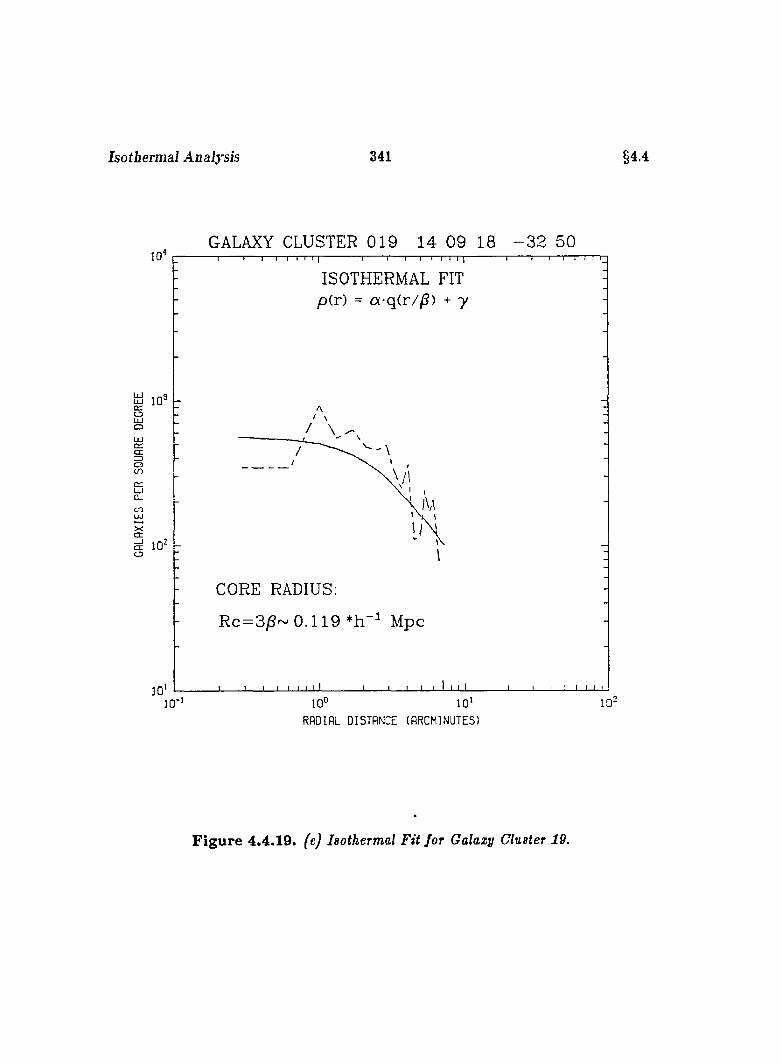
Isothermal Analysis 341 §4.4
GALAXY CLUSTER 019 14 09 18 - 3 2 50
ISOTHERMAL FIT p(r) = a-q(r//S) + y
O
C3cn
cn
XcrΠ1 0 'o
CORE RADIUS;
R c=3/S~ 0 .1 1 9 *h Mpc
10° 10 '
RADIAL DISTANCE (ARCMINUTES)
Figure 4.4.10. / ej Isothermal Fit for Galaxy Cluster 19.
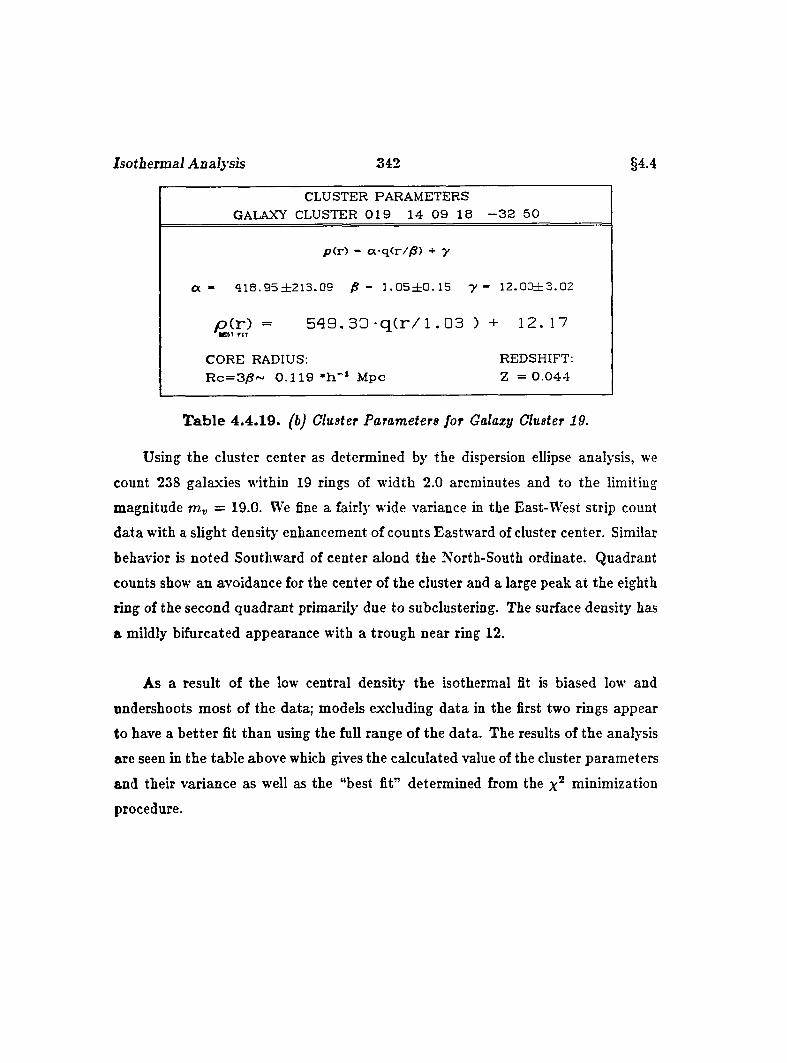
Isothermal Analysis 342 §4.4
CLUSTER PARAMETERSGALAXY CLUSTER 0 1 9 14 0 9 18 - 3 2 50
p(r) - a-q(r//S) + y
a - 418 .95 ± 213 .09 /? - 1 .0 5 ± 0 .1 5 y - 12.0D ±3.02
p ( r ) = 5 4 9 . 3 0 * q ( r / l ,03 ) + 12.17#C 5T F IT
CORE RADIUS; REDSHIFT:R c = 3 /S ~ 0 .1 1 9 M pc Z = 0 .0 4 4
T ab le 4 .4 .19 . (b) Cluster Parameters Jar Galaxy Cluster 19.
Using the cluster center as determined by the dispersion ellipse analysis, we
count 238 galaxies within 19 rings of width 2.0 arcminutes and to the limiting
magnitude m-v = 19.0. We fine a fairly wide variance in the East-West strip count
data with a slight density enhancement of counts Eastward of cluster center. Similar
behavior is noted Southward of center alond the North-South ordinate. Quadrant
counts show an avoidance for the center of the cluster and a large peak at the eighth
ring of the second quadrant primarily due to subclustering. The surface density has
a mildly bifurcated appearance with a trough near ring 12.
As a result of the low central density the isothermal fit is biased low and
undershoots most of the data; models excluding data in the first two rings appear
to have a better fit than using the full range of the data. The results of the analysis
are seen in the table above which gives the calculated value of the cluster parameters
and their variance as well as the “best fit” determined from the minimization
procedure.
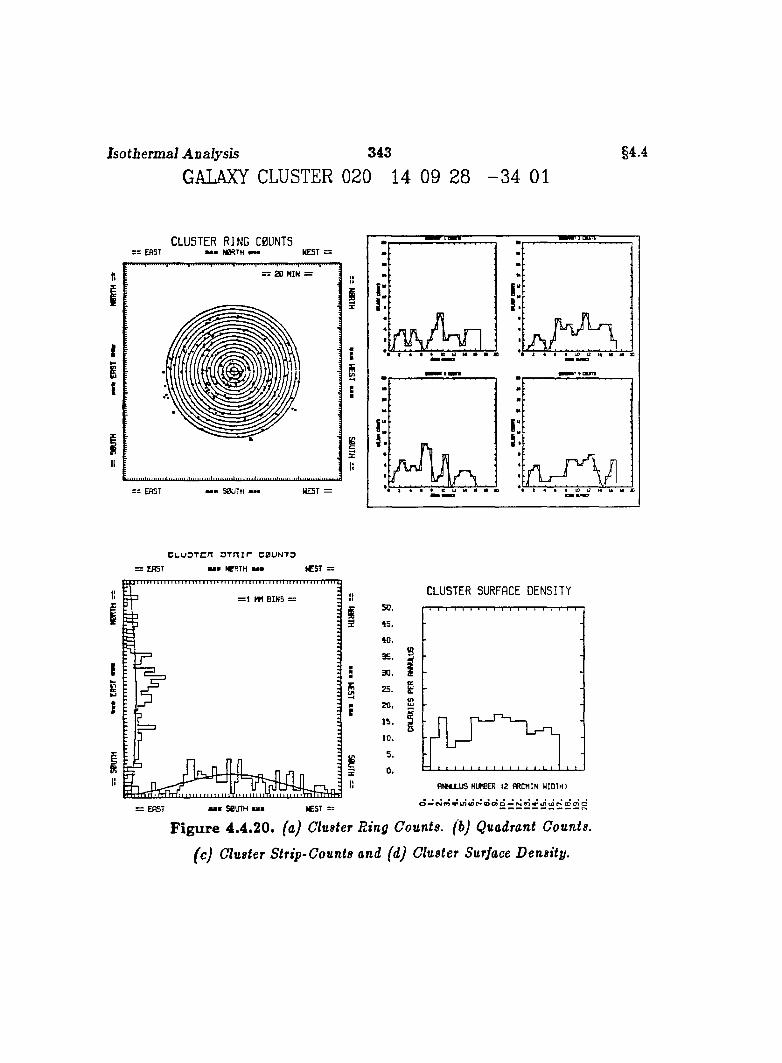
Isotbermal Analysis 343GALAXY CLUSTER 020 14 09 28 - 3 4 01
§4.4
CLUSTER RING COUNTS“ EAST M B N 0A T H * — W EST = .
— 20 MIN =
= = E R S T
:»E
iX
I:
C L U D T c n O T m r c b u n t o
: ERST mmm WRTH mm. WEST =
II = 1 MM BINS =
Ii
= E A ST
CLUSTER SURFACE DENSITY
50.
45.
40.
as.
30.25.
20 .
15.10.
5.
0 .
S
AmULUS NIMER (2 ARCMIN WIDTH)
O**r<ifnvin(0r>a>O)O'*C4(n.*i/)(fir'm cn o
Figure 4.4.20. (a) Cluster Ring Counts, (b) Quadrant Counts,
(c) Cluster Strip-Counts and (d) Cluster Surface Density.
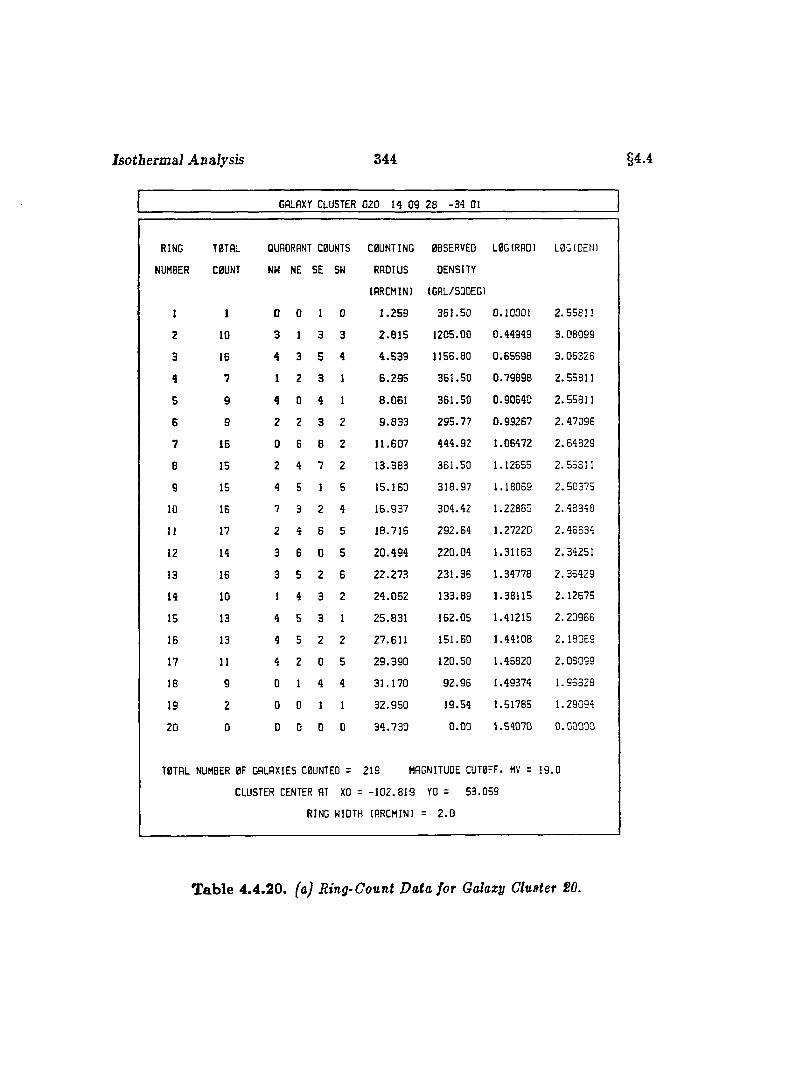
Isotbermal Analysis 344 §4 4
GALAXY CLUSTER 020 14 09 28 -34 01
RING
NUMBER
T0TAL
C0UNT
QUADRANT C0UNTS
NW NE SE SW
COUNTING
RADIUS
(RRCMIN)
OBSERVED
DENSITY
(GAL/SQDEG)
LOG(RAO) L0G1DEH)
I 1 0 0 1 0 1 .2 5 9 3 6 1 .5 0 0 .10001 2 .5 5 8 1 1
2 10 3 1 3 3 2 .8 1 5 1205 .00 0 .4 4 9 4 9 3 .0 8 0 9 9
3 16 4 3 5 4 4 .5 3 9 1156 .80 0 .6 5 6 9 8 3 .0 6 3 2 6
4 7 1 2 3 1 6 .2 9 5 3 6 1 .5 0 0 .7 9 8 9 8 2 .55 8 1 1
5 9 4 0 4 1 8 .0 6 1 3 6 1 .5 0 0 .9 0 6 4 0 2 .5 5 8 1 1
6 9 2 2 3 2 9 .8 3 3 2 9 5 .7 7 0 .9 9 2 6 7 2 .4 7 0 9 6
7 16 0 6 B 2 1 1 .6 0 7 4 4 4 .9 2 1 .06472 2 .6 4 8 2 9
e 15 2 4 7 2 1 3 .3 8 3 3 6 1 .5 0 1 .12655 2 .5 5 8 1 1
g 15 4 5 1 5 1 5 .1 6 0 3 1 8 .9 7 1 .18069 2 .5 0 3 7 5
10 16 7 3 2 4 16 .9 3 7 3 0 4 .4 2 1 .22885 2 .4 8 3 4 8
11 17 2 4 6 5 1 8 .7 1 6 2 9 2 .6 4 1 .27220 2 .4 6 6 3 4
12 14 3 6 0 5 2 0 .4 9 4 2 2 0 .0 4 1 .31163 2 .34 2 5 1
13 16 3 5 2 6 2 2 .2 7 3 2 3 1 .3 6 1 .34778 2 .3 6 4 2 9
14 10 I 4 3 2 2 4 .0 5 2 13 3 .8 9 1 .38115 2. 12675
15 13 4 5 3 1 2 5 .8 3 1 16 2 .0 5 1 .41215 2 .2 0 9 6 6
16 13 4 5 2 2 2 7 .6 1 1 15 1 .6 0 1 .44108 2 .1 8 0 6 9
17 11 4 2 0 5 2 9 .3 9 0 1 2 0 .5 0 1 .46820 2 .0 8 0 9 9
18 9 D 1 4 4 3 1 .1 7 0 9 2 .9 6 1.49374 1 .9 6 8 2 8
19 2 0 0 1 1 3 2 .9 5 0 1 9 .54 1 .51785 1 .2 9 0 9 4
20 0 0 0 D 0 3 4 .7 3 0 0 .0 0 1 .54070 0 .0 0 0 0 0
T0THL NUMBER 0F GALAXIES C0UNTEO =
CLUSTER CENTER AT XO =
RING WIDTH
219 MAGNITUDE CUT0FF. MV =
-1 0 2 .8 1 9 YO = 5 3 .0 5 9
(ARCMIN) = 2 .0
1 9 .0
Table 4.4.20. (a) Ring-Count Data for Galaxy Cluster SO.
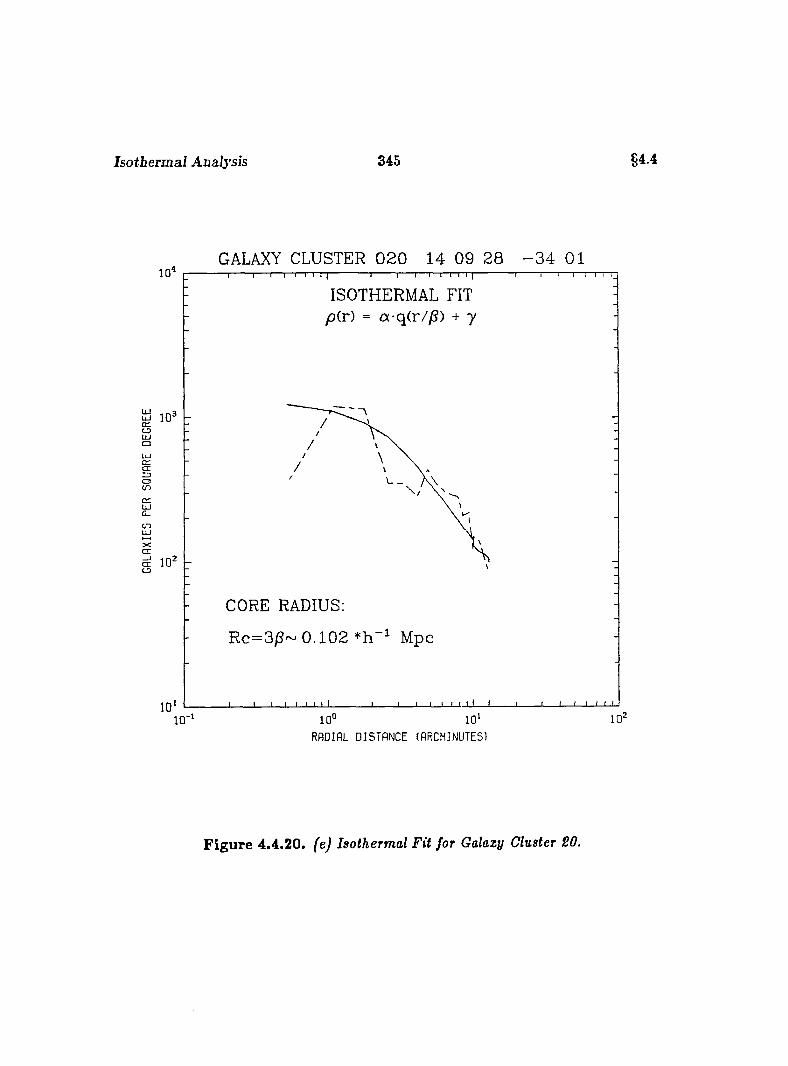
Isotbermal Analysis 345 §4.4
GALAXY CLUSTER 0 2 0 14 09 28 - 3 4 01
LÜ UJ D1 O UJoUJ Ûi Œ ID O (Cd LÜ û_
XŒŒLD
ISOTHERMAL FIT p(r) = a-q(r//3) + 7
CORE RADIUS:
Rc=3/S~ 0 .1 0 2 Mpc
1010° 10 *
RADIAL DISTANCE (ARCMINUTES)
Figure 4.4.20. fej Isothermal Fit for Galaxy Cluster SO.
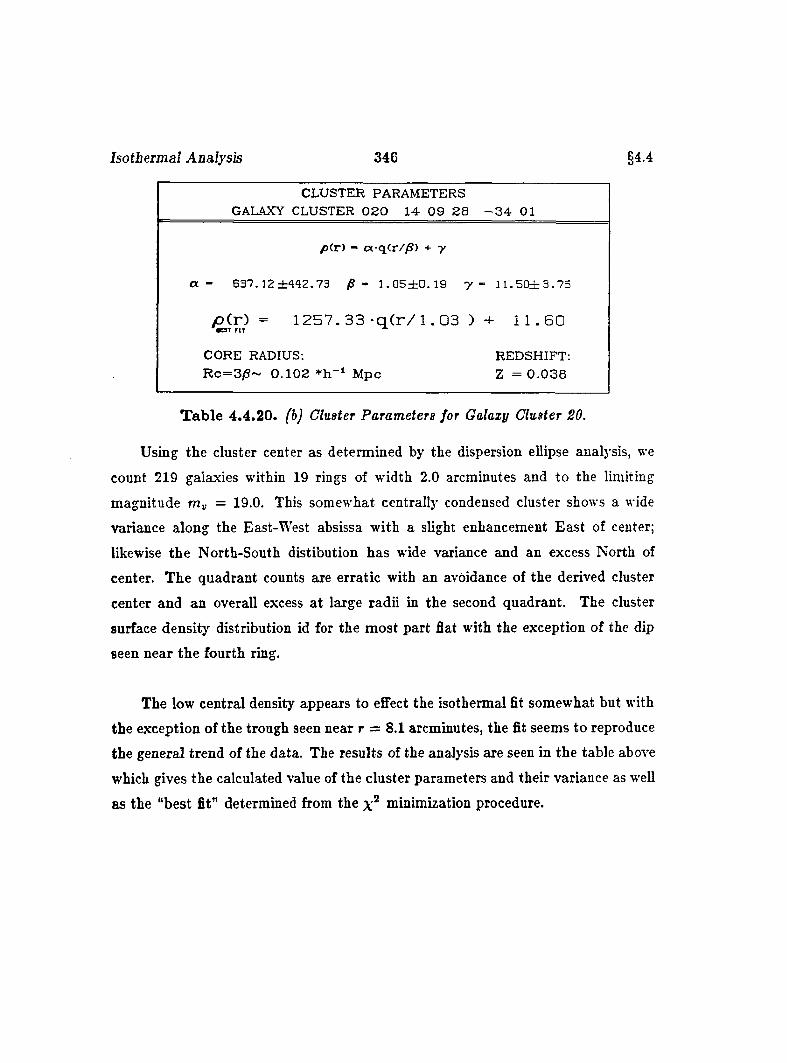
Isotbermal Analysis 346 §4.4
CLUSTER PARAMETERS _______ GAIAXY CLUSTER 0 2 0 14 0 9 2 8 - 3 4 01
/j(r) - cx q(r//S) + y
a - 6 3 7 . 1 2 ± 4 4 2 . 7 3 /S - 1 . 0 5 ± O . 1 9 y - 1 1 . 5 0 ± 3 . 7 5
p ( r ) = 1 2 5 7 . 3 3 - q ( r / 1.03 ) + 11.60
CORE RADIUS;R c = 3 /S ~ 0 .1 0 2 * h - i M pc
REDSHIFT: Z = 0 .0 3 8
T ab le 4.4.20. (b) Cluster Parameters for Galaxy Cluster 20.
Using the cluster center as determined by the dispersion ellipse analysis, we
count 219 galaxies within 19 rings of width 2.0 arcminutes and to the limiting
magnitude = 19.0. This somewhat centrally condensed cluster shows a wide
variance along the East-West absissa with a slight enhancement East of center;
likewise the North-South distibution has wide variance and an excess North of
center. The quadrant counts are erratic with an avoidance of the derived cluster
center and an overall excess a t large radii in the second quadrant. The cluster
surface density distribution id for the most part flat with the exception of the dip
seen near the fourth ring.
The low central density appears to effect the isothermal fit somewhat but with
the exception of the trough seen near r = 8.1 arcminutes, the fit seems to reproduce
the general trend of the data. The results of the analysis are seen in the table above
which gives the calculated value of the cluster parameters and their variance as well
as the “best fit” determined from the minimization procedure.
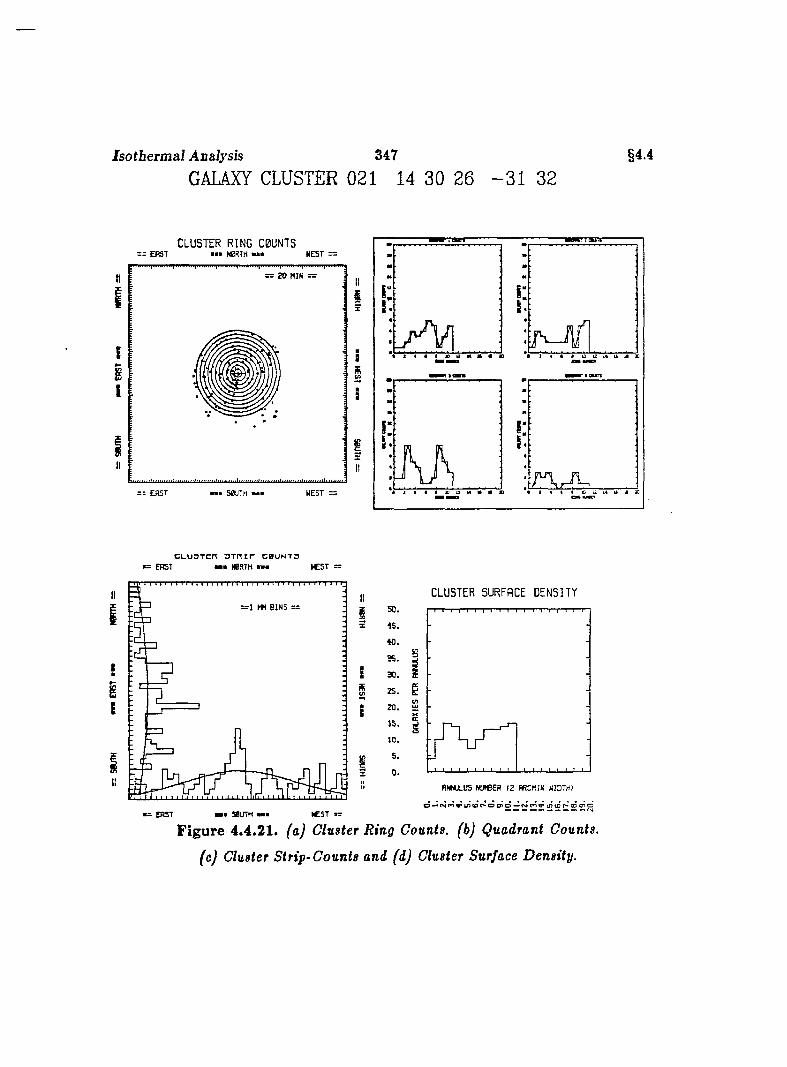
Isotbermal Analysis 347
GALAXY CLUSTER 021 14 30 26 - 3 1 32§4.4
CLUSTER RING COUNTS: E R S T wmm HBRJH mmm N E S T = =
ram
s= 20 M IN z =
y v
WEST —= = E A S T 50UTH
12 i« I t ta X
CLUUTCrX O T R i r C0UNT DE R S T mm# N0RTM > C 5 T
I)B I N S = ==1
IE
5*
CLUSTER SURFACE DENSITY
2 S . É
CCÉ
RN N U LÜ S N i m E R 1 2 A RCM IN W ID TH )
mm SBUTH m#m W EST
Figure 4.4.21. faj Cluster Ring Counts, (b) Quadrant Counts,
(c) Cluster Strip-Counts and (d) Cluster Surface Density.
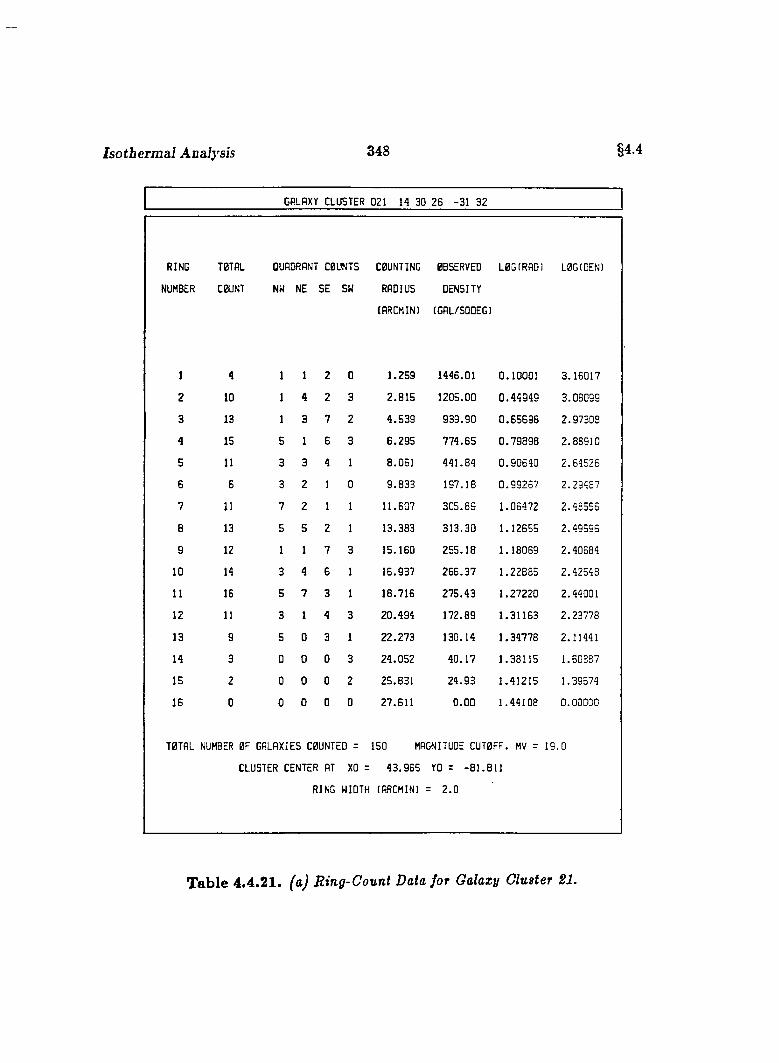
Isotbermal Analysis 348 §4.4
GALAXY CLUSTER 021 14 30 26 -31 32
RING T0TRL QUADRANT C0UNTS COUNTING OBSERVED LOGIRAD) L0GIDEN)
NUMBER C0UNT NW NE SE SW RADIUS DENSITY
(ARCMIN) (GAL/SQDEG)
1 4 1 1 2 0 1 .2 5 9 1446.01 0 .1 0 0 0 1 3 .16 0 1 7
2 10 1 4 2 3 2 .8 1 5 1205 .00 0 .4 4 9 4 9 3 .08099
3 13 1 3 7 2 4 .5 3 9 9 3 9 .9 0 0 .6 5 6 9 8 2 .97303
4 15 5 1 6 3 6 .2 9 S 7 7 4 .6 5 0 .7 9 8 9 8 2 .88910
5 11 3 3 4 1 8 .061 4 4 1 .8 4 0 .9 0 6 4 0 2 .64 5 2 6
6 6 3 2 1 0 9 .8 3 3 197 .18 0 .9 9 2 6 7 2 .29 4 8 7
7 11 7 2 1 1 1 1 .607 3 0 5 .8 9 1 .0 6 4 7 2 2 . 4 8 5 5 6
8 13 5 5 2 1 13 .383 3 1 3 .3 0 1 .1 2 6 5 5 2 .49 5 9 6
g 12 1 1 7 3 15 .160 2 5 5 .1 8 1 .1 8 0 6 9 2 .40684
10 14 3 4 6 1 1 6 .937 2 6 6 .3 7 1 .2 2 8 8 5 2 .42548
11 16 5 7 3 1 18 .716 2 7 5 .4 3 1 .2 7 2 2 0 2.44001
12 11 3 1 4 3 2 0 .4 9 4 172 .89 1 .3 1 1 6 3 2 .23 7 7 8
13 9 5 0 3 1 2 2 .2 7 3 130 .14 1 .3 4 7 7 8 2.11441
14 3 0 0 0 3 2 4 .0 5 2 4 0 .1 7 1 .3 8 1 1 5 1.60387
15 2 0 0 0 2 25 .831 2 4 .9 3 1 .41 2 1 S 1 .3 9 5 7 4
16 0 0 0 0 0 27 .611 O.OD 1 .4 4 1 0 8 0 . 0 0 0 0 0
T0TRL NUMBER 0F GALAXIES COUNTED = 150 MAGNITUDE CUTOFF. MV = 1 9 .0
CLUSTER CENTER AT XO = 4 3 .9 6 5 YD = -8 1 .8 1 1
RING WIDTH lARCMIN) = 2 . 0
Table 4.4.21. faJ Ring-Count Data for Galaxy Cluster SI.
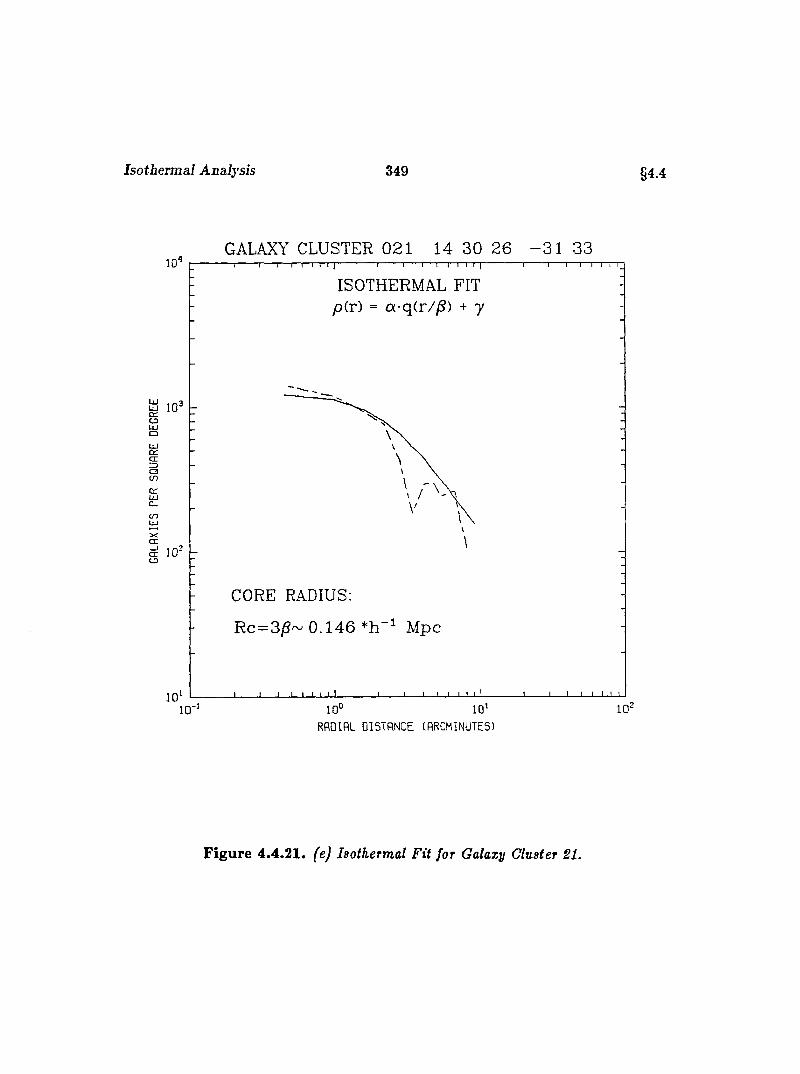
Isotbermal Analysis 349 §4.4
GALAXY CLUSTER 021 14 30 26 - 3 1 33
ISOTHERMAL FIT pir) = a-q(r//S) + 7
Oct:craCO
cnU J
CC
Π10 L3
CORE RADIUS:
R c=3/?~ 0 .1 4 6 *h Mpc
RADIAL DISTANCE (ARCMINUTES)
Figure 4.4.21. (e) Isothermal Fit for Galaxy Cluster 21.
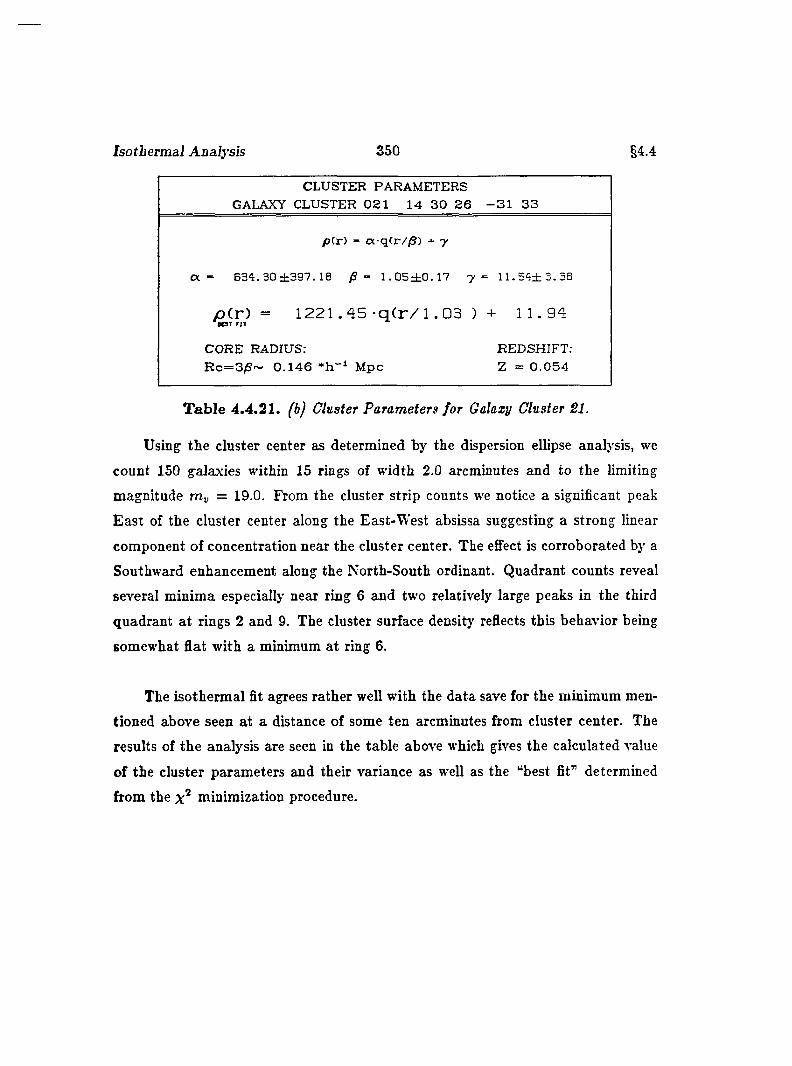
Isotbermal Analysis 350 §4.4
CLUSTER PARAMETERS GALAXY CLUSTER 0 2 1 14 3 0 2 6 - 3 1 3 3
p(r) - ot q(r//S) + y
a - 6 3 4 . 3 0 ± 3 9 7 . 1 8 /S - 1 . 0 5 ± 0 . 1 7 7 = 1 1 . 5 4 ± 3 . 3 8
p ( r ) = 1 2 2 1 .4 5 - q ( r / l .03 ) + 11.94
CORE RADIUS:R c = 3 /S ~ 0 .1 4 6 M pc
REDSHIFT; Z = 0 .0 5 4
T ab le 4.4 .21. (b) Cluster Parameters for Galaxy Cluster SI.
Using the cluster center as determined by the dispersion ellipse analysis, we
count 150 galaxies within 15 rings of width 2.0 arcminutes and to the limiting
magnitude = 19.0. From the cluster strip counts we notice a significant peak
East of the cluster center along the East-West absissa suggesting a strong linear
component of concentration near the cluster center. The effect is corroborated by a
Southward enhancement along the North-South ordinant. Quadrant counts reveal
several minima especially near ring 6 and two relatively large peaks in the third
quadrant a t rings 2 and 9. The cluster surface density reflects this behavior being
somewhat flat with a minimum at ring 6.
The isothermal fit agrees rather well with the data save for the minimum men
tioned above seen a t a distance of some ten arcminutes from cluster center. The
results of the analysis are seen in the table above which gives the calculated value
of the cluster parameters and their variance as well as the “best fit” determined
from the minimization procedure.
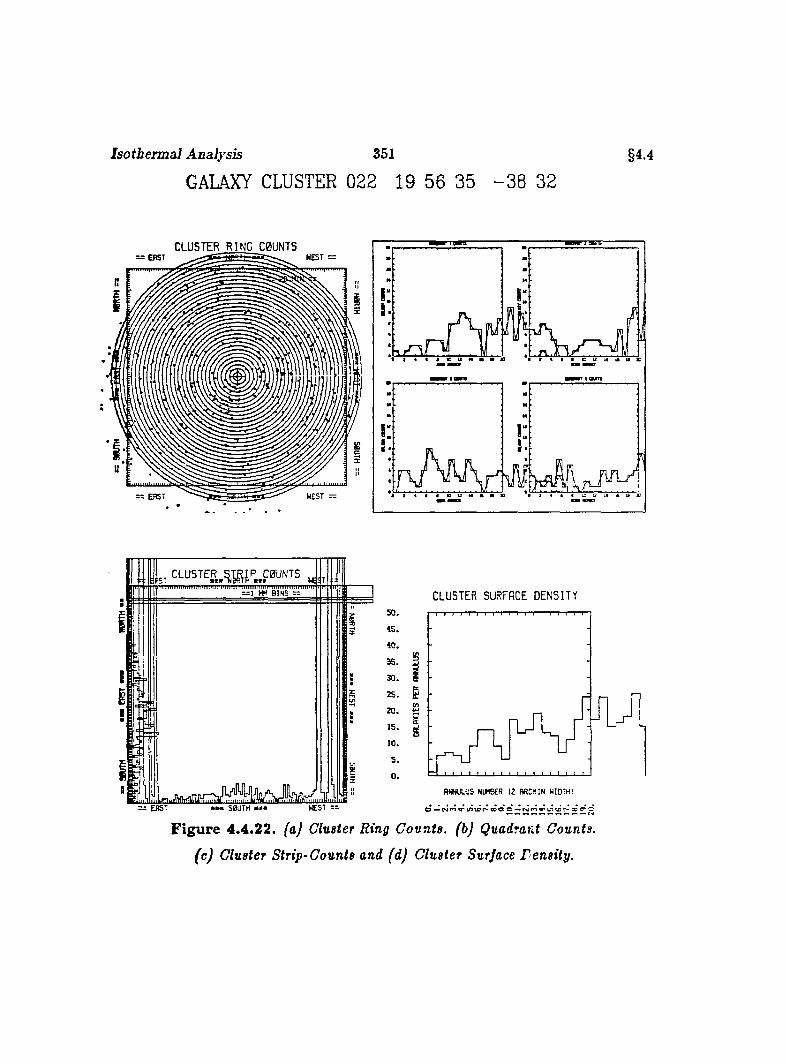
Isotbermal Analysis 351
GALAXY CLUSTER 022 19 56 35 - 3 8 32§4.4
CLUSTER R I N G C0UNTSN E S T == = E A S T
II
I2
5III
W EST —— E R S T
:LU5TER,^%^P,C0UNTSfST
W BINS =
SB U T H
CLUSTER SURFACE DENSITY
5 0 .
4 5 .
3 0 . S
25. B 20 . “
1 5 . I
10.
A NNULUS NUMBER 12 A RCM IN WIDTH I
F ig u re 4.4 .22. (a) Cluster Ring Counts, (b) Quadrant Counts,
(c) Cluster Strip-Counts and (d) Cluster Surface Fensity.
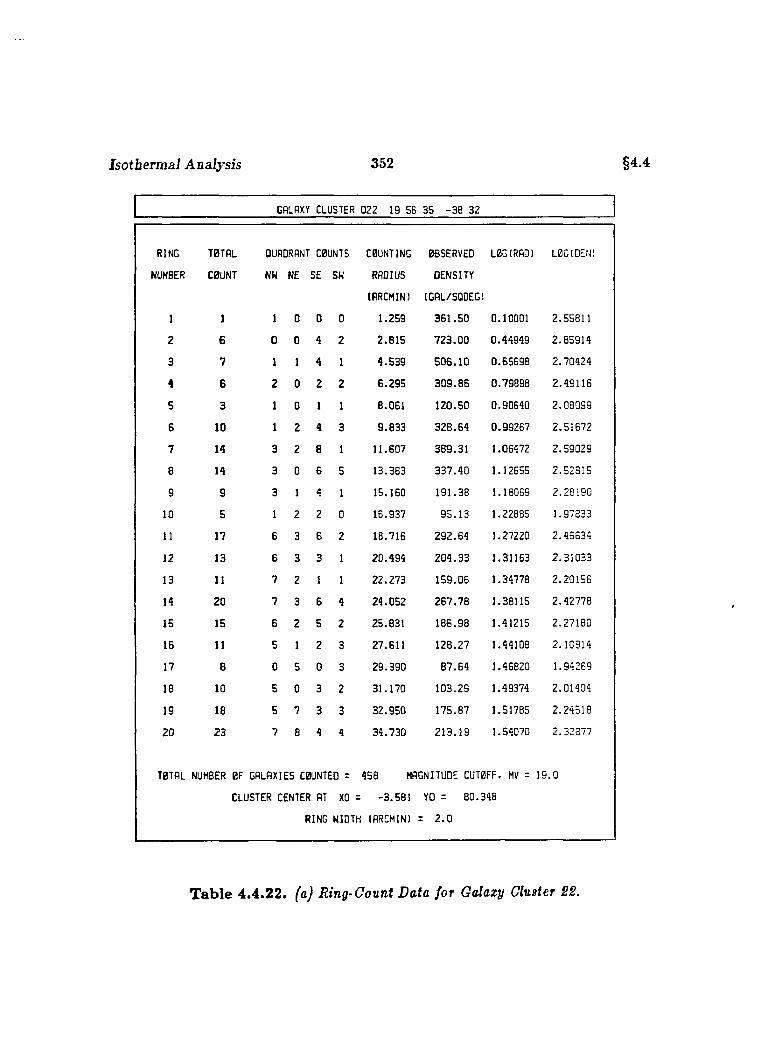
Isotbermal Analysis 352 §4.4
GALAXY CLUSTER 022 19 56 35 -3 8 32
RING T0TRL QUADRANT COUNTS COUNTING OBSERVED LOGIRAD) LOG I DEN)
NUMBER C0UNT NW NE SE SW RADIUS DENSITY
(ARCMIN) (GAL/SQDEG)
1 1 1 0 0 0 1 .2 5 9 3 6 1 .5 0 0 .10001 2 .55811
2 6 0 0 4 2 2 ,8 1 5 7 2 3 .0 0 0 .44 9 4 9 2 .8 5 9 1 4
3 7 1 1 4 1 4 .5 3 9 5 0 6 .1 0 0 .6 5 6 9 8 2 .7 0 4 2 4
4 6 2 0 2 2 8 .2 9 5 3 0 9 .8 6 0 .7 9 8 9 8 2 .4 9 1 1 6
5 3 1 0 1 1 8 .0 6 1 1 2 0 .5 0 0 .9 0 6 4 0 2 .0 8 0 9 9
6 10 1 2 4 3 9 .8 3 3 3 2 8 .6 4 0 .9 9 2 6 7 2 .5 1 6 7 2
7 14 3 2 8 1 1 1 .6 0 7 3 8 9 .3 1 1 .06472 2 .5 9 0 2 9
6 14 3 0 6 5 13 .383 3 3 7 .4 0 1.12655 2 .5 2 8 1 5
9 9 3 1 4 1 15 .160 1 9 1 .3 8 1.18069 2 .2 8 1 9 0
10 5 1 2 2 0 16 .937 9 5 .1 3 1.22885 1 .97833
11 17 6 3 6 2 18 .716 2 9 2 .6 4 1 .27220 2 .4 6 6 3 4
12 13 6 3 3 1 2 0 .4 9 4 2 0 4 .3 3 1 .31163 2 .3 1 0 3 3
13 11 7 2 1 1 2 2 .2 7 3 1 5 9 .0 6 1.34778 2 .2 0 1 5 6
14 20 7 3 6 4 2 4 .0 5 2 2 6 7 .7 8 1 .38115 2 .4 2 7 7 8
15 15 6 2 5 2 25 .831 1 8 6 .9 8 1.41215 2 .2 7 1 8 0
16 11 5 1 2 3 27 .611 1 2 8 .2 7 1.44108 2 .1 0 8 1 4
17 8 0 5 0 3 2 9 .3 9 0 8 7 .6 4 1 .46820 1 .94269
18 10 5 0 3 2 31 .1 7 0 1 0 3 .2 9 1.49374 2 .0 1 4 0 4
19 18 5 7 3 3 3 2 .9 5 0 17 5 .8 7 1.51785 2 .2 4 5 1 8
20 23 7 8 4 4 3 4 .7 3 0 2 1 3 .1 9 1 .54070 2 .3 2 3 7 7
T0TPL NUMBER 0F GALAXIES COUNTED = 458 MAGNITUDE CUT0FF, MV = 1 9 .0
CLUSTER CENTER AT XO = -3 .5 8 1 YO = 80 .3 4 8
RING WIDTH (ARCMIN) = 2 .0
T ab le 4 .4.22. faJ Ring-Count Data for Galaxy Cluster 22.
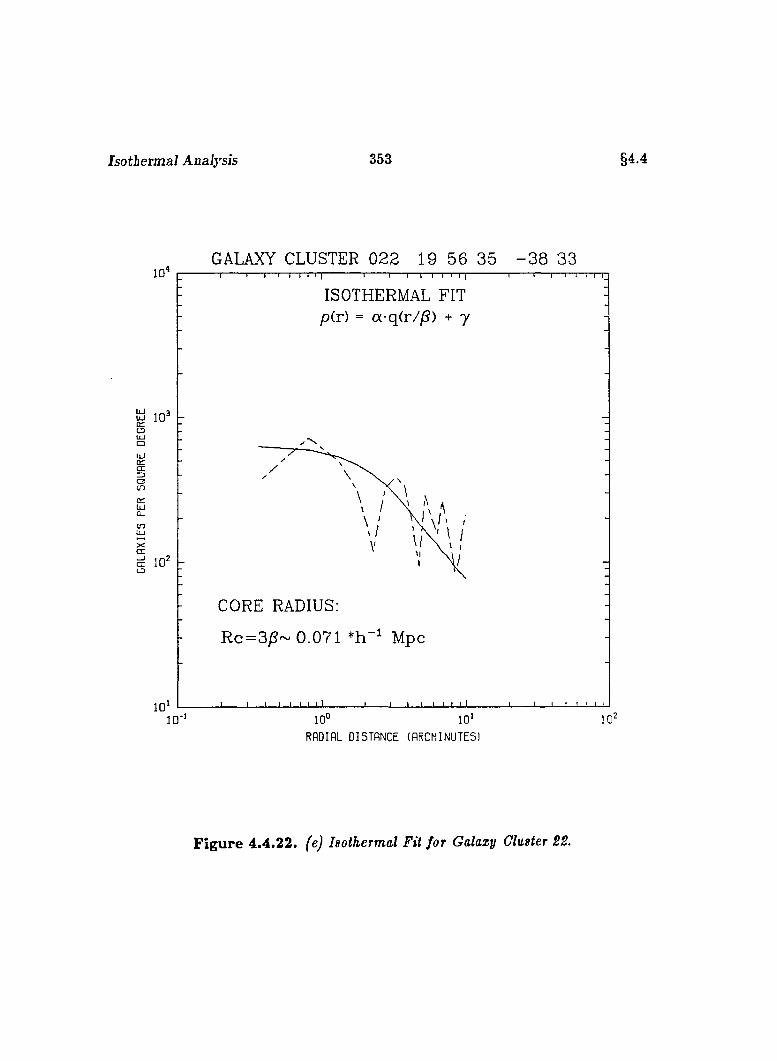
Isotbermal Analysis 353 §4.4
GALAXY CLUSTER 022 19 56 35 - 3 8 3310 '
ISOTHERMAL FIT p(r) = a-q(r//S) + y
y 10'oLUOLUorex
ÛTLUÛ_
CORE RADIUS:
Rc=3jS~ 0.071 Mpc
io‘10° 10*
RADIAL DISTANCE (ARCMINUTES!
F ig u re 4.4.22. fe) Isothermal Fit for Galaxy Cluster 22.
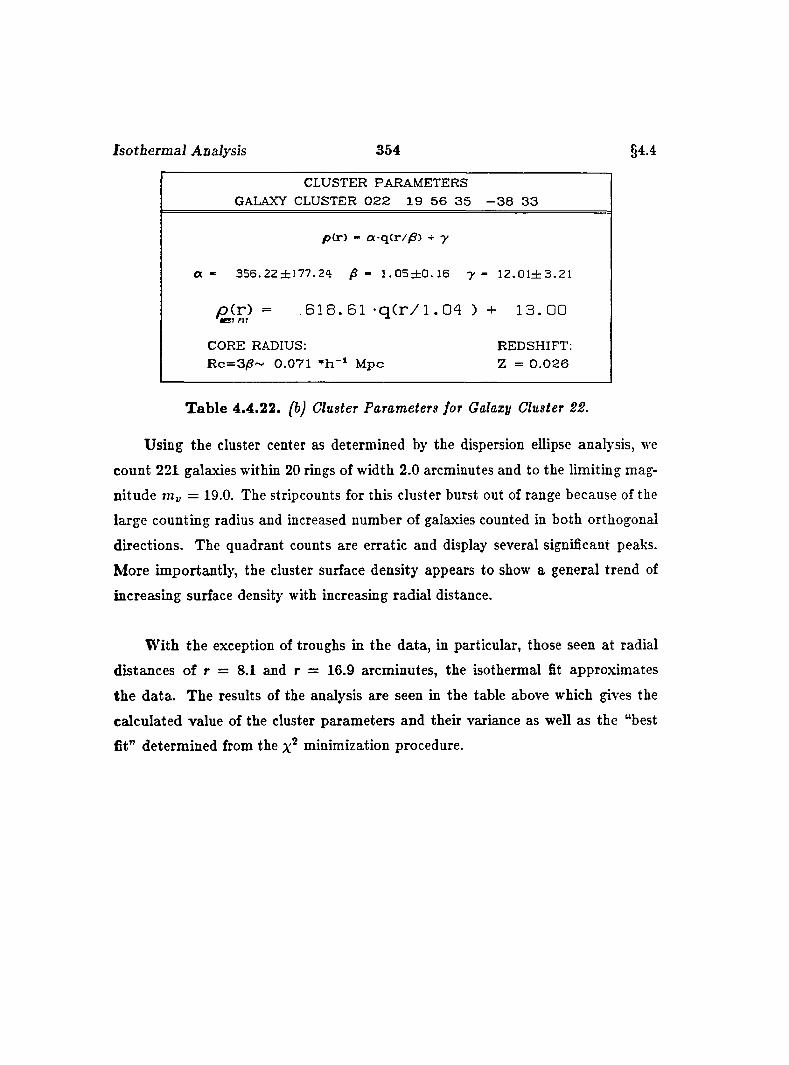
Isotberm al Analysis 354 §4.4
a
CLUSTER PARAMETERS GALAXY CLUSTER 0 2 2 19 5 6 3 5 - 3 8 3 3
p(r) - a -q (r//9 ) + y
~ 356.22 ± 177 .24 /S - 1 .0 5 ± 0 .1 6 y - 1 2 .0 I± 3 .2 1
p ( r ) = , 6 1 8 . 6 1 - q C r / l . 0 4 ) + 1 3 . G O
CORE RADIUS:R c= 3 /S ~ 0 .0 7 1 M pc
REDSHIFT: Z = 0 .0 2 6
T ab le 4.4.22. (b) Cluster Parameters for Galaxy Cluster 22.
Using the cluster center as determined by the dispersion ellipse analysis, we
count 221 galaxies within 20 rings of width 2.0 arcminutes and to the limiting mag
nitude my = 19.0. The stripcounts for this cluster burst out of range because of the
large counting radius and increased number of galaxies counted in both orthogonal
directions. The quadrant counts are erratic and display several significant peaks.
More importantly, the cluster surface density appears to show a general trend of
increasing surface density with increasing radial distance.
W ith the exception of troughs in the data, in particular, those seen at radial
distances of r = 8.1 and r = 16.9 arcminutes, the isothermal fit approximates
the data. The results of the analysis are seen in the table above which gives the
calculated value of the cluster parameters and their variance as well as the “best
fit” determined from the minimization procedure.
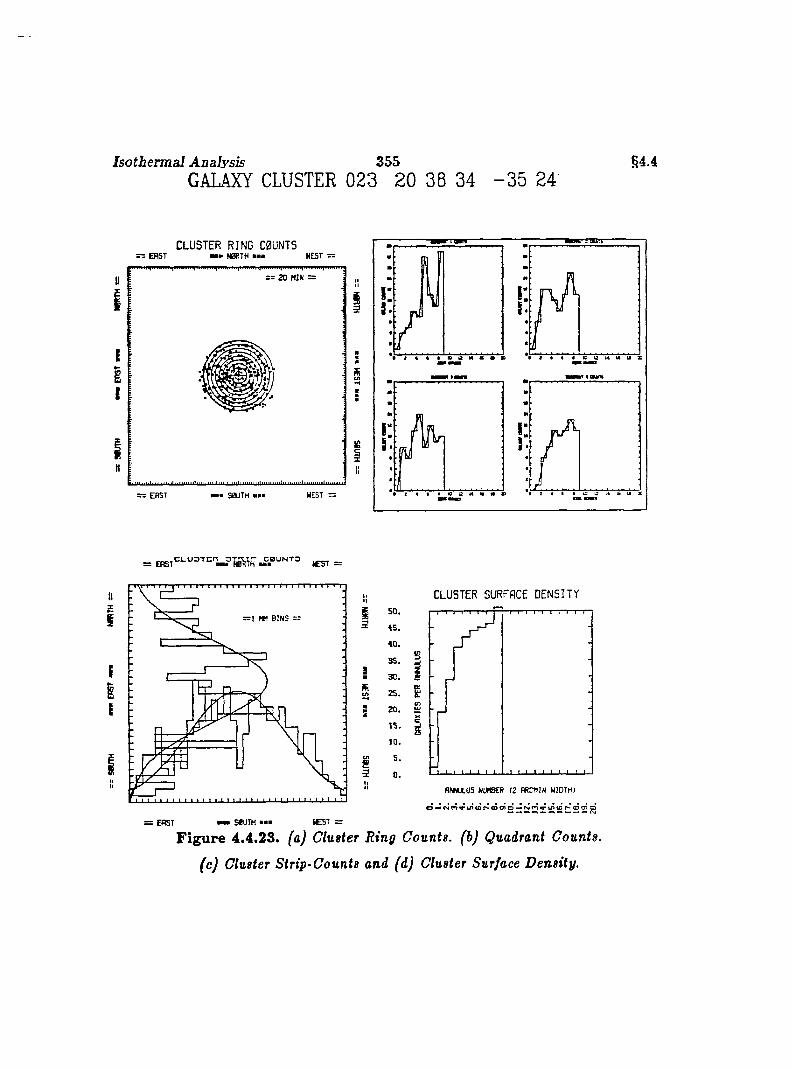
Isotberm al Analysis 355GALAXY CLUSTER 023 20 38 34 - 3 5 24
§4.4
CLUSTER RI NG C0UNT5: E R S T N 0R T H ■ ■ ■ N E S T =
== 20 MIN =
== ERST S 8U T H W EST =
T T H '
;
&1
= E B S T l £ S T =
II5f — 1 MM B IN S ==
IÎ
II
a
= ERST S iU T H I lesT =
5 0 .
4 5 .
4 0 .
3 5 .
3 0 .
2 5 .
20.1 5 .
10.
5 .
0 .
CLUSTER SURFACE DENSITY
S
s
f lN N a U S NUMBER 12 A R C M IN W ID T H )
F ig u re 4.4.23. (a) Cluster Ring Counts, (b) Quadrant Counts,
(c) Cluster Strip-Counts and (d) Cluster Surface Density.
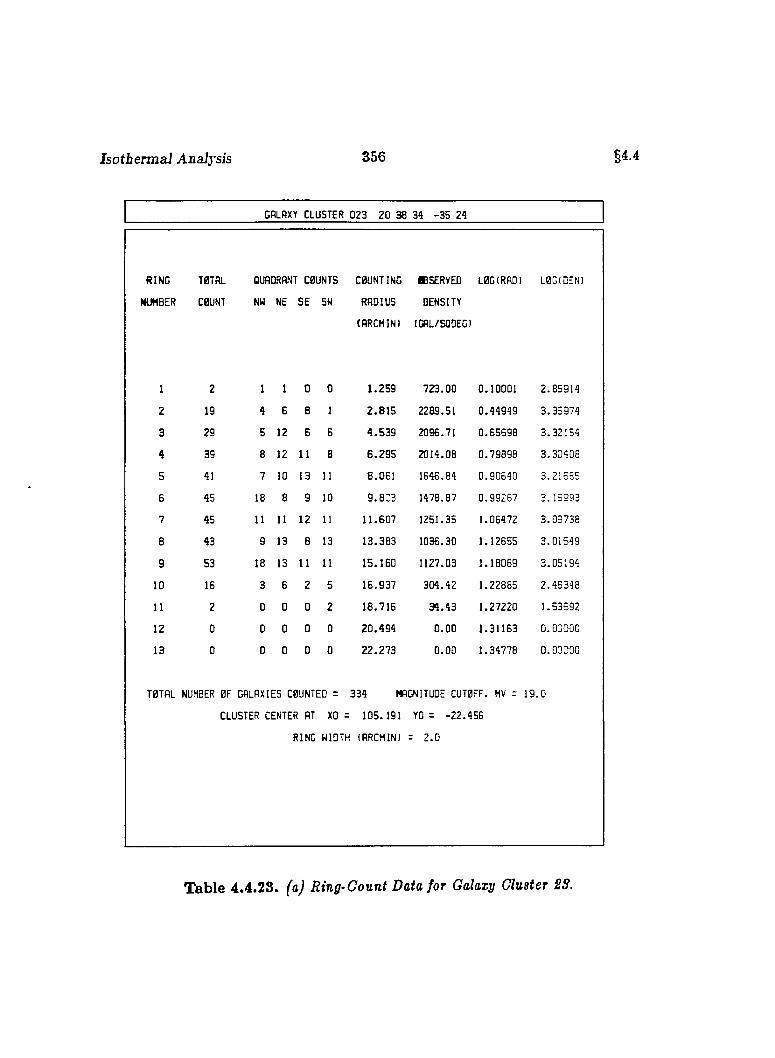
Isotberm al Analysis 356 §4.4
GALAXY CLUSTER 023 20 38 34 -3 5 24
(INC TOTAL OUAORANl■ COUNTS COUNTING «SERVED LOG(RAD) LOG(DEN)
JMBER COUNT NW NE SE SW RADIUS DENSITY
(RRCMIN) (GAL/SQDEG)
1 2 1 1 0 0 1.259 723.00 0.10001 2.85914
2 19 4 6 8 1 2.815 2289.51 0.44949 3.35974
3 29 5 12 G 8 4.539 2096.71 0.65698 3.32154
4 39 8 12 11 8 6.295 2014.08 0.79898 3.30408
5 41 7 10 13 11 8.061 1646.84 0.90640 3.21655
6 45 18 8 9 10 9.8:3 1478.87 0.99267 3.16993
7 45 11 11 12 11 11.607 1251.35 1.06472 3.03738
8 43 9 13 8 13 13.383 1036.30 1.12655 3.01549
9 53 18 13 11 11 15.160 1127.03 1.18069 3.05194
10 16 3 6 2 5 16.937 304.42 1.22885 2.48348
11 2 0 0 0 2 18.716 34.43 1.27220 1.53692
12 0 0 0 0 0 20.494 0.00 1.31163 0.00000
13 0 0 0 0 0 22.273 0.00 1.34778 0.00000
TOTAL NUMBER OF GALAXIES COUNTED = 334 MAGNITUDE CUTOFF, MV z 19.0
CLUSTER CENTER AT XO = 105.191 YO = -22.456
RING WIDTH (ARCMIN) z 2.0
T able 4.4.23. (a) Ring-Count Data for Galaxy Cluster 2S.
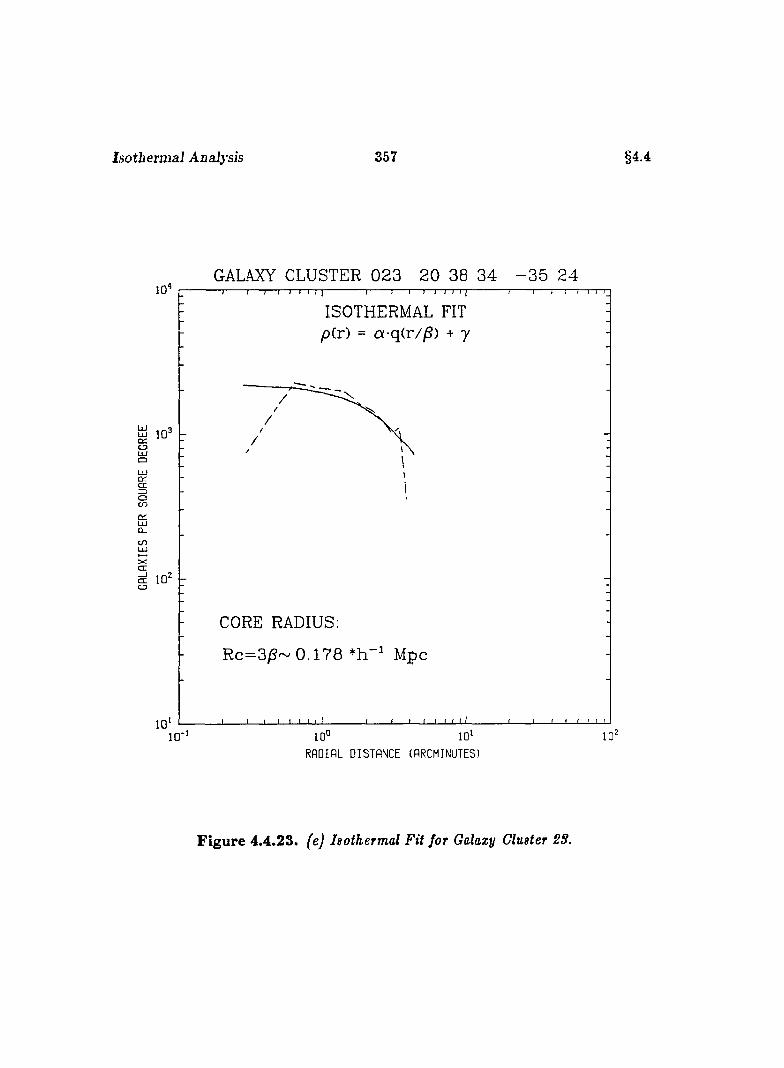
Isotbermal Analysis 357 §4.4
GALAXY CLUSTER 02 3 20 38 34 - 3 5 2 4
ISOTHERMAL FIT p(r) = aq(r//5) + 7
cnCDO
oCO
Û _
cn
CC
Π1 0 'CD
CORE RADIUS:
Rc=3/S~ 0.178 Mpc
RADIAL DISTANCE (ARCMINUTES!
F ig u re 4.4.23. feJ Isothermal Fit for Galaxy Cluster 2S.
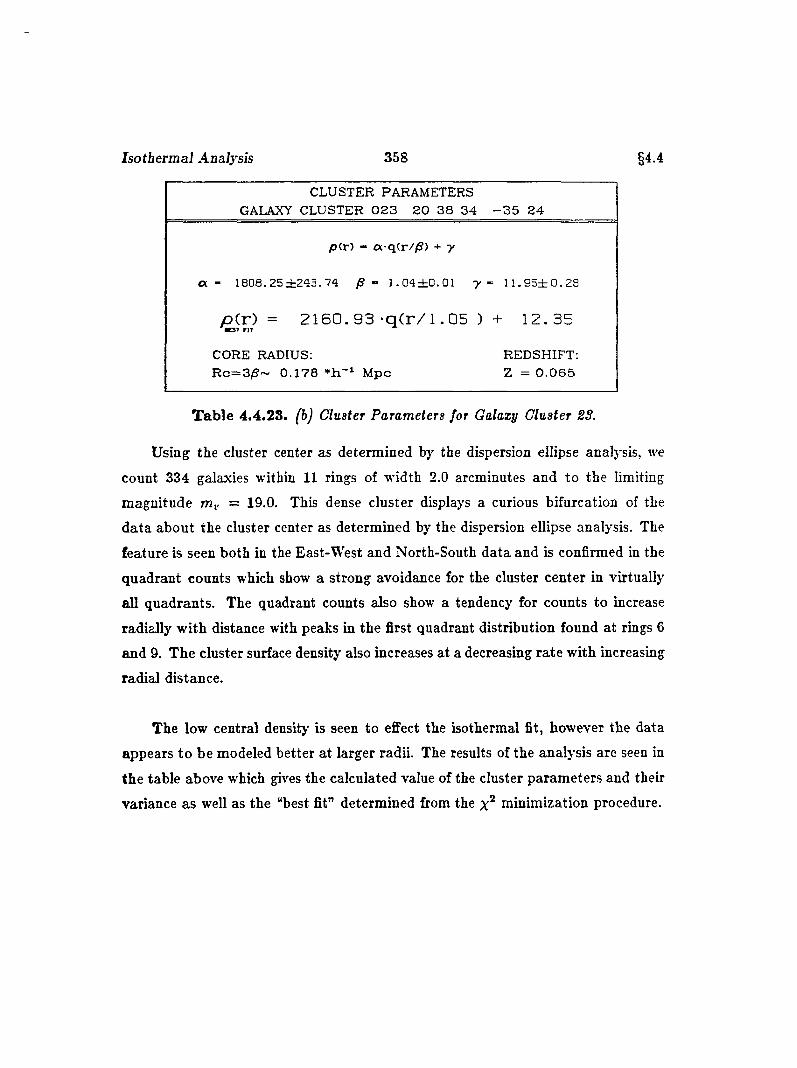
Isotbermal Analysis 358 §4.4
CLUSTER PARAMETERS GALAXY CLUSTER 0 2 3 2 0 3 8 34 - 3 5 2 4
p(r) - a q(r//S) + y
a - 1808. 25 ±243 . 74 /S - 1 .0 4 ± 0 .0 1 y -= 1 1 .9 5 ± 0 .2 8
p ( r ) = 2 1 6 0 . 9 3 - q C r / l . 0 5 )rn
+ 1 2 . 3 5
CORE RADIUS: REDSHIFT;R c= 3 /S ~ 0 .1 7 8 M pc Z = 0 .0 6 5
T ab le 4.4.23. (b) Cluster Parameters for Galazy Cluster S3.
Using the cluster center as determined by the dispersion ellipse analysis, we
count 334 galaxies within 11 rings of width 2.0 arcminutes and to the limiting
magnitude rrii, = 19.0. This dense cluster displays a curious bifurcation of the
data about the cluster center as determined by the dispersion ellipse analysis. The
feature is seen both in the East-West and North-South data and is confirmed in the
quadrant counts which show a strong avoidance for the cluster center in virtually
all quadrants. The quadrant counts also show a tendency for counts to increase
radially with distance with peaks in the first quadrant distribution found at rings 6
and 9. The cluster surface density also increases at a decreasing rate with increasing
radial distance.
The low central density is seen to effect the isothermal fit, however the data
appears to be modeled better at larger radii. The results of the analysis are seen in
the table above which gives the calculated value of the cluster parameters and their
variance as well as the “best fit” determined from the minimization procedure.

Isotberm al Analysis 359
GALAXY CLUSTER 024 20 48 41 - 5 2 08§4.4
CLUSTER RI NG C0ÜN7S= = E R S T mmm N 0R T H m i W EST =
== 20 MIN =II
EIi
II
= ' ERST WEST —
/vfil M a
C L u o T c r r 3 T m r c b u n t d
== ERST ■ n N 0R TH « I W EST —
II B I N S —
I
I
i
II
= : EBST I SOU TH H I WEST =
CLUSTER SURFACE DE NSI TY5 0 .
45.
40.
35.
30.
25.
20.15.
10.
5 .
0 .
s
g
f lW U L U S NUMBER 1 2 R R C M IN W ID TH )
F ig u re 4.4.24. (a) Cluster Ring Counts, (b) Quadrant Counts,
(c) Cluster Strip-Counts and (d) Cluster Surface Density.
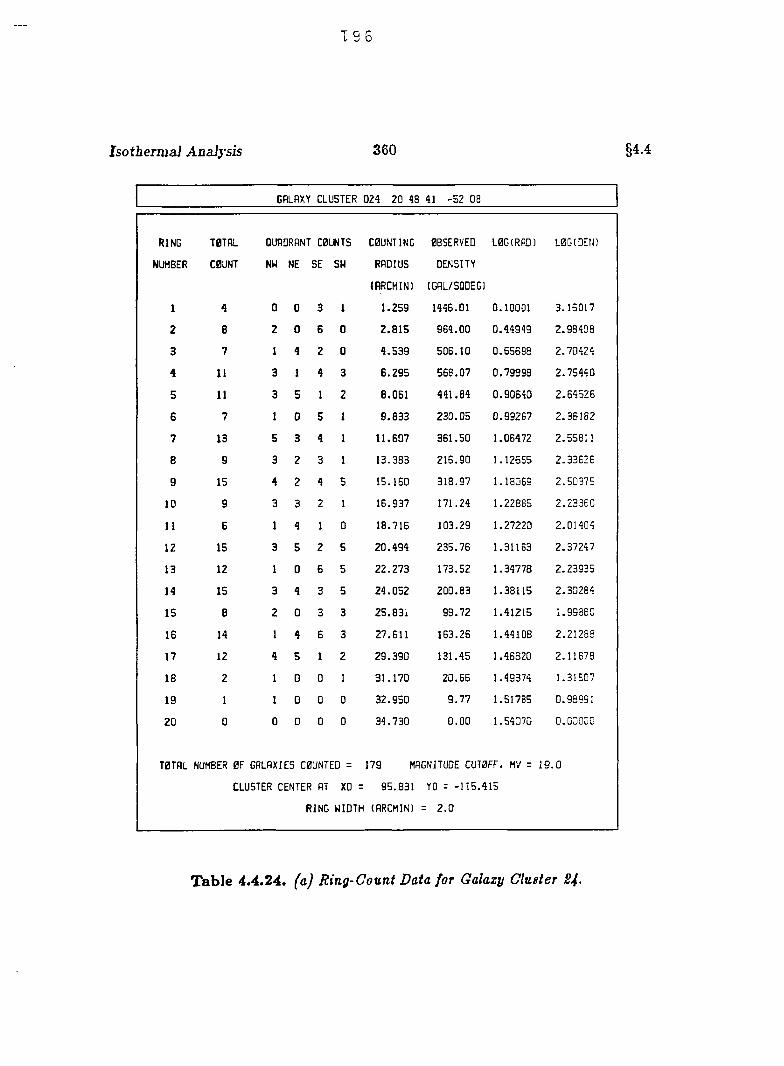
s 5
Isothermal Analysis 360 §4 4
GALAXY CLUSTER 024 20 48 41 -5 2 OS
RING
NUMBER
TOTAL
COUNT
QUADRANT COUNTS
NW NE SE SW
COUNTING
RADIUS
(ARCMIN!
OBSERVED
DENSITY
(GAL/SQDEG)
LOGIRAD) LOG(DEN)
1 4 0 0 3 1 1 .2 5 9 1446.01 0.10001 3 .1 6 0 1 7
2 8 2 0 8 0 2 .8 1 5 9 5 4 .0 0 0 .4 4 9 4 9 2 .9 8 4 0 8
3 7 1 4 2 0 4 .5 3 9 5 0 6 .1 0 0 .6 5 6 9 8 2 .7 0 4 2 4
4 11 3 1 4 3 6 .2 9 5 5 6 8 .0 7 0 .7 9 8 9 8 2 .7 5 4 4 0
5 11 3 5 1 2 8 .0 6 1 44 1 .8 4 0 .9 0 6 4 0 2 .6 4 5 2 6
G 7 1 0 5 1 9 .8 3 3 2 3 0 .0 5 0 .9 9 2 5 7 2 .3 5 1 8 2
7 13 5 3 4 1 11 .6 0 7 3 6 1 .5 0 1 .08472 2 .55811
8 9 3 2 3 1 13 .383 2 1 6 .9 0 1 .12655 2 .3 3 6 2 6
9 15 4 2 4 5 15 .160 3 1 8 .9 7 1 .18069 2 .5 0375
10 9 3 3 2 1 16 .937 171.24 1 .22885 2 .2 3 3 6 0
11 6 1 4 1 0 18 .7 1 6 103 .29 1 .27220 2 .0 1404
12 15 3 5 2 5 2 0 .4 9 4 2 3 5 .7 6 1 .31153 2 .3 7 2 4 7
13 12 1 0 6 5 2 2 .2 7 3 173 .52 1 .34778 2 .2 3 9 3 5
14 15 3 4 3 5 2 4 .0 5 2 2 0 0 .8 3 1 .38115 2 .3 0 2 8 4
15 8 2 0 3 3 2 S .8 3 i 9 9 .7 2 1 .41215 1 .99880
16 14 1 4 6 3 27 .611 163 .26 1 .44108 2 .2 1288
17 12 4 5 1 2 2 9 .3 9 0 131 .45 1 .46820 2 .1 1 6 7 8
18 2 1 0 0 1 3 1 .1 7 0 2 0 .6 6 1 .49374 1 .31507
19 1 1 0 0 0 3 2 .9 5 0 9 .7 7 1 .51785 0 .98991
20 0 0 0 0 0 3 4 .7 3 0 0 .0 0 1 .54070 0 .0 0 0 0 0
TOTAL NUMBER OF GALAXIES COUNTED =
CLUSTER CENTER AT XO =
RING WIDTH
179 MAGNITUDE CUTOFF. H V =
95 .8 3 1 YO = - 1 1 5 .4 1 5
(ARCMIN) = 2 . 0
1 9 .0
T ab le 4 .4 .24 . (a) Ring-Count Data for Galaxy Cluster S4-
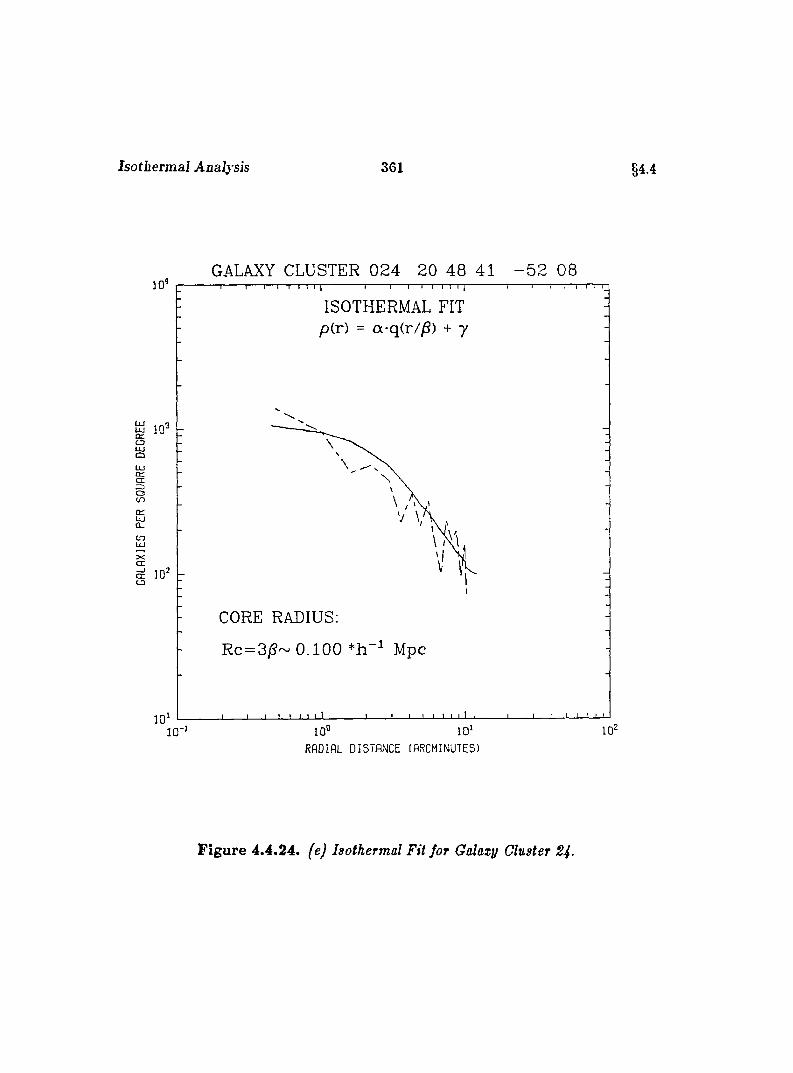
Isothermal Analysis 361 §4.4
GALAXY CLUSTER 0 2 4 20 48 41 - 5 2 08
ISOTHERMAL FIT p(r) = a-q(r//3) + y
OCD
gcn
c r
CD
CORE RADIUS;
Rc = 3jS~ 0.100 Mpc
10°RADIAL DISTANCE (ARCHINDIES)
F ig u re 4.4.24. (e) Isothermal Fit for Galaxy Cluster 24-
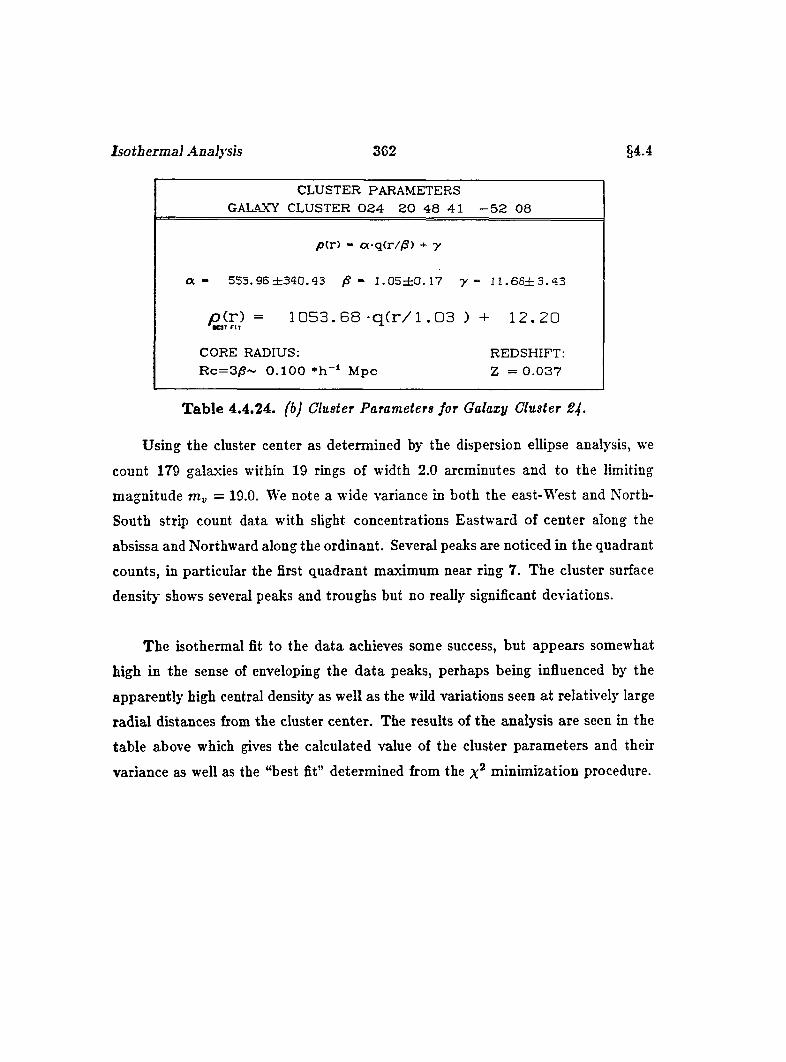
Isothermal Analysis 362 §4.4
a -
CLUSTER PARAMETERS GALAXY CLUSTER 0 2 4 2 0 4 6 41 - 5 2 08
p(r) - a q(r//S) + y
. 9 6 ± 3 4 0 . 4 3 /S - 1 . 0 5 ± 0 . 1 7 1 1 . 6 8 ± 3 . 4 3
p ( r ) = 1 0 5 3 . 6 8 - q ( r / l . 0 3 ) + 1 2 . 2 0
CORE RADIUS:R c= 3 /S ~ 0 .1 0 0 M pc
REDSHIFT: Z - - 0 .0 3 7
T able 4.4.24. (b) Cluster Parameters for Galaxy Cluster 2 \.
Using the cluster center as determined by the dispersion ellipse analysis, we
count 179 galaxies within 19 rings of width 2.0 arcminutes and to the limiting
magnitude m-u — 19.0. We note a wide variance in both the east-West and North-
South strip count data with slight concentrations Eastward of center along the
absissa and Northward along the ordinant. Several peaks are noticed in the quadrant
counts, in particular the first quadrant maximum near ring 7. The cluster surface
density shows several peaks and troughs but no really significant deviations.
The isothermal fit to the data achieves some success, but appears somewhat
high in the sense of enveloping the data peaks, perhaps being influenced by the
apparently high central density as well as the wild variations seen a t relatively large
radial distances ftom the cluster center. The results of the analysis are seen in the
table above which gives the calculated value of the cluster parameters and their
variance as well as the “best fit” determined from the minimization procedure.
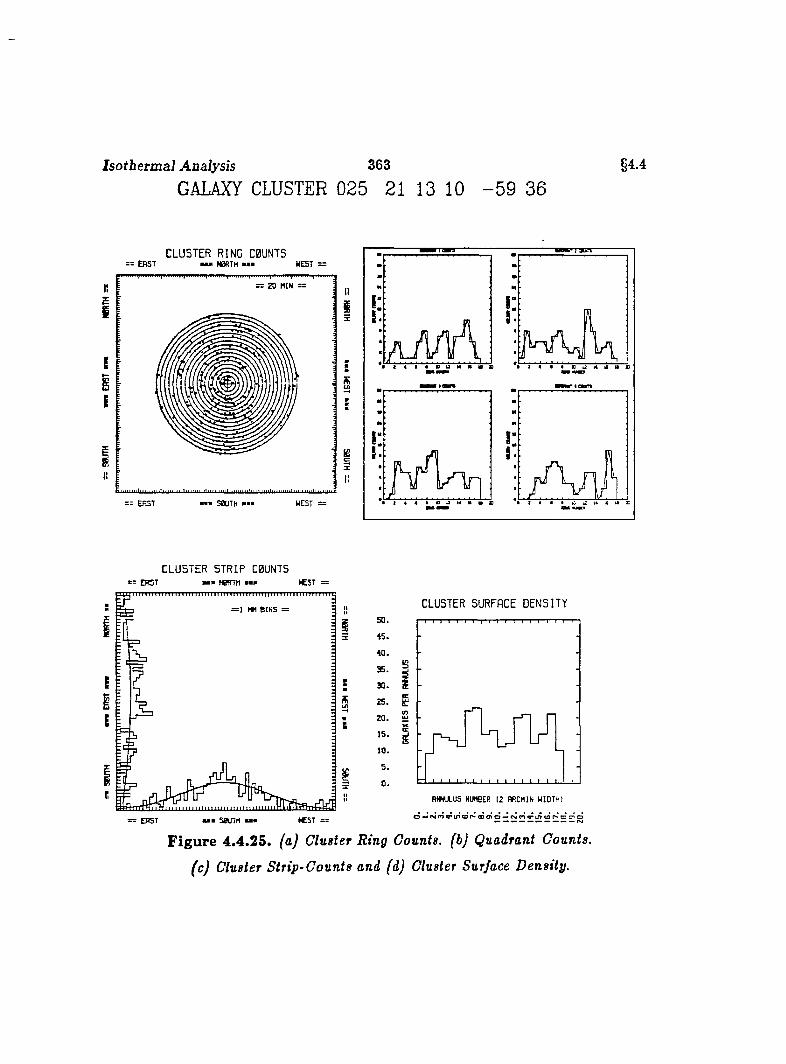
Isotberm al Analysis 363
GALAXY CLUSTER 025 21 13 10 - 5 9 36§4.4
CLUSTER RING COUNTS: E R S T MMM N 0R TH — W EST '
2 0 M IN =
IEIE
II
= = E R S T W EST = z
CLUSTER STRIP COUNTS■ E R S T ■ ■ ■ N0RTM ■ ■ ■ Æ 5 T
B I N S =
E
K
= ERST
CLUSTER SURFACE DENSITY
S
2 S . B
RNMJLUS NIMBER 12 ARCMIN WIDTH)
F ig u re 4 .4.25. (a) Cluster Ring Counts, (b) Quadrant Counts,
(c) Cluster Strip-Counts and (d) Cluster Surface Density.
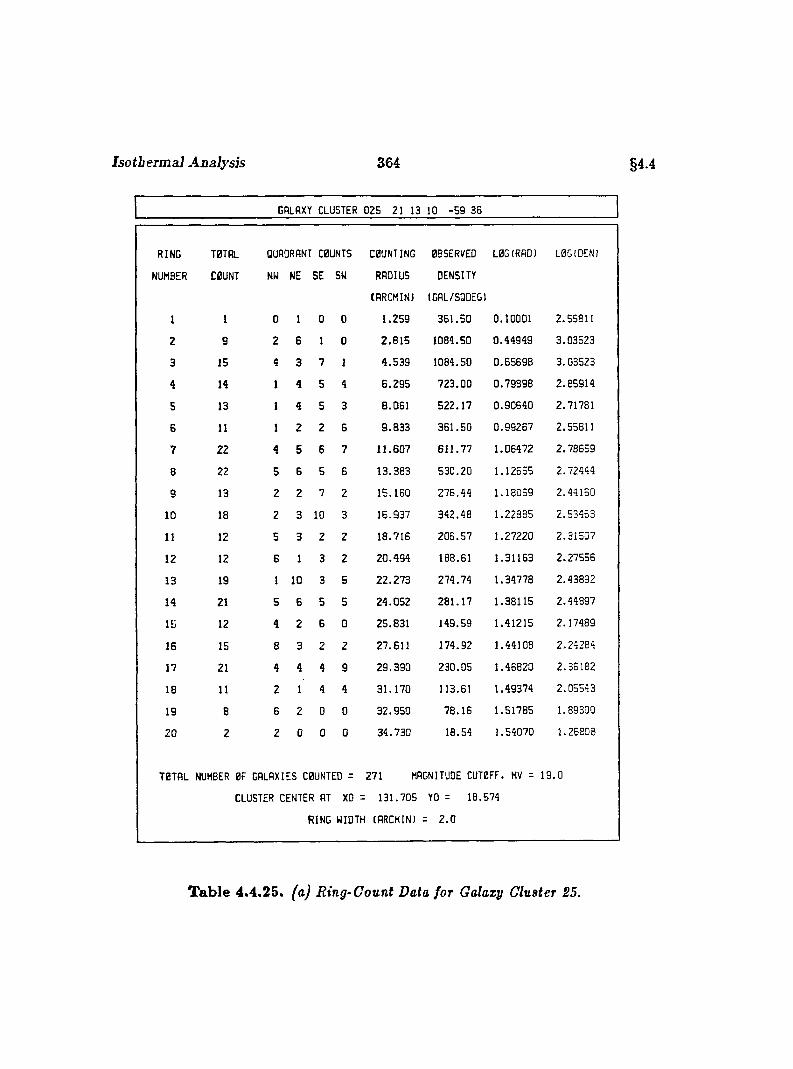
Isotberm al Analysis 364 §4.4
GALAXY CLUSTER 025 21 13 10 -5 9 SB
RING
NUMBER
TOTAL
COUNT
QUADRANT COUNTS
NW NE SE SU
COUNTING
RADIUS
lARCHIN)
OBSERVED
DENSITY
IGAL/SQDEGl
LOG(RAO) LOG(DEN)
I 1 0 1 0 0 1.259 361.50 0.10001 2.55811
2 9 2 G 1 0 2.815 1084.50 0.44949 3.03523
3 IS 4 3 7 1 4.539 1084.50 0.65698 3.03523
4 14 1 4 5 4 6.295 723.00 0.79898 2.85914
5 13 1 4 5 3 8.081 522.17 0.90640 2.71781
6 11 1 2 2 G 9.833 361.50 0.99267 2.55811
7 22 4 5 6 7 11.607 611.77 1.06472 2.78659
8 22 5 G 5 6 13.383 530.20 1.12655 2.72444
9 13 2 2 7 2 15.160 276.44 1.18069 2.44160
10 18 2 3 10 3 16.937 342.48 1.22885 2.53453
11 12 5 3 2 2 18.716 206.57 1.27220 2.31507
12 12 G 1 3 2 20.494 188.61 1.31163 2.27556
13 19 1 10 3 5 22.273 274.74 1.34778 2.43892
14 21 5 G 5 5 24.052 281.17 1.38115 2.44897
15 12 4 2 G 0 25.831 149.59 1.41215 2.17489
16 15 8 3 2 2 27.611 174.92 1.44108 2.24284
17 21 4 4 4 9 29.390 230.05 1.46820 2.36182
18 11 2 1 4 4 31.170 113.61 1.49374 2.05543
19 8 6 2 0 0 32.950 78.16 1.51785 1.89300
20 2 2 0 0 0 34.730 18.54 1.54070 1.26808
T0TRL NUMBER OF GALAXIES COUNTED =
CLUSTER CENTER AT XO =
RING WIDTH
271 MAGNITUDE CUTOFF, MV =
131.705 YO = 18.574
CARCMIN) = 2.0
19.0
T ab le 4.4.25. (a) Ring-Gount Data for Galaxy Gluster 25.
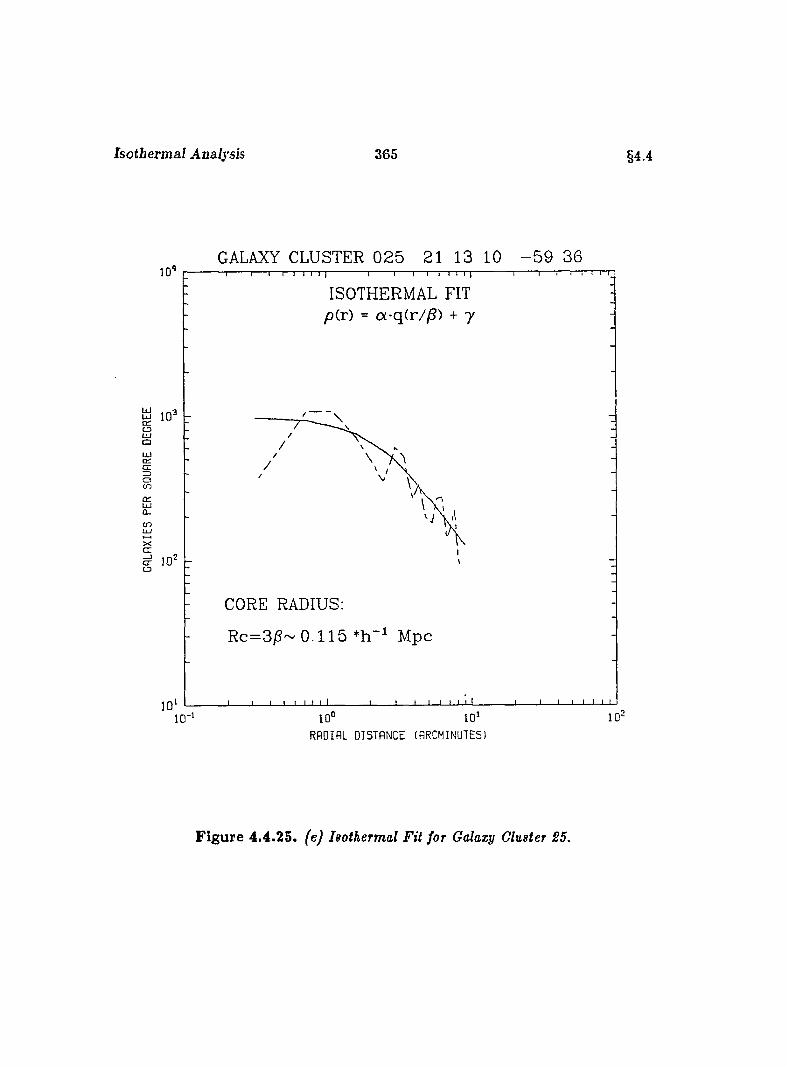
Isotberm al Analysis 365 §4.4
GALAXY CLUSTER 0 2 5 21 13 10 - 5 9 361 0 ^ -------------- 1— I— I— I— 1 I I 11-------------- 1— I— I— I— I I I 11
ISOTHERMAL FIT p(r) = a-q(r//S) + 7
1 0 ^CD
c r=300 1
ÛTLlJCL
1 ,0 'CD
CORE RADIUS:
Rc=3jS~ 0.115 Mpc
10 'I I I I I i J i l I > > > I 1 I » 1 I I I 1 I !
10 " 10° 10* RADIAL DISTANCE (ARCMINUTES)
10“"
F ig u re 4.4.25. fej Isothermal Fit for Galaxy Cluster 25.
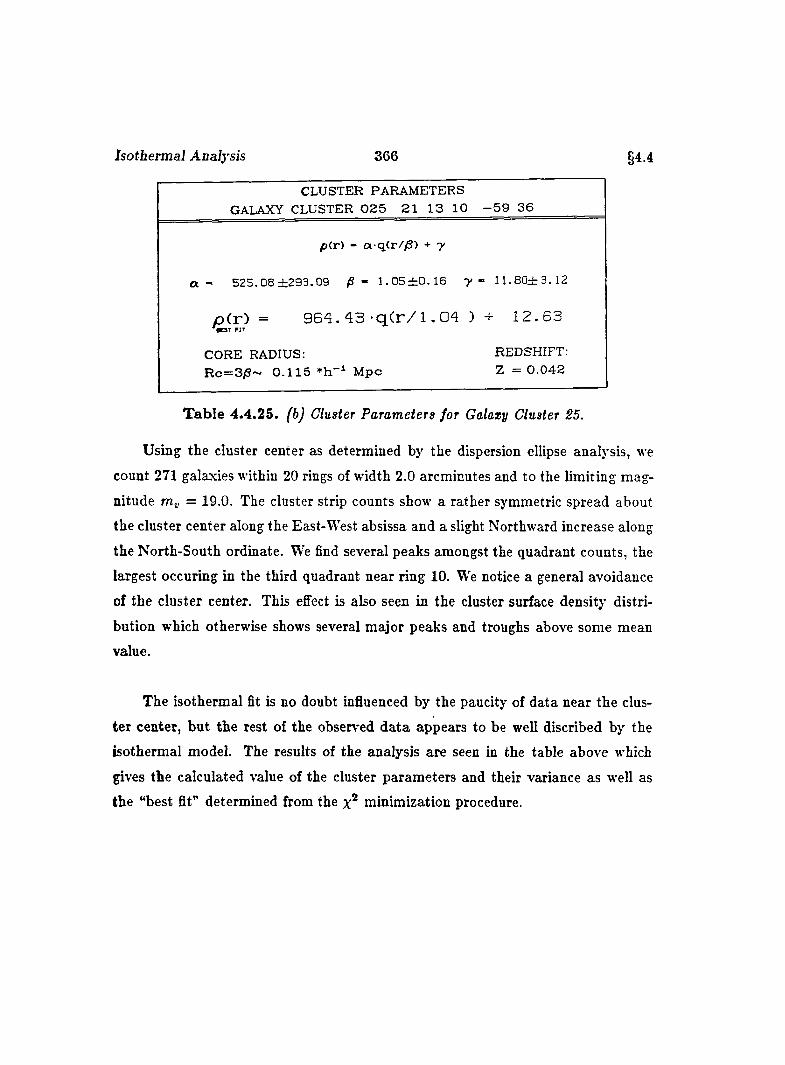
Isotbermal Analysis 366 §4.4
CLUSTER PARAMETERS _______GALAXY CLUSTER 0 2 5 2 1 13 10 - 5 9 3 6
pCr) - a q (r//8 ) + y
a - 525.08 ±293 .09 /S - 1 .0 5 ± 0 .1 5 y - 1 1 .8 0 ± 3 .I2
p ( r ) = 9 6 4 . 4 3 - q C r / l . 0 4 ) + 1 2 . 6 3
CORE RADIUS:R c = 3 / S ~ 0 .1 1 5 M pc
REDSHIFT: Z = 0 .0 4 2
Table 4.4.25. (b) Cltister Parameters for Galaxy Cluster 25.
Using the cluster center as determined by the dispersion ellipse analysis, we
count 271 galaxies within 20 rings of width 2.0 arcminutes and to the limiting mag
nitude = 19.0. The cluster strip counts show a rather symmetric spread about
the cluster center along the East-West absissa and a slight Northward increase along
the North-South ordinate. We find several peaks amongst the quadrant counts, the
largest occuring in the third quadrant near ring 10. We notice a general avoidance
of the cluster center. This efifect is also seen in the cluster surface density distri
bution which otherwise shows several major peaks and troughs above some mean
value.
The isothermal fit is no doubt influenced by the paucity of data near the clus
ter center, but the rest of the observed data appears to be well discribed by the
isothermal model. The results of the analysis are seen in the table above which
gives the calculated value of the cluster parameters and their variance as well as
the “best fit” determined from the minimization procedure.
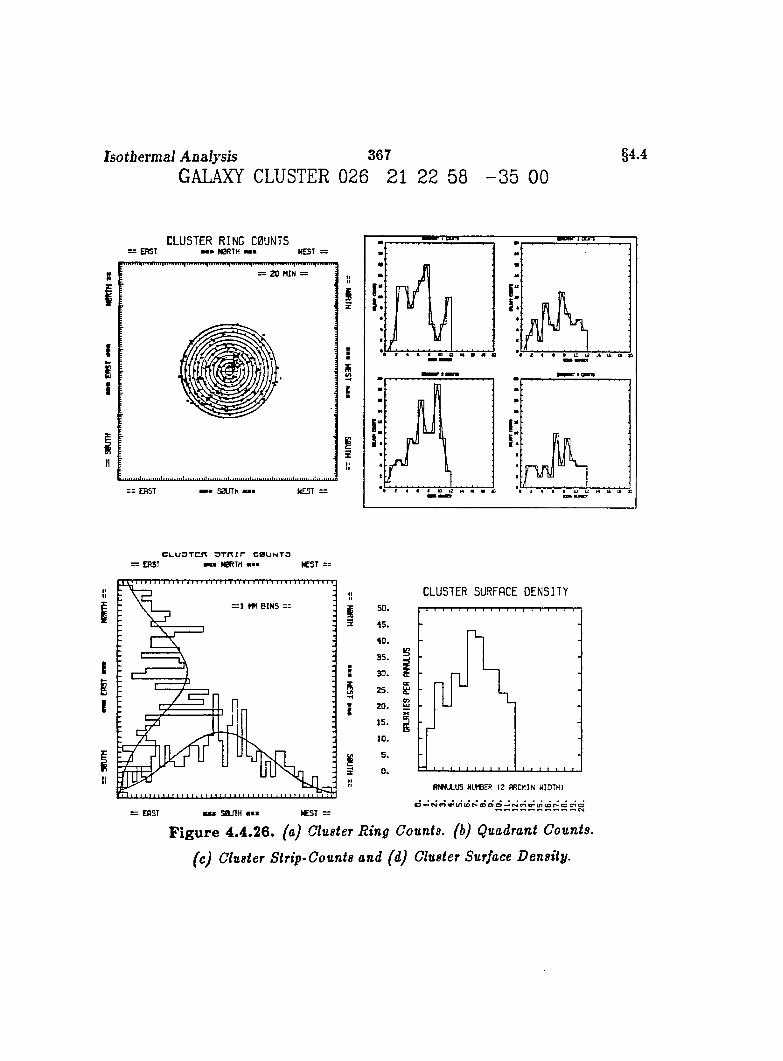
Isotbermal Analysis 367GALAXY CLUSTER 026 21 22 58
§4.4
■35 00
CLUSTER RING C0UNTS— E R S T — * N 0R T H M a W EST =
: 2 0 M IN =
= = E R S T WEST
n / ,
J . '
r
C L u o T c n O T n i r c b u n t o — EA ST » MBRTH « ■ « S T :
= 1 MM B I N S
= EAST u a S flU TH M I W EST —
CLUSTER SURFACE DENSI TY5 0 .
4 5 .
40.
3 5 .
3 0 .
2 5 .
20.1 5 .
10.
5 .
0 .f t f W X U S N W e E R 12 R R CM IN W ID TH )
F ig u re 4.4 .26. {aj Cluster Ring Counts, (b) Quadrant Counts,
(c) Cluster Strip-Counts and (d) Cluster Surface Density.
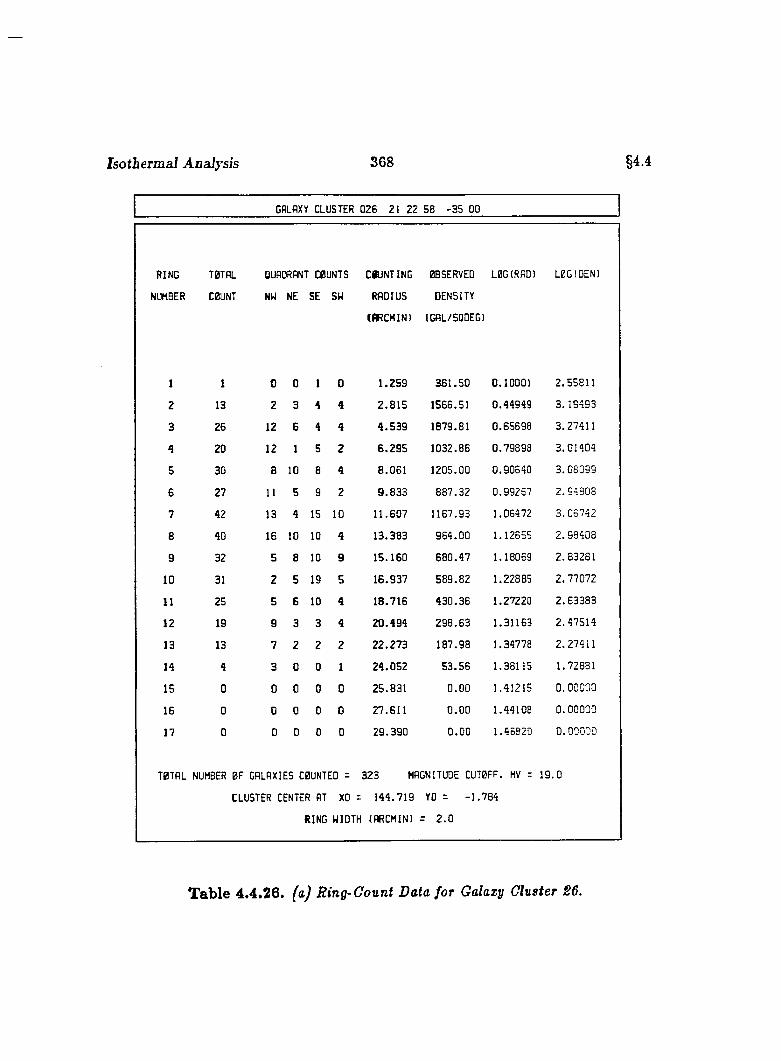
Isotbermal Analysis 368 §4.4
GALAXY CLUSTER 026 21 22 58 -3 5 00
RING TOTAL QUADRANT COUNTS COUNTING OBSERVED LOGIRAD) LOGIDEN)
JMBER COUNT NW NE SE sw RADIUS DENSITY
(RRCMIN) (GAL/SODEG)
1 1 0 0 1 0 1.259 361.50 0.10001 2.55811
2 13 2 3 4 4 2.815 1566.51 0.44949 3.19493
3 26 12 6 4 4 4.539 1879.81 0.65698 3.27411
4 20 12 1 5 2 6.295 1032.86 0.79898 3.01404
5 30 8 10 8 4 8.061 1205.00 0.90640 3.08099
6 27 11 5 9 2 9.833 887.32 0.99287 2.94308
7 42 13 4 15 10 11.607 1167.93 1.06472 3.06742
8 40 16 10 10 4 13.383 964.00 1.12655 2.98408
9 32 5 8 10 9 15.160 680.47 1.18069 2.63281
10 31 2 5 19 5 16.937 589.82 1.22885 2.77072
11 25 5 6 10 4 18.716 430.36 1.27220 2.63383
12 19 9 3 3 4 20.494 298.63 1.31163 2.47514
13 13 7 2 2 2 22.273 187.98 1.34778 2.27411
14 4 3 0 0 1 24.052 53.56 1.38115 1.72881
15 0 0 0 0 0 25.831 O.GO 1.41215 0.00000
16 0 0 0 0 0 27.611 0.00 1.44108 0.00000
17 0 0 0 0 0 29.390 0.00 1.45820 0.00030
TOTAL NUMBER OF GALAXIES COUNTED = 323 MAGNITUDE CUTOFF. MV = 19.0
CLUSTER CENTER AT XD = 144.719 YD = -1.784
RING WIDTH lARCMIN) = 2.0
T ab le 4 .4.26. {aJ Ring-Count Data for Galaxy Cluster S6.
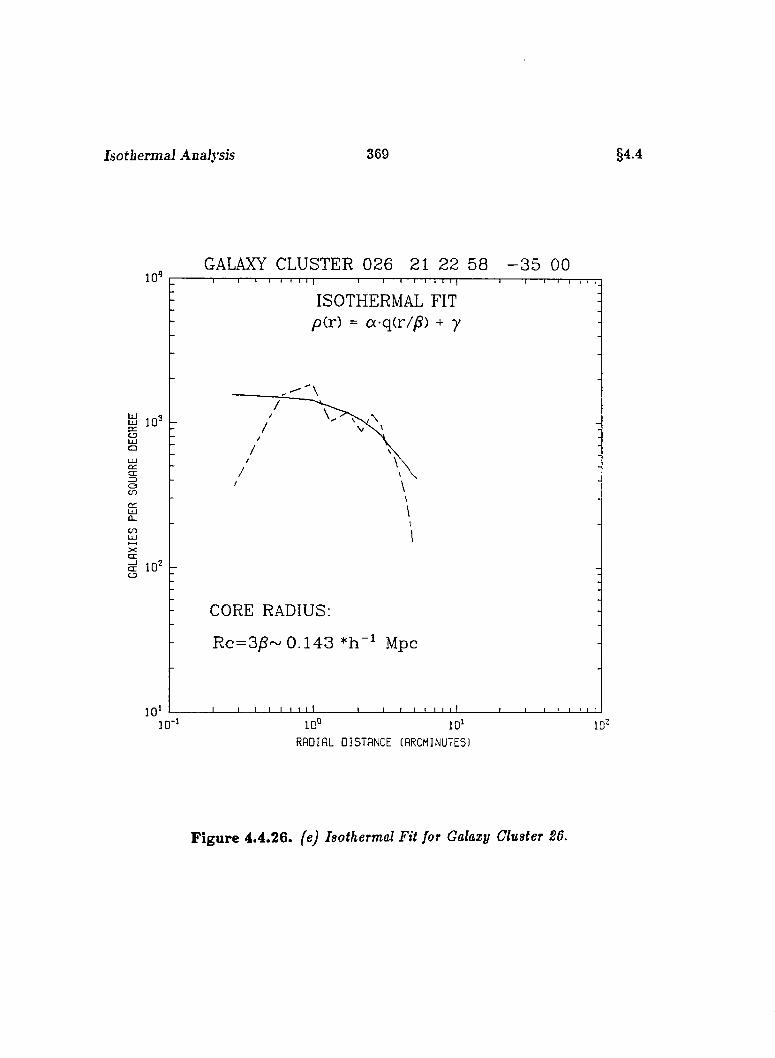
Isotbermal Analysis 369 §4.4
GALAXY CLUSTER 026 21 22 58 - 3 5 0010
ISOTHERMAL FIT /o(r) = a-q(r//S) + 7
DUC3Q
Œ
en
CORE RADIUS:
Rc=3/S~ 0.143 *h Mpc
io‘10° 10 '
RADIAL DISTANCE (ARCMINUTES)
F ig u re 4.4.26. {ej Isothermal Fit for Galaxy Cluster S6.
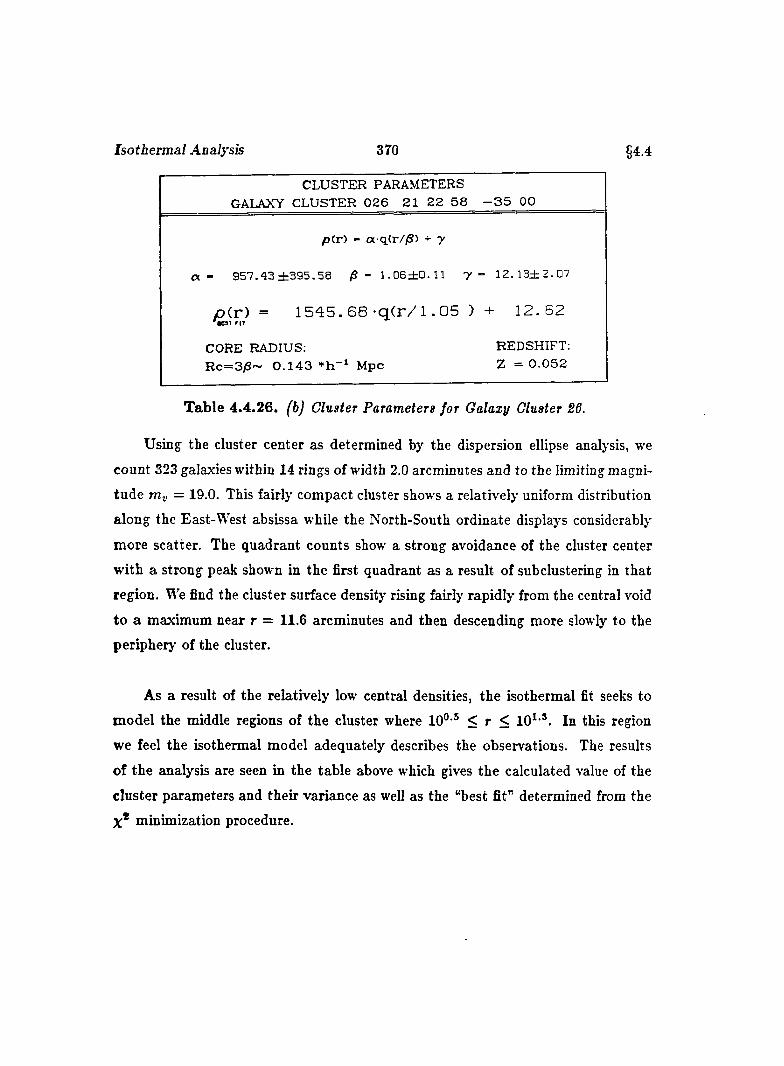
Isotbermal Analysis 370 §4.4
CLUSTER PARAMETERS GALAXY CLUSTER 0 2 6 21 22 5 8 - 3 5 00
p (r) - a q(r//S) + y
a - 9 5 7 . 4 3 ± 3 9 5 . 5 8 /S - 1 . 0 6 ± 0 . 1 1 T = 1 2 . 1 3 ± 2 . 0 7
y o ( r ) = 1 5 4 5 . 6 8 - q ( r / 1 . 0 5 ) + 1 2 . 6 2
CORE RADIUS;R c= 3 /S ~ 0 .1 4 3 Mpc
REDSHIFT; Z = 0 .0 5 2
T able 4.4.26. [h) Cluster Parameters for Galaxy Cluster 26.
Using the cluster center as determined by the dispersion ellipse analysis, we
count 323 galaxies within 14 rings of width 2.0 arcminutes and to the limiting magni
tude m„ = 19.0. This fairly compact cluster shows a relatively uniform distribution
along the East-West absissa while the North-South ordinate displays considerably
more scatter. The quadrant counts show a strong avoidance of the cluster center
with a strong peak shown in the first quadrant as a result of subclustering in that
region. We find the cluster surface density rising fairly rapidly from the central void
to a maximum near r = 11.6 arcminutes and then descending more slowly to the
periphery of the cluster.
As a result of the relatively low central densities, the isothermal fit seeks to
model the middle regions of the cluster where 10°’® < r < 10^’*. In this region
we feel the isothermal model adequately describes the observations. The results
of the analysis are seen in the table above which gives the calculated value of the
cluster parameters and their variance as well as the “best fit” determined from the
X* minimization procedure.
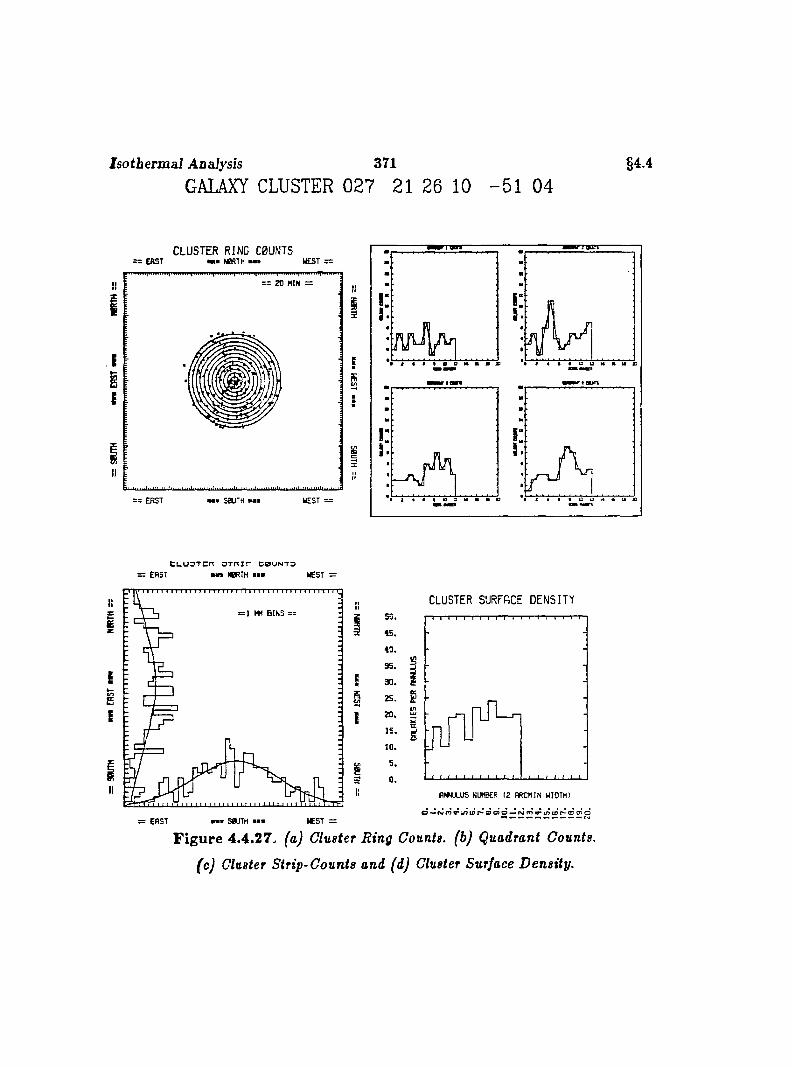
Isotberm al Analysis 371
GALAXY CLUSTER 027 21 26 10 -5 1 04§4.4
CLUSTER RING C0UNT5ERST N0RTH • » WEST %=
rasTT
.......... I.. . . . . . . . . . .20 MIN =
S0UTH
C u u D T c n 3 T n i r c b u n t o
= EA ST N0RTH &CST =
w
I = 1 HM B IN S ==
EBE
II
= E fiS T m s S0ÜTH ■■■ WEST =
5 0 .
45 .
4 0 .
as.
3 0 .
2 5 .
20.
I S ,
10.5.
0 .
CLUSTER SURFACE DENSITY
g
fWMJLUS N W SER 12 RRCMIN WIDTH)
F ig u re 4 .4 .27u (a) Cluster Ring Counts, (b) Quadrant Counts,
(c) Cluster Strip-Counts and (d) Cluster Surface Density.
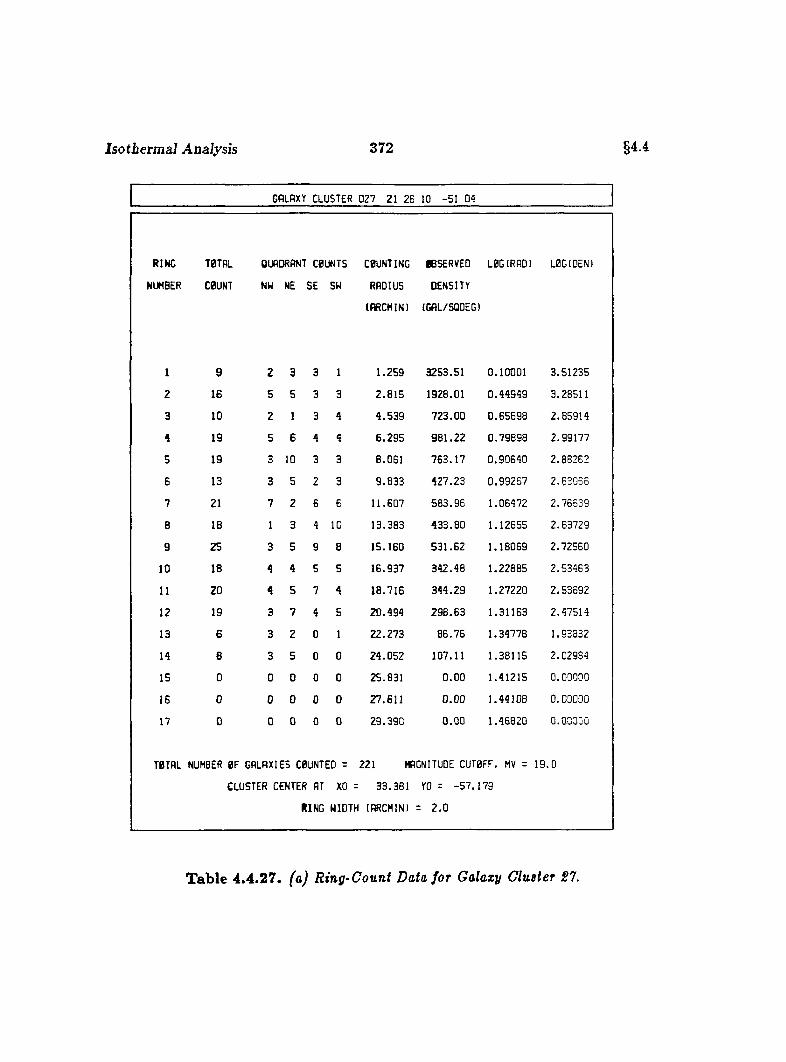
Isotberm al Analysis 372 §4.4
GALAXY CLUSTER 027 21 26 10 -51 04
RING T0TAL QUADRANT C0UNTS COUNTING BSERVED LOGtRAD) LBGtOEN)
NUMBER COUNT NW NE SE SW RADIUS DENSITY
(RRCMIN) (GflL/SQOEG)
1 9 2 3 3 1 1.259 3253.51 0.10001 3.51235
2 16 5 5 3 3 2.815 1928.01 0.44949 3.28511
3 10 2 1 3 4 4.539 723.00 0.65698 2.85914
4 19 5 6 4 4 6.295 981.22 0.79898 2.99177
5 19 3 10 3 3 8.061 763.17 0.90640 2.88262
6 13 3 5 2 3 9.833 427.23 0.99257 2.63066
7 21 7 2 6 6 11.607 583.96 1.06472 2.76639
8 18 1 3 4 10 13.383 433.80 1.12655 2.63729
9 25 3 5 9 8 15.160 531.62 1.18069 2.72560
10 18 4 4 5 5 16.937 342.48 1.22885 2.53463
11 20 4 5 7 4 18.716 344.29 1.27220 2.53592
12 19 3 7 4 5 20.494 298.63 1.31163 2.47514
13 6 3 2 0 1 22.273 86.76 1.34778 1.93832
14 8 3 5 0 0 24.052 107.11 1.38115 2.02984
15 0 0 0 0 0 25.831 0.00 1.41215 0 .00000
16 0 0 0 0 0 27.611 0.00 1.44108 0 .00000
17 0 0 0 0 0 29.390 0.00 1.46820 0 .00300
TOTAL NUMBER OF GALAXIES COUNTED = 221 MAGNITUDE CUTOFF. MV = 19.0
CLUSTER CENTER AT XO = 33.381 YO = -57.179
RING WIDTH IWCMINI = 2.0
T ab le 4 .4.27. (a) Ring-Count Data for Galaxy Cluster £7.
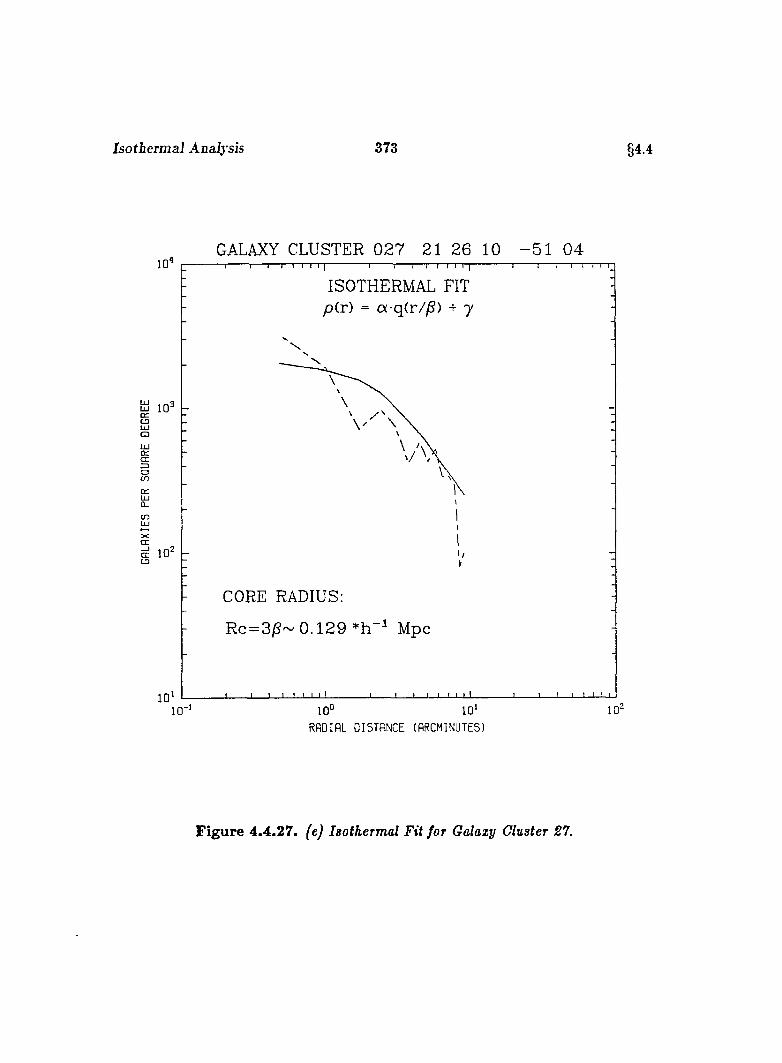
Isothermal Analysis 373 §4.4
GALAXY CLUSTER 0 27 21 26 10 - 5 1 0 410 '
ISOTHERMAL FIT p(r) = a-q(r//S) + y
Ü 10'ULjJQ
CCÜJQ_to
CORE RADIUS:
Rc=3/S~ 0.129 *h Mpc
10° 10RROIfiL DISTANCE (ARCMINUTES)
F ig u re 4.4.27. feJ Isothermal Fit for Galaxy Glaster 21.
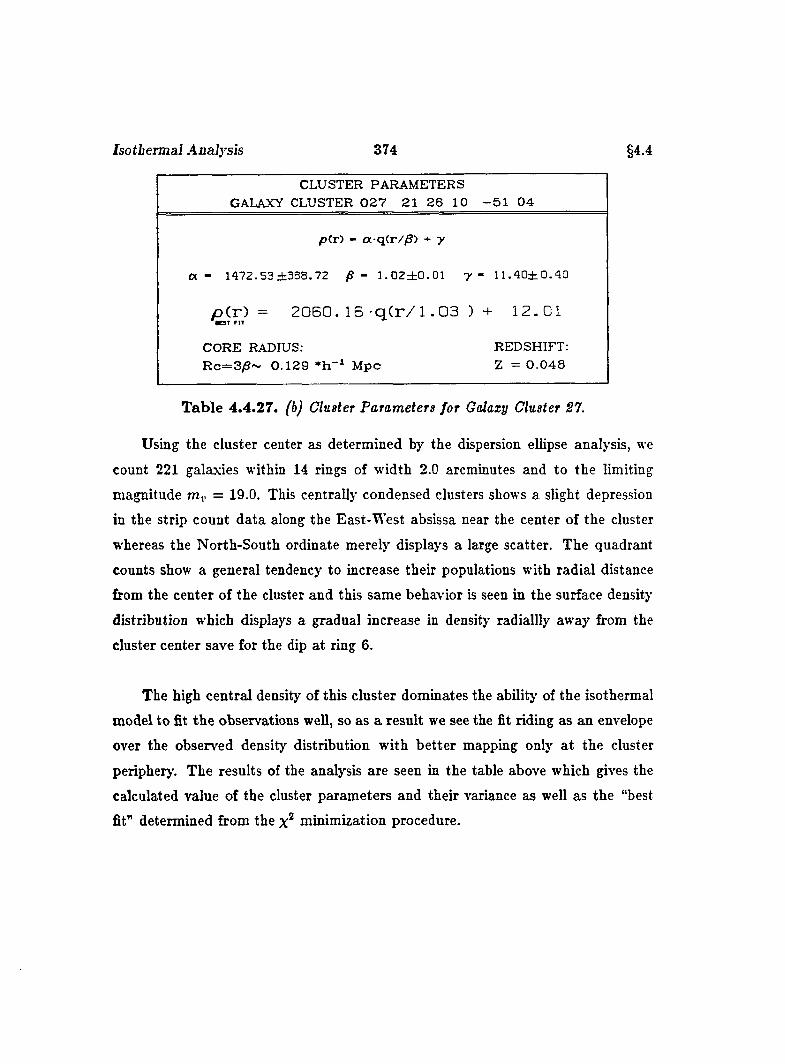
Isothermal Analysis 374 §4.4
CLUSTER PARAMETERS GALAXY CLUSTER 0 2 7 21 2 6 10 - 5 1 0 4
pCr) - oc q(r//S) + y
a - 1472.53 ±388.72 /S - 1 .0 2 ± 0 .0 1 y - n .4 0 ± 0 .4 0
p C r ) = 2 0 6 Ü . 1 6 - q C r / l . 0 3 )•C 5T FIT
+ 1 2 . 0 1
CORE RADIUS; REDSHIFT:R c = 3 /S ~ 0 .1 2 9 M pc Z = 0 .0 4 6
Table 4 .4 .27. (b) Cluster Parameters for Galaxy Cluster S7.
Using the cluster center as determined by the dispersion ellipse analysis, we
count 221 galaxies within 14 rings of width 2.0 arcminutes and to the limiting
magnitude mi, = 19.0. This centrally condensed clusters shows a slight depression
in the strip count data along the East-West absissa near the center of the cluster
whereas the North-South ordinate merely displays a large scatter. The quadrant
counts show a general tendency to increase their populations with radial distance
from the center of the cluster and this same behavior is seen in the surface density
distribution which displays a gradual increase in density radiallly away from the
cluster center save for the dip at ring 6.
The high central density of this cluster dominates the ability of the isothermal
model to fit the observations well, so as a result we see the fit riding as an envelope
over the observed density distribution with better mapping only a t the cluster
periphery’. The results of the analysis are seen in the table above which gives the
calculated value of the cluster parameters and their variance as well as the “best
fit” determined from the x* minimization procedure.
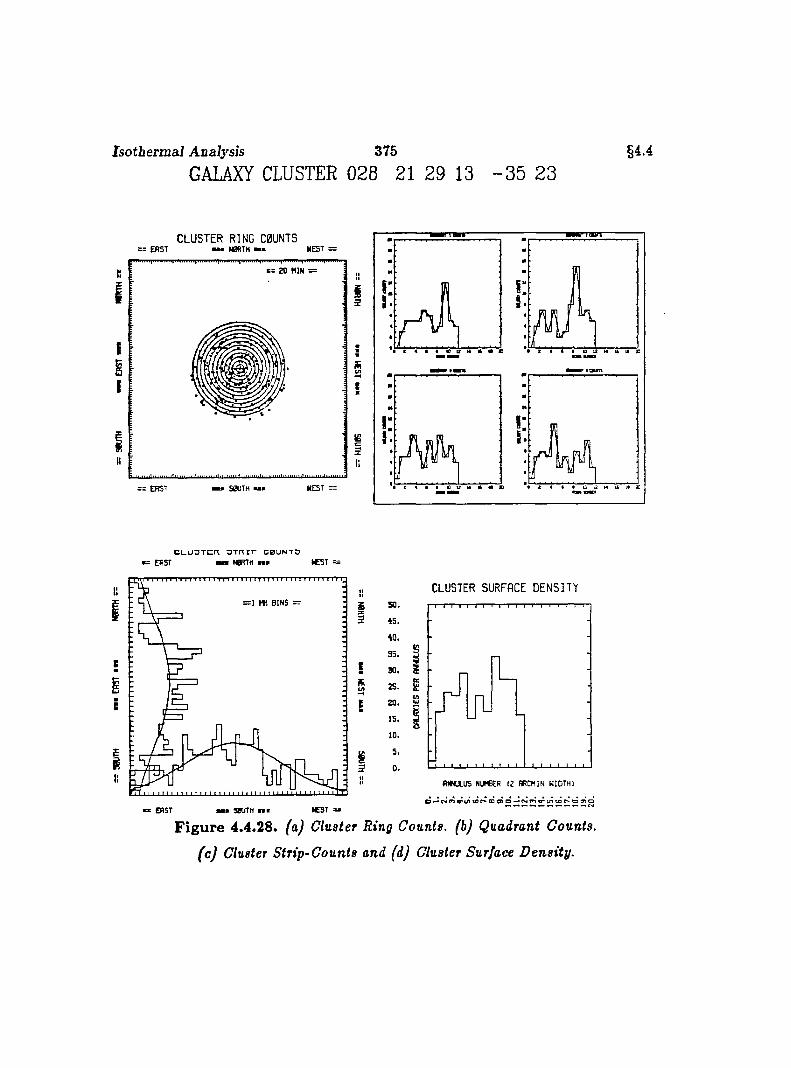
Isotberm al Analysis 375
GALAXY CLUSTER 028 21 29 13 - 3 5 23§4.4
CLUSTER RING C0UNTS= = e r s t mmm N 0R TH H E 5 T
rSBT
s = ZD M IN =
S0U TH= = ERST
c i _ u 3 T c n 3 T R : r c b u n t o
: E R S T M W T M — m N E ST =
= 1 m B I N S =
I
I
I
!
I
CLUSTER SURFACE DENSITY
3 5 . §
2 5 . B
m W U L U S NUMBER IZ R R C ^IIN W ID T H :
EAST mmm S01/T H n m • C 5 T =
F ig u re 4.4.28. (a) Cluster Ring Counts, (b) Quadrant Counts,
(c) Cluster Strip-Counts and (d) Cluster Surface Density.
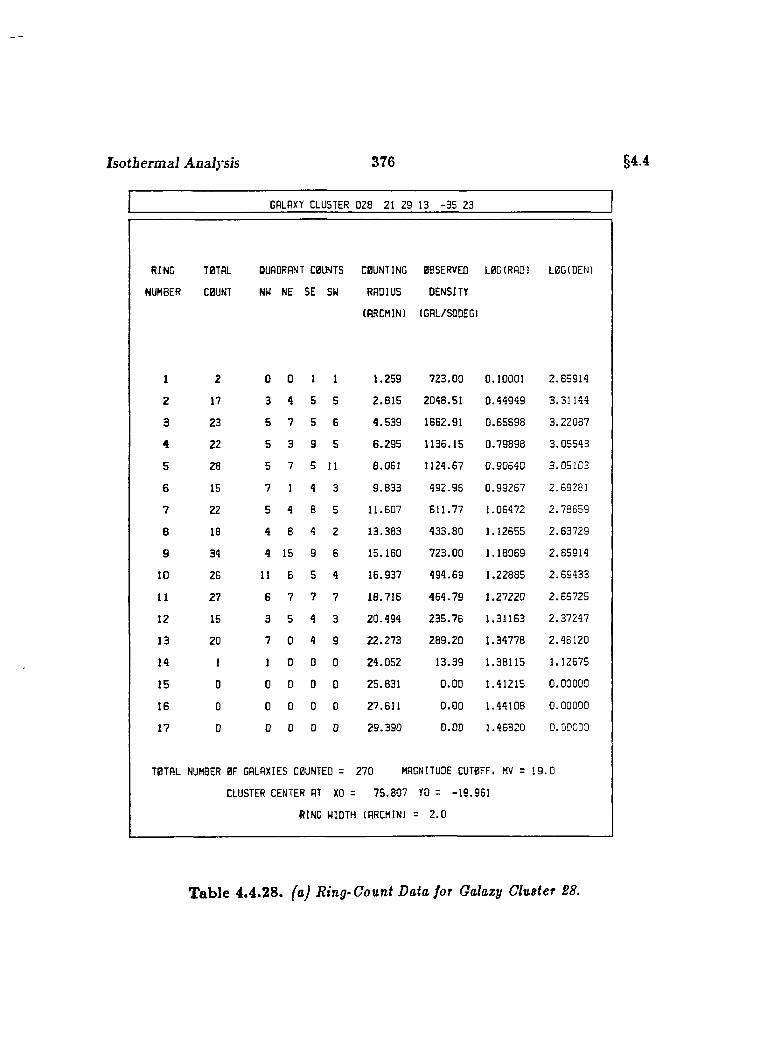
Isotherm al Analysis 376 §4.4
GALAXY CLUSTER 028 21 29 13 -3 5 23
(INC T0TAL QUADRANT C0UNTS COUNTING OBSERVED LOG(RAO) L0G(OEN)
JMBER C0UNT NW NE SE SW RADIUS DENSITY
(RRCMIN) (GAL/SODEG)
1 2 0 0 1 1 1.259 723.00 0.10001 2.85914
2 17 3 4 5 5 2.815 204B.51 0.44949 3.31144
3 23 5 7 5 6 4.539 1862.91 0.65698 3.22087
4 22 5 3 9 5 6.295 1136.15 0.79898 3.05543
5 28 5 7 5 11 8.061 1124.67 0 .9 0 6 4 0 3 .0 5 1 0 3
6 15 7 1 4 3 9.833 492.96 0.99267 2 .6 9281
7 22 5 4 8 5 11.607 611.77 1.06472 2.78659
e 18 4 8 4 2 13.383 433.80 1.12655 2.63729
9 34 4 15 9 6 15.160 723.00 1.18069 2.85914
10 26 11 6 5 4 16.937 494.69 1.22885 2.69433
11 27 6 7 7 7 18.716 464.79 1.27220 2.66725
12 15 3 5 4 3 20.494 235.76 1.31163 2.37247
13 20 7 0 4 9 22.273 289.20 1.34778 2.46120
14 1 1 0 0 0 24.052 13.39 1.38115 1.12675
15 0 0 0 0 0 25.831 0.00 1.41215 0 .0 0 0 0 0
16 0 0 0 0 0 27.611 0.00 1.44108 0 .0 0 0 0 0
17 0 0 0 0 0 29.390 O.OD 1.45820 0 .0 0 0 0 0
T0TRL NUMBER 0F GALAXIES C0UNTED = 270 MAGNITUOE CUT0FF. MV = 19.0
CLUSTER CENTER AT XO = 75.807 YO = -19.961
RING WIOTH (ARCHIN) = 2.0
T able 4.4.28. (a) Ring-Count Data for Galazy Cluster £8.
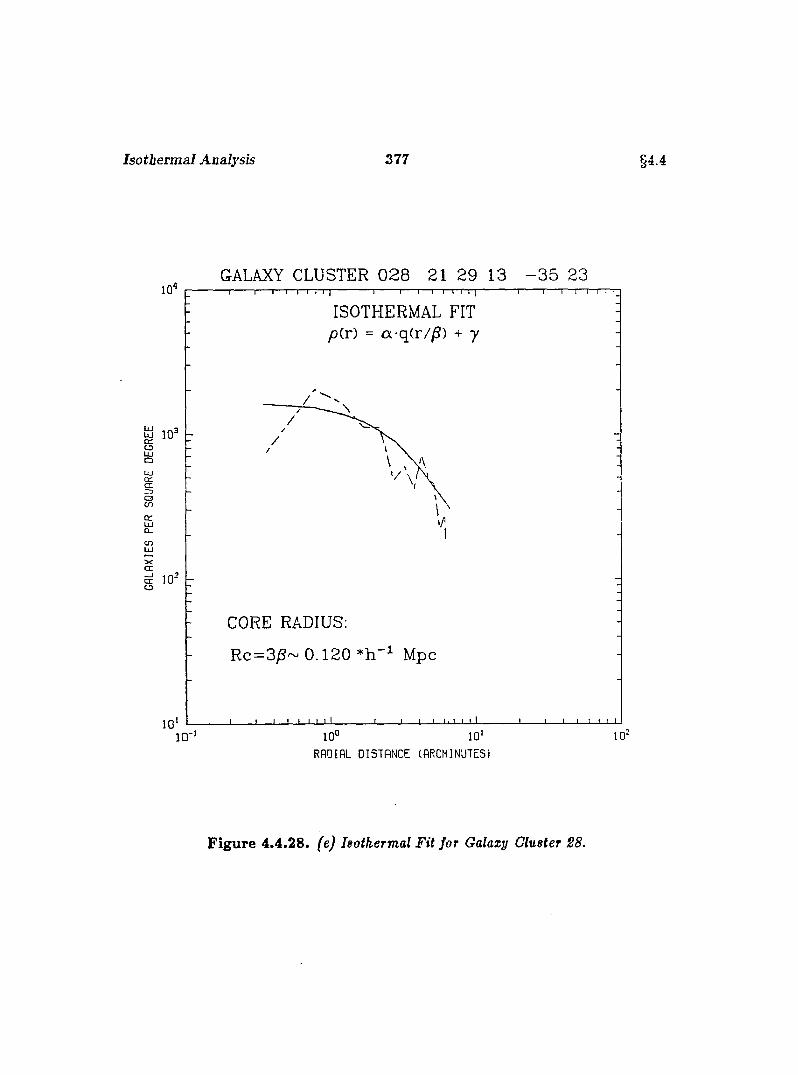
Isotberm al Analysis 377 §4.4
GALAXY CLUSTER 0 2 8 21 29 13 - 3 5 23
ISOTHERMAL FIT pir) = a-q(r//S) + y
y 10'L3ëÜ JQlCE
C3en
coÜJ
I , ,o
CORE RADIUS:
R c= 3^~ 0.120 Mpc
10*10°
RADIAL DISTANCE (ARCMINUTES)
F ig u re 4.4.28. (e) Isothermal Fit for Galazy Cluster 28.
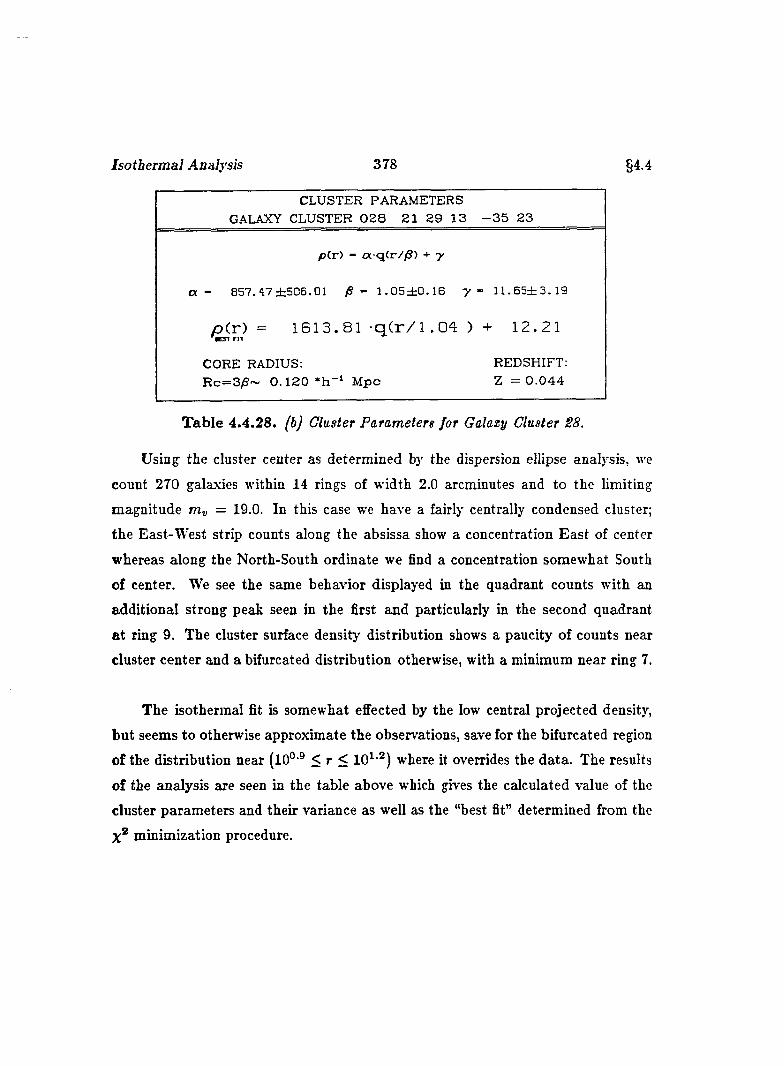
Isothermal Analysis 378 §4.4
CLUSTER PARAMETERSGALAXY CLUSTER 0 2 8 21 2 9 13 - 3 5 23
pCr) - ot q(r//S) + y
a - 8 5 7 . 4 7 ± 5 0 5 . 0 1 /S - 1 . 0 5 ± 0 . 1 6 y - l l . B 5 ± 3 . 1 9
p ( r ) = 1 6 1 3 . 8 1 - q ( r / l . 0 4 ) + 1 2 . 2 1
CORE RADIUS:R c = 3 /S ~ 0 .1 2 0 * h - ‘ M pc
REDSHIFT: Z = 0 .0 4 4
T able 4.4.28. (b) Cluster Parameters for Galaxy Cluster S8.
Using the cluster center as determined by the dispersion ellipse analysis, we
count 270 galaxies within 14 rings of width 2.0 arcminutes and to the limiting
magnitude = 19.0. In this case we have a fairly centrally condensed cluster;
the East-West strip counts along the absissa show a concentration East of center
whereas along the North-South ordinate we find a concentration somewhat South
of center. We see the same behavior displayed in the quadrant counts with an
additional strong peak seen in the first and particularly in the second quadrant
a t ring 9. The cluster surface density distribution shows a paucity of counts near
cluster center and a bifurcated distribution otherwise, with a minimum near ring 7.
The isothermal fit is somewhat effected by the low central projected density,
but seems to otherwise approximate the observations, save for the bifurcated region
of the distribution near {10°’® < r < 10^'^) where it overrides the data. The results
of the analysis are seen in the table above which gives the calculated value of the
cluster parameters and their variance as well as the “best fit” determined from the
X® minimization procedure.
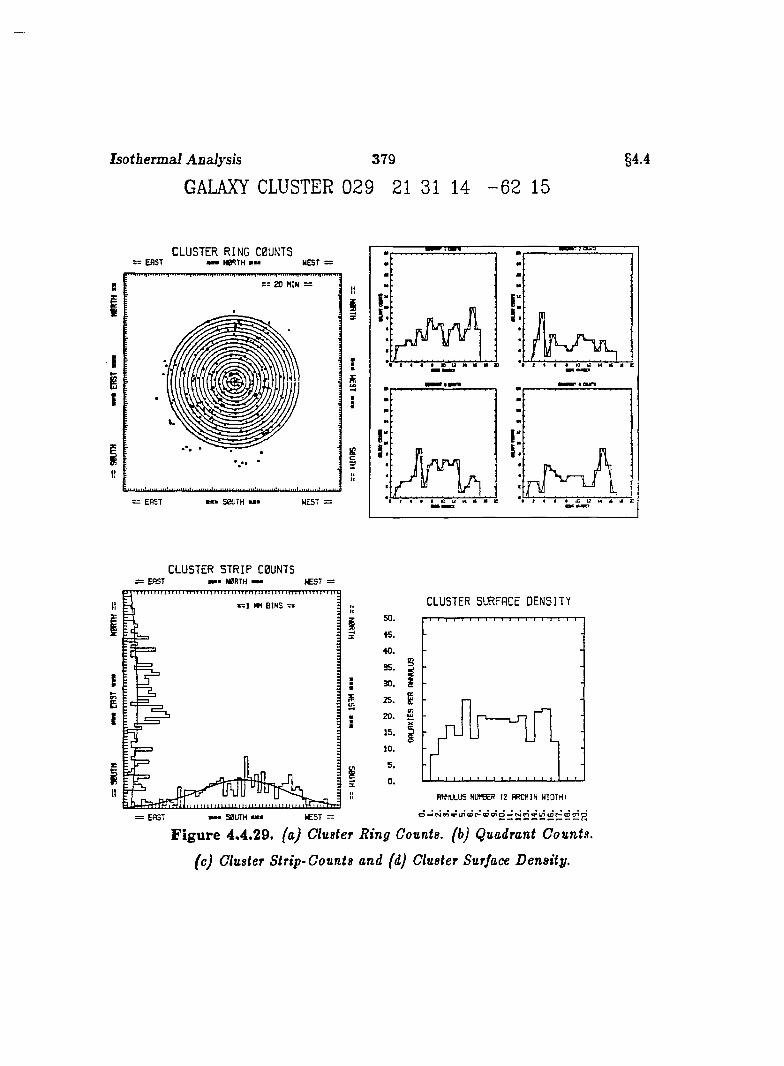
Isotberm al Analysis 379
GALAXY CLUSTER 029 21 31 14 - 6 2 15
§4.4
CLUSTER RING C0UNTS: E A S T mmm W R T H mu W EST =
IHIIHIIIWIIIHIIII'IIIH
2 0 M IN =
— E A S T ■ ■ ■ S 0 U T H I W EST =
II
I
:
:
s
II
CLUSTER S T R IP C0UNTS= E A S T
B I N S - I
IIi
III
= E A ST S B LAM I l E S T -
CLUSTER SURFACE DENSITY
5 0 .
s
B
10.
flwiaus NUMBER 12 RRCM IN H IO T H l
F ig u re 4.4.29. fa j Cluster Ring Counts, (b) Quadrant Counts,
(c) Cluster Strip-Counts and (d) Cluster Surface Density.
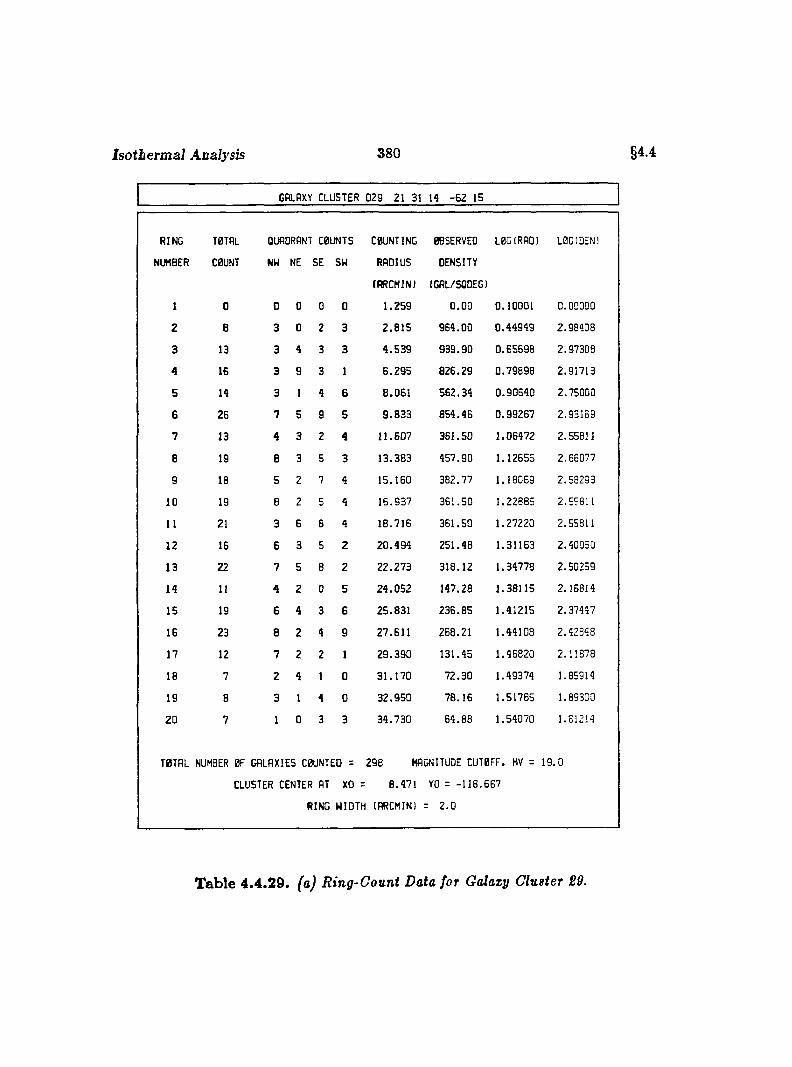
Isotberm al Analysis 380 §4.4
GALAXY CLUSTER 029 21 31 14 -6 2 15
RING T0TAL QUADRANT C0UNTS COUNTING 0BSERVED L0G(RAD) LEGtOENl
NUMBER C0UNT NW NE SE SW RADIUS DENSITY
(RRCMIN) (GAL/SODEG)
1 0 0 0 0 0 1.259 0,00 0.10001 0.00000
2 8 3 0 2 3 2.815 964.00 0.44949 2.98408
3 13 3 4 3 3 4.539 939.90 0.65698 2.97308
4 16 3 9 3 1 6.295 826.29 0.79898 2.91713
5 14 3 1 4 6 8.061 562.34 0.90640 2.75000
6 26 7 5 9 5 9.833 854.46 0.99267 2.93169
7 13 4 3 2 4 11.607 361.50 1.05472 2.55811
8 19 8 3 5 3 13.383 457.90 1.12655 2.65077
9 18 5 2 7 4 15.160 382.77 1.18059 2.58293
10 19 8 2 5 4 16.937 361.50 1.22885 2.55811
11 21 3 6 8 4 18.716 361.50 1.27220 2.55811
12 16 6 3 5 2 20.494 251.48 1.31163 2.40050
13 22 7 5 8 2 22.273 318.12 1.34778 2.50259
14 11 4 2 0 5 24.052 147.28 1.38115 2.16814
15 19 6 4 3 6 25.831 236.85 1.41215 2.37447
16 23 8 2 4 9 27.611 268.21 1.44108 2.42848
17 12 7 2 2 1 29.390 131.45 1.46820 2.11878
18 7 2 4 1 0 31.170 72.30 1.49374 1.85914
19 8 3 1 4 0 32.950 78.16 1.51765 1.89300
20 7 1 0 3 3 34.730 64.88 1.54070 1.61214
T0TAL NUMBER 0F GALAXIES C0UNTED = 298 MAGNITUDE CUT0FF. MV = 19.0
CLUSTER CENTER AT XO = 8.471 YO = -118.667
RING WIDTH (ARCMIN) = 2.0
T able 4 .4.29. (a) Ring-Count Data for Galazy Cluster 29.
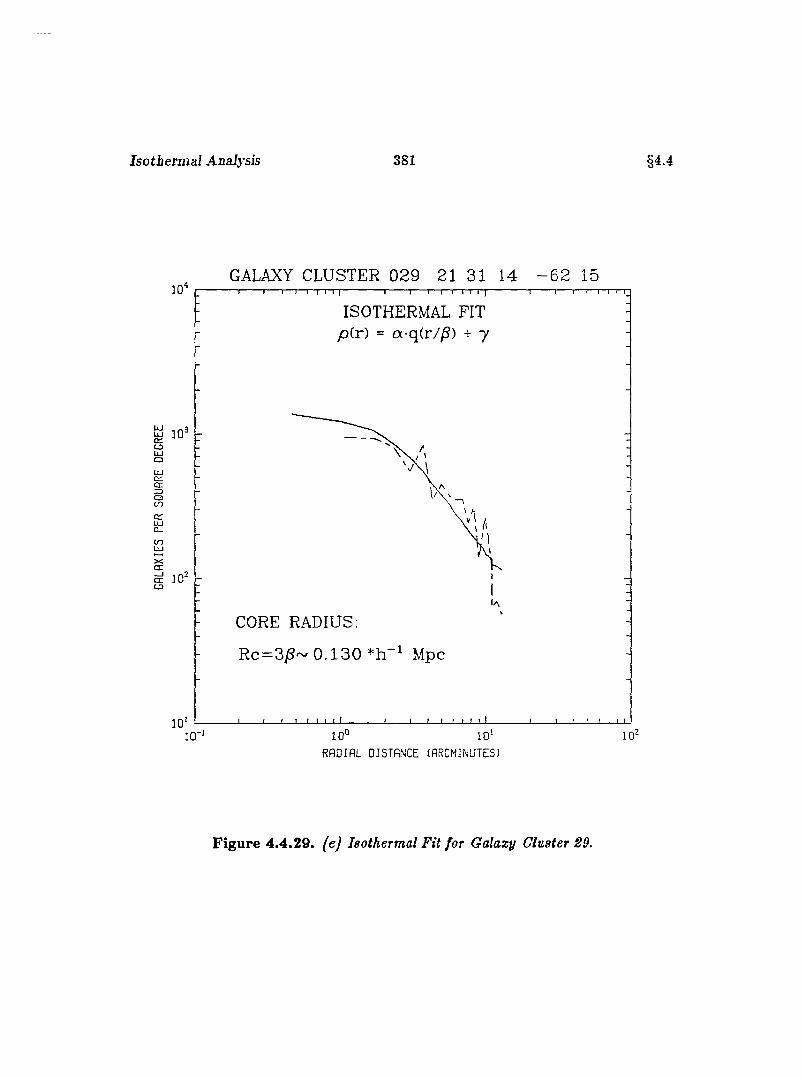
Isotbermal Analysis 381 §4.4
GALAXY CLUSTER 029 21 31 14 - 6 2 1510 '
ISOTHERMAL FIT p(r) = a-q(r//S) + 7
Ü 10OÜJaLUCÜcroto
COÜJc r
CD
CORE RADIUS:
R c=3j8~ 0 . 1 3 0 '•'h Mpc
10'1 0 ° 10' 10'
RADIAL DISTANCE (ARCMINUTES!
F igure 4.4.29. (e) Isothermal Fit for Galaxy Cluster 29.
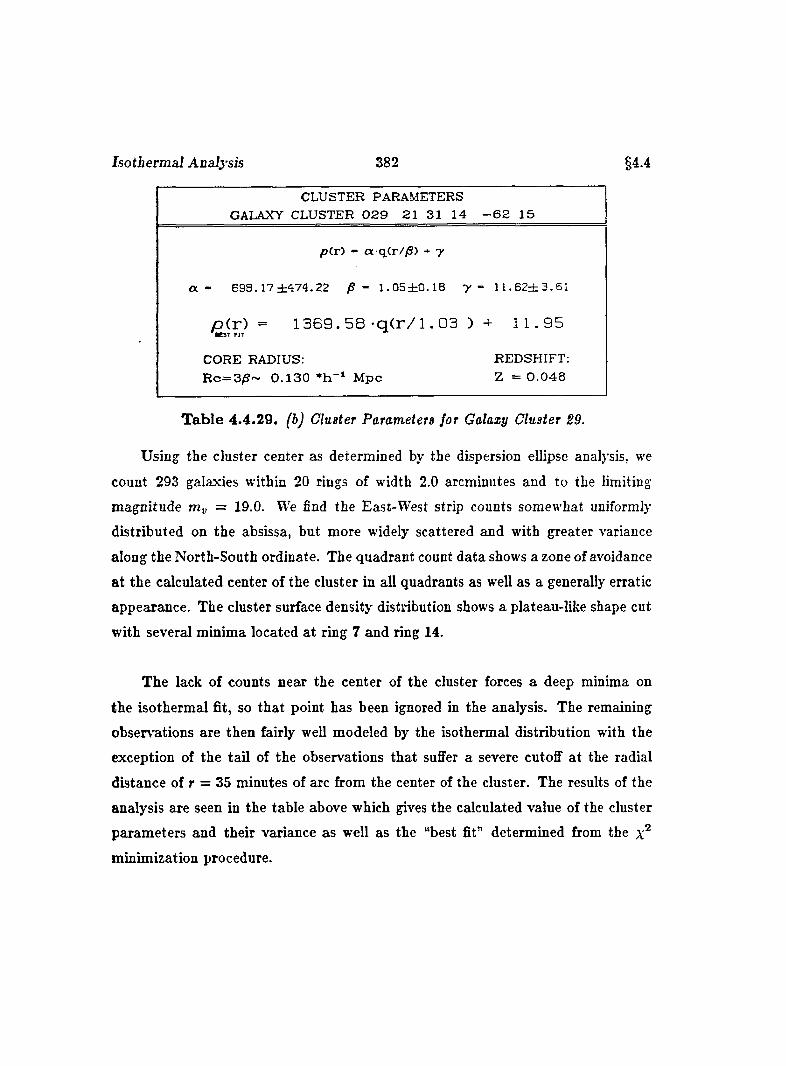
Isotbermal Analysis 382 §4.4
CLUSTER PARAMETERSGALAXY CLUSTER 0 2 9 21 31 14 - 6 2 15
p ( r ) - a q (r //S ) + y
a - 6 9 8 . 1 7 ± 4 7 4 . 2 2 /S - 1 . 0 5 ± 0 . 1 8 y ~ 1 1 . 6 2 ± 3 . 5 1
p ( r ) = 1 3 6 9 . 5 8 - q ( r / 1 . G3 ) + 11.95■ C S1 f l T
CORE RADIUS: REDSHIFT:R c = 3 /S ~ 0 .1 3 0 M pc Z = 0 . 0 4 8
T ab le 4 .4.29. (b) Cluster Parameters for Galaxy Cluster 29.
Usiug the cluster center as determined by the dispersion ellipse analysis, we
count 293 galaxies within 20 rings of width 2.0 arcminutes and to the limiting
magnitude = 19.0. We find the East-West strip counts somewhat uniformly
distributed on the absissa, but more widely scattered and with greater variance
along the North-South ordinate. The quadrant count data shows a zone of avoidance
at the calculated center of the cluster in all quadrants as well as a generally erratic
appearance. The cluster surface density distribution shows a plateau-like shape cut
with several minima located a t ring 7 and ring 14.
The lack of counts near the center of the cluster forces a deep minima on
the isothermal fit, so that point has been ignored in the analysis. The remaining
observations are then fairly well modeled by the isothermal distribution with the
exception of the tail of the observations that suffer a severe cutoff at the radial
distance of r = 35 minutes of arc from the center of the cluster. The results of the
analysis are seen in the table above which gives the calculated value of the cluster
parameters and their variance as well as the “best fit” determined from the
minimization procedure.
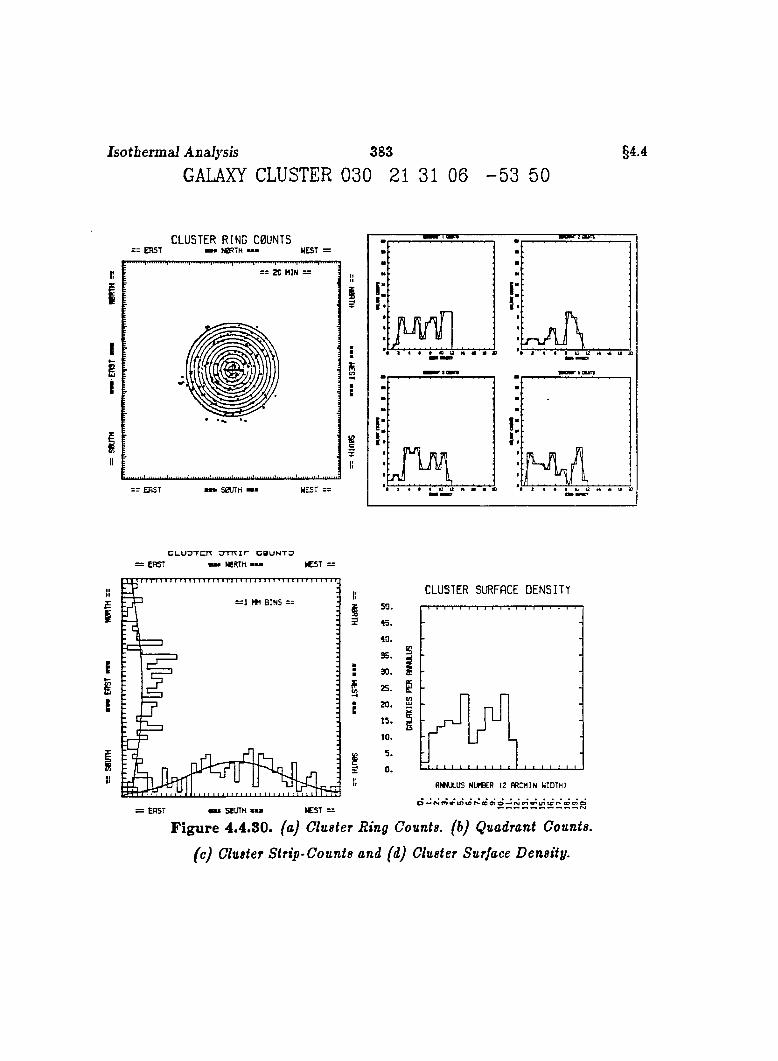
Isotbermal Analysis 383
GALAXY CLUSTER 030 21 31 06 - 5 3 50§4.4
CLUSTER RING C0ÜNTS: ERST MW N0RTH mmm WEST
= = 2 0 M IN =
" . . I . , , ........ I,,
== ERST I S 0U T H mm W EST = =
r r a o r r
II
5
i5
C U U O T C r r O T T T Z r c o u n t s
; ERST «M north mmm »CST =
!!
I —i BINS ==
E
II
:E
CLUSTER SURFACE DENSITY
S
25. Ë
1
flNNULUS NUMBER 12 RRCMIN WIDTH)
: EAST w SOUTH ■■■ EEST —
F ig u re 4.4.30. (a) Cluster Ring Counts, (b) Quadrant Counts,
(c) Cluster Strip-Counts and (d) Cluster Surface Density.
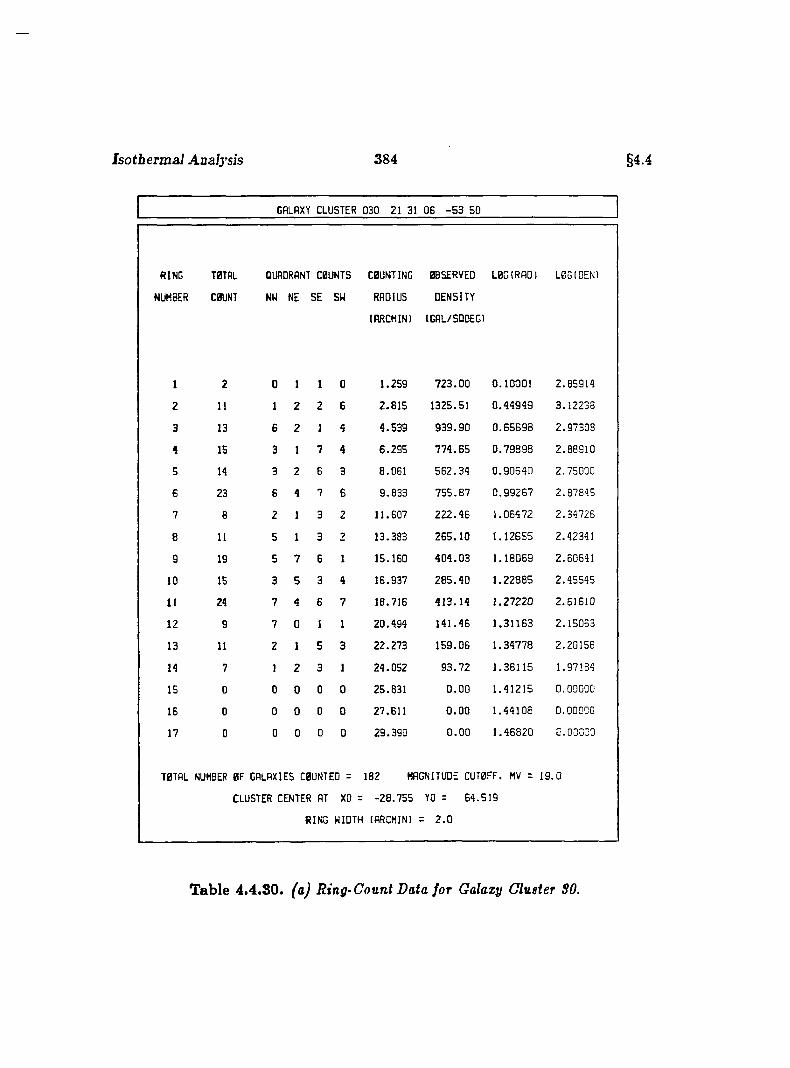
Isotbermal Analysis 384 §4.4
GALAXY CLUSTER 030 21 31 06 -53 50
IING T0TRL QURORRNT C0UNTS COUNTING OBSERVED L0G(RRD) LBG(DEN)
JMBER C0UNT NW NE SE SW RADIUS DENSITY
(ARCMIN) (GAL/SODEG)
1 2 0 1 1 0 1 .2 5 9 7 2 3 .0 0 0 .1 0 0 0 1 2 .8 5 9 1 4
2 11 1 2 2 G 2 .8 1 5 1325 .51 0 .4 4 9 4 9 3 .1 2 2 3 3
3 13 6 2 1 4 4 .5 3 9 9 3 9 .9 0 0 .6 5 6 9 8 2 .9 7 3 0 8
4 15 3 1 7 4 G. 295 7 7 4 .6 5 0 .7 9 8 9 8 2 .8 8 9 1 0
5 14 3 2 6 3 8 .061 5 6 2 .3 4 0 .9 0 5 4 0 2 .7 5 0 0 0
6 23 6 4 7 G 9 .8 3 3 7 5 5 .8 7 0 .9 9 2 6 7 2 .8 7 8 4 5
7 8 2 1 3 2 11 .607 2 2 2 .4 6 1 .0 6 4 7 2 2 .3 4 7 2 6
8 11 5 1 3 2 13 .383 2 6 5 .1 0 1 .1 2 6 5 5 2 .42 3 4 1
9 19 5 7 G 1 15 .160 4 0 4 .0 3 1 .1 8 0 6 9 2 .60 6 4 1
10 15 3 5 3 4 1G.937 2 8 5 .4 0 1 .2 2 8 8 5 2 .4 5 5 4 5
11 24 7 4 G 7 18 .716 4 1 3 .1 4 1 .2 7 2 2 0 2 .6 1 6 1 0
12 9 7 0 1 1 2 0 .4 9 4 1 4 1 .4 6 1 .3 1 1 6 3 2 .1 5 0 6 3
13 11 2 1 5 3 2 2 .2 7 3 1 5 9 .0 6 1 .3 4 7 7 8 2 .2 0 1 5 6
14 7 1 2 3 1 2 4 .0 5 2 9 3 .7 2 1 .3 8 1 1 5 1 .97184
15 0 0 0 0 0 25 .831 0 .0 0 1 .4 1 2 1 5 0 .0 0 0 0 0
16 0 0 0 0 0 27 .611 0 .0 0 1 .4 4 1 0 8 0 .0 0 0 0 0
17 0 0 0 0 0 2 9 .3 9 0 0 .0 0 1 .4 6 8 2 0 0 .0 0 0 0 0
T0TRL NUMBER 0F GALAXIES C0UNTEO = 182 MAGNITUDE CUT0FF. MV = 1 9 .0
CLUSTER CENTER AT XO = -2 8 .7 5 5 YO = 6 4 .5 1 9
RING WIDTH (RRCMIN) = 2 .0
Table 4.4.80. faj Ring-Count Data for Galaxy Cluster SO.

Isotbermal Analysis 385 §4.4
GALAXY CLUSTER 0 3 0 21 31 06 - 5 3 5010'
ISOTHERMAL FIT /D(r) = a-q(r//S) + 7
Occe x
oCO
CO
CORE RADIUS;
R c = 3 ^ ~ 0 .1 3 6 *h Mpc
10'
RADIAL DISTANCE (ARCMINUTES)
F ig u re 4.4.30. {eJ Isothermal Fit for Galaxy Cluster SO.
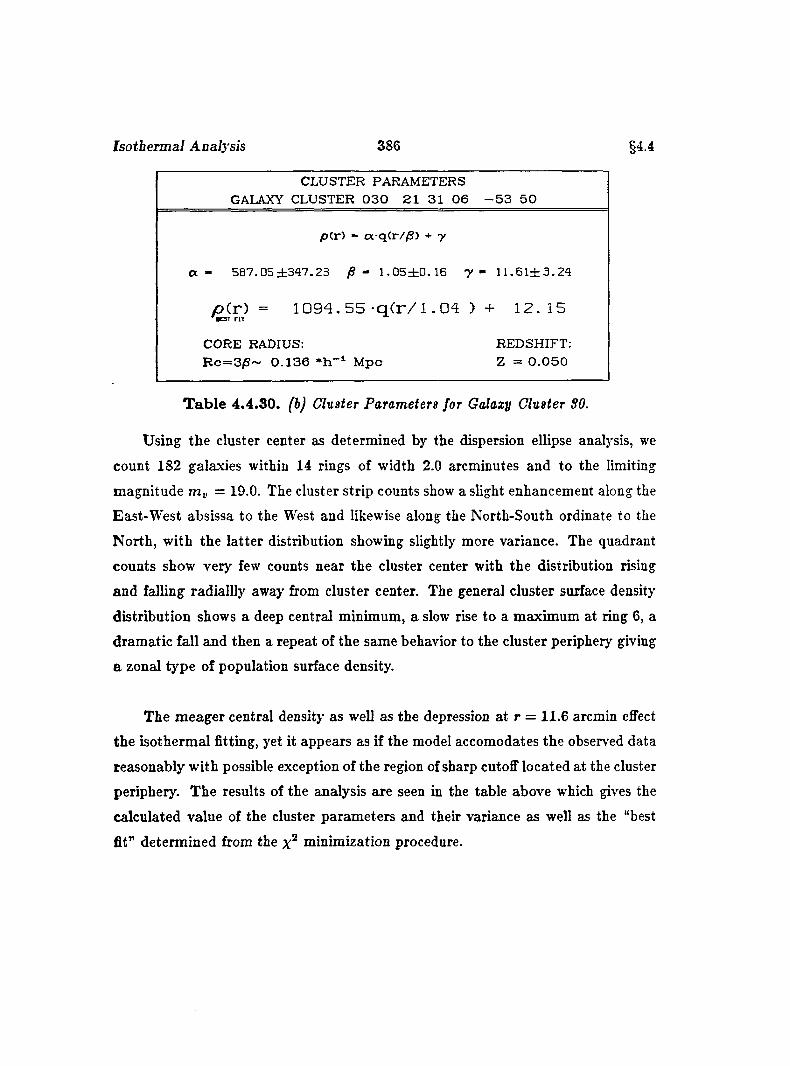
Isothermal Analysis 386 §4 4
CLUSTER PARAMETERS _______ GALAXY CLUSTER 0 3 0 2 1 31 0 6 - 5 3 5 0
p(.r) - cx q ( r / /S ) + y
a - 5 8 7 . 0 5 ± 3 4 7 . 2 3 /S - 1 . 0 5 ± D . 1 6 7 - 1 1 . 6 1 ± 3 . 2 4
/0 (r) = 1 G 9 4 .5 5 -q ( r / l .04 ) + 12.15
CORE RADIUS:R c = 3 /S ~ 0 .1 3 6 * h - i M pc
REDSHIFT; Z = 0 .0 5 0
T a b le 4.4.30. (b) Cluster Parameters for Galaxy Cluster SO.
Using the cluster center as determined by the dispersion ellipse analysis, we
count 182 galaxies within 14 rings of width 2.0 arcminutes and to the limiting
magnitude = 19.0. The cluster strip counts show a slight enhancement along the
East-W est absissa to the West and likewise along the North-South ordinate to the
North, with the latter distribution showing slightly more variance. The quadrant
counts show very few counts near the cluster center with the distribution rising
and falling radiallly away from cluster center. The general cluster surface density
distribution shows a deep central minimum, a slow rise to a maximum at ring 6, a
dram atic fall and then a repeat of the same behavior to the cluster periphery giving
a zonal type of population surface density.
The meager central density as well as the depression at r = 11.6 arcmin effect
the isothermal fitting, yet it appears as if the model accomodates the observed data
reasonably with possible exception of the region of sharp cutoff located at the cluster
periphery. The results of the analysis are seen in the table above which gives the
calculated value of the cluster parameters and their variance as well as the "best
fit” determined from the minimization procedure.
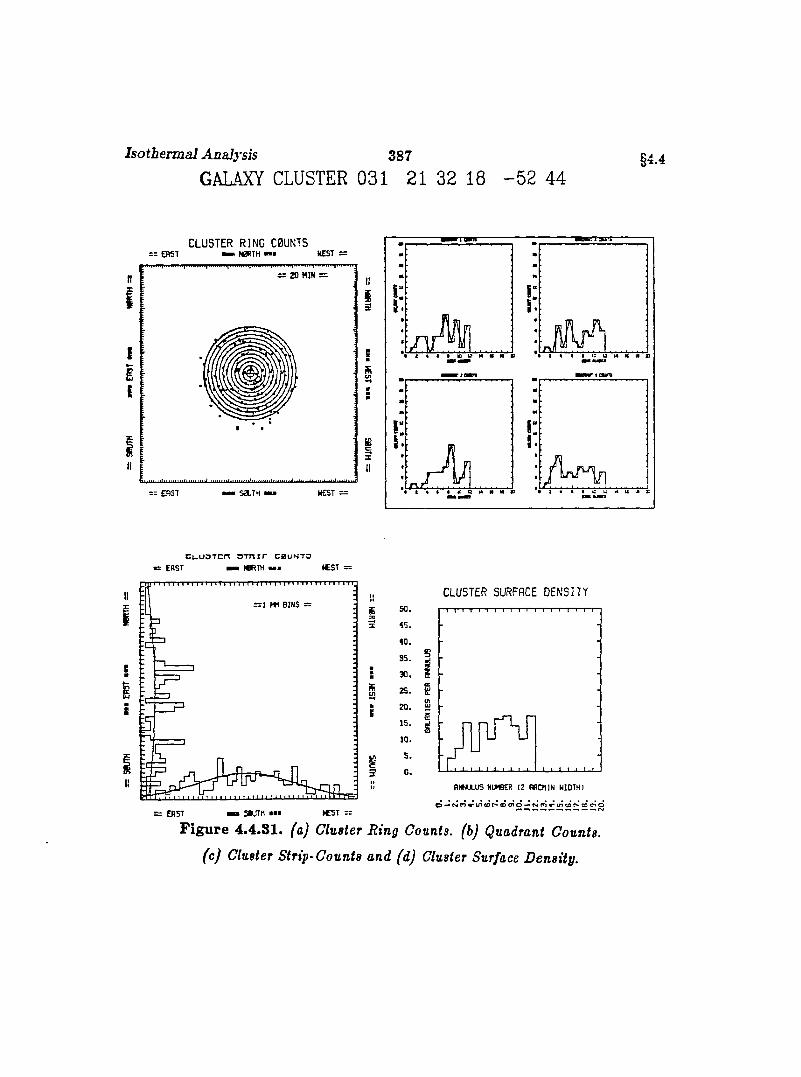
Isothermal Analysis 387
GALAXY CLUSTER 031 21 32 18 - 5 2 44§4.4
CLUSTER RING C0UNTS; ERST ■— N0RTH WEST :
c s 2 0 M IN =
AS aJT H
c t - u o T C P ç D T n i r c b u n t d EAST M N0RTH mm. »CST “
II= 1 W BINS =
5
i
li
!:
= E B S T SKJTM tC S T = :
CLUSTER SURFACE DENSITY
c
É
fiN N a U S NUMBER 12 BRCMIN WIDTH)
F ig u re 4.4.81. (a) Cluster Ring Counts, (b) Quadrant Counts,
(c) Cluster Strip-Counts and (d) Cluster Surface Density.
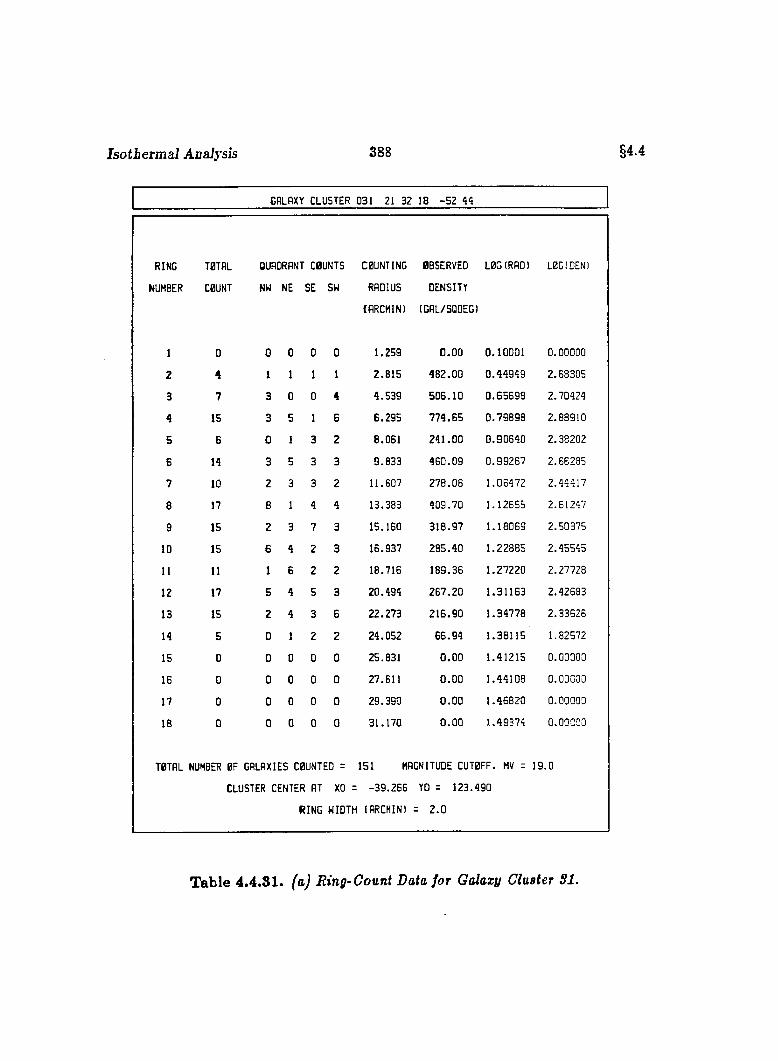
Isothermal Analysis 388 §4.4
GALAXY CLUSTER 031 21 32 18 -52 49
RING TOTAL OUAORANT COUNTS COUNTING OBSERVED LOG(RAO) LOG(DEN)
NUMBER COUNT NW NE SE SW RADIUS DENSITY
(ARCMIN) (GAL/SQDEG)
1 0 0 0 0 0 1 .259 0 .0 0 0 .1 0 0 0 1 0 .00000
2 4 1 1 1 1 2 .8 1 5 4 8 2 .0 0 0 .4 4 9 4 9 2 .68 3 0 5
3 7 3 0 0 4 4 .5 3 9 5 0 6 .1 0 0 .5 5 6 9 8 2 .70424
4 15 3 5 1 6 6 .2 9 5 7 7 4 .6 5 0 .7 9 8 9 8 2 .88910
5 6 0 1 3 2 8 .061 2 4 1 .0 0 0 .9 0 6 4 0 2.38202
6 14 3 5 3 3 9 .8 3 3 4 6 0 .0 9 0 .9 9 2 6 7 2.66285
7 10 2 3 3 2 11.607 2 7 8 .0 8 1 .0 6 4 7 2 2 .44417
8 17 8 1 4 4 13.383 4 0 9 .7 0 1 .1 2 6 5 5 2 .61247
9 15 2 3 7 3 15 .160 3 1 8 .9 7 1 .1 8 0 6 9 2 .50375
10 15 6 4 2 3 16.937 2 8 5 .4 0 1 .2 2 8 8 5 2 .45545
11 11 1 6 2 2 18.716 1 8 9 .3 6 1 .2 7 2 2 0 2.27728
12 17 5 4 5 3 2 0 .4 9 4 2 6 7 .2 0 1 .3 1 1 6 3 2 .42683
13 15 2 4 3 6 2 2 .2 7 3 2 1 6 .9 0 1 .3 4 7 7 8 2 .33 6 2 6
14 5 0 1 2 2 2 4 .0 5 2 6 6 .9 4 1 .3 8 1 1 5 1.82572
15 0 0 0 0 0 25 .831 0 .0 0 1 .4 1 2 1 5 0 . 0 0 0 0 0
16 0 0 0 0 0 27.611 0 .0 0 1 .4 4 1 0 8 0 . 0 0 0 0 0
17 0 0 0 0 0 29 .3 9 0 0 .0 0 1 .4 6 8 2 0 0 . 0 0 0 0 0
18 0 0 0 0 0 3 1 .1 7 0 0 .0 0 1 .4 9 3 7 4 0 . 0 0 0 0 0
TOTAL NUMBER OF GALAXIES COUNTED = 151 MAGNITUDE CUTOFF. MV = 1 9 .0
CLUSTER CENTER AT xo = -3 9 .2 6 6 YD = 123 .490
RING WIDTH (ARCMIN) = 2 .0
T able 4.4.31. (a) Eing-Count Data for Galaxy Cluster SI.

Isothermal Analysis 389
GALAXY CLUSTER 031 21 32 18 - 5 2 44
ISOTHERMAL FIT p(r) = a-q(r//S) + 7
^ 1 0CD5
Œa0 0
cn
XCE
Π10' CD
CORE RADIUS;
Rc=3jS~ 0 .1 1 9 *h Mpc
RADIAL DISTANCE (ARCMINUTES)
F igu re 4.4.81. fej Isothermal Fit for Galaxy Cluster SI.
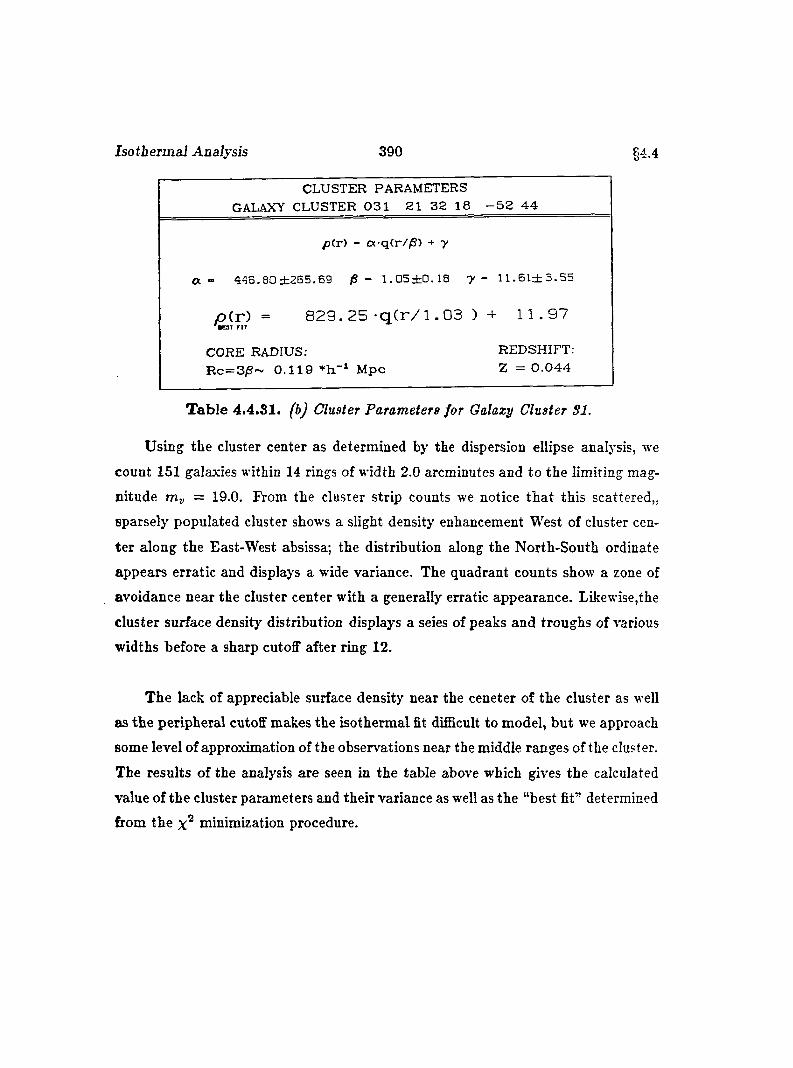
Isotbermal Analysis 390 §4^
CLUSTER PARAMETERS _______GALAXY CLUSTER 0 3 1 21 3 2 18 - 5 2 4 4
p C r ) - £x q ( r / / S ) + 7
a - 4 4 6 . 8 0 ± 2 6 5 . 6 9 /S - l . G 5 ± 0 . 1 8 7 - 1 1 . 6 1 ± 3 . 5 5
yO(r) = 829. 2 5 - q ( r / l .03 ) + 11.97
CORE RADIUS;R c= 3 /S ~ 0 .1 1 9 * l i - i M pc
REDSHIFT: Z = 0 .0 4 4
T ab le 4.4.31. fbj Cluster Parameters for Galaxy Cluster SI.
Using the cluster center as determined by the dispersion ellipse analysis, we
count 151 galaxies within 14 rings of width 2.0 arcminutes and to the limiting mag
nitude rriy = 19.0. From the cluster strip counts we notice th a t this scattered,,
sparsely populated cluster shows a slight density enhancement West of cluster cen
ter along the East-West absissa; the distribution along the North-South ordinate
appears erratic and displays a wide variance. The quadrant counts show a zone of
avoidance near the cluster center with a generally erratic appearance. Likewise,the
cluster surface density distribution displays a seies of peaks and troughs of various
widths before a sharp cutoff after ring 12.
The lack of appreciable surface density near the ceneter of the cluster as well
as the peripheral cutoff makes the isothermal fit difficult to model, but we approach
some level of approximation of the observations near the middle ranges of the cluster.
The results of the analysis are seen in the table above which gives the calculated
value of the cluster parameters and their variance as well as the “best fit” determined
from the minimization procedure.
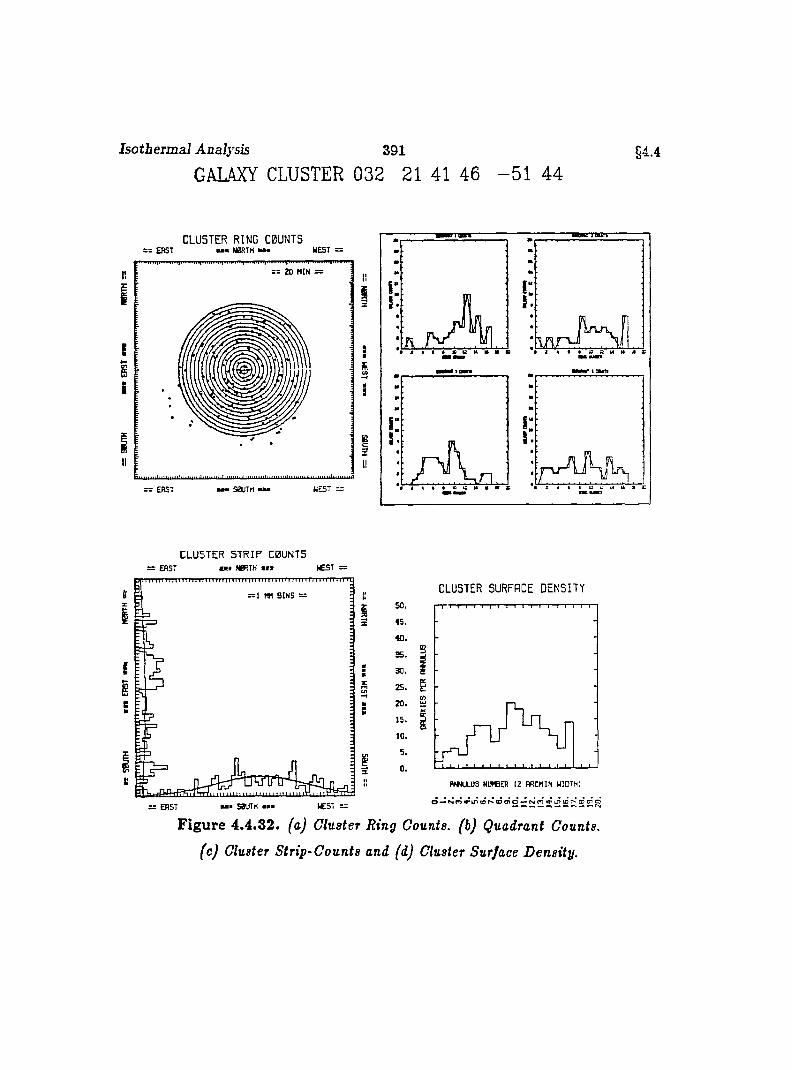
Isotbermal Analysis 391
GALAXY CLUSTER 032 21 41 46 - 5 1 44S44
CLUSTER RING COUNTS= = E R S T m m . n o r t h mmu W EST :
= = 2 0 M IN =
SOUTH= = ERST
IÎ
Is
:
III
CLUSTER STRIP C0UNTS: ERST W RTH M « tC S T
e — 1 MM B IN S =
I
f
e
L■■■ SOUTH= ERST
CLUSTER SURFACE DENSITY50.
53 5 .
3 0 .
c r
i
0.RfM JLUS NWBER 12 RRCMIN WIDTH)
O « ^ N ( n « * m w r > c o o ) o « ^ c s n « * m ( 0 r ^ c D 7 ^ Q
F ig u re 4.4.32. (a) Cluster Ring Counts, (b) Quadrant Counts,
(c) Cluster Strip-Counts and (d) Cluster Surface Density.
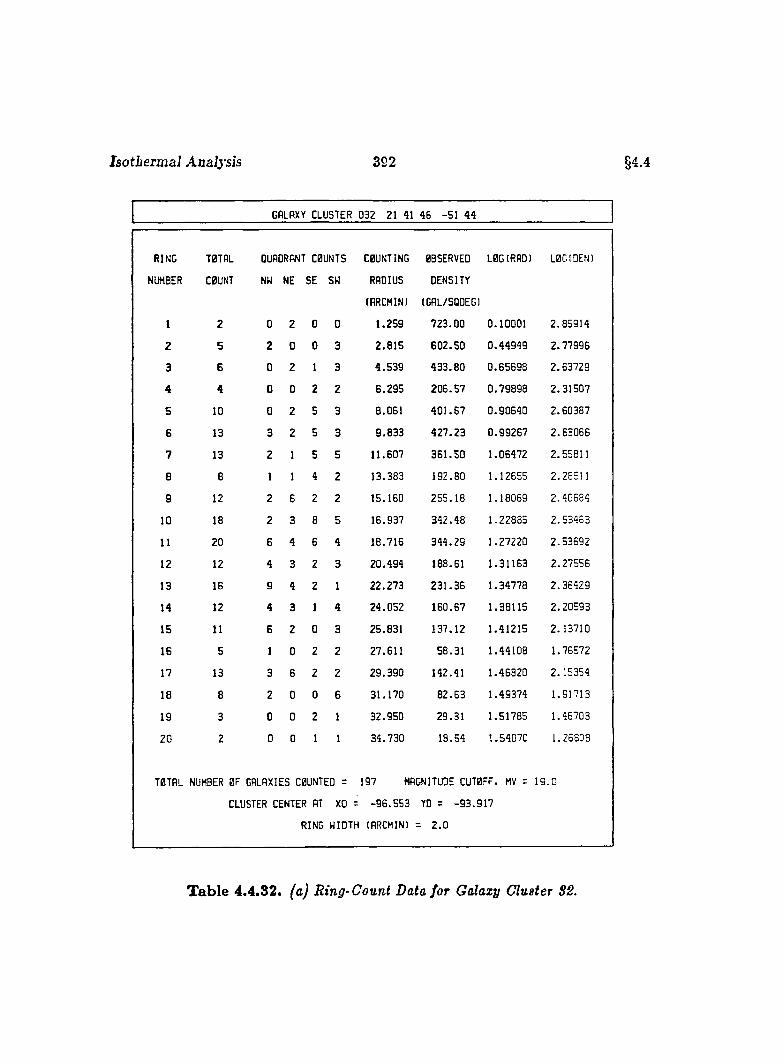
Isothermal Analysis 392 §4.4
GALAXY CLUSTER 032 21 41 46 -51 44
RING TOTAL QUADRANT COUNTS COUNTING OBSERVED LOG(RAD) L0C1OEN)
NUMBER COUNT NW NE SE SW RADIUS DENSITY
(ARCMIN) (GRL/SQOEG)
1 2 0 2 0 0 1 .2 5 9 7 2 3 .0 0 0 .1 0 0 0 1 2 .8 5 9 1 4
2 5 2 0 0 3 2 .8 1 5 6 0 2 .5 0 0 .4 4 9 4 9 2 .7 7 9 9 6
3 6 0 2 1 3 4 .5 3 9 4 3 3 .8 0 0 .6 5 6 9 8 2 .6 3 7 2 9
4 4 0 0 2 2 6 .2 9 5 2 0 6 .5 7 0 .7 9 8 9 8 2 .3 1 5 0 7
5 10 0 2 5 3 8 .0 6 1 4 0 1 .6 7 0 .9 0 6 4 0 2 .6 0 3 8 7
6 13 3 2 5 3 9 .8 3 3 4 2 7 .2 3 0 .9 9 2 6 7 2 .6 3 0 6 6
7 13 2 1 5 5 1 1 .607 3 6 1 .5 0 1 .0 6 4 7 2 2 .55811
6 8 1 1 4 2 1 3 .3 8 3 1 9 2 .8 0 1 .12655 2 .28511
9 12 2 6 2 2 1 5 .160 2 5 5 .1 8 1 .1 8 0 6 9 2 .4 0 6 8 4
10 18 2 3 6 5 1 6 .937 3 4 2 .4 8 1 .2 2 8 8 5 2 .5 3 4 6 3
11 20 6 4 6 4 1 8 .7 1 6 3 4 4 .2 9 1 .2 7 2 2 0 2 .5 3 6 9 2
12 12 4 3 2 3 2 0 .4 9 4 188 .61 1 .3 1 1 6 3 2 .2 7 5 5 6
13 IS 9 4 2 1 2 2 .2 7 3 2 3 1 .3 6 1 .3 4 7 7 8 2 .3 5 4 2 9
14 12 4 3 1 4 2 4 .0 5 2 1 6 0 .6 7 1 .3 8 1 1 5 2 .2 0 5 9 3
15 11 6 2 0 3 2 5 .831 1 3 7 .1 2 1 .4 1 2 1 5 2 .1 3 7 1 0
16 5 1 0 2 2 2 7 .611 5 8 .3 1 1 .4 4 1 0 8 1 .76572
17 13 3 6 2 2 2 9 .3 9 0 142 .41 1 .4 6 8 2 0 2 . 15354
18 8 2 0 0 6 3 1 .1 7 0 8 2 .6 3 1 .4 9 3 7 4 1 .91713
19 3 0 0 2 1 3 2 .9 5 0 2 9 .3 1 1 .5 1 7 8 5 1 .46703
20 2 0 0 1 1 3 4 .7 3 0 18 .5 4 1 .5 4 0 7 0 1 .26808
TOTAL NUMBER OF GALAXIES COUNTED = 197 MAGNITUDE CUTOFF. MV = 1 9 .0
CLUSTER CENTER AT XO = -9 6 .5 5 3 YO = -9 3 .9 1 7
RING WIDTH (RRCMIN) = 2 .0
T ab le 4.4.32. faj Ring-Gount Data for Galaxy Cluster S2.

Isothermal Analysis 393 &L4
GALAXY CLUSTER 032 21 41 46 - 5 1 44
DlO
at:ŒZDaCDtrLlJO -
cnU JXŒCECD
ISOTHERMAL FIT p(r) = a-q(r/)S) + y
CORE RADIUS:
Rc=3j8~ 0 .1 1 7 Mpc
10 '1 0 '10°
RADIAL DISTANCE (ARCMINUTES)
F igu re 4.4.32. (e) Isothermal Fit for Galaxy Cluster S2.
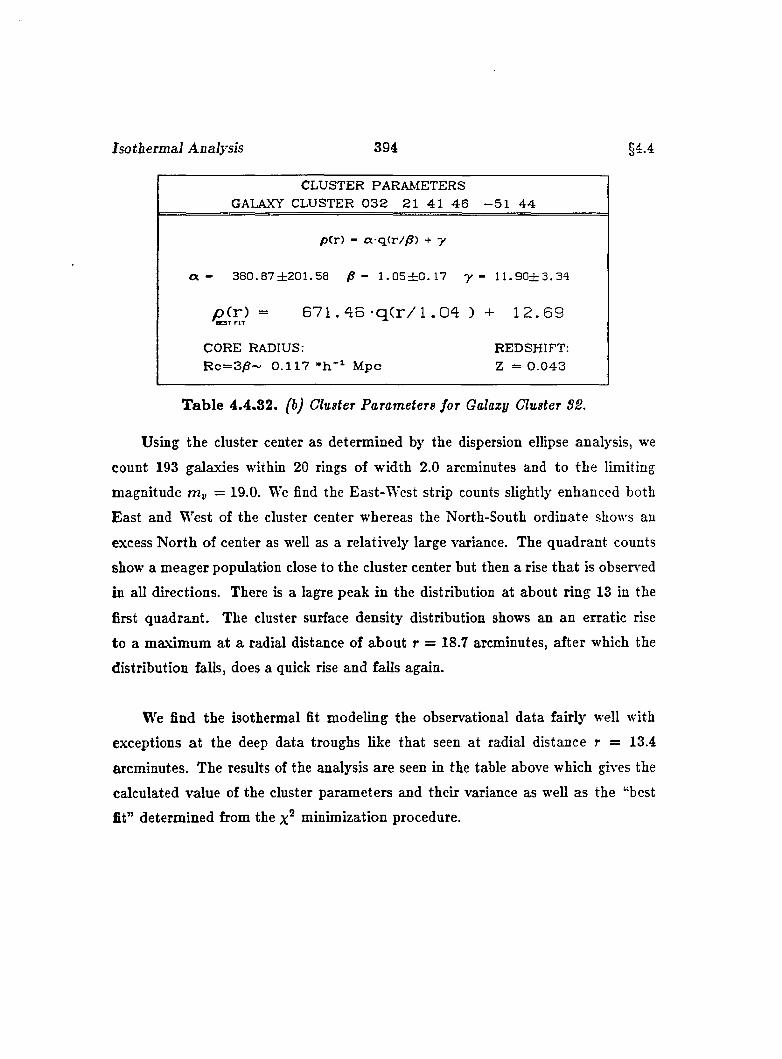
Isothermal Analysis 394 §4.4
CLUSTER PARAMETERS GALAXY CLUSTER 0 3 2 21 4 1 4 6 - 5 1 4 4
p(r) - a-q<r//S) + y
o c - 380.87 ±201 .58 /S - 1 .0 5 ± 0 .1 7 y - 1 1 .9 0 ± 3 .3 4
p(r) = 6 7 1 , 4 6 - q ( r / 1.04 )0E 3 T F IT
+ 12.69
CORE RADIUS: REDSHIFT:R c = 3 /S ~ 0 .1 1 7 M pc Z = 0 .0 4 3
T ab le 4.4.32. (b) Cluster Parameters for Galaxy Cluster S2.
Using the cluster center as determined by the dispersion ellipse analysis, we
count 193 galaxies within 20 rings of width 2.0 arcminutes and to the limiting
magnitude = 19.0. We find the East-West strip counts slightly enhanced both
East and West of the cluster center whereas the North-South ordinate shows an
excess N orth of center as well as a relatively large variance. The quadrant counts
show a meager population close to the cluster center but then a rise tha t is obsers'ed
in all directions. There is a lagre peak in the distribution at about ring 13 in the
first quadrant. The cluster surface density distribution shows an an erratic rise
to a maximum at a radial distance of about r = 18.7 arcminutes, after which the
distribution falls, does a quick rise and falls again.
We find the isothermal fit modeling the observational data fairly well with
exceptions a t the deep data troughs like that seen at radial distance r = 13.4
arcminutes. The results of the analysis are seen in the table above which gives the
calculated value of the cluster parameters and their variance as well as the “best
fit” determined from the minimization procedure.
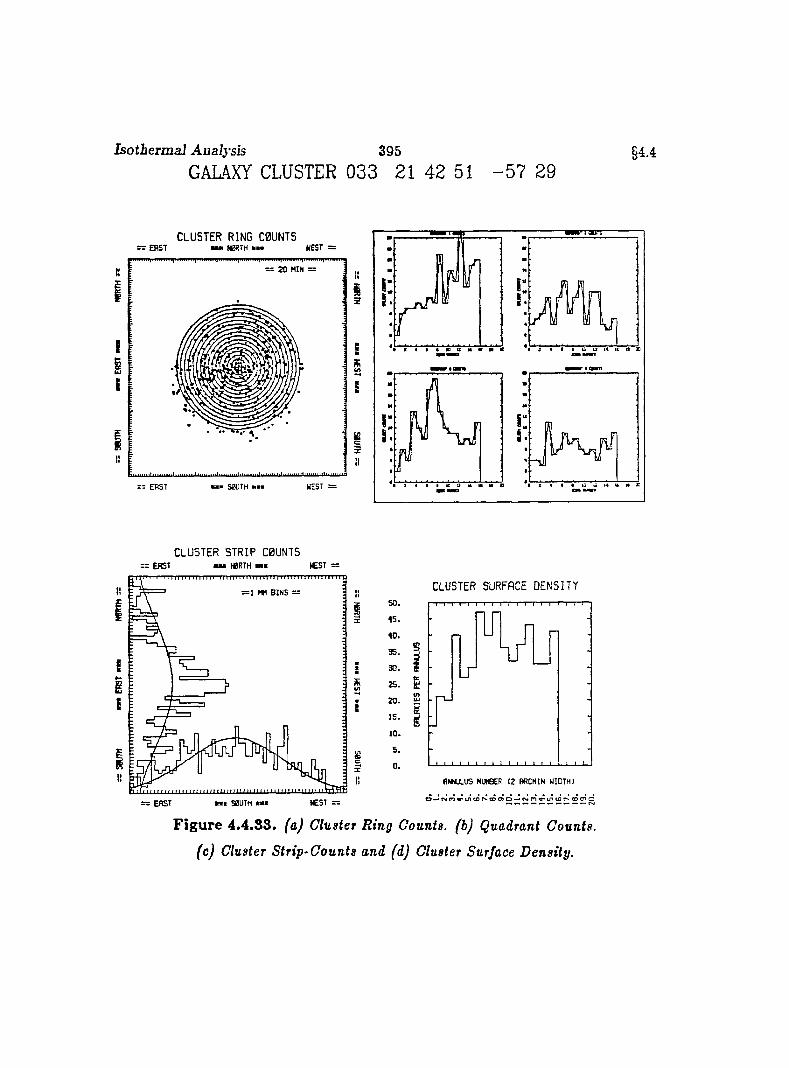
Isothermal Aualysis 395GALAXY CLUSTER 033 21 42 51 - 5 7 29
§4.4
CLUSTER RING C0UNTS; ERST mmm N0RTH WEST =
. .= = 2 0 M IN =
in u i m t i i i i i i m t i m i u i» iit i ii* i» iiÜ M iin iiU
= E R S T I S0U TH I WEST =
:IsI*
II
CLUSTER STR IP C0UNTS : e r s t mmm «RTH ICST =
.I I I t n m I I I ! M l t t i i i I n i l i i m i i i i u t i I t i 111 I I
II B I N S ==1
!ii
II
r= EAST n i S0ÜTH *■* WEST =
CLUSTER SURFACE DENSITY
so.4 5 .
4 0 .
35 .
30 .
25 .
20.
15.10.5 .
0.
S
Ë
ANNULUS N i m R ( 2 R R CM IN W ID TH )
F ig u re 4.4.33. (a) Cluster Ring Counts, (b) Quadrant Counts,
(c) Cluster Strip-Counts and (d) Cluster Surface Density.
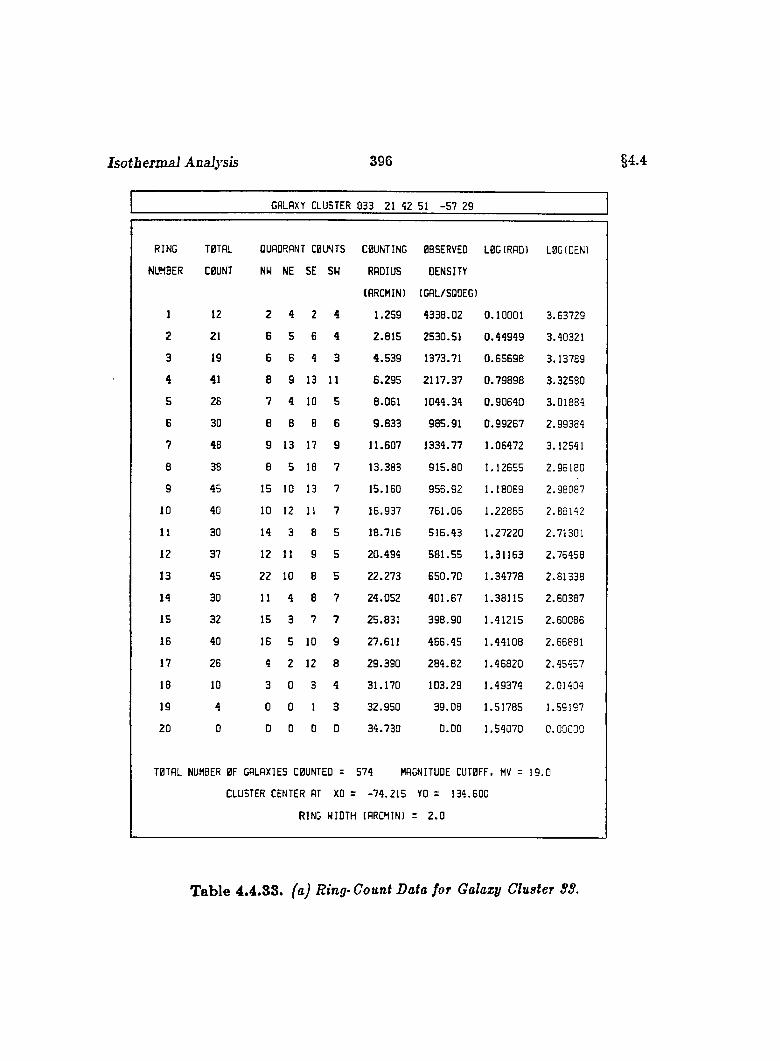
Isotbermal Analysis 396 §4.4
GALAXY CLUSTER 033 21 42 51 -57 29
RING
NUMBER
TOTAL
COUNT
QUADRANT COUNTS
NW NE SE SW
COUNTING
RADIUS
(ARCMIN)
OBSERVED
DENSITY
(GAL/SQDEG)
LOG(RAD) LOG(DEN)
1 12 2 4 2 4 1 .2 5 9 4 3 3 8 .D2 0 .1 0 0 0 1 3 .63 7 2 9
2 21 6 5 6 4 2 .8 1 5 2530 .51 0 .4 4 9 4 9 3.40321
3 19 6 6 4 3 4 .5 3 9 1373.71 0 .6 5 6 9 8 3 .13789
4 41 8 9 13 11 6 .2 9 5 2 1 1 7 .3 7 0 .7 9 8 9 8 3 .32 5 8 0
5 26 7 4 10 5 8 .061 1044 .34 0 .9 0 6 4 0 3 .01884
G 30 6 8 8 6 9 .8 3 3 98 5 .9 1 0 .9 9 2 6 7 2 .99384
7 48 9 13 17 9 11 .607 1334 .77 1 .0 6 4 7 2 3.12S41
a 38 8 5 18 7 13 .383 9 1 5 .8 0 1 .1 2 6 5 5 2 .96 1 8 0
s 45 15 10 13 7 15 .160 9 5 6 .9 2 1 .1 8 0 6 9 2 .98087
10 40 10 12 11 7 16 .937 7 6 1 .0 6 1 .2 2 8 8 5 2 .83 1 4 2
11 30 14 3 8 5 18 .716 5 1 6 .4 3 1 .2 7 2 2 0 2.71301
12 37 12 11 9 5 2 0 .4 9 4 5 8 1 .5 5 1 .3 1 1 6 3 2 .7 6 4 5 8
13 45 22 10 8 5 2 2 .2 7 3 6 5 0 .7 0 1 .3 4 7 7 8 2 .8 1 3 3 8
14 30 11 4 8 7 2 4 .0 5 2 4 0 1 .6 7 1 .3 8 1 1 5 2 .6 0 3 8 7
15 32 15 3 7 7 25 .831 3 9 8 .9 0 1 .4 1 2 1 5 2 .6 0 0 8 6
16 40 16 5 10 9 27 .611 4 6 6 .4 5 1 .44 1 0 8 2 .66881
17 26 4 2 12 8 2 9 .3 9 0 2 8 4 .8 2 1 .46 8 2 0 2 .4 5 4 5 7
18 10 3 0 3 4 3 1 .1 7 0 10 3 .2 9 1 .49 3 7 4 2 .01404
19 4 0 0 1 3 3 2 .9 5 0 3 9 .0 8 1 .51 7 8 5 1.59197
20 0 0 0 0 0 3 4 .7 3 0 D.DO 1 .54 0 7 0 0.00000
T0TRL NUMBER OF GALAXIES COUNTED =
CLUSTER CENTER AT XO =
RING WIDTH
574 MAGNITUDE CUTOFF. MV = 1 9 .0
-7 4 .2 1 5 YO = 134.600
(ARCMIN) = 2 .0
Table 4.4.88. (a) Ring-Count Data for Galaxy Cluster SS.
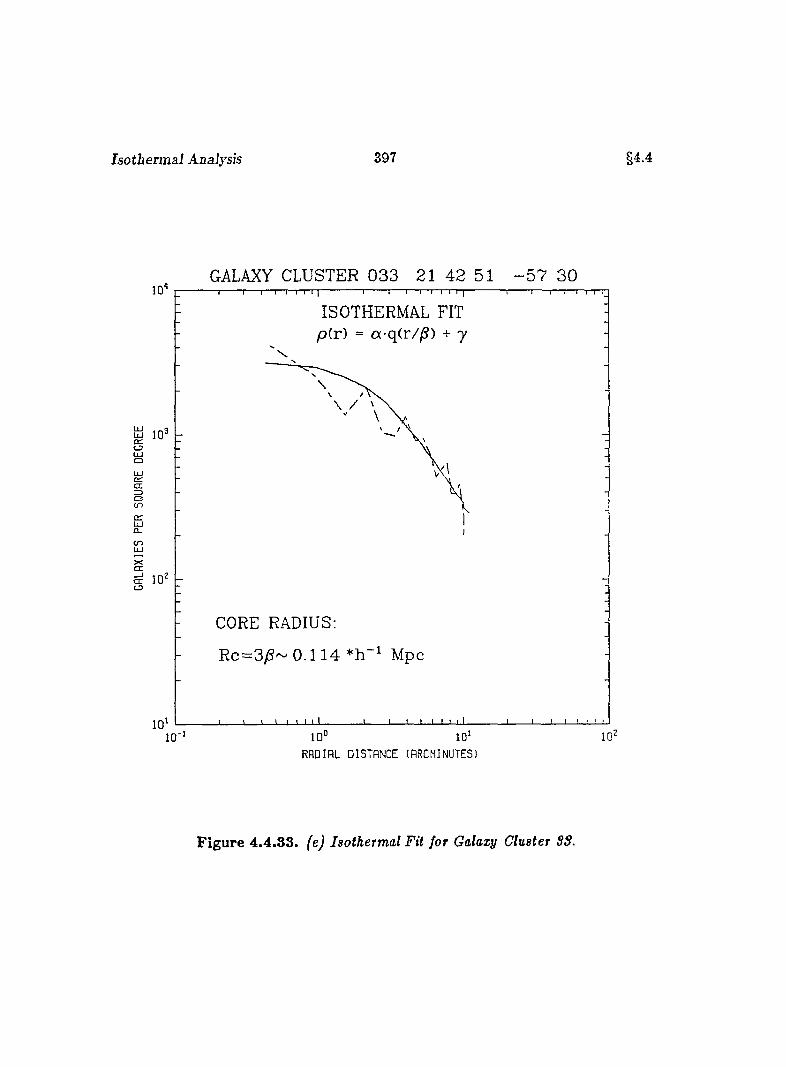
Isotbermal Analysis 397 §4.4
GALAXY CLUSTER 033 21 42 51 - 5 7 30
ISOTHERMAL FIT p(r) = a-q(r//S) + 7
Ü 1 0 ^Oa
001
a .tn
CORE RADIUS;
R c = 3 )g - 0 .1 1 4 Mpc
10°RADIAL DISTANCE (ARCMINUTES)
F igure 4.4.33. feJ Isothermal Fit for Galaxy Cluster SS.
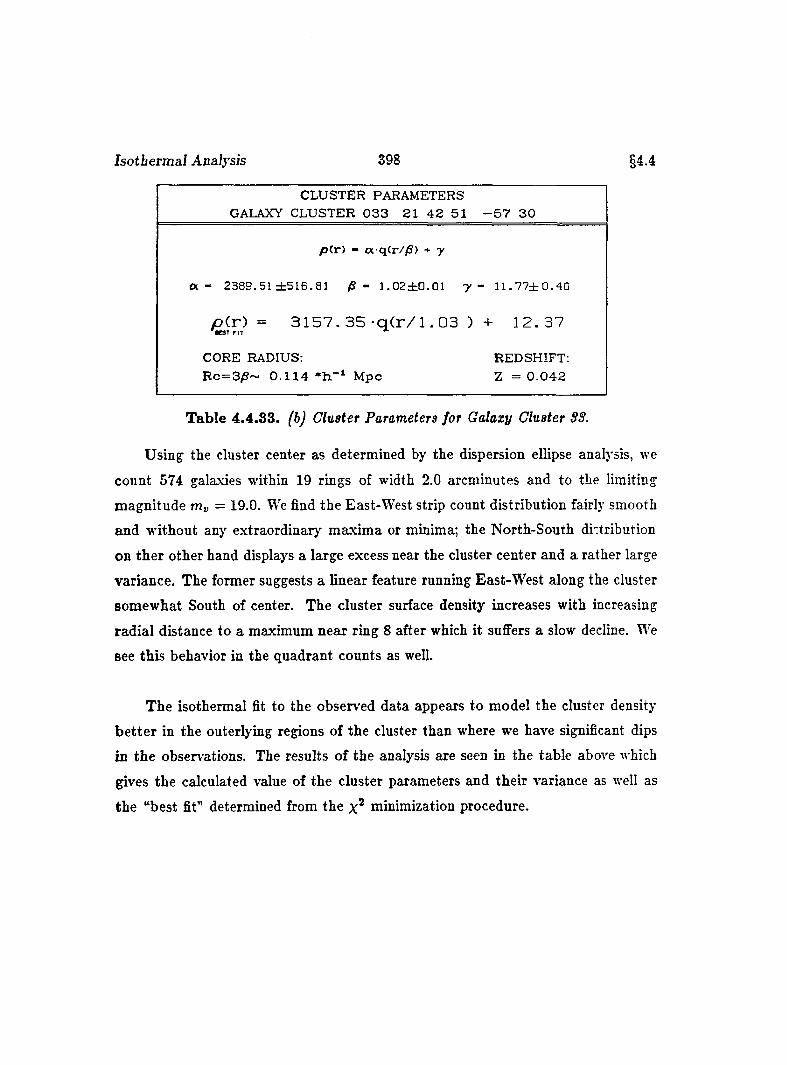
Isotbermal Analysis 398 §4.4
CLUSTER PARAMETERS GALAXY CLUSTER 0 3 3 21 4 2 51 - 5 7 3 0
p (r) - a q(r//S) + y
a - 2389.51 ± 516 .81 /S - 1 .0 2 ± 0 .0 1 y - 1 1 .7 7 ± 0 .4 0
p( r ) = 3 1 5 7 . 3 5 - q ( r / l . 0 3 )mCST FIT *
+ 1 2 . 3 7
CORE RADIUS: REDSHIFT:R c= 3 /S ~ 0 .1 1 4 *h.“ M pc Z = 0 .0 4 2
Table 4.4.33. (bj Cluster Parameters for Galaxy Cluster SS.
Using the cluster center as determined by the dispersion ellipse analysis, we
count 574 galaxies within 19 rings of width 2.0 arcminutes and to the limiting
magnitude rriv = 19.0. We find the East-West strip count distribution fairly smooth
and without any extraordinary maxima or minima; the North-South distribution
on ther other hand displays a large excess near the cluster center and a rather large
variance. The former suggests a linear feature running East-W est along the cluster
somewhat South of center. The cluster surface density increases with increasing
radial distance to a maximum near ring 8 after which it suffers a slow decline. We
see this behavior in the quadrant counts as well.
The isothermal fit to the observed data appears to model the cluster density
b e tte r in the outerlying regions of the cluster than where we have significant dips
in the observations. The results of the analysis are seen in the table above which
gives the calculated value of the cluster parameters and their variance as well as
the “best fit" determined from the minimization procedure.
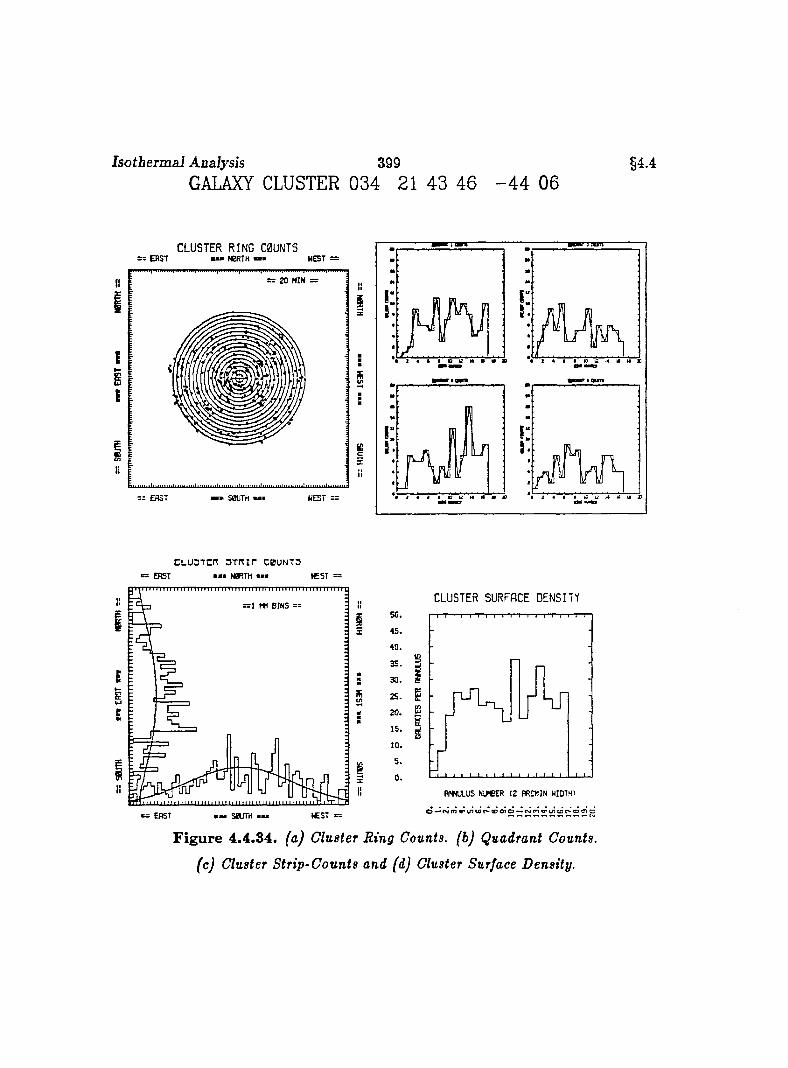
Isotbermal Analysis 399GALAXY CLUSTER 034 21 43 46 - 4 4 06
§4.4
CLUSTER RING C0UNTSmmm N 0R THERST W E ST =
= 2 D M IN = r III
:
:
I= = E A S T WEST —
C L U 3T C n 3 T R i r C 0 U N T 3
E R S T • • • N0RTM « » • l e S T = =
1! = 1 HI B I N S —
Î
E
W EST > == ERST ■ ■ ■ S0U T R mmm
50.4 5 .
4 0 .
3 5 .
3 0 .
2 5 .
20.1 5 .
10.5 .
0 .
CLUSTER SURFACE DENSITY
S
sa
É
F ig u re 4.4.34. (a) Cluster Ring Counts, (b) Quadrant Counts,
(c) Cluster Strip-Counts and (d) Cluster Surface Density.

Isotbermal Analysis 400 §4.4
GRLBXY CLUSTER 034 21 43 46 -44 06
RING
NUMBER
T0TAL
C0UNT
QUADRANT COUNTS
NW NE SE SW
COUNTING
RADIUS
(RRCMIN)
OBSERVED
DENSITY
(GAL/SQDEG)
L0G(RAD) LOG(DENI
1 2 0 0 1 1 1 .2 5 9 7 2 3 .0 0 D .10001 2 .8 5 9 1 4
2 8 1 3 1 3 2 .8 1 5 9 6 4 .0 0 0 .4 4 9 4 9 2 .9 8 4 0 8
3 18 2 5 7 4 4 .5 3 9 1301.41 0 .6 5 6 9 6 3 .1 1 4 4 1
4 26 9 9 6 2 6 .2 9 5 1342 .72 0 .7 9 8 9 8 3 .1 2 7 9 9
5 24 5 6 6 7 8 .0 6 1 9 6 4 .0 0 0 .9 0 6 4 0 2 .9 8 4 0 8
6 27 7 9 8 3 9 .8 3 3 8 8 7 .3 2 0 .9 9 2 5 7 2 .9 4 8 0 8
7 21 5 2 5 9 1 1 .6 0 7 5 8 3 .9 6 1 .0 6 4 7 2 2 .7 6 6 3 9
B 25 11 5 2 7 1 3 .3 8 3 6 0 2 .5 0 1 .1 2 6 5 5 2 .7 7 9 9 5
9 20 3 4 5 8 1 5 .1 6 0 4 2 5 .3 0 1 .18069 2 .6 2 8 5 9
10 18 7 6 3 2 1 6 .9 3 7 3 4 2 .4 8 1 .22 8 8 5 2 .5 3 4 5 3
11 35 10 9 12 4 1 8 .7 1 6 6 0 2 .5 0 1 .27 2 2 0 2 .7 7 9 9 6
12 19 9 2 3 5 2 0 .4 9 4 2 9 8 .6 3 1 .3 I I6 3 2 .4 7 5 1 4
13 22 10 4 6 2 2 2 .2 7 3 3 1 8 .1 2 1 .3 4 7 7 8 2 .5 0 2 5 9
H 35 7 5 17 8 2 4 .0 5 2 468 .61 1 .38 1 1 5 2 .6 7 0 8 1
15 24 5 6 6 7 2 5 .8 3 1 2 9 9 .1 7 1 .41 2 1 5 2 .4 7 5 9 2
IB 22 5 5 8 4 2 7 .6 1 1 2 5 6 .5 5 1 .4 4 1 0 8 2 .4 0 9 1 7
17 26 ID 3 8 5 2 9 .3 9 0 2 8 4 .8 2 1 .4 6 8 2 0 2 .4 5 4 5 7
18 12 2 6 1 3 3 1 .1 7 0 123 .94 1 .49374 2 .0 9 3 2 2
19 0 0 0 0 0 3 2 .9 5 0 0 .0 0 1 .5 1 7 8 5 0 .0 0 0 0 0
20 0 0 0 0 0 3 4 .7 3 0 0 .0 0 1 .54070 0 .0 0 0 0 0
T0TRL NUMBER 0F GALAXIES C0UNTED =
CLUSTER CENTER AT XO =
RING WIDTH
384 MAGNITUDE CUT0FF. MV = 1 9 .0
1 1 9 .8 3 5 YO = 51 .5 6 0
(ARCMIN) = 2 .0
T ab le 4.4.34. (a) Ring-Count Data Jor Galaxy Cluster S4>
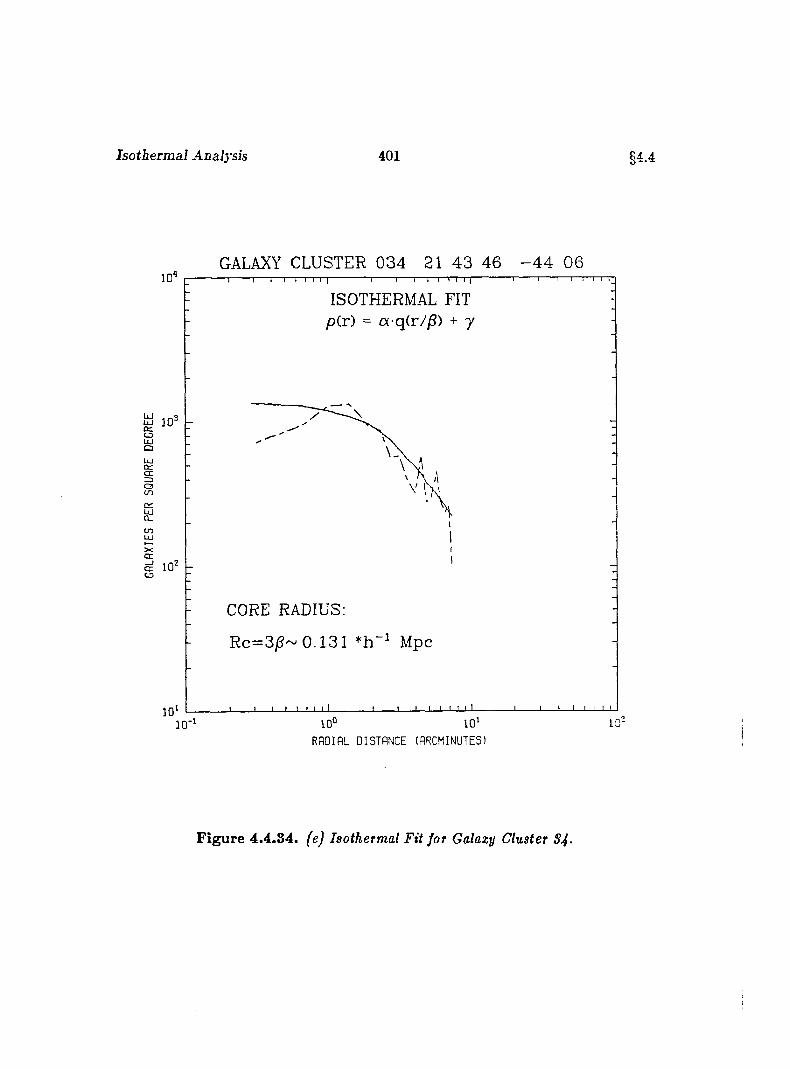
Isotbermal Analysis 401 §4.4
GALAXY CLUSTER 034 21 43 46 - 4 4 06
CK:cr=3gcn
XcrCEO
ISOTHERMAL FIT pir) = aq(r//S) + y
CORE RADIUS;
Rc=3/?~ 0 .131 Mpc
10°
RADIAL DISTANCE (ARCMINUTES)
F ig u re 4.4.34. (e) Isothermal Fit for Galaxy Cluster S4-
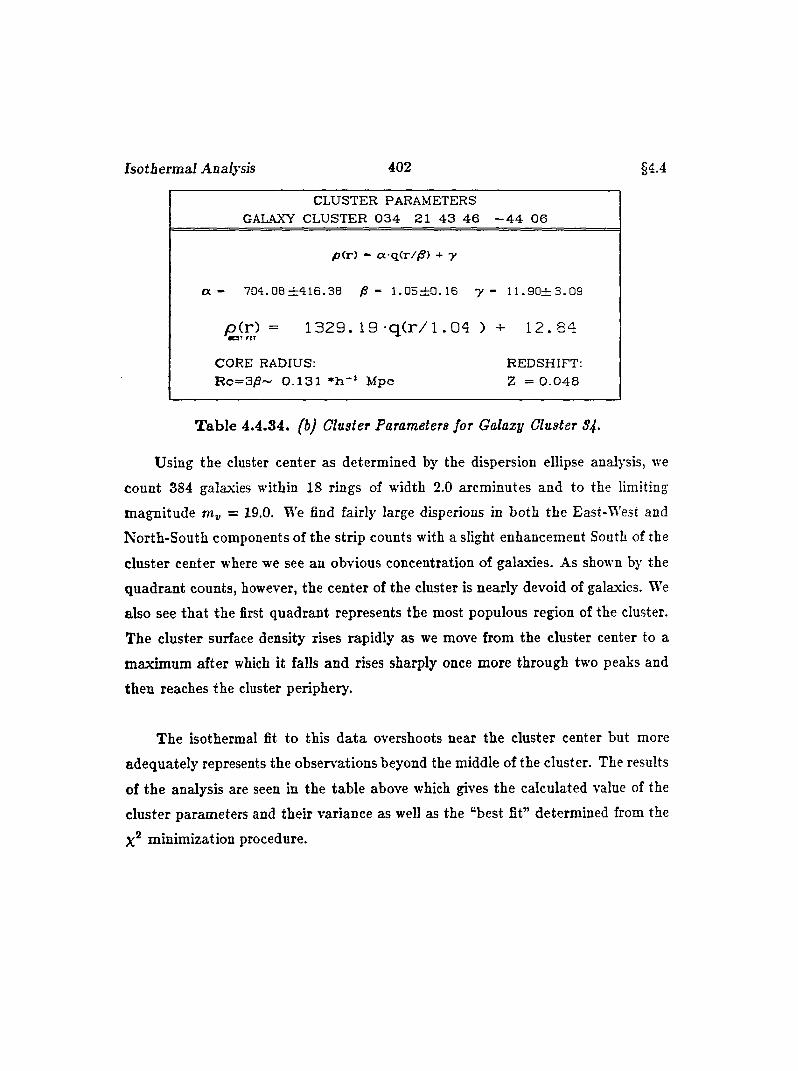
Isothermal Analysis 402 §4^
a
CLUSTER PARAMETERS GALAXY CLUSTER 0 3 4 21 4 3 4 6 - 4 4 0 6
p ( r ) - a - q ( r / / 5 ) + y
- 7 0 4 . 0 8 ± 4 1 6 . 3 8 /S - 1 . 0 5 ± 0 . 1 6 y - 1 1 . 9 G ± 3 . 0 9
p(r ) = 1329. 1 9 - q ( r / l .04 ) + 12.84
CORE RADIUS:R c= 3 /9 ~ 0 . 1 3 1 * h - i Mpc
REDSHIFT: Z = 0 .0 4 8
T ab le 4.4.34. (b) Cluster Parameters for Galaxy Cluster S4.
Using the cluster center as determined by the dispersion ellipse analysis, we
count 384 galaxies within 18 rings of width 2.0 arcminutes and to the limiting
magnitude m.y = 19.0. We find fairly large disperions in both the East-West and
North-South components of the strip counts with a slight enhancement South of the
cluster center where we see an obvious concentration of galaxies. As shown by the
quadrant counts, however, the center of the cluster is nearly devoid of galaxies. We
also see tha t the first quadrant represents the most populous region of the cluster.
The cluster surface density rises rapidly as we move from the cluster center to a
maximum after which it falls and rises sharply once more through two peaks and
then reaches the cluster periphery.
The isothermal fit to this da ta overshoots near the cluster center but more
adequately represents the observations beyond the middle of the cluster. The results
of the analysis are seen in the table above which gives the calculated value of the
cluster parameters and their variance as well as the “best fit” determined from the
X® minimization procedure.
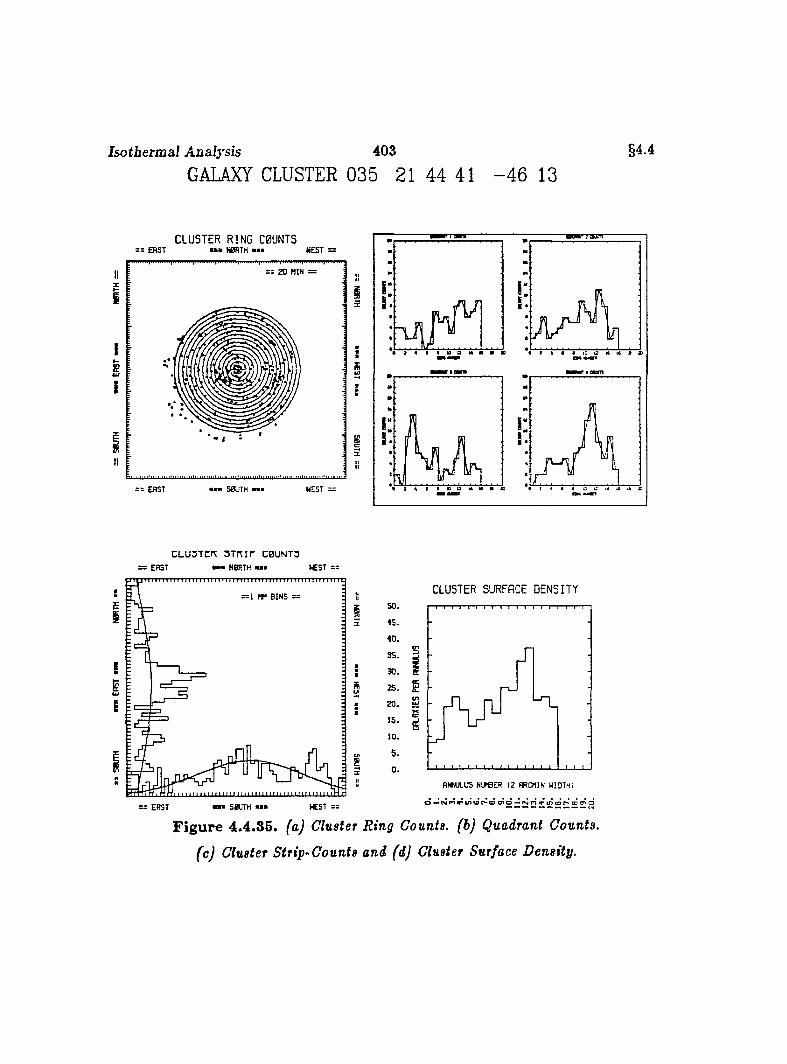
Isotbermal Analysis 403
GALAXY CLUSTER 035 21 44 41 - 4 6 13§4.4
CL UST ER RI NG C0UNT5s : e r s t mmm NORTH W EST =
= : 2 0 M IN =
= = E R S T S0JTH '
is A/I
:
K1II
CLU 3Ttr^ 3 T n i r CBUNT3 ; e r s t — « N BRTH « S T = =
tEI
= 1 MM B I N S =
II
:— ERST S 0 U T H • • •
CLUSTER SURFACE DENSITY
SS. 5
25. Ê
s
F ig u re 4 .4.35. (a) Cluster Ring Counts, (b) Quadrant Counts,
(c) Cluster Strip-Counts and (dj Cluster Surface Density.
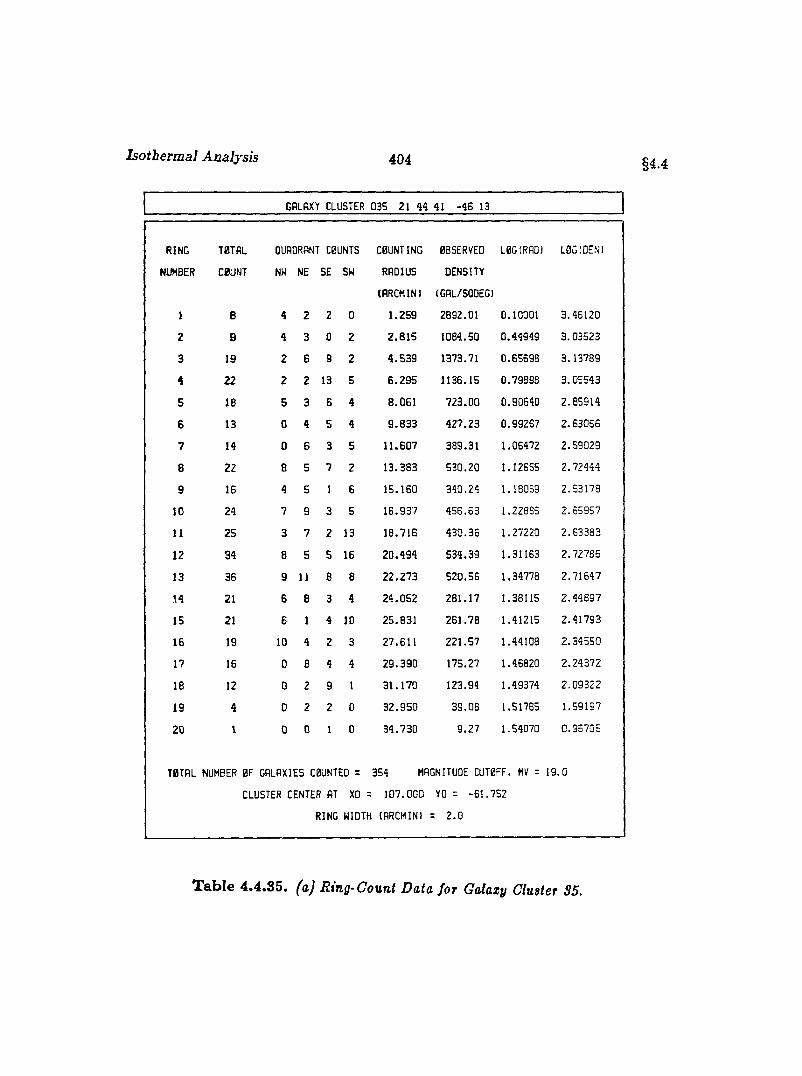
Isothermal Analysis 404 §4.4
GALAXY CLUSTER 035 2144 41 -46 13
RING
NUMBER
T0TAL
C0UNT
QUADRANT C0UNTS
NW NE SE SW
COUNTING
RADIUS
(ARCMIN)
OBSERVED
DENSITY
(GAL/SQDEG)
L0G(RAO) LOG(DEN)
1 8 4 2 2 0 1 .2 5 9 2892 .01 0 .10001 3 .4 5 1 2 0
2 8 4 3 0 2 2 .8 1 5 1084 .50 0 .44 9 4 9 3 .0 3 5 2 3
3 19 2 6 9 2 4 .5 3 9 1373.71 0 .65698 3 .1 3 7 8 9
4 22 2 2 13 5 6 .2 9 5 1 13 6 .1 5 0 .7 9 8 9 8 3 .0 5 5 4 3
5 18 5 3 6 4 8 .0 6 1 7 2 3 .0 0 0 .90 6 4 0 2 .8 5 9 1 4
6 13 0 4 S 4 9 .8 3 3 4 2 7 .2 3 0 .99 2 6 7 2 .6 3 0 5 6
7 14 0 5 3 5 1 1 .6 0 7 38 9 .3 1 1.06472 2 .5 9 0 2 9
8 22 8 5 7 2 1 3 .3 8 3 5 3 0 .2 0 1.12655 2 .7 2 4 4 4
9 16 4 5 1 6 1 5 .1 6 0 3 4 0 .2 4 1 .18069 2 .5 3 1 7 8
10 24 7 9 3 5 1 6 .9 3 7 4 5 6 .6 3 1.22885 2 .6 5 9 5 7
11 25 3 7 2 13 1 8 .7 1 8 4 3 0 .3 6 1 .27220 2 .6 3 3 8 3
12 34 8 5 5 16 2 0 .4 9 4 5 3 4 .3 9 1 .31163 2 .7 2 7 8 6
13 36 9 11 8 8 2 2 .2 7 3 5 2 0 .5 6 1 .34778 2 .7 1 6 4 7
.14 21 6 8 3 4 2 4 .0 5 2 2 8 1 .1 7 1 .38115 2 .4 4 8 9 7
15 21 6 1 4 10 2 5 .8 3 1 2 6 1 .7 8 1 .41215 2 .4 1 7 9 3
16 19 10 4 2 3 2 7 .6 1 1 2 2 1 .5 7 1 .44108 2 .3 4 5 5 0
17 16 0 6 4 4 2 9 .3 9 0 175 .27 1 .46820 2 .2 4 3 7 2
18 12 0 2 9 1 3 1 .1 7 0 123 .94 1 .49374 2 .0 9 3 2 2
19 4 0 2 2 0 3 2 .9 5 0 3 9 .0 8 1 .51785 1 .59 1 9 7
20 1 0 0 1 0 3 4 .7 3 0 9 .2 7 1 .54070 0 .9 5 7 0 5
TOTAL NUMBER 0F GALAXIES COUNTED =
CLUSTER CENTER AT XO =
RING WIDTH
354 MAGNITUDE CUT0FF. MV =
1 0 7 .0 0 0 YO = -6 1 .7 5 2
(ARCMIN) = 2 .0
1 9 .0
T ab le 4.4.85. (a) Ring-Count Data for Galaxy Cluster S5.
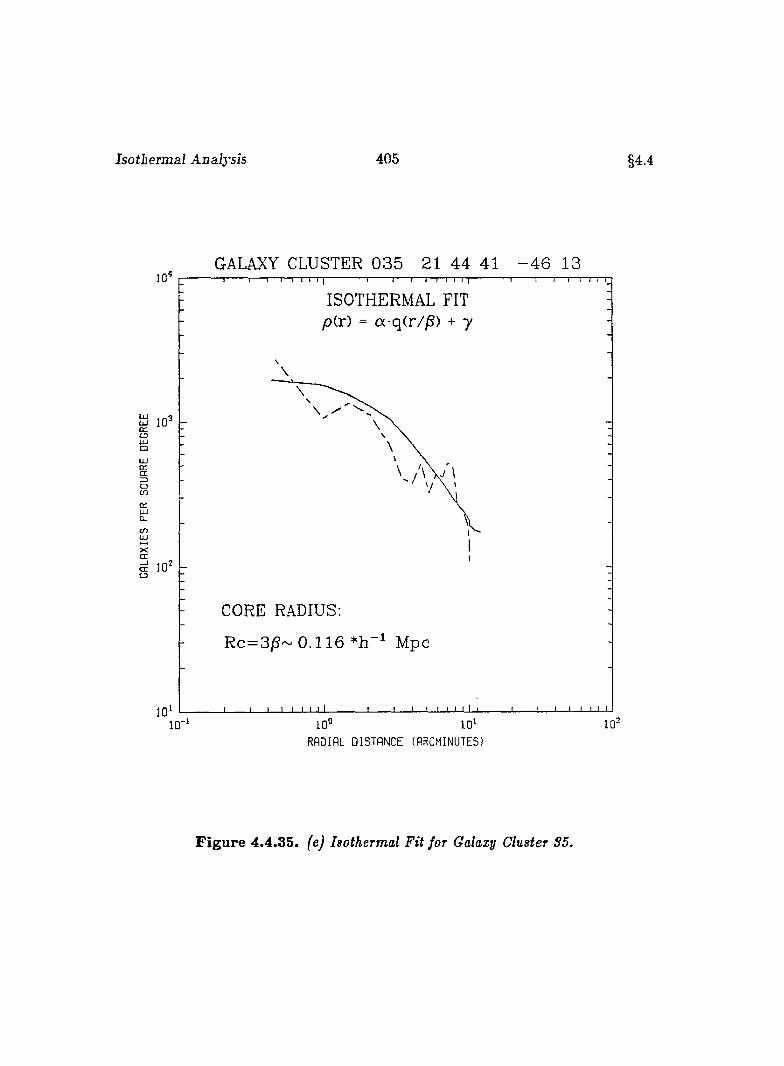
Isothermal Analysis 405 §4^
GALAXY CLUSTER 0 3 5 21 44 41 - 4 6 13]0'
ISOTHERMAL FIT p(r) = aq (r //5 ) + y
Ü 10OUJo
CO
Xc r
CORE RADIUS:
R c=3/?~ 0 .1 1 6 Mpc
10°
RADIAL DISTANCE (ARCMINUTES)
F ig u re 4.4.35. (e) Isothermal Fit for Galaxy Cluster S5.
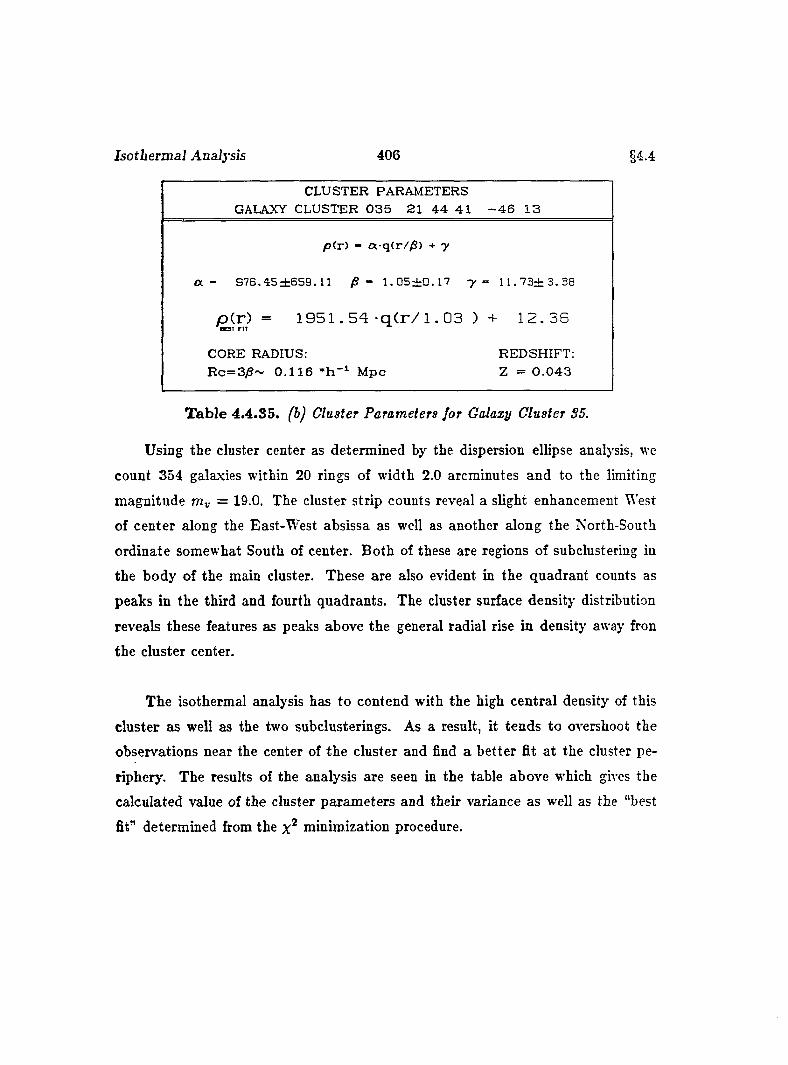
Isothermal Analysis 406 §4.4
CLUSTER PARAMETERS GALAXY CLUSTER 0 3 5 21 4 4 4 1 - 4 6 13
p ( r ) - a - q ( r / / S ) + -y
a - 9 7 6 . A 5 ± 6 5 9 . 11 /S - 1 . 0 5 ± 0 . 1 7 -y - 1 1 . 7 3 ± 3 . 3 8
p(r ) = 1 9 5 1 . 5 4 - q ( r / l .03 ) + 12.36
CORE RADIUS:R c= 3 /S ~ 0 . 1 1 6 Mpc
REDSHIFT: Z = 0 .0 4 3
T ab le 4.4.35. fbj Cluster Parameters Jor Galaxy Cluster S5.
Using the cluster center as determined by the dispersion ellipse analysis, we
count 354 galaxies within 20 rings of width 2.0 arcminutes and to the limiting
magnitude rtiy = 19.0. The cluster strip counts reveal a slight enhancement West
of center along the East-West absissa as well as another along the North-South
ordinate somewhat South of center. Both of these are regions of subclustering in
the body of the main cluster. These are also evident in the quadrant counts as
peaks in the third and fourth quadrants. The cluster surface density distribution
reveals these features as peaks above the general radial rise in density away fron
the cluster center.
The isothermal analysis has to contend with the high central density of this
cluster as well as the two subclusterings. As a result, it tends to overshoot the
observations near the center of the cluster and find a better fit at the cluster pe
riphery'. The results of the analysis are seen in the table above which gh’es the
calculated value of the cluster parameters and their variance as well as the “best
fit” determined from the minimization procedure.
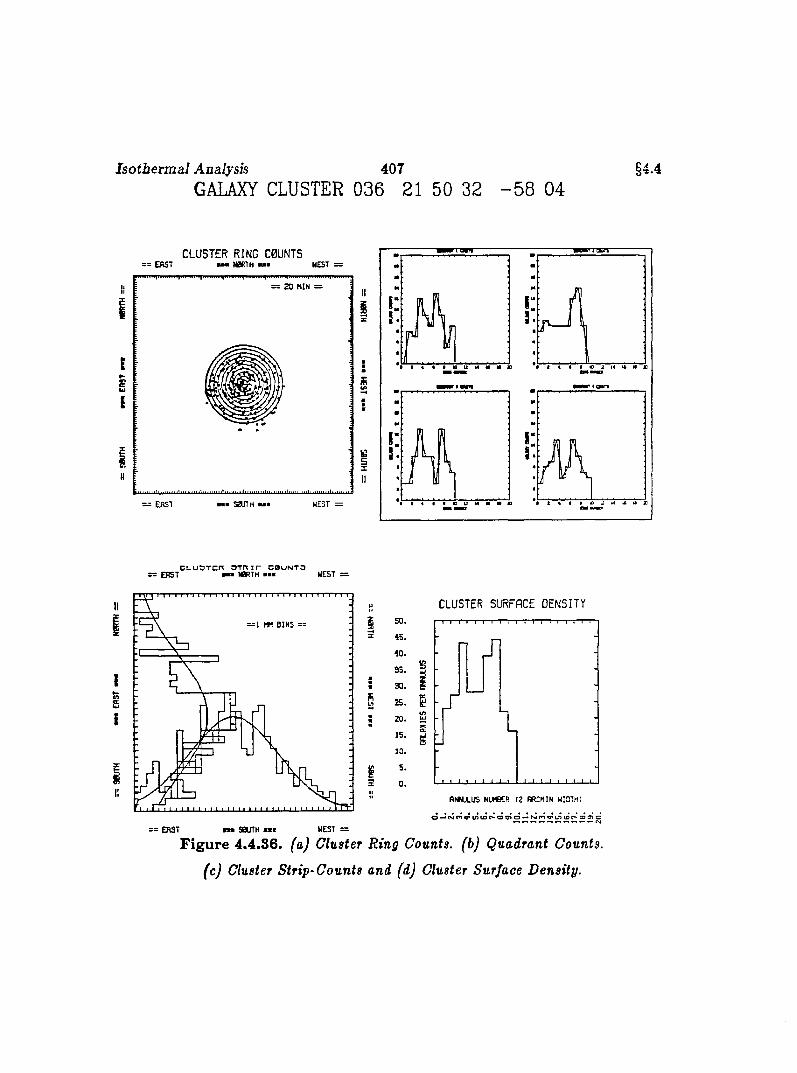
Isotbermal Analysis 407GALAXY CLUSTER 036 21 50 32 - 5 8 04
§4.4
CLUSTER RING C0ÜNTS= = ERST B M N0RÎH w WEST :
.............. .
!ii
= = 2 0 M IN =
ERST S0UTH mmm WEST =
i:
i:
A1 « • fl K tf M « m «
A
C L U 3 T C R O T H i r C 0 U N T 3 : E R S T m m N 0RTH mm W EST =
II— 1 MM B IN S ==
IIi
II
CLUSTER SURFACE DENSITY
S
2 5 . B
3ë
AfWULUS NUMBER 1 2 RRCMIN WIDTH)
o « ^ (v )D « 'i/)c o r^ o o )O -> (s jtn v * L n (0 r* ‘ (D O o
: ERST m S0U1H « I NEST =
F ig u re 4.4.36. faj Cluster Ring Counts, (b) Quadrant Counts,
(c) Cluster Strip-Counts and (d) Cluster Surface Density.
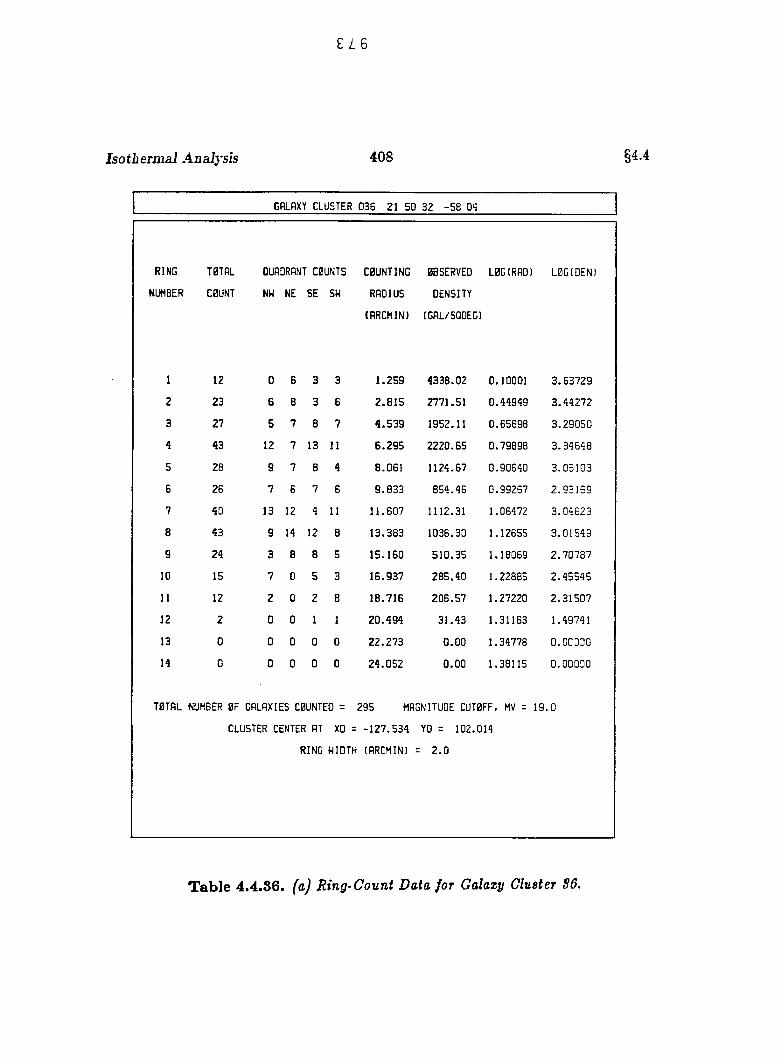
EA6
Isotbermal Analysis 408 §4.4
GALAXY CLUSTER 036 21 50 32 -5 8 04
RING TOTAL QUADRANT COUNTS COUNTING OBSERVED LOG(RAD) LOG(DEN)
UMBER COUNT NW NE SE SW RADIUS DENSITY
(RRCMIN) (GAL/SQDEG)
1 12 0 6 3 3 1 .2 5 9 4 3 3 8 .0 2 0 .10001 3 .6 3 7 2 9
2 23 6 8 3 6 2 .8 1 5 2771 .5 1 0 .4 4 9 4 9 3 .4 4 2 7 2
3 27 5 7 8 7 4 .5 3 9 1952.11 0 .6 5 6 9 8 3 .2 9 0 5 0
4 43 12 7 13 11 6 .2 9 5 2 2 2 0 .6 5 0 .7 9 8 9 8 3 .3 4 6 4 8
5 28 9 7 8 4 8 .0 6 1 1124 .67 0 .9 0 6 4 0 3 .0 5 1 0 3
6 26 7 6 7 6 9 .8 3 3 8 5 4 .4 6 0 .9 9 2 6 7 2 .9 3 1 6 9
7 40 13 12 4 11 1 1 .6 0 7 1112.31 1.06472 3 .0 4 6 2 3
8 43 9 14 12 8 1 3 .3 8 3 1036 .30 1.12655 3 .0 1 5 4 9
9 24 3 8 8 5 1 5 .1 6 0 5 1 0 .3 5 1 .18069 2 .7 0 7 8 7
10 15 7 0 5 3 1 6 .9 3 7 2 8 5 .4 0 1 .22885 2 .4 5 5 4 5
11 12 2 0 2 8 1 8 .7 1 6 2 0 6 .5 7 1 .27 2 2 0 2 .3 1 5 0 7
12 2 0 0 1 1 2 0 .4 9 4 3 1 .4 3 1 .31163 1 .49 7 4 1
13 0 0 0 0 0 2 2 .2 7 3 0 .0 0 1 .34 7 7 8 O.OCDDO
14 0 0 0 0 0 2 4 .0 5 2 0 .0 0 1 .38115 0 .0 0 0 0 0
TOTAL NUMBER OF GALAXIES COUNTED = 295 MAGNITUDE CUTOFF, MV = 1 9 .0
CLUSTER CENTER AT XO = - 1 2 7 .5 3 4 YO = 102.014
RING WIDTH (ARCMIN) = 2 .0
T ab le 4.4.36. (a) Ring-Count Data for Qalazy Cluster S6.
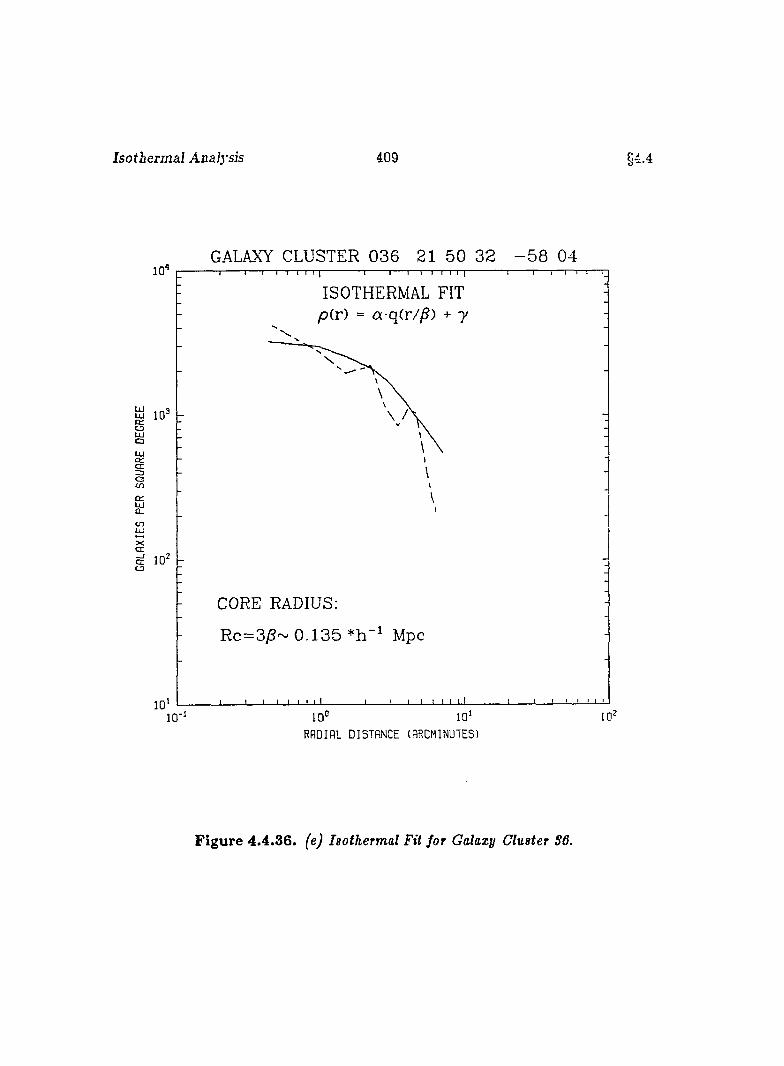
Isothermal Analysis 409
GALAXY CLUSTER 036 21 5 0 32 - 5 8 04
ISOTHERMAL FIT p(r) = aq(r//S) + 7
Ü 1 0 ^CÛLU
CL
OCO
XCE
CJ
CORE RADIUS:
Rc=3y?~ 0 .1 3 5 Mpc
io‘10’10°
RADIAL DISTANCE (ARCMINUTES)
F ig u re 4.4 .36. (ej Isothermal Fit for Galaxy Cluster S6.
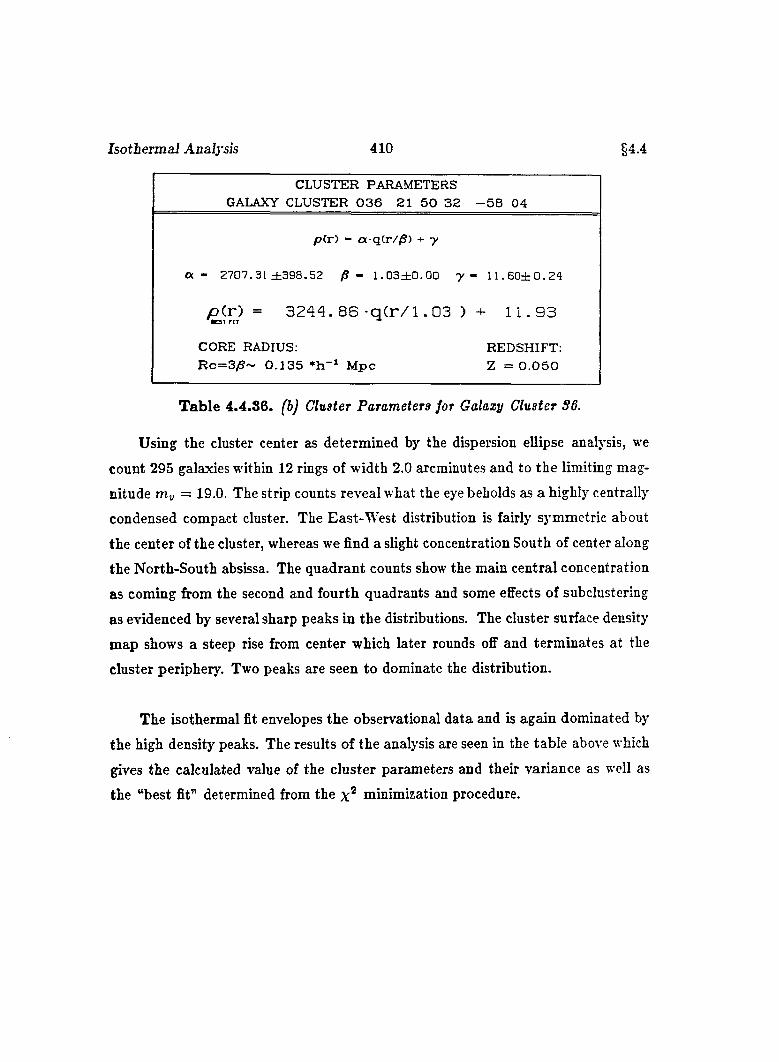
Isotbermal Analysis 410 §4.4
CLUSTER PARAMETERS GALAXY CLUSTER 0 3 6 21 5 0 32 - 5 8 04
/7(r) - a q(r//S) + y
a - 2707.31 ±398 .52 /S - l . O S i O . Q O y - 1 1 . 6 0 ± 0 . 2 4
p ( r ) = 3 2 4 4 . 8 6 - q ( r / l . 03 )•E S T F IT
+ 11 . 93
CORE RADIUS: REDSHIFT:R c= 3 ;S ~ 0 .1 3 5 M pc Z = 0 .0 5 0
T able 4.4.36. (b) Cluster Parameters jor Galaxy Cluster S6.
Using the cluster center as determined by the dispersion ellipse analysis, we
count 295 galaxies within 12 rings of width 2.0 arcminutes and to the limiting mag
nitude ruv = 19.0. The strip counts reveal what the eye beholds as a highly centrally
condensed compact cluster. The East-W est distribution is fairly symmetric about
the center of the cluster, whereas we find a slight concentration South of center along
the North-South absissa. The quadrant counts show the main central concentration
as coming from the second and fourth quadrants and some effects of subclustering
as evidenced by several sharp peaks in the distributions. The cluster surface density
map shows a steep rise from center which later rounds off and terminates at the
cluster periphery. Two peaks are seen to dominate the distribution.
The isothermal fit envelopes the observational data and is again dominated by
the high density peaks. The results of the analysis are seen in the table above which
gives the calculated value of the cluster parameters and their variance as well as
the “best fit” determined from the minimization procedure.
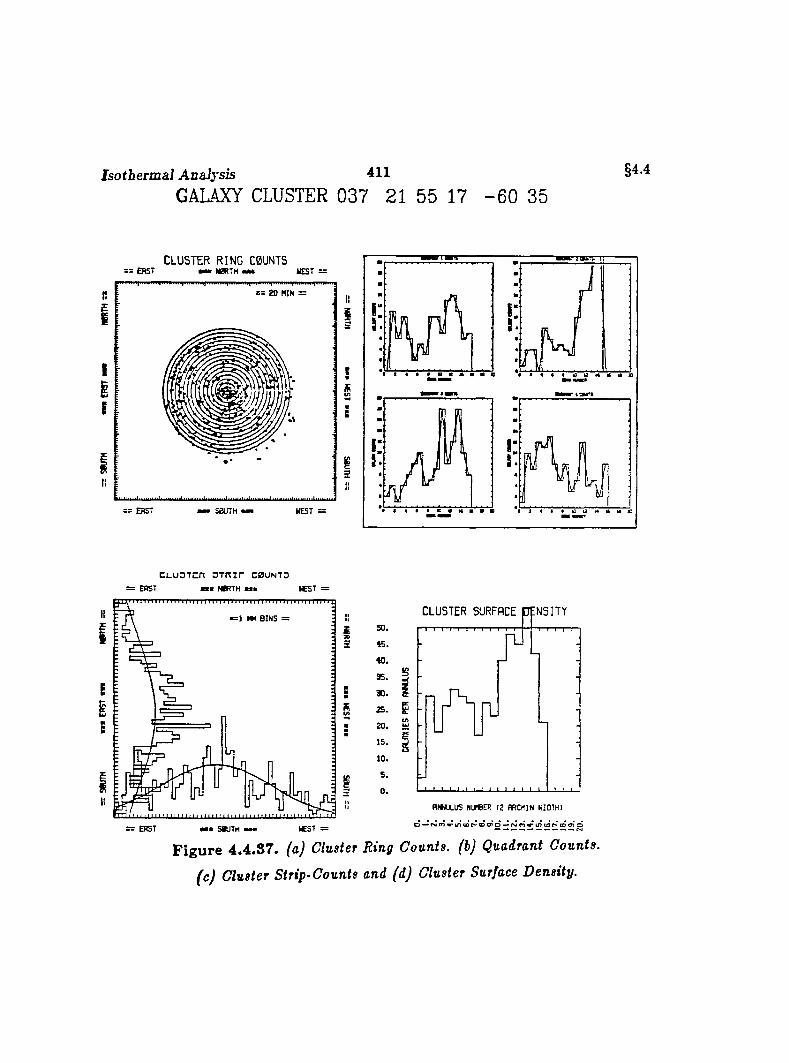
Isotherm al Analysis 411GALAXY CLUSTER 037 21 55 17 - 6 0 35
§4.4
CLUSTER RING C0UNTS= = ERST mmm WRTH w WEST
rm n
z = 2 0 MIN =
S0JTH
C L U D T C n O T T T i r C 0 U N T O
EA S T m m N R T H » ■ W EST :
II
IB IN S =
E
:
II
E R ST WEST =
IIi 50.
1 45.
40.
35. S
s 30. s
* 25. B: 20.
s35.
10.
g5.
3 0.II
CLUSTER SURFACE PENSITY-Ï I I I I I I I I I
AW ULUS NUMBER (2 ARCMIN WIDTH)
Figure 4.4.S7. (a) Cluster Ring Counts, (b) Quadrant Counts,
(c) Cluster Strip-Counts and (d) Cluster Surface Density.

Isothermal Analysis 412 §4.4
GALAXY CLUSTER 037 21 55 17 -6 0 35
RING
NUMBER
TOTAL
COUNT
QUADRANT COUNTS
NW NE SE SU
COUNTING
RADIUS
(ARCMIN)
OBSERVED
DENSITY
(GAL/SQDEG)
LOG(RAO) LOGIDEN)
1 4 0 1 2 1 1 . 2 5 9 1 4 4 6 .0 1 0 .1 0 0 0 1 3 .1 6 0 1 7
2 2 9 11 4 4 10 2 . 8 1 5 3 4 9 4 .5 1 0 .4 4 9 4 9 3 .5 4 3 3 9
3 IB G 4 1 7 4 . 5 3 9 1 3 0 1 .4 1 0 .6 5 6 9 8 3 .1 1 4 4 1
4 2 6 1 0 0 4 1 2 6 . 2 9 5 1 3 4 2 .7 2 0 .7 9 8 9 8 3 .1 2 7 9 9
5 3 0 5 8 G 11 8 .0 6 1 1 2 0 5 .0 0 0 .9 0 5 4 0 3 .0 8 0 9 9
6 3 0 3 6 8 13 9 . 8 3 3 9 8 5 .9 1 0 .9 9 2 6 7 2 .9 9 3 8 4
7 2 6 5 3 1 0 8 1 1 .6 0 7 7 2 3 .0 0 1 .0 6 4 7 2 2 .8 5 9 1 4
e IB 2 5 4 5 1 3 .3 8 3 3 8 5 .6 0 1 .1 2 6 5 5 2.58614
g 2 8 11 5 5 7 1 5 .1 6 0 5 9 5 .4 1 1 .1 8 0 6 9 2.77482
10 2 3 9 3 7 4 1 6 .9 3 7 4 3 7 .6 1 1 .2 2 8 6 5 2.64108
11 3 9 8 9 1 8 4 1 8 .7 1 6 . 6 7 1 .3 6 1 .2 7 2 2 0 2 .8 2 6 9 6
12 4 8 13 15 8 12 2 0 .4 9 4 7 5 4 .4 4 1 .3 1 1 6 3 2 .8 7 7 6 2
13 4 7 14 16 12 5 2 2 . 2 7 3 6 7 9 .6 2 1 .3 4 7 7 8 2 .8 3 2 2 7
14 5 4 11 21 1 8 4 2 4 .0 5 2 7 2 3 . 0 0 1 .3 8 1 1 5 2 .8 5 9 1 4
15 44 6 2 5 10 3 2 5 .8 3 1 5 4 8 . 4 8 1 .4 1 2 1 5 2 .7 3 9 1 6
16 2 0 7 0 G 7 2 7 .6 1 1 2 3 3 . 2 3 1 .4 4 1 0 8 2 .3 6 7 7 8
17 1 0 5 0 1 4 2 9 .3 9 0 1 0 9 .5 5 1 .4 6 8 2 0 2 .0 3 9 5 0
16 1 3 4 0 0 9 3 1 .1 7 0 1 3 4 .2 7 1 .4 9 3 7 4 2 .1 2 7 9 9
19 7 0 0 0 7 3 2 .9 5 0 6 8 . 3 9 1 .5 1 7 8 5 1.83501
2 0 0 0 0 0 0 3 4 .7 3 0 0.00 1 .5 4 0 7 0 0.00030
T0TAL NUMBER OF GALAXIES COUNTED =
CLUSTER CENTER AT XO =
RING WIDTH
512 MAGNITUDE CUTOFF. HV = 19
98.536 YO = -32.630
1ARCMIN] = 2.0
.0
Table 4.4.87. fa j Ring-Count Data fo r Galaxy Cluster 57.
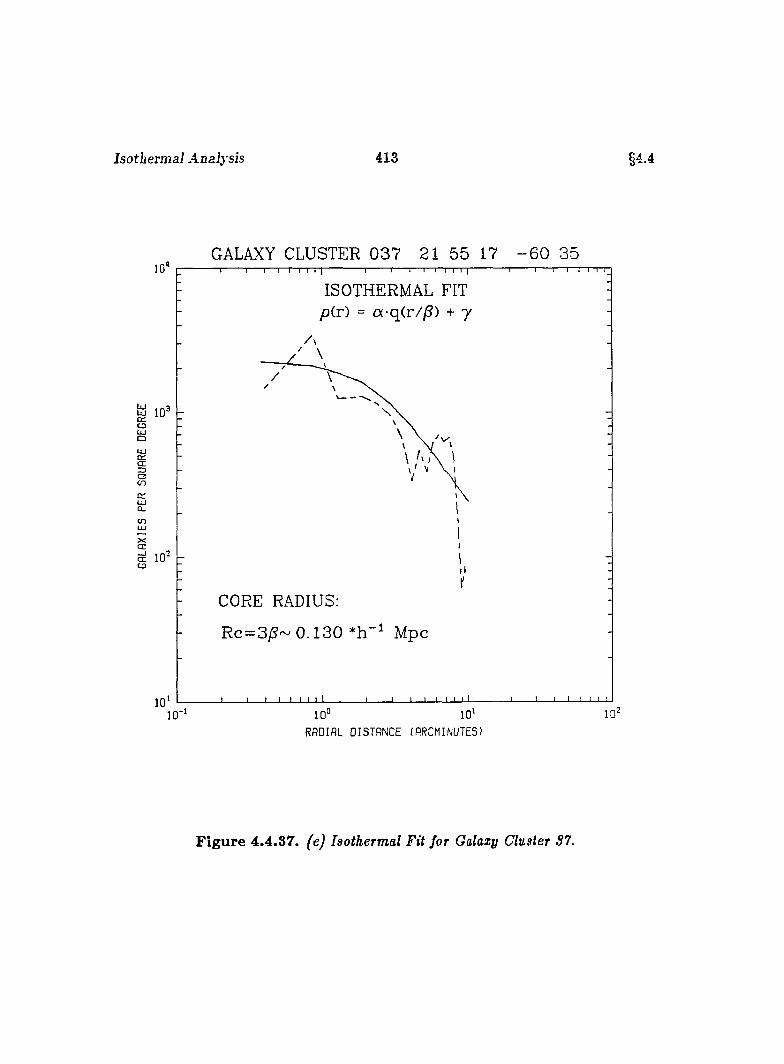
Isothermal Analysis 413 §44
GALAXY CLUSTER 0 3 7 21 55 17 - 6 0 35
gg
ŒZDC3CO
Û:
XccŒCD
ISOTHERMAL FIT yo(r) = a-q(r//S) + 7
CORE RADIUS;
Rc=3/S~ 0.130 Mpc
10'10'10°
RADIAL DISTANCE lARCMINUTES)
Figure 4.4.37. fe j Isothermal Fit for Galaxy Cluster 57.
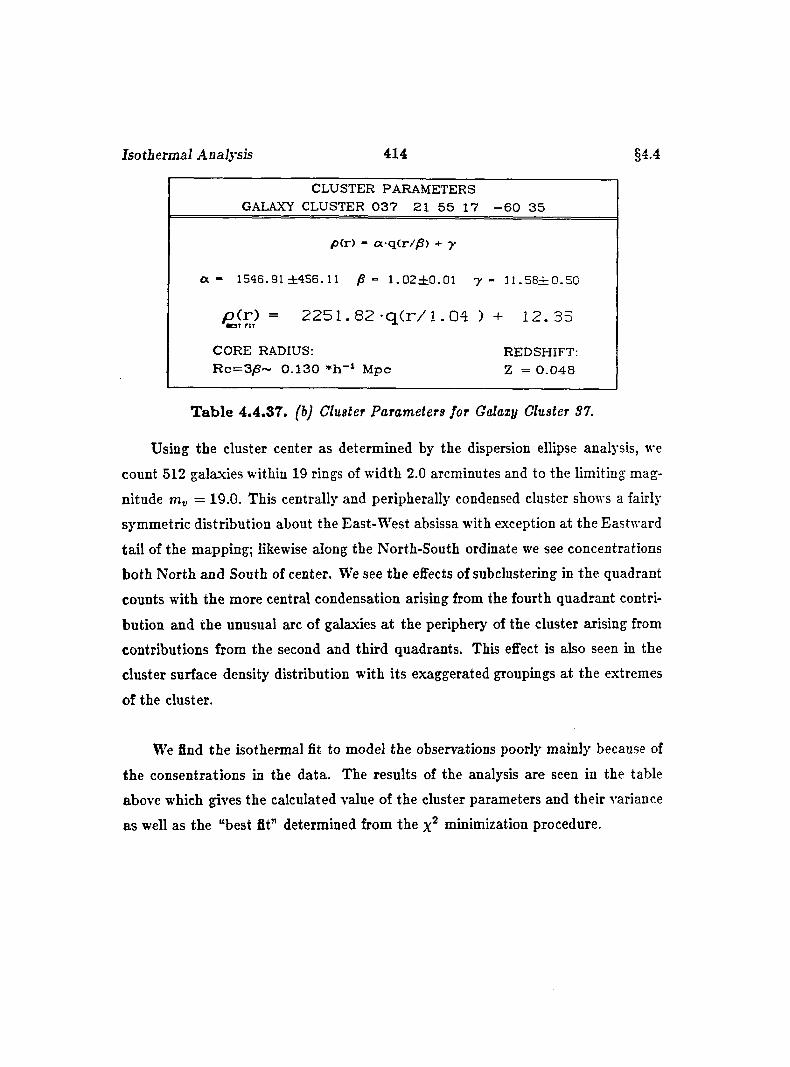
Isothermal Analysis 414 §4.4
CLUSTER PARAMETERS _________ GALAXY CLUSTER 0 3 7 21 5 5 17 - 6 0 3 5 _________
p (r ) - a qCr/yS) + y
a - 1546.91 ± 4 5 6 .1 1 /S •= 1 .0 2 ± 0 .0 1 7 = 1 1 .5 8 ± 0 .5 0
p ( r ) = 2 2 5 1 . 8 2 - q C r / 1 . 0 4 ) + 1 2 . 3 5•tST riT
CORE RADIUS; RED SHIFT:R c = 3 /S ~ 0 .1 3 0 M pc Z = 0 .0 4 8
Table 4 .4.37. (b) Cluster Parameters for Galaxy Cluster 81.
Using the cluster center as determined by the dispersion ellipse analysis, we
count 512 galaxies within 19 rings of width 2.0 arcminutes and to the limiting mag
nitude m„ = 19.0. This centrally and peripherally condensed cluster shows a fairly
symmetric distribution about the East-West absissa with exception at the Eastward
tail of the mapping; likewise along the North-South ordinate we see concentrations
both North and South of center. We see the effects of sub clustering in the quadrant
counts with the more central condensation arising from the fourth quadrant contri
bution and the unusual arc of galaxies at the periphery of the cluster arising from
contributions from the second and third quadrants. This effect is also seen in the
cluster surface density distribution with its exaggerated groupings at the extremes
of the cluster.
We find the isothermal fit to model the observations poorly mainly because of
the consentrations in the data. The results of the analysis are seen in the table
above which gives the calculated value of the cluster parameters and their variance
as well as the “best fit” determined from the minimization procedure.
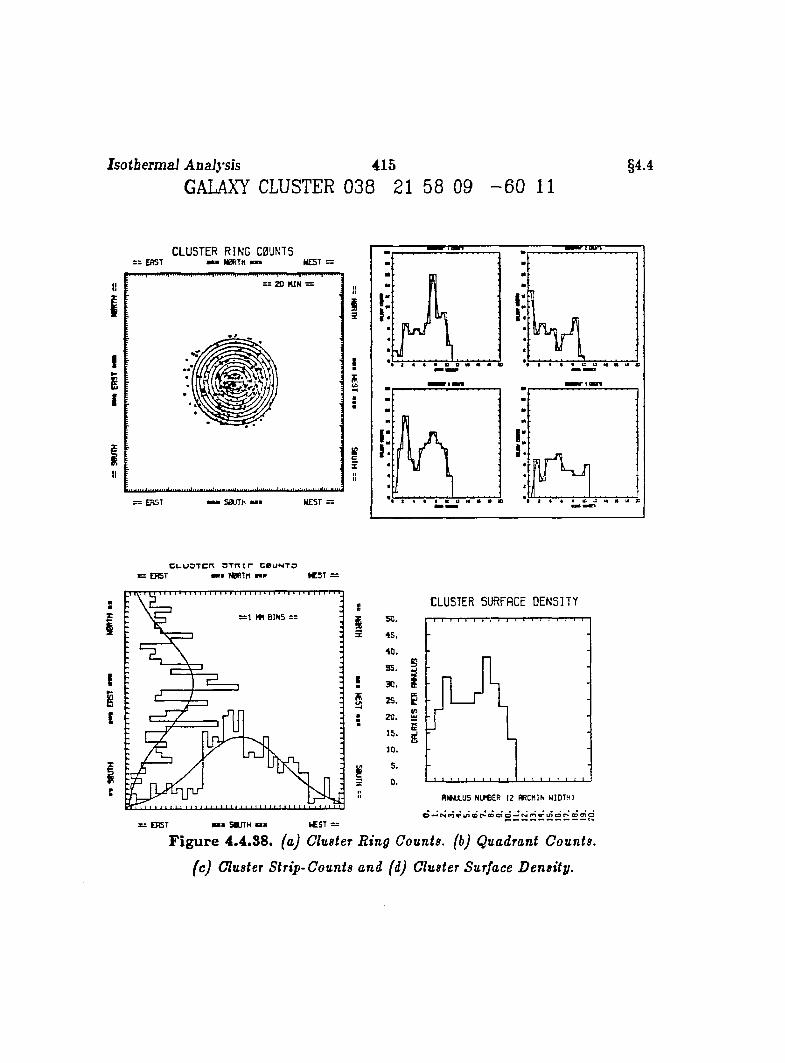
Isotberm aî Analysis 415GALAXY CLUSTER 038 21 58 09 - 6 0 11
§4.4
CLUSTER RING COUNTS= : ERST mmm N0RTH m n WEST =
~ 20 MIN
= ERST S O flH i WEST =
:i 1sA ,
i:8M1
■ s• 1 « • • m n M • ■
i : -
i J1 /k. i:ili
8n 8
« U * K %
C I-U 3 T C T T O T T T ir C 0 U N T 3 sz ERST — » HBRTn mam ftCST =
s = l MM B IN S = =
S
f
T
c
B
IIn
50.
45.
40.
35.30.
25.
20.
I S .
10.
5.
0.
CLUSTER SURFACE DENSITY
5
i
= EnST w m SauTH ■ » ICST —
Figure 4.4.88. (a) ClusteT R ing Counts, (b) Quadrant Counts,
(c) Cluster Strip-Counts and (d) Cluster Surface D ensity.
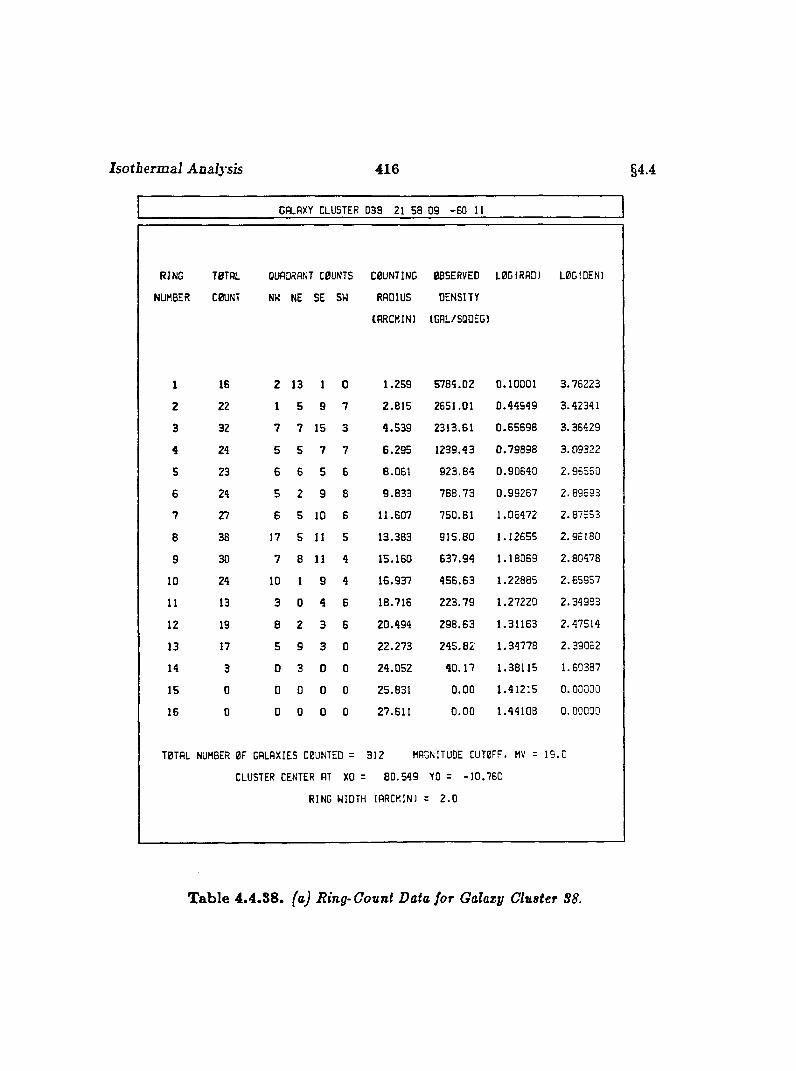
Isothermal Analysis 416 §4.4
GALAXY CLUSTER 038 21 58 09 -6 0 11
;iNG TBTAL QUAORANT COUNTS COUNTING OBSERVED LOGIRAO) L0G1DEN)
JHBER COUNT NW NE SE SW RADIUS DENSITY
(ARCMIN) (GAL/SQDEG)
1 16 2 13 1 0 1.259 5784.02 0.10001 3.76223
2 22 1 5 9 7 2.815 2651.01 0.44949 3.42341
3 32 7 7 15 3 4.539 2313.61 0.65698 3.36429
4 24 5 5 7 7 G. 295 1239.43 0.79898 3.09322
5 23 6 6 5 G 8.061 923.84 0.90640 2.96550
G 24 5 2 g 8 9.833 788.73 0.99267 2.89693
7 27 6 5 10 G 11.607 750.81 1.06472 2.87553
8 38 17 5 11 5 13.383 915.60 1.12655 2.96180
9 30 7 8 11 4 15.160 637.94 1.18069 2.80478
10 24 ID 1 9 4 16.937 456.63 1.22885 2.65957
11 13 3 0 4 6 18.716 223.79 1.27220 2.34983
12 19 8 2 3 G 20.494 298.63 1.31163 2.47514
13 17 5 9 3 0 22.273 245,82 1.34778 2.39052
14 3 0 3 G 0 24.052 40.17 1.38115 1.60387
15 0 0 0 0 0 25.831 0.00 1.41215 0.00000
16 0 0 0 0 0 27.611 0.00 1.44108 0.00000
TOTAL NUMBER 0F GALAXIES C0ÜNTED = 312 MAGNITUDE CUT0FF, MV = 19.0
CLUSTER CENTER AT XO = 80.599 YO = -10.760
RING WIDTH (ARCMIN) = 2.0
Table 4.4.S8. (a) Ring-Count Data for Galaxy Cluster S8.
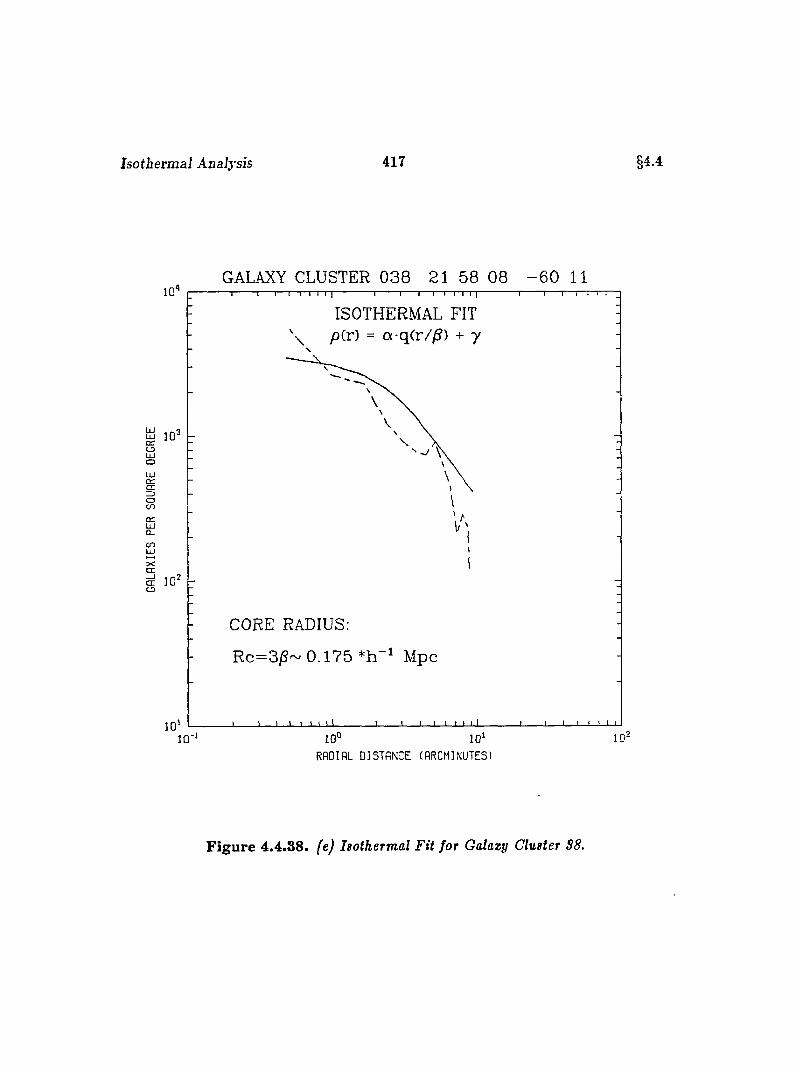
Isotbermaî Analysis 417 §4 4
GALAXY CLUSTER 0 3 8 21 58 06 - 6 0 11
ISOTHERMAL FIT pCr) = a-q(r//S) + y
ë 10oLÜOLUû::ŒO
CH
e n
XŒ
O
CORE RADIUS;
Rc=3)S~ 0.175 *h 1 Mpc
RflDIRL DISTANCE (ARCMINUTES)
Figure 4.4.38. (e) Isothermal F it for Galaxy Cluster S8.
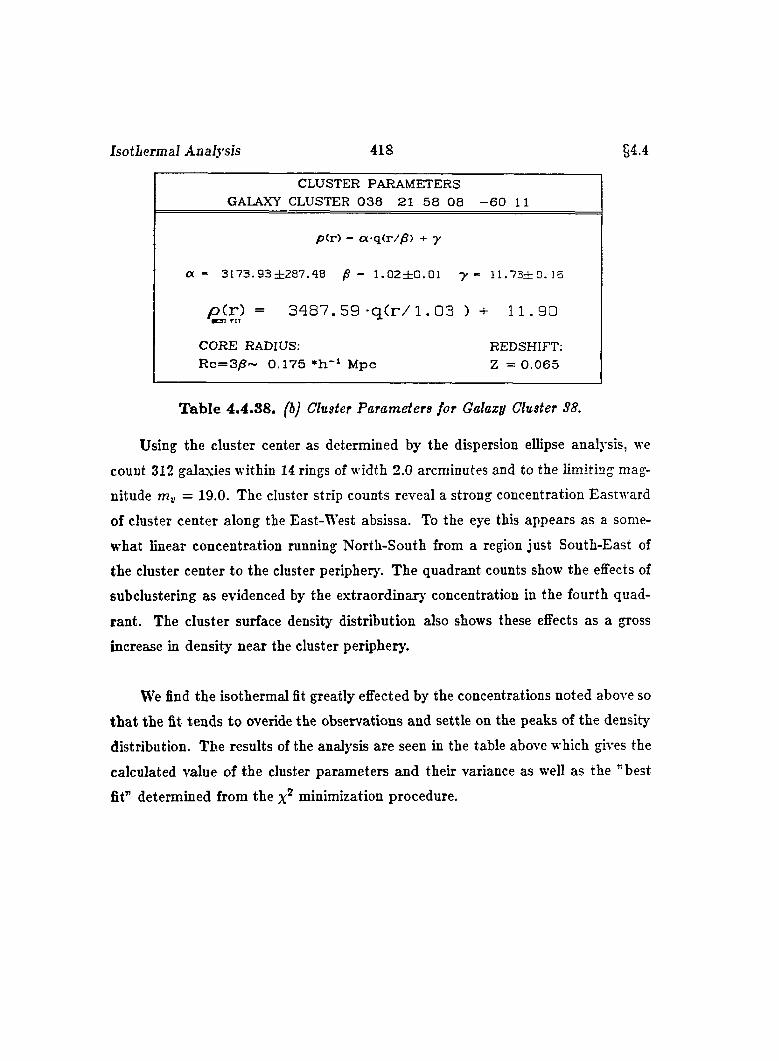
Isothermal Analysis 418 544CLUSTER PARAMETERS
GALAXY CLUSTER 0 3 8 21 5 6 0 8 - 6 0 11
p (r ) - a-q<r//S) + y
a - 3 1 7 3 . 93 ± 2 8 7 . 4 8 /S - 1 . 0 2 ± 0 . 0 1 y - 1 1 . 7 3 ± G . 1 6
p C r ) = 3 4 8 7 . 5 9 - q ( r / 1 . 0 3 ) + 1 1 . 9 0
CORE RADIUS;R c = 3 /S ~ 0 .1 7 5 M pc
REDSHIFT: Z = 0 .0 6 5
Table 4 .4 .38 . (b) Cluster Parameters for Galaxy Cluster 38.
Using the cluster center as determined by the dispersion ellipse analysis, we
count 312 galaxies within 14 rings of width 2.0 arcminutes and to the limiting mag
nitude = 19.0. The cluster strip counts reveal a strong concentration Eastward
of cluster center along the East-West absissa. To the eye this appears as a some
what linear concentration running North-South from a region just South-East of
the cluster center to the cluster periphery. The quadrant counts show the effects of
subclustering as evidenced by the extraordinarj' concentration in the fourth quad
rant. The cluster surface density distribution also shows these effects as a gross
increase in density near the cluster periphery.
We find the isothermal fit greatly effected by the concentrations noted above so
that the fit tends to overide the observations and settle on the peaks of the density
distribution. The results of the analysis are seen in the table above which gives the
calculated value of the cluster parameters and their variance as well as the ’’best
fit” determined from the minimization procedure.
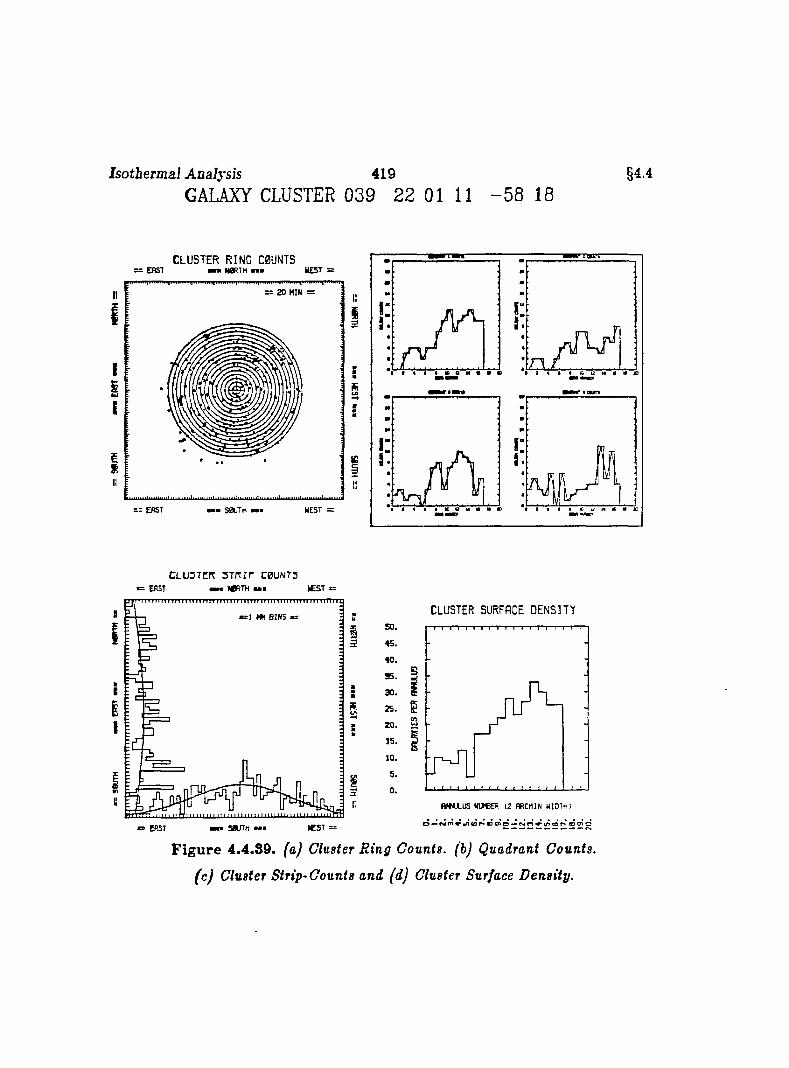
Isotbermaî Analysis 419GALAXY CLUSTER 039 22 01 11 - 5 8 18
§4.4
CLUSTER RING COUNTS= ER ST m m M R T H mmm N E S T :
= 2 0 MIN =
= = ER ST ■ ■ S0LTTH mmm WEST = • « « • • B U M
CLU3Tcrc s i r i r cbuntsEAST » N BR TH m i » £ 5 T &=
8 B IN S J B
I
II
li
CLUSTER SURFACE DENSITY
Sas.3 0 . S= . s10. Ü
1 5 .
Figure 4.4.39. (a) Cluster R ing Counts, (b) Quadrant Counts,
(c) Cluster Strip-Counts and (d) Cluster Surface D ensity.
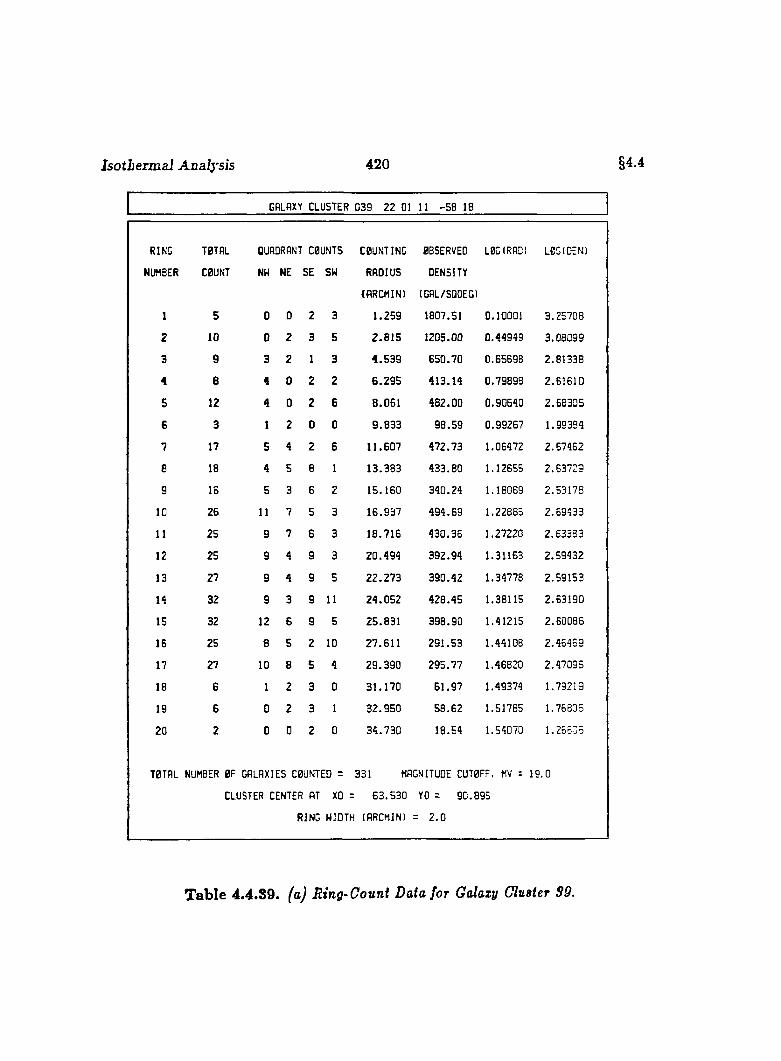
Isothermal Analysis 420 §4.4
GALAXY CLUSTER 039 22 0! 11 -5 8 18
RING TBTAL QUADRANT COUNTS COUNTING 0BSERVEO L0CIRAOI LBGIDEN)
NUMBER CBUNT NW NE 5E SW RADIUS DENSITY
(ARCMIN) (GAL/SQDEG)
1 5 0 0 2 3 1.259 1807.51 0.10001 3.25708
2 10 0 2 3 5 2.815 1205.00 0.44949 3.08099
3 9 3 2 1 3 4.539 650.70 0.65698 2.81338
4 e 4 0 2 2 6.295 413.14 0.79898 2.6161D
5 12 4 0 2 6 8.061 482.00 0.90640 2.68305
6 3 1 2 0 0 9.833 98.59 0.99267 1.99394
7 17 5 4 2 6 11.607 472.73 1.06472 2.67462
e 18 4 5 8 1 13.383 433.80 1.12655 2.63729
9 16 5 3 6 2 15.160 340.24 1.18069 2.53178
10 26 11 7 5 3 16.937 494.69 1.22885 2.69433
11 25 9 7 6 3 18.716 430.36 1.27220 2.63383
12 25 9 4 9 3 20.494 392.94 1.31163 2.59432
13 27 9 4 9 5 22.273 390.42 1.34778 2.59153
14 32 9 3 9 11 24.052 428.45 1.38115 2.63190
15 32 12 6 9 5 25.831 398.90 1.41215 2.60086
16 25 8 5 2 10 27.611 291.53 1.44108 2.46469
17 27 10 8 5 4 29.390 295.77 1.46820 2.47096
18 6 1 2 3 0 31.170 61.97 1.49374 1.79219
19 6 0 2 3 1 32.950 58.62 1.51785 1.75806
20 2 0 0 2 0 34.730 18.54 1.54070 1.25833
TBTAL NUMBER BF GALAXIES COUNTED = 331 MAGNITUDE CUT0FF. MV = 19.0
CLUSTER CENTER AT XO = 63.530 YO = 90.895
RING WIDTH lARCMIN) = 2.0
Table 4.4.89. (a) Ring-Count Data for Galaxy Cluster S9.
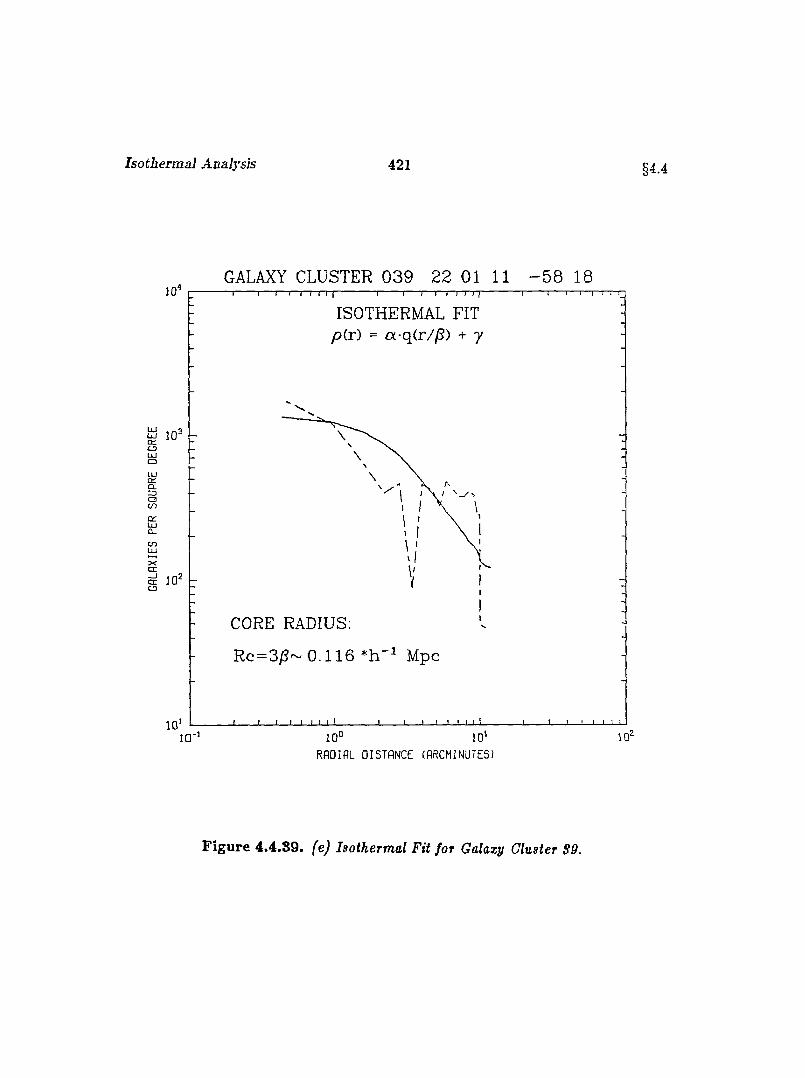
Isotberma.1 Analysis 421 §4.4
GALAXY CLUSTER 0 3 9 22 01 11 - 5 8 1810 '
ISOTHERMAL FIT p(.r) = a-q(r//S) + y
a iCD
Q
CL
C3CD
gCO
CORE RADIUS;
Rc=3/S~ 0.116 *h Mpc
10 '10°
RADIAL DISTANCE (ARCMINUTES)
Figure 4.4.89. (e) Isothermal F it for Galaxy Cluster S9.
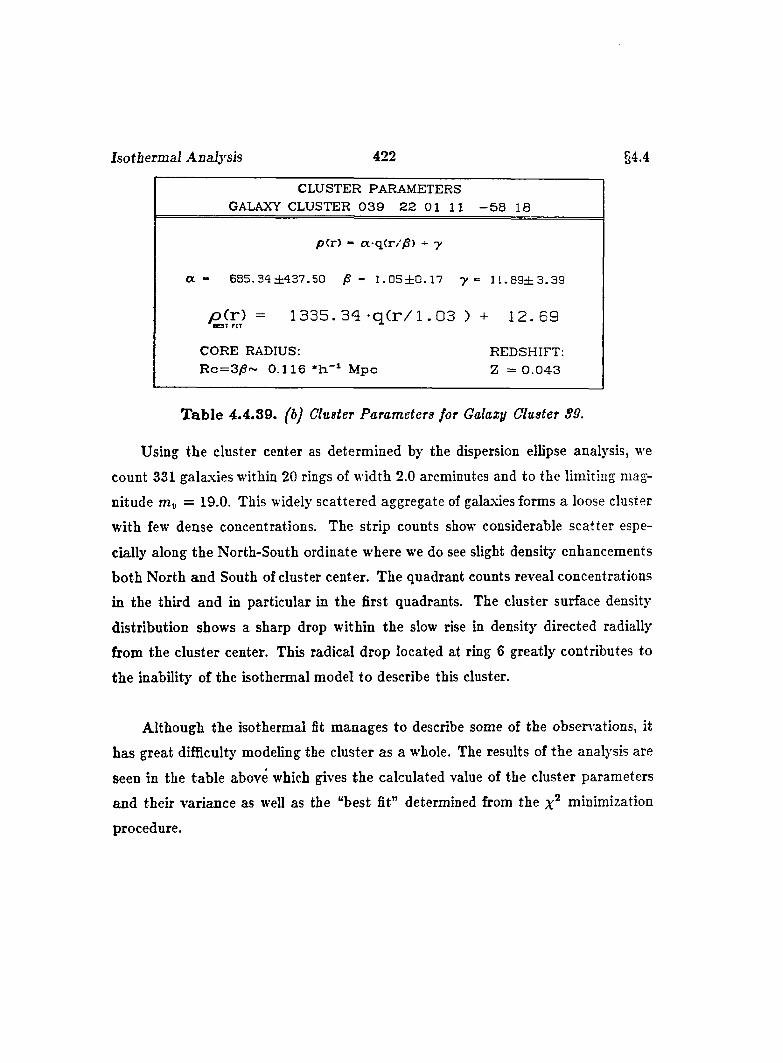
Isothermal Analysis 422 S4.4
CLUSTER PARAMETERS GALAXY CLUSTER 0 3 9 2 2 01 11 - 5 8 18
p ( r ) - a -q (r//S ) + y
a - 685.34 ±437.50 /S - 1 .0 5 ± 0 .1 7 y -= l l .B 3 ± 3 .3 3
p ( r ) = 1 3 3 5 .3 4 - q C r / l . 03 )aOT fIT •*’ + 1 2 . 6 9
CORE RADIUS: REDSHIFT:R c = 3 /8 ~ 0 .1 1 6 M pc Z = 0 .0 4 3
T able 4.4.89. fbj Cluster Parameters for Galaxy Cluster S9.
Using the cluster center as determined by the dispersion elhpse analysis, we
count 331 galaxies within 20 rings of width 2.0 arcminutes and to the limiting mag
nitude = 19.0. This widely scattered aggregate of galaxies forms a loose cluster
with few dense concentrations. The strip counts show considerable scatter espe
cially along the North-South ordinate where we do see slight density enhancements
both North and South of cluster center. The quadrant counts reveal concentrations
in the third and in particular in the first quadrants. The cluster surface density
distribution shows a sharp drop within the slow rise in density directed radially
from the cluster center. This radical drop located at ring 6 greatly contributes to
the inability of the isothermal model to describe this cluster.
Although the isothermal fit manages to describe some of the obsen'ations, it
has great difficulty modeling the cluster as a whole. The results of the analysis are
seen in the table above which gives the calculated value of the cluster parameters
and their variance as well as the “best fit” determined from the minimization
procedure.
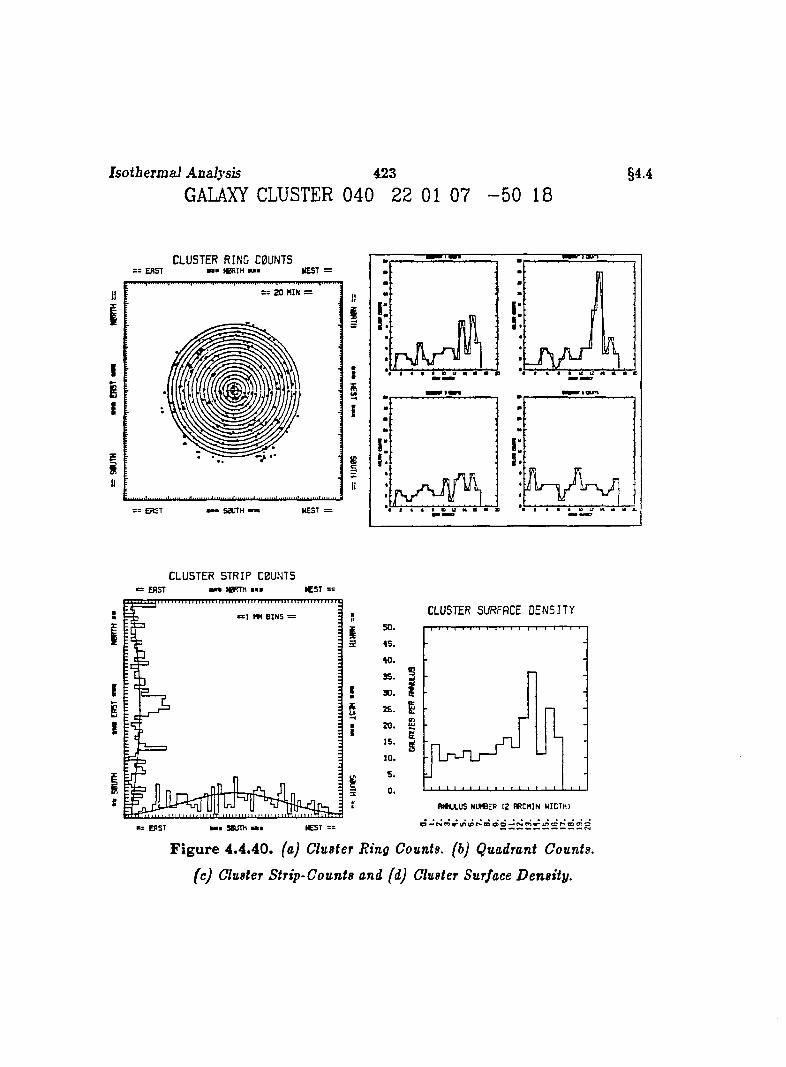
Isotherm al Analysis 423GALAXY CLUSTER 040 22 01 07 - 5 0 18
§4.4
CLUSTER RING C0UNTS: EAST NBRTH WEST =
2 0 MIN =
i l - i A vS0ÜTH
CLUSTER STRIP [BUNTSEAST m n N0FTM u s IC S T ~
B IN S ”
fiE
s
M « S8UTHERST
CLUSTER SURFACE DENSITY
i
M U . U S NUm EA (2 RRCHIN WIDTH)
Figure 4.4.40. (a) Cluster Ring Counts, (b) Quadrant Counts,
(c) Cluster Strip-C ounts and (d) Cluster Surface D ensity.
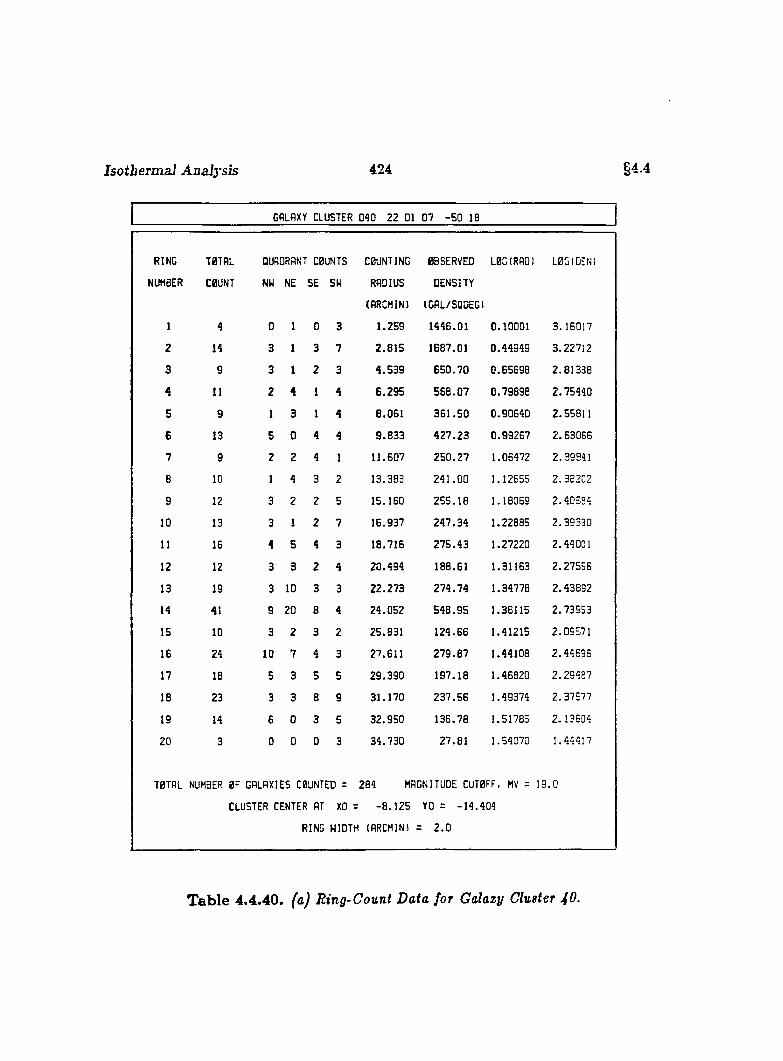
Isothermal Analysis 424 §4.4
GALAXY CLUSTER 040 22 01 07 -5 0 IB
RING
NUMBER
TBTAL
CBUNT
QUADRANT COUNTS
NW NE SE SU
COUNTING
RADIUS
(ARCMIN)
OBSERVED
DENSITY
(GAL/SQDEG)
LOG(RAD) LOGIDEN)
1 4 0 1 0 3 1.259 1446.01 O.lODDl 3 .16D17
2 14 3 1 3 7 2.815 1687.01 0.44949 3.22712
3 9 3 1 2 3 4.539 650.70 0.65698 2.81338
4 11 2 4 1 4 6.295 568.07 0.79898 2.75440
5 9 1 3 1 4 8.061 361.50 0.9DB4D 2.55811
6 13 5 0 4 4 9.833 427.23 0.99267 2.63066
7 9 2 2 4 1 11.607 250.27 1.06472 2.39841
8 10 1 4 3 2 13.383 241.00 1.12GS5 2.38202
S 12 3 2 2 5 15.160 255.18 1.18069 2.40684
10 13 3 1 2 7 16.937 247.34 1.22885 2.39330
11 16 4 5 4 3 18.716 275.43 1.27220 2.44001
12 12 3 3 2 4 20.494 188.61 1.31163 2.27556
13 19 3 10 3 3 22.273 274.74 1.34778 2.43892
14 41 9 20 8 4 24.052 548.95 1.38115 2.73953
15 10 3 2 3 2 25.831 124.66 1.41215 2.09571
16 24 10 7 4 3 27.611 279.87 1.44108 2.44696
17 IB 5 3 5 5 29.390 197.18 1.46820 2.29487
IB 23 3 3 8 9 31.170 237.56 1.49374 2.37577
19 14 6 0 3 5 32.950 136.78 1.51785 2. 13604
20 3 0 0 0 3 34.730 27.81 1.54070 1. 44417
TBTAL NUMBER BF GALAXIES CflUNTEO =
CLUSTER CENTER AT XO =
RING HIOTH
284 MAGNITUDE CUTOFF. MV = 19.0
-8.125 YO = -14.404
(ARCMIN) = 2.0
Table 4.4.40. aj Ring-Count Data for Galaxy Cluster 40 .

Isothermal Analysis 425 U A
GALAXY CLUSTER 040 2 2 01 07 - 5 0 1810'
ISOTHERMAL FIT pir) = aq(r//5 ) + 7
a 10'OoÜ Jc r
cnLUXŒŒ 10 O
CORE RADIUS:
R c= 3iS~ 0 .1 1 3 M pc
io ‘10°
RADIAL DISTANCE (ARCMINUTES)
Figure 4.4.40. (e) Isotherm al F it for Galaxy Cluster J O.
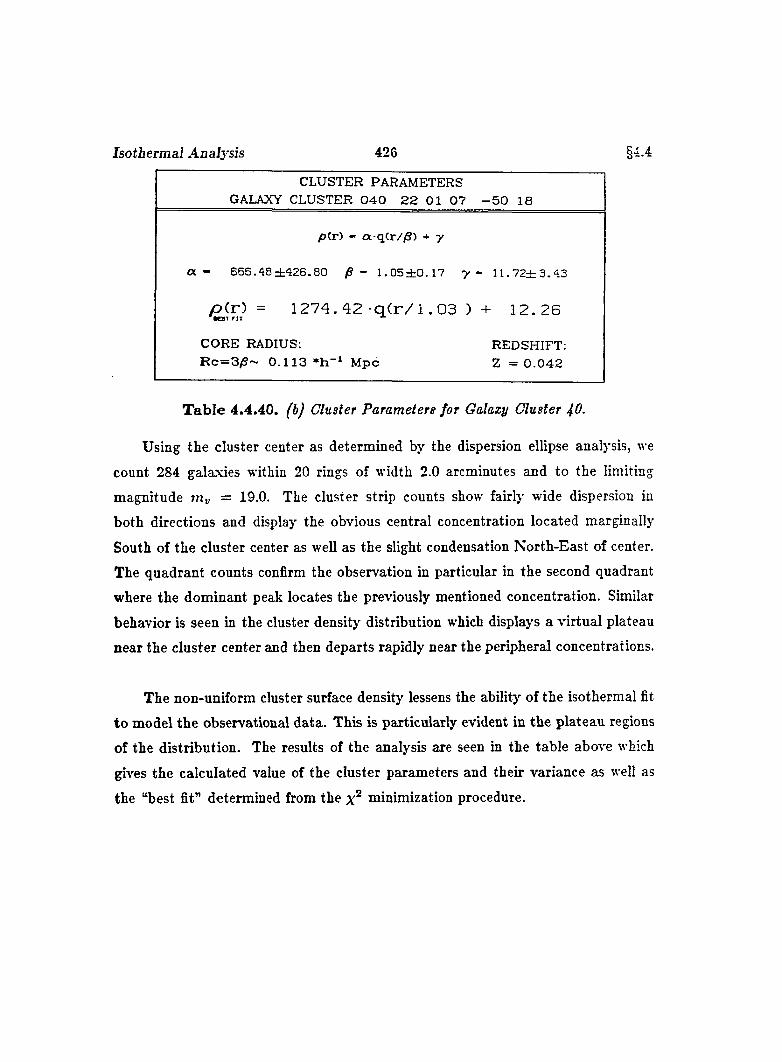
Isothermal Analysis 426 §4.4
CLUSTER PARAMETERS GALAXY CLUSTER 0 4 0 2 2 01 07 - 5 0 18
p (r ) - a q(r//S ) + y
a - 6 6 6 . 4 8 ± 4 2 6 . 8 0 /S - 1 . 0 5 ± Q . 1 7 y ■= U . 7 2 ± 3 . 4 3
p ( r ) = 1 2 7 4 . 4 2 - q C r / l . G S )•C S7 r i T
+ 1 2 . 2 6
CORE RADIUS: REDSHIFT:R c = 3 /S ~ 0 .1 1 3 M pc Z = 0 .0 4 2
T able 4.4.40. fbJ Cluster Parameters for Galaxy Cluster 40.
Using the cluster center as determined by the dispersion ellipse analysis, we
count 284 galaxies within 20 rings of width 2.0 arcminutes and to the limiting
magnitude = 19.0. The cluster strip counts show fairly wide dispersion in
both directions and display the obvious central concentration located marginally
South of the cluster center as well as the slight condensation North-East of center.
The quadrant counts confirm the observation in particular in the second quadrant
where the dominant peak locates the previously mentioned concentration. Similar
behavior is seen in the cluster density distribution which displays a virtual plateau
near the cluster center and then departs rapidly near the peripheral concentrations.
The non-uniform cluster surface density lessens the ability of the isothermal fit
to model the observational data. This is particularly evident in the plateau regions
of the distribution. The results of the analysis are seen in the table above which
gives the calculated value of the cluster parameters and their variance as well as
the “best fit” determined from the minimization procedure.
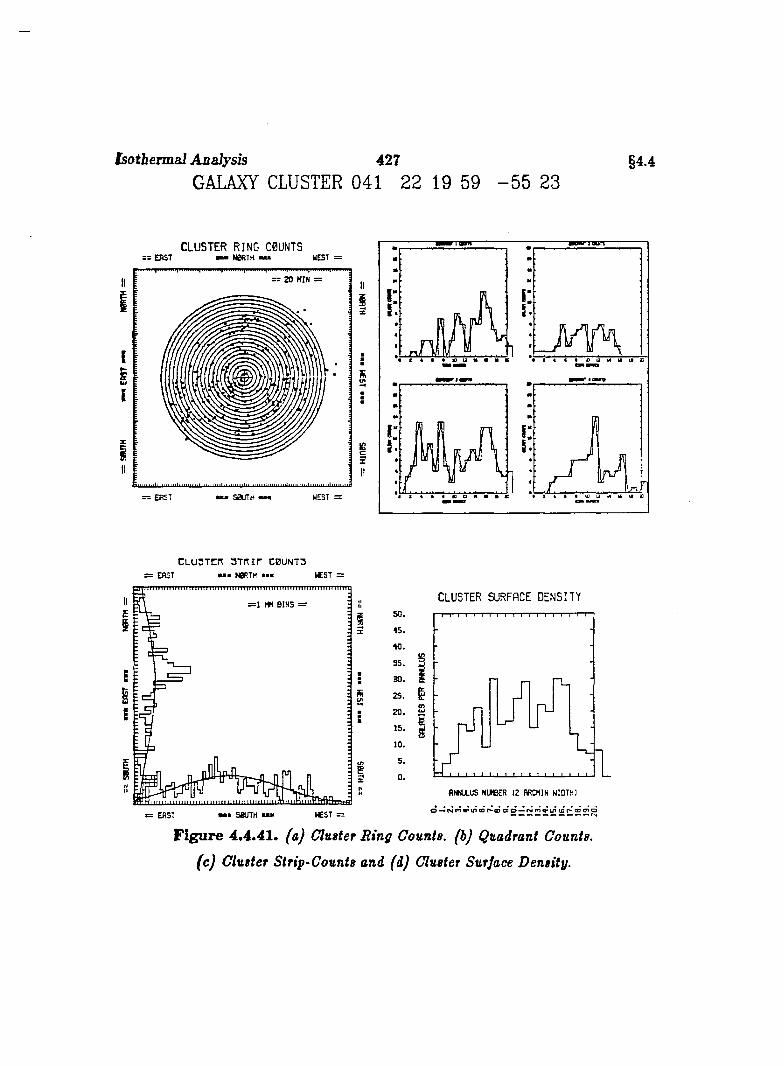
iso tbenna l A nalysis 427
GALAXY CLUSTER 041 22 19 59 - 5 5 23§4.4
CLUSTER RING C0UNTS: ERST — N0RTH u u WEST =
= 2 0 H IN =
= = E R ST
IIIs
E
iII
CLU3TCR 3 T IT ir C0UNT3 EAST NBRTH • • • IC S T =
IIEI
=1 m BINS —
E
WEST —= EAST
CLUSTER SURFACE DENSITYso.
35.
2 S . B
Figure 4.4.41. Cluster R ing Counts, (h) Quadrant Counts,
(c) Cluster Strip-Counts and (d) Cluster Surjace Density.
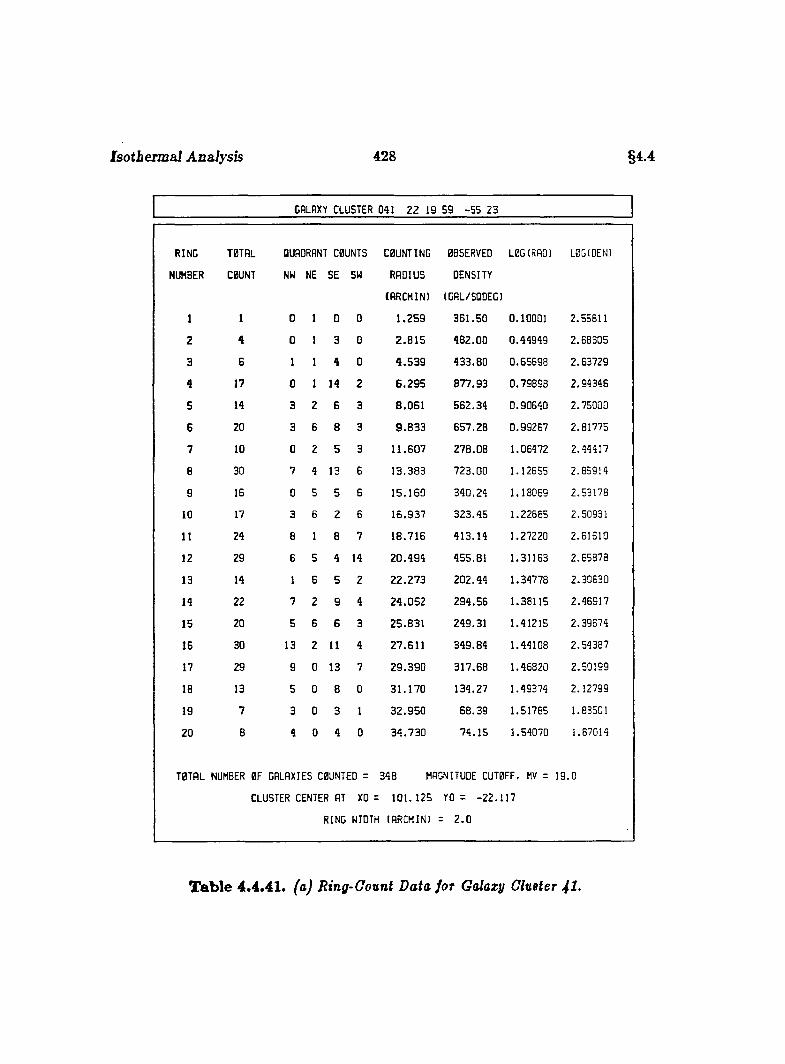
Isothermal Analysis 428 §4.4
GALAXY CLUSTER 041 2 2 19 59 -5 5 23
RING
NUMBER
T0THL
CBUNT
QUADRANT COUNTS
NW NE SE SW
COUNTING
RADIUS
(ARCMIN)
OBSERVED
DENSITY
IGAL/SQOEG)
LOG (RAD) LBGIOEN)
1 1 0 1 0 0 1.259 361.50 0.10001 2.55811
2 4 0 1 3 0 2.815 482.00 0.44949 2.68305
3 6 1 1 4 0 4.539 433.80 0.65698 2.63729
4 17 0 1 14 2 6.295 877.93 0.79898 2.94346
5 14 3 2 6 3 8.061 562.34 0.90640 2.75000
6 20 3 6 8 3 9.833 657.28 0.99267 2.81775
7 10 0 2 5 3 11.607 278.08 1.06472 2.44417
e 30 7 4 13 6 13.383 723.00 1.12655 2.85914
9 16 0 5 5 6 15.160 340.24 1.18059 2.53178
10 17 3 6 2 6 16.937 323.45 1.22685 2.50931
11 24 8 1 8 7 18.716 413.14 1.27220 2.61610
12 29 6 5 4 14 20.494 455.81 1.31163 2.65878
13 14 1 6 5 2 22.273 202.44 1.34778 2.30630
14 22 7 2 9 4 24.052 294.56 1.38115 2.46917
15 20 5 6 6 3 25.831 249.31 1.41215 2.39674
16 30 13 2 11 4 27.611 349.84 1.44108 2.54387
17 29 9 0 13 7 29.390 317.68 1.46820 2.50199
18 13 5 0 8 0 31.170 134.27 1.49374 2.12799
19 7 3 0 3 1 32.950 68.39 1.51785 1.83501
20 8 4 0 4 0 34.730 74.15 1.54070 1.87014
T0TAL NUMBER BF GALAXIES COUNTED =
CLUSTER CENTER AT XO =
RING WIDTH
348 MAGNITUDE CUT0FF. MV =
101.125 YO = -22.117
1ARCMIN) = 2.0
19.0
Table 4.4.41. (a) Ring-Count Data, Jot Galaxy Glueter 4 I.
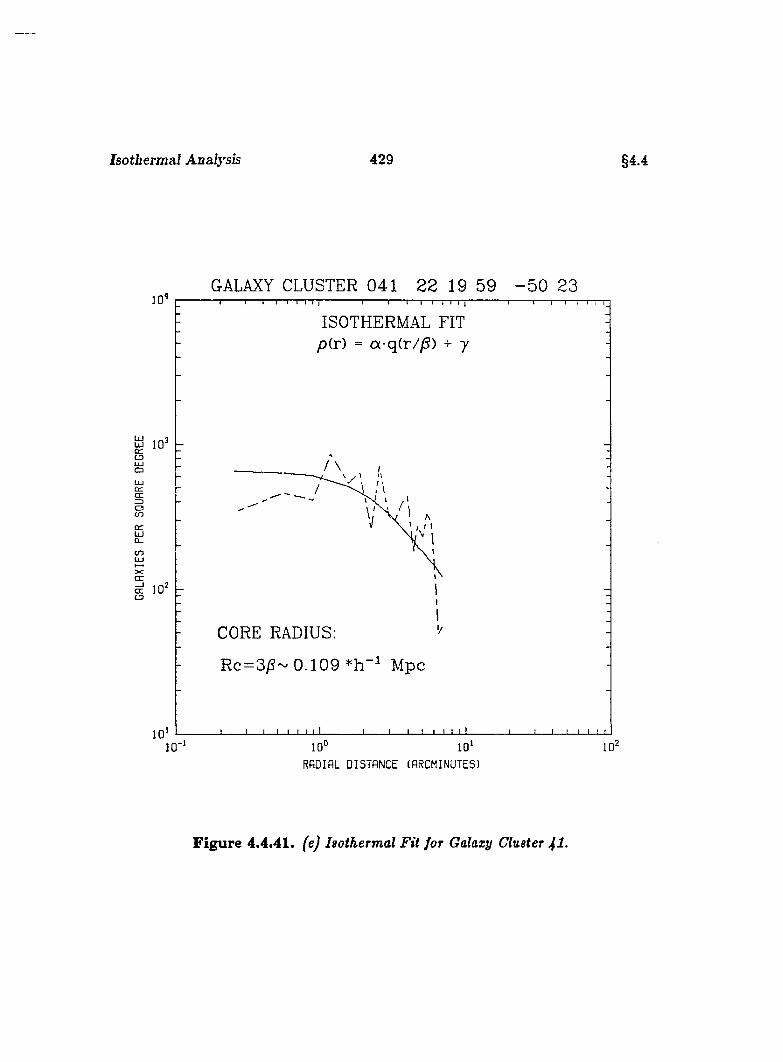
Isotbermaî Analysis 429 §4.4
GALAXY CLUSTER 041 22 19 59 - 5 0 23
ISOTHERMAL FIT pir) = a-q(r//S) + 7
Ü 10CDU JQÜ J
ŒOCO
Q_cn
XŒŒ 10' CD
CORE RADIUS:
R c=3jS~ 0 .1 0 9 M pc
10° 10'RADIAL DISTANCE (ARCMINUTES)
Figure 4.4.41. (e) Isothermal F it for Galaxy Cluster ^1.
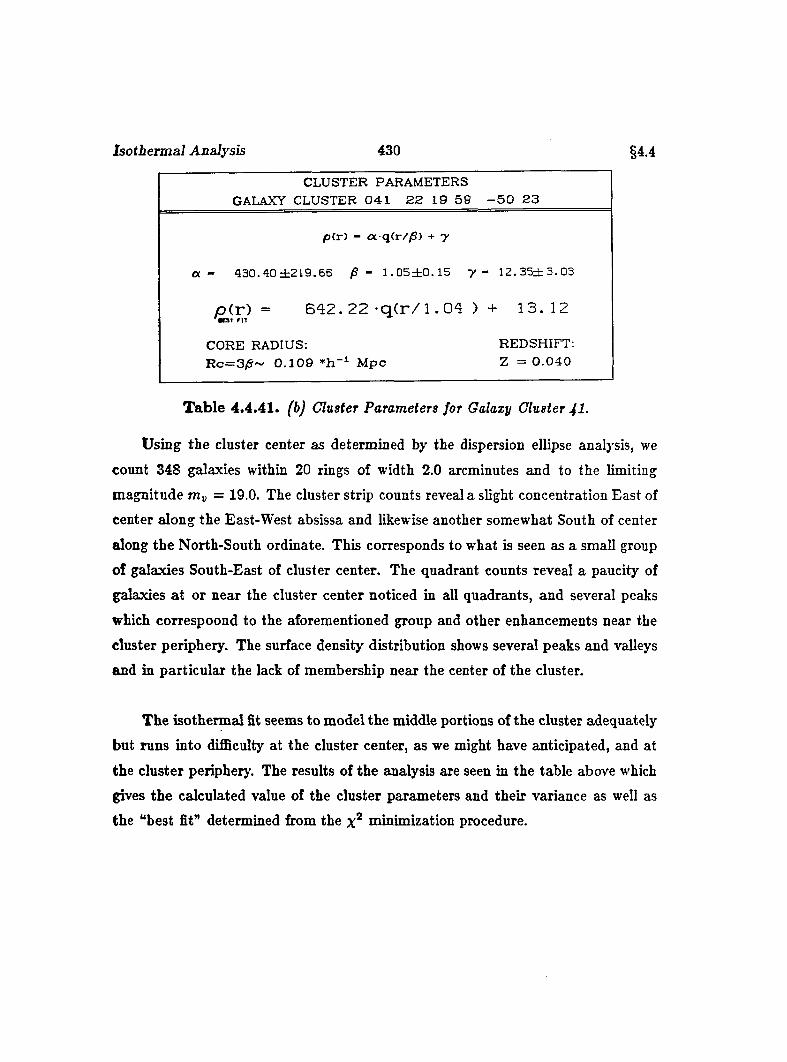
Isotbermaî Analysis 430 §4.4
CLUSTER PARAMETERS _________ GALAXY CLUSTER 0 4 1 2 2 19 5 9 - 5 0 2 3 _________
p (r ) - oc q(r//S) + y
a - 4 3 0 . 4 0 ± 2 1 9 . 6 6 /S - 1 . 0 5 ± 0 . 1 5 y ~ 1 2 . 3 5 ± 3 . 0 3
p ( r ) = 6 4 2 . 2 2 - q ( r / 1 . 0 4 ) + 1 3 . 1 2■ D T FIT
CORE RADIUS: REDSHIFT:R c = 3 /S ~ 0 .1 0 9 » h - i M p c Z = 0 .0 4 0
T ab le 4.4.41. (b) Cluster Parameters for Galaxy Cluster 41-
Using the cluster center as determined by the dispersion ellipse analysis, we
count 348 galaxies within 20 rings of width 2.0 arcminutes and to the limiting
magnitude = 19.0. The cluster strip counts reveal a slight concentration East of
center along the East-West absissa and likewise another somewhat South of center
along the North-South ordinate. This corresponds to what is seen as a small group
of galaxies South-East of cluster center. The quadrant counts reveal a paucity of
galaxies at or near the cluster center noticed in all quadrants, and several peaks
which correspoond to the aforementioned group and other enhancements near the
cluster periphery. The surface density distribution shows several peaks and valleys
and in particular the lack of membership near the center of the cluster.
The isothermal fit seems to model the middle portions of the cluster adequately
but runs into difficulty at the cluster center, as we might have anticipated, and at
the cluster periphery. The results of the analysis are seen in the table above which
gives the calculated value of the cluster parameters and their variance as well as
the “best fit” determined from the minimization procedure.
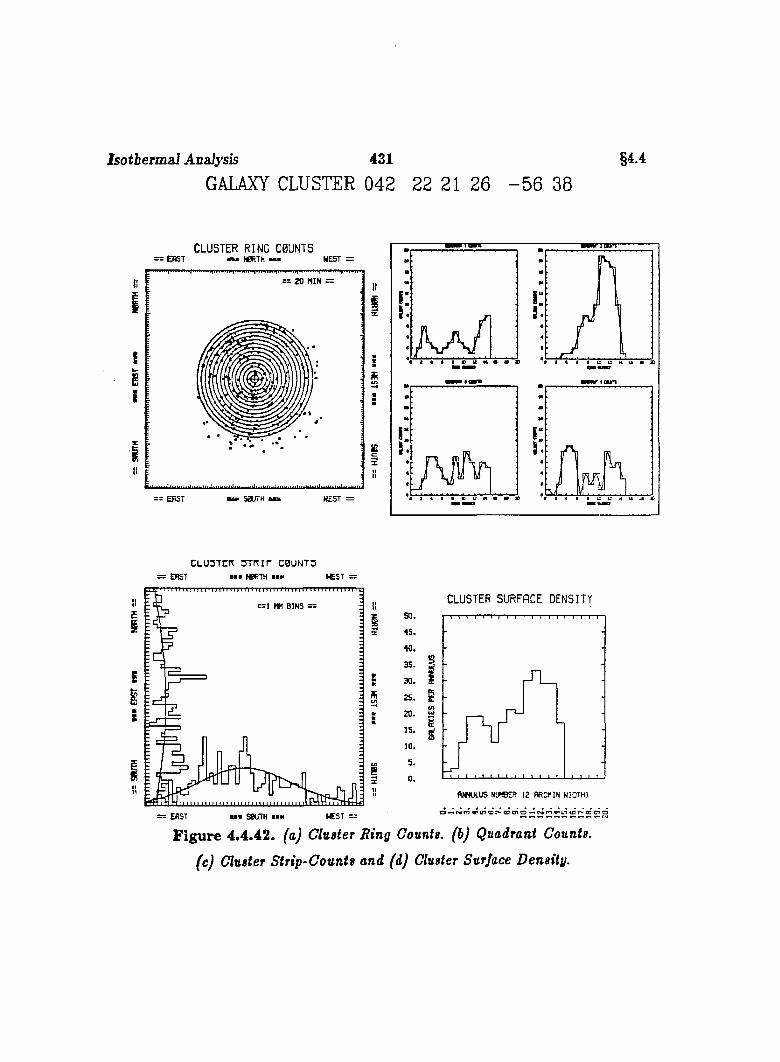
Jsotberm al Analysis 431
GALAXY CLUSTER 042 22 21 26 - 5 6 38§4.4
CLUSTER RING C0UNTS= = EAST — . NBRTH . . . WEST
win H in m i in» i iw in n i i n i i im im ii»iifWNH
= 2 0 MIN =
■ . t . i i l . i m i m l m m i .
== ERST
I ilkaJ : A• i « I « ( O i s K t f t t a
CLU3TDT 3T rÇ ir C0UNT3 ERST ■■■ NBRTH &€ST =
= 1 MM B IN S =
s
II
= EAST
CLUSTER SURFACE DENSITY
3 5 . §
pT!
O M r g m ^ i P < o r * > o o ) o - " r < 4 f n v i n ( c r * ‘ CCOO
Figure 4.4.42. (a) Cluster Ring Counts, (b) Quadrant Counts,
(e) Cluster Strip-Counts and (d) Cluster Surface Density.
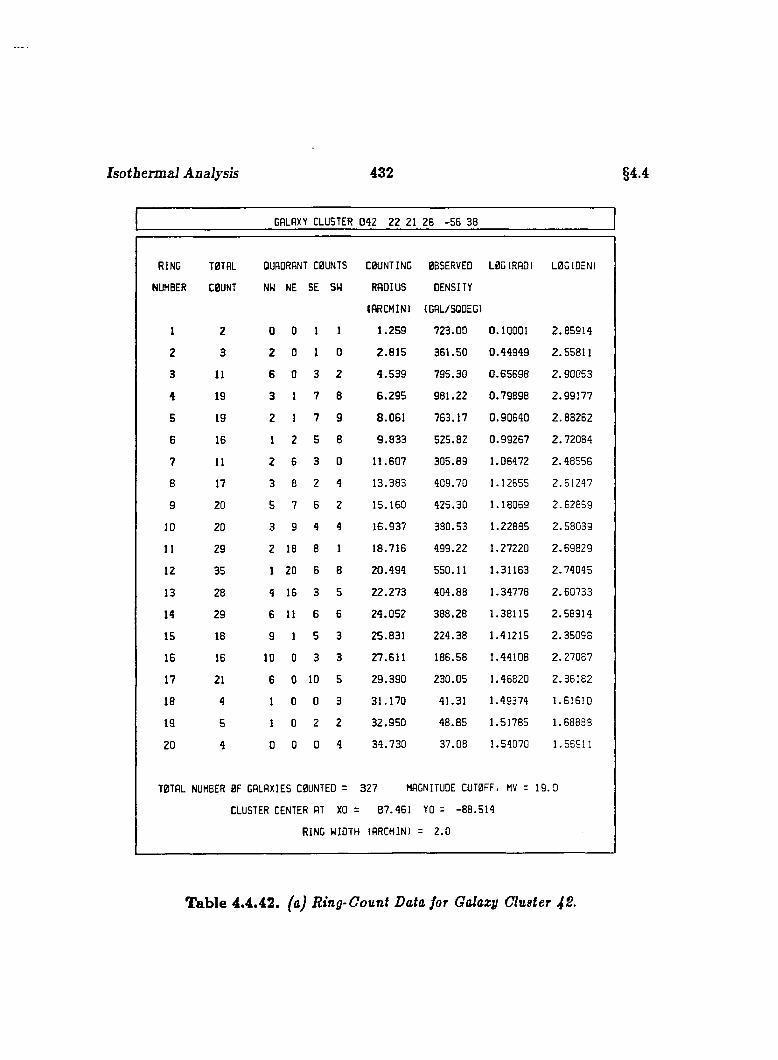
Isothermal Analysis 432 §4.4
GALAXY CLUSTER 042 22 21 26 -5 6 38
RING
NUMBER
TBTAL
CBUNT
QUAORANT CBUNTS
NW NE SE SW
CBUNTING
RAOIUS
(ARCHINl
BBSERVEO
DENSITY
(GAL/SQDEG)
LBG(RAO) LBGIOEN)
1 2 0 0 1 1 1.259 723.00 0.10001 2.85914
2 3 2 0 1 0 2.815 361.50 0.44949 2.55811
3 11 6 0 3 2 4.539 795.30 0.65698 2.90053
4 19 3 1 7 8 6.295 981.22 0.79898 2.99177
5 19 2 I 7 9 8.061 763.17 0.90640 2.88262
6 16 1 2 5 8 9.833 525.82 0.99267 2.72084
7 11 2 6 3 0 11.607 305.89 1.06472 2.48556
8 17 3 8 2 4 13.383 409.70 1.12555 2.61247
g 20 5 7 6 2 15.160 425.30 1.18069 2.62869
10 20 3 9 4 4 16.937 380.53 1.22885 2.58039
11 29 2 18 8 1 18.716 499.22 1.27220 2.69829
12 35 1 20 6 8 20.494 550.11 1.31163 2.74045
13 28 4 16 3 5 22.273 404.88 1.34778 2.60733
14 29 6 11 6 6 24.052 388.28 1.38115 2.58914
15 18 9 1 5 3 25.831 224.38 1.41215 2.35098
16 16 10 0 3 3 27.611 186.58 1.44108 2.27087
17 21 6 0 10 5 29.390 230.05 1.46820 2.36182
18 4 1 0 0 3 31.170 41.31 1.49374 1.61610
19 5 1 0 2 2 32.950 48.85 1.51785 1.68883
20 4 0 0 0 4 34.730 37.08 1.54070 1.55911
TBTAL NUMBER BF GALAXIES C0UNTED =
CLUSTER CENTER AT XO =
RING WIDTH
327 MAGNITUDE CUT0FF. MV = 19
87.461 YO = -88.514
(ARCMIN) = 2.0
0
Table 4.4.42. (a) Ring-Count Data for Galaxy Cluster ^2.
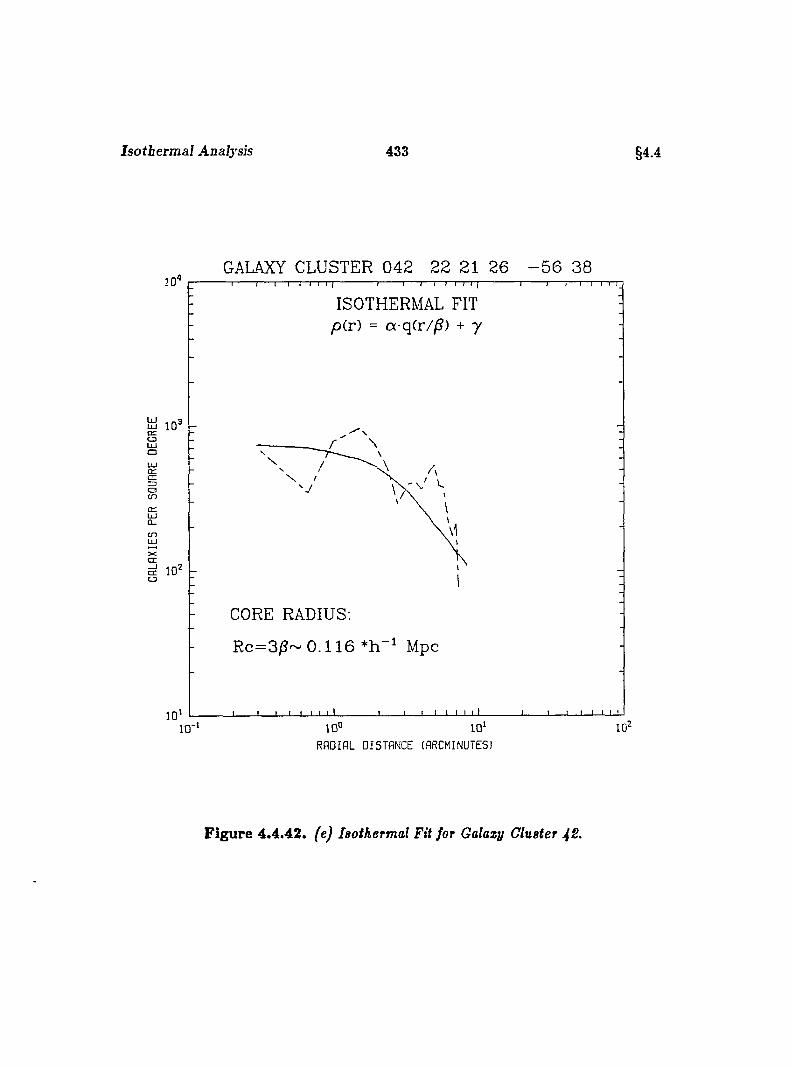
Isotbermaî Analysis 433 §4.4
GALAXY CLUSTER 042 22 21 26 - 5 6 38
ISOTHERMAL FIT p(r) = a-q(r//S) + y
U J
Œ
cn
c rΠ10 'o
CORE RADIUS;
Rc=3)S~ 0 .1 1 6 Mpc
RADIAL DISTANCE (ARCMINUTES)
Figure 4.4.42. {e) Isothermal Fit for Galaxy Cluster J 2.
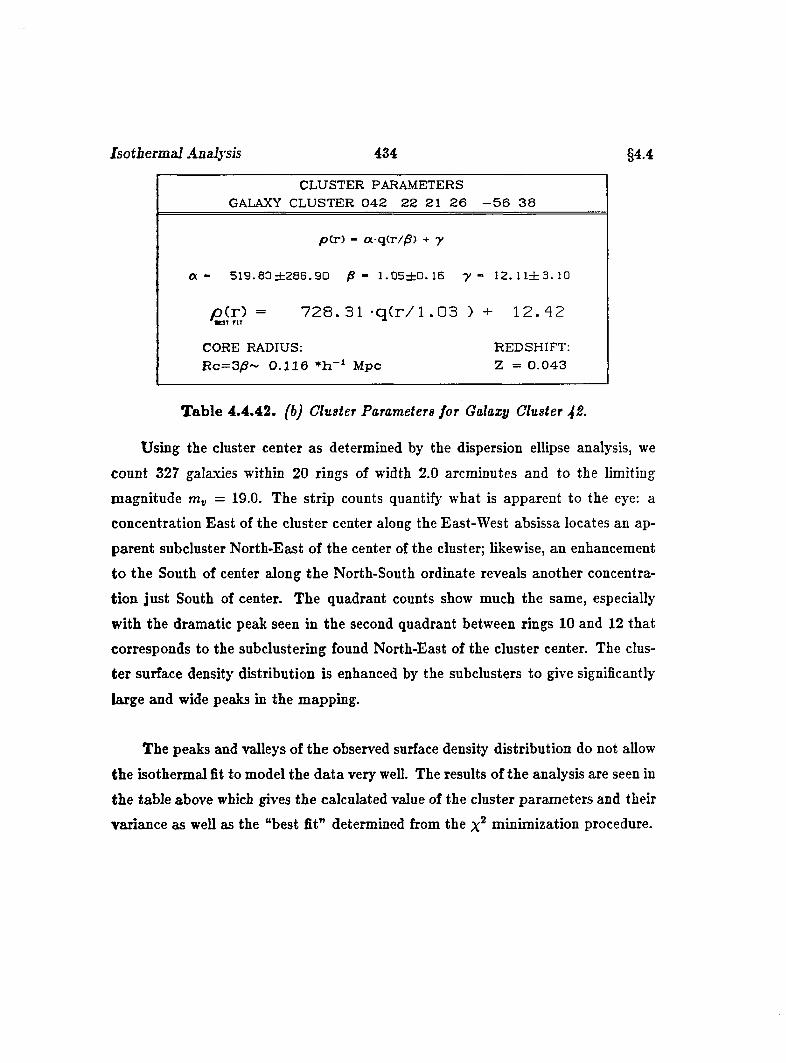
Isothermal Analysis 434
CORE RADIUS;R c = 3 /S ~ 0 . 1 1 6 M pc
REDSH IFT; Z = 0 .0 4 3
§4.4
CLUSTER PARAMETERS _______GALAXY CLUSTER 0 4 2 2 2 21 2 6 - 5 6 3 8
p ( r ) - a q(r//S) + y
a - 519.80 ± 2 8 6 .9 0 /S - 1 .05± 0 .1B y ~ 1 2 .11± 3 .1G
p ( r ) = 7 2 8 . 3 1 - q ( r / l . 0 3 ) + 1 2 . 4 2
Table 4.4.42. (b) Cluster Parameters for Galaxy Cluster 4S.
Using the cluster center as determined by the dispersion ellipse analysis, we
count 327 galaxies within 20 rings of width 2.0 arcminutes and to the limiting
magnitude = 19.0. The strip counts quantify what is apparent to the eye: a
concentration East of the cluster center along the East-West absissa locates an ap
parent subcluster North-East of the center of the cluster; likewise, an enhancement
to the South of center along the North-South ordinate reveals another concentra
tion just South of center. The quadrant counts show much the same, especially
with the dramatic peak seen in the second quadrant between rings 10 and 12 that
corresponds to the subclustering found North-East of the cluster center. The clus
ter surface density distribution is enhanced by the subclusters to give significantly
large and wide peaks in the mapping.
The peaks and valleys of the observed surface density distribution do not allow
the isothermal fit to model the data very well. The results of the analysis are seen in
the table above which gives the calculated value of the cluster parameters and their
variance as well as the “best fit” determined from the minimization procedure.
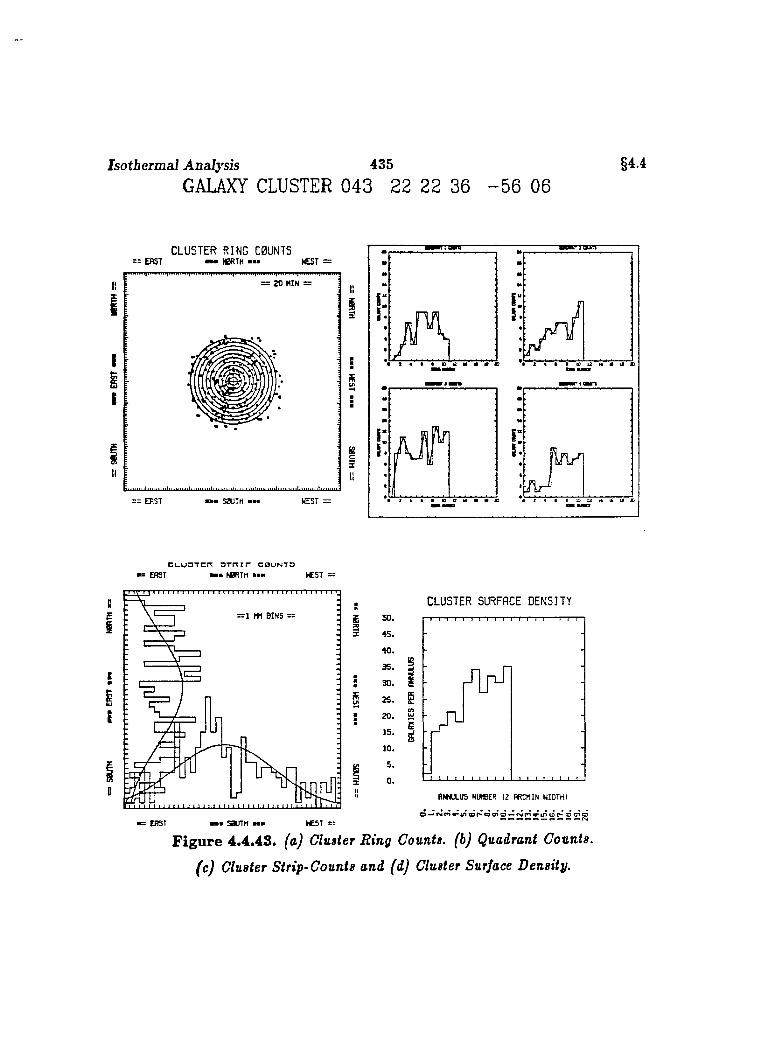
Isothermal Analysis 435GALAXY CLUSTER 043 22 22 36 - 5 6 06
§4.4
CLUSTER RING CBUNTS: EBST NBRTH NEST =
INp t m iH H 111W111 H= = 2 0 M IN =
in i in i i I m M U Jih u M U iJn iy n uI m n i i i ü i i i i i i n i l i i nm tJm m m lo im in U BU
= = ERST « ■ « S0UTH ■■■ WEST =
c i _ u 3 T c r r a r n r r c b u n t d ERST NBRTH IC S T =
:I = 1 MM BINS : =
Ç
I
0
£ 5 0 .35 4 5 .
4 0 .
3 5 .
: 3 0 .
2 5 .
I 2 0 .
1 5 .
1 0 .
g 5 .
1 0 .
1!
CLUSTER SURFACE DENSITY
S
a
1
BIfAJLUS NUWER 12 RRCMIN WIDTH I
: EBST
Figure 4.4.48. (a) Cluster Ring Counts, (b) Quadrant Counts,
(c) Cluster Strip-Counts and (d) Cluster Surface Density.
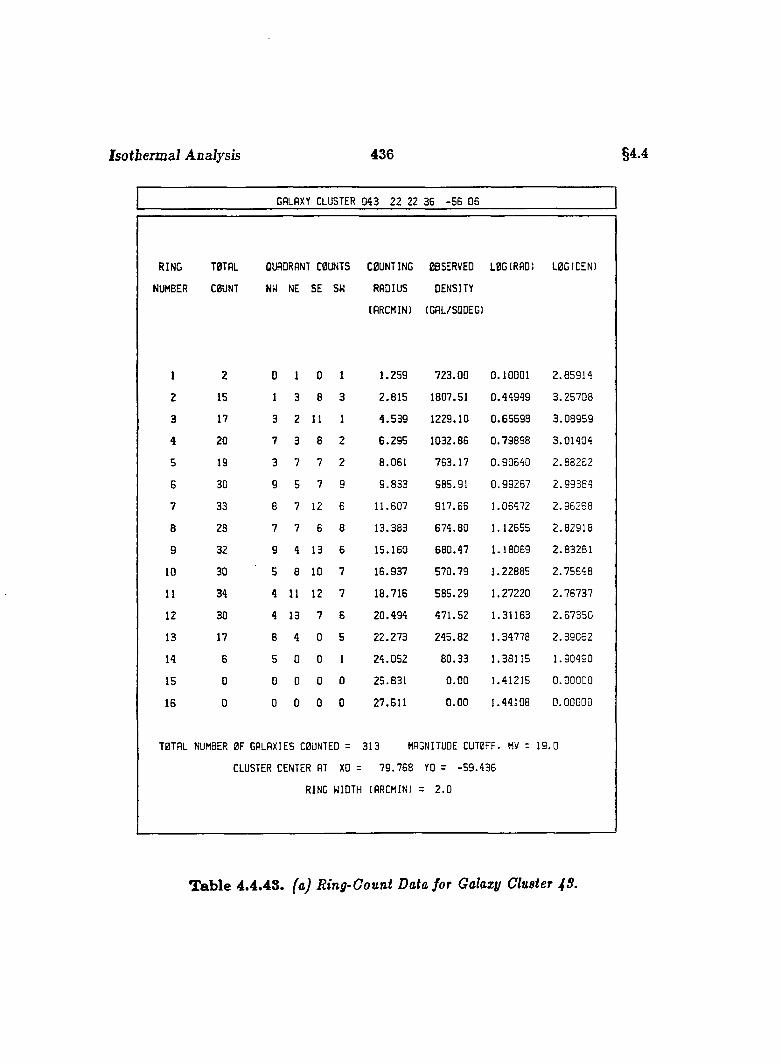
Isothermal Analysis 436 §4.4
GALAXY CLUSTER 093 22 22 36 -5 6 06
ÎING TOTAL OUADRANI■ COUNTS COUNTING OBSERVED LOGIRAO) LOG (DEN)
JMBER C0UNT NW NE SE sw RADIUS DENSITY
(ARCMINl (GAL/SQOEG)
1 2 0 1 0 1 1.259 723.00 0.10001 2.B59I4
2 15 1 3 8 3 2.815 1807.51 0.44949 3.25708
3 17 3 2 11 1 4.539 1229.10 0.65698 3.08959
4 20 7 3 8 2 6.295 1032.86 0.79898 3.01404
5 19 3 7 7 2 8.061 763.17 0.90640 2.88262
6 30 9 5 7 9 9.833 985.91 0.99267 2.99384
7 33 6 7 12 6 11.607 917.66 1.06472 2.96268
8 28 7 7 6 8 13.383 674.80 1.12655 2.82918
9 32 S 4 13 6 15.160 680.47 1.18069 2.83281
10 30 5 8 10 7 16.937 570.79 1.22885 2.75648
11 34 4 11 12 7 18.716 585.29 1.27220 2.76737
12 30 4 13 7 6 20.494 471.52 1.31163 2.67350
13 17 8 4 0 5 22.273 245.82 1.34778 2.39062
14 6 5 0 0 1 24.052 80.33 1.38115 1.90490
15 0 0 0 0 0 25.831 0.00 1.41215 0.00000
16 0 0 0 0 0 27.611 0.00 1.44108 0.00000
T0TAL NUMBER 0F GALAXIES COUNTED = 313 MAGNITUDE CUT0FF. MV = 19 .0
CLUSTER CENTER AT XO = 79.768 YO = -59.436
RING WIDTH (ARCMINl = 2.0
Table 4.4.43. faj Ring-Count Data for Galaxy Cluster J^S.
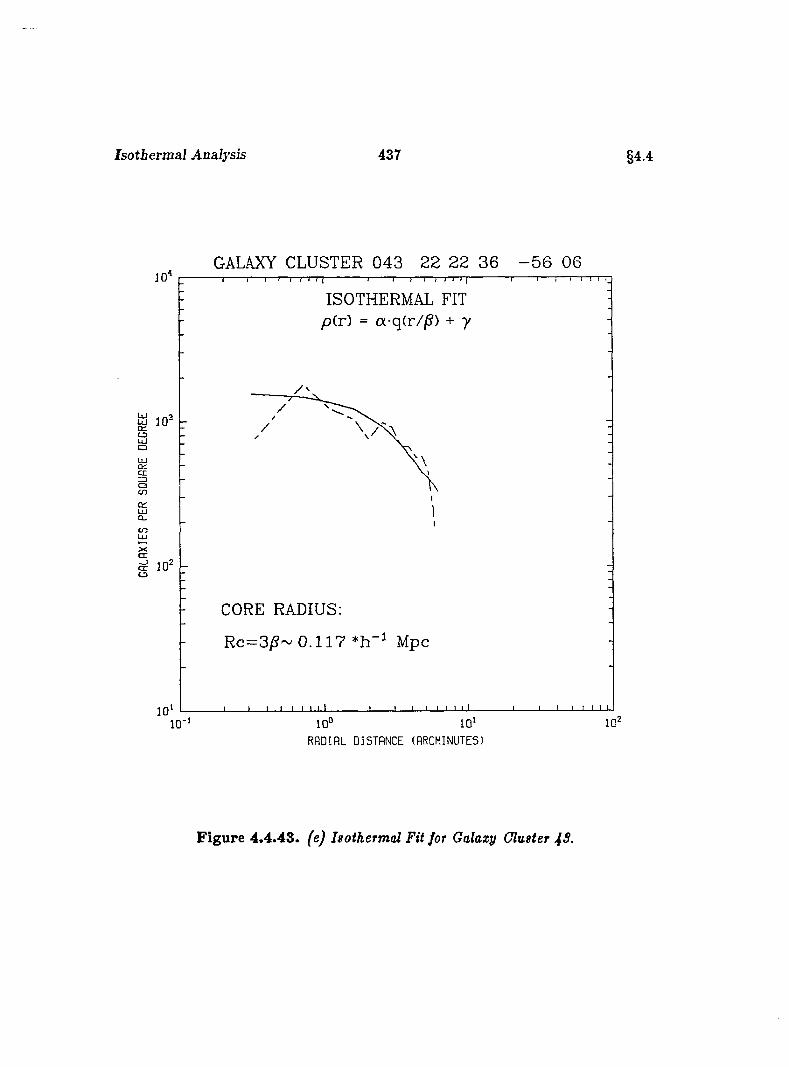
Isothermal Analysis 437 §4.4
GALAXY CLUSTER 043 2 2 2 2 36 - 5 6 06
ISOTHERMAL FIT /o(r) = oc-q(r//S) + y
H 10
aoUJgac n
CO
c rΠ10'o
CORE RADIUS:
R c=3/S~ 0 .1 1 7 Mpc
RADIAL DISTANCE (RRCMINUTES)
Figure 4.4.43. (e) Igothermal Fit for Galaxy Cluster
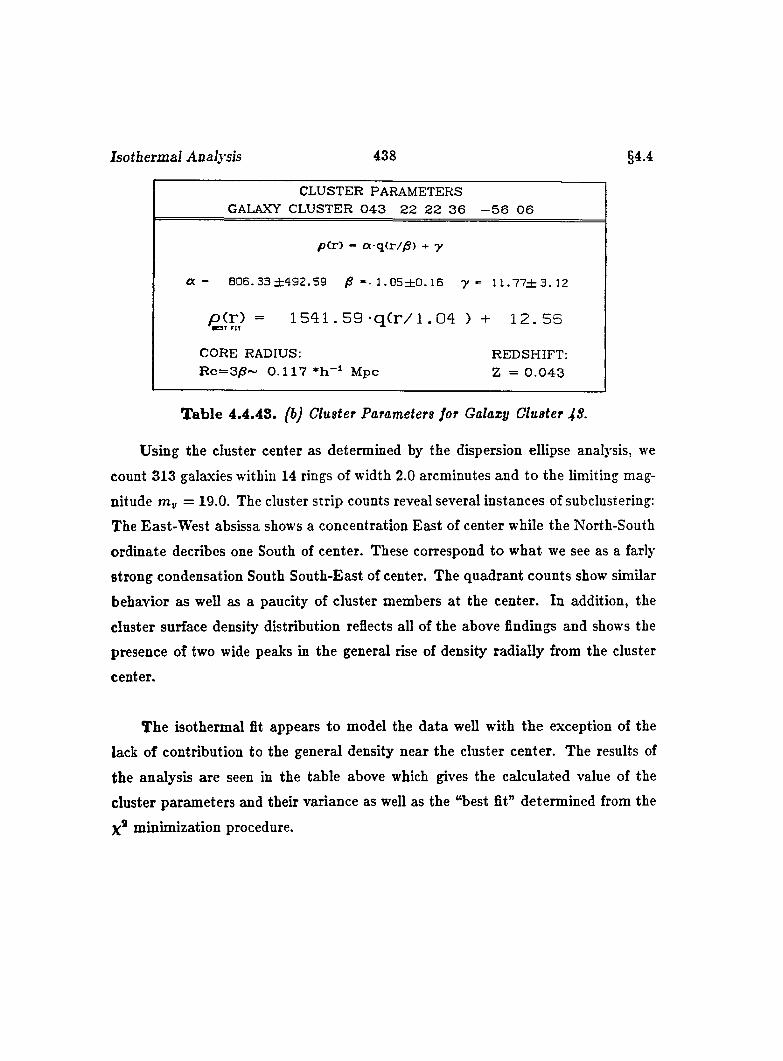
Isothermal Analysis 438 §4.4
CLUSTER PARAMETERS _______ GALAXY CLUSTER 0 4 3 2 2 2 2 3 6 - 5 6 0 6
p ( r ) - ex q(r//S) + y
a - 806. 33 ± 4 9 2 .5 9 /S -• 1. 0 5 ± 0 .16 -y = 1 1 .7 7 ± 3 .1 2
p ( r ) = 1 5 4 1 . 5 9 - q C r / l . 0 4 ) + 1 2 . 5 5
CORE RADIUS:R c= 3 /S ~ 0 .1 1 7 M pc
REDSHIFT; Z = 0 .0 4 3
Table 4.4.48. (b) Cluster Parameters for Galaxy Cluster J S.
Using the cluster center as determined by the dispersion ellipse analysis, we
count 313 galaxies within 14 rings of width 2.0 arcminutes and to the limiting mag
nitude nzv = 19.0. The cluster strip counts reveal several instances of subclustering:
The East-West absissa shows a concentration East of center while the North-South
ordinate decribes one South of center. These correspond to what we see as a farly
strong condensation South South-East of center. The quadrant counts show similar
behavior as well as a paucity of cluster members at the center. In addition, the
cluster surface density distribution reflects all of the above findings and shows the
presence of two wide peaks in the general rise of density radially from the cluster
center.
The isothermal fit appears to model the data well with the exception of the
lack of contribution to the general density near the cluster center. The results of
the analysis are seen in the table above which gives the calculated value of the
cluster parameters and their variance as well as the “best fit” determined from the
X® minimization procedure.
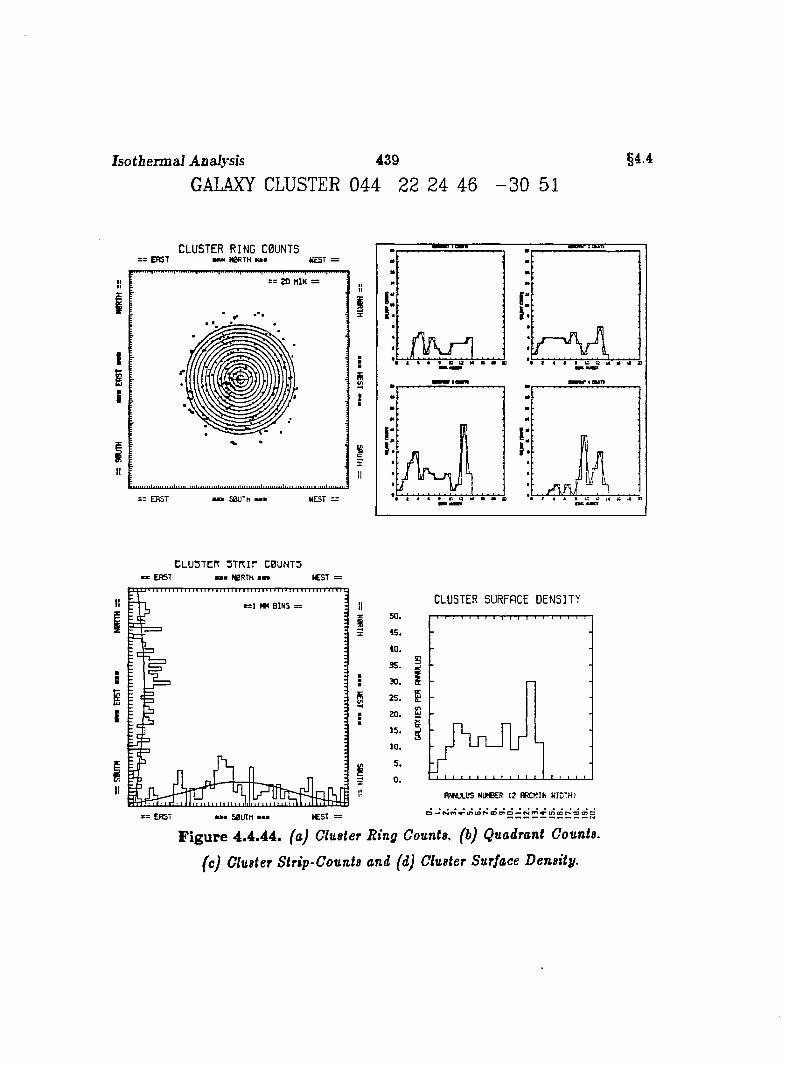
IsotbermaJ Analysis 439
GALAXY CLUSTER 044 22 24 46 - 3 0 51
§44
CLUSTER RING C0UNTS= = ERST mmm N0RTH u a WEST =
rovn non
= = 2 0 M IN =
M JS0ÜTH maa
CLUSTCr 3TRi r C0UNT3: ERST a * a N0RTH * * a >CST =
t! B IN S =
E
:
II
* = ERST >C5T ~
5 0 .
4 5 .
4 0 .
3 5 .
3 0 .
2 5 .
20.
1 5 .
3 0 .
5 .
0 .
CLUSTER SURFACE DENSITY
S
g
ANNULUS NWEER 12 ARCHIN WIDTH)
0 ^ tM r n « ’ incor>a3ato«>(^(*^«*m (jor*‘ (D 7 )a
Figure 4.4.44. (a) Cluster Ring Counts, (b) Quadrant Counts,
(c) Cluster Strip-Counts and (d) Cluster Surface Density.

Isothermal Analysis 440 §4.4
GALAXY CLUSTER 044 22 24 46 -3 0 51
RING TOTAL QUAORANT COUNTS COUNTING OBSERVED LOG(RAD) LBG(DEN)
NUMBER COUNT NW NE SE SU RADIUS DENSITY
(ARCHIN) (GAL/SQOEG)
1 2 0 1 1 0 1.259 723.00 0.10001 2.85914
2 6 D 3 3 0 2.815 723.00 0.44949 2.85914
3 10 0 4 6 0 4.539 723.00 0.6569B 2.85914
4 15 4 4 G 1 6.295 774.65 0.7989B 2.88910
5 14 5 3 4 2 8.061 562.34 0.90640 2.75000
6 11 1 5 5 0 9.833 361.50 0.99267 2.55811
7 14 4 3 5 2 11.607 3B9.31 1.06472 2.59029
8 7 1 3 3 0 13.383 168.70 1.12655 2.22712
6 12 2 5 3 2 15.150 255.18 1.18069 2.40684
10 17 1 1 4 11 16.937 323.45 1.22885 2.50981
11 9 3 3 0 3 18.716 154.93 1.27220 2.19013
12 13 3 2 3 5 20.494 204.33 1.31163 2.31033
13 31 3 7 13 8 22.273 448.26 1.34778 2.65153
14 10 4 1 3 2 24.052 133.89 1.38115 2.12675
15 22 2 6 6 8 25.831 274.24 1.41215 2.43613
16 13 1 4 6 2 27.611 151.60 1.44108 2.18069
17 11 2 4 0 5 29.390 120.50 1.46820 2.08099
18 6 3 3 0 0 31.170 61.97 1.49374 1.79219
19 3 2 1 0 0 32.950 29.31 1.51785 1.46703
20 0 0 0 0 0 34.730 0.00 1.54070 0.00000
TOTAL NUMBER OF GALAXIES C0UNTEO = 228 MAGNITUDE CUTOFF. MV = 19 0
CLUSTER CENTER AT XO = 143.511 YO = -45.125
RING WIOTH (ARCHIN) = 2.0
Table 4.4.44. {aj Einff-Count Data for Galaxy Cluster
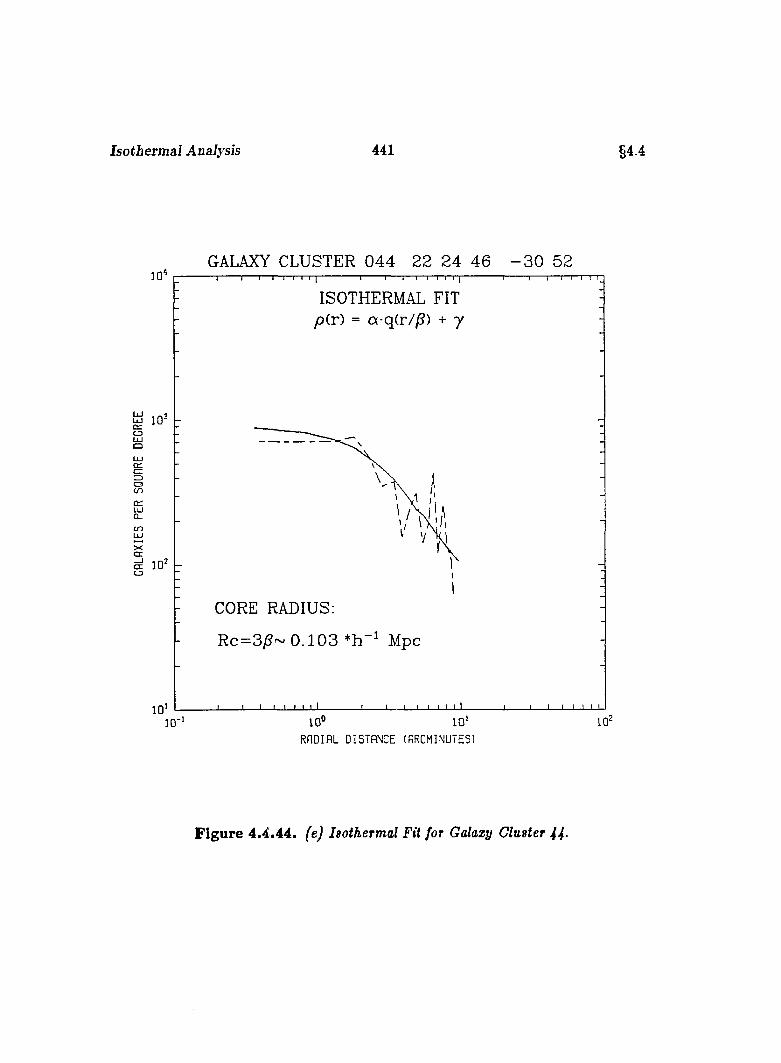
Isotbermal Analysis 441 §4.4
GALAXY CLUSTER 044 22 24 46 - 3 0 5210'
ISOTHERMAL FIT yO(r) = a-q(r//S) + 7
Ü 1Q3
§Ü Jct:ŒC3CO
U J
CO
X(X
Π10 CD
CORE RADIUS;
R c= 3 jS - 0 .1 0 3 Mpc
10'10° io‘
RADIAL DISTANCE (RRCMINUTES)
Figure 4.4.44. (e) Isothermal Fit for Oalaxy Cluster 44-
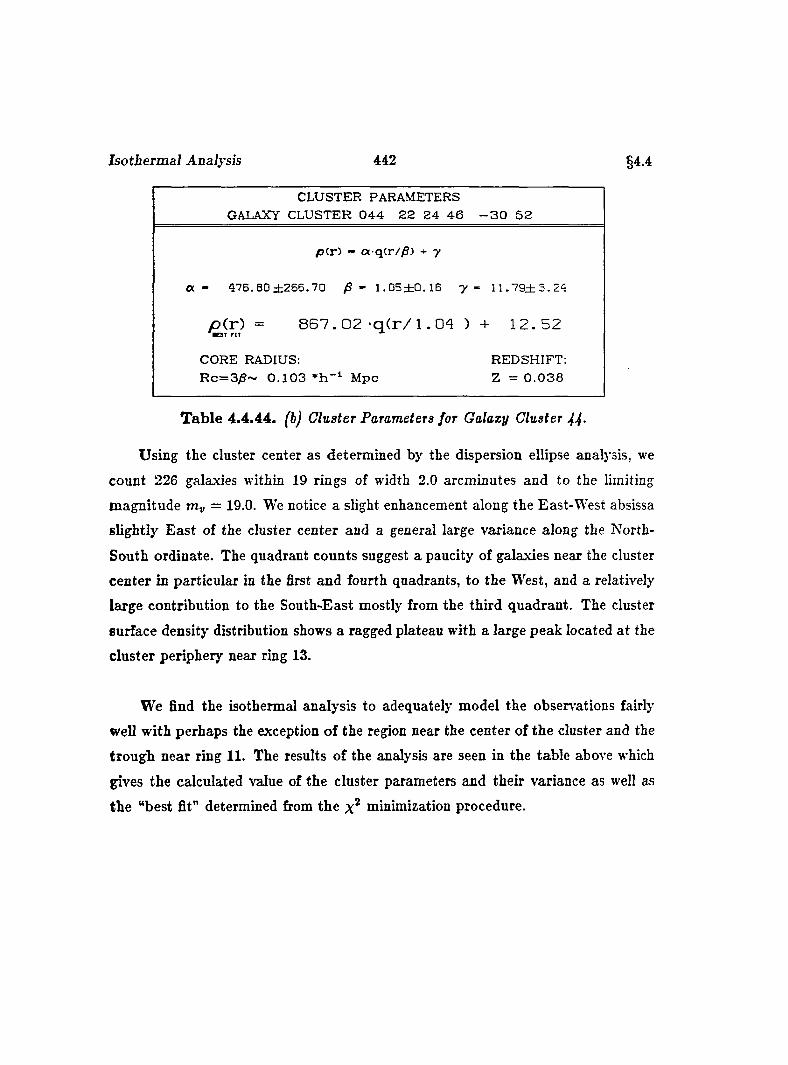
Isotbermal Analysis 442 § 4 . 4
CLUSTER PARAMETERSGALAXY CLUSTER 0 4 4 2 2 2 4 4 6 -3 0 5 2
p ( r ) - £x q(r//S) -t- y
a - 476.60 ± 2 6 6 .7 0 /S - 1.05 ± 0 .1 6 y - 1 1 .7 9 ± 3 .2 4
p(r) = 867. 0 2 -q(r / l .04 ) + 12.52
CORE RADIUS:R c = 3 /S ~ 0 .1 0 3 M pc
REDSHIFT: Z = 0 .0 3 8
T ab le 4.4.44. fbj Cluster Parameters for Galaxy Cluster ^4-
Using the cluster center as determined by the dispersion ellipse analysis, we
count 226 galaxies within 19 rings of width 2.0 arcminutes and to the limiting
magnitude = 19.0. We notice a slight enhancement along the East-West absissa
slightly East of the cluster center and a general large variance along the North-
South ordinate. The quadrant counts suggest a paucity of galaxies near the cluster
center in particular in the first and fourth quadrants, to the W^est, and a relatively
large contribution to the South-East mostly from the third quadrant. The cluster
surface density distribution shows a ragged plateau with a large peak located a t the
cluster periphery near ring 13.
We find the isothermal analysis to adequately model the observ'ations fairly
well with perhaps the exception of the region near the center of the cluster and the
trough near ring 11. The results of the analysis are seen in the table above which
gives the calculated value of the cluster parameters and their variance as well as
the “best fit” determined from the minimization procedure.
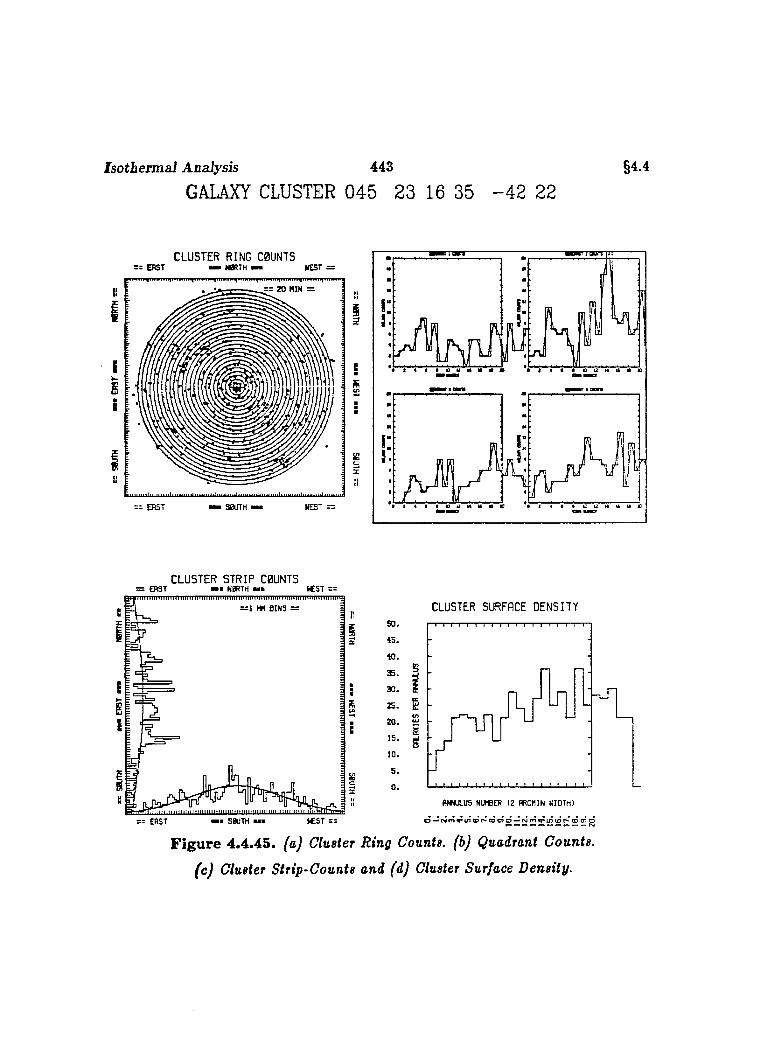
Isotbermal Analysis 443
GALAXY CLUSTER 045 23 16 35 - 4 2 22§4.4
C LUSTER RING C0UNTSs= ERST M N0RTH w WEST :
= = 2 0 M IN =
== ERST
fi
£I;i
CLUSTER S T R I P C0UNTSz= ERST w N0RTH — m (CST ==
B
EI{
et i S0UTH — m
= I!CLUSTER SURFACE DENSITY
5 0 .
4 5 .
4 0 .
3 5 .
3 0 .
2 5 .
20.1 5 .
10.5 .
0 .
S
nn
Figure 4.4.45. faj Cluster Ring Counts, (b) Quadrant Counts,
(c) Cluster Strip-Counts and (d) Cluster Surface Density.

Isotbermal Analysis 444 § 4 . 4
GALAXY CLUSTER 045 23 16 35 -42 22
RING
NUMBER
TOTAL
COUNT
QUADRANT COUNTS
NW NE SE SW
COUNTING
RADIUS
(ARCHIN)
OBSERVED
DENSITY
(GAL/SQOEG)
LOG(RAD) L0GIOEN)
1 5 2 2 0 1 1 . 2 5 9 1 8 0 7 .5 1 0 . 1 0 0 0 1 3 . 2 5 7 0 8
2 11 3 3 0 5 2 , 8 1 5 1 3 2 5 .5 1 0 . 4 4 9 4 9 3 . 1 2 2 3 8
3 14 4 2 2 6 4 . 5 3 9 1 0 1 2 .2 0 0 . 6 5 6 9 8 3 . 0 0 5 2 7
4 21 3 11 5 2 6 . 2 9 5 1 0 8 4 . 5 0 0 . 7 9 8 9 8 3 . 0 3 5 2 3
5 22 7 7 4 4 8 . 0 6 1 8 8 3 . 6 7 0 . 9 0 6 4 0 2 . 9 4 6 2 9
6 20 9 5 2 4 9 . 8 3 3 6 5 7 . 2 8 0 . 9 9 2 6 7 2 . 8 1 7 7 5
7 17 3 7 3 4 1 1 . 6 0 7 4 7 2 . 7 3 1 . 0 6 4 7 2 2 . 6 7 4 6 2
8 23 8 5 3 7 1 3 . 3 8 3 5 5 4 . 3 0 1 . 1 2 6 5 5 2 . 7 4 3 7 5
9 13 1 0 7 5 1 5 . 1 6 0 2 7 6 . 4 4 1 . 1 8 0 6 9 2 . 4 4 1 6 0
10 2 2 1 10 4 7 1 6 . 9 3 7 4 1 8 . 5 8 1 . 2 2 8 8 5 2 . 6 2 1 7 8
11 29 5 4 8 12 1 8 . 7 1 6 4 9 9 . 2 2 1 . 2 7 2 2 0 2 . 6 9 8 2 9
12 24 4 12 0 8 2 0 . 4 9 4 3 7 7 . 2 2 1 . 3 1 1 6 3 2 . 5 7 6 5 9
13 19 3 6 3 7 2 2 . 2 7 3 2 7 4 . 7 4 1 . 3 4 7 7 8 2 . 4 3 8 9 2
14 25 0 14 3 8 2 4 . 0 5 2 3 3 4 . 7 2 1 . 3 8 1 1 5 2 . 5 2 4 6 9
15 37 5 24 3 5 2 5 . 8 3 1 4 6 1 . 2 3 1 . 4 1 2 1 5 2 . 6 6 3 9 1
16 27 5 10 5 7 2 7 . 6 1 1 3 1 4 . 8 8 1 . 4 4 1 0 8 2 . 4 9 8 1 1
17 29 2 8 6 13 2 9 . 3 9 0 3 1 7 . 6 8 1 . 4 6 8 2 0 2 . 5 0 1 9 9
18 19 2 8 6 3 3 1 . 1 7 0 1 9 6 .2 4 1 . 4 9 3 7 4 2 . 2 9 2 8 0
19 33 5 8 10 10 3 2 . 9 5 0 3 2 2 . 4 2 1 . 5 1 7 8 5 2 . 5 0 8 4 2
2 0 30 9 7 7 7 3 4 . 7 3 0 2 7 8 . 0 8 1 . 5 4 0 7 0 2 . 4 4 4 1 7
TOTAL NUMBER OF GALAXIES COUNTED =
CLUSTER CENTER AT XO =
RING WIDTH
5 8 5 MAGNITUDE CUTOFF, MV = 1 9 . 0
7 5 . 5 4 7 YO = - 1 2 6 . 1 5 2
(ARCHIN) = 2 . 0
Table 4.4.45. (a) Ring-Count Data for Galaxy Cluster 45.
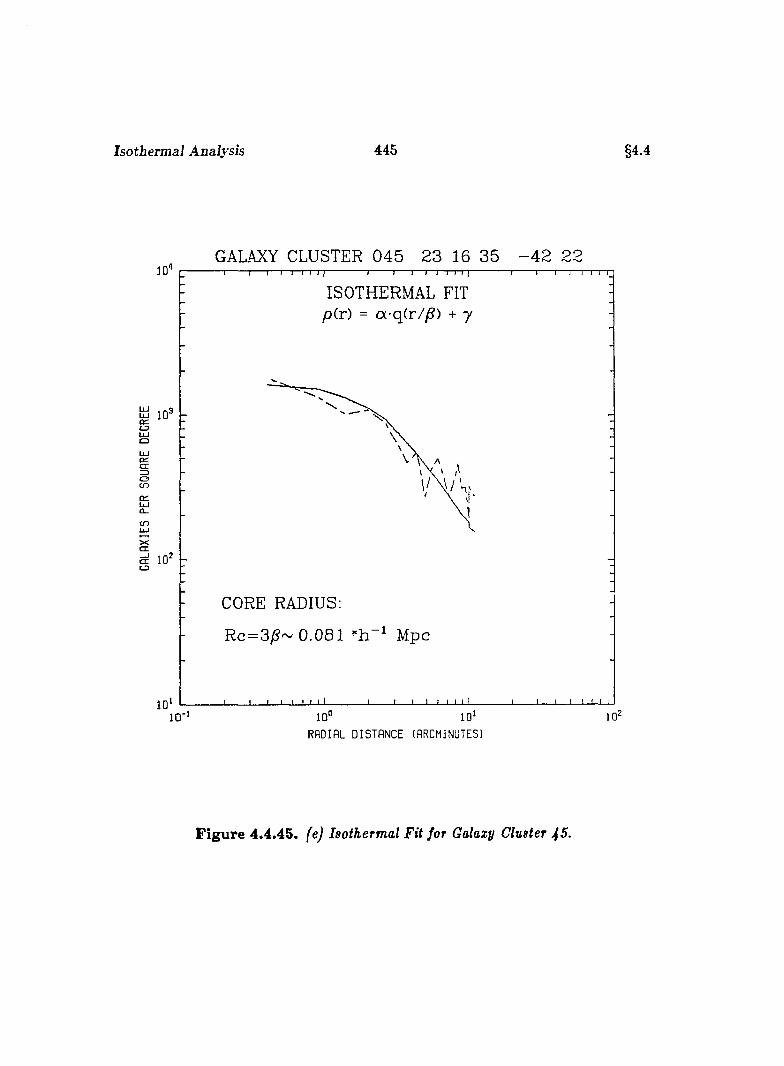
Isotbermal Analysis 445 §4.4
GALAXY CLUSTER 045 23 16 35 - 4 2 22
ISOTHERMAL FIT p(r) = aq(r//S) + y
U J
go
c n
ŒŒ 10' LD
CORE RADIUS:
R c=3iS~ 0 .081 Mpc
RADIAL DIST A N CE (ARCMINUTES)
Figure 4.4.45. fej Isothermal Fit for Galaxy Cluster 45.
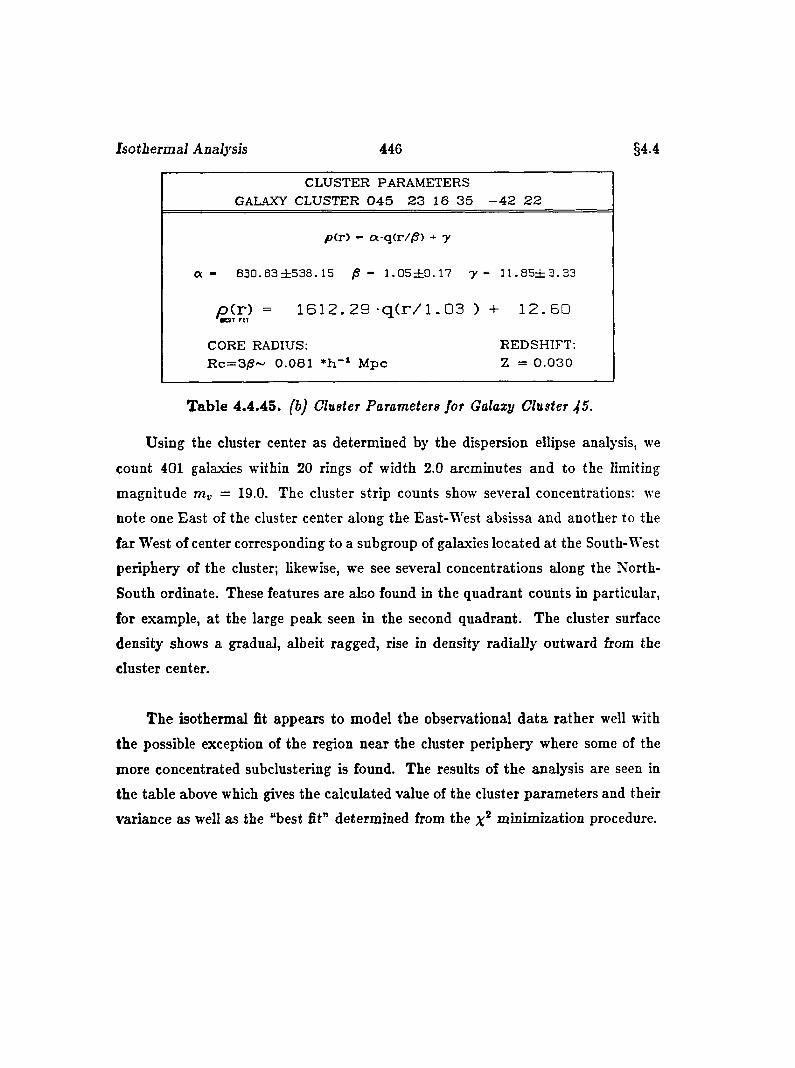
Isotbermal Analysis 4 4 6 § 4 . 4
CLUSTER PARAMETERSGALAXY CLUSTER 0 4 5 2 3 16 3 5 - 4 2 2 2
p(r ) - ot-q(r//S) + y
a - 8 3 0 . 8 3 ± 5 3 8 . 1 5 /S - 1 . 0 5 ± G . 1 7 y ~ U . 8 5 ± 3 . 3 3
p ( r ) = 1 6 1 2 . 2 9 - q ( r / l . 0 3 ) + 12.60
CORE RADIUS:R c = 3 / 3 ~ 0 .0 8 1 * h - i M p c
REDSHIFT: Z = 0 .0 3 0
T able 4.4.45. (b) Cluster Parameters for Galazy Cluster ^5.
Using the cluster center as determined by the dispersion ellipse analysis, we
count 401 galaxies within 20 rings of width 2.0 arcminutes and to the limiting
magnitude = 19.0. The cluster strip counts show several concentrations: we
note one East of the cluster center along the East-West absissa and another to the
far West of center corresponding to a subgroup of galaxies located at the South-West
periphery of the cluster; likewise, we see several concentrations along the North-
South ordinate. These features are also found in the quadrant counts in particular,
for example, a t the large peak seen in the second quadrant. The cluster surface
density shows a gradual, albeit ragged, rise in density radially outward from the
cluster center.
The isothermal fit appears to model the observational da ta rather well with
the possible exception of the region near the cluster periphery where some of the
more concentrated subclustering is found. The results of the analysis are seen in
the table above which gives the calculated value of the cluster parameters and their
variance as well as the “best fit” determined from the minimization procedure.
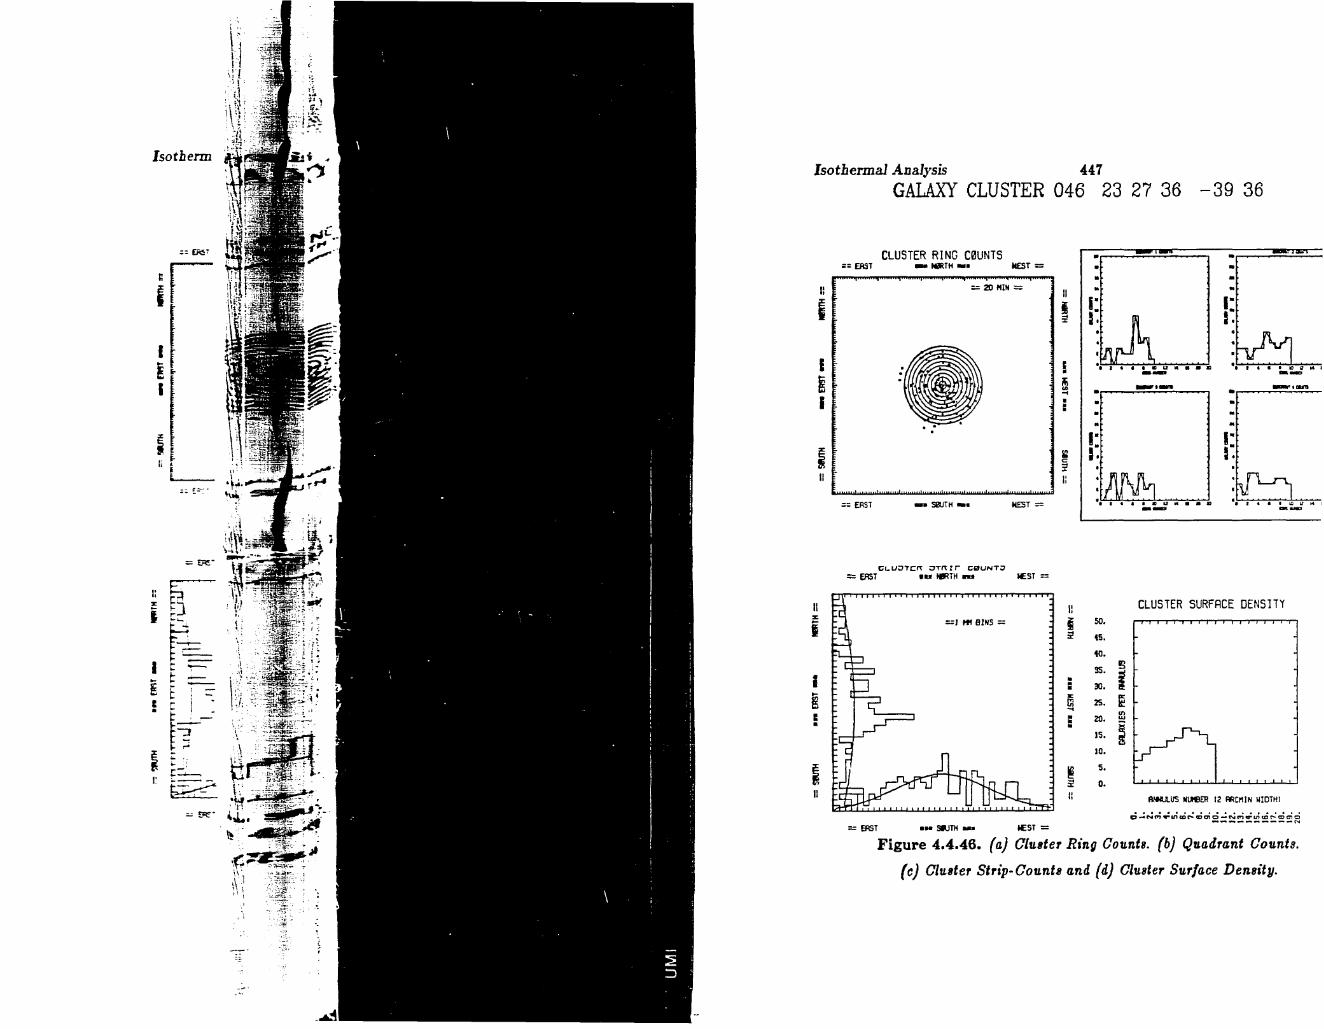
Isotbermal Aaalysis 447GALAXY CLUSTER 046 23 27 36 - 3 9 36
CLUSTER RING C0ÜNTS: e a s t m m N 0R T H W E S T = .
= 2 0 M IN =
E fiS T S 8U T H ' WEST =
III
:
I
A N hII
C C U S T C fT O T H t r C 0 U N T ?= ERST t M N0RTN « u NEST =
I
IIE
g 5 0 .
3 ( 5 .
«. 3 5 .
S 3 0 .
20.
1 5 .
10.
5 .
0.III
= ERST 3HJTH 1 tC S T =
CLUSTER SURFACE DENSITY
5
I
R W U .U S NUWER 12 PRCMIN N ID TH l
Figure 4.4.46. faJ Cluster Ring Counts, (b) Quadrant Counts,
(c) Cluster Strip-Counts and (d) Cluster Surface Density.
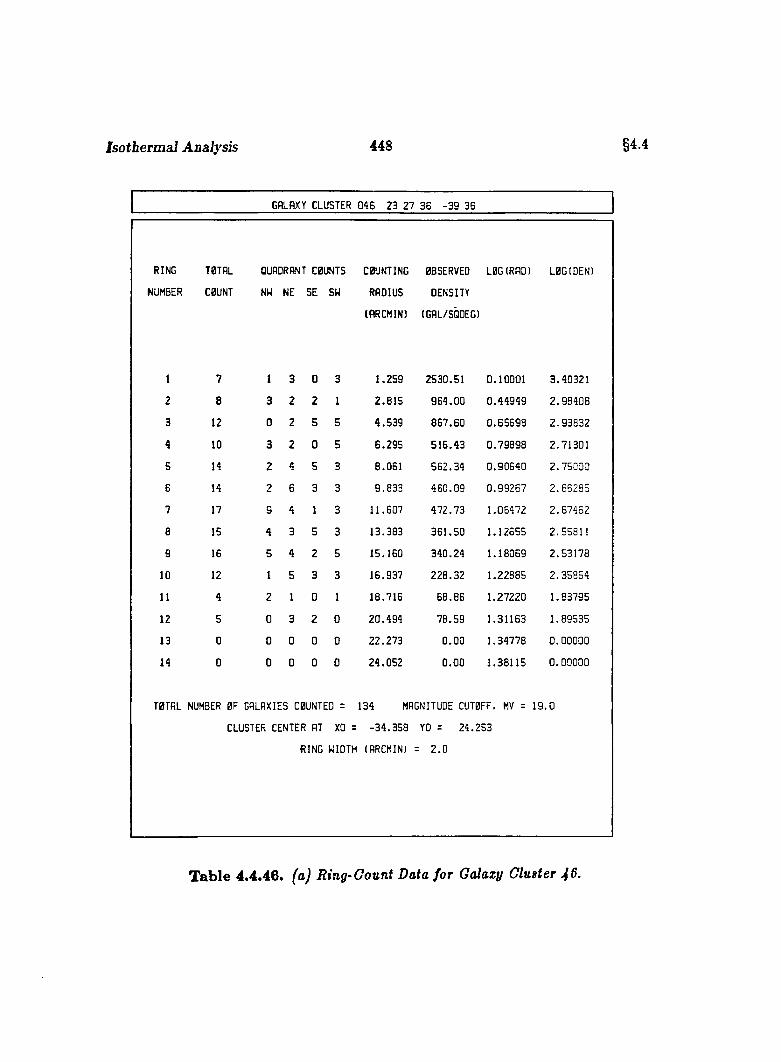
Isotbermal Analysis 448 §4.4
GALAXY CLUSTER 046 23 27 36 -39 36
RING TOTAL QUADRANT COUNTS COUNTING OBSERVED LOGIRAD) LOG IDEN)
JMBER COUNT NW NE SE SW RADIUS DENSITY
(ARCMINl (GAL/SQOEG)
1 7 1 3 G 3 1 . 2 5 9 2 5 3 0 . 5 1 0 . 1 0 0 0 1 3 . 4 0 3 2 1
2 8 3 2 2 1 2 . 8 1 5 9 6 4 . 0 0 0 . 4 4 9 4 9 2 . 9 8 4 0 8
3 12 0 2 5 5 4 . 5 3 9 8 6 7 . 6 0 0 . 6 5 6 9 8 2 . 9 3 8 3 2
4 10 3 2 0 5 6 . 2 9 5 5 1 6 . 4 3 0 . 7 9 8 9 8 2 . 7 1 3 0 1
5 14 2 4 5 3 8 . 0 6 1 5 6 2 . 3 4 0 . 9 0 6 4 0 2 . 7 5 0 0 0
6 14 2 6 3 3 9 . 8 3 3 4 6 0 . 0 9 0 . 9 9 2 6 7 2 . 6 6 2 8 5
7 17 9 4 1 3 1 1 . 6 0 7 4 7 2 . 7 3 1 . 0 6 4 7 2 2 . 6 7 4 6 2
6 15 4 3 5 3 1 3 . 3 8 3 3 6 1 . 5 0 1 . 1 2 6 5 5 2 . 5 5 8 1 1
9 16 5 4 2 5 1 5 . 1 6 0 3 4 0 . 2 4 1 . 1 8 0 6 9 2 . 5 3 1 7 8
10 12 1 5 3 3 1 6 . 9 3 7 2 2 8 . 3 2 1 . 2 2 8 8 5 2 . 3 5 8 5 4
11 4 2 1 0 1 1 8 . 7 1 6 6 8 . 8 6 1 . 2 7 2 2 0 1 . 8 3 7 9 5
12 5 0 3 2 0 2 0 . 4 9 4 7 8 . 5 9 1 . 3 1 1 6 3 1 . 8 9 5 3 5
13 0 0 0 0 0 2 2 . 2 7 3 0 . 0 0 1 . 3 4 7 7 8 0 . 0 0 0 0 0
14 0 0 0 0 0 2 4 . 0 5 2 0 . 0 0 1 . 3 8 1 1 5 0 . 0 0 0 0 0
TOTAL NUMBER OF GALAXIES COUNTED = 134 MAGNITUDE CUTOFF. MV = 1 9 . 0
CLUSTER CENTER AT XO = - 3 4 . 3 5 8 YO = 2 4 . 2 5 3
RING mOTH I ARCMINl = 2 . 0
Table 4.4.46. (a) Ring-Count Data for Galaxy Cluster
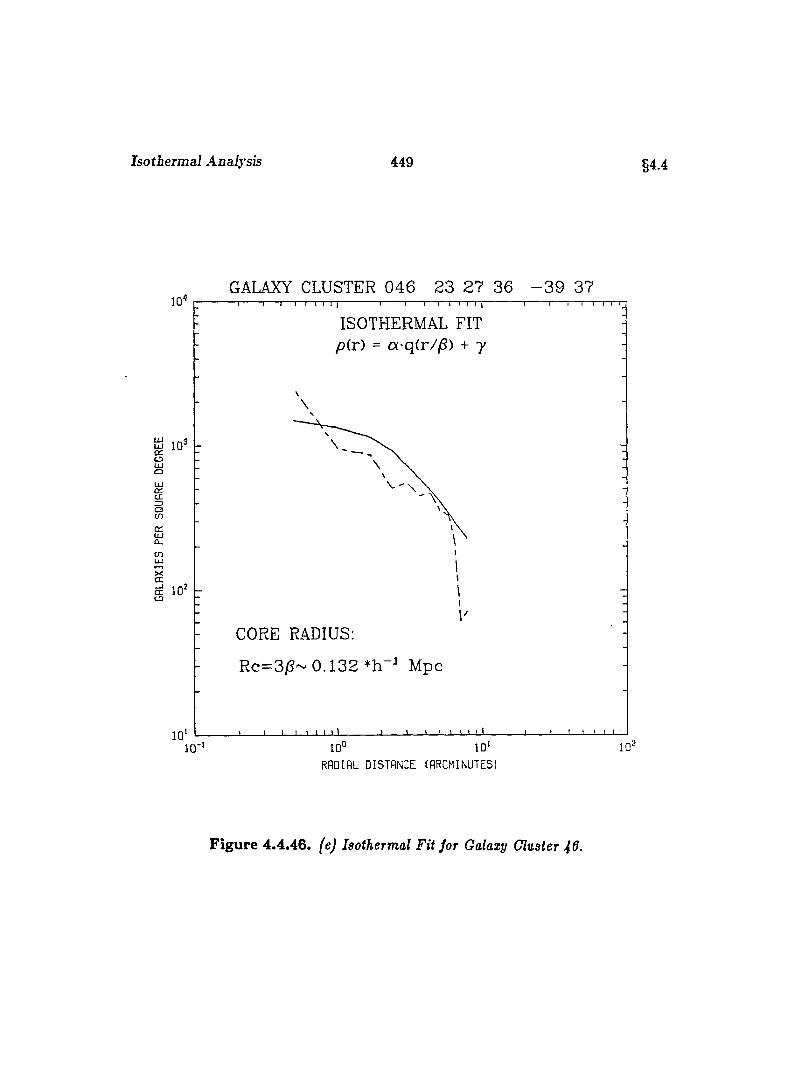
Isotbermal Analysis 449 §4.4
GALAXY CLUSTER 046 23 27 36 - 3 9 3710
ISOTHERMAL FIT pCr) = a-q(r/^) + y
a 10'OU JoU JOfCE
OC O
UJa.cn
XCE
Π10' CD
CORE RADIUS:
Rc=3;S~ 0 .1 3 2 Mpc
10 '10 '10°
RADIAL DISTANCE (ARCMINUTES)
Figure 4.4.46. (e) hothermal Fit for Galaxy Cluster 46.
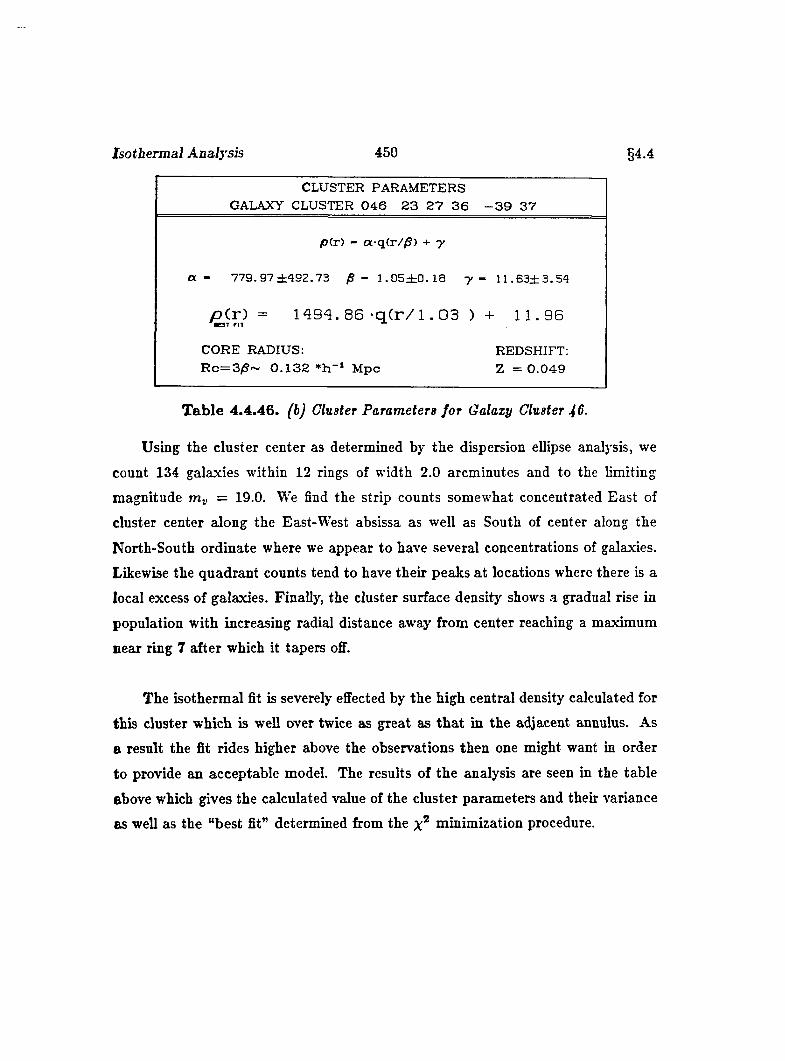
Isotbermal Analysis 450 §4.4
CLUSTER PARAMETERS GALAXY CLUSTER 0 4 6 2 3 2 7 3 6 - 3 9 3 7
p (r ) - a -q (r//S ) + y
a - 779 .97 ± 4 9 2 .7 3 /S - 1.05 ± 0 .1 8 y - 1 1 .63± 3 .54
y O (r ) = 149^. 8 6 -qCr/1 . 03 )« C 3 7 r i T *
+ 11.96
CORE RADIUS: REDSHIFT:R c = 3 /S ~ 0 .1 3 2 M pc Z = 0 .0 4 9
T ab le 4 .4 .46 . (b) Cluster Parameters for Oalaxy Cluster
Using the cluster center as determined by the dispersion ellipse analysis, we
count 134 galaxies within 12 rings of width 2.0 arcminutes and to the limiting
magnitude = 19.0. We find the strip counts somewhat concentrated East of
cluster center along the East-West absissa as well as South of center along the
North-South ordinate where we appear to have several concentrations of galaxies.
Likewise the quadrant counts tend to have their peaks a t locations where there is a
local excess of galaxies. Finally, the cluster surface density shows a gradual rise in
population with increasing radial distance away from center reaching a maximum
near ring 7 after which it tapers off.
The isothermal fit is severely effected by the high central density calculated for
this cluster which is well over twice as great as th a t in the adjacent annulus. As
a result the fit rides higher above the observations then one might want in order
to provide an acceptable model. The results of the analysis are seen in the table
above which gives the calculated value of the cluster parameters and their variance
as well as the “best fit” determined from the minimization procedure.
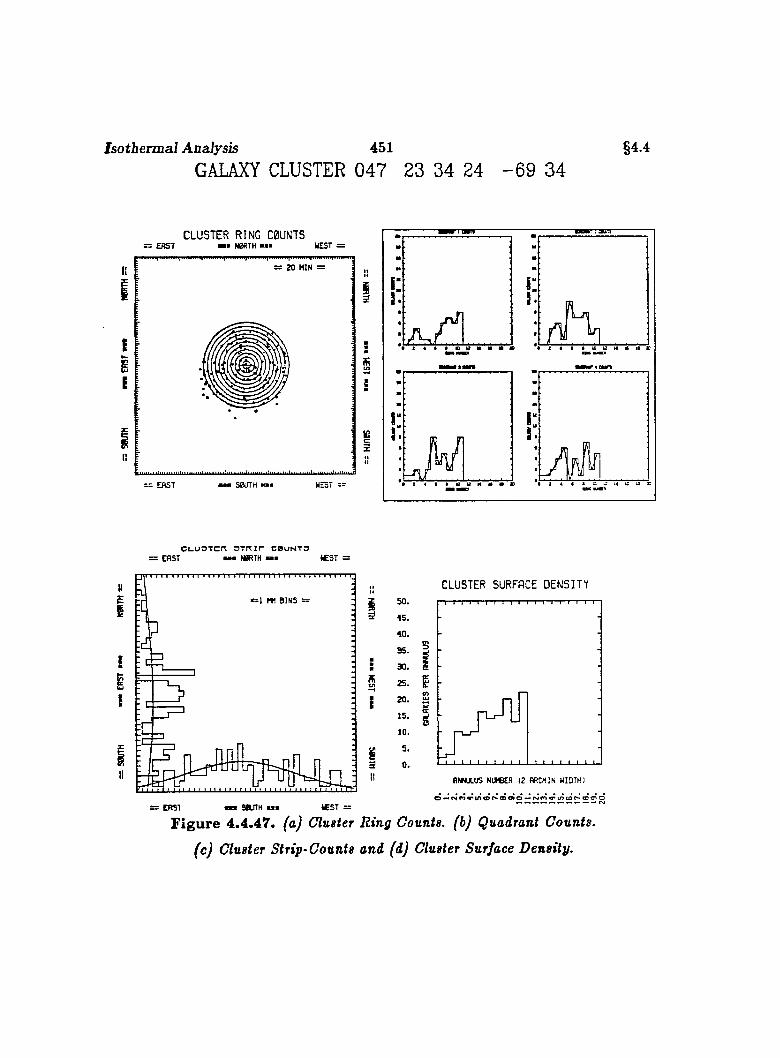
IsotbermaJ Analysis 451GALAXY CLUSTER 047 23 34 24 - 6 9 34
§4.4
CLUSTER RING C0UNTStmm N0RTH ■■■ WEST == ERST
= 20 MIN =
:
I
iX
:== EAST
C I_U 3TCF\ 3 T m r C B U N T 3 ; EAST N0RTH «S T =
w
I BINS
IÎ
II
= ERST « StUTH KST =
i
CLUSTER SURFACE DENSITY
95. S
25. g
i
BNNULUS NUMBER 12 RRCMIN WIDTH)
o« M C 4 n « ' i /> < D r^ o o s o * ^ N m ^ i / ) cD r * > co 9 > o
Figure 4.4.47. (a) Cluster Ring Counts, (b) Quadrant Counts,
(c) Cluster Strip-Counts and (d) Cluster Surface Density.
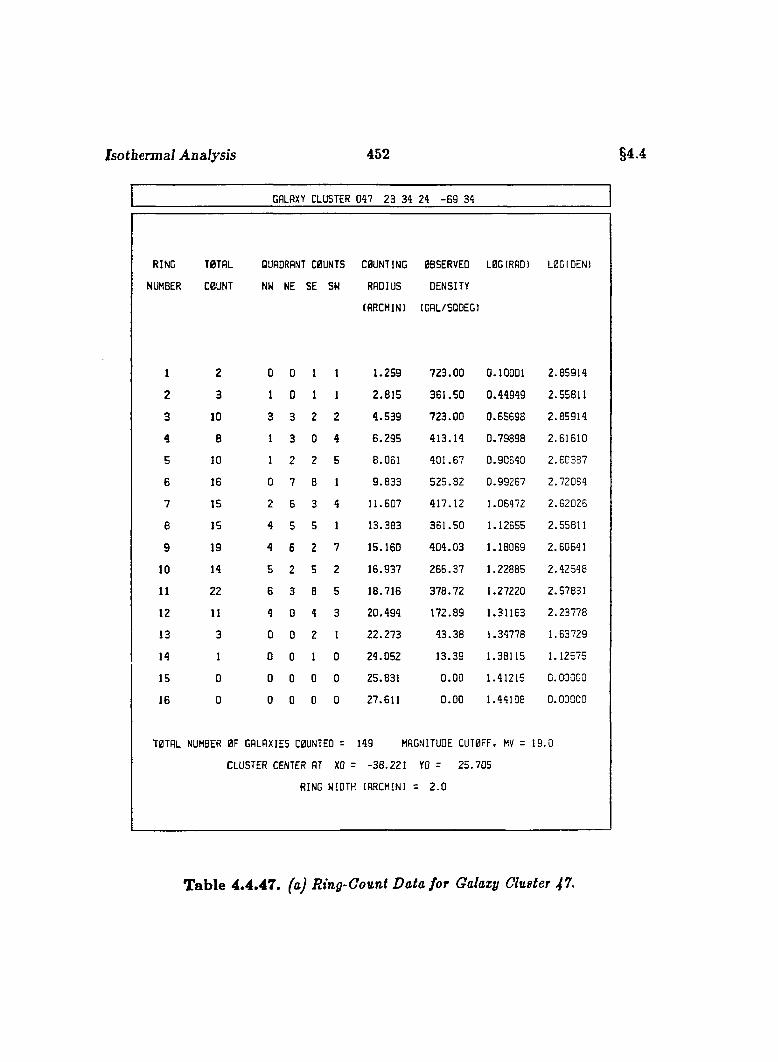
Isotbermal Analysis 452 §4.4
GALAXY CLUSTER 047 23 34 24 -69 34
RING T0TAL OUADRANI C0UNTS C0UNTING 0BSERVED L0GtRAD) L0GIDEN)
JMBER COUNT NW NE SE SW RADIUS DENSITY
(ARCMINl (GAL/SQDEGl
1 2 0 0 1 1 1 . 2 5 9 7 2 3 . 0 0 O.lOODl 2 . 8 5 9 1 4
2 3 1 0 1 1 2 . 8 1 5 3 6 1 . 5 0 0 . 4 4 9 4 9 2 . 5 5 8 1 1
3 10 3 3 2 2 4 . 5 3 9 7 2 3 . 0 0 0 . 6 5 6 9 8 2 . 8 5 9 1 4
4 B 1 3 0 4 6 . 2 9 5 4 1 3 . 1 4 0 . 7 9 8 9 8 2 . 6 1 6 1 0
5 10 1 2 2 5 8 . 0 6 1 4 0 1 . 6 7 0 . 9 0 6 4 0 2 . 6 0 3 8 7
6 16 0 7 8 1 9 . 8 3 3 5 2 5 . 8 2 0 . 9 9 2 6 7 2 . 7 2 0 8 4
7 15 2 6 3 4 1 1 . 6 0 7 4 1 7 . 1 2 1 . 0 6 4 7 2 2 . 6 2 0 2 6
e 15 4 5 5 1 1 3 . 3 8 3 3 6 1 . 5 0 1 . 1 2 6 5 5 2 . 5 5 8 1 1
9 19 4 6 2 7 1 5 . 1 6 0 4 0 4 . 0 3 1 . 1 8 0 6 9 2 . 6 0 6 4 1
10 14 5 2 5 2 1 6 . 9 3 7 2 6 6 . 3 7 1 . 2 2 8 8 5 2 . 4 2 5 4 8
11 22 6 3 8 5 1 8 . 7 1 6 3 7 8 . 7 2 1 . 2 7 2 2 0 2 . 5 7 8 3 1
12 11 4 0 4 3 2 0 . 4 9 4 1 7 2 . 8 9 1 . 3 1 1 6 3 2 . 2 3 7 7 8
13 3 0 0 2 1 2 2 . 2 7 3 4 3 . 3 8 1 . 3 4 7 7 8 1 . 6 3 7 2 9
14 1 0 0 1 0 2 4 . 0 5 2 1 3 . 3 9 1 . 3 8 1 1 5 1 . 1 2 6 7 5
15 0 0 0 0 0 2 5 . 8 3 1 0 . 0 0 1 . 4 1 2 1 5 0 . 0 0 0 0 0
16 0 0 0 0 0 2 7 . 6 1 1 0 . 0 0 1 . 4 4 1 0 8 0 . 0 0 0 0 0
TOTAL NUMBER 0F GALAXIES C0UNTED = 149 MAGNITUDE CUTOFF, MV = 1 9 . 0
CLUSTER CENTER AT XO = - 3 8 . 2 2 1 YO = 2 5 . 7 0 5
RING WIDTH (ARCHIN) = 2 . 0
Table 4.4.47. faj Ring-Gount Data for Galazy Cluster 47.
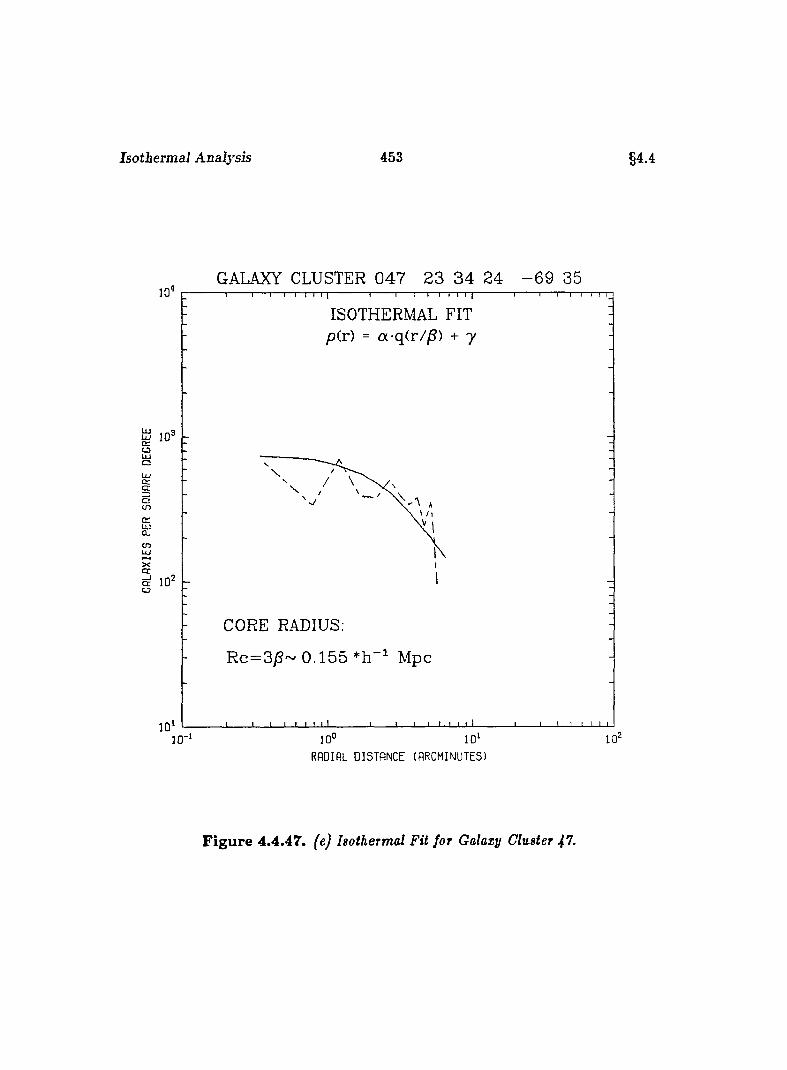
Isothermal Analysis 453 §4.4
GALAXY CLUSTER 047 23 34 24 -6 9 3510 '
ISOTHERMAL FIT pir) = oc-q(r//S) + y
LUû:ceQen
X
o
CORE RADIUS;
R c=3jS~ 0 .1 5 5 *h Mpc
10° 10 '
RADIAL DISTANCE (ARCMINUTES)
Figure 4.4.47. (e) Isothermal Fit for Galaxy Cluster ^7.
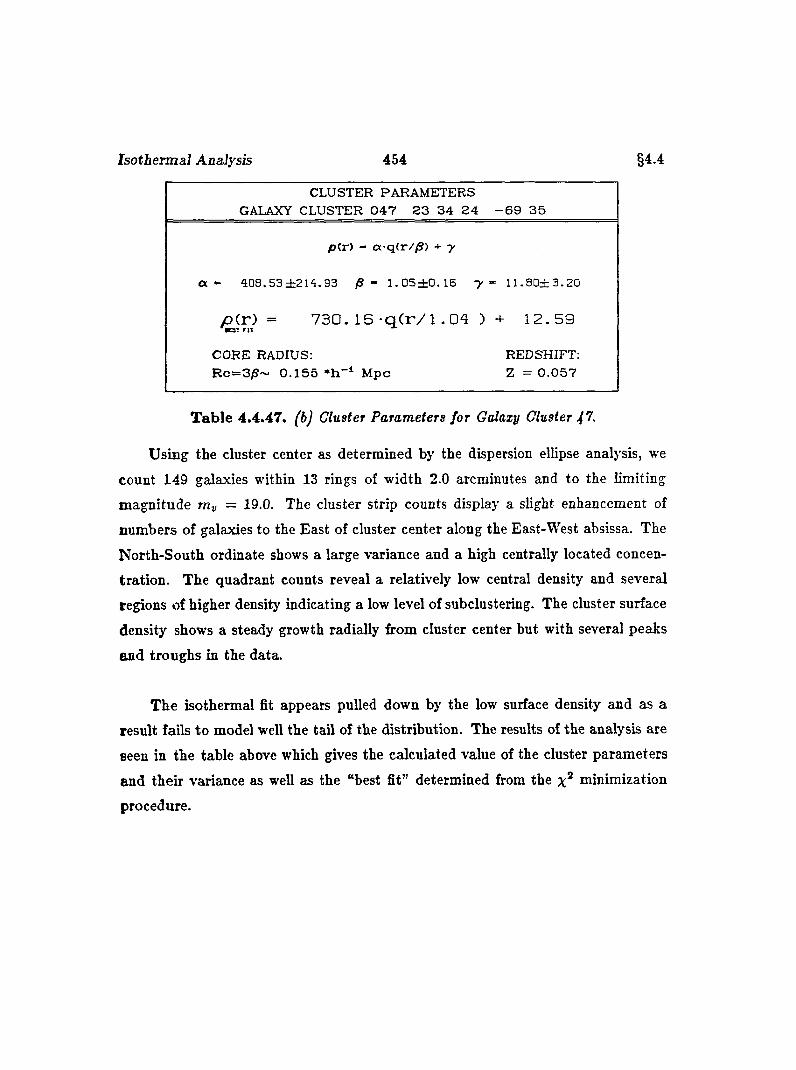
Isotbermal Analysis 454 §4.4
CLUSTER PARAMETERSGALAXY CLUSTER 0 4 7 2 3 3 4 2 4 - 6 9 3 5
pCr) - a q (r//S ) + y
a 4 0 8 . 5 3 ± 2 1 4 . 9 3 /S - 1 . 0 5 ± 0 . 1 6 - y - 1 1 . 8 0 ± 3 . 2 0
p(r) = 7 3 0 . 1 5 - qC r / l .04 ) + 12.59«ES: r n
CORE RADIUS:R c= 3 /S ~ 0 .1 5 5 M pc
REDSHIFT; Z = 0 .0 5 7
T ab le 4.4.47. ('fty Cluster Parameters for Galaxy Cluster fT.
Using the cluster center as determined by the dispersion ellipse analysis, we
count 149 galaxies within 13 rings of width 2.0 arcminutes and to the limiting
m agnitude = 19.0. The cluster strip counts display a slight enhancement of
numbers of galaxies to the East of cluster center along the East-West absissa. The
North-South ordinate shows a large variance and a high centrally located concen
tration. The quadrant counts reveal a relatively low central density and several
regions of higher density indicating a low level of subclustering. The cluster surface
density shows a steady growth radially from cluster center but with several peaks
and troughs in the data.
The isothermal fit appears pulled down by the low surface density and as a
result fails to model well the tail of the distribution. The results of the analysis are
seen in the table above which gives the calculated value of the cluster parameters
and their variance as well as the “best fit” determined from the minimization
procedure.
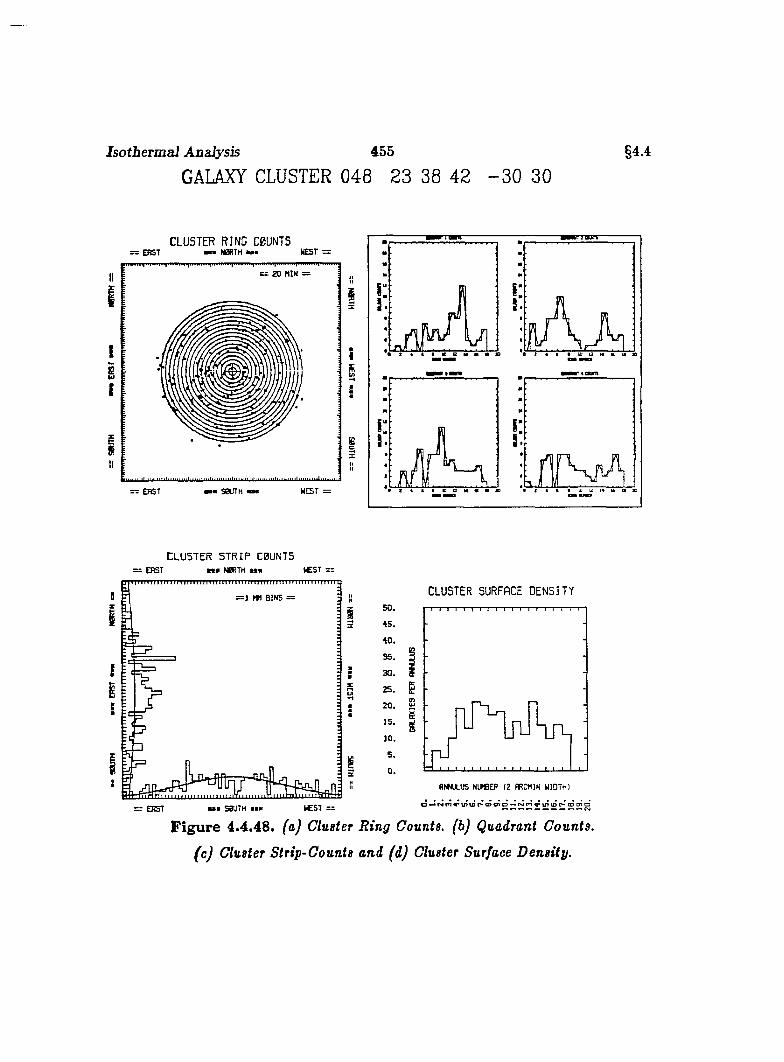
Isotbermal Analysis 455
GALAXY CLUSTER 048 23 38 42 - 3 0 30§4.4
CLUSTER RING C0UNTSm u N0RTH mmm WEST == ERST
K 20 MIN =
I3
I
= - ERST S0OTH
CLUSTER STRIP C0UNT5: ERST n a N0RTH mmm (CST ==
D = J BINS =
I
I
Kmmm SOUTH mmm= : ERST
CLUSTER SURFACE DENSITY
S
1
Figure 4.4.48. (a) Cluster Ring Counts, (b) Quadrant Counts,
(c) Cluster Strip-Counts and (d) Cluster Surface Density.
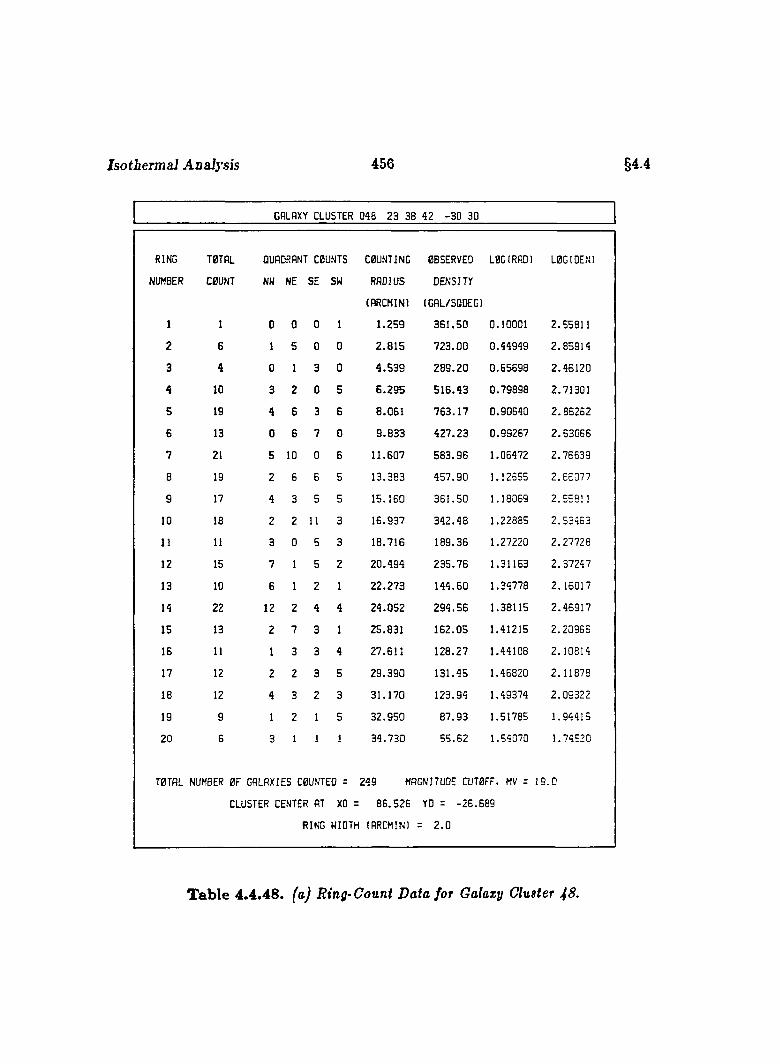
Isothermal Analysis 456 §4.4
GALAXY CLUSTER 048 23 38 42 -30 30
RING
NUMBER
TOTAL
COUNT
QUADRANT COUNTS
NW NE SE SW
COUNTING
RADIUS
(ARCMINl
OBSERVED
DENSITY
(GAL/SODEGl
LOG(RADI L0G1OENJ
1 1 0 0 0 1 1 . 2 5 9 3 5 1 . 5 0 0 .1 0 0 0 1 2 . 5 5 8 1 1
2 6 1 5 0 0 2 . 8 1 5 7 2 3 . 0 0 0 . 4 4 9 4 9 2 . 8 5 9 1 4
3 4 0 1 3 0 4 . 5 3 9 2 8 9 . 2 0 0 . 5 5 6 9 8 2 . 4 6 1 2 0
4 10 3 2 0 5 6 . 2 9 5 5 1 5 . 4 3 0 . 7 9 8 9 8 2 . 7 1 3 0 1
5 19 4 6 3 6 8 . 0 6 1 7 5 3 . 1 7 0 . 9 0 8 4 0 2 . 8 8 2 8 2
6 13 0 6 7 0 9 . 8 3 3 4 2 7 . 2 3 0 . 9 9 2 6 7 2 . 6 3 0 8 5
7 21 5 10 0 6 1 1 . 6 0 7 5 8 3 . 9 6 1 . 0 6 4 7 2 2 . 7 6 5 3 9
8 19 2 6 6 5 1 3 . 3 8 3 4 5 7 . 9 0 1 .1 2 8 5 5 2 . 5 6 0 7 7
9 17 4 3 5 5 1 5 . 1 5 0 3 6 1 . 5 0 1 .1 8 0 5 9 2 . 5 5 8 1 1
10 18 2 2 11 3 1 5 . 9 3 7 3 4 2 . 4 8 1 . 2 2 8 8 5 2 . 5 3 4 6 3
11 11 3 0 5 3 1 8 . 7 1 6 1 8 9 . 3 6 1 .2 7 2 2 0 2 . 2 7 7 2 8
12 15 7 1 5 2 2 0 . 4 9 4 2 3 5 . 7 5 1 .3 1 1 6 3 2 . 3 7 2 4 7
13 10 6 1 2 1 2 2 . 2 7 3 1 4 4 . 5 0 1 .3 4 7 7 8 2 . 1 6 0 1 7
14 22 12 2 4 4 2 4 . 0 5 2 2 9 4 . 5 5 1 . 3 8 1 1 5 2 . 4 6 9 1 7
15 13 2 7 3 1 2 5 . 8 3 1 1 5 2 . 0 5 1 . 4 1 2 1 5 2 . 2 0 9 5 6
15 11 1 3 3 4 2 7 . 6 1 1 1 2 8 . 2 7 1 .4 4 1 0 8 2 . 1 0 8 1 4
17 12 2 2 3 5 2 9 . 3 9 0 1 3 1 . 4 5 1 . 4 6 8 2 0 2 . 1 1 8 7 8
18 12 4 3 2 3 3 1 . 1 7 0 1 2 3 . 9 4 1 .4 9 3 7 4 2 . 0 9 3 2 2
19 9 1 2 1 5 3 2 . 9 5 0 8 7 . 9 3 1 . 5 1 7 8 5 1 . 9 4 4 1 5
20 6 3 1 1 1 3 4 . 7 3 0 5 5 . 6 2 1 . 5 4 0 7 0 1 . 7 4 5 2 0
TOTAL NUMBER OF GALAXIES COUNTED =
CLUSTER CENTER AT XO =
RING WIOTH
2 4 9 MAGNITUDE CUTOFF. MV = 19
8 8 . 5 2 6 YD = - 2 6 . 5 8 9
(ARCMINl = 2 . 0
0
Table 4.4.48. (a) Ring-Count Data for Galaxy Cluster 48.
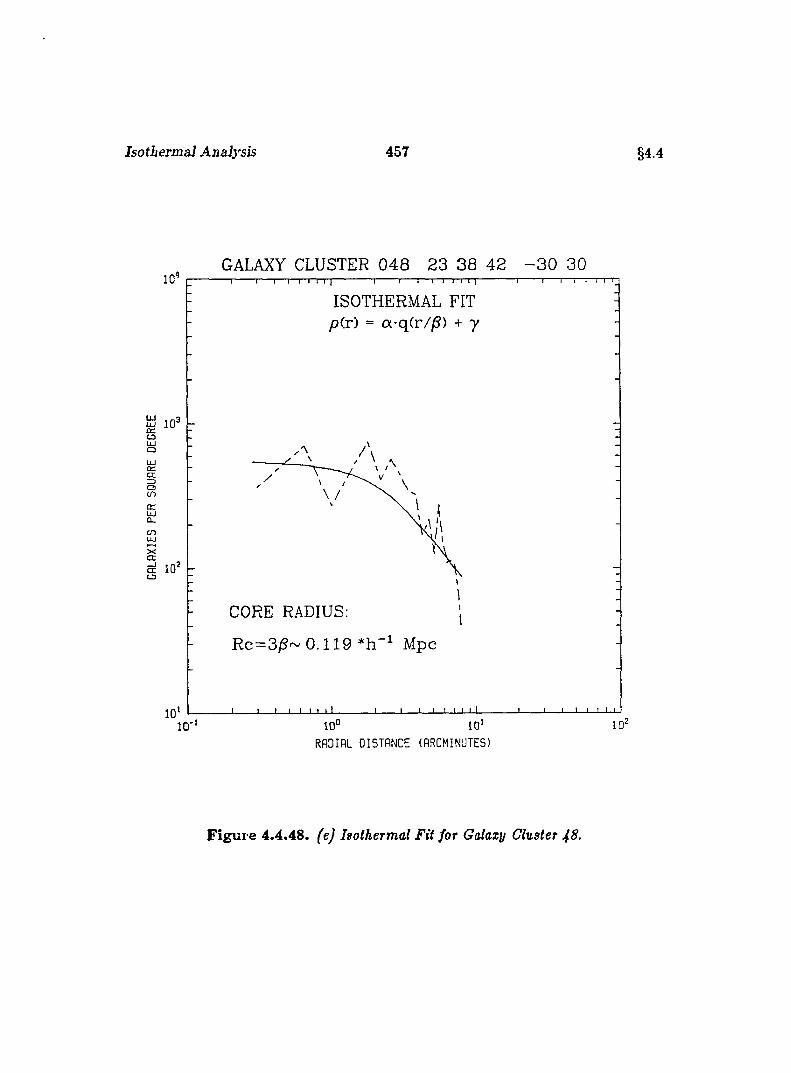
Isotbermal Analysis 457 §4.4
10 ’
ü 10o
g gcn
o rgcn
Xcrg 10c n
10
GALAXY CLUSTER 048 23 38 42 - 3 0 30 1------------- P ■“ !------- n r “ P T ' I I I I I I T " l I I I I I I l T T “
ISOTHERMAL FIT p(.r) = o(-q(r//S) + y
\
CORE RADIUS:
R c= 3 /?~ 0 .1 1 9 Mpc
10“ 10*RADIAL DISTANCE (ARCMINUTES)
I - I - I 1 1 1 1 1
10
Figure 4.4.48. (e) Isothermal Fit for Galaxy Cluster 48.
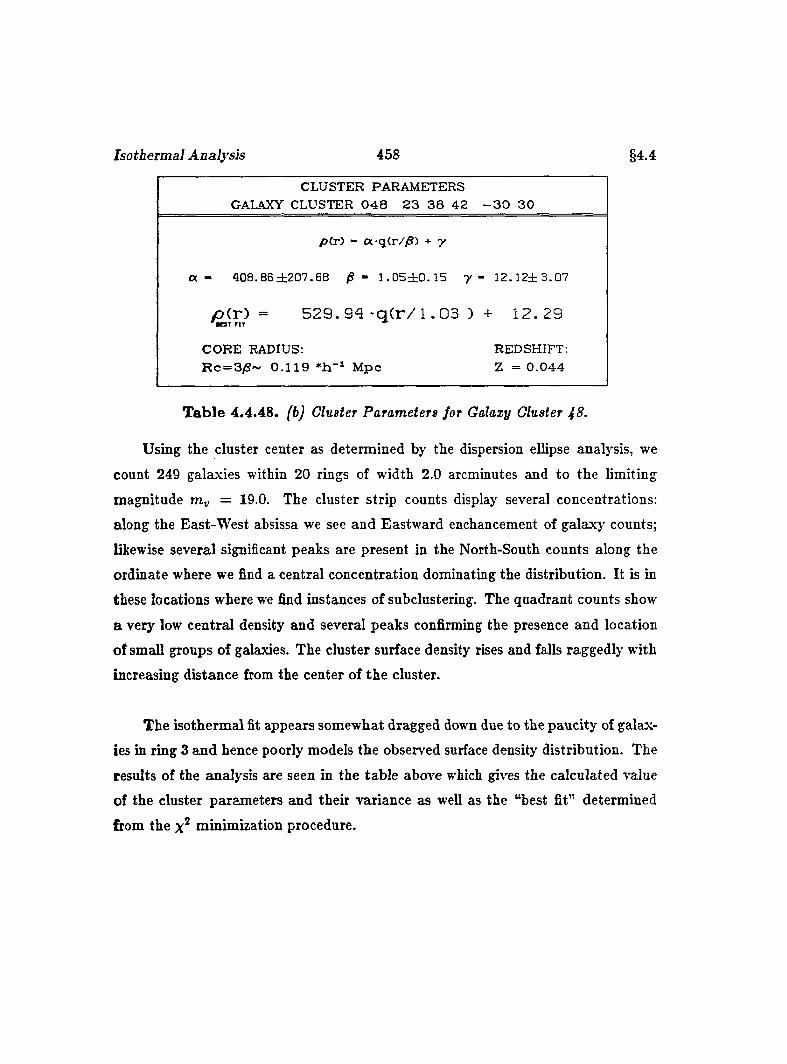
Isotbermal Analysis 458
CORE RADIUS:R c= 3yS ~ 0 .1 1 9 M pc
REDSHIFT: Z = 0 .0 4 4
§4.4
CLUSTER PARAMETERS _______ GALAXY CLUSTER 0 4 8 2 3 3 8 4 2 - 3 0 3 0
p (r ) - a q(r//S ) + y
a - 4 0 8 . 8 6 ± 2 0 7 . 6 8 /S - 1 . 0 5 ± 0 . 1 5 y ~ 1 2 . 1 2 ± 3 . G 7
p(T') = 529.94 * q ( r / l . 03 ) + 12.29
T ab le 4.4.48. (b) Cluster Parameters for Galaxy Cluster f 8 .
Using the cluster center as determined by the dispersion ellipse analysis, we
count 249 galaxies within 20 rings of width 2.0 arcminutes and to the limiting
magnitude m„ = 19.0. The cluster strip counts display several concentrations:
along the East-W est absissa we see and Eastward enchancement of galaxy counts;
likewise several significant peaks are present in the North-South counts along the
ordinate where we find a central concentration dominating the distribution. It is in
these locations where we find instances of subclustering. The quadrant counts show
a very low central density and several peaks confirming the presence and location
of small groups of galaxies. The cluster surface density rises and falls raggedly with
increasing distance from the center of the cluster.
The isothermal fit appears somewhat dragged down due to the paucity of galax
ies in ring 3 and hence poorly models the observed surface density distribution. The
results of the analysis are seen in the table above which gives the calculated value
of the cluster parameters and their variance as well as the “best fit” determined
from the x® minimization procedure.
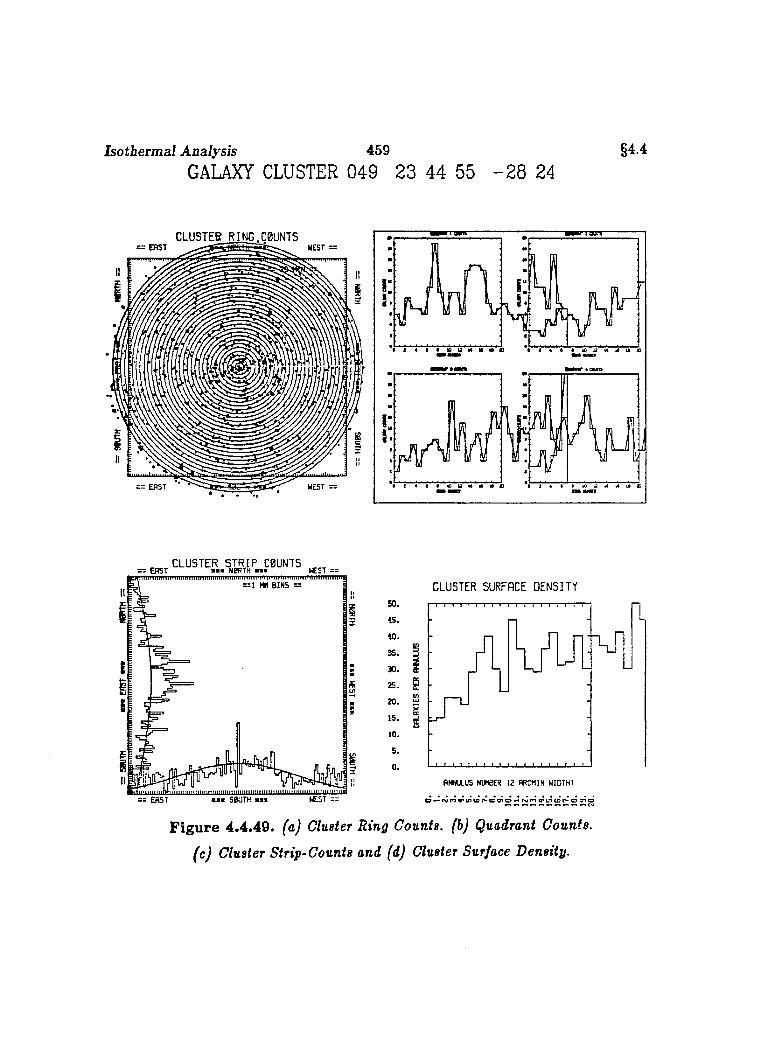
Isotbermal Analysis 459GALAXY CLUSTER 049 23 44 55 - 2 8 24
§4.4
CLUSTEB RING.COUNTS: ERST NEST
i
IfJ y
SK '
> « « a s u M a a B i i a i t i o u M i t i s s
= EAST CLUSTER,^% I 0UNT5= 1 MM B IN S =
I g
WEST ==— EfiST u < S0UTH » i
CLUSTER SURFACE DENSITY
Figure 4.4.49. faj Cluster Ring Counts, (b) Quadrant Counts,
(c) Cluster Strip-Counts and (d) Cluster Surface Density.
5
2 5 . @
i
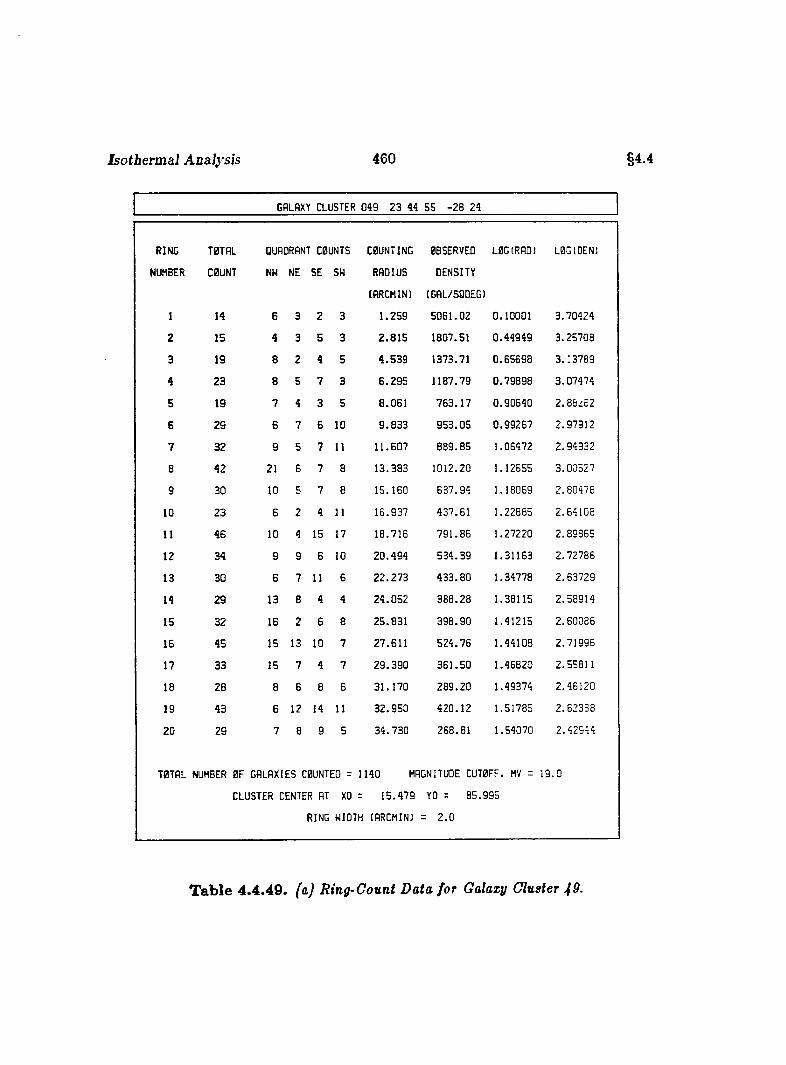
Isotbermal Analysis 460 §4.4
GALAXY CLUSTER 099 23 99 55 -28 29
RING
NUMBER
T0TAL
C0UNT
QUADRANT C0UNTS
NW NE SE SW
COUNTING
RADIUS
(ARCMINl
OBSERVED
DENSITY
(GAL/SQOEGI
L0G(RAD) LBGIOEN)
1 14 6 3 2 3 1 . 2 5 9 5 0 6 1 . 0 2 0 . 1 0 0 0 1 3 . 7 0 9 2 9
2 15 4 3 5 3 2 . 8 1 5 1 8 0 7 . 5 1 0 . 9 9 9 9 9 3 . 2 5 7 0 8
3 19 8 2 4 5 4 . 5 3 9 1 3 7 3 .7 1 0 . 6 5 6 9 8 3 . 1 3 7 8 9
4 2 3 8 5 7 3 6 . 2 9 5 1 1 8 7 . 7 9 0 . 7 9 8 9 8 3 . 0 7 9 7 9
5 19 7 9 3 5 8 . 0 6 1 7 6 3 . 1 7 0 . 9 0 6 9 0 2 .8 5 Z Ô 2
6 2 9 6 7 6 10 9 . 8 3 3 9 5 3 . 0 5 0 . 9 9 2 6 7 2 . 9 7 9 1 2
7 3 2 9 5 7 11 1 1 . 6 0 7 8 8 9 . 8 5 1 . 0 6 9 7 2 2 . 9 9 9 3 2
8 9 2 21 8 7 8 1 3 . 3 8 3 1 0 1 2 . 2 0 1 . 1 2 6 5 5 3 . 0 0 5 2 7
9 30 10 5 7 8 1 5 . 1 6 0 6 3 7 . 9 9 1 . 1 8 0 6 9 2 . 8 0 9 7 8
10 2 3 8 2 9 11 1 6 . 9 3 7 9 3 7 . 6 1 1 . 2 2 8 8 5 2 . 6 4 1 0 8
11 9 6 10 9 15 17 1 8 . 7 1 6 7 9 1 . 8 6 1 . 2 7 2 2 0 2 . 8 9 8 6 5
12 34 9 9 6 10 2 0 . 9 9 9 5 3 9 . 3 9 1 . 3 1 1 6 3 2 . 7 2 7 8 6
13 30 6 7 11 6 2 2 . 2 7 3 9 3 3 . 8 0 1 . 3 9 7 7 8 2 . 6 3 7 2 9
19 2 9 13 8 9 4 2 9 . 0 5 2 3 8 8 . 2 8 1 . 3 8 1 1 5 2 . 5 8 9 1 9
15 3 2 16 2 6 8 2 5 . 8 3 1 3 9 8 . 9 0 1 . 9 1 2 1 5 2 . 6 0 0 8 6
16 4 5 15 13 10 7 2 7 . 6 1 1 5 2 9 . 7 6 1 . 9 9 1 0 8 2 . 7 1 9 9 6
17 3 3 15 7 9 7 2 9 . 3 9 0 3 6 1 . 5 0 1 . 9 6 8 2 0 2 . 5 5 8 1 1
18 28 8 6 8 6 3 1 . 1 7 0 2 8 9 . 2 0 1 . 9 9 3 7 9 2 . 9 6 1 2 0
19 43 6 12 19 11 3 2 . 9 5 0 9 2 0 . 1 2 1 . 5 1 7 8 5 2 . 6 2 3 3 8
2 0 2 9 7 8 9 5 3 9 . 7 3 0 2 6 8 . 8 1 1 . 5 9 0 7 0 2 . 9 2 9 9 9
T0TAL NUMBER 0 F GALAXIES C0UNTED = 119 0 MAGNITUDE CUT0FF. MV =
CLUSTER CENTER AT XO = 1 5 . 9 7 9 YO = 8 5 . 9 9 5
RING WIDTH (ARCMINl = 2 . 0
1 9 . 0
Table 4.4.49. (a) Ring-Count Data for Galazy Cluster 49.
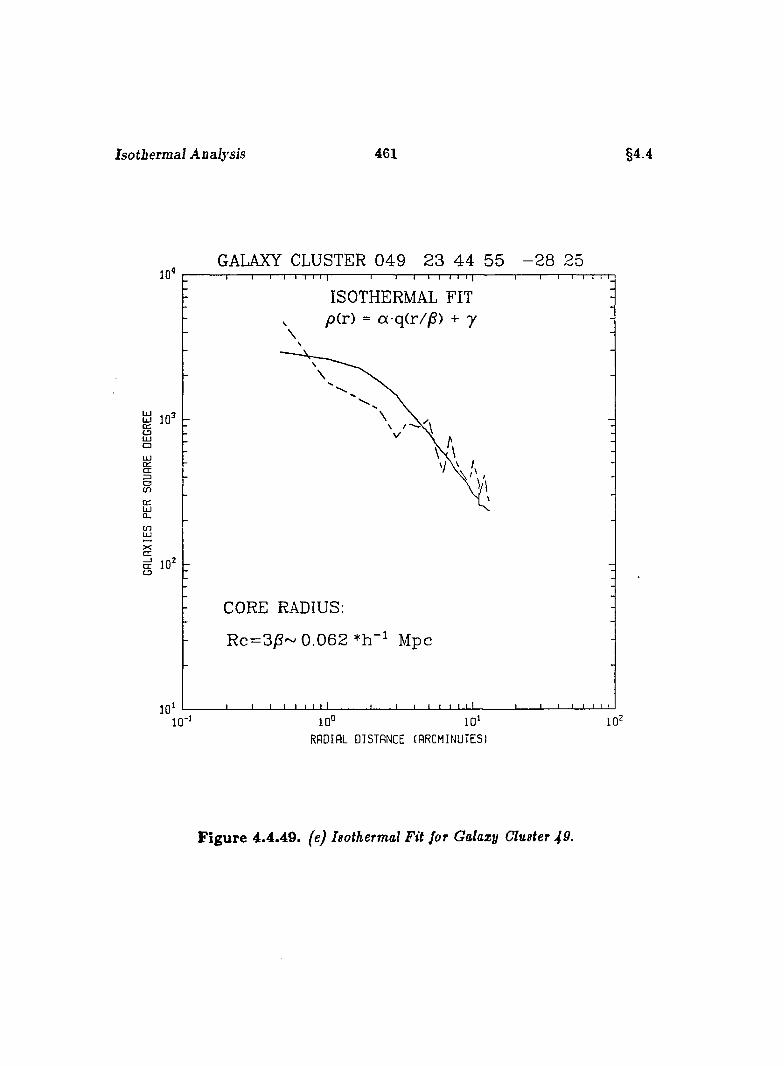
Isothermal Analysis 461 §4.4
GALAXY CLUSTER 049 23 44 55 - 2 8 2510 '
ISOTHERMAL FIT p (r) = a q ( r / /S ) + 7
a 10ULUOLU
g
enLU
cr
CJ
CORE RADIUS:
R c=3)S~ 0 .0 6 2 *h Mpc
io‘10°
RADIAL DISTANCE (ARCMINUTES)
Figure 4.4.49. fej Isothermal Fit for Galaxy Cluster ^9.
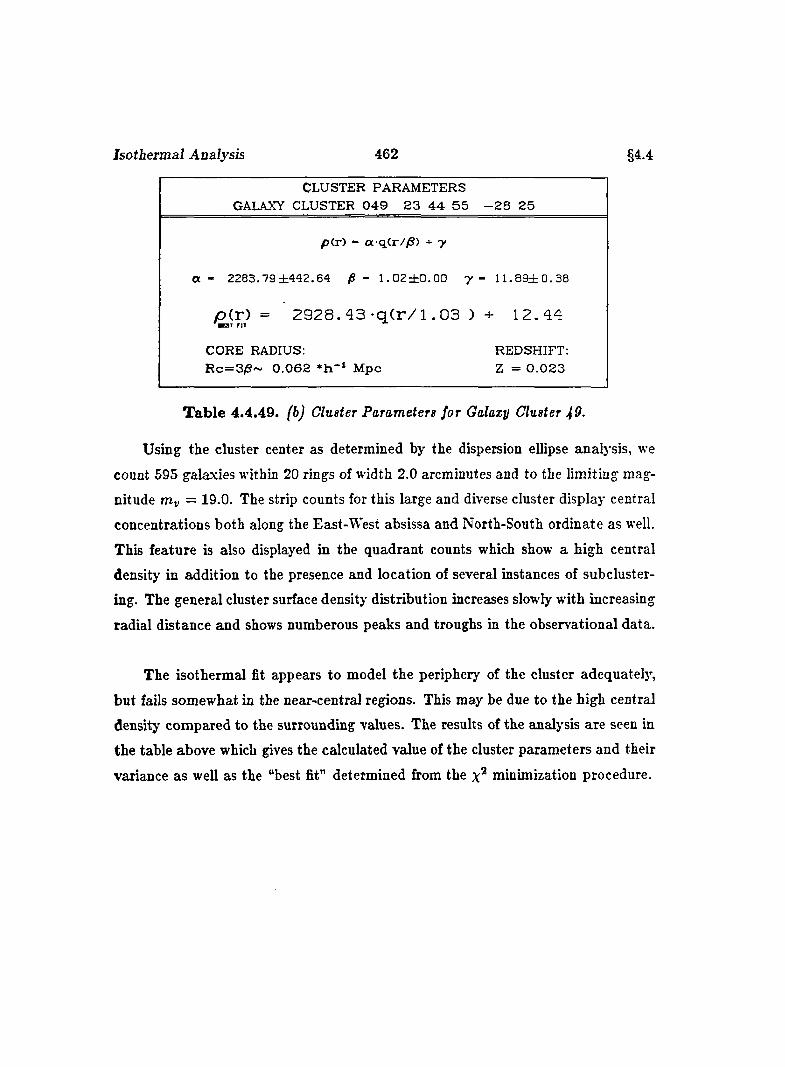
Isothermal Analysis 462 §4.4
CLUSTER PARAMETERSGALAXY CLUSTER 0 4 9 2 3 4 4 5 5 - 2 8 2 5
p ( r ) - a q ( r / / S ) + y
a - 2 2 8 3 . 7 9 ± 4 4 2 . 6 4 /S - 1 . 0 2 ± 0 . 0 0 y - 1 1 . 8 9 ± G . 3 8
p(r) = 2 9 2 8 . 4 3 -qCr/l . 03 ) + 12.44
CORE RADIUS:R c= 3 /S ~ 0 .0 6 2 M pc
REDSHIFT: Z = 0 .0 2 3
T ab le 4.4.49. (b) Cluster Parameters for Galaxy Cluster
Using the cluster center as determined by the dispersion ellipse analysis, we
count 595 galaxies within 20 rings of width 2.0 arcminutes and to the limiting mag
nitude r»v = 19.0. The strip counts for this large and diverse cluster display central
concentrations both along the East-West absissa and North-South ordinate as well.
This feature is also displayed in the quadrant counts which show a high central
density in addition to the presence and location of several instances of subcluster
ing. The general cluster surface density distribution increases slowly with increasing
radial distance and shows numberous peaks and troughs in the observational data.
The isothermal fit appears to model the periphery of the cluster adequately,
but fails somewhat in the near-central regions. This may be due to the high central
density compared to the surrounding values. The results of the analysis are seen in
the table above which gives the calculated value of the cluster parameters and their
variance as well as the “best fit” determined from the minimization procedure.

Isothermal Analysis 463GALAXY CLUSTER 050 23 59 06 - 4 4 07
§4.4
CLU STER RING C0UNTS: ERST wmm N0RTM mmm WEST
s= 20 MIN =
: ;
WEST =S0UTH
CLUSTER S T R I P C0UNTSEAST N0RTH " IC S T =
B IN S =:
Ii
I
EAST
50.
45.
40.
35.30.
25.
20.15.10.5 .
0 .
CLUSTER SURFACE DENSITY
S
g
BNNULUS NUMBER 12 RRCHIN WIDTH)
Figure 4.4.50. (a) Cluster Ring Counts, (b) Quadrant Counts,
(c) Cluster Strip-Counts and (d) Cluster Surface Density.
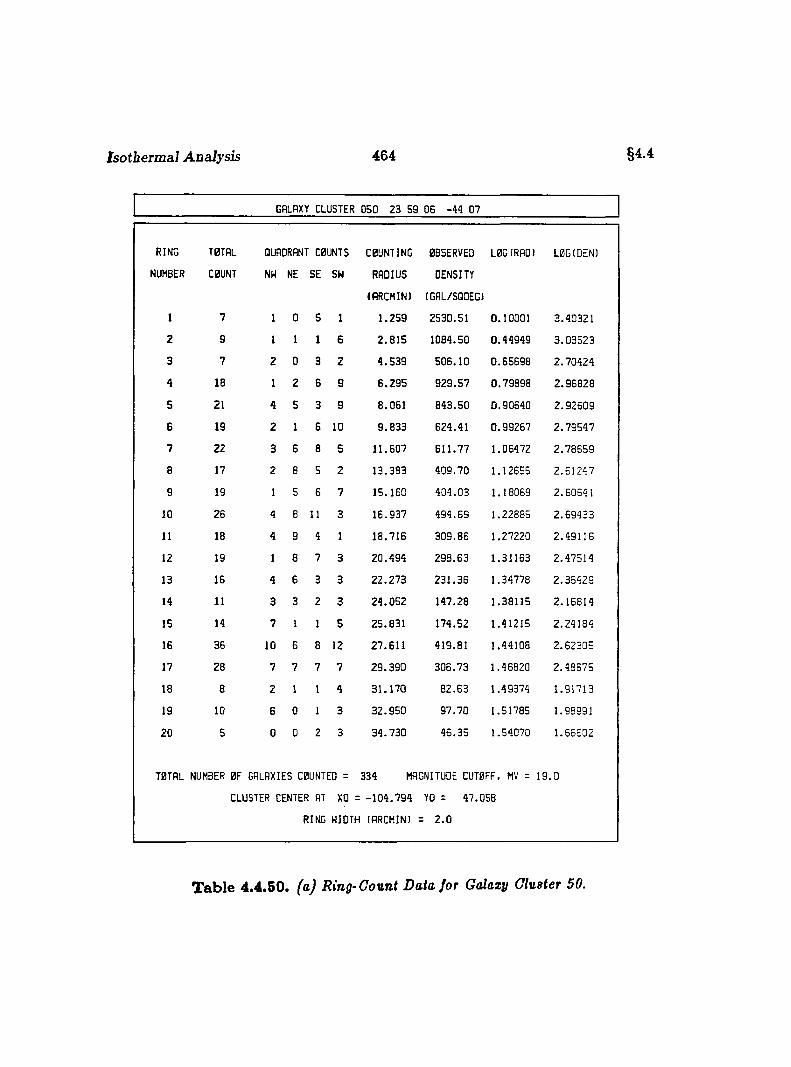
Isotberma.1 Analysis 464 §4.4
GALAXY CLUSTER 050 23 59 05 -44 07
RING TOTAL QUADRANT COUNTS COUNTING OBSERVED LOG(RADI LOG (DENI
NUMBER COUNT NW NE SE SW RADIUS DENSITY
(flRCMIN) (GAL/SQDEG)
1 7 1 0 5 1 1 . 2 5 9 2 5 3 D .5 1 0 . 1 0 0 0 1 3 . 4 0 3 2 1
2 9 1 1 1 6 2 . 8 1 5 1 0 8 4 . 5 0 0 . 4 4 9 4 9 3 . 0 3 5 2 3
3 7 2 0 3 2 4 . 5 3 9 5 0 6 . 1 0 0 . 6 5 6 9 8 2 . 7 0 4 2 4
4 18 1 2 G 9 6 . 2 9 5 9 2 9 . 5 7 0 . 7 9 8 9 8 2 . 9 6 8 2 8
5 21 4 5 3 9 8 . 0 6 1 8 4 3 . 5 0 0 . 9 0 6 4 0 2 . 9 2 5 0 9
6 19 2 1 6 10 9 . 8 3 3 6 2 4 . 4 1 0 . 9 9 2 6 7 2 . 7 9 5 4 7
7 2 2 3 6 8 5 1 1 . 6 0 7 6 1 1 . 7 7 1 . 0 6 4 7 2 2 . 7 8 6 5 9
8 17 2 8 5 2 1 3 . 3 8 3 4 0 9 . 7 0 1 . 1 2 6 5 5 2 . 6 1 2 4 7
9 19 1 5 6 7 1 5 . 1 6 0 4 0 4 . 0 3 1 . 1 8 0 6 9 2 . 6 0 6 4 1
10 2 6 4 8 11 3 1 6 . 9 3 7 4 9 4 . 6 9 1 . 2 2 8 8 5 2 . 6 9 4 3 3
11 18 4 9 4 1 1 8 . 7 1 6 3 0 9 . 8 6 1 . 2 7 2 2 0 2 . 4 9 1 1 6
12 19 1 8 7 3 2 0 . 4 9 4 2 9 8 . 6 3 1 . 3 1 1 6 3 2 . 4 7 5 1 4
13 16 4 6 3 3 2 2 . 2 7 3 2 3 1 . 3 6 1 . 3 4 7 7 8 2 . 3 5 4 2 9
14 11 3 3 2 3 2 4 . 0 5 2 1 4 7 . 2 8 1 . 3 8 1 1 5 2 . 1 6 8 1 4
15 14 7 1 1 5 2 5 . 8 3 1 1 7 4 . 5 2 1 . 4 1 2 1 5 2 . 2 4 1 8 4
16 36 10 6 8 12 2 7 . 6 1 1 4 1 9 . 8 1 1 . 4 4 1 0 8 2 . 6 2 3 0 5
17 2 8 7 7 7 7 2 9 . 3 9 0 3 0 6 . 7 3 1 . 4 6 8 2 0 2 . 4 8 5 7 5
18 8 2 1 1 4 3 1 . 1 7 0 8 2 . 6 3 1 . 4 9 3 7 4 1 . 9 1 7 1 3
19 10 6 0 1 3 3 2 . 9 5 0 9 7 . 7 0 1 . 5 1 7 8 5 1 . 9 8 9 9 1
2 0 5 0 0 2 3 3 4 . 7 3 0 4 6 . 3 5 1 . 5 4 0 7 0 1 . 6 6 5 0 2
T0TPL NUMBER OF GALAXIES COUNTED = 3 34 MAGNITUDE CUTOFF. MV = 19 0
CLUSTER CENTER AT XO = - 1 0 4 . 7 9 4 YO = 4 7 . 0 5 8
RING WIDTH IPRCMIN) = 2 . 0
Table 4.4.50. (a) Ring-Count Data for Galaxy Cluster 50.

Isothermal Analysis 465 §4.4
GALAXY CLUSTER 050 23 59 06 - 4 4 0710'
ISOTHERMAL FIT pir) = CL-qir/^) + y
Ü 103OÜJO
acn
cn
CORE RADIUS;
R c = 3 jS - 0 .103 Mpc
1 0 '10°
RADIAL DISTANCE (ARCMINUTES)
Figure 4.4.50. (e) Isothermal Fit for Galaxy Cluster 50.
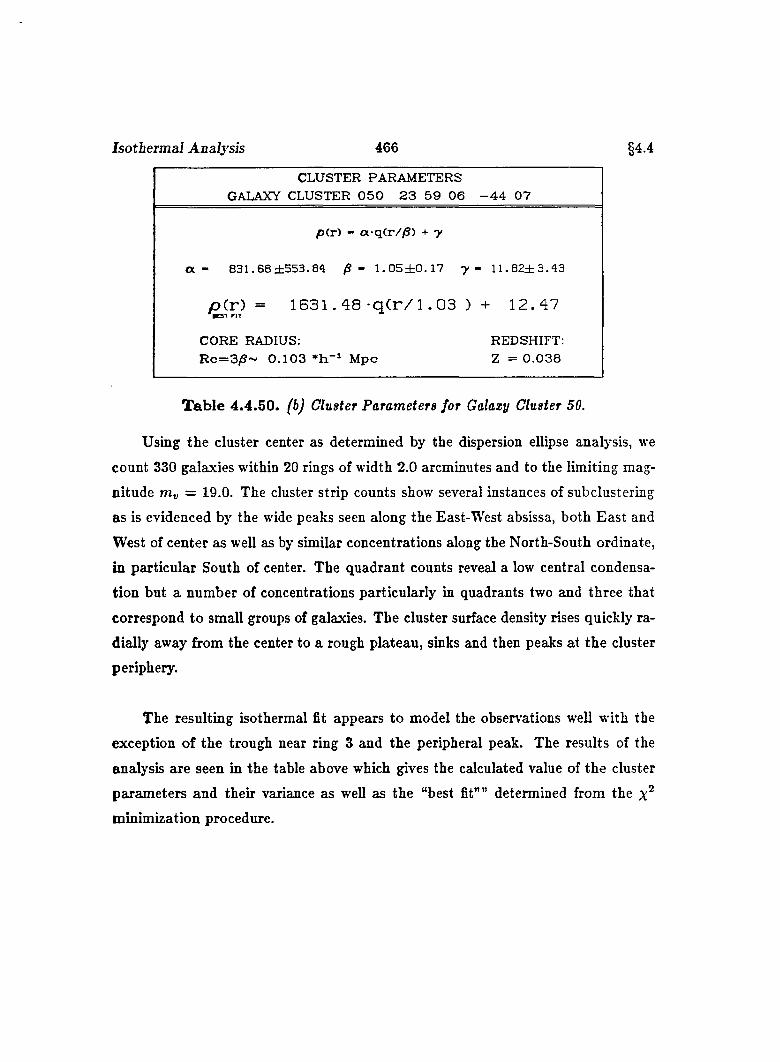
Isothermal Analysis 466
p<r) - a -q (r//S ) + y
a - 831.68 ± 5 5 3 .8<1 /S - 1 .0 5 ± 0 .1 7 y - 1 1 .8 2 ± 3 .4 3
yO(r) = 1631. 4 8 -qC r/ l . 03 ) + 12.47
CORE RADIUS:R c = 3 /S ~ 0 .1 0 3 M pc
REDSHIFT: Z = 0 .0 3 8
§4.4
CLUSTER PARAMETERSGALAXY CLUSTER 0 5 0 2 3 5 9 0 6 - 4 4 07
T a b le 4.4 .50. (b) Cluster Parameters for Galaxy Cluster 50.
Using the cluster center as determined by the dispersion ellipse analysis, we
count 330 galaxies within 20 rings of width 2.0 arcminutes and to the limiting mag
nitude my = 19.0. The cluster strip counts show several instances of subclustering
as is evidenced by the wide peaks seen along the East-West absissa, both East and
West of center as well as by similar concentrations along the North-South ordinate,
in particular South of center. The quadrant counts reveal a low central condensa
tion but a number of concentrations particularly in quadrants two and three that
correspond to small groups of galaxies. The cluster surface density rises quickly ra
dially away from the center to a rough plateau, sinks and then peaks at the cluster
periphery.
The resulting isothermal fit appears to model the observations well with the
exception of the trough near ring 3 and the peripheral peak. The results of the
analysis are seen in the table above which gives the calculated value of the cluster
parameters and their variance as well as the “best fit”” determined from the
minimization procedure.
CHAPTER V
T H E A B E L L C L U ST E R S
But as each revolution of thought has contained some kernel of surviving truth, to we may hope that our present representation of the universe contains something that will last, notwithstanding its faulty expression.- Arthur Stanley Eddington, 1914
In this chapter we provide a condensed version of cluster descriptions and
subsequent isothermal analysis of several Abell Clusters found by Abell (1957) in
his survery of the distribution of rich clusters of galaxies. The present description
serves as an interface between our current work and that which has gone before,
not only to restudy previous efforts but to compare and extend the expanding body
of information with earlier studies. We trust that these first steps will continue
the work of Abell and eventually lead to the large Southern effort th a t he planned
and organized as an all-sky completion of his work carried out in the Northern
hemisphere.
467
The Abell Clusters 468 §5.1
5.1 D escrip tion and Iso th e rm a l A nalysis o f 5 A b e ll C lu ste rs
In this section we present a uniform Description and Isothermal Analysis of
five Abell clusters of galaxies. R ather than publish the data in numerical form,
we choose a graphical and tabular format for ease of comparison between cluster
and cluster. The sample is magnitude-limited and uniform to = 19.0. As in
the previous cases, we provide a general description of the individual clusters, with
relevant commentary, as well as the results of an isothermal analysis performed on
each.
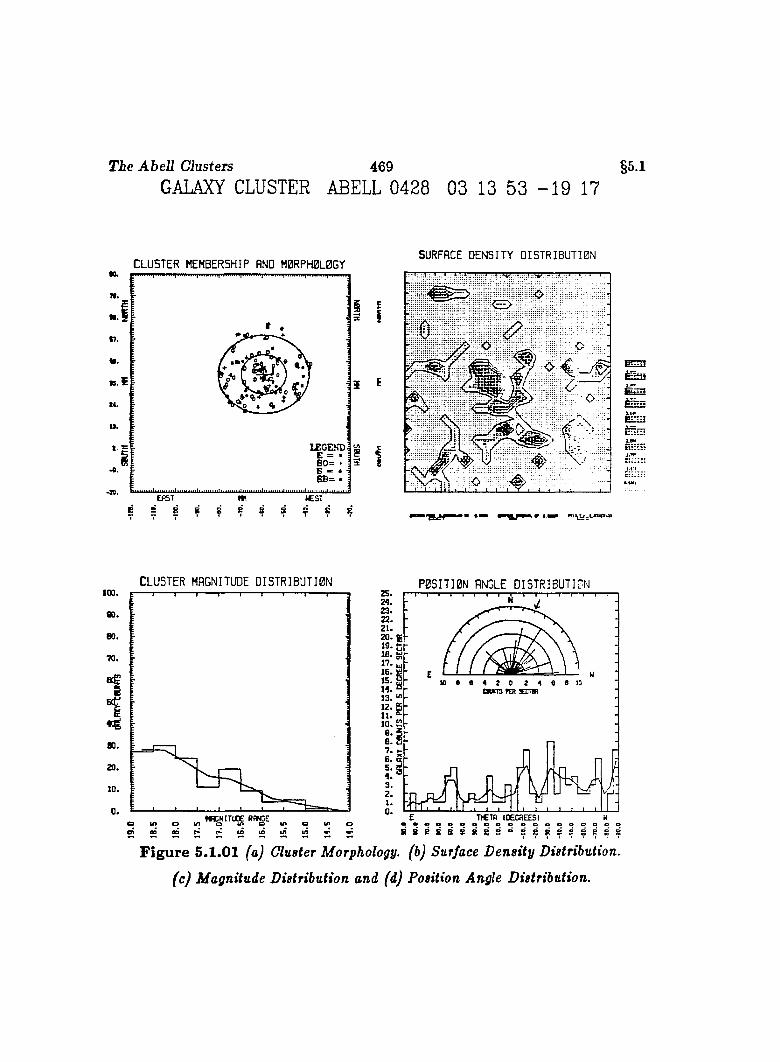
The Abell Clusters 469 §5.1GALAXY CLUSTER ABELL 0428 03 13 53 - 1 9 17
CLUSTER MEMBERSHIP AND M0RPH0L0GYSURFACE DEN SITY O IS T R IB U T I0 N
•0.ft.
u .
17.
e.iu .
u .
X£GENDi E = • :B0= ♦ :B « * T6 f i= • i
EAST m
;Ï
E
èüîî!
S = i ¥ ¥ ? ?
CLUSTER MAGNITUDE DISTRIBUTI0N100.
80.
80.
70.
80.
20.
10.
P0S IT I0N ANGLE OISTRIBUTIGN
r > r » ( c l o t n t n
20. E19-G 18. K
cw m to t jEnw
S . S
DCTfl (DEGREES)
S 8
Figure 5.1.01 (a) Cluster Morphology, (b) Surface Density Distribution,
(e) Magnitude Distribution and (d) Position Angle Distribution.
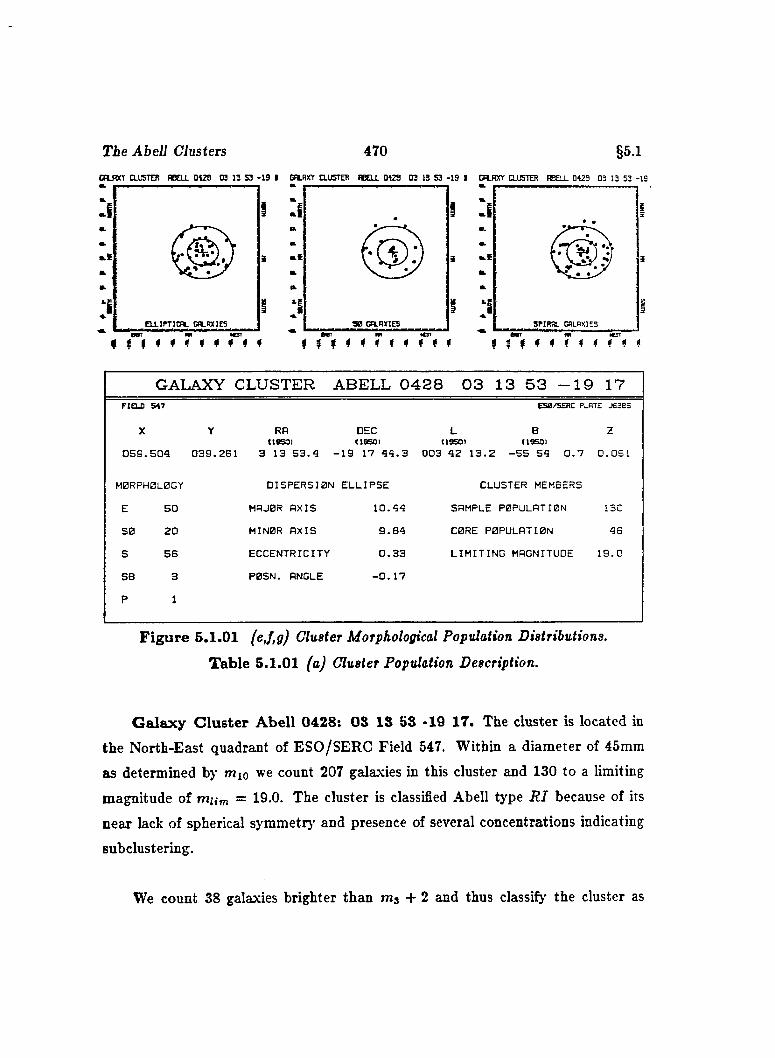
The Abell Clusters 470 §5.1C a W T a u S T E R R B O L 0 1 2 8 03 13 S3 - 1 9 I M J IX Y [LU STER «BELL 0 1 2 8 0 3 13 S3 - 1 9 I CFLRXT [LUSTER BBELL 0 1 2 8 0 3 13 53 -1 9
I I
3 3
f 4 f * t t t t t f ^
GALAXY CLUSTER ABELL 0 4 2 8 0 3 13 5 3 - 1 9 17FIELD S47 ES0/SERÛ PLATE J636S
X059.
Y RA n s s o i
504 039.261 3 13 53.4
DEC L B(19501 119501 (19501
-19 17 44.3 003 42 13.2 -55 54 0.7z
0.051
M0RPH0L0GY DISPERSION ELLIPSE CLUSTER MEMBERS
E 50 MAJOR AXIS 10.44 SAMPLE POPULATION 130
S0 20 MINOR AXIS 9.84 C0RE POPULATION 46
s 56 ECCENTRICITY 0.33 LIMITING MAGNITUDE 19.0
SB 3 P0SN. ANGLE -0. 17
P 1
F ig u re 5.1.01 (e,f,g) Cluster Morphological Population Distributions.
T able 5.1.01 (a) Cluster Population Description.
G alax y C lu s te r A bell 0428: OS IS 5S -19 17. The cluster is located in
the North-East quadrant of ESO/SERC Field 547. Within a diameter of 45mm
as determined by mio we count 207 galaxies in this cluster and 130 to a limiting
magnitude of mum = 19.0. The cluster is classified Abell tj'pe R I because of its
near lack of spherical symmetrj' and presence of several concentrations indicating
sub clustering.
We count 38 galaxies brighter than Mi) 4- 2 and thus classify the cluster as
T ie Abell Clusters 471 §5.1
having an Abell richness of 0. We suggest a B — M type III classification for the
cluster which has no dominant galaxies in the field. For m i,m i, and mio we give
14.9, 15.4 and 15.9, respectively. The value of mio implies a redshift of O.OGl.
The cluster appears somewhat elongated and has several noticable concentra
tions, notably tha t immediately North of center and that South-West of center,
which are the densest and a number of less dense groups scattered throughout
mainly the second and third quadrants of the cluster.
The cluster magnitude distribution appears somewhat bifurcated rising slowly
from the brightest galaxies to a small peak near = 17.0 then falling to a trough
a magnitude later only to rise again to another peak near = 18.5 after which
it falls rapidly to the magnitude limit. The position angle distribution is scattered,
but suggests an excess in the n u m b ers of bright galaxies oriented West of North.
The elliptical galaxies in the cluster appear to be somewhat more concentrated
towards the center of the cluster. The spirals appear to be loosely scattered through
out the cluster, but also somewhat concentrated in the central regions. We find the
{E : SO : 5) ratio to be (i.O : 0.4 : 1.2) indicating nearly twenty percent more
spirals in this cluster than ellipticals. The core population comprises nearly 35% of
the sample enclosed in 0.11 square degrees. This gives a core surface density of 407
gala>des per square degree on the sky.
We note several pairs of close or superposed pairs of galaxies in this cluster such
as the early and late pair of ellipticals at z = 51.9, y = 31.8; and the superposed pair
of lenticulars at z = 74.1, y = 44.8. We also point out the presence of an peculiar
galaxy with the appearance of an amorphous mass with multiple concentrations
located at z = 59.5, y = 36.8.
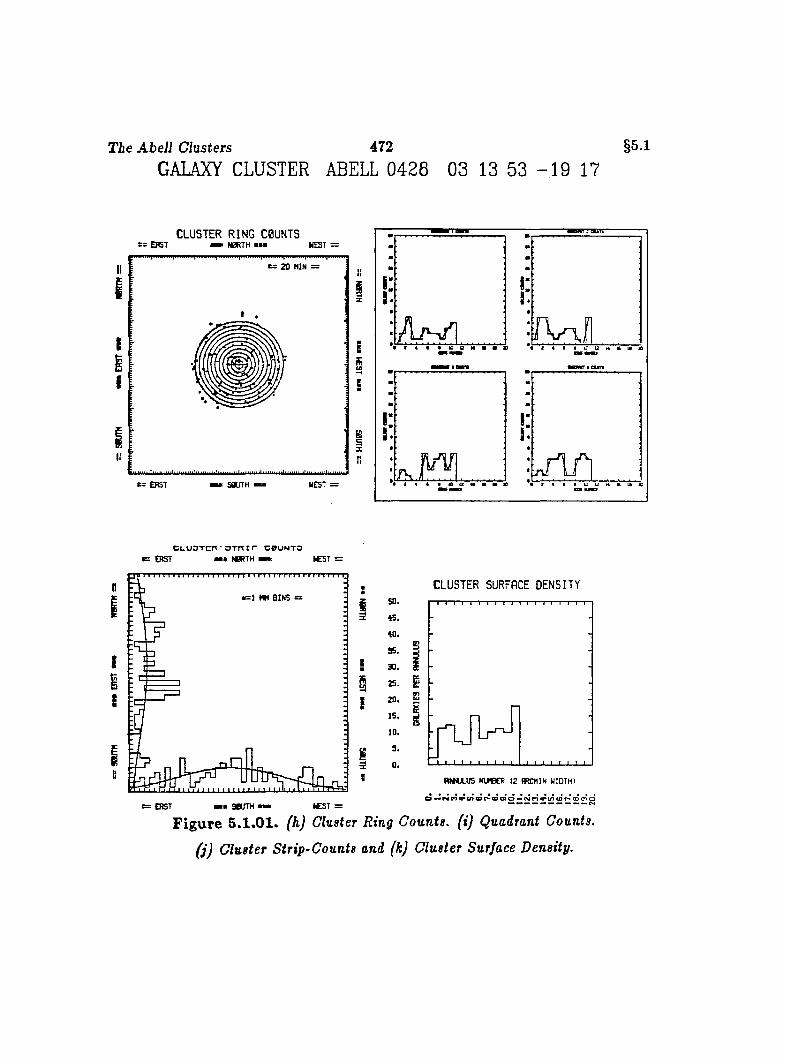
T ie Abell Clusters 472 §5.1
GALAXY CLUSTER ABELL 0428 03 13 53 - 1 9 17
CLUSTER RING C0UNTSr= e r s t » N0RTH mmm WEST :
= 2 D M IN =
| WW EST =t= ERST m m S a U T H
CUUDTCn - OTfT I r C0UNT3 E R S T m m W R T H m m W EST =
B I N S =
I
E
11
:
Ë3g
: ERST ■» sarTH I t C S T =
CLUSTER SURFACE DENSITY
S
0 '* * N n ^ tf> co t^ C D O )0 « « c4 (n o * i/)E o r« co cT o
F ig u re 5 .1 .01 . fhj Cluster Ring Counts, (i) Quadrant Counts,
(i) Cluster Strip-Counts and (k) Cluster Surface Density.
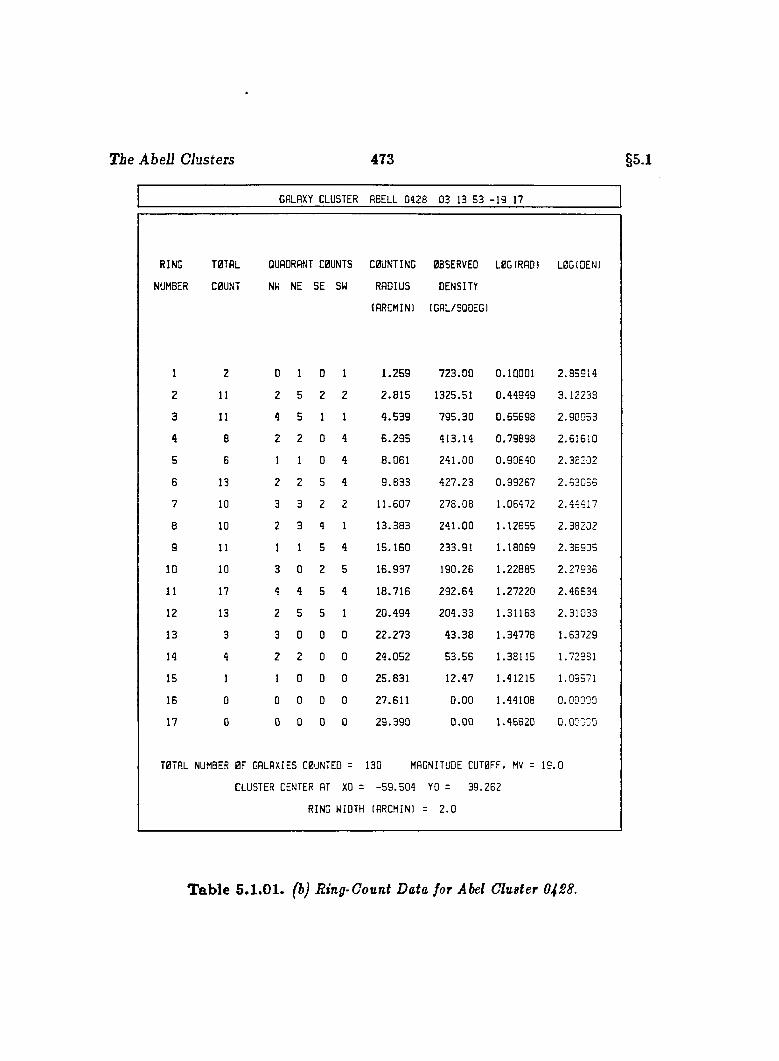
T ie Abell Clusters 473 §5.1
GALAXY CLUSTER ABELL 0428 03 13 53 -1 9 17
RING T0TAL QUADRANT C0UNTS C0UNTING 0BSERVED L0G(RRD) L0GIDEN)
NUMBER C0UNT NW NE SE SW RADIUS DENSITY
(ARCMINl IGAL/SQOEGl
1 2 0 1 0 1 1 .2 5 9 7 2 3 .0 0 0 .10001 2 .8 3 9 1 4
2 11 2 5 2 2 2 . 8 1 5 1325.51 0 .4 4 9 4 9 3 .1 2 2 3 8
3 11 4 5 1 1 4 . 5 3 9 7 9 5 .3 0 0 .5 5 6 9 8 2 .9 0 0 5 3
4 8 2 2 0 4 6 . 2 9 5 4 1 3 .1 4 0 .7 9 8 9 8 2 .6 1 6 1 0
5 6 1 1 0 4 8 .0 6 1 2 4 1 .0 0 0 .9 0 6 4 0 2 .3 3 2 0 2
6 13 2 2 5 4 9 . 6 3 3 4 2 7 .2 3 0 .9 9 2 6 7 2 .6 3 0 3 6
7 10 3 3 2 2 11 .6 0 7 2 7 8 .0 8 1 .06472 2 .4 4 4 1 7
8 10 2 3 4 1 1 3 .3 8 3 2 4 1 .0 0 1 .12655 2 .3 8 2 0 2
9 11 1 1 5 4 1 5 .1 6 0 23 3 .9 1 1 .18069 2 .3 5 9 0 5
10 10 3 0 2 5 1 6 .9 3 7 19 0 .2 6 1 .22885 2 .2 7 9 3 6
11 17 4 4 5 4 1 8 .7 1 6 2 9 2 .6 4 1 .27220 2 .4 5 6 3 4
12 13 2 5 5 1 2 0 .4 9 4 2 0 4 .3 3 1 .31163 2 .3 1 0 3 3
13 3 3 0 0 0 2 2 .2 7 3 4 3 .3 8 1 .34778 1 .63729
14 4 2 2 0 0 2 4 .0 5 2 5 3 .5 6 1 .38115 1.72381
15 1 1 0 0 0 25 .8 3 1 12 .47 1 .41215 1.09371
16 0 0 0 0 0 27 .6 1 1 0 . 0 0 1 .44108 0.00000
17 0 0 0 0 0 2 9 .3 9 0 0 . 0 0 1 .46520 0.00000
T0TAL NUMBER 0F GALAXIES C0UNTEO = 130 MAGNITUDE CUT0FF. MV = 19 0
CLUSTER CENTER AT XO = - 5 9 .5 0 4 YO = 39 .252
RING WIDTH lARCHINl = 2 . 0
T ab le 5.1.01. (b) Ring-Count Data for Abel Cluster O4S8.
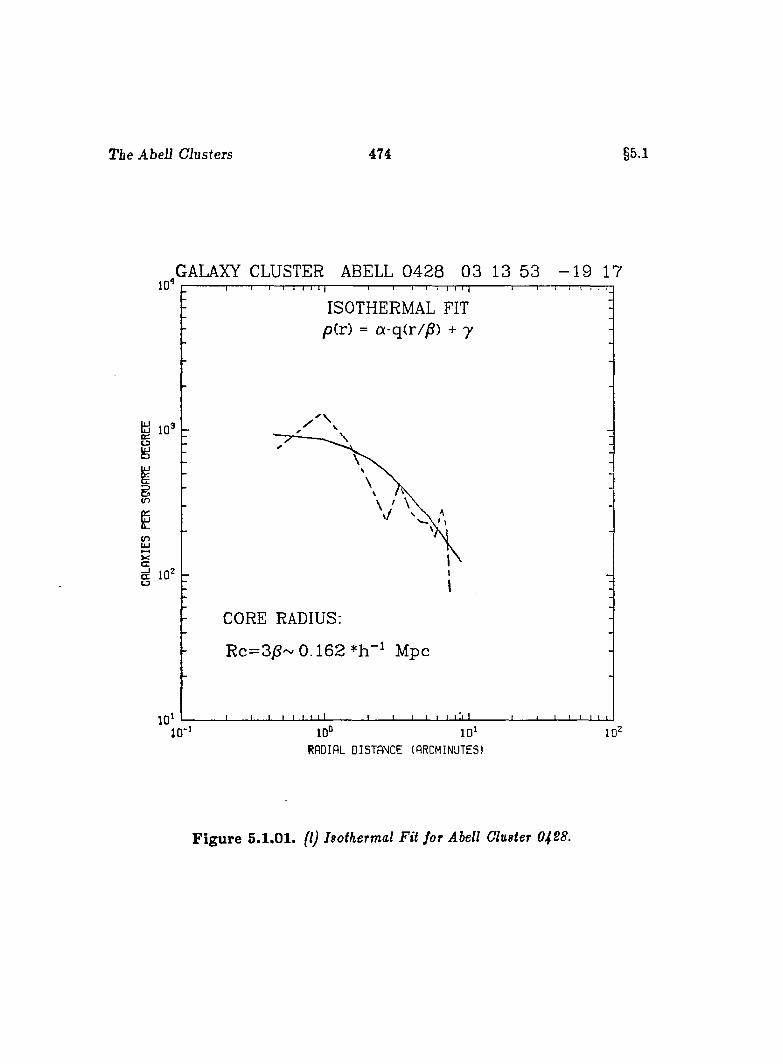
The Abell Clusters 474 §5.1
GALAXY CLUSTER ABELL 0 4 2 8 03 13 53 - 1 9 1710 '
ISOTHERMAL FIT p(r) = a-q(r/^) + y
in
CO
X
CORE RADIUS;
Rc=3jS~ 0 .1 6 2 *h Mpc
10°RADIAL DISTANCE (ARCMINUTES)
F ig u re 5.1.01. (I) Isothermal Fit Jar Abell Cluster 0428.
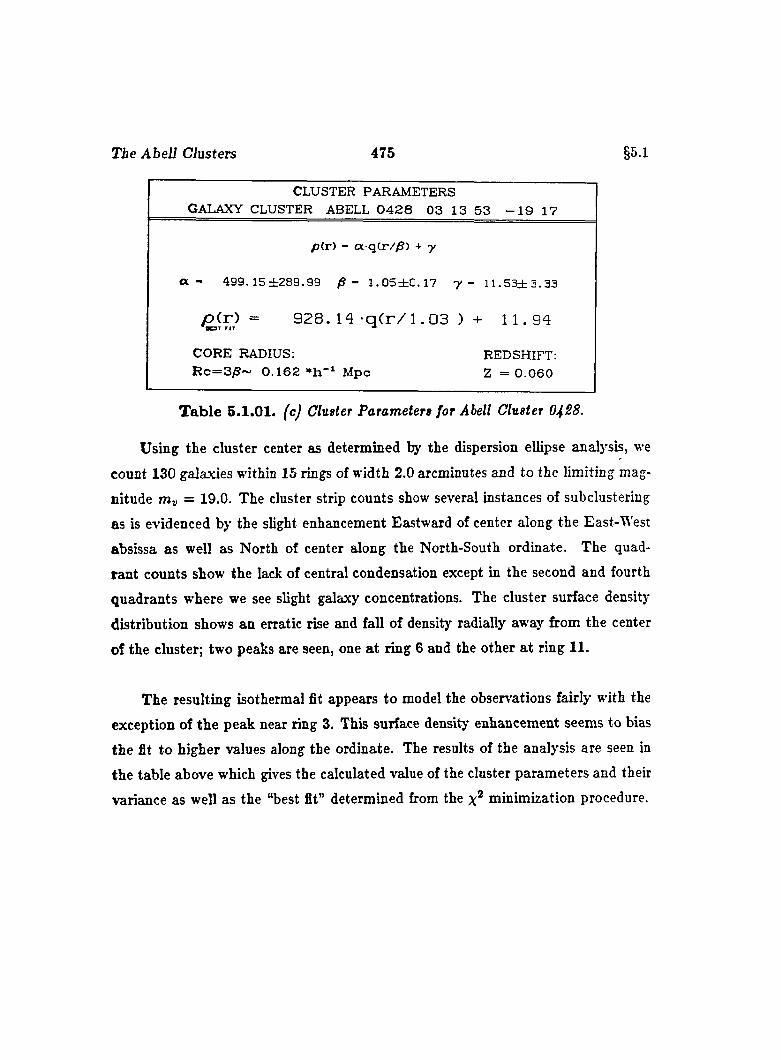
T ie Abell Clusters 475 §5.1
CLUSTER PARAMETERSGALAXY CLUSTER ABELL 0 4 2 8 0 3 13 5 3 - 1 9 17
p(r) - a q(r//S) + y
a - 499. 15 ±289.99 /S - 1 . 0 5 ± 0 . 1 7 7 - 11 .53±3 .33
p ( r ) = 9 2 8 . 1 4 - q C r / 1. 0 3 ) + 1 1 . 9 4■ S T F IT '*■
CORE RADIUS:R c = 3 /S ~ 0 .1 6 2 * h - i Mpc
REDSHIFT: Z = 0 .0 6 0
T ab le 5.1.01. (c) Cluster Parameters for Abell Cluster 0428.
Using the cluster center as determined by the dispersion ellipse analysis, we
count 130 galaxies within 15 rings of width 2.0 arcminutes and to the limiting mag
nitude = 19.0. The cluster strip counts show several instances of subclustering
as is evidenced by the slight enhancement Eastward of center along the East-West
absissa as well as North of center along the North-South ordinate. The quad
rant counts show the lack of central condensation except in the second and fourth
quadrants where we see slight galaxy concentrations. The cluster surface density
distribution shows an erratic rise and fall of density radially away from the center
of the cluster; two peaks are seen, one a t ring 6 and the other a t ring 11.
The resulting isothermal fit appears to model the observations fairly with the
exception of the peak near ring 3. This surface density enhancement seems to bias
the fit to higher values along the ordinate. The results of the analysis are seen in
the table above which gives the calculated value of the cluster parameters and their
variance as well as the “best fit” determined from the minimization procedure.
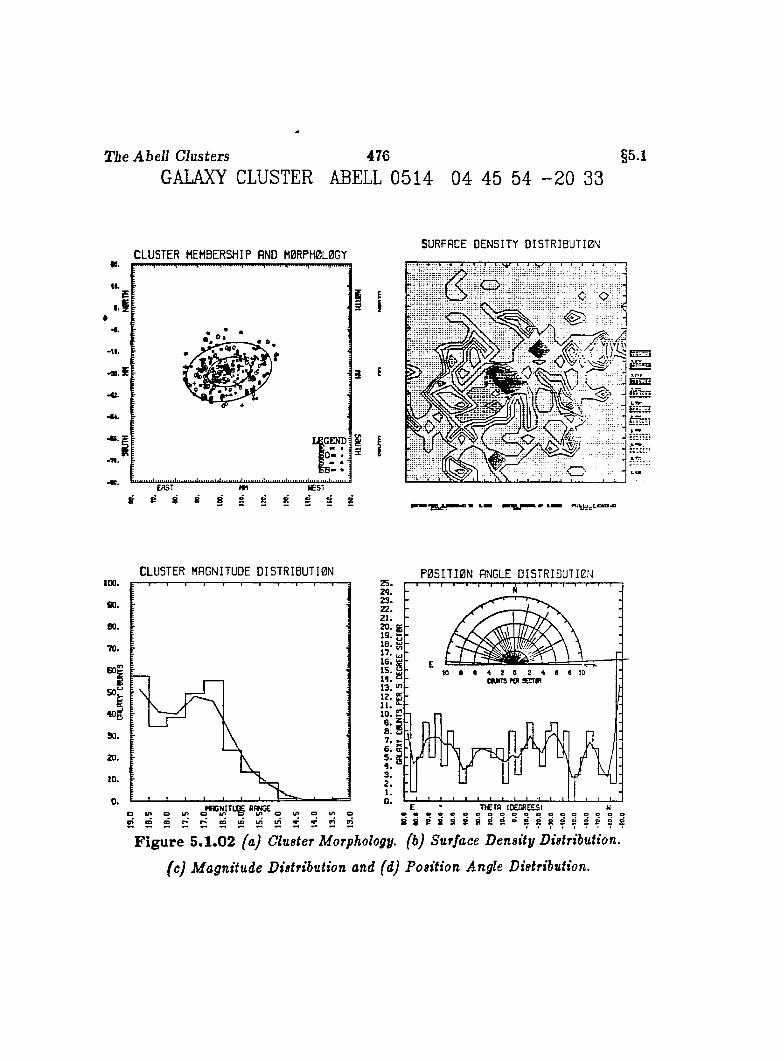
T ie Abell Clusters 476 §5.1GALAXY CLUSTER ABELL 0514 04 45 54 - 2 0 33
to.
II. e•1#
- I I .
-42.
•44.
-7 1 .
CLUSTER MEMBERSHIP AND M0RPH0L0GYSURFACE DENSITY DISTRIBUTI0N
EGEND gO“ ♦
u i t i i i m i i i l i i i m i n l i i i i m i i l i i i m i i i l i n y i i i i l i i m u i i l i i i M i U i l i i i m u i l i iE A S T m 4 C S T
l t ^ 8 8 8 = S 8 S S S
OEi
(
CLUSTER MAGNITUDE DISTRIBUTI0N100.
B O .
80.
70.
390.
20.
to.
0 .
P0SITI0N ANGLE DISTRIBUTION
JBCNITOg R%GE ,r- CD to tn in «■
IS. h
I S .
13. ■" - 12. E - 11. *?- in. S 1
E - TlCTfi lOEOREESI W0 * 0 e o o e e e e e o e e o o o og S P s s
F ig u re 5 .1 .02 (a) Cluster Morphology, (b) Surface Density Distribution.
(c) Magnitude Distribution and (d) Position Angle Distribution.
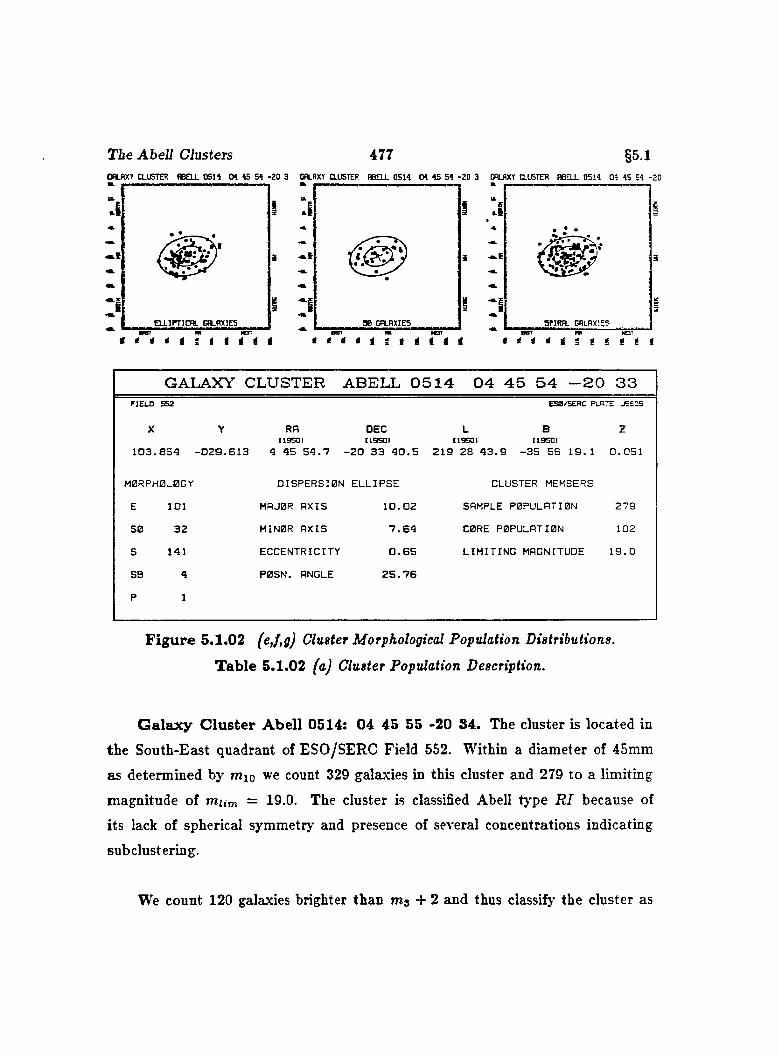
The Abell Clusters 477 §5.1C fiL fiX Y C L U S T E R A B E L L 0 5 1 4 M 4 5 5 4 - 2 0 3 CALRXT C LU ST E R A B E L L 0 5 1 4 0 4 4 5 5 4 - 2 0 3 GALAXY C L U ST E R A B E L L 0 5 1 4 0 4 4 5 5 4 - 2 0
i i
GALAXY CLU STER ABELL 0 5 1 4 0 4 4 5 5 4 - 2 0 3 3FIELD 55 2 ESa/SERC PLATE JES2S
X
103.854
Y RAI1950J
-029 .613 4 45 5 4 .7
DEC L B119501 (19501 (19501
-2 0 33 4 0 .5 219 28 43 .9 -35 56 19.1
z0. 051
M0RPH0L0GY DISPERSION E LL IP S E CLUSTER MEMBERS
E 101 MAJOR A XIS 10.02 SAMPLE POPULATION 2 7 9
80 32 MINOR A XIS 7 .6 4 CORE POPULATION 102
S 141 ECCENTRICITY 0 .6 5 L IM IT IN G MAGNITUDE 19.0
SB 4 P0SN. ANGLE 2 5 .7 6
P 1
F ig u re 5.1.02 (e,f,g) Cluster Morphological Population Distributions.
T ab le 5.1.02 (a) Cluster Population Description.
G a la x y C lu s te r A bell 0514: 04 45 55 -20 34. The cluster is located in
the South-East quadrant of ESO/SERC Field 552. Within a diameter of 45mm
as determined by mio we count 329 galaxies in this cluster and 279 to a limiting
magnitude of mum = 19.0. The cluster is classified Abell tj'pe R I because of
its lack of spherical symmetry and presence of several concentrations indicating
sub clustering.
We count 120 galaxies brighter than m j + 2 and thus classify the cluster as
The Abell Clusters 478 §5.1
having an Abell richness of 2. We suggest & B — M tj'pe II-III classification for the
cluster which has as its brightest galaxies those intermediate in appearance between
giant ellipticals and merely normal bright ellipticals. For m i,1 7 1 3 , and mio we give
13.5,15.3 and 15.5, respectively. The value of mio implies a redshift of 0.051.
The cluster appears quite elongated and has several noticable concentrations,
notably that immediately North of center and tha t South-East of center, which are
the densest and a number of less dense groups scattered throughout mainly the
third and first quadrants of the cluster, the former being the most dominant. The
cluster magnitude distribution appears somewhat bifurcated rising with an almost
exponential rise from the brightest galaxies to a large peak near m„ = 16.5 then
falling to a trough a magnitude and a half later only to rise rapidly to another peak
between m„ = 18.5 and the magnitude limit. This phenomenon may be interpreted
as the possible superposition of two clusters. The position angle distribution is
scattered, but suggests an excess in the numbers of bright galaxies oriented West
of North in particular a t the Western pole somewhat aligned with the major axis
of the dispersion ellipse.
We note the condensation of elliptical galaxies in the South-East portion of the
cluster, near the center. The spirals appear to be loosely scattered throughout the
cluster but there appears to be a major concentration of them near the center. We
find the (E : SO : S ) ratio to be (l.O : 0.3 : 1.4) indicating nearly forty percent
more spirals in this cluster than ellipticals. The core population comprises nearly
37% of the sample enclosed in 0.08 square degrees. This gives a core surface density
of 1 2 1 0 galaxies per square degree on the sky.
We notice several interesting superpositions in the cluster; even the brightest
galaxy in the cluster, located at r = —108.2, p = —26.7, appears to be superposed
with a lenticular galaxy to the North-East. Another pair is seen at z = —124.8, y =
The Abell Clusters 479 §5.1
—22.7 consisting of a lenticular and an elliptical and a pair with an early and late
elliptical a t z = —99.2, y = —29.8. Several barred spiral galaxies are seen with
ring-like structures and ”s-shaped” features such as seen at z = —113.6, y = —34.9.
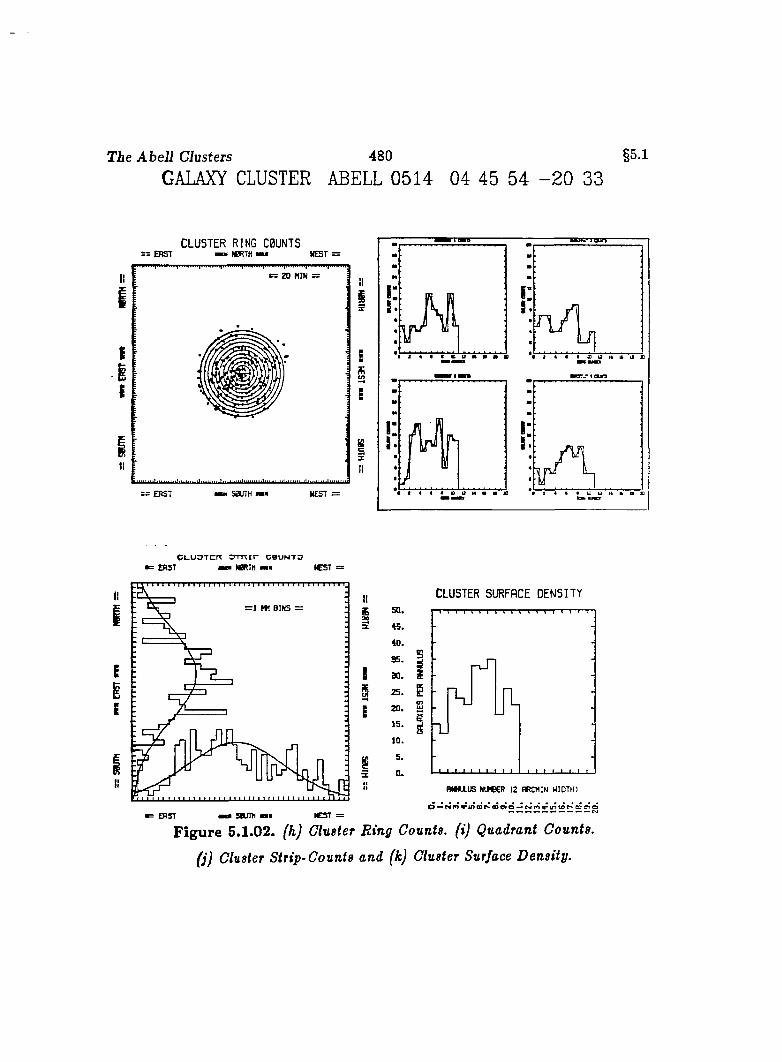
T ie Abell Clusters 480 §5.1GALAXY CLUSTER ABELL 0514 04 45 54 - 2 0 33
CLUSTER RING C0ÜNTS: = E B S T B H 0RTH B N E S T =
= 20 MIN =
— E f iS T I S0U TH I WEST z=
II
I
I
II
C i - u O T C r r o r n i r c b u n t o : EAST B WRTH B ICST =
II= 1 I t t B I N S =
E
E
II
II£
is
5 0 .
«.4 0 .
as.3 0 .
2 5 .
20.I S .
10.
5.0.
CLUSTER SURFACE DENSITY
5
EAST ICST =
(N tH J lU S N I M E P 12 B R C M IN W ID T H )
0 » * f '* r o * " u i c D f * - ( D C T O — r ^ f ’i « r L n t o r * 'C D O T O
F ig u re 5.1.02. (h) Cluster Ring Counts, (i) Quadrant Counts,
(j) Cluster Strip-Counts and (k) Cluster Surface Density.
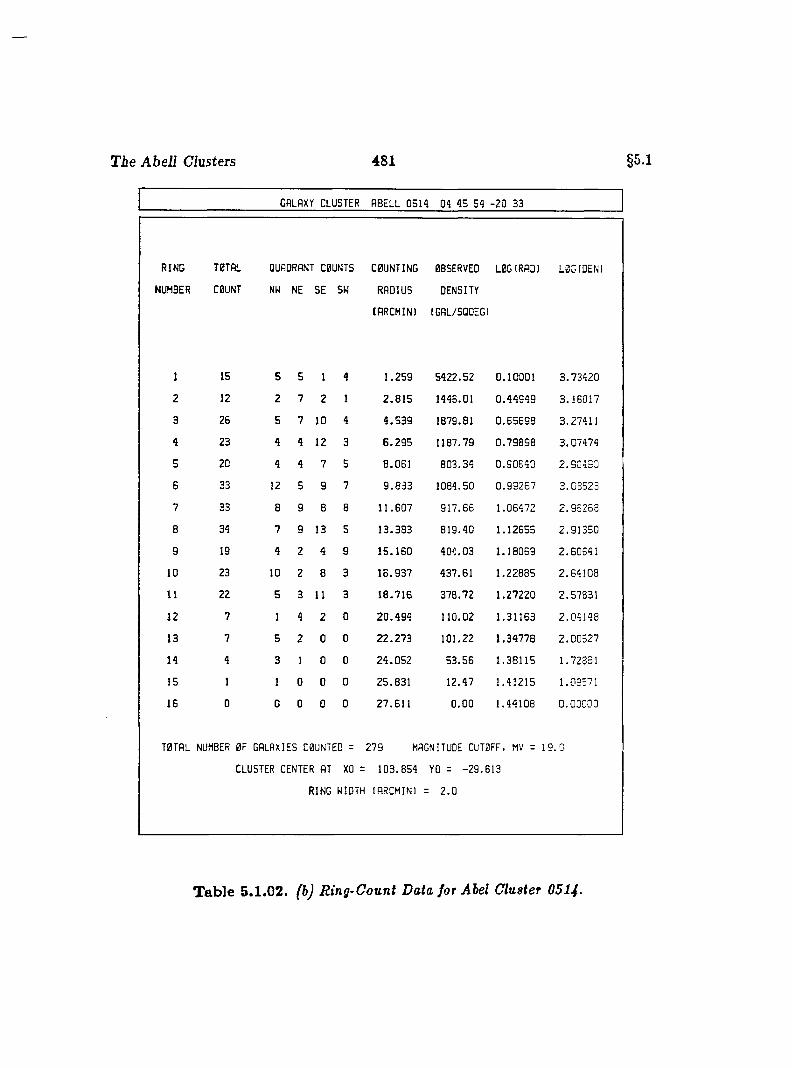
T ie Abell Clusters 481 §5.1
GALAXY CLUSTER ABELL 0514 04 45 54 -2 0 33
RING TOTAL QUADRANT COUNTS COUNTING OBSERVED LOG(RAD) LBG(DEN)
JMBER COUNT NW NE SE 5W RADIUS DENSITY
(ARCMINl tGAL/SQDEG)
1 15 5 5 1 4 1 .2 5 9 54 2 2 .52 0 .1 0 0 0 1 3 .7 3 4 2 0
2 12 2 7 2 1 2 . 8 1 5 1446.01 0 .4 4 9 4 9 3 .1 6 0 1 7
3 26 5 7 10 4 4 .5 3 9 1879.81 0 .6 5 6 9 8 3 .27411
4 23 4 4 12 3 6 . 2 9 5 1187.79 0 .7 9 8 9 8 3 .0 7 4 7 4
5 20 4 4 7 5 8 .0 6 1 80 3 .3 4 0 .9 0 6 4 0 2 .9 0 4 9 3
6 33 12 5 g 7 9 .8 3 3 1084 .50 0 .9 9 2 6 7 3 .0 3 5 2 3
7 33 8 9 8 8 1 1 .6 0 7 9 1 7 .6 6 1 .0 6472 2 .9 5 2 5 8
8 34 7 9 13 5 1 3 .3 8 3 8 1 9 .4 0 1 .1 2655 2 .9 1 3 5 0
9 19 4 2 4 9 1 5 .1 6 0 4 0 4 .0 3 1 .1 8 0 6 9 2 .6 0 5 4 1
10 23 10 2 8 3 1 6 .9 3 7 4 37 .61 1 .2 2 8 8 5 2 .6 4 1 0 8
11 22 5 3 11 3 1 8 .7 1 6 3 7 8 .7 2 1 .2 7 2 2 0 2 .5 7 8 3 1
12 7 1 4 2 0 2 0 .4 9 4 110 .02 1 .3 1 1 6 3 2 .0 4 1 4 8
13 7 5 2 0 0 2 2 .2 7 3 101 .22 1 .3 4 7 7 8 2 .0 0 5 2 7
14 4 3 1 0 0 2 4 .0 5 2 5 3 .5 6 1 .3 8115 1 .72331
15 1 1 0 0 0 2 5 .8 3 1 12 .47 1 .4 1215 1.09371
IB 0 0 0 0 0 2 7 .6 1 1 0 .0 0 1 .4 4108 0 .0 0 0 0 0
TOTAL NUMBER OF GALAXIES COUNTED = 279 MAGNITUDE CUTOFF. MV = 1 9 .0
CLUSTER CENTER AT XO = 1 0 3 . B54 YO = -2 9 .6 1 3
RING WIDTH IARCMINl = 2 .0
T ab le 5.1.02. (b) Ring-Count Data for Abel Cluster 0514.
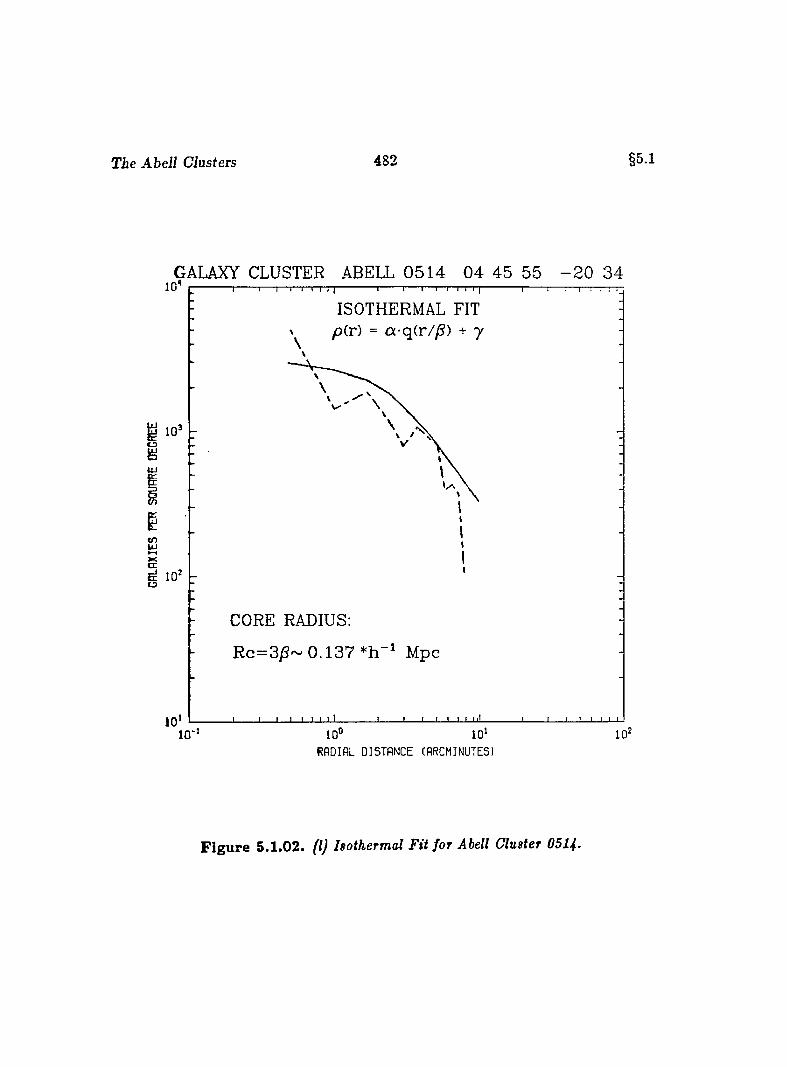
T ie Abell Clusters 482 §5.1
GALAXY CLUSTER ABELL 0 5 1 4 0 4 45 55 - 2 0 34
XCE
10ISOTHERMAL FIT
fi(r) = a-q(r/yS) + 7
CORE RADIUS:
Rc=3jS~ 0 .1 3 7 Mpc
10*1 0 °
RADIAL DISTANCE (ARCMINUTES!
F ig u re 5.1.02. (I) Isothermal Fit for Abell Cluster 0514.
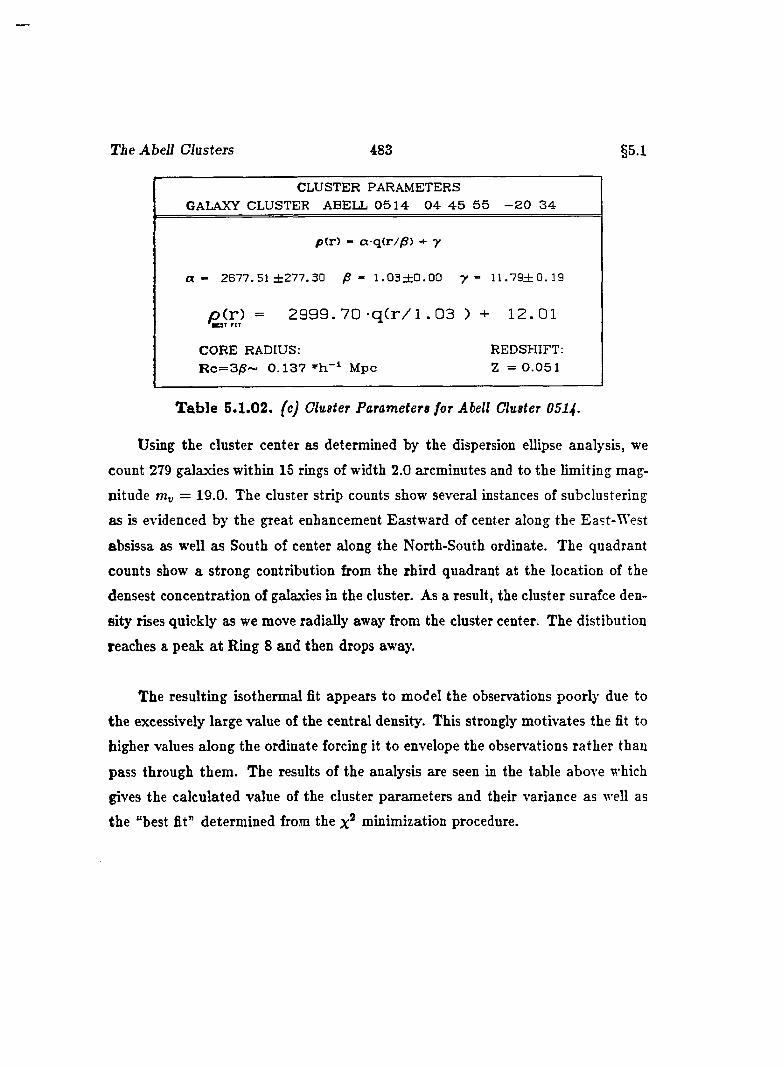
T ie Abell Clusters 483 §5.1
CLUSTER PARAMETERSGALAXY CLUSTER ABELL 0 5 1 4 0 4 4 5 5 5 - 2 0 3 4
p<r) - a q(r//S) + y
a - 2677 .51 ± 2 7 7 .3 0 /S - 1 .0 3 ± 0 .0 0 y ~ 1 1 .7 9 ± 0 .1 9
p i r ) = 2 9 9 9 . 7 0 - q C r / l . 0 3 ) + 1 2 . 0 1' ■ 0 7 r i7
CORE RADIUS; REDSHIFT;R c = 3 /S ~ 0 .1 3 7 Mpc 2 = 0 .0 5 1
T ab le 5.1.02. (c) Cluster Parameters for Abell Cluster 0514-
Using the cluster center as determined by the dispersion ellipse analysis, we
count 279 galaxies within 15 rings of width 2.0 arcminutes and to the limiting mag
nitude ruv = 19.0. The cluster strip counts show several instances of subclustering
as is evidenced by the great enhancement Eastward of center along the East-West
absissa as well as South of center along the North-South ordinate. The quadrant
counts show a strong contribution from the rhird quadrant at the location of the
densest concentration of galaxies in the cluster. As a result, the cluster surafce den
sity rises quickly as we move radially away from the cluster center. The distibution
reaches a peak a t Ring 8 and then drops away.
The resulting isothermal fit appears to model the observations poorly due to
the excessively large value of the central density. This strongly motivates the fit to
higher values along the ordinate forcing it to envelope the observations rather than
pass through them. The results of the analysis are seen in the table above which
gives the calculated value of the cluster parameters and their variance as well as
the “best fit” determined from the x* minimization procedure.
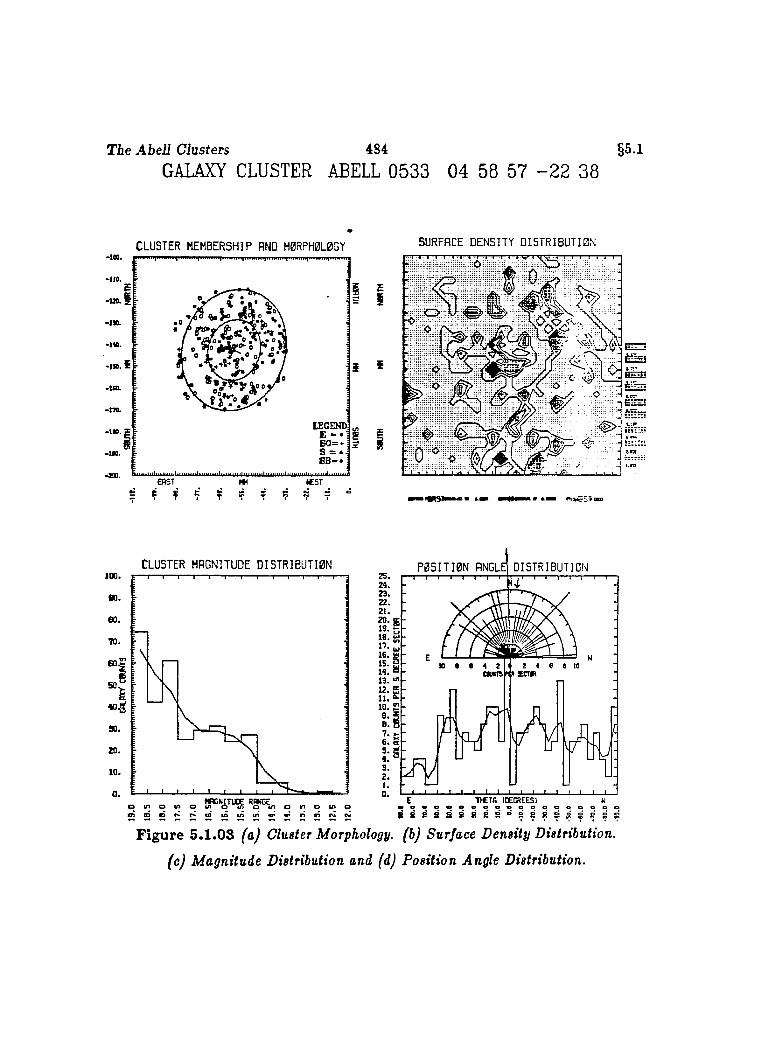
T ie Abell Clusters 484 §5.1GALAXY CLUSTER ABELL 0533 04 58 57 - 2 2 38
CLUSTER MEMBERSHIP AND M0RPH0L0GY SURFACE DENSITY DISTRIBUTION-too.
• t t c .
•uo.
•ISO.
• I t t .
-I» . Ï
• I H .5 0 = -s = *
iC S T
? = ?
i I
i f
CLUSTER MAGNITUDE DISTRIBUTI0N100 .
so.
60.
90.
Z O .
10.
o » o » o o n o u> oL O L / i L D v v n i n c N j r j
P05ITI0N ANGLE DI5TRIBUTIBNzs.
15.
13. •"
6. S
'JVT Æ T A (D EG R EE S)
2 à B R B S D B R S 8 S PF igure 5.1 .03 (a) Cluster Morphology, (b) Surface Density Distribution,
(c) Magnitude Distribution and (d) Position Angle Distribution.
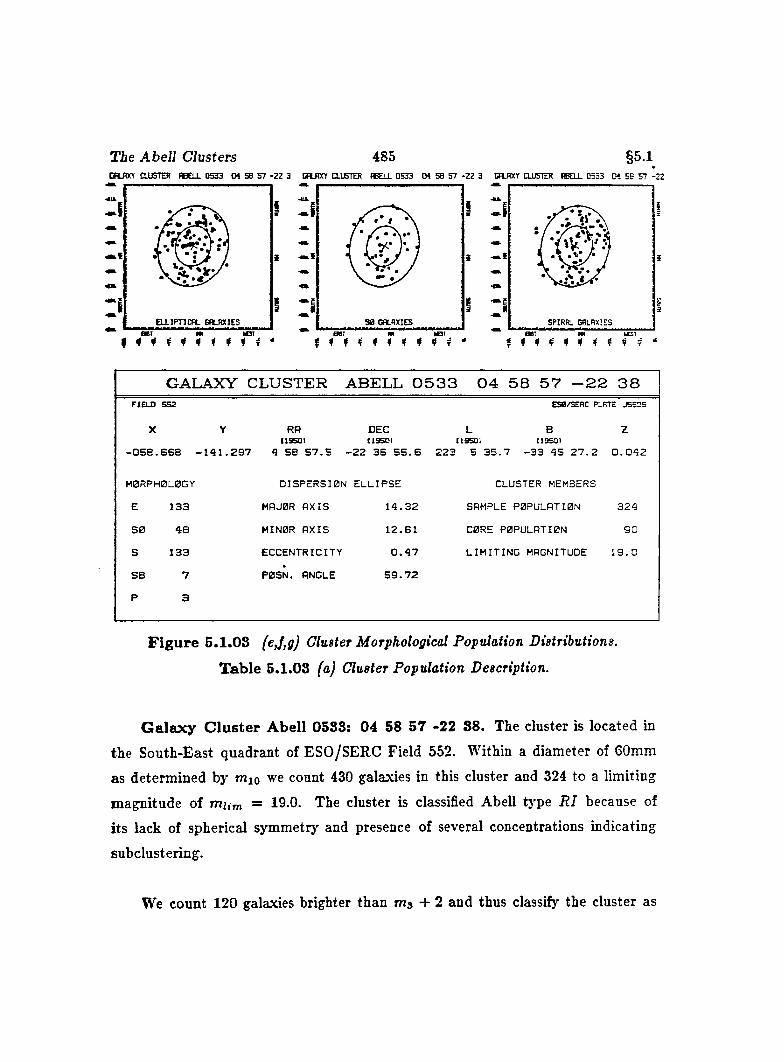
T ie Abell Clusters 485 §5.1C H J5 C Y C L U S T E R B g l L 0 5 3 3 C « S B 5 7 - 2 2 3 CPLR X T [L U S T E R A B E L L 0 5 3 3 M 5 8 5 7 - 2 2 3 CA LRX T C LU STE R A B E L L 0 5 3 3 CH 5 5 5 7 - 2 2
E L L I P T I C A L G A L A X IE S
I
# * * f * * < * * f 'G A L A X IE S
i t t 'f 4 4 i 4 <i 4 “
I
i
GALAXY CLU STER ABELL 0 5 3 3 0 4 5 8 5 7 - 2 2 3 8FIELD 5 5 2
X
ESO/SERC PLATE J5 B0 S
zY RA DEC L B119501 119501 [19501 (19501
0 5 8 .6 6 8 - 1 4 1 . 2 9 7 4 SB 5 7 .5 - 2 2 3 5 5 5 . 6 2 2 3 5 3 5 .7 - 3 3 45 2 7 .2 0 .0 4 2
M0RPH0L0GY
E 133
5 0 4 8
S 1 33
SB 7
P 3
DISPERSION E LLIP SE
MAJ0R A X IS 1 4 .3 2
MIN0R A X IS 1 2 .6 1
ECCENTRICITY 0 .4 7
P0SN. ANGLE 5 9 .7 2
CLUSTER MEMBERS
SAMPLE POPULATION 3 2 4
CORE POPULATION 9 0
L IM IT IN G MAGNITUDE 1 9 .0
F ig u re 5 .1 .OS (e,f,g) Cluster Morphological Population Distributions.
T ab le 5.1.03 (a) Cluster Population Description.
G a la x y C lu s te r A bell 0533: 04 58 57 -22 38. The cluster is located in
the South-East quadrant of ESO/SERC Field 552. Within a diameter of 60mm
as determined by mio we count 430 galaxies in this cluster and 324 to a limiting
magnitude of mum = 19.0. The cluster is classified Abell tj’pe R I because of
its lack of spherical symmetry and presence of several concentrations indicating
subclustering.
We count 120 galaxies brighter than + 2 and thus classify the cluster as
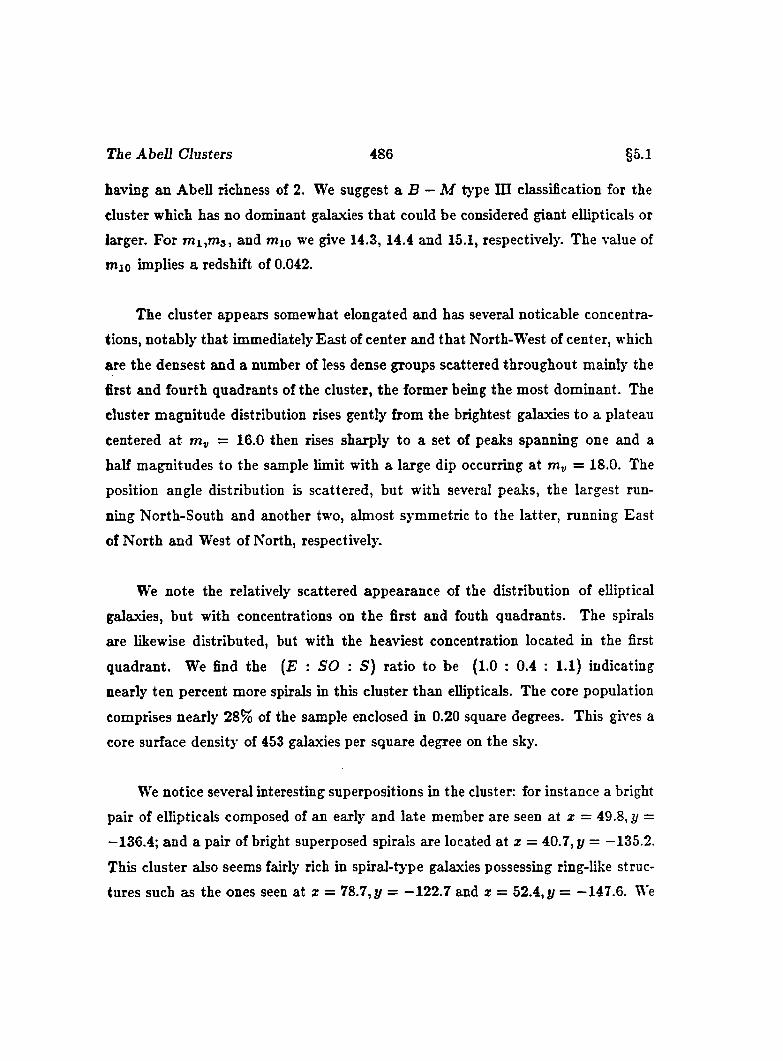
T ie Abell Clusters 486 §5.1
having an Abell richness of 2. We suggest a. B — M type HI classification for the
cluster which has no dominant galaxies tha t could be considered giant ellipticals or
larger. For m i,m s, and mio we give 14.3, 14.4 and 15.1, respectively. The value of
mio implies a redshift of 0.042.
The cluster appears somewhat elongated and has several noticable concentra
tions, notably that immediately East of center and that North-West of center, which
are the densest and a number of less dense groups scattered throughout mainly the
first and fourth quadrants of the cluster, the former being the most dominant. The
cluster magnitude distribution rises gently from the brightest galaxies to a plateau
centered at m„ = 16.0 then rises sharply to a set of peaks spanning one and a
half magnitudes to the sample limit with a large dip occurring at m„ = 18.0. The
position angle distribution is scattered, but with several peaks, the largest run
ning North-South and another two, almost symmetric to the latter, running East
of North and West of North, respectively.
We note the relatively scattered appearance of the distribution of elliptical
galaxies, but with concentrations on the first and fouth quadrants. The spirals
are likewise distributed, but with the heaviest concentration located in the first
quadrant. We find the {E : SO : S ) ratio to be (1.0 : 0.4 : l . l ) indicating
nearly ten percent more spirals in this cluster than ellipticals. The core population
comprises nearly 28% of the sample enclosed in 0.20 square degrees. This gives a
core surface density of 453 galaxies per square degree on the sky.
We notice several interesting superpositions in the cluster: for instance a bright
pair of ellipticals composed of an early and late member are seen at z = 49.8, y =
—136.4; and a pair of bright superposed spirals are located at z = 40.7, y = —135.2.
This cluster also seems fairly rich in spiral-type galaxies possessing ring-like struc
tures such as the ones seen at z = 78.7, y = —122.7 and z = 52.4, j/ = —147.6. We
T ie Abell Clusters 487 §5.1
also make note of an unusual object, seen edge-on, with what appear to be broken
ansae located at z = 74.0, y = —164.1. Several very extended low surface brightness
objects are also noticed in the field at z = 39.9, y = —147.9 and z = 37.2, y = —15G.0
and are likely to be foreground galaxies superposed on the cluster.
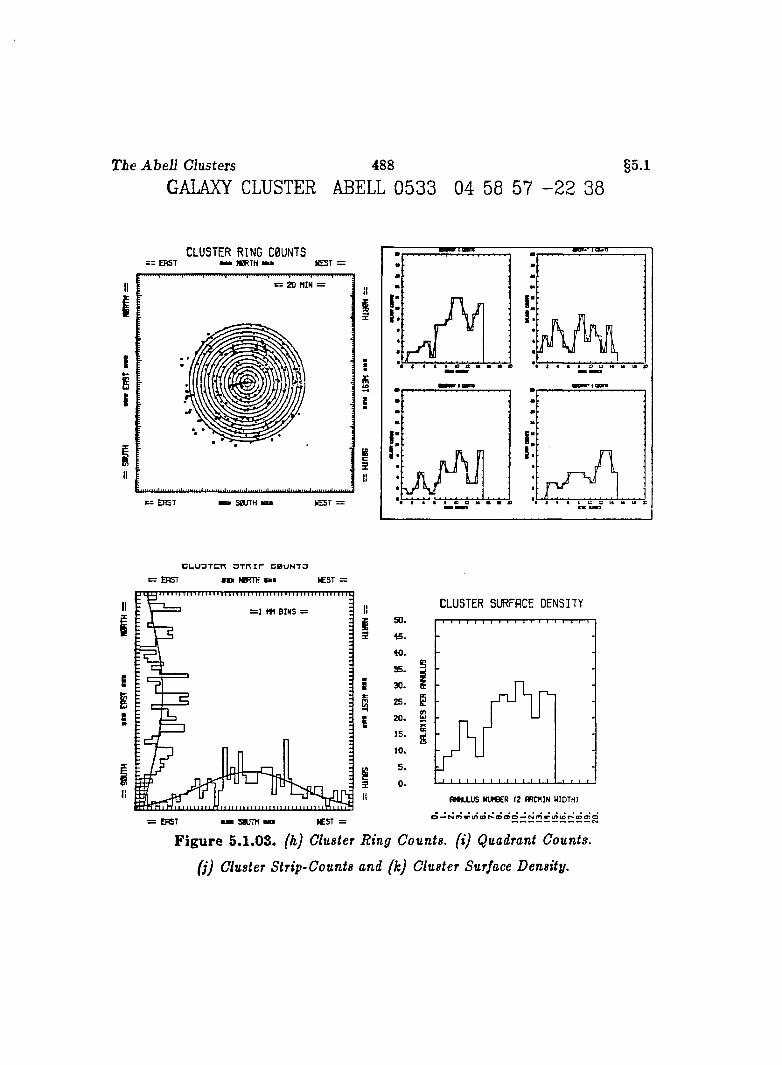
The Abell Clusters 488 §5.1
GALAXY CLUSTER ABELL 0533 04 58 57 - 2 2 38
CLUSTER RING C0ÜNT5= = E R S T — ' N 0R T H n a W ESTm u i yn iy i iii fyniwfu wyfwww!
c z 2 0 M IN =
E R S T ! SOUTH I W EST =
c u u D T c n O T f ^ i r c b u n t o
E A S T r a W R T H «mm ( E S T
II = 1 m B I N S =
E
Ç
II
= EBST
CLUSTER SURFACE DENSITY
95. 5
BS
1
F ig u re 5.1.03. {hj Cluster Ring Counts, (i) Quadrant Counts,
(j) Cluster Strip-Counts and (k) Cluster Surface Density.
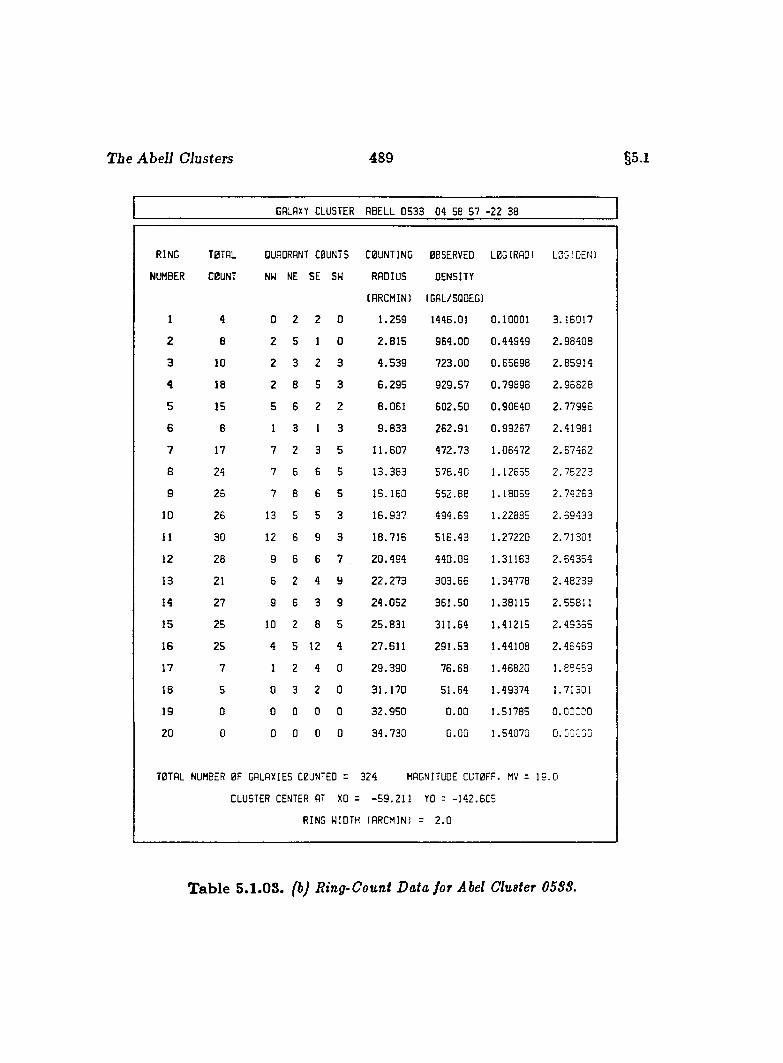
The Abell Clusters 489 §5.1
GALAXY CLUSTER ABELL 053 3 04 58 57 -2 2 38
RING TOTAL QUADRANT COUNTS COUNTING OBSERVED LOG(RAD) LOG(DEN)
NUMBER COUNT NW NE SE SW RADIUS DENSITY
(ARCMIN) (GAL/SQDEG)
1 4 0 2 2 0 1 .2 5 9 1446.01 0.1 0001 3 .1 6 0 1 7
2 B 2 5 1 0 2 . 8 1 5 9 6 4 .0 0 0 .4 4 9 4 9 2 .9 8 4 0 8
3 10 2 3 2 3 4 .5 3 9 7 2 3 .0 0 0 .6 5 6 9 8 2 .8 5 9 1 4
4 18 2 8 5 3 6 . 2 9 5 9 2 9 .5 7 0 .7 9 8 9 8 2 .9 6 8 2 8
5 15 5 6 2 2 8 .0 6 1 6 0 2 .5 0 0 .9 0 6 4 0 2 .7 7 9 9 6
6 8 1 3 1 3 9 .8 3 3 262 .91 0 .9 9 2 6 7 2 .4 1 9 8 1
7 17 7 2 3 5 1 1 .8 0 7 4 7 2 .7 3 1 .06472 2 .6 7 4 5 2
8 24 7 6 6 5 1 3 .3 8 3 5 7 8 .4 0 1 .12555 2 .7 6 2 2 3
9 25 7 8 6 5 1 5 .1 6 0 5 5 2 .8 8 1 .18069 2 .7 4 2 6 3
10 26 13 5 5 3 1 6 .9 3 7 4 9 4 .6 9 1 .22885 2 .6 9 4 3 3
11 30 12 6 9 3 1 8 .7 1 6 5 1 6 .4 3 1 .27220 2 .71301
12 28 9 6 6 7 2 0 .4 9 4 4 4 0 .0 9 1 .31163 2 .6 4 3 5 4
13 21 6 2 4 9 2 2 .2 7 3 3 0 3 .6 6 1 .34778 2 .4 8 2 3 9
14 27 9 6 3 9 2 4 . 0 5 2 3 6 1 .5 0 1 .38115 2 .5 5 8 1 1
15 25 10 2 8 5 2 5 .8 3 1 31 1 .6 4 1.41215 2 .4 9 3 5 5
16 25 4 5 12 4 2 7 .6 1 1 2 9 1 .5 3 1 .44108 2 .4 5 4 6 9
17 7 1 2 4 0 2 9 .3 9 0 7 6 .6 8 1 .46820 1 .8 5 4 5 9
IB 5 0 3 2 0 3 1 .1 7 0 5 1 .6 4 1.49374 1.71301
19 0 0 D 0 0 3 2 .9 5 0 0 .0 0 1.5 1785 0 .0 0 0 3 0
20 0 0 D D 0 3 4 .7 3 0 0 .0 0 1.54070 Ü.COOOÜ
TOTAL NUMBER OF GALAXIES COUNTED = 324 MAGNITUDE CUTOFF. MV = 19 0
CLUSTER CENTER AT XO = - 5 9 . 2 1 1 YO = -1 4 2 .6 0 5
RING WIDTH (ARCMIN) = 2 . 0
T ab le 5.1.03. (b) Ring-Count Data for Abel Cluster 05SS.

The Abell Clusters 490 §5.1
GALAXY CLUSTER ABELL 0 5 3 3 0 4 58 57 - 2 2 39
ISOTHERMAL FIT p(r) = a-q(r//?) + y
tn
c n
ttΠ10 'o
CORE RADIUS;
R c = 3 )S ~ 0 .1 1 4 Mpc
RADIAL DISTANCE (HRCMINUTES)
F ig u re 5.1.03. (I) hothermal Fit Jot Abell Cluster 05SS.
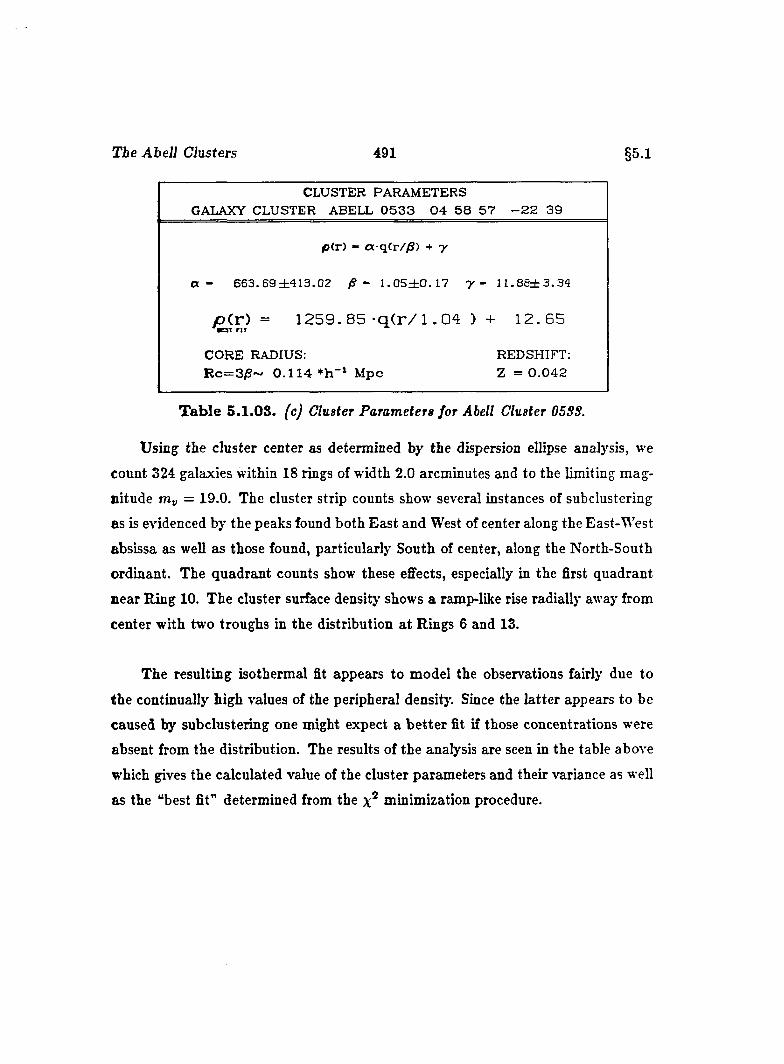
T ie Abell Clusters 491 §5.1
CLUSTER PARAMETERSGALAXY CLUSTER ABELL 0 5 3 3 0 4 5 8 5 7 - 2 2 39
p ( r ) - oc-qCr//S) + y
O - 6 6 3 . 6 9 ± 4 1 3 . 0 2 - 1 . 0 5 ± 0 . 17 y - l l . 8 8 i 3 . 3 4
pCr) = 1259. 8 5 - q ( r / l .04 ) + 12.65
CORE RADIUS:R c = 3 f - 0 .1 1 4 M pc
REDSHIFT: Z = 0 .0 4 2
T ab le 5 .1.08. (c) Cluster Parameters for Abell Cluster 05SS.
Using the cluster center as determined by the dispersion ellipse analysis, we
count 324 galaxies within 18 rings of width 2.0 arcminutes and to the limiting mag
nitude mv = 19.0. The cluster strip counts show several instances of subclustering
as is evidenced by the peaks found both East and West of center along the East-West
absissa as well as those found, particularly South of center, along the North-South
ordinant. The quadrant counts show these effects, especially in the first quadrant
near Ring 10. The cluster surface densitj’ shows a ramp-like rise radially away from
center with two troughs in the distribution a t Rings 6 and 13.
The resulting isothermal fit appears to model the observations fairly due to
the continually high values of the peripheral density. Since the latter appears to be
caused by subclustering one might expect a be tter fit if those concentrations were
absent from the distribution. The results of the analysis are seen in the table above
which gives the calculated value of the cluster parameters and their variance as well
as the “best fit” determined from the x* minimization procedure.
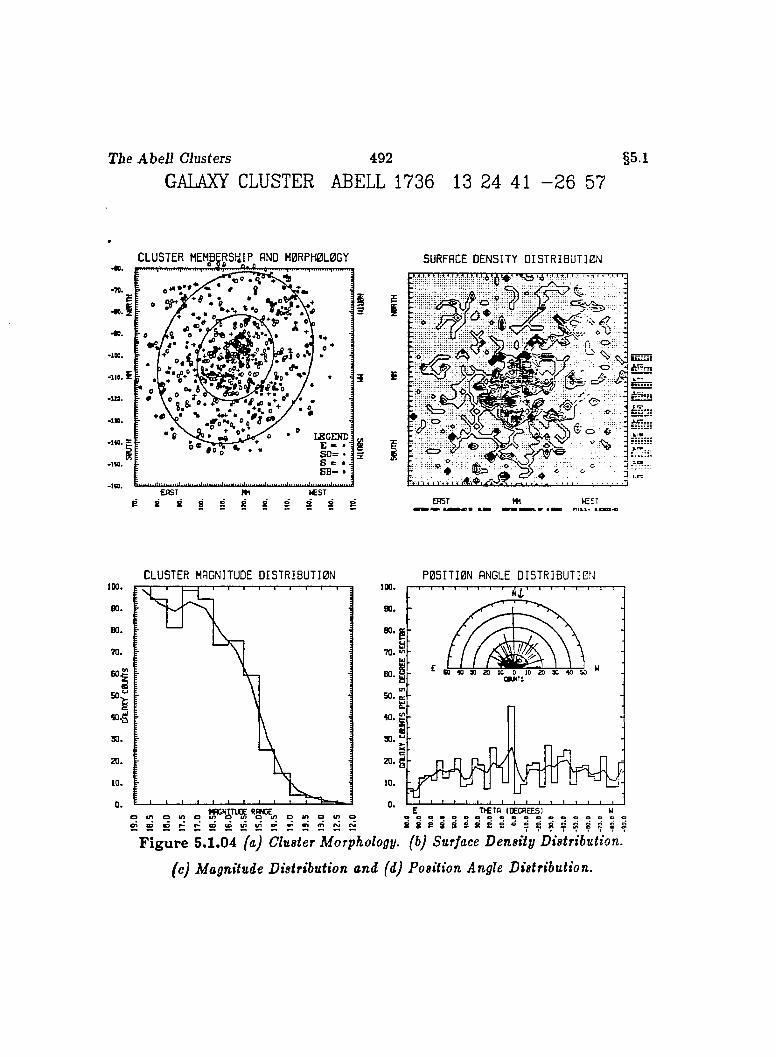
Tie Abell Clusters 492 §5.1
GALAXY CLUSTER ABELL 1736 13 24 41 - 2 6 57
CLUSTER HEHB RShjIP_ AND M0RPH0L0GY
• '■> ' •“ IBGEOT)
ES0=s = * SB—
I
SURFACE DENSITY DISTRIBÜTI0N.> ..l ;H ;V r:» :4 .l .< ..4 ,l 1 ^ 1 :1 I 4 .1 .1 " ' | . ' I 1 I I J
o X=> ’A ^
: k*. 1 ^ : r ^ j g
E R S T m H IS T
CLUSTER MAGNITUDE DISTRIBUTI0N100.60,
BO.
70.
I
30.
20.
10.
0 .
P05ITI0N ANGLE DI5TRIBUTIBN
tpCNHi i / ) o m o t f ) o0 7 C D o r * - r * œ c D u i u 7 w w * B i » n c N j p g
300.
70.
2 0 . g
TH ET A ID E C R E E S ln e e v o B o o o e og g P 8 8 @ R 8 2 « 2 8 2 5 2 2
F ig u re 5.1.04 (a) Cluster Morphology, (b) Surface Density Distribution,
(c) Magnitude Distribution and (d) Position Angle Distribution.
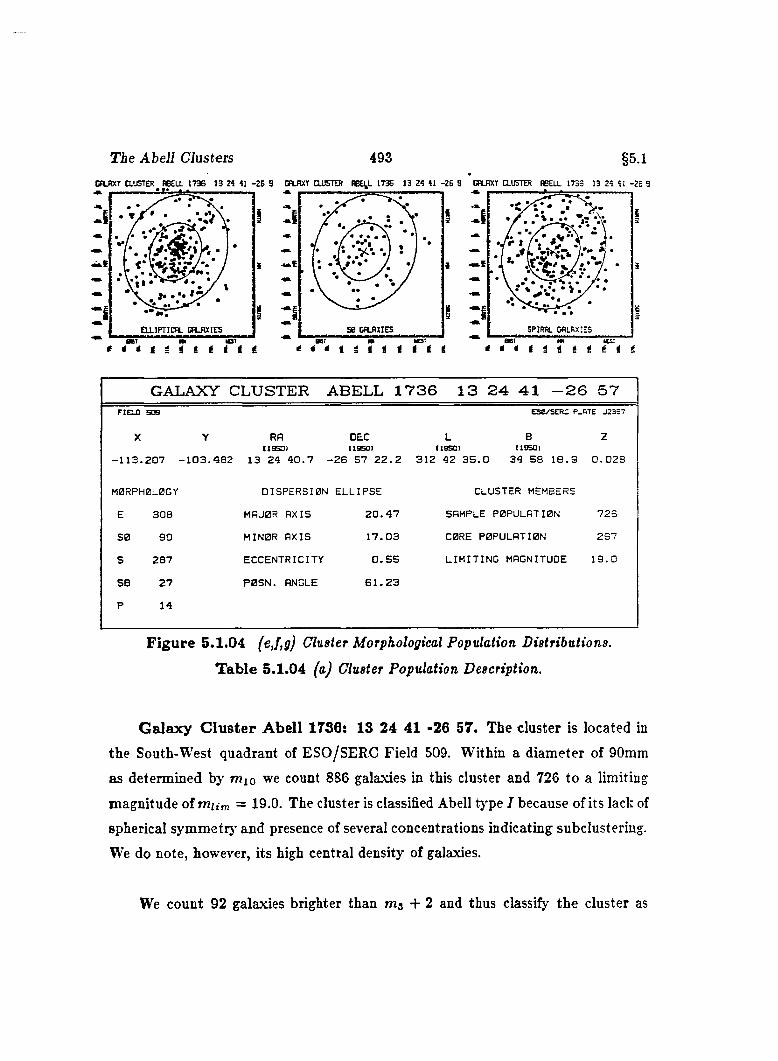
T ie Abell Clusters 493 §5.1C PLRX Y C LU ST E R A B ELL 1 7 3 6 1 3 2 4 4 1 - 2 5 3 C tR X Y C LU STE R A BELL 1 7 3 6 1 3 2 4 4 1 - 2 5 3 GALAXY C LU STE R A B E L L 1 7 3 5 1 3 2 4 4 1 - 2 6 9■a. II .mw— .m ...... ■■ii.i....
# •
a e r m l o i
I A
S P IR A L G A L A X IE SS 0 G A L A X IE S
GALAXY CLUSTER ABELL 1 7 3 6 1 3 2 4 4 1 - 2 6 5 7F i a H 509
X
ES0/SERC P^ATE J23S7
zY RA DEC L BI19SS I (19501 (19501 (19501
1 1 3 .2 0 7 - 1 0 3 .4 8 2 13 24 4 0 .7 - 2 6 57 2 2 .2 312 42 3 5 .0 34 5 8 1 8 .9 0 .0 2 8
MORPHOLOGY
E 3 08
80 90
S 2 87
SB 2 7
P 14
DISPERSION ELLIPSE
MAJOR AXIS 2 0 .4 7
MINOR A XIS 1 7 .0 3
ECCENTRICITY 0 .5 5
P0S N . ANGLE 6 1 .2 3
CLUSTER MEMBERS
SAMPLE POPULATION 7 25
CORE POPULATION 297
L IM IT IN G MAGNITUDE 1 9 .0
F ig u re 5.1.04 (e,f,g) Cltister Morphological Population Distributions.
T ab le 5.1.04 (a) Cluster Population Description.
G alax y C lu s te r A bell 1736: 18 24 41 -26 57. The cluster is located in
the South-West quadrant of ESO/SERC Field 509. Within a diameter of 90mm
as determined by mio we count 886 galaxies in this cluster and 726 to a limiting
magnitude of mum = 19.0. The cluster is classified Abell type I because of its lack of
spherical symmetrj' and presence of several concentrations indicating subclustering.
We do note, however, its high central density of galaxies.
We count 92 galaxies brighter than m j + 2 and thus classify the cluster as
T ie Abell Clusters 494 §5.1
having an Abell richness of 2. We suggest a B — M type III classiication for the
cluster which has no dominant galaxies tha t could be considered giant ellipticals or
larger, although the brightest galaxy in the field is seen to possess a corona. For
nil,m s, and mio we give 13.2,13.5 and 14.3, respectively. The value of mio implies
a redshift of 0.028.
The cluster appears somewhat elongated and has several noticable concentra
tions, notably tha t immediately North North-West of center and that South-East of
center, which are the densest and a number of less dense groups scattered through
out mainly the first quadrant of the cluster. The most dominant subgroup shows a
complicated structure filled with dense groups of galaxies.
The cluster magnitude distribution tends to be somewhat serpentine, rising
quickly from the brightest galaxies to about m„ = 17.0 where it tapers oS". The
bulk of the population can be found in this region. The position angle distribution
is scattered and jagged appearing, but with several peaks, the largest seen running
North-South.
We note the relatively scattered appearance of the distribution of elliptical
galaxies, and their central concentration with an apparent condensation in the first
quadrant. The spirals appear to be more loosely scattered with a slight concentra
tion in the third quadrant, South-East of center. We find the [E : SO : S ) ratio
to be (1.0 : 0.3 : 1.1) indicating nearly ten percent more spirals in this cluster than
ellipticals. The core population comprises nearly 41% of the sample enclosed in 0.38
square degrees. This gives a core surface density of 774 galaxies per square degree
on the sky.
This rich and diverse cluster contains many noteworthy species of galaxies:
several are noticed to possess coronae as the object located at x = —103.3, y =
T ie Abell Clusters 495 §5.1
—144.1; we notice superposed pairs of galaxies, either ellipticals such as those found
a t z = —106.6, p = —97.3 or spirals like are seen at z = —115.7, y = —142.3; and
we see a very close pair of barred-spiral galaxies a t z = —156.257, y = —99.2 and,
remarkably, another located at z = —88.4, y = —123.5.
A curious superposed triplet of elliptical galaxies are seen at z = —131.1, y =
—75.1. Finally, the peculiars can be typified by the unusual object seen at z =
—93.3, y — —94.3.
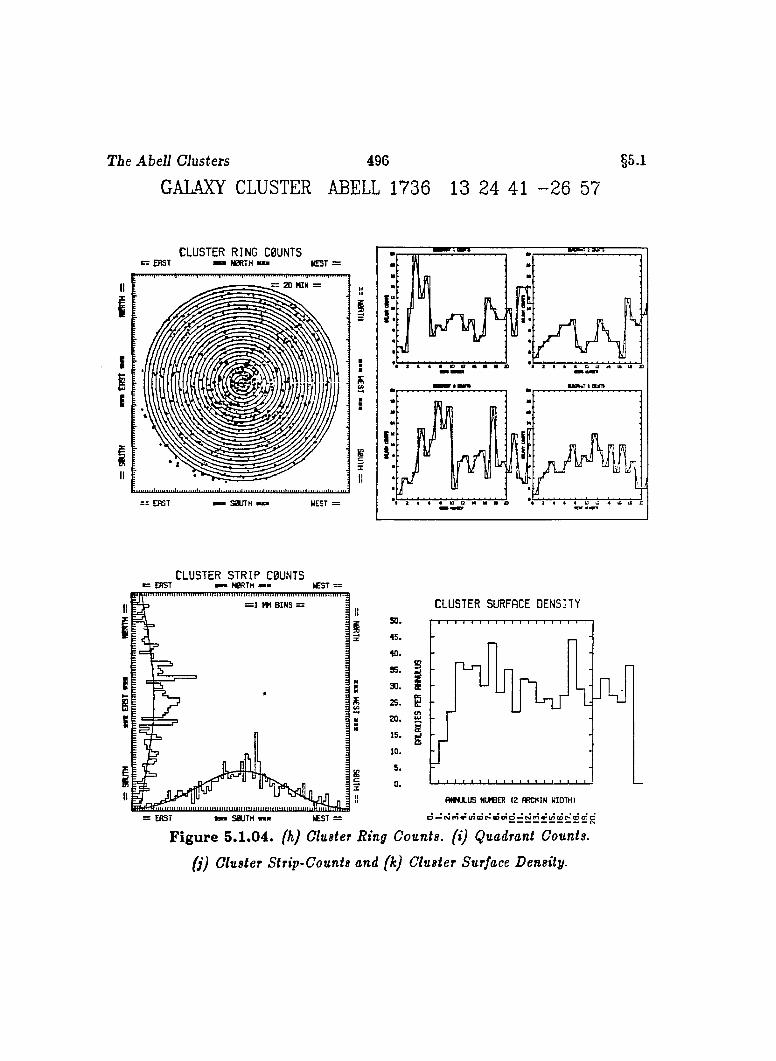
The Abell Clusters 496 §5.1
GALAXY CLUSTER ABELL 1736 13 24 41 - 2 6 57
CLUSTER RING C0UNTSc z e r s t an N 0 R T H m a W EST :
= ZD MIN =
= = E R S T W EST =
II
I
5E
§zII
CLUSTER STRIP C0UNTSE R S T NBRTM a m W EST = =
F W inT TTTT TTT TTTT TTT TTnn rrn j= 1 W B I N S =II
EIE
IIwarm S 0 U T H n « W EST =
5 0 .
4 5 .
4 0 .
35.3 0 .
2 5 .
20.1 5 .
10.
5 .
0.
CLUSTER SURFACE DENSITY
S
A fM J L U S N U tC E R 1 2 ARCM IN W ID TH )
F ig u re 5.1 .04. (h) Cluster Ring Counts, (i) Quadrant Counts,
(j) Cluster Strip-Counts and (k) Cluster Surface Density.
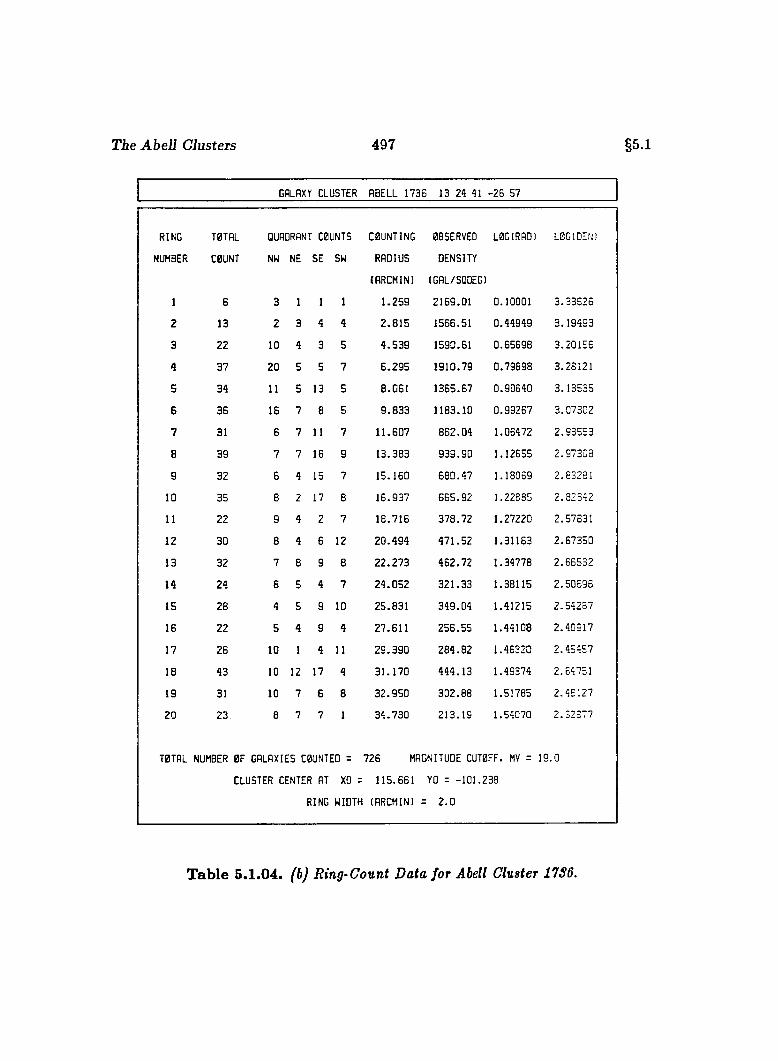
The Abell Clusters 497 §5.1
GALAXY CLUSTER ABELL 1736 13 24 41 -2 6 57
RING
NUMBER
T0TAL
C0UNT
QUADRANT C0ÜNTS
NW NE SE SW
COUNTING
RADIUS
(ARCMIN)
OBSERVED
DENSITY
(GAL/SQDEG)
LOG(RAO) L(3GlDEt;)
1 8 3 1 1 1 1 .2 5 9 2159 .01 0.10001 3 .3 3 6 2 6
2 13 2 3 4 4 2 . 8 1 5 1556.51 0 .44949 3 .1 9 4 9 3
3 22 10 4 3 5 4 . 5 3 9 1590.61 0 .6 5 6 9 8 3 .2 0 1 5 6
4 37 20 5 5 7 6 . 2 9 5 1910 .79 0 .7 9 8 9 8 3.2 8121
5 34 11 5 13 5 8 .0 6 1 1 365 .67 0 .90640 3 .1 3 5 3 5
6 36 16 7 8 5 9 .8 3 3 1183 .10 0 .9 9 2 6 7 3 .0 7 3 0 2
7 31 6 7 11 7 1 1 .6 0 7 8 6 2 .0 4 1.0 6472 2 .9 3 5 5 3
8 39 7 7 16 9 1 3 .3 8 3 9 3 9 .9 0 1.12655 2 .9 7 3 0 3
g 32 6 4 15 7 1 5 .1 6 0 6 6 0 .4 7 1.18069 2 .83281
10 35 8 2 17 8 16 .9 3 7 6 6 5 .9 2 1.22885 2 .8 2 3 4 2
11 22 9 4 2 7 1 8 .7 1 6 3 7 8 .7 2 1 .2 7220 2.57831
12 30 8 4 6 12 2 0 .4 9 4 4 7 1 .5 2 1.31163 2 .6 7 3 5 0
13 32 7 8 9 8 2 2 .2 7 3 4 6 2 .7 2 1.34778 2 .6 6 5 3 2
14 24 8 5 4 7 2 4 .0 5 2 3 2 1 .3 3 1.38115 2 .5 0 6 9 6
15 28 4 5 9 10 2 5 .8 3 1 3 4 9 .0 4 1.41215 2 .5 4 2 8 7
16 22 5 4 9 4 2 7 .6 1 1 2 5 6 .5 5 1.44108 2 .4 0 9 1 7
17 26 10 1 4 11 2 9 .3 9 0 2 8 4 .8 2 1.46320 2 .4 5 4 5 7
18 43 10 12 17 4 3 1 .1 7 0 4 4 4 .1 3 1.49374 2.64751
19 31 10 7 6 8 3 2 .9 5 0 3 0 2 .8 8 1.51785 2 .4 6 1 2 7
20 23 8 7 7 1 3 4 .7 3 0 2 1 3 .1 9 1.54070 2 .3 2 6 7 7
T0TAL NUMBER 0F GALAXIES C0UNTEO =
CLUSTER CENTER AT XO =
RING WIDTH
726 MAGNITUDE CUT0FF. MV = 19 .0
1 15 .661 YO = -101 .238
(ARCMIN) = 2 . 0
T ab le 5.1.04. fbj Ring-Gount Data for Abell Cluster 17S6.
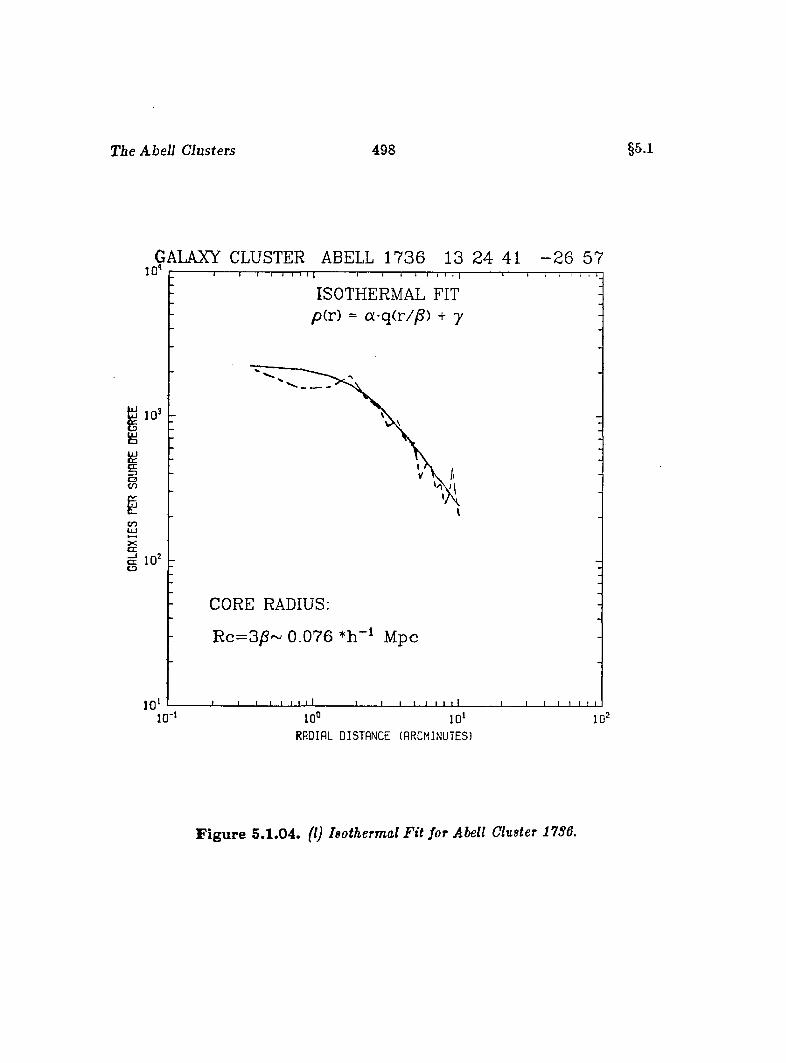
The Abell Clusters 498 §5.1
GALAXY CLUSTER ABELL 173 6 13 2 4 41 - 2 6 5710’
10"
I
Π10' CD
1010-
“ I I I I— I— I I 1 I n I ; I I IIIISOTHERMAL FIT
pir) = a-qir/^) + y
CORE RADIUS:
Rc=3)S~ 0 .076 *h~ Mpc
10° 10*
RADIAL DISTANCE (ARCMINUTES)
" T 1- - - - - - - - - 1- - - - - - - 1- - - - - 1 i 1 1
I I I— I- 1 I I I
10"
F ig u re 5.1.04. (I) hothermal Fit for Abell Cluster 17S6.
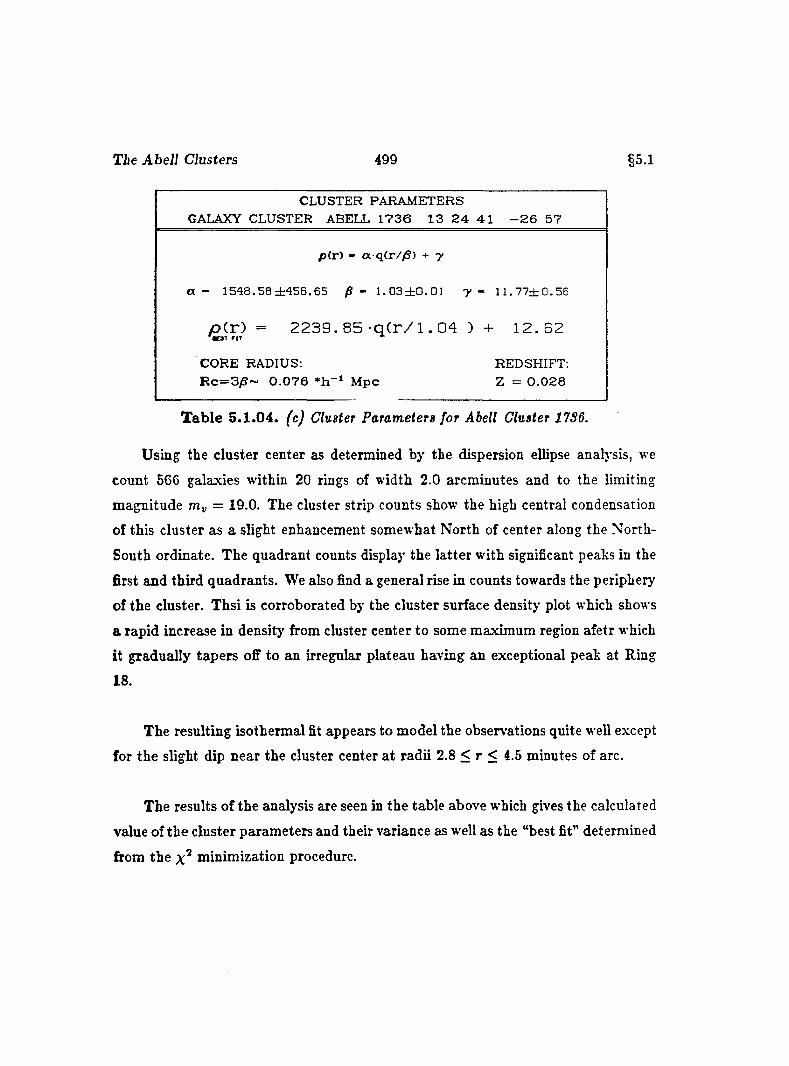
Tie Abell Clusters 499 §5.1
CLUSTER PARAMETERSGALAXY CLUSTER ABELL 1 7 3 6 13 2 4 4 1 - 2 6 57
p(r) - a q(r//S) + y
<X - 1 5 9 8 .5 8 ± 4 5 6 .6 5 /S - 1 .0 3 ± 0 .0 1 -y - 1 1 .7 7 ± 0 .5 6
p ( r ) = 2239. 8 5 -qCr / l . 04 ) + 12.62•E 3T FIT
CORE RADIUS; REDSHIFT:R c = 3 /S ~ 0 .0 7 6 * h - i M pc Z = 0 .0 2 6
T ab le 5 .1 .04 . (c) Cluster Parameters for Abell Cluster 17S6.
Using the cluster center as determined by the dispersion ellipse analysis, we
count 566 galaxies within 20 rings of width 2.0 arcminutes and to the limiting
magnitude = 19.0. The cluster strip counts show the high central condensation
of this cluster as a slight enhancement somewhat North of center along the North-
South ordinate. The quadrant counts display the latter with significant peaks in the
first and third quadrants. We also find a general rise in counts towards the periphery
of the cluster. Thsi is corroborated by the cluster surface density plot which shows
a rapid increase in density from cluster center to some maximum region afetr which
it gradually tapers oflf to an irregular plateau having an exceptional peak at Ring
IS.
The resulting isothermal fit appears to model the observations quite well except
for the slight dip near the cluster center at radii 2.8 < r < 4.5 minutes of arc.
The results of the analysis are seen in the table above which gives the calculated
value of the cluster parameters and their variance as well as the “best fit” determined
from the minimization procedure.
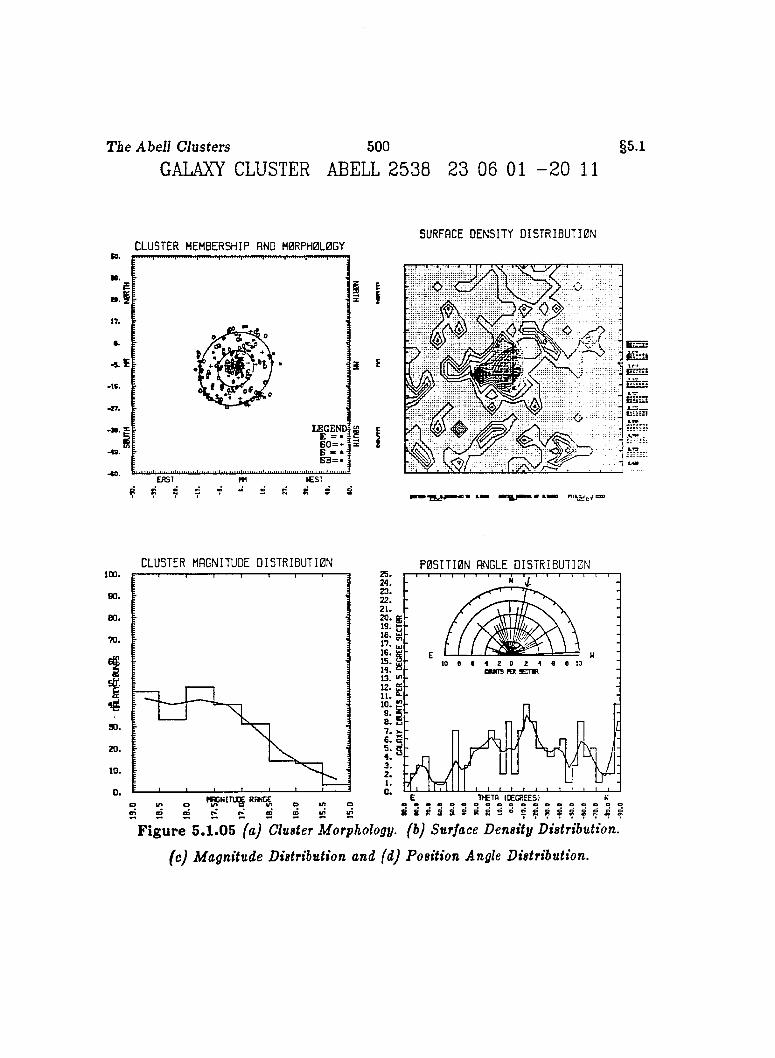
T ie Abell Clusters 500 §5.1
GALAXY CLUSTER ABELL 2538 23 06 01 - 2 0 11
CLUSTER MEMBERSHIP AND H0RPH0L0GYR.M .
tt .
•IS.
l e g e n d ;E = • ■ G 0=* i B5 3 = • :
EAST *£ST3f ? ?
SURFACE DENSITY DISTRIBUTI0N
EH-n
• a-MD
CLUSTER MAGNITUDE DISTRIBUTI0N P05ITI0N ANGLE DISTRIBUTION100.
9 0 .
6 0 .
7 0 .
90.
20.
10.
o ^ N I T U g R W K
2 5 .
1 5 .ctuns rat zcrm
1 3 .
E T > C T fi lO E C R E E S )a « « o o a o e e e e o e3 8 P 8 8 @ R 8 2 « 2 g R I ;F ig u re 5.1.05 faj Cluster Morphology, (b) Surface Density Distribution,
(c) Magnitude Distribution and (d) Position Angle Distribution.
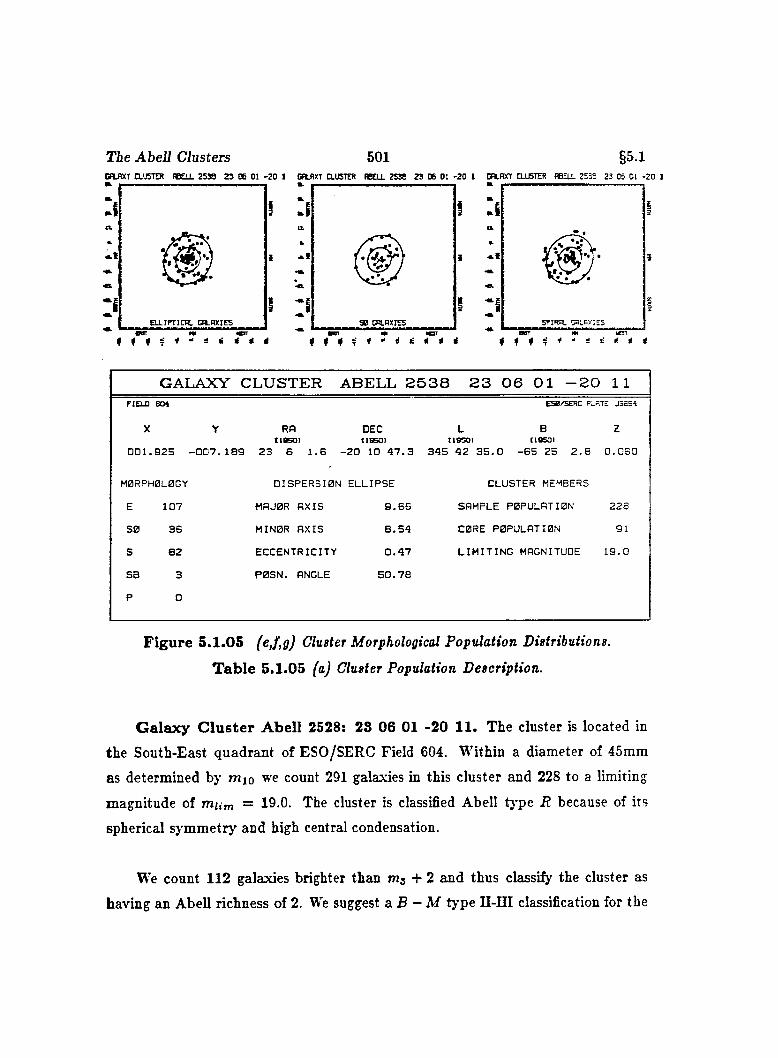
T ie Abell Clusters 501 §5.1CnjW T aUSTER flBOL 2538 23 06 01 -20 I CnLRXT aiSTER BBOL 2538 23 06 01 -20 I CBLnXY CLUSTER BBELL 253S 23 05 01 -2 0 I
i i
6 * < Ë 1 f f i# * # f ♦ ♦ ♦ T- ♦ - S É * i t
GALAXY CLUSTER ABELL 2538 23 06 01 -20 1 1
FIELD EOt ESO/SERC PLR-■E J3B54
X
0 0 1 . 9 2 5
Y RAC1B50)
- 0 0 7 . 1 8 9 2 3 6 1 . 6
DEC L 8tlB SO I 119501 (19501
- 2 0 10 4 7 . 3 3 4 5 4 2 3 5 . 0 - 6 5 2 5 2 . 8
Z
0 . 0 5 0
M0RPH0L0GY D IS P E R S IO N E L L IP S E CLUSTER MEMBERS
E 1 0 7 MAJOR A X IS 9 . 6 6 SAMPLE POPULATION 2 2 3
3 0 3 6 MINOR A X IS 8 . 5 4 CORE POPULATION 91
S 8 2 E C C E N T R IC IT Y 0 . 4 7 L I M I T I N G MAGNITUDE 1 9 . 0
SB 3 P 0 S N . ANGLE 5 0 . 7 8
P 0
F ig u re 5 .1 .05 (ej\g) Cluster Morphological Population Distributions.
T a b le 5.1.05 (a) Cluster Population Description.
G alax y C lu s te r A bell 2528: 23 06 01 -20 11. The cluster is located in
the South-East quadrant of ESO/SERC Field 604. Within a diameter of 45mm
as determined by mio we count 291 galaxies in this cluster and 228 to a limiting
magnitude of mum = 19.0. The cluster is classified Abell type R because of its
spherical symmetry and high central condensation.
We count 112 galaxies brighter than + 2 and thus classify the cluster ashaving an Abell richness of 2. We suggest a B — M type II-III classification for the
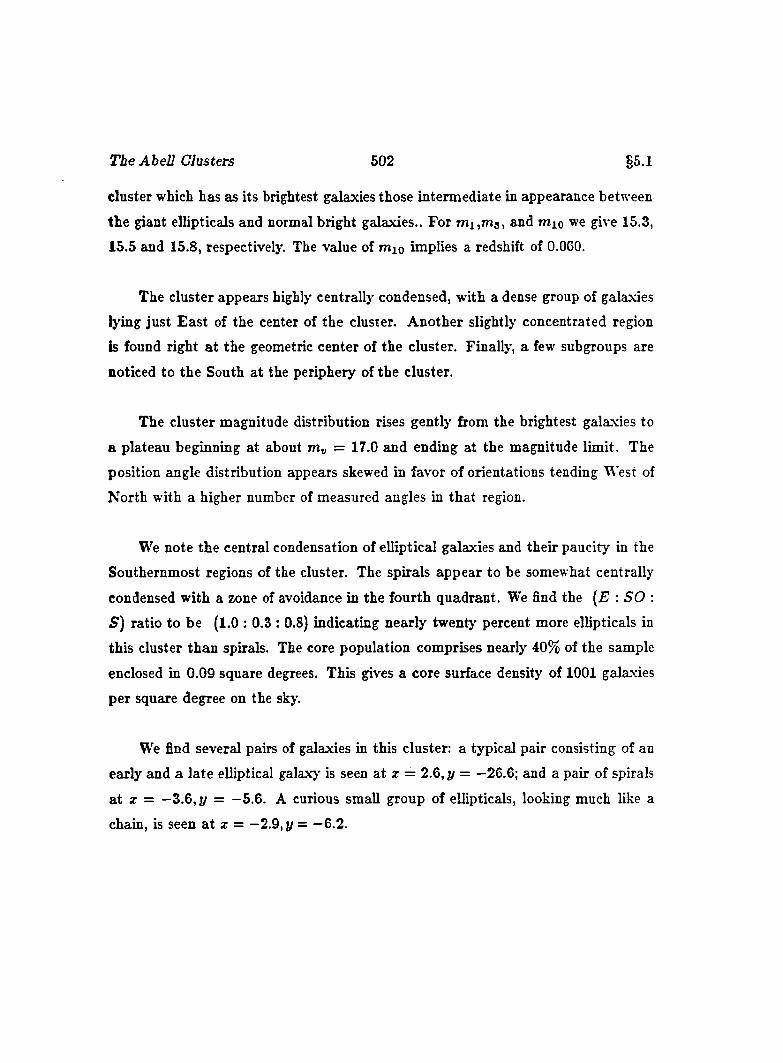
The Abell Clusters 502 §5.1
cluster which has as its brightest galaxies those intermediate in appearance between
the giant ellipticals and normal bright galaxies.. For m i,m 3 , and mio we give 15.3,
15.5 and 15.8, respectively. The value of mio implies a redshift of 0.060.
The cluster appears highly centrally condensed, with a dense group of galaxies
lying just E ast of the center of the cluster. Another slightly concentrated region
is found right a t the geometric center of the cluster. Finally, a few subgroups are
noticed to the South at the periphery of the cluster.
The cluster magnitude distribution rises gently from the brightest galaxies to
a plateau beginning at about m„ = 17.0 and ending at the magnitude limit. The
position angle distribution appears skewed in favor of orientations tending West of
North with a higher number of measured angles in that region.
We note the central condensation of elliptical galaxies and their paucity in the
Southernmost regions of the cluster. The spirals appear to be somewhat centrally
condensed with a zone of avoidance in the fourth quadrant. We find the [E : SO :
S ) ratio to be (1 . 0 ; 0.3 : 0 .8 ) indicating nearly twenty percent more ellipticals in
this cluster than spirals. The core population comprises nearly 40% of the sample
enclosed in 0.09 square degrees. This gives a core surface density of 1 0 0 1 galaxies
per square degree on the sky.
We find several pairs of galaxies in this cluster: a typical pair consisting of an
early and a late elliptical galax}' is seen a t z = 2 .6 , y = —26.6; and a pair of spirals
at z = —3 .6 , 1/ = -5 .6 . A curious small group of ellipticals, looking much like a
chain, is seen a t z = —2.9, y = —6.2.
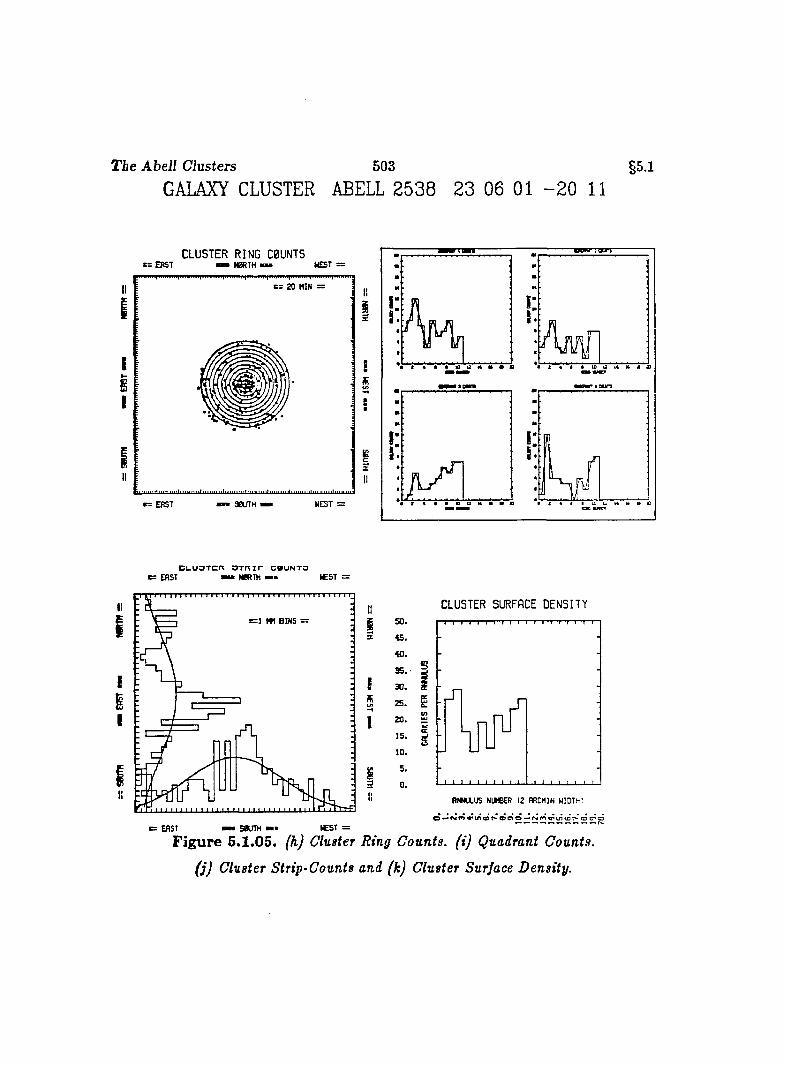
The Abell Clusters 503 §5.1GALAXY CLUSTER ABELL 2538 23 06 01 - 2 0 11
CLUSTER RING C0UNT5K ERST tm m N0RTH ■ » WEST :
c = 2 0 MIN =
: EBST S0LfTH 1 WEST =
Ant « • « e w * # # *
Aji/f
h■ « «
C L U O T C n O T H i r C0UNT3: EAST m m MRTH mm |CST =
II
I : ] m B IN S =
!II
CLUSTER SURFACE DENSITY
Ë
si
n tfW L U S NUtBER 12 ARCMIN WIDTH:
: EAST — « SRJTH — IC ST =
F igure 5.1.05. (h) Cluster Ring Counts, (i) Quadrant Counts,
(j) Cluster Strip-Counts and (k) Cluster Surface Density.
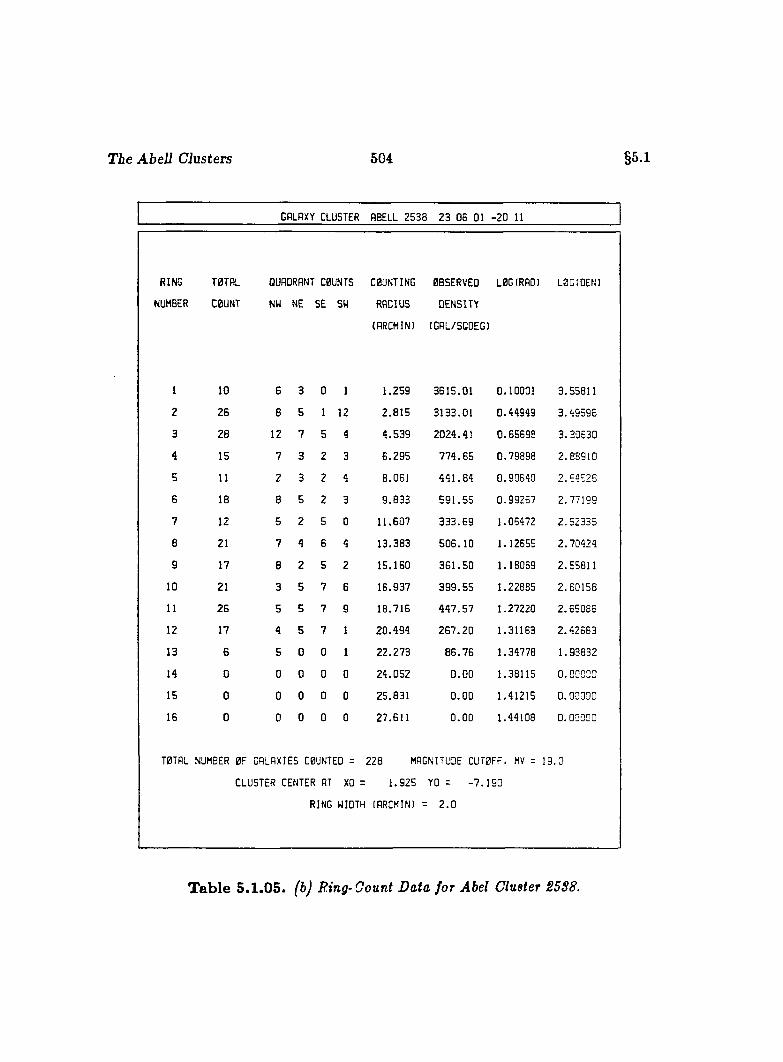
T ie Abell Clusters 504 §5.1
GALAXY CLUSTER ABELL 2538 23 06 01 -2 0 11
TING TOTAL QUADRANT COUNTS COUNTING OBSERVED LOG(RAD) LOG(OEN)
JMBER COUNT NW NE SE SW RADIUS DENSITY
(ARCMIN) (GAL/SQDEG)
1 10 6 3 0 1 1.259 3615.01 0.10001 3.55811
2 26 8 5 1 12 2.815 3133.01 0.44949 3.49596
3 28 12 7 5 4 4.539 2024.41 0.65693 3.30630
4 15 7 3 2 3 6.295 774.65 0.79898 2.88910
5 11 2 3 2 4 8.061 441.84 0.90540 2.54526
6 18 8 5 2 3 9.833 591.55 0.99267 2.77199
7 12 5 2 5 0 11.607 333.69 1.05472 2.52335
6 21 7 4 6 4 13.383 506.10 1.12655 2.70424
9 17 8 2 5 2 15.160 361.50 1.18069 2.55811
10 21 3 5 7 6 16.937 399.55 1.22885 2.60158
11 26 5 5 7 9 18.716 447.57 1.27220 2.65086
12 17 4 5 7 1 20.494 267.20 1.31163 2.42683
13 6 5 0 0 1 22.273 86.76 1.34778 1.93832
14 0 0 0 0 0 24.052 0.00 1.38115 0.00020
15 0 0 0 0 0 25.831 0.00 1.41215 0.00000
16 0 0 0 0 0 27.611 0.00 1.44108 0.00000
TOTAL NUMBER OF GALAXIES COUNTED = 228 MAGNITUDE CUTOFF. MV = 19.0
CLUSTER CENTER AT XO = 1.925 YO = -7.190
RING WIDTH IARCMIN) = 2.0
T able 5.1.05. (b) Ring-Count Data for Abel Cluster S5S8.
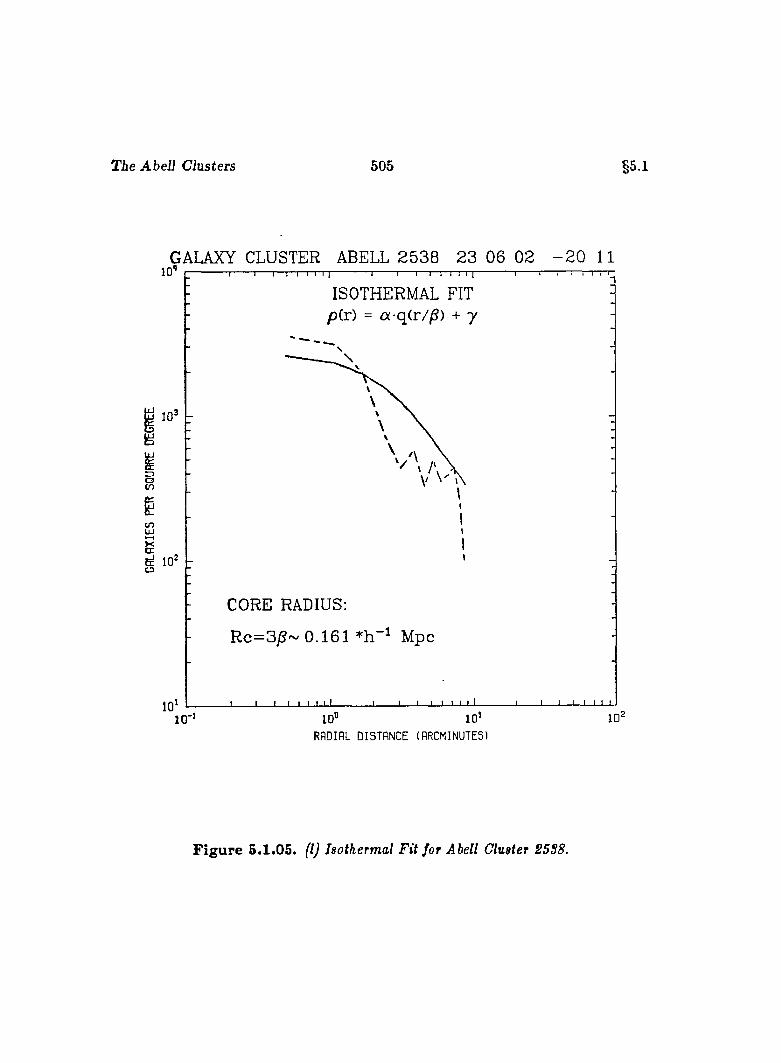
Tie Abell Clusters 505 §5.1
GALAXY CLUSTER ABELL 2 5 3 8 23 06 02 - 2 0 11
I
g
ISOTHERMAL FIT p(r) = «-q(r//S) + 7
CORE RADIUS:
R c=3jS~ 0 .161 Mpc
1010°
RADIAL DISTANCE (ARCMINUTES)
F igu re 5.1.05. (I) Isothermal Fit for Abell Cluster 25S8.
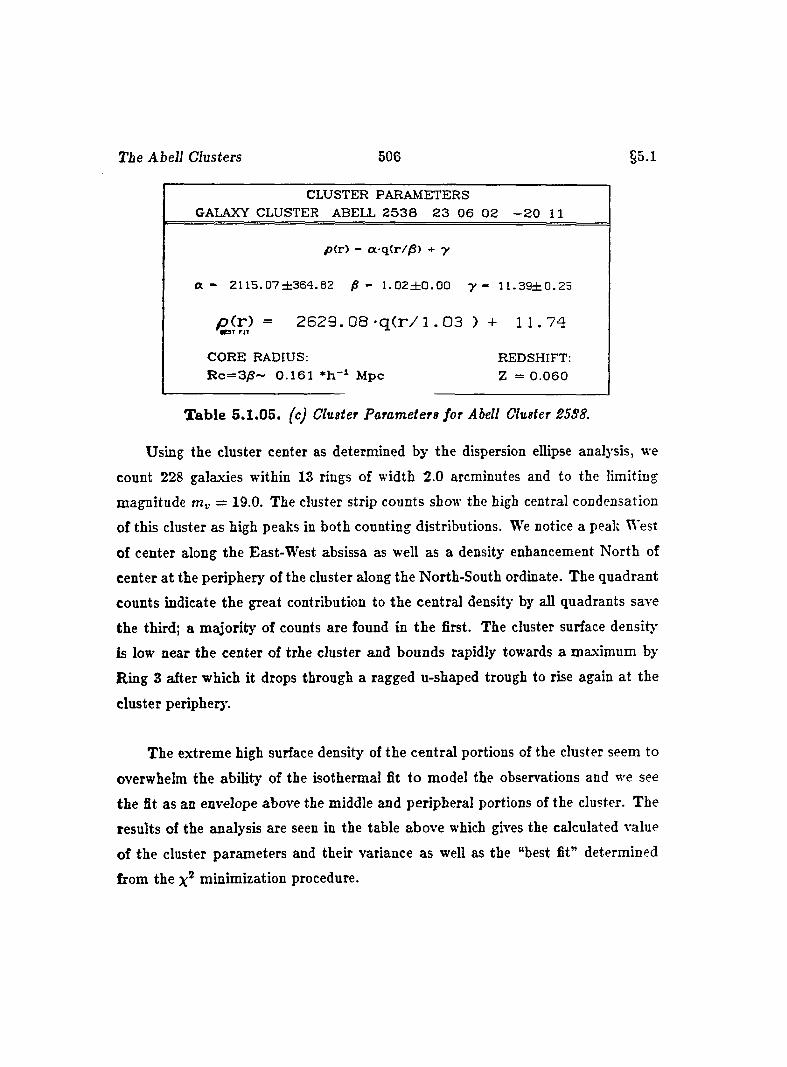
The Abell Clusters 506 §5.1
CLUSTER PARAMETERS GALAXY CLUSTER ABELL 2 5 3 6 2 3 0 6 0 2 - 2 0 11
p (r ) - a q(r//S) + y
a - 2 1 1 5 . 07 ± 3 6 4 . 8 2 /S - 1 . 0 2 ± 0 . 0 0 y - 1 1 . 3 9 ± 0 . 2 5
p ( r ) = 2 6 2 9 . 0 8 - q ( r / l . Q 3 ) + 11.74
CORE RADIUS:R c = 3 /S ~ 0 .1 6 1 M pc
REDSHIFT: Z = 0 .0 6 0
T ab le 5 .1.05. fcj Cltister Parameters for Abell Cluster 25S8.
Using the cluster center as determined by the dispersion ellipse analysis, we
count 228 galaxies within 13 rings of width 2.0 arcminutes and to the limiting
magnitude = 19.0. The cluster strip counts show the high central condensation
of this cluster as high peaks in both counting distributions. We notice a peak West
of center along the East-West absissa as well as a density enhancement North of
center at the periphery of the cluster along the North-South ordinate. The quadrant
counts indicate the great contribution to the central density by all quadrants save
the third; a majority of counts are found in the first. The cluster surface density
is low near the center of trhe cluster and bounds rapidly towards a maximum by
Ring 3 after which it drops through a ragged u-shaped trough to rise again at the
cluster peripherj'.
The extreme high surface density of the central portions of the cluster seem to
overwhelm the ability of the isothermal fit to model the observations and we see
the fit as an envelope above the middle and peripheral portions of the cluster. The
results of the analysis are seen in the table above which gives the calculated value
of the cluster parameters and their variance as well as the “best fit” determined
from the minimization procedure.
C H A P T E R V I
C O N C L U S IO N
But as for certain truth, no man has known it, nor will he know it; neither of the gods, nor yet of all the things o f which I speak.A nd if by chance he were to utter the final truth, he would himself not know it;For all is but a woven web o f guesses.- Xenophanes
Among the few secure conclusions one may draw from the analysis of the past
legs of this journey is that the less one knows about the universe the easier it is to
explain. In this respect, the study of the large scale structure of the universe does
not differ from any other scientific subject m atter of lesser extent. Still, to the study
of the ever-expanding universe, and in particular the study of these aggregates we
call clusters of galaxies, we may apply with special appropriateness the saying, “The
greater the sphere of our knowledge, the larger is the surface of its contact with the
infinity of our ignorance.” The principal reason why this is so is amply documented
507
Conclusion 508 §6.0
in the successive phases of our penetration into the study of the structure of the
universe and received its most timely expression at the dedication ceremonies of the
Hale telescope in the words of Vannevar Bush: “ It is a great tru th of science that
every ending is a beginning, that each question answered leads to new problems
to solve, tha t each opportunity grasped and utilized engenders fresh and greater
opportunities.”
Indeed, the fresh and greater opportunities offered by our current study afford
an embarrassment of riches. Any single aspect or area of concentration of the study
of our d a ta poses new problems when scrutinized in detail. Thus, this effort of data
acquision and preliminary analysis can only serve as a beginning. In this light we
present a catalogue of galaxy clusters and their parameters gleaned from our study.
In T ab le 6.0.1 we present the pertinent data from the measurement of 50
Bright Southern Clusters of Galaxies. The table includes a cluster identification
number. Rectangular Coordinates on the ESO/SERC J plate for the cluster center,
the ESO/SERC Field Number, Right Ascension and Declination for the epoch 1950
of the cluster center, redshift, Abell Richness and Type, Bautz-Morgan Classifica
tion, the number of cluster members to m„ = 19.0 in the sample population and
and estim ate of the cluster core radius in M pc with h = 0.5. F ig u re 6 .0 .1 gives
the epoch 1950 locations of the clusters on the celestial sphere using a Mollweide
projection.
In succeeding sections we will point out particulars of our sample, paying close
attention to similarities and differences between the clusters themselves, as well as
making general comments on what can be said of clusters of galaxies in general. The
latter we do with caution since the very acquistion of our sample is a consequence
of the effects of selection.
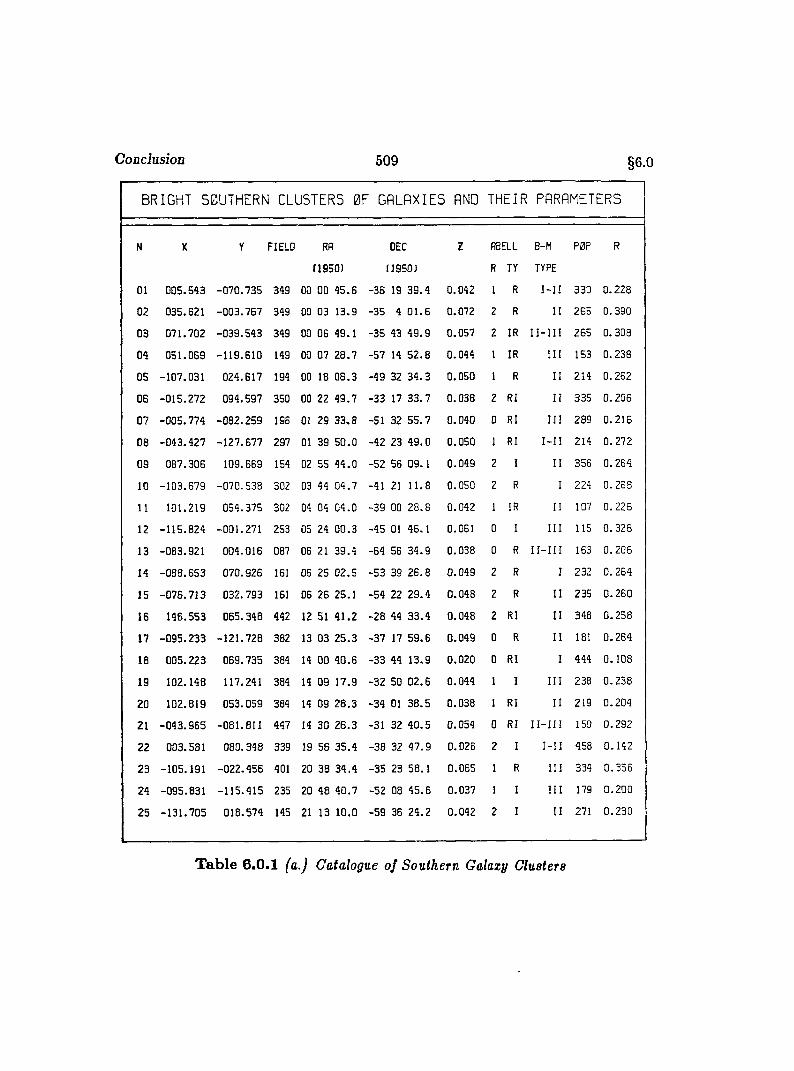
Conclusion 509 §6.0
B R I G H T S 0U T H E R N CLUSTERS 0 F G A L A X I E S AND T H E I R PARAMETERS
N X y FIELD RA DEC Z ABELL B-M POP R
(1950) (1950) R TY TYPE
01 005.543 -070.735 349 00 00 45.,6 -36 19 39.4 0.042 1 R l - I I 330 0. 228
02 035.621 -003.767 349 00 03 13.,9 -35 4 01.6 0.072 2 R II 265 0. 390
03 071.702 -039.543 349 00 06 49.,1 -35 43 49.9 0.057 2 IR 11- I I I 265 0. 308
04 051.069 -119.610 149 00 07 28.,7 -57 14 52.8 0.044 1 IR I I I 153 0. 238
05 -107.031 024.617 194 00 18 08.,3 -49 32 34.3 0.050 1 R II 214 0. 262
06 -015.272 094.597 350 00 22 49.,7 -33 17 33.7 0.038 2 RI I I 335 0. 205
07 -005.774 -082.259 196 01 29 33,,8 -51 32 55.7 0.040 0 RI I I I 289 0. 216
08 -043.427 -127.677 297 01 39 50..0 -42 23 49.0 0.050 1 RI I - I l 214 0. 272
09 087.306 109.669 154 02 55 44..0 -52 56 09.1 0.049 2 I I I 355 0. 264
10 -103.879 -070.538 302 03 44 04..7 -41 21 11.8 0.050 2 R I 224 0. 268
11 101.219 054.375 302 04 04 04..0 -39 00 28.8 0.042 1 IR II 107 0. 228
12 -115.824 -001.271 253 05 24 00.,3 -45 01 46.1 0.051 0 1 I I I 115 0. 328
13 -083.921 004.016 087 06 21 39.,4 -64 56 34.9 0.038 0 R I I - I I I 163 0. 206
14 -088.653 070.926 161 06 25 02.,5 -53 39 26.8 0.049 2 R I 232 0. 264
15 -076.713 032.793 161 06 26 25.,1 -54 22 29.4 0.048 2 R II 235 0. 260
16 146.553 065.348 442 12 51 41.,2 -28 44 33.4 0.048 2 RI I I 348 0. 258
17 -095.233 -121.728 382 13 03 25.,3 -37 17 59.6 0.049 0 R I I 181 0. 264
18 005.223 069.735 384 14 00 40.,6 -33 44 13.9 0.020 0 RI I 444 0. 108
19 102.148 117.241 384 14 09 17,.9 -32 50 02.6 0.044 1 I I I I 238 0. 238
20 102.819 053.059 384 14 09 28.,3 -34 01 38.5 0.038 1 RI I I 219 0. 204
21 -043.965 -081.811 447 14 30 26.,3 -31 32 40.5 0.054 0 RI I I - I I I 150 0. 292
22 003.581 080.348 339 19 56 35,,4 -38 32 47.9 0.026 2 I I - I I 458 0..142
23 -105.191 -022.456 401 20 38 34 .4 -35 23 58.1 0.065 1 R I I I 334 0.,355
24 -095.831 -115.415 235 20 48 40,.7 -52 08 45.6 0.037 1 1 I I I 179 0.,200
25 -131.705 018.574 145 21 13 10,.0 -59 36 24.2 0.042 2 I I I 271 0.,230
Table 6.0.1 fa.) Catalogue of Southern Galaxy Clusters
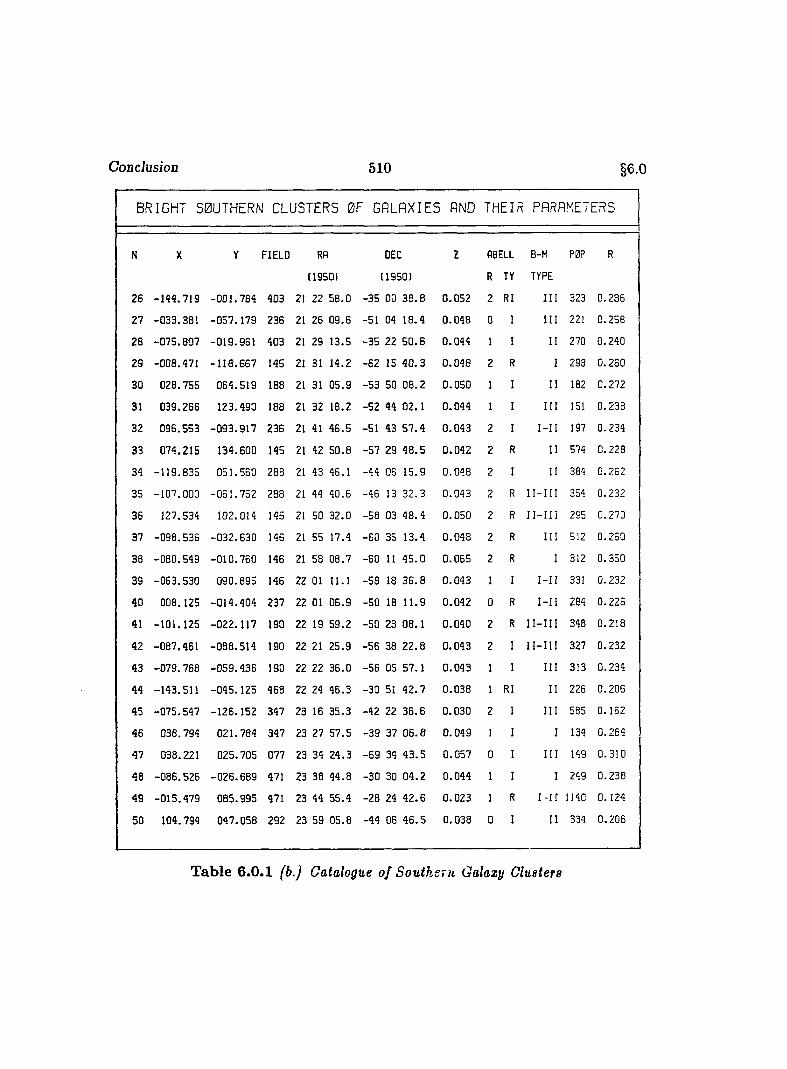
Conclusion 5 1 0 §6.0
BR I G H T S 0UTHERN CLUS T ER S 0 F G A L A X I E S AND TH E IR PARAMETERS
N X FIELD RA DEC 2 ABELL 8-M POP R
(19501 (19501 R TY TYPE
26 -144.719 -0 0 1 . 784 403 21 22 58. 0 -35 00 38. 8 0.052 2 RI I I I 323 0.285
27 -033.381 -057. 179 235 21 25 09 6 -51 04 18. 4 0.048 0 I I I I 221 0.258
28 -075.807 -019. 961 403 21 29 13 5 -35 22 50. 6 0.044 1 I I I 270 0.240
29 -008.471 - l ie . 667 145 21 31 14 2 -62 15 40. 3 0.048 2 R I 298 0.260
30 028.755 064. 519 188 21 31 05 9 -53 50 08. 2 0.050 1 I I I 182 0.272
31 039.266 123. 490 188 21 32 18 2 -52 44 02. 1 0.044 1 1 I I I 151 0.238
32 096.553 -093. 917 235 21 41 45 5 -51 43 57. 4 0.043 2 I I - I I 197 0.234
33 074.215 134. 600 145 21 42 50 8 -57 29 48. 5 0.042 2 R II 574 0.228
34 -119.835 051. 550 288 21 43 45 1 -44 05 15. 9 0.048 2 I II 384 0.262
35 -107.000 -051. 752 288 21 44 40 5 -45 13 32. 3 0.043 2 R I I - I I I 354 0.232
36 127.534 102. 014 145 21 50 32 0 -58 03 48. 4 0.050 2 R 11- I I I 295 0.270
37 -098.536 -032. 630 145 21 55 17 4 -60 35 13. 4 0.048 2 R I I I 512 0.250
38 -080.549 -010. 750 146 21 58 08 7 —60 11 45. 0 0.055 2 R I 312 0.350
39 -063.530 090. 895 146 22 01 11 1 -58 18 36. 8 0.043 1 1 I - I I 331 0.232
40 008.125 -014. 404 237 22 01 05 9 -50 18 11. 9 0.042 0 R I - I I 284 0.225
41 -101.125 -022. 117 190 22 19 59 2 -50 23 08. 1 0.040 2 R I I - I I I 348 0.218
42 -087.461 -088. 514 190 22 21 25 9 -56 38 22. 8 0.043 2 I I I - I I I 327 0.232
43 -079.768 -059. 436 190 22 22 36 0 -56 05 57. 1 0.043 1 I I I I 313 0.234
44 -143.511 -045. 125 468 22 24 45 3 -30 51 42. 7 0.038 1 RI I I 226 0.206
45 -075.547 -126. 152 347 23 16 35 3 -42 22 36. 6 0.030 2 1 I I I 585 0.162
46 038.794 021. 784 347 23 27 57 5 -39 37 05. 8 0.049 1 I I 134 0.254
47 038.221 025. 705 077 23 34 24 3 -69 34 43. 5 0.057 0 1 I I I 149 0.310
46 -086.526 -026. 689 471 23 38 44 8 -30 30 04. 2 0.044 1 I I 249 0.238
49 -015.479 085. 995 471 23 44 55 4 -28 24 42. 6 0.023 1 R I - I I 1140 0.124
50 104.794 047. 058 292 23 59 05 8 -44 06 46. 5 0.038 0 I I I 334 0.206
Table 6.0.1 (b.) Catalogue of Southern Galaxy Clusters
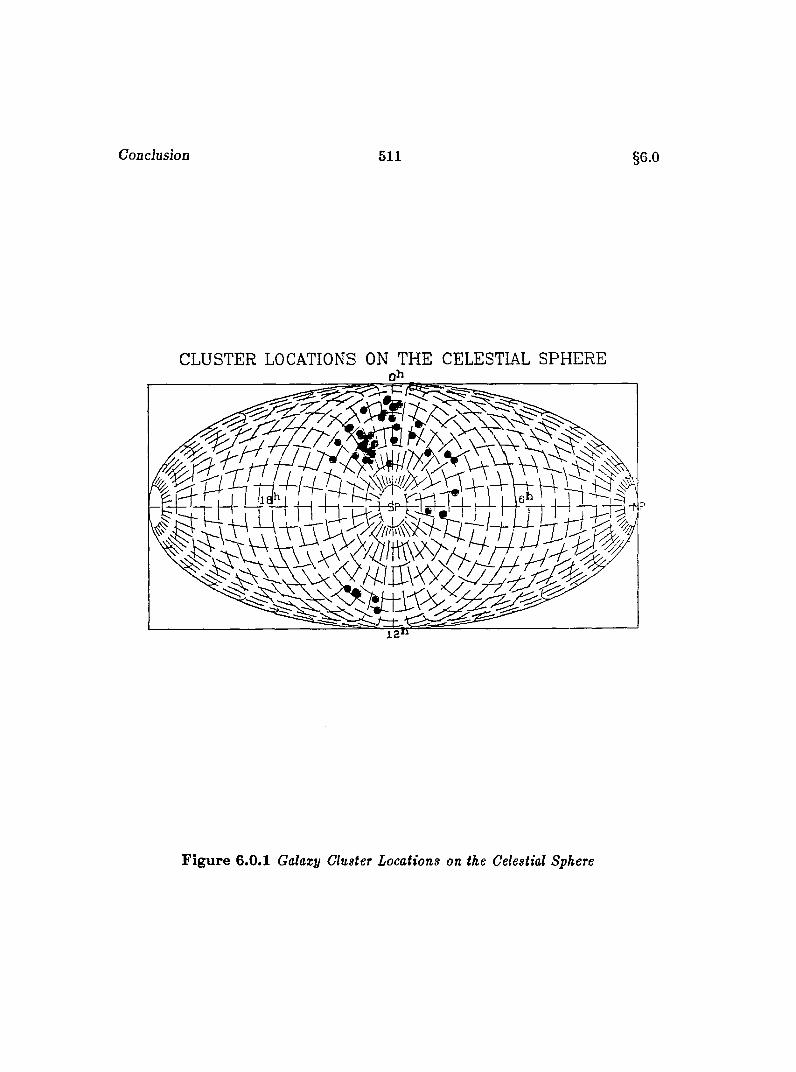
Conclusion 511 §6.0
CLUSTER LOCATIONS ON THE CELESTIAL SPHEREoh
t l
Figure 6.0.1 Galaxy Cluster Locations on the Celestial Sphere
Conclusion 512 §6.1
6.1 O b se rv a tio n a l F eatu res o f B rig h t S o u th e rn C lu ste rs o f G alax ies
Of the galaxy clusters in our sample only a third of them can be considered
Regular in the Abell sense; that is, having spherical symmetry and being highly
centrally condensed. The remainder are either intermediate in class or are desig
nated irregular. It would appear tha t, if this sample is typical of galaxy clusters,
irregularity is the rule rather than the exception. However, of the 7 galaxy clusters
th a t are unambiguously cD clusters we find 5 to be classed Regular so that, as far
as our sample is concerned, the cD phenomenon is related to the symmetry of the
cluster.
We note the suggestion of Peach (1969) that the brightest cluster member is
formed in a special manner before the formation of the other cluster members. In
addition, Tremaine and Richstone (1976) have cited that the statistical variation
ff{m i — m 2 ) as compared to <7(mi) is evidence for the first-ranked cluster member’s
being a special object. Further, Ostriker and Tremaine (1976) have advanced the
idea that the first ranked cluster galaxy grows in luminosity by accretion of other
bright cluster members. Now, whether the cD galaxies in these clusters are objects
of formation or evolution, the case is clear tha t these galaxies are remarkable.
From the magnitude distributions of this group we find tha t the chance of
the cD galaxies being a mere statistical fluctuation is negligible. On the other
hand, if the giant cD galaxies have grown at the expense of other members of their
parent clusters, then indeed they can be considered quite special. A more careful
examination of the luminosity functions and morphological distributions may be
able to distinguish between these two cases, but for the moment the inescapable
conclusion is tha t the cD galaxies in our sample are “special objects.”
The uniqueness of the cD phenomenon has implications beyond formation or
Conclusion 513 §6.1
evolution. The use of cD galaxies as a standard candle has been put forth by sev
eral authors. For instance, Peebles (1968) has suggested that the apparently small
dispersion of M i in his sample is solely due to the steep slope of the luminosity
function. W ithout the construction of either Abell-type or Schechter-type Lumi
nosity Functions, though, it would be difficult to derive a set of corrections to Mj
based on M$, the bright-end turnover, as a standard candle, especially when one
considers the unreliability of M* as pointed out by Dressier (1976). In our sample,
for those few clusters with cD galaxies the redshift spread ranges from 0.02 to 0.06
while the of the cD galaxies ranges from 11.2 to 15.2. It must be left to future
observations and computation of cluster luminosity functions to resolve the m atter.
There are other “special” phenomena noticed in our sample. Throughout the
clusters we have measured there appear to be galaxies in close proximity, that is,
within two galaxy diameters of each other or actually superposed. The curious
feature observed is that many of these are observed as pairs or binary systems with
a typical combination consisting of an early and a late elliptical galaxy. Often,
the earlier companion is seen to be the brighter member of the pair. The usual
numbers of these pairs seen in any particular cluster are few but we call attention
to the remarkable case of 39 pairs seen in Cluster 49 which represents some 7% of
the cluster members. Likewise, Cluster 28 has 15 pairs, or 11% of the sample; and
Cluster 23 has 16 pairs, or 9.5% of the cluster members being binary.
In addition, there are several cases of bright elliptical galaxies observed with
halos in virtually every cluster. However, some of these are truely unusual in the
sense tha t they are surrounded by a population of many faint attendants as if
they were micro-clusters in their own right. W hether we are seeing super massive
globular cluster type objects or very small elliptical galaxies imbedded in a giant
elliptical galaxy’s halo remains to be seen. A prototypical example of this unusual
phenomenon is seen in Cluster 21.
Conclusion 514 §6.2
6.2 C lu s te r P a ra m e te rs
Abell's Ricbness Parameter: The criterion for estimating the Richness of a
cluster of galaxies as developed by Abell (1957) was based on the number of galaxies
within a two magnitude interval of the third brightest cluster member. Richness, as
defined by Abell, is a parameter that is used quite often as an indication of mass:
MviTiai « Richness, or, better, of luminosity M fL <x Richness.
The tacit assumption contained in this definition is that there exists a uni
versal Luminosity Function. Now a change in the slope of the bright end of the
luminosity function from cluster to cluster could add or detract from a cluster’s
richness even though its total population would be unchanged. This and the lack
of precise photometric measurements to establish such a magnitude interval yield
richness determinations that are by-and-large consistent, but occasionally give a
poor estimation of the total cluster population. These limitations notwithstanding,
we cannot overestimate the value of Abell’s method.
A natural richness criterion could be based on the total number of galaxies
counted and complete to some faint limiting magnitude mum- In practice, however,
this would be a difficult number to estimate. Nevertheless, the dispersion analysis
can yield a useful approach. The Gore population may be able to be used to
evaluate a reliable estimate of richness provided the cluster in question is centrally
condensed and symmetric. In this case we would be sampling a known fraction of
the population (~ 40%) as shown in F ig u re 6.2.1.
A method that appears to be more in keeping with the variations of cluster
luminosity functions is an estimate of the total or core luminosity. This could be
converted to mass by virtue of M /L ratios, but due to the many uncertainties
in this type of analysis, in particular because of recent observations in the X-ray
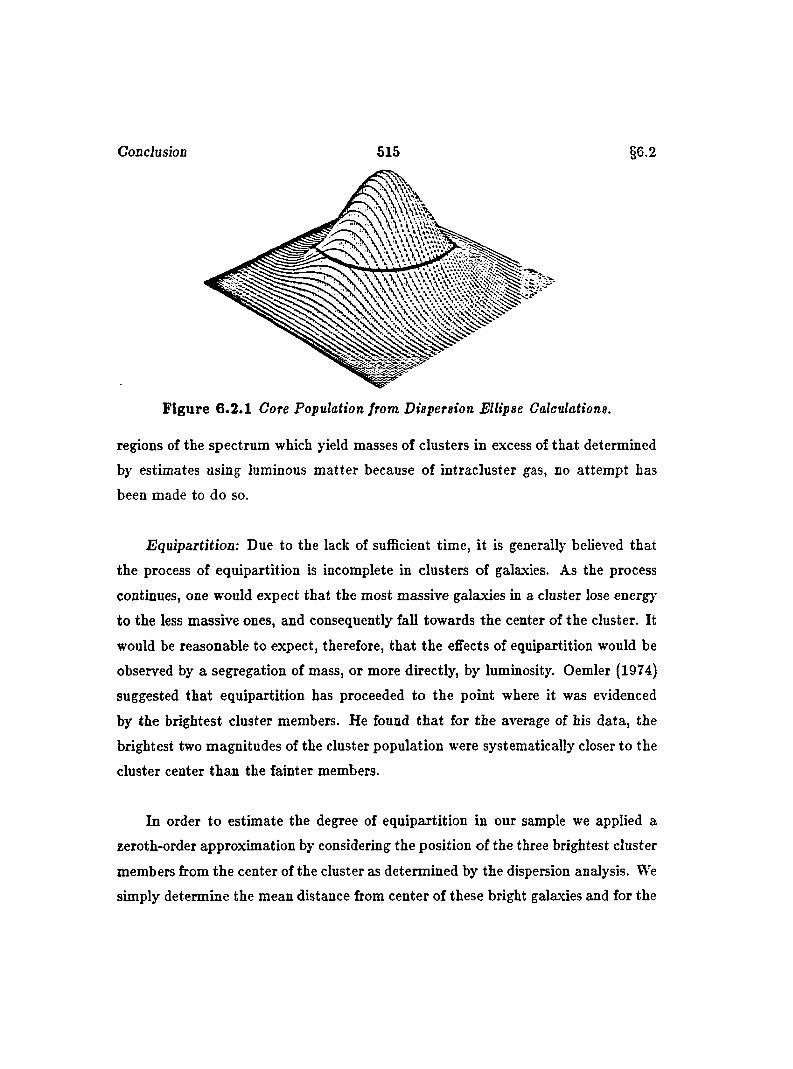
Conclusion 515 §6.2
F igure 6 .2 .1 Core Population from Dispersion Ellipse Calculations.
regions of the spectrum which yield masses of clusters in excess of that determined
by estimates using luminous m atter because of intracluster gas, no attem pt has
been made to do so.
Equipartition: Due to the lack of sufficient time, it is generally believed that
the process of equipartition is incomplete in clusters of galaxies. As the process
continues, one would expect that the most massive galaxies in a cluster lose energy
to the less massive ones, and consequently fall towards the center of the cluster. It
would be reasonable to expect, therefore, that the effects of equipartition would be
observed by a segregation of mass, or more directly, by luminosity. Oemler (1974)
suggested that equipartition has proceeded to the point where it was evidenced
by the brightest cluster members. He found tha t for the average of his data, the
brightest two magnitudes of the cluster population were systematically closer to the
cluster center than the fainter members.
In order to estimate the degree of equipartition in our sample we applied a
zeroth-order approximation by considering the position of the three brightest cluster
members from the center of the cluster as determined by the dispersion analysis. We
simply determine the mean distance from center of these bright galaxies and for the
Conclusion 516 §6.2
55 clusters of our sample their positions are generally less than 5.25 arcminutes from
the cluster with <r = 3.08. We take this as preliminary evidence for equipartitioning
in galaxy clusters in agreement with Oemler’s contention. In the future, it may
be more meaningful to compute the cluster radius in terms of brightness intervals
since in this case statistically significant results could be derived for each cluster. A
curious result tha t comes from this basic analysis is that Cluster 10, a cD cluster,
has a very high dispersion of bright member galaxies which would imply a lack of
evidence for relaxation in this particular cluster of galaxies. Other cD clusters in the
sample show this effect marginally and if Oemler’s point of view that cD clusters
are the most evolved distributions of galaxies, we would expect the segregation
of cluster members to be most pronounced. In only one of the cD galaxies of our
admittedly small sample, Cluster 18, is there evidence of the brightest galaxies being
more concentrated with the mean distance from cluster center of 1.44 arcminutes
with <r = 0.99. These results are meaningful if we interpret them in terms of the
loss of bright galaxies in the core of the cluster to the massive cD galaxy.
Core Radii: From Table 6.0.1 we find the collected results of our Isothermal
Analysis. These results ought to be viewed with caution due to the illness of fit for
most of the cluster core radii and their large dispersion. The effects of subclustering
and large dips and peaks in the surface density distributions virtually forefit our
attem pts to model the observed surface densities with a smooth Isothermal model.
The core radii so determined are small and are reasonable only inasmuch as we are
able to model the very cores of clusters and not their extremities. There are, of
course, portions of our surface density distributions that do agree, but since none of
the cases fit the Isothermal model within statistical uncertainties, any conclusions
drawn m ust be viewed with suspicion.
We do point out, however, the importance of such an analysis. The structural
length, which is one of the parameters determined in the isothermal fitting, has
Conclusion 5 1 7 § 6 . 2
been invoked as a standard candle. Bahcall (1975) measured a sample of 15 rich
clusters with z < 0.14 and concluded that the core radii determined by isothermal
fitting have similar linear values. The mean for the sample was 0.25 Mpc with a
dispersion of 0.04 Mpc. This very small dispersion was very encouraging from the
cosmological point of view and was the stimulus for determining the core radii for
other clusters of galaxies. However, investigations of other authors have brought
distrust in the applicability of the core radius as a standard measure. The core radii
obtained by Austin and Peach (1974) and Dressier (1973) for some of the clusters
in Bahcall’s sample were generally greater than those of Bahcall. The results of
Chincarini and M aterne (1980) are also a t variance with Bahcall’s measures; they
find that although the core radius seems to be fairly constant from cluster to cluster,
it is doubtful when using the data presently available that we can determine it to
an accuracy higher than 0.15 Mpc. Nevertheless, the core radius is a fair standard
size for clusters of galaxies. Whether, however, the core radius as determined for
a single cluster is an accurate parameter to be used with X-ray observations is
uncertain, since the X-ray studies appear to give a more accurate determination of
cluster masses. Combined with galaxy counts in a cluster they may allow a better
modelling of the cluster potential. We may have to take into account asymmetries
as are seen in the surface density distributions in our sample and perhaps find
parameters tha t are less sensitive to the observational uncertainties or better at
reflecting the true nature of a cluster of galaxies.
Luminosity Function: The concept of a Universal Luminosity Function is sum
marized by Schechter (1975) and has found its way into many extragalactic prob
lems. Abell (1963) proposed that luminosity functions of clusters of galaxies fol
lowed a universal form and postulated that all clusters show the same characteristic
absolute magnitude Af* where the luminosity function changes slope. He later
suggested (Bautz and Abell, 1973)that this absolute magnitude can be used as a
standard candle for cosmological investigations.
Conclusion 5 1 8 § 6 . 2
As we have found with the distribution of magnitudes in our survey, other
investigators have attempted to derive means to describe the distribution of cluster
members as a function of their brightness along the lines of Gaussian or similarly
peaked functions (Hubble, 1936). In later studies, though, it became obvious that
the luminosity function was more probably a monitonically increasing sequence
down to as faint a limiting magnitude that could be observed (Zwicky, 1957).
It was then that Abell introduced the idea of an integrated luminosity func
tion, that is, an analytic expression for the number of galaxies found with absolute
magnitudes between M and M -f 6 M . He proposed the form
n(< M ) = Adex{aM ); a = 0.75 M < M*
n{< M ) = B dez(^M ); ^ = 0.25 M > M*
where n (< M ) is the number of galaxies per unit volume which are brighter than
the absolute magnitude M and the constants A and B must satisfy the continuity
condition
Adex{aM f) = Bdex{^M ^).
This expression maps as a pair of straight lines on the logN vs. AbsoluteM agnitude
diagram. The “break,” or A/*, is defined as the the point where the function sufiTers
a change in slope.
The accumulated luminosity function for our sample is given in F ig u re 6.2.2.
and includes all clusters where the hmiting absolute magnitude corresponding to
M = 17.5 is fainter or equal to M = —19.0. In this case, we find M , = —21.3.
From this sample it is reasonable to conclude that the luminosity function can
serve as a standard candle if it relies on the magnitudes of many galaxies.
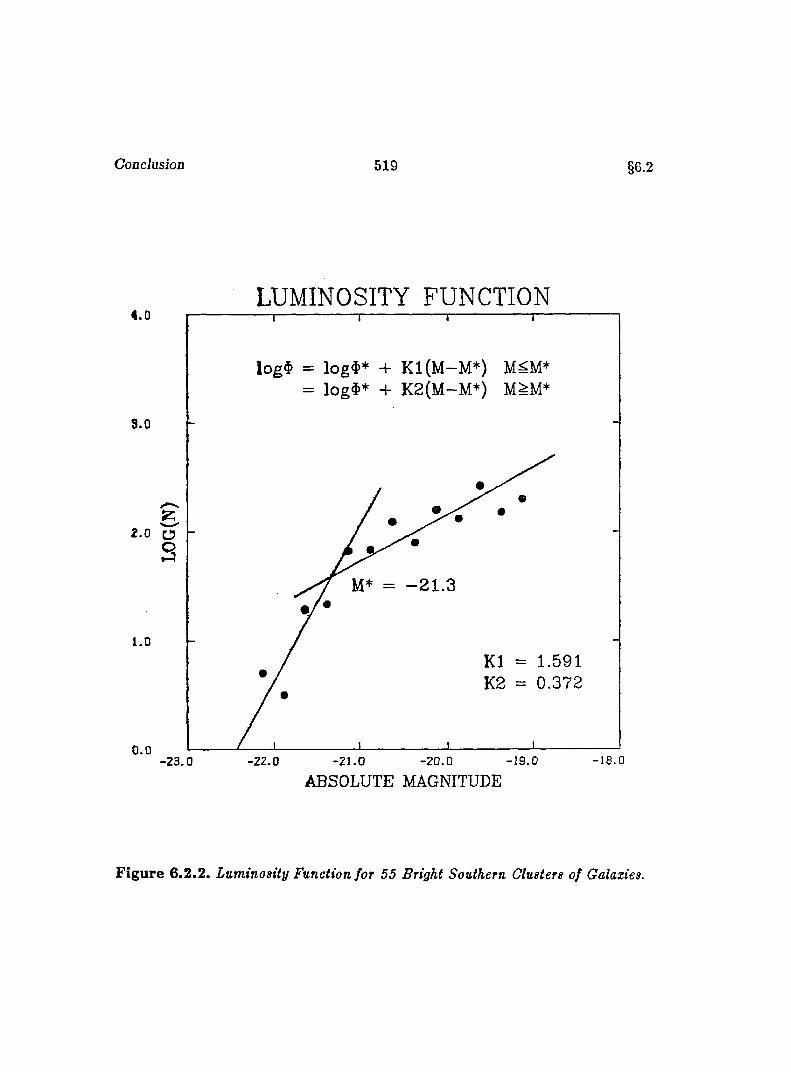
Conclusion 5 1 9 §&2
LUMINOSITY FUNCTION4.0
lo g $ = log$* 4- K1(M—M*)= log$+ + K 2(M -M *) MkM*
3.0
OsM* = - 2 1 .3
K1 = 1.591 K2 = 0 .372
0.0- 18.0- 20.0 -1 9 .0-2 3 .0 - 22.0 - 21.0
ABSOLUTE MAGNITUDE
Figure 6.2.2. Luminosity Function for 55 Bright Southern Clusters of Galaxies.
CoDclusion 520 §6.2
In conclusion we are reminded of a sobering fact to be kept in mind. After more
than three hundred years of spectacular advances, the evaluation of the scientific
cosmology formulated by Salviati, Galileo’s spokesman in the Dialogue, is still valid.
Astronomy, Salviati admitted, has not yet arrived “ at such a state tha t there are
not many things still remaining undecided, and perhaps still more which remain
unknown.”
B IB L IO G R A P H Y
... And ij it serves no other purpose, at least that long catalogue o f authors will be useful to lend authority to your book at the outset.- Miguel de Cervantes
Abell, G. O., 1958. Ap. J. Suppl, S, 211.
Abell, G. O., 1966. in Stars and Stellar Systems, vol. 9, Galaxies and theUniverse, A . & M. Sandage and J. Kristian (eds.) (Chicago: University ofChicago Press), chap. 15.
Abell, G. O., Corwin, H. G. and Olowin, R. P., 1986. Survey of Bright Southern Clusters of Galaxies.
Austin, T. B. and Peach, J. V., 1974. M on. Not. R.A.S., 167, 437.
Baade, W., 1928. Mittel. der Hamburger Sternwarte in Bergedorf 6, 98.
Bahcall, N. A., 1971. Ap. J., 176, 995.
Bahcall, N. A., 1972. Ap. J., 177, 550.
Bahcall, N. A., 1973a. Ap. J., 180, 699.
Bahcall, N. A., 1973b. Ap. J., 183, 783.
Bahcall, N. A., 1973c. Ap. J., 186, 1179.
Bahcall, N. A., 1974a. Ap. J., 187, 439.
Bahcall, N. A., 1974b. Ap. J., 193, 529.
Bahcall, N. A., 1975. Ap. J., 198, 249.
521
Bibliography 522 §7.0
Bevington, P. R. 1969. Bata Redaction and Error Analysis for the Physical Sciences, McGraw-Hill, New York.
Braid, M. K. and MacGillavry, H. T. 1978 Mon. Not. R.A.S., 182, 241-248.
Chandrasekhar, S., 1942. Principles of Stellar Dynamics. (Chicago: University of Chicago Press).
Chincarini, G. and Rood, H. J. 1975. Nature, 257, 294.
Chincarini, G. and Rood, H. J. 1976. Ap. J., 206, 30.
Chincarini, G. 1978. Nature, 272, 515.
Chincarini, G. 1980. in X-Ray Astronomy, eds. R. Giacconi and G. Setti, D. Reidel, Dordrecht, pp. 197-216.
Chincarini, G. and Rood, H. J. 1980. Sky and Telescope, 59, 364.
Chincarini, G. 1984. in Astronomy with Schmidt-Type Telescopes, lAU Coll. 78, ed. M. Cappaccioli, D. Reidel, Dordrecht, pp. 511-526.
Corwin, H. G., Jr., 1980. Mon. Not. R. A. S., 191, 1.
Corwin, H. G., Jr., 1981. Ph. D. Thesis, University of Edinburgh.
Corwin, H. G., Jr., and Emerson, D. 1982. Mon. Not. R. A. S., 200, 621.
Curtis, H. D., 1918. Pah. Lick Obs., 13, 9.
Davis, M. and Geller, P., 1976. Ap. J., 208, 13.
D’Arrest, H., 1865. Astr. Nach., 65, 1.
De Sousa, R. E. and Chincarini, G., 1985. Private Communication.
de Vaucouleurs, G. 1953. Astron. J., 58, 30-32.
de Vaucouleurs, G. 1956. Mem. Mt. Strorrdo Obs., 3, 13.
de Vaucouleurs, G. and de Vaucouleurs A. 1964. Reference Catalogue of Bright Galaxies, University of Texas Press.
de Vaucouleurs, G., de Vaucouleurs A. and Corwin, H. G. 1976. Second Refer
Bibliography 523 §7.0
ence Catalogue of Bright Galaxies, University of Texas Press.
Dressier, A., 1976. Ph. D. Thesis, University of California, Santa Cruz.
Dressier, A., 1978a. Ap. J., 222, 23.
Dressier, A., 1978b. Ap. J., 223, 765.
Dressier, A., 1978c. Ap. J., 226, 55.
Dressier, A., 1979. Ap. J., 231, 659.
Dressier, A., 1980a. Ap. J. Suppl., 42, 565.
Dressier, A,, 1980b. Ap. J., 236, 351.
Dressier, A., 1984a. Clusters and Groups of Galaxies, F. Mardirossian et al. (eds.), D. Reidel, 117-132.
Dressier, A., 1984b. Ann. Rev. Astron. Astrophys., 22, 185.
Dreyer, J. L. E., 1888. New General Catalogue of Nebulae and Clusters, Mem. R. A. S., 49, 1.
Dreyer, J. L. E., 1895. Index Catalogue 1, Mem. R. A. S., 51, 185-228.
Dreyer, J. L. E., 1908. Index Catalogue S, Mem. R. A. S., 59, 105-198.
Edson, J. B. and Zwicky, F. W. 1941. Proc. Nat. Acad. Sci., 27, 366-369.
Eichom, H., 1974. Astronomy of Star Positions. Ungar. New York.
Eichorn, H., 1985. Private communication.
Einasto, J., 1978. The Large-Scale Structure of the Universe, lA U Symp. 79, 51.
Emden, R., 1907. Gaskugeln (Leipzig: Teubner).
Fath, E. A. 1914. Astron. J., 28, 75-86.
Hardcastle, J . A. 1914. Mon. Not. R. A. S., 74, 699-706.
Herschel, J . F. W., 1864. General Catalogue of Nebulae and Clusters of Stars,
BibJiograpby 524 §7.0
Phil. Trans.
Herschel, W., 1784. Collected Works, 1, 157. (London: R.S. and R.A.S., 1912.)
Herschel, W., 1785. Collected Works, 1, 223. (London: R.S. and R.A.S., 1912.)
Hinks, A. R., 1911. Mont. Not. R. A . S., 71, 588.
Holmberg, E., 1946. Medd. Lunds Astr. Obs., (II), No. 117.
Holmberg, E., 1950. Medd. Lunds Astr. Obs., (II), No. 128.
Holmberg, E., 1958. Medd. Lunds Astr. Obs., (II), No. 136.
Holmberg, E., 1969. Ark. Astr., 5, 305.
Holmberg, E., 1974. Ast. & Astrphys., 85, 121.
Humason, M L., Mayall, N. V., and Sandage, A. R. 1956. Astron. J., 61, 97-162.
Hubble, E. P. 1934. Ap. J., 79, 8.
Hubble, E. P. 1936. The Realm of the Nebulae (New Haven: Yale University Press), pp. 79,81.
Hubble, E. P., Ap. J. 71, 131.
Hubble, E. P. and Humason, M. L., 1931. Ap. J., 74, 43.
Humboldt, A. von, 1866. Cosmos (New York: Harper Brothers), 4, p.25.
Jones, K. G. 1968. M essier’s Nebulae, (Faber and Faber, London).
Kamp, P. van de 1967. Principles o f Astrometry, W. H. Freeman and Company, San Francisco.
Keeler, J. E. 1908. Pub. Lick Obs., 8.
King, I. R., 1966., Astron. J., 71, 64.
King, I. R., 1972., Ap. J. Lett., 174, L123.
Klemola, A. R. 1969 Astron. J., 74, 804-806.
Bibliography 525 §7.0
Kron, R. G., Spinrad, H. and King, I. R., 1977. Ap. J., 217, 951-957.
Lundmark, K., 1927. Upps. Medd., SO, fig. 16, p86.
Materne, J., 1978. Astron. & Astrophys., 63, 401.
M aterne, J., et al., 1982. Astron. & Astrophys., 109, 238.
Melnick, J. and Sargent, W. L. W., Ap. J., 215, 401.
Messier, C., 1781. Catalogue des Nebuleuses et des Amas d ’Etoiles, Conn. des Temps pour 118\, p. 227 (Paris, 1781).
MacGillivray, H. T. et al., 1976. Mon. Not. R. A. S., 176, 649.
Neyman, J. and Scott, E. L., 1952. Ap. J. 116, 144.
Neyman, J. and Scott, E. L., 1955. A. J. 60, 33.
Neyman, J., Scott, E. L. and Shane, C. D., 1953. Ap. J., 117, 92.
Neyman, J., Scott, E. L. and Shane, C. D., 1954. Ap. J. Suppl., 1, 269.
Oemler, A. 1973. Ap. J., ISO., 11.
Oemler, A. 1974a. Ap. J., 194., 01.
Oemler, A. 1974b. Ph. D. Thesis. California Institute of Technology.
Oemler, A. 1976. Ap. J., 209., 693.
Oort, J . H., 1983. Annual Rev. Astron. Astrophys., 21, 373.
Peebles, P. J. E., 1968. Ap. J., 158, 13.
Peebles, P. J. E., 1970. Astron. J., 75, 13.
Peebles, P. J. E., 1973. Ap. J., 185, 413.
Peebles, P. J. E., 1974. Astron. Astrophys., 32, 197.
Peebles, P. J. E., 1980. The Large Scale Structure of the Universe., Princeton University Press.
Bibliography 526 §7.0
Peebles, P. J. E. and Hauser. M. G., 1974. Ap. J. Supp. 28. 19.
Proctor, R. A. 1869. Mon. Not. R. A. S., 29, 337-344.
Rose, J. A. 1976. Astron. & Ap. Suppl., 23, 109-114.
Sandage, A. R., 1972. Ap. J., 173, 485.
Sandage, A. R., 1973. Ap. J., 183, 711.
Sandage, A. R. and Hardy, E. 1973. Ap. J., 183, 743.
Schechter, P., 1976. Ap. J., 203, 297.
Scott, E. L., Shane, C. D. and Swanson, M. D., 1954. Ap. J., 119, 91.
Sersic, J. L. Ap. Space Set., 28, 365-373.
Shapley, H. 1933. Proc. Nat. Acad. Set., 19, 389.
Shapley, H. 1947. Galaxies, first ed. (London; Churchill) p. 178.
Shapley, H. and Ames, A. 1932a. H. C. 0. Bull. 865, 1-13.
Shapley, H. and Ames, A. 1932b. H. C. O. Bull. 873, 1-7.
Smart, W. M. 1944. Text-Book on Spherical Astronomy., forth ed. Cambridge University Press. Cambridge.
Snow, T. P. 1970. Astron. J., 75, 237-238.
Staff of the SAG., 1966. Star Catalog. Publication of the Smithsonian Institute of Washington, No. 4562, Washington, D. C.
Taff, L. G. 1981. Computational Spherical Astronomy, John Wiley & Sons. New York.
Vettolani, G., de Sousa, R. E. Marano, B. and Chincarini, G., 1985. Astron. Astrophys. in press.
Wallenquist, A., 1933. Ann. v.d. Bosscha-Sterrenwacht, 4, 6.
Waters, S. 1894. Mon. Not. R. A. S., 54, 526-528.
Bibliography 527 §7.0
Wolf, M., 1901. Astr. Nach., 155, 127.
Wolf, M., 1902. Heidelberg Pubi, 1, 125.
Wolf, M., 1906. Astr. Nach., 170, 211.
Zel’dovich, Y. B., 1978. The Large-Scale Structure of the Universe, lA U Symp. 79.
Zwicky, F . W. 1938. P.A.S.P., 50,218.
Zwicky, F . W. 1952. P.A.S.P., 64,247.
Zwicky, F. W., Herzog, E. and Wild, P. 1961. Catalogue of Galaxies and Clusters of Galaxies, Vol. 1 (California Institute of Technology).
Zwicky, F. W. and Herzog, E. 1963. Catalogue of Galaxies and Clusters of Galaxies, Vol. 2. (California Institute of Technology).
Zwicky, F. W. and Herzog, E. 1966. Catalogue of Galaxies and Clusters of Galaxies, Vol. 8. (California Institute of Technolog} ).
Zwicky, F . W. and Herzog, E. 1968. Catalogue of Galaxies and Clusters of Galaxies, Vol. 4. (California Institute of Technology).
Zwicky, F . W., Karpowicz M. and Kowal, C. T. 1965. Catalogue of Galaxies and Clusters o f Galaxies, Vol. 5 (California Institute of Technology).
Zwicky, F . W. and Kowal, C. T. 1968. Catalogue of Galaxies and Clusters of Galaxies, Vol. 6 (California Institute of Technology).
Zwicky, F . W. 1937a. Ap. J., 86, 217-246.
Zwicky, F . W. 1937b. Proc. Nat. Acad. Sci., 28, 251-256.
Zwicky, F . W. 1938. P.A.S.P., 50, 218-220.
Zwicky, F . W. 1941. Proc. Nat. Acad. Sci., 27, 264-269.
Zwicky, F . W. 1942a. Ap. J., 95, 555-564.
Zwicky, F . W. 1942c. Proc. Nat. Acad. Sci., 28, 317-320.
Zwicky, F . W. 1942d. Proc. Nat. Acad. Sci., 28, 355-361.
Bibliography 528 §7.0
Zwicky, F. W. 1950a. P.A.S.P., 62, 196-201.
Zwicky, F . W. 1950b. P.A.S.P., 62, 256-260.
Zwicky, F. W. 1951. P.A.S.P., 63, 61-71.
Zwicky, F . W. 1952a. P.A.S.P., 64, 242-246.
Zwicky, F. W. 1957a. Morphological Astronomy (Springer-Verlag, Berlin).