2021_rassi_ali_thesis.pdf - shareok
TRANSCRIPT

UNIVERSITY OF OKLAHOMA
GRADUATE COLLEGE
DESIGN AND FABRICATION OF A 3D PRINTED HYBRID IMPLANT
FOR TEMPOROMANDIBULAR JOINT REGENERATION
A THESIS
SUBMITTED TO THE GRADUATE FACULTY
in partial fulfillment of the requirements for the
Degree of
MASTER OF SCIENCE
By
ALI RASSI
Norman, Oklahoma
2021

DESIGN AND FABRICATION OF A 3D PRINTED HYBRID IMPLANT
FOR TEMPOROMANDIBULAR JOINT REGENERATION
A THESIS APPROVED FOR THE
SCHOOL OF INDUSTRIAL & SYSTEMS ENGINEERING
BY THE COMMITTEE CONSISTING OF
Dr. Pedro Huebner, Chair
Dr. Michael Detamore
Dr. Shivakumar Raman

© Copyright by ALI RASSI 2021
All Rights Reserved.
iv
Abstract
Patients suffering from temporomandibular joint (TMJ) disorders have difficulties
performing trivial activities such as chewing, yawning, and even laughing. In severe cases, the
pain is unbearable and clinical care is required. When non- or minimally invasive treatments fall
short to resolve the problem, total joint replacements with permanent alloplastic implants are
recommended by surgeons. However, recent advances in tissue engineering research have
highlighted the potential of using bioengineered implants over their traditional alloplastic
counterparts.
In this study, the design and fabrication processes of a patient-fitted hybrid biodegradable
TMJ implant are studied, focusing on the mitigation of complications and limitations of
conventional implants. The proposed implant design incorporates both bone and cartilage
components of the TMJ in a single heterogeneous unit and is affixed to the ramus of the mandible.
By including microporous features in the condylar head of the implant, we seek to increase
the rate of cell infiltration via capillary forces in the scaffolding structures and reinforce the bond
between the bone and the cartilage regions so as to obtain a faster and more effective regeneration
of the targeted tissues. Statistical design of experiments is adopted to identify the best-performing
features that are ultimately implemented into the final design of the full-size TMJ implant. Lastly,
techniques for incorporating these microarchitectural features and improving the fabrication
process are presented and discussed.

v
Acknowledgments
I would like to thank God for reasons we both know that I will not get into here. Thanks,
God.
I want to thank my mom and my aunt too for supporting me and my siblings like we are the
only ones ever born to be supported. This thesis is dedicated to you.
I also want to thank Samin and Erfan, my sister and brother. They have not helped with the
thesis as much as they could have, but they are hilarious and have said many funny things during
the period in which this thesis was written and earned themselves a little something in the
acknowledgments section.
I was very lucky to have amazing teammates who made the lab my favorite place on campus.
David, Emi, and Boushra thank you for laughing at my jokes and having my back. You guys rock.
I want to thank Dr. Detamore for always being mindful of me and available to help. During
my master's program, I had the privilege of knowing many people who were incredibly kind to me
and went out of their ways to help me grow. I am also grateful for all the opportunities that Dr.
Raman and other faculty and staff from the school of Industrial and Systems Engineering provided
for me.
I have to make an un-scientific statement here. Based on my extensive research on the topic,
I have concluded that my advisor, Dr. Pedro Huebner, and I are the best duo ever. He has helped
me in ways I could not think of and mentored me like no one else would have. A big figure in my
life and someone I will look up to. Cannot thank you enough Pedro for believing in me like you
did. Your next student is one lucky person.
vi
Table of Contents Introduction .................................................................................................................1
1.1 Temporomandibular Joint ..........................................................................................1
1.2 Temporomandibular Joint Disorders .........................................................................2
1.3 Clinical Relevance .....................................................................................................3
1.3.1 Current Treatment Options .................................................................................3
1.4 Tissue Engineering for Treatment of TMJ.................................................................5
1.4.1 Tissue engineering of the TMJ disc ....................................................................6
1.4.2 Tissue engineering of the TMJ mandibular condyle ..........................................6
1.4.3 Additive Manufacturing .....................................................................................7
1.5 Thesis Statement and Outline ....................................................................................8
Phase 1: Micro-Architecture ....................................................................................10
2.1 Introduction ..............................................................................................................10
2.2 Materials and Methods .............................................................................................12
2.2.1 Preparation of the Filament ..............................................................................12
2.2.2 Optimizing Print Settings .................................................................................13
2.2.3 Capillary Action Studies ...................................................................................14
2.2.4 Preparation of the Hydrogel .............................................................................16
2.2.5 Bone-to-Cartilage Integration Studies ..............................................................17
2.3 Results ......................................................................................................................20
2.3.1 Capillary Action Studies Results ......................................................................20
2.3.2 Bone-to-Cartilage Integration Studies ..............................................................26
2.4 Discussions ..............................................................................................................32
Phase 2: Macro-Architecture ...................................................................................35
3.1 Introduction ..............................................................................................................35
3.2 Materials and Methods .............................................................................................37
3.2.1 Design of the Implant .......................................................................................37
3.2.2 Fabrication of the implant.................................................................................39
3.3 Results and Discussion ............................................................................................41

vii
Conclusion ..................................................................................................................43
4.1 Summary ..................................................................................................................43
4.2 Contribution .............................................................................................................44
4.3 Future Works ...........................................................................................................44
References ...................................................................................................................45
Appendix.....................................................................................................................54
viii
List of Figures
FIGURE 2.1 FILAMENT EXTRUDING LINE .......................................................................... 13
FIGURE 2.2 CAPILLARY ACTION STUDY TEST SAMPLE. ................................................ 15
FIGURE 2.3 CAPILLARY ACTION STUDY ............................................................................ 16
FIGURE 2.4 DELAMINATION RIG .......................................................................................... 19
FIGURE 2.5 BONE-TO-CARTILAGE INTEGRATION STUDY RIG ..................................... 20
FIGURE 2.6 UPTAKE RESPONSE ............................................................................................ 21
FIGURE 2.7 SURFACE TREATMENT EFFECT ...................................................................... 26
FIGURE 2.8 PEAK AXIAL FORCE AND STRAIN AT PEAK FORCE................................... 29
FIGURE 2.9 UPTAKE STUDY WELLS ..................................................................................... 32
FIGURE 3.1 FEATURES OF THE TMJ IMPLANT. .................................................................. 39
FIGURE 3.2 IMPLANT PRINT ELEMENTS. ............................................................................ 41

ix
List of Tables
TABLE 1. BONE-TO-CARTILAGE INTEGRATION STUDY MICRO-ARCHITECTURES. 18
TABLE 2. TESTS OF BETWEEN-SUBJECTS EFFECTS FOR THE DEPENDENT
VARIABLE: UPTAKE ........................................................................................................ 22
TABLE 3. UNIVARIATE TESTS FOR THE EFFECT OF LAYER HEIGHT .......................... 23
TABLE 4. PAIRWISE COMPARISONS FOR THE EFFECT OF LAYER HEIGHT ............... 23
TABLE 5. UNIVARIATE TEST FOR THE EFFECT OF LINE DISTANCE ........................... 24
TABLE 6. PAIRWISE COMPARISONS FOR THE EFFECT OF LINE DISTANCE .............. 25
TABLE 7. BONE-TO-CARTILAGE INTEGRATION DATA ................................................... 27
TABLE 8. TESTS OF BETWEEN-SUBJECTS EFFECT FOR DEPENDENT VARIABLE:
PEAK AXIAL FORCE ......................................................................................................... 30
TABLE 9. TESTS OF BETWEEN-SUBJECTS EFFECT FOR DEPENDENT VARIABLE:
STRAIN AT PEAK .............................................................................................................. 30
TABLE 10. PAIRWISE COMPARISONS FOR THE EFFECT OF DESIGN ON THE PEAK
AXIAL FORCE .................................................................................................................... 31
TABLE 11. PAIRWISE COMPARISONS FOR THE EFFECT OF DESIGN ON THE STRAIN
AT PEAK FORCE ................................................................................................................ 31
TABLE 12. GRAPHICAL VIEW OF THE SURGERY PROCEDURE ..................................... 36
TABLE 13. GRAPHICAL VIEWS OF THE IMPLANT AND THE CUTTING GUIDE .......... 38
1
Introduction
1.1 Temporomandibular Joint
We all rely on the function of our joints to perform routine tasks. From pouring water in a
kettle for a morning cup of tea to opening the door of our office and driving back home, we take
advantage of joints, directly or indirectly, to achieve our goals. We interact with up to a couple of
dozens of joints in our day-to-day life. That number, however big it might be, is insignificant when
compared to the 360 joints that we use inside our bodies. This number is not constant between all
humans, but the range of 300 to 400 is consistent with the literature.[1]
Unlike the joints we utilize in our day-to-day life to help us with our tasks, not all the joints
inside our bodies allow for movement. Basically, a joint is the connection between two bones and
a common classification of the joints structure in our body, divide them into 3 groups: fibrous
joints, cartilaginous joints, and synovial joints. These groups differ in their mobility and range of
motion. Some are freely mobile joints (known as diarthrosis), some are slightly mobile (known as
amphiarthrosis) and others are totally immobile (known as synarthrosis). While they lie in the
general definition of a joint, amphiarthrosis and synarthrosis joints do not provide any functional
movement. Synovial joints, on the other hand, allow different types of motions based on their
particular structure, thus are of great interest to us as engineers.
Synovial joints can be classified into 3 types based on their range of motion. First, the
uniaxial joint, which only allows for movement along one axis, such as rotary move. An example
of uniaxial joints would be the rotation of our head around the axis of the neck when we look
around. Second, the biaxial joint, which in turn, allows for movement along 2 distinct axes. One
might think of the movement of the thumb for this type of joint. The last type is the polyaxial (or
multiaxial) joint and, as the name suggests, it allows for movement along 3 or more axes.
The only polyaxial joints are ball-and-socket (or spheroid) joints which are the most mobile
joints in the body and can be found in the shoulder and hip. The hinge joints allow for rotation
along one axis and can be found in the knee and elbow. Pivot (rotary) joints are also uniaxial and
allow for movement along one axis and can be found in the neck. Condylar (or ellipsoid) joints
have a unique structure that only allows for movement in 2 axes that are perpendicular to one
another. This motion is clearly seen in the wrist, where you can only rotate your hand to either left
2
and right or up and down. Next, the saddle joint, in which the convex surface of one bone and the
concave surface of the other, forms a structure that allows for movement along 2 axes and can be
found in the thumb. The last type of joint known as plane joint (or gliding joint), unlike other
joints, does not move around an axis and, instead, permits movement on the plane of the articular
surface.
One of the less-investigated synovial joints in our body and perhaps the most important one,
in that it is responsible for talking, breathing, and chewing food, all of which are essential to the
quality of life, is the temporomandibular joint, also referred to as TMJ for short. This load-bearing
joint connects the condylar head of the lower jaw (mandible) to the mandibular fossa of the
temporal bone, and is the most active joint in our body, with cycles of loading and unloading of
up to 2000 times per day.[2]
With the unique structure of the condylar head, TMJ provides movements in the sagittal axis
called protrusion/retrusion (anterior/posterior, respectively), in the vertical axis called
depression/elevation (lowering/raising, respectively), and in the frontal axis, called lateral
deviation. To open the mouth, the TMJ performs a combination of depression and protrusion, and
to close the mouth the TMJ movement involves a combination of elevation and retrusion. In lateral
movements, left and right TMJs alternate in retrusion and protrusion.[3]
1.2 Temporomandibular Joint Disorders
TMJ disorders or TMDs are referred to a group of disorders in TMJ and the surrounding
tissues that in one way or another cause pain or limit the functionality of the joint. These disorders
could range from clicking noises during the motion of the mouth to pain in the surrounding tissues
of the TMJ, and in some cases, limitation in the range of motion of the TMJ.[4]
There are two main categories for TMJ disorders based on their anatomical origins; masticatory
muscle disorders, which are the problems within the muscles surrounding TMJ, and articular
disorders, which refer to the problems within the articular surfaces of TMJ. [4] Internal
derangement or ID is referred to any interference in smooth joint movement, [5] and several types
of IDs are common in TMJ; Disc derangement, disc adherence, disc adhesion, hypermobility, and
joint dislocation, to name a few.[6]
3
The etiology of TMJ disorders is not clear and many studies have hypothesized different
factors to have an effect on either initiation or perpetuation of TMDs, some of which have been
questioned and in cases, rejected by other studies. [4] Among the most common factors are
parafunctional habits such as teeth clenching or teeth griding and it is also possible that non-TMJ
disorders such as depression, bad sleeping habits, or rheumatism exacerbate the symptoms of
TMD.[7][8][9]
Due to the complex nature of the TMJ and our incomplete understanding of the factors
contributing to TMD, preventive actions to control these disorders are very limited, and oftentimes,
treatments are necessary after the fact.
1.3 Clinical Relevance
Studies on the prevalence of TMJ-related pains show that anywhere between 25% to 75%
of the population have experienced signs of TMD, but only a minority of about 3.6% to 7% have
TMD symptoms with such severity that requires them to seek treatment. [2][7] These symptoms
have been mostly identifiable in young adults and adults from 20 to 50 years of age, and women
have two to three times higher share in the affected population. [10][11]
We should keep in mind that the treatment of TMJ disorders costs about $4 billion every
year in the US alone.[12] A recent study shows that the number of TMJ total joint replacement
(TJR) procedures done in the United States, from 412 cases in 2005 has increased to 572 cases in
2014 and is estimated to go above 900 cases in the year 2030, which shows an increased rate of
58%[13]. One of the bigger TMJ solution companies (TMJ Concepts) alone has more than doubled
its sales of TMJ TJR devices in the same period, and with the rise of newly FDA-approved devices
from different companies, it is expected to have higher demands for such treatments.
1.3.1 Current Treatment Options
The avascular nature of the TMJ does not allow for regeneration and self-healing of the
tissues [14] and available treatment methods often target hindering the progress of the disorder
[15] and regaining the functionality of the joint, instead of completely healing or regenerating the
tissues. Different treatment methods have been advised for people with different levels of TMJ
disorder.[16] In many cases, the symptoms of TMD reduce over time, and 85% of people will have
no sign in 3 years.[17][18] therefore, non-invasive and minimally invasive treatment options are
4
recommended for patients in either early stages or with lower severity of TMD, since invasive
methods could be harmful and the results are irreversible.[17][7]
Currently, treatment options for TMD include non-invasive, minimally invasive, and
invasive, each suggested according to the severity and different stages of the TMD, with the
preference given to non-invasive and minimally invasive treatments in the preliminary stages and
invasive methods reserved for extreme cases where previous methods could not provide favorable
results. [12][19]
Self-care and behavioral interventions are generally considered to be the first step in
addressing the TMD and should be employed even if other treatment methods are necessary. Non-
invasive therapies are the next step in controlling the TMD and several therapy methods are known
to reduce the signs and symptoms. Physical therapies such as lateral jaw movement or resisted jaw
opening/closing[20], psychological interventions like cognitive behavior therapy or stress
management, dental procedures like occlusal therapy[7][8][9][19], medical interventions such as
acetaminophen or anti-depressants, or even hypnosis and acupuncture are said to be effective
methods to control TMJ related pains and regain its functionality.[4] However, further
investigation is required to directly assess the effectiveness of each of these methods on TMD
since, for example, there are studies that conclude and others that reject the improvement in TMD
symptoms when physical therapy is used.[21]
An example of a minimally-invasive treatment would be intra-articular injections with local
anesthetics or Botox for treatment of chronic bruxism, although it is recommended to only use this
method after preservative methods were not sufficient.[17][22] However, there are many studies
that show the high effectiveness of this method and due to the simplicity of the procedure, it can
be repeated if necessary.[23] This is while another study has associated multiple intra-articular
injections with the destruction of articular cartilage.[24] Nonetheless, the necessity of repeated
surgery in itself is a sign of a sub-optimal solution for TMD. Other forms of minimally-invasive
treatments include arthroscopy and arthrocentesis, both of which have been shown to improve the
pain and the range of motion in TMJ patients,[25][26] but there are inconsistencies in the literature
about their effectiveness.[27][28]
The last resort in TMJ management is surgery. The American Association of Oral and
Maxillofacial Surgeons (AAOMS) has published a list of criteria for eligibility of patients in rare
5
cases where previous methods have failed to address the pain and functionality of the TMJ that
should be assessed before proceeding with TMJ surgery.[29] TMJ surgeries involving disc
prosthesis and total joint replacement (TJR) date back to the mid-19th century, but the Proplast-
Teflon disc prosthesis once thought to be promising [30] and the majority of experimental methods
that surgeons have explored over time only yielded short-time results and often caused more
problems in the long term.[31] As of today, there are only 2 FDA-approved manufacturers that
produce TMJ replacement devices.
For management of the TMJ disc, surgical methods include arthroplasty and disc
repositioning,[32] eminectomy,[33] discoplasty,[34] and discectomy.[35] None of these
treatments provide permanent results and follow-up therapies or surgeries are often needed.[36]
For that reason, the development of methods that assure long-term results are imperative. It is
worth mentioning, however, that according to a study on more than 2000 TMD patients, only 2.5%
had to receive surgery and it should only be done when non- or minimally invasive methods have
not been effective.[37]
1.4 Tissue Engineering for Treatment of TMJ
As previously mentioned, many treatment approaches have emerged over the past several
decades to mitigate the symptoms of TMD, hinder its progress, and regain the functionality of the
TMJ, some of which are still in use today. Unfortunately, none of the currently available methods
targets complete healing or restoration of the affected joint and its surrounding tissues, and as a
consequence, patients often need follow-up surgeries.[36] Besides, the few treatment options that
are known to be successful are only suitable for a portion of the affected population who can pass
a long checklist of eligibility criteria.[29] Thus, it is clear that there is a need for new treatment
methods that could address these gaps and produce better and more desirable results for a wider
population. In recent years, tissue engineering has been considered a promising solution for the
regeneration of the TMJ.
There are indications for the use of tissue engineering in the reconstruction of the TMJ
components, such as the TMJ disc and the mandibular condyle, and several studies have explored
these areas. The following is a brief overview of the past and current endeavors in this domain.
6
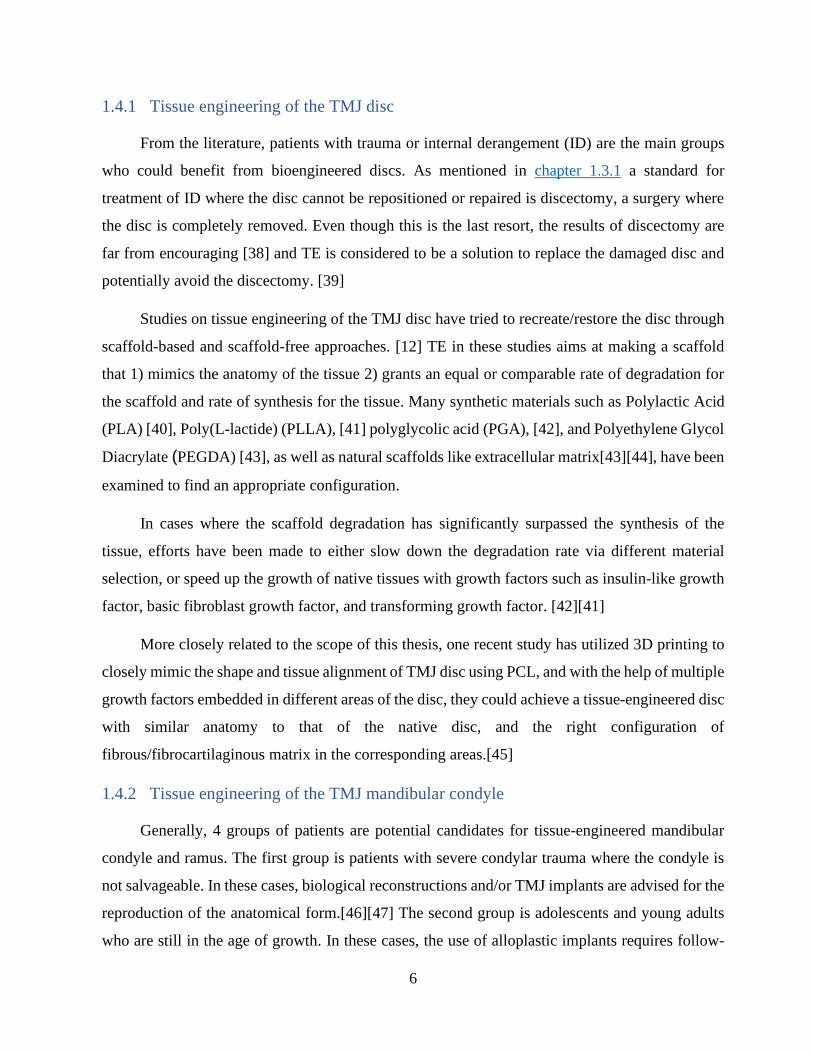
1.4.1 Tissue engineering of the TMJ disc
From the literature, patients with trauma or internal derangement (ID) are the main groups
who could benefit from bioengineered discs. As mentioned in chapter 1.3.1 a standard for
treatment of ID where the disc cannot be repositioned or repaired is discectomy, a surgery where
the disc is completely removed. Even though this is the last resort, the results of discectomy are
far from encouraging [38] and TE is considered to be a solution to replace the damaged disc and
potentially avoid the discectomy. [39]
Studies on tissue engineering of the TMJ disc have tried to recreate/restore the disc through
scaffold-based and scaffold-free approaches. [12] TE in these studies aims at making a scaffold
that 1) mimics the anatomy of the tissue 2) grants an equal or comparable rate of degradation for
the scaffold and rate of synthesis for the tissue. Many synthetic materials such as Polylactic Acid
(PLA) [40], Poly(L-lactide) (PLLA), [41] polyglycolic acid (PGA), [42], and Polyethylene Glycol
Diacrylate (PEGDA) [43], as well as natural scaffolds like extracellular matrix[43][44], have been
examined to find an appropriate configuration.
In cases where the scaffold degradation has significantly surpassed the synthesis of the
tissue, efforts have been made to either slow down the degradation rate via different material
selection, or speed up the growth of native tissues with growth factors such as insulin-like growth
factor, basic fibroblast growth factor, and transforming growth factor. [42][41]
More closely related to the scope of this thesis, one recent study has utilized 3D printing to
closely mimic the shape and tissue alignment of TMJ disc using PCL, and with the help of multiple
growth factors embedded in different areas of the disc, they could achieve a tissue-engineered disc
with similar anatomy to that of the native disc, and the right configuration of
fibrous/fibrocartilaginous matrix in the corresponding areas.[45]
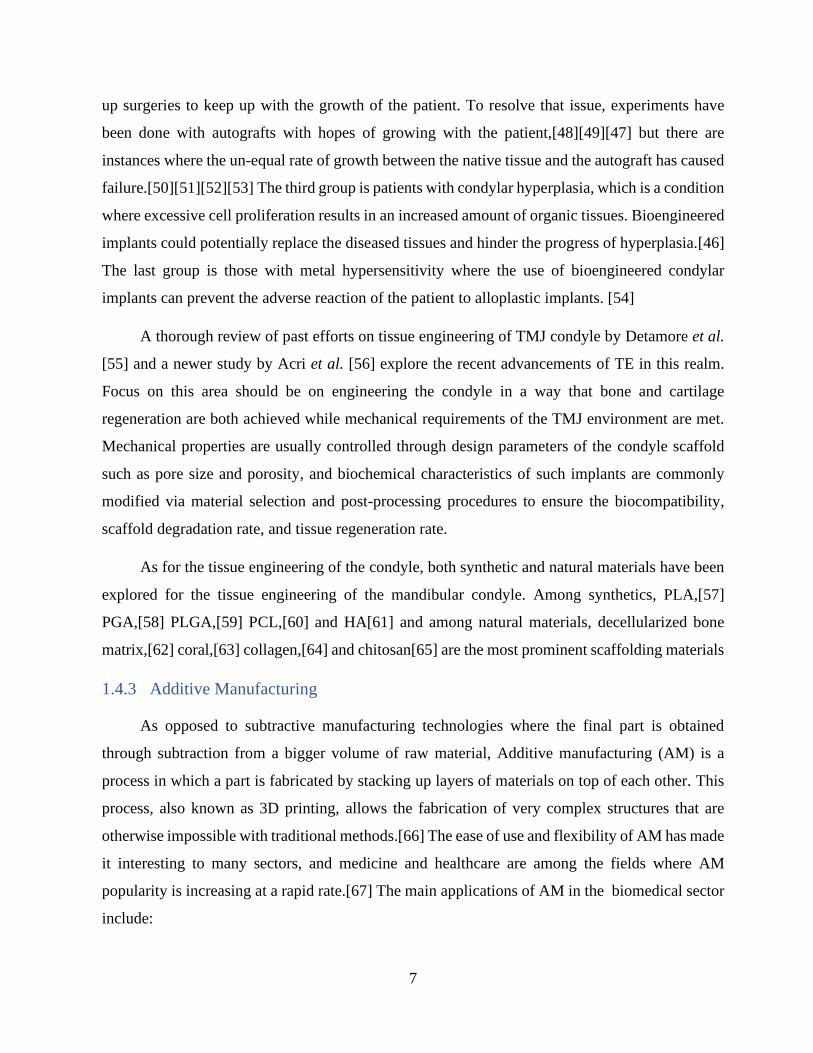
1.4.2 Tissue engineering of the TMJ mandibular condyle
Generally, 4 groups of patients are potential candidates for tissue-engineered mandibular
condyle and ramus. The first group is patients with severe condylar trauma where the condyle is
not salvageable. In these cases, biological reconstructions and/or TMJ implants are advised for the
reproduction of the anatomical form.[46][47] The second group is adolescents and young adults
who are still in the age of growth. In these cases, the use of alloplastic implants requires follow-
7
up surgeries to keep up with the growth of the patient. To resolve that issue, experiments have
been done with autografts with hopes of growing with the patient,[48][49][47] but there are
instances where the un-equal rate of growth between the native tissue and the autograft has caused
failure.[50][51][52][53] The third group is patients with condylar hyperplasia, which is a condition
where excessive cell proliferation results in an increased amount of organic tissues. Bioengineered
implants could potentially replace the diseased tissues and hinder the progress of hyperplasia.[46]
The last group is those with metal hypersensitivity where the use of bioengineered condylar
implants can prevent the adverse reaction of the patient to alloplastic implants. [54]
A thorough review of past efforts on tissue engineering of TMJ condyle by Detamore et al.
[55] and a newer study by Acri et al. [56] explore the recent advancements of TE in this realm.
Focus on this area should be on engineering the condyle in a way that bone and cartilage
regeneration are both achieved while mechanical requirements of the TMJ environment are met.
Mechanical properties are usually controlled through design parameters of the condyle scaffold
such as pore size and porosity, and biochemical characteristics of such implants are commonly
modified via material selection and post-processing procedures to ensure the biocompatibility,
scaffold degradation rate, and tissue regeneration rate.
As for the tissue engineering of the condyle, both synthetic and natural materials have been
explored for the tissue engineering of the mandibular condyle. Among synthetics, PLA,[57]
PGA,[58] PLGA,[59] PCL,[60] and HA[61] and among natural materials, decellularized bone
matrix,[62] coral,[63] collagen,[64] and chitosan[65] are the most prominent scaffolding materials
1.4.3 Additive Manufacturing
As opposed to subtractive manufacturing technologies where the final part is obtained
through subtraction from a bigger volume of raw material, Additive manufacturing (AM) is a
process in which a part is fabricated by stacking up layers of materials on top of each other. This
process, also known as 3D printing, allows the fabrication of very complex structures that are
otherwise impossible with traditional methods.[66] The ease of use and flexibility of AM has made
it interesting to many sectors, and medicine and healthcare are among the fields where AM
popularity is increasing at a rapid rate.[67] The main applications of AM in the biomedical sector
include:
8
• fabrication of tools, instruments and equipment [68]
• physical models for visualization, preoperative planning,[69] testing, and education
• fabrication of customized implants[70]
• biostructures for scaffolds and tissue engineering[60][45]
At its core, FFF (Fused Filament Fabrication) consists of a set of carriers controlled by
stepper motors that move in either cartesian or polar coordinates and position the print head on a
specific point on top of a print bed. Another stepper motor is in the print head where an extruder
is heated up to the melting temperature of the material. This material is usually fed to the printer
as a strand called filament. The print head moves in a defined path to deposit material and then
moves away from the print bed and begins to print another layer on top of the previous layer. This
process repeats until a complete model is printed. This configuration (in cartesian 3D printers)
requires 4 stepper motors to produce the desired shape; 3 to control the position of the head, and
one to extrude material. The defined path is generated by a software (known as a slicer) that slices
the desired model into layers and controls the amount of extrusion at any given point of the print.
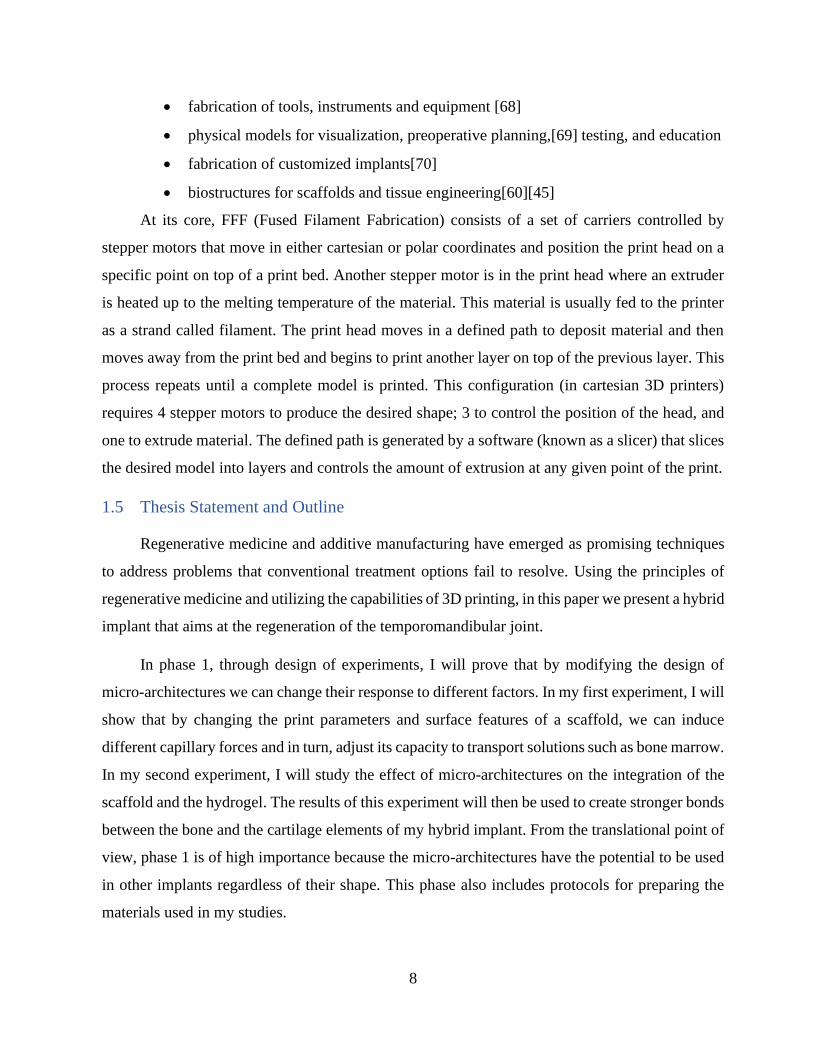
1.5 Thesis Statement and Outline
Regenerative medicine and additive manufacturing have emerged as promising techniques
to address problems that conventional treatment options fail to resolve. Using the principles of
regenerative medicine and utilizing the capabilities of 3D printing, in this paper we present a hybrid
implant that aims at the regeneration of the temporomandibular joint.
In phase 1, through design of experiments, I will prove that by modifying the design of
micro-architectures we can change their response to different factors. In my first experiment, I will
show that by changing the print parameters and surface features of a scaffold, we can induce
different capillary forces and in turn, adjust its capacity to transport solutions such as bone marrow.
In my second experiment, I will study the effect of micro-architectures on the integration of the
scaffold and the hydrogel. The results of this experiment will then be used to create stronger bonds
between the bone and the cartilage elements of my hybrid implant. From the translational point of
view, phase 1 is of high importance because the micro-architectures have the potential to be used
in other implants regardless of their shape. This phase also includes protocols for preparing the
materials used in my studies.

9
In phase two, I will present a framework for the design and fabrication of a full-size hybrid
TMJ implant. I will then use the findings from my experiments to incorporate selected micro-
architectures from phase 1 in the full-size implant that could improve its performance. Additional
features will be added to the implant to facilitate the surgeon’s job during the surgery. The last
chapter includes a summary of the results, discussions, and contributions presented in this thesis
and an outline of opportunities for future work.
10
Phase 1: Micro-Architecture
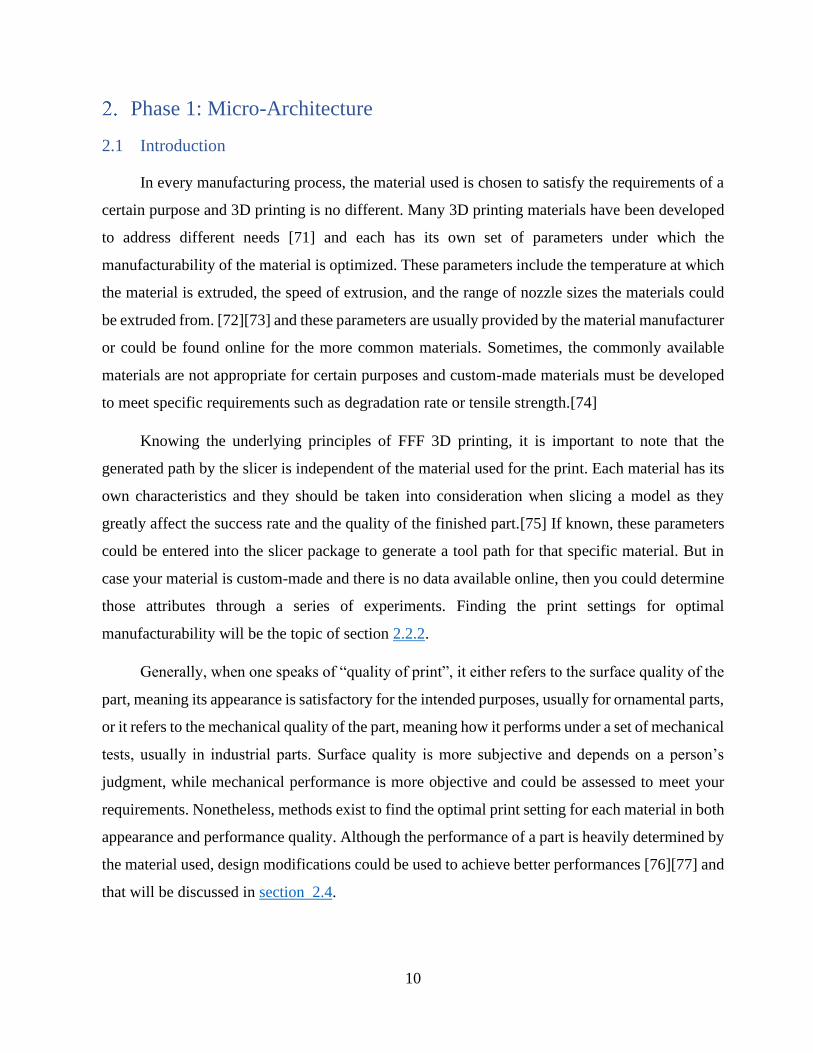
2.1 Introduction
In every manufacturing process, the material used is chosen to satisfy the requirements of a
certain purpose and 3D printing is no different. Many 3D printing materials have been developed
to address different needs [71] and each has its own set of parameters under which the
manufacturability of the material is optimized. These parameters include the temperature at which
the material is extruded, the speed of extrusion, and the range of nozzle sizes the materials could
be extruded from. [72][73] and these parameters are usually provided by the material manufacturer
or could be found online for the more common materials. Sometimes, the commonly available
materials are not appropriate for certain purposes and custom-made materials must be developed
to meet specific requirements such as degradation rate or tensile strength.[74]
Knowing the underlying principles of FFF 3D printing, it is important to note that the
generated path by the slicer is independent of the material used for the print. Each material has its
own characteristics and they should be taken into consideration when slicing a model as they
greatly affect the success rate and the quality of the finished part.[75] If known, these parameters
could be entered into the slicer package to generate a tool path for that specific material. But in
case your material is custom-made and there is no data available online, then you could determine
those attributes through a series of experiments. Finding the print settings for optimal
manufacturability will be the topic of section 2.2.2.
Generally, when one speaks of “quality of print”, it either refers to the surface quality of the
part, meaning its appearance is satisfactory for the intended purposes, usually for ornamental parts,
or it refers to the mechanical quality of the part, meaning how it performs under a set of mechanical
tests, usually in industrial parts. Surface quality is more subjective and depends on a person’s
judgment, while mechanical performance is more objective and could be assessed to meet your
requirements. Nonetheless, methods exist to find the optimal print setting for each material in both
appearance and performance quality. Although the performance of a part is heavily determined by
the material used, design modifications could be used to achieve better performances [76][77] and
that will be discussed in section 2.4.
11
Extruding filament is a straightforward process and mostly requires a filament extruder and
the material you want to have in filament form. The filament extruder has a heated area where the
material is pushed through and the molten material comes out of a nozzle at the end of the machine.
The material is usually fed to the machine either in pellet, powder, or shredded form through a
hopper attached to the heated area.
The precision of the filament is vital to the surface quality of the final print. One of the
parameters entered into the slicer is the diameter of the filament. The slicer then calculates the
volume of material needed to create the deposited line with a certain height and width and runs the
stepper motor to extrude material based on that calculation. This is assuming that the diameter of
the filament is constant when in reality there is always variability in the diameter. So, for example,
when the diameter of the filament reduces at a certain point of the filament, this results in a
deposited line thinner than the ones before and after it and could be easily seen on the surface of
the print. Although simple, extruding a good filament requires several measures to minimize the
variability in the filament diameter and we have incorporated a few of them in our filament
extruding line. The prepared materials were used in the fabrication of test samples for the two
experiments that are included in this phase; the capillary action studies, and the bone-to-cartilage
integration studies.
Including micro-porous structures in the scaffold is known to increase the volume and rate
of bone regeneration by inducing capillary forces.[78] In the capillary action studies, I seek to
determine whether it is possible to increase the rate and capacity of uptake in the implant by
changing the design of micro-architectures in the scaffold. If successful, the results of this
experiment could be used to incorporate porosity with the right parameters in parts of our implants
where bone regeneration is desired.
As mentioned in section 1.1, the opening of the mouth involves a rotational and a
translational movement of the condylar head, during which the condyle slides against the TMJ
disc. The cartilage layer that sits on top of the condylar head allows these movements to be smooth.
In the bone-to-cartilage integration studies, I will experiment with micro-architectures that could
integrate and sustain the hydrogel element on top of the scaffold during TMJ movements. This
study is designed to find the design that maximizes the forces it takes for the hydrogel to be
sheared/delaminated off of the implant scaffold.
12
2.2 Materials and Methods
2.2.1 Preparation of the Filament
Polycaprolactone (PCL) filament with 20% weight hydroxyapatite powder (HAp) was made
using a filament extruder (Noztek Touch). PCL (Polysciences, Inc.) and HAp (Aldrich) were
mixed with the desired ratio and ball-milled for 19 hours. The powder was stored in a desiccator
prior to extruding to evaporate any moisture in the mix, as it noticeably reduces the quality of print.
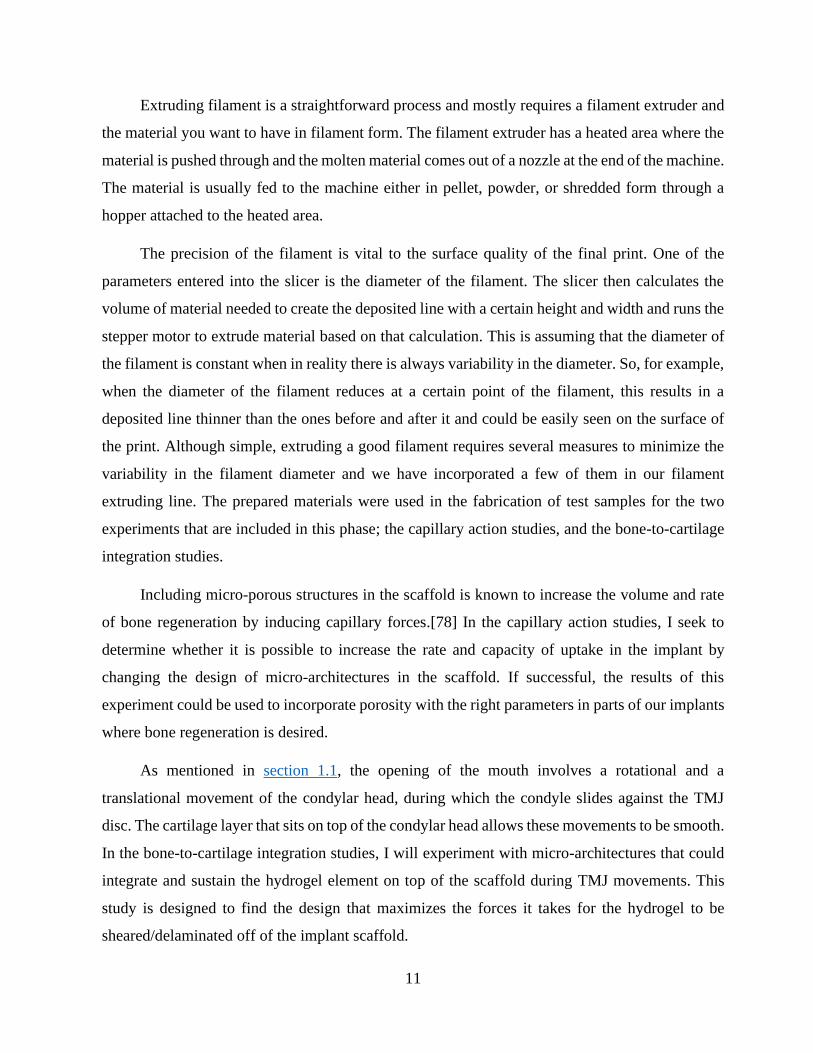
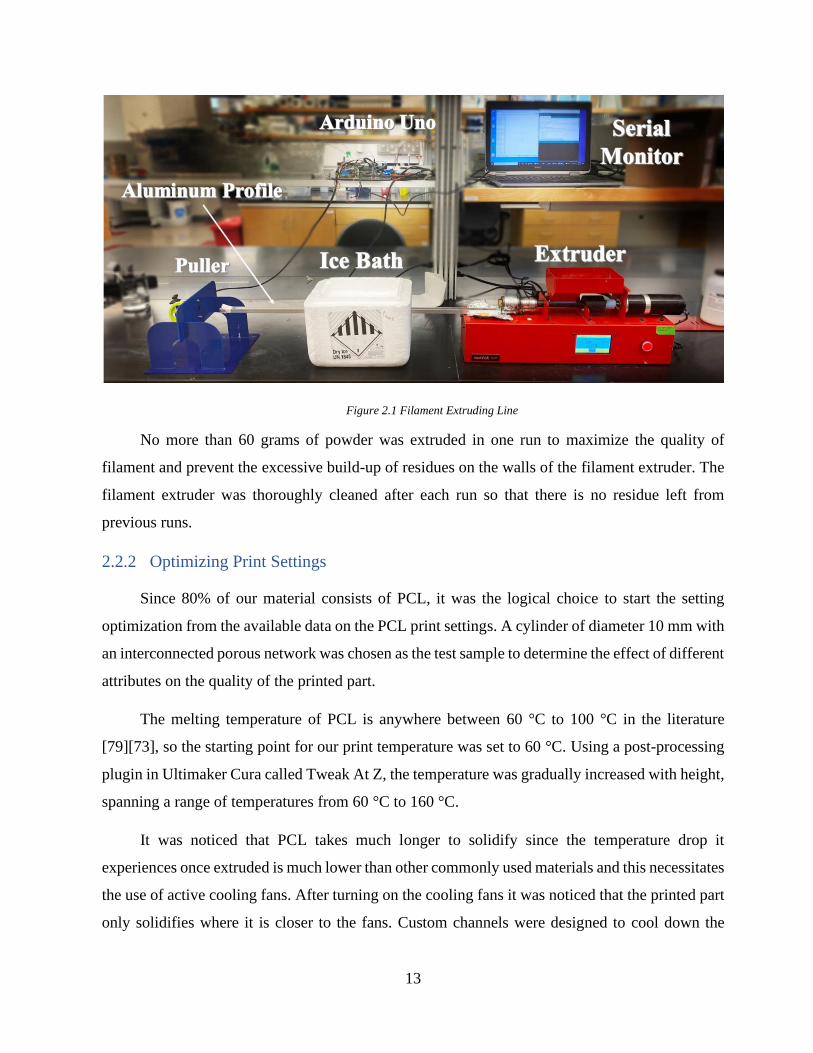
The filament extruder heats the material in two phases using two separate heating elements.
The speed of extruding the filament and the temperature for both heating elements are controlled
via the touchscreen panel on the machine. The first and the second heating elements were set to 80
°C and 140 °C, respectively. The speed of the extruding motor was set to 30 rpm. Figure 2.1 shows
the units that make up the filament extruding line.
The extruded filament was then directed towards a U-shaped aluminum profile of
approximately 1m lengths, filled with deionized water that is placed in an ice bath. After cooling
down and solidifying, the filament was fed to the puller and the speed of pulling was adjusted to
achieve the correct diameter. The filament was made in both 1.75 mm and 2.85 mm diameters for
use with different 3D printers.
A similar gearbox to that of a direct drive 3D printer extruder was used in place of a puller
to control the speed with which the filament is being pulled. The stepper motor in the puller unit
is connected to an Arduino Uno and the speed is controlled via a potentiometer or the serial
monitor. The extruded filament was then coiled around a filament spool using a filament winder
(Noztek Filament Winder 1.0).
13
Figure 2.1 Filament Extruding Line
No more than 60 grams of powder was extruded in one run to maximize the quality of
filament and prevent the excessive build-up of residues on the walls of the filament extruder. The
filament extruder was thoroughly cleaned after each run so that there is no residue left from
previous runs.
2.2.2 Optimizing Print Settings
Since 80% of our material consists of PCL, it was the logical choice to start the setting
optimization from the available data on the PCL print settings. A cylinder of diameter 10 mm with
an interconnected porous network was chosen as the test sample to determine the effect of different
attributes on the quality of the printed part.
The melting temperature of PCL is anywhere between 60 °C to 100 °C in the literature
[79][73], so the starting point for our print temperature was set to 60 °C. Using a post-processing
plugin in Ultimaker Cura called Tweak At Z, the temperature was gradually increased with height,
spanning a range of temperatures from 60 °C to 160 °C.
It was noticed that PCL takes much longer to solidify since the temperature drop it
experiences once extruded is much lower than other commonly used materials and this necessitates
the use of active cooling fans. After turning on the cooling fans it was noticed that the printed part
only solidifies where it is closer to the fans. Custom channels were designed to cool down the

14
printed parts in a more uniform way. This addition visibly improved the quality of the printed
parts.
After determining a feasible print temperature, print speed was decreased from 30 mm/s to
1 mm/s, and the flow rate was increased from 80% to 120%, following the same method. Print bed
temperature was decreased from 80 °C to 30 °C for separate test samples since it only affects the
first layer of the print. Other settings such as retraction, fan speed, and minimum layer time were
modified after a satisfactory print was achieved to optimize the quality.
The material was ultimately printed with the following settings:
• print temperature: 135 °C
• bed temperature: 38 °C
• print speed:
O shell speed: 10 mm/s
O support speed: 10 mm/s
O infill speed: 2.5 mm/s
• fan speed: 100%
• flow rate: calculated based on the diameter of the filament
2.2.3 Capillary Action Studies
Test samples were made to determine the response of capillary actions to different micro-
architectures. Porous cubes of size 12x12x12 mm3 with 3 different pore sizes (0.6 mm, 0.8 mm,
1.0 mm line distance) and 3 different layer heights (0.12 mm, 0.18 mm, 0.3 mm) were used for the
capillary action studies. Each group had 3 samples (n=3) and all samples were cleaned with 70%
ethanol and then air-dried to remove any grease or dirt before the experiments were done.
15
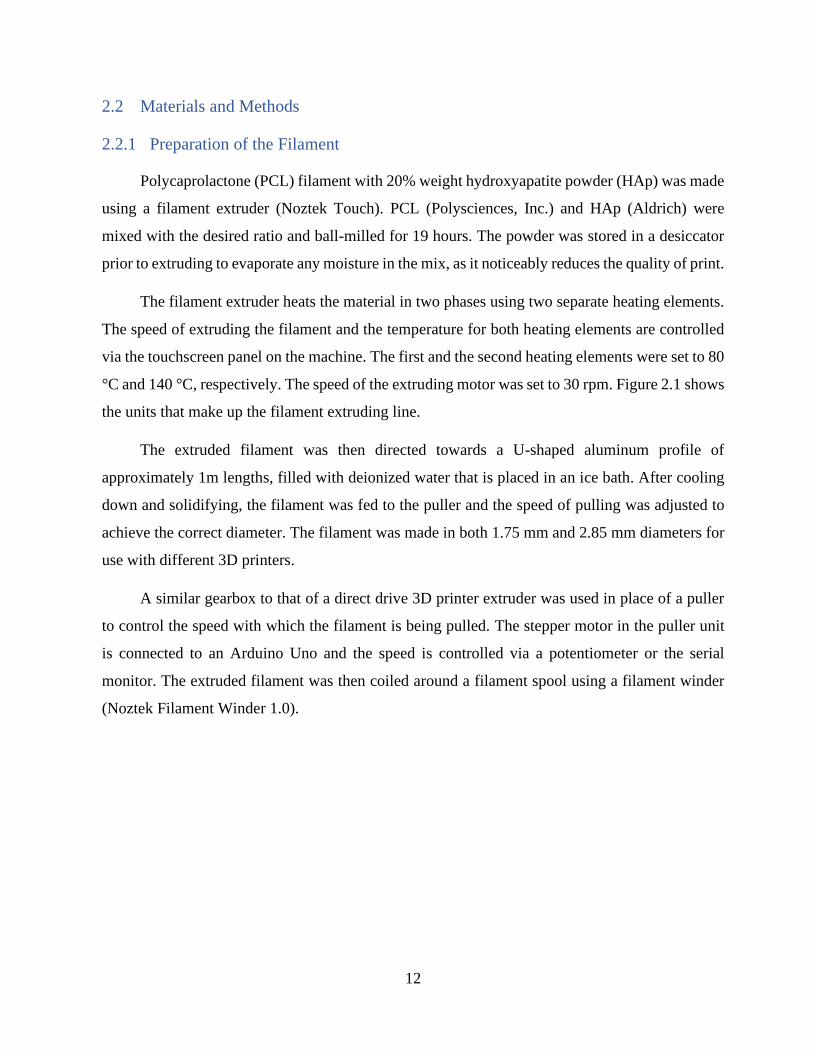
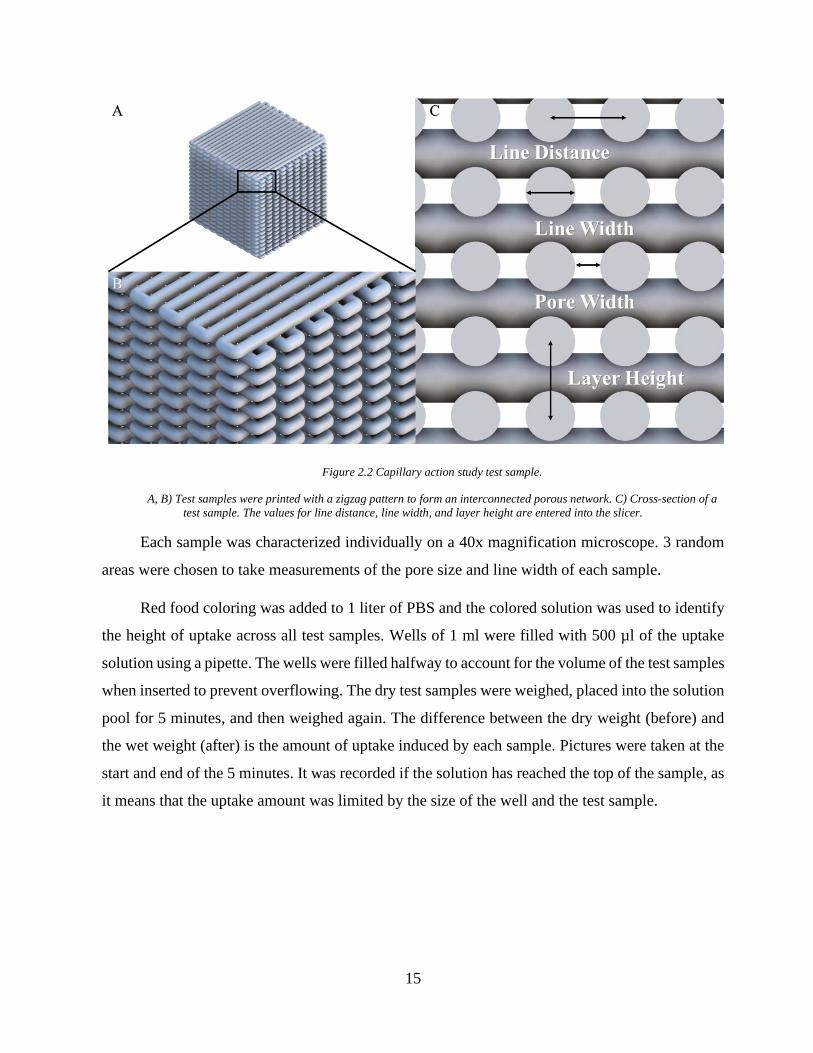
Figure 2.2 Capillary action study test sample.
A, B) Test samples were printed with a zigzag pattern to form an interconnected porous network. C) Cross-section of a
test sample. The values for line distance, line width, and layer height are entered into the slicer.
Each sample was characterized individually on a 40x magnification microscope. 3 random
areas were chosen to take measurements of the pore size and line width of each sample.
Red food coloring was added to 1 liter of PBS and the colored solution was used to identify
the height of uptake across all test samples. Wells of 1 ml were filled with 500 µl of the uptake
solution using a pipette. The wells were filled halfway to account for the volume of the test samples
when inserted to prevent overflowing. The dry test samples were weighed, placed into the solution
pool for 5 minutes, and then weighed again. The difference between the dry weight (before) and
the wet weight (after) is the amount of uptake induced by each sample. Pictures were taken at the
start and end of the 5 minutes. It was recorded if the solution has reached the top of the sample, as
it means that the uptake amount was limited by the size of the well and the test sample.
16
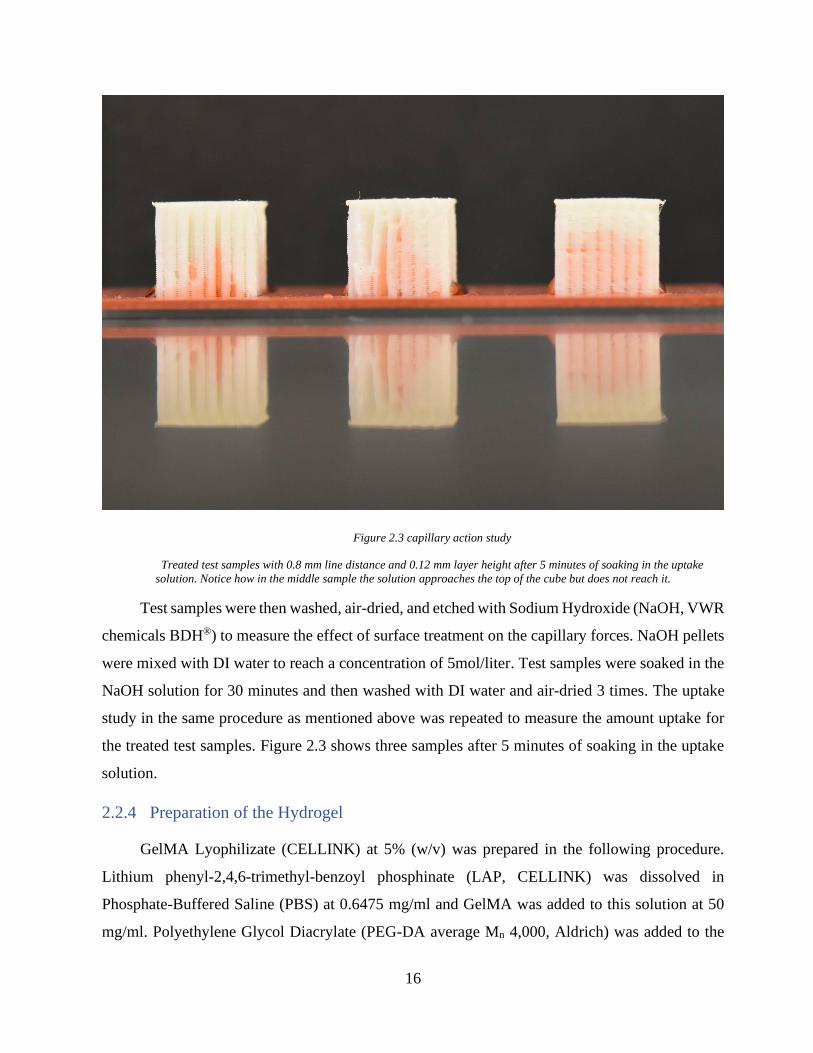
Figure 2.3 capillary action study
Treated test samples with 0.8 mm line distance and 0.12 mm layer height after 5 minutes of soaking in the uptake
solution. Notice how in the middle sample the solution approaches the top of the cube but does not reach it.
Test samples were then washed, air-dried, and etched with Sodium Hydroxide (NaOH, VWR
chemicals BDH®) to measure the effect of surface treatment on the capillary forces. NaOH pellets
were mixed with DI water to reach a concentration of 5mol/liter. Test samples were soaked in the
NaOH solution for 30 minutes and then washed with DI water and air-dried 3 times. The uptake
study in the same procedure as mentioned above was repeated to measure the amount uptake for
the treated test samples. Figure 2.3 shows three samples after 5 minutes of soaking in the uptake
solution.
2.2.4 Preparation of the Hydrogel
GelMA Lyophilizate (CELLINK) at 5% (w/v) was prepared in the following procedure.
Lithium phenyl-2,4,6-trimethyl-benzoyl phosphinate (LAP, CELLINK) was dissolved in
Phosphate-Buffered Saline (PBS) at 0.6475 mg/ml and GelMA was added to this solution at 50
mg/ml. Polyethylene Glycol Diacrylate (PEG-DA average Mn 4,000, Aldrich) was added to the

17
solution until it reached 10% (w/v) of the mix. The final mix was placed in a bead bath at 37 °C
and then vortexed until the GelMA was dissolved and the mix was homogeneous. The mix was
cooled down to room temperature (25 °C) and stored away from light.
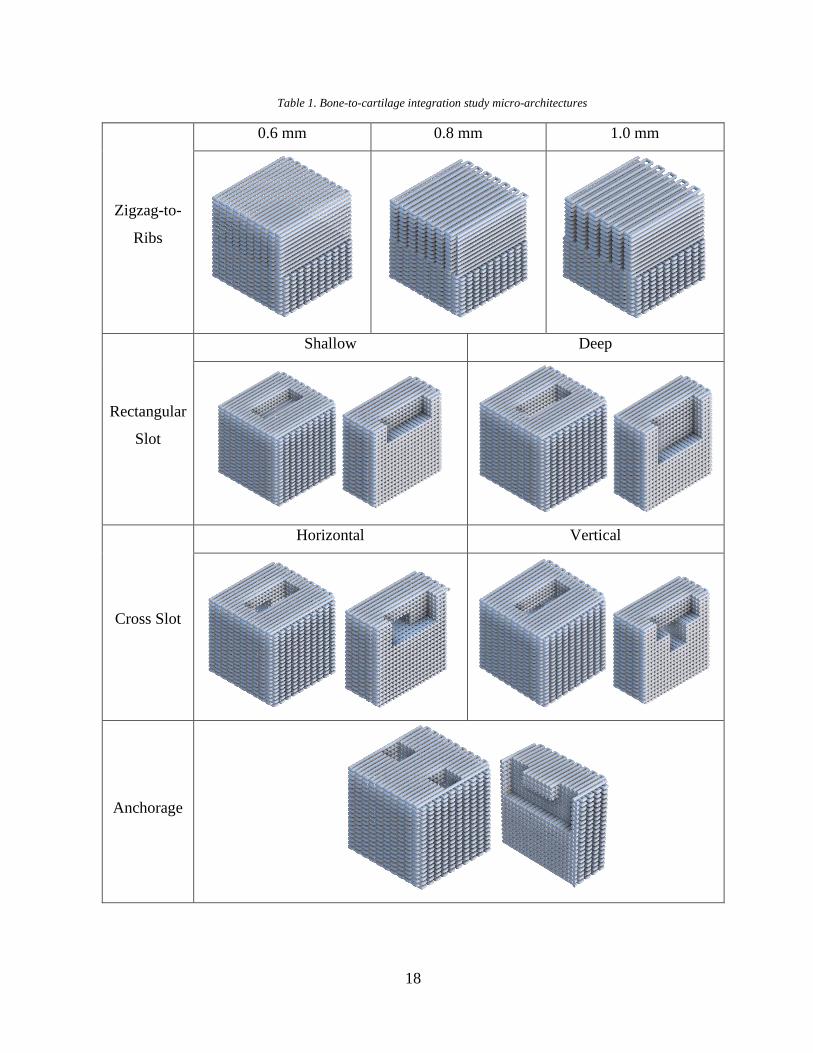
2.2.5 Bone-to-Cartilage Integration Studies
Test samples with different geometries were made to assess the effect of different micro-
architectures on bone-to-cartilage integration. These samples consisted of the micro-architecture
most successful in the capillary action studies with the addition of features that could potentially
reinforce the bond between the hydrogel and the scaffold. Different designs included:
• zigzag-to-ribs:
O from 0.6 mm zigzag on the bottom half to 0.6 mm ribs on the top half
O from 0.6 mm zigzag on the bottom half to 0.8 mm ribs on the top half
O from 0.6 mm zigzag on the bottom half to 1.0 mm ribs on the top half
• rectangular slot:
O shallow (3x8x3 mm3)
O deep (3x8x6 mm3)
• cross slot:
O horizontal
O vertical
• anchorage:
O 2 slots (3x3x3 mm3) connected through a channel (3x8x3 mm3)
A schematic representation of these designs is shown in table 1.
18
Table 1. Bone-to-cartilage integration study micro-architectures
Zigzag-to-
Ribs
0.6 mm 0.8 mm 1.0 mm
Rectangular
Slot
Shallow Deep
Cross Slot
Horizontal Vertical
Anchorage
19
Prior to conducting the study, samples were etched and washed as established in chapter
2.2.4. The hydrogel prepared above (in chapter 3.2.2) was manually syringed inside the test
samples that had slots/anchors. These samples were then placed on the build plate of the
BioAssemblyBot (BAB, Advanced Solutions Life Sciences) and were registered with a 3D
representation of the same sample inside the BAB’s dedicated 3D modeling software Tissue
Structure Information Modeling (TSIM). A rectangular box of size 10x10x2 mm3 was printed on
top of all samples with the hydrogel. Test samples were crosslinked for 10 minutes before the
integration study.
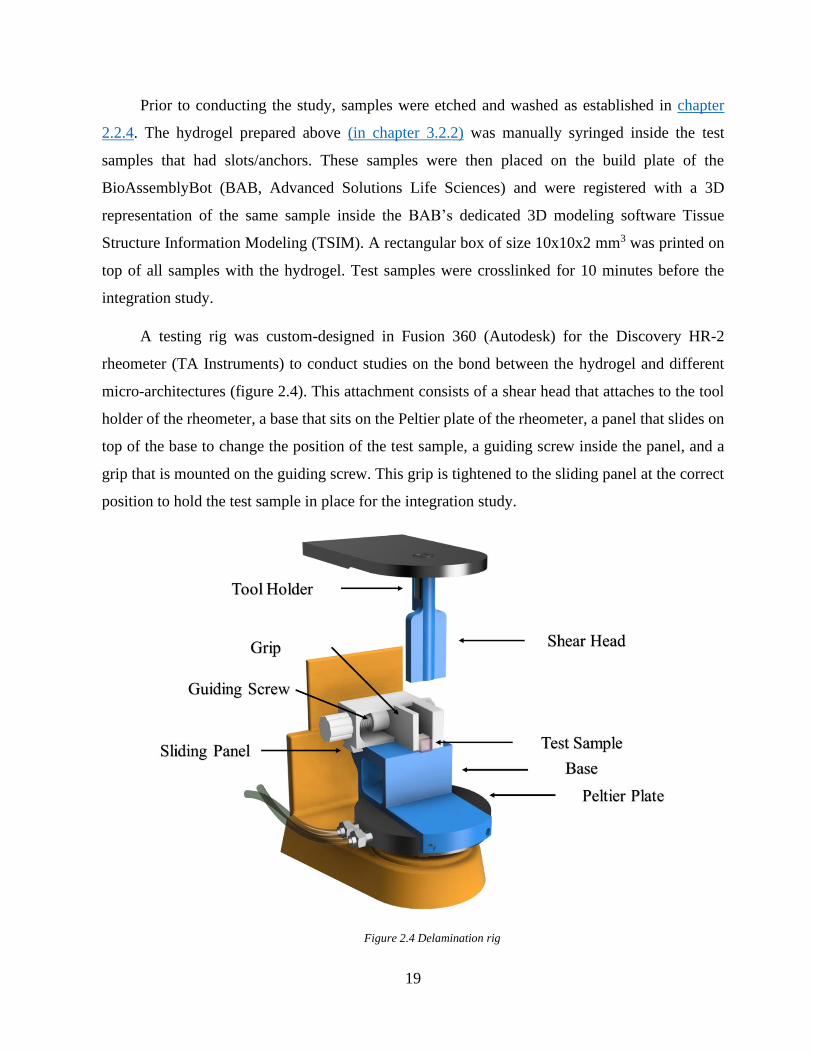
A testing rig was custom-designed in Fusion 360 (Autodesk) for the Discovery HR-2
rheometer (TA Instruments) to conduct studies on the bond between the hydrogel and different
micro-architectures (figure 2.4). This attachment consists of a shear head that attaches to the tool
holder of the rheometer, a base that sits on the Peltier plate of the rheometer, a panel that slides on
top of the base to change the position of the test sample, a guiding screw inside the panel, and a
grip that is mounted on the guiding screw. This grip is tightened to the sliding panel at the correct
position to hold the test sample in place for the integration study.
Figure 2.4 Delamination rig
20
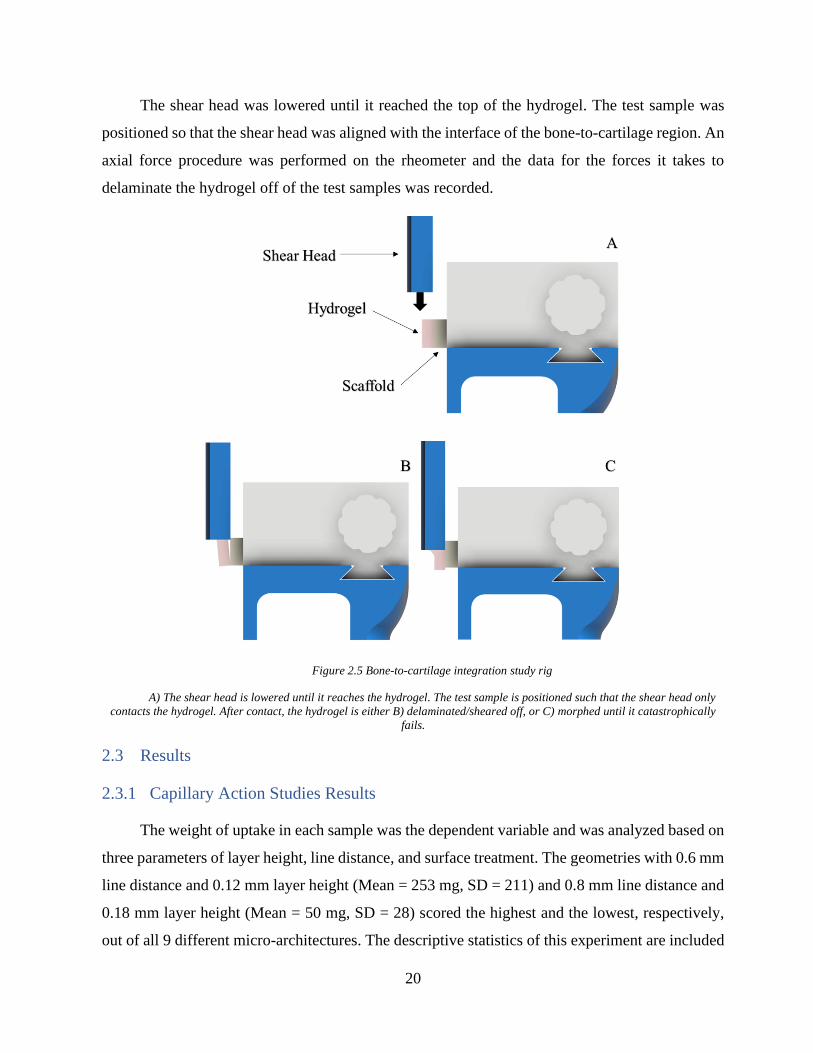
The shear head was lowered until it reached the top of the hydrogel. The test sample was
positioned so that the shear head was aligned with the interface of the bone-to-cartilage region. An
axial force procedure was performed on the rheometer and the data for the forces it takes to
delaminate the hydrogel off of the test samples was recorded.
Figure 2.5 Bone-to-cartilage integration study rig
A) The shear head is lowered until it reaches the hydrogel. The test sample is positioned such that the shear head only
contacts the hydrogel. After contact, the hydrogel is either B) delaminated/sheared off, or C) morphed until it catastrophically
fails.
2.3 Results
2.3.1 Capillary Action Studies Results
The weight of uptake in each sample was the dependent variable and was analyzed based on
three parameters of layer height, line distance, and surface treatment. The geometries with 0.6 mm
line distance and 0.12 mm layer height (Mean = 253 mg, SD = 211) and 0.8 mm line distance and
0.18 mm layer height (Mean = 50 mg, SD = 28) scored the highest and the lowest, respectively,
out of all 9 different micro-architectures. The descriptive statistics of this experiment are included
21
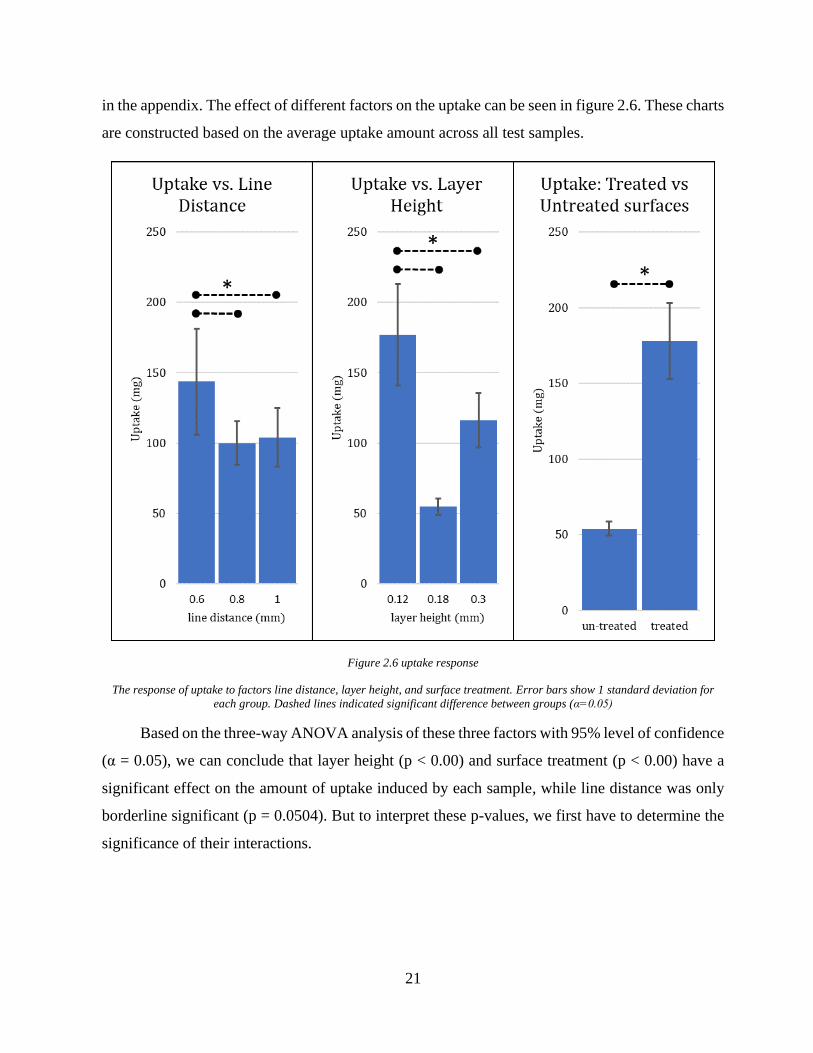
in the appendix. The effect of different factors on the uptake can be seen in figure 2.6. These charts
are constructed based on the average uptake amount across all test samples.
Figure 2.6 uptake response
The response of uptake to factors line distance, layer height, and surface treatment. Error bars show 1 standard deviation for
each group. Dashed lines indicated significant difference between groups (α=0.05)
Based on the three-way ANOVA analysis of these three factors with 95% level of confidence
(α = 0.05), we can conclude that layer height (p < 0.00) and surface treatment (p < 0.00) have a
significant effect on the amount of uptake induced by each sample, while line distance was only
borderline significant (p = 0.0504). But to interpret these p-values, we first have to determine the
significance of their interactions.
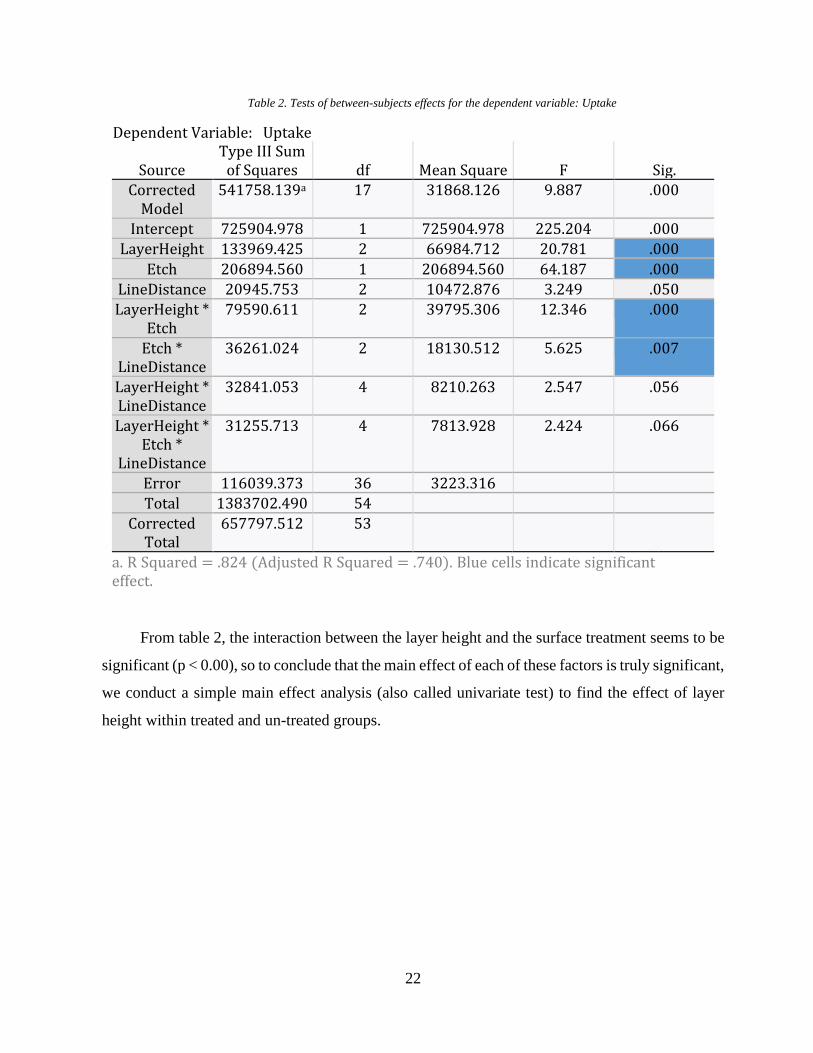
22
Table 2. Tests of between-subjects effects for the dependent variable: Uptake
Dependent Variable: Uptake
Source Type III Sum
of Squares df Mean Square F Sig. Corrected
Model 541758.139a 17 31868.126 9.887 .000
Intercept 725904.978 1 725904.978 225.204 .000
LayerHeight 133969.425 2 66984.712 20.781 .000
Etch 206894.560 1 206894.560 64.187 .000
LineDistance 20945.753 2 10472.876 3.249 .050
LayerHeight * Etch
79590.611 2 39795.306 12.346 .000
Etch * LineDistance
36261.024 2 18130.512 5.625 .007
LayerHeight * LineDistance
32841.053 4 8210.263 2.547 .056
LayerHeight * Etch *
LineDistance
31255.713 4 7813.928 2.424 .066
Error 116039.373 36 3223.316
Total 1383702.490 54
Corrected Total
657797.512 53
a. R Squared = .824 (Adjusted R Squared = .740). Blue cells indicate significant effect.
From table 2, the interaction between the layer height and the surface treatment seems to be
significant (p < 0.00), so to conclude that the main effect of each of these factors is truly significant,
we conduct a simple main effect analysis (also called univariate test) to find the effect of layer
height within treated and un-treated groups.
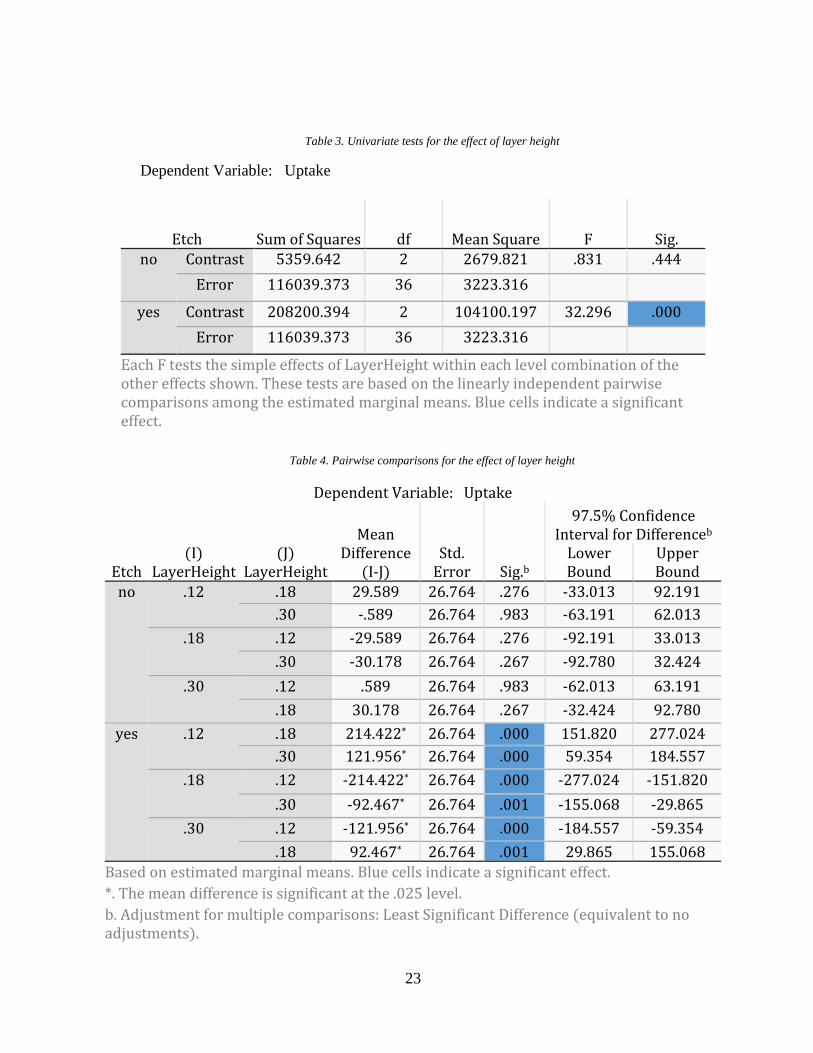
23
Table 3. Univariate tests for the effect of layer height
Dependent Variable: Uptake
Etch Sum of Squares df Mean Square F Sig. no Contrast 5359.642 2 2679.821 .831 .444
Error 116039.373 36 3223.316
yes Contrast 208200.394 2 104100.197 32.296 .000
Error 116039.373 36 3223.316
Each F tests the simple effects of LayerHeight within each level combination of the other effects shown. These tests are based on the linearly independent pairwise comparisons among the estimated marginal means. Blue cells indicate a significant effect.
Table 4. Pairwise comparisons for the effect of layer height
Dependent Variable: Uptake
Etch (I)
LayerHeight (J)
LayerHeight
Mean Difference
(I-J) Std.
Error Sig.b
97.5% Confidence Interval for Differenceb
Lower Bound
Upper Bound
no .12 .18 29.589 26.764 .276 -33.013 92.191
.30 -.589 26.764 .983 -63.191 62.013
.18 .12 -29.589 26.764 .276 -92.191 33.013
.30 -30.178 26.764 .267 -92.780 32.424
.30 .12 .589 26.764 .983 -62.013 63.191
.18 30.178 26.764 .267 -32.424 92.780
yes .12 .18 214.422* 26.764 .000 151.820 277.024
.30 121.956* 26.764 .000 59.354 184.557
.18 .12 -214.422* 26.764 .000 -277.024 -151.820
.30 -92.467* 26.764 .001 -155.068 -29.865
.30 .12 -121.956* 26.764 .000 -184.557 -59.354
.18 92.467* 26.764 .001 29.865 155.068
Based on estimated marginal means. Blue cells indicate a significant effect.
*. The mean difference is significant at the .025 level.
b. Adjustment for multiple comparisons: Least Significant Difference (equivalent to no adjustments).
24
Table 3 shows that the effect of layer height when the samples are not etched is insignificant
on the amount of uptake (p = 0.44). This is while in the treated group, the layer height seems to be
having a significant effect (p < 0.00). To interpret this significance, we have to look at the pairwise
comparisons of different levels of layer height when they are etched. From table 4 it can be seen
that when treated, layer height has a significant effect on the uptake amount in all three levels.
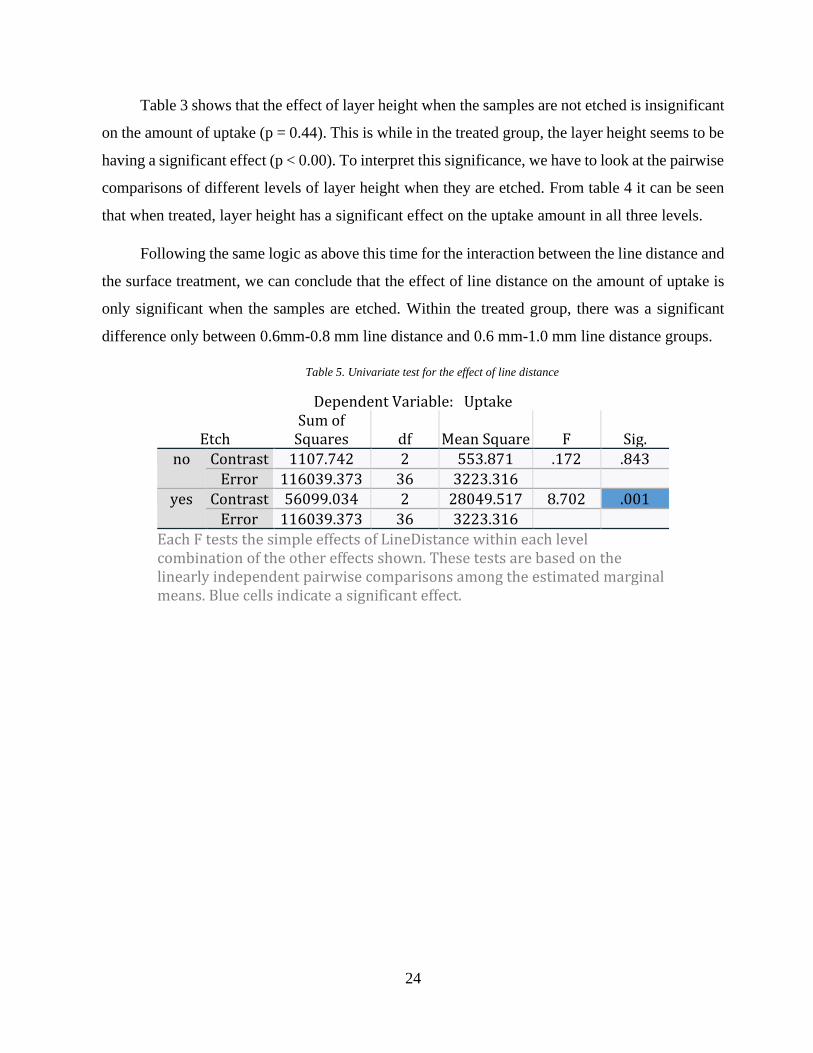
Following the same logic as above this time for the interaction between the line distance and
the surface treatment, we can conclude that the effect of line distance on the amount of uptake is
only significant when the samples are etched. Within the treated group, there was a significant
difference only between 0.6mm-0.8 mm line distance and 0.6 mm-1.0 mm line distance groups.
Table 5. Univariate test for the effect of line distance
Dependent Variable: Uptake
Etch Sum of
Squares df Mean Square F Sig. no Contrast 1107.742 2 553.871 .172 .843
Error 116039.373 36 3223.316 yes Contrast 56099.034 2 28049.517 8.702 .001
Error 116039.373 36 3223.316
Each F tests the simple effects of LineDistance within each level combination of the other effects shown. These tests are based on the linearly independent pairwise comparisons among the estimated marginal means. Blue cells indicate a significant effect.
25
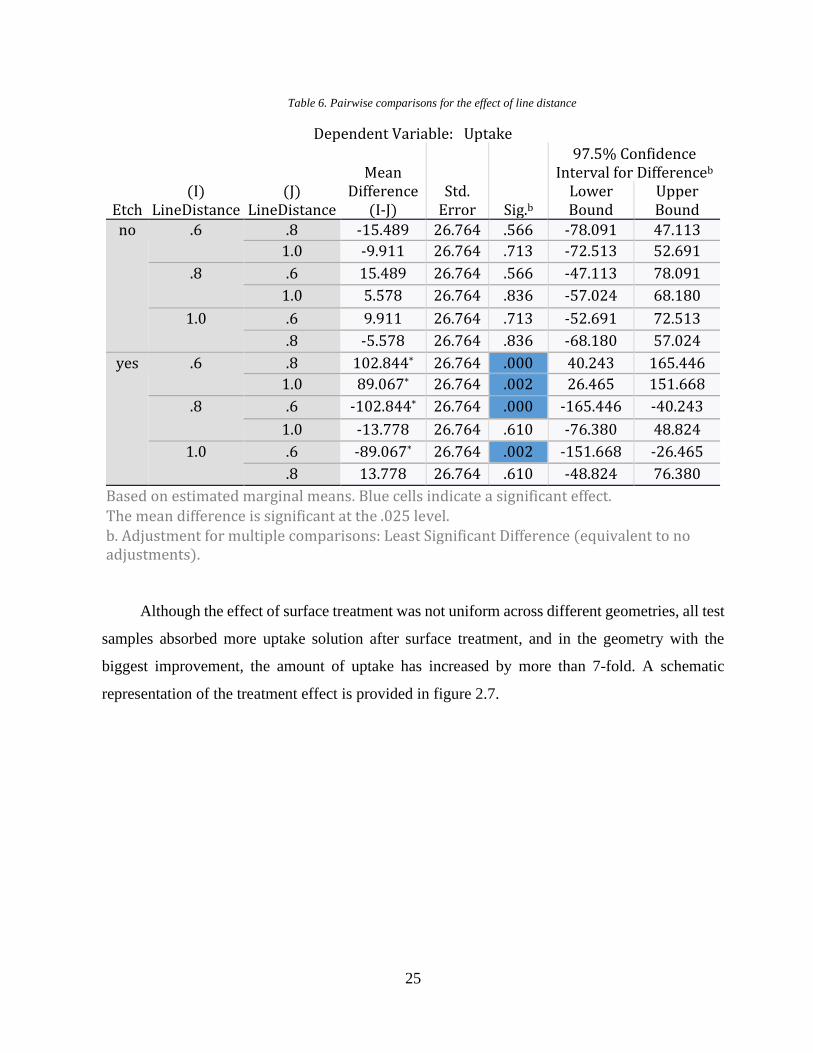
Table 6. Pairwise comparisons for the effect of line distance
Dependent Variable: Uptake
Etch (I)
LineDistance (J)
LineDistance
Mean Difference
(I-J) Std.
Error Sig.b
97.5% Confidence Interval for Differenceb
Lower Bound
Upper Bound
no .6 .8 -15.489 26.764 .566 -78.091 47.113
1.0 -9.911 26.764 .713 -72.513 52.691
.8 .6 15.489 26.764 .566 -47.113 78.091
1.0 5.578 26.764 .836 -57.024 68.180
1.0 .6 9.911 26.764 .713 -52.691 72.513
.8 -5.578 26.764 .836 -68.180 57.024
yes .6 .8 102.844* 26.764 .000 40.243 165.446
1.0 89.067* 26.764 .002 26.465 151.668
.8 .6 -102.844* 26.764 .000 -165.446 -40.243
1.0 -13.778 26.764 .610 -76.380 48.824
1.0 .6 -89.067* 26.764 .002 -151.668 -26.465
.8 13.778 26.764 .610 -48.824 76.380
Based on estimated marginal means. Blue cells indicate a significant effect. The mean difference is significant at the .025 level. b. Adjustment for multiple comparisons: Least Significant Difference (equivalent to no adjustments).
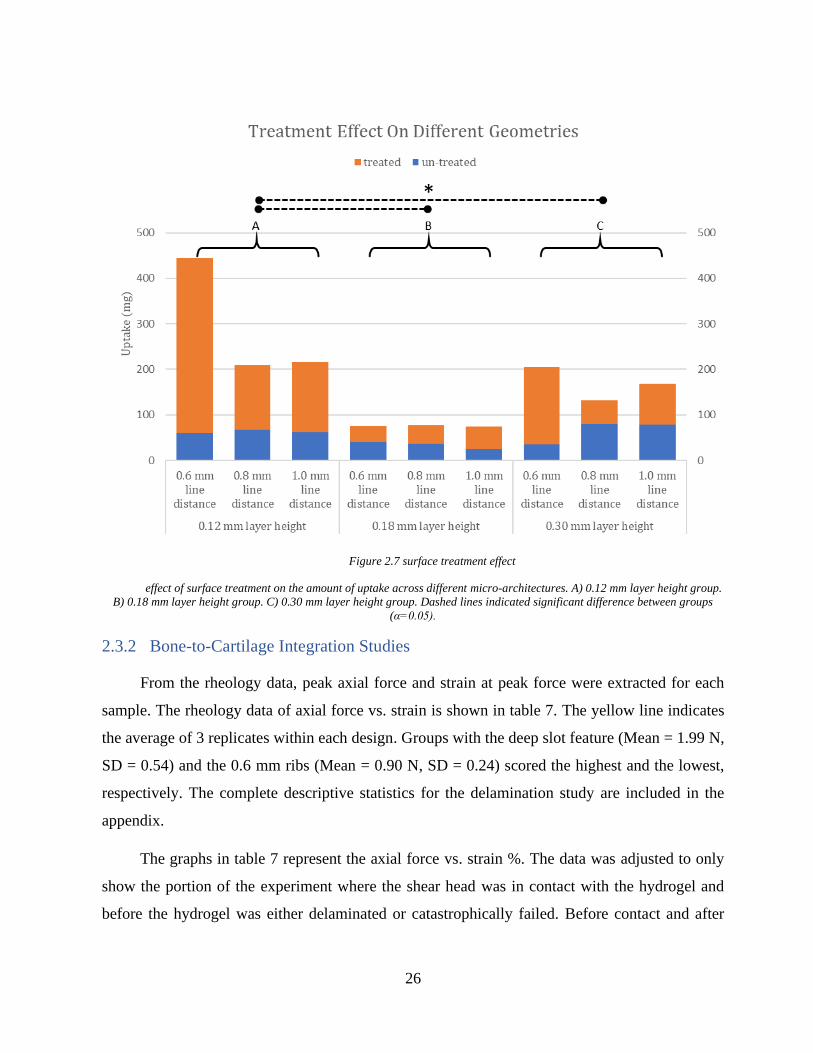
Although the effect of surface treatment was not uniform across different geometries, all test
samples absorbed more uptake solution after surface treatment, and in the geometry with the
biggest improvement, the amount of uptake has increased by more than 7-fold. A schematic
representation of the treatment effect is provided in figure 2.7.
26
Figure 2.7 surface treatment effect
effect of surface treatment on the amount of uptake across different micro-architectures. A) 0.12 mm layer height group.
B) 0.18 mm layer height group. C) 0.30 mm layer height group. Dashed lines indicated significant difference between groups
(α=0.05).
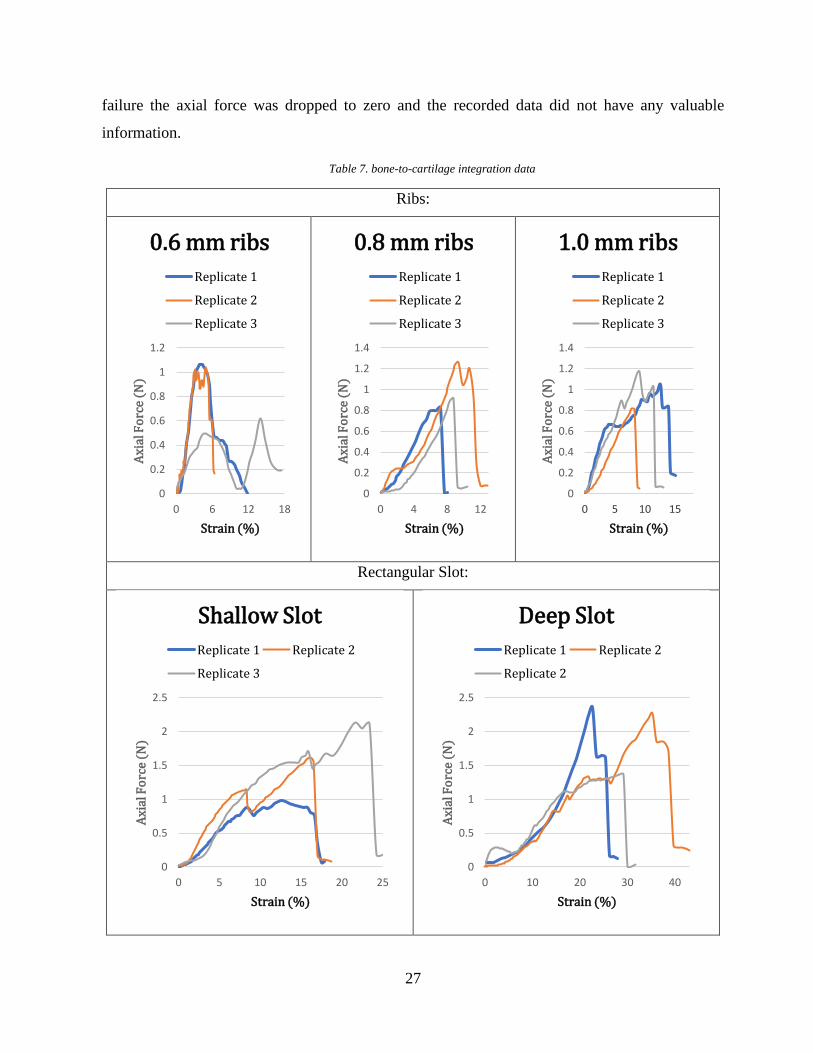
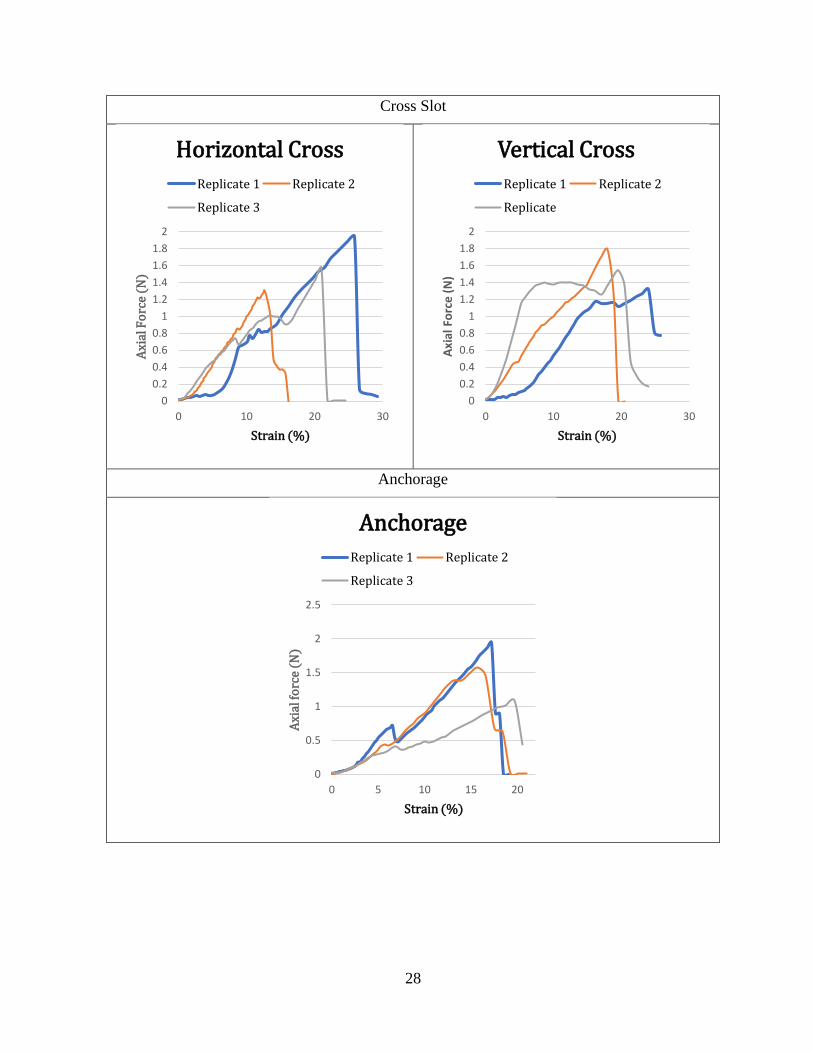
2.3.2 Bone-to-Cartilage Integration Studies
From the rheology data, peak axial force and strain at peak force were extracted for each
sample. The rheology data of axial force vs. strain is shown in table 7. The yellow line indicates
the average of 3 replicates within each design. Groups with the deep slot feature (Mean = 1.99 N,
SD = 0.54) and the 0.6 mm ribs (Mean = 0.90 N, SD = 0.24) scored the highest and the lowest,
respectively. The complete descriptive statistics for the delamination study are included in the
appendix.
The graphs in table 7 represent the axial force vs. strain %. The data was adjusted to only
show the portion of the experiment where the shear head was in contact with the hydrogel and
before the hydrogel was either delaminated or catastrophically failed. Before contact and after
27
failure the axial force was dropped to zero and the recorded data did not have any valuable
information.
Table 7. bone-to-cartilage integration data
Ribs:
Rectangular Slot:
0
0.2
0.4
0.6
0.8
1
1.2
0 6 12 18
Axi
al F
orc
e (N
)
Strain (%)
0.6 mm ribs
Replicate 1
Replicate 2
Replicate 3
0
0.2
0.4
0.6
0.8
1
1.2
1.4
0 4 8 12
Axi
al F
orc
e (N
)
Strain (%)
0.8 mm ribs
Replicate 1
Replicate 2
Replicate 3
0
0.2
0.4
0.6
0.8
1
1.2
1.4
0 5 10 15
Axi
al F
orc
e (N
)
Strain (%)
1.0 mm ribs
Replicate 1
Replicate 2
Replicate 3
0
0.5
1
1.5
2
2.5
0 5 10 15 20 25
Axi
al F
orc
e (N
)
Strain (%)
Shallow Slot
Replicate 1 Replicate 2
Replicate 3
0
0.5
1
1.5
2
2.5
0 10 20 30 40
Axi
al F
orc
e (N
)
Strain (%)
Deep Slot
Replicate 1 Replicate 2
Replicate 2
28
Cross Slot
Anchorage
0
0.2
0.4
0.6
0.8
1
1.2
1.4
1.6
1.8
2
0 10 20 30
Axi
al F
orc
e (N
)
Strain (%)
Horizontal Cross
Replicate 1 Replicate 2
Replicate 3
0
0.2
0.4
0.6
0.8
1
1.2
1.4
1.6
1.8
2
0 10 20 30
Axi
al F
orc
e (
N)
Strain (%)
Vertical Cross
Replicate 1 Replicate 2
Replicate
0
0.5
1
1.5
2
2.5
0 5 10 15 20
Axi
al fo
rce
(N)
Strain (%)
Anchorage
Replicate 1 Replicate 2
Replicate 3
29
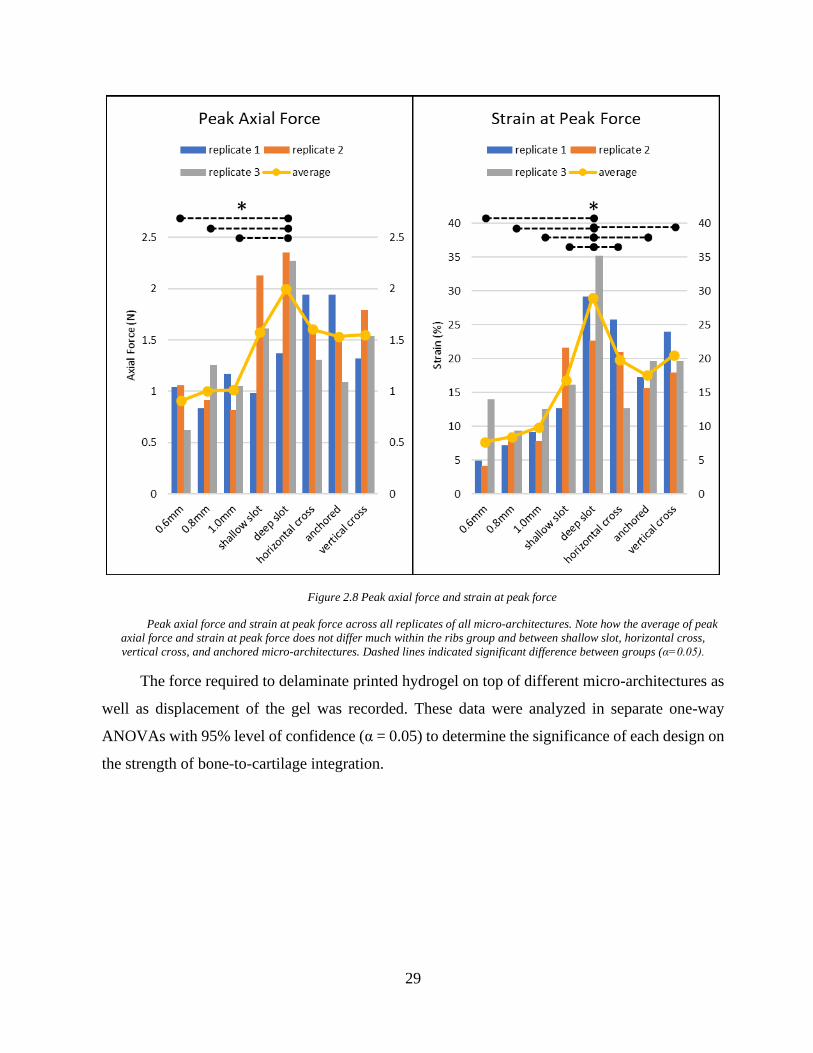
Figure 2.8 Peak axial force and strain at peak force
Peak axial force and strain at peak force across all replicates of all micro-architectures. Note how the average of peak
axial force and strain at peak force does not differ much within the ribs group and between shallow slot, horizontal cross,
vertical cross, and anchored micro-architectures. Dashed lines indicated significant difference between groups (α=0.05).
The force required to delaminate printed hydrogel on top of different micro-architectures as
well as displacement of the gel was recorded. These data were analyzed in separate one-way
ANOVAs with 95% level of confidence (α = 0.05) to determine the significance of each design on
the strength of bone-to-cartilage integration.
30
Table 8. tests of between-subjects effect for dependent variable: Peak Axial Force
Tests of Between-Subjects Effects
Source
Type III Sum of
Squares df Mean
Square F Sig.
Corrected Model
3.054a 7 .436 3.147 .027
Intercept 46.872 1 46.872 338.101
.000
design 3.054 7 .436 3.147 .027
Error 2.218 16 .139
Total 52.144 24 Corrected
Total 5.272 23
a. R Squared = .579 (Adjusted R Squared = .395). Blue cells indicate significant effect.
Table 9. tests of between-subjects effect for dependent variable: strain at peak
Tests of Between-Subjects Effects
Source
Type III Sum of
Squares df Mean
Square F Sig.
Corrected Model
1115.439a 7 159.348 8.229 .000
Intercept 6309.568 1 6309.568 325.835 .000
design 1115.439 7 159.348 8.229 .000
Error 309.829 16 19.364
Total 7734.836 24
Corrected Total
1425.268 23
a. R Squared = .783 (Adjusted R Squared = .688). Blue cells indicate significant effect.
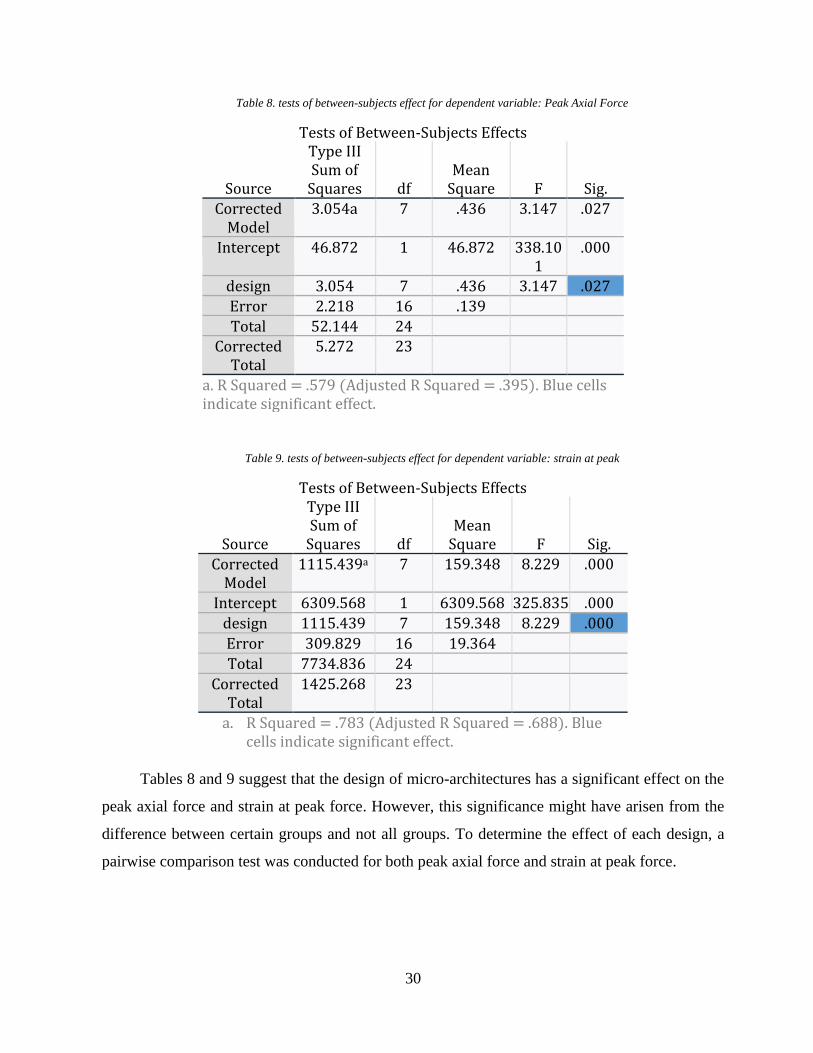
Tables 8 and 9 suggest that the design of micro-architectures has a significant effect on the
peak axial force and strain at peak force. However, this significance might have arisen from the
difference between certain groups and not all groups. To determine the effect of each design, a
pairwise comparison test was conducted for both peak axial force and strain at peak force.
31
Table 10. pairwise comparisons for the effect of design on the Peak Axial Force
Pairwise Comparison:
Peak Axial Force
0.6 mm ribs
0.8 mm ribs
1.0 mm ribs
Shallow Slot
Deep Slot
Horizontal Cross
Vertical Cross
Anchorage
0.6 mm ribs - 0.759 0.734 0.044* 0.002* 0.036* 0.051** 0.056
0.8mm ribs 0.759 - 0.974 0.079 0.005* 0.066 0.091 0.100
1.0 mm ribs 0.734 0.974 - 0.084 0.005* 0.070 0.096 0.106
Shallow Slot 0.044* 0.079 0.084 - 0.183 0.923 0.939 0.896
Deep Slot 0.002* 0.005* 0.005* 0.183 - 0.214 0.161 0.147
Horizontal Cross
0.036* 0.066 0.070 0.923 0.214 - 0.863 0.821
Vertical Cross
0.051** 0.091 0.096 0.939 0.161 0.863 - 0.957
Anchorage 0.056 0.100 0.106 0.896 0.147 0.821 0.957 -
Table 11. pairwise comparisons for the effect of design on the Strain at Peak Force
Pairwise Comparison:
Strain at Peak force
0.6 mm ribs
0.8 mm ribs
1.0 mm ribs
Shallow Slot
Deep Slot
Horizontal Cross
Vertical Cross
Anchorage
0.6 mm ribs - 0.831 0.550 0.022* 0.000* 0.004* 0.003** 0.014*
0.8 mm ribs 0.831 - 0.699 0.033* 0.000* 0.006* 0.004* 0.022*
1.0 mm ribs 0.550 0.699 - 0.071 0.000* 0.014* 0.009* 0.048
Shallow Slot 0.022* 0.033* 0.071 - 0.004* 0.415 0.318 0.841
Deep Slot 0.000* 0.000* 0.000* 0.004* - 0.021* 0.031* 0.006*
Horizontal Cross
0.004* 0.006* 0.014* 0.415 0.021* - 0.848 0.537
Vertical Cross 0.003** 0.004* 0.009* 0.318 0.031* 0.848 - 0.421
Anchorage 0.014* 0.022* 0.048 0.841 0.006* 0.537 0.421 -
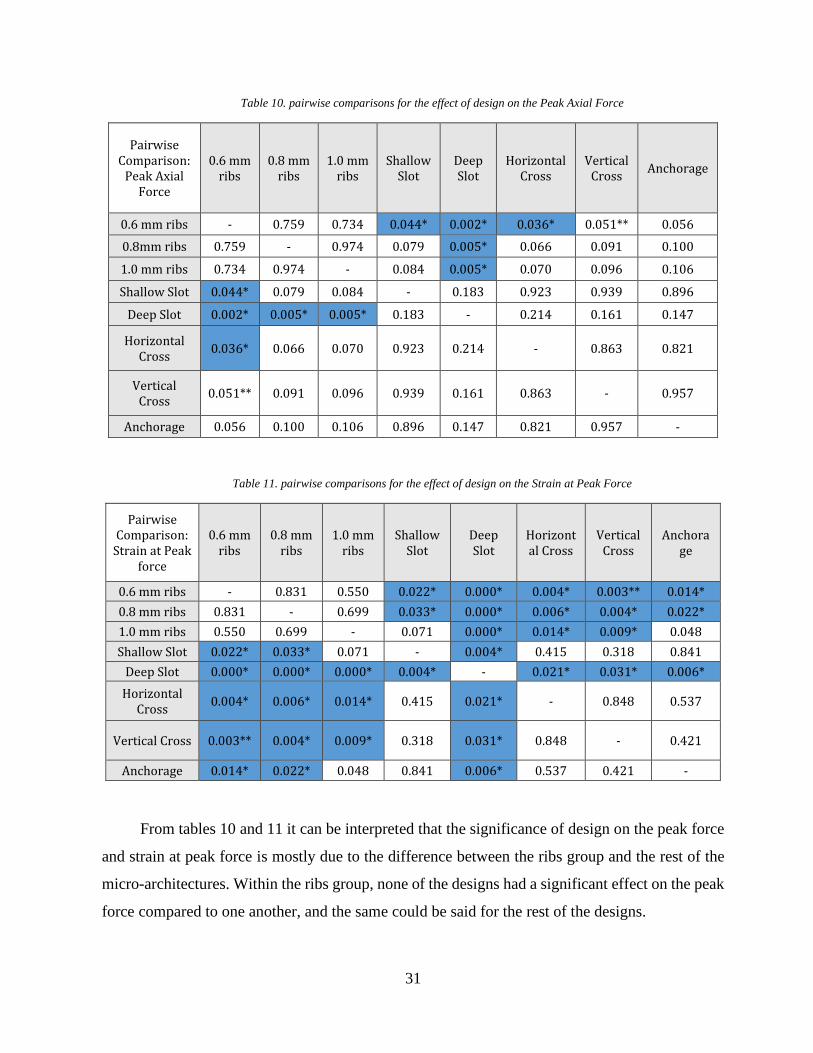
From tables 10 and 11 it can be interpreted that the significance of design on the peak force
and strain at peak force is mostly due to the difference between the ribs group and the rest of the
micro-architectures. Within the ribs group, none of the designs had a significant effect on the peak
force compared to one another, and the same could be said for the rest of the designs.
32
2.4 Discussions
It is evident from the capillary action study data that different geometries in fact induce
different capillary forces. This means we can tailor our architecture in order to expedite the rate of
bone marrow absorption and increase the height it can reach inside our implant. Utilizing these
capillary forces we can ensure that the bone marrow reaches the hydrogel region on top of the
implant.
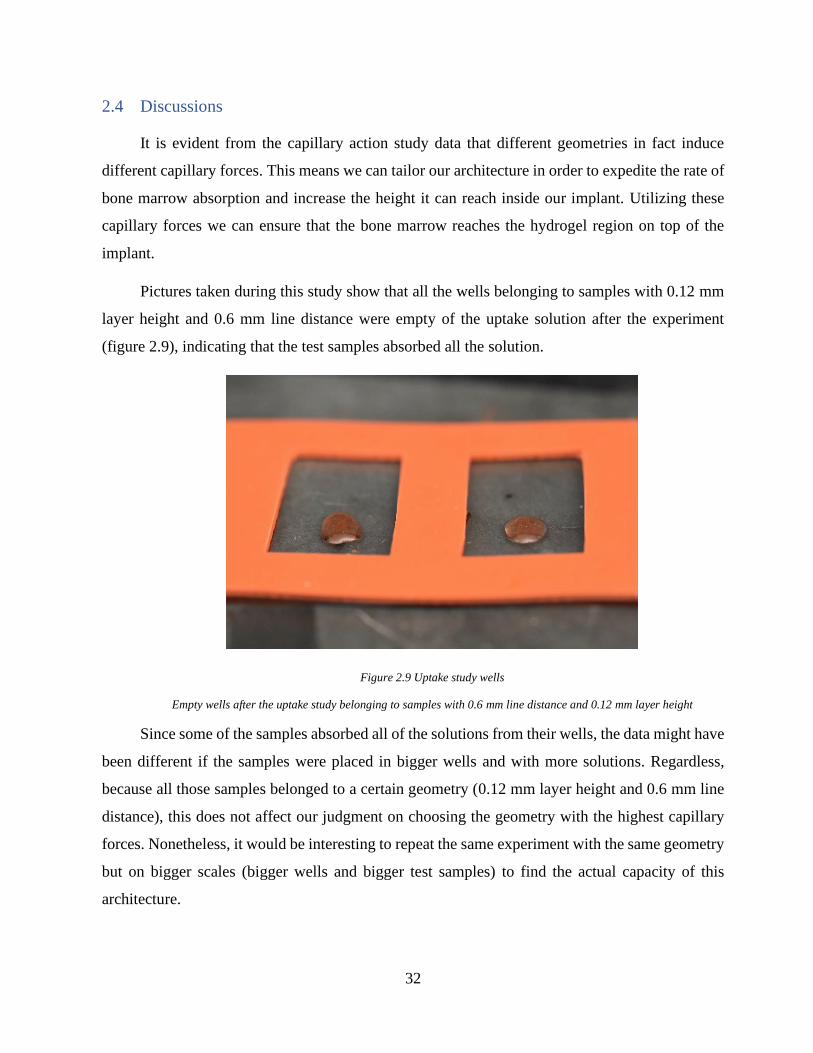
Pictures taken during this study show that all the wells belonging to samples with 0.12 mm
layer height and 0.6 mm line distance were empty of the uptake solution after the experiment
(figure 2.9), indicating that the test samples absorbed all the solution.
Figure 2.9 Uptake study wells
Empty wells after the uptake study belonging to samples with 0.6 mm line distance and 0.12 mm layer height
Since some of the samples absorbed all of the solutions from their wells, the data might have
been different if the samples were placed in bigger wells and with more solutions. Regardless,
because all those samples belonged to a certain geometry (0.12 mm layer height and 0.6 mm line
distance), this does not affect our judgment on choosing the geometry with the highest capillary
forces. Nonetheless, it would be interesting to repeat the same experiment with the same geometry
but on bigger scales (bigger wells and bigger test samples) to find the actual capacity of this
architecture.
33
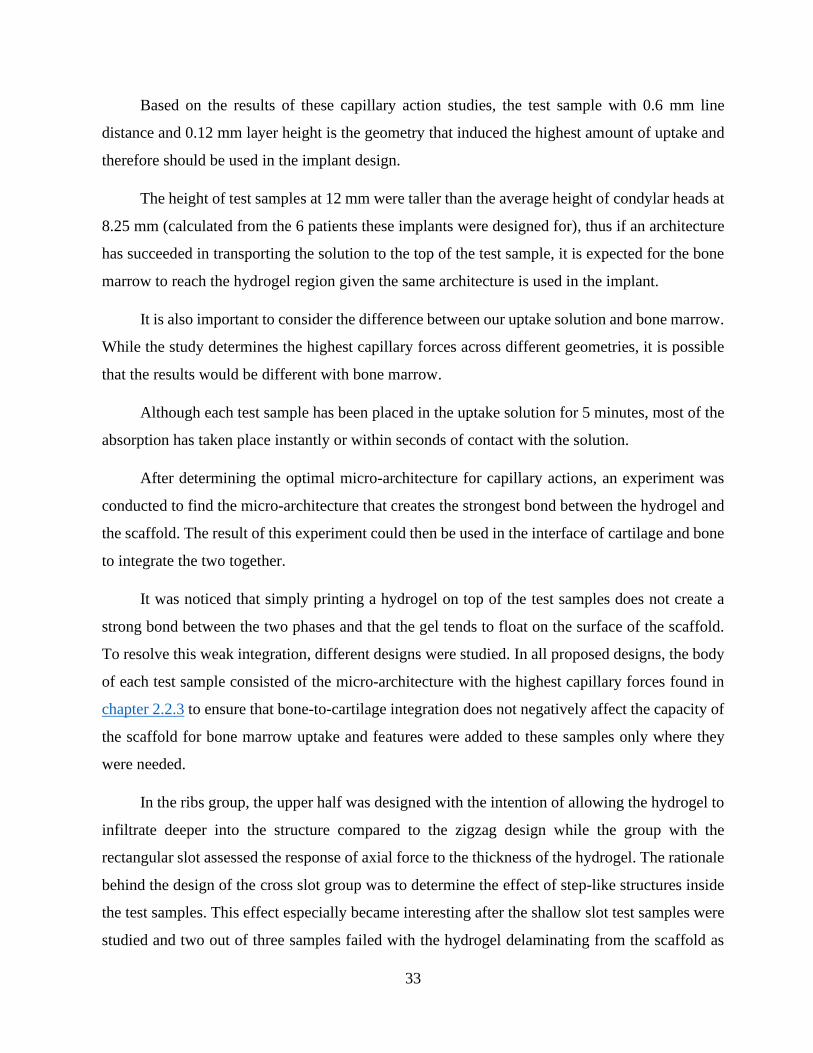
Based on the results of these capillary action studies, the test sample with 0.6 mm line
distance and 0.12 mm layer height is the geometry that induced the highest amount of uptake and
therefore should be used in the implant design.
The height of test samples at 12 mm were taller than the average height of condylar heads at
8.25 mm (calculated from the 6 patients these implants were designed for), thus if an architecture
has succeeded in transporting the solution to the top of the test sample, it is expected for the bone
marrow to reach the hydrogel region given the same architecture is used in the implant.
It is also important to consider the difference between our uptake solution and bone marrow.
While the study determines the highest capillary forces across different geometries, it is possible
that the results would be different with bone marrow.
Although each test sample has been placed in the uptake solution for 5 minutes, most of the
absorption has taken place instantly or within seconds of contact with the solution.
After determining the optimal micro-architecture for capillary actions, an experiment was
conducted to find the micro-architecture that creates the strongest bond between the hydrogel and
the scaffold. The result of this experiment could then be used in the interface of cartilage and bone
to integrate the two together.
It was noticed that simply printing a hydrogel on top of the test samples does not create a
strong bond between the two phases and that the gel tends to float on the surface of the scaffold.
To resolve this weak integration, different designs were studied. In all proposed designs, the body
of each test sample consisted of the micro-architecture with the highest capillary forces found in
chapter 2.2.3 to ensure that bone-to-cartilage integration does not negatively affect the capacity of
the scaffold for bone marrow uptake and features were added to these samples only where they
were needed.
In the ribs group, the upper half was designed with the intention of allowing the hydrogel to
infiltrate deeper into the structure compared to the zigzag design while the group with the
rectangular slot assessed the response of axial force to the thickness of the hydrogel. The rationale
behind the design of the cross slot group was to determine the effect of step-like structures inside
the test samples. This effect especially became interesting after the shallow slot test samples were
studied and two out of three samples failed with the hydrogel delaminating from the scaffold as
34
one piece. This is while in the deep slot, cross slot group (vertical and horizontal), and anchorage
micro-architectures, the hydrogel was not delaminated, rather failed catastrophically. It can be seen
in figure 2.7 that the sample with the shallow slot that did not delaminate as one piece (replicate
2) has a higher peak axial force compared to the other two. This means that trapping the hydrogel
on the surface of the scaffold could increase the peak axial force.
Another consideration was the strain at which the hydrogel was delaminated or failed. This
is important because even if a micro-architecture out-performs other designs at peak axial force,
but ceases to hold the hydrogel intact at a very low strain percentage, it will ultimately fail once
implanted. The optimal configuration will withstand both the force and strain that the native
condylar head experiences in the TMJ.
In the ribs group, due to weak integration, the hydrogel was delaminated in all test samples
and the experiment was finished at a very low strain percentage. The hydrogel on other micro-
architectures did not delaminate and endured a higher strain before failure.
The bone-to-cartilage integration study suggests that the design with the deep slot was the
most successful micro-architecture in both the peak axial force and strain at peak force factors and
with the implementation of this micro-architecture on the interface of the hydrogel and the
scaffold, we can hope to improve the performance of our implant.
35
Phase 2: Macro-Architecture
3.1 Introduction
In phase one we showed that by using certain micro-architectures we can improve the
performance of our test samples. In phase two we will utilize our findings from phase one to design
a full-size TMJ implant.
In this paper our aim is to design and fabricate micro-/macro-architectures that once
implemented, will improve the performance of a full-size implant and the rationale behind the
design of the TMJ implant is outside the scope of this paper.
The general idea of the TMJ implant consists of a porous condylar head attached to the ramus
via a fixture. A contact surface will facilitate bone marrow absorption to the porous condylar head
and provides an environment for the native bone to regenerate as the implant degrades. The
condylar head of the implant mimics the exact shape of the healthy joint and a hydrogel layer on
top of the implant plays the cartilage role.
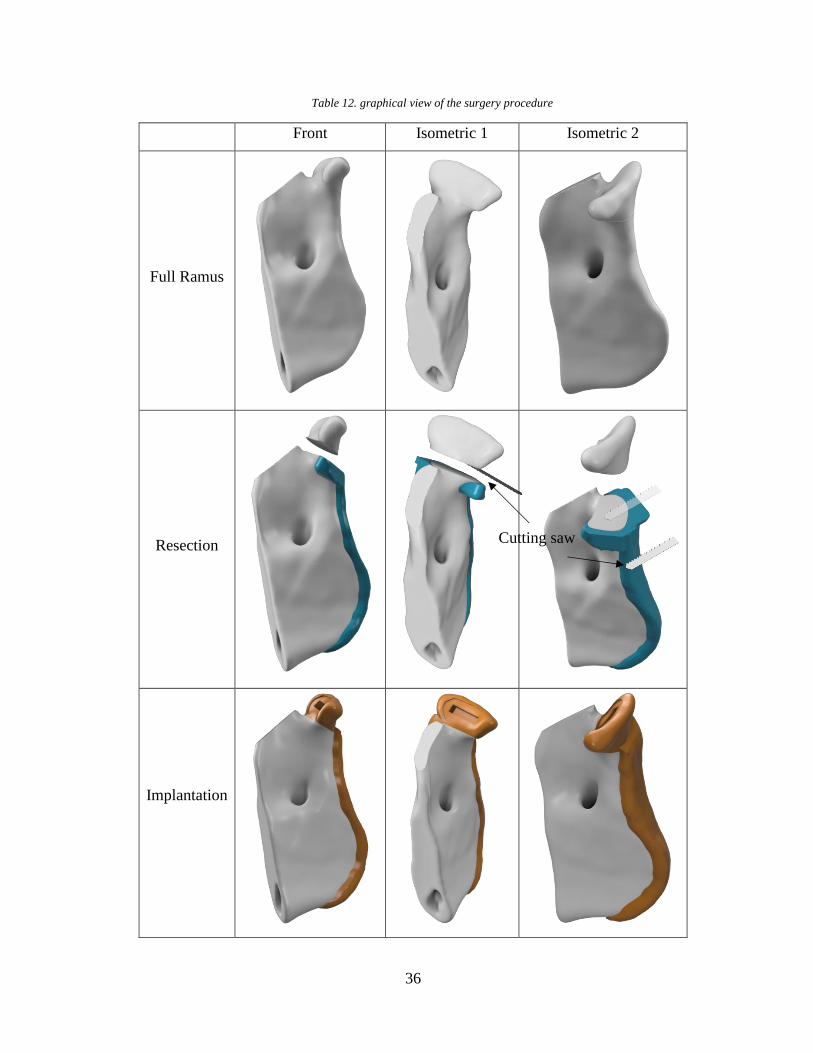
The full-size implant was ultimately designed with the surgery procedure in mind. That is, a
major consideration was given to the method of implantation and how the design could be modified
to facilitates the surgeon’s job in the operating room. The surgery procedure in simple terms
involves the opening of the skin to access the temporomandibular joint, resection of the damaged
condylar head, and implantation of the device. Table 12 provides a graphical representation of the
ramus, the cutting guide, and the TMJ implant in the surgery procedure sequence.
36
Table 12. graphical view of the surgery procedure
Front Isometric 1 Isometric 2
Full Ramus
Resection
Implantation
Cutting saw
37
Through practice surgeries, it was observed that two issues may arise with our initial design.
The first was that the mandible might be resected at the wrong height or at the wrong angle. This
will create a gap between the contact surface and the resected mandible and will halt the flow of
the bone marrow to the condylar head and the hydrogel. The second issue was the thickness of the
implant fixture. If too thin, the implant will bend at the intersection of the condylar head and the
ramus fixture, and if too thick, it makes implantation more difficult and will stick out of the skin
once implanted. These issues were resolved in the final design of the implant discussed in the next
chapters.
The micro-architecture with the highest capillary forces and the micro-architecture with the
strongest bone-to-cartilage bond were incorporated into the condylar head of the implant to
expedite the rate of bone regeneration and to reinforce the hydrogel integration, respectively.
3.2 Materials and Methods
3.2.1 Design of the Implant
DICOM images from the patients’ heads were acquired. These images were imported into
Seg3D (CIBC) to create volumetric files representing the complete head. The condyle was resected
with a sectioning plane that was referenced to four anatomical landmarks, two inferior orbits, and
two superior external auditory meatuses, resulting in a consistently resected condylar head across
all patients. These files were then imported into Meshmixer (Autodesk) to design the implant and
the corresponding cutting guide.
The implant design consists of the condylar head and the ramus fixture. The condylar head
is the exact geometry that was extracted from the DICOM images, and the ramus fixture is an
extension of the ramus that attaches to the resected ramus. The cutting guide consists of the ramus
fixture and an extended plate in place of the resected condylar head that is intended to help the
surgeon with cutting the mandible at the right height and angle.
38
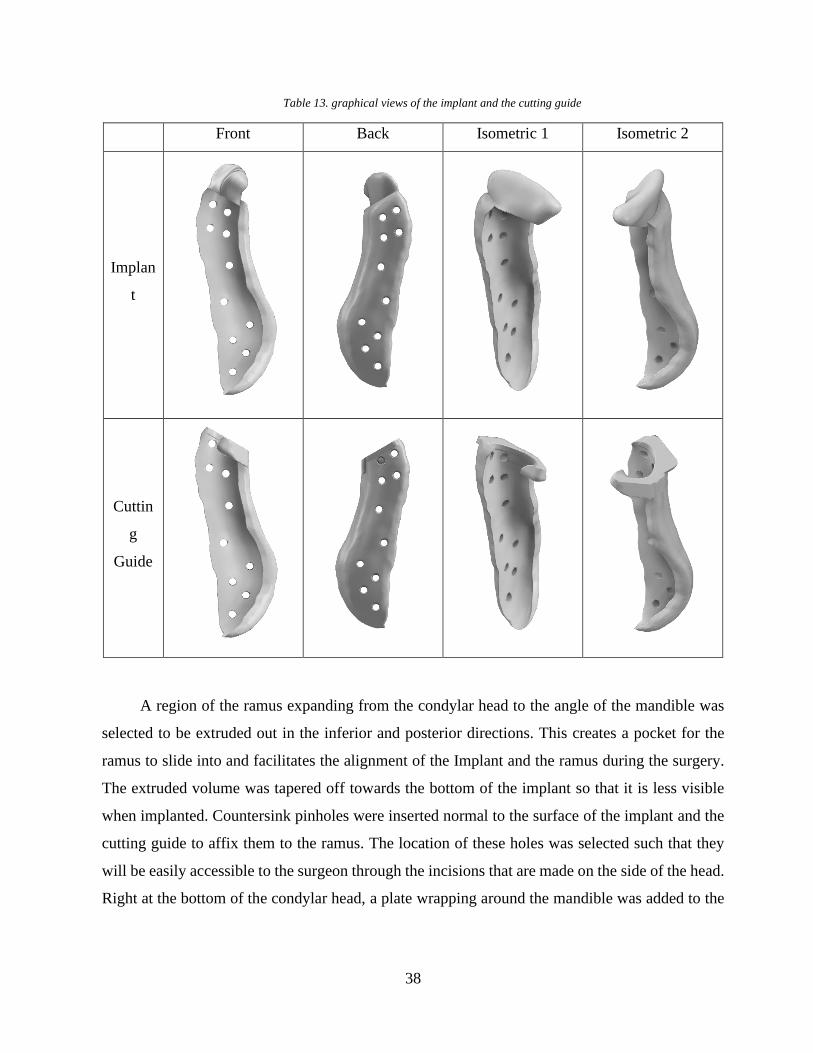
Table 13. graphical views of the implant and the cutting guide
Front Back Isometric 1 Isometric 2
Implan
t
Cuttin
g
Guide
A region of the ramus expanding from the condylar head to the angle of the mandible was
selected to be extruded out in the inferior and posterior directions. This creates a pocket for the
ramus to slide into and facilitates the alignment of the Implant and the ramus during the surgery.
The extruded volume was tapered off towards the bottom of the implant so that it is less visible
when implanted. Countersink pinholes were inserted normal to the surface of the implant and the
cutting guide to affix them to the ramus. The location of these holes was selected such that they
will be easily accessible to the surgeon through the incisions that are made on the side of the head.
Right at the bottom of the condylar head, a plate wrapping around the mandible was added to the
39
cutting guide fixture to help the surgeon align the cutting tool parallel to the contact surface. This
plate was lowered in height to account for the thickness of the cutting tool (table 13).
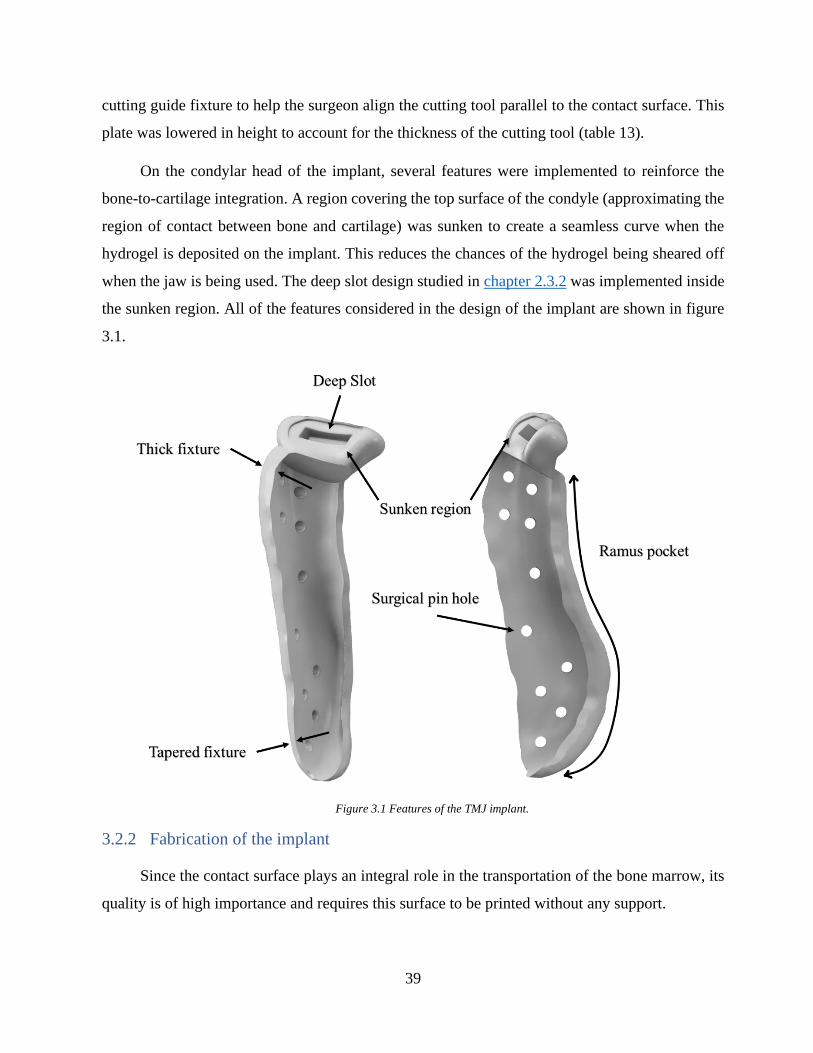
On the condylar head of the implant, several features were implemented to reinforce the
bone-to-cartilage integration. A region covering the top surface of the condyle (approximating the
region of contact between bone and cartilage) was sunken to create a seamless curve when the
hydrogel is deposited on the implant. This reduces the chances of the hydrogel being sheared off
when the jaw is being used. The deep slot design studied in chapter 2.3.2 was implemented inside
the sunken region. All of the features considered in the design of the implant are shown in figure
3.1.
Figure 3.1 Features of the TMJ implant.
3.2.2 Fabrication of the implant
Since the contact surface plays an integral role in the transportation of the bone marrow, its
quality is of high importance and requires this surface to be printed without any support.
40
To determine the maximum overhang printable with our material, an overhang calibration
sample was downloaded from Thingiverse. From the printed part it was observed that up to 50°
overhang produces satisfactory results. The implant was then oriented on the print bed such that
the contact surface had a lower overhang angle than 50°.
To minimize its use, support structures were manually created only for areas where the
overhang was more than 50 degrees. This included the bottom of the implant and the posterior side
of the condylar head.
To impose different micro-architectures in the implant, the condylar head shape was
extracted from the implant model in Meshmixer (Autodesk) and was used as a mask to define new
settings for the condyle internal structure. The print settings have been determined in the previous
chapter based on the results of the capillary action and bone-to-cartilage studies. These parameters
were used in the “Per Model” settings of Cura to create a porous micro-architecture where the
condylar head mask meets the implant.
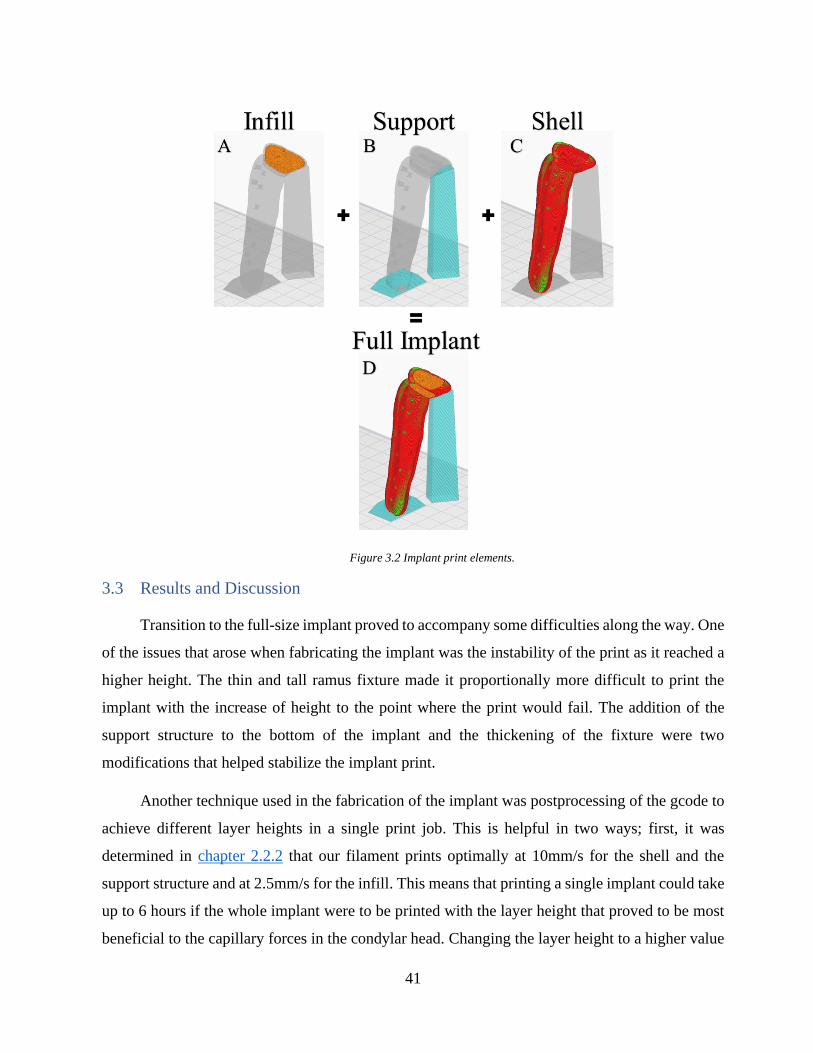
The final print configuration of the implant consists of three elements: the shell, the infill,
and the support structures. The shell (colored red), as the name suggests, refers to the outer wall
of the print models and could be seen in the ramus fixture and around the condylar head (figure
3.2, C). The infill (colored orange) refers to the structures that are located inside the shell (figure
3.2, A). The support structures (colored blue) are the pillars helping the implant to maintain its
shape where the overhang is larger than 50 degrees (figure 3.2, B).
41
Figure 3.2 Implant print elements.
3.3 Results and Discussion
Transition to the full-size implant proved to accompany some difficulties along the way. One
of the issues that arose when fabricating the implant was the instability of the print as it reached a
higher height. The thin and tall ramus fixture made it proportionally more difficult to print the
implant with the increase of height to the point where the print would fail. The addition of the
support structure to the bottom of the implant and the thickening of the fixture were two
modifications that helped stabilize the implant print.
Another technique used in the fabrication of the implant was postprocessing of the gcode to
achieve different layer heights in a single print job. This is helpful in two ways; first, it was
determined in chapter 2.2.2 that our filament prints optimally at 10mm/s for the shell and the
support structure and at 2.5mm/s for the infill. This means that printing a single implant could take
up to 6 hours if the whole implant were to be printed with the layer height that proved to be most
beneficial to the capillary forces in the condylar head. Changing the layer height to a higher value

42
in the ramus fixture could save up to 2.5 hours of print time. Second, we can change the mechanical
properties of the implant by changing the layer height[80][81]. It also could be investigated
whether different layer heights have a different rate of degradation. This means we can tailor our
structure to accommodate the rate of degradation we need in certain locations.
In the initial implant design, the condylar head consisted of only the infill structure. This
was later changed to the current design where a shell wraps around the porous infill structure to
provide a smoother surface for the condylar head. This shell has only one perimeter and allows the
porous structure to extend to the edges of the condylar head so as to not reduce its capacity for
bone regeneration. The sunken region on top of the condylar head was expanded in all directions
in order to cover as much area as possible. The extent of this expansion, however, was limited by
the print orientation and the design of the implant.
43
Conclusion
4.1 Summary
In the first chapter of this paper, we talked about the current treatment options for
temporomandibular disorders and mentioned instances where it falls short. We identified a gap in
the clinical solution to the total joint replacement of the temporomandibular joint and pointed to
several groups of people who would benefit from a novel approach. It was then discussed that
tissue engineering and additive manufacturing have the potential to provide a new strategy to
tackle this problem.
It was proposed that a biodegradable bi-phasic TMJ implant could replace the metal implants
that are the current standard treatment options and overcome some of the limitations of metal
implants. An implant design was conceptualized, and several features were proposed to improve
the functionality of the implant.
This paper is divided into two phases; Micro-Architecture, where we design and fabricate
structures on a micro level, and Macro-Architecture, where we utilized our findings from phase
one to design an improved full-size implant.
In phase one, we started by preparing materials for our studies. This included a filament that
was used to print the bone region of the implant and a hydrogel used to print the cartilage region.
Through experiment, the optimal print settings for these materials were determined.
Several microscopic features were proposed and studied on standardized test samples to
determine their effects. The first group of features was intended to increase the uptake capacity of
the implant which in turn could result in a faster and higher rate of bone regeneration. The second
group of features was intended to reinforce the bond between the bone and the cartilage regions
and keep the hydrogel intact with the scaffolding of the implant.
In phase two, a full-size TMJ implant was designed. The micro-architectures that proved to
be most beneficial to the performance of the test samples were incorporated in the macro-
architecture. Along with the implant, a cutting guide was designed that helps the surgeon to
position the implant correctly during the surgery.
44
4.2 Contribution
In this paper, we proved that by modifying the design and print parameters of micro-/macro-
architectures we can tailor their responses to different factors and improve their performance. In
chapter 2.3.1 we showed that the test sample with 0.6 mm line distance and 0.12 mm layer height
absorbed more solution compared to other designs, and in chapter 2.3.2 we determined that the
geometry with the deep slot had the strongest bond between bone and cartilage regions.
In chapter 3.2.1 and chapter 3.2.2, we proposed a design and the fabrication process for a
full-size implant and a cutting guide that could be a baseline for all future investigations on the
design and performance of this implant.
4.3 Future Works
As mentioned before, the studies in chapter 2.2.3 were performed with colored PBS to
determine the capillary forces induced by several micro-architectures. It is possible that the results
of those experiments would be different if the solution is changed, so it would be interesting to
repeat those experiments with bone marrow to determine whether the results of the study would
change.
It is also interesting to find the actual capacity of the micro-architectures proposed in chapter
2.2.3 by repeating the study at bigger scales. It was observed that the results of the capillary action
studies were limited by the volume of the test samples and the size of their wells.
In the bone-to-cartilage integration studies, it was noticed that the hydrogels that failed,
mostly did so in locations where there were sharp edges, for example, in the corners of slots and
anchors. A future study could characterize the response of the hydrogel to axial force when these
corners are less sharp and less tension is stored in them.
Another domain that could be further investigated is the orientation of the implant on the
print bed, which will affect the mechanical properties, and possibly the degradation rate of the
implant. This could also provide new opportunities for the design and incorporation of new micro-
architectures which are impossible to implement in the current orientation. With the use of soluble
materials, it is possible to find other orientations for the print in which the performance of the
implant improves.
45
References
[1] N. A. Vizniak et al., “Muscle manual,” p. 595, 2002.
[2] L. Guarda-Nardini, D. Manfredini, and G. Ferronato, “Temporomandibular joint total
replacement prosthesis: current knowledge and considerations for the future,” International
Journal of Oral and Maxillofacial Surgery, vol. 37, no. 2. Churchill Livingstone, pp. 103–
110, Feb. 01, 2008, doi: 10.1016/j.ijom.2007.09.175.
[3] Temporomandibular Joint Total Joint Replacement – TMJ TJR. 2016.
[4] J. J. Buescher, “Temporomandibular Joint Disorders,” Nov. 2007. Accessed: Dec. 18, 2020.
[Online]. Available: www.aafp.org/afp.
[5] C. H. Wilkes, “Internal Derangements of the Temporomandibular Joint: Pathological
Variations,” Arch. Otolaryngol. Neck Surg., 1989, doi:
10.1001/archotol.1989.01860280067019.
[6] R. de Leeuw, “Internal Derangements of the Temporomandibular Joint,” Oral and
Maxillofacial Surgery Clinics of North America. 2008, doi: 10.1016/j.coms.2007.12.004.
[7] E. F. Wright and S. L. North, “Management and Treatment of Temporomandibular
Disorders: A Clinical Perspective,” Journal of Manual and Manipulative Therapy, vol. 17,
no. 4. Maney Publishing, pp. 247–254, 2009, doi: 10.1179/106698109791352184.
[8] R. Gray, “Manual of temporomandibular disorders,” Br. Dent. J., vol. 199, no. 6, pp. 399–
399, Sep. 2005, doi: 10.1038/sj.bdj.4812802.
[9] R. N. Arm, “Orofacial Pain. Guidelines for Assessment, Diagnosis, and Management,”
Implant Dent., vol. 5, no. 4, p. 304, 1996, doi: 10.1097/00008505-199600540-00043.
[10] B. Bagis, E. Aydogan Ayaz, S. Turgut, R. Durkan, and M. Özcan, “Gender Difference in
Prevalence of Signs and Symptoms of Temporoman-dibular Joint Disorders: A
Retrospective Study on 243 Consecutive Patients,” Int. J. Med. Sci, vol. 9, no. 7, pp. 539–
544, 2012, doi: 10.7150/ijms.4474.
[11] L. Leresche, “EPIDEMIOLOGY OF TEMPOROMANDIBULAR DISORDERS:
IMPLICATIONS FOR THE INVESTIGATION OF ETIOLOGIC FACTORS.”
46
[12] A. Aryaei, N. Vapniarsky, J. C. Hu, and K. A. Athanasiou, “Recent Tissue Engineering
Advances for the Treatment of Temporomandibular Joint Disorders,” Curr. Osteoporos.
Rep., 2016, doi: 10.1007/s11914-016-0327-y.
[13] U. Onoriobe, M. Miloro, C. Sukotjo, L. G. Mercuri, A. Lotesto, and R. Eke, “How Many
Temporomandibular Joint Total Joint Alloplastic Implants Will Be Placed in the United
States in 2030?,” J. Oral Maxillofac. Surg., vol. 74, no. 8, pp. 1531–1538, Aug. 2016, doi:
10.1016/j.joms.2016.04.011.
[14] W. F. T. Lai, J. Bowley, and J. G. Burch, “Evaluation of Shear Stress of the Human
Temporomandibular Joint Disc,” J. Orofac. Pain, 1998.
[15] M. Wieckiewicz, K. Boening, P. Wiland, Y. Y. Shiau, and A. Paradowska-Stolarz,
“Reported concepts for the treatment modalities and pain management of
temporomandibular disorders,” Journal of Headache and Pain, vol. 16, no. 1. Springer-
Verlag Italia s.r.l., pp. 1–12, Dec. 01, 2015, doi: 10.1186/s10194-015-0586-5.
[16] M. Wieckiewicz, K. Boening, P. Wiland, Y.-Y. Shiau, and A. Paradowska-Stolarz,
“Reported concepts for the treatment modalities and pain management of
temporomandibular disorders,” 2011, doi: 10.1186/s10194-015-0586-5.
[17] R. A. Meyers, K. P. Schellhas, H. D. Hall, A. T. Indresano, and C. H. Wilkes, “Guidelines
for diagnosis and management of disorders involving the temporomandibular joint and
related musculoskeletal structures. American Society of Temporomandibular Joint
Surgeons.,” Northwest Dent., vol. 71, no. 5, pp. 21–27, 1992.
[18] P. A. Toller, “Osteoarthrosis of the mandibular condyle,” Br. Dent. J., 1973, doi:
10.1038/sj.bdj.4802982.
[19] E. Tanaka, M. S. Detamore, and L. G. Mercuri, “Degenerative disorders of the
Temporomandibular joint: etiology, diagnosis, and treatment,” Journal of Dental Research,
vol. 87, no. 4. pp. 296–307, Apr. 2008, doi: 10.1177/154405910808700406.
[20] S. G. G. Richard A. Pertes, “Overview of physical therapy modalities and procedures,” in
Clinical Management of Temporomandibular Disorders and Orofacial Pain, Quintessence
Pub, 1995.
47
[21] M. L. McNeely, S. A. Olivo, and D. J. Magee, “A systematic review of the effectiveness of
physical therapy interventions for temporomandibular disorders,” Physical Therapy. 2006,
doi: 10.1093/ptj/86.5.710.
[22] W. Shankland, “Temporomandibular disorders: standard treatment options.,” undefined,
2004.
[23] D. W. Nitzan, “Arthrocentesis-Incentives for Using This Minimally Invasive Approach for
Temporomandibular Disorders,” Oral and Maxillofacial Surgery Clinics of North America,
vol. 18, no. 3. Elsevier, pp. 311–328, Aug. 01, 2006, doi: 10.1016/j.coms.2006.03.005.
[24] P. A. Toller, “Use and Misuse of Intra-Articular Corticosteroids in Treatment of
Temporomandibular Joint Pain,” J. R. Soc. Med., 1977, doi:
10.1177/003591577707000704.
[25] D. W. Nitzan and A. Price, “The use of arthrocentesis for the treatment of osteoarthritic
temporomandibular joints,” J. Oral Maxillofac. Surg., 2001, doi:
10.1053/joms.2001.26716.
[26] D. Diraçoǧlu et al., “Arthrocentesis versus nonsurgical methods in the treatment of
temporomandibular disc displacement without reduction,” Oral Surgery, Oral Med. Oral
Pathol. Oral Radiol. Endodontology, 2009, doi: 10.1016/j.tripleo.2009.01.005.
[27] C. Linical and P. Ractice, “Internal Derangements of the Temporomandibular Joint: The
Role of Arthroscopic Surgery and Arthrocentesis,” J. Can. Dent. Assoc. (Tor)., 2000.
[28] E. A. Al-Moraissi, “Arthroscopy versus arthrocentesis in the management of internal
derangement of the temporomandibular joint: A systematic review and meta-analysis,”
International Journal of Oral and Maxillofacial Surgery, vol. 44, no. 1. Churchill
Livingstone, pp. 104–112, Jan. 01, 2015, doi: 10.1016/j.ijom.2014.07.008.
[29] M. G. Koslin, A. T. Indresano, and L. G. Mercuri, “Temporomandibular Joint Surgery,” J.
Oral Maxillofac. Surg., vol. 70, no. 11, Supplement 3, pp. e204–e231, 2012, doi:
https://doi.org/10.1016/j.joms.2012.07.036.
[30] J. D. Wagner and E. L. Mosby, “Assessement of Proplast-Teflon disc replacements,” J.
Oral Maxillofac. Surg., vol. 48, no. 11, pp. 1140–1144, Nov. 1990, doi: 10.1016/0278-
48
2391(90)90528-A.
[31] N. De Meurechy and M. Y. Mommaerts, “Alloplastic temporomandibular joint replacement
systems: a systematic review of their history,” International Journal of Oral and
Maxillofacial Surgery, vol. 47, no. 6. Churchill Livingstone, pp. 743–754, Jun. 01, 2018,
doi: 10.1016/j.ijom.2018.01.014.
[32] W. L. McCarty and W. B. Farrar, “Surgery for internal derangements of the
temporomandibular joint,” J. Prosthet. Dent., 1979, doi: 10.1016/0022-3913(79)90174-4.
[33] R. A. Williamson, D. McNamara, and W. McAuliffe, “True eminectomy for internal
derangement of the temporomandibular joint,” Br. J. Oral Maxillofac. Surg., 2000, doi:
10.1054/bjom.2000.0467.
[34] B. L. Florine, D. J. Gatto, M. L. Wade, and D. E. Waite, “Tomographic evaluation of
temporomandibular joints following discoplasty or placement of polytetrafluoroethylene
implants,” J. Oral Maxillofac. Surg., 1988, doi: 10.1016/0278-2391(88)90080-8.
[35] S. J. McKenna, “Discectomy for the treatment of internal derangements of the
temporomandibular joint,” J. Oral Maxillofac. Surg., 2001, doi: 10.1053/joms.2001.26682.
[36] M. K. Murphy, R. F. Macbarb, M. E. Wong, and K. A. Athanasiou, “Temporomandibular
Joint Disorders: A Review of Etiology, Clinical Management, and Tissue Engineering
Strategies HHS Public Access,” 2013.
[37] D. T. Brown and E. L. Gaudet, “Temporomandibular Disorder Treatment Outcomes:
Second Report of a Large-Scale Prospective Clinical Study,” Cranio, 2002, doi:
10.1080/08869634.2002.11746216.
[38] G. A. Loupasis, K. Stamos, P. G. Katonis, G. Sapkas, D. S. Korres, and G. Hartofilakidis,
“Seven- to 20-year outcome of lumbar discectomy,” Spine (Phila. Pa. 1976)., 1999, doi:
10.1097/00007632-199911150-00005.
[39] M. S. Detamore and K. A. Athanasiou, “Motivation, Characterization, and Strategy for
Tissue Engineering the Temporomandibular Joint Disc,” Tissue Engineering. 2003, doi:
10.1089/10763270360727991.
49
[40] K. Ahtiainen et al., “Autologous adipose stem cells and polylactide discs in the replacement
of the rabbit temporomandibular joint disc,” J. R. Soc. Interface, 2013, doi:
10.1098/rsif.2013.0287.
[41] K. D. Allen and K. A. Athanasiou, “Scaffold and growth factor selection in
temporomandibular joint disc engineering,” J. Dent. Res., 2008, doi:
10.1177/154405910808700205.
[42] M. S. Detamore and K. A. Athanasiou, “Evaluation of three growth factors for TMJ disc
tissue engineering,” Ann. Biomed. Eng., 2005, doi: 10.1007/s10439-005-1741-y.
[43] C. Moura, D. Trindade, M. Vieira, L. Francisco, D. F. Ângelo, and N. Alves, “Multi-
Material Implants for Temporomandibular Joint Disc Repair: Tailored Additive
Manufacturing Production,” Front. Bioeng. Biotechnol., 2020, doi:
10.3389/fbioe.2020.00342.
[44] B. N. Brown et al., “Inductive, Scaffold-Based, Regenerative Medicine Approach to
Reconstruction of the Temporomandibular Joint Disk,” J. Oral Maxillofac. Surg., vol. 70,
no. 11, pp. 2656–2668, Nov. 2012, doi: 10.1016/J.JOMS.2011.12.030.
[45] K. Legemate, S. Tarafder, Y. Jun, and C. H. Lee, “Engineering Human TMJ Discs with
Protein-Releasing 3D-Printed Scaffolds,” J. Dent. Res., vol. 95, no. 7, pp. 800–807, Apr.
2016, doi: 10.1177/0022034516642404.
[46] J. R. Salash et al., “Potential Indications for Tissue Engineering in Temporomandibular
Joint Surgery,” Journal of Oral and Maxillofacial Surgery, vol. 74, no. 4. W.B. Saunders,
pp. 705–711, Apr. 01, 2016, doi: 10.1016/j.joms.2015.11.008.
[47] D. E. Poswillo, “Biological reconstruction of the mandibular condyle,” Br. J. Oral
Maxillofac. Surg., 1987, doi: 10.1016/0266-4356(87)90003-9.
[48] R. B. MacIntosh and F. A. Henny, “A spectrum of application of autogenous costochondral
grafts,” J. Maxillofac. Surg., 1977, doi: 10.1016/S0301-0503(77)80120-3.
[49] R. B. MacIntosh, “The use of autogenous tissues for temporomandibular joint
reconstruction,” J. Oral Maxillofac. Surg., 2000, doi: 10.1016/S0278-2391(00)80019-1.
50
[50] G. Obeid, S. A. Guttenberg, and P. W. Connole, “Costochondral grafting in condylar
replacement and mandibular reconstruction,” J. Oral Maxillofac. Surg., 1988, doi:
10.1016/0278-2391(88)90079-1.
[51] N. Samman, L. K. Cheung, and H. Tideman, “Overgrowth of a costochondral graft in an
adult male,” Int. J. Oral Maxillofac. Surg., 1995, doi: 10.1016/S0901-5027(05)80484-9.
[52] T. Peltomäki, “Growth of a costochondral graft in the rat temporomandibular joint,” J. Oral
Maxillofac. Surg., 1992, doi: 10.1016/0278-2391(92)90278-8.
[53] T. Peltomäki, K. Vähätalo, and O. Rönning, “The effect of a unilateral costochondral graft
on the growth of the marmoset mandible,” J. Oral Maxillofac. Surg., 2002, doi:
10.1053/joms.2002.35729.
[54] M. L. Pinson, C. A. Coop, and C. N. Webb, “Metal hypersensitivity in total joint
arthroplasty,” Annals of Allergy, Asthma and Immunology. 2014, doi:
10.1016/j.anai.2014.05.012.
[55] L. Wang and M. S. Detamore, “Review Tissue Engineering the Mandibular Condyle,” doi:
10.1089/ten.2006.0152.
[56] T. M. Acri et al., “Tissue Engineering for the Temporomandibular Joint,” Adv. Healthc.
Mater., vol. 8, no. 2, p. 1801236, Jan. 2019, doi: 10.1002/adhm.201801236.
[57] R. Schek, J. Taboas, S. Hollister, and P. Krebsbach, “Tissue engineering osteochondral
implants for temporomandibular joint repair,” Orthod. Craniofac. Res., vol. 8, no. 4, pp.
313–319, Nov. 2005, doi: 10.1111/J.1601-6343.2005.00354.X.
[58] K. Ueki et al., “The use of polylactic acid/polyglycolic acid copolymer and gelatin sponge
complex containing human recombinant bone morphogenetic protein-2 following
condylectomy in rabbits,” J. Cranio-Maxillofacial Surg., vol. 31, no. 2, pp. 107–114, Apr.
2003, doi: 10.1016/S1010-5182(02)00187-7.
[59] N. H. Dormer, K. Busaidy, C. J. Berkland, and M. S. Detamore, “Osteochondral interface
regeneration of rabbit mandibular condyle with bioactive signal gradients,” J. Oral
Maxillofac. Surg., vol. 69, no. 6, pp. e50–e57, Jun. 2011, doi: 10.1016/j.joms.2010.12.049.
51
[60] J. P. Temple et al., “Engineering anatomically shaped vascularized bone grafts with hASCs
and 3D-printed PCL scaffolds,” J. Biomed. Mater. Res. - Part A, 2014, doi:
10.1002/jbm.a.35107.
[61] L. Ciocca et al., “CAD-CAM-generated hydroxyapatite scaffold to replace the mandibular
condyle in sheep: preliminary results.,” J. Biomater. Appl., vol. 28, no. 2, pp. 207–18, Aug.
2013, doi: 10.1177/0885328212443296.
[62] D. Chen et al., “Tissue engineered autologous cartilage-bone grafts for temporomandibular
joint regeneration,” Sci. Transl. Med., vol. 12, no. 565, p. 6683, Oct. 2020, doi:
10.1126/SCITRANSLMED.ABB6683.
[63] T. L. Aghaloo, P. K. Moy, and E. G. Freymiller, “Bone graft in the shape of human
mandibular condyle reconstruction via seeding marrow-derived osteoblasts into porous
coral in a nude mice model,” J. Oral Maxillofac. Surg., vol. 60, no. 10, pp. 1155–1159, Oct.
2002, doi: 10.1053/joms.2002.34991.
[64] D. Howlader et al., “Hydroxyapatite collagen scaffold with autologous bone marrow
aspirate for mandibular condylar reconstruction,” J. Cranio-Maxillofacial Surg., vol. 45,
no. 9, pp. 1566–1572, Sep. 2017, doi: 10.1016/j.jcms.2017.06.022.
[65] Z. Wang, W. Xi, H. Zhu, and J. Yan, “Preparation and characterization of integrated
condylar biomimetic scaffolds: A pilot study,” J. Hard Tissue Biol., 2016, doi:
10.2485/jhtb.25.89.
[66] I. Gibson, D. W. Rosen, and B. Stucker, Additive manufacturing technologies: Rapid
prototyping to direct digital manufacturing. 2010.
[67] J. Giannatsis and V. Dedoussis, “Additive fabrication technologies applied to medicine and
health care: A review,” Int. J. Adv. Manuf. Technol., 2009, doi: 10.1007/s00170-007-1308-
1.
[68] T. Baden, A. M. Chagas, G. Gage, T. Marzullo, L. L. Prieto-Godino, and T. Euler, “Open
Labware: 3-D Printing Your Own Lab Equipment,” PLoS Biol., 2015, doi:
10.1371/journal.pbio.1002086.
[69] S. Singare et al., “Rapid prototyping assisted surgery planning and custom implant design,”
52
Rapid Prototyp. J., 2009, doi: 10.1108/13552540910925027.
[70] J. Y. Lee, B. Choi, B. Wu, and M. Lee, “Customized biomimetic scaffolds created by
indirect three-dimensional printing for tissue engineering,” Biofabrication, vol. 5, no. 4, p.
045003, Dec. 2013, doi: 10.1088/1758-5082/5/4/045003.
[71] Hiroyuki Tetsuka and S. Ryon Shin, “Materials and technical innovations in 3D printing in
biomedical applications,” J. Mater. Chem. B, vol. 8, no. 15, pp. 2930–2950, Apr. 2020, doi:
10.1039/D0TB00034E.
[72] S. Ding, B. Zou, P. Wang, and H. Ding, “Effects of nozzle temperature and building
orientation on mechanical properties and microstructure of PEEK and PEI printed by 3D-
FDM,” Polym. Test., vol. 78, p. 105948, Sep. 2019, doi:
10.1016/J.POLYMERTESTING.2019.105948.
[73] Ż. Górecka, J. Idaszek, D. Kołbuk, E. Choińska, A. Chlanda, and W. Święszkowski, “The
effect of diameter of fibre on formation of hydrogen bonds and mechanical properties of
3D-printed PCL,” Mater. Sci. Eng. C, vol. 114, p. 111072, Sep. 2020, doi:
10.1016/J.MSEC.2020.111072.
[74] Feng Li, N. P. Macdonald, R. M. Guijt, and M. C. Breadmore, “Increasing the
functionalities of 3D printed microchemical devices by single material, multimaterial, and
print-pause-print 3D printing,” Lab Chip, vol. 19, no. 1, pp. 35–49, Dec. 2018, doi:
10.1039/C8LC00826D.
[75] D. Auhl, F. Rohnstock, O. Löschke, K. Schäfer, P. Wang, and M. H. Wagner, “3D-printing
quality in relation to melt flow and fusion behavior of polymer materials,” AIP Conf. Proc.,
vol. 2107, no. 1, p. 030004, May 2019, doi: 10.1063/1.5109498.
[76] A. Pandzic, D. Hodzic, and A. Milovanovic, “Effect of infill type and density on tensile
properties of pla material for fdm process,” 2019, doi:
10.2507/30th.daaam.proceedings.074.
[77] T. Yao, J. Ye, Z. Deng, K. Zhang, Y. Ma, and H. Ouyang, “Tensile failure strength and
separation angle of FDM 3D printing PLA material: Experimental and theoretical analyses,”
Compos. Part B Eng., vol. 188, p. 107894, May 2020, doi:
53
10.1016/J.COMPOSITESB.2020.107894.
[78] S. J. Polak, “Microstructure-induced capillary force effects on penetration and release in
hydroxyapatite bone scaffolds,” 2012, Accessed: Jul. 15, 2021. [Online]. Available:
https://www.ideals.illinois.edu/handle/2142/42348.
[79] Z. Jiao, B. Luo, S. Xiang, H. Ma, Y. Yu, and W. Yang, “3D printing of HA / PCL composite
tissue engineering scaffolds,” Adv. Ind. Eng. Polym. Res., vol. 2, no. 4, pp. 196–202, Oct.
2019, doi: 10.1016/J.AIEPR.2019.09.003.
[80] S. R. Rajpurohit and H. K. Dave, “Analysis of tensile strength of a fused filament fabricated
PLA part using an open-source 3D printer,” Int. J. Adv. Manuf. Technol. 2018 1015, vol.
101, no. 5, pp. 1525–1536, Nov. 2018, doi: 10.1007/S00170-018-3047-X.
[81] A. M. Sousa, A. C. Pinho, and A. P. Piedade, “Mechanical properties of 3D printed
mouthguards: Influence of layer height and device thickness,” Mater. Des., vol. 203, p.
109624, May 2021, doi: 10.1016/J.MATDES.2021.109624.
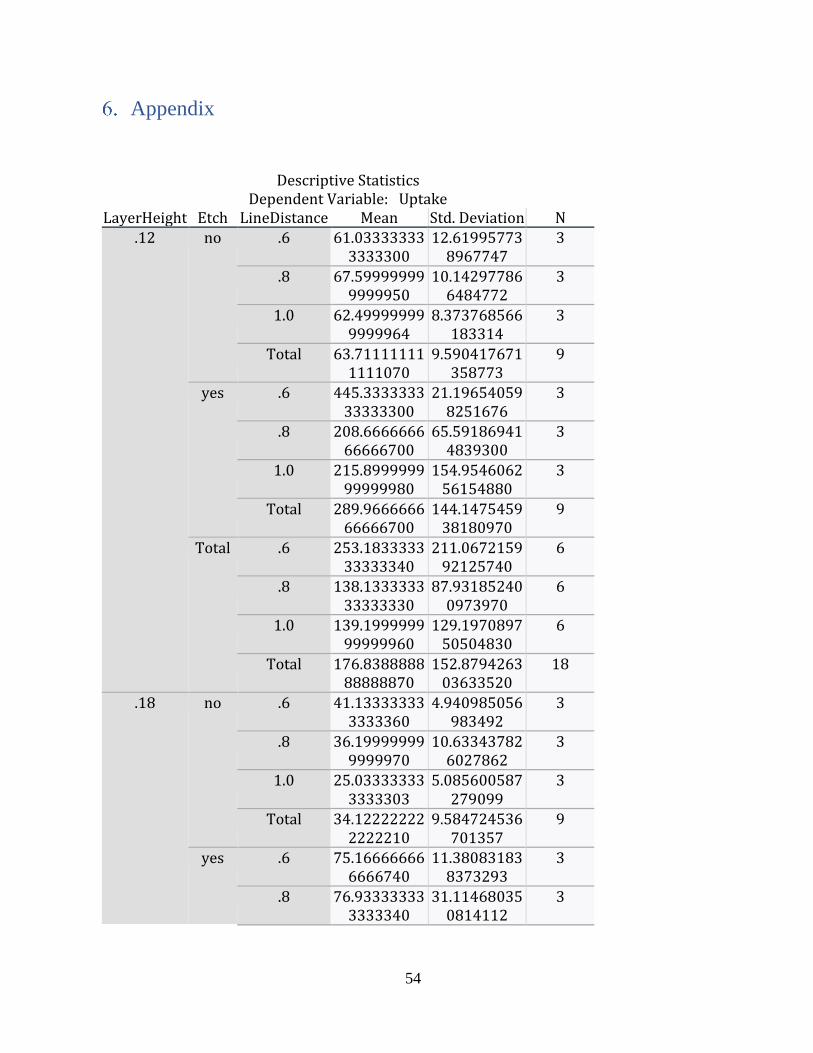
54
Appendix
Descriptive Statistics Dependent Variable: Uptake
LayerHeight Etch LineDistance Mean Std. Deviation N .12 no .6 61.03333333
3333300 12.61995773
8967747 3
.8 67.599999999999950
10.142977866484772
3
1.0 62.499999999999964
8.373768566183314
3
Total 63.711111111111070
9.590417671358773
9
yes .6 445.333333333333300
21.196540598251676
3
.8 208.666666666666700
65.591869414839300
3
1.0 215.899999999999980
154.954606256154880
3
Total 289.966666666666700
144.147545938180970
9
Total .6 253.183333333333340
211.067215992125740
6
.8 138.133333333333330
87.931852400973970
6
1.0 139.199999999999960
129.197089750504830
6
Total 176.838888888888870
152.879426303633520
18
.18 no .6 41.133333333333360
4.940985056983492
3
.8 36.199999999999970
10.633437826027862
3
1.0 25.033333333333303
5.085600587279099
3
Total 34.122222222222210
9.584724536701357
9
yes .6 75.166666666666740
11.380831838373293
3
.8 76.933333333333340
31.114680350814112
3
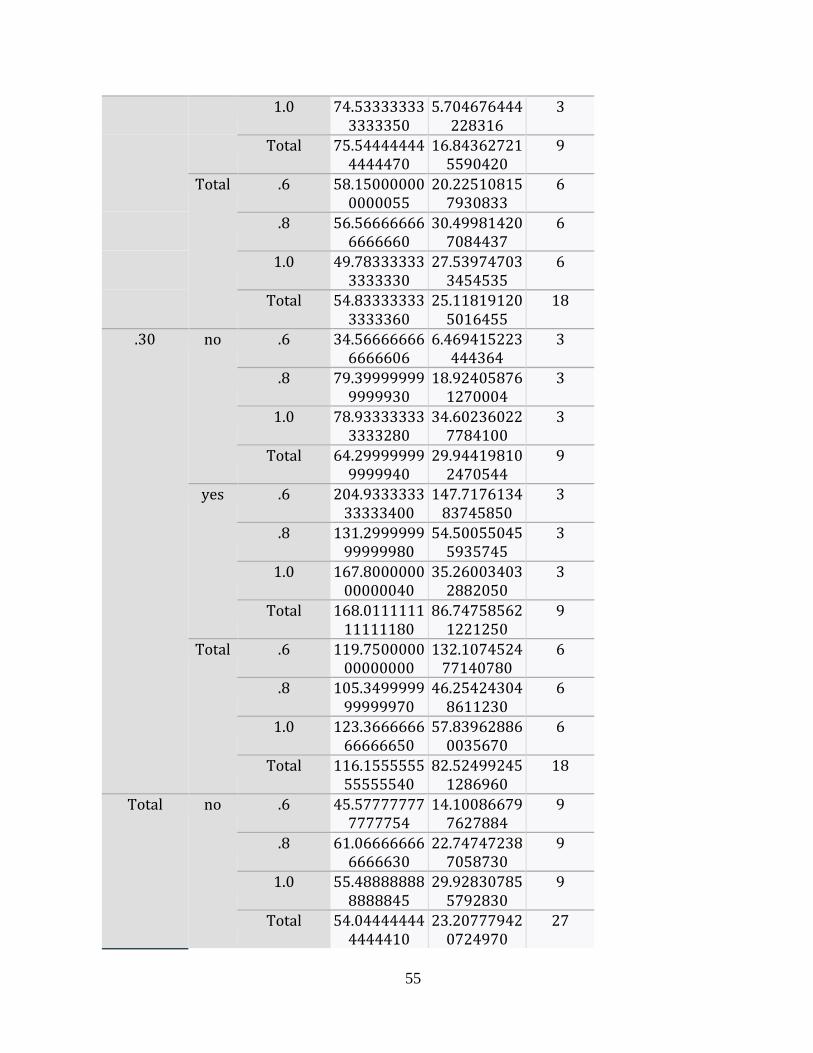
55
1.0 74.533333333333350
5.704676444228316
3
Total 75.544444444444470
16.843627215590420
9
Total .6 58.150000000000055
20.225108157930833
6
.8 56.566666666666660
30.499814207084437
6
1.0 49.783333333333330
27.539747033454535
6
Total 54.833333333333360
25.118191205016455
18
.30 no .6 34.566666666666606
6.469415223444364
3
.8 79.399999999999930
18.924058761270004
3
1.0 78.933333333333280
34.602360227784100
3
Total 64.299999999999940
29.944198102470544
9
yes .6 204.933333333333400
147.717613483745850
3
.8 131.299999999999980
54.500550455935745
3
1.0 167.800000000000040
35.260034032882050
3
Total 168.011111111111180
86.747585621221250
9
Total .6 119.750000000000000
132.107452477140780
6
.8 105.349999999999970
46.254243048611230
6
1.0 123.366666666666650
57.839628860035670
6
Total 116.155555555555540
82.524992451286960
18
Total no .6 45.577777777777754
14.100866797627884
9
.8 61.066666666666630
22.747472387058730
9
1.0 55.488888888888845
29.928307855792830
9
Total 54.044444444444410
23.207779420724970
27
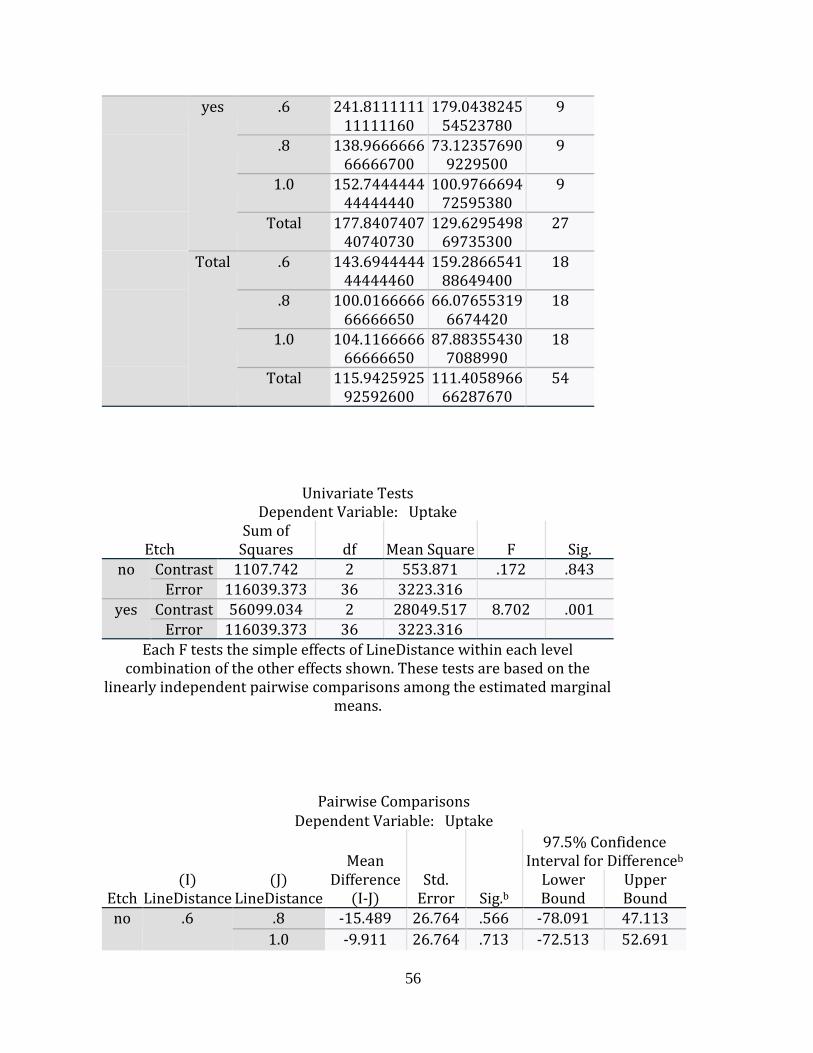
56
yes .6 241.811111111111160
179.043824554523780
9
.8 138.966666666666700
73.123576909229500
9
1.0 152.744444444444440
100.976669472595380
9
Total 177.840740740740730
129.629549869735300
27
Total .6 143.694444444444460
159.286654188649400
18
.8 100.016666666666650
66.076553196674420
18
1.0 104.116666666666650
87.883554307088990
18
Total 115.942592592592600
111.405896666287670
54
Univariate Tests Dependent Variable: Uptake
Etch Sum of
Squares df Mean Square F Sig. no Contrast 1107.742 2 553.871 .172 .843
Error 116039.373 36 3223.316
yes Contrast 56099.034 2 28049.517 8.702 .001 Error 116039.373 36 3223.316
Each F tests the simple effects of LineDistance within each level combination of the other effects shown. These tests are based on the
linearly independent pairwise comparisons among the estimated marginal means.
Pairwise Comparisons Dependent Variable: Uptake
Etch (I)
LineDistance (J)
LineDistance
Mean Difference
(I-J) Std.
Error Sig.b
97.5% Confidence Interval for Differenceb
Lower Bound
Upper Bound
no .6 .8 -15.489 26.764 .566 -78.091 47.113
1.0 -9.911 26.764 .713 -72.513 52.691
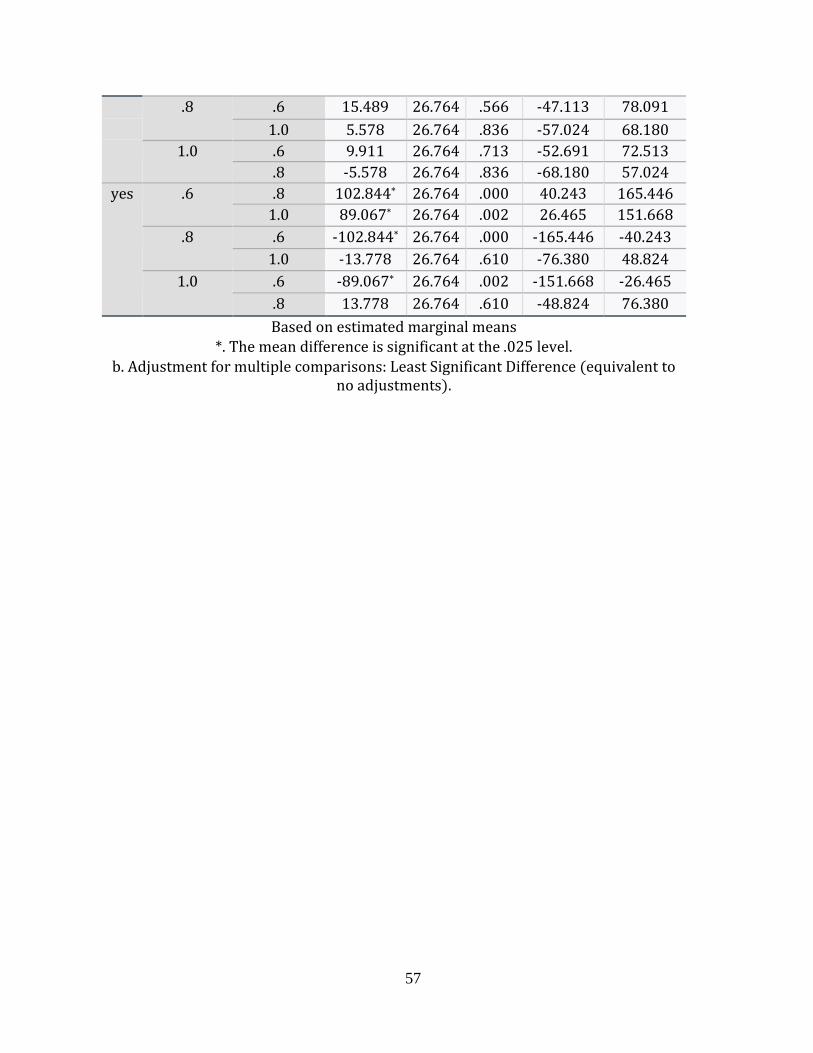
57
.8 .6 15.489 26.764 .566 -47.113 78.091
1.0 5.578 26.764 .836 -57.024 68.180
1.0 .6 9.911 26.764 .713 -52.691 72.513
.8 -5.578 26.764 .836 -68.180 57.024
yes .6 .8 102.844* 26.764 .000 40.243 165.446
1.0 89.067* 26.764 .002 26.465 151.668
.8 .6 -102.844* 26.764 .000 -165.446 -40.243
1.0 -13.778 26.764 .610 -76.380 48.824
1.0 .6 -89.067* 26.764 .002 -151.668 -26.465
.8 13.778 26.764 .610 -48.824 76.380
Based on estimated marginal means *. The mean difference is significant at the .025 level.
b. Adjustment for multiple comparisons: Least Significant Difference (equivalent to no adjustments).