uk food manufacturer responses to voluntary front of package nutrition schemes
TRANSCRIPT
1
UK food manufacturer responses to voluntary front of package nutrition schemes
D.J. Van Camp
Department of Agricultural, Environmental and Development Economics, The Ohio State Univeristy, Columbus, Ohio USA
N.H. Hooker
Department of Agricultural, Environmental and Development Economics, The Ohio State Univeristy, Columbus, Ohio USA
D.M. Souza Monteiro Kent Business School,
University of Kent, Kent, UK
Abstract
After a period of consultation and research, the United Kingdom (UK) Food Standards Agency
(FSA) introduced a voluntary, colour-based front of package (FOP) labelling program called traffic light
system (TLS) in March of 2006. The goal of this program is to promote accessible nutrition information
that will facilitate consumer food decisions and thus encourage healthier diets. Several studies have been
conducted to measure consumer response to front of package labelling schemes. However, the existing
literature does not address how food manufacturers and retailers are responding to voluntary labelling
systems or to the ongoing debate over potential mandatory nutrition labelling requirements across the
European Union (EU). A food innovation database (Global New Products Database) was used to track all
food products released in the UK from January 1, 2002 through December 31, 2008. Meal, bakery and
breakfast cereal products were further classified into two groups, according to the targeted foods
categories defined by the Food Standard Agency (FSA). Analysis consists of descriptive statistics on
product innovation-level compilation, as well as cross tabulations of factors such as product category,
type of FOP scheme, firm, and year. Research revealed that private label brands dominate food
innovations in the UK. The use of FOP labels is selective among firms and across food categories.
Guideline daily allowance (GDA) labelling is more widely adopted than the traffic light labelling system
(TLS) in the UK. Both systems have been more broadly adopted in target food categories when compared
to general (non-target) foods. Future research efforts should focus on tools which expand FOP to
additional food categories which are significant in the average UK diet and firm incentives to increase
FOP adoption.
Keywords- Food innovation, front of package (FOP) labels, traffic light system (TLS) labels, guideline
daily amount (GDA) labels, nutrition icons
2
Introduction
Nutrition labelling practices for packaged food products sold in the UK are influenced by
international regulations, directives, and decisions from the European Commission (EC), as well
as domestic policies shaped by the Food Standards Agency (FSA). Both governmental
organizations have pushed for improved nutritional labelling in light of an increasing body of
scientific evidence linking poor diet with a host of health conditions including heart disease,
diabetes, cancer, and obesity (Curry Report, 2002; EC, 2005). Ongoing research and policy
debates within the EU and the UK are seeking to understand ways in which front of package
(FOP) nutritional labelling can best be used to promote healthier diet choices among consumers
and to influence food manufacturers to formulate healthier products (Cabinet Report, 2008; EC,
2007).
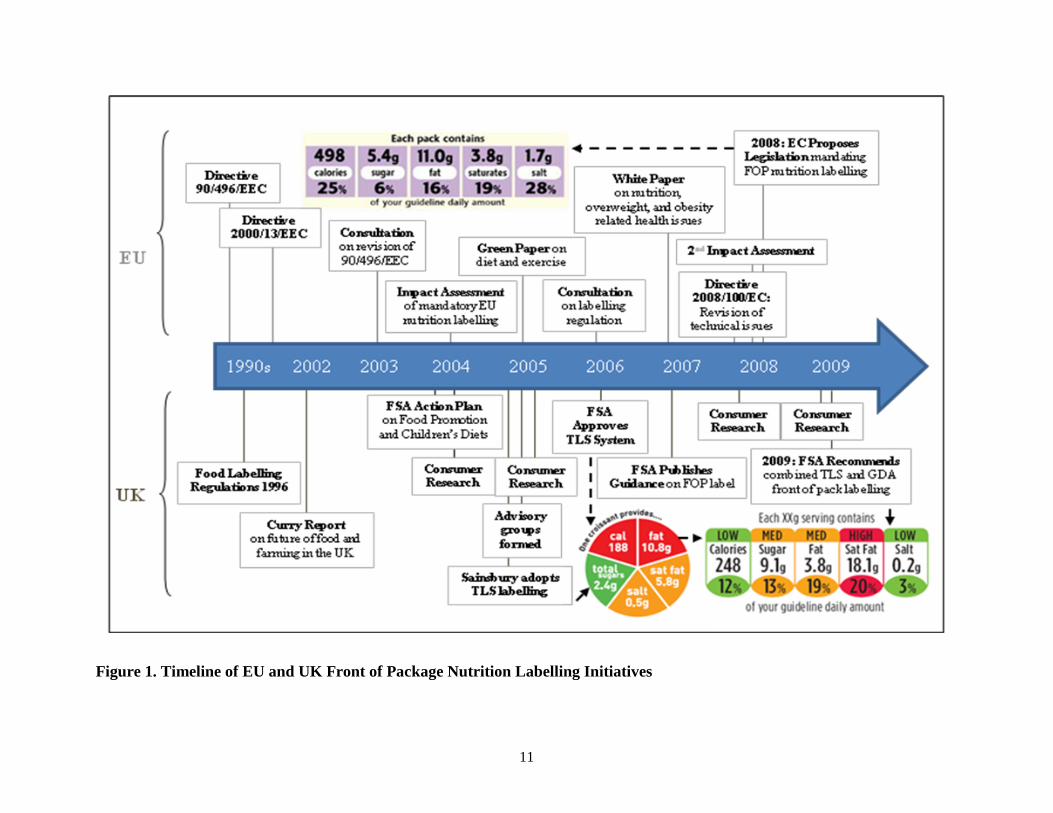
In January 2008, the European Commission adopted a proposal to standardize and
improve food labelling by combining and revising Council Directive 90/496/EEC and Directive
2000/13/EC. Member States are currently reviewing the proposed regulation, which would
mandate FOP nutrition labelling of energy, fat, saturated fat, sugar, and salt content, expressed in
terms of both amount per 100ml/100g or per portion and relation to daily reference intakes (EC,
2008). The UK is one of a small group of Member states which have developed a voluntary FOP
scheme. The proposed EU regulations are a culmination of five years of research and discussion
on the issue of mandatory nutritional labelling, including two impact assessments and two
periods of consultation with Member states (Figure 1).
The recommended EU labelling system is nearly identical to the guideline daily amount
(GDA) system already used by several national food manufacturers and private retailers. While
the majority of Members agree with the need for mandatory nutritional labelling, a provision
allowing for the coexistence of voluntary national schemes has sparked considerable debate due
to concern over possible consumer confusion (EU Council, 2008). Certain Members assert that
national schemes can play a critical role in promoting innovation through national-level
consumer-focused public health policy (EU Council, 2008; FSA, 2006).
In the UK, following three years of research and consultation with consumers, the food
industry and health experts, the FSA Board adopted the Traffic Light (TLS) system in March
2006. This colour-based system highlights total fat, saturated fat, sugar and salt content on the
front panel of food packages. Each nutrient has a colour rating of red, amber, or green
3
corresponding respectively to high, medium, or low levels of the nutrient based on criteria
established by the FSA in consultation with nutritionists, dieticians, and stakeholder groups
(GOS, 2009).
FOP schemes, in general, and the TLS, in particular, are designed to provide consumers
with nutrition information that can be read and processed quickly to provide a basis for easy
comparison of food products (Malam et al., 2009). The FSA has focused largely on
recommending the use of TLS on private label food products and has specifically encouraged
labelling on seven types of convenience foods including ready meals, pizzas, sausages, burgers,
pies, sandwiches and breakfast cereals. These seven target areas were selected based on
consumer research and consultation with advisory groups.
FSA conducted a survey in 2005 asking consumers to identify what food categories they
most wanted to see signpost labelling (Synovate, 2005). Of twenty-three food categories
analyzed, the highest scores were meal centre components (84%), chilled and frozen ready meals
(83%), breakfast cereals (83%), and pizzas (82%), cakes and biscuits (82%), crisps (80%). FSA’s
voluntary labelling campaign has received the endorsement of numerous health and consumer
organizations in the UK, including the British Heart Foundation, the Royal College of
Physicians, and the National Consumer Council (FSA, 2008).
Recent research and much of the literature assessing different FOP labelling schemes has
focused on consumer acceptance (Feunekes et al., 2007; Kelly et al., 2009). However, there is
need for research on food manufacturer response to changes in food labelling policies and
voluntary schemes (Golan et al., 2009). In order to assess the public health impact of new
labelling systems, it is imperative to understand the adoption of schemes across firms and food
categories and to examine the influence on food product innovation and reformulation. This
paper complements consumer based research on FOP nutritional labelling by examining firm
response to TLS labelling schemes in the UK.
Methodology
A real-time food innovation resource, Global New Product Database (GNPD) - Mintel,
was used to analyze packaged food products released in the UK from 2002-2008. The product
level observations in the database were populated using information gathered by a network of
field associates referred to as “Shoppers” (GNPD, 2009). All key retail distribution channels are
4
monitored by GNPD’s shopper network, including supermarkets, drug stores/chemists, natural
food stores/health shops, gas stations/petrol forecourts, convenience stores and other independent
outlets. GNPD also gathers data on product innovations through trade shows, press releases and
company tracking (GNPD, 2009). Types of food innovations in the data set ranged from new
packaging and new varieties to reformulated and novel products. A total of 27,004 product
observations were downloaded and categorized by private label or national brand. The five most
innovative food retailers and manufacturers were identified in each category.
Meal, bakery, and breakfast cereal innovations released in the UK from 2002-2008 were
further analyzed to examine the adoption of TLS. These broad food types were specifically
chosen because they encompass the seven specific food categories which FSA targeted for traffic
light labelling. Pictures in the GNPD database were used to classify each of the 7,044 meal,
bakery, and breakfast cereal products with one or more of the following FOP descriptions: GDA,
TLS, other, none, unclassified. A food was classified as GDA if it included the percentage share
of a daily amount of calories, sugar, fat, saturates, and salt. A food was labelled TLS if it used
red, yellow, and green colouring to illustrate high, medium, and low levels of total fat, saturates,
sugar, and salt. An “other” product was defined as having two or more nutritional facts, claims,
or statements on the front of package, but did not conform to either the TLS or GDA formats.
Where applicable, some products were classified as using a combination of GDA, TLS, and
other labels. Foods that did not have any FOP nutritional labelling were grouped under “none”,
and foods without complete information due to a missing or inadequate pictures were labelled
“unclassified”.
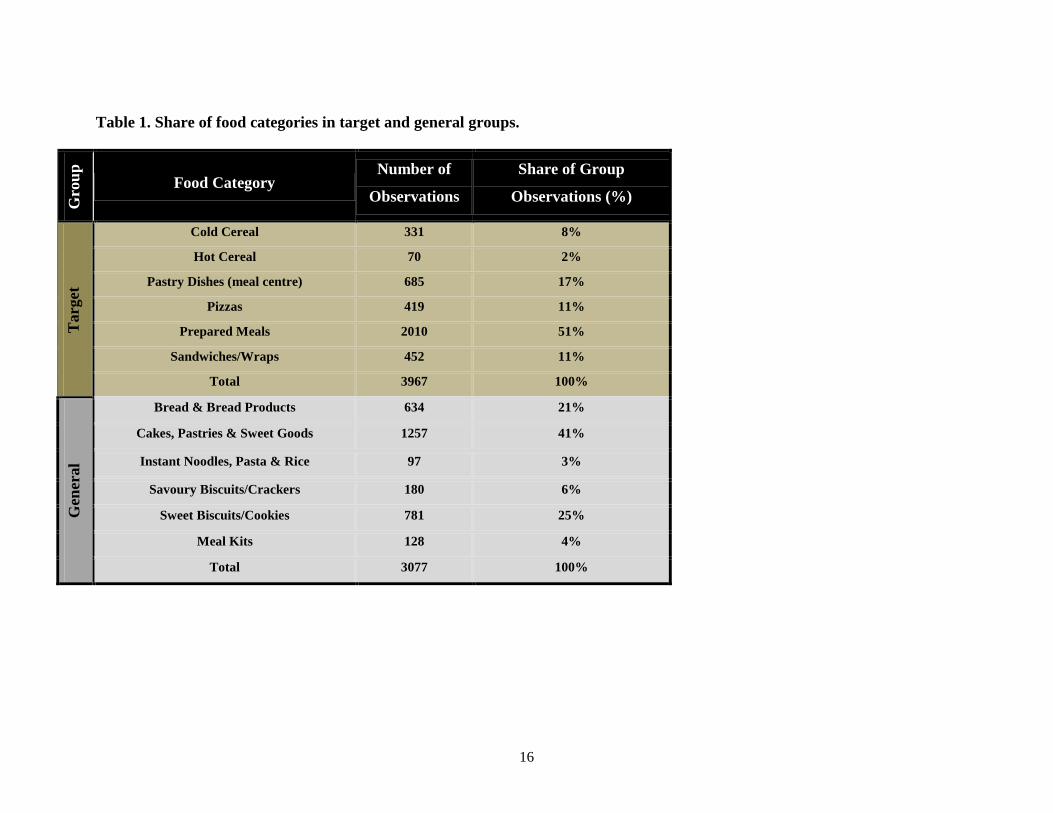
After the labelling scheme used on each product was recorded, the foods were divided
into twelve specific food categories. The categories were then aggregated into two groups
according to whether or not the food type was a target of the FSA’s signposting campaign (Table
1). The “target” group comprises food categories identified by FSA on their preliminary research
and consultation period.. This group included hot cereal, cold cereal, pastry dishes, pizzas,
prepared meals, and sandwiches. The “general” group contained meal and bakery foods which
were not specifically targeted by FSA. This group included bread, cakes/pies/sweet goods,
savoury biscuits, sweet biscuits, instant noodle/pasta/rice, and meal kits. The adoption of FOP
nutritional labelling was compared between the two groups from 2002-2008. Descriptive
5
statistics and cross tabulations of group, type of labelling system used, and firm were also
compared for 2008.
Findings
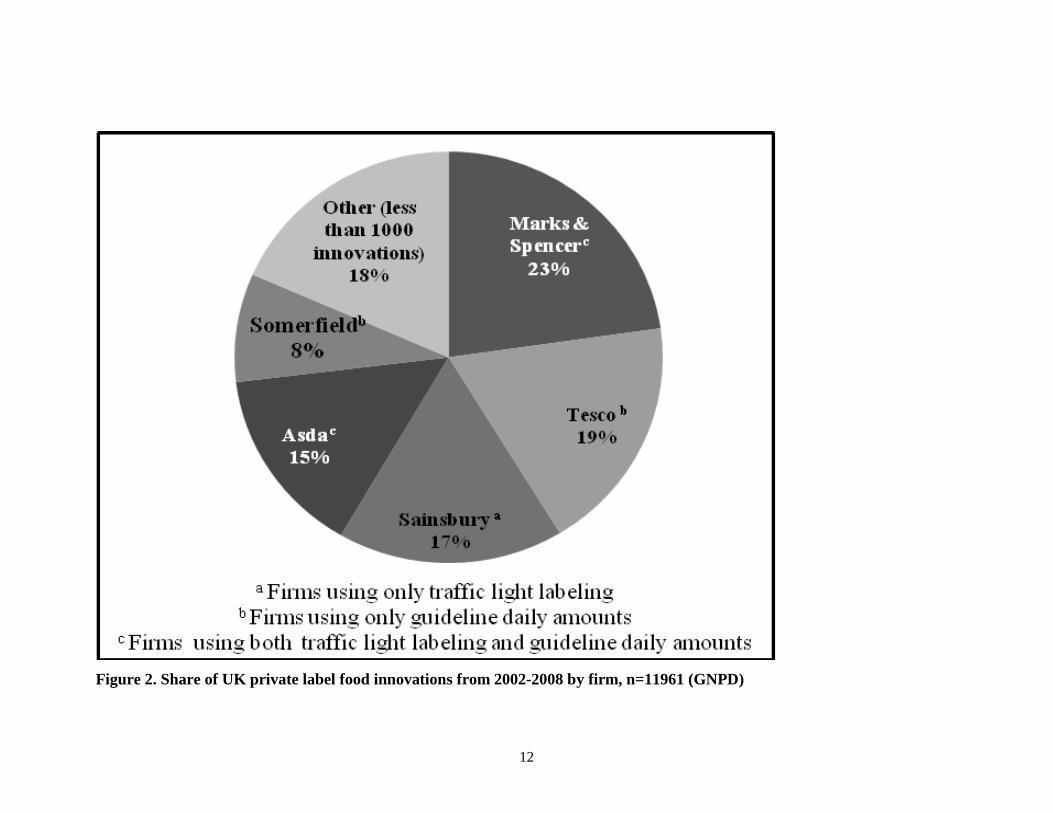
A few private label brands dominate food innovations in the UK. Private label products
comprise 48% of all food innovations from 2002 to 2008, and the five most innovative firms
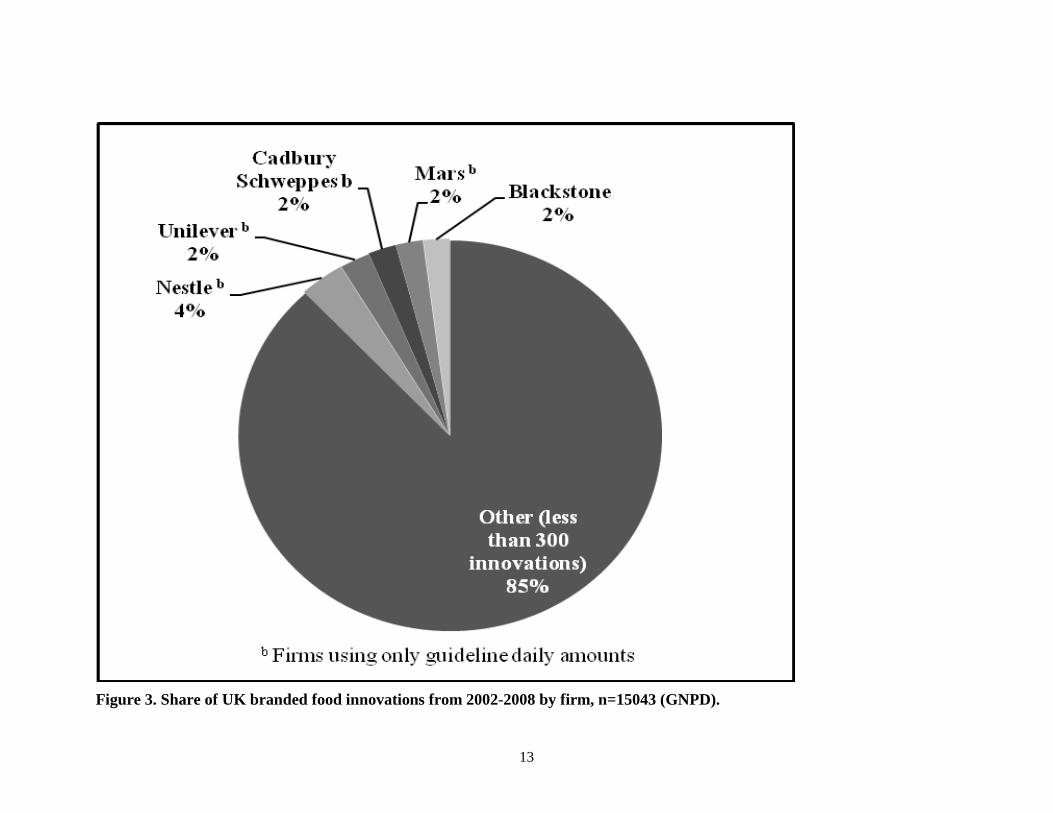
account for 82% of observations (Figure 2). Branded products account for the remaining 52% of
innovations, but the branded market is highly segmented with the top five firms accounting for
only 12% of all innovations (Figure 3). A study of private label sales in the EU conducted by
Neilson confirms these findings, suggesting that private label products, including food,
accounted for 40% of all retail sales in the UK (Willmer, 2007). Market share was higher than
the average for certain food categories, including bakery in which private label products
comprise 58% of sales (Willmer, 2007).
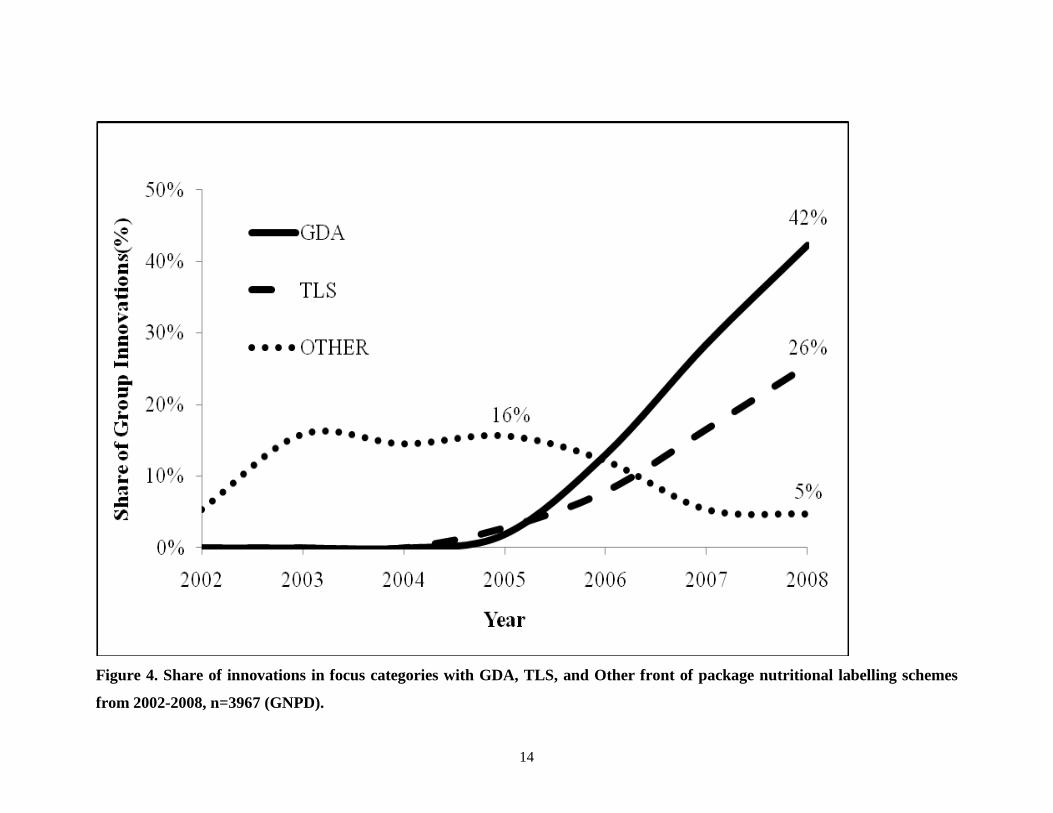
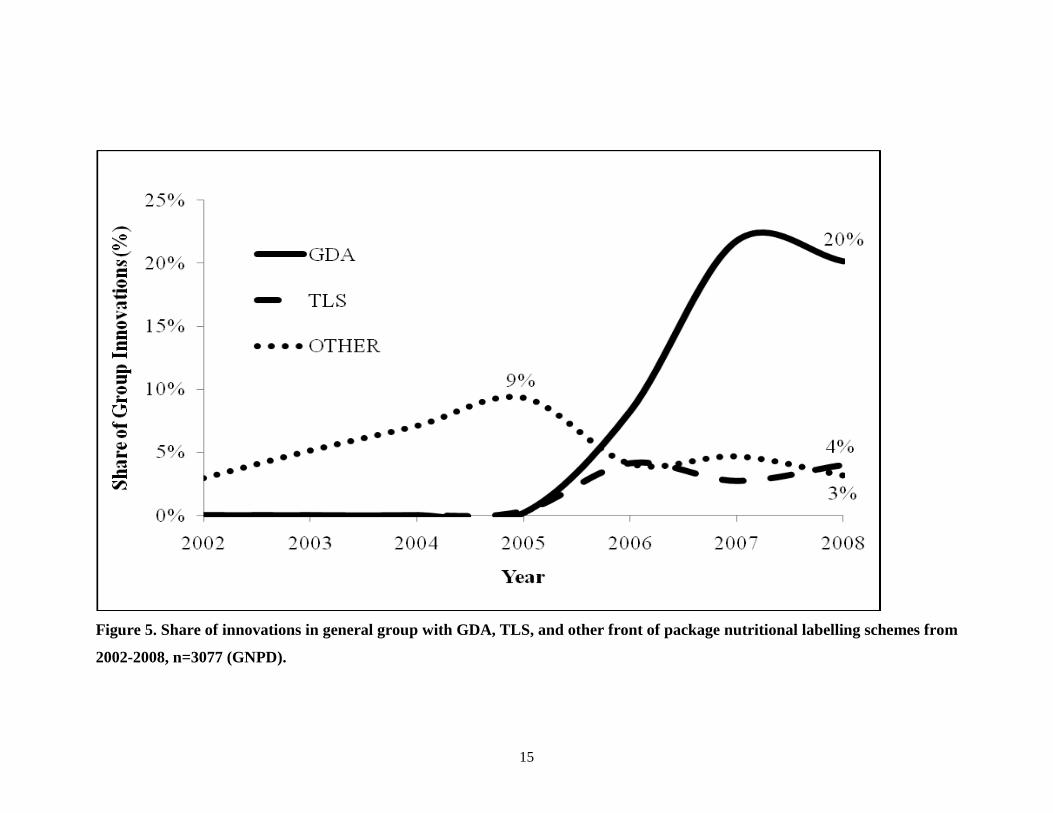
The “target” and “general” groups showed similar trends of adoption of FOP nutritional
labelling. In both groups, there was an increase in the use of TLS and GDA labels and a decline
in the use of other labels after 2005. GDA had a higher percentage of adoption than TLS in both
groups. However, both GDA and TLS labels were adopted a year earlier and in a larger share of
food products in the target group (Figures 4 and 5). In 2008, 55% of all products released in the
target group had some type of FOP nutritional labelling compared to just 27% of all products in
the general group. The shares of GDA and TLS labelled foods in the target group were 42% and
26%, respectively in 2008. While the same shares for the general group were only 20% and 4%.
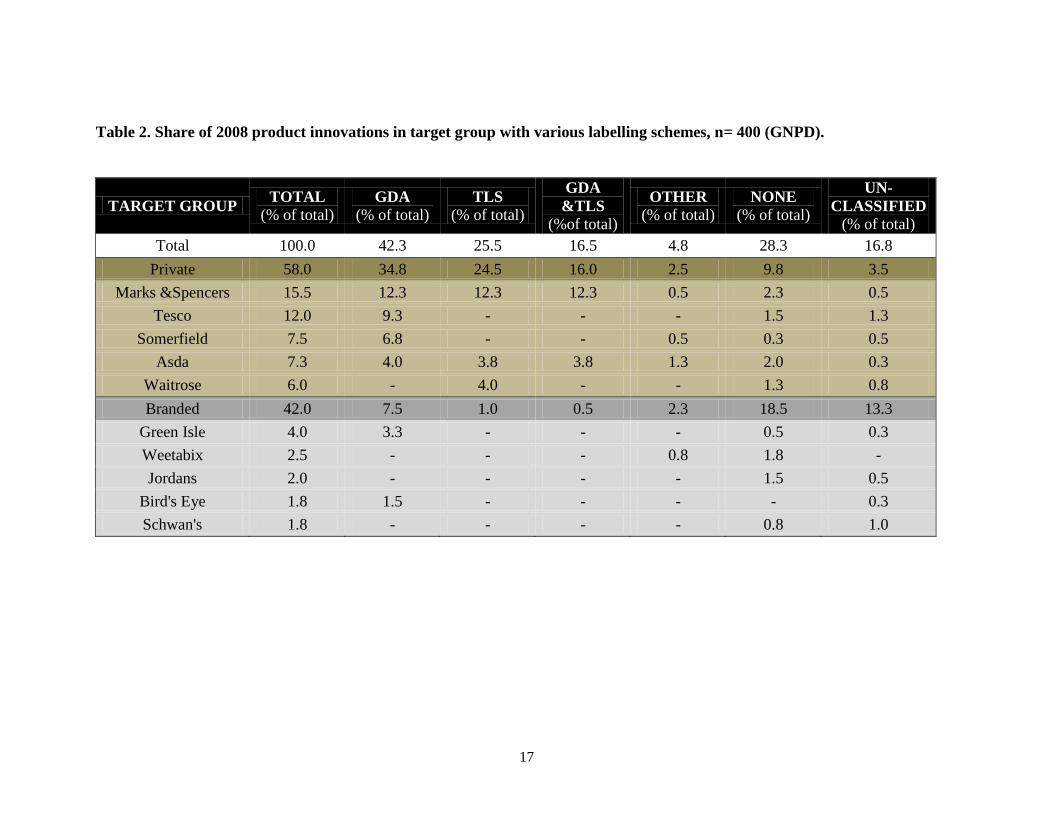
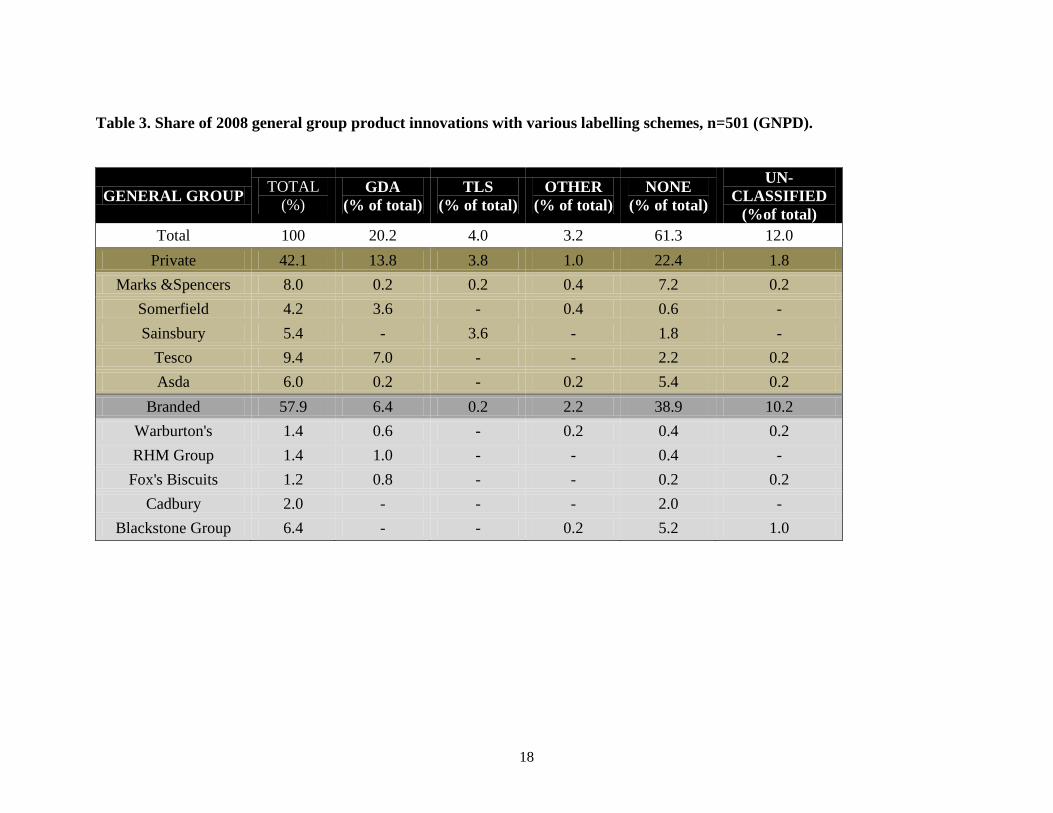
The data also reveals that FOP adoption strategies have varied significantly between
private label and branded products. None of the leading branded food manufacturers have
adopted TLS labelling (Figure 3; Tables 2 and 3). Thus the adoption of TLS in these foods has
been driven almost entirely by a few private label firms (Figure 2; Tables 2 and 3). However,
even among retailers the use of TLS labels has been selective across both firms and food
categories. Sainsbury and Waitrose have committed to only using TLS labelling, but do not use
FOP labelling on all products. For example, in 2008, Sainsbury had 5.4% of all innovations in
the general group, but only used TLS labelling on 3.6% of products (Table 3). Tesco and
Somerfield, like the leading brands, have chosen to use only GDA labelling, but do not use the
FOP scheme on all products (Tables 2 and 3). Marks & Spencer and Asda have opted to use a
6
combination TLS and GDA label, but both companies use the label much more frequently on
foods that are in the targeted categories. For example in 2008 Marks & Spencer and Asda
labelled 80% and 52% of food products released in the target group respectively. However, in
the same year, the combined label was used on only one product in the general group.
Discussion
Firm Response and Widespread Adoption of GDA
The adoption of both TLS and GDA labelling in both the target and general groups
illustrates that food manufacturers quickly responded to proposed, voluntary food labelling
changes. This response was likely driven by a competition to appeal to health conscious
consumers and build a wholesome and socially responsibly brand image (Golan et al., 2009). By
supporting voluntary labelling schemes industry is engaging in a proactive partnership with
regulators, but may also strategically be mitigating the need for, deferring or, at least influencing
the design of future mandatory labels (Segerson, 1999).
In both the targeted and general groups, GDA has been the most widely adopted labelling
scheme by both private label and branded firms in the UK. This has occurred despite a national
campaign for traffic light labelling from FSA, which was supported by leading UK health
organizations and consumer associations (FSA, 2008). The widespread adoption of GDA rather
than TLS labelling may be attributed to influence of proposed EU legislation and competitive
pressure for manufacturers to reformulate products. Since the European Commission’s first
consultation on the revision of EU nutrition labelling requirements in 2003, there has been
growing debate over imposing mandatory labelling requirements at the EU level. Through a
series of impact assessments, consultations, and discussion papers it became clear that the
Commission supported a labelling scheme similar to the GDA format. This position was
confirmed in the proposed legislation adopted by the Commission in 2008. Food manufacturers
may have thought it more important to align with EU regulations rather than national schemes in
order to reduce labelling costs and consumer confusion. This sentiment was reflected by Stephen
Robertson Director General of the British Retail Consortium, “Until a final decision about a
front-of-pack labelling scheme is taken at European level, it would be premature for the UK to
adopt any new regime of its own. Changing and then changing again would just produce extra
costs and customer confusion,” (Charles, 2009).
7
Food manufacturers may also view TLS (more than GDA) as imposing additional
pressure to reformulate a product that is high in sugar, salt, fat, or saturates with little guarantee
of marketing benefits. A study by the United States Economic Research Service reported that
nutritional labelling regulations can incite competitive reformulation among manufacturers of
processed foods to appeal to health-conscious consumers and promote brand reputation (Golan et
al., 2009). TLS does not differentiate between levels of high, medium, and low nutrients from
one food category to another (GOS, 2009). While this facilitates comparisons across food
categories it may stifle reformulation incentives within a category. Therefore, a prepared meal
with 5g of saturates and another with 15g of saturates per 100g would both be labelled red, and
may not be easily differentiated by consumers. Major product reformulations to reduce nutrients
from high to medium or low levels may influence taste and other quality attributes which could
lead to a decline in product demand or brand equity. Therefore, food manufacturers may view
traffic light labels as high cost with relatively small potential return.
Consumer Confusion
With the adoption of GDA and TLS labelling schemes there has been a concurrent
reduction in the use of “other” FOP nutrition labels. In spite of this trend towards
standardization, recent research has shown that consumers are confused by the coexistence of
TLS and GDA schemes. Research has shown that consumers cannot easily compare the nutrition
information on products using two different labels, and that consumers are often confused about
the meaning of different colours on various labels. In May 2009, FSA published consumer
research which suggested the ideal FOP labelling scheme is a traffic light coloured GDA with
the text “high”, “medium”, and “low” (FSA, 2009). The study also revealed that consumer
preference for a particular label does not necessarily correspond to an ability to interpret the label
information. For example, the wheel TLS format, which was adopted by Sainsbury in 2005, was
one of the top two most preferred labels, yet had one of the weakest comprehension test scores in
the study. These findings suggest that in order to reduce consumer confusion and achieve the
desired public health impacts, it may be necessary to standardize FOP nutrition labelling to a
format that is accepted by consumers and easy to comprehend.
Greater Adoption in Target Food Categories
8
Under the broad food types of bakery, meals, and breakfast cereals, it is clear that
products in target categories are much more likely to carry FOP nutrition labels than products in
the general group. It seems that FSA’s decision to target these specific food categories was based
largely on consumer preference research and the recommendations of advisory groups. While the
spill-over adoption of FOP labelling in the general group is a promising start, in the future it will
be important to promote the expansion of FOP labelling to other food categories which comprise
a significant portion of the average UK diet. The main energy source for the average consumer is
cereal and cereal products including biscuits, buns, cakes, and pastries (Swan, 2004). Therefore,
targeting some of the general bakery and snack food categories in the future may increase the
public health impact of FOP labelling.
Conclusions and Future Research
Concern over the effects of unhealthy food consumption is driving policies on nutritional
labelling. However, consumers do not seem to be responding to the nutrition information
available on packaged foods (Nayga, 2008). Recent studies have shown that consumers find
detailed nutritional information packages confusing (Feunekes et al., 2007; Kelly et al., 2009).
This has led the EU and the UK to propose simplified and easily read FOP nutritional labelling.
While consumer responses to such new labels are currently being evaluated (Malam et al., 2009;
FSA, 2009), to the best of our knowledge there are no comparable studies documenting industry
response. This paper starts to fill that gap investigating how manufacturers are using voluntary
FOP on food innovations.
Our findings suggest that the industry started to use the two leading FOP schemes under
consideration in the UK and EU following discussions which started in 2004. Interestingly, more
private label innovations support TLS. Perhaps in anticipation of the EU position on this issue,
food manufacturers have supported GDA over TLS schemes. The adoption of TLS was stronger
in the product categories targeted by FSA.
As FSA suggests (FSA, 2008), use FOP nutritional labels may create incentives for the
industry to reformulate product offerings towards healthier products. The GNPD database
records information on both nutrient content and ingredient composition of food innovations.
Therefore, a natural extension of this work is to investigate whether in the time span considered
here there is evidence of reformulation. Do new products have a healthier nutritional value?
9
References
[Cabinet Report] Jarvis, A. (unit leader), (2008), “Food Matters Toward A Strategy for the 21st Century”, Cabinet Office Report, London: Crown Copyright.
Charles, G., (2009) “FSA labelling research calls for hybrid scheme using traffic-lights labels
and guideline daily amounts”, Marketing Magazine. available at: http://www.marketingmagazine.co.uk/sectors/retail/article/903674/FSA-labelling-research-calls-hybrid-scheme-using-traffic-lights-labels-guideline-daily-amounts/
[Curry Report] Policy Commission on Future of Farming and Food, Curry, Sir D. (Chair),
(2002), “Future of Farming and Food: A Sustainable Future”, available at: http://www.cabinet-office.gov.uk/farming/pdf/PC%20Report2.pdf
[EC] European Commission, (2005), Green Paper: “Promoting healthy diets and physical
activity: A European dimension for the prevention of overweight, obesity and chronic disease”, COM/2005/637, Brussels.
[EC] European Commission, (2007), White Paper: “A Strategy for Europe on Nutrition,
Overweight and Obesity related health issues”, COM/2007/279, Brussels. [EC] European Commission, (2008), “Proposal for a regulation of the European Parliament and
of the Council on the provision of food information to consumers”, COM/2008/40, Brussels.
European Council (2008), “Presidency's progress report: Document prepared for Council
Meeting on 16 December”, available at: http://www.rdg.ac.uk/foodlaw/f-eu-new.htm [FSA] Food Standards Agency, (2006), “Board agrees principles for front of pack labelling”,
available at: http://www.food.gov.uk/news/newsarchive/2006/mar/signpostnewsmarch [FSA] Food Standards Agency, (2008), “Supporters of FSA’s approach to signpost labelling”,
available at: http://www.food.gov.uk/foodlabelling/signposting/supportfsasignp [FSA] Food Standards Agency, (2009), “Comprehension and use of UK nutrition signpost
labelling schemes”, available at: http://www.food.gov.uk/multimedia/pdfs/pmpreport.pdf Feunekes, G., Gortemaker, I., Willems, A., Lion, R. and van den Kommer, M. (2007) “Front-of-
pack nutrition labelling: Testing effectiveness of different nutrition labelling formats front –of-pack in four European countries. Appetite 50: 57-70
[GNPD] Global New Products Database, (2009), “How we do it”. Mintel International Group
Ltd, available at: http://www.gnpd.com/sinatra/gnpd&lang=br/info/id=how Golan E., Mancino L., Unnevehr L., (2009), Food Policy Check the List of Ingredients, Amber
Waves, Vol.7 No.2, pp.16-21.
10
[GOS] Government Office of Science, (2009), “Traffic-light Signposting Case Study”, Steering Panel for the Food Standards Agency, available at: www.dius.gov.uk/~/media/publications/A/Annex3TrafficLightsCaseStudyv74.doc
Kelly, B., Hughes, C., Chapman, K., Chun-Yu Louie, J., Dixon, H., Crawford, J., King, L.,
Daube, M. and Slevin, T. (2009) “Consumer testing of the acceptability and effectiveness of front-of-pack food labelling systems for the Australian grocery market.” Health Promotion International 24: 120-129
Malam, S., Clegg, S., Kirwin, S., and McGinigal, S., (2009), “Comprehension and use of UK
nutrition signpost labelling schemes”, British Market Research Bureau, available at: http://www.food.gov.uk/multimedia/pdfs/pmpreport.pdf
Nayga Jr., R. (2008) “Nutrition, obesity and health: policies and economic research challenges.”
European Review of Agricultural Economics 35(3): 281-302 Segerson, K. (1999). "Mandatory versus Voluntary Approaches to Food Safety." Agribusiness
15(1): 53-70 Swan G., (2004), Findings from the Latest National Diet and Nutrition Survey. Proceedings of
the Nutrition Society, 63: 505–512. Synovate, (2005), “Quantitative Evaluation of Alternative Food Signposting Concepts”, Report
prepared for the Food Standards Agency. Willmer, K., (2007), “Private label bakery keeps strong market position”, Confectionary News,
available at: http://www.confectionerynews.com/The-Big-Picture/Private-label-bakery-keeps-strong-market-position
11
Figure 1. Timeline of EU and UK Front of Package Nutrition Labelling Initiatives
12
Figure 2. Share of UK private label food innovations from 2002-2008 by firm, n=11961 (GNPD)
13
Figure 3. Share of UK branded food innovations from 2002-2008 by firm, n=15043 (GNPD).
14
Figure 4. Share of innovations in focus categories with GDA, TLS, and Other front of package nutritional labelling schemes
from 2002-2008, n=3967 (GNPD).
15
Figure 5. Share of innovations in general group with GDA, TLS, and other front of package nutritional labelling schemes from
2002-2008, n=3077 (GNPD).
16
Table 1. Share of food categories in target and general groups.
Gro
up
Food Category Number of
Observations
Share of Group
Observations (%)
Tar
get
Cold Cereal 331 8%
Hot Cereal 70 2%
Pastry Dishes (meal centre) 685 17%
Pizzas 419 11%
Prepared Meals 2010 51%
Sandwiches/Wraps 452 11%
Total 3967 100%
Gen
eral
Bread & Bread Products 634 21%
Cakes, Pastries & Sweet Goods 1257 41%
Instant Noodles, Pasta & Rice 97 3%
Savoury Biscuits/Crackers 180 6%
Sweet Biscuits/Cookies 781 25%
Meal Kits 128 4%
Total 3077 100%
17
Table 2. Share of 2008 product innovations in target group with various labelling schemes, n= 400 (GNPD).
TARGET GROUP TOTAL (% of total)
GDA (% of total)
TLS (% of total)
GDA &TLS
(%of total)
OTHER (% of total)
NONE (% of total)
UN-CLASSIFIED
(% of total) Total 100.0 42.3 25.5 16.5 4.8 28.3 16.8
Private 58.0 34.8 24.5 16.0 2.5 9.8 3.5 Marks &Spencers 15.5 12.3 12.3 12.3 0.5 2.3 0.5
Tesco 12.0 9.3 - - - 1.5 1.3 Somerfield 7.5 6.8 - - 0.5 0.3 0.5
Asda 7.3 4.0 3.8 3.8 1.3 2.0 0.3 Waitrose 6.0 - 4.0 - - 1.3 0.8 Branded 42.0 7.5 1.0 0.5 2.3 18.5 13.3
Green Isle 4.0 3.3 - - - 0.5 0.3 Weetabix 2.5 - - - 0.8 1.8 - Jordans 2.0 - - - - 1.5 0.5
Bird's Eye 1.8 1.5 - - - - 0.3 Schwan's 1.8 - - - - 0.8 1.0
18
Table 3. Share of 2008 general group product innovations with various labelling schemes, n=501 (GNPD).
GENERAL GROUP TOTAL (%)
GDA (% of total)
TLS (% of total)
OTHER (% of total)
NONE (% of total)
UN-CLASSIFIED
(%of total) Total 100 20.2 4.0 3.2 61.3 12.0
Private 42.1 13.8 3.8 1.0 22.4 1.8 Marks &Spencers 8.0 0.2 0.2 0.4 7.2 0.2
Somerfield 4.2 3.6 - 0.4 0.6 - Sainsbury 5.4 - 3.6 - 1.8 -
Tesco 9.4 7.0 - - 2.2 0.2 Asda 6.0 0.2 - 0.2 5.4 0.2
Branded 57.9 6.4 0.2 2.2 38.9 10.2 Warburton's 1.4 0.6 - 0.2 0.4 0.2 RHM Group 1.4 1.0 - - 0.4 -
Fox's Biscuits 1.2 0.8 - - 0.2 0.2 Cadbury 2.0 - - - 2.0 -
Blackstone Group 6.4 - - 0.2 5.2 1.0