ubi-ami: real-time metering of energy consumption at homes using multi-hop ip-based wireless sensor...
TRANSCRIPT
UBI-AMI: Real-Time Metering of Energy
Consumption at Homes Using Multi-hop IP-based
Wireless Sensor Networks
Timo Ojala1, Pauli Närhi1, Teemu Leppänen
1, Jani Ylioja
1, Szymon Sasin
2 and
Zach Shelby2
1 MediaTeam Oulu, University of Oulu, P.O.Box 4500, 90014 University of Oulu, Finland
{Timo.Ojala, Pauli.Narhi, Teemu.Leppanen, Jani.Ylioja}@ee.oulu.fi
2Sensinode Ltd., Hallituskatu 13-17 D, 90100 Oulu, Finland
{Szymon.Sasin, Zach.Shelby}@sensinode.com
Abstract. We present a system for real-time metering of aggregate power
consumption and appliance level loads in homes. The power consumption data
is collected by sensors in a multi-hop IP-based wireless sensor network. The
data is stored at a central server which prepares various representations of the
data to be viewed with a web browser. The findings of a longitudinal user
evaluation of our system by seven households testify for a successful design
and implementation.
Keywords: IEEE 802.15.4, 6LoWPAN, web service
1 Introduction
Despite numerous energy efficiency policies and programs electricity consumption
continues to grow. In the EU-25 member states the consumption of the residential
sector increased by 10.8% during the period of 1999-2004. In the USA the annual
power consumption has tripled during the past two decades. Residential and
commercial buildings contribute significant proportion of the total energy
consumption, 54% in the EU-25 and 72% in the USA. Further, in has been estimated
that 30% of that energy consumption is wasted. [2, 11, 12]
Past studies such as Chetty et al. [3] have proven that awareness of energy
consumption in homes and offices can lead to up to 20% reduction in electricity
usage. While Stern [10] showed a long time ago that real-time, per-appliance data on
electricity consumption would provide substantially greater utility and actionable
information, the customers of today’s utility companies typically have to be content
with data that is aggregated, delayed and difficult to access.
Electricity is distributed through a building along a tree-like structure called a load
tree, where the root connects the building to the power grid and the leaves correspond
to individual electric appliances. In an ideal case we would want to have a full,
detailed and real-time view of the load tree by monitoring the aggregate load at the

root (top-down view) and the individual loads at every appliance (bottom-up view).
However, this is rarely possible in practice due to cost and scalability issues, when a
building contains hundreds or thousands of appliances.
Numerous academic and industrial approaches have been proposed for monitoring
appliance level loads, for example the MIT Plug [7] for profiling a load over short and
long time scales. Many startups have introduced wireless energy monitoring solutions
based on ZigBee technology [25]. These products provide detailed power
measurements of selected individual loads, which contribute to a bottom-up view of
the power consumption.
By monitoring the load at the root a top-down view of the load tree can be pursued.
Many utility companies have introduced AMI solutions that provide almost real-time
data on the aggregate energy consumption of homes. Some utilities are collaborating
with aggregators such as Google PowerMeter [17] and Microsoft Ohm [20] to provide
more detailed feedback on energy consumption at a household level. Reactive and
real power signatures of appliances can be employed for disaggregating individual
loads from the aggregate load as originally proposed by Hart [5] and later refined by
many studies. The approach is feasible for a small number of loads that have
distinguishable differences in power signatures.
We present a system called UBI-AMI for automated power metering of a
household by measuring the loads both at the root and at selected individual
appliances with wireless sensors. The sensors transmit load measurements over a
multi-hop IP-based wireless sensor network (WSN) to a router which forwards data to
a UBI-AMI server. The server creates different representations of the data which can
be viewed with a web-based user interface (UI) and downloaded as RSS feeds. The
UI also allows the user to turn individual sensors (i.e. appliances attached to them) on
and off, and request email/SMS alarms based on load measurements. The UBI-AMI
system is assessed by a longitudinal user evaluation with seven households.
This paper is organized as follows. The implementation of the UBI-AMI system is
presented in Section 2. The setup and main findings of the user evaluation are
reported in Section 3. Conclusions and our plans for future work are discussed in
Section 4.
2 System Implementation
Fig. 1. shows the architecture of the UBI-AMI system, which comprises of three
functional building blocks:
1. Sensors in multiple 6LoWPAN sensor networks measure the loads and turn on/off
devices connected to the sensors. Each network has a router collecting packets
from multiple sensors over a multi-hop mesh topology, i.e. a sensor is able to
forward packets of other sensors.
2. Central UBI-AMI server receives packets from the routers, stores the data in a
database and creates different representations of the data.
3. User can browse the measurement data with a web browser and subscribe to RSS
feeds summarizing the data. Further, the user can control the sensors and subscribe
to email/SMS alerts based on load measurements.

Fig. 1. Architecture of the UBI-AMI system.
2.1 Sensors
We have built two types of wireless sensors. A socket sensor (Fig. 2(a)) measures the
loads of individual devices or groups of devices equipped with pluggable power
cords. A mains sensor (Fig. 2(b)) measures the load at the root of the load tree of a
building, including all non-pluggable devices such as electrical heating, hot water
boiler and lighting. The sensors are furnished with a Radiocrafts RC2301 IEEE
802.15.4 radio module on the 2.4 GHz band [22]. It is flashed with the Sensinode
NanoStack 2.0 protocol stack, which implements the IETF 6LoWPAN specification
for transmitting IPv6 packets over IEEE 802.15.4 devices [8]. Effectively, the
protocol stack provides the sensors with half-duplex multi-hop IPv6 connectivity. The
sensors transmit measurement data every 10 seconds and receive possible turn on/off
commands in a response message.
Socket Sensor
The components of a socket sensor are placed on an in-house PCB (Fig. 3), which is
isolated from the mains current by an optocoupler and a transformer. The load
measurement is conducted with a circuit extracted from a commercial AVEC A9999
energy meter [15]. Atmel ATmega 164P microcontroller [14] collects and packetizes
the load mesurements into UDP packets which are passed via a serial port to the
Radiocrafts RC2301 radio module for wireless transmission using the 6LoWPAN
protocol stack. LM60CIZ temperature sensor [19] and Vishay TEPT5700 illumination

sensor [24] are integrated in the enclosure, together with two LEDs providing simple
status information. A relay capable of switching 16 amperes is integrated to turn
on/off the appliances plugged into the sensor. An external 3 dBi omnidirectional
antenna is connected to the radio module to boost the range of the low-power 2.4 GHz
radio. The socket sensor is furnished with a 1.5 m three-socket extension cord, to
allow easy placement of the sensor unit and the load measurement of multiple
appliances simultaneously. The unit price of a socket sensor was 69 EUR when built
by us in small quantities.
(a)
(b)
Fig. 2. (a) Socket sensor; (b) Mains sensor.
RC2301
RADIO MODULELOAD
LED
LINK
LED
ANTENNA
230V
PLUG
N
P
E
230V SOCKETS
ENERGY
MEASUREMENT
CIRCUIT
3V
OPTOCOUPLER
3V
12V
RELAY
LM60CIZ
TEMPERATURE
SENSOR
TEPT5700
ILLUMINATION
SENSOR
ATMEGA 164P
MICROCONTROLLER
LOGIC
PSU
Fig. 3. Block diagram of the in-house PCB.

Mains Sensor The mains sensor is built using mostly the same components as in the socket sensor. It
measures the load of a building or a home with a simple phototransistor counting the
pulses of the S0 interface of a main switch board. The mains sensor does not have
mains current on board but is instead equipped with an external power supply. It does
not have the extension cord neither the relay unit. The unit price of a mains sensor
was 52 EUR when built by us in small quantities.
2.2 WSN Router
We built the WSN router on an affordable Linksys WRT54GS WLAN router [18] by
adding a Radiocrafts RC2301 radio module to a free serial port connected to an
external antenna connector (Fig. 4). The Linksys router is flashed with a customized
OpenWRT Linux firmware capable of routing packets between the 6LoWPAN sensor
network and the Internet. When connected to any IPv4 network providing an IP
address via DHCP, the router establishes two SSH connections to the UBI-AMI
server. The first connection is used to securely transfer the packets received from the
sensors, together with any commands between the router and the server. The second
connection is used to access the router remotely for management purposes. The
wireless links between the router and the sensors are protected by 128-bit AES
encryption. The unit price of a WSN router was 100 EUR when built by us in small
quantities.
Fig. 4. WSN router with the placement of the RC2301 radio module highlighted.
2.3 UBI-AMI Server and User Interface
The UBI-AMI server is realized atop the open source GSN (Global Sensor Network)
middleware in Java [1]. So-called wrapper components receive the measurement data

from the routers and store the data into a MySQL database [21]. For security purposes
the server authenticates each router with MAC address filtering and all
communication takes place through SSH tunnels. To save storage space, at certain
intervals the server compresses and disposes of ‘old’ data by representing it with
average values. The server also keeps tracks of the alarms configured by the users.
(a)
(b)
Fig. 5. Screenshots of UBI-AMI user interface: (a) power consumption; (b) energy.

The UBI-AMI UI user interface (UI) is implemented as a website atop the open
source GlassFish application server [16] as Java Server Pages. Fig. 5 shows
screenshots of the two most commonly used pages, power and energy. Other views
based on the sensor data include energy bill, temperature, and illumination. Each type
of data can be viewed on different time scales (hourly, daily, weekly, monthly). The
UI has separate tabs for drawing the floor plan and for configuring alarms received
either via email or SMS to mobile phone. To stimulate participation and community
engagement the users can view the consumption data of other members in the
community. The UI has also a separate tab for configuring settings such as the price
of energy and RSS feeds reporting the real-time power consumption for the last 1, 4
or 24 hours. The header shows the user’s current real-time energy consumption with
relative change over the past 24 hours.
When a user starts using the UBI-AMI service, (s)he has to first deploy the sensors
around home. Once the floor plan is drawn the icons of sensors can be placed on it
and assigned with their friendly names (e.g. ‘TV’ or ‘fridge’). When the icon of a
sensor is clicked, a real-time view of the sensor’s latest data measurement is provided.
Further, in case of a socket sensor the user can turn on/off the sensor, i.e. the
appliances plugged into the sensor.
3 Longitudinal User Evaluation
The UBI-AMI system was evaluated by seven households in the Oulu region in 2010.
Each household was provided with a demo kit comprising of a router, a mains sensor
and four socket sensors. The kits were deployed in late January 2010, so that
researchers first conducted an initial interview mapping the household’s electrical
appliances and attitudes towards saving energy. Then the researchers introduced the
UBI-AMI system and showed how to install the router, the socket sensors and the
mains sensor and how to use the web UI. Quantitative data has been obtained by
logging at the server and qualitative data by follow-up interviews of the test users.
All seven households lived in a detached house equipped with electrical heating, an
electric sauna and a hot water boiler. While some of the households had previously
used the traditional separate energy meters for determining appliance level
consumptions, none of them had used any WSN based monitoring systems similar to
our UBI-AMI.
Table 1 shows that the test users listed easy deployment, low operational expenses,
possibility to measure electricity consumption of an individual appliance and
timeliness of the electricity consumption data as the most relevant features of the
UBI-AMI service in the opening interviews.
Table 2 tallies the test users’ expectations on the impact of the UBI-AMI service
on their households. While all test users expected the UBI-AMI service have some
sort of an effect, none expected the electricity consumption to reduce a lot.
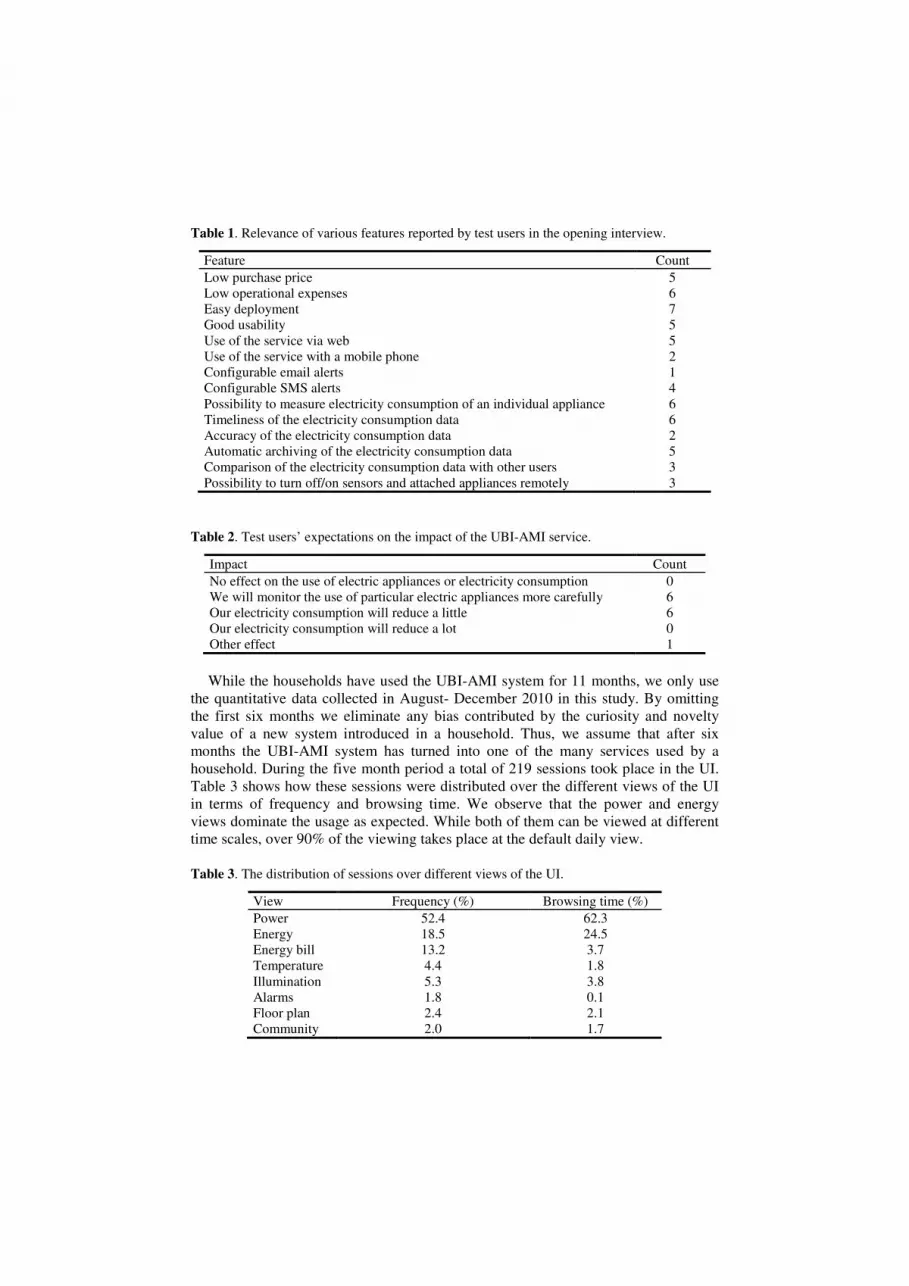
Table 1. Relevance of various features reported by test users in the opening interview.
Feature Count
Low purchase price 5
Low operational expenses 6
Easy deployment 7
Good usability 5
Use of the service via web 5
Use of the service with a mobile phone 2
Configurable email alerts 1
Configurable SMS alerts 4
Possibility to measure electricity consumption of an individual appliance 6
Timeliness of the electricity consumption data 6
Accuracy of the electricity consumption data 2
Automatic archiving of the electricity consumption data 5
Comparison of the electricity consumption data with other users 3
Possibility to turn off/on sensors and attached appliances remotely 3
Table 2. Test users’ expectations on the impact of the UBI-AMI service.
Impact Count
No effect on the use of electric appliances or electricity consumption 0
We will monitor the use of particular electric appliances more carefully 6
Our electricity consumption will reduce a little 6
Our electricity consumption will reduce a lot 0
Other effect 1
While the households have used the UBI-AMI system for 11 months, we only use
the quantitative data collected in August- December 2010 in this study. By omitting
the first six months we eliminate any bias contributed by the curiosity and novelty
value of a new system introduced in a household. Thus, we assume that after six
months the UBI-AMI system has turned into one of the many services used by a
household. During the five month period a total of 219 sessions took place in the UI.
Table 3 shows how these sessions were distributed over the different views of the UI
in terms of frequency and browsing time. We observe that the power and energy
views dominate the usage as expected. While both of them can be viewed at different
time scales, over 90% of the viewing takes place at the default daily view.
Table 3. The distribution of sessions over different views of the UI.
View Frequency (%) Browsing time (%)
Power 52.4 62.3
Energy 18.5 24.5
Energy bill 13.2 3.7
Temperature 4.4 1.8
Illumination 5.3 3.8
Alarms 1.8 0.1
Floor plan 2.4 2.1
Community 2.0 1.7

Table 4. Test users’ assessment of selected statements.
Statement Disagree Don’t
know Agree
Deployment of socket sensors was easy 0 0 7
Socket sensors functioned reliably 1 1 5
Deployment of mains sensor was easy 1 0 6
Mains sensor functioned reliably 1 1 5
Deployment of router was easy 0 0 7
Router functioned reliably 2 1 4
Web UI was easy to learn to use 0 0 7
Web UI is easy to use 0 1 6
Web UI is clear 1 1 5
Web UI is pleasant to use 1 3 3
Possibility to turn off/on sensors and appliances remotely is useful 1 2 4
Configurable alarms are useful 1 0 6
UBI-AMI is useful service 0 0 7
UBI-AMI gives reliable information on energy consumption 1 1 5
UBI-AMI gives comprehensive information on energy consumption 1 0 6
UBI-AMI gives timely information on energy consumption 0 0 7
UBI-AMI has improved our awareness of energy consumption 0 0 7
UBI-AMI has impacted our way of using electric appliances 3 1 3
UBI-AMI has reduced energy consumption in our household 3 3 1
I wish to use UBI-AMI in the future 0 1 6
I would recommend UBI-AMI to other people 0 0 7
In the follow-up interviews the test users were asked to assess various statements
on a 5-point Likert scale (1=totally disagree … 5=totally agree). Table 4 summarizes
responses to selected statements so that responses 1 and 2 are tallied under “disagree”,
3 under “don’t know” and 4 and 5 under “agree”. Exactly one test user reported the
UBI-AMI service to have had reduced the energy consumption in their household.
Overall, the responses testify for successful design and implementation. In some cases
the observed technical unreliability of the system was actually attributed to the
household’s Internet connection being temporarily disconnected.
Test users reported that their continuous interest in real-time loads of individual
appliances wore out rather quickly. Instead, they would have preferred visualizing the
monetary expenses of energy consumption, together with any rapid relative changes,
as an ambient media whose observation would not require any conscious or dedicated
action on their part. Further, sensors for measuring non-socket appliances such as
sauna stoves and hot water boilers were requested, together with automatic
incorporation of outdoor temperature, which in Finland is crucial for assessing the
contribution of electric heating into the power consumption.
4 Conclusion
Our study shows that visibility to both the aggregate load and appliance level loads in
a home is very useful functionality that has an impact on how people use electric
appliances. IP-based wireless sensor networks and web provide a very potent

technology platform for implementing such functionality in a cost-effective, reliable
and standardized manner, in contrast to the many proprietary solutions on the market.
While many systems similar to our UBI-AMI have been proposed earlier, e.g. [6, 9,
13], our study is distinguished from most other studies by the longitudinal evaluation
of the system by seven real households. Such long-term assessment by real users in
authentic setting is needed to reliably study the adoption and impact of this type of
ubiquitous computing systems, which require sufficient technical and cultural
readiness to be successful [4]. Further, our system employs multi-hop data
dissemination, and allows users to configure alarms based on measurements and to
turn on/off appliances remotely.
The UBI-AMI system has also other shortcomings in addition to those discussed in
the evaluation. The sensors use unreliable transport protocol (UDP), assuming that a
packet is forwarded all the way to the UBI-AMI server after transmission. However,
if for example the Internet connection between the router and the server is
disconnected, the packets and thus the data are lost. This could be addressed by either
the sensors or the router storing the measurements for delay tolerant delivery or by
using a reliable transport protocol, but at the cost of extra computation and
communication overhead. The 2.4 GHz radio coupled with the 1 mW transmission
power does not provide sufficient penetration and range for networking in brick
buildings. The design of our sensor casings and the plastic cables limited deployment
to dry indoor facilities with nonfreezing temperatures.
We are currently busy building new types of sensors. Their radios will use the sub-
GHz (868 MHz) radio, which provides much better penetration and range than 2.4
GHz. We will integrate so-called clamp sensors into the mains sensor for measuring
the loads of non-socket appliances from the main switch board. We are also
considering other types of sensors such as environmental sensors. We also need to
enhance the UI in many respects, e.g. to include budget tracker and energy bill
estimation [17] and mobile phone client [13]. The new sensors and the improved UI
will be employed in a larger trial to be conducted atop a city-wide wireless sensor
network dubbed panOULU WSN. We have deployed around downtown Oulu dozen
routers, which provide half-duplex multi-hop connectivity to low power sensors on
the sub-GHz (868 MHz) band using the IEEE 802.15.4 radio and the 6LoWPAN
protocol stack. The routers provide typically 500 meter line-of-sight range with 1 mW
transmission power. Households within the coverage area of the panOULU WSN will
not need the dedicated router used in this study.
5 Acknowledgments
The authors gratefully acknowledge financial support from the Finnish Funding
Agency for Technology and Innovation, the European Regional Development Fund,
the City of Oulu, and the UBI (UrBan Interactions) consortium.
References
1. Aberer, K., Hauswirth, M., Salehi, A.: A middleware for fast and flexible sensor network
deployment. In: 32nd International Conference on Very Large Databases, pp. 1199--1202
(2006)
2. Bertoldi, P., Atanasiu, B.: Electricity consumption and efficiency trends in the enlarged
European Union. European Commission Report EUR 22753 EN (2006)
3. Chetty, M., Tran, D., Grinter, R.E.: Getting to green: understanding resource consumption in
the home. In: 10th international Conference on Ubiquitous Computing, pp. 242--251 (2008)
4. Greenberg, S., Buxton, B.: Usability evaluation considered harmful (some of the time). In:
26th Annual CHI Conference on Human Factors in Computing Systems, pp. 111--120 (2008)
5. Hart, G.: Nonintrusive appliance load monitoring. Proceedings of the IEEE, pp. 1870--1891
(1992)
6. Jiang, X., Van Ly, M., Taneja, J., Dutta, P., Culler, D.: Experiences with a high-fidelity
wireless building energy auditing network. In: 7th ACM Conference on Embedded
Networked Sensor Systems, pp. 113--126 (2009)
7. Lifton, J., Feldmeier, M., Ono, Y., Lewis, C., Paradiso, J.A.: A platform for ubiquitous
sensor deployment in occupational and domestic environments. In: 6th nternational
Conference on Information Processing in Sensor Networks (2007)
8. Montenegro, G., Kushalnagar, N., Hui, J., Culler, D.: Transmission of IPv6 packets over
IEEE 802.15.4 networks. IETF RFC 4944.
9. Stavropoulos, T.G., Tsioliaridou, A., Koutitas, G., Vrakas, D., Vlahavas, I.: System
architecture for a smart university building. In: 20th International Conference on Artificial
Neural Networks, pp.477--482 (2010)
10. Stern, P.: What psychology knows about energy conservation. American Psychologist
47(10), pp. 1224--1232 (1992)
11. U.S. DOE: Buildings Energy Data Book (2008)
12. U.S. DOE: Commercial buildings energy consumption survey (2003)
13. Weiss, M., Mattern, F., Graml, T., Staake, T., Fleisch, E.: Handy feedback: connecting
smart meters with mobile phones. In: 8th International Conference on Mobile and Ubiquitous
Multimedia (2009)
14. Atmel ATmega 164P, http://www.atmel.com/dyn/resources/prod_documents/doc8011.pdf.
15. AVEC A9999, http://www.semac.fi/product_info.php?products_id=55.
16. GlassFish, http://glassfish.java.net.
17. Google PowerMeter, http://www.google.org/powermeter.
18. Linksys WRT54GS, http://downloads.linksysbycisco.com/downloads/datasheet/1224638902575/wrt54gs_ds_2.pdf.
19. LM60CIZ, http://www.national.com/ds/LM/LM60.pdf.
20. Microsoft Hohm, http://www.microsoft-hohm.com.
21. MySQL, http://www.mysql.com.
22. Radiocrafts RC2301, http://radiocrafts.com/uploads/rc230x_data_sheet_1_2.pdf.
23. Sensinode NanoStack 2.0, http://www.sensinode.com/EN/products/software.html.
24. Vishay TEPT5700, http://www.vishay.com/docs/81321/tept5700.pdf.
25. ZigBee, http://www.zigbee.org.