tutorial: mosaic raster geodata - microimages
TRANSCRIPT
Mosaicking Raster Geodata
page 1
Tutorial
MosaickingRaster Geodata
with
TNTmips®
MOSAICKING
Mosaicking Raster Geodata
page 2
Before Getting Started
It may be difficult to identify the important points in some illustrations without acolor copy of this booklet. You can print or read this booklet in color fromMicroImages’ web site. The web site is also your source for the newest tutorialbooklets on other topics. You can download an installation guide, sample data,and the latest version of TNTlite.
http://www.microimages.com
This booklet introduces procedures for creating raster image mosaics in TNTmips®.The Mosaic process provides two modes for assembling images: automatic posi-tioning of georeferenced images, and manual positioning by placing tie pointsbetween pairs of overlapping images. The exercises in this booklet introduce theMosaic interface and show you how to use the many tools for creating a nearlyseamless mosaic, including integrated masking with processing areas, contrastand color matching, and varied overlap processing options.
Prerequisite Skills This booklet assumes that you have completed the exercisesin the tutorial booklets Displaying Geospatial Data and Navigating. Those exer-cises introduce essential skills and basic techniques that are not covered againhere. Please consult those booklets for any review you need.
Sample Data The exercises presented in this booklet use sample data that isdistributed with the TNT products. If you do not have access to a TNT productsCD, you can download the data from MicroImages’ web site. In particular, thisbooklet uses sample files in the MOSAIC data collection.
More Documentation This booklet is intended only as an introduction tomosaicking raster objects. Details of the process can be found in a variety oftutorial booklets, color plates, and Quick Guides, which are all available fromMicroImages’ web site (go to http://www.microimages.com/search to quicklysearch all available materials, or you can narrow your search to include only tuto-rials or plates.
TNTmips and TNTlite® TNTmips comes in two versions: the professional ver-sion and the free TNTlite version. This booklet refers to both versions as“TNTmips.” If you did not purchase the professional version (which requires asoftware license key), TNTmips operates in TNTlite mode, which limits objectsize and does not allow preparation of linked atlases.
The Mosaic process is not available in TNTview, TNTedit, or TNTatlas. All ofthe exercises can be completed in TNTlite using the sample geodata provided.
Randall B. Smith, Ph.D.,24 July 2006©MicroImages, Inc., 1997-2006
Mosaicking Raster Geodata
page 3
The Mosaic process in TNTmips lets you combineraster images of varied types into a single mosaicimage. You can mosaic grayscale rasters, RGB colorraster sets, or color composites. The input compo-nents do not have to be of the same type; you canmosaic different types of grayscale rasters, RGB ras-ter sets with color composites, or even color withgrayscale rasters.
Image positions in the mosaic can be established intwo ways. If all input images are georeferenced, usethe Automatic positioning option to automaticallyplace the images in the specified map projection. Ifsome or all of the images lack georeferencing, usethe Manual positioning mode to place tie points be-tween pairs of overlapping images. Manual modeuses a bundle adjustment algorithm to compute aleast-squares best fit for all tie points and any avail-able ground control points.
A number of options allow you to fine-tune the ap-pearance of the mosaic. You can define thegeographic extents of the mosaic manually by draw-ing an extents box or match the extents to a referenceobject. If you want to exclude parts of the inputimages from the mosaic, such as the fiducial marksand marginal data blocks on scanned aerial photo-graphs, there is no need to crop the images prior toentering the mosaic process. Simply define Process-ing Areas to automatically mask unwanted portionsof each input object (or object set) as the mosaic isprocessed.
The Mosaic process allows you the option to applycontrast enhancement to each input raster in con-structing the mosaic and to set up contrast matchingof input objects. You can specify a reference formatching or match all objects to a model histogram.There are also a number of options for processingoverlap areas to produce nearly imperceptible tran-sitions between input images.
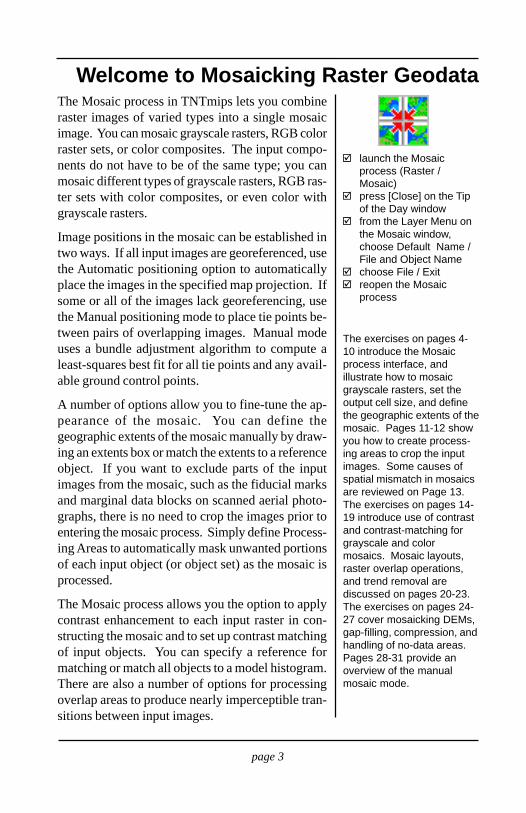
launch the Mosaicprocess (Raster /Mosaic)press [Close] on the Tipof the Day windowfrom the Layer Menu onthe Mosaic window,choose Default Name /File and Object Namechoose File / Exitreopen the Mosaicprocess
The exercises on pages 4-10 introduce the Mosaicprocess interface, andillustrate how to mosaicgrayscale rasters, set theoutput cell size, and definethe geographic extents of themosaic. Pages 11-12 showyou how to create process-ing areas to crop the inputimages. Some causes ofspatial mismatch in mosaicsare reviewed on Page 13.The exercises on pages 14-19 introduce use of contrastand contrast-matching forgrayscale and colormosaics. Mosaic layouts,raster overlap operations,and trend removal arediscussed on pages 20-23.The exercises on pages 24-27 cover mosaicking DEMs,gap-filling, compression, andhandling of no-data areas.Pages 28-31 provide anoverview of the manualmosaic mode.
Welcome to Mosaicking Raster Geodata
Mosaicking Raster Geodata
page 4
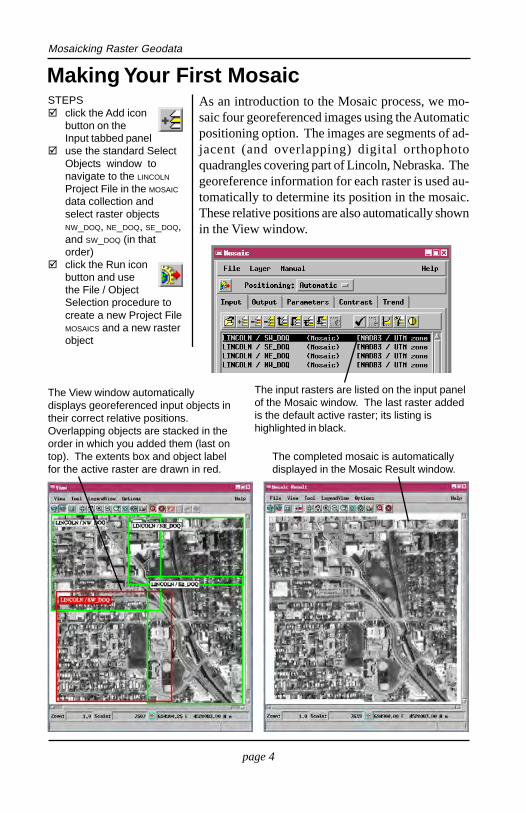
As an introduction to the Mosaic process, we mo-saic four georeferenced images using the Automaticpositioning option. The images are segments of ad-jacent (and overlapping) digital orthophotoquadrangles covering part of Lincoln, Nebraska. Thegeoreference information for each raster is used au-tomatically to determine its position in the mosaic.These relative positions are also automatically shownin the View window.
STEPSclick the Add iconbutton on theInput tabbed paneluse the standard SelectObjects window tonavigate to the LINCOLN
Project File in the MOSAIC
data collection andselect raster objectsNW_DOQ, NE_DOQ, SE_DOQ,and SW_DOQ (in thatorder)click the Run iconbutton and usethe File / ObjectSelection procedure tocreate a new Project FileMOSAICS and a new rasterobject
Making Your First Mosaic
The View window automaticallydisplays georeferenced input objects intheir correct relative positions.Overlapping objects are stacked in theorder in which you added them (last ontop). The extents box and object labelfor the active raster are drawn in red.
The completed mosaic is automaticallydisplayed in the Mosaic Result window.
The input rasters are listed on the input panelof the Mosaic window. The last raster addedis the default active raster; its listing ishighlighted in black.
Mosaicking Raster Geodata
page 5
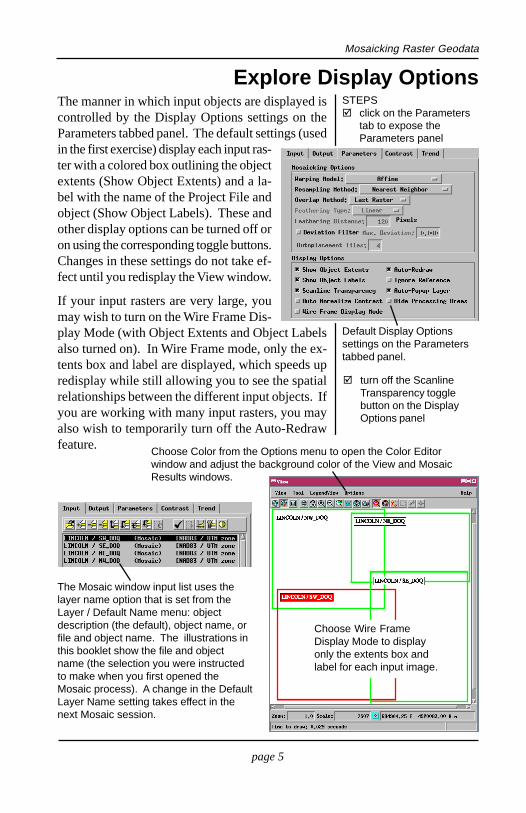
The manner in which input objects are displayed iscontrolled by the Display Options settings on theParameters tabbed panel. The default settings (usedin the first exercise) display each input ras-ter with a colored box outlining the objectextents (Show Object Extents) and a la-bel with the name of the Project File andobject (Show Object Labels). These andother display options can be turned off oron using the corresponding toggle buttons.Changes in these settings do not take ef-fect until you redisplay the View window.
If your input rasters are very large, youmay wish to turn on the Wire Frame Dis-play Mode (with Object Extents and Object Labelsalso turned on). In Wire Frame mode, only the ex-tents box and label are displayed, which speeds upredisplay while still allowing you to see the spatialrelationships between the different input objects. Ifyou are working with many input rasters, you mayalso wish to temporarily turn off the Auto-Redrawfeature.
Explore Display Options
Default Display Optionssettings on the Parameterstabbed panel.
Choose Color from the Options menu to open the Color Editorwindow and adjust the background color of the View and MosaicResults windows.
The Mosaic window input list uses thelayer name option that is set from theLayer / Default Name menu: objectdescription (the default), object name, orfile and object name. The illustrations inthis booklet show the file and objectname (the selection you were instructedto make when you first opened theMosaic process). A change in the DefaultLayer Name setting takes effect in thenext Mosaic session.
turn off the ScanlineTransparency togglebutton on the DisplayOptions panel
STEPSclick on the Parameterstab to expose theParameters panel
Choose Wire FrameDisplay Mode to displayonly the extents box andlabel for each input image.
Mosaicking Raster Geodata
page 6
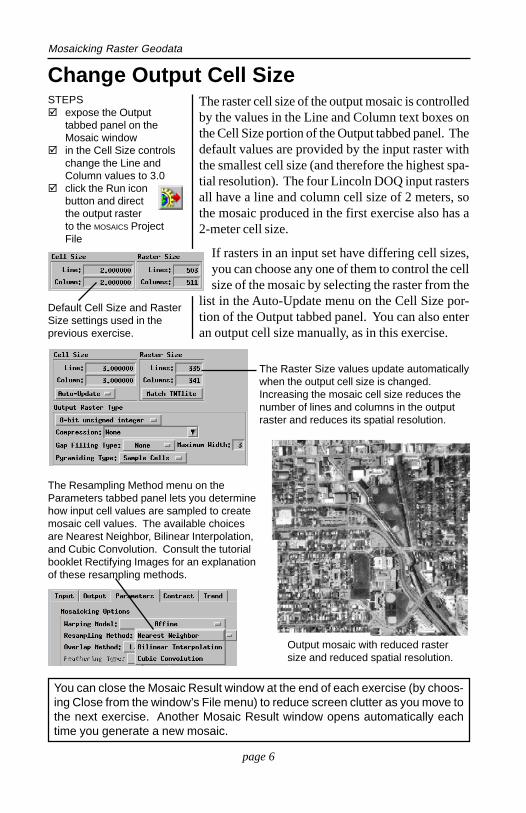
The raster cell size of the output mosaic is controlledby the values in the Line and Column text boxes onthe Cell Size portion of the Output tabbed panel. Thedefault values are provided by the input raster withthe smallest cell size (and therefore the highest spa-tial resolution). The four Lincoln DOQ input rastersall have a line and column cell size of 2 meters, sothe mosaic produced in the first exercise also has a2-meter cell size.
If rasters in an input set have differing cell sizes,you can choose any one of them to control the cellsize of the mosaic by selecting the raster from the
list in the Auto-Update menu on the Cell Size por-tion of the Output tabbed panel. You can also enteran output cell size manually, as in this exercise.
STEPSexpose the Outputtabbed panel on theMosaic windowin the Cell Size controlschange the Line andColumn values to 3.0click the Run iconbutton and directthe output rasterto the MOSAICS ProjectFile
Change Output Cell Size
You can close the Mosaic Result window at the end of each exercise (by choos-ing Close from the window’s File menu) to reduce screen clutter as you move tothe next exercise. Another Mosaic Result window opens automatically eachtime you generate a new mosaic.
Default Cell Size and RasterSize settings used in theprevious exercise.
The Raster Size values update automaticallywhen the output cell size is changed.Increasing the mosaic cell size reduces thenumber of lines and columns in the outputraster and reduces its spatial resolution.
Output mosaic with reduced rastersize and reduced spatial resolution.
The Resampling Method menu on theParameters tabbed panel lets you determinehow input cell values are sampled to createmosaic cell values. The available choicesare Nearest Neighbor, Bilinear Interpolation,and Cubic Convolution. Consult the tutorialbooklet Rectifying Images for an explanationof these resampling methods.
Mosaicking Raster Geodata
page 7
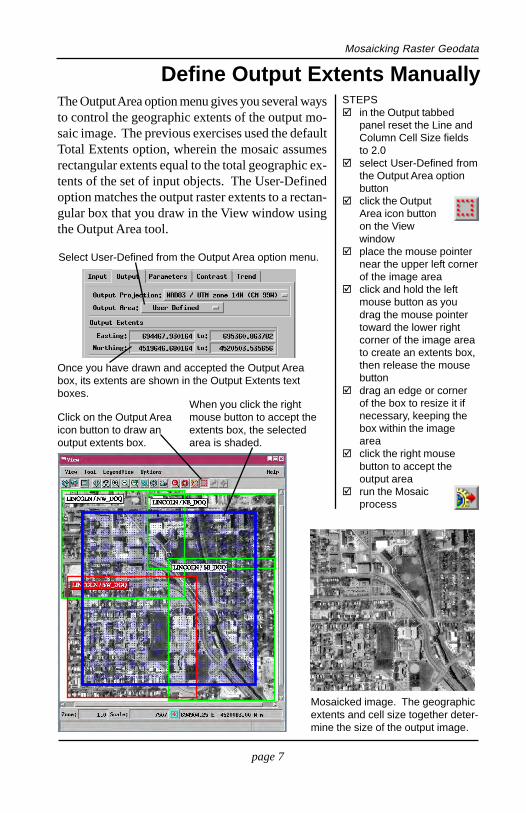
The Output Area option menu gives you several waysto control the geographic extents of the output mo-saic image. The previous exercises used the defaultTotal Extents option, wherein the mosaic assumesrectangular extents equal to the total geographic ex-tents of the set of input objects. The User-Definedoption matches the output raster extents to a rectan-gular box that you draw in the View window usingthe Output Area tool.
STEPSin the Output tabbedpanel reset the Line andColumn Cell Size fieldsto 2.0select User-Defined fromthe Output Area optionbuttonclick the OutputArea icon buttonon the Viewwindowplace the mouse pointernear the upper left cornerof the image areaclick and hold the leftmouse button as youdrag the mouse pointertoward the lower rightcorner of the image areato create an extents box,then release the mousebuttondrag an edge or cornerof the box to resize it ifnecessary, keeping thebox within the imageareaclick the right mousebutton to accept theoutput arearun the Mosaicprocess
Define Output Extents Manually
Mosaicked image. The geographicextents and cell size together deter-mine the size of the output image.
Select User-Defined from the Output Area option menu.
Once you have drawn and accepted the Output Areabox, its extents are shown in the Output Extents textboxes.
Click on the Output Areaicon button to draw anoutput extents box.
When you click the rightmouse button to accept theextents box, the selectedarea is shaded.
Mosaicking Raster Geodata
page 8
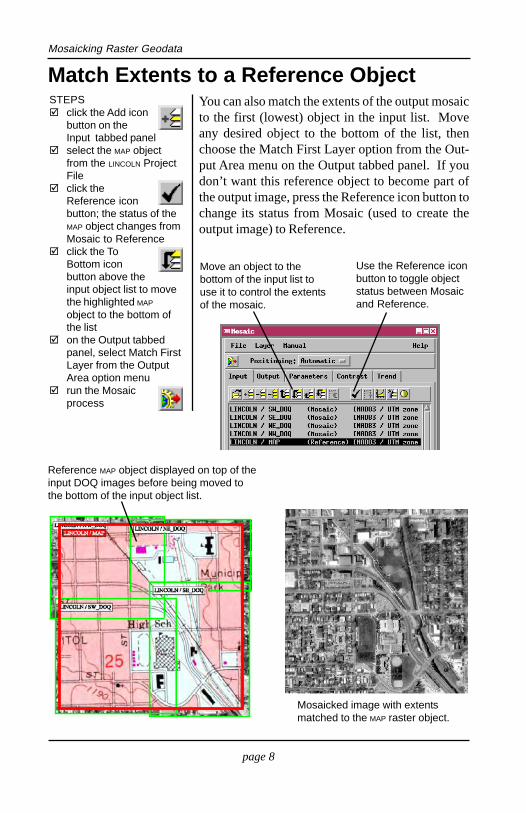
You can also match the extents of the output mosaicto the first (lowest) object in the input list. Moveany desired object to the bottom of the list, thenchoose the Match First Layer option from the Out-put Area menu on the Output tabbed panel. If youdon’t want this reference object to become part ofthe output image, press the Reference icon button tochange its status from Mosaic (used to create theoutput image) to Reference.
STEPSclick the Add iconbutton on theInput tabbed panelselect the MAP objectfrom the LINCOLN ProjectFileclick theReference iconbutton; the status of theMAP object changes fromMosaic to Referenceclick the ToBottom iconbutton above theinput object list to movethe highlighted MAP
object to the bottom ofthe liston the Output tabbedpanel, select Match FirstLayer from the OutputArea option menurun the Mosaicprocess
Move an object to thebottom of the input list touse it to control the extentsof the mosaic.
Use the Reference iconbutton to toggle objectstatus between Mosaicand Reference.
Reference MAP object displayed on top of theinput DOQ images before being moved tothe bottom of the input object list.
Mosaicked image with extentsmatched to the MAP raster object.
Match Extents to a Reference Object
Mosaicking Raster Geodata
page 9
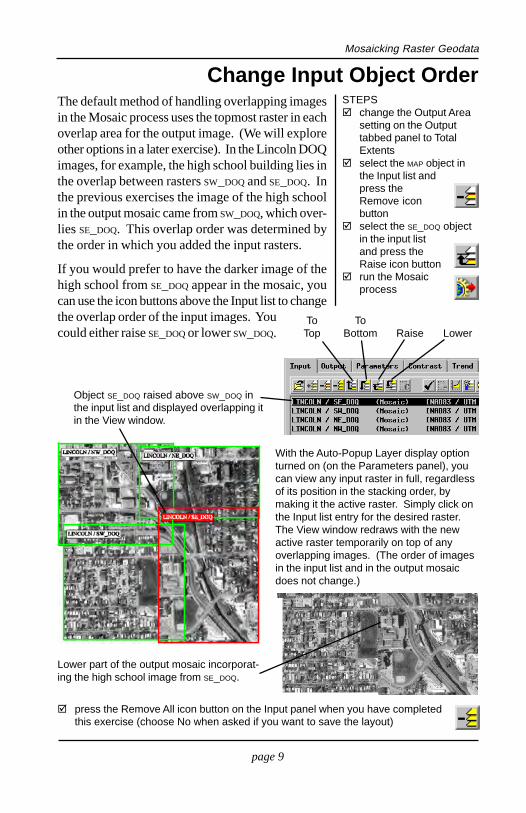
The default method of handling overlapping imagesin the Mosaic process uses the topmost raster in eachoverlap area for the output image. (We will exploreother options in a later exercise). In the Lincoln DOQimages, for example, the high school building lies inthe overlap between rasters SW_DOQ and SE_DOQ. Inthe previous exercises the image of the high schoolin the output mosaic came from SW_DOQ, which over-lies SE_DOQ. This overlap order was determined bythe order in which you added the input rasters.
If you would prefer to have the darker image of thehigh school from SE_DOQ appear in the mosaic, youcan use the icon buttons above the Input list to changethe overlap order of the input images. Youcould either raise SE_DOQ or lower SW_DOQ.
STEPSchange the Output Areasetting on the Outputtabbed panel to TotalExtentsselect the MAP object inthe Input list andpress theRemove iconbuttonselect the SE_DOQ objectin the input listand press theRaise icon buttonrun the Mosaicprocess
Change Input Object Order
Lower part of the output mosaic incorporat-ing the high school image from SE_DOQ.
Object SE_DOQ raised above SW_DOQ inthe input list and displayed overlapping itin the View window.
press the Remove All icon button on the Input panel when you have completedthis exercise (choose No when asked if you want to save the layout)
ToTop
ToBottom Raise Lower
With the Auto-Popup Layer display optionturned on (on the Parameters panel), youcan view any input raster in full, regardlessof its position in the stacking order, bymaking it the active raster. Simply click onthe Input list entry for the desired raster.The View window redraws with the newactive raster temporarily on top of anyoverlapping images. (The order of imagesin the input list and in the output mosaicdoes not change.)
Mosaicking Raster Geodata
page 10
Choose the Output ProjectionSTEPS
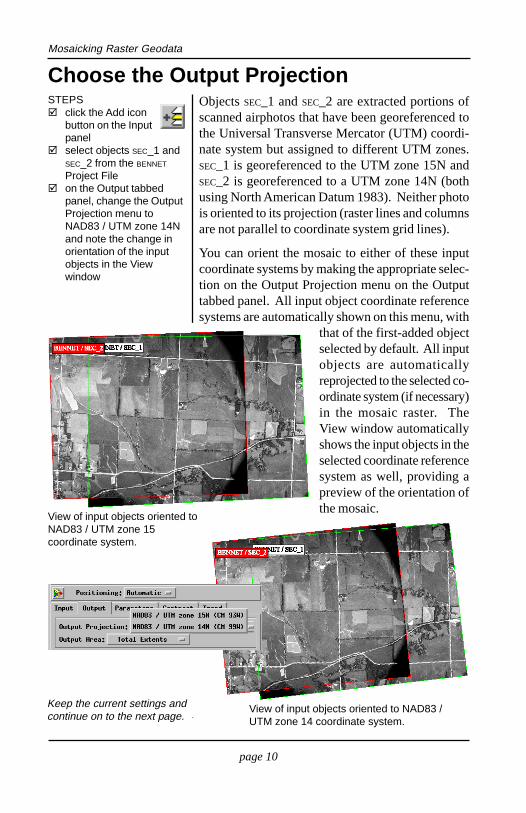
click the Add iconbutton on the Inputpanelselect objects SEC_1 andSEC_2 from the BENNET
Project Fileon the Output tabbedpanel, change the OutputProjection menu toNAD83 / UTM zone 14Nand note the change inorientation of the inputobjects in the Viewwindow
Objects SEC_1 and SEC_2 are extracted portions ofscanned airphotos that have been georeferenced tothe Universal Transverse Mercator (UTM) coordi-nate system but assigned to different UTM zones.SEC_1 is georeferenced to the UTM zone 15N andSEC_2 is georeferenced to a UTM zone 14N (bothusing North American Datum 1983). Neither photois oriented to its projection (raster lines and columnsare not parallel to coordinate system grid lines).
You can orient the mosaic to either of these inputcoordinate systems by making the appropriate selec-tion on the Output Projection menu on the Outputtabbed panel. All input object coordinate referencesystems are automatically shown on this menu, with
that of the first-added objectselected by default. All inputobjects are automaticallyreprojected to the selected co-ordinate system (if necessary)in the mosaic raster. TheView window automaticallyshows the input objects in theselected coordinate referencesystem as well, providing apreview of the orientation ofthe mosaic.
View of input objects oriented to NAD83 /UTM zone 14 coordinate system.
View of input objects oriented toNAD83 / UTM zone 15coordinate system.
Keep the current settings andcontinue on to the next page.
Mosaicking Raster Geodata
page 11
Create a Processing Area for MaskingSTEPS
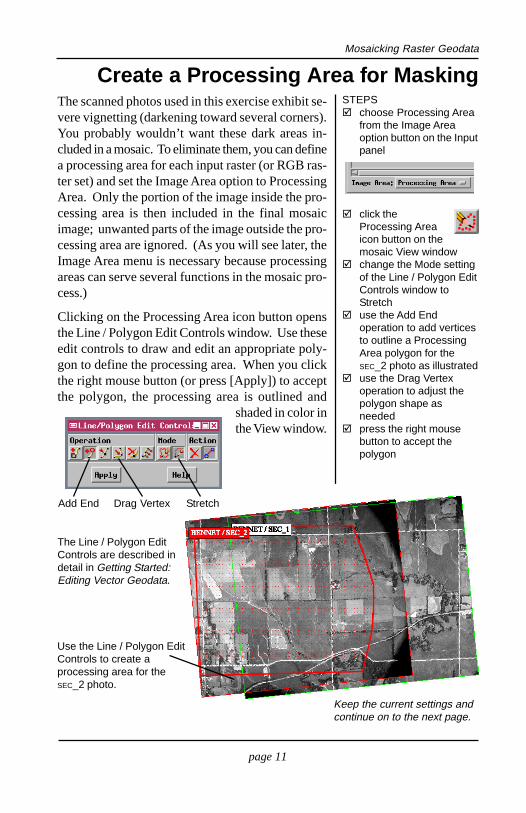
choose Processing Areafrom the Image Areaoption button on the Inputpanel
click theProcessing Areaicon button on themosaic View windowchange the Mode settingof the Line / Polygon EditControls window toStretchuse the Add Endoperation to add verticesto outline a ProcessingArea polygon for theSEC_2 photo as illustrateduse the Drag Vertexoperation to adjust thepolygon shape asneededpress the right mousebutton to accept thepolygon
Keep the current settings andcontinue on to the next page.
The scanned photos used in this exercise exhibit se-vere vignetting (darkening toward several corners).You probably wouldn’t want these dark areas in-cluded in a mosaic. To eliminate them, you can definea processing area for each input raster (or RGB ras-ter set) and set the Image Area option to ProcessingArea. Only the portion of the image inside the pro-cessing area is then included in the final mosaicimage; unwanted parts of the image outside the pro-cessing area are ignored. (As you will see later, theImage Area menu is necessary because processingareas can serve several functions in the mosaic pro-cess.)
Clicking on the Processing Area icon button opensthe Line / Polygon Edit Controls window. Use theseedit controls to draw and edit an appropriate poly-gon to define the processing area. When you clickthe right mouse button (or press [Apply]) to acceptthe polygon, the processing area is outlined and
shaded in color inthe View window.
The Line / Polygon EditControls are described indetail in Getting Started:Editing Vector Geodata.
Use the Line / Polygon EditControls to create aprocessing area for theSEC_2 photo.
Add End Drag Vertex Stretch
Mosaicking Raster Geodata
page 12
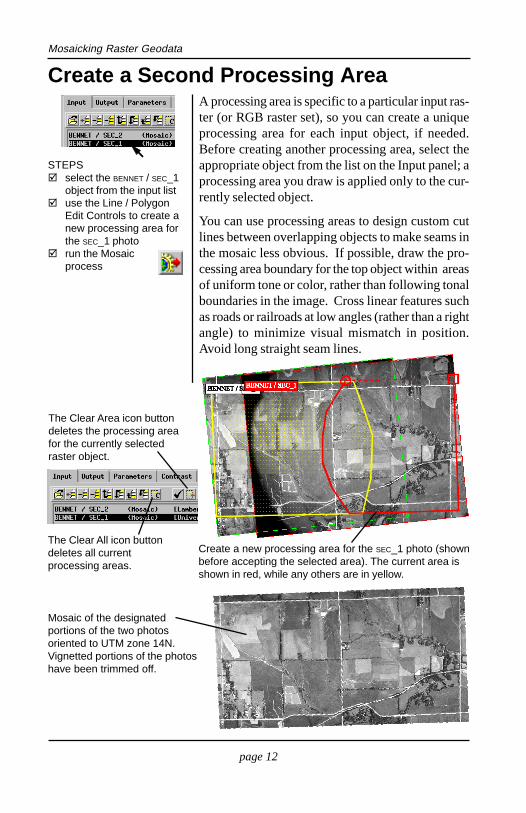
STEPSselect the BENNET / SEC_1object from the input listuse the Line / PolygonEdit Controls to create anew processing area forthe SEC_1 photorun the Mosaicprocess
Create a Second Processing Area
Create a new processing area for the SEC_1 photo (shownbefore accepting the selected area). The current area isshown in red, while any others are in yellow.
Mosaic of the designatedportions of the two photosoriented to UTM zone 14N.Vignetted portions of the photoshave been trimmed off.
The Clear All icon buttondeletes all currentprocessing areas.
The Clear Area icon buttondeletes the processing areafor the currently selectedraster object.
A processing area is specific to a particular input ras-ter (or RGB raster set), so you can create a uniqueprocessing area for each input object, if needed.Before creating another processing area, select theappropriate object from the list on the Input panel; aprocessing area you draw is applied only to the cur-rently selected object.
You can use processing areas to design custom cutlines between overlapping objects to make seams inthe mosaic less obvious. If possible, draw the pro-cessing area boundary for the top object within areasof uniform tone or color, rather than following tonalboundaries in the image. Cross linear features suchas roads or railroads at low angles (rather than a rightangle) to minimize visual mismatch in position.Avoid long straight seam lines.
Mosaicking Raster Geodata
page 13
Causes of Spatial Mismatch in MosaicsAs you examined the mosaic created in the preced-ing exercise, you may have noticed some slightmisalignment of roads and other features along theseam between the input images. This is probably agood point to stop and consider the potential causesof such problems.
When you mosaic scanned planimetric or topographicmaps, all map features are presumed to be shown intheir correct horizontal positions, as if each objectwere viewed from a unique vantage point directlyoverhead. If the maps have the same projection andcoordinate system, we might expect features at theseam to match exactly. However, minor mismatchesmight occur because of georeferencing errors or car-tographic errors in the original maps.
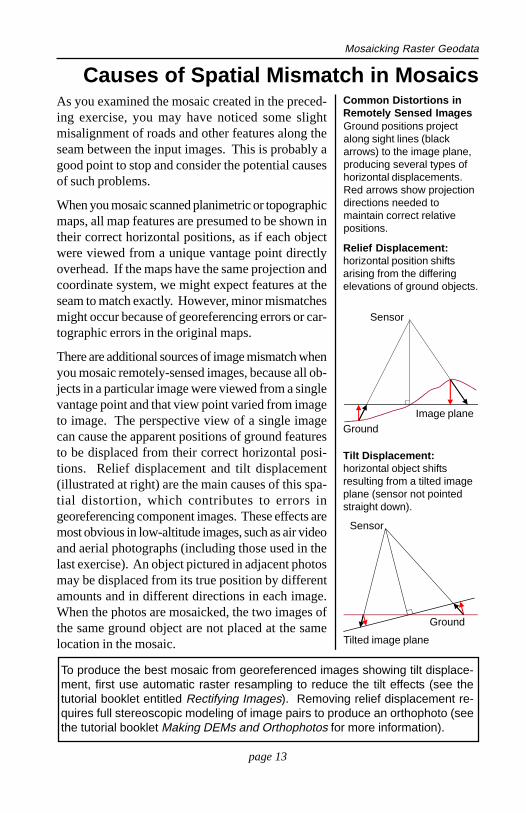
There are additional sources of image mismatch whenyou mosaic remotely-sensed images, because all ob-jects in a particular image were viewed from a singlevantage point and that view point varied from imageto image. The perspective view of a single imagecan cause the apparent positions of ground featuresto be displaced from their correct horizontal posi-tions. Relief displacement and tilt displacement(illustrated at right) are the main causes of this spa-tial distortion, which contributes to errors ingeoreferencing component images. These effects aremost obvious in low-altitude images, such as air videoand aerial photographs (including those used in thelast exercise). An object pictured in adjacent photosmay be displaced from its true position by differentamounts and in different directions in each image.When the photos are mosaicked, the two images ofthe same ground object are not placed at the samelocation in the mosaic.
To produce the best mosaic from georeferenced images showing tilt displace-ment, first use automatic raster resampling to reduce the tilt effects (see thetutorial booklet entitled Rectifying Images). Removing relief displacement re-quires full stereoscopic modeling of image pairs to produce an orthophoto (seethe tutorial booklet Making DEMs and Orthophotos for more information).
Ground positions projectalong sight lines (blackarrows) to the image plane,producing several types ofhorizontal displacements.Red arrows show projectiondirections needed tomaintain correct relativepositions.
Tilt Displacement:horizontal object shiftsresulting from a tilted imageplane (sensor not pointedstraight down).
Relief Displacement:horizontal position shiftsarising from the differingelevations of ground objects.
Common Distortions inRemotely Sensed Images
Ground
Tilted image plane
Sensor
Sensor
GroundImage plane
Mosaicking Raster Geodata
page 14
Apply Contrast TablesSTEPS
press theRemove All iconbutton on the Input paneland choose No whenasked if you want tosave the layoutclick the Add icon buttonand select objectsSPOT_RED and TM_RED
from the FRANKLIN ProjectFile
on the Contrast panel,make sure that the ApplyContrast Tables togglebutton is turned onrun the Mosaicprocess
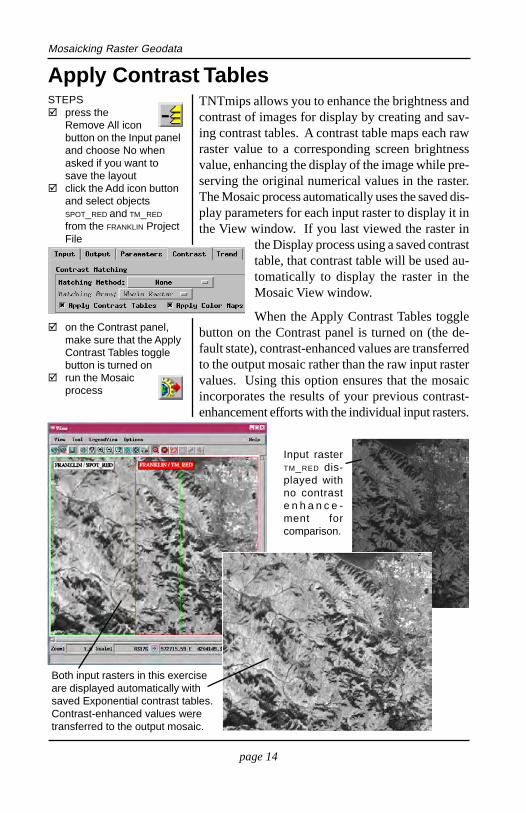
TNTmips allows you to enhance the brightness andcontrast of images for display by creating and sav-ing contrast tables. A contrast table maps each rawraster value to a corresponding screen brightnessvalue, enhancing the display of the image while pre-serving the original numerical values in the raster.The Mosaic process automatically uses the saved dis-play parameters for each input raster to display it inthe View window. If you last viewed the raster in
the Display process using a saved contrasttable, that contrast table will be used au-tomatically to display the raster in theMosaic View window.
When the Apply Contrast Tables togglebutton on the Contrast panel is turned on (the de-fault state), contrast-enhanced values are transferredto the output mosaic rather than the raw input rastervalues. Using this option ensures that the mosaicincorporates the results of your previous contrast-enhancement efforts with the individual input rasters.
Both input rasters in this exerciseare displayed automatically withsaved Exponential contrast tables.Contrast-enhanced values weretransferred to the output mosaic.
Input rasterTM_RED dis-played withno contraste n h a n c e -ment forcomparison.
Mosaicking Raster Geodata
page 15
Set Contrast All LayersSTEPS
on the Input panel,click the Contrasticon buttonclose the resultingRaster ContrastEnhancement window bychoosing Close from itsFile menuclick the SetContrast AllLayers icon button andselect AutoNormalizerun the Mosaicprocess
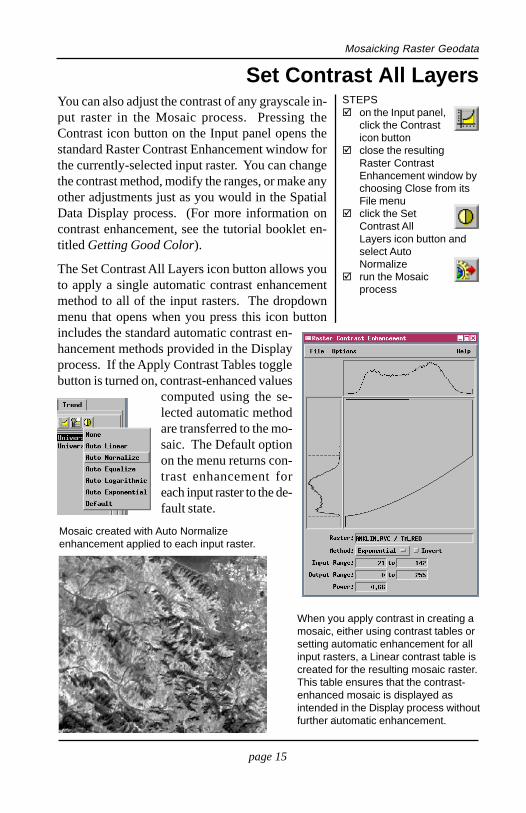
You can also adjust the contrast of any grayscale in-put raster in the Mosaic process. Pressing theContrast icon button on the Input panel opens thestandard Raster Contrast Enhancement window forthe currently-selected input raster. You can changethe contrast method, modify the ranges, or make anyother adjustments just as you would in the SpatialData Display process. (For more information oncontrast enhancement, see the tutorial booklet en-titled Getting Good Color).
The Set Contrast All Layers icon button allows youto apply a single automatic contrast enhancementmethod to all of the input rasters. The dropdownmenu that opens when you press this icon buttonincludes the standard automatic contrast en-hancement methods provided in the Displayprocess. If the Apply Contrast Tables togglebutton is turned on, contrast-enhanced values
computed using the se-lected automatic methodare transferred to the mo-saic. The Default optionon the menu returns con-trast enhancement foreach input raster to the de-fault state.
Mosaic created with Auto Normalizeenhancement applied to each input raster.
When you apply contrast in creating amosaic, either using contrast tables orsetting automatic enhancement for allinput rasters, a Linear contrast table iscreated for the resulting mosaic raster.This table ensures that the contrast-enhanced mosaic is displayed asintended in the Display process withoutfurther automatic enhancement.
Mosaicking Raster Geodata
page 16
STEPSclick the RemoveAll icon button onthe input panel and donot save the layoutmake sure the AutoNormalize Contrastoption is turned off onthe Parameters panelclick the Add iconbutton and selectobject TM_NIR fromthe BRK_TM Project Fileand object SPOT_NIR fromthe BRK_SPOT Project Fileselect TM_NIR from theAuto-Update menu in theCell Size portion of theOutput panelselect Reference Rasterfrom the MatchingMethod option button onthe Contrast panelselect TM_NIR from theReference Raster optionbuttonturn on the SmoothHistogram toggle buttonrun the Mosaicprocess
Contrast Match Grayscale Rasters
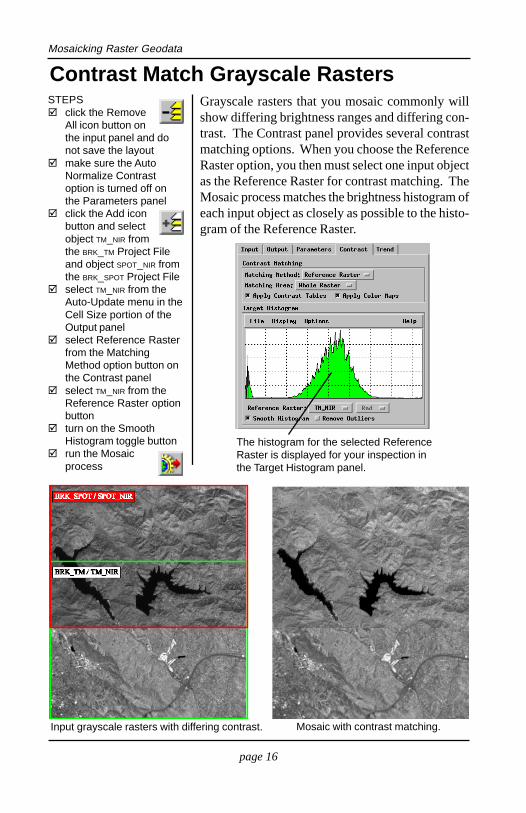
Mosaic with contrast matching.Input grayscale rasters with differing contrast.
Grayscale rasters that you mosaic commonly willshow differing brightness ranges and differing con-trast. The Contrast panel provides several contrastmatching options. When you choose the ReferenceRaster option, you then must select one input objectas the Reference Raster for contrast matching. TheMosaic process matches the brightness histogram ofeach input object as closely as possible to the histo-gram of the Reference Raster.
The histogram for the selected ReferenceRaster is displayed for your inspection inthe Target Histogram panel.
Mosaicking Raster Geodata
page 17
Mosaic RGB Color Raster SetsSTEPS
click the RemoveAll icon button onthe input panelchoose Add Project File(RGB) from the Filemenu, and select theBRK_TM and BRK_SPOT
Project Filesselect TM_NIR from theAuto-Update menu in theCell Size portion of theOutput panelon the Contrast panel setthe Contrast MatchingMethod to ReferenceRaster and choose theTM raster set as thereferencerun the Mosaicprocess andname the Red, Green,and Blue output rastercomponents
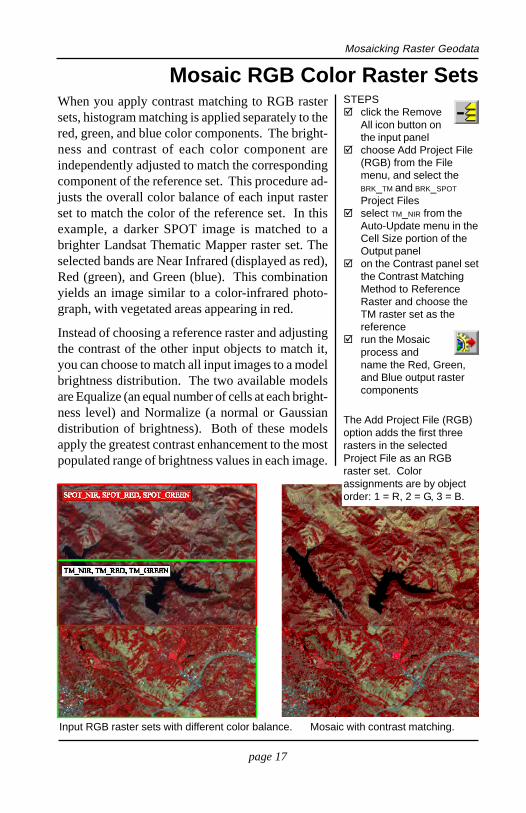
When you apply contrast matching to RGB rastersets, histogram matching is applied separately to thered, green, and blue color components. The bright-ness and contrast of each color component areindependently adjusted to match the correspondingcomponent of the reference set. This procedure ad-justs the overall color balance of each input rasterset to match the color of the reference set. In thisexample, a darker SPOT image is matched to abrighter Landsat Thematic Mapper raster set. Theselected bands are Near Infrared (displayed as red),Red (green), and Green (blue). This combinationyields an image similar to a color-infrared photo-graph, with vegetated areas appearing in red.
Instead of choosing a reference raster and adjustingthe contrast of the other input objects to match it,you can choose to match all input images to a modelbrightness distribution. The two available modelsare Equalize (an equal number of cells at each bright-ness level) and Normalize (a normal or Gaussiandistribution of brightness). Both of these modelsapply the greatest contrast enhancement to the mostpopulated range of brightness values in each image.
Input RGB raster sets with different color balance. Mosaic with contrast matching.
The Add Project File (RGB)option adds the first threerasters in the selectedProject File as an RGBraster set. Colorassignments are by objectorder: 1 = R, 2 = G, 3 = B.
Mosaicking Raster Geodata
page 18
STEPSclick the RemoveAll icon button onthe input panelclick the Add iconbutton on theInput panelselect object TM_24COMP
from the BRK_TM ProjectFile and objectSPOT_24COMP from theBRK_SPOT Project Fileselect TM_24COMP fromthe Auto-Update menu inthe Cell Size portion ofthe Output panelon the Contrast panelchoose TM_24COMP as theReference Rasterrun the Mosaicprocess
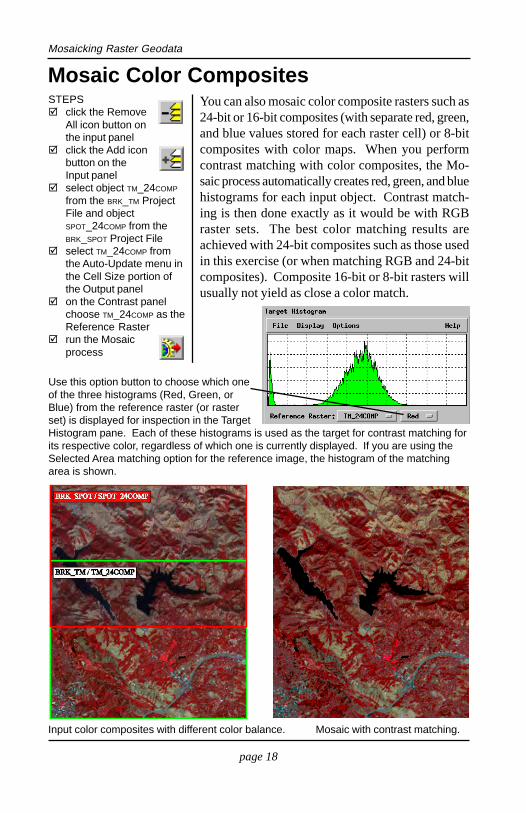
You can also mosaic color composite rasters such as24-bit or 16-bit composites (with separate red, green,and blue values stored for each raster cell) or 8-bitcomposites with color maps. When you performcontrast matching with color composites, the Mo-saic process automatically creates red, green, and bluehistograms for each input object. Contrast match-ing is then done exactly as it would be with RGBraster sets. The best color matching results areachieved with 24-bit composites such as those usedin this exercise (or when matching RGB and 24-bitcomposites). Composite 16-bit or 8-bit rasters willusually not yield as close a color match.
Input color composites with different color balance. Mosaic with contrast matching.
Use this option button to choose which oneof the three histograms (Red, Green, orBlue) from the reference raster (or rasterset) is displayed for inspection in the TargetHistogram pane. Each of these histograms is used as the target for contrast matching forits respective color, regardless of which one is currently displayed. If you are using theSelected Area matching option for the reference image, the histogram of the matchingarea is shown.
Mosaic Color Composites
Mosaicking Raster Geodata
page 19
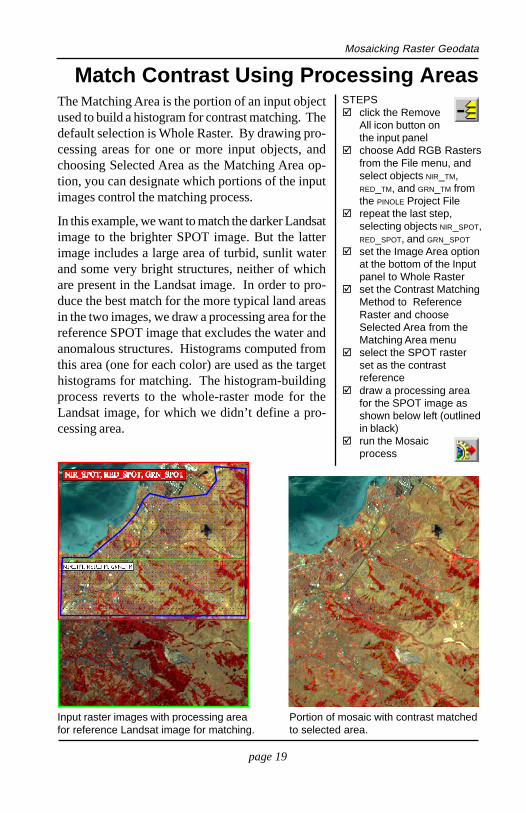
The Matching Area is the portion of an input objectused to build a histogram for contrast matching. Thedefault selection is Whole Raster. By drawing pro-cessing areas for one or more input objects, andchoosing Selected Area as the Matching Area op-tion, you can designate which portions of the inputimages control the matching process.
In this example, we want to match the darker Landsatimage to the brighter SPOT image. But the latterimage includes a large area of turbid, sunlit waterand some very bright structures, neither of whichare present in the Landsat image. In order to pro-duce the best match for the more typical land areasin the two images, we draw a processing area for thereference SPOT image that excludes the water andanomalous structures. Histograms computed fromthis area (one for each color) are used as the targethistograms for matching. The histogram-buildingprocess reverts to the whole-raster mode for theLandsat image, for which we didn’t define a pro-cessing area.
STEPSclick the RemoveAll icon button onthe input panelchoose Add RGB Rastersfrom the File menu, andselect objects NIR_TM,RED_TM, and GRN_TM fromthe PINOLE Project Filerepeat the last step,selecting objects NIR_SPOT,RED_SPOT, and GRN_SPOT
set the Image Area optionat the bottom of the Inputpanel to Whole Rasterset the Contrast MatchingMethod to ReferenceRaster and chooseSelected Area from theMatching Area menuselect the SPOT rasterset as the contrastreferencedraw a processing areafor the SPOT image asshown below left (outlinedin black)run the Mosaicprocess
Match Contrast Using Processing Areas
Input raster images with processing areafor reference Landsat image for matching.
Portion of mosaic with contrast matchedto selected area.
Mosaicking Raster Geodata
page 20
Save and Open Mosaic LayoutsSTEPS
click the RemoveAll icon button onthe input panelclick the OpenLayout iconbuttonselect object MOS_LAYOUT
from the BENNET ProjectFile
If a mosaic layout object thatyou save refers to inputobjects in different ProjectFiles, do not move thesefiles to different directoriesor drives after saving thelayout. If you do, the Mosaicprocess may not be able tofind them.
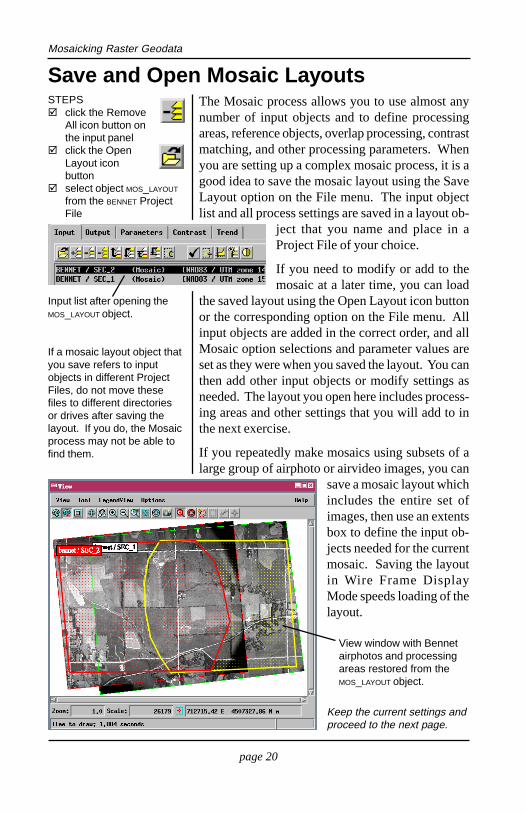
Input list after opening theMOS_LAYOUT object.
View window with Bennetairphotos and processingareas restored from theMOS_LAYOUT object.
The Mosaic process allows you to use almost anynumber of input objects and to define processingareas, reference objects, overlap processing, contrastmatching, and other processing parameters. Whenyou are setting up a complex mosaic process, it is agood idea to save the mosaic layout using the SaveLayout option on the File menu. The input objectlist and all process settings are saved in a layout ob-
ject that you name and place in aProject File of your choice.
If you need to modify or add to themosaic at a later time, you can load
the saved layout using the Open Layout icon buttonor the corresponding option on the File menu. Allinput objects are added in the correct order, and allMosaic option selections and parameter values areset as they were when you saved the layout. You canthen add other input objects or modify settings asneeded. The layout you open here includes process-ing areas and other settings that you will add to inthe next exercise.
If you repeatedly make mosaics using subsets of alarge group of airphoto or airvideo images, you can
save a mosaic layout whichincludes the entire set ofimages, then use an extentsbox to define the input ob-jects needed for the currentmosaic. Saving the layoutin Wire Frame DisplayMode speeds loading of thelayout.
Keep the current settings andproceed to the next page.
Mosaicking Raster Geodata
page 21
Trend RemovalSTEPS
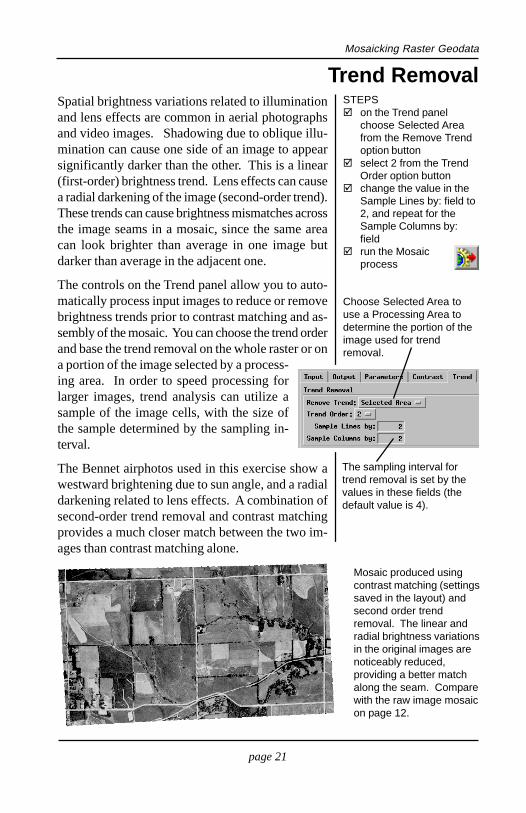
on the Trend panelchoose Selected Areafrom the Remove Trendoption buttonselect 2 from the TrendOrder option buttonchange the value in theSample Lines by: field to2, and repeat for theSample Columns by:fieldrun the Mosaicprocess
Spatial brightness variations related to illuminationand lens effects are common in aerial photographsand video images. Shadowing due to oblique illu-mination can cause one side of an image to appearsignificantly darker than the other. This is a linear(first-order) brightness trend. Lens effects can causea radial darkening of the image (second-order trend).These trends can cause brightness mismatches acrossthe image seams in a mosaic, since the same areacan look brighter than average in one image butdarker than average in the adjacent one.
The controls on the Trend panel allow you to auto-matically process input images to reduce or removebrightness trends prior to contrast matching and as-sembly of the mosaic. You can choose the trend orderand base the trend removal on the whole raster or ona portion of the image selected by a process-ing area. In order to speed processing forlarger images, trend analysis can utilize asample of the image cells, with the size ofthe sample determined by the sampling in-terval.
The Bennet airphotos used in this exercise show awestward brightening due to sun angle, and a radialdarkening related to lens effects. A combination ofsecond-order trend removal and contrast matchingprovides a much closer match between the two im-ages than contrast matching alone.
Mosaic produced usingcontrast matching (settingssaved in the layout) andsecond order trendremoval. The linear andradial brightness variationsin the original images arenoticeably reduced,providing a better matchalong the seam. Comparewith the raw image mosaicon page 12.
Choose Selected Area touse a Processing Area todetermine the portion of theimage used for trendremoval.
The sampling interval fortrend removal is set by thevalues in these fields (thedefault value is 4).
Mosaicking Raster Geodata
page 22
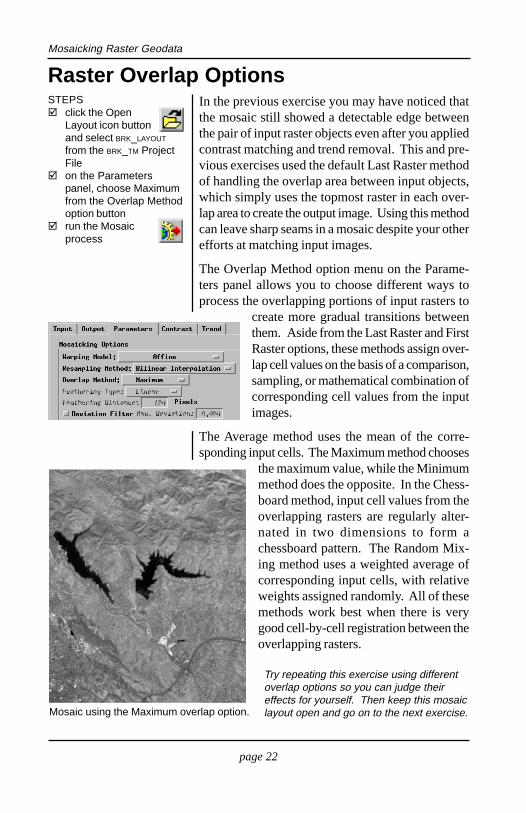
In the previous exercise you may have noticed thatthe mosaic still showed a detectable edge betweenthe pair of input raster objects even after you appliedcontrast matching and trend removal. This and pre-vious exercises used the default Last Raster methodof handling the overlap area between input objects,which simply uses the topmost raster in each over-lap area to create the output image. Using this methodcan leave sharp seams in a mosaic despite your otherefforts at matching input images.
The Overlap Method option menu on the Parame-ters panel allows you to choose different ways toprocess the overlapping portions of input rasters to
create more gradual transitions betweenthem. Aside from the Last Raster and FirstRaster options, these methods assign over-lap cell values on the basis of a comparison,sampling, or mathematical combination ofcorresponding cell values from the inputimages.
The Average method uses the mean of the corre-sponding input cells. The Maximum method chooses
the maximum value, while the Minimummethod does the opposite. In the Chess-board method, input cell values from theoverlapping rasters are regularly alter-nated in two dimensions to form achessboard pattern. The Random Mix-ing method uses a weighted average ofcorresponding input cells, with relativeweights assigned randomly. All of thesemethods work best when there is verygood cell-by-cell registration between theoverlapping rasters.
Try repeating this exercise using differentoverlap options so you can judge theireffects for yourself. Then keep this mosaiclayout open and go on to the next exercise.
Raster Overlap OptionsSTEPS
click the OpenLayout icon buttonand select BRK_LAYOUT
from the BRK_TM ProjectFileon the Parameterspanel, choose Maximumfrom the Overlap Methodoption buttonrun the Mosaicprocess
Mosaic using the Maximum overlap option.
Mosaicking Raster Geodata
page 23
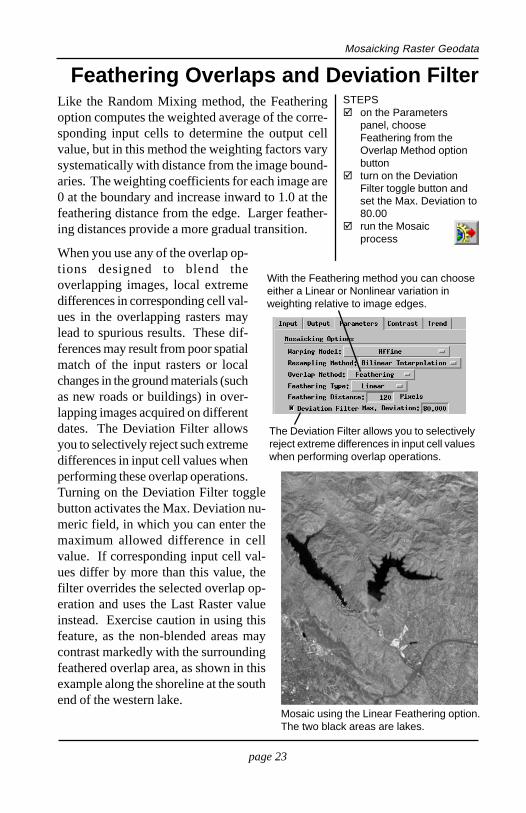
The Deviation Filter allows you to selectivelyreject extreme differences in input cell valueswhen performing overlap operations.
With the Feathering method you can chooseeither a Linear or Nonlinear variation inweighting relative to image edges.
Mosaic using the Linear Feathering option.The two black areas are lakes.
Feathering Overlaps and Deviation FilterSTEPS
on the Parameterspanel, chooseFeathering from theOverlap Method optionbuttonturn on the DeviationFilter toggle button andset the Max. Deviation to80.00run the Mosaicprocess
Like the Random Mixing method, the Featheringoption computes the weighted average of the corre-sponding input cells to determine the output cellvalue, but in this method the weighting factors varysystematically with distance from the image bound-aries. The weighting coefficients for each image are0 at the boundary and increase inward to 1.0 at thefeathering distance from the edge. Larger feather-ing distances provide a more gradual transition.
When you use any of the overlap op-tions designed to blend theoverlapping images, local extremedifferences in corresponding cell val-ues in the overlapping rasters maylead to spurious results. These dif-ferences may result from poor spatialmatch of the input rasters or localchanges in the ground materials (suchas new roads or buildings) in over-lapping images acquired on differentdates. The Deviation Filter allowsyou to selectively reject such extremedifferences in input cell values whenperforming these overlap operations.Turning on the Deviation Filter togglebutton activates the Max. Deviation nu-meric field, in which you can enter themaximum allowed difference in cellvalue. If corresponding input cell val-ues differ by more than this value, thefilter overrides the selected overlap op-eration and uses the Last Raster valueinstead. Exercise caution in using thisfeature, as the non-blended areas maycontrast markedly with the surroundingfeathered overlap area, as shown in thisexample along the shoreline at the southend of the western lake.
Mosaicking Raster Geodata
page 24
Mosaic Digital Elevation ModelsSTEPS
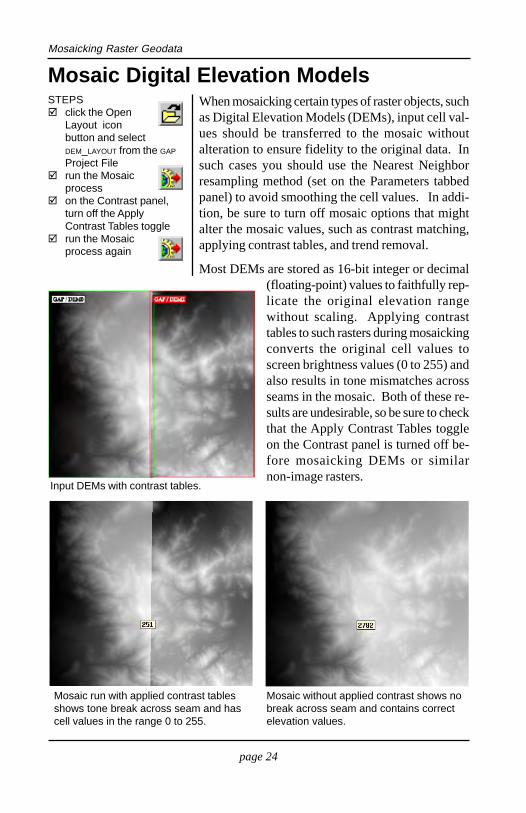
click the OpenLayout iconbutton and selectDEM_LAYOUT from the GAP
Project Filerun the Mosaicprocesson the Contrast panel,turn off the ApplyContrast Tables togglerun the Mosaicprocess again
Mosaic run with applied contrast tablesshows tone break across seam and hascell values in the range 0 to 255.
Mosaic without applied contrast shows nobreak across seam and contains correctelevation values.
Input DEMs with contrast tables.
When mosaicking certain types of raster objects, suchas Digital Elevation Models (DEMs), input cell val-ues should be transferred to the mosaic withoutalteration to ensure fidelity to the original data. Insuch cases you should use the Nearest Neighborresampling method (set on the Parameters tabbedpanel) to avoid smoothing the cell values. In addi-tion, be sure to turn off mosaic options that mightalter the mosaic values, such as contrast matching,applying contrast tables, and trend removal.
Most DEMs are stored as 16-bit integer or decimal(floating-point) values to faithfully rep-licate the original elevation rangewithout scaling. Applying contrasttables to such rasters during mosaickingconverts the original cell values toscreen brightness values (0 to 255) andalso results in tone mismatches acrossseams in the mosaic. Both of these re-sults are undesirable, so be sure to checkthat the Apply Contrast Tables toggleon the Contrast panel is turned off be-fore mosaicking DEMs or similarnon-image rasters.
Mosaicking Raster Geodata
page 25
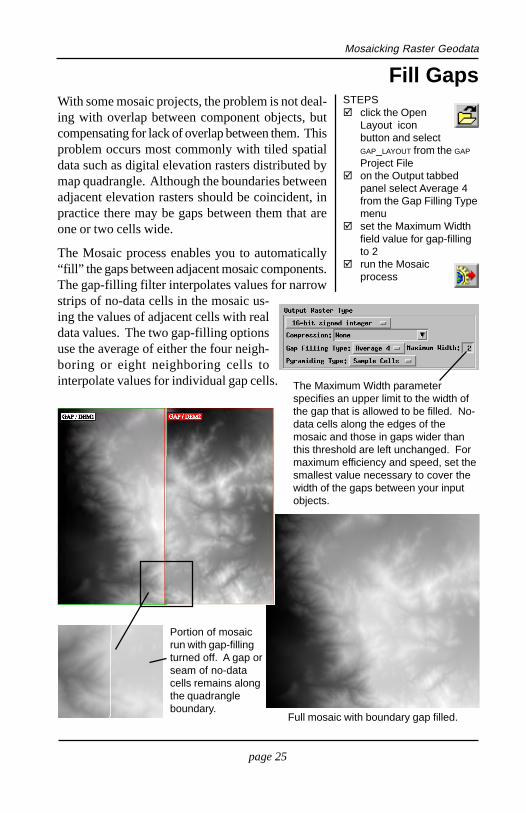
Fill GapsSTEPS
click the OpenLayout iconbutton and selectGAP_LAYOUT from the GAP
Project Fileon the Output tabbedpanel select Average 4from the Gap Filling Typemenuset the Maximum Widthfield value for gap-fillingto 2run the Mosaicprocess
With some mosaic projects, the problem is not deal-ing with overlap between component objects, butcompensating for lack of overlap between them. Thisproblem occurs most commonly with tiled spatialdata such as digital elevation rasters distributed bymap quadrangle. Although the boundaries betweenadjacent elevation rasters should be coincident, inpractice there may be gaps between them that areone or two cells wide.
The Mosaic process enables you to automatically“fill” the gaps between adjacent mosaic components.The gap-filling filter interpolates values for narrowstrips of no-data cells in the mosaic us-ing the values of adjacent cells with realdata values. The two gap-filling optionsuse the average of either the four neigh-boring or eight neighboring cells tointerpolate values for individual gap cells.
Portion of mosaicrun with gap-fillingturned off. A gap orseam of no-datacells remains alongthe quadrangleboundary.
Full mosaic with boundary gap filled.
The Maximum Width parameterspecifies an upper limit to the width ofthe gap that is allowed to be filled. No-data cells along the edges of themosaic and those in gaps wider thanthis threshold are left unchanged. Formaximum efficiency and speed, set thesmallest value necessary to cover thewidth of the gaps between your inputobjects.
Mosaicking Raster Geodata
page 26
Compression for Large Mosaics
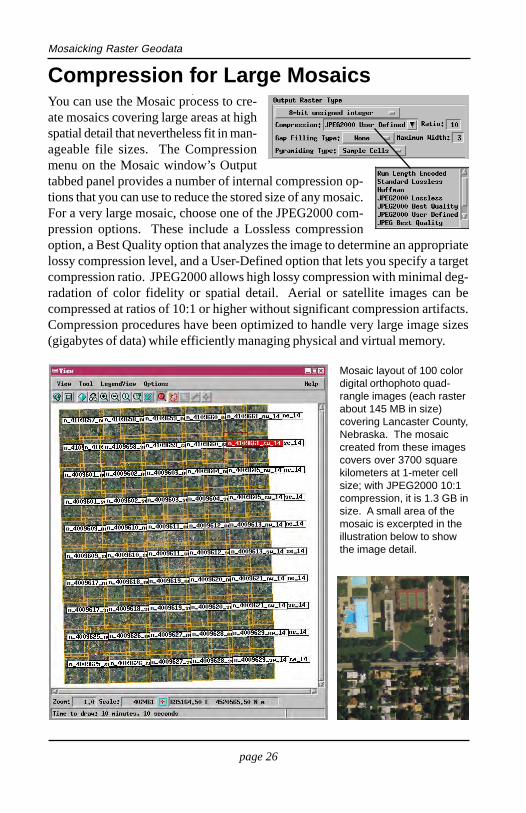
Mosaic layout of 100 colordigital orthophoto quad-rangle images (each rasterabout 145 MB in size)covering Lancaster County,Nebraska. The mosaiccreated from these imagescovers over 3700 squarekilometers at 1-meter cellsize; with JPEG2000 10:1compression, it is 1.3 GB insize. A small area of themosaic is excerpted in theillustration below to showthe image detail.
You can use the Mosaic process to cre-ate mosaics covering large areas at highspatial detail that nevertheless fit in man-ageable file sizes. The Compressionmenu on the Mosaic window’s Outputtabbed panel provides a number of internal compression op-tions that you can use to reduce the stored size of any mosaic.For a very large mosaic, choose one of the JPEG2000 com-pression options. These include a Lossless compressionoption, a Best Quality option that analyzes the image to determine an appropriatelossy compression level, and a User-Defined option that lets you specify a targetcompression ratio. JPEG2000 allows high lossy compression with minimal deg-radation of color fidelity or spatial detail. Aerial or satellite images can becompressed at ratios of 10:1 or higher without significant compression artifacts.Compression procedures have been optimized to handle very large image sizes(gigabytes of data) while efficiently managing physical and virtual memory.
Mosaicking Raster Geodata
page 27
No-Data Areas and Null Masks
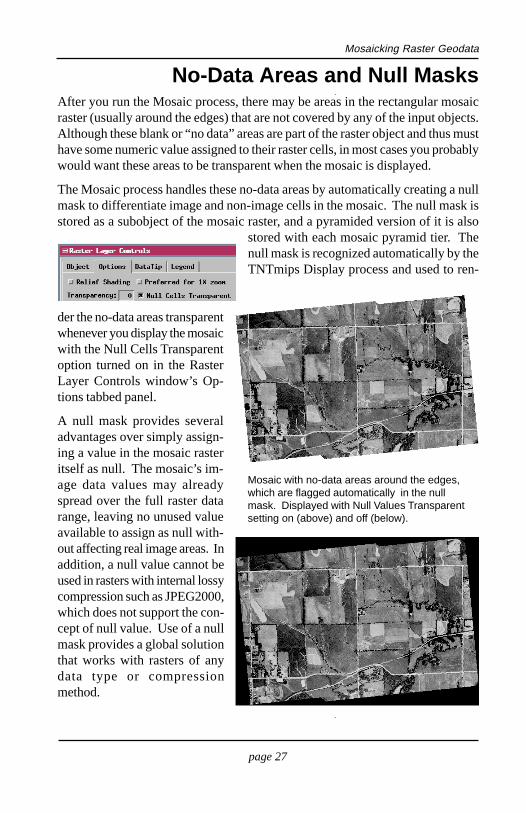
Mosaic with no-data areas around the edges,which are flagged automatically in the nullmask. Displayed with Null Values Transparentsetting on (above) and off (below).
After you run the Mosaic process, there may be areas in the rectangular mosaicraster (usually around the edges) that are not covered by any of the input objects.Although these blank or “no data” areas are part of the raster object and thus musthave some numeric value assigned to their raster cells, in most cases you probablywould want these areas to be transparent when the mosaic is displayed.
The Mosaic process handles these no-data areas by automatically creating a nullmask to differentiate image and non-image cells in the mosaic. The null mask isstored as a subobject of the mosaic raster, and a pyramided version of it is also
stored with each mosaic pyramid tier. Thenull mask is recognized automatically by theTNTmips Display process and used to ren-
der the no-data areas transparentwhenever you display the mosaicwith the Null Cells Transparentoption turned on in the RasterLayer Controls window’s Op-tions tabbed panel.
A null mask provides severaladvantages over simply assign-ing a value in the mosaic rasteritself as null. The mosaic’s im-age data values may alreadyspread over the full raster datarange, leaving no unused valueavailable to assign as null with-out affecting real image areas. Inaddition, a null value cannot beused in rasters with internal lossycompression such as JPEG2000,which does not support the con-cept of null value. Use of a nullmask provides a global solutionthat works with rasters of anydata type or compressionmethod.
Mosaicking Raster Geodata
page 28
STEPSclick the OpenLayout iconbutton and selectMAN_LAYOUT from theRAYMOND Project Filenote that the Positioningmenu option haschanged to Manualselect SEC1 in the Inputlistclick on theManualPositioning icon buttonon the View windowdrag the lower rightcorner of the extents boxfor the middle photo(SEC1) to enlarge itclick the right mousebutton to redraw theimagerepeat until features inSEC1 appear at about thesame scale as in theflanking imagesdrag SEC1 to the right ifnecessary to uncoverthe right edge of SEC2
Manual Mosaicking
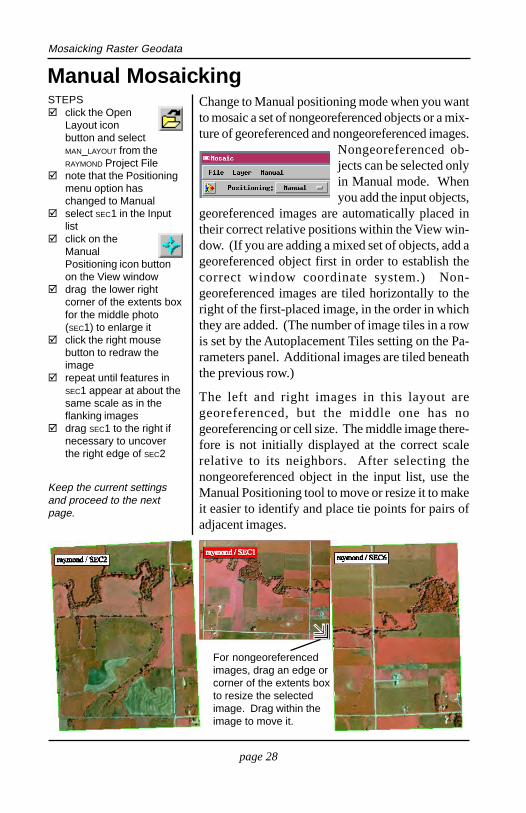
For nongeoreferencedimages, drag an edge orcorner of the extents boxto resize the selectedimage. Drag within theimage to move it.
Change to Manual positioning mode when you wantto mosaic a set of nongeoreferenced objects or a mix-ture of georeferenced and nongeoreferenced images.
Nongeoreferenced ob-jects can be selected onlyin Manual mode. Whenyou add the input objects,
georeferenced images are automatically placed intheir correct relative positions within the View win-dow. (If you are adding a mixed set of objects, add ageoreferenced object first in order to establish thecorrect window coordinate system.) Non-georeferenced images are tiled horizontally to theright of the first-placed image, in the order in whichthey are added. (The number of image tiles in a rowis set by the Autoplacement Tiles setting on the Pa-rameters panel. Additional images are tiled beneaththe previous row.)
The left and right images in this layout aregeoreferenced, but the middle one has nogeoreferencing or cell size. The middle image there-fore is not initially displayed at the correct scalerelative to its neighbors. After selecting thenongeoreferenced object in the input list, use theManual Positioning tool to move or resize it to makeit easier to identify and place tie points for pairs ofadjacent images.
Keep the current settingsand proceed to the nextpage.
Mosaicking Raster Geodata
page 29
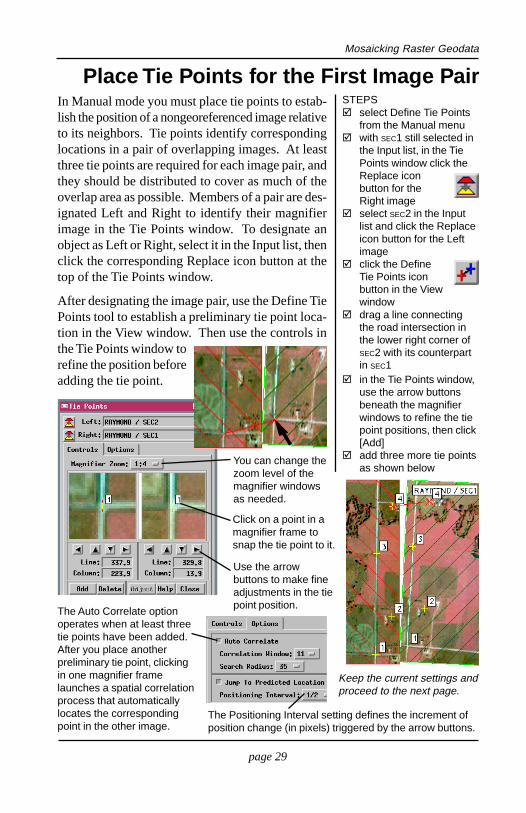
STEPSselect Define Tie Pointsfrom the Manual menuwith SEC1 still selected inthe Input list, in the TiePoints window click theReplace iconbutton for theRight imageselect SEC2 in the Inputlist and click the Replaceicon button for the Leftimageclick the DefineTie Points iconbutton in the Viewwindowdrag a line connectingthe road intersection inthe lower right corner ofSEC2 with its counterpartin SEC1
Place Tie Points for the First Image Pair
in the Tie Points window,use the arrow buttonsbeneath the magnifierwindows to refine the tiepoint positions, then click[Add]add three more tie pointsas shown below
In Manual mode you must place tie points to estab-lish the position of a nongeoreferenced image relativeto its neighbors. Tie points identify correspondinglocations in a pair of overlapping images. At leastthree tie points are required for each image pair, andthey should be distributed to cover as much of theoverlap area as possible. Members of a pair are des-ignated Left and Right to identify their magnifierimage in the Tie Points window. To designate anobject as Left or Right, select it in the Input list, thenclick the corresponding Replace icon button at thetop of the Tie Points window.
After designating the image pair, use the Define TiePoints tool to establish a preliminary tie point loca-tion in the View window. Then use the controls inthe Tie Points window torefine the position beforeadding the tie point.
You can change thezoom level of themagnifier windowsas needed.
The Auto Correlate optionoperates when at least threetie points have been added.After you place anotherpreliminary tie point, clickingin one magnifier framelaunches a spatial correlationprocess that automaticallylocates the correspondingpoint in the other image.
The Positioning Interval setting defines the increment ofposition change (in pixels) triggered by the arrow buttons.
Keep the current settings andproceed to the next page.
Use the arrowbuttons to make fineadjustments in the tiepoint position.
Click on a point in amagnifier frame tosnap the tie point to it.
Mosaicking Raster Geodata
page 30
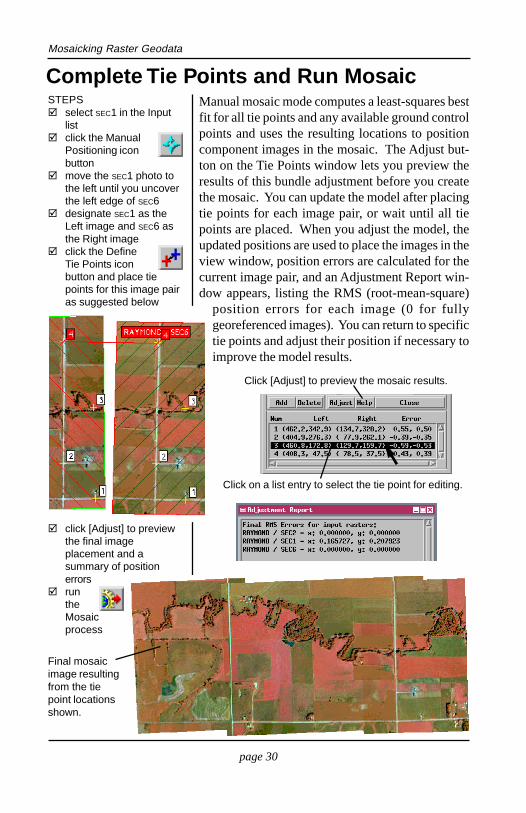
STEPSselect SEC1 in the Inputlistclick the ManualPositioning iconbuttonmove the SEC1 photo tothe left until you uncoverthe left edge of SEC6designate SEC1 as theLeft image and SEC6 asthe Right imageclick the DefineTie Points iconbutton and place tiepoints for this image pairas suggested below
Complete Tie Points and Run Mosaic
click [Adjust] to previewthe final imageplacement and asummary of positionerrorsruntheMosaicprocess
Final mosaicimage resultingfrom the tiepoint locationsshown.
Manual mosaic mode computes a least-squares bestfit for all tie points and any available ground controlpoints and uses the resulting locations to positioncomponent images in the mosaic. The Adjust but-ton on the Tie Points window lets you preview theresults of this bundle adjustment before you createthe mosaic. You can update the model after placingtie points for each image pair, or wait until all tiepoints are placed. When you adjust the model, theupdated positions are used to place the images in theview window, position errors are calculated for thecurrent image pair, and an Adjustment Report win-dow appears, listing the RMS (root-mean-square)
position errors for each image (0 for fullygeoreferenced images). You can return to specifictie points and adjust their position if necessary toimprove the model results.
Click [Adjust] to preview the mosaic results.
Click on a list entry to select the tie point for editing.
Mosaicking Raster Geodata
page 31
The Mosaic process accepts a full range of input raster types including binary (1-bit), grayscale, RGB color separates, and color composites. The range of grayscalerasters includes 2-bit and 4-bit integer, signed or unsigned 8-, 16-, or 32-bit inte-ger, and floating point (32-bit or 64-bit). Color composite types include 24-bitand 16-bit RGB and BGR composites and 8-bit composites with a color map.
You will usually get the best results from the Mosaic process if all input rasterobjects contain the same data type. However, the process does allow you to in-clude different raster data types in a mosaic. The default output raster type dependson the specific input raster types and is designed to preserve the maximum datafidelity. The sections below summarize these relationships.
Grayscale Input Grayscale OutputAll same bit-depth and sign Same as inputAll same bit-depth, signed and unsigned Signed integerDifferent bit-depths Highest bit-depth32-bit unsigned and 32-bit floating point 32-bit floating point32-bit signed and 32-bit floating point 32-bit signed integer
If you mix signed and unsigned integer rasters, be aware that no scaling of rastervalues is performed by the Mosaic process, so some loss of data may occur ifinput values extend beyond the range of the output raster type.
Color Input Color OutputAll RGB RGBAll 24-bit composite 24-bit compositeAll 16-bit composite 16-bit compositeSame bit-depth RGB- and BGR composite RGB-compositeAll 8-bit composite with color map RGBRGB and any composite RGBComposites with different bit-depth Maximum composite bit-depth
There is no option to produce an 8-bit color-mapped mosaic. You can use theColor Conversion process (Raster / Combine / Convert Color) to convert a com-pleted color mosaic to an 8-bit composite raster if desired.
Mixed color and grayscaleYou can also mix color and grayscale rasters in a mosaic if you lack completecolor image coverage. The grayscale input raster will appear in grayscale in thecolor mosaic raster or RGB raster set.
Input and Output Raster Types
Mosaicking Raster Geodata
page 32
Advanced Software for Geospatial AnalysisMOSAICKING
MicroImages, Inc.
MicroImages, Inc. publishes a complete line of professional software for advanced geospatialdata visualization, analysis, and publishing. Contact us or visit our web site for detailed prod-uct information.
TNTmips TNTmips is a professional system for fully integrated GIS, image analysis, CAD,TIN, desktop cartography, and geospatial database management.
TNTedit TNTedit provides interactive tools to create, georeference, and edit vector,image, CAD, TIN, and relational database project materials in a wide variety of formats.
TNTview TNTview has the same powerful display features as TNTmips and is perfect forthose who do not need the technical processing and preparation features of TNTmips.
TNTatlas TNTatlas lets you publish and distribute your spatial project materials on CD-ROM at low cost. TNTatlas CDs can be used on any popular computing platform.
TNTserver TNTserver lets you publish TNTatlases on the Internet or on your intranet.Navigate through geodata atlases with your web browser and the TNTclient Java applet.
TNTlite TNTlite is a free version of TNTmips for students and professionals with smallprojects. You can download TNTlite from MicroImages’ web site, or you can orderTNTlite on CD-ROM.
Indexautomatic positioning mode......................3,4bundle adjustment...........................3,30cell size...............................................6compression...................................26,27contrast, applying
contrast tables.....................................14setting for all input..............................15
contrast matching...............................3,16-19grayscale rasters..................................16color................................................17-18matching area......................................19
digital elevation models.............................24display options..........................................5,9feathering seams...........................................23gaps, filling..................................................25georeferencing..........................................3,4histogram................................................16-19image area options......................................11layouts........................................................20manual positioning mode.........................3,28
masking unwanted areas.......................11,12null mask....................................................27object order..................................................9output area................................................7,8Output panel..............................................6,7output projection, choosing........................10overlap areas.........................................3,22-23Parameters panel..........................................5reference object
matching extents to................................8matching contrast to.......................16-19
relief displacement.....................................13processing areas..............................3,11,12,19rasters
composite..................................3,18,31grayscale....................................3,16,31RGB sets..................................3,17,31
tie points...............................................28-30tilt displacement.........................................13trend removal.............................................21