turbulent boundary layers on a systematically varied rough wall
TRANSCRIPT
Turbulent boundary layers on a systematically varied rough wallMichael P. Schultz1 and Karen A. Flack2
1Department of Naval Architecture and Ocean Engineering, United States Naval Academy, Annapolis,Maryland 21402, USA2Department of Mechanical Engineering, United States Naval Academy, Annapolis, Maryland 21402, USA
�Received 18 July 2008; accepted 20 November 2008; published online 15 January 2009�
Results of an experimental investigation of the flow over a model roughness are presented. Theseries of roughness consists of close-packed pyramids in which both the height and the slope weresystematically varied. The aim of this work was to document the mean flow and subsequently gaininsight into the physical roughness scales which contribute to drag. The mean velocity profiles forall nine rough surfaces collapse with smooth-wall results when presented in velocity-defect form,supporting the use of similarity methods. The results for the six steepest surfaces indicate that theroughness function �U+ scales almost entirely on the roughness height with little dependence on theslope of the pyramids. However, �U+ for the three surfaces with the smallest slope does not scalesatisfactorily on the roughness height, indicating that these surfaces might not be thought of assurface “roughness” in a traditional sense but instead surface “waviness.”�DOI: 10.1063/1.3059630�
I. INTRODUCTION
Surface roughness can have a significant effect on a widerange of engineering flows. Examples include, but are notlimited to, industrial piping systems,1 open channel flows,2
turbomachines,3 marine vehicles,4 and aircraft.5 Because ofthe ubiquitous nature of these flows in practice, there hasbeen a long history of research on the effect of roughness onwall-bounded turbulence. Some of the earliest work was car-ried out by Darcy6 who investigated the pressure losses aris-ing from roughness in a pipe. Nikuradse7 subsequently con-ducted a thorough set of experiments on the effects ofuniform sand roughness on turbulent pipe flow which signifi-cantly furthered the understanding of roughness effects.Later, Moody,8 guided largely by the findings of Colebrook,9
developed a diagram to predict the head losses in smooth andrough pipes. The impact of the Moody diagram is difficult tooverstate, as it has been a cornerstone in the field of hydrau-lic engineering for over 60 years.
During the same period, there has also been a large bodyof research focused on a better fundamental understanding ofthe turbulence structure over rough walls. The classical ideais that the roughness only exerts a direct influence on theturbulence within a few roughness heights of the wall, andthe outer flow is unaffected except in the role the roughnessplays in determining the outer velocity and length scales.This is often referred to as Townsend’s hypothesis.10 Therecent review of Jiménez11 concluded that most experimentalevidence supports Townsend’s hypothesis provided theroughness is not too large compared to the boundary layerthickness. Since this review, the concept of outer layer simi-larity in the mean velocity,1,12–14 Reynolds stresses,12,15–17
and large scale turbulence structure15,18 has received furtherexperimental support for flows over a wide range of three-dimensional roughness.
However, despite the considerable effort devoted toroughness research, many questions remain unresolved. Per-
haps the most important practical issue is how to predict thefrictional drag �or for internal flows, the head loss� of a ge-neric surface based on measurements of the roughness topog-raphy. At present, it is not clear which roughness lengthscales and parameters best describe a surface in a hydraulicsense. Over the years, many investigators have worked onthis problem �e.g., Refs. 19–28�. A wide range of surfaceparameters have been identified as correlating with frictionaldrag. These include the roughness height �e.g., root meansquare height krms,
13 maximum peak to trough height kt,27
mean amplitude ka,28 etc.�, slope,22 density,20 and aspect
ratio.29 Higher moments of the surface amplitude probabilitydensity function22 as well as the first three even moments ofthe wavenumber power spectra of the surface amplitude30
have also been suggested as correlating the frictional drag ofrough surfaces. Even with modest success of these correla-tions for a specific roughness type, it can be concluded that,at present, there is no sufficiently satisfactory scaling for ageneric, three-dimensional roughness. In fact, the lack ofmeaningful progress toward this goal led Grigson31 to assertthat the statistics of the surface profile alone could never beexpected to allow reliable frictional drag predictions, andexperimental tests of the surface of interest would always berequired. It is hoped, however, that investigations whichcombine reliable fluid mechanics measurements with de-tailed documentation of surface topography may allow fur-ther progress on roughness scaling.
The usual avenue to studying the effect of a given pa-rameter is to keep all other parameters fixed and examine theeffect of varying the parameter of interest. This is difficultwith surface roughness since for most irregular three-dimensional roughness altering the roughness height, for ex-ample, leads to concomitant changes in a host of other pa-rameters. For this reason, there are very few data availablefor three-dimensional roughness in which the surface topog-raphy is systematically varied. In the present experimental
PHYSICS OF FLUIDS 21, 015104 �2009�
1070-6631/2009/21�1�/015104/9/$25.00 21, 015104-1
Author complimentary copy. Redistribution subject to AIP license or copyright, see http://phf.aip.org/phf/copyright.jsp
Report Documentation Page Form ApprovedOMB No. 0704-0188
Public reporting burden for the collection of information is estimated to average 1 hour per response, including the time for reviewing instructions, searching existing data sources, gathering andmaintaining the data needed, and completing and reviewing the collection of information. Send comments regarding this burden estimate or any other aspect of this collection of information,including suggestions for reducing this burden, to Washington Headquarters Services, Directorate for Information Operations and Reports, 1215 Jefferson Davis Highway, Suite 1204, ArlingtonVA 22202-4302. Respondents should be aware that notwithstanding any other provision of law, no person shall be subject to a penalty for failing to comply with a collection of information if itdoes not display a currently valid OMB control number.
1. REPORT DATE JUL 2008 2. REPORT TYPE
3. DATES COVERED 00-00-2008 to 00-00-2008
4. TITLE AND SUBTITLE Turbulent boundary layers on a systematically varied rough wall
5a. CONTRACT NUMBER
5b. GRANT NUMBER
5c. PROGRAM ELEMENT NUMBER
6. AUTHOR(S) 5d. PROJECT NUMBER
5e. TASK NUMBER
5f. WORK UNIT NUMBER
7. PERFORMING ORGANIZATION NAME(S) AND ADDRESS(ES) United States Naval Academy,Department of Naval Architecture andOcean Engineering,Annapolis,MD,21402
8. PERFORMING ORGANIZATIONREPORT NUMBER
9. SPONSORING/MONITORING AGENCY NAME(S) AND ADDRESS(ES) 10. SPONSOR/MONITOR’S ACRONYM(S)
11. SPONSOR/MONITOR’S REPORT NUMBER(S)
12. DISTRIBUTION/AVAILABILITY STATEMENT Approved for public release; distribution unlimited
13. SUPPLEMENTARY NOTES
14. ABSTRACT
15. SUBJECT TERMS
16. SECURITY CLASSIFICATION OF: 17. LIMITATION OF ABSTRACT Same as
Report (SAR)
18. NUMBEROF PAGES
9
19a. NAME OFRESPONSIBLE PERSON
a. REPORT unclassified
b. ABSTRACT unclassified
c. THIS PAGE unclassified
Standard Form 298 (Rev. 8-98) Prescribed by ANSI Std Z39-18
investigation, boundary layer measurements are made of theflow over a model roughness. The series of roughness con-sists of close-packed pyramids in which both the height andthe slope are varied. The aim of this work is to gain insightinto how both roughness height and slope contribute to fric-tional drag for three-dimensional roughness.
II. BACKGROUND
The mean velocity in the overlap region of the inner andouter layers for smooth-wall-bounded turbulent flows is wellrepresented by the classical log law,32
U+ =1
�ln�y+� + B , �1�
where U+ is the inner-normalized mean streamwise velocity,� is the von Kármán constant �0.41, y+ is the inner-normalized distance from the wall, and B is the smooth-walllog-law intercept �5.0. For flows over rough walls, there isan increased momentum deficit arising from the pressuredrag on the roughness elements. Hama33 noted that the pri-mary result of this is a downward shift in the inner-normalized mean velocity profile termed the roughness func-tion �U+. The log law for flow over a rough surface is,therefore, given as
U+ =1
�ln�y+� + B − �U+. �2�
Hama also observed that the mean flow in the outer layerwas unaffected by the roughness and followed the same pro-file as the smooth wall. This is called the velocity-defect lawand is given as34
Ue − U
U�
= f� y
�� , �3�
where Ue is mean streamwise velocity at the edge of theboundary layer, U� is the friction velocity, and � is theboundary layer thickness.
The roughness function �U+ is directly related to theincrease in skin friction resulting from the roughness. Forexample, in a turbulent boundary layer, �U+ is a function ofthe skin-friction coefficients Cf for the smooth and roughwalls at the same displacement thickness Reynolds numberRe�� given as33
�U+ = �� 2
Cf�
S− �� 2
Cf�
R. �4�
The roughness function depends on both the nature ofthe roughness and the Reynolds number of the flow such that
�U+ = f�k+� . �5�
Once the functional dependence expressed in Eq. �5� isknown for a given rough surface, the frictional drag for anarbitrary body covered with that roughness can be predictedat any Reynolds number using a computational boundarylayer code35 or a similarity law analysis.28
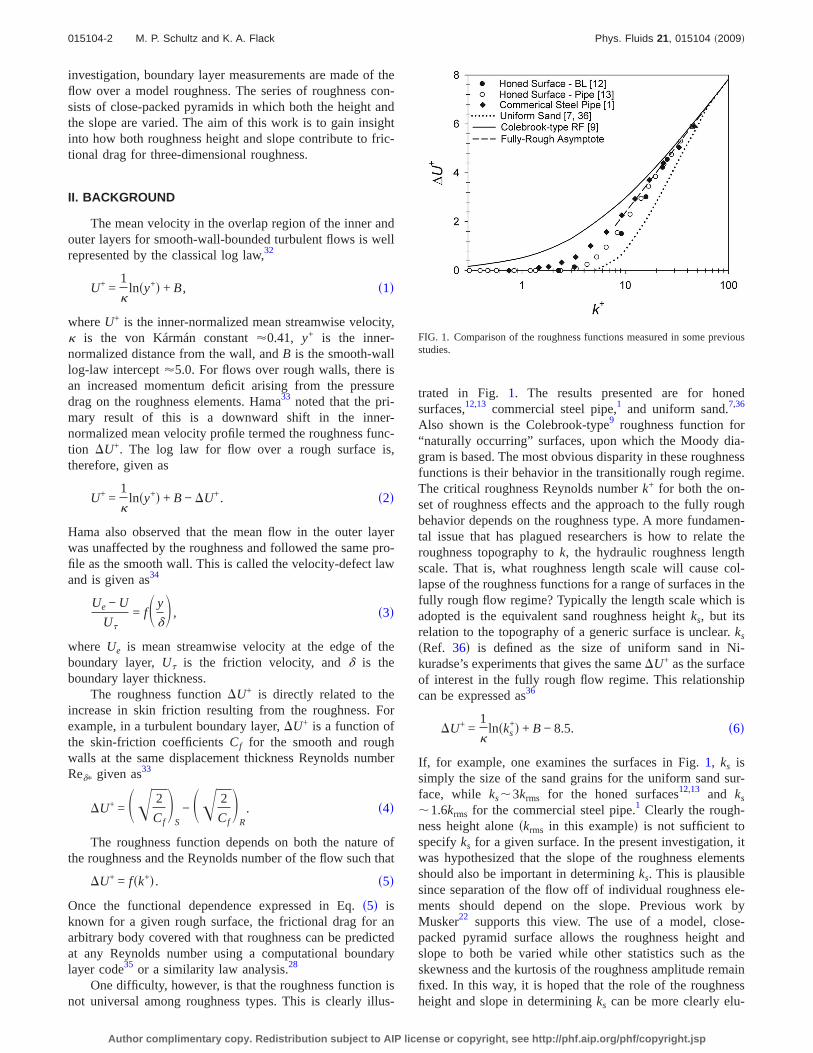
One difficulty, however, is that the roughness function isnot universal among roughness types. This is clearly illus-
trated in Fig. 1. The results presented are for honedsurfaces,12,13 commercial steel pipe,1 and uniform sand.7,36
Also shown is the Colebrook-type9 roughness function for“naturally occurring” surfaces, upon which the Moody dia-gram is based. The most obvious disparity in these roughnessfunctions is their behavior in the transitionally rough regime.The critical roughness Reynolds number k+ for both the on-set of roughness effects and the approach to the fully roughbehavior depends on the roughness type. A more fundamen-tal issue that has plagued researchers is how to relate theroughness topography to k, the hydraulic roughness lengthscale. That is, what roughness length scale will cause col-lapse of the roughness functions for a range of surfaces in thefully rough flow regime? Typically the length scale which isadopted is the equivalent sand roughness height ks, but itsrelation to the topography of a generic surface is unclear. ks
�Ref. 36� is defined as the size of uniform sand in Ni-kuradse’s experiments that gives the same �U+ as the surfaceof interest in the fully rough flow regime. This relationshipcan be expressed as36
�U+ =1
�ln�ks
+� + B − 8.5. �6�
If, for example, one examines the surfaces in Fig. 1, ks issimply the size of the sand grains for the uniform sand sur-face, while ks�3krms for the honed surfaces12,13 and ks
�1.6krms for the commercial steel pipe.1 Clearly the rough-ness height alone �krms in this example� is not sufficient tospecify ks for a given surface. In the present investigation, itwas hypothesized that the slope of the roughness elementsshould also be important in determining ks. This is plausiblesince separation of the flow off of individual roughness ele-ments should depend on the slope. Previous work byMusker22 supports this view. The use of a model, close-packed pyramid surface allows the roughness height andslope to both be varied while other statistics such as theskewness and the kurtosis of the roughness amplitude remainfixed. In this way, it is hoped that the role of the roughnessheight and slope in determining ks can be more clearly elu-
FIG. 1. Comparison of the roughness functions measured in some previousstudies.
015104-2 M. P. Schultz and K. A. Flack Phys. Fluids 21, 015104 �2009�
Author complimentary copy. Redistribution subject to AIP license or copyright, see http://phf.aip.org/phf/copyright.jsp
cidated. This work is part of a larger effort to collect resultsfor three-dimensional rough surfaces in an effort to deter-mine the roughness scales which contribute to frictionaldrag.
III. EXPERIMENTAL FACILITIES AND METHOD
The experiments were conducted in the high-speed watertunnel facility at the United States Naval Academy Hydro-mechanics Laboratory. The test section has a cross section of40�40 cm2 and is 1.8 m in length. A velocity range of 0–9m/s can be produced in the test section. In the present ex-periments, four freestream velocities were tested rangingfrom 1 to 7 m/s. Flow management devices in the facilityinclude turning vanes in the tunnel corners and a honeycombflow straightener in the settling chamber. The honeycombhas 19 mm cells that are 150 mm in length. The area ratiobetween the settling chamber and the test section is 20:1. Theresulting freestream turbulence intensity in the test section is�0.5%.
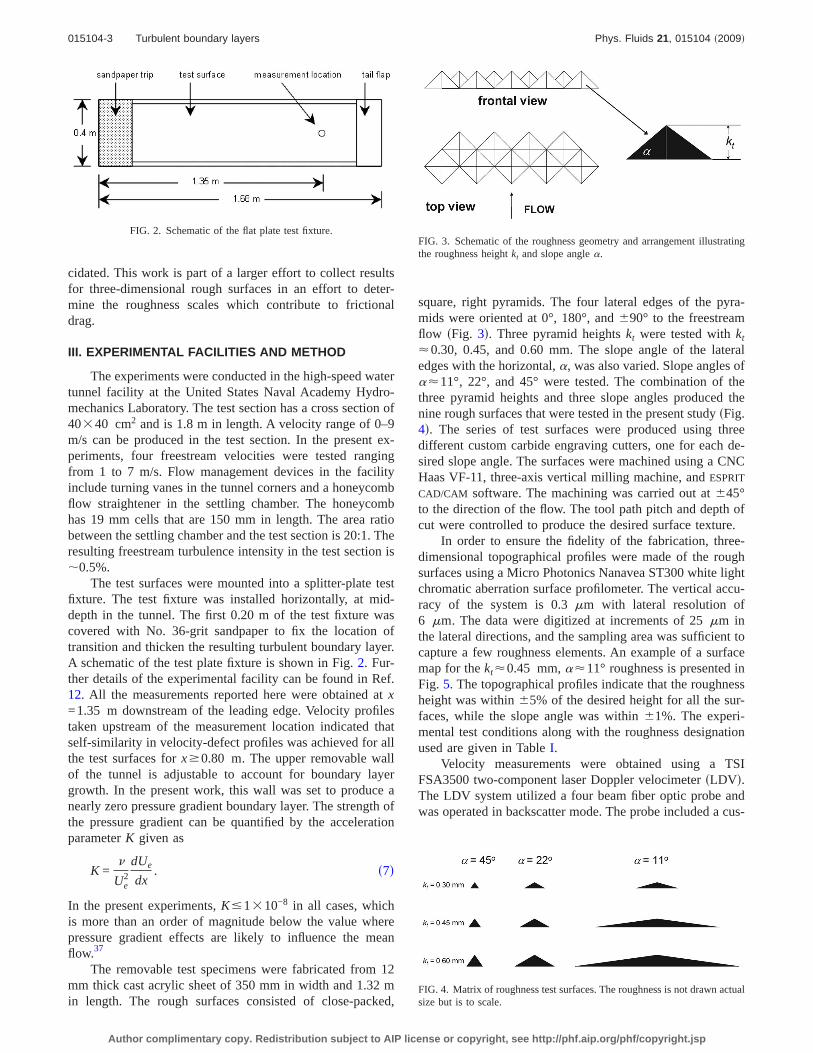
The test surfaces were mounted into a splitter-plate testfixture. The test fixture was installed horizontally, at mid-depth in the tunnel. The first 0.20 m of the test fixture wascovered with No. 36-grit sandpaper to fix the location oftransition and thicken the resulting turbulent boundary layer.A schematic of the test plate fixture is shown in Fig. 2. Fur-ther details of the experimental facility can be found in Ref.12. All the measurements reported here were obtained at x=1.35 m downstream of the leading edge. Velocity profilestaken upstream of the measurement location indicated thatself-similarity in velocity-defect profiles was achieved for allthe test surfaces for x�0.80 m. The upper removable wallof the tunnel is adjustable to account for boundary layergrowth. In the present work, this wall was set to produce anearly zero pressure gradient boundary layer. The strength ofthe pressure gradient can be quantified by the accelerationparameter K given as
K =�
Ue2
dUe
dx. �7�
In the present experiments, K�1�10−8 in all cases, whichis more than an order of magnitude below the value wherepressure gradient effects are likely to influence the meanflow.37
The removable test specimens were fabricated from 12mm thick cast acrylic sheet of 350 mm in width and 1.32 min length. The rough surfaces consisted of close-packed,
square, right pyramids. The four lateral edges of the pyra-mids were oriented at 0°, 180°, and 90° to the freestreamflow �Fig. 3�. Three pyramid heights kt were tested with kt
0.30, 0.45, and 0.60 mm. The slope angle of the lateraledges with the horizontal, , was also varied. Slope angles of11°, 22°, and 45° were tested. The combination of thethree pyramid heights and three slope angles produced thenine rough surfaces that were tested in the present study �Fig.4�. The series of test surfaces were produced using threedifferent custom carbide engraving cutters, one for each de-sired slope angle. The surfaces were machined using a CNCHaas VF-11, three-axis vertical milling machine, and ESPRIT
CAD/CAM software. The machining was carried out at 45°to the direction of the flow. The tool path pitch and depth ofcut were controlled to produce the desired surface texture.
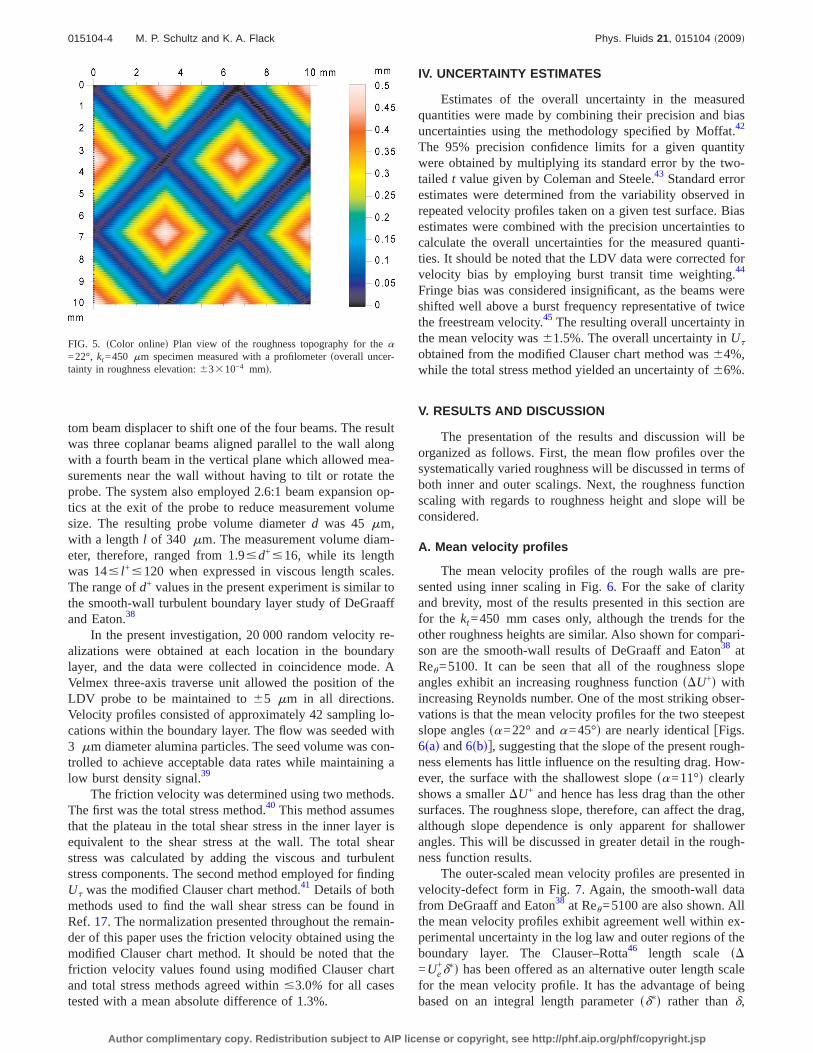
In order to ensure the fidelity of the fabrication, three-dimensional topographical profiles were made of the roughsurfaces using a Micro Photonics Nanavea ST300 white lightchromatic aberration surface profilometer. The vertical accu-racy of the system is 0.3 �m with lateral resolution of6 �m. The data were digitized at increments of 25 �m inthe lateral directions, and the sampling area was sufficient tocapture a few roughness elements. An example of a surfacemap for the kt0.45 mm, 11° roughness is presented inFig. 5. The topographical profiles indicate that the roughnessheight was within 5% of the desired height for all the sur-faces, while the slope angle was within 1%. The experi-mental test conditions along with the roughness designationused are given in Table I.
Velocity measurements were obtained using a TSIFSA3500 two-component laser Doppler velocimeter �LDV�.The LDV system utilized a four beam fiber optic probe andwas operated in backscatter mode. The probe included a cus-
FIG. 2. Schematic of the flat plate test fixture.FIG. 3. Schematic of the roughness geometry and arrangement illustratingthe roughness height kt and slope angle .
FIG. 4. Matrix of roughness test surfaces. The roughness is not drawn actualsize but is to scale.
015104-3 Turbulent boundary layers Phys. Fluids 21, 015104 �2009�
Author complimentary copy. Redistribution subject to AIP license or copyright, see http://phf.aip.org/phf/copyright.jsp
tom beam displacer to shift one of the four beams. The resultwas three coplanar beams aligned parallel to the wall alongwith a fourth beam in the vertical plane which allowed mea-surements near the wall without having to tilt or rotate theprobe. The system also employed 2.6:1 beam expansion op-tics at the exit of the probe to reduce measurement volumesize. The resulting probe volume diameter d was 45 �m,with a length l of 340 �m. The measurement volume diam-eter, therefore, ranged from 1.9�d+�16, while its lengthwas 14� l+�120 when expressed in viscous length scales.The range of d+ values in the present experiment is similar tothe smooth-wall turbulent boundary layer study of DeGraaffand Eaton.38
In the present investigation, 20 000 random velocity re-alizations were obtained at each location in the boundarylayer, and the data were collected in coincidence mode. AVelmex three-axis traverse unit allowed the position of theLDV probe to be maintained to 5 �m in all directions.Velocity profiles consisted of approximately 42 sampling lo-cations within the boundary layer. The flow was seeded with3 �m diameter alumina particles. The seed volume was con-trolled to achieve acceptable data rates while maintaining alow burst density signal.39
The friction velocity was determined using two methods.The first was the total stress method.40 This method assumesthat the plateau in the total shear stress in the inner layer isequivalent to the shear stress at the wall. The total shearstress was calculated by adding the viscous and turbulentstress components. The second method employed for findingU� was the modified Clauser chart method.41 Details of bothmethods used to find the wall shear stress can be found inRef. 17. The normalization presented throughout the remain-der of this paper uses the friction velocity obtained using themodified Clauser chart method. It should be noted that thefriction velocity values found using modified Clauser chartand total stress methods agreed within �3.0% for all casestested with a mean absolute difference of 1.3%.
IV. UNCERTAINTY ESTIMATES
Estimates of the overall uncertainty in the measuredquantities were made by combining their precision and biasuncertainties using the methodology specified by Moffat.42
The 95% precision confidence limits for a given quantitywere obtained by multiplying its standard error by the two-tailed t value given by Coleman and Steele.43 Standard errorestimates were determined from the variability observed inrepeated velocity profiles taken on a given test surface. Biasestimates were combined with the precision uncertainties tocalculate the overall uncertainties for the measured quanti-ties. It should be noted that the LDV data were corrected forvelocity bias by employing burst transit time weighting.44
Fringe bias was considered insignificant, as the beams wereshifted well above a burst frequency representative of twicethe freestream velocity.45 The resulting overall uncertainty inthe mean velocity was 1.5%. The overall uncertainty in U�
obtained from the modified Clauser chart method was 4%,while the total stress method yielded an uncertainty of 6%.
V. RESULTS AND DISCUSSION
The presentation of the results and discussion will beorganized as follows. First, the mean flow profiles over thesystematically varied roughness will be discussed in terms ofboth inner and outer scalings. Next, the roughness functionscaling with regards to roughness height and slope will beconsidered.
A. Mean velocity profiles
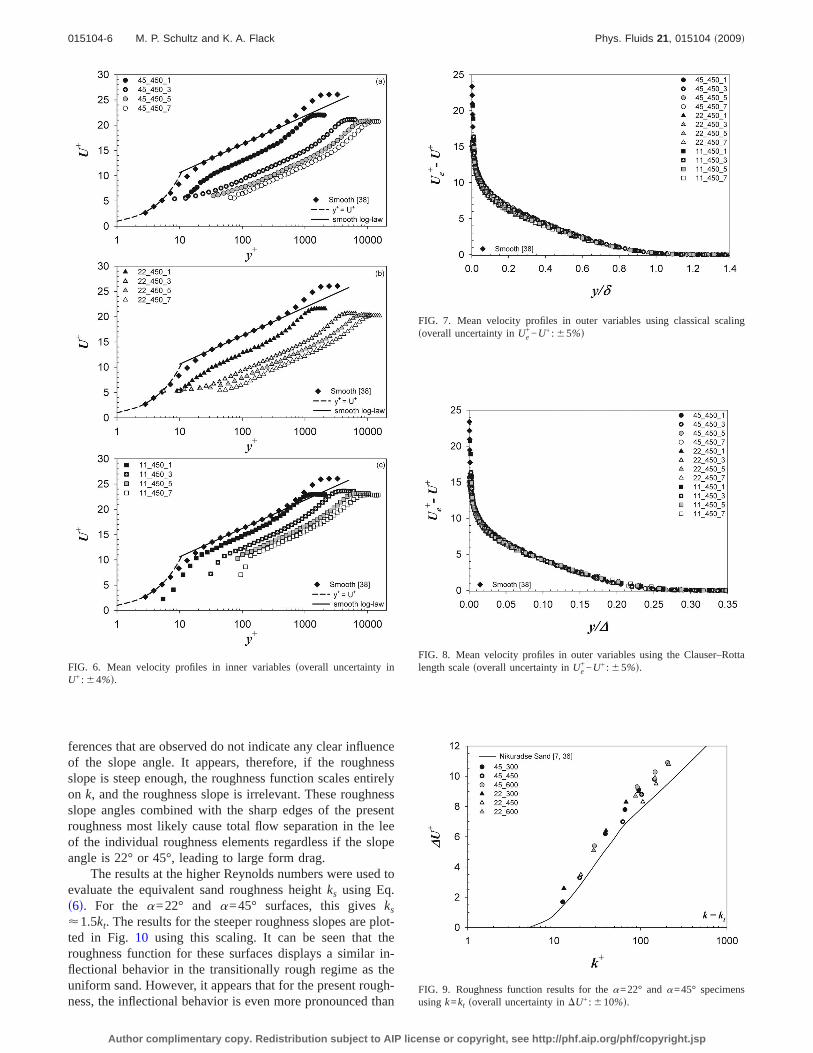
The mean velocity profiles of the rough walls are pre-sented using inner scaling in Fig. 6. For the sake of clarityand brevity, most of the results presented in this section arefor the kt=450 mm cases only, although the trends for theother roughness heights are similar. Also shown for compari-son are the smooth-wall results of DeGraaff and Eaton38 atRe�=5100. It can be seen that all of the roughness slopeangles exhibit an increasing roughness function ��U+� withincreasing Reynolds number. One of the most striking obser-vations is that the mean velocity profiles for the two steepestslope angles �=22° and =45°� are nearly identical �Figs.6�a� and 6�b��, suggesting that the slope of the present rough-ness elements has little influence on the resulting drag. How-ever, the surface with the shallowest slope �=11°� clearlyshows a smaller �U+ and hence has less drag than the othersurfaces. The roughness slope, therefore, can affect the drag,although slope dependence is only apparent for shallowerangles. This will be discussed in greater detail in the rough-ness function results.
The outer-scaled mean velocity profiles are presented invelocity-defect form in Fig. 7. Again, the smooth-wall datafrom DeGraaff and Eaton38 at Re�=5100 are also shown. Allthe mean velocity profiles exhibit agreement well within ex-perimental uncertainty in the log law and outer regions of theboundary layer. The Clauser–Rotta46 length scale ��=Ue
+��� has been offered as an alternative outer length scalefor the mean velocity profile. It has the advantage of beingbased on an integral length parameter ���� rather than �,
FIG. 5. �Color online� Plan view of the roughness topography for the =22°, kt=450 �m specimen measured with a profilometer �overall uncer-tainty in roughness elevation: 3�10−4 mm�.
015104-4 M. P. Schultz and K. A. Flack Phys. Fluids 21, 015104 �2009�
Author complimentary copy. Redistribution subject to AIP license or copyright, see http://phf.aip.org/phf/copyright.jsp
whose definition is somewhat arbitrary. It also can accountfor Reynolds number dependence through Ue
+. The outer-scaled mean velocity profiles are presented in velocity-defectform using the Clauser–Rotta scaling in Fig. 8. The resultsshow excellent collapse throughout the log law and outerregions of the boundary layer for both the smooth and roughwalls. These mean flow results support Townsend’shypothesis10 that the surface condition has no direct effect onthe outer flow but simply plays a role in setting the outerlength and velocity scales. This is in agreement with earlierwork by the authors12,14 for range of three-dimensionalroughness of various heights and types. Recent results47
show that this mean flow similarity is very robust and ismaintained for flows over three-dimensional roughness inwhich the roughness height is a significant fraction of theboundary layer thickness �relative roughness as large as
kt /�0.2�. Collapse of mean flow profiles for rough andsmooth walls in velocity-defect form is important in accurateprediction of drag, since mean flow similarity in outer vari-ables is assumed both when relating laboratory results to fullscale using boundary layer similarity laws48 as well as whenusing wall function models for numerical computations.35
B. Roughness function �U+
The roughness function results for the two steepestroughness slope angles �=22° and =45°� are shown inFig. 9 along with the results for Nikuradse’s7,36 uniformsand. For the present results, the roughness height k wasinitially taken to be the peak-to-trough height kt. Figure 9shows reasonable agreement between the roughness func-tions observed on the =22° and =45° surfaces. Any dif-
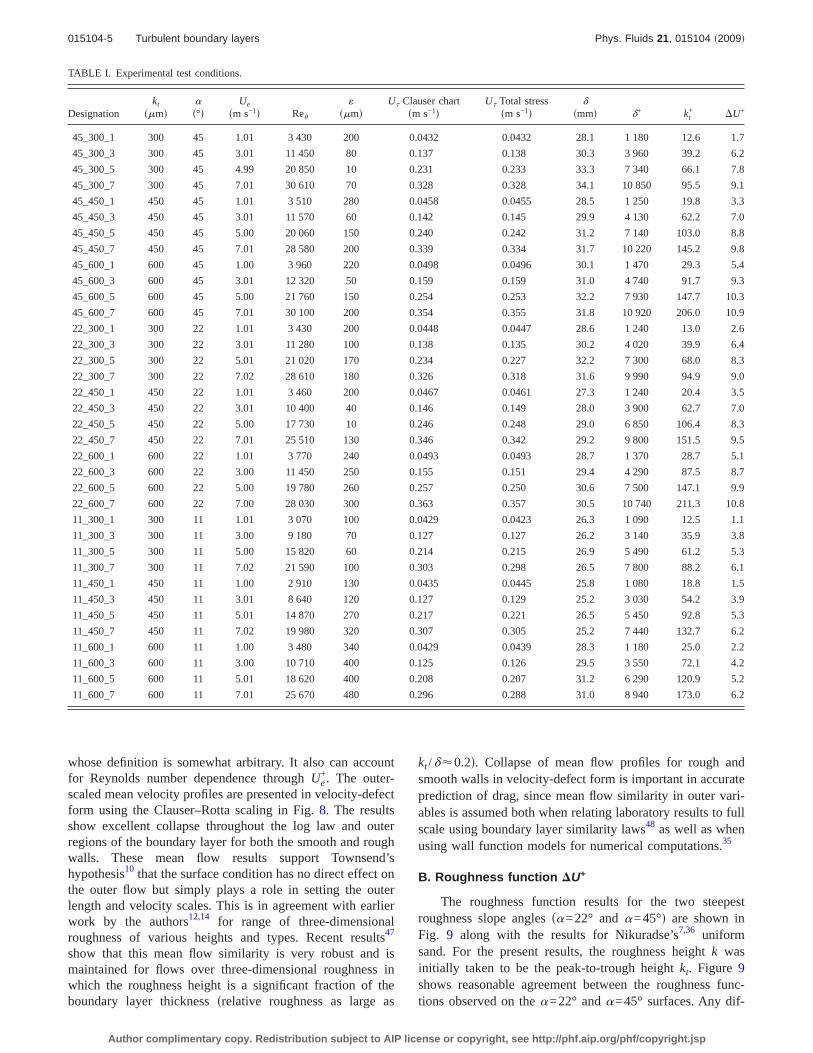
TABLE I. Experimental test conditions.
Designationkt
��m��°�
Ue
�m s−1� Re�
��m�
U� Clauser chart�m s−1�
U� Total stress�m s−1�
��mm� �+ kt
+ �U+
45_300_1 300 45 1.01 3 430 200 0.0432 0.0432 28.1 1 180 12.6 1.7
45_300_3 300 45 3.01 11 450 80 0.137 0.138 30.3 3 960 39.2 6.2
45_300_5 300 45 4.99 20 850 10 0.231 0.233 33.3 7 340 66.1 7.8
45_300_7 300 45 7.01 30 610 70 0.328 0.328 34.1 10 850 95.5 9.1
45_450_1 450 45 1.01 3 510 280 0.0458 0.0455 28.5 1 250 19.8 3.3
45_450_3 450 45 3.01 11 570 60 0.142 0.145 29.9 4 130 62.2 7.0
45_450_5 450 45 5.00 20 060 150 0.240 0.242 31.2 7 140 103.0 8.8
45_450_7 450 45 7.01 28 580 200 0.339 0.334 31.7 10 220 145.2 9.8
45_600_1 600 45 1.00 3 960 220 0.0498 0.0496 30.1 1 470 29.3 5.4
45_600_3 600 45 3.01 12 320 50 0.159 0.159 31.0 4 740 91.7 9.3
45_600_5 600 45 5.00 21 760 150 0.254 0.253 32.2 7 930 147.7 10.3
45_600_7 600 45 7.01 30 100 200 0.354 0.355 31.8 10 920 206.0 10.9
22_300_1 300 22 1.01 3 430 200 0.0448 0.0447 28.6 1 240 13.0 2.6
22_300_3 300 22 3.01 11 280 100 0.138 0.135 30.2 4 020 39.9 6.4
22_300_5 300 22 5.01 21 020 170 0.234 0.227 32.2 7 300 68.0 8.3
22_300_7 300 22 7.02 28 610 180 0.326 0.318 31.6 9 990 94.9 9.0
22_450_1 450 22 1.01 3 460 200 0.0467 0.0461 27.3 1 240 20.4 3.5
22_450_3 450 22 3.01 10 400 40 0.146 0.149 28.0 3 900 62.7 7.0
22_450_5 450 22 5.00 17 730 10 0.246 0.248 29.0 6 850 106.4 8.3
22_450_7 450 22 7.01 25 510 130 0.346 0.342 29.2 9 800 151.5 9.5
22_600_1 600 22 1.01 3 770 240 0.0493 0.0493 28.7 1 370 28.7 5.1
22_600_3 600 22 3.00 11 450 250 0.155 0.151 29.4 4 290 87.5 8.7
22_600_5 600 22 5.00 19 780 260 0.257 0.250 30.6 7 500 147.1 9.9
22_600_7 600 22 7.00 28 030 300 0.363 0.357 30.5 10 740 211.3 10.8
11_300_1 300 11 1.01 3 070 100 0.0429 0.0423 26.3 1 090 12.5 1.1
11_300_3 300 11 3.00 9 180 70 0.127 0.127 26.2 3 140 35.9 3.8
11_300_5 300 11 5.00 15 820 60 0.214 0.215 26.9 5 490 61.2 5.3
11_300_7 300 11 7.02 21 590 100 0.303 0.298 26.5 7 800 88.2 6.1
11_450_1 450 11 1.00 2 910 130 0.0435 0.0445 25.8 1 080 18.8 1.5
11_450_3 450 11 3.01 8 640 120 0.127 0.129 25.2 3 030 54.2 3.9
11_450_5 450 11 5.01 14 870 270 0.217 0.221 26.5 5 450 92.8 5.3
11_450_7 450 11 7.02 19 980 320 0.307 0.305 25.2 7 440 132.7 6.2
11_600_1 600 11 1.00 3 480 340 0.0429 0.0439 28.3 1 180 25.0 2.2
11_600_3 600 11 3.00 10 710 400 0.125 0.126 29.5 3 550 72.1 4.2
11_600_5 600 11 5.01 18 620 400 0.208 0.207 31.2 6 290 120.9 5.2
11_600_7 600 11 7.01 25 670 480 0.296 0.288 31.0 8 940 173.0 6.2
015104-5 Turbulent boundary layers Phys. Fluids 21, 015104 �2009�
Author complimentary copy. Redistribution subject to AIP license or copyright, see http://phf.aip.org/phf/copyright.jsp
ferences that are observed do not indicate any clear influenceof the slope angle. It appears, therefore, if the roughnessslope is steep enough, the roughness function scales entirelyon k, and the roughness slope is irrelevant. These roughnessslope angles combined with the sharp edges of the presentroughness most likely cause total flow separation in the leeof the individual roughness elements regardless if the slopeangle is 22° or 45°, leading to large form drag.
The results at the higher Reynolds numbers were used toevaluate the equivalent sand roughness height ks using Eq.�6�. For the =22° and =45° surfaces, this gives ks
1.5kt. The results for the steeper roughness slopes are plot-ted in Fig. 10 using this scaling. It can be seen that theroughness function for these surfaces displays a similar in-flectional behavior in the transitionally rough regime as theuniform sand. However, it appears that for the present rough-ness, the inflectional behavior is even more pronounced than
FIG. 6. Mean velocity profiles in inner variables �overall uncertainty inU+ : 4%�.
FIG. 7. Mean velocity profiles in outer variables using classical scaling�overall uncertainty in Ue
+−U+ : 5%�
FIG. 8. Mean velocity profiles in outer variables using the Clauser–Rottalength scale �overall uncertainty in Ue
+−U+ : 5%�.
FIG. 9. Roughness function results for the =22° and =45° specimensusing k=kt �overall uncertainty in �U+ : 10%�.
015104-6 M. P. Schultz and K. A. Flack Phys. Fluids 21, 015104 �2009�
Author complimentary copy. Redistribution subject to AIP license or copyright, see http://phf.aip.org/phf/copyright.jsp
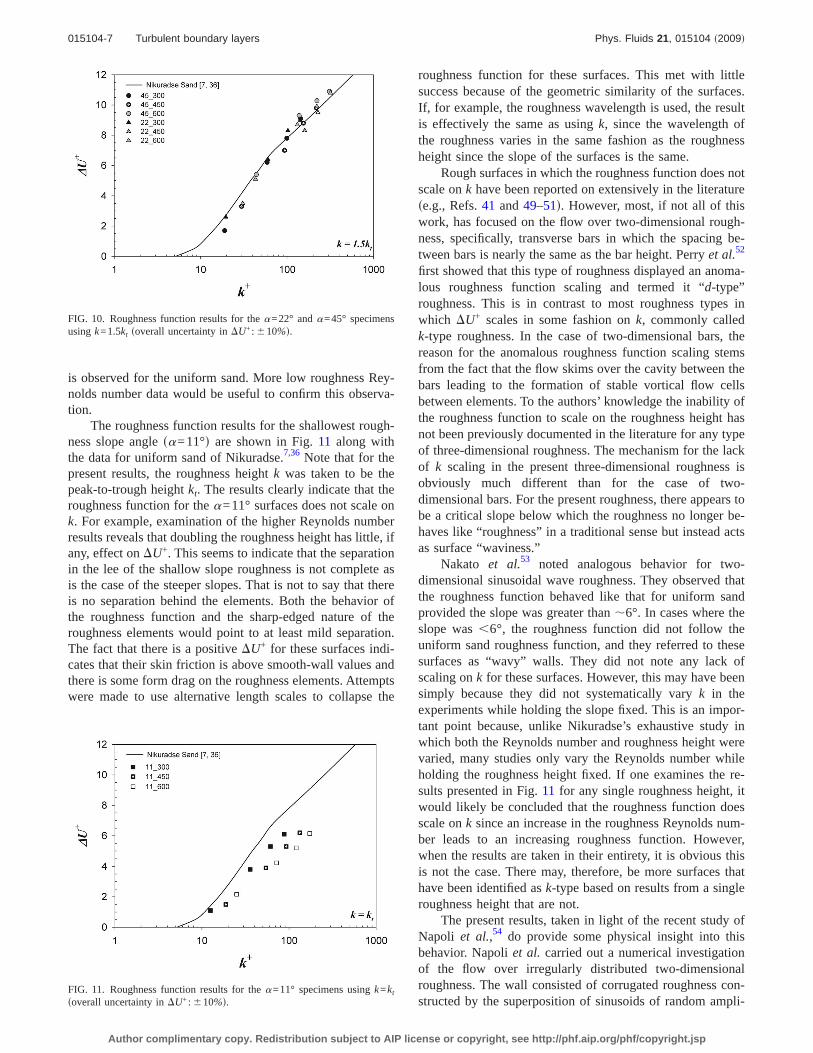
is observed for the uniform sand. More low roughness Rey-nolds number data would be useful to confirm this observa-tion.
The roughness function results for the shallowest rough-ness slope angle �=11°� are shown in Fig. 11 along withthe data for uniform sand of Nikuradse.7,36 Note that for thepresent results, the roughness height k was taken to be thepeak-to-trough height kt. The results clearly indicate that theroughness function for the =11° surfaces does not scale onk. For example, examination of the higher Reynolds numberresults reveals that doubling the roughness height has little, ifany, effect on �U+. This seems to indicate that the separationin the lee of the shallow slope roughness is not complete asis the case of the steeper slopes. That is not to say that thereis no separation behind the elements. Both the behavior ofthe roughness function and the sharp-edged nature of theroughness elements would point to at least mild separation.The fact that there is a positive �U+ for these surfaces indi-cates that their skin friction is above smooth-wall values andthere is some form drag on the roughness elements. Attemptswere made to use alternative length scales to collapse the
roughness function for these surfaces. This met with littlesuccess because of the geometric similarity of the surfaces.If, for example, the roughness wavelength is used, the resultis effectively the same as using k, since the wavelength ofthe roughness varies in the same fashion as the roughnessheight since the slope of the surfaces is the same.
Rough surfaces in which the roughness function does notscale on k have been reported on extensively in the literature�e.g., Refs. 41 and 49–51�. However, most, if not all of thiswork, has focused on the flow over two-dimensional rough-ness, specifically, transverse bars in which the spacing be-tween bars is nearly the same as the bar height. Perry et al.52
first showed that this type of roughness displayed an anoma-lous roughness function scaling and termed it “d-type”roughness. This is in contrast to most roughness types inwhich �U+ scales in some fashion on k, commonly calledk-type roughness. In the case of two-dimensional bars, thereason for the anomalous roughness function scaling stemsfrom the fact that the flow skims over the cavity between thebars leading to the formation of stable vortical flow cellsbetween elements. To the authors’ knowledge the inability ofthe roughness function to scale on the roughness height hasnot been previously documented in the literature for any typeof three-dimensional roughness. The mechanism for the lackof k scaling in the present three-dimensional roughness isobviously much different than for the case of two-dimensional bars. For the present roughness, there appears tobe a critical slope below which the roughness no longer be-haves like “roughness” in a traditional sense but instead actsas surface “waviness.”
Nakato et al.53 noted analogous behavior for two-dimensional sinusoidal wave roughness. They observed thatthe roughness function behaved like that for uniform sandprovided the slope was greater than �6°. In cases where theslope was �6°, the roughness function did not follow theuniform sand roughness function, and they referred to thesesurfaces as “wavy” walls. They did not note any lack ofscaling on k for these surfaces. However, this may have beensimply because they did not systematically vary k in theexperiments while holding the slope fixed. This is an impor-tant point because, unlike Nikuradse’s exhaustive study inwhich both the Reynolds number and roughness height werevaried, many studies only vary the Reynolds number whileholding the roughness height fixed. If one examines the re-sults presented in Fig. 11 for any single roughness height, itwould likely be concluded that the roughness function doesscale on k since an increase in the roughness Reynolds num-ber leads to an increasing roughness function. However,when the results are taken in their entirety, it is obvious thisis not the case. There may, therefore, be more surfaces thathave been identified as k-type based on results from a singleroughness height that are not.
The present results, taken in light of the recent study ofNapoli et al.,54 do provide some physical insight into thisbehavior. Napoli et al. carried out a numerical investigationof the flow over irregularly distributed two-dimensionalroughness. The wall consisted of corrugated roughness con-structed by the superposition of sinusoids of random ampli-
FIG. 10. Roughness function results for the =22° and =45° specimensusing k=1.5kt �overall uncertainty in �U+ : 10%�.
FIG. 11. Roughness function results for the =11° specimens using k=kt
�overall uncertainty in �U+ : 10%�.
015104-7 Turbulent boundary layers Phys. Fluids 21, 015104 �2009�
Author complimentary copy. Redistribution subject to AIP license or copyright, see http://phf.aip.org/phf/copyright.jsp
tude. In this work, they developed a roughness parametertermed the effective slope �ES�, defined as follows:
ES =1
L
L� �r
�x�dx , �8�
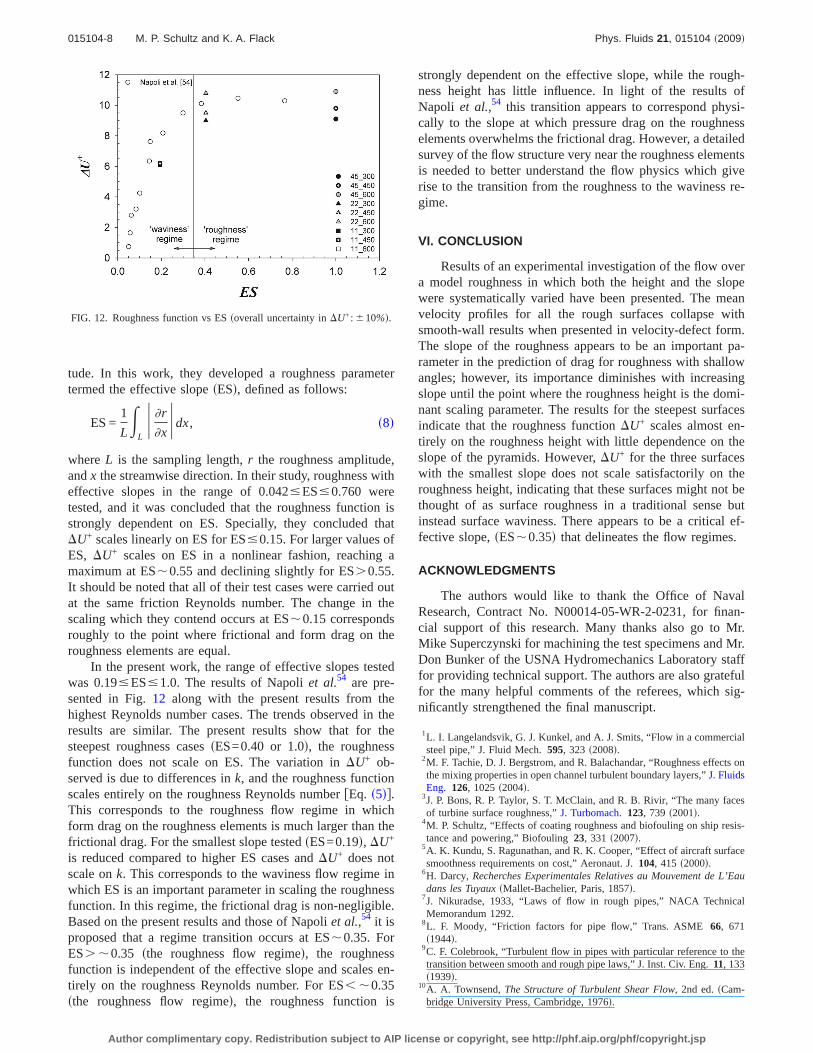
where L is the sampling length, r the roughness amplitude,and x the streamwise direction. In their study, roughness witheffective slopes in the range of 0.042�ES�0.760 weretested, and it was concluded that the roughness function isstrongly dependent on ES. Specially, they concluded that�U+ scales linearly on ES for ES�0.15. For larger values ofES, �U+ scales on ES in a nonlinear fashion, reaching amaximum at ES�0.55 and declining slightly for ES�0.55.It should be noted that all of their test cases were carried outat the same friction Reynolds number. The change in thescaling which they contend occurs at ES�0.15 correspondsroughly to the point where frictional and form drag on theroughness elements are equal.
In the present work, the range of effective slopes testedwas 0.19�ES�1.0. The results of Napoli et al.54 are pre-sented in Fig. 12 along with the present results from thehighest Reynolds number cases. The trends observed in theresults are similar. The present results show that for thesteepest roughness cases �ES=0.40 or 1.0�, the roughnessfunction does not scale on ES. The variation in �U+ ob-served is due to differences in k, and the roughness functionscales entirely on the roughness Reynolds number �Eq. �5��.This corresponds to the roughness flow regime in whichform drag on the roughness elements is much larger than thefrictional drag. For the smallest slope tested �ES=0.19�, �U+
is reduced compared to higher ES cases and �U+ does notscale on k. This corresponds to the waviness flow regime inwhich ES is an important parameter in scaling the roughnessfunction. In this regime, the frictional drag is non-negligible.Based on the present results and those of Napoli et al.,54 it isproposed that a regime transition occurs at ES�0.35. ForES� �0.35 �the roughness flow regime�, the roughnessfunction is independent of the effective slope and scales en-tirely on the roughness Reynolds number. For ES� �0.35�the roughness flow regime�, the roughness function is
strongly dependent on the effective slope, while the rough-ness height has little influence. In light of the results ofNapoli et al.,54 this transition appears to correspond physi-cally to the slope at which pressure drag on the roughnesselements overwhelms the frictional drag. However, a detailedsurvey of the flow structure very near the roughness elementsis needed to better understand the flow physics which giverise to the transition from the roughness to the waviness re-gime.
VI. CONCLUSION
Results of an experimental investigation of the flow overa model roughness in which both the height and the slopewere systematically varied have been presented. The meanvelocity profiles for all the rough surfaces collapse withsmooth-wall results when presented in velocity-defect form.The slope of the roughness appears to be an important pa-rameter in the prediction of drag for roughness with shallowangles; however, its importance diminishes with increasingslope until the point where the roughness height is the domi-nant scaling parameter. The results for the steepest surfacesindicate that the roughness function �U+ scales almost en-tirely on the roughness height with little dependence on theslope of the pyramids. However, �U+ for the three surfaceswith the smallest slope does not scale satisfactorily on theroughness height, indicating that these surfaces might not bethought of as surface roughness in a traditional sense butinstead surface waviness. There appears to be a critical ef-fective slope, �ES�0.35� that delineates the flow regimes.
ACKNOWLEDGMENTS
The authors would like to thank the Office of NavalResearch, Contract No. N00014-05-WR-2-0231, for finan-cial support of this research. Many thanks also go to Mr.Mike Superczynski for machining the test specimens and Mr.Don Bunker of the USNA Hydromechanics Laboratory stafffor providing technical support. The authors are also gratefulfor the many helpful comments of the referees, which sig-nificantly strengthened the final manuscript.
1L. I. Langelandsvik, G. J. Kunkel, and A. J. Smits, “Flow in a commercialsteel pipe,” J. Fluid Mech. 595, 323 �2008�.
2M. F. Tachie, D. J. Bergstrom, and R. Balachandar, “Roughness effects onthe mixing properties in open channel turbulent boundary layers,” J. FluidsEng. 126, 1025 �2004�.
3J. P. Bons, R. P. Taylor, S. T. McClain, and R. B. Rivir, “The many facesof turbine surface roughness,” J. Turbomach. 123, 739 �2001�.
4M. P. Schultz, “Effects of coating roughness and biofouling on ship resis-tance and powering,” Biofouling 23, 331 �2007�.
5A. K. Kundu, S. Ragunathan, and R. K. Cooper, “Effect of aircraft surfacesmoothness requirements on cost,” Aeronaut. J. 104, 415 �2000�.
6H. Darcy, Recherches Experimentales Relatives au Mouvement de L’Eaudans les Tuyaux �Mallet-Bachelier, Paris, 1857�.
7J. Nikuradse, 1933, “Laws of flow in rough pipes,” NACA TechnicalMemorandum 1292.
8L. F. Moody, “Friction factors for pipe flow,” Trans. ASME 66, 671�1944�.
9C. F. Colebrook, “Turbulent flow in pipes with particular reference to thetransition between smooth and rough pipe laws,” J. Inst. Civ. Eng. 11, 133�1939�.
10A. A. Townsend, The Structure of Turbulent Shear Flow, 2nd ed. �Cam-bridge University Press, Cambridge, 1976�.
FIG. 12. Roughness function vs ES �overall uncertainty in �U+ : 10%�.
015104-8 M. P. Schultz and K. A. Flack Phys. Fluids 21, 015104 �2009�
Author complimentary copy. Redistribution subject to AIP license or copyright, see http://phf.aip.org/phf/copyright.jsp
11J. Jiménez, “Turbulent flows over rough walls,” Annu. Rev. Fluid Mech.36, 173 �2004�.
12M. P. Schultz and K. A. Flack, “The rough-wall turbulent boundary layerfrom the hydraulically smooth to the fully rough regime,” J. Fluid Mech.580, 381 �2007�.
13M. A. Shockling, J. J. Allen, and A. J. Smits, “Roughness effects in tur-bulent pipe flow,” J. Fluid Mech. 564, 267 �2006�.
14J. S. Connelly, M. P. Schultz, and K. A. Flack, “Velocity-defect scaling forturbulent boundary layers with a range of relative roughness,” Exp. Fluids40, 188 �2006�.
15Y. Wu and K. T. Christensen, “Outer-layer similarity in the presence of apractical rough-wall topography,” Phys. Fluids 19, 085108 �2007�.
16K. A. Flack, M. P. Schultz, and T. A. Shapiro, “Experimental support forTownsend’s Reynolds number similarity hypothesis on rough walls,”Phys. Fluids 17, 035102 �2005�.
17K. A. Flack, M. P. Schultz, and J. S. Connelly, “Examination of a criticalroughness height for outer layer similarity,” Phys. Fluids 19, 095104�2007�.
18R. J. Volino, M. P. Schultz, and K. A. Flack, “Turbulence structure inrough- and smooth-wall boundary layers,” J. Fluid Mech. 592, 263�2007�.
19D. Bettermann, “Contribtion a l’etude de la couche limite turbulent le longde plaques regueuses,” Center National de la Recherche Scientifique Re-port No. 65–6, 1965.
20F. A. Dvorak, “Calculation of turbulent boundary layers on rough surfacesin pressure gradients,” AIAA J. 7, 1752 �1969�.
21R. B. Dirling, “A method for computing rough wall heat transfer rates onre-entry nosetips,” AIAA Pap. 73-763 �1973�.
22A. J. Musker, “Universal roughness functions for naturally-occurring sur-faces,” Trans. Can. Soc. Mech. Eng. 1, 1 �1980�.
23J. S. Medhurst, “The systematic measurement and correlation of the fric-tional resistance and topography of ship Hull coatings, with particularreference to ablative antifoulings,” Ph.D. thesis, University of Newcastle-upon-Tyne, 1989.
24D. R. Waigh and R. J. Kind, “Improved aerodynamic characterization ofregular three-dimensional roughness,” AIAA J. 36, 1117 �1998�.
25J. A. van Rij, B. J. Belnap, and P. M. Ligrani, “Analysis and experimentson three-dimensional, irregular surface roughness,” J. Fluids Eng. 124,671 �2002�.
26 J. P. Bons, “St and cf augmentation for real turbine roughness with el-evated freestream turbulence,” J. Fluids Eng. 124, 632 �2002�.
27M. P. Schultz and K. A. Flack, “Turbulent boundary layers over surfacessmoothed by sanding,” J. Fluids Eng. 125, 863 �2003�.
28M. P. Schultz, “Frictional resistance of antifouling coating systems,” J.Fluids Eng. 126, 1039 �2004�.
29P. R. Bandyopadhyay and R. D. Watson, “Structure of rough-wall bound-ary layers,” Phys. Fluids 31, 1877 �1988�.
30R. L. Townsin and S. K. Dey, “The correlation of roughness drag withsurface characteristics,” Proceedings of the RINA International Workshopon Marine Roughness and Drag, London, UK, 1990 �Wiley, New York,1938�.
31C. W. B. Grigson, “Drag losses of new ships caused by Hull finish,” J.Ship Res. 36, 182 �1992�.
32C. M. Millikan, 1938, “A critical discussion of turbulent flows in channelsand circular tubes,” Proceedings of the Fifth International Congress onApplied Mechanics, Cambridge, MA �Royal Institute of Naval Architects,London, 1990�, pp. 386–392.
33F. R. Hama, “Boundary-layer characteristics for rough and smooth sur-faces,” Soc. Nav. Archit. Mar. Eng., Trans.tea 62, 333 �1954�.
34T. von Kármán, “Mechanishe aehnlichkeit and turbulenz,” Nachr. Ges.Wiss. Goettingen, Math.-Phys. Kl., pp. 58�76 �1930�.
35V. C. Patel, “Perspective: Flow at high Reynolds number and over roughsurfaces—Achilles Heel of CFD,” J. Fluids Eng. 120, 434 �1998�.
36H. Schlichting, Boundary-Layer Theory, 7th ed. �McGraw-Hill, NewYork, 1979�.
37V. C. Patel, “Calibration of the Preston tube and limitations on its use inpressure gradients,” J. Fluid Mech. 23, 185 �1965�.
38D. B. DeGraaff and J. K. Eaton, “Reynolds-number scaling of the flat-plate turbulent boundary layer,” J. Fluid Mech. 422, 319 �2000�.
39R. J. Adrian, in Fluid Mechanics Measurements, edited by R. J. Goldstein�Hemisphere, Washington, DC, 1983�.
40P. M. Ligrani and R. J. Moffat, “Structure of transitionally rough and fullyrough turbulent boundary layers,” J. Fluid Mech. 162, 69 �1986�.
41A. E. Perry and J. D. Li, “Experimental support for the attached-eddyhypothesis in zero-pressure gradient turbulent boundary layers,” J. FluidMech. 218, 405 �1990�.
42R. J. Moffat, “Describing the uncertainties in experimental results,” Exp.Therm. Fluid Sci. 1, 3 �1988�.
43H. W. Coleman and W. G. Steele, “Engineering application of experimen-tal uncertainty analysis,” AIAA J. 33, 1888 �1995�.
44P. Buchhave, W. K. George, and J. L. Lumley, “The measurement ofturbulence with the laser-Doppler anemometer,” Annu. Rev. Fluid Mech.11, 443 �1979�.
45R. V. Edwards, “Report of the special panel on statistical particle biasproblems in laser anemometry,” ASME J. Fluids Eng. 109, 89 �1987�.
46F. H. Clauser, “Turbulent boundary layers in adverse pressure gradients,”J. Aeronaut. Sci. 21, 91 �1954�.
47I. P. Castro, “Rough-wall boundary layers: Mean flow universality,” J.Fluid Mech. 585, 469 �2007�.
48P. S. Granville, “The frictional resistance and turbulent boundary layer ofrough surfaces,” J. Ship Res. 1, 52 �1958�.
49S. Leonardi, P. Orlandi, and R. A. Antonia, “Properties of d- and k-typeroughness in turbulent channel flow,” Phys. Fluids 19, 125101 �2007�.
50D. H. Wood and R. A. Antonia, “Measurements in a turbulent boundarylayer over d-type surface roughness,” J. Appl. Mech. 42, 591 �1975�.
51L. Djenidi, R. Elavarasan, and R. A. Antonia, “The turbulent boundarylayer over transverse square bars,” J. Fluid Mech. 395, 271 �1999�.
52A. E. Perry, W. H. Schofield, and P. N. Joubert, “Rough wall turbulentboundary layers,” J. Fluid Mech. 37, 383 �1969�.
53M. Nakato, H. Onogi, Y. Himeno, I. Tanaka, and T. Suzuki, 1985, “Resis-tance due to surface roughness,” Proceedings of the 15th Symposium onNaval Hydrodynamics, pp. 553–568.
54E. Napoli, V. Armenio, and M. DeMarchis, “The effect of the slope ofirregularly distributed roughness elements on turbulent wall-boundedflows,” J. Fluid Mech. 613, 385 �2008�.
015104-9 Turbulent boundary layers Phys. Fluids 21, 015104 �2009�
Author complimentary copy. Redistribution subject to AIP license or copyright, see http://phf.aip.org/phf/copyright.jsp