trust and fiscal performance: a panel analysis with swiss data
TRANSCRIPT
CREMA
Center for Research in Economics, Management and the Arts
CREMA Gellertstrasse 24 CH - 4052 Basel www.crema-research.ch
Trust and Fiscal Performance:
A Panel Analysis with Swiss Data
Christoph A. Schaltegger
Benno Torgler
Working Paper No. 2005 – 05
Trust and Fiscal Performance: A Panel Analysis with Swiss Data∗
by
Christoph A. Schaltegger
Swiss Federal Tax Administration, University of St. Gallen and
CREMA, Center for Research in Economics, Management and the Arts
and
Benno Torgler
Yale Center for International and Area Studies, Leitner Program in International & Comparative
Political Economy and CREMA, Center for Research in Economics, Management and the Arts
Abstract
Citizens are willing to abandon their short-term financial interest in free-riding considerably, if govern-ments act in their interest, if procedures of the public decisions-making process are felt to be fair and if other fellow-citizens have to contribute also an adequate share to the community. In such a situation trustworthiness of a government and trust in a government is high. This paper provides empirical evi-dence that trust is crucial for fiscal performance using data for the full sample of Swiss cantons over the 1981-2001 period. In cantons with high levels of trust, the level of indebtedness is significantly lower. Trust supports fiscal discipline. In order to get a useful approximation for mutual trust among citizens and between citizens and their representatives, we use information from direct voter participation on political issues (initiatives and public referenda) held in Swiss state (cantonal) governments. Electoral support of government proposals reveals an important aspect of trust in a real world setting. Hence, our trust variable measures the behavior at the ballots thereby reducing possible subjective biases derived from surveys and questionnaires.
Keywords: Trust, Social capital, Fiscal performance, Indebtedness.
∗ We are very grateful to Jakob de Haan, Martin Paldam and Gebhard Kirchgässner for their helpful comments and suggestions, Alexander Trechsel as well as the cantonal statistical offices for providing us with information on the data source of cantonal ballots and Justina Fischer. The authors have additionally benefited from comments of par-ticipants of the Annual Meeting of the Public Choice Society 2005 in New Orleans and the Annual Meeting of the European Public Choice Society 2005 in Durham. Financial support from the Max Geldner-Stiftung, the Janggen-Pöhn-Stifung, the FAG (Freiwillige Akademische Gesellschaft), and the University of Basel (Fonds zur Förderung des Akademischen Nachwuchses) is gratefully acknowledged. The authors are responsible for all remaining short-comings in the article.
2
Social capital is a new field, suffering from a great lack of good, reliable data. Both time
series and cross-country evidence are missing. In the meantime much speculation is going on
... it is hopefully clear that social capital is a promising concept, which can be operationalized
by relatively simple measurement. However, it will take some time and a lot of work has to be
done before it is known if social capital can deliver what it promises (p. 649).
Paldam (2000, p. 649)
1. Introduction
Several OECD countries have accumulated large government debts over the last 30 years. Very
much the same applies for sub-federal governments. Why do we observe large debts in certain
governments but not in others? An explanation to that question can be found looking at the insti-
tutional framework of jurisdictions. They are particularly important for fiscal policy decisions as
fiscal institutions create the environment, the incentives, the rules, the regulations and the con-
straints under which budgets are drafted, approved, and implemented. Fiscal institutions can
promote fiscal discipline if properly designed while an institutional framework that results in soft
budget constraints provides incentives for loose fiscal discipline. These rules greatly vary over
governments and thus provide a reasonable explanation for cross-section variations in debt levels
(Alesina and Perotti 1995, Poterba and von Hagen1999 or Persson and Tabellini 2001).
According to Buchanan (1980) we can broadly distinguish between quantitative and pro-
cedural institutions. Quantitative rules entail tax and expenditures limitation laws, debt brakes
and other formal restraints to balance the budget. As empirically shown by Bohn and Inman
(1996), Poterba (1997) or Shadbegian (1998) such budget rules can effectively support the fiscal
discipline of policy makers. Procedural institutions define how property rights over political de-
cisions are acquired, and who can exercise them. As shown by Persson and Tabellini (2003) the

3
constitutional design of the regime type and the electoral rules also shape fiscal policy decisions
to a significant extent.
However, it will never be possible to design a constitution and to establish a framework
of quantitative and procedural institutions that answers all future questions of a society. Hence,
in all those cases where there is a degree of uncertainty, trust becomes a crucial aspect. Guerra
and Zizzo (2003) point out that “without uncertainty, trust is not a significant issue because cer-
tainty means the outcome will be the same whether or not a trusting act was involved” (p. 3).
Mutual trust in the case of uncertainty reduces transaction costs and makes the institutional ar-
chitecture to work smoothly (Putnam 1993, 2000; Fukuyama 1995). Trust can be seen as the
social capital of a society. Alesina and La Ferrara (2002) point out that social capital and trust
lead to better functioning of public institutions and help in case of market imperfections. Conse-
quently, trust should be a crucial aspect in explaining fiscal policy decisions. Moreover, it is rea-
sonable to assume that deep-seated social capital fosters fiscal discipline.
The paper concentrates on the relationship between public debts and trust in the govern-
ment using the full sample of Swiss state governments over the 1981-2001 period. We measure
trust as the ratio of concurrence between Swiss state (cantonal) government’s recommendation
for an issue put to a vote and the actual outcome at the ballot, but also taking into consideration
the number of ballots per year to measure the level of citizens’ chance to express their prefer-
ences. Ballots help to increase governmental accountability, so that the government is forced to
be responsive to citizens’ preferences and the underlying “social contract” at large, which leads
to a higher level of fiscal discipline. Our hypothesis states that more trust in government, meas-
ured as the electoral support of government decisions is a signal for a stronger social cohesion
between the government and the electorate and within the electorate, which in turn results in
sounder fiscal policy decisions. The results indicate that we find a fairly robust negative relation-
ship between trust in the government and public debt. Thus, we conclude that fiscal policy is
4
strongly influenced by individuals’ trust in the government. A higher level of citizens’ trust in
the state leads to a stronger fiscal discipline.
To our knowledge, our paper provides some novelties compared to previous studies:
First, empirical studies in the social capital literature often work with cross-country data. How-
ever, it is very difficult to draw conclusions from cross-cultural comparisons. Institutional and
Cultural frameworks typical for specific countries might influence trust. The problem is that such
features cannot always be controlled in a satisfactory manner. Our study on the other hand, fo-
cuses on within country data at the state (cantonal) level and thus allows to better isolate the im-
pact of trust. Second, social capital is usually measured by survey data asking individuals ques-
tions about trust (social trust, agreement to the statement whether most people can be trusted)
and the level of participation in voluntary organizations. Rose-Ackerman points out that meas-
ures of generalized trust “are very difficult to interpret and to translate into concrete proposal”
(p. 3). Glaeser et al. (2000) criticize that these survey questions are interesting but “also vague,
abstract, and hard to interpret” (p. 812). Furthermore, it cannot be assumed that attitudinal ques-
tions predict observable behavior. Even Putnam (1995) is aware of it stressing that it would be
desirable to have behavioural indicators of social capital. Thus, in this paper we search for a so-
cial capital proxy that measures individuals’ observable behavior rather than their attitudes or
statements. Our behavioral trust variable that measures the behavior at the ballot reduces possi-
ble subjective biases derived from survey questionnaires. Third, a huge amount of studies work
with cross-sectional data. Our panel analysis, covering a long period of more than 20 years, al-
lows exploiting time variation in trust, too.
The remainder of the paper is as follows: First, we provide a quick overview of the litera-
ture on social capital and trust. Then, we develop a concept of trust revealed in a real world set-
ting and present some evidence of the level of trust among Swiss cantons over the last twenty

5
years. In section five follows the empirical implementation of the impact of trust on fiscal per-
formance while section six offers some concluding remarks.
2. Overview: Social Capital and Trust
Social capital has been studies at length by many different disciplines. It has advanced to
an important concept in social sciences, enforcing the interdisciplinary social discourse among
researchers. The rapid growth of the social capital literature underlines a widespread unease with
the standard explanations for the differential political and economic performances not only
across nations but also across sub-national jurisdictions (Ostrom and Ahn 2003). Many studies in
the last ten years tried to check to which extent social capital can be seen as an important omitted
factor in previous studies.
The political scientists Almond and Verba (1963) have been among the first who inten-
sively investigated the concept of social capital. Many years later, there has been a renewed in-
terest in the social basis of political and economic life thanks to the work by researchers such as
Putnam (1993) and Fukuyama (1995). Social capital advanced to an important research agenda
in political sciences. Putnam (1993) claims the importance of social capital for the effective gov-
ernance of democracy. He defines social capital as “features of social organization, such as trust,
norms, and networks that can improve the efficiency of society by facilitating coordinated ac-
tions” (p. 167). Many authors have singled out social capital as an important feature of produc-
tive social relationships (see, e.g., Gambetta 1988, Hardin 1993). Sociologists have also inten-
sively investigated the concept of social capital. Key figures at the beginning were Bourdieu
(1979) and Coleman (1988, 1990). They both have strongly influenced the social capital litera-
ture focusing on individuals and small societal units. Portes and Mooney (2002) point out that
the most widely accepted definition of the term social capital in sociology is the “the ability to
secure resources by virtue of membership in social networks or larger social structures” (p. 305).
6
Also economists increasingly pay attention to the concept of social capital and trust. Many stud-
ies have been published in leading economic journals (see, e.g., Knack and Keefer 1997, Zak and
Knack 2001, Glaeser et al. 2000, Alesina and La Ferrara 2002). For example, Knack and Keefer
(1997) tested the impact of civic duty and trust on growth and investment rates in a cross section
analysis. They find a strong and significant positive relationship between social capital variables
and economic growth. Looking at the public finance literature, Slemrod (1998) argues that the
social capital derived from the willingness to pay taxes voluntarily lowers the cost of the operat-
ing government and of equitably assigning its cost to citizens. Social capital has also attracted
non-academic institutions such as the World Bank, which developed a Social Capital Initiative
focusing mainly on developing countries and investigating the practical relevance of this con-
cept. Grootaert (2001, pp. 10-11) stresses that there are three major views on social capital: First,
the concept developed by Putnam (1993) interpreting social capital as a social network, as net-
works of civic engagement facilitating coordination and cooperation. Second, Coleman’s (1988,
p. 598) approach defines social capital as “a variety of different entities”, consisting of some
aspects of social structure and facilitating certain actions of actors. This allows taking into ac-
count not only horizontal but also vertical social relationships. The third concept considers the
social and political environment that enforces norms and shapes social structures.
According to Paldam (2000, p. 630), there are three families of social capital concepts:
trust, cooperation and network. He points out that “most people build trust in and networks to
others and come to cooperate with them” (p. 629). Trust and cooperation are closely related. He
defines social capital as the ability of a person to work voluntarily together with others, for a
common purpose in groups and organizations (p. 635). But what exactly is trust? There are dif-
ferent conceptualizations of trust. Uslaner (2002) differentiates between moralistic trust and stra-
tegic trust. Strategic trust reflects “expectations about how other people will behave” (p. 23). On
the other hand, “moralistic trust is a statement about how people should behave. People ought to

7
trust each other” (p. 23). Thus, moralistic trust works also in the absence of reciprocity. In a fur-
ther step, Uslaner (2002) points out that the distinction between strategic and moralistic trust is a
“continuum from particularized to generalized trust” (p. 26)1. Generalized trust is the belief that
most people can be trusted and thus does not dependent upon specific individual or group char-
acteristics. On the other hand, particularized trust is the belief that only a specific individuals or
groups can be trusted2. While particularized trust relies strongly upon experiences (strategic
trust), moralistic trust is the foundation of generalized trust. Uslaner points out that the “central
idea distinguishing generalized from particularized trust is how inclusive your moral community
is” (pp. 26-27).
If trust is a multidimensional concept, not only the analytical distinction between particu-
larized and generalized trust is relevant, but also the empirical one. To measure generalized trust,
many researchers have relied upon the following survey question derived by Rosenberg (1956)
many years ago: “Generally speaking, do you believe most people can be trusted or can’t you be
too careful in dealing with people?”. It indicates that not only well-know people are trusted but
also strangers. Particularized trust can be measured using group categories to classify people in
their own network, for example, asking survey questions regarding respondents’ trust in their
neighbors, friends, co-workers or family and club members. Contrary to previous studies we try
to find with field data a proxy that measures individuals’ observable behavior rather than meas-
uring trust with survey data. Observing the behavior at the ballots reduces possible subjective
biases derived from survey questionnaires. Glaeser et al. (2000) combined experiments and sur-
1 See also Granovetter (1973) who also differentiates between generalised trust and specific trust. 2 Other researchers use similar concepts, for example, thin and thick trust, bonding and bridging social capital, per-sonal and social trust (see, e.g., Williams 1988, Putnam 1993, 2000, Rahn and Transue 1998).

8
veys together and find that standard attitudinal questions do not predict subject choices in their
experiments3.
Our investigation in this paper grounds basically on the third concept, which takes the
more formalized institutional relationship between state and citizens at the vertical level into
account. As trust is a multidimensional concept, we restrict our focus on a specific dimension:
citizens’ political trust. This is in line with Rothstein (2003), who argues that the explanation of
social capital is much more grounded in political instead of sociological variables.
3. Trust in Politics
There are three ways in which trust affects government performance according to Knack (1999).
First, trust broadens government accountability. Policy decisions have to be responsive to the
preferences of a large part of the population. Knack (1999), for example, provides empirical evi-
dence, that US states with a higher social capital significantly perform better than the other
states. Second, trust can facilitate an agreement, where political preferences are polarized. Third,
social cohesion in a society is a breeding ground for innovations in politics. In general, the space
for innovations is greater if trust between members of a society is established. If new challenges
have to be tackled, governments with high social capital are more flexible in adapting to the new
circumstances than regions with widespread interests. Little political polarization in regions with
a strong social cohesion makes it easier for the government to implement policies preferred by
the electorate. Moreover, little social fragmentation in the society reduces the asymmetry be-
tween spending claims of different interest groups and taxing decisions. Therefore, a more ho-
mogenous citizenry supports fiscal discipline.
3 However, questions about trusting attitudes seem to predict trustworthiness. The authors conclude that “to deter-mine whether someone is trusting, ask him about specific instances of past trusting behaviors. To determine whether someone is trustworthy, ask him if he trusts others” (p. 840).

9
Government accountability can be seen as the most important aspect of trust with respect
to fiscal performance. Engagement, involvement and participation in political and public issues
by a large part of the electorate are an important feature to hold politicians and bureaucrats ac-
countable. In Putnam (2000, p. 346) words: “Citizens in civic communities expect better gov-
ernment, and (in part through their own efforts) they get it … if decision makers expect citizens
to hold them politically accountable, they are more inclined to temper their worst impulses rather
than face public protests”. Political participation in ballots allows citizens to discuss the topics
and helps to improve political awareness. Thus, the government knows that citizens are discuss-
ing and monitoring their behaviour, which will produce the incentive to govern more effectively.
It also offers citizens the possibility to articulate themselves and thus to visualize their prefer-
ences which contributes to a more effective governance, too. As the government is better aware
of citizens’ preferences, policies will better reflect citizens’ needs (see Boix and Posner 1998).
Game theory and experimental findings have shown that trust facilitates the co-operation
between the actors and allows reaching superior social outcomes. However, Boix and Posner
(1998) criticize that such an investigation “leaves us without an explicit articulation of the
mechanism by which the ability of people in society to co-operate affects the performance of the
governmental institutions (p. 689)”. Our study takes this into account by trying to investigate the
interaction between citizens and their state. Trust in politics measures the level of confidence
citizens have in their political leaders or institutions. In these cases trust is close to “approval”
and “validation” revealing a widespread belief that the government is carrying-out those actions
that are in the interest of the citizenry (Slemrod 2003). To capture such an interpretation of trust,
contrary to previous studies, we measure trust as the ratio of concurrence between Swiss state
(cantonal) government’s recommendation for an issue put to a vote and the actual outcome at the
ballot, but also taking into consideration the number of ballots per year to measure the level of
citizens’ chance to express their preferences. Thus, we have a trust proxy that measures indi-
10
viduals’ observable behavior interacting with the government, rather than measuring trust with
survey data.
If the citizens and the authorities interact in a sense of collective responsibility influenced
by the institutional structures, then the system may be better governed and its policies may be
more effective. Trust promotes effectiveness through its impact on governments’ behavior. In
our paper we focus on public debt as dependent variable. It is reasonable to argue that a prudent
debt management and thus a certain level of fiscal discipline can be seen as a proxy for govern-
mental performance. Ballots help to increase governmental accountability, so that the govern-
ment is forced to be responsive to citizens’ preferences and the underlying “social contract” at
large, favoring a higher level of fiscal discipline. Trust in government is a signal for a stronger
social cohesion between the government and the electorate and within the electorate, which in
turn results in sounder fiscal policy decisions. Thus, the following hypothesis can be derived:
Hypothesis: The stronger trust is established in a jurisdiction the better its fiscal performance.
4. Measuring Trust in the Swiss Cantons
The political process in Swiss cantons offers a fruitful database to measure trust. In our case, we
use information from direct voter participation on political issues by voter initiatives and public
referenda as an approximation for mutual trust among citizens and between citizens and their
representatives. Several aspects of trust are of importance in the process of direct voter participa-
tion in Switzerland. To launch a voter initiative or to veto government decisions by a popular
referendum represent possibilities to reveal distrust in the government. Even if we assume that
the government is benevolent, such instruments can be useful in case the governments fall out of
step and make mistakes in interpreting voters’ preferences (Matsusaka, 2004). This may happen

11
as a result of strong political polarization on a specific issue or high information costs. Contrar-
ily, if social cohesion in the electorate is strong, it is easier for the government to implement
policies according to the preferences of the electorate. They make fewer mistakes in interpreting
the voters’ preferences. Hence, if social cohesion is strong, fewer decisions by the government
will be vetoed and fewer voter initiatives will be successfully launched. As a consequence, sup-
port of government decisions by the electorate is a useful indication of trust and social capital
among members of a society.
Assuming now that the government is not benevolent in any case, direct voter participa-
tion in this case is a possibility to control the discretionary power of politicians. Voter control
can help to limit the abuse of political power by selfish politicians. As citizens cannot completely
foresee the preferences of their incumbents, elements of direct democracy empowers them with
an instrument to control their government. This also has an ex ante effect on policy formulation
by the elected incumbents since they always have to take into account a possible voter interven-
tion. If politicians should try to abuse their policy discretion, voters will increasingly reject the
governments’ proposals. Thus, the support of government decisions by direct voter participation
is also a measure of trust in government. If government proposals acknowledge common inter-
ests, voters will support the trustworthiness of their incumbents at the ballots.
Table 1: Ballots in all 26 Swiss cantons from 1981 to 2001
Number of ballots 3100
Average number of ballots per year 148
Average number of ballots per canton 119
Lowest value (number of ballots) 22 (Jura)
Highest value (number of ballots) 285 (Zurich)*
Ratio of accepted government proposals 75.7 %
Highest value (Ratio of accepted government proposals) 94.3 % (Appenzell a. Rh.)
Lowest value (Ratio of accepted government proposals) 37.7 % (Jura)
* In the town-meeting canton Glarus 294 ballots were held.
12
In order to take both aspects of trust into account – trust among members of a society and trust
between principal and agent – we collected data from all cantonal ballots held between 1981 and
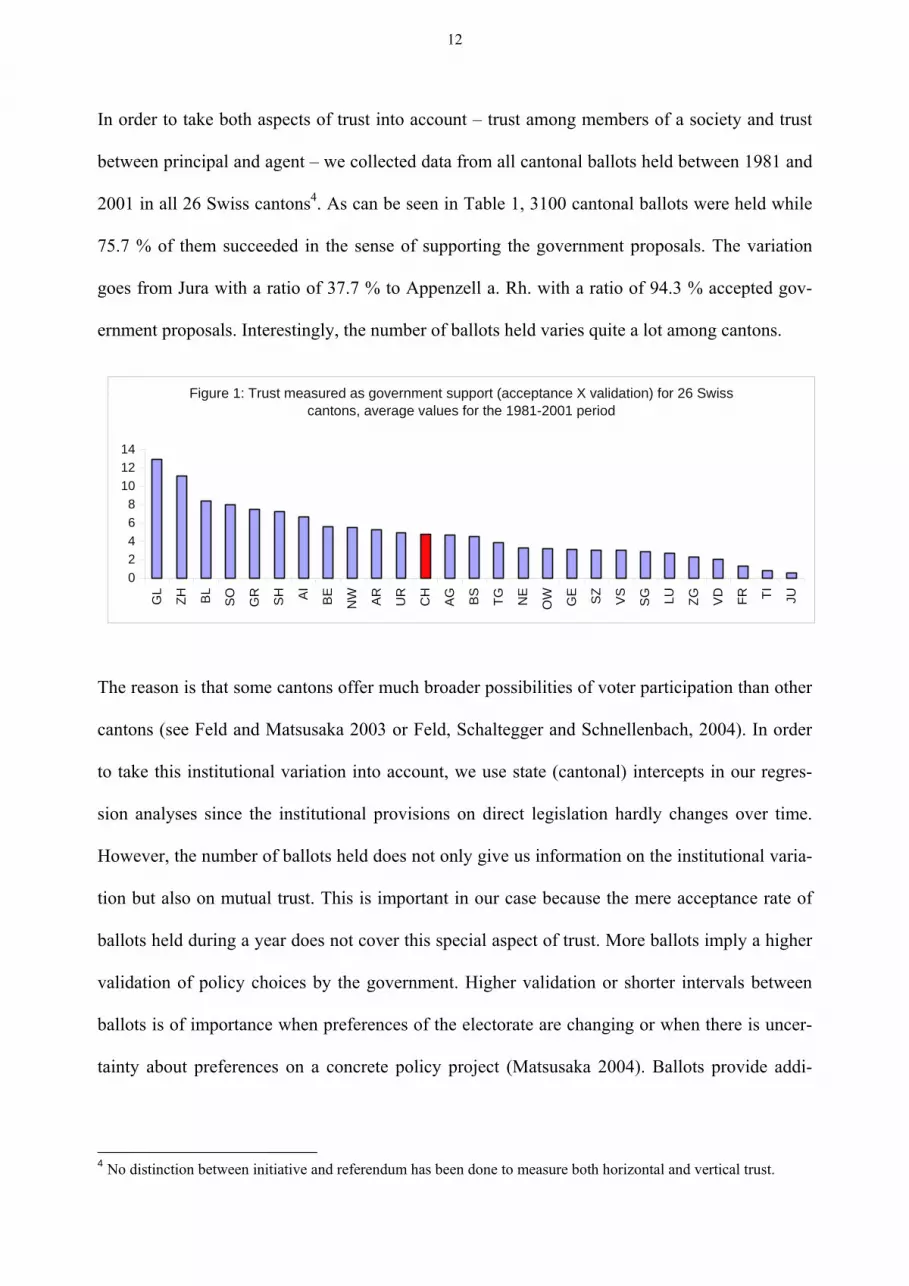
2001 in all 26 Swiss cantons4. As can be seen in Table 1, 3100 cantonal ballots were held while
75.7 % of them succeeded in the sense of supporting the government proposals. The variation
goes from Jura with a ratio of 37.7 % to Appenzell a. Rh. with a ratio of 94.3 % accepted gov-
ernment proposals. Interestingly, the number of ballots held varies quite a lot among cantons.
The reason is that some cantons offer much broader possibilities of voter participation than other
cantons (see Feld and Matsusaka 2003 or Feld, Schaltegger and Schnellenbach, 2004). In order
to take this institutional variation into account, we use state (cantonal) intercepts in our regres-
sion analyses since the institutional provisions on direct legislation hardly changes over time.
However, the number of ballots held does not only give us information on the institutional varia-
tion but also on mutual trust. This is important in our case because the mere acceptance rate of
ballots held during a year does not cover this special aspect of trust. More ballots imply a higher
validation of policy choices by the government. Higher validation or shorter intervals between
ballots is of importance when preferences of the electorate are changing or when there is uncer-
tainty about preferences on a concrete policy project (Matsusaka 2004). Ballots provide addi-
4 No distinction between initiative and referendum has been done to measure both horizontal and vertical trust.
Figure 1: Trust measured as government support (acceptance X validation) for 26 Swiss cantons, average values for the 1981-2001 period
02468
101214
GL
ZH BL
SO
GR
SH AI
BE
NW AR
UR
CH
AG BS
TG NE
OW GE SZ
VS
SG LU ZG VD FR TI JU

13
tional information for the government, which in turn enriches the decision-making process5.
Thus, we construct our trust measure by the ratio of at the ballots accepted government proposals
multiplied with the number of ballots held (acceptance X validation). This particular measure of
trust allows us to incorporate both aspects of trust: Acceptance of government decisions and
validation of government decisions. We include both measures in our trust variable, as they are
not independent of each other. The validation of government decisions fosters acceptance of
government decisions offering individuals the change to express their preferences. Thus, prefer-
ences of the people bearing the costs and benefits of government actions are visible which fosters
citizens’ trust. On the other hand, a higher acceptance of government decisions preserves gov-
ernment’s interests to use ballots as an instrument and thus preserves the validation of govern-
ment decisions6. This makes it useful to include both aspects in one variable in our model.
As Figure 1 shows trust varies considerably among cantons over the 1981-2001 period.
The lowest value accounts for 0.57 represented by canton Jura while the highest value with 13
belongs to the canton Glarus. Similarly, there is a variation of trust over time as can be seen in
Figure 2. With 3.615 the lowest value of trust is observed in 2001 while in 1988 trust was high-
est with a value of 5.75. Such a strong variation among cantons as well as over time allows ex-
ploiting within-country variation to identify effects of trust on governments’ fiscal performances.
It is also important to note, that the correlation between real GDP-growth and trust is only
0.0323, indicating that our measure is not just reflecting subjective well-being or perhaps even
government’s general popularity, which has been found in many empirical studies to be influ-
enced by economic development7. In general, a multivariate analysis conducted in the next sec-
tion will allow isolating the impact of trust on public debt.
5 In general, previous studies have shown that repeated interactions or a higher level of familiarity facilitate trust (see, e.g., Glaeser et al. 2000, Alesina and La Ferrara (2002). 6 This arguments is supported looking at the level of correlation between the variables. Furthermore, it should be noticed that using it as one variable leads to slightly better predictions. 7 For an overview see e.g., Pickup (2004).

14
5. Empirical investigation
In order to test whether trust fosters fiscal discipline, we propose the following baseline equa-
tion:
DEBTit = α + β CTRLit +ζ TRUSTit + TDt + CDi + εit (1)
where i indexes the 26 cantons in the sample, DEBTit denotes the cantonal debt-levels per capita
and per GDP over the 1981-2001 period and TRUSTit is our indicator for trust described in the
previous section. The regression contains also several control variables CTRLit like GDP per cap-
ita, share of urban population, share of workforce, share of population with higher schooling,
share of unemployed, share of pensioners, share of pupils, population and a variable for the share
of German speaking population in a canton. In order to control for time as well as cantonal in-
Figure 2: Trust measured as government support (acceptance X validation) from 1981 to 2001, average values for the 26 cantons
0
1
2
3
4
5
6
7
1981
1982
1983
1984
1985
1986
1987
1988
1989
1990
1991
1992
1993
1994
1995
1996
1997
1998
1999
2000
2001
-2.0%
-1.0%
0.0%
1.0%
2.0%
3.0%
4.0%
5.0%Trust Real GDP-Growth

15
variant factors we include fixed time TDt and fixed cantonal CDi effects. εit denotes the error
term.
In Table 2 and 3 we present three different kind of empirical methodologies: pooling,
random effect and fixed effect regressions using cantonal debt-levels per capita (Table 2) and
debt levels per GDP (Table 3) as dependent variables. In the pooled estimations we present the
beta or standardized regression coefficients to compare the magnitude and thus to see the rela-
tive importance of the used variables. To get robust standard errors in the pooled estimations, we
also used the Huber/White/Sandwich estimators of standard errors. To check which one is most
suitable, we perform the Langrangian Multiplier (LM) test (see Breusch and Pagan 1980) to test
the random effect versus the pooling model and the Hausman specification test (see Hausman
1978) to compare the fixed effect versus the random effect model. The LM test indicates that the
null hypothesis is rejected at the 1% significance level for both dependent variables. This sug-
gests that pooling regression is less suitable than random effect regression. The Hausman test
shows that the null hypothesis is rejected at the 5% significance level in Table 2 and rejected at
the 1% significance level in Table 3. This suggests that it is more appropriate to use fixed effect
models. Thus, for all the following extensions we present fixed effect regressions.
As can be seen by the multivariate analysis trust has a statistically significant negative
impact on fiscal discipline (public debt) in all the regressions presented in Table 2 and 3, control-
ling for other determinants. Thus, our hypothesis finds strong empirical support looking at Swiss
cantons over the periods 1981-2001. However, it can be criticized that institutional differences
reflect long-standing differences in voters’ trust towards the government. To check whether this
argument holds, Appendix D presents estimations controlling for democratic participation rights.
The used direct democracy index reflects the extent of direct democratic participation (1= lowest

16
and 6 highest degree of participation) at the cantonal level.8 As can be seen in most of the cases,
the variable TRUST remains statistically significant after controlling for democratic participation
rights. A higher level of direct democratic participation rights has also a significantly negative
effect on public debts. Appendix D indicates a relatively strong quantitative effect. In general, it
should be noticed that there is a relatively high correlation between trust and the index of direct
democracy (r=0.42***, significant at the 0.01 level), which may explain the lower effect of the
TRUST variable. Our TRUST variable also takes into account the number of ballots held and
thus controls for institutional variation. Furthermore, trust and direct democratic participation
rights are not independent of each others. A higher level of direct democracy may foster trust as
it imposes credible constraints on politicians and public officials. Trust is then a rational re-
sponse to it (see Rose-Ackerman 2001). Sztompka (1999) points out that “the more there is insti-
tutionalized distrust, the more there will be spontaneous trust” (p. 140). Not surprising, in most
of the cases the real GDP per capita reduces public debts significantly and sizeable, too. On the
other hand, the share of urban population pushes up debt levels. This points to a higher govern-
mental willingness to increase public debts in urban areas, which may be caused by specific
problems of central cities like social heterogeneity. The provision and maintenance of central
city infrastructure such as higher education, traffic, public health, public security or cultural fa-
cilities require high government revenue for the central city. At the same time, the tax bases in
central cities are sensitive to high tax burdens. People react to tax incentives and move from the
center to nearby local communities where the tax burden is lower. The asymmetry of spending
claims and revenue capacity is often seen as a major driving force for problems of fiscal disci-
pline in urban jurisdictions (Frey 1990, Brueckner 1983). Socio-demographical factors such as
8 The index includes the four legal instruments: the popular initiative to change the canton’s constitution, the popular initiative to change the canton’s law, the compulsory and the optional referendum to prevent new law or changing of a law and the compulsory and the optional referendum to prevent new state expenditure. The index is based on the degree of restrictions in form of the necessary signatures to use an instrument, the time span to collect the signatures and the level of new expenditure which allows to use the financial referendum (for a detailed discussion see Stutzer 1999).

17
the share of elderly and the share of pupils expectably push up debt-levels, too. These two
groups only perceive a small fraction of the initiated costs eventually creating pressure for higher
government spending. In addition, especially pensioners have an incentive to finance public ser-
vices by deficit spending in order to postpone the costs to future generations (Meltzer and Rich-
ard 1981). The language variable is significantly negative indicating that the German speaking
population cares more about fiscal discipline than their French and Italian speaking counterparts.
The result is very much in line to the results in federal ballots and the behaviour of members of
parliament from the roman part of Switzerland. The other control variables have not a robust and
significant impact on public debt. In particular, there seems not to be a significant positive im-
pact of better educated citizens on fiscal discipline. Obviously, better educated voters do not de-
mand a more fiscally prudent government, which is somewhat surprising. One could have
thought of a “supply side” effect since better educated citizens provide a larger tax base which in
turn may make it easier to offer higher salaries to the public servants and also provide a larger
pool of talents from which the government can recruit (Knack 1999).
In addition, we have included a variable capturing the degree of centralization of canton
governments in Switzerland to check the sensitivity of our results. As shown by Shadbegian
(1999) and other researchers for US states and by Feld, Kirchgässner and Schaltegger (2003) and
Schaltegger (2003) for Swiss cantons government centralization favors the size of government.
De Mello (2004) shows that fiscal decentralization also strengthens social capital in a cross-
country study. Thus, it is not surprising that in our analysis government centralization is of high
explanatory power for the level of government indebtedness, too. Note that also after including
government centralization, trust remains an important and significant feature in explaining fiscal
performance of governments.
Next, proprietors of houses have made a commitment to their jurisdiction by voluntarily
increasing their opportunity costs for the exit option to migrate to another jurisdiction. This can

18
be seen as an alternative measure of trust in government9. However, the inclusion of the share of
housing proprietors as a further regressor in the equation does not significantly increase the ex-
planatory power of our public debts regressions.
Notes: t-statistics in parentheses. *,** and *** denote significance at the 10%, 5% and 1% level. RE: random effect, FE: fixed effect. OLS estimations: robust standard errors and beta coefficients. Lagrangian Multiplier test (LM test): test the random effect model versus the pooling regression. Hausman specification test: test the fixed-effect mode versus the random effect model. For definitions of variables see Appendix.
9 Note that the simple correlation of the variables “trust” and “share of housing proprietors” in our data sample is rather weak with a value of 0.017.
Table 2: Regression Results on the Impact of Trust on Public Debt, 26 Swiss Cantons, 1981-2001. Dependent Variable: Debt per Capita
Explanatory Variables OLS OLS RE FE FE FE
-0.090*** -0.075*** -0.004*** -0.004*** -0.004** -0.004** Trust (-3.71) (-2.96) (-2.76) (-2.72) (-2.58) (-2.57)
1.184*** 1.179*** Government centralization (6.22) (6.19)
-0.492 Share of registered house proprietors (-0.91)
-0.055 -0.379*** 0.117 -0.806*** -1.141*** -1.089*** GDP (-0.57) (-2.81) (0.57) (-2.90) (-4.17) (-3.90)
0.005 0.079 0.329 0.564 0.557 0.643* Labor Force (0.16) (1.57) (0.90) (1.53) (1.57) (1.75)
0.347*** 0.058 0.857*** 0.227 0.160 0.186 Higher Schooling (4.77) (0.64) (2.96) (0.74) (0.54) (0.63)
0.067** 0.033 0.021*** 0.004 0.002 0.003 Unemployment Rate (2.09) (0.45) (2.74) (0.50) (0.21) (0.42)
0.362* 0.613*** 0.583*** 0.564** 0.734*** 0.716*** Urban (1.90) (3.02) (4.33) (2.51) (3.37) (3.27)
0.593 -3.279** -0.025 -1.553*** -1.986*** -2.049*** Population (0.72) (-2.56) (-0.33) (-3.25) (-4.26) (-4.34)
0.318*** 0.210** 2.507*** 2.332*** 2.681*** 2.904*** Population > 65 (4.53) (2.30) (3.05) (2.53) (3.01) (3.15)
0.636*** 0.608*** 5.626*** 5.787*** 6.655*** 6.930*** Population < 15 (6.39) (4.56) (6.76) (6.47) (7.63) (7.50)
-1.549*** -2.860*** -0.132 -1.856*** -1.792*** -1.732*** German Language (-3.18) (-4.29) (-1.39) (-4.08) (-4.09) (-3.91)
State (Canton) Effects Yes Yes No Yes Yes Yes Year Effects No Yes Yes Yes Yes Yes LM test 0.000 Hausman test 0.021 R-Squared 0.815 0.831 0.399 0.822 0.835 0.835 # of Observations 546 546 546 546 546 546

19
Notes: t-statistics in parentheses. *,** and *** denote significance at the 10%, 5% and 1% level. RE: random effect, FE: fixed effect. OLS estimations: robust standard errors and beta coefficients. Lagrangian Multiplier test (LM test): test the random effect model versus the pooling regression. Hausman specification test: test the fixed-effect mode versus the random effect model. For definitions of variables see Appendix.
Other institutional variations in Swiss cantons that do hardly vary over time are not in-
cluded in our regressions since state (canton) dummy variables have been included. The canton
dummies would render these institutional feature variables insignificant, anyway.
Table 4 differs from the previous tables in using instruments for our trust variable. Evalu-
ating the direct effect of trust on fiscal performance in a setting where unobserved voter prefer-
Table 3: Regression Results on the Impact of Trust on Public Debt, 26 Swiss Cantons, 1981-2001. Dependent Variable: Debt per GDP
Explanatory Variables OLS OLS RE FE FE FE
-0.093*** -0.066** -0.001** -0.001** -0.001** -0.001* Trust (-3.52) (-2.44) (-2.14) (-2.14) (-1.97) (-1.96)
0.354*** 0.351*** Government centralization (6.45) (6.41)
-0.227 Share of registered house proprietors (-1.46)
-0.512*** -0.876*** -0.254*** -0.481*** -0.581*** -0.557*** GDP (-4.84) (-6.24) (-4.17) (-5.99) (-7.38) (-6.93)
-0.003 0.016 0.005 0.030 0.028 0.067 Labor Force (-0.09) (0.29) (0.05) (0.28) (0.27) (0.64)
0.419*** 0.075 0.304*** 0.075 0.055 0.067 Higher Schooling (5.19) (0.77) (3.58) (0.86) (0.65) (0.79)
0.048 0.073 0.009*** 0.002 0.002 0.002 Unemployment Rate (1.22) (0.91) (4.11) (1.00) (0.71) (1.04)
0.511** 0.868*** 0.212*** 0.206*** 0.257*** 0.249*** Urban (2.18) (3.58) (5.38) (3.18) (4.09) (3.95)
2.781*** -1.822 -0.005 -0.223 -0.352*** -0.381*** Population (3.83) (-1.24) (-0.23) (-1.61) (-2.62) (-2.81)
0.465*** 0.314*** 0.778*** 0.899*** 1.003*** 1.106*** Population > 65 (5.40) (3.10) (3.23) (3.38) (3.92) (4.17)
0.967*** 0.895*** 2.048*** 2.201*** 2.460*** 2.587*** Population < 15 (7.90) (5.53) (8.39) (8.53) (9.79) (9.75)
-3.474*** -4.888*** -0.048* -0.819*** -0.800*** -0.772*** German Language (-6.00) (-6.73) (-1.71) (-6.24) (-6.34) (-6.06)
State (Canton) Effects Yes Yes No Yes Yes Yes Year Effects No Yes Yes Yes Yes Yes LM test(Prob>chi2) 0.000 Hausman test(Prob>chi2) 0.000 R-Squared 0.765 0.789 0.270 0.766 0.784 0.785 # of Observations 546 546 546 546 546 546
20
ences might affect both trust and fiscal performance requires an instrumental variable technique
to separate the impact of trust from the underlying voter preferences. A suitable instrument must
be contemporaneously uncorrelated with the error term but must be highly correlated with trust.
In our case, we use the number of votes as an instrument. Conceivably, in cantons in which vot-
ers have frequent possibilities to reveal their trust, trust will be more likely. Now, to test for pos-
sible endogeneity of trust a Hausman test is carried out in two steps. First, we regress the number
of votes on trust including all other regressors from equation (1). The number of votes is highly
significant in explaining trust, as expected. Second, we take the obtained residuals from that re-
gression and include them in the original regression of equation (1). Since the coefficients of the
included residuals are not significant (t-value of –0.187), trust can be considered as an exoge-
nous variable. Thus, unsurprisingly the coefficients of the trust variable in the two-stage least
square estimations in Table 4 do hardly change from those obtained in the ordinary least square
regressions. This suggests that there is not much of a reverse causation from government debt to
trust. We cannot observe that in the 2SLS regressions the coefficients for our trust variable are
smaller than the ones estimated using OLS, what other would indicate that reverse causation may
bias the OLS coefficient for trust upward (see Knack 1999). In addition, reversed causality is
unlikely in our case from a theoretical point of view: at the time when voters go to the polls, data
on public debts of the current year are unknown and will usually be published not before the fol-
lowing year.10
As can be seen in Appendix C two cantons are considered as outliers. The cantons Basel-
Stadt (BS) as well as Geneva (GE) have a relatively and extraordinary high level of indebted-
ness. In the following, in order to check the robustness of the results, we take these two cantons
out from our sample (excluding outliers). In Table 4, columns two and four present the results.
10 According to a yearly conducted survey on behalf of the Swiss Federal Department of Finance, the electorate is relatively well informed on public finances. In 2004 for example, 35 % of all the 1516 interview participants have estimated the accumulated level of debt for the federal level correctly (the interviews have been conducted by Demoscope, a professional institute on market research in Switzerland).

21
The coefficients of the trust variable remain significant even after excluding outliers indicating
that our basic hypothesis is supported.
Table 4: Sensitivity regressions on the Impact of Trust on Public Debt, 26 Swiss Cantons, 1981-2001. Dependent Variable: Debt per capita / debt per GDP
Explanatory Variables Debt p.c.♠ Debt p.c.♣ Debt p.c.♥ Debt p.GDP♠ Debt p.GDP♣ Debt p.GDP♥-0.004*** -0.004*** -0.004** -0.001* -0.001*** -0.001* Trust
(-2.64) (-2.65) (-2.54) (-1.827) (-2.657) (-1.93) 1.142*** 0.341*** Government
centralization (6.08) (6.32) -0.447 -0.1978* Share of Protestants (-1.11) (-1.71)
1.100*** 0.288** Share of Catholics (2.66) (2.43)
-0.807*** -1.013*** -1.263*** -0.482*** -0.491*** -0.619*** GDP (-2.82) (-3.13) (-4.66) (-6.267) (-5.842) (-7.96)
0.562 0.221 0.301 0.028 -0.011 -0.033 Labor Force (1.56) (0.498) (0.81) (0.274) (-0.097) (-0.31)
0.226 -0.097 0.139 0.074 -0.004 0.052 Higher Schooling (0.64) (-0.246) (0.48) (0.758) (-0.036) (0.62)
0.004 0.008 -0.003 0.002 0.002 0.0002 Unemployment Rate (0.45) (0.876) (-0.34) (0.913) (0.608) (0.08)
0.565*** 0.967*** 0.922*** 0.207*** 0.276*** 0.312*** Urban (3.03) (4.293) (4.19) (3.604) (4.457) (4.95)
-1.556** -2.678*** -1.104** -0.225 -0.545*** -0.073 Population (-2.57) (-3.954) (-2.17) (-1.251) (-2.856) (-0.50)
2.332** 3.050*** 3.061*** 0.899*** 0.893*** 1.084*** Population > 65 (2.30) (2.850) (3.36) (3.103) (2.962) (4.14)
5.786*** 7.265*** 5.230*** 2.199*** 2.289*** 1.931*** Population < 15 (4.56) (5.543) (4.77) (5.520) (5.723) (6.13)
-1.858*** -2.258*** -2.224*** -0.820*** -0.804*** -0.929*** German Language (-4.30) (-4.784) (-5.00) (-6.741) (-6.258) (-7.27)
State (Canton) Effects Yes Yes Yes Yes Yes Yes Year Effects Yes Yes Yes Yes Yes Yes R-Squared 0.831 0.659 0.840 0.789 0.680 0.792 # of Observations 546 504 546 546 504 546 Notes: t-statistics in parentheses. *,** and *** denote significance at the 10%, 5% and 1% level. For definitions of variables see Appendix. ♠ denotes the two stage least square regressions. Instrument for trust is the number of votes. ♣ denotes regression after excluding the values of the canton Basel-Stadt (BS) and the canton Geneva (GE), which are considered as outliers (see Appendix C). ♥ There is a high simple correlation between the two regressors share of Protestants and share of Catholics (-0.921). However, eliminating either the former or the latter variable from the regression hardly changes the estimated coeffi-cients as well as their significance level.
22
In the next step, we control for the religious composition of the cantons. Putnam (2000) recog-
nizes the religion denomination as an important factor in building social capital. Knack (1999)
finds a high correlation between trust and the mainline Protestants in the US states. Hence, reli-
gious composition may serve as a good instrument for trust. In fact, La Porta et al. (1997) and
Knack (1999) both use religious composition to instrument for interpersonal trust. However, in
our case there is only a weak simple correlation between trust and the share of Protestants
(0.394) or share of Catholics (0.348). A further sensitivity analysis has been performed in order
to evaluate whether these two variables affect the size or the significance of our trust variable.
Columns three and six show that trust still has a statistically significant negative impact
on the level of indebtedness after including the two most important religious groups in Switzer-
land. Interestingly, religion denomination has an impact on fiscal performance. While we obtain
a negative impact of Protestantism on cantonal indebtedness, the share of catholic population on
total cantonal population is positively associated with the level of debt. The negative impact of
the share of Protestants can be explained using the concept of Protestant ethic, that emphasizes
specific values such as the virtues of prudent reinvestment of savings, individual entrepreneurial
initiatives, and independence (see Weber 1930, Norris and Inglehart 2004). Such moral values at
the individual level seemed to have an impact on states’ fiscal discipline, especially in societies
based on active political participation rights.
All in all, the significant impact of the trust variable remains unaffected whether we con-
trol only for one or for two religious groups, whether we additionally include government cen-
tralization or not and whether we additionally control for the share of registered house proprie-
tors or not.

23
6. Conclusion
This panel analysis within Switzerland provides evidence for the hypothesis that trust in a soci-
ety influences fiscal performance. The stronger mutual trust is established, the sounder fiscal
policy decisions and hence the lower public debts. The results are robust to a number of control
variables and the inclusion of additional variables such as government centralization or direct
democratic participation rights in Swiss states (cantons). In our case, we use information from
direct voter participation on political issues (voter initiatives and public referenda) held in Swiss
state governments to measure mutual trust among citizens and between citizens and their repre-
sentatives. In order to take both aspects of trust into account – trust among members of a society
and trust between the incumbent and the constituency – we collected data from all cantonal bal-
lots held between 1981 and 2001 in all 26 Swiss cantons. In total, we analyzed data from 3,100
cantonal ballots that were held in our period of observation. While 75.7 % of the ballots suc-
ceeded in the sense of supporting the government proposals, 24.3% failed to support the gov-
ernment. However, since there is a considerable variation in the extent to which Swiss cantons
offer possibilities of direct voter participation, the ratio of accepted government proposals would
give a biased picture of trust. In order to take the institutional variation into account, we con-
struct our trust measure as the ratio of the ballots that accepted government proposals multiplied
with the number of ballots held (acceptance X validation).
These results are consistent with those reported by Putnam (1993) from Italian regions,
Keefer and Knack (1997), La Porta et al. (1999) or Zak and Knack (2001) from cross-country
regressions or Knack (1999) from US state governments for government performance. The re-
sults presented in this paper as well as in previous studies underline the importance of trust as an
essential aspect for the well functioning of a government and the institutional architecture in
place. However, the understanding of how social capital is built and how government can foster
trust remains a fruitful field for further research.
24
References
Alesina, A. and R. Perotti (1995). The Political Economy of Budget Deficits, IMF Staff Papers 42, 1-31.
Alesina, A. and E. La Ferrara (2002). Who Trusts others?, Journal of Public Economics 85, 207-234.
Almond, G. A. and S. Verba (1963). The Civic Culture: Political Attitudes and Democracy in Five Nations. Prince-
ton: Princeton University Press.
Bohn, H. und R.P. Inman (1996). Balanced-Budget Rules and Public Deficits: Evidence from the U.S. States, Car-
negie-Rochester Conference Series on Public Policy 45, 13-76.
Boix, C. and D. Posner (1998). Social Capital: Explaining Its Origins and Effects on Government Performance,
British Journal of Political Science 28, 686-695.
Bourdieu, P. (1979). Les trois états du capital culturel, Actes de la recherché en sciences socials 30, 3-6.
Bourdieu, P. (1980). Le capital social: Notes provisoires, Actes de la recherché en sciences socials 31, 2-3.
Breusch, T. and A. Pagan (1980). The Lagrange Multiplier Test and Its Applications to Model Specification in
Econometrics, Review of Economic Studies 47, 239-253.
Brueckner, J.K. (1983). Central City Income Redistribution and the Flight to the Suburbs, Regional Science and
Urban Economics 13, 177-193.
Buchanan, J.M. (1980). Procedural and Quantitative Constitutional Constraints on Fiscal Authority, in W.S. Moore,
R.G. Penner (eds.), The Constitution and the Budget, Washington and London, 80-84.
Coleman, J. S. (1988). Social Capital in the Creation of Human Capital, American Journal of Sociology 94, 95-121.
Colemen, J. S. (1990). Foundations of Social Theory. Cambridge, Mass: Belknap Press of Harvard University Press.
De Mello, L.R. (2004). Can Fiscal Decentralization Strengthen Social Capital?, Public Finance Review 32, 4-35.
Feld, L.P, C.A. Schaltegger and J. Schnellenbach (2004). On Government Centralization and Fiscal Referendums: A
Theoretical Model and Evidence from Switzerland, University of Marburg.
Feld, L.P. and J.G. Matsusaka (2003). Budget Referendums and Government Spending: Evidence from Swiss Can-
tons, Journal of Public Economics 87, 2703-2724.
Feld, L.P., G. Kirchgässner and C.A. Schaltegger (2003), Decentralized Taxation and the Size of Government: Evi-
dence from Swiss State and Local Governments, CESifo Working Paper No. 1087.
Frey, R.L. (1990). Städtewachstum – Städtewandel, Eine ökonomische Analyse der schweizerischen Agglomeratio-
nen, Basel und Frankfurt, Helbing und Lichtenhahn.
Fukuyama, F. (1995). Social Capital and the Global Economy, Foreign Affairs 74, 89-103.
Gambetta, D. (1988). Trust, Making and Breaking Cooperative Relations. Oxford: Blackwell.
Glaeser, E., D. Laibson, José A. Scheinkman and C. L. Soutter (2000). Measuring Trust, Quarterly Journal of Eco-
nomics 115, 811-846.

25
Grootaert, C. (2001). Social Capital: The Missing Link?, in: P. Dekker and E. Uslaner (eds.), Social Capital and
Participation in Everyday Life. London: Routledge: 9-29.
Guerra, G.A. and D.J. Zizzo (2003). Economics of Trust in the Information Economy: Issues of Identity, Privacy
and Security, University of Oxford.
Hardin, R. (1993). The Street-Level Epistemology of Trust, Politics and Society 21, 505-531.
Hausman, J. A. (1978). Specification Tests in Econometrics, Econometrica 46, 1251-1271.
Knack, S. (1999). Social Capital and the Quality of Government: Evidence from the U.S. States, World Bank Policy
Research Working Paper Series: 2504
Knack, S. and P. Keefer (1997). Does Social Capital Have an Economic Payoff? A Cross-Country Investigation,
Quarterly Journal of Economics 4, 1251-1288.
La Porta, R.; F. Lopez-de-Silanes, A. Shleifer and R.W. Vishny (1997). Trust in Large Organizations, American
Economic Review 87, 333-338.
La Porta, R., F. Lopez-de-Silanes, A. Shleifer, and R. Vishny (1999). The Quality of Government, Journal of Law,
Economics, and Organization 15, 222-279.
Matsusaka, J.G. (2004). For the Many or the Few: The Initiative, Public Policy, and American Democracy, Univer-
sity of Chicago Press, Chicago.
Meltzer, A.H. and S. Richard (1981). A Rational Theory of the Size of Government, Journal of Political Economy
89, 914-927.
Norris, P. and R. Inglehart (2004). Sacred and Secular: Religion and Politics Worldwide. Cambridge Studies in
Social Theory, Religion and Politics. Cambridge: Cambridge University Press.
Ostrom, E. and T. K. Ahn (eds.) (2003). Foundation of Social Capital. Critical Studies in Economic Institutions.
Cheltenahm, UK: Edward Elgar.
Paldam, M. (2000). Social Capital: One or Many? Definition and Measurement, Journal of Economic Surveys 14,
629-653.
Persson, T. and G. Tabellini (2001). Political Institutions and Policy Outcomes: What are the Stylized Facts?,
mimeo, Stockholm University and London School of Economics.
Persson, T. and G. Tabellini (2003). The Economic Effects of Constitutions: What Do the Data Say?. Cambridge:
MIT Press.
Pickup, M. (2004). Economic Performance and Electoral Accountability: The Economy and Party Popularity in
Canada, 1957-2000, paper presented at the 2004 Annual Meeting of the Canadian Political Science Association,
Winnipeg, Manitoba, June, 2004.
Portes, A. and M. Mooney (2002). Social Capital and Community Development, in: M. F. Guillén, R. Collins, P.
England and M. Meyer (eds.), The New Economic Sociology. Development in an Emerging Field. Russell Sage
Foundation. New York: 303-329.
26
Poterba, J. M. and J. von Hagen (1999). Fiscal Institutions and Fiscal Performance, NBER, University of Chicago
Presss, Chicago.
Poterba, J.M. (1997). Do Budget Rules Work?, in: A.J. Auerbach (ed.), Fiscal Policy: Lessons from Economic Re-
search, MIT Press, Cambridge (Mass.) 1997, 53-86.
Putnam, R. (2000). Bowling Alone: Collapse and Revival of American Community. New York, Simon and Schuster.
Putnam, R. (1995). The Case of the Missing Social Capital, unpublished manuscript.
Putnam, R. D. (1993). Making Democracy Work. Civic Traditions in Modern Italy. Princeton: Princeton University
Press.
Rahn, W. M. and J. E. Transue (1998). Social Trust and Value Change: The Decline of Social Capital in American
Youth, 1976-1995, Political Psychology 19, 545-565.
Rose-Ackerman, S. (2001). Trust, Honesty, and Corruption: Reflection on the State-Building Process, Yale Law
School John M. Olin Center for Studies in Law, Economics, and Public Policy Working Paper Series, No. 255.
Rothstein, B. (2003). Social Capital, Economic Growth and Quality of Government: The Causal Mechanism, New
Political Economy 8, 49-71.
Schaltegger, C.A. (2003). Fiskalischer Föderalismus und Staatstätigkeit, Zeitschrift für Wirtschaftspolitik 52, 84-
110.
Shadbegian, R.J. (1998). Do Tax and Expenditure Limitations Affect Local Government Budgets? Evidence from
Panel Data, Public Finance Review 26, 118-136.
Shadbegian, R.J. (1999). Fiscal Federalism, Collusion, and Government Size: Evidence from the States, Public
Finance Review 27, 262-281.
Slemrod, J. (2003), Trust in Public Finance, in S. Cnossen and H.W. Sinn (eds.), Public Finance and Public Policy
in the New Century. Cambridge, MIT Press: 49-88.
Slemrod, J. (1998). On Voluntary Compliance, Voluntary Taxes, and Social Capital, National Tax Journal 51, 485-
492.
Sztompka, P. (1999). Trust: A Sociological Theory. Cambridge: Cambridge University Press.
Uslaner, E. M. (2002). The Moral Foundation of Trust. Cambridge: Cambridge University Press.
Williams, B. (1988). Formal Structure and Social Reality, in D. Gambetta (ed.), Trust: Making and Breaking Coop-
erative Relations. New York, NY: Basil Blackwell.
Weber, M. (1930). The Protestant Ethic and the Spirit of Capitalism. New York: Charles Sribner’s Sons.
Zak, P.J. and S. Knack (2001). Trust and Growth, Economic Journal 111, 295-321.

27
Appendix A
Data description
Variable name Description Source Trust Electoral support of government proposals
multiplied by number of ballots (support X validation)
Own investigations on the basis of the C2D-Database, Amtsblätter of Obwal-den and Appenzell a. Rh. and protocols of town meetings in Glarus, Appenzell i.Rh and Nidwalden.
Debt p. c.
Cantonal debt per capita deflated to the year 1980 in CHF (logarithmized in the estimations)
Swiss Federal Finance Administration
Debt p. GDP
Nominal cantonal debt per nominal GDP
Swiss Federal Finance Administration
Share of registered house proprietors
Share of registered cantonal house proprie-tors on the cantonal population
Swiss Federal Statistical Office
Share of protestants Share of protestant population on the total cantonal population
Swiss Federal Statistical Office
Share of catholics Share of catholic population on the total cantonal population
Swiss Federal Statistical Office
Government Centralization
Share of cantonal public spending on can-tonal and local spending
Swiss Federal Finance Administration
GDP Real cantonal GDP per capita (logarith-mized in the estimations)
BAK Basel Economics
Labor Force Share of employment on the cantonal population
Swiss Federal Statistical Office
Higher Schooling Share of population with secondary education on the cantonal population
Swiss Federal Statistical Office
Unemployment Rate
Share of unemployment on the cantonal population
Own calculations on the basis of Swiss Federal Statistical Office
Agglomeration Proportion of local communities having more than 10’000 inhabitants.
Swiss Federal Statistical Office
Population Cantonal population (logarithmized in the estimations)
Swiss Federal Statistical Office
Population > 65 Share of cantonal population over the age 65 on total cantonal population
Swiss Federal Statistical Office
Population < 15 Share of cantonal population under the age 15 on total cantonal population
Swiss Federal Statistical Office
German Language Share of German Speaking population Swiss Federal Statistical Office

28
Appendix B
Descriptive statistics Variable Mean Std. Dev. Minimum Maximum
Trust 4.785 4.103 0 25 Debt per capita 3850 2865 795 20453 log (debt per capita) 3.513 0.229 2.900 0.018 Debt per GDP 0.129 0.059 0.019 0.458 Share of registered house proprietors 0.410 0.113 0.125 0.628 Share of protestants 0.310 0.199 0.051 0.783 Share of catholics 0.562 0.231 0.161 0.931 Government Centralization 0.673 0.106 0.510 0.99 GDP 41590 13064 26324 117228 Labor Force 0.480 0.032 0.396 0.564 Higher Schooling 0.137 0.059 0.023 0.334 Unemployment Rate 0.018 0.018 0 0.078 Agglomeration 0.324 0.249 0 0.995 Population 261938 272497 12781 1228628 Population > 65 0.146 0.021 0.103 0.210 Population < 15 0.186 0.024 0.113 0.241 German Language 0.714 0.353 0.050 0.980
Notes: For a detailed description of the variables see Appendix A. All statistics are computed for 546 observations.

29
Appendix C
Indebtedness in Swiss cantons, average values between 1981-2001
0
2000
4000
6000
8000
10000
12000
14000
GE
BS NE
LU VD BL
OW AR
VS
NW GR FR SO UR JU AI
TG BE TI SH
ZH SZ
GL
SG
AG ZG
0%
5%
10%
15%
20%
25%
30%
Debt per capita Debt per GDP

30
Appendix D
Regression Results on the Impact of Trust on Public Debt Controlling for Democratic Participation Rights, 26 Swiss Cantons, 1981-2001.
Dependent Variable Debt p.c. Debt p.c. Debt p.c. Debt p.GDP Debt p.GDP Debt p.GDP Explanatory Variables OLS RE FE OLS RE FE
-0.059** -0.003** -0.003* -0.062** -0.001 -0.001 Trust (-2.35) (-2.01) (-1.79) (-2.28) (-1.61) (-1.34)
Democratic Participation -0.650*** -0.080*** -0.106*** -0.643*** -0.016*** -0.026*** Rights (-6.09) (-3.89) (-4.89) (-4.70) (-2.65) (-4.12)
-0.086 0.019 -0.863*** -0.543*** -0.277*** -0.495*** GDP (-0.94) (0.09) (-3.17) (-5.29) -4.51 -6.25 -0.010 0.222 0.341 -0.019 -0.016 -0.025 Labor Force (-0.34) (0.61) (0.94) (-0.59) (-0.15) (-0.24)
0.340*** 0.980*** 0.332 0.412*** 0.327*** 0.101 Higher Schooling (4.72) (3.41) (1.11) (5.17) (3.85) (1.17)
0.062** 0.023*** 0.004 0.043 0.009*** 0.002 Unemployment Rate (2.01) (3.05) (0.51) (1.14) (4.30) (1.01) 0.217 0.548*** 0.436** 0.367* 0.207*** 0.175*** Urban (1.21) (4.01) (1.97) (1.68) (5.14) (2.72) 0.476 -0.079 -1.431*** 2.664*** -0.016 -0.193 Population (0.60) (-1.00) (-3.05) (2.79) (-0.68) (-1.42)
0.279*** 2.408*** 2.197** 0.426*** 0.765*** 0.866*** Population > 65 (4.09) (2.94) (2.44) (4.99) (3.16) (3.31)
0.586*** 5.513*** 5.654*** 0.917*** 2.032*** 2.168*** Population < 15 (5.90) (6.68) (6.47) (7.38) (8.34) (8.53)
-1.947*** 0.069 -1.986*** -3.868*** -0.009 -0.851*** German Language (-4.16) (0.61) (-4.46) (-6.95) (-0.27) (-6.57)
State (Canton) Effects Yes No Yes Yes No Yes Year Effects No Yes Yes No Yes Yes R-Squared 0.826 0.369 0.830 0.776 0.269 0.774 # of Observations 546 546 546 546 546 546 Notes: t-statistics in parentheses. *,** and *** denote significance at the 10%, 5% and 1% level. OLS estimations: robust standard errors and beta coefficients. RE: random effect, FE: fixed effect.