innovation and labour productivity in the swiss manufacturing sector: an analysis based on firm...
TRANSCRIPT

Konjunkturforschungsstelle Swiss Institute for Business Cycle Research
Arbeitspapiere/ Working Papers Spyros Arvanitis
Innovation and Labour Productivity in the Swiss Manufacturing Sector: An Analysis Based on Firm Panel Data
No. 149, October 2006


Innovation and Labour Productivity in the Swiss Manufacturing Sector: An Analysis Based on Firm Panel Data*
Spyros Arvanitis ETH Zurich, KOF Swiss Institute for Business Cycle Research 8092 Zurich, Switzerland Phone: +41 44 632 51 68 Fax: +41 44 632 13 52 E-mail [email protected]
Key words: innovation, labour productivity, R&D expenditures
JEL Classification: O30
This draft: September 2006
* This study was financially supported by the Swiss Science Foundation (SNF). The author acknowledges gratefully the fruitful comments and suggestions by the participants of the Workshop “Innovation Systems and firm Performance”, Kasteel Oud-Poelgeest, 2340 BC Oegstgeest, Netherlands, 4–6 October 2006.

Abstract
This paper investigates (a) the determinants of innovation performance and (b) the impact of innovation performance on labour productivity of Swiss manufacturing firms in the period 1994-2002. The data used in this study come from the KOF panel database and were collected in 1996, 1999 and 2002 respectively based on a questionnaire quite similar to that used in the Community Innovation Surveys (CIS). The use of a wide spectrum of indicators helps to test the robustness of the specification of the innovation equation as well as the robustness of the impact of innovation on economic performance. We find a clear-cut positive effect of innovation on labour productivity.

1. Introduction
This paper investigates (a) the determinants of innovation performance and (b) the impact of innovation performance on labour productivity of Swiss manufacturing firms in the period 1994-2002. The study is in the spirit of the paper of Crépon, Duguet and Mairesse, which was published 1998 in the Economics of Innovation and New Technology (see Crépon et al. 1998).
Our model of the innovative behaviour of Swiss manufacturing firms builds on the wide consent in economic literature that demand prospects, type and intensity of competition, market structure, factors governing the production of knowledge (appropriability, technological opportunities), resource endowment as well as firm size (as a variable controlling for further unobserved influences) are the main determinants of a firm's innovative activity. Labour productivity depends on physical and human capital as well as on new knowledge and innovation. Economies that develop more and more in the direction of a “knowledge-based economy” are relying increasingly on technological innovation. Hence, it is important to have some insights with respect to the (quantitative) relationship between innovation and economic performance.
The data used in this study come from the KOF panel database and were collected in 1996, 1999 and 2002 respectively based on a questionnaire quite similar to that used in the CIS. Most of the qualitative data refer to a period of three years (1994-1996; 1997-1999; 2000-2002). The database contains, among other things, firm data on several innovation indicators, on various innovation determinants (demand perspectives, conditions of market competition, appropriability conditions and technological opportunities, etc.), on firm performance (value added per employee) and other firm characteristics. We use an (unbalanced) panel of 1691 manufacturing firms.
In a first step, we specify an innovation equation containing as independent variables measures of demand expectations; measures of the intensity of price and non-price competition; the number of competitors in the most important market segment a firm is operating in; measures of technological opportunities (sources of external knowledge, technological potential); measures of the effectiveness of imitation protection; measures for skill shortage and shortage of internal financing. Further, it contains controls for industry affiliation and firm size. Firm size is inserted in the form of a polynomial (linear and quadratic term) with respect to the number of employees). This allows testing for scale effects. We use five dichotomous innovation measures (product innovations yes/no; process innovations yes/no; R&D activities yes/no; at least one patent application yes/no; products new to the market yes/no) and three metric measures (R&D expenditure as a percentage of sales; sales share of new products; sales share of considerably modified (already existing) products). The use of a wide spectrum of indicators helps to test the robustness of the specification of the innovation equation. The equations of the five dichotomous variables are estimated (a) by a simple probit for the pooled data using year dummies; (b) a probit with random effects in

order to take into consideration heterogeneity due to the panel character of the data. The equations of the three metric variables are estimated (a) by a simple tobit (for the pooled data using year dummies) in order to take account of the truncation of the variables (a lot of zero values as downward limit); (b) by a tobit with random effects.
In a second step, we specify a labour productivity equation (value added per employee) containing a variable for human capital (share of employees with tertiary-level education), a variable for physical capital (value added share of non-labour firm income), a measure of R&D personnel shortage and an instrumented innovation variable. Further, it contains controls for industry affiliation and firm size. As instruments we use the independent variables of the innovation equation specified in the first step. We investigate also in this second equation all eight innovation variables already introduced in the first step. Hence, we estimate eight different models, each one with two methods: (a) two-stage least squares with pooled data and year dummies; (b) generalized two-stage least squares with random effects.
We refrain here from specifying separately equations for innovation input and innovation output, hence to postulate a knowledge production function, because, with the exception of innovation input determining innovation output per definition, all other determinants in both equations are identical. We prefer to investigate directly the (presumably) different impact of innovation input and innovation output on economic performance without the transmitting role of a knowledge production function; for whose identification our mostly qualitative data would be too crude.
The new elements that this paper adds to empirical literature are, first, the use of a broad spectrum of variables covering most factors proposed and discussed in literature as possible determinants of innovative activity; second, the consideration of several innovation indicators, thus allowing testing the robustness of the relationship between innovation and economic performance; third, the use of panel data for the period 1997-2002, since only few studies until now could dispose of panel data.
Section 2 gives a short summary of related empirical literature. In section 3 we present the framework of analysis and the specification of the innovation and the productivity equation respectively. Section 4 deals with the data used in the study. In section 5 we discuss the empirical results. Section 6 contains a summary and some conclusions
2. Summary of Empirical Literature
We concentrate here to empirical studies that (a) develop a multi-equation model for innovation and productivity at the firm level and (b) use CIS-like micro data.1
1 The volume of Kleinknecht (1996) contains studies on the determinants of innovation for France, Germany, the Netherlands and Switzerland in the mid-nineties; Raymond et al. (2004) give a survey of recent studies of the determinants of innovation. See also the papers in the Special Issue of Economics and New Technology of

Crépon et al. (1998) studied the links between productivity, innovation and research based on a structural model that explained productivity by innovation output, and innovation output by research investment based on a cross-section of French firm data. They found that the probability of engaging in R&D increases with its size, its market share and diversification, and with the demand pull and technology push indicators. R&D capital intensity increases with the same variables, except for size (only linear effect). The innovation output, as measured by patents numbers or innovative sales, rises with R&D capital intensity, demand pull and technology push indicators. Finally, firm productivity correlates positively with a higher innovation output, after controlling for labour skill and physical capital intensity. In a further study with French data Duguet (2006) distinguished two types of innovation, namely radical innovations and radical innovations. He found for a cross-section of French firm data that radical innovations are the only significant contributors to TFP growth.
Lööf et al. (2001), Janz et al. (2003) and Griffith et al. (2005) conducted comparative studies for many countries using the framework of analysis developed by Crépon et al. (1998). The former study covers three Nordic countries (Finland, Norway and Sweden); the latter one compares German firms with Swedish firms. The third study deals with four European countries, namely France, Germany, Spain and the UK. All three studies are cross-section investigations based on CIS-Data. Lööf et al. found that the estimated elasticity of productivity with respect to innovation output is higher in Norway than in the other two countries. Surprisingly no significant relationship was found between innovation and productivity in Finland. The authors are reluctant to draw definite conclusions from these findings because of data errors, differences in model specification or unobserved country-specific effects. Janz et al. analyzed the relationship between productivity, innovation output and R&D expenditure for a pooled sample of German and Swedish firms. The analysis showed that the two main parameter estimates, the elasticity of labour productivity with respect to innovation output and the elasticity of innovation output with respect to innovation input, are not significantly different between the two countries. Finally, the authors of the third study found using different innovation output measures that the innovation output is significantly determined by the innovation effort in all four countries. In contrast to that, productivity effects of innovation showed up only for France, Spain and UK, but not for Germany.
In a recent study based on Irish panel data Love et al. (2005) estimated a recursive system comprising an innovation production function which related knowledge inputs to innovation success, and equations which related innovation to productivity. Results indicated that external sources of knowledge are important determinants of innovation success. Product innovation has a strong positive effect on growth, and has a negative contemporaneous effect,
June/July 2006. Wieser (2006) gives a survey of empirical work on the relationship between research and development and productivity at the firm level.

but positive lagged effect, on productivity. Process innovation has a positive effect on productivity with no lagged effect.
Finally, Lööf and Heshmati (2006) and Van Leeuwen and Klomp (2006) discuss and apply alternative econometric approaches and model specifications. The former study examines using Swedish cross-section firm data the sensitivity of the estimated relationship between innovation and firm performance by carrying out comparisons in a number of ways (assuming different error structure for the same data source, estimating the same model with different data bases, using different classifications of firms’ performance and/or innovation, etc.). In the latter study, which is based on Dutch firm data, the value-added production function framework is replaced by a revenue function approach. A positive impact on productivity is found only for revenue per employee but not for value-added per employee.
On the whole, the comparability of existing studies is rather limited due not only to data problems but also to differences with respect to the applied econometric methodology but also with respect to model specification.
3. Framework of Analysis
3.1 Specification of the Innovation Equation
Dependent variables. In view of the complexity of the innovation process, characterized by several stages from basic research to the penetration of the market with new products, an approach relying on a single measure of innovation may leave out important relationships and produce results which are not robust (see e.g. Kleinknecht et al. 2002). In this study we use a set of innovation measures covering several stages of the innovation process, namely five binary indicators (product innovations yes/no; process innovations yes/no; R&D activities yes/no; patent applications yes/no; products new for the (world) market yes/no) and three metric indicators (R&D expenditure/sales; sales share of new products; sales share of considerably modified (existing) products).
Independent variables. For specifying the innovation equation we apply an eclectic approach by taking into account a series of important factors that are considered to be relevant for innovation at firm level in economic literature. There is a wide consent that demand growth potential, type and intensity of competition, market structure, firm size as well as factors governing the generation of knowledge (appropriability of the returns of innovations, technological opportunities in the relevant fields of activities) are the main determinants of the innovation activity at firm level. In accordance to this tradition, the empirical model used in this study comprises variables for the most important determinants of innovative activity as considered in the literature (see for example, Dasgupta 1986; Dosi 1988; Cohen and Levin 1989; and Cohen 1995 for reviews of this literature).

We distinguish four groups of explanatory variables. First, we include an indicator for demand conditions: variable D measures the expected development of demand on the relevant product markets in the medium run (next three years).
A second category of explanatory variables is related to the (product) market conditions under which the firms are operating, particularly the competitive pressures they are exposed to. Mostly, market concentration, a structural variable, is taken to reflect competitive pressures. Standard industrial organization models of product differentiation and monopolistic competition typically predict that more intense product market competition, measured by an increase in the substitutability between differentiated products, reduces post-entry rents, and therefore increases market concentration (see e.g. Kamien and Schwartz 1970, Dixit and Stiglitz 1977; see also the discussion in Aghion et al. 2005). In the game-theoretic literature the impact of market structure upon the schedule of innovation is shown to depend critically on the difference of profit rates preceding and following the innovation (see e.g. Reinganum 1981). This dependence being quite complicated, most studies do not come to theoretical unambiguous results with respect to the effects of market concentration on innovation (see Reinganum 1989 for a review of such studies). Recently, Aghion et al. (2005) developed a model that predicts an inverted-U relationship between product market competition and innovation. The authors found strong evidence for this model using U.K. panel data. In sum, whether positive effects in the tradition of Schumpeter are stronger than negative “free competition effects”, as some empirical studies find (see e.g. Geroski 1995, Blundell et al. 1999), has to be resolved at the empirical level. We use three variables to capture the influence of the market environment, namely a measure of the intensity of price competition on a firm’s specific market (variable IPC), a measure of the intensity of non-price competition and a measure of the market structure as reflected by the number of main competitors on a firm’s most important (worldwide) product market. We expect a positive effect of the intensity of non-price competition on innovation. This is in accordance with models of product differentiation, in which product quality is the main dimension of competition among firms and which are interpreted as models of incremental innovation (see e.g. Stoneman 1983, Levin and Reiss 1988). We do not have an a priori expectation with respect to the effect of price competition. A positive effect would confirm the “free competition effect”, a negative one the Schumpeter effect. We do not dispose of a quantitative measure of market concentration of the innovation-relevant market, so we cannot test the hypothesis of a U-inverted relationship. Our variable is defined only for some intervals with respect to the number of main competitors on a firm’s most important (worldwide) product market: up to 5 competitors, 6 to 15 competitors, 16 to 50 competitors, 50 and more competitors. What we can test with these data is the relationship between a certain market environment and innovation. To this end we include three dummies for the three market types (up to 5 competitors, 5 to 15 competitors, 16 to 50 competitors). Also in this case we do not have a priori sign expectations.

A third category of exploratory variables refers to the factors governing the production of knowledge (appropriability, technological opportunities). Theoretical literature focuses primarily on the effect of imperfect appropriability of results of innovation activities on the incentives to innovate (see e.g. Spence 1984). There is a twofold incentive problem. On the one hand, the existence of imperfect appropriability (above a critical level of the underlying knowledge spillovers) decreases the incentives to innovate, because of external losses of innovation rents caused by imperfect appropriability (“outgoing spillovers”). On the other hand, imperfect appropriability also increases the incentives to utilize spillovers coming from outside the firm (“incoming spillovers”). The extent of incoming spillovers depends also on the amount of external knowledge that is available or can be anticipated as being available (technological opportunities).
We use a measure of appropriability based on the firms’ assessment of the overall effectiveness of formal and informal mechanisms of protection of innovation returns (variable APPR; see Levin et al. 1987). We expect a positive effect of this variable. Technological opportunities representing the supply conditions of innovation-generating activities are proxied by two (sets) of variables. The first variable reflects the general technological potential characterizing the fields of activity that are relevant for the firm (variable TPOT). TPOT tries to capture the extent of overall accumulation of “basic knowledge”, part of which comes from science-oriented basic research. We expect a positive effect for this variable. The second (group) of technological opportunity variable(s) measures the importance of several sources of external knowledge for a firm’s innovative activities (see Klevorick et al. 1995). We use information for seven different sources of information, namely users, suppliers (of equipment, components etc.), competitors, affiliated firms, universities, patent disclosures and fairs and exhibitions. We expect a positive effect for the entire set of these variables but only necessarily for each of them.
Fourth, measures for financial and human resources assigned to the generation of new products and new processes are taken into account. Thus, in the innovation equation are also included a measure of shortage of internal financial resources for innovation (variable FIN_IMPED) and a measure of shortage of skilled labour (variable SKILL_IMPED). We expect negative effects for both variables.
Furthermore, firm size, an explanatory variables used in most innovation studies (see e.g. Cohen 1995), is also included in the present study. Firm size, which is expected to be positively related to innovation, plays a special role: it may prove to be an independent (additional) determinant of adoption, in which case it stands for firm-specific effects not explicitly modelled (range of activities, management capabilities etc.) and/or it may function as a proxy for other variables in the model in case it is strongly correlated with them (size-dependence of the model variables; see Arvanitis 1997); we concentrate here to the effects as an additional determinant. We use the number of employees in full-time equivalents as a

measure of firm size. We include a linear and a quadratic term with respect to the number of employees (variables L, L2) in the innovation equation in order to capture possible nonlinearities. We expect that innovation increases with firm size but at a decreasing rate.
Finally, we control for manufacturing sub-sectors (dummy for high-tech manufacturing) and the time (two time dummies for 1999 and 2002 for the estimates with pooled data). We expect time dummies to reflect the effects of macroeconomic conditions on innovation not already captured by the demand variable D.
3.2 Specification of the Productivity Equation
The productivity equation (dependent variable: logarithm of value added per employee) contains proxies of the intensity of human capital (variable LHK; logarithm of the share of employees with tertiary-level education), a variable for shortage of R&D personnel (variable RDSKILL_IMPED; a specific problem of the Swiss economy especially in boom periods), physical capital (variable LC; logarithm of capital income per employee) and knowledge capital approximated alternatively by the five binary and the three metric innovation indicators that already served as dependent variables of the innovation equations. Further, we control for firm being a foreign one or not (dummy variable FOREIGN; foreign firm yes/no), for firm size, industry affiliation and time (if necessary). We expect positive effects for the resource endowment variables LC and LHK and a negative one for RDSKILL_IMPED. Our main hypothesis with respect to the binary innovation indicators is that innovation activities would contribute as an additional production factor to an improvement of labour productivity firms compared to firms that are not involved in such activities (see Griliches 1979, 1995). The use of several binary variables for different kinds of innovation activities allows a serves to test the robustness of the innovation effect on economic performance. Positive effects are expected also for the three metric variables that measure the intensity of innovative activity. The signs for the variable FOREIGN as well as for the firm size dummies are not a priori clear.
Finally, we take into account the endogenous character of innovative activities by estimating a version of the productivity equation, in which the innovation indicators are instrumented. As instruments we use the independent variables of the innovation equation.
4. Data
The data used in this study were collected in the course of three surveys among Swiss enterprises in the years 1996, 1999 and 2002 using a questionnaire which included besides questions on some basic firm characteristics (sales, exports, employment, investment and employees’ vocational education) also several innovation indicators quite similar to those in

the Innovation Surveys of the European Community (CIS).2 The survey was based on a (with respect to firm size) disproportionately stratified random sample of firms with at least 5 employees covering all relevant industries of the manufacturing sector, the construction sector and selected service industries as well as firm size classes (on the whole 18 industries and within each industry three industry-specific firm size classes with full coverage of the upper class of large firms). We used in this study only data for manufacturing firms. Answers were received from 33.5% (1996), 33.7% (1999) and 44.6% (2002) respectively of the manufacturing firms in the underlying sample. The response rates do not vary much across industries and size classes with a few exceptions (over-representation of machinery, under-representation of clothing/leather and wood processing). The final data set includes 1691 enterprises from all fields of activity and size classes and may be considered as representative of Swiss manufacturing (see table A.1 in the appendix for the structure of the used data set by industry, firm size class and year respectively).
5. Results
5.1 Innovation Equation
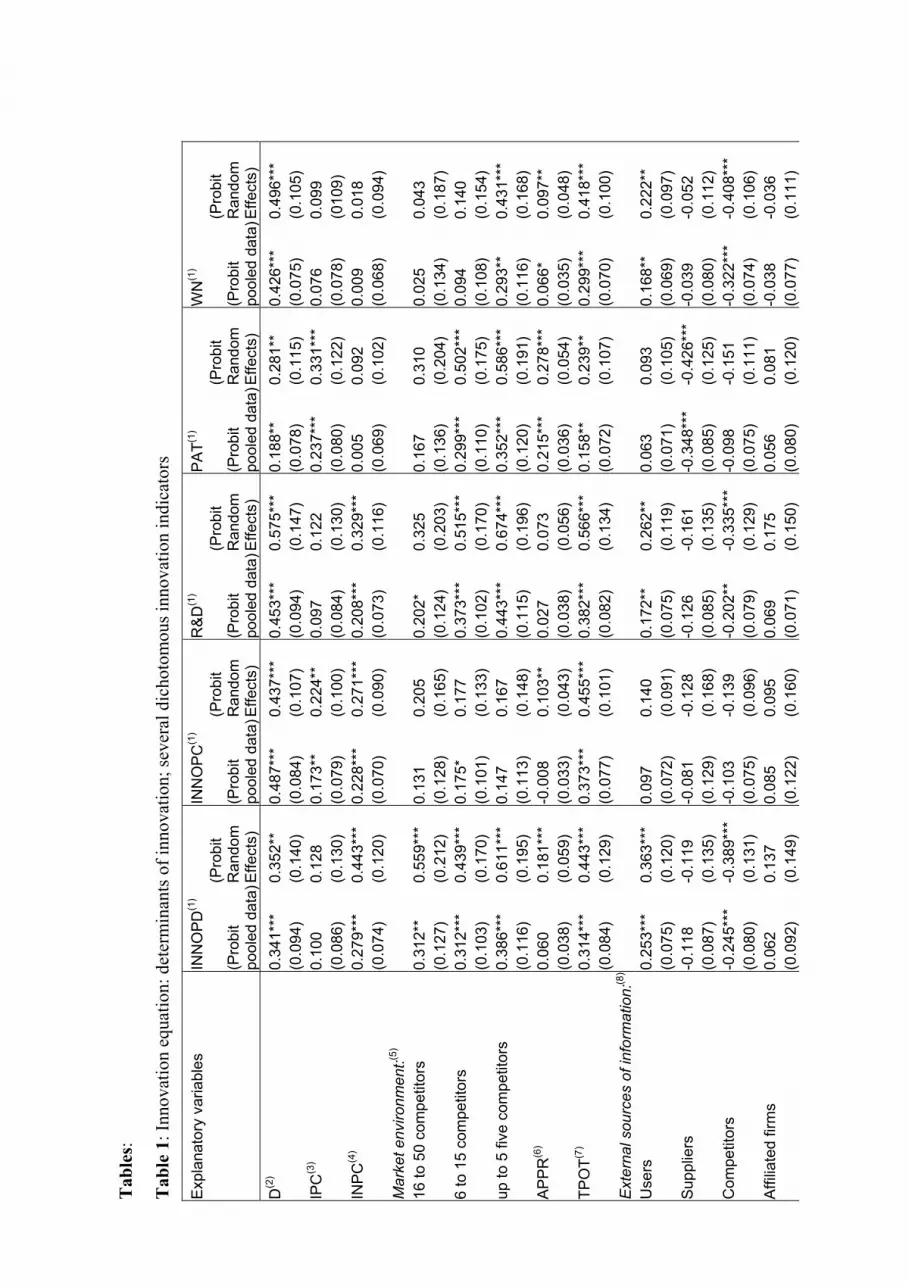
For each binary innovation variable we estimated (a) a probit model with the pooled data for all three years and two time dummies and (b) a probit model with random effects. In both cases heteroscedasticity-robust standard errors according to the White-procedure were computed. All estimations were conducted with STATA, Version 8. The rather high share of variance due to heterogeneity (τ=0.41-0.61 in Table 1) shows that taking account of random effect is the appropriate methodology for panel data. Table 1 shows the estimates for the five binary variables; it also contains detailed information on the construction of the model variables.
We take the estimates binary variables INNOPD and INNOPC as a reference in order to describe the main pattern of the determinants of innovation activities, which we then compare (a) with the pattern for the other three binary indicators and (b) with that for the three metric variables.3
Demand expectations: Positive medium-term demand expectations (variable D) in one period have a positive effect on the likelihood to introduce a product and or a process innovation in the next period. This result is accordance to theory and also many other empirical studies based on micro data.
Competition: As expected, there is a positive correlation between the intensity of non-price competition and the propensity to introduce product and/or process innovations (variable
2 Versions of the questionnaire in German and French are available in www.kof.ethz.ch. 3 We refrain here from presenting marginal effects instead of coefficients because most of the model variables are dummy variables and the economic interpretation of marginal effects is in this case rather problematic.

INPC). We also find a positive effect of the intensity of price competition but only for process innovation (variable IPC). In this case the “free competition effect” seems to be more important than the Schumpeterian effect. Intuitively, it is quite sensible to assume that high price competition for (obviously) quite substitutable products would be a strong incentive for reducing production costs through process innovation (see e.g. Levin and Reiss 1988).4
All three dummies for the market structure have positive and statistically significant coefficients in the estimates for product innovation but not in the estimates for process innovation. This means that all three concentration thresholds define market environments for which the likelihood of product innovations is significantly larger than in the polypolistic market with more tan 50 competitors. In the random effect estimates for product innovations the differences between the coefficients of the three dummies are statistically significant but the coefficient for the threshold (6 to 15 competitors is smaller than the respective coefficients for the other two thresholds (16 to 50 competitors) and (up to five competitors). In the simple probit model with time dummies two thresholds have the same coefficient. Thus, there is no monotonic positive relationship between concentration (as measured by the number of competitors) and the propensity to innovate. How can we interpret economically the effects of the concentration thresholds in the case of product innovations? Rather than the market power in the narrow sense of “high-concentration markets” with permanent high entry barriers they reflect the ability of innovative SMEs to operate in market “niches” (with less than 50 competitors) based on product differentiation due to incremental product innovation.
Appropriability: As expected, a high appropriability of innovation returns, as measured by a high effectiveness of formal and informal protection mechanisms (variable APPR), is important for both kinds of innovation.
Technological opportunities: The variable TPOT measuring the overall effect of externally available knowledge that is relevant for a firm’s innovative activity shows a statistically significant positive effect in all four estimates for INNOPD and INNOPC. A joint test for the seven single external sources of information showed that the overall effect is positive. Three single sources, namely users, patent disclosures and fairs and exhibitions have a significant positive effect on the propensity to introduce product innovations. Patent disclosures and fairs and exhibitions are a relevant information source also for process innovations. The variable for knowledge from competitors has a negative sign in the estimates for product innovations. Spillovers from competitors are obviously not a means to encourage innovative activities in a firm. The coefficients of the variables for suppliers, universities and affiliate firms are statistically insignificant. On the whole, incoming spillovers are transmitted through only a few channels.
Shortages of resources: Lacking enough (internal) financial resources for innovation is a serious obstacle of innovative activities, especially of product innovations, as the negative 4 An alternative strategy would be product innovation.

sign of this variable shows. Since we control for a firm’s specific demand development as well as for macroeconomic conditions (time dummies) this kind of impediment seems to be of structural nature, thus a possible matter of concern for policy makers. Skill shortages are relevant only for product innovations. Also in this case we identify a structural obstacle of innovative activity that could also reveal a policy problem.
Firm size: Also in a panel framework we find the same pattern as in the single cross-sections (see e.g. Arvanitis 1997), namely a significantly positive coefficient for the linear term L and a significantly negative coefficient for the quadratic term (L2). This non-linear relationship shows that the likelihood to innovate is clearly increasing with firm size but with diminishing rate.
Control variables: There is a positive effect for firms in high-tech manufacturing reflecting presumably further advantages of firms in this sub-sector that are not captured by the other model variables. This effect is found only for product innovations. Obviously the differences between high-tech and low-tech manufacturing are not primarily related to differences in the efficiency of production techniques. The signs and the magnitudes of the coefficients of the time dummies in the pooled data probit estimates for product innovations show that the general economic conditions were quite unfavourable for innovative activities in the period 1997-1998 (year 1999) compared to the reference period 1994-1996 and improved in the period 2000-2002 (year 2002). For process innovations the general conditions were in both periods worse than in the reference period. This result is contrary to the theoretical expectation that firms increase their activities with respect to cost-saving process innovations under adverse economic conditions (see e.g. Utterback and Abernathy 1975).
In sum, all four groups of hypothesized variables and firm size as well are statistically relevant. This general finding is in accordance to previous studies (see e.g. Arvanitis and Hollenstein 1996 for a similar analysis with cross-section data of 1993).
Other binary innovation indicators: For the dichotomous variable R&D we obtain almost the same pattern as for INNOPD with the exception of the variable APPR (positive but statistically insignificant coefficient) and the variable FIN_IMPED (negative but statistically insignificant coefficient). A further difference refers to the results with respect to the variable for the market concentration: in this case the coefficients of the dummies become larger with increasing concentration. The coefficients of the time dummies are statistically insignificant. This means that the general economic conditions did not influence the likelihood of conducting R&D but only the R&D intensity (see below).
For the variables PAT and WN we obtain similarities to the reference pattern for product innovations with respect to demand expectations (D), appropriability (APPR), technological potential (TPOT), patent disclosures as an important external information source and firm size. There are also some differences as to the relevance of market conditions: non-price competition is not relevant for PAT and WN, price competition only for WN; for the

likelihood to file patent applications (PAT) we observe, similar to R&D, a (rather weak) tendency of increasing with rising market concentration (Schumpeterian effect). This is not the case for WN. University knowledge seems to be important for patenting. Finally the variables for resource shortages show the expected negative sign but are statistically insignificant in the estimates for PAT and WN. For both indicators general economic conditions improved in the last period 2000-2002.
On the whole, for the four binary indicators referring mainly to product innovations we find a series of robust results across all estimates that are worth noting once more here: positive effects for demand expectations, technological potential, patent disclosures as an important external knowledge source firm size; also positive effects for firms operating on a market niche with up to five competitors; partly also positive impact for the intensity of non-price competition, appropriability conditions and users as relevant knowledge source. Finally, belonging to high-tech manufacturing contributes to a higher innovation performance, even after we control for all other determinants.
Metric innovation variables:
We estimated (a) a tobit model with pooled data and time dummies and (b) a tobit model with random effects for each of the three metric innovation indicators, namely the logarithm of R&D intensity (LRDS; R&D expenditure divided by sales), the logarithm of the sales share of new products (LNEWS) and the logarithm of the sales share of significantly modified already existing products (LIMPS).5 All estimations were conducted with STATA, Version 8. Table 2 shows the estimates for the three metric variables; it also contains detailed information on the construction of the model variables. Also in these estimates we find a considerable amount of heterogeneity (τ=0.37-0.64 in Table 2).
Demand conditions: We find also for these indicators significant positive effects of demand expectations on innovation performance.
Competition: the intensity of non-price competition is important for input-oriented as well as output-oriented indicators; the intensity of price competition is relevant for the variable IMPS that measures the sales share of considerably modified existing products, which are more price-sensitive than thoroughly new products (variable LNEWS). Market niches with up to five competitors are as market environment significantly more favourable for innovation than a market with more than 50 competitors; this result is valid for all three metric indicators. For the variables LRDS and LIMPS this is valid also for markets with 6 to 15 competitors;
5 In order to be able to calculate the logarithms of R&D intensity for firms without R&D expenditures, thus LRDS=0, we put these firms at the minimum value of R&D intensity of the firms with R&D expenditure which was 0.00001. We then calculated the logarithms of RDS and subtracted log(0.00001)=-11.513 to get 0 values for the firms without R&D expenditures. The minimum value for the sales share of new products was 0.4, thus LNEWS=-0.916, for the sales share of considerably modified already existing products 0.6, thus LIMPRS=-0.511; also in this case we performed a linear transformation of the data in order to get zero values for the firms without sales of innovative products.

moreover, the coefficient of the dummy for up to five competitors is significantly larger than that for 6 to 15 competitors. This result we interpret as (weak) evidence for the existence of the Schumpeterian effect of competition. In the estimates for LNEWS we find at clearest the tendency of R&D intensity to increase with increasing concentration.
Appropriability: We find positive effects for the variables LRDS and LNEWS; appropriability is not relevant for modified products with a lower degree of innovativeness than thoroughly new products.
Technological opportunities: The (anticipated) technological potential is also with respect to these innovation measures variables quite relevant. Users as a knowledge source show positive effects for both categories of innovative products but not for R&D intensity. In the estimates for LRDS and LIMPS we obtain also positive effects for university knowledge. Thus, the acquisition and utilization of science-based knowledge seems to correlate positively with the intensity of innovation activities. On the contrary, the likelihood to get involved in innovation activities is not dependent on such specialized knowledge.
Firm size: We obtain the standard pattern as for the binary variables (positive linear term, negative quadratic term.
Shortages of resources: The coefficients for the variables for shortages in finance and high-skilled personnel are throughout negative but only in the estimates for LNEWS statistically significant.
Control variables: For all three indicators the affiliation to high-tech manufacturing is positively related to a higher innovation performance. The general economic conditions are relevant only for LRDS.
5.2 Productivity Equation
We estimated eight different models, namely five with the instrumented binary innovation variables and three with the instrumented three metric indicators, each one of them with two methods: (a) two-stage least squares with pooled data and year dummies; (b) generalized two-stage least squares with random effects. As instruments were used the independent variables of the innovation equation in Tables 1 and 2. All estimations were conducted with STATA, Version 8. The high share of variance due to heterogeneity (τ=0.53-0.73 in Tables 3 and 4) shows that taking account of random effect is the appropriate methodology for panel data. Table 3 shows the estimates of the productivity equation with five alternative binary measures of innovation, Table 4 the respective estimates with the three metric innovation indicators. Both tables contain detailed information on the construction of the model variables.
As expected, the coefficients of the variables for resource endowment (LHK; LC) are positive and highly statistically significant across all estimates. The elasticity of capital income per

employee varies between 0.046 and 0.073 in Table 3, meaning that an increase of 1% of this variable is correlated with an increase of 0.046% to 0.073% of labour productivity; the elasticity of the share of employees with tertiary-level education is lower (0.023-0.030) but much more stable across the model versions presented in this table. The coefficient of the variable FOREIGN is also positive and highly significant, which can be interpreted as a hint that foreign firms are, after controlling for all other factors, more productive than domestic ones. Further, the coefficient of the shortage variable RDSKILL_IMPED is negative and statistically significant in all estimates with the exception of the estimates with INNOPD. This kind of resource shortage should be a matter of particular policy concern.
Now we turn to the binary innovation variables. The coefficients of all five instrumented innovation indicators are positive and statistically significant.6 They vary between 0.23 (variable WN) and 0.58 (variable R&D). An economic interpretation of these coefficients is that, for example, on average a switch from a firm without product innovations to a firm that has introduced product innovations, is correlated to an increase of 41% to 44% of labour productivity.7 The smallest impact is found for WN (21%) and the largest for PAT (46%).
We find throughout a significant positive impact also for all three metric indicators. A change of 1% of the R&D intensity (R&D expenditure divided by sales) impacts an increase of 0.052% to 0.056% of productivity, all other things being equal.8 For comparison, the respective effects for human capital and physical capital are 0.046% and 0.027% respectively. The corresponding effects for the sales share of new products and the sales share of highly improved (already) existing) products are larger, namely 0.100% to 0.113% and 0.135% to 0.141% respectively. Thus, the output-oriented variables LNEWS and LIMPS show a considerably larger effect on economic performance than the input-oriented measure LRDS.
6. Summary and Conclusions
The results for the innovation equations can be summarized as follows: Favourable demand conditions are an important precondition for innovative activities to be undertaken by private enterprises (introduction of product and/or process innovations, R&D activities, patenting). They also enhance innovation performance as measured by the R&D intensity (LRSD) or the sales shares of innovative products (LNEWS, LIMPS). Competition pressures are more important for the intensity of innovation activities than for the basic decisions to engage in innovation activities as measured by the binary indicators. The most robust result across all estimates with respect to market environment is that a market niche with up to five competitors is considerably more favourable for a firm than most other market constellations. 6 This result is much less clear without instrumented variables. 7 We calculated the relative increase of labour productivity by the formulas: 100*ln(1+0.072)= 6.9 and 100*ln(1+0.076)= 7.3 respectively; see Halvorsen and Palmquist 1980, p. 475. 8 We found an elasticity of R&D capital of 0.043 in an earlier study based on cross-section data for 1990 (see Arvanitis and Hollenstein 2002).

The finding complements and is not contradictory to the finding with respect to the intensity of price and non-price competition. A monotonic relationship between innovation and market concentration could be found only for single indicators. Further, appropriability conditions are significantly positively related with most innovation indicators. The intense use of patent disclosures and users as knowledge sources is shown to be positively correlated with innovation in most estimates. University knowledge seems to be relevant mainly for innovation performance, less for the basic decision to engage in innovation activities (with the exception of patenting). Shortages of resources are relevant primarily for the basic decision to get involved in innovation activities. Belonging to high-tech manufacturing is throughout a characteristic of above-average innovative firms. Rather unexpectedly, the shares of the innovative product are not dependent on general economic conditions, rather on the development of the specific demand of such products as measured by the variable D. On the contrary, R&D intensity varies with the general economic conditions; for both periods 1997-1999 and 2000-2002 it was on average higher than in the reference period 1994-1996.
The results for the productivity equations can be summarized as follows: we find significantly positive coefficients for all eight instrumented innovation variables. The magnitude of the impact effect on productivity of the five dichotomous variables varies between 21% and 46%. This means that dependent on the concrete innovation indicator the shift from a firm without innovation activities to the one with such activities correlates with a productivity increase of 21% to 46%. Further, a 1% change of the R&D intensity (R&D expenditure divided by sales) impacts an increase of 0.054% of productivity, all other things being equal. The respective effects for the sales share of new products and the sales share of highly improved (already) existing) products are larger, namely 0.106% and 0.138% respectively.
Finally, the persistence of shortages of internal finance of innovation and qualified personnel (in some of the estimates of the innovation equations) as well as of R&D personnel (in most estimates of the productivity equation) points at possible structural problems that should be a matter of concern of economic policy.

References Aghion, P., Bloom, N., Blundell, R., Griffith, R. and P. Howitt (2005): Competition and Innovation:
An Inverted-U Relationship, Quarterly Journal of Economics, 115, 701-728.
Arvanitis S. (1997): The Impact of Firm Size on Innovative Activity: An Empirical Analysis Based on Swiss Firm Data, Small Business Economics, 9, 473-490.
Arvanitis, S. and H. Hollenstein (1996): Industrial Innovation in Switzerland: A Model-based Analysis with Survey Data, in A. Kleinknecht (ed.), Determinants of Innovation and Diffusion. The Message from New Indicators, Macmillan Press, London.
Arvanitis, S. and H. Hollenstein (2002): The Impact of Technological Spillovers and Knowledge Heterogeneity on Firm Performance: Evidence from Swiss Manufacturing, in A. Kleinknecht and P. Mohnen (eds.), Innovation and Firm Performance, Palgrave, London.
Blundell, R., Griffith, R. and J. Van Reenen (1999): Market Share, market value and Innovation in a Panel of British Manufacturing Firms, Review of Economic Studies, 66, 529-554.
Cohen, W.M. (1995): Empirical Studies of Innovative Activity, in P. Stoneman (ed.), Handbook of Innovation and Technological Change, Blackwell, Oxford.
Cohen, W.M. and R.C. Levin (1989): Empirical Studies of Innovation and Market Structure in R. Schmalensee and R.D. Willig (eds.), Handbook of Industrial Organization, North-Holland, London.
Crépon, B., Duguet, E. and J. Mairesse (1998): Research, Innovation and Productivity: An Econometric Analysis at the Firm Level, Economics of Innovation and New Technology, 7, 115-158.
Dasgupta, P. (1986): The Theory of Technological Competition, in J.E. Stiglitz and G.F. Mathewson (eds.), New Developments in the Analysis of Market Structure, MIT Press, Cambridge, Mass.
Dixit, A. and J. Stiglitz (1977): Monopolistic Competition and Optimum Product Diversity, American Economic Review, 68, 297-308.
Dosi, G. (1988): Sources, Procedures, and Microeconomic Effects of Innovation, Journal of Economic Literature, 26, 1120-1171.
Duguet, E. (2006): Innovation Height, Spillovers and TFP Growth at the Firm Level: Evidence from French Manufacturing, Economics of Innovation and New Technology, 15(4/5), 415-442.
Geroski, P. (1995): Market Structure, Corporate Performance and Innovative Activity, Oxford University Press, Oxford.
Griffith, R., Huergo, E., and J. Mairesse (2005): Innovation and Productivity across Four European Countries, Paper Presented at the 32nd Conference of the European Association for Research in Industrial Economics (EARIE), Porto, September 1-4.
Griliches, Z. (1979): Issues in Assessing the Contribution of Research and Development to Productivity Growth, Bell Journal of Economics, 10, 92-116.
Griliches, Z. (1995): R&D and Productivity: Econometric Results and Measurement Issues, in P. Stoneman (ed.), Handbook of the Economics of Innovation and Technological Change, Blackwell, Oxford.
Halvorsen, R. and R. Palmquist (1980): The Interpretation of Dummy Variables in Semilogarithmic Equations, American Economic Review, 70(3), 474-475.
Janz, N., Lööf, H. and B. Peters (2003): Firm Level Innovation and Productivity – Is There a Common Story Across Countries? ZEW Discussion Paper No. 03/26, Mannheim.
Kamien, M and N. Schwartz (1970): Market Structure, Elasticity of Demand and Incentive to Invent, Journal of Law and Economics, 13(1), 241-252.
Kleinknecht, A. (ed.) (1996): Determinants of Innovation and Diffusion. The Message from New Indicators, Macmillan Press, London.
Kleinknecht, A., Van Montfort, K. and E. Brouwer (2002): The Non-trivial Choice between Innovation Indicators, Economic of Innovation and New Technology, 11(2), 109-121.
Klevorick, A.K, Levin, R.C., Nelson, R.R. and S.G. Winter (1995): On the Sources and Significance of Interindustry Differences in Technological Opportunities, Research Policy, 24, 185-205.
Levin, R.C., Klevorick, A.K., Nelson, R.R. and S.G. Winter (1987): Appropriating the Returns from Industrial Research and Development, Brookings Papers on Economic Activity, 3, 783-831.
Levin, R.C. and P.C. Reiss (1988): Cost-reducing and Demand-creating R&D with Spillovers, Rand Journal of Economics, 19, 538-556.
Lööf, H. and A. Hesmati (2006): On the Relationship between Innovation and Performance: A Sensitivity Analysis, Economics of Innovation and New Technology, 15(4/5), 317-344.
Lööf, H., Hesmati, A., Asplund, R. and S.-O. Naas (2001): Innovation and Performance in Manufacturing Industries: A Comparison of the Nordic Countries, SSE/EFI Working Paper Series in Economics and Finance No. 457, Stockholm.
Love, J.H. and S. Proper (2005): Innovation, Productivity and Growth: An Analysis of Irish Panel Data, Paper Presented at the 32nd Conference of the European Association for Research in Industrial Economics (EARIE), Porto, September 1-4.
Raymond, W., Mohnen, P. Palm, F. and S.S. van der Loeff (2004): An Empirically-based Taxonomy of Dutch Manufacturing: Innovation Policy Implications, MERIT-Infonomics Research Memorandum Series No. 2004-011, Maastricht.
Reinganum, J.F. (1981) Market Structure and the Diffusion of New Technology, Bell Journal of Economics, 12, 618-624.
Reinganum, J.F. (1989): The Timing of Innovation: Research, Development and Diffusion in R. Schmalensee and R. Willig (eds.), Handbook of Industrial Organization, Vol. 1, New York: Elsevier Science Publishers, pp. 849-908.
Spence, M., (1984): Cost Reduction, Competition and Industry Performance, Econometrica, 25, 101-121.
Stoneman, P. (1983): The Economic Analysis of Technological Change, Oxford University Press, Oxford.
Utterback, J.M. and W.J. Abernathy (1975): A Dynamic Model of Process and Product Innovation, OMEGA, 3, 639-656.
Van Leeuwen, G. and L. Klomp (2006): On the Contribution of Innovation to Multi-factor Productivity Growth, Economics of Innovation and New Technology, 15(4/5), 367-390.
Wieser, R. (2005): Research and Development, Productivity and Spillovers: Empirical Evidence at the Firm level, Journal of Economic Surveys, 19(4), 587-621.
Tab
les:
Tab
le 1
: Inn
ovat
ion
equa
tion:
det
erm
inan
ts o
f inn
ovat
ion;
seve
ral d
icho
tom
ous i
nnov
atio
n in
dica
tors
Exp
lana
tory
var
iabl
es
INN
OPD
(1)
IN
NO
PC(1
)
R&
D(1
)
PAT(1
)
WN
(1)
(P
robi
t po
oled
dat
a)
(Pro
bit
Ran
dom
Ef
fect
s)
(Pro
bit
pool
ed d
ata)
(Pro
bit
Ran
dom
Ef
fect
s)
(Pro
bit
pool
ed d
ata)
(Pro
bit
Ran
dom
Ef
fect
s)
(Pro
bit
pool
ed d
ata)
(Pro
bit
Ran
dom
Ef
fect
s)
(Pro
bit
pool
ed d
ata)
(Pro
bit
Ran
dom
Ef
fect
s)
D(2
) 0.
341*
**
0.35
2**
0.48
7***
0.
437*
**
0.45
3***
0.
575*
**
0.18
8**
0.28
1**
0.42
6***
0.
496*
**
(0
.094
) (0
.140
) (0
.084
) (0
.107
) (0
.094
) (0
.147
) (0
.078
) (0
.115
) (0
.075
) (0
.105
) IP
C(3
) 0.
100
0.12
8 0.
173*
* 0.
224*
* 0.
097
0.12
2 0.
237*
**
0.33
1***
0.
076
0.09
9
(0.0
86)
(0.1
30)
(0.0
79)
(0.1
00)
(0.0
84)
(0.1
30)
(0.0
80)
(0.1
22)
(0.0
78)
(010
9)
INP
C(4
) 0.
279*
**
0.44
3***
0.
228*
**
0.27
1***
0.
208*
**
0.32
9***
0.
005
0.09
2 0.
009
0.01
8
(0.0
74)
(0.1
20)
(0.0
70)
(0.0
90)
(0.0
73)
(0.1
16)
(0.0
69)
(0.1
02)
(0.0
68)
(0.0
94)
Mar
ket e
nviro
nmen
t:(5)
16 to
50
com
petit
ors
0.31
2**
0.55
9***
0.
131
0.20
5 0.
202*
0.
325
0.16
7 0.
310
0.02
5 0.
043
(0
.127
) (0
.212
) (0
.128
) (0
.165
) (0
.124
) (0
.203
) (0
.136
) (0
.204
) (0
.134
) (0
.187
) 6
to 1
5 co
mpe
titor
s 0.
312*
**
0.43
9***
0.
175*
0.
177
0.37
3***
0.
515*
**
0.29
9***
0.
502*
**
0.09
4 0.
140
(0
.103
) (0
.170
) (0
.101
) (0
.133
) (0
.102
) (0
.170
) (0
.110
) (0
.175
) (0
.108
) (0
.154
) up
to 5
five
com
petit
ors
0.38
6***
0.
611*
**
0.14
7 0.
167
0.44
3***
0.
674*
**
0.35
2***
0.
586*
**
0.29
3**
0.43
1***
(0.1
16)
(0.1
95)
(0.1
13)
(0.1
48)
(0.1
15)
(0.1
96)
(0.1
20)
(0.1
91)
(0.1
16)
(0.1
68)
APPR
(6)
0.06
0 0.
181*
**
-0.0
08
0.10
3**
0.02
7 0.
073
0.21
5***
0.
278*
**
0.06
6*
0.09
7**
(0
.038
) (0
.059
) (0
.033
) (0
.043
) (0
.038
) (0
.056
) (0
.036
) (0
.054
) (0
.035
) (0
.048
) TP
OT(7
) 0.
314*
**
0.44
3***
0.
373*
**
0.45
5***
0.
382*
**
0.56
6***
0.
158*
* 0.
239*
* 0.
299*
**
0.41
8***
(0.0
84)
(0.1
29)
(0.0
77)
(0.1
01)
(0.0
82)
(0.1
34)
(0.0
72)
(0.1
07)
(0.0
70)
(0.1
00)
Ext
erna
l sou
rces
of i
nfor
mat
ion:
(8)
U
sers
0.
253*
**
0.36
3***
0.
097
0.14
0 0.
172*
* 0.
262*
* 0.
063
0.09
3 0.
168*
* 0.
222*
*
(0.0
75)
(0.1
20)
(0.0
72)
(0.0
91)
(0.0
75)
(0.1
19)
(0.0
71)
(0.1
05)
(0.0
69)
(0.0
97)
Sup
plie
rs
-0.1
18
-0.1
19
-0.0
81
-0.1
28
-0.1
26
-0.1
61
-0.3
48**
* -0
.426
***
-0.0
39
-0.0
52
(0
.087
) (0
.135
) (0
.129
) (0
.168
) (0
.085
) (0
.135
) (0
.085
) (0
.125
) (0
.080
) (0
.112
) C
ompe
titor
s -0
.245
***
-0.3
89**
* -0
.103
-0
.139
-0
.202
**
-0.3
35**
* -0
.098
-0
.151
-0
.322
***
-0.4
08**
*
(0.0
80)
(0.1
31)
(0.0
75)
(0.0
96)
(0.0
79)
(0.1
29)
(0.0
75)
(0.1
11)
(0.0
74)
(0.1
06)
Affi
liate
d fir
ms
0.06
2 0.
137
0.08
5 0.
095
0.06
9 0.
175
0.05
6 0.
081
-0.0
38
-0.0
36
(0
.092
) (0
.149
) (0
.122
) (0
.160
) (0
.071
) (0
.150
) (0
.080
) (0
.120
) (0
.077
) (0
.111
)

Uni
vers
ities
-0
.013
-0
.073
-0
.001
-0
.065
0.
117
0.14
8 0.
157*
* 0.
299*
* 0.
108
0.09
1
(0.0
94)
(0.1
45)
(0.0
85)
(0.1
09)
(0.0
93)
(0.1
48)
(0.0
80)
(0.1
22)
(0.0
78)
(0.1
10)
Pat
ent d
iscl
osur
es
0.35
2***
0.
520*
* 0.
260*
* 0.
350*
* 0.
315*
* 0.
435*
* 0.
755*
**
1.04
3***
0.
231*
* 0.
278*
*
(0.1
29)
(0.2
08)
(0.1
07)
(0.1
41)
(0.1
31)
(0.2
03)
(0.0
98)
(0.1
53)
(0.0
92)
(0.1
29)
Fairs
, exh
ibiti
ons
0.16
5**
0.28
1**
0.10
1 0.
173*
0.
218*
**
0.34
0***
0.
040
0.04
1 0.
064
0.10
4
(0.0
77)
(0.1
22)
(0.0
72)
(0.0
93)
(0.0
74)
(0.1
23)
(0.0
72)
(0.1
06)
(0.0
69)
(0.0
98)
FIN
_IM
PE
D(9
) -0
.294
***
-0.4
33**
* -0
.153
* -0
.150
-0
.109
-0
.115
-0
.030
-0
.104
-0
.087
-0
.096
(0.0
84)
(0.1
33)
(0.0
83)
(0.1
06)
(0.0
84)
(0.1
33)
(0.0
80)
(0.1
26)
(0.0
80)
(0.1
16)
SK
ILL_
IMP
ED
(10)
-0
.182
**
-0.2
53*
-0.0
24
0.00
4 -0
.129
-0
.224
* -0
.135
* -0
.158
-0
.041
-0
.031
(0.0
83)
(0.1
30)
(0.0
79)
(0.1
02)
(0.0
82)
(0.1
32)
(0.0
82)
(0.1
20)
(0.0
78)
(0.1
11)
L(11)
1.
4E+0
3***
2.
2E-0
3***
7.7E
-04*
**
9.3E
-04*
**1.
9E-0
3***
2.
9E-0
3***
1.2E
-03*
**
1.8E
-03*
**6.
7E-0
4***
9.
2E-0
4***
(3.5
E+0
4)
(4.7
E+0
4)
(2.0
E-0
4)
(2.2
E-0
4)
(3.8
E-0
4)
(5.2
E-0
4)
(1.9
E-0
4)
(2.6
E-0
4)
(1.2
E-0
4)
(1.8
E-0
4)
L2(11
) -6
.8E
-08*
**
-1.0
E-0
7***
-3.7
E-0
8***
-4
.3E
-08*
**-9
.0E
-08*
**
-1.4
E-0
7***
-5.9
E-0
8***
-8
.6E
-08*
**-3
.9E
-08*
**
-5.2
E-0
8***
(1.7
E-0
8)
(3.2
E-0
8)
(9.9
E-0
9)
(1.5
E-0
8)
(1.9
E-0
8)
(3.3
E-0
8)
(9.4
E-0
9)
(1.7
E-0
8)
(8.6
E-0
9)
(1.9
E-0
9)
Hig
h-te
ch m
anuf
actu
ring(1
2)
0.34
9***
0.
563*
**
0.03
5 0.
026
0.43
7***
0.
726*
**
0.38
6***
0.
614*
**
0.38
0***
0.
580*
**
(0
.076
) (0
.140
) (0
.071
) (0
.096
) (0
.075
) (0
.147
) (0
.070
) (0
.123
) (0
.069
) (0
.113
) Y
ear 1
999
-0.2
48**
* //
-0.6
25**
* //
-0.0
96
// 0.
140*
//
-0.0
87
//
(0.0
82)
(-
0.08
0)
(0
.082
)
(0.0
80)
(0
.078
)
Yea
r 200
2 0.
197*
//
-0.3
77**
* //
0.14
7 //
0.33
0***
//
0.19
5**
//
(0.1
06)
(0
.099
)
(0.1
03)
(0
.089
)
(0.0
87)
C
onst
. -0
.412
**
-0.9
12**
* 0.
016
-0.6
20**
* -0
.638
***
-1.0
27**
* -2
.137
***
-3.0
32**
* -1
.432
***
-2.0
55**
*
(0.1
62)
(0.2
43)
(0.1
54)
(0.1
90)
-0.1
63
(0.2
45)
(0.1
70)
(0.3
14)
(0.1
59)
(0.2
47)
N
1691
16
91
1691
16
91
1691
16
91
1691
16
91
1691
16
91
Pse
udo
R2
0.17
9
0.11
3
0.19
5
0.23
1
0.14
2
LR (χ
2 ) 25
5***
90
***
187*
**
87**
* 29
3***
97
***
405*
**
161*
**
300*
**
142*
**
τ
0.60
5
0.40
6
0.61
0
0.57
2
0.50
9 LR
(χ2 );
τ =0
41**
*
20**
*
42**
*
62**
*
54**
*
Not
es: (
1) IN
NO
PD (I
NN
OPC
): in
trodu
ctio
n of
pro
duct
(pro
cess
) inn
ovat
ions
yes
/no;
R&
D: R
&D
act
iviti
es y
es/n
o; P
AT:
pat
ent a
pplic
atio
ns y
es/n
o; W
N: p
rodu
cts
new
for t
he
(wor
ld) m
arke
t; in
199
4-19
96, 1
997-
1999
and
200
0-20
02 re
spec
tivel
y; (2
) D: e
xpec
tatio
ns w
ith re
spec
t to
dem
and
deve
lopm
ent i
n th
e ne
xt th
ree
year
s; tr
ansf
orm
atio
n of
a fi
ve-
leve
l ord
inal
var
iabl
e (le
vel 1
: ‚ve
ry w
eak’
; lev
el 5
: ‚ve
ry s
trong
“) to
a b
inar
y va
riabl
e (v
alue
1: l
evel
s 4
and
5 of
the
orig
inal
five
-leve
l var
iabl
e; v
alue
0: l
evel
s 1,
2 a
nd 3
of t
he
orig
inal
var
iabl
e); (
3) IP
C: i
nten
sity
of p
rice
com
petit
ion;
orig
inal
and
tran
sfor
med
var
iabl
e as
D; (
4) IN
PC: i
nten
sity
of n
on-p
rice
com
petit
ion;
orig
inal
and
tran
sfor
med
as D
; (5)
m
arke
t env
ironm
ent:
thre
e du
mm
ies
for t
he m
arke
t typ
es: u
p to
5 m
ain
com
petit
ors
on th
e (w
orld
wid
e) p
rodu
ct m
arke
t; 6
to 1
5 co
mpe
titor
s; 1
6-50
com
petit
ors)
; ref
eren
ce: 5
0 an
d m
ore
com
petit
ors;
(6) A
PPR
: ove
rall
effe
ctiv
enes
s of
form
al a
nd in
form
al m
echa
nism
s of
app
ropr
iatio
n of
inno
vatio
n re
turn
s; tr
ansf
orm
atio
n of
a fi
ve-le
vel o
rdin
al v
aria
ble

(leve
l 1: ‚
not e
ffec
tive’
; lev
el 5
: ‚ve
ry e
ffec
tive“
) to
a bi
nary
var
iabl
e (v
alue
1: l
evel
s 4 a
nd 5
of t
he o
rigin
al fi
ve-le
vel v
aria
ble;
val
ue 0
: lev
els 1
, 2 a
nd 3
of t
he o
rigin
al v
aria
ble)
; (7
) TPO
T: te
chno
logi
cal p
oten
tial,
i.e. s
cien
tific
and
tech
nolo
gica
l kno
wle
dge
rele
vant
to th
e fir
m’s
inno
vativ
e ac
tivity
; tra
nsfo
rmat
ion
of a
five
-leve
l ord
inal
var
iabl
e (le
vel 1
: ‚v
ery
low
’; le
vel 5
: ‚ve
ry h
igh“
) to
a bi
nary
var
iabl
e (v
alue
1: l
evel
s 4 a
nd 5
of t
he o
rigin
al fi
ve-le
vel v
aria
ble;
val
ue 0
: lev
els
1, 2
and
3 o
f the
orig
inal
var
iabl
e); (
8): i
mpo
rtanc
e of
sev
en s
ourc
es d
iffer
ent s
ourc
es o
f inn
ovat
ion-
rele
vant
ext
erna
l inf
orm
atio
n; tr
ansf
orm
atio
n of
a fi
ve-le
vel o
rdin
al v
aria
ble
(leve
l 1: ‚
not i
mpo
rtant
’; le
vel 5
: ‚ve
ry im
porta
nt“)
to
a b
inar
y va
riabl
e (v
alue
1: l
evel
s 4
and
5 of
the
orig
inal
five
-leve
l var
iabl
e; v
alue
0: l
evel
s 1,
2 a
nd 3
of t
he o
rigin
al v
aria
ble)
; (9)
: FIN
_IM
PED
: im
porta
nce
of s
horta
ge o
f in
tern
al fi
nanc
ing
reso
urce
s as
an
impe
dim
ent o
f inn
ovat
ive
activ
ity; o
rigin
al a
nd tr
ansf
orm
ed v
aria
ble
as in
(8);
(10)
: SK
ILL_
IMPE
D: i
mpo
rtanc
e of
sho
rtage
of s
kille
d la
bour
; or
igin
al a
nd tr
ansf
orm
ed v
aria
ble
as in
(8)
; (11
): L,
L2 : n
umbe
r of
em
ploy
ees
(in f
ull-t
ime
equi
vale
nts)
; squ
are
of th
e nu
mbe
r of
em
ploy
ees;
(12
) H
igh-
tech
man
ufac
turin
g:
chem
ical
s, pl
astic
s, el
ectri
cal a
nd n
on-e
lect
rical
mac
hine
ry, v
ehic
les;
ele
ctro
nics
/sci
entif
ic in
stru
men
ts; r
efer
ence
: low
-tech
man
ufac
turin
g: fo
od, b
ever
age
and
toba
cco,
text
iles,
clot
hing
and
leat
her,
woo
d pr
oces
sing
, pap
er, p
rintin
g, g
lass
, sto
ne a
nd c
lay,
met
al, m
etal
wor
king
, wat
ches
, oth
er m
anuf
actu
ring,
ene
rgy;
tim
e du
mm
ies
for
1999
and
200
2;
refe
renc
e ye
ar: 1
996;
***
, **,
* d
enot
e st
atis
tical
sign
ifica
nce
at th
e 1%
, 5%
and
10%
test
leve
l res
pect
ivel
y; h
eter
osce
dast
icity
-rob
ust s
tand
ard
erro
rs (W
hite
pro
cedu
re); τ:
shar
e of
var
ianc
e th
at c
an b
e tra
ced
back
to h
eter
ogen
eity
.

Tab
le 2
: Inn
ovat
ion
equa
tion:
det
erm
inan
ts o
f inn
ovat
ion;
met
ric in
nova
tion
indi
cato
rs
Exp
lana
tory
var
iabl
es
LRD
S(1
)
LNE
WS(1
)
LIM
PS(1
)
(T
obit
po
oled
dat
a)
(Tob
it R
ando
m
Effe
cts)
(T
obit
po
oled
dat
a)
(Tob
it R
ando
m
Effe
cts)
(T
obit
po
oled
dat
a) (T
obit
Ran
dom
Ef
fect
s)
D(2
) 1.
402*
**
1.26
9***
0.
697*
**
0.56
4***
0.
492*
**
0.37
5***
(0.2
69)
(0.2
45)
(0.1
12)
(0.1
07)
(0.1
25)
(0.1
22)
IPC
(3)
0.51
5*
0.38
6 0.
066
0.08
8 0.
426*
**
0.42
2***
(0.2
76)
(0.2
61)
(0.1
14)
(0.1
11)
(0.1
28)
(0.1
26)
INP
C(4
) 0.
644*
**
0.69
7***
0.
256*
* 0.
221*
* 0.
320*
**
0.30
5***
(0.2
39)
(0.2
22)
(0.1
00)
(0.0
96)
(0.1
11)
(0.1
08)
Mar
ket e
nviro
nmen
t:(5)
16 to
50
com
petit
ors
0.71
0 0.
591
0.52
7***
0.
462*
* 0.
287
0.20
3
(0.4
66)
(0.4
39)
(0.1
94)
(0.1
89)
(0.2
16)
(0.2
13)
6 to
15
com
petit
ors
1.78
3***
1.
589*
**
0.57
0***
0.
501*
**
0.49
9***
0.
456*
**
(0
.374
) (0
.369
) (0
.158
) (0
.159
) (0
.176
) (0
.177
) up
to 5
five
com
petit
ors
2.09
2 2.
112*
**
0.52
1***
0.
473*
**
0.49
1***
0.
485*
*
(0.4
09)
(0.4
05)
(0.1
72)
(0.1
74)
(0.1
91)
(0.1
93)
APPR
(6)
0.27
5**
0.27
9**
0.09
8*
0.10
4**
0.02
0 0.
034
(0
.122
) (0
.111
) (0
.051
) (0
.048
) (0
.057
) (0
.054
) TP
OT(7
) 1.
488*
**
1.19
8***
0.
373*
**
0.25
9**
0.40
8***
0.
366*
**
(0
.250
) (0
.235
) (0
.106
) (0
.103
) (0
.117
) (0
.115
) E
xter
nal s
ourc
es o
f inf
orm
atio
n:(8
)
Use
rs
0.32
4 0.
220
0.30
8***
0.
298*
**
0.27
8**
0.25
1**
(0
.242
) (0
.227
) (0
.102
) (0
.099
) (0
.113
) (0
.112
) S
uppl
iers
-0
.849
***
-0.6
36**
-0
.072
-0
.019
-0
.191
-0
.139
(0.2
86)
(0.2
67)
(0.1
19)
(0.1
15)
(0.1
32)
(0.1
30)
Com
petit
ors
-0.5
31**
-0
.542
**
-0.2
80**
* -0
.249
**
-0.3
83**
* -0
.411
***
(0
.255
) (0
.237
) (0
.106
) (0
.103
) (0
.118
) (0
.117
) A
ffilia
ted
firm
s 0.
168
0.25
9 0.
033
0.05
8 0.
308*
* 0.
242*
(0.2
75)
(0.2
72)
(0.1
14)
(0.1
14)
(0.1
27)
(0.1
28)
Uni
vers
ities
0.
759*
**
0.66
6**
0.03
8 0.
026
0.25
9**
0.26
0**

(0
.275
) (0
.261
) (0
.116
) (0
.115
) (0
.129
) (0
.129
) P
aten
t dis
clos
ures
1.
064*
**
0.81
8***
0.
173
0.15
9 0.
196
0.21
3
(0.3
33)
(0.3
14)
(0.1
37)
(0.1
34)
(0.1
52)
(0.1
50)
Fairs
, exh
ibiti
ons
0.40
4*
0.33
2 0.
354*
**
0.32
4***
0.
271*
* 0.
310*
**
(0
.244
) (0
.230
) (0
.102
) (0
.100
) (0
.113
) (0
.112
) FI
N_I
MP
ED
(9)
-0.4
48
-0.3
01
-0.2
40**
-0
.215
* -0
.205
-0
.161
(0.2
83)
(0.2
75)
(0.1
19)
(0.1
19)
(0.1
32)
(0.1
33)
SK
ILL_
IMP
ED
(10)
-0
.391
-0
.342
-0
.199
* -0
.185
* -0
.178
-0
.152
(0.2
79)
(0.2
63)
(0.1
15)
(0.1
13)
(0.1
28)
(0.1
27)
L(11)
7.
5E-0
4***
1.
0E-0
3***
3.6E
-04*
**
3.9E
-04*
**5.
1E-0
4***
5.
9E-0
4***
(2.5
E-0
4)
(2.9
E-0
4)(1
.3E
-04)
(1
.5E
-04)
(1.5
E-0
4)
(1.6
E-0
4)
L2(11
) -4
.3E
-08*
**
-5.5
E-0
8**-
2.3E
-08*
-2
.4E
-08*
-3.9
E-0
8***
-4
.3E
-08)
***
(1
.7E
-08)
(1
.9E
-08)
(1.2
E-0
8)
(1.3
E-0
8)(1
.4E
-08)
(1
.5E
-08)
H
igh-
tech
man
ufac
turin
g(12)
2.
169*
**
2.34
5***
0.
559*
**
0.60
4***
0.
494*
**
0.50
8***
(0.2
49)
(0.2
77)
(0.1
04)
(0.1
13)
(0.1
16)
(0.1
23)
Yea
r 199
9 0.
641*
* //
-0.2
53**
//
-0.1
44
//
(0.2
73)
(0
.114
)
(0.1
28)
Y
ear 2
002
1.28
7***
//
-0.0
60
// -0
.049
//
(0
.307
)
(0.1
27)
(0
.142
)
Con
st.
-1.9
03**
* -1
.298
**
-0.1
23
-0.1
86
-0.2
25
-0.3
04
(0
.562
) (0
.525
) (0
.238
) (0
.223
) (0
.264
) (0
.249
) N
16
91
1691
16
91
1691
16
91
1691
N
(left-
cens
ored
)
471
51
8
576
Pse
udo
R2
0.07
2
0.04
5
0.03
8
LR (χ
2 ) 50
4***
38
3***
27
3***
20
5***
22
7***
19
5***
τ
(χ2 )
0.
637*
**
0.
460*
**
0.
373*
**
Not
es:
(1)
LRD
S: lo
garit
hm o
f R
&D
exp
endi
ture
s di
vide
d bx
ale
s; L
NEW
S: lo
garit
hm o
f sa
les
shar
e of
new
pro
duct
s; L
IMPS
: log
arith
m o
f sa
les
shar
e of
(al
read
y ex
istin
g)
cons
ider
ably
mod
ified
pro
duct
s; in
199
5, 1
998
and
2001
resp
ectiv
ely;
(2) D
: exp
ecta
tions
with
resp
ect t
o de
man
d de
velo
pmen
t in
the
next
thre
e ye
ars;
tran
sfor
mat
ion
of a
five
-le
vel o
rdin
al v
aria
ble
(leve
l 1: ‚
very
wea
k’; l
evel
5: ‚
very
stro
ng“)
to a
bin
ary
varia
ble
(val
ue 1
: lev
els
4 an
d 5
of th
e or
igin
al fi
ve-le
vel v
aria
ble;
val
ue 0
: lev
els
1, 2
and
3 o
f the
or
igin
al v
aria
ble)
; (3)
IPC
: int
ensi
ty o
f pric
e co
mpe
titio
n; o
rigin
al a
nd tr
ansf
orm
ed v
aria
ble
as D
; (4)
INPC
: int
ensi
ty o
f non
-pric
e co
mpe
titio
n; o
rigin
al a
nd tr
ansf
orm
ed a
s D; (
5)
mar
ket e
nviro
nmen
t: th
ree
dum
mie
s fo
r the
mar
ket t
ypes
: up
to 5
mai
n co
mpe
titor
s on
the
(wor
ldw
ide)
pro
duct
mar
ket;
6 to
15
com
petit
ors;
16-
50 c
ompe
titor
s); r
efer
ence
: 50
and
mor
e co
mpe
titor
s; (6
) APP
R: o
vera
ll ef
fect
iven
ess
of fo
rmal
and
info
rmal
mec
hani
sms
of a
ppro
pria
tion
of in
nova
tion
retu
rns;
tran
sfor
mat
ion
of a
five
-leve
l ord
inal
var
iabl
e (le
vel 1
: ‚no
t eff
ectiv
e’; l
evel
5: ‚
very
eff
ectiv
e“) t
o a
bina
ry v
aria
ble
(val
ue 1
: lev
els 4
and
5 o
f the
orig
inal
five
-leve
l var
iabl
e; v
alue
0: l
evel
s 1, 2
and
3 o
f the
orig
inal
var
iabl
e);

(7) T
POT:
tech
nolo
gica
l pot
entia
l, i.e
. sci
entif
ic a
nd te
chno
logi
cal k
now
ledg
e re
leva
nt to
the
firm
’s in
nova
tive
activ
ity; t
rans
form
atio
n of
a fi
ve-le
vel o
rdin
al v
aria
ble
(leve
l 1:
‚ver
y lo
w’;
leve
l 5: ‚
very
hig
h“) t
o a
bina
ry v
aria
ble
(val
ue 1
: lev
els 4
and
5 o
f the
orig
inal
five
-leve
l var
iabl
e; v
alue
0: l
evel
s 1,
2 a
nd 3
of t
he o
rigin
al v
aria
ble)
; (8)
: im
porta
nce
of s
even
sou
rces
diff
eren
t sou
rces
of i
nnov
atio
n-re
leva
nt e
xter
nal i
nfor
mat
ion;
tran
sfor
mat
ion
of a
five
-leve
l ord
inal
var
iabl
e (le
vel 1
: ‚no
t im
porta
nt’;
leve
l 5: ‚
very
impo
rtant
“)
to a
bin
ary
varia
ble
(val
ue 1
: lev
els
4 an
d 5
of th
e or
igin
al fi
ve-le
vel v
aria
ble;
val
ue 0
: lev
els
1, 2
and
3 o
f the
orig
inal
var
iabl
e); (
9): F
IN_I
MPE
D: i
mpo
rtanc
e of
sho
rtage
of
inte
rnal
fina
ncin
g re
sour
ces
as a
n im
pedi
men
t of i
nnov
ativ
e ac
tivity
; orig
inal
and
tran
sfor
med
var
iabl
e as
in (8
); (1
0): S
KIL
L_IM
PED
: im
porta
nce
of s
horta
ge o
f ski
lled
labo
ur;
orig
inal
and
tra
nsfo
rmed
var
iabl
e as
in
(8);
(11)
: L,
L2 :
num
ber
of e
mpl
oyee
s (in
ful
l-tim
e eq
uiva
lent
s; s
quar
e of
the
num
ber
of e
mpl
oyee
s; (
12)
Hig
h-te
ch m
anuf
actu
ring:
ch
emic
als,
plas
tics,
elec
trica
l and
non
-ele
ctric
al m
achi
nery
, veh
icle
s; e
lect
roni
cs/s
cien
tific
inst
rum
ents
; ref
eren
ce: l
ow-te
ch m
anuf
actu
ring:
food
, bev
erag
e an
d to
bacc
o, te
xtile
s, cl
othi
ng a
nd le
athe
r, w
ood
proc
essi
ng, p
aper
, prin
ting,
gla
ss, s
tone
and
cla
y, m
etal
, met
alw
orki
ng, w
atch
es, o
ther
man
ufac
turin
g, e
nerg
y; ti
me
dum
mie
s fo
r 19
99 a
nd 2
002;
re
fere
nce
year
: 199
6; *
**, *
*, *
den
ote
stat
istic
al si
gnifi
canc
e at
the
1%, 5
% a
nd 1
0% te
st le
vel r
espe
ctiv
ely;
het
eros
ceda
stic
ity-r
obus
t sta
ndar
d er
rors
(Whi
te p
roce
dure
); τ:
shar
e of
var
ianc
e th
at c
an b
e tra
ced
back
to h
eter
ogen
eity
.
.

Tab
le 3
: Pro
duct
ivity
equ
atio
n; d
epen
dent
var
iabl
e: v
alue
add
ed p
er e
mpl
oyee
; dic
hoto
mou
s inn
ovat
ion
indi
cato
rs
Exp
lana
tory
var
iabl
es
2SLS
poo
led
data
G2S
LS
Ran
dom
-ef
fect
s 2S
LS p
oole
d da
ta
G2S
LS
Ran
dom
-ef
fect
s 2S
LS p
oole
d da
ta
G2S
LS
Ran
dom
-ef
fect
s 2S
LS p
oole
d da
ta
G2S
LS
Ran
dom
-ef
fect
s
2SLS
po
oled
da
ta
G2S
LS
Ran
dom
-ef
fect
s
(INN
OP
D
(INN
OP
D
INN
OPC
(IN
NO
PC
(R
&D
(R&D
(P
AT
(PA
T (W
N
(WN
in
stru
- m
ente
d)
inst
ru-
men
ted)
In
stru
- m
ente
d in
stru
- m
ente
d)
Inst
ru-
men
ted)
in
stru
- m
ente
d)
inst
ru-
Men
ted)
in
stru
- M
ente
d)
inst
ru-
men
ted)
in
stru
- M
ente
d)
LHK(1
) 0.
073*
**
0.05
0***
0.
074*
**
0.06
7***
0.
051*
**
0.04
6***
0.
056*
**
0.04
8***
0.
063*
**
0.05
5***
(0.0
14)
(0.0
14)
(0.0
14)
(0.0
13)
(0.0
14)
(0.0
14)
(0.0
13)
(0.0
13)
(0.0
13)
(0.0
13)
RD
SK
ILL_
IMP
ED
(2)
-0.0
05
-0.0
30
-0.0
48**
-0
.049
**
-0.0
41*
-0.0
40*
-0.0
63**
* -0
.057
***
-0.0
54**
-0
.052
**
(0
.026
) (0
.023
) (0
.023
) (0
.022
) (0
.023
) (0
.023
) (0
.022
) (0
.021
) (0
.021
) (0
.021
) LC
(3)
0.02
6***
0.
024*
**
0.03
0***
0.
023*
**
0.02
8***
0.
026*
**
0.02
7***
0.
026*
**
0.02
7***
0.
025*
**
(0
.007
) (0
.004
) (0
.008
) (0
.004
) (0
.007
) (0
.004
) (0
.008
) (0
.004
) (0
.007
) (0
.004
) IN
NO
PD(4
) 0.
500*
**
0.55
2***
//
// //
// //
// //
//
(0.1
12)
(0.1
25)
INN
OPC
(5)
// //
0.45
4***
0.
411*
**
// //
// //
// //
(0
.100
) (0
.105
)
R
&D
(6)
// //
// //
0.50
2***
0.
582*
**
// //
// //
(0
.101
) (0
.120
)
PA
T(7)
// //
// //
// //
0.37
1***
0.
393*
**
// //
(0
.080
) (0
.094
)
W
N(8
) //
// //
// //
// //
// 0.
231*
**
0.29
4***
(0.0
83)
(0.1
05)
FOR
EIG
N(9
) 0.
114*
**
0.08
7***
0.
137*
**
0.08
5***
0.
130*
**
0.10
9***
0.
131*
**
0.09
3***
0.
105*
**
0.07
2***
(0.0
33)
(0.0
32)
(0.0
36)
(0.0
33)
(0.0
33)
(0.0
32)
(0.0
32)
(0.0
30)
(0.0
31)
(0.0
30)
Yea
r 199
9 0.
086*
**
// 0.
130*
**
// 0.
061*
* //
0.04
2*
// 0.
054*
* //
(0
.026
)
(0.0
32)
(0
.024
)
(0.0
23)
(0
.022
)
Yea
r 200
2 0.
093*
**
// 0.
159*
**
// 0.
092*
**
// 0.
066*
* //
0.10
3***
//
(0
.027
)
(0.0
32)
(0
.027
)
(0.0
29)
(0
.026
)
Con
st.
11.6
64**
* 11
.687
***
11.7
14**
* 11
.819
***
11.6
66**
* 11
.657
***
11.9
99**
* 12
.020
***
11.9
90**
*12.
026*
**
(0
.105
) (0
.098
) (0
.103
) (0
.087
) (0
.098
) (0
.098
) (0
.067
) (0
.057
) (0
.064
) (0
.056
) In
dust
ry d
umm
ies
yes
(17)
ye
s (1
7)
yes
(17)
ye
s (1
7)
yes
(17)
ye
s (1
7)
yes
(17)
ye
s (1
7)
yes
(17)
Firm
siz
e du
mm
ies
yes
(6)
yes
(6)
yes
(6)
yes
(6)
yes
(6)
yes
(6)
yes
(6)
yes
(6)
yes
(6)
yes
(6)

N
1691
16
91
1691
16
91
1691
16
91
1691
16
91
1691
16
91
R2
0.01
5
0.04
3
0.03
4
0.12
9
0.18
1
F 12
***
13
***
12
***
13
***
14
***
S
ER
0.
395
0.
395
0.
391
0.
371
0.
361
R
2 ove
rall
0.
096
0.
120
0.
104
0.
150
0.
155
Wal
d (χ
2 )
235*
**
22
0***
243*
**
26
3***
265*
**
τ
0.
590
0.
725
0.
574
0.
623
0.
597
Not
es: (
1) L
HK
: log
arith
m o
f th
e sh
are
of e
mpl
oyee
s w
ith te
rtiar
y-le
vel e
duca
tion;
(2)
RD
SKIL
L_IM
PED
: sho
rtage
of
R&
D p
erso
nnel
; tra
nsfo
rmat
ion
of a
fiv
e-le
vel o
rdin
al
varia
ble
(leve
l 1: ‚
not i
mpo
rtant
’; le
vel 5
: ‚ve
ry im
porta
nt’)
to a
bin
ary
varia
ble
(val
ue 1
: lev
els 4
and
5 o
f the
orig
inal
five
-leve
l var
iabl
e; v
alue
0: l
evel
s 1, 2
and
3 o
f the
orig
inal
va
riabl
e); (
3) L
C: l
ogar
ithm
of
capi
tal i
ncom
e pr
o em
ploy
ee (
capi
tal i
ncom
e=va
lue
adde
d m
inus
wag
e co
sts)
; (4)
IN
NO
PD: i
ntro
duct
ion
of p
rodu
ct in
nova
tions
yes
/no;
(5)
: in
trodu
ctio
n of
pro
cess
inno
vatio
ns; (
6) R
&D
: R&
D a
ctiv
ities
yes
/no;
(7) P
AT:
pat
ent a
pplic
atio
ns y
es/n
o; (8
) WN
: pro
duct
s ne
w fo
r the
(wor
ld) m
arke
t; in
199
4-19
96, 1
997-
1999
and
200
0-20
02 r
espe
ctiv
ely;
(9)
: FO
REI
GN
: for
eign
firm
yes
/no;
dum
my
varia
bles
for
2-d
igit
indu
strie
s an
d fir
m s
ize;
ref
eren
ce in
dust
ry: f
ood,
bev
erag
e an
d to
bacc
o;
refe
renc
e fir
m s
ize
clas
s: 5
-19
empl
oyee
s; ti
me
dum
mie
s fo
r 19
99 a
nd 2
002;
ref
eren
ce y
ear:
1996
; ***
, **,
* d
enot
e st
atis
tical
sig
nific
ance
at t
he 1
%, 5
% a
nd 1
0% te
st le
vel
resp
ectiv
ely;
het
eros
ceda
stic
ity-r
obus
t sta
ndar
d er
rors
(Whi
te p
roce
dure
); τ:
shar
e of
var
ianc
e th
at c
an b
e tra
ced
back
to h
eter
ogen
eity
.
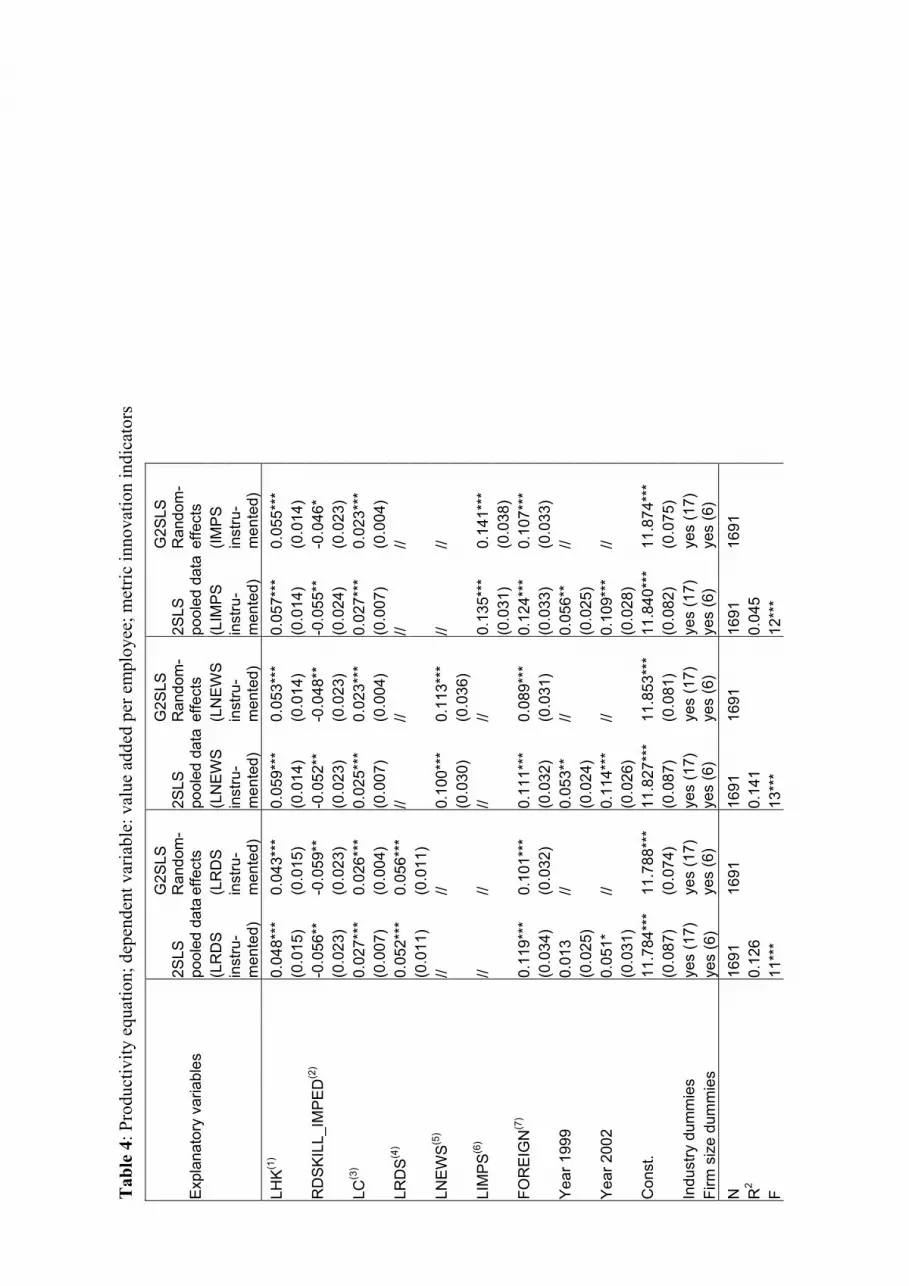
Tab
le 4
: Pro
duct
ivity
equ
atio
n; d
epen
dent
var
iabl
e: v
alue
add
ed p
er e
mpl
oyee
; met
ric in
nova
tion
indi
cato
rs
Exp
lana
tory
var
iabl
es
2SLS
po
oled
dat
a
G2S
LS
Ran
dom
-ef
fect
s 2S
LS
pool
ed d
ata
G2S
LS
Ran
dom
-ef
fect
s 2S
LS
pool
ed d
ata
G2S
LS
Ran
dom
-ef
fect
s
(LR
DS
(LR
DS
(L
NE
WS
(LN
EW
S
(LIM
PS
(IMP
S
in
stru
- m
ente
d)
inst
ru-
men
ted)
in
stru
- m
ente
d)
inst
ru-
men
ted)
in
stru
- m
ente
d)
inst
ru-
men
ted)
LH
K(1)
0.04
8***
0.
043*
**
0.05
9***
0.
053*
**
0.05
7***
0.
055*
**
(0
.015
) (0
.015
) (0
.014
) (0
.014
) (0
.014
) (0
.014
) R
DS
KIL
L_IM
PE
D(2
) -0
.056
**
-0.0
59**
-0
.052
**
-0.0
48**
-0
.055
**
-0.0
46*
(0
.023
) (0
.023
) (0
.023
) (0
.023
) (0
.024
) (0
.023
) LC
(3)
0.02
7***
0.
026*
**
0.02
5***
0.
023*
**
0.02
7***
0.
023*
**
(0
.007
) (0
.004
) (0
.007
) (0
.004
) (0
.007
) (0
.004
) LR
DS(4
) 0.
052*
**
0.05
6***
//
// //
//
(0.0
11)
(0.0
11)
LNE
WS(5
) //
// 0.
100*
**
0.11
3***
//
//
(0.0
30)
(0.0
36)
LIM
PS(6
) //
// //
// 0.
135*
**
0.14
1***
(0.0
31)
(0.0
38)
FOR
EIG
N(7
) 0.
119*
**
0.10
1***
0.
111*
**
0.08
9***
0.
124*
**
0.10
7***
(0.0
34)
(0.0
32)
(0.0
32)
(0.0
31)
(0.0
33)
(0.0
33)
Yea
r 199
9 0.
013
// 0.
053*
* //
0.05
6**
//
(0.0
25)
(0
.024
)
(0.0
25)
Y
ear 2
002
0.05
1*
// 0.
114*
**
// 0.
109*
**
//
(0.0
31)
(0
.026
)
(0.0
28)
C
onst
. 11
.784
***
11.7
88**
* 11
.827
***
11.8
53**
* 11
.840
***
11.8
74**
*
(0.0
87)
(0.0
74)
(0.0
87)
(0.0
81)
(0.0
82)
(0.0
75)
Indu
stry
dum
mie
s ye
s (1
7)
yes
(17)
ye
s (1
7)
yes
(17)
ye
s (1
7)
yes
(17)
Fi
rm s
ize
dum
mie
s ye
s (6
) ye
s (6
) ye
s (6
) ye
s (6
) ye
s (6
) ye
s (6
)
N
1691
16
91
1691
16
91
1691
16
91
R2
0.12
6
0.14
1
0.04
5
F 11
***
13
***
12
***

SE
R
0.37
1
0.37
2
0.39
2
R2 o
vera
ll
0.14
8
0.14
1
0.11
6 W
ald
(χ2 )
24
1***
259*
**
22
7***
Τ
0.
549
0.
525
0.
621
Not
es:
(1)
LHK
: log
arith
m o
f th
e sh
are
of e
mpl
oyee
s w
ith te
rtiar
y-le
vel e
duca
tion;
(2)
RD
SKIL
L_IM
PED
: sho
rtage
of
R&
D p
erso
nnel
; tra
nsfo
rmat
ion
of a
fiv
e-le
vel o
rdin
al
varia
ble
(leve
l 1: ‚
not i
mpo
rtant
’; le
vel 5
: ‚ve
ry im
porta
nt’)
to a
bin
ary
varia
ble
(val
ue 1
: lev
els 4
and
5 o
f the
orig
inal
five
-leve
l var
iabl
e; v
alue
0: l
evel
s 1, 2
and
3 o
f the
orig
inal
va
riabl
e); (
3) L
C: l
ogar
ithm
of c
apita
l inc
ome
pro
empl
oyee
(cap
ital i
ncom
e=va
lue
adde
d m
inus
wag
e co
sts)
; (4)
LR
DS:
loga
rithm
of
R&
D e
xpen
ditu
res
divi
ded
by s
ales
; (5)
LN
EWS:
log
arith
m o
f sa
les
shar
e of
new
pro
duct
s; (
6) L
IMPS
: lo
garit
hm o
f sa
les
shar
e of
(al
read
y ex
istin
g) c
onsi
dera
bly
mod
ified
pro
duct
s; i
n 19
95,
1998
and
200
1 re
spec
tivel
y; (7
): FO
REI
GN
: for
eign
firm
yes
/no;
dum
my
varia
bles
for 2
-dig
it in
dust
ries
and
firm
siz
e; re
fere
nce
indu
stry
: foo
d, b
ever
age
and
toba
cco;
refe
renc
e fir
m s
ize
clas
s:
5-19
em
ploy
ees;
tim
e du
mm
ies
for
1999
and
200
2; r
efer
ence
yea
r: 19
96;
***,
**,
* d
enot
e st
atis
tical
sig
nific
ance
at
the
1%,
5% a
nd 1
0% t
est
leve
l re
spec
tivel
y;
hete
rosc
edas
ticity
-rob
ust s
tand
ard
erro
rs (W
hite
pro
cedu
re); τ:
shar
e of
var
ianc
e th
at c
an b
e tra
ced
back
to h
eter
ogen
eity
.

APPENDIX:
Table A.1: Composition of the dataset
Industry N Percentage of firms Food, beverage, tobacco 125 7.4 Textiles 54 3.2 Clothing, leather 27 1.6 Wood processing 79 4.7 Paper 41 2.4 Printing 107 6.3 Chemicals 98 5.8 Plastics, rubber 86 5.1 Glass, stone, clay 79 4.7 Metal 39 2.3 Metalworking 252 14.9 Machinery 260 15.4 Electrical machinery 73 4.3 Electronics, instruments 162 9.6 Watches 59 3.5 Vehicles 32 1.9 Other manufacturing 78 4.6 Energy 39 2.3 Firm size 5 to 19 employees 399 23.6 20-49 employees 370 21.9 50-99 employees 296 17.5 100-199 employees 298 17.6 200-499 employees 213 12.6 500-999 employees 71 4.2 1000 employees and more 44 2.6 Year 1996 512 30.3 Year 1999 512 30.3 Year 2002 666 39.4 Total 1691 100
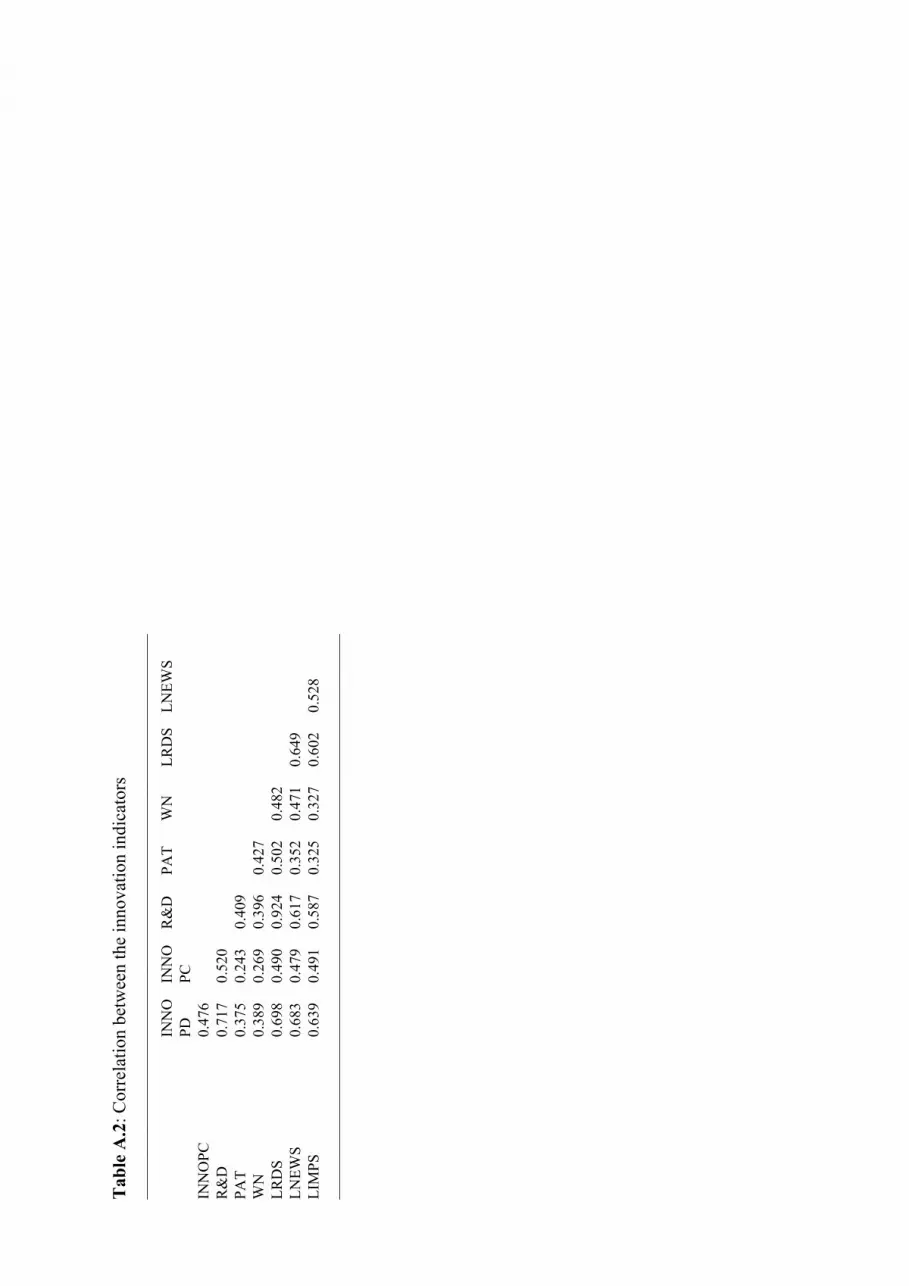
Tab
le A
.2: C
orre
latio
n be
twee
n th
e in
nova
tion
indi
cato
rs
____
____
____
____
____
____
____
____
____
____
____
____
____
____
____
____
____
____
__
IN
NO
IN
NO
R
&D
PA
T W
N
LRD
S LN
EWS
PD
PC
IN
NO
PC
0.
476
R&
D
0.71
7 0.
520
PAT
0.37
5 0.
243
0.40
9 W
N
0.38
9 0.
269
0.39
6 0.
427
LRD
S
0.
698
0.49
0 0.
924
0.50
2 0.
482
LNEW
S
0.68
3 0.
479
0.61
7 0.
352
0.47
1 0.
649
LIM
PS
0.
639
0.49
1 0.
587
0.32
5 0.
327
0.60
2 0.
528
____
____
____
____
____
____
____
____
____
____
____
____
____
____
____
____
____
____
__

Tab
le A
.3: C
orre
latio
n m
atrix
; inn
ovat
ion
mod
el
____
____
____
____
____
____
____
____
____
____
____
____
____
____
____
____
____
____
____
____
____
____
____
____
____
____
____
____
____
____
____
____
____
____
____
_
D
IP
C
INPC
16
-50
6-15
up
to 5
A
PPR
TP
OT
user
s su
ppl.
com
pet.
affil
. un
iver
s. pa
tent
fa
irs
FIN
_ SK
ILL_
co
mp.
co
mp.
co
mp.
disc
l. ex
hib.
IM
PED
IM
PED
IP
C
-0.0
85
INPC
0
.096
-0
.009
16
-50
com
petit
ors
-0.0
58
0.0
42
-0.0
27
6-15
com
petit
ors
0
.037
0
.035
0
.043
-0
.359
up
to 5
com
petit
ors
0.0
70
-0.1
15
-0.0
43
-0.2
25
-0.5
13
APP
R
0.1
16
0.0
09
0.1
60
-0.0
41
0.0
23
0.0
80
TPO
T
0
.110
0
.047
0
.120
-0
.027
0
.026
0
.021
0
.234
us
ers
0.0
38
0.0
38
0.0
71
-0.0
24
0.0
30
0.0
23
0.1
52
0.11
7 su
pplie
rs
-0
.003
0
.063
0
.071
-0
.001
0
.031
0
.056
0
.069
0.
074
0.12
7 co
mpe
titor
s
0.0
03
0.0
66
0.0
91
-0.0
12
0.0
14
0.0
14
0.1
20
0.09
7 0.
216
0.13
4 af
filia
ted
firm
s
0.0
19
0.0
52
0.0
77
-0.0
22
0.0
53
0.0
39
0.1
24
0.08
0 0.
128
0.04
3 0.
187
univ
ersi
ties
0
.063
0
.053
0
.097
-0
.036
0
.033
0
.028
0
.161
0.
261
0.07
6 0.
039
0.11
3 0
.151
pa
tent
dis
clos
ures
0
.113
0
.025
0
.066
-0
.030
0
.032
0
.060
0
.270
0.
170
0.10
4 0.
022
0.10
1 0
.102
0
.240
fa
irs, e
xhib
ition
s
0.0
05
0.0
58
0.0
94
0.0
18
0.0
14
0.0
11
0.1
62
0.10
9 0.
239
0.16
1 0.
185
0.0
59
0.1
01
0.1
76
FIN
_IM
PED
-0.0
35
0.0
72
0.0
01
0.2
70
0.0
15
0.0
54
-0.0
02
0.05
0 0.
044
0.04
4 0.
028
-0.0
58
0.0
19
-0.0
26
0.07
8 SK
ILL_
IMPE
D
-0.0
22
0.0
51
0.0
20
0.0
21
-0.0
10
-0.0
46
-0.0
07
0.03
7 0.
044
0.09
4 0.
056
-0.0
08
0.0
26
0.0
02
0.07
1 0
.129
L
0.0
76
0.1
48
0.0
65
-0.0
31
0.1
31
0.0
34
0.1
58
0.12
5 0.
114
0.03
7 0.
093
0.2
67
0.1
63
0.1
82
0.04
2 -0
.191
-0
.044
__
____
____
____
____
____
____
____
____
____
____
____
____
____
____
____
____
____
____
____
____
____
____
____
____
____
____
____
____
____
____
____
____
____
____
__

Tab
le A
.4: C
orre
latio
n m
atrix
; pro
duct
ivity
mod
el
____
____
____
____
____
____
____
____
____
____
____
____
____
____
_
LC
LH
K
RD
SKIL
L F
OR
EIG
N
IM
PED
LH
K
-0.0
30
RD
SKIL
L_IM
PED
0
.022
-0
.004
FO
REI
GN
0.0
10
0.0
22
0.0
45
INN
OPD
0.0
11
-0.0
13
0.0
18
0.
107
INN
OPC
0.0
09
-0.0
92
0.0
48
0.
002
R&
D
0.0
09
-0.0
18
0.0
46
0.
085
PAT
-0.0
15
-0.0
58
0.0
74
0.
097
WN
0
.001
0
.075
0
.054
0.09
7 LR
DS
-0.0
23
0.0
71
0.0
68
0.
117
LNEW
S
0.0
25
0.0
13
0.0
17
0.
101
LIM
PS
-0
.024
-0
.007
0
.015
0.07
1 __
____
____
____
____
____
____
____
____
____
____
____
____
____
___