triplet-triplet annihilation upconversion based nanocapsules for bioimaging under excitation by red...
TRANSCRIPT

Full Paper
1422
Triplet–Triplet Annihilation UpconversionBased Nanocapsules for Bioimaging UnderExcitation by Red and Deep-Red Lighta
Christian Wohnhaas, Volker Mail€ander, Melanie Dr€oge, Mikhail A. Filatov,Dmitry Busko, Yuri Avlasevich, Stanislav Baluschev,* Tzenka Miteva,Katharina Landfester, Andrey Turshatov*
Non-toxic and biocompatible triplet–triplet annihilation upconversion based nanocapsules(size less than 225nm) were successfully fabricated by the combination of miniemulsion andsolvent evaporation techniques. A first type of nanocapsules displays an upconversionspectrum characterized by the maximum of emission at lmax¼ 550nm under illumination byred light, lexc¼ 633nm. The second type of nanocapsules fluoresces at lmax¼ 555nm when
excited with deep-red light, lexc¼ 708nm. Conventionalconfocal laser scanning microscopy (CLSM) and flowcytometry were applied to determine uptake andtoxicity of the nanocapsules for various (mesenchymalstem and HeLa) cells. Red light (lexc¼ 633nm) withextremely low optical power (less than 0.3mW) or deep-red light (lexc¼ 708nm) was used in CLSM experimentsto generate green upconversion fluorescence. The cellimages obtained with upconversion excitation demon-strate order of magnitude better signal to backgroundratio than the cell images obtainedwith direct excitationof the same fluorescence marker.Dr. C. Wohnhaas, Dr. V. Mail€ander, M. Dr€oge, Dr. M. A. Filatov,D. Busko, Dr. Y. Avlasevich, Prof. Dr. S. Baluschev,Prof. K. Landfester, Dr. A. TurshatovMax Planck Institute for Polymer Research, Ackermannweg 10,55128 Mainz, GermanyE-mail: [email protected]
Dr. V. Mail€anThird DepartJohannes GuGermanyProf. Dr. S. BOptics and SUniversity ‘‘SBulgariaDr. T. MitevaMaterials ScHedelfingers
aSupporting Information is available at Wiley Online Library or fromthe author.
� 2013 WILEY-VCH Verlag GmbH & Co. KGaA, WeinheimMacromol. Biosci. 2013, 13, 1422–1430
wileyonlinelibrary.com
1. Introduction
The process of the generation of photons with a higher
energy under excitation by photons with a lower energy is
known as photon upconversion (UC). There are a number of
upconversion techniques, for example, second harmonic
generation,[1] two-photon absorption,[2] sequential energy
transfer (or excited-state absorption) in rare earth ion-
derment of Medicine, University Medicine of thetenberg University, Langenbeckstr. 1, 55131 Mainz,
aluschevpectroscopy Department, Faculty of Physics, Sofiat. Kliment Ochridski,’’ James Bourchier 5, 1164 Sofia,
ience Laboratory, Sony Deutschland GmbH,tr. 61, 70327 Stuttgart, Germany
DOI: 10.1002/mabi.201300149

Triplet–Triplet Annihilation Upconversion Based Nanocapsules . . .
www.mbs-journal.de
doped inorganic glasses,[3] and triplet–triplet annihilation
assisted upconversion (TTA-UC).[4–13] In comparison with
the mentioned upconversion tools, TTA-UC shows several
outstanding advantages. First, UC emission is observed
under very weak excitation intensity (down to mW cm�2)
and low spectral power density (as low as mW nm�1).
Therefore, the technical requirements for the appropriate
excitation sources could be fulfilled by low-power continu-
ous wave (cw) – diode lasers or other conventional light
sources (such as light emitting diodes). Second, the
excitation wavelength of the TTA-UC process is easily
tunable and can be gradually extended from visible to NIR
region by using sensitizers with red-shifted absorption
bands.[14] By tuning the molar ratio of the sensitizer to the
emitter, one can find a composition where the optical
signals of the UC fluorescence and the residual phospho-
rescence of the sensitizer have a comparable intensity.
The phosphorescence of the sensitizer shows a bath-
ochromic shift relative to the excitation wavelength
(DlPhos> 150nm) whereas the corresponding UC fluores-
cence has a hypsochromic shift relative to the excitation
wavelength (DlUC> 100nm). Consequently, two optical
signals (the residual phosphorescence and the delayed UC
fluorescence) could provide a ratiometric measuring
scheme. Furthermore, phosphorescence and upconversion
fluorescence are examples of delayed emission. Therefore, a
time-resolved registration might provide an additional
improvement of the detection quality: the problems,which
are caused by scattering of the excitation light or by
autofluorescence with short lifetime, can be eliminated by
using a pulsed excitation and time-gated detection.
Summarizing all advantages, we can conclude that the
TTA-UC is a highly promising tool for bioimaging operating
under red or near infrared (NIR) optical excitation,
since only excitation light with wavelength longer than
600 nm[15–17] penetrates deep enough into the tissue and
can locally generate via TTA-UC process blue photons,
which canbeused for FRETassays ormulticolor targetingof
cancer cells.
Despite the demonstrated advantages, a few significant
drawbacks restrict the applicability of TTA-UC in biosci-
ence: the typical TTA-UC system consists of two dyes
(sensitizer and emitter) dissolved in an oxygen-free organic
solvent (toluene, for instance). An imperative requirement
for bio-applications is transferring the TTA-UC process
from the organic solvent into aqueousmedia. Recently, the
TTA-UC was performed in water environment via an
encapsulation of the UC dyes in micelles out of a
biocompatible non-ionic surfactant,[18] polymer nanopar-
ticles with sizes of 1[19] and 322nm,[20] poly(propylene
oxide) core/silica dioxide shell nanoparticles (size nearly
22.5 nm)[21] or microcapsules with the size of 200[22] and
350mm.[23]Most of the fabricatedmaterials have, however,
one similar characteristic: palladium (PdOEP) or platinum
Macromol. Biosci. 20
� 2013 WILEY-VCH Verlag Gmwww.MaterialsViews.com
octaethyl porphyrin and diphenylanthracene (DPA) were
used as upconverting dyes (UC excitation lexc¼ 532nm,UC
fluorescencewith lmax¼ 435nm).[19–22] Thus, there remain
open questions. First, could the methods suggested
elsewhere[19–22] be expanded with UC sensitizers which
absorb light in red or NIR regions of the spectrum?
Substantial progress was achieved recently when Liu
et al.[24] reported a successful example of red-to-green
upconversion measured in vivo (in living mouse) by using
nanocapsules designed as the soybean oil core and a shell
formed from a bovine serum albumin–dextran conjugate.
Another important question is: are all fabricated nano-
materials able to work efficiently under conditions with
different concentrations ofmolecular oxygen? For instance,
there isasignificantoxygentensionof0.5–2.5 kPa (less than
in air 21 kPa) in a tissue.[25] Thus, TTA-UCmight be strongly
quenched bymolecular oxygen.[26] Monguzzi et al.[19] have
shown that highly crosslinked polymer nanoparticles are
able to protect the TTA-UC process fromoxygen quenching.
Retarding the molecular oxygen by a cross-linked polymer
shell in microcapsules was demonstrated by Kang and
Reichmanis[23] as well. Liu et al.[21] synthesized the poly
(propylene oxide) core/silica dioxide shell nanoparticles
(with PdOEP and DPA as UC dyes) and reported rather high
UC quantum yield of 4% in aerobic conditions. In contrast,
there are two publications[27,28] where the authors
synthesized nanoparticles, which have equivalent proper-
ties with respect to the nanoparticles reported by Liu
etal.[21] (there isonly insignificantdifference in theoriginof
the loaded dyes) and proved the penetration of the
molecular oxygen through the silica dioxide shell. More-
over, nanoparticles (loaded with platinum(II) meso-tetra-
phenyltetrabenzoporphyrin) prepared by Wang at al.[28]
demonstrate strong quenching of the phosphorescence of
the porphyrin by molecular oxygen and are used as an
oxygen sensor. In order to reduce the effect of molecular
oxygen, an alternative method was demonstrated by Kim
and Kim.[22] They used the mixture of hexadecane and
polyisobutylene (PIB) as the inner solvent phase for
upconverting microcapsules and postulated that the
vanishing of the oxygen quenching is related to the oxygen
impermeability of PIB. Indeed, the PIB polymer demon-
strates low permeability to gas molecules. However, this
explanation is unpersuasive in case of 5% PIB solution in
hexadecane.
In our previous paper, we described an efficient method
to incorporate the UC system in polymeric nanocapsules
(NCs) via radical miniemulsion polymerization.[29] The UC
couple of dyes dissolved in a liquid hexadecane core was
embeddedwithin polystyrene-co-polyacrylic acid NCs (size
180nm). However, the radicals generated in the process of
the radical miniemulsion polymerization reacted with the
potential sensitizers for red and deep-red excitation
(tetrabenzoporphyrins and tetranaphthoporphyrins) and
13, 13, 1422–1430
bH & Co. KGaA, Weinheim 1423

www.mbs-journal.de
C. Wohnhaas et al.
1424
destroyed them chemically. Taking into account this
limitation,we havemodified themethod. Themodification
allowed to incorporate red and deep-red UC sensitizers
into polymer NCs by combination of miniemulsion and
solvent evaporation techniques.[30]
The aim of the current work is a demonstration of the
progress in a development of the TTA-UC NCs for the
excitation with red and deep-red light. Essentially, the NCs
should be nontoxic for living cells and demonstrate UC
performance in vitro. Additionally, the NCs should be
suitable for investigations with well-established biomedi-
cal techniques, namely confocal laser scanningmicroscope
(CLSM), plate reader, or flow cytometry.
2. Experimental Section
2.1. Materials
All solvents were used as receivedwithout additional purification.
Palladium(II) meso-tetraphenyltetrabenzoporphyrin (PdTBP), per-
ylene, and 1-phenyl-heptadecane (PHD), were purchased from
Aldrich. Sodium n-dodecyl sulfate (SDS) was purchased from Alfa
Aesar. Polymethylmethacrylate (pMMA; Mn ¼ 120kDa) was pur-
chased from Merck. For the synthesis of 1,3,5,7-tetramethyl-8-
phenyl-2,6-diethyl dipyrromethane �BF2 (dye 550) we followed
synthetic procedure reported byWagner and Lindsey[31] Palladium
(II) meso-tetraaryltetranaphthoporphyrin (PdTNP) was synthe-
sized in agreement with literature.[32,33] The detailed synthesis
of 3,9(10)-Bis(4-tert-Butylphenylethynyl)perylene (dye 555) is
reported in the Supporting Information.
2.2. Synthesis of the Capsules
The pMMA-capsules NC633 and NC708 were formed via solvent
evaporation process in miniemulsion. The first step of this process
was to mix two phases, the disperse phase and the continuous
phase, and stir them for 1h (1200 rpm) to get an emulsion. The
continuous phase consists of 10mg SDS and 10g demineralized
water. The disperse phase contains 150mg pMMA, 300mg PHD,
0.3mg PdTBP as UC sensitizer, 1.3mg dye 550 as UC emitter,
and 2.5 g chloroform as co-solvent (preparation of NC633).
Alternatively, 0.048mg PdTNP and 0.198mg dye 555 (all other
componentswere taken as for NC633)weremixed in the synthesis
of NC708.
To receive miniemulsion (second step) with a droplet size
between 50 and 500nm, high shear power is necessarywhichwas
reachedwith sonificationbyanultrasound tip (BransonsonifierW-
450D, 1/2 in. Tip, 90% Amplitude, 120 s, 10 s pulse/10 s break, ice
cooling). The last step was the slow evaporation of the solvent
(CHCl3) under stirring and room temperature overnight. Due to the
evaporation of the co-solvent the pMMA precipitated and a phase
separation between the pMMA and PHD took place. As a result of
different surface tensions, the hydrophobic PHD formed the inner
core and the hydrophilic pMMA arranged at the water interphase
as shell, so the core-shell morphology with liquid core and solid
polymer-shell was built up.
Macromol. Biosci. 201
� 2013 WILEY-VCH Verlag GmbH
2.3. Characterization of the Nanocapsules
Dynamic light scattering (DLS) was performed with Submicron
Particle Sizer Nicomp 380 (fixed scattering angle of 908, laserwavelengthl¼ 633nm) formeasurements of the size of theNCs in
dispersion (concentration �0.2mgmL�1). The transmission elec-
tron microscopy (TEM) was done with a Zeiss EM-912 (operating
voltage 120kV). For sample preparation, 5mL of diluted dispersion
(3mL of sample in 3mL of demineralized water) were attached
on a carbon coated copper grid and left to dry. The dry sample
was covered by an additionally carbon layer in order to
avoid decomposition of the polymer and to increase the image
contrast.
2.4. TTA-UC Measurements
For upconversion measurements, the dispersion was filled into
a cuvette (1mm thickness) under nitrogen atmosphere (UNIlab
glove box, M.braun GmbH) and then sealed to prevent oxygen
penetration. A supercontinuum laser (repetition rate 20MHz,
mean spectral power density 1mWnm�1, pulse duration 10ps)
SC450-2-PP (Fianium Inc.) was integrated in the optical scheme.
Generally, output radiation of the laser was passed through a
4F-monochromator in order to select the excitation wavelength.
Typically, excitationwithabandwidthofDl�10–15nmwasused.
A series of reflective neutral density filters (Thorlabs Inc.) placed on
a revolving optical holder was used to attenuate smoothly the
beam power. The laser beam was guided by ultrabroadband
mirrors (MaxMirror, Semrock Inc.) and finally focused by an
achromatic lens (NA¼ 0.24) onto the sample. The excitation
spot diameter was permanently controlled by a beam profiler
BP104-VIS (Thorlabs Inc.). The luminescence emissiongeneratedby
the sample was collected by the same achromatic lens, thus the
excitation- and observation-spots were completely spatially over-
lapped. The excitation light (lexc¼633nm) was rejected by a
notch filter NF03-633U-25 (Semrock Inc.). The excitation light
(lexc¼ 708nm) was rejected by a tilted at 458 notch filter NF03-
785E-25 (Semrock Inc.) or a short-pass filter FF01-694/SP-25
(Semrock Inc.). The emission spectra were registered by a
CCD-spectrometer (C10083CA, Hamamatsu Inc.). Detailed exam-
ples of absorption and UC spectra of investigated compounds in
toluene can be found in the literature[34] and in the Supporting
Information.
2.5. Confocal Laser Scanning Microscope (CLSM)
Imaging
The images of NC633 NCs were obtained with a Leica TCS SP5X
microscope. The sample was excited with different wavelengths:
lexc¼488nm of an Arþ laser for direct excitation of dye 550 and
lexc¼633nmofHeNe laser forUCexcitationof PdTBPor excitation
of CellMask Deep Red (Invitrogen). Two detectors were used, a
photomultiplier tube (PMT) and an avalanche photodiode (APD). In
case of theAPD, thedetection channelwas equippedwithayellow-
wavelengthcenteredbandpassfilterHQ525/50M(ChromaInc.) for
fluorescence andUC luminescenceof dye 550. The PMTwasused to
detect the emission from CellMask Deep Red (in the range 650–
700nm).
3, 13, 1422–1430
& Co. KGaA, Weinheim www.MaterialsViews.com

Triplet–Triplet Annihilation Upconversion Based Nanocapsules . . .
www.mbs-journal.de
The images ofNC708NCswereobtainedwith ahomebuilt CLSM
microscope. A supercontinuumfiber laser SC-450HP (Fianium Inc.)
provided both the direct and UC excitation. A wavelength for the
direct excitation of dye 555was extracted from the spectrumof the
supercontinuum laser by a dichroic bandpass filter BP510/20
(Chroma Inc.). A wavelength for excitation of PdTNPwas extracted
byaspeciallydesignedmonochromator (lexc¼708nm,Dl¼5nm).
Bothbeamswere focusedby a1.4NAobjective lens (HCXPLAPOCS
100� oil, Leica Microsystems). The image acquisition was
performed by scanning the sample with a 3D piezo stage
MAX341/M (Thorlabs Inc.). The fluorescence was collected by the
same objective lens, separated from the excitation light by the
dichroic mirrors and an additional bandpass filter BP570/60
(Chroma Inc.), and finally focused into the multimode optical fiber
(diameter 62.5mm) serving as a pinhole to be detected by photon
counting module MP 900 (Perkin Elmer).
2.6. Cell Cultures
HeLa cells were obtained from Deutsche Sammlung von Mikroor-
ganismen und Zellkulturen (DSMZ) and kept in Dubbecco’s
modified essential medium (DMEM), whereas mesenchymal stem
cells (MSC) were generated from bone marrow aspirations or
explanted hips after obtaining informed consent and kept in
a-minimal essential medium (MEM, Lonza). Both media were
supplemented with 10% fetal calf serum (FCS; HeLa) and 20% FSC
(MSC), 100 units penicillin and 100mgmL�1 streptavidin (all
from Invitrogen) and especially for MSC cells, 1mM Na-pyruvate
(Invitrogen) and 0.6% ciprofloxacin (Fluka) were added. For the
incubation, adherent cells were seeded at a density of 5000 cells
cm�2 (HeLa)and4000cells cm�2 (MSC) inam-dish (d¼35mm,high,
Ibidi). On the 2nd day, the NCs were added at a concentration of
3000mgmL�1 to themediawithout using a transfection agent. The
incubation time was 24h in a humidified incubator in order to
facilitate cell uptake (37 8C, 5% CO2). After incubation, themedium
was removed from the m-dish and the sample was washed three
timeswith 3mL of phosphate buffered saline (PBS, Invitrogen). The
additionalmembrane-stainingwas realizedwith 0.25mL CellMask
Deep Red directly added before studies on the CLSM. The treatment
with valinomycin (Aldrich; 1mmol L�1) was proceeded for 10min.
2.7. Flow Cytometry
To analyze the viability and the uptake of the NCs to the different
cell lines, flow cytometry experiments were performed in the
followingway. Firstly, the adherent cells were detached in trypsin
(Gibco) and seeded in FCS supplemented medium at a density of
20 000 (HeLa) or 10 000 cells cm�2 (MSC) in a 6-well plate (Greiner
BioOne). On the next day, the pMMA capsules were added at
different concentrations (from 75mg to 5000mgmL�1) to the
medium.The incubation timewas24h inahumidified incubator in
order to facilitate cell uptake (37 8C, 5% CO2). For analysis the cells
were washed with PBS, trypsinized, centrifuged (3min, 1500 rpm)
and stained with 28.6mgmL�1 7-aminoactinomycin (7-AAD) as
fluorescent apoptosis marker for 15min at room temperature,
before resuspending in PBS. The measurements were performed
with a CyFlowML using FlowMax 3.0 software (Partec, Germany).
Macromol. Biosci. 20
� 2013 WILEY-VCH Verlag Gmwww.MaterialsViews.com
The FL1 channel (lexc¼488nm, ldet¼ 527nm)was used to analyze
the uptake of NCs and FL6 channel (lexc¼ 561nm, ldet¼675nm)
for 7-AAD experiments. For the analysis, cells were selected on a
forward scatter/sideward scatter plot, thereby excluding cell
debris. These gated events were then further analyzed for the
two channels. This corresponds to the amount of NCs taken up or
associated with individual cells. For 7-AAD the events in cell gate
were analyzed on a FL1/FL6 dot-plot and three different
populations (viable, apoptotic, and dead) were determined by
using negative controls and the apoptotic and dead cells present in
thecell cultures.All valuesare triplicateswithastandarddeviation.
3. Results and Discussion
In general, capsule formation might occur if the polymer
and the dispersed liquid are immiscible and the interface
‘‘polymer/continuous phase’’ is more favorable than the
interface ‘‘dispersed liquid/continuous phase.’’[35] In the
case of fabrication of polymer NCs by the solvent
evaporation method,[36,37] an additional co-solvent pro-
vides compatibility of hydrophobic components before and
during the process of miniemulsification. Later this co-
solventhas tobe removedbyevaporation. Inorder toobtain
a stable polymeric shell, we chose pMMA. Non-volatile
organic solvents (1-phenyl heptadecane) were used as a
liquid core. All synthesized dispersions (none dialyzed)
were stable during months.
Figure 1a shows the TEM image of slightly deformed
NC633NCs.Aperfect core/shell structure is clearlyobserved
in the image. DLS measurements confirm a narrow and
uniform size distributionwith ahydrodynamic diameter of
dh¼ 225nm. Figure 1b shows a typical luminescence
spectrum (the red line) of NC633 NCs dispersed in water
at room temperature. Strong UC fluorescence of dye 550
withlmax¼ 550nmandresidualphosphorescenceofPdTBP
with lmax¼ 800nm are observed. For comparison, the
luminescence spectrum (the black line) for the same
sensitizer/emitter couple in toluene is presented as well.
It is important to mention, that the TTA-UC process in
bulk organic solvent is more efficient than in confined
environment. The substantial decrease of local mobility of
the interacting molecules species is likely the main reason
for the decrease of UC efficiency in the confined environ-
ment.[38,39] Additionally, we observed a decrease in the UC
intensity by a factor of 5, when measurement were done
under air conditions. Apparently, the 20nm pMMA shell of
the NCs is not able to protect TTA-UC process from oxygen
quenching. However, it will be shown further that the level
of theUC intensity is high enough to detectUCfluorescence
with CLSM in living MSC or HeLa cells.
The reliability of the TTA-UC process in the absence of
molecular oxygen is demonstrated in Figure 2. The
experiment underlines, that NCs were successfully loaded
with sensitizer and emitter dyes. When the UC NCs were
13, 13, 1422–1430
bH & Co. KGaA, Weinheim 1425

Figure 1. a) TEM image of theNC633 NCs; b) UC spectra ofmixturePdTBP/dye 550 in toluene (black line, CPdTBP¼ 10�5mol L�1/Cdye550¼ 10�4mol L�1) and water dispersion of NC633 NCs (redline, 4% w/w of the dispersed phase, CPdTBP¼ 10�3mol L�1/Cdye550¼ 10�2mol L�1 in the dispersed phase (PHD)). Excitationlexc¼633 nm. Both samples are sealed in a glove-box withoxygen concentration below 2ppm. Inset: sketch of theprocesses leading to TTA-UC in NCs; c) Simplified diagram ofenergy levels explained TTA-UC in the fabricated NCs (indexes (S),(T), (ISC), (TTT), and (TTA) are related to singlet state, triplet state,intersystem crossing, triplet–triplet transfer, and triplet–tripletannihilation, correspondingly). It should be noted that twomolecules (triplet states) of emitter take part in the TTAprocess. One of the excited emitter triplet returns to theground state, but the other molecule accumulates the totalenergy of the two triplets and the excited singlet state ispopulated.
www.mbs-journal.de
C. Wohnhaas et al.
Macromol. Biosci. 201
� 2013 WILEY-VCH Verlag GmbH1426
placedontopofamicroscope slideandsealed inoxygenfree
atmosphere, the CLSM images under direct (Figure 2a) and
UC photoexcitation (Figure 2b) reflected ideal co-localiza-
tion of the emitting species. In other words, 1:1 overlap of
the CLSM images is observed (Figure 2c).
The cell toxicity of the synthesized NCs was determined
in a standard test: after 24h of incubationwith theNCs, the
cell death rate was detected by staining with 7-amino-
actinomycin D (7-AAD). The amounts of living, apoptotic
and dead cells for different concentrations of NCs (100–
5000mgmL�1) are shown in Figure 3. The long incubation
timewas chosen in order to achieve amaximum loading of
the cells.
As evident from Figure 3, the toxicity of the NCs is
increased at higher NC concentrations. Please note, that in
UC experiments of other groups, the toxicity was deter-
mined for much lower nanoparticles concentrations
(well below 1000mgmL�1): for instance, water dispersions
of inorganic UC nanoparticles with a concentration of
50mgmL�1 and a diameter of d¼ 50nm,[40] or 200mgmL�1
and a diameter of d¼ 10nm,[41] or 10mgmL�1 and
a diameter of d¼ 28 nm[42] have been employed. The
TTA-UC NCs, presented in this work, are relatively large
(dh¼ 225nm), therefore the same number of NCs per
volume could be achieved only at highmass concentrations.
Therefore, inordertohaveacomparablemolarconcentration
ofUCNCs as inother invitro experiments[40–42] thevalues of
3000 and 5000mgmL�1 were chosen. The exact mechanism
of uptake (clathrin, caveolin, or other pathways like flotillin)
was not determined for the particles described here. The
uptake mechanism should not alter the optical properties.
Also, the pMMA NCs are not biodegradable and therefore
the exact cellular environment should not influence the
stability of the capsule on the discussed time scale.
Efficient UC luminescence in living cells was shown by
CLSM. Two cell types were incubated for 24h with NC633
NCs (concentration of 3000 or 5000mgmL�1). The dishes
with cell cultures in PBS (under air) were placed in a
microscope sample holder and the dyes were excited from
underneathwith light, passing through a LeicaHCX PL APO
CS 1.4/63� oil immersion objective. Figure 4 represents
CLSM images of a living MSC cell treated with UC NCs.
Figure 4a,c demonstrate the direct photoexcitation of the
dye 550with lexc¼ 488nm,whereas Figure 4b andd shows
photoexcitation in the UC regime with lexc¼ 633nm. The
two types of photoexcitation (direct and UC regime) are
necessary in order to identify possible artifacts. For a better
visualization, the cell membrane was stained with
CellMask Deep Red. As evident from Figures 4,5 the UC
NCs arewell observable inside of livingMSC andHeLa cells.
The experimental conditions for acquiring of the CLSM
images in UC regime deserve special attention: the cell
images, demonstrated in Figures 4b,d,5c, were collected by
using a cw HeNe laser (l¼ 633nm) and pixel dwell time
3, 13, 1422–1430
& Co. KGaA, Weinheim www.MaterialsViews.com

Figure 2. CLSM images of NC633 NCs displaced on a top of a microscope slide: a) direct excitation (lexc¼488nm, ldet¼ 500–550nm); b) UCexcitation (lexc¼633 nm, lde t¼ 500–550nm); c) overlay of images a) and b).
Triplet–Triplet Annihilation Upconversion Based Nanocapsules . . .
www.mbs-journal.de
of 1.2ms. The sample was irradiated with a laser power
less than 0.3mW, consequently, the average light intensity
at the focal spot of the microscope was less than
100Wcm�2. In order to prove the detection of UC
fluorescence we tested NCs loaded only with the dye 550
(Figure S9, Supporting Information). HeLa cells incubated
with such NCs demonstrate bright fluorescence when the
laser with lexc¼ 488nm is used. In contrast, irradiation
with red light (lexc¼ 633nm) is not accompanied by the
Figure 3. Toxicity of the NC633 NCs for HeLa cells a) and MSCs b).
Macromol. Biosci. 20
� 2013 WILEY-VCH Verlag Gmwww.MaterialsViews.com
detection of any fluorescent photons within the detection
interval Dldet¼ 500–550nm.
The additional advantage of the UC excitation scheme
can be persuasively demonstrated: the required excitation
intensity is extremely low, therefore, not only the scattered
laser light is reduced, also the possibility of unwanted (not
controlled) nonlinear processes (such as two-photon
absorption) is completely avoided. Since the optical
registration region has a substantial hypsochromic shift
relative to the excitation wavelength, the cell autofluor-
escence is also entirely rejected. As a result, an order of
magnitude higher signal to background (S/B) ratio for the
cell images, demonstrated in Figure 4, is observed. For
Figure 4. CLSM images of living MSCs incubated with NC633 NCs(5 000mgmL�1): a) direct excitation (lexc¼488nm, Dldet¼ 500–550nm); b) UC excitation (lexc¼633 nm, Dldet¼ 500–550nm).CLSM images of living MSCs incubated with the NC633 NCs (3000mgmL�1): c) direct excitation (lexc¼488nm, Dldet¼ 500–550nm); d) UC excitation (lexc¼633 nm, Dldet¼ 500–550nm),cell membrane was additionally stained with CellMask Deep Red.
13, 13, 1422–1430
bH & Co. KGaA, Weinheim 1427
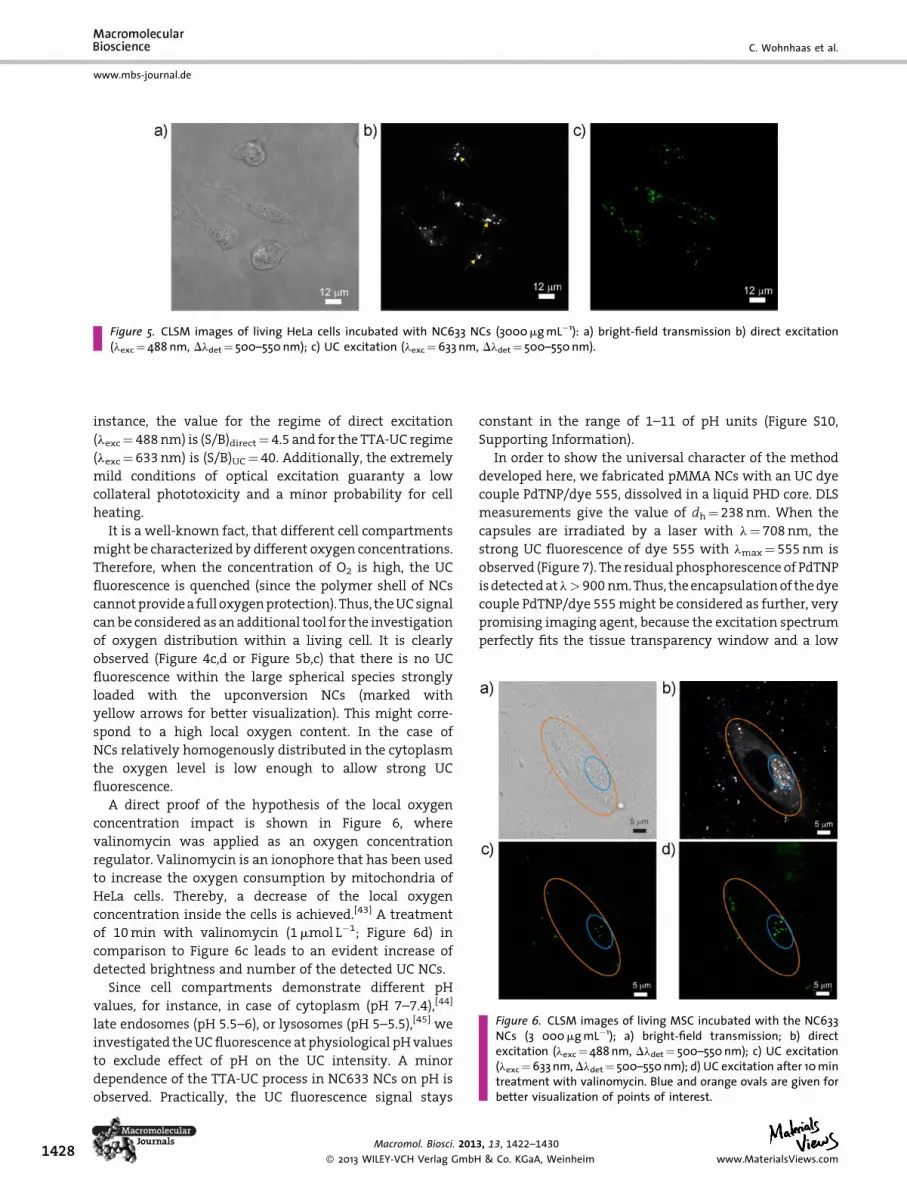
Figure 5. CLSM images of living HeLa cells incubated with NC633 NCs (3000mgmL�1): a) bright-field transmission b) direct excitation(lexc¼ 488nm, Dldet¼ 500–550nm); c) UC excitation (lexc¼633nm, Dldet¼ 500–550nm).
Figure 6. CLSM images of living MSC incubated with the NC633NCs (3 000mgmL�1); a) bright-field transmission; b) directexcitation (lexc¼488nm, Dldet¼ 500–550nm); c) UC excitation(lexc¼633nm, Dldet¼ 500–550nm); d) UC excitation after 10mintreatment with valinomycin. Blue and orange ovals are given forbetter visualization of points of interest.
www.mbs-journal.de
C. Wohnhaas et al.
1428
instance, the value for the regime of direct excitation
(lexc¼ 488nm) is (S/B)direct¼ 4.5 and for the TTA-UC regime
(lexc¼ 633nm) is (S/B)UC¼ 40. Additionally, the extremely
mild conditions of optical excitation guaranty a low
collateral phototoxicity and a minor probability for cell
heating.
It is a well-known fact, that different cell compartments
might be characterized by different oxygen concentrations.
Therefore, when the concentration of O2 is high, the UC
fluorescence is quenched (since the polymer shell of NCs
cannotprovidea full oxygenprotection). Thus, theUCsignal
canbe considered as an additional tool for the investigation
of oxygen distribution within a living cell. It is clearly
observed (Figure 4c,d or Figure 5b,c) that there is no UC
fluorescence within the large spherical species strongly
loaded with the upconversion NCs (marked with
yellow arrows for better visualization). This might corre-
spond to a high local oxygen content. In the case of
NCs relatively homogenously distributed in the cytoplasm
the oxygen level is low enough to allow strong UC
fluorescence.
A direct proof of the hypothesis of the local oxygen
concentration impact is shown in Figure 6, where
valinomycin was applied as an oxygen concentration
regulator. Valinomycin is an ionophore that has been used
to increase the oxygen consumption by mitochondria of
HeLa cells. Thereby, a decrease of the local oxygen
concentration inside the cells is achieved.[43] A treatment
of 10min with valinomycin (1mmol L�1; Figure 6d) in
comparison to Figure 6c leads to an evident increase of
detected brightness and number of the detected UC NCs.
Since cell compartments demonstrate different pH
values, for instance, in case of cytoplasm (pH 7–7.4),[44]
late endosomes (pH 5.5–6), or lysosomes (pH 5–5.5),[45] we
investigated theUCfluorescence at physiological pHvalues
to exclude effect of pH on the UC intensity. A minor
dependence of the TTA-UC process in NC633 NCs on pH is
observed. Practically, the UC fluorescence signal stays
Macromol. Biosci. 201
� 2013 WILEY-VCH Verlag GmbH
constant in the range of 1–11 of pH units (Figure S10,
Supporting Information).
In order to show the universal character of the method
developed here, we fabricated pMMA NCs with an UC dye
couple PdTNP/dye 555, dissolved in a liquid PHD core. DLS
measurements give the value of dh¼ 238nm. When the
capsules are irradiated by a laser with l¼ 708nm, the
strong UC fluorescence of dye 555 with lmax¼ 555nm is
observed (Figure 7). The residual phosphorescence of PdTNP
isdetectedatl> 900nm.Thus, theencapsulationof thedye
couple PdTNP/dye 555might be considered as further, very
promising imaging agent, because the excitation spectrum
perfectly fits the tissue transparency window and a low
3, 13, 1422–1430
& Co. KGaA, Weinheim www.MaterialsViews.com

Figure 7. a) TEM images of the NC708 NCs; b) UC spectra of water dispersion of NC708 NCs (4w/w% of the dispersed phase,CPdTNP¼ 1� 10�4mol L�1 and Cdye555¼ 1� 10�3mol L�1 in the dispersed phase (PHD)). Excitation l¼ 708 nm. The sample is sealed in aglove-box with oxygen concentration below 2 ppm. Inset: sketch of the processes leading to TTA-UC in NC708 NCs; c) Simplified diagram ofenergy levels explained TTA-UC in the fabricated NCs (indexes (S), (T), (ISC), (TTT), and (TTA) are related to singlet state, triplet state,intersystem crossing, triplet–triplet transfer, and triplet–triplet annihilation, correspondingly). It should be noted that two molecules(triplet states) of emitter take part in the TTA process. One of the excited emitter triplet returns to the ground state, but the other moleculeaccumulates the total energy of the two triplets and the excited singlet state is populated; CLSM images of fixed HeLa cell incubatedwith the NC708NCs (3 000mgmL�1): d) direct excitation (lexc¼ 510 nm,Dldet¼ 540–600nm); e) UC excitation (lexc¼ 708nm,Dldet¼ 540–600nm). Before CLSM imaging the sample was sealed in oxygen free atmosphere.
Triplet–Triplet Annihilation Upconversion Based Nanocapsules . . .
www.mbs-journal.de
autofluorescence under excitation with lexc � 700nm is
expected. To demonstrate theUCfluorescence of theNC708
NCs in cells, we designed a homebuilt CLSM microscope.
Spectrally separated output (lexc¼ 708nm) of a super-
continuum laser was used for excitation of the NCs. The
UC fluorescence (lmax¼ 555nm) inside fixed HeLa cells
was detected and results are presented in Figure 7e
(together with CLSM images obtained under direct excita-
tion (lexc¼ 510nm) of the dye 555 (Figure 7d).
4. Conclusion
In summary, we developed an universal methodology for
fabrication of polymer NCs with TTA-UC capability by a
combination of miniemulsion and solvent evaporation
techniques. The preparation method allows straightfor-
ward variation of the sensitizer/emitter UC couple. Such
NCs show low cell toxicity together with effective
internalization by different cell lines. Red excitation light
Macromol. Biosci. 20
� 2013 WILEY-VCH Verlag Gmwww.MaterialsViews.com
(lexc¼ 633nm)withextremely lowoptical power (<0.3mW
in CLSM) generates TTA-UC fluorescence with lmax at
550nm.We demonstrated that CLSM could be also used for
detection of UC excited by deep-red light (lexc¼ 708nm).
The cell images obtainedbya conventional CLSMtechnique
with an UC excitation regimes show order of magnitude
better quality than the cell images obtained in the direct
excitation of the same fluorescence marker. The simple
synthesis of the TTA-UC NCs, together with the high
reproducibility make them a reliable alternative for
imaging applications, local generation of blue shifted
photons for fluorescence resonance energy transfer assays
or multicolor targeting of cancer cells.
Acknowledgements: C.W. and V. M. contributed equally to thiswork. A.T. acknowledges the EU-founded FP-7 project EphoCell(N 227127) for the financial support, and S.B. acknowledges theReintegration Grant RG-09-0002(DRG-02/2) Bulgarian NationalScience Fund for the financial support.
13, 13, 1422–1430
bH & Co. KGaA, Weinheim 1429

www.mbs-journal.de
C. Wohnhaas et al.
1430
Received: March 21, 2013; Revised: June 6, 2013; Published online:July 19, 2013; DOI: 10.1002/mabi.201300149
Keywords: confocal laser scanning microscopy; living cell imag-ing; polymer nanocapsules; triplet–triplet annihilationupconversion
[1] R. W. Boyd, Nonlinear Optics, 3rd ed. Academic Press,Burlington MA 2008.
[2] W. Denk, J. H. Strickler, W. W. Webb, Science 1990, 248, 73.[3] M. Haase, H. Sch€afer, Angew. Chem. Int. Ed. 2011, 50, 5808.[4] P. E. Keivanidis, S. Baluschev, T. Miteva, G. Nelles, U. Scherf,
A. Yasuda, G. Wegner, Adv. Mater. 2003, 15, 2095.[5] D. V. Kozlov, F. N. Castellano, Chem. Commun. 2004, 29, 2860.[6] S. Baluschev, J. Jacob, Y. S. Avlasevich, P. E. Keivanidis,
T. Miteva, A. Yasuda, G. Nelles, A. C. Grimsdale, K. M€ullen,G. Wegner, ChemPhysChem 2005, 6, 1250.
[7] S. Baluschev, T. Miteva, V. Yakutkin, G. Nelles, A. Yasuda,G. Wegner, Phys. Rev. Lett. 2006, 97, 143903.
[8] S. Baluschev, V. Yakutkin, G. Wegner, T. Miteva, G. Nelles,A. Yasuda, S. Chernov, S. Aleshchenkov, A. Cheprakov, Appl.Phys. Lett. 2007, 90, 181103.
[9] T. N. Singh-Rachford, F. N. Castellano, J. Phys. Chem. A 2009,113, 5912.
[10] T. N. Singh-Rachford, A. Haefele, R. Ziessel, F. N. Castellano, J.Am. Chem. Soc. 2008, 130, 16164.
[11] T. Miteva, V. Yakutkin, G. Nelles, S. Baluschev,N. J. Phys. 2008,10, 103002.
[12] H. C. Chen, C. Y. Hung, K. H. Wang, W. S. F. D. September, F. C.Chien, P. Chen, T. J. Chow, C. P. Hsu, S. S. Sun, Chem. Commun.2009, 27, 4064.
[13] S. Ji, W. Wu, W. Wu, H. Guo, J. Zhao, Angew. Chem. Int. Ed.2011, 50, 1626.
[14] V. Yakutkin, S. Aleshchenkov, S. Chernov, T. Miteva, G. Nelles,A. Cheprakov, S. Baluschev, Chem. A Eur. J. 2008, 14, 9846.
[15] S. Mallidi, G. P. Luke, S. Emelianov, Trends Biotechnol. 2011,29, 213.
[16] M. Drobizhev, N. S. Makarov, S. E. Tillo, T. E. Hughes, A.Rebane, Nat. Methods 2011, 8, 393.
[17] T. G. Phan, A. Bullen, Immunol. Cell Biol. 2010, 88, 438.[18] A. Turshatov, D. Busko, S. Baluschev, T. Miteva, K. Landfester,
N. J. Phys. 2011, 13, 083035.[19] A.Monguzzi, M. Frigoli, C. Larpent, R. Tubino, F.Meinardi,Adv.
Funct. Mater. 2012, 22, 139.[20] Y. C. Simon, S. Bai, M. K. Sing, H. Dietsch, M. Achermann, C.
Weder, Macromol. Rapid Commun. 2012, 33, 498.
Macromol. Biosci. 201
� 2013 WILEY-VCH Verlag GmbH
[21] Q. Liu, T. Yang,W. Feng, F. Li, J. Am. Chem. Soc. 2012, 134, 5390.[22] J. H. Kim, J. H. Kim, J. Am. Chem. Soc. 2012, 134, 17478.[23] J. H. Kang, E. Reichmanis, Angew. Chem. Int. Ed. 2012, 51,
11841.[24] Q. Liu, B. Yin, T. Yang, Y. Yang, Z. Shen, P. Yao, F. Li, J. Am. Chem.
Soc. 2013, 135, 5029.[25] M. Sitkovsky, D. Lukashev, Nat. Rev. Immunol. 2005, 5,
712.[26] Y. C. Simon, C. Weder, J. Mater. Chem. 2012, 22, 20817.[27] S. Zanarini, E. Rampazzo, S. Bonacchi, R. Juris, M. Marcaccio,
M. Montalti, F. Paolucci, L. Prodi, J. Am. Chem. Soc. 2009, 131,14208.
[28] X. Wang, J. A. Stolwijk, T. Lang, M. Sperber, R. J. Meier, J.Wegener, O. S. Wolfbeis, J. Am. Chem. Soc. 2012, 134, 17011.
[29] C. Wohnhaas, A. Turshatov, V. Mail€ander, S. Lorenz, S.Baluschev, T. Miteva, K. Landfester, Macromol. Biosci. 2011,11, 772.
[30] C. Wohnhaas, K. Friedemann, D. Busko, K. Landfester, S.Baluschev, D. Crespy, A. Turshatov, ACS Macro Lett. 2013, 2,446.
[31] R. W. Wagner, J. S. Lindsey, Pure Appl. Chem. 1996, 68,1373.
[32] O. S. Finikova, S. E. Aleshchenkov, R. P. Bri~nas, A. V. Cheprakov,P. J. Carroll, S. A. Vinogradov, J. Org. Chem. 2005, 70, 4617.
[33] A. V. Cheprakov, M. A. Filatov, J. Porphyrins Phthalocyanines2009, 13, 291.
[34] A. Turshatov, D. Busko, Y. Avlasevich, T. Miteva, K. Landfester,S. Baluschev, ChemPhysChem 2012, 13, 3112.
[35] S. Torza, S. Mason, J. Colloid Interface Sci. 1970, 33, 67.[36] R. H. Staff, P. Rupper, I. Lieberwirth, K. Landfester, D. Crespy,
Soft Matter 2011, 7, 10219.[37] J. Fickert, C. Wohnhaas, A. Turshatov, K. Landfester, D. Crespy,
Macromolecules 2013, 46, 573.[38] W. H. Thompson, J. Chem. Phys. 2004, 120, 8125.[39] X. Feng, W. H. Thompson, J. Phys. Chem. C 2010, 114, 4279.[40] J. Jin, Y. Gu, C.Man, J. Cheng, Z. Xu, Y. Zhang, H.Wang, V. Lee, S.
Cheng, W. Wong, ACS Nano 2011, 5, 7838.[41] Q. Liu, J. Peng, L. Sun, F. Li, ACS Nano 2011, 5, 8040.[42] J. C. Zhou, Z. L. Yang, W. Dong, R. J. Tang, L. D. Sun, C. H. Yan,
Biomaterials 2011, 32, 9059.[43] T. C. O’Riordan, K. Fitzgerald, G. V. Ponomarev, J. Mackrill, J.
Hynes, C. Taylor, D. B. Papkovsky, Am. J. Physiol. 2007, 292,R1613.
[44] G. R. Bright, G. W. Fisher, J. Rogowska, D. L. Taylor, J. Cell Biol.1987, 104, 1019.
[45] F. R. Maxfield, T. E. McGraw, Nat. Rev. Mol. Cell Biol. 2004, 5,121.
3, 13, 1422–1430
& Co. KGaA, Weinheim www.MaterialsViews.com