tree species composition, diversity, and regeneration patterns in undisturbed and disturbed forests...
TRANSCRIPT
nternational Journal of Ecology and Environmental Sciences 37 (3): 131-141, 2011
© NATIONAL INSTITUTE OF ECOLOGY, NEW DELHI
Tree Species Composition, Diversity, and Regeneration Patterns in
Undisturbed and Disturbed Forests of Barak Valley, South Assam, India
NEPOLION BORAH AND S.C. GARKOTI 1 2
Department of Ecology and Environmental Science, Assam University, Silchar 788011, Assam, India1
School of Environmental Sciences, Jawaharlal Nehru University, New Delhi 110067, India2
* Corresponding Author: Email: [email protected]
ABSTRACT
Database on occurrence and distribution of floral species provides useful information for prioritizing sites in terms of biodiversity
values and management. The effect of human disturbances on species diversity is an issue that has engaged the attention of
ecologist for last several decades both from theoretical and applied standpoints. Present study was conducted to examine effect
of human disturbance in forest species composition, diversity and regeneration in four tropical forests in Barak Valley, Assam.
A total of 137 species were recorded in this study. Cynometra polyandra was dominant species in both the undisturbed forests
(IVI values 20.1 and 27.8, respectively in Innerline undisturbed reserve forest (IRUF) and Barak undisturbed reserve forest
(BRUF). In Inner line disturbed reserve forest (IRDF) Tetrameles nudiflora (IVI 36.8) and Barak disturbed reserve forest (BRDF)
Artocarpus chama (IVI 19.9) were dominant the species. The results revealed that in undisturbed forest, 42-46% of the quadrats
had less than 5 species while in the disturbed forest stand it is seen than 72 to 86% plots had less than 5 species. The Shannon
Weaver diversity index (H) was higher in undisturbed forests (1.69 and 1.77, respectively in IRUF and BRUF) compared to
disturbed forests (1.46 in IRDF and 1.52 in BRDF). The basal area and tree density in undisturbed forest stands found higher than
that of disturbed forest stand. Majority of the species (91.84% to 95.65%) were contagiously distributed in all four forest stand.
All the forests of the present study showed reversed J-shaped density distribution curves. 31-45% of total species were recorded
in sapling stage. The density and basal area of saplings were higher in undisturbed forests than that of disturbed forests. Dominance
distribution curves for all the sites fit the geometric series which confirms to the niche preemption hypothesis.
Key Words: Basal Area, Density, Distribution, Disturbance, Diversity, Seedlings, Tropical Forest.
Introduction
Eastern Himalaya is one of the 34 biodiversity hotspotsof the world and is rich in species diversity andendemism (Mittermier et al. 2005). At the confluence ofthe Indo-Malayan, Indo-Chinese and Indian biogeo-graphical realms, the region is unique in providing avariety of habitat types which in turn support a diversebiota with a high level of endemism. A large part of thisregion retains significant proportion of its phytodi-versity (Rao and Murti 1990), possibly due to long yearsof isolation and difficult terrains but is now underincreasing pressure to unleash its resources for economicdevelopment. Due to an increase in human population,the vegetation is subjected in intense anthropogenicdisturbances such as deforestation, grazing, lopping of
tree branches for fuelwood, and slash and burn of treesfor shifting cultivation (Nath et al. 2005, Arunachalamet al. 2002). These disturbances are chronic in nature(Singh 1998) as the removal of small amount of biomassfrom the forests occurs continuously without allowingrecovery time which ultimately results in the decline inforest structure and loss of biodiversity.
Forest diversity is one of the important sources ofliving in north eastern region. Increase in population inlast few decades resulted into massive exploitation ofnatural flora and fauna and habitat degradation in theregion. Recent studies indicate that if present scenariocontinues uninterrupted and effective conservationmeasures are not taken, most of the remaining nativeforests in the region would be replaced by secondaryforests (Beniwal and Haridasan 1992, Nath et al. 2005).
Borah and Garkoti: Forest Community and Regeneration Int. J. Ecol. Environ. Sci.132
Although some literature on the ecology of the forestsin the region is available there is no published record onplant species composition, diversity, and regenerationespecially from the South Assam covering Barak valley,N.C. Hills, and Karbi Anglong. A base line informationof plant diversity of these tropical forests is required forits potential human use and management in the face ofthe global change. The present study aims to assess treespecies diversity, composition and regeneration patternsin disturbed and undisturbed forests of Barak Valley,Cachar, Assam.
STUDY AREA AND METHODOLOGY
The Barak valley is situated in the southern part ofAssam, India. Barak valley has a tropical monsoonclimate with high annual precipitation and hightemperature. Rainfall is unevenly distributed bothspatially and temporally. Climate during October-March/April is characterized by dry conditions withmoderate temperature. There are 14 reserve forests inthis valley. The characteristic vegetation is tropicalevergreen and tropical semi evergreen. The present studywas carried out in two reserve forests namely, Innerlinereserve forest and Barak reserve forest.
Based on disturbance index one undisturbed andone disturbed forest were selected in each reserve andnamed as: Innerline reserve undisturbed forest (IRUF, at24 38' 38.2" N and 92 46' 52.6" E), Innerline reserveo o
disturbed forest (IRDF, at 24 33' 01.4" N and 92 45'o o
08.5" E), Barak reserve undisturbed forest (BRUF, at 24o
36' 08.2" N and 93 03' 52.7" E), Barak reserve disturbedo
forest (BRDF, at 24 33' 01.4" N and 92 45' 08.5" E).o o
The disturbance index was calculated as the basal areaof cut trees measured at the ground level expressed asfraction of total basal area of all trees, including felledones (Rao et al. 1990). The disturbance index was 0%for undisturbed forest while it was more than 20% fordisturbed forest stands.
Trees were sampled by laying fifty quadrats of 10m x 10 m along a 500 m belt transect in each forestbetween August 2008 and December 2009. All treespecies ($ 10 cm cbh) in each quadrat were sampled. Allthe species were identified by using ‘Flora of Assam’(Kanjilal 1934-1940) and identification of samplespecimens were confirmed at BSI (Botanical Survey ofIndia), Shillong.
The cbh of each tree was measured in all forestsand grouped into eleven girth classes (10-30, 30-60, 60-
90, 90-120, 120-150, 150-180, 180-210, 210-240, 240-270, 270-300 and above 300 cm). The density and basalarea of each species were determined in different classesaccording to Mueller-Dombois and Ellenberg (1974).Individuals with a girth of 3-10 cm were considered assaplings. The saplings were sampled after each 50 malong the belt transect by laying a 5 m × 5 m quadrat.Thepopulation structure was analyzed at the communitylevel with the help of density-diameter curve. Whitfordindex was used to study dispersion pattern (Whitford1948). Shannon index of diversity (H), evenness index(Pielou 1975), Margalef index (Margalef 1968) andSimpson dominance index (D) (Shannon and Weaver1963, Simpson 1949) were calculated to analyze speciesdiversity and dominance in the community.
RESULTS
Species Composition and Abundance
A total of 137 tree species were recorded in presentstudy. In IRUF and IRDF respectively, total 69 and 57species were present, and in BRUF and BRDF 91 and 49species were present in respectively. Although numberof species has declined in both the reserves but the lossof species due to disturbance in Barak reserve was muchhigher than Inner line reserve.
Cynometra polyandra was the dominant species inboth the undisturbed forest with an IVI of 27.8 and 20.1,respectively in IRUF and BRUF (Table 1). Dysoxylumbinectariferum (19.04) Palaquium polyanthus (14.02)and Tetrameles nudiflora (11.58) were the otherimportant species in IRUF. In BRUF, the dominance wasshared by Hyndocarpus kurzii (IVI 16.49), Artocarpuschama (14.64), Palaquium polyanthus (12.05) andStecospermum chelonoides (11.60). Artocarpus chamawas the dominant species in IRDF with an IVI value of19.9, where as in BRDF Tetrameles nudiflora wasdominant tree species ( IVI 36.85), followed byStecospermum chelonoides (21.9), Mesua ferrea (21.6),Pterygota alata (16.8), Artocarpus chama (13.8), Theother dominant tree species IRDF were Castanopsisindica (17.0), Sapindus baccatum (14.9), Tectonagrandis (13.0) and Emblica ribes (11.0).
In all the forests of the present study majority of thespecies (91.84% - 95.65%) were contagiously distributedand remaining 4.35% - 8.16% species were randomlydistributed. No regular distribution pattern of the specieswas observed in the present study (Table 2).
37: 131-141 Borah and Garkoti: Forest Community and Regeneration 133
Table 1. Importance Value Index (IVI) of different species in undisturbed and disturbed forests in Innerline andBarak Reserves in south Assam. D = Disturbed; UD = Undisturbed
Species Name Barak RF Innerline RF
UD D UD D
Actinodaphne angustifolia Nees NT 1.65 2.77 5.87 1.79
Actinodaphne obovata (Nees) Bl. NT 5.19 -- -- --
Ailanthus integrifolia Lam T 2.66 -- 5.47 5.65
Albizia lebbeck (L.) Benth. T 2.73 1.94 -- 2.71
Albizia lucidior (Steud.) Nielson ex Hara T 0.65 -- -- --
Albizia sp T -- -- -- 2.28
Alseodaphne andersonii (King ex Hook. f.) Kostel T 2.05 -- -- 5.95
Alseodaphne sp T 1.31 7.3 -- --
Alstonia scholaris (L.) R.Br. T 2 -- -- --
Amoora wallichii King. T -- 5.67 -- --
Annona recticulum L. NT -- -- 0.57 --
Anthocephalus chinensis (Lamk) A. Rich. Ex Walp T 0.71 -- -- --
Aporusa roxburghii Baill. NT -- 4.11 -- --
Aporusa sp NT -- -- 0.59 --
Aquilaria malaccensis Lam. NT 0.46 -- 0.58 --
Artocarpus chama Buch-Ham. T 14.64 13.79 9.13 19.86
Artocarpus lacucha Buch-Ham. T 2.25 -- 0.84 9.68
Baccaurea ramiflora Lour. NT 3.11 -- 8.29 --
Bauhinia sp NT 3.41 6.01 1.23 6.59
Bombax ceiba L. T 7.77 1.2 -- --
Callicarpa arborea Roxb. NT 2.83 -- -- 3.56
Carallia branchiata (Lour.) Merr. T 0.77 -- 4.22 2.15
Castanopsis indica (Roxb. ex Lindl.) A. DC. T -- 6.93 -- --
Castanopsis purpurella (Miq.) Balak. T 3.55 3.34 0.62 16.98
Cinnamomum cacharensis Parker. T -- -- -- 1.69
Cinnamomum caudatum Nees. NT 1.87 -- -- --
Cinnamomum glaucescens (Nees) Hand-Mazz. T 3.17 -- -- 1.82
Cinnamomum tamala (Ham.) Nees & Eberm. NT -- 1.11 -- --
Cordia dichotoma Forst. f. T -- 8.5 -- 1.8
Croton joufra Roxb. NT 1.23 -- 1.16 --
Crysophyllum roxburghii G. Don. T -- -- 6.1 --
Cynometra polyandra Roxb. T 20.13 -- 27.79 7.57
Desmos longiflorus (Roxb.) Safford. NT 3.16 -- -- --
Dillenia indica L. NT 1.07 2 -- 6.55
Dillenia pentagyna Roxb. T 0.81 -- 0.07 --
Diospyros toposia Buck-Ham. T -- 9.92 -- --
Dipterocarpus macrocarpus Vesque. T -- -- -- 1.76
Dipterocarpus turbinatus Gaertn. T -- -- -- 8.26
Duabanga grandiflora (Roxb. ex DC.) Walp T 5.09 6.39 -- --
Dysoxylum binectariferum (Roxb.) Hook. f. T 3.59 8.58 19.04 4.12
Dysoxylum sp NT 10.44 -- 5.95 3.49
Dysoxylum sp T 1.17 -- 4.12 9.47
Elaeagnus sp NT 1.11 4.03 1.99 3.85
Elaeocarpus sp T 4.54 -- -- --
Embelica ribes Burm. f. NT -- 5.06 -- --
Endospermum chinensis Benth T -- -- 2.77 1.84
Eurya acuminata DC. NT 1.16 -- 2.03 10.99
Evodia meliaefolia Benth T 3.75 -- -- --
Excoecaria oppositifolia Griff NT 1.54 -- -- --
Borah and Garkoti: Forest Community and Regeneration Int. J. Ecol. Environ. Sci.134
Species Name Barak RF Innerline RF
UD D UD D
Ficus hirta Vahl. NT 1.45 2.06 4.99 1.7
Ficus hispida Vahl. NT 1.85 -- 3.53 6.12
Ficus racemosa L. T 5.71 2.51 -- --
Ficus sp NT 3.14 7.55 -- --
Garcinia cowa Roxb. ex DC. NT 0.59 -- 4.43 --
Garcinia xanthochymus Hook. f. T -- -- -- 1.82
Garcinia sp NT 0.76 -- -- --
Garuga pinnata Roxb. NT -- 1.14 0.83 --
Glochidion lanceolarium (Roxb.) Voigt. NT -- 4.69 -- 2.06
Glochidion sp NT -- -- 7.78 --
Gmelina arborea Roxb. T 4.39 1.58 -- --
Gynocardia odorata R. Br. T -- -- 3.33 1.76
Haldina cordifolia (Roxb.) Ridsd. T -- -- -- 2.09
Heteropanax fragrans Seem. NT 0.65 -- -- --
Hibiscus macrophyllus Roxb NT -- -- -- 4.44
Hydnocarpus kurzii (King) Warb. T 16.49 2.94 4.62 2.19
Hydnocarpus sp NT 1.08 -- -- --
Knema linifolia Roxb NT -- -- 4.51 --
Kydia calycina Roxb. T -- 1.64 2.05 --
Lagerstroemia raginae Roxb. T 1.66 -- -- --
Leea indica (Burm. f.) Merr. NT -- -- 2.29 --
Litsea laeta Wall. NT -- -- 0.98 --
Litsea monopetala (Roxb.) Pers. T 1.27 1.5 0.67 1.75
Litsea salicifolia (Roxb. ex Nees) Hook. f. NT 3.33 4.52 0.58 --
Litsea sp NT 1.12 -- -- 1.68
Macaranga denticulata (Blume) Müll.Arg. NT -- -- -- 4.08
Macaranga peltata Roxb. NT 2.69 12.42 2.1 8.99
Maesa indica (Roxb) A.DC. NT 0.67 1.62 -- --
Maesa montana A. DC. NT 1.96 1.11 1.77 --
Mallotus ferrugineus (Roxb.) Muell.Arg. NT 2.1 13.05 -- 3.55
Mallotus roxburghianus Muell. Arg. NT -- -- 6.46 --
Mangifera indica L. T 1.39 -- 0.6 --
Mangifera sylvatica Roxb. T 1.01 -- -- --
Manihot esculenta Crantz NT 0.49 -- 2.29 --
Meliosma pinnata (Roxb.) Maxim NT -- 1.1 -- --
Memecylon colastrinum Kurz. NT -- -- 3.85 --
Memecylon umbellatum f. NT 2 -- -- --
Mesua ferrea L T 6.66 21.56 2.85 --
Mesua floribuanda (Wall.) Koste. T 1.55 -- 2.75 --
Michelia champaca L. T 2.11 -- 10.31 --
Michelia sp T 1.09 -- -- --
Micromelum pubescens Blume. NT -- 1.11 -- --
Mitragyna rotundifolia (Roxb.) O. Kuntze NT -- -- -- 3.74
Morus loevigata Wall. ex bend NT 1.8 -- -- --
Nephelium longana Camb. T 4.03 -- -- --
Oreocnide integrifolia (Gaud) Miq. NT -- 3.09 -- --
Oroxylum indicum (L.) Vent. NT 2 -- 1.27 6.1
Ostodes sp T -- -- 1.43 --
Pajanelia longifolia (Wild.) Schum. NT -- -- -- 1.8
Palaquium polyanthum Benth. T 12.05 10.73 14.02 1.95
Phoebe goalparensis Hutchinson. T 1.91 -- -- --
Phyllanthus emblica L. NT 1.21 -- -- --
Podocarpus nerifolia D. Don T -- -- 1.17 1.82
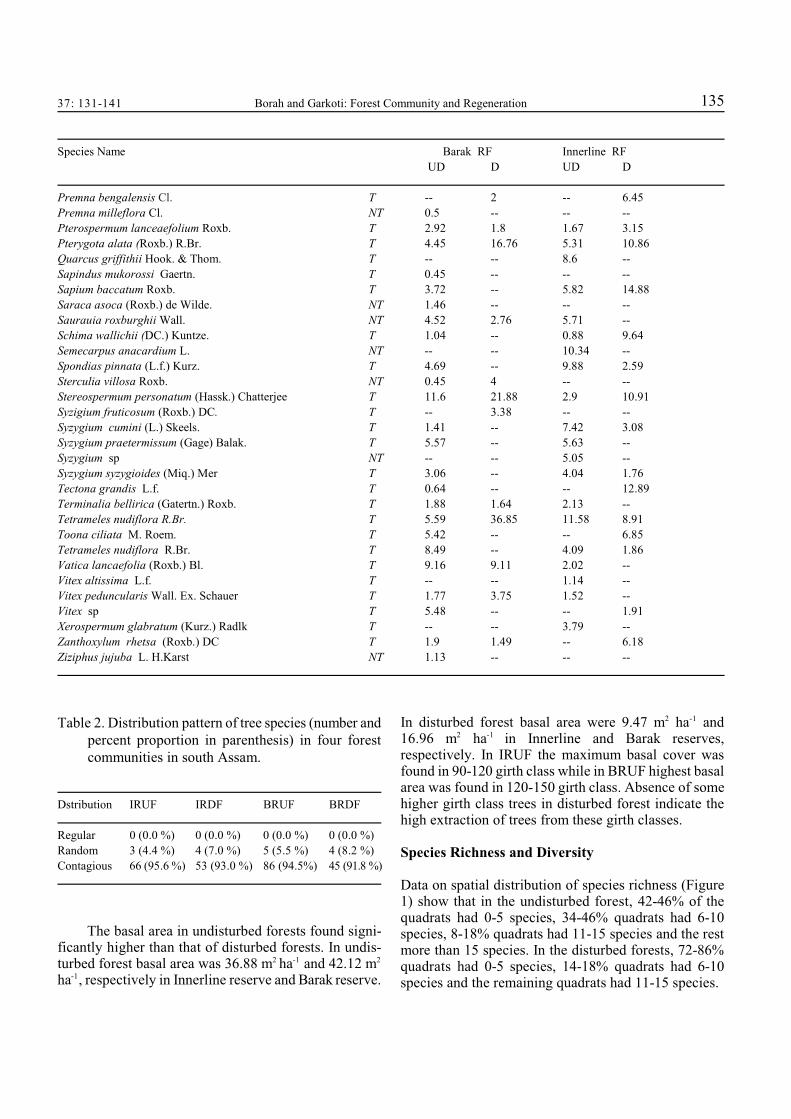
37: 131-141 Borah and Garkoti: Forest Community and Regeneration 135
Species Name Barak RF Innerline RF
UD D UD D
Premna bengalensis Cl. T -- 2 -- 6.45
Premna milleflora Cl. NT 0.5 -- -- --
Pterospermum lanceaefolium Roxb. T 2.92 1.8 1.67 3.15
Pterygota alata (Roxb.) R.Br. T 4.45 16.76 5.31 10.86
Quarcus griffithii Hook. & Thom. T -- -- 8.6 --
Sapindus mukorossi Gaertn. T 0.45 -- -- --
Sapium baccatum Roxb. T 3.72 -- 5.82 14.88
Saraca asoca (Roxb.) de Wilde. NT 1.46 -- -- --
Saurauia roxburghii Wall. NT 4.52 2.76 5.71 --
Schima wallichii (DC.) Kuntze. T 1.04 -- 0.88 9.64
Semecarpus anacardium L. NT -- -- 10.34 --
Spondias pinnata (L.f.) Kurz. T 4.69 -- 9.88 2.59
Sterculia villosa Roxb. NT 0.45 4 -- --
Stereospermum personatum (Hassk.) Chatterjee T 11.6 21.88 2.9 10.91
Syzigium fruticosum (Roxb.) DC. T -- 3.38 -- --
Syzygium cumini (L.) Skeels. T 1.41 -- 7.42 3.08
Syzygium praetermissum (Gage) Balak. T 5.57 -- 5.63 --
Syzygium sp NT -- -- 5.05 --
Syzygium syzygioides (Miq.) Mer T 3.06 -- 4.04 1.76
Tectona grandis L.f. T 0.64 -- -- 12.89
Terminalia bellirica (Gatertn.) Roxb. T 1.88 1.64 2.13 --
Tetrameles nudiflora R.Br. T 5.59 36.85 11.58 8.91
Toona ciliata M. Roem. T 5.42 -- -- 6.85
Tetrameles nudiflora R.Br. T 8.49 -- 4.09 1.86
Vatica lancaefolia (Roxb.) Bl. T 9.16 9.11 2.02 --
Vitex altissima L.f. T -- -- 1.14 --
Vitex peduncularis Wall. Ex. Schauer T 1.77 3.75 1.52 --
Vitex sp T 5.48 -- -- 1.91
Xerospermum glabratum (Kurz.) Radlk T -- -- 3.79 --
Zanthoxylum rhetsa (Roxb.) DC T 1.9 1.49 -- 6.18
Ziziphus jujuba L. H.Karst NT 1.13 -- -- --
Table 2. Distribution pattern of tree species (number andpercent proportion in parenthesis) in four forestcommunities in south Assam.
Dstribution IRUF IRDF BRUF BRDF
Regular 0 (0.0 %) 0 (0.0 %) 0 (0.0 %) 0 (0.0 %)
Random 3 (4.4 %) 4 (7.0 %) 5 (5.5 %) 4 (8.2 %)
Contagious 66 (95.6 %) 53 (93.0 %) 86 (94.5%) 45 (91.8 %)
The basal area in undisturbed forests found signi-ficantly higher than that of disturbed forests. In undis-turbed forest basal area was 36.88 m ha and 42.12 m2 -1 2
ha , respectively in Innerline reserve and Barak reserve.-1
In disturbed forest basal area were 9.47 m ha and2 -1
16.96 m ha in Innerline and Barak reserves,2 -1
respectively. In IRUF the maximum basal cover wasfound in 90-120 girth class while in BRUF highest basalarea was found in 120-150 girth class. Absence of somehigher girth class trees in disturbed forest indicate thehigh extraction of trees from these girth classes.
Species Richness and Diversity
Data on spatial distribution of species richness (Figure1) show that in the undisturbed forest, 42-46% of thequadrats had 0-5 species, 34-46% quadrats had 6-10species, 8-18% quadrats had 11-15 species and the restmore than 15 species. In the disturbed forests, 72-86%quadrats had 0-5 species, 14-18% quadrats had 6-10species and the remaining quadrats had 11-15 species.

Borah and Garkoti: Forest Community and Regeneration Int. J. Ecol. Environ. Sci.136
Figure 1. Plant species richness in undisturbed and disturbed forests
in Innerline and Barak reserves in south Assam.
The Shannon Weaver diversity index (H) washigher in both undisturbed forests (1.69 and 1.77;respectively in Innerline reserve and Barak reserve). TheSimpson Index ranged in undisturbed forest of presentstudy 0.024 to 0.027 while it ranged in disturbed forest0.040 to 0.053 (Table 3).The Evenness and Margalef’sindices were also higher in undisturbed forests than inthe disturbed forests (Table 3).
Table 3. Tree density, basal area and diversity inundisturbed and disturbed forests in Innerline andBarak reserves in south Asssam.
Parameter IRUF IRDF BRUF BRDF
Density (tree ha ) 846 572 1110 396-1
Basal area (m ha ) 36.88 9.47 42.12 16.962 -1
Species Richness 69 57 91 49
Shannon Index (H) 1.69 1.46 1.77 1.52
Simpson Index 0.027 0.053 0.024 .040
Species Evenness (J’) 0.40 0.36 0.39 0.39
Margalef Index 36.97 31.89 32.80 20.90
Density Distribution
Present study recorded higher plant density in undis-turbed forests compared to disturbed forests (IRUF, 846tree ha ; BRUF,1110 tree ha ; IRDF, 572 tree ha and-1 -1 -1
BRDF 396 tree ha ). In IRUF highest density was-1
recorded for Dysoxylum sp. (60 tree ha ), followed by-1
Palaquium polyanthum (56 trees ha ) and Cynometra-1
polyandra (50 trees ha ). In BRUF, Cynometra-1
polyandra was found densely distributed species (72trees ha ), followed by Palaquium polyanthum (70 trees-1
ha ). In disturbed IRDF Mitragyna rotundifolia was-1
recorded densely distributed species (72 trees ha )-1
followed by Schima wallichii (62 trees ha ). In BRDF-1
the densely distributed tree species was Stecospermumchelonoides (28 trees ha ). The relationship between the-1
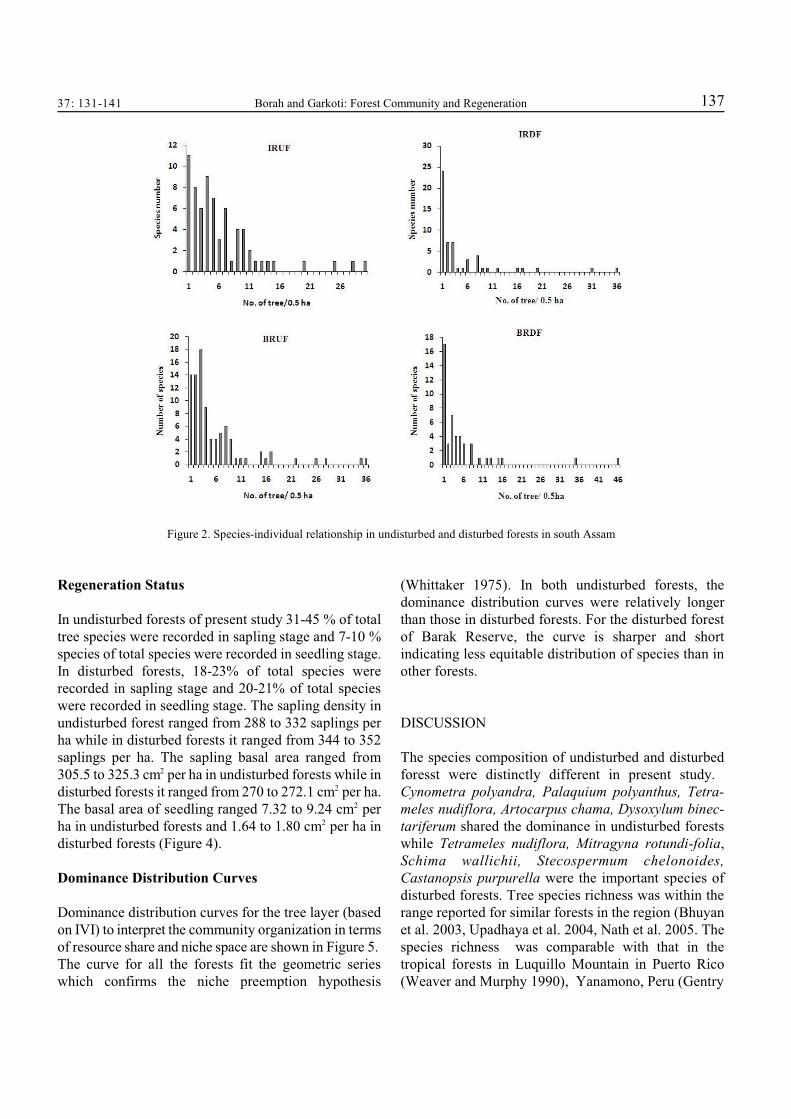
number of species and number of individuals is shown15January 2012 in Figure 2.
In all four forests of the present study, majority ofthe species were represented by few individuals and onlya few species had relatively large population density. Population Structure
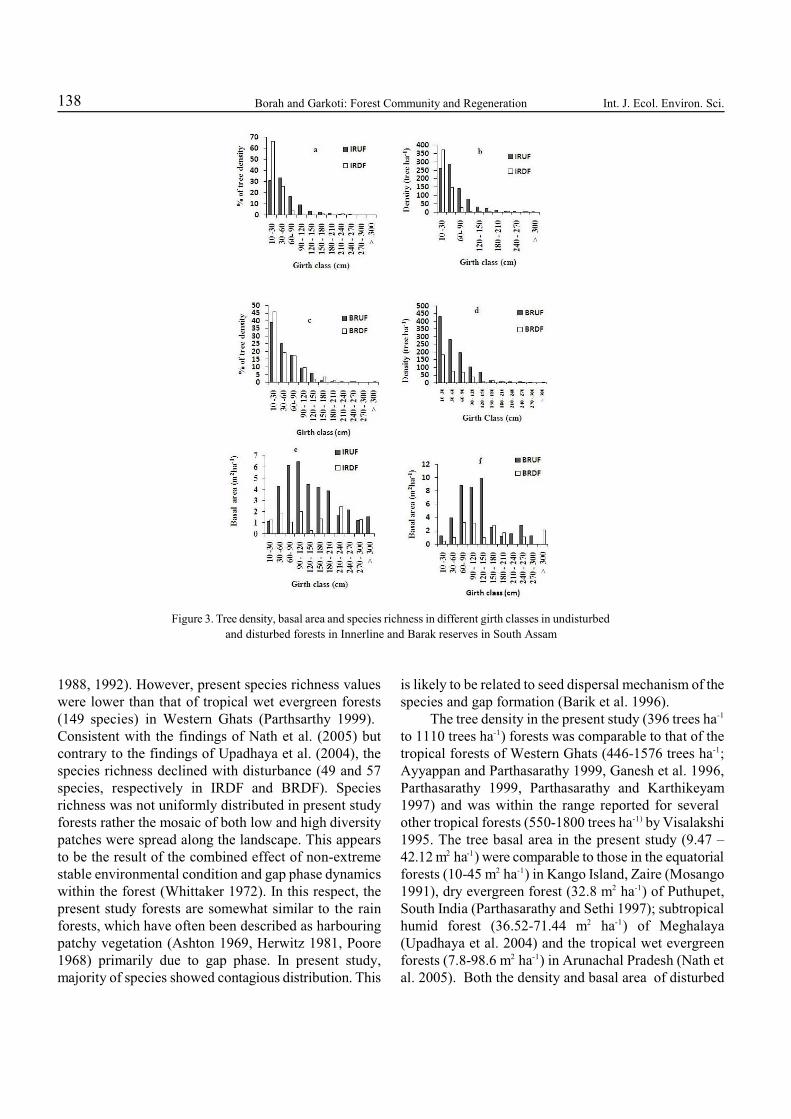
Data on the density distribution reveals reversed J-shaped curves (Figures 3 a, b). In the undisturbed forestsof present study, 31-38% of the trees have 10-30 cmgirth and 25-33% of trees have 30-60 cm girth. Indisturbed forests, 45-66% trees had 10-30 cm girth.Trees of higher girth class were absent in both thedisturbed forests. Distribution of species richness indifferent girth classes indicates that species richness wasinversely related to the girth class (Figures 3 e, f).
37: 131-141 Borah and Garkoti: Forest Community and Regeneration 137
Figure 2. Species-individual relationship in undisturbed and disturbed forests in south Assam
Regeneration Status
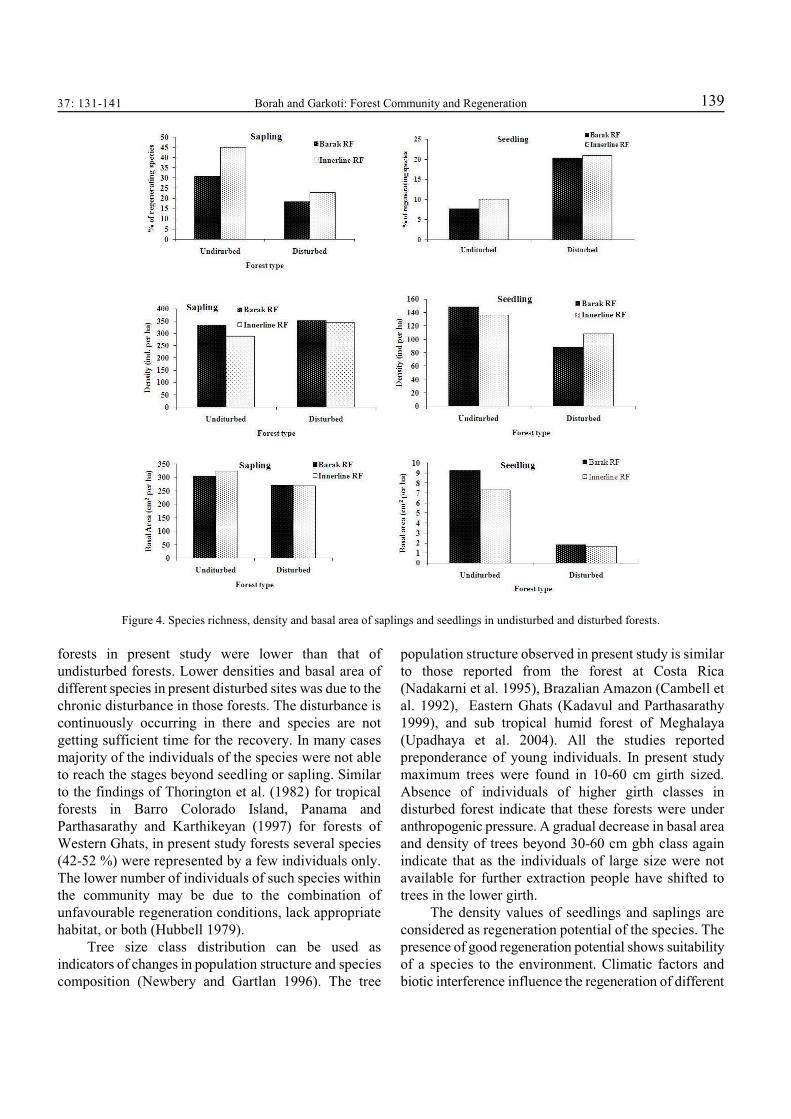
In undisturbed forests of present study 31-45 % of totaltree species were recorded in sapling stage and 7-10 %species of total species were recorded in seedling stage.In disturbed forests, 18-23% of total species wererecorded in sapling stage and 20-21% of total specieswere recorded in seedling stage. The sapling density inundisturbed forest ranged from 288 to 332 saplings perha while in disturbed forests it ranged from 344 to 352saplings per ha. The sapling basal area ranged from305.5 to 325.3 cm per ha in undisturbed forests while in2
disturbed forests it ranged from 270 to 272.1 cm per ha.2
The basal area of seedling ranged 7.32 to 9.24 cm per2
ha in undisturbed forests and 1.64 to 1.80 cm per ha in2
disturbed forests (Figure 4).
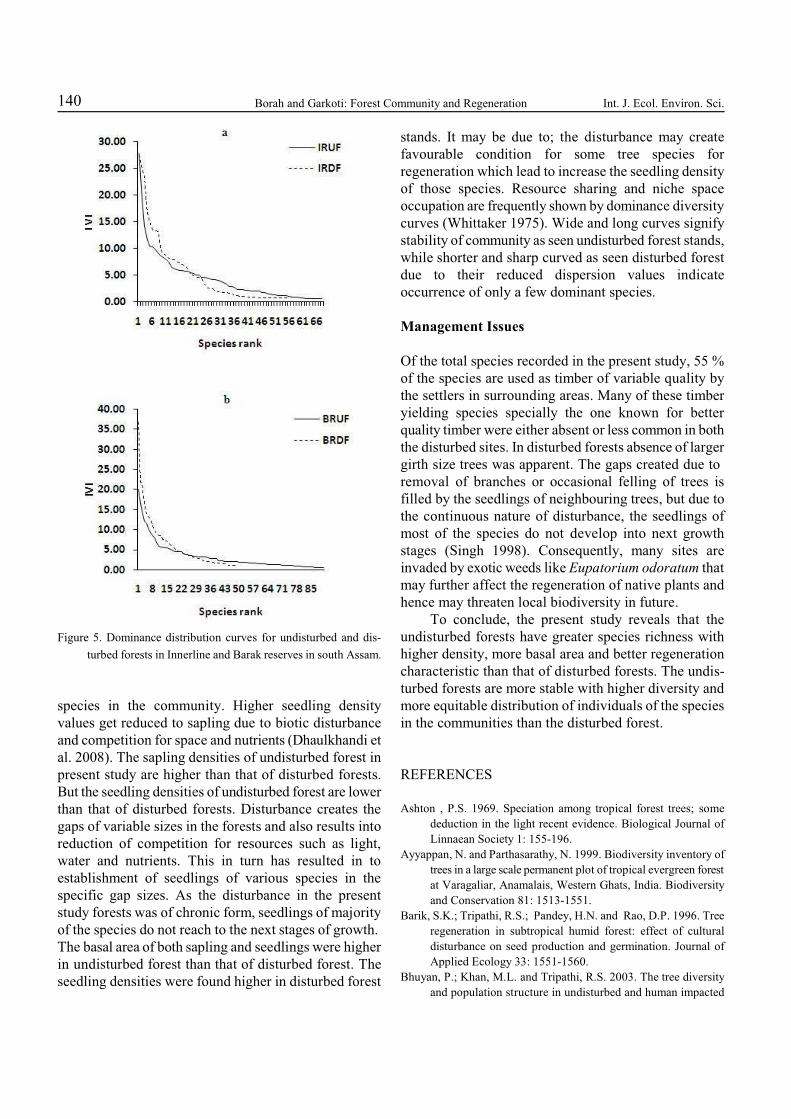
Dominance Distribution Curves
Dominance distribution curves for the tree layer (basedon IVI) to interpret the community organization in termsof resource share and niche space are shown in Figure 5. The curve for all the forests fit the geometric serieswhich confirms the niche preemption hypothesis
(Whittaker 1975). In both undisturbed forests, thedominance distribution curves were relatively longerthan those in disturbed forests. For the disturbed forestof Barak Reserve, the curve is sharper and shortindicating less equitable distribution of species than inother forests.
DISCUSSION
The species composition of undisturbed and disturbedforesst were distinctly different in present study. Cynometra polyandra, Palaquium polyanthus, Tetra-meles nudiflora, Artocarpus chama, Dysoxylum binec-tariferum shared the dominance in undisturbed forestswhile Tetrameles nudiflora, Mitragyna rotundi-folia,Schima wallichii, Stecospermum chelonoides,Castanopsis purpurella were the important species ofdisturbed forests. Tree species richness was within therange reported for similar forests in the region (Bhuyanet al. 2003, Upadhaya et al. 2004, Nath et al. 2005. Thespecies richness was comparable with that in thetropical forests in Luquillo Mountain in Puerto Rico(Weaver and Murphy 1990), Yanamono, Peru (Gentry
Borah and Garkoti: Forest Community and Regeneration Int. J. Ecol. Environ. Sci.138
Figure 3. Tree density, basal area and species richness in different girth classes in undisturbed
and disturbed forests in Innerline and Barak reserves in South Assam
1988, 1992). However, present species richness valueswere lower than that of tropical wet evergreen forests(149 species) in Western Ghats (Parthsarthy 1999). Consistent with the findings of Nath et al. (2005) butcontrary to the findings of Upadhaya et al. (2004), thespecies richness declined with disturbance (49 and 57species, respectively in IRDF and BRDF). Speciesrichness was not uniformly distributed in present studyforests rather the mosaic of both low and high diversitypatches were spread along the landscape. This appearsto be the result of the combined effect of non-extremestable environmental condition and gap phase dynamicswithin the forest (Whittaker 1972). In this respect, thepresent study forests are somewhat similar to the rainforests, which have often been described as harbouringpatchy vegetation (Ashton 1969, Herwitz 1981, Poore1968) primarily due to gap phase. In present study,majority of species showed contagious distribution. This
is likely to be related to seed dispersal mechanism of thespecies and gap formation (Barik et al. 1996).
The tree density in the present study (396 trees ha-1
to 1110 trees ha ) forests was comparable to that of the-1
tropical forests of Western Ghats (446-1576 trees ha ;-1
Ayyappan and Parthasarathy 1999, Ganesh et al. 1996,Parthasarathy 1999, Parthasarathy and Karthikeyam1997) and was within the range reported for several other tropical forests (550-1800 trees ha by Visalakshi-1)
1995. The tree basal area in the present study (9.47 –42.12 m ha ) were comparable to those in the equatorial2 -1
forests (10-45 m ha ) in Kango Island, Zaire (Mosango2 -1
1991), dry evergreen forest (32.8 m ha ) of Puthupet,2 -1
South India (Parthasarathy and Sethi 1997); subtropicalhumid forest (36.52-71.44 m ha ) of Meghalaya2 -1
(Upadhaya et al. 2004) and the tropical wet evergreenforests (7.8-98.6 m ha ) in Arunachal Pradesh (Nath et2 -1
al. 2005). Both the density and basal area of disturbed
37: 131-141 Borah and Garkoti: Forest Community and Regeneration 139
Figure 4. Species richness, density and basal area of saplings and seedlings in undisturbed and disturbed forests.
forests in present study were lower than that ofundisturbed forests. Lower densities and basal area ofdifferent species in present disturbed sites was due to thechronic disturbance in those forests. The disturbance iscontinuously occurring in there and species are notgetting sufficient time for the recovery. In many casesmajority of the individuals of the species were not ableto reach the stages beyond seedling or sapling. Similarto the findings of Thorington et al. (1982) for tropicalforests in Barro Colorado Island, Panama andParthasarathy and Karthikeyan (1997) for forests ofWestern Ghats, in present study forests several species(42-52 %) were represented by a few individuals only.The lower number of individuals of such species withinthe community may be due to the combination ofunfavourable regeneration conditions, lack appropriatehabitat, or both (Hubbell 1979).
Tree size class distribution can be used asindicators of changes in population structure and speciescomposition (Newbery and Gartlan 1996). The tree
population structure observed in present study is similarto those reported from the forest at Costa Rica(Nadakarni et al. 1995), Brazalian Amazon (Cambell etal. 1992), Eastern Ghats (Kadavul and Parthasarathy1999), and sub tropical humid forest of Meghalaya(Upadhaya et al. 2004). All the studies reportedpreponderance of young individuals. In present studymaximum trees were found in 10-60 cm girth sized.Absence of individuals of higher girth classes indisturbed forest indicate that these forests were underanthropogenic pressure. A gradual decrease in basal areaand density of trees beyond 30-60 cm gbh class againindicate that as the individuals of large size were notavailable for further extraction people have shifted totrees in the lower girth.
The density values of seedlings and saplings areconsidered as regeneration potential of the species. Thepresence of good regeneration potential shows suitabilityof a species to the environment. Climatic factors andbiotic interference influence the regeneration of different
Borah and Garkoti: Forest Community and Regeneration Int. J. Ecol. Environ. Sci.140
Figure 5. Dominance distribution curves for undisturbed and dis-
turbed forests in Innerline and Barak reserves in south Assam.
species in the community. Higher seedling densityvalues get reduced to sapling due to biotic disturbanceand competition for space and nutrients (Dhaulkhandi etal. 2008). The sapling densities of undisturbed forest inpresent study are higher than that of disturbed forests.But the seedling densities of undisturbed forest are lowerthan that of disturbed forests. Disturbance creates thegaps of variable sizes in the forests and also results intoreduction of competition for resources such as light,water and nutrients. This in turn has resulted in toestablishment of seedlings of various species in thespecific gap sizes. As the disturbance in the presentstudy forests was of chronic form, seedlings of majorityof the species do not reach to the next stages of growth. The basal area of both sapling and seedlings were higherin undisturbed forest than that of disturbed forest. Theseedling densities were found higher in disturbed forest
stands. It may be due to; the disturbance may createfavourable condition for some tree species forregeneration which lead to increase the seedling densityof those species. Resource sharing and niche spaceoccupation are frequently shown by dominance diversitycurves (Whittaker 1975). Wide and long curves signifystability of community as seen undisturbed forest stands,while shorter and sharp curved as seen disturbed forestdue to their reduced dispersion values indicateoccurrence of only a few dominant species.
Management Issues
Of the total species recorded in the present study, 55 %of the species are used as timber of variable quality bythe settlers in surrounding areas. Many of these timberyielding species specially the one known for betterquality timber were either absent or less common in boththe disturbed sites. In disturbed forests absence of largergirth size trees was apparent. The gaps created due to removal of branches or occasional felling of trees isfilled by the seedlings of neighbouring trees, but due tothe continuous nature of disturbance, the seedlings ofmost of the species do not develop into next growthstages (Singh 1998). Consequently, many sites areinvaded by exotic weeds like Eupatorium odoratum thatmay further affect the regeneration of native plants andhence may threaten local biodiversity in future.
To conclude, the present study reveals that theundisturbed forests have greater species richness withhigher density, more basal area and better regenerationcharacteristic than that of disturbed forests. The undis-turbed forests are more stable with higher diversity andmore equitable distribution of individuals of the speciesin the communities than the disturbed forest.
REFERENCES
Ashton , P.S. 1969. Speciation among tropical forest trees; some
deduction in the light recent evidence. Biological Journal of
Linnaean Society 1: 155-196.
Ayyappan, N. and Parthasarathy, N. 1999. Biodiversity inventory of
trees in a large scale permanent plot of tropical evergreen forest
at Varagaliar, Anamalais, Western Ghats, India. Biodiversity
and Conservation 81: 1513-1551.
Barik, S.K.; Tripathi, R.S.; Pandey, H.N. and Rao, D.P. 1996. Tree
regeneration in subtropical humid forest: effect of cultural
disturbance on seed production and germination. Journal of
Applied Ecology 33: 1551-1560.
Bhuyan, P.; Khan, M.L. and Tripathi, R.S. 2003. The tree diversity
and population structure in undisturbed and human impacted
37: 131-141 Borah and Garkoti: Forest Community and Regeneration 141
stands of tropical wet evergreen forest in Arunachal Pradesh,
Eastern Himalayas, India. Biodiversity and Conservation 12
(8): 1753-1773.
Campbell, D.G.; Stone, J.L. and Rosas, A. Jr. 1992. A comparison
of the phytosociology and dynamics of three floodplain
(Varzea) forest of known ages. Rio Jurua.Western Brazilian
Amazon. Botanical Journal of Linnaean Society 108: 213-237.
Dhaulkhandi, M.; Dobhal, A.; Bhatt, S. and Kumar, M. 2008.
Community structure and regeneration potential of natural
forest sites in Gangotri, India. Journal of Basic and Applied
Sciences 4: 49-52.
Ganesh, T.; Ganesan, R.; Devy, M.S.; Davidar, P. and Bawa, K.S.
1996. Assessment of plant biodiversity at mid-elevation
evergreen forest of Kalakand Mundanthuari Tiger Reserve,
Western Ghats, India. Current Science 71: 379-392.
Geldenhuys, C.J. and Murray, B. 1993. Floristic and structural
composition of Hanglip forest in the south Pansberg, Northern
Transvaal. South African Forestry Journal 165: 9-20.
Gentry, A. H. 1992. Tropical forests biodiversity, distributional
patterns and their conservational significance. Oikos 93: 19-28.
Gentry, H.A. 1988. Tree species richness of upper Amazon forest.
Proceedings of National Academy of Science, USA 85: 156-
459.
Herwitz, R.S. 1981. Regeneration of Selected Tropical Tree Species
in Corcovado National Park, Costa Rica. Publication in
Geography 24. University of California, Berkeley, California.
141 pages.
Hubbell, S.P. 1979. Tree dispersion, abundance and diversity in a
tropical dry forest. Science 203: 1299-1309.
Kadavul, K. and Parthasarathy, N. 1999. Structure and composition
of woody species in tropical semi evergreen forest of Kalayan
Hills, Eastern Ghats, India. Tropical Ecology 40: 247-260.
Kanjilal, U.N. (1934-1940). Flora of Assam. Vol. I-IV. Govt. of
Assam. Shillong.
Margalef, R. (1968). Perspective in Ecological Theory. University of
Chicago Press. Chicago. 111 pages.
Mittermeier, R.A.; Gil, P.R.; Hoffman, M.; Pilgrim, J.; Brooks, T.;
Mittermeier, C.G.; Lamoreux, J. da and Fonseca, G.A.B. 2005.
Hotspots Revisited: Earth's Biologically Richest and Most
Threatened Terrestrial Ecoregions. The University of Chicago
Press, Chicago. 390 pages..
Mosango, M. 1991. Contribution à l'étude botanique et bio-
géographique de l'écosystème forêt en région équatoriale (Ile
Kongolo, Zaïre). John Wiley, New York.
Mueller Dombios, D. and Ellenberg, H. 1974. Aims and Methods of
Vegetation Analysis. John Wiley, New York. 547 pages.
Nadkarni, N.M.; Matelson, T.J. and Haber, W.A. 1995. Structural
characteristic and floristic composition of neotropical cloud
forest, Montenerde, Costa Rica. Journal of Tropical Ecology
11: 482-495.
Newbery, D.M.C.C. and Gartlan, J.S. 1996. A structural analysis of
rain forests at Korup and Douala-Edea, Cameroon.
Proceedings of Royal Society Edinburgh 104: 107-224.
Parthasarathy, N. and Sethi, P. 1997. Tree and Lianas species and
population structure in a tropical dry evergreen forest in South
India. Tropical Ecology 38: 19-30.
Parthasarathy, N. 1999. Changes in tropical forest composition and
structure in three sites of tropical wet evergreen forest around
Sengaltheri. Western Ghats. Current Science 80: 389-393.
Parthasarathy, N. and Karthikeyam, R. 1997. Plant biodiversity
inventory and conservation of two tropical dry evergreen
forests on Coromandal Coast, South India. Biodiversity and
Conservation 6: 1063-1083.
Pielou, E.C. 1975. Ecological Diversity. John Wiley, New York.
Xxx pages.
Poore, M.E.D. 1968. Studies in Malayasian rain forest. I. The forest
on Trassic sediments in Jengka forest reserve. Journal of
Ecology 56: 143-196.
Rao, P.; Barik, S.K.; Pandey, H.N. and Tripathi, R.S. 1990.
Community composition and tree population structure of
subtropical humid forest along a disturbance gradient.
Vegetatio 88: 151-192.
Shannon C.E. and Weaver, W. 1963. The Mathematical Theory of
Communication. University of Illinois Press, Urbana. 117
pages.
Simpson, E. H. 1949. Measurement of diversity. Nature (London)
163: 688.
Singh, S.P. 1998. Chronic disturbance, a principal cause of
environmental degradation in developing countries.
Environmental Conservation 25: 1-2.
Stapanian, M.A.; Cassell, D.L. and Cline, S.P. 1997. Regional
patterns of local diversity of tree: associations with
anthropogenic disturbance. Forest Ecology and Management
93: 33-44.
Tilman, D.1994. Competition and biodiversity in spatially structured
habitats. Ecology 75: 2–16.
Thorington, Jr. R.W.; Tannenbaum, B.; Tarak A. and Rudran, R.
1982. Distribuition of trees on Barro Colorado Island. A five
hectare saple. pages 83-94, In: Leigh, Jr E.G.; Rand, A.S. and
Winddror, D.M. (Editors). The Ecology of Tropical Forest
Seasonal Rhythms and Long Term Changes. Smithsoman
Institution Press, Washinton, DC.
Upadhaya, K.; Pandey, H.N.; Law, P.S. and Tripathi, R.S. 2004.
Diversity and population characteristics of woody species in
subtropical humid forest exposed to cultural disturbance in
Meghalaya, Northeast India. Tropical Ecology 45(2): 303-314.
Visalakshi, N. 1995. Vegetation analysis of two tropical dry
evergreen forest in southern India. Tropical Ecology 36: 117-
142.
Weaver, P. L. and Murphy, P.G. 1990. Forest structure and
productivity in Puerto Rico’s Loquillo Mountains. Biotropica
22: 69-82.
Whiteford, P.B. 1948. Distribution of woodland plants in relation to
succession and clonal growth. Ecology 30: 199-208.
Whittaker, R.H. 1972. Evolution and measurement of species
diversity. Taxon 21: 213-251.
Whittaker, R.H. 1975. Communities and Ecosystems. Second
edition. Macmillan, New York. 162 pages.
Received 10 September 2011After Revision, Accepted 18 September 2011