assessment via discriminant analysis of soil suitability for effluent renovation using undisturbed...
TRANSCRIPT

1
Author version of paper published as: Carroll, Steven and Goonetilleke, Ashantha and Khalil, Wael Al-Shiekh and Frost, Ray (2006) Assessment via discriminant analysis of soil suitability for effluent renovation using undisturbed soil columns. Geoderma 131(1-2):pp. 201-217.
Copyright 2005 Elsevier
Assessment via discriminant analysis of soil suitability for effluent renovation using undisturbed soil columns.
Steven Carroll*a, Ashantha Goonetillekea, Wael Al-Shiek Khalila Ray Frostb,
a School of Civil Engineering, Queensland University of Technology, Brisbane Australia b School of Physical Sciences, Queensland University of Technology, Brisbane Australia
Abstract
The use of onsite wastewater treatment systems for the treatment and disposal of
effluent is common in urban fringe areas which are not serviced by centralised
wastewater collection systems. However, due to inappropriate siting and soil
characteristics, the inherent failure of these systems, in particular subsurface soil
treatment systems, are numerous. In order to ensure that these systems are capable of
providing adequate treatment and disposal of effluent in the long term, it is essential
that the soils’ ability to both renovate as well as dispose of discharged effluent is
adequately assessed. This paper discusses the outcomes of a research study
undertaken through the use of undisturbed soil columns, to assess the ability different
soil types to treat and dispose of primary treated effluent. Discriminant Analysis (DA)
was utilised for classification of the various soil types based on their respective
physical and chemical characteristics and to identify relative changes in each soil type
after an extended period of application of effluent. Ferrosol and Dermosol soils were
found to provide the most satisfactory conditions for effluent renovation. Kurosol,
Sodosl and Chromosol soils even though were found to provide suitable means for
removing effluent pollutants, reductions in the soils’ permeability over time indicated
that these soils may not be appropriate for long term effluent treatment. Finally,

2
Podosol soils were found to have minimal ability to provide adequate treatment of
effluent.
Keywords: Onsite wastewater treatment, soil columns, effluent renovation,
Discriminant Analysis
Introduction The onsite treatment and disposal of wastewater is the most feasible option in urban
fringe areas which are not serviced by reticulated wastewater collection systems. The
use of these systems for the treatment and disposal of wastewater is dependant on a
range of soil and site related factors (Dawes and Goonetilleke 2003, Whitehead and
Geary 2000). Soil plays a major role in the attenuation and removal of different
pollutants contained in the effluent. This is because common onsite wastewater
treatment systems such as septic tanks are designed to treat sewage only partially and
there is an explicit dependency on soil systems for final treatment and appropriate
disposal. Unfortunately, not all soil types have the capacity to provide adequate
treatment and disposal of sewage effluent. The ability of soil to provide adequate
treatment is particularly important in the case of septic tank-subsurface effluent
disposal systems which is by far the most common system adopted in practice. A
typical septic tank soil adsorption systems is depicted in Figure 1. The failure of
onsite systems is common and is cause for concern as the release of poorly treated
effluent into the surrounding environment can substantially increase environmental
and public health risks. Studies undertaken in Australia have noted a general failure
rate of over 70% (Goonetilleke et al 2000, Goonetilleke et al 2002, Whitehead and
Geary 2000, Martens and Geary 1999, Martens and Warner 1995). Similarly, in the
USA septic tank failure rates of up to 72% have been reported (USEPA 1997).
To be able to adequately treat and dispose of discharged effluent, the soil must have
sufficient permeability and drainage characteristics to allow the effluent to infiltrate
through the soil matrix. This allows further chemical processes to take place in order
to remove pollutants such as nutrients. The soil must also contain sufficient ion
exchange properties to permit the adsorption of effluent constituents. Cation
Exchange Capacity, or CEC, is one property which provides an indication of the ionic

3
charge of the soil and therefore acts as a measure for evaluating its ability for effluent
renovation (Khalil et al 2004, Dawes and Goonetilleke 2003). The CEC of a soil is
influenced by a number of factors. Organic matter (%OM) for example, retains very
high ionic forces which can increase a soil’s ionic exchange capacity (Oorts et al
2003). However, large amounts of organic matter can also cause water repellence, and
therefore reduce infiltration (Ferreira et al 2000). Similarly, both the amount and type
of clay present in the soil also has an impact on the CEC, as well as the permeability
of a soil. Clays that has smectite mineralogy generally have higher CEC levels
compared to soils with other clay minerology such as kaolinite or illite (Coppin et al
2002, Khalil et al 2004). However, smectite is also a high-shrink swell clay, which
can impede water infiltration, particularly if a high percentage is present in the soil
(Miranda-Trevino and Coles 2003, Di Maio et al 2004)).
Individual cations, such as magnesium (Mg), calcium (Ca) and sodium (Na) can also
influence the renovation and infiltration of effluent through a soil. Although providing
numerous cation exchange sites for adsorbing effluent pollutants, high concentrations
of cations such as Na and Mg, can cause dispersion of the clay particles and
effectively impede water flow through the soil (Dawes and Goonetilleke 2003, Prasad
et al 2001). This is of particular significance to onsite systems as high levels of Na are
typically found in effluent from the use of washing powders and cleaners.
Additionally it can also increase over time the levels of sodium ions in the soil.
Therefore, in order to adequately assess a soil’s long-term ability to renovate effluent
including its ability to attenuate effluent pollutants and provide sufficient disposal
capability, permeability and drainage characteristics, as well as the physico-chemical
characteristics, such as CEC and %OM need to be investigated.
A suitability ranking based on soil renovation ability was developed by Carroll et al
(2004) for common soil types found in the Southeast region of Queensland State,
Australia. The soils were classified according to the Australian Soil Classification
(Isbell 2002). This work was based on detailed field investigations and soil sampling
to assess the important soil physical and chemical properties that influence the ability
of a soil to provide suitable renovation of effluent. The outcomes of multivariate
statistical analysis of the collected soil physical and chemical characteristics were
used to provide a soil renovation suitability for the different soil types assessed.

4
Although this research provided a thorough assessment of the different soil types and
their renovation ability, the suitability ranking was developed using natural soils that
had not been used for effluent treatment. However, in order to strengthen the practical
nature of the suitability ranking, a soil’s effluent renovation ability is best assessed
based on the changes soils undergo with the application of sewage effluent.
This paper describes the outcomes of a research study undertaken to assess the soil
suitability for renovating effluent using undisturbed soil columns. The main aim was
to investigate the ability of the different soils to provide suitable attenuation and
removal of sewage effluents, and in particular nutrients (nitrogen and phosphorus).
The changes in the soil’s textural and physico-chemical makeup were investigated to
assess long term impacts due to effluent application. Discriminant Analysis (DA) was
utilised to allow classification of the various soil characteristics and to identify
relative changes in each soil after the application of effluent.
Materials and Methods Soil Column Setup
Six undisturbed cores were obtained representing the major soil types commonly
found in the Southeast region of Queensland State, Australia. The six soil types
included Kurosol, Ferrosol, Podosol, Sodosol, Dermosol and Chromosol soil groups
(Isbell 2002). Table 1 gives the relevant physical and chemical soil properties of the
six soil cores and their respective soil classifications based on the Australian Soil
Classification and equivalent Soil Taxonomy Order (NRCS 1999), together with a
general soil profile description. The undisturbed cores were obtained using an 85mm
hollow flite auger and driven to a depth of 1300mm. The internal hollow tube was
retracted and the soil core was transferred to a 100mm diameter, 2000mm long PVC
tube to provide secure conditions for transportation of the samples to the laboratory.
Whilst in storage in the laboratory the cores were periodically sprayed with deionised
water to prevent the soil from drying out. This was to ensure that no unintentional
cracks occurred through the soil structure that may provide preferential flow paths to
occur.

5
Test columns, as depicted in Figure 2, were fabricated using 100mm φ Perspex tubing
capped with a 10mm thick square Perspex base plate. Three effluent sampling points
were located along the length of each column at 150, 450 and 800mm from the top. A
fourth effluent sampling point was centrally located at the base. Additionally, three
soil sample ports were located at the same heights but opposite to the effluent
sampling points. Effluent samples were collected from the soil columns using 75mm
long stainless steel tubes (10mm φ), which were inserted through the soil at each
effluent sampling point. Sampling bottles were attached to each effluent sampling
point using PVC tubing. Fifteen predrilled holes (3mm φ) were positioned along the
top and sides of the steel tube to allow percolating effluent to enter and flow out into
connected sample bottles.
Prior to inserting each soil core into the prepared columns, the top 400mm was
removed. This was to replicate as closely as possible the installation depth of a typical
soil absorption system commonly used in Australia (Figure 1). The collected soil
cores were carefully inserted into the prepared test columns to minimise any
disturbance. The gap between the soil core and the column was filled with liquefied
petroleum jelly to prevent any preferential flow between the soil core and the column
wall and to ensure that all applied effluent would infiltrate through the soil.
Effluent Application and Sampling
Primary treated effluent collected from a municipal sewage treatment plant was
applied to the top of the column at the rate of 240 mL/day until ponding occurred due
to the formation of a clogging mat. The effluent application rate was based on typical
household effluent flow rates and system sizes, and adjusted (scaled) for the cross-
sectional of the soil column. Average quality characteristics of the effluent used is
given in Table 2. After effluent ponding had taken place, application rates were
reduced to 120mL/day to allow sufficient time for effluent to percolate through the
clogging mat and infiltrate into the soil. A reduction in effluent infiltration as a result
of the clogging mat occurred over a 3-4 month period before steady state infiltration
occurred. Effluent application to all six soil columns continued over an eight month
period. Effluent which had infiltrated through the soil column were collected and
analysed on a weekly basis or earlier if the sampling bottles were full. The collected

6
samples were analysed for pH, Electrical Conductivity (EC), Total Kjeldahl Nitrogen
(TKN - organic and ammonia nitrogen) and Phosphorus (PO43--P).
Soil Sampling and Analysis
Samples were also taken from the soil cores prior to their insertion into the test
columns to determine the original phyisico-chemical characteristics of each soil type.
The results obtained are given in Table 1. Subsequently, soil samples were collected
at each of the three soil sampling points in the test columns after eight months of
effluent application. This was to evaluate the changes to soil physico-chemical
characteristics after long term effluent application. The soil parameters measured and
the test methods adopted for analysis are given in Table 3.
Discriminant Analysis (DA)
To assess the ability of the different soil types for renovating effluent, discriminant
analysis (DA) was employed to discriminate between major soil characteristics
influencing the relevant processes. Discriminant analysis is a multivariate statistical
analysis technique where a data set containing X variables is separated into a number
of pre-defined groups using linear combinations of analysed variables. This allows
analysis of their spatial relationships and identification of the respective
discriminative variables for each group (Wilson 2002) Objects that retain similar
variances in the analysed variables will have similar discriminant scores, and
therefore when plotted, will cluster together. Likewise, relationships between
variables can be easily identified by the respective coefficients. Strongly correlated
variables will generally have the same magnitude and orientation when plotted,
whereas uncorrelated variables are typically orthogonal to each other. There are two
main functions for which DA is commonly employed. Firstly, it is used to analyse the
differences between two or more groups of multivariate data using one or more
discriminant functions in order to maximally separate the identified groups. Secondly,
DA can be employed to obtain linear mathematical functions which can be used to
classify the original data, or new, unclassified data, into the respective groups
(Brereton 1990).
Due to the ability of DA to classify objects according to specific variables, DA has
been used in soil analysis successfully to classify unknown soil properties into

7
respective known classes. For example, Wilson (2002) used stepwise discriminant
analysis to distinguish between Palaeocene and Plio–Pleistocene chalk deposits using
particle size and heavy metal data from 276 samples. DA provided good
differentiation between the clustered chalk deposits, and successfully allowed for the
classification of unknown chalk deposits. Splechtna and Klinka (2001) used DA to
identify relationships between field identified and measured soil nutrient properties.
Similarly, DA provided excellent classification (>70%) of the field identified and
measured soil properties. However, in the case of the study discussed in this paper, as
the soils were already classified, DA was adopted for its grouping functionality in
order to identify variations in the soil types. Analysis of the soil column data was
achieved by undertaking DA on the different data using statistiXL ver 1.3 (statisiXL
2003). To evaluate the suitability of the six different soil columns for renovating
effluent and to assess changes throughout the soil profile due to effluent application,
three DA analyses were performed.
Initially DA was undertaken to distinguish between the major physico-chemical
characteristics of the various soil types used, based on a selection of variables
employed to evaluate the soil’s ability to renovate effluent. The variables for the
initial DA were pH, EC, organic matter (%OM), cation exchange capacity (CEC),
effective cation exchange capcity (ECEC), exchangeable sodium percentage (ESP)
and percent clay (%C). These initial variables were selected based on the suite of tests
generally carried out in land resource evaluation (Rayment and Higginson 1992).
These tests have been developed through extensive agricultural research and are
designed to distinguish between deficient, adequate and toxic availability of elements
in soil and between degraded and non-degraded soil conditions. These parameters
have recently been more widely used to assess the attenuation and removal of effluent
pollutants from onsite wastewater treatment systems. Additionally, these parameters
also match with variables selected for analysis in research undertaken by Carroll et al
(2004) for developing a soil suitability framework for effluent renovation.
DA was also used to analyse the obtained soil data to assess the various changes
occurring in the soil columns as a result of long-term effluent application. Three data
sets were constructed including the original soil data and soil data obtained after
effluent application. Firstly, the same suite of variables used in the previous DA were

8
re-analysed with the additional soil data obtained after effluent application. The
variables were pH, EC, %OM, CEC, ECEC, ESP and %C. This was undertaken to
assess the changes in the soil as a result of effluent application. Secondly, DA was
also undertaken using the variables pH, EC, Cl-, CEC, %OM, %C, TKN, NO3--N,
PO43--P and TP. This was to assess how successful the different soil types were at
accumulating and removing effluent pollutants, particularly nitrogen and phosphorus.
pH, EC, %OM, CEC and %C were also used to help discriminate the soils based on
the parameters that have a major influence on effluent renovation. Thirdly, DA was
undertaken on the soil’s individual cation data to assess the impact effluent had on
soil cations and respective ionic charges. The data set used for analysis included pH,
CEC, ECEC, %C, ESP, Ca:Mg ratio, Al, Fe, Mg, Na, Ca.
Results and Discussion
Effluent results
Analysis of the effluent samples taken from the column indicated that four out of the
six columns assessed provided suitable attenuation and removal of effluent pollutants.
However, only two columns (Columns 2 and 5), were permeable enough to allow the
effluent to percolate through the entire soil column. Table 4 provides the average
concentrations of effluent constituents and average percentage removal of nitrogen
and phosphorus after passing through the individual soil core. Columns 2, 4, 5 and 6
provided > 90% reduction of both nitrogen (TKN) and phosphorus (PO43--P) applied
to the soil. However, the reduction in TKN may not necessarily be specifically related
to attenuation. Most of the TKN will eventually undergo nitrification and
denitrification, depending on the characteristics of the soil, in particular the presence
of aerobic and anaerobic conditions. Subsequently, some or all of the TKN may be
nitrified and allowed to move through the soil as NO3--N. The level of removal of
nitrogen as a species will therefore depend on the ability of the soil to denitrify the
existing nitrate.
In the study, most of the nitrogen was observed to be removed or nitrified by the time
the effluent had infiltrated to the second sampling point, except for Column 2 and 3.

9
Column 2 was successful in reducing only 42% of the TKN by the second sampling
point, but had been removed 99% by the time the effluent had reached the third
sampling point. The main reason for this is most likely due to Column 2 having a
lower clay fraction in the upper soil horizons, with increasing clay content down
through the profile. As shown in the soil’s mineralogy, it had a mixed mineralogy in
the upper horizons with the smectite found in the lower B horizon. Smectite typically
retains high CEC levels, which would explain the high removal in the lower half of
the column. Column 3 was a sandy soil which had a low CEC and OM content,
indicating that inadequate conditions exist for suitably adsorbing nitrogen. Increases
in the level of TKN at the third sampling point are most likely due to ponding of
effluent lower down in the column, thereby increasing TKN concentrations. Due to
the high permeability of the sand in Column 3, percolating effluent was found to
discharge from the base of the column within 1-2 hours. As the applied effluent
infiltrated through the soil at a faster rate than the effluent could pass out through the
lower sampling points, ponding occurred. Subsequently, ponding in the lower half of
the column would also provide anaerobic conditions, thereby causing an accumulation
of TKN at the base due to poor nitrifying conditions.
A majority of the phosphorus content discharged with the effluent was already
adsorbed by the soil by the time the effluent had infiltrated to the second sampling
point, except in Column 3. Column 3 was only capable of removing 30% of the
phosphorus, and in fact, effluent samples taken from the first two sampling points had
higher levels of PO43--P than the initial effluent. This suggests that the sand has poor
adsorption ability, and subsequently, the nutrients were being desorbed and
transported through the soil with the percolating effluent, into the lower reaches of the
soil profile. As was the case for nitrogen, the high permeability allowed transportation
of PO43--P through the column, allowing accumulation and increase in concentration
in the lower half of the column. In a field situation, this is a cause for major concern.
Sandy soils, similar to that in Column 3, although successful in removing larger solid
particles, will not be particularly effective in removing the smaller particulates or
soluble pollutants.
Columns 1, 4 and 6, although showing that most pollutants were being removed by
the soil, were not receiving any effluent from below the second sampling point. The

10
effluent was only able to infiltrate through the soil very slowly, indicating that the
permeability of these soils was quite slow. The possibility of a restrictive layer (an
impermeable layer of soil such as impermeable clay or hardpans) within the soil
Column may also explain this occurrence. In order for a soil to provide suitable
renovation of effluent, it must first be able to infiltrate through the soil at a rate
appropriate to provide adequate treatment and also the disposal of the effluent.
However if the rate is too slow, discharged effluent will not be able to infiltrate
through the soil, and ponding will occur.
Discriminant Analysis of Soil Results
Results from the DA undertaken on the original soil data signified that most of the
soils had distinct differences in their chemical makeup, and clustered based on their
respective soil classifications. Soil types that had similar soil properties, for example
column 5 and 6, did however cluster closely together, although the respective clusters
were still distinct. Figure 3 provides a DA scores plot of the soil analysis for six soil
columns. In the DA analysis, 96.3% of the variance was contained in the first two
discriminate functions, and these were therefore considered in the analysis.
The main factors contributing to whether a soil can be considered suitable for effluent
renovation was CEC, %OM, the type and content of clay present and permeability. As
highlighted in Figure 3, three soil columns, Columns 1, 2 and 4, all have satisfactory
levels of CEC, %OM and %C. This is typical, as generally a significant amount of
CEC is attributed to the available organic matter in the soil, with the remaining CEC
related to the clay content and type and the individual cations present in the soil.
(Oorts et al 2003). This is shown in the DA (Figure 3) with these variables being
strongly correlated. Furthermore ECEC, based on the contribution of individual
cations, is related to the soil CEC, but not to %OM, as shown in Figure 3.
Columns 5 and 6 are more highly correlated with the ECEC and ESP. The results of
original soil samples from Columns 5 and 6 suggest that these soils could be sodic in
nature, as indicted by the higher levels of ESP in the soil itself. Typically, sodic soils
have a high proportion of sodium ions in relation to other cations. A high proportion
of Na ions on the clay mineral exchange weakens the bonds of the corresponding clay
particle when the soil is moistened, causing the clay to swell and disperse (Irvine and

11
Reid 2001). Subsequently, through the derivation of ESP the concentration of Na is
inversely proportional to the CEC, as depicted in Figure 3. However, the
discrimination of column 6 is scattered on function 1, with more discrimination based
on ECEC, rather than ESP. Therefore, individual cations other than Na are more
likely to have significant concentrations in Column 6. Column 4, however, retains
high ESP values which agree with its original classification of a Sodosol. This poses a
significant issue in relation to this particular soil’s ability to treat effluent. Additional
Na added to the soil via the applied effluent may cause the clay particles to disperse,
consequently reducing the soil’s infiltration and effluent renovation ability. Column 3,
a Podosol is grouped by itself, mostly due to this soil having relatively very low CEC
and little organic matter. Columns 3, 5 and 6 have the strongest relationship with
permeability, k. Although Column 3 has the highest permeability of all columns. It
also has the weakest correlations with the other variables. As such, the overall
correlation with k is reduced.
From the initial DA (Figure 3), it can be observed that Columns 1, 2 and 4 (Kurosol,
Ferrosol and Sodsol soil types respectively) indicate that, based on the physico-
chemical parameters, they will be the most suitable for effluent renovation. This
corresponds well with the soil suitability rankings described by Carroll et al (2004).
However, Sodosol soils (Column 4) should be assessed with caution due to their
inherent tendency to disperse. The original soil conditions may indicate that the
Sodosol soil is satisfactory for effluent renovation, but the soil structure may
deteriorate over time, particularly if there is a high concentration of Na present in the
effluent. Column 5 (Dermosol), although having a reasonable CEC, has lower levels
of %C and %OM, slightly reducing its overall renovation ability. A majority of the
available CEC is developed from the individual cations present in the soil. However,
due to the higher permeability of this soil, the time required for the appropriate
exchanges to take place between the effluent and cations may be relatively too short.
Chromosol soils (Column 6) were classified as being suitable with regards to effluent
renovation in terms of its chemical characteristics, but again caution must be
exercised. Due to the abrupt changes in clay content which can occur in these soils, a
high percentage of clay lower down in the soil profile will result in poor effluent
infiltration, thereby reducing the overall ability of the Chromosol soil for effluent

12
renovation. The Chromosol soils investigated by Carroll et al (2004), although having
abrupt changes in clay content, still retained a significant proportion of sand, resulting
in adequate permeability to treat effluent. The Chromosol soil investigated in the
current laboratory study also had an adequate permeability, but did not have a high
CEC, consequently reducing its overall suitability. The DA analysis highlights that
Column 3 obviously provides the lowest ability for the renovation of effluent amongst
the investigated soils. It has the lowest CEC, %OM and ECEC levels, and therefore
has little pollutant attenuation and removal capabilities. Column 3 also had the highest
permeability, and due to its poor renovation ability, most pollutants will be
transported rapidly through the soil matrix.
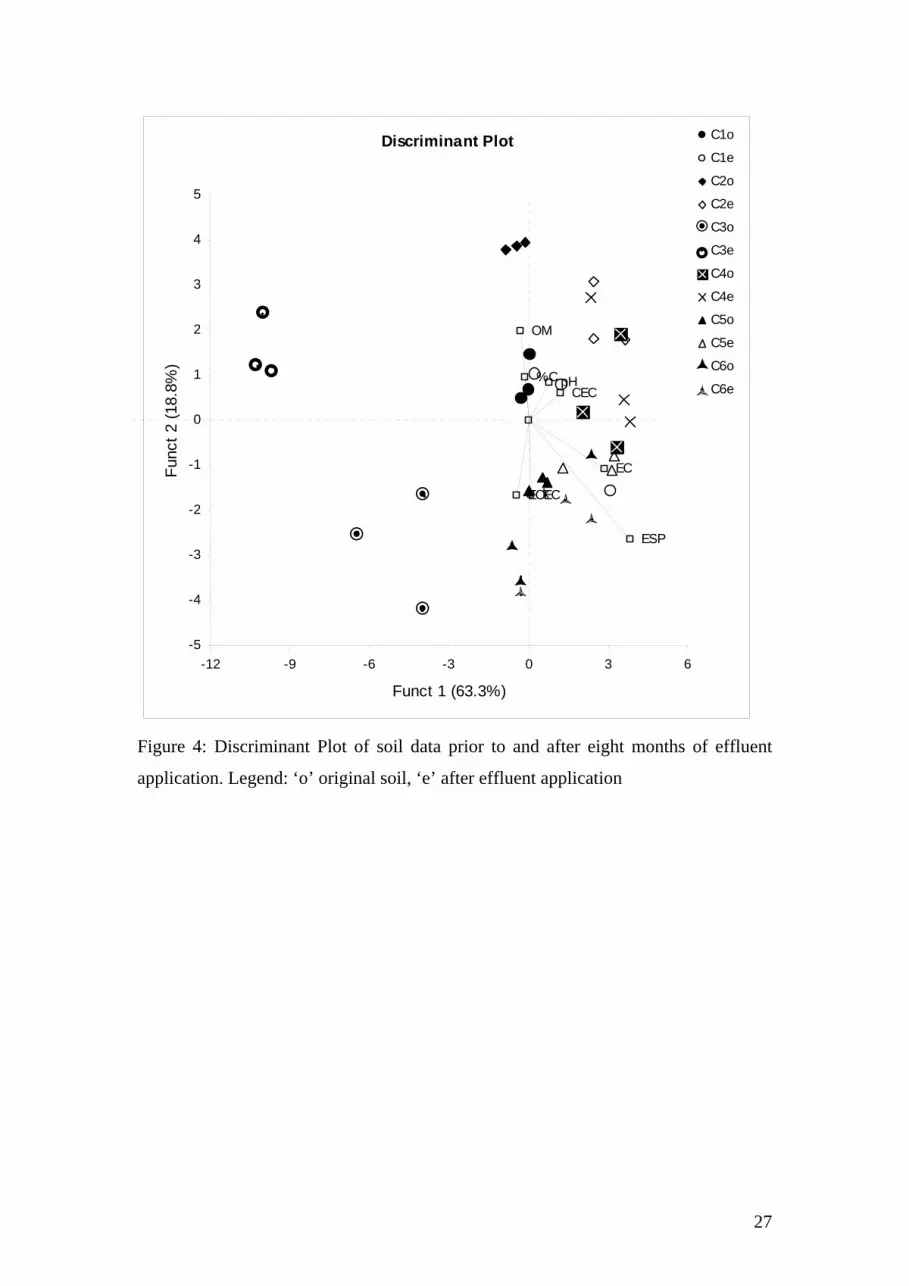
Figure 4 shows the DA undertaken on the original soil column data and after effluent
application (retaining 82.1% of the total data variance within the first two
discriminant functions). It indicates that substantial changes have occurred within the
soil matrix due to the infiltration of effluent. This is mostly in relation to increases in
the level of organic matter introduced to the soil. All soil columns, except Column 6,
showed increased organic matter throughout the column and in most cases had the
highest increases within the top section of the Column. Column 3 exhibited the largest
increase in soil organic matter, primarily due to the small amount of organic matter
present in the original soil. Column 6, however, showed little accumulation of organic
matter at the first sampling point, but had significant increases at the second and third
sampling points. Due to increases in the organic matter content, increases in the
respective CEC levels were also noticeable, with Columns 1, 2 and 5 showing
substantial increases.
Contrastingly, even though the CEC of all columns increased, the ECEC was in fact
found to decrease in some columns. This can be expected for two reasons. Firstly,
increases in organic matter increased the overall CEC, as already discussed. Secondly,
the individual cations which contribute to ECEC, may have been desorbed from the
clay particles with the percolating effluent, and either migrated further down through
the soil column or washed out with the effluent through the sampling points.
Individual cations in the effluent were not analysed during the present study. Changes
in the ECEC were most noticeable in Column 3. However, all soil columns were
found to have reductions in ECEC to some degree.

13
ESP was shown to increase for Columns 2, 4 5 and 6, most probably due to increase
in Na present in the effluent itself. The largest increase was in Column 1 at the first
sampling point and at all sampling points in Column 4. The increase in Na in Column
4 also resulted in minor reductions in permeability throughout the column. Obviously,
the sodic nature of this soil along with increase in Na from the effluent is causing the
soil to disperse, thereby reducing the permeability and effectiveness of the soil to treat
effluent.
Increases in pH and EC for all columns except Column 3 were observed. This is to be
expected as sewage is generally alkaline. Column 3, being a Podosolic soil from a
saline environment, had a high EC with a near neutral pH. Consequently, the EC will
inevitably reduce over time due to the lower EC of the applied effluent. However, due
to the applied effluent having a pH of 8.0, the subsequent pH of the soil in Column 3
slightly increased.
In relation to the sewage effluent renovation ability of the soil, the initial DA analysis
corresponds well with the results achieved by Carroll et al (2004). Primarily columns
1, 2 and 4, which were classified as the most suitable soils for effluent renovation
based on the chemical analysis, were also found to be suitable using DA. Columns 5
and 6 matched with the medium classification, whereas Column 3 was also found to
be unsuitable for renovation of effluent. However, although the initial analysis
collaborated well with previous research, further assessment was necessary to ensure
that the different soil types investigated were suitable for effluent renovation.
Analysis of the six columns performance in relation to contaminant attenuation and
removal, particularly the major nutrients of nitrogen and phosphorus, was
subsequently undertaken
Figure 5 provides the DA undertaken to analyse the soils’ ability for removing
pollutants. From the analysis, 81% of the total data variance was retained in the first
two discriminate functions. As indicated by this plot, two significant clusters are
evident. These clusters highlight the soils’ ability to attenuate or remove nitrogen and
phosphorus. In this particular analysis, increases in the soil nutrient content indicate
that higher attenuation levels are being achieved. Soils which originally had high CEC

14
and %OM levels should be suitable for renovating effluent, subject to other physical
and chemical characteristics such as %C and permeability. Columns 1, 2, 4 and 5 had
increases in the level of organic matter and consequently the overall CEC. Column 3
is an exception, as although increases were found, they were minimal. On the other
hand, very little increase in %OM was observed in Column 6, however, a significant
reduction in CEC was apparent in. Subsequent to effluent application, Columns 1, 2, 4
and 5 all show a high increase in TKN and TP, which would be accounted for due to
the soil adsorbing these. Increases in NO3--N concentrations in Columns 1, 2, 4 and 5
however, suggests that a substantial proportion of the organic nitrogen (TKN) is also
being converted to NO3--N, which is typically not adsorbed to soil particles.
Column 3 however showed little accumulation of nutrients. In fact, it was observed
during the experiment that the effluent extracted from the columns had higher levels
of nutrients than the original effluent over the first three months of the experiment.
This was due to the poor adsorption characteristics of the soil where the percolation of
effluent caused the nutrients to desorb and wash off nutrients in the soil. Levels of
PO43--P was highest in Columns 3 and 6. Column 6 also had low levels of nutrients
after effluent application, indicating that either little adsorption of nutrients had taken
place or the effluent was unable to percolate through the soil matrix or possible
preferential flow was occurring, bypassing the soil sampling points. As the %C in
Column 6 is not high, this suggests that poor adsorption ability is the most likely
explanation. DA on the initial data (Figure 3) shows that Column 6 does in fact have a
lower CEC and OM content than the other columns, indicating poor nutrient
attenuation ability. Nitrate levels were also found to have increased with high levels
found in Columns 1, 2, 4 and 5, indicating that the free movement of NO3- through
these soils is reduced, as compared to Columns 3 and 6.
The final DA analysis assessing the individual cations (retaining 83.1% of the total
data variance within the first two discriminant functions) as shown in Figure 6
indicated two major soil clusters were evident. Column 4 was clustered individually
based on the level of Na and Mg ions present in this soil. This is not surprising as this
soil retains sodic conditions. Ca tends to aid more in the flocculation of soil particles,
whereas Mg and Na are more likely to cause dispersion (Dawes and Goonetlleke
2003, Emerson 1977) Consequently, soil with Ca:Mg ration <0.5 typically imply high

15
ESP and high exchangeable Na. On the other hand, soils with moderate to high CEC,
Ca:Mg >0.5 having dominant Ca or Mg over Na (and therefore low ESP) have a
higher ability for effluent renovation without major soil structure breakdown (Dawes
and Goonetilleke 2003).
All remaining soil columns had similar discrimination of the Al, CEC and ECEC
variables, and were discriminated mostly by Al, Ca, Ca:Mg ratio and pH.
Significantly, most columns showed similar patterns with reductions in Ca, and
increase in Al. Due to the reduction in Ca, the Ca:Mg ratio also reduced accordingly.
Columns 3 and 6 were distinguished by increases in Al and Fe and subsequently also
had distinctive increases in the ECEC. Columns 1, 2 and 5 had reductions in Al and
Fe, but increases in Ca and Na. The reductions in Al and Fe are most likely due to
these cations being desorbed and washed off the soil particles by the percolating
effluent. For Al, this phenomenon typically occurs in soils that have low pH which
can cause the clay particles to deteriorate thereby releasing the aluminium ions (Brady
and Weil 2002, Gustafsson et al 2001). These desorbed ions are subsequently replaced
by Ca and Na which typically have high concentrations in effluent. Most soil
columns, except Column 4, also showed slight reductions or had no change in
concentrations of Mg. After effluent application, columns that had reduced Mg levels,
also had increased Ca:Mg ratio, due to the Ca becoming more dominant.
Soil Suitability
Discrimiant Analysis of the soil physico-chemical data indicates that two of the six
undisturbed soil columns investigated in this study provided adequate attenuation and
removal of effluent pollutants, and retained sufficient permeability through the soil
matrix to continue receiving effluent. This is confirmed by the substantial reductions
in nitrogen and phosphorus in the effluent samples collected after passing through the
soil cores. Column 2 and 5 (Ferrosol and Dermosol) both showed reductions of >90%
for both phosphorus and nitrogen without major reductions in soil permeability,
thereby indicating satisfactory performance over a long time period. Columns 1, 4 and
6 (Kurosol, Sodosol and Chromosol soils respectively), although indicating that
removal of pollutants in the effluent is highly achievable, reductions in the soil
permeability over eight months of effluent application point to the fact that these soils
may not be able to adequately treat effluent over the long term. Therefore, alternative

16
means of treatment and disposal, such as increasing the effluent disposal area, regular
replacement of the disposal area or providing alternative treatment systems to soil
adsorption trenches may be required. However, in the case of these particular soils it
is important to thoroughly investigate them prior to designing the effluent disposal
system in order to ensure adequate effluent renovation will occur. Column 3
(Podosol) had the poorest renovation ability, indicating poor pollutant attenuation and
removal. Column 3 also has a high permeability, which reduces the time available for
appropriate ionic exchanges between pollutants and the soil to occur, as well as
providing a means to transport pollutants through the soil and into groundwater.
Conclusions The use of undisturbed soil cores to assess the suitability of different soil types for
renovating effluent indicated that soils that have an initial high CEC, %OM, medium
%C and a medium permeability are more suitable. In this study, soil columns that had
a very high %C did not sufficiently transmit applied effluent through the soil column
to allow continued long term application. Likewise, it was observed that soils with a
high permeability, and low CEC, %OM and %C did not provide sufficient attenuation
and removal of effluent pollutants prior to the effluent exiting the column. Therefore,
from the results of this study, it can be concluded that Ferrosol and Dermosol soil
types provide the most satisfactory conditions for the proper treatment and disposal of
sewage effluent. Kurosol, Sodosol and Chromosol soils provided a suitable treatment
level. However, reductions in the soils permeability over the time of the experiment
indicates that these soil types may have problems with adequately disposing of
effluent from onsite systems in the long term. Lastly, the Podosol soil provided very
poor treatment ability to treat effluent, indicating that sandy soils with high
permeability and little ionic exchange capacity are not suitable for subsurface
treatment and disposal of effluent.

17
References
Bish, D. and Post, J., 1989, Modern powder diffraction, Reviews in Mineralogy, Vol.
20, Mineralogical Society of America, Washington, DC
Brady, N.C. and Weils, R.R., 2002, The Nature and Properties of Soils, 13th edition,
Prentice Hall, New Jersey
Brereton, RG, 1990, Chemometrics: applications of mathematics and statistics to
laboratory systems, E. Horwood, New York.
Carroll, S., Goonetilleke, A. and Dawes, L., 2004, Framework for soil suitability
evaluation for sewage effluent renovation, Environmental Geology, Vol. Article
in Press, No.
Coppin, F., Berger, G., Bauer, A., Castet, S. and Loubet, M., 2002, Sorption of
lanthanides on smectite and kaolinite, Chemical Geology, Vol. 182, No. 2-4, pp.
57-68.
Dawes, L. and Goonetilleke, A., 2003, An Investigation into the role of site and soil
characteristics in onsite sewage treatment, Environmental Geology, Vol. 44, No.
4, pp. 467-77.
Di Maio, C., Santoli, L. and Schiavone, P., 2004, Volume change behaviour of clays:
the influence of mineral composition, pore fluid composition and stress state,
Mechanics of Materials, Vol. 36, No. 5-6, pp. 435-51.
Ferreira, A. J. D., Coelho, C. O. A., Walsh, R. P. D., Shakesby, R. A., Ceballos, A.
and Doerr, S. H., 2000, Hydrological Implications of Soil Water-Repellency in
Eucalyptus globulus Forests, North-Central Portugal, Journal of Hydrology, Vol.
231-232, No., pp. 165-77.
Goonetilleke, A., Dawes, L. and Biddel, D., 2002, Performance Evaluation of Septic
Tanks in the Gold Coast Region, Environmetal Studies, Gold Coast City Council
Research Unit, Volume 8, Gold Coast, Australia.

18
Gustafsson, J.P., Berggren, D., Sinmonsson, M., Zysset, M. and Mulder, J., 2001,
Aluminium solubility mechanisms in moderately acid Bs horizons of podzolized
soils, European Journal of Soil Science, 52: 655-665
Irvine, S. and Reid, D., 2001, Field prediction of sodicity in dryland agriculture in
Central Queensland, Australia, Australian Journal of Soil Research, Vol. 36, No.
6, pp. 1349-57.
Isbell, R. F., 2002, The Australian Soil Classification, CSIRO Publishing,
Collingwood, Victoria, Australia.
Jelliffe, P. A., 1995, A Study of the Performance of On-site Treatment and Disposal
Systems in Maroochy Shire, Maroochy Shire Council, Maroochy.
Khalil, W. A.-S., Goonetilleke, A., Kokot, S. and Carroll, S., 2003, Use of
Chemometric Methods and Mulitcriteria Decision-Making for Site Selection for
Sustainable On-site Sewage Effluent Disposal, Analytica Chimica Acta, Vol.
506, No. 1, pp. 41-56.
Miranda-Trevino, J. C. and Coles, C. A., 2003, Kaolinite properties, structure and
influence of metal retention on pH, Applied Clay Science, Vol. 23, No. 1-4, pp.
133-39.
NRCS, 1999, Soil Taxonomy: A Basic System of Soil Classification for Making and
Interpreting Soil Surveys, Agriculture Handbook No.436 United States
Department of Agriculture, Natural Resources Conservation Service.
Oorts, K., Vanlauwe, B. and Merckxa, R., 2003, Cation exchange capacities of soil
organic matter fractions in a Ferric Lixisol with different organic matter inputs,
Agriculture, Ecosystems and Environment, Vol. 100, No. 2-3, pp. 161-71.
Prasad, A., Kumar, D. and Singh, D., 2001, Effect of residual sodium carbonate in
irrigation water on the soil sodication and yield of palmarosa (Cymbopogon
martinni) and lemongrass (Cymbopogon flexuosus), Agricultural Water
Management, Vol. 50, No. 3, pp. 161-72.
Rayment, G. E. and Higginson, F. R., 1992, Australian Laboratory Handbook of Soil
and Water Chemical Methods - Australian Soil and Land Survey Handbook,
Inkata Press, Sydney.
Splechtna, B. E. and Klinka, K., 2001, Quantitative characterization of nutrient
regimes of high-elevation forest soils in the southern coastal region of British
Columbia, Canada, Geoderma, Vol. 102, No. 1-2, pp. 153-74.
statistiXL, 2003, statistiXL,

19
US EPA, 1997, Response to Congress on Use of Decentralized Wastewater Treatment
Systems, United States Environmental Protection Agency, EPA 832-R-97-001b.
Whitehead, J. H. and Geary, P. M., 2000, Geotechnical Aspects of Domestic On-site
Effluent Management Systems, Australian Journal of Earth Sciences, Vol. 47,
No., pp. 75-82.
Wilson, D. I., 2002, Derivation of the chalk superficial deposits of the North Downs,
England: an application of discriminant analysis, Geomorphology, Vol. 42, No.
3-4, pp. 343-64.

20
Table 1 Selected soil physico-chemcial characteristics
Parameter Column 1 Column 2 Column 3 Column 4 Column 5 Column 6 Soil Classification (Isbell 2002) Kurosol Ferrosol Podosol Sodosol Dermosol Chromosol
Soil Taxonomy (NRCS 1999) Alfisols or Ultisols Oxisols Spodosols Alfisols Utisols Alfisols
Soil Profile Description
Soils with a clear or abrupt textural B horizon Major part of B horizon is strongly acidic
Soils with B horizon with free iron oxide content >5% Fe in fine earth fraction (<2mm).
Soils that have Bs, Bhs or Bh horizons
Soils with clear or abrupt textural B horizon Upper 0.2m of B2 horizon is highly sodic (ESP >6%)
Soils with B2 horizon with more developed structure
Soils with a clear and abrupt textural change in B horizon (abrupt increase in clay content)
Clay (%C) 31.6 83.1 0.2 19.6 24.9 21.8 Silt (%Si) 25.3 2.1 6.5 21.7 3.9 10.9 Sand (%S) 43.1 14.8 93.3 58.7 71.2 67.3
Clay Mineralogy Kaolinite Some Smectite in lower B horizon
Kaolinite Mixed KI in upper horizons and Smectite in lower B horizon
Kaolinite Kaolinite Kaolinite Kaolinite
pH 4.7 4.5 6.0 4.9 5.0 6.1 EC μS/cm 122 47.3 649.3 924.3 150.9 384.3 Organic Matter (%OM) 11 18 1.6 12.6 4.7 6.5 CEC meq 100g-1 39.5 48.7 10.6 43.6 30.5 17.1 ECEC meq 100g-1 31.3 48.4 9.4 23.1 20.9 11.2 TKN mg/Kg 111.4 156.3 168.2 243.8 189.1 175 NO3
- -N mg/Kg 15.7 7.7 23.7 28 50.3 33.3 PO4
3- -P mg/Kg 0.7 0.4 0.3 0.6 0.7 0.2 TP mg/Kg 2.3 1.3 0.5 0.9 1.5 0.7 ESP (%) 0.9 0.2 1.1 7.2 0.8 2.6

21
Table 2 Average Effluent Characteristics of applied effluent
Parameter ConcentrationpH 8.00 EC mS/cm 0.98 NO3
- -N mg/L 4.00 TKN mg/L 8.80 PO4
3--P mg/L 1.00

22
Table 3 Soil Sample analysis methods
Parameter Analytical Method pH Soil Effluent
4A1: pH of 1:5 soil/water suspension at 25°C (Rayment and Higginson 1992) TPS-81 pH-conductivity meter
Electrical Conductivity (EC) Soil Effluent
3A1 EC of 1:5 soil/water suspension at 25°C (Rayment and Higginson 1992) 2520-Conductivity (APHA 1999)
Chloride ions (Cl-) Soil Effluent
5A1 chloride 1:5 soil/water filtered suspension at 25°C (Rayment and Higginson 1992) and measured using 4500-Cl-
E Automated Ferricyanide Method (APHA 1999) 4500-Cl-E Automated Ferricyanide Method (APHA 1999)
Total Kjeldahl Nitrogen Soil and (TKN = organic + ammonia) Effluent
Wet oxidation method (Kjeldahl 1983) 4500-Norg C (APHA 1999)
Nitrates (NO3-) Soil only 7CB1 Water Soluble Nitrate 1:5 soil/water filtered
suspension at 25°C (Rayment and Higginson 1992) Measured using 4500-NO3
- F Automated Cadmium Reduction (APHA 1999)
Orthophosphate (PO43-) Soil
Effluent
9G2 Acid extractable phosphate 1:200 soil/0.005M H2SO4 at 25°C (Rayment and Higginson 1992) and measure using 4500-P C Vanadomolybdophosphoric Acid Colourmetric method (APHA 1999) 4500-P F Automated Ascorbic Acid Reduction (APHA 1999)
Total Phosphorus (TP) Soil only Digestion of soil using 4500-P F Automated Ascorbic Acid Reduction (APHA 1999)
Organic Matter (%OM) Sol oxidised with 50% H2O2 and heated to 1300°C to burn organic matter. Weight loss difference equal to organic matter content
Cation Exchange Capacity (CEC) Ammonium selective electrode method (Borden and Giese 2001) Ammonia Standards made as per 4500-NH3 E (APHA 1999)
Effective Cation Exchange Capacity (ECEC)
ECEC = exchangeable cations + exchangeable acidity = (Ca + Mg + Na + K) + (Al + H)
Exchangeable Cations (Al, Fe, Mg, Na, Ca and K)
Measured using Varian AA6 Flame Atomic Absorption Spectrophotometer. Acetylene flame used to measure Fe, propane used to measure Na and K, and nitrous oxide used to measure Ca, Mg and Al
Exchangeable Sodium Percentage (ESP)
ESP = (100 x Exchangeable Na+)/ECEC
Soil Mineralogy (Clay type) Samples prepared using method developed by Bish and Post (1989) Mineralogy determined via X-ray diffraction using Phillips PW1050/25 vertical goniometer, with a graphite diffracted beam monochromator
Particle Size Distribution: Percent Clay (%C), Silt (%Si) and Sand (%S)
Determined from Soil mineralogy measured using X-ray diffraction

23
Table 4 Average effluent characteristics of effluent collected form soil columns
Column Sampling Point pH EC NO3
- TKN PO43- -P TP %NH3
Removal %PO4
Removal
Total Volume
of Effluent
L 1 6.75 506.75 3.68 0.08 58.2 92 2 6.20 352.60 0.98 0.02 88.9 97.8 1 3 ~ ~ ~ ~ ~ ~
5.0
1 6.21 663.71 6.21 1.01 29.4 0* 2 5.08 45.00 5.08 0.11 42.3 89.5 2 3 4.70 7.00 0.01 0.01 99.9 99
4.8
1 5.81 855.67 44.33 1.45 0* 0* 2 4.61 883.67 41.67 9.76 0* 0* 3 4.39 905.7 ~ 6.63 25.6 ~ 24.7 0*
3
4 3.96 421.3 1.53 0.7 82.6 30
4.8
1 6.21 181.15 0.81 0.37 90.8 63 2 5.60 12.00 0.10 0.01 98.9 99 4 3 ~ ~ ~ ~ ~ ~
5.5
1 6.87 365.25 1.94 0.22 78.0 78 2 5.80 178.25 1.00 0.26 88.6 74 5 3 4.80 15.18 0.02 0.09 99.8 91
6.0
1 6.82 137.43 1.04 0.04 88.2 96 2 6.00 61.50 0.70 0.01 92.0 99 6
3 ~ ~ ~ ~ ~ ~
5.6

24
Figure 1: Typical septic tank-soil adsorption system used in Australia

25
Figure 2: Soil column setup
85mm
100mm
Vaseline
Soil Core
Effluent Sampling Port 1
Effluent Sampling Port 2
Effluent Sampling Port 3
Soil Sampling Port 1
Soil Sampling Port 2
Soil Sampling Port 3
Effluent Sampling Port 4
Bases plate
350mm
Primary Effluent
PVC Column
300mm
150mm

26
Discriminant Plot
%C
ESPECEC
CEC
OM
ECpH
k
-6
-5
-4
-3
-2
-1
0
1
2
3
4
5
-10 -5 0 5 10
Funct 1 (72.9%)
Func
t 2 (2
3.4%
)
C1o
C2o
C3o
C4o
C5o
C6o
Figure 3 Discriminant Plot of original soil data. Legend: ‘o’ original soil
Soils with suitable renovation ability
Soils with moderate renovation ability
Soils with poor renovation ability
27
Discriminant Plot
k
pH
EC
OM
CEC
ECEC
ESP
%C
-5
-4
-3
-2
-1
0
1
2
3
4
5
-12 -9 -6 -3 0 3 6
Funct 1 (63.3%)
Func
t 2 (1
8.8%
)
C1o
C1e
C2o
C2e
C3o
C3e
C4o
C4e
C5o
C5e
C6o
C6e
Figure 4: Discriminant Plot of soil data prior to and after eight months of effluent
application. Legend: ‘o’ original soil, ‘e’ after effluent application

28
Discriminant Plot
pH
EC
Cl
OM
CEC
PO4 PTP
NO3
TKN
%C
-7
-6
-5
-4
-3
-2
-1
0
1
2
3
4
-10 -5 0 5
Funct 1 (50.8%)
Func
t 2 (3
0.2%
)
C1o
C1e
C2o
C2e
C3o
C3e
C4o
C4e
C5o
C5e
C6o
C6e
Figure 5 Discriminant plot of soil nutrient and selected physico-chemical data
indicating soils that have suitable effluent renovation ability. Legend: ‘o’ original soil,
‘e’ after effluent application
Soils with Good nutrient attenuation
Soils with poor nutrient attenuation
Soils with medium nutrient attenuation

29
Discriminant Plot
Ca:Mg
CaNa
Mg
FeAl
%CESP
ECEC
pH
-6
-4
-2
0
2
4
6
-15 -10 -5 0 5 10
Funct 1 (67.5%)
Func
t 2 (1
5.6%
)
C1o
C1e
C2o
C2e
C3o
C3e
C4o
C4e
C5o
C5e
C6o
C6e
Figure 6: Discriminant plot of soil individual cations. Legend: ‘o’ original soil, ‘e’
after effluent application

30