transgene expression and transgene-induced silencing in diploid and autotetraploid arabidopsis
TRANSCRIPT

Copyright � 2011 by the Genetics Society of AmericaDOI: 10.1534/genetics.110.124370
Transgene Expression and Transgene-Induced Silencing in Diploidand Autotetraploid Arabidopsis
Thomas E. Finn,1 Lei Wang,1,2 David Smolilo,1 Neil A. Smith, Rosemary White, Abed Chaudhury,Elizabeth S. Dennis and Ming-Bo Wang3
Commonwealth Scientific and Industrial Research Organization Plant Industry, Canberra, ACT 2601, Australia
Manuscript received June 14, 2010Accepted for publication October 26, 2010
ABSTRACT
Previous studies have suggested that transgene expression in plants can be affected by ploidy. Here weshow that three different transgenes, a reporter transgene, an antisense transgene, and a hairpin RNA(hpRNA) transgene, are all expressed at a lower level in autotetraploid (4n) than in diploid (2n)Arabidopsis. RNA silencing of two endogenous genes was induced by the antisense and hpRNA transgenesand this silencing is significantly less effective in 4n than in 2n Arabidopsis; furthermore, the reducedsilencing in 4n Arabidopsis correlated with reduced accumulation of silencing-inducer RNAs. Methylationanalysis both of independent 2n and 4n transgenic lines and of 2n and 4n progeny derived from the same3n transgenic parent, indicated that transgenes are more methylated in 4n than 2n Arabidopsis. Theseresults suggest that transgenes are transcriptionally repressed in the 4n background, resulting inexpression levels lower than in the 2n background. Transgenes designed to silence endogenous genesexpress lower concentrations of silencing-inducer RNAs in 4n Arabidopsis plants, resulting in less effectivesilencing of target genes than in 2n Arabidopsis plants.
POLYPLOIDIZATION, or whole genome duplica-tion, occurs frequently in plants and is a major
source of plant speciation (Stebbins 1966; Adams andWendel 2005). Recent studies using newly formedsynthetic auto- or allopolyploid plants have shown thatpolyploidization is associated with genome-wide changesin gene expression, and these changes appear to be con-trolled primarily by epigenetic mechanisms such ascytosine methylation and small RNAs (Comai et al. 2000;Kashkush et al. 2002; Wang et al. 2004; Xu et al. 2009;Yu et al. 2010).
In addition to changes in endogenous gene expres-sion, polyploidization also affects the expression oftransgenes. Transgenes in plants can be inactivatedeither transcriptionally, through inactivation of pro-moters by DNA methylation and histone deacetylationor postranscriptionally through sequence-specific degra-dation of mRNA (Matzke et al. 2002). A stably expressedhygromycin phosphotransferase (HPT) transgene indiploid Arabidopsis was subject to transcriptional in-activation when brought into triploid or tetraploidbackgrounds (achieved either by crossing with 4n Arabi-dopsis or by chromosome doubling) (Mittelsten
Scheid et al. 1996). This transcriptional inactivation wasindependent of transgene copy number and occurredsolely as a consequence of a change in ploidy. A follow-upstudy demonstrated that the transcriptionally inactivatedHPTallele could trans-inactivate a formerly active allele ofthe HPT transgene in tetraploid but not diploid Arabi-dopsis (Mittelsten Scheid et al. 2003). These findingssuggest that transgenes are more prone to transcriptionalinactivation in polyploids than in diploids.
The inactivated HPT allele is associated with bothDNA methylation and heterochromatic histone mod-ifications and can be reactivated only when both of thesemodifications are reversed (Mittelsten Scheid et al.2003; Hetzl et al. 2007; Baubec et al. 2010). The authorsproposed that DNA methylation and histone modifica-tions cooperate to form a ‘‘double lock’’ on ploidy-associated transcriptional inactivation (Baubec et al.2010), but how these mechanisms are initiated remainsunknown.
Double-stranded RNA (dsRNA)-induced silencing, orRNA interference (RNAi), has become a powerful toolfor knocking down gene expression in plants andanimals (Wang and Waterhouse 2002; Hannon andRossi 2004). During RNAi, dsRNA or hairpin RNA(hpRNA) is processed by Dicer, an RNase III-likeenzyme, into 20–25 nt small interfering RNAs (siRNAs).These siRNAs are bound by Argonaute protein, guidingthe Argonaute to cleave homologous single-strandedRNAs (Baulcombe 2004; Hannon and Rossi 2004). Inplants, effective RNAi has been achieved mainly by
Supporting information is available online at http://www.genetics.org/cgi/content/full/genetics.110.124370/DC1.
1These authors contributed equally to this work.2Present address: Biotechnology Research Institute, Chinese Academy of
Agricultural Sciences, Beijing 100081, China.3Corresponding author: CSIRO Plant Industry, P. O. Box 1600, Clunies
Ross St., Canberra, ACT 2601, Australia. E-mail: [email protected]
Genetics 187: 409–423 (February 2011)
expression of transgenes designed to express silencing-inducer RNAs (Eamens et al. 2008). Such transgene-induced RNAi is best studied in model plants such asArabidopsis and rice, which are mostly diploids, yetmany of the agriculturally important crops, such aswheat, cotton, and sugarcane, are polyploids.
The objective of the current work was to investigatewhether or not the effectiveness of transgene-inducedRNAi is altered by plant ploidy. The effectiveness ofRNAi is expected to depend on the expression level ofthe silencing-inducer RNAs from the RNAi constructs.Thus, if ploidy alters the transcriptional activity of theRNAi transgenes (and hence the accumulation ofsilencing-inducer RNAs) it would also alter the effec-tiveness of target gene silencing. We investigated thispossibility using diploid (2n) and autotetraploid (4n)Arabidopsis as model systems. By analyzing large num-bers of independent 2n and 4n transgenic lines, and bycomparing 2n and 4n progenies derived from the sametriploid (3n) transgenic parents, we demonstrate thatboth the level of transgene expression and the effec-tiveness of transgene-induced RNAi are lower in 4n thanin 2n plants. We also show that transgenes tend to bemore methylated in 4n than in 2n Arabidopsis and thisis likely to account for the relatively low levels oftransgene expression and transgene-induced RNAi in4n Arabidopsis.
MATERIALS AND METHODS
Plasmid constructs: The b-glucuronidase (GUS) constructshown in Figure 1A was the same plasmid named as pCON inChen et al. (2005). The hpCHS construct was previouslydescribed in Fusaro et al. (2006). To make the antisenseconstruct, a 586-bp fragment of the EIN2 cDNA near the 59region was PCR amplified using primers 59GCTGGATCCGGTACCTTGAATCCTACTCTGAG 39 (forward) and 59GAGATCGATCTCAGACTGACTCAGCA39 (reverse), cloned intopGEM-T Easy (Promega), into which a BglII-digested full-length potato spindle tuber viroid (PSTVd) sequence was theninserted at the BamHI site. The asEIN2–PSTVd fusionsequence was then digested with XbaI and inserted at the XbaIsite of pHannibal (Wesley et al. 2001), from which the 35S-intron-asEIN2-PSTVd-Ocs39 fragment was excised with NotIand inserted into pWBVec2a (Wang et al. 1998), forming thefinal asEIN2 construct. For preparation of the hpEIN2construct, a 911-bp fragment of EIN2 genomic DNA over-lapping with the cDNA fragment was amplified using the sameprimers and cloned into pART7 (Gleave 1992), into whichthe PDK intron from pHannibal, and the EIN2 cDNAfragment from the asEIN2 construct, were inserted at theHindIII and XbaI sites, respectively. The 35S promoter-senseEIN2 genomic-intron-asEIN2-Ocs39 fragment was then ex-cised with NotI and inserted into pART27 (Gleave 1992),giving rise to the hpEIN2 construct.
Plant materials, transformation, crossing, and identifica-tion of 2n and 4n progeny: The 2n and 4n Arabidopsis usedfor transformation were the diploid Arabidopsis thalianaecotype Landsberg erecta (Ler) and a stable Ler tetraploid lineobtained by chromosome doubling with colchicine treatment.Agrobacterium-mediated transformation was performed
using the ‘‘floral dip’’ method described by Clough and Bent
(1998). To select for transgenic lines, seed collected fromAgrobacterium-infected plants was sterilized (Chen et al.2005) and plated on MS medium containing 100 mg/literof timentin plus appropriate selective agents [20 mg/liter ofhygromycin for the GUS and asEIN2 constructs, 50 mg/liter ofkanamycin for hpEIN2, and 5 mg/liter of phosphinothricin(PPT) for hpCHS]. Antibiotic or PPT-resistant seedlings weretransferred to fresh MS plates containing the selective agentsbefore being planted in soil. Crossing between 2n and 4nArabidopsis was carried out by removing immature anthersfrom unopened flower buds in the 4n plants and fertilizing thestigma with pollen from freshly opened flowers of the 2nplants. To isolate 2n and 4n progeny from a 3n line, seed wascollected from individual F2 plants and inspected for seed size(a 4n seed weighs �320 mg, �1.5 times bigger than a 2n seedthat weighs �210 mg), and plants with uniformly larger- orsmaller-sized seed were further checked for ploidy bycounting chloroplast number in guard cells ( Jacobs andYoder 1989; Ho et al. 1990) from 10–12 stomata on the abaxialsurface of leaves from each line using a confocal microscope,with 405 nm excitation generating autofluorescence from450–550 nm to detect cell outlines, and 633 nm excitationgenerating strong chloroplast autofluorescence from 650 to720 nm (a 4n guard cell has 8–12 chloroplasts, while a 2n cellhas 4–6 chloroplasts). To select for homozygous or near-homozygous lines, individual F3 plants with relatively hightransgene copy number were selected on the basis of semi-quantitative PCR using a primer pair for the GUS codingsequence and a primer pair for the Arabidopsis endogenousgene proteasome b-subunit G1 (primer sequences availableupon request). Seed collected from the selected F3 plantswas germinated on MS medium containing 20 mg/liter ofhygromycin, and hygromycin-sensitive seedlings were furtheranalyzed for GUS expression by staining with X-glucuronide( Jefferson et al. 1987).
Analysis of EIN2 silencing and GUS expression: To assayfor EIN2 silencing, seed was sterilized (Chen et al. 2005)and plated on MS medium containing 50 mg/liter of ACC(1-aminocyclopropane-1-carboxylic acid). The plates weresealed tightly with parafilm and incubated in total darknessat 4� for 2 days and then 22� for up to 2 weeks. Silencing wasscored by visually comparing the elongation of hypocotyls withwild-type Arabidopsis. GUS activity was either quantitativelydetermined using the kinetic fluorimetric 4-methylumbelliferryl-b-glucuronide (MUG) assay (Chen et al. 2005) or visualizedby histochemical staining of Arabidopsis seedlings with X-glucuronide ( Jefferson et al. 1987). For T1 plants (the primarytransformants), protein used for the MUG assay was extractedfrom 2–6 leaves of an individual plant, while for T2, 3n, andtheir progeny lines, protein was extracted from a pool ofmultiple (�20–50) hygromycin-resistant sibling plants. MUGassays were performed on two different fluorometric machineswith different parameter settings for the T1 plants and the restof the materials, thereby giving different scales of readings andslope values. For the T1 plants (Figure 2A), the relative GUSactivity represents slope value per 5 mg of protein, while for therest, it is slope value per 1 mg of protein.
DNA and RNA analysis: DNA from the T2 GUS lines wasisolated using the CTAB method described by Draper andScott (1988). Total RNA from the T2 hpCHS lines wasextracted using TRIzol reagent (Invitrogen) following themanufacturer’s instruction. DNA and high molecular weight(HMW) RNA from all other samples was prepared followingthe phenol extraction method as previously described (Wang
et al. 2008). Southern blot hybridization was performed asdescribed (Wang et al. 2008) using a full-length octopinesynthase terminator sequence as probe, which was excised
410 T. E. Finn et al.

from pART7 (Gleave 1992) with BamHI and NotI digestion,gel purified and radioactively labeled with a-32P using theMegaprimer DNA labeling kit (Amersham Biosciences). ForNorthern blot hybridization, 30 mg of total or HMW RNA wasseparated in 1.3% formaldehyde–agarose gel and blotted to aHybond-N filter. The blot was hybridized (Wang et al. 2008)with 32P-labeled complementary RNA probes obtained byin vitro transcription using T7 or SP6 RNA polymerase andradioactive UTP from the respective sequences cloned intopGEM plasmids (Promega), including the 586 nt asEIN2sequence, the full-length GUS coding sequence, and the bargene sequence. For detection of chalcone synthase (CHS)siRNAs, �40 mg of total RNA samples was separated in 15%denaturing polyacrylamide gel, electroblotted and UV cross-linked onto Hybond-N filter, and hybridized with the same bargene RNA probe following the procedure in Wang et al.(2008).
Methylation analysis using bisulphite PCR: Bisulphitetreatment of genomic DNA was carried out using the Methyl-Easy kit (Human Genetic Signatures) following the manufac-turer’s instruction. Approximately 5 mg of DNA from eachsample was treated and purified with MethylEasy. Nested PCRwas used to amplify the 35S promoter sequence from thebisulphite-treated DNA: the first round PCR was performedusing the primers Top35S-F1 (59TTAAGGTAAGTAATAGAGATTGGAGT39) and Top35S-R2 (59CTCCAAATAAAATAAACTTCCTTATATA39), and the secondary PCR was performedwith the nested primers Top35S-F2 (59GAGATTGGAGTTTTTAAAAAGGTAGTT39) and Top35S-R1 (59TCAATAAAAATATCACATCAATCCACTT39) (also see Figure 1A), using thesame PCR cycles as described previously (Wang et al. 2001).These primers were designed to minimize biased amplifica-tion of methylated vs. unmethylated DNA: the last 13–19nucleotides correspond to GUS sequences that contain nocytosines, so the primers bind to both bisulphite-converted(unmethylated) or unconverted (methylated) DNA. Forsequencing analysis, the nested PCR product was gel purifiedusing the UltraCleanTM 15 DNA purification kit (MO BIOLaboratories) and sequenced directly with BigDye 3.1 usingone of the nested primers. To check the efficiency ofbisulphite conversion, a 157-bp sequence of the chloroplast-encoded psaA protein gene was PCR amplified from the samebisulphite-treated DNA using the primers 59ATGATGTTGTTAGAATTTYATATAGG39 (forward) and 59CATCATTTARCTATCRCAATTCTTT39 (reverse).
Statistical analysis: Populations were compared using a one-or two-tailed Welch’s T-test (as specified) using Microsoft Excel2002 (1-.3406.3501) SP 1. Where multiple measurements weretaken of a single variable, the mean was taken as the score foranalysis.
RESULTS
Expression of a b-glucuronidase transgene in 2n and4n Arabidopsis: Previous studies exploring how ploidyaffects transgene expression have been based on theanalysis of only a small number of transgenic lines.Here, diploid (2n) and tetraploid (4n) Arabidopsisplants were transformed with a construct expressing aGUS reporter gene (Figure 1A). Sixty-four 4n and forty2n first generation transgenic lines (T1) were randomlyselected and screened for GUS expression using fluo-rometric MUG assays.
The 4n and 2n transgenic populations showed a cleardifference in the distribution of GUS expression levels(Figures 2A). The majority (89.0%) of the individual 4nlines had an intermediate level of GUS activity between5 and 30 (arbitrary units, AU). In contrast, the 2n linesexpressed a much wider range of GUS activity, with 15lines (37.5%) showing an activity above .30 and 8 lines(20.0%) ,2. A two-tailed T-test revealed a statisticallysignificant difference (P ¼ 0.036) between the meanGUS activity of the 2n (22.3 AU) and 4n (16.3 AU)transformants (Figure 2B, left panel; supporting in-formation, Table S1A). The mean difference was 6.02AU with a 95% C.I. of 0.4–11.6 AU. Furthermore, if thelines with GUS activity ,2 AU were treated as ‘‘inacti-vated’’ or ‘‘silenced’’ and not included in the statisticalanalysis, the difference between the 2n and 4n trans-formants was even more striking. The mean GUS activitywas 28.7 and 17.6 AU for the ‘‘active’’ 2n and 4ntransformants, respectively, with a mean difference of11.03 AU (95% C.I. 6.04–16.02; P , 0.001) (Figure 2B,right panel; Table S1B).
Figure 1.—Constructs used in this study. (A)The GUS overexpression construct. The stripedbar below indicates the bisulphite PCR-amplifiedregion. HindIII cleavage sites are indicated. (B)The EIN2 antisense construct. (C) The EIN2hpRNA construct. (D) The chalcone synthasehpRNA construct. Ocs39, Agrobacterium octo-pine synthase 39 region; 35S-P, the cauliflower mo-saic virus 35S promoter; 35S, a shorter version ofthe 35S promoter; Tml9, Agrobacterium tumormorphology large gene 39 region; Nos-P andNos39, Agrobacterium nopaline synthase pro-moter and 39 region, respectively; NPTII, neomy-cin phosphotransferase gene for kanamycinresistance; bar, phosphinothricin resistance gene;HPT, hygromycin phosphotransferase gene forhygromycin resistance; intron, the second intronof the Flaveria trinervia pyruvate orthophosphatedikinase (PdkA) gene; RB and LB, AgrobacteriumT-DNA right and left borders, respectively.
Effect of Ploidy on Transgene-Induced Silencing 411

To further compare the 2n and 4n transgenicpopulations, 72 sec-generation (T2) lines derived froma subset of the T1 transformants were selected andanalyzed for GUS expression and transgene insertionpattern. The pattern of GUS expression was maintainedin the T2 generation: the majority of 4n lines showedintermediate levels of GUS activity compared to themuch wider range seen in the 2n lines (Figure 3A).Southern blot hybridization showed that there was noclear difference in overall transgene copy numberdistribution between the 4n and 2n lines (Mann–Whitney U test, P ¼ 0.90), estimated to be ranging from1 to 7 copies based on the number of hybridizationbands and a mean of 2.3 copies in both groups (Figure3, B and C; Figure S1). Of note, the multiple-copy linestended to show lower levels of GUS expression than thelow-copy number lines, which was particularly true forthe 4n population. These results suggested that thevariation in GUS expression between the 4n and 2npopulations was not caused by bias in transgene copynumber distribution or differences in transgene dosage.
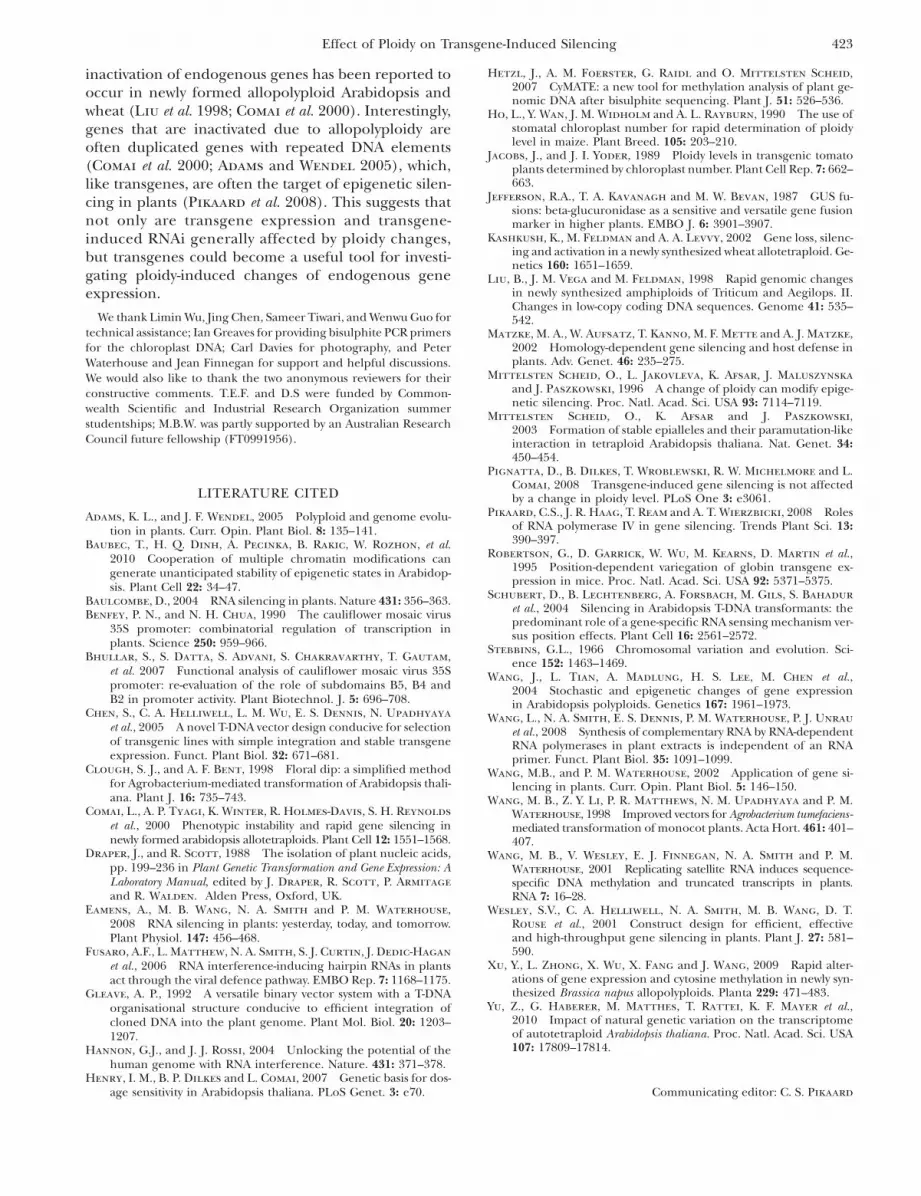
Methylation status of the GUS transgene in 2n and4n Arabidopsis: The majority of the 4n lines (32 of 36)contained a HMW band on Southern blots with HindIIIdigestion (Figure 3B), while relatively few 2n lines (10–12 out of 36) contained a similar band (Figure 3C). Thisband was not due to insufficient amounts of the HindIIIenzyme in the digestion reactions: the DNA was uni-formly digested across all 4n and 2n samples (FigureS2), and replicate experiments using different batchesof DNA gave the same hybridization pattern (e.g., Figure5G). This observation may be explained by the methyl-ation sensitivity of HindIII: HindIII cuts at the sequenceAAGCTT, but is inhibited by methylation of the cytosineresidue. Thus, the HMW band may have been caused byincomplete digestion due to partial cytosine methyla-tion at the HindIII sites, and the higher proportion of
4n lines displaying the HMW band suggests morewidespread methylation of the transgene in 4n than2n lines.
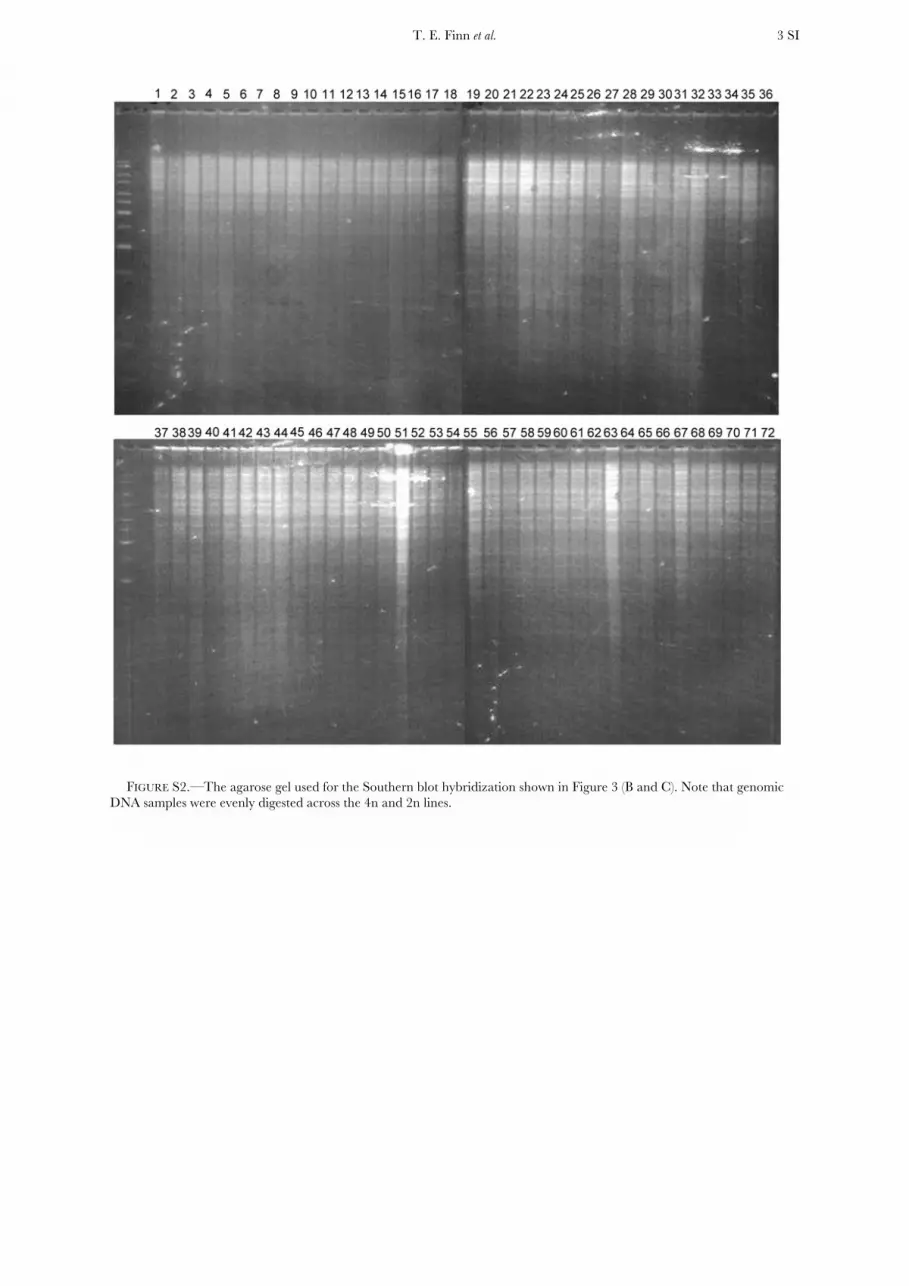
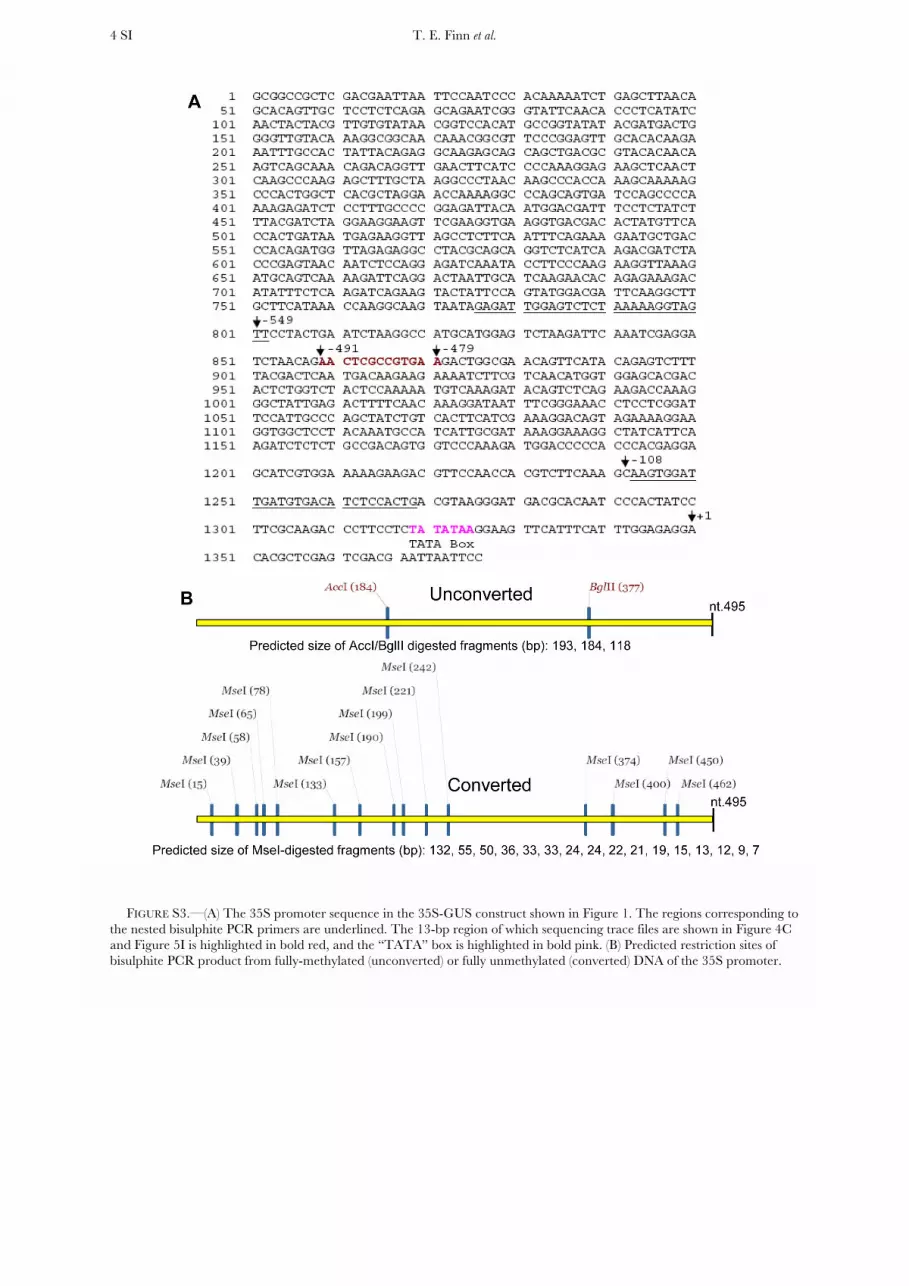
The GUS transgene construct contains only threeHindIII sites, all of which are outside the transgenepromoter (Figure 1A), so the pattern of HindIII di-gestion might not reflect the DNA methylation statusof the GUS transcriptional unit, particularly in its pro-moter sequence. To investigate the methylation status,DNA samples from 7 each of the 4n and 2n T2 lines(indicated by asterisks in Figure 3A), composed of low-and high-copy number individuals, were treated withbisulphite—a process that converts unmethylated cyto-sines to uracils but does not affect methylated cytosines.A 442-bp sequence, from �108 to �549 of the 35Spromoter including the B2–B5 domains importantfor the promoter activity (Figure 1A and Figure S3A)(Benfey and Chua 1990; Bhullar et al. 2007), was thenPCR amplified with unbiased primers specific for thetop strand. The PCR product was then digested withMseI or BglII/AccI and separated in an agarose gel. MseIrecognizes the TTAA sequence that only occurs (14times) in the bisulphite-converted PCR product ofunmethylated DNA. BglII and AccI, on the other hand,recognize the AGATCT and GTCGAC sequences foundonly in the unconverted PCR product from methylatedDNA (Figure S3B) and can therefore be used tocorroborate the MseI digest result. To test the efficiencyof bisulphite conversion, a 157-bp region of the Arabi-dopsis chloroplast gene encoding psaA protein (FigureS4, A and B), which is free of cytosine methylation, wasPCR amplified from the same bisulphite-treated DNAand digested with MseI.
As shown in Figure 4A, PCR products from six of the4n lines (GUS-4, -9, -11, -20, -25 and -31) and three ofthe 2n lines (GUS-39, -40, and -57) showed significantresistance to MseI digestion, indicating that the 35S
Figure 2.—GUS activity in T1 transgenic linesdetermined by kinetic MUG assays at 37�. (A)Distribution of GUS expression levels for 4nand 2n T1 transgenic lines. The T1 populationwas heterozygous for the GUS transgene. (B)The overall level of GUS expression is signifi-cantly lower for the 4n population than the 2npopulation. (Left) Difference in mean GUS activ-ity between the whole 2n and 4n populations inA. (Right) Difference after removing the ‘‘inacti-vated’’ or ‘‘silenced’’ lines (GUS activity ,2). Therelative GUS activity represents slope values per5 mg of total plant protein.
412 T. E. Finn et al.

promoter was methylated to various degrees in theselines. This was confirmed by the BglII/AccI digestion,which gave cleaved fragments indicating the presenceof methylated cytosines. PCR products from the one
remaining 4n line (GUS-15) and the four 2n lines (GUS-45, -50, -58, and -63) were almost completely digested byMseI but resistant to BglII/AccI digestion, indicating anear-complete absence of cytosine methylation. Bisul-
Figure 3.—Molecular analysis of 36 4n or 2n T2 lines derived from a subset of the T1 transformants analyzed in Figure 2. The T2lines were heterozygous for the GUS transgene. (A) GUS expression analysis. The relative GUS activity is slope values per 1 mg oftotal protein. The MUG assays for T2 plants and the rest of the samples shown in this article were determined using a differentfluorometric machine, therefore giving a different scale of readings to the T1 samples in Figure 2. Error bars represent standarddeviation of four measurements. Lines used in DNA methylation analysis (Figure 4) and in crossing for generating 3n progeny(Figure 5A) are marked with red asterisks and purple triangles, respectively. (B and C) Southern blot hybridization analysis. DNAwas digested with HindIII and hybridized with the Ocs39 fragment as a probe. The horizontal arrows indicate the high molecularweight band (�10 kb in size) suggestive of cytosine methylation. The estimated transgene copy number is given below the blot. M,GeneRuler 1 kb DNA ladder (MBI Fermentas).
Effect of Ploidy on Transgene-Induced Silencing 413

phite PCR product of the chloroplast DNA from all 14samples was fully digested by MseI (Figure 4B; alsoFigure S4C for sequencing trace files that showed verylittle unconverted cytosine), indicating uniform andefficient bisulphite conversion. The restriction digestssuggested that the 4n lines were more methylated thanthe 2n lines.
Sequencing of the bisulphite PCR product confirmedmethylation differences between the 4n and 2n lines.Figure 4C shows a 13-bp region of the sequencing tracefiles that reflects the overall cytosine methylation statusof the bisulphite-PCR product. This region (�479 to�491 of the 35S promoter; Figure S3A) contains fourcytosine residues: two in CG context, one in CHGcontext (‘‘H’’ representing A, C, or T), and one inCHH context (see the sequence on top of Figure 4C).The relative height between the cytosine peaks (blue)and the overlapping thymine peaks (red) should reflectthe degree of cytosine methylation; a higher blue peakindicates stronger methylation and lower blue peaks,weaker methylation. Four of the seven 4n lines (GUS-11,GUS-20, GUS-25, and GUS-31) had the blue peaksdominating the red peaks, suggesting strong cytosine
methylation. Two of these (GUS-25 and GUS-31)showed very low red thymine peaks at the cytosinepositions, indicating almost complete methylation. The4n lines GUS-9 and GUS-15 also showed significantamounts of unconverted cytosines (blue peaks) indica-tive of partial methylation. In contrast, only one 2n line,GUS40, exhibited a strong methylation pattern, withtwo lines (GUS-39 and GUS-57) showing an intermedi-ate level of methylation (blue peaks ¼ red peaks). Fourof the 2n lines (GUS-45, GUS-50, GUS-58, and GUS-63)showed very little unconverted cytosines (blue peaks),indicating that they were almost completely unmethy-lated. This result is consistent with the restrictiondigestion result: both the frequency and degree ofcytosine methylation were higher among the seven 4nlines than among the seven 2n lines analyzed.
There appeared to be an inverse correlation betweenthe level of DNA methylation and that of gene expres-sion (Figures 3A and 4). Despite this general trend, the2n line GUS-40 had significant levels of cytosinemethylation yet showed high-level GUS expression.Also, the 4n line GUS-4 showed very little methylationbut had similar levels of GUS expression to the other
Figure 4.—Cytosine methylation analysis us-ing bisulphite PCR. (A) Bisulphite PCR productwas digested with MseI (upper) or BglII/AccI(lower) and separated in 3% NuSieve 3:1 agarosegel. M, GeneRuler 1 kb DNA Ladder. (B) MseI di-gestion of bisulphite PCR product of a 157-bp re-gion of the chloroplast-encoded psaA proteingene amplified from the same bisulphite-treatedgenomic DNA as for the 35S promoter sequenceshown in A. Bisulphite PCR product was eithertreated (1) or untreated (�) with MseI and sep-arated in 4% NuSieve agarose gel. Note that theDNA is fully digested by MseI for all samples, in-dicating uniform and efficient bisulphite conver-sion. (C) Part of the sequencing trace files for thebisulphite PCR products of the 35S promoter.The original DNA sequence of the correspond-ing 13-bp region is given above. The four differ-ent nucleotides, A, T, C, and G, are shown ingreen, red, blue, and black, respectively. Thered and blue mixed peaks indicate the presenceof both bisulphite-converted and unconvertedcytosines. The asterisks indicate the positionsof cytosines.
414 T. E. Finn et al.

four moderately expressing 4n lines (Figures 3A and 4).This variability may be due to the effect of differentialinsertion sites and copy numbers between lines, as thismay affect the methylation and expression of thetransgene.
Comparison of GUS transgene expression among2n, 3n, and 4n plants containing identical transgeneinsertions: We generated plants of different ploidy butcontaining identical transgene insertions. A subset ofthe 2n and 4n GUS lines shown in Figure 3A werecrossed with wild-type 4n and 2n Arabidopsis, respec-tively, to generate triploid (3n) GUS transgenic lines(Figure 5, A and B). Both GUS-expressing (4n, GUS-9and GUS-15; 2n, GUS-40 and GUS-63) and GUS-inactivated (4n, GUS-25 and GUS-31; 2n, GUS-57) lineswere selected as the transgene donor lines.
There was no significant change in GUS expressionbetween the 4n transgenic parental lines and their 3nprogeny (P ¼ 0.94, two-tailed Welch’s T-Test). Incontrast, the 2n parental lines and their 3n F1 progenyshowed a clear difference in GUS expression (Figure5A), however the small sample size did not allowstatistical significance to be established. In the twohigh-expressor 2n lines (GUS-40 and GUS-63), the levelof GUS expression decreased in the 3n progeny by �31and 45%, respectively. Unlike the high expressors, the3n F1 plants derived from the cross with the inactivated2n line (GUS-57) showed a threefold increase in GUSexpression, suggesting a partial release of inactivation.
Triploid (3n) Arabidopsis plants can be fertile andgive rise to diploid (2n) and tetraploid (4n) progeny(Henry et al. 2007), and this was true for the 3n GUSlines. Therefore, from the 3n progeny of the crossbetween the single-copy 4n line (GUS-15) and wild-type2n Arabidopsis, F2 plants were isolated with a 2n or 4nkaryotype. This was done first by inspecting seed sizefrom individual F2 plants followed by microscopiccounting of chloroplast number in the guard cells(Figure 5C). As a result, three 4n and two 2n lines wereisolated. Analysis of the F3 population of these linesshowed that the level of GUS expression was lower in thethree 4n lines than in the two 2n lines (Figure 5D),despite the two ploidy populations containing the sametransgene locus.
The F3 populations should be heterozygous for theGUS transgene, so the differential GUS expressionshown in Figure 5D could be due to differences intransgene dosage between the 4n and 2n lines. Toaddress this issue, homozygous or near-homozygouspopulations were isolated and used for expressionanalysis. Isolation of homozygous 2n lines was straight-forward, as progeny from a heterozygous plant alwaysgave a 3:1 segregation for GUS activity and hygromycinresistance while those from a homozygous plant in-variably showed 100% activity and resistance. Thesegregation pattern is far more complex for 4n plants;thus, to isolate homozygous or near-homozygous 4n lines,
semiquantitative PCR was performed to find individualF3 plants that contained a relatively high-copy numberof the GUS transgene. We then screened the F4 and F5
populations derived from these F3 plants for hygrom-ycin resistance and/or GUS activity. As a result, three F5
lines derived from the F3 line b (shown in Figure 5D)were isolated, which were homozygous or near homo-zygous (Table S2). The difference in GUS expressionremained in these F5 populations (Figure 5, E and F),suggesting that it was not caused by gene dosagedifferences.
An unexpected observation during the isolation ofhomozygous lines was that a small proportion of the F5
4n plants (18 out of 1420) showed dramatic inactivationof the GUS transgene as indicated by low-intensity orlocalized GUS staining (Figure S5). Such GUS inactiva-tion was not observed in any of the 2n plants analyzed.Taken together, these results suggested that the GUStransgene was transcriptionally less active and moreprone to transcriptional inactivation in 4n than in 2nbackgrounds.
To investigate whether DNA methylation differedbetween the 4n and 2n F5 lines, Southern blot hybrid-ization of HindIII-digested DNA and MseI digestion ofbisulphite-PCR product of the 35S promoter wereperformed as before. Both analyses showed an overalldifference in cytosine methylation between the twopopulations. All three of the 4n lines showed significantlevels of cytosine methylation, as indicated both by theHMW hybridizing band on the Southern blot (Figure5G, lanes 2–4) and by the partial MseI digestion of thebisulphite-PCR product (Figures 5H, lanes 2–4). Incontrast, two of the five 2n lines (d-1 and e-3) showedalmost no methylation on the basis of the Southern blot(Figure 5G, lanes 5 and 8). The reduced methylation inthe 2n lines was further indicated by MseI digestion ofthe bisulphite-PCR product: four 2n lines (including d-1and e-3 plus e1 and e4) showed much reduced levels ofcytosine methylation in the 35S promoter regioncompared to the three 4n lines (Figure 5H, comparelanes 5, 6, 8, and 9 with lanes 2–4). Sequencing of thebisulphite PCR product confirmed the MseI digestionresult: one or more of the four cytosines showndisplayed heavier methylation in the three 4n lines thanfor the five 2n lines (Figure 5I). Bisulphite PCR productsof the 157-bp chloroplast DNA from all the eight sampleswere fully digested by MseI (Figure S6A; also see FigureS6B for sequencing trace files), indicating efficient anduniform bisulphite conversion. These results indicatethat the methylation of the GUS transgene that occurredin the parental 4n line (GUS-15) was retained through 3nto its subsequent F5 4n progeny, but that this methylationwas lost in some of the F5 2n progeny. Thus, methylationis more likely to be established and maintained in the 4ncompared to the 2n genetic background.
Effect of ploidy on transgene-induced RNAi: Theexperiments with the GUS transgene suggested that
Effect of Ploidy on Transgene-Induced Silencing 415

Figure 5.—Expressionand cytosine methylationanalyses of 3n F1 GUS linesand the 2n and 4n progenyplants derived from the 3nline 3n-15. (A) Compari-son of GUS expression be-tween 3n plants and theirparental 4n or 2n lines.These lines were heterozy-gous for the GUS trans-gene. Each pair of barsrepresents the mean valueof GUS activity from threeMUG assays of a parental4n or 2n line (red or blue)and its 3n progeny (green).Error bars represent stan-dard deviation. (B and C)Examples of visualizationof chloroplasts in leafguard cell confirming the3n, 4n, or 2n ploidy levelof the lines analyzed forGUS expression in A andD, respectively. (D) GUSexpression analysis of 4n(a–c) and 2n (d and e) F3
progeny derived from the3n F1 line 3n-15 in A. TheseF3 progeny plants were het-erozygous for the GUStransgene. The asterisks in-dicate the three lines fromwhich the F5 plants in Ewere derived. (E) GUS ex-pression analysis of F5 linesderived from the F3 lines b,d, and e shown in D. TheseF5 lines were homozygousor near homozygous (seeTable S2). NT, nontrans-genic control. (F) North-ern blot hybridization ofGUS mRNA (upper) inthe same F5 lines as shownin E, and ethidium bromide-stained rRNA as loadingcontrol (lower). (G) South-ern blot hybridization anal-ysis of the F5 lines. DNA wasdigested with HindIII andhybridized with Ocs39.The red arrow indicatesthe high molecular weightband, suggesting partialresistance to HindIII diges-tion. M, GeneRuler 1 kbDNA marker. (H) MseI di-gestion of bisulphite PCR
product for the F5 lines. M, GeneRuler 100 bp DNA marker. The red arrow indicates undigested PCR product, suggesting cytosinemethylation. (I) Part of the sequencing trace files for the bisulphite PCR products of the F5 lines. As in Figure 4C, the four dif-ferent nucleotides, A, T, C, and G, are shown in green, red, blue, and black, respectively. The red (T) and blue (C) mixed peaksindicate the presence of both bisulphite-converted and -unconverted cytosines. The original DNA sequence of the corresponding13-bp region is given above. The asterisks indicate the position of cytosines.
416 T. E. Finn et al.
transgenes are expressed at lower levels in 4n than 2nArabidopsis. Transgenes coding for silencing-inducerRNAs may show a similar difference in expression, re-sulting in reduced silencing of target genes in 4n plants.To investigate this, we transformed 2n and 4n Arabi-dopsis lines with one of three different silencing con-structs: an antisense construct against the ETHYLENEINSENSITIVE 2 (EIN2) gene (Figure 1B), an hpRNAconstruct against EIN2 (Figure 1C), or an hpRNAconstruct against a CHS (Figure 1D) gene.
EIN2 and CHS were chosen as the target endogenousgenes because silencing could be easily assayed. Silenc-ing of the EIN2 gene can be evaluated by comparing thehypocotyl length of seedlings germinated in the dark onmedium containing ACC. ACC inhibits hypocotyl growth,but EIN2-silenced seedlings have reduced sensitivity toACC and grow longer hypocotyls than unsilenced orwild-type Arabidopsis, with the length of the hypocotylreflecting the degree of EIN2 silencing. Silencing ofthe CHS gene results in the loss of the dark pigmenta-tion (anthocyanin) in the seed coat, and the whitenessof the seed coat reflects the degree of CHS silencing.We included an antisense construct in addition to themore effective hpRNA constructs in the experimentbecause we expected that any difference in silencingbetween 2n and 4n transformants was more likely to beobserved with the antisense construct due to its moder-ate efficacy.
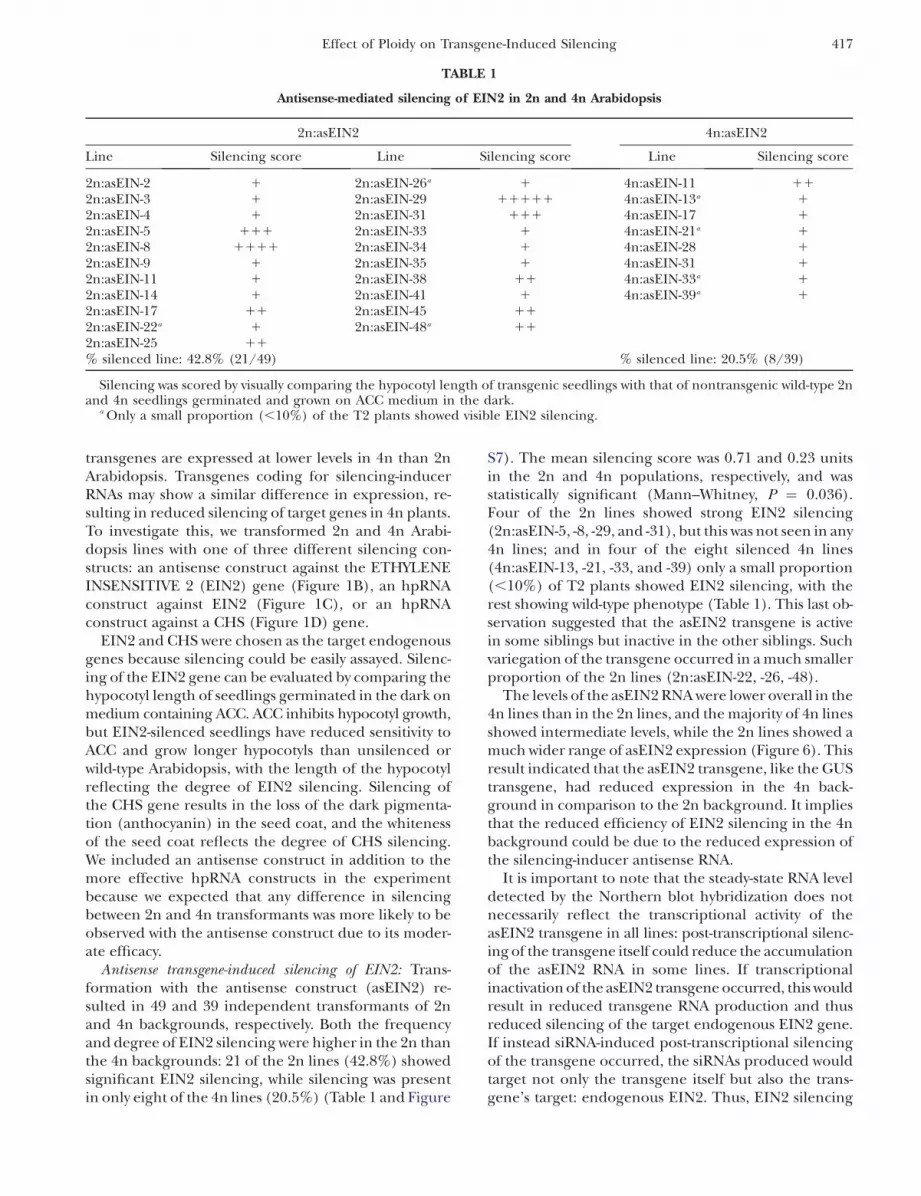
Antisense transgene-induced silencing of EIN2: Trans-formation with the antisense construct (asEIN2) re-sulted in 49 and 39 independent transformants of 2nand 4n backgrounds, respectively. Both the frequencyand degree of EIN2 silencing were higher in the 2n thanthe 4n backgrounds: 21 of the 2n lines (42.8%) showedsignificant EIN2 silencing, while silencing was presentin only eight of the 4n lines (20.5%) (Table 1 and Figure
S7). The mean silencing score was 0.71 and 0.23 unitsin the 2n and 4n populations, respectively, and wasstatistically significant (Mann–Whitney, P ¼ 0.036).Four of the 2n lines showed strong EIN2 silencing(2n:asEIN-5, -8, -29, and -31), but this was not seen in any4n lines; and in four of the eight silenced 4n lines(4n:asEIN-13, -21, -33, and -39) only a small proportion(,10%) of T2 plants showed EIN2 silencing, with therest showing wild-type phenotype (Table 1). This last ob-servation suggested that the asEIN2 transgene is activein some siblings but inactive in the other siblings. Suchvariegation of the transgene occurred in a much smallerproportion of the 2n lines (2n:asEIN-22, -26, -48).
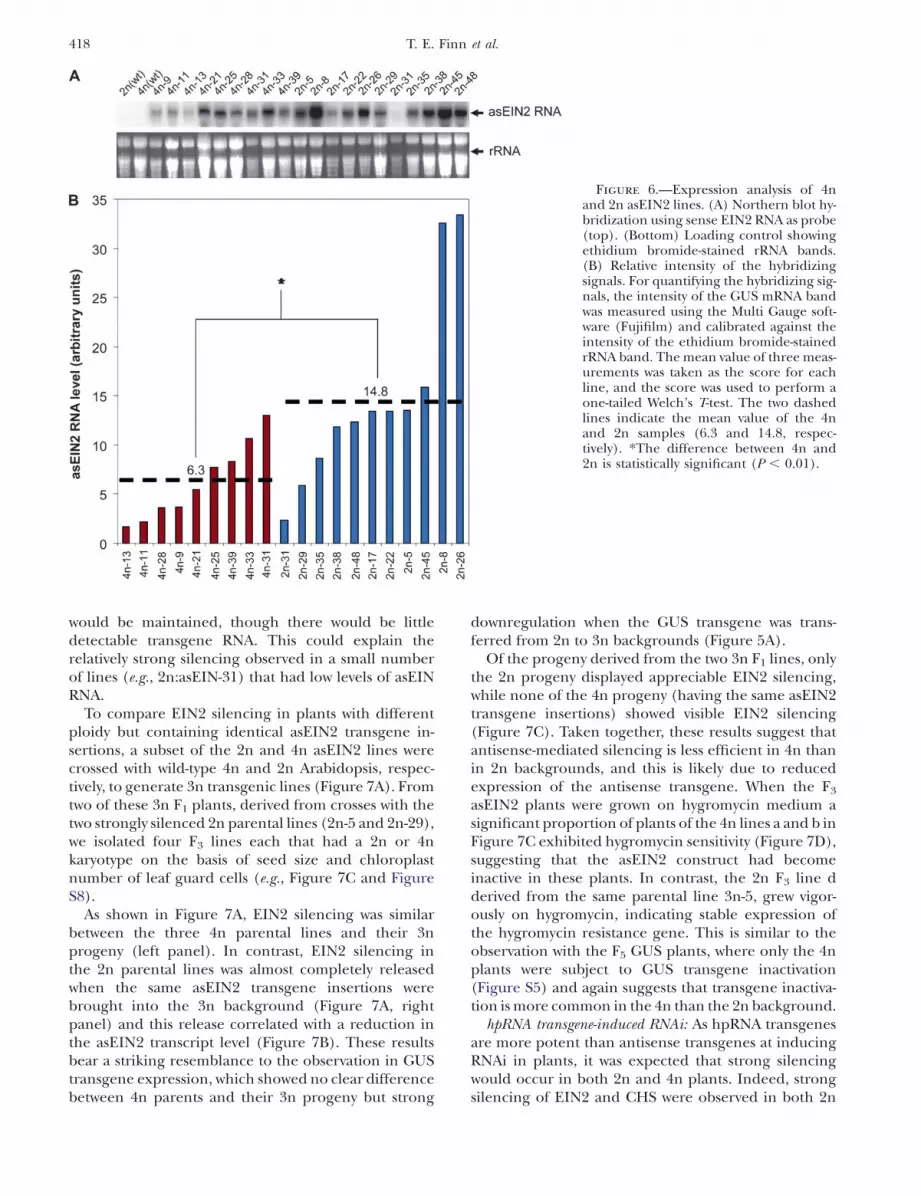
The levels of the asEIN2 RNA were lower overall in the4n lines than in the 2n lines, and the majority of 4n linesshowed intermediate levels, while the 2n lines showed amuch wider range of asEIN2 expression (Figure 6). Thisresult indicated that the asEIN2 transgene, like the GUStransgene, had reduced expression in the 4n back-ground in comparison to the 2n background. It impliesthat the reduced efficiency of EIN2 silencing in the 4nbackground could be due to the reduced expression ofthe silencing-inducer antisense RNA.
It is important to note that the steady-state RNA leveldetected by the Northern blot hybridization does notnecessarily reflect the transcriptional activity of theasEIN2 transgene in all lines: post-transcriptional silenc-ing of the transgene itself could reduce the accumulationof the asEIN2 RNA in some lines. If transcriptionalinactivation of the asEIN2 transgene occurred, this wouldresult in reduced transgene RNA production and thusreduced silencing of the target endogenous EIN2 gene.If instead siRNA-induced post-transcriptional silencingof the transgene occurred, the siRNAs produced wouldtarget not only the transgene itself but also the trans-gene’s target: endogenous EIN2. Thus, EIN2 silencing
TABLE 1
Antisense-mediated silencing of EIN2 in 2n and 4n Arabidopsis
2n:asEIN2 4n:asEIN2
Line Silencing score Line Silencing score Line Silencing score
2n:asEIN-2 1 2n:asEIN-26a 1 4n:asEIN-11 11
2n:asEIN-3 1 2n:asEIN-29 11111 4n:asEIN-13a 1
2n:asEIN-4 1 2n:asEIN-31 111 4n:asEIN-17 1
2n:asEIN-5 111 2n:asEIN-33 1 4n:asEIN-21a 1
2n:asEIN-8 1111 2n:asEIN-34 1 4n:asEIN-28 1
2n:asEIN-9 1 2n:asEIN-35 1 4n:asEIN-31 1
2n:asEIN-11 1 2n:asEIN-38 11 4n:asEIN-33a 1
2n:asEIN-14 1 2n:asEIN-41 1 4n:asEIN-39a 1
2n:asEIN-17 11 2n:asEIN-45 11
2n:asEIN-22a 1 2n:asEIN-48a 11
2n:asEIN-25 11
% silenced line: 42.8% (21/49) % silenced line: 20.5% (8/39)
Silencing was scored by visually comparing the hypocotyl length of transgenic seedlings with that of nontransgenic wild-type 2nand 4n seedlings germinated and grown on ACC medium in the dark.
a Only a small proportion (,10%) of the T2 plants showed visible EIN2 silencing.
Effect of Ploidy on Transgene-Induced Silencing 417
would be maintained, though there would be littledetectable transgene RNA. This could explain therelatively strong silencing observed in a small numberof lines (e.g., 2n:asEIN-31) that had low levels of asEINRNA.
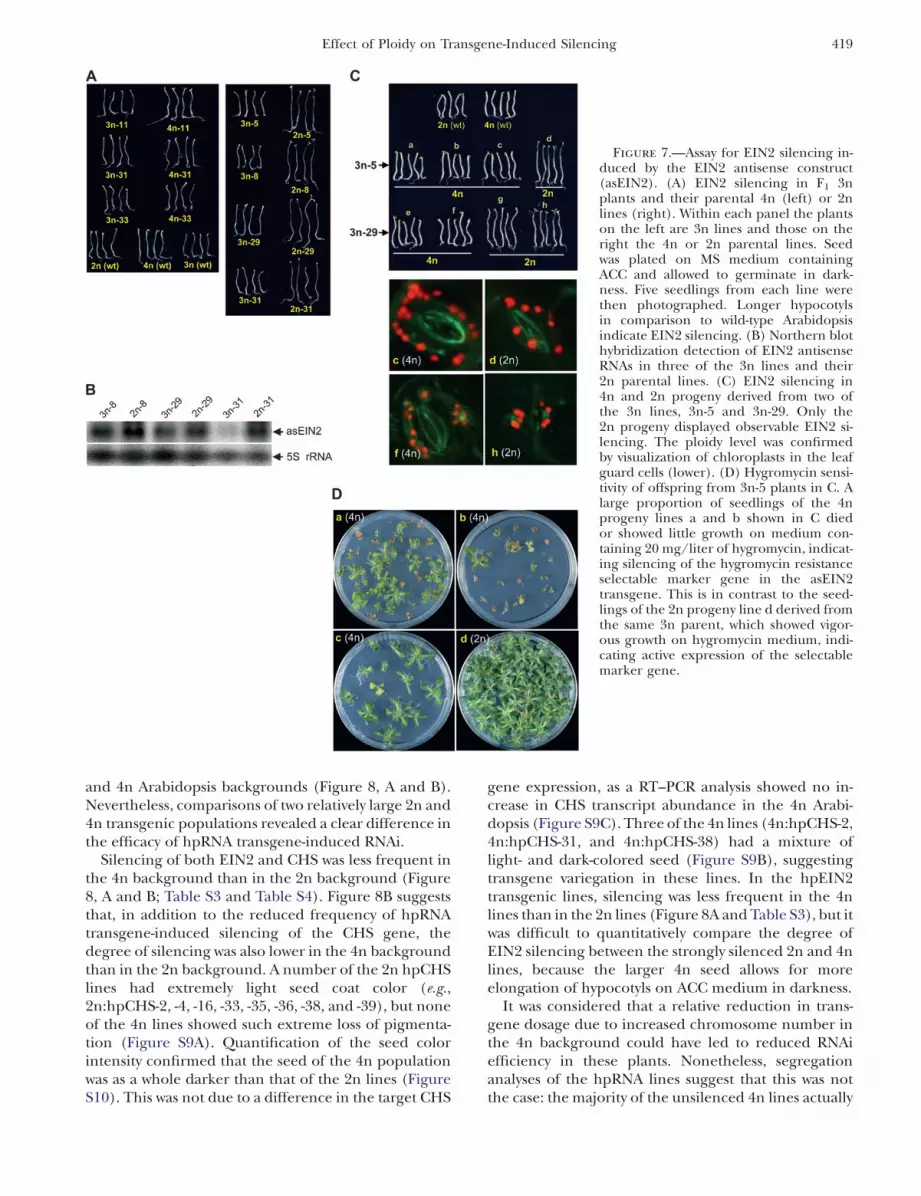
To compare EIN2 silencing in plants with differentploidy but containing identical asEIN2 transgene in-sertions, a subset of the 2n and 4n asEIN2 lines werecrossed with wild-type 4n and 2n Arabidopsis, respec-tively, to generate 3n transgenic lines (Figure 7A). Fromtwo of these 3n F1 plants, derived from crosses with thetwo strongly silenced 2n parental lines (2n-5 and 2n-29),we isolated four F3 lines each that had a 2n or 4nkaryotype on the basis of seed size and chloroplastnumber of leaf guard cells (e.g., Figure 7C and FigureS8).
As shown in Figure 7A, EIN2 silencing was similarbetween the three 4n parental lines and their 3nprogeny (left panel). In contrast, EIN2 silencing inthe 2n parental lines was almost completely releasedwhen the same asEIN2 transgene insertions werebrought into the 3n background (Figure 7A, rightpanel) and this release correlated with a reduction inthe asEIN2 transcript level (Figure 7B). These resultsbear a striking resemblance to the observation in GUStransgene expression, which showed no clear differencebetween 4n parents and their 3n progeny but strong
downregulation when the GUS transgene was trans-ferred from 2n to 3n backgrounds (Figure 5A).
Of the progeny derived from the two 3n F1 lines, onlythe 2n progeny displayed appreciable EIN2 silencing,while none of the 4n progeny (having the same asEIN2transgene insertions) showed visible EIN2 silencing(Figure 7C). Taken together, these results suggest thatantisense-mediated silencing is less efficient in 4n thanin 2n backgrounds, and this is likely due to reducedexpression of the antisense transgene. When the F3
asEIN2 plants were grown on hygromycin medium asignificant proportion of plants of the 4n lines a and b inFigure 7C exhibited hygromycin sensitivity (Figure 7D),suggesting that the asEIN2 construct had becomeinactive in these plants. In contrast, the 2n F3 line dderived from the same parental line 3n-5, grew vigor-ously on hygromycin, indicating stable expression ofthe hygromycin resistance gene. This is similar to theobservation with the F5 GUS plants, where only the 4nplants were subject to GUS transgene inactivation(Figure S5) and again suggests that transgene inactiva-tion is more common in the 4n than the 2n background.
hpRNA transgene-induced RNAi: As hpRNA transgenesare more potent than antisense transgenes at inducingRNAi in plants, it was expected that strong silencingwould occur in both 2n and 4n plants. Indeed, strongsilencing of EIN2 and CHS were observed in both 2n
Figure 6.—Expression analysis of 4nand 2n asEIN2 lines. (A) Northern blot hy-bridization using sense EIN2 RNA as probe(top). (Bottom) Loading control showingethidium bromide-stained rRNA bands.(B) Relative intensity of the hybridizingsignals. For quantifying the hybridizing sig-nals, the intensity of the GUS mRNA bandwas measured using the Multi Gauge soft-ware (Fujifilm) and calibrated against theintensity of the ethidium bromide-stainedrRNA band. The mean value of three meas-urements was taken as the score for eachline, and the score was used to perform aone-tailed Welch’s T-test. The two dashedlines indicate the mean value of the 4nand 2n samples (6.3 and 14.8, respec-tively). *The difference between 4n and2n is statistically significant (P , 0.01).
418 T. E. Finn et al.
and 4n Arabidopsis backgrounds (Figure 8, A and B).Nevertheless, comparisons of two relatively large 2n and4n transgenic populations revealed a clear difference inthe efficacy of hpRNA transgene-induced RNAi.
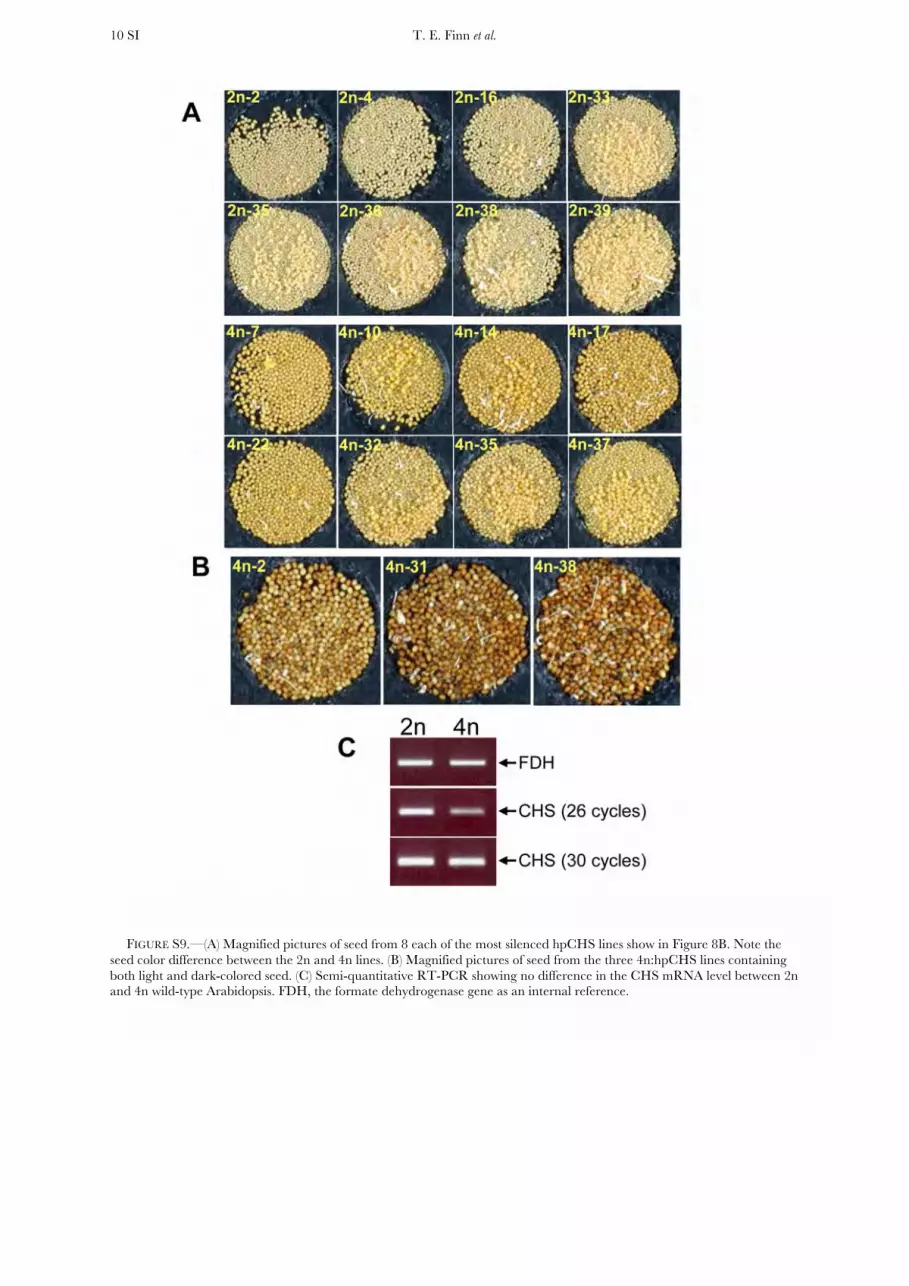
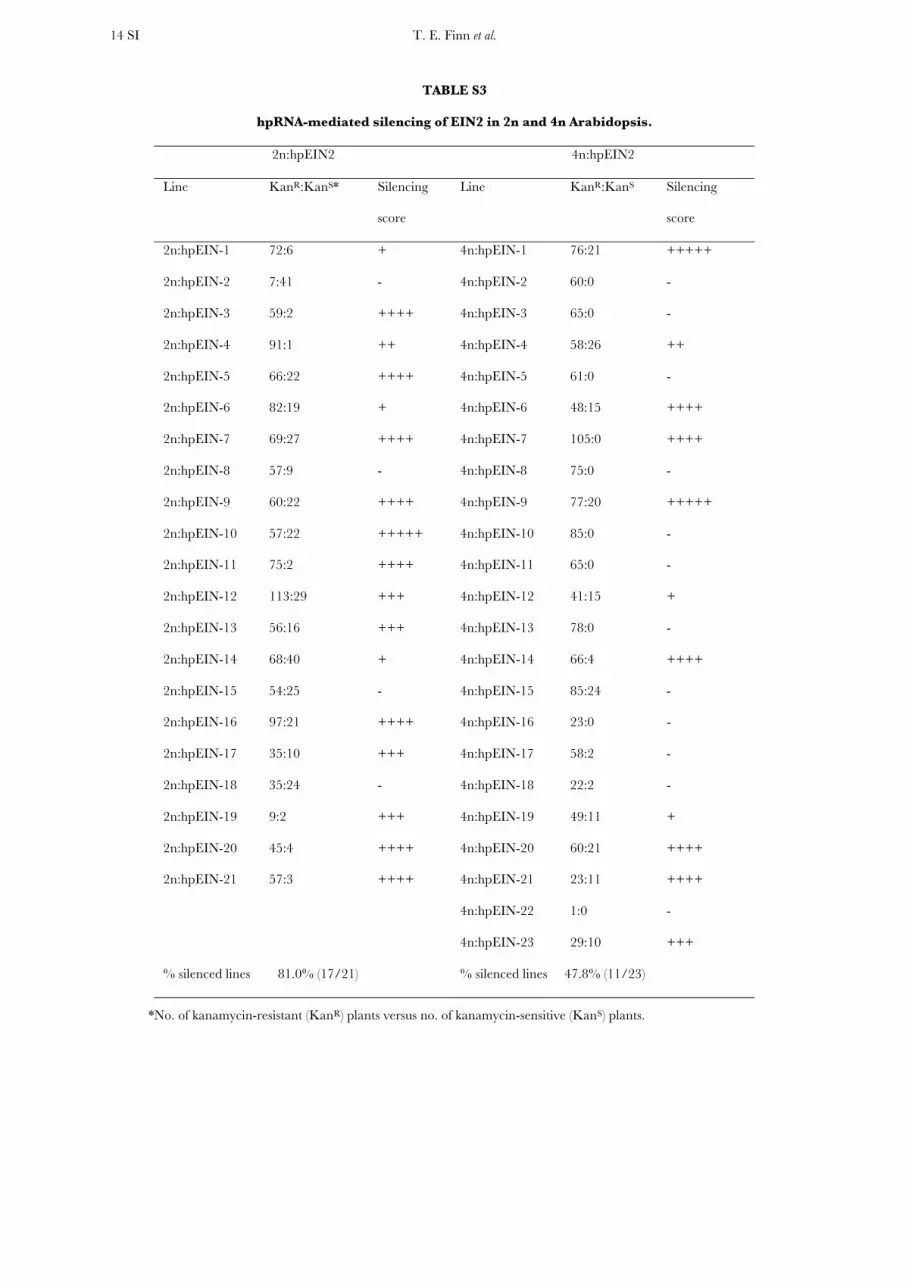
Silencing of both EIN2 and CHS was less frequent inthe 4n background than in the 2n background (Figure8, A and B; Table S3 and Table S4). Figure 8B suggeststhat, in addition to the reduced frequency of hpRNAtransgene-induced silencing of the CHS gene, thedegree of silencing was also lower in the 4n backgroundthan in the 2n background. A number of the 2n hpCHSlines had extremely light seed coat color (e.g.,2n:hpCHS-2, -4, -16, -33, -35, -36, -38, and -39), but noneof the 4n lines showed such extreme loss of pigmenta-tion (Figure S9A). Quantification of the seed colorintensity confirmed that the seed of the 4n populationwas as a whole darker than that of the 2n lines (FigureS10). This was not due to a difference in the target CHS
gene expression, as a RT–PCR analysis showed no in-crease in CHS transcript abundance in the 4n Arabi-dopsis (Figure S9C). Three of the 4n lines (4n:hpCHS-2,4n:hpCHS-31, and 4n:hpCHS-38) had a mixture oflight- and dark-colored seed (Figure S9B), suggestingtransgene variegation in these lines. In the hpEIN2transgenic lines, silencing was less frequent in the 4nlines than in the 2n lines (Figure 8A and Table S3), but itwas difficult to quantitatively compare the degree ofEIN2 silencing between the strongly silenced 2n and 4nlines, because the larger 4n seed allows for moreelongation of hypocotyls on ACC medium in darkness.
It was considered that a relative reduction in trans-gene dosage due to increased chromosome number inthe 4n background could have led to reduced RNAiefficiency in these plants. Nonetheless, segregationanalyses of the hpRNA lines suggest that this was notthe case: the majority of the unsilenced 4n lines actually
Figure 7.—Assay for EIN2 silencing in-duced by the EIN2 antisense construct(asEIN2). (A) EIN2 silencing in F1 3nplants and their parental 4n (left) or 2nlines (right). Within each panel the plantson the left are 3n lines and those on theright the 4n or 2n parental lines. Seedwas plated on MS medium containingACC and allowed to germinate in dark-ness. Five seedlings from each line werethen photographed. Longer hypocotylsin comparison to wild-type Arabidopsisindicate EIN2 silencing. (B) Northern blothybridization detection of EIN2 antisenseRNAs in three of the 3n lines and their2n parental lines. (C) EIN2 silencing in4n and 2n progeny derived from two ofthe 3n lines, 3n-5 and 3n-29. Only the2n progeny displayed observable EIN2 si-lencing. The ploidy level was confirmedby visualization of chloroplasts in the leafguard cells (lower). (D) Hygromycin sensi-tivity of offspring from 3n-5 plants in C. Alarge proportion of seedlings of the 4nprogeny lines a and b shown in C diedor showed little growth on medium con-taining 20 mg/liter of hygromycin, indicat-ing silencing of the hygromycin resistanceselectable marker gene in the asEIN2transgene. This is in contrast to the seed-lings of the 2n progeny line d derived fromthe same 3n parent, which showed vigor-ous growth on hygromycin medium, indi-cating active expression of the selectablemarker gene.
Effect of Ploidy on Transgene-Induced Silencing 419

420 T. E. Finn et al.

contained relatively high copy numbers of the hpEIN2or hpCHS transgenes as indicated by the high segrega-tion ratio for kanamycin (Kan) or phosphinothricin(PPT) resistance (Table S3 and Table S4). On the otherhand, the 4n lines with a lower copy number tended tobe the more strongly silenced lines. Thus, thereappeared to be an inverse correlation between trans-gene copy number and the level of hpRNA transgene-induced RNAi in the 4n Arabidopsis. In contrast to thehigh-copy number 4n lines (most of which showed nosilencing of the target genes), many of the high-copynumber 2n lines showed various degrees of target genesilencing, including strong silencing (Table S3 andTable S4). As was the case with the 4n plants, the low-copy number 2n lines tended to be among the moststrongly silenced.
A subset of the hpCHS lines was analyzed withNorthern blot hybridization. The expression level ofhpCHS RNA is difficult to determine as it is the substratefor Dicer, so instead the expression of the PPTresistancegene bar (part of the hpCHS construct) and the level ofhpCHS-derived siRNAs were measured. As shown inFigures 8C, the overall expression levels of bar werelower in the 4n lines than the 2n lines. This ploidy-dependent expression difference was reminiscent ofthat seen in the GUS and antisense EIN2 transgenes(Figures 3A and 6) and suggests that the hpRNAtransgenes are less expressed in 4n than in 2n back-grounds. Northern blot hybridization of siRNAs showeda similar trend: as a whole the 4n lines accumulatedlower levels of siRNAs than the 2n lines analyzed (Figure8D). The abundance of the siRNAs correlated relativelywell (though not perfectly) with the degree of CHSsilencing. Taken together, these results suggested that,like the antisense transgene, hpRNA transgenes areexpressed at lower levels, and hence induce less effectiveRNAi in 4n than in 2n backgrounds.
DISCUSSION
In this article we provide evidence that transgenes areexpressed at a lower level in an autotetraploid back-ground than in a diploid background. The three trans-genes tested, namely the GUS sense transgene, the EIN2antisense transgene, and the CHS hpRNA transgene, allshowed a lower overall level of expression in 4n than 2nArabidopsis.
Transgenes can be inactivated at both transcriptionaland post-transcriptional levels, and transcriptional re-pression in plants is often associated with increasedcytosine methylation especially in the promoter regionof a gene (Matzke et al. 2002; Baulcombe 2004). Ouranalysis of the GUS transgenic lines indicated thattransgenes have more widespread cytosine methylationin the 4n background than in the 2n background (Figures3 and 4). In addition to this, we analyzed the offspring ofa single 3n GUS transgenic parent for methylation statusof the transgenic DNA: the transgene was more meth-ylated in the 4n than the 2n progeny, and GUSexpression levels showed an inverse correlation withthe degree of DNA methylation in the transgene pro-moter (Figure 5, E–I). These results suggest that thereduction of transgene expression in 4n Arabidopsis isdue to reduced transgene transcription rather than post-transcriptional RNA degradation. This is consistent withthe previous observation of ploidy-associated transcrip-tional inactivation of an HPT transgene that is also as-sociated with increased DNA methylation (Mittelsten
Scheid et al. 1996).Despite the higher overall level of transgene expres-
sion, the 2n GUS transgenic population contained alarger proportion of lines (8 out of 40) than the 4npopulation (4 out of 64) that showed extremely lowlevels (or inactivation) of GUS expression (Figure 2).Also, an inactive GUS transgene in a 2n line became sig-nificantly reactivated when introduced into a 3n back-ground by crossing with wild-type 4n Arabidopsis (Figure5A). A possible explanation for this seeming paradox isthat the GUS transgene in these lines is transcribed atexcessive levels, triggering post-transcriptional silencingor cosuppression (Schubert et al. 2004); the generallyhigher levels of transgene transcription in the 2nbackground would cause more frequent cosupression,resulting in a higher proportion of GUS-silenced linesthan in the 4n background.
While the expression and methylation analyses sug-gested that transgenes are transcriptionally repressed inthe 4n lines, most of these lines showed an intermediatelevel of transgene expression. This differs from the con-ventionally defined transcriptional gene silencing asso-ciated with dramatic reduction in transgene expression(Matzke et al. 2002). A transgenic study in animals mayprovide an explanation for the transcriptional repres-sion in 4n Arabidopsis: Robertson et al. (1995) showedthat the expression of a globin transgene within all
Figure 8.—hpRNA transgene-induced silencing in 2n and 4n Arabidopsis. (A) Assay for EIN2 silencing in 2n and 4n Arabi-dopsis transformed with the EIN2 hpRNA construct. Longer hypocotyls indicate EIN2 silencing. (B) Pictures of seed from 2n and4n Arabidopsis transformed with the chalcone synthase hpRNA construct. The reduction or loss of the brown pigmentation in-dicates CHS silencing. (C) Northern blot hybridization analysis of 2n and 4n hpCHS lines using 32P-labeled bar antisense RNA as aprobe. The lower panel is ethidium bromide-stained rRNA as a loading control. (D) Detection of siRNAs derived the hpCHStransgene in a subset of the 2n and 4n hpCHS lines. The number of 1 symbols indicates degrees of CHS silencing. The lowerpanel is U6 RNA hybridized with a 32P-labeled antisense oligo as a loading control.
Effect of Ploidy on Transgene-Induced Silencing 421
mouse lines is heterocellular, with individual cells eithershowing no expression of the transgene at all orexpressing it at a high level, characteristic of a particularline. The authors found that although the number oftransgene-expressing cells varies greatly between differ-ent transgenic lines, within a transgenic line, individualmice have strikingly similar numbers of expressing cells.Thus, the variation in total transgene activity betweenlines is due mainly to differences in the percentage ofcells that actively express the transgene. The authorscalled the phenomenon position-dependent variegation,since the degree of variation appears to depend ontransgene integration site but not transgene copy number.
The following observations raise the possibility thatsimilar position-dependent transgene variegation mayoccur in Arabidopsis plants: among the asEIN2 andhpCHS transgenics, some lines gave rise to both si-lenced and unsilenced progeny, more frequently in the4n than the 2n populations; of the F5 GUS siblingsderived from a 3n parent, a small number of 4n plantsshowed strong GUS inactivation, while this was notobserved in the 2n plants of the same parent (the rest ofthe siblings showing active GUS expression; Figure S5);digestion of the bisulphite PCR product by MseIappeared to yield either fully cut or fully uncut DNAbut not intermediate fragments (Figures 4A and 5H);and the HindIII digestion of genomic DNA also ap-peared to primarily give either fully cut or fully uncutbut not intermediate hybridizing bands (Figures 3, Band C, and 5G). These appear to suggest that DNA fromindividual cells of a particular transgenic line is eitherfully unmethylated or fully methylated. Thus, the trans-genic Arabidopsis lines may contain a mixture of trans-criptionally active and transcriptionally inactive cells,and the overall transgene expression levels may reflectthe percentage of the cells that are actively expressingthe transgene.
Our results show that RNAi induced by antisense andhairpin RNA transgenes is less effective in 4n than in 2nArabidopsis. This reduced RNAi effectiveness appearsto be due to reduced expression of the silencing-inducer RNAs. With the EIN2 antisense transgene, nostrongly silenced lines could be recovered from the4n population. Furthermore, transgene-induced EIN2silencing in the 2n lines was largely lost when theantisense transgene was introduced into the 3n back-ground by crossing with wild-type 4n Arabidopsis. Thisstrong effect of ploidy on antisense-induced silencing isprobably due to the dependence of this silencingmethod on the level of antisense transgene expression.
With the two hpRNA constructs, strong RNAi of thetwo endogenous target genes could be achieved in boththe 2n and 4n Arabidopsis, indicating that the RNAitechnology can be successfully applied to knocking downgene expression in polyploidy plants. However, theproportion of plants showing strong RNAi was signifi-cantly lower in the 4n populations. Furthermore, com-
paring the strongly silenced 4n and 2n populations, the4n lines appear to show a reduced intensity of targetgene silencing. This result appears to be in conflict with arecent report indicating that hpRNA transgene-inducedsilencing is not affected by ploidy change (Pignatta
et al. 2008). In their report the authors selected foursingle-copy 2n hpCHS lines with various degrees of CHSsilencing, converted them into 4n plants by colchicinetreatment, and then compared CHS silencing betweenthe 2n and 4n populations. They detected no significantchanges in the mRNA level of the target CHS gene orthe accumulation of its biosynthetic product anthocyaninbetween the 2n lines and their respective 4n counter-parts. The authors concluded that transgene-inducedsilencing is not affected by a change in ploidy. We cannotexplain the discrepancy between our result and that ofPignatta et al. (2008), although some possible sourcesof differences may be identified. For one, Pignatta et al.(2008) did not examine the epigenetic status andexpression of the hpCHS transgene, which could haveundergone changes during colchicine-induced chromo-some doubling but which were not sufficient to cause asignificant change in target gene silencing. In our study,random transgenic populations were examined, whichshowed a clear difference between 2n and 4n popula-tions primarily in the frequency of silencing, while inthe reported study, the authors used selected single-copy lines that might be inherently stable in regard totransgene expression and transgene-induced targetgene silencing. Ploidy-dependent epigenetic changesare often progressive (Adams and Wendel 2005), and itwould be interesting to investigate whether the dif-ference in hpRNA transgene-induced RNA silencingbecomes more prominent in subsequent generations ofthe 2n and 4n lines in the two studies.
The negative effect of high ploidy on transgeneexpression and transgene-induced RNAi suggested byour study has practical implications. For instance, toobtain transgenic polyploid lines with high levels oftransgene product or efficient transgene-induced RNAi,one might need to generate relatively large numbers oftransgenic lines. To possibly make matters worse, a poly-ploid species might be particularly difficult to transformusing conventional vectors because the selectable markergenes could be expressed poorly in the poplyploidbackground, resulting in inefficient selection of stabletransformants.
Our study was carried out using a newly formedsynthetic autotetraploid Arabidopsis line, where weobserved ploidy-induced transcriptional repression sim-ilar to the previously reported HPT transgene silencing(Mittelsten Scheid et al. 1996, 2003). It remains to beinvestigated whether or not such ploidy-dependentreduction of transgene expression as well as transgene-induced RNAi occurs in naturally occurring autopoly-ploid plants or in allopolyploids, which comprise manyof the important crop species. Rapid and widespread
422 T. E. Finn et al.
inactivation of endogenous genes has been reported tooccur in newly formed allopolyploid Arabidopsis andwheat (Liu et al. 1998; Comai et al. 2000). Interestingly,genes that are inactivated due to allopolyploidy areoften duplicated genes with repeated DNA elements(Comai et al. 2000; Adams and Wendel 2005), which,like transgenes, are often the target of epigenetic silen-cing in plants (Pikaard et al. 2008). This suggests thatnot only are transgene expression and transgene-induced RNAi generally affected by ploidy changes,but transgenes could become a useful tool for investi-gating ploidy-induced changes of endogenous geneexpression.
We thank Limin Wu, Jing Chen, Sameer Tiwari, and Wenwu Guo fortechnical assistance; Ian Greaves for providing bisulphite PCR primersfor the chloroplast DNA; Carl Davies for photography, and PeterWaterhouse and Jean Finnegan for support and helpful discussions.We would also like to thank the two anonymous reviewers for theirconstructive comments. T.E.F. and D.S were funded by Common-wealth Scientific and Industrial Research Organization summerstudentships; M.B.W. was partly supported by an Australian ResearchCouncil future fellowship (FT0991956).
LITERATURE CITED
Adams, K. L., and J. F. Wendel, 2005 Polyploid and genome evolu-tion in plants. Curr. Opin. Plant Biol. 8: 135–141.
Baubec, T., H. Q. Dinh, A. Pecinka, B. Rakic, W. Rozhon, et al.2010 Cooperation of multiple chromatin modifications cangenerate unanticipated stability of epigenetic states in Arabidop-sis. Plant Cell 22: 34–47.
Baulcombe, D., 2004 RNA silencing in plants. Nature 431: 356–363.Benfey, P. N., and N. H. Chua, 1990 The cauliflower mosaic virus
35S promoter: combinatorial regulation of transcription inplants. Science 250: 959–966.
Bhullar, S., S. Datta, S. Advani, S. Chakravarthy, T. Gautam,et al. 2007 Functional analysis of cauliflower mosaic virus 35Spromoter: re-evaluation of the role of subdomains B5, B4 andB2 in promoter activity. Plant Biotechnol. J. 5: 696–708.
Chen, S., C. A. Helliwell, L. M. Wu, E. S. Dennis, N. Upadhyaya
et al., 2005 A novel T-DNA vector design conducive for selectionof transgenic lines with simple integration and stable transgeneexpression. Funct. Plant Biol. 32: 671–681.
Clough, S. J., and A. F. Bent, 1998 Floral dip: a simplified methodfor Agrobacterium-mediated transformation of Arabidopsis thali-ana. Plant J. 16: 735–743.
Comai, L., A. P. Tyagi, K. Winter, R. Holmes-Davis, S. H. Reynolds
et al., 2000 Phenotypic instability and rapid gene silencing innewly formed arabidopsis allotetraploids. Plant Cell 12: 1551–1568.
Draper, J., and R. Scott, 1988 The isolation of plant nucleic acids,pp. 199–236 in Plant Genetic Transformation and Gene Expression: ALaboratory Manual, edited by J. Draper, R. Scott, P. Armitage
and R. Walden. Alden Press, Oxford, UK.Eamens, A., M. B. Wang, N. A. Smith and P. M. Waterhouse,
2008 RNA silencing in plants: yesterday, today, and tomorrow.Plant Physiol. 147: 456–468.
Fusaro, A.F., L. Matthew, N. A. Smith, S. J. Curtin, J. Dedic-Hagan
et al., 2006 RNA interference-inducing hairpin RNAs in plantsact through the viral defence pathway. EMBO Rep. 7: 1168–1175.
Gleave, A. P., 1992 A versatile binary vector system with a T-DNAorganisational structure conducive to efficient integration ofcloned DNA into the plant genome. Plant Mol. Biol. 20: 1203–1207.
Hannon, G.J., and J. J. Rossi, 2004 Unlocking the potential of thehuman genome with RNA interference. Nature. 431: 371–378.
Henry, I. M., B. P. Dilkes and L. Comai, 2007 Genetic basis for dos-age sensitivity in Arabidopsis thaliana. PLoS Genet. 3: e70.
Hetzl, J., A. M. Foerster, G. Raidl and O. Mittelsten Scheid,2007 CyMATE: a new tool for methylation analysis of plant ge-nomic DNA after bisulphite sequencing. Plant J. 51: 526–536.
Ho, L., Y. Wan, J. M. Widholm and A. L. Rayburn, 1990 The use ofstomatal chloroplast number for rapid determination of ploidylevel in maize. Plant Breed. 105: 203–210.
Jacobs, J., and J. I. Yoder, 1989 Ploidy levels in transgenic tomatoplants determined by chloroplast number. Plant Cell Rep. 7: 662–663.
Jefferson, R.A., T. A. Kavanagh and M. W. Bevan, 1987 GUS fu-sions: beta-glucuronidase as a sensitive and versatile gene fusionmarker in higher plants. EMBO J. 6: 3901–3907.
Kashkush, K., M. Feldman and A. A. Levvy, 2002 Gene loss, silenc-ing and activation in a newly synthesized wheat allotetraploid. Ge-netics 160: 1651–1659.
Liu, B., J. M. Vega and M. Feldman, 1998 Rapid genomic changesin newly synthesized amphiploids of Triticum and Aegilops. II.Changes in low-copy coding DNA sequences. Genome 41: 535–542.
Matzke, M. A., W. Aufsatz, T. Kanno, M. F. Mette and A. J. Matzke,2002 Homology-dependent gene silencing and host defense inplants. Adv. Genet. 46: 235–275.
Mittelsten Scheid, O., L. Jakovleva, K. Afsar, J. Maluszynska
and J. Paszkowski, 1996 A change of ploidy can modify epige-netic silencing. Proc. Natl. Acad. Sci. USA 93: 7114–7119.
Mittelsten Scheid, O., K. Afsar and J. Paszkowski,2003 Formation of stable epialleles and their paramutation-likeinteraction in tetraploid Arabidopsis thaliana. Nat. Genet. 34:450–454.
Pignatta, D., B. Dilkes, T. Wroblewski, R. W. Michelmore and L.Comai, 2008 Transgene-induced gene silencing is not affectedby a change in ploidy level. PLoS One 3: e3061.
Pikaard, C.S., J. R. Haag, T. Ream and A. T. Wierzbicki, 2008 Rolesof RNA polymerase IV in gene silencing. Trends Plant Sci. 13:390–397.
Robertson, G., D. Garrick, W. Wu, M. Kearns, D. Martin et al.,1995 Position-dependent variegation of globin transgene ex-pression in mice. Proc. Natl. Acad. Sci. USA 92: 5371–5375.
Schubert, D., B. Lechtenberg, A. Forsbach, M. Gils, S. Bahadur
et al., 2004 Silencing in Arabidopsis T-DNA transformants: thepredominant role of a gene-specific RNA sensing mechanism ver-sus position effects. Plant Cell 16: 2561–2572.
Stebbins, G.L., 1966 Chromosomal variation and evolution. Sci-ence 152: 1463–1469.
Wang, J., L. Tian, A. Madlung, H. S. Lee, M. Chen et al.,2004 Stochastic and epigenetic changes of gene expressionin Arabidopsis polyploids. Genetics 167: 1961–1973.
Wang, L., N. A. Smith, E. S. Dennis, P. M. Waterhouse, P. J. Unrau
et al., 2008 Synthesis of complementary RNA by RNA-dependentRNA polymerases in plant extracts is independent of an RNAprimer. Funct. Plant Biol. 35: 1091–1099.
Wang, M.B., and P. M. Waterhouse, 2002 Application of gene si-lencing in plants. Curr. Opin. Plant Biol. 5: 146–150.
Wang, M. B., Z. Y. Li, P. R. Matthews, N. M. Upadhyaya and P. M.Waterhouse, 1998 Improved vectors for Agrobacterium tumefaciens -mediated transformation of monocot plants. Acta Hort. 461: 401–407.
Wang, M. B., V. Wesley, E. J. Finnegan, N. A. Smith and P. M.Waterhouse, 2001 Replicating satellite RNA induces sequence-specific DNA methylation and truncated transcripts in plants.RNA 7: 16–28.
Wesley, S.V., C. A. Helliwell, N. A. Smith, M. B. Wang, D. T.Rouse et al., 2001 Construct design for efficient, effectiveand high-throughput gene silencing in plants. Plant J. 27: 581–590.
Xu, Y., L. Zhong, X. Wu, X. Fang and J. Wang, 2009 Rapid alter-ations of gene expression and cytosine methylation in newly syn-thesized Brassica napus allopolyploids. Planta 229: 471–483.
Yu, Z., G. Haberer, M. Matthes, T. Rattei, K. F. Mayer et al.,2010 Impact of natural genetic variation on the transcriptomeof autotetraploid Arabidopsis thaliana. Proc. Natl. Acad. Sci. USA107: 17809–17814.
Communicating editor: C. S. Pikaard
Effect of Ploidy on Transgene-Induced Silencing 423

GENETICSSupporting Information
http://www.genetics.org/cgi/content/full/genetics.110.124370/DC1
Transgene Expression and Transgene-Induced Silencing in Diploidand Autotetraploid Arabidopsis
Thomas E. Finn, Lei Wang, David Smolilo, Neil A. Smith, Rosemary White, Abed Chaudhury,Elizabeth S. Dennis and Ming-Bo Wang
Copyright � 2011 by the Genetics Society of AmericaDOI: 10.1534/genetics.110.124370

T. E. Finn et al. 2 SI
FIGURE S1.—Statistical analysis shows no significant difference in estimated transgene copy number distribution between
the 4n and 2n GUS lines shown in Figure 3.
T. E. Finn et al. 3 SI
FIGURE S2.—The agarose gel used for the Southern blot hybridization shown in Figure 3 (B and C). Note that genomic
DNA samples were evenly digested across the 4n and 2n lines.
T. E. Finn et al. 4 SI
FIGURE S3.—(A) The 35S promoter sequence in the 35S-GUS construct shown in Figure 1. The regions corresponding to
the nested bisulphite PCR primers are underlined. The 13-bp region of which sequencing trace files are shown in Figure 4C
and Figure 5I is highlighted in bold red, and the “TATA” box is highlighted in bold pink. (B) Predicted restriction sites of
bisulphite PCR product from fully-methylated (unconverted) or fully unmethylated (converted) DNA of the 35S promoter.

T. E. Finn et al. 5 SI
FIGURE S4.—Bisulphite PCR analysis of a chloroplast gene encoding psaA protein using the same bisulphite-treated
genomic DNA as for the analysis of 35S promoter methylation in Figure 4A and C. (A). The sequence of the analysed region of the chloroplast DNA (157 bp; reverse complement of nt. 880-1036 of ATCG00350). Letters in red indicate the sequences
against which the forward and reverse bisulphite PCR primers are designed. Pink letters indicate the region of which the
bisulphite sequencing trace files are shown below in C. Underlined letters correspond to the two Msel sites created when the
cytosines are converted to thymines. (B). Msel restriction sites in bisulphite converted DNA. (C). Sequencing trace files of the
region spanning the two Msel sites in bisulphite-treated chloroplast DNA from the T2 lines showing significant 35S promoter
methylation. Note that the level of cytosines (blue peaks) is minimal in comparison with that of thymines, indicating efficient
and uniform bisulphite conversion.

T. E. Finn et al. 6 SI
FIGURE S5.—Examples of individual 4n F5 plants, derived from the F1 parent of the GUS-15x2n (wt) cross (3n-15), that
showed strong GUS silencing. The top row are unsilenced control.

T. E. Finn et al. 7 SI
FIGURE S6.—Bisulphite PCR analysis of a chloroplast gene encoding psaA protein using the same bisulphite-treated
genomic DNA as for analysis of 35S promoter in Figure 5H-I. (A). Bisulphite PCR product was digested (+) or undigested (-)
with Msel and separated in 4% NuSieve agarose gel. Note that there is little undigested DNA indicating efficient and
uniform bisulphite conversion. (B). Sequencing trace files of the region spanning the two Msel sites in bisulphite-treated
chloroplast DNA from the four F5 lines showing significant 35S promoter methylation.

T. E. Finn et al. 8 SI
FIGURE S7.—Examples of the 2n and 4n asEIN2 lines germinated on ACC medium in the dark.

T. E. Finn et al. 9 SI
FIGURE S8.—Ploidy levels of the 4n and 2n progeny lines shown in Figure 5 and Figure 7. The ploidy levels were
determined by counting the chloroplast number in leaf guard cell using confocal microscope. For each line, 4 individual
plants were analysed, with 16 guard cells from each counted for chloroplast number. The 2n lines have 4-6 chloroplasts per
guard cells, while the 4n lines have 8-12 chloroplasts per guard cell.
T. E. Finn et al. 10 SI
FIGURE S9.—(A) Magnified pictures of seed from 8 each of the most silenced hpCHS lines show in Figure 8B. Note the
seed color difference between the 2n and 4n lines. (B) Magnified pictures of seed from the three 4n:hpCHS lines containing
both light and dark-colored seed. (C) Semi-quantitative RT-PCR showing no difference in the CHS mRNA level between 2n and 4n wild-type Arabidopsis. FDH, the formate dehydrogenase gene as an internal reference.

T. E. Finn et al. 11 SI
FIGURE S10.—Quantification of seed color intensity of the hpCHS lines shown in Figure 8B, using the Multi Gauge software (FUJIFILM).

T. E. Finn et al. 12 SI
TABLE S1
Statistic analysis of GUS expression levels shown in Figure 2A and 2B.
A. Statistical analysis of the whole T1 populations
Group Statistics
Ploidy N Mean Std. Deviation Std. Error Mean
GUS 2n
4n
40
64
22.3063
16.2906
16.14821
9.23085
2.55326
1.15386
Independent Samples Test
Levene’s Test for
Equality of
Variances
t-test for Equality of Means
95% Confidence Interval of
the Difference
F Sig. t df Sig.
(2-tailed)
Mean
Difference
Std. Error
Difference
Lower Upper
GUS Equal variances
assumed
Equal variances
not assumed
24.62
.000
2.418
2.147
102
55.133
.017
.036
6.0156
6.0156
2.48767
2.80187
1.08133
.40085
10.94992
11.63040
B. Statistical analysis of the T1 populations excluding “inactivated” lines (GUS activity<2)
Group Statistics
Ploidy N Mean Std. Deviation Std. Error Mean
GUS 2n
4n
31
59
28.6584
17.6300
12.39489
8.31722
2.22619
1.08281
Independent Samples Test
Levene’s Test
for Equality of
Variances
t-test for Equality of Means
95% Confidence Interval of
the Difference
F Sig. t df Sig.
(2-tailed)
Mean
Difference
Std. Error
Difference
Lower Upper
GUS Equal variances
assumed
Equal variances
not assumed
7.086
.009
5.023
4.455
88
44.583
.000
.000
11.0284
11.0284
2.19562
2.47556
6.66505
6.04107
15.39172
16.01571
The normality of distribution was determined using the Kolmogorov-Smirnov test with Lilliefors correction (SPSS for windows,
Rel. 11.0.1 2001. SPSS inc, Chicago).

T. E. Finn et al. 13 SI
TABLE S2
Transgene segregation in selected homozygous or near-homozygous F5 4n and 2n lines derived from 3n F1
line of the GUS-15 2n (wt) cross.
F5 line b-1 b-2 b-3 d-1 e-1 e-2 e-3 e-4
Hygromycin
resistance/GUS-
positive:hygromycin
sensitive/GUS-
negative
383:0 635:2 472:9 257:0 218:0 263:0 210:0 310:0
T. E. Finn et al. 14 SI
TABLE S3
hpRNA-mediated silencing of EIN2 in 2n and 4n Arabidopsis.
2n:hpEIN2 4n:hpEIN2
Line KanR:KanS* Silencing
score
Line KanR:KanS Silencing
score
2n:hpEIN-1 72:6 + 4n:hpEIN-1 76:21 +++++
2n:hpEIN-2 7:41 - 4n:hpEIN-2 60:0 -
2n:hpEIN-3 59:2 ++++ 4n:hpEIN-3 65:0 -
2n:hpEIN-4 91:1 ++ 4n:hpEIN-4 58:26 ++
2n:hpEIN-5 66:22 ++++ 4n:hpEIN-5 61:0 -
2n:hpEIN-6 82:19 + 4n:hpEIN-6 48:15 ++++
2n:hpEIN-7 69:27 ++++ 4n:hpEIN-7 105:0 ++++
2n:hpEIN-8 57:9 - 4n:hpEIN-8 75:0 -
2n:hpEIN-9 60:22 ++++ 4n:hpEIN-9 77:20 +++++
2n:hpEIN-10 57:22 +++++ 4n:hpEIN-10 85:0 -
2n:hpEIN-11 75:2 ++++ 4n:hpEIN-11 65:0 -
2n:hpEIN-12 113:29 +++ 4n:hpEIN-12 41:15 +
2n:hpEIN-13 56:16 +++ 4n:hpEIN-13 78:0 -
2n:hpEIN-14 68:40 + 4n:hpEIN-14 66:4 ++++
2n:hpEIN-15 54:25 - 4n:hpEIN-15 85:24 -
2n:hpEIN-16 97:21 ++++ 4n:hpEIN-16 23:0 -
2n:hpEIN-17 35:10 +++ 4n:hpEIN-17 58:2 -
2n:hpEIN-18 35:24 - 4n:hpEIN-18 22:2 -
2n:hpEIN-19 9:2 +++ 4n:hpEIN-19 49:11 +
2n:hpEIN-20 45:4 ++++ 4n:hpEIN-20 60:21 ++++
2n:hpEIN-21 57:3 ++++ 4n:hpEIN-21 23:11 ++++
4n:hpEIN-22 1:0 -
4n:hpEIN-23 29:10 +++
% silenced lines 81.0% (17/21) % silenced lines 47.8% (11/23)
*No. of kanamycin-resistant (KanR) plants versus no. of kanamycin-sensitive (KanS) plants.

T. E. Finn et al. 15 SI
TABLE S4
hpRNA-mediated silencing of the chalcone synthase (CHS) gene in 2n and 4n Arabidopsis
2n:hpCHS 4n:hpCHS
Line PPTR:PPTS* Silencing score Line PPTR:PPTS Silencing score
2n:hpCHS-1 50:5 +++ 4n:hpCHS-1 46:16 +++
2n:hpCHS-2 30:8 +++++ 4n:hpCHS-2 30:1 -
2n:hpCHS-3 41:6 +++ 4n:hpCHS-3** 30:22 -
2n:hpCHS-4 25:15 +++++ 4n:hpCHS-4 31:17 ++
2n:hpCHS-5 24:8 ++++ 4n:hpCHS-5 59:13 +++
2n:hpCHS-6 40:14 ++++ 4n:hpCHS-6 37:5 +++
2n:hpCHS-7 60:4 +++ 4n:hpCHS-7 38:11 ++++
2n:hpCHS-8** 62:14 ++ 4n:hpCHS-8*** 33:11 -
2n:hpCHS-9 44:2 ++++ 4n:hpCHS-9 43:12 +++
2n:hpCHS-10 49:6 +++++ 4n:hpCHS-10 52:11 ++++
2n:hpCHS-11 37:11 +++ 4n:hpCHS-11 43:6 -
2n:hpCHS-12 39:11 +++ 4n:hpCHS-12 50:17 +++
2n:hpCHS-13 55:9 +++ 4n:hpCHS-13 45:7 +++
2n:hpCHS-14 50:7 ++++ 4n:hpCHS-14 41:8 +++
2n:hpCHS-15 26:19 ++++ 4n:hpCHS-15 60:0 +++
2n:hpCHS-16 25:15 +++++ 4n:hpCHS-16 45:1 ++++
2n:hpCHS-17 40:5 +++++ 4n:hpCHS-17 42:16 +++
2n:hpCHS-18 36:2 - 4n:hpCHS-18** 41:4 -
2n:hpCHS-19 43:10 ++++ 4n:hpCHS-19 43:13 +
2n:hpCHS-20 60:9 +++ 4n:hpCHS-20 45:11 ++
2n:hpCHS-21 48:4 - 4n:hpCHS-21 44:14 ++++
2n:hpCHS-22 60:3 +++ 4n:hpCHS-22 48:20 ++++
2n:hpCHS-23 62:9 +++ 4n:hpCHS-23 45:11 +++
2n:hpCHS-24 45:20 +++ 4n:hpCHS-24 44:8 +
2n:hpCHS-25*** 54:15 ++++ 4n:hpCHS-25 45:4 +++
2n:hpCHS-26 44:12 +++ 4n:hpCHS-26 40:4 ++
2n:hpCHS-27 68:19 +++++ 4n:hpCHS-27 40:2 +
2n:hpCHS-28 63:15 + 4n:hpCHS-28 19:3 -
2n:hpCHS-29 53:9 ++++ 4n:hpCHS-29 57:23 +++
2n:hpCHS-30 78:14 +++++ 4n:hpCHS-30 45:15 ++++
2n:hpCHS-31 48:3 - 4n:hpCHS-31*** 42:21 +
2n:hpCHS-32 31:10 +++ 4n:hpCHS-32 nd ++++
2n:hpCHS-33 32:9 +++++ 4n:hpCHS-33*** 1:5 -
2n:hpCHS-34 39:3 ++++ 4n:hpCHS-34 33:17 ++++
2n:hpCHS-35 43:7 +++++ 4n:hpCHS-35*** 24:16 ++++
2n:hpCHS-36 49:3 ++++++ 4n:hpCHS-36** 32:14 +++
2n:hpCHS-37 53:2 +++++ 4n:hpCHS-37 14:8 ++++
2n:hpCHS-38 27:8 +++++ 4n:hpCHS-38 25:12 +
2n:hpCHS-39 40:9 +++++
% silenced lines 92.3% (36/39) % silenced lines 81.5% (31/38)
*No.of phosphinothricin (PPT)-resistant (PPTR) plants versus no. of PPT-sensitive (PPTS) plants. **The PPTR plants were
relatively small indicating that they were not fully resistant to PPT. This suggests that the expression level of the bar gene was

T. E. Finn et al. 16 SI
relatively low in these lines. ***Some of the PPTS plants were not totally bleached or died indicating residual levels of PPT
resistance. This suggested that the bar gene existed in these individuals but was silenced.