transcriptomic analysis of prunus domestica undergoing hypersensitive response to plum pox virus...
TRANSCRIPT
Transcriptomic Analysis of Prunus domesticaUndergoing Hypersensitive Response to Plum Pox VirusInfectionBernardo Rodamilans1*, David San Leon1, Louisa Muhlberger2, Thierry Candresse3, Michael Neumuller2,
Juan Carlos Oliveros1, Juan Antonio Garcıa1
1 Centro Nacional de Biotecnologıa-CSIC, Campus Universidad Autonoma de Madrid, Madrid, Spain, 2 Center of Life and Food Sciences Weihenstephan, Unit of Fruit
Science, Technische Universitat Munchen, Freising, Germany, 3 UMR 1332 Biologie du Fruit et Pathologie, CS20032, Villenave d’Ornon, France
Abstract
Plum pox virus (PPV) infects Prunus trees around the globe, posing serious fruit production problems and causing severeeconomic losses. One variety of Prunus domestica, named ‘Jojo’, develops a hypersensitive response to viral infection. Herewe compared infected and non-infected samples using next-generation RNA sequencing to characterize the geneticcomplexity of the viral population in infected samples and to identify genes involved in development of the resistanceresponse. Analysis of viral reads from the infected samples allowed reconstruction of a PPV-D consensus sequence. De novoreconstruction showed a second viral isolate of the PPV-Rec strain. RNA-seq analysis of PPV-infected ‘Jojo’ trees identified2,234 and 786 unigenes that were significantly up- or downregulated, respectively (false discovery rate; FDR#0.01).Expression of genes associated with defense was generally enhanced, while expression of those related to photosynthesiswas repressed. Of the total of 3,020 differentially expressed unigenes, 154 were characterized as potential resistance genes,10 of which were included in the NBS-LRR type. Given their possible role in plant defense, we selected 75 additionalunigenes as candidates for further study. The combination of next-generation sequencing and a Prunus variety thatdevelops a hypersensitive response to PPV infection provided an opportunity to study the factors involved in this plantdefense mechanism. Transcriptomic analysis presented an overview of the changes that occur during PPV infection as awhole, and identified candidates suitable for further functional characterization.
Citation: Rodamilans B, San Leon D, Muhlberger L, Candresse T, Neumuller M, et al. (2014) Transcriptomic Analysis of Prunus domestica UndergoingHypersensitive Response to Plum Pox Virus Infection. PLoS ONE 9(6): e100477. doi:10.1371/journal.pone.0100477
Editor: A.L.N. Rao, University of California, Riverside, United States of America
Received March 3, 2014; Accepted May 25, 2014; Published June 24, 2014
Copyright: � 2014 Rodamilans et al. This is an open-access article distributed under the terms of the Creative Commons Attribution License, which permitsunrestricted use, distribution, and reproduction in any medium, provided the original author and source are credited.
Data Availability: The authors confirm that all data underlying the findings are fully available without restriction. All data are included within the manuscript.
Funding: The authors acknowledge support of the EU in the frame of the FP7 KBBE-204429 SharCo project. Research is also supported by grants BIO2010-18541from the Spanish MCI. The funders had no role in study design, data collection and analysis, decision to publish, or preparation of the manuscript.
Competing Interests: The authors have declared that no competing interests exist.
* Email: [email protected]
Introduction
Plum pox virus (PPV) is the causative agent of sharka, a serious
disease that challenges stone-fruit production worldwide [1–3].
PPV is a member of the Potyviridae family, the largest group of
plant viruses [4–6]. A single-stranded positive RNA molecule of
,10 kb forms its genome. At its 59-end, the RNA is linked to the
viral genome-linked protein VPg, and the 39-end carries a poly-A
tail. The genome codes for a large polyprotein and a truncated
frameshift product that are processed by three self-encoded
proteases into at least 11 proteins [7,8].
PPV is transmitted by various aphid species in a non-persistent
manner [9,10]. Eight PPV strains have been identified based on
their biological, serological and molecular properties as able to
infect a wide host range of Prunus species [11–14]. One strain,
PPV-D, regularly infects domestic plum (Prunus domestica), causing
variable symptoms in leaves and fruits [15]. Only very few P.
domestica varieties show a hypersensitive response (HR) to PPV
infection, e. g., K4-Hybride, Ort6Stan 34 and ‘Jojo’ [16–18]; they
display necrosis on leaves and bark as well as death of new top
sprouts, which stops viral propagation. ‘Jojo’, a descendant of the
parent cultivars ‘Ortenauer’ and ‘Stanley’, is the variety with the
largest number of PPV isolates analyzed and the largest number of
replications; its HR is elicited by all PPV isolates tested (PPV D,
M, Rec, EA and W strains) [17]. This makes ‘Jojo’ an attractive
candidate for study of the factors involved in this type of resistance.
In plants, proteins encoded by resistance genes (R genes) trigger
HR through direct or indirect interaction with avirulence proteins,
initiating a cascade reaction within the cell. The majority of cloned
R genes encode nucleotide binding site-leucine-rich repeat proteins
(NBS-LRR,) making this family one of the largest, most variable
gene families in plants [19]. Several studies have focused on
resistance gene analogs in Prunus species, the natural host of PPV
[20,21], but to our knowledge, none, addresses the mechanisms of
Prunus HR to PPV.
Next-generation sequencing, referred to as RNA sequencing
(RNA-seq), has proved to be a valuable tool for assessing gene
expression differences across the entire transcriptome for a wide
range of organisms [22,23]. Unlike microarrays, these types of
analyses can be performed when a genome sequence is unavail-
able, thus providing information on the biology of non-model
organisms [24–26]. RNA-seq has proved useful not only for
PLOS ONE | www.plosone.org 1 June 2014 | Volume 9 | Issue 6 | e100477
analysis of endogenous genes transcribed in the plant, but also for
viral genome reconstruction and recognition; it allows study of the
diversity of the infecting viral population, which is relevant for
adaptation and survival [27–30].
Here we used this technology to compare gene expression
between PPV-infected ‘Jojo’ trees at the beginning of an HR
response and that of non-infected trees. We performed two studies,
one focused on viral reconstruction and heterogeneity analyses,
and the other on endogenous plant sequences. The former allowed
recognition of an unanticipated isolate of PPV-Rec during the
course of the infection, and the latter permitted de novo
reconstruction of the plant transcriptome and assessment of gene
expression changes possibly related to HR in Prunus. In silico and
qPCR tests confirmed the quality and strength of the results.
Materials and Methods
Grafting, infection and tissue collectionIn year 1, one-year-old Prunus cerasifera ‘Myrobalan’ seedlings
and in vitro-propagated P. domestica ‘Wangenheims’ (Weiwa) plants
were planted in an insect-proof greenhouse. Half of the plants, for
use as rootstock, were inoculated by chip budding in February
with a PPV-D isolate present in the Baden region, Germany, using
budsticks from PPV-D infected P. domestica ‘Katinka’ trees. One
year later (year 2), plants were tested for PPV by DASI-ELISA. In
mid-May of year 2, two dormant buds of P. domestica ‘Jojo’ were
chip-grafted onto each plant used as rootstock and began to grow
after four weeks. At the first visible symptoms of the hypersensi-
tivity response, young ‘Jojo’ shoots were harvested and frozen
immediately in liquid nitrogen. Leaves from 6 or 2 plants,
respectively, were used to prepare Jojo-M+PPV and Jojo-W+PPV
samples. Young ‘Jojo’ shoots growing on 5 PPV-free rootstocks
were sampled simultaneously by the same procedure.
Total RNA extractionFrozen tissue was crushed in liquid nitrogen using a mortar and
pestle. Total RNA was extracted following the protocol of Carrier
et al. [31] modified by Pichaut JP, Labonne G and Dallot S
(unpublished; private communication) as follows: 1 g tissue was
resuspended in 20 ml preheated buffer 1 [200 mM Tris-HCl
pH 8.5, 50 mM EDTA, 500 mM NaCl, 0.5% SDS, 1%
PVP40000, 20 mg proteinase K, 1% b-mercaptoethanol] followed
by incubation (55uC, 15 min). The sample was aliquoted in 1 ml
fractions. KAc (5 M; 300 ml) was added to each tube and
incubated on ice (10 min), then centrifuged (10,000 g, 4uC,
10 min). Buffer 2 (1/3 guanidium chloride 7.8 M+2/3 96%
ethanol; 450 mL) and 50 mL silica suspension were added to each
supernatant and silica was pelleted by centrifugation (1000 g,
2 min, room temperature). Pellets were washed twice with 600 mL
buffer 3 (1/3 160 mM KAc, 23 mM Tris-HCl pH 8.0, 0.1 mM
EDTA+2/3 170 mL 96% ethanol). Silica was resuspended in
200 ml H2O followed by centrifugation (1000 g, 2 min). Superna-
tants were incubated overnight with 167 ml 8 M LiCl to
precipitate RNA. In a final step, RNase-free DNAse treatment
(Promega) was performed to remove possible residual DNA.
RNA-seq and preliminary data processingLibrary construction and RNA sequencing were performed by
the Beijing Genomics Institute (BGI-Shenzhen, Shenzhen, China).
Briefly, from 30 mg total RNA, poly-A+RNA was selected by
oligo-dT chromatography, followed by RNA fragmentation.
Fragmented mRNA was converted into double-stranded cDNA
using random-hexamer primers followed by end repair, 39 end
adenylation and adapter ligation. cDNA fragments were selected
by agarose gel extraction and enriched by PCR amplification. The
library was loaded onto an Illumina HiSeq 2000 instrument for
pair-end sequencing. The average read length of 90 bp was
generated as raw data.
Prior to assembly, FastQC software [32] was used to obtain
information about the quality of the sequencing data. This
information was used for the initial filtering of sequences by the
FASTX Toolkit [33], removing the adapters and cleaning low
quality sequences (mean Q,20 or more than 20% nucleotides
with Q,15) and sequences with unknown nucleotides which could
affect later bioinformatic analyses.
Virus assemblyVirus reconstruction using PPV-D EF569214.1 as reference was
done by mapping the sequences from the RNA-seq samples using
the Bowtie aligner [34]. Selection of the most frequent nucleotide
from the resulting alignments generated the consensus sequence. If
the number of aligned reads at a position was zero, the nucleotide
was designated ‘N’. A second alignment of the viral reads using the
reconstructed viral genome as reference was carried out to obtain
the final consensus sequence. De novo reconstruction was
performed by Oases assembler and the output transcripts were
searched against the viral genomes of the NCBI nucleotide
database [35] using blastn and blastx. Clustering using CAP3 [36]
and CD-HIT [37] followed by extension of the genomic sequence
was performed. As in the previous case of viral reconstruction
using reference data, the de novo rebuilt sequence was used as
reference to map the viral reads again using Bowtie aligner.
Viral heterogeneity analysis of ‘Jojo’ sequencesThe population of viral sequences identified in the virus
assembly was filtered to avoid possible PCR and sequencing
errors. For viral genome alignment, only paired sequences were
selected. To avoid insertion and deletion errors, border regions of
the sequences were discarded, and only 60 nucleotides of the
central region of each sequence was considered. The frequency of
each site-specific heterogeneity was calculated as the percentage of
mismatches to the consensus sequence of the aligned reads. Since
some heterogeneities were artifacts due to the sequencing process,
the quality score of each nucleotide read was used to compute the
average probability of sequencing error. Assuming that sequencing
errors were independent, when the number of alignment
mismatches for a certain heterogeneity point was smaller than
the expected number of errors (the mean of the binomial
distribution B(x;pini) where pi is the average probability of
sequencing error in the position i and ni is the coverage in the
position i), that point was considered a sequencing error and
removed from the analysis. Entropies of the viral populations were
calculated as described by Wright et al. [38].
Analysis of selective pressuresFor the analysis of the viral intraspecies, a previous quasispecies
formation was done with QuasiRecomb software [39] using
nucleotides 892-9568 due to software coverage requirements.
Recombination was not allowed to decrease complexity of the
analysis. The ratio of non-synonymous-to-synonymous nucleotide-
substitution rates (dN/dS) was assessed by Model selection
program implemented in Hyphy package [40] and employed for
both intra- and interspecies studies. The SLAC [41], a maximum
likelyhood method, was used to identify the global synonymous
nucleotide-substitution rate (posterior probabilities bigger than
90%).
Prunus domestica Response to Plum Pox Virus
PLOS ONE | www.plosone.org 2 June 2014 | Volume 9 | Issue 6 | e100477
Viral diversity analysis of SharCo sequencesTo start the analyses, full genome sequences of PPV-D and
PPV-Rec isolates stored in the SharCo database [42] were
collected. Sequences were aligned using ClustalW [43]. Consensus
sequences as well as nucleotide variation data were obtained from
the multiple sequence alignment.
Differential expressionTranscriptome assembly was done with Velvet [44] and Oases
programs [45]. Input in both cases was a combination of the four
samples and the best output, Velvet + Oases (multi-k), was selected
based on the N50 value. Subsequent analyses used the contigs of
this assembler. Oases was operated with multi-k option (K = 47,
51, 61, 65, 67, 71, 75) and the option of minimum length of
transcript was assigned to 200. Sequences were mapped to the
transcripts with BWA [46] and distribution of the expression in the
predicted unigene alignments was determined with RSEM [47].
Differential expression analysis was calculated with edgeR [48].
Results were visualized with the FIESTA program [49]. To add
functional information to the genes, blastn and blastx were
employed using several databases (NCBI EST [50], NCBI
nucleotide [35], NCBI protein [51] and PRGdb [52]), and
Interproscan to determine significant domains (e-value,1025 in
all cases). Blast2GO [53] was used to join all functional
annotations and to obtain the enriched GO-terms associated to
the differentially expressed unigenes (FDR#0.005).
Phylogenetic analysesWe used ClustalW for multiple sequence alignment [43],
followed by searching of the best fitted evolutionary model
implemented in MEGA5 [54] with ProtTest [55]. A phylogenetic
tree was built using the maximum likelihood algorithm with the
parameters provided by the best protein model found by MEGA5
[54]. The phylogeny test was done by the bootstrap method. One
thousand replicas were used to obtain the percentages of replicate
trees in which the associated taxa clustered [56].
Real-time quantitative PCR (qPCR)The first cDNA strand was generated from 1 mg total RNA used
in the RNA-seq experiment in the presence of oligo(dT)12-18 and
Superscript III reverse transcriptase (Invitrogen). PCR was
performed in triplicates using Fast Universal SYBR Green Master
mix (ROX; Roche) in an ABI 7300 Real Time PCR System
(Applied Biosystems). Primers were designed using the program
Primer3 [57] as shown in Table S5. Gene expression was
normalized to the unigenes that matched TEF2 and RPII genes
of P. persica. Data were calculated by the DDCT method described
by Pfaffl [58] and are shown as the x-fold change in gene
expression relative to the control sample.
Results and Discussion
In this transcriptome analysis, we analyzed four samples by
next-generation sequencing. Due to difficulties in direct infection
of ‘Jojo’ trees, PPV was inoculated by grafting onto infected
rootstocks. Two samples, Jojo-W+PPV and Jojo-M+PPV, corre-
spond to RNA isolated from ‘Jojo’ grafted onto infected
Wangenheims (Weiwa) and Myrobalan (Myro) rootstocks, respec-
tively. As control, we used two experimental replicas, Jojo-W1 and
Jojo-W2, corresponding to RNA from ‘Jojo’ tissue grafted onto
non-infected Weiwa rootstocks. Data from RNA-seq of these four
samples were used for de novo assembly of contigs using Velvet [44],
followed by Oases [45]. A general summary of the data obtained is
presented in Table 1.
Analysis of the viral reads showed notable differences between
the two infected samples. Jojo-M+PPV had 150 times fewer PPV
reads than Jojo-W+PPV (2,203 and 330,439 reads, respectively),
probably caused by experimental factors such as a stronger
response to PPV by ‘Jojo’ plants grafted onto Myro, different viral
propagation rates between the grafted trees, or other factors
difficult to address due to the variable nature of these infection
experiments. A few viral reads were found during analysis of the
non-infected tissue samples (80 reads in Jojo-W1 and 132 in Jojo-
W2), possibly due to contamination during sample preparation or
sequencing, but should not affect subsequent analyses (NCBI-SRA
study accession: SRP041925).
Analysis of viral sequencesViral reconstruction. Rootstocks used to infect ‘Jojo’ trees
were previously inoculated using budsticks from PPV-D infected P.
domestica ‘Katinka’ trees. The sequence of this PPV-D isolate was
Table 1. Summary of de novo sequence assembly using Velvet and Oases.
Group Read # Kmer Unigene # N50 Unigene # .1 Kb Max. Len.
Jojo-W+PPV 38,907,078 71 33,184 415 906 3,625
Jojo-M+PPV 40,125,506 67 40,655 412 985 3,255
Jojo-W1 38,864,360 71 26,400 389 506 3,099
Jojo-W2 39,467,930 71 27,820 416 738 3,170
Jojo-M+PPV|Jojo-W+PPV 79,032,584 75 35,252 434 1,154 3,153
Jojo-W1|Jojo-W2 78,332,290 73 33,619 445 1,146 3,845
all 157,364,874 75 49,821 464 2,183 3,602
Group Read # KmerTranscript #/Unigene # N50 Unigene #.1 Kb Max. Len.
all 157,364,874 multi 117,919/35,339 1,324 8,200 7,599
The white section of the table shows the data calculated with Velvet; the grey sections indicates the data processed using Oases. Read#: total number of readsincluding viral sequences; Kmer: length, in base pairs, of the words being hashed to create the transcripts; Transcript #: total number of transcripts; Unigene #:total number of unigenes, where a unigene is a hypothetical gene represented by a cluster of similar transcripts thought to be isoforms in the de novo transcriptomeassembly; N50: unigene length such that using equal or longer unigenes produces half the bases of the total unigenes; Unigene #.1 Kb: number of unigenes largerthan 1 Kb; Max.Len.: largest unigene in each group.doi:10.1371/journal.pone.0100477.t001
Prunus domestica Response to Plum Pox Virus
PLOS ONE | www.plosone.org 3 June 2014 | Volume 9 | Issue 6 | e100477
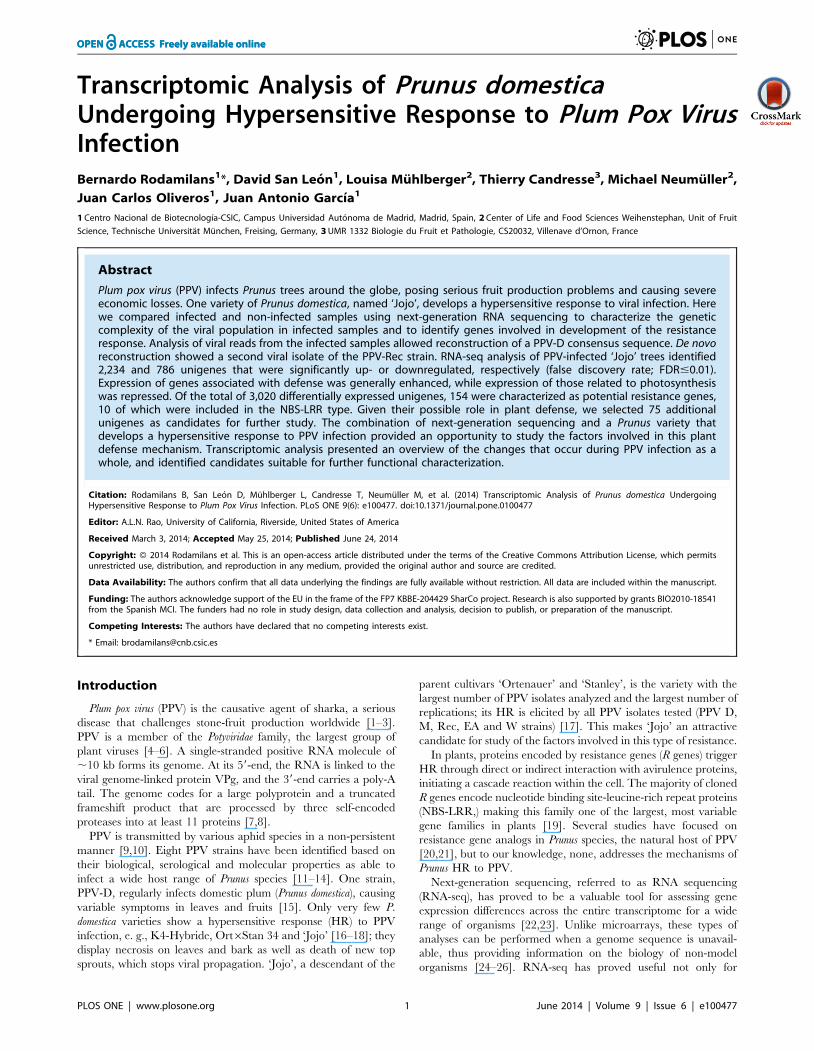
unknown. For viral reconstruction, a viral template (EF569214)
was chosen by searching PPV-D in the NCBI database [35].
Alignment of the Jojo-W+PPV reads against this template allowed
reconstruction of the near-complete viral genome, using the most
abundant nucleotide at each position to build the consensus
sequence (Figure 1A). PPV-D isolate FR-65pl from the SharCo
database [42] was the most similar viral homologue of PPV-Jojo-
W.
For heterogeneity analysis, a position was defined as heteroge-
neous when occupied by a nucleotide different from that of the
consensus sequence. Changes were filtered to avoid base
miscalling in the sequencing or amplification processes. A total
of 1,261 nucleotide changes were found, and the overall pattern
revealed two peculiar features (Figure 1B), the unusually high
percentages of heterogeneities in most genomic regions, and the
existence of a region at the N-terminal part of the capsid protein
(CP) with no marked heterogeneities; this was more striking
considering that this region is described as a highly variable
genomic region in Potyviridae [3].
To test for a possible mistake in the viral reconstruction, we
followed a de novo approach that also used the assembled contigs
from infected samples that matched PPV sequences of the NCBI
database [35]. A first analysis retrieved a consensus sequence
identical to that obtained using EF569214 as template. Detailed
analysis of the results showed the formation of two minor contigs
discarded in the first assembly process, which belonged to the
recombinant PPV-Rec strain. In this strain, the genome from the
59 region to the NIb C-terminal region derives from PPV-D,
whereas the remainder derives from PPV-M. The two contigs
discarded during initial reconstruction belonged to the PPV-M
part of PPV-Rec. Six contigs from the PPV-D part of PPV-Rec
were sufficiently similar to PPV-D to be included in the first
sequence reconstruction, thus contributing to the high genome
heterogeneity. In contrast, heterogeneity of the CP N-terminal
Figure 1. Viral reconstruction using reads from the Jojo-W+PPV sample. (A) Coverage of the viral genome was obtained by the template-based approach. Protein-coding sequences and untranslated regions are labeled and colored. Nucleotide positions at their borders are marked. (B)Heterogeneity analysis. The viral genome is depicted in a colored bar as in (A). Line height indicates the heterogeneity values of the Jojo-W+PPVpopulation relative to the consensus sequence as determined by the template-based approach. Changes that alter the amino acid sequence are inred; region with no significant heterogeneities is indicated by a black line beneath the genome. (C) PPV-D and PPV-Rec sequences obtained afterspecific clustering of the viral reads. Their corresponding coverages are depicted in grey. Both strains are shown schematically; PPV-D genome (blue),PPV-Rec genome (orange and white). Orange indicates the part of PPV-Rec similar to PPV-D; white indicates the part similar to PPV-M. Nucleotidechange distribution between the consensus sequences (grey) is shown in the space between the genomes.doi:10.1371/journal.pone.0100477.g001
Prunus domestica Response to Plum Pox Virus
PLOS ONE | www.plosone.org 4 June 2014 | Volume 9 | Issue 6 | e100477
region, covered by reads from a single isolate, was correspondingly
low.
Once the presence of a mixed infection was identified, reads
corresponding to one or the other isolate were distributed to
reconstruct them and reassess coverage. There were 200,034 reads
for the PPV-D isolate and 97,188 reads that matched the PPV-Rec
isolate; 17,932 reads could not be assigned to one or the other and
were removed from subsequent analyses. New consensus sequenc-
es were obtained by de novo assembly, as previously detailed. The
PPV-D isolate consensus sequence did not vary. The consensus of
the PPV-Rec isolate had closest homology to the Slovakian isolate
SK-1002ap in the SharCo database [42] (Figure 1C).
The sequence of the virus that infected the Jojo-M sample could
only be obtained using the template-based approach, because of
the low number of reads available. A total of 25 reads for PPV-Rec
were identified from a total of 2,154; this was a lower ratio than in
the previous case, but not surprising given the variability of the
experiment. The assembled PPV-D sequence had 99.3% sequence
similarity at the nucleotide level compared with the PPV-D in the
Jojo-W sample (Figure S1A). There were not enough reads to
assemble the PPV-Rec sequence in the Jojo-M sample.
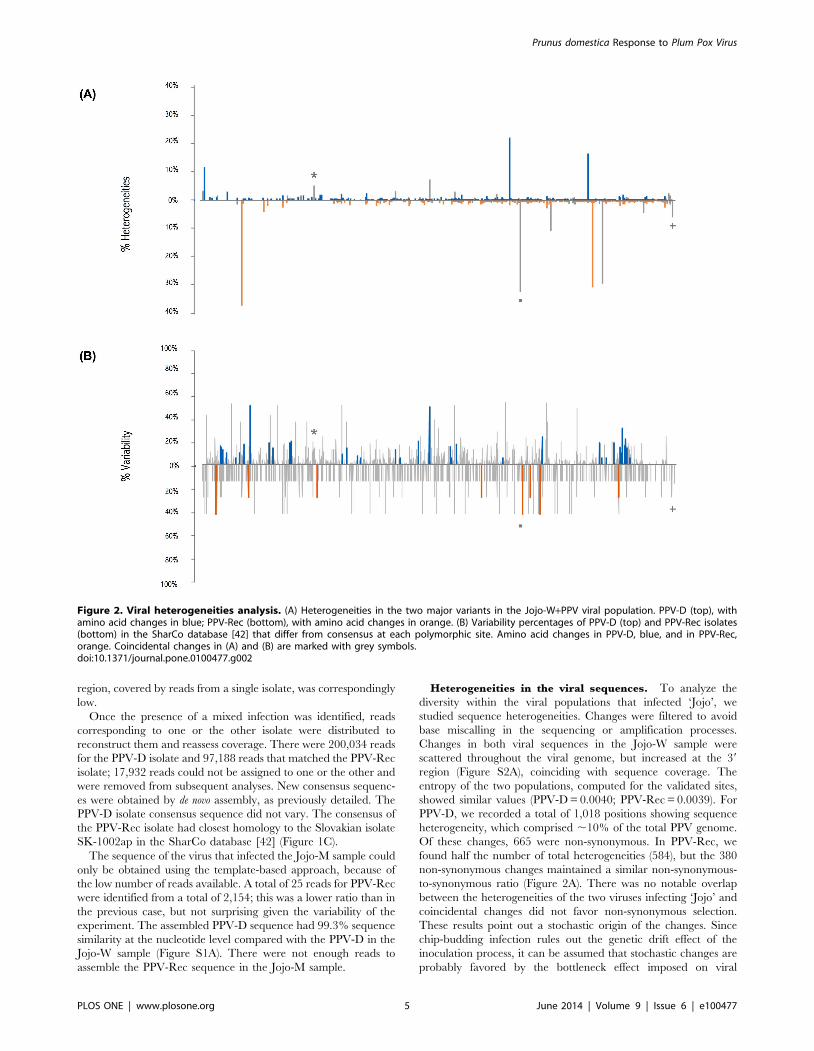
Heterogeneities in the viral sequences. To analyze the
diversity within the viral populations that infected ‘Jojo’, we
studied sequence heterogeneities. Changes were filtered to avoid
base miscalling in the sequencing or amplification processes.
Changes in both viral sequences in the Jojo-W sample were
scattered throughout the viral genome, but increased at the 39
region (Figure S2A), coinciding with sequence coverage. The
entropy of the two populations, computed for the validated sites,
showed similar values (PPV-D = 0.0040; PPV-Rec = 0.0039). For
PPV-D, we recorded a total of 1,018 positions showing sequence
heterogeneity, which comprised ,10% of the total PPV genome.
Of these changes, 665 were non-synonymous. In PPV-Rec, we
found half the number of total heterogeneities (584), but the 380
non-synonymous changes maintained a similar non-synonymous-
to-synonymous ratio (Figure 2A). There was no notable overlap
between the heterogeneities of the two viruses infecting ‘Jojo’ and
coincidental changes did not favor non-synonymous selection.
These results point out a stochastic origin of the changes. Since
chip-budding infection rules out the genetic drift effect of the
inoculation process, it can be assumed that stochastic changes are
probably favored by the bottleneck effect imposed on viral
Figure 2. Viral heterogeneities analysis. (A) Heterogeneities in the two major variants in the Jojo-W+PPV viral population. PPV-D (top), withamino acid changes in blue; PPV-Rec (bottom), with amino acid changes in orange. (B) Variability percentages of PPV-D (top) and PPV-Rec isolates(bottom) in the SharCo database [42] that differ from consensus at each polymorphic site. Amino acid changes in PPV-D, blue, and in PPV-Rec,orange. Coincidental changes in (A) and (B) are marked with grey symbols.doi:10.1371/journal.pone.0100477.g002
Prunus domestica Response to Plum Pox Virus
PLOS ONE | www.plosone.org 5 June 2014 | Volume 9 | Issue 6 | e100477
populations by their invasion of new leaves [59-62]. Nonetheless,
as the dN/dS analysis shows, a slight purifying selection can be
considered in both cases (PPV-D = 0.67, PPV-Rec = 0.80) and this
is in agreement with results from a previous experiment in P.
domestica infected with PPV-D, PPV-Rec and PPV-M, in which
viruses displayed weak negative selective pressures [63]. The idea
of viral seclusion [59,64] cannot be addressed here, since the
sample analyzed is a pooled sample from different leaves and trees.
Sequences of full PPV-D (84 sequences) and PPV-Rec (8
sequences) isolates in the SharCo database [42] were used to build
two consensus sequences and address inter-isolate variability. In
both cases, changes were evenly distributed throughout the
genome (Figure S2B). PPV-D and PPV-Rec showed 109 common
variable sites and, in contrast to the intra-isolate heterogeneity of
the ‘Jojo’ samples, changes at nucleotide three of codon triplets
were more frequent than in the other two positions (27, 34 and
159 for first, second and third nucleotides, respectively). This is
expected for an analysis of inter-isolate variability performed on
consensus sequences that have undergone evolutionary pressure.
We found few high percentage heterogeneities (.5%) in viral
sequences in the Jojo-W; there were four in PPV-D, three of which
were non-synonymous, and five in PPV-Rec (two non-synony-
mous). None of the changes were coincidental between strains.
The non-coding change of ‘Jojo’ PPV-D (position 2340) appeared
in the SharCo PPV-D variability, and two non-coding changes of
‘Jojo’ PPV-Rec (positions 6597 and 9721) were also present in the
PPV-Rec variability in SharCo. None of the amino acid changes
in the ‘Jojo’ viral sequences was found in the SharCo reconstruct-
ed consensus sequences (Figure 2B). Given the small number of
related changes, it is difficult to address their statistical significance,
but the fact that they appear at the nucleotide level supports a
random origin.
We analyzed the heterogeneities in the Jojo-M+PPV sample for
the PPV-D reconstructed sequence as for the Jojo-W+PPV.
Distribution of changes was not homogeneous,and heterogeneities
were again more numerous at the 39 end of the genome (Figure
S1B). There was no notable overlap between changes in this
sequence and those in the other infected sample. The pattern was
nonetheless similar to that observed for the inter-isolate analyses,
with changes in the third nucleotide position favored over changes
in the other two (6, 9 and 52 for first, second and third nucleotides,
respectively).
Analysis of the plum tree transcribed sequencesGeneral overview. The combined reads from all four
samples were used to assemble 117,919 transcripts that corre-
sponded to 35,339 unigenes (Table 1). Blast search of these
unigenes was performed against four databases, Plant Resistance
Genes database (PRGdb) [52], Prunus persica EST [50], plants EST
[50] and nr/nt NCBI [35,51]. To analyze the number of mapped
reads against the unigene sequences, the BWA [46] aligner was
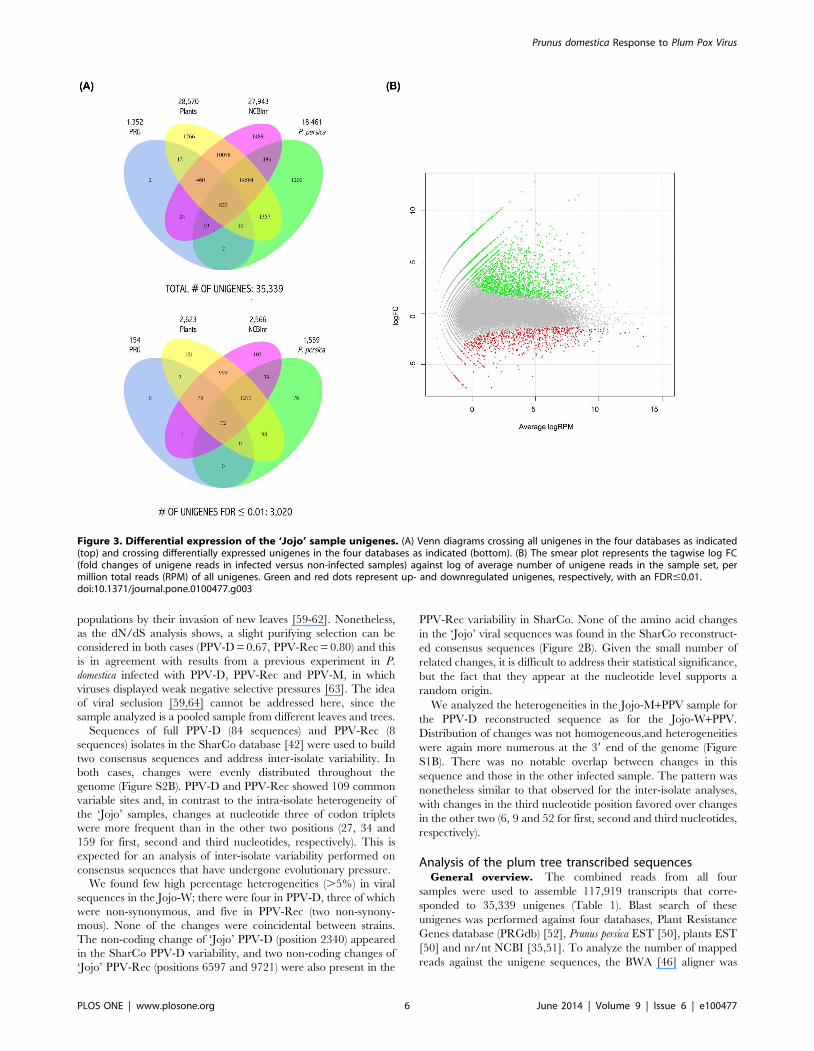
Figure 3. Differential expression of the ‘Jojo’ sample unigenes. (A) Venn diagrams crossing all unigenes in the four databases as indicated(top) and crossing differentially expressed unigenes in the four databases as indicated (bottom). (B) The smear plot represents the tagwise log FC(fold changes of unigene reads in infected versus non-infected samples) against log of average number of unigene reads in the sample set, permillion total reads (RPM) of all unigenes. Green and red dots represent up- and downregulated unigenes, respectively, with an FDR#0.01.doi:10.1371/journal.pone.0100477.g003
Prunus domestica Response to Plum Pox Virus
PLOS ONE | www.plosone.org 6 June 2014 | Volume 9 | Issue 6 | e100477
used with default parameters. Statistical analysis was performed
using EdgeR [48], a bioconductor package (www.bioconductor.
org) for RNA-seq. Total data were filtered to identify the
differentially expressed unigenes with statistical significance, using
a threshold of false discovery rate (FDR) equal to or less than 0.01.
A visual summary of the results obtained by comparing the four
databases can be seen in Figure 3A. A total of 3,547 unigenes did
not match any sequence in the databases used.
The 35,339 unigenes are depicted on a smear plot (Figure 3B).
A total of 3,020 unigenes were found to be differentially expressed
in infected versus non-infected samples; 2,234 genes were
upregulated and 786 genes were downregulated (Table S1).
Homologs for 2,843 of these unigenes were detected in the
PRGdb, P. persica EST, plants EST or nr/nt NCBI databases. To
describe the main pathways modified in ‘Jojo’ plants during PPV
infection, we studied the unigenes by Gene Ontology assignment,
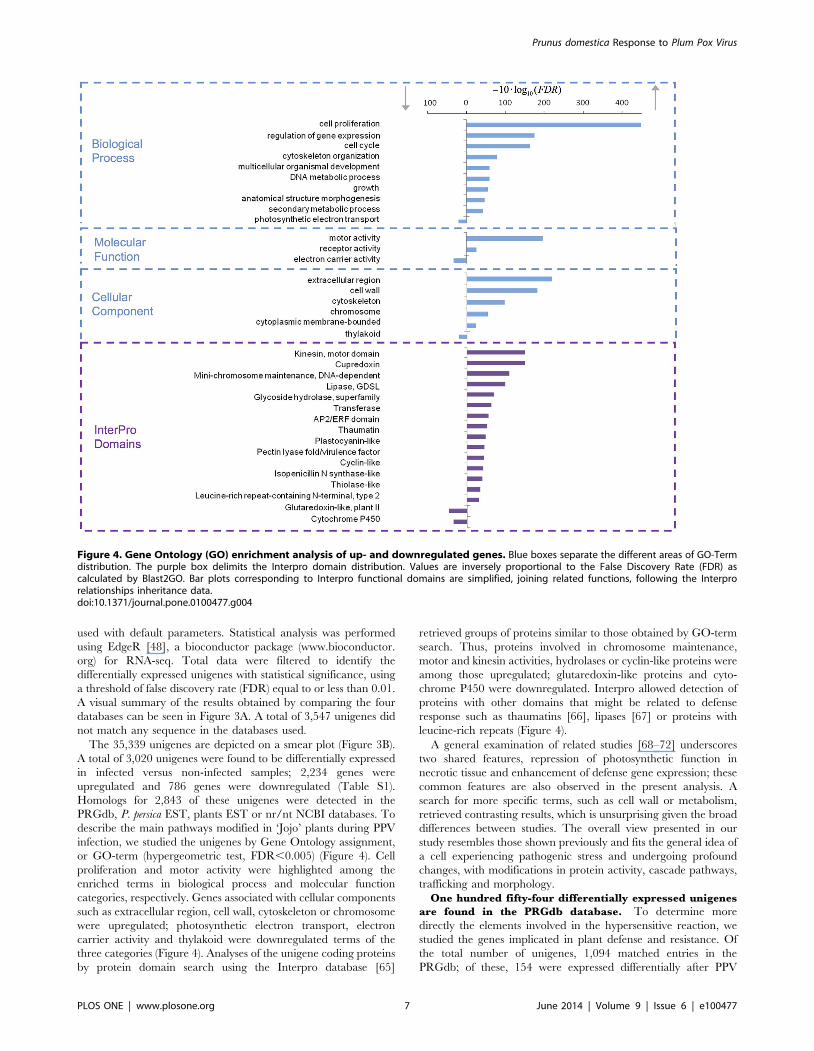
or GO-term (hypergeometric test, FDR,0.005) (Figure 4). Cell
proliferation and motor activity were highlighted among the
enriched terms in biological process and molecular function
categories, respectively. Genes associated with cellular components
such as extracellular region, cell wall, cytoskeleton or chromosome
were upregulated; photosynthetic electron transport, electron
carrier activity and thylakoid were downregulated terms of the
three categories (Figure 4). Analyses of the unigene coding proteins
by protein domain search using the Interpro database [65]
retrieved groups of proteins similar to those obtained by GO-term
search. Thus, proteins involved in chromosome maintenance,
motor and kinesin activities, hydrolases or cyclin-like proteins were
among those upregulated; glutaredoxin-like proteins and cyto-
chrome P450 were downregulated. Interpro allowed detection of
proteins with other domains that might be related to defense
response such as thaumatins [66], lipases [67] or proteins with
leucine-rich repeats (Figure 4).
A general examination of related studies [68–72] underscores
two shared features, repression of photosynthetic function in
necrotic tissue and enhancement of defense gene expression; these
common features are also observed in the present analysis. A
search for more specific terms, such as cell wall or metabolism,
retrieved contrasting results, which is unsurprising given the broad
differences between studies. The overall view presented in our
study resembles those shown previously and fits the general idea of
a cell experiencing pathogenic stress and undergoing profound
changes, with modifications in protein activity, cascade pathways,
trafficking and morphology.
One hundred fifty-four differentially expressed unigenes
are found in the PRGdb database. To determine more
directly the elements involved in the hypersensitive reaction, we
studied the genes implicated in plant defense and resistance. Of
the total number of unigenes, 1,094 matched entries in the
PRGdb; of these, 154 were expressed differentially after PPV
Figure 4. Gene Ontology (GO) enrichment analysis of up- and downregulated genes. Blue boxes separate the different areas of GO-Termdistribution. The purple box delimits the Interpro domain distribution. Values are inversely proportional to the False Discovery Rate (FDR) ascalculated by Blast2GO. Bar plots corresponding to Interpro functional domains are simplified, joining related functions, following the Interprorelationships inheritance data.doi:10.1371/journal.pone.0100477.g004
Prunus domestica Response to Plum Pox Virus
PLOS ONE | www.plosone.org 7 June 2014 | Volume 9 | Issue 6 | e100477
infection, 126 up- and 28 downregulated (Table S2). More than
50% of these unigenes corresponded to proteins with suspected
kinase activity, and 13%, mainly among those upregulated, coded
for LRR receptors. Moreover, a small percentage of resistance-
related upregulated unigenes (4%) encoded proteins with pre-
sumed nucleotide binding activity. Overall, ,20% of the unigenes
that matched PRGdb sequences showed miscellaneous functions
and 10% of the total had no defined function.
Due to the importance of NBS-LRR genes in resistance to viral
infections [73], we focused specifically on these types of genes. In
general, after pathogen detection, R genes unleash a cascade
mechanism within the cell that results in HR and systemic
acquired resistance signaling. For the plant to provide an
organized reaction, R gene expression must be tightly controlled
during pathogen attack; nonetheless, the mechanisms responsible
for this regulation remain a mystery. There are reports of R gene
upregulation following infection, indicating a dosage effect [74–
76], whereas others describe R genes for which expression levels
remained unchanged during HR, suggesting a distinct activation
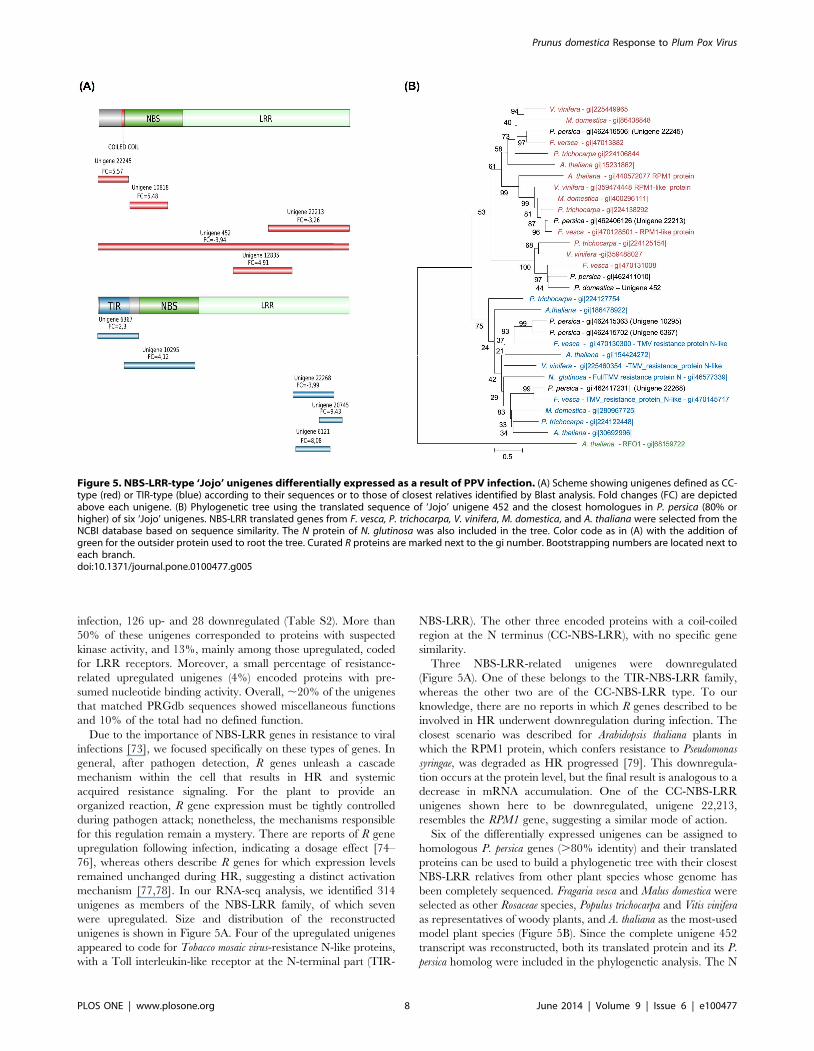
mechanism [77,78]. In our RNA-seq analysis, we identified 314
unigenes as members of the NBS-LRR family, of which seven
were upregulated. Size and distribution of the reconstructed
unigenes is shown in Figure 5A. Four of the upregulated unigenes
appeared to code for Tobacco mosaic virus-resistance N-like proteins,
with a Toll interleukin-like receptor at the N-terminal part (TIR-
NBS-LRR). The other three encoded proteins with a coil-coiled
region at the N terminus (CC-NBS-LRR), with no specific gene
similarity.
Three NBS-LRR-related unigenes were downregulated
(Figure 5A). One of these belongs to the TIR-NBS-LRR family,
whereas the other two are of the CC-NBS-LRR type. To our
knowledge, there are no reports in which R genes described to be
involved in HR underwent downregulation during infection. The
closest scenario was described for Arabidopsis thaliana plants in
which the RPM1 protein, which confers resistance to Pseudomonas
syringae, was degraded as HR progressed [79]. This downregula-
tion occurs at the protein level, but the final result is analogous to a
decrease in mRNA accumulation. One of the CC-NBS-LRR
unigenes shown here to be downregulated, unigene 22,213,
resembles the RPM1 gene, suggesting a similar mode of action.
Six of the differentially expressed unigenes can be assigned to
homologous P. persica genes (.80% identity) and their translated
proteins can be used to build a phylogenetic tree with their closest
NBS-LRR relatives from other plant species whose genome has
been completely sequenced. Fragaria vesca and Malus domestica were
selected as other Rosaceae species, Populus trichocarpa and Vitis vinifera
as representatives of woody plants, and A. thaliana as the most-used
model plant species (Figure 5B). Since the complete unigene 452
transcript was reconstructed, both its translated protein and its P.
persica homolog were included in the phylogenetic analysis. The N
Figure 5. NBS-LRR-type ‘Jojo’ unigenes differentially expressed as a result of PPV infection. (A) Scheme showing unigenes defined as CC-type (red) or TIR-type (blue) according to their sequences or to those of closest relatives identified by Blast analysis. Fold changes (FC) are depictedabove each unigene. (B) Phylogenetic tree using the translated sequence of ‘Jojo’ unigene 452 and the closest homologues in P. persica (80% orhigher) of six ‘Jojo’ unigenes. NBS-LRR translated genes from F. vesca, P. trichocarpa, V. vinifera, M. domestica, and A. thaliana were selected from theNCBI database based on sequence similarity. The N protein of N. glutinosa was also included in the tree. Color code as in (A) with the addition ofgreen for the outsider protein used to root the tree. Curated R proteins are marked next to the gi number. Bootstrapping numbers are located next toeach branch.doi:10.1371/journal.pone.0100477.g005
Prunus domestica Response to Plum Pox Virus
PLOS ONE | www.plosone.org 8 June 2014 | Volume 9 | Issue 6 | e100477
protein from Nicotiana glutinosa was also included, and a resistance
protein from the PRGdb that did not belong to the NBS-LRR
type was used as an outgroup to root the tree. In all cases, the F.
vesca R protein was the closest relative to the translated P. persica-
related unigenes, and the topology of the tree suggested that they
were bona fide homologues. The tree showed separate clusters of N-
and RPM1-like proteins, including the corresponding Prunus
homologues, which suggests high conservation of these proteins.
In the other cases, the R protein homologues identified did not
show a defined function.
Genes not in the PRGdb that might be involved in plant
defense. Among the 3,020 unigenes differentially expressed
during PPV infection, some were not described as R genes, but
might be involved in plant defense and HR. To perform a detailed
gene-to-gene analysis based on literature findings, we first
narrowed the unigene population. The unigenes selected were
those absent from the PRGdb and with an absolute FC.20 and
an FDR#0.01. This reduced the list to 703 unigenes, a
manageable number for a comprehensive study; of these, 75 were
chosen as possibly involved in plant response to PPV (Table S3).
The list included a wide range of genes coding for proteins as
diverse as histones [80], aspartic proteases [81] or polyphenol
oxidases [82] and define a clear starting point for future research
on plant defense.
Data quality control: in silico and experimental testsIn silico analysis. Read quality was assessed following well-
established parameters in RNA-seq protocols (see Methods). Data
were further validated by the statistical parameters of the
programs used. As an additional checkpoint, we performed a so-
called fold change test. Reconstructed unigenes do not necessarily
cover the entire sequence of a gene, and two or more unigenes can
correspond to the same gene; these sequences would present
similar up- or downregulation expression patterns. For simplicity,
this test was carried out only with the differentially expressed
unigenes in PRGdb [52]. In this database, seven genes were
matched by more than one unigene, and fold changes were
consistent in all cases (Table S4). To illustrate this test, two
representative examples in which several unigenes were part of a
single gene are detailed graphically (Figure S3).
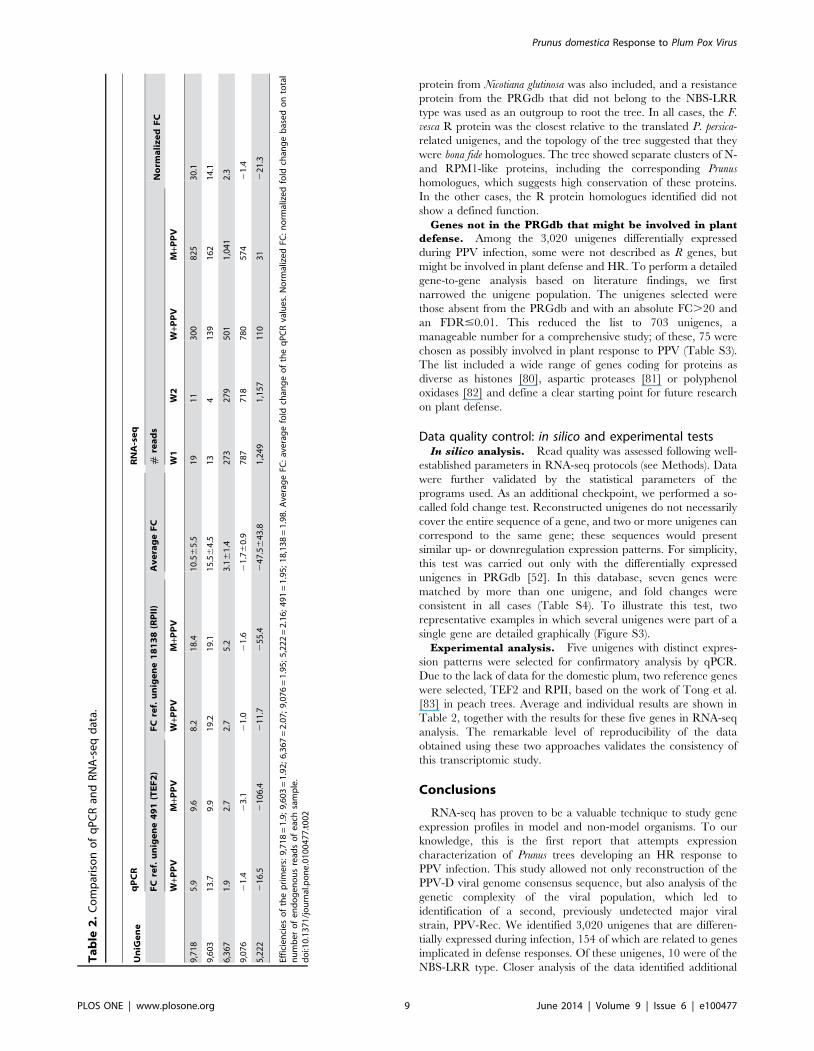
Experimental analysis. Five unigenes with distinct expres-
sion patterns were selected for confirmatory analysis by qPCR.
Due to the lack of data for the domestic plum, two reference genes
were selected, TEF2 and RPII, based on the work of Tong et al.
[83] in peach trees. Average and individual results are shown in
Table 2, together with the results for these five genes in RNA-seq
analysis. The remarkable level of reproducibility of the data
obtained using these two approaches validates the consistency of
this transcriptomic study.
Conclusions
RNA-seq has proven to be a valuable technique to study gene
expression profiles in model and non-model organisms. To our
knowledge, this is the first report that attempts expression
characterization of Prunus trees developing an HR response to
PPV infection. This study allowed not only reconstruction of the
PPV-D viral genome consensus sequence, but also analysis of the
genetic complexity of the viral population, which led to
identification of a second, previously undetected major viral
strain, PPV-Rec. We identified 3,020 unigenes that are differen-
tially expressed during infection, 154 of which are related to genes
implicated in defense responses. Of these unigenes, 10 were of the
NBS-LRR type. Closer analysis of the data identified additional
Ta
ble
2.
Co
mp
aris
on
of
qP
CR
and
RN
A-s
eq
dat
a.
Un
iGe
ne
qP
CR
RN
A-s
eq
FC
ref.
un
ige
ne
49
1(T
EF
2)
FC
ref.
un
ige
ne
18
13
8(R
PII
)A
ve
rag
eF
C#
rea
ds
No
rma
liz
ed
FC
W+P
PV
M+P
PV
W+P
PV
M+P
PV
W1
W2
W+P
PV
M+P
PV
9,7
18
5.9
9.6
8.2
18
.41
0.5
65
.51
91
13
00
82
53
0.1
9,6
03
13
.79
.91
9.2
19
.11
5.5
64
.51
34
13
91
62
14
.1
6,3
67
1.9
2.7
2.7
5.2
3.1
61
.42
73
27
95
01
1,0
41
2.3
9,0
76
21
.42
3.1
21
.02
1.6
21
.76
0.9
78
77
18
78
05
74
21
.4
5,2
22
21
6.5
21
06
.42
11
.72
55
.42
47
.56
43
.81
,24
91
,15
71
10
31
22
1.3
Effi
cie
nci
es
of
the
pri
me
rs:
9,7
18
=1
.9;
9,6
03
=1
.92
;6
,36
7=
2.0
7;
9,0
76
=1
.95
;5
,22
2=
2.1
6;
49
1=
1.9
5;
18
,13
8=
1.9
8.
Ave
rag
eFC
:av
era
ge
fold
chan
ge
of
the
qP
CR
valu
es.
No
rmal
ize
dFC
:n
orm
aliz
ed
fold
chan
ge
bas
ed
on
tota
ln
um
be
ro
fe
nd
og
en
ou
sre
ads
of
eac
hsa
mp
le.
do
i:10
.13
71
/jo
urn
al.p
on
e.0
10
04
77
.t0
02
Prunus domestica Response to Plum Pox Virus
PLOS ONE | www.plosone.org 9 June 2014 | Volume 9 | Issue 6 | e100477
candidate genes that show large variations in their mRNA levels
and might be involved in viral resistance, establishing the basis for
further functional analyses.
Supporting Information
Figure S1 Viral reconstruction using reads found in theJojo-M+PPV sample. (A) Coverage of the viral genome.
Protein-coding sequences are labeled and colored. The nucleotide
positions at their borders are marked. (B) Heterogeneity analysis.
The viral genome is depicted using a colored bar as in (A). Line
height indicates the heterogeneity values of the Jojo-M PPV
population (above the genome) in the indicated position. Amino
acid differences are depicted in red. Below the genome, grey and
red lines represent silent and non-silent differences, respectively,
relative to Jojo-W+PPV consensus sequence. The green line shows
an amino acid change in PIPO.
(TIF)
Figure S2 Intra- and inter-isolate heterogeneities anal-ysis. (A) Intra-isolate heterogeneities distribution in PPV-D (blue)
and PPV-Rec (orange) from the Jojo-W+PPV sample. Heteroge-
neities are grouped by 490 nucleotides. Grey lines between the two
strains mark changes common to both. (B) Inter-isolate variability
distribution in PPV-D (blue) and PPV-Rec (orange) from the
SharCo database [42]. Polymorphic sites are grouped by 490
nucleotides. Grey lines between the two strains mark changes
common to both.
(TIF)
Figure S3 Parallel fold change test. Schemes of two genes
from the PRGdb [52] that are matched by several differentially
expressed ‘Jojo’ unigenes. Green (W1 and W2) and red (W and M)
boxes show the numbers of reads corresponding to non-infected
and infected samples, respectively.
(TIF)
Table S1 Differentially expressed unigenes. The raw
number of reads found on each sample is given in columns Jojo-
W1, Jojo-W2, Jojo-W+PPV and Jojo-M+PPV. Fold changes
between infected and non-infected samples and FDR values are
detailed in columns FC and FDR, respectively. Column labeled
Description expands on the details of each unigene, including
length in nucleotides.
(XLS)
Table S2 Differentially expressed unigenes found inPRGdb. The raw number of reads found on each sample is given
in columns Jojo-W1, Jojo-W2, Jojo-W+PPV and Jojo-M+PPV.
Fold changes between infected and non-infected samples and FDR
values are detailed in columns FC and FDR, respectively. Column
labeled Description expands on the details of each unigene,
including length in nucleotides.
(XLS)
Table S3 Genes possibly involved in plant defense notincluded in the PRGdb. Similarity to a known protein is given
in the Homology column. The raw number of reads found on each
sample is given in columns Jojo-W1, Jojo-W2, Jojo-W+PPV and
Jojo-M+PPV. Fold changes between infected and non-infected
samples and FDR values are detailed in columns FC and FDR,
respectively. Column labeled Description expands on the details of
each unigene, including length in nucleotides.
(XLS)
Table S4 List of genes from PRGdb matched by morethan one ‘Jojo’ unigene. Reference numbers of the matched
genes are shown in the NCBI Match column. The raw number of
reads found on each sample is shown in columns Jojo-W1, Jojo-
W2, Jojo-W+PPV and Jojo-M+PPV. Fold changes between
infected and non-infected samples is given in column FC. Column
labeled Description expands on the details of each gene.
(XLS)
Table S5 Primers used in qPCR experiment.
(DOC)
Acknowledgments
We are grateful to Beatriz Garcıa for technical assistance, to Sylvie Dallot,
Gerard Labonne and Jean-Philippe Pichaut for providing the protocol for
total nucleic acid extraction, to Miguel Arenas for assistance in the analysis
of selective pressure in the viral population, and to Catherine Mark for
editorial assistance.
Author Contributions
Conceived and designed the experiments: BR JAG. Performed the
experiments: BR LM MN. Analyzed the data: BR DSL TC JCO JAG.
Contributed reagents/materials/analysis tools: MN JCO. Wrote the paper:
BR DSL TC MN JCO JAG.
References
1. Cambra M, Capote N, Myrta A, Llacer G (2006) Plum pox virus and the stimated
costs associated with sharka disease. EPPO Bull 36: 202–204.
2. Lopez-Moya JJ, Fernandez-Fernandez MR, Cambra M, Garcıa JA (2000)
Biotechnological aspects of plum pox virus. J Biotechnol 76: 121–136.
3. Sochor J, Babula P, Adam V, Krska B, Kizek R (2012) Sharka: the past, the
present and the future. Viruses 4: 2853–2901.
4. Adams MJ, Zerbini FM, French R, Rabenstein F, Stenger DC, et al. (2012)
Family Potyviridae. In: A. M. Q. King, M. J. Adams, E. B. Carstens and E. J.
Lefkowitz, editors. Virus Taxonomy. Oxford: Elsevier. pp. 1069–1090.
5. Lopez-Moya JJ, Garcıa JA (2008) Potyviruses. In: B. W. J. Mahy and M. H. V.
Van Regenmortel, editors. Encyclopedia of Virology, Third Edition. Oxford:
Elsevier. pp. 313–322.
6. Ivanov KI, Eskelin K, Lohmus A, Makinen K (2014) Molecular and Cellular
Mechanisms Underlying Potyvirus Infection. J Gen Virol doi: 10.10999/
vir.0.064220-0
7. Garcıa JA, Glasa M, Cambra M, Candresse T (2013) Plum pox virus and sharka: a
model potyvirus and a major disease. Mol Plant Pathol 15: 226–241.
8. Subr Z, Glasa M (2013) Unfolding the secrets of plum pox virus: from
epidemiology to genomics. Acta Virol 57: 217–228.
9. Gildow F, Damsteegt V, Stone A, Schneider W, Luster D, et al. (2004) Plum pox
in north america: identification of aphid vectors and a potential role for fruit in
virus spread. Phytopathology 94: 868–874.
10. Labonne G, Ybon M, Quiot JB, Avinert L, Llacer G (1995) Aphids as potential
vectors of Plum pox virus: Comparison of methods of testing and epidemiological
consequences. Acta Hortic 386: 207–218.
11. Candresse T, Cambra M (2006) Causal agent of sharka disease: historical
perspective and current status of Plum pox virus strains. EPPO Bull 36: 239–246.
12. Glasa M, Prikhodko Y, Predajna L, Nagyova A, Shneyder Y, et al. (2013)
Characterization of sour cherry isolates of Plum pox virus from the Volga basin in
Russia reveals a new cherry strain of the virus. Phytopathology 103: 972–979.
13. Llacer G, Cambra M (2006) Hosts and symptoms of Plum pox virus: fruiting Prunus
species. EPPO Bull 36: 219–221.
14. Ulubas Serce C, Candresse T, Svanella-Dumas L, Krizbai L, Gazel M, et al.
(2009) Further characterization of a new recombinant group of Plum pox virus
isolates, PPV-T, found in orchards in the Ankara province of Turkey. Virus Res
142: 121–126.
15. Fuchs M, Cox R, Cox K (2008) Plum pox disease of stone fruits. IPM Fact
Sheet. Available: http://nysipm.cornell.edu/factsheets/treefruit/diseases/pp/
pp.pdf. Accessed 2014 Jun 2.
16. Lichtenegger L, Neumuller M, Treutter D, Hartmann W (2010) The inheritance
of the hypersensitivity resistance of European plum (Prunus domestica L.) against
the Plum pox virus. Julius-Kuhn-Archiv 427: 327–329.
17. Neumuller M, Hartmann W (2008) The phenotypically quantitative nature of
hypersensitivity of European plum (Prunus domestica L.) against the Plum pox virus
and its description using the hypersensitivity index. Hortic Sci 35: 50–64.
Prunus domestica Response to Plum Pox Virus
PLOS ONE | www.plosone.org 10 June 2014 | Volume 9 | Issue 6 | e100477
18. Neumuller M, Hartmann W, Stosser R (2005) The hypersensitivity of European
plum against Plum pox virus (PPV) as a promising mechanism of resistance.
Phytopathologia Polonica: 77–83.
19. Moffett P (2009) Mechanisms of recognition in dominant R gene mediated
resistance. Adv Virus Res 75: 1–33.
20. Decroocq V, Foulongne M, Lambert P, Gall OL, Mantin C, et al. (2005)
Analogues of virus resistance genes map to QTLs for resistance to sharka disease
in Prunus davidiana. Mol Genet Genomics 272: 680–689.
21. Soriano JM, Vilanova S, Romero C, Llacer G, Badenes ML (2005)
Characterization and mapping of NBS-LRR resistance gene analogs in apricot
(Prunus armeniaca L.). Theor Appl Genet 110: 980–989.
22. Martin JA, Wang Z (2011) Next-generation transcriptome assembly. Nat Rev
Genet 12: 671–682.
23. Wang Z, Gerstein M, Snyder M (2009) RNA-Seq: a revolutionary tool for
transcriptomics. Nat Rev Genet 10: 57–63.
24. Gahlan P, Singh HR, Shankar R, Sharma N, Kumari A, et al. (2012) De novo
sequencing and characterization of Picrorhiza kurrooa transcriptome at two
temperatures showed major transcriptome adjustments. BMC Genomics 13:
126.
25. Kawahara-Miki R, Wada K, Azuma N, Chiba S (2011) Expression profiling
without genome sequence information in a non-model species, Pandalid shrimp
(Pandalus latirostris), by next-generation sequencing. PLoS One 6: e26043.
26. Xu DL, Long H, Liang JJ, Zhang J, Chen X, et al. (2012) De novo assembly and
characterization of the root transcriptome of Aegilops variabilis during an
interaction with the cereal cyst nematode. BMC Genomics 13: 133.
27. Kreuze JF, Perez A, Untiveros M, Quispe D, Fuentes S, et al. (2009) Complete
viral genome sequence and discovery of novel viruses by deep sequencing of
small RNAs: a generic method for diagnosis, discovery and sequencing of
viruses. Virology 388: 1–7.
28. Wu Q, Luo Y, Lu R, Lau N, Lai EC, et al. (2010) Virus discovery by deep
sequencing and assembly of virus-derived small silencing RNAs. Proc Natl Acad
Sci USA 107: 1606–1611.
29. Zagordi O, Daumer M, Beisel C, Beerenwinkel N (2012) Read length versus
depth of coverage for viral quasispecies reconstruction. PLoS One 7: e47046.
30. Kwok H, Tong AH, Lin CH, Lok S, Farrell PJ, et al. (2012) Genomic
sequencing and comparative analysis of Epstein-Barr virus genome isolated from
primary nasopharyngeal carcinoma biopsy. PLoS One 7: e36939.
31. Carrier G, Santoni S, Rodier-Goud M, Canaguier A, Kochko A, et al. (2011) An
efficient and rapid protocol for plant nuclear DNA preparation suitable for next
generation sequencing methods. Am J Bot 98: e13–15.
32. Babraham Bioinformatics. FASTQC, A quality tool for high throughput
sequence data. http://www.bioinformatics.babraham.ac.uk/projects/fastqc/.
Accessed 2014 Jun 2.
33. HannonLab FASTX Toolkit. http://hannonlab.cshl.edu/fastx_toolkit/index.
html Accessed 2014 Jun 2.
34. Salzberg BL, Steven L (2012) Fast gapped-read alignment with Bowtie 2. Nat
Methods 9: 357–359.
35. NCBI nuccore (nt). http://www.ncbi.nlm.nih.gov/nuccore. Accessed 2014 June
2.
36. Xiaoqiu H, Madan A (1999) CAP3: A DNA Sequence Assembly Program.
Genome Res 9: 868–877.
37. Fu L, Niu B, Zhu Z, Wu S, Li W (2012) CD-HIT: accelerated for clustering the
next-generation sequencing data. Bioinformatics 28: 3150–3152.
38. Wright CF, Morelli MJ, Thebaud G, Knowles NJ, Herzyk P, et al. (2010)
Beyond the consensus: dissecting within-host viral population diversity of foot-
and-mouth disease virus by using next-generation genome sequencing. J Virol
85: 2266–2275.
39. Topfer A, Zagordi O, Prabhakaran S, Roth V, Halperin E, et al. (2013)
Probabilistic inference of viral quasispecies subject to recombination. J Comput
Biol 20: 113–123.
40. Delport W, Poon AF, Frost SD, Kosakovsky Pond SL (2010) Datamonkey 2010:
a suite of phylogenetic analysis tools for evolutionary biology. Bioinformatics 26:
2455–2457.
41. Kosakovsky Pond SL, Frost SD (2005) Not so different after all: a comparison of
methods for detecting amino acid sites under selection. Mol Biol Evol 22: 1208–
1222.
42. Plum Pox Virus Database. SHARCO: SHARKA CONTAINMENT IN VIEW
OF EU EXPANSION.http:\\w3.pierroton.inra.fr:8060. Accessed 2014 June 2.
43. Larkin MA, Blackshields G, Brown NP, Chenna R, McGettigan PA, et al. (2007)
Clustal W and Clustal X version 2.0. Bioinformatics 23: 2947–2948.
44. Zerbino DR, Birney E (2008) Velvet: algorithms for de novo short read assembly
using de Bruijn graphs. Genome Res 18: 821–829.
45. Schulz MH, Zerbino DR, Vingron M, Birney E (2012) Oases: robust de novo
RNA-seq assembly across the dynamic range of expression levels. Bioinformatics
28: 1086–1092.
46. Li H, Durbin R (2010) Fast and accurate long-read alignment with Burrows–
Wheeler transform. Bioinformatics 26: 589–595.
47. Li B, Dewey CN (2011) RSEM: accurate transcript quantification from RNA-
Seq data with or without a reference genome. BMC Bioinformatics 12: 323.
48. Robinson MD, McCarthy DJ, Smyth GK (2010) edgeR: a Bioconductor
package for differential expression analysis of digital gene expression data.
Bioinformatics 26: 139–140.
49. Oliveros JC (2007) [email protected] interactive server for analyzing
DNA microarray experiments with replicates. http://bioinfogp.cnb.csic.es/tools/FIESTA. Accessed 2014 June 2.
50. NCBI EST. http://www.ncbi.nlm.nih.gov/nucest. Accessed 2014 June 2.
51. NCBI Protein (nr). http://www.ncbi.nlm.nih.gov/protein. Accessed 2014 June
2.
52. Sanseverino W, Roma G, De Simone M, Faino L, Melito S, et al. (2010)
PRGdb: a bioinformatics platform for plant resistance gene analysis. Nucleic
Acids Res 38: D814–821.
53. Conesa A, Gotz S, Garcıa-Gomez JM, Terol J, Talon M, et al. (2005) Blast2GO:
a universal tool for annotation, visualization and analysis in functional genomics
research. Bioinformatics 21: 3674–3676.
54. Tamura K, Peterson D, Peterson N, Stecher G, Nei M, et al. (2011) MEGA5:
molecular evolutionary genetics analysis using maximum likelihood, evolution-ary distance, and maximum parsimony methods. Mol Biol Evol 28: 2731–2739.
55. Abascal F, Zardoya R, Posada D (2005) ProtTest: selection of best-fit models of
protein evolution. Bioinformatics 21: 2104–2105.
56. Felsenstein J (1985) Confidence limits on phylogenies: An approach using thebootstrap. Evolution 39: 783–791.
57. Rozen S, Skaletsky H (2000) Primer3 on the WWW for general users and for
biologist programmers. Methods Mol Biol 132: 365–386.
58. Pfaffl MW (2001) A new mathematical model for relative quantification in real-
time RT-PCR. Nucleic Acids Res 29: e45.
59. Jridi C, Martin JF, Marie-Jeanne V, Labonne G, Blanc S (2006) Distinct viral
populations differentiate and evolve independently in a single perennial host
plant. J Virol 80: 2349–2357.
60. Li H, Roossinck MJ (2004) Genetic bottlenecks reduce population variation in
an experimental RNA virus population. J Virol 78: 10582–10587.
61. Kuss SK, Etheredge CA, Pfeiffer JK (2008) Multiple host barriers restrict
poliovirus trafficking in mice. PLoS Pathog 4: e1000082.
62. Sacristan S, Malpica JM, Fraile A, Garcıa-Arenal F (2003) Estimation of
population bottlenecks during systemic movement of tobacco mosaic virus in
tobacco plants. J Virol 77: 9906–9911.
63. Predajna L, Subr Z, Candresse T, Glasa M (2012) Evaluation of the geneticdiversity of Plum pox virus in a single plum tree. Virus Res 167: 112–117.
64. Dietrich C, Maiss E (2003) Fluorescent labelling reveals spatial separation of
potyvirus populations in mixed infected Nicotiana benthamiana plants. J Gen
Virol 84: 2871–2876.
65. Hunter S, Apweiler R, Attwood TK, Bairoch A, Bateman A, et al. (2009)
InterPro: the integrative protein signature database. Nucleic Acids Res 37:
D211–215.
66. Kim MJ, Ham BK, Kim HR, Lee IJ, Kim YJ, et al. (2005) In vitro and in plantainteraction evidence between Nicotiana tabacum thaumatin-like protein 1
(TLP1) and cucumber mosaic virus proteins. Plant Mol Biol 59: 981–994.
67. Kwon SJ, Jin HC, Lee S, Nam MH, Chung JH, et al. (2009) GDSL lipase-like 1
regulates systemic resistance associated with ethylene signaling in Arabidopsis.
Plant J 58: 235–245.
68. Babu M, Griffiths JS, Huang TS, Wang A (2008) Altered gene expression
changes in Arabidopsis leaf tissues and protoplasts in response to Plum pox virus
infection. BMC Genomics 9: 325.
69. Dardick C (2007) Comparative expression profiling of Nicotiana benthamiana leavessystemically infected with three fruit tree viruses. Mol Plant Microbe Interact 20:
1004–1017.
70. Dıaz-Vivancos P, Clemente-Moreno MJ, Rubio M, Olmos E, Garcıa JA, et al.
(2008) Alteration in the chloroplastic metabolism leads to ROS accumulation in
pea plants in response to plum pox virus. J Exp Bot 59: 2147–2160.
71. Pacheco R, Garcıa-Marcos A, Manzano A, de Lacoba MG, Camanes G, et al.
(2012) Comparative analysis of transcriptomic and hormonal responses to
compatible and incompatible plant-virus interactions that lead to cell death. Mol
Plant Microbe Interact 25: 709–723.
72. Rodrigo G, Carrera J, Ruiz-Ferrer V, del Toro FJ, Llave C, et al. (2012) A meta-
analysis reveals the commonalities and differences in Arabidopsis thaliana
response to different viral pathogens. PLoS One 7: e40526.
73. Gururani MA, Venkatesh J, Upadhyaya CP, Nookaraju A, Pandey SK, et al.
(2012) Plant disease resistance genes: Current status and future directions.Physiol Mol Plant Pathol 78: 51–65.
74. Levy M, Edelbaum O, Sela I (2004) Tobacco mosaic virus regulates the
expression of its own resistance gene N. Plant Physiol 135: 2392–2397.
75. Mohr TJ, Mammarella ND, Hoff T, Woffenden BJ, Jelesko JG, et al. (2010) The
Arabidopsis downy mildew resistance gene RPP8 is induced by pathogens and
salicylic acid and is regulated by W box cis elements. Mol Plant Microbe Interact
23: 1303–1315.
76. Yoshimura S, Yamanouchi U, Katayose Y, Toki S, Wang ZX, et al. (1998)Expression of Xa1, a bacterial blight-resistance gene in rice, is induced by
bacterial inoculation. Proc Natl Acad Sci USA 95: 1663–1668.
77. Mes JJ, van Doorn AA, Wijbrandi J, Simons G, Cornelissen BJ, et al. (2000)
Expression of the Fusarium resistance gene I-2 colocalizes with the site of fungal
containment. Plant J 23: 183–193.
78. Tan X, Meyers BC, Kozik A, West MA, Morgante M, et al. (2007) Global
expression analysis of nucleotide binding site-leucine rich repeat-encoding and
related genes in Arabidopsis. BMC Plant Biol 7: 56.
79. Boyes DC, Nam J, Dangl JL (1998) The Arabidopsis thaliana RPM1 diseaseresistance gene product is a peripheral plasma membrane protein that is
Prunus domestica Response to Plum Pox Virus
PLOS ONE | www.plosone.org 11 June 2014 | Volume 9 | Issue 6 | e100477
degraded coincident with the hypersensitive response. Proc Natl Acad Sci USA
95: 15849–15854.80. Ma KW, Flores C, Ma W (2011) Chromatin configuration as a battlefield in
plant-bacteria interactions. Plant Physiol 157: 535–543.
81. Mazorra-Manzano MA, Tanaka T, Dee DR, Yada RY (2010) Structure-function characterization of the recombinant aspartic proteinase A1 from
Arabidopsis thaliana. Phytochemistry 71: 515–523.
82. Li L, Steffens JC (2002) Overexpression of polyphenol oxidase in transgenic
tomato plants results in enhanced bacterial disease resistance. Planta 215: 239–
247.
83. Tong Z, Gao Z, Wang F, Zhou J, Zhang Z (2009) Selection of reliable reference
genes for gene expression studies in peach using real-time PCR. BMC Mol Biol
10: 71.
Prunus domestica Response to Plum Pox Virus
PLOS ONE | www.plosone.org 12 June 2014 | Volume 9 | Issue 6 | e100477