transcriptome profile analysis reveals specific signatures of pollutants in atlantic eels
TRANSCRIPT
Transcriptome profile analysis reveals specific signaturesof pollutants in Atlantic eels
Lucie Baillon • Fabien Pierron • Raphael Coudret • Eric Normendeau •
Antoine Caron • Laurent Peluhet • Pierre Labadie • Helene Budzinski •
Gilles Durrieu • Jerome Sarraco • Pierre Elie • Patrice Couture •
Magalie Baudrimont • Louis Bernatchez
Accepted: 19 September 2014
� Springer Science+Business Media New York 2014
Abstract Identifying specific effects of contaminants in a
multi-stress field context remain a challenge in ecotoxi-
cology. In this context, ‘‘omics’’ technologies, by allowing
the simultaneous measurement of numerous biological
endpoints, could help unravel the in situ toxicity of con-
taminants. In this study, wild Atlantic eels were sampled in
8 sites presenting a broad contamination gradient in France
and Canada. The global hepatic transcriptome of animals
was determined by RNA-Seq. In parallel, the contamina-
tion level of fish to 8 metals and 25 organic pollutants was
determined. Factor analysis for multiple testing was used to
identify genes that are most likely to be related to a single
factor. Among the variables analyzed, arsenic (As), cad-
mium (Cd), lindane (c-HCH) and the hepato-somatic index
(HSI) were found to be the main factors affecting eel’s
transcriptome. Genes associated with As exposure were
involved in the mechanisms that have been described
during As vasculotoxicity in mammals. Genes correlated
with Cd were involved in cell cycle and energy metabo-
lism. For c-HCH, genes were involved in lipolysis and cell
growth. Genes associated with HSI were involved in pro-
tein, lipid and iron metabolisms. Our study proposes spe-
cific gene signatures of pollutants and their impacts in fish
exposed to multi-stress conditions.
Keywords Transcriptome � Multi-pollutant � Wild fish
populations � Atlantic eels
Introduction
Identifying and predicting the specific impacts of contam-
inants on wild organisms still remains a huge challenge.
Indeed, aquatic ecosystems not only present a variety of
man-induced stressors but also vary spatially and tempo-
rally due to variations in natural factors (Thrush et al.
2009). Moreover, in a multi-stress context, the effects of a
given factor can be modulated or amplified in interaction
with another, and organisms can be more vulnerable if
additive or synergistic effects occur (Lapointe et al. 2011).
In this context, particular emphasis was placed in
recent years on the potential use of ‘‘omics’’ technologies
in ecotoxicology. By allowing a global approach,
‘‘omics’’ technologies have indeed the potential to dis-
cover new mechanisms of toxicity and to classify the
Electronic supplementary material The online version of thisarticle (doi:10.1007/s10646-014-1356-x) contains supplementarymaterial, which is available to authorized users.
L. Baillon � F. Pierron (&) � L. Peluhet � P. Labadie �H. Budzinski � M. Baudrimont
Univ. Bordeaux, UMR EPOC CNRS 5805, 33400, Talence,
France
e-mail: [email protected]
R. Coudret � J. Sarraco
CQFD team, INRIA Bordeaux Sud-Ouest, Talence, France
E. Normendeau � L. Bernatchez
Departement de biologie, Institut de Biologie Integrative et des
Systemes (IBIS), Universite Laval, G1V 0A6, Quebec, QC,
Canada
A. Caron � P. Couture
Centre Eau Terre Environnement, Institut National de la
Recherche Scientifique, 490 de la Couronne, Quebec,
QC G1K 9A9, Canada
G. Durrieu
Universite de Bretagne Sud, LMBA, UMR CNRS 6205,
56000, Vannes, France
P. Elie
IRSTEA, 50 avenue de Verdun-Gazinet, 33612 Cestas, France
123
Ecotoxicology
DOI 10.1007/s10646-014-1356-x
toxicity of contaminants. In molecular medicine, where
these technologies (i.e. genomic, transcriptomic, epige-
nomic, proteomic or metabolomic) are already widely
used, successful prospective and diagnostic cases studies
were conducted with such approaches (Vlaanderen et al.
2010). In 2008, the fish toxicogenomics consortium thus
proposed to use ‘‘omic’’ technologies in the aquatic risk
assessment process (Van Aggelen et al. 2010). Among the
‘‘omics’’ technologies, the recent development of next
generation sequencing (NGS) technologies and bioinfor-
matic tools to analyze these large datasets offers the
opportunity for ecotoxicologists to investigate the effects
of contaminants on genome-wide evolution or on tran-
scriptome-wide response in non-model but environmen-
tally relevant species (Webster and Bury 2013; Regier
et al. 2013). Gene expression profiling using RNA-seq
(also called whole transcriptome shotgun sequencing)
could play a key role to identify new biomarkers of
exposure and adverse effects and to discover new toxicity
pathways.
In the present study, we thus used RNA-seq technology
on two threatened species, the European eel (Anguilla
anguilla) and the American eel (Anguilla rostrata), to test
whether changes in transcriptome profiles in wild fish
may be used to detect and unravel the toxicity of pollu-
tants in a context of in situ exposure. Atlantic eels are
catadromous fish species with a complex life cycle
including marine (spawning, larval phase and sexual
maturation) and continental (feeding and somatic growth)
environments. Historically abundant and widespread in
Europe and North America, populations of Atlantic eels
have suffered a sharp decline. European eel’s recruitment
is only one tenth of what it was in the early 1980s (Stone
2003; ICES report 2009). In Canada, and more precisely
in one of the most important rivers of the North American
continent, the St. Lawrence River, the situation appears to
be equally worrying. Available data show a decrease in
recruitment of around 40 to 80 % depending on the sites
and years, some sites having registered a decrease of
98 % since early 1980s (de Lafontaine et al. 2010). In
view of these data, the European species is currently
considered as critically endangered (IUCN red list) and
the American eel was recently designated as threatened
species by the Committee on the Status of Endangered
Wildlife in Canada. As the unusual life cycle of Atlantic
eels makes them particularly vulnerable to pollution,
Atlantic eels are considered as sentinel species in eco-
toxicology (Belpaire and Goemans 2007; Geeraerts and
Belpaire 2010).
Thus, wild immature yellow eels (i.e. growth somatic
phase) were sampled in 8 sites (4 Canadian and 4 French
sites) presenting a contamination gradient and also a wide
range of physicochemical conditions notably in term of
salinity and temperature. In France, European eels were
sampled along a historically cadmium-contaminated hy-
drosystem, the Garonne–Gironde continuum (Durrieu
et al. 2005). In addition, recent investigations have
reported high concentrations of PCBs in the muscle of
eels inhabiting the Gironde estuary (up to 3,399 ng g-1
dw, Tapie et al. 2011). In Canada, fish were sampled
along the St. Lawrence River. Past studies carried out on
the muscle of American eels inhabiting this hydrosystem
(Hodson et al. 1994) have reported high concentrations in
PCBs (up to 0.83 lg g-1 wet w), organochlorinated pes-
ticides (up to 0.70 lg g-1 wet w) and in mercury (up to
0.26 lg g-1 wet w). The individual hepatic transcriptome
of 6 replicate specimens of eel per sampling site was
determined by high throughput RNA sequencing using
Illumina Hiseq 2000 technology. In parallel, the contam-
ination levels of fish in 25 organic pollutants and 8 metals
were determined. Then, we carried out correlation anal-
yses between the transcriptional level of a given gene and
contaminant concentrations in each individual fish. Rather
than perform comparisons among sampling sites, we
combined fish from all sites before carrying out the sta-
tistical analyses. In addition, data from both European and
American eels were combined before carrying our statis-
tical analyses in order to (i) identify common genes and
thus potential biomarkers of exposure that could be
extrapolated across fish species and (ii) to work with the
widest range of physic-chemical conditions and thus to
remove as much as possible genes that are more likely to
be affected by natural factors. Finally, condition indices
such as the relative condition index (Kn), the hepato-
somatic index (HSI) and the spleen somatic index (SSI)
were added in the model in order to identify genes for
which transcription levels could be associated to the
general health status of animals.
Materials and methods
Wild eel sample collection
Eight sampling sites were selected in Quebec (Canada) and
in France on the basis of their known gradient of contami-
nation by metallic and organic pollutants (Lee et al. 1999;
Durrieu et al. 2005). In Quebec, yellow eels (sexually
undetermined fish) were collected in four sites (see Table 1)
located near or in the St Lawrence Estuary (St Jean Lake:
48�5104000N 64�2804700O, Sud-Ouest River: 48�2202700N68�4300200O, St Pierre Lake: 46�0901800N 74�2300400WO, St
Francois Lake: 46�1905000N, 74�2300400WO). In France,
immature yellow eels were collected in four sites along the
Gironde aquatic system (Dordogne: 44�54030.3000N0�15000.6100O, Garonne: 45�12006.6200N 0�43034.7200O and
L. Baillon et al.
123

Ta
ble
1M
orp
ho
met
ric
mea
sure
s(m
ean
±S
E,
n=
6)
and
aver
age
con
cen
trat
ion
so
fm
usc
leo
rgan
icp
oll
uta
nts
(ex
pre
ssed
asn
gg
-1,
dw
)an
dk
idn
eys
met
alco
nce
ntr
atio
ns
(ex
pre
ssed
as
lg
g-
1,
dw
)in
Atl
anti
cee
lssa
mp
led
in8
site
slo
cate
din
Can
ada
and
Fra
nce
Can
adia
nsi
tes
(Anguil
laro
stra
ta)
Fre
nch
site
s(A
nguil
laanguil
la)
Gro
ups
of
var
iable
sV
aria
ble
sS
tJe
anS
ud-O
ues
tS
tF
ranco
isS
tP
ierr
eC
erte
sD
ord
ogne
Gar
onne
Gir
onde
Bio
met
ryL
ength
529.2
6±
22.4
3347.5
3±
18.4
7827.9
3±
14.1
2890.8
7±
10.5
3434.5
3±
19.2
338
±12.7
8442.6
6±
17.7
3578.6
6±
15.0
2
Wei
ght
290.1
3±
37.6
77.8
7±
18.6
61,2
22.3
3±
32.1
71,4
34.6
6±
53.9
2157.3
3±
31.2
563
±10.6
5156.2
6±
22.3
2349.4
6±
32.0
SS
I0.2
7±
0.0
7a
0.2
2±
0.0
5a
0.0
9±
0.0
1b
,c0.0
9±
0.0
1b
0.1
1±
0.0
1b
,c0.0
9±
0.0
1b
,c0.1
2±
0.0
1c
0.0
6±
0.0
04
d
HS
I2.0
9±
0.1
3a
1.6
2±
0.0
6b
1.0
4±
0.0
5c,d
,e1.0
7±
0.0
6c,d
,e1.1
8±
0.0
2d
0.9
6±
0.0
4e,f
1.1
4±
0.0
4d
,c0.8
8±
0.0
3f
Kn
0.4
±0.0
1a,c
0.3
9±
0.0
1a,c
0.4
8±
0.0
2a
0.3
8±
0.0
1c
0.5
1±
0.0
2b
0.4
8±
0.0
1b
0.4
8±
0.0
1b
0.4
6±
0.0
1b
Nat
ura
lfa
ctor
Tem
per
ature
(�C
)17.0
19.1
22.0
12.0
21.9
22.2
21.4
21.3
Sal
init
y(%
)1.9
16.5
0.0
0.1
119.9
0.3
20.1
37.7
8
Conta
min
ants
Met
als
Cd
2.3
5±
0.7
5a
2.2
3±
0.1
4a,c
1.7
5±
0.1
9a
4.7
6±
1.2
9c
0.4
7±
0.1
7d
27.2
9±
5.2
6b
9.0
9±
2.5
1c
52.3
±11.3
5b
Cu
6.0
1±
0.6
7a
9.3
±1.0
4b
5.9
4±
0.3
9c
8.7
8±
1.1
6b
7.1
8±
0.8
0a,b
,c6.5
4±
035
a,b
,c6.0
6±
0.9
8a,c
8.7
±0.6
5b
Zn
253.2
±32.8
a250.5
1±
22.6
4a
182.7
±40.9
a205.1
±17.6
a227.0
±17.4
a255.7
±7.9
a198.6
±16.9
a246.7
±31.9
a
Ag
0.0
8±
0.0
1a
0.3
9±
0.1
4a
0.0
9±
0.0
2a
0.6
3±
0.4
1a
0.0
1±
0.0
01
a0.0
9±
0.0
3a
0.1
3±
0.0
5a
3.3
8±
1.4
8b
As
2.5
8±
0.3
6a,c
1.5
9±
0.2
4c,d
0.9
7±
0.1
0d
2.3
6±
0.1
4d
4.2
5±
0.8
3a,b
2.9
8±
0.7
6a,c
1.0
8±
0.1
6d
6.3
3±
1.4
8b
Pb
0.1
9±
0.0
6a,c
0.1
2±
0.0
2a,c
0.0
9±
0.0
2c
0.3
6±
0.1
6a
0.2
5±
0.0
3a
0.7
3±
0.1
6d
2.7
±1.5
4b
,d2.6
8±
0.6
2b
Cr
0.6
2±
0.0
6a
0.6
5±
0.0
4a
0.8
5±
0.0
7a
0.6
9±
0.0
5a
0.9
3±
0.1
3a
1.4
±0.4
5a
0.7
±0.0
9a
0.9
1±
0.2
5a
Ni
0.6
6±
0.0
8a,b
0.5
5±
0.0
7a,b
0.2
6±
0.0
3c
0.4
7±
0.1
5b
,c0.9
7±
0.3
3a,d
0.5
6±
0.1
7b
,d0.4
6±
0.0
8b
,c0.8
8±
0.1
7a,d
Hg
0.0
8±
0.0
1a
0.3
0±
0.0
7c
0.6
6±
0.0
6b
1.0
7±
0.2
1b
0.1
3±
0.0
5a
d0.2
7±
0.0
5c
0.0
9±
0.0
1d
1.1
9±
0.2
1b
PO
Ps
PB
DE
_47
1.9
8±
0.4
a1.6
1±
0.4
a7.5
6±
0.9
4c,e
24.3
3±
9.7
7b
,c1.1
9±
0.7
9d
6.3
7±
1.2
5e
22.6
3±
8.5
3b
c19.7
1±
4.2
5b
Sum
of
all
PC
Bs
33.4
4±
3.8
6a
28.4
1±
3.4
2a
142.1
1±
15.7
9c
164.2
5±
33.1
9c
77.4
8±
12.5
4d
325.6
5±
56.2
5c
1753.7
2±
750.9
2b
1477.6
9±
309.6
4b
HC
B4.8
5±
1.2
2a,d
1.5
2±
0.1
7b
2.7
3±
0.3
6a,c
4.0
1±
0.4
2a,d
2.2
4±
0.4
5c
3.8
9±
0.6
5c,d
4.4
±0.9
5a
4.6
7±
0.9
9a
cHC
H0.1
9±
0.0
2a
0.1
3±
0.0
2a
0.1
5±
0.0
1a
0.1
2±
0.0
1a
0.8
4±
0.1
7b
5.5
7±
1.3
9c
4.0
1±
1.0
7c
0.9
8±
0.1
7b
Tra
ns-
nonac
hlo
r9.0
8±
1.7
3a,c
4.3
3±
0.5
6b
7.0
1±
0.4
2c
11.2
5±
1.7
1a,c
1.5
5±
0.9
5d
3.3
3±
0.6
7b
10.2
3±
1.9
9a,c
11.3
2±
2.2
6a
2.40 D
DE
2.3
0±
0.3
4a,e
1.9
0±
0.2
8c,e
3.4
9±
0.3
7a,c
,d4.4
4±
0.7
1a,d
1.3
3±
0.5
6e
2.3
5±
0.5
9e
10.8
8±
3.2
7b
4.5
4±
0.9
5b
,d
4.40 D
DE
?die
ldri
n19.3
6±
5.1
a,c
14.0
8±
2.7
c34.6
3±
2.7
1a,b
96.1
3±
24.5
9b
,e7.1
1±
4.6
8f
52.0
8±
9.7
9b
136.5
8±
30.0
3d
,e164.1
9±
33.4
3d
4.40 D
DD
2.4
8±
0.5
7a
1.3
2±
0.1
2a
6.4
8±
0.4
3b
14.2
3±
5.2
6b
1.9
6±
0.6
4a
10.0
9±
1.8
b43.4
6±
10.2
7c
50.8
7±
10.8
2c
2.40 D
DT
6.8
3±
1.7
2a
1.8
2±
0.3
9c
12.0
7±
0.1
8b
15.9
0±
2.7
9b
2.2
6±
1.7
7e
4.3
1±
0.9
1a
23.0
2±
4.8
1b
,d25.7
9±
5.3
5d
Sum
of
DD
Tan
dm
etab
oli
tes
7.7
4±
1.9
2a
4.7
9±
1.2
9a
14.3
82.6
8d
32.6
8±
9.7
0b
,d1.4
6±
0.2
6e
17.2
6±
4.8
3d
51.3
1±
11.5
7b
,c72.8
3±
15.8
c
Sum
of
all
OC
Ps
44.9
1±
9.7
9a,c
25.0
0±
3.2
9c
66.4
2±
3.2
a,e
145.9
7±
31.5
4b
,e16.4
5±
8.9
9f
76.0
7±
13.5
7a,e
228.6
0±
47.1
5b
,d261.4
0±
52.4
6d
For
each
countr
y,
the
four
site
sar
est
ore
din
agra
die
nt
of
conta
min
atio
n.
All
dat
aar
eex
pre
ssed
asm
ean
±S
E(n
=6
per
site
).M
eans
des
ignat
edw
ith
dif
fere
nt
lett
ers
are
signifi
cantl
ydif
fere
nt
(LS
Dte
st,
p\
0.0
5)
Transcriptome profile analysis reveals specific signatures
123
Gironde estuary: 45�12006.6200N 0�43034.7200O), and in the
Arcachon Bay, considered as a pristine environment (Certes:
44�4101800N 1�103900W). For all sites, temperature, salinity
and dissolved oxygen concentrations were measured.
All fish were collected between May 24 and June 24 of
2011, using a trawl, a fyke net or by electrical fishing. All
yellow eels were size selected to minimize potential
allometric bias. The total length of American and Euro-
pean eels (672.8 ± 38.55 and 482.04 ± 31.01 mm,
respectively; mean ± SE, n = 24) and weight
(811.42 ± 118.41 and 221.33 ± 34.06 g, respectively;
mean ± SE, n = 24) were recorded for each fish in order
to estimate the relative condition factor [Kn: (total weight
(g)/(0. 0004 9 (total length (cm))3.3828) 9 100], the
Hepato-Somatic Index [HSI: (weight liver/total
weight) 9 100] and spleen condition index [SSI: (spleen
weight/total weight) 9 100]. For each sampling region, a
total of 6 fish were collected and used for subsequent
analyses. Fish were dissected as soon as possible and
organs were divided into several samples. Samples for
gene transcription analyses were stored in RNA later at
-20 �C until needed. For both organic and metal analy-
ses, samples were stored at -80 �C.
Metal analyses
Metal analyses were determined from the kidneys, i.e. a main
organ of metal bioaccumulation (Barbier et al. 2005). Kidney
samples were freeze-dried in PFA vials (Savillex) and kept in
these vials during the whole digestion process. A 50 mg sub-
sample was taken after the freeze-drying step to perform the
mercury analysis. These sub-samples were processed in a
mercury analyser (Milestone DMA-80) and MESS-3 certi-
fied reference material (National Research Council Canada)
was used, with a recovery rate of 98.8 ± 2.5 %. The rests of
the samples were digested overnight at room temperature in
pure trace metal grade nitric acid (HNO3). The following day,
sample digestion was completed by autoclave (All American
25X-1) for 2 h at 15 PSI. Samples were then diluted in Milli-
Q water to obtain a final concentration of 10 % HNO3. Metal
concentrations for Ag, As, Cd, Cr, Cu, Ni, Pb and Zn were
measured by inductively coupled plasma–mass spectrometry
(ICP–MS; Thermo Scientific XSeries 2), inductively coupled
plasma–atomic emission spectrometry (ICP–AES; Varian
Vista AX) or both methods. Blanks and standards (TORT-2
and DOLT-4, National Research Council Canada) were
submitted to the same digestion protocol as kidney samples to
monitor the efficiency of the procedure. Recovery rates
(expressed as % of certified values) were: Ag = 80.2 ±
1.2 %; As = 106.5 ± 3.8 %; Cd = 102.9 ± 1.2 %; Cr =
90.8 ± 5.2 %; Cu = 88.8 ± 1.9 %; Ni = 86.1 ± 2.7 %;
Pb = 82.9 ± 26.0 %; Zn = 100.4 ± 1.6 %.
Organic pollutants analyses
Analysis of the seven indicator PCBs (CB50 ? 28, CB52,
CB101, CB118, CB138, CB153, and CB180), 14 OCPs
(hexachlorobenzene or HCB, lindane or c-HCH, dieldrin,
heptachlor, heptaclorepoxide, cis-chlordane, trans-nona-
chlor, mirex, and DDTs), and 4 PBDEs (BDE47, BDE99,
BDE119, and BDE153) were performed on muscle sam-
ples (following the procedures described by Tapie et al.
2008 and Tapie et al. 2011). PCB, PBDE and OCP analyses
were carried out on an HP 5890 series II gas chromato-
graph from Hewlett-Packard (Avondale, CA, USA) cou-
pled to a 63Ni electron capture detector (ECD). A capillary
column HP5-MS (Agilent Technologies, Massy, France)
was used (30 m 9 0.25 mm 9 0.25 lm).
As described by Labadie et al. 2010, POPs levels were
blank corrected and the method detection limit (LoD) was
derived from the blank value variability, For PCBs LoQs
were comprised between 0.2 and 2 ng/g dw; for OCPs they
were comprised between 0.1 and 0.4 ng/g dw; for PBDEs
they were comprised between 0.1 and 0.2 ng/g dw.
Preparation of cDNA libraries and contig assembly
For the transcriptomic sequencing, the liver was selected
due to its wide range of functions, including detoxification
and energy metabolism. For each sampling site (Quebec
and France), six biological replicates were used (n = 48
eels). Briefly, total RNAs were individually extracted from
fish liver using the PureLinkTM RNA mini kit (Invitrogen).
During this step, samples were submitted to DNAseI
treatment, according to the manufacturer’s instructions.
Then, preparation of cDNA libraries for Illumina
HiSeq 2000 sequencing was done using the TruseqTM
Stranded mRNA sample prep kit, following the manufac-
turer’s instructions. The 48 individually tagged libraries
were randomly pooled in equal amounts and sequenced on
4 lanes at the Genome Quebec innovation Center (McGill
University, Montreal, QC, Canada) using Illumina HiSeq
2,000 technology (100 bp paired-ends reads).
Base calling was performed using PyroBayes (Quinlan
et al. 2008) after trimming adapters. Each read was then
renamed according to its individual barcode. This barcode
and the potential primers used for cDNA amplification
were subsequently removed. To construct the transcrip-
tome, a consensus sequence of one step was used to per-
form the next. Therefore any sequencing errors have been
ignored because they have not been included in the con-
sensus sequence. Then the CLC Genomic Workbench 4.9
software was used to align the reads back against the
assembled transcriptome. A similarity of 0.98 and a length
fraction of 0.6 were used while leaving the other parame-
ters to their default values. The consensus sequence of each
L. Baillon et al.
123

de novo built contig was then used as a template for a
reference assembly under the same parameters. This sec-
ond round of assembly aimed at screening for additional
reads that were not included into contigs during the step of
de novo assemblies and excluding poor-quality contigs that
did not recruit any read during the reference assembly
procedure. To annotate these contigs based on similarity
with known proteins, they were blasted on both the
swissprot and nr protein databases using BLAST program.
Gene transcription was normalized by using RPKM
(Mortazavi et al. 2008) (Reads Per Kilobase per Million
mapped reads) before statistical analyses.
Real-time quantitative RT-PCR (RT-qPCR) validation
Eight genes that showed strong variations in their tran-
scription levels among sampling sites were quantified by
RT-qPCR on the same liver samples used for RNA-seq.
For each gene, specific primer pairs were determined (see
supplementary material Table S1) using the lightcycler
probe design software (Roche). RNAs were extracted from
30 mg of tissue using the SV total RNA isolation system
(Promega) according to the manufacturer’s instruction.
One lg of total RNAs was used for cDNA synthesis using
Goscript reverse transcriptase (Promega), oligodT primer
and random primers according to manufacturer’s instruc-
tions. Resulting cDNAs were diluted 2-fold for PCR
reactions. RT-qPCR reactions of 20 ll were performed in a
Stratagene Mx 3,000p system using Brilliant III Fast SYBR
Green QPCR Master Mix (Stratagene-Agilent) and 1 ll of
diluted cDNAs. The reaction specificity was determined for
each reaction from the dissociation curve of the PCR
product and electrophoresis. Data analysis was performed
using the b-actin gene as reference. Hence, during our
experiment, total RNAs were quantified and 1 lg was used
to be reverse-transcribed. During the subsequent qPCR
amplifications, the output cycle corresponding to the b-
actin was examined. This output cycle did not show sig-
nificant differences among fish, demonstrating the rele-
vance of the b-actin as reference gene in our conditions.
Statistical analyses
Concerning contaminant analyses, comparisons between
fish groups were performed by analysis of variance
(ANOVA), after checking assumptions of normality and
homoscedasticity of the error terms. The Least Square
Deviation test (LSD) was used to determine whether means
between pairs of samples were significantly different from
one another. Computations were performed using the sta-
tistical software Sigma Stat.
Due to the wide distribution area of eels and since
factors unique to each site but unrelated to metal or organic
contamination (e.g. temperature, salinity,…), can also
affect the gene transcription level, the FAMT approach was
adopted to increase statistical power between a variation in
the transcription level of an individual gene and the con-
tamination level of fish for a given contaminant. Thus, in
addition to contaminants, natural factors that showed sig-
nificant variations among sites (mainly temperature and
salinity) as well as some morphometric measurements
(length and weight) were added to the model in order to
remove, at least in part, genes for which transcription levels
could be more likely related to these factors rather than
with contaminants. Then, the variables such as pollutant
concentrations, condition indices (i.e. the relative condition
index (Kn), the hepato-somatic index (HSI) and the spleen
somatic index (SSI)) or physicochemical conditions of
sampling sites (i.e. temperature and salinity) were gathered
in a matrix made of independent observations from a
standard normal distribution. This model has been studied
in Friguet et al. (2009) and modified for our transcriptomic
data (for more information see Coudret 2013). By using
this test, we also controlled the False Discovery Rate
(FDR) over the set of contigs for a given variable. The R
package FAMT (Causeur 2011) allowed us to produce a p
value between a factor and contigs. For every studied
variables, we then introduced two thresholds di,1 and di,2
and we selected a contig according to the two thresholds. In
this way, the pvalue calculated between a given variable
and one contig had to satisfy the thresholds di,1 and p value
calculated between another variable for the same contig
had to satisfy the thresholds di,2. For each contig and each
variable, the b represents the correlation length (see sup-
plementary material for more details).
Results and discussion
Condition and contamination levels of eels
Morphometric measurements, conditions indices and con-
tamination levels of all eels and their difference among
sampling sites are presented in Table 1. Generally, the
highest levels of contamination in both metallic and
organic contaminants were observed in eels from France.
Significant increases in pollutant concentrations were
observed along the French gradient from Cer-
tes ? Dordogne ? Garonne ? Gironde. To a lesser
extent, we observed a contamination gradient from St.
Jean ? Sud-Ouest ? St. Francois ? St. Pierre for Que-
bec. Concerning metals, the highest variations were
observed for cadmium (Cd) and silver (Ag). For Cd, ani-
mals inhabiting the Gironde estuary were 112-fold more
contaminated than eels from Certes, i.e. the cleanest site in
France, and 11-fold superior to Lake St. Pierre, i.e. the
Transcriptome profile analysis reveals specific signatures
123
most contaminated site in Quebec. For Ag, eels from
Gironde were 338-fold superior to eels from Certes with
low concentrations of 3.4 ± 1.5 and 0.01 ± 0.001 ng g-1
respectively. Concerning organic pollutants, the highest
variations were observed for metabolites of DDT and
PCBs. For Gironde, eels were 56 and 2.3-fold more con-
taminated than eels from Certes and St Pierre Lake,
respectively. For PCBs, eels from Gironde were 24-fold
more contaminated than eels from Certes and 10.6-fold
more contaminated than eels from St Pierre Lake. These
high contamination pressures in Gironde were associated
with a poor health status of eels. Eels from Gironde pre-
sented the lowest values for Kn, HSI and SSI in compari-
son to eels from the other French sites.
RNA-seq data
RNA-seq generated 2.7 billion fragments averaging 75
bases in length. The assembly of these reads generated a
total of 54,140 contigs, 95 % of the contigs were longer
than 200 bp and 11.7 % were longer than 1,000 bp. A total
of 18,115 contigs showed high homology with known
sequences (BLASTX, Evalue B 10-10). A total of 11,547
unique genes of known function were identified (i.e. mul-
tiple contigs that had the same annotation were removed).
To validate the sequencing data, the transcriptional level
of 8 genes that showed strong variations in their tran-
scription levels among sampling sites was measured by
RT-qPCR method. These two independent measures, by
RNA-seq and RT-qPCR, of transcript abundance gave
consistent results, i.e. transcription data obtained by these
two methods were significantly correlated (p \ 0.0001 for
all of genes tested; see supplementary material table S2).
Quantitative influence of factors on eel’s transcriptome
In order to get an overview of the effects of natural and
anthropogenic factors on the transcriptome profiles of
eels, we first used the FAMT method with low stringency
thresholds: di,1 = 0.009 and di,2 = 0. From the 11,547
unique genes, the transcription level of 1,523 single genes
of known function was significantly correlated with pol-
lutants or natural factors. We then counted how many
contigs were linearly linked with each of the n = 19
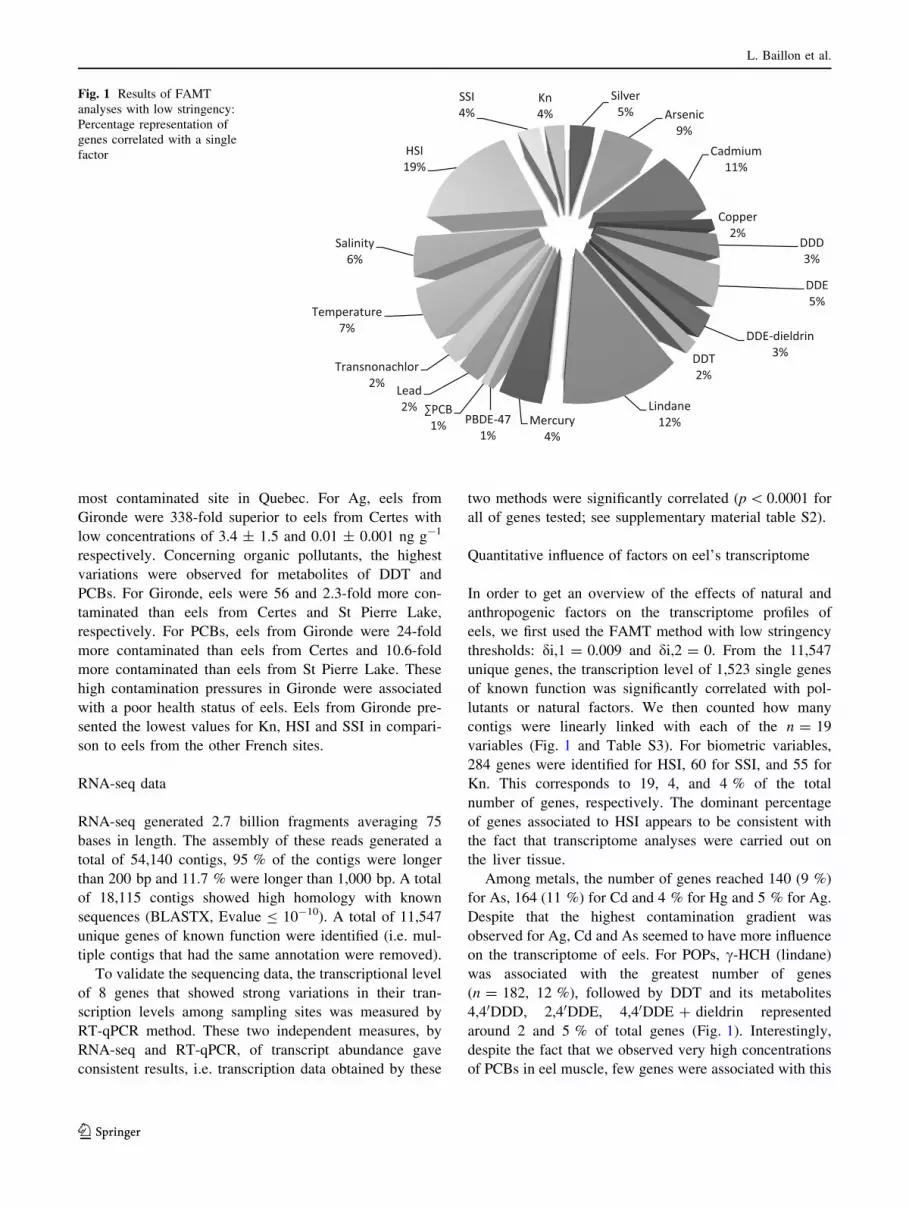
variables (Fig. 1 and Table S3). For biometric variables,
284 genes were identified for HSI, 60 for SSI, and 55 for
Kn. This corresponds to 19, 4, and 4 % of the total
number of genes, respectively. The dominant percentage
of genes associated to HSI appears to be consistent with
the fact that transcriptome analyses were carried out on
the liver tissue.
Among metals, the number of genes reached 140 (9 %)
for As, 164 (11 %) for Cd and 4 % for Hg and 5 % for Ag.
Despite that the highest contamination gradient was
observed for Ag, Cd and As seemed to have more influence
on the transcriptome of eels. For POPs, c-HCH (lindane)
was associated with the greatest number of genes
(n = 182, 12 %), followed by DDT and its metabolites
4,40DDD, 2,40DDE, 4,40DDE ? dieldrin represented
around 2 and 5 % of total genes (Fig. 1). Interestingly,
despite the fact that we observed very high concentrations
of PCBs in eel muscle, few genes were associated with this
Silver 5% Arsenic
9% Cadmium
11%
Copper 2%
DDD 3%
DDE 5%
DDE-dieldrin 3% DDT
2%
Lindane 12% Mercury
4% PBDE-47
1% 1%
Lead 2%
Transnonachlor 2%
Temperature 7%
Salinity 6%
HSI 19%
SSI 4%
Kn 4%
Fig. 1 Results of FAMT
analyses with low stringency:
Percentage representation of
genes correlated with a single
factor
L. Baillon et al.
123
contaminant. In contrary, numerous genes were associated
with lindane whereas it was found weakly accumulated in
eels. Temperature and salinity were respectively linked
with 6 and 5 % of genes. Since they are essential factors
controlling the food intake and growth rates in fish, it is
quite surprisingly that these two factors were less repre-
sented than pollutants. This could suggest that contami-
nants have more influence on the liver transcriptome of eels
than temperature, which could be related to the fact that the
liver is a major target of pollutant metabolism, accumula-
tion and toxicity.
Genes associated with several factors
The aim of the present study was to unravel the effects
engendered by anthropogenic or natural factor in wild
organisms. However, it was also interesting to study genes
that were associated with several factors. They could
indeed represent genes that are involved in a more general
stress response and that could be used to assess the general
health status of animals. Among genes highlighted by the
FAMT analysis, 57 were significantly associated with four
or more factors (Table S3). Surprisingly, no genes that are
known to respond to oxidative stress or metal toxicity, such
as metallothionein or heat shock proteins, were found
among the 57 genes. However, a significant correlation was
observed for the metalloreductase STEAP4 gene. This gene
encodes for a protein located in the Golgi apparatus and
that is involved in Fe3? and Cu2? reduction. This gene was
negatively associated with Hg, Cd, As and Ag. Moreover,
three genes encoding for zinc finger proteins (zinc finger
and BTB domain-containing protein 12, zinc finger protein
ZPR1, zinc finger MYM-type protein 2) showed significant
correlations with salinity, temperature, As, Cd or lindane.
Zinc finger proteins are known to be important targets of
metals like Cd, Ni or Co. Interactions of these proteins with
metals can induce change in either their structure or
function (Hartwig 2001). Thus, our results suggest a
potential effect of as, Cd and lindane on these proteins.
This could lead to disorders in gene transcription, cell
growth or DNA repair (Hartwig 2001). Moreover, in the
present results, numerous genes involved in gene tran-
scription regulation and RNA processing such as the his-
tone-lysine N-methyltransferase SETD1B-A, mediator of
RNA polymerase II transcription subunit 6 gene, ribosomal
RNA methyltransferase NOP2 and ribosomal RNA small
subunit methyltransferase NEP1 genes showed significant
correlations not only with some metals and organic com-
pounds but also with salinity and/or temperature. The fact
that some metals or organic pollutants can induce changes
in the transcription level of genes that are also regulated by
natural factors such as temperature or salinity suggest that
chronic exposure to pollutants could impair the adaptive
response developed by fish to curb with variations in nat-
ural factors (Lapointe et al., 2011).
Genes associated with arsenic, cadmium, lindane
and HSI
As HSI, As, Cd and c-HCH were linked with the greatest
number of contigs in their respective group (i.e. condition
indices, metal and organic pollutants), we then focused our
investigations on these variables. To do this, we re-ana-
lyzed our data by the FAMT method but by using more
restrictive thresholds (see Table 2 and Table S4 for more
details). The aim of this approach was to identify genes that
are most likely to be related to a single variable.
Hepato-somatic index
The hepato-somatic index (HSI) is a useful and robust
index commonly used to estimate the energy status of fish
(Chellappa et al. 1995). This parameter was incorporated in
our FAMT model in order to identify genes that could
represent biomarkers of the general health status of fish.
The transcription level of 14 genes (Table 2) showed
significant correlations with the HSI of fish. Among these
genes, 4 genes encode for ribosomal proteins, i.e. 60S
ribosomal protein L5 (rpl5), 40S ribosomal protein S29
(rps29), 60S ribosomal protein L23 (rpl23) and ubiquitin-
60S ribosomal protein L40 (uba52). Interestingly, the
transcription level of these genes was found to increase or
decrease with increasing fish HSI. This could be linked, at
least in part, to the fact that these genes are not only
involved in protein translation but also in cell cycle by
regulating the accumulation of the p53 protein in cell (Horn
and Vousden 2008; Lee et al. 2012). The p53 protein is
involved in cell cycle arrest and apoptosis. In this view, it is
interesting to note that increasing fish HSI were signifi-
cantly correlated with a drastic and similar decrease in rpl5
(b = -2.82) and glioma tumor suppressor candidate
region gene 2 protein (gltscr2, b = -2.10) transcription
levels. Both gltscr2 and rpl5 genes are involved in the
ribosomal protein-Mdm2-p53 pathway. Its activation is
known to induce p53 stabilization. Moreover, recent dis-
coveries tend to show that this pathway could play a pivotal
role in cellular energy homeostasis, the ribosomal protein-
Mdm2-p53 pathway serving as a molecular metabolizing
switch to direct nutrient utilization in an effort to promote
cell survival (Deisenroth and Zhang 2011). Our results
could suggest an important role of ribosomal proteins as
well as the ribosomal protein-Mdm2-p53 pathway in liver
development and hepatic accumulation of energy reserves.
Another potential marker of cell division and hepatic
growth is the gene encoding for thioredoxin (txn). The
Transcriptome profile analysis reveals specific signatures
123
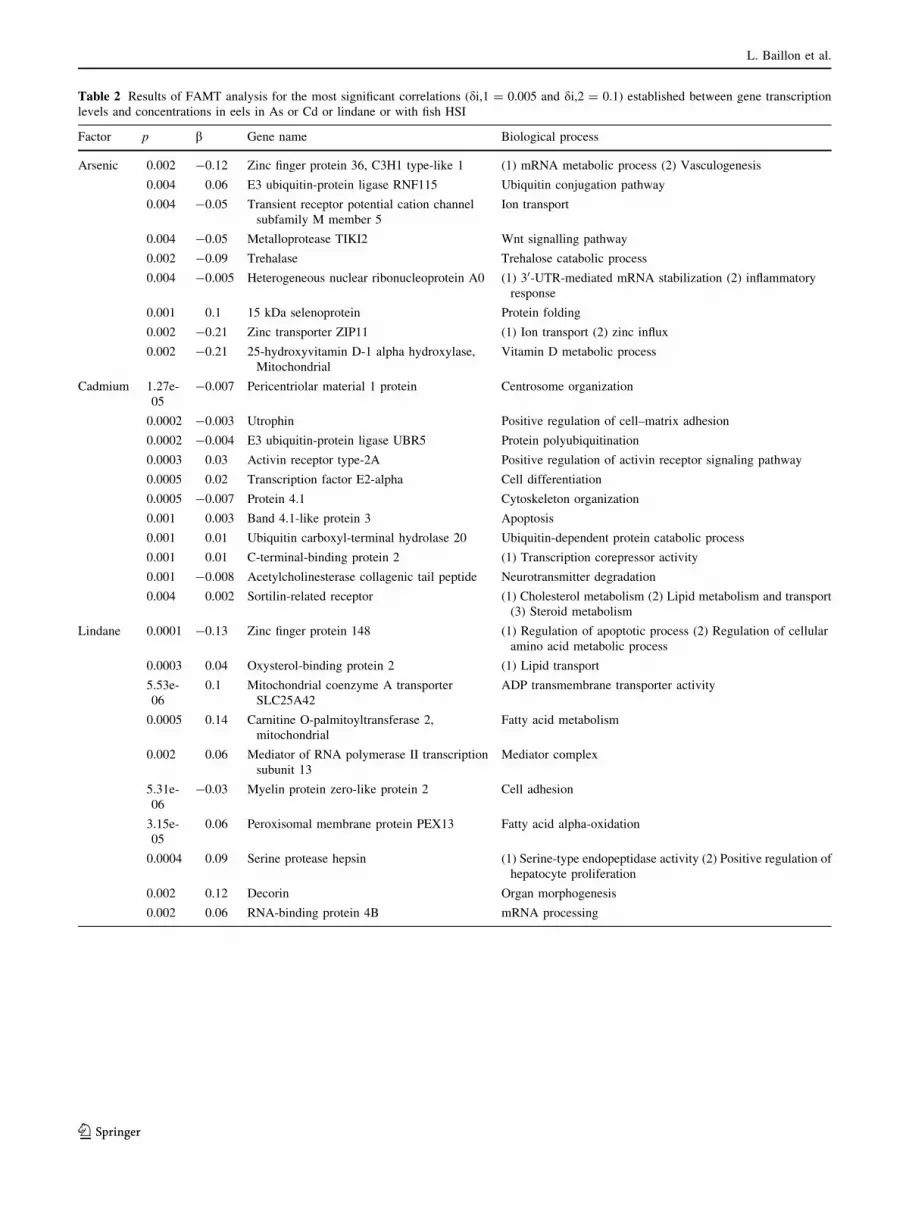
Table 2 Results of FAMT analysis for the most significant correlations (di,1 = 0.005 and di,2 = 0.1) established between gene transcription
levels and concentrations in eels in As or Cd or lindane or with fish HSI
Factor p b Gene name Biological process
Arsenic 0.002 -0.12 Zinc finger protein 36, C3H1 type-like 1 (1) mRNA metabolic process (2) Vasculogenesis
0.004 0.06 E3 ubiquitin-protein ligase RNF115 Ubiquitin conjugation pathway
0.004 -0.05 Transient receptor potential cation channel
subfamily M member 5
Ion transport
0.004 -0.05 Metalloprotease TIKI2 Wnt signalling pathway
0.002 -0.09 Trehalase Trehalose catabolic process
0.004 -0.005 Heterogeneous nuclear ribonucleoprotein A0 (1) 30-UTR-mediated mRNA stabilization (2) inflammatory
response
0.001 0.1 15 kDa selenoprotein Protein folding
0.002 -0.21 Zinc transporter ZIP11 (1) Ion transport (2) zinc influx
0.002 -0.21 25-hydroxyvitamin D-1 alpha hydroxylase,
Mitochondrial
Vitamin D metabolic process
Cadmium 1.27e-
05
-0.007 Pericentriolar material 1 protein Centrosome organization
0.0002 -0.003 Utrophin Positive regulation of cell–matrix adhesion
0.0002 -0.004 E3 ubiquitin-protein ligase UBR5 Protein polyubiquitination
0.0003 0.03 Activin receptor type-2A Positive regulation of activin receptor signaling pathway
0.0005 0.02 Transcription factor E2-alpha Cell differentiation
0.0005 -0.007 Protein 4.1 Cytoskeleton organization
0.001 0.003 Band 4.1-like protein 3 Apoptosis
0.001 0.01 Ubiquitin carboxyl-terminal hydrolase 20 Ubiquitin-dependent protein catabolic process
0.001 0.01 C-terminal-binding protein 2 (1) Transcription corepressor activity
0.001 -0.008 Acetylcholinesterase collagenic tail peptide Neurotransmitter degradation
0.004 0.002 Sortilin-related receptor (1) Cholesterol metabolism (2) Lipid metabolism and transport
(3) Steroid metabolism
Lindane 0.0001 -0.13 Zinc finger protein 148 (1) Regulation of apoptotic process (2) Regulation of cellular
amino acid metabolic process
0.0003 0.04 Oxysterol-binding protein 2 (1) Lipid transport
5.53e-
06
0.1 Mitochondrial coenzyme A transporter
SLC25A42
ADP transmembrane transporter activity
0.0005 0.14 Carnitine O-palmitoyltransferase 2,
mitochondrial
Fatty acid metabolism
0.002 0.06 Mediator of RNA polymerase II transcription
subunit 13
Mediator complex
5.31e-
06
-0.03 Myelin protein zero-like protein 2 Cell adhesion
3.15e-
05
0.06 Peroxisomal membrane protein PEX13 Fatty acid alpha-oxidation
0.0004 0.09 Serine protease hepsin (1) Serine-type endopeptidase activity (2) Positive regulation of
hepatocyte proliferation
0.002 0.12 Decorin Organ morphogenesis
0.002 0.06 RNA-binding protein 4B mRNA processing
L. Baillon et al.
123

transcription level of txn was positively associated with fish
HSI (b = 1.54). The TXN protein is known to play an
important role in cell viability by inducing cell prolifera-
tion and increasing cell lifetime (Yoshida 2005). The
transcription levels of 2 other genes involved in protein
metabolism were found to be positively correlated with fish
HSI. These genes, i.e. proteasome activator complex sub-
unit 2 (psme2) and cathepsin B (ctsb), encode proteins that
are responsible for proteolysis (Min et al. 2013; Mohamed
and Sloane 2006). Cathepsin B is known to play a key role
in protein turnover (Mohamed and Sloane 2006).
In addition to genes involved in protein metabolism and
cell division, significant correlations were observed with
genes that encode proteins involved in lipid and iron
metabolism. The two genes involved in lipid metabolism,
i.e. Acyl-CoA-binding protein (acbp) and Ethanolamine-
phosphotransferase 1 (ept1), were negatively correlated
with fish HSI (b = -0.10 and b = -0.96, respectively).
The EPT1 protein catalyzes the biosynthesis of phospha-
tidylethanolamine (PE), i.e. a major phospholipid (Gibel-
lini and Smith 2010). It is somewhat surprising that an
increase in fish HSI was associated with a decrease in ept1
transcription level. This could be linked to the fact that PE
is the precursor of many biologically active molecules such
as pro-apoptotic substances (Gibellini and Smith 2010).
The ACBP protein has been shown to act as intracellular
acyl-CoA pool former, transporter and regulator of gene
transcription (Oikari et al. 2008). In a recent study,
overexpression of acbp in transgenic rats was found to
trigger a down-regulation of peroxisome proliferator-acti-
vated receptor c and sterol regulatory element-binding
protein-1 gene transcription levels, i.e. metabolic regulators
involved in lipogenesis and lipid synthesis (Oikari et al.
2008). Thus, a decrease in acbp transcription level could
indicate lipid storage. Finally, an increase in fish HSI was
associated with an up-regulation of genes involved in both
iron secretion and influx, i.e. hephaestin-like protein 1
(hephl1) and putative ferric-chelate reductase 1(frrs1),
respectively. Such results appear consistent with the fact
that iron plays a key role in cellular respiration and energy
metabolism. This is also consistent with the fact that fish
liver plays a central role in iron metabolism and hemo-
globin turn-over (Graham and Chua 2007).
In summary, our results showed that an increase in fish
HSI is associated with changes in the transcription level of
genes involved in several biological pathways including
cell division, protein turnover, lipid metabolism and iron
transport.
Arsenic
The FAMT method with highly restrictive thresholds
allowed us to identify 9 genes for which transcription
levels were significantly correlated with the As content of
eels. The majority of these genes, i.e. 7 genes (Table 2),
were found to be down-regulated and 2 genes were up-
Table 2 continued
Factor p b Gene name Biological process
HSI 0.004 -2.10 Glioma tumor suppressor candidate region
gene 2 protein
/
0.003 -2.82 60S ribosomal protein L5 Translation
0.003 0.51 40S ribosomal protein S29 Translation
1.29e-
06
1.93 Putative ferric-chelate reductase 1 Electron transport chain
0.005 0.86 Cathepsin B Proteolysis
0.004 0.98 60S ribosomal protein L23 Translation
0.002 -0.93 Ubiquitin-60S ribosomal protein L40 (1) Translation (2) DNA repair (3) G1/S transition of mitotic
cell cycle
0.004 -0.96 Ethanolaminephosphotransferase 1 Phospholipid biosynthesis
0.002 0.63 Hephaestin-like protein 1 Iron homeostasis
0.0009 0.13 Transmembrane channel-like protein 7 Ion transport
0.003 1.01 UDP-N-acetylglucosamine–dolichyl-
phosphate
Protein glycosylation
N-acetylglucosaminephosphotransferase
0.001 1.54 Thioredoxin (1) Cell redox homeostasis (2) Cell proliferation
0.0005 1.08 Proteasome activator complex subunit 2 Proteasome activator complex
0.004 -0.10 Acyl-CoA-binding protein Triglyceride metabolic process
Transcriptome profile analysis reveals specific signatures
123
regulated. These 2 up-regulated genes, i.e. E3 ubiquitin-
protein ligase RNF115 (Rnf115) and 15 kDA selenoprotein
(sep15), are involved in protein metabolism. RNF115 is an
ubiquitin-protein involved in the ubiquitination pathway
and proteolysis (Burger et al. 2006). SEP15 is involved in
the quality control of protein folding and in the endoplas-
mic reticulum stress response (Labunskyy et al. 2007).
Such a pattern could be linked to the fact that As is well
known to interfere with protein folding, leading to accu-
mulation of protein aggregates in cell (Martın-Pardillos
et al. 2013). The up-regulation of these genes could aim to
limit the accumulation of unfolded proteins in cell in
response to As exposure. Interestingly, among the down-
regulated genes, numerous genes are involved in biological
functions that are known to be involved in the vasculo-
toxicity of As in mammals. The various mechanisms that
have been observed during As vasculotoxicity include
endoplasmic reticulum stress (as described above), apop-
tosis, oxidative stress, inflammatory mediators and vasular
smooth muscle cells (VSMC) calcification (Martın-Pardil-
los et al. 2013). Thus, a down-regulation of the heteroge-
neous nuclear ribonucleoprotein A0 (HNRPA0) gene that
encodes a protein involved in the inflammatory response by
controlling cytokine synthesis was observed in As-con-
taminated fish. The zinc finger protein 36 (zfp36l1) that is
known to be involved in vasculogenesis (Bell et al. 2006)
was also found to be down-regulated. The metalloprotease
TIKI2 (trabd2) gene was down-regulated in eels exposed to
As. Trabd2 encodes for a protein that antagonizes the Wnt
signaling pathway (Clevers and Nusse 2012). Recent works
have shown that Wnt signaling pathway activation can
tigger calcification of VSMCs (Martınez-Moreno et al.
2012). We also observed a decrease of threhalase gene
transcription level. This gene encodes for an enzyme that
hydrolyses trehalose. Trehalose is a disaccharide known to
protect membranes in case of extreme environmental
conditions (Higashiyama 2002). Moreover, in osteoporosis
mice model, trehalose has been shown to decrease the
development of osteoporosis (Higashiyama 2002). In the
same way, it is interesting to note that we observed a strong
effect of As on the transcription of 25-hydroxyvitamin D-1
alpha hydroxylase gene (cyp27b1). This gene encodes an
enzyme that synthetizes the active form of vitamin D3
(Rowling et al. 2007). Vitamin D3 under its active form
acts as a hormone that controls growth and bone remod-
eling. In this context, we must note that VSMCs calcifi-
cation during As exposure in rats was found to be
accelerated by intraperitoneal injection of vitamin D3
(Martın-Pardillos et al. 2013). We could thus hypothesize
that the down-regulation of cyp27b1 could aim to protect
the hepatic vasculatory system against calcification. Two
last genes involved in ion transport were found down-
regulated in response to As exposure, the zinc transporter
ZIP11 (slc39a11) and transient receptor potential cation
channel subfamily M member 5 (trpm5), suggesting an
effect of As on cellular homeostasis. To conclude, it is
interesting to pinpoint that many mechanisms that have
been reported in mammals during As vasculotoxicity are
affected in fish chronically exposed to As, thus suggesting
that the hepatic vascular system could be a main target of
As toxicity in wild fish.
Cadmium
Among genes that showed significant correlations with Cd
concentrations in fish, 5 genes were found to be down-
regulated and 6 were found to be up-regulated.
Among down-regulated genes (Table 2), two genes
involved in acetylcholine metabolism were identified. First,
our results showed that Acetylcholinesterase collagenic tail
peptide (colq) was down-regulated by Cd exposure. This
gene encodes for a protein that anchors the catalytic sub-
units of asymetric acetylcholinesterase (AChE) to the
synaptic basal lamina (Deprez et al. 2003). This down-
regulation of colq could be linked to the down-regulation
of another gene, i.e. utrophin (utrn; b = -0.003). UTRN is
indeed found in postsynaptic cell membrane where it is
involved in the clustering of acetylcholine receptors
(Campanelli et al. 1994). As a down-regulation or a
decreased activity of AChE is a well-known biomarker of
liver damage (Xing et al. 2012), our results could suggest
that chronic Cd exposure is responsible for liver damage in
wild eels.
Interestingly, such biomarkers of tissue damage were
associated with changes in the transcription level of genes
involved in cell cycle regulation and apoptosis. First, the
activin receptor type-2A (acvr2a) gene that encodes a
receptor complex for Activin A protein was found to be up-
regulated in Cd-contaminated fish (b = 0.03). Activin A
protein is a member of the transforming growth factor-bsuper family (Letterio and Roberts 1998).These factors are
known to be important mediators of apoptosis in liver
(Rodgarkia-Dara et al. 2006). Such a result is consistent
with the up-regulation (b = 0.003) of the Band 4.1-like
protein 3 (epb41l3) gene. This gene encodes a protein that
inhibits cell proliferation and induces apoptosis (Li et al.
2011). In addition, the pericentriolar material 1 protein
gene (pcm1) was found to be down-regulated in Cd-con-
taminated fish. PCM1 is known to be responsible for the
correct localization of several centrosomal proteins that are
required for regulation of centrosome structure at the G2/M
transition and thus, for cell division (Hames and Crookes
2005). Cd contamination seems to affect genes involved in
cell division and particularly mechanisms that are respon-
sible to cell cycle arrest. Our results could indicate that
chronic Cd exposure represses hepatocyte division. This
L. Baillon et al.
123
hypothesis is further supported by the fact that Cd con-
tamination was also associated with an up-regulation of the
C-terminal binding protein 2 gene (ctbp2). CtBPs are
transcriptional co-repressors acting via epigenetic mecha-
nisms and more precisely by recruiting histone deacetylase
and histone methyltransferase (Kim et al. 2005). It has been
shown that these proteins serve as energy sensing-repres-
sor. Their activation by low energy or NADH levels leads
to repression of gene transcription and particularly to the
down-regulation of genes involved in cell division. In this
view, it is interesting to note that our results also showed
that Cd exposure affects the transcription of genes involved
in lipid transport and protein metabolism. Cd contamina-
tion was associated with an increase of sortilin-related
receptor (sorl1) gene transcription level, a multifunctional
endocytic receptor that is involved in the uptake of lipo-
proteins and proteases from plasma. This enzyme notably
presents a high affinity for apoE-rich lipoproteins and b-
VLDL (Taira et al. 2011). Such an increase could appear in
accordance with previous results obtained by Pierron et al.
2007 who reported a significant increase in lipolysis and
energy needs in the liver of eels experimentally exposed to
dissolved Cd at 5 lg L-1 during 30 days. Finally, two
genes encoding enzymes involved in ubiquitin conjugation
pathway were also affected by Cd contamination. The gene
E3 ubiquitin-protein ligase UBR5 (ubr5) which encodes a
protein responsible for protein ubiquitination and thus to
their degradation by the proteasome (Ernst et al. 2011), was
found to be down-regulated in response to metal contam-
ination. In contrast, the ubiquitin carboxyl terminal
hydrolase 20 gene (usp20) that encodes an enzyme that
leads to protein deubiquitination was found to be up-reg-
ulated. This could potentially limit protein turnover and
thus limit energy expenditure. It is interesting to note that a
similar pattern was reported in wild yellow perch (Perca
flavescens) chronically exposed to Cd pollution (Pierron
et al. 2011). Using RNA-seq, authors hypothesized that
chronic Cd exposure leads to energy restriction and to the
activation of epigenetic mechanisms responsible for gene
silencing, notably on genes involved in lipid and protein
metabolism.
Lindane
First, two genes involved in transcription (Table 2), i.e.
mediator of RNA polymerase II transcription subunit 13
(med13) and RNA-binding protein 4B (rbm4b), were both
up-regulated at the same level (b = 0.06) in c-HCH con-
taminated-fish. Med13 encodes a transcriptional co-acti-
vator that is required for the expression of all RNA
polymerase II-dependent genes (Zhang et al. 2005).
RBM4B is involved in mRNA processing (Lin et al. 2012).
Up-regulation of these two genes could indicate a general
increase in cell transcriptional activity.
This potential increase in transcriptional activity was
coupled with an up-regulation of several genes involved in
lipid catabolism. Indeed, our results showed an up-regu-
lation of the carnitine-O-palmitoyltransferase 2 (cpt2) and
mitochondrial coenzyme A transporter SLC 25A42
(slc25a42) genes. These genes encode for enzymes
involved in mitochondrial fatty acid b-oxidation (Kang
et al. 2007). Moreover, these up-regulations were associ-
ated to an up-regulation of the peroxisomal membrane
protein PEX13 gene (pex13; b = 0.06). This gene encodes
for a protein that is involved in the peroxisomal degrada-
tion of long chain fatty acids (Mannaerts 2000). Because
mitochondrial b-oxidization can only use short and median
fatty acids to generate energy (Mannaerts 2000), the up-
regulation of pex13 could contribute to provide to mito-
chondria short fatty acids via degradation of long fatty
acids. It is interesting to note that oxysterol-binding protein
2 (osbp2), involved in lipid transport and cholesterol
metabolism, was also up-regulated. Thus, our results tend
to show that chronic exposure to c-HCH triggers an
increased lipolysis and energy production in eels. Such a
result is consistent with a previous study carried out on
Daphnia magna which showed that exposure to sub-lethal
concentrations of c-HCH triggers an increase in the Kreb’s
cycle activity (De Coen et al. 2001). These up-regulations
of transcriptional activity and energy metabolism were
further associated with changes in the transcription level of
genes that are known to be involved in tumorigenesis. First,
the gene serine protease hepsin (hpn) was found to be up-
regulated. This gene encodes for a protein that plays an
essential role in cell growth (Nakamura et al. 2008). This
gene is known to have prominent expression in human
liver, prostate and ovarian tumors (Herter et al. 2005). Such
a potential role of c-HCH in tumorigenesis in eel liver is
further supported by the significant decrease in zinc-finger
protein 148 (znf148) gene transcription level in c-HCH-
contaminated fish. This gene presents anti-tumor properties
when over-expressed in hepatocellular carcinoma by
increasing apoptotic processes (Zhang et al. 2012). Fur-
thermore, it is noteworthy that a gene encoding a protein
involved in hemophilic cell–cell adhesion, the myelin
protein zero-like protein 2 gene (mpzl2) was also down-
regulated. A loss of hemophilic cell–cell adhesion mole-
cules induces signals promoting cell proliferation and
migration and thus, tumor progression (Craig and Brady-
Kalnay 2011). In contrast, a gene described to have a tumor
suppressor role in colorectal cancers and in malignant
thyroid tumors (Mlakar et al. 2009; Arnaldi et al. 2005), i.e.
the decorin gene (dcn), was up-regulated in our findings
(b = 0.12). We must note however that the primary role of
dcn is to control extracellular matrix assembly. DCN is
Transcriptome profile analysis reveals specific signatures
123
known to be expressed during hepatic fibrosis (Baghy and
Laszlo 2010). This could be in accordance with a study that
reported hepatic fibrosis in several fish species exposed to
accidental discharge of c-HCH (Ortiz et al. 2003). To
conclude, our results show that chronic c-HCH exposure is
associated with an up-regulation of global transcriptional
activity and lipolysis. This up-regulation of cellular
metabolism was further associated with changes in the
transcription level of genes involved in tumorogenesis,
suggesting that c-HCH could lead to cancer development
in eels. This tumor promoter role of c-HCH had already
been described in fish by Kroll et al. (1999). An alternative
hypothesis would be that this increase in cellular metabo-
lism and cell proliferation are signs of liver regeneration
(King and Newmark 2012). Indeed, c-HCH was reported to
trigger hepatocyte necrosis in fish (Ortiz et al. 2003).
Conclusion
Our approach allowed us to establish significant relation-
ships between the hepatic expression levels of specific
transcripts and the concentrations of individual contami-
nants measured in fish. The aim was to identify some genes
that are more likely related to a given factor. The genes
identified for each anthropogenic or natural factor were
involved in numerous and common biological processes.
For example, fish HSI and Cd contamination were associ-
ated with changes in the transcription levels of genes
involved in the p53 signaling pathway and in the lipid and
protein metabolism, suggesting an effect of Cd on the
hepatic energy metabolism. In this view, it is interesting to
note that some discrepancies appear between our work and
previous field transcriptomic studies. For example, in the
studies carried out by (Pujolar et al. 2012, 2013), during
which the transcriptome of eels from a clean site was
compared with the transcriptome of eels from polluted sites
by means of DNA microarray, significant changes in the
transcription level of genes involved in detoxification, in
the fight against oxidative stress and in the general stress
response (e.g. metallothioneins, heat shock proteins) were
observed. Such genes have not been highlighted in our
study. This could be linked to the fact that our statistical
approach (i.e. FAMT analysis) aimed to eliminate as much
as possible genes for which transcription levels are corre-
lated with several factors. However, such genes are known
to vary in response to many factors, including both
anthropogenic (including both metals and organic pollu-
tants) and natural (e.g. temperature, hypoxia, age..) (Bœuf
and Payan 2001; Podrabsky and Somero 2004) factors. Our
study thus proposes an alternative method that could give
more specific ‘‘signatures’’ of exposure. Further studies are
however required at the protein level to test whether such
variations in gene transcription levels are associated with
adverse effects in eels and to deepen our understanding
about the mechanisms of toxicity of pollutants in wild
contaminated fish.
Acknowledgments We wish to acknowledge the contributions of
our support staff, without whom this study could not have been
completed. First, we would like to thank all the personnel of INRS-
ETE and UMR EPOC (University of Bordeaux) who participated in
the field sampling, and also Patrick Girard and Pierre Elie for veter-
inary expertise. We would thank Charline Gesset for technical
assistance. This work was supported by the ANR-CRSNG IMMOR-
TEEL (ANR-10-INTB-1704) and by Aquitaine region (GAGILAU
and MICANG projects). Lucie Baillon was supported by a collabo-
rative doctoral fellowship between the University of Bordeaux
(France) and the University of Laval (Quebec, Canada).
Conflict of interest The authors declare that they have no conflict
of interest.
References
Arnaldi L, Borra R, Maciel R, Cerruti J (2005) Gene expression
profiles reveal that DCN, DIO, and DIO2 are underexpressed in
benign and malignant thyroid tumors. Thyroid 15(3):210–221
Baghy KK, Laszlo V (2010) Ablation of the decorin gene enhances
experimental hepatic fibrosis and impairs hepatic healing in
mice. Lab Invest 91:439–451
Barbier O, Jacquillet G, Tauc M, Cougnon M, Poujeol P (2005) Effect
of heavy metals on, and handling by, the kidney. Nephron
Physiol 99:105–110
Bell SE, Sanchez MJ, Spasic-Boskovic O, Santalucia T, Gambardella
L, Burton GJ, Murphy JJ, Norton JD, Clark AR, Turner M
(2006) The RNA Binding Protein Zfp36l1 Is Required for
Normal Vascularisation and Post-transcriptionally Regulates
VEGF Expression. Dev Dyn 235:3144–3155
Belpaire C, Goemans G (2007) Eels: contaminant cocktails pinpointing
environmental contamination. ICES J Mar Sci 64(7):1423–1436
Bœuf G, Payan P (2001) How should salinity influence fish growth?
Comp Biochem Physiol C 130:411–423
Burger A, Amemiya Y, Kitching R, Seth AK (2006) Novel RING E3
ubiquitin ligases in breast cancer. Neoplasia 8(8):689–695
Campanelli JT, Roberds SL, Campbell KP, Scheller RH (1994) A role
of dystrophin-associated glycoproteins and utrophin in agrin-
induced AChR clustering. Cell 77:663–674
Causeur D (2011) Factor analysis for multiple testing (famt): an r
package for large-scale significance testing under dependence.
J Stat Softw 40(14):1–19
Chellappa S, Huntingford FA, Strang RHC, Thomson RY (1995)
Condition factor and hepatosomatic index as estimates of energy
status in male three-spined stickleback. J Fish Biol 47(5):775–787
Clevers H, Nusse R (2012) Wnt/b-catenin signaling and disease. Cell
149(6):1192–1205
Coudret R (2013) Stochastic modelling using large data sets:
applications in ecology and genetics. PhD. Dissertation, Bor-
deaux 1 University, Bordeaux
Craig SEL, Brady-Kalnay SM (2011) Cancer cells cut homophilic cell
adhesion molecules and run. Cancer Res 71(2):303–309
De Coen W, De Janssen C, Segner H (2001) The use of biomarkers in
Daphnia magna toxicity testing V. In vivo alterations in the
carbohydrate metabolism of Daphnia magna exposed to suble-
thal concentrations of mercury and lindane. Ecotoxicol Environ
Safe 48:223–234
L. Baillon et al.
123
de Lafontaine Y, Gagnon P, Cote B (2010) Abundance and individual
size of American eel (Anguilla rostrata) in the St. Lawrence
River over the past four decades. Hydrobiologia 647:185–198
Deisenroth C, Zhang Y (2011) The ribosomal protein-Mdm2-p53
pathway and energy metabolism bridging the gap between feast
and famine. Genes Cancer 2(4):392–403
Deprez P, Inestrosa NC, Krejci E (2003) Two different heparin-
binding domains in collagen tail subunit of synaptic the triple-
helical domain of ColQ, the acetylcholinesterase. J Biol Chem
278:23233–23242
Durrieu G, Maury-Brachet R, Girardin M (2005) Contamination by
heavy metals (Cd, Zn, Cu, and Hg) of eight fish species in the
Gironde estuary (France). Estuaries 28(4):581–591
Ernst R, Claessen JHL, Mueller B, Sanyal S, Spooner E, van der Veen
AG et al (2011) Enzymatic blockade of the ubiquitin-proteasome
pathway. PLoS Biol 8(3):e1000605
Friguet C, Kloareg M, Causeur D (2009) A factor model approach to
multiple testing under dependence. J Am Stat Assoc
104(488):1406–1415
Geeraerts C, Belpaire C (2010) The effects of contaminants in
European eel: a review. Ecotoxicology 19:239–266
Gibellini F, Smith TK (2010) The kennedy pathway de novo synthesis
of phosphatidylethanolamine and phosphatidylcholine. IUBMB
Life 62(6):414–428
Graham R, Chua A (2007) Liver iron transport. World J Gastroenterol
13(35):4725–4736
Hames R, Crookes R (2005) Dynamic recruitment of Nek2 kinase to
the centrosome involves microtubules, PCM-1, and localized
proteasomal degradation. Mol Biol Cell 16:1711–1724
Hartwig A (2001) Zinc finger proteins as potential targets for toxic
metal ions: differential effects on structure and function.
Antioxid Redox Signal 3(4):625–634
Herter S, Piper DE, Aaron W, Gabriele T, Cutler G, Cao P, Bhatt AS,
Choe Y, Craik CS, Walker N, Meininger D, Hoey T, Austin RJ
(2005) Hepatocyte growth factor is a preferred in vitro substrate
for human hepsin, a membrane-anchored serine protease impli-
cated in prostate and ovarian cancers. Biochem J 390:125–136
Higashiyama T (2002) Novel functions and applications of trehalose.
Pure Appl Chem 74(7):1263–1269
Hodson PV, Castsnguay M, Couillard CM, Desjardins C, Pelletier E,
Mcleod R (1994) Spatial and temporal variations in chemical
contamination of American eels, Anguilla rostrata, captured in
the estuary of the St. Lawrence River. Can J Fish Aquat Sci
51:464–478
Horn HF, Vousden KH (2008) Cooperation between the ribosomal
proteins L5 and L11 in the p53 pathway. Oncogene
27:5774–5784
ICES (2009) Report of the 2009 Session of the Joint EIFAC/ICES
Working Group on Eels (WGEEL), 7–12 September 2009,
Goteborg, Sweden. ICES CM 2009, 137
Kang HW, Bhimidi GR, Odom DP, Brun PJ, Fernandez ML,
McGrane MM (2007) Altered lipid catabolism in the vitamin A
deficient liver. Mol Cell Endocrinol 271:18–27
Kim J, Cho E, Kim S, Youn H (2005) CtBP represses p300-mediated
transcriptional activation by direct association with its bromod-
omain. Nat Struct Mol Biol 6(24):3070–3077
King R, Newmark P (2012) The cell biology of regeneration. J Cell
Biol 196(5):553–562
Kroll B, Kunz S, Klein T, Schwarz LR (1999) Effect of lindane and
phenobarbital on cyclooxygenase-2 expression and protanoid
synthesis by kuppfer cells. Carcinogenesis 20(8):1411–1416
Labadie P, Alliot F, Bourges C, Desportes A, Chevreuil M (2010)
Determination of polybrominated diphenyl ethers in fish tissues
by matrix solid-phase dispersion and gas chromatography
coupled to triple quadrupole mass spectrometry: case study on
European eel (Anguilla anguilla) from Mediterranean coastal
lagoons. Anal Chim Acta 675(2):97–105
Labunskyy VM, Dolph LH, Gladyshev VN (2007) The Sep15 protein
family: roles in disulfide bond formation and quality control in
the endoplasmic reticulum. IUBMB Life 59(1):1–5
Lapointe D, Pierron F, Couture P (2011) Individual and combined
effects of heat stress and aqueous or dietary copper exposure in
fathead minnows (Pimephales promelas). Aquat Toxicol
104:80–85
Lee K, Nagler J, Fournier M, Lebeuf M, Cyr D (1999) Toxicological
characterization of sediments from Baie des Anglais on the St
Lawrence Estuary. Chemosphere 39(6):1019–1035
Lee S, Kim JY, Kim Y, Seok K, Kim JH, Chang YJ (2012) Nucleolar
protein GLTSCR2 stabilizes p53 in response to ribosomal
stresses. Cell Death Differ 19(10):1613–1622
Letterio J, Roberts A (1998) Regulation of immune responses TGF-b.
Annu Rev Immunol 16:137–161
Li X, Zhang Y, Zhang H, Liu X, Gong T, Li M (2011) miRNA-223
promotes gastric cancer invasion and metastasis by targeting
tumor suppressor EPB41L3. Mol Cancer Res 9(7):824–833
Lin JC, Yan YT, Hsieh WK, Peng PK, Su CH, Tarn WY (2012)
RBM4 promotes pancreas cell differentiation and insulin
expression. Mol Cell Biol 33(2):319–327
Mannaerts G (2000) Peroxisomal lipid degradation via b-and a-
oxidation in mammals. Cell Biochem Biophys 32:73–87
Martınez-Moreno JM, Munoz-Castaneda JR, Herencia C, Perez-
Martinez A, Aguilera-Tejero E, Canalej A (2012) In vascular
smooth muscle cells paricalcitol prevents phosphate-induced
Wnt/b-catenin activation. Am J Physiol Ren Physiol
303:1136–1144
Martın-Pardillos A, Sosa C, Sorribas V (2013) Arsenic increases Pi-
mediated vascular calcification and induces premature senes-
cence in vascular smooth muscle cells. Toxicol Sci
131(2):641–653
Min L, Xu H, Wang J, Qu L, Jiang B, Zeng Y (2013) N-a-
acetyltransferase 10 protein is a negative regulator of 28S
proteasome through interaction with PA28b. FEBS Lett
587:1630–1637
Mlakar V, Berginc G, Volavsek M, Stor Z, Rems M, Glavac D (2009)
Presence of activating KRAS mutations correlates significantly
with expression of tumour suppressor genes DCN and TPM1 in
colorectal cancer. BMC Cancer 9:282
Mohamed MM, Sloane BF (2006) Cysteine cathepsins: multifunc-
tional enzymes in cancer. Nat Rev Cancer 6:764–775
Mortazavi A, Williams B, McCue K (2008) Mapping and quantifying
mammalian transcriptomes by RNA-Seq. Nat Methods
5(7):621–628
Nakamura K, Takamoto N, Abarzua F, Hongo A, Kodama J, Nasu Y,
Kumon H, Hiramatsu Y (2008) Hepsin inhibits the cell growth of
endometrial cancer. Int J Mol Med 22:389–397
Oikari S, Ahtialansaari T, Heinonen MV, Mauriala T, Auriola S,
Kiehne K (2008) Down-regulation of PPARs and SREBP by
acyl-CoA-binding protein over-expression in transgenic rats. Eur
J Physiol 456:369–377
Ortiz JB, Luisa Gonzales de Canales M, Sarasquete C (2003)
Histopathological changes induced by lindane (c-HCH) in
various organs of fishes. Sci Mar 67(1):53–61
Pierron F, Baudrimont M, Bossy A, Bourdineaud JP, Brethes D, Elie
P, Massabuau JC (2007) Impairment of lipid storage by
cadmium in the European eel (Anguilla anguilla). Aquat Toxicol
88:304–311
Pierron F, Normandeau E, Defo MA, Campbell PGC, Bernatchez L,
Couture P (2011) Effects of chronic metal exposure on wild fish
populations revealed by high-throughput cDNA sequencing.
Ecotoxicology 20(6):1388–1399
Transcriptome profile analysis reveals specific signatures
123

Podrabsky JE, Somero GN (2004) Changes in gene expression
associated with acclimation to constant temperatures and fluc-
tuating daily temperatures in an annual killifish Austrofundulus
limnaeus. J Exp Biol 207:2237–2254
Pujolar JM, Marino IAM, Massimo M et al (2012) Surviving in a
toxic world: transcriptomics and gene expression profiling in
response to environmental pollution in the critically endangered
European eel. BMC Genomics 13:507
Pujolar JM, Milan M, Marino IAM, Capoccioni F, Ciccotti E,
Belpaire C, Covaci A, Malarvannan G, Patarnello T, Bargelloni
L, Zane L, Maes GE (2013) Detecting genome-wide gene
transcription profiles associated with high pollution burden in the
critically endangered European eel. Aquat Toxicol
132–133:157–164
Quinlan A, Stewart D, Stromberg M, Marth G (2008) Pyrobayes: an
improved base caller for SNP discovery in pyrosequences. Nat
Methods 5(2):179–181
Regier N, Baerlocher L, Munsterkotter M, Farinelli L, Cosio C (2013)
Analysis of the elodea nuttallii transcriptome in response to
mercury and cadmium pollution: development of sensitive tools
for rapid ecotoxicological testing. Environ Sci Technol
47:8825–8834
Rodgarkia-Dara C, Vejda S, Erlach N (2006) The activin axis in liver
biology and disease. Muta Res 613:123–137
Rowling MJ, Gliniak C, Welsh J, Fleet JC (2007) High dietary
vitamin D prevents hypocalcemia and osteomalacia in CYP27B1
knockout mice. J Nutr 137:2608–2615
Stone R (2003) Freshwater eels are slip-sliding away. Science
302(5643):221–222
Taira K, Bujo H, Hirayama S (2011) LR11, a mosaic LDL receptor
family member, mediates the uptake of ApoE-rich lipoproteins
in vitro. Artherioscler Thromb Vasc 21:1501–1506
Tapie N, Budzinski H, Le Menach K (2008) Fast and efficient
extraction methods for the analysis of polychlorinated biphenyls
and polybrominated diphenyl ethers in biological matrices. Anal
Bioanal Chem 391:2169–2177
Tapie N, Le Menach K, Pasquaud S, Elie P, Devier MH, Budzinski H
(2011) PBDE and PCB contamination of eels from the Gironde
estuary: from glass eels to silver eels. Chemosphere 83:175–185
Thrush SF, Hewitt JE, Dayton PK, Coco G, Lohrer AM, Norkko A
(2009) Forecasting the limits of resilience: integrating empirical
research with theory. Proc R Soc Lond B 276(1671):3209–3217
Van Aggelen G, Ankley GT, Baldwin WS, Bearden DW, Benson
WH, Chipman JK (2010) Integrating omic technologies into
aquatic ecological risk assessment and environmental monitor-
ing: hurdles, achievements, and future outlook. Environ Health
Perspect 118(1):1–5
Vlaanderen J, Moore LE, Smith MT, Lan Q, Zhang L, Skibola CF
(2010) Application of OMICS technologies in occupational and
environmental health research; current status and projections.
Occup Environ Med 67(2):136–143
Webster TU, Bury N (2013) Global transcriptome profiling reveals
molecular mechanisms of metal tolerance in a chronically
exposed wild population of brown trout. Environ Sci Technol
47:8869–8877
Xing H, Wu H, Sun G, Zhang Z, Xu S, Li S (2012) Alterations in
activity and mRNA expression of acetylcholinesterase in the
liver, kidney and gill of common carp exposed to atrazine and
chlorpyrifos. Environ Toxicol Pharmacol 35:47–54
Yoshida T (2005) The involvement of thioredoxin and thioredoxin
binding protein 2 on cellular proliferation and aging process.
Ann N Y Acad Sci 1055:1–12
Zhang X, Krutchinsky A, Fukuda A, Chen W, Yamamura S, Chait
BT, Roeder RG (2005) MED1/TRAP220 exists predominantly in
a TRAP/Mediator subpopulation enriched in RNA Polymerase II
and is required for ER-mediated transcription. Mol Cell
19:89–100
Zhang CZ, Cao Y, Yun JP, Chen GG, Lai PBS (2012) Increased
expression of ZBP-89 and its prognostic significance in hepa-
tocellular carcinoma. Histopathology 60(7):1114–1124
L. Baillon et al.
123