trainable high resolution melt curve machine learning classifier for large-scale reliable genotyping...
TRANSCRIPT
Trainable High Resolution Melt Curve Machine LearningClassifier for Large-Scale Reliable Genotyping ofSequence VariantsPornpat Athamanolap1., Vishwa Parekh3,5., Stephanie I. Fraley1,2., Vatsal Agarwal1., Dong J. Shin1,
Michael A. Jacobs5,6, Tza-Huei Wang1,4*, Samuel Yang2*
1 Department of Biomedical Engineering, Johns Hopkins University, Baltimore, Maryland, United States of America, 2 Department of Emergency Medicine, Johns Hopkins
Medicine, Baltimore, Maryland, United States of America, 3 Department of Computer Science, Johns Hopkins University, Baltimore, Maryland, United States of America,
4 Department of Mechanical Engineering, Johns Hopkins University, Baltimore, Maryland, United States of America, 5 The Russell H. Morgan Department of Radiology and
Radiological Sciences, Johns Hopkins Medicine, Baltimore, Maryland, United States of America, 6 The Sidney Kimmel Comprehensive Cancer Center, Johns Hopkins
Medicine, Baltimore, Maryland, United States of America
Abstract
High resolution melt (HRM) is gaining considerable popularity as a simple and robust method for genotyping sequencevariants. However, accurate genotyping of an unknown sample for which a large number of possible variants may exist willrequire an automated HRM curve identification method capable of comparing unknowns against a large cohort of knownsequence variants. Herein, we describe a new method for automated HRM curve classification based on machine learningmethods and learned tolerance for reaction condition deviations. We tested this method in silico through multiple cross-validations using curves generated from 9 different simulated experimental conditions to classify 92 known serotypes ofStreptococcus pneumoniae and demonstrated over 99% accuracy with 8 training curves per serotype. In vitro verification ofthe algorithm was tested using sequence variants of a cancer-related gene and demonstrated 100% accuracy with 3 trainingcurves per sequence variant. The machine learning algorithm enabled reliable, scalable, and automated HRM genotypinganalysis with broad potential clinical and epidemiological applications.
Citation: Athamanolap P, Parekh V, Fraley SI, Agarwal V, Shin DJ, et al. (2014) Trainable High Resolution Melt Curve Machine Learning Classifier for Large-ScaleReliable Genotyping of Sequence Variants. PLoS ONE 9(10): e109094. doi:10.1371/journal.pone.0109094
Editor: John Z Metcalfe, University of California, San Francisco, United States of America
Received March 17, 2014; Accepted September 2, 2014; Published October 2, 2014
Copyright: � 2014 Athamanolap et al. This is an open-access article distributed under the terms of the Creative Commons Attribution License, which permitsunrestricted use, distribution, and reproduction in any medium, provided the original author and source are credited.
Data Availability: The authors confirm that all data underlying the findings are fully available without restriction. All data are included within the paper.
Funding: This work was supported by the E. W. ‘‘Al’’ Thrasher Research Award, National Science Foundation [1159771 and 1033744] and National Institutes ofHealth [R01CA15305, U01CA140204]. SF is supported by a Burroughs Wellcome Fund Career Award at the Scientific Interface. The funders had no role in studydesign, data collection and analysis, decision to publish, or preparation of the manuscript.
Competing Interests: The authors have declared that no competing interests exist.
* Email: [email protected] (SY); [email protected] (THW)
. These authors contributed equally to this work.
Introduction
Nucleic acid characterization by High Resolution Melting
(HRM) is a powerful technique for identifying sequence variation.
By measuring the fluorescence of a saturating intercalating dye as
PCR-amplified DNA fragments are heated and disassociate,
sequence-defined melt curves are generated with single-nucleotide
resolution in a closed-tube reaction [1,2]. HRM curve shape and
melting temperature are both related to sequence composition.
But can vary slightly due to differences in the final concentration of
DNA amplicon and buffer conditions. Nonetheless, its simplicity,
speed, low cost, ease of use, flexibility, and high sensitivity/
specificity make HRM an attractive genotyping tool with broad
potential clinical diagnostic and research applications, including
infectious diseases, oncology, inherited diseases, and epigenetics
[3–16]. Also almost all modern qPCR machines include high-
resolution melt functionality which is an automatic, single and
direct step after target amplification. Researchers including our
group have combined the use of broad-range PCR primers with
HRM to enable ‘‘fingerprinting’’ of diverse genetic sequence
heterogeneity. By amplifying three hypervariable regions within
the 16S rRNA gene using flanking conserved primers followed by
HRM, we were able to generate unique curve signatures from 58
bacterial species [17]. These curves were subsequently catalogued
as a reference library to identify species in blinded clinical samples
through curve matching. However, to enable the interrogation of
larger libraries of highly polymorphic genetic loci, enhanced and
automated methods to analyze HRM data for genotyping are still
needed.
Current methods of curve matching rely on either arbitrary
visual inspection, subtraction (difference) plot against a known
control sample, or via the use of a clustering function included in
the instrument software [5–14,18]. Unfortunately, these methods
are impractical for analysis of larger HRM data sets. A recent
meta analysis of 195 studies showed that while HRM is sensitive
there remains specificity issues as well as differences across
instruments and analysis algorithms [19]. Given that HRM is
highly sensitive to subtle variations in experimental conditions,
analysis of multiple curves often requires software parameter
adjustment to a low-sensitivity setting to ensure correct grouping of
PLOS ONE | www.plosone.org 1 October 2014 | Volume 9 | Issue 10 | e109094
curves derived from identical sequences [19]. This sacrifices
discriminatory power.
Some commercially available HRM analysis software such as
ScreenClust [20], which is used for both variant detection [6,7]
and DNA methylation analysis [21], employs a principle
component analysis (PCA) [22] to cluster all the populations
together simultaneously. However, machine learning methods
such as linear kernel SVM can be used to determine hyperplane
on multidimensional space that optimally separates different
classes [23]. For example, the optimal hyperplane maximizes the
margin between vectors (i.e. melt curves) of each class. The SVM
uses input (slack) parameters to determine error tolerance. The
‘‘support’’ vectors are created from the training data to define the
hyperplane. The ability of SVM to obtain this maximum margin
hyperplane makes it very powerful in the case of low noise training
data, such as melt curves. Other frequently used classifying
algorithms are Naive Bayes, Linear Discriminant Analysis (LDA)
and k Nearest Neighbors (KNN) [24,25]. However, we show
herein that these methods are not as robust as the SVM we
developed.
Herein, we adopted the use of such a machine learning
algorithm based on a linear SVM to classify melt curves with
trained tolerance for variations in reaction conditions. We also
created an algorithm to identify the minimal set of conserved
primers flanking hypervariable regions capable of discriminating
all sequence variants in a given data set. As proof of concept, we
demonstrated in silico the ability of our approach to identify all
known 92 serotypes of Streptococcus pneumoniae based on their
predicted melt curves. We further verified our method experi-
mentally using a panel of synthetic DNA for various alleles of the
human RASSF1A gene.
Materials and Methods
Primers SelectionOur primer-finding algorithm, implemented with Python, was
developed to enable the selection of primer pairs among conserved
regions which flank variable regions that differentiate all desired
sequences. Sequences were first aligned using the multiple
sequence alignment tool Kalign [26] with default parameters.
Then, the aligned sequences were analyzed using Gblocks [27] to
find conserved regions as shown in Figure 1. The parameters used
were specific to align DNA sequences with 18 nucleotides
minimum block length, no gap/no mismatch allowed, and use
default values for remaining parameters. All combinations of
exact-matched 18-mer from two blocks within approximately 500
base pair length were initially chosen as primers, then the regions
between those primers were examined to determine how many
sequences could be discriminated by each primer set using
BLASTClust [28] with single nucleotide different sensitivity.
BLASTClust would cluster the input DNA sequences base on
the nucleotide similarity. The sequences would be grouped
together if they were identical. The melting temperature, GC
content of each primer site, and the number of GC differences
between primers were constrained while selecting a primer pair
[29]. The primer pair that could give the maximum number of
distinguishable sequences was selected. A new sequence set was
then created from the remaining indistinguishable sequences, and
the algorithm was applied again. In this study, the capsule
polysaccharide synthesis (cps) gene locus which are believed to
influence the antigenic diversity in the human immune system [30]
of 92 published serotypes of S. pneumoniae were used, including
90 serotypes from the Wellcome Trust and two recently disclosed
serotypes: 6C (GenBank accession code EF538714) and 6D
(accession code HM171374) [30–32].
Generating Predicted Melt CurvesWe generated predicted melt curves from the optimized primer
sets using uMelt web application [33]. First, we used the computer
algorithm to find the list of all possible amplicons that could be
flanked by each primer set and then input all the amplicons into
uMelt batch mode. The parameters for uMelt were set as follow:
Temperature range 65uC–95uC with 0.5uC resolution and default
thermodynamic set as Unified-SantaLucia 1998. We simulated
data with the combination of monovalent cation [Mono+]: 47, 50,
and 53 mM and [Mg++]: 1.4, 1.5, and 1.6 mM with 0% of
dimethylsulfoxide for a total of 9 conditions applied to all
amplicons. The output temperature and fluorescence intensity
data from each sequence (Dataset S1–S7) was used for subsequent
SVM analysis.
ClassificationData Preprocessing. Pre-processing involves deriving a
feature vector from a melt curve. Every normalized melt curve
Figure 1. Gblocks output. The blue-highlight underneath represents the region that passes the criteria according to the parameters and thisregion will be considered as a candidate to be a primer.doi:10.1371/journal.pone.0109094.g001
Trainable HRM Machine Learning Classifier for Sequence Variants
PLOS ONE | www.plosone.org 2 October 2014 | Volume 9 | Issue 10 | e109094

is a plot of helicity values corresponding to various temperature
values, starting from helicity at 100% to helicity at 0%. We further
normalize the melt curves to give us exactly 300 helicity value
points between temperature values of 65 degrees and 95 degree
Celsius. If the number of helicity value points generated from melt
curve analysis is not 300, piecewise linear interpolation is used to
ensure exactly 300 points. Since what we intend to capture is the
variation in the helicity with temperature and not the exact values
of helicity, we need to have a method that would be oblivious to
changes in the melting points. Thus after having 300 points for
each input melt curve, we rotate all the curves such that helicity
values on the x axis and the temperature values become the
dependent variable plotted on the y axis. This data is then
interpolated to have 1000 temperature values between helicity
values of 100 and 0. This acts as a feature vector input to the
Machine Learning classifier. We developed our software using the
Matlab programming environment (Mathworks, Natik, MA).
Naive Bayes based classifier. This classifier is based on
Bayes theorem, which requires a large amount of estimated
samples needed for accurate classification. However, Naive Bayes
reduces the number of estimated parameters needed by using a
conditional independence assumption. Conditional independence
is defined as: if given variables A, B, and C. A and B are
conditionally independent given C, if
P(A\BDC)~P(ADC):P(BDC)
That is, if A and B are conditionally independent given C, then
B contains no information about A that is not contained in C.
The Naive Bayes formulates the prior probabilities of each of
the classifiers and based on the maximum likelihood estimate of
the test melt curve, computes the posterior probability of the test
curve belonging to each of the classes trained. We assume equal
priors for each class. The class with the maximum posterior
probability is assigned to the test curve.
k Nearest Neighbor based classifier (KNN). The KNN is
an instance based classifier based on the similarity of each
neighbor in data space using a distance metric [34]. For example,
every melt curve was classified in the same class as k (pre-
determined) neighboring melt curves from the training dataset
based on the Euclidean distance between two data points. The
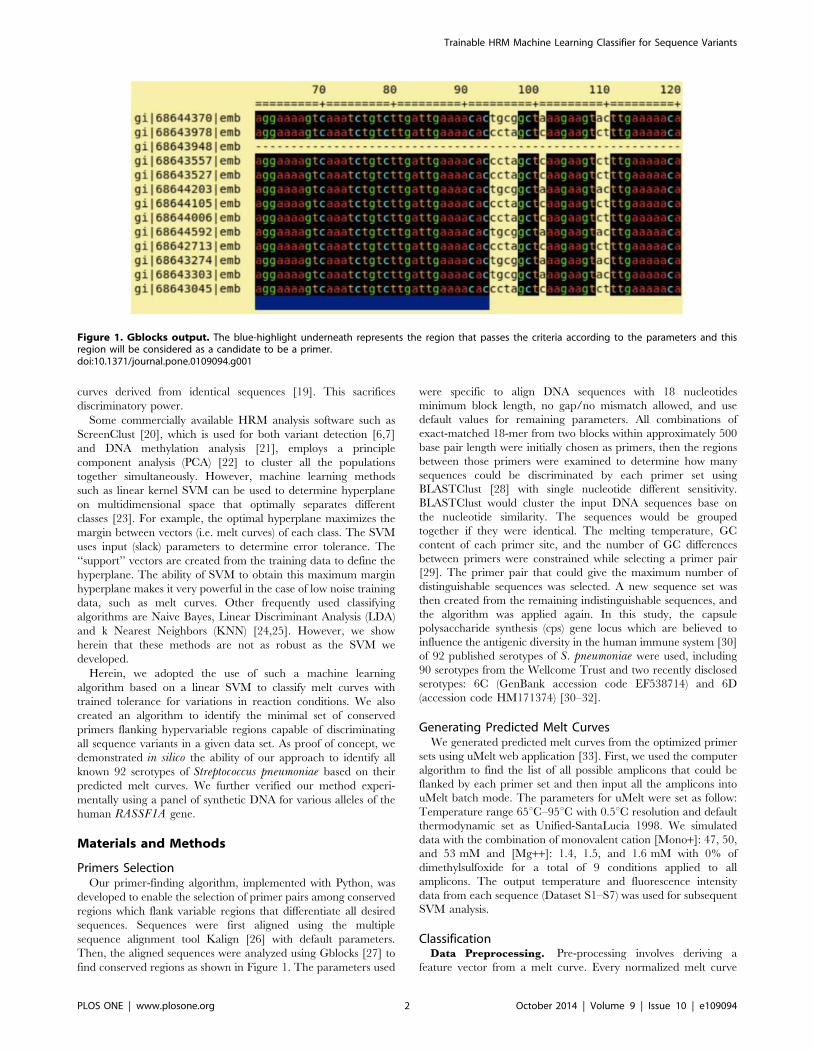
number of neighboring melt curves were varied from k = 1 to k = 7
and the results show that the best performance for the classifier
was k = 1. This analysis is shown in Figure 2A.
Principal component analysis (PCA) - Linear
Discriminant Analysis (LDA) based classifier. This hybrid
algorithm involves application of PCA to reduce the dimension-
ality of the data with subsequent application of LDA to classify the
data. The LDA suffers from curse of dimensionality because the
pooled covariance of the training data of melt curves was not
positive semidefinite and failed. To overcome this problem, we
used the PCA algorithm. PCA is a linear dimensionality reduction
algorithm that maximizes the variance of lower dimensional data
and was used prior to LDA. In order for LDA to run, the within
class covariance matrix for the training data must be invertible i.e.
full rank. Since the input data of melting curves is a sparse dataset
with a large number of training points, a dimensionality reduction
technique is required to reduce the number of points in training
sample. Here, in this case, using PCA, we reduced the
dimensionality of the training and test data and then applied the
LDA on this reduced dimensional data set for classification. The
PCA-LDA algorithm was tested for dimensionality reduction to
one through seven different eigenvectors and the best results were
achieved using six eigenvectors and shown in Figure 2B.
Support Vector Machine based classifier. Herein, we
used a one vs. one ensemble of linear kernel SVM with Least
Squares optimization. The SVM was trained with two groups of
feature vectors. At each data point location, i, which represents a
melt curve in a 1000-dimensional feature space, the melt curve
was represented by a vector x. With this terminology we assigned a
label, y, which uses the values of 21 and +1, to represent the melt
curve type, to every possible feature vector x. By a statistical
sampling of respective feature vectors along with their labels, the
SVM method derived a detection rule by taking a pairwise
similarity index between these samples k(x,x9) and computing the
solution to the following set of equations:
maxa
Xi
ai{1
2
Xi,j
aiajyiyjk ~xxi,~xxj
� � !
Subject to: ai§0 , i~1,2,:::,n
Xi
aiyi~0
Here, the vector ~aa corresponds to the hyperplane such that
1= ~aak k2 represents the margin of the hyperplane, based on the l2-
norm. It is known that if the matrix of values k(x,x9) is positive
semidefinite then the solution implicitly corresponds to a linear
separation rule in higher dimensional space and that the distance
between this linear boundary and the nearest sample points is
maximized by the support feature vectors defined by constraints in
the above equations [35].
Moreover, to test and validate the SVM margins, we used the
leave-one-out cross validation (LOOCV) error of the detection
rule:
signX
i
aiyik ~xxi,~xxð Þzb
!
Here, b is the scalar bias term, which ensures that the
hyperplane is not forced to go through the zero [23].
SVM Training: Our ensemble classifier consisted of
N| N{1ð Þð Þ=2 SVM feature vectors described above. Where
N refers to the number of classes (e.g. 92 serotypes) the input data
is grouped into. The classifier for an N class input is developed as
follows: for each of the different sequences, we generated feature
vectors, Si where i = {1,2,3,…,92} as explained in the pre-
processing step. Next, we trained an SVM to distinguish every
Si against every Sj for i = {1,2,3,…,92} and j = {1,2,3,…,92}
giving ensemble of 92|91ð Þ=2 trained SVM that works as a single
unit for classification.
Decision-making: In each binary testing of the SVM, all 18
curves (9 curves from each serotype) were used. The decision
making was based on the scoring scheme shown in Figure 3. Here
Ci,j denotes the classifier that classifies i against j where
i = {1,2,3,…,92} and j = {1,2,3,…,92} - i. The value of Ci,j is
one when the curve is classified as i and zero when the curve is
classified as j. The number of ones in every row i of Figure 3
indicates how many times the curve was recognized as i. The row
with the highest score is the serotype that the melt curve is
Trainable HRM Machine Learning Classifier for Sequence Variants
PLOS ONE | www.plosone.org 3 October 2014 | Volume 9 | Issue 10 | e109094
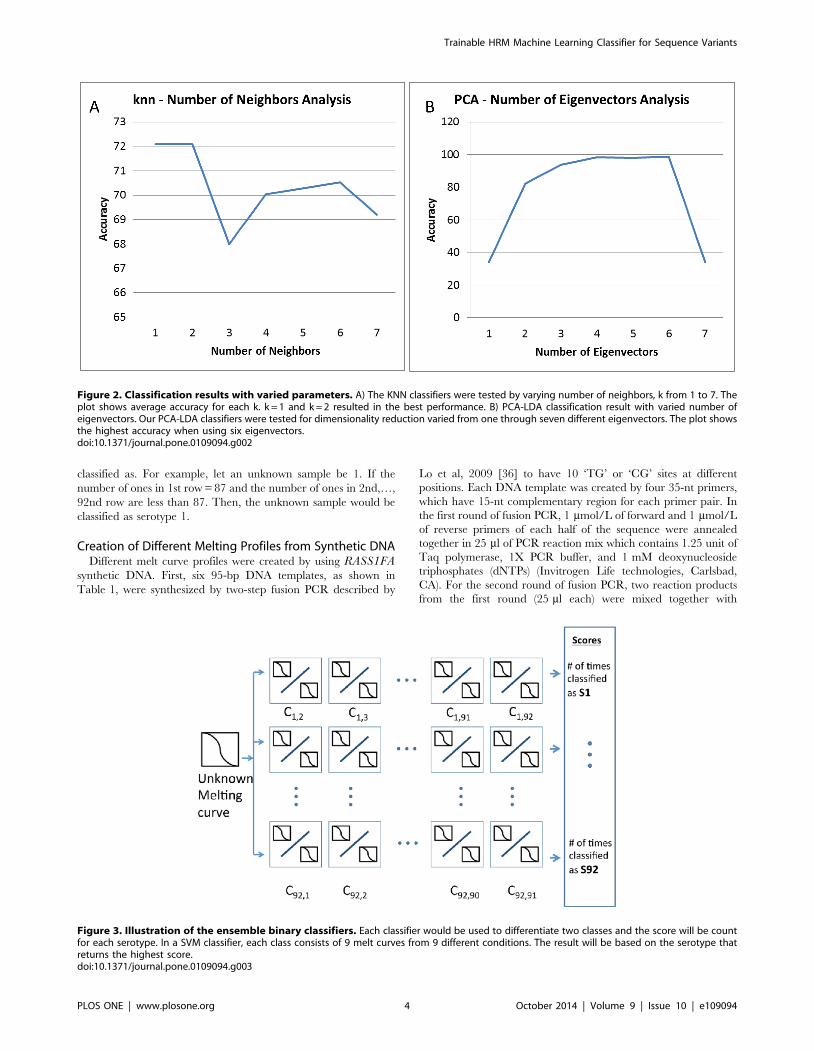
classified as. For example, let an unknown sample be 1. If the
number of ones in 1st row = 87 and the number of ones in 2nd,…,
92nd row are less than 87. Then, the unknown sample would be
classified as serotype 1.
Creation of Different Melting Profiles from Synthetic DNADifferent melt curve profiles were created by using RASS1FA
synthetic DNA. First, six 95-bp DNA templates, as shown in
Table 1, were synthesized by two-step fusion PCR described by
Lo et al, 2009 [36] to have 10 ‘TG’ or ‘CG’ sites at different
positions. Each DNA template was created by four 35-nt primers,
which have 15-nt complementary region for each primer pair. In
the first round of fusion PCR, 1 mmol/L of forward and 1 mmol/L
of reverse primers of each half of the sequence were annealed
together in 25 ml of PCR reaction mix which contains 1.25 unit of
Taq polymerase, 1X PCR buffer, and 1 mM deoxynucleoside
triphosphates (dNTPs) (Invitrogen Life technologies, Carlsbad,
CA). For the second round of fusion PCR, two reaction products
from the first round (25 ml each) were mixed together with
Figure 2. Classification results with varied parameters. A) The KNN classifiers were tested by varying number of neighbors, k from 1 to 7. Theplot shows average accuracy for each k. k = 1 and k = 2 resulted in the best performance. B) PCA-LDA classification result with varied number ofeigenvectors. Our PCA-LDA classifiers were tested for dimensionality reduction varied from one through seven different eigenvectors. The plot showsthe highest accuracy when using six eigenvectors.doi:10.1371/journal.pone.0109094.g002
Figure 3. Illustration of the ensemble binary classifiers. Each classifier would be used to differentiate two classes and the score will be countfor each serotype. In a SVM classifier, each class consists of 9 melt curves from 9 different conditions. The result will be based on the serotype thatreturns the highest score.doi:10.1371/journal.pone.0109094.g003
Trainable HRM Machine Learning Classifier for Sequence Variants
PLOS ONE | www.plosone.org 4 October 2014 | Volume 9 | Issue 10 | e109094
additional of 1.25 units of Taq polymerase added. The reaction
cycle of both fusion PCRs consisted of 98uC for 1 minute, down to
60uC at the rate of 21uC/3 seconds, 60uC for 2 minutes, down to
43uC at the rate of 21uC/10 seconds, 43uC for 1 minute, up to
60uC at the rate of +1uC/DT sec (DT: the temperature difference
compared to 43uC, for example, if the temperature is increasing
from 51uC to 52uC, the rate will be +1uC/9 seconds [52243 = 9],
and 10 minutes for final extension at 60uC. The 20-fold diluted
amplicons will be subsequently used for melt curve analysis by
performing quantitative SYBR green-based PCR. The 25 ml-final
volume PCR reaction contains 2 ml of the diluted amplicon, 1X
Advanced SYBR Green Supermix (2X stock, Bio-Rad), and 400
nmol/L of each forward and reverse primers, which are 35-nt at
the beginning and the end of each sequence respectively. The
PCR program consisted of 95uC for 2 minutes, followed by 40
cycles of 95uC for 15 seconds, 60uC for 15 seconds, and 72uC for
45 seconds with another cycle for the melting step: 95uC for 15
seconds and ramping from 60uC to 95uC with ramping rate
0.2uC/sec. The melting profiles were obtained from a Bio-Rad
iCycler real-time PCR machine after endpoint PCR product
detection. To compensate slight well-to-well variations across the
plate, we utilized the fluorescent level outside the amplicon melting
region to calculate background for each well separately. Then, we
performed exponential background subtraction and normalization
the melt curves between 0% and 100% according to the method
published elsewhere [37].
Results
Least primer-set selection for Streptococcus pneumoniaeTo test our curve classification algorithm in silico for a model
application, we set out to identify all the different serotypes of S.pneumoniae by PCR amplifying the capsule polysaccharide
synthesis (cps) gene locus for subsequent HRM analysis. Epide-
miologic surveillance of pneumococcal serotype distribution is
important for assessing vaccine effectiveness and monitoring
emergence of non-vaccine strains [38]. Due to PCR constraint
[29], we sought for the minimum set of conserved primer pairs
capable of amplifying all 92 known serotypes of S. pneumoniae,
with each primer pair flanking regions of high sequence variability
for serotype discrimination. Since none of the existing primer-
finding programs available take into consideration our primer
design constraints, we developed our own primer selection
algorithm. As a result, we identified a set of seven conserved
primer pairs (Table 2) capable of discriminating of all the 92
serotypes by their amplicon sequences in silico.
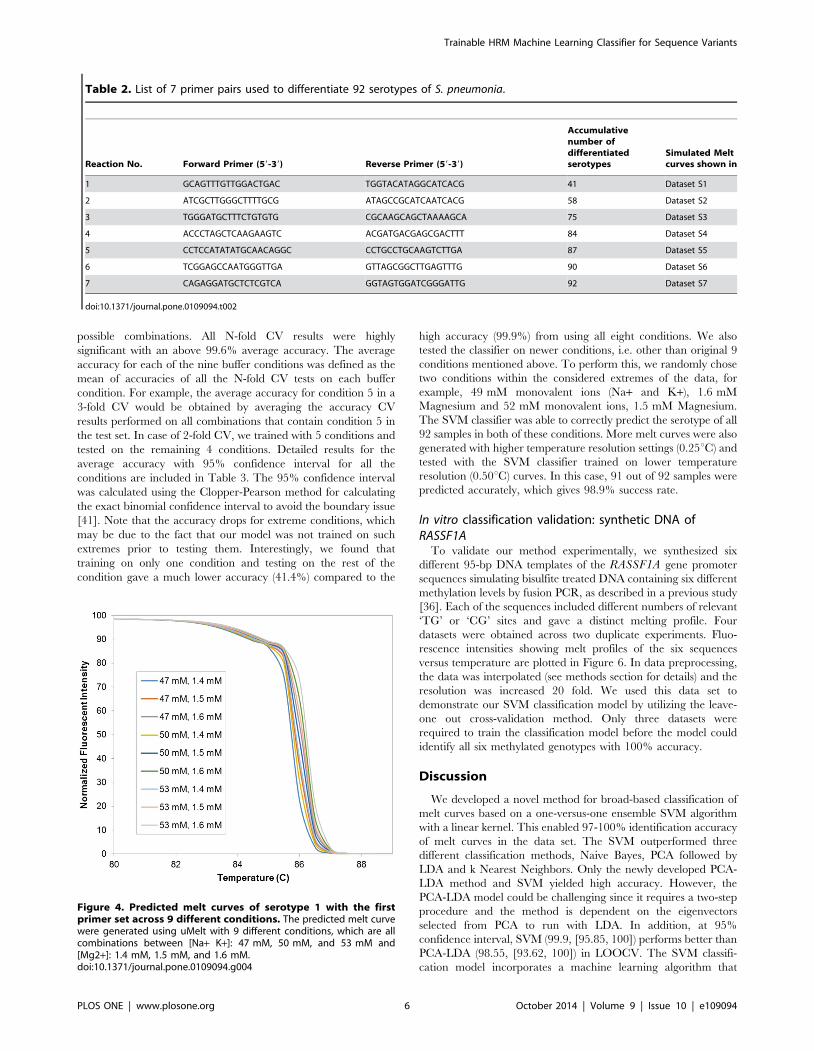
Generating training data: simulated melt curvesTo train our melt curve classifier, amplicon sequences (Dataset
S8) derived from the seven primer pairs in Table 2 were used to
calculate theoretical melt curves with the web-based tool uMelt
[33]. The resulting curves depend on required inputs of several
PCR conditions, specifically ion concentrations, for the theoretical
calculation. In order to mimic run-to-run variations in experi-
mental conditions and considering reported intrinsic variability of
1–2% [39,40] across different reactions and different days, we
produced theoretical melt data for multiple conditions, ranging up
to 5% above and below the commonly used salt concentrations
(50 mM for monovalent ions such as Sodium and Potassium and
1.5 mM for Magnesium), giving us a total of 9 conditions for
training our classifier. An example of simulated experimental
variations in melt curves of serotype 1 derived from the first primer
pair is shown in Figure 4.
In silico validation of melt curve classifier forstreptococcus pneumoniae serotyping
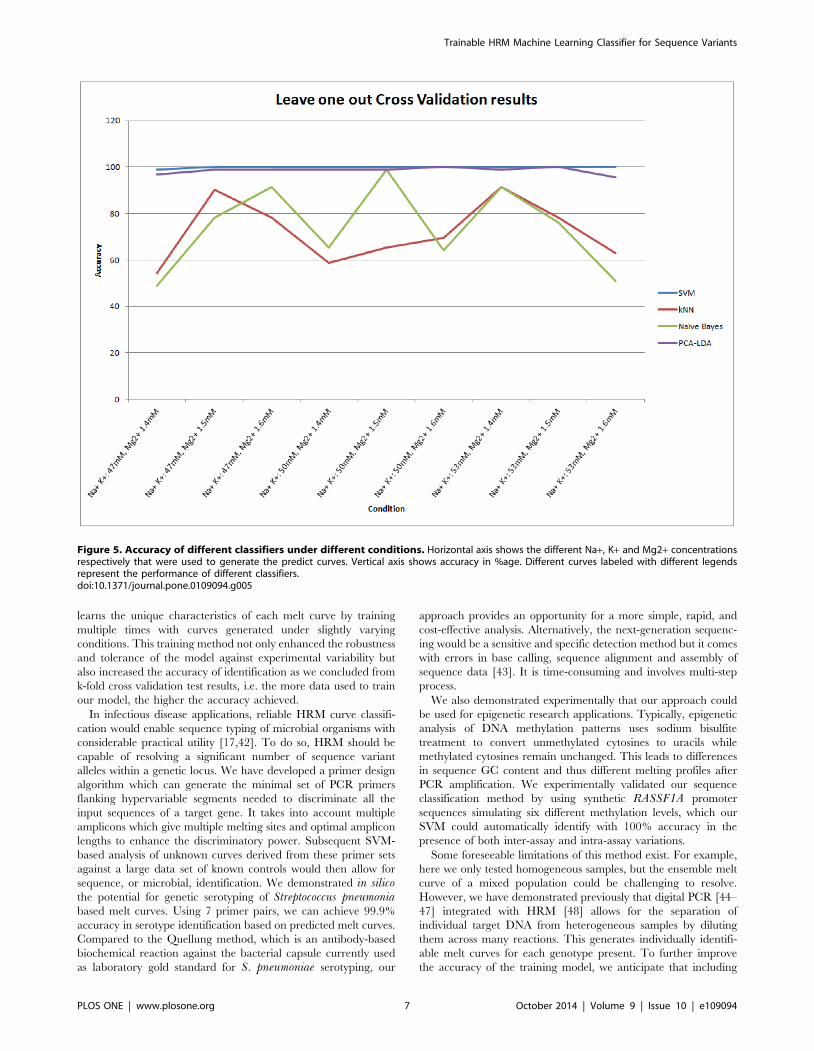
To test the accuracy of the classifier, we performed Leave one
out Cross Validation (LOOCV) which can predict the identity of a
melt curve under one condition using a machine learning classifier
trained on all the other remaining curves from all other conditions.
We compared the results for our SVM with Naive Bayes, KNN
and a newly developed PCA-LDA based classifier. We had to
develop the PCA-LDA classifier because LDA alone did not work
in classifying the curves. The PCA was followed by LDA to insure
that the within class covariance matrix for the training data was
invertible. The top six eigenvectors from the PCA results were
selected for LDA classification. The KNN parameter was k = 1 for
the number of neighbors as described above. Our results
demonstrated that by iteratively testing each condition in this
mode, the SVM based classifier resulted in an average accuracy of
99.9% as compared to 98.55% using PCA-LDA, 73.91% using
Naive Bayes and the lowest 72.10% using KNN (Figure 5).
It was observed that the SVM based classifier yielded maximum
accuracy. To further validate our findings, we performed two-fold
(2-fold), three-fold (3-fold) and four-fold (4-fold) cross validation
(CV). In general, k-fold CV involves splitting set of genotype
specific melt data into k bins where the classifier is trained on data
from k-1 bins and tested on the remaining bin iteratively for all
Table 1. List of target DNA sequences.
Seq No. %Methylation # of ‘CG’ Nucleotide sequence
1 100 10 59GGGTTCGTTTTGTGGTTTCGTTCGGTTCGCGTTTGTTAGCGTTTAAAG-TTAGCGAAGTACGGGTTTAATCGGGTTATGTCGGGGGAGTTTGAGTT-39
2 80 8 59GGGTTCGTTTTGTGGTTTCGTTCGGTTCGTGTTTGTTAGTGTTT-AAAGTTAGCGAAGTACGGGTTTAATCGGGTTATGTCGGGGGAGTTTGAGTT-39
3 60 6 59GGGTTCGTTTTGTGGTTTCGTTTGGTTTGTGTTTGTTAGTGTTTAAAGTTAGC-GAAGTACGGGTTTAATCGGGTTATGTCGGGGGAGTTTGAGTT-39
4 40 4 59GGGTTCGTTTTGTGGTTTCGTTTGGTTTGTGTTTGTTAGTGTTTAAAGTTAGT-GAAGTATGGGTTTAATCGGGTTATGTCGGGGGAGTTTGAGTT-39
5 20 2 59GGGTTCGTTTTGTGGTTTCGTTTGGTTTGTGTTTGTTAGTGTTTAAAGTTAG-TGAAGTATGGGTTTAATTGGGTTATGTTGGGGGAGTTTGAGT-39
6 0 0 59GGGTTTGTTTTGTGGTTTTGTTTGGTTTGTGTTTGTTAGTGTTTAAAGTTAG-TGAAGTATGGGTTTAATTGGGTTATGTTGGGGGAGTTTGAGTT-39
doi:10.1371/journal.pone.0109094.t001
Trainable HRM Machine Learning Classifier for Sequence Variants
PLOS ONE | www.plosone.org 5 October 2014 | Volume 9 | Issue 10 | e109094
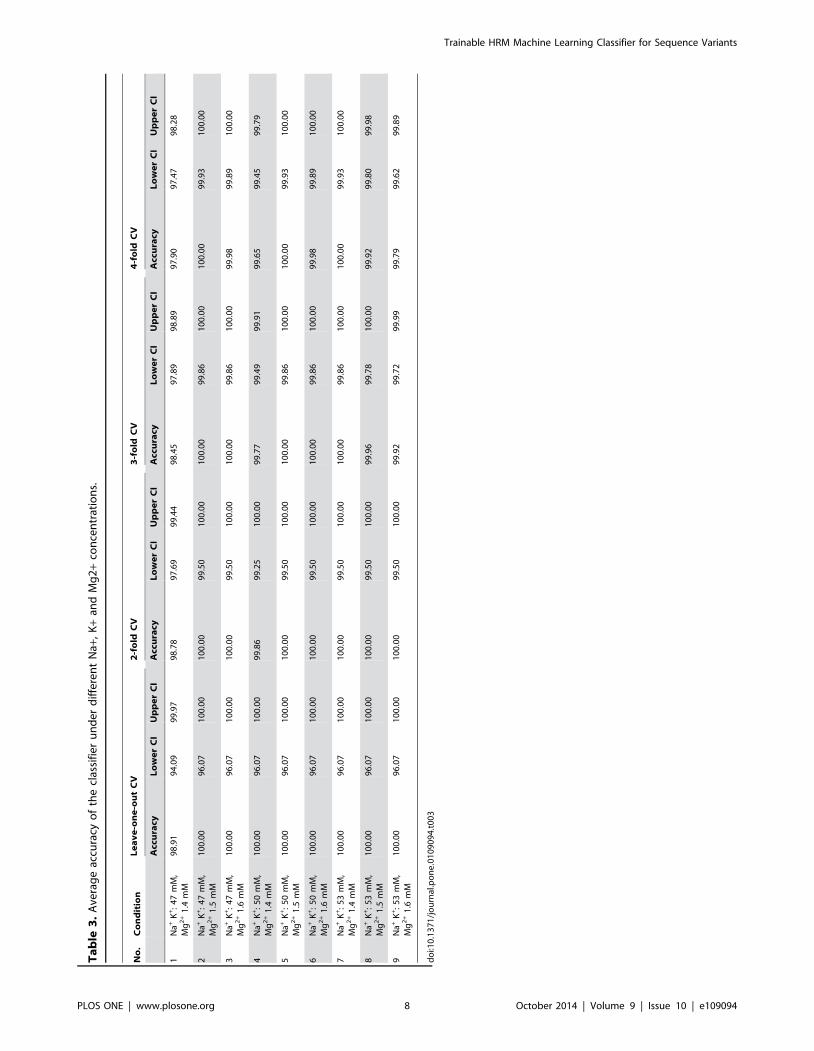
possible combinations. All N-fold CV results were highly
significant with an above 99.6% average accuracy. The average
accuracy for each of the nine buffer conditions was defined as the
mean of accuracies of all the N-fold CV tests on each buffer
condition. For example, the average accuracy for condition 5 in a
3-fold CV would be obtained by averaging the accuracy CV
results performed on all combinations that contain condition 5 in
the test set. In case of 2-fold CV, we trained with 5 conditions and
tested on the remaining 4 conditions. Detailed results for the
average accuracy with 95% confidence interval for all the
conditions are included in Table 3. The 95% confidence interval
was calculated using the Clopper-Pearson method for calculating
the exact binomial confidence interval to avoid the boundary issue
[41]. Note that the accuracy drops for extreme conditions, which
may be due to the fact that our model was not trained on such
extremes prior to testing them. Interestingly, we found that
training on only one condition and testing on the rest of the
condition gave a much lower accuracy (41.4%) compared to the
high accuracy (99.9%) from using all eight conditions. We also
tested the classifier on newer conditions, i.e. other than original 9
conditions mentioned above. To perform this, we randomly chose
two conditions within the considered extremes of the data, for
example, 49 mM monovalent ions (Na+ and K+), 1.6 mM
Magnesium and 52 mM monovalent ions, 1.5 mM Magnesium.
The SVM classifier was able to correctly predict the serotype of all
92 samples in both of these conditions. More melt curves were also
generated with higher temperature resolution settings (0.25uC) and
tested with the SVM classifier trained on lower temperature
resolution (0.50uC) curves. In this case, 91 out of 92 samples were
predicted accurately, which gives 98.9% success rate.
In vitro classification validation: synthetic DNA ofRASSF1A
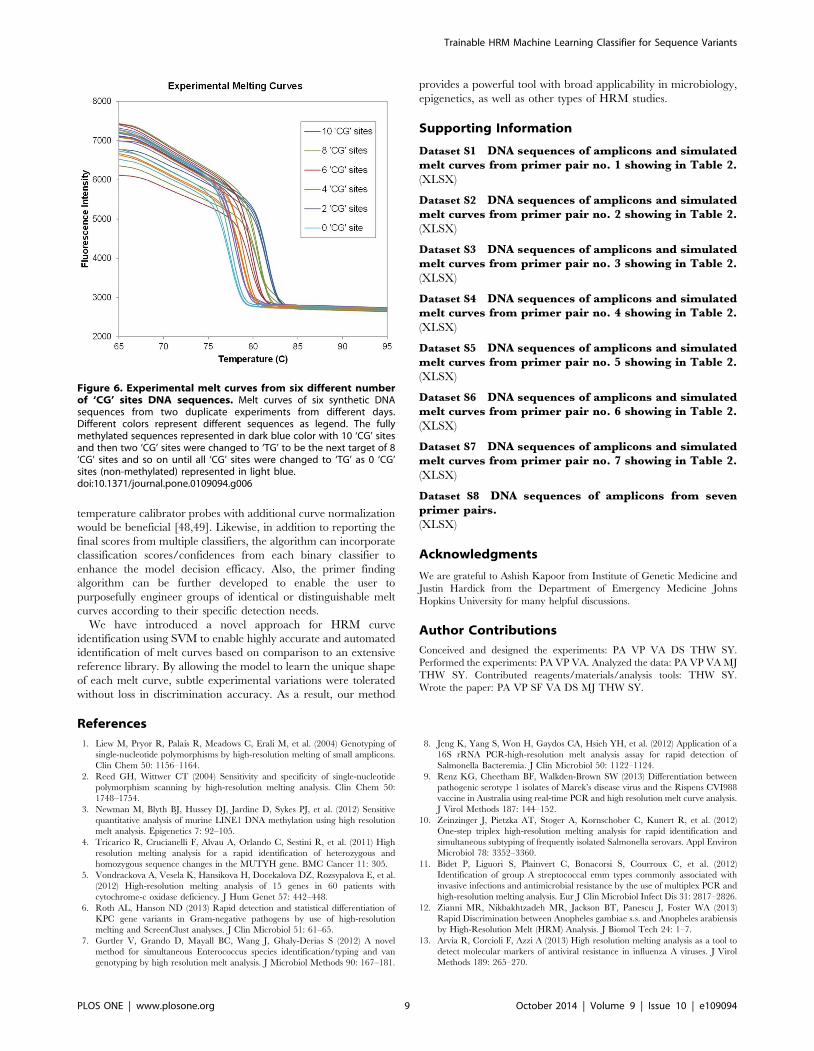
To validate our method experimentally, we synthesized six
different 95-bp DNA templates of the RASSF1A gene promoter
sequences simulating bisulfite treated DNA containing six different
methylation levels by fusion PCR, as described in a previous study
[36]. Each of the sequences included different numbers of relevant
‘TG’ or ‘CG’ sites and gave a distinct melting profile. Four
datasets were obtained across two duplicate experiments. Fluo-
rescence intensities showing melt profiles of the six sequences
versus temperature are plotted in Figure 6. In data preprocessing,
the data was interpolated (see methods section for details) and the
resolution was increased 20 fold. We used this data set to
demonstrate our SVM classification model by utilizing the leave-
one out cross-validation method. Only three datasets were
required to train the classification model before the model could
identify all six methylated genotypes with 100% accuracy.
Discussion
We developed a novel method for broad-based classification of
melt curves based on a one-versus-one ensemble SVM algorithm
with a linear kernel. This enabled 97-100% identification accuracy
of melt curves in the data set. The SVM outperformed three
different classification methods, Naive Bayes, PCA followed by
LDA and k Nearest Neighbors. Only the newly developed PCA-
LDA method and SVM yielded high accuracy. However, the
PCA-LDA model could be challenging since it requires a two-step
procedure and the method is dependent on the eigenvectors
selected from PCA to run with LDA. In addition, at 95%
confidence interval, SVM (99.9, [95.85, 100]) performs better than
PCA-LDA (98.55, [93.62, 100]) in LOOCV. The SVM classifi-
cation model incorporates a machine learning algorithm that
Table 2. List of 7 primer pairs used to differentiate 92 serotypes of S. pneumonia.
Reaction No. Forward Primer (59-39) Reverse Primer (59-39)
Accumulativenumber ofdifferentiatedserotypes
Simulated Meltcurves shown in
1 GCAGTTTGTTGGACTGAC TGGTACATAGGCATCACG 41 Dataset S1
2 ATCGCTTGGGCTTTTGCG ATAGCCGCATCAATCACG 58 Dataset S2
3 TGGGATGCTTTCTGTGTG CGCAAGCAGCTAAAAGCA 75 Dataset S3
4 ACCCTAGCTCAAGAAGTC ACGATGACGAGCGACTTT 84 Dataset S4
5 CCTCCATATATGCAACAGGC CCTGCCTGCAAGTCTTGA 87 Dataset S5
6 TCGGAGCCAATGGGTTGA GTTAGCGGCTTGAGTTTG 90 Dataset S6
7 CAGAGGATGCTCTCGTCA GGTAGTGGATCGGGATTG 92 Dataset S7
doi:10.1371/journal.pone.0109094.t002
Figure 4. Predicted melt curves of serotype 1 with the firstprimer set across 9 different conditions. The predicted melt curvewere generated using uMelt with 9 different conditions, which are allcombinations between [Na+ K+]: 47 mM, 50 mM, and 53 mM and[Mg2+]: 1.4 mM, 1.5 mM, and 1.6 mM.doi:10.1371/journal.pone.0109094.g004
Trainable HRM Machine Learning Classifier for Sequence Variants
PLOS ONE | www.plosone.org 6 October 2014 | Volume 9 | Issue 10 | e109094
learns the unique characteristics of each melt curve by training
multiple times with curves generated under slightly varying
conditions. This training method not only enhanced the robustness
and tolerance of the model against experimental variability but
also increased the accuracy of identification as we concluded from
k-fold cross validation test results, i.e. the more data used to train
our model, the higher the accuracy achieved.
In infectious disease applications, reliable HRM curve classifi-
cation would enable sequence typing of microbial organisms with
considerable practical utility [17,42]. To do so, HRM should be
capable of resolving a significant number of sequence variant
alleles within a genetic locus. We have developed a primer design
algorithm which can generate the minimal set of PCR primers
flanking hypervariable segments needed to discriminate all the
input sequences of a target gene. It takes into account multiple
amplicons which give multiple melting sites and optimal amplicon
lengths to enhance the discriminatory power. Subsequent SVM-
based analysis of unknown curves derived from these primer sets
against a large data set of known controls would then allow for
sequence, or microbial, identification. We demonstrated in silicothe potential for genetic serotyping of Streptococcus pneumoniabased melt curves. Using 7 primer pairs, we can achieve 99.9%
accuracy in serotype identification based on predicted melt curves.
Compared to the Quellung method, which is an antibody-based
biochemical reaction against the bacterial capsule currently used
as laboratory gold standard for S. pneumoniae serotyping, our
approach provides an opportunity for a more simple, rapid, and
cost-effective analysis. Alternatively, the next-generation sequenc-
ing would be a sensitive and specific detection method but it comes
with errors in base calling, sequence alignment and assembly of
sequence data [43]. It is time-consuming and involves multi-step
process.
We also demonstrated experimentally that our approach could
be used for epigenetic research applications. Typically, epigenetic
analysis of DNA methylation patterns uses sodium bisulfite
treatment to convert unmethylated cytosines to uracils while
methylated cytosines remain unchanged. This leads to differences
in sequence GC content and thus different melting profiles after
PCR amplification. We experimentally validated our sequence
classification method by using synthetic RASSF1A promoter
sequences simulating six different methylation levels, which our
SVM could automatically identify with 100% accuracy in the
presence of both inter-assay and intra-assay variations.
Some foreseeable limitations of this method exist. For example,
here we only tested homogeneous samples, but the ensemble melt
curve of a mixed population could be challenging to resolve.
However, we have demonstrated previously that digital PCR [44–
47] integrated with HRM [48] allows for the separation of
individual target DNA from heterogeneous samples by diluting
them across many reactions. This generates individually identifi-
able melt curves for each genotype present. To further improve
the accuracy of the training model, we anticipate that including
Figure 5. Accuracy of different classifiers under different conditions. Horizontal axis shows the different Na+, K+ and Mg2+ concentrationsrespectively that were used to generate the predict curves. Vertical axis shows accuracy in %age. Different curves labeled with different legendsrepresent the performance of different classifiers.doi:10.1371/journal.pone.0109094.g005
Trainable HRM Machine Learning Classifier for Sequence Variants
PLOS ONE | www.plosone.org 7 October 2014 | Volume 9 | Issue 10 | e109094
Ta
ble
3.
Ave
rag
eac
cura
cyo
fth
ecl
assi
fie
ru
nd
er
dif
fere
nt
Na+
,K
+an
dM
g2
+co
nce
ntr
atio
ns.
No
.C
on
dit
ion
Le
av
e-o
ne
-ou
tC
V2
-fo
ldC
V3
-fo
ldC
V4
-fo
ldC
V
Acc
ura
cyL
ow
er
CI
Up
pe
rC
IA
ccu
racy
Lo
we
rC
IU
pp
er
CI
Acc
ura
cyL
ow
er
CI
Up
pe
rC
IA
ccu
racy
Lo
we
rC
IU
pp
er
CI
1N
a+K
+ :4
7m
M,
Mg
2+
1.4
mM
98
.91
94
.09
99
.97
98
.78
97
.69
99
.44
98
.45
97
.89
98
.89
97
.90
97
.47
98
.28
2N
a+K
+ :4
7m
M,
Mg
2+
1.5
mM
10
0.0
09
6.0
71
00
.00
10
0.0
09
9.5
01
00
.00
10
0.0
09
9.8
61
00
.00
10
0.0
09
9.9
31
00
.00
3N
a+K
+ :4
7m
M,
Mg
2+
1.6
mM
10
0.0
09
6.0
71
00
.00
10
0.0
09
9.5
01
00
.00
10
0.0
09
9.8
61
00
.00
99
.98
99
.89
10
0.0
0
4N
a+K
+ :5
0m
M,
Mg
2+
1.4
mM
10
0.0
09
6.0
71
00
.00
99
.86
99
.25
10
0.0
09
9.7
79
9.4
99
9.9
19
9.6
59
9.4
59
9.7
9
5N
a+K
+ :5
0m
M,
Mg
2+
1.5
mM
10
0.0
09
6.0
71
00
.00
10
0.0
09
9.5
01
00
.00
10
0.0
09
9.8
61
00
.00
10
0.0
09
9.9
31
00
.00
6N
a+K
+ :5
0m
M,
Mg
2+
1.6
mM
10
0.0
09
6.0
71
00
.00
10
0.0
09
9.5
01
00
.00
10
0.0
09
9.8
61
00
.00
99
.98
99
.89
10
0.0
0
7N
a+K
+ :5
3m
M,
Mg
2+
1.4
mM
10
0.0
09
6.0
71
00
.00
10
0.0
09
9.5
01
00
.00
10
0.0
09
9.8
61
00
.00
10
0.0
09
9.9
31
00
.00
8N
a+K
+ :5
3m
M,
Mg
2+
1.5
mM
10
0.0
09
6.0
71
00
.00
10
0.0
09
9.5
01
00
.00
99
.96
99
.78
10
0.0
09
9.9
29
9.8
09
9.9
8
9N
a+K
+ :5
3m
M,
Mg
2+
1.6
mM
10
0.0
09
6.0
71
00
.00
10
0.0
09
9.5
01
00
.00
99
.92
99
.72
99
.99
99
.79
99
.62
99
.89
do
i:10
.13
71
/jo
urn
al.p
on
e.0
10
90
94
.t0
03
Trainable HRM Machine Learning Classifier for Sequence Variants
PLOS ONE | www.plosone.org 8 October 2014 | Volume 9 | Issue 10 | e109094
temperature calibrator probes with additional curve normalization
would be beneficial [48,49]. Likewise, in addition to reporting the
final scores from multiple classifiers, the algorithm can incorporate
classification scores/confidences from each binary classifier to
enhance the model decision efficacy. Also, the primer finding
algorithm can be further developed to enable the user to
purposefully engineer groups of identical or distinguishable melt
curves according to their specific detection needs.
We have introduced a novel approach for HRM curve
identification using SVM to enable highly accurate and automated
identification of melt curves based on comparison to an extensive
reference library. By allowing the model to learn the unique shape
of each melt curve, subtle experimental variations were tolerated
without loss in discrimination accuracy. As a result, our method
provides a powerful tool with broad applicability in microbiology,
epigenetics, as well as other types of HRM studies.
Supporting Information
Dataset S1 DNA sequences of amplicons and simulatedmelt curves from primer pair no. 1 showing in Table 2.
(XLSX)
Dataset S2 DNA sequences of amplicons and simulatedmelt curves from primer pair no. 2 showing in Table 2.
(XLSX)
Dataset S3 DNA sequences of amplicons and simulatedmelt curves from primer pair no. 3 showing in Table 2.
(XLSX)
Dataset S4 DNA sequences of amplicons and simulatedmelt curves from primer pair no. 4 showing in Table 2.
(XLSX)
Dataset S5 DNA sequences of amplicons and simulatedmelt curves from primer pair no. 5 showing in Table 2.
(XLSX)
Dataset S6 DNA sequences of amplicons and simulatedmelt curves from primer pair no. 6 showing in Table 2.
(XLSX)
Dataset S7 DNA sequences of amplicons and simulatedmelt curves from primer pair no. 7 showing in Table 2.
(XLSX)
Dataset S8 DNA sequences of amplicons from sevenprimer pairs.
(XLSX)
Acknowledgments
We are grateful to Ashish Kapoor from Institute of Genetic Medicine and
Justin Hardick from the Department of Emergency Medicine Johns
Hopkins University for many helpful discussions.
Author Contributions
Conceived and designed the experiments: PA VP VA DS THW SY.
Performed the experiments: PA VP VA. Analyzed the data: PA VP VA MJ
THW SY. Contributed reagents/materials/analysis tools: THW SY.
Wrote the paper: PA VP SF VA DS MJ THW SY.
References
1. Liew M, Pryor R, Palais R, Meadows C, Erali M, et al. (2004) Genotyping of
single-nucleotide polymorphisms by high-resolution melting of small amplicons.
Clin Chem 50: 1156–1164.
2. Reed GH, Wittwer CT (2004) Sensitivity and specificity of single-nucleotide
polymorphism scanning by high-resolution melting analysis. Clin Chem 50:
1748–1754.
3. Newman M, Blyth BJ, Hussey DJ, Jardine D, Sykes PJ, et al. (2012) Sensitive
quantitative analysis of murine LINE1 DNA methylation using high resolution
melt analysis. Epigenetics 7: 92–105.
4. Tricarico R, Crucianelli F, Alvau A, Orlando C, Sestini R, et al. (2011) High
resolution melting analysis for a rapid identification of heterozygous and
homozygous sequence changes in the MUTYH gene. BMC Cancer 11: 305.
5. Vondrackova A, Vesela K, Hansikova H, Docekalova DZ, Rozsypalova E, et al.
(2012) High-resolution melting analysis of 15 genes in 60 patients with
cytochrome-c oxidase deficiency. J Hum Genet 57: 442–448.
6. Roth AL, Hanson ND (2013) Rapid detection and statistical differentiation of
KPC gene variants in Gram-negative pathogens by use of high-resolution
melting and ScreenClust analyses. J Clin Microbiol 51: 61–65.
7. Gurtler V, Grando D, Mayall BC, Wang J, Ghaly-Derias S (2012) A novel
method for simultaneous Enterococcus species identification/typing and van
genotyping by high resolution melt analysis. J Microbiol Methods 90: 167–181.
8. Jeng K, Yang S, Won H, Gaydos CA, Hsieh YH, et al. (2012) Application of a
16S rRNA PCR-high-resolution melt analysis assay for rapid detection of
Salmonella Bacteremia. J Clin Microbiol 50: 1122–1124.
9. Renz KG, Cheetham BF, Walkden-Brown SW (2013) Differentiation between
pathogenic serotype 1 isolates of Marek’s disease virus and the Rispens CVI988
vaccine in Australia using real-time PCR and high resolution melt curve analysis.
J Virol Methods 187: 144–152.
10. Zeinzinger J, Pietzka AT, Stoger A, Kornschober C, Kunert R, et al. (2012)
One-step triplex high-resolution melting analysis for rapid identification and
simultaneous subtyping of frequently isolated Salmonella serovars. Appl Environ
Microbiol 78: 3352–3360.
11. Bidet P, Liguori S, Plainvert C, Bonacorsi S, Courroux C, et al. (2012)
Identification of group A streptococcal emm types commonly associated with
invasive infections and antimicrobial resistance by the use of multiplex PCR and
high-resolution melting analysis. Eur J Clin Microbiol Infect Dis 31: 2817–2826.
12. Zianni MR, Nikbakhtzadeh MR, Jackson BT, Panescu J, Foster WA (2013)
Rapid Discrimination between Anopheles gambiae s.s. and Anopheles arabiensis
by High-Resolution Melt (HRM) Analysis. J Biomol Tech 24: 1–7.
13. Arvia R, Corcioli F, Azzi A (2013) High resolution melting analysis as a tool to
detect molecular markers of antiviral resistance in influenza A viruses. J Virol
Methods 189: 265–270.
Figure 6. Experimental melt curves from six different numberof ‘CG’ sites DNA sequences. Melt curves of six synthetic DNAsequences from two duplicate experiments from different days.Different colors represent different sequences as legend. The fullymethylated sequences represented in dark blue color with 10 ‘CG’ sitesand then two ‘CG’ sites were changed to ‘TG’ to be the next target of 8‘CG’ sites and so on until all ‘CG’ sites were changed to ‘TG’ as 0 ‘CG’sites (non-methylated) represented in light blue.doi:10.1371/journal.pone.0109094.g006
Trainable HRM Machine Learning Classifier for Sequence Variants
PLOS ONE | www.plosone.org 9 October 2014 | Volume 9 | Issue 10 | e109094

14. Gori A, Cerboneschi M, Tegli S (2012) High-resolution melting analysis as a
powerful tool to discriminate and genotype Pseudomonas savastanoi pathovars
and strains. PLoS One 7: e30199.
15. Er TK, Chang JG (2012) High-resolution melting: applications in genetic
disorders. Clin Chim Acta 414: 197–201.
16. Bougel S, Lhermitte B, Gallagher G, de Flaugergues JC, Janzer RC, et al. (2013)
Methylation of the hTERT Promoter: A Novel Cancer Biomarker for
Leptomeningeal Metastasis Detection in Cerebrospinal Fluids. Clin Cancer
Res 19: 2216–2223.
17. Yang S, Ramachandran P, Rothman R, Hsieh YH, Hardick A, et al. (2009)
Rapid identification of biothreat and other clinically relevant bacterial species by
use of universal PCR coupled with high-resolution melting analysis. J Clin
Microbiol 47: 2252–2255.
18. Pang Y, Liu G, Wang Y, Zheng S, Zhao YL (2013) Combining COLD-PCR
and high-resolution melt analysis for rapid detection of low-level, rifampin-
resistant mutations in Mycobacterium tuberculosis. J Microbiol Methods 93:
32–36.
19. Li BS, Wang XY, Ma FL, Jiang B, Song XX, et al. (2011) Is high resolution
melting analysis (HRMA) accurate for detection of human disease-associated
mutations? A meta analysis. PLoS One 6: e28078.
20. Reja V, Kwok A, Stone G, Yang L, Missel A, et al. (2010) ScreenClust:
Advanced statistical software for supervised and unsupervised high resolution
melting (HRM) analysis. Methods 50: S10–14.
21. Rodriguez Lopez CM, Guzman Asenjo B, Lloyd AJ, Wilkinson MJ (2010) Direct
Detection and Quantification of Methylation in Nucleic Acid Sequences Using
High-Resolution Melting Analysis. Anal Chem.
22. Hotelling H (1933) Analysis of a complex of statistical variables into principal
components. Journal of educational psychology 24: 417.
23. Cortes C, Vapnik V (1995) Support-vector networks. Machine learning 20: 273–
297.
24. Cover T, Hart P (1967) Nearest neighbor pattern classification. Information
Theory, IEEE Transactions on 13: 21–27.
25. Fisher RA (1936) The use of multiple measurements in taxonomic problems.
Annals of eugenics 7: 179–188.
26. Lassmann T, Sonnhammer EL (2005) Kalign—an accurate and fast multiple
sequence alignment algorithm. BMC Bioinformatics 6: 298.
27. Castresana J (2000) Selection of conserved blocks from multiple alignments for
their use in phylogenetic analysis. Mol Biol Evol 17: 540–552.
28. Altschul SF, Madden TL, Schaffer AA, Zhang J, Zhang Z, et al. (1997) Gapped
BLAST and PSI-BLAST: a new generation of protein database search
programs. Nucleic Acids Res 25: 3389–3402.
29. Dieffenbach CW, Lowe TM, Dveksler GS (1993) General concepts for PCR
primer design. PCR Methods Appl 3: S30–37.
30. Bentley SD, Aanensen DM, Mavroidi A, Saunders D, Rabbinowitsch E, et al.
(2006) Genetic analysis of the capsular biosynthetic locus from all 90
pneumococcal serotypes. PLoS Genet 2: e31.
31. Bratcher PE, Kim KH, Kang JH, Hong JY, Nahm MH (2010) Identification of
natural pneumococcal isolates expressing serotype 6D by genetic, biochemicaland serological characterization. Microbiology 156: 555–560.
32. Park IH, Park S, Hollingshead SK, Nahm MH (2007) Genetic basis for the new
pneumococcal serotype, 6C. Infect Immun 75: 4482–4489.33. Dwight Z, Palais R, Wittwer CT (2011) uMELT: prediction of high-resolution
melting curves and dynamic melting profiles of PCR products in a rich webapplication. Bioinformatics 27: 1019–1020.
34. Weinberger KQ, Saul LK (2009) Distance Metric Learning for Large Margin
Nearest Neighbor Classification. J Mach Learn Res 10: 207–244.35. Vapnik V (1995) The Nature of Statistical Learning Theory: Springer-Verlag,
New York.36. Lo PK, Watanabe H, Cheng PC, Teo WW, Liang X, et al. (2009) MethySYBR,
a novel quantitative PCR assay for the dual analysis of DNA methylation andCpG methylation density. J Mol Diagn 11: 400–414.
37. Erali M, Wittwer C (2008) SNP genotyping by unlabeled probe melting analysis.
Molecular Beacons: Signalling Nucleic Acid Probes, Methods, and Protocols:Springer. pp. 199–206.
38. Pichon B, Ladhani SN, Slack MP, Segonds-Pichon A, Andrews NJ, et al. (2013)Changes in molecular epidemiology of streptococcus pneumoniae causing
meningitis following introduction of pneumococcal conjugate vaccination in
England and Wales. J Clin Microbiol 51: 820–827.39. Lievens A, Van Aelst S, Van den Bulcke M, Goetghebeur E (2012) Simulation of
between repeat variability in real time PCR reactions. PLoS One 7: e47112.40. D’Haene B, Vandesompele J, Hellemans J (2010) Accurate and objective copy
number profiling using real-time quantitative PCR. Methods 50: 262–270.41. Clopper CJ, Pearson ES (1934) The use of confidence or fiducial limits illustrated
in the case of the binomial. Biometrika: 404-413%@ 0006–3444.
42. Tong SY, Giffard PM (2012) Microbiological applications of high-resolutionmelting analysis. J Clin Microbiol 50: 3418–3421.
43. Nielsen R, Paul JS, Albrechtsen A, Song YS (2011) Genotype and SNP callingfrom next-generation sequencing data. Nat Rev Genet 12: 443–451.
44. Hayden RT, Gu Z, Ingersoll J, Abdul-Ali D, Shi L, et al. (2013) Comparison of
droplet digital PCR to real-time PCR for quantitative detection of cytomega-lovirus. J Clin Microbiol 51: 540–546.
45. Whale AS, Cowen S, Foy CA, Huggett JF (2013) Methods for applying accuratedigital PCR analysis on low copy DNA samples. PLoS One 8: e58177.
46. Zou H, Taylor WR, Harrington JJ, Hussain FT, Cao X, et al. (2009) Highdetection rates of colorectal neoplasia by stool DNA testing with a novel digital
melt curve assay. Gastroenterology 136: 459–470.
47. Vogelstein B, Kinzler KW (1999) Digital PCR. Proc Natl Acad Sci U S A 96:9236–9241.
48. Fraley SI, Hardick J, Jo Masek B, Athamanolap P, Rothman RE, et al. (2013)Universal digital high-resolution melt: a novel approach to broad-based profiling
of heterogeneous biological samples. Nucleic Acids Res 41: e175.
49. Gundry CN, Dobrowolski SF, Martin YR, Robbins TC, Nay LM, et al. (2008)Base-pair neutral homozygotes can be discriminated by calibrated high-
resolution melting of small amplicons. Nucleic Acids Res 36: 3401–3408.
Trainable HRM Machine Learning Classifier for Sequence Variants
PLOS ONE | www.plosone.org 10 October 2014 | Volume 9 | Issue 10 | e109094