toxicological review of trimethylbenzenes - us epa web
TRANSCRIPT
EPA/635/R-16/161Fb www.epa.gov/iris
Toxicological Review of Trimethylbenzenes
[CASRNs 25551-13-7, 95-63-6, 526-73-8, and 108-67-8]
Supplemental Information
September 2016
Integrated Risk Information System National Center for Environmental Assessment
Office of Research and Development U.S. Environmental Protection Agenc
Washington, DCy

Supplemental Information―Trimethylbenzenes
ii
DISCLAIMER
This document has been reviewed in accordance with U.S. Environmental Protection Agency policy and approved for publication. Mention of trade names or commercial products does not constitute endorsement or recommendation for use.
Supplemental Information―Trimethylbenzenes
iii
CONTENTS
APPENDIX A. RESPONSE TO EXTERNAL PEER REVIEW COMMENTS PROVIDED BY THE CHEMICAL ASSESSMENT ADVISORY COMMITTEE OF THE SCIENCE ADVISORY BOARD......... A-1
APPENDIX B. HEALTH ASSESSMENTS AND REGULATORY LIMITS BY OTHER NATIONAL AND INTERNATIONAL HEALTH AGENCIES .................................................................... B-1
APPENDIX C. INFORMATION IN SUPPORT OF HAZARD IDENTIFICATION AND DOSE-RESPONSE ANALYSIS .............................................................................................................. C-1
C.1. TOXICOKINETICS .................................................................................... C-1
C.1.1. Absorption ................................................................................ C-1
C.1.2. Distribution ............................................................................... C-2
C.1.3. Metabolism ............................................................................... C-3
C.1.4. Excretion ................................................................................... C-7
C.2. PHYSIOLOGICALLY-BASED PHARMACOKINETIC MODELS ...................... C-7
C.2.1. Summary of Available Physiologically Based Pharmacokinetic (PBPK) Models for 1,2,4-TMB ................................................... C-7
C.2.2. 1,2,4-TMB PBPK Model Selection ........................................... C-14
C.2.3. Details of Hissink et al. (2007) Model Analysis ....................... C-15
C.2.4. Summary of Available PBPK models for 1,3,5-TMB or 1,2,3-TMB ............................................................................... C-49
C.3. HUMAN STUDIES.................................................................................. C-49
C.4. ANIMAL TOXICOLOGY STUDIES ........................................................... C-61
C.5. HUMAN TOXICOKINETIC STUDIES...................................................... C-181
C.6. ANIMAL TOXICOKINETIC STUDIES ...................................................... C-195
C.7. ANIMAL AND HUMAN TOXICOKINETIC STUDIES ............................... C-221
APPENDIX D. DOSE-RESPONSE MODELING FOR THE DERIVATION OF REFERENCE VALUES FOR EFFECTS OTHER THAN CANCER AND THE DERIVATION OF CANCER RISK ESTIMATES ........................................................................................................... D-1
D.1. BENCHMARK DOSE (BMD) MODELING SUMMARY .............................. D-1
D.1.1. Noncancer Endpoints ............................................................... D-1
REFERENCES FOR APPENDICES ..................................................................................................... R-1
Supplemental Information―Trimethylbenzenes
iv
TABLES Table B-1. Other national and international health agency assessments for trimethylbenzenes
(TMBs) ....................................................................................................................... B-1 Table C-1. Measured and calculated partition coefficients for TMB isomers at 37°C ................. C-9 Table C-2. PBPK model parameters for 1,2,4-TMB toxicokinetics in humans using the Järnberg
and Johanson (1999) model structure .................................................................... C-10 Table C-3. Comparison of rat anatomical and physiological parameters in Hissink et al. (2007) to
those of Brown et al. (1997) .................................................................................... C-17 Table C-4. Comparison of human anatomical and physiological parameters in Hissink et al.
(2007) to those of Williams and Leggett (1989) as reported by Brown et al. (1997) . C-19
Table C-5. Comparison of chemical-specific parameters in Hissink et al. (2007) to literature data .......................................................................................................................... C-20
Table C-6. Parameter values for the rat and human PBPK models for 1,2,4-TMB used by EPA C-26 Table C-7. Rat 1,2,4-TMB kinetic studies used in model development and testing .................. C-27 Table C-8. Model simulated and experimental measured venous blood concentrations of 1,2,4-
TMB in male Wistar rats exposed to 1,2,4-TMB ..................................................... C-30 Table C-9. Model simulated and experimental measured tissue concentrations of 1,2,4-TMB in
male Wistar rats exposed to 1,2,4-TMB .................................................................. C-32 Table C-10. Model simulated and experimental measured concentrations of 1,2,4-TMB in male
Sprague-Dawley rats exposed to 100 ppm (492 mg/m3) 1,2,4-TMB (12 hours/day, for 3 days) at the end of exposure or 12 hours after the last exposure ....................... C-33
Table C-11. Model simulated and experimental measured concentrations of 1,2,4-TMB in male Sprague-Dawley rats exposed to 1,2,4-TMB at the end of 12-hour exposure........ C-34
Table C-12. Model simulated and experimental measured concentrations of 1,2,4-TMB in male Sprague-Dawley rats exposed to 1,000 ppm (4,920 mg/m3) 1,2,4-TMB (12 hours/day, for 14 days) at the end of exposure ...................................................... C-35
Table C-13. Human kinetic studies of 1,2,4-TMB used in model validation .............................. C-36 Table C-14. Parameter sensitivity for venous blood 1,2,4-TMB concentration in rats exposed to
1,2,4-TMB via inhalation ......................................................................................... C-45 Table C-15. Parameter sensitivity for steady-state venous blood 1,2,4-TMB concentration in
humans exposed to 1,2,4-TMB via inhalation ......................................................... C-47 Table C-16. Characteristics and quantitative results for epidemiologic and controlled human
exposure studies of TMB and related compounds and mixtures ........................... C-50 Table C-17. Characteristics and quantitative results for Adenuga et al. (2014) ........................ C-61 Table C-18. Characteristics and quantitative results for Bättig et al. (1958) ............................. C-68 Table C-19. Characteristics and quantitative results for Carrillo et al. (2014) ........................... C-72 Table C-20. Characteristics and quantitative results for Clark et al. (1989) .............................. C-78 Table C-21. Characteristics and quantitative results for Douglas et al. (1993) .......................... C-83 Table C-22. Characteristics and quantitative results for Gralewicz et al. (1997b) ..................... C-88 Table C-23. Characteristics and quantitative results for Gralewicz et al. (1997a) ..................... C-92 Table C-24. Characteristics and quantitative results for Gralewicz and Wiaderna (2001) ........ C-94 Table C-25. Characteristics and quantitative results for Janik-Spiechowicz et al. (1998) .......... C-97 Table C-26. Characteristics and quantitative results for Koch Industries (1995b) .................. C-101 Table C-27. Characteristics and quantitative results for Korsak et al. (1995) .......................... C-110 Table C-28. Characteristics and quantitative results for Korsak and Rydzyński (1996) ........... C-113
Supplemental Information―Trimethylbenzenes
v
Table C-29. Characteristics and quantitative results for Korsak et al. (1997) .......................... C-118 Table C-30. Characteristics and quantitative results for Korsak et al. (2000a) ........................ C-120 Table C-31. Characteristics and quantitative results for Korsak et al. (2000b) ........................ C-125 Table C-32. Characteristics and quantitative results for Lammers et al. (2007) ...................... C-130 Table C-33. Characteristics and quantitative results for Lutz et al. (2010) .............................. C-133 Table C-34. Characteristics and quantitative results for Maltoni et al. (1997) ........................ C-136 Table C-35. Characteristics and quantitative results for Mckee et al. (1990) .......................... C-138 Table C-36. Characteristics and quantitative results for Mckee et al. (2010) .......................... C-145 Table C-37. Characteristics and quantitative results for Saillenfait et al. (2005) ..................... C-148 Table C-38. Characteristics and quantitative results for Schreiner et al. (1989) ..................... C-153 Table C-39. Characteristics and quantitative results for Tomas et al. (1999a) ........................ C-161 Table C-40. Characteristics and quantitative results for Tomas et al. (1999b) ........................ C-163 Table C-41. Characteristics and quantitative results for Tomas et al. (1999c) ........................ C-164 Table C-42. Characteristics and quantitative results for Wiaderna et al. (1998) ..................... C-167 Table C-43. Characteristics and quantitative results for Wiaderna et al. (2002) ..................... C-171 Table C-44. Characteristics and quantitative results for Wiglusz et al. (1975b) ...................... C-173 Table C-45. Characteristics and quantitative results for Wiglusz et al. (1975a) ...................... C-177 Table C-46. Characteristics and quantitative results for Järnberg et al. (1996) ...................... C-181 Table C-47. Characteristics and quantitative results for Järnberg et al. (1997a) ..................... C-185 Table C-48. Characteristics and quantitative results for Järnberg et al. (1997b) .................... C-187 Table C-49. Characteristics and quantitative results for Järnberg et al. (1998) ...................... C-188 Table C-50. Characteristics and quantitative results for Jones et al. (2006) ........................... C-189 Table C-51. Characteristics and quantitative results for Kostrzewski et al. (1997) ................. C-191 Table C-52. Characteristics and quantitative results for Dahl et al. (1988) ............................. C-195 Table C-53. Characteristics and quantitative results for Eide and Zahlsen (1996) .................. C-196 Table C-54. Characteristics and quantitative results for Huo et al. (1989) .............................. C-197 Table C-55. Characteristics and quantitative results for Mikulski and Wiglusz (1975) ............ C-199 Table C-56 Characteristics and quantitative results for Swiercz et al. (2002) .......................... C-200 Table C-57. Characteristics and quantitative results for Swiercz et al. (2003) ........................ C-202 Table C-58. Characteristics and quantitative results for Swiercz et al. (2006) ........................ C-204 Table C-59. Characteristics and quantitative results for Świercz et al. (2016) ........................ C-207 Table C-60. Characteristics and quantitative results for Tsujimoto et al. (2000) .................... C-214 Table C-61. Characteristics and quantitative results for Tsujimoto et al. (2005) .................... C-215 Table C-62. Characteristics and quantitative results for Tsujino et al. (2002) ......................... C-216 Table C-63. Characteristics and quantitative results for Zahlsen et al. (1990) ........................ C-218 Table C-64. Characteristics and quantitative results for Zahlsen et al. (1992) ........................ C-220 Table C-65. Characteristics and quantitative results for Meulenberg and Vijverberg (2000) . C-221 Table D-1. Noncancer endpoints selected for dose-response modeling for 1,2,3-TMB,
1,2,4-TMB, and 1,3,5-TMB ....................................................................................... D-2 Table D-2. Summary of BMD modeling results for increased latency to paw-lick in male Wistar
rats exposed to 1,2,4-TMB by inhalation for 3 months; BMR = 1 SD change from control mean (constant variance) (Korsak and Rydzyński, 1996) ............................ D-4
Table D-3. Summary of BMD modeling results for increased latency to paw-lick in male Wistar rats exposed to 1,2,4-TMB by inhalation for 3 months; BMR = 1 SD change from control mean (modeled variance) (Korsak and Rydzyński, 1996) ............................ D-5
Table D-4. Summary of BMD modeling results for increased latency to paw-lick in male Wistar rats exposed to 1,2,4-TMB by inhalation for 3 months; BMR = 1 SD change from
Supplemental Information―Trimethylbenzenes
vi
control mean (constant variance, high dose dropped) (Korsak and Rydzyński, 1996) ......................................................................................................................... D-6
Table D-5. Summary of BMD modeling results for increased latency to paw-lick in male Wistar rats exposed to 1,2,3-TMB by inhalation for 3 months; BMR = 1 SD change from control mean (constant variance) (Korsak and Rydzyński, 1996) ............................ D-8
Table D-6. Summary of BMD modeling results for increased latency to paw-lick in male Wistar rats exposed to 1,2,3-TMB by inhalation for 3 months; BMR = 1 SD change from control mean (modeled variance) (Korsak and Rydzyński, 1996) ............................ D-9
Table D-7. Summary of BMD modeling results for increased latency to paw-lick in male Wistar rats exposed to 1,2,3-TMB by inhalation for 3 months; BMR = 1 SD change from control mean (constant variance, high dose dropped) (Korsak and Rydzyński, 1996) ....................................................................................................................... D-10
Table D-8. Summary of BMD modeling results for increased latency to paw-lick in male Wistar rats exposed to 1,2,3-TMB by inhalation for 3 months; BMR = 1 SD change from control mean (modeled variance, high dose dropped) (Korsak and Rydzyński, 1996) ....................................................................................................................... D-11
Table D-9. Summary of BMD modeling results for decreased RBCs in male Wistar rats exposed to 1,2,4-TMB by inhalation for 3 months; BMR = 1 SD change from control mean (constant variance) (Korsak et al., 2000a) .............................................................. D-13
Table D-10. Summary of BMD modeling results for decreased clotting time in female Wistar rats exposed to 1,2,4-TMB by inhalation for 3 months; BMR = 1 SD change from control mean (constant variance) (Korsak et al., 2000a) .................................................... D-16
Table D-11. Summary of BMD modeling results for decreased clotting time in female Wistar rats exposed to 1,2,4-TMB by inhalation for 3 months; BMR = 1 SD change from control mean (modeled variance) (Korsak et al., 2000a) ................................................... D-17
Table D-12. Summary of BMD modeling results for decreased clotting time in female Wistar rats exposed to 1,2,4-TMB by inhalation for 3 months; BMR = 1 SD change from control mean (constant variance, high dose dropped) (Korsak et al., 2000a) ................... D-18
Table D-13. Summary of BMD modeling results for decreased clotting time in female Wistar rats exposed to 1,2,4-TMB by inhalation for 3 months; BMR = 1 SD change from control mean (modeled variance, high dose dropped) (Korsak et al., 2000a) ................... D-19
Table D-14. Summary of BMD modeling results for decreased segmented neutrophils in male Wistar rats exposed to 1,2,3-TMB by inhalation for 3 months; BMR = 1 SD change from control mean (constant variance) (Korsak et al., 2000a) .............................. D-20
Table D-15. Summary of BMD modeling results for decreased segmented neutrophils in female Wistar rats exposed to 1,2,3-TMB by inhalation for 3 months; BMR = 1 SD change from control mean (constant variance) (Korsak et al., 2000a) .............................. D-23
Table D-16. Summary of BMD modeling results for increased reticulocytes in female Wistar rats exposed to 1,2,3-TMB by inhalation for 3 months; BMR = 1 SD change from control mean (constant variance) (Korsak et al., 2000a) .................................................... D-26
Table D-17. Summary of BMD modeling results for decreased fetal weight in male Sprague-Dawley rat pups exposed to 1,2,4-TMB by inhalation on GDs 6−20; BMR = 1 SD or 5% change from control mean (constant variance) (Saillenfait et al., 2005) ......... D-29
Table D-18. Summary of BMD modeling results for decreased fetal weight in male Sprague-Dawley rat pups exposed to 1,3,5-TMB by inhalation on GDs 6−20; BMR = 1 SD change from control mean (constant variance) (Saillenfait et al., 2005) ............... D-32
Supplemental Information―Trimethylbenzenes
vii
Table D-19. Summary of BMD modeling results for decreased fetal weight in male Sprague-Dawley rat pups exposed to 1,3,5-TMB by inhalation on GDs 6−20; BMR = 1 SD change from control mean (modeled variance) (Saillenfait et al., 2005) .............. D-33
Table D-20. Summary of BMD modeling results for decreased fetal weight in male Sprague-Dawley rat pups exposed to 1,3,5-TMB by inhalation on GDs 6−20; BMR = 1 SD change from control mean (constant variance, high dose dropped) (Saillenfait et al., 2005) ....................................................................................................................... D-34
Table D-21. Summary of BMD modeling results for decreased fetal weight in male Sprague-Dawley rat pups exposed to 1,3,5-TMB by inhalation on GDs 6−20; BMR = 1 SD change from control mean (modeled variance, high dose dropped) (Saillenfait et al., 2005) ....................................................................................................................... D-35
Table D-22. Summary of BMD modeling results for decreased fetal weight in female Sprague-Dawley rat pups exposed to 1,2,4-TMB by inhalation on GDs 6−20; BMR = 1 SD or 5% change from control mean (constant variance) (Saillenfait et al., 2005) ......... D-36
Table D-23. Summary of BMD modeling results for decreased fetal weight in female Sprague-Dawley rat pups exposed to 1,3,5-TMB by inhalation on GDs 6−20; BMR = 1 SD change from control mean (constant variance) (Saillenfait et al., 2005) ............... D-39
Table D-24. Summary of BMD modeling results for decreased fetal weight in female Sprague-Dawley rat pups exposed to 1,3,5-TMB by inhalation on GDs 6−20; BMR = 1 SD change from control mean (modeled variance) (Saillenfait et al., 2005) .............. D-40
Table D-25. Summary of BMD modeling results for decreased fetal weight in female Sprague-Dawley rat pups exposed to 1,3,5-TMB by inhalation on GDs 6−20; BMR = 1 SD change from control mean (constant variance, high dose dropped) (Saillenfait et al., 2005) ....................................................................................................................... D-41
Table D-26. Summary of BMD modeling results for decreased fetal weight in female Sprague-Dawley rat pups exposed to 1,3,5-TMB by inhalation on GDs 6−20; BMR = 1 SD change from control mean (modeled variance, high dose dropped) (Saillenfait et al., 2005) ....................................................................................................................... D-42
Table D-27. Summary of BMD modeling results for decreased dam weight gain in female Sprague-Dawley rats exposed to 1,2,4-TMB by inhalation on GDs 6−20; BMR = 1 SD or 10% change from control mean (constant variance) (Saillenfait et al., 2005) .. D-43
Table D-28. Summary of BMD modeling results for decreased dam weight gain in female Sprague-Dawley rats exposed to 1,2,4-TMB by inhalation on GDs 6−20; BMR = 1 SD or 10% change from control mean (modeled variance) (Saillenfait et al., 2005) .. D-44
Table D-29. Summary of BMD modeling results for decreased dam weight gain in female Sprague-Dawley rats exposed to 1,3,5-TMB by inhalation on GDs 6−20; BMR = 1 SD change from control mean (constant variance) (Saillenfait et al., 2005) ............... D-47
Table D-30. Summary of BMD modeling results for decreased dam weight gain in female Sprague-Dawley rats exposed to 1,3,5-TMB by inhalation on GDs 6−20; BMR = 1 SD change from control mean (modeled variance) (Saillenfait et al., 2005) .............. D-48
Table D-31. Summary of BMD modeling results for decreased dam weight gain in female Sprague-Dawley rats exposed to 1,3,5-TMB by inhalation on GDs 6−20; BMR = 1 SD change from control mean (constant variance, high dose dropped) (Saillenfait et al., 2005) ....................................................................................................................... D-49
Table D-32. Summary of BMD modeling results for decreased dam weight gain in female Sprague-Dawley rats exposed to 1,3,5-TMB by inhalation on GDs 6−20; BMR = 1 SD change from control mean (modeled variance, high dose dropped) (Saillenfait et al., 2005) ....................................................................................................................... D-50
Supplemental Information―Trimethylbenzenes
viii
Table D-33. Summary of BMD modeling results for increased monocytes in male Wistar rats exposed to 1,3,5-TMB by gavage for 13 weeks; BMR = 1 SD change from control mean (constant variance) (Adenuga et al., 2014) .................................................. D-51
Table D-34. Summary of BMD modeling results for increased monocytes in male Wistar rats exposed to 1,3,5-TMB by gavage for 13 weeks; BMR = 1 SD change from control mean (modeled variance) (Adenuga et al., 2014) .................................................. D-52
Supplemental Information―Trimethylbenzenes
ix
FIGURES
Figure C-1. Metabolic scheme for 1,2,4-TMB. ............................................................................. C-5 Figure C-2. Metabolic scheme for 1,2,3-TMB. ............................................................................. C-6 Figure C-3. Metabolic scheme for 1,3,5-TMB. ............................................................................. C-6 Figure C-4. Physiologically based toxicokinetic model for 1,2,4-TMB in humans. ...................... C-8 Figure C-5. Schematic of human model structure for 1,2,4-TMB using the NLE-based model
approach. ................................................................................................................. C-12 Figure C-6. Schematic of rat and human PBPK model structure. .............................................. C-14 Figure C-7. Simulated and measured blood concentrations of 1,2,4,-TMB in rats exposed to 600,
2,400, or 4,800 mg/m3 white spirit for 8 hours. ...................................................... C-22 Figure C-8. Simulated and measured brain concentrations of 1,2,4-TMB in rats exposed to 600,
2,400, or 4,800 mg/m3 white spirit for 8 hours. ...................................................... C-23 Figure C-9. Simulated and measured exhaled air concentrations of 1,2,4-TMB in three
volunteers exposed to 600 mg/m3 white spirit for 4 hours. ................................... C-24 Figure C-10. Comparisons of model predictions to measured blood concentrations in rats
exposed to 1,2,4-TMB in white spirit (Hissink et al., 2007) (a) before and (b) after numerical optimization. .......................................................................................... C-28
Figure C-11. Comparisons of model predictions to measured brain concentrations in rats exposed to 1,2,4-TMB in white spirit (Hissink et al., 2007) using model parameters optimized for fit to Hissink et al. (2007) rat blood data. ......................................... C-29
Figure C-12. Comparisons of model predictions to measured venous blood concentrations by Swiercz et al. (2003) in rats repeatedly exposed to 1,2,4-TMB (a) before and (b) after numerical optimization. .......................................................................................... C-30
Figure C-13. Comparisons of model predictions to measured rat venous blood concentrations by Swiercz et al. (2002) in acutely exposed rats (a) during and (b) after exposure. .... C-31
Figure C-14. Comparisons of model predictions to measured human venous blood concentrations of Kostrzewski et al. (1997) in volunteers exposed to 154 mg 1,2,4-TMB/m3 for 8 hours. ...................................................................................... C-37
Figure C-15. Comparisons of model predictions to measured human venous blood concentrations in volunteers exposed to 2 or 25 ppm (~10 or 123 mg/m3) 1,2,4-TMB for 2 hours while riding a bicycle (50 W) (Järnberg et al., 1998, 1997a; Järnberg et al., 1996). ................................................................................................................. C-38
Figure C-16. Comparisons of model predictions to measured (a) human venous blood and (b) end of exposure exhaled air 1,2,4-TMB in volunteers exposed to 100 ppm white spirit with 7.8% 1,2,4-TMB (38.4 mg/m3 1,2,4-TMB) (Hissink et al., 2007). ........... C-38
Figure C-17. Time course of NSCs of moderately sensitive chemical-specific parameters (response: venous blood concentration) in rats exposed to (a) 25 ppm (123 mg/m3) or (b) 250 ppm (1,230 mg/m3) of 1,2,4-TMB via inhalation for 6 hours (Swiercz et al., 2003; Swiercz et al., 2002). ..................................................................................... C-46
Figure C-18. Effect of route of exposure and dose rate on steady-state venous blood concentration (t = 1,200 hours) for continuous human exposure to 1,2,4-TMB. ... C-49
Figure D-1. Plot of mean response by dose for increased latency to paw-lick in male Wistar rats, with fitted curve for Linear model with constant variance (Korsak and Rydzyński, 1996). ........................................................................................................................ D-6
Supplemental Information―Trimethylbenzenes
x
Figure D-2. Plot of mean response by dose for increased latency to paw-lick in male Wistar rats, with fitted curve for Linear model with constant variance (Korsak and Rydzyński, 1996). ...................................................................................................................... D-11
Figure D-3. Plot of mean response by dose for decreased RBCs in male Wistar rats, with fitted curve for Exponential 2 model with constant variance (Korsak and Rydzyński, 1996). ...................................................................................................................... D-14
Figure D-4. Plot of mean response by dose for decreased segmented neutrophils in male Wistar rats, with fitted curve for Exponential M2 model with constant variance (Korsak et al., 2000a). .............................................................................................................. D-21
Figure D-5. Plot of mean response by dose for decreased segmented neutrophils in female Wistar rats, with fitted curve for Hill model with constant variance (Korsak et al., 2000a). .................................................................................................................... D-24
Figure D-6. Plot of mean response by dose for increased reticulocytes in female Wistar rats, with fitted curve for Linear model with constant variance (Korsak et al., 2000a). D-27
Figure D-7. Plot of mean response by dose for decreased fetal weight in male Sprague-Dawley rat pups, with fitted curve for Linear model with constant variance (Saillenfait et al., 2005). ...................................................................................................................... D-30
Figure D-8. Plot of mean response by dose for decreased fetal weight in male Sprague-Dawley rat pups, with fitted curve for Linear model with constant variance (Saillenfait et al., 2005). ...................................................................................................................... D-30
Figure D-9. Plot of mean response by dose for decreased fetal weight in female Sprague-Dawley rat pups, with fitted curve for Linear model with constant variance (Saillenfait et al., 2005). ...................................................................................................................... D-37
Figure D-10. Plot of mean response by dose for decreased fetal weight in female Sprague-Dawley rat pups, with fitted curve for Linear model with constant variance (Saillenfait et al., 2005). .......................................................................................... D-37
Figure D-11. Plot of mean response by dose for decreased dam weight gain in female Sprague-Dawley rats, with fitted curve for Polynomial 3 model with modeled variance (Saillenfait et al., 2005). .......................................................................................... D-45
Figure D-12. Plot of mean response by dose for decreased dam weight gain in female Sprague-Dawley rats, with fitted curve for Polynomial 3 model with modeled variance (Saillenfait et al., 2005). .......................................................................................... D-45
Figure D-13. Plot of mean response by dose for increased monocytes in male Wistar rats, with fitted curve for Exponential M4 model with modeled variance (Adenuga et al., 2014). ...................................................................................................................... D-53
Supplemental Information―Trimethylbenzenes
xi
ABBREVIATIONS AAQC Ambient air quality criterion ABR amount of 1,2,4-TMB in the brain ADME absorption, distribution, metabolism,
and excretion AEGL Acute Exposure Guideline Level AIC Akaike Information Criterion ALT alanine aminotransferase ANCOVA analysis of covariance ANOVA analysis of variance AP alkaline phosphatase AST aspartate aminotransferase AUC area under the curve BAL bronchoalveolar lavage BMCL lower confidence limit on the
benchmark concentration BMD benchmark dose BMDL lower confidence limit on the
benchmark dose BMDS benchmark dose software BMR benchmark response BrdU 5-bromo-2’-deoxyuridine BUN blood urea nitrogen BW body weight CAAC Chemical Assessment and Advisory
Committee CASRN Chemical Abstracts Service Registry
Number CE cloning efficiency CHO Chinese hamster ovary CI confidence interval CMIX average of arterial and venous blood
concentrations CNS central nervous system CV concentration in venous blood CVS concentration in venous blood exiting
slowly perfused tissues CXEQ concentration in exhaled breath CYP450 cytochrome P450 DAF dosimetric adjustment factor df degree of freedom DMBA dimethylbenzoic acid DMHA dimethylhippuric acid DMSO dimethylsulfoxide DNA deoxyribonucleic acid EC50 half maximal effective concentration EEG electroencephalogram EPA U.S. Environmental Protection Agency fMRI functional magnetic resonance imaging GABA gamma-aminobutyric acid GD gestational day GGT gamma-glutamyl transpeptidase
Hb/g-A animal blood:gas partition coefficient Hb/g-H human blood:gas partition coefficient HEC human equivalent concentration HED human equivalent dose HERO Health and Environmental Research
Online HFAN High-Flash Aromatic Naphtha HLVOC highly lipophilic volatile organic
chemical HSDB Hazardous Substances Data Bank IL-8 interleukin-8 i.p. intraperitoneal IRIS Integrated Risk Information System JP-8 jet propulsion fuel 8 KCCT kaolin-cephalin coagulation time Km Michaelis-Menten constant LLF log-likelihood function LOAEL lowest-observed-adverse-effect level MCH mean corpuscular hemoglobin MCHC mean corpuscular hemoglobin
concentration MCV mean cell volume MMS methyl methanesulfate MOE Ministry of the Environment NIOSH National Institute for Occupational
Safety and Health NLE neutral lipid equivalent NLM National Library of Medicine NMDA N-methyl-D-aspartate NOAEL no-observed-adverse-effect level NOEL no-observed-effect level NRC National Research Council NSC normalized sensitivity coefficient OSHA Occupational Safety and Health
Administration p-value probability value PBPK physiologically based pharmacokinetic
(model) PCV packed cell volume pg picogram PMR proportional mortality ratio PND postnatal day POD point of departure PODADJ duration-adjusted POD ppm parts per million QPC alveolar ventilation rate OR odds ratio QRTOTC sum of fractional flows to rapidly
perfused tissues, liver, and brain QSTOTC sum of fractional flows to slowly
perfused tissues
Supplemental Information―Trimethylbenzenes
xii
RBC red blood cell RD relative deviation RD50 50% respiratory rate decrease REL recommended exposure limit RfC reference concentration RfD reference dose ROS reactive oxygen species SAB Science Advisory Board SCE sister chromatid exchange SCI Science Citation Index SD standard deviation SDH sorbitol dehydrogenase SE standard error SMR standardized mortality ratio SOA secondary organic aerosol SVEP short-latency visual evoked potential SWD spike-wave discharge TLV threshold limit value TMB trimethylbenzene
TOXLINE Toxicology Literature Online TWA time-weighted average UF uncertainty factor UFA interspecies uncertainty factor UFH intraspecies uncertainty factor UFS subchronic-to-chronic uncertainty
factor UFL LOAEL-to-NOAEL uncertainty factor UFD database deficiency uncertainty factor VEP visual evoked potential Vmax ½ maximal enzyme rate VOC volatile organic compound W watt WBC white blood cell WOS Web of Science χ2 chi-squared
Supplemental Information―Trimethylbenzenes
A-1
APPENDIX A. RESPONSE TO EXTERNAL PEER REVIEW COMMENTS PROVIDED BY THE CHEMICAL ASSESSMENT ADVISORY COMMITTEE OF THE SCIENCE ADVISORY BOARD
The Toxicological Review of Trimethylbenzenes (TMBs) has undergone a formal external peer review by the Chemical Assessment Advisory Committee (CAAC) of the U.S. Environmental Protection Agency (EPA) Science Advisory Board (SAB). An external peer-review workshop was held June 14−16, 2014. The CAAC Panel was tasked with providing written answers to general questions on the overall assessment and on chemical-specific questions in areas of scientific controversy or uncertainty; these comments and answers were then provided to EPA in the form of a Peer Review Report. The following sections present the CAAC Panel’s comments on the external peer review draft of the Toxicological Review of Trimethylbenzenes; in most cases, the CAAC Panel comments were paraphrased for presentation, but in some situations, the Appendix uses direct language from the CAAC. Each CAAC Panel comment is followed by an EPA response reflecting consideration of the comment and revisions made to the Toxicological Review in light of that comment. Given the overall nature of the CAAC comments, based on EPA policy guidance, no additional review by the CAAC is warranted.
General Charge Questions
SAB Comment 1: In providing comments on the first four charge questions related to how the Agency has implemented recommendations provided by the National Research Council (NRC), the SAB noted that the Agency was implementing a phased approach to address the NRC recommendations for several assessments that were under review. The SAB recognized that the Agency was implementing the first phase of the Agency’s efforts to enhance the Integrated Risk Information System (IRIS) process in the TMB draft assessment and the SAB acknowledged the improvement in the new format for IRIS assessments and commended the Agency for its progress in addressing the NRC recommendations. The SAB noted that it used the peer review of the Toxicological Review of Trimethylbenzenes as a case study to provide advice and comments on improving IRIS toxicological assessments by further addressing the NRC recommendations. Specific comments on developing the Preamble and Executive Summary for future assessments, as well as the TMB assessment, were provided in the SAB’s report. The SAB noted that it anticipates that after several IRIS reviews are completed, the CAAC will compare the reviews to provide the Agency, through the Chartered SAB, with advice and comments on the Agency’s progress to enhance IRIS assessments.
Supplemental Information―Trimethylbenzenes
A-2
EPA Response 1: The SAB noted that it is using the review of the draft TMB assessment as a case study to provide recommendations on strategies to implement the NRC’s recommendations regarding improvements to the IRIS document structure. Although SAB noted that these recommendations are intended for future assessments, EPA has implemented some recommendations, where possible, in order to facilitate the rapid improvement of IRIS products. Other recommendations, such as full implementation of systematic review methods, are not implemented in order to prevent undue delays in posting the final IRIS TMB assessment. In comments below, it is noted that SAB acknowledges and supports this rationale for the phased implementation of the NRC recommendations.
General Charge Question 1: NRC (2011) indicated that the introductory section of IRIS assessments needed to be expanded to describe more fully the methods of the assessment. NRC stated that they were “not recommending the addition of long descriptions of EPA guidelines to the introduction, but rather clear, concise statements of criteria used to exclude, include, and advance studies for derivation of [toxicity values].” Please comment on whether the new Preamble provides a clear and concise description of the guidance and methods that EPA uses in developing IRIS assessments.
SAB Comment GC.1-1: The SAB noted that “[t]o a substantial degree, the Preamble as currently written provides a concise and clear description of the process that is followed, its steps, the places in the process where decisions or judgments are made, the guidance that applies to making those judgments (with explanation of the main considerations and available choices), and the process by which the results of each step feed into the next.” The SAB further noted that it presumed that the Preamble “will change from one assessment to the next to reflect newly adopted procedures” and recommended that the current assessment note where it has not fully implemented procedures outlined in the Preamble and planned for subsequent assessments. The SAB also recommended that Section 2 on the IRIS Process include further discussion, as part of the problem formulation step, on issues needing to be addressed in assessments, including how these issues will be addressed with the available data and how uncertainties and alternative interpretations will be considered. The SAB also recommended that the EPA make clear that the Preamble itself is not guidance and ensure that the Preamble refers users to the appropriate guidance documents, taking care to not imply that it supersedes policy existing guidance. The SAB helpfully pointed out a number of instances where it might be construed that the Preamble contradicts current guidance. The SAB also noted that Section 5.5 could be confusing as to what guidelines for assessing causality were used in the TMBs assessment and advised that discussing the intent of weight-of-evidence descriptors was more advisable.
EPA Response GC.1-1: In the time since the SAB External Review meeting for the Toxicological Review of Trimethylbenzenes, the IRIS program has substantially revised the Preamble based on a number of considerations, including: (1) experience with implementing the new document structure and systematic review procedures after the trimethylbenzenes assessment was
Supplemental Information―Trimethylbenzenes
A-3
submitted for SAB review in 2013; (2) recommendations from SAB reports on other draft assessments (such as ammonia); and (3) comments from EPA’s program and regional offices, other federal agencies, and the Executive Office of the President, and the public.
The revised Preamble reflects recommendations for a shorter Preamble, and some information previously in the Preamble is now discussed in the Toxicological Review (e.g., literature searching, screening, and study evaluation) or in the upcoming IRIS Handbook of Operating Procedures for Systematic Review being developed by the IRIS Program. The Preamble begins with a new statement that it summarizes general principles and systematic review procedures, and specifically states in Section 1 that the “… Preamble summarizes and does not change IRIS operating procedures or EPA guidance.” Consistent with SAB recommendations, new text was also added to the Preface to describe where approaches in the trimethlybenzenes assessment differ from those outlined in the Preamble. Additionally, Section 2 of the Preamble has been rewritten to elaborate that through the Problem Formulation step of the IRIS Process, EPA identifies the science questions that will be addressed in an IRIS assessment and that Problem Formulation includes input from the scientific community and public. Problem formulation further includes multiple systematic reviews of the literature. Section 2 in the updated Preamble also delineates that protocols will be established and used by EPA to conduct its literature searches, considerations for evaluating study quality, and extracting data. It is through the Problem Formulation step and application of protocols that EPA will determine how to address the science issues covered by the assessment and how to appropriately consider any uncertainties and plausible alternative interpretations. As stated above, the Preamble now clearly states that it does not change existing EPA guidance and that IRIS assessments follow existing EPA guidance documents. The shortened format of the Preamble no longer includes specific citations to guidance documents, but rather directs users to IRIS’s guidance website. With a shorter, refocused Preamble, specific instances where it seemed that the Preamble superseded existing guidance have been removed. Section 5 of the revised Preamble (Integrating the Evidence of Causation for Each Health Outcome) has been rewritten to report that EPA uses standardized hazard descriptors for cancer endpoints and that the “objective is to promote clarity and consistency of conclusions across assessments.” EPA still describes briefly what level of evidence is generally required for determination of the individual descriptors. The Preamble further reports that IRIS is currently discussing the potential for development of a causality framework for noncancer effects.
General Charge Question 2: NRC (2011) provided comments on ways to improve the presentation of steps used to generate IRIS assessments and indicated key outcomes at each step, including systematic review of evidence, hazard identification, and dose-response assessment. Please comment on the new IRIS document structure and whether it will increase the ability for assessment to be more clear, concise and easy to follow.
SAB Comment GC.2-1: The SAB recommended that the revised structure for IRIS assessments should allow for three different modes of reading the document: (1) quickly to get the
Supplemental Information―Trimethylbenzenes
A-4
main qualitative and quantitative conclusions; (2) more thoroughly, but still rapidly, to get a complete idea of the types of data and toxicity information that were considered, the main features and issues involved in the interpretation of those data, and the choices that were made and their rationale; and (3) in detail in order to find the particulars of individual study features, data, and analyses. The SAB found that, in general, the structure of the TMB assessment has markedly improved compared to previous IRIS assessments, and the current document structure facilitates all three modes of recommended reading.
EPA Response GC.2-1: No response necessary.
Consistent Presentation of the Studies Considered
SAB Comment GC.2-2: The SAB recommended that each study used in the assessment should be in a consistently formatted table. The table should be in an appropriate appendix and present the study-specific considerations that bear on evaluation of study quality and pertinence, including shortcomings and assumptions that are needed to interpret the study's outcomes. Consistency of format is important within each document, but it would also be a useful goal to achieve from one IRIS assessment to another.
EPA Response GC.2-2: Currently, a study summary table is included for each study cited in the assessment. These tables are formatted consistently to the extent possible given the varying type, amount, and detail of information provided in the individual studies. Information is provided at the head of each table regarding additional study details important to interpretation of study findings.
As EPA moves forward with implementing systematic review methodology, the SAB’s recommendations to include study-specific information such as evaluations of study quality and strengths and weaknesses will be more fully implemented. In the current assessment, the study summary tables provide some information that can be used to judge the overall quality of the study (including numbers of animals, dosing schemes, etc.).
SAB Comment GC.2-3: The SAB suggested that it would be useful for each study to have a short overview section (also in its appendix listing, not repeating tabulated details) of the nature of the study, its examined endpoints, and relevant findings. The goal of the overview is to provide context for the tabulated details, so that the details need not be read in full to gain an idea of the general nature of the study and its importance to the assessment as a whole. This overview should not discuss interpretations.
EPA Response GC.2-3: This information is provided at the head of each study summary table included in Appendix C. Specifically, general information about what effects were observed and at what dose levels those effects occurred are provided in the “Additional study details” section in each study summary table provided in Appendix C. For example, for Gralewicz and Wiaderna (2001), Table C-24, it is noted in a bullet that “1,2,3-TMB-, 1,2,4-TMB-, and 1,3,5-TMB-exposed rats showed alterations in performance in spontaneous locomotor activity, passive avoidance learning, and paw-lick latencies.”
Supplemental Information―Trimethylbenzenes
A-5
SAB Comment GC.2-4: The SAB recommended that as IRIS makes enhancements to the systematic review process, the overriding issue is transparency regarding study selection criteria. Studies that support a hypothesized human hazard should be included, but studies that are contrary to these hypotheses should also be included as they result in alternative, scientifically supportable conclusions regarding human risk.
EPA Response GC.2-4: The revised Preamble includes discussion of criteria for study selection. In the TMB assessment, studies most relevant to hazard identification and dose-response analyses have been included in the main body of the text, including those data that may seem inconsistent. For example, while an argument of sufficient similarity is used in the assessment to support adopting reference concentrations (RfCs) derived for one isomer as the RfC for another isomer when lacking sufficient isomer-specific data, instances where the toxicities or toxicokinetics appear to differ between isomers are clearly discussed. Additionally, information contained in appendices in the draft TMB assessment regarding the C9 fraction studies, including differences between these studies and isomer-specific studies, have been included in the main body of the assessment consistent with the recommendation of the SAB.
Describing the Literature Search
SAB Comment GC.2-5: The SAB commented that the Literature Search Strategy section is brief and focuses only on identification of pertinent studies from the literature. The SAB was concerned that the general description of the process and the specific implementation for TMBs may be too exclusive, missing potentially informative ancillary studies that could help in interpretation or evaluation of those studies strictly observing toxicity outcomes of the TMBs alone in controlled settings. The SAB recommended a more inclusive literature search in which evidence from related compounds are incorporated in order to provide context to evidence gleaned from the chemicals under assessment (i.e., TMBs).
EPA Response GC.2-5: The “primary” (initial) TMB literature search has been re-tagged in the Health and Environmental Research Online (HERO) database such that all of the identified studies are tagged more thoroughly, including those references determined to not be relevant to the assessment. For example, there are now exclusion tags that identify which studies were excluded based on being published in non-relevant journals (e.g., chemical engineering journals) and which studies were excluded based on title and abstract screenings. The “primary” (initial) literature search has also been updated to November, 2015 and the results of this literature search update are reported in a similar fashion.
A secondary, targeted literature search for information pertaining to the effects and properties of similar chemicals has been conducted, and the results of this literature search are also reported. Briefly, the literature search was limited to integrated reviews of the toxicological effects of related compounds (see SAB Comment GC.2-6 below for further details).
SAB Comment GC.2-6: The SAB recommended that the primary literature search be comprehensive and subjected to an orderly process of systematic review, and further commented
Supplemental Information―Trimethylbenzenes
A-6
that the secondary search is for literature that is useful to provide context, in terms of what might be expected given the knowledge of other chemicals and of the potential pathways of toxic action. The SAB recommended that the secondary search need not be comprehensive and could include reviews as well as original experimental studies in order to provide information that can potentially fill data gaps that exist in the primary TMB literature.
EPA Response GC.2-6: In response to the SAB recommendation, a secondary literature search was conducted to identify studies on related compounds focused primarily on review articles in order to assess a large body of literature for the pertinent pieces of information that could serve to fill data gaps in the primary TMB literature. The related chemicals included in this targeted, secondary literature search were toluene, xylene, styrene, and ethylbenzene; specific toxicity endpoints in the secondary literature search included neurotoxicity, developmental neurotoxicity, respiratory toxicity, developmental toxicity, and hematotoxicity. The literature search was set up as: (at least one chemical) + (at least one toxicity endpoint) + (review article). The secondary literature search resulted in approximately 70 review articles that were manually screened for relevance to provide context for the TMB assessment, and to identify additional relevant primary literature. The final TMB assessment includes both relevant review articles and new primary literature identified through the secondary literature search. Information from the secondary, targeted literature search was used to fill in gaps in the existing TMB database, and to help inform decisions in setting the value of the database uncertainty factor (UFD).
Describing the Hazard Identification Step
SAB Comment GC.2-7: The SAB recommended that the individual endpoint sections of the Hazard Identification section have some discussion about interpretation across studies and evaluations of bearing and relevance, though further discussion of interpretation rationales and consideration of alternatives would be beneficial. The SAB made this recommendation in the context of the larger process of a systematic review of the literature, stating that it is the middle section of systematic review—after the studies are chosen but before the interpretation of their overall bearing gets considered—that does not have a clear home in the current document structure. The SAB recognized that the implementation of systematic review methods have not been fully implemented and recommended that the Agency further develop its approach for systematic review so that the ways for abstracting data, judging study quality, documenting factors bearing on interpretation and its limits, and considering the impact of related studies have discrete locations in the updated IRIS document structure.
EPA Response GC.2-7: EPA agrees with the SAB’s comments regarding the evolving structure of the systematic review of the literature. It is EPA’s intention that, moving forward, the NRC recommendations will be fully implemented in future assessments and that specific comments received from SAB on current assessments will be invaluable in the implementation of those recommendations.
Supplemental Information―Trimethylbenzenes
A-7
In the final TMB assessment, EPA has partially addressed this SAB comment by strengthening the discussion of the interpretation of studies, including the consideration of alternative explanations or conflicting evidence, in the synthesis sections at the end of each organ section. For example, in the write-up for the neurotoxic effects observed in animal toxicology studies, full discussions of the Douglas et al. (1993) neurotoxicity study have been included. Instances where the results of the Douglas et al. (1993) C9 study and individual isomer studies differ in observed effects have been exhaustively discussed, and possible interpretations of those differences are included in the text. This discussion of differing results and possible interpretational issues across studies is also included in other health effects sections, and in Sections 1.2.7 (Similarities among TMB Isomers Regarding Observed Inhalation and Oral Toxicity) and 1.3.1 (Weight of Evidence for Effects Other than Cancer).
SAB Comment GC.2-8: The SAB noted that Preamble has a section (Section 5) on evaluation of causality, which depends on the existence of such a documented review and evaluation process, but that the TMB assessment has no particular place where the Preamble's named considerations—strength, consistency, specificity, temporal relationship, biologic plausibility, coherence, natural experiments, and analogy—are systematically considered or documented.
EPA Response GC.2-8: Although the Preamble lays out the precepts by which human or animal evidence can be evaluated systematically for causality, a systematic causality framework has not been fully implemented in this assessment. However, the evidence was more clearly characterized with respect to the various considerations affecting causality determinations (e.g., strength, consistency, specificity, temporal relationship, biologic plausibility, coherence, natural experiments, and analogy). For example, in evaluating the evidence in the neurotoxicity database, the TMB assessment notes that “[n]eurotoxicity is strongly and consistently (emphasis added) associated with exposure to TMBs in multiple studies, and these associations are coherent in human populations exposed to mixtures containing TMBs and in laboratory animals exposed to individual TMB isomers.” Additionally, the TMB assessment notes that “TMBs are neurotoxic following inhalation or oral exposure, based on strong and consistent effects in experimental animals that are coherent with observations in exposed humans; biological plausibility based primarily on similarities to findings from related chemicals; evidence of effects that worsen with increasing duration of exposure; delayed-onset and/or latent neurological effects in animals several weeks following exposure; and observed exposure-response relationships in animals tested immediately after exposure.” The considerations that relate to evaluation of causality are also applied to the other health effect domains throughout the document.
SAB Comment GC.2-9: The SAB recommended adding a brief summary of the main features of the assessment—in this case, pharmacokinetics and metabolism—before the section on Hazard Identification. The SAB noted that the aim of this section would not be to replace the fuller treatment of these issues in an appendix, but rather to set the context for the interpretation of studies bearing on hazard, and the main presentation of pharmacokinetic details should continue to
Supplemental Information―Trimethylbenzenes
A-8
reside in an appendix. The SAB suggested that the main text's section would note such things as extent of absorption, rapidity of elimination, main metabolic processes, main means of clearance (and what part of that is by metabolism), indications of whether metabolic saturation or enzyme induction might play a relevant role in toxicity studies, and any notable unusual differences between experimental animals and humans.
EPA Response GC.2-9: Previously, all information on the toxicokinetic properties of the TMB isomers was located in Appendix B of the External Peer Review draft Supplemental Information document. Given CAAC’s recommendation, this section has been moved to Section 1.1.1 of the main body of the final assessment. Section 1.1.2 was added to provide a brief overview of the available physiologically based pharmacokinetic (PBPK) models for TMB isomers.
SAB Comment GC.2-10: The SAB noted that the current IRIS document structure in which the Hazard Identification section is separated into assessments of each endpoint, with relevant data for that endpoint being reviewed within the section is a great improvement over the past practice of summarizing study by study. The SAB was also impressed that the endpoint-by-endpoint analysis permits the examination of consistency and sufficiency of data to draw hazard conclusions about each effect. The SAB commented that there were possible overarching ties among endpoints that would help in evaluation of the hazard characterization of each that should be discussed in an appropriate place. The SAB further recommended that it would be useful to include considerations that might indicate a study as the critical study.
EPA Response GC.2-10: A short discussion of commonalities between endpoints regarding possible modes of action has been added to Section 1.3.1. Discussions of important considerations that might help indicate a study a potential critical study, especially extensive discussions on study design and its effect on the observation of particular endpoints, have been added throughout Section 1.
SAB Comment GC.2-11: The SAB commented that the tabulation of studies into Evidence Tables is useful, noting that the inclusion of dose levels and dose-specific responses are important details to provide. The SAB also noted that providing hyperlinks to the study summary tables in the Supplemental Information document makes finding relevant data easier, and that the Exposure-Response arrays provide a valuable overview of the data.
EPA Response GC.2-11: No response necessary.
Describing the Dose-Response Steps
SAB Comment GC.2-12: The SAB noted that the tabulation of points of departure (PODs), human equivalent concentrations (HECs), and applied uncertainty factors (UFs) is useful and allows for the comparison of endpoints and the distinction between a low POD with few UFs and a high POD and many UFs.
EPA Response GC.2-12: No response necessary. SAB Comment GC.2-13: The SAB noted that the inclusion of discussions of consistencies
and inconsistencies among data, relevance of studies for human risk evaluation, knowledge of mode
Supplemental Information―Trimethylbenzenes
A-9
of action (even if it must say that little is known), and alternative interpretations of the available data on potential causation for each endpoint represents an important advance in the Hazard Identification sections. The SAB further noted concern that these interpretation passages are too concise and recommended that a consistent way be developed to document these arguments without unduly distracting from the main Hazard Identification discussions.
EPA Response GC.2-13: Discussions in the interpretations of the organ-specific TMB-induced toxicities have been augmented where appropriate to highlight commonalities across effects. As IRIS continues to implement NRC- and SAB-recommended changes to the documents, a more consistent way to present summaries and interpretations will be developed.
Presenting Outcomes
SAB Comment GC.2-14: The SAB noted that the both the Hazard Identification and Dose-Response Analysis sections simply dive in to the first endpoint or analysis to be considered, and then have separate sections on each. The SAB commented that there is little overview to prepare a reader for what is coming or to point to the parts that are critical versus those that are there for completeness. In general, to help enable a reader to grasp the main lines of argument and only go into detail when needed, the SAB recommended that both the Hazard Identification and the Dose-Response Analysis sections have an initial paragraph setting out the main issues that will be considered and indicating which considerations (to be developed in the subsequent text) are the most notable for the larger assessment process. The SAB also recommended a parallel paragraph at the end of each of these chapters to summarize what its contents have provided to the larger assessment process. The aim of these paragraphs would be to make it possible to not only read the document in more detail than provided in the Executive Summary, but also still quickly see the deeper structure of the report and where to focus for more information on particular aspects.
EPA Response GC.2-14: An introductory paragraph has been added to the beginning of the Hazard Identification section. This paragraph summarizes the broad scope and purpose of the Hazard Identification section and analysis/interpretations therein, including highlighting particular sections most important for the assessment conclusions (i.e., the neurotoxicity section, similarities in toxicity between isomers, and the differing results observed in the C9 studies). No new concluding paragraph was added to the Hazard Identification section as such a paragraph would be largely duplicative of Section 1.3 (Summary and Evaluation). An introductory paragraph has also been added to the Dose-Response Analysis section, briefly highlighting what types of benchmark dose (BMD), PBPK, and/or default dosimetric adjustment analyses were performed and the major conclusions of the dose-response section.
General Charge Question 3: NRC (2011) states that “all critical studies need to be thoroughly evaluated with standardized approaches that are clearly formulated” and that “strengthened, more integrative, and more transparent discussions of weight of evidence are needed.” NRC also indicated that the changes suggested would involve a multiyear process. Please comment on EPA’s success thus far in implementing these recommendations.
Supplemental Information―Trimethylbenzenes
A-10
SAB Comment GC.3-1: The SAB found that, in general, a great deal of progress has been made in restructuring the document to focus the main body on documenting and explaining the interpretations, choices, and analyses, and relegating the supporting information to appendices. However, the SAB also noted that the process of systematic review still needs development. Documentation of the process of identifying literature has progressed, but further development is needed in establishing standard practices for abstracting relevant data, evaluating study quality, strengths, and shortcomings, and integrating evidence across studies. In making this recommendation, the SAB recognized that an important challenge facing the Agency is that assessments must go ahead even as this further development proceeds and before all aspects are complete. Ultimately, the SAB recommended that a good principle to follow in conducting assessments during the process of revision is to consider the reasons behind the recommendations for change, and to make efforts to address the issues and explain how the chosen approaches seek to reflect the NRC recommendations, although the methods may not yet be fully developed and agreed upon.
EPA Response GC.3-1: The SAB acknowledged and agreed with EPA’s phased implementation of the NRC recommendations for improving the IRIS process. As such, EPA is fully implementing systematic review methods (e.g., including methods to systematically judge study quality and the consistent application of study exclusion/inclusion criteria) in new IRIS assessments that are in the Problem Formulation or Draft Development steps. Assessments that are further along in the IRIS process, such as the TMB assessment, are incorporating elements of systematic review methods, as well as other document improvements such as streamlining the document structure and increased incorporation of tables, figures, and exposure-response arrays for the efficient presentation of data, in order to keep the program at large on track.
General Charge Question 4: EPA solicited public comments on the draft IRIS assessment of trimethylbenzenes [May 2012] and has revised the assessment to respond to the scientific issues raised in the comments. A summary of the public comments and EPA’s responses are provided in Appendix F of the Supplemental Information to the Toxicological Review of Trimethylbenzenes. Are there scientific issues that were raised by the public as described in Appendix F that may not have been adequately addressed by EPA?
SAB Comment GC.4-1: While the SAB felt that Appendix F (External Peer Review draft) addressed issues raised in public comments in a transparent manner, the panel was divided on the adequacy and dispositions that were made as presented in the appendix. Most importantly, the SAB panel expressed a number of opinions on the role that the C9 fraction studies should play in the assessment and whether or not the possible reversibility of the critical effect of decreased pain sensitivity was discussed adequately.
EPA Response GC.4-1: The Agency appreciates that the SAB found that Appendix F in the External Peer Review draft assessment was generally responsive to public comments. Regarding the adequacy and disposition of comments regarding the C9 fraction studies, in the final TMB
Supplemental Information―Trimethylbenzenes
A-11
assessment, the C9 studies are covered more extensively below in EPA Responses C.1 (Synthesis of Evidence)-6 and -8. The issues surrounding the possible reversibility of decreased pain sensitivity are covered below in EPA Responses E.1-5 and E.4-4; briefly, it was concluded that when the entire pain sensitivity database was taken into consideration (short-term TMB and subchronic TMB or C9 studies), the data clearly indicated that decreased pain sensitivity was not a transient effect, and that exposure to TMB isomers resulted in persistent alterations in an organism’s ability to correctly process painful stimuli. For a full record of EPA’s responses to public comments, readers are referred to the External Peer Review Draft of the Trimethylbenzenes Toxicological Review.
Chemical-Specific Charge Questions
Charge Question A.1: The major conclusions of the assessment pertaining to the hazard identification and dose-response analysis have been summarized in the Executive Summary. Please comment on whether the conclusions have been clearly and sufficiently described for purposes of condensing the Toxicological Review information into a concise summary.
SAB Comment A.1-1: While the SAB commented that the Executive Summary did an adequate job at condensing a large amount of information presented in the TMB assessment, the panel provided a number of recommendations for improving the presentation and flow of information included. The SAB recommended that the Executive Summary be shortened to emphasize the major conclusions of the assessment. Specifically, the panel recommended removing all citations and combining the duplicative sections on “Confidence” into a single succinct section. The SAB also recommended that information not be duplicated in tables and the text of the Executive Summary. Finally, the SAB noted that much of Section 15 of the Executive Summary seemed speculative and should not be included.
EPA Response A.1-2: All recommendations made regarding the Executive Summary have been incorporated. The Executive Summary has been shortened to emphasize major conclusions of the assessments: the available information in the inhalation and oral toxicity databases and the derivation of the RfC and reference dose (RfD). Citations have been removed. The structure of the executive summary has changed to consolidate discussions of particular issues (confidence, etc.) into one section covering all isomers; this follows the restructuring of the Dose-Response Analysis section in the main body of the assessment. All of the discussion regarding Susceptible Populations and Lifestages has been removed from the Executive Summary other than to state “No TMB-specific data that would allow for the identification of populations or lifestages with increased susceptibility to TMB exposure exist.”
Charge Question B.1: The process for identifying and selecting pertinent studies for consideration in developing the assessment is detailed in the Literature Search Strategy/Study Selection section. Please comment on whether the literature search approach, screening, evaluation, and selection of studies for inclusion in the assessment are clearly described and supported. Please identify any additional peer-reviewed studies from the primary literature that should be considered in the assessment of noncancer and cancer health effects of 1,2,3-TMB, 1,2,4-TMB, and 1,3,5-TMB.
Supplemental Information―Trimethylbenzenes
A-12
SAB Comment B.1-1: The SAB found that the search strategy was clearly articulated and that the databases and search terms were clearly defined. However, the SAB noted some concerns that the way that studies were selected for use in the assessment was not transparent. Specifically, the SAB noted that while it was clear which papers were included in the assessment, there were no means of determining which papers were excluded from the assessment and for what reasons. The SAB recommended that the EPA provide citations for all studies identified via the literature search and group them according to reasons why they were excluded from consideration.
EPA Response B.1-1: As noted above in EPA Response GC.2-5, EPA has provided all of the identified studies in the HERO database, and has re-tagged all of the references such that all of the identified studies are tagged more thoroughly, including those references determined to not be relevant to the assessment. For example, there are now exclusion tags that identify which studies were excluded based on being published in non-relevant journals (e.g., chemical engineering journals) and which studies were excluded based on title and abstract screenings. The primary (initial) literature search has also been updated to November 2015 and the results of this literature search update are reported in a similar fashion.
SAB Comment B.1-2: The SAB further commented that in the External Peer Review Draft, 65 references were excluded “based upon manual review of papers/abstracts,” but these papers were not individually identified. The SAB also commented that excluding papers because they were not available in English is not a valid reason for exclusion. Lastly, SAB noted that reporting some papers as being excluded based on being in vitro reports, but including other in vitro reports elsewhere in the document, was inconsistent.
EPA Response B.1-2: The entire primary (initial) literature search has been re-tagged in the HERO database. As such, all studies found via the literature search are now included in the database, and users can now determine which individual studies were excluded for which reasons at what step in the process (i.e., some references were excluded based on which journals they were published in, and some were excluded based on manual screening of titles/abstracts based on whether they were exposure studies, in nonrelevant in vitro systems [e.g., bacterial systems], etc.). A number of papers were previously excluded based on being published in foreign language journals; these foreign language journal articles were re-screened based on their title and/or abstract. If it was judged that any non-English reference should be excluded on content or subject, it was binned in the appropriate exclusion bin. If a non-English reference was judged to possibly be relevant to the assessment, it was placed in the “Considered” bin and reviewed further to determine whether it should be translated into English. Ultimately, no non-English references were judged to be critical to the needs of the assessment and correspondingly, no references were translated into English. In re-tagging all of the references in the TMB database, any decision to exclude in vitro studies has been tagged such that it is clear that the study was excluded because it was unrelated and uninformative to the purposes of the TMB assessment, not for simply being an in vitro study.
Supplemental Information―Trimethylbenzenes
A-13
SAB Comment B.1-3: The SAB noted that the search strategy did not mention compounds structurally related to TMB isomers, including xylenes or ethylbenzenes, and that this may have resulted in important studies being excluded from the assessment. The SAB recommended a number of human occupational studies investigating the effects of exposure to complex mixtures of volatile organic compounds (VOCs) that should be added to the assessment in order to strengthen its conclusions:
1. Chapter 8 on TMBs (NRC, 2013)
2. Health hazards of solvents exposure among workers in paint industry (El Hamid Hassan et al., 2013)
3. Xylene-induced auditory dysfunction in humans (Fuente et al., 2013)
4. Hearing loss associated with xylene exposure in a laboratory worker (Fuente et al., 2012)
5. Visual dysfunction in workers exposed to a mixture of organic solvents (Gong et al., 2003)
6. Ototoxicity effects of low exposure to solvent mixture among paint manufacturing workers (Juárez-Pérez et al., 2014)
7. Short latency visual evoked potentials (SLVEPs) in occupational exposure to organic solvents (Pratt et al., 2000)
8. Auditory brainstem response in gas station attendants (da Silva Quevedo et al., 2012) EPA Response B.1-3: The studies recommended by the SAB for inclusion have been added
to the TMB assessment where appropriate. However, it should be noted that these studies either involve human exposures to complex organic solvent mixtures or related alkylbenzene compounds. Therefore, while these studies provide further qualitative support that exposure to TMBs and/or related compounds as part of complex solvent mixtures result in adverse health effects, caveats regarding their interpretations still apply. Namely, it’s not possible to attribute the observed effects completely to one specific component of the mixture, and there is some uncertainty that related alkylbenzenes would elicit the exact same health effects as TMBs. Other shortcomings of the human studies involved imprecision in effect estimates due to low statistical power and lack of quantitative exposure assessment. As discussed above in EPA Responses GC.2-5 and GC.2-6, EPA also conducted a targeted secondary literature search of review papers on related compounds in order to identify additional data that would potentially strengthen the conclusions of the assessment.
SAB Comment B.1-4: The SAB recommended that a summary table be included for each human health effect that reports study design, inclusion/exclusion criteria, results, etc. in Appendix B.
EPA Response B.1-4: Instead of including a summary table covering all of the human studies included in the assessment, EPA replaced all of the individual human study summary tables
Supplemental Information―Trimethylbenzenes
A-14
with Table C-16, which provides all of the pertinent study details requested by SAB, as well as study details previously reported in the individual tables.
Charge Question C.1 (Synthesis of Evidence): A synthesis of the evidence for trimethylbenzene toxicity is provided in Chapter 1, Hazard Identification. Please comment on whether the available data have been clearly and appropriately synthesized for each toxicological effect. Please comment on whether the weight of evidence for hazard identification has been clearly described and scientifically supported.
SAB Comment C.1 (Synthesis of Evidence)-1: The SAB noted that the synthesis of evidence for the three TMB isomers was efficiently divided up into sections corresponding to the various target organs or forms of toxicity, and then by human versus animal studies and route of exposure when possible. The SAB noted that the studies chosen for review were clearly described and that the evidence tables and exposure-response arrays augmented the text effectively. The SAB recommended that an introductory paragraph describing the section layout, including the summary tables for each endpoint, would improve readability.
EPA Response C.1 (Synthesis of Evidence)-1: As noted above in EPA Response GC.2-14, an introductory paragraph has been added to the beginning of the Hazard Identification section. This paragraph briefly outlines the structure of the Hazard Identification section and what types of data are presented.
SAB Comment C.1 (Synthesis of Evidence)-2: The SAB expressed concern that the discussion of individual endpoints was flawed by questionable statistical statements or inferences. Several instances in the document were provided as evidence of these flawed statistical statements. For example, the TMB document notes, regarding decreased performance on the rotarod, that “This impaired function [i.e., failures on the rotarod apparatus] was still evident at 2 weeks post-exposure and, while not statistically significant for 1,2,4-TMB, may indicate long-lasting neuromuscular effects of subchronic exposures to 1,2,4-TMB and 1,2,3-TMB.” The SAB recommended that descriptions of results more closely adhere to the rule that statistical significance provides the criterion of whether an effect has occurred.
EPA Response C.1 (Synthesis of Evidence)-2: The purpose of this evaluation is to understand the extent to which individuals could demonstrate some adverse effect in response to exposure; both biological and statistical significance of the effects considered aid in these evaluations. When suitable, well-designed studies are used, and a pattern of statistically significant results for an effect, or related effects, across such studies generally increases the confidence that the effect is associated with the exposure. It is important to note, however, that statistical significance testing, while a useful tool for the systematic evaluation of data, has limitations, that, when overlooked, can lead to flawed conclusions. Specifically, lack of statistical significance should not automatically be interpreted as evidence of no effect. For example, if an exposure at a particular level leads to a measurable effect, studies with low statistical power are unlikely to produce statistically significant results. Further, when both biological and statistical significance
Supplemental Information―Trimethylbenzenes
A-15
can be evaluated, “precedence is given to biological significance, and a statistically significant change that lacks biological significance is not considered an adverse effect” (U.S. EPA, 2002). It is also important to note that at the population level, even small changes in the average of a response parameter can result in an increase in the number of people in the “abnormal” or “impaired” range for the particular endpoint. Thus, a relatively small difference can be considered biologically significant. When biological significance is uncertain or understood less clearly (e.g., no suitable normal range), statistical significance testing has been used to augment this evaluation. Additionally, it is important to examine patterns in results across all studies that report data for the same endpoint, taking into account relative exposure ranges and variability of effects. The final TMB assessment has been revised such that discussions of observed health effects appropriately note cases of both statistical and biological significance, taking particular care to note trends across studies and isomers. Using the example above (failures on the rotarod apparatus), EPA notes that:
Significant decreases in rotarod performance were observed at 1,230 mg/m3 1,2,4-TMB (40% response) and ≥493 mg/m3 1,2,3-TMB (50−70% response) when tested immediately after exposure for 13 weeks (Korsak and Rydzyński, 1996); an exposure duration-dependency for this effect was observed, with less robust, but statistically significant, decreases in performance also reported at 1,230 mg/m3 after 4 (40 and 30% response) or 8 (60 and 40% response) weeks of exposure to 1,2,3-TMB or 1,2,4-TMB, respectively. This impaired function was still evident at 2 weeks post-exposure, indicating a persistence of this effect. Specifically, failures in 70 and 40% of animals after 13 weeks of exposure to 1,230 mg/m3 1,2,3-TMB and 1,2,4-TMB, respectively (compared to 0% of animals in control groups at any time), were 50 and 30% at 2 weeks post-exposure, although 30% failures at 15 weeks for 1,2,4-TMB was no longer significantly different from controls (note: statistical comparisons did not appear to include a repeated measures component and comparisons to the 13-week time-point were not performed). The observation of substantial decrements in rotarod performance is interpreted as a biologically relevant response in light of the lack of failures in controls and the similarities in response magnitude across isomers. It is important to note that this discussion of nonstatistically significant, but possibly
biologically significant, decreases in rotarod performance was included in the context of other statistically significant decrements of neuromuscular performance. All discussions of biologically significant, but not statistically significant, effects are included in that context. In other words, when nonstatistically significant effects are included in the discussion, they are used to compare results across studies and isomers in order to provide a fuller account of the pattern of TMB-induced toxicity.
SAB Comment C.1 (Synthesis of Evidence)-3: The SAB recommended that the discussion of respiratory effects should be strengthened by further consideration of the relevance to humans of the effects observed in the high-dose animal studies. The SAB noted that while it is clear that respiratory effects are observed and are a relevant endpoint in humans, the distinction between the high-dose animal effects and the human effects could have been made more clearly. The SAB also
Supplemental Information―Trimethylbenzenes
A-16
recommended that the limitations of the human evidence for hematological and clinical chemistry effect, based on the uncertainties in exposures (mixture components, doses) also be more clearly described. The SAB noted that the TMB assessment clearly communicates the inadequacy of the cancer toxicity database, including the minimal genotoxicity database.
EPA Response C.1 (Synthesis of Evidence)-3: The discussions regarding the human relevance of respiratory effects observed in high-dose animals and the limitations of the human hematological evidence have been augmented in the final TMB assessment.
SAB Comment C.1 (Synthesis of Evidence)-4: The SAB noted that the summary table (Table 1-7 in the External Peer Review draft; Table 1-8 in the current document) was very helpful in understanding the points made with regard to the toxicological similarities across TMB isomers, and recommended that a summary table or scheme regarding toxicokinetics and metabolism would also be useful.
EPA Response C.1 (Synthesis of Evidence)-4: A summary table presenting the similarities in toxicokinetics (absorption, distribution, metabolism, and excretion [ADME]) has been added to Section 1.1.1 (Toxicokinetics of TMB Isomers).
SAB Comment C.1 (Synthesis of Evidence)-5: The SAB noted that the synthesis section that provides weight-of-evidence determinations for the noncancer and cancer effects would be a good place for a separate subsection that describes the major uncertainties and gaps present in the TMB toxicological database.
EPA Response C.1 (Synthesis of Evidence)-5: A discussion of the major gaps and uncertainties in the TMB toxicological database has been added to Section 1.3.1 (Weight of Evidence for Effects Other than Cancer).
SAB Comment C.1 (Synthesis of Evidence)-6: The SAB noted that the current synthesis discussions are brief and do not weigh the value of evidence from related chemicals or from studies done on the C9 fraction. The SAB further noted that structurally related alkylbenzenes such as toluene, xylene, ethylbenzene, and styrene have similarities in neurotoxic effect and metabolic disposition and that use of such information is clearly supported in the External Peer Review draft version of the IRIS Preamble, Section 3.1 (lines 11−15) "[s]earches for information on mechanisms of toxicity are inherently specialized and may include studies on other agents that act through related mechanisms” and in Section 5.4, p. xxiii (lines 18−21), "Pertinent information may also come from studies of metabolites or of compounds that are structurally similar or that act through similar mechanisms.” SAB therefore recommended that additional animal and human studies on related aromatic solvents be considered in the qualitative and mechanistic interpretations of TMB toxicity. A list of such studies are included in SAB Comment 3 of Charge Question B.1. The SAB suggested that these data be used in multiple fashions, including the determination of whether effects seen in TMB-only studies are consistent across related compounds and to inform potential modes of action. The SAB noted that perfect consistency is not required, but major discrepancies should be noted.

Supplemental Information―Trimethylbenzenes
A-17
EPA Response C.1 (Synthesis of Evidence)-6: As noted above in EPA Response B.1-3, the human studies investigating the health effects of related compounds or mixtures containing those substances have been added to the TMB assessment where appropriate. Additionally, a targeted literature search has been conducted to identify review articles on related compounds in order to assess a large body of literature for the pertinent pieces of information that could serve to fill data gaps in the primary TMB literature. Information gleaned from these review articles, and from additional primary literature identified through the evaluation of the review articles, has been included in the TMB assessment to make informed assumptions regarding TMB isomers’ potential mode of action and whether it can be reasonably anticipated that TMB isomers could cause certain types of toxicity when isomer-specific data are missing (e.g., developmental neurotoxicity) (see EPA Responses GC.2-5 and GC.2-6).
SAB Comment C.1 (Synthesis of Evidence)-7: The SAB noted that the data gaps for the TMB database appear to be the lack of a developmental neurotoxicity study, the lack of a multi-generational reproduction study, and the lack of a chronic noncancer (neurotoxicity) study. The SAB recommended that the EPA could potentially utilize data from these analogous alkylbenzenes to inform these data gaps and inform the selection of the value for the database UF.
EPA Response C.1 (Synthesis of Evidence)-7: EPA agrees with the SAB regarding the major limitations in the TMB toxicity database. Information obtained through the secondary literature search has been used to fill in data gaps in the TMB toxicological database, especially regarding the potential mode of action of TMBs and the possibility that gestational exposure to TMB isomers affects neurodevelopment. Consideration of the fuller database, TMB isomer, related alkylbenzene, and C9 fraction studies helped further support EPA’s selection of a UFD of 3 (see EPA Response E.4-5 below for complete details).
SAB Comment C.1 (Synthesis of Evidence)-8: The SAB recommended that the discussion of the existing C9 mixtures studies be brought into the main document describing their strengths, weaknesses, and relevance to the setting of RfDs/RfCs for individual TMB isomers, with particular emphasis on whether they provide evidence to inform the aforementioned data gaps. For example, regarding the developmental neurotoxicity data gap, the SAB noted that a Hungarian study (Lehotzky et al., 1985) tested a C9 mixture containing TMBs (Aromatol) for developmental neurotoxicity in rats. The SAB reported that the study had minimal reporting of results, simply stating that there were no effects of Aromatol on dams or offspring at any time point in spite of the fact that the high dose of Aromatol was 2,000 mg/m3, a dose that one would expect to have a neurotoxic effect in dams during and after exposure, based upon results of other testing. The SAB concluded that the lack of any toxicity in dams or offspring, combined with the lack of reporting of any data (including Aromatol treatment group neurological testing or Aromatol composition), and the fact that it was a mixture and not a specific TMB, makes this study of limited utility for filling the developmental neurotoxicity data gap. The SAB further noted that other issues relevant to the interpretation of the C9 faction studies be discussed in the TMB assessment, including issues
Supplemental Information―Trimethylbenzenes
A-18
related to possible differences in metabolic clearance and distribution between TMB isomers and the C9 fraction. The SAB noted that considering this information is relevant for the evaluation of individual TMB isomers and would help strengthen the Agency’s decisions regarding the role of the C9 fraction in the current assessment.
EPA Response C.1 (Synthesis of Evidence)-8: Information on the C9 studies has been brought into the main body of the text and discussed in the relevant subsections of the Hazard Identification section. Discussions regarding the utility of the C9 studies for deriving reference values has also been expanded in the Dose-Response Analysis section, with a particular focus on whether these studies are suitable for derivation of reference values and whether or not consideration of these studies and other studies on related compounds (i.e., toluene, etc.) help inform decisions related to selecting the value for the database UF for TMB isomer-specific reference values. Ultimately it was determined that the C9 fraction studies were not suitable for derivation of reference values. However, consideration of the related alkylbenzenes data was judged to be useful for supporting EPA’s selection of the UFD (see EPA Response E.4-5 below for complete details).
Two other industry reports regarding the toxicity of mixtures containing the isomers (IBT Labs, 1992; Chevron, 1985), however, were carefully considered but not included in the Toxicological Review. There were multiple rationales for the exclusion of these studies. Of note, these studies were not peer-reviewed and did not investigate the toxicity of individual TMB isomers. EPA generally only includes studies that are peer-reviewed, and will seek out a peer-review for a non-peer-reviewed reference if it appears to be critical for the needs of the assessment. Neither of these references were deemed critical for the assessment. The reasons for excluding the Chevron (1985) study included deficiencies in reporting the composition of the test substance, the conclusion that there was no need for a 1-generation reproduction C9 fraction study when a full multigenerational reproduction C9 fraction study was already included in the database (McKee et al., 1990), and that it was a dermal toxicity study. The main rationale for the exclusion of the IBT Labs (1992) study was that it was a short-term inhalation study of a complex mixture containing TMB isomers not likely to be critical to the needs of the assessment. As such, peer-review was not sought for either of these references. Another industry report investigating the oral toxicity of 1,2,4-TMB was further considered for inclusion in the Toxicological Review (Borriston, 1983). In this study, male F344 rats (N = 10) were exposed to high oral doses of either 0.5 or 2.0 g/kg-day 1,2,4-TMB for 28 days. All rats in the high-dose group and one rat in the low-dose group died during exposure (no times given). Other reported effects were enlarged adrenal glands, mottled and red thymuses, and congested lungs. Given the limited toxicological information provided in this report (other than total mortality in the high-dose group), this report was not included in the Toxicological Review.
Charge Question C.1 (Summary and Evaluation): Does EPA’s hazard assessment of noncancer human health effects of trimethylbenzenes clearly integrate the available scientific
Supplemental Information―Trimethylbenzenes
A-19
evidence (i.e., human, experimental animal, and mechanistic evidence) to support the conclusions that trimethylbenzenes pose potential hazards to the nervous system, respiratory system, the developing fetus, and the circulatory system (i.e., blood)?
SAB Comment C.1 (Summary and Evaluation)-1: The SAB noted that, while Section 1.3.1 (Weight of Evidence for Effects Other than Cancer) contains a summary description of the toxicological evidence of effects of the TMBs on the nervous, respiratory, circulatory, and developmental systems, the section does not adequately describe the limitations and uncertainties within the database or how the results of the hazard assessment will be utilized in the subsequent dose-response evaluation. The SAB recommended that Section 1.3.1 be revised to include the following: (1) a short summary of the toxicokinetic similarities and differences among the three isomers early in the section to provide context to the subsequent effect summaries; (2) a short summary of the neurological effects database limitations and accompanying uncertainties such as lack of subchronic data for some isomers, lack of chronic data for all isomers, questions of reversibility, and lack of mechanistic data; (3) statement(s) regarding the confidence in the hazard identification results given the limitations of the available database; and (4) inclusion of a concluding paragraph(s) that states how the results of the hazard identification will be utilized in the subsequent dose-response evaluation.
EPA Response C.1 (Summary and Evaluation)-1: All of the SAB-recommended additions to Section 1.3.1 have been incorporated into the text.
Charge Question C.2 (Summary and Evaluation): Does EPA’s hazard assessment of the carcinogenicity of trimethylbenzenes clearly integrate the available scientific evidence to support the conclusions that under EPA’s Guidelines for Carcinogen Risk Assessment (U.S. EPA, 2005), there is “inadequate information to assess the carcinogenic potential” of trimethylbenzenes?
SAB Comment C.2 (Summary and Evaluation)-1: The SAB agreed with the EPA’s determination that there was “inadequate information to assess the carcinogenic potential” of TMB isomers and concluded that EPA’s hazard assessment of the carcinogenicity of TMB isomers did integrate all available scientific evidence. The SAB recommended that EPA incorporate data on related compounds qualitatively to fill data gaps if possible.
EPA Response C.2 (Summary and Evaluation)-1: Information on related alkylbenzene compounds has been incorporated into the cancer hazard assessment to the extent possible.
Charge Question D.1: Data characterizing the toxicokinetics of 1,2,3-TMB, 1,2,4-TMB, and 1,3,5-TMB following inhalation and oral exposures in humans and experimental animals support the use of physiologically-based pharmacokinetic (PBPK) models for 1,2,4-TMB. For the purposes of this assessment, the Hissink et al. (2007) model, originally describing 1,2,4-TMB toxicokinetics following exposure to white spirit (a complex mixture of volatile organic compounds), was modified by EPA to calculate internal dose metrics following exposure to 1,2,4-TMB alone for the derivation of an inhalation RfC for 1,2,4-TMB. Additionally, the model was further modified by the addition of an oral route of exposure for use in a route-to-route extrapolation for the derivation of an oral RfD for
Supplemental Information―Trimethylbenzenes
A-20
1,2,4-TMB. Please comment on whether the selected PBPK model (Hissink et al., 2007) with EPA’s modifications adequately describe the toxicokinetics of 1,2,4-TMB (Appendix B [of the TMB Assessment]). Was the PBPK modeling appropriately utilized and clearly described? Are the model assumptions and parameters scientifically supported and clearly described? Are the uncertainties in the model structure adequately characterized and discussed?
SAB Comment D.1-1: The SAB found that the selected model did an adequate job of simulating the time-course of TMB in the blood of human subjects during and following acute inhalation exposures. The SAB noted that there was excellent agreement between predicted and measured blood TMB levels, both during and following 4-hour exposures, for the subjects of Hissink et al. (2007) inhaling 100 ppm white spirit. The SAB noted that the model modestly, but consistently, under-predicted blood levels in volunteers inhaling 30 ppm TMB for 8 hours (Kostrzewski et al., 1997) and also consistently under-predicted blood levels in persons inhaling 2 or 25 ppm TMB for 2 hours (Järnberg et al., 1998, 1997a; Järnberg et al., 1996), but to a larger degree. The SAB noted that these subjects exercised during exposure, which would increase their systemic uptake of TMB.
EPA Response D.1-1: It should be noted that while exercise will increase systemic uptake, as stated by the reviewers (by increasing respiration rate and cardiac output), the accompanying increase in cardiac output would also increase TMB’s distribution to the liver, which would therefore also increase the rate of metabolic clearance. It is unclear how the respective increases in both respiration and cardiac output, as well as distribution to the liver due to exercise would influence the ultimate model predictions of TMB blood levels following exercise, in humans. However, given that the model did an adequate job of simulating the time-course of TMB in the blood of human subjects, EPA determined there was no need to further investigate the “modest” under-predictions of some of the human data.
SAB Comment D.1-2: The SAB concluded that, in most instances, the model over-predicted blood TMB levels in rats subjected to single exposures to white spirit (Hissink et al., 2007) and TMB (Świercz et al., 2003). The differences between predicted and empirical levels typically increased from 1.5−2-fold at lower inhaled concentrations to 4−6-fold at ≥100 ppm. The accuracy of predictions of brain levels was similar to those for blood. The SAB found that the model reasonably simulated blood and brain levels in rats after repeated TMB exposures, and that disparity between simulated and empirical data also increased with increasing vapor concentration. With the repeated exposure data of Świercz et al. (2003), there were ~2- and 3-fold differences for the 25 and 50 ppm exposures, respectively. Differences in brain levels after 606 hours were somewhat greater. The SAB found that there was more disparity (4−5-fold) for blood and brain levels in the rats of Zahlsen et al. (1992) inhaling 100 ppm TMB for 3 days.
EPA Response D.1-2: In considering these comments on the model fit to the Świercz et al. (2003) data, further attention was given to the discrepancy between the results in Table C-9 and the model fits in Figure C-12. The data in Figure C-12 come from Table 2 of Świercz et al. (2003)
Supplemental Information―Trimethylbenzenes
A-21
and the data in Table C-9 come from Table 4 of that paper, but the results are significantly different. For example, Świercz et al. (2003) Table 2 lists the 1,2,4-TMB (venous) blood concentration at 3 minutes post-exposure (end of 4th week) as 4.06 ± 0.46 mg/L, while Table 4 lists the (arterial) blood concentration after “4 weeks” as 1.54 ± 0.32 mg/L. The model calibration used time-course data from tail-vein sampling, such as in Świercz et al. (2003) Table 2, and the internal dose being used is venous concentration, so Table C-8 has been updated to provide a numerical comparison of these two. At 25 and 100 ppm, the model results are within 30% of the tail-vein data, mostly within 10%, all within 1 standard deviation (SD). At 250 ppm, the discrepancy ranges from a factor of 1.5 (50% over-prediction) to 6-fold.
In the experimental methods, Świercz et al. (2003) only stated that the samples for Table 4 were collected “after decapitation.” During the time, or range of times, between removal of animals from the exposure chamber and decapitation, and until a tissue sample is chilled, evaporative loss of TMB could occur. Therefore, the table has been revised to compare the data for model results 30−60 minutes post-exposure, rather than immediately after exposure. In contrast, Zahlsen et al. (1992) state that animals were removed from the exposure chamber and tissues were collected within 3 minutes.
SAB Comment D.1-3: The SAB noted that the poor model prediction for inhaled concentrations ≥100 ppm in rats is acknowledged by the EPA authors. The SAB further noted that EPA uses the PBPK model to provide simulations for exposures outside its application domain. This is necessitated by the fact that the 100 ppm dose is in the middle of the rat dose-response range used for BMD modeling. The SAB concluded that over-predicting rat dosimetry in this range thus has the potential to influence the results of dose-response modeling and extrapolation of potency to humans. Marked over-prediction of high-dose data necessitated the omission of the highest dose for BMD modeling.
The SAB recommended two possible options for alleviating this issue. The first option is to refine the rat PBPK model to improve fits or conduct BMD modeling first using inhaled concentration to identify the POD, and then using the rat and human PBPK models to determine the HEC. The SAB noted that refining the PBPK model may require recalibration of some type, such as the addition of a first-order metabolic pathway consistent with the PBPK model of Järnberg and Johanson (1999), or changing hepatic blood flow to 25%, instead of 17%, of cardiac output.
The second option proposed by the SAB is for EPA to conduct BMD modeling of the Korsak and Rydzyński (1996) data using air TMB concentration as the dose metric to derive the POD. Subsequently, the PBPK model would be used to convert the POD to the weekly average blood concentration.
EPA Response D.1-3: EPA has chosen to pursue the second option offered by the SAB. When implementing this option, EPA ensured that the resulting lower confidence limits on the BMD (BMDLs) used for HEC estimation were below the 100 ppm (492 mg/m3) threshold of model validation.
Supplemental Information―Trimethylbenzenes
A-22
SAB Comment D.1-4: The SAB noted that they conducted a quality control/quality assurance review and confirmed that the model simulations presented in Appendix B of the IRIS document draft were accurate. The SAB noted that aside from a couple of minor technical issues that were identified, no fundamental flaws or issues were found.
EPA Response D.1-4: No response necessary. SAB Comment D.1-5: The SAB found that the EPA’s assumptions, in modifying the Hissink
et al. (2007) model to predict the kinetics of inhaled TMB for repeated exposure scenarios, were reasonable and appropriate. The major caveats, however, were not identified up-front on page B-20 (e.g., that the original model and its parameters were for TMB and white spirit, lack of parameters for the oral route, lack of parameters for pregnancy). The SAB recommended that the EPA expand the explanation and justification for the modifications of model parameters. Specifically, the discussion of the input parameters (e.g., human tissue:blood partition coefficients, cardiac output, liver blood flow) should be justified. Additionally the use of scaled-up rat Vmax values, when human values were available, requires further explanation. Metabolic constants could be questioned, as they summarily reflect the rate of TMB metabolism during mixed exposures to white spirits, rather than exposure to TMB alone. The EPA did not attempt any re-estimation or adjustment of parameters for chronic exposure (e.g., enzyme induction, dose-dependency, growth dilution). Results of sensitivity analyses can be used to indicate whether the choice of liver blood flow substantially impacts the model predictions and thus warrants revisiting. It was noted that human tissue:blood partition coefficients used in modeling were twice those for rats. Meulenberg and Vijverberg (2000) estimated human brain:blood, fat:blood, and kidney:blood partition coefficients that were higher for rats than for humans. It was suggested that first-order and saturable metabolism be incorporated into the model, and that the model be run to explore the impact of the change.
EPA Response D.1-5: As recommended by the SAB, the major caveats and concerns for the Hissink et al. (2007) model have been added to Section C.2.2. Additional points on specific items have been added at appropriate points in Section C.2.3. A justification statement for revising model parameters (i.e., to address the caveats and concerns identified above) was added at the beginning of Section C.2.3.2, with further justification provided at appropriate points in the section. A sentence was added to the description of the human model fits, and a brief paragraph was added to the “Summary of Optimization and Validation,” to explain that because the scaled Vmax (i.e., rat-derived VmaxC) and rat-derived Km were found to adequately predict the human data, and numerical optimization did not provide a significant improvement in the fit, the scaled Vmax and rat Km were used for the human model.
Regarding the SAB’s comment related to fractional blood flow to the liver: if the fractional blood flow to the liver was increased and no other parameters were changed, then the predictable result is that the net rate of metabolism would increase. However, the metabolic rate constant Vmax was calibrated using the fractional hepatic blood flow set in model. To fully evaluate the model
Supplemental Information―Trimethylbenzenes
A-23
behavior, if hepatic blood flow were increased to 25% of cardiac output for example, there is a need to first make that change and then re-calibrate the Vmax to the available data. It seems likely that doing both of these things in combination would, for the most part, cancel out any impact of increasing hepatic blood flow alone. The chance of obtaining a significant improvement is uncertain and this sensitivity analysis would entail considerable effort. As the SAB's overall conclusion was that the model was adequate in describing TMB blood concentrations as currently parameterized, the significant, additional effort required for this type of sensitivity analysis was not undertaken. Although Meulenberg and Vijverberg (2000) reported tissue:blood partition coefficients that were higher in rats than in humans, the original partition coefficients (as identified by Hissink et al. (2007)) used in the original model fitting were retained in the current PBPK model.
SAB Comment D.1-6: The SAB did not find a specific discussion of the uncertainties in the model’s structure. While these uncertainties may be implicitly included in the uncertainties discussion, SAB recommended that they should be specifically discussed in reference to the PBPK model.
EPA Response D.1-6: An extensive discussion of modeling uncertainties was added to Section C.2.3.2.
SAB Comment D.1-7: One SAB Panelist noted that there is a published human PBPK model (Järnberg and Johanson, 1999). The SAB acknowledged that the EPA requested the model code through email and was unable to obtain the model. The SAB noted that the model is for TMB alone, and suggested that using this model may have the following benefits over the Hissink et al. (2007) model: (1) it avoids the complications and uncertainties of concurrent exposure to other components in white spirit and necessary species-to-species extrapolations; (2) empirical human kinetic data are available from the same laboratory for model parameterization and validation; and (3) human neurobehavioral data are also available in the literature from other research groups. The SAB noted that the results of these studies identify human no-observed-adverse-effect levels (NOAELs)/lowest-observed-adverse-effect levels (LOAELs) for acute irritation and central nervous system (CNS) effects by TMB and white spirit. The SAB noted that EPA policy is to use and consider human data and validated human models when available. Because the EPA could not obtain the Järnberg and Johanson (1999) model, the SAB provided recommendations to improve the use of the Hissink et al. (2007) model and encouraged the EPA to, at a minimum, be more transparent in its discussion of available models and model selection in this and future assessments.
EPA Response D.1-7: The EPA has followed its practices for using human toxicokinetic data, including data from Järnberg and Johanson (1999) and previous studies by these authors, and of using a validated human model (i.e., Hissink et al. (2007)) in the TMB assessment. The toxicokinetic data generated from the Järnberg and Johanson studies were used in the validation of the human Hissink et al. (2007) model; these validations are extensively reported and discussed in Section C.2.3.2. Discussions of the other PBPK models (Section C.2.1) were expanded, specifically addressing the lack of availability of the Järnberg and Johanson (1999) model and noting that the
Supplemental Information―Trimethylbenzenes
A-24
EPA generally prefers to use model structures that have been shown to fit both animal and human data, as this consistency is considered a validation of the model structure.
Charge Question D.2: The internal dose metric selected for use in the derivation of the RfC and RfD for 1,2,4-TMB was the steady-state weekly average venous blood concentration (mg/L) of 1,2,4-TMB for rats exposed for 6 h/day, 5 days/week. Please comment on whether the selection of this dose metric is scientifically supported and clearly described. If a different dose metric is recommended for deriving the RfC, please identify this metric and provide scientific support for this choice. Are the uncertainties in the selected dose metric adequately characterized and discussed?
SAB Comment D.2-1: The SAB stated that the use of any dose metric should be guided by the mode of action of the chemical being examined. For TMBs, the SAB acknowledged that there is a paucity of information on their mode of action, and that the Agency has inferred the mode of action to be similar to that for chemicals such as toluene. Given the uncertainties in the mode of action, the SAB found that the selection of the internal dose metric of the venous blood concentration averaged over a week of exposure is reasonable.
EPA Response D.2-1: No response necessary. SAB Comment D.2-2: The SAB stated that clarification is needed on how the average weekly
venous concentration was determined given that the longer phase half-life of the TMB isomers indicates that an exposure period longer than a week is required for blood levels to achieve a steady state. In addition, the SAB noted that the experimental data for both rats and humans show that steady state is not achieved with only a single week of exposure. Executing the PBPK model over a 4-week period shows that the average blood levels are still continuing to rise slightly. The SAB recommended that the model should be run long enough to come to a weekly steady state and then the associated venous blood concentration should be used as the internal dose metric.
EPA Response D.2-2: This discussion has been added to the relevant section (where internal metrics are described). The average weekly venous concentration was calculated by simulating 3 weeks of exposure (6 hours/day, 5 days/week) and calculating the area under the curve (AUC) during the 3rd week, divided by 168 hours. Extending the simulation to 4 weeks and using the 4th week for the calculation changed the results by <0.02%.
SAB Comment D.2-3: The SAB noted that the multiple tissues of interest for derivation of an RfC are primarily extrapulmonary tissues. However, the Agency has a goal to establish RfCs for multiple endpoints beyond the critical effect endpoint currently being addressed. If an effect in the respiratory tract is established (such as a change in bronchial alveolar lavage fluid composition) and an RfC is to be determined, then the appropriate dose metric would be based on the mass deposited per unit surface area of the lung rather than on the average venous blood concentration. A mass per unit lung surface area dose metric enables species with significantly different lung sizes than humans to be used in the derivation of the RfC.
Supplemental Information―Trimethylbenzenes
A-25
EPA Response D.2-3: A dose metric of mass of TMB deposited per unit surface area of the lung was used in the derivation of RfC values for respiratory effects (i.e., increased inflammatory lung lesions) (see Section 2.1.2).
SAB Comment D.2-4: The SAB noted that using the PBPK model-estimated internal dose metrics as the dose inputs for BMD modeling required the Agency to drop the high-dose exposures from all modeling efforts because the venous blood dose metrics consistently over-predicted experimental results for high exposures. This overestimation may be due, in part, to the Agency using minute ventilation as the driver function for internal dose rather than decomposing minute ventilation into its two components, namely tidal volume and breathing frequency. The SAB noted that while the exposure level is high, which may lead to a 50% reduction in respiratory rate, respiratory irritants such as TMBs cause subtle shifts in the breathing pattern while maintaining the same overall minute ventilation. Shallower breathing leads to a shift upward in the respiratory tract for the site of deposition. In addition, PBPK modeling for humans did not take into account the periods of exercise that the subjects underwent, which may explain the model’s greater deviations from experimental results at high exposure levels. Consistent with previous comments, the SAB noted that external air can be used as the dose metric and then the PBPK model can be used to back-calculate the appropriate venous blood level. If the SAB’s suggestions for improvements in the PBPK model do not lead to a better agreement with the high-dose exposures, the SAB recommended that the Agency include the external air dose metric and corresponding venous blood back-calculations.
EPA Response D.2-4: None of the existing PBPK models specifically account for the impact of varying tidal volume versus breathing frequency on regional deposition and uptake in the respiratory tract. While compartmental models exist that do so (e.g., for acetaldehyde), such a revision in model structure would be a very large effort and is beyond the scope of what EPA would consider for this assessment. Given this decision, EPA has redone all of the BMD modeling using the external air concentrations as the dose inputs and then calculated the HEC based on the BMDL values, consistent with SAB recommendations in SAB Comment 3 of Charge Question D.1.
SAB Comment D.2-5: The SAB noted that, while uncertainties concerning model parameters, potential for kinetic changes with repeated exposures, and model estimates of internal dose are discussed, the uncertainties in the selected dose metric (weekly average venous blood concentration) are not adequately characterized or discussed in the TMB assessment.
EPA Response D.2-5: This discussion was added to Appendix C (Section C.2.3.2). Charge Question E.1: A 90-day inhalation toxicity study of 1,2,4-TMB in male rats (Korsak
and Rydzyński, 1996) was selected as the basis for the derivation of the RfC. Please comment on whether the selection of this study is scientifically supported and clearly described. If a different study is recommended as the basis for the RfC, please identify this study and provide scientific support for this choice.
Supplemental Information―Trimethylbenzenes
A-26
SAB Comment E.1-1: The SAB generally agreed with the choice of the Korsak and Rydzyński (1996) study as the basis for derivation of the RfC for 1,2,4-TMB. The study utilized a 90-day exposure period and, thus, the longest duration exposure study available in the literature; in addition, it included multiple exposure levels. It was well-conducted and utilized adequate sample sizes of rats. In addition, it was based on widely-used behavioral assays. An examination of the study indicates that these behavioral studies were carefully carried out and data from control animals were consistent with previously published observations. However, the SAB recommended several ways in which the clarification for this choice could be strengthened (see SAB Comments E.1-2−E.1-8 below for specifics).
EPA Response E.1-1: See EPA Responses E.1-2 through E.1-8 below for detailed responses to the individual recommendations.
SAB Comment E.1-2: The SAB noted that the rationale for the choice of Korsak and Rydzyński (1996) is not specifically described and recommends that the reasons for its choice over other studies (e.g., the 4-week exposure studies) be more clearly stated.
EPA Response E.1-2: An increased justification for selection of the Korsak and Rydzyński (1996) study was added to Section 2.1.5, including the rationale for selection of that study over the other neurotoxicity studies that utilized a short-term exposure protocol (Wiaderna et al., 2002; Gralewicz and Wiaderna, 2001; Wiaderna et al., 1998; Gralewicz et al., 1997b).
SAB Comment E.1-3: The SAB expressed concern that the TMB assessment, as currently written, is confusing regarding the chronicity of exposure versus effects. The SAB recommended that it would be helpful to modify the terminology, particularly related to outcome measures, perhaps as acute effects versus long-term effects/irreversible effects, and to retain the use of the word chronic/subchronic etc. to descriptions of statements related specifically to exposure.
EPA Response E.1-3: The Hazard Identification and Dose-Response Analysis sections have been edited to increase clarity with respect to language describing either the chronicity of exposure or the nature of the described effects (i.e., acute or long-term/latent effects).
SAB Comment E.1-4: The SAB recommended that EPA separate the dose-response write-up into sections that specifically elaborate on the acute effects and provide a separate section related to effects observed post-exposure. The SAB also recommended that, given the commonality of the trends in data across these studies, some mention of the biological significance in the absence of statistical significance should be mentioned.
EPA Response E.1-4: The discussion of acute and post-exposure effects has been reorganized in the Dose-Response Analysis section to the extent possible. A discussion of the biological significance of the post-exposure data was also included in the assessment. However, acute and long-term/latent/post-exposure effects have not been separated into distinct sections as each type of data, when considered in tandem, informs the larger decisions made in the assessment regarding the suitability of the decreased pain endpoint for derivation of the RfC. As such, EPA concluded that, while more clearly delineating the types of effects was possible within a single
Supplemental Information―Trimethylbenzenes
A-27
section, separating the effects into individual sections would possibly obscure the rationales behind EPA’s conclusions.
SAB Comment E.1-5: The SAB recommended that the text, where applicable, could include additional qualifications as to “reversibility of effects” at the 2-week post-exposure time point. This assessment of reversible effects of failures on the rotarod is based on the finding of a lack of statistical difference between treated and control groups at 1 week post-exposure following a 13-week exposure period for one of two isomers. Some TMB Panel members felt that this was sufficient evidence for reversibility, while other members did not feel that this provided sufficient evidence. Specifically, this interpretation of a reversal relied on a reduction from 40% rotarod failure during the final week of exposure compared to 35% 1 week post-exposure, as compared to 0% rates for controls. There was no such statistical reversal for the other isomer, and for both isomers, the magnitude of the reduction post-exposure was minimal. Further, it was not clear that the statistical analyses of these data incorporated a repeated measures component that would be required by the experimental design. Thus, while a case was stated for a statistically significant reversal, several TMB Panel members felt that it was not consistent nor did it appear to be biologically meaningful.
EPA Response E.1-5: Additional qualifications on the determination of whether the decreased pain sensitivity endpoint was reversible have been added to Sections 1.2.1, 1.3.1, and 2.1.5. In particular, it is noted throughout the section that all of the available evidence, especially considering information from the short-term studies, strongly indicates that the pain sensitivity endpoint is not immediately reversible upon termination of exposure, and that persistent changes to the nervous system occur due to TMB exposure. It should be noted that the SAB focused solely on decreased rotarod performance in their comment, which is not used in the RfC derivation. The data for decreased rotarod performance, as a measure of decreased neuromuscular function, were determined by EPA to not be appropriate for consideration for derivation of the RfC (Section 2.1.1) due to the manner in which the data were reported. Failures on the rotarod were recorded as quantal data (percent of animals “failing” on the rotarod due to latencies of up to 119 seconds) rather than being recorded as a continuous variable (i.e., latency to falling off rotarod apparatus). Therefore, as the rotarod data were not considered for derivation of the RfC, extensive discussions regarding the possible reversibility of this endpoint were not added to the assessment. However, where possible, evidence from all effects has been discussed in the context of overall alterations of neurological function due to TMB exposure.
SAB Comment E.1-6: The SAB recommended that the EPA re-calculate the RfC as if the study were subchronic (i.e., UF converts to 1 from 3) and report these subchronic RfC values as well.
EPA Response E.1-6: EPA has calculated and included these subchronic RfC values in Section 2.1.8 of the Dose-Response Analysis section.
Supplemental Information―Trimethylbenzenes
A-28
SAB Comment E.1-7: The SAB recommended that more specific mention of the potential cumulative neurotoxicity that is suggested by the repeated measurement finding of rotarod performance failures across the course of exposure be included in the document.
EPA Response E.1-7: As the rotarod data were not considered for derivation of the RfC, this discussion was not added to the assessment. Data on decreased pain sensitivity were not provided in the same manner as rotarod data (i.e., measures of effect provided at multiple intervening time points during the period of exposure) and therefore, a discussion of the possible cumulative effects regarding decreased pain sensitivity was likewise not added to the document.
SAB Comment E.1-8: The SAB recommended including more specific descriptions of the similarity of the animal behavioral endpoints to what has been observed in humans.
EPA Response E.1-8: A discussion of the similarity of animal neurobehavioral endpoints to the measures of neurotoxicity observed in human studies has been added to Section 2.1.5.
Charge Question E.2: Decreased pain sensitivity (measured as an increased latency to pawlick response after a hotplate test) in male Wistar rats was concluded by EPA to be an adverse effect on the nervous system and was selected as the critical effect for the derivation of the RfC. Please comment on whether the selection and characterization of this critical effect is scientifically supported and clearly described. If a different endpoint(s) is recommended as the critical effect(s) for deriving the RfC, please identify this effect and provide scientific support for this choice.
SAB Comment E.2-1: The SAB agreed that the reduction in pain sensitivity, as indicated by an increased latency to paw-lick response in a hot plate test, is a valid adverse nervous system effect and was appropriately selected as a critical effect for the derivation of the RfC. This effect was variously seen in response to short-term, 4-week, and 90-day studies. The associated U-shaped dose-effect curves seen with these isomers, moreover, are highly consistent with the effects of various other pharmacological agents (e.g., opioids) on this response and likely reflective of the mechanisms by which these isomers act. This assay is widely used in the behavioral pharmacology literature and particularly in the study of pain nociception and opioid pharmacology.
EPA Response E.2-1: No response necessary. SAB Comment E.2-2: The SAB agreed that the observation of prolonged latency in the hot
plate test 24-hour post-footshock delivery that was observed in studies by Gralewicz and colleagues (Gralewicz and Wiaderna, 2001; Gralewicz et al., 1997b) also constitutes an adverse effect. The administration of footshock immediately after the hot plate test trial strains the capabilities of the nervous system and, thus, provides a type of nervous system probe that then unmasks a prolonged latency to a hot plate stimulus 24 hours later. It shows that when the nervous system is maximally stressed, it cannot respond/recover in a normal timeframe.
EPA Response E.2-2: No response necessary. SAB Comment E.2-3: The SAB, in addition to making the recommendations above for the
document related to the nervous system effects, also noted that this section could benefit from some additional description of the hot plate procedures, including the rationale/approach for using
Supplemental Information―Trimethylbenzenes
A-29
the footshock intervention in the post-exposure behavioral assessments carried out after the 4-week exposures.
EPA Response E.2-3: Additional details on the hot plate procedure have been added to the Hazard Identification and Dose-Response Analyses sections. Additional rationale for the inclusion of the footshock challenge in the short-term studies has also been added to the assessment.
Charge Question E.3: In order to characterize the observed dose-response relationship comprehensively, benchmark dose (BMD) modeling was used in conjunction with dosimetric adjustments for calculating the human equivalent concentration (HEC) from a rat and human PBPK model (Hissink et al., 2007) to identify the point of departure (POD) for derivation of the RfC. Please comment on whether this approach is scientifically supported for the available data, and clearly described.
A. Has the modeling been appropriately conducted and clearly described, based on EPA’s Benchmark Dose Technical Guidance U.S. EPA (2012)?
B. Has the choice of the benchmark response (BMR) for use in deriving the POD (i.e., a BMR equal to 1 standard deviation change in the control mean for the latency to pawlick response) been supported and clearly described?
SAB Comment E.3-1: The SAB expressed concern over EPA’s decision to omit the high-dose group from the Korsak and Rydzyński (1996) study before BMD modeling. However, a BMD analysis conducted by the SAB on the same dataset using air concentration as the dose metric results in the same POD air concentration as BMD modeling based on internal dose and using the low- and mid-dose groups. As a result, the SAB agreed that the overall results for the POD generated by the EPA are adequate, but strongly suggested that the Agency provide a more robust explanation of any analyses. The SAB also considered Appendix C-2 in the TMB Assessment (External Review Draft) as inappropriate and recommended deleting it. If the EPA is so inclined, the BMD analysis could be replaced by using air concentration as the dose metric.
EPA Response E.3-1: In SAB’s analysis above, one model (Exponential M4) was run against the data, as that was the model that was selected in External Peer Review draft. It is true that this model returns the same POD regardless of whether air concentrations or internal dose is used. However, the method that the SAB used doesn’t take into account other model fits or the model selection protocols that EPA uses in BMD modeling. When all available continuous models were run against the decreased pain sensitivity endpoint, the HEC generated for decreased pain sensitivity due to exposure to 1,2,4-TMB using the SAB-suggested modeling method (model air concentrations and then convert to HEC using the PBPK model) differs slightly from the POD included in the External Peer Review Draft of the TMB assessment (18.1 versus 15.8 mg/m3). However, SAB’s larger point stands in that it is appropriate to model the TMB toxicity endpoints using the external air concentrations as the dose inputs and then convert the resultant BMDLs into HECs using the available PBPK model. This methodology obviates the need for extensive revisions to the PBPK model code, and ensures that any HECs generated from the PBPK model originate from
Supplemental Information―Trimethylbenzenes
A-30
BMDLs that fall within the model’s range of validation. As such, all BMD modeling has been redone according to SAB’s recommendations. EPA also agrees with the SAB regarding Appendix C-2 (External Peer Review draft); this appendix has been removed from the document.
SAB Comment E.3-2: The SAB recommended that the EPA provide better justification for applying the “one standard deviation” from the mean of the control group for the neuro-toxicological endpoint than using the Agency default value. The EPA should also provide better explanation of the issues associated with the homogeneity of variance across dose groups in the Korsak and Rydzyński (1996) study, its implications for BMD modeling, and how the EPA addressed this in their BMD modeling.
EPA Response E.3-2: A more robust justification for the selection of 1 control group SD as the BMR for modeling some continuous endpoints has been added to Section 2.1.2, and a brief discussion regarding the uncertainty around the BMR selection has been added to Section 2.1.6. The observation of differential variance estimates across dose groups, and how this was handled when performing BMD modeling, was also discussed more extensively in Section 2.12. For example, the variances reported for decreased pain sensitivity were clearly non-constant, with the reported variances at 492 mg/m3 being lower (1,2,4-TMB) or higher (1,2,3-TMB) compared to other dose groups. This heteroscedasticity could reflect measurement error (e.g., different lab technicians recording responses differently) or experimental error (e.g., the hot plate apparatus may not have held a constant temperature), or may reflect that the latency response may be log-normally distributed rather than the assumed normal distribution. The latter possibility does not seem to be the case as the approximation of geometric means and SDs from the reported arithmetic means and SDs did not reduce the heterogeneity in reported variances. In order to account for data with reported heteroscedasticity, BMD modeling was performed using variance estimates that were modeled as a power function of the reported mean value.
Charge Question E.4: Please comment on the rationale for the selection of the uncertainty factors (UFs) applied to the POD for the derivation of the RfC for 1,2,4-TMB. Are the UFs appropriate based on the recommendations described in Section 4.4.5 of A Review of the Reference Dose and Reference Concentration Process U.S. EPA (2002), and clearly described? If changes to the selected UFs are proposed, please identify and provide scientific support for the proposed changes.
SAB Comment E.4-1: The SAB agreed with the UFA of 3 and its rationale. The default UFA of 10 can be divided into two half-log UF components of 3 each to account for species differences in toxicokinetics and toxicodynamics, respectively. In developing the RfC for 1,2,4-TMB, the EPA used PBPK modeling to convert estimated internal doses in rats in toxicity studies of 1,2,4-TMB to corresponding applied doses in humans. PBPK modeling substantially reduces uncertainty associated with extrapolating animal exposures to humans based upon toxicokinetic differences, justifying elimination of one of the half-log components of the default UFA of 10 (U.S. EPA, 2002). Uncertainty regarding possible toxicodynamic differences among species (i.e., different sensitivity
Supplemental Information―Trimethylbenzenes
A-31
to toxicity at equivalent internal doses) remains, justifying keeping the other half-log component of 3.
EPA Response E.4-1: No response necessary. SAB Comment E.4-2: The SAB agreed with the UFH of 10 and its rationale, although one
TMB Review Panel member thought that a UFH of 3 would be adequate. This UF is intended to account for potential differences among individuals in susceptibility to toxicity. The EPA concluded that no information on potential variability in human susceptibility to 1,2,4-TMB toxicity exists with which to justify using a value other than the default of 10. It was noted during discussion that numerous clinical studies have demonstrated that humans, including pediatric and geriatric patients, differ by only about 2-fold in their susceptibility/sensitivity to inhaled lipophilic anesthetics (e.g., chloroform, halothane), indicating to one Panel member that a UFH of 3 would be scientifically defensible given the neurotoxicity endpoint used to establish the POD. Other TMB Panel members disagreed, stating that the mode of action of neurotoxicity of 1,2,4-TMB is unknown and that the actions of general anesthetics may have little or no bearing on variability in TMB susceptibility. In their opinion, the full UFH of 10 is warranted.
EPA Response E.4-2: EPA agrees with the majority of the SAB Panel members in that, given the lack of information regarding TMB’s mode of action, limited information exists that could predict the potential for variation in human susceptibility to TMB exposure. Therefore, the value of UFH = 10 is retained in the TMB assessment.
SAB Comment E.4-3: The SAB agreed with the EPA’s choices for UFL values (i.e., a UFL of 1 for all endpoints except increased bronchoalveolar lung cells, for which a UFL of 10 was selected). However, the SAB suggested that the justification for the UFL be strengthened. This UF is intended to be used when the POD is a LOAEL rather than a NOAEL. In conducting BMD modeling, a BMD equal to 1 SD change in the control mean for modeled endpoints was selected. The document would be improved by adding an explanation of the reasoning for selection of 1 SD (versus 0.5 SD) along with a clearer discussion of why this is expected to lead to a POD for which a UFL of 1 is appropriate.
EPA Response E.4-3: A stronger justification for selection of a BMR = 1 control SD has been added to the text. The LOAEL to NOAEL UF, UFL, of 1 was applied for endpoints modeled with the EPA Benchmark Dose Software (BMDS) because the current approach is to address this factor as one of the considerations in selecting a BMR for BMD modeling. In other words, when selecting a BMR value, care should be taken to select a response level that constitutes a minimal, biologically significant change so that the estimated BMDLs can be assumed to conceptually correspond to a NOAEL. In the case of TMBs, BMRs were preferentially selected based on biological information on what constitutes a biologically significant change for these effects. For example, a 5% reduction in fetal body weight was selected as the BMR for that endpoint based on the fact that a 10% reduction in adult body weight is considered adverse, the assumption that fetuses are a susceptible population and thus more vulnerable to body weight changes, and the fact that decreases in fetal
Supplemental Information―Trimethylbenzenes
A-32
weight in humans are associated with a number of chronic diseases such as hypertension and diabetes. For endpoints for which there was no information available to make assumptions about what constitutes a minimal, biologically significant response, a BMR equal to a 1 SD change in the control mean was selected. In both cases, the BMR selected was assumed to return BMDL values that conceptually correspond to a NOAEL, thus obviating the need for a LOAEL to NOAEL UF.
SAB Comment E.4-4: The SAB agreed with the UFS of 3, although one TMB Panel member thought that a UFS of 10 would be more appropriate. When the data used to generate a chronic RfC are from subchronic studies, a UFS is used to address uncertainty around whether longer exposures might lead to effects at lower doses. The EPA justified using less than a full default factor of 10 for this UF based on evidence suggesting possible reversibility of neurotoxicity and hematotoxicity endpoints. Most of the SAB Panel members were satisfied with this justification, but some members of the TMB Panel disputed the evidence for reversibility of effects. In addition, several TMB Panel members noted that reversibility following cessation of exposure was irrelevant since the chronic RfC is applicable to lifetime exposure (i.e., there is no post-exposure period). The discussion regarding reversibility of neurotoxic effects is presented in response to the RfC for 1,2,4-TMB (see Section 2.2.5). The TMB Review Panel discussed that some hematologic effects considered by the EPA appeared to resolve when exposure ceased, but other effects did not resolve, and that inflammatory pulmonary effects can lead to persistent injury. The SAB noted that factors other than reversibility could contribute to selection of a UFS less than 10, such as evidence from PBPK modeling that 1,2,4-TMB does not accumulate in the body over time and empirical evidence that the POD does not appear to decrease when results from subchronic studies are compared with studies of shorter duration. One TMB Panel member thought that none of these considerations had sufficient merit to justify using less than the full default UFS of 10.
EPA Response E.4-4: Upon reconsideration of the neurotoxicity, hematological toxicity, and respiratory toxicity data contained in the TMB database, EPA agrees with members of the SAB Panel recommending a UFS of 3. Given that the adaptive responses of the nervous system appear to be impaired several weeks after short-term exposure, including prolongation of decreased pain sensitivity phenotypes following environmental challenge using a footshock, the concern that chronic exposures may more thoroughly overwhelm adaptive responses in the nervous system, and thus lead to more severe responses, remains. In addition, there is evidence that neurotoxicity worsens with continued exposure, and thus, effects are expected to be more severe following chronic exposure. For example, decrements in rotarod function were shown to increase in magnitude as a function of exposure duration, worsening from 4 to 8 weeks of exposure, and worsening further from 8 to 13 weeks of exposure (Korsak and Rydzyński, 1996). Although a similar time-course is not available for reduced pain sensitivity, reduced pain sensitivity is observed at approximately 5-fold lower concentrations following subchronic exposure, as compared to acute exposure (see discussion in Section 1.2.1 of the Toxicological Review). However, there does not seem to be an exacerbation of other neurotoxic effects at lower doses when
Supplemental Information―Trimethylbenzenes
A-33
comparing subchronic exposures to short-term exposures. Further, evidence from toxicokinetic studies indicates that blood and organ concentrations of TMBs are similar following repeated versus acute exposures (approximately 600 hours versus 6 hours, respectively; see Table C-9) and the PBPK model predicts less than a 5% increase between the first day and subsequent days of repeated exposures. By extension, it can be reasonably assumed that TMB isomers would not accumulate to an appreciably greater degree following a longer chronic exposure and thus may not lead to effects at lower doses compared to shorter duration studies. Taken together, the toxicokinetic and toxicological data support the application of a UFS of 3 for neurotoxic, hematological, and respiratory endpoints. The text regarding the selection of the UFS has been revised in Section 2.1.3 to reflect these conclusions, and a UFS of 3 has been applied to all endpoints other than fetal weight. Additionally, as previously discussed in EPA Response E.1-5, a more extensive discussion of the possible reversibility of the decreased pain endpoint has been added to Sections 1.2.1, 1.3.1, and 2.1.5.
SAB Comment E.4-5: The SAB was divided on whether the UFD should be 3, as selected by the Agency, or 10. The purpose of this UF is to account for overall deficiencies in the database of studies available to assess potential toxicity. The EPA cited strengths in the database in terms of availability of information on multiple organ/systems from three well-designed subchronic toxicity studies in justifying not using the full default factor of 10. In retaining a half-log factor of 3, the EPA noted the absence of a multi-generation reproductive/developmental toxicity study as a weakness in the database, and specifically concern for the absence of a developmental neurotoxicity study for 1,2,4-TMB given the importance of neurotoxicity in establishing the RfC. Among those who agreed with a UFD of 3, some found the justification provided by the EPA to be satisfactory, while others thought that toxicity data available for C9 mixtures should contribute to the rationale to lower the value from the default of 10. Others disagreed with including C9 mixture data as relevant to the database UF. Panel members who thought that the UFD should be 10 cited various reasons, including the absence of data in other species and the absence of a multi-generational reproductive study, as well as the opinion that the absence of a developmental neurotoxicity study alone warranted a full factor of 10. One TMB Panel member pointed out that analogy with toluene suggests that the perinatal exposure could lead to neurodevelopmental effects at doses 10-fold lower than the NOAEL for effects in adults. An additional point made by another Panel member was that the RfCs for all of the isomers are being set at the same value, whereas the database is severely limited for the 1,2,3- and 1,3,5-TMB isomers and the latter two compounds deserve a UFD of 10. Therefore, for consistency, a factor of 10 should be used for all the isomers.
EPA Response E.4-5: After careful consideration of the available TMB toxicity database, and the database for mixtures containing TMB isomers (i.e., the C9 fraction) and information pertaining to related alkylbenzenes, EPA determined that a UFD of 3 was the most appropriate value. This decision was further supported by the restructuring of the TMB RfC derivation section into an overarching section covering all three TMB isomers, rather than three individual RfC sections
Supplemental Information―Trimethylbenzenes
A-34
covering a single isomer. In this manner, the entirety of the TMB toxicity database for all isomers could be considered in total. Strengths of this database include three well-conducted subchronic studies that investigated effects in multiple organ/systems in Wistar rats (nervous, respiratory, and hematological systems) and a well-conducted developmental toxicity study that investigated maternal and fetal toxicity in a different strain of rats (Sprague-Dawley). Consideration of developmental toxicity studies investigating the effects of mixtures containing TMB isomers (McKee et al., 1990; Ungváry and Tátrai, 1985) supports the general observation of the developmental toxicity of individual TMB isomers. In these studies, developmental toxicity was observed in rats, mice, and rabbits, but only at doses ≥500 mg/m3, which is higher than the lowest LOAEL for neurotoxicity effects in rats (i.e., 123 mg/m3 for decreased pain sensitivity following exposure to 1,2,3-TMB). Identified gaps in the TMB database include the lack of a multi-generational reproductive study and the lack of a developmental neurotoxicity study. Regarding the lack of a reproductive study, information from a C9 fraction study investigating reproductive and developmental toxicity in rats provided suggestive evidence of reproductive toxicity (decreased male fertility in the F1 generation and a possible intergeneration effect on body weight in which fetal/pup/adult body weights were decreased at lower doses in later generations compared to earlier generations) (McKee et al., 1990). However, the lowest concentration of TMB isomers that elicited these results was 1,353 mg/m3 (as part of the total mixture), which is much greater than TMB concentrations that elicit neurotoxicity in adult animals (123 mg/m3 for 1,2,3-TMB and 492 mg/m3 for 1,2,4-TMB).
Another gap in the TMB database is the lack of a developmental neurotoxicity study. Current U.S. EPA (2002) guidance, EPA’s A Review of the Reference Dose and Reference Concentration Processes, recommends that the database UF take into consideration where there is concern from the available toxicity database that the developing organism may be particularly susceptible to effects in any organ/system. Given the observations that exposure to all three TMB isomers elicits strong and consistent markers of neurotoxicity, that exposure to TMB isomers results in developmental toxicity, as well as explicit information that TMB isomers can cross the placenta, there exists a concern that exposure to TMB isomers may result in developmental neurotoxicity. However, evidence from the toluene literature indicates that, while toluene does cross the placenta and that toluene levels in the placenta, amniotic fluid, and fetal brains increased with increasing exposures, concentrations in the amniotic fluid were less than those in maternal tissues. Although this fails to account for potential differences in sensitivity of the developing organism to induced effects, or for differences in metabolism, it does suggest that gestational exposure to TMBs might result in lower exposure concentrations to the fetus, which raises uncertainty in the TMB and related compound database regarding whether sufficient amounts of the toxic agent crosses the placenta to elicit effects, and whether the concentrations necessary to elicit effects are lower than those that result in neurotoxicity in the adult organism. Further, while there is clear evidence from the human and animal literature that exposure to related
Supplemental Information―Trimethylbenzenes
A-35
alkylbenzenes results in developmental neurotoxicity, much of this evidence comes from epidemiological studies of inhalant abuse or animal studies using exposure paradigms intended to approximate inhalant abuse patterns (i.e., high exposure concentrations and intermittent and noncontinuous exposures). Therefore, there is some uncertainty whether the concentrations necessary to cause developmental neurotoxicity are lower than those that result in neurotoxicity in the adult organism.
However, evidence from perinatal exposures (during a period of postnatal brain development that continues processes begun early in embryogenesis, including synaptogenesis and myelination) indicates that the developing organism is at some risk of early life exposures (and possibly prenatal exposures). These studies (Win-Shwe et al., 2012; Win-Shwe and Fujimaki, 2010) demonstrated that low-level exposures early in life (5 ppm toluene, postnatal days [PNDs] 4−12) altered the expression of neurotransmitter receptors and increased the expression of neuroimmune markers in the hippocampus of mice. Additionally, early postnatal exposure to 5 ppm toluene produced decrements in spatial learning compared to higher adult doses (50 ppm) that induced the same effect. Ultimately, it is difficult to parse out exactly how the database UF should account for this. Sensitive subpopulations, including children, are protected against the effects of exposure to environmental toxicity through the application of the human variability UF. However, as the processes that are perturbed in the Win-Shwe studies (Win-Shwe et al., 2012; Win-Shwe and Fujimaki, 2010) begin during gestation, residual uncertainty exists concerning developmental susceptibility to the neurotoxic effects of TMB isomers. As such, EPA determined that a 3-fold database UF should be applied to the PODHEC in order to account for the lack of a developmental neurotoxicity study in the available toxicity database for TMB isomers.
Charge Question F.1: A 90-day inhalation toxicity study of 1,2,3-TMB in male rats (Korsak and Rydzyński, 1996) was selected as the basis for the derivation of the RfC. Please comment on whether the selection of this study is scientifically supported and clearly described. If a different study is recommended as the basis for the RfC, please identify this study and provide scientific support for this choice.
SAB Comment F.1-1: The SAB agreed with the EPA’s conclusion not to base the RfC derivation for 1,2,3-TMB on isomer-specific data. The justification for this conclusion is supported and clearly described. The SAB was not aware of chronic or subchronic studies that could be used to support an RfC derivation for 1,2,3-TMB with neurotoxicity as the critical endpoint, similar to the Korsak and Rydzyński (1996) study used to develop the 1,2,4-TMB RfC. As with 1,2,4-TMB, the SAB found that the clarification of this choice, however, could be greatly improved by expanding the assessment on the same points discussed for 1,2,4-TMB (see SAB Comments 2−8 under Charge Question E.1).
EPA Response F.1-1: Contrary to SAB’s statement regarding the RfC for 1,2,3-TMB, the EPA did use isomer-specific data on decreased pain sensitivity observed in Korsak and Rydzyński (1996) to derive the RfC for 1,2,3-TMB in the External Peer Review Draft for TMBs (i.e., both
Supplemental Information―Trimethylbenzenes
A-36
1,2,4-TMB and 1,2,3-TMB isomer-specific data were available in this study). This analysis is retained in the current assessment. In the revised TMB assessment, the RfC derivation sections for all isomers have been combined into a unified section. Therefore, in responding to SAB Comments 2−8 under Charge Question E.1 (and most other comments made under Charge Questions F and G), the recommendations made under this comment have been achieved in reorganizing the overall section (see EPA Responses E.1-2 through E.1-8).
Charge Question F.2: Decreased pain sensitivity (measured as an increased latency to pawlick response after a hotplate test) in male Wistar rats was concluded by EPA to be an adverse effect on the nervous system and was selected as the critical effect for the derivation of the RfC. Please comment on whether the selection and characterization of this critical effect is scientifically supported and clearly described. If a different endpoint(s) is recommended as the critical effect(s) for deriving the RfC, please identify this effect and provide scientific support for this choice.
SAB Comment F.2-1: The SAB agreed that reduction in pain sensitivity as indicated by an increased latency to paw-lick response in a hot plate test was a valid adverse nervous system effect and was appropriately selected as a critical effect for RfC derivation of 1,2,3-TMB. The SAB noted that the Agency appropriately uses the same rationale to derive the RfC for 1,2,4-TMB, and as such, the comments provided under Charge Question E.2 pertain to the derivation of the RfC for 1,2,3-TMB.
EPA Response F.2-1: In the revised TMB assessment, the RfC derivation sections for all isomers have been combined into a unified section. Therefore, in responding to the comments under Charge Question E.2, the recommendations made under this comment have been achieved in reorganizing the overall section (see responses to Charge Question E.2).
Charge Question F.3: In order to characterize the observed dose-response relationship comprehensively, benchmark dose (BMD) modeling was used in conjunction with default dosimetric adjustments (U.S. EPA, 1994b) for calculating the human equivalent concentration (HEC) to identify the point of departure (POD) for derivation of the RfC. Please comment on whether this approach is scientifically supported for the available data, and clearly described.
A. Has the modeling been appropriately conducted and clearly described, based on EPA’s Benchmark Dose Technical Guidance U.S. EPA (2012)?
B. Has the choice of the benchmark response (BMR) for use in deriving the POD (i.e., a BMR equal to a 1 standard deviation change in the control mean for the latency to pawlick response) been supported and clearly described?
SAB Comment F.3-1: The SAB response to this charge question deals with the same issues as charge question for 1,2,4-TMB and did not identify any issues specific to 1,2,3-TMB; see Charge Question E.3 for specific comments.
EPA Response F.3-1: See EPA Response E.3-2 for details regarding providing a more robust justification for use of 1 SD change as the BMR for BMD modeling purposes. SAB Comment 1 to
Supplemental Information―Trimethylbenzenes
A-37
Charge Question E.3 does not pertain to 1,2,3-TMB, as the available PBPK model was not used generate HEC values for 1,2,3-TMB; default dosimetric methods were employed.
Charge Question F.4: Please comment on the rationale for the selection of the uncertainty factors (UFs) applied to the POD for the derivation of the RfC for 1,2,3-TMB. Are the UFs appropriate based on the recommendations described in Section 4.4.5 of A Review of the Reference Dose and Reference Concentration Process U.S. EPA (2002), and clearly described? If changes to the selected UFs are proposed, please identify and provide scientific support for the proposed changes.
SAB Comment F.4-1: The SAB noted that the UF values selected by the EPA for 1,2,3-TMB are identical to those selected for 1,2,4-TMB, and that the justifications are the same. Thus, all recommendations made by SAB under Charge Question E.4 pertain to the derivation of the RfC for 1,2,3-TMB as well.
EPA Response F.4-1: As all of the individual RfC sections for each isomer have been combined into a unified RfC section; please refer to EPA Responses E.4-1 through E.4-5 for full details on EPA’s response.
Charge Question G.1: One developmental toxicity study (Saillenfait et al., 2005) following inhalation exposure to 1,3,5-TMB was identified in the literature and was considered as a potential principal study for the derivation of the RfC for 1,3,5-TMB. However, the candidate RfC derived for 1,3,5-TMB based on this study (and the critical effect of decreased maternal weight gain) was 20-fold higher than the RfC derived for 1,2,4-TMB (based on decreased pain sensitivity). Given the available toxicological database for 1,2,4-TMB and 1,3,5-TMB, there are several important similarities in the two isomers’ neurotoxicity that support an RfC for 1,3,5-TMB that is not substantially different than the RfC derived for 1,2,4-TMB. Additionally, the available toxicokinetic database for the two chemicals indicates that internal dose metrics would be comparable. Thus, EPA concluded that deriving such disparate RfCs for these two isomers was not scientifically supported. Rather, EPA concluded that given the similarities in toxicokinetics and toxicity between the two isomers, there was sufficient evidence to support adopting the RfC for 1,2,4-TMB as the RfC for 1,3,5-TMB.
Please comment on EPA’s conclusion to not base the RfC derivation for 1,3,5-TMB on isomer-specific data. Is the scientific justification for not deriving an RfC based on the available data for 1,3,5-TMB supported and has been clearly described?
SAB Comment G.1-1: The SAB agreed with the EPA conclusion not to base the RfC derivation for 1,3,5-TMB on isomer-specific data. The justification for this conclusion is supported and clearly described. The SAB was not aware of chronic or subchronic studies that could be used to support an RfC derivation for 1,3,5-TMB with neurotoxicity as the critical endpoint, similar to the Korsak and Rydzyński (1996) study used to develop the 1,2,4-TMB RfC. The candidate inhalation values for 1,3,5-TMB, based on maternal and fetal toxicity from the study of Saillenfait et al. (2005), are presented by EPA, but were not chosen as the overall RfC. Although the SAB took issue with the PODs selected by EPA in their analysis of the Saillenfait et al. (2005) study, as discussed below in SAB Comments G.1-2 and G.1-3, it nevertheless agreed with the decision not to use this study to
Supplemental Information―Trimethylbenzenes
A-38
derive the overall RfC for 1,3,5-TMB. The SAB concurred with EPA that the best approach under the circumstances is to adopt the RfC for 1,2,4-TMB, based on decreased pain sensitivity, as the overall RfC for 1,3,5-TMB.
EPA Response G.1-1: As detailed above, EPA has significantly restructured the RfC derivation section for the three TMB isomers. Whereas before, a single RfC section was provided for each individual TMB isomer, the revised draft includes a unified RfC derivation section that covers all three TMB isomers. EPA restructured the RfC section in this way to reduce the difficulty of reading three separate RfC sections, and to make more apparent the scientific decisions that were reached in deriving RfCs for the individual TMBs. In the old RfC section structure, a final RfC value was selected in each RfC section for the individual RfC isomers. This led to the situation where the “final” RfC for 1,3,5-TMB, based on isomer-specific data on decreased maternal weight gain, was 20-fold higher than the “final” RfC for 1,2,4-TMB (based on decreased pain sensitivity). In this situation, EPA made the justification that the toxicokinetic and toxicological databases for 1,2,4-TMB and 1,3,5-TMB did not support such disparate RfCs for the two isomers. Thus, EPA provided a justification for adopting the RfC for 1,2,4-TMB as the RfC for 1,3,5-TMB. However, the structure for the new RfC section in the revised draft is streamlined such that all of the RfCs for the TMB isomers are presented together, and then one final RfC value is selected that applies to all three isomers.
SAB Comment G.1-2: The SAB noted that EPA incorrectly identified the appropriate effects for maternal toxicity and the NOAEL values for decreased maternal weight gain in the External Peer Review Draft TMB assessment. Saillenfait et al. (2005) selected 100 ppm (492 mg/m3) for the maternal NOAEL for 1,3,5-TMB with 300 ppm (1,476 mg/m3) as the maternal LOAEL based on decreased maternal weight gain and food intake. In the External Peer Review Draft TMB Assessment, the EPA set the maternal NOAEL at 300 ppm (1,476 mg/m3) and the maternal LOAEL at 600 ppm (2,952 mg/m3) based on decreased corrected body weight gain and higher exposure levels than Saillenfait et al. (2005). The SAB found that this is not a correct interpretation of a maternal NOAEL for the Saillenfait et al. (2005) paper. Decreased corrected body weight gain was measured only at one time point (C-section) 1 day after cessation of exposure. Statistically significant decreased maternal weights were observed at gestational days (GDs) 13−21 when the fetuses would be contributing far less to the mother’s weight and at GDs 6−21 (entire treatment period). Reduced maternal body weights correspond exactly with the statistically significant decreased food consumption values recorded at GDs 6−13, 13−21, and 6−21 (entire treatment period). The SAB recommended that EPA use decreased maternal body weight gain data from GDs 6−13 and 6−21 as the basis of the maternal endpoint POD and RfC rather than corrected maternal weight gain data. If BMD modeling is unsuccessful, the SAB recommended that EPA use the maternal NOAEL of 492 mg/m3 as the POD.
EPA Response G.1-2: EPA agrees with the SAB comments and has revised the RfC derivations for 1,3,5-TMB. In the revised draft, EPA selected decreased maternal weight gain from
Supplemental Information―Trimethylbenzenes
A-39
GDs 6−21 as the basis for the maternal endpoint, and used a NOAEL of 497 mg/m3 (measured concentration) as the basis for derivation of the RfC.
SAB Comment G.1-3: The SAB found that EPA incorrectly identified 2,974 mg/m3 as the NOAEL for decreased male fetal weight. Saillenfait et al. (2005) identified the developmental NOAEL in the study as 300 ppm (1,476 mg/m3) and the developmental LOAEL as 600 ppm (2,952 mg/m3) based on decreased mean male fetal body weights. The SAB recommended using the NOAEL of 1,476 mg/m3 as the POD for derivation of a developmental endpoint RfC. The SAB also suggested that EPA consider increasing the UFD from 3 to 10, to address the lack of neurodevelopmental testing, in the derivation of the developmental RfC. The SAB noted that this approach may not fully address neurological effects that serve as the basis for the other isomers. However, the revised developmental endpoint RfC calculation will be based on a more appropriate POD and improve the justification for using the extrapolation from the lower neurological-based RfC from 1,2,4-TMB.
EPA Response G.1-3: EPA used the correct NOAEL of 1,471 mg/m3 (measured concentration) as the basis for derivation of the RfC for decreased male fetal weight. As stated above (see EPA Response E.4-5 for details), EPA revised the RfC section for TMB isomers to cover all three isomers simultaneously rather than have three separate RfC sections for each individual isomer. This allows the whole TMB toxicity database to be considered holistically. As such, EPA determined that a UFD of 3 was appropriate to account for the lack of a developmental neurotoxicity study in the TMB toxicity database.
SAB Comment G.1-4: In addition to the above analysis and considerations, the SAB noted the following minor errors in the description of the 1,3,5-TMB inhalation data: (1) in Table 2-12, the female fetal body weight average for the 100 ppm (492 mg/m3) group should be 5.47 ± 0.21 and not 5.74 ± 0.21 (it is correct in other tables of the document); (2) the level of significance for decreased maternal body weight gain for the 600 ppm (2,952 mg/m3) group should have two (**) and not one (*) asterisk to indicate p < 0.01; and (3) the table also states with a footnote (b) that numbers of live fetuses were not explicitly reported. However, Saillenfait et al. (2005) did report them in Table 3 of their manuscript. The total numbers of fetuses were 297, 314, 282, 217, and 236, for the control and exposure groups, respectively, and should be included in Tables 2-2 and 2-12 of the draft TMB Review document.
EPA Response G.1-4: The minor errors in Tables 2-2 and 2-12 have been corrected; the correct information is now presented in Table 2-3 in the unified RfC section.
Charge Question G.2: Please comment on whether EPA’s approach to developing the RfC for 1,3,5-TMB is scientifically supported for the available data and clearly described.
SAB Comment G.2-1: The SAB acknowledged that the Agency’s approach to developing the overall RfC (based on neurological effects) for 1,3,5-TMB based on a structurally and toxicologically related isomer is scientifically appropriate. However, the SAB recommended that the Agency strengthen the justification for using this approach for 1,3,5-TMB by: (1) following the
Supplemental Information―Trimethylbenzenes
A-40
recommendations provided above regarding recalculating the maternal- and developmental-based RfCs from Saillenfait et al. (2005); and (2) discussing the differences as well as similarities in physical and toxicological parameters (i.e., Henry’s Law constant and toxicokinetics) for 1,3,5-TMB as compared with the other isomers.
EPA Response G.2-1: As noted above (EPA Responses F.2-1 and G.1-1), EPA has completely restructured the RfC section for the TMB assessment. This restructuring has, in a large part, removed the necessity to set RfCs for one isomer as that for other data-poor isomers. In the new structure, RfCs are derived for each isomer-endpoint combination, and then a single, overarching RfC is selected for TMBs as a whole (this is detailed in Section 2.1.5 in the assessment). However, following SAB’s recommendations above, EPA has: (1) recalculated all of the maternal- and developmental-based RfCs for 1,3,5-TMB; and (2) discussed the similarities and differences between the physical and toxicokinetic properties for the individual isomers (see Section 1.1.1)
Charge Question H.1: The oral database for 1,2,4-TMB was considered inadequate for derivation of an RfD. However, available evidence demonstrates similar qualitative profiles of metabolism and patterns of parent compound distribution across exposure routes (i.e., oral and inhalation). Furthermore, there is no evidence that would suggest the toxicity profiles would differ to a substantial degree between oral and inhalation exposures. Therefore, route-to-route extrapolation, from inhalation to oral, using the modified Hissink et al. (2007) PBPK model was used to derive a chronic oral RfD for 1,2,4-TMB. In order to perform the route-to-route extrapolation, an oral component was added to the model, assuming a constant infusion rate into the liver. Specifically, in the absence of isomer-specific information, an assumption was made that 100% of the ingested 1,2,4-TMB would be absorbed by constant infusion of the oral dose into the liver compartment. The contribution of first-pass metabolism was also evaluated. Please comment on whether EPA’s conclusion that the oral database for 1,2,4-TMB is inadequate for derivation of an RfD is scientifically supported and clearly described. Please comment on whether oral data are available to support the derivation of an RfD for 1,2,4-TMB. If so, please identify these data.
SAB Comment H.1-1: The SAB agreed that the primary toxicological endpoints for 1,2,4-TMB (neurotoxicity, hematotoxicity) can be extrapolated across dose routes from the inhalation data with the assistance of PBPK modeling. There is ample precedent with IRIS assessments to use this approach to derive a reference value for a chemical with missing data by a particular dose route.
EPA Response H.1-1: No response necessary. SAB Comment H.1-2: The SAB noted that they were not aware of adequate repeat-dose
studies for 1,2,4-TMB via the oral dose route. The available acute exposure studies offer limited support in developing an RfD. The SAB recognized that this represents a data gap and that one potential way to fill this data gap is to use oral data for a closely related TMB isomer such as the subchronic gavage toxicology data available for 1,3,5-TMB (Adenuga et al., 2014; Koch Industries, 1995b). The SAB disagreed with EPA’s decision to not use the Adenuga et al. (2014)/Koch
Supplemental Information―Trimethylbenzenes
A-41
Industries (1995b) study for derivation of an RfD due to the lack of neurotoxicity data. The SAB recommended that the EPA derive RfD(s) for endpoints observed in the oral 1,3,5-TMB study, such as liver and kidney weight changes. The SAB commented that this would be consistent with EPA’s goal to derive RfD values for multiple endpoints (such as what was done with the RfC). The SAB then stated that these RfDs could then be considered for extrapolation to other TMB isomers. The SAB commented that the EPA should consider the appropriateness of applying a database UF to the oral POD to compensate for the data gap of not having an oral neurotoxicity endpoint in the current approach. Finally, the SAB noted that by comparing the RfD(s) generated from the oral studies and from the extrapolation from the RfC through using route-to-route extrapolation, the EPA can provide a clear explanation for why the use of the PBPK route-to-route-based RfD for 1,2,4-TMB may be preferable to application of a database UF to an oral POD.
EPA Response H.1-2: Upon further consideration of the Adenuga et al. (2014) study, EPA agreed with SAB that it was suitable for derivation of a candidate oral value for increased monocytes. This is a hematological effect that is consistent with effects seen following inhalation exposures to 1,2,4-TMB and 1,2,3-TMB. A full discussion of the appropriateness of this endpoint for derivation of an RfD has been included in Section 2.2.1. However, the EPA further determined that the changes in kidney and liver weight would not support RfD derivations, as no accompanying histopathological changes were noted in these organs following examination. Given that organ weight changes occurring in the absence of histopathological lesions or other evidence of clear adversity may be compensatory or adaptive changes, the liver and kidney weight changes observed in subchronic inhalation studies for 1,2,4-TMB and 1,2,3-TMB were similarly discounted; no RfD values were derived for these endpoints. To support the decision to not consider the organ weight changes as suitable for reference value derivations text was added in multiple places in the assessment. First, Section 1.2.5 (General Toxicity) was added to the Hazard Identification section to discuss the observation of organ weight changes. Secondly, Sections 2.1.1 and 2.2.1 in the Dose-Response Analysis section more thoroughly covered the Agency’s rationale behind the determination that these endpoints were not suitable for reference value derivations.
After consideration of the oral TMB toxicity data, and by extension the inhalation database as well, EPA determined that the application of a 3-fold database UF was suitable to account for the lack of an oral neurotoxicity or developmental neurotoxicity study. EPA’s rationale for this decision regarding the lack of developmental neurotoxicity study is the same as was used for the derivation of the RfC for TMB isomers (see EPA Response E.4-5 for details). EPA determined that there was no need to increase the UFD to 10-fold to account for the lack of an oral neurotoxicity study as the derived RfCs for neurotoxicity and hematotoxicity endpoints were equal, indicating that RfDs calculated for these endpoints might also be assumed to be equivalent. However, in order to fully explore this possibility, EPA used the available PBPK model to perform a route-to-route extrapolation on the decreased pain sensitivity endpoint for 1,2,4-TMB. In doing so, EPA subsequently derived an RfD of 1 × 10⁻² mg/kg-day for decreased pain sensitivity, equal to the RfD
Supplemental Information―Trimethylbenzenes
A-42
derived for decreased monocytes. As with the RfC derivations, this result indicates that some endpoints in the hematological system are equivalently as sensitive to exposure to TMB isomers as endpoints in the nervous system. This determination is further supported by the derivation of an RfD of 1 × 10⁻² mg/kg-day for 1,2,4-TMB based on decreased clotting time via a route-to-route extrapolation. Ultimately, EPA decided to select the RfD based on the route-to-route extrapolation of the decreased pain sensitivity endpoint given the confidence in the PBPK model extrapolations and that neurotoxicity endpoints are the most consistently observed effects in the TMB toxicity database.
SAB Comment H.1-3: The SAB noted that there were limitations in the Koch Industries study (primarily that it didn’t involve neurotoxicity endpoints) and that use of the study would involve an extrapolation across congeners. Presented with those limitations, the SAB determined that the Koch Industries study does not provide a superior alternative to the PBPK approach for dose route extrapolation that the EPA implemented. As discussed in SAB Comment 1 of Charge Question H.1, the SAB noted that the Koch Industries study may provide a means to derive RfDs for several additional endpoints (e.g., liver, kidney) for 1,3,5-TMB. The SAB recommended that EPA consider such additional RfDs and whether they are potentially useful for 1,2,4-TMB based upon extrapolation across congeners.
EPA Response H.1-3: EPA agrees that the Adenuga et al. (2014) study does not provide a clearly superior alternative to the route-to-route extrapolation that has been used to derive the RfD for TMB isomers. However (as discussed above in EPA Response H.1-1), the EPA derived an RfD from data on increased monocytes reported in Adenuga et al. (2014), and has compared this isomer-route-specific RfD to the RfD derived from the route-to-route extrapolation. As thoroughly discussed in Section 2.2.3, use of the monocyte data results in an RfD of 1 × 10⁻² mg/kg-day, compared to an RfD of 1 × 10⁻² mg/kg-day for decreased pain sensitivity when using the route-to-route approach. Ultimately, the EPA chose the RfD based on the route-to-route extrapolation given the increased confidence in using the validated PBPK model to conduct the route-to-route extrapolation and numerous lines of evidence indicating the similarities in the toxicological and toxicokinetic properties of the TMB isomers.
Charge Question H.2: A route-to-route extrapolation from inhalation to oral exposure using the modified Hissink et al. (2007) PBPK model has been used to derive an oral RfD for 1,2,4-TMB. Please comment on whether the PBPK modeling been appropriately utilized and clearly described. Are the model assumptions and parameters scientifically supported and clearly described? Are the uncertainties in the model structure adequately characterized and discussed? Please comment on whether this approach is scientifically supported and clearly described in the document.
SAB Comment H.2-1: The SAB noted that the EPA adapted the modified Hissink et al. (2007) model for dose route extrapolation of internal dose by adding an oral delivery component (continuous gastric infusion, instantaneous and complete absorption). The Hissink et al. (2007) inhalation human model is a reasonable starting point as it simulated the available human
Supplemental Information―Trimethylbenzenes
A-43
toxicokinetic data fairly well. The SAB concluded that, while the incorporation of the oral dose route is simplistic, it is acceptable for the current purposes in that the dose metric used for dose-response modeling (parent compound average weekly venous concentration) is not sensitive to peaks and valleys of a more normal oral intake pattern. A constant infusion averages out the exposure over the course of the day, thus creating an average venous concentration that is compatible with the dose metric without further calculation. Overall, the SAB determined that the modified Hissink et al. (2007) model adapted for the oral route is likely to adequately predict human oral exposures and be useful for dose-response modeling and the derivation of the RfD.
EPA Response H.2-1: Although the SAB concluded that an assumption of constant infusion was acceptable, albeit simplistic, for the route-to-route extrapolation, EPA, upon further consideration of the data, implemented a more realistic pattern of human oral exposure. In this new scenario, ingestion was simulated as an idealized pattern of six events, each lasting 30 minutes. Twenty-five percent of the total daily dose was assumed to be ingested at each of three events beginning at 7 am, 12 pm (noon), and 6 pm (total of 75%). Ten percent of the daily dose was assumed to be ingested at events beginning at 10 am and 3 pm (total of 20%). The final 5% was assumed to be ingested in an event beginning at 10 pm.
Charge Question H.3: Please comment on the rationale for the selection of the uncertainty factors (UFs) applied to the POD for the derivation of the RfD for 1,2,4-TMB. Are the UFs appropriate based on the recommendations described in Section 4.4.5 of A Review of the Reference Dose and Reference Concentration Processes, and clearly described? If changes to the selected UFs are proposed, please identify and provide scientific support for the proposed changes.
SAB Comment H.3-1: The SAB agreed with the UFs selected in the development of the oral RfD for 1,2,4-TMB. As discussed in the SAB Comment 1 of Charge Question H.2, the oral RfD for 1,2,4-TMB was derived by incorporating an oral intake component into the PBPK model for 1,2,4-TMB to obtain a human equivalent oral dose POD and then used the same UFs for the oral RfD as were used in the development of the inhalation RfC. Given that the oral RfD was based upon the same endpoint and derived from the same study as the RfC, the SAB agreed that it is logical to use the same UFs. Thus, the comments and recommendations regarding UFs for the RfC derivations (Charge Questions E.4 and F.4) are applicable to this charge question as well.
EPA Response H.3-1: No response necessary. SAB Comment H.3-2: The SAB discussed whether there is additional uncertainty associated
with incorporation of the oral intake component in the PBPK model, and specifically regarding assumptions made with that component regarding oral absorption of 1,2,4-TMB and first-pass metabolism. Unlike modeling of internal concentrations from inhalation exposure that can be verified with existing experimental data, there are no data with which to assess model predictions of internal doses following oral 1,2,4-TMB exposures. The SAB ultimately did not consider this additional uncertainty sufficient to increase the composite UF for the oral RfD, largely because the nature of the uncertainty (possible lower absorption by the oral route) would add extra health
Supplemental Information―Trimethylbenzenes
A-44
protection. The SAB recommended that the potential uncertainties associated with oral bioavailability of 1,2,4-TMB be discussed more clearly in the document.
EPA Response H.3-2: A discussion of the uncertainty surrounding the assumption of 100% bioavailability of ingested TMB isomers has been added to Section 2.2.4.
Charge Question I.1: The oral database for 1,2,3-TMB was considered to be inadequate for derivation of an RfD. Based on the similarities in chemical properties, toxicokinetics, and toxicity profiles between the 1,2,4-TMB and 1,2,3-TMB isomers, EPA concluded that there was sufficient evidence to support adopting the 1,2,4-TMB RfD as the RfD for 1,2,3-TMB. Please comment on whether EPA’s conclusion that the oral database for 1,2,3-TMB is inadequate for derivation of an RfD is scientifically supported and clearly described. Please comment on whether oral data are available to support the derivation of an RfD for 1,2,3-TMB. If so, please identify these data. Please comment on whether EPA’s approach to developing the RfD for 1,2,3-TMB is scientifically supported and clearly described.
SAB Comment I.1-1: The SAB was not aware of adequate repeat-dose studies for 1,2,3-TMB via the oral dose route. The available acute exposure studies offer limited support in developing an RfD. The SAB agreed that the primary toxicological endpoints used for 1,2,4-TMB (neurotoxicity, hematotoxicity) and extrapolated across dose routes from the inhalation data with the assistance of PBPK modeling are appropriate for 1,2,3-TMB. There is ample precedent within the IRIS system for this approach to derive a reference value for a chemical with missing data by a particular dose route. The SAB noted that the Agency appropriately uses the same rationale to derive the RfD for 1,2,4-TMB.
EPA Response I.1-1: It should be noted that, as with the RfC section, the individual isomer RfD sections have been combined into a unified RfD section for all of the isomers. As such, given SAB comments on both the 1,2,4-TMB and 1,3,5-TMB RfD sections, the unified RfD section covers extensive discussion and quantitation of RfDs based on increased monocytes (1,3,5-TMB oral-specific data) and decreased pain sensitivity (1,2,4-TMB route-to-route extrapolation), including the ultimate adoption of the route-to-route-derived RfD as the RfD for TMBs. Thus, while an explicit discussion of adoption of 1,2,4-TMB’s RfD as the RfD for 1,2,3-TMB no longer is included in the document, the discussion regarding the ultimate adoption of 1,2,4-TMB’s RfD as the RfD for all isomers still covers the issues identified by SAB above.
Charge Question J.1: The oral database for 1,3,5-TMB was considered to be inadequate for derivation of an RfD. EPA concluded that given the similarities in the chemical properties, toxicokinetics, and toxicity profiles between the two isomers, there was sufficient evidence to support adopting the RfD for 1,2,4-TMB as the RfD for 1,3,5-TMB. Please comment on whether EPA’s conclusion that the oral database for 1,3,5-TMB is inadequate for derivation of an RfD is scientifically supported and clearly described. Please comment on whether oral data are available to support the derivation of an RfD for 1,3,5-TMB. If so, please identify these data.
Supplemental Information―Trimethylbenzenes
A-45
SAB Comment J.1-1: The SAB agreed with the EPA’s approach to extrapolating the RfD of 1,2,4-TMB to 1,3,5-TMB. However, the SAB was aware of an isomer-specific study (Koch Industries, 1995b) and the recently released data on 1,3,5-TMB (Adenuga et al., 2014) provided by public commenters.
EPA Response J.1-1: EPA incorporated data from Adenuga et al. (2014) in the RfD derivation section as outlined below.
SAB Comment J.1-2: The SAB commented that the Koch Industries (1995b) study was the only isomer-specific and route-specific study available in the peer-reviewed literature for oral exposure to 1,3,5-TMB when the TMB assessment was drafted in 2013. Although EPA’s rationale for not using this study for RfD derivation is clearly described (i.e., it did not assess the potential for neurological effects and “presented limited toxicological information”), the SAB disagreed and considered the Koch Industries (1995b) study suitable for development of one or more candidate oral values for 1,3,5-TMB.
EPA Response J.1-2: The Adenuga et al. (2014)/Koch Industries (1995b) study has been used in the current draft to derive an RfD based on increased monocytes.
SAB Comment J.1-3: The SAB found that the Koch Industries study of 1,3,5-TMB toxicity after subchronic (90-day) gavage treatment was consistent with good laboratory practices and requirements and, when submitted for an EPA Office of Water test rule, was peer-reviewed by three senior scientists (Versar, 2013). Although the study does not include neurological endpoints, it does provide information on toxicity to other organs such as liver and kidney. The SAB concluded that this study is suitable for providing candidate oral values for one or more endpoints in the same way that, for example, candidate values based upon a variety of endpoints were developed and presented for 1,2,4-TMB (see Table 2-4 of the draft TMB Toxicological Review).
EPA Response J.1-3: As noted above, the Adenuga et al. (2014)/Koch Industries (1995b) study has been used to derive an RfD for increased monocytes in the current draft. One note of clarification, the Koch Industries study was not peer-reviewed when submitted for an EPA Office of Water test rule, but was peer-reviewed in order to include it in the IRIS Toxicological Review of Trimethylbenzenes.
SAB Comment J.1-4: The SAB noted that, given the importance of neurotoxicity as a critical endpoint for inhalation exposure to TMB isomers, there should be confidence that any value selected as the RfD for 1,3-5-TMB is adequately protective of this type of effect. In order to produce an RfD protective of neurotoxicity using PODs from the Koch Industries study, a large UFD (e.g., 10) could be used to account for the absence of isomer- and route-specific neurotoxicity data. However, the SAB concluded that there is stronger scientific support for use of a PBPK-extrapolated RfD for 1,2,4-TMB based on a neurotoxic endpoint as the overall RfD for 1,3,5-TMB. Thus, while the SAB recommended use of the Koch Industries data and Adenuga et al. (2014) to develop candidate oral values for comparison purposes, it agrees with the overall RfD for 1,3,5-TMB as proposed by EPA.
EPA Response J.1-4: No response necessary.
Supplemental Information―Trimethylbenzenes
A-46
Charge Question K.1: The draft Toxicological Review of Trimethylbenzenes did not conduct a quantitative cancer assessment for any isomer due to the lack of available studies. Please comment on whether data are available to support the derivation of a quantitative cancer risk estimate.
SAB Comment K.1-1: The SAB found that the evidence for carcinogenicity of TMBs is limited and that this fact was well presented by the EPA in the draft toxicological review.
EPA Response K.1-1: No response necessary. SAB Comment K.1-2: The SAB agreed with the Agency that TMBs do not appear to be
genotoxic when assessed in a standard battery of genotoxicity assays. The one exception was 1,2,3-TMB in the Ames assay in the absence of S9. The SAB concluded that the significance of the finding was uncertain because it was not clear what mechanism could lead to such a response.
EPA Response K.1-2: No response necessary. SAB Comment K.1-3: The SAB was not aware of any human studies on carcinogenicity of
TMBs, but noted that a number of biomarker studies and their association with cancer of various sites have been published. These biomarker studies should be reviewed and included. Some examples are: (1) solid-phase microextraction, mass spectrometry, and metabolomic approaches for detection of potential urinary cancer biomarkers—a powerful strategy for breast cancer diagnosis (Silva et al., 2012); (2) investigation of urinary volatile organic metabolites as potential cancer biomarkers by solid-phase microextraction in combination with gas chromatography-mass spectrometry (Silva et al., 2011); and (3) cellular responses after exposure of lung cell cultures to secondary organic aerosol particles (Gaschen et al., 2010).
EPA Response K.1-3: Information gleaned from studies on biomarkers of exposure and their association with cancers at various sites in humans has been added the Carcinogenicity section (Section 1.2.6) of the Hazard Identification section where applicable.
SAB Comment K.1-4: Based upon the deficiencies of the Maltoni et al. (1997) study, the lack of bioassays with 1,2,3-TMB and 1,3,5-TMB, and the lack of human studies, the SAB agreed that the EPA could not conduct a quantitative cancer assessment for any isomer due to the lack of appropriate studies.
EPA Response K.1-4: No response necessary.
Additional SAB Recommendations
1. Candidate Reference Values
SAB Comment AR.1-1: The SAB noted that Section 7.6 of the Preamble (External Peer Review draft version) describes how IRIS assessments derive candidate values for each suitable data set and effect that is credibly associated with an agent. These results are arrayed, using common dose metrics, to show where effects occur across a range of exposures using guidance on methods to derive RfCs and RfDs. The assessment process develops an organ- or system-specific reference value for each organ or system affected by the agent and selects an overall RfD and an overall RfC for the agent to represent lifetime human exposure levels where effects are not
Supplemental Information―Trimethylbenzenes
A-47
anticipated to occur. Providing these organ/system-specific reference values, IRIS assessments may facilitate subsequent risk assessments that consider the combined effect of multiple agents acting at a common site or through common mechanisms.
EPA Response AR.1-1: No response necessary. SAB Comment AR.1-2: The SAB encountered an issue where further clarification by EPA is
strongly encouraged. Interest by the EPA in developing PODs and RfCs/RfDs for multiple endpoints in new IRIS profiles is noted. As shown in this toxicological review, one of the uses of RfCs/RfDs for various endpoints is as candidates for selection as the overall toxicity value. The overall toxicity value is one that is intended to be protective of toxicity of all types, and this is taken into consideration when selecting the UFD. Another use of these RfCs/RfDs is to better understand the effects of combined chemical exposures. Risks from combined or cumulative exposures to chemicals is generally of greatest concern when the chemicals affect the same targets organs. While an overall RfC or RfD is based upon one effect chosen as the critical effect, that chemical may produce other types of toxicity at doses that are only marginally higher than the selected overall toxicity value. To illustrate the problem, consider the situation in which individuals are exposed to three chemicals, each with an RfC based upon a different endpoint, but all have the potential to affect the liver. For the risk assessor, the combined effect of the three chemicals on the liver may be greater concern than the effects of the individual chemicals on other organ/systems. In order to evaluate the risk of liver injury from combined exposure, the risk assessor needs a liver RfC for each compound. Conceivably, this information could come from RfCs for the chemicals, if available for the liver, but there is a difference in the way that an RfC for this use would be developed versus an RfC suitable for selection as the overall RfC. The difference is in the way that the UFD is selected—on one hand to ensure that the RfC is protective against all forms of toxicity and on the other that it is reliably protective of toxicity to a specific target organ. Conceivably, the UFD values selected for those two purposes, and the resulting RfC/RfD values, could be quite different. The SAB was unaware of any discussion of this issue by EPA or clear description of how organ/system-specific RfC/RfD values are to be developed and used. As the IRIS process moves forward, it will be important to provide much greater clarity on this subject.
EPA Response AR.1-2: EPA agrees that as the IRIS Program moves forward, the process by which organ/system-specific RfCs/RfDs are derived must be clearly defined and presented transparently to the public. In the current assessment, however, the RfCs/RfDs were derived via the application of a composite UF that took into account database uncertainties (UFD of 3 for lack of developmental neurotoxicity information). Calculation of RfCs/RfDs associated with systems that are likely not affected by the lack of additional developmental neurotoxicity information could use a composite UF of 100 (UFA of 3, UFH of 10, UFS of 3, UFL of 1, UFD of 1 [hematological, respiratory, or maternal endpoint]) or UF of 30 (UFA of 3, UFH of 10, UFS of 1, UFL of 1, UFD of 1 [developmental endpoints]).
Supplemental Information―Trimethylbenzenes
A-48
2. Sensitive Lifestages and Vulnerable Populations
SAB Comment AR.2-1: The draft TMB assessment provided only one paragraph on this subject. While the SAB found that it correctly identified various types of immaturity (metabolism, renal clearance) as potentially leading to greater vulnerability in early life, the Panel felt that this section could provide a better outline of the kinds of information needed to understand the potential vulnerabilities in early life, including key aspects of TMB mode of action and key developmental features.
EPA Response AR.2-1: This section was expanded according to the specific comments that SAB provided below.
SAB Comment AR.2-2: Regarding mode of action, the SAB noted that it is important to know: (1) whether it is the parent compound or metabolites (or both) that contribute to toxic effect; (2) which metabolic systems are responsible for removing the parent compound and creating important metabolites; and (3) the role of distributional phenomena (e.g., uptake into brain; partitioning into fat) and other clearance mechanisms in determining chemical fate and access to target sites. Based upon the available mode-of-action information, the developmental factors that may influence toxicokinetics can be discussed in this section. For TMBs, the draft document assumes that the parent compound is responsible for toxicity with modeling assuming that a saturable Phase I oxidative cytochrome P450 (CYP450) process is responsible for decreasing parent compound levels in venous blood. This section should state whether it is known which CYP450(s) are responsible for TMB saturable metabolism, as different CYP450s have different developmental patterns. Analogy may be drawn with other alkylbenzenes that do have toxicokinetic modeling data in early life such as toluene. Toluene has already been referred to in the mode-of-action section of the document; it is also neurotoxic and its mode of action is based upon parent compound, with the level getting to the brain determined by saturable CYP450 metabolism. If the EPA determines these parallels to provide a useful analogy, then early life modeling papers for toluene by Pelekis et al. (2001) and Nong et al. (2006) may be useful for describing the degree of toxicokinetic uncertainty presented by early lifestage exposure to TMBs.
EPA Response AR.2-2: A more detailed discussion of what is known regarding the mode of action for TMB isomers and whether information exists on what CYP450 isozyme is responsible for metabolizing parent compound has been added to Section 1.3.3 (Susceptible Populations and Lifestages). Information from early-life modeling on toluene was also incorporated into the discussion to support the conclusion that early life may be a susceptible lifestage for the neurotoxic effects of TMB exposure.
SAB Comment AR.2-3: The SAB concluded that some discussion was warranted concerning what is known about early life vulnerability to aromatic solvent neurotoxicity. Several studies are available suggesting a vulnerable window of brain development in mice to the neurotoxic effects of toluene (Win-Shwe et al., 2012; Win-Shwe et al., 2010). The SAB recommended that the EPA evaluate this evidence relative to other developmental neurotoxicity studies that may be available
Supplemental Information―Trimethylbenzenes
A-49
for toluene and other related alkylbenzenes to determine whether this data gap represents a large uncertainty.
EPA Response AR.2-3: A discussion of the possible developmental neurotoxicity of toluene as a surrogate for TMB was added to Section 1.3.3 (Susceptible Populations and Lifestages) to support the decision that early life is a window of susceptibility for the neurotoxic effects of TMB exposure.
SAB Comment AR.2-4: The SAB noted that this section should conclude with a statement as to whether any specific data exist for TMBs that would show the extent of early life vulnerability based upon toxicokinetic and toxicodynamics considerations and the degree to which such data for related alkylbenzenes help to fill these data gaps.
EPA Response AR.2-4: A concluding statement was added to this section.
3. Developing Subchronic RfCs and RfDs
SAB Comment AR.3-1: The SAB noted that the EPA and other environmental regulatory agencies are frequently required to address the risks associated with exposures lasting less than a lifetime. Because the toxic endpoint(s) of concern for a given chemical, as well as threshold doses or concentrations for toxicity, can change with exposure duration, the toxicity value used in risk assessment should be matched to the extent possible to the length of exposure associated with the scenario of interest. Recognizing the need for toxicity values for less-than-lifetime exposures, the EPA Risk Assessment Forum recommended that the Agency develop such values and incorporate them into the IRIS database (U.S. EPA, 2002).
EPA Response AR.3-1: No response necessary. SAB Comment AR.3-2: In the case of the TMBs, the SAB noted that the principal studies
used to create the proposed RfCs and RfDs are all subchronic in duration, and the analysis needed to support a robust set of subchronic toxicity values has, in effect, already been done for these chemicals. The SAB acknowledged that the derivation of subchronic RfCs and RfDs may not always be appropriate. However, the toxic endpoints and dose-response relationships for the TMBs in the draft report are clearly relevant for subchronic exposure, and the same PODs and the same UFs—except UFS, which is used to generate a chronic toxicity value from subchronic study data—would apply to the development of a set of subchronic RfCs and RfDs.
EPA Response AR.3-2: No response necessary. SAB Comment AR.3-3: Given the potential usefulness of these toxicity values for risk
assessment, the importance of having the values available on IRIS, and the very small amount of additional work required to add them to the TMB assessment, the SAB suggested that the EPA consider including subchronic RfCs and RfDs for 1,2,4-TMB, 1,2,3-TMB, and 1,3,5-TMB. These values would be calculated using the same inputs as for the chronic toxicity values, but omitting the UFs. The SAB anticipated that incorporation of these values would require minimal edits to existing tables and text.
Supplemental Information―Trimethylbenzenes
A-50
EPA Response AR.3-3: EPA has provided a set of subchronic RfCs and RfDs (both the candidate and final values) for the TMB isomers in Sections 2.1.8 and 2.2.6 (respectively).
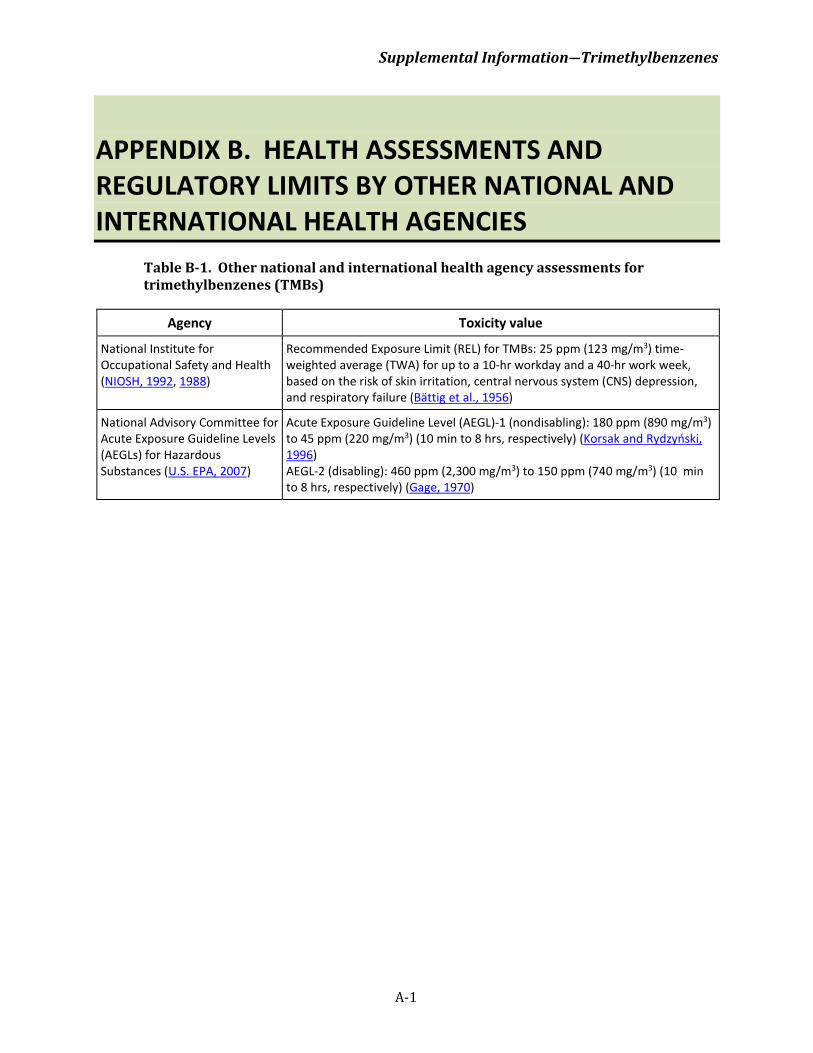
Supplemental Information―Trimethylbenzenes
A-1
APPENDIX B. HEALTH ASSESSMENTS AND REGULATORY LIMITS BY OTHER NATIONAL AND INTERNATIONAL HEALTH AGENCIES
Table B-1. Other national and international health agency assessments for trimethylbenzenes (TMBs)
Agency Toxicity value
National Institute for Occupational Safety and Health (NIOSH, 1992, 1988)
Recommended Exposure Limit (REL) for TMBs: 25 ppm (123 mg/m3) time-weighted average (TWA) for up to a 10-hr workday and a 40-hr work week, based on the risk of skin irritation, central nervous system (CNS) depression, and respiratory failure (Bättig et al., 1956)
National Advisory Committee for Acute Exposure Guideline Levels (AEGLs) for Hazardous Substances (U.S. EPA, 2007)
Acute Exposure Guideline Level (AEGL)-1 (nondisabling): 180 ppm (890 mg/m3) to 45 ppm (220 mg/m3) (10 min to 8 hrs, respectively) (Korsak and Rydzyński, 1996) AEGL-2 (disabling): 460 ppm (2,300 mg/m3) to 150 ppm (740 mg/m3) (10 min to 8 hrs, respectively) (Gage, 1970)
Supplemental Information―Trimethylbenzenes
B-1
APPENDIX C. INFORMATION IN SUPPORT OF HAZARD IDENTIFICATION AND DOSE-RESPONSE ANALYSIS
C.1. TOXICOKINETICS There has been a significant amount of research conducted on the toxicokinetics of
1,2,4-trimethylbenzene (TMB), 1,2,3-TMB, and 1,3,5-TMB in experimental animals and humans. In vivo studies have been conducted to evaluate the adsorption, distribution, metabolism, and excretion (ADME) of all isomers following exposure via multiple routes of exposure in rats (Świercz et al., 2006; Tsujimoto et al., 2005; Świercz et al., 2003; Świercz et al., 2002; Tsujino et al., 2002; Tsujimoto et al., 2000; Eide and Zahlsen, 1996; Zahlsen et al., 1990; Huo et al., 1989; Dahl et al., 1988; Mikulski and Wiglusz, 1975) and volunteers (Świercz et al., 2016; Janasik et al., 2008; Jones et al., 2006; Järnberg et al., 1997a; Järnberg et al., 1997b; Kostrzewski et al., 1997; Järnberg et al., 1996; Kostrewski and Wiaderna-Brycht, 1995; Fukaya et al., 1994; Ichiba et al., 1992). The following sections provide a summary of the toxicokinetic properties for all three isomers. For complete details regarding the toxicokinetics of TMB isomers in humans and animals, see Tables C-46−C-64 in Appendices C.6−C.8.
C.1.1. Absorption
Both humans and rats readily absorb 1,2,4-TMB, 1,2,3-TMB, and 1,3,5-TMB into the bloodstream following exposure via inhalation. Humans (N = 9−10, Caucasian males) exposed to 25 ppm (123 mg/m3) 1,2,4-TMB or 1,3,5-TMB for 2 hours exhibited similar maximum capillary blood concentrations (6.5 ± 0.88 and 6.2 ± 1.6 µM, respectively [digitized data]), whereas absorption for 1,2,3-TMB was observed to be higher (7.3 ± 1.0 µM [digitized data]) (Järnberg et al., 1998, 1997a; Järnberg et al., 1996). Kostrzewski et al. (1997) observed equivalent maximal capillary blood concentrations in humans (N = 5) exposed to 30.5 ppm (150 mg/m3) 1,2,4-TMB or 1,3,5-TMB for 8 hours (8.15 ± 1.4 and 6.3 ± 1.0 µM, respectively). In the same study, volunteers exposed to 100 mg/m3 (20.3 ppm) 1,2,3-TMB had capillary blood concentrations of 4.3 ± 1.1 µM. In humans (N = 4, 2 males, 2 females) exposed to 25 ppm (123 mg/m3) 1,3,5-TMB for 4 hours, venous blood concentrations were markedly lower (0.85 µM, no standard deviation [SD] reported), but this may be related to measurement of 1,3,5-TMB in the venous blood (Jones et al., 2006). 1,3,5-TMB has a higher blood:fat partition coefficient (230) than 1,2,4-TMB (173) or 1,2,3-TMB (164) (Järnberg and Johanson, 1999) and therefore, much of the 1,3,5-TMB absorbed into capillary blood may preferentially distribute to adipose tissue before entering into the venous blood supply.
Supplemental Information―Trimethylbenzenes
B-2
Measurements of respiratory uptake of 1,2,4-TMB, 1,2,3-TMB, or 1,3,5-TMB are similar in humans (N = 10, Caucasian males) (60 ± 3, 48 ± 3, and 55 ± 2%, respectively).
In rats, rapid absorption into the bloodstream was observed in many studies following single exposures to 1,2,4-TMB, with maximal blood concentrations of 537 ± 100, 221 (no SD reported), and 64.6 ± 13.6 µM observed after exposures to 1,000 ppm (4,920 mg/m3) for 12 hours, 450 ppm (2,214 mg/m3) for 12 hours, and 250 ppm (1,230 mg/m3) for 6 hours (Świercz et al., 2003; Eide and Zahlsen, 1996; Zahlsen et al., 1990). Zahlsen et al. (1990) observed a decrease in blood concentrations of 1,2,4-TMB following repeated exposures, which they attributed to induction of metabolizing enzymes; a similar decrease in 1,2,4-TMB blood concentrations following repeated exposures was not observed in Świercz et al. (2003). Using a four-compartment toxicokinetic model, Yoshida (2010) estimated that a rat exposed to 50 µg/m3 1,2,4-TMB for 2 hours would absorb 6.6 µg/kg body weight (no SD reported). Using this same model, the authors estimated that humans exposed to 24 µg/m3 1,2,4-TMB for 2 hours would absorb 0.45 µg/kg body weight (no SD reported). 1,2,4-TMB, 1,2,3-TMB, and 1,3,5-TMB have also been observed to be absorbed and distributed via blood circulation following oral and dermal exposures in rats (Tsujino et al., 2002; Huo et al., 1989). Lastly, calculated blood:air partition coefficients for 1,2,4-TMB, 1,2,3-TMB, and 1,3,5-TMB (59.1 [56.9−61.3], 66.5 [63.7−69.3], and 43.0 [40.8−45.2], respectively) were similar in humans (N = 10, 5 males, 5 females), indicating that the two isomers would partition similarly into the blood (Järnberg and Johanson, 1995). Additionally, the blood:air partition coefficients between humans and rats were very similar for all three isomers: 1,2,4-TMB (59.1 versus 57.7), 1,2,3-TMB (66.5 versus 62.6), and 1,3,5-TMB (43.0 versus 55.7) (Meulenberg and Vijverberg, 2000). This further indicates that patterns of absorption would be similar across species.
C.1.2. Distribution
No information exists regarding the distribution of any isomer in adult humans. However, experimentally calculated tissue-specific partition coefficients were similar for all three isomers across a number of organs/systems (fat, brain, liver, muscle, and kidney) (Meulenberg and Vijverberg, 2000). This strongly indicates that 1,2,4-TMB, 1,2,3-TMB, and 1,3,5-TMB can be expected to partition similarly into these various organs/systems. TMBs (unspecified isomer) have also been detected in cord blood, and can therefore be expected to partition into the fetal compartment (Cooper et al., 2001; Dowty et al., 1976). In rats, 1,2,4-TMB was observed to distribute widely to all examined organs/systems following oral exposure, with the highest concentrations found in the stomach (509 ± 313 µg/g) and adipose tissue (200 ± 64 µg/g) (Huo et al., 1989). Following inhalation exposures, 1,2,4-TMB, 1,2,3-TMB, and 1,3,5-TMB were observed to distribute to all tissues examined, with tissue-specific concentrations dependent on the external exposure concentration (Świercz et al., 2016; Świercz et al., 2006; Świercz et al., 2003; Eide and Zahlsen, 1996). 1,2,4-TMB distributed to the adipose tissue to a much higher degree than to the brain, liver, or kidneys (Eide and Zahlsen, 1996). Venous blood concentrations of 1,2,4-TMB,
Supplemental Information―Trimethylbenzenes
B-3
1,2,3-TMB, and 1,3,5-TMB and liver concentrations of 1,2,4-TMB were observed to be significantly lower in repeatedly exposed animals versus animals exposed only once to higher concentrations (Świercz et al., 2016; Świercz et al., 2006; Świercz et al., 2003; Świercz et al., 2002). Kidney concentrations of 1,3,5-TMB were observed to be lower in repeatedly exposed animals versus animals exposed once, but only at the lowest exposure concentration. However, kidney concentrations of 1,2,3-TMB were observed to be higher in repeatedly exposed animals versus those exposed only once at low and medium doses, but not high doses (Świercz et al., 2016). The authors suggested that lower tissue concentrations of TMB isomers observed in repeatedly-exposed animals is mostly likely due to induction of metabolizing enzymes at higher exposure concentrations. This hypothesis is supported by the observation of cytochrome P450 (CYP450) enzyme induction in the livers, kidneys, and lungs of rats exposed to 1,200 mg/kg-day 1,3,5-TMB for 3 days (Pyykkö, 1980).
1,2,4-TMB was also observed to distribute to individual brain structures, with the brainstem and hippocampus having the highest concentrations following exposure (Świercz et al., 2003). Zahlsen et al. (1990) also observed decreasing blood, brain, and adipose tissue concentrations following repeated exposures versus single-day exposures in rats exposed to 1,000 ppm (4,920 mg/m3). The only studies to investigate distribution following dermal exposure utilized kerosene as the test agent. In one study, 1,2,4-TMB preferentially distributed to the kidneys (Tsujino et al., 2002). Concentrations in the blood, brain, liver, and adipose tissue were similar to one another, but 1,2,4-TMB concentrations only increased in a dose-dependent manner in adipose tissue, and continued to accumulate in that tissue following the termination of exposure. Similar results were reported for 1,2,3-TMB and 1,3,5-TMB, but specific data were not presented. Other studies simply reported that 1,2,4-TMB was detected in blood following dermal exposure to kerosene (Kimura et al., 1991; Kimura et al., 1988).
C.1.3. Metabolism
The metabolic profiles for each isomer were qualitatively similar between humans and rats, although in some cases, quantitative differences were reported. In humans (N = 10, Caucasian males), all three isomers are observed to be metabolized to benzoic and hippuric acids. Approximately 22% of inhaled 1,2,4-TMB was collected as hippuric acid metabolites in urine 24 hours after 2-hour exposures to 25 ppm (123 mg/m3) 1,2,4-TMB (Järnberg et al., 1997b). 3,4-Dimethylhippuric acid (DMHA) comprised 82% of the DMHAs collected after exposure to 1,2,4-TMB, indicating that steric factors are important in the oxidation and/or glycine conjugation of 1,2,4-TMB in humans. Approximately 11% of inhaled 1,2,3-TMB was collected as hippuric acid metabolites (Järnberg et al., 1997b). As with 1,2,4-TMB, steric influences seem to play an important role in the preferential selection of which metabolites are formed: 2,3-DMHA comprised 82% of all hippuric acid metabolites collected. Urinary hippuric acid metabolites for 1,3,5-TMB following the same exposure protocol accounted for only 3% of inhaled dose. The lower levels of hippuric acids recovered in urine following exposure to 1,3,5-TMB may be a result of differing pKa values. The
Supplemental Information―Trimethylbenzenes
B-4
DMHA metabolite of 1,3,5-TMB has the highest pKa value of any DMHA metabolite, indicating that it ionizes to a lesser degree in urine. This may lead to increased reabsorption in the kidney tubules, consequently lowering the total amount of DMHA metabolite excreted within 24 hours (Järnberg et al., 1997b). Greater amounts of urinary benzoic and hippuric acid metabolites (73%) were observed in humans (N = 5) following exposure to higher amounts of 1,3,5-TMB (up to 30.5 ppm) for 8 hours (Kostrzewski et al., 1997; Kostrewski and Wiaderna-Brycht, 1995). Following occupational exposure to 1,2,4-TMB or 1,3,5-TMB, urinary benzoic acid and hippuric acid metabolites in workers (N = 6−12) were highly correlated with TMB isomer air concentrations (Jones et al., 2006; Fukaya et al., 1994; Ichiba et al., 1992).
Following oral exposures in animals, the quantitative metabolic profiles of the three isomers appears to differ. Mikulski and Wiglusz (1975) observed that 73% of the administered dose of 1,3,5-TMB was recovered as glycine (i.e., hippuric acid, 59.1 ± 5.2%), glucuronide (4.9 ± 1.0), or sulfate (9.2 ± 0.8%) conjugates in the urine of rats within 48 hours after exposure. However, the total amount of metabolites recovered following exposure to 1,2,3-TMB and 1,2,4-TMB was much less (33.0 and ~37%, respectively). The major terminal metabolites for 1,2,4-TMB and 1,3,5-TMB are DMHAs (23.9 ± 2.3 and 59.1 ± 5.2% total dose, respectively). DMHA metabolites represent a smaller fraction (10.1 ± 1.2 %) of the metabolites produced following 1,2,3-TMB exposure. When an estimate of the total amount of metabolite was calculated, differences between isomers remained, but were in closer agreement: 93.7% (1,3,5-TMB), 62.6% (1,2,4-TMB), and 56.6% (1,2,3-TMB) (no SD reported). It is important to note that Mikulski and Wiglusz (1975) did not measure other TMB metabolites, such as mercapturic acid conjugates, trimethylphenols (TMPs), or dimethylbenzoic acids (DMBAs). Huo et al. (1989) reported that the total amount of metabolites (phenols, benzyl alcohols, benzoic acids, and hippuric acids) recovered with 24 hours following exposure to 1,2,4-TMB was 86.4 ± 23% of the administered dose (~100 g/kg).
Similar profiles in metabolism were observed in rabbits: DMBAs and DMHAs were observed following oral exposure of rabbits to either 1,2,4-TMB or 1,3,5-TMB (Laham and Potvin, 1989; Cerf et al., 1980). Specifically for 1,3,5-TMB, 68.5% of the administered oral dose was recovered as the DMHA metabolite, with only 9% recovered as the DMBA metabolite. Additionally, a minor metabolite not observed in rats, 5-methylisophthalic acid, was observed following exposure of rabbits (Laham and Potvin, 1989). Additional terminal metabolites for the three isomers include mercapturic acids (~14−19% total dose), phenols (~12% total dose), and glucuronides and sulphuric acid conjugates (4−9% total dose) for 1,2,4-TMB; mercapturic acids (~5% total dose), phenols (<1−8% total dose), and glucuronides and sulphuric acid conjugates (8−15% total dose) for 1,2,3-TMB; and phenols (~4−8% total dose) and glucuronides and sulphuric acid conjugates (~59% total dose) for 1,3,5-TMB (Tsujimoto et al., 2005; Tsujimoto et al., 2000, 1999; Huo et al., 1989; Wiglusz, 1979; Mikulski and Wiglusz, 1975).
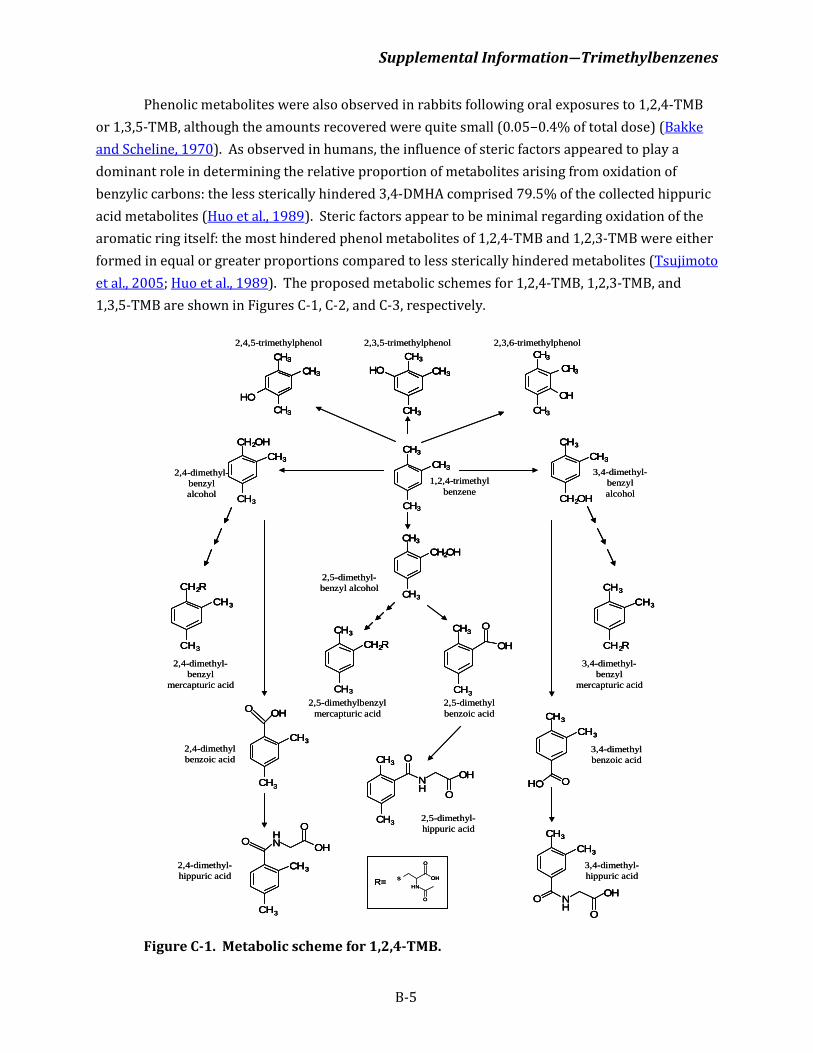
Supplemental Information―Trimethylbenzenes
B-5
Phenolic metabolites were also observed in rabbits following oral exposures to 1,2,4-TMB or 1,3,5-TMB, although the amounts recovered were quite small (0.05−0.4% of total dose) (Bakke and Scheline, 1970). As observed in humans, the influence of steric factors appeared to play a dominant role in determining the relative proportion of metabolites arising from oxidation of benzylic carbons: the less sterically hindered 3,4-DMHA comprised 79.5% of the collected hippuric acid metabolites (Huo et al., 1989). Steric factors appear to be minimal regarding oxidation of the aromatic ring itself: the most hindered phenol metabolites of 1,2,4-TMB and 1,2,3-TMB were either formed in equal or greater proportions compared to less sterically hindered metabolites (Tsujimoto et al., 2005; Huo et al., 1989). The proposed metabolic schemes for 1,2,4-TMB, 1,2,3-TMB, and 1,3,5-TMB are shown in Figures C-1, C-2, and C-3, respectively.
Figure C-1. Metabolic scheme for 1,2,4-TMB.
CH3
CH3
CH3
CH3
CH3
CH3
OHHCH3
CH3
CH3
O
CH3
CH3
CH3
OH
CH2OH
CH3
CH3
3
CH2OHCH3
CH
CH3
CH3
CH2OH
CH3
CH2R
CH3
3
CH3
CH
OHO
3
NH
OH
O
CH3
CH
O
3
CH2RCH3
CH
OH
CH3
CH3
O
NH
CH3
CH3
O
OH
O
3CHCH3
CH2R
CH3
CH3
HO O
OH
O
CH3
CH3
O NH
2,3,6-trimethylphenol2,3,5-trimethylphenol2,4,5-trimethylphenol
1,2,4-trimethyl benzene
3,4-dimethyl-benzyl alcohol
2,4-dimethyl-benzyl alcohol
2,5-dimethyl-benzyl alcohol
2,5-dimethylbenzyl mercapturic acid
2,5-dimethyl benzoic acid
2,4-dimethyl-benzyl
mercapturic acid
3,4-dimethyl-benzyl
mercapturic acid
2,5-dimethyl-hippuric acid
3,4-dimethyl-hippuric acid
2,4-dimethyl-hippuric acid
2,4-dimethyl benzoic acid
3,4-dimethyl benzoic acid
R= S
NH
OH
O
O
CH3
CH3
CH3
CH3CH3
CH3CH3
CH3
CH3
CH3
CH3
OH
CH3CH3
CH3CH3
CH3
OHOHHCH3
CH3
CH3
OHCH3
CH3
CH3
OCH3
CH3CH3
CH3CH3H3
O
CH3
CH3
CH3
OHCH3CH3
CH3
CH3
OH CH3CH3
CH3
OHOH
CH2OH
CH3
CH3
CH2OHCH2OH
CH3
CH3CH3
3
CH2OHCH3
CH3
CH2OHCH2OHCH3CH3
CH
CH3
CH3
CH2OH
CH3CH3
CH3CH3
CH2OH
CH3
CH2R
CH3
CH3CH3
CH2RCH2R
CH3
3
CH3
CH
OHO
3
CH3CH3
CH
OHOHO
3
NH
OH
O
CH3
CH
O
3
NH
OHOH
O
CH3CH3
CH
O
3
CH2RCH3
CH3
CH2RCH2RCH3CH3
CH
OH
CH3
CH3
O
OHOH
CH3CH3
CH3
O
NH
CH3
CH3
O
OH
ONH
CH3CH3
CH3
O
OHOH
O
3CHCH3
CH2R
3CH3CHCH3CH3
CH2R
CH3
CH3
HO O
CH3CH3
CH3CH3
HOHO O
OH
O
CH3
CH3
O NH
OHOH
O
CH3CH3
CH3CH3
O NH
2,3,6-trimethylphenol2,3,5-trimethylphenol2,4,5-trimethylphenol
1,2,4-trimethyl benzene
3,4-dimethyl-benzyl alcohol
2,4-dimethyl-benzyl alcohol
2,5-dimethyl-benzyl alcohol
2,5-dimethylbenzyl mercapturic acid
2,5-dimethyl benzoic acid
2,4-dimethyl-benzyl
mercapturic acid
3,4-dimethyl-benzyl
mercapturic acid
2,5-dimethyl-hippuric acid
3,4-dimethyl-hippuric acid
2,4-dimethyl-hippuric acid
2,4-dimethyl benzoic acid
3,4-dimethyl benzoic acid
R= S
NH
OH
O
O
R= S
NH
OHOH
O
O
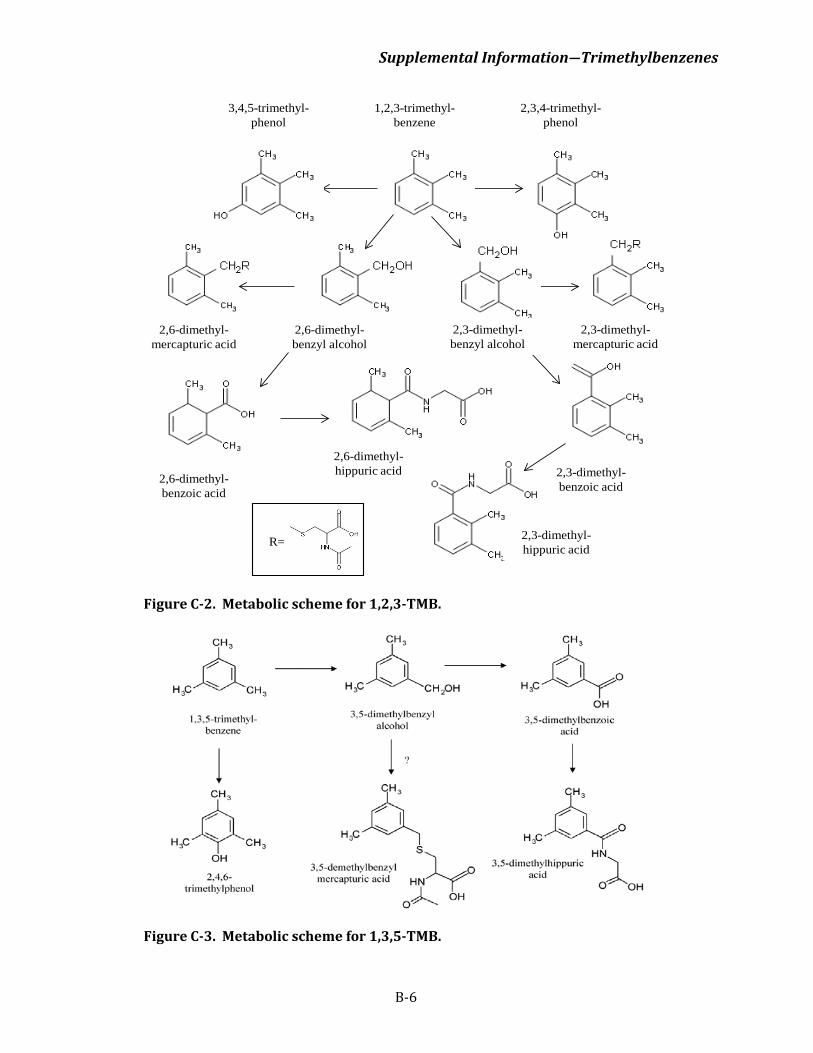
Supplemental Information―Trimethylbenzenes
B-6
Figure C-2. Metabolic scheme for 1,2,3-TMB.
Figure C-3. Metabolic scheme for 1,3,5-TMB.
R=
1,2,3-trimethyl-benzene
2,3,4-trimethyl-phenol
3,4,5-trimethyl-phenol
2,6-dimethyl-benzyl alcohol
2,3-dimethyl-mercapturic acid
2,6-dimethyl-mercapturic acid
2,6-dimethyl-benzoic acid
2,3-dimethyl-benzoic acid
2,6-dimethyl-hippuric acid
2,3-dimethyl-hippuric acid
2,3-dimethyl-benzyl alcohol
Supplemental Information―Trimethylbenzenes
B-7
C.1.4. Excretion
In humans (N = 10, Caucasian males) at low doses (25 ppm [123 mg/m3]), half-lives of elimination from the blood of all TMB isomers were split into four distinct phases, with the half-lives of the first three phases being similar across isomers: 1,2,4-TMB (1.3 ± 0.8 minutes, 21 ± 5 minutes, 3.6 ± 1.1 hours), 1,2,3-TMB (1.5 ± 0.9 minutes, 24 ± 9 minutes, 4.7 ± 1.6 hours), and 1,3,5-TMB (1.7 ± 0.8 minutes, 27 ± 5 minutes, 4.9 ± 1.4 hours) (Järnberg et al., 1996). 1,3,5-TMB had a higher total blood clearance value compared with 1,2,4-TMB or 1,2,3-TMB (0.97 ± 0.06 versus 0.68 ± 0.13 or 0.63 ± 0.13 L/hour/kg, respectively). The half-life of elimination for 1,3,5-TMB in the last and longest phase is much greater than those for 1,2,4-TMB or 1,2,3-TMB (120 ± 41 versus 87 ± 27 and 78 ± 22 hours, respectively). Urinary excretion of unchanged parent compound was extremely low (<0.002%) in humans (N = 6−10, male) for all three isomers (Janasik et al., 2008; Järnberg et al., 1997b). The half-life of elimination of hippuric acid metabolites from the urine was also greater for 1,3,5-TMB, compared to 1,2,4-TMB or 1,2,3-TMB (16 versus 3.8−5.8 and 4.8−8.1 hours, respectively) (Järnberg et al., 1997b).
Differences in the values of terminal half-lives may be related to interindividual variation in a small sample population (N = 8−10) and difficulty measuring slow elimination phases. All three isomers were eliminated via exhalation: 20−37% of the absorbed dose of 1,2,4-TMB, 1,2,3-TMB, or 1,3,5-TMB was eliminated via exhalation during exposure to 123 mg/m3 (25 ppm) for 2 hours (Järnberg et al., 1996) and elimination of 1,3,5-TMB via breath was biphasic with an initial half-life of 60 minutes, and a terminal half-life of 600 minutes (Jones et al., 2006). Following exposure of rats to 25 ppm (123 mg/m3) 1,2,4-TMB, 1,2,3-TMB, or 1,3,5-TMB for 6 hours, the terminal half-life of elimination of 1,3,5-TMB from the blood (2.7 hours) was shorter than that for 1,2,4-TMB (3.6 hours) or 1,2,3-TMB (3.1 hours) (Świercz et al., 2016; Świercz et al., 2006; Świercz et al., 2002). As dose increased, the half-lives for elimination from blood following single exposures to 1,2,4-TMB (17.3 hours) became much longer than those for 1,3,5-TMB (4.1 hours) or 1,2,3-TMB (5.3 hours). Following repeated-dose experiments (4 weeks), the terminal half-lives of elimination of TMB isomers in venous blood were similar for 1,2,4-TMB and 1,2,3-TMB (9.9 and 8.0 hours, respectively), but larger than that of 1,3,5-TMB (4.6) (Świercz et al., 2016; Świercz et al., 2006; Świercz et al., 2003; Świercz et al., 2002).
C.2. PHYSIOLOGICALLY-BASED PHARMACOKINETIC MODELS
C.2.1. Summary of Available Physiologically Based Pharmacokinetic (PBPK) Models for 1,2,4-TMB
Järnberg and Johanson (1999)
Järnberg and Johanson (1999) described a PBPK model for inhalation of 1,2,4-TMB in humans. The model is composed of six compartments (lungs, adipose, working muscles, resting muscles, liver, and rapidly perfused tissues) for the parent compound and one (volume of
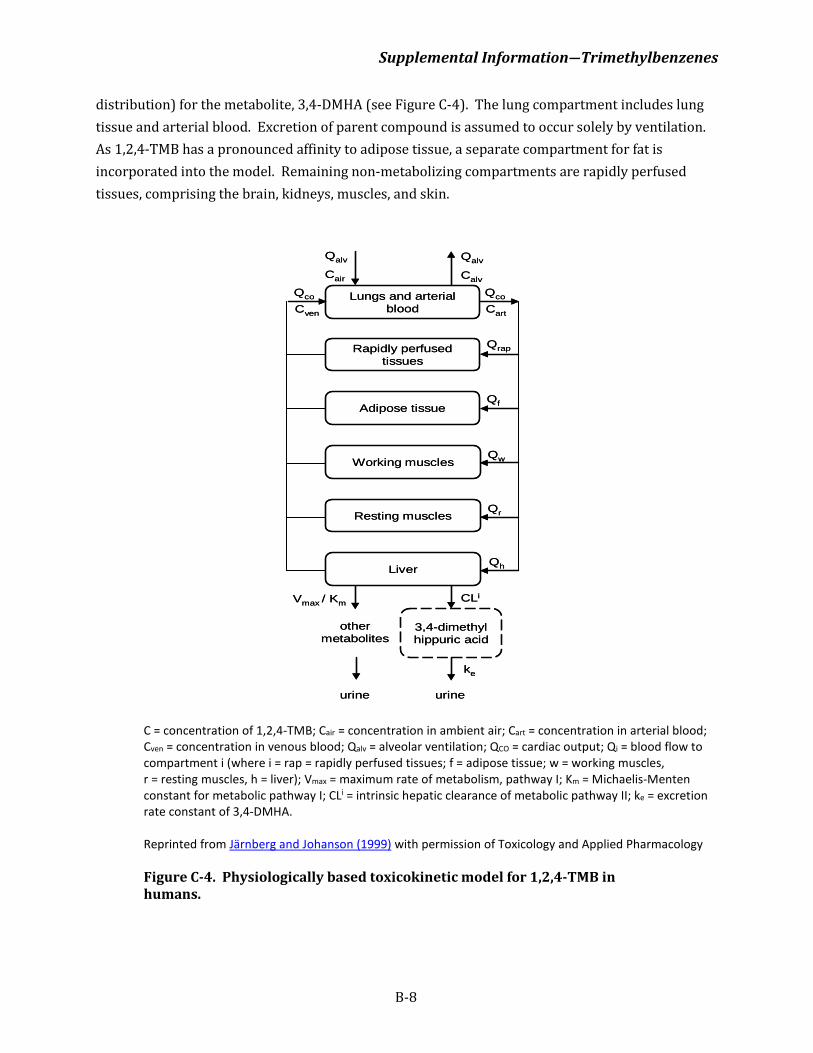
Supplemental Information―Trimethylbenzenes
B-8
distribution) for the metabolite, 3,4-DMHA (see Figure C-4). The lung compartment includes lung tissue and arterial blood. Excretion of parent compound is assumed to occur solely by ventilation. As 1,2,4-TMB has a pronounced affinity to adipose tissue, a separate compartment for fat is incorporated into the model. Remaining non-metabolizing compartments are rapidly perfused tissues, comprising the brain, kidneys, muscles, and skin.
C = concentration of 1,2,4-TMB; Cair = concentration in ambient air; Cart = concentration in arterial blood; Cven = concentration in venous blood; Qalv = alveolar ventilation; QCO = cardiac output; Qi = blood flow to compartment i (where i = rap = rapidly perfused tissues; f = adipose tissue; w = working muscles, r = resting muscles, h = liver); Vmax = maximum rate of metabolism, pathway I; Km = Michaelis-Menten constant for metabolic pathway I; CLi = intrinsic hepatic clearance of metabolic pathway II; ke = excretion rate constant of 3,4-DMHA.
Reprinted from Järnberg and Johanson (1999) with permission of Toxicology and Applied Pharmacology
Figure C-4. Physiologically based toxicokinetic model for 1,2,4-TMB in humans.
Lungs and arterial blood
Rapidly perfusedtissues
Resting muscles
Adipose tissue
Working muscles
Liver
3,4-dimethyl hippuric acid
other metabolites
urine urine
Qalv
Cair
Qalv
Calv
Qco
Cart
Qrap
Qf
Qw
Qr
Qh
Qco
Cven
Vmax / Km CLi
ke
Lungs and arterial blood
Rapidly perfusedtissues
Resting muscles
Adipose tissue
Working muscles
Liver
3,4-dimethyl hippuric acid
other metabolites
urine urine
Qalv
Cair
Qalv
Calv
Qco
Cart
Qrap
Qf
Qw
Qr
Qh
Qco
Cven
Vmax / Km CLi
ke
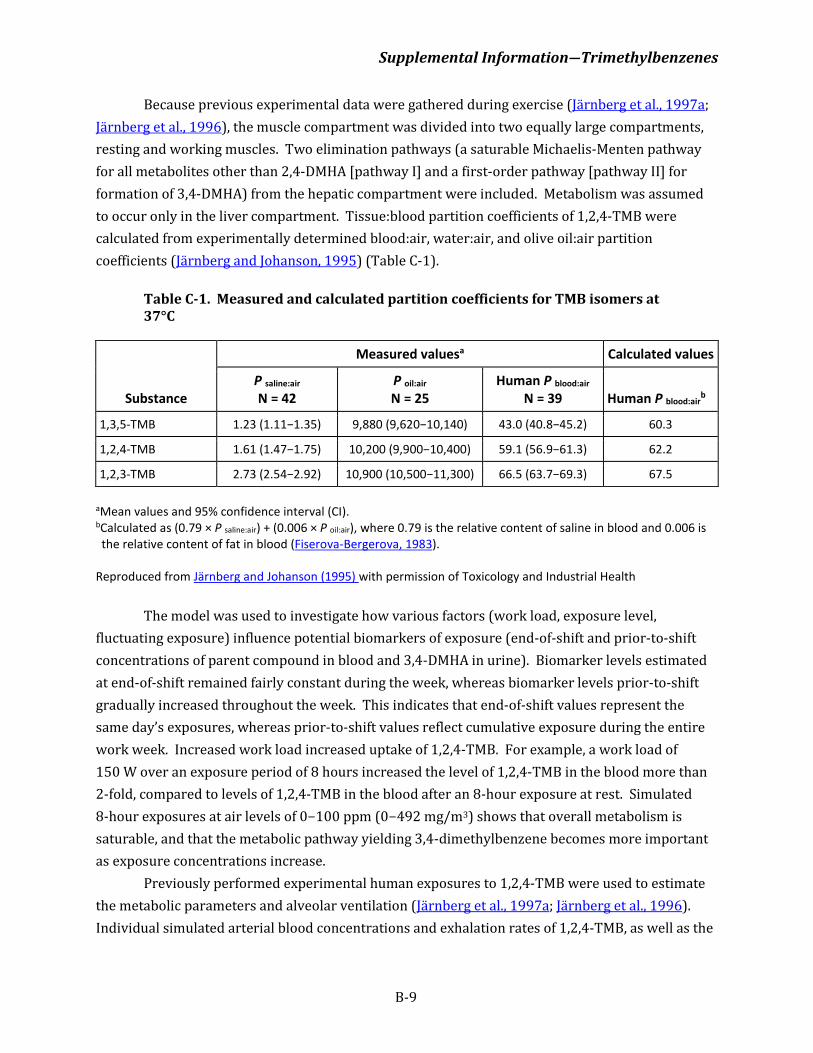
Supplemental Information―Trimethylbenzenes
B-9
Because previous experimental data were gathered during exercise (Järnberg et al., 1997a; Järnberg et al., 1996), the muscle compartment was divided into two equally large compartments, resting and working muscles. Two elimination pathways (a saturable Michaelis-Menten pathway for all metabolites other than 2,4-DMHA [pathway I] and a first-order pathway [pathway II] for formation of 3,4-DMHA) from the hepatic compartment were included. Metabolism was assumed to occur only in the liver compartment. Tissue:blood partition coefficients of 1,2,4-TMB were calculated from experimentally determined blood:air, water:air, and olive oil:air partition coefficients (Järnberg and Johanson, 1995) (Table C-1).
Table C-1. Measured and calculated partition coefficients for TMB isomers at 37°C
Substance
Measured valuesa Calculated values
P saline:air
N = 42 P oil:air
N = 25 Human P blood:air
N = 39 Human P blood:airb
1,3,5-TMB 1.23 (1.11−1.35) 9,880 (9,620−10,140) 43.0 (40.8−45.2) 60.3
1,2,4-TMB 1.61 (1.47−1.75) 10,200 (9,900−10,400) 59.1 (56.9−61.3) 62.2
1,2,3-TMB 2.73 (2.54−2.92) 10,900 (10,500−11,300) 66.5 (63.7−69.3) 67.5
aMean values and 95% confidence interval (CI). bCalculated as (0.79 × P saline:air) + (0.006 × P oil:air), where 0.79 is the relative content of saline in blood and 0.006 is the relative content of fat in blood (Fiserova-Bergerova, 1983).
Reproduced from Järnberg and Johanson (1995) with permission of Toxicology and Industrial Health
The model was used to investigate how various factors (work load, exposure level,
fluctuating exposure) influence potential biomarkers of exposure (end-of-shift and prior-to-shift concentrations of parent compound in blood and 3,4-DMHA in urine). Biomarker levels estimated at end-of-shift remained fairly constant during the week, whereas biomarker levels prior-to-shift gradually increased throughout the week. This indicates that end-of-shift values represent the same day’s exposures, whereas prior-to-shift values reflect cumulative exposure during the entire work week. Increased work load increased uptake of 1,2,4-TMB. For example, a work load of 150 W over an exposure period of 8 hours increased the level of 1,2,4-TMB in the blood more than 2-fold, compared to levels of 1,2,4-TMB in the blood after an 8-hour exposure at rest. Simulated 8-hour exposures at air levels of 0−100 ppm (0−492 mg/m3) shows that overall metabolism is saturable, and that the metabolic pathway yielding 3,4-dimethylbenzene becomes more important as exposure concentrations increase.
Previously performed experimental human exposures to 1,2,4-TMB were used to estimate the metabolic parameters and alveolar ventilation (Järnberg et al., 1997a; Järnberg et al., 1996). Individual simulated arterial blood concentrations and exhalation rates of 1,2,4-TMB, as well as the
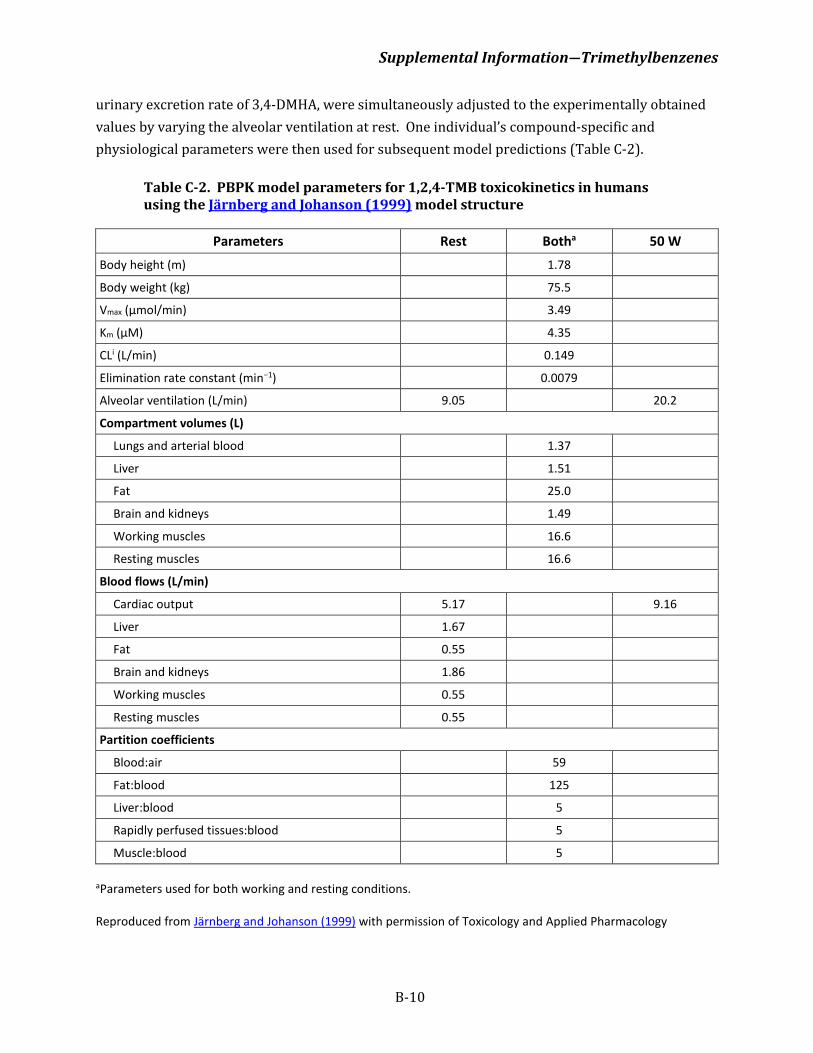
Supplemental Information―Trimethylbenzenes
B-10
urinary excretion rate of 3,4-DMHA, were simultaneously adjusted to the experimentally obtained values by varying the alveolar ventilation at rest. One individual’s compound-specific and physiological parameters were then used for subsequent model predictions (Table C-2).
Table C-2. PBPK model parameters for 1,2,4-TMB toxicokinetics in humans using the Järnberg and Johanson (1999) model structure
Parameters Rest Botha 50 W Body height (m) 1.78
Body weight (kg) 75.5
Vmax (μmol/min) 3.49
Km (μM) 4.35
CLi (L/min) 0.149
Elimination rate constant (min−1) 0.0079
Alveolar ventilation (L/min) 9.05 20.2
Compartment volumes (L)
Lungs and arterial blood 1.37
Liver 1.51
Fat 25.0
Brain and kidneys 1.49
Working muscles 16.6
Resting muscles 16.6
Blood flows (L/min)
Cardiac output 5.17 9.16
Liver 1.67
Fat 0.55
Brain and kidneys 1.86
Working muscles 0.55
Resting muscles 0.55
Partition coefficients
Blood:air 59
Fat:blood 125
Liver:blood 5
Rapidly perfused tissues:blood 5
Muscle:blood 5 aParameters used for both working and resting conditions. Reproduced from Järnberg and Johanson (1999) with permission of Toxicology and Applied Pharmacology
Supplemental Information―Trimethylbenzenes
B-11
While based on the published results, the Järnberg and Johanson (1999) model appears to provide a good description of 1,2,4-TMB kinetics in humans, the model code could not be obtained from the authors. Based on previous experience with other PBPK models, the U.S. Environmental Protection Agency (EPA) has determined that attempting to reproduce (and thereby validate) a model based only on the published description is nearly impossible. Therefore, because the model code is not available, this model is not considered further in the Integrated Risk Information System (IRIS) TMB Assessment.
Emond and Krishnan (2006)
The Emond and Krishnan (2006) model was not developed specifically for 1,2,4-TMB, but rather to test a modeling concept. The PBPK model developed was to test the hypothesis that a model could be developed for highly lipophilic volatile organic chemicals (HLVOCs) using the neutral lipid-equivalent (NLE) content of tissues and blood as the basis. This NLE-based modeling approach was tested by simulating uptake and distribution kinetics in humans for several chemicals including α-pinene, d-limonene, and 1,2,4-TMB. The focus of this model review is the use of the model for the prediction of 1,2,4-TMB kinetics and distribution.
This model consisted of five compartments (see Figure C-5) with systemic circulation, where the tissue volumes corresponded to the volumes of the neutral lipids (i.e., their NLEs), rather than actual tissue volume as more commonly found. NLE is the sum of the neutral (nonpolar) lipids and 30% of the tissue phospholipid (fraction of phospholipids with solubility similar to neutral lipids) content. The model describes inhalation of 1,2,4-TMB using a lumped lung/arterial blood compartment. Clearance of 1,2,4-TMB is described in the model with exhalation, but more significantly through first-order hepatic metabolism. First-order metabolism is appropriate in the low-dose region (<100 ppm [<492 mg/m3]), where metabolism is not expected to be saturated.
In the study description, the mixed lung/arterial blood compartment is not a standard structure for the lung/blood/air interface. The concentration in lung tissue is assumed equal to alveolar blood, and the exhaled air concentration is equal to the lung/blood concentration divided by the blood:air partition coefficient. This approach is appropriate, and appears to be accurately represented mathematically by the authors.
Physiological parameters appear to be within ranges normally reported. The calculation of the NLE fraction is clearly explained and values used in the calculations are clear and transparent. Other model parameters (e.g., alveolar ventilation, cardiac output, blood flows, and volumes of compartments) were taken from Järnberg and Johanson (1999) and converted to the approximate NLE. Hepatic clearance rates were taken from literature on in vivo human clearance calculations and then expressed in terms of NLE. The NLE-based model was able to adequately predict human blood concentrations of 1,2,4-TMB following inhalation of 2 or 25 ppm (9.8 or 123 mg/m3) for 2 hours without alteration to model parameters obtained from literature.
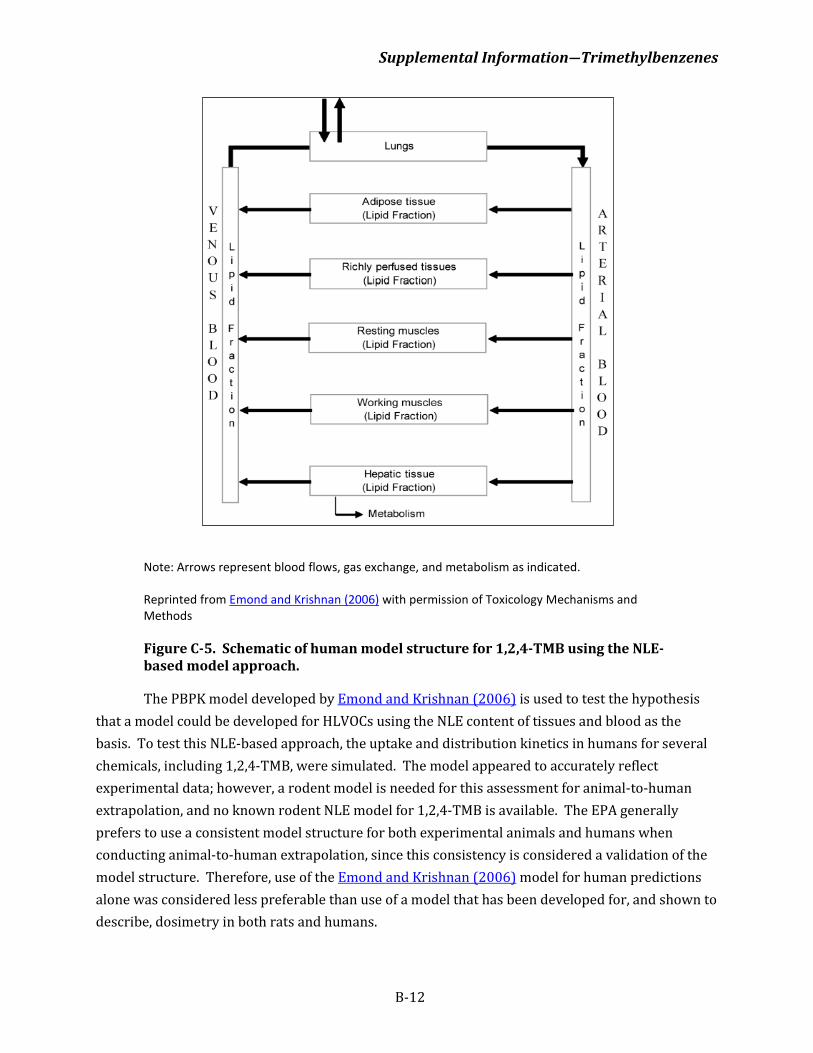
Supplemental Information―Trimethylbenzenes
B-12
Note: Arrows represent blood flows, gas exchange, and metabolism as indicated. Reprinted from Emond and Krishnan (2006) with permission of Toxicology Mechanisms and Methods
Figure C-5. Schematic of human model structure for 1,2,4-TMB using the NLE-based model approach.
The PBPK model developed by Emond and Krishnan (2006) is used to test the hypothesis that a model could be developed for HLVOCs using the NLE content of tissues and blood as the basis. To test this NLE-based approach, the uptake and distribution kinetics in humans for several chemicals, including 1,2,4-TMB, were simulated. The model appeared to accurately reflect experimental data; however, a rodent model is needed for this assessment for animal-to-human extrapolation, and no known rodent NLE model for 1,2,4-TMB is available. The EPA generally prefers to use a consistent model structure for both experimental animals and humans when conducting animal-to-human extrapolation, since this consistency is considered a validation of the model structure. Therefore, use of the Emond and Krishnan (2006) model for human predictions alone was considered less preferable than use of a model that has been developed for, and shown to describe, dosimetry in both rats and humans.
Supplemental Information―Trimethylbenzenes
B-13
Hissink et al. (2007)
This model was developed to characterize internal exposure following white spirit inhalation. Since white spirit is a complex mixture of hydrocarbons, including straight and branched paraffins, two marker compounds were used including 1,2,4-TMB and n-decane. The rat models were developed to predict the levels of 1,2,4-TMB and n-decane in blood and brain, and the rat model was then scaled allometrically to obtain estimates for human blood following inhalation. Toxicokinetic data on blood and brain concentrations in rats of two marker compounds, 1,2,4-TMB and n-decane, together with in vitro partition coefficients, were used to develop the model. The models were used to estimate an air concentration that would produce human brain concentrations similar to those in rats at the no-observed-effect-level (NOEL) for central nervous system (CNS) effects.
This is a conventional five-compartment PBPK model for 1,2,4-TMB similar to previously published models for inhaled solvents. The five compartments are: liver, fat, slowly perfused tissues, rapidly perfused tissues, and brain (Figure C-6).
All compartments are described as well mixed/perfusion limited. A lung compartment is used to describe gas exchange. The liver was the primary metabolizing organ where 1,2,4-TMB metabolism was described as saturable using Michaelis-Menten kinetics. Since the brain is the target organ for CNS effects due to exposure to hydrocarbon solvents, it was included as a separate compartment. For the rat, the authors reported that Km and Vmax values were obtained by fitting predicted elimination time courses to observed blood concentration profiles at three different exposure levels (obtained from the rat exposure portion of the study). For the human model, rat Vmax data were scaled to human body weight (BW0.74) and Km values were used unchanged.
The model appears to effectively predict blood concentrations in rats and humans and in the brains of rats following inhalation of white spirit. Changes to the rat model parameters to fit the human data were as expected. The model is simple and includes tissues of interest for potential dose metrics.
In rats, the model-predicted blood and brain concentrations of 1,2,4-TMB were in concordance with the experimentally derived concentrations. In humans, experimental blood concentrations of 1,2,4-TMB were well predicted by the model, but the predicted rate of decrease in air concentration between 4 and 12 hours was lower compared to measured values. The authors did not provide information on how model predictions compared to data from animals or humans exposed to pure 1,2,4-TMB. Based on good model fits of experimental data in both rats and humans, the model was valid for the purpose of interspecies extrapolation of blood and brain concentrations of 1,2,4-TMB as a component of white spirit. Moreover, the fact that the model was demonstrated to adequately fit or predict both rat and human data with a single model structure is considered a degree of validation of the model structure that does not exist for the other published models described above.
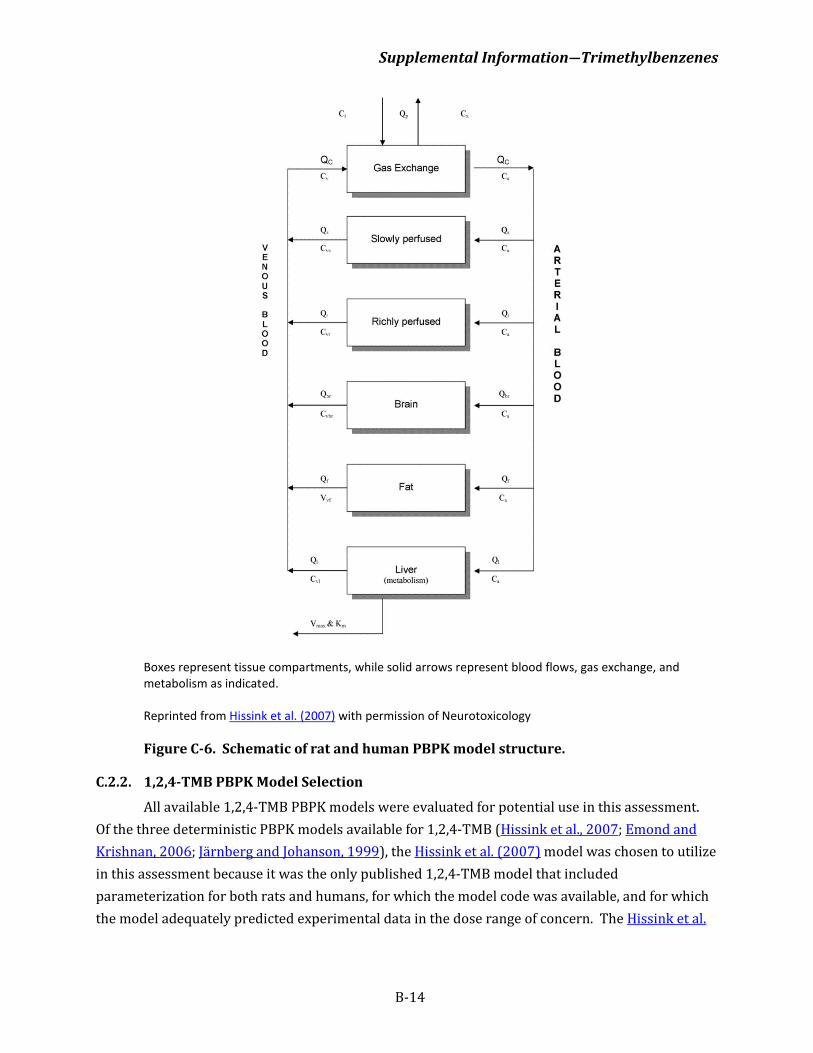
Supplemental Information―Trimethylbenzenes
B-14
Boxes represent tissue compartments, while solid arrows represent blood flows, gas exchange, and metabolism as indicated. Reprinted from Hissink et al. (2007) with permission of Neurotoxicology
Figure C-6. Schematic of rat and human PBPK model structure.
C.2.2. 1,2,4-TMB PBPK Model Selection
All available 1,2,4-TMB PBPK models were evaluated for potential use in this assessment. Of the three deterministic PBPK models available for 1,2,4-TMB (Hissink et al., 2007; Emond and Krishnan, 2006; Järnberg and Johanson, 1999), the Hissink et al. (2007) model was chosen to utilize in this assessment because it was the only published 1,2,4-TMB model that included parameterization for both rats and humans, for which the model code was available, and for which the model adequately predicted experimental data in the dose range of concern. The Hissink et al.
Supplemental Information―Trimethylbenzenes
B-15
(2007) model was thoroughly evaluated, including a detailed computer code analysis (details follow in Section C.2.3).
While the Hissink et al. (2007) model had the noted advantages, it did have the following shortcomings and sources of uncertainty that EPA needed to address:
1) the model was developed and calibrated only for inhalation exposure;
2) the rat model used a different value for the maximum metabolic capacity, Vmax, for each exposure level, which makes extrapolation or interpolation of the model problematic;
3) the model describes a typical adult and is not parameterized for pregnancy;
4) some physiological parameter values were not consistent with published sources, in particular, values more commonly used today; and
5) data used to calibrate the model were from inhalation exposure to white spirit, a complex mixture, and the model does not include all of the resulting potential interactions.
In particular, the metabolic parameters calibrated against white-spirit data could reflect metabolic interactions from the mixture, and not accurately predict dosimetry for exposure to 1,2,4-TMB alone. For this reason, model predictions were compared to additional pharmacokinetic data, a single value of Vmax was identified and used for consistency across the dose range, and some other model parameters were revised to better match those data, or make better use of existing biochemical and physiological data. The changes made and specific justifications are detailed in the following sections, including more minor issues not mentioned here.
C.2.3. Details of Hissink et al. (2007) Model Analysis
C.2.3.1. Review and Verification of the Hissink et al. (2007) 1,2,4-TMB PBPK Model
Verification of accuracy of the model code
In general, the model code and the description of the model in Hissink et al. (2007) were in agreement. The one significant discrepancy was that the model code contained an element that changed the metabolism rate (Vmax) during exposure in a manner that was not documented in the paper. This additional piece of model code, when used in 8-hour rat simulations with a body weight of 0.2095 kg, resulted in Vmax holding at 1.17 from the beginning of exposure to t = 1 hour, then increasing linearly to 1.87 by the end of the exposure and to 2.67 by the end of the post-exposure monitoring period (t = 16 hours, 8 hours after the end of exposure). The published rat simulations, however, did not appear to be entirely consistent with the inclusion of these Vmax adjustments, raising questions as to whether the code that was verified was the code that was actually used in the final analyses done for the published simulations. Further, this type of time-dependence is not based on a predictable or verifiable factor (e.g., dose-dependent metabolic induction); hence, it is
Supplemental Information―Trimethylbenzenes
B-16
inconsistent with the intention to extrapolate the model to bioassay conditions. The impact of this deviation from the published Vmax value is described below with regard to the verification of the Hissink et al. (2007) model.
Other minor issues were identified by examining the code and comparing it to the model documentation in Hissink et al. (2007). The code contained some elements that were not necessary (e.g., intravenous dosing, repeated exposure, interruptions in daily exposure), but since these do not hinder proper functioning of the model, these elements were not removed or modified. The mass balance equation omitted one term, the amount of 1,2,4-TMB in the brain (ABR); this term has been added. The coding for the blood flow was not set up so as to ensure flow/mass balance. That is, values of sum of fractional flows to rapidly perfused tissues, liver, and brain (QRTOTC) and sum of fractional flows to slowly perfused tissues (QSTOTC) were selected such that their sum equals one, but if one value were to be changed, the model code would not automatically compensate by changing the other. Therefore, the code was modified so that QSTOTC = 1 – QRTOTC, to facilitate future sensitivity analyses.
Human exhaled breath concentrations were compared to CXEQ (= CV/PB based on the model code and consistent with the description of the experiment), which would be equivalent to the end-exhaled alveolar air after breath holding, but the method used to calculate CXEQ was not noted in Hissink et al. (2007). This is important because there can be different definitions of exhaled breath depending on the measurement technique. For example, mixed exhaled breath is typically calculated as 70% alveolar air and 30% “inhaled” concentration, due the mixing of air exiting the alveolar region with air that has only entered the pulmonary dead space.
Comparisons between the computer .m files and published descriptions (Hissink et al., 2007) indicated minor discrepancies and uncertainties in exposure concentrations and body weight. Exposure concentrations in the simulations were set at the nominal exposure levels, rather than analytically determined levels. The maximum deviation between the nominal level and analytically determined levels occurred in the rat high exposure group, with a nominal exposure of 4,800 mg/m3 white spirit (7.8% [38.4 mg/m3] 1,2,4-TMB) and mean analytical concentrations ranging from 4,440 to 4,769 mg/m3—as much as 9.2% lower. Rat body weights at time of exposure were reported as 242−296 g (Hissink et al., 2007), but the .m files used values of 210.01, 204.88, and 209.88 g in the low-, mid-, and high-exposure groups, respectively. Volunteer body weights reportedly ranged from 69 to 82 kg, and the text states that the fitted Vmax and Km were obtained for a 70-kg male (Hissink et al., 2007), but a body weight of 74.9 kg was used in the .m file. No changes to these parameters were made in the model code, based on the assumption that additional data were available to the model authors.
Measured human blood concentrations were compared to the average of arterial and venous blood concentrations (CMIX), while the protocol states that blood was taken from the cubital vein, so a more appropriate measure may have been venous blood exiting the slowly perfused tissues compartment (CVS). This choice of dose metric is unlikely to have contributed
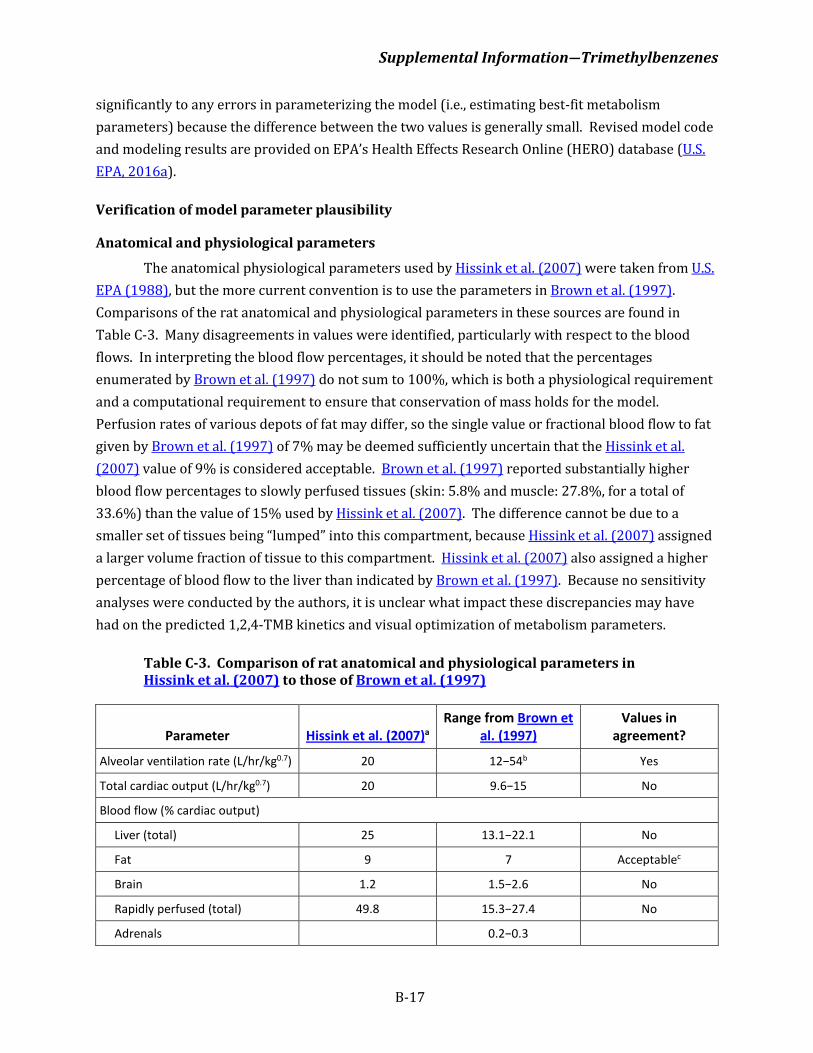
Supplemental Information―Trimethylbenzenes
B-17
significantly to any errors in parameterizing the model (i.e., estimating best-fit metabolism parameters) because the difference between the two values is generally small. Revised model code and modeling results are provided on EPA’s Health Effects Research Online (HERO) database (U.S. EPA, 2016a).
Verification of model parameter plausibility
Anatomical and physiological parameters
The anatomical physiological parameters used by Hissink et al. (2007) were taken from U.S. EPA (1988), but the more current convention is to use the parameters in Brown et al. (1997). Comparisons of the rat anatomical and physiological parameters in these sources are found in Table C-3. Many disagreements in values were identified, particularly with respect to the blood flows. In interpreting the blood flow percentages, it should be noted that the percentages enumerated by Brown et al. (1997) do not sum to 100%, which is both a physiological requirement and a computational requirement to ensure that conservation of mass holds for the model. Perfusion rates of various depots of fat may differ, so the single value or fractional blood flow to fat given by Brown et al. (1997) of 7% may be deemed sufficiently uncertain that the Hissink et al. (2007) value of 9% is considered acceptable. Brown et al. (1997) reported substantially higher blood flow percentages to slowly perfused tissues (skin: 5.8% and muscle: 27.8%, for a total of 33.6%) than the value of 15% used by Hissink et al. (2007). The difference cannot be due to a smaller set of tissues being “lumped” into this compartment, because Hissink et al. (2007) assigned a larger volume fraction of tissue to this compartment. Hissink et al. (2007) also assigned a higher percentage of blood flow to the liver than indicated by Brown et al. (1997). Because no sensitivity analyses were conducted by the authors, it is unclear what impact these discrepancies may have had on the predicted 1,2,4-TMB kinetics and visual optimization of metabolism parameters.
Table C-3. Comparison of rat anatomical and physiological parameters in Hissink et al. (2007) to those of Brown et al. (1997)
Parameter Hissink et al. (2007)a Range from Brown et
al. (1997) Values in
agreement?
Alveolar ventilation rate (L/hr/kg0.7) 20 12−54b Yes
Total cardiac output (L/hr/kg0.7) 20 9.6−15 No
Blood flow (% cardiac output)
Liver (total) 25 13.1−22.1 No
Fat 9 7 Acceptablec
Brain 1.2 1.5−2.6 No
Rapidly perfused (total) 49.8 15.3−27.4 No
Adrenals 0.2−0.3
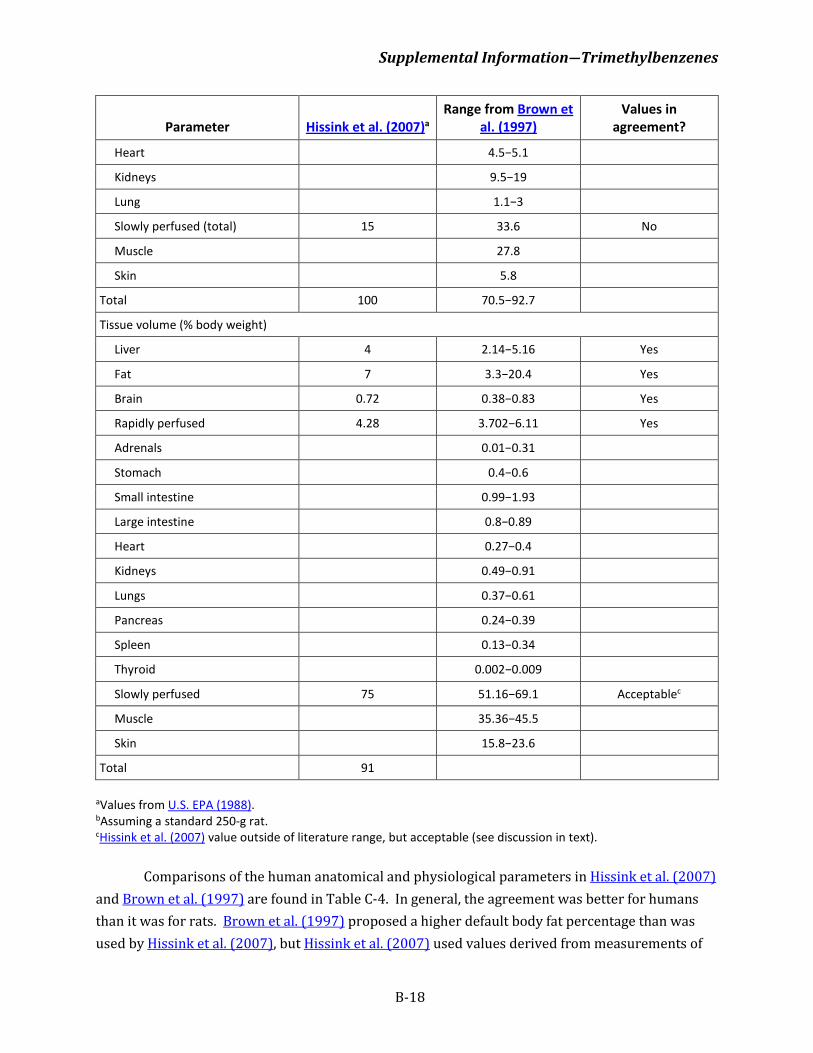
Supplemental Information―Trimethylbenzenes
B-18
Parameter Hissink et al. (2007)a Range from Brown et
al. (1997) Values in
agreement?
Heart 4.5−5.1
Kidneys 9.5−19
Lung 1.1−3
Slowly perfused (total) 15 33.6 No
Muscle 27.8
Skin 5.8
Total 100 70.5−92.7
Tissue volume (% body weight)
Liver 4 2.14−5.16 Yes
Fat 7 3.3−20.4 Yes
Brain 0.72 0.38−0.83 Yes
Rapidly perfused 4.28 3.702−6.11 Yes
Adrenals 0.01−0.31
Stomach 0.4−0.6
Small intestine 0.99−1.93
Large intestine 0.8−0.89
Heart 0.27−0.4
Kidneys 0.49−0.91
Lungs 0.37−0.61
Pancreas 0.24−0.39
Spleen 0.13−0.34
Thyroid 0.002−0.009
Slowly perfused 75 51.16−69.1 Acceptablec
Muscle 35.36−45.5
Skin 15.8−23.6
Total 91
aValues from U.S. EPA (1988). bAssuming a standard 250-g rat. cHissink et al. (2007) value outside of literature range, but acceptable (see discussion in text).
Comparisons of the human anatomical and physiological parameters in Hissink et al. (2007)
and Brown et al. (1997) are found in Table C-4. In general, the agreement was better for humans than it was for rats. Brown et al. (1997) proposed a higher default body fat percentage than was used by Hissink et al. (2007), but Hissink et al. (2007) used values derived from measurements of
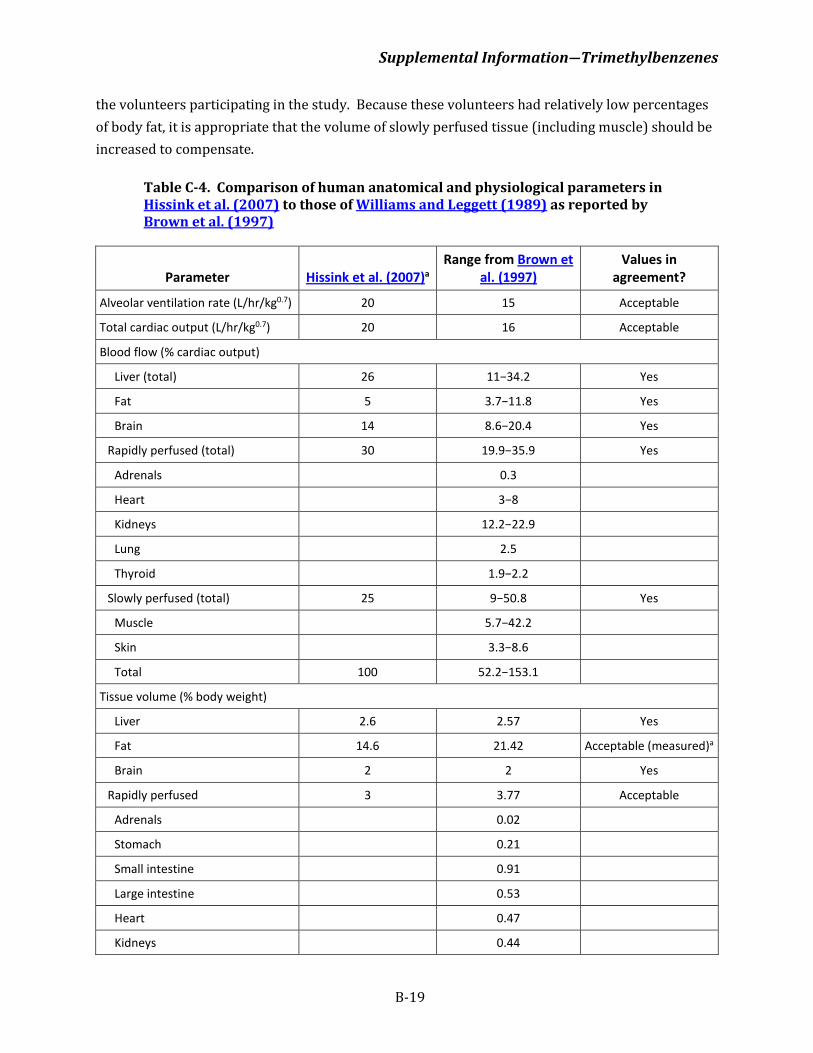
Supplemental Information―Trimethylbenzenes
B-19
the volunteers participating in the study. Because these volunteers had relatively low percentages of body fat, it is appropriate that the volume of slowly perfused tissue (including muscle) should be increased to compensate.
Table C-4. Comparison of human anatomical and physiological parameters in Hissink et al. (2007) to those of Williams and Leggett (1989) as reported by Brown et al. (1997)
Parameter Hissink et al. (2007)a Range from Brown et
al. (1997) Values in
agreement?
Alveolar ventilation rate (L/hr/kg0.7) 20 15 Acceptable
Total cardiac output (L/hr/kg0.7) 20 16 Acceptable
Blood flow (% cardiac output)
Liver (total) 26 11−34.2 Yes
Fat 5 3.7−11.8 Yes
Brain 14 8.6−20.4 Yes
Rapidly perfused (total) 30 19.9−35.9 Yes
Adrenals 0.3
Heart 3−8
Kidneys 12.2−22.9
Lung 2.5
Thyroid 1.9−2.2
Slowly perfused (total) 25 9−50.8 Yes
Muscle 5.7−42.2
Skin 3.3−8.6
Total 100 52.2−153.1
Tissue volume (% body weight)
Liver 2.6 2.57 Yes
Fat 14.6 21.42 Acceptable (measured)a
Brain 2 2 Yes
Rapidly perfused 3 3.77 Acceptable
Adrenals 0.02
Stomach 0.21
Small intestine 0.91
Large intestine 0.53
Heart 0.47
Kidneys 0.44
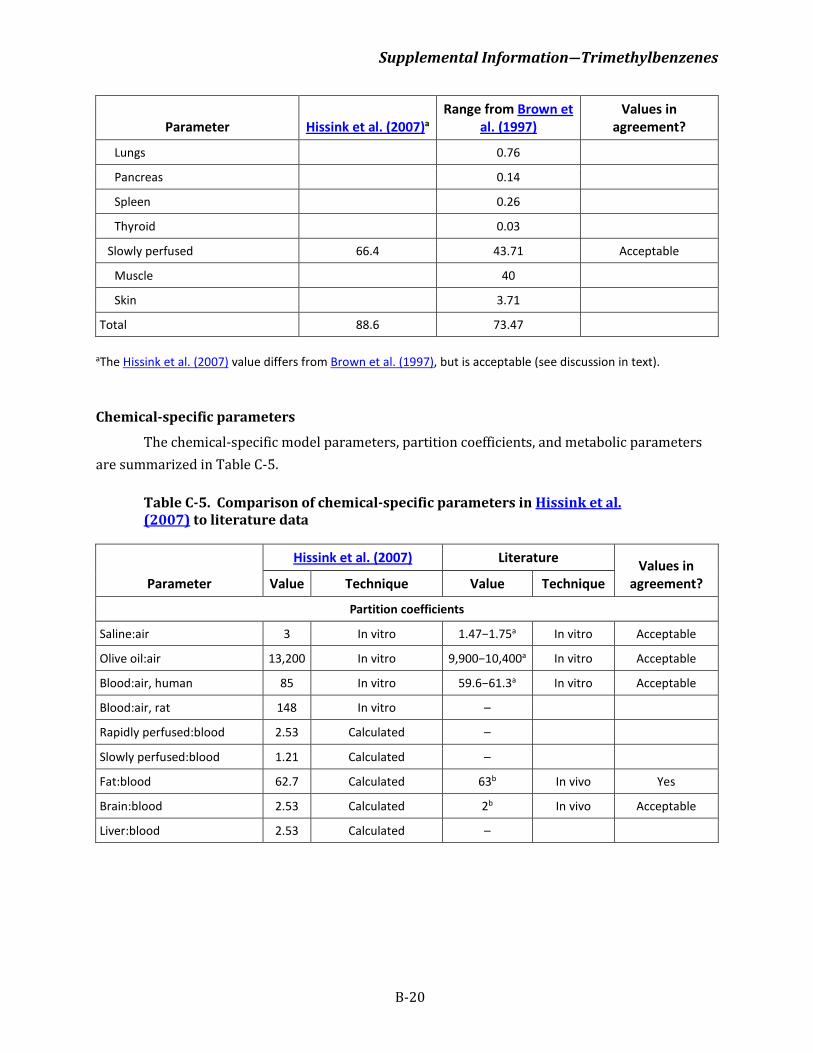
Supplemental Information―Trimethylbenzenes
B-20
Parameter Hissink et al. (2007)a Range from Brown et
al. (1997) Values in
agreement?
Lungs 0.76
Pancreas 0.14
Spleen 0.26
Thyroid 0.03
Slowly perfused 66.4 43.71 Acceptable
Muscle 40
Skin 3.71
Total 88.6 73.47 aThe Hissink et al. (2007) value differs from Brown et al. (1997), but is acceptable (see discussion in text).
Chemical-specific parameters
The chemical-specific model parameters, partition coefficients, and metabolic parameters are summarized in Table C-5.
Table C-5. Comparison of chemical-specific parameters in Hissink et al. (2007) to literature data
Parameter
Hissink et al. (2007) Literature Values in agreement? Value Technique Value Technique
Partition coefficients
Saline:air 3 In vitro 1.47−1.75a In vitro Acceptable
Olive oil:air 13,200 In vitro 9,900−10,400a In vitro Acceptable
Blood:air, human 85 In vitro 59.6−61.3a In vitro Acceptable
Blood:air, rat 148 In vitro –
Rapidly perfused:blood 2.53 Calculated –
Slowly perfused:blood 1.21 Calculated –
Fat:blood 62.7 Calculated 63b In vivo Yes
Brain:blood 2.53 Calculated 2b In vivo Acceptable
Liver:blood 2.53 Calculated –
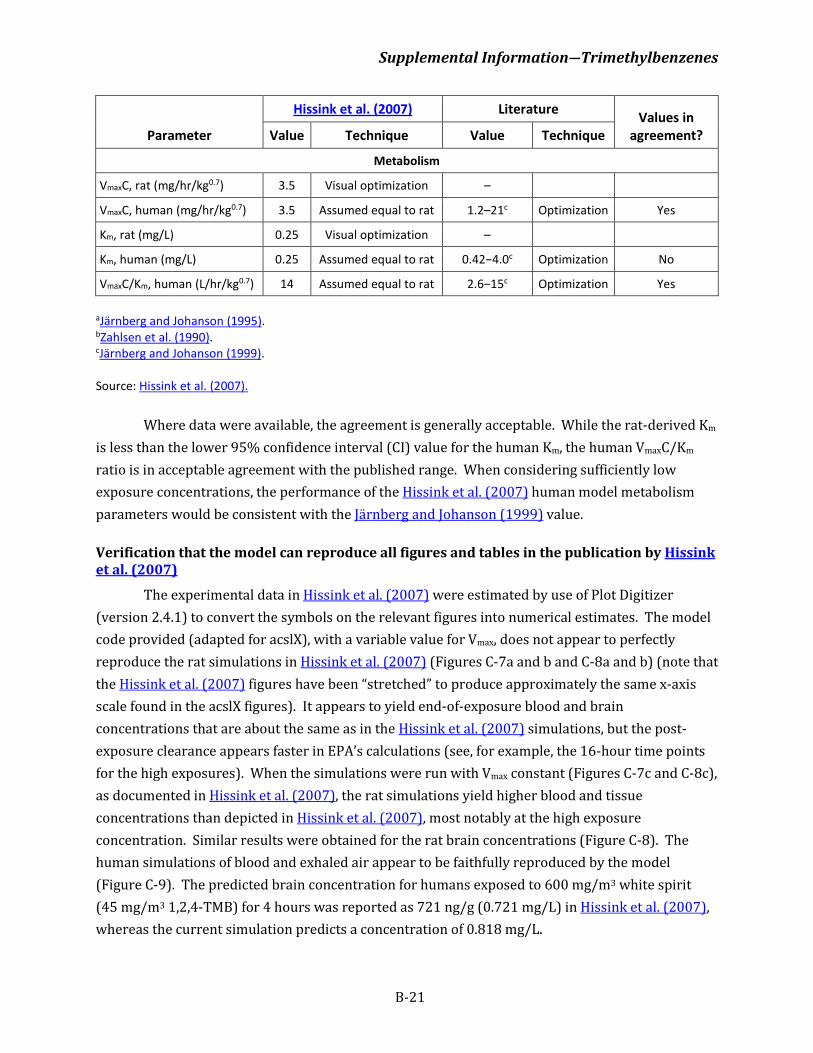
Supplemental Information―Trimethylbenzenes
B-21
Parameter
Hissink et al. (2007) Literature Values in agreement? Value Technique Value Technique
Metabolism
VmaxC, rat (mg/hr/kg0.7) 3.5 Visual optimization –
VmaxC, human (mg/hr/kg0.7) 3.5 Assumed equal to rat 1.2–21c Optimization Yes
Km, rat (mg/L) 0.25 Visual optimization –
Km, human (mg/L) 0.25 Assumed equal to rat 0.42−4.0c Optimization No
VmaxC/Km, human (L/hr/kg0.7) 14 Assumed equal to rat 2.6−15c Optimization Yes aJärnberg and Johanson (1995). bZahlsen et al. (1990). cJärnberg and Johanson (1999). Source: Hissink et al. (2007).
Where data were available, the agreement is generally acceptable. While the rat-derived Km
is less than the lower 95% confidence interval (CI) value for the human Km, the human VmaxC/Km ratio is in acceptable agreement with the published range. When considering sufficiently low exposure concentrations, the performance of the Hissink et al. (2007) human model metabolism parameters would be consistent with the Jarnberg and Johanson (1999) value.
Verification that the model can reproduce all figures and tables in the publication by Hissink et al. (2007)
The experimental data in Hissink et al. (2007) were estimated by use of Plot Digitizer (version 2.4.1) to convert the symbols on the relevant figures into numerical estimates. The model code provided (adapted for acslX), with a variable value for Vmax, does not appear to perfectly reproduce the rat simulations in Hissink et al. (2007) (Figures C-7a and b and C-8a and b) (note that the Hissink et al. (2007) figures have been “stretched” to produce approximately the same x-axis scale found in the acslX figures). It appears to yield end-of-exposure blood and brain concentrations that are about the same as in the Hissink et al. (2007) simulations, but the post-exposure clearance appears faster in EPA’s calculations (see, for example, the 16-hour time points for the high exposures). When the simulations were run with Vmax constant (Figures C-7c and C-8c), as documented in Hissink et al. (2007), the rat simulations yield higher blood and tissue concentrations than depicted in Hissink et al. (2007), most notably at the high exposure concentration. Similar results were obtained for the rat brain concentrations (Figure C-8). The human simulations of blood and exhaled air appear to be faithfully reproduced by the model (Figure C-9). The predicted brain concentration for humans exposed to 600 mg/m3 white spirit (45 mg/m3 1,2,4-TMB) for 4 hours was reported as 721 ng/g (0.721 mg/L) in Hissink et al. (2007), whereas the current simulation predicts a concentration of 0.818 mg/L.
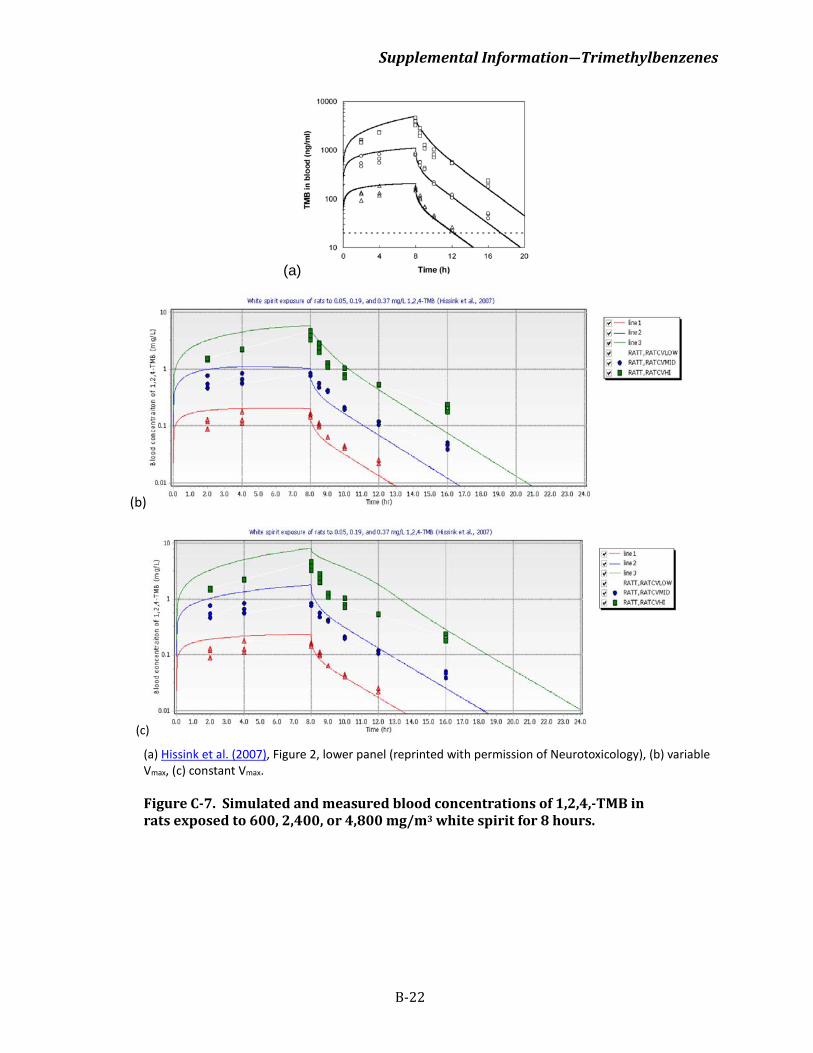
Supplemental Information―Trimethylbenzenes
B-22
(a)
(b)
(c)
(a) Hissink et al. (2007), Figure 2, lower panel (reprinted with permission of Neurotoxicology), (b) variable Vmax, (c) constant Vmax.
Figure C-7. Simulated and measured blood concentrations of 1,2,4,-TMB in rats exposed to 600, 2,400, or 4,800 mg/m3 white spirit for 8 hours.
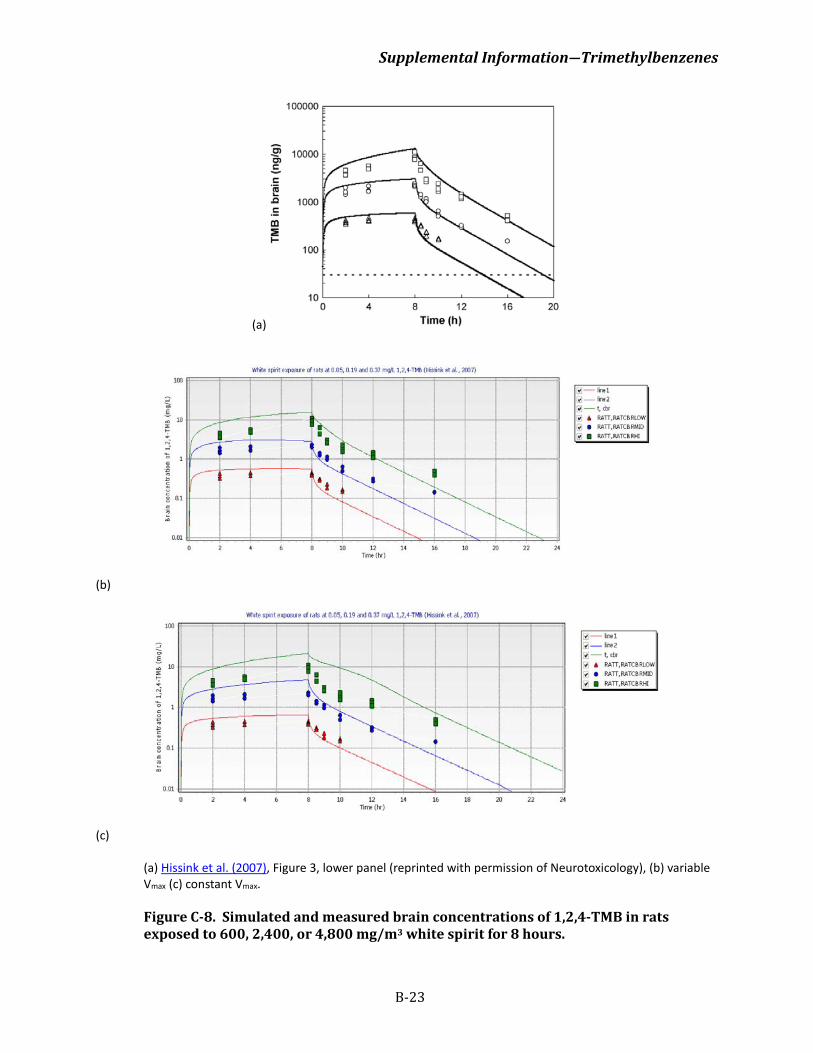
Supplemental Information―Trimethylbenzenes
B-23
(a)
(b)
(c)
(a) Hissink et al. (2007), Figure 3, lower panel (reprinted with permission of Neurotoxicology), (b) variable Vmax (c) constant Vmax.
Figure C-8. Simulated and measured brain concentrations of 1,2,4-TMB in rats exposed to 600, 2,400, or 4,800 mg/m3 white spirit for 8 hours.
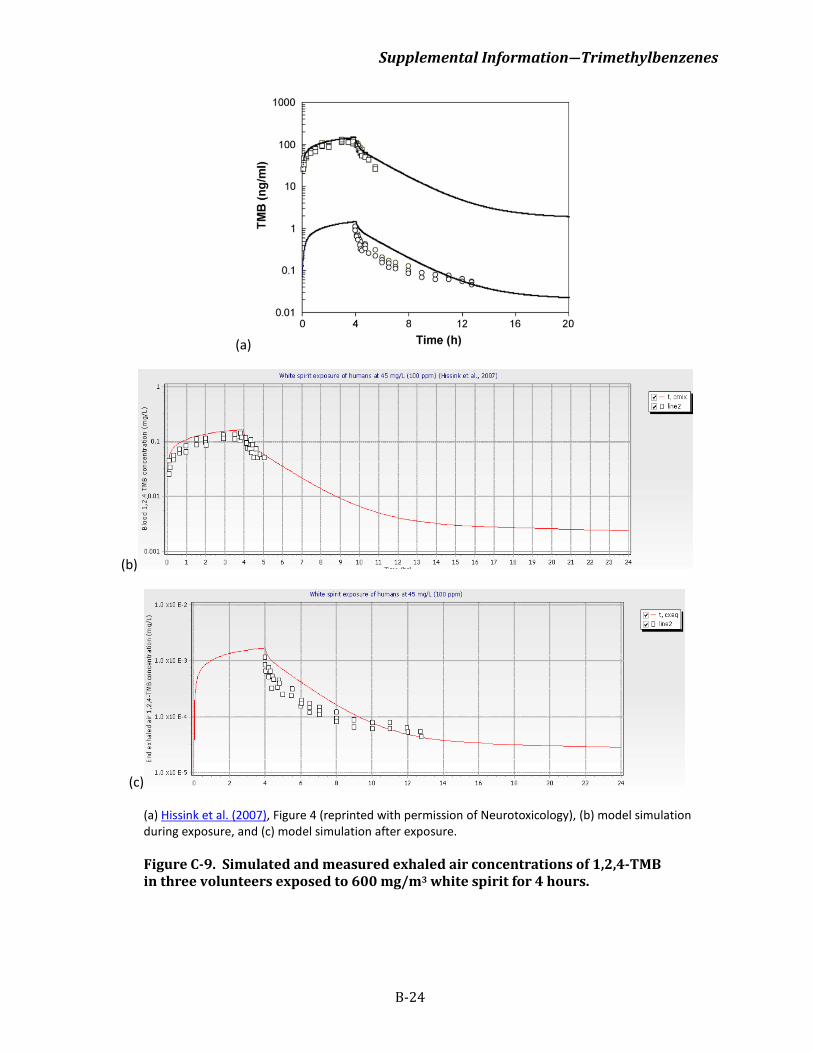
Supplemental Information―Trimethylbenzenes
B-24
(a)
(b)
(c)
(a) Hissink et al. (2007), Figure 4 (reprinted with permission of Neurotoxicology), (b) model simulation during exposure, and (c) model simulation after exposure.
Figure C-9. Simulated and measured exhaled air concentrations of 1,2,4-TMB in three volunteers exposed to 600 mg/m3 white spirit for 4 hours.
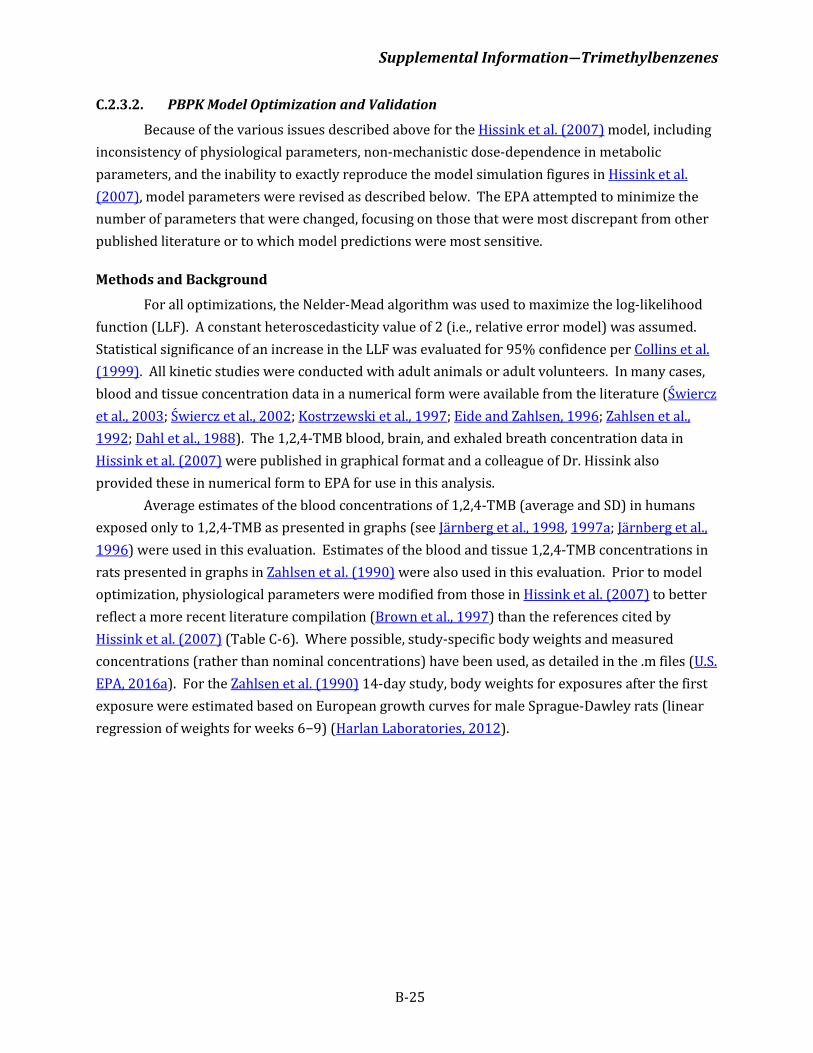
Supplemental Information―Trimethylbenzenes
B-25
C.2.3.2. PBPK Model Optimization and Validation
Because of the various issues described above for the Hissink et al. (2007) model, including inconsistency of physiological parameters, non-mechanistic dose-dependence in metabolic parameters, and the inability to exactly reproduce the model simulation figures in Hissink et al. (2007), model parameters were revised as described below. The EPA attempted to minimize the number of parameters that were changed, focusing on those that were most discrepant from other published literature or to which model predictions were most sensitive.
Methods and Background
For all optimizations, the Nelder-Mead algorithm was used to maximize the log-likelihood function (LLF). A constant heteroscedasticity value of 2 (i.e., relative error model) was assumed. Statistical significance of an increase in the LLF was evaluated for 95% confidence per Collins et al. (1999). All kinetic studies were conducted with adult animals or adult volunteers. In many cases, blood and tissue concentration data in a numerical form were available from the literature (Świercz et al., 2003; Świercz et al., 2002; Kostrzewski et al., 1997; Eide and Zahlsen, 1996; Zahlsen et al., 1992; Dahl et al., 1988). The 1,2,4-TMB blood, brain, and exhaled breath concentration data in Hissink et al. (2007) were published in graphical format and a colleague of Dr. Hissink also provided these in numerical form to EPA for use in this analysis.
Average estimates of the blood concentrations of 1,2,4-TMB (average and SD) in humans exposed only to 1,2,4-TMB as presented in graphs (see Järnberg et al., 1998, 1997a; Järnberg et al., 1996) were used in this evaluation. Estimates of the blood and tissue 1,2,4-TMB concentrations in rats presented in graphs in Zahlsen et al. (1990) were also used in this evaluation. Prior to model optimization, physiological parameters were modified from those in Hissink et al. (2007) to better reflect a more recent literature compilation (Brown et al., 1997) than the references cited by Hissink et al. (2007) (Table C-6). Where possible, study-specific body weights and measured concentrations (rather than nominal concentrations) have been used, as detailed in the .m files (U.S. EPA, 2016a). For the Zahlsen et al. (1990) 14-day study, body weights for exposures after the first exposure were estimated based on European growth curves for male Sprague-Dawley rats (linear regression of weights for weeks 6−9) (Harlan Laboratories, 2012).
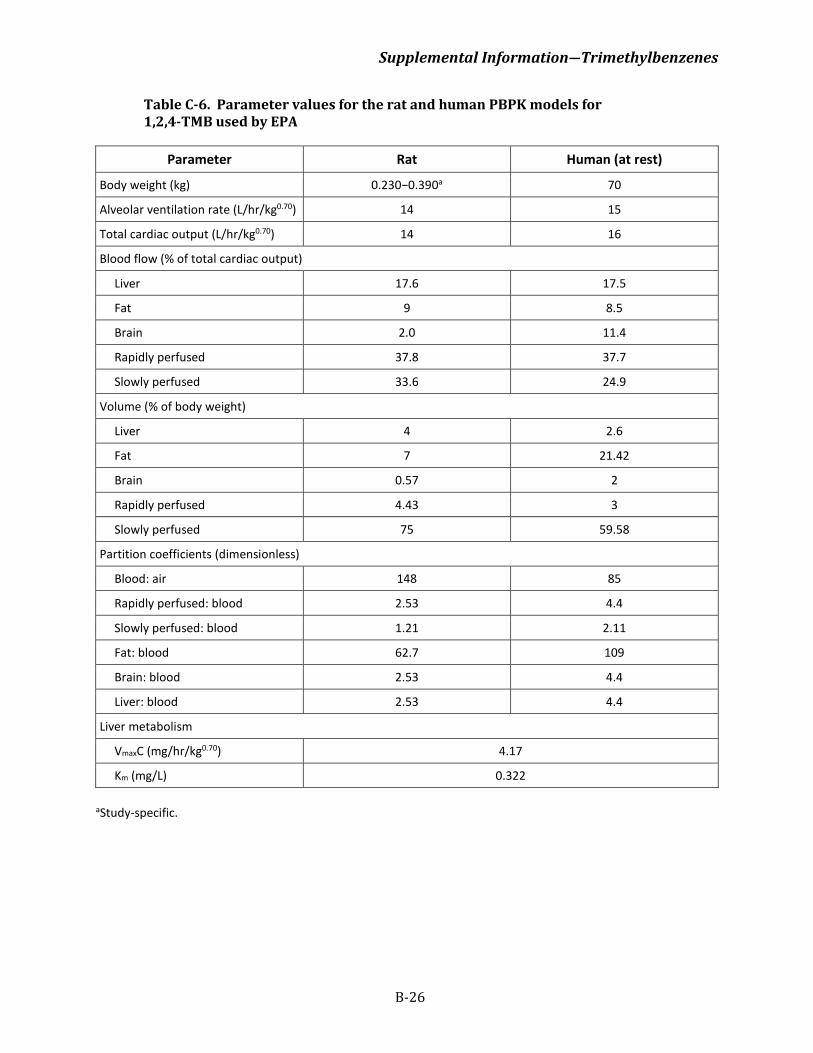
Supplemental Information―Trimethylbenzenes
B-26
Table C-6. Parameter values for the rat and human PBPK models for 1,2,4-TMB used by EPA
Parameter Rat Human (at rest)
Body weight (kg) 0.230−0.390a 70
Alveolar ventilation rate (L/hr/kg0.70) 14 15
Total cardiac output (L/hr/kg0.70) 14 16
Blood flow (% of total cardiac output)
Liver 17.6 17.5
Fat 9 8.5
Brain 2.0 11.4
Rapidly perfused 37.8 37.7
Slowly perfused 33.6 24.9
Volume (% of body weight)
Liver 4 2.6
Fat 7 21.42
Brain 0.57 2
Rapidly perfused 4.43 3
Slowly perfused 75 59.58
Partition coefficients (dimensionless)
Blood: air 148 85
Rapidly perfused: blood 2.53 4.4
Slowly perfused: blood 1.21 2.11
Fat: blood 62.7 109
Brain: blood 2.53 4.4
Liver: blood 2.53 4.4
Liver metabolism
VmaxC (mg/hr/kg0.70) 4.17
Km (mg/L) 0.322 aStudy-specific.
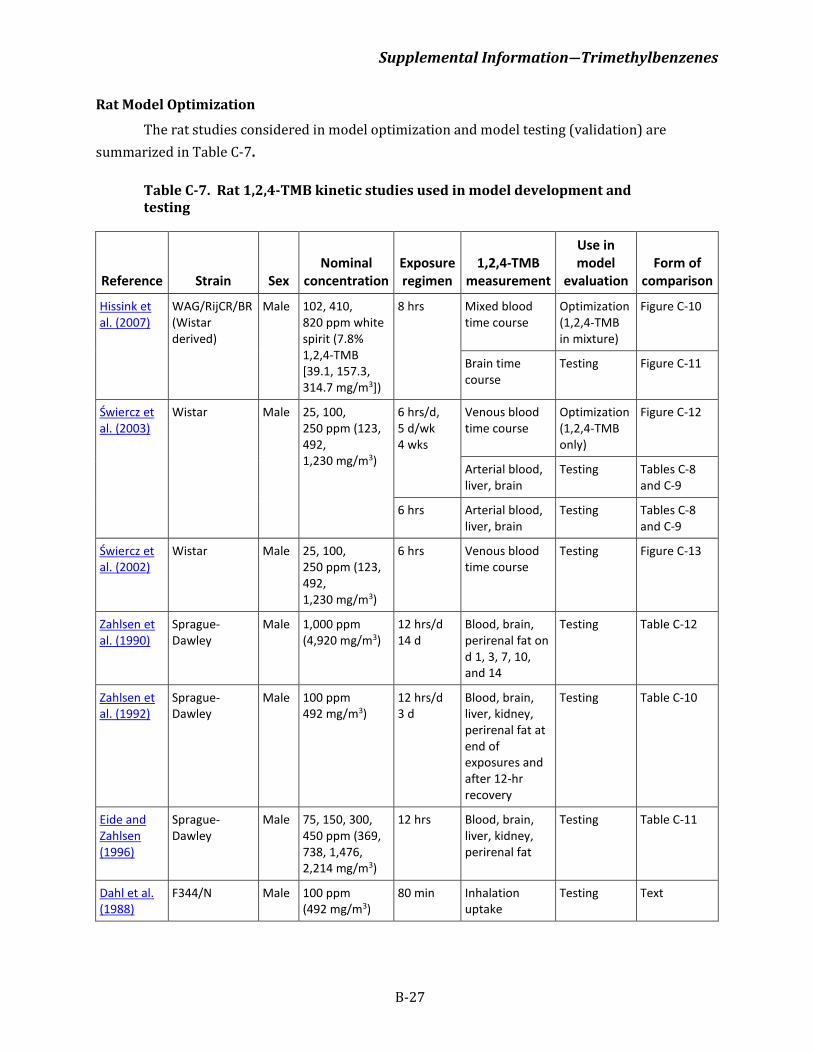
Supplemental Information―Trimethylbenzenes
B-27
Rat Model Optimization
The rat studies considered in model optimization and model testing (validation) are summarized in Table C-7.
Table C-7. Rat 1,2,4-TMB kinetic studies used in model development and testing
Reference Strain Sex Nominal
concentration Exposure regimen
1,2,4-TMB measurement
Use in model
evaluation Form of
comparison
Hissink et al. (2007)
WAG/RijCR/BR (Wistar derived)
Male 102, 410, 820 ppm white spirit (7.8% 1,2,4-TMB [39.1, 157.3, 314.7 mg/m3])
8 hrs Mixed blood time course
Optimization (1,2,4-TMB in mixture)
Figure C-10
Brain time course
Testing Figure C-11
Świercz et al. (2003)
Wistar Male 25, 100, 250 ppm (123, 492, 1,230 mg/m3)
6 hrs/d, 5 d/wk 4 wks
Venous blood time course
Optimization (1,2,4-TMB only)
Figure C-12
Arterial blood, liver, brain
Testing Tables C-8 and C-9
6 hrs Arterial blood, liver, brain
Testing Tables C-8 and C-9
Świercz et al. (2002)
Wistar Male 25, 100, 250 ppm (123, 492, 1,230 mg/m3)
6 hrs Venous blood time course
Testing Figure C-13
Zahlsen et al. (1990)
Sprague-Dawley
Male 1,000 ppm (4,920 mg/m3)
12 hrs/d 14 d
Blood, brain, perirenal fat on d 1, 3, 7, 10, and 14
Testing Table C-12
Zahlsen et al. (1992)
Sprague-Dawley
Male 100 ppm 492 mg/m3)
12 hrs/d 3 d
Blood, brain, liver, kidney, perirenal fat at end of exposures and after 12-hr recovery
Testing Table C-10
Eide and Zahlsen (1996)
Sprague-Dawley
Male 75, 150, 300, 450 ppm (369, 738, 1,476, 2,214 mg/m3)
12 hrs Blood, brain, liver, kidney, perirenal fat
Testing Table C-11
Dahl et al. (1988)
F344/N Male 100 ppm (492 mg/m3)
80 min Inhalation uptake
Testing Text
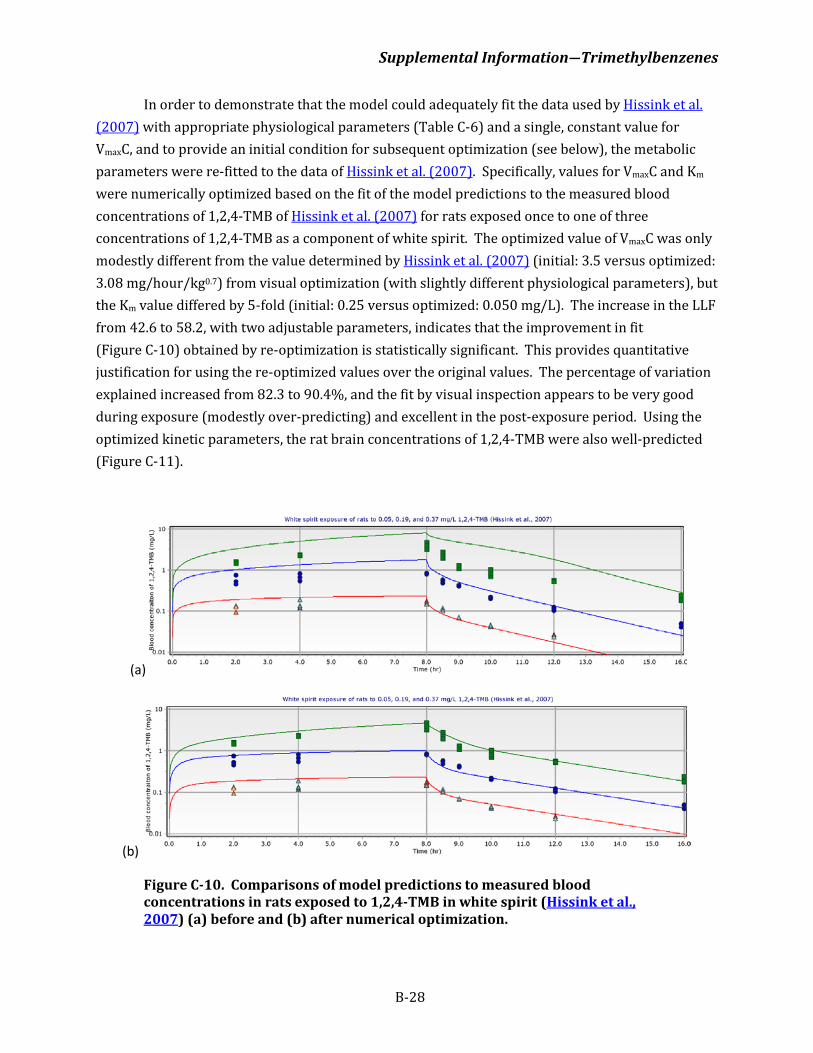
Supplemental Information―Trimethylbenzenes
B-28
In order to demonstrate that the model could adequately fit the data used by Hissink et al. (2007) with appropriate physiological parameters (Table C-6) and a single, constant value for VmaxC, and to provide an initial condition for subsequent optimization (see below), the metabolic parameters were re-fitted to the data of Hissink et al. (2007). Specifically, values for VmaxC and Km were numerically optimized based on the fit of the model predictions to the measured blood concentrations of 1,2,4-TMB of Hissink et al. (2007) for rats exposed once to one of three concentrations of 1,2,4-TMB as a component of white spirit. The optimized value of VmaxC was only modestly different from the value determined by Hissink et al. (2007) (initial: 3.5 versus optimized: 3.08 mg/hour/kg0.7) from visual optimization (with slightly different physiological parameters), but the Km value differed by 5-fold (initial: 0.25 versus optimized: 0.050 mg/L). The increase in the LLF from 42.6 to 58.2, with two adjustable parameters, indicates that the improvement in fit (Figure C-10) obtained by re-optimization is statistically significant. This provides quantitative justification for using the re-optimized values over the original values. The percentage of variation explained increased from 82.3 to 90.4%, and the fit by visual inspection appears to be very good during exposure (modestly over-predicting) and excellent in the post-exposure period. Using the optimized kinetic parameters, the rat brain concentrations of 1,2,4-TMB were also well-predicted (Figure C-11).
(a)
(b)
Figure C-10. Comparisons of model predictions to measured blood concentrations in rats exposed to 1,2,4-TMB in white spirit (Hissink et al., 2007) (a) before and (b) after numerical optimization.
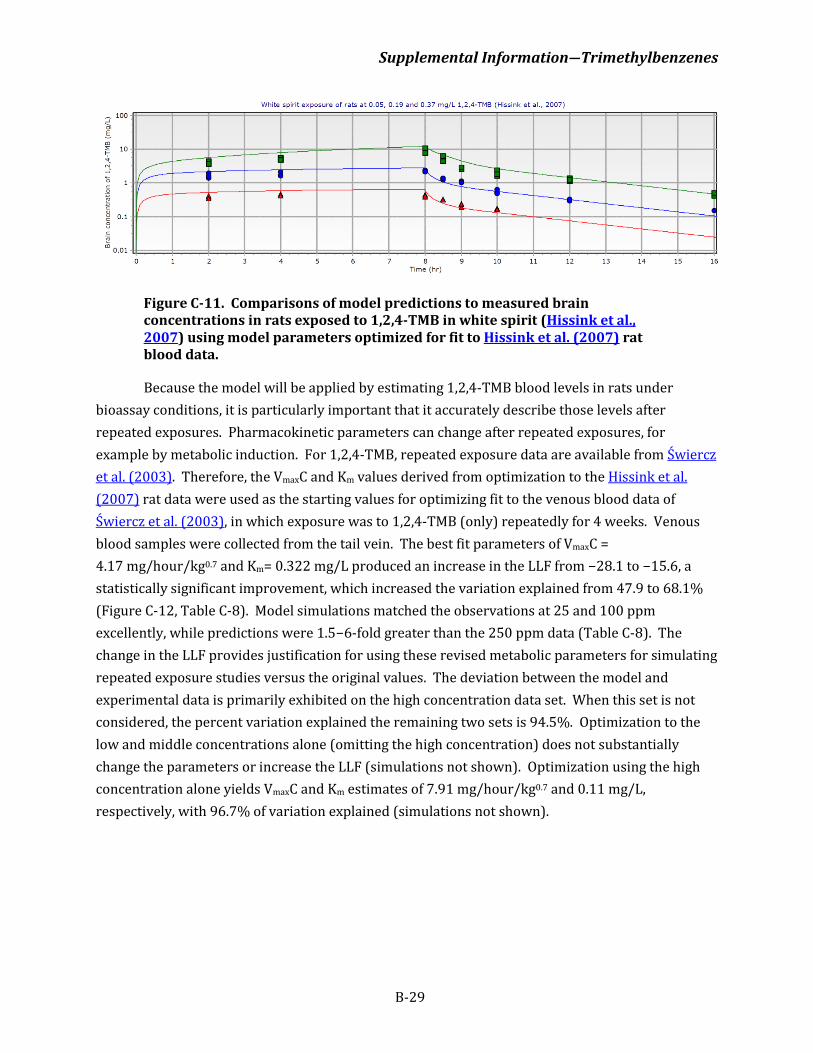
Supplemental Information―Trimethylbenzenes
B-29
Figure C-11. Comparisons of model predictions to measured brain concentrations in rats exposed to 1,2,4-TMB in white spirit (Hissink et al., 2007) using model parameters optimized for fit to Hissink et al. (2007) rat blood data.
Because the model will be applied by estimating 1,2,4-TMB blood levels in rats under bioassay conditions, it is particularly important that it accurately describe those levels after repeated exposures. Pharmacokinetic parameters can change after repeated exposures, for example by metabolic induction. For 1,2,4-TMB, repeated exposure data are available from Świercz et al. (2003). Therefore, the VmaxC and Km values derived from optimization to the Hissink et al. (2007) rat data were used as the starting values for optimizing fit to the venous blood data of Świercz et al. (2003), in which exposure was to 1,2,4-TMB (only) repeatedly for 4 weeks. Venous blood samples were collected from the tail vein. The best fit parameters of VmaxC = 4.17 mg/hour/kg0.7 and Km= 0.322 mg/L produced an increase in the LLF from −28.1 to −15.6, a statistically significant improvement, which increased the variation explained from 47.9 to 68.1% (Figure C-12, Table C-8). Model simulations matched the observations at 25 and 100 ppm excellently, while predictions were 1.5−6-fold greater than the 250 ppm data (Table C-8). The change in the LLF provides justification for using these revised metabolic parameters for simulating repeated exposure studies versus the original values. The deviation between the model and experimental data is primarily exhibited on the high concentration data set. When this set is not considered, the percent variation explained the remaining two sets is 94.5%. Optimization to the low and middle concentrations alone (omitting the high concentration) does not substantially change the parameters or increase the LLF (simulations not shown). Optimization using the high concentration alone yields VmaxC and Km estimates of 7.91 mg/hour/kg0.7 and 0.11 mg/L, respectively, with 96.7% of variation explained (simulations not shown).
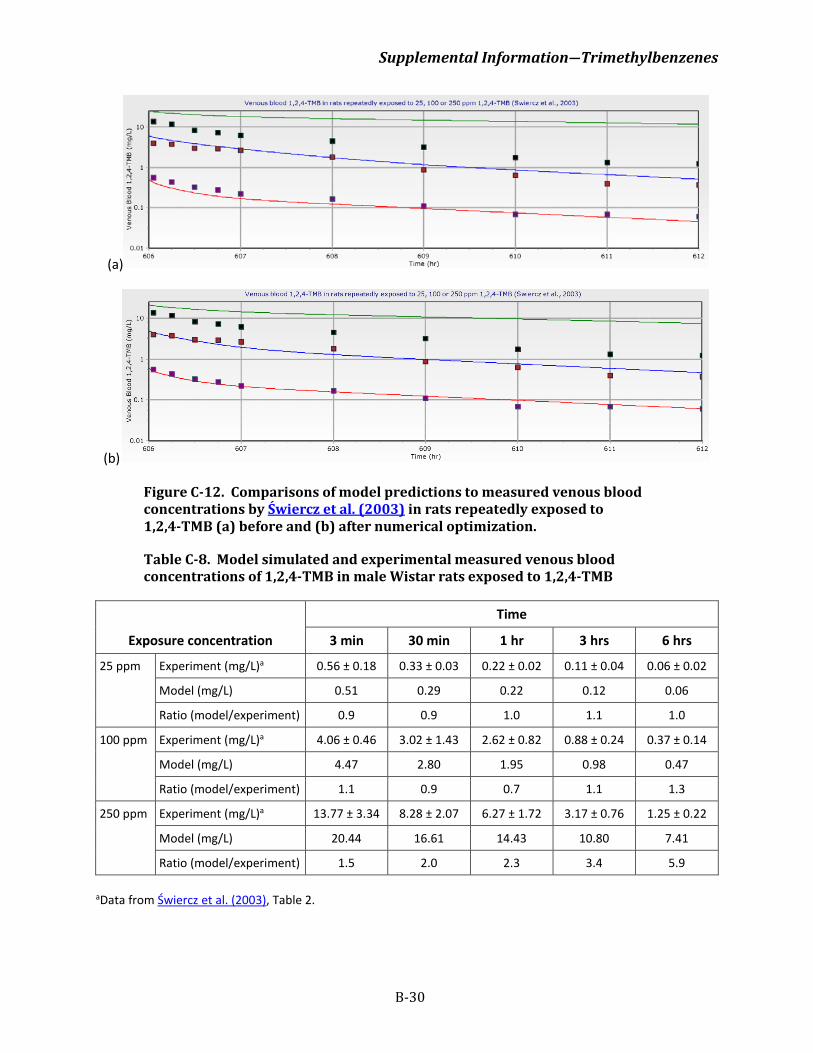
Supplemental Information―Trimethylbenzenes
B-30
(a)
(b)
Figure C-12. Comparisons of model predictions to measured venous blood concentrations by Świercz et al. (2003) in rats repeatedly exposed to 1,2,4-TMB (a) before and (b) after numerical optimization.
Table C-8. Model simulated and experimental measured venous blood concentrations of 1,2,4-TMB in male Wistar rats exposed to 1,2,4-TMB
Exposure concentration
Time
3 min 30 min 1 hr 3 hrs 6 hrs
25 ppm Experiment (mg/L)a 0.56 ± 0.18 0.33 ± 0.03 0.22 ± 0.02 0.11 ± 0.04 0.06 ± 0.02
Model (mg/L) 0.51 0.29 0.22 0.12 0.06
Ratio (model/experiment) 0.9 0.9 1.0 1.1 1.0
100 ppm Experiment (mg/L)a 4.06 ± 0.46 3.02 ± 1.43 2.62 ± 0.82 0.88 ± 0.24 0.37 ± 0.14
Model (mg/L) 4.47 2.80 1.95 0.98 0.47
Ratio (model/experiment) 1.1 0.9 0.7 1.1 1.3
250 ppm Experiment (mg/L)a 13.77 ± 3.34 8.28 ± 2.07 6.27 ± 1.72 3.17 ± 0.76 1.25 ± 0.22
Model (mg/L) 20.44 16.61 14.43 10.80 7.41
Ratio (model/experiment) 1.5 2.0 2.3 3.4 5.9
aData from Świercz et al. (2003), Table 2.
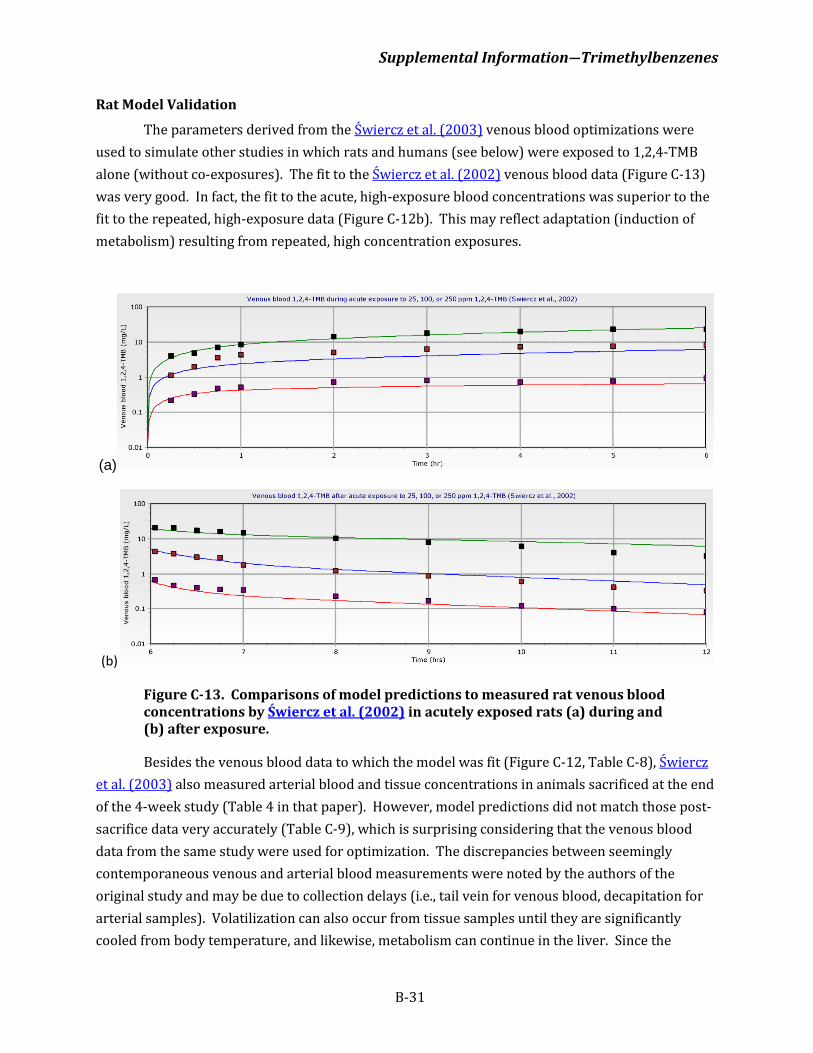
Supplemental Information―Trimethylbenzenes
B-31
Rat Model Validation
The parameters derived from the Świercz et al. (2003) venous blood optimizations were used to simulate other studies in which rats and humans (see below) were exposed to 1,2,4-TMB alone (without co-exposures). The fit to the Świercz et al. (2002) venous blood data (Figure C-13) was very good. In fact, the fit to the acute, high-exposure blood concentrations was superior to the fit to the repeated, high-exposure data (Figure C-12b). This may reflect adaptation (induction of metabolism) resulting from repeated, high concentration exposures.
(a)
(b)
Figure C-13. Comparisons of model predictions to measured rat venous blood concentrations by Świercz et al. (2002) in acutely exposed rats (a) during and (b) after exposure.
Besides the venous blood data to which the model was fit (Figure C-12, Table C-8), Świercz et al. (2003) also measured arterial blood and tissue concentrations in animals sacrificed at the end of the 4-week study (Table 4 in that paper). However, model predictions did not match those post-sacrifice data very accurately (Table C-9), which is surprising considering that the venous blood data from the same study were used for optimization. The discrepancies between seemingly contemporaneous venous and arterial blood measurements were noted by the authors of the original study and may be due to collection delays (i.e., tail vein for venous blood, decapitation for arterial samples). Volatilization can also occur from tissue samples until they are significantly cooled from body temperature, and likewise, metabolism can continue in the liver. Since the
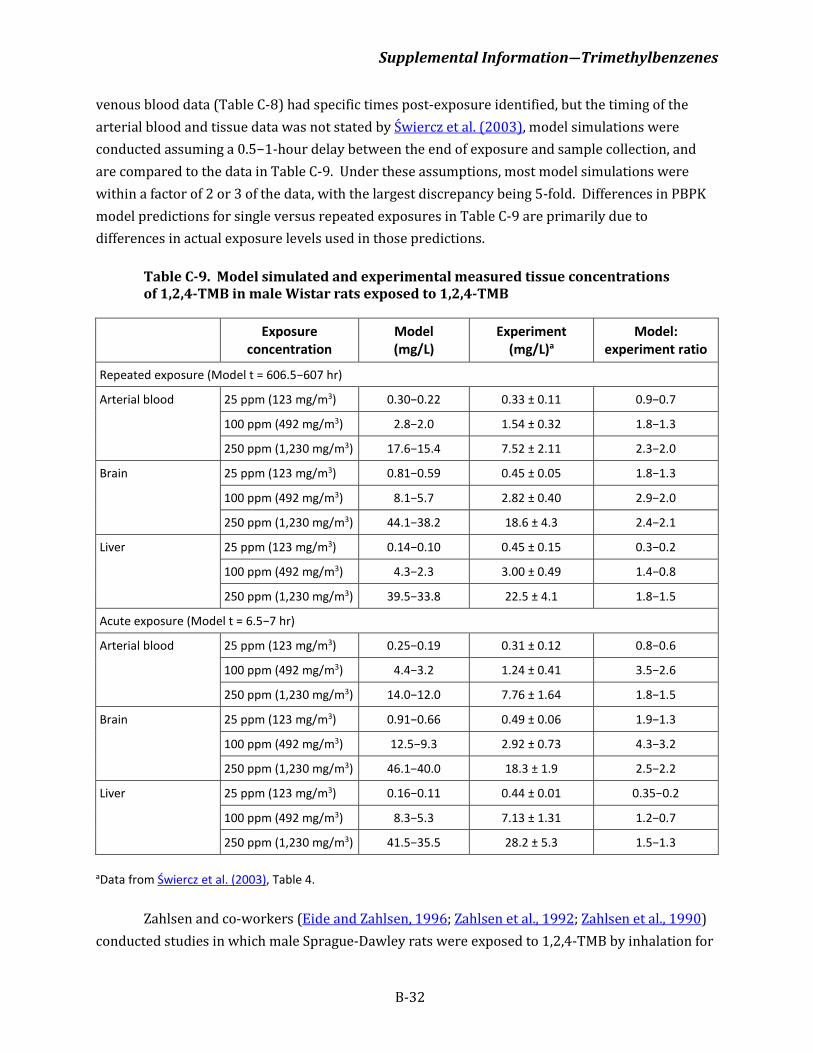
Supplemental Information―Trimethylbenzenes
B-32
venous blood data (Table C-8) had specific times post-exposure identified, but the timing of the arterial blood and tissue data was not stated by Świercz et al. (2003), model simulations were conducted assuming a 0.5−1-hour delay between the end of exposure and sample collection, and are compared to the data in Table C-9. Under these assumptions, most model simulations were within a factor of 2 or 3 of the data, with the largest discrepancy being 5-fold. Differences in PBPK model predictions for single versus repeated exposures in Table C-9 are primarily due to differences in actual exposure levels used in those predictions.
Table C-9. Model simulated and experimental measured tissue concentrations of 1,2,4-TMB in male Wistar rats exposed to 1,2,4-TMB
Exposure
concentration Model (mg/L)
Experiment (mg/L)a
Model: experiment ratio
Repeated exposure (Model t = 606.5−607 hr)
Arterial blood 25 ppm (123 mg/m3) 0.30−0.22 0.33 ± 0.11 0.9−0.7
100 ppm (492 mg/m3) 2.8−2.0 1.54 ± 0.32 1.8−1.3
250 ppm (1,230 mg/m3) 17.6−15.4 7.52 ± 2.11 2.3−2.0
Brain 25 ppm (123 mg/m3) 0.81−0.59 0.45 ± 0.05 1.8−1.3
100 ppm (492 mg/m3) 8.1−5.7 2.82 ± 0.40 2.9−2.0
250 ppm (1,230 mg/m3) 44.1−38.2 18.6 ± 4.3 2.4−2.1
Liver 25 ppm (123 mg/m3) 0.14−0.10 0.45 ± 0.15 0.3−0.2
100 ppm (492 mg/m3) 4.3−2.3 3.00 ± 0.49 1.4−0.8
250 ppm (1,230 mg/m3) 39.5−33.8 22.5 ± 4.1 1.8−1.5
Acute exposure (Model t = 6.5−7 hr)
Arterial blood 25 ppm (123 mg/m3) 0.25−0.19 0.31 ± 0.12 0.8−0.6
100 ppm (492 mg/m3) 4.4−3.2 1.24 ± 0.41 3.5−2.6
250 ppm (1,230 mg/m3) 14.0−12.0 7.76 ± 1.64 1.8−1.5
Brain 25 ppm (123 mg/m3) 0.91−0.66 0.49 ± 0.06 1.9−1.3
100 ppm (492 mg/m3) 12.5−9.3 2.92 ± 0.73 4.3−3.2
250 ppm (1,230 mg/m3) 46.1−40.0 18.3 ± 1.9 2.5−2.2
Liver 25 ppm (123 mg/m3) 0.16−0.11 0.44 ± 0.01 0.35−0.2
100 ppm (492 mg/m3) 8.3−5.3 7.13 ± 1.31 1.2−0.7
250 ppm (1,230 mg/m3) 41.5−35.5 28.2 ± 5.3 1.5−1.3
aData from Świercz et al. (2003), Table 4. Zahlsen and co-workers (Eide and Zahlsen, 1996; Zahlsen et al., 1992; Zahlsen et al., 1990)
conducted studies in which male Sprague-Dawley rats were exposed to 1,2,4-TMB by inhalation for
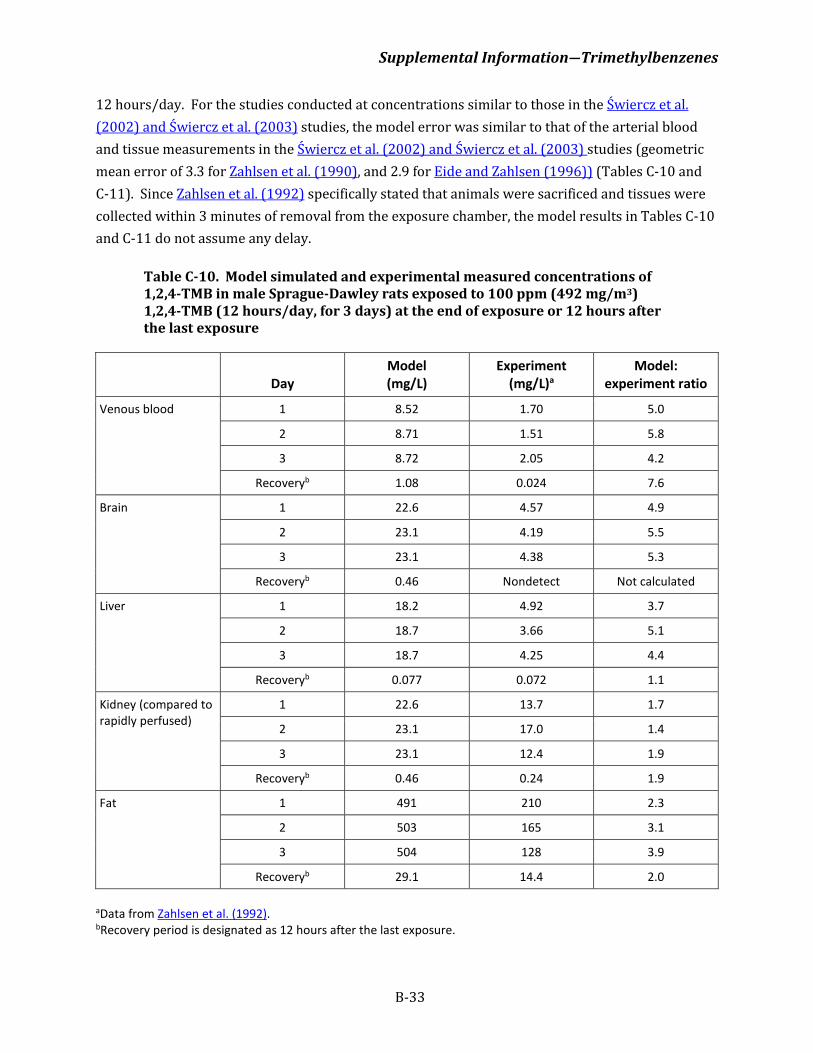
Supplemental Information―Trimethylbenzenes
B-33
12 hours/day. For the studies conducted at concentrations similar to those in the Świercz et al. (2002) and Świercz et al. (2003) studies, the model error was similar to that of the arterial blood and tissue measurements in the Świercz et al. (2002) and Świercz et al. (2003) studies (geometric mean error of 3.3 for Zahlsen et al. (1990), and 2.9 for Eide and Zahlsen (1996)) (Tables C-10 and C-11). Since Zahlsen et al. (1992) specifically stated that animals were sacrificed and tissues were collected within 3 minutes of removal from the exposure chamber, the model results in Tables C-10 and C-11 do not assume any delay.
Table C-10. Model simulated and experimental measured concentrations of 1,2,4-TMB in male Sprague-Dawley rats exposed to 100 ppm (492 mg/m3) 1,2,4-TMB (12 hours/day, for 3 days) at the end of exposure or 12 hours after the last exposure
Day Model (mg/L)
Experiment (mg/L)a
Model: experiment ratio
Venous blood 1 8.52 1.70 5.0
2 8.71 1.51 5.8
3 8.72 2.05 4.2
Recoveryb 1.08 0.024 7.6
Brain 1 22.6 4.57 4.9
2 23.1 4.19 5.5
3 23.1 4.38 5.3
Recoveryb 0.46 Nondetect Not calculated
Liver 1 18.2 4.92 3.7
2 18.7 3.66 5.1
3 18.7 4.25 4.4
Recoveryb 0.077 0.072 1.1
Kidney (compared to rapidly perfused)
1 22.6 13.7 1.7
2 23.1 17.0 1.4
3 23.1 12.4 1.9
Recoveryb 0.46 0.24 1.9
Fat 1 491 210 2.3
2 503 165 3.1
3 504 128 3.9
Recoveryb 29.1 14.4 2.0 aData from Zahlsen et al. (1992). bRecovery period is designated as 12 hours after the last exposure.
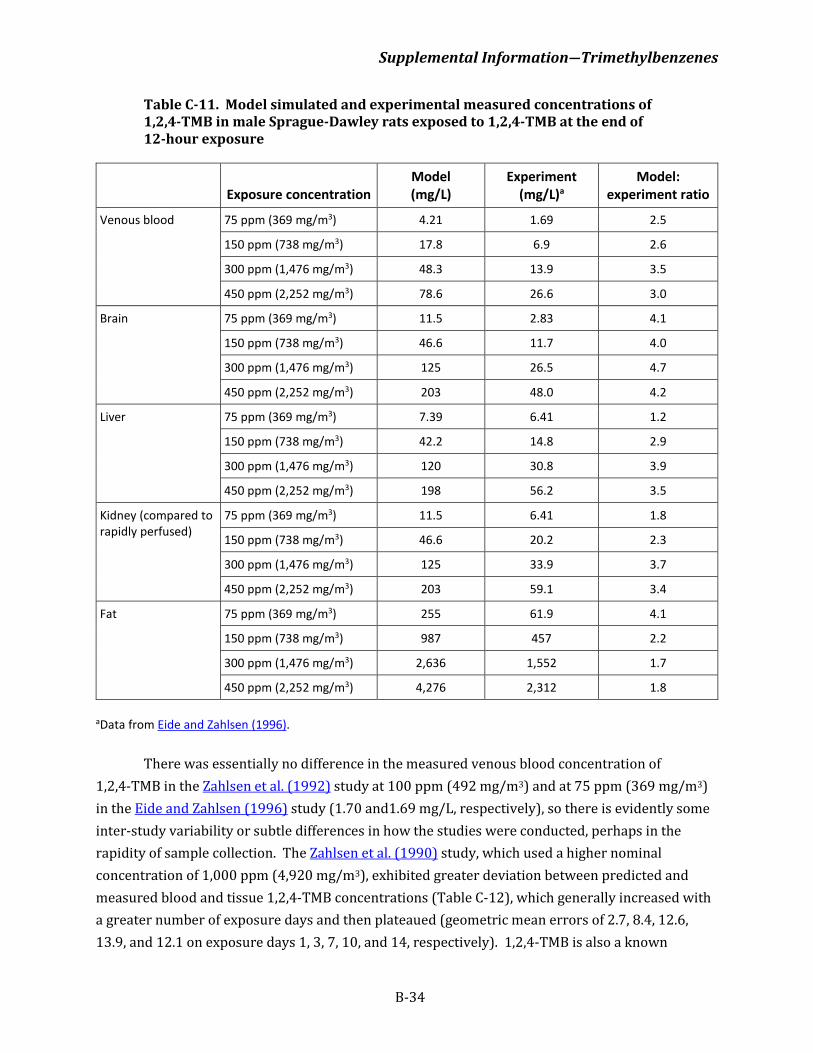
Supplemental Information―Trimethylbenzenes
B-34
Table C-11. Model simulated and experimental measured concentrations of 1,2,4-TMB in male Sprague-Dawley rats exposed to 1,2,4-TMB at the end of 12-hour exposure
Exposure concentration Model (mg/L)
Experiment (mg/L)a
Model: experiment ratio
Venous blood 75 ppm (369 mg/m3) 4.21 1.69 2.5
150 ppm (738 mg/m3) 17.8 6.9 2.6
300 ppm (1,476 mg/m3) 48.3 13.9 3.5
450 ppm (2,252 mg/m3) 78.6 26.6 3.0
Brain 75 ppm (369 mg/m3) 11.5 2.83 4.1
150 ppm (738 mg/m3) 46.6 11.7 4.0
300 ppm (1,476 mg/m3) 125 26.5 4.7
450 ppm (2,252 mg/m3) 203 48.0 4.2
Liver 75 ppm (369 mg/m3) 7.39 6.41 1.2
150 ppm (738 mg/m3) 42.2 14.8 2.9
300 ppm (1,476 mg/m3) 120 30.8 3.9
450 ppm (2,252 mg/m3) 198 56.2 3.5
Kidney (compared to rapidly perfused)
75 ppm (369 mg/m3) 11.5 6.41 1.8
150 ppm (738 mg/m3) 46.6 20.2 2.3
300 ppm (1,476 mg/m3) 125 33.9 3.7
450 ppm (2,252 mg/m3) 203 59.1 3.4
Fat 75 ppm (369 mg/m3) 255 61.9 4.1
150 ppm (738 mg/m3) 987 457 2.2
300 ppm (1,476 mg/m3) 2,636 1,552 1.7
450 ppm (2,252 mg/m3) 4,276 2,312 1.8
aData from Eide and Zahlsen (1996). There was essentially no difference in the measured venous blood concentration of
1,2,4-TMB in the Zahlsen et al. (1992) study at 100 ppm (492 mg/m3) and at 75 ppm (369 mg/m3) in the Eide and Zahlsen (1996) study (1.70 and1.69 mg/L, respectively), so there is evidently some inter-study variability or subtle differences in how the studies were conducted, perhaps in the rapidity of sample collection. The Zahlsen et al. (1990) study, which used a higher nominal concentration of 1,000 ppm (4,920 mg/m3), exhibited greater deviation between predicted and measured blood and tissue 1,2,4-TMB concentrations (Table C-12), which generally increased with a greater number of exposure days and then plateaued (geometric mean errors of 2.7, 8.4, 12.6, 13.9, and 12.1 on exposure days 1, 3, 7, 10, and 14, respectively). 1,2,4-TMB is also a known
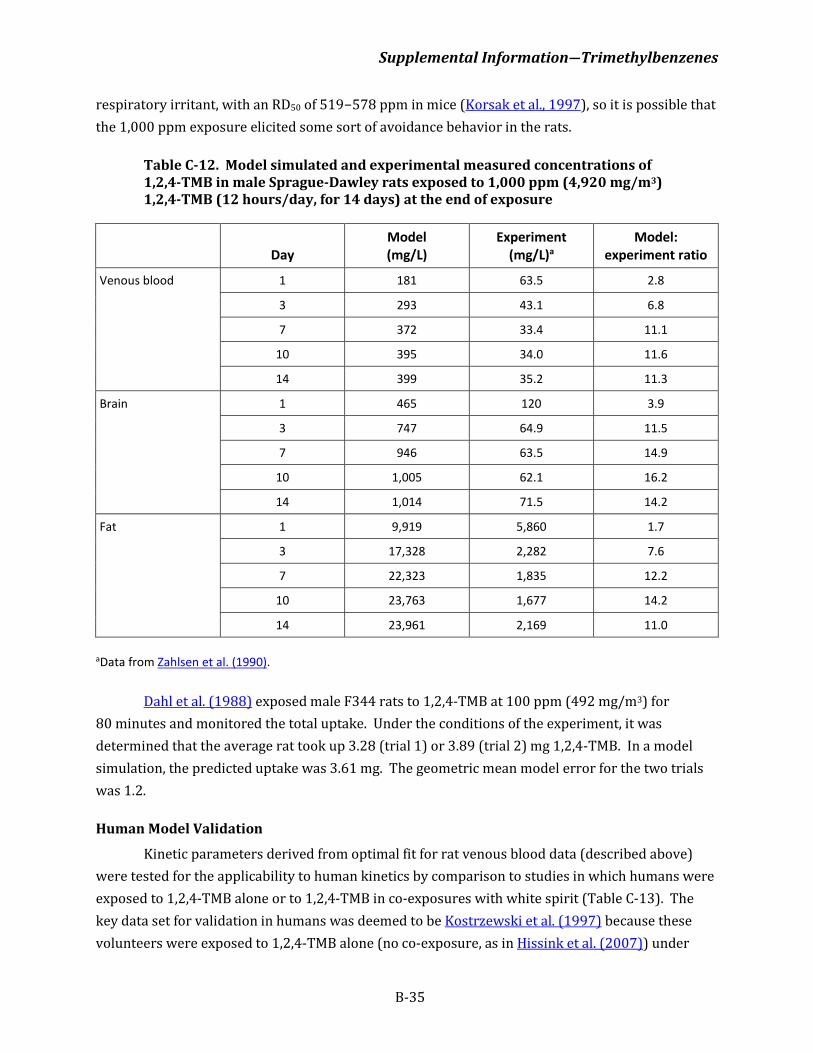
Supplemental Information―Trimethylbenzenes
B-35
respiratory irritant, with an RD50 of 519−578 ppm in mice (Korsak et al., 1997), so it is possible that the 1,000 ppm exposure elicited some sort of avoidance behavior in the rats.
Table C-12. Model simulated and experimental measured concentrations of 1,2,4-TMB in male Sprague-Dawley rats exposed to 1,000 ppm (4,920 mg/m3) 1,2,4-TMB (12 hours/day, for 14 days) at the end of exposure
Day Model (mg/L)
Experiment (mg/L)a
Model: experiment ratio
Venous blood 1 181 63.5 2.8
3 293 43.1 6.8
7 372 33.4 11.1
10 395 34.0 11.6
14 399 35.2 11.3
Brain 1 465 120 3.9
3 747 64.9 11.5
7 946 63.5 14.9
10 1,005 62.1 16.2
14 1,014 71.5 14.2
Fat 1 9,919 5,860 1.7
3 17,328 2,282 7.6
7 22,323 1,835 12.2
10 23,763 1,677 14.2
14 23,961 2,169 11.0
aData from Zahlsen et al. (1990). Dahl et al. (1988) exposed male F344 rats to 1,2,4-TMB at 100 ppm (492 mg/m3) for
80 minutes and monitored the total uptake. Under the conditions of the experiment, it was determined that the average rat took up 3.28 (trial 1) or 3.89 (trial 2) mg 1,2,4-TMB. In a model simulation, the predicted uptake was 3.61 mg. The geometric mean model error for the two trials was 1.2.
Human Model Validation
Kinetic parameters derived from optimal fit for rat venous blood data (described above) were tested for the applicability to human kinetics by comparison to studies in which humans were exposed to 1,2,4-TMB alone or to 1,2,4-TMB in co-exposures with white spirit (Table C-13). The key data set for validation in humans was deemed to be Kostrzewski et al. (1997) because these volunteers were exposed to 1,2,4-TMB alone (no co-exposure, as in Hissink et al. (2007)) under
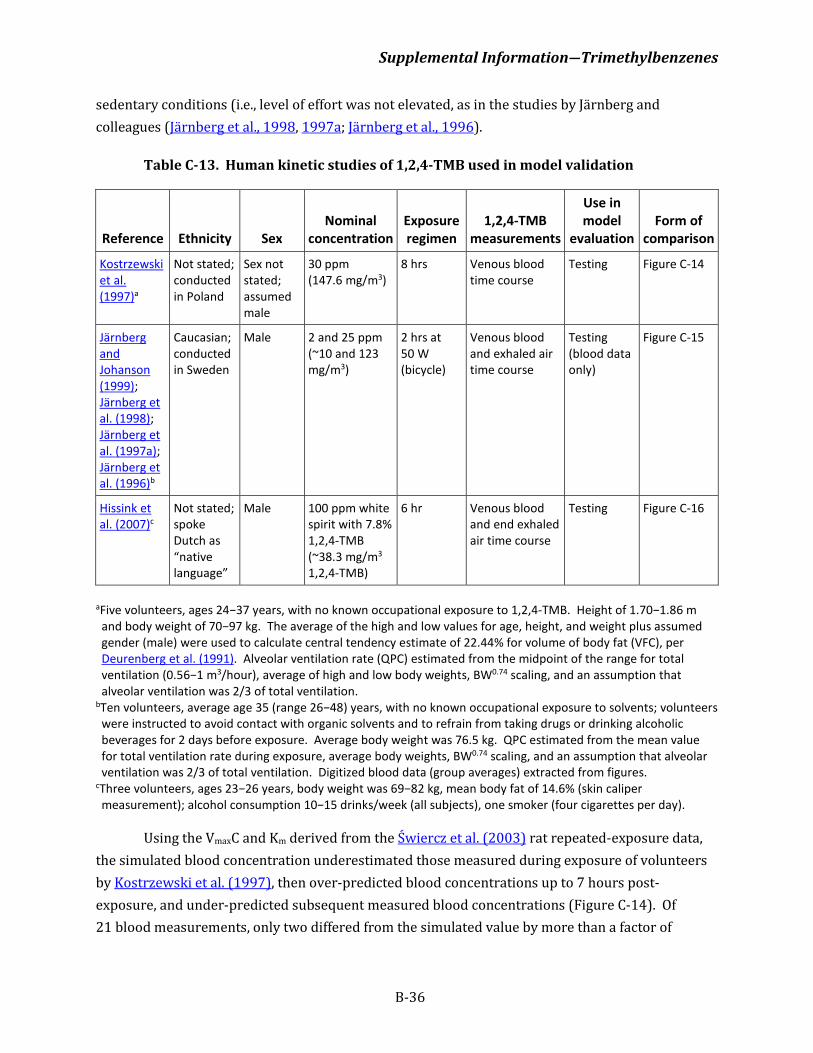
Supplemental Information―Trimethylbenzenes
B-36
sedentary conditions (i.e., level of effort was not elevated, as in the studies by Järnberg and colleagues (Järnberg et al., 1998, 1997a; Järnberg et al., 1996).
Table C-13. Human kinetic studies of 1,2,4-TMB used in model validation
Reference Ethnicity Sex Nominal
concentration Exposure regimen
1,2,4-TMB measurements
Use in model
evaluation Form of
comparison
Kostrzewski et al. (1997)a
Not stated; conducted in Poland
Sex not stated; assumed male
30 ppm (147.6 mg/m3)
8 hrs Venous blood time course
Testing Figure C-14
Järnberg and Johanson (1999); Järnberg et al. (1998); Järnberg et al. (1997a); Järnberg et al. (1996)b
Caucasian; conducted in Sweden
Male 2 and 25 ppm (~10 and 123 mg/m3)
2 hrs at 50 W (bicycle)
Venous blood and exhaled air time course
Testing (blood data only)
Figure C-15
Hissink et al. (2007)c
Not stated; spoke Dutch as “native language”
Male 100 ppm white spirit with 7.8% 1,2,4-TMB (~38.3 mg/m3 1,2,4-TMB)
6 hr Venous blood and end exhaled air time course
Testing Figure C-16
aFive volunteers, ages 24−37 years, with no known occupational exposure to 1,2,4-TMB. Height of 1.70−1.86 m and body weight of 70−97 kg. The average of the high and low values for age, height, and weight plus assumed gender (male) were used to calculate central tendency estimate of 22.44% for volume of body fat (VFC), per Deurenberg et al. (1991). Alveolar ventilation rate (QPC) estimated from the midpoint of the range for total ventilation (0.56−1 m3/hour), average of high and low body weights, BW0.74 scaling, and an assumption that alveolar ventilation was 2/3 of total ventilation.
bTen volunteers, average age 35 (range 26−48) years, with no known occupational exposure to solvents; volunteers were instructed to avoid contact with organic solvents and to refrain from taking drugs or drinking alcoholic beverages for 2 days before exposure. Average body weight was 76.5 kg. QPC estimated from the mean value for total ventilation rate during exposure, average body weights, BW0.74 scaling, and an assumption that alveolar ventilation was 2/3 of total ventilation. Digitized blood data (group averages) extracted from figures.
cThree volunteers, ages 23−26 years, body weight was 69−82 kg, mean body fat of 14.6% (skin caliper measurement); alcohol consumption 10−15 drinks/week (all subjects), one smoker (four cigarettes per day).
Using the VmaxC and Km derived from the Świercz et al. (2003) rat repeated-exposure data,
the simulated blood concentration underestimated those measured during exposure of volunteers by Kostrzewski et al. (1997), then over-predicted blood concentrations up to 7 hours post-exposure, and under-predicted subsequent measured blood concentrations (Figure C-14). Of 21 blood measurements, only two differed from the simulated value by more than a factor of
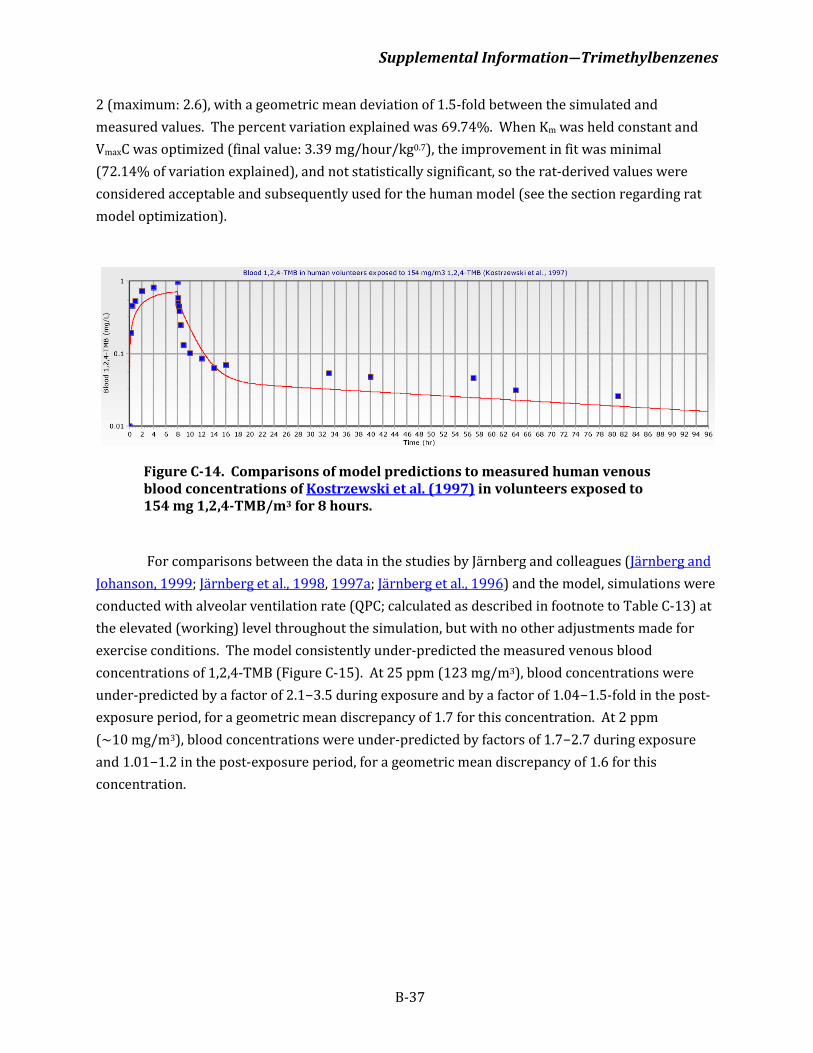
Supplemental Information―Trimethylbenzenes
B-37
2 (maximum: 2.6), with a geometric mean deviation of 1.5-fold between the simulated and measured values. The percent variation explained was 69.74%. When Km was held constant and VmaxC was optimized (final value: 3.39 mg/hour/kg0.7), the improvement in fit was minimal (72.14% of variation explained), and not statistically significant, so the rat-derived values were considered acceptable and subsequently used for the human model (see the section regarding rat model optimization).
Figure C-14. Comparisons of model predictions to measured human venous blood concentrations of Kostrzewski et al. (1997) in volunteers exposed to 154 mg 1,2,4-TMB/m3 for 8 hours.
For comparisons between the data in the studies by Järnberg and colleagues (Järnberg and
Johanson, 1999; Järnberg et al., 1998, 1997a; Järnberg et al., 1996) and the model, simulations were conducted with alveolar ventilation rate (QPC; calculated as described in footnote to Table C-13) at the elevated (working) level throughout the simulation, but with no other adjustments made for exercise conditions. The model consistently under-predicted the measured venous blood concentrations of 1,2,4-TMB (Figure C-15). At 25 ppm (123 mg/m3), blood concentrations were under-predicted by a factor of 2.1−3.5 during exposure and by a factor of 1.04−1.5-fold in the post-exposure period, for a geometric mean discrepancy of 1.7 for this concentration. At 2 ppm (~10 mg/m3), blood concentrations were under-predicted by factors of 1.7−2.7 during exposure and 1.01−1.2 in the post-exposure period, for a geometric mean discrepancy of 1.6 for this concentration.
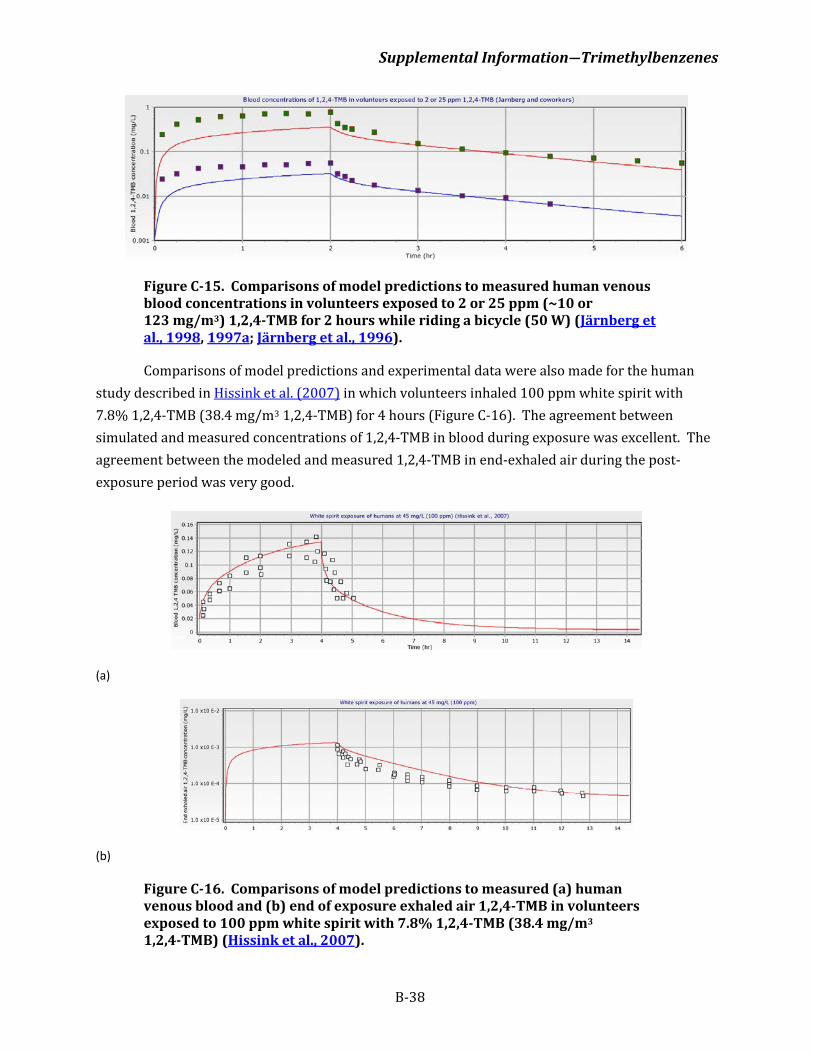
Supplemental Information―Trimethylbenzenes
B-38
Figure C-15. Comparisons of model predictions to measured human venous blood concentrations in volunteers exposed to 2 or 25 ppm (~10 or 123 mg/m3) 1,2,4-TMB for 2 hours while riding a bicycle (50 W) (Järnberg et al., 1998, 1997a; Järnberg et al., 1996).
Comparisons of model predictions and experimental data were also made for the human study described in Hissink et al. (2007) in which volunteers inhaled 100 ppm white spirit with 7.8% 1,2,4-TMB (38.4 mg/m3 1,2,4-TMB) for 4 hours (Figure C-16). The agreement between simulated and measured concentrations of 1,2,4-TMB in blood during exposure was excellent. The agreement between the modeled and measured 1,2,4-TMB in end-exhaled air during the post-exposure period was very good.
(a)
(b)
Figure C-16. Comparisons of model predictions to measured (a) human venous blood and (b) end of exposure exhaled air 1,2,4-TMB in volunteers exposed to 100 ppm white spirit with 7.8% 1,2,4-TMB (38.4 mg/m3 1,2,4-TMB) (Hissink et al., 2007).
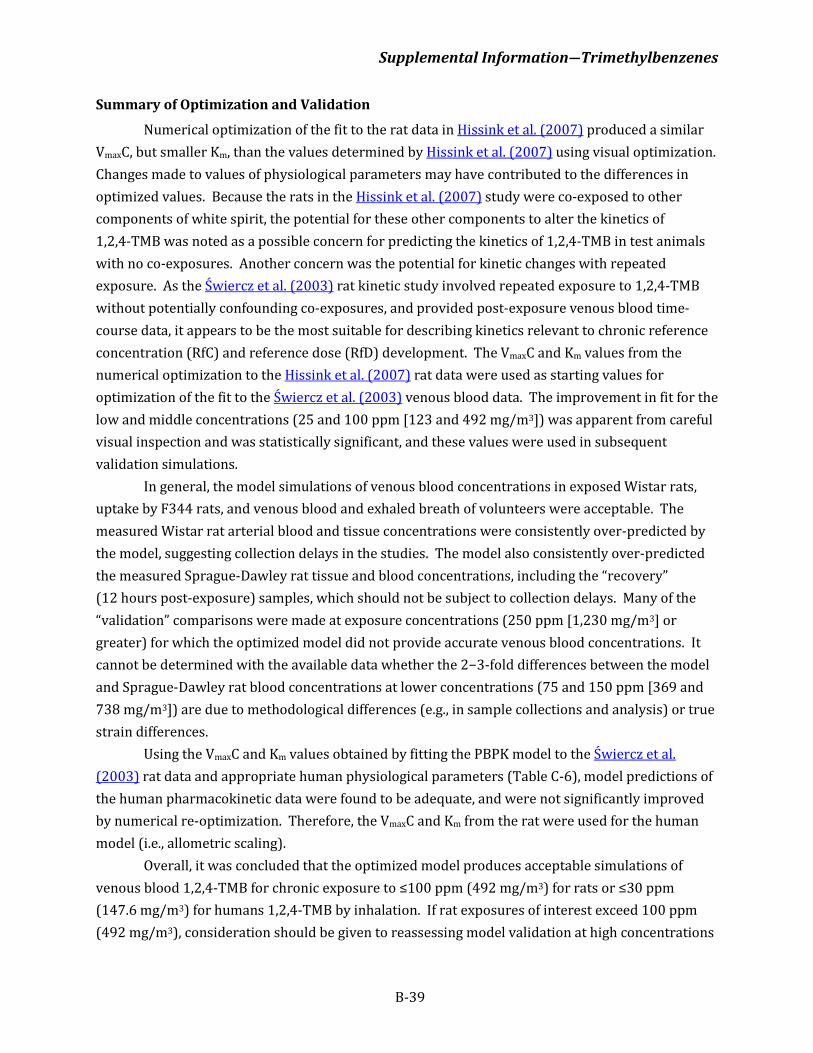
Supplemental Information―Trimethylbenzenes
B-39
Summary of Optimization and Validation
Numerical optimization of the fit to the rat data in Hissink et al. (2007) produced a similar VmaxC, but smaller Km, than the values determined by Hissink et al. (2007) using visual optimization. Changes made to values of physiological parameters may have contributed to the differences in optimized values. Because the rats in the Hissink et al. (2007) study were co-exposed to other components of white spirit, the potential for these other components to alter the kinetics of 1,2,4-TMB was noted as a possible concern for predicting the kinetics of 1,2,4-TMB in test animals with no co-exposures. Another concern was the potential for kinetic changes with repeated exposure. As the Świercz et al. (2003) rat kinetic study involved repeated exposure to 1,2,4-TMB without potentially confounding co-exposures, and provided post-exposure venous blood time-course data, it appears to be the most suitable for describing kinetics relevant to chronic reference concentration (RfC) and reference dose (RfD) development. The VmaxC and Km values from the numerical optimization to the Hissink et al. (2007) rat data were used as starting values for optimization of the fit to the Świercz et al. (2003) venous blood data. The improvement in fit for the low and middle concentrations (25 and 100 ppm [123 and 492 mg/m3]) was apparent from careful visual inspection and was statistically significant, and these values were used in subsequent validation simulations.
In general, the model simulations of venous blood concentrations in exposed Wistar rats, uptake by F344 rats, and venous blood and exhaled breath of volunteers were acceptable. The measured Wistar rat arterial blood and tissue concentrations were consistently over-predicted by the model, suggesting collection delays in the studies. The model also consistently over-predicted the measured Sprague-Dawley rat tissue and blood concentrations, including the “recovery” (12 hours post-exposure) samples, which should not be subject to collection delays. Many of the “validation” comparisons were made at exposure concentrations (250 ppm [1,230 mg/m3] or greater) for which the optimized model did not provide accurate venous blood concentrations. It cannot be determined with the available data whether the 2−3-fold differences between the model and Sprague-Dawley rat blood concentrations at lower concentrations (75 and 150 ppm [369 and 738 mg/m3]) are due to methodological differences (e.g., in sample collections and analysis) or true strain differences.
Using the VmaxC and Km values obtained by fitting the PBPK model to the Świercz et al. (2003) rat data and appropriate human physiological parameters (Table C-6), model predictions of the human pharmacokinetic data were found to be adequate, and were not significantly improved by numerical re-optimization. Therefore, the VmaxC and Km from the rat were used for the human model (i.e., allometric scaling).
Overall, it was concluded that the optimized model produces acceptable simulations of venous blood 1,2,4-TMB for chronic exposure to ≤100 ppm (492 mg/m3) for rats or ≤30 ppm (147.6 mg/m3) for humans 1,2,4-TMB by inhalation. If rat exposures of interest exceed 100 ppm (492 mg/m3), consideration should be given to reassessing model validation at high concentrations
Supplemental Information―Trimethylbenzenes
B-40
using VmaxC and Km parameters optimized for repeated, high concentration exposures (e.g., 250 ppm (1,230 mg/m3) from Świercz et al. (2003)).
Uncertainties in Model Structure
All PBPK models are a simplification of physical reality, and a full discussion of the resulting uncertainties is beyond the scope of this review. For example, this model uses the typical assumption of perfusion-limited transport between circulating blood and tissues, but a more realistic representation that also requires more data and parameters is diffusion-limited transport. If model predictions systematically over-predicted the rate of change of 1,2,4-TMB in blood, then diffusion-limited transport could have been evaluated as a more accurate model structure, but given the overall agreement in model predictions and measured kinetics, such an evaluation was not considered a valuable use of existing resources.
A simplification in the model structure used in Hissink et al. (2007) versus that of Järnberg and Johanson (1999) is that Järnberg and Johanson (1999) included working versus resting muscle compartments, which effectively allowed a higher fraction of cardiac output to go to the muscle compartment under working conditions versus resting. When simulating the corresponding human exposure data (Järnberg et al., 1998, 1997a; Järnberg et al., 1996), the Hissink et al. (2007) model was adjusted for the working conditions by increasing cardiac output, but that adjustment would increase blood flow to all tissues proportionally, including hepatic blood flow, which then can increase the predicted rate of metabolism (more so than Järnberg and Johanson, 1999). This simpler approach offers an explanation of why the blood-levels are under-predicted in Figure C-15 by ~2−3 fold. This difference suggests a comparable uncertainty in the model for predicting blood levels during working conditions, but the model matched the post-exposure data in Figure C-15 quite well, within a factor of 1.5 beyond the first couple of time-points. Hence, while the model might be improved by adding a working muscle compartment and appropriate work-level parameterization, the impact for predictions of 30 working hours in a 168-hour week are expected to be less than a factor of 1.5. (Assuming an error of 2.5-fold for 30/168 hours, the average error is 2.5*30/168 = 0.45-fold.)
Another place where systematic differences between model predictions and data suggest model structure errors is that the model over-predicted the 250 ppm rat venous blood data of Świercz et al. (2003) after 4 weeks of exposure, although it did fit the 25 and 100 ppm data (Figure C-12, panel (b)), and it fit the acute-exposure data Świercz et al. (2002) at all three concentrations (Figure C-13). The over-prediction of 1,000 ppm, 14-day rat data (Table C-12; Zahlsen et al., 1990) was significantly greater than the over-prediction of 75−450 ppm acute-exposure data (Figure C-12; Eide and Zahlsen, 1996). One possible explanation for the dose-dependence of the errors is that a first-order (or high-Km) metabolic pathway was operative only significantly at higher exposure levels. However, in that regard, one would have expected optimization of the single Km in the existing model to have identified an intermediate value that better-predicted the 250 ppm 4-week data from Świercz et al. (2003). Identifying more complex
Supplemental Information―Trimethylbenzenes
B-41
metabolic schemes is difficult using only parent-concentration in vivo data. The hypothesis of multiple metabolic pathways with differing dose-dependence would best be evaluated by careful in vitro metabolic studies, but the possibility is certainly suggested given the multiple routes of metabolism shown in Figure C-1.
A second structural possibility suggested by these discrepancies between rat model predictions and data (which is not exclusive of multiple pathway kinetics discussed in the preceding paragraph) is metabolic induction, which would be both time-dependent (i.e., would not occur, or occur to a lesser extent, with acute exposures) and concentration-dependent. The results in Table C-12, where measured blood and tissue levels decline and hence model:data ratios increase with exposure days, are particularly suggestive of this possibility. However there was not a clear time-dependent change in the 3-day study of Zahlsen et al. (1992) (Table C-10), at 100 ppm. So this hypothetical mechanism may not be relevant at exposures near the point of departure (POD) (benchmark dose [BMD] levels). In any case, verification of this hypothesis would require a combination of in vivo and in vitro studies, where liver samples are collected from rats after different exposure levels and durations, and evaluated for metabolic capacity.
A third possible explanation for the discrepancies is that, given 1,2,4-TMBs irritancy (Korsak et al., 1997), rats exposed in open cages may be reducing their activity level or otherwise finding ways to reduce their exposure. For example, by huddling or tucking their noses into their fur, the rats could be re-breathing a portion of expired air, which would then have a lower 1,2,4-TMB concentration than in the rest of the exposure chamber. Testing of this hypothesis could be performed by observation of rat behavior in open exposure chambers as a function of exposure level and duration, and comparison of results to nose-only exposures, in conjunction with plethysmography to determine any changes in respiration rates.
In summary, based on comparisons of model predictions to various data sets, it appears that the most significant structural uncertainty for the human PBPK model is the lack of realism in predicting physiological changes due to work/physical activity, but the overall impact of this uncertainty is less than a factor of 1.5. Discrepancies between the rat model and reported data suggest two model structure uncertainties (the presence of multiple metabolic pathways with significantly different concentration-dependence, and metabolic induction) and one possibility related to exposure levels or specification (avoidance behavior, which is not a part of the model itself). In the range of application, these uncertainties in the rat model for estimating venous blood levels represent a factor of 2−3-fold, though the lack of fit of the model to the data becomes more severe at higher exposure levels.
Uncertainties Due to Choice of Dose Metric
The use of the average, parent-chemical venous blood concentration as the internal dose for predicting systemic effects of 1,2,4-TMB is based on the following assumptions/general expectations:
Supplemental Information―Trimethylbenzenes
B-42
1) the parent chemical, and not a metabolite, is the causative agent for systemic effects;
2) average concentration (equivalent to the area under the curve [AUC] calculated over comparable total time in rats and humans) is a good predictor of risk;
3) the ratio of 1,2,4-TMB’s concentration in the target tissue to the venous blood is approximately the same in humans as in rats; and
4) while target-tissue concentrations are generally expected to be better predictors than blood concentration, this expectation is counter-balanced by the lack of target-tissue dosimetry in humans, leading to greater uncertainty in human target tissue estimates.
As discussed in the mode-of-action section, little is known about the mechanisms of action for 1,2,4-TMB, in particular whether the parent or a metabolite is responsible for the hematological or neurological effects. One might assume that if a metabolite is causative, then the concentration of the metabolite would vary in proportion to the parent. However, if two individuals have similar exposures, and thus absorb 1,2,4-TMB at a similar rate, but metabolism to the toxic compound is twice as fast in the second individual, then the venous concentration of 1,2,4-TMB in that individual would be lower than the first (because it’s being metabolized faster), but the rate of toxic metabolite production is higher. Likewise, the blood:air concentration ratio of 1,24-TMB in humans might be lower than in rats, but the concentration of the toxic metabolite in humans could be higher. But for this lack of proportionality to occur, the scaling of the metabolic conversion of 1,2,4-TMB to the toxic metabolite, between rats and humans, would have to be significantly different from the scaling for the rate at which the toxic metabolite is cleared from the body. Such a difference can occur, but the general expectation is that metabolism and other physiological processes that affect clearance (including blood-flow) scale allometrically, as BW0.75. In fact, for 1,2,4-TMB, the metabolism in humans was found to be fairly consistent with this scaling. Therefore, a lack in proportionality of a subsequent (toxic) metabolite would only occur if the clearance of that metabolite does NOT scale allometrically. In summary, it is possible that misidentification of the toxic metabolite could result in a very large error in the predicted human risk, but the fact that most metabolic and clearance processes scale similarly (allometrically) makes this possibility unlikely. Quantifying the resulting uncertainty is beyond the scope of this assessment.
The use of average concentration, or AUC, calculated over a similar time-frame (1 week) in rats and humans reflects the assumption that the observed hematological and neurological effects result from an accumulation of cellular or tissue damage, that the damage accumulates in proportion to 1,2,4-TMB concentration, and that clearance or repair of the damage is relatively slow (i.e., requires weeks or longer). Testing of this hypothesis would require a set of experiments where exposure level and duration were varied independently (i.e., C × t experiments), and damage was assessed at multiple recovery times. Such data are mostly not available for 1,2,4-TMB. However, the hematological effects are likely the result of cytotoxicity, which is expected to
Supplemental Information―Trimethylbenzenes
B-43
increase with both concentration and duration. Therefore, the uncertainty for using average concentration for this endpoint is considered low.
Since the dose-dependent delayed recovery from a sensory challenge (footshock/paw-lick experiments) shows a persistent effect, 50+ days after exposure ended, that effect is also assumed to result from cumulative damage, rather than a single day of exposure. Whether the same effect level would have been seen after a single week’s exposure, or if chronic exposure might have resulted in a more severe effect at a given exposure level, is simply not known. The uncertainty in using subchronic exposure data to set a reference level is mitigated by application of the subchronic-to-chronic uncertainty factor (UFS). The use of the weekly average (blood) concentration is still appropriate, even if the effect only takes 1−2 weeks to develop, since the damage is still likely to accumulate within that time-frame according to the number of hours/week of exposure. For a presumed continuous (24 × 7) inhalation exposure to the general human population, use of weekly average concentration results in a more appropriate reference level than use of peak concentration. If the effect is not cumulative for exposure beyond several hours (i.e., can be better predicted from peak concentration), then use of the weekly average would over-predict human risk by a factor of 5−6 (~168 hours/30 hours).
The use of venous blood versus tissue concentrations creates some uncertainty, but this uncertainty is counterbalanced by uncertainties in the exact tissues where effects occur and the partitioning of 1,2,4-TMB into those tissues. The tissue:blood partition coefficients of Hissink et al. (2007) are obtained by combining a correlation for tissue:air partition coefficients, developed previously using data for a single representative tissue from a single species, against oil:air and saline:air partition coefficients (which have been measured for 1,2,4-TMB), with values for the blood:air partition coefficient measured separately with rat and human blood. So there is considerable uncertainty in the use of these partition coefficients for human versus rat bone marrow, for example (assuming that this is the site for hematological effects), given that species- and chemical-specific values for bone marrow are not available. The measured blood:air partition coefficients for 1,2,4-TMB indicate that its affinity for human blood is 1.74 times lower than for rat blood, so if the typical assumption was made that the affinity for other tissues does not vary across species, then use of tissue versus venous blood concentration would result in an approximately 1.7-fold increase in the estimated human risk. However, such use would also increase the level of uncertainty because there are no human tissue data to validate those model predictions, and because the site of action is uncertain. For example, it’s not known if the neurological effects occur primarily due to effects in the brain or to effects on peripheral nerves, and, if the latter, whether the partition coefficient for “brain” versus “slowly perfused” tissue (which differ ~2-fold) should be used. As with other aspects of uncertainty, a full quantitation of the uncertainty resulting from the use of venous blood versus tissue concentrations is beyond the scope of this assessment. But the identifiable uncertainty is less than a factor of 2. The direction of this uncertainty is the opposite of that from using average versus peak concentration for continuous human exposures.

Supplemental Information―Trimethylbenzenes
B-44
C.2.3.3. Sensitivity Analysis of Rat Model Predictions
The primary objective of the sensitivity analysis was to evaluate the ability of the available data to unambiguously determine the values of both VmaxC and Km (i.e., parameter identifiability). Toward this end, sensitivity analyses were conducted using acslX. Because the selected key data set was the venous blood concentrations in the Świercz et al. (2003) study, simulations were conducted to see how small changes in parameters changed the estimated venous blood concentrations under the conditions of this study, simulating the first 12 hours (6 hours of exposure, 6 hours post-exposure), conditions that are essentially identical to those in Świercz et al. (2002). The evaluations were limited to the lowest (25 ppm [123 mg/m3]) and highest (250 ppm [1,230 mg/m3]) exposure concentrations. It should be noted that after the optimization (Figure C-13b), the agreement between the model and the experimental data at the lower exposure concentration was superior to the agreement at the high concentration, so the low concentration sensitivity analysis results are somewhat more meaningful than the high concentration results. The results are calculated as normalized sensitivity coefficients (NSC) (i.e., percent change in output/percent change in input, calculated using the central difference method).
The interpretation of the sensitivity analysis outputs focused on the times during which blood concentrations were measured, so the sensitivity analyses for the first 15 minutes of exposure were not considered relevant. Parameters are grouped (Table C-14) as relatively insensitive (maximum|NSC| < 0.2 for 0.25 hours < t < 12 hours), moderately sensitive (0.2 < maximum|NSC| < 1.0), or highly sensitive (maximum|NSC| > 1.0).
VmaxC/Km was identifiable from the data (as opposed to VmaxC and Km each being identifiable); one would expect that the NSC for these parameters would always be opposite in sign, and equal in magnitude, which is not the case. It was concluded that Km and VmaxC are distinctly identifiable using the Świercz et al. (2003) and Świercz et al. (2002) data.
While the focus of this sensitivity analysis was to evaluate the identifiability of chemical-specific parameters from the available data, additional insights can be obtained by considering the other “sensitive” parameters. Predicted blood concentrations were sensitive to the value of QPC (ventilation rate). If high concentrations produce a sedative effect, decreases in ventilation could contribute to the model’s greater over-prediction of the experimentally measured values at high concentrations (e.g., as high as 1,000 ppm [4,920 mg/m3], in Zahlsen et al. (1990)). The accuracy of the predicted net uptake in the Dahl et al. (1988) study indicates that, at 100 ppm (492 mg/m3), the model value of QPC is likely appropriate, since net uptake in this relatively short experiment (80 minutes) is highly sensitive to the breathing rate (simulations not shown). The fractional volumes of the fat and slowly perfused tissue compartments are also moderately important parameters (with time courses similar to those of the corresponding partition coefficients shown in Figure C-17). The volume of the fat compartment in particular is known to vary with age and strain (Brown et al., 1997), so using the same value for all studies might have an impact on the predicted kinetics.
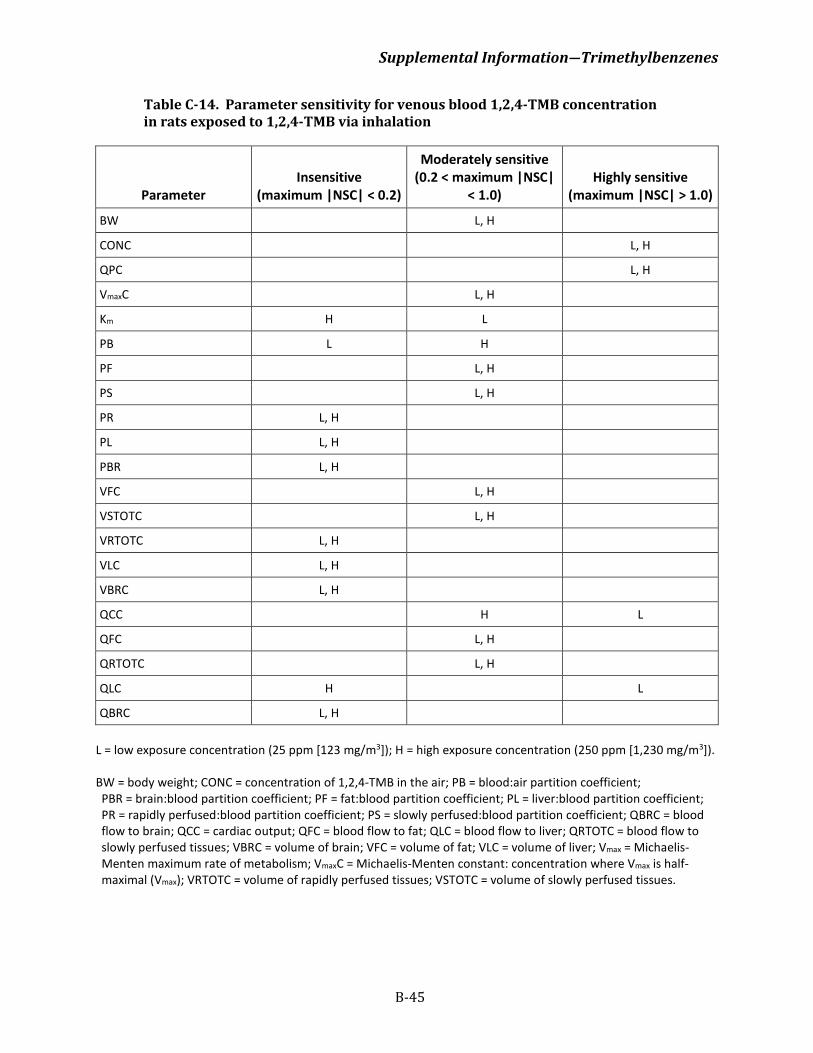
Supplemental Information―Trimethylbenzenes
B-45
Table C-14. Parameter sensitivity for venous blood 1,2,4-TMB concentration in rats exposed to 1,2,4-TMB via inhalation
Parameter Insensitive
(maximum |NSC| < 0.2)
Moderately sensitive (0.2 < maximum |NSC|
< 1.0) Highly sensitive
(maximum |NSC| > 1.0)
BW L, H
CONC L, H
QPC L, H
VmaxC L, H
Km H L
PB L H
PF L, H
PS L, H
PR L, H
PL L, H
PBR L, H
VFC L, H
VSTOTC L, H
VRTOTC L, H
VLC L, H
VBRC L, H
QCC H L
QFC L, H
QRTOTC L, H
QLC H L
QBRC L, H L = low exposure concentration (25 ppm [123 mg/m3]); H = high exposure concentration (250 ppm [1,230 mg/m3]). BW = body weight; CONC = concentration of 1,2,4-TMB in the air; PB = blood:air partition coefficient; PBR = brain:blood partition coefficient; PF = fat:blood partition coefficient; PL = liver:blood partition coefficient; PR = rapidly perfused:blood partition coefficient; PS = slowly perfused:blood partition coefficient; QBRC = blood flow to brain; QCC = cardiac output; QFC = blood flow to fat; QLC = blood flow to liver; QRTOTC = blood flow to slowly perfused tissues; VBRC = volume of brain; VFC = volume of fat; VLC = volume of liver; Vmax = Michaelis-Menten maximum rate of metabolism; VmaxC = Michaelis-Menten constant: concentration where Vmax is half-maximal (Vmax); VRTOTC = volume of rapidly perfused tissues; VSTOTC = volume of slowly perfused tissues.
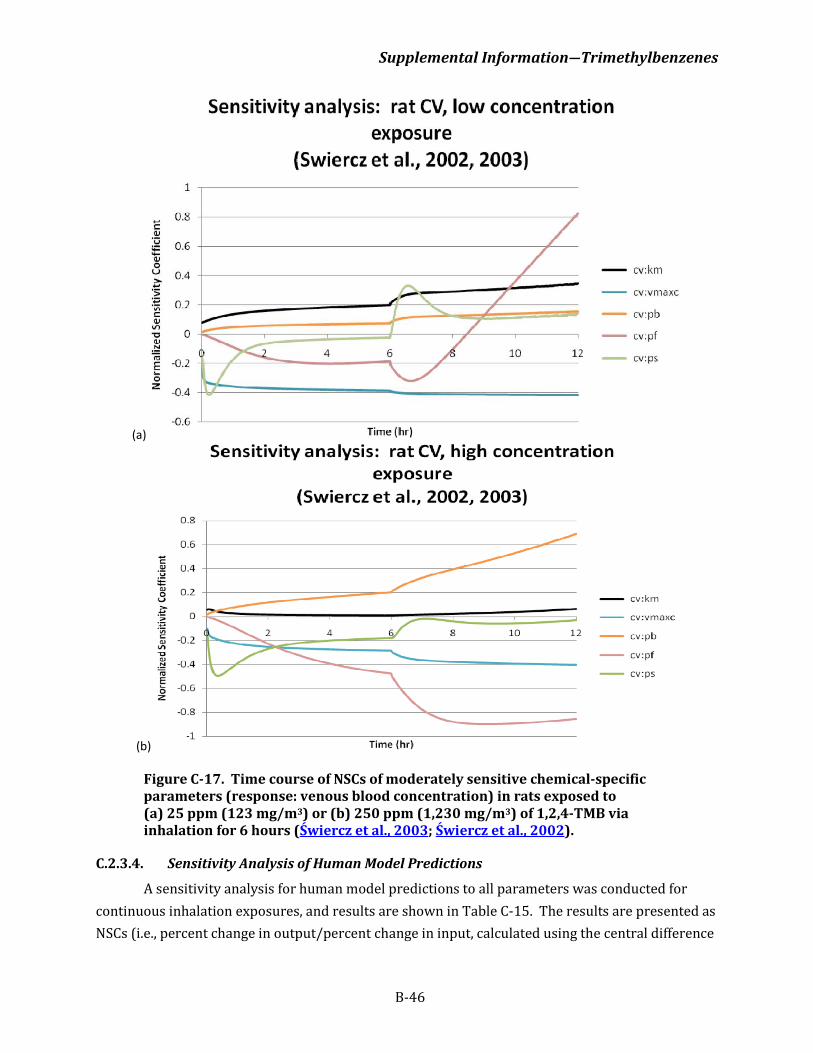
Supplemental Information―Trimethylbenzenes
B-46
(a)
(b)
Figure C-17. Time course of NSCs of moderately sensitive chemical-specific parameters (response: venous blood concentration) in rats exposed to (a) 25 ppm (123 mg/m3) or (b) 250 ppm (1,230 mg/m3) of 1,2,4-TMB via inhalation for 6 hours (Świercz et al., 2003; Świercz et al., 2002).
C.2.3.4. Sensitivity Analysis of Human Model Predictions
A sensitivity analysis for human model predictions to all parameters was conducted for continuous inhalation exposures, and results are shown in Table C-15. The results are presented as NSCs (i.e., percent change in output/percent change in input, calculated using the central difference
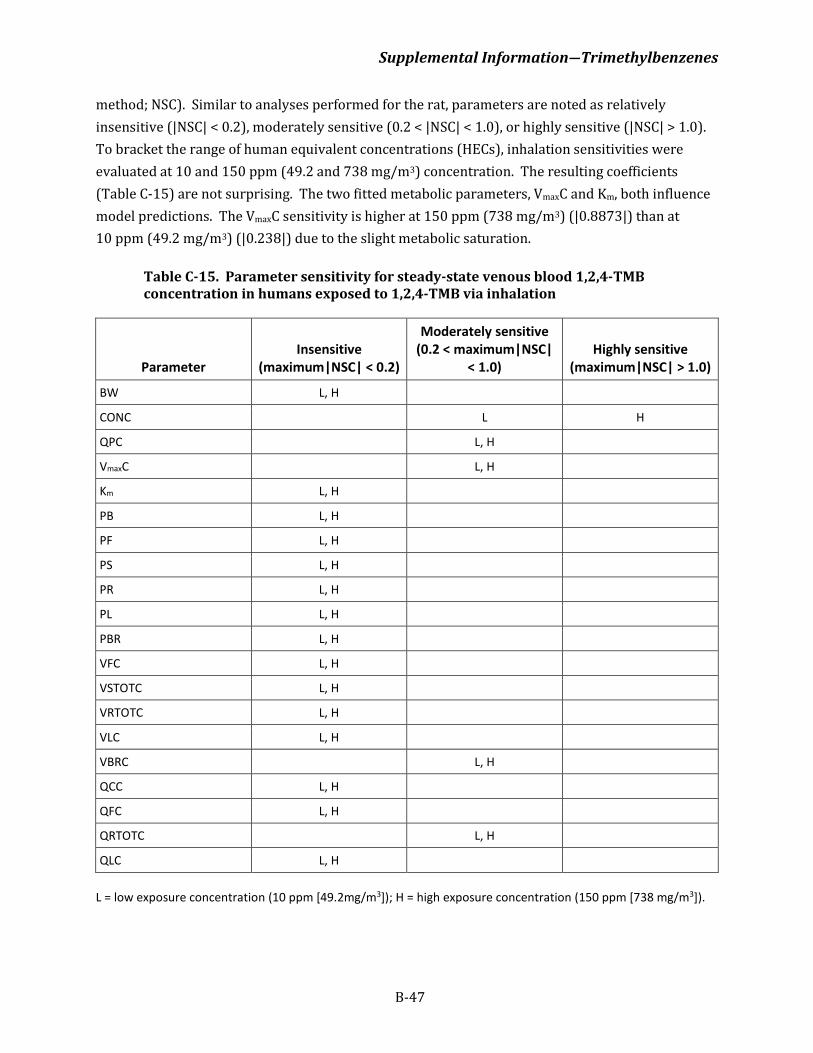
Supplemental Information―Trimethylbenzenes
B-47
method; NSC). Similar to analyses performed for the rat, parameters are noted as relatively insensitive (|NSC| < 0.2), moderately sensitive (0.2 < |NSC| < 1.0), or highly sensitive (|NSC| > 1.0). To bracket the range of human equivalent concentrations (HECs), inhalation sensitivities were evaluated at 10 and 150 ppm (49.2 and 738 mg/m3) concentration. The resulting coefficients (Table C-15) are not surprising. The two fitted metabolic parameters, VmaxC and Km, both influence model predictions. The VmaxC sensitivity is higher at 150 ppm (738 mg/m3) (|0.8873|) than at 10 ppm (49.2 mg/m3) (|0.238|) due to the slight metabolic saturation.
Table C-15. Parameter sensitivity for steady-state venous blood 1,2,4-TMB concentration in humans exposed to 1,2,4-TMB via inhalation
Parameter Insensitive
(maximum|NSC| < 0.2)
Moderately sensitive (0.2 < maximum|NSC|
< 1.0) Highly sensitive
(maximum|NSC| > 1.0)
BW L, H
CONC L H
QPC L, H
VmaxC L, H
Km L, H
PB L, H
PF L, H
PS L, H
PR L, H
PL L, H
PBR L, H
VFC L, H
VSTOTC L, H
VRTOTC L, H
VLC L, H
VBRC L, H
QCC L, H
QFC L, H
QRTOTC L, H
QLC L, H L = low exposure concentration (10 ppm [49.2mg/m3]); H = high exposure concentration (150 ppm [738 mg/m3]).
Supplemental Information―Trimethylbenzenes
B-48
C.2.3.5. Modification of the Hissink et al. (2007) model to include oral route of exposure
For derivation of an oral RfD, the updated 1,2,4-TMB PBPK model based on Hissink et al. (2007) was further modified by adding code for continuous oral ingestion. It was assumed that 100% of the ingested 1,2,4-TMB is absorbed by constant infusion of the oral dose into the liver compartment. There were no oral data available to calibrate the model for oral absorption, and no data were available to evaluate the model predictions following oral ingestion either. Thus, although the assumption that 100% of the dose would enter the liver is a common assumption, it does represent an area of uncertainty in the route-to-route extrapolation used to derive oral reference values. To more accurately approximate patterns of human oral ingestion, ingestion was simulated as an idealized pattern of six events, each lasting 30 minutes. Twenty-five percent of the total daily dose was assumed to be ingested at each of three events beginning at 7 am, 12 pm (noon), and 6 pm (total of 75%). Ten percent of the daily dose was assumed to be ingested at events beginning at 10 am and 3 pm (total of 20%). The final 5% was assumed to be ingested in an event beginning at 10 pm. After the daily blood concentration profile achieved a repeating pattern, or periodicity, the weekly average blood concentration was then used to determine the human equivalent dose (HED).
The contribution of the first-pass metabolism in the liver for oral dosing was evaluated by simulating steady-state venous blood levels (at the end of 50 days of continuous exposure) for a standard human at rest (70 kg) for a range of concentrations and doses. For ease of visual comparison (Figure C-18), concentrations were converted to daily doses based on the amount of 1,2,4-TMB inhaled, as computed by the model. (An inhaled concentration of 0.001 mg/L [0.20 ppm (0.98 mg/m3)] is equivalent to an inhaled dose of 0.12 mg/kg-day.) At both very low and very high daily doses by inhalation or oral dosing, steady-state CV is essentially linear with respect to the daily dose, but with different CV/dose ratios and a transition zone between 1 and 100 mg/kg-day. At low daily doses, equivalent inhalation doses result in steady-state blood concentrations 4-fold higher than an equivalent oral dose due to the hepatic first-pass effect. The first-pass effect becomes insignificant with respect to steady-state venous blood concentrations for daily doses in excess of ~50 mg/kg-day.
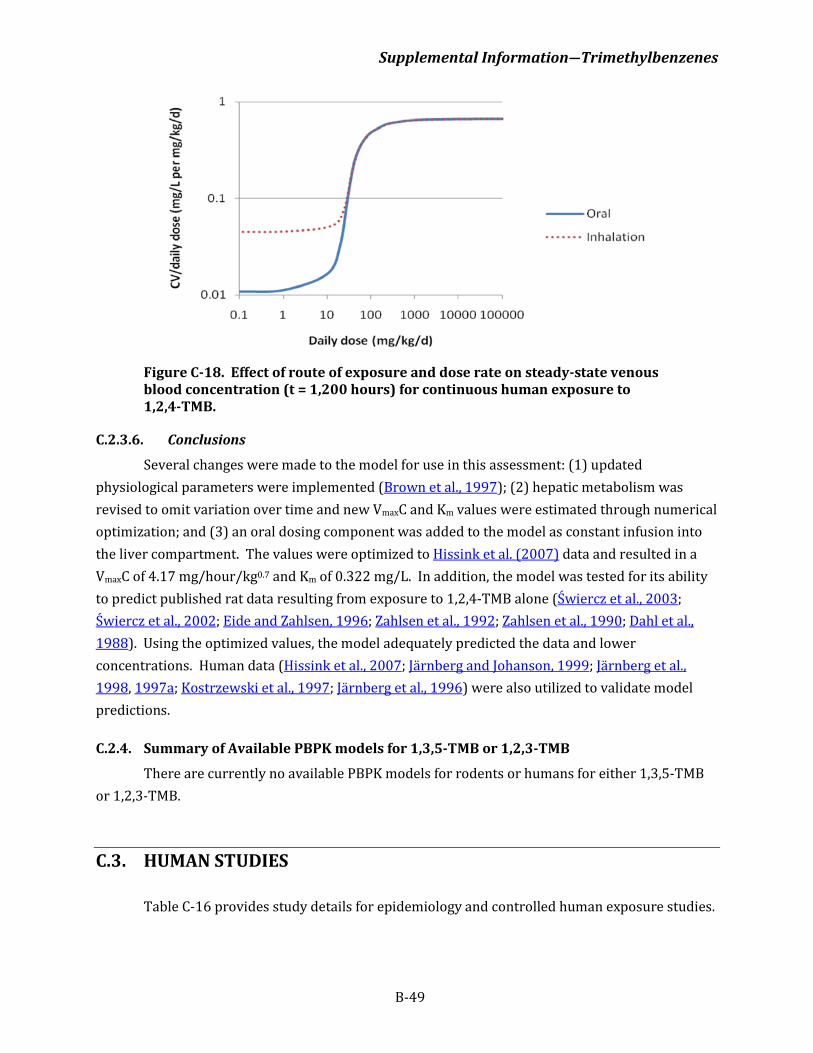
Supplemental Information―Trimethylbenzenes
B-49
Figure C-18. Effect of route of exposure and dose rate on steady-state venous blood concentration (t = 1,200 hours) for continuous human exposure to 1,2,4-TMB.
C.2.3.6. Conclusions
Several changes were made to the model for use in this assessment: (1) updated physiological parameters were implemented (Brown et al., 1997); (2) hepatic metabolism was revised to omit variation over time and new VmaxC and Km values were estimated through numerical optimization; and (3) an oral dosing component was added to the model as constant infusion into the liver compartment. The values were optimized to Hissink et al. (2007) data and resulted in a VmaxC of 4.17 mg/hour/kg0.7 and Km of 0.322 mg/L. In addition, the model was tested for its ability to predict published rat data resulting from exposure to 1,2,4-TMB alone (Świercz et al., 2003; Świercz et al., 2002; Eide and Zahlsen, 1996; Zahlsen et al., 1992; Zahlsen et al., 1990; Dahl et al., 1988). Using the optimized values, the model adequately predicted the data and lower concentrations. Human data (Hissink et al., 2007; Järnberg and Johanson, 1999; Järnberg et al., 1998, 1997a; Kostrzewski et al., 1997; Järnberg et al., 1996) were also utilized to validate model predictions.
C.2.4. Summary of Available PBPK models for 1,3,5-TMB or 1,2,3-TMB
There are currently no available PBPK models for rodents or humans for either 1,3,5-TMB or 1,2,3-TMB.
C.3. HUMAN STUDIES Table C-16 provides study details for epidemiology and controlled human exposure studies.
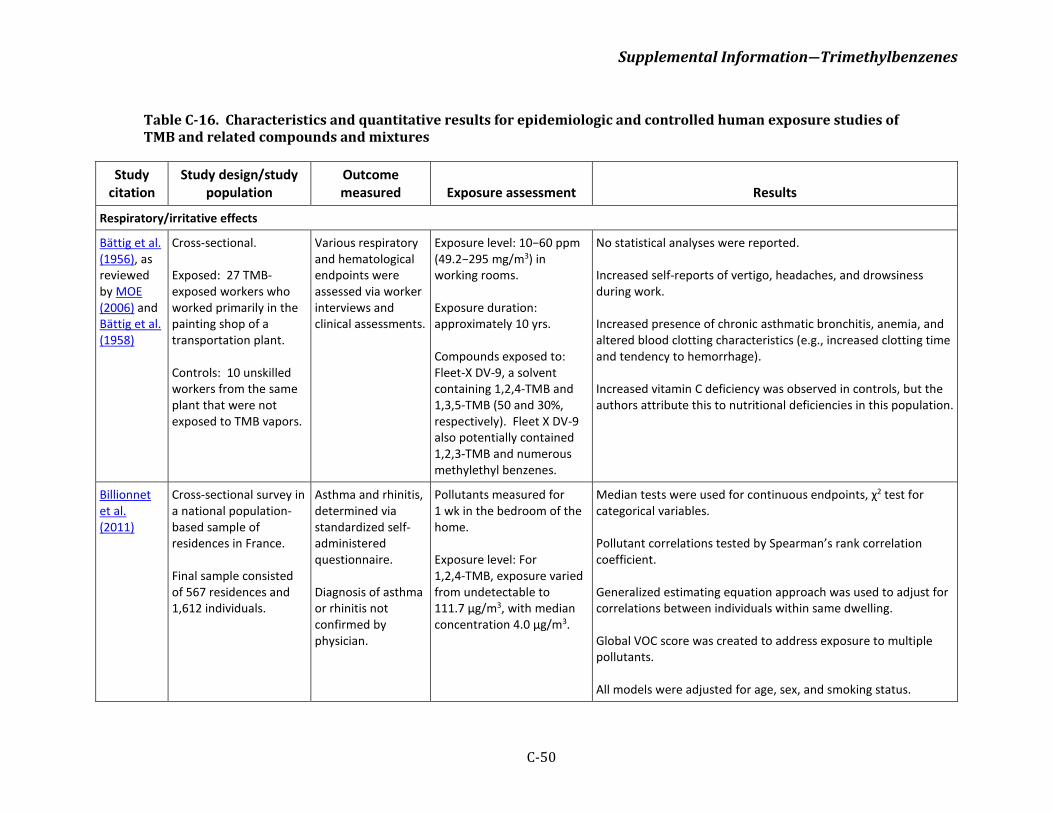
Supplemental Information―Trimethylbenzenes
C-50
Table C-16. Characteristics and quantitative results for epidemiologic and controlled human exposure studies of TMB and related compounds and mixtures
Study citation
Study design/study population
Outcome measured Exposure assessment Results
Respiratory/irritative effects
Bättig et al. (1956), as reviewed by MOE (2006) and Bättig et al. (1958)
Cross-sectional. Exposed: 27 TMB-exposed workers who worked primarily in the painting shop of a transportation plant. Controls: 10 unskilled workers from the same plant that were not exposed to TMB vapors.
Various respiratory and hematological endpoints were assessed via worker interviews and clinical assessments.
Exposure level: 10−60 ppm (49.2−295 mg/m3) in working rooms. Exposure duration: approximately 10 yrs. Compounds exposed to: Fleet-X DV-9, a solvent containing 1,2,4-TMB and 1,3,5-TMB (50 and 30%, respectively). Fleet X DV-9 also potentially contained 1,2,3-TMB and numerous methylethyl benzenes.
No statistical analyses were reported. Increased self-reports of vertigo, headaches, and drowsiness during work. Increased presence of chronic asthmatic bronchitis, anemia, and altered blood clotting characteristics (e.g., increased clotting time and tendency to hemorrhage). Increased vitamin C deficiency was observed in controls, but the authors attribute this to nutritional deficiencies in this population.
Billionnet et al. (2011)
Cross-sectional survey in a national population-based sample of residences in France. Final sample consisted of 567 residences and 1,612 individuals.
Asthma and rhinitis, determined via standardized self-administered questionnaire. Diagnosis of asthma or rhinitis not confirmed by physician.
Pollutants measured for 1 wk in the bedroom of the home. Exposure level: For 1,2,4-TMB, exposure varied from undetectable to 111.7 µg/m3, with median concentration 4.0 µg/m3.
Median tests were used for continuous endpoints, χ2 test for categorical variables. Pollutant correlations tested by Spearman’s rank correlation coefficient. Generalized estimating equation approach was used to adjust for correlations between individuals within same dwelling. Global VOC score was created to address exposure to multiple pollutants. All models were adjusted for age, sex, and smoking status.
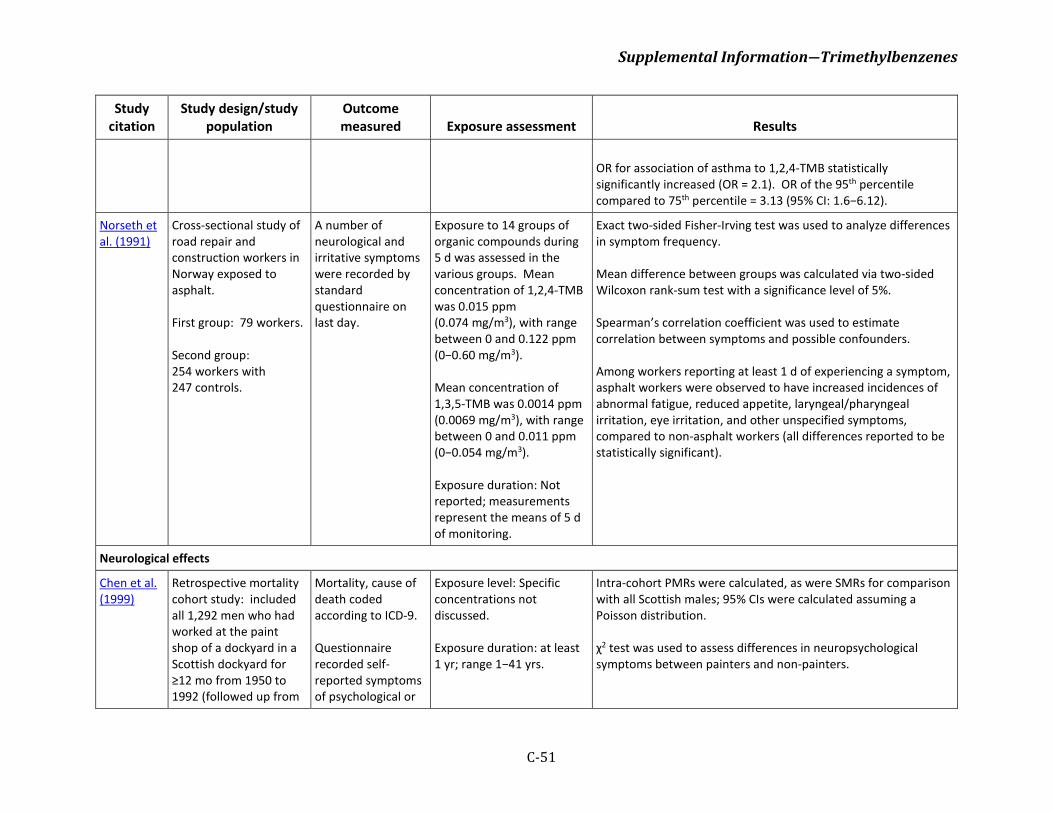
Supplemental Information―Trimethylbenzenes
C-51
Study citation
Study design/study population
Outcome measured Exposure assessment Results
OR for association of asthma to 1,2,4-TMB statistically significantly increased (OR = 2.1). OR of the 95th percentile compared to 75th percentile = 3.13 (95% CI: 1.6−6.12).
Norseth et al. (1991)
Cross-sectional study of road repair and construction workers in Norway exposed to asphalt. First group: 79 workers. Second group: 254 workers with 247 controls.
A number of neurological and irritative symptoms were recorded by standard questionnaire on last day.
Exposure to 14 groups of organic compounds during 5 d was assessed in the various groups. Mean concentration of 1,2,4-TMB was 0.015 ppm (0.074 mg/m3), with range between 0 and 0.122 ppm (0−0.60 mg/m3). Mean concentration of 1,3,5-TMB was 0.0014 ppm (0.0069 mg/m3), with range between 0 and 0.011 ppm (0−0.054 mg/m3). Exposure duration: Not reported; measurements represent the means of 5 d of monitoring.
Exact two-sided Fisher-Irving test was used to analyze differences in symptom frequency. Mean difference between groups was calculated via two-sided Wilcoxon rank-sum test with a significance level of 5%. Spearman’s correlation coefficient was used to estimate correlation between symptoms and possible confounders. Among workers reporting at least 1 d of experiencing a symptom, asphalt workers were observed to have increased incidences of abnormal fatigue, reduced appetite, laryngeal/pharyngeal irritation, eye irritation, and other unspecified symptoms, compared to non-asphalt workers (all differences reported to be statistically significant).
Neurological effects
Chen et al. (1999)
Retrospective mortality cohort study: included all 1,292 men who had worked at the paint shop of a dockyard in a Scottish dockyard for ≥12 mo from 1950 to 1992 (followed up from
Mortality, cause of death coded according to ICD-9. Questionnaire recorded self-reported symptoms of psychological or
Exposure level: Specific concentrations not discussed. Exposure duration: at least 1 yr; range 1−41 yrs.
Intra-cohort PMRs were calculated, as were SMRs for comparison with all Scottish males; 95% CIs were calculated assuming a Poisson distribution. χ2 test was used to assess differences in neuropsychological symptoms between painters and non-painters.
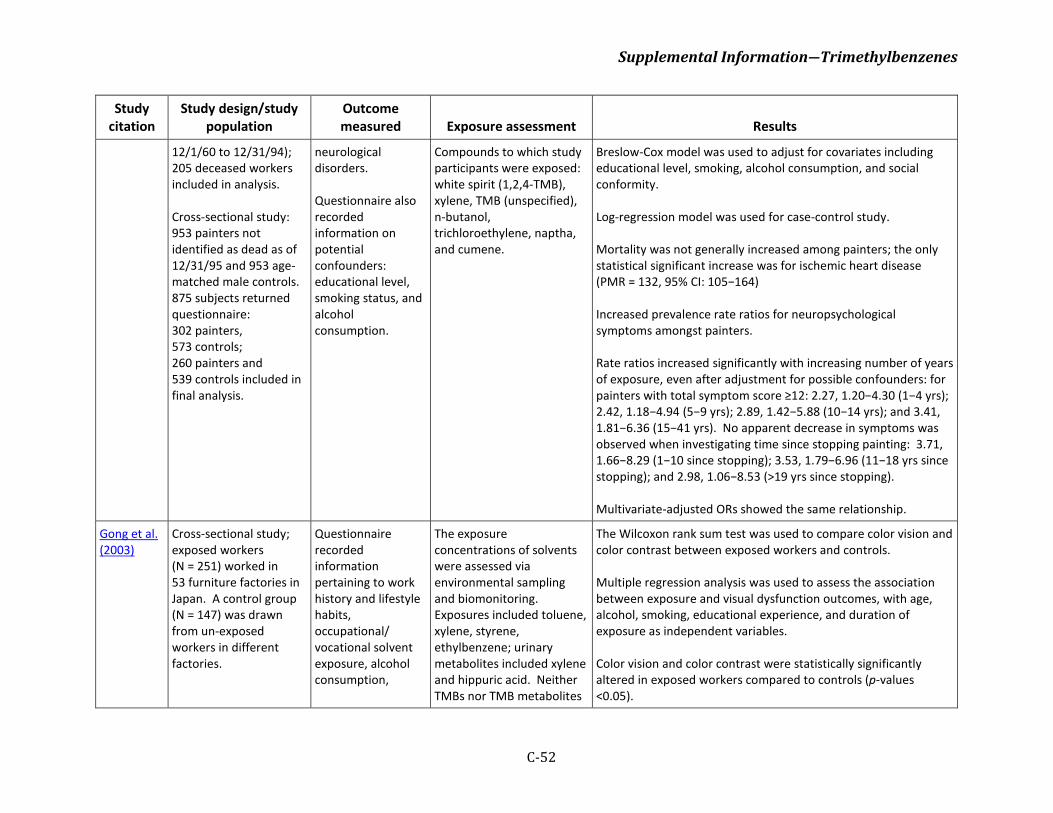
Supplemental Information―Trimethylbenzenes
C-52
Study citation
Study design/study population
Outcome measured Exposure assessment Results
12/1/60 to 12/31/94); 205 deceased workers included in analysis. Cross-sectional study: 953 painters not identified as dead as of 12/31/95 and 953 age-matched male controls. 875 subjects returned questionnaire: 302 painters, 573 controls; 260 painters and 539 controls included in final analysis.
neurological disorders. Questionnaire also recorded information on potential confounders: educational level, smoking status, and alcohol consumption.
Compounds to which study participants were exposed: white spirit (1,2,4-TMB), xylene, TMB (unspecified), n-butanol, trichloroethylene, naptha, and cumene.
Breslow-Cox model was used to adjust for covariates including educational level, smoking, alcohol consumption, and social conformity. Log-regression model was used for case-control study. Mortality was not generally increased among painters; the only statistical significant increase was for ischemic heart disease (PMR = 132, 95% CI: 105−164) Increased prevalence rate ratios for neuropsychological symptoms amongst painters. Rate ratios increased significantly with increasing number of years of exposure, even after adjustment for possible confounders: for painters with total symptom score ≥12: 2.27, 1.20−4.30 (1−4 yrs); 2.42, 1.18−4.94 (5−9 yrs); 2.89, 1.42−5.88 (10−14 yrs); and 3.41, 1.81−6.36 (15−41 yrs). No apparent decrease in symptoms was observed when investigating time since stopping painting: 3.71, 1.66−8.29 (1−10 since stopping); 3.53, 1.79−6.96 (11−18 yrs since stopping); and 2.98, 1.06−8.53 (>19 yrs since stopping). Multivariate-adjusted ORs showed the same relationship.
Gong et al. (2003)
Cross-sectional study; exposed workers (N = 251) worked in 53 furniture factories in Japan. A control group (N = 147) was drawn from un-exposed workers in different factories.
Questionnaire recorded information pertaining to work history and lifestyle habits, occupational/ vocational solvent exposure, alcohol consumption,
The exposure concentrations of solvents were assessed via environmental sampling and biomonitoring. Exposures included toluene, xylene, styrene, ethylbenzene; urinary metabolites included xylene and hippuric acid. Neither TMBs nor TMB metabolites
The Wilcoxon rank sum test was used to compare color vision and color contrast between exposed workers and controls. Multiple regression analysis was used to assess the association between exposure and visual dysfunction outcomes, with age, alcohol, smoking, educational experience, and duration of exposure as independent variables. Color vision and color contrast were statistically significantly altered in exposed workers compared to controls (p-values <0.05).
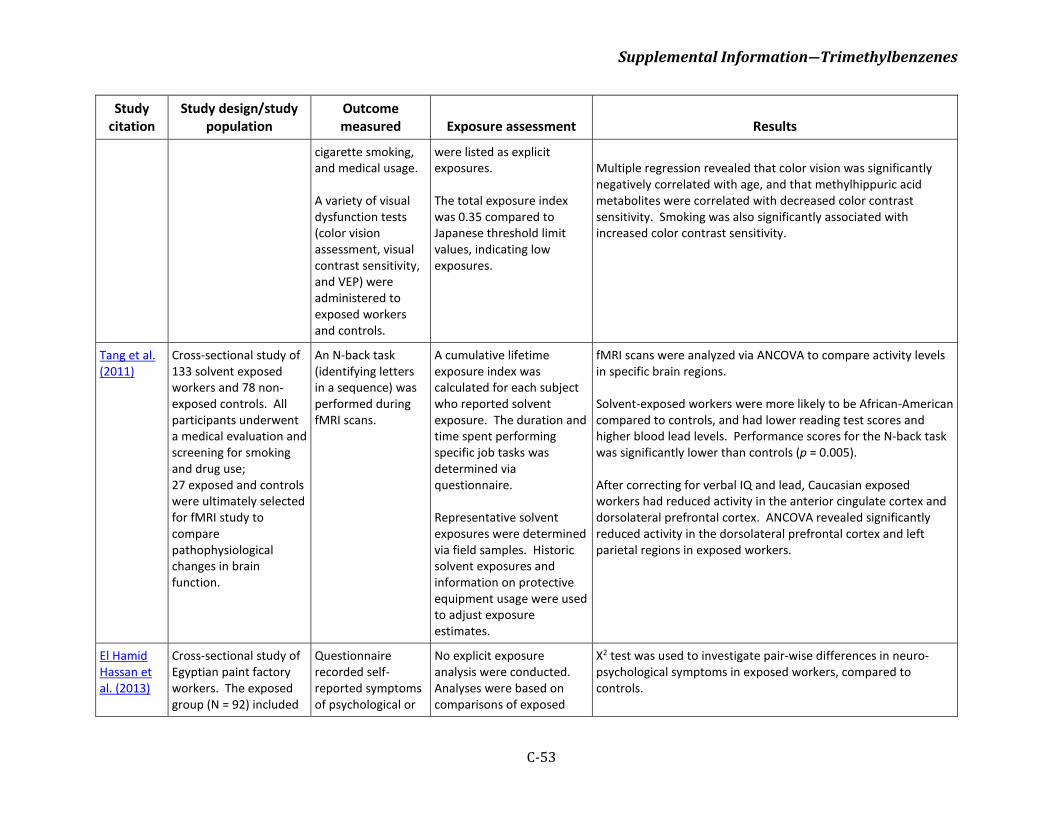
Supplemental Information―Trimethylbenzenes
C-53
Study citation
Study design/study population
Outcome measured Exposure assessment Results
cigarette smoking, and medical usage. A variety of visual dysfunction tests (color vision assessment, visual contrast sensitivity, and VEP) were administered to exposed workers and controls.
were listed as explicit exposures. The total exposure index was 0.35 compared to Japanese threshold limit values, indicating low exposures.
Multiple regression revealed that color vision was significantly negatively correlated with age, and that methylhippuric acid metabolites were correlated with decreased color contrast sensitivity. Smoking was also significantly associated with increased color contrast sensitivity.
Tang et al. (2011)
Cross-sectional study of 133 solvent exposed workers and 78 non-exposed controls. All participants underwent a medical evaluation and screening for smoking and drug use; 27 exposed and controls were ultimately selected for fMRI study to compare pathophysiological changes in brain function.
An N-back task (identifying letters in a sequence) was performed during fMRI scans.
A cumulative lifetime exposure index was calculated for each subject who reported solvent exposure. The duration and time spent performing specific job tasks was determined via questionnaire. Representative solvent exposures were determined via field samples. Historic solvent exposures and information on protective equipment usage were used to adjust exposure estimates.
fMRI scans were analyzed via ANCOVA to compare activity levels in specific brain regions. Solvent-exposed workers were more likely to be African-American compared to controls, and had lower reading test scores and higher blood lead levels. Performance scores for the N-back task was significantly lower than controls (p = 0.005). After correcting for verbal IQ and lead, Caucasian exposed workers had reduced activity in the anterior cingulate cortex and dorsolateral prefrontal cortex. ANCOVA revealed significantly reduced activity in the dorsolateral prefrontal cortex and left parietal regions in exposed workers.
El Hamid Hassan et al. (2013)
Cross-sectional study of Egyptian paint factory workers. The exposed group (N = 92) included
Questionnaire recorded self-reported symptoms of psychological or
No explicit exposure analysis were conducted. Analyses were based on comparisons of exposed
Χ2 test was used to investigate pair-wise differences in neuro-psychological symptoms in exposed workers, compared to controls.
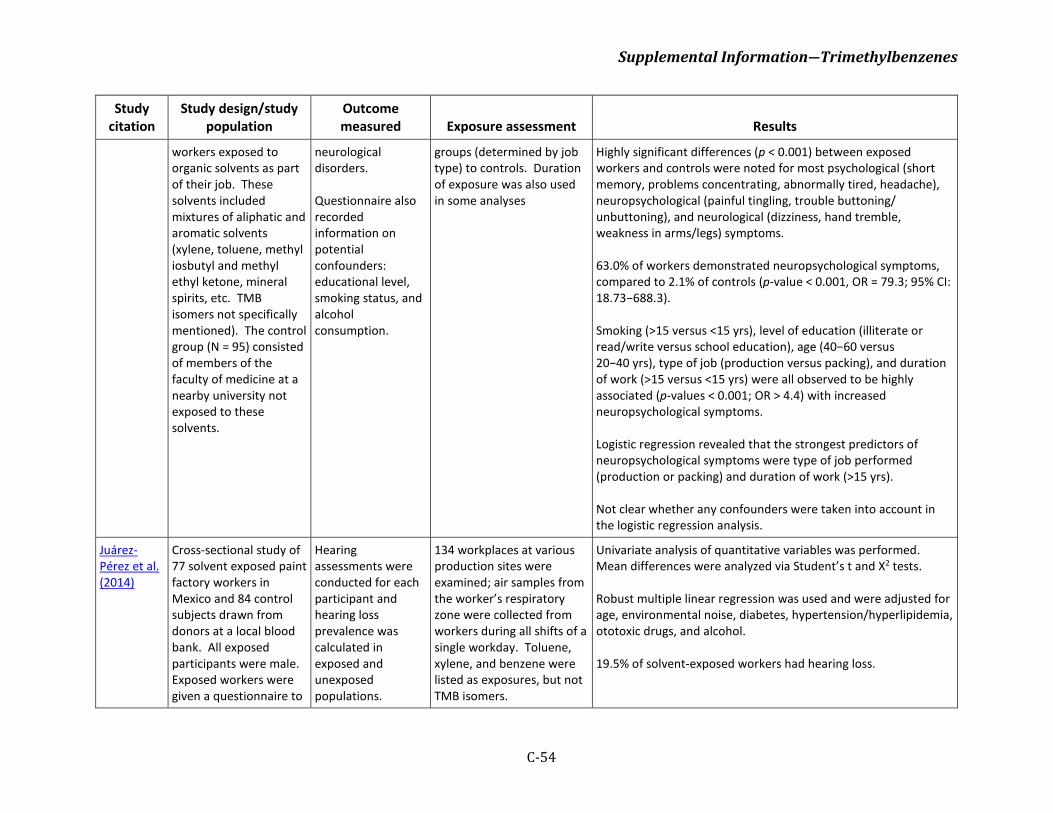
Supplemental Information―Trimethylbenzenes
C-54
Study citation
Study design/study population
Outcome measured Exposure assessment Results
workers exposed to organic solvents as part of their job. These solvents included mixtures of aliphatic and aromatic solvents (xylene, toluene, methyl iosbutyl and methyl ethyl ketone, mineral spirits, etc. TMB isomers not specifically mentioned). The control group (N = 95) consisted of members of the faculty of medicine at a nearby university not exposed to these solvents.
neurological disorders. Questionnaire also recorded information on potential confounders: educational level, smoking status, and alcohol consumption.
groups (determined by job type) to controls. Duration of exposure was also used in some analyses
Highly significant differences (p < 0.001) between exposed workers and controls were noted for most psychological (short memory, problems concentrating, abnormally tired, headache), neuropsychological (painful tingling, trouble buttoning/unbuttoning), and neurological (dizziness, hand tremble, weakness in arms/legs) symptoms. 63.0% of workers demonstrated neuropsychological symptoms, compared to 2.1% of controls (p-value < 0.001, OR = 79.3; 95% CI: 18.73−688.3). Smoking (>15 versus <15 yrs), level of education (illiterate or read/write versus school education), age (40−60 versus 20−40 yrs), type of job (production versus packing), and duration of work (>15 versus <15 yrs) were all observed to be highly associated (p-values < 0.001; OR > 4.4) with increased neuropsychological symptoms. Logistic regression revealed that the strongest predictors of neuropsychological symptoms were type of job performed (production or packing) and duration of work (>15 yrs). Not clear whether any confounders were taken into account in the logistic regression analysis.
Juárez-Pérez et al. (2014)
Cross-sectional study of 77 solvent exposed paint factory workers in Mexico and 84 control subjects drawn from donors at a local blood bank. All exposed participants were male. Exposed workers were given a questionnaire to
Hearing assessments were conducted for each participant and hearing loss prevalence was calculated in exposed and unexposed populations.
134 workplaces at various production sites were examined; air samples from the worker’s respiratory zone were collected from workers during all shifts of a single workday. Toluene, xylene, and benzene were listed as exposures, but not TMB isomers.
Univariate analysis of quantitative variables was performed. Mean differences were analyzed via Student’s t and Χ2 tests. Robust multiple linear regression was used and were adjusted for age, environmental noise, diabetes, hypertension/hyperlipidemia, ototoxic drugs, and alcohol. 19.5% of solvent-exposed workers had hearing loss.
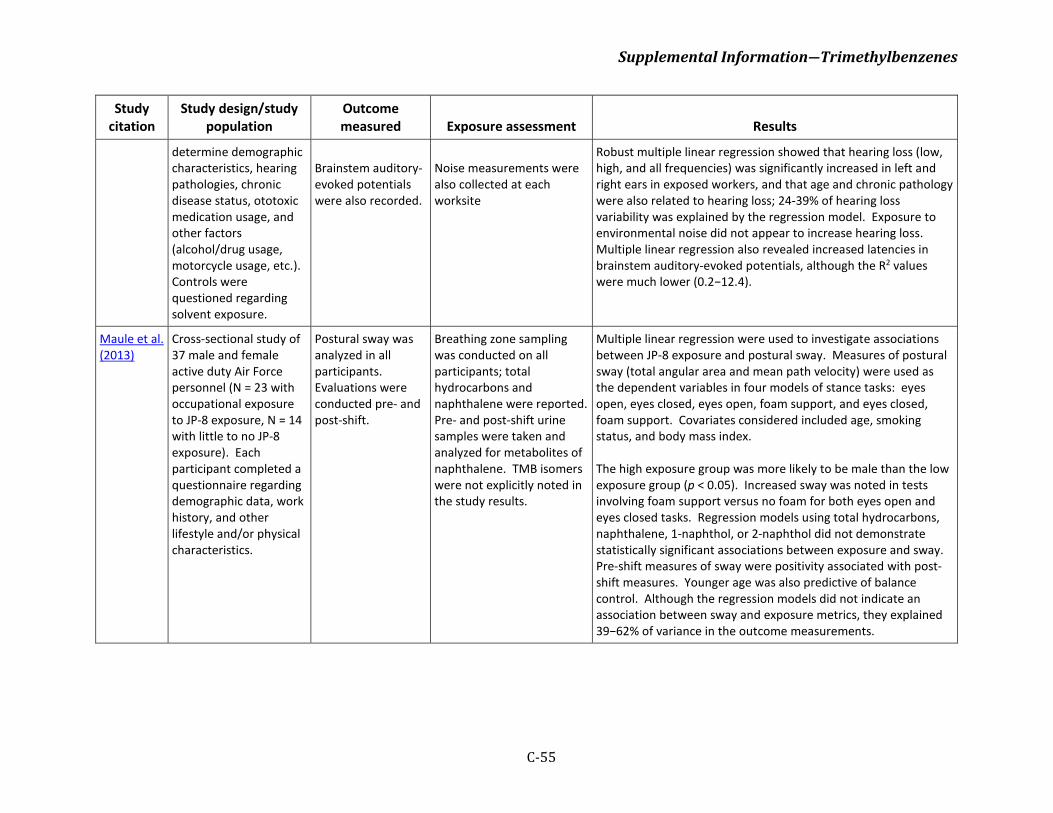
Supplemental Information―Trimethylbenzenes
C-55
Study citation
Study design/study population
Outcome measured Exposure assessment Results
determine demographic characteristics, hearing pathologies, chronic disease status, ototoxic medication usage, and other factors (alcohol/drug usage, motorcycle usage, etc.). Controls were questioned regarding solvent exposure.
Brainstem auditory-evoked potentials were also recorded.
Noise measurements were also collected at each worksite
Robust multiple linear regression showed that hearing loss (low, high, and all frequencies) was significantly increased in left and right ears in exposed workers, and that age and chronic pathology were also related to hearing loss; 24-39% of hearing loss variability was explained by the regression model. Exposure to environmental noise did not appear to increase hearing loss. Multiple linear regression also revealed increased latencies in brainstem auditory-evoked potentials, although the R2 values were much lower (0.2−12.4).
Maule et al. (2013)
Cross-sectional study of 37 male and female active duty Air Force personnel (N = 23 with occupational exposure to JP-8 exposure, N = 14 with little to no JP-8 exposure). Each participant completed a questionnaire regarding demographic data, work history, and other lifestyle and/or physical characteristics.
Postural sway was analyzed in all participants. Evaluations were conducted pre- and post-shift.
Breathing zone sampling was conducted on all participants; total hydrocarbons and naphthalene were reported. Pre- and post-shift urine samples were taken and analyzed for metabolites of naphthalene. TMB isomers were not explicitly noted in the study results.
Multiple linear regression were used to investigate associations between JP-8 exposure and postural sway. Measures of postural sway (total angular area and mean path velocity) were used as the dependent variables in four models of stance tasks: eyes open, eyes closed, eyes open, foam support, and eyes closed, foam support. Covariates considered included age, smoking status, and body mass index. The high exposure group was more likely to be male than the low exposure group (p < 0.05). Increased sway was noted in tests involving foam support versus no foam for both eyes open and eyes closed tasks. Regression models using total hydrocarbons, naphthalene, 1-naphthol, or 2-naphthol did not demonstrate statistically significant associations between exposure and sway. Pre-shift measures of sway were positivity associated with post-shift measures. Younger age was also predictive of balance control. Although the regression models did not indicate an association between sway and exposure metrics, they explained 39−62% of variance in the outcome measurements.
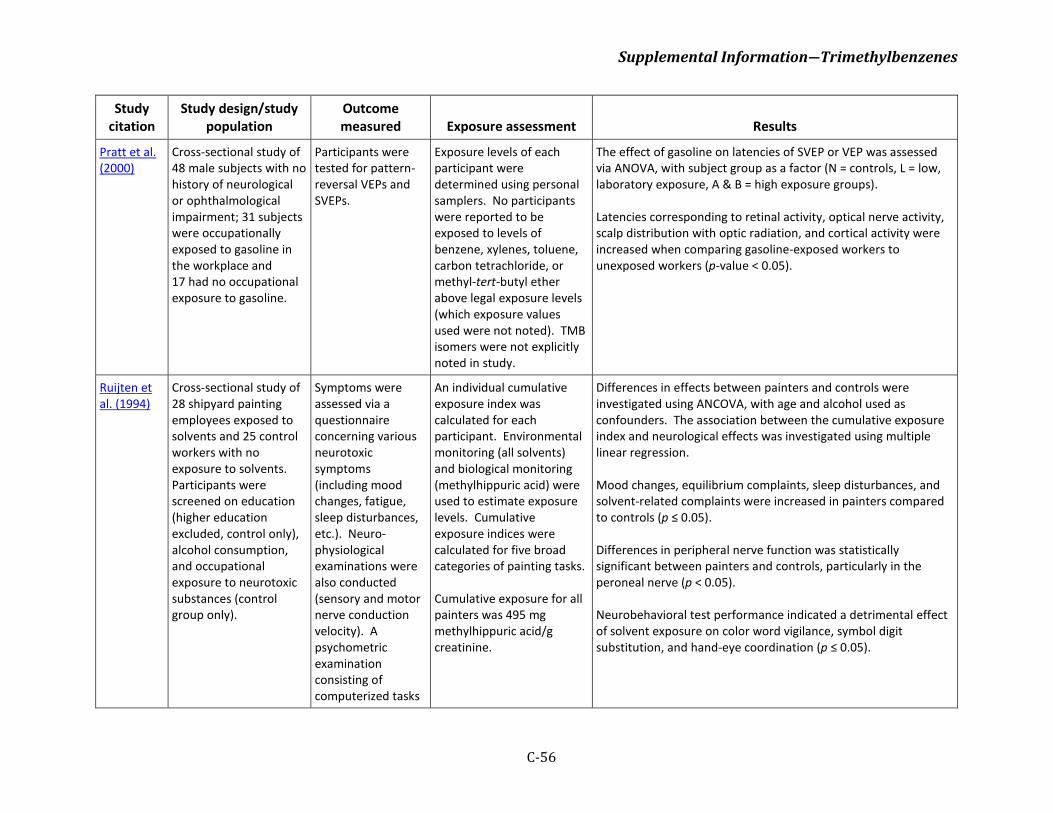
Supplemental Information―Trimethylbenzenes
C-56
Study citation
Study design/study population
Outcome measured Exposure assessment Results
Pratt et al. (2000)
Cross-sectional study of 48 male subjects with no history of neurological or ophthalmological impairment; 31 subjects were occupationally exposed to gasoline in the workplace and 17 had no occupational exposure to gasoline.
Participants were tested for pattern-reversal VEPs and SVEPs.
Exposure levels of each participant were determined using personal samplers. No participants were reported to be exposed to levels of benzene, xylenes, toluene, carbon tetrachloride, or methyl-tert-butyl ether above legal exposure levels (which exposure values used were not noted). TMB isomers were not explicitly noted in study.
The effect of gasoline on latencies of SVEP or VEP was assessed via ANOVA, with subject group as a factor (N = controls, L = low, laboratory exposure, A & B = high exposure groups). Latencies corresponding to retinal activity, optical nerve activity, scalp distribution with optic radiation, and cortical activity were increased when comparing gasoline-exposed workers to unexposed workers (p-value < 0.05).
Ruijten et al. (1994)
Cross-sectional study of 28 shipyard painting employees exposed to solvents and 25 control workers with no exposure to solvents. Participants were screened on education (higher education excluded, control only), alcohol consumption, and occupational exposure to neurotoxic substances (control group only).
Symptoms were assessed via a questionnaire concerning various neurotoxic symptoms (including mood changes, fatigue, sleep disturbances, etc.). Neuro-physiological examinations were also conducted (sensory and motor nerve conduction velocity). A psychometric examination consisting of computerized tasks
An individual cumulative exposure index was calculated for each participant. Environmental monitoring (all solvents) and biological monitoring (methylhippuric acid) were used to estimate exposure levels. Cumulative exposure indices were calculated for five broad categories of painting tasks. Cumulative exposure for all painters was 495 mg methylhippuric acid/g creatinine.
Differences in effects between painters and controls were investigated using ANCOVA, with age and alcohol used as confounders. The association between the cumulative exposure index and neurological effects was investigated using multiple linear regression. Mood changes, equilibrium complaints, sleep disturbances, and solvent-related complaints were increased in painters compared to controls (p ≤ 0.05). Differences in peripheral nerve function was statistically significant between painters and controls, particularly in the peroneal nerve (p < 0.05). Neurobehavioral test performance indicated a detrimental effect of solvent exposure on color word vigilance, symbol digit substitution, and hand-eye coordination (p ≤ 0.05).
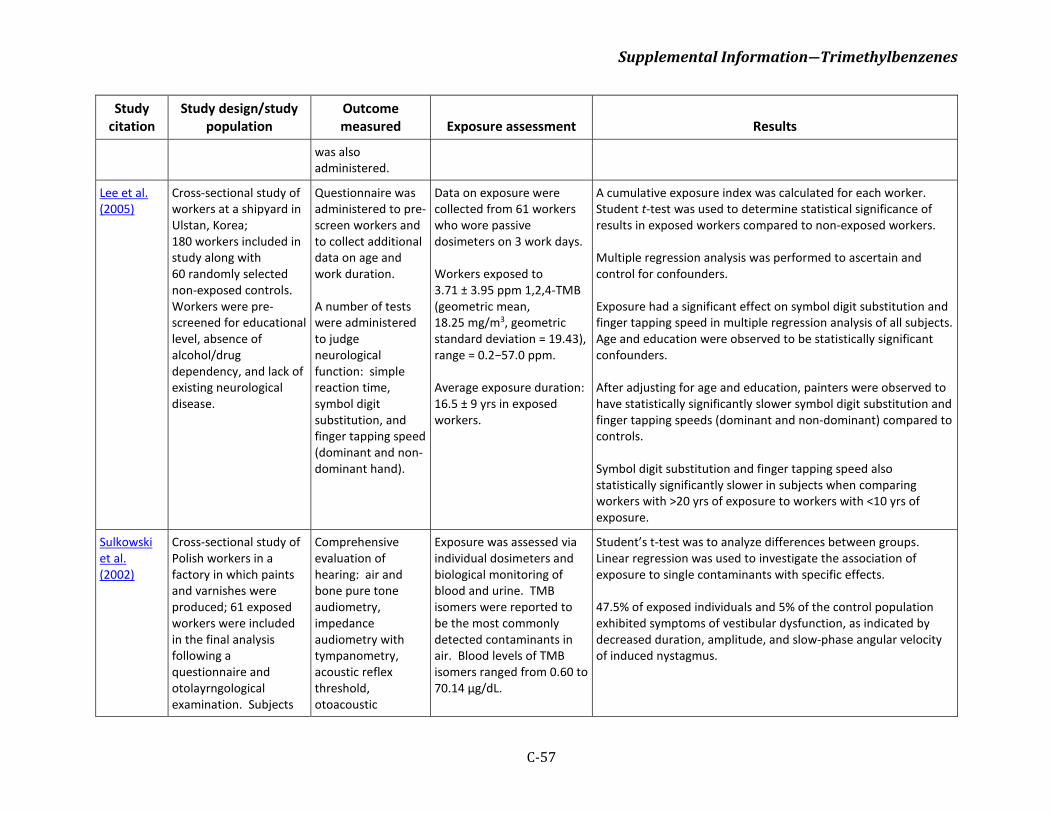
Supplemental Information―Trimethylbenzenes
C-57
Study citation
Study design/study population
Outcome measured Exposure assessment Results
was also administered.
Lee et al. (2005)
Cross-sectional study of workers at a shipyard in Ulstan, Korea; 180 workers included in study along with 60 randomly selected non-exposed controls. Workers were pre-screened for educational level, absence of alcohol/drug dependency, and lack of existing neurological disease.
Questionnaire was administered to pre-screen workers and to collect additional data on age and work duration. A number of tests were administered to judge neurological function: simple reaction time, symbol digit substitution, and finger tapping speed (dominant and non-dominant hand).
Data on exposure were collected from 61 workers who wore passive dosimeters on 3 work days. Workers exposed to 3.71 ± 3.95 ppm 1,2,4-TMB (geometric mean, 18.25 mg/m3, geometric standard deviation = 19.43), range = 0.2−57.0 ppm. Average exposure duration: 16.5 ± 9 yrs in exposed workers.
A cumulative exposure index was calculated for each worker. Student t-test was used to determine statistical significance of results in exposed workers compared to non-exposed workers. Multiple regression analysis was performed to ascertain and control for confounders. Exposure had a significant effect on symbol digit substitution and finger tapping speed in multiple regression analysis of all subjects. Age and education were observed to be statistically significant confounders. After adjusting for age and education, painters were observed to have statistically significantly slower symbol digit substitution and finger tapping speeds (dominant and non-dominant) compared to controls. Symbol digit substitution and finger tapping speed also statistically significantly slower in subjects when comparing workers with >20 yrs of exposure to workers with <10 yrs of exposure.
Sulkowski et al. (2002)
Cross-sectional study of Polish workers in a factory in which paints and varnishes were produced; 61 exposed workers were included in the final analysis following a questionnaire and otolayrngological examination. Subjects
Comprehensive evaluation of hearing: air and bone pure tone audiometry, impedance audiometry with tympanometry, acoustic reflex threshold, otoacoustic
Exposure was assessed via individual dosimeters and biological monitoring of blood and urine. TMB isomers were reported to be the most commonly detected contaminants in air. Blood levels of TMB isomers ranged from 0.60 to 70.14 µg/dL.
Student’s t-test was to analyze differences between groups. Linear regression was used to investigate the association of exposure to single contaminants with specific effects. 47.5% of exposed individuals and 5% of the control population exhibited symptoms of vestibular dysfunction, as indicated by decreased duration, amplitude, and slow-phase angular velocity of induced nystagmus.
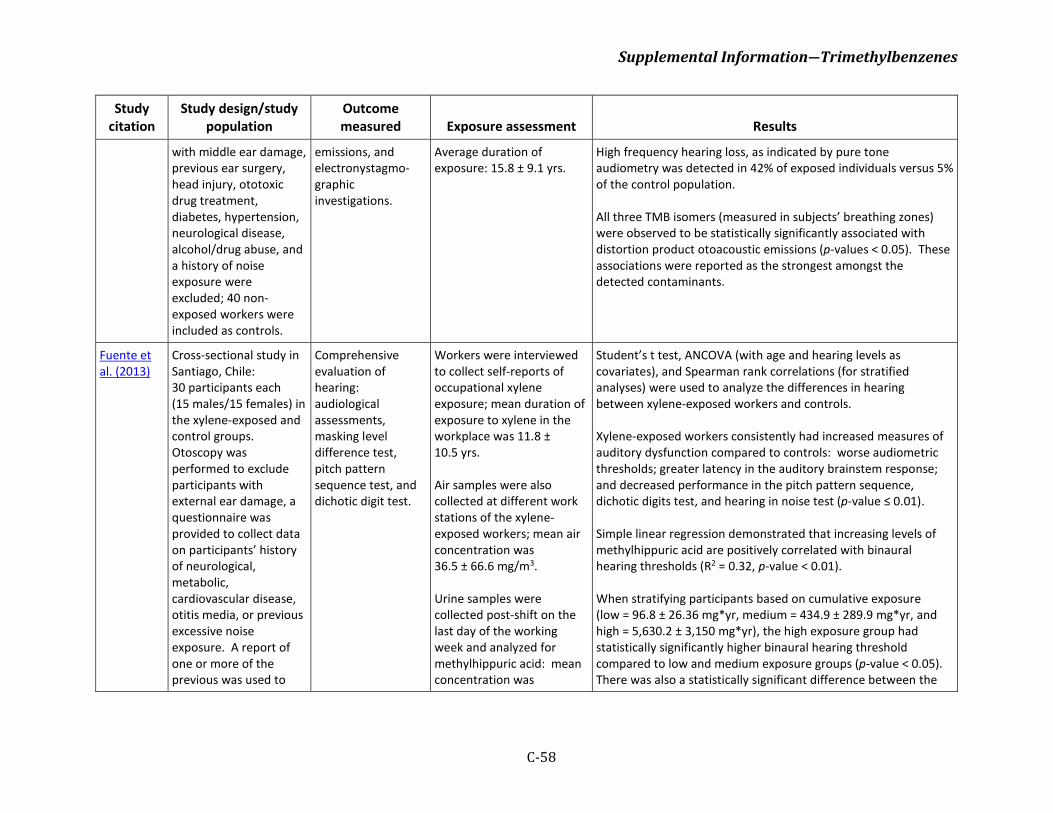
Supplemental Information―Trimethylbenzenes
C-58
Study citation
Study design/study population
Outcome measured Exposure assessment Results
with middle ear damage, previous ear surgery, head injury, ototoxic drug treatment, diabetes, hypertension, neurological disease, alcohol/drug abuse, and a history of noise exposure were excluded; 40 non-exposed workers were included as controls.
emissions, and electronystagmo-graphic investigations.
Average duration of exposure: 15.8 ± 9.1 yrs.
High frequency hearing loss, as indicated by pure tone audiometry was detected in 42% of exposed individuals versus 5% of the control population. All three TMB isomers (measured in subjects’ breathing zones) were observed to be statistically significantly associated with distortion product otoacoustic emissions (p-values < 0.05). These associations were reported as the strongest amongst the detected contaminants.
Fuente et al. (2013)
Cross-sectional study in Santiago, Chile: 30 participants each (15 males/15 females) in the xylene-exposed and control groups. Otoscopy was performed to exclude participants with external ear damage, a questionnaire was provided to collect data on participants’ history of neurological, metabolic, cardiovascular disease, otitis media, or previous excessive noise exposure. A report of one or more of the previous was used to
Comprehensive evaluation of hearing: audiological assessments, masking level difference test, pitch pattern sequence test, and dichotic digit test.
Workers were interviewed to collect self-reports of occupational xylene exposure; mean duration of exposure to xylene in the workplace was 11.8 ± 10.5 yrs. Air samples were also collected at different work stations of the xylene-exposed workers; mean air concentration was 36.5 ± 66.6 mg/m3. Urine samples were collected post-shift on the last day of the working week and analyzed for methylhippuric acid: mean concentration was
Student’s t test, ANCOVA (with age and hearing levels as covariates), and Spearman rank correlations (for stratified analyses) were used to analyze the differences in hearing between xylene-exposed workers and controls. Xylene-exposed workers consistently had increased measures of auditory dysfunction compared to controls: worse audiometric thresholds; greater latency in the auditory brainstem response; and decreased performance in the pitch pattern sequence, dichotic digits test, and hearing in noise test (p-value ≤ 0.01). Simple linear regression demonstrated that increasing levels of methylhippuric acid are positively correlated with binaural hearing thresholds (R2 = 0.32, p-value < 0.01). When stratifying participants based on cumulative exposure (low = 96.8 ± 26.36 mg*yr, medium = 434.9 ± 289.9 mg*yr, and high = 5,630.2 ± 3,150 mg*yr), the high exposure group had statistically significantly higher binaural hearing threshold compared to low and medium exposure groups (p-value < 0.05). There was also a statistically significant difference between the
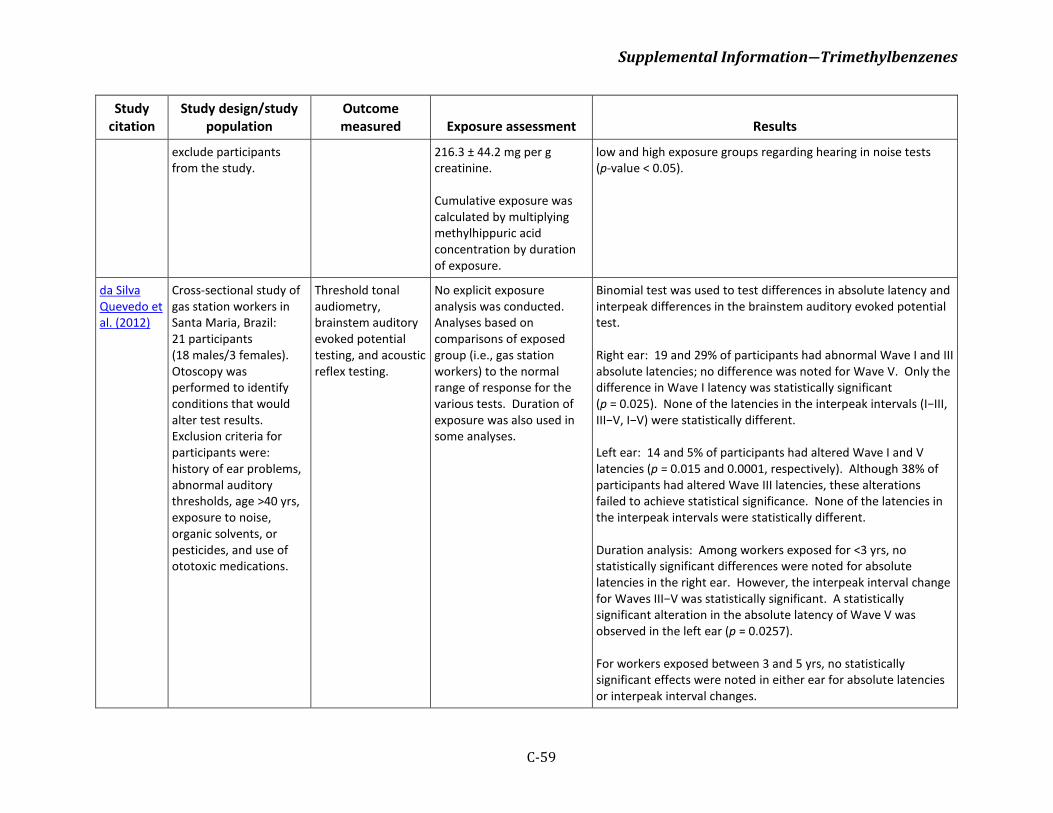
Supplemental Information―Trimethylbenzenes
C-59
Study citation
Study design/study population
Outcome measured Exposure assessment Results
exclude participants from the study.
216.3 ± 44.2 mg per g creatinine. Cumulative exposure was calculated by multiplying methylhippuric acid concentration by duration of exposure.
low and high exposure groups regarding hearing in noise tests (p-value < 0.05).
da Silva Quevedo et al. (2012)
Cross-sectional study of gas station workers in Santa Maria, Brazil: 21 participants (18 males/3 females). Otoscopy was performed to identify conditions that would alter test results. Exclusion criteria for participants were: history of ear problems, abnormal auditory thresholds, age >40 yrs, exposure to noise, organic solvents, or pesticides, and use of ototoxic medications.
Threshold tonal audiometry, brainstem auditory evoked potential testing, and acoustic reflex testing.
No explicit exposure analysis was conducted. Analyses based on comparisons of exposed group (i.e., gas station workers) to the normal range of response for the various tests. Duration of exposure was also used in some analyses.
Binomial test was used to test differences in absolute latency and interpeak differences in the brainstem auditory evoked potential test. Right ear: 19 and 29% of participants had abnormal Wave I and III absolute latencies; no difference was noted for Wave V. Only the difference in Wave I latency was statistically significant (p = 0.025). None of the latencies in the interpeak intervals (I−III, III−V, I−V) were statistically different. Left ear: 14 and 5% of participants had altered Wave I and V latencies (p = 0.015 and 0.0001, respectively). Although 38% of participants had altered Wave III latencies, these alterations failed to achieve statistical significance. None of the latencies in the interpeak intervals were statistically different. Duration analysis: Among workers exposed for <3 yrs, no statistically significant differences were noted for absolute latencies in the right ear. However, the interpeak interval change for Waves III−V was statistically significant. A statistically significant alteration in the absolute latency of Wave V was observed in the left ear (p = 0.0257). For workers exposed between 3 and 5 yrs, no statistically significant effects were noted in either ear for absolute latencies or interpeak interval changes.
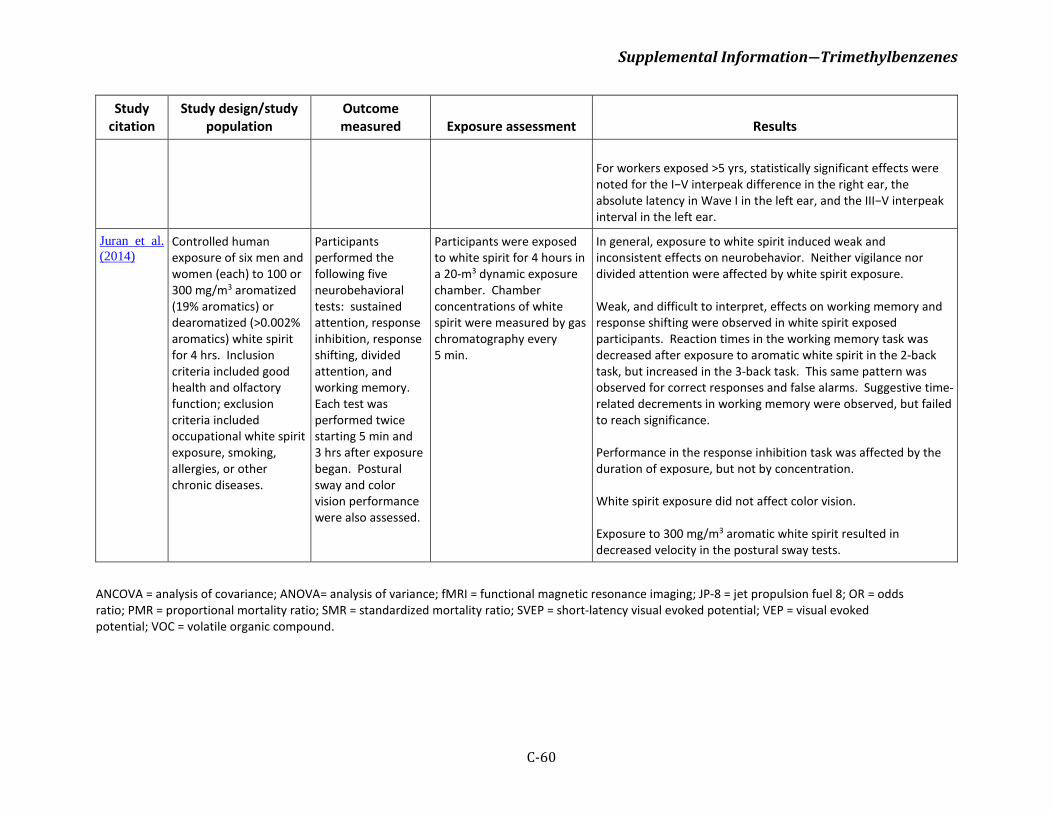
Supplemental Information―Trimethylbenzenes
C-60
Study citation
Study design/study population
Outcome measured Exposure assessment Results
For workers exposed >5 yrs, statistically significant effects were noted for the I−V interpeak difference in the right ear, the absolute latency in Wave I in the left ear, and the III−V interpeak interval in the left ear.
Juran et al. (2014)
Controlled human exposure of six men and women (each) to 100 or 300 mg/m3 aromatized (19% aromatics) or dearomatized (>0.002% aromatics) white spirit for 4 hrs. Inclusion criteria included good health and olfactory function; exclusion criteria included occupational white spirit exposure, smoking, allergies, or other chronic diseases.
Participants performed the following five neurobehavioral tests: sustained attention, response inhibition, response shifting, divided attention, and working memory. Each test was performed twice starting 5 min and 3 hrs after exposure began. Postural sway and color vision performance were also assessed.
Participants were exposed to white spirit for 4 hours in a 20-m3 dynamic exposure chamber. Chamber concentrations of white spirit were measured by gas chromatography every 5 min.
In general, exposure to white spirit induced weak and inconsistent effects on neurobehavior. Neither vigilance nor divided attention were affected by white spirit exposure. Weak, and difficult to interpret, effects on working memory and response shifting were observed in white spirit exposed participants. Reaction times in the working memory task was decreased after exposure to aromatic white spirit in the 2-back task, but increased in the 3-back task. This same pattern was observed for correct responses and false alarms. Suggestive time-related decrements in working memory were observed, but failed to reach significance. Performance in the response inhibition task was affected by the duration of exposure, but not by concentration. White spirit exposure did not affect color vision. Exposure to 300 mg/m3 aromatic white spirit resulted in decreased velocity in the postural sway tests.
ANCOVA = analysis of covariance; ANOVA= analysis of variance; fMRI = functional magnetic resonance imaging; JP-8 = jet propulsion fuel 8; OR = odds ratio; PMR = proportional mortality ratio; SMR = standardized mortality ratio; SVEP = short-latency visual evoked potential; VEP = visual evoked potential; VOC = volatile organic compound.
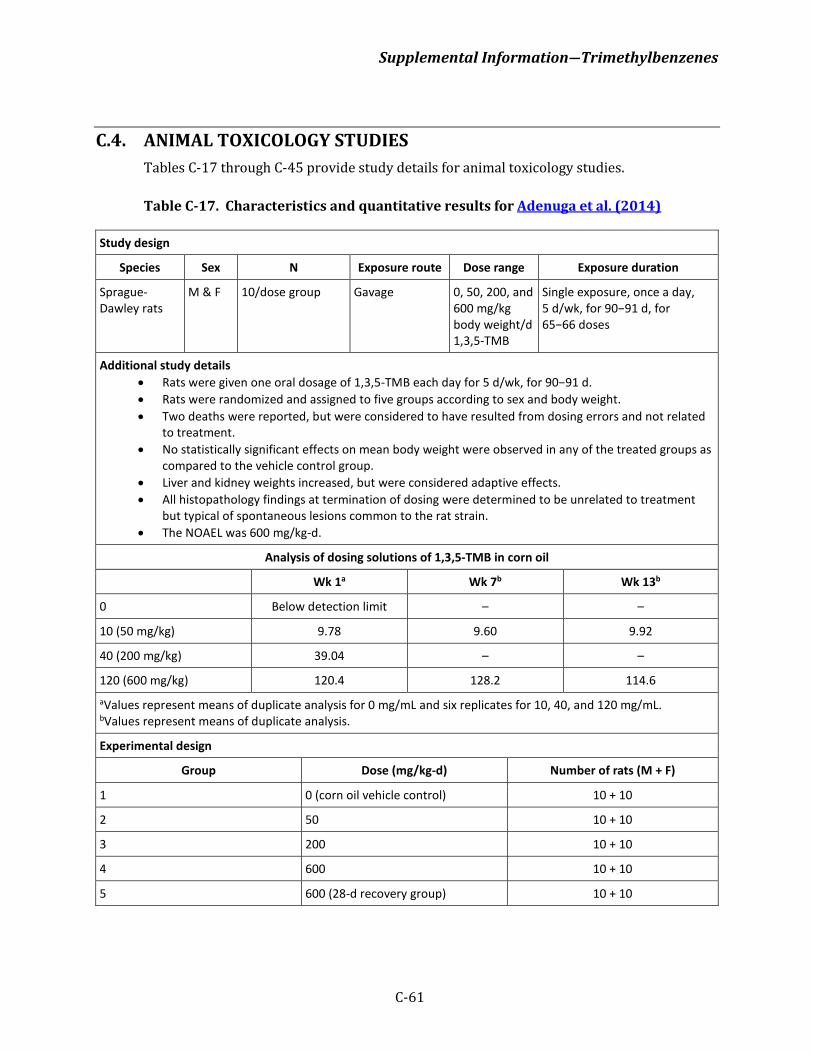
Supplemental Information―Trimethylbenzenes
C-61
C.4. ANIMAL TOXICOLOGY STUDIES Tables C-17 through C-45 provide study details for animal toxicology studies.
Table C-17. Characteristics and quantitative results for Adenuga et al. (2014)
Study design
Species Sex N Exposure route Dose range Exposure duration
Sprague-Dawley rats
M & F 10/dose group Gavage 0, 50, 200, and 600 mg/kg body weight/d 1,3,5-TMB
Single exposure, once a day, 5 d/wk, for 90−91 d, for 65−66 doses
Additional study details • Rats were given one oral dosage of 1,3,5-TMB each day for 5 d/wk, for 90−91 d. • Rats were randomized and assigned to five groups according to sex and body weight. • Two deaths were reported, but were considered to have resulted from dosing errors and not related
to treatment. • No statistically significant effects on mean body weight were observed in any of the treated groups as
compared to the vehicle control group. • Liver and kidney weights increased, but were considered adaptive effects. • All histopathology findings at termination of dosing were determined to be unrelated to treatment
but typical of spontaneous lesions common to the rat strain. • The NOAEL was 600 mg/kg-d.
Analysis of dosing solutions of 1,3,5-TMB in corn oil
Wk 1a Wk 7b Wk 13b
0 Below detection limit – –
10 (50 mg/kg) 9.78 9.60 9.92
40 (200 mg/kg) 39.04 – –
120 (600 mg/kg) 120.4 128.2 114.6 aValues represent means of duplicate analysis for 0 mg/mL and six replicates for 10, 40, and 120 mg/mL. bValues represent means of duplicate analysis.
Experimental design
Group Dose (mg/kg-d) Number of rats (M + F)
1 0 (corn oil vehicle control) 10 + 10
2 50 10 + 10
3 200 10 + 10
4 600 10 + 10
5 600 (28-d recovery group) 10 + 10
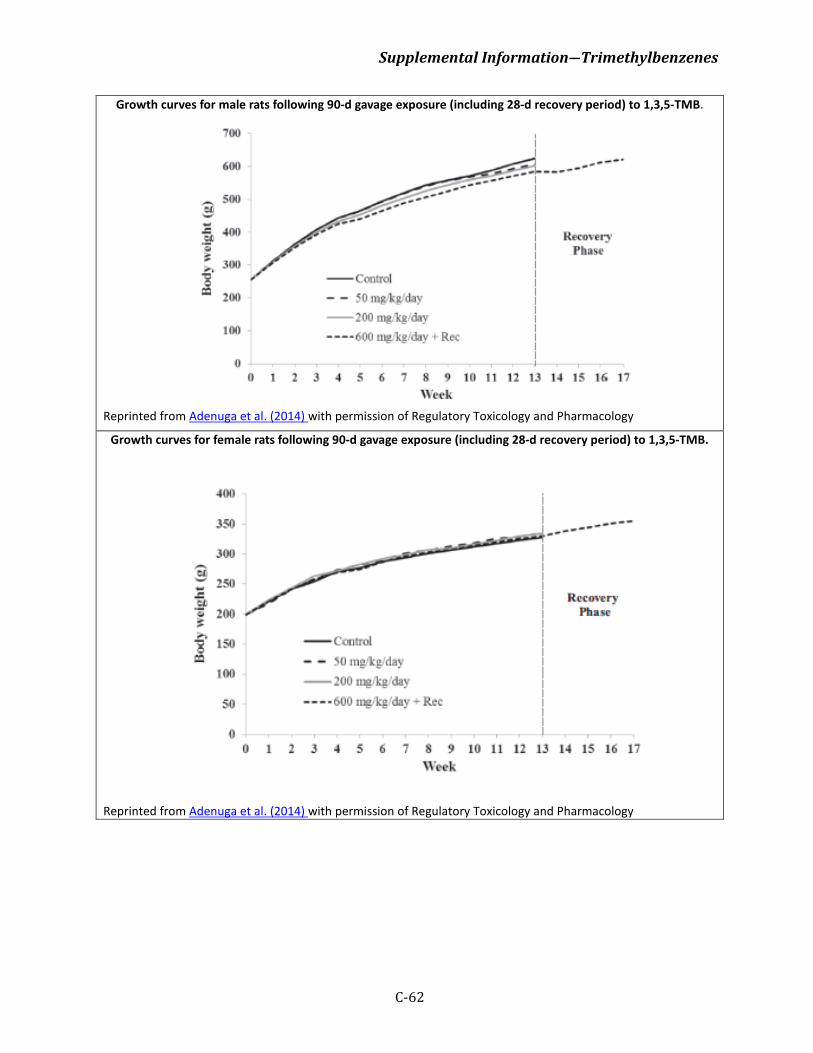
Supplemental Information―Trimethylbenzenes
C-62
Growth curves for male rats following 90-d gavage exposure (including 28-d recovery period) to 1,3,5-TMB.
Reprinted from Adenuga et al. (2014) with permission of Regulatory Toxicology and Pharmacology
Growth curves for female rats following 90-d gavage exposure (including 28-d recovery period) to 1,3,5-TMB.
Reprinted from Adenuga et al. (2014) with permission of Regulatory Toxicology and Pharmacology
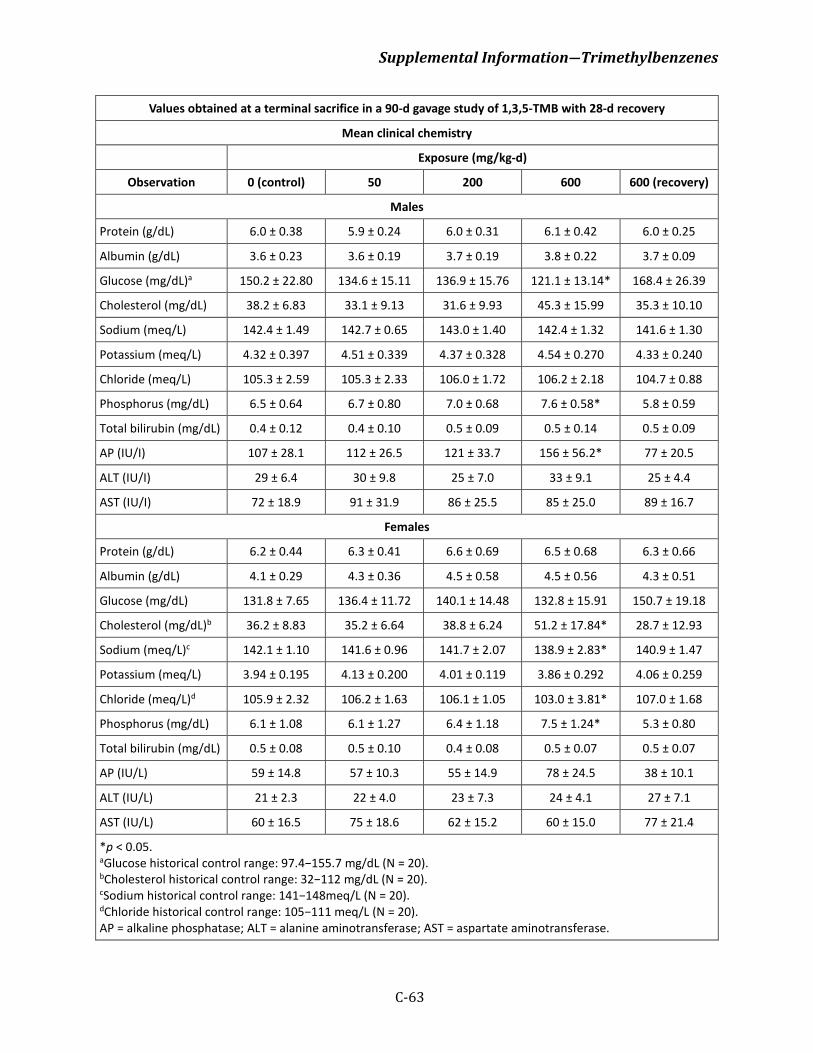
Supplemental Information―Trimethylbenzenes
C-63
Values obtained at a terminal sacrifice in a 90-d gavage study of 1,3,5-TMB with 28-d recovery
Mean clinical chemistry
Exposure (mg/kg-d)
Observation 0 (control) 50 200 600 600 (recovery)
Males
Protein (g/dL) 6.0 ± 0.38 5.9 ± 0.24 6.0 ± 0.31 6.1 ± 0.42 6.0 ± 0.25
Albumin (g/dL) 3.6 ± 0.23 3.6 ± 0.19 3.7 ± 0.19 3.8 ± 0.22 3.7 ± 0.09
Glucose (mg/dL)a 150.2 ± 22.80 134.6 ± 15.11 136.9 ± 15.76 121.1 ± 13.14* 168.4 ± 26.39
Cholesterol (mg/dL) 38.2 ± 6.83 33.1 ± 9.13 31.6 ± 9.93 45.3 ± 15.99 35.3 ± 10.10
Sodium (meq/L) 142.4 ± 1.49 142.7 ± 0.65 143.0 ± 1.40 142.4 ± 1.32 141.6 ± 1.30
Potassium (meq/L) 4.32 ± 0.397 4.51 ± 0.339 4.37 ± 0.328 4.54 ± 0.270 4.33 ± 0.240
Chloride (meq/L) 105.3 ± 2.59 105.3 ± 2.33 106.0 ± 1.72 106.2 ± 2.18 104.7 ± 0.88
Phosphorus (mg/dL) 6.5 ± 0.64 6.7 ± 0.80 7.0 ± 0.68 7.6 ± 0.58* 5.8 ± 0.59
Total bilirubin (mg/dL) 0.4 ± 0.12 0.4 ± 0.10 0.5 ± 0.09 0.5 ± 0.14 0.5 ± 0.09
AP (IU/I) 107 ± 28.1 112 ± 26.5 121 ± 33.7 156 ± 56.2* 77 ± 20.5
ALT (IU/I) 29 ± 6.4 30 ± 9.8 25 ± 7.0 33 ± 9.1 25 ± 4.4
AST (IU/I) 72 ± 18.9 91 ± 31.9 86 ± 25.5 85 ± 25.0 89 ± 16.7
Females
Protein (g/dL) 6.2 ± 0.44 6.3 ± 0.41 6.6 ± 0.69 6.5 ± 0.68 6.3 ± 0.66
Albumin (g/dL) 4.1 ± 0.29 4.3 ± 0.36 4.5 ± 0.58 4.5 ± 0.56 4.3 ± 0.51
Glucose (mg/dL) 131.8 ± 7.65 136.4 ± 11.72 140.1 ± 14.48 132.8 ± 15.91 150.7 ± 19.18
Cholesterol (mg/dL)b 36.2 ± 8.83 35.2 ± 6.64 38.8 ± 6.24 51.2 ± 17.84* 28.7 ± 12.93
Sodium (meq/L)c 142.1 ± 1.10 141.6 ± 0.96 141.7 ± 2.07 138.9 ± 2.83* 140.9 ± 1.47
Potassium (meq/L) 3.94 ± 0.195 4.13 ± 0.200 4.01 ± 0.119 3.86 ± 0.292 4.06 ± 0.259
Chloride (meq/L)d 105.9 ± 2.32 106.2 ± 1.63 106.1 ± 1.05 103.0 ± 3.81* 107.0 ± 1.68
Phosphorus (mg/dL) 6.1 ± 1.08 6.1 ± 1.27 6.4 ± 1.18 7.5 ± 1.24* 5.3 ± 0.80
Total bilirubin (mg/dL) 0.5 ± 0.08 0.5 ± 0.10 0.4 ± 0.08 0.5 ± 0.07 0.5 ± 0.07
AP (IU/L) 59 ± 14.8 57 ± 10.3 55 ± 14.9 78 ± 24.5 38 ± 10.1
ALT (IU/L) 21 ± 2.3 22 ± 4.0 23 ± 7.3 24 ± 4.1 27 ± 7.1
AST (IU/L) 60 ± 16.5 75 ± 18.6 62 ± 15.2 60 ± 15.0 77 ± 21.4
*p < 0.05. aGlucose historical control range: 97.4−155.7 mg/dL (N = 20). bCholesterol historical control range: 32−112 mg/dL (N = 20). cSodium historical control range: 141−148meq/L (N = 20). dChloride historical control range: 105−111 meq/L (N = 20). AP = alkaline phosphatase; ALT = alanine aminotransferase; AST = aspartate aminotransferase.
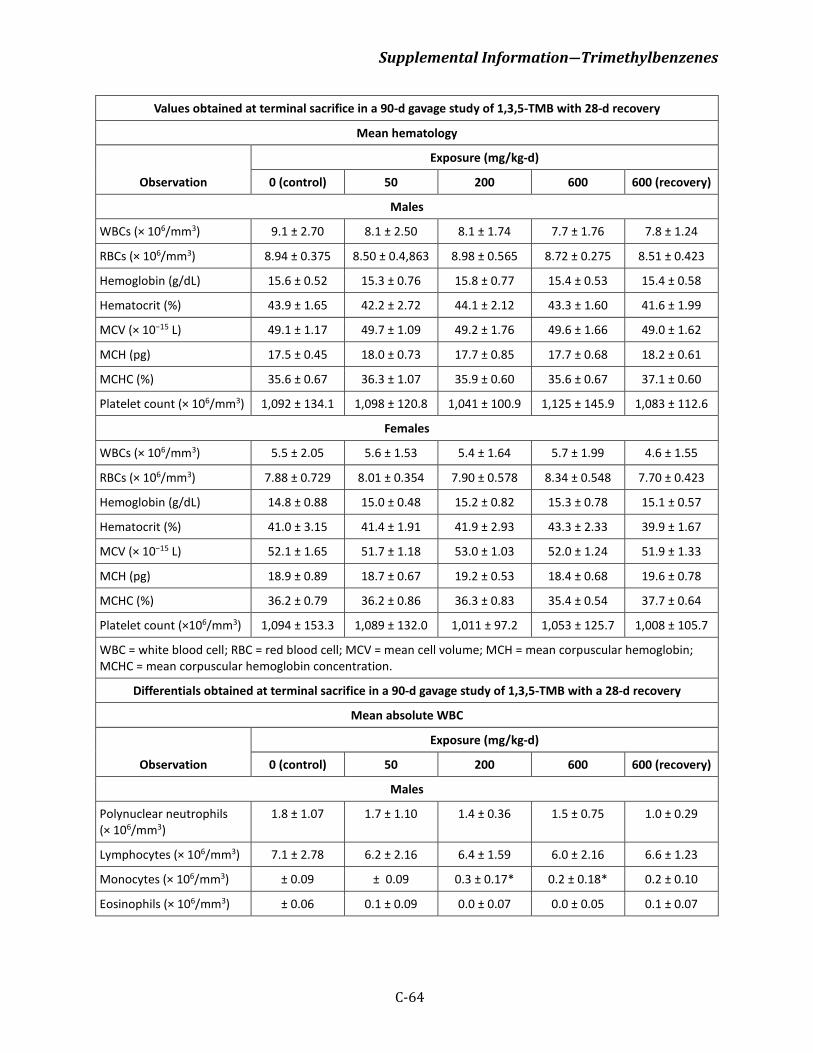
Supplemental Information―Trimethylbenzenes
C-64
Values obtained at terminal sacrifice in a 90-d gavage study of 1,3,5-TMB with 28-d recovery
Mean hematology
Observation
Exposure (mg/kg-d)
0 (control) 50 200 600 600 (recovery)
Males
WBCs (× 106/mm3) 9.1 ± 2.70 8.1 ± 2.50 8.1 ± 1.74 7.7 ± 1.76 7.8 ± 1.24
RBCs (× 106/mm3) 8.94 ± 0.375 8.50 ± 0.4,863 8.98 ± 0.565 8.72 ± 0.275 8.51 ± 0.423
Hemoglobin (g/dL) 15.6 ± 0.52 15.3 ± 0.76 15.8 ± 0.77 15.4 ± 0.53 15.4 ± 0.58
Hematocrit (%) 43.9 ± 1.65 42.2 ± 2.72 44.1 ± 2.12 43.3 ± 1.60 41.6 ± 1.99
MCV (× 10−15 L) 49.1 ± 1.17 49.7 ± 1.09 49.2 ± 1.76 49.6 ± 1.66 49.0 ± 1.62
MCH (pg) 17.5 ± 0.45 18.0 ± 0.73 17.7 ± 0.85 17.7 ± 0.68 18.2 ± 0.61
MCHC (%) 35.6 ± 0.67 36.3 ± 1.07 35.9 ± 0.60 35.6 ± 0.67 37.1 ± 0.60
Platelet count (× 106/mm3) 1,092 ± 134.1 1,098 ± 120.8 1,041 ± 100.9 1,125 ± 145.9 1,083 ± 112.6
Females
WBCs (× 106/mm3) 5.5 ± 2.05 5.6 ± 1.53 5.4 ± 1.64 5.7 ± 1.99 4.6 ± 1.55
RBCs (× 106/mm3) 7.88 ± 0.729 8.01 ± 0.354 7.90 ± 0.578 8.34 ± 0.548 7.70 ± 0.423
Hemoglobin (g/dL) 14.8 ± 0.88 15.0 ± 0.48 15.2 ± 0.82 15.3 ± 0.78 15.1 ± 0.57
Hematocrit (%) 41.0 ± 3.15 41.4 ± 1.91 41.9 ± 2.93 43.3 ± 2.33 39.9 ± 1.67
MCV (× 10−15 L) 52.1 ± 1.65 51.7 ± 1.18 53.0 ± 1.03 52.0 ± 1.24 51.9 ± 1.33
MCH (pg) 18.9 ± 0.89 18.7 ± 0.67 19.2 ± 0.53 18.4 ± 0.68 19.6 ± 0.78
MCHC (%) 36.2 ± 0.79 36.2 ± 0.86 36.3 ± 0.83 35.4 ± 0.54 37.7 ± 0.64
Platelet count (×106/mm3) 1,094 ± 153.3 1,089 ± 132.0 1,011 ± 97.2 1,053 ± 125.7 1,008 ± 105.7
WBC = white blood cell; RBC = red blood cell; MCV = mean cell volume; MCH = mean corpuscular hemoglobin; MCHC = mean corpuscular hemoglobin concentration.
Differentials obtained at terminal sacrifice in a 90-d gavage study of 1,3,5-TMB with a 28-d recovery
Mean absolute WBC
Observation
Exposure (mg/kg-d)
0 (control) 50 200 600 600 (recovery)
Males
Polynuclear neutrophils (× 106/mm3)
1.8 ± 1.07 1.7 ± 1.10 1.4 ± 0.36 1.5 ± 0.75 1.0 ± 0.29
Lymphocytes (× 106/mm3) 7.1 ± 2.78 6.2 ± 2.16 6.4 ± 1.59 6.0 ± 2.16 6.6 ± 1.23
Monocytes (× 106/mm3) ± 0.09 ± 0.09 0.3 ± 0.17* 0.2 ± 0.18* 0.2 ± 0.10
Eosinophils (× 106/mm3) ± 0.06 0.1 ± 0.09 0.0 ± 0.07 0.0 ± 0.05 0.1 ± 0.07
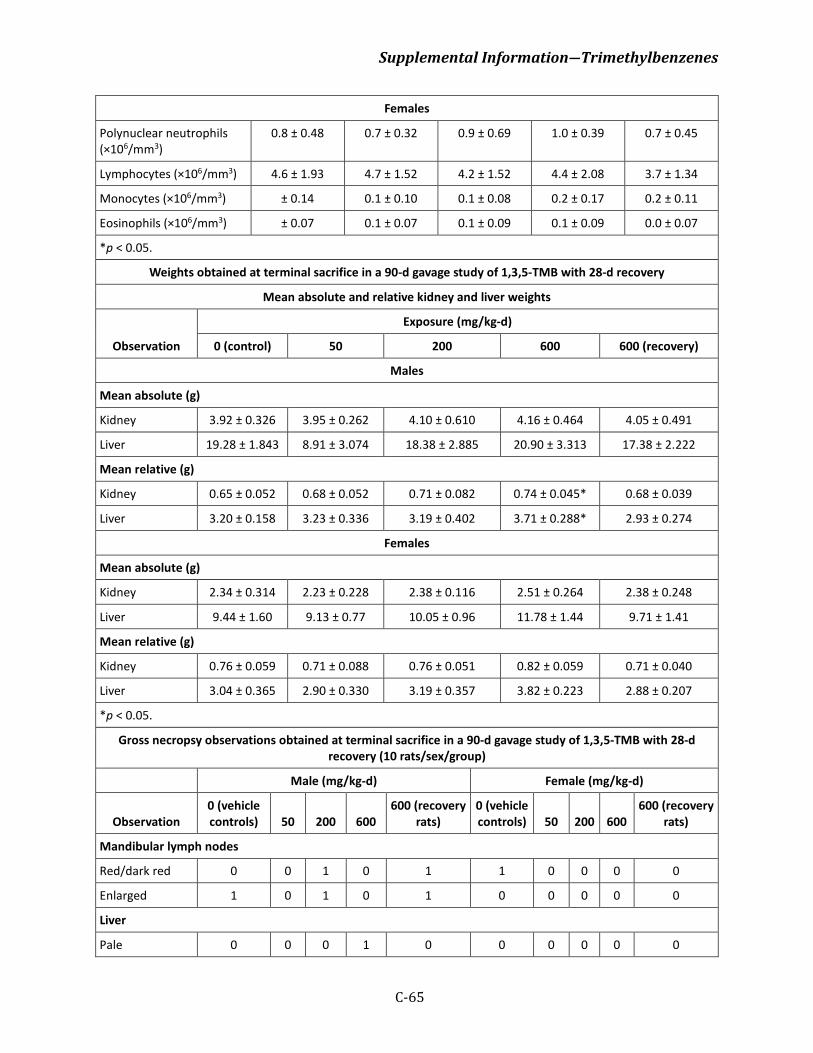
Supplemental Information―Trimethylbenzenes
C-65
Females
Polynuclear neutrophils (×106/mm3)
0.8 ± 0.48 0.7 ± 0.32 0.9 ± 0.69 1.0 ± 0.39 0.7 ± 0.45
Lymphocytes (×106/mm3) 4.6 ± 1.93 4.7 ± 1.52 4.2 ± 1.52 4.4 ± 2.08 3.7 ± 1.34
Monocytes (×106/mm3) ± 0.14 0.1 ± 0.10 0.1 ± 0.08 0.2 ± 0.17 0.2 ± 0.11
Eosinophils (×106/mm3) ± 0.07 0.1 ± 0.07 0.1 ± 0.09 0.1 ± 0.09 0.0 ± 0.07
*p < 0.05.
Weights obtained at terminal sacrifice in a 90-d gavage study of 1,3,5-TMB with 28-d recovery
Mean absolute and relative kidney and liver weights
Observation
Exposure (mg/kg-d)
0 (control) 50 200 600 600 (recovery)
Males
Mean absolute (g)
Kidney 3.92 ± 0.326 3.95 ± 0.262 4.10 ± 0.610 4.16 ± 0.464 4.05 ± 0.491
Liver 19.28 ± 1.843 8.91 ± 3.074 18.38 ± 2.885 20.90 ± 3.313 17.38 ± 2.222
Mean relative (g)
Kidney 0.65 ± 0.052 0.68 ± 0.052 0.71 ± 0.082 0.74 ± 0.045* 0.68 ± 0.039
Liver 3.20 ± 0.158 3.23 ± 0.336 3.19 ± 0.402 3.71 ± 0.288* 2.93 ± 0.274
Females
Mean absolute (g)
Kidney 2.34 ± 0.314 2.23 ± 0.228 2.38 ± 0.116 2.51 ± 0.264 2.38 ± 0.248
Liver 9.44 ± 1.60 9.13 ± 0.77 10.05 ± 0.96 11.78 ± 1.44 9.71 ± 1.41
Mean relative (g)
Kidney 0.76 ± 0.059 0.71 ± 0.088 0.76 ± 0.051 0.82 ± 0.059 0.71 ± 0.040
Liver 3.04 ± 0.365 2.90 ± 0.330 3.19 ± 0.357 3.82 ± 0.223 2.88 ± 0.207
*p < 0.05.
Gross necropsy observations obtained at terminal sacrifice in a 90-d gavage study of 1,3,5-TMB with 28-d recovery (10 rats/sex/group)
Male (mg/kg-d) Female (mg/kg-d)
Observation 0 (vehicle controls) 50 200 600
600 (recovery rats)
0 (vehicle controls) 50 200 600
600 (recovery rats)
Mandibular lymph nodes
Red/dark red 0 0 1 0 1 1 0 0 0 0
Enlarged 1 0 1 0 1 0 0 0 0 0
Liver
Pale 0 0 0 1 0 0 0 0 0 0

Supplemental Information―Trimethylbenzenes
C-66
Lung
Enlarged 0 0 1a 0 0 0 0 0 0 0
Thymus
Focus, red 0 0 0 0 0 0 1 0 0 0
Mottled 0 0 0 1 0 0 0 0 0 0
Adrenals
Small, unilateral 0 1 0 0 0 0 0 0 0 0 aAccidental death due to gavage error.
Histopathological findings in the kidney and liver obtained at terminal sacrifice in a 90-d gavage study of 1,3,5-TMB
Male (mg/kg-d) Female (mg/kg-d)
Observation 0 50 200 600 0 50 200 600
Liver/chronic inflammation
Incidence (%) 40 –a – 30 50 – – 50
Mean grade 0.40 – – 0.30 0.50 – – 0.60
Liver/necrosis
Incidence (%) 0 – – 0 10 – – 0
Mean grade 0 – – 0 0.10 – – 0
Kidney mineralization
Incidence (%) 0 – – 0 70 – – 70
Mean grade 0 – – 0 0.80 – – 0.70
Kidney nephropathy
Incidence (%) 30 – – 10 0 – – 0
Mean grade 0.30 – – 0.10 0 – – 0 aDose group not examined.
Histopathological findings in the liver of rats obtained at terminal sacrifice in a 14-d gavage study of 1,3,5-TMB
Male (mg/kg-d)a Female (mg/kg-d)a
Observation 0 50 200 600 Rb 0 50 200 600 Rb
Liver/chronic inflammation
Incidence (%) 30 20 10 20 20 60 20 10 30 20
Mean grade 0.23 0.20 0.10 0.05 0.20 0.25 0.20 0.10 0.13 0.20
Liver/necrosis
Incidence (%) 0 0 0 10 0 0 0 0 0 0
Mean grade 0 0 0 0.15 0 0 0 0 0 0
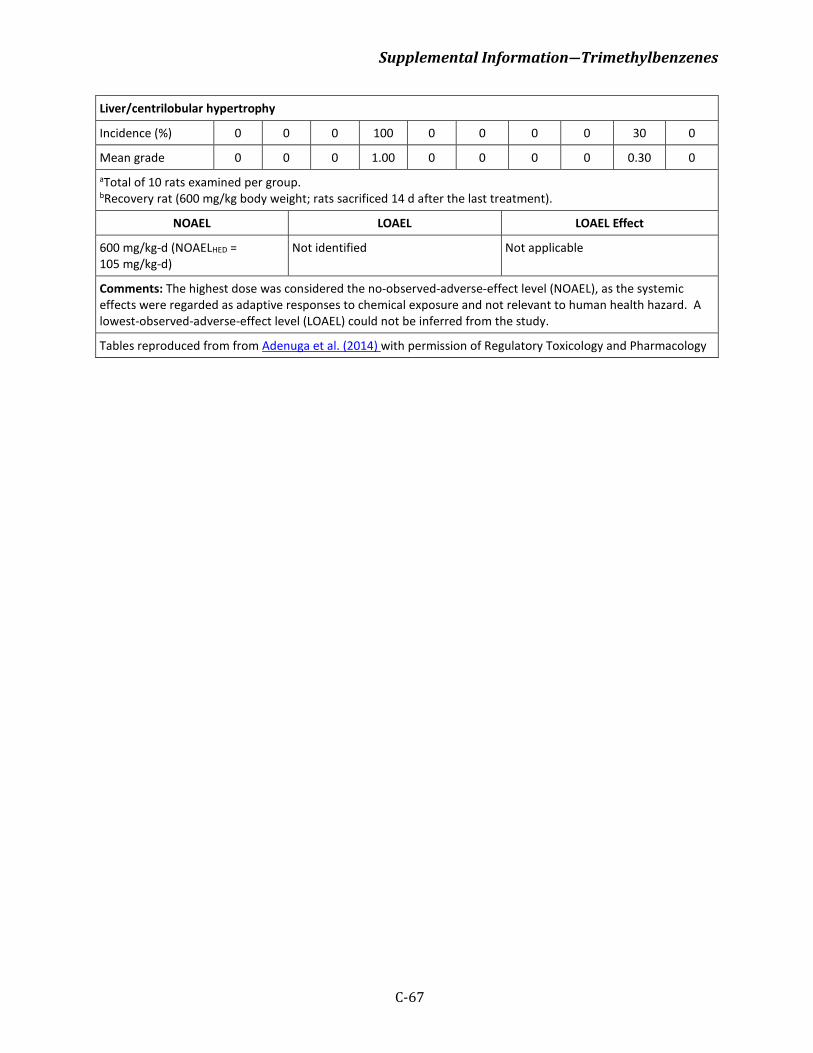
Supplemental Information―Trimethylbenzenes
C-67
Liver/centrilobular hypertrophy
Incidence (%) 0 0 0 100 0 0 0 0 30 0
Mean grade 0 0 0 1.00 0 0 0 0 0.30 0 aTotal of 10 rats examined per group. bRecovery rat (600 mg/kg body weight; rats sacrificed 14 d after the last treatment).
NOAEL LOAEL LOAEL Effect
600 mg/kg-d (NOAELHED = 105 mg/kg-d)
Not identified Not applicable
Comments: The highest dose was considered the no-observed-adverse-effect level (NOAEL), as the systemic effects were regarded as adaptive responses to chemical exposure and not relevant to human health hazard. A lowest-observed-adverse-effect level (LOAEL) could not be inferred from the study.
Tables reproduced from from Adenuga et al. (2014) with permission of Regulatory Toxicology and Pharmacology
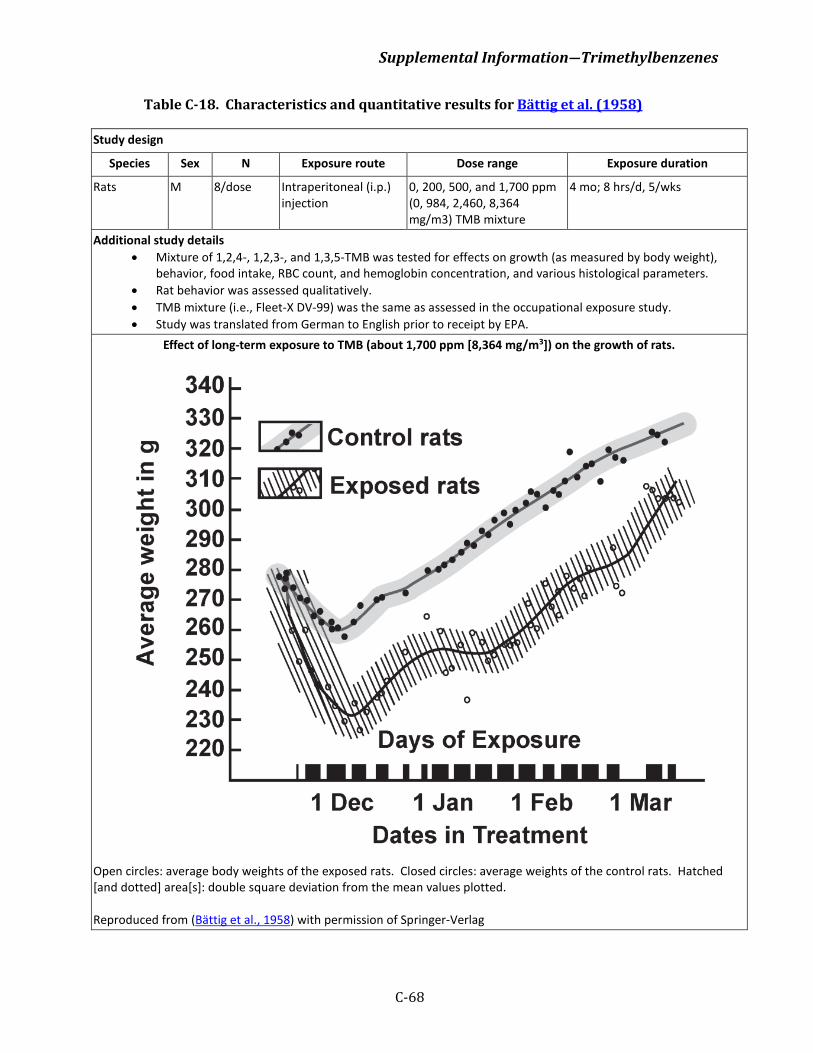
Supplemental Information―Trimethylbenzenes
C-68
Table C-18. Characteristics and quantitative results for Bättig et al. (1958)
Study design
Species Sex N Exposure route Dose range Exposure duration
Rats M 8/dose Intraperitoneal (i.p.) injection
0, 200, 500, and 1,700 ppm (0, 984, 2,460, 8,364 mg/m3) TMB mixture
4 mo; 8 hrs/d, 5/wks
Additional study details • Mixture of 1,2,4-, 1,2,3-, and 1,3,5-TMB was tested for effects on growth (as measured by body weight),
behavior, food intake, RBC count, and hemoglobin concentration, and various histological parameters. • Rat behavior was assessed qualitatively. • TMB mixture (i.e., Fleet-X DV-99) was the same as assessed in the occupational exposure study. • Study was translated from German to English prior to receipt by EPA.
Effect of long-term exposure to TMB (about 1,700 ppm [8,364 mg/m3]) on the growth of rats.
Open circles: average body weights of the exposed rats. Closed circles: average weights of the control rats. Hatched [and dotted] area[s]: double square deviation from the mean values plotted. Reproduced from (Bättig et al., 1958) with permission of Springer-Verlag
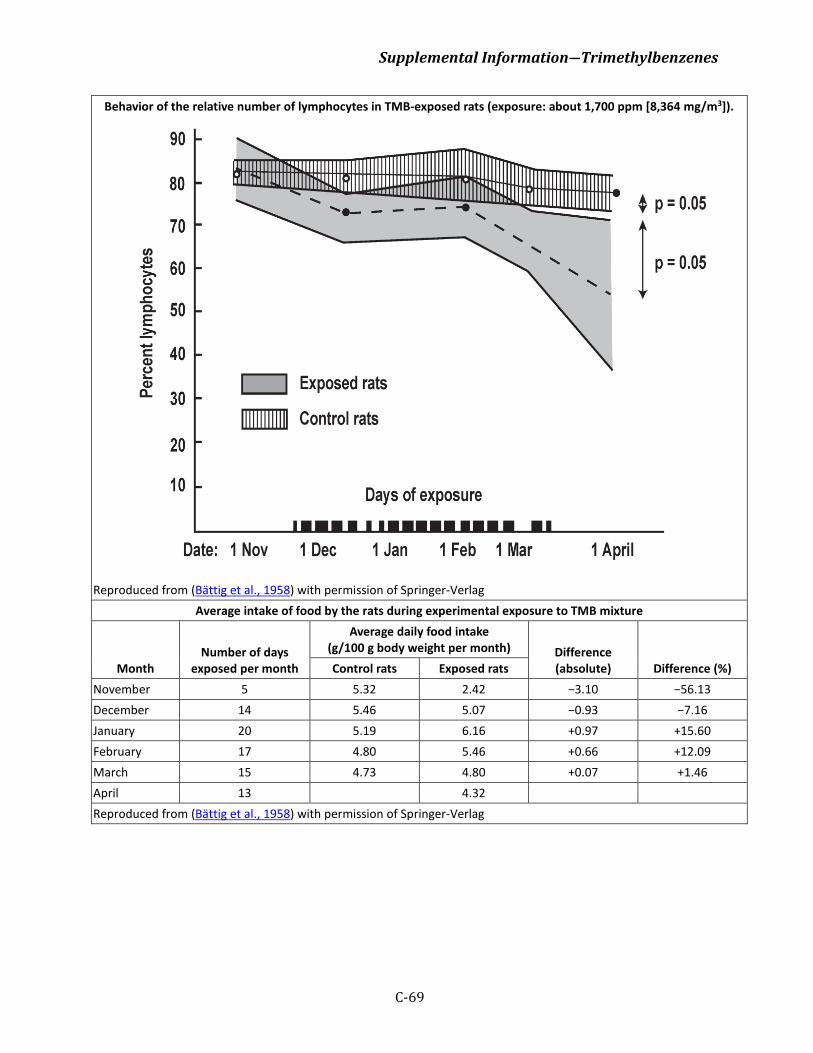
Supplemental Information―Trimethylbenzenes
C-69
Behavior of the relative number of lymphocytes in TMB-exposed rats (exposure: about 1,700 ppm [8,364 mg/m3]).
Reproduced from (Bättig et al., 1958) with permission of Springer-Verlag
Average intake of food by the rats during experimental exposure to TMB mixture
Month Number of days
exposed per month
Average daily food intake (g/100 g body weight per month) Difference
(absolute) Difference (%) Control rats Exposed rats November 5 5.32 2.42 −3.10 −56.13 December 14 5.46 5.07 −0.93 −7.16 January 20 5.19 6.16 +0.97 +15.60 February 17 4.80 5.46 +0.66 +12.09 March 15 4.73 4.80 +0.07 +1.46 April 13 4.32 Reproduced from (Bättig et al., 1958) with permission of Springer-Verlag
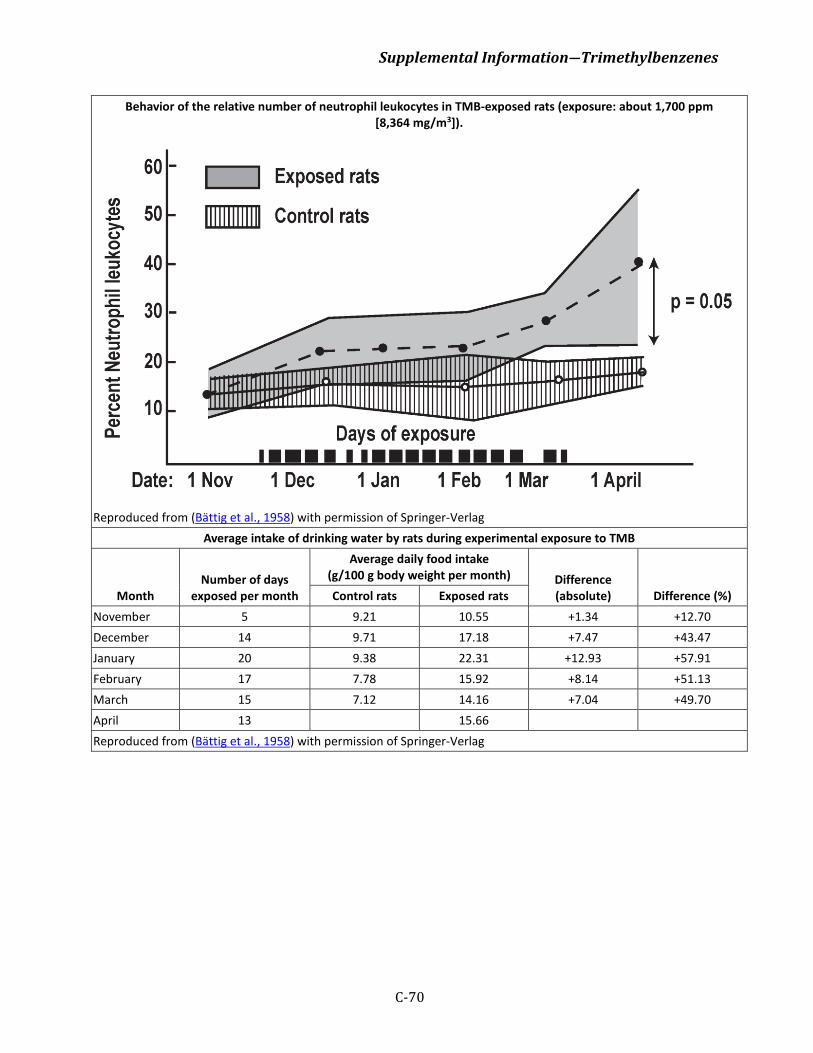
Supplemental Information―Trimethylbenzenes
C-70
Behavior of the relative number of neutrophil leukocytes in TMB-exposed rats (exposure: about 1,700 ppm [8,364 mg/m3]).
Reproduced from (Bättig et al., 1958) with permission of Springer-Verlag
Average intake of drinking water by rats during experimental exposure to TMB
Month Number of days
exposed per month
Average daily food intake (g/100 g body weight per month) Difference
(absolute) Difference (%) Control rats Exposed rats November 5 9.21 10.55 +1.34 +12.70 December 14 9.71 17.18 +7.47 +43.47 January 20 9.38 22.31 +12.93 +57.91 February 17 7.78 15.92 +8.14 +51.13 March 15 7.12 14.16 +7.04 +49.70 April 13 15.66 Reproduced from (Bättig et al., 1958) with permission of Springer-Verlag
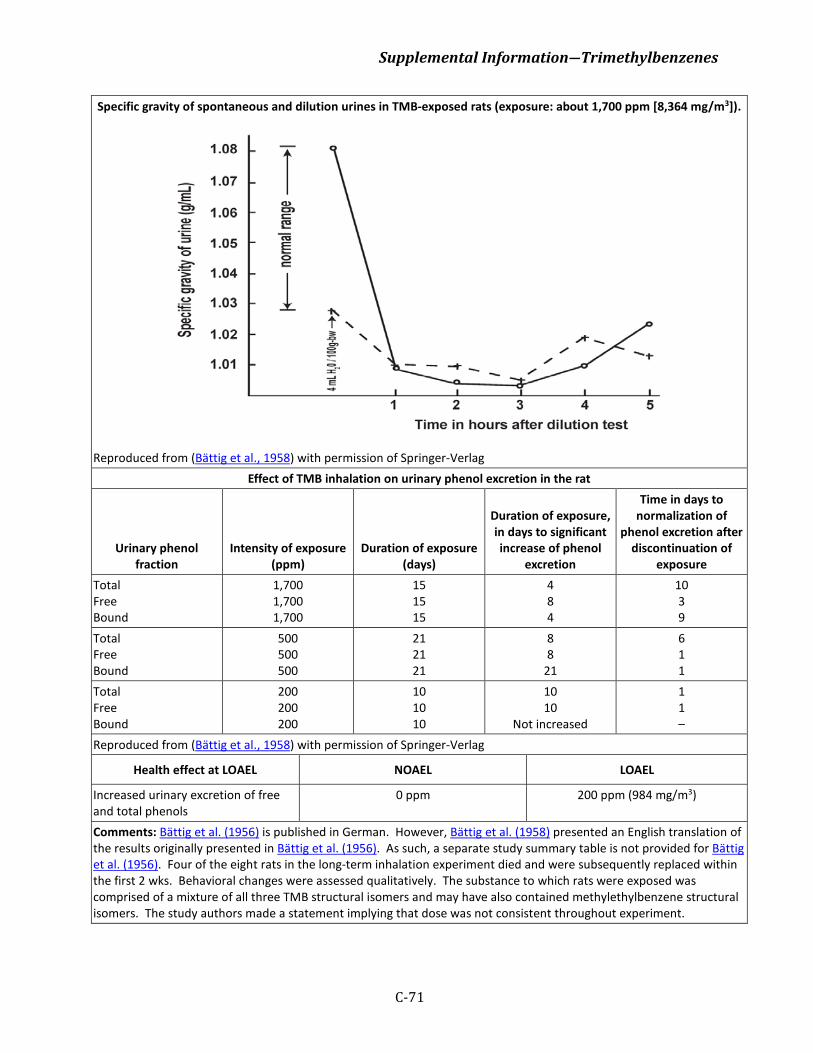
Supplemental Information―Trimethylbenzenes
C-71
Specific gravity of spontaneous and dilution urines in TMB-exposed rats (exposure: about 1,700 ppm [8,364 mg/m3]).
Reproduced from (Bättig et al., 1958) with permission of Springer-Verlag Effect of TMB inhalation on urinary phenol excretion in the rat
Urinary phenol fraction
Intensity of exposure (ppm)
Duration of exposure (days)
Duration of exposure, in days to significant increase of phenol
excretion
Time in days to normalization of
phenol excretion after discontinuation of
exposure Total Free Bound
1,700 1,700 1,700
15 15 15
4 8 4
10 3 9
Total Free Bound
500 500 500
21 21 21
8 8
21
6 1 1
Total Free Bound
200 200 200
10 10 10
10 10
Not increased
1 1 –
Reproduced from (Bättig et al., 1958) with permission of Springer-Verlag
Health effect at LOAEL NOAEL LOAEL
Increased urinary excretion of free and total phenols
0 ppm 200 ppm (984 mg/m3)
Comments: Bättig et al. (1956) is published in German. However, Bättig et al. (1958) presented an English translation of the results originally presented in Bättig et al. (1956). As such, a separate study summary table is not provided for Bättig et al. (1956). Four of the eight rats in the long-term inhalation experiment died and were subsequently replaced within the first 2 wks. Behavioral changes were assessed qualitatively. The substance to which rats were exposed was comprised of a mixture of all three TMB structural isomers and may have also contained methylethylbenzene structural isomers. The study authors made a statement implying that dose was not consistent throughout experiment.
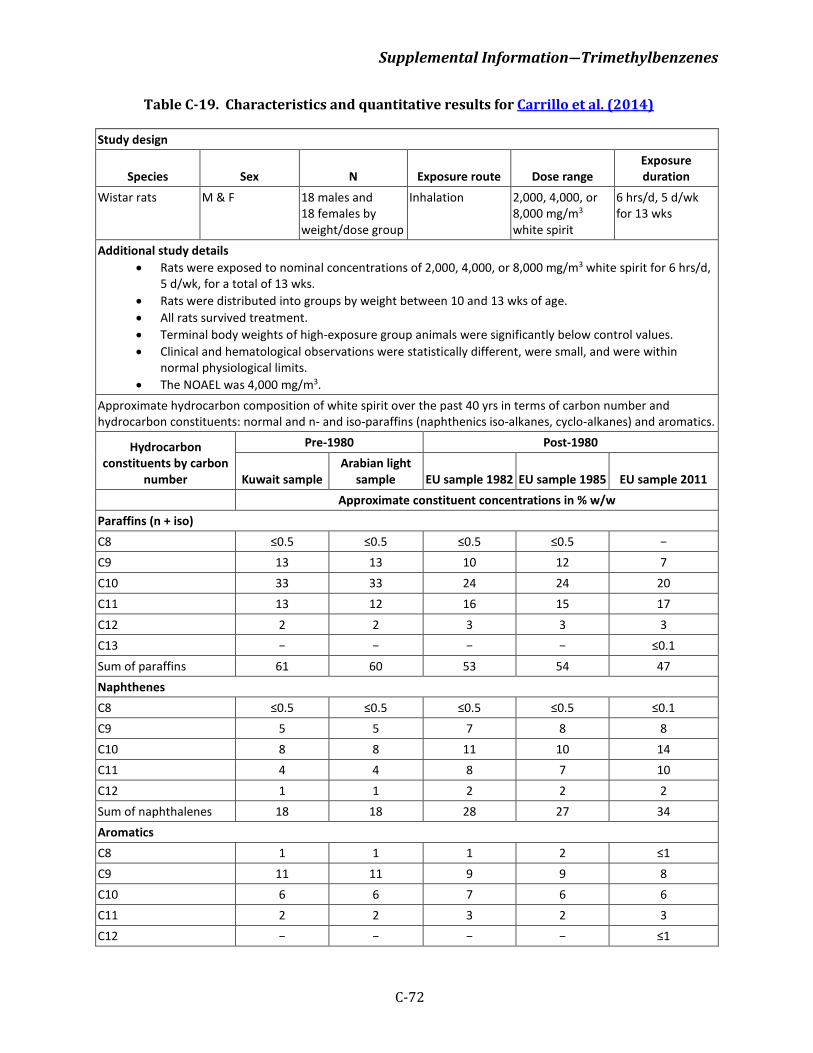
Supplemental Information―Trimethylbenzenes
C-72
Table C-19. Characteristics and quantitative results for Carrillo et al. (2014)
Study design
Species Sex N Exposure route Dose range Exposure duration
Wistar rats M & F 18 males and 18 females by weight/dose group
Inhalation 2,000, 4,000, or 8,000 mg/m3 white spirit
6 hrs/d, 5 d/wk for 13 wks
Additional study details • Rats were exposed to nominal concentrations of 2,000, 4,000, or 8,000 mg/m3 white spirit for 6 hrs/d,
5 d/wk, for a total of 13 wks. • Rats were distributed into groups by weight between 10 and 13 wks of age. • All rats survived treatment. • Terminal body weights of high-exposure group animals were significantly below control values. • Clinical and hematological observations were statistically different, were small, and were within
normal physiological limits. • The NOAEL was 4,000 mg/m3.
Approximate hydrocarbon composition of white spirit over the past 40 yrs in terms of carbon number and hydrocarbon constituents: normal and n- and iso-paraffins (naphthenics iso-alkanes, cyclo-alkanes) and aromatics.
Hydrocarbon constituents by carbon
number
Pre-1980 Post-1980
Kuwait sample Arabian light
sample EU sample 1982 EU sample 1985 EU sample 2011 Approximate constituent concentrations in % w/w Paraffins (n + iso) C8 ≤0.5 ≤0.5 ≤0.5 ≤0.5 − C9 13 13 10 12 7 C10 33 33 24 24 20 C11 13 12 16 15 17 C12 2 2 3 3 3 C13 − − − − ≤0.1 Sum of paraffins 61 60 53 54 47 Naphthenes C8 ≤0.5 ≤0.5 ≤0.5 ≤0.5 ≤0.1 C9 5 5 7 8 8 C10 8 8 11 10 14 C11 4 4 8 7 10 C12 1 1 2 2 2 Sum of naphthalenes 18 18 28 27 34 Aromatics C8 1 1 1 2 ≤1 C9 11 11 9 9 8 C10 6 6 7 6 6 C11 2 2 3 2 3 C12 − − − − ≤1
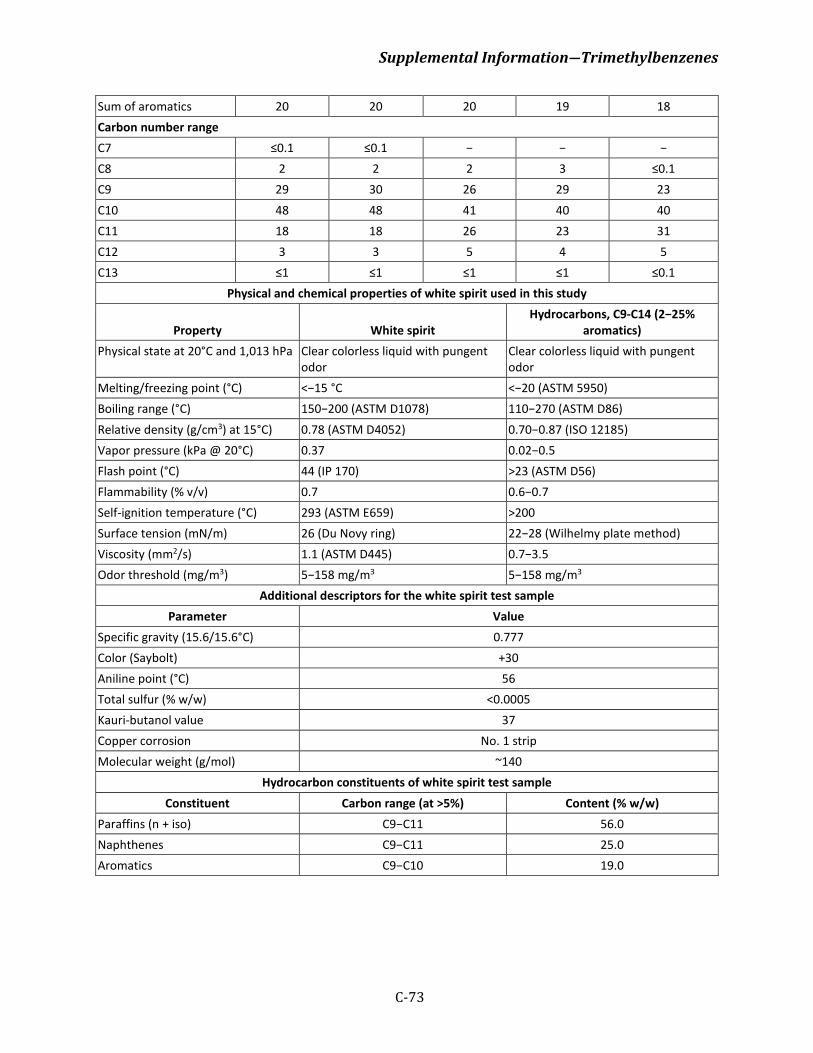
Supplemental Information―Trimethylbenzenes
C-73
Sum of aromatics 20 20 20 19 18 Carbon number range C7 ≤0.1 ≤0.1 − − − C8 2 2 2 3 ≤0.1 C9 29 30 26 29 23 C10 48 48 41 40 40 C11 18 18 26 23 31 C12 3 3 5 4 5 C13 ≤1 ≤1 ≤1 ≤1 ≤0.1
Physical and chemical properties of white spirit used in this study
Property White spirit Hydrocarbons, C9-C14 (2−25%
aromatics) Physical state at 20°C and 1,013 hPa Clear colorless liquid with pungent
odor Clear colorless liquid with pungent odor
Melting/freezing point (°C) <−15 °C <−20 (ASTM 5950) Boiling range (°C) 150−200 (ASTM D1078) 110−270 (ASTM D86) Relative density (g/cm3) at 15°C) 0.78 (ASTM D4052) 0.70−0.87 (ISO 12185) Vapor pressure (kPa @ 20°C) 0.37 0.02−0.5 Flash point (°C) 44 (IP 170) >23 (ASTM D56) Flammability (% v/v) 0.7 0.6−0.7 Self-ignition temperature (°C) 293 (ASTM E659) >200 Surface tension (mN/m) 26 (Du Novy ring) 22−28 (Wilhelmy plate method) Viscosity (mm2/s) 1.1 (ASTM D445) 0.7−3.5 Odor threshold (mg/m3) 5−158 mg/m3 5−158 mg/m3
Additional descriptors for the white spirit test sample Parameter Value
Specific gravity (15.6/15.6°C) 0.777 Color (Saybolt) +30 Aniline point (°C) 56 Total sulfur (% w/w) <0.0005 Kauri-butanol value 37 Copper corrosion No. 1 strip Molecular weight (g/mol) ~140
Hydrocarbon constituents of white spirit test sample Constituent Carbon range (at >5%) Content (% w/w)
Paraffins (n + iso) C9−C11 56.0 Naphthenes C9−C11 25.0 Aromatics C9−C10 19.0
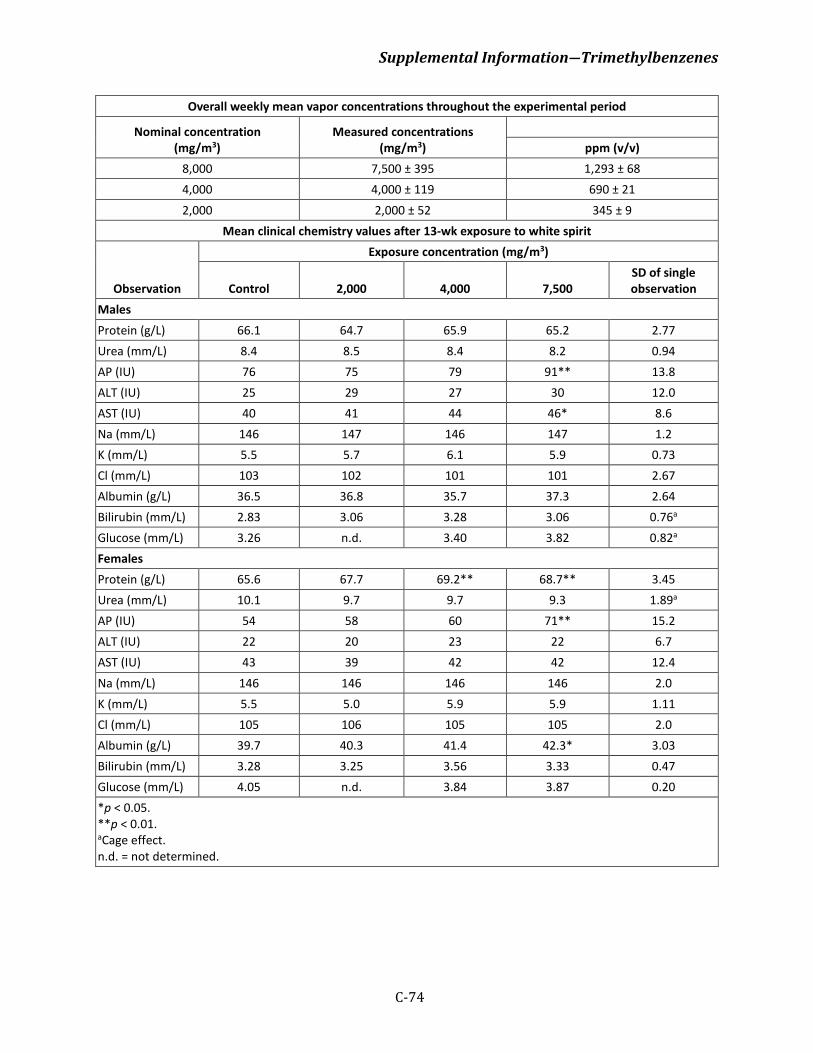
Supplemental Information―Trimethylbenzenes
C-74
Overall weekly mean vapor concentrations throughout the experimental period
Nominal concentration (mg/m3)
Measured concentrations (mg/m3)
ppm (v/v)
8,000 7,500 ± 395 1,293 ± 68 4,000 4,000 ± 119 690 ± 21 2,000 2,000 ± 52 345 ± 9
Mean clinical chemistry values after 13-wk exposure to white spirit
Observation
Exposure concentration (mg/m3)
Control 2,000 4,000 7,500 SD of single observation
Males Protein (g/L) 66.1 64.7 65.9 65.2 2.77 Urea (mm/L) 8.4 8.5 8.4 8.2 0.94 AP (IU) 76 75 79 91** 13.8 ALT (IU) 25 29 27 30 12.0 AST (IU) 40 41 44 46* 8.6 Na (mm/L) 146 147 146 147 1.2 K (mm/L) 5.5 5.7 6.1 5.9 0.73 Cl (mm/L) 103 102 101 101 2.67 Albumin (g/L) 36.5 36.8 35.7 37.3 2.64 Bilirubin (mm/L) 2.83 3.06 3.28 3.06 0.76a
Glucose (mm/L) 3.26 n.d. 3.40 3.82 0.82a
Females Protein (g/L) 65.6 67.7 69.2** 68.7** 3.45 Urea (mm/L) 10.1 9.7 9.7 9.3 1.89a
AP (IU) 54 58 60 71** 15.2 ALT (IU) 22 20 23 22 6.7 AST (IU) 43 39 42 42 12.4 Na (mm/L) 146 146 146 146 2.0
K (mm/L) 5.5 5.0 5.9 5.9 1.11
Cl (mm/L) 105 106 105 105 2.0 Albumin (g/L) 39.7 40.3 41.4 42.3* 3.03 Bilirubin (mm/L) 3.28 3.25 3.56 3.33 0.47 Glucose (mm/L) 4.05 n.d. 3.84 3.87 0.20 *p < 0.05. **p < 0.01. aCage effect. n.d. = not determined.
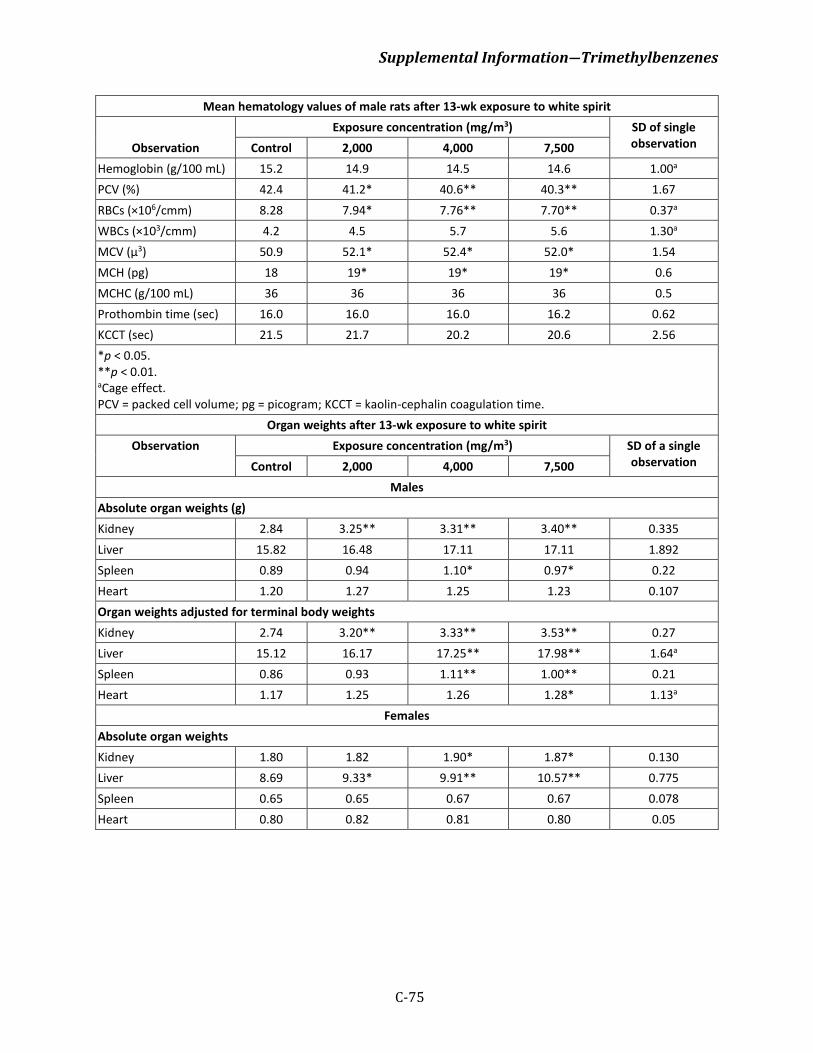
Supplemental Information―Trimethylbenzenes
C-75
Mean hematology values of male rats after 13-wk exposure to white spirit
Observation Exposure concentration (mg/m3) SD of single
observation Control 2,000 4,000 7,500 Hemoglobin (g/100 mL) 15.2 14.9 14.5 14.6 1.00a
PCV (%) 42.4 41.2* 40.6** 40.3** 1.67 RBCs (×106/cmm) 8.28 7.94* 7.76** 7.70** 0.37a
WBCs (×103/cmm) 4.2 4.5 5.7 5.6 1.30a
MCV (µ3) 50.9 52.1* 52.4* 52.0* 1.54 MCH (pg) 18 19* 19* 19* 0.6 MCHC (g/100 mL) 36 36 36 36 0.5 Prothombin time (sec) 16.0 16.0 16.0 16.2 0.62 KCCT (sec) 21.5 21.7 20.2 20.6 2.56 *p < 0.05. **p < 0.01. aCage effect. PCV = packed cell volume; pg = picogram; KCCT = kaolin-cephalin coagulation time.
Organ weights after 13-wk exposure to white spirit Observation Exposure concentration (mg/m3) SD of a single
observation Control 2,000 4,000 7,500 Males
Absolute organ weights (g) Kidney 2.84 3.25** 3.31** 3.40** 0.335 Liver 15.82 16.48 17.11 17.11 1.892 Spleen 0.89 0.94 1.10* 0.97* 0.22 Heart 1.20 1.27 1.25 1.23 0.107 Organ weights adjusted for terminal body weights Kidney 2.74 3.20** 3.33** 3.53** 0.27 Liver 15.12 16.17 17.25** 17.98** 1.64a
Spleen 0.86 0.93 1.11** 1.00** 0.21 Heart 1.17 1.25 1.26 1.28* 1.13a
Females Absolute organ weights Kidney 1.80 1.82 1.90* 1.87* 0.130 Liver 8.69 9.33* 9.91** 10.57** 0.775 Spleen 0.65 0.65 0.67 0.67 0.078 Heart 0.80 0.82 0.81 0.80 0.05
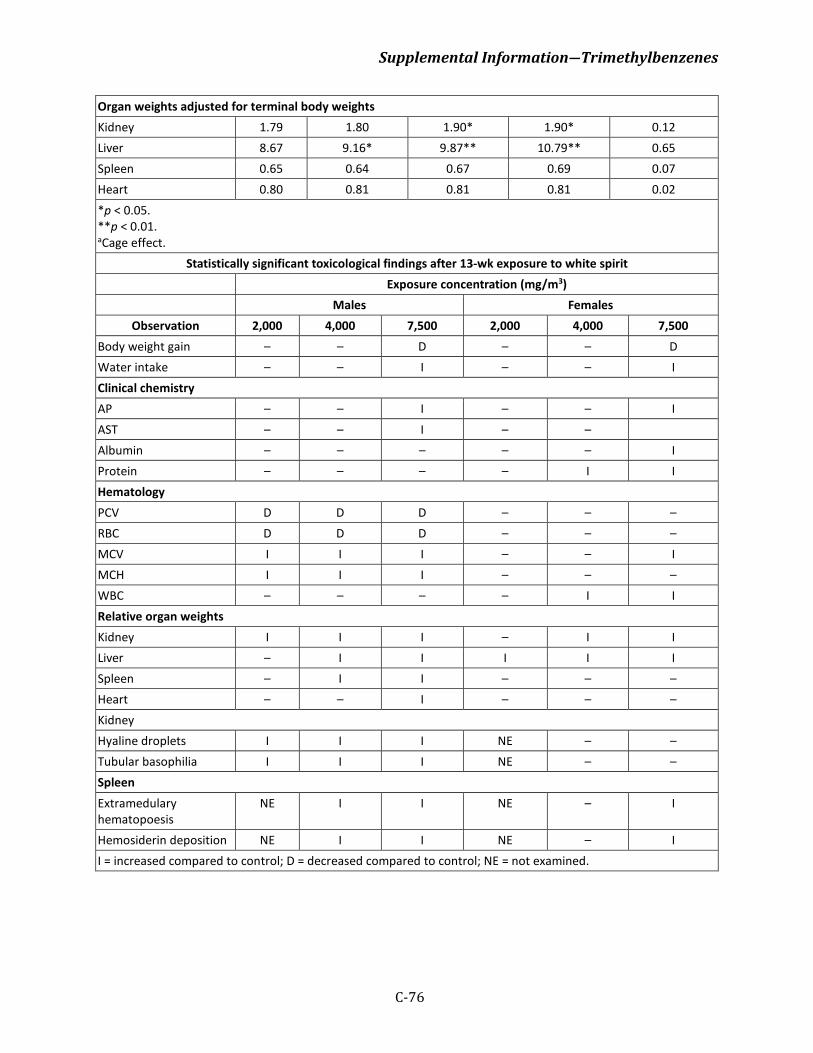
Supplemental Information―Trimethylbenzenes
C-76
Organ weights adjusted for terminal body weights Kidney 1.79 1.80 1.90* 1.90* 0.12 Liver 8.67 9.16* 9.87** 10.79** 0.65 Spleen 0.65 0.64 0.67 0.69 0.07 Heart 0.80 0.81 0.81 0.81 0.02 *p < 0.05. **p < 0.01. aCage effect.
Statistically significant toxicological findings after 13-wk exposure to white spirit Exposure concentration (mg/m3) Males Females
Observation 2,000 4,000 7,500 2,000 4,000 7,500 Body weight gain – – D – – D Water intake – – I – – I Clinical chemistry AP – – I – – I AST – – I – – Albumin – – – – – I Protein – – – – I I Hematology PCV D D D – – – RBC D D D – – – MCV I I I – – I MCH I I I – – – WBC – – – – I I Relative organ weights Kidney I I I – I I Liver – I I I I I Spleen – I I – – – Heart – – I – – – Kidney Hyaline droplets I I I NE – – Tubular basophilia I I I NE – – Spleen Extramedulary hematopoesis
NE I I NE – I
Hemosiderin deposition NE I I NE – I I = increased compared to control; D = decreased compared to control; NE = not examined.
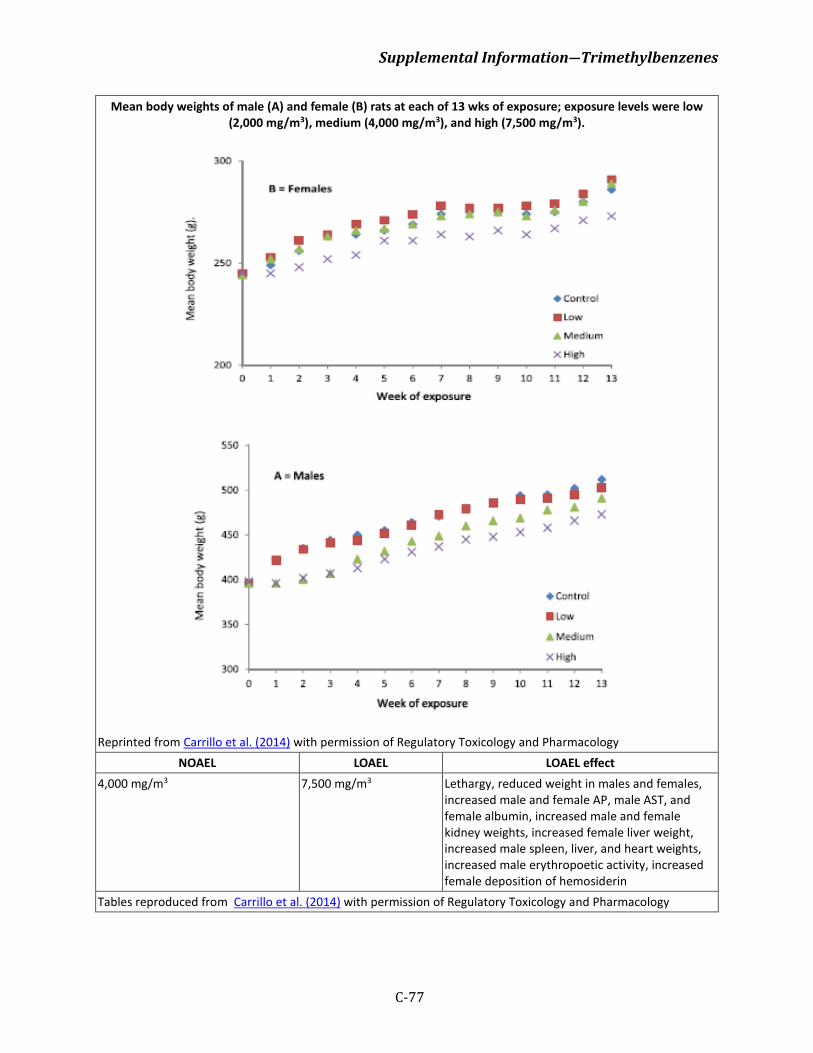
Supplemental Information―Trimethylbenzenes
C-77
Mean body weights of male (A) and female (B) rats at each of 13 wks of exposure; exposure levels were low (2,000 mg/m3), medium (4,000 mg/m3), and high (7,500 mg/m3).
Reprinted from Carrillo et al. (2014) with permission of Regulatory Toxicology and Pharmacology NOAEL LOAEL LOAEL effect
4,000 mg/m3 7,500 mg/m3 Lethargy, reduced weight in males and females, increased male and female AP, male AST, and female albumin, increased male and female kidney weights, increased female liver weight, increased male spleen, liver, and heart weights, increased male erythropoetic activity, increased female deposition of hemosiderin
Tables reproduced from Carrillo et al. (2014) with permission of Regulatory Toxicology and Pharmacology
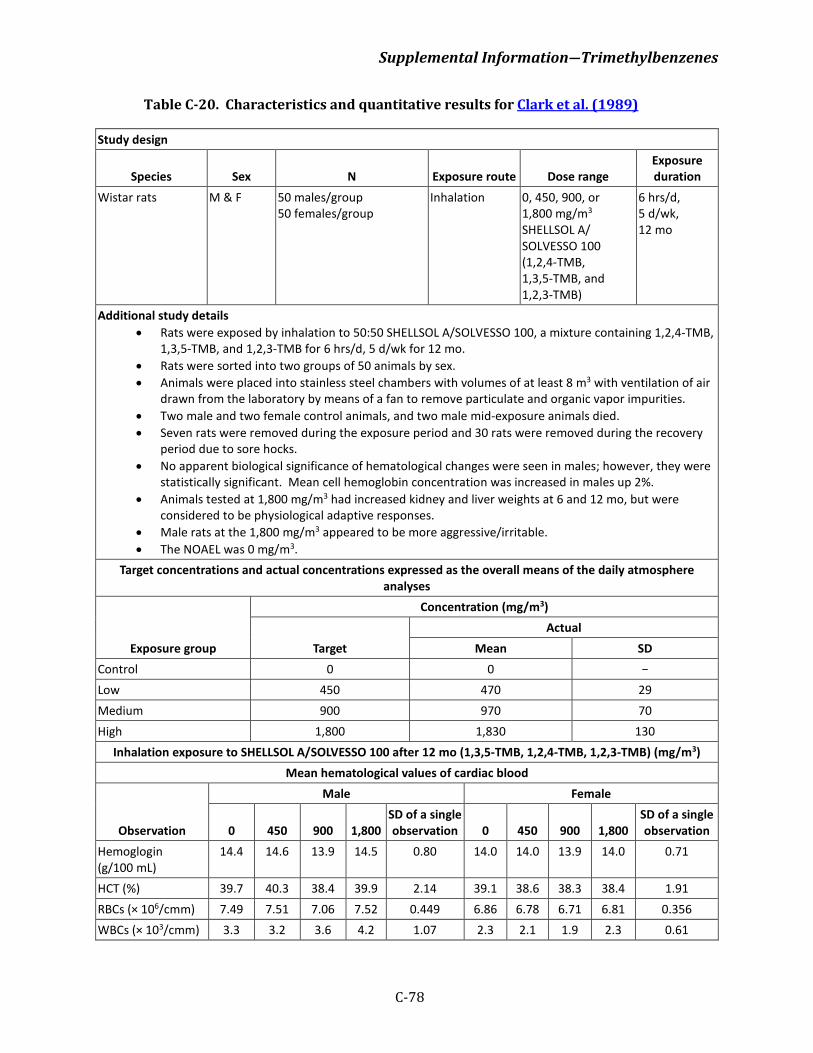
Supplemental Information―Trimethylbenzenes
C-78
Table C-20. Characteristics and quantitative results for Clark et al. (1989)
Study design
Species Sex N Exposure route Dose range Exposure duration
Wistar rats M & F 50 males/group 50 females/group
Inhalation 0, 450, 900, or 1,800 mg/m3 SHELLSOL A/SOLVESSO 100 (1,2,4-TMB, 1,3,5-TMB, and 1,2,3-TMB)
6 hrs/d, 5 d/wk, 12 mo
Additional study details • Rats were exposed by inhalation to 50:50 SHELLSOL A/SOLVESSO 100, a mixture containing 1,2,4-TMB,
1,3,5-TMB, and 1,2,3-TMB for 6 hrs/d, 5 d/wk for 12 mo. • Rats were sorted into two groups of 50 animals by sex. • Animals were placed into stainless steel chambers with volumes of at least 8 m3 with ventilation of air
drawn from the laboratory by means of a fan to remove particulate and organic vapor impurities. • Two male and two female control animals, and two male mid-exposure animals died. • Seven rats were removed during the exposure period and 30 rats were removed during the recovery
period due to sore hocks. • No apparent biological significance of hematological changes were seen in males; however, they were
statistically significant. Mean cell hemoglobin concentration was increased in males up 2%. • Animals tested at 1,800 mg/m3 had increased kidney and liver weights at 6 and 12 mo, but were
considered to be physiological adaptive responses. • Male rats at the 1,800 mg/m3 appeared to be more aggressive/irritable. • The NOAEL was 0 mg/m3.
Target concentrations and actual concentrations expressed as the overall means of the daily atmosphere analyses
Exposure group
Concentration (mg/m3)
Target
Actual Mean SD
Control 0 0 − Low 450 470 29 Medium 900 970 70 High 1,800 1,830 130
Inhalation exposure to SHELLSOL A/SOLVESSO 100 after 12 mo (1,3,5-TMB, 1,2,4-TMB, 1,2,3-TMB) (mg/m3) Mean hematological values of cardiac blood
Observation
Male Female
0 450 900 1,800 SD of a single observation 0 450 900 1,800
SD of a single observation
Hemoglogin (g/100 mL)
14.4 14.6 13.9 14.5 0.80 14.0 14.0 13.9 14.0 0.71
HCT (%) 39.7 40.3 38.4 39.9 2.14 39.1 38.6 38.3 38.4 1.91 RBCs (× 106/cmm) 7.49 7.51 7.06 7.52 0.449 6.86 6.78 6.71 6.81 0.356 WBCs (× 103/cmm) 3.3 3.2 3.6 4.2 1.07 2.3 2.1 1.9 2.3 0.61
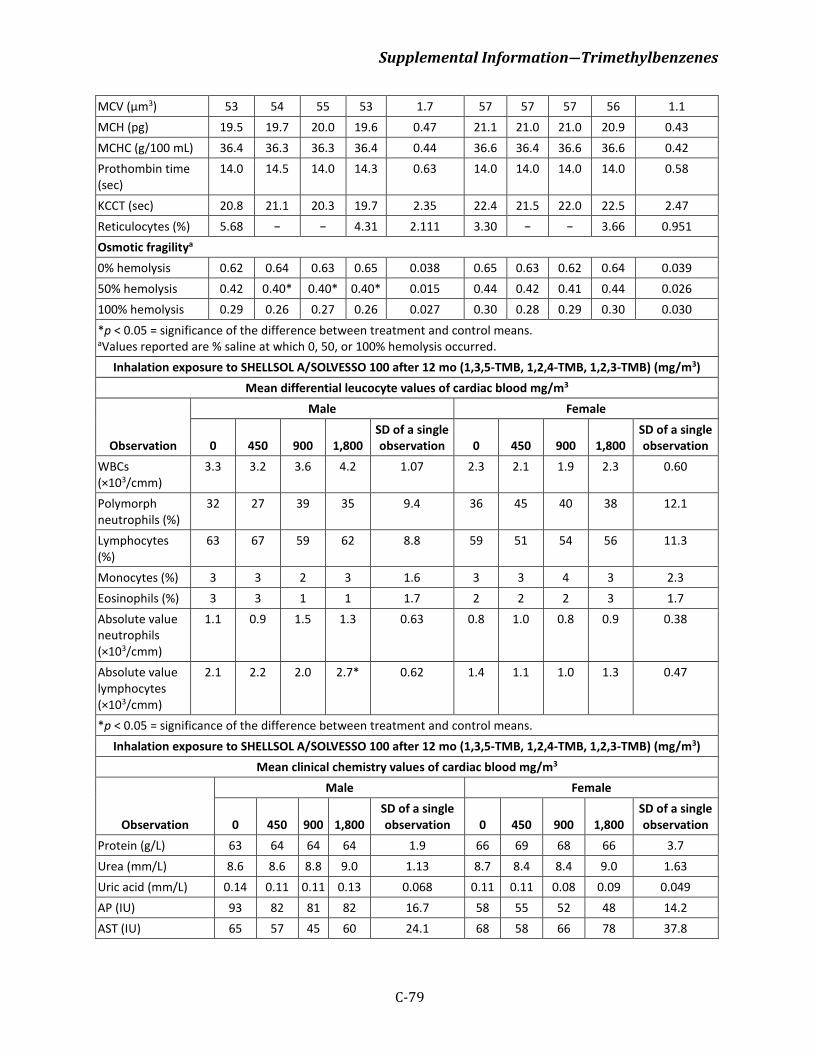
Supplemental Information―Trimethylbenzenes
C-79
MCV (µm3) 53 54 55 53 1.7 57 57 57 56 1.1 MCH (pg) 19.5 19.7 20.0 19.6 0.47 21.1 21.0 21.0 20.9 0.43 MCHC (g/100 mL) 36.4 36.3 36.3 36.4 0.44 36.6 36.4 36.6 36.6 0.42 Prothombin time (sec)
14.0 14.5 14.0 14.3 0.63 14.0 14.0 14.0 14.0 0.58
KCCT (sec) 20.8 21.1 20.3 19.7 2.35 22.4 21.5 22.0 22.5 2.47 Reticulocytes (%) 5.68 − − 4.31 2.111 3.30 − − 3.66 0.951 Osmotic fragilitya 0% hemolysis 0.62 0.64 0.63 0.65 0.038 0.65 0.63 0.62 0.64 0.039 50% hemolysis 0.42 0.40* 0.40* 0.40* 0.015 0.44 0.42 0.41 0.44 0.026 100% hemolysis 0.29 0.26 0.27 0.26 0.027 0.30 0.28 0.29 0.30 0.030 *p < 0.05 = significance of the difference between treatment and control means. aValues reported are % saline at which 0, 50, or 100% hemolysis occurred.
Inhalation exposure to SHELLSOL A/SOLVESSO 100 after 12 mo (1,3,5-TMB, 1,2,4-TMB, 1,2,3-TMB) (mg/m3) Mean differential leucocyte values of cardiac blood mg/m3
Observation
Male Female
0 450 900 1,800 SD of a single observation 0 450 900 1,800
SD of a single observation
WBCs (×103/cmm)
3.3 3.2 3.6 4.2 1.07 2.3 2.1 1.9 2.3 0.60
Polymorph neutrophils (%)
32 27 39 35 9.4 36 45 40 38 12.1
Lymphocytes (%)
63 67 59 62 8.8 59 51 54 56 11.3
Monocytes (%) 3 3 2 3 1.6 3 3 4 3 2.3 Eosinophils (%) 3 3 1 1 1.7 2 2 2 3 1.7 Absolute value neutrophils (×103/cmm)
1.1 0.9 1.5 1.3 0.63 0.8 1.0 0.8 0.9 0.38
Absolute value lymphocytes (×103/cmm)
2.1 2.2 2.0 2.7* 0.62 1.4 1.1 1.0 1.3 0.47
*p < 0.05 = significance of the difference between treatment and control means. Inhalation exposure to SHELLSOL A/SOLVESSO 100 after 12 mo (1,3,5-TMB, 1,2,4-TMB, 1,2,3-TMB) (mg/m3)
Mean clinical chemistry values of cardiac blood mg/m3
Observation
Male Female
0 450 900 1,800 SD of a single observation 0 450 900 1,800
SD of a single observation
Protein (g/L) 63 64 64 64 1.9 66 69 68 66 3.7 Urea (mm/L) 8.6 8.6 8.8 9.0 1.13 8.7 8.4 8.4 9.0 1.63 Uric acid (mm/L) 0.14 0.11 0.11 0.13 0.068 0.11 0.11 0.08 0.09 0.049 AP (IU) 93 82 81 82 16.7 58 55 52 48 14.2 AST (IU) 65 57 45 60 24.1 68 58 66 78 37.8
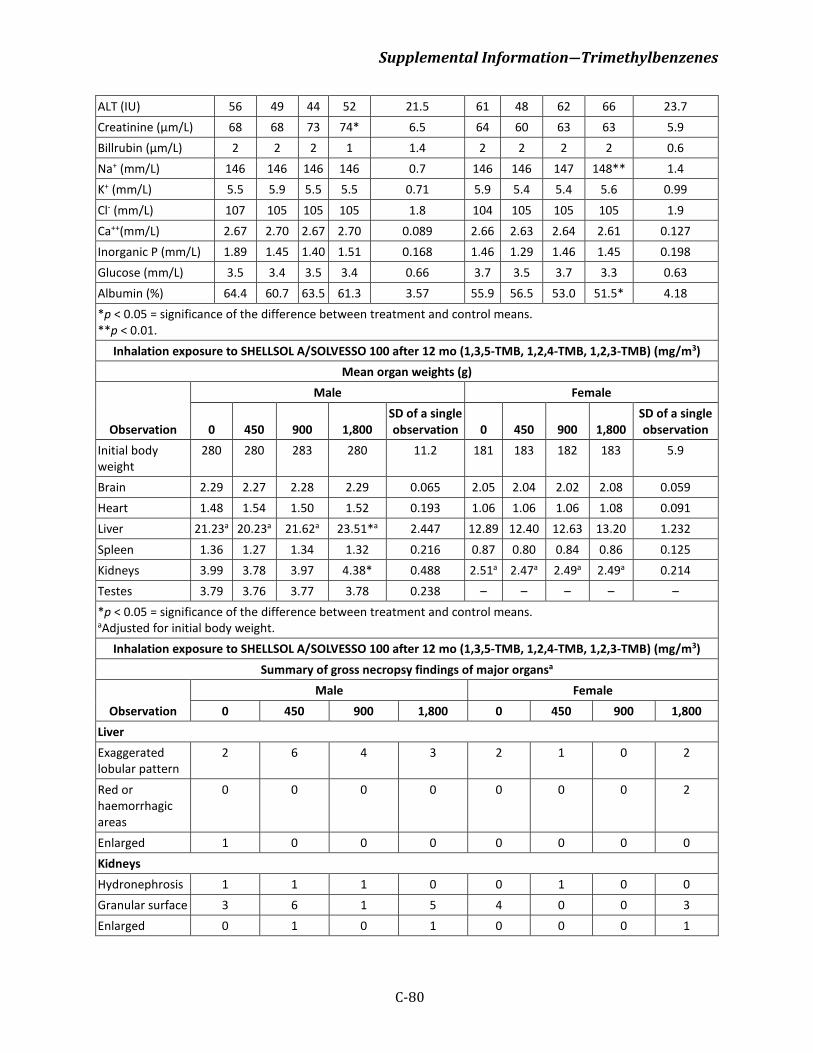
Supplemental Information―Trimethylbenzenes
C-80
ALT (IU) 56 49 44 52 21.5 61 48 62 66 23.7 Creatinine (µm/L) 68 68 73 74* 6.5 64 60 63 63 5.9 Billrubin (µm/L) 2 2 2 1 1.4 2 2 2 2 0.6 Na+ (mm/L) 146 146 146 146 0.7 146 146 147 148** 1.4 K+ (mm/L) 5.5 5.9 5.5 5.5 0.71 5.9 5.4 5.4 5.6 0.99 Cl- (mm/L) 107 105 105 105 1.8 104 105 105 105 1.9 Ca++(mm/L) 2.67 2.70 2.67 2.70 0.089 2.66 2.63 2.64 2.61 0.127 Inorganic P (mm/L) 1.89 1.45 1.40 1.51 0.168 1.46 1.29 1.46 1.45 0.198 Glucose (mm/L) 3.5 3.4 3.5 3.4 0.66 3.7 3.5 3.7 3.3 0.63 Albumin (%) 64.4 60.7 63.5 61.3 3.57 55.9 56.5 53.0 51.5* 4.18 *p < 0.05 = significance of the difference between treatment and control means. **p < 0.01.
Inhalation exposure to SHELLSOL A/SOLVESSO 100 after 12 mo (1,3,5-TMB, 1,2,4-TMB, 1,2,3-TMB) (mg/m3) Mean organ weights (g)
Observation
Male Female
0 450 900 1,800 SD of a single observation 0 450 900 1,800
SD of a single observation
Initial body weight
280 280 283 280 11.2 181 183 182 183 5.9
Brain 2.29 2.27 2.28 2.29 0.065 2.05 2.04 2.02 2.08 0.059 Heart 1.48 1.54 1.50 1.52 0.193 1.06 1.06 1.06 1.08 0.091 Liver 21.23a 20.23a 21.62a 23.51*a 2.447 12.89 12.40 12.63 13.20 1.232 Spleen 1.36 1.27 1.34 1.32 0.216 0.87 0.80 0.84 0.86 0.125 Kidneys 3.99 3.78 3.97 4.38* 0.488 2.51a 2.47a 2.49a 2.49a 0.214 Testes 3.79 3.76 3.77 3.78 0.238 – – – – – *p < 0.05 = significance of the difference between treatment and control means. aAdjusted for initial body weight.
Inhalation exposure to SHELLSOL A/SOLVESSO 100 after 12 mo (1,3,5-TMB, 1,2,4-TMB, 1,2,3-TMB) (mg/m3) Summary of gross necropsy findings of major organsa
Observation Male Female
0 450 900 1,800 0 450 900 1,800 Liver Exaggerated lobular pattern
2 6 4 3 2 1 0 2
Red or haemorrhagic areas
0 0 0 0 0 0 0 2
Enlarged 1 0 0 0 0 0 0 0 Kidneys Hydronephrosis 1 1 1 0 0 1 0 0 Granular surface 3 6 1 5 4 0 0 3 Enlarged 0 1 0 1 0 0 0 1
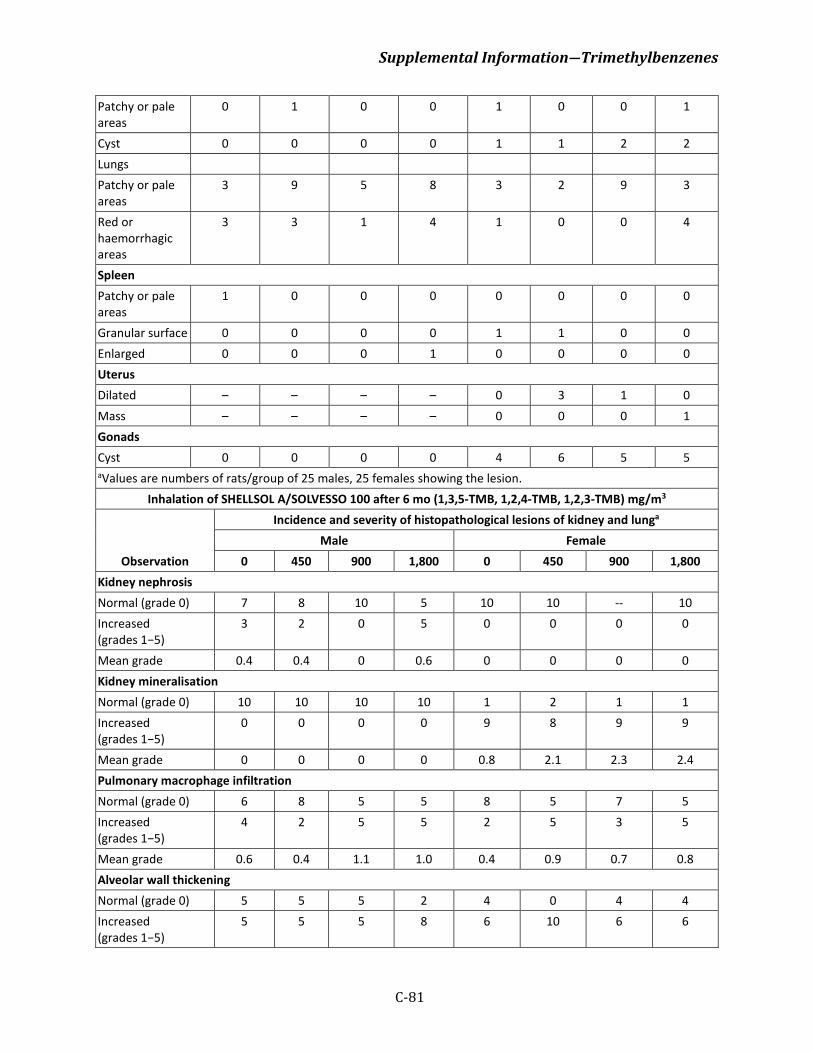
Supplemental Information―Trimethylbenzenes
C-81
Patchy or pale areas
0 1 0 0 1 0 0 1
Cyst 0 0 0 0 1 1 2 2 Lungs Patchy or pale areas
3 9 5 8 3 2 9 3
Red or haemorrhagic areas
3 3 1 4 1 0 0 4
Spleen Patchy or pale areas
1 0 0 0 0 0 0 0
Granular surface 0 0 0 0 1 1 0 0 Enlarged 0 0 0 1 0 0 0 0 Uterus Dilated – – – – 0 3 1 0 Mass – – – – 0 0 0 1 Gonads Cyst 0 0 0 0 4 6 5 5 aValues are numbers of rats/group of 25 males, 25 females showing the lesion.
Inhalation of SHELLSOL A/SOLVESSO 100 after 6 mo (1,3,5-TMB, 1,2,4-TMB, 1,2,3-TMB) mg/m3
Observation
Incidence and severity of histopathological lesions of kidney and lunga Male Female
0 450 900 1,800 0 450 900 1,800 Kidney nephrosis Normal (grade 0) 7 8 10 5 10 10 -- 10 Increased (grades 1−5)
3 2 0 5 0 0 0 0
Mean grade 0.4 0.4 0 0.6 0 0 0 0 Kidney mineralisation Normal (grade 0) 10 10 10 10 1 2 1 1 Increased (grades 1−5)
0 0 0 0 9 8 9 9
Mean grade 0 0 0 0 0.8 2.1 2.3 2.4 Pulmonary macrophage infiltration Normal (grade 0) 6 8 5 5 8 5 7 5 Increased (grades 1−5)
4 2 5 5 2 5 3 5
Mean grade 0.6 0.4 1.1 1.0 0.4 0.9 0.7 0.8 Alveolar wall thickening Normal (grade 0) 5 5 5 2 4 0 4 4 Increased (grades 1−5)
5 5 5 8 6 10 6 6
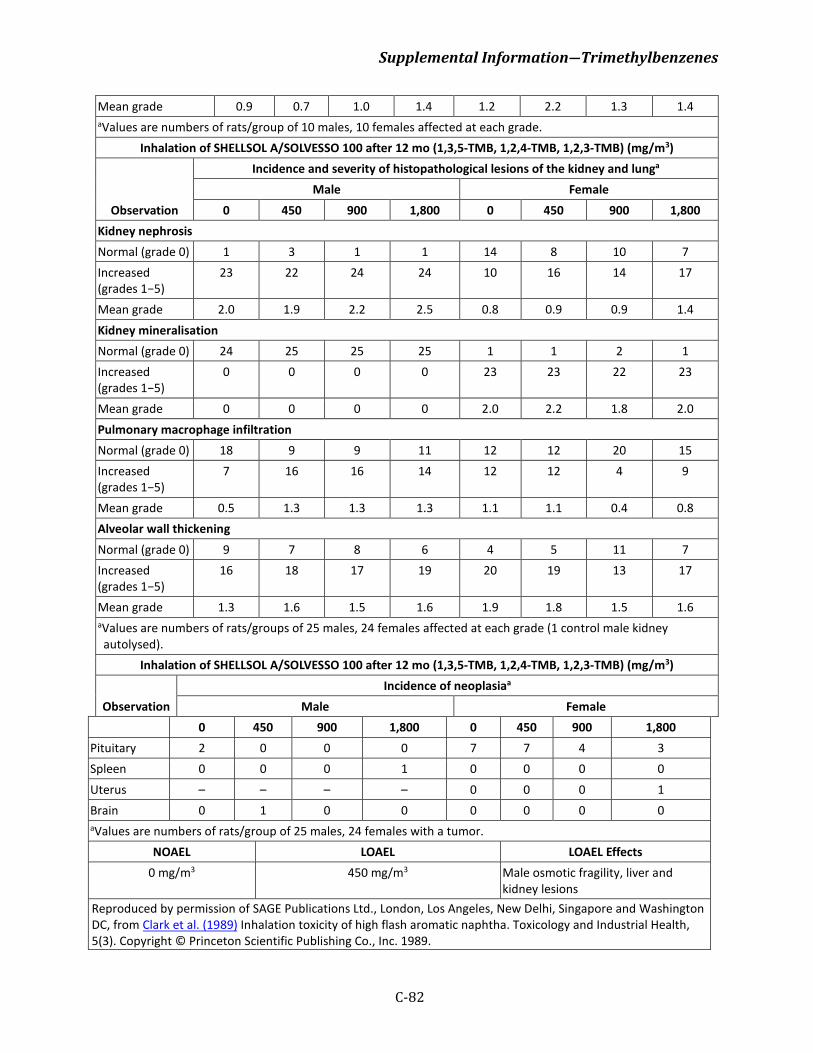
Supplemental Information―Trimethylbenzenes
C-82
Mean grade 0.9 0.7 1.0 1.4 1.2 2.2 1.3 1.4 aValues are numbers of rats/group of 10 males, 10 females affected at each grade.
Inhalation of SHELLSOL A/SOLVESSO 100 after 12 mo (1,3,5-TMB, 1,2,4-TMB, 1,2,3-TMB) (mg/m3)
Observation
Incidence and severity of histopathological lesions of the kidney and lunga Male Female
0 450 900 1,800 0 450 900 1,800 Kidney nephrosis Normal (grade 0) 1 3 1 1 14 8 10 7 Increased (grades 1−5)
23 22 24 24 10 16 14 17
Mean grade 2.0 1.9 2.2 2.5 0.8 0.9 0.9 1.4 Kidney mineralisation Normal (grade 0) 24 25 25 25 1 1 2 1 Increased (grades 1−5)
0 0 0 0 23 23 22 23
Mean grade 0 0 0 0 2.0 2.2 1.8 2.0 Pulmonary macrophage infiltration Normal (grade 0) 18 9 9 11 12 12 20 15 Increased (grades 1−5)
7 16 16 14 12 12 4 9
Mean grade 0.5 1.3 1.3 1.3 1.1 1.1 0.4 0.8 Alveolar wall thickening Normal (grade 0) 9 7 8 6 4 5 11 7 Increased (grades 1−5)
16 18 17 19 20 19 13 17
Mean grade 1.3 1.6 1.5 1.6 1.9 1.8 1.5 1.6 aValues are numbers of rats/groups of 25 males, 24 females affected at each grade (1 control male kidney autolysed).
Inhalation of SHELLSOL A/SOLVESSO 100 after 12 mo (1,3,5-TMB, 1,2,4-TMB, 1,2,3-TMB) (mg/m3)
Observation Incidence of neoplasiaa
Male Female 0 450 900 1,800 0 450 900 1,800
Pituitary 2 0 0 0 7 7 4 3 Spleen 0 0 0 1 0 0 0 0 Uterus – – – – 0 0 0 1 Brain 0 1 0 0 0 0 0 0 aValues are numbers of rats/group of 25 males, 24 females with a tumor.
NOAEL LOAEL LOAEL Effects 0 mg/m3 450 mg/m3 Male osmotic fragility, liver and
kidney lesions Reproduced by permission of SAGE Publications Ltd., London, Los Angeles, New Delhi, Singapore and Washington DC, from Clark et al. (1989) Inhalation toxicity of high flash aromatic naphtha. Toxicology and Industrial Health, 5(3). Copyright © Princeton Scientific Publishing Co., Inc. 1989.
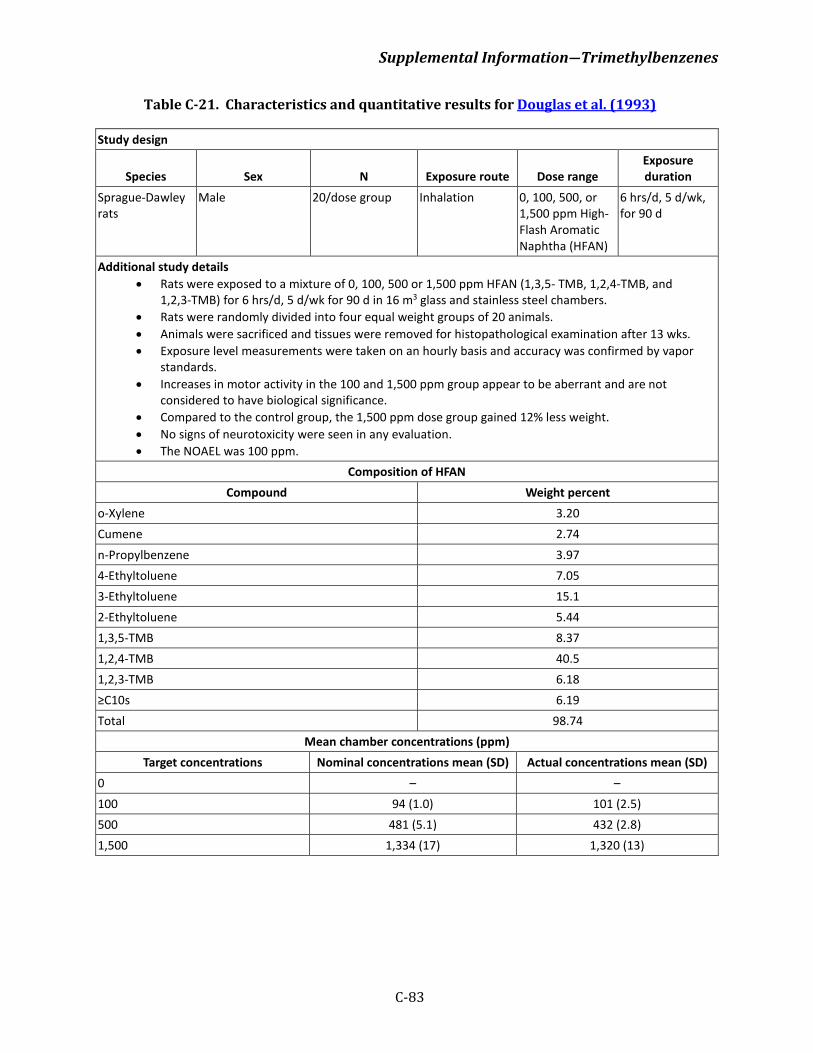
Supplemental Information―Trimethylbenzenes
C-83
Table C-21. Characteristics and quantitative results for Douglas et al. (1993)
Study design
Species Sex N Exposure route Dose range Exposure duration
Sprague-Dawley rats
Male 20/dose group Inhalation 0, 100, 500, or 1,500 ppm High- Flash Aromatic Naphtha (HFAN)
6 hrs/d, 5 d/wk, for 90 d
Additional study details • Rats were exposed to a mixture of 0, 100, 500 or 1,500 ppm HFAN (1,3,5- TMB, 1,2,4-TMB, and
1,2,3-TMB) for 6 hrs/d, 5 d/wk for 90 d in 16 m3 glass and stainless steel chambers. • Rats were randomly divided into four equal weight groups of 20 animals. • Animals were sacrificed and tissues were removed for histopathological examination after 13 wks. • Exposure level measurements were taken on an hourly basis and accuracy was confirmed by vapor
standards. • Increases in motor activity in the 100 and 1,500 ppm group appear to be aberrant and are not
considered to have biological significance. • Compared to the control group, the 1,500 ppm dose group gained 12% less weight. • No signs of neurotoxicity were seen in any evaluation. • The NOAEL was 100 ppm.
Composition of HFAN Compound Weight percent
o-Xylene 3.20 Cumene 2.74 n-Propylbenzene 3.97 4-Ethyltoluene 7.05 3-Ethyltoluene 15.1 2-Ethyltoluene 5.44 1,3,5-TMB 8.37 1,2,4-TMB 40.5 1,2,3-TMB 6.18 ≥C10s 6.19 Total 98.74
Mean chamber concentrations (ppm) Target concentrations Nominal concentrations mean (SD) Actual concentrations mean (SD)
0 – – 100 94 (1.0) 101 (2.5) 500 481 (5.1) 432 (2.8) 1,500 1,334 (17) 1,320 (13)
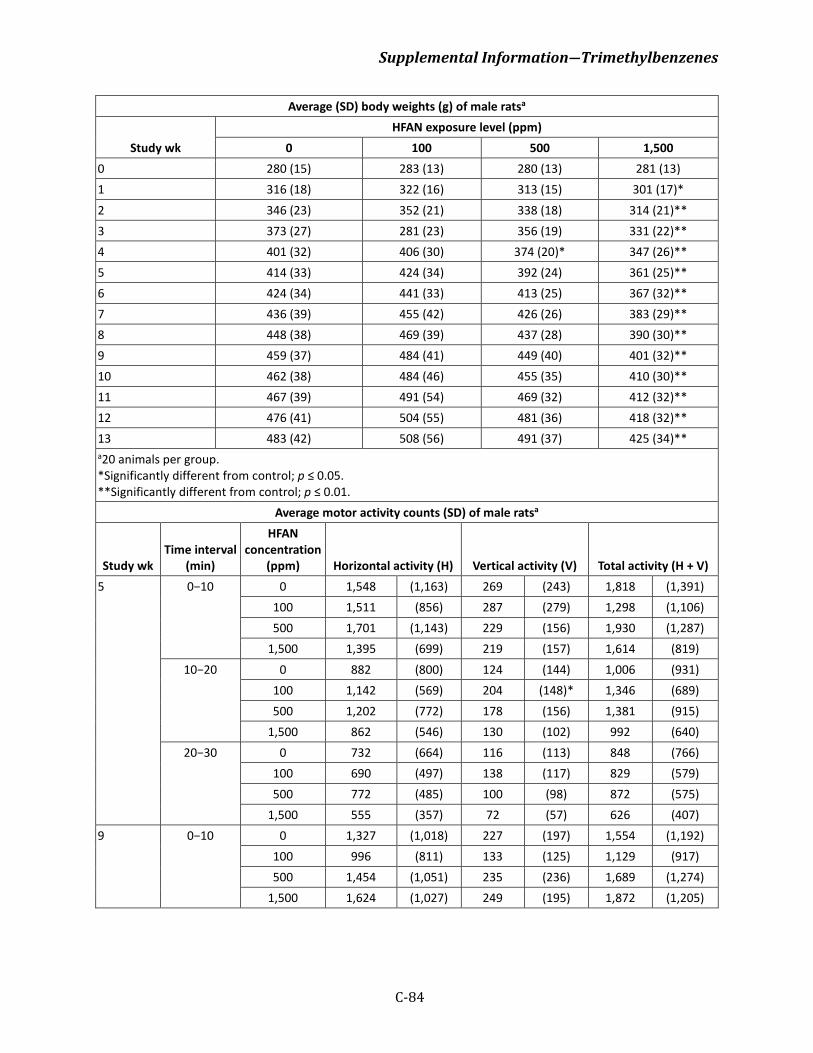
Supplemental Information―Trimethylbenzenes
C-84
Average (SD) body weights (g) of male ratsa
Study wk HFAN exposure level (ppm)
0 100 500 1,500 0 280 (15) 283 (13) 280 (13) 281 (13) 1 316 (18) 322 (16) 313 (15) 301 (17)* 2 346 (23) 352 (21) 338 (18) 314 (21)** 3 373 (27) 281 (23) 356 (19) 331 (22)** 4 401 (32) 406 (30) 374 (20)* 347 (26)** 5 414 (33) 424 (34) 392 (24) 361 (25)** 6 424 (34) 441 (33) 413 (25) 367 (32)** 7 436 (39) 455 (42) 426 (26) 383 (29)** 8 448 (38) 469 (39) 437 (28) 390 (30)** 9 459 (37) 484 (41) 449 (40) 401 (32)** 10 462 (38) 484 (46) 455 (35) 410 (30)** 11 467 (39) 491 (54) 469 (32) 412 (32)** 12 476 (41) 504 (55) 481 (36) 418 (32)** 13 483 (42) 508 (56) 491 (37) 425 (34)** a20 animals per group. *Significantly different from control; p ≤ 0.05. **Significantly different from control; p ≤ 0.01.
Average motor activity counts (SD) of male ratsa
Study wk Time interval
(min)
HFAN concentration
(ppm) Horizontal activity (H) Vertical activity (V) Total activity (H + V) 5 0−10 0 1,548 (1,163) 269 (243) 1,818 (1,391)
100 1,511 (856) 287 (279) 1,298 (1,106) 500 1,701 (1,143) 229 (156) 1,930 (1,287)
1,500 1,395 (699) 219 (157) 1,614 (819) 10−20 0 882 (800) 124 (144) 1,006 (931)
100 1,142 (569) 204 (148)* 1,346 (689) 500 1,202 (772) 178 (156) 1,381 (915)
1,500 862 (546) 130 (102) 992 (640) 20−30 0 732 (664) 116 (113) 848 (766)
100 690 (497) 138 (117) 829 (579) 500 772 (485) 100 (98) 872 (575)
1,500 555 (357) 72 (57) 626 (407) 9 0−10 0 1,327 (1,018) 227 (197) 1,554 (1,192)
100 996 (811) 133 (125) 1,129 (917) 500 1,454 (1,051) 235 (236) 1,689 (1,274)
1,500 1,624 (1,027) 249 (195) 1,872 (1,205)
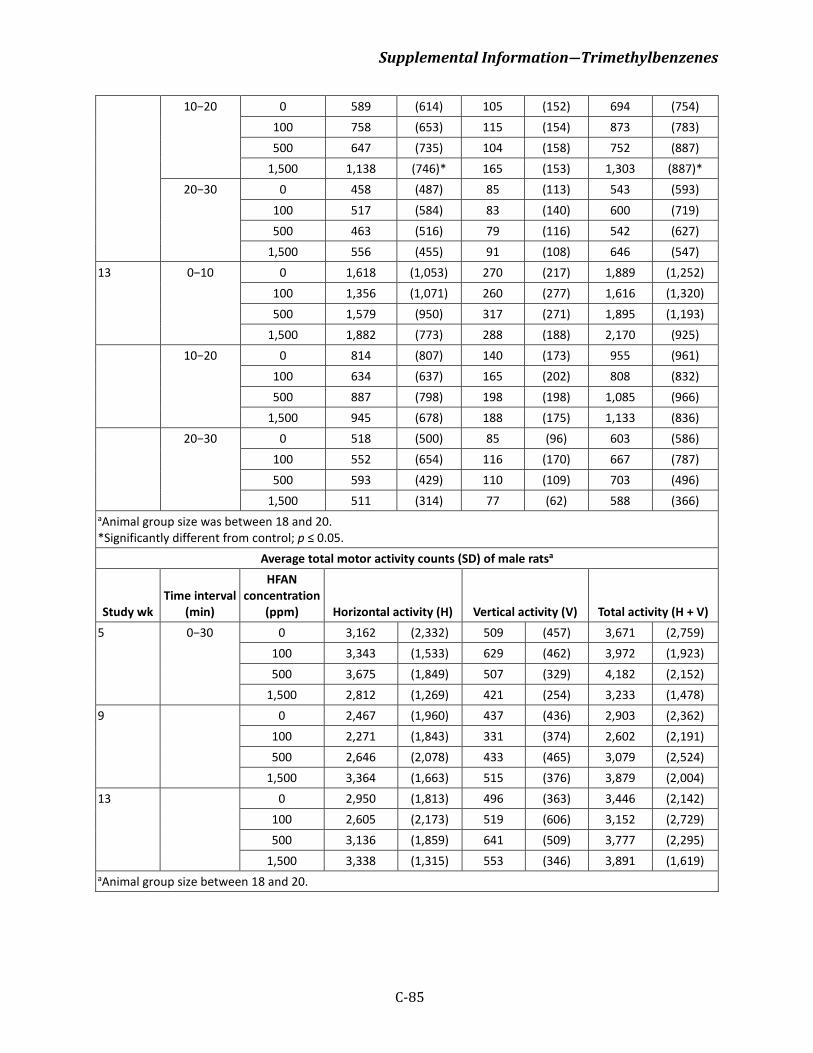
Supplemental Information―Trimethylbenzenes
C-85
10−20 0 589 (614) 105 (152) 694 (754) 100 758 (653) 115 (154) 873 (783) 500 647 (735) 104 (158) 752 (887)
1,500 1,138 (746)* 165 (153) 1,303 (887)*
20−30 0 458 (487) 85 (113) 543 (593) 100 517 (584) 83 (140) 600 (719) 500 463 (516) 79 (116) 542 (627)
1,500 556 (455) 91 (108) 646 (547) 13 0−10 0 1,618 (1,053) 270 (217) 1,889 (1,252)
100 1,356 (1,071) 260 (277) 1,616 (1,320) 500 1,579 (950) 317 (271) 1,895 (1,193)
1,500 1,882 (773) 288 (188) 2,170 (925) 10−20 0 814 (807) 140 (173) 955 (961)
100 634 (637) 165 (202) 808 (832) 500 887 (798) 198 (198) 1,085 (966)
1,500 945 (678) 188 (175) 1,133 (836) 20−30 0 518 (500) 85 (96) 603 (586)
100 552 (654) 116 (170) 667 (787) 500 593 (429) 110 (109) 703 (496)
1,500 511 (314) 77 (62) 588 (366) aAnimal group size was between 18 and 20. *Significantly different from control; p ≤ 0.05.
Average total motor activity counts (SD) of male ratsa
Study wk Time interval
(min)
HFAN concentration
(ppm) Horizontal activity (H) Vertical activity (V) Total activity (H + V) 5 0−30 0 3,162 (2,332) 509 (457) 3,671 (2,759)
100 3,343 (1,533) 629 (462) 3,972 (1,923) 500 3,675 (1,849) 507 (329) 4,182 (2,152)
1,500 2,812 (1,269) 421 (254) 3,233 (1,478) 9 0 2,467 (1,960) 437 (436) 2,903 (2,362)
100 2,271 (1,843) 331 (374) 2,602 (2,191) 500 2,646 (2,078) 433 (465) 3,079 (2,524)
1,500 3,364 (1,663) 515 (376) 3,879 (2,004) 13 0 2,950 (1,813) 496 (363) 3,446 (2,142)
100 2,605 (2,173) 519 (606) 3,152 (2,729) 500 3,136 (1,859) 641 (509) 3,777 (2,295)
1,500 3,338 (1,315) 553 (346) 3,891 (1,619) aAnimal group size between 18 and 20.
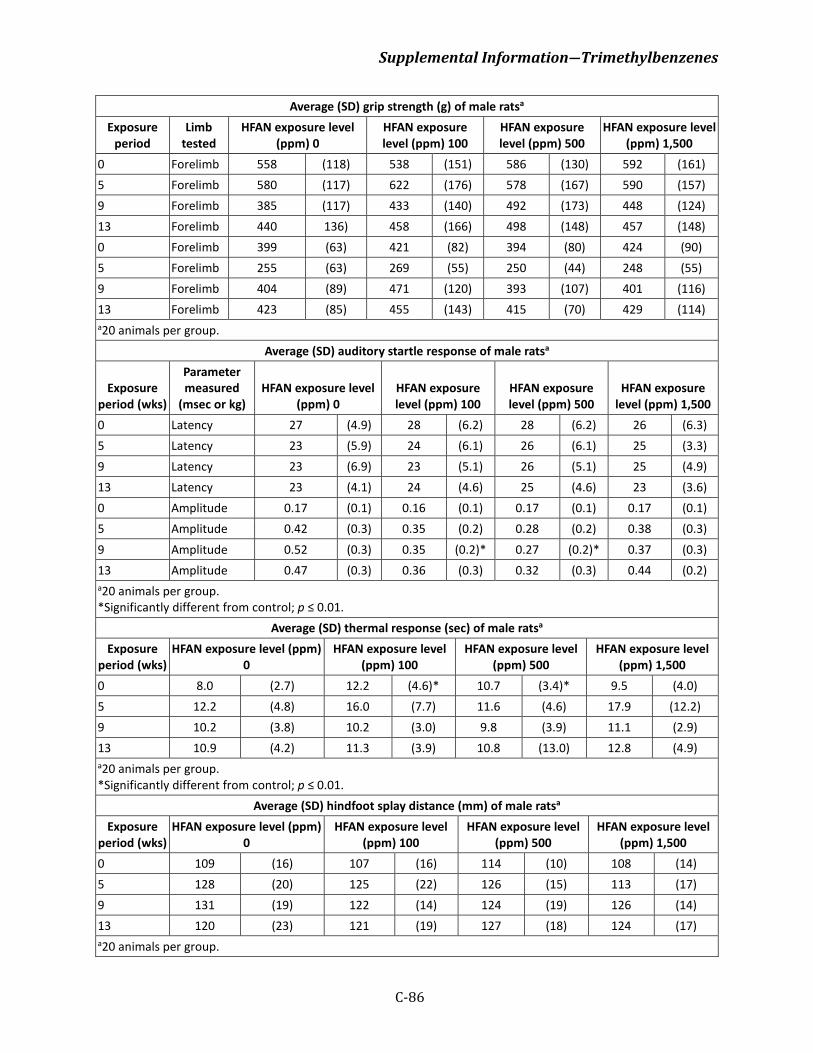
Supplemental Information―Trimethylbenzenes
C-86
Average (SD) grip strength (g) of male ratsa Exposure
period Limb
tested HFAN exposure level
(ppm) 0 HFAN exposure level (ppm) 100
HFAN exposure level (ppm) 500
HFAN exposure level (ppm) 1,500
0 Forelimb 558 (118) 538 (151) 586 (130) 592 (161) 5 Forelimb 580 (117) 622 (176) 578 (167) 590 (157) 9 Forelimb 385 (117) 433 (140) 492 (173) 448 (124) 13 Forelimb 440 136) 458 (166) 498 (148) 457 (148) 0 Forelimb 399 (63) 421 (82) 394 (80) 424 (90) 5 Forelimb 255 (63) 269 (55) 250 (44) 248 (55) 9 Forelimb 404 (89) 471 (120) 393 (107) 401 (116) 13 Forelimb 423 (85) 455 (143) 415 (70) 429 (114) a20 animals per group.
Average (SD) auditory startle response of male ratsa
Exposure period (wks)
Parameter measured
(msec or kg) HFAN exposure level
(ppm) 0 HFAN exposure level (ppm) 100
HFAN exposure level (ppm) 500
HFAN exposure level (ppm) 1,500
0 Latency 27 (4.9) 28 (6.2) 28 (6.2) 26 (6.3) 5 Latency 23 (5.9) 24 (6.1) 26 (6.1) 25 (3.3) 9 Latency 23 (6.9) 23 (5.1) 26 (5.1) 25 (4.9) 13 Latency 23 (4.1) 24 (4.6) 25 (4.6) 23 (3.6) 0 Amplitude 0.17 (0.1) 0.16 (0.1) 0.17 (0.1) 0.17 (0.1) 5 Amplitude 0.42 (0.3) 0.35 (0.2) 0.28 (0.2) 0.38 (0.3) 9 Amplitude 0.52 (0.3) 0.35 (0.2)* 0.27 (0.2)* 0.37 (0.3) 13 Amplitude 0.47 (0.3) 0.36 (0.3) 0.32 (0.3) 0.44 (0.2) a20 animals per group. *Significantly different from control; p ≤ 0.01.
Average (SD) thermal response (sec) of male ratsa Exposure
period (wks) HFAN exposure level (ppm)
0 HFAN exposure level
(ppm) 100 HFAN exposure level
(ppm) 500 HFAN exposure level
(ppm) 1,500 0 8.0 (2.7) 12.2 (4.6)* 10.7 (3.4)* 9.5 (4.0) 5 12.2 (4.8) 16.0 (7.7) 11.6 (4.6) 17.9 (12.2) 9 10.2 (3.8) 10.2 (3.0) 9.8 (3.9) 11.1 (2.9) 13 10.9 (4.2) 11.3 (3.9) 10.8 (13.0) 12.8 (4.9) a20 animals per group.
*Significantly different from control; p ≤ 0.01. Average (SD) hindfoot splay distance (mm) of male ratsa
Exposure period (wks)
HFAN exposure level (ppm) 0
HFAN exposure level (ppm) 100
HFAN exposure level (ppm) 500
HFAN exposure level (ppm) 1,500
0 109 (16) 107 (16) 114 (10) 108 (14) 5 128 (20) 125 (22) 126 (15) 113 (17) 9 131 (19) 122 (14) 124 (19) 126 (14) 13 120 (23) 121 (19) 127 (18) 124 (17) a20 animals per group.
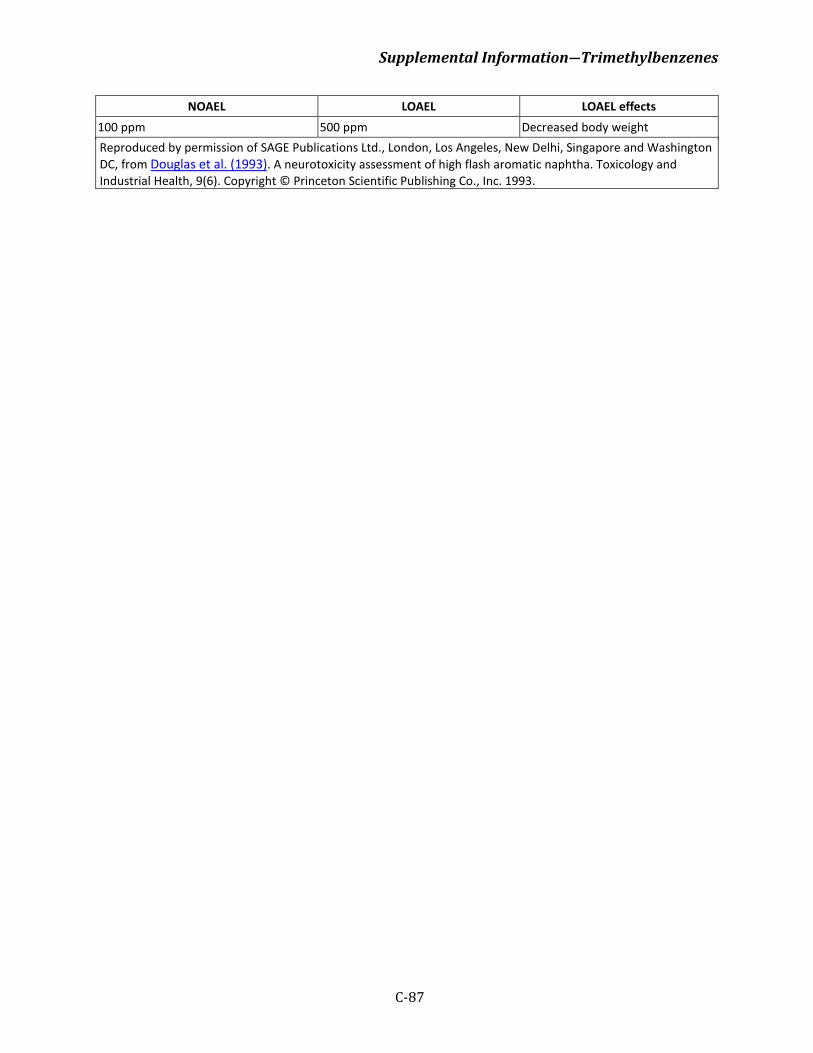
Supplemental Information―Trimethylbenzenes
C-87
NOAEL LOAEL LOAEL effects 100 ppm 500 ppm Decreased body weight Reproduced by permission of SAGE Publications Ltd., London, Los Angeles, New Delhi, Singapore and Washington DC, from Douglas et al. (1993). A neurotoxicity assessment of high flash aromatic naphtha. Toxicology and Industrial Health, 9(6). Copyright © Princeton Scientific Publishing Co., Inc. 1993.
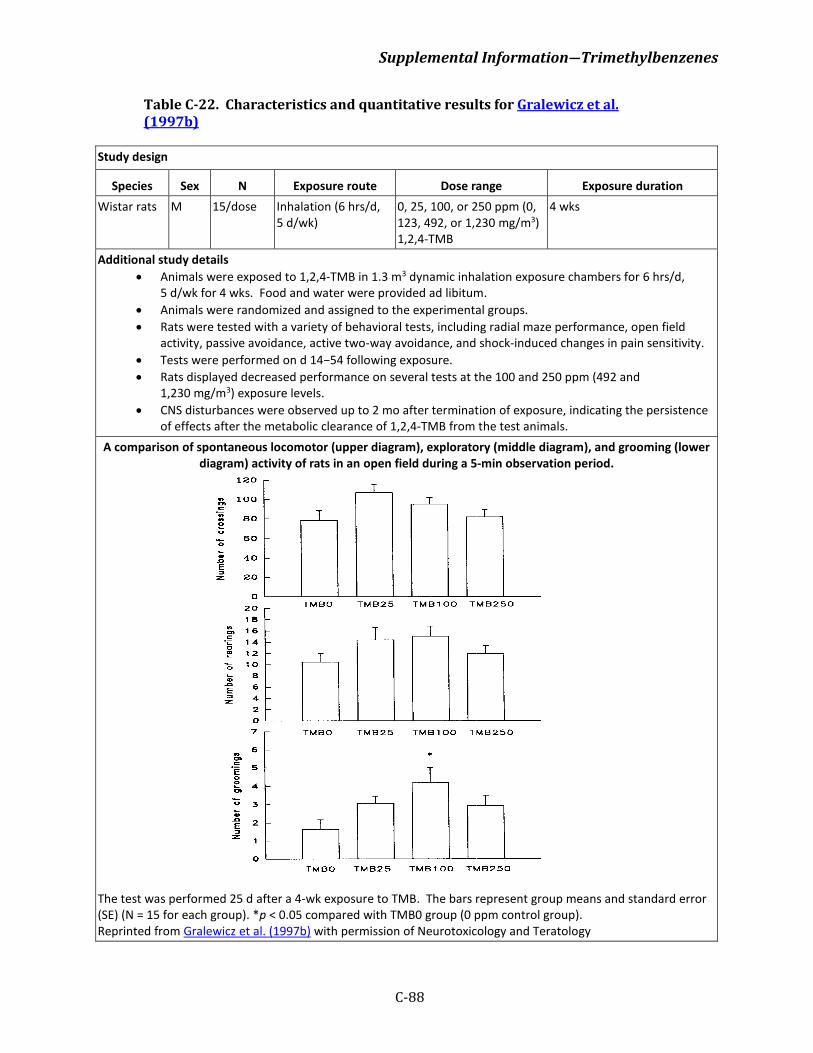
Supplemental Information―Trimethylbenzenes
C-88
Table C-22. Characteristics and quantitative results for Gralewicz et al. (1997b)
Study design
Species Sex N Exposure route Dose range Exposure duration Wistar rats M 15/dose Inhalation (6 hrs/d,
5 d/wk) 0, 25, 100, or 250 ppm (0, 123, 492, or 1,230 mg/m3) 1,2,4-TMB
4 wks
Additional study details • Animals were exposed to 1,2,4-TMB in 1.3 m3 dynamic inhalation exposure chambers for 6 hrs/d,
5 d/wk for 4 wks. Food and water were provided ad libitum. • Animals were randomized and assigned to the experimental groups. • Rats were tested with a variety of behavioral tests, including radial maze performance, open field
activity, passive avoidance, active two-way avoidance, and shock-induced changes in pain sensitivity. • Tests were performed on d 14−54 following exposure. • Rats displayed decreased performance on several tests at the 100 and 250 ppm (492 and
1,230 mg/m3) exposure levels. • CNS disturbances were observed up to 2 mo after termination of exposure, indicating the persistence
of effects after the metabolic clearance of 1,2,4-TMB from the test animals. A comparison of spontaneous locomotor (upper diagram), exploratory (middle diagram), and grooming (lower
diagram) activity of rats in an open field during a 5-min observation period.
The test was performed 25 d after a 4-wk exposure to TMB. The bars represent group means and standard error (SE) (N = 15 for each group). *p < 0.05 compared with TMB0 group (0 ppm control group). Reprinted from Gralewicz et al. (1997b) with permission of Neurotoxicology and Teratology
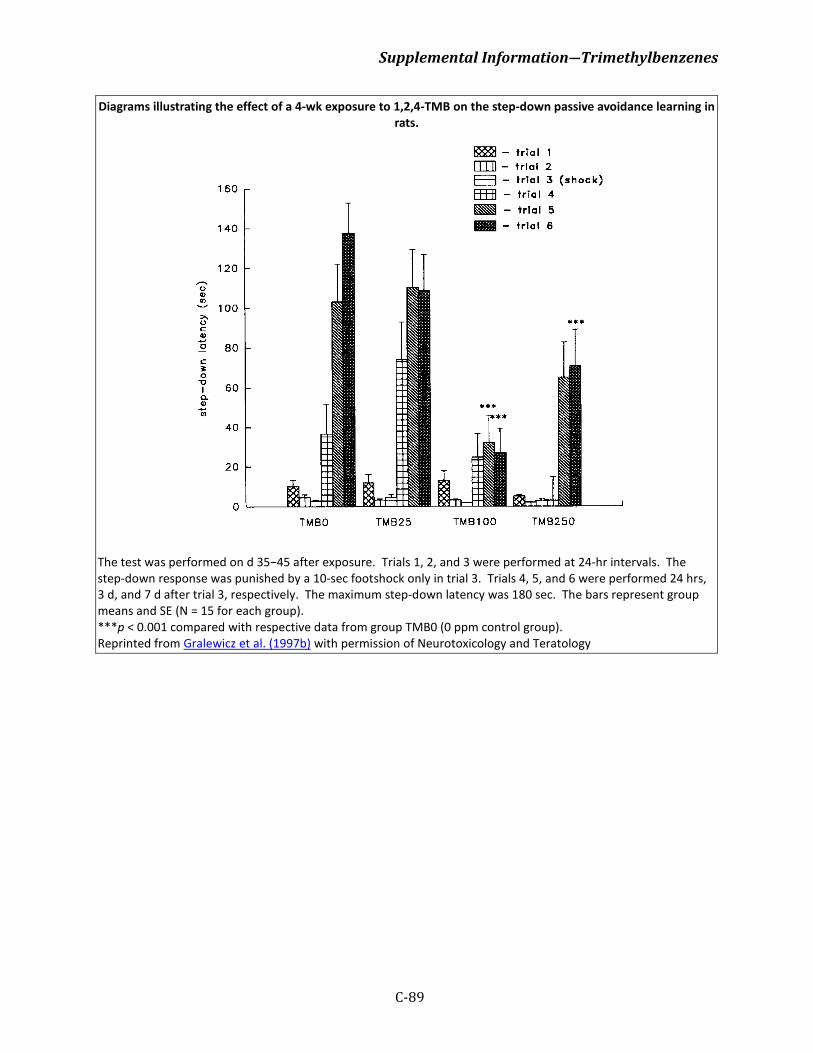
Supplemental Information―Trimethylbenzenes
C-89
Diagrams illustrating the effect of a 4-wk exposure to 1,2,4-TMB on the step-down passive avoidance learning in rats.
The test was performed on d 35−45 after exposure. Trials 1, 2, and 3 were performed at 24-hr intervals. The step-down response was punished by a 10-sec footshock only in trial 3. Trials 4, 5, and 6 were performed 24 hrs, 3 d, and 7 d after trial 3, respectively. The maximum step-down latency was 180 sec. The bars represent group means and SE (N = 15 for each group). ***p < 0.001 compared with respective data from group TMB0 (0 ppm control group). Reprinted from Gralewicz et al. (1997b) with permission of Neurotoxicology and Teratology
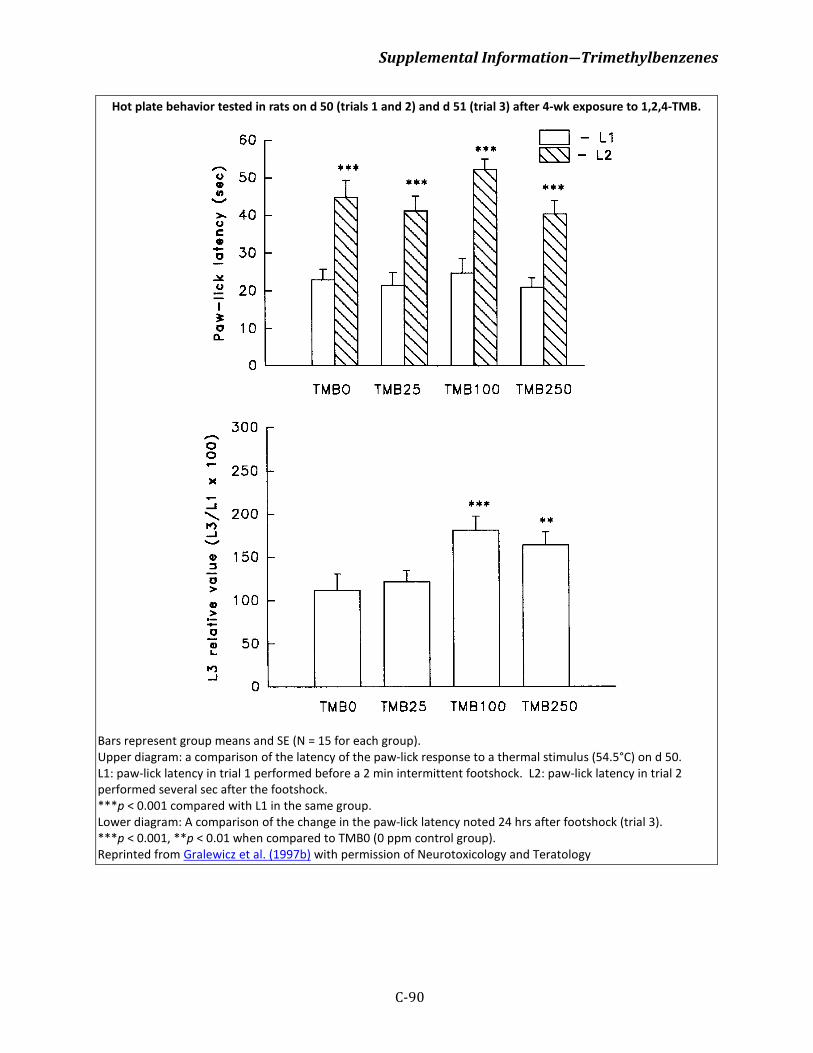
Supplemental Information―Trimethylbenzenes
C-90
Hot plate behavior tested in rats on d 50 (trials 1 and 2) and d 51 (trial 3) after 4-wk exposure to 1,2,4-TMB.
Bars represent group means and SE (N = 15 for each group). Upper diagram: a comparison of the latency of the paw-lick response to a thermal stimulus (54.5°C) on d 50. L1: paw-lick latency in trial 1 performed before a 2 min intermittent footshock. L2: paw-lick latency in trial 2 performed several sec after the footshock. ***p < 0.001 compared with L1 in the same group. Lower diagram: A comparison of the change in the paw-lick latency noted 24 hrs after footshock (trial 3). ***p < 0.001, **p < 0.01 when compared to TMB0 (0 ppm control group). Reprinted from Gralewicz et al. (1997b) with permission of Neurotoxicology and Teratology
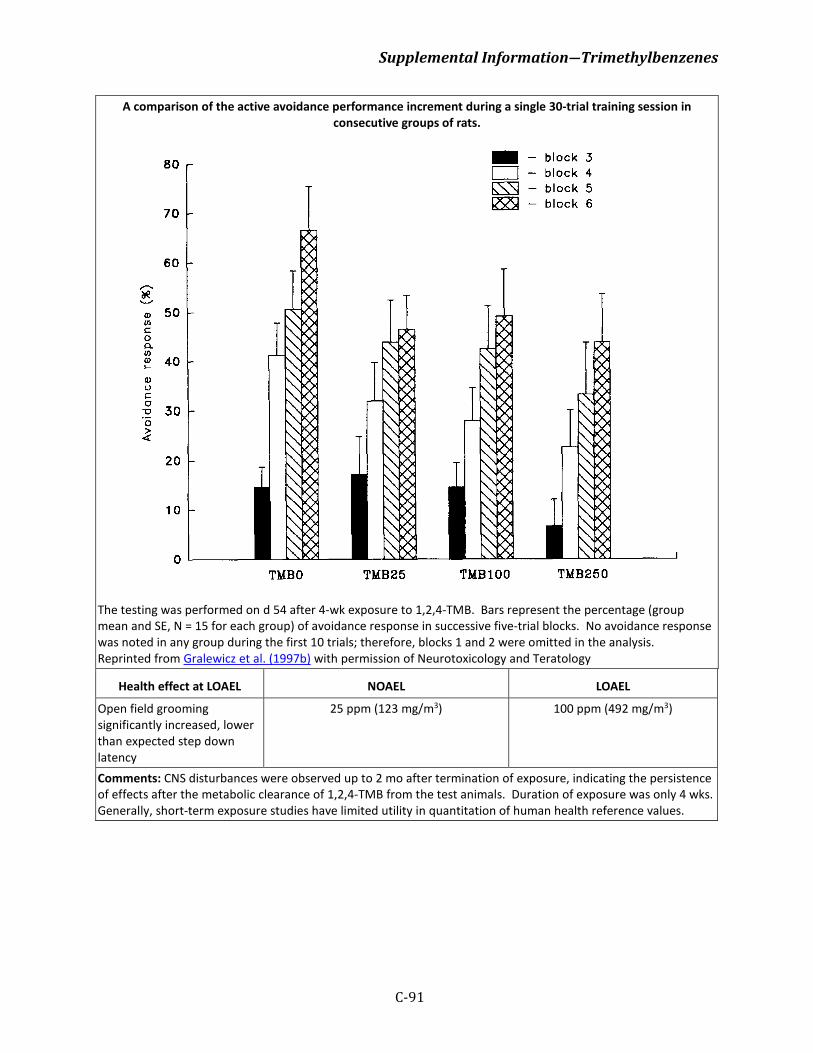
Supplemental Information―Trimethylbenzenes
C-91
A comparison of the active avoidance performance increment during a single 30-trial training session in consecutive groups of rats.
The testing was performed on d 54 after 4-wk exposure to 1,2,4-TMB. Bars represent the percentage (group mean and SE, N = 15 for each group) of avoidance response in successive five-trial blocks. No avoidance response was noted in any group during the first 10 trials; therefore, blocks 1 and 2 were omitted in the analysis. Reprinted from Gralewicz et al. (1997b) with permission of Neurotoxicology and Teratology
Health effect at LOAEL NOAEL LOAEL
Open field grooming significantly increased, lower than expected step down latency
25 ppm (123 mg/m3) 100 ppm (492 mg/m3)
Comments: CNS disturbances were observed up to 2 mo after termination of exposure, indicating the persistence of effects after the metabolic clearance of 1,2,4-TMB from the test animals. Duration of exposure was only 4 wks. Generally, short-term exposure studies have limited utility in quantitation of human health reference values.
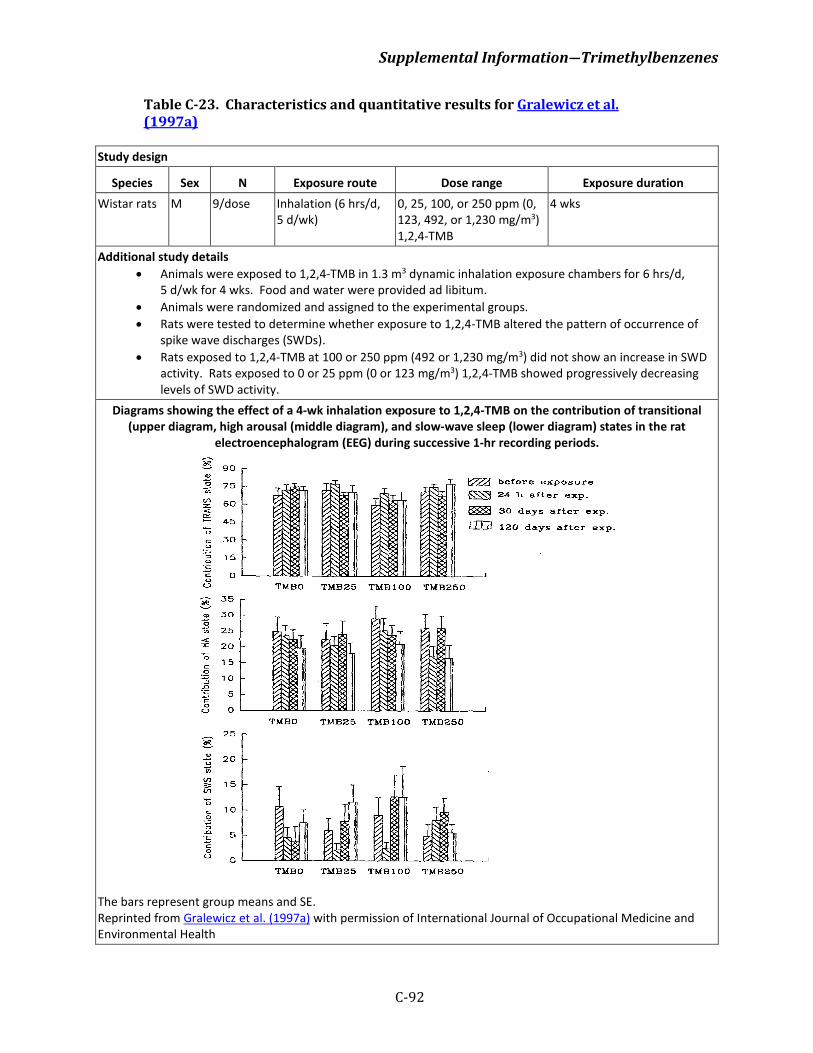
Supplemental Information―Trimethylbenzenes
C-92
Table C-23. Characteristics and quantitative results for Gralewicz et al. (1997a)
Study design
Species Sex N Exposure route Dose range Exposure duration Wistar rats M 9/dose Inhalation (6 hrs/d,
5 d/wk) 0, 25, 100, or 250 ppm (0, 123, 492, or 1,230 mg/m3) 1,2,4-TMB
4 wks
Additional study details • Animals were exposed to 1,2,4-TMB in 1.3 m3 dynamic inhalation exposure chambers for 6 hrs/d,
5 d/wk for 4 wks. Food and water were provided ad libitum. • Animals were randomized and assigned to the experimental groups. • Rats were tested to determine whether exposure to 1,2,4-TMB altered the pattern of occurrence of
spike wave discharges (SWDs). • Rats exposed to 1,2,4-TMB at 100 or 250 ppm (492 or 1,230 mg/m3) did not show an increase in SWD
activity. Rats exposed to 0 or 25 ppm (0 or 123 mg/m3) 1,2,4-TMB showed progressively decreasing levels of SWD activity.
Diagrams showing the effect of a 4-wk inhalation exposure to 1,2,4-TMB on the contribution of transitional (upper diagram, high arousal (middle diagram), and slow-wave sleep (lower diagram) states in the rat
electroencephalogram (EEG) during successive 1-hr recording periods.
The bars represent group means and SE. Reprinted from Gralewicz et al. (1997a) with permission of International Journal of Occupational Medicine and Environmental Health
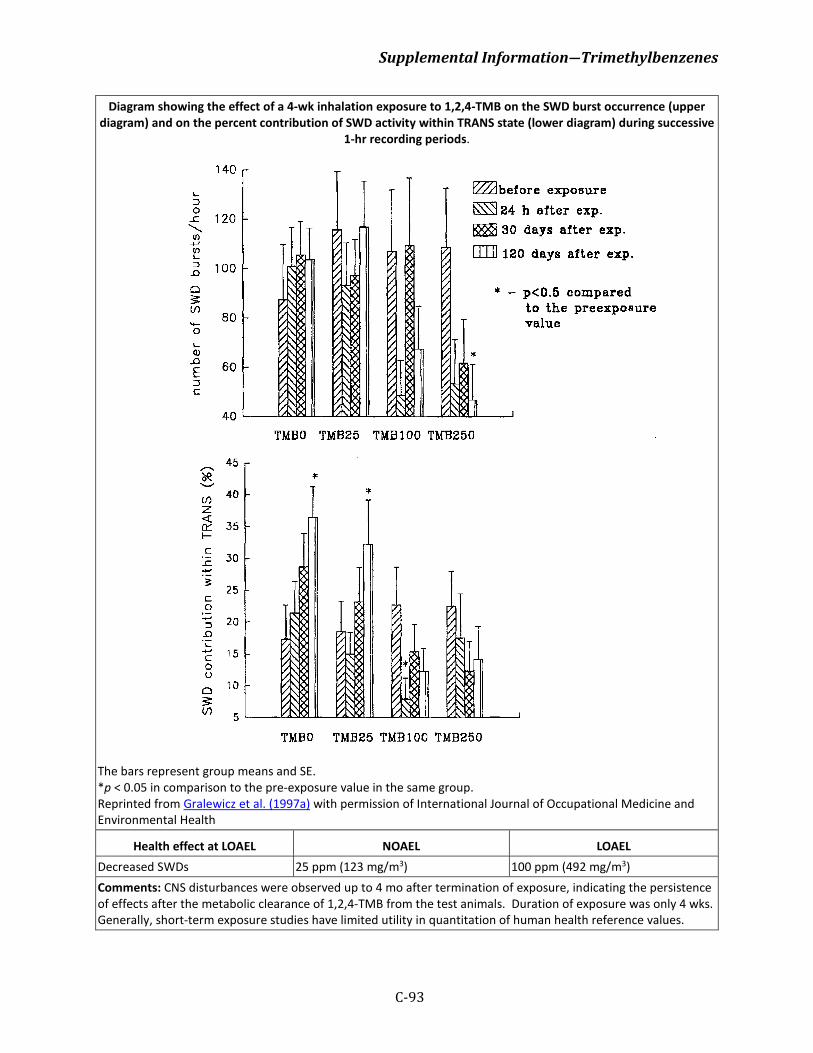
Supplemental Information―Trimethylbenzenes
C-93
Diagram showing the effect of a 4-wk inhalation exposure to 1,2,4-TMB on the SWD burst occurrence (upper diagram) and on the percent contribution of SWD activity within TRANS state (lower diagram) during successive
1-hr recording periods.
The bars represent group means and SE. *p < 0.05 in comparison to the pre-exposure value in the same group. Reprinted from Gralewicz et al. (1997a) with permission of International Journal of Occupational Medicine and Environmental Health
Health effect at LOAEL NOAEL LOAEL Decreased SWDs 25 ppm (123 mg/m3) 100 ppm (492 mg/m3) Comments: CNS disturbances were observed up to 4 mo after termination of exposure, indicating the persistence of effects after the metabolic clearance of 1,2,4-TMB from the test animals. Duration of exposure was only 4 wks. Generally, short-term exposure studies have limited utility in quantitation of human health reference values.
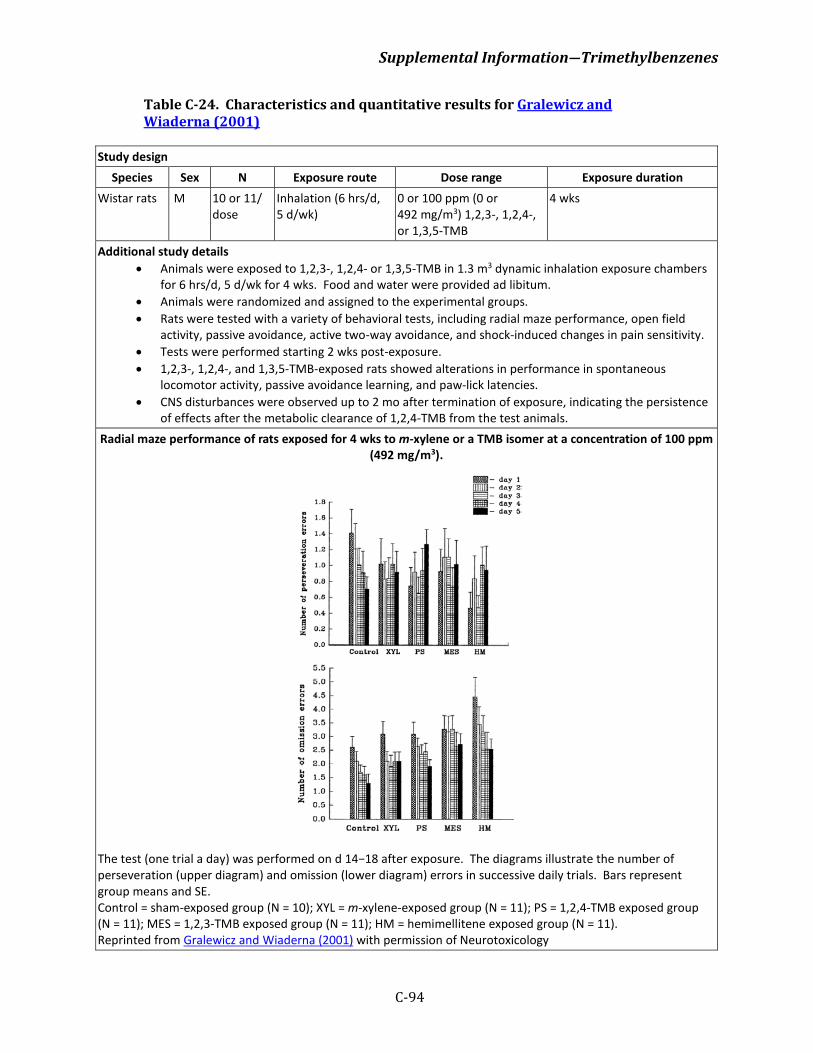
Supplemental Information―Trimethylbenzenes
C-94
Table C-24. Characteristics and quantitative results for Gralewicz and Wiaderna (2001)
Study design Species Sex N Exposure route Dose range Exposure duration
Wistar rats M 10 or 11/dose
Inhalation (6 hrs/d, 5 d/wk)
0 or 100 ppm (0 or 492 mg/m3) 1,2,3-, 1,2,4-, or 1,3,5-TMB
4 wks
Additional study details • Animals were exposed to 1,2,3-, 1,2,4- or 1,3,5-TMB in 1.3 m3 dynamic inhalation exposure chambers
for 6 hrs/d, 5 d/wk for 4 wks. Food and water were provided ad libitum. • Animals were randomized and assigned to the experimental groups. • Rats were tested with a variety of behavioral tests, including radial maze performance, open field
activity, passive avoidance, active two-way avoidance, and shock-induced changes in pain sensitivity. • Tests were performed starting 2 wks post-exposure. • 1,2,3-, 1,2,4-, and 1,3,5-TMB-exposed rats showed alterations in performance in spontaneous
locomotor activity, passive avoidance learning, and paw-lick latencies. • CNS disturbances were observed up to 2 mo after termination of exposure, indicating the persistence
of effects after the metabolic clearance of 1,2,4-TMB from the test animals. Radial maze performance of rats exposed for 4 wks to m-xylene or a TMB isomer at a concentration of 100 ppm
(492 mg/m3).
The test (one trial a day) was performed on d 14−18 after exposure. The diagrams illustrate the number of perseveration (upper diagram) and omission (lower diagram) errors in successive daily trials. Bars represent group means and SE. Control = sham-exposed group (N = 10); XYL = m-xylene-exposed group (N = 11); PS = 1,2,4-TMB exposed group (N = 11); MES = 1,2,3-TMB exposed group (N = 11); HM = hemimellitene exposed group (N = 11). Reprinted from Gralewicz and Wiaderna (2001) with permission of Neurotoxicology
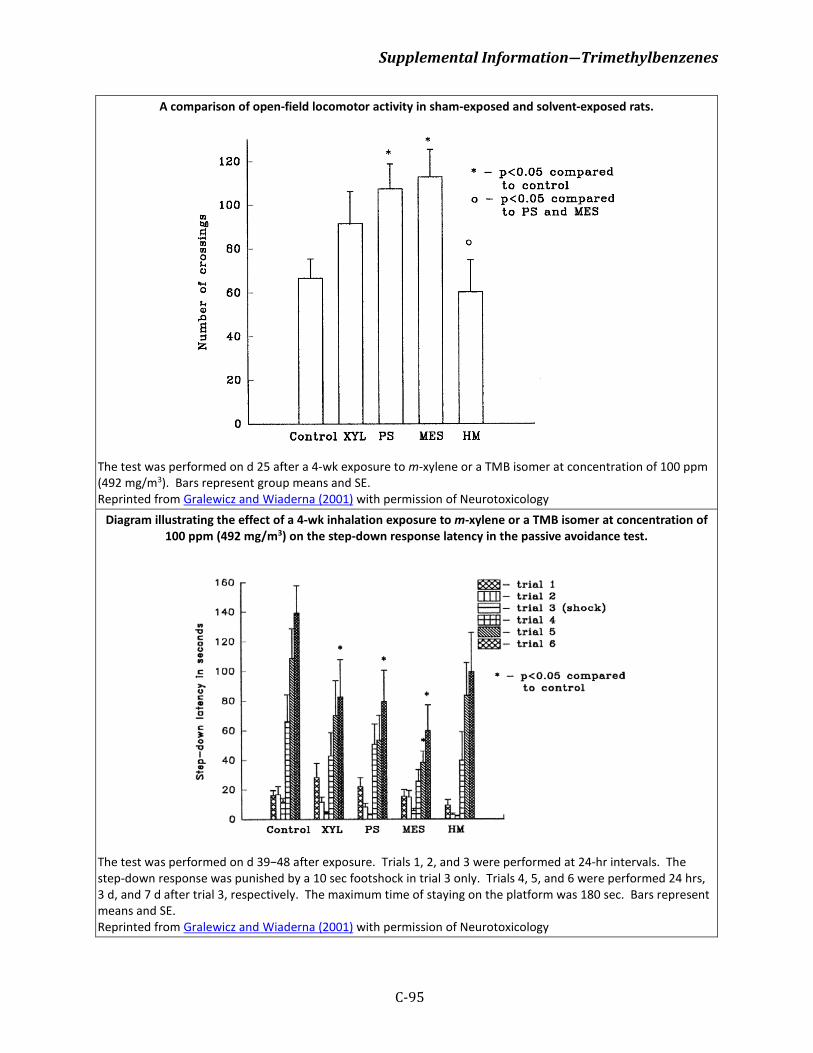
Supplemental Information―Trimethylbenzenes
C-95
A comparison of open-field locomotor activity in sham-exposed and solvent-exposed rats.
The test was performed on d 25 after a 4-wk exposure to m-xylene or a TMB isomer at concentration of 100 ppm (492 mg/m3). Bars represent group means and SE. Reprinted from Gralewicz and Wiaderna (2001) with permission of Neurotoxicology
Diagram illustrating the effect of a 4-wk inhalation exposure to m-xylene or a TMB isomer at concentration of 100 ppm (492 mg/m3) on the step-down response latency in the passive avoidance test.
The test was performed on d 39−48 after exposure. Trials 1, 2, and 3 were performed at 24-hr intervals. The step-down response was punished by a 10 sec footshock in trial 3 only. Trials 4, 5, and 6 were performed 24 hrs, 3 d, and 7 d after trial 3, respectively. The maximum time of staying on the platform was 180 sec. Bars represent means and SE. Reprinted from Gralewicz and Wiaderna (2001) with permission of Neurotoxicology
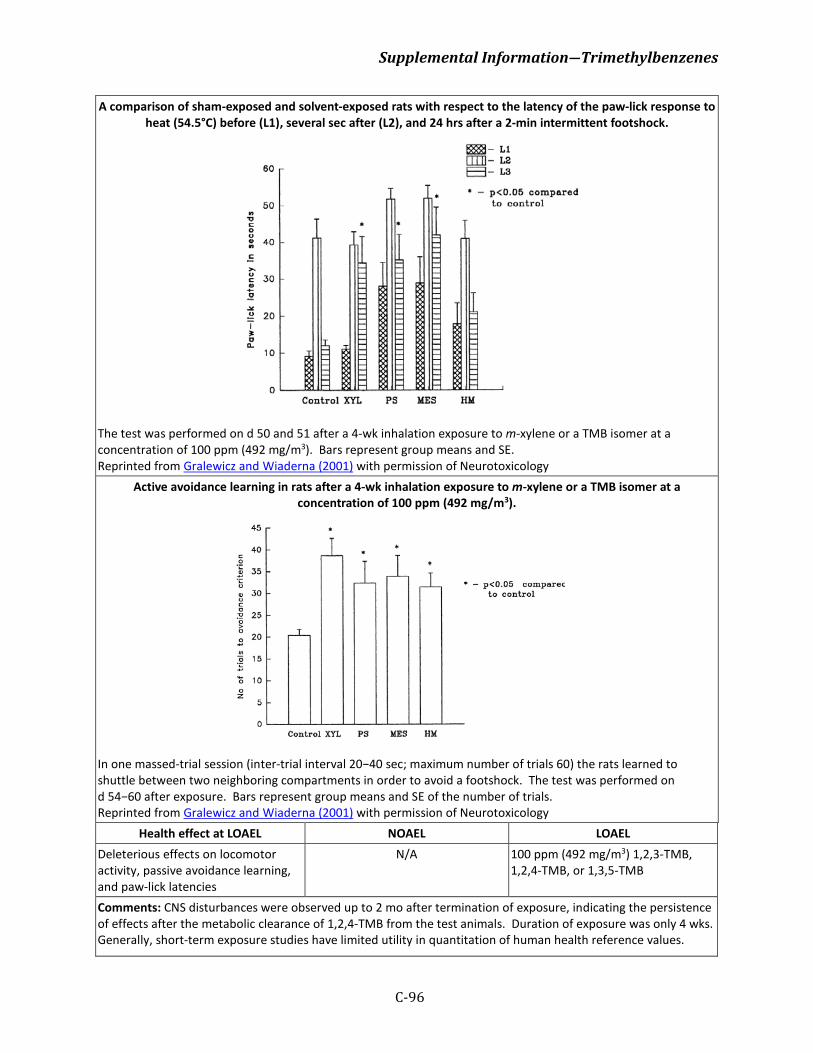
Supplemental Information―Trimethylbenzenes
C-96
A comparison of sham-exposed and solvent-exposed rats with respect to the latency of the paw-lick response to heat (54.5°C) before (L1), several sec after (L2), and 24 hrs after a 2-min intermittent footshock.
The test was performed on d 50 and 51 after a 4-wk inhalation exposure to m-xylene or a TMB isomer at a concentration of 100 ppm (492 mg/m3). Bars represent group means and SE. Reprinted from Gralewicz and Wiaderna (2001) with permission of Neurotoxicology
Active avoidance learning in rats after a 4-wk inhalation exposure to m-xylene or a TMB isomer at a concentration of 100 ppm (492 mg/m3).
In one massed-trial session (inter-trial interval 20−40 sec; maximum number of trials 60) the rats learned to shuttle between two neighboring compartments in order to avoid a footshock. The test was performed on d 54−60 after exposure. Bars represent group means and SE of the number of trials. Reprinted from Gralewicz and Wiaderna (2001) with permission of Neurotoxicology
Health effect at LOAEL NOAEL LOAEL Deleterious effects on locomotor activity, passive avoidance learning, and paw-lick latencies
N/A 100 ppm (492 mg/m3) 1,2,3-TMB, 1,2,4-TMB, or 1,3,5-TMB
Comments: CNS disturbances were observed up to 2 mo after termination of exposure, indicating the persistence of effects after the metabolic clearance of 1,2,4-TMB from the test animals. Duration of exposure was only 4 wks. Generally, short-term exposure studies have limited utility in quantitation of human health reference values.
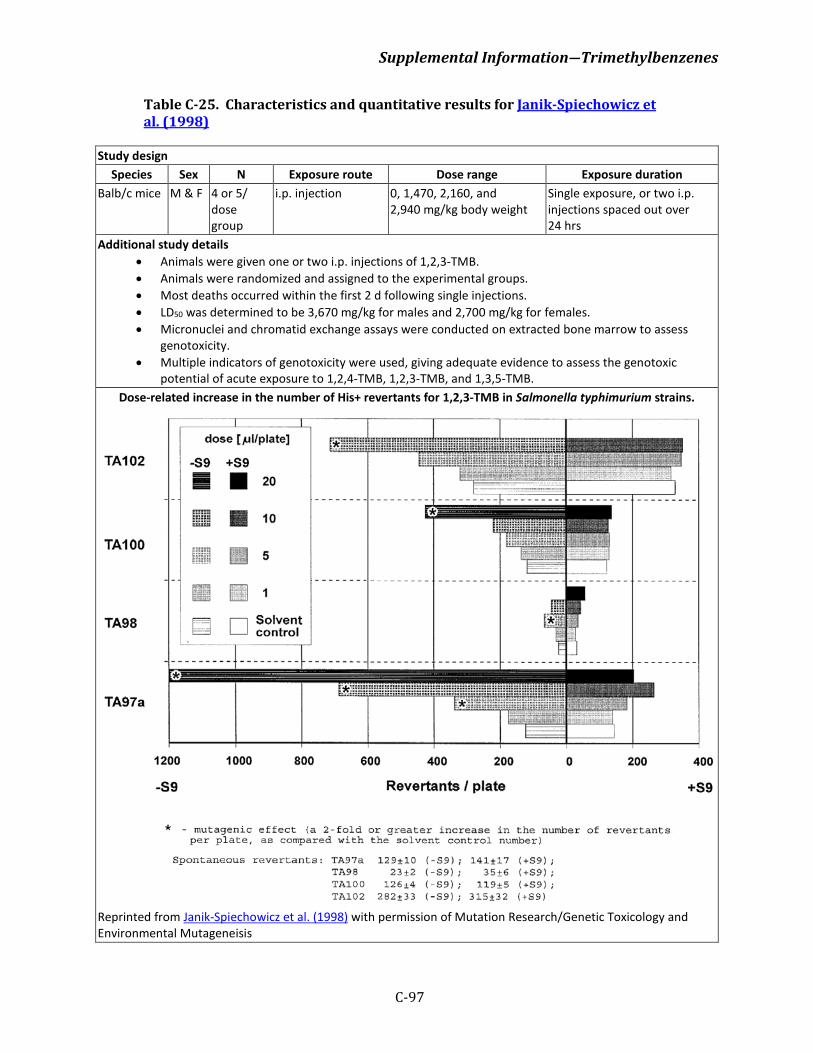
Supplemental Information―Trimethylbenzenes
C-97
Table C-25. Characteristics and quantitative results for Janik-Spiechowicz et al. (1998)
Study design Species Sex N Exposure route Dose range Exposure duration
Balb/c mice M & F 4 or 5/dose group
i.p. injection 0, 1,470, 2,160, and 2,940 mg/kg body weight
Single exposure, or two i.p. injections spaced out over 24 hrs
Additional study details • Animals were given one or two i.p. injections of 1,2,3-TMB. • Animals were randomized and assigned to the experimental groups. • Most deaths occurred within the first 2 d following single injections. • LD50 was determined to be 3,670 mg/kg for males and 2,700 mg/kg for females. • Micronuclei and chromatid exchange assays were conducted on extracted bone marrow to assess
genotoxicity. • Multiple indicators of genotoxicity were used, giving adequate evidence to assess the genotoxic
potential of acute exposure to 1,2,4-TMB, 1,2,3-TMB, and 1,3,5-TMB. Dose-related increase in the number of His+ revertants for 1,2,3-TMB in Salmonella typhimurium strains.
Reprinted from Janik-Spiechowicz et al. (1998) with permission of Mutation Research/Genetic Toxicology and Environmental Mutageneisis
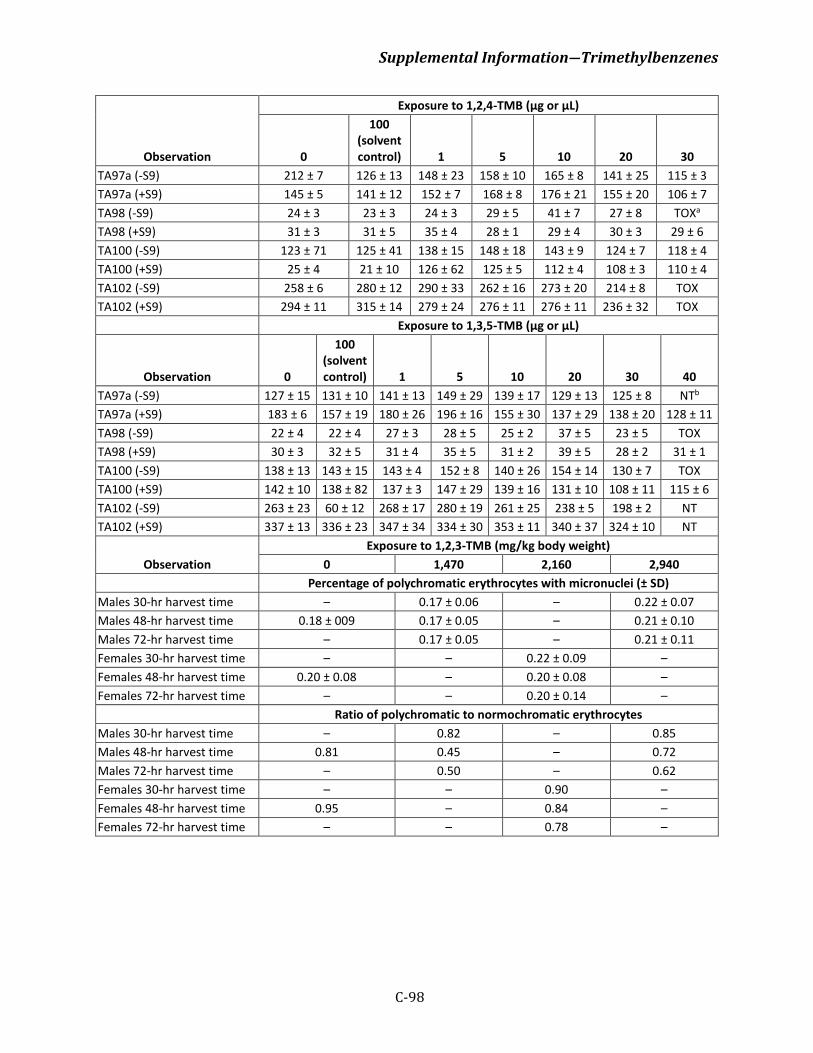
Supplemental Information―Trimethylbenzenes
C-98
Observation
Exposure to 1,2,4-TMB (µg or µL)
0
100 (solvent control) 1 5 10 20 30
TA97a (-S9) 212 ± 7 126 ± 13 148 ± 23 158 ± 10 165 ± 8 141 ± 25 115 ± 3 TA97a (+S9) 145 ± 5 141 ± 12 152 ± 7 168 ± 8 176 ± 21 155 ± 20 106 ± 7 TA98 (-S9) 24 ± 3 23 ± 3 24 ± 3 29 ± 5 41 ± 7 27 ± 8 TOXa TA98 (+S9) 31 ± 3 31 ± 5 35 ± 4 28 ± 1 29 ± 4 30 ± 3 29 ± 6 TA100 (-S9) 123 ± 71 125 ± 41 138 ± 15 148 ± 18 143 ± 9 124 ± 7 118 ± 4 TA100 (+S9) 25 ± 4 21 ± 10 126 ± 62 125 ± 5 112 ± 4 108 ± 3 110 ± 4 TA102 (-S9) 258 ± 6 280 ± 12 290 ± 33 262 ± 16 273 ± 20 214 ± 8 TOX TA102 (+S9) 294 ± 11 315 ± 14 279 ± 24 276 ± 11 276 ± 11 236 ± 32 TOX
Exposure to 1,3,5-TMB (µg or µL)
Observation 0
100 (solvent control) 1 5 10 20 30 40
TA97a (-S9) 127 ± 15 131 ± 10 141 ± 13 149 ± 29 139 ± 17 129 ± 13 125 ± 8 NTb TA97a (+S9) 183 ± 6 157 ± 19 180 ± 26 196 ± 16 155 ± 30 137 ± 29 138 ± 20 128 ± 11 TA98 (-S9) 22 ± 4 22 ± 4 27 ± 3 28 ± 5 25 ± 2 37 ± 5 23 ± 5 TOX TA98 (+S9) 30 ± 3 32 ± 5 31 ± 4 35 ± 5 31 ± 2 39 ± 5 28 ± 2 31 ± 1 TA100 (-S9) 138 ± 13 143 ± 15 143 ± 4 152 ± 8 140 ± 26 154 ± 14 130 ± 7 TOX TA100 (+S9) 142 ± 10 138 ± 82 137 ± 3 147 ± 29 139 ± 16 131 ± 10 108 ± 11 115 ± 6 TA102 (-S9) 263 ± 23 60 ± 12 268 ± 17 280 ± 19 261 ± 25 238 ± 5 198 ± 2 NT TA102 (+S9) 337 ± 13 336 ± 23 347 ± 34 334 ± 30 353 ± 11 340 ± 37 324 ± 10 NT
Observation Exposure to 1,2,3-TMB (mg/kg body weight)
0 1,470 2,160 2,940 Percentage of polychromatic erythrocytes with micronuclei (± SD)
Males 30-hr harvest time – 0.17 ± 0.06 – 0.22 ± 0.07 Males 48-hr harvest time 0.18 ± 009 0.17 ± 0.05 – 0.21 ± 0.10 Males 72-hr harvest time – 0.17 ± 0.05 – 0.21 ± 0.11 Females 30-hr harvest time – – 0.22 ± 0.09 – Females 48-hr harvest time 0.20 ± 0.08 – 0.20 ± 0.08 – Females 72-hr harvest time – – 0.20 ± 0.14 – Ratio of polychromatic to normochromatic erythrocytes Males 30-hr harvest time – 0.82 – 0.85 Males 48-hr harvest time 0.81 0.45 – 0.72 Males 72-hr harvest time – 0.50 – 0.62 Females 30-hr harvest time – – 0.90 – Females 48-hr harvest time 0.95 – 0.84 – Females 72-hr harvest time – – 0.78 –
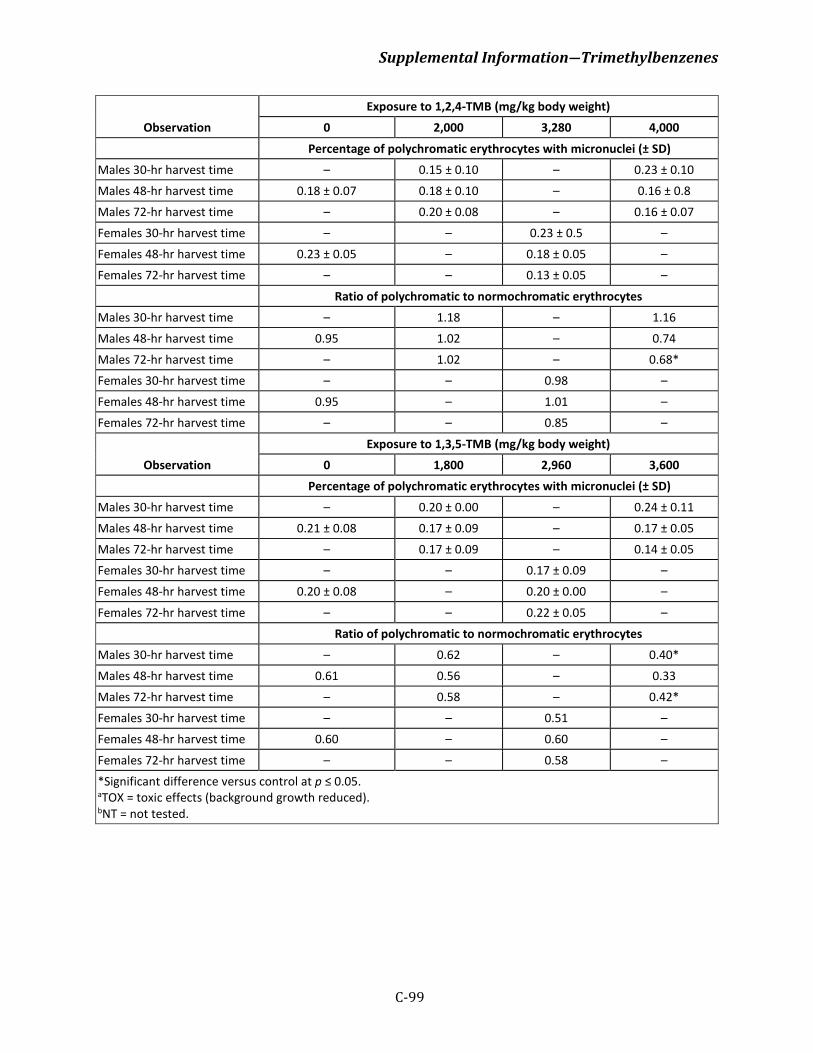
Supplemental Information―Trimethylbenzenes
C-99
Observation
Exposure to 1,2,4-TMB (mg/kg body weight)
0 2,000 3,280 4,000
Percentage of polychromatic erythrocytes with micronuclei (± SD)
Males 30-hr harvest time – 0.15 ± 0.10 – 0.23 ± 0.10
Males 48-hr harvest time 0.18 ± 0.07 0.18 ± 0.10 – 0.16 ± 0.8
Males 72-hr harvest time – 0.20 ± 0.08 – 0.16 ± 0.07
Females 30-hr harvest time – – 0.23 ± 0.5 –
Females 48-hr harvest time 0.23 ± 0.05 – 0.18 ± 0.05 –
Females 72-hr harvest time – – 0.13 ± 0.05 –
Ratio of polychromatic to normochromatic erythrocytes
Males 30-hr harvest time – 1.18 – 1.16
Males 48-hr harvest time 0.95 1.02 – 0.74
Males 72-hr harvest time – 1.02 – 0.68*
Females 30-hr harvest time – – 0.98 –
Females 48-hr harvest time 0.95 – 1.01 –
Females 72-hr harvest time – – 0.85 –
Observation
Exposure to 1,3,5-TMB (mg/kg body weight)
0 1,800 2,960 3,600
Percentage of polychromatic erythrocytes with micronuclei (± SD)
Males 30-hr harvest time – 0.20 ± 0.00 – 0.24 ± 0.11
Males 48-hr harvest time 0.21 ± 0.08 0.17 ± 0.09 – 0.17 ± 0.05
Males 72-hr harvest time – 0.17 ± 0.09 – 0.14 ± 0.05
Females 30-hr harvest time – – 0.17 ± 0.09 –
Females 48-hr harvest time 0.20 ± 0.08 – 0.20 ± 0.00 –
Females 72-hr harvest time – – 0.22 ± 0.05 –
Ratio of polychromatic to normochromatic erythrocytes
Males 30-hr harvest time – 0.62 – 0.40*
Males 48-hr harvest time 0.61 0.56 – 0.33
Males 72-hr harvest time – 0.58 – 0.42*
Females 30-hr harvest time – – 0.51 –
Females 48-hr harvest time 0.60 – 0.60 –
Females 72-hr harvest time – – 0.58 –
*Significant difference versus control at p ≤ 0.05. aTOX = toxic effects (background growth reduced). bNT = not tested.
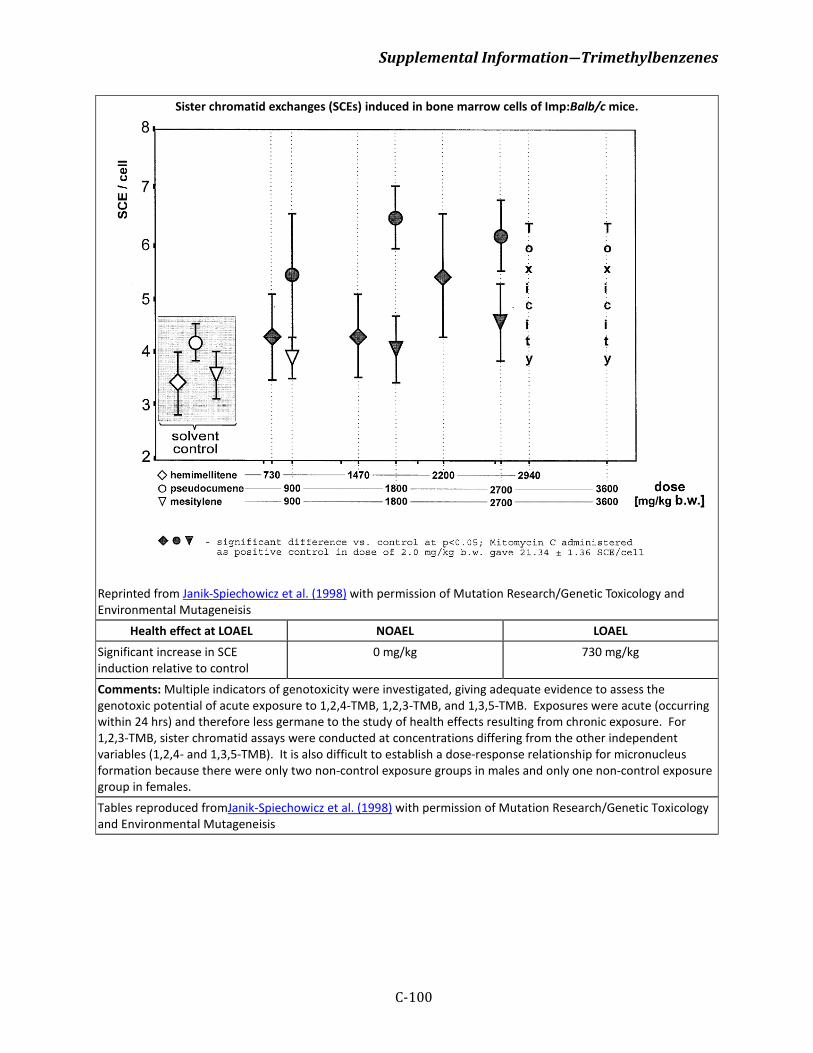
Supplemental Information―Trimethylbenzenes
C-100
Sister chromatid exchanges (SCEs) induced in bone marrow cells of Imp:Balb/c mice.
Reprinted from Janik-Spiechowicz et al. (1998) with permission of Mutation Research/Genetic Toxicology and Environmental Mutageneisis
Health effect at LOAEL NOAEL LOAEL
Significant increase in SCE induction relative to control
0 mg/kg 730 mg/kg
Comments: Multiple indicators of genotoxicity were investigated, giving adequate evidence to assess the genotoxic potential of acute exposure to 1,2,4-TMB, 1,2,3-TMB, and 1,3,5-TMB. Exposures were acute (occurring within 24 hrs) and therefore less germane to the study of health effects resulting from chronic exposure. For 1,2,3-TMB, sister chromatid assays were conducted at concentrations differing from the other independent variables (1,2,4- and 1,3,5-TMB). It is also difficult to establish a dose-response relationship for micronucleus formation because there were only two non-control exposure groups in males and only one non-control exposure group in females.
Tables reproduced fromJanik-Spiechowicz et al. (1998) with permission of Mutation Research/Genetic Toxicology and Environmental Mutageneisis
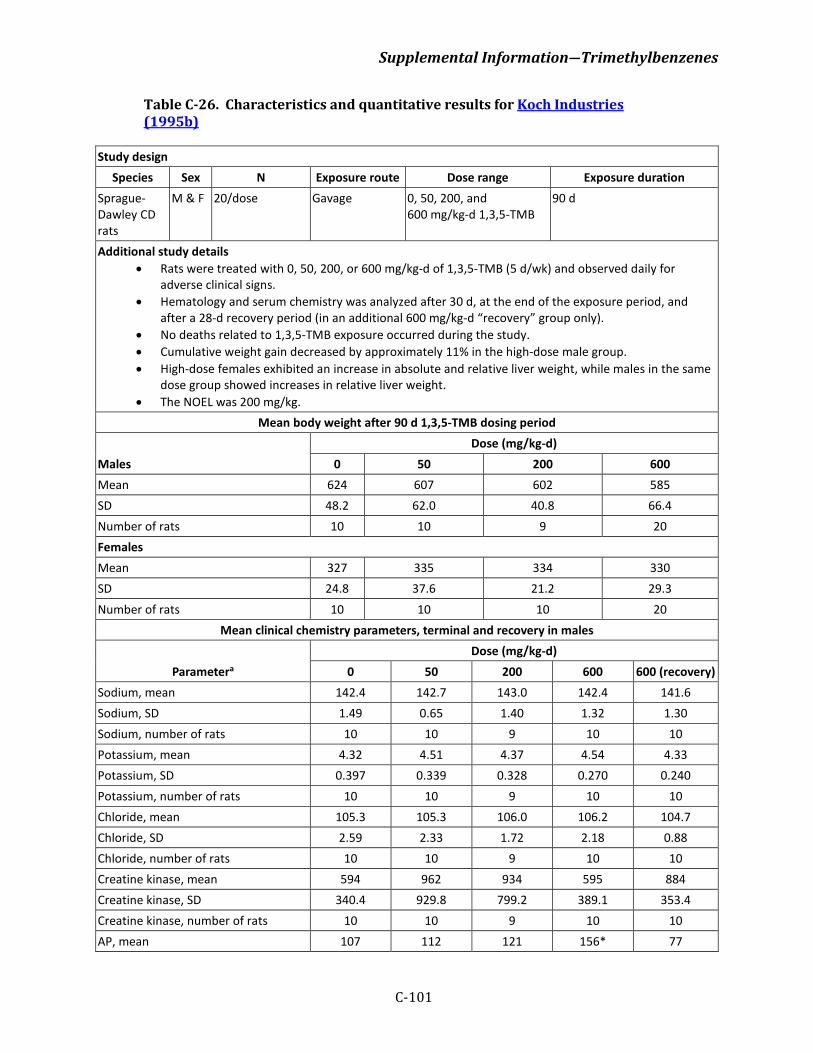
Supplemental Information―Trimethylbenzenes
C-101
Table C-26. Characteristics and quantitative results for Koch Industries (1995b)
Study design Species Sex N Exposure route Dose range Exposure duration
Sprague-Dawley CD rats
M & F 20/dose Gavage 0, 50, 200, and 600 mg/kg-d 1,3,5-TMB
90 d
Additional study details • Rats were treated with 0, 50, 200, or 600 mg/kg-d of 1,3,5-TMB (5 d/wk) and observed daily for
adverse clinical signs. • Hematology and serum chemistry was analyzed after 30 d, at the end of the exposure period, and
after a 28-d recovery period (in an additional 600 mg/kg-d “recovery” group only). • No deaths related to 1,3,5-TMB exposure occurred during the study. • Cumulative weight gain decreased by approximately 11% in the high-dose male group. • High-dose females exhibited an increase in absolute and relative liver weight, while males in the same
dose group showed increases in relative liver weight. • The NOEL was 200 mg/kg.
Mean body weight after 90 d 1,3,5-TMB dosing period
Males Dose (mg/kg-d)
0 50 200 600 Mean 624 607 602 585 SD 48.2 62.0 40.8 66.4 Number of rats 10 10 9 20 Females Mean 327 335 334 330 SD 24.8 37.6 21.2 29.3 Number of rats 10 10 10 20
Mean clinical chemistry parameters, terminal and recovery in males
Parametera Dose (mg/kg-d)
0 50 200 600 600 (recovery) Sodium, mean 142.4 142.7 143.0 142.4 141.6 Sodium, SD 1.49 0.65 1.40 1.32 1.30 Sodium, number of rats 10 10 9 10 10 Potassium, mean 4.32 4.51 4.37 4.54 4.33 Potassium, SD 0.397 0.339 0.328 0.270 0.240 Potassium, number of rats 10 10 9 10 10 Chloride, mean 105.3 105.3 106.0 106.2 104.7 Chloride, SD 2.59 2.33 1.72 2.18 0.88 Chloride, number of rats 10 10 9 10 10 Creatine kinase, mean 594 962 934 595 884 Creatine kinase, SD 340.4 929.8 799.2 389.1 353.4 Creatine kinase, number of rats 10 10 9 10 10 AP, mean 107 112 121 156* 77
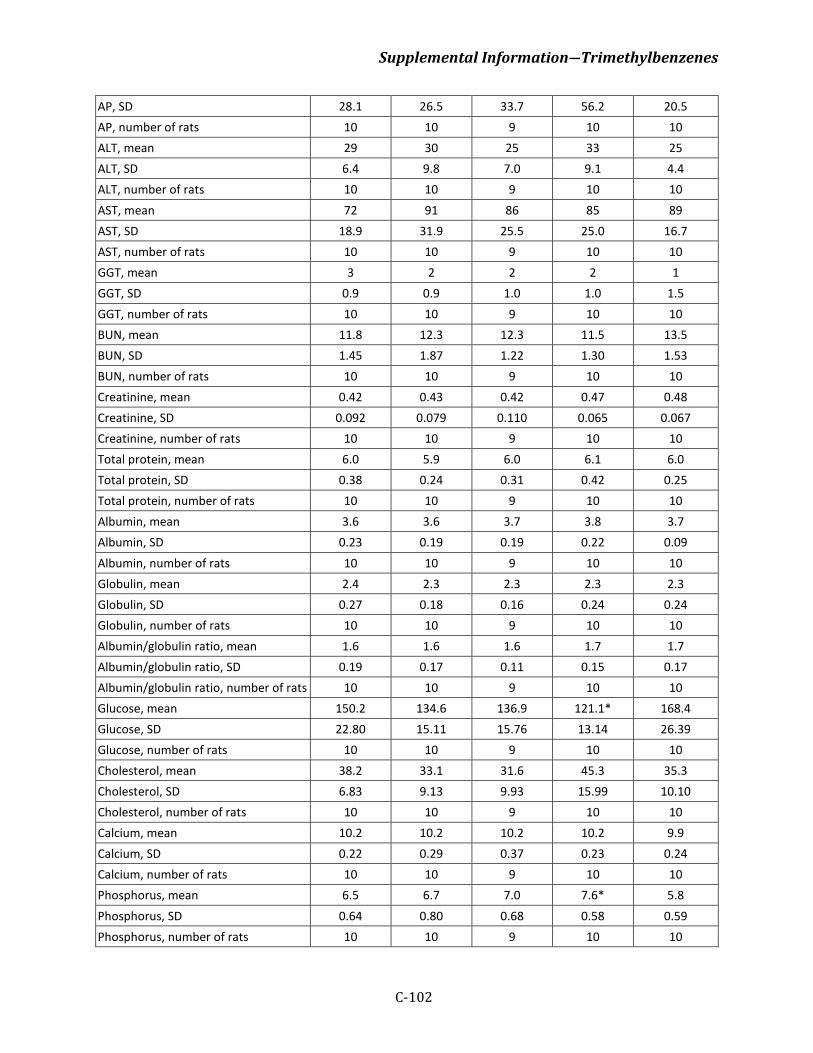
Supplemental Information―Trimethylbenzenes
C-102
AP, SD 28.1 26.5 33.7 56.2 20.5 AP, number of rats 10 10 9 10 10 ALT, mean 29 30 25 33 25 ALT, SD 6.4 9.8 7.0 9.1 4.4 ALT, number of rats 10 10 9 10 10 AST, mean 72 91 86 85 89 AST, SD 18.9 31.9 25.5 25.0 16.7 AST, number of rats 10 10 9 10 10 GGT, mean 3 2 2 2 1 GGT, SD 0.9 0.9 1.0 1.0 1.5 GGT, number of rats 10 10 9 10 10 BUN, mean 11.8 12.3 12.3 11.5 13.5 BUN, SD 1.45 1.87 1.22 1.30 1.53 BUN, number of rats 10 10 9 10 10 Creatinine, mean 0.42 0.43 0.42 0.47 0.48 Creatinine, SD 0.092 0.079 0.110 0.065 0.067 Creatinine, number of rats 10 10 9 10 10 Total protein, mean 6.0 5.9 6.0 6.1 6.0 Total protein, SD 0.38 0.24 0.31 0.42 0.25 Total protein, number of rats 10 10 9 10 10 Albumin, mean 3.6 3.6 3.7 3.8 3.7 Albumin, SD 0.23 0.19 0.19 0.22 0.09 Albumin, number of rats 10 10 9 10 10 Globulin, mean 2.4 2.3 2.3 2.3 2.3 Globulin, SD 0.27 0.18 0.16 0.24 0.24 Globulin, number of rats 10 10 9 10 10 Albumin/globulin ratio, mean 1.6 1.6 1.6 1.7 1.7 Albumin/globulin ratio, SD 0.19 0.17 0.11 0.15 0.17 Albumin/globulin ratio, number of rats 10 10 9 10 10 Glucose, mean 150.2 134.6 136.9 121.1* 168.4 Glucose, SD 22.80 15.11 15.76 13.14 26.39 Glucose, number of rats 10 10 9 10 10 Cholesterol, mean 38.2 33.1 31.6 45.3 35.3 Cholesterol, SD 6.83 9.13 9.93 15.99 10.10 Cholesterol, number of rats 10 10 9 10 10 Calcium, mean 10.2 10.2 10.2 10.2 9.9 Calcium, SD 0.22 0.29 0.37 0.23 0.24 Calcium, number of rats 10 10 9 10 10 Phosphorus, mean 6.5 6.7 7.0 7.6* 5.8 Phosphorus, SD 0.64 0.80 0.68 0.58 0.59 Phosphorus, number of rats 10 10 9 10 10
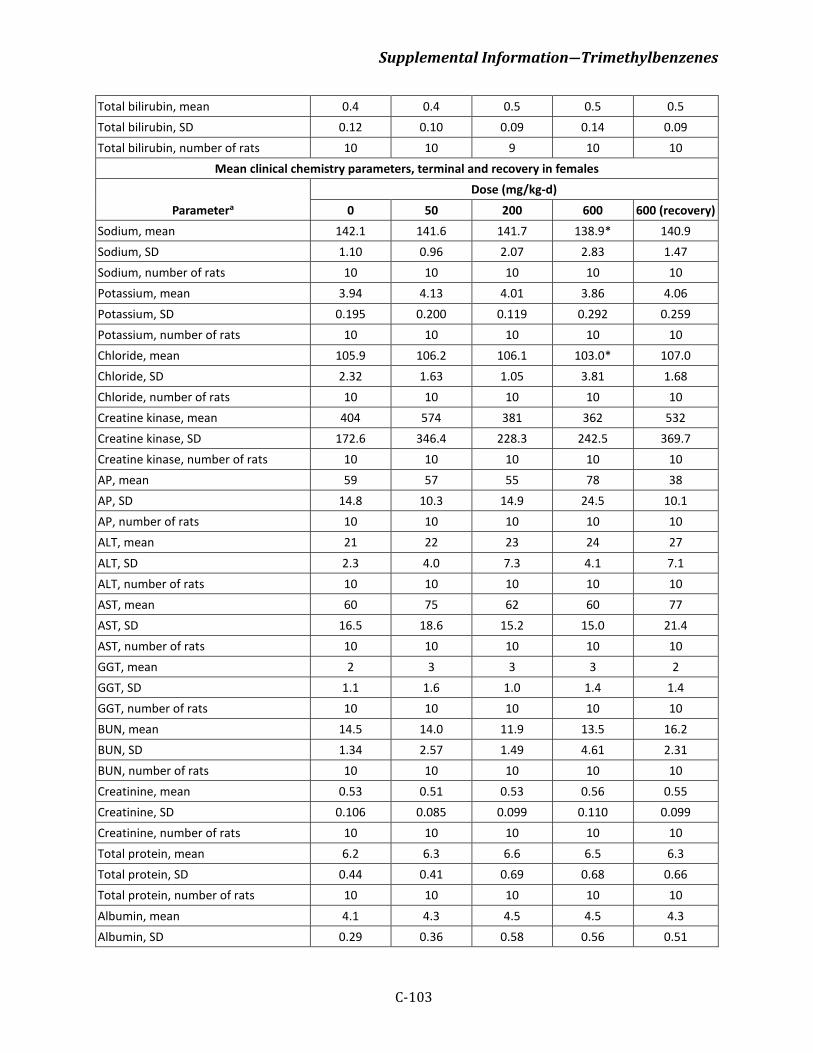
Supplemental Information―Trimethylbenzenes
C-103
Total bilirubin, mean 0.4 0.4 0.5 0.5 0.5 Total bilirubin, SD 0.12 0.10 0.09 0.14 0.09 Total bilirubin, number of rats 10 10 9 10 10
Mean clinical chemistry parameters, terminal and recovery in females
Parametera Dose (mg/kg-d)
0 50 200 600 600 (recovery) Sodium, mean 142.1 141.6 141.7 138.9* 140.9 Sodium, SD 1.10 0.96 2.07 2.83 1.47 Sodium, number of rats 10 10 10 10 10 Potassium, mean 3.94 4.13 4.01 3.86 4.06 Potassium, SD 0.195 0.200 0.119 0.292 0.259 Potassium, number of rats 10 10 10 10 10 Chloride, mean 105.9 106.2 106.1 103.0* 107.0 Chloride, SD 2.32 1.63 1.05 3.81 1.68 Chloride, number of rats 10 10 10 10 10 Creatine kinase, mean 404 574 381 362 532 Creatine kinase, SD 172.6 346.4 228.3 242.5 369.7 Creatine kinase, number of rats 10 10 10 10 10 AP, mean 59 57 55 78 38 AP, SD 14.8 10.3 14.9 24.5 10.1 AP, number of rats 10 10 10 10 10 ALT, mean 21 22 23 24 27 ALT, SD 2.3 4.0 7.3 4.1 7.1 ALT, number of rats 10 10 10 10 10 AST, mean 60 75 62 60 77 AST, SD 16.5 18.6 15.2 15.0 21.4 AST, number of rats 10 10 10 10 10 GGT, mean 2 3 3 3 2 GGT, SD 1.1 1.6 1.0 1.4 1.4 GGT, number of rats 10 10 10 10 10 BUN, mean 14.5 14.0 11.9 13.5 16.2 BUN, SD 1.34 2.57 1.49 4.61 2.31 BUN, number of rats 10 10 10 10 10 Creatinine, mean 0.53 0.51 0.53 0.56 0.55 Creatinine, SD 0.106 0.085 0.099 0.110 0.099 Creatinine, number of rats 10 10 10 10 10 Total protein, mean 6.2 6.3 6.6 6.5 6.3 Total protein, SD 0.44 0.41 0.69 0.68 0.66 Total protein, number of rats 10 10 10 10 10 Albumin, mean 4.1 4.3 4.5 4.5 4.3 Albumin, SD 0.29 0.36 0.58 0.56 0.51
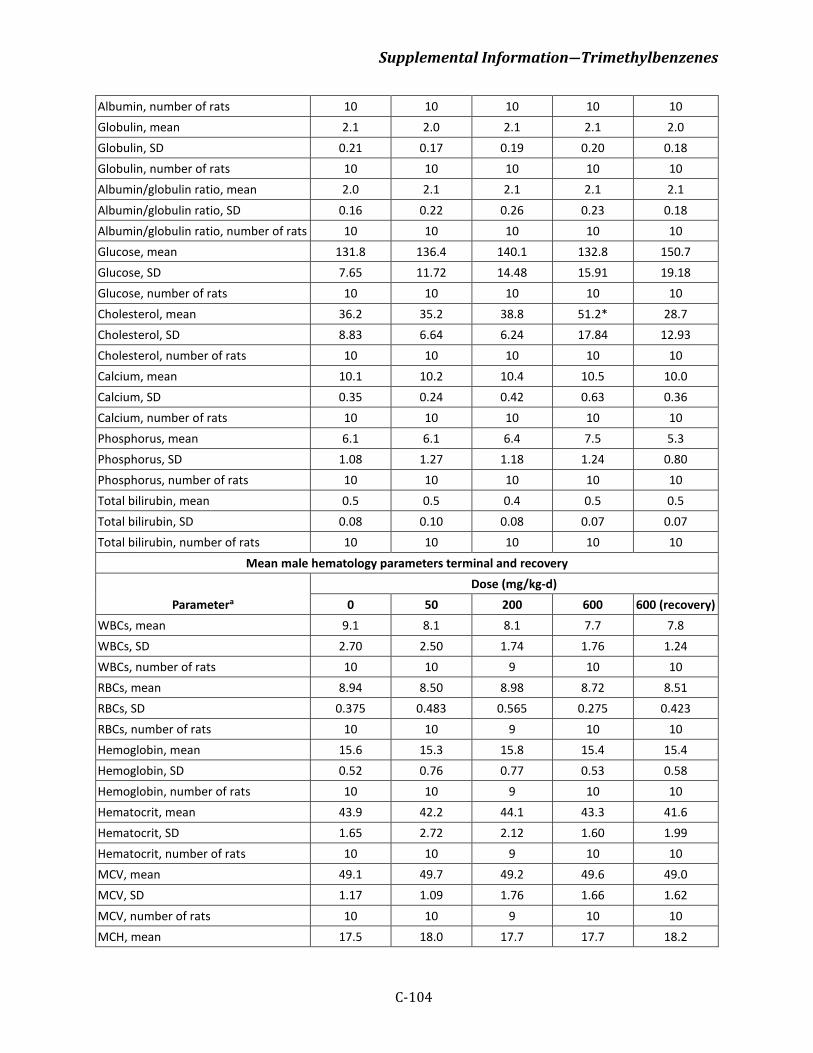
Supplemental Information―Trimethylbenzenes
C-104
Albumin, number of rats 10 10 10 10 10 Globulin, mean 2.1 2.0 2.1 2.1 2.0 Globulin, SD 0.21 0.17 0.19 0.20 0.18 Globulin, number of rats 10 10 10 10 10 Albumin/globulin ratio, mean 2.0 2.1 2.1 2.1 2.1 Albumin/globulin ratio, SD 0.16 0.22 0.26 0.23 0.18 Albumin/globulin ratio, number of rats 10 10 10 10 10 Glucose, mean 131.8 136.4 140.1 132.8 150.7 Glucose, SD 7.65 11.72 14.48 15.91 19.18 Glucose, number of rats 10 10 10 10 10 Cholesterol, mean 36.2 35.2 38.8 51.2* 28.7 Cholesterol, SD 8.83 6.64 6.24 17.84 12.93 Cholesterol, number of rats 10 10 10 10 10 Calcium, mean 10.1 10.2 10.4 10.5 10.0 Calcium, SD 0.35 0.24 0.42 0.63 0.36 Calcium, number of rats 10 10 10 10 10 Phosphorus, mean 6.1 6.1 6.4 7.5 5.3 Phosphorus, SD 1.08 1.27 1.18 1.24 0.80 Phosphorus, number of rats 10 10 10 10 10 Total bilirubin, mean 0.5 0.5 0.4 0.5 0.5 Total bilirubin, SD 0.08 0.10 0.08 0.07 0.07 Total bilirubin, number of rats 10 10 10 10 10
Mean male hematology parameters terminal and recovery
Parametera Dose (mg/kg-d)
0 50 200 600 600 (recovery) WBCs, mean 9.1 8.1 8.1 7.7 7.8 WBCs, SD 2.70 2.50 1.74 1.76 1.24 WBCs, number of rats 10 10 9 10 10 RBCs, mean 8.94 8.50 8.98 8.72 8.51 RBCs, SD 0.375 0.483 0.565 0.275 0.423 RBCs, number of rats 10 10 9 10 10 Hemoglobin, mean 15.6 15.3 15.8 15.4 15.4 Hemoglobin, SD 0.52 0.76 0.77 0.53 0.58 Hemoglobin, number of rats 10 10 9 10 10 Hematocrit, mean 43.9 42.2 44.1 43.3 41.6 Hematocrit, SD 1.65 2.72 2.12 1.60 1.99 Hematocrit, number of rats 10 10 9 10 10 MCV, mean 49.1 49.7 49.2 49.6 49.0 MCV, SD 1.17 1.09 1.76 1.66 1.62 MCV, number of rats 10 10 9 10 10 MCH, mean 17.5 18.0 17.7 17.7 18.2
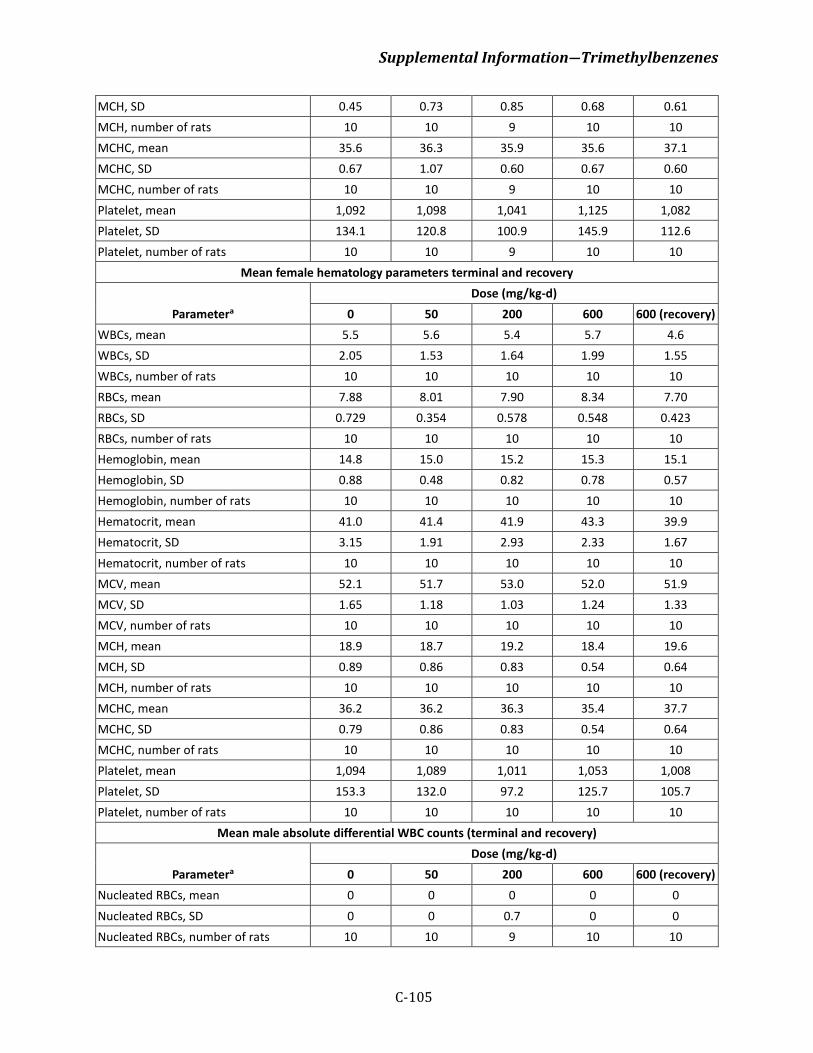
Supplemental Information―Trimethylbenzenes
C-105
MCH, SD 0.45 0.73 0.85 0.68 0.61 MCH, number of rats 10 10 9 10 10 MCHC, mean 35.6 36.3 35.9 35.6 37.1 MCHC, SD 0.67 1.07 0.60 0.67 0.60 MCHC, number of rats 10 10 9 10 10 Platelet, mean 1,092 1,098 1,041 1,125 1,082 Platelet, SD 134.1 120.8 100.9 145.9 112.6 Platelet, number of rats 10 10 9 10 10
Mean female hematology parameters terminal and recovery
Parametera Dose (mg/kg-d)
0 50 200 600 600 (recovery) WBCs, mean 5.5 5.6 5.4 5.7 4.6 WBCs, SD 2.05 1.53 1.64 1.99 1.55 WBCs, number of rats 10 10 10 10 10 RBCs, mean 7.88 8.01 7.90 8.34 7.70 RBCs, SD 0.729 0.354 0.578 0.548 0.423 RBCs, number of rats 10 10 10 10 10 Hemoglobin, mean 14.8 15.0 15.2 15.3 15.1 Hemoglobin, SD 0.88 0.48 0.82 0.78 0.57 Hemoglobin, number of rats 10 10 10 10 10 Hematocrit, mean 41.0 41.4 41.9 43.3 39.9 Hematocrit, SD 3.15 1.91 2.93 2.33 1.67 Hematocrit, number of rats 10 10 10 10 10 MCV, mean 52.1 51.7 53.0 52.0 51.9 MCV, SD 1.65 1.18 1.03 1.24 1.33 MCV, number of rats 10 10 10 10 10 MCH, mean 18.9 18.7 19.2 18.4 19.6 MCH, SD 0.89 0.86 0.83 0.54 0.64 MCH, number of rats 10 10 10 10 10 MCHC, mean 36.2 36.2 36.3 35.4 37.7 MCHC, SD 0.79 0.86 0.83 0.54 0.64 MCHC, number of rats 10 10 10 10 10 Platelet, mean 1,094 1,089 1,011 1,053 1,008 Platelet, SD 153.3 132.0 97.2 125.7 105.7 Platelet, number of rats 10 10 10 10 10
Mean male absolute differential WBC counts (terminal and recovery)
Parametera Dose (mg/kg-d)
0 50 200 600 600 (recovery) Nucleated RBCs, mean 0 0 0 0 0 Nucleated RBCs, SD 0 0 0.7 0 0 Nucleated RBCs, number of rats 10 10 9 10 10
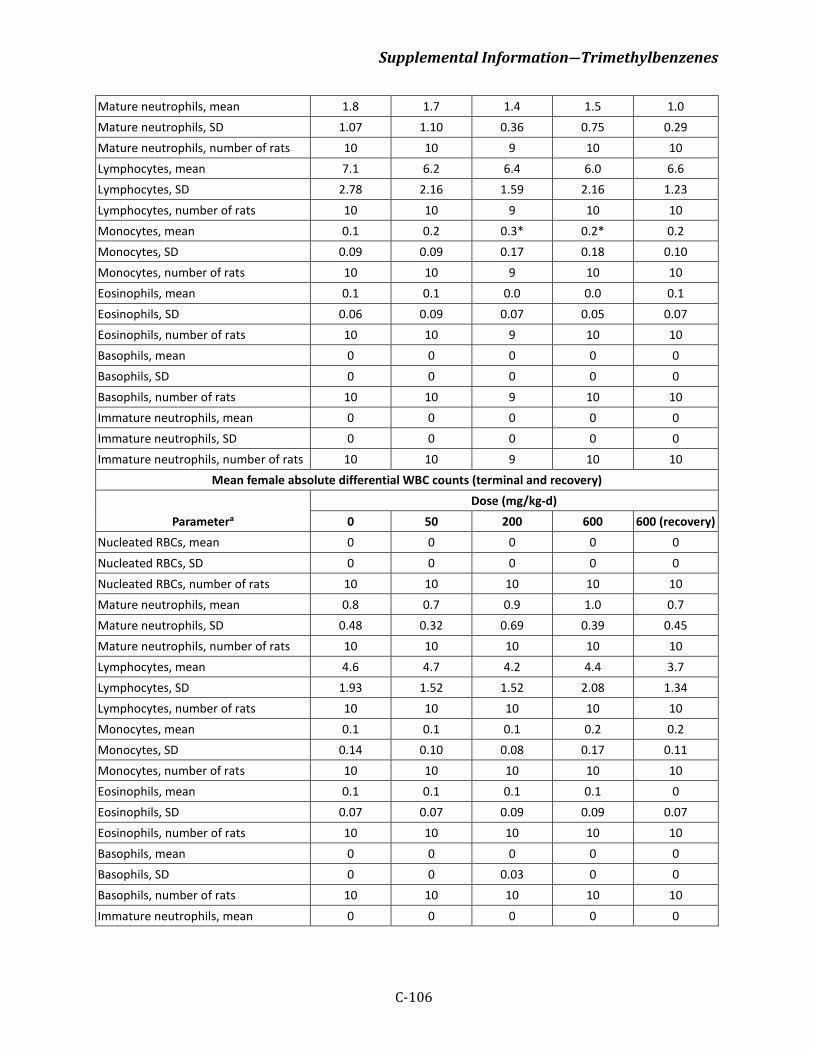
Supplemental Information―Trimethylbenzenes
C-106
Mature neutrophils, mean 1.8 1.7 1.4 1.5 1.0 Mature neutrophils, SD 1.07 1.10 0.36 0.75 0.29 Mature neutrophils, number of rats 10 10 9 10 10 Lymphocytes, mean 7.1 6.2 6.4 6.0 6.6 Lymphocytes, SD 2.78 2.16 1.59 2.16 1.23 Lymphocytes, number of rats 10 10 9 10 10 Monocytes, mean 0.1 0.2 0.3* 0.2* 0.2 Monocytes, SD 0.09 0.09 0.17 0.18 0.10 Monocytes, number of rats 10 10 9 10 10 Eosinophils, mean 0.1 0.1 0.0 0.0 0.1 Eosinophils, SD 0.06 0.09 0.07 0.05 0.07 Eosinophils, number of rats 10 10 9 10 10 Basophils, mean 0 0 0 0 0 Basophils, SD 0 0 0 0 0 Basophils, number of rats 10 10 9 10 10 Immature neutrophils, mean 0 0 0 0 0 Immature neutrophils, SD 0 0 0 0 0 Immature neutrophils, number of rats 10 10 9 10 10
Mean female absolute differential WBC counts (terminal and recovery)
Parametera Dose (mg/kg-d)
0 50 200 600 600 (recovery) Nucleated RBCs, mean 0 0 0 0 0 Nucleated RBCs, SD 0 0 0 0 0 Nucleated RBCs, number of rats 10 10 10 10 10 Mature neutrophils, mean 0.8 0.7 0.9 1.0 0.7 Mature neutrophils, SD 0.48 0.32 0.69 0.39 0.45 Mature neutrophils, number of rats 10 10 10 10 10 Lymphocytes, mean 4.6 4.7 4.2 4.4 3.7 Lymphocytes, SD 1.93 1.52 1.52 2.08 1.34 Lymphocytes, number of rats 10 10 10 10 10 Monocytes, mean 0.1 0.1 0.1 0.2 0.2 Monocytes, SD 0.14 0.10 0.08 0.17 0.11 Monocytes, number of rats 10 10 10 10 10 Eosinophils, mean 0.1 0.1 0.1 0.1 0 Eosinophils, SD 0.07 0.07 0.09 0.09 0.07 Eosinophils, number of rats 10 10 10 10 10 Basophils, mean 0 0 0 0 0 Basophils, SD 0 0 0.03 0 0 Basophils, number of rats 10 10 10 10 10 Immature neutrophils, mean 0 0 0 0 0
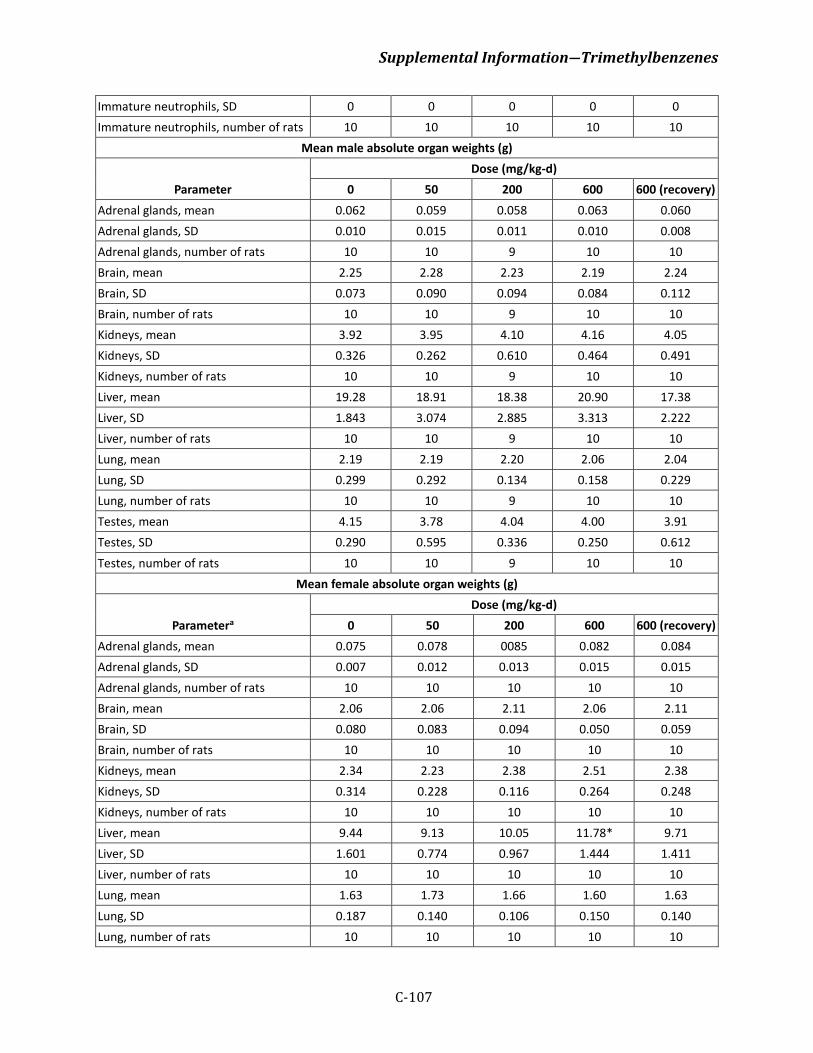
Supplemental Information―Trimethylbenzenes
C-107
Immature neutrophils, SD 0 0 0 0 0 Immature neutrophils, number of rats 10 10 10 10 10
Mean male absolute organ weights (g)
Parameter Dose (mg/kg-d)
0 50 200 600 600 (recovery) Adrenal glands, mean 0.062 0.059 0.058 0.063 0.060 Adrenal glands, SD 0.010 0.015 0.011 0.010 0.008 Adrenal glands, number of rats 10 10 9 10 10 Brain, mean 2.25 2.28 2.23 2.19 2.24 Brain, SD 0.073 0.090 0.094 0.084 0.112 Brain, number of rats 10 10 9 10 10 Kidneys, mean 3.92 3.95 4.10 4.16 4.05 Kidneys, SD 0.326 0.262 0.610 0.464 0.491 Kidneys, number of rats 10 10 9 10 10 Liver, mean 19.28 18.91 18.38 20.90 17.38 Liver, SD 1.843 3.074 2.885 3.313 2.222 Liver, number of rats 10 10 9 10 10 Lung, mean 2.19 2.19 2.20 2.06 2.04 Lung, SD 0.299 0.292 0.134 0.158 0.229 Lung, number of rats 10 10 9 10 10 Testes, mean 4.15 3.78 4.04 4.00 3.91 Testes, SD 0.290 0.595 0.336 0.250 0.612 Testes, number of rats 10 10 9 10 10
Mean female absolute organ weights (g)
Parametera Dose (mg/kg-d)
0 50 200 600 600 (recovery) Adrenal glands, mean 0.075 0.078 0085 0.082 0.084 Adrenal glands, SD 0.007 0.012 0.013 0.015 0.015 Adrenal glands, number of rats 10 10 10 10 10 Brain, mean 2.06 2.06 2.11 2.06 2.11 Brain, SD 0.080 0.083 0.094 0.050 0.059 Brain, number of rats 10 10 10 10 10 Kidneys, mean 2.34 2.23 2.38 2.51 2.38 Kidneys, SD 0.314 0.228 0.116 0.264 0.248 Kidneys, number of rats 10 10 10 10 10 Liver, mean 9.44 9.13 10.05 11.78* 9.71 Liver, SD 1.601 0.774 0.967 1.444 1.411 Liver, number of rats 10 10 10 10 10 Lung, mean 1.63 1.73 1.66 1.60 1.63 Lung, SD 0.187 0.140 0.106 0.150 0.140 Lung, number of rats 10 10 10 10 10
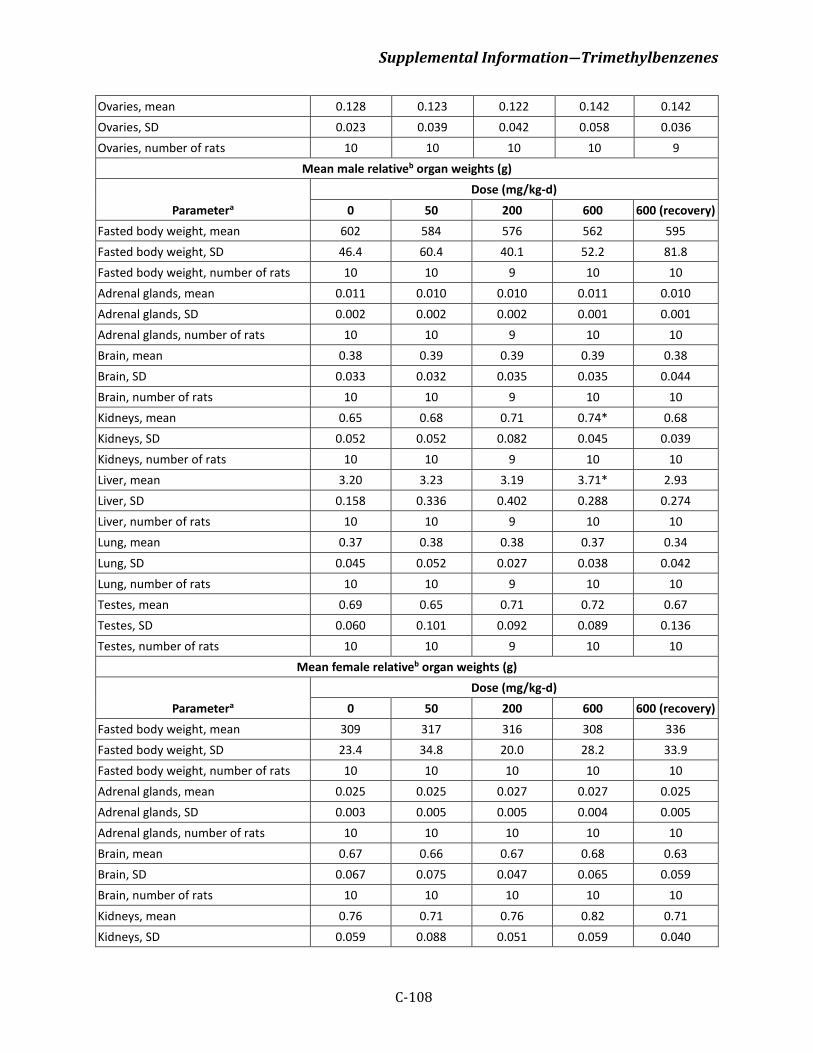
Supplemental Information―Trimethylbenzenes
C-108
Ovaries, mean 0.128 0.123 0.122 0.142 0.142 Ovaries, SD 0.023 0.039 0.042 0.058 0.036 Ovaries, number of rats 10 10 10 10 9
Mean male relativeb organ weights (g)
Parametera Dose (mg/kg-d)
0 50 200 600 600 (recovery) Fasted body weight, mean 602 584 576 562 595 Fasted body weight, SD 46.4 60.4 40.1 52.2 81.8 Fasted body weight, number of rats 10 10 9 10 10 Adrenal glands, mean 0.011 0.010 0.010 0.011 0.010 Adrenal glands, SD 0.002 0.002 0.002 0.001 0.001 Adrenal glands, number of rats 10 10 9 10 10 Brain, mean 0.38 0.39 0.39 0.39 0.38 Brain, SD 0.033 0.032 0.035 0.035 0.044 Brain, number of rats 10 10 9 10 10 Kidneys, mean 0.65 0.68 0.71 0.74* 0.68 Kidneys, SD 0.052 0.052 0.082 0.045 0.039 Kidneys, number of rats 10 10 9 10 10 Liver, mean 3.20 3.23 3.19 3.71* 2.93 Liver, SD 0.158 0.336 0.402 0.288 0.274 Liver, number of rats 10 10 9 10 10 Lung, mean 0.37 0.38 0.38 0.37 0.34 Lung, SD 0.045 0.052 0.027 0.038 0.042 Lung, number of rats 10 10 9 10 10 Testes, mean 0.69 0.65 0.71 0.72 0.67 Testes, SD 0.060 0.101 0.092 0.089 0.136 Testes, number of rats 10 10 9 10 10
Mean female relativeb organ weights (g)
Parametera Dose (mg/kg-d)
0 50 200 600 600 (recovery) Fasted body weight, mean 309 317 316 308 336 Fasted body weight, SD 23.4 34.8 20.0 28.2 33.9 Fasted body weight, number of rats 10 10 10 10 10 Adrenal glands, mean 0.025 0.025 0.027 0.027 0.025 Adrenal glands, SD 0.003 0.005 0.005 0.004 0.005 Adrenal glands, number of rats 10 10 10 10 10 Brain, mean 0.67 0.66 0.67 0.68 0.63 Brain, SD 0.067 0.075 0.047 0.065 0.059 Brain, number of rats 10 10 10 10 10 Kidneys, mean 0.76 0.71 0.76 0.82 0.71 Kidneys, SD 0.059 0.088 0.051 0.059 0.040
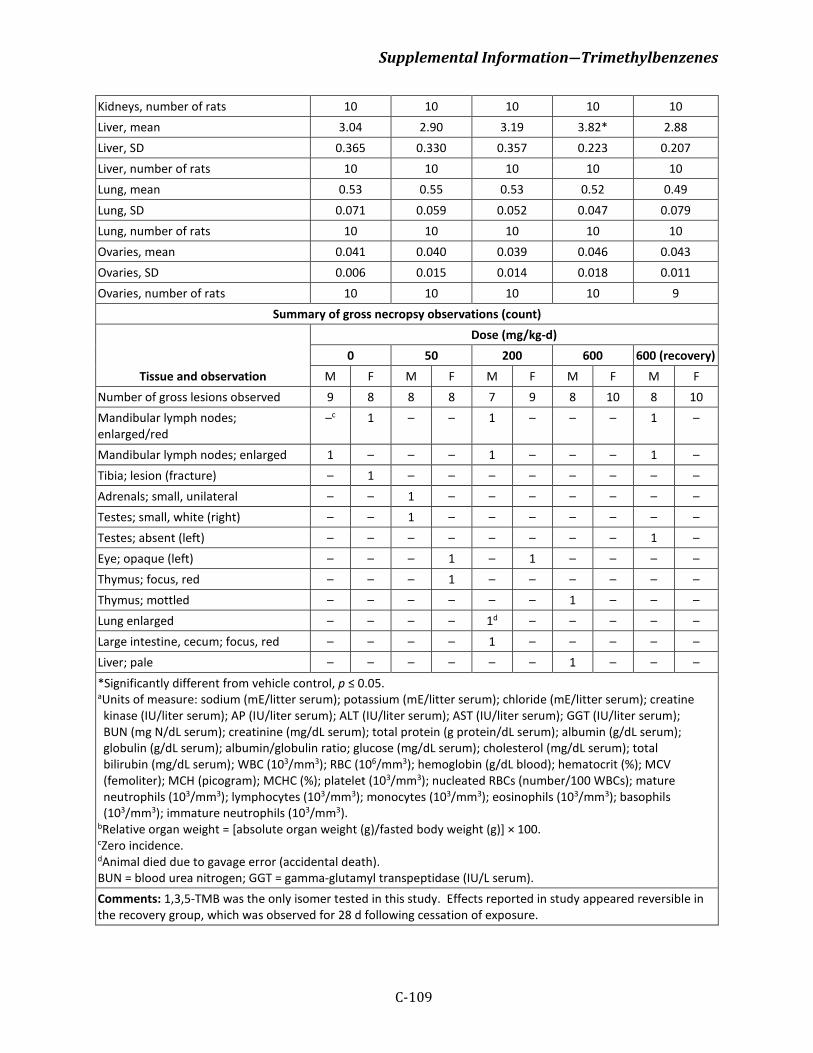
Supplemental Information―Trimethylbenzenes
C-109
Kidneys, number of rats 10 10 10 10 10 Liver, mean 3.04 2.90 3.19 3.82* 2.88 Liver, SD 0.365 0.330 0.357 0.223 0.207 Liver, number of rats 10 10 10 10 10 Lung, mean 0.53 0.55 0.53 0.52 0.49 Lung, SD 0.071 0.059 0.052 0.047 0.079 Lung, number of rats 10 10 10 10 10 Ovaries, mean 0.041 0.040 0.039 0.046 0.043 Ovaries, SD 0.006 0.015 0.014 0.018 0.011 Ovaries, number of rats 10 10 10 10 9
Summary of gross necropsy observations (count)
Tissue and observation
Dose (mg/kg-d) 0 50 200 600 600 (recovery)
M F M F M F M F M F Number of gross lesions observed 9 8 8 8 7 9 8 10 8 10 Mandibular lymph nodes; enlarged/red
–c 1 – – 1 – – – 1 –
Mandibular lymph nodes; enlarged 1 – – – 1 – – – 1 – Tibia; lesion (fracture) – 1 – – – – – – – – Adrenals; small, unilateral – – 1 – – – – – – – Testes; small, white (right) – – 1 – – – – – – – Testes; absent (left) – – – – – – – – 1 – Eye; opaque (left) – – – 1 – 1 – – – – Thymus; focus, red – – – 1 – – – – – – Thymus; mottled – – – – – – 1 – – – Lung enlarged – – – – 1d – – – – – Large intestine, cecum; focus, red – – – – 1 – – – – – Liver; pale – – – – – – 1 – – – *Significantly different from vehicle control, p ≤ 0.05. aUnits of measure: sodium (mE/litter serum); potassium (mE/litter serum); chloride (mE/litter serum); creatine kinase (IU/liter serum); AP (IU/liter serum); ALT (IU/liter serum); AST (IU/liter serum); GGT (IU/liter serum); BUN (mg N/dL serum); creatinine (mg/dL serum); total protein (g protein/dL serum); albumin (g/dL serum); globulin (g/dL serum); albumin/globulin ratio; glucose (mg/dL serum); cholesterol (mg/dL serum); total bilirubin (mg/dL serum); WBC (103/mm3); RBC (106/mm3); hemoglobin (g/dL blood); hematocrit (%); MCV (femoliter); MCH (picogram); MCHC (%); platelet (103/mm3); nucleated RBCs (number/100 WBCs); mature neutrophils (103/mm3); lymphocytes (103/mm3); monocytes (103/mm3); eosinophils (103/mm3); basophils (103/mm3); immature neutrophils (103/mm3).
bRelative organ weight = [absolute organ weight (g)/fasted body weight (g)] × 100. cZero incidence. dAnimal died due to gavage error (accidental death). BUN = blood urea nitrogen; GGT = gamma-glutamyl transpeptidase (IU/L serum). Comments: 1,3,5-TMB was the only isomer tested in this study. Effects reported in study appeared reversible in the recovery group, which was observed for 28 d following cessation of exposure.
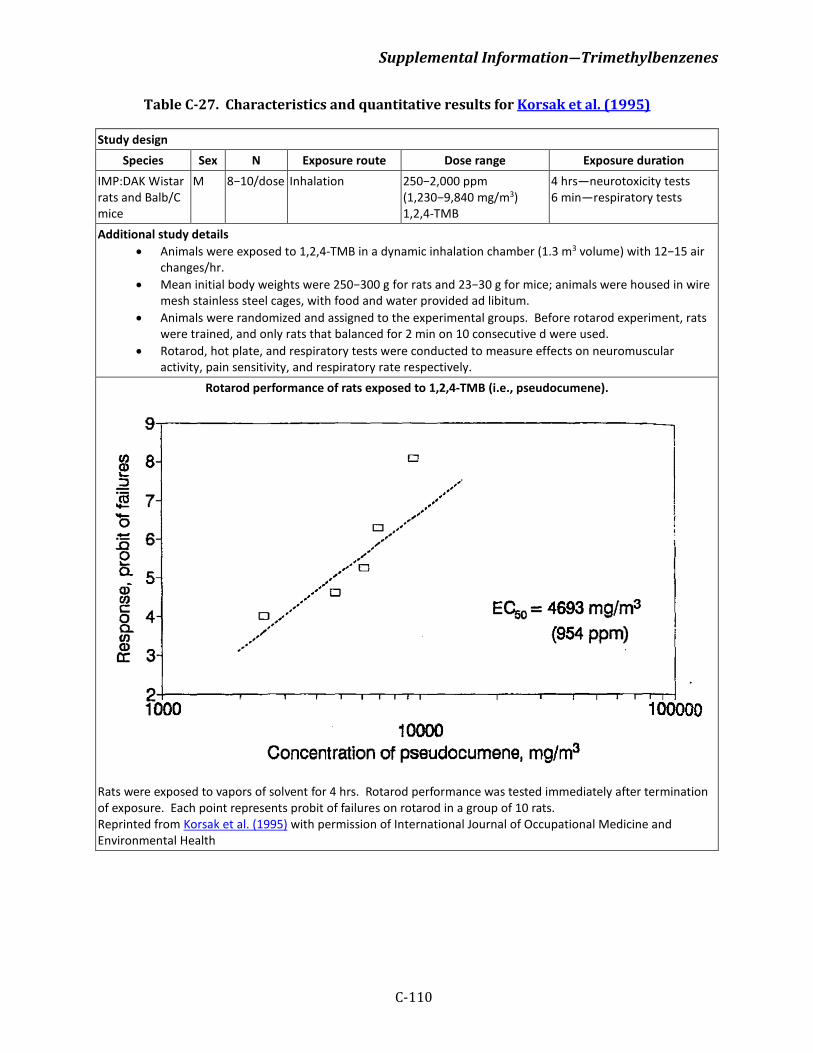
Supplemental Information―Trimethylbenzenes
C-110
Table C-27. Characteristics and quantitative results for Korsak et al. (1995)
Study design Species Sex N Exposure route Dose range Exposure duration
IMP:DAK Wistar rats and Balb/C mice
M 8−10/dose Inhalation 250−2,000 ppm (1,230−9,840 mg/m3) 1,2,4-TMB
4 hrs—neurotoxicity tests 6 min—respiratory tests
Additional study details • Animals were exposed to 1,2,4-TMB in a dynamic inhalation chamber (1.3 m3 volume) with 12−15 air
changes/hr. • Mean initial body weights were 250−300 g for rats and 23−30 g for mice; animals were housed in wire
mesh stainless steel cages, with food and water provided ad libitum. • Animals were randomized and assigned to the experimental groups. Before rotarod experiment, rats
were trained, and only rats that balanced for 2 min on 10 consecutive d were used. • Rotarod, hot plate, and respiratory tests were conducted to measure effects on neuromuscular
activity, pain sensitivity, and respiratory rate respectively. Rotarod performance of rats exposed to 1,2,4-TMB (i.e., pseudocumene).
Rats were exposed to vapors of solvent for 4 hrs. Rotarod performance was tested immediately after termination of exposure. Each point represents probit of failures on rotarod in a group of 10 rats. Reprinted from Korsak et al. (1995) with permission of International Journal of Occupational Medicine and Environmental Health
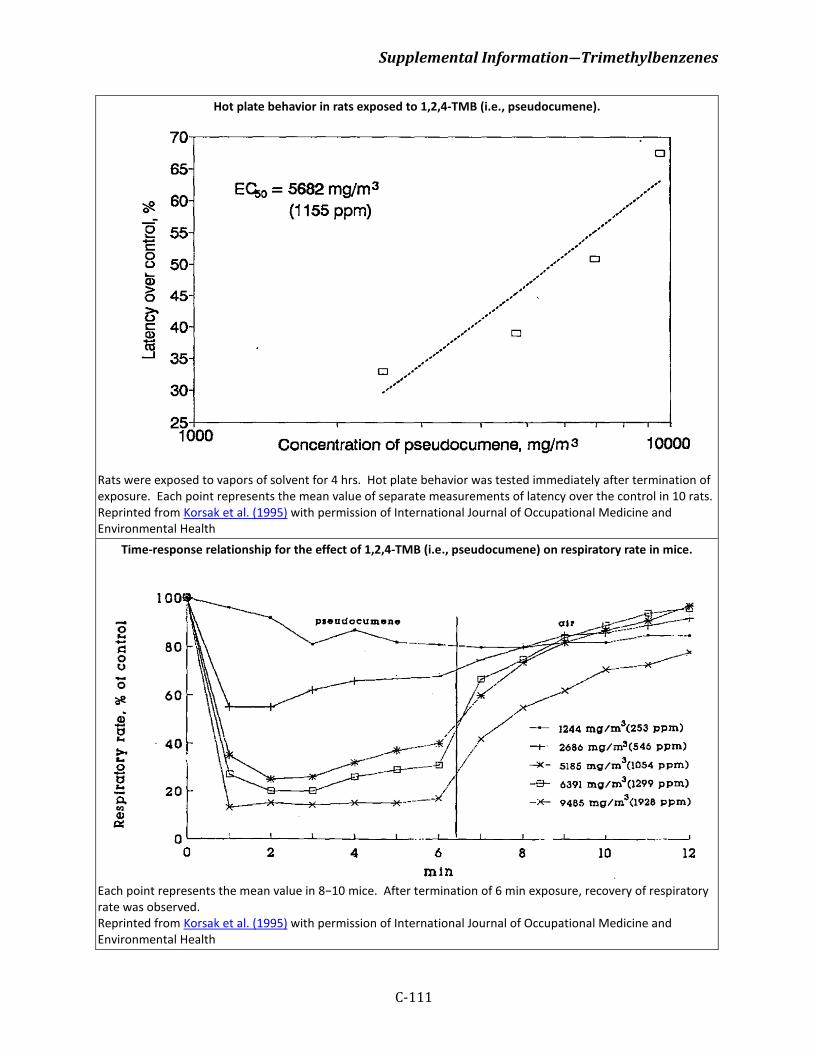
Supplemental Information―Trimethylbenzenes
C-111
Hot plate behavior in rats exposed to 1,2,4-TMB (i.e., pseudocumene).
Rats were exposed to vapors of solvent for 4 hrs. Hot plate behavior was tested immediately after termination of exposure. Each point represents the mean value of separate measurements of latency over the control in 10 rats. Reprinted from Korsak et al. (1995) with permission of International Journal of Occupational Medicine and Environmental Health
Time-response relationship for the effect of 1,2,4-TMB (i.e., pseudocumene) on respiratory rate in mice.
Each point represents the mean value in 8−10 mice. After termination of 6 min exposure, recovery of respiratory rate was observed. Reprinted from Korsak et al. (1995) with permission of International Journal of Occupational Medicine and Environmental Health
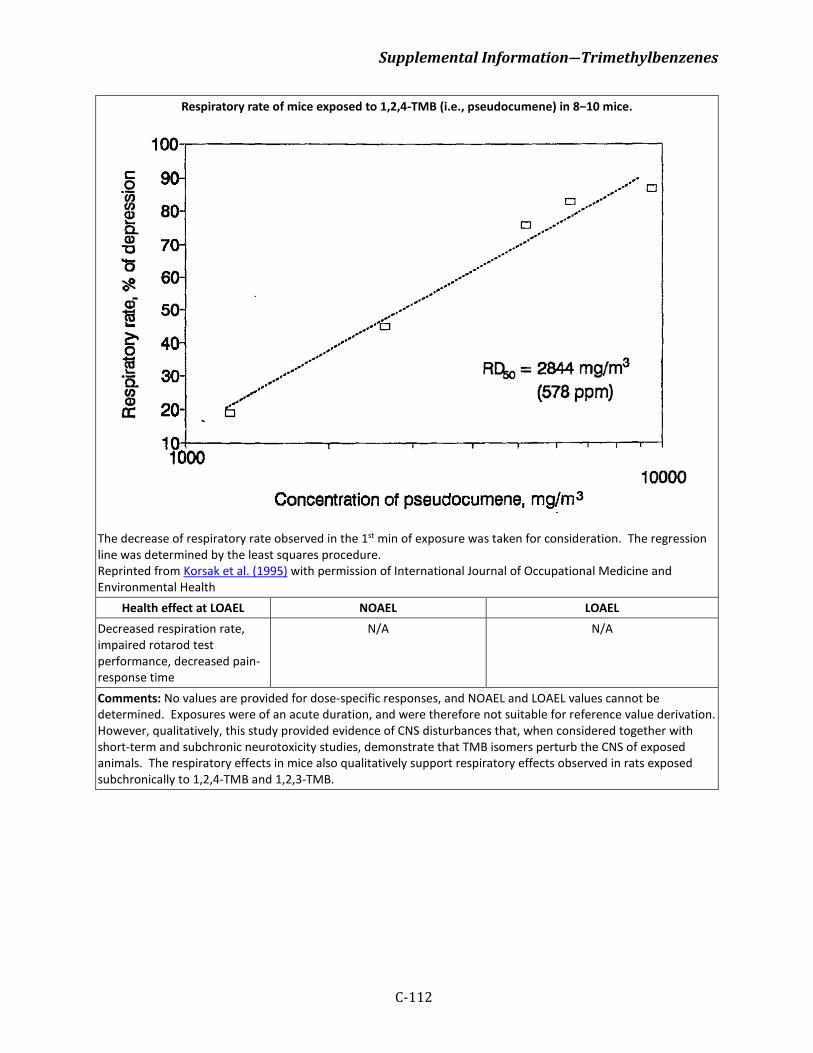
Supplemental Information―Trimethylbenzenes
C-112
Respiratory rate of mice exposed to 1,2,4-TMB (i.e., pseudocumene) in 8−10 mice.
The decrease of respiratory rate observed in the 1st min of exposure was taken for consideration. The regression line was determined by the least squares procedure. Reprinted from Korsak et al. (1995) with permission of International Journal of Occupational Medicine and Environmental Health
Health effect at LOAEL NOAEL LOAEL Decreased respiration rate, impaired rotarod test performance, decreased pain-response time
N/A N/A
Comments: No values are provided for dose-specific responses, and NOAEL and LOAEL values cannot be determined. Exposures were of an acute duration, and were therefore not suitable for reference value derivation. However, qualitatively, this study provided evidence of CNS disturbances that, when considered together with short-term and subchronic neurotoxicity studies, demonstrate that TMB isomers perturb the CNS of exposed animals. The respiratory effects in mice also qualitatively support respiratory effects observed in rats exposed subchronically to 1,2,4-TMB and 1,2,3-TMB.
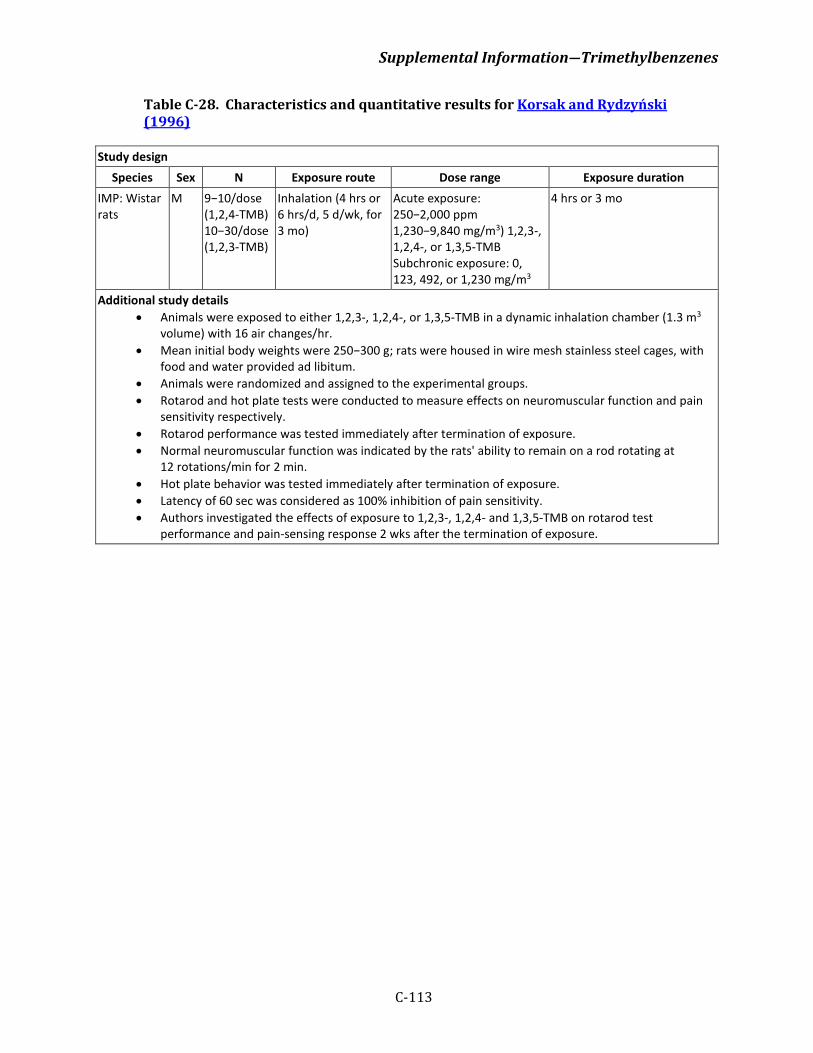
Supplemental Information―Trimethylbenzenes
C-113
Table C-28. Characteristics and quantitative results for Korsak and Rydzyński (1996)
Study design Species Sex N Exposure route Dose range Exposure duration
IMP: Wistar rats
M 9−10/dose (1,2,4-TMB) 10−30/dose (1,2,3-TMB)
Inhalation (4 hrs or 6 hrs/d, 5 d/wk, for 3 mo)
Acute exposure: 250−2,000 ppm 1,230−9,840 mg/m3) 1,2,3-, 1,2,4-, or 1,3,5-TMB Subchronic exposure: 0, 123, 492, or 1,230 mg/m3
4 hrs or 3 mo
Additional study details • Animals were exposed to either 1,2,3-, 1,2,4-, or 1,3,5-TMB in a dynamic inhalation chamber (1.3 m3
volume) with 16 air changes/hr. • Mean initial body weights were 250−300 g; rats were housed in wire mesh stainless steel cages, with
food and water provided ad libitum. • Animals were randomized and assigned to the experimental groups. • Rotarod and hot plate tests were conducted to measure effects on neuromuscular function and pain
sensitivity respectively. • Rotarod performance was tested immediately after termination of exposure. • Normal neuromuscular function was indicated by the rats' ability to remain on a rod rotating at
12 rotations/min for 2 min. • Hot plate behavior was tested immediately after termination of exposure. • Latency of 60 sec was considered as 100% inhibition of pain sensitivity. • Authors investigated the effects of exposure to 1,2,3-, 1,2,4- and 1,3,5-TMB on rotarod test
performance and pain-sensing response 2 wks after the termination of exposure.

Supplemental Information―Trimethylbenzenes
C-114
Rotarod performance of rats exposed to 1,2,3-TMB (hemimellitene), 1,2,4-TMB (pseudocumene), or 1,3,5-TMB (mesitylene).
Rats were exposed to solvent vapors for 4 hrs. Rotarod performance was tested immediately after termination of exposure. Each point represents probit of failures on rotarod in a group of 10 rats. Normal neuromuscular function was indicated by the rats' ability to remain on a rod rotating at 12 rotations/min for 2 min. The rotating rod was suspended 20 cm above metal bars connected to a 80 V/2 mA power source. Reprinted from Korsak and Rydzyński (1996) with permission of International Journal of Occupational Medicine and Environmental Health
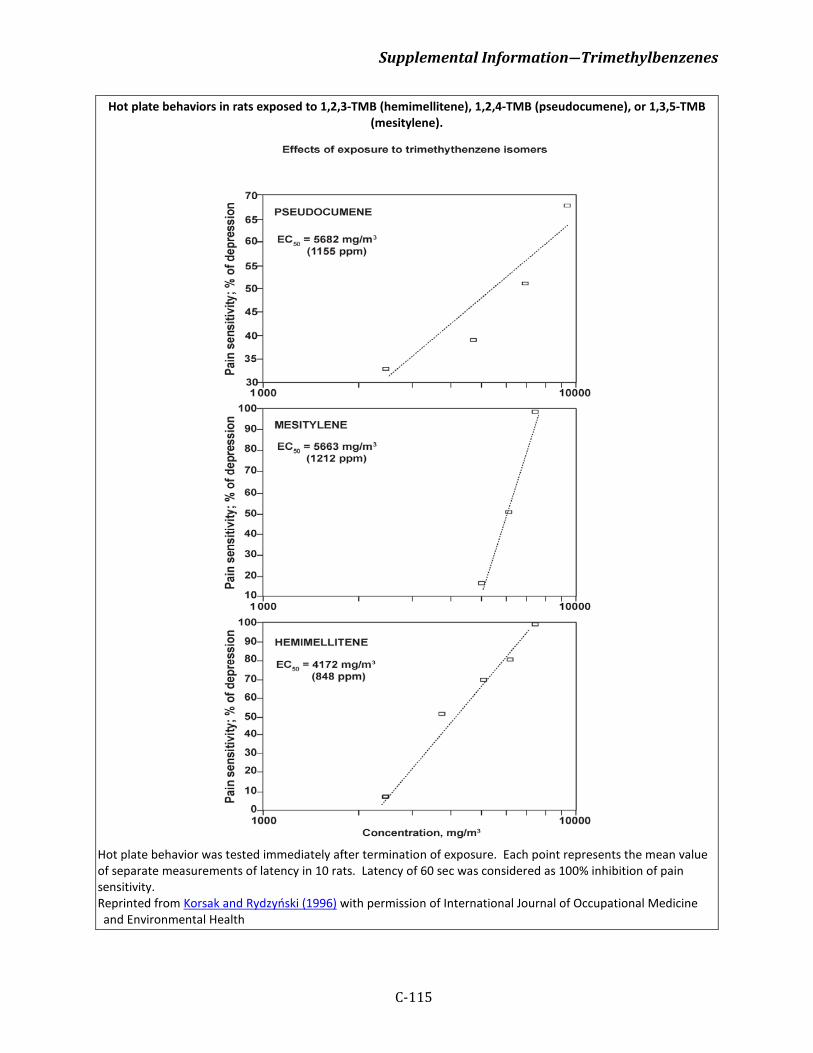
Supplemental Information―Trimethylbenzenes
C-115
Hot plate behaviors in rats exposed to 1,2,3-TMB (hemimellitene), 1,2,4-TMB (pseudocumene), or 1,3,5-TMB (mesitylene).
Hot plate behavior was tested immediately after termination of exposure. Each point represents the mean value of separate measurements of latency in 10 rats. Latency of 60 sec was considered as 100% inhibition of pain sensitivity. Reprinted from Korsak and Rydzyński (1996) with permission of International Journal of Occupational Medicine and Environmental Health
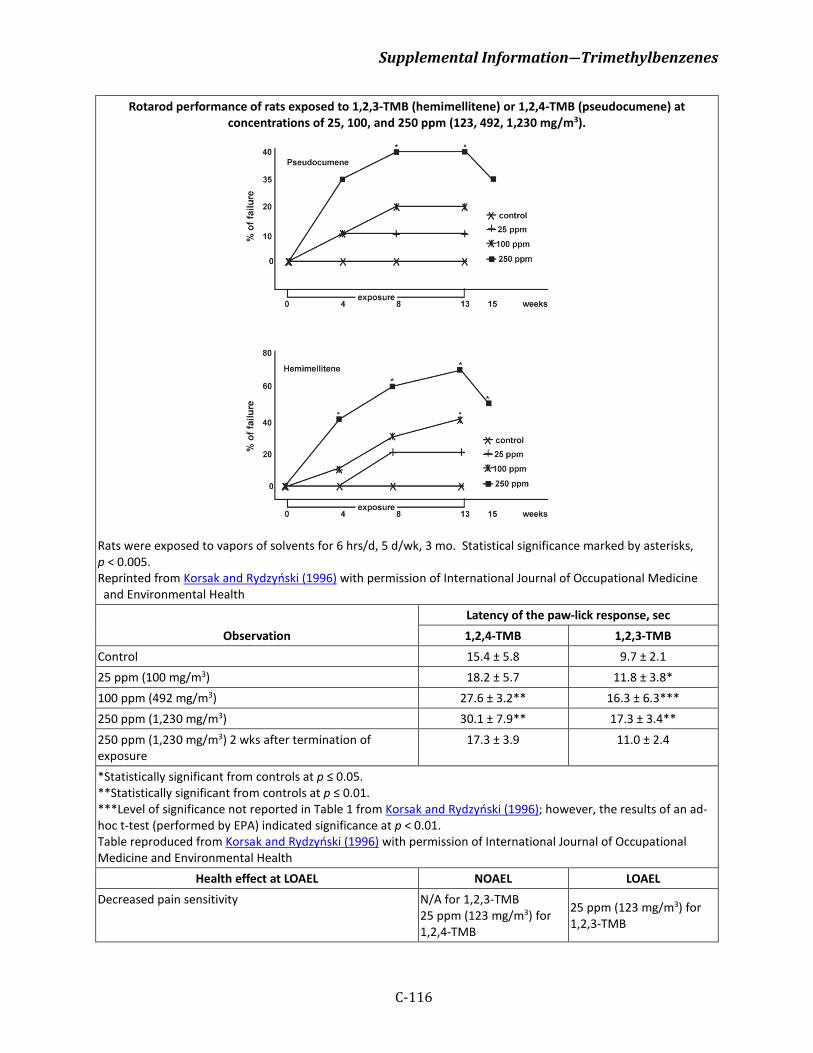
Supplemental Information―Trimethylbenzenes
C-116
Rotarod performance of rats exposed to 1,2,3-TMB (hemimellitene) or 1,2,4-TMB (pseudocumene) at concentrations of 25, 100, and 250 ppm (123, 492, 1,230 mg/m3).
Rats were exposed to vapors of solvents for 6 hrs/d, 5 d/wk, 3 mo. Statistical significance marked by asterisks, p < 0.005. Reprinted from Korsak and Rydzyński (1996) with permission of International Journal of Occupational Medicine and Environmental Health
Observation Latency of the paw-lick response, sec 1,2,4-TMB 1,2,3-TMB
Control 15.4 ± 5.8 9.7 ± 2.1 25 ppm (100 mg/m3) 18.2 ± 5.7 11.8 ± 3.8* 100 ppm (492 mg/m3) 27.6 ± 3.2** 16.3 ± 6.3*** 250 ppm (1,230 mg/m3) 30.1 ± 7.9** 17.3 ± 3.4** 250 ppm (1,230 mg/m3) 2 wks after termination of exposure
17.3 ± 3.9 11.0 ± 2.4
*Statistically significant from controls at p ≤ 0.05. **Statistically significant from controls at p ≤ 0.01. ***Level of significance not reported in Table 1 from Korsak and Rydzyński (1996); however, the results of an ad-hoc t-test (performed by EPA) indicated significance at p < 0.01. Table reproduced from Korsak and Rydzyński (1996) with permission of International Journal of Occupational Medicine and Environmental Health
Health effect at LOAEL NOAEL LOAEL Decreased pain sensitivity N/A for 1,2,3-TMB
25 ppm (123 mg/m3) for 1,2,4-TMB
25 ppm (123 mg/m3) for 1,2,3-TMB
Supplemental Information―Trimethylbenzenes
C-117
100 ppm (492 mg/m3) for 1,2,4-TMB
Comments: Although rotarod data are useful in providing a qualitative description of neuromuscular impairment following 1,2,4-TMB or 1,2,3-TMB exposure, in comparison to effects on pain sensitivity, the data are not considered as robust regarding suitability for derivation of reference values. Namely, data are presented as dichotomized values instead of a continuous measurement of latency. The acute exposures were not suitable for reference value derivation. However, qualitatively, effects observed following acute exposures provided evidence of CNS disturbances that, when considered together with subchronic neurotoxicity tests, demonstrate that TMB isomers perturb the CNS of exposed animals. It is unclear whether the latency to paw-lick and rotarod tests were performed sequentially in the same cohort of animals.
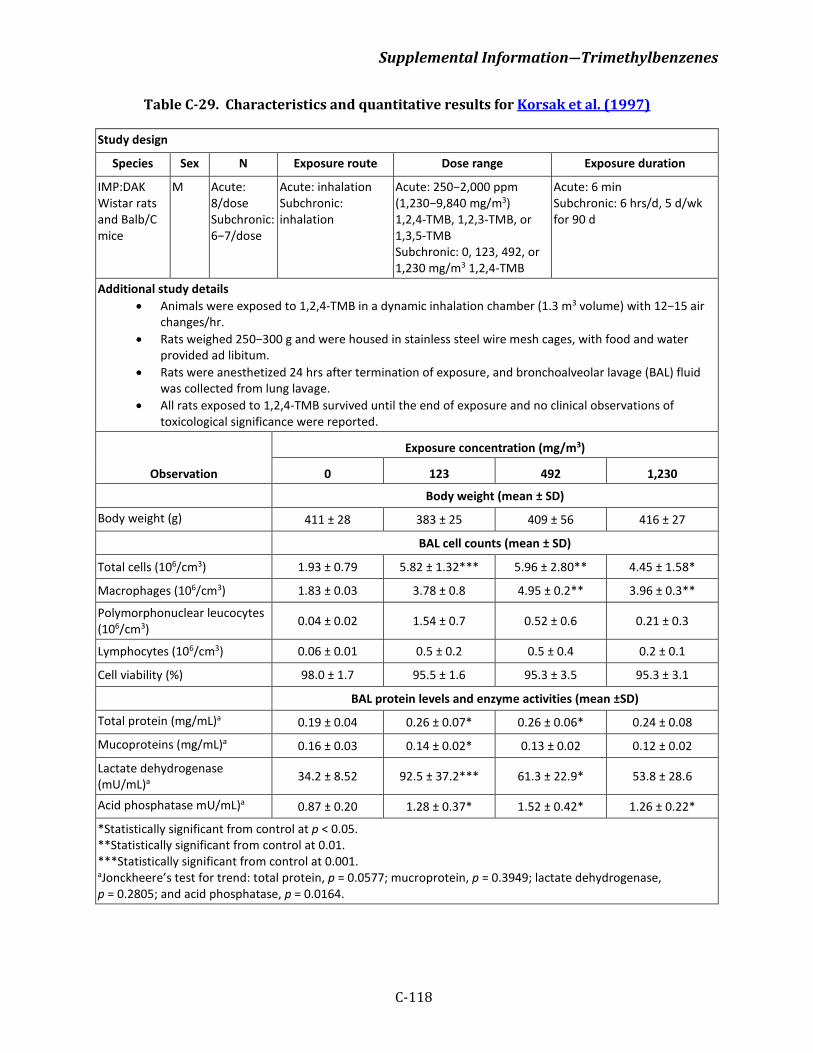
Supplemental Information―Trimethylbenzenes
C-118
Table C-29. Characteristics and quantitative results for Korsak et al. (1997)
Study design
Species Sex N Exposure route Dose range Exposure duration
IMP:DAK Wistar rats and Balb/C mice
M Acute: 8/dose Subchronic: 6−7/dose
Acute: inhalation Subchronic: inhalation
Acute: 250−2,000 ppm (1,230−9,840 mg/m3) 1,2,4-TMB, 1,2,3-TMB, or 1,3,5-TMB Subchronic: 0, 123, 492, or 1,230 mg/m3 1,2,4-TMB
Acute: 6 min Subchronic: 6 hrs/d, 5 d/wk for 90 d
Additional study details • Animals were exposed to 1,2,4-TMB in a dynamic inhalation chamber (1.3 m3 volume) with 12−15 air
changes/hr. • Rats weighed 250−300 g and were housed in stainless steel wire mesh cages, with food and water
provided ad libitum. • Rats were anesthetized 24 hrs after termination of exposure, and bronchoalveolar lavage (BAL) fluid
was collected from lung lavage. • All rats exposed to 1,2,4-TMB survived until the end of exposure and no clinical observations of
toxicological significance were reported.
Observation
Exposure concentration (mg/m3)
0 123 492 1,230
Body weight (mean ± SD)
Body weight (g) 411 ± 28 383 ± 25 409 ± 56 416 ± 27
BAL cell counts (mean ± SD)
Total cells (106/cm3) 1.93 ± 0.79 5.82 ± 1.32*** 5.96 ± 2.80** 4.45 ± 1.58*
Macrophages (106/cm3) 1.83 ± 0.03 3.78 ± 0.8 4.95 ± 0.2** 3.96 ± 0.3**
Polymorphonuclear leucocytes (106/cm3) 0.04 ± 0.02 1.54 ± 0.7 0.52 ± 0.6 0.21 ± 0.3
Lymphocytes (106/cm3) 0.06 ± 0.01 0.5 ± 0.2 0.5 ± 0.4 0.2 ± 0.1
Cell viability (%) 98.0 ± 1.7 95.5 ± 1.6 95.3 ± 3.5 95.3 ± 3.1
BAL protein levels and enzyme activities (mean ±SD)
Total protein (mg/mL)a 0.19 ± 0.04 0.26 ± 0.07* 0.26 ± 0.06* 0.24 ± 0.08
Mucoproteins (mg/mL)a 0.16 ± 0.03 0.14 ± 0.02* 0.13 ± 0.02 0.12 ± 0.02
Lactate dehydrogenase (mU/mL)a 34.2 ± 8.52 92.5 ± 37.2*** 61.3 ± 22.9* 53.8 ± 28.6
Acid phosphatase mU/mL)a 0.87 ± 0.20 1.28 ± 0.37* 1.52 ± 0.42* 1.26 ± 0.22*
*Statistically significant from control at p < 0.05. **Statistically significant from control at 0.01. ***Statistically significant from control at 0.001. aJonckheere’s test for trend: total protein, p = 0.0577; mucroprotein, p = 0.3949; lactate dehydrogenase, p = 0.2805; and acid phosphatase, p = 0.0164.
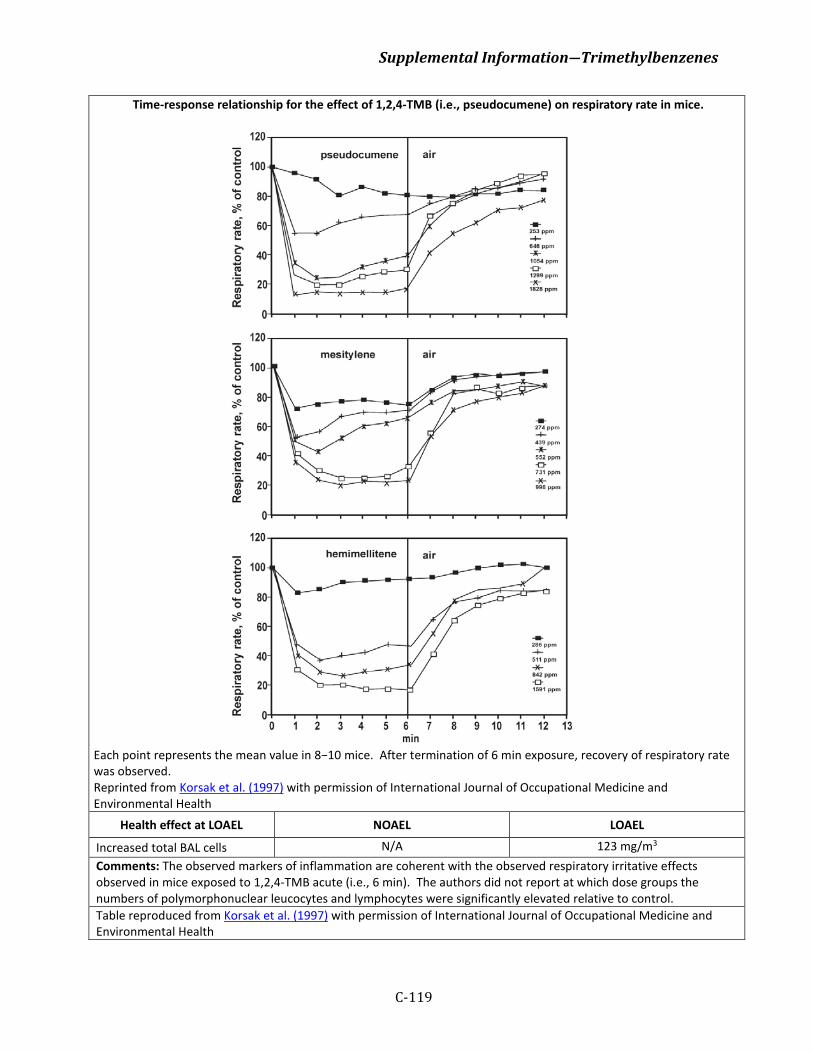
Supplemental Information―Trimethylbenzenes
C-119
Time-response relationship for the effect of 1,2,4-TMB (i.e., pseudocumene) on respiratory rate in mice.
Each point represents the mean value in 8−10 mice. After termination of 6 min exposure, recovery of respiratory rate was observed. Reprinted from Korsak et al. (1997) with permission of International Journal of Occupational Medicine and Environmental Health
Health effect at LOAEL NOAEL LOAEL
Increased total BAL cells N/A 123 mg/m3
Comments: The observed markers of inflammation are coherent with the observed respiratory irritative effects observed in mice exposed to 1,2,4-TMB acute (i.e., 6 min). The authors did not report at which dose groups the numbers of polymorphonuclear leucocytes and lymphocytes were significantly elevated relative to control. Table reproduced from Korsak et al. (1997) with permission of International Journal of Occupational Medicine and Environmental Health
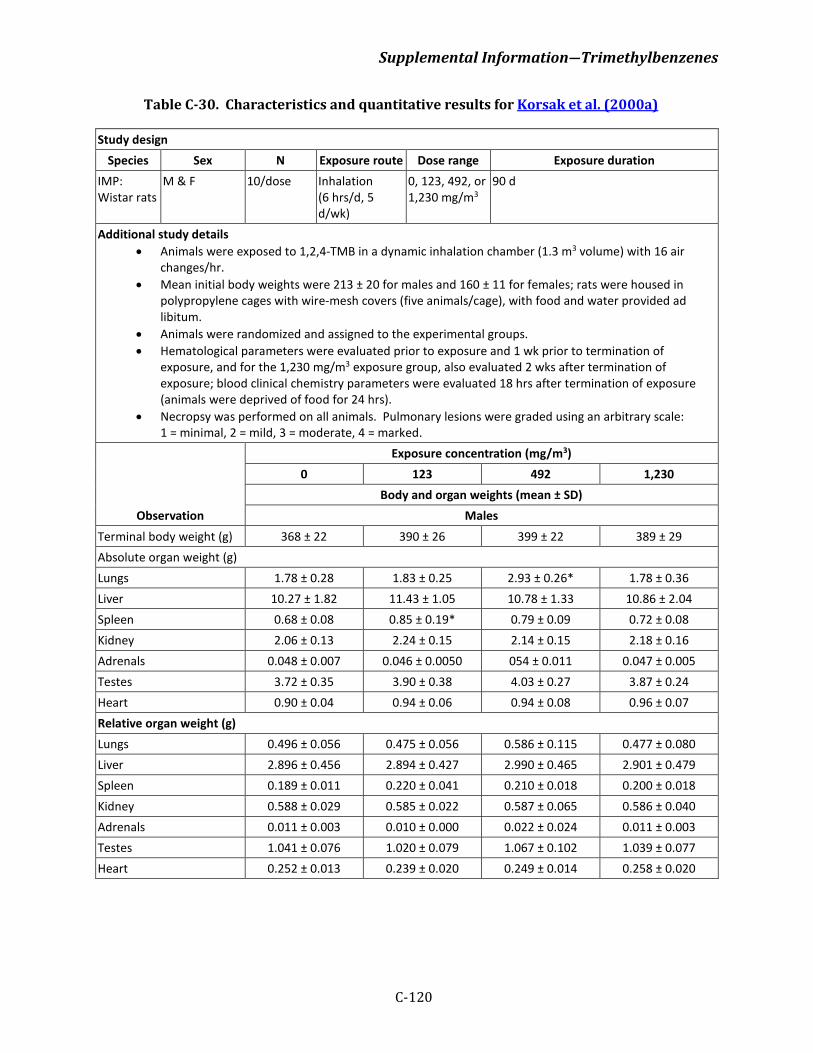
Supplemental Information―Trimethylbenzenes
C-120
Table C-30. Characteristics and quantitative results for Korsak et al. (2000a)
Study design Species Sex N Exposure route Dose range Exposure duration
IMP: Wistar rats
M & F 10/dose Inhalation (6 hrs/d, 5 d/wk)
0, 123, 492, or 1,230 mg/m3
90 d
Additional study details • Animals were exposed to 1,2,4-TMB in a dynamic inhalation chamber (1.3 m3 volume) with 16 air
changes/hr. • Mean initial body weights were 213 ± 20 for males and 160 ± 11 for females; rats were housed in
polypropylene cages with wire-mesh covers (five animals/cage), with food and water provided ad libitum.
• Animals were randomized and assigned to the experimental groups. • Hematological parameters were evaluated prior to exposure and 1 wk prior to termination of
exposure, and for the 1,230 mg/m3 exposure group, also evaluated 2 wks after termination of exposure; blood clinical chemistry parameters were evaluated 18 hrs after termination of exposure (animals were deprived of food for 24 hrs).
• Necropsy was performed on all animals. Pulmonary lesions were graded using an arbitrary scale: 1 = minimal, 2 = mild, 3 = moderate, 4 = marked.
Observation
Exposure concentration (mg/m3) 0 123 492 1,230
Body and organ weights (mean ± SD) Males
Terminal body weight (g) 368 ± 22 390 ± 26 399 ± 22 389 ± 29 Absolute organ weight (g) Lungs 1.78 ± 0.28 1.83 ± 0.25 2.93 ± 0.26* 1.78 ± 0.36 Liver 10.27 ± 1.82 11.43 ± 1.05 10.78 ± 1.33 10.86 ± 2.04 Spleen 0.68 ± 0.08 0.85 ± 0.19* 0.79 ± 0.09 0.72 ± 0.08 Kidney 2.06 ± 0.13 2.24 ± 0.15 2.14 ± 0.15 2.18 ± 0.16 Adrenals 0.048 ± 0.007 0.046 ± 0.0050 054 ± 0.011 0.047 ± 0.005 Testes 3.72 ± 0.35 3.90 ± 0.38 4.03 ± 0.27 3.87 ± 0.24 Heart 0.90 ± 0.04 0.94 ± 0.06 0.94 ± 0.08 0.96 ± 0.07 Relative organ weight (g) Lungs 0.496 ± 0.056 0.475 ± 0.056 0.586 ± 0.115 0.477 ± 0.080 Liver 2.896 ± 0.456 2.894 ± 0.427 2.990 ± 0.465 2.901 ± 0.479 Spleen 0.189 ± 0.011 0.220 ± 0.041 0.210 ± 0.018 0.200 ± 0.018 Kidney 0.588 ± 0.029 0.585 ± 0.022 0.587 ± 0.065 0.586 ± 0.040 Adrenals 0.011 ± 0.003 0.010 ± 0.000 0.022 ± 0.024 0.011 ± 0.003 Testes 1.041 ± 0.076 1.020 ± 0.079 1.067 ± 0.102 1.039 ± 0.077 Heart 0.252 ± 0.013 0.239 ± 0.020 0.249 ± 0.014 0.258 ± 0.020
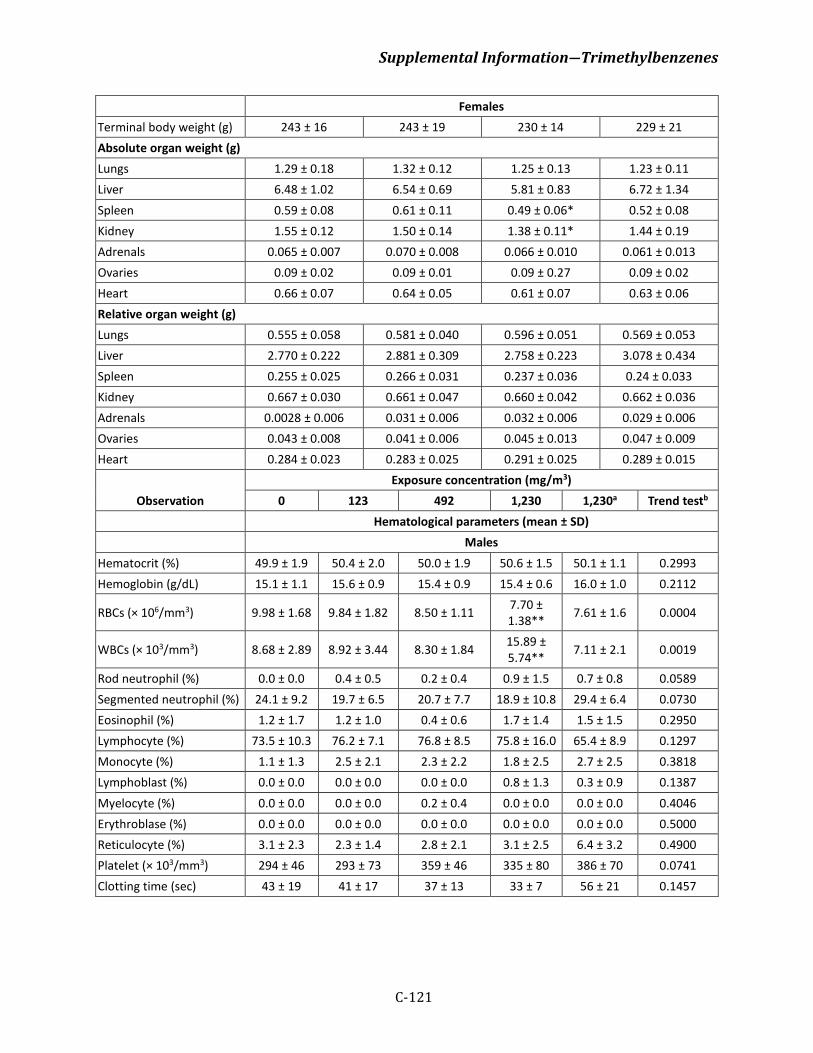
Supplemental Information―Trimethylbenzenes
C-121
Females Terminal body weight (g) 243 ± 16 243 ± 19 230 ± 14 229 ± 21 Absolute organ weight (g) Lungs 1.29 ± 0.18 1.32 ± 0.12 1.25 ± 0.13 1.23 ± 0.11 Liver 6.48 ± 1.02 6.54 ± 0.69 5.81 ± 0.83 6.72 ± 1.34 Spleen 0.59 ± 0.08 0.61 ± 0.11 0.49 ± 0.06* 0.52 ± 0.08 Kidney 1.55 ± 0.12 1.50 ± 0.14 1.38 ± 0.11* 1.44 ± 0.19 Adrenals 0.065 ± 0.007 0.070 ± 0.008 0.066 ± 0.010 0.061 ± 0.013 Ovaries 0.09 ± 0.02 0.09 ± 0.01 0.09 ± 0.27 0.09 ± 0.02 Heart 0.66 ± 0.07 0.64 ± 0.05 0.61 ± 0.07 0.63 ± 0.06 Relative organ weight (g) Lungs 0.555 ± 0.058 0.581 ± 0.040 0.596 ± 0.051 0.569 ± 0.053 Liver 2.770 ± 0.222 2.881 ± 0.309 2.758 ± 0.223 3.078 ± 0.434 Spleen 0.255 ± 0.025 0.266 ± 0.031 0.237 ± 0.036 0.24 ± 0.033 Kidney 0.667 ± 0.030 0.661 ± 0.047 0.660 ± 0.042 0.662 ± 0.036 Adrenals 0.0028 ± 0.006 0.031 ± 0.006 0.032 ± 0.006 0.029 ± 0.006 Ovaries 0.043 ± 0.008 0.041 ± 0.006 0.045 ± 0.013 0.047 ± 0.009 Heart 0.284 ± 0.023 0.283 ± 0.025 0.291 ± 0.025 0.289 ± 0.015
Observation Exposure concentration (mg/m3)
0 123 492 1,230 1,230a Trend testb
Hematological parameters (mean ± SD) Males
Hematocrit (%) 49.9 ± 1.9 50.4 ± 2.0 50.0 ± 1.9 50.6 ± 1.5 50.1 ± 1.1 0.2993 Hemoglobin (g/dL) 15.1 ± 1.1 15.6 ± 0.9 15.4 ± 0.9 15.4 ± 0.6 16.0 ± 1.0 0.2112
RBCs (× 106/mm3) 9.98 ± 1.68 9.84 ± 1.82 8.50 ± 1.11 7.70 ± 1.38** 7.61 ± 1.6 0.0004
WBCs (× 103/mm3) 8.68 ± 2.89 8.92 ± 3.44 8.30 ± 1.84 15.89 ± 5.74** 7.11 ± 2.1 0.0019
Rod neutrophil (%) 0.0 ± 0.0 0.4 ± 0.5 0.2 ± 0.4 0.9 ± 1.5 0.7 ± 0.8 0.0589 Segmented neutrophil (%) 24.1 ± 9.2 19.7 ± 6.5 20.7 ± 7.7 18.9 ± 10.8 29.4 ± 6.4 0.0730 Eosinophil (%) 1.2 ± 1.7 1.2 ± 1.0 0.4 ± 0.6 1.7 ± 1.4 1.5 ± 1.5 0.2950 Lymphocyte (%) 73.5 ± 10.3 76.2 ± 7.1 76.8 ± 8.5 75.8 ± 16.0 65.4 ± 8.9 0.1297 Monocyte (%) 1.1 ± 1.3 2.5 ± 2.1 2.3 ± 2.2 1.8 ± 2.5 2.7 ± 2.5 0.3818 Lymphoblast (%) 0.0 ± 0.0 0.0 ± 0.0 0.0 ± 0.0 0.8 ± 1.3 0.3 ± 0.9 0.1387 Myelocyte (%) 0.0 ± 0.0 0.0 ± 0.0 0.2 ± 0.4 0.0 ± 0.0 0.0 ± 0.0 0.4046 Erythroblase (%) 0.0 ± 0.0 0.0 ± 0.0 0.0 ± 0.0 0.0 ± 0.0 0.0 ± 0.0 0.5000 Reticulocyte (%) 3.1 ± 2.3 2.3 ± 1.4 2.8 ± 2.1 3.1 ± 2.5 6.4 ± 3.2 0.4900 Platelet (× 103/mm3) 294 ± 46 293 ± 73 359 ± 46 335 ± 80 386 ± 70 0.0741 Clotting time (sec) 43 ± 19 41 ± 17 37 ± 13 33 ± 7 56 ± 21 0.1457
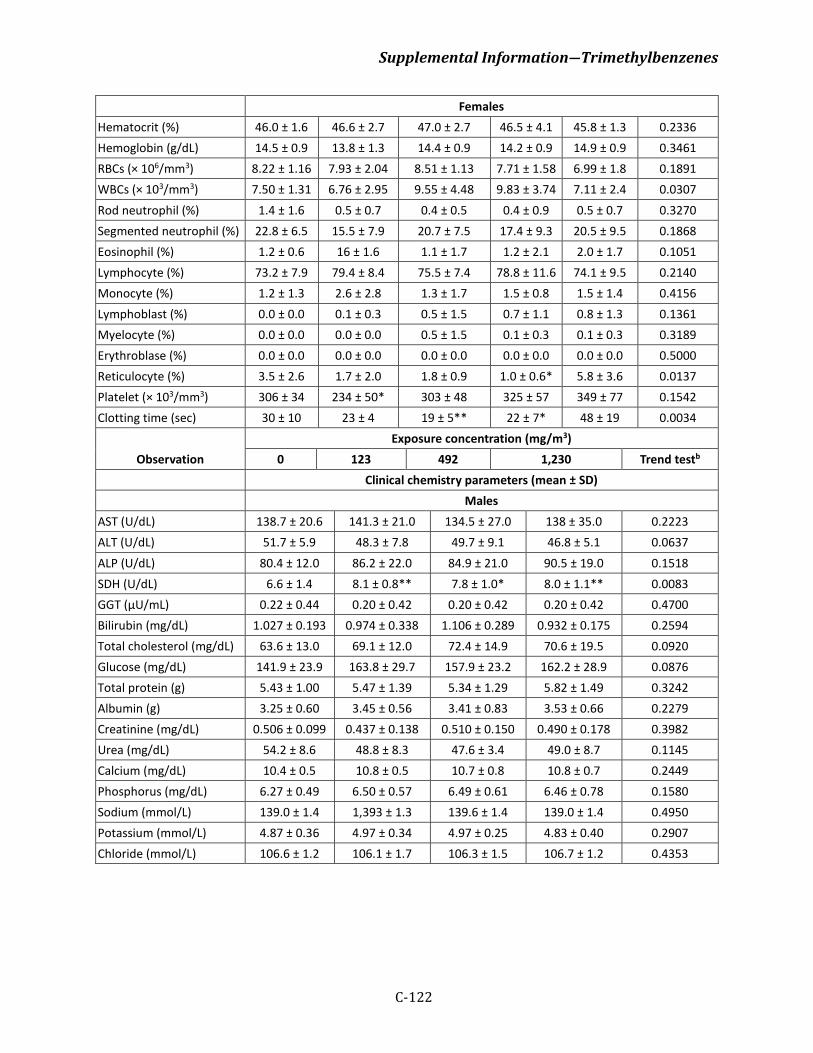
Supplemental Information―Trimethylbenzenes
C-122
Females Hematocrit (%) 46.0 ± 1.6 46.6 ± 2.7 47.0 ± 2.7 46.5 ± 4.1 45.8 ± 1.3 0.2336 Hemoglobin (g/dL) 14.5 ± 0.9 13.8 ± 1.3 14.4 ± 0.9 14.2 ± 0.9 14.9 ± 0.9 0.3461 RBCs (× 106/mm3) 8.22 ± 1.16 7.93 ± 2.04 8.51 ± 1.13 7.71 ± 1.58 6.99 ± 1.8 0.1891 WBCs (× 103/mm3) 7.50 ± 1.31 6.76 ± 2.95 9.55 ± 4.48 9.83 ± 3.74 7.11 ± 2.4 0.0307 Rod neutrophil (%) 1.4 ± 1.6 0.5 ± 0.7 0.4 ± 0.5 0.4 ± 0.9 0.5 ± 0.7 0.3270 Segmented neutrophil (%) 22.8 ± 6.5 15.5 ± 7.9 20.7 ± 7.5 17.4 ± 9.3 20.5 ± 9.5 0.1868 Eosinophil (%) 1.2 ± 0.6 16 ± 1.6 1.1 ± 1.7 1.2 ± 2.1 2.0 ± 1.7 0.1051 Lymphocyte (%) 73.2 ± 7.9 79.4 ± 8.4 75.5 ± 7.4 78.8 ± 11.6 74.1 ± 9.5 0.2140 Monocyte (%) 1.2 ± 1.3 2.6 ± 2.8 1.3 ± 1.7 1.5 ± 0.8 1.5 ± 1.4 0.4156 Lymphoblast (%) 0.0 ± 0.0 0.1 ± 0.3 0.5 ± 1.5 0.7 ± 1.1 0.8 ± 1.3 0.1361 Myelocyte (%) 0.0 ± 0.0 0.0 ± 0.0 0.5 ± 1.5 0.1 ± 0.3 0.1 ± 0.3 0.3189 Erythroblase (%) 0.0 ± 0.0 0.0 ± 0.0 0.0 ± 0.0 0.0 ± 0.0 0.0 ± 0.0 0.5000 Reticulocyte (%) 3.5 ± 2.6 1.7 ± 2.0 1.8 ± 0.9 1.0 ± 0.6* 5.8 ± 3.6 0.0137 Platelet (× 103/mm3) 306 ± 34 234 ± 50* 303 ± 48 325 ± 57 349 ± 77 0.1542 Clotting time (sec) 30 ± 10 23 ± 4 19 ± 5** 22 ± 7* 48 ± 19 0.0034
Observation Exposure concentration (mg/m3)
0 123 492 1,230 Trend testb
Clinical chemistry parameters (mean ± SD) Males
AST (U/dL) 138.7 ± 20.6 141.3 ± 21.0 134.5 ± 27.0 138 ± 35.0 0.2223 ALT (U/dL) 51.7 ± 5.9 48.3 ± 7.8 49.7 ± 9.1 46.8 ± 5.1 0.0637 ALP (U/dL) 80.4 ± 12.0 86.2 ± 22.0 84.9 ± 21.0 90.5 ± 19.0 0.1518 SDH (U/dL) 6.6 ± 1.4 8.1 ± 0.8** 7.8 ± 1.0* 8.0 ± 1.1** 0.0083 GGT (µU/mL) 0.22 ± 0.44 0.20 ± 0.42 0.20 ± 0.42 0.20 ± 0.42 0.4700 Bilirubin (mg/dL) 1.027 ± 0.193 0.974 ± 0.338 1.106 ± 0.289 0.932 ± 0.175 0.2594 Total cholesterol (mg/dL) 63.6 ± 13.0 69.1 ± 12.0 72.4 ± 14.9 70.6 ± 19.5 0.0920 Glucose (mg/dL) 141.9 ± 23.9 163.8 ± 29.7 157.9 ± 23.2 162.2 ± 28.9 0.0876 Total protein (g) 5.43 ± 1.00 5.47 ± 1.39 5.34 ± 1.29 5.82 ± 1.49 0.3242 Albumin (g) 3.25 ± 0.60 3.45 ± 0.56 3.41 ± 0.83 3.53 ± 0.66 0.2279 Creatinine (mg/dL) 0.506 ± 0.099 0.437 ± 0.138 0.510 ± 0.150 0.490 ± 0.178 0.3982 Urea (mg/dL) 54.2 ± 8.6 48.8 ± 8.3 47.6 ± 3.4 49.0 ± 8.7 0.1145 Calcium (mg/dL) 10.4 ± 0.5 10.8 ± 0.5 10.7 ± 0.8 10.8 ± 0.7 0.2449 Phosphorus (mg/dL) 6.27 ± 0.49 6.50 ± 0.57 6.49 ± 0.61 6.46 ± 0.78 0.1580 Sodium (mmol/L) 139.0 ± 1.4 1,393 ± 1.3 139.6 ± 1.4 139.0 ± 1.4 0.4950 Potassium (mmol/L) 4.87 ± 0.36 4.97 ± 0.34 4.97 ± 0.25 4.83 ± 0.40 0.2907 Chloride (mmol/L) 106.6 ± 1.2 106.1 ± 1.7 106.3 ± 1.5 106.7 ± 1.2 0.4353
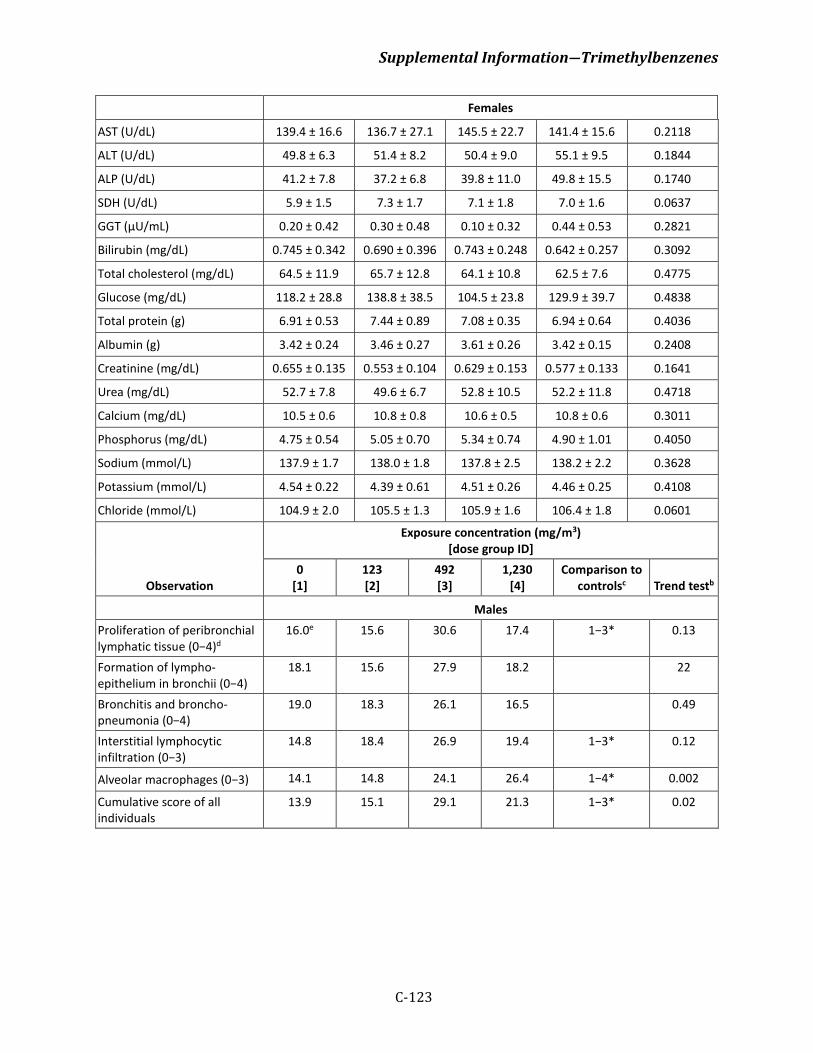
Supplemental Information―Trimethylbenzenes
C-123
Females
AST (U/dL) 139.4 ± 16.6 136.7 ± 27.1 145.5 ± 22.7 141.4 ± 15.6 0.2118
ALT (U/dL) 49.8 ± 6.3 51.4 ± 8.2 50.4 ± 9.0 55.1 ± 9.5 0.1844
ALP (U/dL) 41.2 ± 7.8 37.2 ± 6.8 39.8 ± 11.0 49.8 ± 15.5 0.1740
SDH (U/dL) 5.9 ± 1.5 7.3 ± 1.7 7.1 ± 1.8 7.0 ± 1.6 0.0637
GGT (µU/mL) 0.20 ± 0.42 0.30 ± 0.48 0.10 ± 0.32 0.44 ± 0.53 0.2821
Bilirubin (mg/dL) 0.745 ± 0.342 0.690 ± 0.396 0.743 ± 0.248 0.642 ± 0.257 0.3092
Total cholesterol (mg/dL) 64.5 ± 11.9 65.7 ± 12.8 64.1 ± 10.8 62.5 ± 7.6 0.4775
Glucose (mg/dL) 118.2 ± 28.8 138.8 ± 38.5 104.5 ± 23.8 129.9 ± 39.7 0.4838
Total protein (g) 6.91 ± 0.53 7.44 ± 0.89 7.08 ± 0.35 6.94 ± 0.64 0.4036
Albumin (g) 3.42 ± 0.24 3.46 ± 0.27 3.61 ± 0.26 3.42 ± 0.15 0.2408
Creatinine (mg/dL) 0.655 ± 0.135 0.553 ± 0.104 0.629 ± 0.153 0.577 ± 0.133 0.1641
Urea (mg/dL) 52.7 ± 7.8 49.6 ± 6.7 52.8 ± 10.5 52.2 ± 11.8 0.4718
Calcium (mg/dL) 10.5 ± 0.6 10.8 ± 0.8 10.6 ± 0.5 10.8 ± 0.6 0.3011
Phosphorus (mg/dL) 4.75 ± 0.54 5.05 ± 0.70 5.34 ± 0.74 4.90 ± 1.01 0.4050
Sodium (mmol/L) 137.9 ± 1.7 138.0 ± 1.8 137.8 ± 2.5 138.2 ± 2.2 0.3628
Potassium (mmol/L) 4.54 ± 0.22 4.39 ± 0.61 4.51 ± 0.26 4.46 ± 0.25 0.4108
Chloride (mmol/L) 104.9 ± 2.0 105.5 ± 1.3 105.9 ± 1.6 106.4 ± 1.8 0.0601
Observation
Exposure concentration (mg/m3) [dose group ID]
0 [1]
123 [2]
492 [3]
1,230 [4]
Comparison to controlsc Trend testb
Males Proliferation of peribronchial lymphatic tissue (0−4)d
16.0e 15.6 30.6 17.4 1−3* 0.13
Formation of lympho-epithelium in bronchii (0−4)
18.1 15.6 27.9 18.2 22
Bronchitis and broncho-pneumonia (0−4)
19.0 18.3 26.1 16.5 0.49
Interstitial lymphocytic infiltration (0−3)
14.8 18.4 26.9 19.4 1−3* 0.12
Alveolar macrophages (0−3) 14.1 14.8 24.1 26.4 1−4* 0.002
Cumulative score of all individuals
13.9 15.1 29.1 21.3 1−3* 0.02
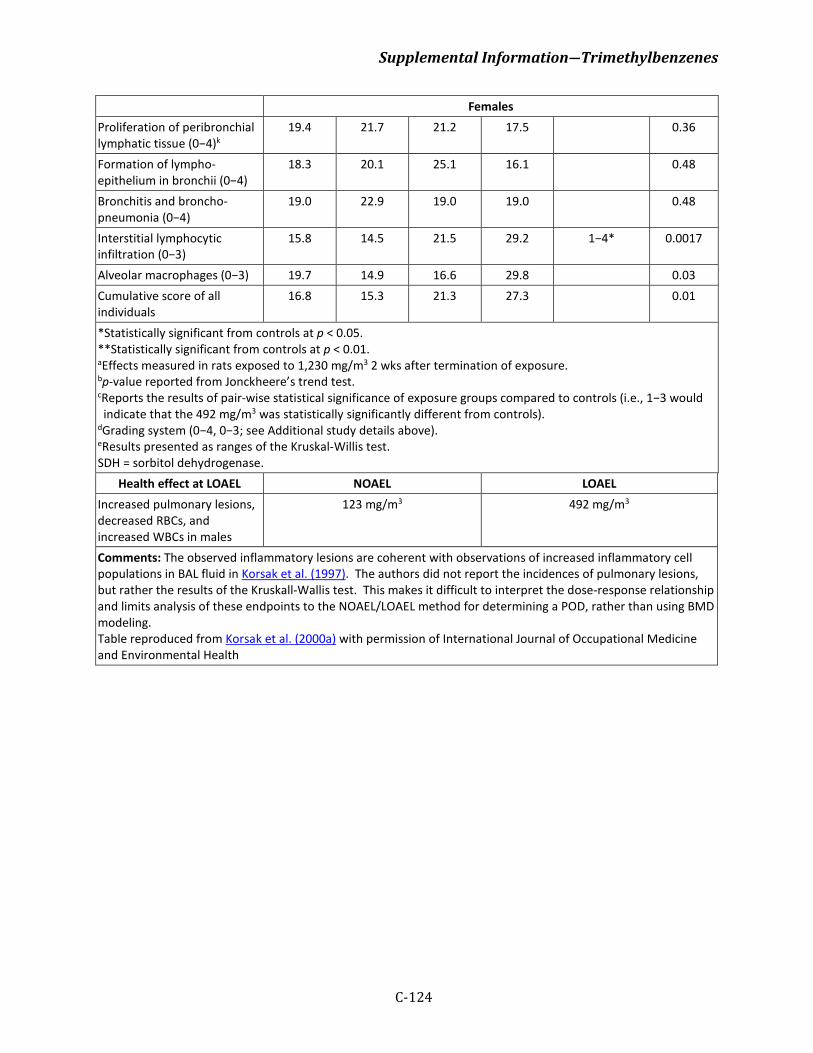
Supplemental Information―Trimethylbenzenes
C-124
Females Proliferation of peribronchial lymphatic tissue (0−4)k
19.4 21.7 21.2 17.5 0.36
Formation of lympho-epithelium in bronchii (0−4)
18.3 20.1 25.1 16.1 0.48
Bronchitis and broncho-pneumonia (0−4)
19.0 22.9 19.0 19.0 0.48
Interstitial lymphocytic infiltration (0−3)
15.8 14.5 21.5 29.2 1−4* 0.0017
Alveolar macrophages (0−3) 19.7 14.9 16.6 29.8 0.03 Cumulative score of all individuals
16.8 15.3 21.3 27.3 0.01
*Statistically significant from controls at p < 0.05. **Statistically significant from controls at p < 0.01. aEffects measured in rats exposed to 1,230 mg/m3 2 wks after termination of exposure. bp-value reported from Jonckheere’s trend test.
cReports the results of pair-wise statistical significance of exposure groups compared to controls (i.e., 1−3 would indicate that the 492 mg/m3 was statistically significantly different from controls).
dGrading system (0−4, 0−3; see Additional study details above). eResults presented as ranges of the Kruskal-Willis test. SDH = sorbitol dehydrogenase.
Health effect at LOAEL NOAEL LOAEL Increased pulmonary lesions, decreased RBCs, and increased WBCs in males
123 mg/m3 492 mg/m3
Comments: The observed inflammatory lesions are coherent with observations of increased inflammatory cell populations in BAL fluid in Korsak et al. (1997). The authors did not report the incidences of pulmonary lesions, but rather the results of the Kruskall-Wallis test. This makes it difficult to interpret the dose-response relationship and limits analysis of these endpoints to the NOAEL/LOAEL method for determining a POD, rather than using BMD modeling. Table reproduced from Korsak et al. (2000a) with permission of International Journal of Occupational Medicine and Environmental Health
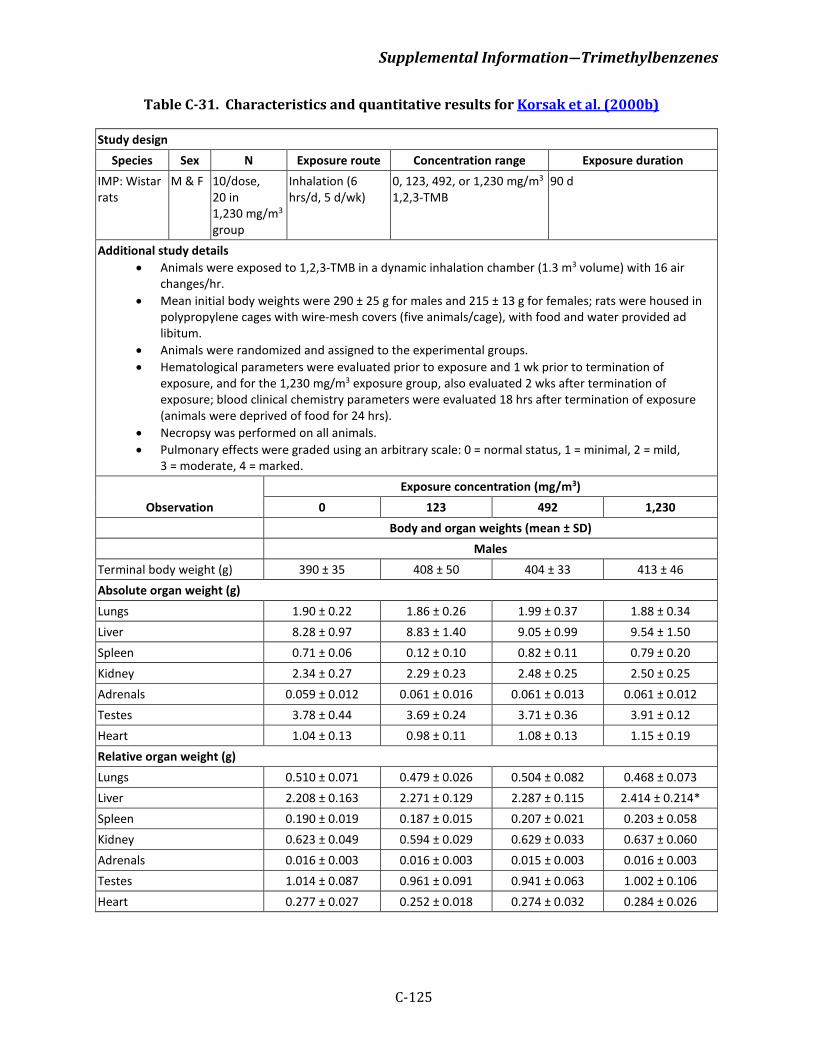
Supplemental Information―Trimethylbenzenes
C-125
Table C-31. Characteristics and quantitative results for Korsak et al. (2000b)
Study design Species Sex N Exposure route Concentration range Exposure duration
IMP: Wistar rats
M & F 10/dose, 20 in 1,230 mg/m3 group
Inhalation (6 hrs/d, 5 d/wk)
0, 123, 492, or 1,230 mg/m3 1,2,3-TMB
90 d
Additional study details • Animals were exposed to 1,2,3-TMB in a dynamic inhalation chamber (1.3 m3 volume) with 16 air
changes/hr. • Mean initial body weights were 290 ± 25 g for males and 215 ± 13 g for females; rats were housed in
polypropylene cages with wire-mesh covers (five animals/cage), with food and water provided ad libitum.
• Animals were randomized and assigned to the experimental groups. • Hematological parameters were evaluated prior to exposure and 1 wk prior to termination of
exposure, and for the 1,230 mg/m3 exposure group, also evaluated 2 wks after termination of exposure; blood clinical chemistry parameters were evaluated 18 hrs after termination of exposure (animals were deprived of food for 24 hrs).
• Necropsy was performed on all animals. • Pulmonary effects were graded using an arbitrary scale: 0 = normal status, 1 = minimal, 2 = mild,
3 = moderate, 4 = marked.
Observation Exposure concentration (mg/m3)
0 123 492 1,230 Body and organ weights (mean ± SD) Males
Terminal body weight (g) 390 ± 35 408 ± 50 404 ± 33 413 ± 46 Absolute organ weight (g) Lungs 1.90 ± 0.22 1.86 ± 0.26 1.99 ± 0.37 1.88 ± 0.34 Liver 8.28 ± 0.97 8.83 ± 1.40 9.05 ± 0.99 9.54 ± 1.50 Spleen 0.71 ± 0.06 0.12 ± 0.10 0.82 ± 0.11 0.79 ± 0.20 Kidney 2.34 ± 0.27 2.29 ± 0.23 2.48 ± 0.25 2.50 ± 0.25 Adrenals 0.059 ± 0.012 0.061 ± 0.016 0.061 ± 0.013 0.061 ± 0.012 Testes 3.78 ± 0.44 3.69 ± 0.24 3.71 ± 0.36 3.91 ± 0.12 Heart 1.04 ± 0.13 0.98 ± 0.11 1.08 ± 0.13 1.15 ± 0.19 Relative organ weight (g) Lungs 0.510 ± 0.071 0.479 ± 0.026 0.504 ± 0.082 0.468 ± 0.073 Liver 2.208 ± 0.163 2.271 ± 0.129 2.287 ± 0.115 2.414 ± 0.214* Spleen 0.190 ± 0.019 0.187 ± 0.015 0.207 ± 0.021 0.203 ± 0.058 Kidney 0.623 ± 0.049 0.594 ± 0.029 0.629 ± 0.033 0.637 ± 0.060 Adrenals 0.016 ± 0.003 0.016 ± 0.003 0.015 ± 0.003 0.016 ± 0.003 Testes 1.014 ± 0.087 0.961 ± 0.091 0.941 ± 0.063 1.002 ± 0.106 Heart 0.277 ± 0.027 0.252 ± 0.018 0.274 ± 0.032 0.284 ± 0.026
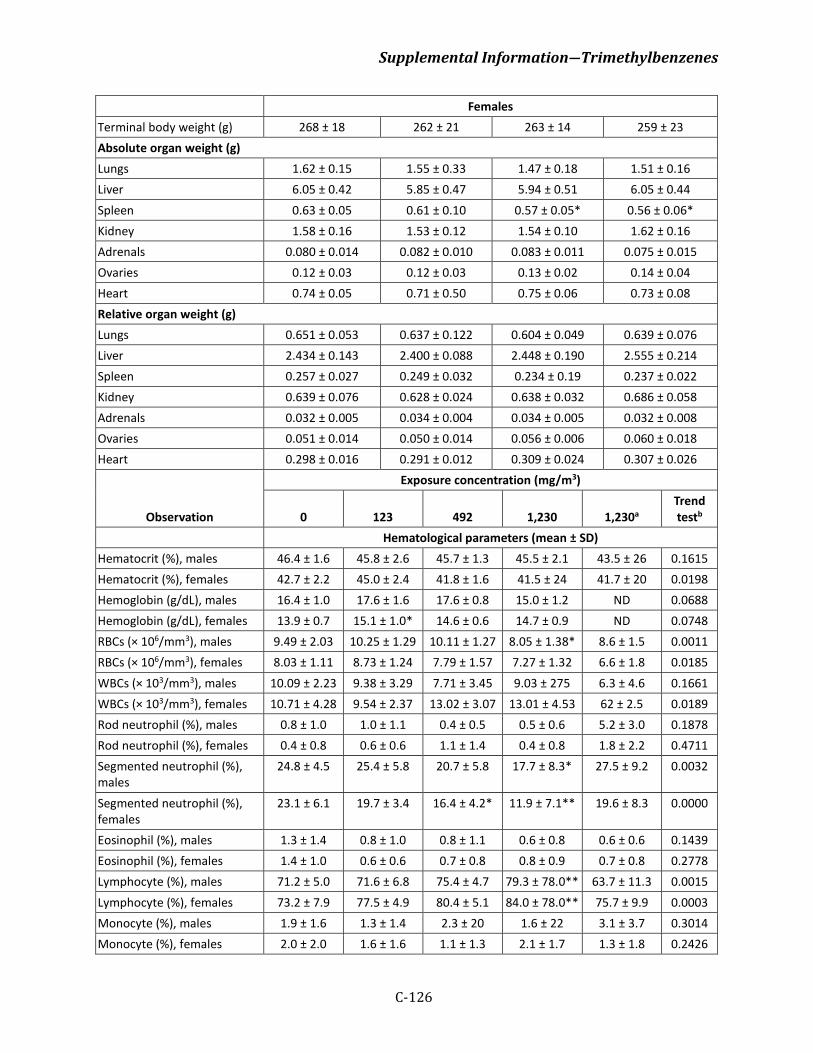
Supplemental Information―Trimethylbenzenes
C-126
Females Terminal body weight (g) 268 ± 18 262 ± 21 263 ± 14 259 ± 23 Absolute organ weight (g) Lungs 1.62 ± 0.15 1.55 ± 0.33 1.47 ± 0.18 1.51 ± 0.16 Liver 6.05 ± 0.42 5.85 ± 0.47 5.94 ± 0.51 6.05 ± 0.44 Spleen 0.63 ± 0.05 0.61 ± 0.10 0.57 ± 0.05* 0.56 ± 0.06* Kidney 1.58 ± 0.16 1.53 ± 0.12 1.54 ± 0.10 1.62 ± 0.16 Adrenals 0.080 ± 0.014 0.082 ± 0.010 0.083 ± 0.011 0.075 ± 0.015 Ovaries 0.12 ± 0.03 0.12 ± 0.03 0.13 ± 0.02 0.14 ± 0.04 Heart 0.74 ± 0.05 0.71 ± 0.50 0.75 ± 0.06 0.73 ± 0.08 Relative organ weight (g) Lungs 0.651 ± 0.053 0.637 ± 0.122 0.604 ± 0.049 0.639 ± 0.076 Liver 2.434 ± 0.143 2.400 ± 0.088 2.448 ± 0.190 2.555 ± 0.214 Spleen 0.257 ± 0.027 0.249 ± 0.032 0.234 ± 0.19 0.237 ± 0.022 Kidney 0.639 ± 0.076 0.628 ± 0.024 0.638 ± 0.032 0.686 ± 0.058 Adrenals 0.032 ± 0.005 0.034 ± 0.004 0.034 ± 0.005 0.032 ± 0.008 Ovaries 0.051 ± 0.014 0.050 ± 0.014 0.056 ± 0.006 0.060 ± 0.018 Heart 0.298 ± 0.016 0.291 ± 0.012 0.309 ± 0.024 0.307 ± 0.026
Observation
Exposure concentration (mg/m3)
0 123 492 1,230 1,230a Trend testb
Hematological parameters (mean ± SD) Hematocrit (%), males 46.4 ± 1.6 45.8 ± 2.6 45.7 ± 1.3 45.5 ± 2.1 43.5 ± 26 0.1615 Hematocrit (%), females 42.7 ± 2.2 45.0 ± 2.4 41.8 ± 1.6 41.5 ± 24 41.7 ± 20 0.0198 Hemoglobin (g/dL), males 16.4 ± 1.0 17.6 ± 1.6 17.6 ± 0.8 15.0 ± 1.2 ND 0.0688 Hemoglobin (g/dL), females 13.9 ± 0.7 15.1 ± 1.0* 14.6 ± 0.6 14.7 ± 0.9 ND 0.0748 RBCs (× 106/mm3), males 9.49 ± 2.03 10.25 ± 1.29 10.11 ± 1.27 8.05 ± 1.38* 8.6 ± 1.5 0.0011 RBCs (× 106/mm3), females 8.03 ± 1.11 8.73 ± 1.24 7.79 ± 1.57 7.27 ± 1.32 6.6 ± 1.8 0.0185 WBCs (× 103/mm3), males 10.09 ± 2.23 9.38 ± 3.29 7.71 ± 3.45 9.03 ± 275 6.3 ± 4.6 0.1661 WBCs (× 103/mm3), females 10.71 ± 4.28 9.54 ± 2.37 13.02 ± 3.07 13.01 ± 4.53 62 ± 2.5 0.0189 Rod neutrophil (%), males 0.8 ± 1.0 1.0 ± 1.1 0.4 ± 0.5 0.5 ± 0.6 5.2 ± 3.0 0.1878 Rod neutrophil (%), females 0.4 ± 0.8 0.6 ± 0.6 1.1 ± 1.4 0.4 ± 0.8 1.8 ± 2.2 0.4711 Segmented neutrophil (%), males
24.8 ± 4.5 25.4 ± 5.8 20.7 ± 5.8 17.7 ± 8.3* 27.5 ± 9.2 0.0032
Segmented neutrophil (%), females
23.1 ± 6.1 19.7 ± 3.4 16.4 ± 4.2* 11.9 ± 7.1** 19.6 ± 8.3 0.0000
Eosinophil (%), males 1.3 ± 1.4 0.8 ± 1.0 0.8 ± 1.1 0.6 ± 0.8 0.6 ± 0.6 0.1439 Eosinophil (%), females 1.4 ± 1.0 0.6 ± 0.6 0.7 ± 0.8 0.8 ± 0.9 0.7 ± 0.8 0.2778 Lymphocyte (%), males 71.2 ± 5.0 71.6 ± 6.8 75.4 ± 4.7 79.3 ± 78.0** 63.7 ± 11.3 0.0015 Lymphocyte (%), females 73.2 ± 7.9 77.5 ± 4.9 80.4 ± 5.1 84.0 ± 78.0** 75.7 ± 9.9 0.0003 Monocyte (%), males 1.9 ± 1.6 1.3 ± 1.4 2.3 ± 20 1.6 ± 22 3.1 ± 3.7 0.3014 Monocyte (%), females 2.0 ± 2.0 1.6 ± 1.6 1.1 ± 1.3 2.1 ± 1.7 1.3 ± 1.8 0.2426
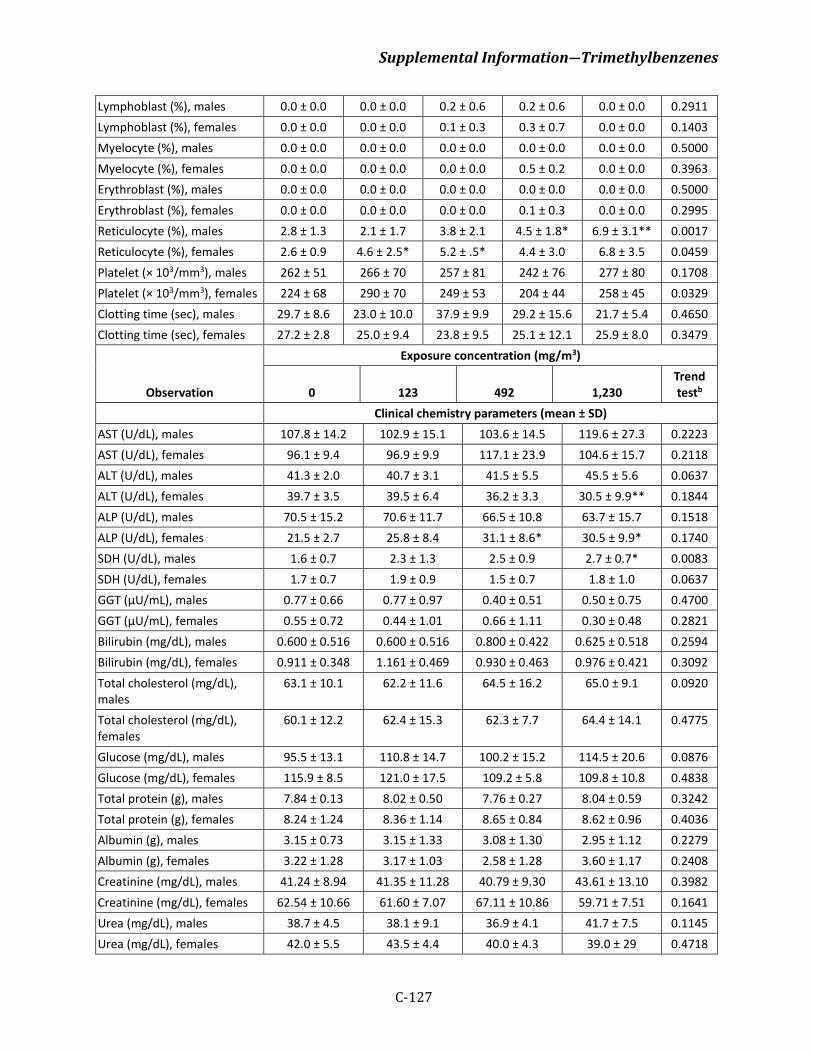
Supplemental Information―Trimethylbenzenes
C-127
Lymphoblast (%), males 0.0 ± 0.0 0.0 ± 0.0 0.2 ± 0.6 0.2 ± 0.6 0.0 ± 0.0 0.2911 Lymphoblast (%), females 0.0 ± 0.0 0.0 ± 0.0 0.1 ± 0.3 0.3 ± 0.7 0.0 ± 0.0 0.1403 Myelocyte (%), males 0.0 ± 0.0 0.0 ± 0.0 0.0 ± 0.0 0.0 ± 0.0 0.0 ± 0.0 0.5000 Myelocyte (%), females 0.0 ± 0.0 0.0 ± 0.0 0.0 ± 0.0 0.5 ± 0.2 0.0 ± 0.0 0.3963 Erythroblast (%), males 0.0 ± 0.0 0.0 ± 0.0 0.0 ± 0.0 0.0 ± 0.0 0.0 ± 0.0 0.5000 Erythroblast (%), females 0.0 ± 0.0 0.0 ± 0.0 0.0 ± 0.0 0.1 ± 0.3 0.0 ± 0.0 0.2995 Reticulocyte (%), males 2.8 ± 1.3 2.1 ± 1.7 3.8 ± 2.1 4.5 ± 1.8* 6.9 ± 3.1** 0.0017 Reticulocyte (%), females 2.6 ± 0.9 4.6 ± 2.5* 5.2 ± .5* 4.4 ± 3.0 6.8 ± 3.5 0.0459 Platelet (× 103/mm3), males 262 ± 51 266 ± 70 257 ± 81 242 ± 76 277 ± 80 0.1708 Platelet (× 103/mm3), females 224 ± 68 290 ± 70 249 ± 53 204 ± 44 258 ± 45 0.0329 Clotting time (sec), males 29.7 ± 8.6 23.0 ± 10.0 37.9 ± 9.9 29.2 ± 15.6 21.7 ± 5.4 0.4650 Clotting time (sec), females 27.2 ± 2.8 25.0 ± 9.4 23.8 ± 9.5 25.1 ± 12.1 25.9 ± 8.0 0.3479
Observation
Exposure concentration (mg/m3)
0 123 492 1,230 Trend testb
Clinical chemistry parameters (mean ± SD) AST (U/dL), males 107.8 ± 14.2 102.9 ± 15.1 103.6 ± 14.5 119.6 ± 27.3 0.2223 AST (U/dL), females 96.1 ± 9.4 96.9 ± 9.9 117.1 ± 23.9 104.6 ± 15.7 0.2118 ALT (U/dL), males 41.3 ± 2.0 40.7 ± 3.1 41.5 ± 5.5 45.5 ± 5.6 0.0637 ALT (U/dL), females 39.7 ± 3.5 39.5 ± 6.4 36.2 ± 3.3 30.5 ± 9.9** 0.1844 ALP (U/dL), males 70.5 ± 15.2 70.6 ± 11.7 66.5 ± 10.8 63.7 ± 15.7 0.1518 ALP (U/dL), females 21.5 ± 2.7 25.8 ± 8.4 31.1 ± 8.6* 30.5 ± 9.9* 0.1740 SDH (U/dL), males 1.6 ± 0.7 2.3 ± 1.3 2.5 ± 0.9 2.7 ± 0.7* 0.0083 SDH (U/dL), females 1.7 ± 0.7 1.9 ± 0.9 1.5 ± 0.7 1.8 ± 1.0 0.0637 GGT (µU/mL), males 0.77 ± 0.66 0.77 ± 0.97 0.40 ± 0.51 0.50 ± 0.75 0.4700 GGT (µU/mL), females 0.55 ± 0.72 0.44 ± 1.01 0.66 ± 1.11 0.30 ± 0.48 0.2821 Bilirubin (mg/dL), males 0.600 ± 0.516 0.600 ± 0.516 0.800 ± 0.422 0.625 ± 0.518 0.2594 Bilirubin (mg/dL), females 0.911 ± 0.348 1.161 ± 0.469 0.930 ± 0.463 0.976 ± 0.421 0.3092 Total cholesterol (mg/dL), males
63.1 ± 10.1 62.2 ± 11.6 64.5 ± 16.2 65.0 ± 9.1 0.0920
Total cholesterol (mg/dL), females
60.1 ± 12.2 62.4 ± 15.3 62.3 ± 7.7 64.4 ± 14.1 0.4775
Glucose (mg/dL), males 95.5 ± 13.1 110.8 ± 14.7 100.2 ± 15.2 114.5 ± 20.6 0.0876 Glucose (mg/dL), females 115.9 ± 8.5 121.0 ± 17.5 109.2 ± 5.8 109.8 ± 10.8 0.4838 Total protein (g), males 7.84 ± 0.13 8.02 ± 0.50 7.76 ± 0.27 8.04 ± 0.59 0.3242 Total protein (g), females 8.24 ± 1.24 8.36 ± 1.14 8.65 ± 0.84 8.62 ± 0.96 0.4036 Albumin (g), males 3.15 ± 0.73 3.15 ± 1.33 3.08 ± 1.30 2.95 ± 1.12 0.2279 Albumin (g), females 3.22 ± 1.28 3.17 ± 1.03 2.58 ± 1.28 3.60 ± 1.17 0.2408 Creatinine (mg/dL), males 41.24 ± 8.94 41.35 ± 11.28 40.79 ± 9.30 43.61 ± 13.10 0.3982 Creatinine (mg/dL), females 62.54 ± 10.66 61.60 ± 7.07 67.11 ± 10.86 59.71 ± 7.51 0.1641 Urea (mg/dL), males 38.7 ± 4.5 38.1 ± 9.1 36.9 ± 4.1 41.7 ± 7.5 0.1145 Urea (mg/dL), females 42.0 ± 5.5 43.5 ± 4.4 40.0 ± 4.3 39.0 ± 29 0.4718
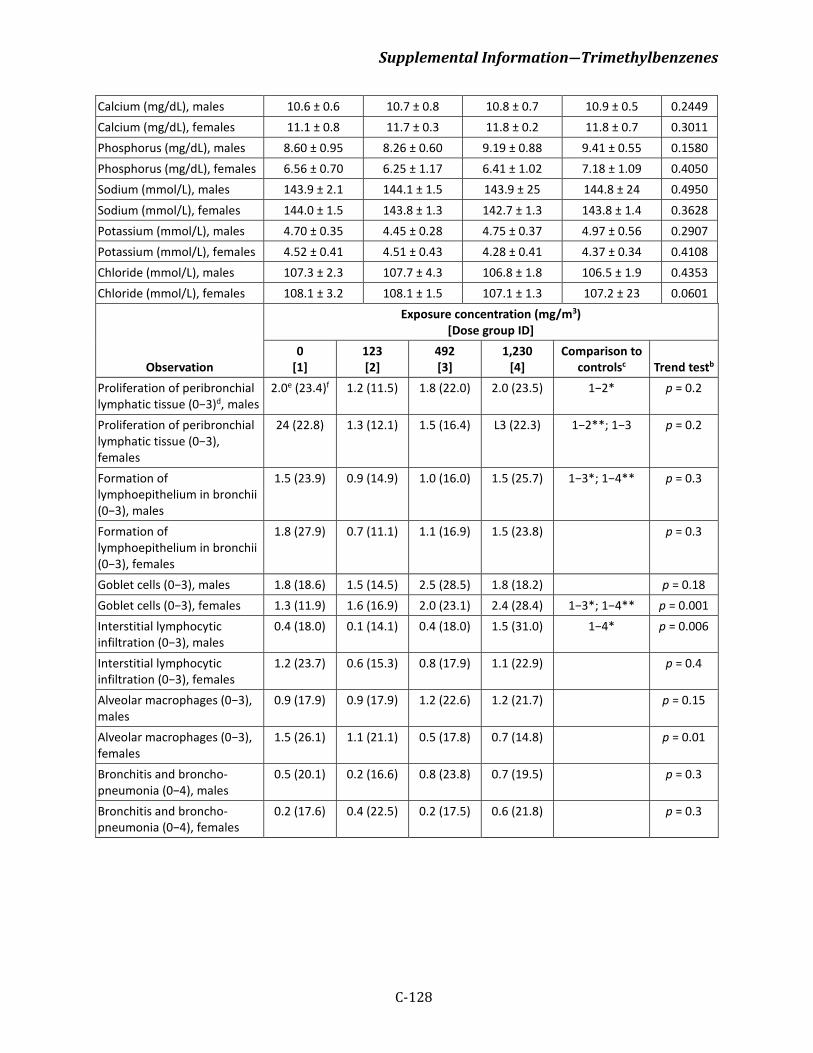
Supplemental Information―Trimethylbenzenes
C-128
Calcium (mg/dL), males 10.6 ± 0.6 10.7 ± 0.8 10.8 ± 0.7 10.9 ± 0.5 0.2449 Calcium (mg/dL), females 11.1 ± 0.8 11.7 ± 0.3 11.8 ± 0.2 11.8 ± 0.7 0.3011 Phosphorus (mg/dL), males 8.60 ± 0.95 8.26 ± 0.60 9.19 ± 0.88 9.41 ± 0.55 0.1580 Phosphorus (mg/dL), females 6.56 ± 0.70 6.25 ± 1.17 6.41 ± 1.02 7.18 ± 1.09 0.4050 Sodium (mmol/L), males 143.9 ± 2.1 144.1 ± 1.5 143.9 ± 25 144.8 ± 24 0.4950 Sodium (mmol/L), females 144.0 ± 1.5 143.8 ± 1.3 142.7 ± 1.3 143.8 ± 1.4 0.3628 Potassium (mmol/L), males 4.70 ± 0.35 4.45 ± 0.28 4.75 ± 0.37 4.97 ± 0.56 0.2907 Potassium (mmol/L), females 4.52 ± 0.41 4.51 ± 0.43 4.28 ± 0.41 4.37 ± 0.34 0.4108 Chloride (mmol/L), males 107.3 ± 2.3 107.7 ± 4.3 106.8 ± 1.8 106.5 ± 1.9 0.4353 Chloride (mmol/L), females 108.1 ± 3.2 108.1 ± 1.5 107.1 ± 1.3 107.2 ± 23 0.0601
Observation
Exposure concentration (mg/m3) [Dose group ID]
0 [1]
123 [2]
492 [3]
1,230 [4]
Comparison to controlsc Trend testb
Proliferation of peribronchial lymphatic tissue (0−3)d, males
2.0e (23.4)f 1.2 (11.5) 1.8 (22.0) 2.0 (23.5) 1−2* p = 0.2
Proliferation of peribronchial lymphatic tissue (0−3), females
24 (22.8) 1.3 (12.1) 1.5 (16.4) L3 (22.3) 1−2**; 1−3 p = 0.2
Formation of lymphoepithelium in bronchii (0−3), males
1.5 (23.9) 0.9 (14.9) 1.0 (16.0) 1.5 (25.7) 1−3*; 1−4** p = 0.3
Formation of lymphoepithelium in bronchii (0−3), females
1.8 (27.9) 0.7 (11.1) 1.1 (16.9) 1.5 (23.8) p = 0.3
Goblet cells (0−3), males 1.8 (18.6) 1.5 (14.5) 2.5 (28.5) 1.8 (18.2) p = 0.18 Goblet cells (0−3), females 1.3 (11.9) 1.6 (16.9) 2.0 (23.1) 2.4 (28.4) 1−3*; 1−4** p = 0.001 Interstitial lymphocytic infiltration (0−3), males
0.4 (18.0) 0.1 (14.1) 0.4 (18.0) 1.5 (31.0) 1−4* p = 0.006
Interstitial lymphocytic infiltration (0−3), females
1.2 (23.7) 0.6 (15.3) 0.8 (17.9) 1.1 (22.9) p = 0.4
Alveolar macrophages (0−3), males
0.9 (17.9) 0.9 (17.9) 1.2 (22.6) 1.2 (21.7) p = 0.15
Alveolar macrophages (0−3), females
1.5 (26.1) 1.1 (21.1) 0.5 (17.8) 0.7 (14.8) p = 0.01
Bronchitis and broncho-pneumonia (0−4), males
0.5 (20.1) 0.2 (16.6) 0.8 (23.8) 0.7 (19.5) p = 0.3
Bronchitis and broncho-pneumonia (0−4), females
0.2 (17.6) 0.4 (22.5) 0.2 (17.5) 0.6 (21.8) p = 0.3
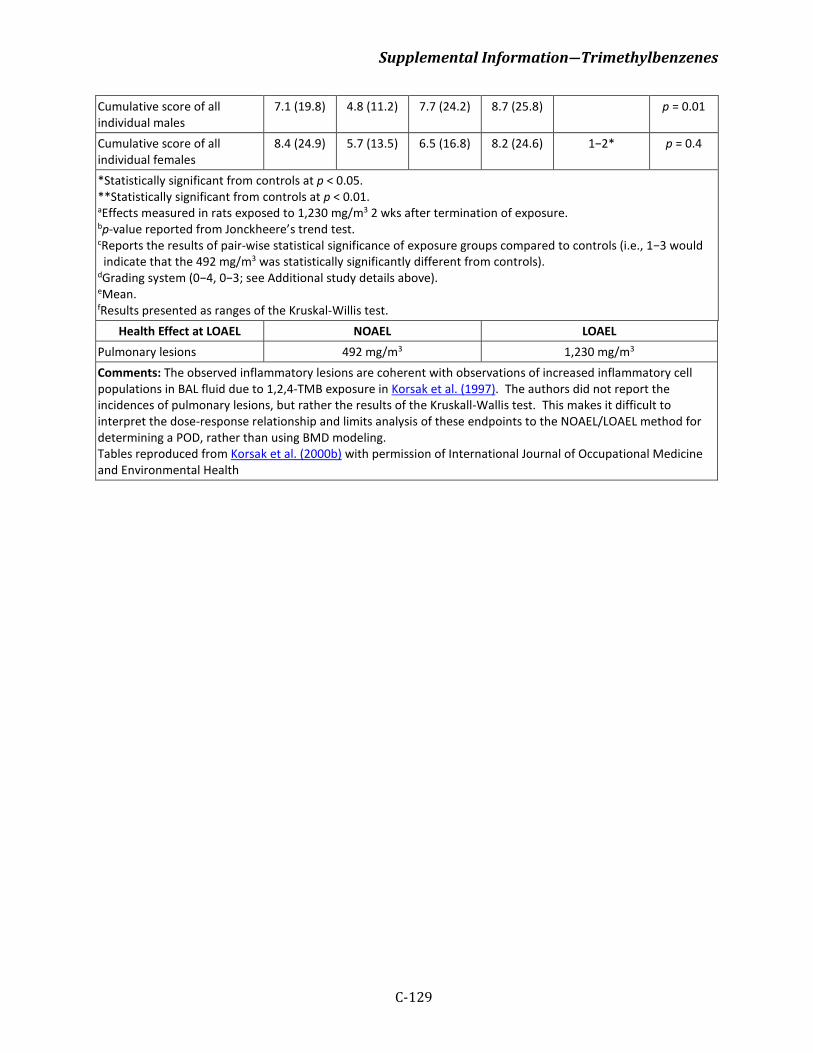
Supplemental Information―Trimethylbenzenes
C-129
Cumulative score of all individual males
7.1 (19.8) 4.8 (11.2) 7.7 (24.2) 8.7 (25.8) p = 0.01
Cumulative score of all individual females
8.4 (24.9) 5.7 (13.5) 6.5 (16.8) 8.2 (24.6) 1−2* p = 0.4
*Statistically significant from controls at p < 0.05. **Statistically significant from controls at p < 0.01. aEffects measured in rats exposed to 1,230 mg/m3 2 wks after termination of exposure. bp-value reported from Jonckheere’s trend test.
cReports the results of pair-wise statistical significance of exposure groups compared to controls (i.e., 1−3 would indicate that the 492 mg/m3 was statistically significantly different from controls).
dGrading system (0−4, 0−3; see Additional study details above). eMean. fResults presented as ranges of the Kruskal-Willis test.
Health Effect at LOAEL NOAEL LOAEL Pulmonary lesions 492 mg/m3 1,230 mg/m3
Comments: The observed inflammatory lesions are coherent with observations of increased inflammatory cell populations in BAL fluid due to 1,2,4-TMB exposure in Korsak et al. (1997). The authors did not report the incidences of pulmonary lesions, but rather the results of the Kruskall-Wallis test. This makes it difficult to interpret the dose-response relationship and limits analysis of these endpoints to the NOAEL/LOAEL method for determining a POD, rather than using BMD modeling. Tables reproduced from Korsak et al. (2000b) with permission of International Journal of Occupational Medicine and Environmental Health
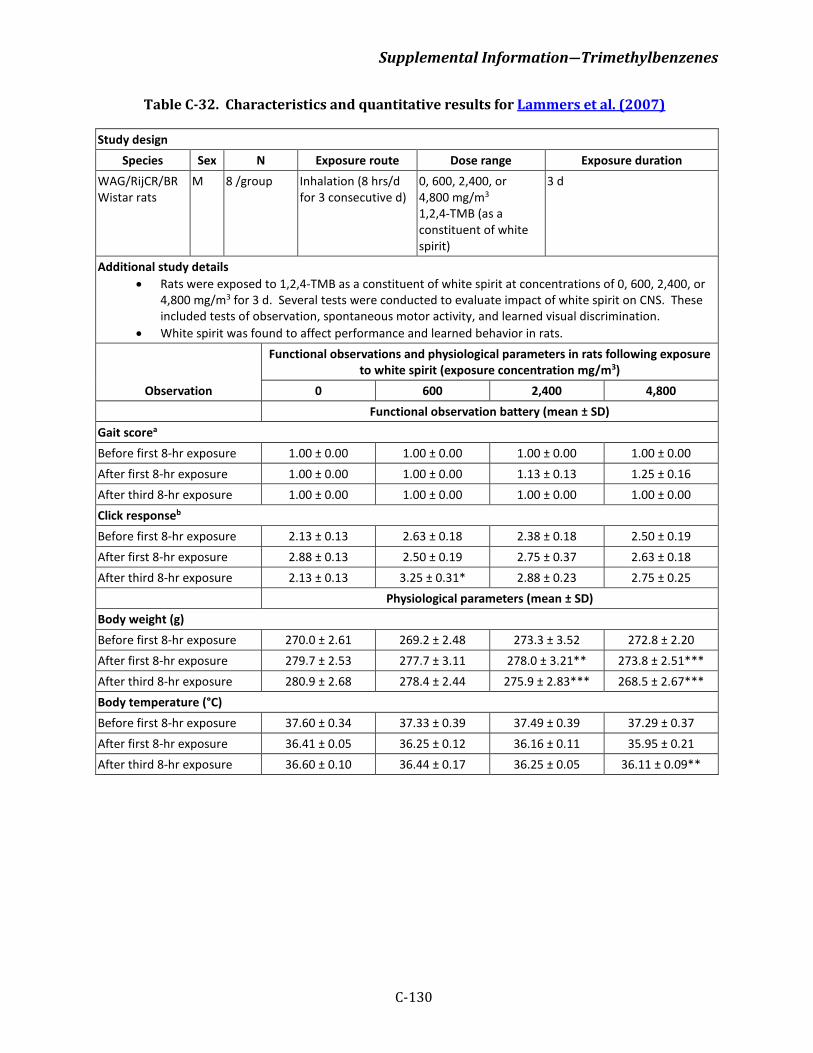
Supplemental Information―Trimethylbenzenes
C-130
Table C-32. Characteristics and quantitative results for Lammers et al. (2007)
Study design Species Sex N Exposure route Dose range Exposure duration
WAG/RijCR/BR Wistar rats
M 8 /group Inhalation (8 hrs/d for 3 consecutive d)
0, 600, 2,400, or 4,800 mg/m3
1,2,4-TMB (as a constituent of white spirit)
3 d
Additional study details • Rats were exposed to 1,2,4-TMB as a constituent of white spirit at concentrations of 0, 600, 2,400, or
4,800 mg/m3 for 3 d. Several tests were conducted to evaluate impact of white spirit on CNS. These included tests of observation, spontaneous motor activity, and learned visual discrimination.
• White spirit was found to affect performance and learned behavior in rats.
Observation
Functional observations and physiological parameters in rats following exposure to white spirit (exposure concentration mg/m3)
0 600 2,400 4,800 Functional observation battery (mean ± SD)
Gait scorea Before first 8-hr exposure 1.00 ± 0.00 1.00 ± 0.00 1.00 ± 0.00 1.00 ± 0.00 After first 8-hr exposure 1.00 ± 0.00 1.00 ± 0.00 1.13 ± 0.13 1.25 ± 0.16 After third 8-hr exposure 1.00 ± 0.00 1.00 ± 0.00 1.00 ± 0.00 1.00 ± 0.00 Click responseb Before first 8-hr exposure 2.13 ± 0.13 2.63 ± 0.18 2.38 ± 0.18 2.50 ± 0.19 After first 8-hr exposure 2.88 ± 0.13 2.50 ± 0.19 2.75 ± 0.37 2.63 ± 0.18 After third 8-hr exposure 2.13 ± 0.13 3.25 ± 0.31* 2.88 ± 0.23 2.75 ± 0.25 Physiological parameters (mean ± SD) Body weight (g) Before first 8-hr exposure 270.0 ± 2.61 269.2 ± 2.48 273.3 ± 3.52 272.8 ± 2.20 After first 8-hr exposure 279.7 ± 2.53 277.7 ± 3.11 278.0 ± 3.21** 273.8 ± 2.51*** After third 8-hr exposure 280.9 ± 2.68 278.4 ± 2.44 275.9 ± 2.83*** 268.5 ± 2.67*** Body temperature (°C) Before first 8-hr exposure 37.60 ± 0.34 37.33 ± 0.39 37.49 ± 0.39 37.29 ± 0.37 After first 8-hr exposure 36.41 ± 0.05 36.25 ± 0.12 36.16 ± 0.11 35.95 ± 0.21 After third 8-hr exposure 36.60 ± 0.10 36.44 ± 0.17 36.25 ± 0.05 36.11 ± 0.09**
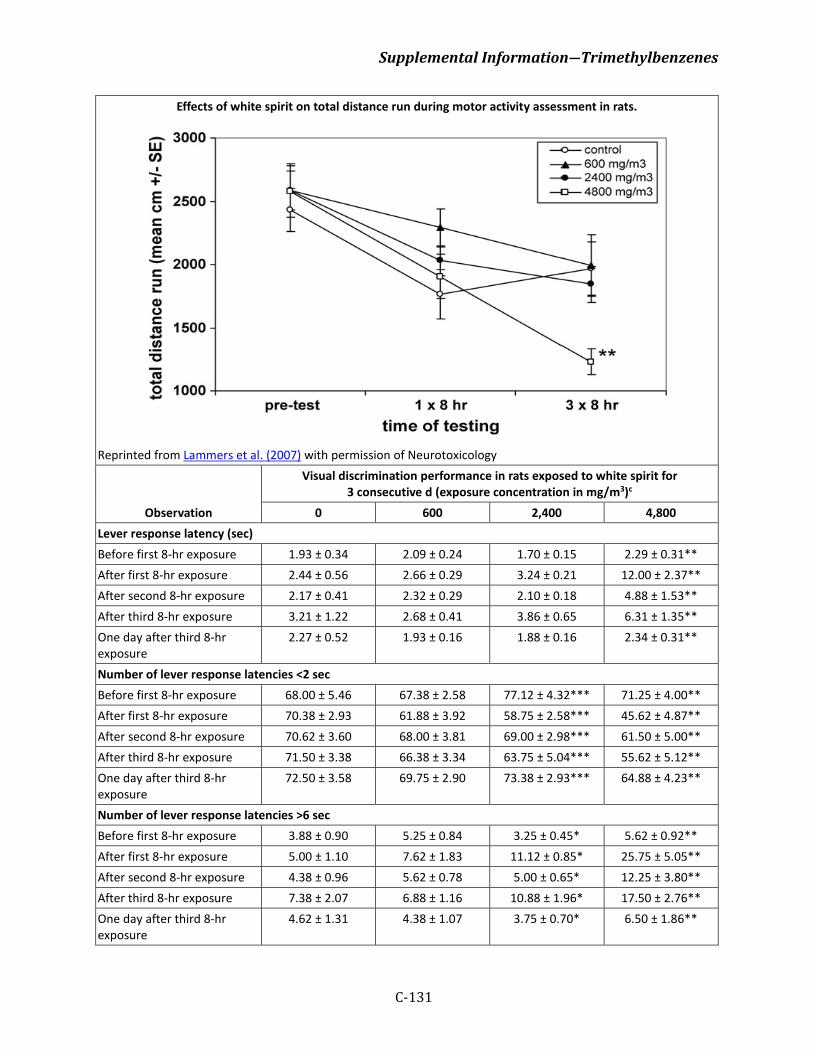
Supplemental Information―Trimethylbenzenes
C-131
Effects of white spirit on total distance run during motor activity assessment in rats.
Reprinted from Lammers et al. (2007) with permission of Neurotoxicology
Observation
Visual discrimination performance in rats exposed to white spirit for 3 consecutive d (exposure concentration in mg/m3)c
0 600 2,400 4,800 Lever response latency (sec) Before first 8-hr exposure 1.93 ± 0.34 2.09 ± 0.24 1.70 ± 0.15 2.29 ± 0.31** After first 8-hr exposure 2.44 ± 0.56 2.66 ± 0.29 3.24 ± 0.21 12.00 ± 2.37** After second 8-hr exposure 2.17 ± 0.41 2.32 ± 0.29 2.10 ± 0.18 4.88 ± 1.53** After third 8-hr exposure 3.21 ± 1.22 2.68 ± 0.41 3.86 ± 0.65 6.31 ± 1.35** One day after third 8-hr exposure
2.27 ± 0.52 1.93 ± 0.16 1.88 ± 0.16 2.34 ± 0.31**
Number of lever response latencies <2 sec Before first 8-hr exposure 68.00 ± 5.46 67.38 ± 2.58 77.12 ± 4.32*** 71.25 ± 4.00** After first 8-hr exposure 70.38 ± 2.93 61.88 ± 3.92 58.75 ± 2.58*** 45.62 ± 4.87** After second 8-hr exposure 70.62 ± 3.60 68.00 ± 3.81 69.00 ± 2.98*** 61.50 ± 5.00** After third 8-hr exposure 71.50 ± 3.38 66.38 ± 3.34 63.75 ± 5.04*** 55.62 ± 5.12** One day after third 8-hr exposure
72.50 ± 3.58 69.75 ± 2.90 73.38 ± 2.93*** 64.88 ± 4.23**
Number of lever response latencies >6 sec Before first 8-hr exposure 3.88 ± 0.90 5.25 ± 0.84 3.25 ± 0.45* 5.62 ± 0.92** After first 8-hr exposure 5.00 ± 1.10 7.62 ± 1.83 11.12 ± 0.85* 25.75 ± 5.05** After second 8-hr exposure 4.38 ± 0.96 5.62 ± 0.78 5.00 ± 0.65* 12.25 ± 3.80** After third 8-hr exposure 7.38 ± 2.07 6.88 ± 1.16 10.88 ± 1.96* 17.50 ± 2.76** One day after third 8-hr exposure
4.62 ± 1.31 4.38 ± 1.07 3.75 ± 0.70* 6.50 ± 1.86**
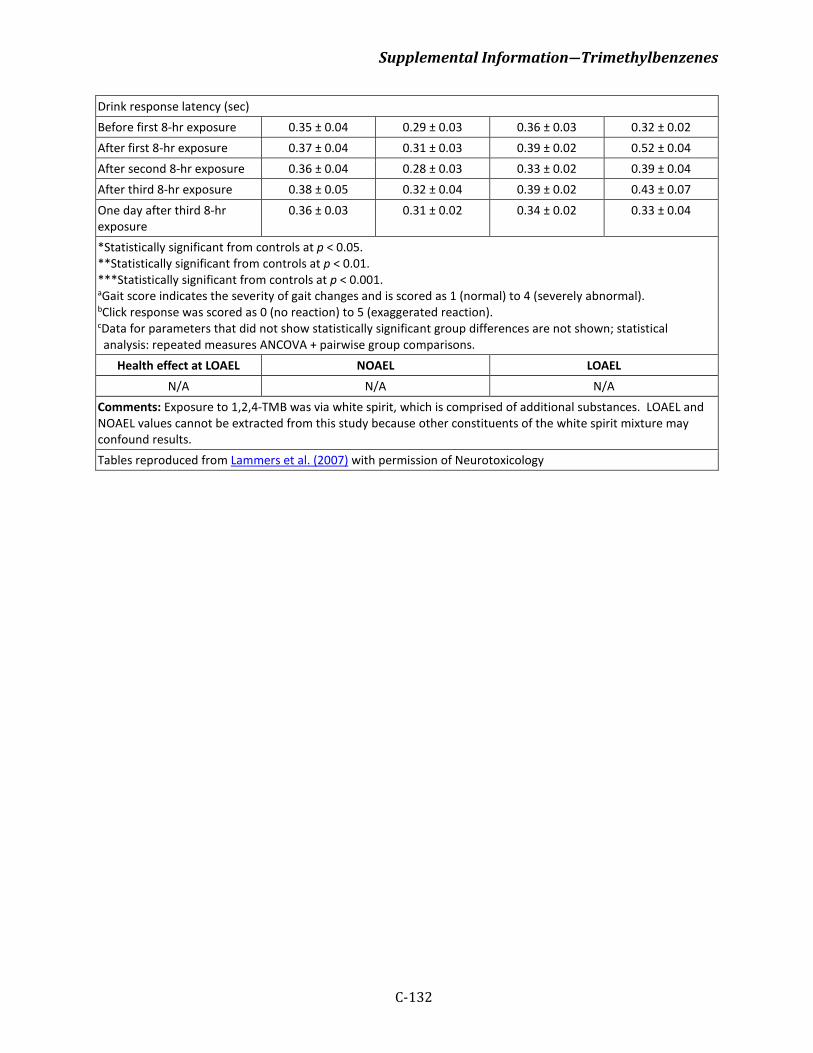
Supplemental Information―Trimethylbenzenes
C-132
Drink response latency (sec) Before first 8-hr exposure 0.35 ± 0.04 0.29 ± 0.03 0.36 ± 0.03 0.32 ± 0.02 After first 8-hr exposure 0.37 ± 0.04 0.31 ± 0.03 0.39 ± 0.02 0.52 ± 0.04 After second 8-hr exposure 0.36 ± 0.04 0.28 ± 0.03 0.33 ± 0.02 0.39 ± 0.04 After third 8-hr exposure 0.38 ± 0.05 0.32 ± 0.04 0.39 ± 0.02 0.43 ± 0.07 One day after third 8-hr exposure
0.36 ± 0.03 0.31 ± 0.02 0.34 ± 0.02 0.33 ± 0.04
*Statistically significant from controls at p < 0.05. **Statistically significant from controls at p < 0.01. ***Statistically significant from controls at p < 0.001. aGait score indicates the severity of gait changes and is scored as 1 (normal) to 4 (severely abnormal). bClick response was scored as 0 (no reaction) to 5 (exaggerated reaction). cData for parameters that did not show statistically significant group differences are not shown; statistical analysis: repeated measures ANCOVA + pairwise group comparisons.
Health effect at LOAEL NOAEL LOAEL N/A N/A N/A
Comments: Exposure to 1,2,4-TMB was via white spirit, which is comprised of additional substances. LOAEL and NOAEL values cannot be extracted from this study because other constituents of the white spirit mixture may confound results. Tables reproduced from Lammers et al. (2007) with permission of Neurotoxicology
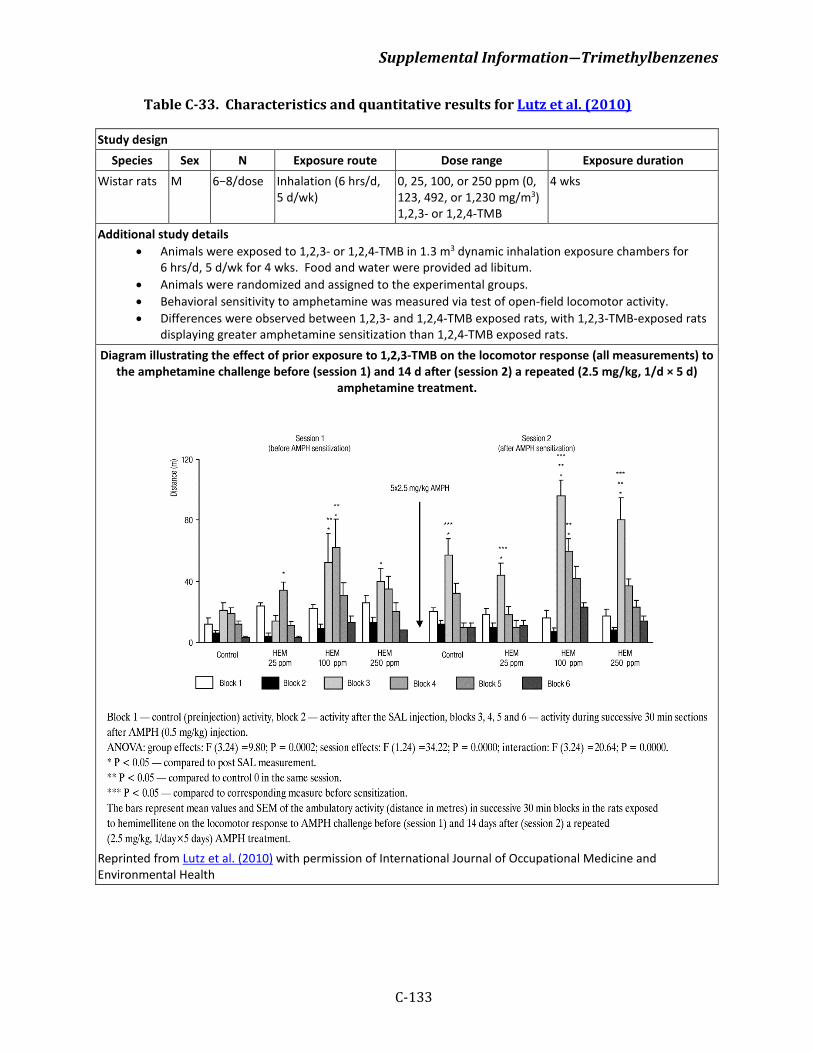
Supplemental Information―Trimethylbenzenes
C-133
Table C-33. Characteristics and quantitative results for Lutz et al. (2010)
Study design Species Sex N Exposure route Dose range Exposure duration
Wistar rats M 6−8/dose Inhalation (6 hrs/d, 5 d/wk)
0, 25, 100, or 250 ppm (0, 123, 492, or 1,230 mg/m3) 1,2,3- or 1,2,4-TMB
4 wks
Additional study details • Animals were exposed to 1,2,3- or 1,2,4-TMB in 1.3 m3 dynamic inhalation exposure chambers for
6 hrs/d, 5 d/wk for 4 wks. Food and water were provided ad libitum. • Animals were randomized and assigned to the experimental groups. • Behavioral sensitivity to amphetamine was measured via test of open-field locomotor activity. • Differences were observed between 1,2,3- and 1,2,4-TMB exposed rats, with 1,2,3-TMB-exposed rats
displaying greater amphetamine sensitization than 1,2,4-TMB exposed rats. Diagram illustrating the effect of prior exposure to 1,2,3-TMB on the locomotor response (all measurements) to
the amphetamine challenge before (session 1) and 14 d after (session 2) a repeated (2.5 mg/kg, 1/d × 5 d) amphetamine treatment.
Reprinted from Lutz et al. (2010) with permission of International Journal of Occupational Medicine and Environmental Health
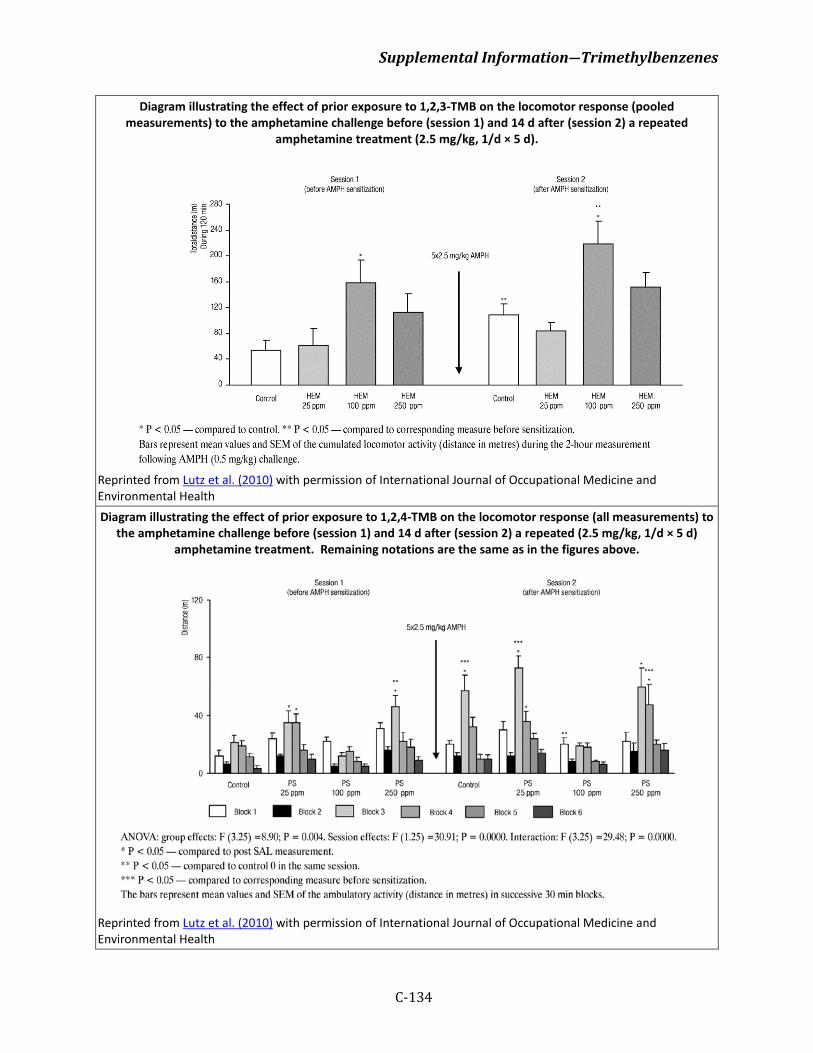
Supplemental Information―Trimethylbenzenes
C-134
Diagram illustrating the effect of prior exposure to 1,2,3-TMB on the locomotor response (pooled measurements) to the amphetamine challenge before (session 1) and 14 d after (session 2) a repeated
amphetamine treatment (2.5 mg/kg, 1/d × 5 d).
Reprinted from Lutz et al. (2010) with permission of International Journal of Occupational Medicine and Environmental Health Diagram illustrating the effect of prior exposure to 1,2,4-TMB on the locomotor response (all measurements) to
the amphetamine challenge before (session 1) and 14 d after (session 2) a repeated (2.5 mg/kg, 1/d × 5 d) amphetamine treatment. Remaining notations are the same as in the figures above.
Reprinted from Lutz et al. (2010) with permission of International Journal of Occupational Medicine and Environmental Health
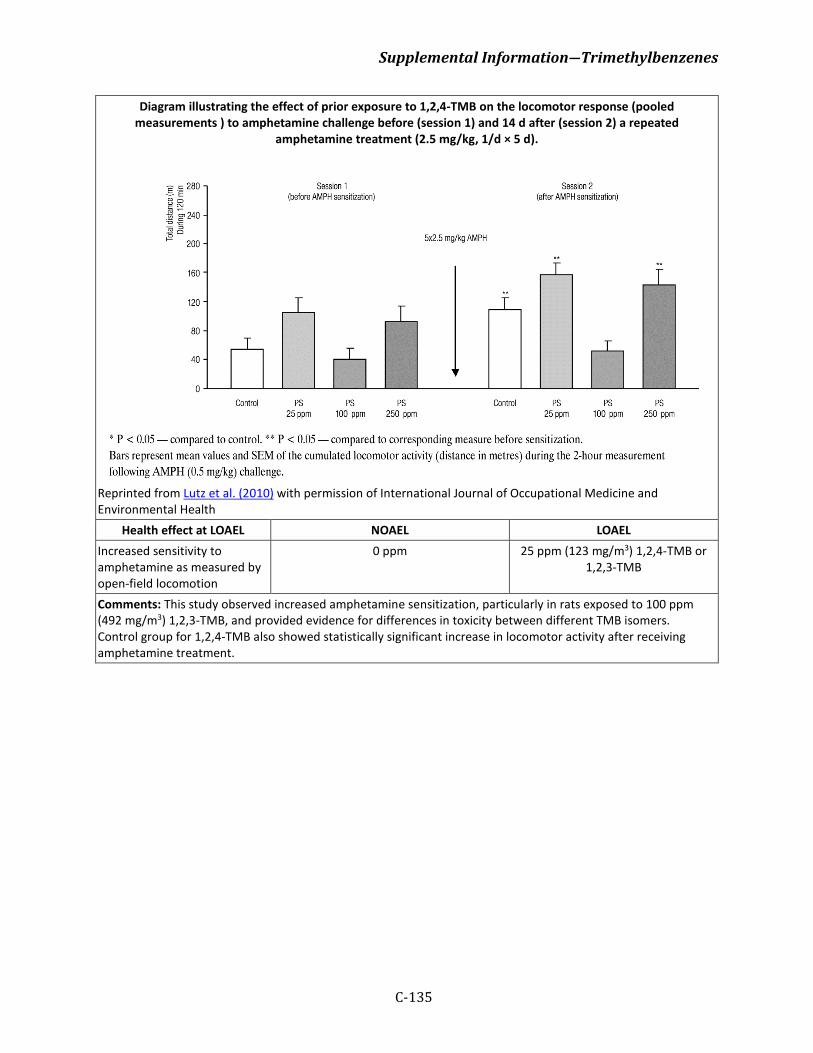
Supplemental Information―Trimethylbenzenes
C-135
Diagram illustrating the effect of prior exposure to 1,2,4-TMB on the locomotor response (pooled measurements ) to amphetamine challenge before (session 1) and 14 d after (session 2) a repeated
amphetamine treatment (2.5 mg/kg, 1/d × 5 d).
Reprinted from Lutz et al. (2010) with permission of International Journal of Occupational Medicine and Environmental Health
Health effect at LOAEL NOAEL LOAEL Increased sensitivity to amphetamine as measured by open-field locomotion
0 ppm 25 ppm (123 mg/m3) 1,2,4-TMB or 1,2,3-TMB
Comments: This study observed increased amphetamine sensitization, particularly in rats exposed to 100 ppm (492 mg/m3) 1,2,3-TMB, and provided evidence for differences in toxicity between different TMB isomers. Control group for 1,2,4-TMB also showed statistically significant increase in locomotor activity after receiving amphetamine treatment.
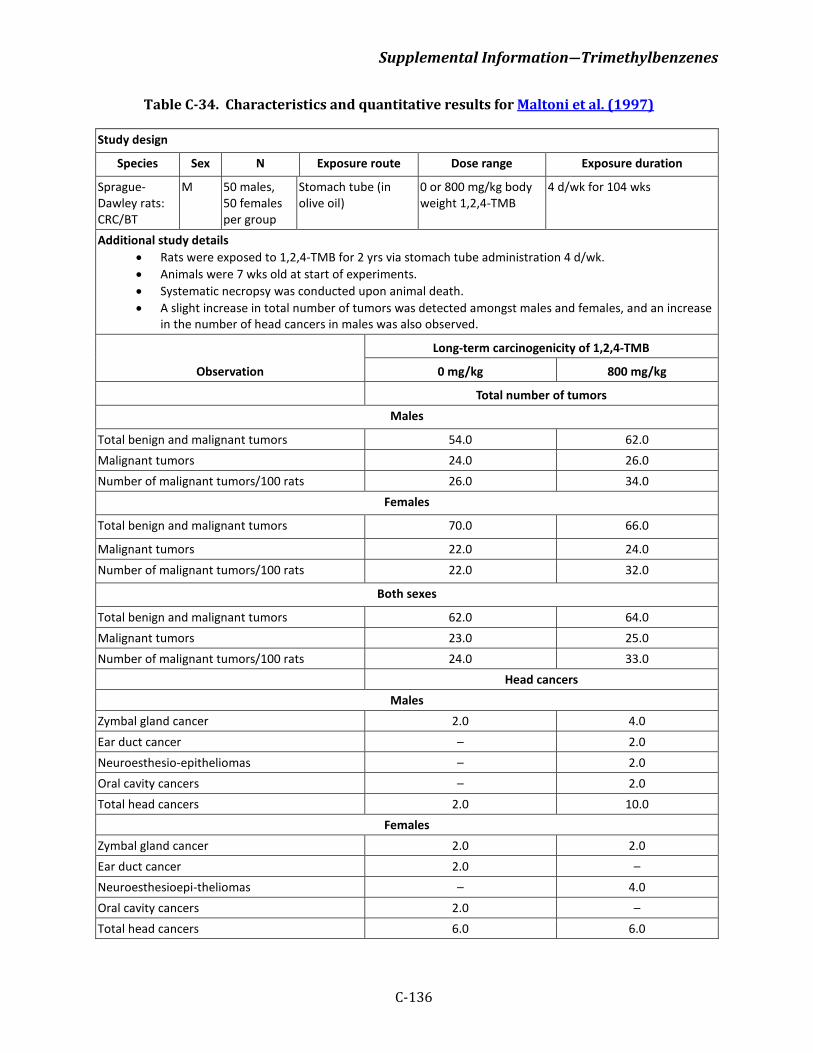
Supplemental Information―Trimethylbenzenes
C-136
Table C-34. Characteristics and quantitative results for Maltoni et al. (1997)
Study design
Species Sex N Exposure route Dose range Exposure duration
Sprague-Dawley rats: CRC/BT
M 50 males, 50 females per group
Stomach tube (in olive oil)
0 or 800 mg/kg body weight 1,2,4-TMB
4 d/wk for 104 wks
Additional study details • Rats were exposed to 1,2,4-TMB for 2 yrs via stomach tube administration 4 d/wk. • Animals were 7 wks old at start of experiments. • Systematic necropsy was conducted upon animal death. • A slight increase in total number of tumors was detected amongst males and females, and an increase
in the number of head cancers in males was also observed.
Observation
Long-term carcinogenicity of 1,2,4-TMB
0 mg/kg 800 mg/kg
Total number of tumors Males
Total benign and malignant tumors 54.0 62.0 Malignant tumors 24.0 26.0 Number of malignant tumors/100 rats 26.0 34.0
Females
Total benign and malignant tumors 70.0 66.0
Malignant tumors 22.0 24.0 Number of malignant tumors/100 rats 22.0 32.0
Both sexes
Total benign and malignant tumors 62.0 64.0 Malignant tumors 23.0 25.0 Number of malignant tumors/100 rats 24.0 33.0
Head cancers Males
Zymbal gland cancer 2.0 4.0 Ear duct cancer – 2.0 Neuroesthesio-epitheliomas – 2.0 Oral cavity cancers – 2.0 Total head cancers 2.0 10.0
Females Zymbal gland cancer 2.0 2.0 Ear duct cancer 2.0 – Neuroesthesioepi-theliomas – 4.0 Oral cavity cancers 2.0 – Total head cancers 6.0 6.0
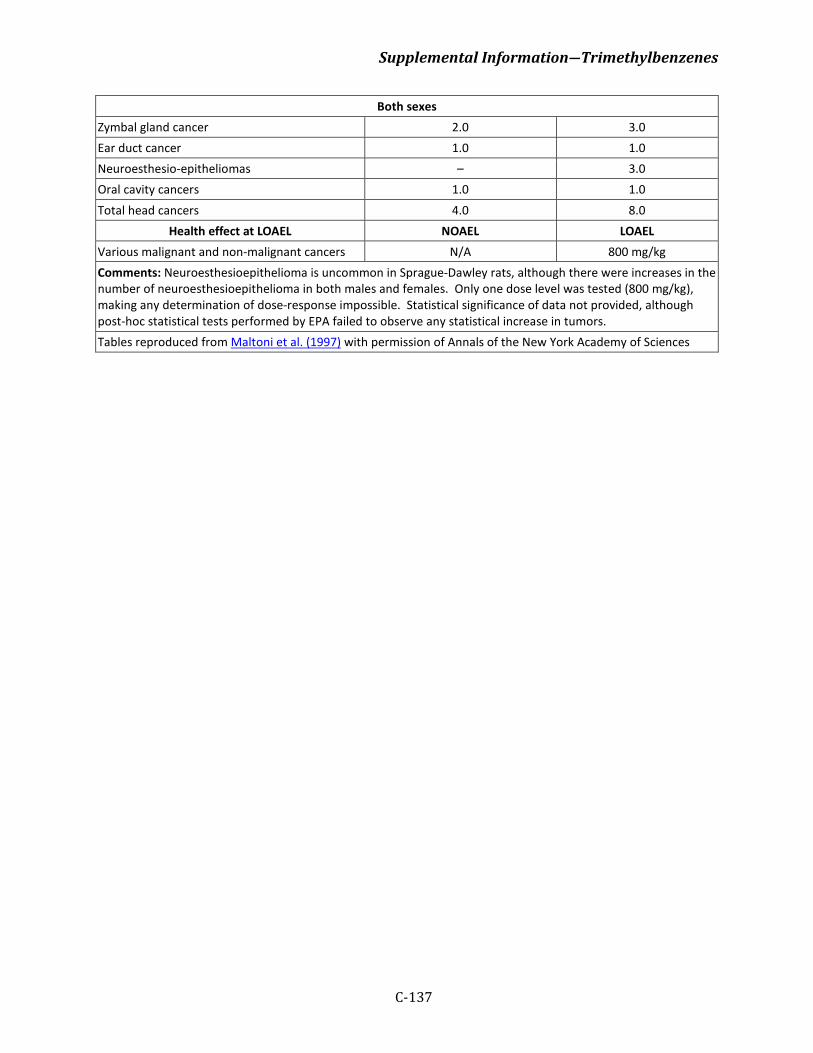
Supplemental Information―Trimethylbenzenes
C-137
Both sexes Zymbal gland cancer 2.0 3.0 Ear duct cancer 1.0 1.0 Neuroesthesio-epitheliomas – 3.0 Oral cavity cancers 1.0 1.0 Total head cancers 4.0 8.0
Health effect at LOAEL NOAEL LOAEL Various malignant and non-malignant cancers N/A 800 mg/kg Comments: Neuroesthesioepithelioma is uncommon in Sprague-Dawley rats, although there were increases in the number of neuroesthesioepithelioma in both males and females. Only one dose level was tested (800 mg/kg), making any determination of dose-response impossible. Statistical significance of data not provided, although post-hoc statistical tests performed by EPA failed to observe any statistical increase in tumors. Tables reproduced from Maltoni et al. (1997) with permission of Annals of the New York Academy of Sciences
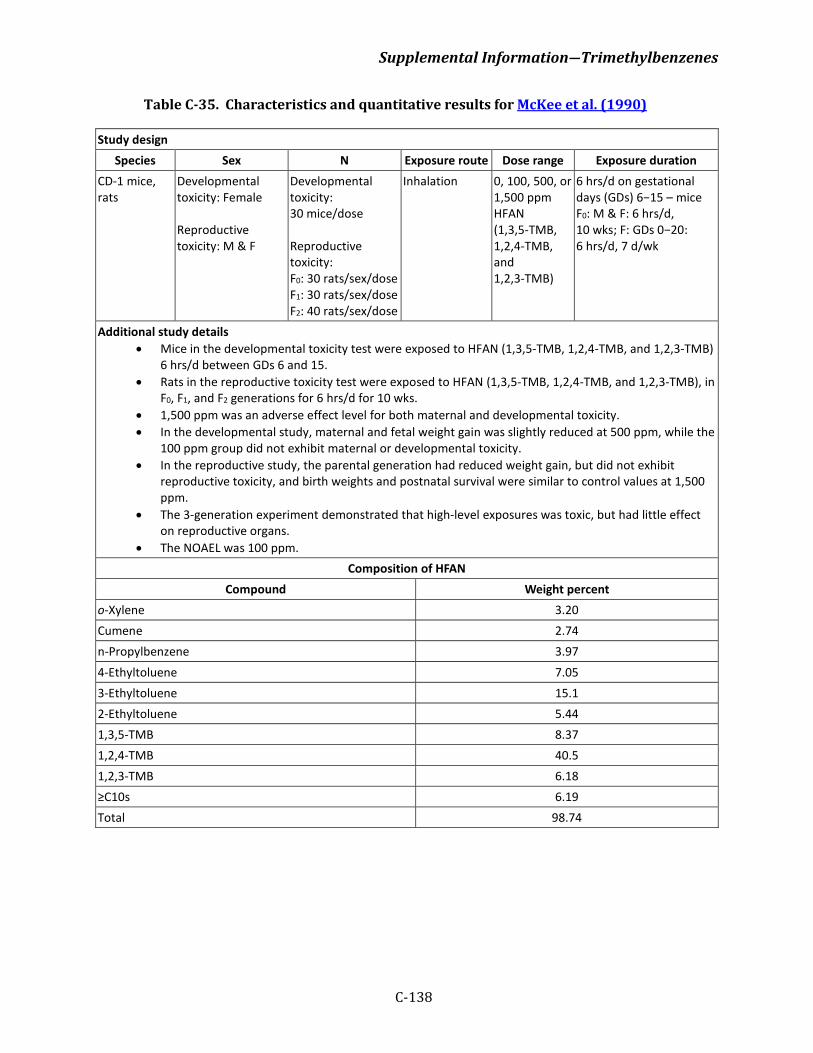
Supplemental Information―Trimethylbenzenes
C-138
Table C-35. Characteristics and quantitative results for McKee et al. (1990)
Study design Species Sex N Exposure route Dose range Exposure duration
CD-1 mice, rats
Developmental toxicity: Female Reproductive toxicity: M & F
Developmental toxicity: 30 mice/dose Reproductive toxicity: F0: 30 rats/sex/dose F1: 30 rats/sex/dose F2: 40 rats/sex/dose
Inhalation 0, 100, 500, or 1,500 ppm HFAN (1,3,5-TMB, 1,2,4-TMB, and 1,2,3-TMB)
6 hrs/d on gestational days (GDs) 6−15 – mice F0: M & F: 6 hrs/d, 10 wks; F: GDs 0−20: 6 hrs/d, 7 d/wk
Additional study details • Mice in the developmental toxicity test were exposed to HFAN (1,3,5-TMB, 1,2,4-TMB, and 1,2,3-TMB)
6 hrs/d between GDs 6 and 15. • Rats in the reproductive toxicity test were exposed to HFAN (1,3,5-TMB, 1,2,4-TMB, and 1,2,3-TMB), in
F0, F1, and F2 generations for 6 hrs/d for 10 wks. • 1,500 ppm was an adverse effect level for both maternal and developmental toxicity. • In the developmental study, maternal and fetal weight gain was slightly reduced at 500 ppm, while the
100 ppm group did not exhibit maternal or developmental toxicity. • In the reproductive study, the parental generation had reduced weight gain, but did not exhibit
reproductive toxicity, and birth weights and postnatal survival were similar to control values at 1,500 ppm.
• The 3-generation experiment demonstrated that high-level exposures was toxic, but had little effect on reproductive organs.
• The NOAEL was 100 ppm. Composition of HFAN
Compound Weight percent o-Xylene 3.20 Cumene 2.74 n-Propylbenzene 3.97 4-Ethyltoluene 7.05 3-Ethyltoluene 15.1 2-Ethyltoluene 5.44 1,3,5-TMB 8.37 1,2,4-TMB 40.5 1,2,3-TMB 6.18 ≥C10s 6.19 Total 98.74
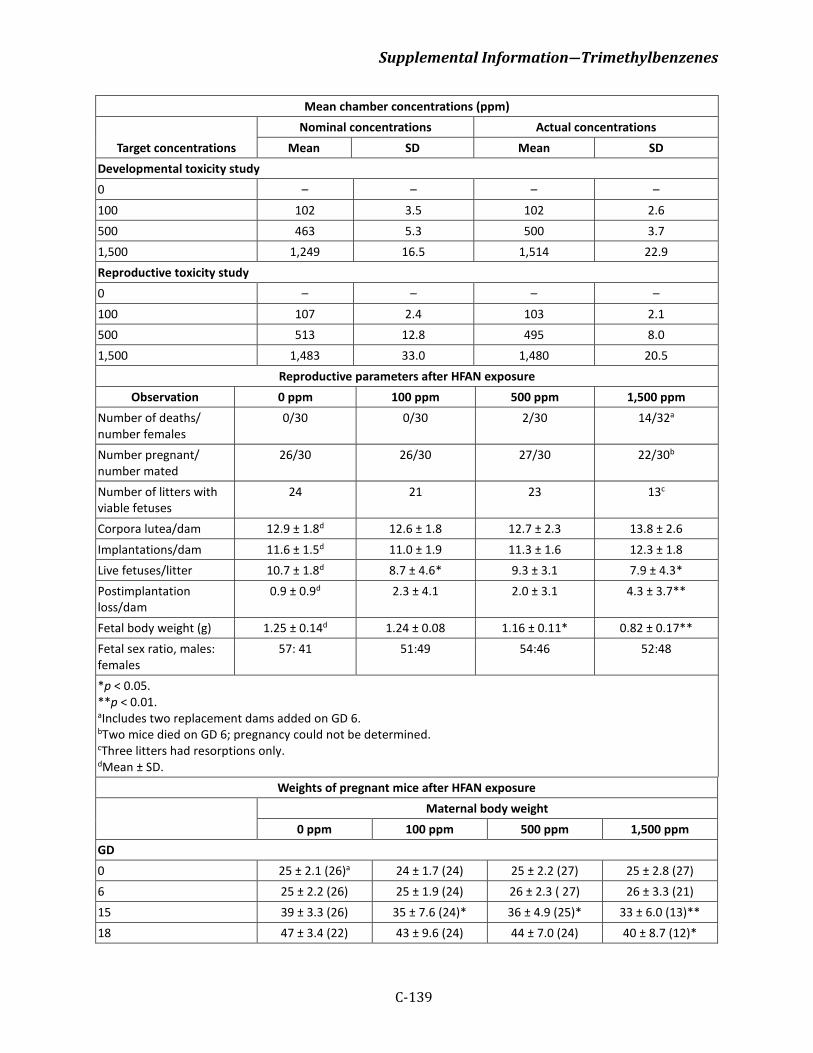
Supplemental Information―Trimethylbenzenes
C-139
Mean chamber concentrations (ppm)
Target concentrations Nominal concentrations Actual concentrations
Mean SD Mean SD Developmental toxicity study 0 – – – – 100 102 3.5 102 2.6 500 463 5.3 500 3.7 1,500 1,249 16.5 1,514 22.9 Reproductive toxicity study 0 – – – – 100 107 2.4 103 2.1 500 513 12.8 495 8.0 1,500 1,483 33.0 1,480 20.5
Reproductive parameters after HFAN exposure Observation 0 ppm 100 ppm 500 ppm 1,500 ppm
Number of deaths/number females
0/30 0/30 2/30 14/32a
Number pregnant/number mated
26/30 26/30 27/30 22/30b
Number of litters with viable fetuses
24 21 23 13c
Corpora lutea/dam 12.9 ± 1.8d 12.6 ± 1.8 12.7 ± 2.3 13.8 ± 2.6 Implantations/dam 11.6 ± 1.5d 11.0 ± 1.9 11.3 ± 1.6 12.3 ± 1.8 Live fetuses/litter 10.7 ± 1.8d 8.7 ± 4.6* 9.3 ± 3.1 7.9 ± 4.3* Postimplantation loss/dam
0.9 ± 0.9d 2.3 ± 4.1 2.0 ± 3.1 4.3 ± 3.7**
Fetal body weight (g) 1.25 ± 0.14d 1.24 ± 0.08 1.16 ± 0.11* 0.82 ± 0.17** Fetal sex ratio, males: females
57: 41 51:49 54:46 52:48
*p < 0.05. **p < 0.01. aIncludes two replacement dams added on GD 6. bTwo mice died on GD 6; pregnancy could not be determined. cThree litters had resorptions only. dMean ± SD.
Weights of pregnant mice after HFAN exposure Maternal body weight
0 ppm 100 ppm 500 ppm 1,500 ppm GD 0 25 ± 2.1 (26)a 24 ± 1.7 (24) 25 ± 2.2 (27) 25 ± 2.8 (27) 6 25 ± 2.2 (26) 25 ± 1.9 (24) 26 ± 2.3 ( 27) 26 ± 3.3 (21) 15 39 ± 3.3 (26) 35 ± 7.6 (24)* 36 ± 4.9 (25)* 33 ± 6.0 (13)** 18 47 ± 3.4 (22) 43 ± 9.6 (24) 44 ± 7.0 (24) 40 ± 8.7 (12)*
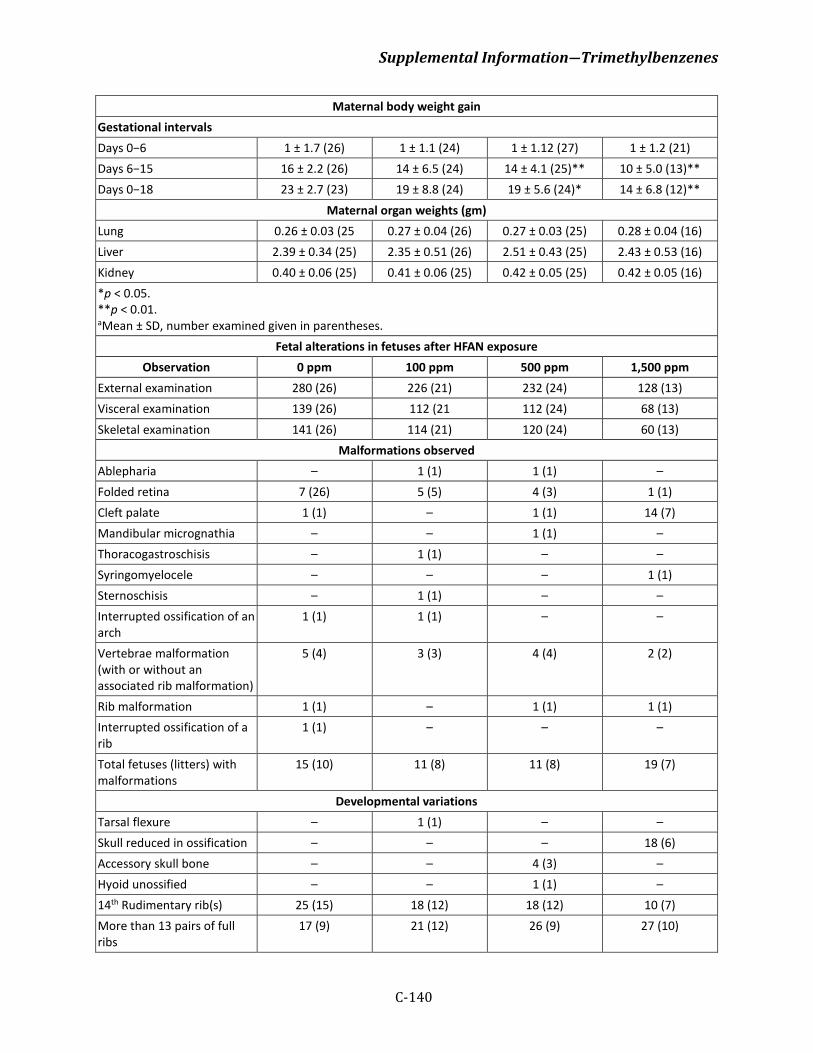
Supplemental Information―Trimethylbenzenes
C-140
Maternal body weight gain Gestational intervals Days 0−6 1 ± 1.7 (26) 1 ± 1.1 (24) 1 ± 1.12 (27) 1 ± 1.2 (21) Days 6−15 16 ± 2.2 (26) 14 ± 6.5 (24) 14 ± 4.1 (25)** 10 ± 5.0 (13)** Days 0−18 23 ± 2.7 (23) 19 ± 8.8 (24) 19 ± 5.6 (24)* 14 ± 6.8 (12)**
Maternal organ weights (gm) Lung 0.26 ± 0.03 (25 0.27 ± 0.04 (26) 0.27 ± 0.03 (25) 0.28 ± 0.04 (16) Liver 2.39 ± 0.34 (25) 2.35 ± 0.51 (26) 2.51 ± 0.43 (25) 2.43 ± 0.53 (16) Kidney 0.40 ± 0.06 (25) 0.41 ± 0.06 (25) 0.42 ± 0.05 (25) 0.42 ± 0.05 (16) *p < 0.05. **p < 0.01. aMean ± SD, number examined given in parentheses.
Fetal alterations in fetuses after HFAN exposure Observation 0 ppm 100 ppm 500 ppm 1,500 ppm
External examination 280 (26) 226 (21) 232 (24) 128 (13) Visceral examination 139 (26) 112 (21 112 (24) 68 (13) Skeletal examination 141 (26) 114 (21) 120 (24) 60 (13)
Malformations observed Ablepharia – 1 (1) 1 (1) – Folded retina 7 (26) 5 (5) 4 (3) 1 (1) Cleft palate 1 (1) – 1 (1) 14 (7) Mandibular micrognathia – – 1 (1) – Thoracogastroschisis – 1 (1) – – Syringomyelocele – – – 1 (1) Sternoschisis – 1 (1) – – Interrupted ossification of an arch
1 (1) 1 (1) – –
Vertebrae malformation (with or without an associated rib malformation)
5 (4) 3 (3) 4 (4) 2 (2)
Rib malformation 1 (1) – 1 (1) 1 (1) Interrupted ossification of a rib
1 (1) – – –
Total fetuses (litters) with malformations
15 (10) 11 (8) 11 (8) 19 (7)
Developmental variations Tarsal flexure – 1 (1) – – Skull reduced in ossification – – – 18 (6) Accessory skull bone – – 4 (3) – Hyoid unossified – – 1 (1) – 14th Rudimentary rib(s) 25 (15) 18 (12) 18 (12) 10 (7) More than 13 pairs of full ribs
17 (9) 21 (12) 26 (9) 27 (10)
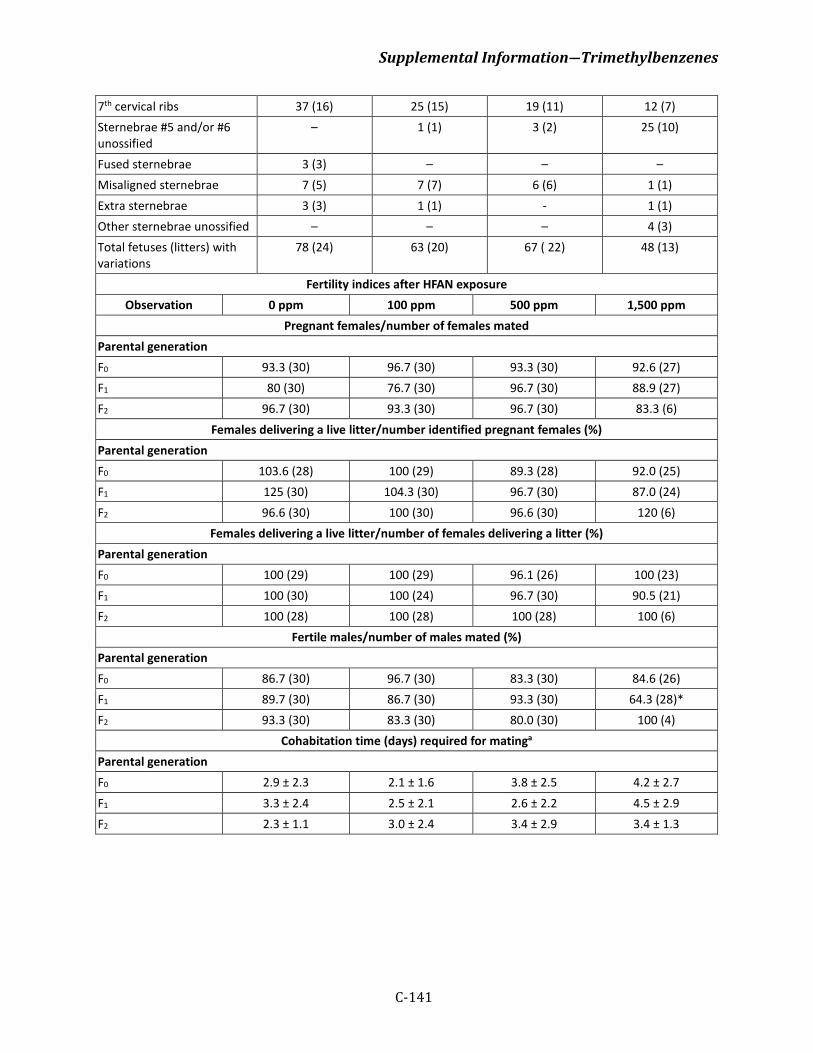
Supplemental Information―Trimethylbenzenes
C-141
7th cervical ribs 37 (16) 25 (15) 19 (11) 12 (7) Sternebrae #5 and/or #6 unossified
– 1 (1) 3 (2) 25 (10)
Fused sternebrae 3 (3) – – – Misaligned sternebrae 7 (5) 7 (7) 6 (6) 1 (1) Extra sternebrae 3 (3) 1 (1) - 1 (1) Other sternebrae unossified – – – 4 (3) Total fetuses (litters) with variations
78 (24) 63 (20) 67 ( 22) 48 (13)
Fertility indices after HFAN exposure Observation 0 ppm 100 ppm 500 ppm 1,500 ppm
Pregnant females/number of females mated Parental generation F0 93.3 (30) 96.7 (30) 93.3 (30) 92.6 (27) F1 80 (30) 76.7 (30) 96.7 (30) 88.9 (27) F2 96.7 (30) 93.3 (30) 96.7 (30) 83.3 (6)
Females delivering a live litter/number identified pregnant females (%) Parental generation F0 103.6 (28) 100 (29) 89.3 (28) 92.0 (25) F1 125 (30) 104.3 (30) 96.7 (30) 87.0 (24) F2 96.6 (30) 100 (30) 96.6 (30) 120 (6)
Females delivering a live litter/number of females delivering a litter (%) Parental generation F0 100 (29) 100 (29) 96.1 (26) 100 (23) F1 100 (30) 100 (24) 96.7 (30) 90.5 (21) F2 100 (28) 100 (28) 100 (28) 100 (6)
Fertile males/number of males mated (%) Parental generation F0 86.7 (30) 96.7 (30) 83.3 (30) 84.6 (26) F1 89.7 (30) 86.7 (30) 93.3 (30) 64.3 (28)* F2 93.3 (30) 83.3 (30) 80.0 (30) 100 (4)
Cohabitation time (days) required for matinga
Parental generation F0 2.9 ± 2.3 2.1 ± 1.6 3.8 ± 2.5 4.2 ± 2.7 F1 3.3 ± 2.4 2.5 ± 2.1 2.6 ± 2.2 4.5 ± 2.9 F2 2.3 ± 1.1 3.0 ± 2.4 3.4 ± 2.9 3.4 ± 1.3
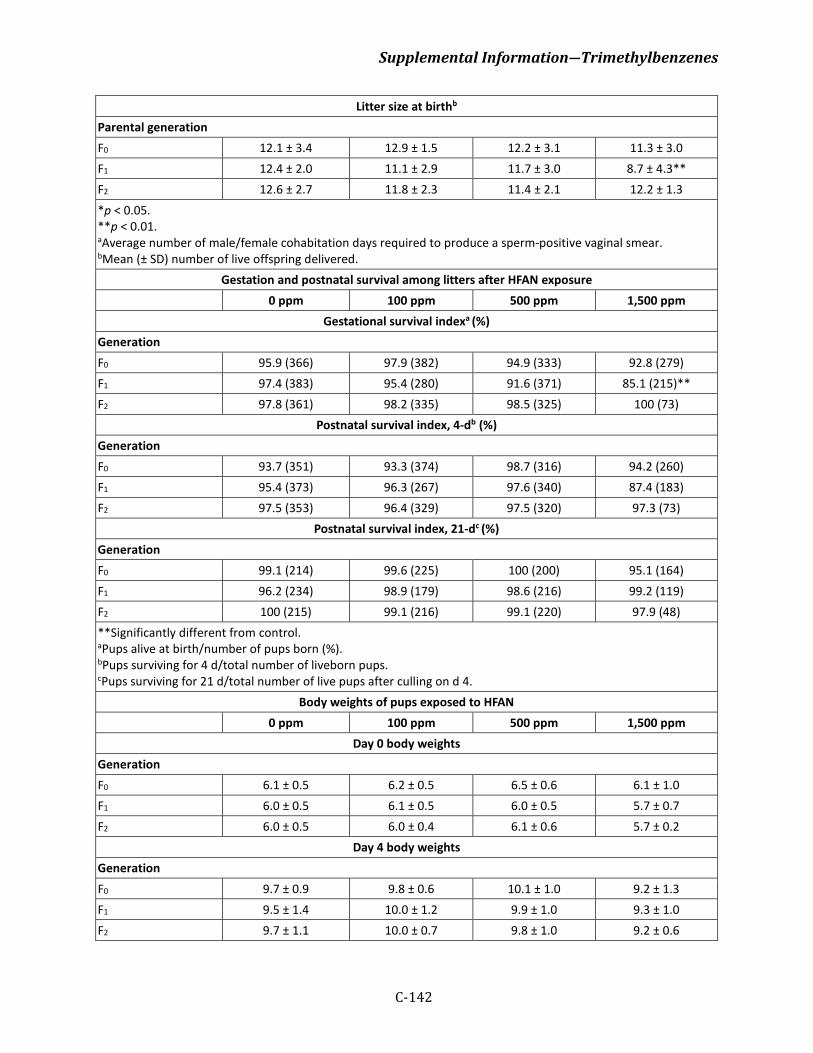
Supplemental Information―Trimethylbenzenes
C-142
Litter size at birthb
Parental generation F0 12.1 ± 3.4 12.9 ± 1.5 12.2 ± 3.1 11.3 ± 3.0 F1 12.4 ± 2.0 11.1 ± 2.9 11.7 ± 3.0 8.7 ± 4.3** F2 12.6 ± 2.7 11.8 ± 2.3 11.4 ± 2.1 12.2 ± 1.3 *p < 0.05. **p < 0.01. aAverage number of male/female cohabitation days required to produce a sperm-positive vaginal smear. bMean (± SD) number of live offspring delivered.
Gestation and postnatal survival among litters after HFAN exposure 0 ppm 100 ppm 500 ppm 1,500 ppm
Gestational survival indexa (%) Generation F0 95.9 (366) 97.9 (382) 94.9 (333) 92.8 (279) F1 97.4 (383) 95.4 (280) 91.6 (371) 85.1 (215)** F2 97.8 (361) 98.2 (335) 98.5 (325) 100 (73)
Postnatal survival index, 4-db (%) Generation F0 93.7 (351) 93.3 (374) 98.7 (316) 94.2 (260) F1 95.4 (373) 96.3 (267) 97.6 (340) 87.4 (183) F2 97.5 (353) 96.4 (329) 97.5 (320) 97.3 (73)
Postnatal survival index, 21-dc (%) Generation F0 99.1 (214) 99.6 (225) 100 (200) 95.1 (164) F1 96.2 (234) 98.9 (179) 98.6 (216) 99.2 (119) F2 100 (215) 99.1 (216) 99.1 (220) 97.9 (48) **Significantly different from control. aPups alive at birth/number of pups born (%). bPups surviving for 4 d/total number of liveborn pups. cPups surviving for 21 d/total number of live pups after culling on d 4.
Body weights of pups exposed to HFAN 0 ppm 100 ppm 500 ppm 1,500 ppm
Day 0 body weights Generation F0 6.1 ± 0.5 6.2 ± 0.5 6.5 ± 0.6 6.1 ± 1.0 F1 6.0 ± 0.5 6.1 ± 0.5 6.0 ± 0.5 5.7 ± 0.7 F2 6.0 ± 0.5 6.0 ± 0.4 6.1 ± 0.6 5.7 ± 0.2
Day 4 body weights Generation F0 9.7 ± 0.9 9.8 ± 0.6 10.1 ± 1.0 9.2 ± 1.3 F1 9.5 ± 1.4 10.0 ± 1.2 9.9 ± 1.0 9.3 ± 1.0 F2 9.7 ± 1.1 10.0 ± 0.7 9.8 ± 1.0 9.2 ± 0.6
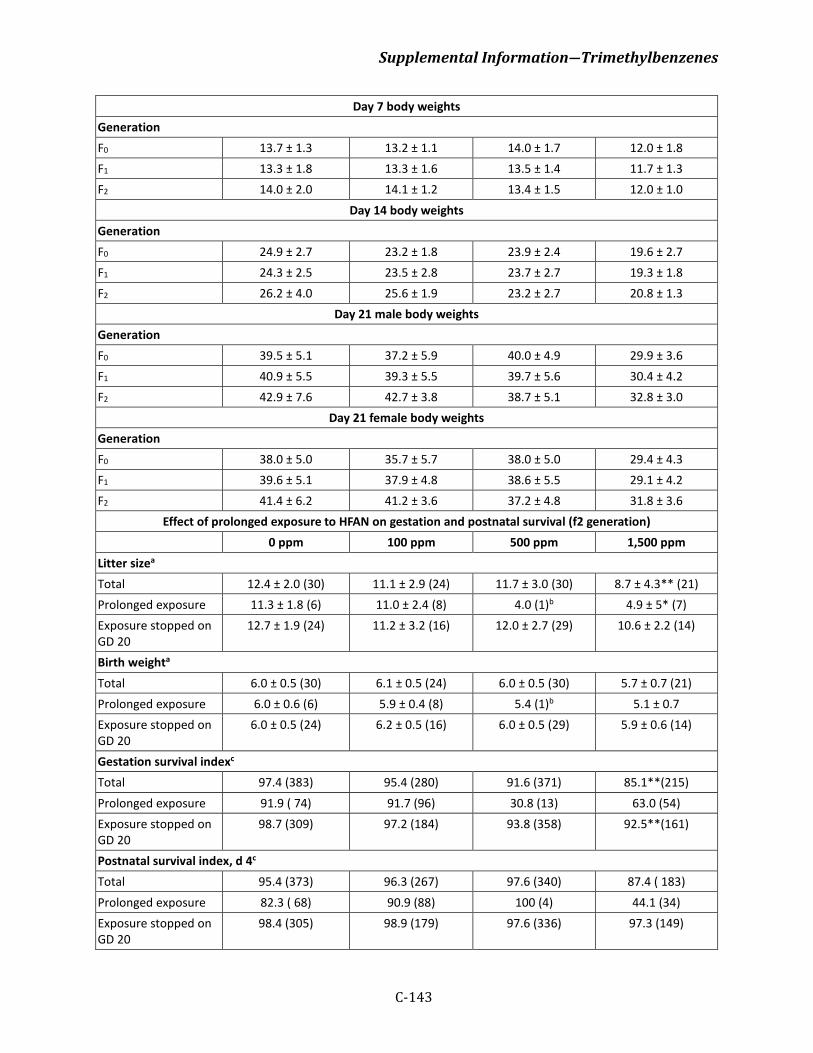
Supplemental Information―Trimethylbenzenes
C-143
Day 7 body weights Generation F0 13.7 ± 1.3 13.2 ± 1.1 14.0 ± 1.7 12.0 ± 1.8 F1 13.3 ± 1.8 13.3 ± 1.6 13.5 ± 1.4 11.7 ± 1.3 F2 14.0 ± 2.0 14.1 ± 1.2 13.4 ± 1.5 12.0 ± 1.0
Day 14 body weights Generation F0 24.9 ± 2.7 23.2 ± 1.8 23.9 ± 2.4 19.6 ± 2.7 F1 24.3 ± 2.5 23.5 ± 2.8 23.7 ± 2.7 19.3 ± 1.8 F2 26.2 ± 4.0 25.6 ± 1.9 23.2 ± 2.7 20.8 ± 1.3
Day 21 male body weights Generation F0 39.5 ± 5.1 37.2 ± 5.9 40.0 ± 4.9 29.9 ± 3.6 F1 40.9 ± 5.5 39.3 ± 5.5 39.7 ± 5.6 30.4 ± 4.2 F2 42.9 ± 7.6 42.7 ± 3.8 38.7 ± 5.1 32.8 ± 3.0
Day 21 female body weights Generation F0 38.0 ± 5.0 35.7 ± 5.7 38.0 ± 5.0 29.4 ± 4.3 F1 39.6 ± 5.1 37.9 ± 4.8 38.6 ± 5.5 29.1 ± 4.2 F2 41.4 ± 6.2 41.2 ± 3.6 37.2 ± 4.8 31.8 ± 3.6
Effect of prolonged exposure to HFAN on gestation and postnatal survival (f2 generation) 0 ppm 100 ppm 500 ppm 1,500 ppm
Litter sizea
Total 12.4 ± 2.0 (30) 11.1 ± 2.9 (24) 11.7 ± 3.0 (30) 8.7 ± 4.3** (21) Prolonged exposure 11.3 ± 1.8 (6) 11.0 ± 2.4 (8) 4.0 (1)b 4.9 ± 5* (7) Exposure stopped on GD 20
12.7 ± 1.9 (24) 11.2 ± 3.2 (16) 12.0 ± 2.7 (29) 10.6 ± 2.2 (14)
Birth weighta
Total 6.0 ± 0.5 (30) 6.1 ± 0.5 (24) 6.0 ± 0.5 (30) 5.7 ± 0.7 (21) Prolonged exposure 6.0 ± 0.6 (6) 5.9 ± 0.4 (8) 5.4 (1)b 5.1 ± 0.7 Exposure stopped on GD 20
6.0 ± 0.5 (24) 6.2 ± 0.5 (16) 6.0 ± 0.5 (29) 5.9 ± 0.6 (14)
Gestation survival indexc
Total 97.4 (383) 95.4 (280) 91.6 (371) 85.1**(215) Prolonged exposure 91.9 ( 74) 91.7 (96) 30.8 (13) 63.0 (54) Exposure stopped on GD 20
98.7 (309) 97.2 (184) 93.8 (358) 92.5**(161)
Postnatal survival index, d 4c
Total 95.4 (373) 96.3 (267) 97.6 (340) 87.4 ( 183) Prolonged exposure 82.3 ( 68) 90.9 (88) 100 (4) 44.1 (34) Exposure stopped on GD 20
98.4 (305) 98.9 (179) 97.6 (336) 97.3 (149)
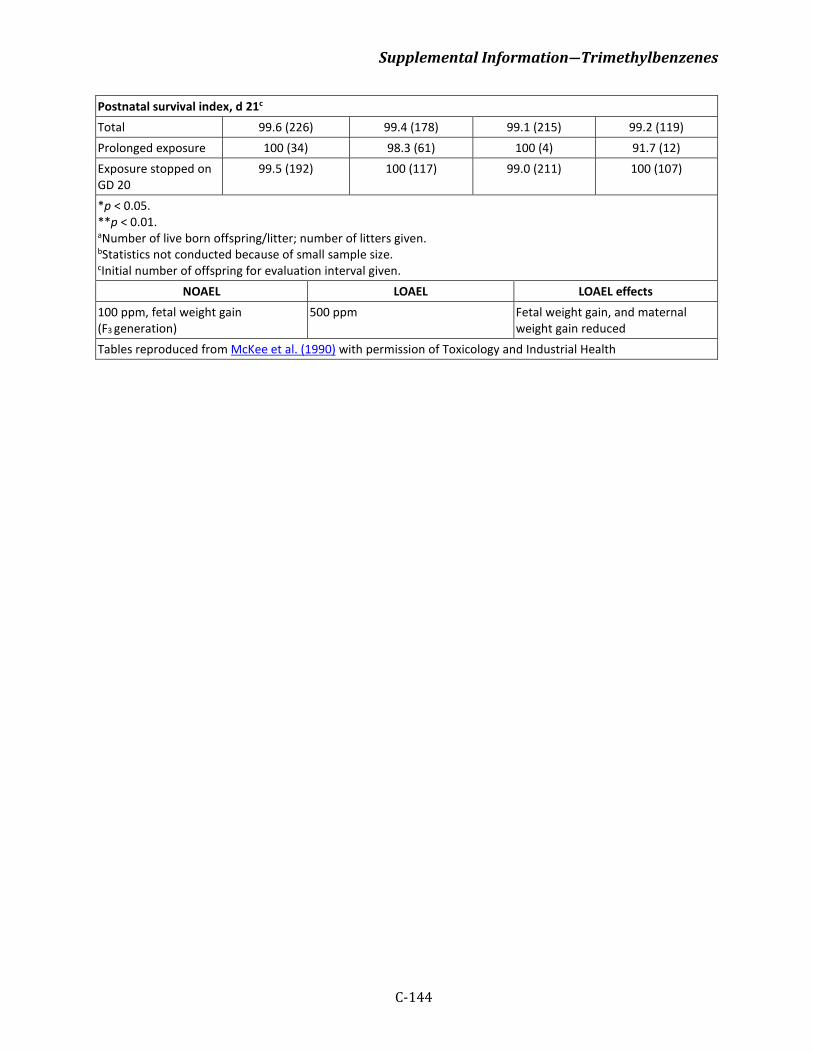
Supplemental Information―Trimethylbenzenes
C-144
Postnatal survival index, d 21c
Total 99.6 (226) 99.4 (178) 99.1 (215) 99.2 (119) Prolonged exposure 100 (34) 98.3 (61) 100 (4) 91.7 (12) Exposure stopped on GD 20
99.5 (192) 100 (117) 99.0 (211) 100 (107)
*p < 0.05. **p < 0.01. aNumber of live born offspring/litter; number of litters given. bStatistics not conducted because of small sample size. cInitial number of offspring for evaluation interval given.
NOAEL LOAEL LOAEL effects 100 ppm, fetal weight gain (F3 generation)
500 ppm Fetal weight gain, and maternal weight gain reduced
Tables reproduced from McKee et al. (1990) with permission of Toxicology and Industrial Health
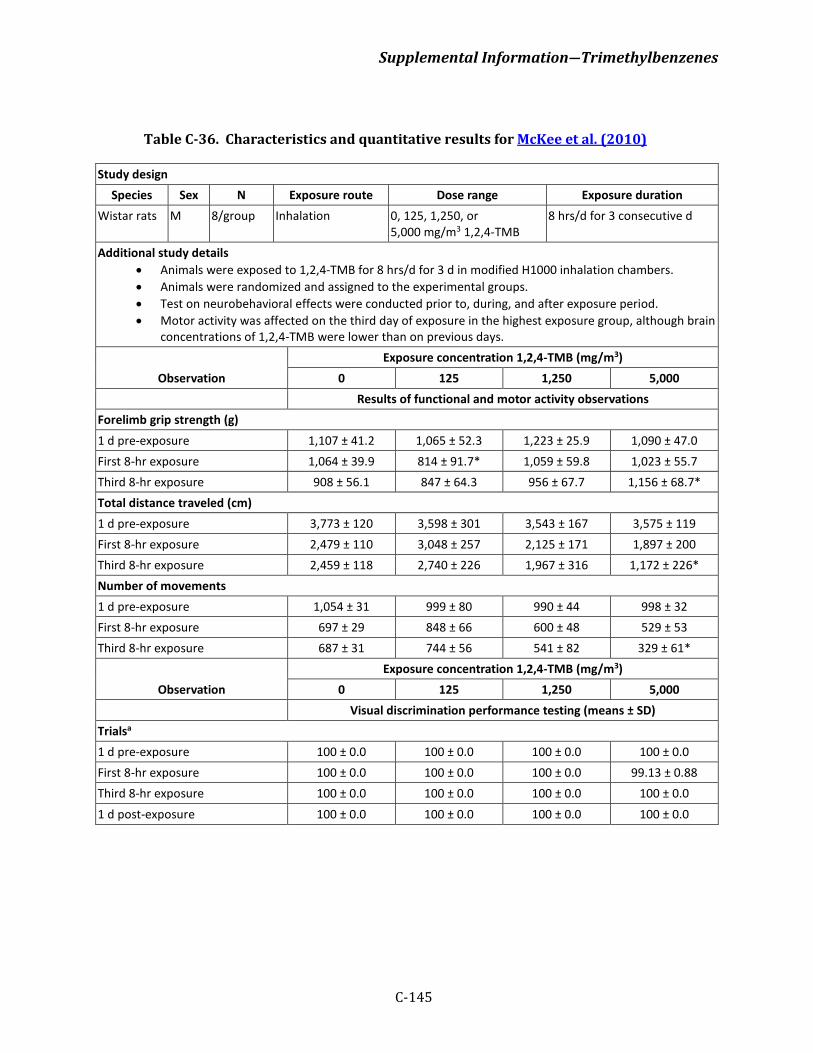
Supplemental Information―Trimethylbenzenes
C-145
Table C-36. Characteristics and quantitative results for McKee et al. (2010)
Study design Species Sex N Exposure route Dose range Exposure duration
Wistar rats M 8/group Inhalation 0, 125, 1,250, or 5,000 mg/m3 1,2,4-TMB
8 hrs/d for 3 consecutive d
Additional study details • Animals were exposed to 1,2,4-TMB for 8 hrs/d for 3 d in modified H1000 inhalation chambers. • Animals were randomized and assigned to the experimental groups. • Test on neurobehavioral effects were conducted prior to, during, and after exposure period. • Motor activity was affected on the third day of exposure in the highest exposure group, although brain
concentrations of 1,2,4-TMB were lower than on previous days.
Observation Exposure concentration 1,2,4-TMB (mg/m3)
0 125 1,250 5,000 Results of functional and motor activity observations
Forelimb grip strength (g) 1 d pre-exposure 1,107 ± 41.2 1,065 ± 52.3 1,223 ± 25.9 1,090 ± 47.0 First 8-hr exposure 1,064 ± 39.9 814 ± 91.7* 1,059 ± 59.8 1,023 ± 55.7 Third 8-hr exposure 908 ± 56.1 847 ± 64.3 956 ± 67.7 1,156 ± 68.7* Total distance traveled (cm) 1 d pre-exposure 3,773 ± 120 3,598 ± 301 3,543 ± 167 3,575 ± 119 First 8-hr exposure 2,479 ± 110 3,048 ± 257 2,125 ± 171 1,897 ± 200 Third 8-hr exposure 2,459 ± 118 2,740 ± 226 1,967 ± 316 1,172 ± 226* Number of movements 1 d pre-exposure 1,054 ± 31 999 ± 80 990 ± 44 998 ± 32 First 8-hr exposure 697 ± 29 848 ± 66 600 ± 48 529 ± 53 Third 8-hr exposure 687 ± 31 744 ± 56 541 ± 82 329 ± 61*
Observation Exposure concentration 1,2,4-TMB (mg/m3)
0 125 1,250 5,000 Visual discrimination performance testing (means ± SD)
Trialsa 1 d pre-exposure 100 ± 0.0 100 ± 0.0 100 ± 0.0 100 ± 0.0 First 8-hr exposure 100 ± 0.0 100 ± 0.0 100 ± 0.0 99.13 ± 0.88 Third 8-hr exposure 100 ± 0.0 100 ± 0.0 100 ± 0.0 100 ± 0.0 1 d post-exposure 100 ± 0.0 100 ± 0.0 100 ± 0.0 100 ± 0.0
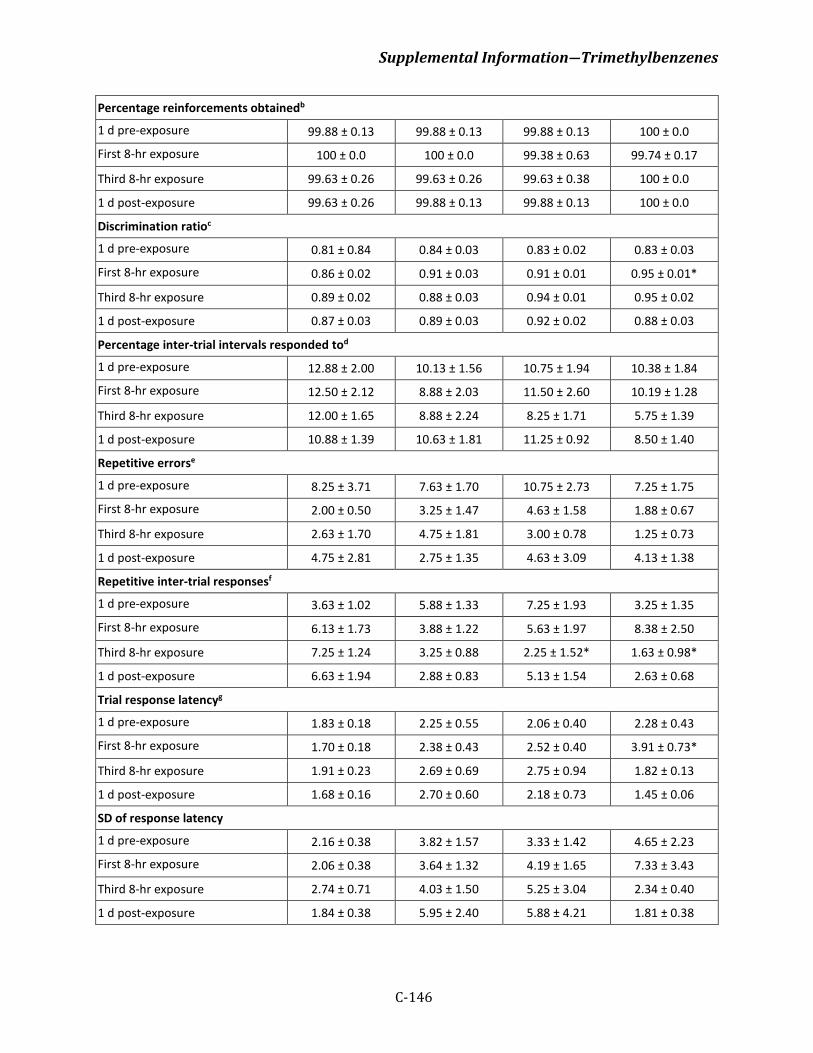
Supplemental Information―Trimethylbenzenes
C-146
Percentage reinforcements obtainedb
1 d pre-exposure 99.88 ± 0.13 99.88 ± 0.13 99.88 ± 0.13 100 ± 0.0
First 8-hr exposure 100 ± 0.0 100 ± 0.0 99.38 ± 0.63 99.74 ± 0.17
Third 8-hr exposure 99.63 ± 0.26 99.63 ± 0.26 99.63 ± 0.38 100 ± 0.0
1 d post-exposure 99.63 ± 0.26 99.88 ± 0.13 99.88 ± 0.13 100 ± 0.0
Discrimination ratioc
1 d pre-exposure 0.81 ± 0.84 0.84 ± 0.03 0.83 ± 0.02 0.83 ± 0.03
First 8-hr exposure 0.86 ± 0.02 0.91 ± 0.03 0.91 ± 0.01 0.95 ± 0.01*
Third 8-hr exposure 0.89 ± 0.02 0.88 ± 0.03 0.94 ± 0.01 0.95 ± 0.02
1 d post-exposure 0.87 ± 0.03 0.89 ± 0.03 0.92 ± 0.02 0.88 ± 0.03
Percentage inter-trial intervals responded tod
1 d pre-exposure 12.88 ± 2.00 10.13 ± 1.56 10.75 ± 1.94 10.38 ± 1.84
First 8-hr exposure 12.50 ± 2.12 8.88 ± 2.03 11.50 ± 2.60 10.19 ± 1.28
Third 8-hr exposure 12.00 ± 1.65 8.88 ± 2.24 8.25 ± 1.71 5.75 ± 1.39
1 d post-exposure 10.88 ± 1.39 10.63 ± 1.81 11.25 ± 0.92 8.50 ± 1.40
Repetitive errorse
1 d pre-exposure 8.25 ± 3.71 7.63 ± 1.70 10.75 ± 2.73 7.25 ± 1.75
First 8-hr exposure 2.00 ± 0.50 3.25 ± 1.47 4.63 ± 1.58 1.88 ± 0.67
Third 8-hr exposure 2.63 ± 1.70 4.75 ± 1.81 3.00 ± 0.78 1.25 ± 0.73
1 d post-exposure 4.75 ± 2.81 2.75 ± 1.35 4.63 ± 3.09 4.13 ± 1.38
Repetitive inter-trial responsesf
1 d pre-exposure 3.63 ± 1.02 5.88 ± 1.33 7.25 ± 1.93 3.25 ± 1.35
First 8-hr exposure 6.13 ± 1.73 3.88 ± 1.22 5.63 ± 1.97 8.38 ± 2.50
Third 8-hr exposure 7.25 ± 1.24 3.25 ± 0.88 2.25 ± 1.52* 1.63 ± 0.98*
1 d post-exposure 6.63 ± 1.94 2.88 ± 0.83 5.13 ± 1.54 2.63 ± 0.68
Trial response latencyg
1 d pre-exposure 1.83 ± 0.18 2.25 ± 0.55 2.06 ± 0.40 2.28 ± 0.43
First 8-hr exposure 1.70 ± 0.18 2.38 ± 0.43 2.52 ± 0.40 3.91 ± 0.73*
Third 8-hr exposure 1.91 ± 0.23 2.69 ± 0.69 2.75 ± 0.94 1.82 ± 0.13
1 d post-exposure 1.68 ± 0.16 2.70 ± 0.60 2.18 ± 0.73 1.45 ± 0.06
SD of response latency
1 d pre-exposure 2.16 ± 0.38 3.82 ± 1.57 3.33 ± 1.42 4.65 ± 2.23
First 8-hr exposure 2.06 ± 0.38 3.64 ± 1.32 4.19 ± 1.65 7.33 ± 3.43
Third 8-hr exposure 2.74 ± 0.71 4.03 ± 1.50 5.25 ± 3.04 2.34 ± 0.40
1 d post-exposure 1.84 ± 0.38 5.95 ± 2.40 5.88 ± 4.21 1.81 ± 0.38
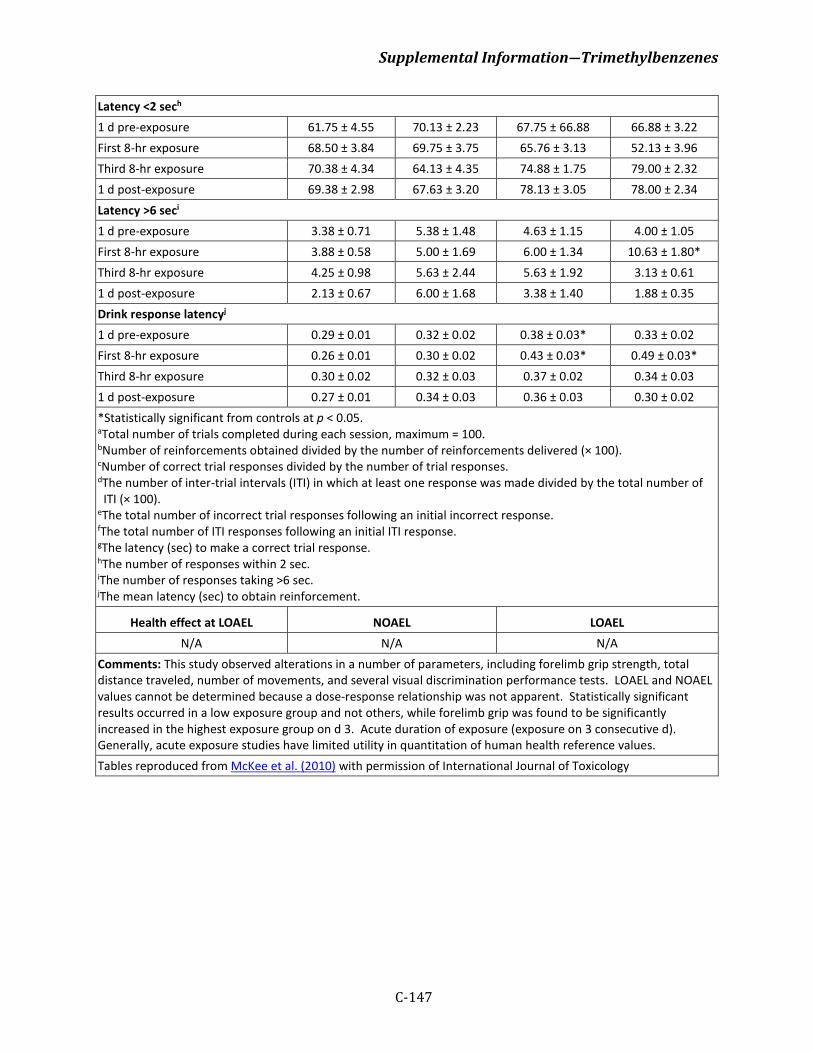
Supplemental Information―Trimethylbenzenes
C-147
Latency <2 sech 1 d pre-exposure 61.75 ± 4.55 70.13 ± 2.23 67.75 ± 66.88 66.88 ± 3.22 First 8-hr exposure 68.50 ± 3.84 69.75 ± 3.75 65.76 ± 3.13 52.13 ± 3.96 Third 8-hr exposure 70.38 ± 4.34 64.13 ± 4.35 74.88 ± 1.75 79.00 ± 2.32 1 d post-exposure 69.38 ± 2.98 67.63 ± 3.20 78.13 ± 3.05 78.00 ± 2.34 Latency >6 seci 1 d pre-exposure 3.38 ± 0.71 5.38 ± 1.48 4.63 ± 1.15 4.00 ± 1.05 First 8-hr exposure 3.88 ± 0.58 5.00 ± 1.69 6.00 ± 1.34 10.63 ± 1.80* Third 8-hr exposure 4.25 ± 0.98 5.63 ± 2.44 5.63 ± 1.92 3.13 ± 0.61 1 d post-exposure 2.13 ± 0.67 6.00 ± 1.68 3.38 ± 1.40 1.88 ± 0.35 Drink response latencyj 1 d pre-exposure 0.29 ± 0.01 0.32 ± 0.02 0.38 ± 0.03* 0.33 ± 0.02 First 8-hr exposure 0.26 ± 0.01 0.30 ± 0.02 0.43 ± 0.03* 0.49 ± 0.03* Third 8-hr exposure 0.30 ± 0.02 0.32 ± 0.03 0.37 ± 0.02 0.34 ± 0.03 1 d post-exposure 0.27 ± 0.01 0.34 ± 0.03 0.36 ± 0.03 0.30 ± 0.02 *Statistically significant from controls at p < 0.05. aTotal number of trials completed during each session, maximum = 100. bNumber of reinforcements obtained divided by the number of reinforcements delivered (× 100). cNumber of correct trial responses divided by the number of trial responses. dThe number of inter-trial intervals (ITI) in which at least one response was made divided by the total number of ITI (× 100).
eThe total number of incorrect trial responses following an initial incorrect response. fThe total number of ITI responses following an initial ITI response. gThe latency (sec) to make a correct trial response. hThe number of responses within 2 sec. iThe number of responses taking >6 sec.
jThe mean latency (sec) to obtain reinforcement.
Health effect at LOAEL NOAEL LOAEL N/A N/A N/A
Comments: This study observed alterations in a number of parameters, including forelimb grip strength, total distance traveled, number of movements, and several visual discrimination performance tests. LOAEL and NOAEL values cannot be determined because a dose-response relationship was not apparent. Statistically significant results occurred in a low exposure group and not others, while forelimb grip was found to be significantly increased in the highest exposure group on d 3. Acute duration of exposure (exposure on 3 consecutive d). Generally, acute exposure studies have limited utility in quantitation of human health reference values. Tables reproduced from McKee et al. (2010) with permission of International Journal of Toxicology
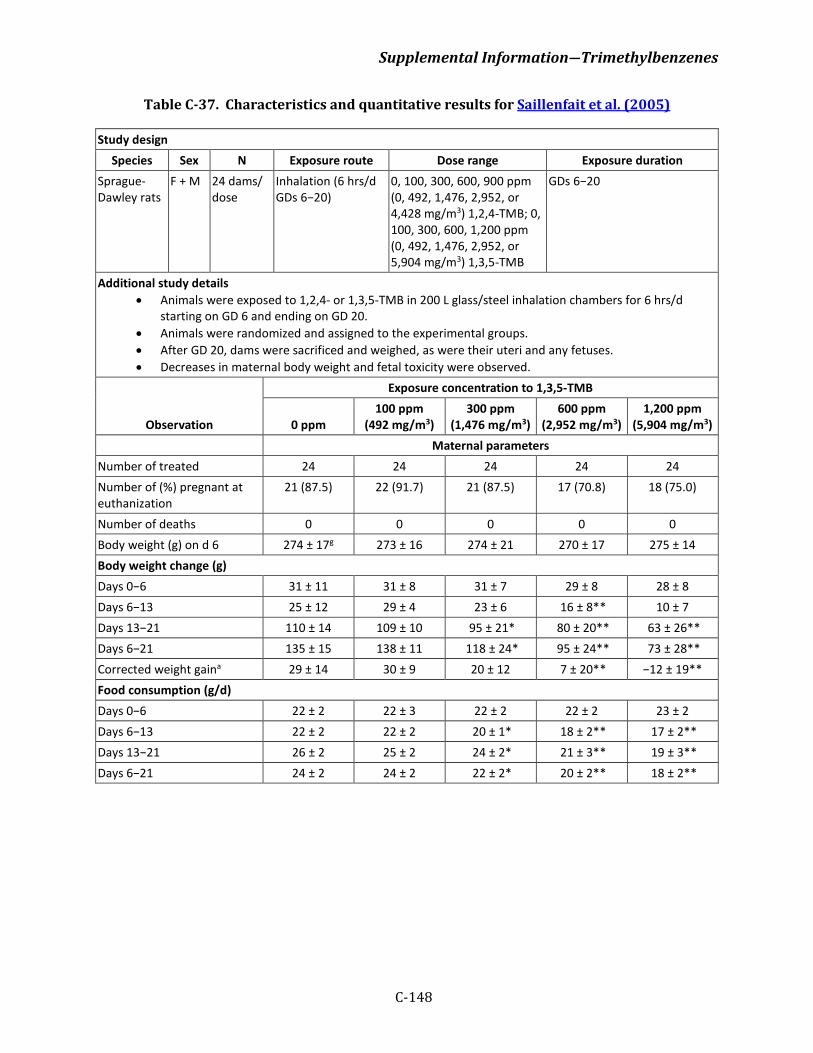
Supplemental Information―Trimethylbenzenes
C-148
Table C-37. Characteristics and quantitative results for Saillenfait et al. (2005)
Study design Species Sex N Exposure route Dose range Exposure duration
Sprague-Dawley rats
F + M 24 dams/dose
Inhalation (6 hrs/d GDs 6−20)
0, 100, 300, 600, 900 ppm (0, 492, 1,476, 2,952, or 4,428 mg/m3) 1,2,4-TMB; 0, 100, 300, 600, 1,200 ppm (0, 492, 1,476, 2,952, or 5,904 mg/m3) 1,3,5-TMB
GDs 6−20
Additional study details • Animals were exposed to 1,2,4- or 1,3,5-TMB in 200 L glass/steel inhalation chambers for 6 hrs/d
starting on GD 6 and ending on GD 20. • Animals were randomized and assigned to the experimental groups. • After GD 20, dams were sacrificed and weighed, as were their uteri and any fetuses. • Decreases in maternal body weight and fetal toxicity were observed.
Observation
Exposure concentration to 1,3,5-TMB
0 ppm 100 ppm
(492 mg/m3) 300 ppm
(1,476 mg/m3) 600 ppm
(2,952 mg/m3) 1,200 ppm
(5,904 mg/m3) Maternal parameters
Number of treated 24 24 24 24 24 Number of (%) pregnant at euthanization
21 (87.5) 22 (91.7) 21 (87.5) 17 (70.8) 18 (75.0)
Number of deaths 0 0 0 0 0 Body weight (g) on d 6 274 ± 17g 273 ± 16 274 ± 21 270 ± 17 275 ± 14 Body weight change (g) Days 0−6 31 ± 11 31 ± 8 31 ± 7 29 ± 8 28 ± 8 Days 6−13 25 ± 12 29 ± 4 23 ± 6 16 ± 8** 10 ± 7 Days 13−21 110 ± 14 109 ± 10 95 ± 21* 80 ± 20** 63 ± 26** Days 6−21 135 ± 15 138 ± 11 118 ± 24* 95 ± 24** 73 ± 28** Corrected weight gaina 29 ± 14 30 ± 9 20 ± 12 7 ± 20** −12 ± 19** Food consumption (g/d) Days 0−6 22 ± 2 22 ± 3 22 ± 2 22 ± 2 23 ± 2 Days 6−13 22 ± 2 22 ± 2 20 ± 1* 18 ± 2** 17 ± 2** Days 13−21 26 ± 2 25 ± 2 24 ± 2* 21 ± 3** 19 ± 3** Days 6−21 24 ± 2 24 ± 2 22 ± 2* 20 ± 2** 18 ± 2**
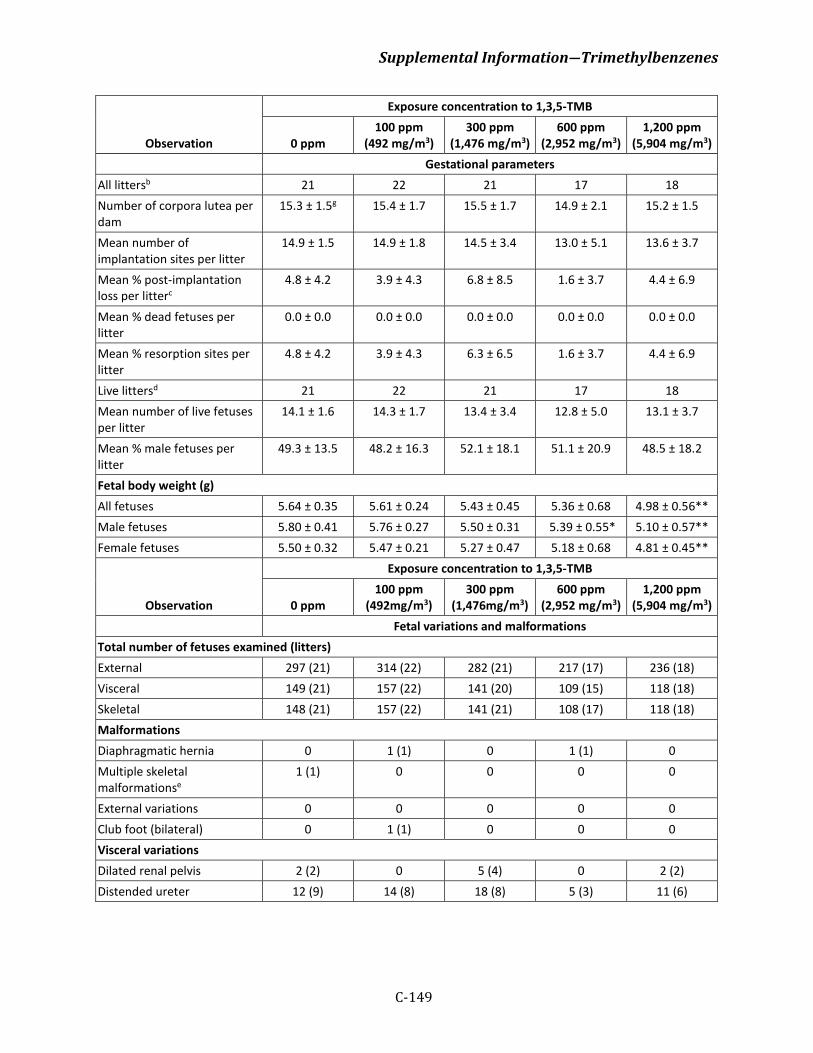
Supplemental Information―Trimethylbenzenes
C-149
Observation
Exposure concentration to 1,3,5-TMB
0 ppm 100 ppm
(492 mg/m3) 300 ppm
(1,476 mg/m3) 600 ppm
(2,952 mg/m3) 1,200 ppm
(5,904 mg/m3) Gestational parameters
All littersb 21 22 21 17 18 Number of corpora lutea per dam
15.3 ± 1.5g 15.4 ± 1.7 15.5 ± 1.7 14.9 ± 2.1 15.2 ± 1.5
Mean number of implantation sites per litter
14.9 ± 1.5 14.9 ± 1.8 14.5 ± 3.4 13.0 ± 5.1 13.6 ± 3.7
Mean % post-implantation loss per litterc
4.8 ± 4.2 3.9 ± 4.3 6.8 ± 8.5 1.6 ± 3.7 4.4 ± 6.9
Mean % dead fetuses per litter
0.0 ± 0.0 0.0 ± 0.0 0.0 ± 0.0 0.0 ± 0.0 0.0 ± 0.0
Mean % resorption sites per litter
4.8 ± 4.2 3.9 ± 4.3 6.3 ± 6.5 1.6 ± 3.7 4.4 ± 6.9
Live littersd 21 22 21 17 18 Mean number of live fetuses per litter
14.1 ± 1.6 14.3 ± 1.7 13.4 ± 3.4 12.8 ± 5.0 13.1 ± 3.7
Mean % male fetuses per litter
49.3 ± 13.5 48.2 ± 16.3 52.1 ± 18.1 51.1 ± 20.9 48.5 ± 18.2
Fetal body weight (g) All fetuses 5.64 ± 0.35 5.61 ± 0.24 5.43 ± 0.45 5.36 ± 0.68 4.98 ± 0.56** Male fetuses 5.80 ± 0.41 5.76 ± 0.27 5.50 ± 0.31 5.39 ± 0.55* 5.10 ± 0.57** Female fetuses 5.50 ± 0.32 5.47 ± 0.21 5.27 ± 0.47 5.18 ± 0.68 4.81 ± 0.45**
Observation
Exposure concentration to 1,3,5-TMB
0 ppm 100 ppm
(492mg/m3) 300 ppm
(1,476mg/m3) 600 ppm
(2,952 mg/m3) 1,200 ppm
(5,904 mg/m3)
Fetal variations and malformations Total number of fetuses examined (litters) External 297 (21) 314 (22) 282 (21) 217 (17) 236 (18) Visceral 149 (21) 157 (22) 141 (20) 109 (15) 118 (18) Skeletal 148 (21) 157 (22) 141 (21) 108 (17) 118 (18) Malformations Diaphragmatic hernia 0 1 (1) 0 1 (1) 0 Multiple skeletal malformationse
1 (1) 0 0 0 0
External variations 0 0 0 0 0 Club foot (bilateral) 0 1 (1) 0 0 0 Visceral variations Dilated renal pelvis 2 (2) 0 5 (4) 0 2 (2) Distended ureter 12 (9) 14 (8) 18 (8) 5 (3) 11 (6)
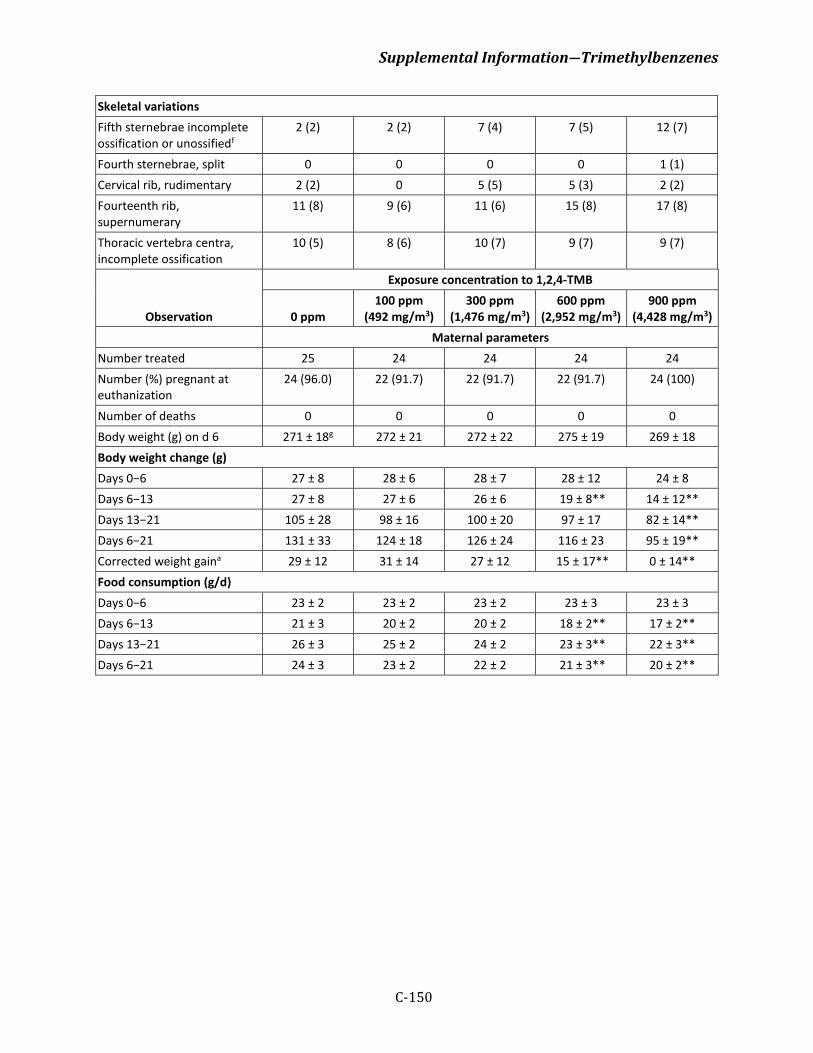
Supplemental Information―Trimethylbenzenes
C-150
Skeletal variations Fifth sternebrae incomplete ossification or unossifiedf
2 (2) 2 (2) 7 (4) 7 (5) 12 (7)
Fourth sternebrae, split 0 0 0 0 1 (1) Cervical rib, rudimentary 2 (2) 0 5 (5) 5 (3) 2 (2) Fourteenth rib, supernumerary
11 (8) 9 (6) 11 (6) 15 (8) 17 (8)
Thoracic vertebra centra, incomplete ossification
10 (5) 8 (6) 10 (7) 9 (7) 9 (7)
Observation
Exposure concentration to 1,2,4-TMB
0 ppm 100 ppm
(492 mg/m3) 300 ppm
(1,476 mg/m3) 600 ppm
(2,952 mg/m3) 900 ppm
(4,428 mg/m3) Maternal parameters
Number treated 25 24 24 24 24 Number (%) pregnant at euthanization
24 (96.0) 22 (91.7) 22 (91.7) 22 (91.7) 24 (100)
Number of deaths 0 0 0 0 0 Body weight (g) on d 6 271 ± 18g 272 ± 21 272 ± 22 275 ± 19 269 ± 18 Body weight change (g) Days 0−6 27 ± 8 28 ± 6 28 ± 7 28 ± 12 24 ± 8 Days 6−13 27 ± 8 27 ± 6 26 ± 6 19 ± 8** 14 ± 12** Days 13−21 105 ± 28 98 ± 16 100 ± 20 97 ± 17 82 ± 14** Days 6−21 131 ± 33 124 ± 18 126 ± 24 116 ± 23 95 ± 19** Corrected weight gaina 29 ± 12 31 ± 14 27 ± 12 15 ± 17** 0 ± 14** Food consumption (g/d) Days 0−6 23 ± 2 23 ± 2 23 ± 2 23 ± 3 23 ± 3 Days 6−13 21 ± 3 20 ± 2 20 ± 2 18 ± 2** 17 ± 2** Days 13−21 26 ± 3 25 ± 2 24 ± 2 23 ± 3** 22 ± 3** Days 6−21 24 ± 3 23 ± 2 22 ± 2 21 ± 3** 20 ± 2**
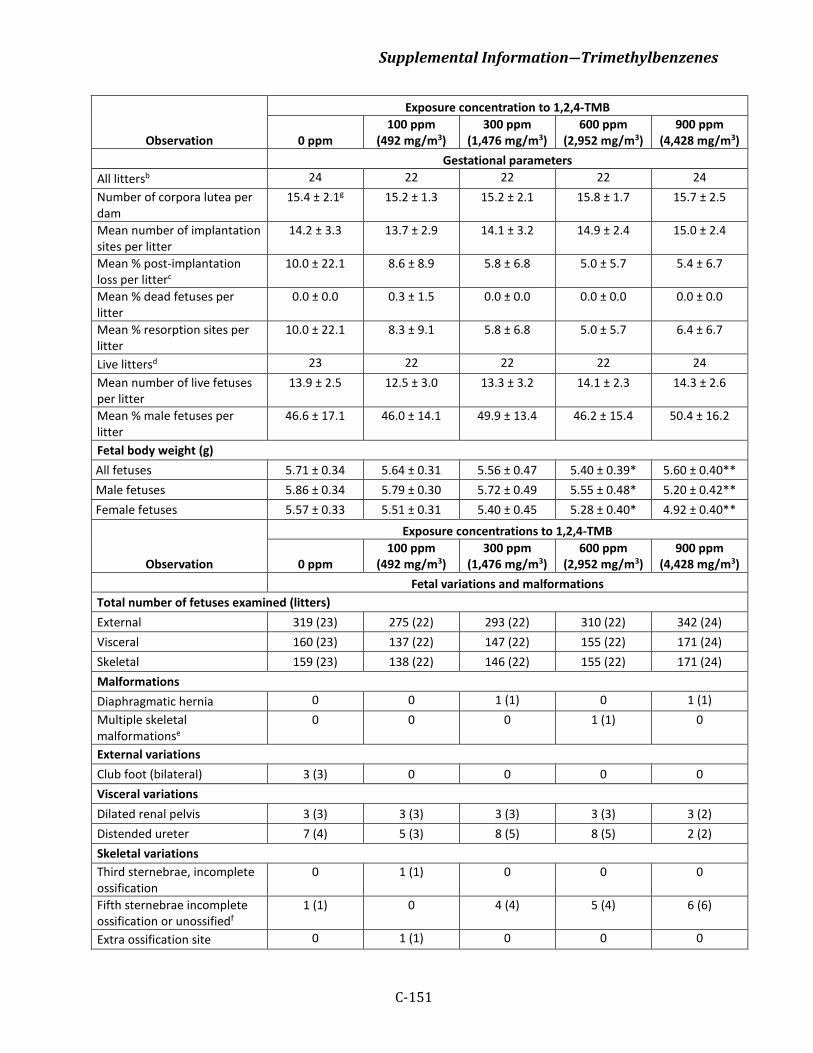
Supplemental Information―Trimethylbenzenes
C-151
Observation
Exposure concentration to 1,2,4-TMB
0 ppm 100 ppm
(492 mg/m3) 300 ppm
(1,476 mg/m3) 600 ppm
(2,952 mg/m3) 900 ppm
(4,428 mg/m3) Gestational parameters
All littersb 24 22 22 22 24 Number of corpora lutea per dam
15.4 ± 2.1g 15.2 ± 1.3 15.2 ± 2.1 15.8 ± 1.7 15.7 ± 2.5
Mean number of implantation sites per litter
14.2 ± 3.3 13.7 ± 2.9 14.1 ± 3.2 14.9 ± 2.4 15.0 ± 2.4
Mean % post-implantation loss per litterc
10.0 ± 22.1 8.6 ± 8.9 5.8 ± 6.8 5.0 ± 5.7 5.4 ± 6.7
Mean % dead fetuses per litter
0.0 ± 0.0 0.3 ± 1.5 0.0 ± 0.0 0.0 ± 0.0 0.0 ± 0.0
Mean % resorption sites per litter
10.0 ± 22.1 8.3 ± 9.1 5.8 ± 6.8 5.0 ± 5.7 6.4 ± 6.7
Live littersd 23 22 22 22 24 Mean number of live fetuses per litter
13.9 ± 2.5 12.5 ± 3.0 13.3 ± 3.2 14.1 ± 2.3 14.3 ± 2.6
Mean % male fetuses per litter
46.6 ± 17.1 46.0 ± 14.1 49.9 ± 13.4 46.2 ± 15.4 50.4 ± 16.2
Fetal body weight (g) All fetuses 5.71 ± 0.34 5.64 ± 0.31 5.56 ± 0.47 5.40 ± 0.39* 5.60 ± 0.40** Male fetuses 5.86 ± 0.34 5.79 ± 0.30 5.72 ± 0.49 5.55 ± 0.48* 5.20 ± 0.42** Female fetuses 5.57 ± 0.33 5.51 ± 0.31 5.40 ± 0.45 5.28 ± 0.40* 4.92 ± 0.40**
Observation
Exposure concentrations to 1,2,4-TMB
0 ppm 100 ppm
(492 mg/m3) 300 ppm
(1,476 mg/m3) 600 ppm
(2,952 mg/m3) 900 ppm
(4,428 mg/m3) Fetal variations and malformations
Total number of fetuses examined (litters) External 319 (23) 275 (22) 293 (22) 310 (22) 342 (24) Visceral 160 (23) 137 (22) 147 (22) 155 (22) 171 (24) Skeletal 159 (23) 138 (22) 146 (22) 155 (22) 171 (24) Malformations Diaphragmatic hernia 0 0 1 (1) 0 1 (1) Multiple skeletal malformationse
0 0 0 1 (1) 0
External variations Club foot (bilateral) 3 (3) 0 0 0 0 Visceral variations Dilated renal pelvis 3 (3) 3 (3) 3 (3) 3 (3) 3 (2) Distended ureter 7 (4) 5 (3) 8 (5) 8 (5) 2 (2) Skeletal variations Third sternebrae, incomplete ossification
0 1 (1) 0 0 0
Fifth sternebrae incomplete ossification or unossifiedf
1 (1) 0 4 (4) 5 (4) 6 (6)
Extra ossification site 0 1 (1) 0 0 0
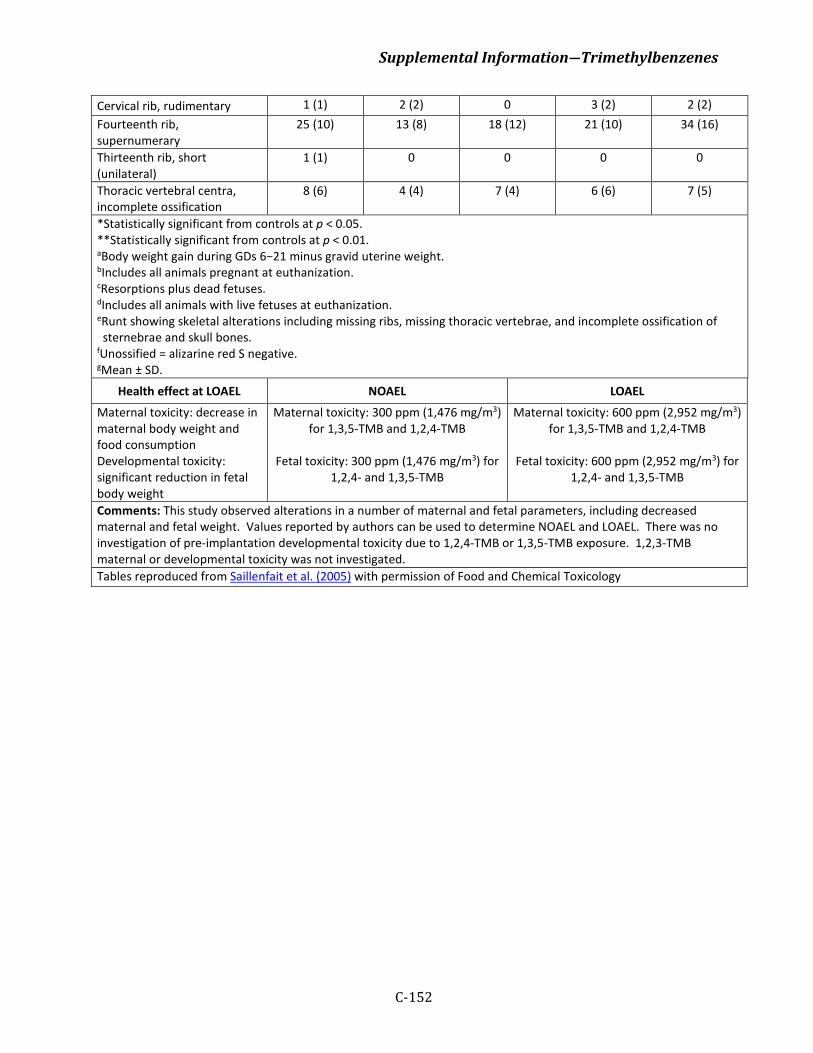
Supplemental Information―Trimethylbenzenes
C-152
Cervical rib, rudimentary 1 (1) 2 (2) 0 3 (2) 2 (2) Fourteenth rib, supernumerary
25 (10) 13 (8) 18 (12) 21 (10) 34 (16)
Thirteenth rib, short (unilateral)
1 (1) 0 0 0 0
Thoracic vertebral centra, incomplete ossification
8 (6) 4 (4) 7 (4) 6 (6) 7 (5)
*Statistically significant from controls at p < 0.05. **Statistically significant from controls at p < 0.01. aBody weight gain during GDs 6−21 minus gravid uterine weight. bIncludes all animals pregnant at euthanization. cResorptions plus dead fetuses. dIncludes all animals with live fetuses at euthanization. eRunt showing skeletal alterations including missing ribs, missing thoracic vertebrae, and incomplete ossification of sternebrae and skull bones.
fUnossified = alizarine red S negative. gMean ± SD.
Health effect at LOAEL NOAEL LOAEL
Maternal toxicity: decrease in maternal body weight and food consumption Developmental toxicity: significant reduction in fetal body weight
Maternal toxicity: 300 ppm (1,476 mg/m3) for 1,3,5-TMB and 1,2,4-TMB
Fetal toxicity: 300 ppm (1,476 mg/m3) for
1,2,4- and 1,3,5-TMB
Maternal toxicity: 600 ppm (2,952 mg/m3) for 1,3,5-TMB and 1,2,4-TMB
Fetal toxicity: 600 ppm (2,952 mg/m3) for
1,2,4- and 1,3,5-TMB
Comments: This study observed alterations in a number of maternal and fetal parameters, including decreased maternal and fetal weight. Values reported by authors can be used to determine NOAEL and LOAEL. There was no investigation of pre-implantation developmental toxicity due to 1,2,4-TMB or 1,3,5-TMB exposure. 1,2,3-TMB maternal or developmental toxicity was not investigated. Tables reproduced from Saillenfait et al. (2005) with permission of Food and Chemical Toxicology
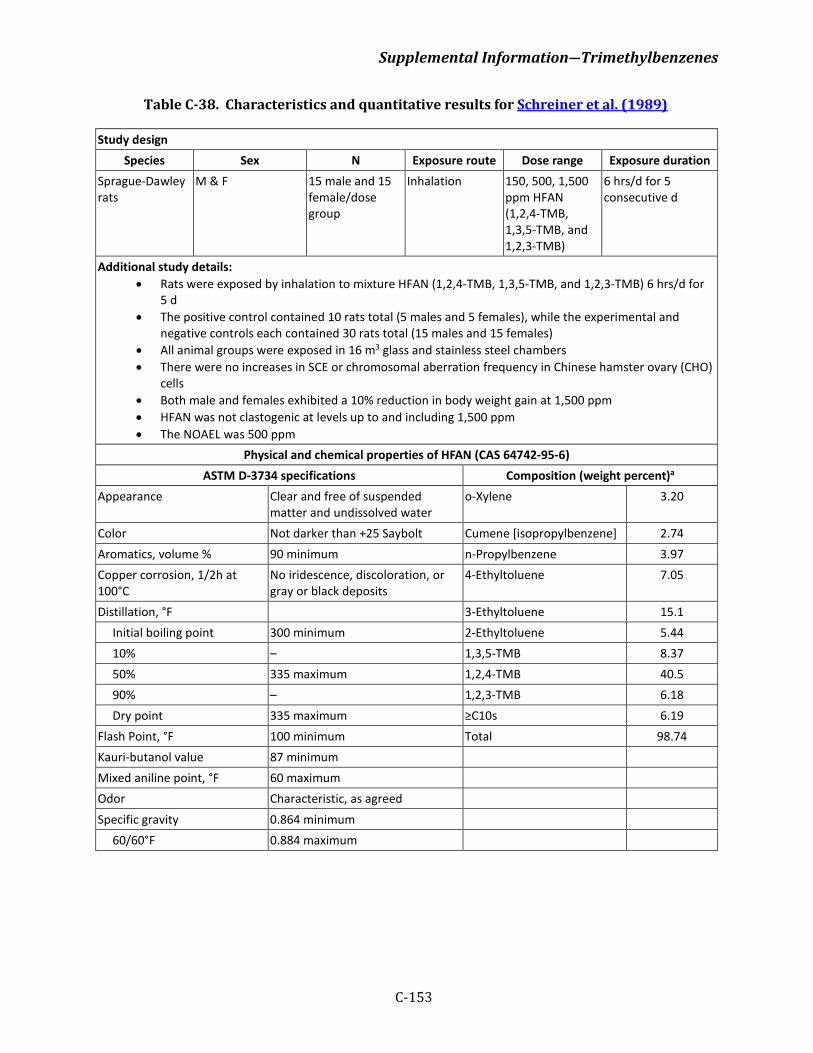
Supplemental Information―Trimethylbenzenes
C-153
Table C-38. Characteristics and quantitative results for Schreiner et al. (1989)
Study design Species Sex N Exposure route Dose range Exposure duration
Sprague-Dawley rats
M & F 15 male and 15 female/dose group
Inhalation 150, 500, 1,500 ppm HFAN (1,2,4-TMB, 1,3,5-TMB, and 1,2,3-TMB)
6 hrs/d for 5 consecutive d
Additional study details: • Rats were exposed by inhalation to mixture HFAN (1,2,4-TMB, 1,3,5-TMB, and 1,2,3-TMB) 6 hrs/d for
5 d • The positive control contained 10 rats total (5 males and 5 females), while the experimental and
negative controls each contained 30 rats total (15 males and 15 females) • All animal groups were exposed in 16 m3 glass and stainless steel chambers • There were no increases in SCE or chromosomal aberration frequency in Chinese hamster ovary (CHO)
cells • Both male and females exhibited a 10% reduction in body weight gain at 1,500 ppm • HFAN was not clastogenic at levels up to and including 1,500 ppm • The NOAEL was 500 ppm
Physical and chemical properties of HFAN (CAS 64742-95-6) ASTM D-3734 specifications Composition (weight percent)a
Appearance Clear and free of suspended matter and undissolved water
o-Xylene 3.20
Color Not darker than +25 Saybolt Cumene [isopropylbenzene] 2.74 Aromatics, volume % 90 minimum n-Propylbenzene 3.97 Copper corrosion, 1/2h at 100°C
No iridescence, discoloration, or gray or black deposits
4-Ethyltoluene 7.05
Distillation, °F 3-Ethyltoluene 15.1 Initial boiling point 300 minimum 2-Ethyltoluene 5.44 10% – 1,3,5-TMB 8.37 50% 335 maximum 1,2,4-TMB 40.5 90% – 1,2,3-TMB 6.18 Dry point 335 maximum ≥C10s 6.19
Flash Point, °F 100 minimum Total 98.74 Kauri-butanol value 87 minimum Mixed aniline point, °F 60 maximum Odor Characteristic, as agreed Specific gravity 0.864 minimum
60/60°F 0.884 maximum
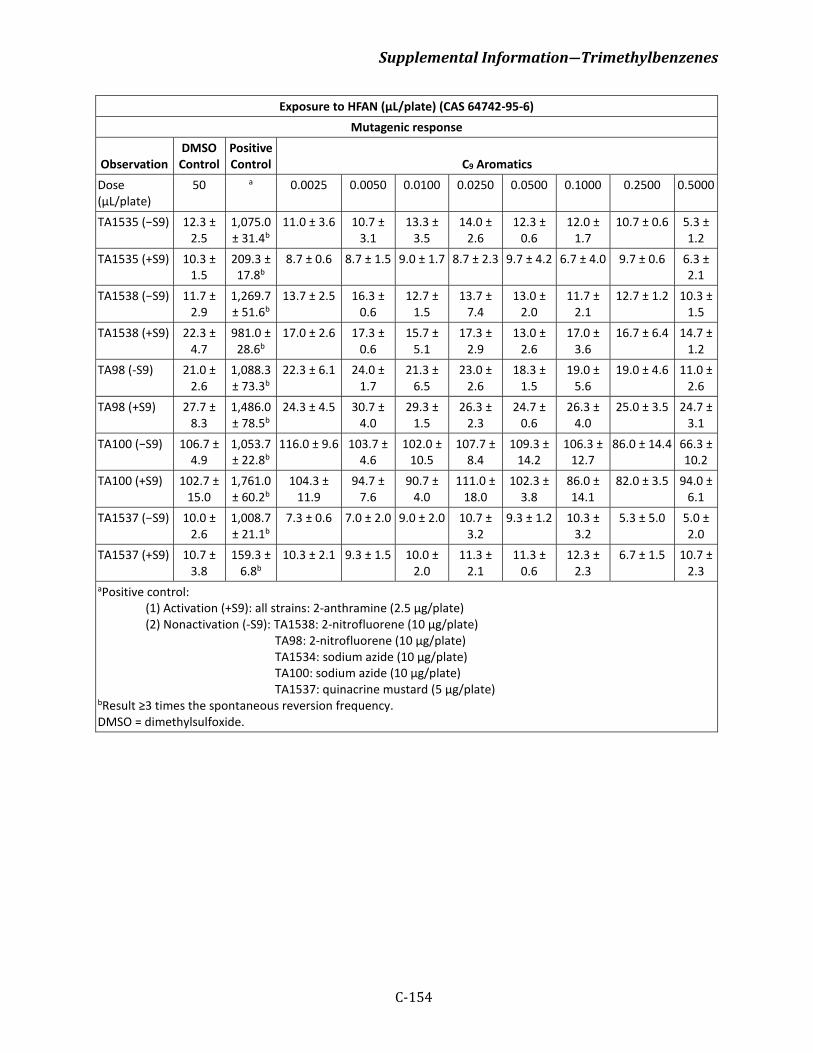
Supplemental Information―Trimethylbenzenes
C-154
Exposure to HFAN (µL/plate) (CAS 64742-95-6) Mutagenic response
Observation DMSO Control
Positive Control C9 Aromatics
Dose (µL/plate)
50 a 0.0025 0.0050 0.0100 0.0250 0.0500 0.1000 0.2500 0.5000
TA1535 (−S9) 12.3 ± 2.5
1,075.0 ± 31.4b
11.0 ± 3.6 10.7 ± 3.1
13.3 ± 3.5
14.0 ± 2.6
12.3 ± 0.6
12.0 ± 1.7
10.7 ± 0.6 5.3 ± 1.2
TA1535 (+S9) 10.3 ± 1.5
209.3 ± 17.8b
8.7 ± 0.6 8.7 ± 1.5 9.0 ± 1.7 8.7 ± 2.3 9.7 ± 4.2 6.7 ± 4.0 9.7 ± 0.6 6.3 ± 2.1
TA1538 (−S9) 11.7 ± 2.9
1,269.7 ± 51.6b
13.7 ± 2.5 16.3 ± 0.6
12.7 ± 1.5
13.7 ± 7.4
13.0 ± 2.0
11.7 ± 2.1
12.7 ± 1.2 10.3 ± 1.5
TA1538 (+S9) 22.3 ± 4.7
981.0 ± 28.6b
17.0 ± 2.6 17.3 ± 0.6
15.7 ± 5.1
17.3 ± 2.9
13.0 ± 2.6
17.0 ± 3.6
16.7 ± 6.4 14.7 ± 1.2
TA98 (-S9) 21.0 ± 2.6
1,088.3 ± 73.3b
22.3 ± 6.1 24.0 ± 1.7
21.3 ± 6.5
23.0 ± 2.6
18.3 ± 1.5
19.0 ± 5.6
19.0 ± 4.6 11.0 ± 2.6
TA98 (+S9) 27.7 ± 8.3
1,486.0 ± 78.5b
24.3 ± 4.5 30.7 ± 4.0
29.3 ± 1.5
26.3 ± 2.3
24.7 ± 0.6
26.3 ± 4.0
25.0 ± 3.5 24.7 ± 3.1
TA100 (−S9) 106.7 ± 4.9
1,053.7 ± 22.8b
116.0 ± 9.6 103.7 ± 4.6
102.0 ± 10.5
107.7 ± 8.4
109.3 ± 14.2
106.3 ± 12.7
86.0 ± 14.4 66.3 ± 10.2
TA100 (+S9) 102.7 ± 15.0
1,761.0 ± 60.2b
104.3 ± 11.9
94.7 ± 7.6
90.7 ± 4.0
111.0 ± 18.0
102.3 ± 3.8
86.0 ± 14.1
82.0 ± 3.5 94.0 ± 6.1
TA1537 (−S9) 10.0 ± 2.6
1,008.7 ± 21.1b
7.3 ± 0.6 7.0 ± 2.0 9.0 ± 2.0 10.7 ± 3.2
9.3 ± 1.2 10.3 ± 3.2
5.3 ± 5.0 5.0 ± 2.0
TA1537 (+S9) 10.7 ± 3.8
159.3 ± 6.8b
10.3 ± 2.1 9.3 ± 1.5 10.0 ± 2.0
11.3 ± 2.1
11.3 ± 0.6
12.3 ± 2.3
6.7 ± 1.5 10.7 ± 2.3
aPositive control: (1) Activation (+S9): all strains: 2-anthramine (2.5 µg/plate) (2) Nonactivation (-S9): TA1538: 2-nitrofluorene (10 µg/plate)
TA98: 2-nitrofluorene (10 µg/plate) TA1534: sodium azide (10 µg/plate) TA100: sodium azide (10 µg/plate) TA1537: quinacrine mustard (5 µg/plate)
bResult ≥3 times the spontaneous reversion frequency. DMSO = dimethylsulfoxide.
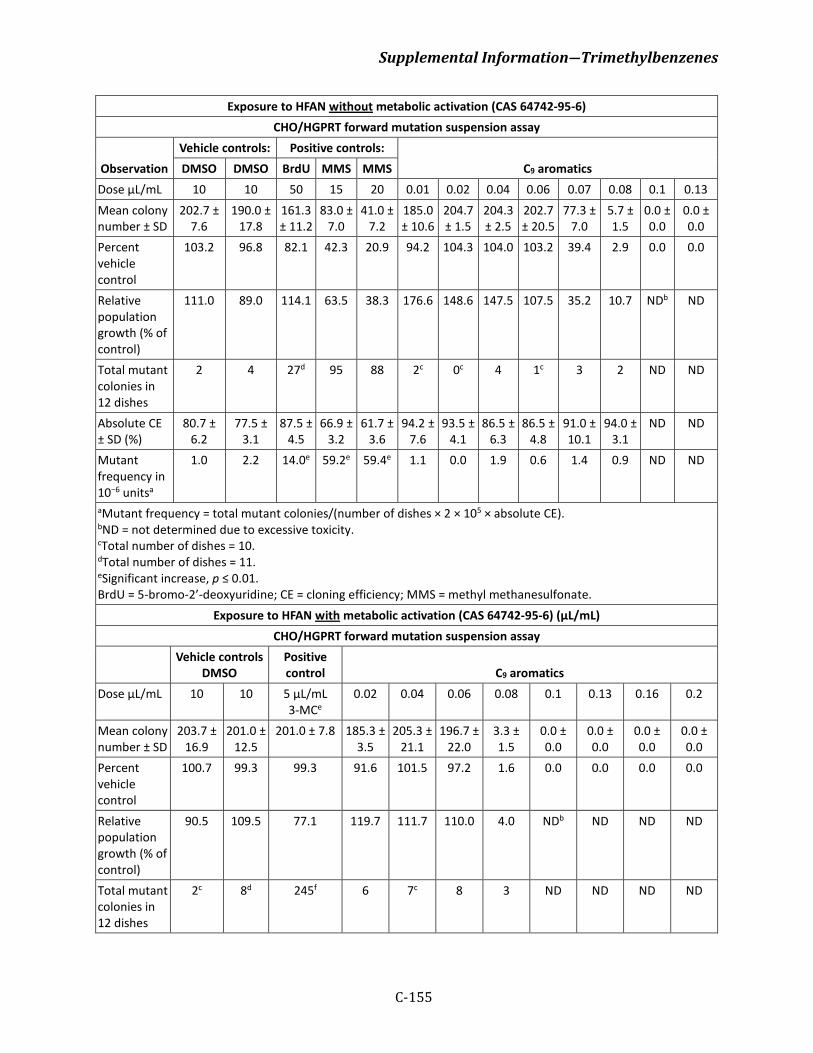
Supplemental Information―Trimethylbenzenes
C-155
Exposure to HFAN without metabolic activation (CAS 64742-95-6) CHO/HGPRT forward mutation suspension assay
Observation Vehicle controls: Positive controls:
C9 aromatics DMSO DMSO BrdU MMS MMS Dose µL/mL 10 10 50 15 20 0.01 0.02 0.04 0.06 0.07 0.08 0.1 0.13 Mean colony number ± SD
202.7 ± 7.6
190.0 ± 17.8
161.3 ± 11.2
83.0 ± 7.0
41.0 ± 7.2
185.0 ± 10.6
204.7 ± 1.5
204.3 ± 2.5
202.7 ± 20.5
77.3 ± 7.0
5.7 ± 1.5
0.0 ± 0.0
0.0 ± 0.0
Percent vehicle control
103.2 96.8 82.1 42.3 20.9 94.2 104.3 104.0 103.2 39.4 2.9 0.0 0.0
Relative population growth (% of control)
111.0 89.0 114.1 63.5 38.3 176.6 148.6 147.5 107.5 35.2 10.7 NDb ND
Total mutant colonies in 12 dishes
2 4 27d 95 88 2c 0c 4 1c 3 2 ND ND
Absolute CE ± SD (%)
80.7 ± 6.2
77.5 ± 3.1
87.5 ± 4.5
66.9 ± 3.2
61.7 ± 3.6
94.2 ± 7.6
93.5 ± 4.1
86.5 ± 6.3
86.5 ± 4.8
91.0 ± 10.1
94.0 ± 3.1
ND ND
Mutant frequency in 10−6 unitsa
1.0 2.2 14.0e 59.2e 59.4e 1.1 0.0 1.9 0.6 1.4 0.9 ND ND
aMutant frequency = total mutant colonies/(number of dishes × 2 × 10⁵ × absolute CE). bND = not determined due to excessive toxicity. cTotal number of dishes = 10. dTotal number of dishes = 11. eSignificant increase, p ≤ 0.01. BrdU = 5-bromo-2’-deoxyuridine; CE = cloning efficiency; MMS = methyl methanesulfonate.
Exposure to HFAN with metabolic activation (CAS 64742-95-6) (µL/mL) CHO/HGPRT forward mutation suspension assay
Vehicle controls
DMSO Positive control C9 aromatics
Dose µL/mL 10 10 5 µL/mL 3-MCe
0.02 0.04 0.06 0.08 0.1 0.13 0.16 0.2
Mean colony number ± SD
203.7 ± 16.9
201.0 ± 12.5
201.0 ± 7.8 185.3 ± 3.5
205.3 ± 21.1
196.7 ± 22.0
3.3 ± 1.5
0.0 ± 0.0
0.0 ± 0.0
0.0 ± 0.0
0.0 ± 0.0
Percent vehicle control
100.7 99.3 99.3 91.6 101.5 97.2 1.6 0.0 0.0 0.0 0.0
Relative population growth (% of control)
90.5 109.5 77.1 119.7 111.7 110.0 4.0 NDb ND ND ND
Total mutant colonies in 12 dishes
2c 8d 245f 6 7c 8 3 ND ND ND ND
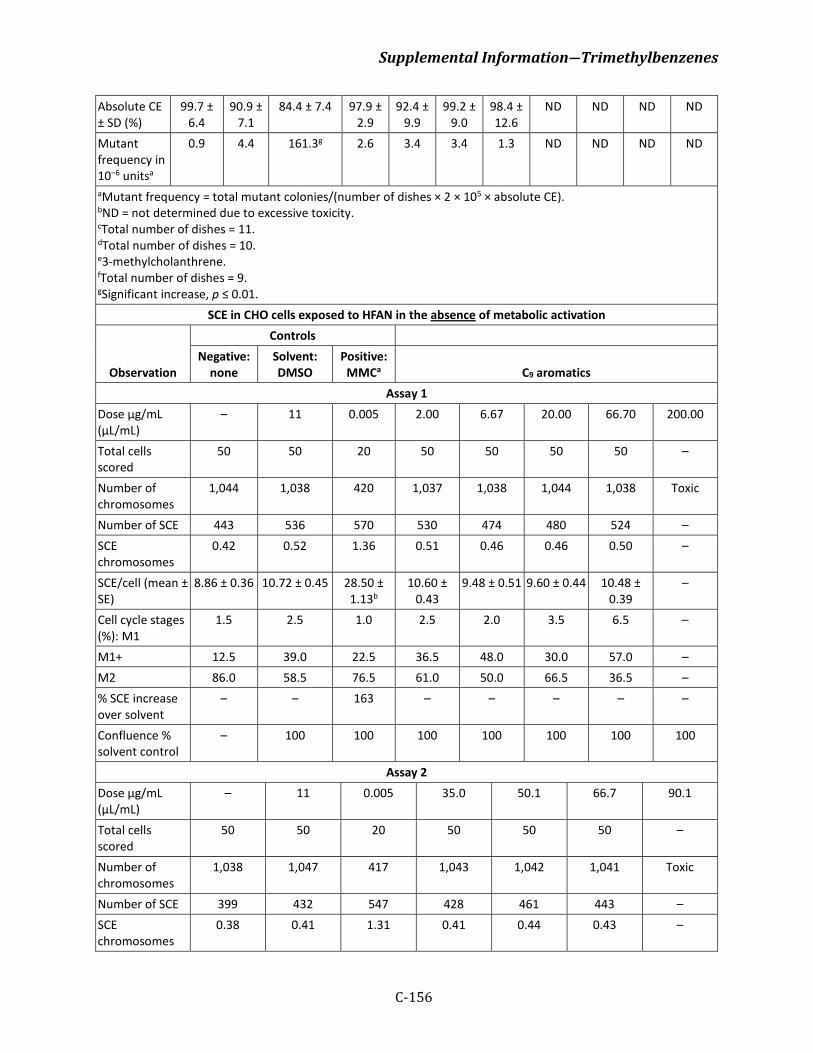
Supplemental Information―Trimethylbenzenes
C-156
Absolute CE ± SD (%)
99.7 ± 6.4
90.9 ± 7.1
84.4 ± 7.4 97.9 ± 2.9
92.4 ± 9.9
99.2 ± 9.0
98.4 ± 12.6
ND ND ND ND
Mutant frequency in 10−6 unitsa
0.9 4.4 161.3g 2.6 3.4 3.4 1.3 ND ND ND ND
aMutant frequency = total mutant colonies/(number of dishes × 2 × 10⁵ × absolute CE). bND = not determined due to excessive toxicity. cTotal number of dishes = 11. dTotal number of dishes = 10. e3-methylcholanthrene. fTotal number of dishes = 9. gSignificant increase, p ≤ 0.01.
SCE in CHO cells exposed to HFAN in the absence of metabolic activation
Observation
Controls Negative:
none Solvent: DMSO
Positive: MMCa C9 aromatics
Assay 1 Dose µg/mL (µL/mL)
– 11 0.005 2.00 6.67 20.00 66.70 200.00
Total cells scored
50 50 20 50 50 50 50 –
Number of chromosomes
1,044 1,038 420 1,037 1,038 1,044 1,038 Toxic
Number of SCE 443 536 570 530 474 480 524 – SCE chromosomes
0.42 0.52 1.36 0.51 0.46 0.46 0.50 –
SCE/cell (mean ± SE)
8.86 ± 0.36 10.72 ± 0.45 28.50 ± 1.13b
10.60 ± 0.43
9.48 ± 0.51 9.60 ± 0.44 10.48 ± 0.39
–
Cell cycle stages (%): M1
1.5 2.5 1.0 2.5 2.0 3.5 6.5 –
M1+ 12.5 39.0 22.5 36.5 48.0 30.0 57.0 – M2 86.0 58.5 76.5 61.0 50.0 66.5 36.5 – % SCE increase over solvent
– – 163 – – – – –
Confluence % solvent control
– 100 100 100 100 100 100 100
Assay 2 Dose µg/mL (µL/mL)
– 11 0.005 35.0 50.1 66.7 90.1
Total cells scored
50 50 20 50 50 50 –
Number of chromosomes
1,038 1,047 417 1,043 1,042 1,041 Toxic
Number of SCE 399 432 547 428 461 443 – SCE chromosomes
0.38 0.41 1.31 0.41 0.44 0.43 –
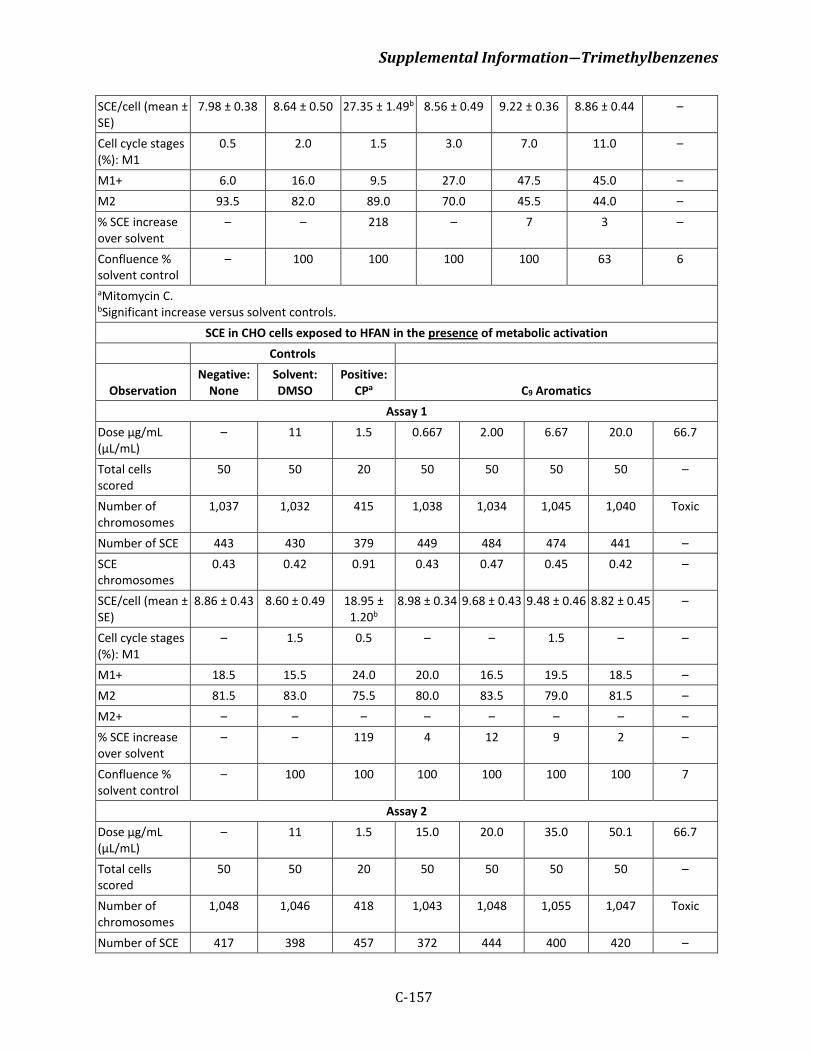
Supplemental Information―Trimethylbenzenes
C-157
SCE/cell (mean ± SE)
7.98 ± 0.38 8.64 ± 0.50 27.35 ± 1.49b 8.56 ± 0.49 9.22 ± 0.36 8.86 ± 0.44 –
Cell cycle stages (%): M1
0.5 2.0 1.5 3.0 7.0 11.0 –
M1+ 6.0 16.0 9.5 27.0 47.5 45.0 – M2 93.5 82.0 89.0 70.0 45.5 44.0 – % SCE increase over solvent
– – 218 – 7 3 –
Confluence % solvent control
– 100 100 100 100 63 6
aMitomycin C. bSignificant increase versus solvent controls.
SCE in CHO cells exposed to HFAN in the presence of metabolic activation Controls
Observation Negative:
None Solvent: DMSO
Positive: CPa C9 Aromatics
Assay 1 Dose µg/mL (µL/mL)
– 11 1.5 0.667 2.00 6.67 20.0 66.7
Total cells scored
50 50 20 50 50 50 50 –
Number of chromosomes
1,037 1,032 415 1,038 1,034 1,045 1,040 Toxic
Number of SCE 443 430 379 449 484 474 441 – SCE chromosomes
0.43 0.42 0.91 0.43 0.47 0.45 0.42 –
SCE/cell (mean ± SE)
8.86 ± 0.43 8.60 ± 0.49 18.95 ± 1.20b
8.98 ± 0.34 9.68 ± 0.43 9.48 ± 0.46 8.82 ± 0.45 –
Cell cycle stages (%): M1
– 1.5 0.5 – – 1.5 – –
M1+ 18.5 15.5 24.0 20.0 16.5 19.5 18.5 – M2 81.5 83.0 75.5 80.0 83.5 79.0 81.5 – M2+ – – – – – – – – % SCE increase over solvent
– – 119 4 12 9 2 –
Confluence % solvent control
– 100 100 100 100 100 100 7
Assay 2 Dose µg/mL (µL/mL)
– 11 1.5 15.0 20.0 35.0 50.1 66.7
Total cells scored
50 50 20 50 50 50 50 –
Number of chromosomes
1,048 1,046 418 1,043 1,048 1,055 1,047 Toxic
Number of SCE 417 398 457 372 444 400 420 –
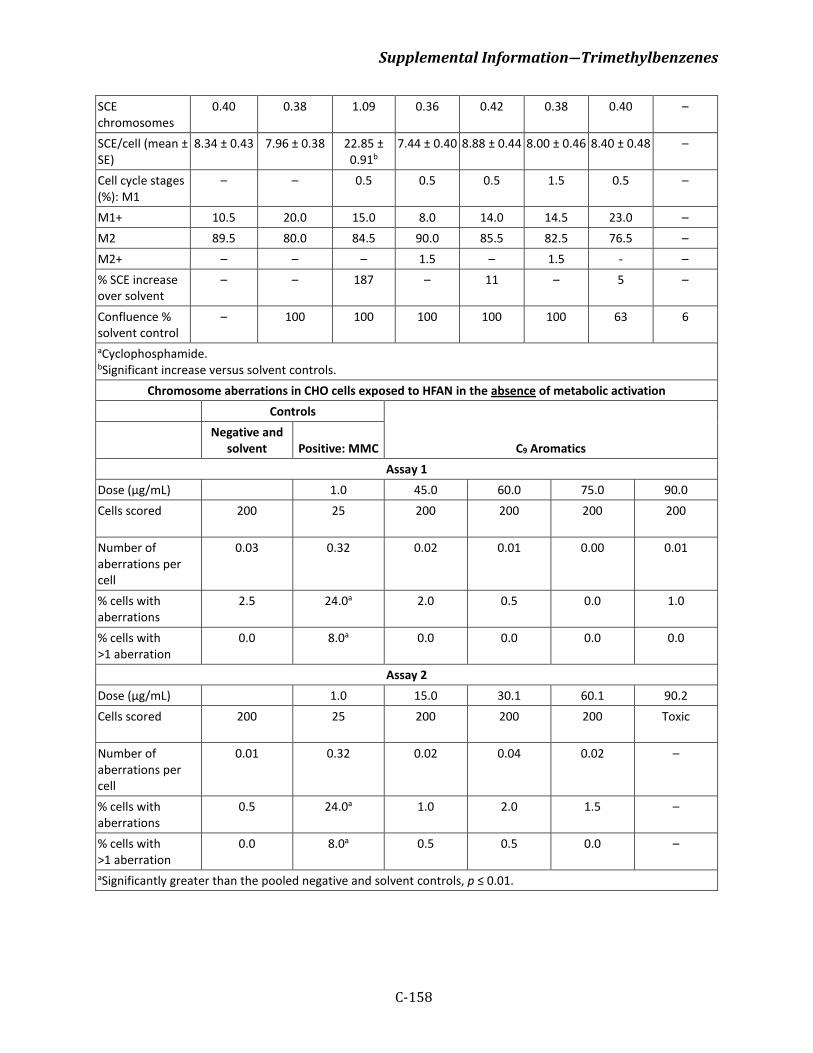
Supplemental Information―Trimethylbenzenes
C-158
SCE chromosomes
0.40 0.38 1.09 0.36 0.42 0.38 0.40 –
SCE/cell (mean ± SE)
8.34 ± 0.43 7.96 ± 0.38 22.85 ± 0.91b
7.44 ± 0.40 8.88 ± 0.44 8.00 ± 0.46 8.40 ± 0.48 –
Cell cycle stages (%): M1
– – 0.5 0.5 0.5 1.5 0.5 –
M1+ 10.5 20.0 15.0 8.0 14.0 14.5 23.0 – M2 89.5 80.0 84.5 90.0 85.5 82.5 76.5 – M2+ – – – 1.5 – 1.5 - – % SCE increase over solvent
– – 187 – 11 – 5 –
Confluence % solvent control
– 100 100 100 100 100 63 6
aCyclophosphamide. bSignificant increase versus solvent controls.
Chromosome aberrations in CHO cells exposed to HFAN in the absence of metabolic activation Controls
C9 Aromatics
Negative and solvent Positive: MMC
Assay 1 Dose (µg/mL) 1.0 45.0 60.0 75.0 90.0 Cells scored
200 25 200 200 200 200
Number of aberrations per cell
0.03 0.32 0.02 0.01 0.00 0.01
% cells with aberrations
2.5 24.0a 2.0 0.5 0.0 1.0
% cells with >1 aberration
0.0 8.0a 0.0 0.0 0.0 0.0
Assay 2 Dose (µg/mL) 1.0 15.0 30.1 60.1 90.2 Cells scored
200 25 200 200 200 Toxic
Number of aberrations per cell
0.01 0.32 0.02 0.04 0.02 –
% cells with aberrations
0.5 24.0a 1.0 2.0 1.5 –
% cells with >1 aberration
0.0 8.0a 0.5 0.5 0.0 –
aSignificantly greater than the pooled negative and solvent controls, p ≤ 0.01.
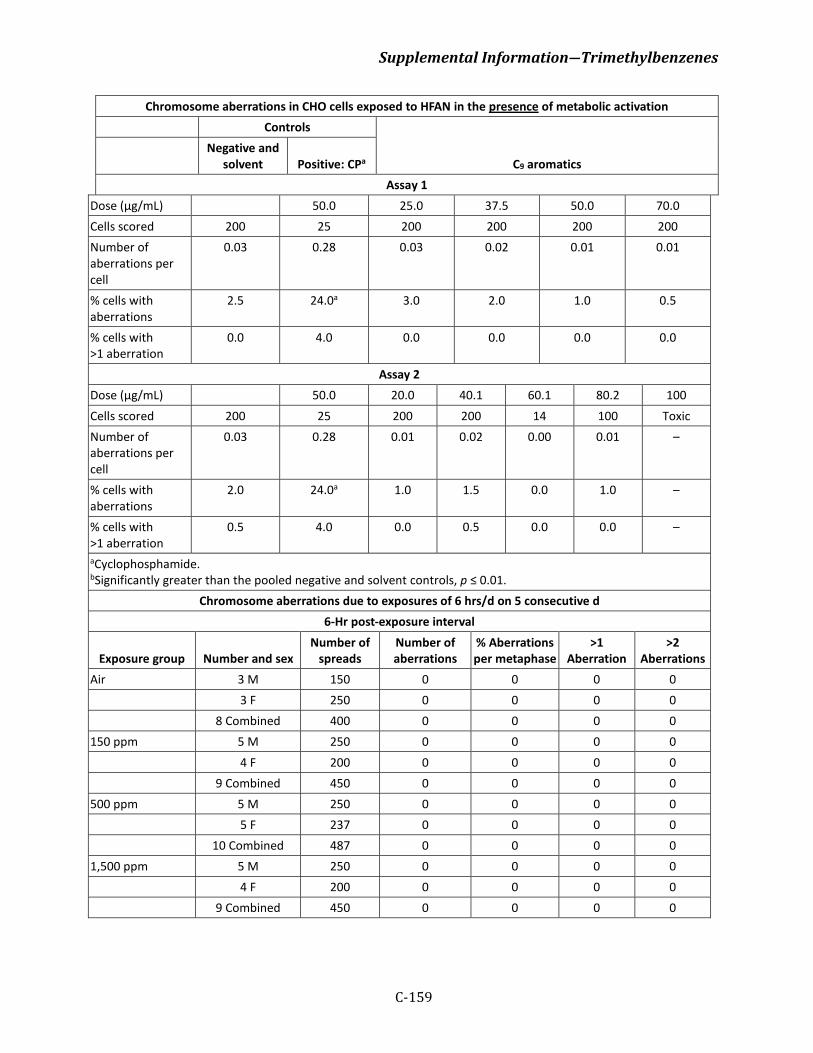
Supplemental Information―Trimethylbenzenes
C-159
Chromosome aberrations in CHO cells exposed to HFAN in the presence of metabolic activation Controls
C9 aromatics
Negative and solvent Positive: CPa
Assay 1 Dose (µg/mL) 50.0 25.0 37.5 50.0 70.0 Cells scored 200 25 200 200 200 200 Number of aberrations per cell
0.03 0.28 0.03 0.02 0.01 0.01
% cells with aberrations
2.5 24.0a 3.0 2.0 1.0 0.5
% cells with >1 aberration
0.0 4.0 0.0 0.0 0.0 0.0
Assay 2 Dose (µg/mL) 50.0 20.0 40.1 60.1 80.2 100 Cells scored 200 25 200 200 14 100 Toxic Number of aberrations per cell
0.03 0.28 0.01 0.02 0.00 0.01 –
% cells with aberrations
2.0 24.0a 1.0 1.5 0.0 1.0 –
% cells with >1 aberration
0.5 4.0 0.0 0.5 0.0 0.0 –
aCyclophosphamide. bSignificantly greater than the pooled negative and solvent controls, p ≤ 0.01.
Chromosome aberrations due to exposures of 6 hrs/d on 5 consecutive d 6-Hr post-exposure interval
Exposure group Number and sex Number of
spreads Number of aberrations
% Aberrations per metaphase
>1 Aberration
>2 Aberrations
Air 3 M 150 0 0 0 0 3 F 250 0 0 0 0 8 Combined 400 0 0 0 0 150 ppm 5 M 250 0 0 0 0 4 F 200 0 0 0 0 9 Combined 450 0 0 0 0 500 ppm 5 M 250 0 0 0 0 5 F 237 0 0 0 0 10 Combined 487 0 0 0 0 1,500 ppm 5 M 250 0 0 0 0 4 F 200 0 0 0 0 9 Combined 450 0 0 0 0

Supplemental Information―Trimethylbenzenes
C-160
24-Hr post-exposure interval Air 4 M 200 0 0 0 0 5 F 250 1 0.4 0.4 0 9 Combined 450 1 0.2 0.2 0 150 ppm 5 M 250 0 0 0 0 5 F 432 0 0 0 0 10 Combined 482 0 0 0 0 500 ppm 5 M 250 0 0 0 0 5 F 250 0 0 0 0 10 Combined 500 0 0 0 0 1,500 ppm 5 M 250 1 0.4 0.4 0 5 F 250 0 0 0 0 10 Combined 500 1 0.2 0.2 0 Cyclophosphamide 4 M 203 70b 34.5b 16.3b 10.3b
5 F 250 60b 24b 13.2b 6.4b
9 Combined 453 130b 28.7b 14.6b 8.2b
48-Hr exposure interval Air 2 M 100 0 0 0 0 2 F 100 0 0 0 0 4 Combined 200 0 0 0 0 150 ppm 2 M 100 0 0 0 0 2 F 100 0 0 0 0 4 Combined 200 0 0 0 0 500 ppm 3 M 150 0 0 0 0 1 F 20 0 0 0 0 4 Combined 200 0 0 0 0 1,500 ppm 2 M 100 0 0 0 0 1 F 20 0 0 0 0 3 Combined 150 0 0 0 0 aData were evaluated only under the following conditions: (1) Animal had at least 30 readable metaphase spreads. (2) At least three animals (of either sex) with adequate data at any time point. bStatistical increase.
NOAEL LOAEL LOAEL effects 500 ppm 1,500 ppm Reduced body weight gain in males
and females Tables reproduced from Schreiner et al. (1989) with permission of Cell Biology and Toxicology
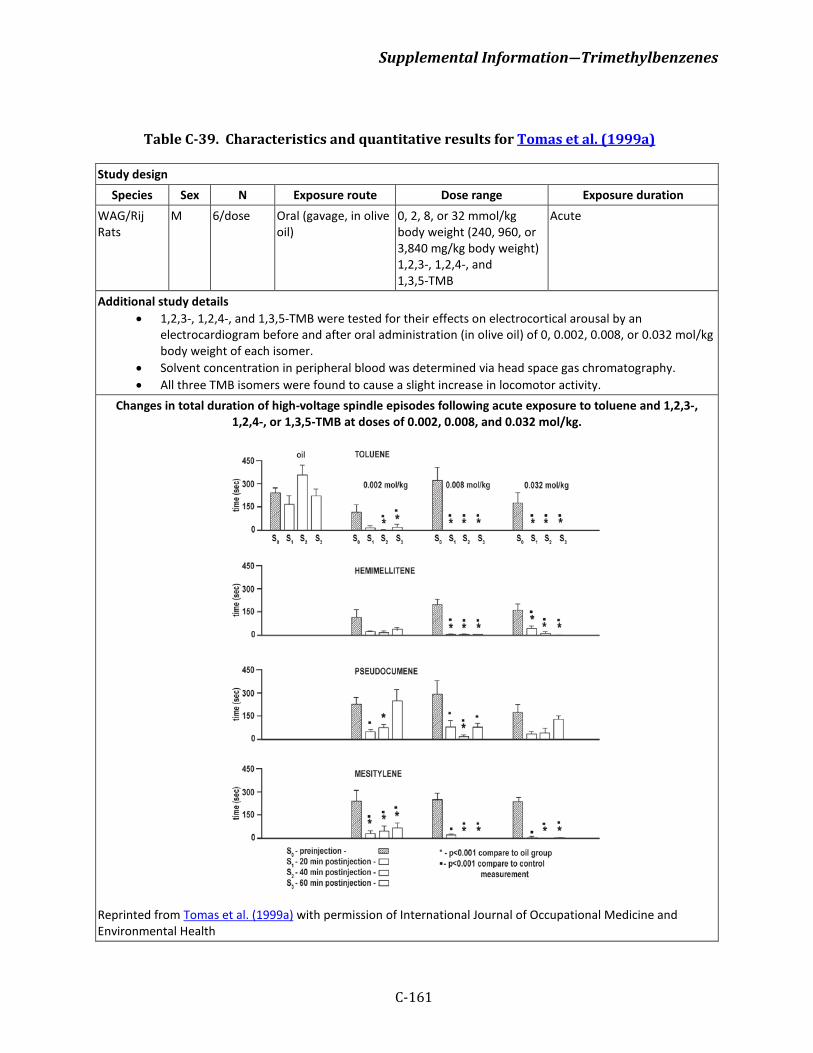
Supplemental Information―Trimethylbenzenes
C-161
Table C-39. Characteristics and quantitative results for Tomas et al. (1999a)
Study design Species Sex N Exposure route Dose range Exposure duration
WAG/Rij Rats
M 6/dose Oral (gavage, in olive oil)
0, 2, 8, or 32 mmol/kg body weight (240, 960, or 3,840 mg/kg body weight) 1,2,3-, 1,2,4-, and 1,3,5-TMB
Acute
Additional study details • 1,2,3-, 1,2,4-, and 1,3,5-TMB were tested for their effects on electrocortical arousal by an
electrocardiogram before and after oral administration (in olive oil) of 0, 0.002, 0.008, or 0.032 mol/kg body weight of each isomer.
• Solvent concentration in peripheral blood was determined via head space gas chromatography. • All three TMB isomers were found to cause a slight increase in locomotor activity.
Changes in total duration of high-voltage spindle episodes following acute exposure to toluene and 1,2,3-, 1,2,4-, or 1,3,5-TMB at doses of 0.002, 0.008, and 0.032 mol/kg.
Reprinted from Tomas et al. (1999a) with permission of International Journal of Occupational Medicine and Environmental Health
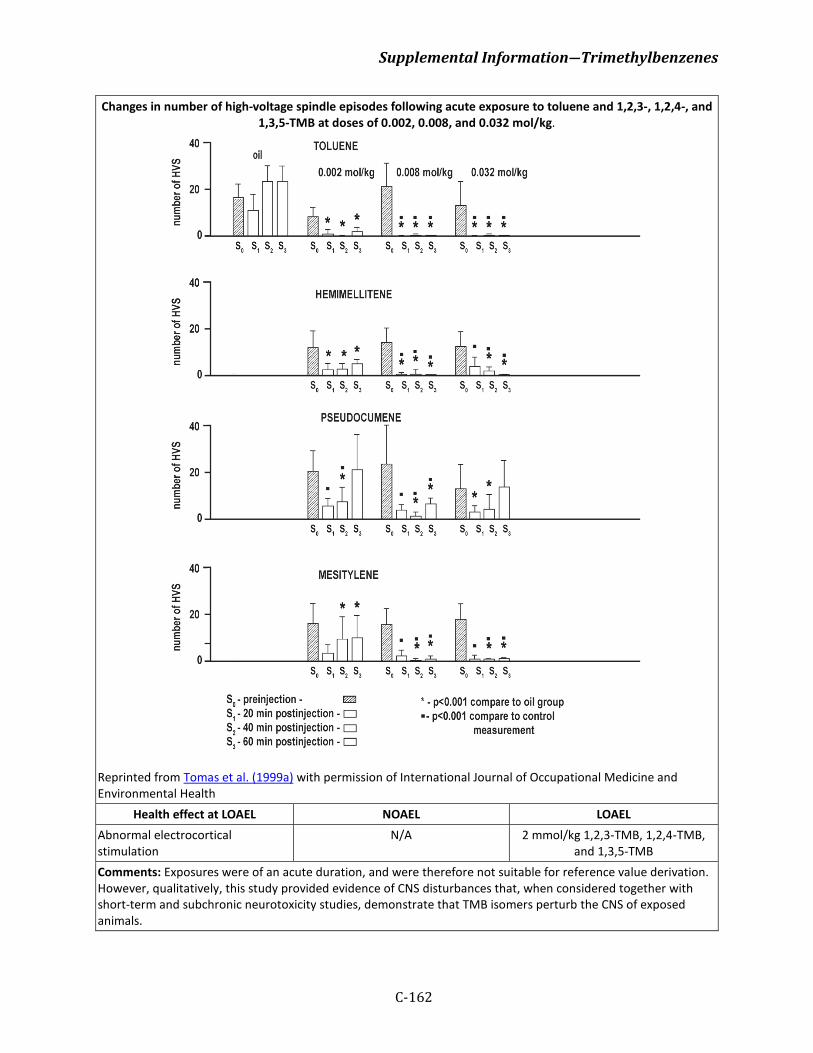
Supplemental Information―Trimethylbenzenes
C-162
Changes in number of high-voltage spindle episodes following acute exposure to toluene and 1,2,3-, 1,2,4-, and 1,3,5-TMB at doses of 0.002, 0.008, and 0.032 mol/kg.
Reprinted from Tomas et al. (1999a) with permission of International Journal of Occupational Medicine and Environmental Health
Health effect at LOAEL NOAEL LOAEL Abnormal electrocortical stimulation
N/A 2 mmol/kg 1,2,3-TMB, 1,2,4-TMB, and 1,3,5-TMB
Comments: Exposures were of an acute duration, and were therefore not suitable for reference value derivation. However, qualitatively, this study provided evidence of CNS disturbances that, when considered together with short-term and subchronic neurotoxicity studies, demonstrate that TMB isomers perturb the CNS of exposed animals.
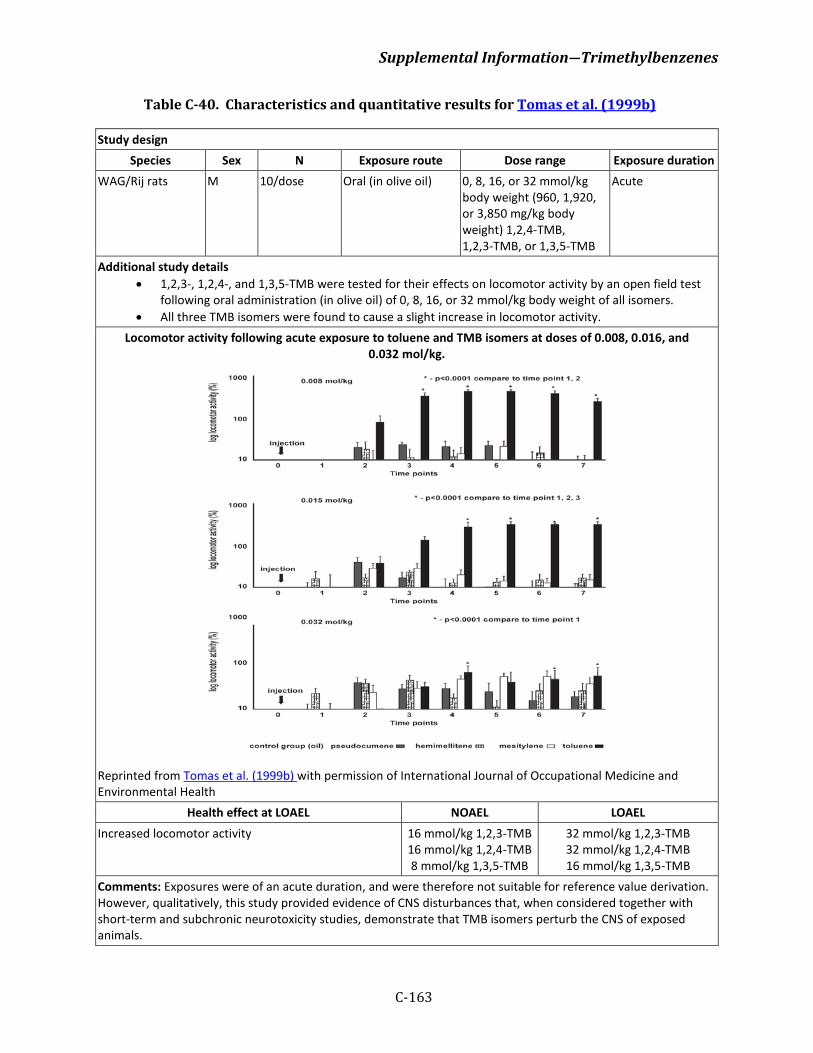
Supplemental Information―Trimethylbenzenes
C-163
Table C-40. Characteristics and quantitative results for Tomas et al. (1999b)
Study design Species Sex N Exposure route Dose range Exposure duration
WAG/Rij rats M 10/dose Oral (in olive oil) 0, 8, 16, or 32 mmol/kg body weight (960, 1,920, or 3,850 mg/kg body weight) 1,2,4-TMB, 1,2,3-TMB, or 1,3,5-TMB
Acute
Additional study details • 1,2,3-, 1,2,4-, and 1,3,5-TMB were tested for their effects on locomotor activity by an open field test
following oral administration (in olive oil) of 0, 8, 16, or 32 mmol/kg body weight of all isomers. • All three TMB isomers were found to cause a slight increase in locomotor activity.
Locomotor activity following acute exposure to toluene and TMB isomers at doses of 0.008, 0.016, and 0.032 mol/kg.
Reprinted from Tomas et al. (1999b) with permission of International Journal of Occupational Medicine and Environmental Health
Health effect at LOAEL NOAEL LOAEL Increased locomotor activity 16 mmol/kg 1,2,3-TMB
16 mmol/kg 1,2,4-TMB 8 mmol/kg 1,3,5-TMB
32 mmol/kg 1,2,3-TMB 32 mmol/kg 1,2,4-TMB 16 mmol/kg 1,3,5-TMB
Comments: Exposures were of an acute duration, and were therefore not suitable for reference value derivation. However, qualitatively, this study provided evidence of CNS disturbances that, when considered together with short-term and subchronic neurotoxicity studies, demonstrate that TMB isomers perturb the CNS of exposed animals.
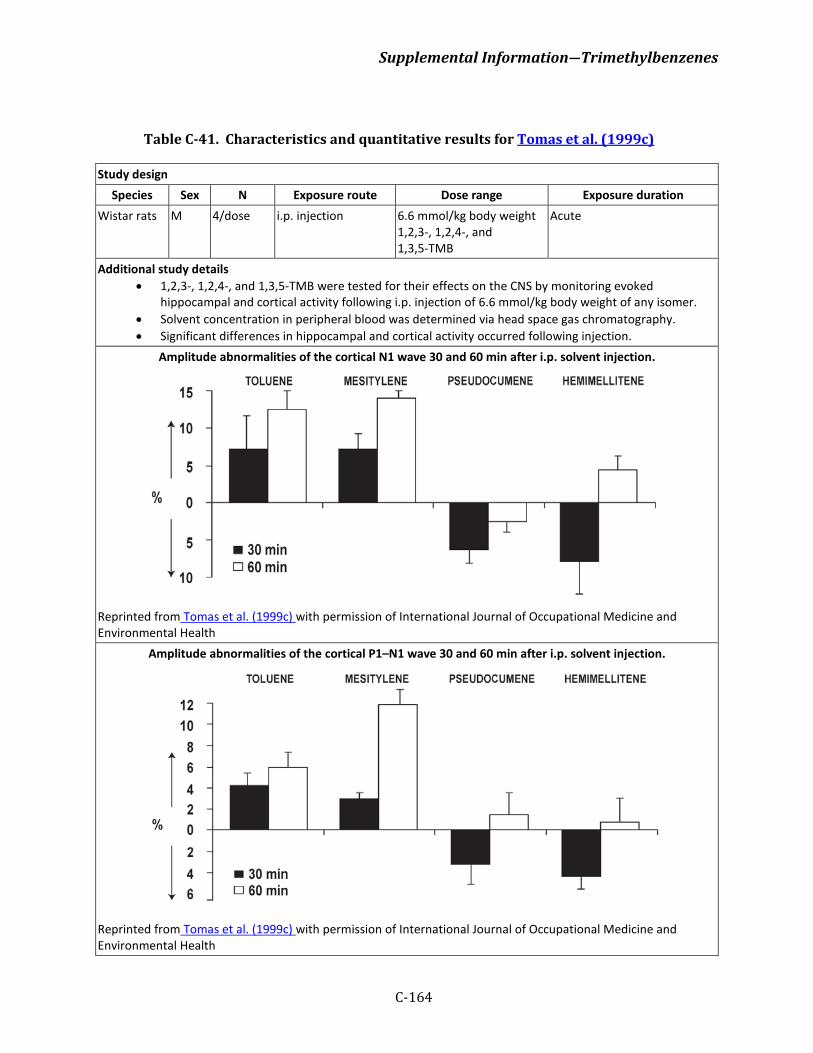
Supplemental Information―Trimethylbenzenes
C-164
Table C-41. Characteristics and quantitative results for Tomas et al. (1999c)
Study design Species Sex N Exposure route Dose range Exposure duration
Wistar rats M 4/dose i.p. injection 6.6 mmol/kg body weight 1,2,3-, 1,2,4-, and 1,3,5-TMB
Acute
Additional study details • 1,2,3-, 1,2,4-, and 1,3,5-TMB were tested for their effects on the CNS by monitoring evoked
hippocampal and cortical activity following i.p. injection of 6.6 mmol/kg body weight of any isomer. • Solvent concentration in peripheral blood was determined via head space gas chromatography. • Significant differences in hippocampal and cortical activity occurred following injection.
Amplitude abnormalities of the cortical N1 wave 30 and 60 min after i.p. solvent injection. Reprinted from Tomas et al. (1999c) with permission of International Journal of Occupational Medicine and Environmental Health
Amplitude abnormalities of the cortical P1–N1 wave 30 and 60 min after i.p. solvent injection.
Reprinted from Tomas et al. (1999c) with permission of International Journal of Occupational Medicine and Environmental Health
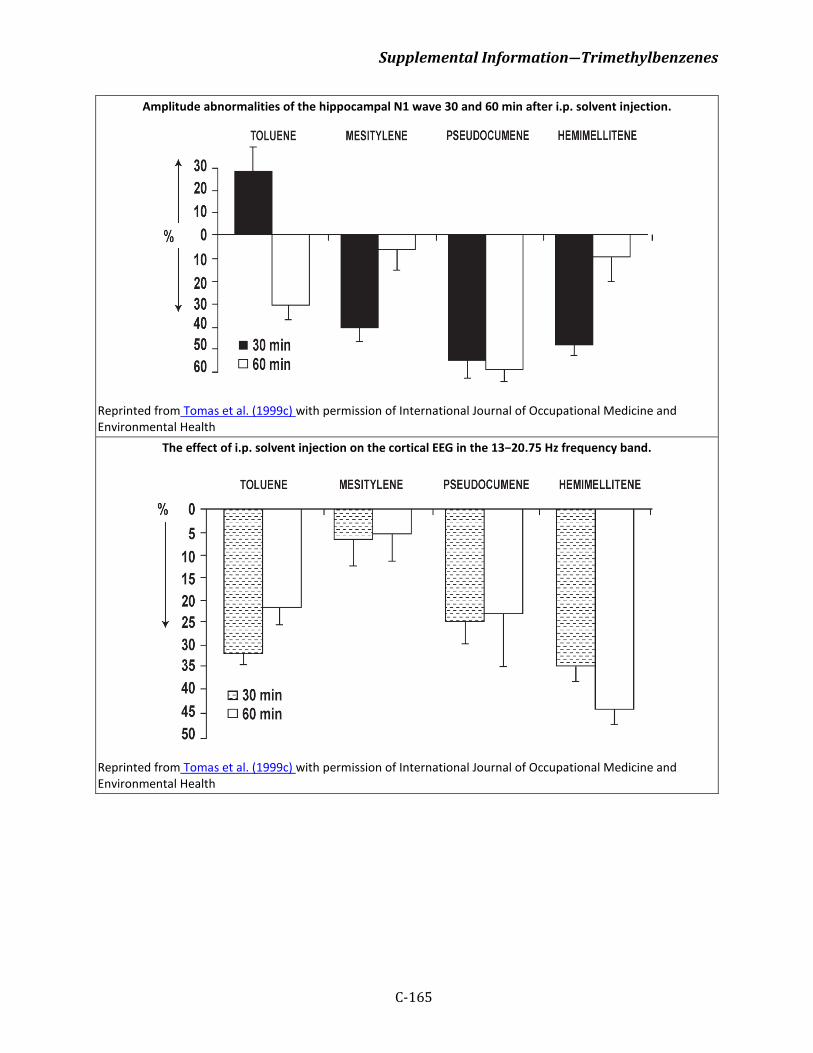
Supplemental Information―Trimethylbenzenes
C-165
Amplitude abnormalities of the hippocampal N1 wave 30 and 60 min after i.p. solvent injection.
Reprinted from Tomas et al. (1999c) with permission of International Journal of Occupational Medicine and Environmental Health
The effect of i.p. solvent injection on the cortical EEG in the 13−20.75 Hz frequency band.
Reprinted from Tomas et al. (1999c) with permission of International Journal of Occupational Medicine and Environmental Health
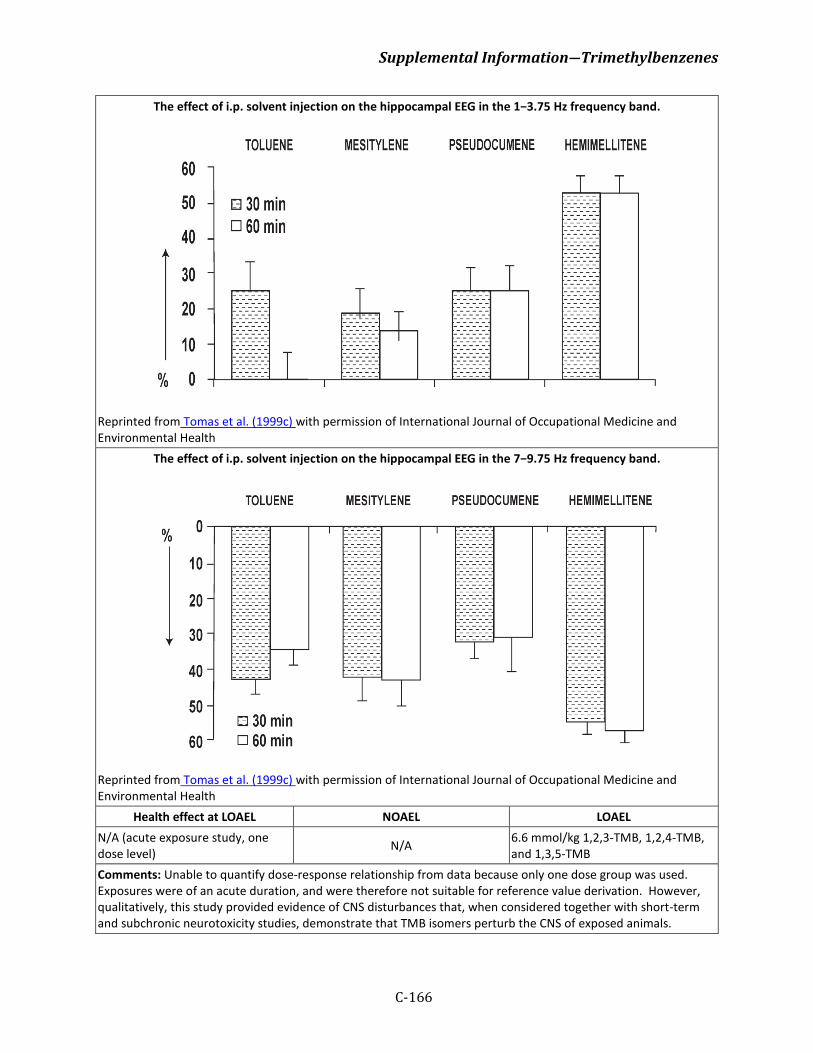
Supplemental Information―Trimethylbenzenes
C-166
The effect of i.p. solvent injection on the hippocampal EEG in the 1−3.75 Hz frequency band.
Reprinted from Tomas et al. (1999c) with permission of International Journal of Occupational Medicine and Environmental Health
The effect of i.p. solvent injection on the hippocampal EEG in the 7−9.75 Hz frequency band.
Reprinted from Tomas et al. (1999c) with permission of International Journal of Occupational Medicine and Environmental Health
Health effect at LOAEL NOAEL LOAEL N/A (acute exposure study, one dose level) N/A 6.6 mmol/kg 1,2,3-TMB, 1,2,4-TMB,
and 1,3,5-TMB Comments: Unable to quantify dose-response relationship from data because only one dose group was used. Exposures were of an acute duration, and were therefore not suitable for reference value derivation. However, qualitatively, this study provided evidence of CNS disturbances that, when considered together with short-term and subchronic neurotoxicity studies, demonstrate that TMB isomers perturb the CNS of exposed animals.
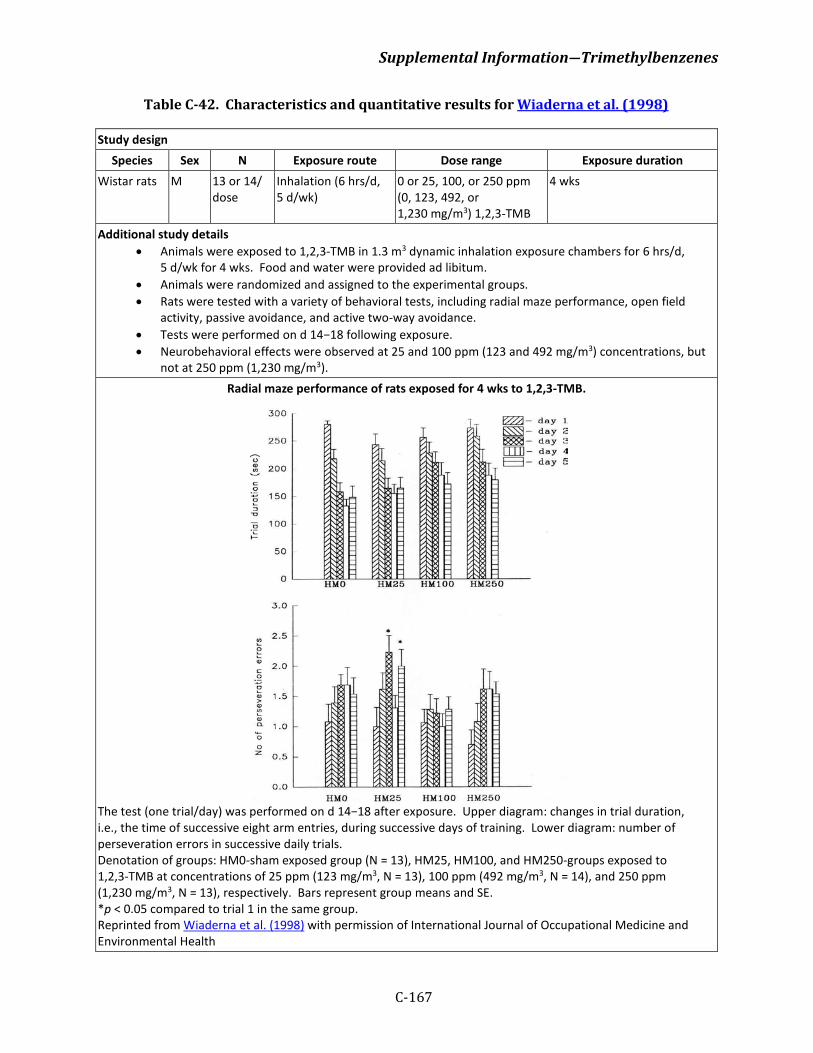
Supplemental Information―Trimethylbenzenes
C-167
Table C-42. Characteristics and quantitative results for Wiaderna et al. (1998)
Study design Species Sex N Exposure route Dose range Exposure duration
Wistar rats M 13 or 14/dose
Inhalation (6 hrs/d, 5 d/wk)
0 or 25, 100, or 250 ppm (0, 123, 492, or 1,230 mg/m3) 1,2,3-TMB
4 wks
Additional study details • Animals were exposed to 1,2,3-TMB in 1.3 m3 dynamic inhalation exposure chambers for 6 hrs/d,
5 d/wk for 4 wks. Food and water were provided ad libitum. • Animals were randomized and assigned to the experimental groups. • Rats were tested with a variety of behavioral tests, including radial maze performance, open field
activity, passive avoidance, and active two-way avoidance. • Tests were performed on d 14−18 following exposure. • Neurobehavioral effects were observed at 25 and 100 ppm (123 and 492 mg/m3) concentrations, but
not at 250 ppm (1,230 mg/m3). Radial maze performance of rats exposed for 4 wks to 1,2,3-TMB.
The test (one trial/day) was performed on d 14−18 after exposure. Upper diagram: changes in trial duration, i.e., the time of successive eight arm entries, during successive days of training. Lower diagram: number of perseveration errors in successive daily trials. Denotation of groups: HM0-sham exposed group (N = 13), HM25, HM100, and HM250-groups exposed to 1,2,3-TMB at concentrations of 25 ppm (123 mg/m3, N = 13), 100 ppm (492 mg/m3, N = 14), and 250 ppm (1,230 mg/m3, N = 13), respectively. Bars represent group means and SE. *p < 0.05 compared to trial 1 in the same group. Reprinted from Wiaderna et al. (1998) with permission of International Journal of Occupational Medicine and Environmental Health
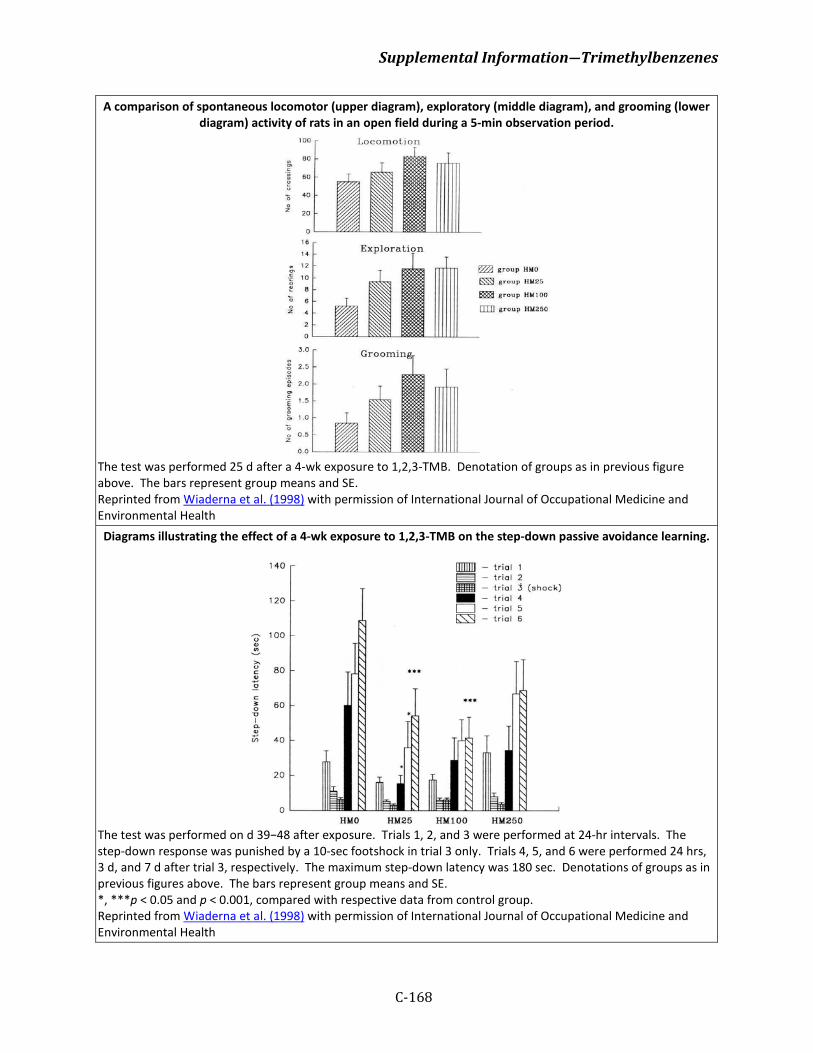
Supplemental Information―Trimethylbenzenes
C-168
A comparison of spontaneous locomotor (upper diagram), exploratory (middle diagram), and grooming (lower diagram) activity of rats in an open field during a 5-min observation period.
The test was performed 25 d after a 4-wk exposure to 1,2,3-TMB. Denotation of groups as in previous figure above. The bars represent group means and SE. Reprinted from Wiaderna et al. (1998) with permission of International Journal of Occupational Medicine and Environmental Health Diagrams illustrating the effect of a 4-wk exposure to 1,2,3-TMB on the step-down passive avoidance learning.
The test was performed on d 39−48 after exposure. Trials 1, 2, and 3 were performed at 24-hr intervals. The step-down response was punished by a 10-sec footshock in trial 3 only. Trials 4, 5, and 6 were performed 24 hrs, 3 d, and 7 d after trial 3, respectively. The maximum step-down latency was 180 sec. Denotations of groups as in previous figures above. The bars represent group means and SE. *, ***p < 0.05 and p < 0.001, compared with respective data from control group. Reprinted from Wiaderna et al. (1998) with permission of International Journal of Occupational Medicine and Environmental Health
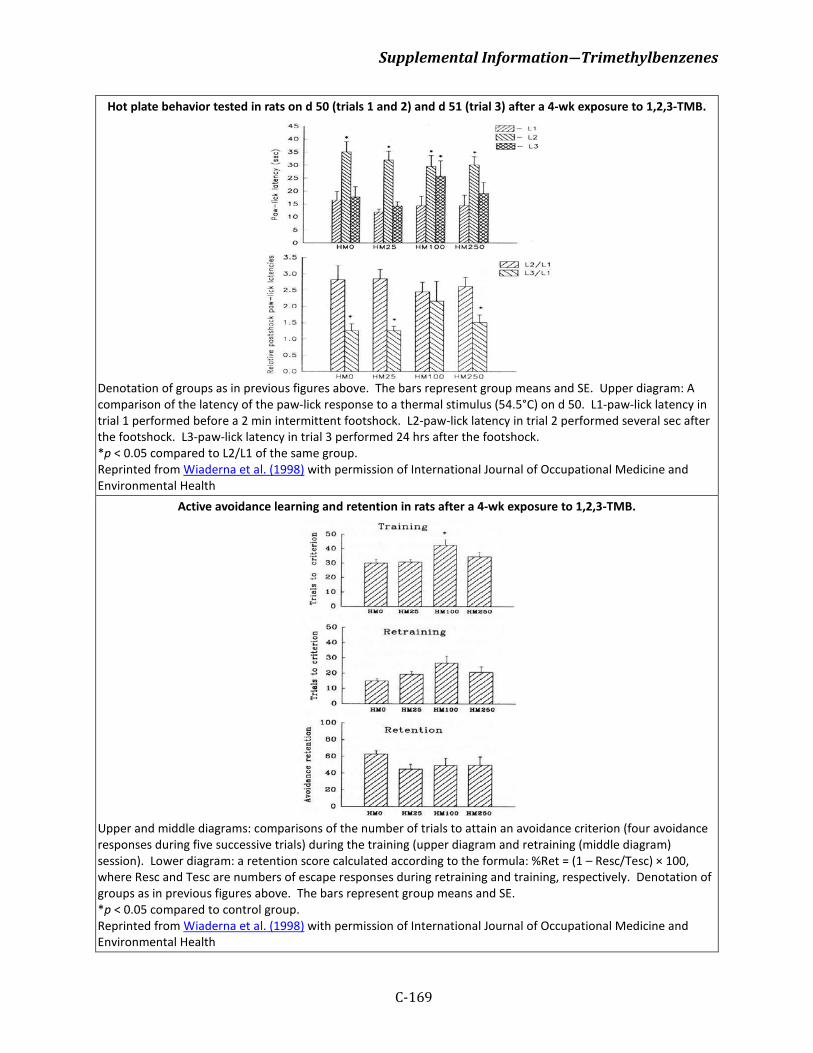
Supplemental Information―Trimethylbenzenes
C-169
Hot plate behavior tested in rats on d 50 (trials 1 and 2) and d 51 (trial 3) after a 4-wk exposure to 1,2,3-TMB.
Denotation of groups as in previous figures above. The bars represent group means and SE. Upper diagram: A comparison of the latency of the paw-lick response to a thermal stimulus (54.5°C) on d 50. L1-paw-lick latency in trial 1 performed before a 2 min intermittent footshock. L2-paw-lick latency in trial 2 performed several sec after the footshock. L3-paw-lick latency in trial 3 performed 24 hrs after the footshock. *p < 0.05 compared to L2/L1 of the same group. Reprinted from Wiaderna et al. (1998) with permission of International Journal of Occupational Medicine and Environmental Health
Active avoidance learning and retention in rats after a 4-wk exposure to 1,2,3-TMB.
Upper and middle diagrams: comparisons of the number of trials to attain an avoidance criterion (four avoidance responses during five successive trials) during the training (upper diagram and retraining (middle diagram) session). Lower diagram: a retention score calculated according to the formula: %Ret = (1 – Resc/Tesc) × 100, where Resc and Tesc are numbers of escape responses during retraining and training, respectively. Denotation of groups as in previous figures above. The bars represent group means and SE. *p < 0.05 compared to control group. Reprinted from Wiaderna et al. (1998) with permission of International Journal of Occupational Medicine and Environmental Health
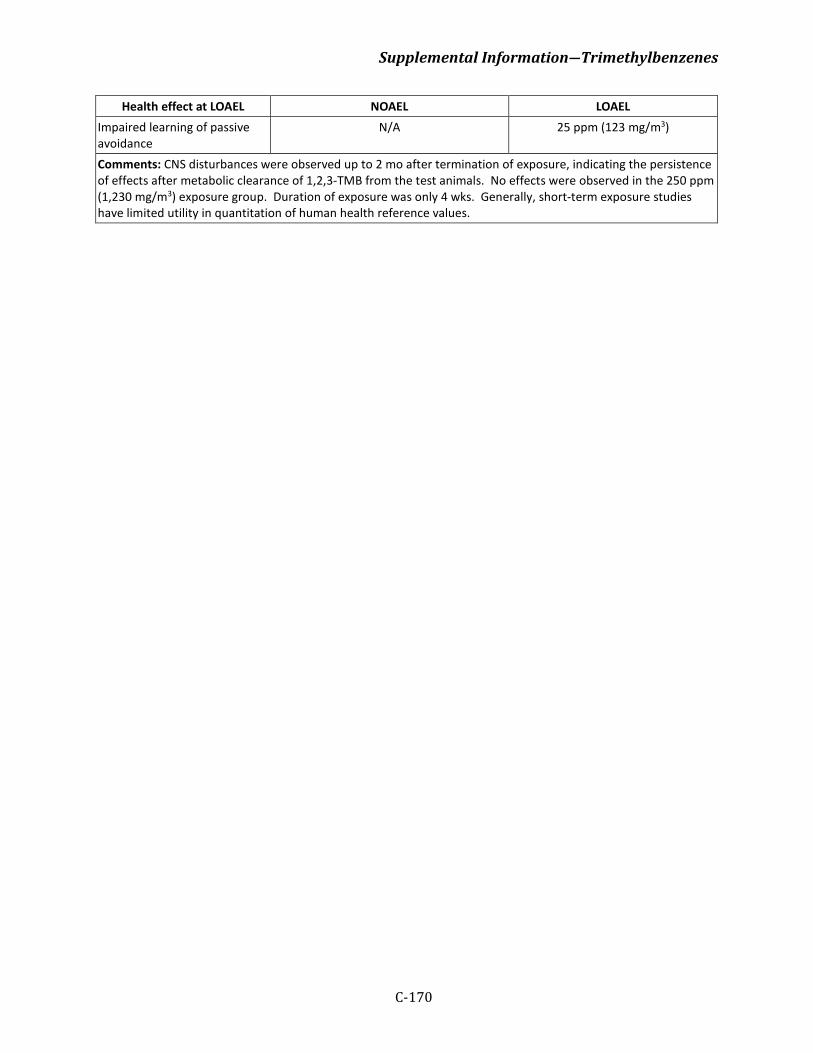
Supplemental Information―Trimethylbenzenes
C-170
Health effect at LOAEL NOAEL LOAEL Impaired learning of passive avoidance
N/A 25 ppm (123 mg/m3)
Comments: CNS disturbances were observed up to 2 mo after termination of exposure, indicating the persistence of effects after metabolic clearance of 1,2,3-TMB from the test animals. No effects were observed in the 250 ppm (1,230 mg/m3) exposure group. Duration of exposure was only 4 wks. Generally, short-term exposure studies have limited utility in quantitation of human health reference values.
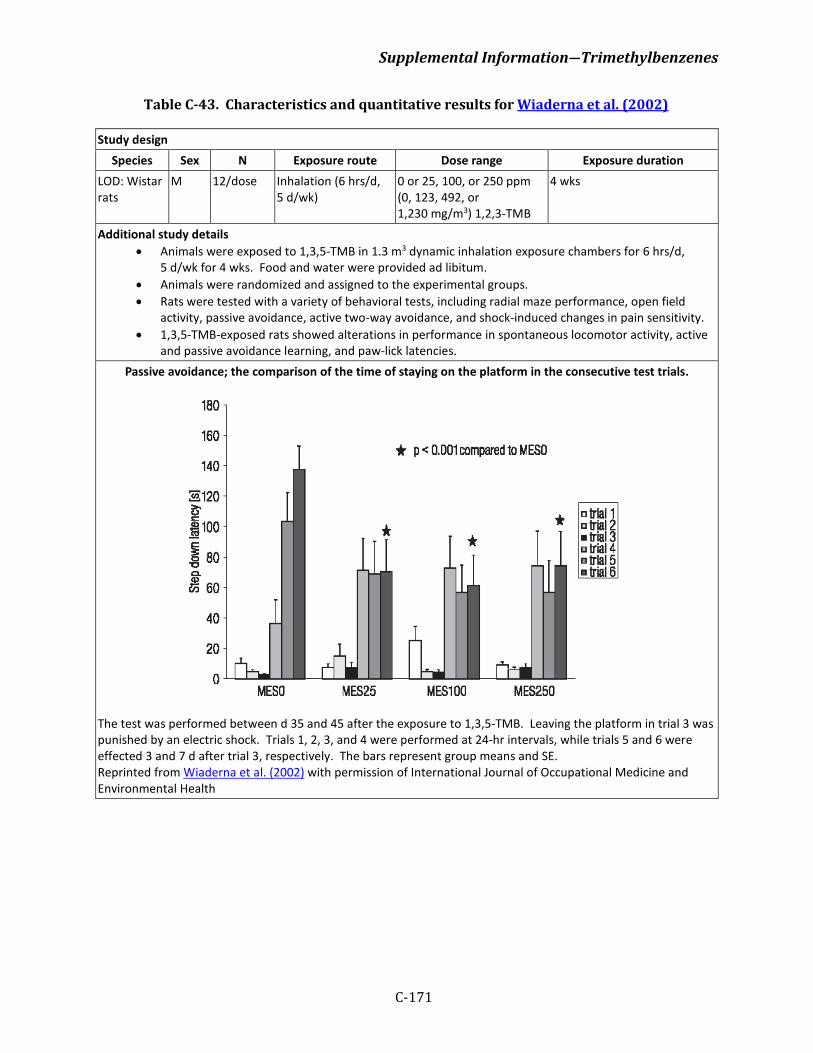
Supplemental Information―Trimethylbenzenes
C-171
Table C-43. Characteristics and quantitative results for Wiaderna et al. (2002)
Study design Species Sex N Exposure route Dose range Exposure duration
LOD: Wistar rats
M 12/dose Inhalation (6 hrs/d, 5 d/wk)
0 or 25, 100, or 250 ppm (0, 123, 492, or 1,230 mg/m3) 1,2,3-TMB
4 wks
Additional study details • Animals were exposed to 1,3,5-TMB in 1.3 m3 dynamic inhalation exposure chambers for 6 hrs/d,
5 d/wk for 4 wks. Food and water were provided ad libitum. • Animals were randomized and assigned to the experimental groups. • Rats were tested with a variety of behavioral tests, including radial maze performance, open field
activity, passive avoidance, active two-way avoidance, and shock-induced changes in pain sensitivity. • 1,3,5-TMB-exposed rats showed alterations in performance in spontaneous locomotor activity, active
and passive avoidance learning, and paw-lick latencies. Passive avoidance; the comparison of the time of staying on the platform in the consecutive test trials.
The test was performed between d 35 and 45 after the exposure to 1,3,5-TMB. Leaving the platform in trial 3 was punished by an electric shock. Trials 1, 2, 3, and 4 were performed at 24-hr intervals, while trials 5 and 6 were effected 3 and 7 d after trial 3, respectively. The bars represent group means and SE. Reprinted from Wiaderna et al. (2002) with permission of International Journal of Occupational Medicine and Environmental Health
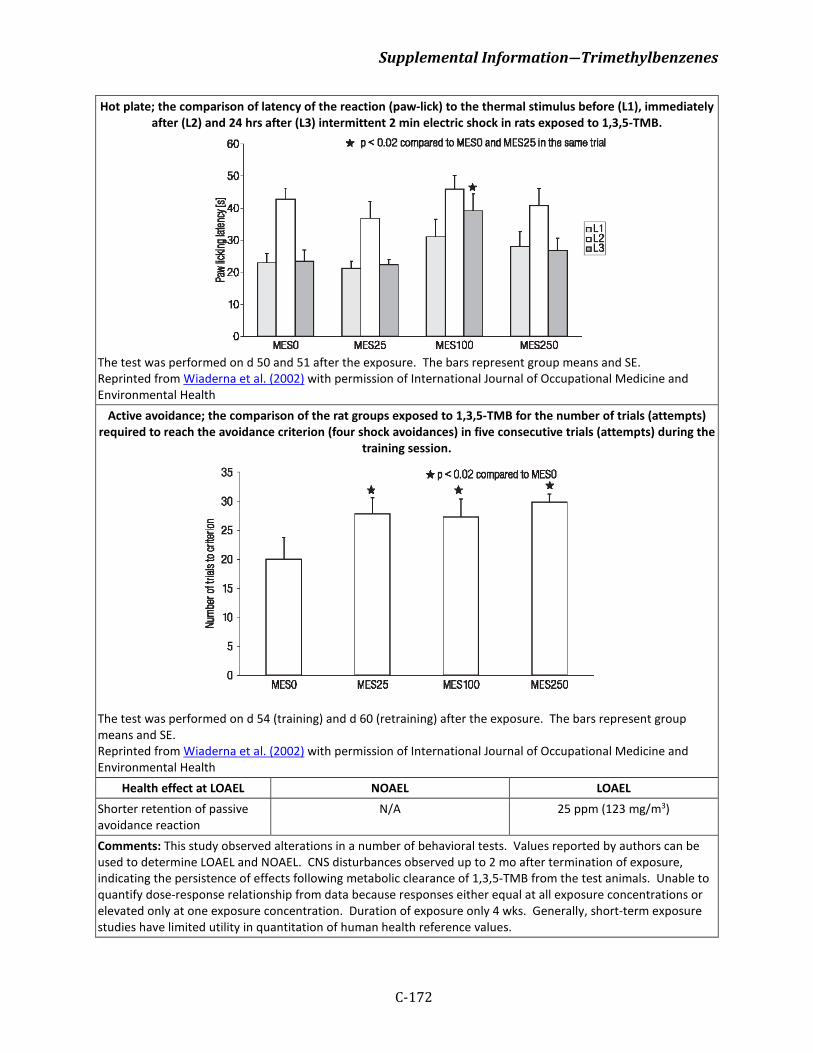
Supplemental Information―Trimethylbenzenes
C-172
Hot plate; the comparison of latency of the reaction (paw-lick) to the thermal stimulus before (L1), immediately after (L2) and 24 hrs after (L3) intermittent 2 min electric shock in rats exposed to 1,3,5-TMB.
The test was performed on d 50 and 51 after the exposure. The bars represent group means and SE. Reprinted from Wiaderna et al. (2002) with permission of International Journal of Occupational Medicine and Environmental Health
Active avoidance; the comparison of the rat groups exposed to 1,3,5-TMB for the number of trials (attempts) required to reach the avoidance criterion (four shock avoidances) in five consecutive trials (attempts) during the
training session.
The test was performed on d 54 (training) and d 60 (retraining) after the exposure. The bars represent group means and SE. Reprinted from Wiaderna et al. (2002) with permission of International Journal of Occupational Medicine and Environmental Health
Health effect at LOAEL NOAEL LOAEL Shorter retention of passive avoidance reaction
N/A 25 ppm (123 mg/m3)
Comments: This study observed alterations in a number of behavioral tests. Values reported by authors can be used to determine LOAEL and NOAEL. CNS disturbances observed up to 2 mo after termination of exposure, indicating the persistence of effects following metabolic clearance of 1,3,5-TMB from the test animals. Unable to quantify dose-response relationship from data because responses either equal at all exposure concentrations or elevated only at one exposure concentration. Duration of exposure only 4 wks. Generally, short-term exposure studies have limited utility in quantitation of human health reference values.
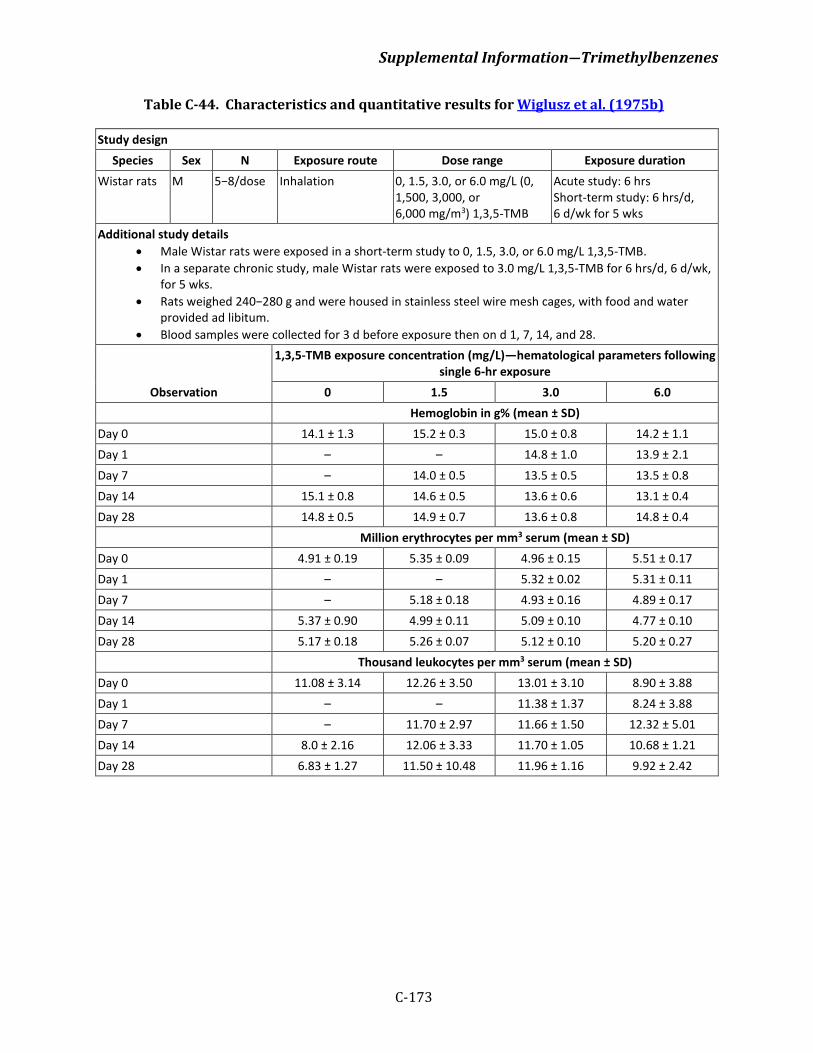
Supplemental Information―Trimethylbenzenes
C-173
Table C-44. Characteristics and quantitative results for Wiglusz et al. (1975b)
Study design Species Sex N Exposure route Dose range Exposure duration
Wistar rats M 5−8/dose Inhalation 0, 1.5, 3.0, or 6.0 mg/L (0, 1,500, 3,000, or 6,000 mg/m3) 1,3,5-TMB
Acute study: 6 hrs Short-term study: 6 hrs/d, 6 d/wk for 5 wks
Additional study details • Male Wistar rats were exposed in a short-term study to 0, 1.5, 3.0, or 6.0 mg/L 1,3,5-TMB. • In a separate chronic study, male Wistar rats were exposed to 3.0 mg/L 1,3,5-TMB for 6 hrs/d, 6 d/wk,
for 5 wks. • Rats weighed 240−280 g and were housed in stainless steel wire mesh cages, with food and water
provided ad libitum. • Blood samples were collected for 3 d before exposure then on d 1, 7, 14, and 28.
Observation
1,3,5-TMB exposure concentration (mg/L)—hematological parameters following single 6-hr exposure
0 1.5 3.0 6.0 Hemoglobin in g% (mean ± SD)
Day 0 14.1 ± 1.3 15.2 ± 0.3 15.0 ± 0.8 14.2 ± 1.1 Day 1 – – 14.8 ± 1.0 13.9 ± 2.1 Day 7 – 14.0 ± 0.5 13.5 ± 0.5 13.5 ± 0.8 Day 14 15.1 ± 0.8 14.6 ± 0.5 13.6 ± 0.6 13.1 ± 0.4 Day 28 14.8 ± 0.5 14.9 ± 0.7 13.6 ± 0.8 14.8 ± 0.4 Million erythrocytes per mm3 serum (mean ± SD) Day 0 4.91 ± 0.19 5.35 ± 0.09 4.96 ± 0.15 5.51 ± 0.17 Day 1 – – 5.32 ± 0.02 5.31 ± 0.11 Day 7 – 5.18 ± 0.18 4.93 ± 0.16 4.89 ± 0.17 Day 14 5.37 ± 0.90 4.99 ± 0.11 5.09 ± 0.10 4.77 ± 0.10 Day 28 5.17 ± 0.18 5.26 ± 0.07 5.12 ± 0.10 5.20 ± 0.27 Thousand leukocytes per mm3 serum (mean ± SD) Day 0 11.08 ± 3.14 12.26 ± 3.50 13.01 ± 3.10 8.90 ± 3.88 Day 1 – – 11.38 ± 1.37 8.24 ± 3.88 Day 7 – 11.70 ± 2.97 11.66 ± 1.50 12.32 ± 5.01 Day 14 8.0 ± 2.16 12.06 ± 3.33 11.70 ± 1.05 10.68 ± 1.21 Day 28 6.83 ± 1.27 11.50 ± 10.48 11.96 ± 1.16 9.92 ± 2.42
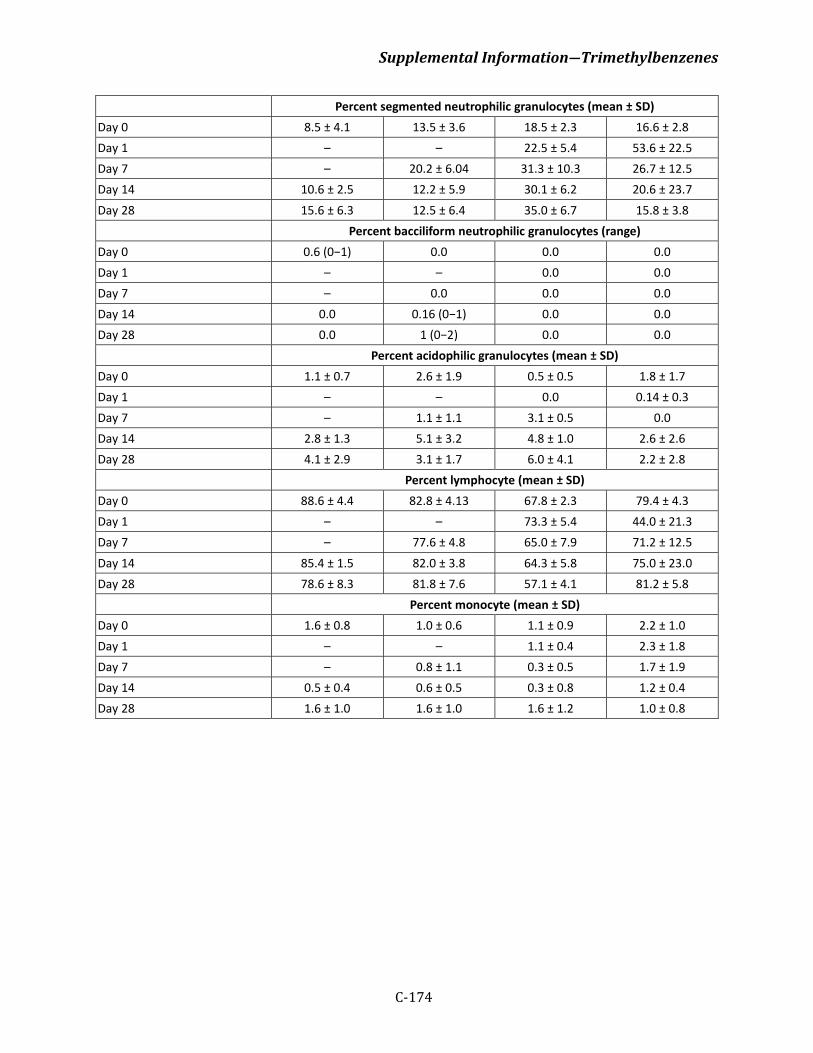
Supplemental Information―Trimethylbenzenes
C-174
Percent segmented neutrophilic granulocytes (mean ± SD) Day 0 8.5 ± 4.1 13.5 ± 3.6 18.5 ± 2.3 16.6 ± 2.8 Day 1 – – 22.5 ± 5.4 53.6 ± 22.5 Day 7 – 20.2 ± 6.04 31.3 ± 10.3 26.7 ± 12.5 Day 14 10.6 ± 2.5 12.2 ± 5.9 30.1 ± 6.2 20.6 ± 23.7 Day 28 15.6 ± 6.3 12.5 ± 6.4 35.0 ± 6.7 15.8 ± 3.8 Percent bacciliform neutrophilic granulocytes (range) Day 0 0.6 (0−1) 0.0 0.0 0.0 Day 1 – – 0.0 0.0 Day 7 – 0.0 0.0 0.0 Day 14 0.0 0.16 (0−1) 0.0 0.0 Day 28 0.0 1 (0−2) 0.0 0.0 Percent acidophilic granulocytes (mean ± SD) Day 0 1.1 ± 0.7 2.6 ± 1.9 0.5 ± 0.5 1.8 ± 1.7 Day 1 – – 0.0 0.14 ± 0.3 Day 7 – 1.1 ± 1.1 3.1 ± 0.5 0.0 Day 14 2.8 ± 1.3 5.1 ± 3.2 4.8 ± 1.0 2.6 ± 2.6 Day 28 4.1 ± 2.9 3.1 ± 1.7 6.0 ± 4.1 2.2 ± 2.8 Percent lymphocyte (mean ± SD) Day 0 88.6 ± 4.4 82.8 ± 4.13 67.8 ± 2.3 79.4 ± 4.3 Day 1 – – 73.3 ± 5.4 44.0 ± 21.3 Day 7 – 77.6 ± 4.8 65.0 ± 7.9 71.2 ± 12.5 Day 14 85.4 ± 1.5 82.0 ± 3.8 64.3 ± 5.8 75.0 ± 23.0 Day 28 78.6 ± 8.3 81.8 ± 7.6 57.1 ± 4.1 81.2 ± 5.8 Percent monocyte (mean ± SD) Day 0 1.6 ± 0.8 1.0 ± 0.6 1.1 ± 0.9 2.2 ± 1.0 Day 1 – – 1.1 ± 0.4 2.3 ± 1.8 Day 7 – 0.8 ± 1.1 0.3 ± 0.5 1.7 ± 1.9 Day 14 0.5 ± 0.4 0.6 ± 0.5 0.3 ± 0.8 1.2 ± 0.4 Day 28 1.6 ± 1.0 1.6 ± 1.0 1.6 ± 1.2 1.0 ± 0.8
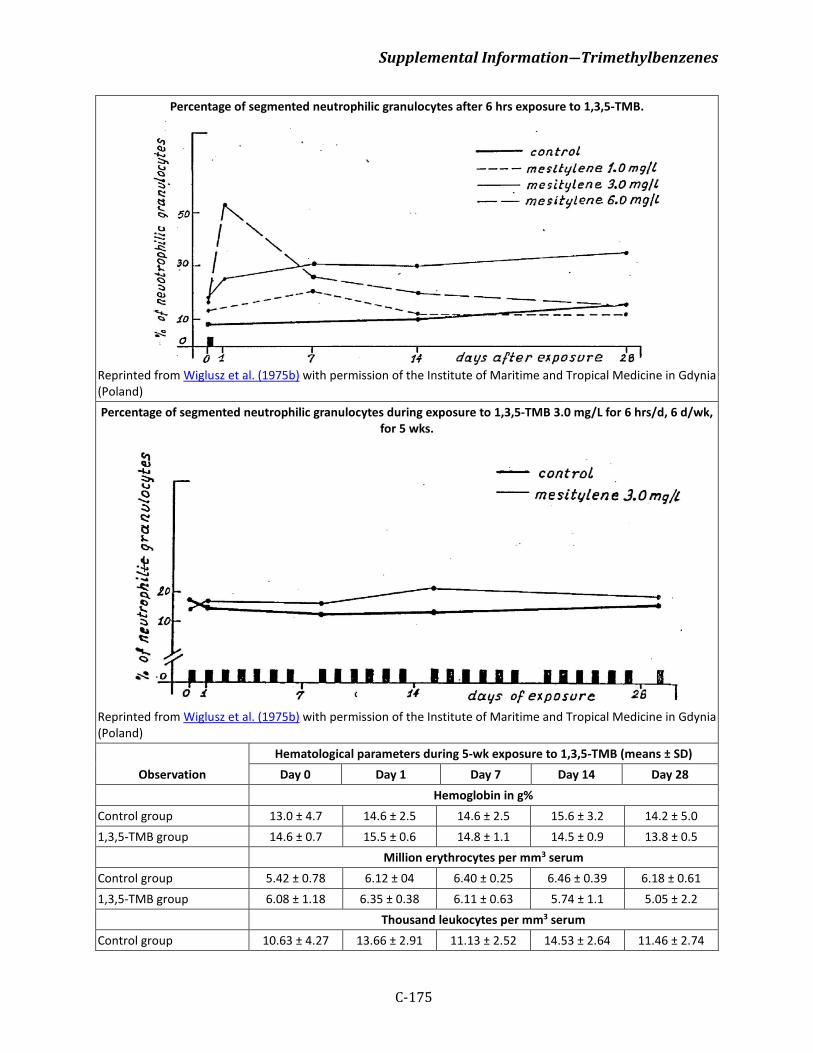
Supplemental Information―Trimethylbenzenes
C-175
Percentage of segmented neutrophilic granulocytes after 6 hrs exposure to 1,3,5-TMB.
Reprinted from Wiglusz et al. (1975b) with permission of the Institute of Maritime and Tropical Medicine in Gdynia (Poland) Percentage of segmented neutrophilic granulocytes during exposure to 1,3,5-TMB 3.0 mg/L for 6 hrs/d, 6 d/wk,
for 5 wks.
Reprinted from Wiglusz et al. (1975b) with permission of the Institute of Maritime and Tropical Medicine in Gdynia (Poland)
Observation Hematological parameters during 5-wk exposure to 1,3,5-TMB (means ± SD) Day 0 Day 1 Day 7 Day 14 Day 28
Hemoglobin in g% Control group 13.0 ± 4.7 14.6 ± 2.5 14.6 ± 2.5 15.6 ± 3.2 14.2 ± 5.0 1,3,5-TMB group 14.6 ± 0.7 15.5 ± 0.6 14.8 ± 1.1 14.5 ± 0.9 13.8 ± 0.5 Million erythrocytes per mm3 serum Control group 5.42 ± 0.78 6.12 ± 04 6.40 ± 0.25 6.46 ± 0.39 6.18 ± 0.61 1,3,5-TMB group 6.08 ± 1.18 6.35 ± 0.38 6.11 ± 0.63 5.74 ± 1.1 5.05 ± 2.2 Thousand leukocytes per mm3 serum Control group 10.63 ± 4.27 13.66 ± 2.91 11.13 ± 2.52 14.53 ± 2.64 11.46 ± 2.74
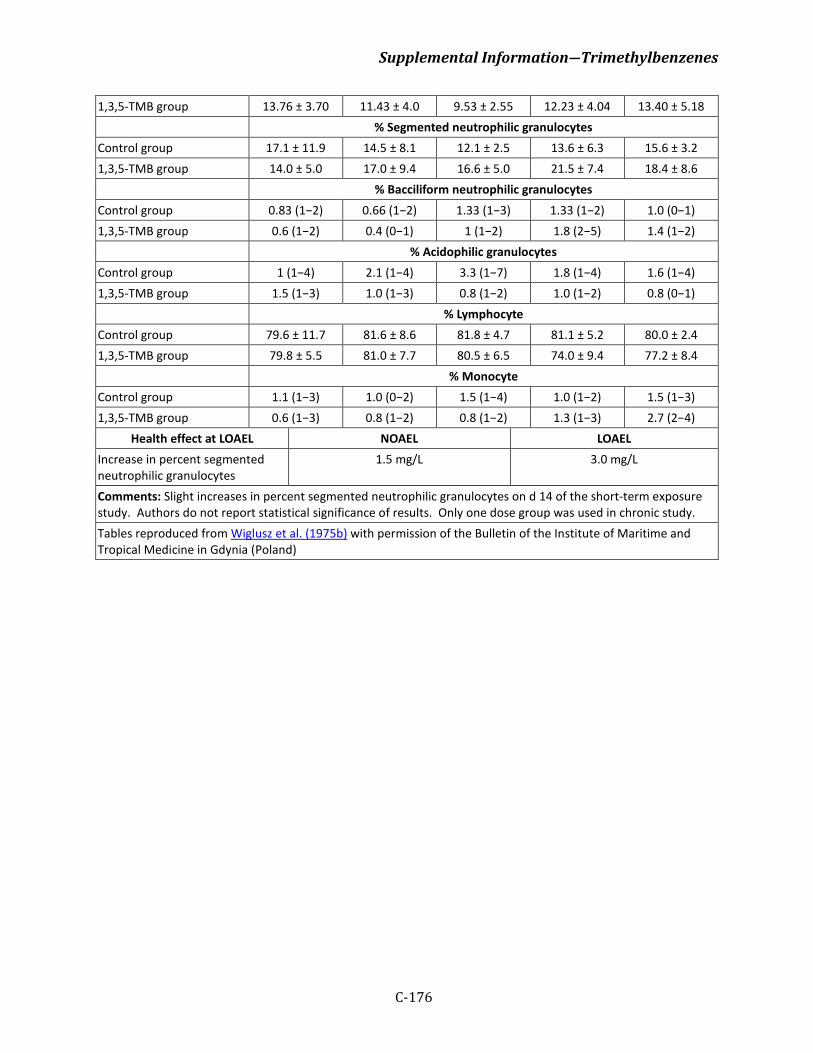
Supplemental Information―Trimethylbenzenes
C-176
1,3,5-TMB group 13.76 ± 3.70 11.43 ± 4.0 9.53 ± 2.55 12.23 ± 4.04 13.40 ± 5.18 % Segmented neutrophilic granulocytes Control group 17.1 ± 11.9 14.5 ± 8.1 12.1 ± 2.5 13.6 ± 6.3 15.6 ± 3.2 1,3,5-TMB group 14.0 ± 5.0 17.0 ± 9.4 16.6 ± 5.0 21.5 ± 7.4 18.4 ± 8.6 % Bacciliform neutrophilic granulocytes Control group 0.83 (1−2) 0.66 (1−2) 1.33 (1−3) 1.33 (1−2) 1.0 (0−1) 1,3,5-TMB group 0.6 (1−2) 0.4 (0−1) 1 (1−2) 1.8 (2−5) 1.4 (1−2) % Acidophilic granulocytes Control group 1 (1−4) 2.1 (1−4) 3.3 (1−7) 1.8 (1−4) 1.6 (1−4) 1,3,5-TMB group 1.5 (1−3) 1.0 (1−3) 0.8 (1−2) 1.0 (1−2) 0.8 (0−1) % Lymphocyte Control group 79.6 ± 11.7 81.6 ± 8.6 81.8 ± 4.7 81.1 ± 5.2 80.0 ± 2.4 1,3,5-TMB group 79.8 ± 5.5 81.0 ± 7.7 80.5 ± 6.5 74.0 ± 9.4 77.2 ± 8.4 % Monocyte Control group 1.1 (1−3) 1.0 (0−2) 1.5 (1−4) 1.0 (1−2) 1.5 (1−3) 1,3,5-TMB group 0.6 (1−3) 0.8 (1−2) 0.8 (1−2) 1.3 (1−3) 2.7 (2−4)
Health effect at LOAEL NOAEL LOAEL Increase in percent segmented neutrophilic granulocytes
1.5 mg/L 3.0 mg/L
Comments: Slight increases in percent segmented neutrophilic granulocytes on d 14 of the short-term exposure study. Authors do not report statistical significance of results. Only one dose group was used in chronic study. Tables reproduced from Wiglusz et al. (1975b) with permission of the Bulletin of the Institute of Maritime and Tropical Medicine in Gdynia (Poland)
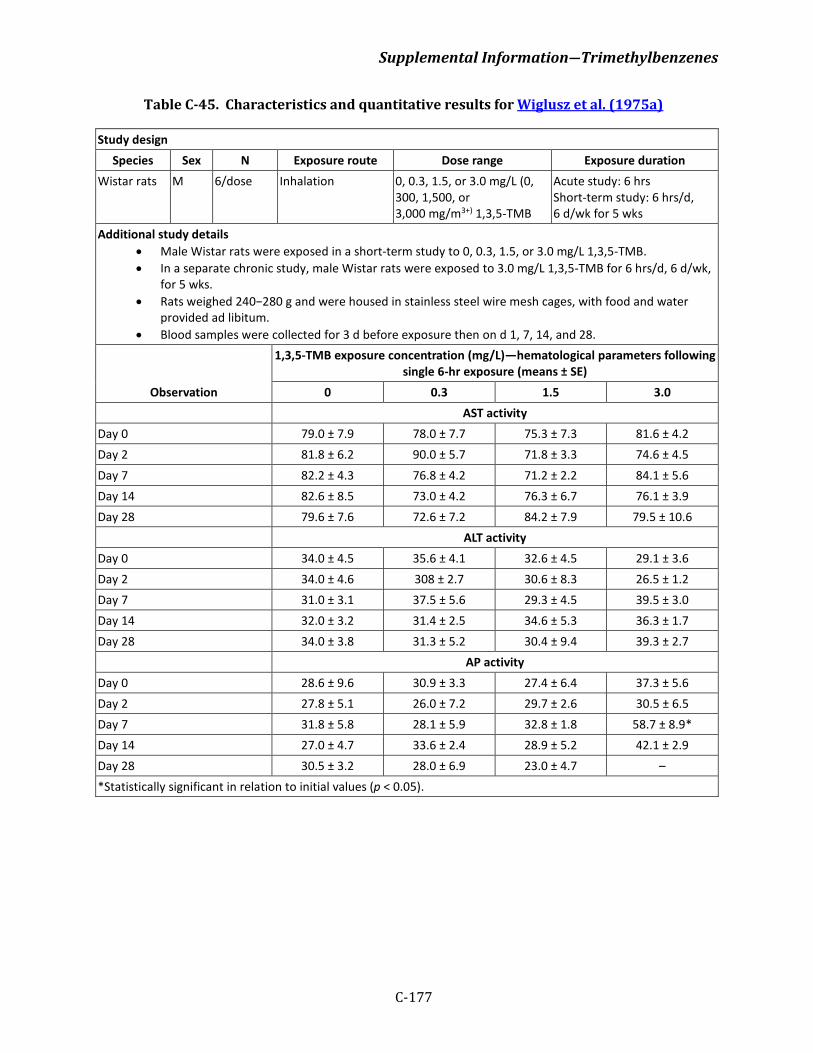
Supplemental Information―Trimethylbenzenes
C-177
Table C-45. Characteristics and quantitative results for Wiglusz et al. (1975a)
Study design Species Sex N Exposure route Dose range Exposure duration
Wistar rats M 6/dose Inhalation 0, 0.3, 1.5, or 3.0 mg/L (0, 300, 1,500, or 3,000 mg/m3+) 1,3,5-TMB
Acute study: 6 hrs Short-term study: 6 hrs/d, 6 d/wk for 5 wks
Additional study details • Male Wistar rats were exposed in a short-term study to 0, 0.3, 1.5, or 3.0 mg/L 1,3,5-TMB. • In a separate chronic study, male Wistar rats were exposed to 3.0 mg/L 1,3,5-TMB for 6 hrs/d, 6 d/wk,
for 5 wks. • Rats weighed 240−280 g and were housed in stainless steel wire mesh cages, with food and water
provided ad libitum. • Blood samples were collected for 3 d before exposure then on d 1, 7, 14, and 28.
Observation
1,3,5-TMB exposure concentration (mg/L)—hematological parameters following single 6-hr exposure (means ± SE)
0 0.3 1.5 3.0 AST activity Day 0 79.0 ± 7.9 78.0 ± 7.7 75.3 ± 7.3 81.6 ± 4.2 Day 2 81.8 ± 6.2 90.0 ± 5.7 71.8 ± 3.3 74.6 ± 4.5 Day 7 82.2 ± 4.3 76.8 ± 4.2 71.2 ± 2.2 84.1 ± 5.6 Day 14 82.6 ± 8.5 73.0 ± 4.2 76.3 ± 6.7 76.1 ± 3.9 Day 28 79.6 ± 7.6 72.6 ± 7.2 84.2 ± 7.9 79.5 ± 10.6 ALT activity Day 0 34.0 ± 4.5 35.6 ± 4.1 32.6 ± 4.5 29.1 ± 3.6 Day 2 34.0 ± 4.6 308 ± 2.7 30.6 ± 8.3 26.5 ± 1.2 Day 7 31.0 ± 3.1 37.5 ± 5.6 29.3 ± 4.5 39.5 ± 3.0 Day 14 32.0 ± 3.2 31.4 ± 2.5 34.6 ± 5.3 36.3 ± 1.7 Day 28 34.0 ± 3.8 31.3 ± 5.2 30.4 ± 9.4 39.3 ± 2.7 AP activity Day 0 28.6 ± 9.6 30.9 ± 3.3 27.4 ± 6.4 37.3 ± 5.6 Day 2 27.8 ± 5.1 26.0 ± 7.2 29.7 ± 2.6 30.5 ± 6.5 Day 7 31.8 ± 5.8 28.1 ± 5.9 32.8 ± 1.8 58.7 ± 8.9* Day 14 27.0 ± 4.7 33.6 ± 2.4 28.9 ± 5.2 42.1 ± 2.9 Day 28 30.5 ± 3.2 28.0 ± 6.9 23.0 ± 4.7 – *Statistically significant in relation to initial values (p < 0.05).
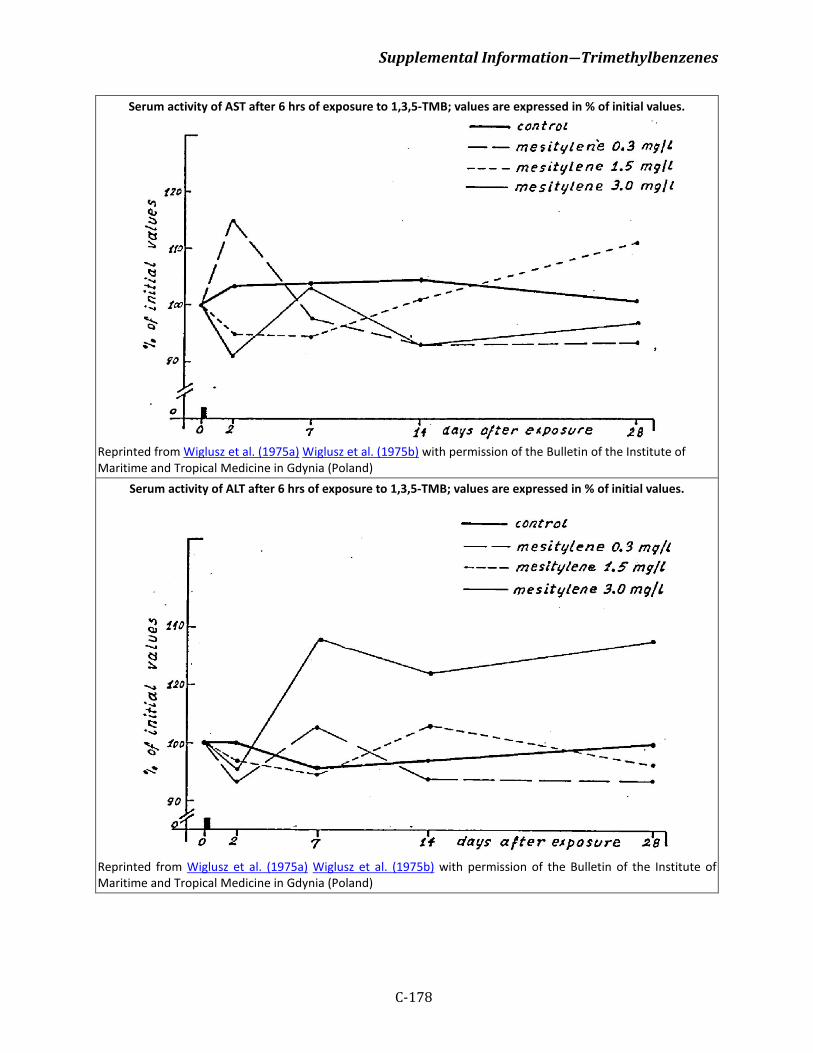
Supplemental Information―Trimethylbenzenes
C-178
Serum activity of AST after 6 hrs of exposure to 1,3,5-TMB; values are expressed in % of initial values.
Reprinted from Wiglusz et al. (1975a) Wiglusz et al. (1975b) with permission of the Bulletin of the Institute of Maritime and Tropical Medicine in Gdynia (Poland)
Serum activity of ALT after 6 hrs of exposure to 1,3,5-TMB; values are expressed in % of initial values.
Reprinted from Wiglusz et al. (1975a) Wiglusz et al. (1975b) with permission of the Bulletin of the Institute of Maritime and Tropical Medicine in Gdynia (Poland)
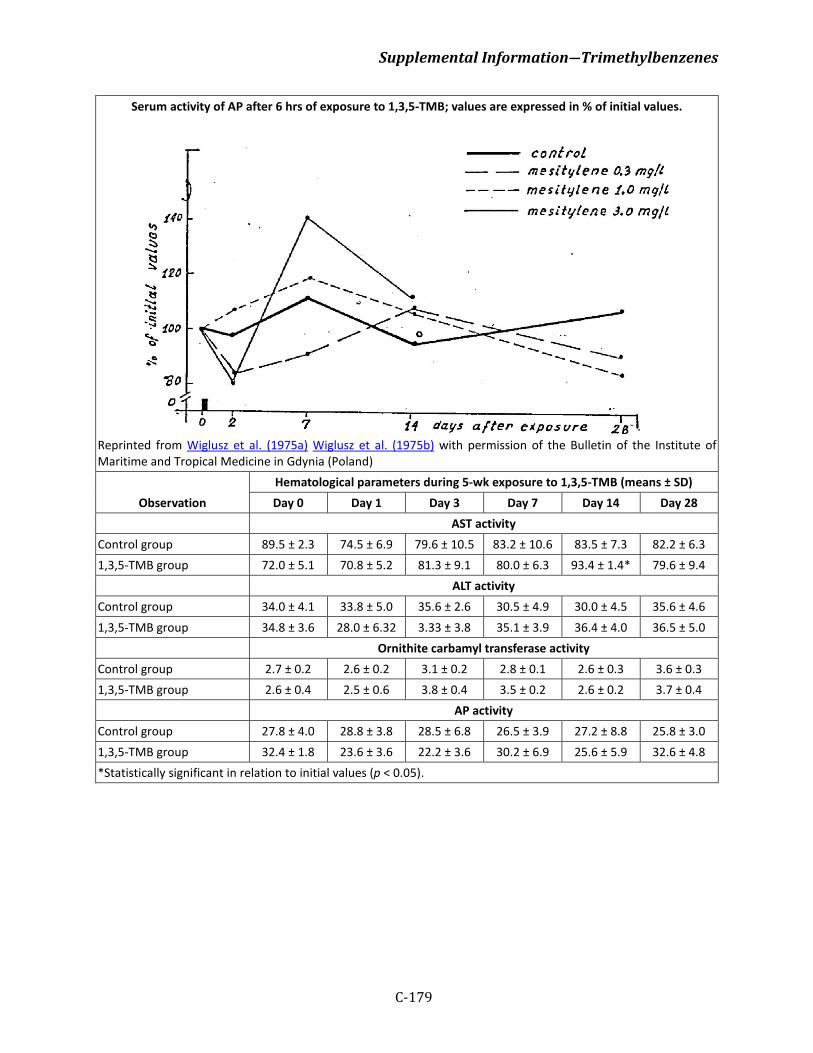
Supplemental Information―Trimethylbenzenes
C-179
Serum activity of AP after 6 hrs of exposure to 1,3,5-TMB; values are expressed in % of initial values.
Reprinted from Wiglusz et al. (1975a) Wiglusz et al. (1975b) with permission of the Bulletin of the Institute of Maritime and Tropical Medicine in Gdynia (Poland)
Observation Hematological parameters during 5-wk exposure to 1,3,5-TMB (means ± SD) Day 0 Day 1 Day 3 Day 7 Day 14 Day 28
AST activity Control group 89.5 ± 2.3 74.5 ± 6.9 79.6 ± 10.5 83.2 ± 10.6 83.5 ± 7.3 82.2 ± 6.3 1,3,5-TMB group 72.0 ± 5.1 70.8 ± 5.2 81.3 ± 9.1 80.0 ± 6.3 93.4 ± 1.4* 79.6 ± 9.4 ALT activity Control group 34.0 ± 4.1 33.8 ± 5.0 35.6 ± 2.6 30.5 ± 4.9 30.0 ± 4.5 35.6 ± 4.6 1,3,5-TMB group 34.8 ± 3.6 28.0 ± 6.32 3.33 ± 3.8 35.1 ± 3.9 36.4 ± 4.0 36.5 ± 5.0 Ornithite carbamyl transferase activity Control group 2.7 ± 0.2 2.6 ± 0.2 3.1 ± 0.2 2.8 ± 0.1 2.6 ± 0.3 3.6 ± 0.3 1,3,5-TMB group 2.6 ± 0.4 2.5 ± 0.6 3.8 ± 0.4 3.5 ± 0.2 2.6 ± 0.2 3.7 ± 0.4 AP activity Control group 27.8 ± 4.0 28.8 ± 3.8 28.5 ± 6.8 26.5 ± 3.9 27.2 ± 8.8 25.8 ± 3.0 1,3,5-TMB group 32.4 ± 1.8 23.6 ± 3.6 22.2 ± 3.6 30.2 ± 6.9 25.6 ± 5.9 32.6 ± 4.8 *Statistically significant in relation to initial values (p < 0.05).
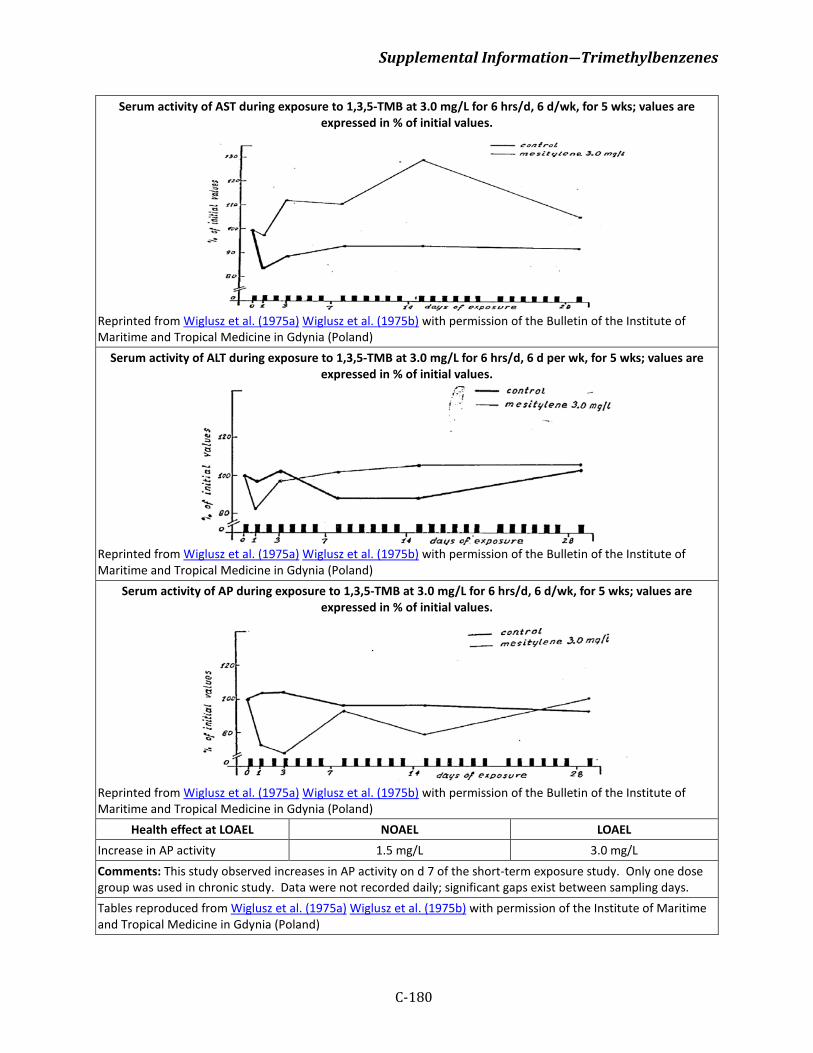
Supplemental Information―Trimethylbenzenes
C-180
Serum activity of AST during exposure to 1,3,5-TMB at 3.0 mg/L for 6 hrs/d, 6 d/wk, for 5 wks; values are expressed in % of initial values.
Reprinted from Wiglusz et al. (1975a) Wiglusz et al. (1975b) with permission of the Bulletin of the Institute of Maritime and Tropical Medicine in Gdynia (Poland)
Serum activity of ALT during exposure to 1,3,5-TMB at 3.0 mg/L for 6 hrs/d, 6 d per wk, for 5 wks; values are expressed in % of initial values.
Reprinted from Wiglusz et al. (1975a) Wiglusz et al. (1975b) with permission of the Bulletin of the Institute of Maritime and Tropical Medicine in Gdynia (Poland)
Serum activity of AP during exposure to 1,3,5-TMB at 3.0 mg/L for 6 hrs/d, 6 d/wk, for 5 wks; values are expressed in % of initial values.
Reprinted from Wiglusz et al. (1975a) Wiglusz et al. (1975b) with permission of the Bulletin of the Institute of Maritime and Tropical Medicine in Gdynia (Poland)
Health effect at LOAEL NOAEL LOAEL Increase in AP activity 1.5 mg/L 3.0 mg/L
Comments: This study observed increases in AP activity on d 7 of the short-term exposure study. Only one dose group was used in chronic study. Data were not recorded daily; significant gaps exist between sampling days. Tables reproduced from Wiglusz et al. (1975a) Wiglusz et al. (1975b) with permission of the Institute of Maritime and Tropical Medicine in Gdynia (Poland)
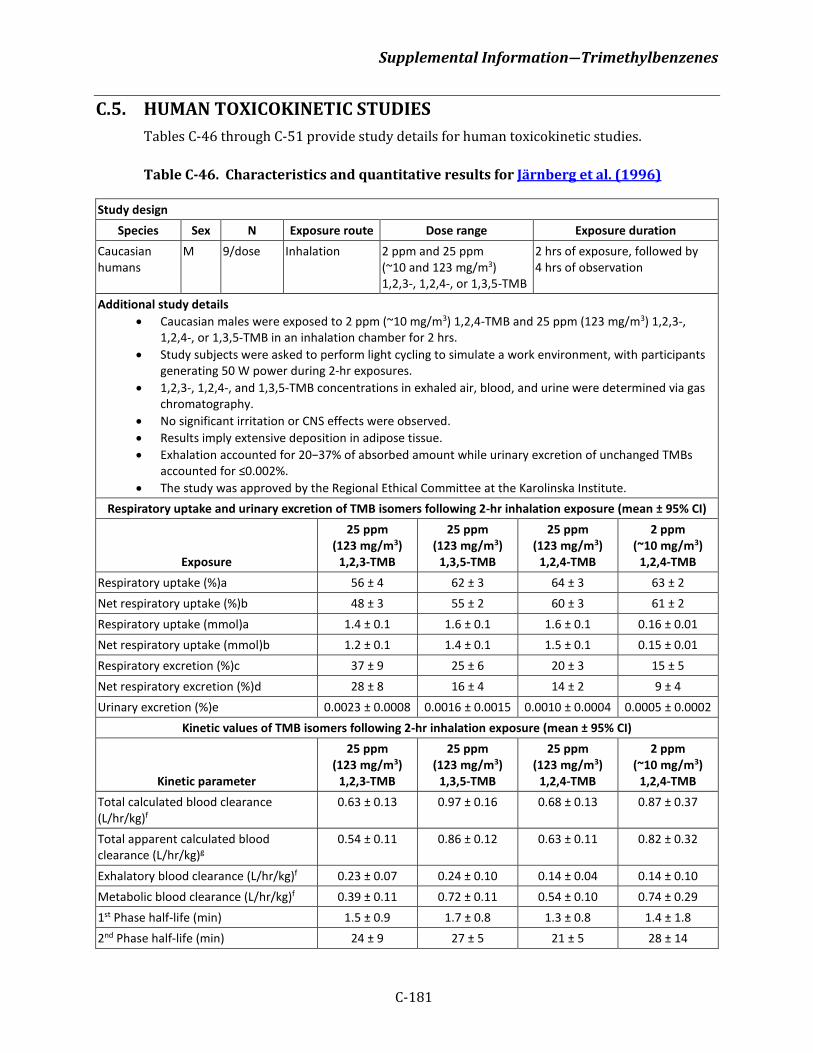
Supplemental Information―Trimethylbenzenes
C-181
C.5. HUMAN TOXICOKINETIC STUDIES Tables C-46 through C-51 provide study details for human toxicokinetic studies.
Table C-46. Characteristics and quantitative results for Järnberg et al. (1996)
Study design Species Sex N Exposure route Dose range Exposure duration
Caucasian humans
M 9/dose Inhalation 2 ppm and 25 ppm (~10 and 123 mg/m3) 1,2,3-, 1,2,4-, or 1,3,5-TMB
2 hrs of exposure, followed by 4 hrs of observation
Additional study details • Caucasian males were exposed to 2 ppm (~10 mg/m3) 1,2,4-TMB and 25 ppm (123 mg/m3) 1,2,3-,
1,2,4-, or 1,3,5-TMB in an inhalation chamber for 2 hrs. • Study subjects were asked to perform light cycling to simulate a work environment, with participants
generating 50 W power during 2-hr exposures. • 1,2,3-, 1,2,4-, and 1,3,5-TMB concentrations in exhaled air, blood, and urine were determined via gas
chromatography. • No significant irritation or CNS effects were observed. • Results imply extensive deposition in adipose tissue. • Exhalation accounted for 20−37% of absorbed amount while urinary excretion of unchanged TMBs
accounted for ≤0.002%. • The study was approved by the Regional Ethical Committee at the Karolinska Institute.
Respiratory uptake and urinary excretion of TMB isomers following 2-hr inhalation exposure (mean ± 95% CI)
Exposure
25 ppm (123 mg/m3)
1,2,3-TMB
25 ppm (123 mg/m3)
1,3,5-TMB
25 ppm (123 mg/m3)
1,2,4-TMB
2 ppm (~10 mg/m3)
1,2,4-TMB Respiratory uptake (%)a 56 ± 4 62 ± 3 64 ± 3 63 ± 2 Net respiratory uptake (%)b 48 ± 3 55 ± 2 60 ± 3 61 ± 2 Respiratory uptake (mmol)a 1.4 ± 0.1 1.6 ± 0.1 1.6 ± 0.1 0.16 ± 0.01 Net respiratory uptake (mmol)b 1.2 ± 0.1 1.4 ± 0.1 1.5 ± 0.1 0.15 ± 0.01 Respiratory excretion (%)c 37 ± 9 25 ± 6 20 ± 3 15 ± 5 Net respiratory excretion (%)d 28 ± 8 16 ± 4 14 ± 2 9 ± 4 Urinary excretion (%)e 0.0023 ± 0.0008 0.0016 ± 0.0015 0.0010 ± 0.0004 0.0005 ± 0.0002
Kinetic values of TMB isomers following 2-hr inhalation exposure (mean ± 95% CI)
Kinetic parameter
25 ppm (123 mg/m3)
1,2,3-TMB
25 ppm (123 mg/m3)
1,3,5-TMB
25 ppm (123 mg/m3)
1,2,4-TMB
2 ppm (~10 mg/m3)
1,2,4-TMB Total calculated blood clearance (L/hr/kg)f
0.63 ± 0.13 0.97 ± 0.16 0.68 ± 0.13 0.87 ± 0.37
Total apparent calculated blood clearance (L/hr/kg)g
0.54 ± 0.11 0.86 ± 0.12 0.63 ± 0.11 0.82 ± 0.32
Exhalatory blood clearance (L/hr/kg)f 0.23 ± 0.07 0.24 ± 0.10 0.14 ± 0.04 0.14 ± 0.10 Metabolic blood clearance (L/hr/kg)f 0.39 ± 0.11 0.72 ± 0.11 0.54 ± 0.10 0.74 ± 0.29 1st Phase half-life (min) 1.5 ± 0.9 1.7 ± 0.8 1.3 ± 0.8 1.4 ± 1.8 2nd Phase half-life (min) 24 ± 9 27 ± 5 21 ± 5 28 ± 14
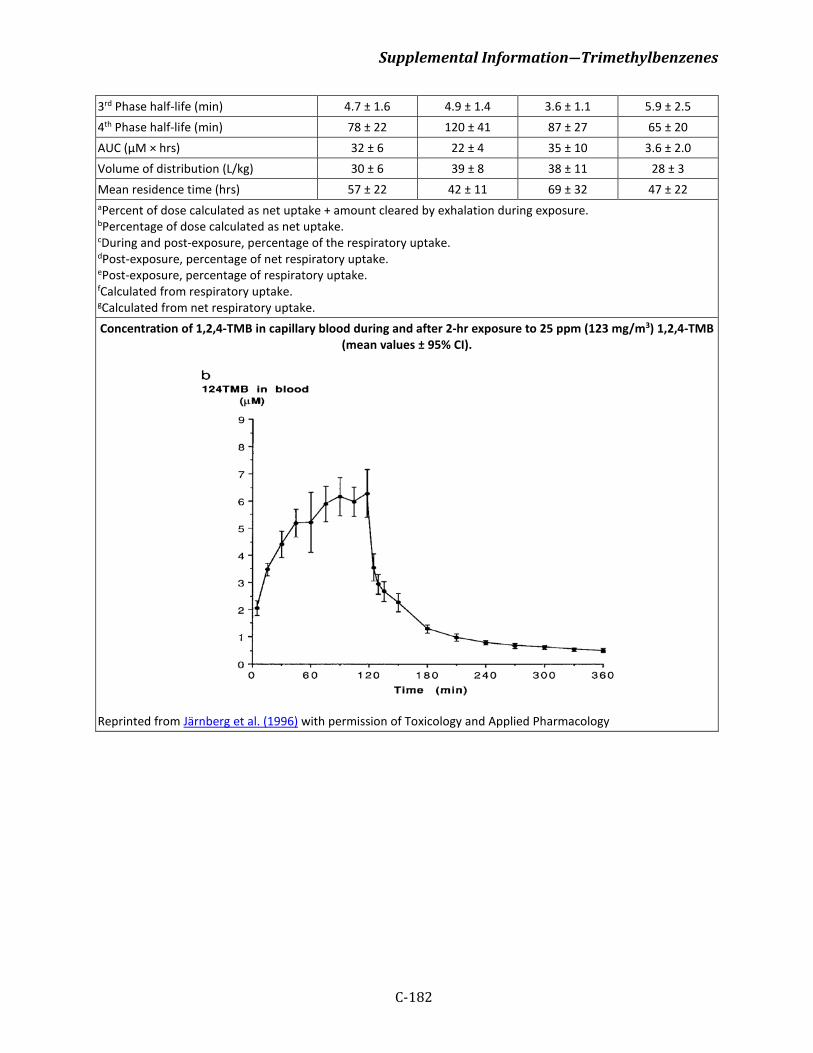
Supplemental Information―Trimethylbenzenes
C-182
3rd Phase half-life (min) 4.7 ± 1.6 4.9 ± 1.4 3.6 ± 1.1 5.9 ± 2.5 4th Phase half-life (min) 78 ± 22 120 ± 41 87 ± 27 65 ± 20 AUC (µM × hrs) 32 ± 6 22 ± 4 35 ± 10 3.6 ± 2.0 Volume of distribution (L/kg) 30 ± 6 39 ± 8 38 ± 11 28 ± 3 Mean residence time (hrs) 57 ± 22 42 ± 11 69 ± 32 47 ± 22 aPercent of dose calculated as net uptake + amount cleared by exhalation during exposure. bPercentage of dose calculated as net uptake. cDuring and post-exposure, percentage of the respiratory uptake. dPost-exposure, percentage of net respiratory uptake. ePost-exposure, percentage of respiratory uptake. fCalculated from respiratory uptake. gCalculated from net respiratory uptake. Concentration of 1,2,4-TMB in capillary blood during and after 2-hr exposure to 25 ppm (123 mg/m3) 1,2,4-TMB
(mean values ± 95% CI).
Reprinted from Järnberg et al. (1996) with permission of Toxicology and Applied Pharmacology
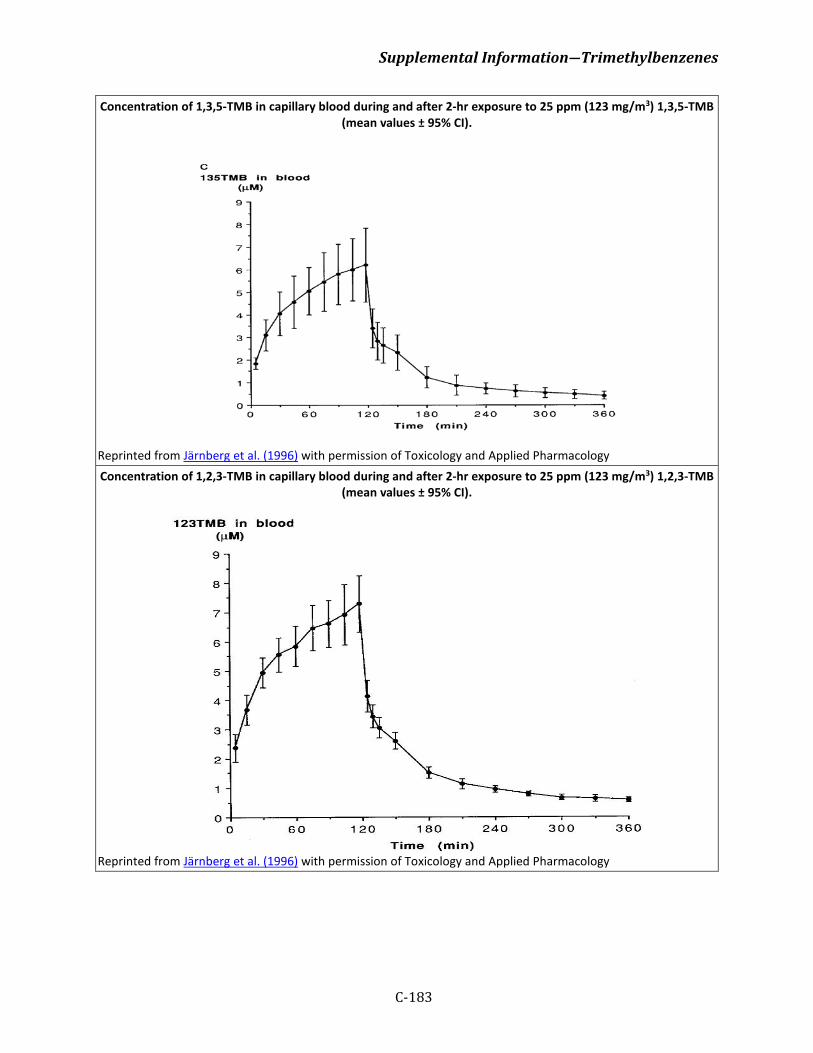
Supplemental Information―Trimethylbenzenes
C-183
Concentration of 1,3,5-TMB in capillary blood during and after 2-hr exposure to 25 ppm (123 mg/m3) 1,3,5-TMB (mean values ± 95% CI).
Reprinted from Järnberg et al. (1996) with permission of Toxicology and Applied Pharmacology Concentration of 1,2,3-TMB in capillary blood during and after 2-hr exposure to 25 ppm (123 mg/m3) 1,2,3-TMB
(mean values ± 95% CI).
Reprinted from Järnberg et al. (1996) with permission of Toxicology and Applied Pharmacology
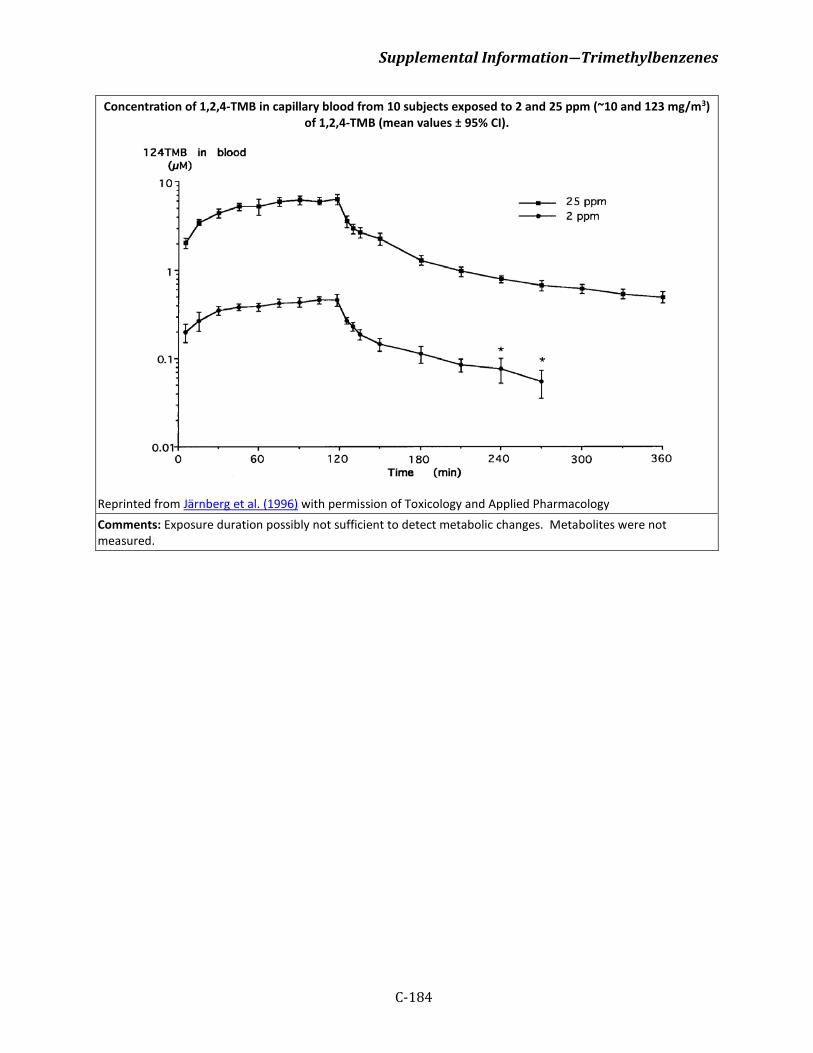
Supplemental Information―Trimethylbenzenes
C-184
Concentration of 1,2,4-TMB in capillary blood from 10 subjects exposed to 2 and 25 ppm (~10 and 123 mg/m3) of 1,2,4-TMB (mean values ± 95% CI).
Reprinted from Järnberg et al. (1996) with permission of Toxicology and Applied Pharmacology Comments: Exposure duration possibly not sufficient to detect metabolic changes. Metabolites were not measured.
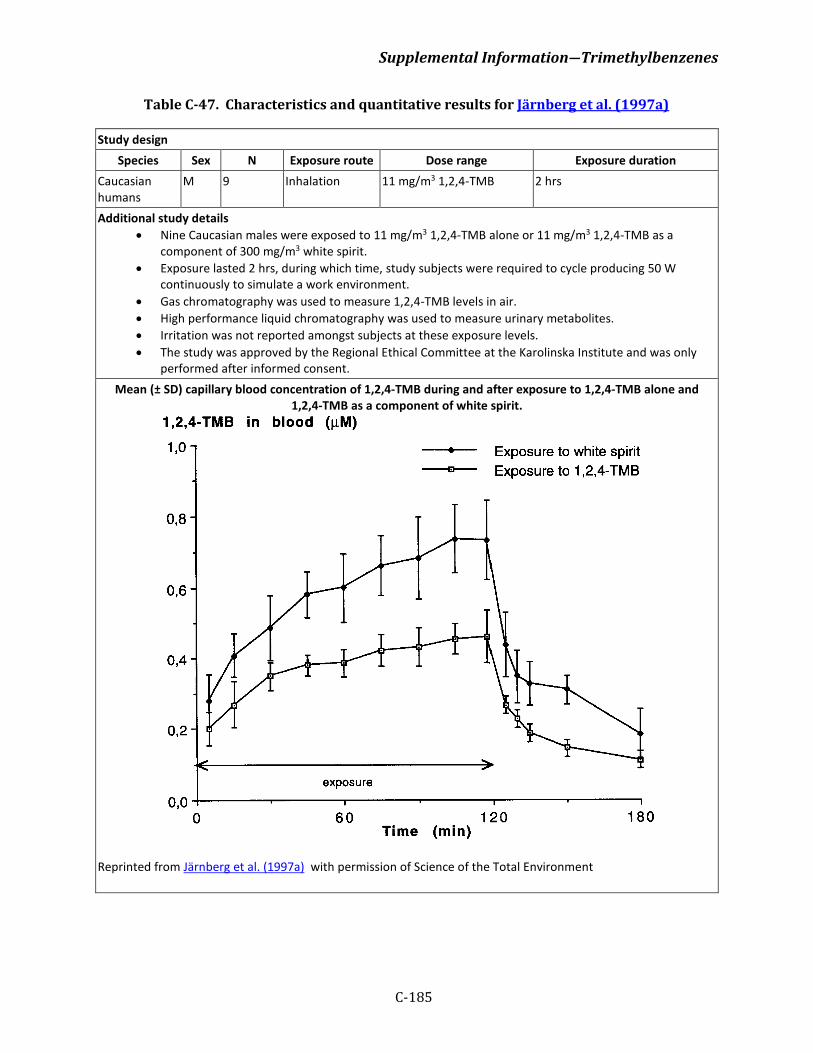
Supplemental Information―Trimethylbenzenes
C-185
Table C-47. Characteristics and quantitative results for Järnberg et al. (1997a)
Study design Species Sex N Exposure route Dose range Exposure duration
Caucasian humans
M 9 Inhalation 11 mg/m3 1,2,4-TMB 2 hrs
Additional study details • Nine Caucasian males were exposed to 11 mg/m3 1,2,4-TMB alone or 11 mg/m3 1,2,4-TMB as a
component of 300 mg/m3 white spirit. • Exposure lasted 2 hrs, during which time, study subjects were required to cycle producing 50 W
continuously to simulate a work environment. • Gas chromatography was used to measure 1,2,4-TMB levels in air. • High performance liquid chromatography was used to measure urinary metabolites. • Irritation was not reported amongst subjects at these exposure levels. • The study was approved by the Regional Ethical Committee at the Karolinska Institute and was only
performed after informed consent. Mean (± SD) capillary blood concentration of 1,2,4-TMB during and after exposure to 1,2,4-TMB alone and
1,2,4-TMB as a component of white spirit.
Reprinted from Järnberg et al. (1997a) with permission of Science of the Total Environment
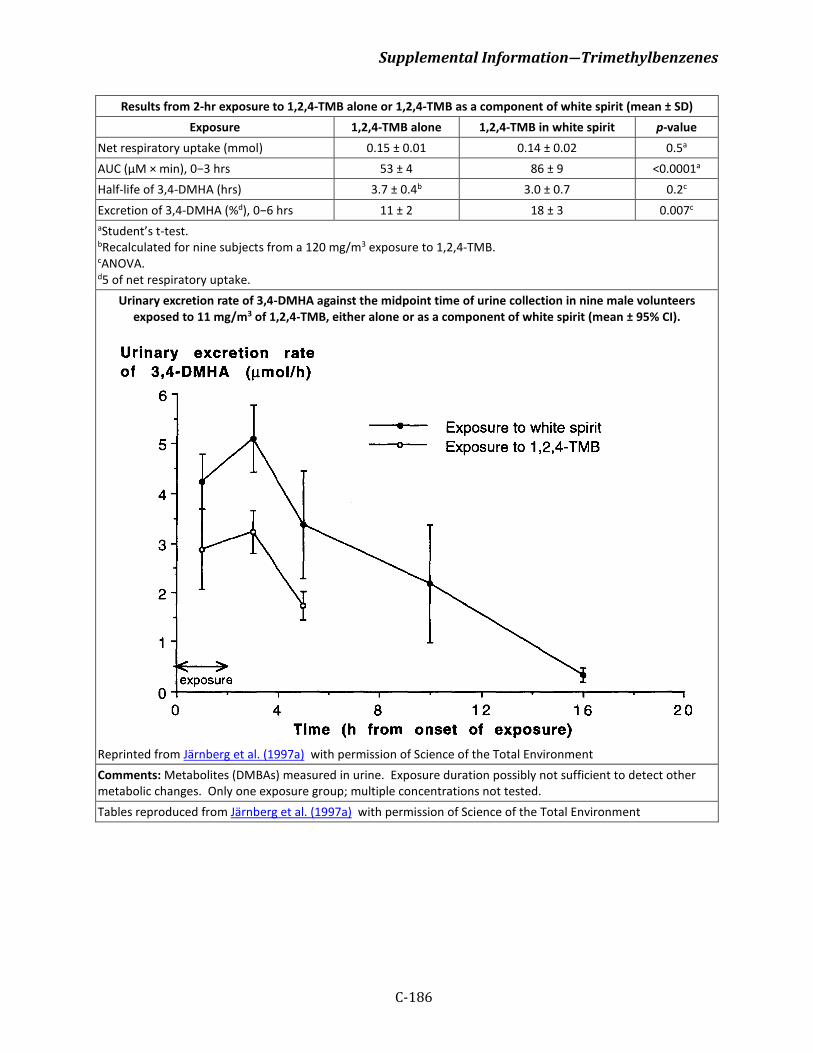
Supplemental Information―Trimethylbenzenes
C-186
Results from 2-hr exposure to 1,2,4-TMB alone or 1,2,4-TMB as a component of white spirit (mean ± SD) Exposure 1,2,4-TMB alone 1,2,4-TMB in white spirit p-value
Net respiratory uptake (mmol) 0.15 ± 0.01 0.14 ± 0.02 0.5a
AUC (µM × min), 0−3 hrs 53 ± 4 86 ± 9 <0.0001a
Half-life of 3,4-DMHA (hrs) 3.7 ± 0.4b 3.0 ± 0.7 0.2c
Excretion of 3,4-DMHA (%d), 0−6 hrs 11 ± 2 18 ± 3 0.007c
aStudent’s t-test. bRecalculated for nine subjects from a 120 mg/m3 exposure to 1,2,4-TMB. cANOVA. d5 of net respiratory uptake.
Urinary excretion rate of 3,4-DMHA against the midpoint time of urine collection in nine male volunteers exposed to 11 mg/m3 of 1,2,4-TMB, either alone or as a component of white spirit (mean ± 95% CI).
Reprinted from Järnberg et al. (1997a) with permission of Science of the Total Environment Comments: Metabolites (DMBAs) measured in urine. Exposure duration possibly not sufficient to detect other metabolic changes. Only one exposure group; multiple concentrations not tested. Tables reproduced from Järnberg et al. (1997a) with permission of Science of the Total Environment
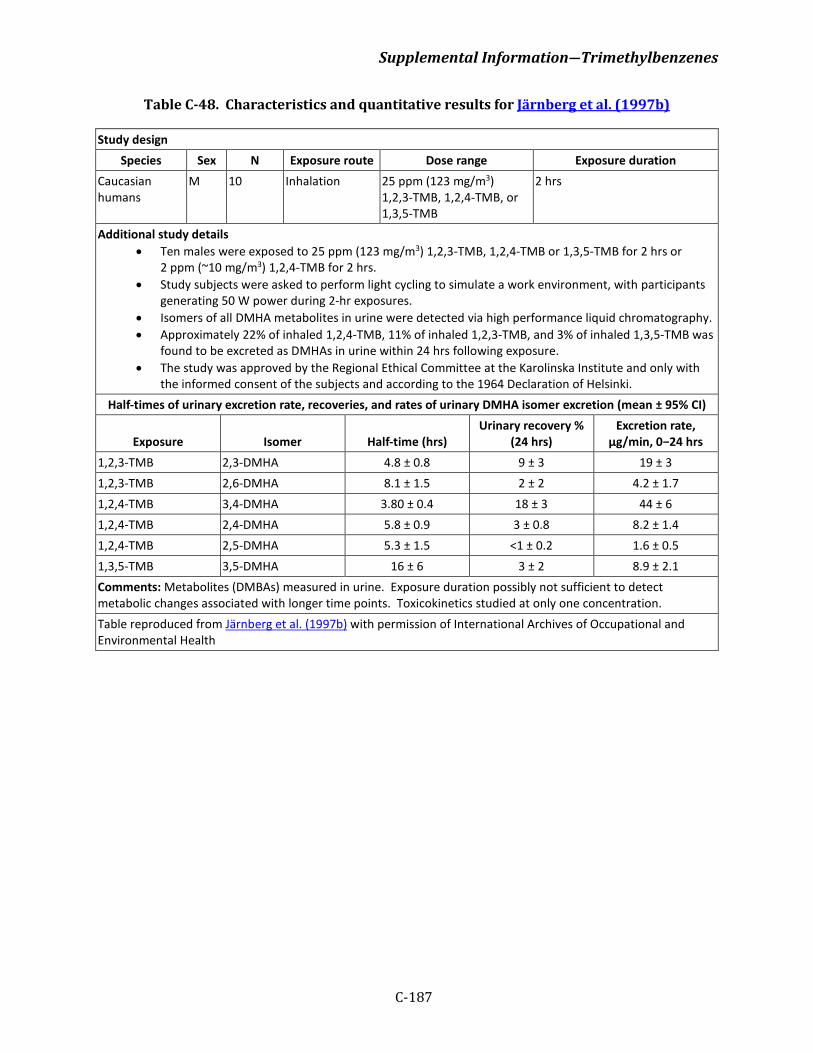
Supplemental Information―Trimethylbenzenes
C-187
Table C-48. Characteristics and quantitative results for Järnberg et al. (1997b)
Study design Species Sex N Exposure route Dose range Exposure duration
Caucasian humans
M 10 Inhalation 25 ppm (123 mg/m3) 1,2,3-TMB, 1,2,4-TMB, or 1,3,5-TMB
2 hrs
Additional study details • Ten males were exposed to 25 ppm (123 mg/m3) 1,2,3-TMB, 1,2,4-TMB or 1,3,5-TMB for 2 hrs or
2 ppm (~10 mg/m3) 1,2,4-TMB for 2 hrs. • Study subjects were asked to perform light cycling to simulate a work environment, with participants
generating 50 W power during 2-hr exposures. • Isomers of all DMHA metabolites in urine were detected via high performance liquid chromatography. • Approximately 22% of inhaled 1,2,4-TMB, 11% of inhaled 1,2,3-TMB, and 3% of inhaled 1,3,5-TMB was
found to be excreted as DMHAs in urine within 24 hrs following exposure. • The study was approved by the Regional Ethical Committee at the Karolinska Institute and only with
the informed consent of the subjects and according to the 1964 Declaration of Helsinki. Half-times of urinary excretion rate, recoveries, and rates of urinary DMHA isomer excretion (mean ± 95% CI)
Exposure Isomer Half-time (hrs) Urinary recovery %
(24 hrs) Excretion rate,
µg/min, 0−24 hrs 1,2,3-TMB 2,3-DMHA 4.8 ± 0.8 9 ± 3 19 ± 3 1,2,3-TMB 2,6-DMHA 8.1 ± 1.5 2 ± 2 4.2 ± 1.7 1,2,4-TMB 3,4-DMHA 3.80 ± 0.4 18 ± 3 44 ± 6 1,2,4-TMB 2,4-DMHA 5.8 ± 0.9 3 ± 0.8 8.2 ± 1.4 1,2,4-TMB 2,5-DMHA 5.3 ± 1.5 <1 ± 0.2 1.6 ± 0.5 1,3,5-TMB 3,5-DMHA 16 ± 6 3 ± 2 8.9 ± 2.1 Comments: Metabolites (DMBAs) measured in urine. Exposure duration possibly not sufficient to detect metabolic changes associated with longer time points. Toxicokinetics studied at only one concentration. Table reproduced from Järnberg et al. (1997b) with permission of International Archives of Occupational and Environmental Health
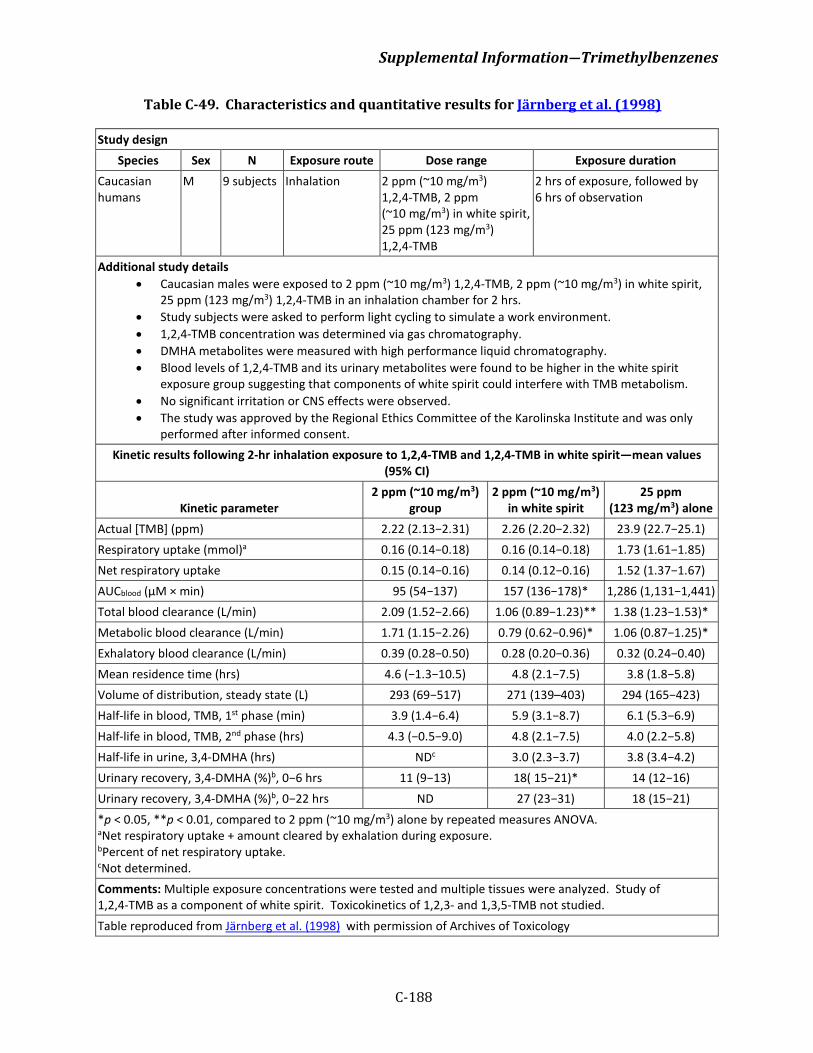
Supplemental Information―Trimethylbenzenes
C-188
Table C-49. Characteristics and quantitative results for Järnberg et al. (1998)
Study design Species Sex N Exposure route Dose range Exposure duration
Caucasian humans
M 9 subjects Inhalation 2 ppm (~10 mg/m3) 1,2,4-TMB, 2 ppm (~10 mg/m3) in white spirit, 25 ppm (123 mg/m3) 1,2,4-TMB
2 hrs of exposure, followed by 6 hrs of observation
Additional study details • Caucasian males were exposed to 2 ppm (~10 mg/m3) 1,2,4-TMB, 2 ppm (~10 mg/m3) in white spirit,
25 ppm (123 mg/m3) 1,2,4-TMB in an inhalation chamber for 2 hrs. • Study subjects were asked to perform light cycling to simulate a work environment. • 1,2,4-TMB concentration was determined via gas chromatography. • DMHA metabolites were measured with high performance liquid chromatography. • Blood levels of 1,2,4-TMB and its urinary metabolites were found to be higher in the white spirit
exposure group suggesting that components of white spirit could interfere with TMB metabolism. • No significant irritation or CNS effects were observed. • The study was approved by the Regional Ethics Committee of the Karolinska Institute and was only
performed after informed consent. Kinetic results following 2-hr inhalation exposure to 1,2,4-TMB and 1,2,4-TMB in white spirit—mean values
(95% CI)
Kinetic parameter 2 ppm (~10 mg/m3)
group 2 ppm (~10 mg/m3)
in white spirit 25 ppm
(123 mg/m3) alone Actual [TMB] (ppm) 2.22 (2.13−2.31) 2.26 (2.20−2.32) 23.9 (22.7−25.1) Respiratory uptake (mmol)a 0.16 (0.14−0.18) 0.16 (0.14−0.18) 1.73 (1.61−1.85) Net respiratory uptake 0.15 (0.14−0.16) 0.14 (0.12−0.16) 1.52 (1.37−1.67) AUCblood (µM × min) 95 (54−137) 157 (136−178)* 1,286 (1,131−1,441) Total blood clearance (L/min) 2.09 (1.52−2.66) 1.06 (0.89−1.23)** 1.38 (1.23−1.53)* Metabolic blood clearance (L/min) 1.71 (1.15−2.26) 0.79 (0.62−0.96)* 1.06 (0.87−1.25)* Exhalatory blood clearance (L/min) 0.39 (0.28−0.50) 0.28 (0.20−0.36) 0.32 (0.24−0.40) Mean residence time (hrs) 4.6 (−1.3−10.5) 4.8 (2.1−7.5) 3.8 (1.8−5.8) Volume of distribution, steady state (L) 293 (69−517) 271 (139–403) 294 (165−423) Half-life in blood, TMB, 1st phase (min) 3.9 (1.4−6.4) 5.9 (3.1−8.7) 6.1 (5.3−6.9) Half-life in blood, TMB, 2nd phase (hrs) 4.3 (−0.5−9.0) 4.8 (2.1−7.5) 4.0 (2.2−5.8) Half-life in urine, 3,4-DMHA (hrs) NDc 3.0 (2.3−3.7) 3.8 (3.4−4.2) Urinary recovery, 3,4-DMHA (%)b, 0−6 hrs 11 (9−13) 18( 15−21)* 14 (12−16) Urinary recovery, 3,4-DMHA (%)b, 0−22 hrs ND 27 (23−31) 18 (15−21) *p < 0.05, **p < 0.01, compared to 2 ppm (~10 mg/m3) alone by repeated measures ANOVA. aNet respiratory uptake + amount cleared by exhalation during exposure. bPercent of net respiratory uptake. cNot determined. Comments: Multiple exposure concentrations were tested and multiple tissues were analyzed. Study of 1,2,4-TMB as a component of white spirit. Toxicokinetics of 1,2,3- and 1,3,5-TMB not studied. Table reproduced from Järnberg et al. (1998) with permission of Archives of Toxicology
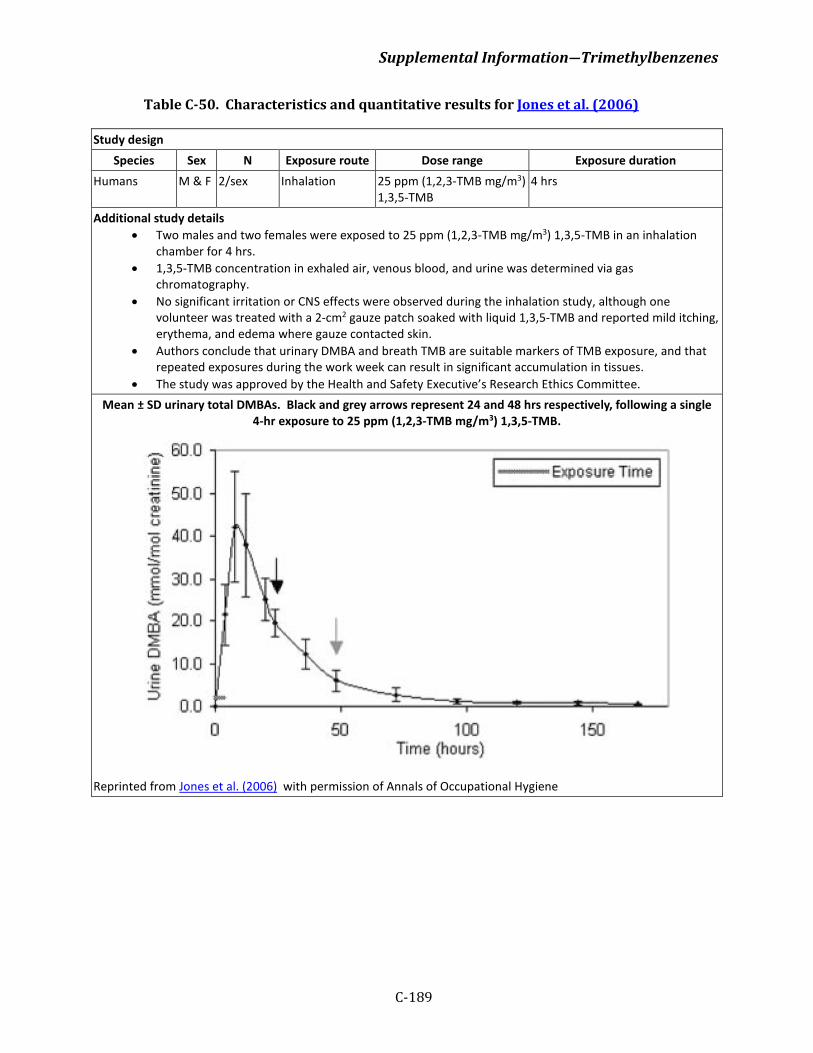
Supplemental Information―Trimethylbenzenes
C-189
Table C-50. Characteristics and quantitative results for Jones et al. (2006)
Study design Species Sex N Exposure route Dose range Exposure duration
Humans M & F 2/sex Inhalation 25 ppm (1,2,3-TMB mg/m3) 1,3,5-TMB
4 hrs
Additional study details • Two males and two females were exposed to 25 ppm (1,2,3-TMB mg/m3) 1,3,5-TMB in an inhalation
chamber for 4 hrs. • 1,3,5-TMB concentration in exhaled air, venous blood, and urine was determined via gas
chromatography. • No significant irritation or CNS effects were observed during the inhalation study, although one
volunteer was treated with a 2-cm2 gauze patch soaked with liquid 1,3,5-TMB and reported mild itching, erythema, and edema where gauze contacted skin.
• Authors conclude that urinary DMBA and breath TMB are suitable markers of TMB exposure, and that repeated exposures during the work week can result in significant accumulation in tissues.
• The study was approved by the Health and Safety Executive’s Research Ethics Committee. Mean ± SD urinary total DMBAs. Black and grey arrows represent 24 and 48 hrs respectively, following a single
4-hr exposure to 25 ppm (1,2,3-TMB mg/m3) 1,3,5-TMB.
Reprinted from Jones et al. (2006) with permission of Annals of Occupational Hygiene
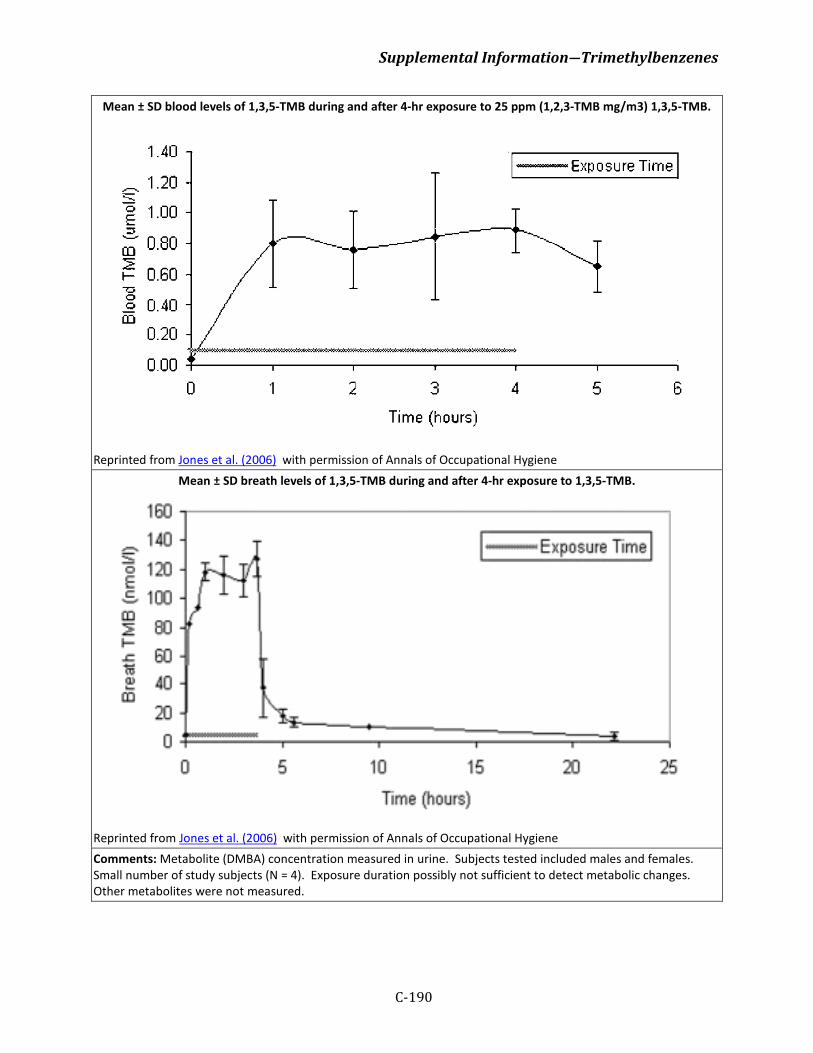
Supplemental Information―Trimethylbenzenes
C-190
Mean ± SD blood levels of 1,3,5-TMB during and after 4-hr exposure to 25 ppm (1,2,3-TMB mg/m3) 1,3,5-TMB.
Reprinted from Jones et al. (2006) with permission of Annals of Occupational Hygiene
Mean ± SD breath levels of 1,3,5-TMB during and after 4-hr exposure to 1,3,5-TMB.
Reprinted from Jones et al. (2006) with permission of Annals of Occupational Hygiene Comments: Metabolite (DMBA) concentration measured in urine. Subjects tested included males and females. Small number of study subjects (N = 4). Exposure duration possibly not sufficient to detect metabolic changes. Other metabolites were not measured.
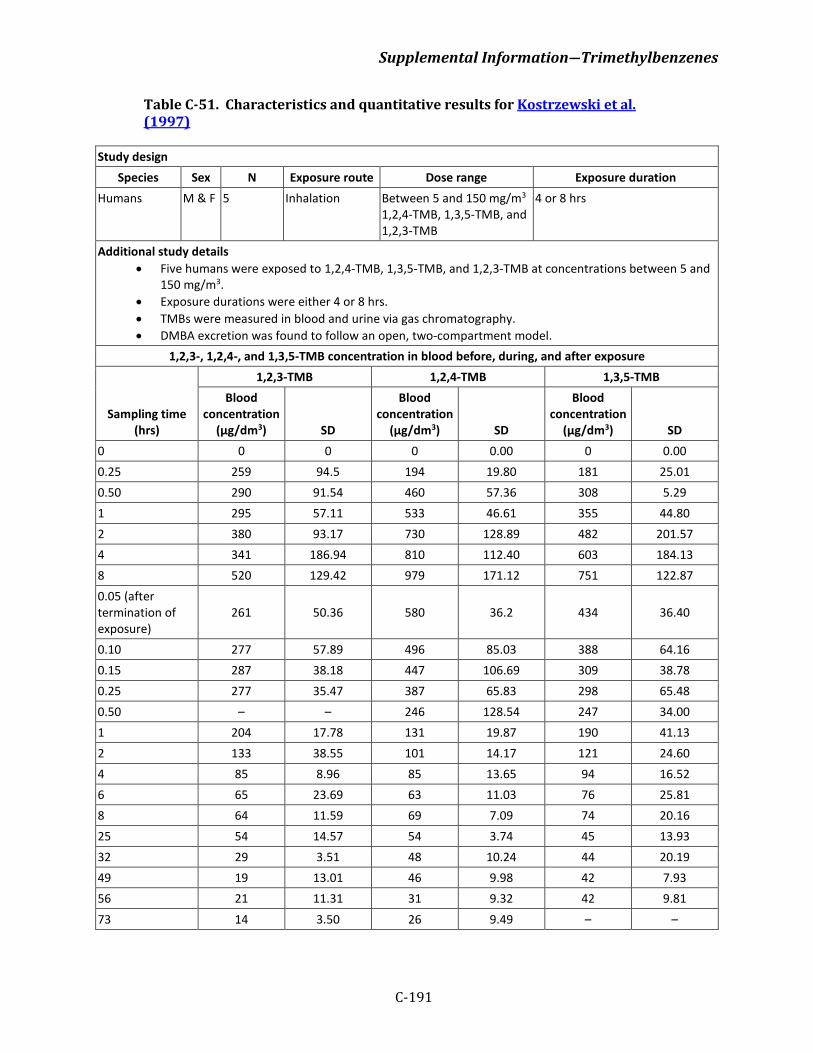
Supplemental Information―Trimethylbenzenes
C-191
Table C-51. Characteristics and quantitative results for Kostrzewski et al. (1997)
Study design Species Sex N Exposure route Dose range Exposure duration
Humans M & F 5 Inhalation Between 5 and 150 mg/m3 1,2,4-TMB, 1,3,5-TMB, and 1,2,3-TMB
4 or 8 hrs
Additional study details • Five humans were exposed to 1,2,4-TMB, 1,3,5-TMB, and 1,2,3-TMB at concentrations between 5 and
150 mg/m3. • Exposure durations were either 4 or 8 hrs. • TMBs were measured in blood and urine via gas chromatography. • DMBA excretion was found to follow an open, two-compartment model.
1,2,3-, 1,2,4-, and 1,3,5-TMB concentration in blood before, during, and after exposure
Sampling time (hrs)
1,2,3-TMB 1,2,4-TMB 1,3,5-TMB Blood
concentration (µg/dm3) SD
Blood concentration
(µg/dm3) SD
Blood concentration
(µg/dm3) SD 0 0 0 0 0.00 0 0.00 0.25 259 94.5 194 19.80 181 25.01 0.50 290 91.54 460 57.36 308 5.29 1 295 57.11 533 46.61 355 44.80 2 380 93.17 730 128.89 482 201.57 4 341 186.94 810 112.40 603 184.13 8 520 129.42 979 171.12 751 122.87 0.05 (after termination of exposure)
261 50.36 580 36.2 434 36.40
0.10 277 57.89 496 85.03 388 64.16 0.15 287 38.18 447 106.69 309 38.78 0.25 277 35.47 387 65.83 298 65.48 0.50 – – 246 128.54 247 34.00 1 204 17.78 131 19.87 190 41.13 2 133 38.55 101 14.17 121 24.60 4 85 8.96 85 13.65 94 16.52 6 65 23.69 63 11.03 76 25.81 8 64 11.59 69 7.09 74 20.16 25 54 14.57 54 3.74 45 13.93 32 29 3.51 48 10.24 44 20.19 49 19 13.01 46 9.98 42 7.93 56 21 11.31 31 9.32 42 9.81 73 14 3.50 26 9.49 – –
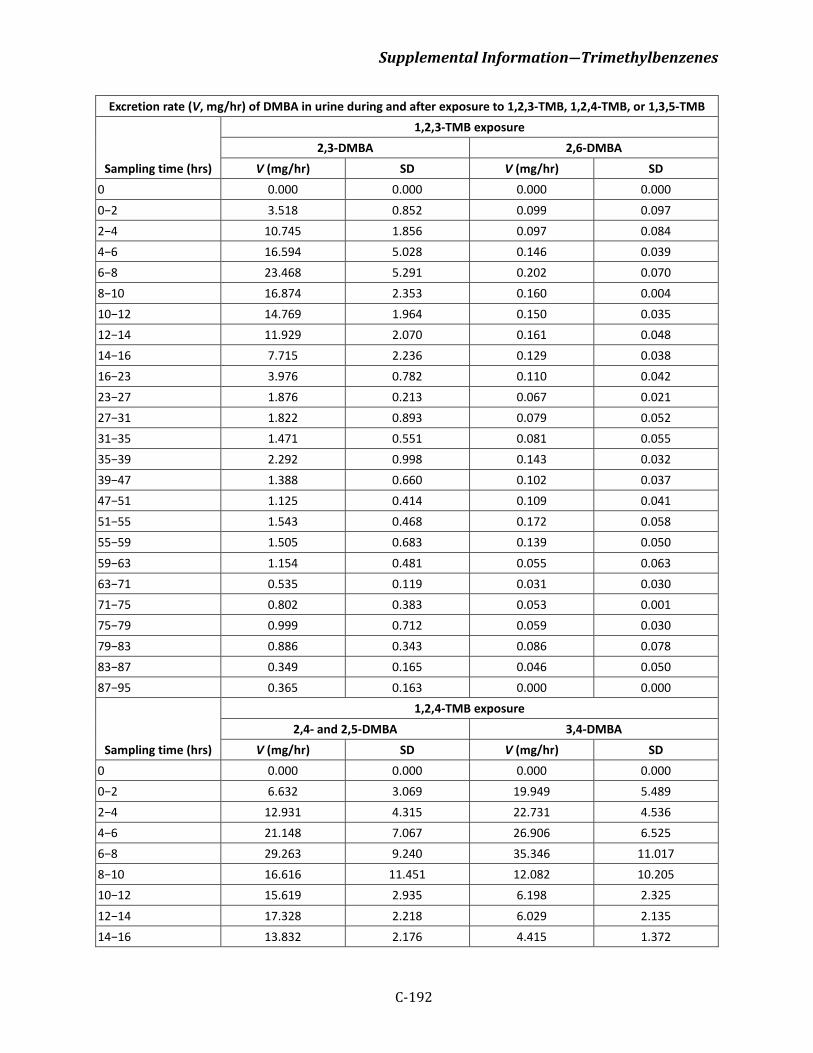
Supplemental Information―Trimethylbenzenes
C-192
Excretion rate (V, mg/hr) of DMBA in urine during and after exposure to 1,2,3-TMB, 1,2,4-TMB, or 1,3,5-TMB
Sampling time (hrs)
1,2,3-TMB exposure 2,3-DMBA 2,6-DMBA
V (mg/hr) SD V (mg/hr) SD 0 0.000 0.000 0.000 0.000 0−2 3.518 0.852 0.099 0.097 2−4 10.745 1.856 0.097 0.084 4−6 16.594 5.028 0.146 0.039 6−8 23.468 5.291 0.202 0.070 8−10 16.874 2.353 0.160 0.004 10−12 14.769 1.964 0.150 0.035 12−14 11.929 2.070 0.161 0.048 14−16 7.715 2.236 0.129 0.038 16−23 3.976 0.782 0.110 0.042 23−27 1.876 0.213 0.067 0.021 27−31 1.822 0.893 0.079 0.052 31−35 1.471 0.551 0.081 0.055 35−39 2.292 0.998 0.143 0.032 39−47 1.388 0.660 0.102 0.037 47−51 1.125 0.414 0.109 0.041 51−55 1.543 0.468 0.172 0.058 55−59 1.505 0.683 0.139 0.050 59−63 1.154 0.481 0.055 0.063 63−71 0.535 0.119 0.031 0.030 71−75 0.802 0.383 0.053 0.001 75−79 0.999 0.712 0.059 0.030 79−83 0.886 0.343 0.086 0.078 83−87 0.349 0.165 0.046 0.050 87−95 0.365 0.163 0.000 0.000
Sampling time (hrs)
1,2,4-TMB exposure 2,4- and 2,5-DMBA 3,4-DMBA
V (mg/hr) SD V (mg/hr) SD 0 0.000 0.000 0.000 0.000 0−2 6.632 3.069 19.949 5.489 2−4 12.931 4.315 22.731 4.536 4−6 21.148 7.067 26.906 6.525 6−8 29.263 9.240 35.346 11.017 8−10 16.616 11.451 12.082 10.205 10−12 15.619 2.935 6.198 2.325 12−14 17.328 2.218 6.029 2.135 14−16 13.832 2.176 4.415 1.372
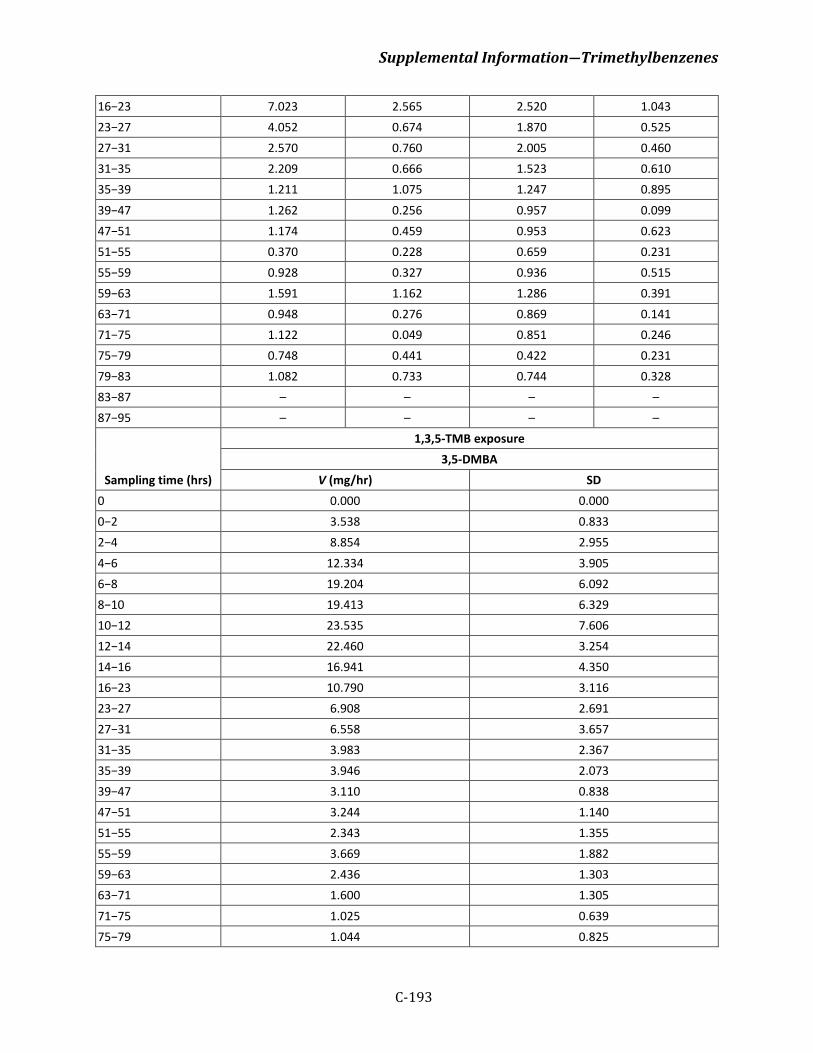
Supplemental Information―Trimethylbenzenes
C-193
16−23 7.023 2.565 2.520 1.043 23−27 4.052 0.674 1.870 0.525 27−31 2.570 0.760 2.005 0.460 31−35 2.209 0.666 1.523 0.610 35−39 1.211 1.075 1.247 0.895 39−47 1.262 0.256 0.957 0.099 47−51 1.174 0.459 0.953 0.623 51−55 0.370 0.228 0.659 0.231 55−59 0.928 0.327 0.936 0.515 59−63 1.591 1.162 1.286 0.391 63−71 0.948 0.276 0.869 0.141 71−75 1.122 0.049 0.851 0.246 75−79 0.748 0.441 0.422 0.231 79−83 1.082 0.733 0.744 0.328 83−87 – – – – 87−95 – – – –
Sampling time (hrs)
1,3,5-TMB exposure 3,5-DMBA
V (mg/hr) SD 0 0.000 0.000 0−2 3.538 0.833 2−4 8.854 2.955 4−6 12.334 3.905 6−8 19.204 6.092 8−10 19.413 6.329 10−12 23.535 7.606 12−14 22.460 3.254 14−16 16.941 4.350 16−23 10.790 3.116 23−27 6.908 2.691 27−31 6.558 3.657 31−35 3.983 2.367 35−39 3.946 2.073 39−47 3.110 0.838 47−51 3.244 1.140 51−55 2.343 1.355 55−59 3.669 1.882 59−63 2.436 1.303 63−71 1.600 1.305 71−75 1.025 0.639 75−79 1.044 0.825
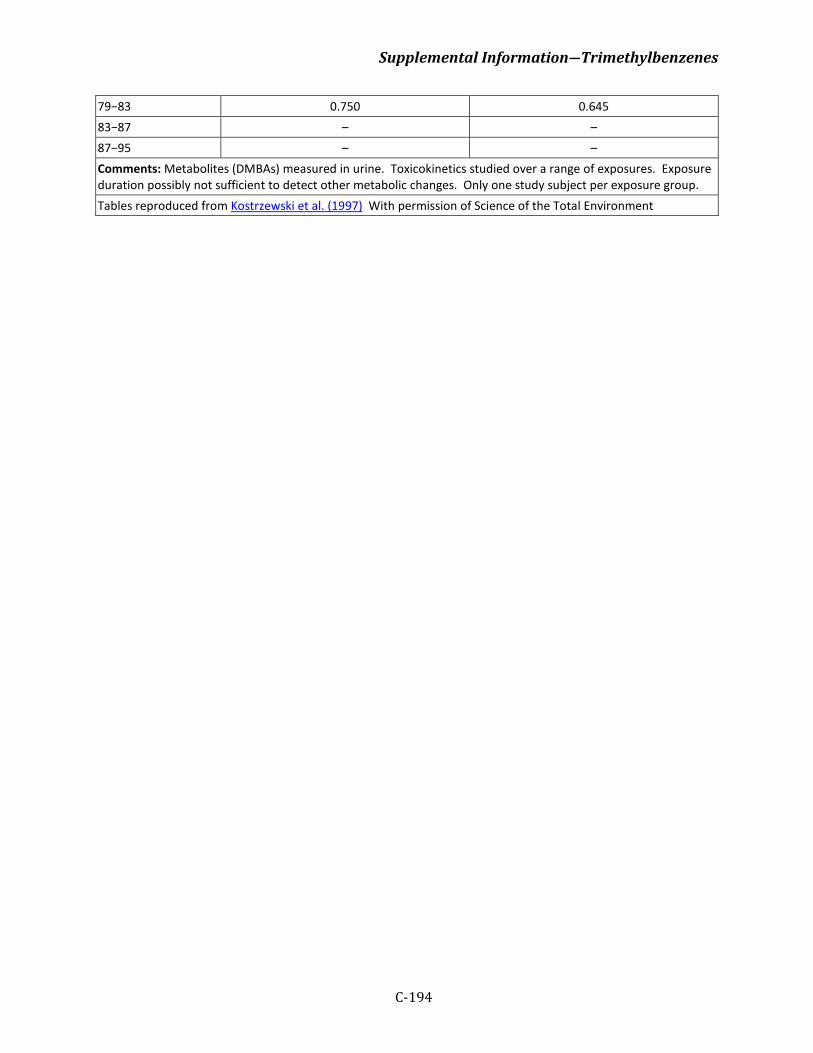
Supplemental Information―Trimethylbenzenes
C-194
79−83 0.750 0.645 83−87 – – 87−95 – – Comments: Metabolites (DMBAs) measured in urine. Toxicokinetics studied over a range of exposures. Exposure duration possibly not sufficient to detect other metabolic changes. Only one study subject per exposure group. Tables reproduced from Kostrzewski et al. (1997) With permission of Science of the Total Environment
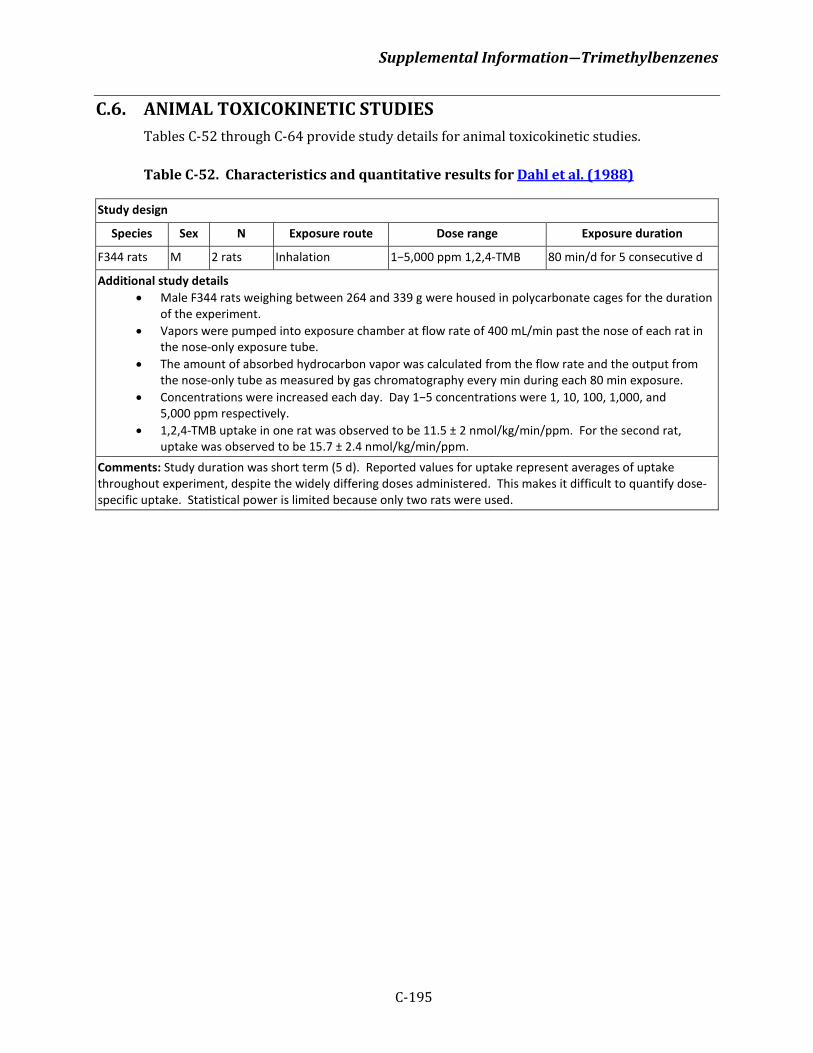
Supplemental Information―Trimethylbenzenes
C-195
C.6. ANIMAL TOXICOKINETIC STUDIES Tables C-52 through C-64 provide study details for animal toxicokinetic studies.
Table C-52. Characteristics and quantitative results for Dahl et al. (1988)
Study design
Species Sex N Exposure route Dose range Exposure duration
F344 rats M 2 rats Inhalation 1−5,000 ppm 1,2,4-TMB 80 min/d for 5 consecutive d
Additional study details • Male F344 rats weighing between 264 and 339 g were housed in polycarbonate cages for the duration
of the experiment. • Vapors were pumped into exposure chamber at flow rate of 400 mL/min past the nose of each rat in
the nose-only exposure tube. • The amount of absorbed hydrocarbon vapor was calculated from the flow rate and the output from
the nose-only tube as measured by gas chromatography every min during each 80 min exposure. • Concentrations were increased each day. Day 1−5 concentrations were 1, 10, 100, 1,000, and
5,000 ppm respectively. • 1,2,4-TMB uptake in one rat was observed to be 11.5 ± 2 nmol/kg/min/ppm. For the second rat,
uptake was observed to be 15.7 ± 2.4 nmol/kg/min/ppm. Comments: Study duration was short term (5 d). Reported values for uptake represent averages of uptake throughout experiment, despite the widely differing doses administered. This makes it difficult to quantify dose-specific uptake. Statistical power is limited because only two rats were used.
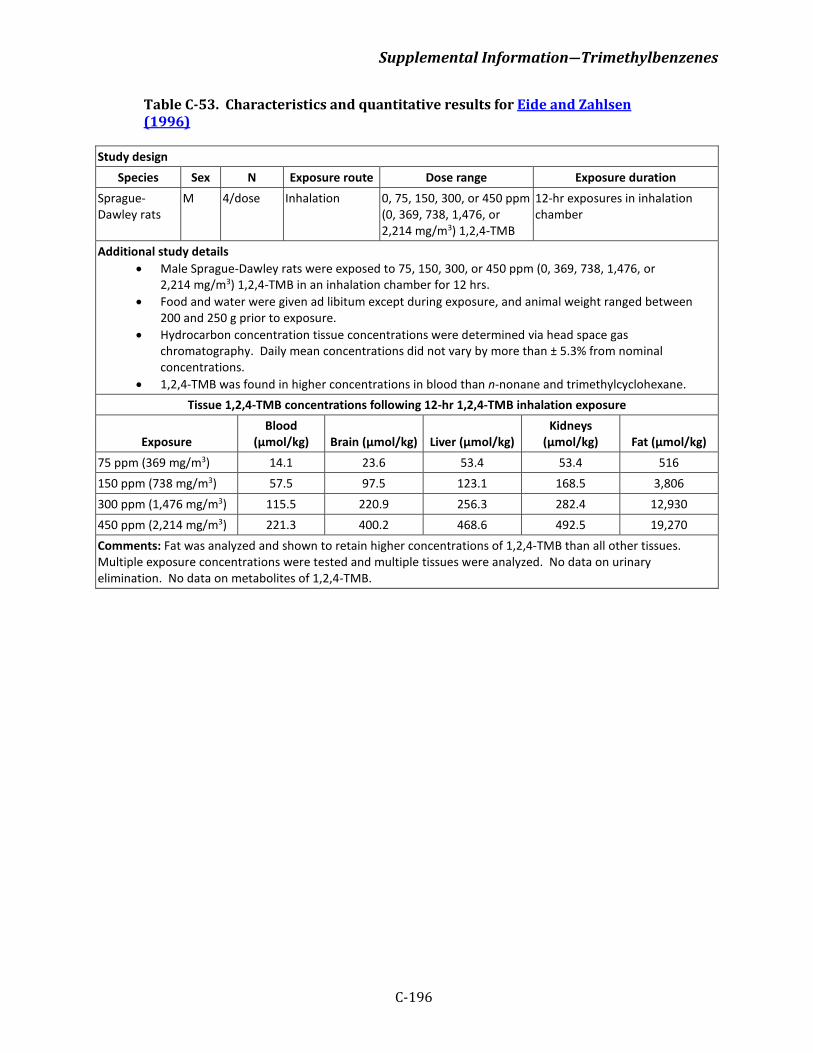
Supplemental Information―Trimethylbenzenes
C-196
Table C-53. Characteristics and quantitative results for Eide and Zahlsen (1996)
Study design Species Sex N Exposure route Dose range Exposure duration
Sprague-Dawley rats
M 4/dose Inhalation 0, 75, 150, 300, or 450 ppm (0, 369, 738, 1,476, or 2,214 mg/m3) 1,2,4-TMB
12-hr exposures in inhalation chamber
Additional study details • Male Sprague-Dawley rats were exposed to 75, 150, 300, or 450 ppm (0, 369, 738, 1,476, or
2,214 mg/m3) 1,2,4-TMB in an inhalation chamber for 12 hrs. • Food and water were given ad libitum except during exposure, and animal weight ranged between
200 and 250 g prior to exposure. • Hydrocarbon concentration tissue concentrations were determined via head space gas
chromatography. Daily mean concentrations did not vary by more than ± 5.3% from nominal concentrations.
• 1,2,4-TMB was found in higher concentrations in blood than n-nonane and trimethylcyclohexane. Tissue 1,2,4-TMB concentrations following 12-hr 1,2,4-TMB inhalation exposure
Exposure Blood
(µmol/kg) Brain (µmol/kg) Liver (µmol/kg) Kidneys
(µmol/kg) Fat (µmol/kg) 75 ppm (369 mg/m3) 14.1 23.6 53.4 53.4 516 150 ppm (738 mg/m3) 57.5 97.5 123.1 168.5 3,806 300 ppm (1,476 mg/m3) 115.5 220.9 256.3 282.4 12,930 450 ppm (2,214 mg/m3) 221.3 400.2 468.6 492.5 19,270 Comments: Fat was analyzed and shown to retain higher concentrations of 1,2,4-TMB than all other tissues. Multiple exposure concentrations were tested and multiple tissues were analyzed. No data on urinary elimination. No data on metabolites of 1,2,4-TMB.
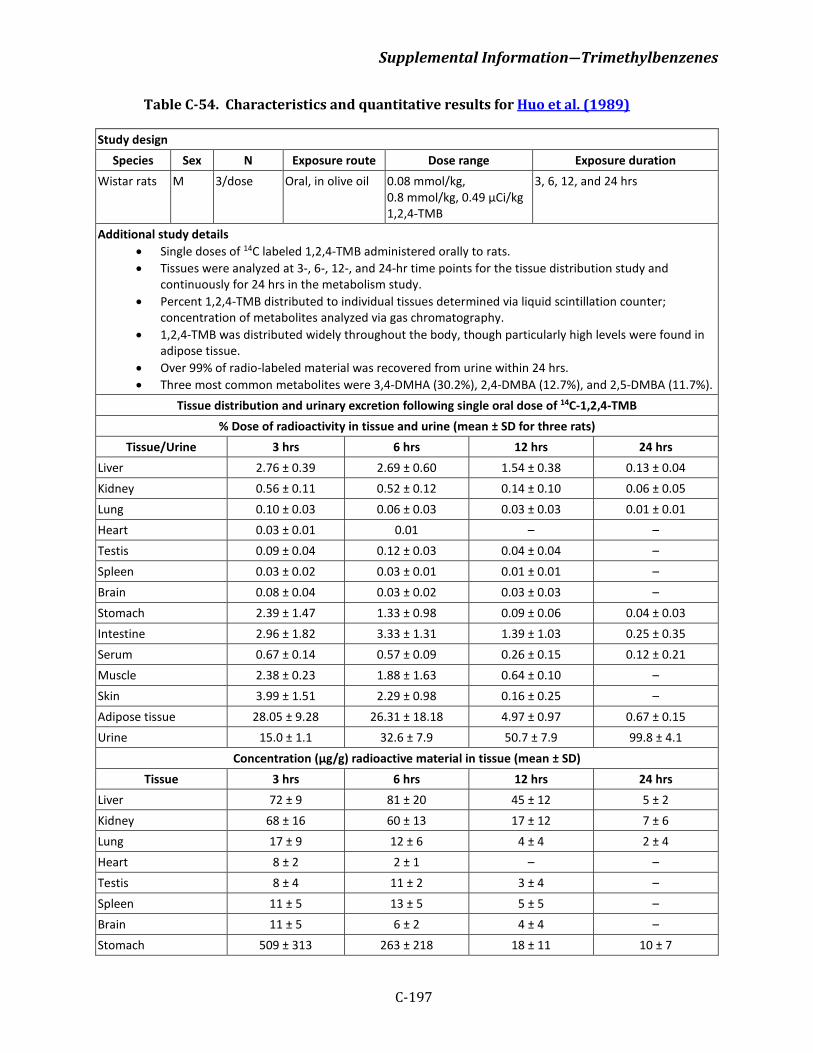
Supplemental Information―Trimethylbenzenes
C-197
Table C-54. Characteristics and quantitative results for Huo et al. (1989)
Study design Species Sex N Exposure route Dose range Exposure duration
Wistar rats M 3/dose Oral, in olive oil 0.08 mmol/kg, 0.8 mmol/kg, 0.49 µCi/kg 1,2,4-TMB
3, 6, 12, and 24 hrs
Additional study details • Single doses of 14C labeled 1,2,4-TMB administered orally to rats. • Tissues were analyzed at 3-, 6-, 12-, and 24-hr time points for the tissue distribution study and
continuously for 24 hrs in the metabolism study. • Percent 1,2,4-TMB distributed to individual tissues determined via liquid scintillation counter;
concentration of metabolites analyzed via gas chromatography. • 1,2,4-TMB was distributed widely throughout the body, though particularly high levels were found in
adipose tissue. • Over 99% of radio-labeled material was recovered from urine within 24 hrs. • Three most common metabolites were 3,4-DMHA (30.2%), 2,4-DMBA (12.7%), and 2,5-DMBA (11.7%).
Tissue distribution and urinary excretion following single oral dose of 14C-1,2,4-TMB % Dose of radioactivity in tissue and urine (mean ± SD for three rats)
Tissue/Urine 3 hrs 6 hrs 12 hrs 24 hrs Liver 2.76 ± 0.39 2.69 ± 0.60 1.54 ± 0.38 0.13 ± 0.04 Kidney 0.56 ± 0.11 0.52 ± 0.12 0.14 ± 0.10 0.06 ± 0.05 Lung 0.10 ± 0.03 0.06 ± 0.03 0.03 ± 0.03 0.01 ± 0.01 Heart 0.03 ± 0.01 0.01 – – Testis 0.09 ± 0.04 0.12 ± 0.03 0.04 ± 0.04 – Spleen 0.03 ± 0.02 0.03 ± 0.01 0.01 ± 0.01 – Brain 0.08 ± 0.04 0.03 ± 0.02 0.03 ± 0.03 – Stomach 2.39 ± 1.47 1.33 ± 0.98 0.09 ± 0.06 0.04 ± 0.03 Intestine 2.96 ± 1.82 3.33 ± 1.31 1.39 ± 1.03 0.25 ± 0.35 Serum 0.67 ± 0.14 0.57 ± 0.09 0.26 ± 0.15 0.12 ± 0.21 Muscle 2.38 ± 0.23 1.88 ± 1.63 0.64 ± 0.10 – Skin 3.99 ± 1.51 2.29 ± 0.98 0.16 ± 0.25 – Adipose tissue 28.05 ± 9.28 26.31 ± 18.18 4.97 ± 0.97 0.67 ± 0.15 Urine 15.0 ± 1.1 32.6 ± 7.9 50.7 ± 7.9 99.8 ± 4.1
Concentration (µg/g) radioactive material in tissue (mean ± SD) Tissue 3 hrs 6 hrs 12 hrs 24 hrs
Liver 72 ± 9 81 ± 20 45 ± 12 5 ± 2 Kidney 68 ± 16 60 ± 13 17 ± 12 7 ± 6 Lung 17 ± 9 12 ± 6 4 ± 4 2 ± 4 Heart 8 ± 2 2 ± 1 – – Testis 8 ± 4 11 ± 2 3 ± 4 – Spleen 11 ± 5 13 ± 5 5 ± 5 – Brain 11 ± 5 6 ± 2 4 ± 4 – Stomach 509 ± 313 263 ± 218 18 ± 11 10 ± 7
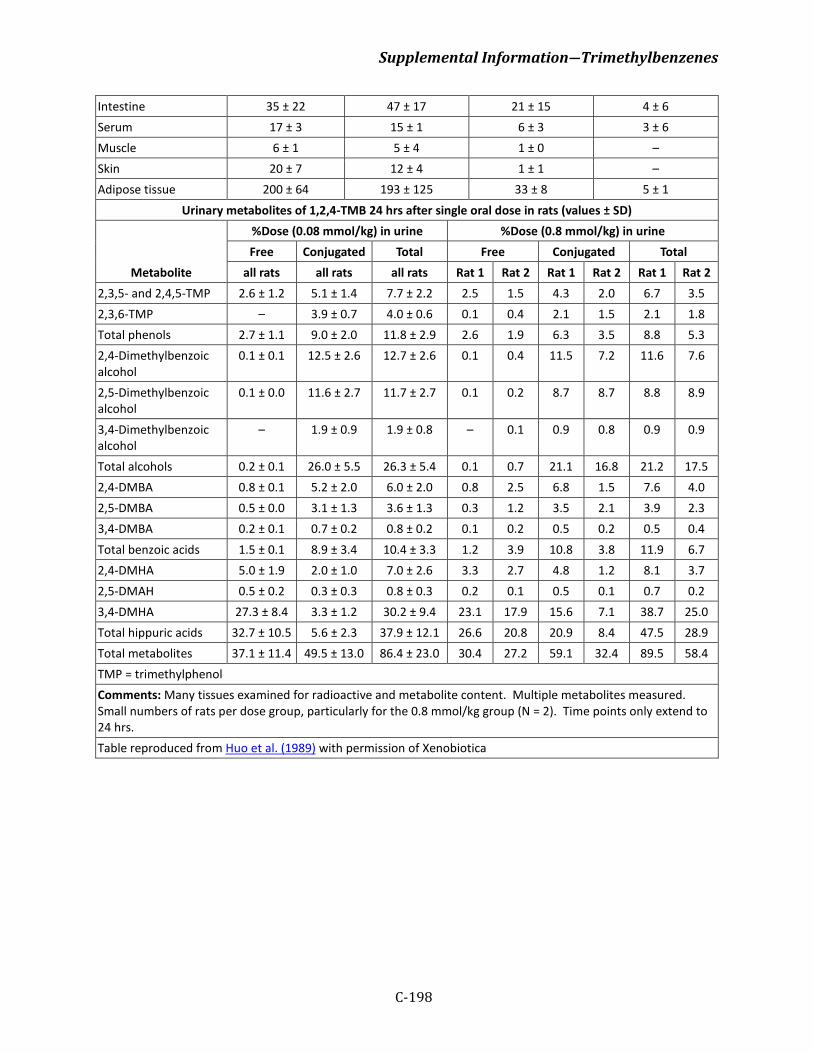
Supplemental Information―Trimethylbenzenes
C-198
Intestine 35 ± 22 47 ± 17 21 ± 15 4 ± 6 Serum 17 ± 3 15 ± 1 6 ± 3 3 ± 6 Muscle 6 ± 1 5 ± 4 1 ± 0 – Skin 20 ± 7 12 ± 4 1 ± 1 – Adipose tissue 200 ± 64 193 ± 125 33 ± 8 5 ± 1
Urinary metabolites of 1,2,4-TMB 24 hrs after single oral dose in rats (values ± SD)
Metabolite
%Dose (0.08 mmol/kg) in urine %Dose (0.8 mmol/kg) in urine Free Conjugated Total Free Conjugated Total
all rats all rats all rats Rat 1 Rat 2 Rat 1 Rat 2 Rat 1 Rat 2 2,3,5- and 2,4,5-TMP 2.6 ± 1.2 5.1 ± 1.4 7.7 ± 2.2 2.5 1.5 4.3 2.0 6.7 3.5 2,3,6-TMP – 3.9 ± 0.7 4.0 ± 0.6 0.1 0.4 2.1 1.5 2.1 1.8 Total phenols 2.7 ± 1.1 9.0 ± 2.0 11.8 ± 2.9 2.6 1.9 6.3 3.5 8.8 5.3 2,4-Dimethylbenzoic alcohol
0.1 ± 0.1 12.5 ± 2.6 12.7 ± 2.6 0.1 0.4 11.5 7.2 11.6 7.6
2,5-Dimethylbenzoic alcohol
0.1 ± 0.0 11.6 ± 2.7 11.7 ± 2.7 0.1 0.2 8.7 8.7 8.8 8.9
3,4-Dimethylbenzoic alcohol
– 1.9 ± 0.9 1.9 ± 0.8 – 0.1 0.9 0.8 0.9 0.9
Total alcohols 0.2 ± 0.1 26.0 ± 5.5 26.3 ± 5.4 0.1 0.7 21.1 16.8 21.2 17.5 2,4-DMBA 0.8 ± 0.1 5.2 ± 2.0 6.0 ± 2.0 0.8 2.5 6.8 1.5 7.6 4.0 2,5-DMBA 0.5 ± 0.0 3.1 ± 1.3 3.6 ± 1.3 0.3 1.2 3.5 2.1 3.9 2.3 3,4-DMBA 0.2 ± 0.1 0.7 ± 0.2 0.8 ± 0.2 0.1 0.2 0.5 0.2 0.5 0.4 Total benzoic acids 1.5 ± 0.1 8.9 ± 3.4 10.4 ± 3.3 1.2 3.9 10.8 3.8 11.9 6.7 2,4-DMHA 5.0 ± 1.9 2.0 ± 1.0 7.0 ± 2.6 3.3 2.7 4.8 1.2 8.1 3.7 2,5-DMAH 0.5 ± 0.2 0.3 ± 0.3 0.8 ± 0.3 0.2 0.1 0.5 0.1 0.7 0.2 3,4-DMHA 27.3 ± 8.4 3.3 ± 1.2 30.2 ± 9.4 23.1 17.9 15.6 7.1 38.7 25.0 Total hippuric acids 32.7 ± 10.5 5.6 ± 2.3 37.9 ± 12.1 26.6 20.8 20.9 8.4 47.5 28.9 Total metabolites 37.1 ± 11.4 49.5 ± 13.0 86.4 ± 23.0 30.4 27.2 59.1 32.4 89.5 58.4 TMP = trimethylphenol Comments: Many tissues examined for radioactive and metabolite content. Multiple metabolites measured. Small numbers of rats per dose group, particularly for the 0.8 mmol/kg group (N = 2). Time points only extend to 24 hrs. Table reproduced from Huo et al. (1989) with permission of Xenobiotica
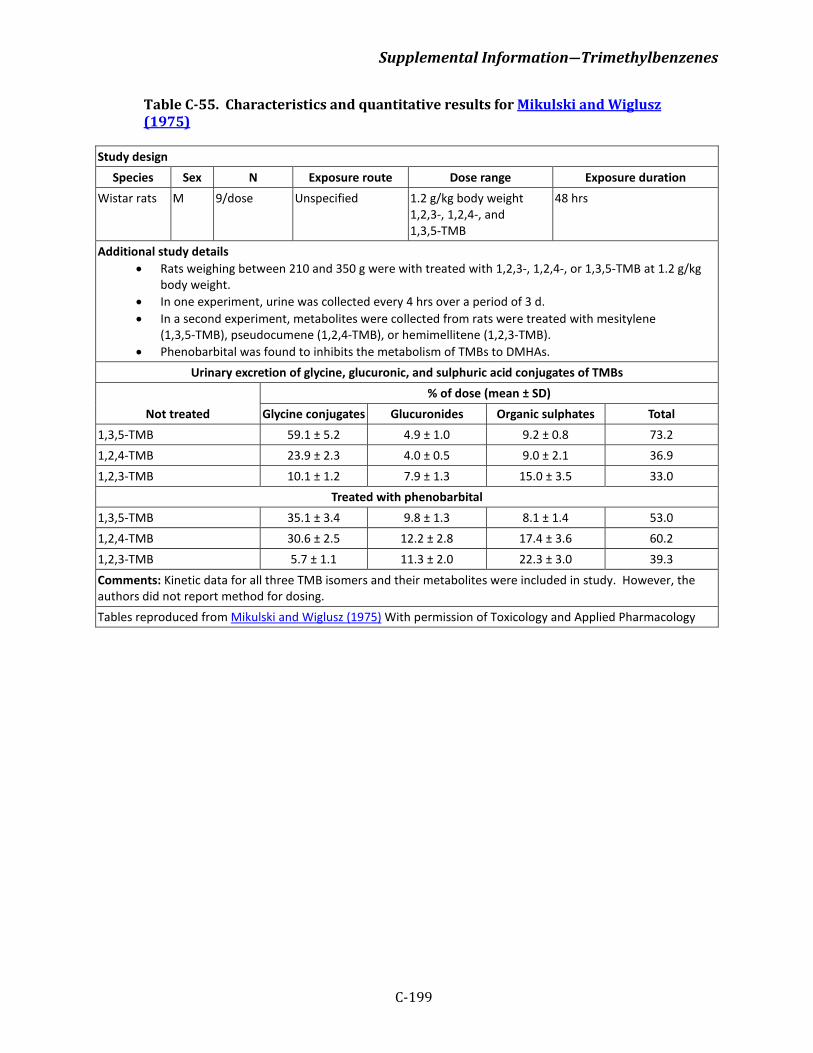
Supplemental Information―Trimethylbenzenes
C-199
Table C-55. Characteristics and quantitative results for Mikulski and Wiglusz (1975)
Study design Species Sex N Exposure route Dose range Exposure duration
Wistar rats M 9/dose Unspecified 1.2 g/kg body weight 1,2,3-, 1,2,4-, and 1,3,5-TMB
48 hrs
Additional study details • Rats weighing between 210 and 350 g were with treated with 1,2,3-, 1,2,4-, or 1,3,5-TMB at 1.2 g/kg
body weight. • In one experiment, urine was collected every 4 hrs over a period of 3 d. • In a second experiment, metabolites were collected from rats were treated with mesitylene
(1,3,5-TMB), pseudocumene (1,2,4-TMB), or hemimellitene (1,2,3-TMB). • Phenobarbital was found to inhibits the metabolism of TMBs to DMHAs.
Urinary excretion of glycine, glucuronic, and sulphuric acid conjugates of TMBs
Not treated % of dose (mean ± SD)
Glycine conjugates Glucuronides Organic sulphates Total 1,3,5-TMB 59.1 ± 5.2 4.9 ± 1.0 9.2 ± 0.8 73.2 1,2,4-TMB 23.9 ± 2.3 4.0 ± 0.5 9.0 ± 2.1 36.9 1,2,3-TMB 10.1 ± 1.2 7.9 ± 1.3 15.0 ± 3.5 33.0
Treated with phenobarbital 1,3,5-TMB 35.1 ± 3.4 9.8 ± 1.3 8.1 ± 1.4 53.0 1,2,4-TMB 30.6 ± 2.5 12.2 ± 2.8 17.4 ± 3.6 60.2 1,2,3-TMB 5.7 ± 1.1 11.3 ± 2.0 22.3 ± 3.0 39.3 Comments: Kinetic data for all three TMB isomers and their metabolites were included in study. However, the authors did not report method for dosing. Tables reproduced from Mikulski and Wiglusz (1975) With permission of Toxicology and Applied Pharmacology
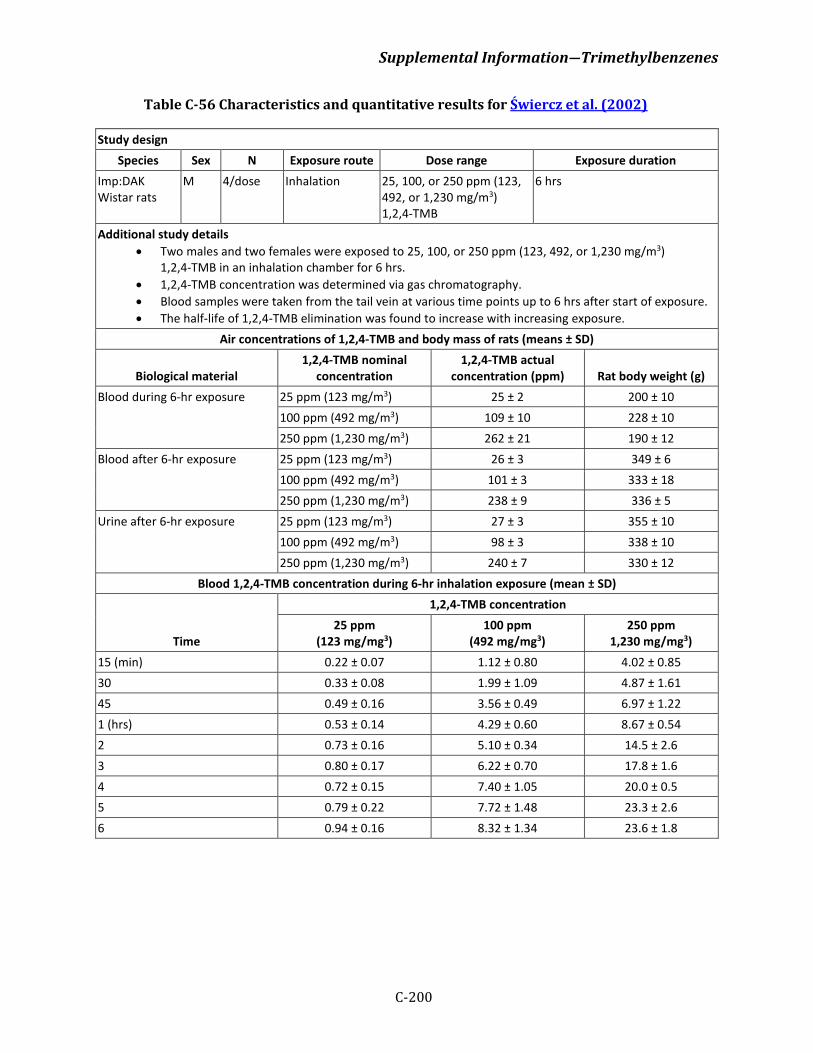
Supplemental Information―Trimethylbenzenes
C-200
Table C-56 Characteristics and quantitative results for Świercz et al. (2002)
Study design Species Sex N Exposure route Dose range Exposure duration
Imp:DAK Wistar rats
M 4/dose Inhalation 25, 100, or 250 ppm (123, 492, or 1,230 mg/m3) 1,2,4-TMB
6 hrs
Additional study details • Two males and two females were exposed to 25, 100, or 250 ppm (123, 492, or 1,230 mg/m3)
1,2,4-TMB in an inhalation chamber for 6 hrs. • 1,2,4-TMB concentration was determined via gas chromatography. • Blood samples were taken from the tail vein at various time points up to 6 hrs after start of exposure. • The half-life of 1,2,4-TMB elimination was found to increase with increasing exposure.
Air concentrations of 1,2,4-TMB and body mass of rats (means ± SD)
Biological material 1,2,4-TMB nominal
concentration 1,2,4-TMB actual
concentration (ppm) Rat body weight (g) Blood during 6-hr exposure 25 ppm (123 mg/m3) 25 ± 2 200 ± 10
100 ppm (492 mg/m3) 109 ± 10 228 ± 10 250 ppm (1,230 mg/m3) 262 ± 21 190 ± 12
Blood after 6-hr exposure 25 ppm (123 mg/m3) 26 ± 3 349 ± 6 100 ppm (492 mg/m3) 101 ± 3 333 ± 18 250 ppm (1,230 mg/m3) 238 ± 9 336 ± 5
Urine after 6-hr exposure 25 ppm (123 mg/m3) 27 ± 3 355 ± 10 100 ppm (492 mg/m3) 98 ± 3 338 ± 10 250 ppm (1,230 mg/m3) 240 ± 7 330 ± 12
Blood 1,2,4-TMB concentration during 6-hr inhalation exposure (mean ± SD)
Time
1,2,4-TMB concentration 25 ppm
(123 mg/mg3) 100 ppm
(492 mg/mg3) 250 ppm
1,230 mg/mg3) 15 (min) 0.22 ± 0.07 1.12 ± 0.80 4.02 ± 0.85 30 0.33 ± 0.08 1.99 ± 1.09 4.87 ± 1.61 45 0.49 ± 0.16 3.56 ± 0.49 6.97 ± 1.22 1 (hrs) 0.53 ± 0.14 4.29 ± 0.60 8.67 ± 0.54 2 0.73 ± 0.16 5.10 ± 0.34 14.5 ± 2.6 3 0.80 ± 0.17 6.22 ± 0.70 17.8 ± 1.6 4 0.72 ± 0.15 7.40 ± 1.05 20.0 ± 0.5 5 0.79 ± 0.22 7.72 ± 1.48 23.3 ± 2.6 6 0.94 ± 0.16 8.32 ± 1.34 23.6 ± 1.8
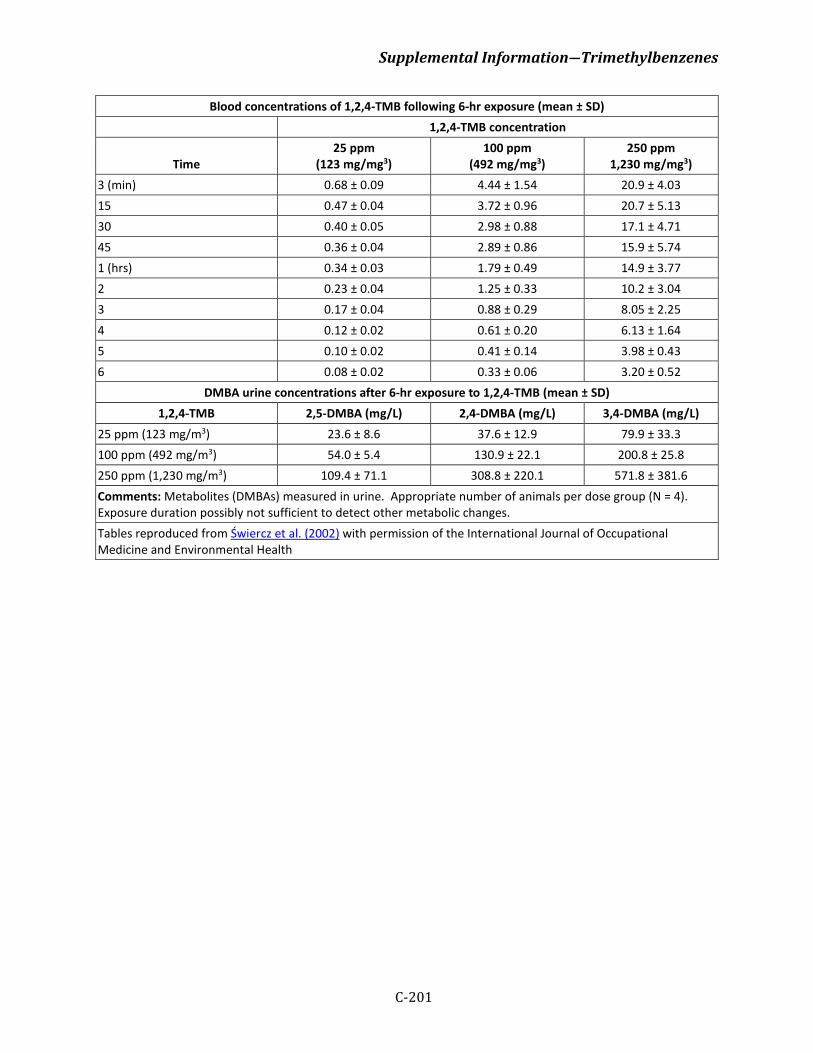
Supplemental Information―Trimethylbenzenes
C-201
Blood concentrations of 1,2,4-TMB following 6-hr exposure (mean ± SD) 1,2,4-TMB concentration
Time 25 ppm
(123 mg/mg3) 100 ppm
(492 mg/mg3) 250 ppm
1,230 mg/mg3) 3 (min) 0.68 ± 0.09 4.44 ± 1.54 20.9 ± 4.03 15 0.47 ± 0.04 3.72 ± 0.96 20.7 ± 5.13 30 0.40 ± 0.05 2.98 ± 0.88 17.1 ± 4.71 45 0.36 ± 0.04 2.89 ± 0.86 15.9 ± 5.74 1 (hrs) 0.34 ± 0.03 1.79 ± 0.49 14.9 ± 3.77 2 0.23 ± 0.04 1.25 ± 0.33 10.2 ± 3.04 3 0.17 ± 0.04 0.88 ± 0.29 8.05 ± 2.25 4 0.12 ± 0.02 0.61 ± 0.20 6.13 ± 1.64 5 0.10 ± 0.02 0.41 ± 0.14 3.98 ± 0.43 6 0.08 ± 0.02 0.33 ± 0.06 3.20 ± 0.52
DMBA urine concentrations after 6-hr exposure to 1,2,4-TMB (mean ± SD) 1,2,4-TMB 2,5-DMBA (mg/L) 2,4-DMBA (mg/L) 3,4-DMBA (mg/L)
25 ppm (123 mg/m3) 23.6 ± 8.6 37.6 ± 12.9 79.9 ± 33.3 100 ppm (492 mg/m3) 54.0 ± 5.4 130.9 ± 22.1 200.8 ± 25.8 250 ppm (1,230 mg/m3) 109.4 ± 71.1 308.8 ± 220.1 571.8 ± 381.6 Comments: Metabolites (DMBAs) measured in urine. Appropriate number of animals per dose group (N = 4). Exposure duration possibly not sufficient to detect other metabolic changes. Tables reproduced from Świercz et al. (2002) with permission of the International Journal of Occupational Medicine and Environmental Health
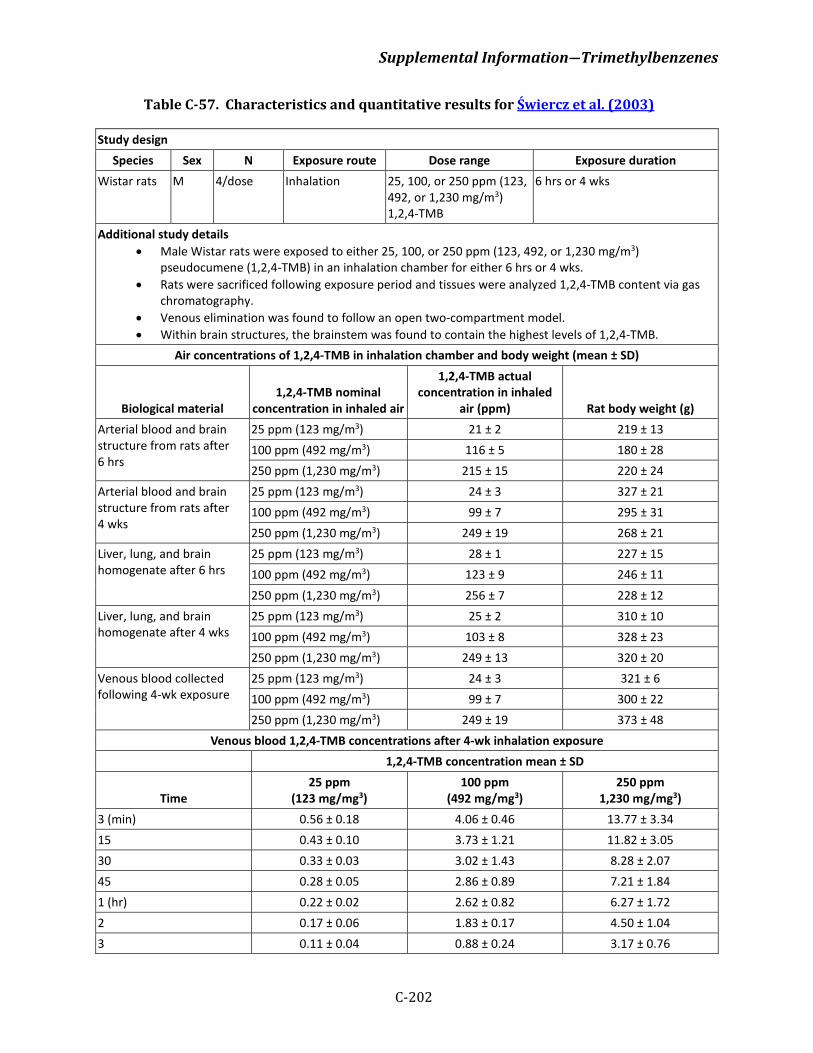
Supplemental Information―Trimethylbenzenes
C-202
Table C-57. Characteristics and quantitative results for Świercz et al. (2003)
Study design Species Sex N Exposure route Dose range Exposure duration
Wistar rats M 4/dose Inhalation 25, 100, or 250 ppm (123, 492, or 1,230 mg/m3) 1,2,4-TMB
6 hrs or 4 wks
Additional study details • Male Wistar rats were exposed to either 25, 100, or 250 ppm (123, 492, or 1,230 mg/m3)
pseudocumene (1,2,4-TMB) in an inhalation chamber for either 6 hrs or 4 wks. • Rats were sacrificed following exposure period and tissues were analyzed 1,2,4-TMB content via gas
chromatography. • Venous elimination was found to follow an open two-compartment model. • Within brain structures, the brainstem was found to contain the highest levels of 1,2,4-TMB.
Air concentrations of 1,2,4-TMB in inhalation chamber and body weight (mean ± SD)
Biological material 1,2,4-TMB nominal
concentration in inhaled air
1,2,4-TMB actual concentration in inhaled
air (ppm) Rat body weight (g) Arterial blood and brain structure from rats after 6 hrs
25 ppm (123 mg/m3) 21 ± 2 219 ± 13 100 ppm (492 mg/m3) 116 ± 5 180 ± 28 250 ppm (1,230 mg/m3) 215 ± 15 220 ± 24
Arterial blood and brain structure from rats after 4 wks
25 ppm (123 mg/m3) 24 ± 3 327 ± 21 100 ppm (492 mg/m3) 99 ± 7 295 ± 31 250 ppm (1,230 mg/m3) 249 ± 19 268 ± 21
Liver, lung, and brain homogenate after 6 hrs
25 ppm (123 mg/m3) 28 ± 1 227 ± 15 100 ppm (492 mg/m3) 123 ± 9 246 ± 11 250 ppm (1,230 mg/m3) 256 ± 7 228 ± 12
Liver, lung, and brain homogenate after 4 wks
25 ppm (123 mg/m3) 25 ± 2 310 ± 10 100 ppm (492 mg/m3) 103 ± 8 328 ± 23 250 ppm (1,230 mg/m3) 249 ± 13 320 ± 20
Venous blood collected following 4-wk exposure
25 ppm (123 mg/m3) 24 ± 3 321 ± 6 100 ppm (492 mg/m3) 99 ± 7 300 ± 22 250 ppm (1,230 mg/m3) 249 ± 19 373 ± 48
Venous blood 1,2,4-TMB concentrations after 4-wk inhalation exposure 1,2,4-TMB concentration mean ± SD
Time 25 ppm
(123 mg/mg3) 100 ppm
(492 mg/mg3) 250 ppm
1,230 mg/mg3) 3 (min) 0.56 ± 0.18 4.06 ± 0.46 13.77 ± 3.34 15 0.43 ± 0.10 3.73 ± 1.21 11.82 ± 3.05 30 0.33 ± 0.03 3.02 ± 1.43 8.28 ± 2.07 45 0.28 ± 0.05 2.86 ± 0.89 7.21 ± 1.84 1 (hr) 0.22 ± 0.02 2.62 ± 0.82 6.27 ± 1.72 2 0.17 ± 0.06 1.83 ± 0.17 4.50 ± 1.04 3 0.11 ± 0.04 0.88 ± 0.24 3.17 ± 0.76
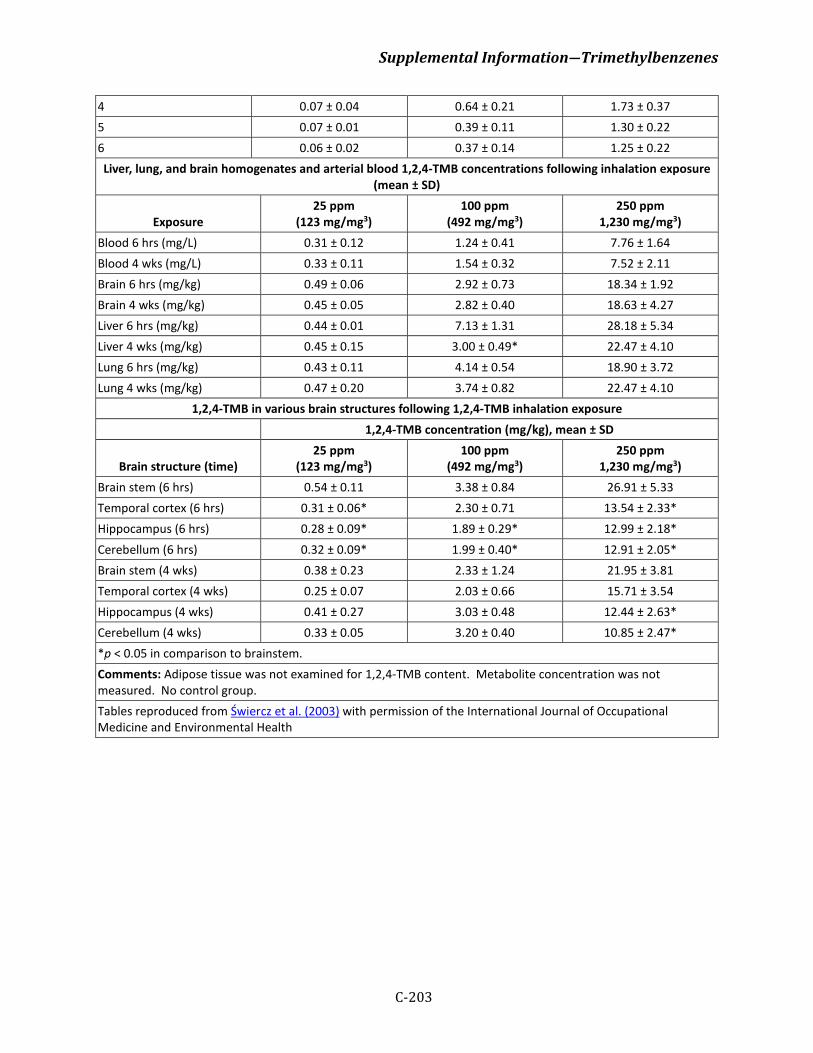
Supplemental Information―Trimethylbenzenes
C-203
4 0.07 ± 0.04 0.64 ± 0.21 1.73 ± 0.37 5 0.07 ± 0.01 0.39 ± 0.11 1.30 ± 0.22 6 0.06 ± 0.02 0.37 ± 0.14 1.25 ± 0.22 Liver, lung, and brain homogenates and arterial blood 1,2,4-TMB concentrations following inhalation exposure
(mean ± SD)
Exposure 25 ppm
(123 mg/mg3) 100 ppm
(492 mg/mg3) 250 ppm
1,230 mg/mg3) Blood 6 hrs (mg/L) 0.31 ± 0.12 1.24 ± 0.41 7.76 ± 1.64 Blood 4 wks (mg/L) 0.33 ± 0.11 1.54 ± 0.32 7.52 ± 2.11 Brain 6 hrs (mg/kg) 0.49 ± 0.06 2.92 ± 0.73 18.34 ± 1.92 Brain 4 wks (mg/kg) 0.45 ± 0.05 2.82 ± 0.40 18.63 ± 4.27 Liver 6 hrs (mg/kg) 0.44 ± 0.01 7.13 ± 1.31 28.18 ± 5.34 Liver 4 wks (mg/kg) 0.45 ± 0.15 3.00 ± 0.49* 22.47 ± 4.10 Lung 6 hrs (mg/kg) 0.43 ± 0.11 4.14 ± 0.54 18.90 ± 3.72 Lung 4 wks (mg/kg) 0.47 ± 0.20 3.74 ± 0.82 22.47 ± 4.10
1,2,4-TMB in various brain structures following 1,2,4-TMB inhalation exposure 1,2,4-TMB concentration (mg/kg), mean ± SD
Brain structure (time) 25 ppm
(123 mg/mg3) 100 ppm
(492 mg/mg3) 250 ppm
1,230 mg/mg3) Brain stem (6 hrs) 0.54 ± 0.11 3.38 ± 0.84 26.91 ± 5.33 Temporal cortex (6 hrs) 0.31 ± 0.06* 2.30 ± 0.71 13.54 ± 2.33* Hippocampus (6 hrs) 0.28 ± 0.09* 1.89 ± 0.29* 12.99 ± 2.18* Cerebellum (6 hrs) 0.32 ± 0.09* 1.99 ± 0.40* 12.91 ± 2.05* Brain stem (4 wks) 0.38 ± 0.23 2.33 ± 1.24 21.95 ± 3.81 Temporal cortex (4 wks) 0.25 ± 0.07 2.03 ± 0.66 15.71 ± 3.54 Hippocampus (4 wks) 0.41 ± 0.27 3.03 ± 0.48 12.44 ± 2.63* Cerebellum (4 wks) 0.33 ± 0.05 3.20 ± 0.40 10.85 ± 2.47* *p < 0.05 in comparison to brainstem. Comments: Adipose tissue was not examined for 1,2,4-TMB content. Metabolite concentration was not measured. No control group. Tables reproduced from Świercz et al. (2003) with permission of the International Journal of Occupational Medicine and Environmental Health
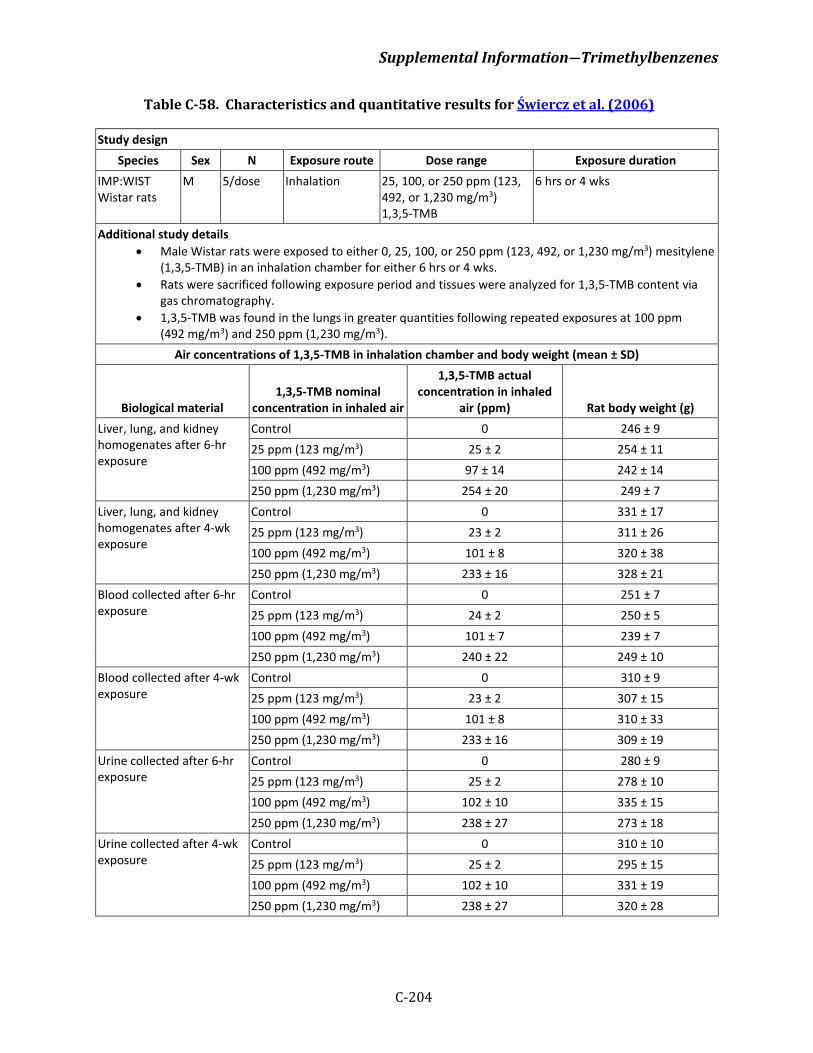
Supplemental Information―Trimethylbenzenes
C-204
Table C-58. Characteristics and quantitative results for Świercz et al. (2006)
Study design Species Sex N Exposure route Dose range Exposure duration
IMP:WIST Wistar rats
M 5/dose Inhalation 25, 100, or 250 ppm (123, 492, or 1,230 mg/m3) 1,3,5-TMB
6 hrs or 4 wks
Additional study details • Male Wistar rats were exposed to either 0, 25, 100, or 250 ppm (123, 492, or 1,230 mg/m3) mesitylene
(1,3,5-TMB) in an inhalation chamber for either 6 hrs or 4 wks. • Rats were sacrificed following exposure period and tissues were analyzed for 1,3,5-TMB content via
gas chromatography. • 1,3,5-TMB was found in the lungs in greater quantities following repeated exposures at 100 ppm
(492 mg/m3) and 250 ppm (1,230 mg/m3). Air concentrations of 1,3,5-TMB in inhalation chamber and body weight (mean ± SD)
Biological material 1,3,5-TMB nominal
concentration in inhaled air
1,3,5-TMB actual concentration in inhaled
air (ppm) Rat body weight (g) Liver, lung, and kidney homogenates after 6-hr exposure
Control 0 246 ± 9 25 ppm (123 mg/m3) 25 ± 2 254 ± 11 100 ppm (492 mg/m3) 97 ± 14 242 ± 14 250 ppm (1,230 mg/m3) 254 ± 20 249 ± 7
Liver, lung, and kidney homogenates after 4-wk exposure
Control 0 331 ± 17 25 ppm (123 mg/m3) 23 ± 2 311 ± 26 100 ppm (492 mg/m3) 101 ± 8 320 ± 38 250 ppm (1,230 mg/m3) 233 ± 16 328 ± 21
Blood collected after 6-hr exposure
Control 0 251 ± 7 25 ppm (123 mg/m3) 24 ± 2 250 ± 5 100 ppm (492 mg/m3) 101 ± 7 239 ± 7 250 ppm (1,230 mg/m3) 240 ± 22 249 ± 10
Blood collected after 4-wk exposure
Control 0 310 ± 9 25 ppm (123 mg/m3) 23 ± 2 307 ± 15 100 ppm (492 mg/m3) 101 ± 8 310 ± 33 250 ppm (1,230 mg/m3) 233 ± 16 309 ± 19
Urine collected after 6-hr exposure
Control 0 280 ± 9 25 ppm (123 mg/m3) 25 ± 2 278 ± 10 100 ppm (492 mg/m3) 102 ± 10 335 ± 15 250 ppm (1,230 mg/m3) 238 ± 27 273 ± 18
Urine collected after 4-wk exposure
Control 0 310 ± 10 25 ppm (123 mg/m3) 25 ± 2 295 ± 15 100 ppm (492 mg/m3) 102 ± 10 331 ± 19 250 ppm (1,230 mg/m3) 238 ± 27 320 ± 28
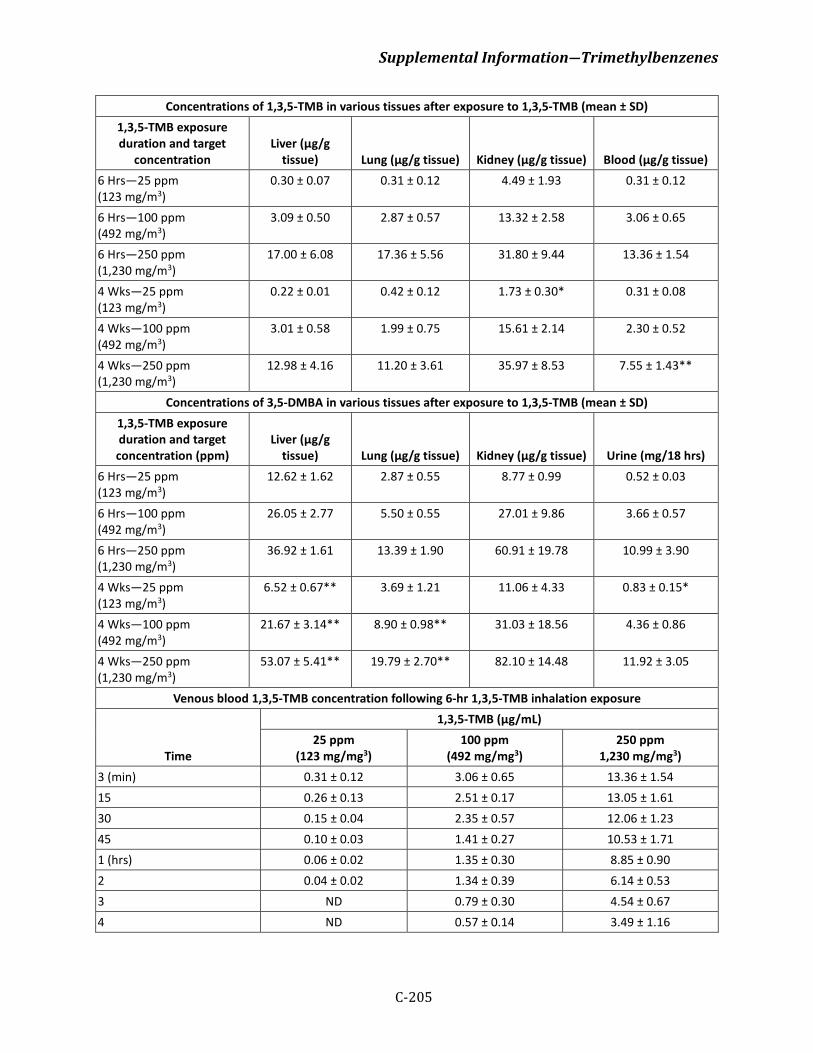
Supplemental Information―Trimethylbenzenes
C-205
Concentrations of 1,3,5-TMB in various tissues after exposure to 1,3,5-TMB (mean ± SD) 1,3,5-TMB exposure duration and target
concentration Liver (µg/g
tissue) Lung (µg/g tissue) Kidney (µg/g tissue) Blood (µg/g tissue) 6 Hrs—25 ppm (123 mg/m3)
0.30 ± 0.07 0.31 ± 0.12 4.49 ± 1.93 0.31 ± 0.12
6 Hrs—100 ppm (492 mg/m3)
3.09 ± 0.50 2.87 ± 0.57 13.32 ± 2.58 3.06 ± 0.65
6 Hrs—250 ppm (1,230 mg/m3)
17.00 ± 6.08 17.36 ± 5.56 31.80 ± 9.44 13.36 ± 1.54
4 Wks—25 ppm (123 mg/m3)
0.22 ± 0.01 0.42 ± 0.12 1.73 ± 0.30* 0.31 ± 0.08
4 Wks—100 ppm (492 mg/m3)
3.01 ± 0.58 1.99 ± 0.75 15.61 ± 2.14 2.30 ± 0.52
4 Wks—250 ppm (1,230 mg/m3)
12.98 ± 4.16 11.20 ± 3.61 35.97 ± 8.53 7.55 ± 1.43**
Concentrations of 3,5-DMBA in various tissues after exposure to 1,3,5-TMB (mean ± SD) 1,3,5-TMB exposure duration and target concentration (ppm)
Liver (µg/g tissue) Lung (µg/g tissue) Kidney (µg/g tissue) Urine (mg/18 hrs)
6 Hrs—25 ppm (123 mg/m3)
12.62 ± 1.62 2.87 ± 0.55 8.77 ± 0.99 0.52 ± 0.03
6 Hrs—100 ppm (492 mg/m3)
26.05 ± 2.77 5.50 ± 0.55 27.01 ± 9.86 3.66 ± 0.57
6 Hrs—250 ppm (1,230 mg/m3)
36.92 ± 1.61 13.39 ± 1.90 60.91 ± 19.78 10.99 ± 3.90
4 Wks—25 ppm (123 mg/m3)
6.52 ± 0.67** 3.69 ± 1.21 11.06 ± 4.33 0.83 ± 0.15*
4 Wks—100 ppm (492 mg/m3)
21.67 ± 3.14** 8.90 ± 0.98** 31.03 ± 18.56 4.36 ± 0.86
4 Wks—250 ppm (1,230 mg/m3)
53.07 ± 5.41** 19.79 ± 2.70** 82.10 ± 14.48 11.92 ± 3.05
Venous blood 1,3,5-TMB concentration following 6-hr 1,3,5-TMB inhalation exposure
Time
1,3,5-TMB (µg/mL) 25 ppm
(123 mg/mg3) 100 ppm
(492 mg/mg3) 250 ppm
1,230 mg/mg3) 3 (min) 0.31 ± 0.12 3.06 ± 0.65 13.36 ± 1.54 15 0.26 ± 0.13 2.51 ± 0.17 13.05 ± 1.61 30 0.15 ± 0.04 2.35 ± 0.57 12.06 ± 1.23 45 0.10 ± 0.03 1.41 ± 0.27 10.53 ± 1.71 1 (hrs) 0.06 ± 0.02 1.35 ± 0.30 8.85 ± 0.90 2 0.04 ± 0.02 1.34 ± 0.39 6.14 ± 0.53 3 ND 0.79 ± 0.30 4.54 ± 0.67 4 ND 0.57 ± 0.14 3.49 ± 1.16
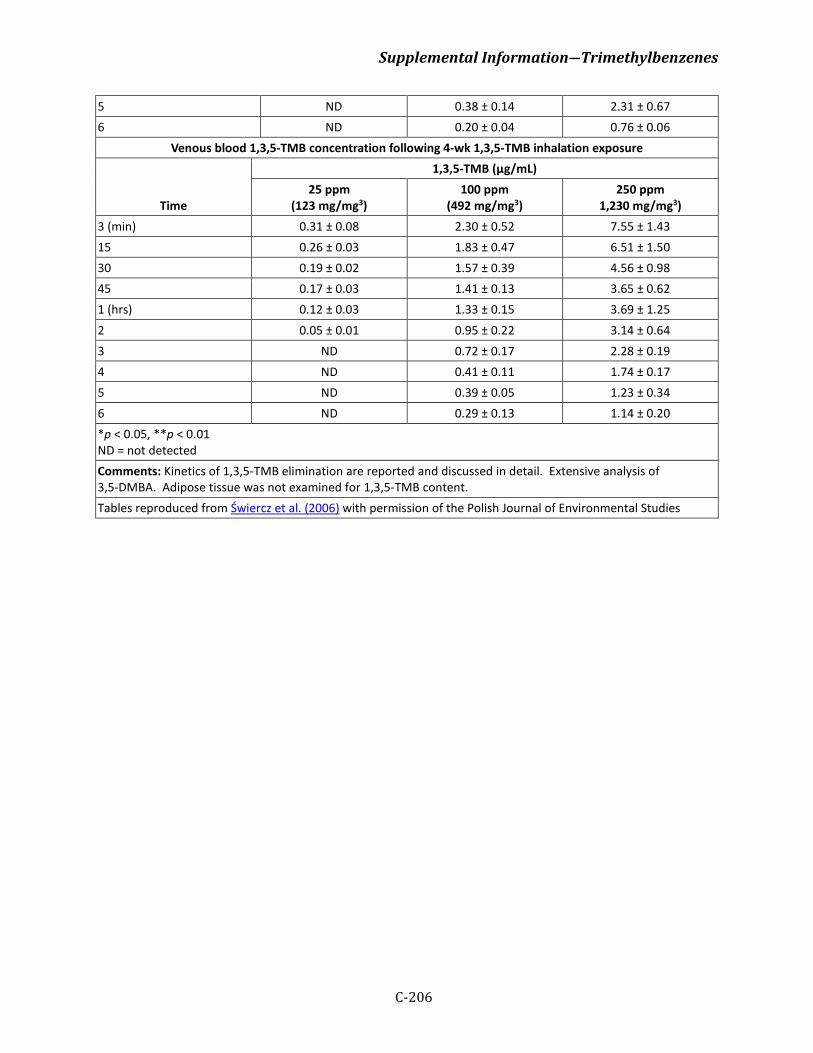
Supplemental Information―Trimethylbenzenes
C-206
5 ND 0.38 ± 0.14 2.31 ± 0.67 6 ND 0.20 ± 0.04 0.76 ± 0.06
Venous blood 1,3,5-TMB concentration following 4-wk 1,3,5-TMB inhalation exposure
Time
1,3,5-TMB (µg/mL) 25 ppm
(123 mg/mg3) 100 ppm
(492 mg/mg3) 250 ppm
1,230 mg/mg3) 3 (min) 0.31 ± 0.08 2.30 ± 0.52 7.55 ± 1.43 15 0.26 ± 0.03 1.83 ± 0.47 6.51 ± 1.50 30 0.19 ± 0.02 1.57 ± 0.39 4.56 ± 0.98 45 0.17 ± 0.03 1.41 ± 0.13 3.65 ± 0.62 1 (hrs) 0.12 ± 0.03 1.33 ± 0.15 3.69 ± 1.25 2 0.05 ± 0.01 0.95 ± 0.22 3.14 ± 0.64 3 ND 0.72 ± 0.17 2.28 ± 0.19 4 ND 0.41 ± 0.11 1.74 ± 0.17 5 ND 0.39 ± 0.05 1.23 ± 0.34 6 ND 0.29 ± 0.13 1.14 ± 0.20 *p < 0.05, **p < 0.01 ND = not detected Comments: Kinetics of 1,3,5-TMB elimination are reported and discussed in detail. Extensive analysis of 3,5-DMBA. Adipose tissue was not examined for 1,3,5-TMB content. Tables reproduced from Świercz et al. (2006) with permission of the Polish Journal of Environmental Studies
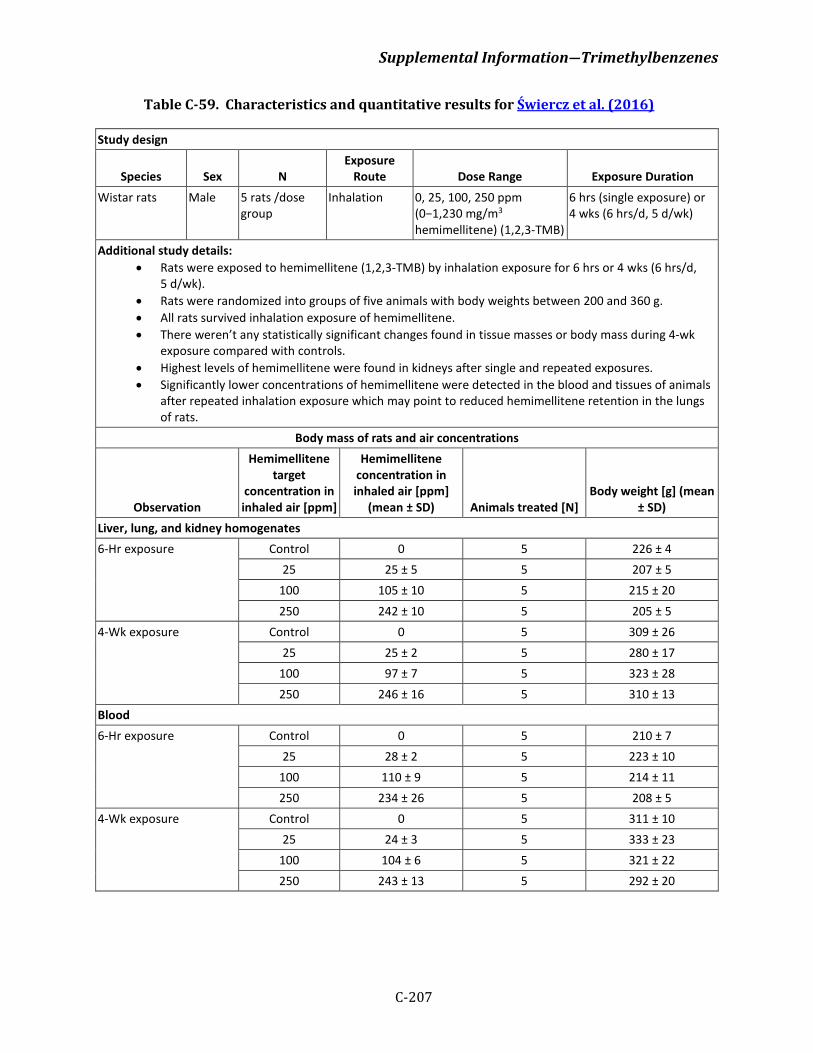
Supplemental Information―Trimethylbenzenes
C-207
Table C-59. Characteristics and quantitative results for Świercz et al. (2016)
Study design
Species Sex N Exposure
Route Dose Range Exposure Duration Wistar rats Male 5 rats /dose
group Inhalation 0, 25, 100, 250 ppm
(0−1,230 mg/m3 hemimellitene) (1,2,3-TMB)
6 hrs (single exposure) or 4 wks (6 hrs/d, 5 d/wk)
Additional study details: • Rats were exposed to hemimellitene (1,2,3-TMB) by inhalation exposure for 6 hrs or 4 wks (6 hrs/d,
5 d/wk). • Rats were randomized into groups of five animals with body weights between 200 and 360 g. • All rats survived inhalation exposure of hemimellitene. • There weren’t any statistically significant changes found in tissue masses or body mass during 4-wk
exposure compared with controls. • Highest levels of hemimellitene were found in kidneys after single and repeated exposures. • Significantly lower concentrations of hemimellitene were detected in the blood and tissues of animals
after repeated inhalation exposure which may point to reduced hemimellitene retention in the lungs of rats.
Body mass of rats and air concentrations
Observation
Hemimellitene target
concentration in inhaled air [ppm]
Hemimellitene concentration in inhaled air [ppm]
(mean ± SD) Animals treated [N] Body weight [g] (mean
± SD) Liver, lung, and kidney homogenates 6-Hr exposure Control 0 5 226 ± 4
25 25 ± 5 5 207 ± 5 100 105 ± 10 5 215 ± 20 250 242 ± 10 5 205 ± 5
4-Wk exposure Control 0 5 309 ± 26 25 25 ± 2 5 280 ± 17
100 97 ± 7 5 323 ± 28 250 246 ± 16 5 310 ± 13
Blood 6-Hr exposure Control 0 5 210 ± 7
25 28 ± 2 5 223 ± 10 100 110 ± 9 5 214 ± 11 250 234 ± 26 5 208 ± 5
4-Wk exposure Control 0 5 311 ± 10 25 24 ± 3 5 333 ± 23
100 104 ± 6 5 321 ± 22 250 243 ± 13 5 292 ± 20

Supplemental Information―Trimethylbenzenes
C-208
Urine 6-Hr exposure Control 0 5 250 ± 9
25 21 ± 1 5 243 ± 10 100 99 ± 3 5 251 ± 15 250 225 ± 13 5 238 ± 14
4-Wk exposure Control 0 5 310 ± 10 25 25 ± 2 5 305 ± 15
100 97 ± 7 5 317 ± 22 250 246 ± 16 5 284 ± 23
Absolute and relative weight of liver, lung, and kidney
Observation
Hemimellitene target concentration in inhaled air (ppm) 6-Hr exposure
Control 0 25 100 250 Absolute organ weight (mean ± SD) Liver 9.48 ± 0.63 9.25 ± 0.46 13.37 ± 2.37 13.15 ± 1.12 Lung 1.31 ± 0.13 1.17 ± 0.30 1.34 ± 0.29 1.21 ± 0.20 Kidney 1.83 ± 0.19 1.93 ± 0.15 1.82 ± 0.11 1.87 ± 0.16 Relative organ weight (g/100 g body weight; mean ± SD) Liver 4.50 ± 0.41 4.47 ± 0.26 4.27 ± 0.72 4.57 ± 0.35 Lung 0.62 ± 0.08 0.57 ± 0.14 0.63 ± 0.17 0.59 ± 0.09 Kidney 0.87 ± 0.10 0.93 ± 0.07 0.85 ± 0.04 0.91 ± 0.08
4-Hr exposure Absolute organ weight (mean ± SD) Liver 12.63 ± 1.02 11.61 ± 1.62 13.37 ± 2.37 13.15 ± 1.12 Lung 1.47 ± 0.24 1.63 ± 0.32 1.54 ± 0.33 1.43 ± 0.33 Kidney 2.28 ± 0.19 2.07 ± 0.08 2.51 ± 0.32 2.49 ± 0.17 Relative organ weight (g/100 g body weight; mean ± SD) Liver 4.09 ± 0.27 4.14 ± 0.50 4.11 ± 0.42 4.24 ± 0.31 Lung 0.47 ± 0.06 0.58 ± 0.10 0.48 ± 0.09 0.46 ± 0.09 Kidney 0.74 ± 0.08 0.74 ± 0.01 0.77 ± 0.04 0.80 ± 0.05
Concentration of hemimellitene in liver, lung, and kidney homogenates and venous blood 6-Hr exposure
Hemimellitene target concentration in inhaled air (ppm) 25 100 250
Hemimellitene concentration (mean ± SD) Liver (µg/g tissue) 1.66 ± 0.48 4.20 ± 0.85 20.75 ± 3.30 Lung (µg/g tissue) 0.62 ± 0.08 2.57 ± 0.40 18.73 ± 2.81 Kidney (µg/g tissue) 2.81 ± 0.40 7.78 ± 3.17 31.16 ± 3.84 Blood (µg/mL) 0.76 ± 0.09 3.82 ± 0.94 10.73 ± 1.30
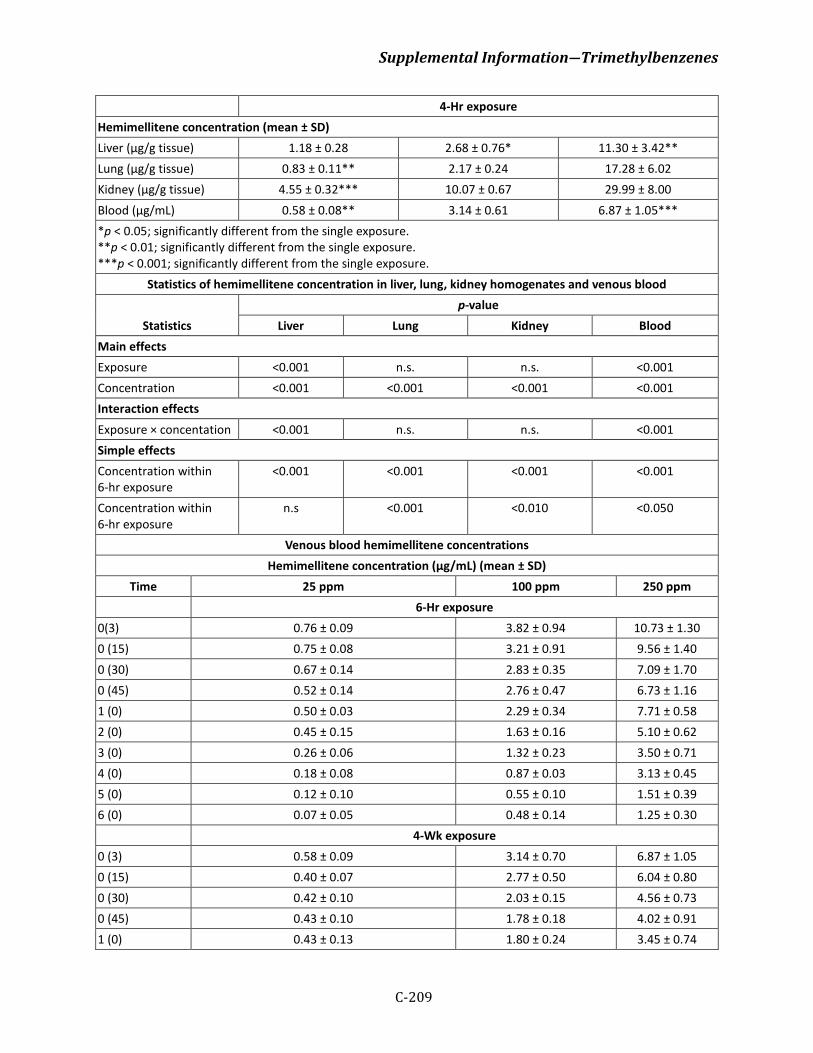
Supplemental Information―Trimethylbenzenes
C-209
4-Hr exposure Hemimellitene concentration (mean ± SD) Liver (µg/g tissue) 1.18 ± 0.28 2.68 ± 0.76* 11.30 ± 3.42** Lung (µg/g tissue) 0.83 ± 0.11** 2.17 ± 0.24 17.28 ± 6.02 Kidney (µg/g tissue) 4.55 ± 0.32*** 10.07 ± 0.67 29.99 ± 8.00 Blood (µg/mL) 0.58 ± 0.08** 3.14 ± 0.61 6.87 ± 1.05*** *p < 0.05; significantly different from the single exposure. **p < 0.01; significantly different from the single exposure. ***p < 0.001; significantly different from the single exposure.
Statistics of hemimellitene concentration in liver, lung, kidney homogenates and venous blood
Statistics p-value
Liver Lung Kidney Blood Main effects Exposure <0.001 n.s. n.s. <0.001 Concentration <0.001 <0.001 <0.001 <0.001 Interaction effects Exposure × concentation <0.001 n.s. n.s. <0.001 Simple effects Concentration within 6-hr exposure
<0.001 <0.001 <0.001 <0.001
Concentration within 6-hr exposure
n.s <0.001 <0.010 <0.050
Venous blood hemimellitene concentrations Hemimellitene concentration (µg/mL) (mean ± SD)
Time 25 ppm 100 ppm 250 ppm 6-Hr exposure
0(3) 0.76 ± 0.09 3.82 ± 0.94 10.73 ± 1.30 0 (15) 0.75 ± 0.08 3.21 ± 0.91 9.56 ± 1.40 0 (30) 0.67 ± 0.14 2.83 ± 0.35 7.09 ± 1.70 0 (45) 0.52 ± 0.14 2.76 ± 0.47 6.73 ± 1.16 1 (0) 0.50 ± 0.03 2.29 ± 0.34 7.71 ± 0.58 2 (0) 0.45 ± 0.15 1.63 ± 0.16 5.10 ± 0.62 3 (0) 0.26 ± 0.06 1.32 ± 0.23 3.50 ± 0.71 4 (0) 0.18 ± 0.08 0.87 ± 0.03 3.13 ± 0.45 5 (0) 0.12 ± 0.10 0.55 ± 0.10 1.51 ± 0.39 6 (0) 0.07 ± 0.05 0.48 ± 0.14 1.25 ± 0.30
4-Wk exposure 0 (3) 0.58 ± 0.09 3.14 ± 0.70 6.87 ± 1.05 0 (15) 0.40 ± 0.07 2.77 ± 0.50 6.04 ± 0.80 0 (30) 0.42 ± 0.10 2.03 ± 0.15 4.56 ± 0.73 0 (45) 0.43 ± 0.10 1.78 ± 0.18 4.02 ± 0.91 1 (0) 0.43 ± 0.13 1.80 ± 0.24 3.45 ± 0.74
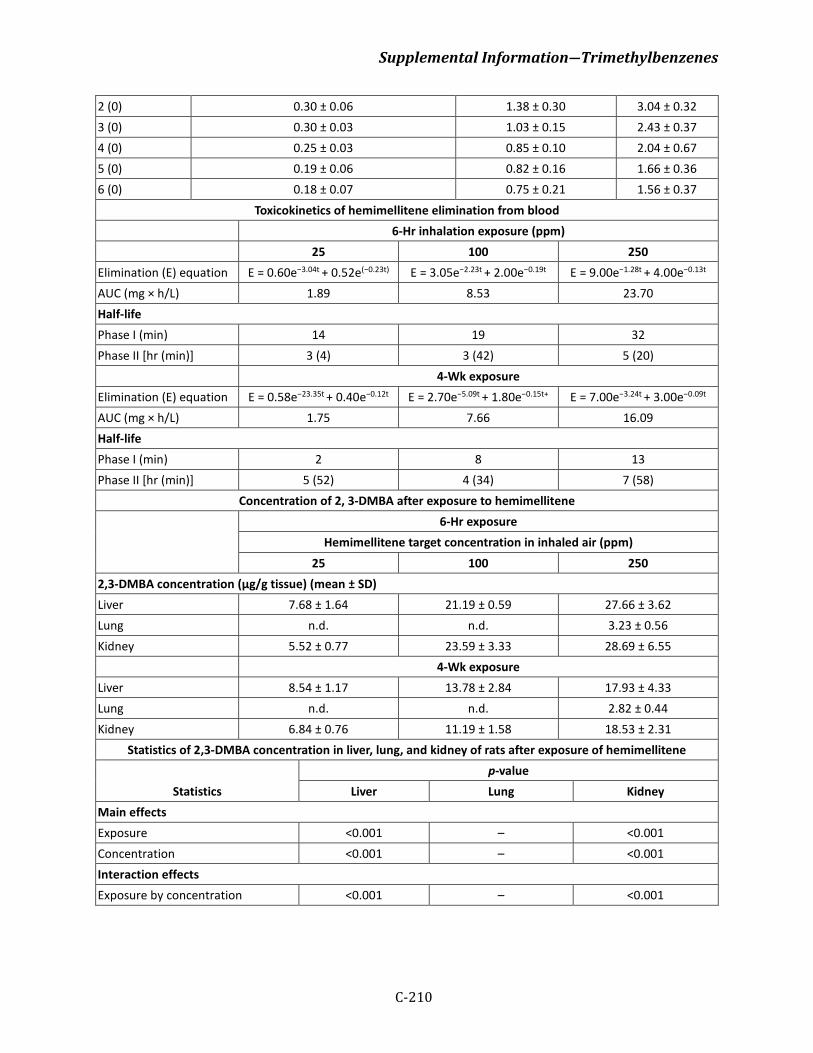
Supplemental Information―Trimethylbenzenes
C-210
2 (0) 0.30 ± 0.06 1.38 ± 0.30 3.04 ± 0.32 3 (0) 0.30 ± 0.03 1.03 ± 0.15 2.43 ± 0.37 4 (0) 0.25 ± 0.03 0.85 ± 0.10 2.04 ± 0.67 5 (0) 0.19 ± 0.06 0.82 ± 0.16 1.66 ± 0.36 6 (0) 0.18 ± 0.07 0.75 ± 0.21 1.56 ± 0.37
Toxicokinetics of hemimellitene elimination from blood 6-Hr inhalation exposure (ppm) 25 100 250
Elimination (E) equation E = 0.60e−3.04t + 0.52e(−0.23t) E = 3.05e−2.23t + 2.00e−0.19t E = 9.00e−1.28t + 4.00e−0.13t
AUC (mg × h/L) 1.89 8.53 23.70 Half-life Phase I (min) 14 19 32 Phase II [hr (min)] 3 (4) 3 (42) 5 (20)
4-Wk exposure Elimination (E) equation E = 0.58e−23.35t + 0.40e−0.12t E = 2.70e−5.09t + 1.80e−0.15t+ E = 7.00e−3.24t + 3.00e−0.09t
AUC (mg × h/L) 1.75 7.66 16.09 Half-life Phase I (min) 2 8 13 Phase II [hr (min)] 5 (52) 4 (34) 7 (58)
Concentration of 2, 3-DMBA after exposure to hemimellitene 6-Hr exposure
Hemimellitene target concentration in inhaled air (ppm) 25 100 250
2,3-DMBA concentration (µg/g tissue) (mean ± SD) Liver 7.68 ± 1.64 21.19 ± 0.59 27.66 ± 3.62 Lung n.d. n.d. 3.23 ± 0.56 Kidney 5.52 ± 0.77 23.59 ± 3.33 28.69 ± 6.55
4-Wk exposure Liver 8.54 ± 1.17 13.78 ± 2.84 17.93 ± 4.33 Lung n.d. n.d. 2.82 ± 0.44 Kidney 6.84 ± 0.76 11.19 ± 1.58 18.53 ± 2.31
Statistics of 2,3-DMBA concentration in liver, lung, and kidney of rats after exposure of hemimellitene
Statistics p-value
Liver Lung Kidney Main effects Exposure <0.001 – <0.001 Concentration <0.001 – <0.001 Interaction effects Exposure by concentration <0.001 – <0.001
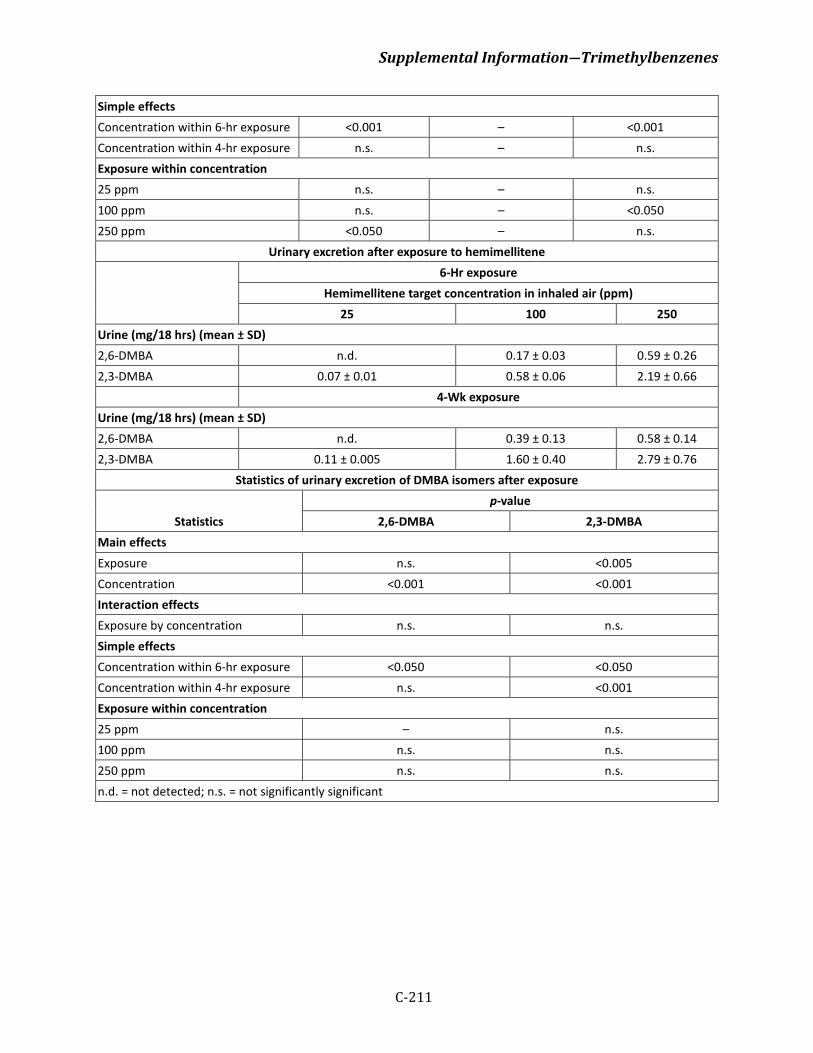
Supplemental Information―Trimethylbenzenes
C-211
Simple effects Concentration within 6-hr exposure <0.001 – <0.001 Concentration within 4-hr exposure n.s. – n.s. Exposure within concentration 25 ppm n.s. – n.s. 100 ppm n.s. – <0.050 250 ppm <0.050 – n.s.
Urinary excretion after exposure to hemimellitene 6-Hr exposure
Hemimellitene target concentration in inhaled air (ppm) 25 100 250
Urine (mg/18 hrs) (mean ± SD) 2,6-DMBA n.d. 0.17 ± 0.03 0.59 ± 0.26 2,3-DMBA 0.07 ± 0.01 0.58 ± 0.06 2.19 ± 0.66
4-Wk exposure Urine (mg/18 hrs) (mean ± SD) 2,6-DMBA n.d. 0.39 ± 0.13 0.58 ± 0.14 2,3-DMBA 0.11 ± 0.005 1.60 ± 0.40 2.79 ± 0.76
Statistics of urinary excretion of DMBA isomers after exposure
Statistics p-value
2,6-DMBA 2,3-DMBA Main effects Exposure n.s. <0.005 Concentration <0.001 <0.001 Interaction effects Exposure by concentration n.s. n.s. Simple effects Concentration within 6-hr exposure <0.050 <0.050 Concentration within 4-hr exposure n.s. <0.001 Exposure within concentration 25 ppm – n.s. 100 ppm n.s. n.s. 250 ppm n.s. n.s. n.d. = not detected; n.s. = not significantly significant
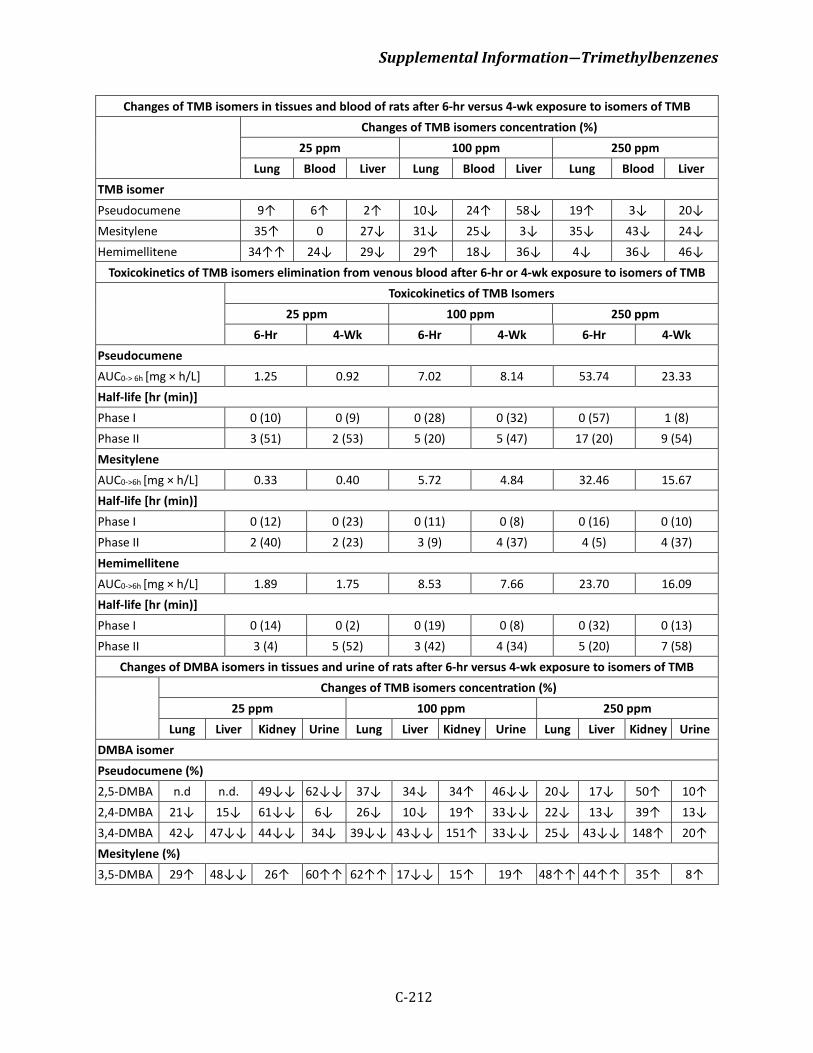
Supplemental Information―Trimethylbenzenes
C-212
Changes of TMB isomers in tissues and blood of rats after 6-hr versus 4-wk exposure to isomers of TMB Changes of TMB isomers concentration (%)
25 ppm 100 ppm 250 ppm Lung Blood Liver Lung Blood Liver Lung Blood Liver
TMB isomer Pseudocumene 9↑ 6↑ 2↑ 10↓ 24↑ 58↓ 19↑ 3↓ 20↓ Mesitylene 35↑ 0 27↓ 31↓ 25↓ 3↓ 35↓ 43↓ 24↓ Hemimellitene 34↑↑ 24↓ 29↓ 29↑ 18↓ 36↓ 4↓ 36↓ 46↓
Toxicokinetics of TMB isomers elimination from venous blood after 6-hr or 4-wk exposure to isomers of TMB Toxicokinetics of TMB Isomers
25 ppm 100 ppm 250 ppm 6-Hr 4-Wk 6-Hr 4-Wk 6-Hr 4-Wk
Pseudocumene AUC0-> 6h [mg × h/L] 1.25 0.92 7.02 8.14 53.74 23.33 Half-life [hr (min)] Phase I 0 (10) 0 (9) 0 (28) 0 (32) 0 (57) 1 (8) Phase II 3 (51) 2 (53) 5 (20) 5 (47) 17 (20) 9 (54) Mesitylene AUC0->6h [mg × h/L] 0.33 0.40 5.72 4.84 32.46 15.67 Half-life [hr (min)] Phase I 0 (12) 0 (23) 0 (11) 0 (8) 0 (16) 0 (10) Phase II 2 (40) 2 (23) 3 (9) 4 (37) 4 (5) 4 (37) Hemimellitene AUC0->6h [mg × h/L] 1.89 1.75 8.53 7.66 23.70 16.09 Half-life [hr (min)] Phase I 0 (14) 0 (2) 0 (19) 0 (8) 0 (32) 0 (13) Phase II 3 (4) 5 (52) 3 (42) 4 (34) 5 (20) 7 (58)
Changes of DMBA isomers in tissues and urine of rats after 6-hr versus 4-wk exposure to isomers of TMB Changes of TMB isomers concentration (%)
25 ppm 100 ppm 250 ppm Lung Liver Kidney Urine Lung Liver Kidney Urine Lung Liver Kidney Urine
DMBA isomer Pseudocumene (%) 2,5-DMBA n.d n.d. 49↓↓ 62↓↓ 37↓ 34↓ 34↑ 46↓↓ 20↓ 17↓ 50↑ 10↑ 2,4-DMBA 21↓ 15↓ 61↓↓ 6↓ 26↓ 10↓ 19↑ 33↓↓ 22↓ 13↓ 39↑ 13↓ 3,4-DMBA 42↓ 47↓↓ 44↓↓ 34↓ 39↓↓ 43↓↓ 151↑ 33↓↓ 25↓ 43↓↓ 148↑ 20↑ Mesitylene (%) 3,5-DMBA 29↑ 48↓↓ 26↑ 60↑↑ 62↑↑ 17↓↓ 15↑ 19↑ 48↑↑ 44↑↑ 35↑ 8↑
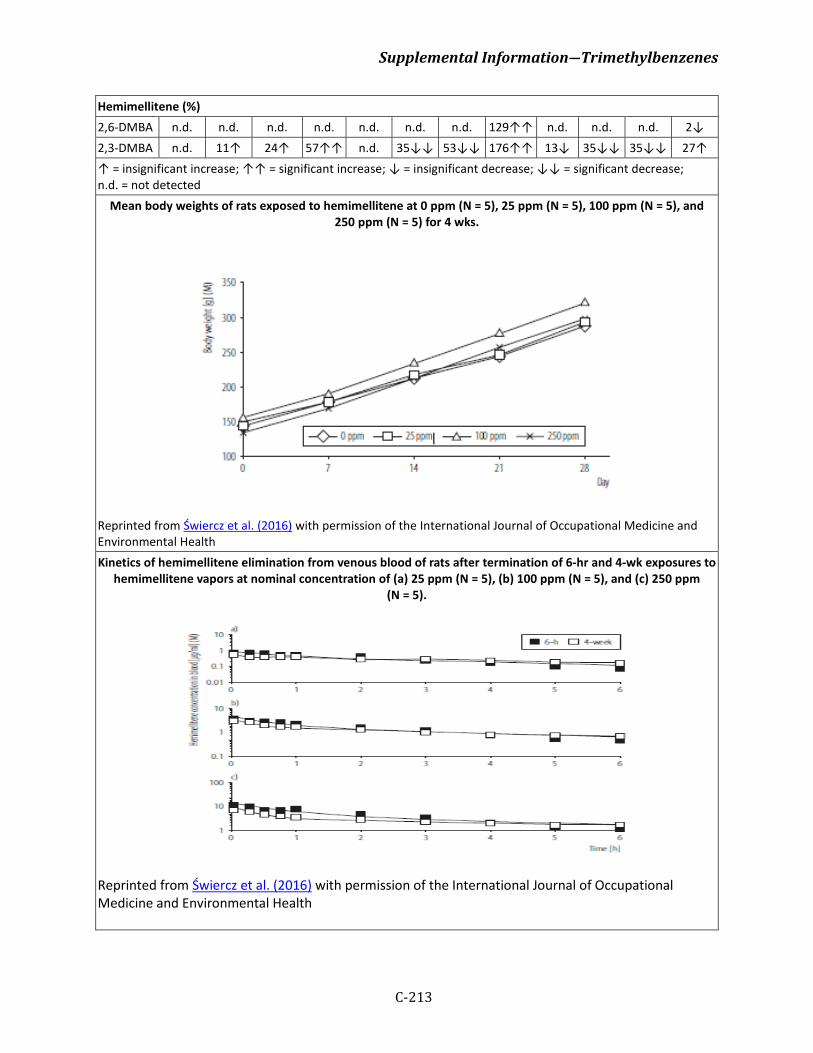
Supplemental Information―Trimethylbenzenes
C-213
Hemimellitene (%) 2,6-DMBA n.d. n.d. n.d. n.d. n.d. n.d. n.d. 129↑↑ n.d. n.d. n.d. 2↓ 2,3-DMBA n.d. 11↑ 24↑ 57↑↑ n.d. 35↓↓ 53↓↓ 176↑↑ 13↓ 35↓↓ 35↓↓ 27↑ ↑ = insignificant increase; ↑↑ = significant increase; ↓ = insignificant decrease; ↓↓ = significant decrease; n.d. = not detected
Mean body weights of rats exposed to hemimellitene at 0 ppm (N = 5), 25 ppm (N = 5), 100 ppm (N = 5), and 250 ppm (N = 5) for 4 wks.
Reprinted from Świercz et al. (2016) with permission of the International Journal of Occupational Medicine and Environmental Health Kinetics of hemimellitene elimination from venous blood of rats after termination of 6-hr and 4-wk exposures to
hemimellitene vapors at nominal concentration of (a) 25 ppm (N = 5), (b) 100 ppm (N = 5), and (c) 250 ppm (N = 5).
Reprinted from Świercz et al. (2016) with permission of the International Journal of Occupational Medicine and Environmental Health
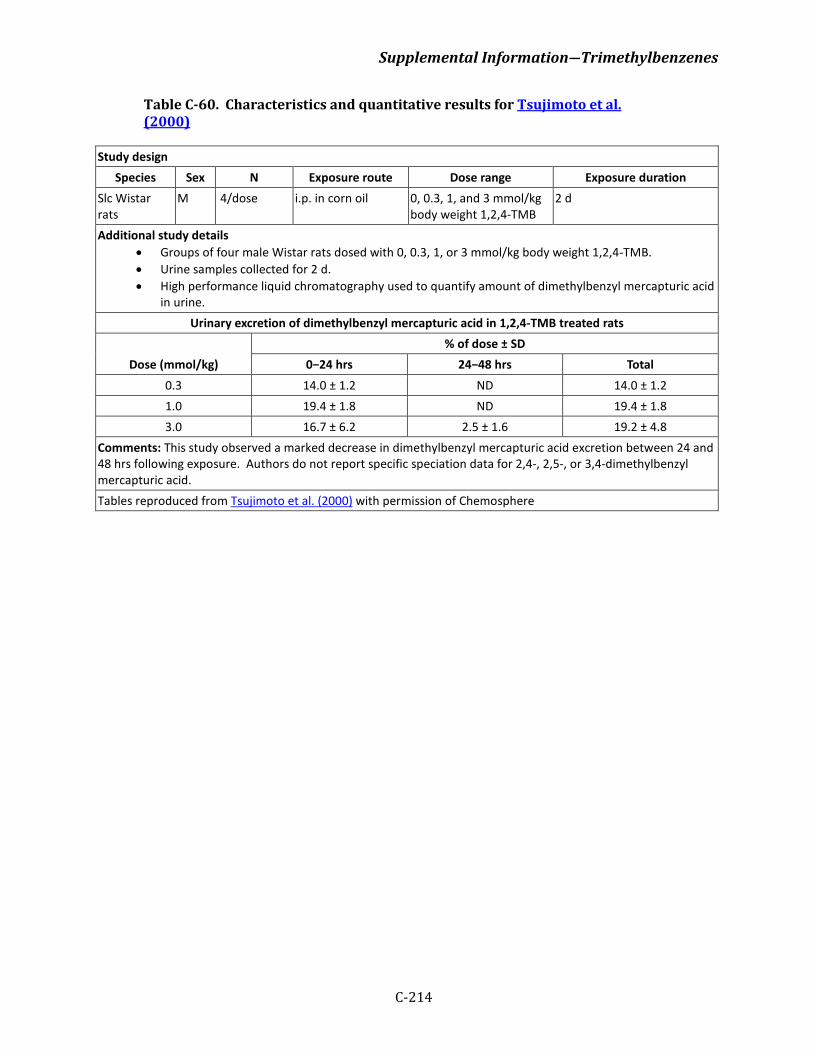
Supplemental Information―Trimethylbenzenes
C-214
Table C-60. Characteristics and quantitative results for Tsujimoto et al. (2000)
Study design Species Sex N Exposure route Dose range Exposure duration
Slc Wistar rats
M 4/dose i.p. in corn oil 0, 0.3, 1, and 3 mmol/kg body weight 1,2,4-TMB
2 d
Additional study details • Groups of four male Wistar rats dosed with 0, 0.3, 1, or 3 mmol/kg body weight 1,2,4-TMB. • Urine samples collected for 2 d. • High performance liquid chromatography used to quantify amount of dimethylbenzyl mercapturic acid
in urine. Urinary excretion of dimethylbenzyl mercapturic acid in 1,2,4-TMB treated rats
Dose (mmol/kg) % of dose ± SD
0−24 hrs 24−48 hrs Total 0.3 14.0 ± 1.2 ND 14.0 ± 1.2 1.0 19.4 ± 1.8 ND 19.4 ± 1.8 3.0 16.7 ± 6.2 2.5 ± 1.6 19.2 ± 4.8
Comments: This study observed a marked decrease in dimethylbenzyl mercapturic acid excretion between 24 and 48 hrs following exposure. Authors do not report specific speciation data for 2,4-, 2,5-, or 3,4-dimethylbenzyl mercapturic acid. Tables reproduced from Tsujimoto et al. (2000) with permission of Chemosphere
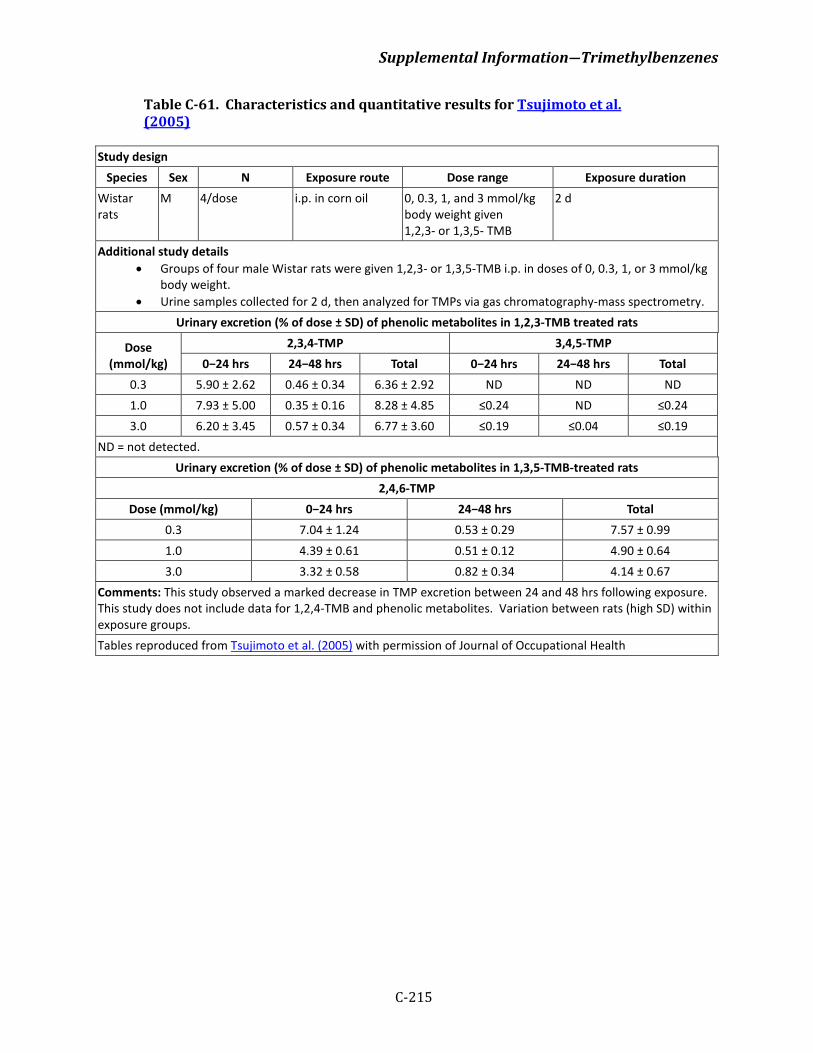
Supplemental Information―Trimethylbenzenes
C-215
Table C-61. Characteristics and quantitative results for Tsujimoto et al. (2005)
Study design Species Sex N Exposure route Dose range Exposure duration
Wistar rats
M 4/dose i.p. in corn oil 0, 0.3, 1, and 3 mmol/kg body weight given 1,2,3- or 1,3,5- TMB
2 d
Additional study details • Groups of four male Wistar rats were given 1,2,3- or 1,3,5-TMB i.p. in doses of 0, 0.3, 1, or 3 mmol/kg
body weight. • Urine samples collected for 2 d, then analyzed for TMPs via gas chromatography-mass spectrometry.
Urinary excretion (% of dose ± SD) of phenolic metabolites in 1,2,3-TMB treated rats
Dose (mmol/kg)
2,3,4-TMP 3,4,5-TMP 0−24 hrs 24−48 hrs Total 0−24 hrs 24−48 hrs Total
0.3 5.90 ± 2.62 0.46 ± 0.34 6.36 ± 2.92 ND ND ND 1.0 7.93 ± 5.00 0.35 ± 0.16 8.28 ± 4.85 ≤0.24 ND ≤0.24 3.0 6.20 ± 3.45 0.57 ± 0.34 6.77 ± 3.60 ≤0.19 ≤0.04 ≤0.19
ND = not detected. Urinary excretion (% of dose ± SD) of phenolic metabolites in 1,3,5-TMB-treated rats
2,4,6-TMP Dose (mmol/kg) 0−24 hrs 24−48 hrs Total
0.3 7.04 ± 1.24 0.53 ± 0.29 7.57 ± 0.99 1.0 4.39 ± 0.61 0.51 ± 0.12 4.90 ± 0.64 3.0 3.32 ± 0.58 0.82 ± 0.34 4.14 ± 0.67
Comments: This study observed a marked decrease in TMP excretion between 24 and 48 hrs following exposure. This study does not include data for 1,2,4-TMB and phenolic metabolites. Variation between rats (high SD) within exposure groups. Tables reproduced from Tsujimoto et al. (2005) with permission of Journal of Occupational Health
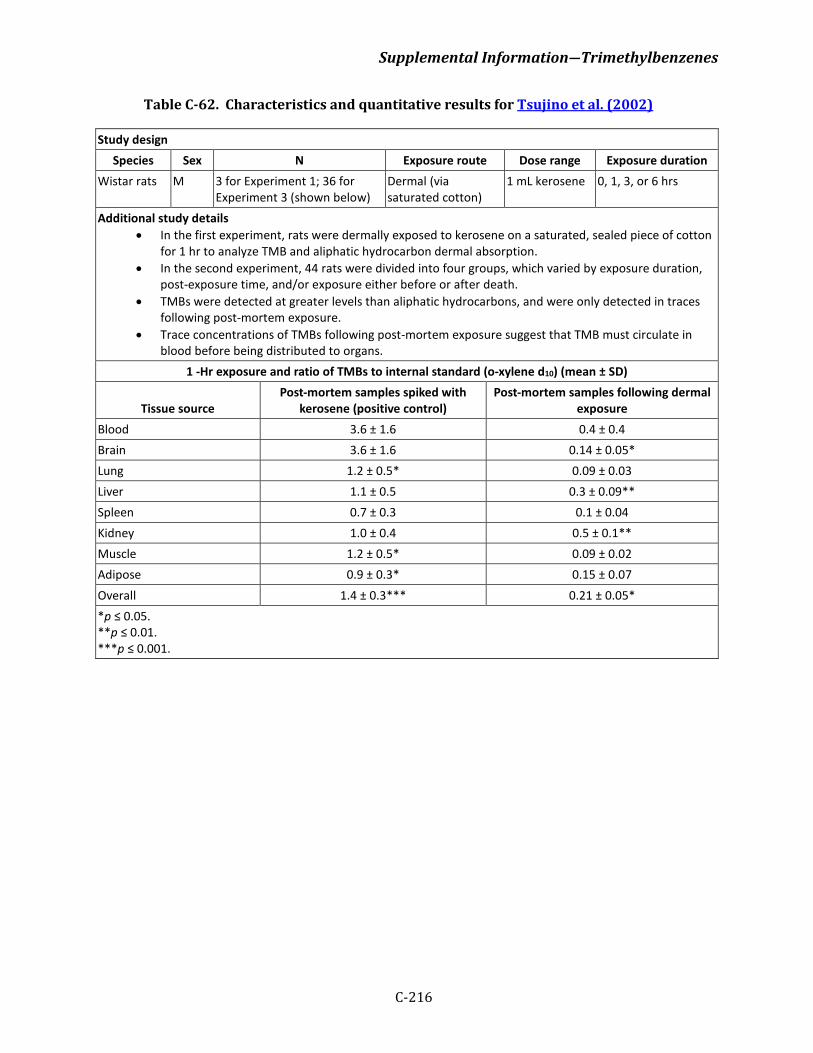
Supplemental Information―Trimethylbenzenes
C-216
Table C-62. Characteristics and quantitative results for Tsujino et al. (2002)
Study design Species Sex N Exposure route Dose range Exposure duration
Wistar rats M 3 for Experiment 1; 36 for Experiment 3 (shown below)
Dermal (via saturated cotton)
1 mL kerosene 0, 1, 3, or 6 hrs
Additional study details • In the first experiment, rats were dermally exposed to kerosene on a saturated, sealed piece of cotton
for 1 hr to analyze TMB and aliphatic hydrocarbon dermal absorption. • In the second experiment, 44 rats were divided into four groups, which varied by exposure duration,
post-exposure time, and/or exposure either before or after death. • TMBs were detected at greater levels than aliphatic hydrocarbons, and were only detected in traces
following post-mortem exposure. • Trace concentrations of TMBs following post-mortem exposure suggest that TMB must circulate in
blood before being distributed to organs. 1 -Hr exposure and ratio of TMBs to internal standard (o-xylene d10) (mean ± SD)
Tissue source Post-mortem samples spiked with
kerosene (positive control) Post-mortem samples following dermal
exposure Blood 3.6 ± 1.6 0.4 ± 0.4 Brain 3.6 ± 1.6 0.14 ± 0.05* Lung 1.2 ± 0.5* 0.09 ± 0.03 Liver 1.1 ± 0.5 0.3 ± 0.09** Spleen 0.7 ± 0.3 0.1 ± 0.04 Kidney 1.0 ± 0.4 0.5 ± 0.1** Muscle 1.2 ± 0.5* 0.09 ± 0.02 Adipose 0.9 ± 0.3* 0.15 ± 0.07 Overall 1.4 ± 0.3*** 0.21 ± 0.05* *p ≤ 0.05. **p ≤ 0.01. ***p ≤ 0.001.
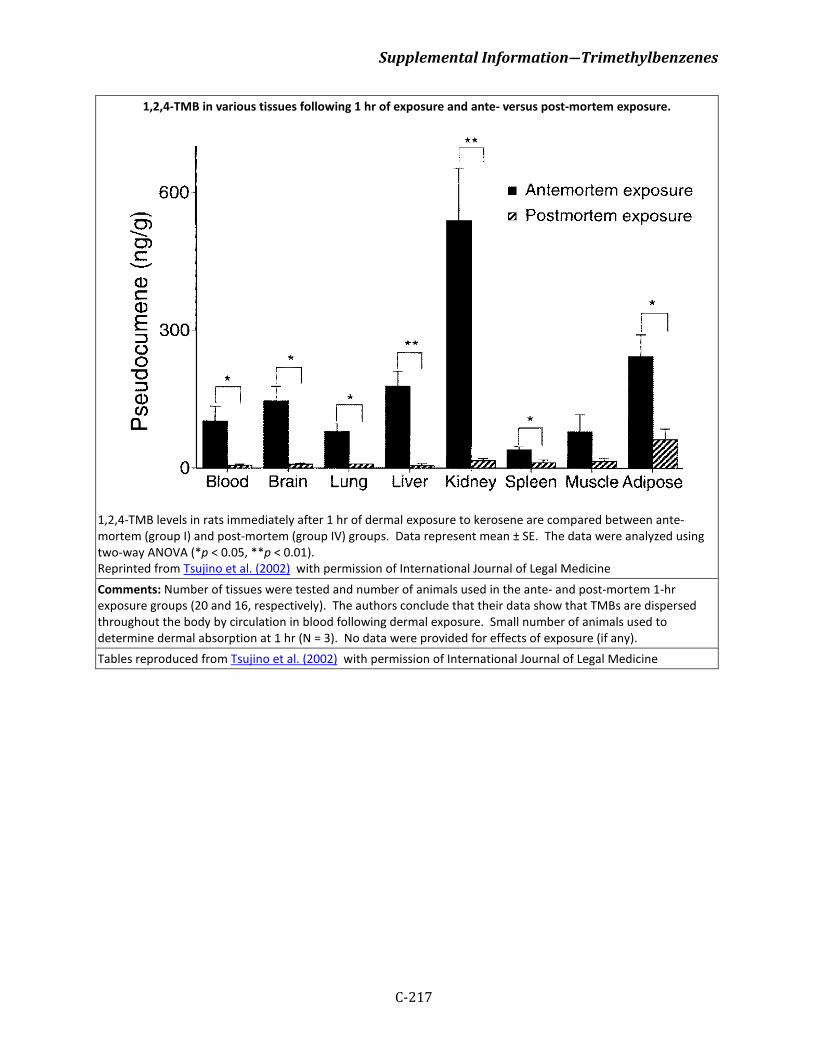
Supplemental Information―Trimethylbenzenes
C-217
1,2,4-TMB in various tissues following 1 hr of exposure and ante- versus post-mortem exposure.
1,2,4-TMB levels in rats immediately after 1 hr of dermal exposure to kerosene are compared between ante-mortem (group I) and post-mortem (group IV) groups. Data represent mean ± SE. The data were analyzed using two-way ANOVA (*p < 0.05, **p < 0.01). Reprinted from Tsujino et al. (2002) with permission of International Journal of Legal Medicine Comments: Number of tissues were tested and number of animals used in the ante- and post-mortem 1-hr exposure groups (20 and 16, respectively). The authors conclude that their data show that TMBs are dispersed throughout the body by circulation in blood following dermal exposure. Small number of animals used to determine dermal absorption at 1 hr (N = 3). No data were provided for effects of exposure (if any). Tables reproduced from Tsujino et al. (2002) with permission of International Journal of Legal Medicine
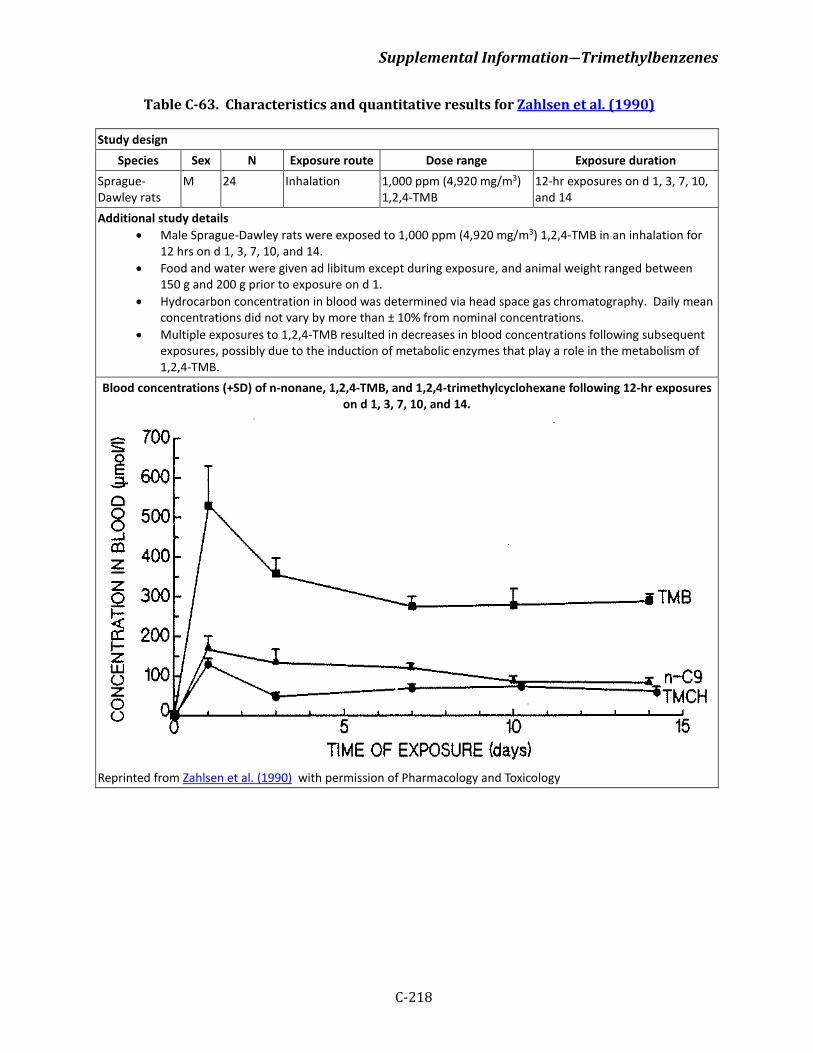
Supplemental Information―Trimethylbenzenes
C-218
Table C-63. Characteristics and quantitative results for Zahlsen et al. (1990)
Study design Species Sex N Exposure route Dose range Exposure duration
Sprague-Dawley rats
M 24 Inhalation 1,000 ppm (4,920 mg/m3) 1,2,4-TMB
12-hr exposures on d 1, 3, 7, 10, and 14
Additional study details • Male Sprague-Dawley rats were exposed to 1,000 ppm (4,920 mg/m3) 1,2,4-TMB in an inhalation for
12 hrs on d 1, 3, 7, 10, and 14. • Food and water were given ad libitum except during exposure, and animal weight ranged between
150 g and 200 g prior to exposure on d 1. • Hydrocarbon concentration in blood was determined via head space gas chromatography. Daily mean
concentrations did not vary by more than ± 10% from nominal concentrations. • Multiple exposures to 1,2,4-TMB resulted in decreases in blood concentrations following subsequent
exposures, possibly due to the induction of metabolic enzymes that play a role in the metabolism of 1,2,4-TMB.
Blood concentrations (+SD) of n-nonane, 1,2,4-TMB, and 1,2,4-trimethylcyclohexane following 12-hr exposures on d 1, 3, 7, 10, and 14.
Reprinted from Zahlsen et al. (1990) with permission of Pharmacology and Toxicology
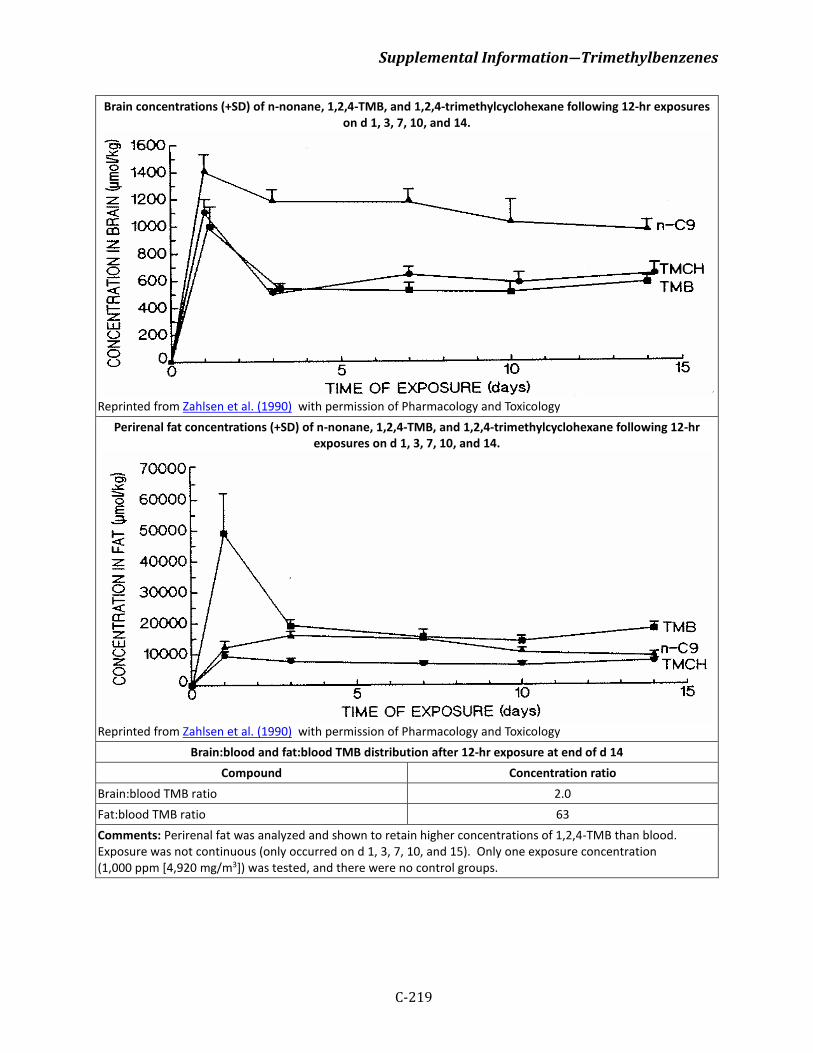
Supplemental Information―Trimethylbenzenes
C-219
Brain concentrations (+SD) of n-nonane, 1,2,4-TMB, and 1,2,4-trimethylcyclohexane following 12-hr exposures on d 1, 3, 7, 10, and 14.
Reprinted from Zahlsen et al. (1990) with permission of Pharmacology and Toxicology
Perirenal fat concentrations (+SD) of n-nonane, 1,2,4-TMB, and 1,2,4-trimethylcyclohexane following 12-hr exposures on d 1, 3, 7, 10, and 14.
Reprinted from Zahlsen et al. (1990) with permission of Pharmacology and Toxicology
Brain:blood and fat:blood TMB distribution after 12-hr exposure at end of d 14 Compound Concentration ratio
Brain:blood TMB ratio 2.0 Fat:blood TMB ratio 63 Comments: Perirenal fat was analyzed and shown to retain higher concentrations of 1,2,4-TMB than blood. Exposure was not continuous (only occurred on d 1, 3, 7, 10, and 15). Only one exposure concentration (1,000 ppm [4,920 mg/m3]) was tested, and there were no control groups.
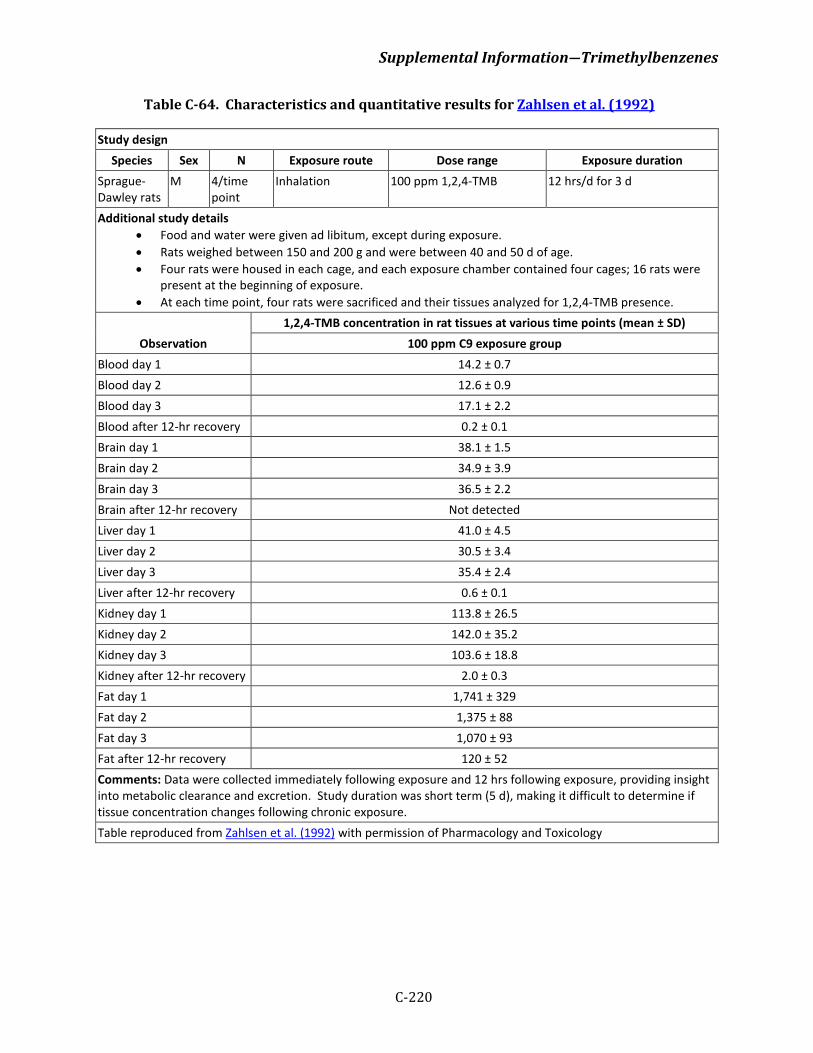
Supplemental Information―Trimethylbenzenes
C-220
Table C-64. Characteristics and quantitative results for Zahlsen et al. (1992)
Study design Species Sex N Exposure route Dose range Exposure duration
Sprague-Dawley rats
M 4/time point
Inhalation 100 ppm 1,2,4-TMB 12 hrs/d for 3 d
Additional study details • Food and water were given ad libitum, except during exposure. • Rats weighed between 150 and 200 g and were between 40 and 50 d of age. • Four rats were housed in each cage, and each exposure chamber contained four cages; 16 rats were
present at the beginning of exposure. • At each time point, four rats were sacrificed and their tissues analyzed for 1,2,4-TMB presence.
Observation 1,2,4-TMB concentration in rat tissues at various time points (mean ± SD)
100 ppm C9 exposure group Blood day 1 14.2 ± 0.7 Blood day 2 12.6 ± 0.9 Blood day 3 17.1 ± 2.2 Blood after 12-hr recovery 0.2 ± 0.1 Brain day 1 38.1 ± 1.5 Brain day 2 34.9 ± 3.9 Brain day 3 36.5 ± 2.2 Brain after 12-hr recovery Not detected Liver day 1 41.0 ± 4.5 Liver day 2 30.5 ± 3.4 Liver day 3 35.4 ± 2.4 Liver after 12-hr recovery 0.6 ± 0.1 Kidney day 1 113.8 ± 26.5 Kidney day 2 142.0 ± 35.2 Kidney day 3 103.6 ± 18.8 Kidney after 12-hr recovery 2.0 ± 0.3 Fat day 1 1,741 ± 329 Fat day 2 1,375 ± 88 Fat day 3 1,070 ± 93 Fat after 12-hr recovery 120 ± 52 Comments: Data were collected immediately following exposure and 12 hrs following exposure, providing insight into metabolic clearance and excretion. Study duration was short term (5 d), making it difficult to determine if tissue concentration changes following chronic exposure. Table reproduced from Zahlsen et al. (1992) with permission of Pharmacology and Toxicology
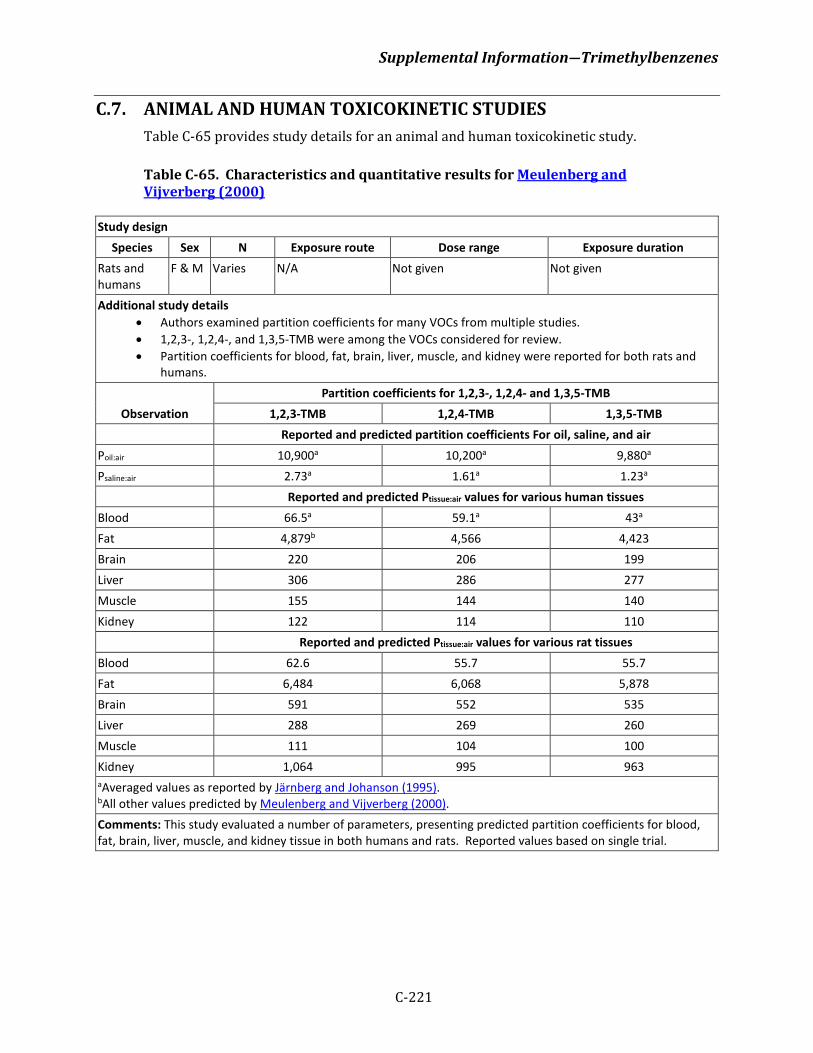
Supplemental Information―Trimethylbenzenes
C-221
C.7. ANIMAL AND HUMAN TOXICOKINETIC STUDIES Table C-65 provides study details for an animal and human toxicokinetic study.
Table C-65. Characteristics and quantitative results for Meulenberg and Vijverberg (2000)
Study design Species Sex N Exposure route Dose range Exposure duration
Rats and humans
F & M Varies N/A Not given Not given
Additional study details • Authors examined partition coefficients for many VOCs from multiple studies. • 1,2,3-, 1,2,4-, and 1,3,5-TMB were among the VOCs considered for review. • Partition coefficients for blood, fat, brain, liver, muscle, and kidney were reported for both rats and
humans.
Observation Partition coefficients for 1,2,3-, 1,2,4- and 1,3,5-TMB
1,2,3-TMB 1,2,4-TMB 1,3,5-TMB Reported and predicted partition coefficients For oil, saline, and air
Poil:air 10,900a 10,200a 9,880a Psaline:air 2.73a 1.61a 1.23a Reported and predicted Ptissue:air values for various human tissues Blood 66.5a 59.1a 43a
Fat 4,879b 4,566 4,423 Brain 220 206 199 Liver 306 286 277 Muscle 155 144 140 Kidney 122 114 110
Reported and predicted Ptissue:air values for various rat tissues Blood 62.6 55.7 55.7 Fat 6,484 6,068 5,878 Brain 591 552 535 Liver 288 269 260 Muscle 111 104 100 Kidney 1,064 995 963 aAveraged values as reported by Järnberg and Johanson (1995). bAll other values predicted by Meulenberg and Vijverberg (2000). Comments: This study evaluated a number of parameters, presenting predicted partition coefficients for blood, fat, brain, liver, muscle, and kidney tissue in both humans and rats. Reported values based on single trial.
Supplemental Information―Trimethylbenzenes
C-1
APPENDIX D. DOSE-RESPONSE MODELING FOR THE DERIVATION OF REFERENCE VALUES FOR EFFECTS OTHER THAN CANCER AND THE DERIVATION OF CANCER RISK ESTIMATES
D.1. BENCHMARK DOSE (BMD) MODELING SUMMARY This appendix provides technical detail on dose-response evaluation and determination of
points of departure (PODs) for relevant neurological, hematological, and developmental toxicity endpoints in the trimethylbenzene (TMB) database. The endpoints were modeled using the U.S. Environmental Protection Agency (EPA) Benchmark Dose Software (BMDS, version 2.6.0.1). Sections D.1.1.1 and D.1.1.2 (noncancer) describe the common practices used in evaluating the model fit and selecting the appropriate model for determining the POD, as outlined in the Benchmark Dose Technical Guidance Document (U.S. EPA, 2012). In some cases, it may be appropriate to use alternative methods, based on statistical judgement; exceptions are noted as necessary in the summary of the modeling results.
D.1.1. Noncancer Endpoints
D.1.1.1. Evaluation of Model Fit
For each continuous endpoint (see Table D-1), BMDS continuous models were fitted to the data using the maximum likelihood method. Model fit was assessed by a series of tests as follows. For each model, first the homogeneity of the variances was tested using a likelihood ratio test (BMDS Test 2). If Test 2 was not rejected (χ2 p-value ≥ 0.10), the model was fitted to the data assuming constant variance. If Test 2 was rejected (χ2 p-value < 0.10), the variance was modeled as a power function of the mean, and the variance model was tested for adequacy of fit using a likelihood ratio test (BMDS Test 3). For fitting models using either constant variance or modeled variance, models for the mean response were tested for adequacy of fit using a likelihood ratio test (BMDS Test 4, with χ2 p-value < 0.10 indicating inadequate fit). Other factors were also used to assess the model fit, such as scaled residuals, visual fit, and adequacy of fit in the low-dose region and in the vicinity of the benchmark response (BMR).
D.1.1.2. Model Selection
For each endpoint, the BMDL estimate (95% lower confidence limit on the BMD, as estimated by the profile likelihood method) and Akaike Information Criterion (AIC) value were
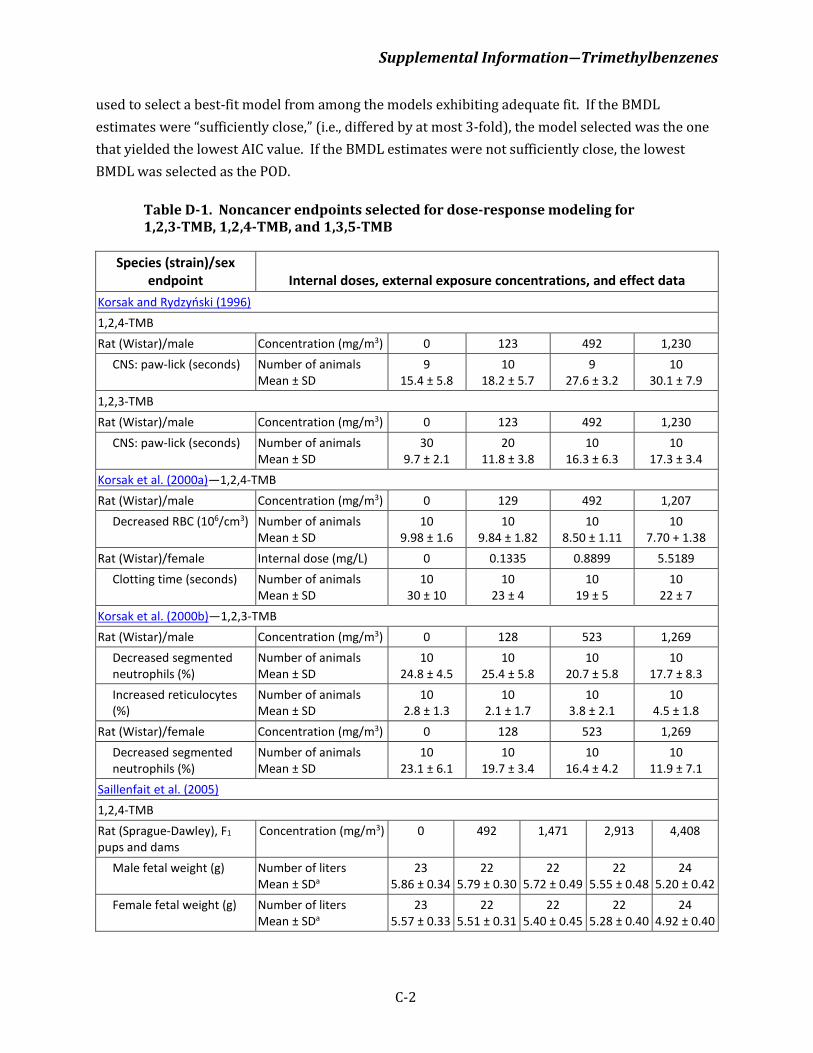
Supplemental Information―Trimethylbenzenes
C-2
used to select a best-fit model from among the models exhibiting adequate fit. If the BMDL estimates were “sufficiently close,” (i.e., differed by at most 3-fold), the model selected was the one that yielded the lowest AIC value. If the BMDL estimates were not sufficiently close, the lowest BMDL was selected as the POD.
Table D-1. Noncancer endpoints selected for dose-response modeling for 1,2,3-TMB, 1,2,4-TMB, and 1,3,5-TMB
Species (strain)/sex endpoint Internal doses, external exposure concentrations, and effect data
Korsak and Rydzyński (1996)
1,2,4-TMB Rat (Wistar)/male Concentration (mg/m3) 0 123 492 1,230
CNS: paw-lick (seconds) Number of animals Mean ± SD
9 15.4 ± 5.8
10 18.2 ± 5.7
9 27.6 ± 3.2
10 30.1 ± 7.9
1,2,3-TMB Rat (Wistar)/male Concentration (mg/m3) 0 123 492 1,230
CNS: paw-lick (seconds) Number of animals Mean ± SD
30 9.7 ± 2.1
20 11.8 ± 3.8
10 16.3 ± 6.3
10 17.3 ± 3.4
Korsak et al. (2000a)—1,2,4-TMB Rat (Wistar)/male Concentration (mg/m3) 0 129 492 1,207
Decreased RBC (106/cm3) Number of animals Mean ± SD
10 9.98 ± 1.6
10 9.84 ± 1.82
10 8.50 ± 1.11
10 7.70 + 1.38
Rat (Wistar)/female Internal dose (mg/L) 0 0.1335 0.8899 5.5189 Clotting time (seconds) Number of animals
Mean ± SD 10
30 ± 10 10
23 ± 4 10
19 ± 5 10
22 ± 7
Korsak et al. (2000b)—1,2,3-TMB Rat (Wistar)/male Concentration (mg/m3) 0 128 523 1,269
Decreased segmented neutrophils (%)
Number of animals Mean ± SD
10 24.8 ± 4.5
10 25.4 ± 5.8
10 20.7 ± 5.8
10 17.7 ± 8.3
Increased reticulocytes (%)
Number of animals Mean ± SD
10 2.8 ± 1.3
10 2.1 ± 1.7
10 3.8 ± 2.1
10 4.5 ± 1.8
Rat (Wistar)/female Concentration (mg/m3) 0 128 523 1,269 Decreased segmented neutrophils (%)
Number of animals Mean ± SD
10 23.1 ± 6.1
10 19.7 ± 3.4
10 16.4 ± 4.2
10 11.9 ± 7.1
Saillenfait et al. (2005)
1,2,4-TMB Rat (Sprague-Dawley), F1 pups and dams
Concentration (mg/m3) 0 492 1,471 2,913 4,408
Male fetal weight (g) Number of liters Mean ± SDa
23 5.86 ± 0.34
22 5.79 ± 0.30
22 5.72 ± 0.49
22 5.55 ± 0.48
24 5.20 ± 0.42
Female fetal weight (g) Number of liters Mean ± SDa
23 5.57 ± 0.33
22 5.51 ± 0.31
22 5.40 ± 0.45
22 5.28 ± 0.40
24 4.92 ± 0.40
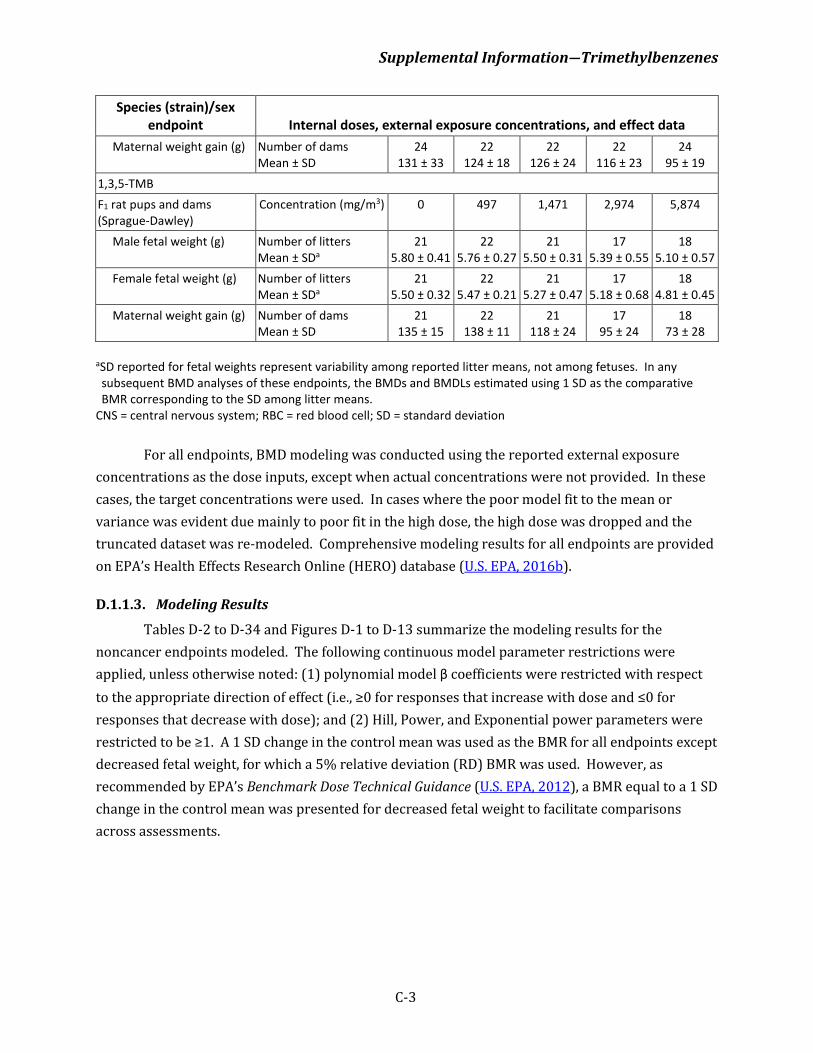
Supplemental Information―Trimethylbenzenes
C-3
Species (strain)/sex endpoint Internal doses, external exposure concentrations, and effect data
Maternal weight gain (g) Number of dams Mean ± SD
24 131 ± 33
22 124 ± 18
22 126 ± 24
22 116 ± 23
24 95 ± 19
1,3,5-TMB F1 rat pups and dams (Sprague-Dawley)
Concentration (mg/m3) 0 497 1,471 2,974 5,874
Male fetal weight (g) Number of litters Mean ± SDa
21 5.80 ± 0.41
22 5.76 ± 0.27
21 5.50 ± 0.31
17 5.39 ± 0.55
18 5.10 ± 0.57
Female fetal weight (g) Number of litters Mean ± SDa
21 5.50 ± 0.32
22 5.47 ± 0.21
21 5.27 ± 0.47
17 5.18 ± 0.68
18 4.81 ± 0.45
Maternal weight gain (g) Number of dams Mean ± SD
21 135 ± 15
22 138 ± 11
21 118 ± 24
17 95 ± 24
18 73 ± 28
aSD reported for fetal weights represent variability among reported litter means, not among fetuses. In any subsequent BMD analyses of these endpoints, the BMDs and BMDLs estimated using 1 SD as the comparative BMR corresponding to the SD among litter means.
CNS = central nervous system; RBC = red blood cell; SD = standard deviation For all endpoints, BMD modeling was conducted using the reported external exposure
concentrations as the dose inputs, except when actual concentrations were not provided. In these cases, the target concentrations were used. In cases where the poor model fit to the mean or variance was evident due mainly to poor fit in the high dose, the high dose was dropped and the truncated dataset was re-modeled. Comprehensive modeling results for all endpoints are provided on EPA’s Health Effects Research Online (HERO) database (U.S. EPA, 2016b).
D.1.1.3. Modeling Results
Tables D-2 to D-34 and Figures D-1 to D-13 summarize the modeling results for the noncancer endpoints modeled. The following continuous model parameter restrictions were applied, unless otherwise noted: (1) polynomial model β coefficients were restricted with respect to the appropriate direction of effect (i.e., ≥0 for responses that increase with dose and ≤0 for responses that decrease with dose); and (2) Hill, Power, and Exponential power parameters were restricted to be ≥1. A 1 SD change in the control mean was used as the BMR for all endpoints except decreased fetal weight, for which a 5% relative deviation (RD) BMR was used. However, as recommended by EPA’s Benchmark Dose Technical Guidance (U.S. EPA, 2012), a BMR equal to a 1 SD change in the control mean was presented for decreased fetal weight to facilitate comparisons across assessments.
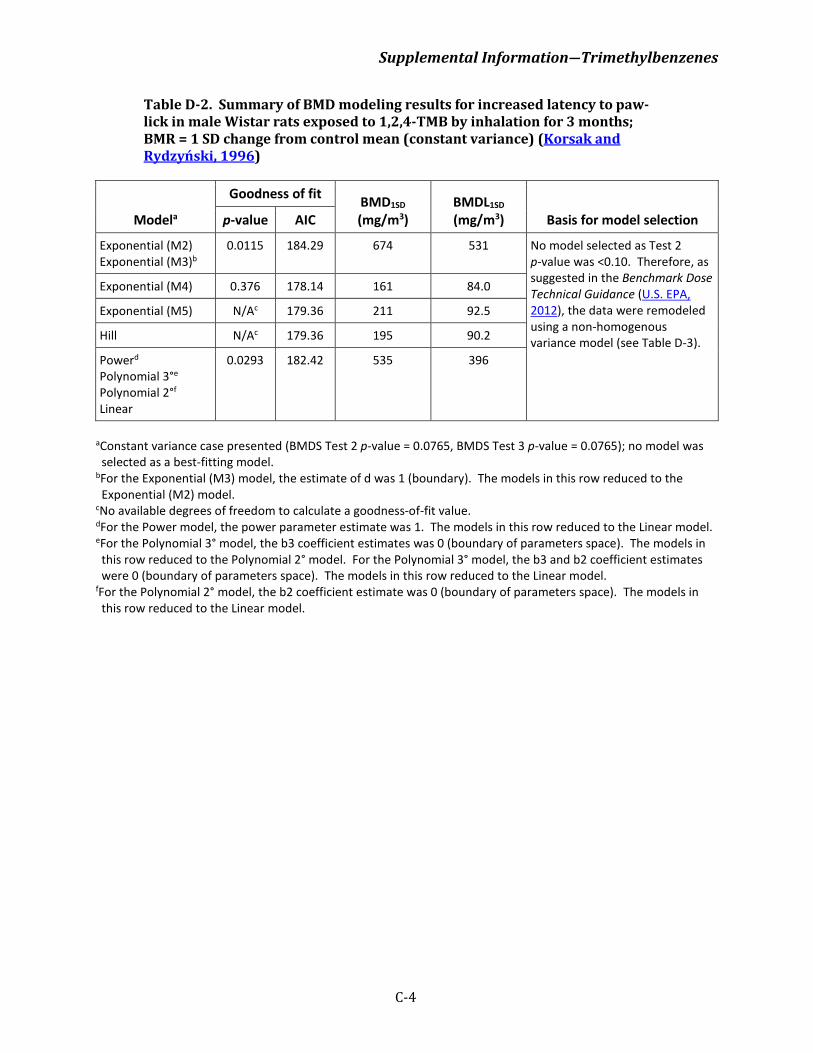
Supplemental Information―Trimethylbenzenes
C-4
Table D-2. Summary of BMD modeling results for increased latency to paw-lick in male Wistar rats exposed to 1,2,4-TMB by inhalation for 3 months; BMR = 1 SD change from control mean (constant variance) (Korsak and Rydzyński, 1996)
Modela
Goodness of fit BMD1SD (mg/m3)
BMDL1SD (mg/m3) Basis for model selection p-value AIC
Exponential (M2) Exponential (M3)b
0.0115 184.29 674 531 No model selected as Test 2 p-value was <0.10. Therefore, as suggested in the Benchmark Dose Technical Guidance (U.S. EPA, 2012), the data were remodeled using a non-homogenous variance model (see Table D-3).
Exponential (M4) 0.376 178.14 161 84.0
Exponential (M5) N/Ac 179.36 211 92.5
Hill N/Ac 179.36 195 90.2
Powerd Polynomial 3°e Polynomial 2°f Linear
0.0293 182.42 535 396
aConstant variance case presented (BMDS Test 2 p-value = 0.0765, BMDS Test 3 p-value = 0.0765); no model was selected as a best-fitting model.
bFor the Exponential (M3) model, the estimate of d was 1 (boundary). The models in this row reduced to the Exponential (M2) model.
cNo available degrees of freedom to calculate a goodness-of-fit value. dFor the Power model, the power parameter estimate was 1. The models in this row reduced to the Linear model. eFor the Polynomial 3° model, the b3 coefficient estimates was 0 (boundary of parameters space). The models in this row reduced to the Polynomial 2° model. For the Polynomial 3° model, the b3 and b2 coefficient estimates were 0 (boundary of parameters space). The models in this row reduced to the Linear model.
fFor the Polynomial 2° model, the b2 coefficient estimate was 0 (boundary of parameters space). The models in this row reduced to the Linear model.
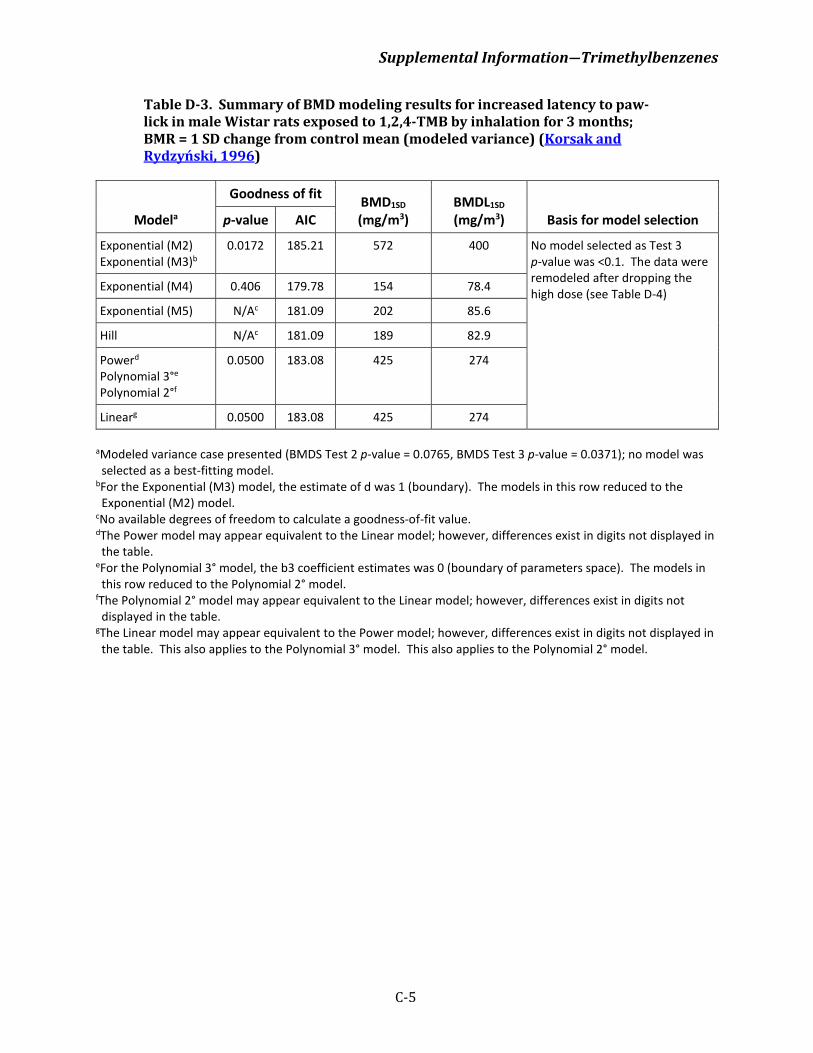
Supplemental Information―Trimethylbenzenes
C-5
Table D-3. Summary of BMD modeling results for increased latency to paw-lick in male Wistar rats exposed to 1,2,4-TMB by inhalation for 3 months; BMR = 1 SD change from control mean (modeled variance) (Korsak and Rydzyński, 1996)
Modela
Goodness of fit BMD1SD (mg/m3)
BMDL1SD (mg/m3) Basis for model selection p-value AIC
Exponential (M2) Exponential (M3)b
0.0172 185.21 572 400 No model selected as Test 3 p-value was <0.1. The data were remodeled after dropping the high dose (see Table D-4) Exponential (M4) 0.406 179.78 154 78.4
Exponential (M5) N/Ac 181.09 202 85.6
Hill N/Ac 181.09 189 82.9
Powerd Polynomial 3°e Polynomial 2°f
0.0500 183.08 425 274
Linearg 0.0500 183.08 425 274 aModeled variance case presented (BMDS Test 2 p-value = 0.0765, BMDS Test 3 p-value = 0.0371); no model was selected as a best-fitting model.
bFor the Exponential (M3) model, the estimate of d was 1 (boundary). The models in this row reduced to the Exponential (M2) model.
cNo available degrees of freedom to calculate a goodness-of-fit value. dThe Power model may appear equivalent to the Linear model; however, differences exist in digits not displayed in the table.
eFor the Polynomial 3° model, the b3 coefficient estimates was 0 (boundary of parameters space). The models in this row reduced to the Polynomial 2° model.
fThe Polynomial 2° model may appear equivalent to the Linear model; however, differences exist in digits not displayed in the table.
gThe Linear model may appear equivalent to the Power model; however, differences exist in digits not displayed in the table. This also applies to the Polynomial 3° model. This also applies to the Polynomial 2° model.
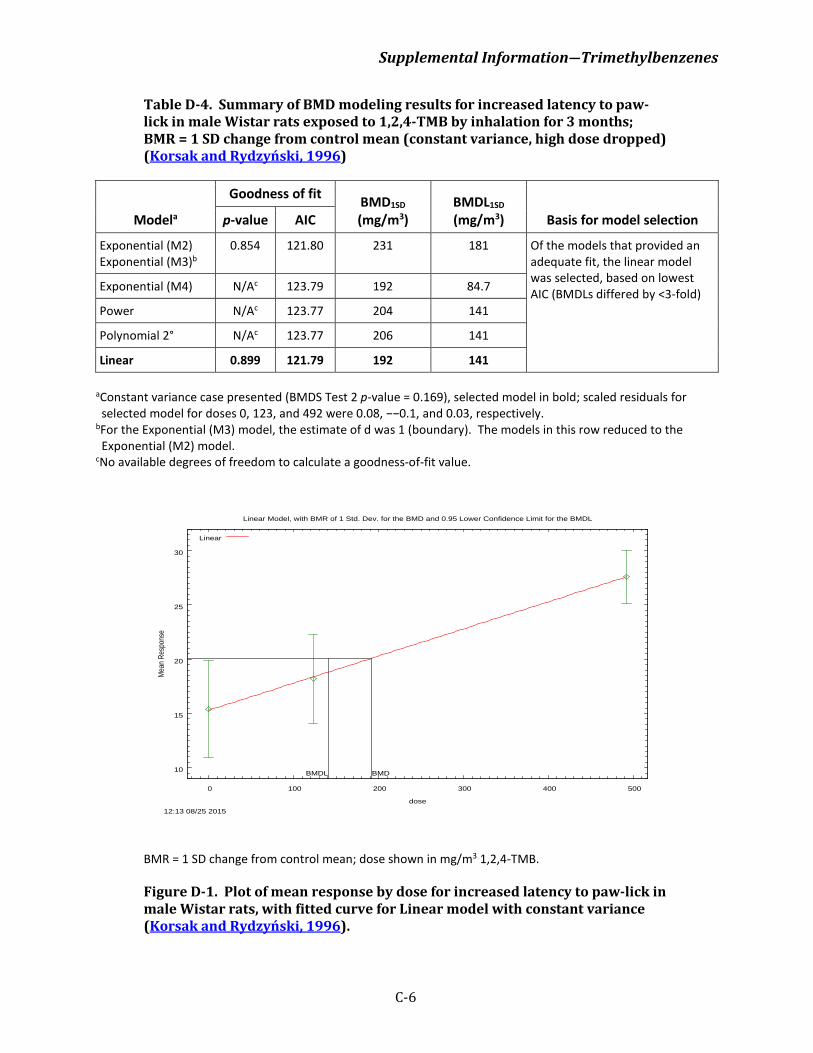
Supplemental Information―Trimethylbenzenes
C-6
Table D-4. Summary of BMD modeling results for increased latency to paw-lick in male Wistar rats exposed to 1,2,4-TMB by inhalation for 3 months; BMR = 1 SD change from control mean (constant variance, high dose dropped) (Korsak and Rydzyński, 1996)
Modela
Goodness of fit BMD1SD (mg/m3)
BMDL1SD (mg/m3) Basis for model selection p-value AIC
Exponential (M2) Exponential (M3)b
0.854 121.80 231 181 Of the models that provided an adequate fit, the linear model was selected, based on lowest AIC (BMDLs differed by <3-fold) Exponential (M4) N/Ac 123.79 192 84.7
Power N/Ac 123.77 204 141
Polynomial 2° N/Ac 123.77 206 141
Linear 0.899 121.79 192 141 aConstant variance case presented (BMDS Test 2 p-value = 0.169), selected model in bold; scaled residuals for selected model for doses 0, 123, and 492 were 0.08, −−0.1, and 0.03, respectively.
bFor the Exponential (M3) model, the estimate of d was 1 (boundary). The models in this row reduced to the Exponential (M2) model.
cNo available degrees of freedom to calculate a goodness-of-fit value.
BMR = 1 SD change from control mean; dose shown in mg/m3 1,2,4-TMB.
Figure D-1. Plot of mean response by dose for increased latency to paw-lick in male Wistar rats, with fitted curve for Linear model with constant variance (Korsak and Rydzyński, 1996).
10
15
20
25
30
0 100 200 300 400 500
Mea
n Re
spon
se
dose
Linear Model, with BMR of 1 Std. Dev. for the BMD and 0.95 Lower Confidence Limit for the BMDL
12:13 08/25 2015
BMDBMDL
Linear
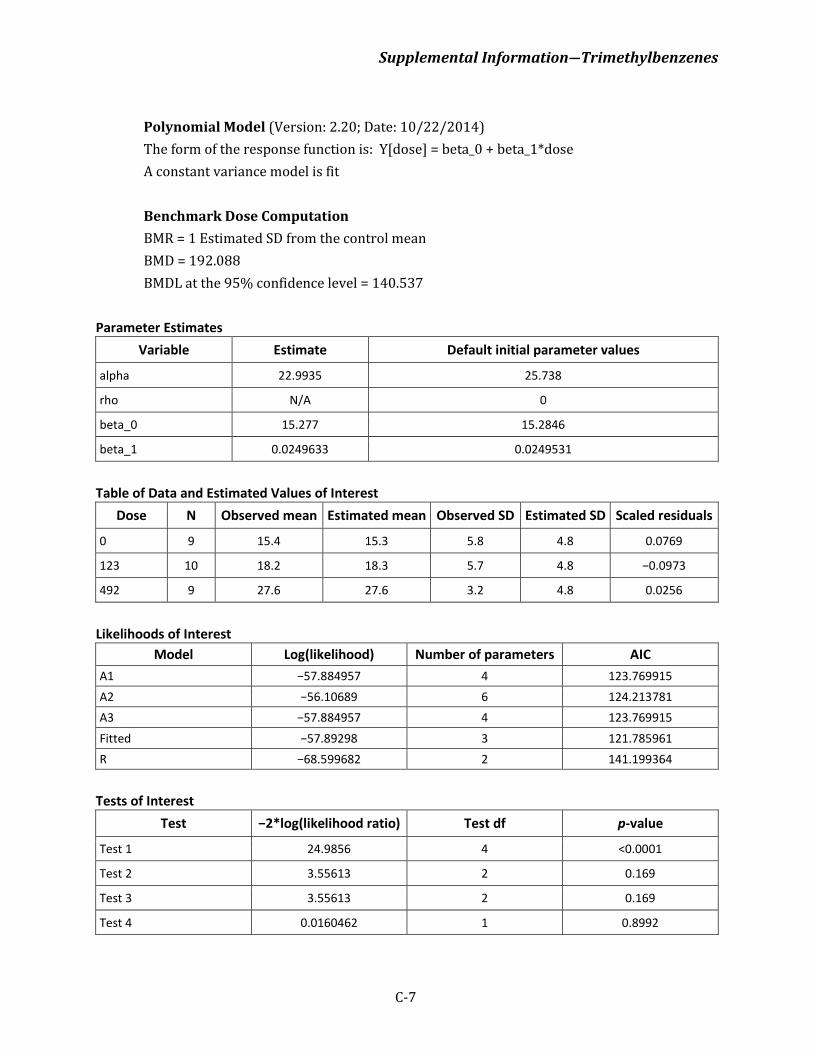
Supplemental Information―Trimethylbenzenes
C-7
Polynomial Model (Version: 2.20; Date: 10/22/2014) The form of the response function is: Y[dose] = beta_0 + beta_1*dose A constant variance model is fit Benchmark Dose Computation BMR = 1 Estimated SD from the control mean BMD = 192.088 BMDL at the 95% confidence level = 140.537
Parameter Estimates Variable Estimate Default initial parameter values
alpha 22.9935 25.738
rho N/A 0
beta_0 15.277 15.2846
beta_1 0.0249633 0.0249531
Table of Data and Estimated Values of Interest
Dose N Observed mean Estimated mean Observed SD Estimated SD Scaled residuals
0 9 15.4 15.3 5.8 4.8 0.0769
123 10 18.2 18.3 5.7 4.8 −0.0973
492 9 27.6 27.6 3.2 4.8 0.0256
Likelihoods of Interest
Model Log(likelihood) Number of parameters AIC A1 −57.884957 4 123.769915 A2 −56.10689 6 124.213781 A3 −57.884957 4 123.769915 Fitted −57.89298 3 121.785961 R −68.599682 2 141.199364
Tests of Interest
Test −2*log(likelihood ratio) Test df p-value
Test 1 24.9856 4 <0.0001
Test 2 3.55613 2 0.169
Test 3 3.55613 2 0.169
Test 4 0.0160462 1 0.8992
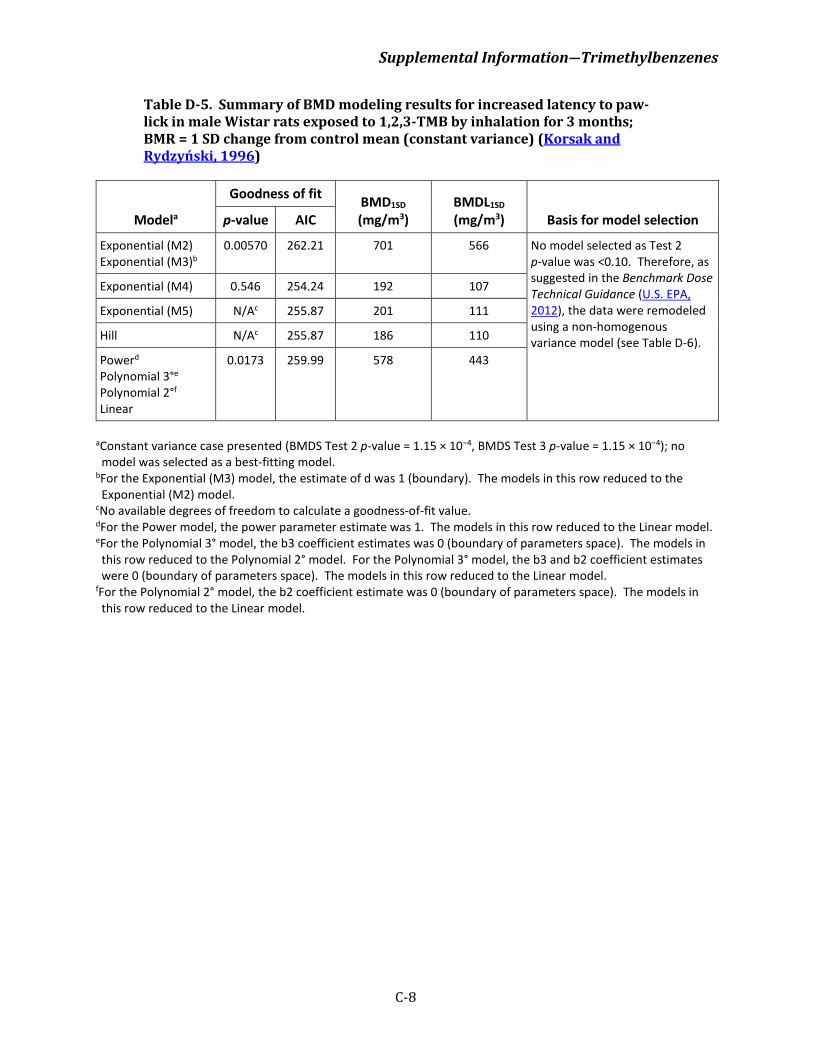
Supplemental Information―Trimethylbenzenes
C-8
Table D-5. Summary of BMD modeling results for increased latency to paw-lick in male Wistar rats exposed to 1,2,3-TMB by inhalation for 3 months; BMR = 1 SD change from control mean (constant variance) (Korsak and Rydzyński, 1996)
Modela
Goodness of fit BMD1SD (mg/m3)
BMDL1SD (mg/m3) Basis for model selection p-value AIC
Exponential (M2) Exponential (M3)b
0.00570 262.21 701 566 No model selected as Test 2 p-value was <0.10. Therefore, as suggested in the Benchmark Dose Technical Guidance (U.S. EPA, 2012), the data were remodeled using a non-homogenous variance model (see Table D-6).
Exponential (M4) 0.546 254.24 192 107
Exponential (M5) N/Ac 255.87 201 111
Hill N/Ac 255.87 186 110
Powerd Polynomial 3°e Polynomial 2°f Linear
0.0173 259.99 578 443
aConstant variance case presented (BMDS Test 2 p-value = 1.15 × 10⁻⁴, BMDS Test 3 p-value = 1.15 × 10⁻⁴); no model was selected as a best-fitting model.
bFor the Exponential (M3) model, the estimate of d was 1 (boundary). The models in this row reduced to the Exponential (M2) model.
cNo available degrees of freedom to calculate a goodness-of-fit value. dFor the Power model, the power parameter estimate was 1. The models in this row reduced to the Linear model. eFor the Polynomial 3° model, the b3 coefficient estimates was 0 (boundary of parameters space). The models in this row reduced to the Polynomial 2° model. For the Polynomial 3° model, the b3 and b2 coefficient estimates were 0 (boundary of parameters space). The models in this row reduced to the Linear model.
fFor the Polynomial 2° model, the b2 coefficient estimate was 0 (boundary of parameters space). The models in this row reduced to the Linear model.
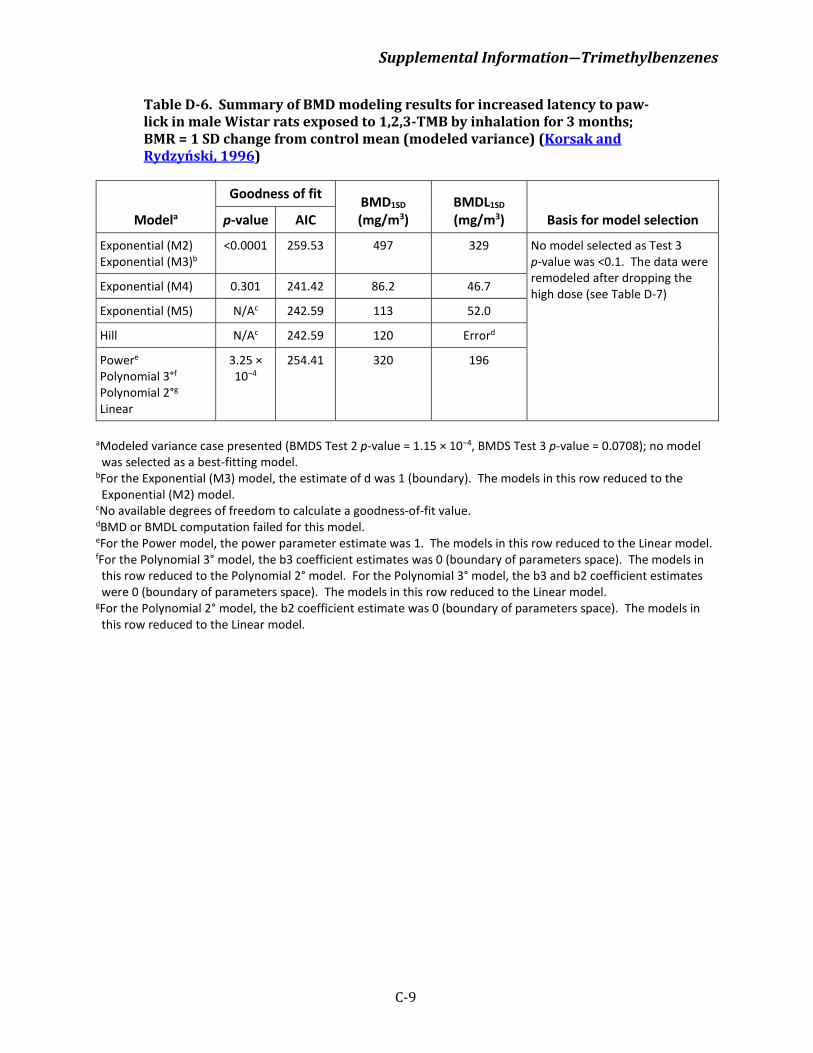
Supplemental Information―Trimethylbenzenes
C-9
Table D-6. Summary of BMD modeling results for increased latency to paw-lick in male Wistar rats exposed to 1,2,3-TMB by inhalation for 3 months; BMR = 1 SD change from control mean (modeled variance) (Korsak and Rydzyński, 1996)
Modela
Goodness of fit BMD1SD (mg/m3)
BMDL1SD (mg/m3) Basis for model selection p-value AIC
Exponential (M2) Exponential (M3)b
<0.0001 259.53 497 329 No model selected as Test 3 p-value was <0.1. The data were remodeled after dropping the high dose (see Table D-7) Exponential (M4) 0.301 241.42 86.2 46.7
Exponential (M5) N/Ac 242.59 113 52.0
Hill N/Ac 242.59 120 Errord
Powere Polynomial 3°f Polynomial 2°g Linear
3.25 × 10⁻⁴
254.41 320 196
aModeled variance case presented (BMDS Test 2 p-value = 1.15 × 10⁻⁴, BMDS Test 3 p-value = 0.0708); no model was selected as a best-fitting model.
bFor the Exponential (M3) model, the estimate of d was 1 (boundary). The models in this row reduced to the Exponential (M2) model.
cNo available degrees of freedom to calculate a goodness-of-fit value. dBMD or BMDL computation failed for this model. eFor the Power model, the power parameter estimate was 1. The models in this row reduced to the Linear model. fFor the Polynomial 3° model, the b3 coefficient estimates was 0 (boundary of parameters space). The models in this row reduced to the Polynomial 2° model. For the Polynomial 3° model, the b3 and b2 coefficient estimates were 0 (boundary of parameters space). The models in this row reduced to the Linear model.
gFor the Polynomial 2° model, the b2 coefficient estimate was 0 (boundary of parameters space). The models in this row reduced to the Linear model.
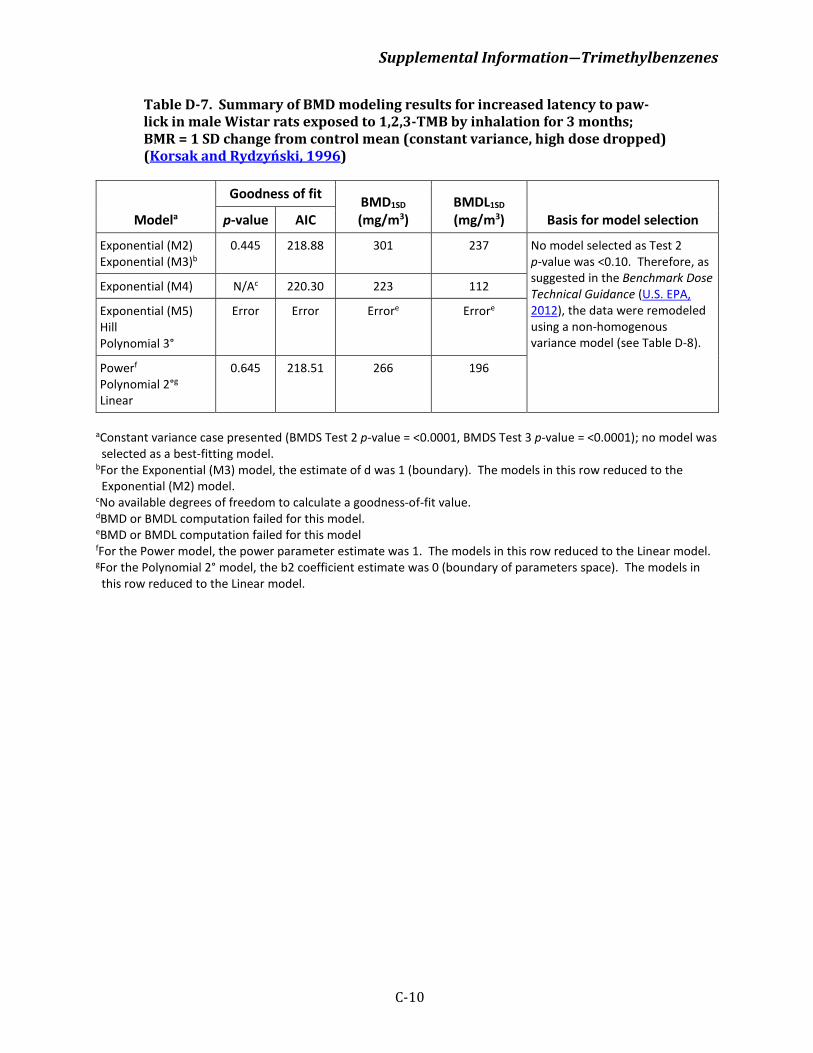
Supplemental Information―Trimethylbenzenes
C-10
Table D-7. Summary of BMD modeling results for increased latency to paw-lick in male Wistar rats exposed to 1,2,3-TMB by inhalation for 3 months; BMR = 1 SD change from control mean (constant variance, high dose dropped) (Korsak and Rydzyński, 1996)
Modela
Goodness of fit BMD1SD (mg/m3)
BMDL1SD (mg/m3) Basis for model selection p-value AIC
Exponential (M2) Exponential (M3)b
0.445 218.88 301 237 No model selected as Test 2 p-value was <0.10. Therefore, as suggested in the Benchmark Dose Technical Guidance (U.S. EPA, 2012), the data were remodeled using a non-homogenous variance model (see Table D-8).
Exponential (M4) N/Ac 220.30 223 112
Exponential (M5) Hill Polynomial 3°
Error Error Errore Errore
Powerf Polynomial 2°g Linear
0.645 218.51 266 196
aConstant variance case presented (BMDS Test 2 p-value = <0.0001, BMDS Test 3 p-value = <0.0001); no model was selected as a best-fitting model.
bFor the Exponential (M3) model, the estimate of d was 1 (boundary). The models in this row reduced to the Exponential (M2) model.
cNo available degrees of freedom to calculate a goodness-of-fit value. dBMD or BMDL computation failed for this model. eBMD or BMDL computation failed for this model fFor the Power model, the power parameter estimate was 1. The models in this row reduced to the Linear model. gFor the Polynomial 2° model, the b2 coefficient estimate was 0 (boundary of parameters space). The models in this row reduced to the Linear model.
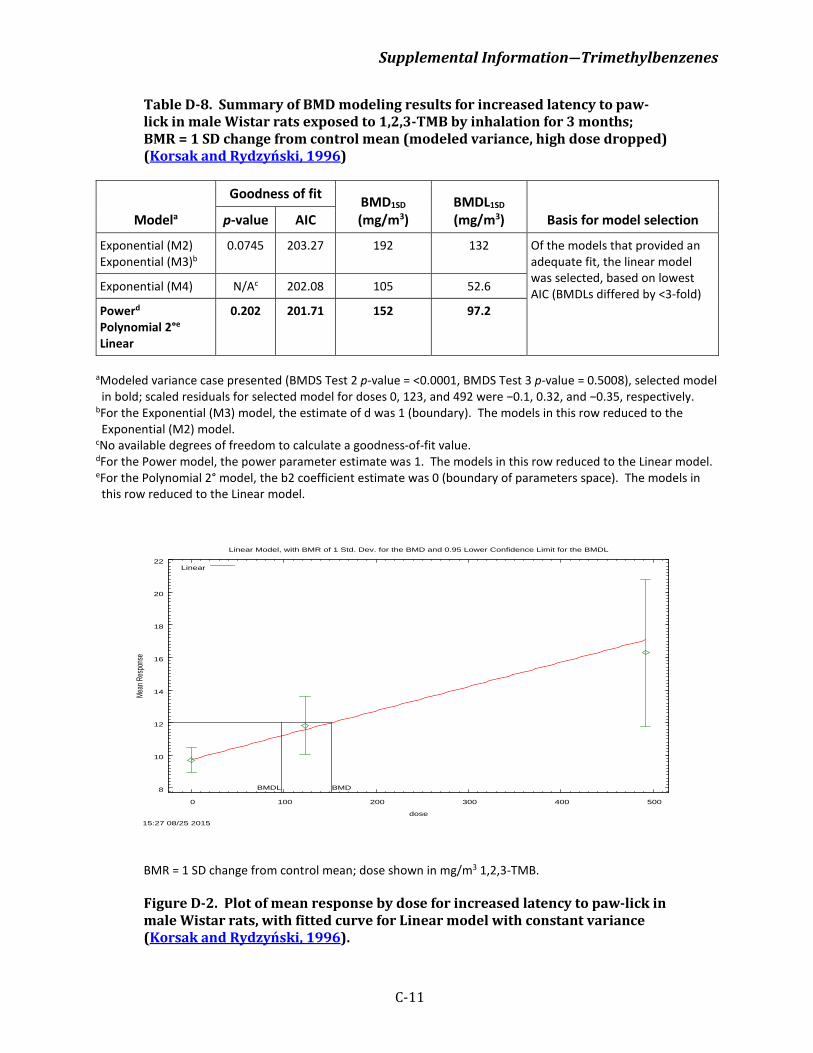
Supplemental Information―Trimethylbenzenes
C-11
Table D-8. Summary of BMD modeling results for increased latency to paw-lick in male Wistar rats exposed to 1,2,3-TMB by inhalation for 3 months; BMR = 1 SD change from control mean (modeled variance, high dose dropped) (Korsak and Rydzyński, 1996)
Modela
Goodness of fit BMD1SD (mg/m3)
BMDL1SD (mg/m3) Basis for model selection p-value AIC
Exponential (M2) Exponential (M3)b
0.0745 203.27 192 132 Of the models that provided an adequate fit, the linear model was selected, based on lowest AIC (BMDLs differed by <3-fold) Exponential (M4) N/Ac 202.08 105 52.6
Powerd Polynomial 2°e Linear
0.202 201.71 152 97.2
aModeled variance case presented (BMDS Test 2 p-value = <0.0001, BMDS Test 3 p-value = 0.5008), selected model in bold; scaled residuals for selected model for doses 0, 123, and 492 were −0.1, 0.32, and −0.35, respectively.
bFor the Exponential (M3) model, the estimate of d was 1 (boundary). The models in this row reduced to the Exponential (M2) model.
cNo available degrees of freedom to calculate a goodness-of-fit value. dFor the Power model, the power parameter estimate was 1. The models in this row reduced to the Linear model. eFor the Polynomial 2° model, the b2 coefficient estimate was 0 (boundary of parameters space). The models in this row reduced to the Linear model.
BMR = 1 SD change from control mean; dose shown in mg/m3 1,2,3-TMB.
Figure D-2. Plot of mean response by dose for increased latency to paw-lick in male Wistar rats, with fitted curve for Linear model with constant variance (Korsak and Rydzyński, 1996).
8
10
12
14
16
18
20
22
0 100 200 300 400 500
Mean
Res
pons
e
dose
Linear Model, with BMR of 1 Std. Dev. for the BMD and 0.95 Lower Confidence Limit for the BMDL
15:27 08/25 2015
BMDBMDL
Linear
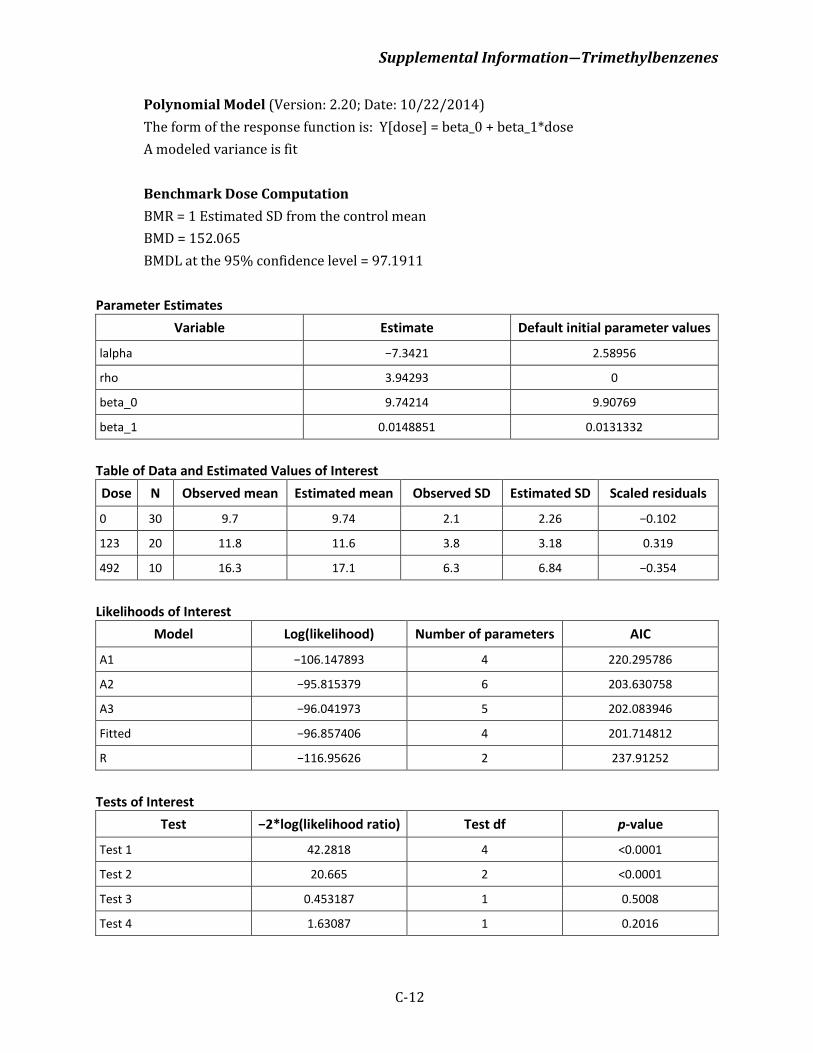
Supplemental Information―Trimethylbenzenes
C-12
Polynomial Model (Version: 2.20; Date: 10/22/2014) The form of the response function is: Y[dose] = beta_0 + beta_1*dose A modeled variance is fit Benchmark Dose Computation BMR = 1 Estimated SD from the control mean BMD = 152.065 BMDL at the 95% confidence level = 97.1911
Parameter Estimates Variable Estimate Default initial parameter values
lalpha −7.3421 2.58956
rho 3.94293 0
beta_0 9.74214 9.90769
beta_1 0.0148851 0.0131332
Table of Data and Estimated Values of Interest Dose N Observed mean Estimated mean Observed SD Estimated SD Scaled residuals
0 30 9.7 9.74 2.1 2.26 −0.102
123 20 11.8 11.6 3.8 3.18 0.319
492 10 16.3 17.1 6.3 6.84 −0.354
Likelihoods of Interest
Model Log(likelihood) Number of parameters AIC
A1 −106.147893 4 220.295786
A2 −95.815379 6 203.630758
A3 −96.041973 5 202.083946
Fitted −96.857406 4 201.714812
R −116.95626 2 237.91252
Tests of Interest
Test −2*log(likelihood ratio) Test df p-value
Test 1 42.2818 4 <0.0001
Test 2 20.665 2 <0.0001
Test 3 0.453187 1 0.5008
Test 4 1.63087 1 0.2016
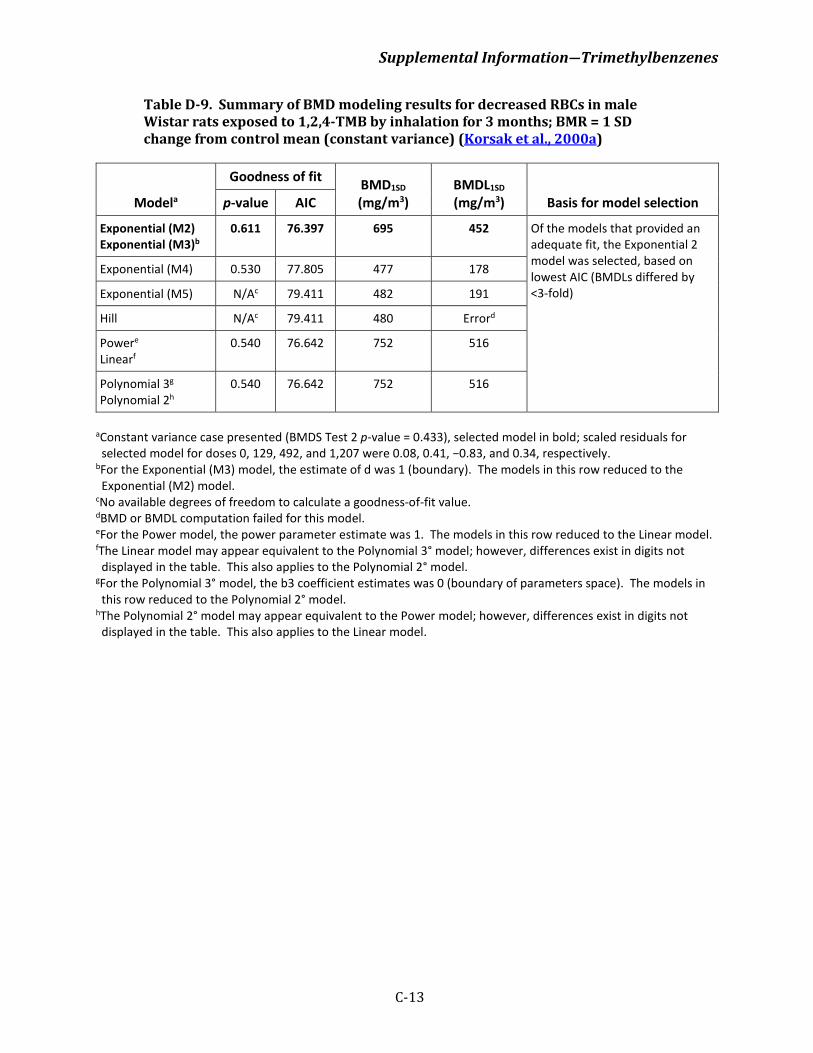
Supplemental Information―Trimethylbenzenes
C-13
Table D-9. Summary of BMD modeling results for decreased RBCs in male Wistar rats exposed to 1,2,4-TMB by inhalation for 3 months; BMR = 1 SD change from control mean (constant variance) (Korsak et al., 2000a)
Modela
Goodness of fit BMD1SD (mg/m3)
BMDL1SD (mg/m3) Basis for model selection p-value AIC
Exponential (M2) Exponential (M3)b
0.611 76.397 695 452 Of the models that provided an adequate fit, the Exponential 2 model was selected, based on lowest AIC (BMDLs differed by <3-fold)
Exponential (M4) 0.530 77.805 477 178
Exponential (M5) N/Ac 79.411 482 191
Hill N/Ac 79.411 480 Errord
Powere Linearf
0.540 76.642 752 516
Polynomial 3g Polynomial 2h
0.540 76.642 752 516
aConstant variance case presented (BMDS Test 2 p-value = 0.433), selected model in bold; scaled residuals for selected model for doses 0, 129, 492, and 1,207 were 0.08, 0.41, −0.83, and 0.34, respectively.
bFor the Exponential (M3) model, the estimate of d was 1 (boundary). The models in this row reduced to the Exponential (M2) model.
cNo available degrees of freedom to calculate a goodness-of-fit value. dBMD or BMDL computation failed for this model. eFor the Power model, the power parameter estimate was 1. The models in this row reduced to the Linear model. fThe Linear model may appear equivalent to the Polynomial 3° model; however, differences exist in digits not displayed in the table. This also applies to the Polynomial 2° model.
gFor the Polynomial 3° model, the b3 coefficient estimates was 0 (boundary of parameters space). The models in this row reduced to the Polynomial 2° model.
hThe Polynomial 2° model may appear equivalent to the Power model; however, differences exist in digits not displayed in the table. This also applies to the Linear model.
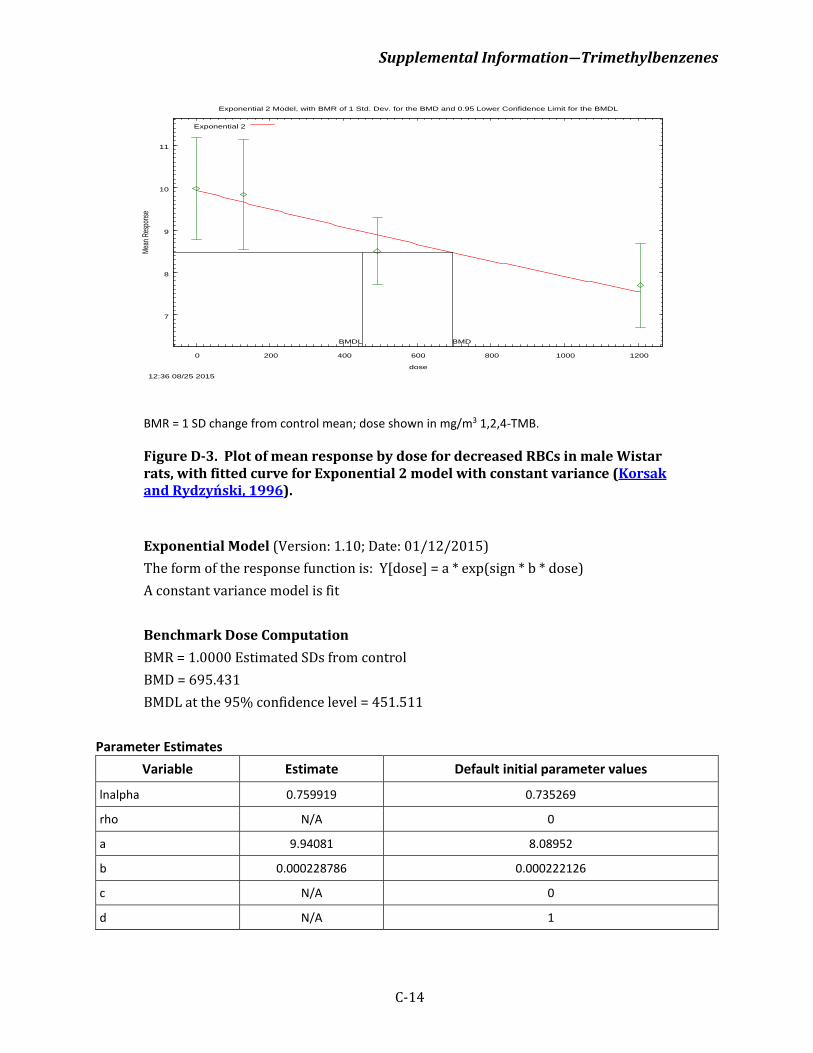
Supplemental Information―Trimethylbenzenes
C-14
BMR = 1 SD change from control mean; dose shown in mg/m3 1,2,4-TMB.
Figure D-3. Plot of mean response by dose for decreased RBCs in male Wistar rats, with fitted curve for Exponential 2 model with constant variance (Korsak and Rydzyński, 1996).
Exponential Model (Version: 1.10; Date: 01/12/2015) The form of the response function is: Y[dose] = a * exp(sign * b * dose) A constant variance model is fit Benchmark Dose Computation BMR = 1.0000 Estimated SDs from control BMD = 695.431 BMDL at the 95% confidence level = 451.511
Parameter Estimates Variable Estimate Default initial parameter values
lnalpha 0.759919 0.735269
rho N/A 0
a 9.94081 8.08952
b 0.000228786 0.000222126
c N/A 0
d N/A 1
7
8
9
10
11
0 200 400 600 800 1000 1200
Mean
Res
pons
e
dose
Exponential 2 Model, with BMR of 1 Std. Dev. for the BMD and 0.95 Lower Confidence Limit for the BMDL
12:36 08/25 2015
BMDBMDL
Exponential 2
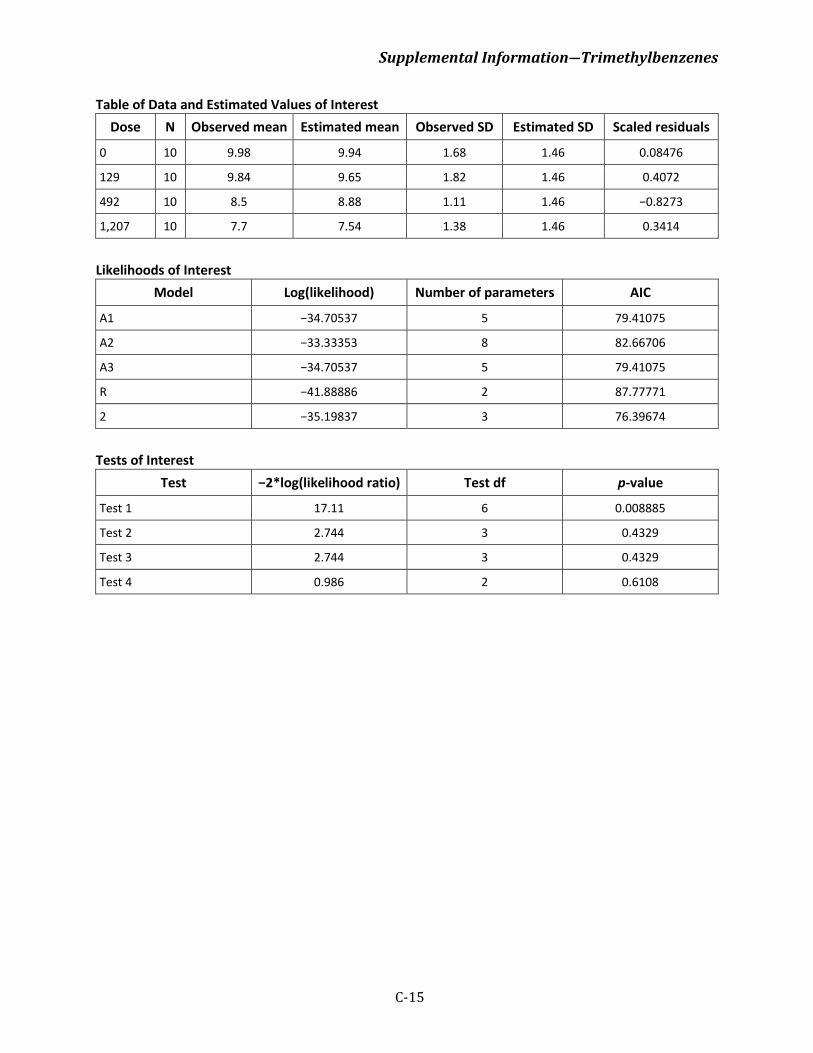
Supplemental Information―Trimethylbenzenes
C-15
Table of Data and Estimated Values of Interest Dose N Observed mean Estimated mean Observed SD Estimated SD Scaled residuals
0 10 9.98 9.94 1.68 1.46 0.08476
129 10 9.84 9.65 1.82 1.46 0.4072
492 10 8.5 8.88 1.11 1.46 −0.8273
1,207 10 7.7 7.54 1.38 1.46 0.3414
Likelihoods of Interest
Model Log(likelihood) Number of parameters AIC
A1 −34.70537 5 79.41075
A2 −33.33353 8 82.66706
A3 −34.70537 5 79.41075
R −41.88886 2 87.77771
2 −35.19837 3 76.39674
Tests of Interest
Test −2*log(likelihood ratio) Test df p-value
Test 1 17.11 6 0.008885
Test 2 2.744 3 0.4329
Test 3 2.744 3 0.4329
Test 4 0.986 2 0.6108
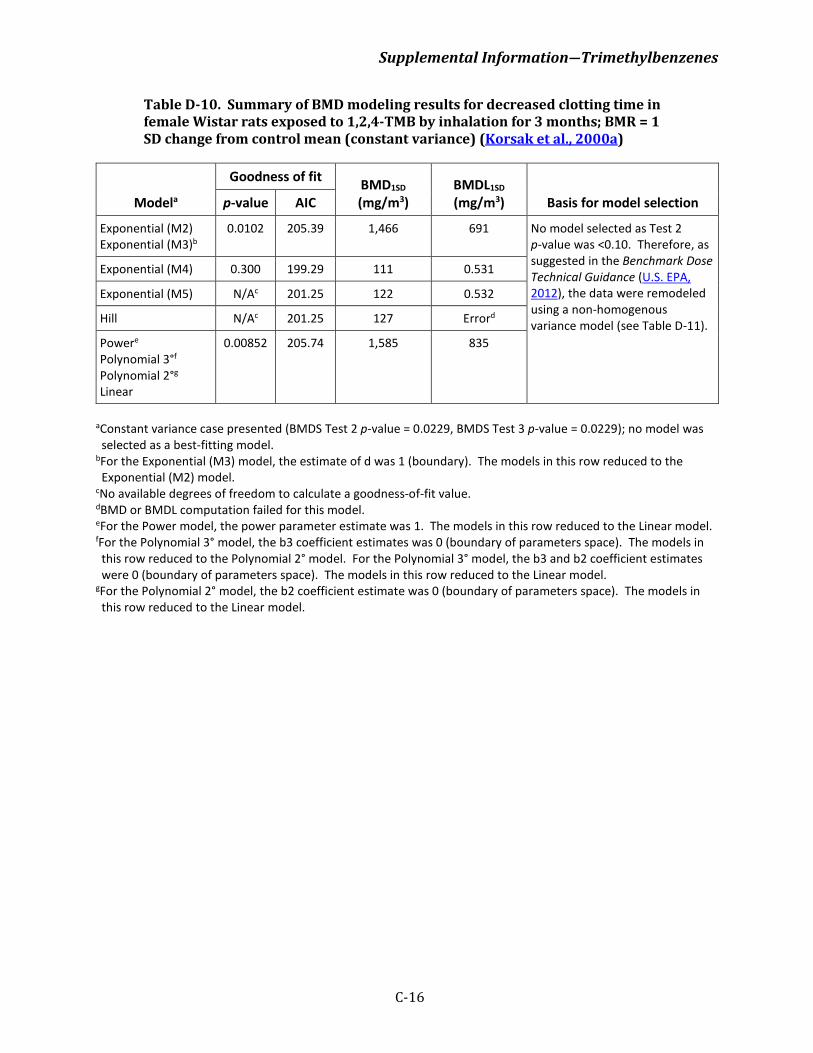
Supplemental Information―Trimethylbenzenes
C-16
Table D-10. Summary of BMD modeling results for decreased clotting time in female Wistar rats exposed to 1,2,4-TMB by inhalation for 3 months; BMR = 1 SD change from control mean (constant variance) (Korsak et al., 2000a)
Modela
Goodness of fit BMD1SD (mg/m3)
BMDL1SD (mg/m3) Basis for model selection p-value AIC
Exponential (M2) Exponential (M3)b
0.0102 205.39 1,466 691 No model selected as Test 2 p-value was <0.10. Therefore, as suggested in the Benchmark Dose Technical Guidance (U.S. EPA, 2012), the data were remodeled using a non-homogenous variance model (see Table D-11).
Exponential (M4) 0.300 199.29 111 0.531
Exponential (M5) N/Ac 201.25 122 0.532
Hill N/Ac 201.25 127 Errord
Powere Polynomial 3°f Polynomial 2°g Linear
0.00852 205.74 1,585 835
aConstant variance case presented (BMDS Test 2 p-value = 0.0229, BMDS Test 3 p-value = 0.0229); no model was selected as a best-fitting model.
bFor the Exponential (M3) model, the estimate of d was 1 (boundary). The models in this row reduced to the Exponential (M2) model.
cNo available degrees of freedom to calculate a goodness-of-fit value. dBMD or BMDL computation failed for this model. eFor the Power model, the power parameter estimate was 1. The models in this row reduced to the Linear model. fFor the Polynomial 3° model, the b3 coefficient estimates was 0 (boundary of parameters space). The models in this row reduced to the Polynomial 2° model. For the Polynomial 3° model, the b3 and b2 coefficient estimates were 0 (boundary of parameters space). The models in this row reduced to the Linear model.
gFor the Polynomial 2° model, the b2 coefficient estimate was 0 (boundary of parameters space). The models in this row reduced to the Linear model.
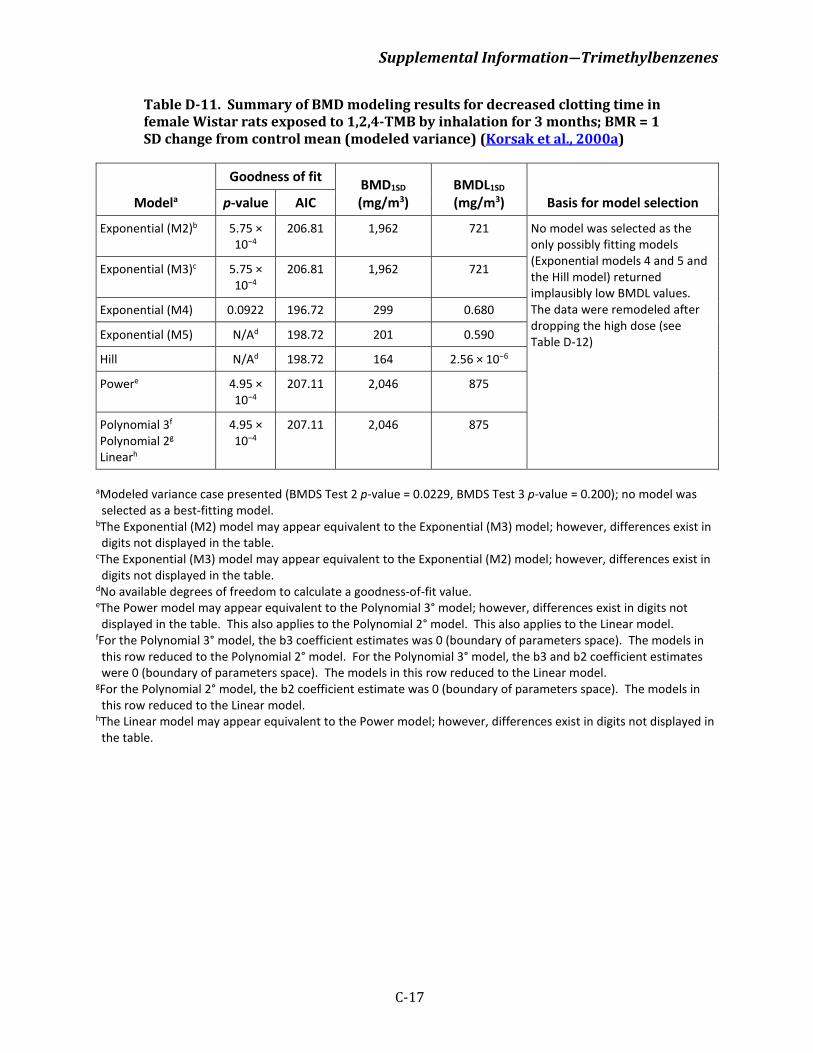
Supplemental Information―Trimethylbenzenes
C-17
Table D-11. Summary of BMD modeling results for decreased clotting time in female Wistar rats exposed to 1,2,4-TMB by inhalation for 3 months; BMR = 1 SD change from control mean (modeled variance) (Korsak et al., 2000a)
Modela
Goodness of fit BMD1SD (mg/m3)
BMDL1SD (mg/m3) Basis for model selection p-value AIC
Exponential (M2)b 5.75 × 10⁻⁴
206.81 1,962 721 No model was selected as the only possibly fitting models (Exponential models 4 and 5 and the Hill model) returned implausibly low BMDL values. The data were remodeled after dropping the high dose (see Table D-12)
Exponential (M3)c 5.75 × 10⁻⁴
206.81 1,962 721
Exponential (M4) 0.0922 196.72 299 0.680
Exponential (M5) N/Ad 198.72 201 0.590
Hill N/Ad 198.72 164 2.56 × 10⁻⁶
Powere 4.95 × 10⁻⁴
207.11 2,046 875
Polynomial 3f Polynomial 2g Linearh
4.95 × 10⁻⁴
207.11 2,046 875
aModeled variance case presented (BMDS Test 2 p-value = 0.0229, BMDS Test 3 p-value = 0.200); no model was selected as a best-fitting model.
bThe Exponential (M2) model may appear equivalent to the Exponential (M3) model; however, differences exist in digits not displayed in the table.
cThe Exponential (M3) model may appear equivalent to the Exponential (M2) model; however, differences exist in digits not displayed in the table.
dNo available degrees of freedom to calculate a goodness-of-fit value. eThe Power model may appear equivalent to the Polynomial 3° model; however, differences exist in digits not displayed in the table. This also applies to the Polynomial 2° model. This also applies to the Linear model.
fFor the Polynomial 3° model, the b3 coefficient estimates was 0 (boundary of parameters space). The models in this row reduced to the Polynomial 2° model. For the Polynomial 3° model, the b3 and b2 coefficient estimates were 0 (boundary of parameters space). The models in this row reduced to the Linear model.
gFor the Polynomial 2° model, the b2 coefficient estimate was 0 (boundary of parameters space). The models in this row reduced to the Linear model.
hThe Linear model may appear equivalent to the Power model; however, differences exist in digits not displayed in the table.
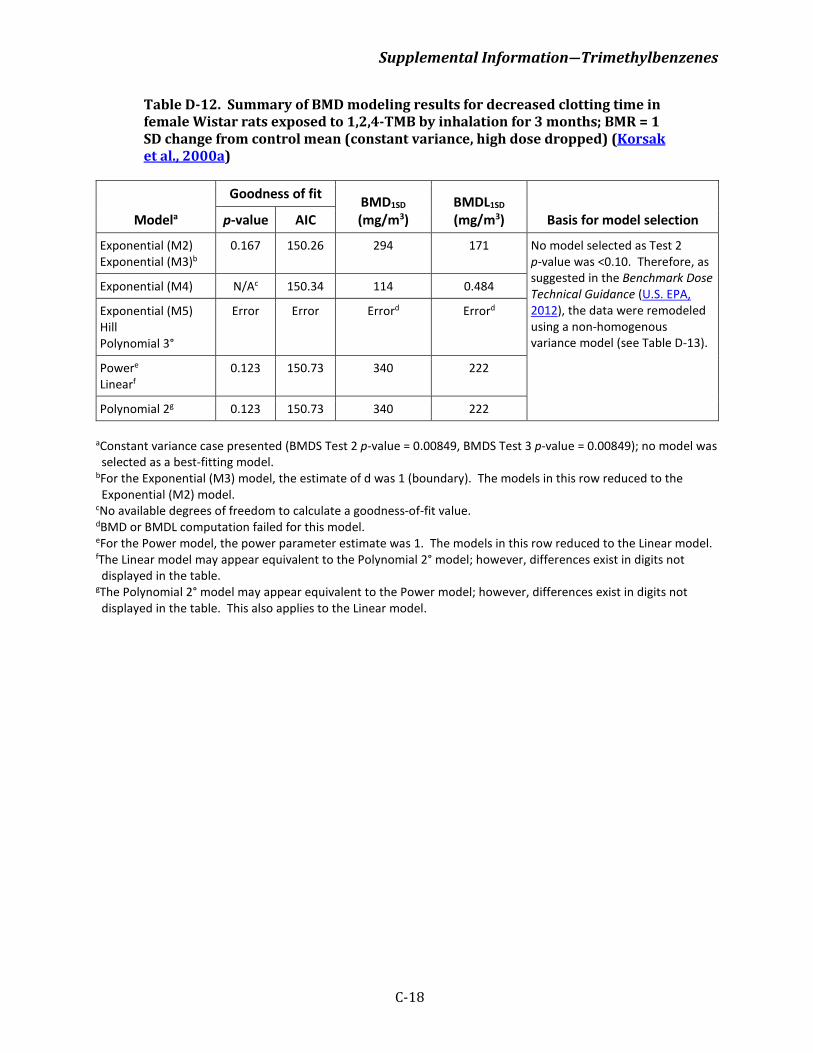
Supplemental Information―Trimethylbenzenes
C-18
Table D-12. Summary of BMD modeling results for decreased clotting time in female Wistar rats exposed to 1,2,4-TMB by inhalation for 3 months; BMR = 1 SD change from control mean (constant variance, high dose dropped) (Korsak et al., 2000a)
Modela
Goodness of fit BMD1SD (mg/m3)
BMDL1SD (mg/m3) Basis for model selection p-value AIC
Exponential (M2) Exponential (M3)b
0.167 150.26 294 171 No model selected as Test 2 p-value was <0.10. Therefore, as suggested in the Benchmark Dose Technical Guidance (U.S. EPA, 2012), the data were remodeled using a non-homogenous variance model (see Table D-13).
Exponential (M4) N/Ac 150.34 114 0.484
Exponential (M5) Hill Polynomial 3°
Error Error Errord Errord
Powere Linearf
0.123 150.73 340 222
Polynomial 2g 0.123 150.73 340 222
aConstant variance case presented (BMDS Test 2 p-value = 0.00849, BMDS Test 3 p-value = 0.00849); no model was selected as a best-fitting model.
bFor the Exponential (M3) model, the estimate of d was 1 (boundary). The models in this row reduced to the Exponential (M2) model.
cNo available degrees of freedom to calculate a goodness-of-fit value. dBMD or BMDL computation failed for this model. eFor the Power model, the power parameter estimate was 1. The models in this row reduced to the Linear model. fThe Linear model may appear equivalent to the Polynomial 2° model; however, differences exist in digits not displayed in the table.
gThe Polynomial 2° model may appear equivalent to the Power model; however, differences exist in digits not displayed in the table. This also applies to the Linear model.
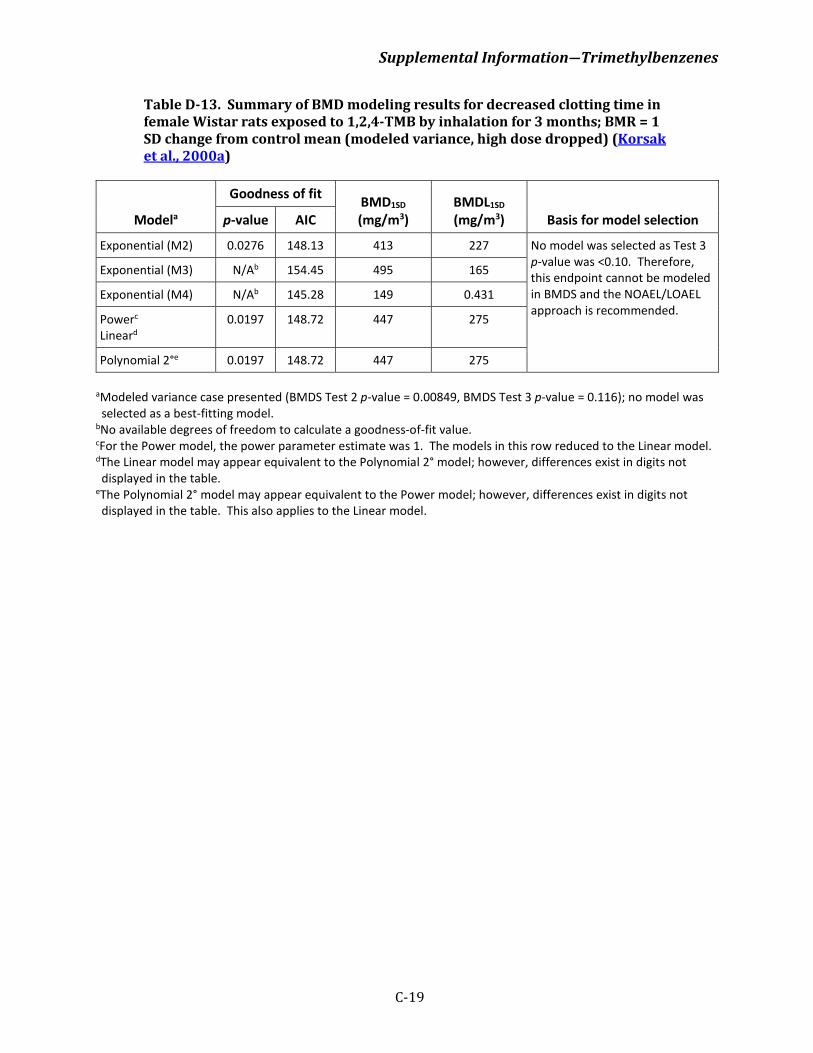
Supplemental Information―Trimethylbenzenes
C-19
Table D-13. Summary of BMD modeling results for decreased clotting time in female Wistar rats exposed to 1,2,4-TMB by inhalation for 3 months; BMR = 1 SD change from control mean (modeled variance, high dose dropped) (Korsak et al., 2000a)
Modela
Goodness of fit BMD1SD (mg/m3)
BMDL1SD (mg/m3) Basis for model selection p-value AIC
Exponential (M2) 0.0276 148.13 413 227 No model was selected as Test 3 p-value was <0.10. Therefore, this endpoint cannot be modeled in BMDS and the NOAEL/LOAEL approach is recommended.
Exponential (M3) N/Ab 154.45 495 165
Exponential (M4) N/Ab 145.28 149 0.431
Powerc Lineard
0.0197 148.72 447 275
Polynomial 2°e 0.0197 148.72 447 275 aModeled variance case presented (BMDS Test 2 p-value = 0.00849, BMDS Test 3 p-value = 0.116); no model was selected as a best-fitting model.
bNo available degrees of freedom to calculate a goodness-of-fit value. cFor the Power model, the power parameter estimate was 1. The models in this row reduced to the Linear model. dThe Linear model may appear equivalent to the Polynomial 2° model; however, differences exist in digits not displayed in the table.
eThe Polynomial 2° model may appear equivalent to the Power model; however, differences exist in digits not displayed in the table. This also applies to the Linear model.
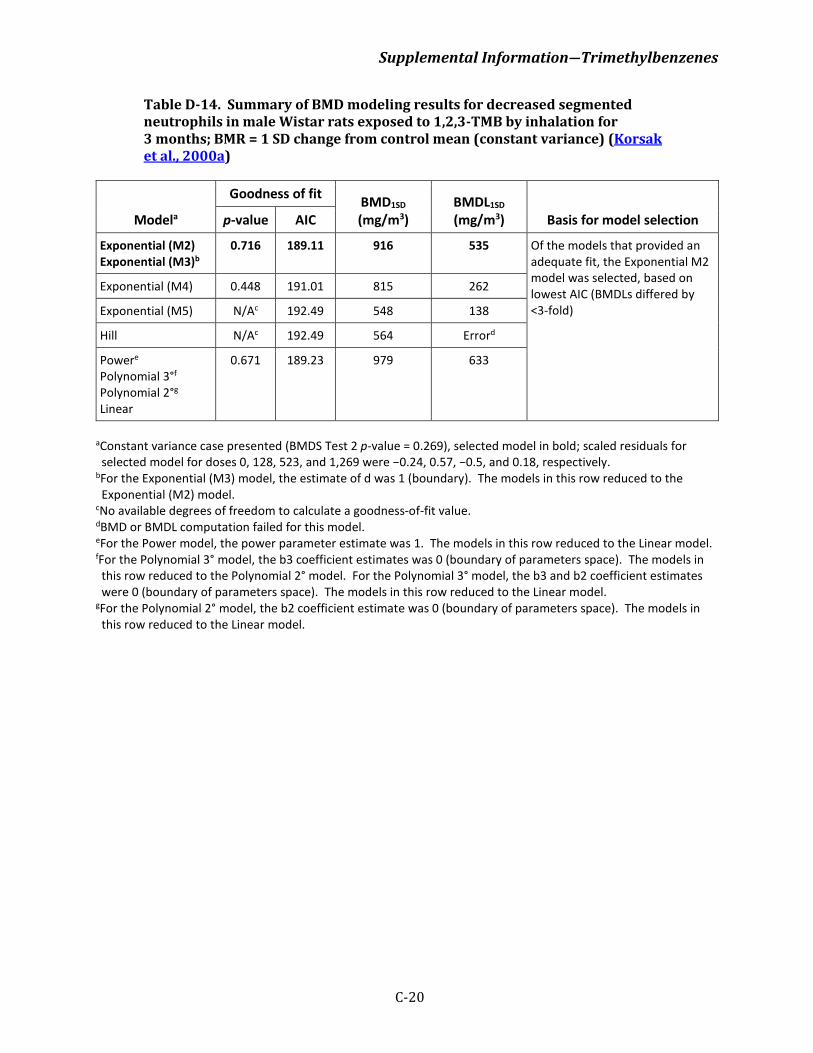
Supplemental Information―Trimethylbenzenes
C-20
Table D-14. Summary of BMD modeling results for decreased segmented neutrophils in male Wistar rats exposed to 1,2,3-TMB by inhalation for 3 months; BMR = 1 SD change from control mean (constant variance) (Korsak et al., 2000a)
Modela
Goodness of fit BMD1SD (mg/m3)
BMDL1SD (mg/m3) Basis for model selection p-value AIC
Exponential (M2) Exponential (M3)b
0.716 189.11 916 535 Of the models that provided an adequate fit, the Exponential M2 model was selected, based on lowest AIC (BMDLs differed by <3-fold)
Exponential (M4) 0.448 191.01 815 262
Exponential (M5) N/Ac 192.49 548 138
Hill N/Ac 192.49 564 Errord
Powere Polynomial 3°f Polynomial 2°g Linear
0.671 189.23 979 633
aConstant variance case presented (BMDS Test 2 p-value = 0.269), selected model in bold; scaled residuals for selected model for doses 0, 128, 523, and 1,269 were −0.24, 0.57, −0.5, and 0.18, respectively.
bFor the Exponential (M3) model, the estimate of d was 1 (boundary). The models in this row reduced to the Exponential (M2) model.
cNo available degrees of freedom to calculate a goodness-of-fit value. dBMD or BMDL computation failed for this model. eFor the Power model, the power parameter estimate was 1. The models in this row reduced to the Linear model. fFor the Polynomial 3° model, the b3 coefficient estimates was 0 (boundary of parameters space). The models in this row reduced to the Polynomial 2° model. For the Polynomial 3° model, the b3 and b2 coefficient estimates were 0 (boundary of parameters space). The models in this row reduced to the Linear model.
gFor the Polynomial 2° model, the b2 coefficient estimate was 0 (boundary of parameters space). The models in this row reduced to the Linear model.
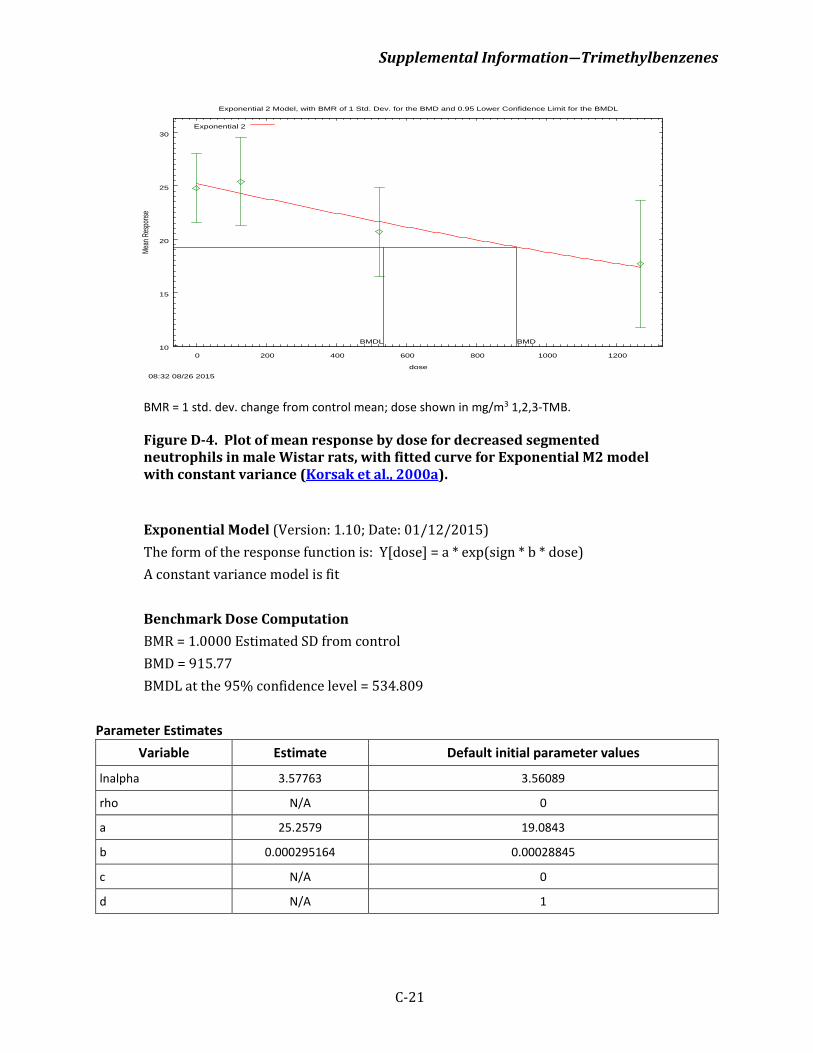
Supplemental Information―Trimethylbenzenes
C-21
BMR = 1 std. dev. change from control mean; dose shown in mg/m3 1,2,3-TMB.
Figure D-4. Plot of mean response by dose for decreased segmented neutrophils in male Wistar rats, with fitted curve for Exponential M2 model with constant variance (Korsak et al., 2000a).
Exponential Model (Version: 1.10; Date: 01/12/2015) The form of the response function is: Y[dose] = a * exp(sign * b * dose) A constant variance model is fit Benchmark Dose Computation BMR = 1.0000 Estimated SD from control BMD = 915.77 BMDL at the 95% confidence level = 534.809
Parameter Estimates Variable Estimate Default initial parameter values
lnalpha 3.57763 3.56089
rho N/A 0
a 25.2579 19.0843
b 0.000295164 0.00028845
c N/A 0
d N/A 1
10
15
20
25
30
0 200 400 600 800 1000 1200
Mean
Res
pons
e
dose
Exponential 2 Model, with BMR of 1 Std. Dev. for the BMD and 0.95 Lower Confidence Limit for the BMDL
08:32 08/26 2015
BMDBMDL
Exponential 2
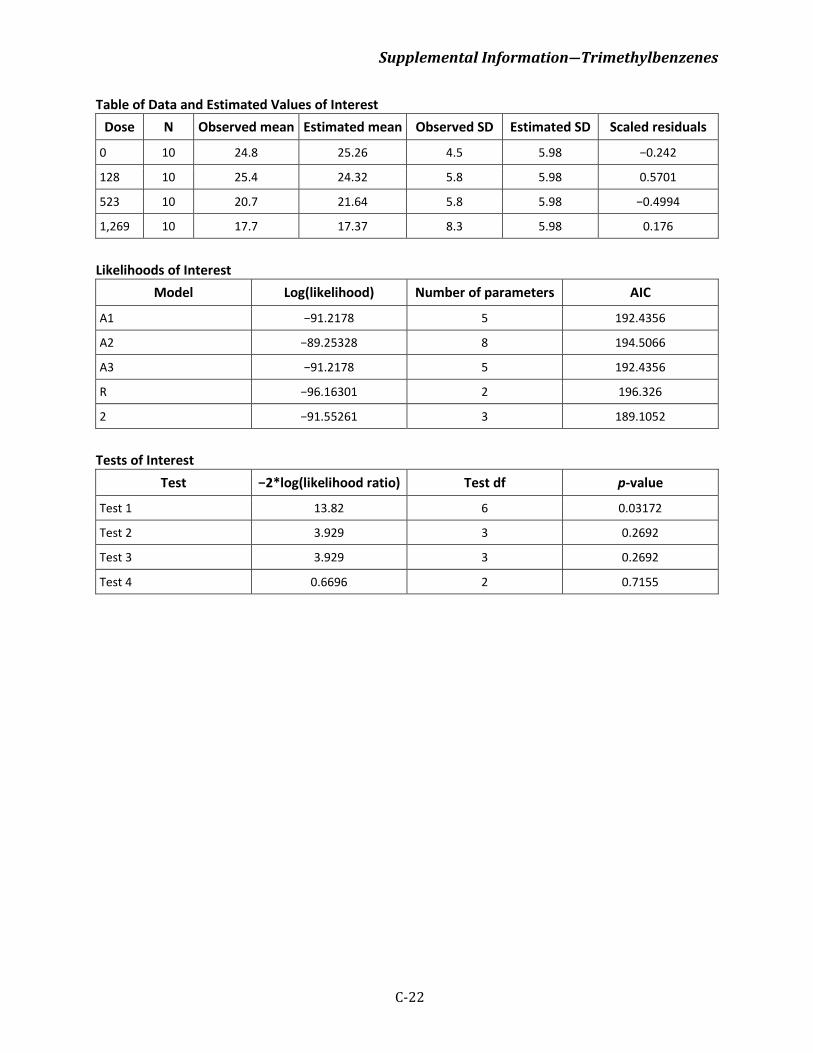
Supplemental Information―Trimethylbenzenes
C-22
Table of Data and Estimated Values of Interest Dose N Observed mean Estimated mean Observed SD Estimated SD Scaled residuals
0 10 24.8 25.26 4.5 5.98 −0.242
128 10 25.4 24.32 5.8 5.98 0.5701
523 10 20.7 21.64 5.8 5.98 −0.4994
1,269 10 17.7 17.37 8.3 5.98 0.176
Likelihoods of Interest
Model Log(likelihood) Number of parameters AIC
A1 −91.2178 5 192.4356
A2 −89.25328 8 194.5066
A3 −91.2178 5 192.4356
R −96.16301 2 196.326
2 −91.55261 3 189.1052
Tests of Interest
Test −2*log(likelihood ratio) Test df p-value
Test 1 13.82 6 0.03172
Test 2 3.929 3 0.2692
Test 3 3.929 3 0.2692
Test 4 0.6696 2 0.7155
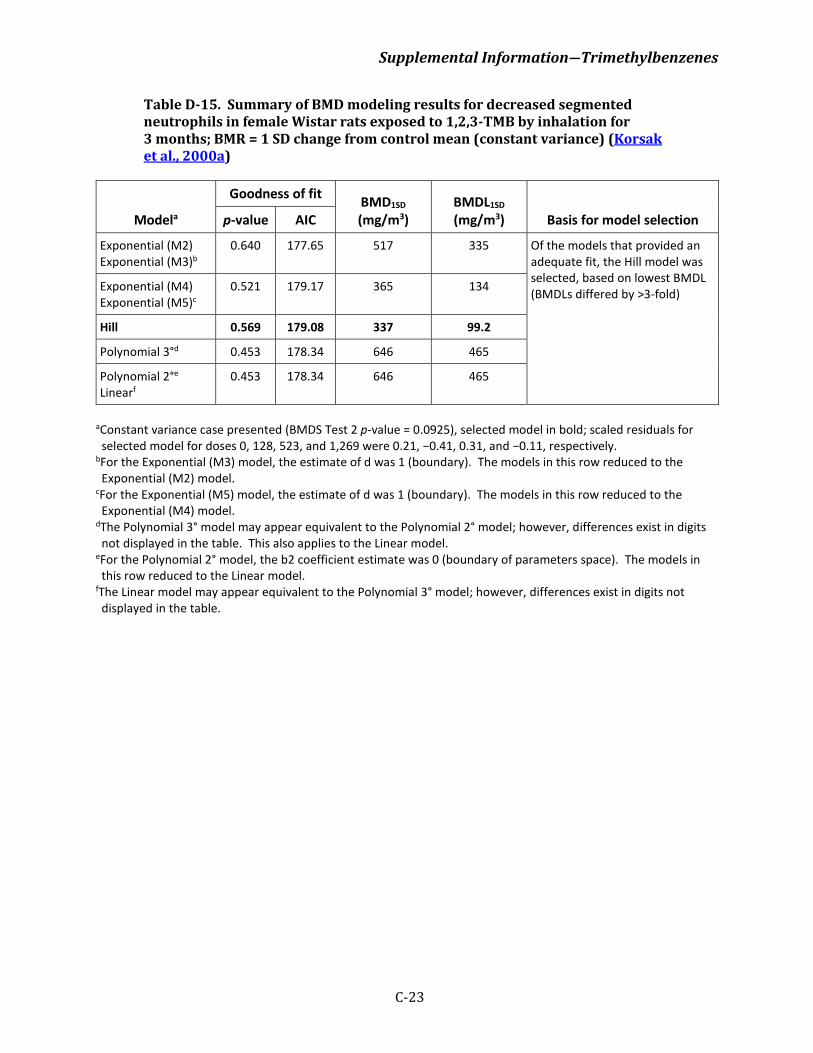
Supplemental Information―Trimethylbenzenes
C-23
Table D-15. Summary of BMD modeling results for decreased segmented neutrophils in female Wistar rats exposed to 1,2,3-TMB by inhalation for 3 months; BMR = 1 SD change from control mean (constant variance) (Korsak et al., 2000a)
Modela
Goodness of fit BMD1SD (mg/m3)
BMDL1SD (mg/m3) Basis for model selection p-value AIC
Exponential (M2) Exponential (M3)b
0.640 177.65 517 335 Of the models that provided an adequate fit, the Hill model was selected, based on lowest BMDL (BMDLs differed by >3-fold) Exponential (M4)
Exponential (M5)c 0.521 179.17 365 134
Hill 0.569 179.08 337 99.2
Polynomial 3°d 0.453 178.34 646 465
Polynomial 2°e Linearf
0.453 178.34 646 465
aConstant variance case presented (BMDS Test 2 p-value = 0.0925), selected model in bold; scaled residuals for selected model for doses 0, 128, 523, and 1,269 were 0.21, −0.41, 0.31, and −0.11, respectively.
bFor the Exponential (M3) model, the estimate of d was 1 (boundary). The models in this row reduced to the Exponential (M2) model.
cFor the Exponential (M5) model, the estimate of d was 1 (boundary). The models in this row reduced to the Exponential (M4) model.
dThe Polynomial 3° model may appear equivalent to the Polynomial 2° model; however, differences exist in digits not displayed in the table. This also applies to the Linear model.
eFor the Polynomial 2° model, the b2 coefficient estimate was 0 (boundary of parameters space). The models in this row reduced to the Linear model.
fThe Linear model may appear equivalent to the Polynomial 3° model; however, differences exist in digits not displayed in the table.
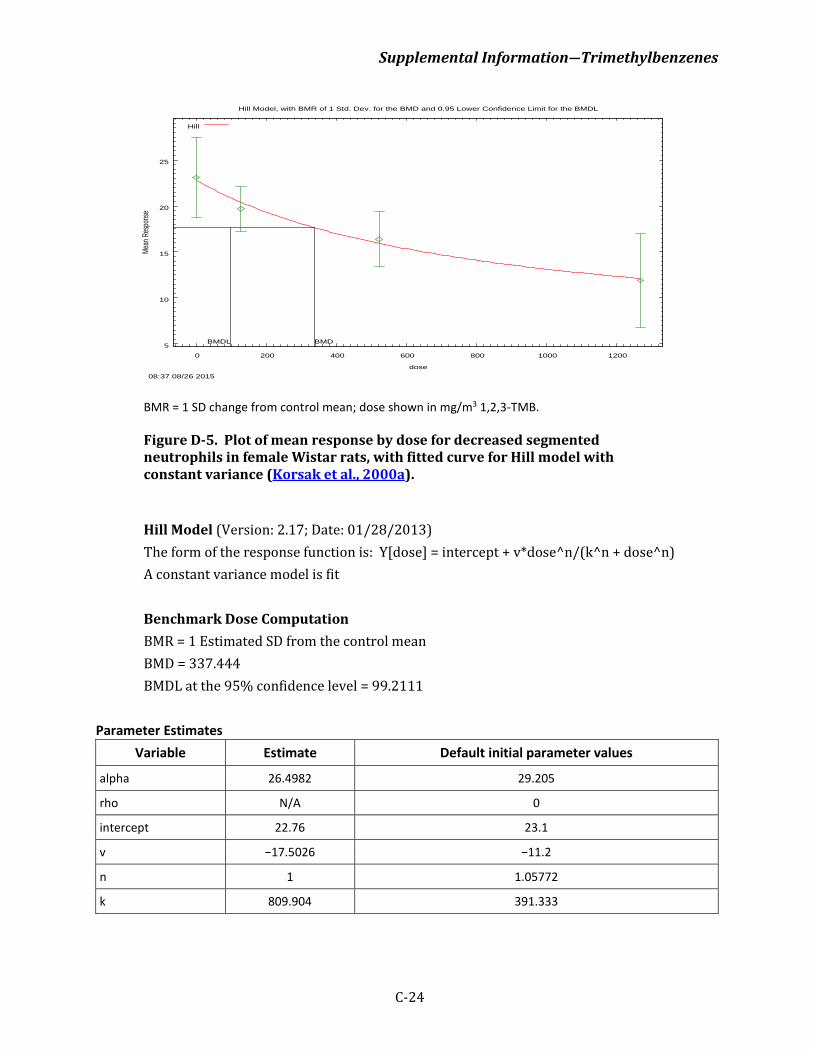
Supplemental Information―Trimethylbenzenes
C-24
BMR = 1 SD change from control mean; dose shown in mg/m3 1,2,3-TMB.
Figure D-5. Plot of mean response by dose for decreased segmented neutrophils in female Wistar rats, with fitted curve for Hill model with constant variance (Korsak et al., 2000a).
Hill Model (Version: 2.17; Date: 01/28/2013) The form of the response function is: Y[dose] = intercept + v*dose^n/(k^n + dose^n) A constant variance model is fit Benchmark Dose Computation BMR = 1 Estimated SD from the control mean BMD = 337.444 BMDL at the 95% confidence level = 99.2111
Parameter Estimates Variable Estimate Default initial parameter values
alpha 26.4982 29.205
rho N/A 0
intercept 22.76 23.1
v −17.5026 −11.2
n 1 1.05772
k 809.904 391.333
5
10
15
20
25
0 200 400 600 800 1000 1200
Mean
Res
pons
e
dose
Hill Model, with BMR of 1 Std. Dev. for the BMD and 0.95 Lower Confidence Limit for the BMDL
08:37 08/26 2015
BMDBMDL
Hill
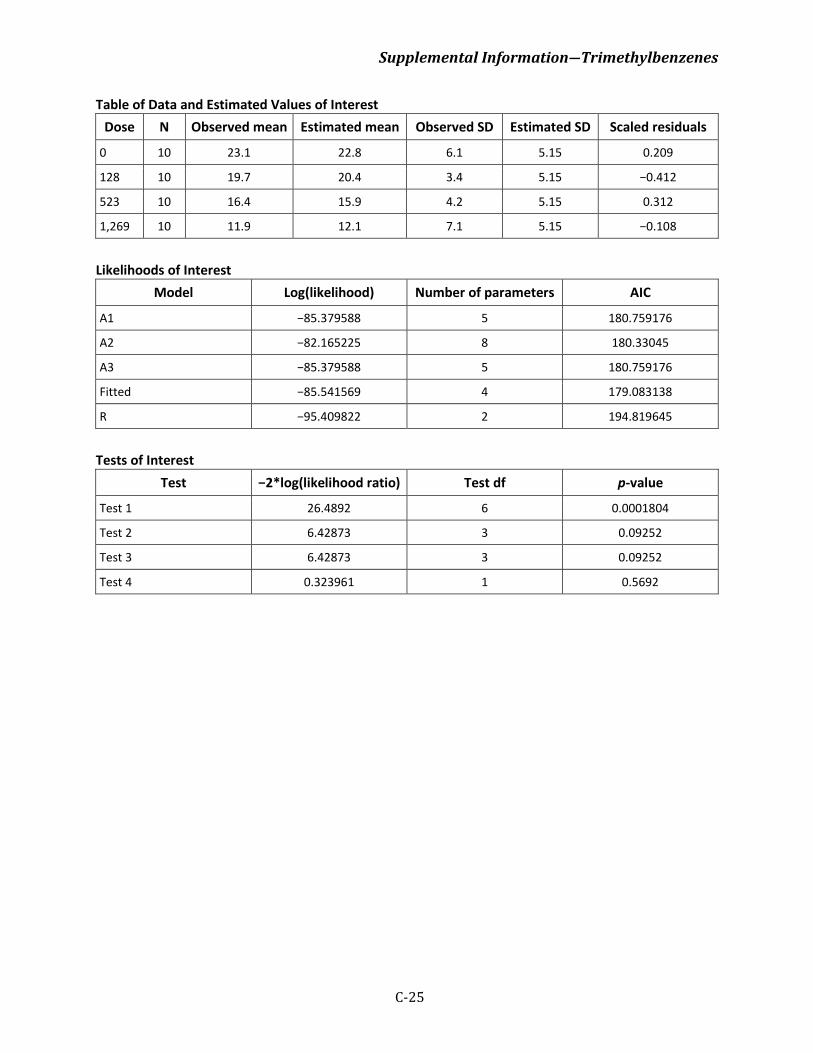
Supplemental Information―Trimethylbenzenes
C-25
Table of Data and Estimated Values of Interest Dose N Observed mean Estimated mean Observed SD Estimated SD Scaled residuals
0 10 23.1 22.8 6.1 5.15 0.209
128 10 19.7 20.4 3.4 5.15 −0.412
523 10 16.4 15.9 4.2 5.15 0.312
1,269 10 11.9 12.1 7.1 5.15 −0.108
Likelihoods of Interest
Model Log(likelihood) Number of parameters AIC
A1 −85.379588 5 180.759176
A2 −82.165225 8 180.33045
A3 −85.379588 5 180.759176
Fitted −85.541569 4 179.083138
R −95.409822 2 194.819645
Tests of Interest
Test −2*log(likelihood ratio) Test df p-value
Test 1 26.4892 6 0.0001804
Test 2 6.42873 3 0.09252
Test 3 6.42873 3 0.09252
Test 4 0.323961 1 0.5692
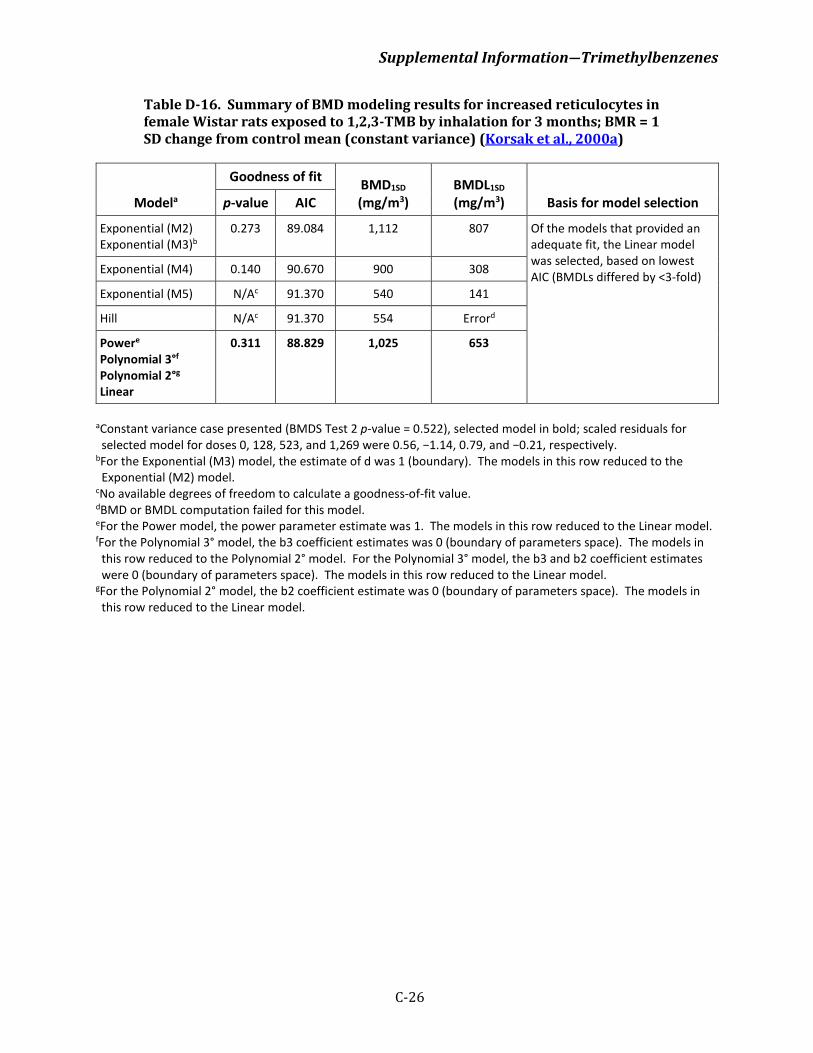
Supplemental Information―Trimethylbenzenes
C-26
Table D-16. Summary of BMD modeling results for increased reticulocytes in female Wistar rats exposed to 1,2,3-TMB by inhalation for 3 months; BMR = 1 SD change from control mean (constant variance) (Korsak et al., 2000a)
Modela
Goodness of fit BMD1SD (mg/m3)
BMDL1SD (mg/m3) Basis for model selection p-value AIC
Exponential (M2) Exponential (M3)b
0.273 89.084 1,112 807 Of the models that provided an adequate fit, the Linear model was selected, based on lowest AIC (BMDLs differed by <3-fold) Exponential (M4) 0.140 90.670 900 308
Exponential (M5) N/Ac 91.370 540 141
Hill N/Ac 91.370 554 Errord
Powere Polynomial 3°f Polynomial 2°g Linear
0.311 88.829 1,025 653
aConstant variance case presented (BMDS Test 2 p-value = 0.522), selected model in bold; scaled residuals for selected model for doses 0, 128, 523, and 1,269 were 0.56, −1.14, 0.79, and −0.21, respectively.
bFor the Exponential (M3) model, the estimate of d was 1 (boundary). The models in this row reduced to the Exponential (M2) model.
cNo available degrees of freedom to calculate a goodness-of-fit value. dBMD or BMDL computation failed for this model. eFor the Power model, the power parameter estimate was 1. The models in this row reduced to the Linear model. fFor the Polynomial 3° model, the b3 coefficient estimates was 0 (boundary of parameters space). The models in this row reduced to the Polynomial 2° model. For the Polynomial 3° model, the b3 and b2 coefficient estimates were 0 (boundary of parameters space). The models in this row reduced to the Linear model.
gFor the Polynomial 2° model, the b2 coefficient estimate was 0 (boundary of parameters space). The models in this row reduced to the Linear model.
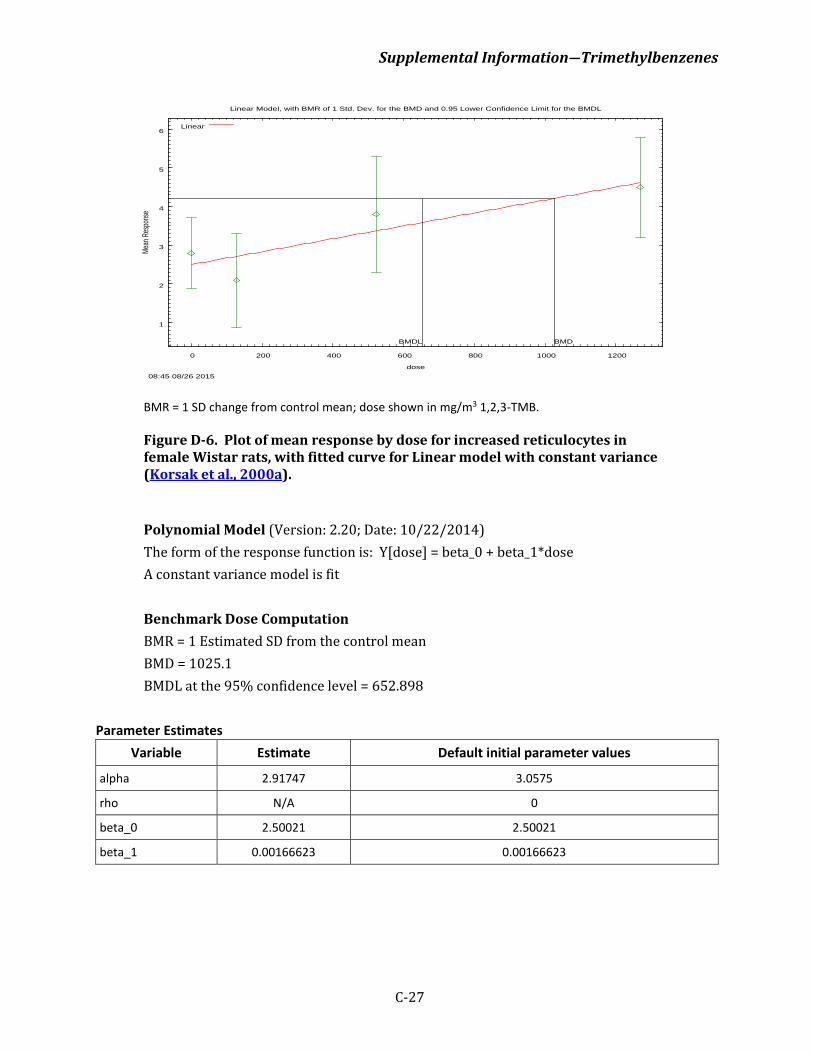
Supplemental Information―Trimethylbenzenes
C-27
BMR = 1 SD change from control mean; dose shown in mg/m3 1,2,3-TMB.
Figure D-6. Plot of mean response by dose for increased reticulocytes in female Wistar rats, with fitted curve for Linear model with constant variance (Korsak et al., 2000a).
Polynomial Model (Version: 2.20; Date: 10/22/2014) The form of the response function is: Y[dose] = beta_0 + beta_1*dose A constant variance model is fit Benchmark Dose Computation BMR = 1 Estimated SD from the control mean BMD = 1025.1 BMDL at the 95% confidence level = 652.898
Parameter Estimates Variable Estimate Default initial parameter values
alpha 2.91747 3.0575
rho N/A 0
beta_0 2.50021 2.50021
beta_1 0.00166623 0.00166623
1
2
3
4
5
6
0 200 400 600 800 1000 1200
Mean
Res
pons
e
dose
Linear Model, with BMR of 1 Std. Dev. for the BMD and 0.95 Lower Confidence Limit for the BMDL
08:45 08/26 2015
BMDBMDL
Linear
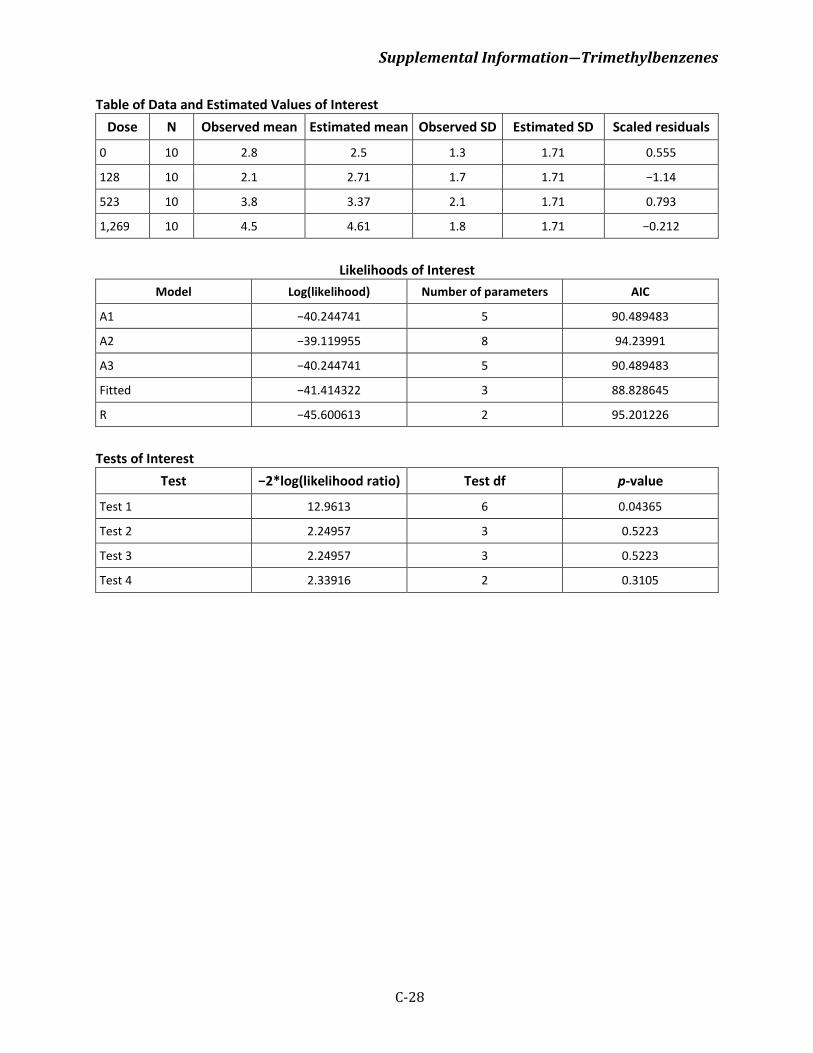
Supplemental Information―Trimethylbenzenes
C-28
Table of Data and Estimated Values of Interest Dose N Observed mean Estimated mean Observed SD Estimated SD Scaled residuals
0 10 2.8 2.5 1.3 1.71 0.555
128 10 2.1 2.71 1.7 1.71 −1.14
523 10 3.8 3.37 2.1 1.71 0.793
1,269 10 4.5 4.61 1.8 1.71 −0.212
Likelihoods of Interest
Model Log(likelihood) Number of parameters AIC
A1 −40.244741 5 90.489483
A2 −39.119955 8 94.23991
A3 −40.244741 5 90.489483
Fitted −41.414322 3 88.828645
R −45.600613 2 95.201226
Tests of Interest
Test −2*log(likelihood ratio) Test df p-value
Test 1 12.9613 6 0.04365
Test 2 2.24957 3 0.5223
Test 3 2.24957 3 0.5223
Test 4 2.33916 2 0.3105
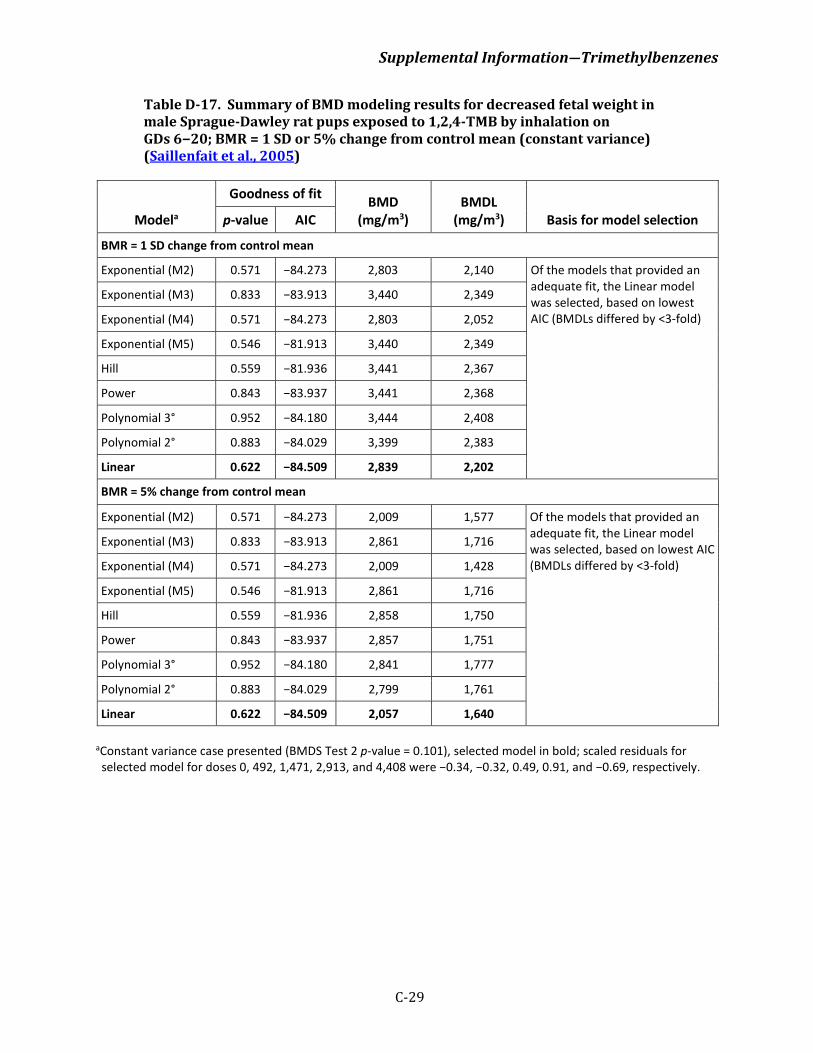
Supplemental Information―Trimethylbenzenes
C-29
Table D-17. Summary of BMD modeling results for decreased fetal weight in male Sprague-Dawley rat pups exposed to 1,2,4-TMB by inhalation on GDs 6−20; BMR = 1 SD or 5% change from control mean (constant variance) (Saillenfait et al., 2005)
Modela
Goodness of fit BMD (mg/m3)
BMDL (mg/m3) Basis for model selection p-value AIC
BMR = 1 SD change from control mean
Exponential (M2) 0.571 −84.273 2,803 2,140 Of the models that provided an adequate fit, the Linear model was selected, based on lowest AIC (BMDLs differed by <3-fold)
Exponential (M3) 0.833 −83.913 3,440 2,349
Exponential (M4) 0.571 −84.273 2,803 2,052
Exponential (M5) 0.546 −81.913 3,440 2,349
Hill 0.559 −81.936 3,441 2,367
Power 0.843 −83.937 3,441 2,368
Polynomial 3° 0.952 −84.180 3,444 2,408
Polynomial 2° 0.883 −84.029 3,399 2,383
Linear 0.622 −84.509 2,839 2,202
BMR = 5% change from control mean
Exponential (M2) 0.571 −84.273 2,009 1,577 Of the models that provided an adequate fit, the Linear model was selected, based on lowest AIC (BMDLs differed by <3-fold)
Exponential (M3) 0.833 −83.913 2,861 1,716
Exponential (M4) 0.571 −84.273 2,009 1,428
Exponential (M5) 0.546 −81.913 2,861 1,716
Hill 0.559 −81.936 2,858 1,750
Power 0.843 −83.937 2,857 1,751
Polynomial 3° 0.952 −84.180 2,841 1,777
Polynomial 2° 0.883 −84.029 2,799 1,761
Linear 0.622 −84.509 2,057 1,640
aConstant variance case presented (BMDS Test 2 p-value = 0.101), selected model in bold; scaled residuals for selected model for doses 0, 492, 1,471, 2,913, and 4,408 were −0.34, −0.32, 0.49, 0.91, and −0.69, respectively.
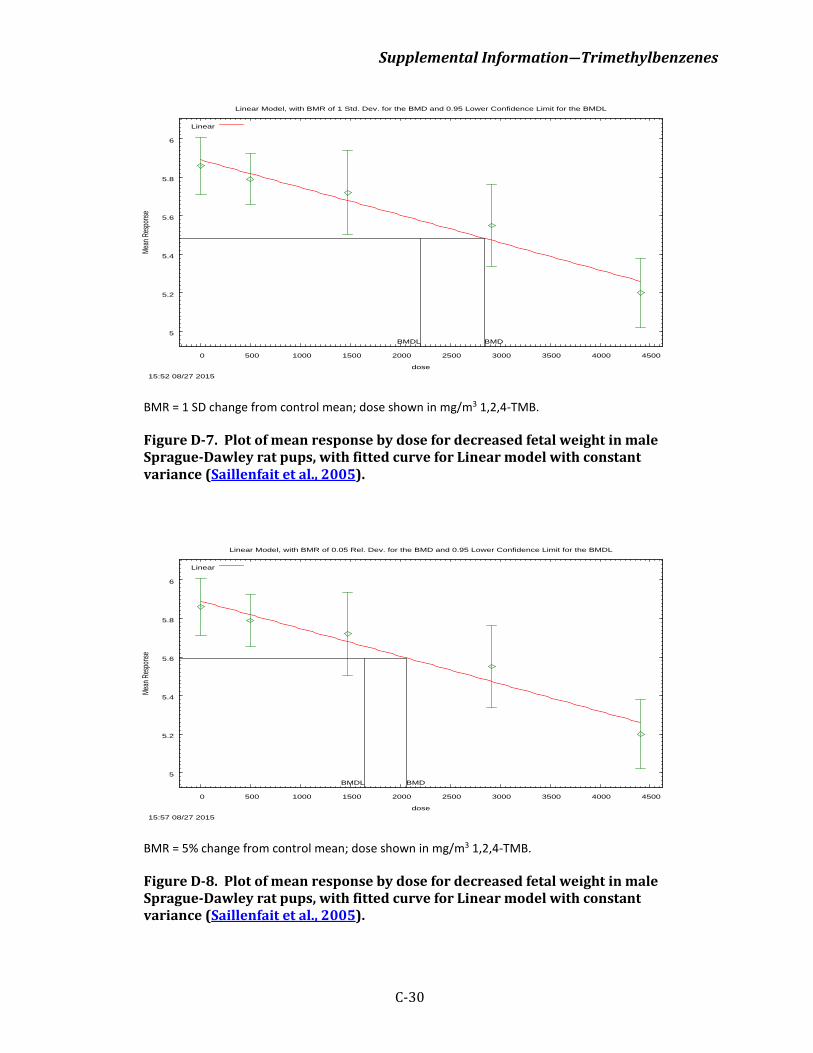
Supplemental Information―Trimethylbenzenes
C-30
BMR = 1 SD change from control mean; dose shown in mg/m3 1,2,4-TMB.
Figure D-7. Plot of mean response by dose for decreased fetal weight in male Sprague-Dawley rat pups, with fitted curve for Linear model with constant variance (Saillenfait et al., 2005).
BMR = 5% change from control mean; dose shown in mg/m3 1,2,4-TMB.
Figure D-8. Plot of mean response by dose for decreased fetal weight in male Sprague-Dawley rat pups, with fitted curve for Linear model with constant variance (Saillenfait et al., 2005).
5
5.2
5.4
5.6
5.8
6
0 500 1000 1500 2000 2500 3000 3500 4000 4500
Mean
Res
pons
e
dose
Linear Model, with BMR of 1 Std. Dev. for the BMD and 0.95 Lower Confidence Limit for the BMDL
15:52 08/27 2015
BMDBMDL
Linear
5
5.2
5.4
5.6
5.8
6
0 500 1000 1500 2000 2500 3000 3500 4000 4500
Mean
Res
pons
e
dose
Linear Model, with BMR of 0.05 Rel. Dev. for the BMD and 0.95 Lower Confidence Limit for the BMDL
15:57 08/27 2015
BMDBMDL
Linear
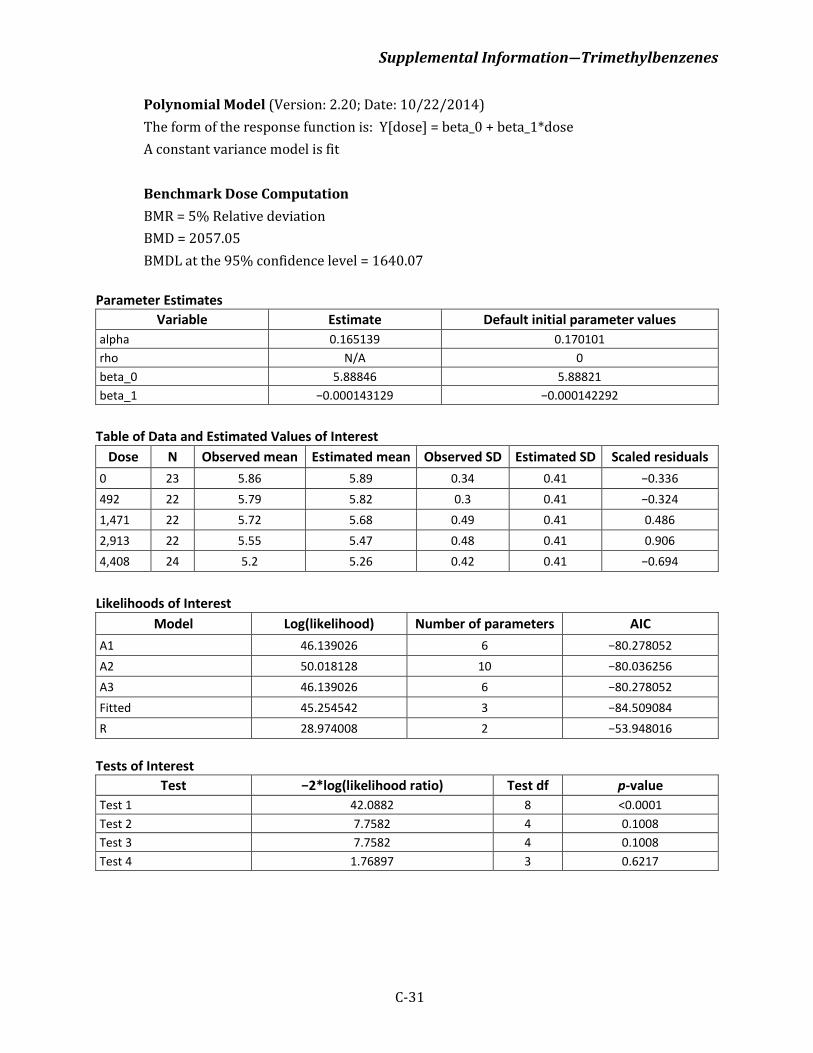
Supplemental Information―Trimethylbenzenes
C-31
Polynomial Model (Version: 2.20; Date: 10/22/2014) The form of the response function is: Y[dose] = beta_0 + beta_1*dose A constant variance model is fit Benchmark Dose Computation BMR = 5% Relative deviation BMD = 2057.05 BMDL at the 95% confidence level = 1640.07
Parameter Estimates Variable Estimate Default initial parameter values
alpha 0.165139 0.170101 rho N/A 0 beta_0 5.88846 5.88821 beta_1 −0.000143129 −0.000142292
Table of Data and Estimated Values of Interest
Dose N Observed mean Estimated mean Observed SD Estimated SD Scaled residuals 0 23 5.86 5.89 0.34 0.41 −0.336 492 22 5.79 5.82 0.3 0.41 −0.324 1,471 22 5.72 5.68 0.49 0.41 0.486 2,913 22 5.55 5.47 0.48 0.41 0.906 4,408 24 5.2 5.26 0.42 0.41 −0.694
Likelihoods of Interest
Model Log(likelihood) Number of parameters AIC A1 46.139026 6 −80.278052 A2 50.018128 10 −80.036256 A3 46.139026 6 −80.278052 Fitted 45.254542 3 −84.509084 R 28.974008 2 −53.948016
Tests of Interest
Test −2*log(likelihood ratio) Test df p-value Test 1 42.0882 8 <0.0001 Test 2 7.7582 4 0.1008 Test 3 7.7582 4 0.1008 Test 4 1.76897 3 0.6217
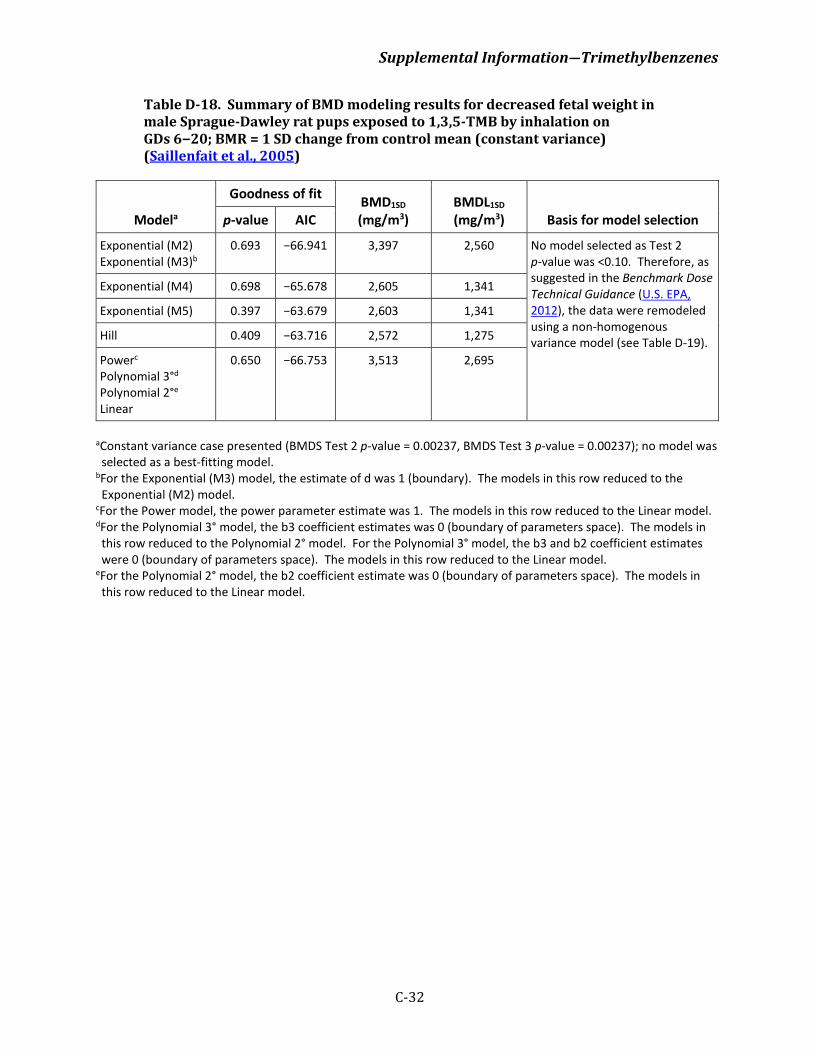
Supplemental Information―Trimethylbenzenes
C-32
Table D-18. Summary of BMD modeling results for decreased fetal weight in male Sprague-Dawley rat pups exposed to 1,3,5-TMB by inhalation on GDs 6−20; BMR = 1 SD change from control mean (constant variance) (Saillenfait et al., 2005)
Modela
Goodness of fit BMD1SD (mg/m3)
BMDL1SD (mg/m3) Basis for model selection p-value AIC
Exponential (M2) Exponential (M3)b
0.693 −66.941 3,397 2,560 No model selected as Test 2 p-value was <0.10. Therefore, as suggested in the Benchmark Dose Technical Guidance (U.S. EPA, 2012), the data were remodeled using a non-homogenous variance model (see Table D-19).
Exponential (M4) 0.698 −65.678 2,605 1,341
Exponential (M5) 0.397 −63.679 2,603 1,341
Hill 0.409 −63.716 2,572 1,275
Powerc Polynomial 3°d Polynomial 2°e Linear
0.650 −66.753 3,513 2,695
aConstant variance case presented (BMDS Test 2 p-value = 0.00237, BMDS Test 3 p-value = 0.00237); no model was selected as a best-fitting model.
bFor the Exponential (M3) model, the estimate of d was 1 (boundary). The models in this row reduced to the Exponential (M2) model.
cFor the Power model, the power parameter estimate was 1. The models in this row reduced to the Linear model. dFor the Polynomial 3° model, the b3 coefficient estimates was 0 (boundary of parameters space). The models in this row reduced to the Polynomial 2° model. For the Polynomial 3° model, the b3 and b2 coefficient estimates were 0 (boundary of parameters space). The models in this row reduced to the Linear model.
eFor the Polynomial 2° model, the b2 coefficient estimate was 0 (boundary of parameters space). The models in this row reduced to the Linear model.

Supplemental Information―Trimethylbenzenes
C-33
Table D-19. Summary of BMD modeling results for decreased fetal weight in male Sprague-Dawley rat pups exposed to 1,3,5-TMB by inhalation on GDs 6−20; BMR = 1 SD change from control mean (modeled variance) (Saillenfait et al., 2005)
Modela
Goodness of fit BMD1SD (mg/m3)
BMDL1SD (mg/m3) Basis for model selection p-value AIC
Exponential (M2) Exponential (M3)b
0.521 −73.291 2,523 1,779 No model selected as Test 3 p-value was <0.1. The data were remodeled after dropping the high dose (see Table D-20) Exponential (M4) 0.430 −71.859 2,042 1,125
Exponential (M5) 0.388 −70.799 2,045 1,238
Hill 0.458 −70.996 1,984 1,235
Powerc Polynomial 3°d Polynomial 2°e Linear
0.479 −73.067 2,636 1,890
aModeled variance case presented (BMDS Test 2 p-value = 0.00237, BMDS Test 3 p-value = 0.0603); no model was selected as a best-fitting model.
bFor the Exponential (M3) model, the estimate of d was 1 (boundary). The models in this row reduced to the Exponential (M2) model.
cFor the Power model, the power parameter estimate was 1. The models in this row reduced to the Linear model. dFor the Polynomial 3° model, the b3 coefficient estimates was 0 (boundary of parameters space). The models in this row reduced to the Polynomial 2° model. For the Polynomial 3° model, the b3 and b2 coefficient estimates were 0 (boundary of parameters space). The models in this row reduced to the Linear model.
eFor the Polynomial 2° model, the b2 coefficient estimate was 0 (boundary of parameters space). The models in this row reduced to the Linear model.
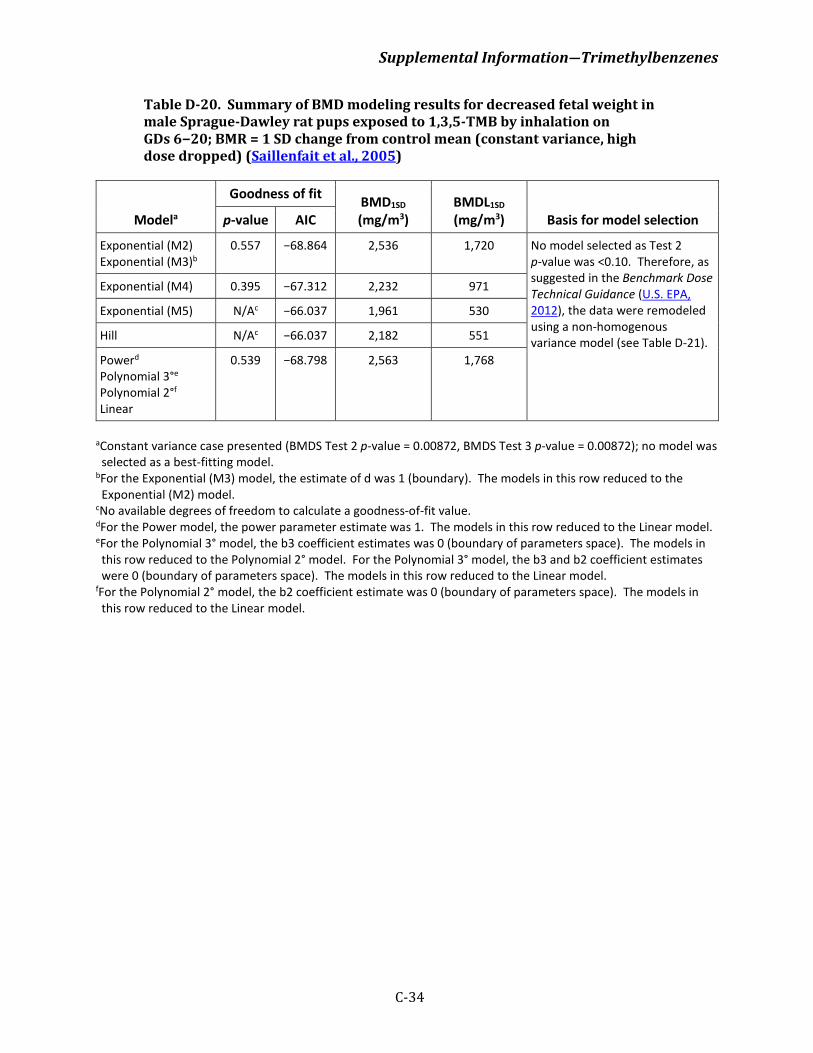
Supplemental Information―Trimethylbenzenes
C-34
Table D-20. Summary of BMD modeling results for decreased fetal weight in male Sprague-Dawley rat pups exposed to 1,3,5-TMB by inhalation on GDs 6−20; BMR = 1 SD change from control mean (constant variance, high dose dropped) (Saillenfait et al., 2005)
Modela
Goodness of fit BMD1SD (mg/m3)
BMDL1SD (mg/m3) Basis for model selection p-value AIC
Exponential (M2) Exponential (M3)b
0.557 −68.864 2,536 1,720 No model selected as Test 2 p-value was <0.10. Therefore, as suggested in the Benchmark Dose Technical Guidance (U.S. EPA, 2012), the data were remodeled using a non-homogenous variance model (see Table D-21).
Exponential (M4) 0.395 −67.312 2,232 971
Exponential (M5) N/Ac −66.037 1,961 530
Hill N/Ac −66.037 2,182 551
Powerd Polynomial 3°e Polynomial 2°f Linear
0.539 −68.798 2,563 1,768
aConstant variance case presented (BMDS Test 2 p-value = 0.00872, BMDS Test 3 p-value = 0.00872); no model was selected as a best-fitting model.
bFor the Exponential (M3) model, the estimate of d was 1 (boundary). The models in this row reduced to the Exponential (M2) model.
cNo available degrees of freedom to calculate a goodness-of-fit value. dFor the Power model, the power parameter estimate was 1. The models in this row reduced to the Linear model. eFor the Polynomial 3° model, the b3 coefficient estimates was 0 (boundary of parameters space). The models in this row reduced to the Polynomial 2° model. For the Polynomial 3° model, the b3 and b2 coefficient estimates were 0 (boundary of parameters space). The models in this row reduced to the Linear model.
fFor the Polynomial 2° model, the b2 coefficient estimate was 0 (boundary of parameters space). The models in this row reduced to the Linear model.

Supplemental Information―Trimethylbenzenes
C-35
Table D-21. Summary of BMD modeling results for decreased fetal weight in male Sprague-Dawley rat pups exposed to 1,3,5-TMB by inhalation on GDs 6−20; BMR = 1 SD change from control mean (modeled variance, high dose dropped) (Saillenfait et al., 2005)
Modela
Goodness of fit BMD1SD (mg/m3)
BMDL1SD (mg/m3) Basis for model selection p-value AIC
Exponential (M2) 0.454 −70.868 2,049 1,327 No model was selected as Test 3 p-value was <0.10. Therefore, this endpoint cannot be modeled in BMDS and the NOAEL/LOAEL approach is recommended.
Exponential (M3) 0.272 −69.242 2,226 1,364
Exponential (M4) 0.454 −70.868 2,049 1,130
Exponential (M5) N/Ab −68.255 1,549 1,204
Hill N/Ab −68.255 1,568 1,156
Power 0.266 −69.213 2,236 1,390
Polynomial 3°c Polynomial 2°
0.233 −69.024 2,218 1,372
Linear 0.462 −70.905 2,067 1,360
aModeled variance case presented (BMDS Test 2 p-value = 0.00872, BMDS Test 3 p-value = 0.0269); no model was selected as a best-fitting model.
bNo available degrees of freedom to calculate a goodness-of-fit value. cFor the Polynomial 3° model, the b3 coefficient estimates was 0 (boundary of parameters space). The models in this row reduced to the Polynomial 2° model.

Supplemental Information―Trimethylbenzenes
C-36
Table D-22. Summary of BMD modeling results for decreased fetal weight in female Sprague-Dawley rat pups exposed to 1,2,4-TMB by inhalation on GDs 6−20; BMR = 1 SD or 5% change from control mean (constant variance) (Saillenfait et al., 2005)
Modela
Goodness of fit BMD (mg/m3)
BMDL (mg/m3) Basis for model selection p-value AIC
BMR = 1 SD change from control mean
Exponential (M2) 0.506 −101.65 2,651 2,045 Of the models that provided an adequate fit, the Linear model was selected, based on lowest AIC (BMDLs differed by <3-fold)
Exponential (M3) 0.654 −101.14 3,313 2,212
Exponential (M4) 0.506 −101.65 2,651 1,948
Exponential (M5) 0.357 −99.136 3,313 2,212
Hill 0.370 −99.180 3,312 2,241
Power 0.669 −101.18 3,312 2,242
Polynomial 3° 0.832 −101.62 3,322 2,307
Polynomial 2° 0.725 −101.34 3,259 2,264
Linear 0.555 −101.90 2,692 2,109
BMR = 5% change from control mean
Exponential (M2) 0.506 −101.65 1,951 1,549 Of the models that provided an adequate fit, the Linear model was selected, based on lowest AIC (BMDLs differed by <3-fold)
Exponential (M3) 0.654 −101.14 2,779 1,663
Exponential (M4) 0.506 −101.65 1,951 1,398
Exponential (M5) 0.357 −99.136 2,779 1,663
Hill 0.370 −99.180 2,774 1,702
Power 0.669 −101.18 2,773 1,704
Polynomial 3° 0.832 −101.62 2,765 1,747
Polynomial 2° 0.725 −101.34 2,703 1,719
Linear 0.555 −101.90 2,001 1,613
aConstant variance case presented (BMDS Test 2 p-value = 0.394), selected model in bold; scaled residuals for selected model for doses 0, 492, 1,471, 2,913, and 4,408 were −0.31, −0.19, 0.14, 1.16, and −0.76, respectively.
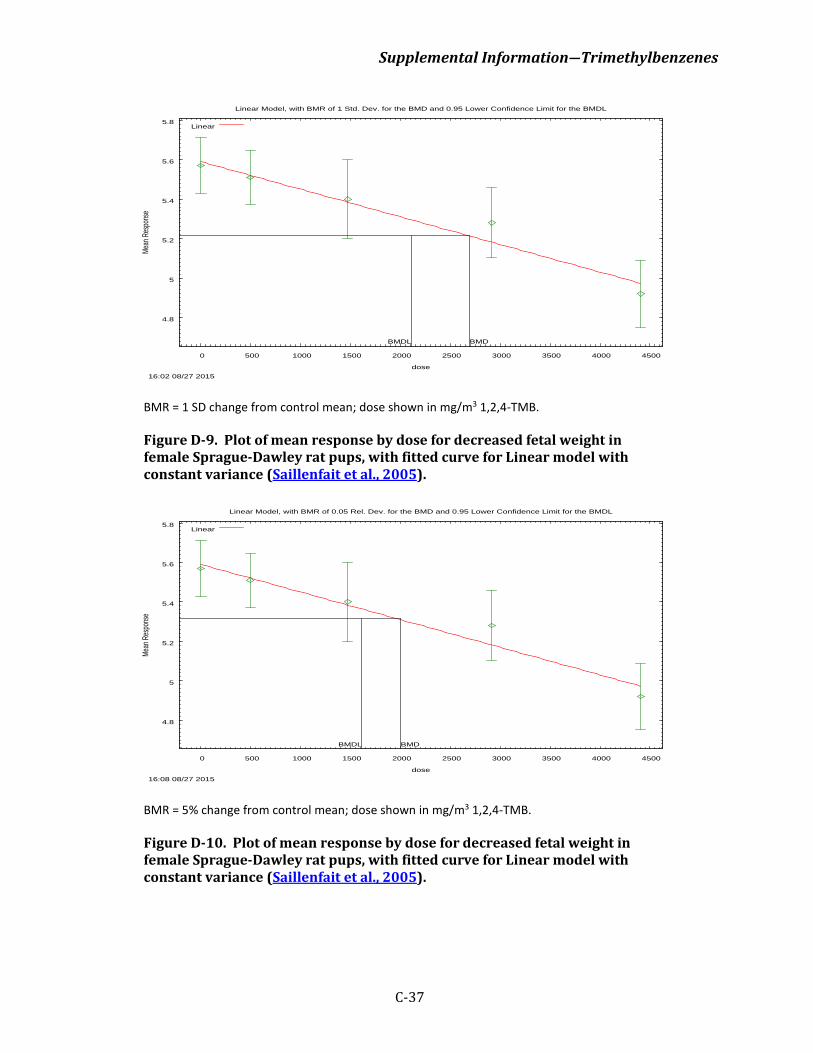
Supplemental Information―Trimethylbenzenes
C-37
BMR = 1 SD change from control mean; dose shown in mg/m3 1,2,4-TMB.
Figure D-9. Plot of mean response by dose for decreased fetal weight in female Sprague-Dawley rat pups, with fitted curve for Linear model with constant variance (Saillenfait et al., 2005).
BMR = 5% change from control mean; dose shown in mg/m3 1,2,4-TMB.
Figure D-10. Plot of mean response by dose for decreased fetal weight in female Sprague-Dawley rat pups, with fitted curve for Linear model with constant variance (Saillenfait et al., 2005).
4.8
5
5.2
5.4
5.6
5.8
0 500 1000 1500 2000 2500 3000 3500 4000 4500
Mean
Res
pons
e
dose
Linear Model, with BMR of 1 Std. Dev. for the BMD and 0.95 Lower Confidence Limit for the BMDL
16:02 08/27 2015
BMDBMDL
Linear
4.8
5
5.2
5.4
5.6
5.8
0 500 1000 1500 2000 2500 3000 3500 4000 4500
Mean
Res
pons
e
dose
Linear Model, with BMR of 0.05 Rel. Dev. for the BMD and 0.95 Lower Confidence Limit for the BMDL
16:08 08/27 2015
BMDBMDL
Linear
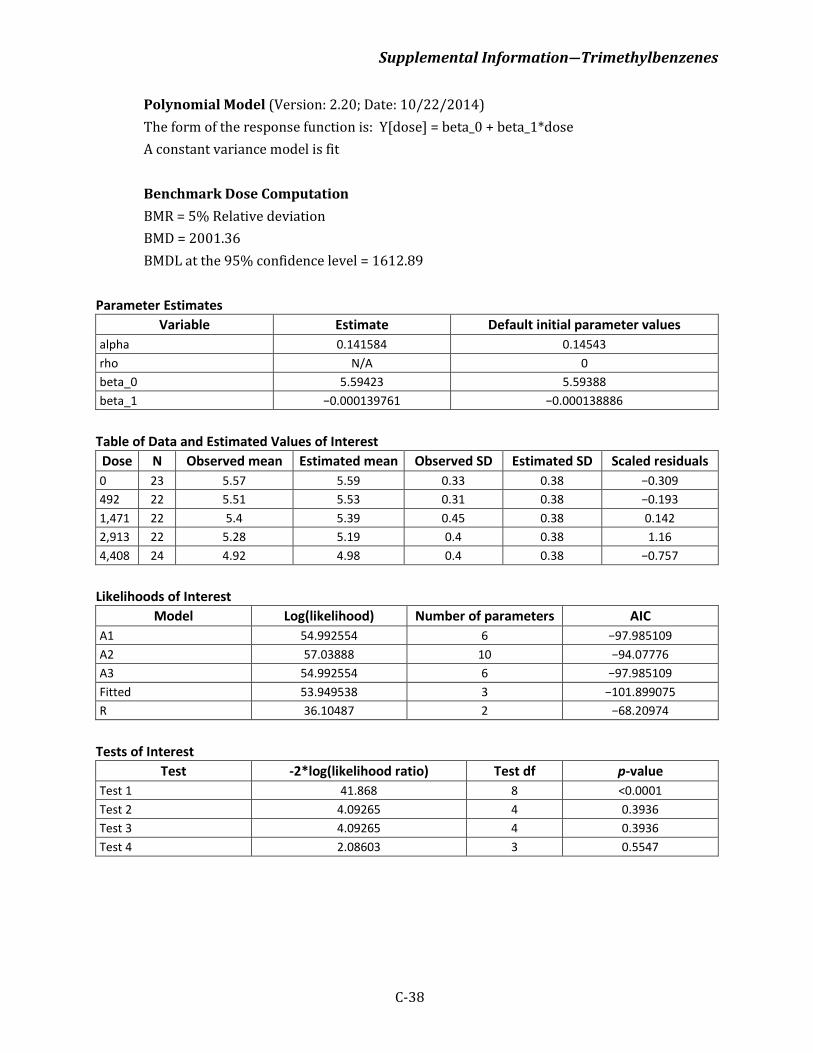
Supplemental Information―Trimethylbenzenes
C-38
Polynomial Model (Version: 2.20; Date: 10/22/2014) The form of the response function is: Y[dose] = beta_0 + beta_1*dose A constant variance model is fit Benchmark Dose Computation BMR = 5% Relative deviation BMD = 2001.36 BMDL at the 95% confidence level = 1612.89
Parameter Estimates Variable Estimate Default initial parameter values
alpha 0.141584 0.14543 rho N/A 0 beta_0 5.59423 5.59388 beta_1 −0.000139761 −0.000138886
Table of Data and Estimated Values of Interest Dose N Observed mean Estimated mean Observed SD Estimated SD Scaled residuals 0 23 5.57 5.59 0.33 0.38 −0.309 492 22 5.51 5.53 0.31 0.38 −0.193 1,471 22 5.4 5.39 0.45 0.38 0.142 2,913 22 5.28 5.19 0.4 0.38 1.16 4,408 24 4.92 4.98 0.4 0.38 −0.757
Likelihoods of Interest
Model Log(likelihood) Number of parameters AIC A1 54.992554 6 −97.985109 A2 57.03888 10 −94.07776 A3 54.992554 6 −97.985109 Fitted 53.949538 3 −101.899075 R 36.10487 2 −68.20974
Tests of Interest
Test -2*log(likelihood ratio) Test df p-value Test 1 41.868 8 <0.0001 Test 2 4.09265 4 0.3936 Test 3 4.09265 4 0.3936 Test 4 2.08603 3 0.5547
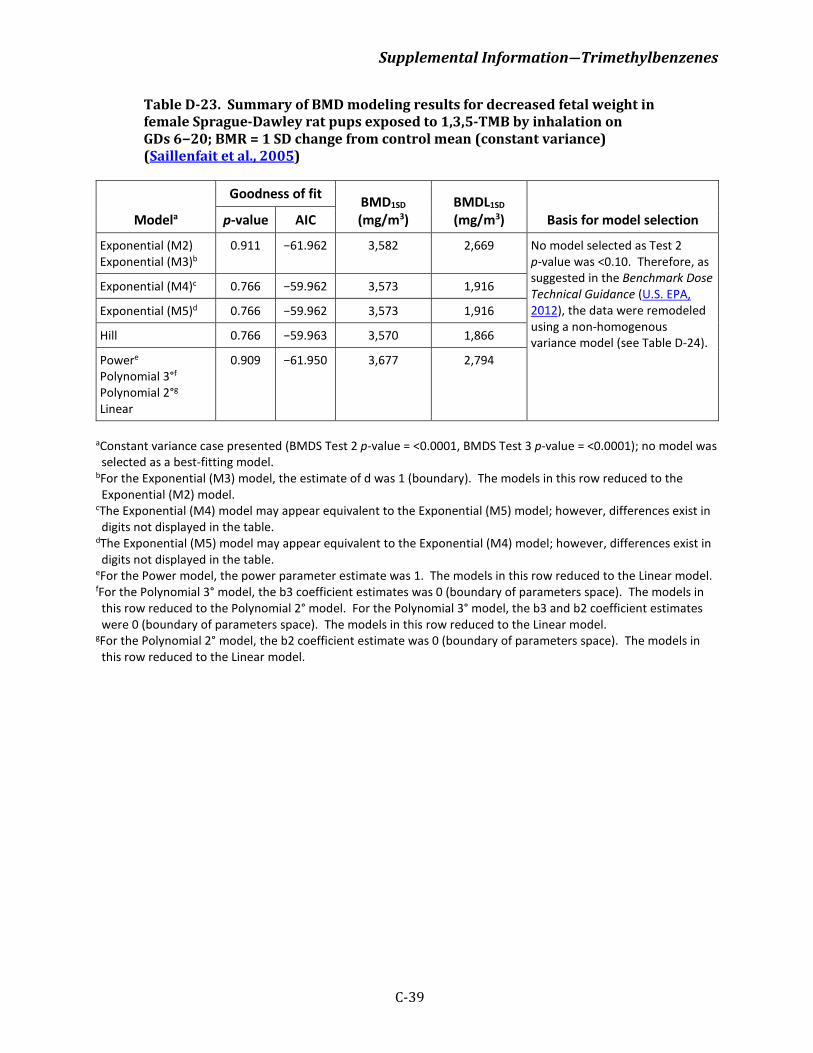
Supplemental Information―Trimethylbenzenes
C-39
Table D-23. Summary of BMD modeling results for decreased fetal weight in female Sprague-Dawley rat pups exposed to 1,3,5-TMB by inhalation on GDs 6−20; BMR = 1 SD change from control mean (constant variance) (Saillenfait et al., 2005)
Modela
Goodness of fit BMD1SD (mg/m3)
BMDL1SD (mg/m3) Basis for model selection p-value AIC
Exponential (M2) Exponential (M3)b
0.911 −61.962 3,582 2,669 No model selected as Test 2 p-value was <0.10. Therefore, as suggested in the Benchmark Dose Technical Guidance (U.S. EPA, 2012), the data were remodeled using a non-homogenous variance model (see Table D-24).
Exponential (M4)c 0.766 −59.962 3,573 1,916
Exponential (M5)d 0.766 −59.962 3,573 1,916
Hill 0.766 −59.963 3,570 1,866
Powere Polynomial 3°f Polynomial 2°g Linear
0.909 −61.950 3,677 2,794
aConstant variance case presented (BMDS Test 2 p-value = <0.0001, BMDS Test 3 p-value = <0.0001); no model was selected as a best-fitting model.
bFor the Exponential (M3) model, the estimate of d was 1 (boundary). The models in this row reduced to the Exponential (M2) model.
cThe Exponential (M4) model may appear equivalent to the Exponential (M5) model; however, differences exist in digits not displayed in the table.
dThe Exponential (M5) model may appear equivalent to the Exponential (M4) model; however, differences exist in digits not displayed in the table.
eFor the Power model, the power parameter estimate was 1. The models in this row reduced to the Linear model. fFor the Polynomial 3° model, the b3 coefficient estimates was 0 (boundary of parameters space). The models in this row reduced to the Polynomial 2° model. For the Polynomial 3° model, the b3 and b2 coefficient estimates were 0 (boundary of parameters space). The models in this row reduced to the Linear model.
gFor the Polynomial 2° model, the b2 coefficient estimate was 0 (boundary of parameters space). The models in this row reduced to the Linear model.
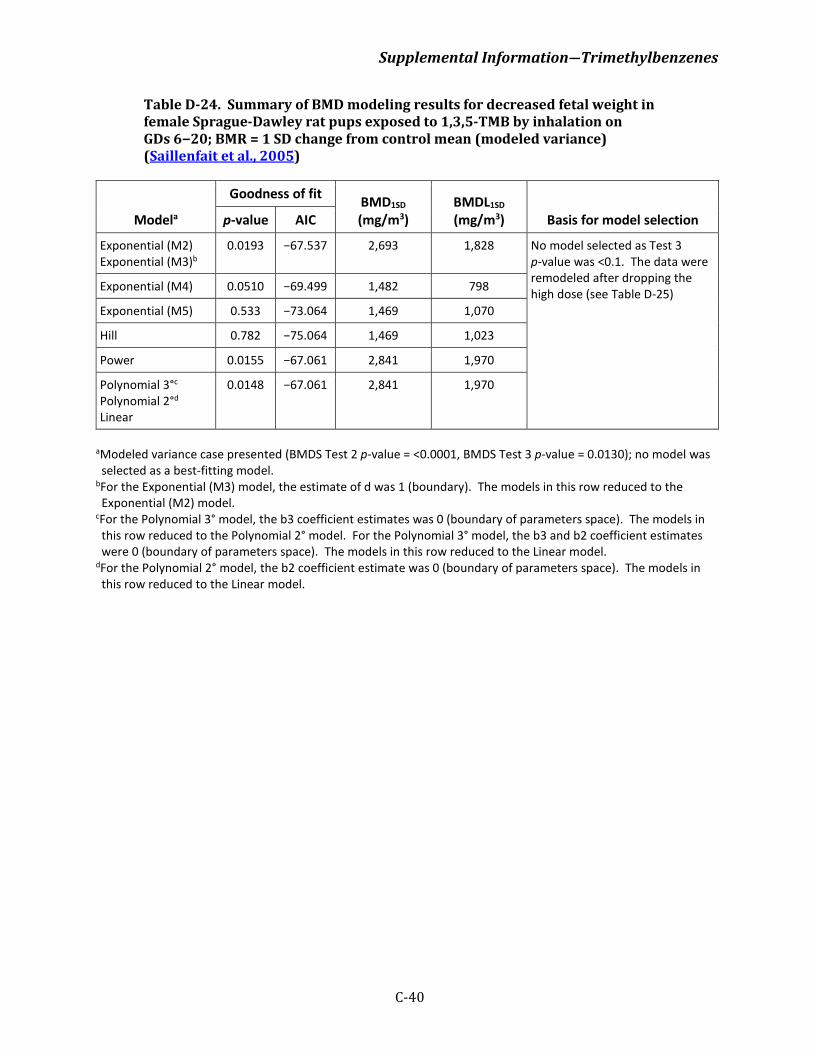
Supplemental Information―Trimethylbenzenes
C-40
Table D-24. Summary of BMD modeling results for decreased fetal weight in female Sprague-Dawley rat pups exposed to 1,3,5-TMB by inhalation on GDs 6−20; BMR = 1 SD change from control mean (modeled variance) (Saillenfait et al., 2005)
Modela
Goodness of fit BMD1SD (mg/m3)
BMDL1SD (mg/m3) Basis for model selection p-value AIC
Exponential (M2) Exponential (M3)b
0.0193 −67.537 2,693 1,828 No model selected as Test 3 p-value was <0.1. The data were remodeled after dropping the high dose (see Table D-25) Exponential (M4) 0.0510 −69.499 1,482 798
Exponential (M5) 0.533 −73.064 1,469 1,070
Hill 0.782 −75.064 1,469 1,023
Power 0.0155 −67.061 2,841 1,970
Polynomial 3°c Polynomial 2°d Linear
0.0148 −67.061 2,841 1,970
aModeled variance case presented (BMDS Test 2 p-value = <0.0001, BMDS Test 3 p-value = 0.0130); no model was selected as a best-fitting model.
bFor the Exponential (M3) model, the estimate of d was 1 (boundary). The models in this row reduced to the Exponential (M2) model.
cFor the Polynomial 3° model, the b3 coefficient estimates was 0 (boundary of parameters space). The models in this row reduced to the Polynomial 2° model. For the Polynomial 3° model, the b3 and b2 coefficient estimates were 0 (boundary of parameters space). The models in this row reduced to the Linear model.
dFor the Polynomial 2° model, the b2 coefficient estimate was 0 (boundary of parameters space). The models in this row reduced to the Linear model.
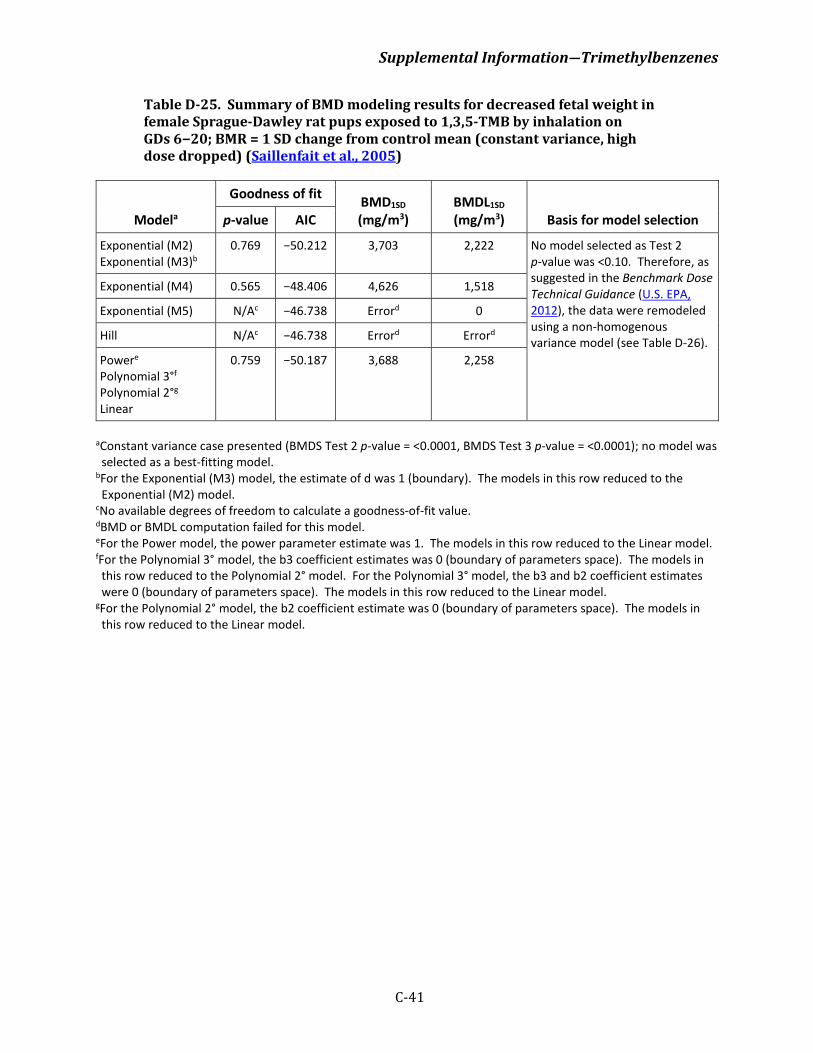
Supplemental Information―Trimethylbenzenes
C-41
Table D-25. Summary of BMD modeling results for decreased fetal weight in female Sprague-Dawley rat pups exposed to 1,3,5-TMB by inhalation on GDs 6−20; BMR = 1 SD change from control mean (constant variance, high dose dropped) (Saillenfait et al., 2005)
Modela
Goodness of fit BMD1SD (mg/m3)
BMDL1SD (mg/m3) Basis for model selection p-value AIC
Exponential (M2) Exponential (M3)b
0.769 −50.212 3,703 2,222 No model selected as Test 2 p-value was <0.10. Therefore, as suggested in the Benchmark Dose Technical Guidance (U.S. EPA, 2012), the data were remodeled using a non-homogenous variance model (see Table D-26).
Exponential (M4) 0.565 −48.406 4,626 1,518
Exponential (M5) N/Ac −46.738 Errord 0
Hill N/Ac −46.738 Errord Errord
Powere Polynomial 3°f Polynomial 2°g Linear
0.759 −50.187 3,688 2,258
aConstant variance case presented (BMDS Test 2 p-value = <0.0001, BMDS Test 3 p-value = <0.0001); no model was selected as a best-fitting model.
bFor the Exponential (M3) model, the estimate of d was 1 (boundary). The models in this row reduced to the Exponential (M2) model.
cNo available degrees of freedom to calculate a goodness-of-fit value. dBMD or BMDL computation failed for this model. eFor the Power model, the power parameter estimate was 1. The models in this row reduced to the Linear model. fFor the Polynomial 3° model, the b3 coefficient estimates was 0 (boundary of parameters space). The models in this row reduced to the Polynomial 2° model. For the Polynomial 3° model, the b3 and b2 coefficient estimates were 0 (boundary of parameters space). The models in this row reduced to the Linear model.
gFor the Polynomial 2° model, the b2 coefficient estimate was 0 (boundary of parameters space). The models in this row reduced to the Linear model.
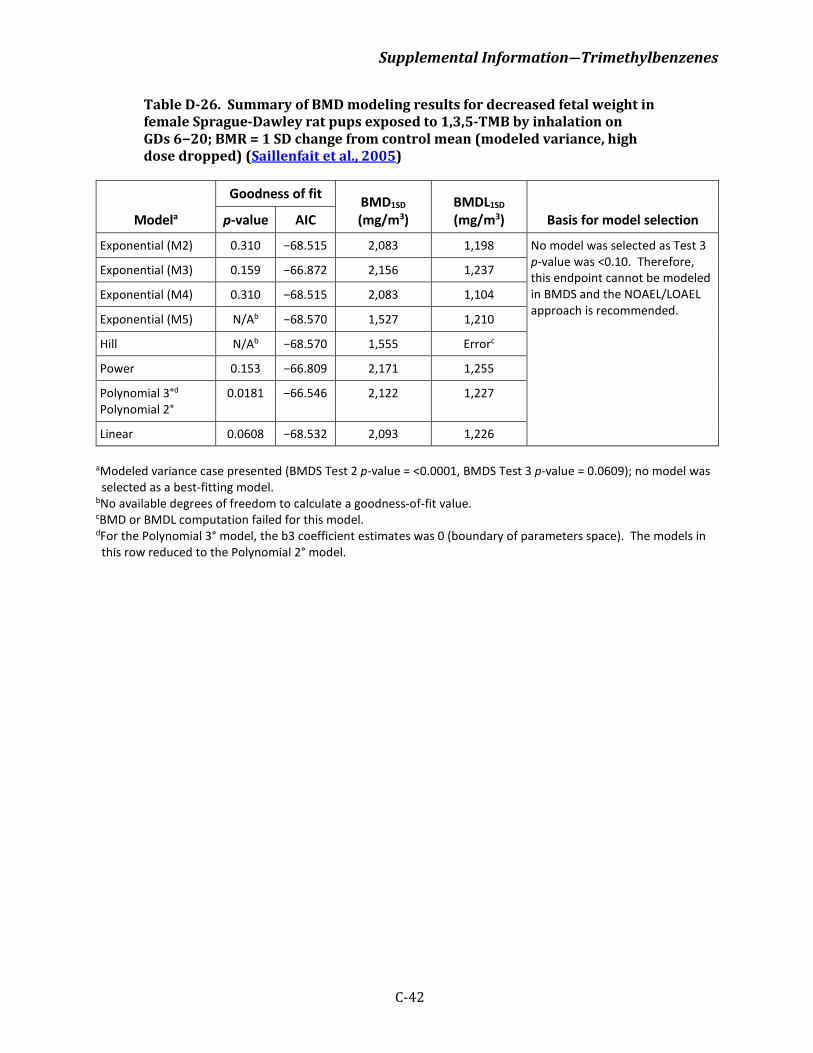
Supplemental Information―Trimethylbenzenes
C-42
Table D-26. Summary of BMD modeling results for decreased fetal weight in female Sprague-Dawley rat pups exposed to 1,3,5-TMB by inhalation on GDs 6−20; BMR = 1 SD change from control mean (modeled variance, high dose dropped) (Saillenfait et al., 2005)
Modela
Goodness of fit BMD1SD (mg/m3)
BMDL1SD (mg/m3) Basis for model selection p-value AIC
Exponential (M2) 0.310 −68.515 2,083 1,198 No model was selected as Test 3 p-value was <0.10. Therefore, this endpoint cannot be modeled in BMDS and the NOAEL/LOAEL approach is recommended.
Exponential (M3) 0.159 −66.872 2,156 1,237
Exponential (M4) 0.310 −68.515 2,083 1,104
Exponential (M5) N/Ab −68.570 1,527 1,210
Hill N/Ab −68.570 1,555 Errorc
Power 0.153 −66.809 2,171 1,255
Polynomial 3°d Polynomial 2°
0.0181 −66.546 2,122 1,227
Linear 0.0608 −68.532 2,093 1,226
aModeled variance case presented (BMDS Test 2 p-value = <0.0001, BMDS Test 3 p-value = 0.0609); no model was selected as a best-fitting model.
bNo available degrees of freedom to calculate a goodness-of-fit value. cBMD or BMDL computation failed for this model. dFor the Polynomial 3° model, the b3 coefficient estimates was 0 (boundary of parameters space). The models in this row reduced to the Polynomial 2° model.
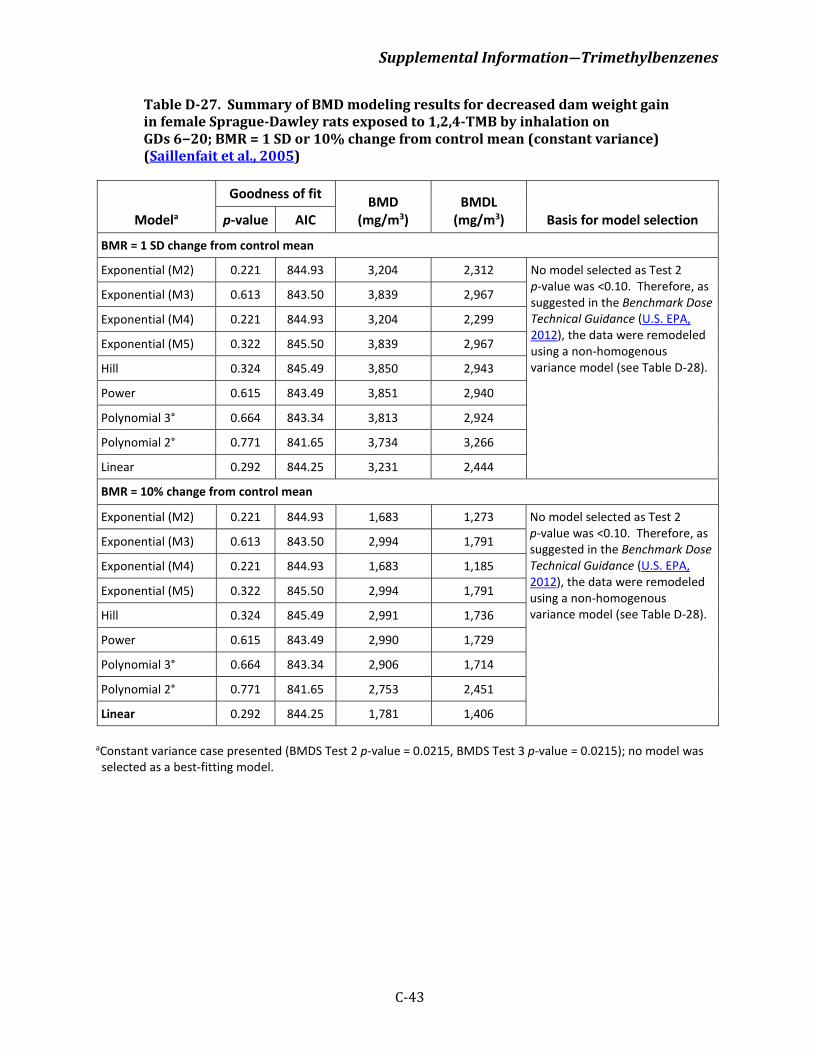
Supplemental Information―Trimethylbenzenes
C-43
Table D-27. Summary of BMD modeling results for decreased dam weight gain in female Sprague-Dawley rats exposed to 1,2,4-TMB by inhalation on GDs 6−20; BMR = 1 SD or 10% change from control mean (constant variance) (Saillenfait et al., 2005)
Modela
Goodness of fit BMD (mg/m3)
BMDL (mg/m3) Basis for model selection p-value AIC
BMR = 1 SD change from control mean
Exponential (M2) 0.221 844.93 3,204 2,312 No model selected as Test 2 p-value was <0.10. Therefore, as suggested in the Benchmark Dose Technical Guidance (U.S. EPA, 2012), the data were remodeled using a non-homogenous variance model (see Table D-28).
Exponential (M3) 0.613 843.50 3,839 2,967
Exponential (M4) 0.221 844.93 3,204 2,299
Exponential (M5) 0.322 845.50 3,839 2,967
Hill 0.324 845.49 3,850 2,943
Power 0.615 843.49 3,851 2,940
Polynomial 3° 0.664 843.34 3,813 2,924
Polynomial 2° 0.771 841.65 3,734 3,266
Linear 0.292 844.25 3,231 2,444
BMR = 10% change from control mean
Exponential (M2) 0.221 844.93 1,683 1,273 No model selected as Test 2 p-value was <0.10. Therefore, as suggested in the Benchmark Dose Technical Guidance (U.S. EPA, 2012), the data were remodeled using a non-homogenous variance model (see Table D-28).
Exponential (M3) 0.613 843.50 2,994 1,791
Exponential (M4) 0.221 844.93 1,683 1,185
Exponential (M5) 0.322 845.50 2,994 1,791
Hill 0.324 845.49 2,991 1,736
Power 0.615 843.49 2,990 1,729
Polynomial 3° 0.664 843.34 2,906 1,714
Polynomial 2° 0.771 841.65 2,753 2,451
Linear 0.292 844.25 1,781 1,406
aConstant variance case presented (BMDS Test 2 p-value = 0.0215, BMDS Test 3 p-value = 0.0215); no model was selected as a best-fitting model.
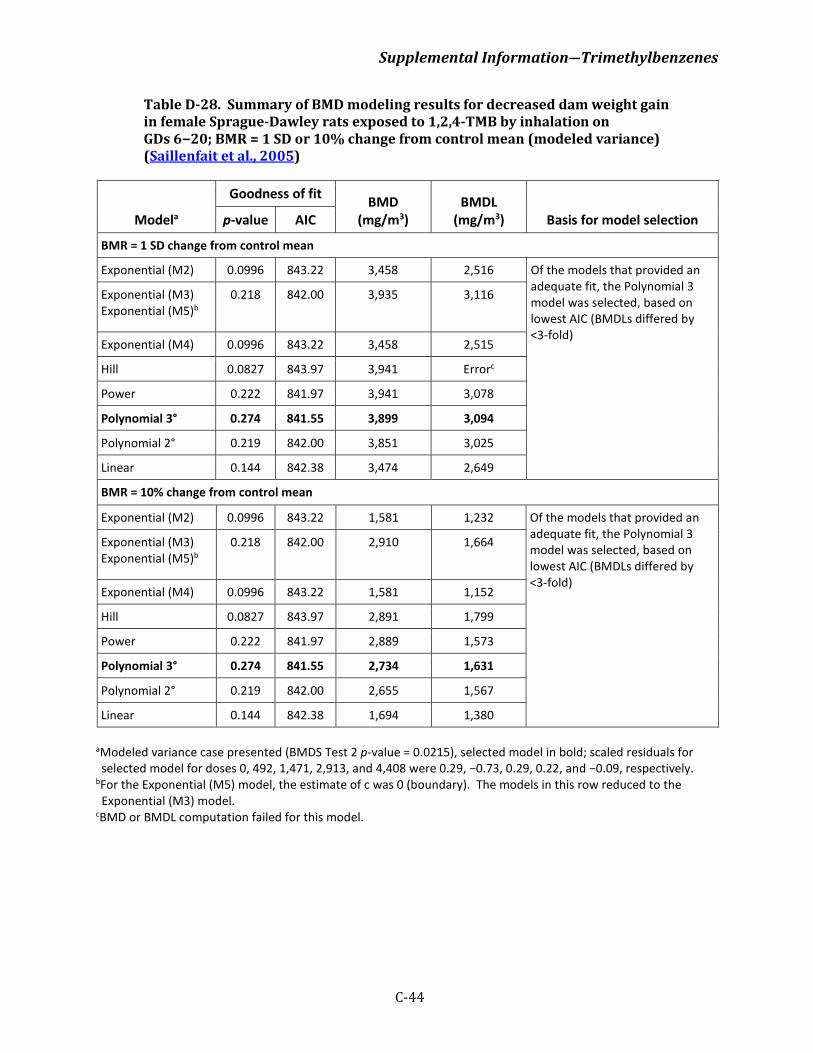
Supplemental Information―Trimethylbenzenes
C-44
Table D-28. Summary of BMD modeling results for decreased dam weight gain in female Sprague-Dawley rats exposed to 1,2,4-TMB by inhalation on GDs 6−20; BMR = 1 SD or 10% change from control mean (modeled variance) (Saillenfait et al., 2005)
Modela
Goodness of fit BMD (mg/m3)
BMDL (mg/m3) Basis for model selection p-value AIC
BMR = 1 SD change from control mean
Exponential (M2) 0.0996 843.22 3,458 2,516 Of the models that provided an adequate fit, the Polynomial 3 model was selected, based on lowest AIC (BMDLs differed by <3-fold)
Exponential (M3) Exponential (M5)b
0.218 842.00 3,935 3,116
Exponential (M4) 0.0996 843.22 3,458 2,515
Hill 0.0827 843.97 3,941 Errorc
Power 0.222 841.97 3,941 3,078
Polynomial 3° 0.274 841.55 3,899 3,094
Polynomial 2° 0.219 842.00 3,851 3,025
Linear 0.144 842.38 3,474 2,649
BMR = 10% change from control mean
Exponential (M2) 0.0996 843.22 1,581 1,232 Of the models that provided an adequate fit, the Polynomial 3 model was selected, based on lowest AIC (BMDLs differed by <3-fold)
Exponential (M3) Exponential (M5)b
0.218 842.00 2,910 1,664
Exponential (M4) 0.0996 843.22 1,581 1,152
Hill 0.0827 843.97 2,891 1,799
Power 0.222 841.97 2,889 1,573
Polynomial 3° 0.274 841.55 2,734 1,631
Polynomial 2° 0.219 842.00 2,655 1,567
Linear 0.144 842.38 1,694 1,380
aModeled variance case presented (BMDS Test 2 p-value = 0.0215), selected model in bold; scaled residuals for selected model for doses 0, 492, 1,471, 2,913, and 4,408 were 0.29, −0.73, 0.29, 0.22, and −0.09, respectively.
bFor the Exponential (M5) model, the estimate of c was 0 (boundary). The models in this row reduced to the Exponential (M3) model.
cBMD or BMDL computation failed for this model.
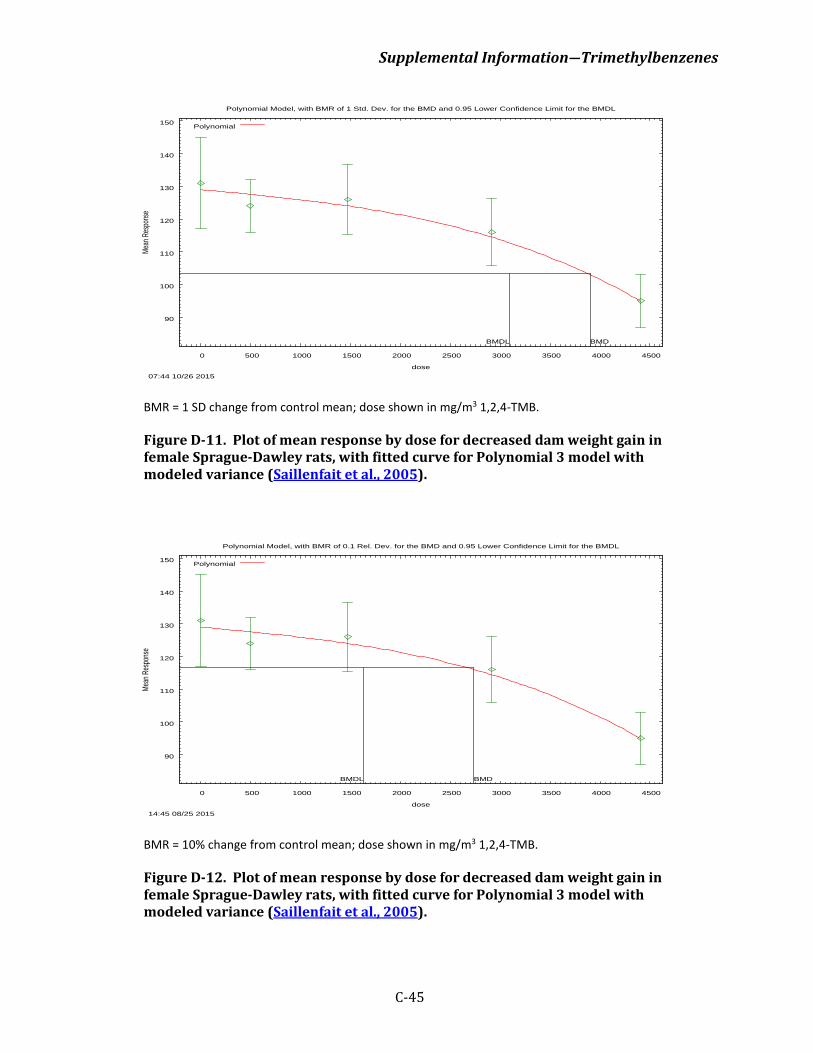
Supplemental Information―Trimethylbenzenes
C-45
BMR = 1 SD change from control mean; dose shown in mg/m3 1,2,4-TMB.
Figure D-11. Plot of mean response by dose for decreased dam weight gain in female Sprague-Dawley rats, with fitted curve for Polynomial 3 model with modeled variance (Saillenfait et al., 2005).
BMR = 10% change from control mean; dose shown in mg/m3 1,2,4-TMB.
Figure D-12. Plot of mean response by dose for decreased dam weight gain in female Sprague-Dawley rats, with fitted curve for Polynomial 3 model with modeled variance (Saillenfait et al., 2005).
90
100
110
120
130
140
150
0 500 1000 1500 2000 2500 3000 3500 4000 4500
Mean
Res
pons
e
dose
Polynomial Model, with BMR of 1 Std. Dev. for the BMD and 0.95 Lower Confidence Limit for the BMDL
07:44 10/26 2015
BMDBMDL
Polynomial
90
100
110
120
130
140
150
0 500 1000 1500 2000 2500 3000 3500 4000 4500
Mean
Res
pons
e
dose
Polynomial Model, with BMR of 0.1 Rel. Dev. for the BMD and 0.95 Lower Confidence Limit for the BMDL
14:45 08/25 2015
BMDBMDL
Polynomial
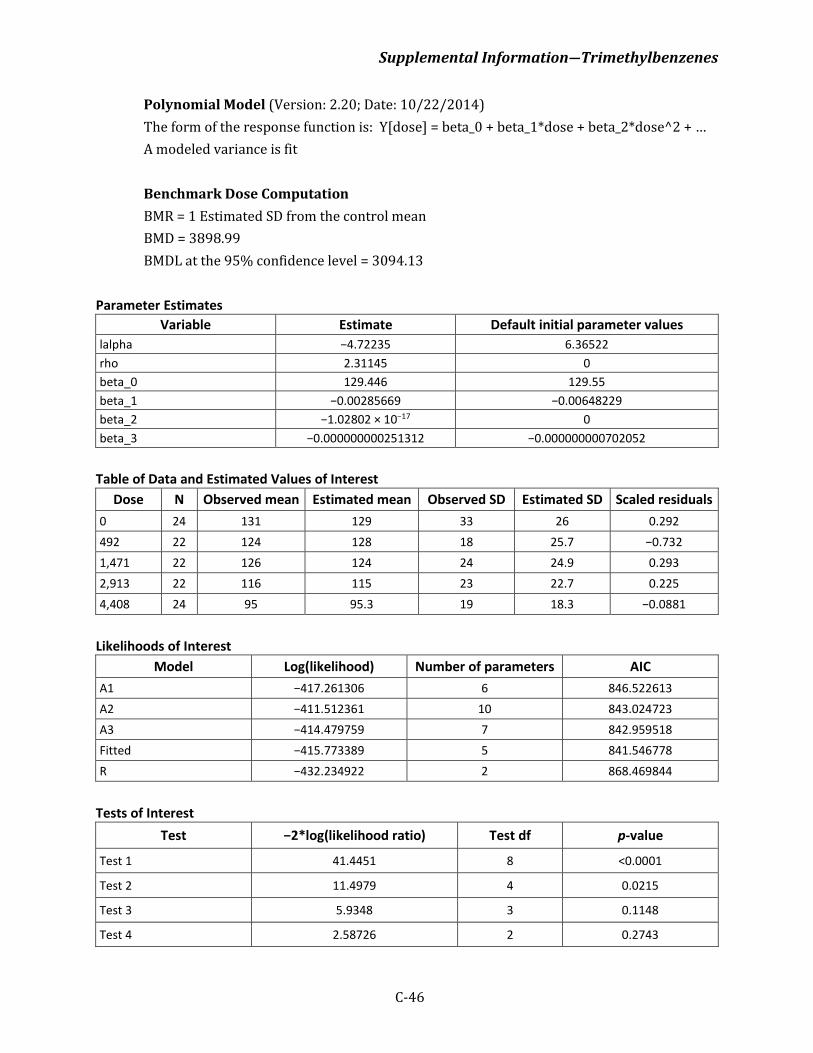
Supplemental Information―Trimethylbenzenes
C-46
Polynomial Model (Version: 2.20; Date: 10/22/2014) The form of the response function is: Y[dose] = beta_0 + beta_1*dose + beta_2*dose^2 + … A modeled variance is fit Benchmark Dose Computation BMR = 1 Estimated SD from the control mean BMD = 3898.99 BMDL at the 95% confidence level = 3094.13
Parameter Estimates Variable Estimate Default initial parameter values
lalpha −4.72235 6.36522 rho 2.31145 0 beta_0 129.446 129.55 beta_1 −0.00285669 −0.00648229 beta_2 −1.02802 × 10⁻¹⁷ 0 beta_3 −0.000000000251312 −0.000000000702052
Table of Data and Estimated Values of Interest
Dose N Observed mean Estimated mean Observed SD Estimated SD Scaled residuals 0 24 131 129 33 26 0.292 492 22 124 128 18 25.7 −0.732 1,471 22 126 124 24 24.9 0.293 2,913 22 116 115 23 22.7 0.225 4,408 24 95 95.3 19 18.3 −0.0881
Likelihoods of Interest
Model Log(likelihood) Number of parameters AIC A1 −417.261306 6 846.522613 A2 −411.512361 10 843.024723 A3 −414.479759 7 842.959518 Fitted −415.773389 5 841.546778 R −432.234922 2 868.469844
Tests of Interest
Test −2*log(likelihood ratio) Test df p-value
Test 1 41.4451 8 <0.0001
Test 2 11.4979 4 0.0215
Test 3 5.9348 3 0.1148
Test 4 2.58726 2 0.2743
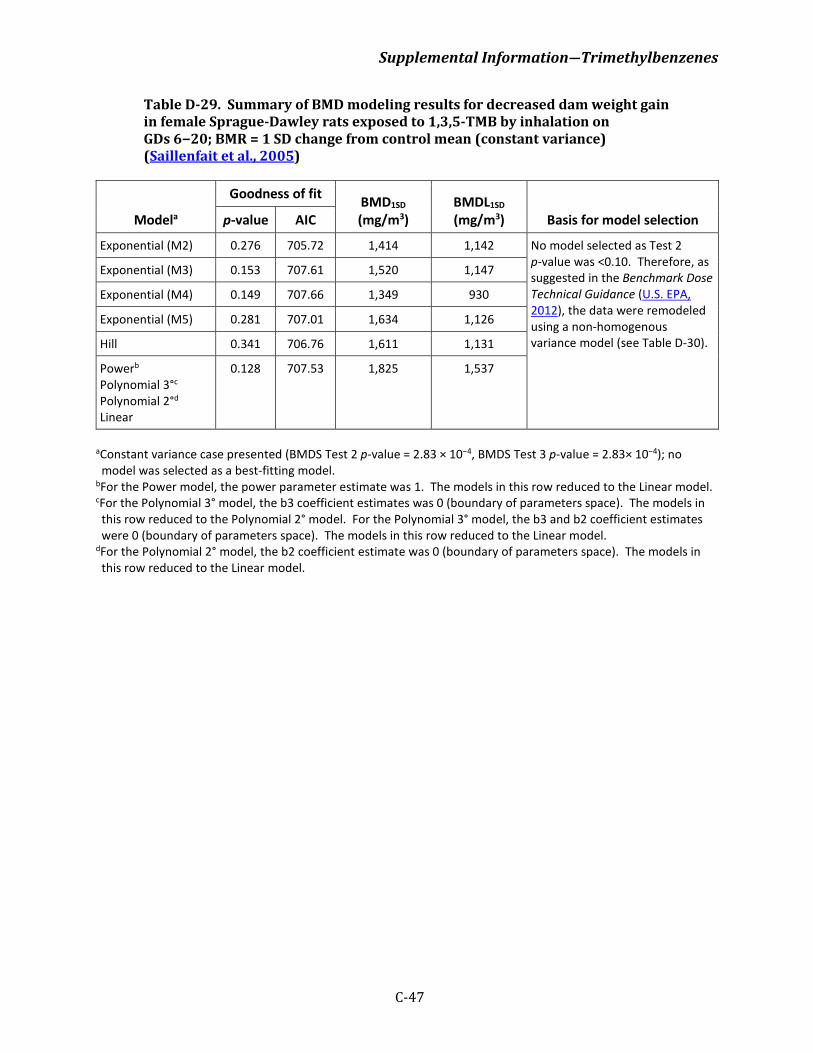
Supplemental Information―Trimethylbenzenes
C-47
Table D-29. Summary of BMD modeling results for decreased dam weight gain in female Sprague-Dawley rats exposed to 1,3,5-TMB by inhalation on GDs 6−20; BMR = 1 SD change from control mean (constant variance) (Saillenfait et al., 2005)
Modela
Goodness of fit BMD1SD (mg/m3)
BMDL1SD (mg/m3) Basis for model selection p-value AIC
Exponential (M2) 0.276 705.72 1,414 1,142 No model selected as Test 2 p-value was <0.10. Therefore, as suggested in the Benchmark Dose Technical Guidance (U.S. EPA, 2012), the data were remodeled using a non-homogenous variance model (see Table D-30).
Exponential (M3) 0.153 707.61 1,520 1,147
Exponential (M4) 0.149 707.66 1,349 930
Exponential (M5) 0.281 707.01 1,634 1,126
Hill 0.341 706.76 1,611 1,131
Powerb Polynomial 3°c Polynomial 2°d Linear
0.128 707.53 1,825 1,537
aConstant variance case presented (BMDS Test 2 p-value = 2.83 × 10⁻⁴, BMDS Test 3 p-value = 2.83× 10⁻⁴); no model was selected as a best-fitting model.
bFor the Power model, the power parameter estimate was 1. The models in this row reduced to the Linear model. cFor the Polynomial 3° model, the b3 coefficient estimates was 0 (boundary of parameters space). The models in this row reduced to the Polynomial 2° model. For the Polynomial 3° model, the b3 and b2 coefficient estimates were 0 (boundary of parameters space). The models in this row reduced to the Linear model.
dFor the Polynomial 2° model, the b2 coefficient estimate was 0 (boundary of parameters space). The models in this row reduced to the Linear model.
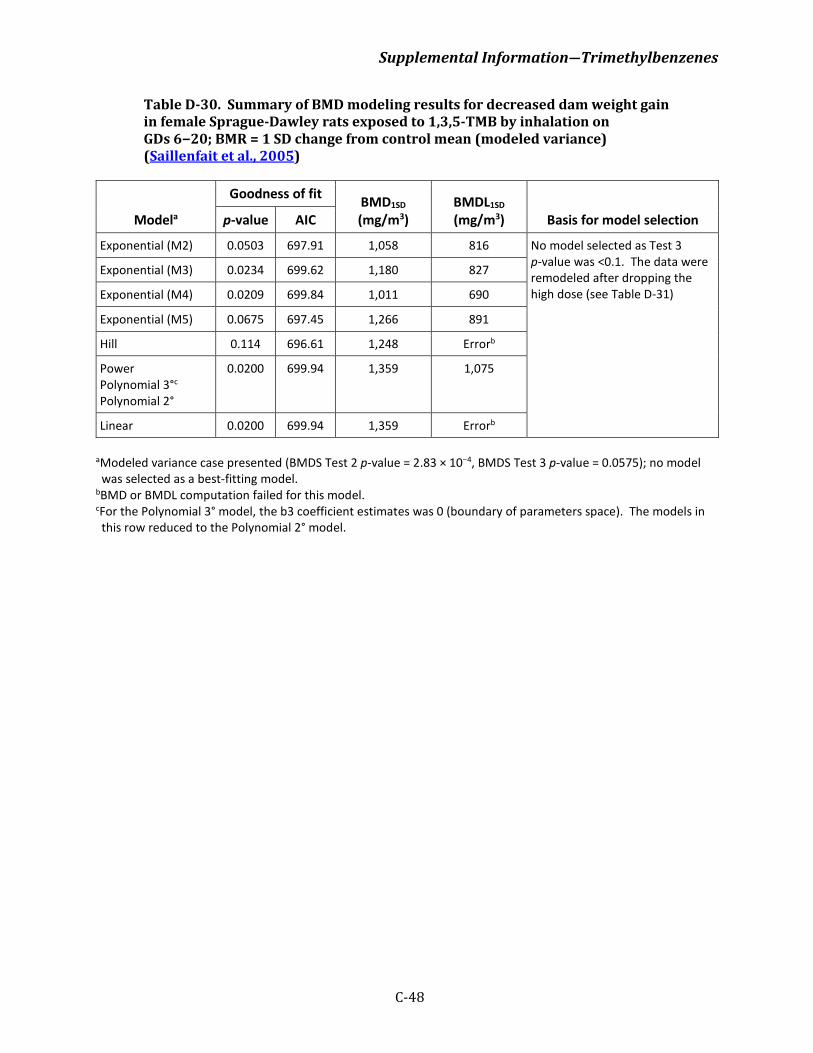
Supplemental Information―Trimethylbenzenes
C-48
Table D-30. Summary of BMD modeling results for decreased dam weight gain in female Sprague-Dawley rats exposed to 1,3,5-TMB by inhalation on GDs 6−20; BMR = 1 SD change from control mean (modeled variance) (Saillenfait et al., 2005)
Modela
Goodness of fit BMD1SD (mg/m3)
BMDL1SD (mg/m3) Basis for model selection p-value AIC
Exponential (M2) 0.0503 697.91 1,058 816 No model selected as Test 3 p-value was <0.1. The data were remodeled after dropping the high dose (see Table D-31)
Exponential (M3) 0.0234 699.62 1,180 827
Exponential (M4) 0.0209 699.84 1,011 690
Exponential (M5) 0.0675 697.45 1,266 891
Hill 0.114 696.61 1,248 Errorb
Power Polynomial 3°c Polynomial 2°
0.0200 699.94 1,359 1,075
Linear 0.0200 699.94 1,359 Errorb
aModeled variance case presented (BMDS Test 2 p-value = 2.83 × 10⁻⁴, BMDS Test 3 p-value = 0.0575); no model was selected as a best-fitting model.
bBMD or BMDL computation failed for this model. cFor the Polynomial 3° model, the b3 coefficient estimates was 0 (boundary of parameters space). The models in this row reduced to the Polynomial 2° model.
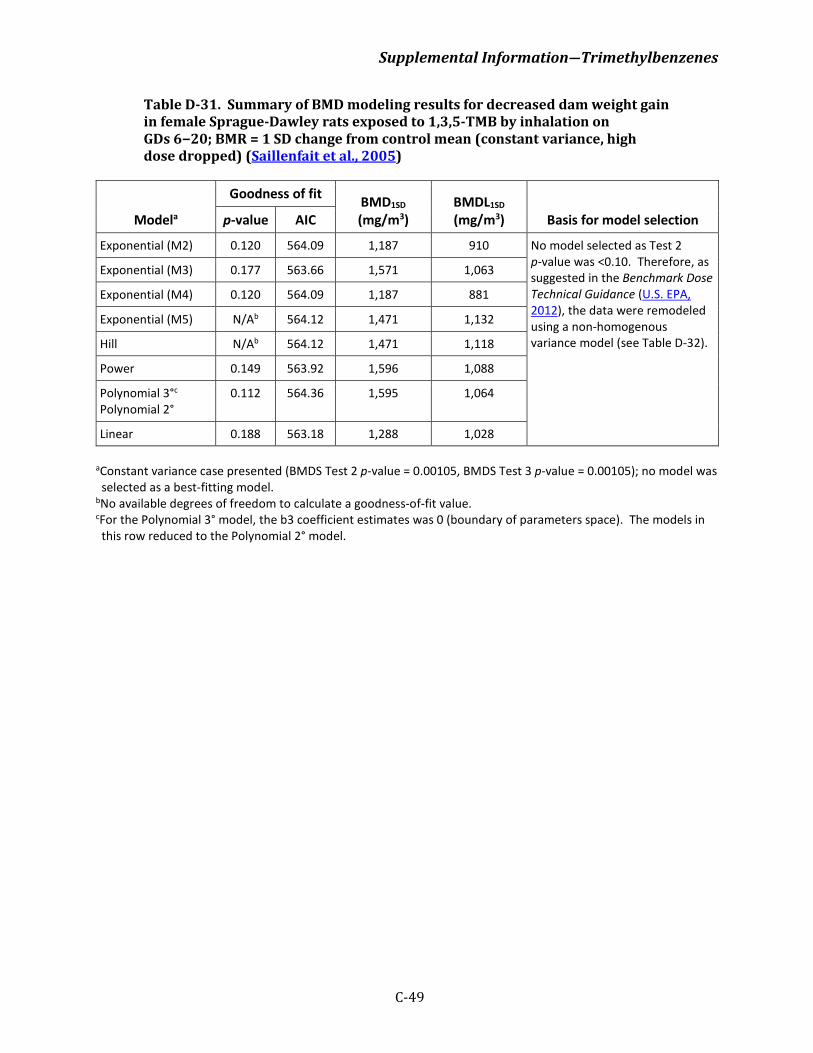
Supplemental Information―Trimethylbenzenes
C-49
Table D-31. Summary of BMD modeling results for decreased dam weight gain in female Sprague-Dawley rats exposed to 1,3,5-TMB by inhalation on GDs 6−20; BMR = 1 SD change from control mean (constant variance, high dose dropped) (Saillenfait et al., 2005)
Modela
Goodness of fit BMD1SD (mg/m3)
BMDL1SD (mg/m3) Basis for model selection p-value AIC
Exponential (M2) 0.120 564.09 1,187 910 No model selected as Test 2 p-value was <0.10. Therefore, as suggested in the Benchmark Dose Technical Guidance (U.S. EPA, 2012), the data were remodeled using a non-homogenous variance model (see Table D-32).
Exponential (M3) 0.177 563.66 1,571 1,063
Exponential (M4) 0.120 564.09 1,187 881
Exponential (M5) N/Ab 564.12 1,471 1,132
Hill N/Ab 564.12 1,471 1,118
Power 0.149 563.92 1,596 1,088
Polynomial 3°c Polynomial 2°
0.112 564.36 1,595 1,064
Linear 0.188 563.18 1,288 1,028
aConstant variance case presented (BMDS Test 2 p-value = 0.00105, BMDS Test 3 p-value = 0.00105); no model was selected as a best-fitting model.
bNo available degrees of freedom to calculate a goodness-of-fit value. cFor the Polynomial 3° model, the b3 coefficient estimates was 0 (boundary of parameters space). The models in this row reduced to the Polynomial 2° model.
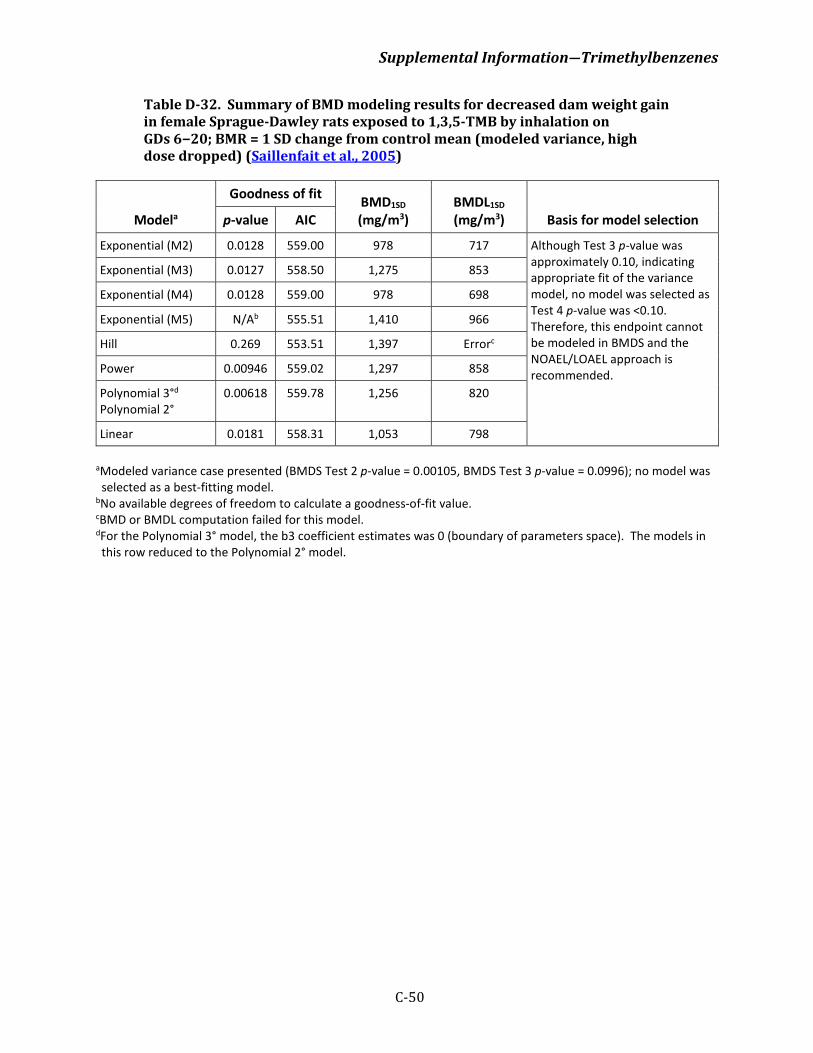
Supplemental Information―Trimethylbenzenes
C-50
Table D-32. Summary of BMD modeling results for decreased dam weight gain in female Sprague-Dawley rats exposed to 1,3,5-TMB by inhalation on GDs 6−20; BMR = 1 SD change from control mean (modeled variance, high dose dropped) (Saillenfait et al., 2005)
Modela
Goodness of fit BMD1SD (mg/m3)
BMDL1SD (mg/m3) Basis for model selection p-value AIC
Exponential (M2) 0.0128 559.00 978 717 Although Test 3 p-value was approximately 0.10, indicating appropriate fit of the variance model, no model was selected as Test 4 p-value was <0.10. Therefore, this endpoint cannot be modeled in BMDS and the NOAEL/LOAEL approach is recommended.
Exponential (M3) 0.0127 558.50 1,275 853
Exponential (M4) 0.0128 559.00 978 698
Exponential (M5) N/Ab 555.51 1,410 966
Hill 0.269 553.51 1,397 Errorc
Power 0.00946 559.02 1,297 858
Polynomial 3°d Polynomial 2°
0.00618 559.78 1,256 820
Linear 0.0181 558.31 1,053 798
aModeled variance case presented (BMDS Test 2 p-value = 0.00105, BMDS Test 3 p-value = 0.0996); no model was selected as a best-fitting model.
bNo available degrees of freedom to calculate a goodness-of-fit value. cBMD or BMDL computation failed for this model. dFor the Polynomial 3° model, the b3 coefficient estimates was 0 (boundary of parameters space). The models in this row reduced to the Polynomial 2° model.
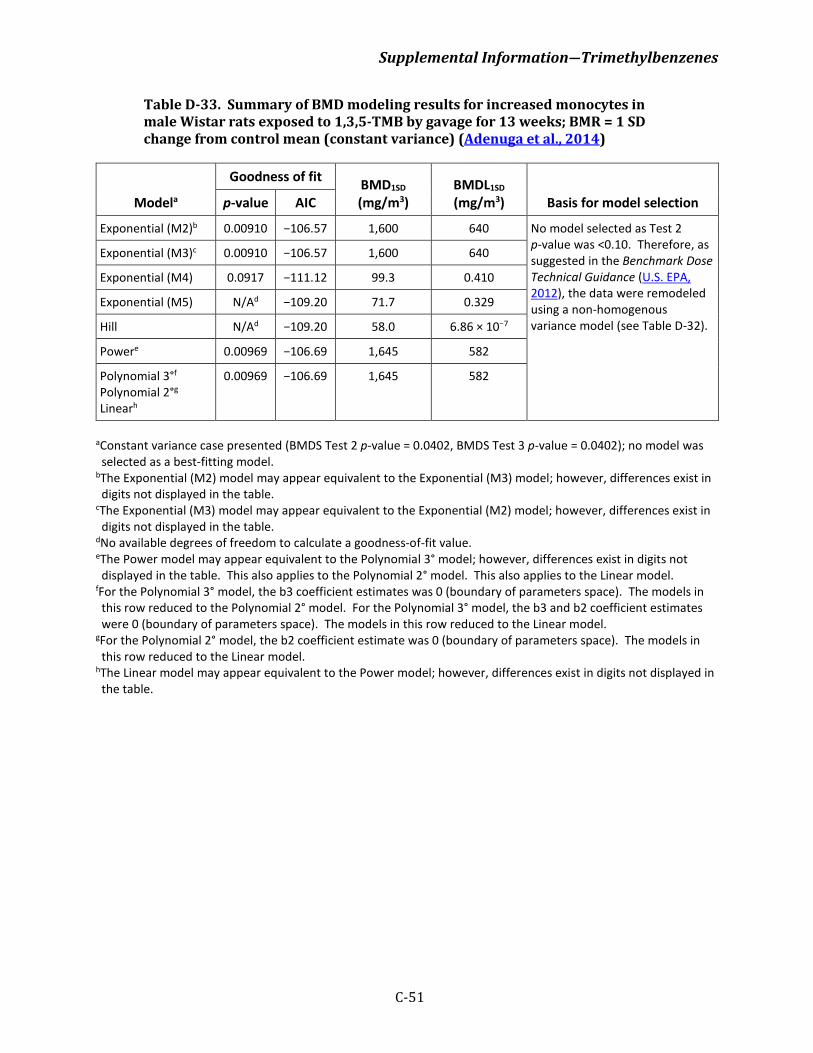
Supplemental Information―Trimethylbenzenes
C-51
Table D-33. Summary of BMD modeling results for increased monocytes in male Wistar rats exposed to 1,3,5-TMB by gavage for 13 weeks; BMR = 1 SD change from control mean (constant variance) (Adenuga et al., 2014)
Modela
Goodness of fit BMD1SD (mg/m3)
BMDL1SD (mg/m3) Basis for model selection p-value AIC
Exponential (M2)b 0.00910 −106.57 1,600 640 No model selected as Test 2 p-value was <0.10. Therefore, as suggested in the Benchmark Dose Technical Guidance (U.S. EPA, 2012), the data were remodeled using a non-homogenous variance model (see Table D-32).
Exponential (M3)c 0.00910 −106.57 1,600 640
Exponential (M4) 0.0917 −111.12 99.3 0.410
Exponential (M5) N/Ad −109.20 71.7 0.329
Hill N/Ad −109.20 58.0 6.86 × 10⁻⁷
Powere 0.00969 −106.69 1,645 582
Polynomial 3°f Polynomial 2°g Linearh
0.00969 −106.69 1,645 582
aConstant variance case presented (BMDS Test 2 p-value = 0.0402, BMDS Test 3 p-value = 0.0402); no model was selected as a best-fitting model.
bThe Exponential (M2) model may appear equivalent to the Exponential (M3) model; however, differences exist in digits not displayed in the table.
cThe Exponential (M3) model may appear equivalent to the Exponential (M2) model; however, differences exist in digits not displayed in the table.
dNo available degrees of freedom to calculate a goodness-of-fit value. eThe Power model may appear equivalent to the Polynomial 3° model; however, differences exist in digits not displayed in the table. This also applies to the Polynomial 2° model. This also applies to the Linear model.
fFor the Polynomial 3° model, the b3 coefficient estimates was 0 (boundary of parameters space). The models in this row reduced to the Polynomial 2° model. For the Polynomial 3° model, the b3 and b2 coefficient estimates were 0 (boundary of parameters space). The models in this row reduced to the Linear model.
gFor the Polynomial 2° model, the b2 coefficient estimate was 0 (boundary of parameters space). The models in this row reduced to the Linear model.
hThe Linear model may appear equivalent to the Power model; however, differences exist in digits not displayed in the table.
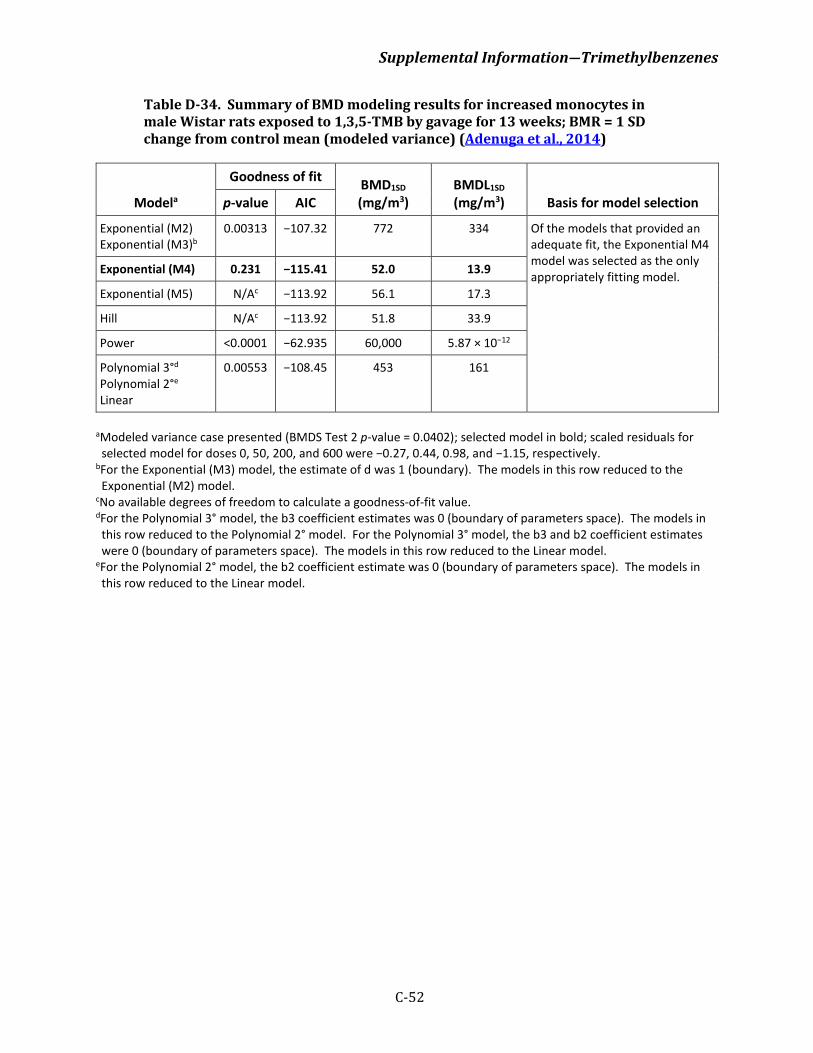
Supplemental Information―Trimethylbenzenes
C-52
Table D-34. Summary of BMD modeling results for increased monocytes in male Wistar rats exposed to 1,3,5-TMB by gavage for 13 weeks; BMR = 1 SD change from control mean (modeled variance) (Adenuga et al., 2014)
Modela
Goodness of fit BMD1SD (mg/m3)
BMDL1SD (mg/m3) Basis for model selection p-value AIC
Exponential (M2) Exponential (M3)b
0.00313 −107.32 772 334 Of the models that provided an adequate fit, the Exponential M4 model was selected as the only appropriately fitting model. Exponential (M4) 0.231 −115.41 52.0 13.9
Exponential (M5) N/Ac −113.92 56.1 17.3
Hill N/Ac −113.92 51.8 33.9
Power <0.0001 −62.935 60,000 5.87 × 10⁻¹²
Polynomial 3°d Polynomial 2°e Linear
0.00553 −108.45 453 161
aModeled variance case presented (BMDS Test 2 p-value = 0.0402); selected model in bold; scaled residuals for selected model for doses 0, 50, 200, and 600 were −0.27, 0.44, 0.98, and −1.15, respectively.
bFor the Exponential (M3) model, the estimate of d was 1 (boundary). The models in this row reduced to the Exponential (M2) model.
cNo available degrees of freedom to calculate a goodness-of-fit value. dFor the Polynomial 3° model, the b3 coefficient estimates was 0 (boundary of parameters space). The models in this row reduced to the Polynomial 2° model. For the Polynomial 3° model, the b3 and b2 coefficient estimates were 0 (boundary of parameters space). The models in this row reduced to the Linear model.
eFor the Polynomial 2° model, the b2 coefficient estimate was 0 (boundary of parameters space). The models in this row reduced to the Linear model.
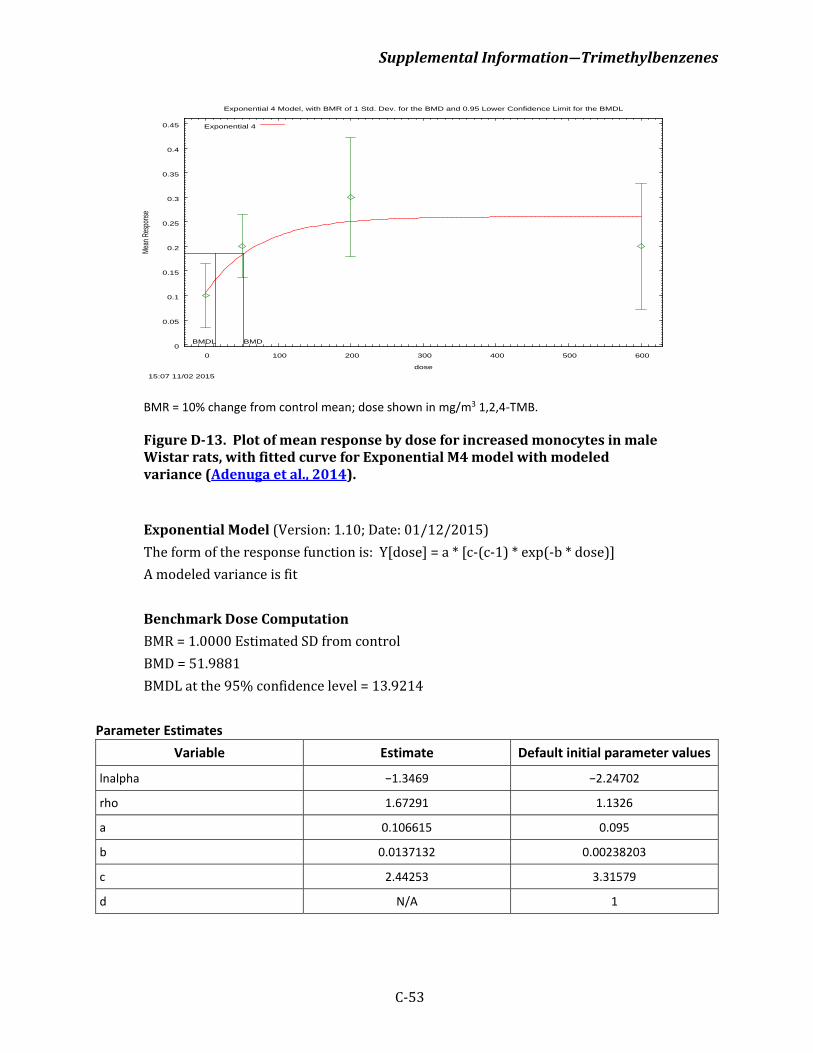
Supplemental Information―Trimethylbenzenes
C-53
BMR = 10% change from control mean; dose shown in mg/m3 1,2,4-TMB.
Figure D-13. Plot of mean response by dose for increased monocytes in male Wistar rats, with fitted curve for Exponential M4 model with modeled variance (Adenuga et al., 2014).
Exponential Model (Version: 1.10; Date: 01/12/2015) The form of the response function is: Y[dose] = a * [c-(c-1) * exp(-b * dose)] A modeled variance is fit Benchmark Dose Computation BMR = 1.0000 Estimated SD from control BMD = 51.9881 BMDL at the 95% confidence level = 13.9214
Parameter Estimates Variable Estimate Default initial parameter values
lnalpha −1.3469 −2.24702
rho 1.67291 1.1326
a 0.106615 0.095
b 0.0137132 0.00238203
c 2.44253 3.31579
d N/A 1
0
0.05
0.1
0.15
0.2
0.25
0.3
0.35
0.4
0.45
0 100 200 300 400 500 600
Mean
Res
pons
e
dose
Exponential 4 Model, with BMR of 1 Std. Dev. for the BMD and 0.95 Lower Confidence Limit for the BMDL
15:07 11/02 2015
BMDBMDL
Exponential 4

Supplemental Information―Trimethylbenzenes
C-54
Table of Data and Estimated Values of Interest Dose N Observed mean Estimated mean Observed SD Estimated SD Scaled residuals
0 10 0.1 0.11 0.09 0.08 −0.2668
50 10 0.2 0.18 0.09 0.12 0.4381
200 10 0.3 0.25 0.17 0.16 0.977
600 10 0.2 0.26 0.18 0.17 −1.154
Likelihoods of Interest
Model Log(likelihood) Number of parameters AIC
A1 60.98264 5 −111.9653
A2 65.13368 8 −114.2674
A3 63.4237 6 −114.8474
R 55.94043 2 −107.8809
4 62.70505 5 −115.4101
Tests of Interest
Test −2*log(likelihood ratio) Test df p-value
Test 1 18.39 6 0.005336
Test 2 8.302 3 0.04016
Test 3 3.42 2 0.1809
Test 6a 1.437 1 0.2306
Supplemental Information―Trimethylbenzenes
R-1
REFERENCES FOR APPENDICES1
Adenuga, D; Carrillo, J, -C; Mckee, RH. (2014). The sub-chronic oral toxicity of 1,3,5-
trimethylbenzene in Sprague-Dawley rats. Regul Toxicol Pharmacol 69: 143-153. http://dx.doi.org/10.1016/j.yrtph.2014.03.006
Bakke, OM; Scheline, RR. (1970). Hydroxylation of aromatic hydrocarbons in the rat. Toxicol Appl Pharmacol 16: 691-700. http://dx.doi.org/10.1016/0041-008X(70)90074-8
Bättig, K; Grandjean, E; Rossi, L; Rickenbacher, J. (1958). Toxicologische untersuchungen uber trimethylbenzol. Archiv fuer Gewerbepathologie und Gewerbehygiene 16: 555-566.
Bättig, K; Grandjean, E; Turrian, V. (1956). [Health damage after continuous exposure to trimethyl benzene in a painting workshop]. Soz Praventivmed 1: 389-403. http://dx.doi.org/10.1007/BF02031676
Billionnet, C; Gay, E; Kirchner, S; Leynaert, B; Annesi-Maesano, I. (2011). Quantitative assessments of indoor air pollution and respiratory health in a population-based sample of French dwellings. Environ Res 111: 425-434. http://dx.doi.org/10.1016/j.envres.2011.02.008
Borriston (Borriston Laboratories). (1983). Four-week oral nephrotoxicity screening study in male F-344 rats. (1706). Temple Hills, MD. https://ntrl.ntis.gov/NTRL/dashboard/searchResults.xhtml?searchQuery=OTS00004600
Brown, RP; Delp, MD; Lindstedt, SL; Rhomberg, LR; Beliles, RP. (1997). Physiological parameter values for physiologically based pharmacokinetic models [Review]. Toxicol Ind Health 13: 407-484. http://dx.doi.org/10.1177/074823379701300401
Carrillo, J, -C; Adenuga, MD; Mckee, RH. (2014). The sub-chronic toxicity of regular White Spirit in rats. Regul Toxicol Pharmacol 70: 222-230. http://dx.doi.org/10.1016/j.yrtph.2014.07.007
Cerf, J; Potvin, M; Laham, S. (1980). Acidic metabolites of pseudocumene in rabbit urine. Arch Toxicol 45: 93-100. http://dx.doi.org/10.1007/BF01270906
Chen, R; Dick, F; Seaton, A. (1999). Health effects of solvent exposure among dockyard painters: Mortality and neuropsychological symptoms. Occup Environ Med 56: 383-387. http://dx.doi.org/10.1136/oem.56.6.383
Chevron (Chevron Chemical Company). (1985). One-generation reproduction study of PED 5450 in rats with cover letter. (OTS0206739). Washington, DC: U.S. EPA. https://ntrl.ntis.gov/NTRL/dashboard/searchResults/titleDetail/OTS0206739.xhtml
Clark, DG; Butterworth, ST; Martin, JG; Roderick, HR; Bird, MG. (1989). Inhalation toxicity of high flash aromatic naphtha. Toxicol Ind Health 5: 415-428.
Collins, AS; Sumner, SCJ; Borghoff, SJ; Medinsky, MA. (1999). A physiological model for tert-amyl methyl ether and tert-amyl alcohol: Hypothesis testing of model structures. Toxicol Sci 49: 15-28. http://dx.doi.org/10.1093/toxsci/49.1.15
Cooper, SP; Burau, K; Sweeney, A; Robison, T; Smith, MA; Symanski, E; Colt, JS; Laseter, J; Zahm, SH. (2001). Prenatal exposure to pesticides: A feasibility study among migrant and seasonal farmworkers. Am J Ind Med 40: 578-585. http://dx.doi.org/10.1002/ajim.1123
da Silva Quevedo, L; Tochetto, T; Siqueira, MA; Machado, MS. (2012). Auditory brainstem response in gas station attendants. Braz J Otorhinolaryngol 78: 63-68. http://dx.doi.org/10.5935/1808-8694.20120035
1Multiple references published in the same year by the same author(s) have been assigned a letter (e.g., 1986a, 1986b) in Volume 1 of the Toxicological Review, based on which publication’s title comes first alphabetically.
Supplemental Information―Trimethylbenzenes
R-2
Dahl, AR; Damon, EG; Mauderly, JL; Rothenberg, SJ; Seiler, FA; McClellan, RO. (1988). Uptake of 19 hydrocarbon vapors inhaled by F344 rats. Fundam Appl Toxicol 10: 262-269. http://dx.doi.org/10.1016/0272-0590(88)90310-7
Deurenberg, P; Weststrate, JA; Seidell, JC. (1991). Body mass index as a measure of body fatness: Age- and sex-specific prediction formulas. Br J Nutr 65: 105-114. http://dx.doi.org/10.1079/BJN19910073
Douglas, JF; McKee, RH; Cagen, SZ; Schmitt, SL; Beatty, PW; Swanson, MS; Schreiner, CA; Ulrich, CE; Cockrell, BY. (1993). A neurotoxicity assessment of high flash aromatic naphtha. Toxicol Ind Health 9: 1047-1058.
Dowty, BJ; Laseter, JL; Storer, J. (1976). The transplacental migration and accumulation in blood of volatile organic constituents. Pediatr Res 10: 696-701. http://dx.doi.org/10.1203/00006450-197607000-00013
Eide, I; Zahlsen, K. (1996). Inhalation experiments with mixtures of hydrocarbons. Experimental design, statistics and interpretation of kinetics and possible interactions. Arch Toxicol 70: 397-404. http://dx.doi.org/10.1007/s002040050291
El Hamid Hassan, AA; El Moez Elnagar, SA; El Tayeb, IM; El Halim Bolbol, SA. (2013). Health hazards of solvents exposure among workers in paint industry. OJSST 3: 87-95. http://dx.doi.org/10.4236/ojsst.2013.34011
Emond, C; Krishnan, K. (2006). A physiological pharmacokinetic model based on tissue lipid content for simulating inhalation pharmacokinetics of highly lipophilic volatile organic chemicals. Toxicol Mech Meth 16: 395-403. http://dx.doi.org/10.1080/15376510600860474
Fiserova-Bergerova, V. (1983). Gases and their solubility: A review of fundamentals. In Modeling of Inhalation Exposure to Vapors: Uptake, Distribution, and Elimination. Boca Raton, FL: CRC Press.
Fuente, A; McPherson, B; Cardemil, F. (2013). Xylene-induced auditory dysfunction in humans. Ear Hear 34: 651-660. http://dx.doi.org/10.1097/AUD.0b013e31828d27d7
Fuente, A; McPherson, B; Hood, LJ. (2012). Hearing loss associated with xylene exposure in a laboratory worker. J Am Acad Audiol 23: 824-830. http://dx.doi.org/10.3766/jaaa.23.10.7
Fukaya, Y; Saito, I; Matsumoto, T; Takeuchi, Y; Tokudome, S. (1994). Determination of 3,4-dimethylhippuric acid as a biological monitoring index for trimethylbenzene exposure in transfer printing workers. Int Arch Occup Environ Health 65: 295-297. http://dx.doi.org/10.1007/BF00405692
Gage, JC. (1970). The subacute inhalation toxicity of 109 industrial chemicals. Br J Ind Med 27: 1-18. http://dx.doi.org/10.1136/oem.27.1.1
Gaschen, A; Lang, D; Kalberer, M; Savi, M; Geiser, T; Gazdhar, A; Lehr, C, -M; Bur, M; Dommen, J; Baltensperger, U; Geiser, M. (2010). Cellular responses after exposure of lung cell cultures to secondary organic aerosol particles. Environ Sci Technol 44: 1424-1430. http://dx.doi.org/10.1021/es902261m
Gong, Y; Kishi, R; Kasai, S; Katakura, Y; Fujiwara, K; Umemura, T; Kondo, T; Sato, T; Sata, F; Tsukishima, E; Tozaki, S; Kawai, T; Miyama, Y. (2003). Visual dysfunction in workers exposed to a mixture of organic solvents. Neurotoxicology 24: 703-710. http://dx.doi.org/10.1016/S0161-813X(03)00034-2
Gralewicz, S; Wiaderna, D. (2001). Behavioral effects following subacute inhalation exposure to m-xylene or trimethylbenzene in the rat: A comparative study. Neurotoxicology 22: 79-89. http://dx.doi.org/10.1016/S0161-813X(00)00003-6
Gralewicz, S; Wiaderna, D; Tomas, T. (1997a). Retardation of the age-related increase in spontaneous cortical spike-wave discharges (SWD) in rats after a 28-day inhalation exposure to an industrial solvent, pseudocumene (1,2,4-trimethylbenzene). Int J Occup Med Environ Health 10: 213-222.
Supplemental Information―Trimethylbenzenes
R-3
Gralewicz, S; Wiaderna, D; Tomas, T; Rydzyński, K. (1997b). Behavioral changes following 4-week inhalation exposure to pseudocumene (1,2,4-trimethylbenzene) in the rat. Neurotoxicol Teratol 19: 327-333. http://dx.doi.org/10.1016/S0892-0362(97)00001-9
Harlan Laboratories. (2012). Sprague Dawley: Outbred Rat. Available online at http://www.envigo.com/products-services/research-models-services/models/research-models/rats/outbred/sprague-dawley-aged-outbred-rat/hsdsprague-dawley-sd-aged/u.s.aspx (accessed June 4, 2012).
Hissink, AM; Krüse, J; Kulig, BM; Verwei, M; Muijser, H; Salmon, F; Leenheers, LH; Owen, DE; Lammers, JH; Freidig, AP; McKee, RH. (2007). Model studies for evaluating the neurobehavioral effects of complex hydrocarbon solvents III. PBPK modeling of white spirit constituents as a tool for integrating animal and human test data. Neurotoxicology 28: 751-760. http://dx.doi.org/10.1016/j.neuro.2007.03.005
Huo, J, -Z; Aldous, S; Campbell, K; Davies, N. (1989). Distribution and metabolism of 1,2,4-trimethylbenzene (pseudocumene) in the rat. Xenobiotica 19: 161-170. http://dx.doi.org/10.3109/00498258909034688
IBT Labs (Industrial Bio-Test Laboratories, Inc.). (1992). Four-week subacute aerosol inhalation toxicity study with MCS-1809 in albino rats. (88920007305; OTS0545631). St. Louis, MO: Monsanto Company.
Ichiba, M; Hama, H; Yukitake, S; Kubota, M; Kawasaki, S; Tomokuni, K. (1992). Urinary excretion of 3,4-dimethylhippuric acid in workers exposed to 1,2,4-trimethylbenzene. Int Arch Occup Environ Health 64: 325-327. http://dx.doi.org/10.1007/BF00379541
Janasik, B; Jakubowski, M; Jałowiecki, P. (2008). Excretion of unchanged volatile organic compounds (toluene, ethylbenzene, xylene and mesitylene) in urine as result of experimental human volunteer exposure. Int Arch Occup Environ Health 81: 443-449. http://dx.doi.org/10.1007/s00420-007-0233-9
Janik-Spiechowicz, E; Wyszyńska, K; Dziubałtowska, E. (1998). Genotoxicity evaluation of trimethylbenzenes. Mutat Res Genet Toxicol Environ Mutagen 412: 299-305. http://dx.doi.org/10.1016/S1383-5718(97)00202-7
Järnberg, J; Johanson, G. (1995). Liquid/air partition coefficients of the trimethylbenzenes. Toxicol Ind Health 11: 81-88. http://dx.doi.org/10.1177/074823379501100107
Järnberg, J; Johanson, G. (1999). Physiologically based modeling of 1,2,4-trimethylbenzene inhalation toxicokinetics. Toxicol Appl Pharmacol 155: 203-214. http://dx.doi.org/10.1006/taap.1998.8596
Järnberg, J; Johanson, G; Löf, A. (1996). Toxicokinetics of inhaled trimethylbenzenes in man. Toxicol Appl Pharmacol 140: 281-288. http://dx.doi.org/10.1006/taap.1996.0223
Järnberg, J; Johanson, G; Löf, A; Ståhlbom, B. (1997a). Inhalation toxicokinetics of 1,2,4-trimethylbenzene in volunteers: Comparison between exposure to white spirit and 1,2,4-trimethylbenzene alone. Sci Total Environ 199: 65-71. http://dx.doi.org/10.1016/S0048-9697(97)05482-X
Järnberg, J; Johanson, G; Löf, A; Ståhlbom, B. (1998). Toxicokinetics of 1,2,4-trimethylbenzene in humans exposed to vapours of white spirit: Comparison with exposure to 1,2,4-trimethylbenzene alone. Arch Toxicol 72: 483-491. http://dx.doi.org/10.1007/s002040050532
Järnberg, J; Ståhlbom, B; Johanson, G; Löf, A. (1997b). Urinary excretion of dimethylhippuric acids in humans after exposure to trimethylbenzenes. Int Arch Occup Environ Health 69: 491-497. http://dx.doi.org/10.1007/s004200050179
Jones, K; Meldrum, M; Baird, E; Cottrell, S; Kaur, P; Plant, N; Dyne, D; Cocker, J. (2006). Biological monitoring for trimethylbenzene exposure: A human volunteer study and a practical example in the workplace. Ann Occup Hyg 50: 593-598. http://dx.doi.org/10.1093/annhyg/mel016

Supplemental Information―Trimethylbenzenes
R-4
Juárez-Pérez, CA; Torres-Valenzuela, A; Haro-García, LC; Borja-Aburto, VH; Aguilar-Madrid, G. (2014). Ototoxicity effects of low exposure to solvent mixture among paint manufacturing workers. Int J Audiol 53: 370-376. http://dx.doi.org/10.3109/14992027.2014.888597
Juran, SA; Johanson, G; Ernstgård, L; Iregren, A; van Thriel, C. (2014). Neurobehavioral performance in volunteers after inhalation of white spirits with high and low aromatic content. Arch Toxicol 88: 1127-1140. http://dx.doi.org/10.1007/s00204-014-1236-4
Kimura, K; Nagata, T; Hara, K; Kageura, M. (1988). Gasoline and kerosene components in blood--A forensic analysis. Hum Toxicol 7: 299-305. http://dx.doi.org/10.1177/096032718800700401
Kimura, K; Nagata, T; Kudo, K; Imamura, T; Hara, K. (1991). Determination of kerosene and light oil components in blood. Biological Mass Spectrometry 20: 493-497. http://dx.doi.org/10.1002/bms.1200200810
Koch Industries (Koch Industries, Incorporated). (1995a). 14-day oral gavage toxicity study of 1,3,5-trimethylbenzene in rats with a recovery group, with cover letter dated 2/7/95. (44616). Wichita, KS: Koch Industries, Inc. https://ntrl.ntis.gov/NTRL/dashboard/searchResults.xhtml?searchQuery=OTS0558836
Koch Industries (Koch Industries, Incorporated). (1995b). 90-day oral gavage toxicity study of 1,3,5-trimethylbenzene in rats with a recovery group. (44618). Wichita, KS: Koch Industries, Inc.
Korsak, Z; Rydzyński, K. (1996). Neurotoxic effects of acute and subchronic inhalation exposure to trimethylbenzene isomers (pseudocumene, mesitylene, hemimellitene) in rats. Int J Occup Med Environ Health 9: 341-349.
Korsak, Z; Rydzyński, K; Jajte, J. (1997). Respiratory irritative effects of trimethylbenzenes: An experimental animal study. Int J Occup Med Environ Health 10: 303-311.
Korsak, Z; Stetkiewicz, J; Majcherek, W; Stetkiewicz, I; Jajte, J; Rydzyński, K. (2000a). Sub-chronic inhalation toxicity of 1,2,4-trimethylbenzene (pseudocumene) in rats. Int J Occup Med Environ Health 13: 155-164.
Korsak, Z; Stetkiewicz, J; Majcherek, W; Stetkiewicz, I; Jajte, J; Rydzyński, K. (2000b). Subchronic inhalation toxicity of 1,2,3-trimethylbenzene (hemimellitene) in rats. Int J Occup Med Environ Health 13: 223-232.
Korsak, Z; Swiercz, R; Rydzyński, K. (1995). Toxic effects of acute inhalation exposure to 1,2,4-trimethylbenzene (pseudocumene) in experimental animals. Int J Occup Med Environ Health 8: 331-337.
Kostrewski, P; Wiaderna-Brycht, A. (1995). Kinetics of elimination of mesitylene and 3,5-dimethylbenzoic acid after experimental human exposure. Toxicol Lett 77: 259-264. http://dx.doi.org/10.1016/0378-4274(95)03305-X
Kostrzewski, P; Wiaderna-Brycht, A; Czerski, B. (1997). Biological monitoring of experimental human exposure to trimethylbenzene. Sci Total Environ 199: 73-81. http://dx.doi.org/10.1016/S0048-9697(97)05504-6
Laham, S; Potvin, M. (1989). Identification and determination of mesitylene acidic metabolites in rabbit urine. Toxicol Environ Chem 24: 57-69. http://dx.doi.org/10.1080/02772248909357477
Lammers, JH; Emmen, HH; Muijser, H; Hoogendijk, EM; McKee, RH; Owen, DE; Kulig, BM. (2007). Model studies for evaluating the neurobehavioral effects of complex hydrocarbon solvents II. Neurobehavioral effects of white spirit in rat and human. Neurotoxicology 28: 736-750. http://dx.doi.org/10.1016/j.neuro.2007.03.003
Lee, CR; Jeong, KS; Kim, Y; Yoo, CI; Lee, JH; Choi, YH. (2005). Neurobehavioral changes of shipyard painters exposed to mixed organic solvents. Ind Health 43: 320-326. http://dx.doi.org/10.2486/indhealth.43.320
Supplemental Information―Trimethylbenzenes
R-5
Lehotzky, K; Szeberényi, JM; Ungváry, G, y; Kiss, A. (1985). Behavioural effects of prenatal exposure to carbon disulphide and to aromatol in rats. Arch Toxicol Suppl 8: 442-446. http://dx.doi.org/10.1007/978-3-642-69928-3_100
Lutz, P; Gralewicz, S; Wiaderna, D; Świercz, R; Grzelińska, Z; Majcherek, W. (2010). Contrasting effects of 4-week inhalation exposure to pseudocumene or hemimellitene on sensitivity to amphetamine and propensity to amphetamine sensitization in the rat. Int J Occup Med Environ Health 23: 85-94. http://dx.doi.org/10.2478/v10001-010-0005-8
Maltoni, C; Ciliberti, A; Pinto, C; Soffritti, M; Belpoggi, F; Menarini, L. (1997). Results of long-term experimental carcinogenicity studies of the effects of gasoline, correlated fuels, and major gasoline aromatics on rats. Ann N Y Acad Sci 837: 15-52. http://dx.doi.org/10.1111/j.1749-6632.1997.tb56863.x
Maule, AL; Heaton, KJ; Rodrigues, E; Smith, KW; McClean, MD; Proctor, SP. (2013). Postural sway and exposure to jet propulsion fuel 8 among US Air Force personnel. J Occup Environ Med 55: 446-453. http://dx.doi.org/10.1097/JOM.0b013e31827db94b
McKee, RH; Lammers, JH; Muijser, H; Owen, DE; Kulig, BM. (2010). Neurobehavioral effects of acute exposure to aromatic hydrocarbons. Int J Toxicol 29: 277-290. http://dx.doi.org/10.1177/1091581810365089
McKee, RH; Wong, ZA; Schmitt, S; Beatty, P; Swanson, M; Schreiner, CA; Schardein, JL. (1990). The reproductive and developmental toxicity of High Flash Aromatic Naphtha. Toxicol Ind Health 6: 441-460. http://dx.doi.org/10.1177/074823379000600307
Meulenberg, CJ; Vijverberg, HP. (2000). Empirical relations predicting human and rat tissue: Air partition coefficients of volatile organic compounds. Toxicol Appl Pharmacol 165: 206-216. http://dx.doi.org/10.1006/taap.2000.8929
Mikulski, PI; Wiglusz, R. (1975). The comparative metabolism of mesitylene, pseudocumene, and hemimellitene in rats. Toxicol Appl Pharmacol 31: 21-31. http://dx.doi.org/10.1016/0041-008X(75)90048-4
MOE (Ontario Ministry of the Environment). (2006). Rationale for the development of Ontario air standards for trimethylbenzenes: 1,2,3-trimethylbenzene 1,2,4-trimethylbenzene 1,3,5-trimethylbenzene. Ontario, Canada: Standards Development Branch, Ontario Ministry of the Environment.
NIOSH (National Institute for Occupational Safety and Health). (1988). Testimony of the National Institute for Occupational Safety and Health on the Occupational Safety and Health Administration's proposed rule on air contaminants, 29 CFR Part 1910, OSHA Docket No. H020. Presented at the OSHA informal public hearing, August 1, 1988. NIOSH policy statements. Cincinnati, OH. https://www.cdc.gov/niosh/docket/archive/pdfs/NIOSH-240/1988policyStatement.pdf
NIOSH (National Institute for Occupational Safety and Health). (1992). NIOSH recommendations for occupational safety and health: Compendium of policy documents and statements. (92-100). Cincinnati, OH: U.S. Department of Health and Human Services, Public Health Service, Centers for Disease Control, National Institute for Occupational Safety and Health. https://www.cdc.gov/niosh/docs/92-100/
Nong, A; McCarver, DG; Hines, RN; Krishnan, K. (2006). Modeling interchild differences in pharmacokinetics on the basis of subject-specific data on physiology and hepatic CYP2E1 levels: A case study with toluene. Toxicol Appl Pharmacol 214: 78-87. http://dx.doi.org/10.1016/j.taap.2005.12.001
Norseth, T; Waage, J; Dale, I. (1991). Acute effects and exposure to organic compounds in road maintenance workers exposed to asphalt. Am J Ind Med 20: 737-744. http://dx.doi.org/10.1002/ajim.4700200604
NRC (National Research Council). (2011). Review of the Environmental Protection Agency's draft IRIS assessment of formaldehyde. In Review of the Environmental Protection Agency's Draft
Supplemental Information―Trimethylbenzenes
R-6
IRIS Assessment of Formaldehyde (pp. 194). Washington, DC: The National Academies Press. http://www.nap.edu/catalog/13142.html
NRC (National Research Council). (2013). Acute exposure guideline levels for selected airborne chemicals. In Acute Exposure Guideline Levels for Selected Airborne Chemicals. Washington, DC: National Academies Press. http://www.nap.edu/catalog/15852/acute-exposure-guideline-levels-for-selected-airborne-chemicals-volume-13
Pelekis, M; Gephart, LA; Lerman, SE. (2001). Physiological-model-based derivation of the adult and child pharmacokinetic intraspecies uncertainty factors for volatile organic compounds. Regul Toxicol Pharmacol 33: 12-20. http://dx.doi.org/10.1006/rtph.2000.1436
Pratt, H; Karim, N; Bleich, N; Mittelman, N. (2000). Short latency visual evoked potentials in occupational exposure to organic solvents. Neurophysiol Clin 30: 306-312. http://dx.doi.org/10.1016/S0987-7053(00)00230-6
Pyykkö, K. (1980). Effects of methylbenzenes on microsomal enzymes in rat liver, kidney and lung. Biochim Biophys Acta 633: 1-9. http://dx.doi.org/10.1016/0304-4165(80)90032-X
Ruijten, MW; Hooisma, J; Brons, JT; Habets, CE; Emmen, HH; Muijser, H. (1994). Neurobehavioral effects of long-term exposure to xylene and mixed organic solvents in shipyard spray painters. Neurotoxicology 15: 613-620.
Saillenfait, AM; Gallissot, F; Sabate, JP; Morel, G. (2005). Developmental toxicity of two trimethylbenzene isomers, mesitylene and pseudocumene, in rats following inhalation exposure. Food Chem Toxicol 43: 1055-1063. http://dx.doi.org/10.1016/j.fct.2005.02.008
Schreiner, CA; Edwards, DA; Mckee, RH; Swanson, M; Wong, ZA; Schmitt, S; Beatty, P. (1989). The mutagenic potential of high flash aromatic naphtha. Cell Biol Toxicol 5: 169-188. http://dx.doi.org/10.1007/BF00122651
Silva, CL; Passos, M; Câmara, JS. (2011). Investigation of urinary volatile organic metabolites as potential cancer biomarkers by solid-phase microextraction in combination with gas chromatography-mass spectrometry. Br J Cancer 105: 1894-1904. http://dx.doi.org/10.1038/bjc.2011.437
Silva, CL; Passos, M; Câmara, JS. (2012). Solid phase microextraction, mass spectrometry and metabolomic approaches for detection of potential urinary cancer biomarkers--A powerful strategy for breast cancer diagnosis. Talanta 89: 360-368. http://dx.doi.org/10.1016/j.talanta.2011.12.041
Sulkowski, WJ; Kowalska, S; Matyja, W; Guzek, W; Wesolowski, W; Szymczak, W; Kostrzewski, P. (2002). Effects of occupational exposure to a mixture of solvents on the inner ear: A field study. Int J Occup Med Environ Health 15: 247-256.
Świercz, R; Majcherek, W; Wąsowicz, W. (2016). Hemimellitene (1,2,3-trimethylbenzene) in the liver, lung, kidney, and blood, and dimethylbenzoic acid isomers in the liver, lung, kidney and urine of rats after single and repeated inhalation exposure to hemimellitene. Int J Occup Med Environ Health 29: 113-128. http://dx.doi.org/10.13075/ijomeh.1896.00599
Świercz, R; Rydzyński, K; Wąsowicz, W; Majcherek, W; Wesołowski, W. (2002). Toxicokinetics and metabolism of pseudocumene (1,2,4-trimethylbenzene) after inhalation exposure in rats. Int J Occup Med Environ Health 15: 37-42.
Świercz, R; Wąsowicz, W; Majcherek, W. (2006). Mesitylene (1,3,5-trimethylbenzene) in the liver, lung, kidney, and blood and 3,5-dimethylbenzoic acid in the liver, lung, kidney and urine of rats after single and repeated inhalation exposure to mesitylene. Pol J Environ Stud 15: 485-492.
Świercz, R; Wiaderna, D; Wąsowicz, W; Rydzyński, K. (2003). Pseudocumene in brain, liver, lung and blood of rats after single and repeated inhalation exposure. Int J Occup Med Environ Health 16: 61-66.
Supplemental Information―Trimethylbenzenes
R-7
Tang, CY; Carpenter, DM; Eaves, EL; Ng, J; Ganeshalingam, N; Weisel, C; Qian, H; Lange, G; Fiedler, NL. (2011). Occupational solvent exposure and brain function: An fMRI study. Environ Health Perspect 119: 908-913. http://dx.doi.org/10.1289/ehp.1002529
Tomas, T; Lutz, P; Wiaderna, D. (1999a). Changes in electrocortical arousal following acute trimethylbenzene administration in rats. Int J Occup Med Environ Health 12: 67-78.
Tomas, T; Świercz, R; Wiaderna, D; Gralewicz, S. (1999b). Effects of acute exposure to aromatic hydrocarbons C 9 on locomotor activity in rats. Trimethylbenzene isomers. Int J Occup Med Environ Health 12: 331-343.
Tomas, T; Wiaderna, D; Świercz, R. (1999c). Neurotoxicity assessment of selected organic solvents based on spontaneous and evoked cortical and hippocampal activity in rats. Int J Occup Med Environ Health 12: 73-84.
Tsujimoto, Y; Noda, T; Shimizu, M; Moriwaki, H; Tanaka, M. (1999). Identification of the dimethylbenzyl mercapturic acid in urine of rats treated with 1,2,3-trimethylbenzene. Chemosphere 39: 725-730. http://dx.doi.org/10.1016/S0045-6535(99)00008-9
Tsujimoto, Y; Noda, T; Shimizu, M; Moriwaki, H; Tanaka, M. (2000). Identification of the dimethylbenzyl mercapturic acid in urine of rats administered with 1,2,4-trimethylbenzene. Chemosphere 40: 893-896. http://dx.doi.org/10.1016/S0045-6535(99)00467-1
Tsujimoto, Y; Warashina, M; Nam, VD; Noda, T; Shimizu, M; Yamaguchi, Y; Moriwaki, H; Morimoto, T; Kakiuchi, K; Maeda, Y; Tanaka, M. (2005). Determination of urinary phenolic metabolites from rats treated with 1,2,3-and 1,3,5-trimethylbenzenes. J Occup Health 47: 337-339. http://dx.doi.org/10.1539/joh.47.337
Tsujino, Y; Hieda, Y; Kimura, K; Eto, H; Yakabe, T; Takayama, K; Dekio, S. (2002). Distribution of kerosene components in rats following dermal exposure. Int J Legal Med 116: 207-211. http://dx.doi.org/10.1007/s00414-001-0282-7
U.S. EPA (U.S. Environmental Protection Agency). (1988). Reference physiological parameters in pharmacokinetic modeling [EPA Report]. (EPA/600/6-88/004). Washington, DC: U.S. Environmental Proctection Agency. https://ntrl.ntis.gov/NTRL/dashboard/searchResults.xhtml?searchQuery=PB88196019
U.S. EPA (U.S. Environmental Protection Agency). (1994a). Chemical summary for 1,2,4-trimethylbenzene [EPA Report]. (EPA/749/F-94/022A). Washington, DC: U.S. Environmental Protection Agency, Office of Pollution Prevention and Toxics. http://www.epa.gov/chemfact/s_trimet.txt
U.S. EPA (U.S. Environmental Protection Agency). (1994b). Methods for derivation of inhalation reference concentrations and application of inhalation dosimetry [EPA Report] (pp. 1-409). (EPA/600/8-90/066F). Research Triangle Park, NC: U.S. Environmental Protection Agency, Office of Research and Development, Office of Health and Environmental Assessment, Environmental Criteria and Assessment Office. https://cfpub.epa.gov/ncea/risk/recordisplay.cfm?deid=71993&CFID=51174829&CFTOKEN=25006317
U.S. EPA (U.S. Environmental Protection Agency). (2002). A review of the reference dose and reference concentration processes (pp. 1-192). (EPA/630/P-02/002F). Washington, DC: U.S. Environmental Protection Agency, Risk Assessment Forum. http://www.epa.gov/osa/review-reference-dose-and-reference-concentration-processes
U.S. EPA (U.S. Environmental Protection Agency). (2005). Guidelines for carcinogen risk assessment [EPA Report] (pp. 1-166). (EPA/630/P-03/001F). Washington, DC: U.S. Environmental Protection Agency, Risk Assessment Forum. http://www2.epa.gov/osa/guidelines-carcinogen-risk-assessment
U.S. EPA (U.S. Environmental Protection Agency). (2007). Acute exposure guideline levels (AEGLs) for 1,3,5-trimethylbenzene (CAS reg. no. 108-67-8), 1,2,4-trimethylbenzene (CAS reg. no. 95-63-6), 1,2,3-trimethylbenzene (CAS reg. no. 526-73-8) [EPA Report] (pp. 1-41).
Supplemental Information―Trimethylbenzenes
R-8
Washington, DC. http://www.epa.gov/opptintr/aegl/pubs/123_%20124_%20135_trimethylbenzenes_%20interim_11_2007.v1.pdf
U.S. EPA (U.S. Environmental Protection Agency). (2012). Benchmark dose technical guidance (pp. 1-99). (EPA/100/R-12/001). Washington, DC: U.S. Environmental Protection Agency, Risk Assessment Forum. https://www.epa.gov/risk/benchmark-dose-technical-guidance
U.S. EPA (U.S. Environmental Protection Agency). (2016a). PBPK data files for TMB (updated February 2016) [PBPK]. Research Triangle Park, NC.
U.S. EPA (U.S. Environmental Protection Agency). (2016b). Results of the BMD analyses for 1,2,4-TMB, 1,2,3-TMB, and 1,3,5-TMB [BMDS]. Research Triangle Park, NC.
Ungváry, G; Tátrai, E. (1985). On the embryotoxic effects of benzene and its alkyl derivatives in mice, rats and rabbits. Arch Toxicol 8: 425-430. http://dx.doi.org/10.1007/978-3-642-69928-3_95
Versar (Versar Inc.). (2013). Peer review report: External peer review of the 1995 Koch Industries study report: 90-day oral gavage toxicity study of 1,3,5-trimethylbenzene in rats with a recovery group (pp. 1-23). (EP-C-12-045). Springfiled, VA: Versar, Inc. http://ofmpub.epa.gov/eims/eimscomm.getfile?p_download_id=517403
Wiaderna, D; Gralewicz, S; Tomas, T. (1998). Behavioral changes following a four-week inhalation exposure to hemimellitene (1,2,3-trimethylbenzene) in rats. Int J Occup Med Environ Health 11: 319-334.
Wiaderna, D; Gralewicz, S; Tomas, T. (2002). Assessment of long-term neurotoxic effects of exposure to mesitylene (1,3,5-trimethylbenzene) based on the analysis of selected behavioral responses. Int J Occup Med Environ Health 15: 385-392.
Wiglusz, R. (1979). The effect of 1, 3, 5-trimethylbenzene inhalation exposure on the glucuronic acid pathway and activity of some xenobiotic-metabolizing enzymes. Bull Inst Marit Trop Med Gdynia 30: 189-196.
Wiglusz, R; Delag, G; Mikulski, P. (1975a). Serum enzymes activity of mesitylene vapour treated rats. Bull Inst Marit Trop Med Gdynia 26: 303-313.
Wiglusz, R; Kienitz, M; Delag, G; Galuszko, E; Mikulski, P. (1975b). Peripheral blood of mesitylene vapour treated rats. Bull Inst Marit Trop Med Gdynia 26: 315-321.
Williams, LR; Leggett, RW. (1989). Reference values for resting blood flow to organs of man [Review]. Clinical Physics and Physiological Measurement 10: 187-217. http://dx.doi.org/10.1088/0143-0815/10/3/001
Win-Shwe, T, -T; Fujimaki, H. (2010). Neurotoxicity of toluene [Review]. Toxicol Lett 198: 93-99. http://dx.doi.org/10.1016/j.toxlet.2010.06.022
Win-Shwe, T, -T; Kunugita, N; Yoshida, Y; Nakajima, D; Tsukahara, S; Fujimaki, H. (2012). Differential mRNA expression of neuroimmune markers in the hippocampus of infant mice following toluene exposure during brain developmental period. J Appl Toxicol 32: 126-134. http://dx.doi.org/10.1002/jat.1643
Win-Shwe, T, -T; Yoshida, Y; Kunugita, N; Tsukahara, S; Fujimaki, H. (2010). Does early life toluene exposure alter the expression of NMDA receptor subunits and signal transduction pathway in infant mouse hippocampus? Neurotoxicology 31: 647-653. http://dx.doi.org/10.1016/j.neuro.2010.08.006
Yoshida, T. (2010). Estimation of absorption of aromatic hydrocarbons diffusing from interior materials in automobile cabins by inhalation toxicokinetic analysis in rats. J Appl Toxicol 30: 525-535. http://dx.doi.org/10.1002/jat.1522
Zahlsen, K; Eide, I; Nilsen, AM; Nilsen, OG. (1992). Inhalation kinetics of C6 to C10 aliphatic, aromatic and naphthenic hydrocarbons in rat after repeated exposures. Pharmacol Toxicol 71: 144-149. http://dx.doi.org/10.1111/j.1600-0773.1992.tb00534.x

Supplemental Information―Trimethylbenzenes
R-9
Zahlsen, K; Nilsen, AM; Eide, I; Nilsen, OG. (1990). Accumulation and distribution of aliphatic (n-nonane), aromatic (1,2,4-trimethylbenzene) and naphthenic (1,2,4-trimethylcyclohexane) hydrocarbons in the rat after repeated inhalation. Pharmacol Toxicol 67: 436-440. http://dx.doi.org/10.1111/j.1600-0773.1990.tb00859.x