us epa-pesticides; pyraclostrobin
TRANSCRIPT
Chemical: Carbamic acid, ?2-???l-(4-chloropheny1)-
PC Code: 099100 HED Pile Code 11000 Chemistry Reviews Memo Date: 11/28/2001 File ID: DPD269668 Accession Number: 412-02-0281
HED Records Reference Center 04/30/2002
r)+cEo SQ).
3 n".u rwj UNITED STATES ENVIRONMENTAL PROTECTION AGENCY ?. P %GL pRo~cG
WASHINGTON, D.C. 20460
OFFICE OF
November 28,2001
MEMORANDUM
SUBJECT: PP#OF06139. PC Code 099100. Pyraclostrobin on Various Crops: Bananas (import), Barley, Berries, Bulb Vegetables, Citrus Fruits, Cucurbit Vegetables, Dried Shelled Pea & Bean (except Soybean), Fruiting Vegetables, Grapes, Grass, Peanut, Pistachio, Root Vegetables (except Sugar Beet), Rye, Snap Beans, Stone Fruits, Strawbeny, Sugar Beet, Tree Nuts, Tuberous and Corm Vegetables, and Wheat. Review of Analytical Methods and Residue Data. EPA File Symbols: 7969-RIT, 7969-RIA. CAS # 175013-18-0. DP Barcodes: D269668, D272771, D272789, D274095, D274192, D274471, D274957, D275843, D278429.
MRID #s: 451 184-28, 451 184-29,451184-30,451184-31,451184-32,451184-33, 451184-34,451184-35,451184-36,451184-37,451185-01, 451185-02,451185-03, 451185-04,451185-05,451185-06,451185-07,451185-08,451185-09,451185-10, 451185-11,451185-12,451185-14,451185-15,45l185-16,451185-17,451185-l8, 451185-19,451185-20,451185-21,451185-22,451185-23,451185-24,451185-25, 451 185-26,451185-27,451185-28,451185-29,45ll85-30,451l85-3l, 451 185-32, 451 185-33,451185-34,451185-35,451185-36,451185-37,451186-01,451186-02, 45 1186-03,451186-04,451186-05,451186-06,451186-07,451186-08,451l86-09, 451186-10,451186-11,451186-12,451186-1;,451186-14,451186-15,451186-16, 451186-17,451186-18, 451 186-19,451186-20,451186-21,451186-22,451186-23, 451 186-24,451186-25,451605-01,452728-01,452749-01,453211-01,453675-01, 453994-01 (replaced 45 1184-28 with minor corrections), 454299-01
FROM: Leung Cheng, Chemist Registration Action Bran Health Effects Division (7509C)
THROUGH: Stephen Dapson, Branch Senior Scientist Registration Action Branch 3 Health Effects Division (7509C)
TO: Cynthia Giles-ParkerIJohn B e n , Team 22
Fungicide Branch Registration Division (7505C)
Following is the chemistry assessment of a petition from BASF Corp. for the establishment of permanent tolejances for residues of the fungicide, pyraclostrobin [carbamic acid, [2-[[[I -(4-chlorophenyl)y;1H-pyrazol-3-yl]oxy]methyl]phenyl]methoxy-, methyl ester], inlon many crops: bananas (i&pax&X barley, berries, bulb yegetables, citrus fruits, cucurbit vegetables, dried shelled pea & beA-(ex~&~t soybean), fruiting vegetables, grapes, grass, peanut, pistachio, root vegetables (except sugar beet) , rye, snap beans, stone fruits, strawberry, sugar beet, tree nuts, tuberous and corm vegetables, and wheat. The review was performed by the Dynamac Corp. under the supervision of RAB3, HED. The data assessment has undergone secondary review within the branch and has been revised to reflect current HED and OPP policy. If any additional input is needed, please advise.
Executive Summary of Residue Chemistry Deficiencies
. Product chemistry (under the purview of the Registration Division). . Amend Section B and labels. . Agency validation of enforcement methods. . Revise Section F. . Submit final storage stability data for livestock commodities. Submit additional crop field trials. . Submit sample storage intervals for the confined rotational crop study.
cc:RAB3 Reading F, Cheng, Wassell RDiI:Team:6/21/200 1 :ChemSACIPMRAICDPR:8/2/2001 :SDapson: 1 1/6/200 1 7509C:RAB3:LCheng:CM#2:RM810A: 11/21/2001 :3rab/pyraclostrobin
PYRACLOSTROBDJ
PP#OF06139: EVALUATION OF RESIDUE CHEMISTRY DATA TO SUPPORT
PERMANENT TOLERANCES FOR USE OF PYRACLOSTROBIN
ON BANANAS (IMPORT). BARLEY. BERRIES. BULB VEGETABLES, CITRUS FRUITS,
CUCURBIT VEGETABLES. DRIED SHELLED PEA & BEAN (EXCEPT SOYBEAN).
VEGETABLES (EXCEPT SUGAR BEET), RYE, SNAP BEANS. STONE FRUITS,
STRAWBERRY, SUGAR BEET. TREE NUTS,
TUBEROUS AND CORM VEGETABLES. AND WHEAT
(DP BARCODES D269668, D272771. D272789. D274095. D274192. D274471, D274957,
INTRODUCTION
BASF Corporation has submitted a petition for the establishment of permanent tolerances for residues of the new foliar fungicide pyraclostrobin (BAS 500 F) in conjunction with a request for Section 3 registrations of a 20% water dispersible granular formulation (WDG; EPA File Symbol 7969-RIT) and a 2 lblgal emulsifiable concentrate formulation (EC; EPA File Symbol 7969- RIA) for use of pyraclostrobin on many foodlfeed crops.
Pyraclostrobin [carbamic acid, [2-[[[1-(4-chlorophenyl)-lH-pyrazol-3-yl]oxyjmethylj phenyllmethoxy-, methyl ester] (CAS name) belongs to the strobilurin class of fungicides (P- methoxyacrylate class of compounds). Strobilurins are synthetic analogs of a natural antifungal substance which inhibits spore germination and inhibits mycelial growth and sporulation of the fungus on the leaf surface.
The petitioner is proposing in a revised Section F dated June 12,2001 the establishment of permanent tolerances for the combined residues of pyraclostrobin methyl-N-[[[I-(4- chlorophenyl)pyrazol-3-yl]oxy]o-tolylj-N-methoxycarbamate and its desmethoxy metabolite, methyl-N-[[[l-(4-chlorophenyl)pyrazol-3-yl]oxy]o-tolyl] carbamate, expressed as parent compound, inion the following raw agricultural and processed commodities:
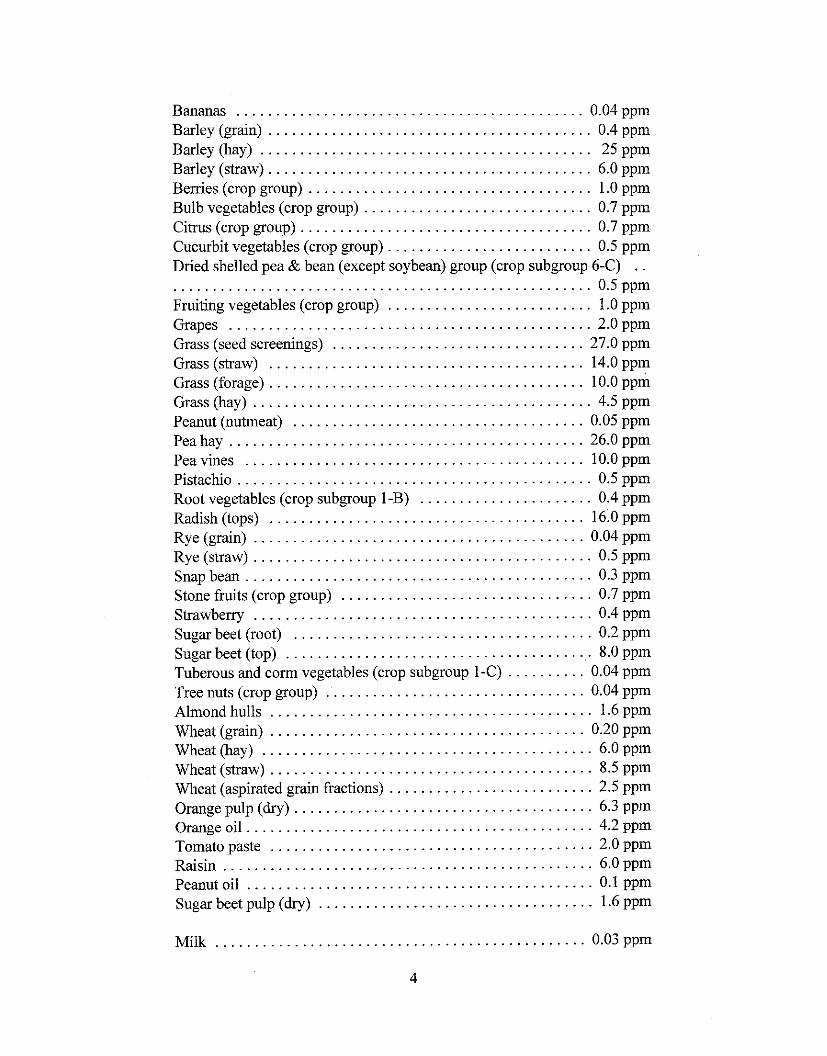
Bananas . . . . . . . . . . . . . . . . . . . . . . . . . . . . . . . . . . . . . . . . . . . . 0.04 ppm . . . . . . . . . . . . . . . . . . . . . . . . . . . . . . . . . . . . . . . . . Barley (grain) 0.4 ppm
Barley(hay) . . . . . . . . . . . . . . . . . . . . . . . . . . . . . . . . . . . . . . . . . . 25ppm . . . . . . . . . . . . . . . . . . . . . . . . . . . . . . . . . . . . . . . . . Barley (straw) 6.0 ppm
. . . . . . . . . . . . . . . . . . . . . . . . . . . . . . . . . . . . Berries (crop group) 1.0 ppm Bulb vegetables (crop group) . . . . . . . . . . . . . . . . . . . . . . . . . . . . . 0.7 ppm
. . . . . . . . . . . . . . . . . . . . . . . . . . . . . . . . . . . . . Citrus (crop group) 0.7 ppm Cucurbit vegetables (crop group) . . . . . . . . . . . . . . . . . . . . . . . . . . 0.5 ppm Dried shelled pea & bean (except soybean) group (crop subgroup 6-C) . . . . . . . . . . . . . . . . . . . . . . . . . . . . . . . . . . . . . . . . . . . . . . . . . . . . . . . 0.5 ppm Fruiting vegetables (crop group) . . . . . . . . . . . . . . . . . . . . . . . . . . 1.0 ppm Grapes . . . . . . . . . . . . . . . . . . . . . . . . . . . . . . . . . . . . . . . . . . . . . . 2.0ppm
. . . . . . . . . . . . . . . . . . . . . . . . . . . . . . . . Grass (seed screenings) 27.0 ppm . . . . . . . . . . . . . . . . . . . . . . . . . . . . . . . . . . . . . . . . Grass (straw) 14.0 ppm . . . . . . . . . . . . . . . . . . . . . . . . . . . . . . . . . . . . . . . . Grass (forage) 10.0 ppm
. . . . . . . . . . . . . . . . . . . . . . . . . . . . . . . . . . . . . . . . . . . Grass (hay) 4.5 ppm . . . . . . . . . . . . . . . . . . . . . . . . . . . . . . . . . . . . . Peanut (nutmeat) 0.05 ppm
. . . . . . . . . . . . . . . . . . . . . . . . . . . . . . . . . . . . . . . . . . . . . Pea hay 26.0 ppm . . . . . . . . . . . . . . . . . . . . . . . . . . . . . . . . . . . . . . . . . . . Pea vines 10.0 ppm
. . . . . . . . . . . . . . . . . . . . . . . . . . . . . . . . . . . . . . . . . . . . . Pistachio 0.5 ppm . . . . . . . . . . . . . . . . . . . . . . Root vegetables (crop subgroup 1 -B) 0.4 ppm
. . . . . . . . . . . . . . . . . . . . . . . . . . . . . . . . . . . . . . . . Radish (tops) 16.0 ppm . . . . . . . . . . . . . . . . . . . . . . . . . . . . . . . . . . . . . . . . . . Rye (grain) 0.04 ppm . . . . . . . . . . . . . . . . . . . . . . . . . . . . . . . . . . . . . . . . . . . Rye (straw) 0.5 ppm
. . . . . . . . . . . . . . . . . . . . . . . . . . . . . . . . . . . . . . . . . . . . Snap bean 0.3 ppm . . . . . . . . . . . . . . . . . . . . . . . . . . . . . . . . Stone fruits (crop group) 0.7 ppm
Strawbeny . . . . . . . . . . . . . . . . . . . . . . . . . . . . . . . . . . . . . . . . . . . 0.4ppm . . . . . . . . . . . . . . . . . . . . . . . . . . . . . . . . . . . . . . Sugar beet (root) 0.2 ppm
. . . . . . . . . . . . . . . . . . . . . . . . . . . . . . . . . . . . . . . Sugar beet (top) 8.0 ppm . . . . . . . . . . Tuberous and corm vegetables (crop subgroup 1-C) 0.04 ppm
. . . . . . . . . . . . . . . . . . . . . . . . . . . . . . . . . Tree nuts (crop group) 0.04 ppm . . . . . . . . . . . . . . . . . . . . . . . . . . . . . . . . . . . . . . . . . Almond hulls 1.6 ppm . . . . . . . . . . . . . . . . . . . . . . . . . . . . . . . . . . . . . . . . Wheat (grain) 0.20 ppm
. . . . . . . . . . . . . . . . . . . . . . . . . . . . . . . . . . . . . . . . . . Wheat (hay) 6.0 ppm . . . . . . . . . . . . . . . . . . . . . . . . . . . . . . . . . . . . . . . . . Wheat (straw) 8.5 ppm
. . . . . . . . . . . . . . . . . . . . . . . . . . Wheat (aspirated grain fractions) 2.5 ppm . . . . . . . . . . . . . . . . . . . . . . . . . . . . . . . . . . . . . . Orange pulp (dry) 6.3 ppm
. . . . . . . . . . . . . . . . . . . . . . . . . . . . . . . . . . . . . . . . . . . . Orange oil 4.2 ppm . . . . . . . . . . . . . . . . . . . . . . . . . . . . . . . . . . . . . . . . . Tomato paste 2.0 ppm . . . . . . . . . . . . . . . . . . . . . . . . . . . . . . . . . . . . . . . . . . . . . . . . . Raisin 6.0 ppm
. . . . . . . . . . . . . . . . . . . . . . . . . . . . . . . . . . . . . . . . . . . . Peanut oil 0.1 ppm . . . . . . . . . . . . . . . . . . . . . . . . . . . . . . . . . . . Sugar beet pulp (dry) 1.6 ppm
. . . . . . . . . . . . . . . . . . . . . . . . . . . . . . . . . . . . . . . . . . . . . . . Milk 0.03 ppm
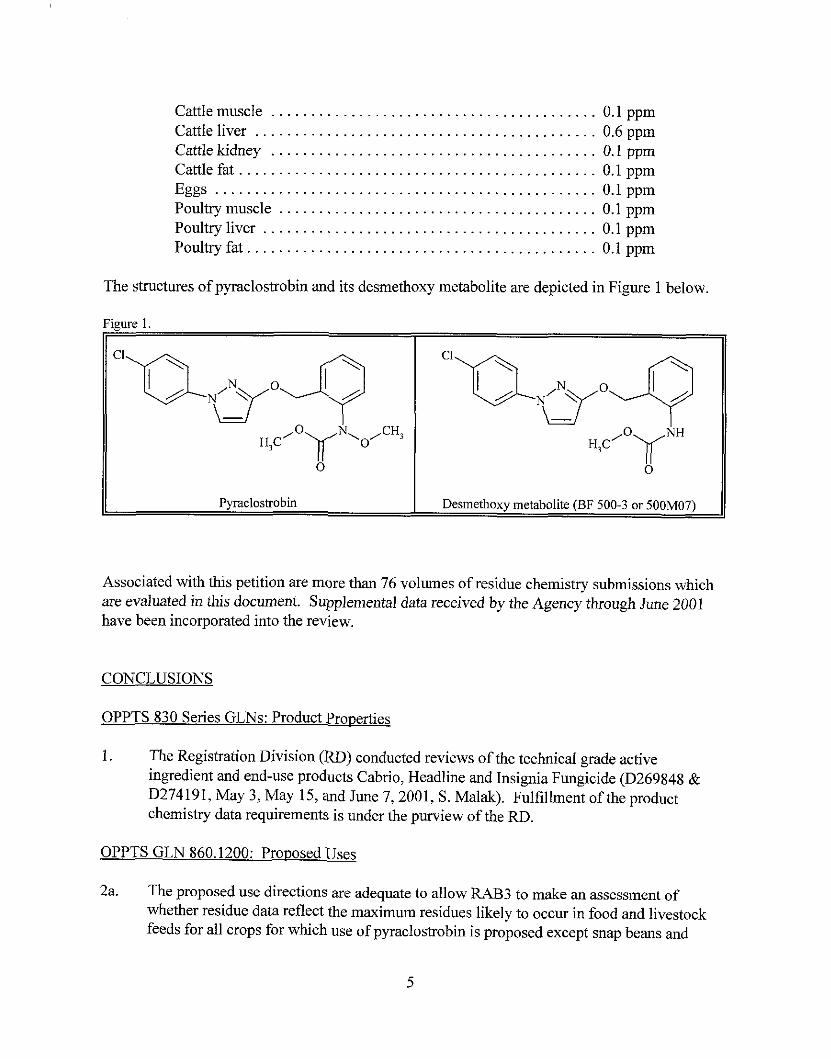
Cattle muscle . . . . . . . . . . . . . . . . . . . . . . . . . . . . . . . . . . . . . . . . . 0.1 ppm Cattle liver . . . . . . . . . . . . . . . . . . . . . . . . . . . . . . . . . . . . . . . . . . . 0.6 ppm Cattle kidney . . . . . . . . . . . . . . . . . . . . . . . . . . . . . . . . . . . . . . . . . 0.1 ppm Cattle fat . . . . . . . . . . . . . . . . . . . . . . . . . . . . . . . . . . . . . . . . . . . . . 0.1 ppm Eggs . . . . . . . . . . . . . . . . . . . . . . . . . . . . . . . . . . . . . . . . . . . . . . . . 0.lppm Poultry muscle . . . . . . . . . . . . . . . . . . . . . . . . . . . . . . . . . . . . . . . . 0.1 ppm Poultryliver . . . . . . . . . . . . . . . . . . . . . . . . . . . . . . . . . . . . . . . . . . 0.lppm Poultryfat . . . . . . . . . . . . . . . . . . . . . . . . . . . . . . . . . . . . . . . . . . . . 0.1ppm
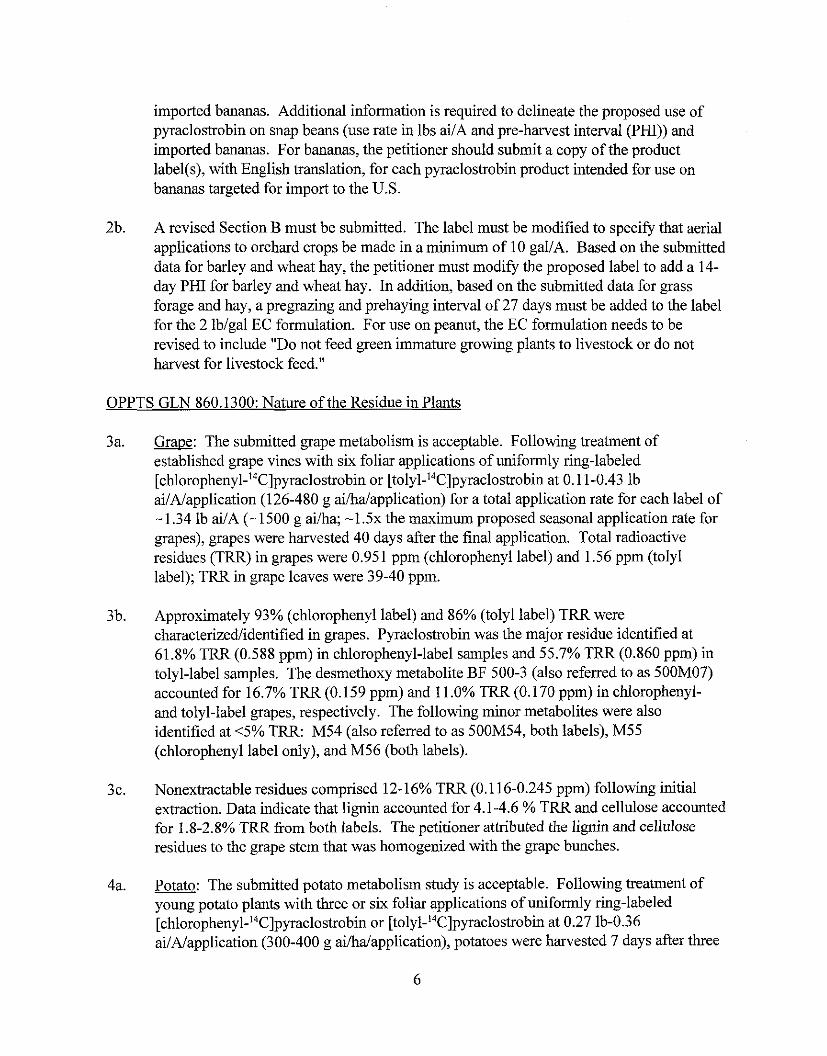
The structures of pyraclostrobin and its desmethoxy metabolite are depicted in Figure 1 below
Associated with this petition are more than 76 volumes of residue chemistry submissions which are evaluated in this document. Supplemental data received by the Agency through June 2001 have been incorporated into the review.
Figure 1.
CONCLUSIONS
CI
'QN30+ - N, ,CH3
H , C / O y 0
0
Pyraclostrobin
1. The Registration Division (RD) conducted reviews of the technical grade active ingredient and end-use products Cabrio, Headline and Insignia Fungicide (D269848 & D274191, May 3, May 15, and June 7,2001, S. Malak). Fulfillment of the product chemistry data requirements is under the purview of the RD.
C1
'QN30+ -
H F ' O ~ N H
0
Desmethoxy metabolite (BE 500-3 or 500M07)
OPPTS GLN 860.1200: Prooosed Uses
2a. The proposed use directions are adequate to allow RAB3 to make an assessment of whether residue data reflect the maximum residues likely to occur in food and livestock feeds for all crops for which use of pyraclostrobin is proposed except snap beans and
imported bananas. Additional information is required to delineate the proposed use of pyraclostrobin on snap beans (use rate in lbs ai/A and pre-harvest interval (PHI)) and imported bananas. For bananas, the petitioner should submit a copy of the product label(s), with English translation, for each pyraclostrobin product intended for use on bananas targeted for import to the U.S.
2b. A revised Section B must be submitted. The label must be modified to specify that aerial applications to orchard crops be made in a minimum of 10 gal/A. Based on the submitted data for barley and wheat hay, the petitioner must modify the proposed label to add a 14- day PHI for barley and wheat hay. In addition, based on the submitted data for grass forage and hay, a pregrazing and prehaying interval of 27 days must be added to the label for the 2 lblgal EC formulation. For use on peanut, the EC formulation needs to be revised to include "Do not feed green immature growing plants to livestock or do not harvest for livestock feed."
OPPTS GLN 860.1300: Nature of the Residue in Plants
3a. u: The submitted grape metabolism is acceptable. Following treatment of established grape vines with six foliar applications of uniformly ring-labeled [chlorophenyl-'4C]pyraclostrobin or [tolyl-'4C]pyraclostrobin at 0.1 1-0.43 lb ai1Alapplication (126-480 g ailhdapplication) for a total application rate for each label of - 1.34 lb ai/A (- 1500 g ailha; - 1 . 5 ~ the maximum proposed seasonal application rate for grapes), grapes were harvested 40 days after the final application. Total radioactive residues (TRR) in grapes were 0.951 pprn (chlorophenyl label) and 1.56 pprn (tolyl label); TRR in grape leaves were 39-40 ppm.
3b. Approximately 93% (chlorophenyl label) and 86% (tolyl label) TRR were characterizedtidentified in grapes. Pyraclostrobin was the major residue identified at 61.8% TRR (0.588 ppm) in chlorophenyl-label samples and 55.7% TRR (0.860 ppm) in tolyl-label samples. The desmethoxy metabolite BF 500-3 (also referred to as 500M07) accounted for 16.7% TRR (0.159 ppm) and I 1 .O% TRR (0.170 ppm) in chlorophenyl- and tolyl-label grapes, respectively. The following minor metabolites were also identified at <5% TRR: M54 (also referred to as 500M54, both labels), M55 (chlorophenyl label only), and M56 (both labels).
3c. Nonextractable residues comprised 12-16% TRR (0.1 16-0.245 ppm) following initial extraction. Data indicate that lignin accounted for 4.1-4.6 % TRR and cellulose accounted for 1.8-2.8% TRR from both labels. The petitioner attributed the lignin and cellulose residues to the grape stem that was homogenized with the grape bunches.
4a. m: The submitted potato metabolism study is acceptable. Following treatment of young potato plants with three or six foliar applications of uniformly ring-labeled [chlorophenyl-14C]pyraclostrobin or [tolyl-'4C]pyraclostrobin at 0.27 lb-0.36 ai/A/application (300-400 g ai/hdapplication), potatoes were harvested 7 days after three
applications (immature; total application rate for each label of 0.8 lb ailA; -0 .7~) or 7 days after six applications (mature; total application rate for each label of 1.7 lb ailA; 1 . 4 ~ the maximum proposed rate for any tuberous and corm crop). In chlorophenyl-label samples, TRR were 19.6 pprn and 0.009 pprn in immature foliage and tubers, respectively, and 69.8 pprn and 0.040 pprn in mature foliage and tubers. In tolyl-label samples, TRR were 9.86 pprn and 0.014 pprn in immature foliage and tubers, respectively, and 47.8 pprn and 0.048 pprn in mature foliage and tubers.
4b. Approximately 40-55% TRR and 89-96% TRR were characterizedlidentified in potato tubers and foliage, respectively from both labels. Pyraclostrobin was the major residue identified in all matrices except tolyl-label tubers. Pyraclostrobin accounted for 21% and 29.4% TRR (0.002 pprn and 0.012 ppm) in immature and mature chlorophenyl-label tubers, but for only 2.5% TRR (<0.001 ppm) in immature tolyl-label tubers; residues were nondetectable in mature tolyl-label tubers. In potato foliage, pyraclostrobin accounted for 56.5% and 55.1% TRR (1 1.1 and 38.5 ppm) in chlorophenyl-label foliage (mature and immature) and 65.2% and 64.6% TRR (6.43 and 30.9 ppm) in mature and immature tolyl-label foliage. The following metabolites were also detected in chlorophenyl-label tubers (mature and immature, respectively): the desmethoxy metabolite, 500M07 (BF 500-3), at 5.8% and 6.6% TRR, metabolite 500M54 at 6.2% and 2.6% TRR, the glucose conjugate of pyraclostrobin, 500M68, together with the chlorophenyl pyrazolol metabolite, 500M04, at 1.5% and 1.7% TRR, and the cleavage product, 500M79, at 0.4% and 3.3% TRR. These same metabolites were identified in chlorophenyl-label immature and mature foliage. In tolyl-label tubers, the major identified residue was the amino acid L-tryptophan, 500M72, which accounted for 10% TRR (0.001 ppm) and 29.2% TRR (0.014 ppm) in immature and mature tubers, respectively; L-tryptophan was also identified at 2.9% TRR (0.001 ppm) in the nonextractable residues of tolyl-label mature tubers following extraction with ammonia. One additional metabolite, 500M07, was identified at 0.6% TRR in immature tubers. In tolyl-label foliage, metabolite 500M07 was identified at 16.2% TRR (immature) and 21.4% TRR (mature). Metabolites 500M68 and 500M54 were also identified in immature tolyl-label foliage at 0.6% and 1.8% TRR, respectively.
5a. m: The submitted wheat metabolism study is acceptable. Following treatment of summer wheat plants with two foliar applications of uniformly ring-labeled [chlorophenyl-'4C]pyraclostrobin or [tolyl-14C]pyraclostrobin at 0.27 lb ai1Napplication (300 g ailhdapplication) for a total application rate of 0.54 lb ailA (- 1.6x), samples of wheat forage were harvested 0 and 3 1 days following the second application, and samples of mature wheat (straw, grain, and chaff) were harvested 41 days following the second application. In chlorophenyl-label samples TRR were 6.53 pprn in forage, 37.8 pprn in straw, 0.098 pprn in grain, and 24.3 pprn in chaff. In tolyl-label samples, TRR were 6.79 pprn in forage, 40.5 pprn in straw, 0.441 pprn in grain, and 30.6 pprn in chaff.
5b. Approximately 85-91 % TRR were characterizedlidentified in wheat forage, straw, and grain from both labels. Pyraclostrobin was the major residue identified in all matrices
except tolyl-label grain. In chlorophenyl-label and tolyl-label forage and straw, pyraclostrobin accounted for at least 53-58% TRR (3.72 and 3.60 pprn in forage, and 21.2 and 23.3 ppm in straw). In grain, pyraclostrobin accounted for 36.1% TRR (0.036 ppm) in the chlorophenyl-label sample, but only 7.8% TRR (0.034 ppm) in tolyl-label grain. The desmethoxy metabolite, 500M07 (BF 500-3), was also a significant component in forage and straw from both labels (at least 12-15% TRR) and in chlorophenyl-label grain (10.5% TRR); it accounted for 3.2% TRR in tolyl-label grain. The major identified component in tolyl-label grain was 500M72 (L-tryptophan), which accounted for 36.8% TRR (0.162 ppm) and the cleavage product 500M24 accounted for 10.4% TRR (0.047 ppm) in tolyl-label grain; these metabolites were not detected in any other wheat matrix. The following additional metabolites were identified in chlorophenyl- and tolyl-label forage and straw at 24% TRR: 500M68,500M70, and 500M71 (glucose conjugates), 500M76,500M54, and 500M34. In addition, metabolite 500M04 was identified in chlorophenyl-label wheat forage and straw at 1.7% and 3.7% TRR. Together the metabolites 500M68,500M70, and 500M71 accounted for 4.3% TRR in chlorophenyl- label grain.
5c. Nonextractable residues in forage, straw, and grain were subjected to extensive procedures to characterize crude cellulose and lignin. In chlorophenyl-label forage and straw, cellulose accounted for 1.8% and 1.0% TRR and lignin accounted for 4.4% and 6.8% TRR in forage and straw. In tolyl-label samples, cellulose accounted for 1.8% and 2.6% TRR in forage and straw, and lignin accounted for 6.8% and 7.9% TRR in forage and straw. In grain, 10.5% and 5.0% TRR were characterized as starch in chlorophenyl- and tolyl-label grain, and 1.7% TRR in tolyl-label grain were characterized as cellulose.
6. The HED Metabolism Assessment Review Committee (MARC) discussed the metabolism of pyraclostrobin in plants on September 20,2001 and has concluded that, based on the results of three dissimilar crop studies (grape, potato, and wheat), the nature of the residue in plants is understood for pyraclostrobin, and the residues of concern in plant commodities consist of pyraclostrobin and its desmethoxy metabolite for tolerance and risk assessment (D278044, L. Cheng, October 9,2001).
7. In addition to the above metabolism studies, the petitioner submitted a translocation study with wheat which demonstrated that very little radioactivity translocated from the treated leaves to the untreated plant part.
OPPTS GLN 860.1300: Nature of the Residue in Livestock
8a. Ruminants: The submitted goat metabolism study adequately delineates the nature of the residue in ruminants. Following oral administration of [14C]pyraclostrobin, labeled in - either the chlorophenyl ring or the tolyl ring, to lactating goats for 5 consecutive days at a feeding level of 12.2 ppm (-0.34~ the maximum theoretical dietary burden, MTDB, for beef cattle and dairy cattle), the TRR were 0.013-0.058 ppm in milk, 0.018 and 0.022
8
pprn in muscle, 0.082 and 0.094 pprn in fat, 0.054 and 0.085 pprn in kidney, and 0.241 and 0.383 pprn in liver.
8b. Following oral administration of [L4C]pyraclostrobin to lactating goats for 5 consecutive days at feeding levels of 70 pprn (tolyl label) or 78 pprn (chlorophenyl label) (- 1.9-2.2~ the MTDB for beef cattle and dairy cattle), TRR were 0.051-0.247 and 0.283-0.659 pprn in milk, 0.063 and 0.117 pprn in muscle, 0.380 and 0.928 pprn in fat, 0.316 and 0.335 pprn in kidney, and 0.828 and 1.51 pprn in liver. Residue levels were generally comparable for the two labels. Residues in milk plateaued about 36 hours after the first dose (tolyl label).
8c. Approximately 79-101% of the TRR were characterizedlidentified in the milk and tissues from the high-dose group. The parent, pyraclostrobin, was the major residue identified in muscle and fat, at 76.2-88.2% TRR (0.048-0.819 pprn). The parent was also identified in liver (1.4-8.4% TRR, 0.021-0.070 ppm) and in milk and kidney (17.4-23.2% TRR, 0.027- 0.074 pprn). However, in milk and kidney, the parent was not resolved from the desmethoxy metabolite, 500M07 (elsewhere referenced as BF 500-3). Metabolite 500M07 was also identified in muscle, fat, and liver, at 1.5-15.4% TRR (0.005-0.082 ppm). Additional major metabolites identified were 500M04 (in chlorophenyl-label milk at 16.3% TRR and in chlorophenyl-label kidney at 4.4% TRR), 500M05 (in chlorophenyl-label milk at 14.1% TRR and in chlorophenyl-label kidney at 13.4% TRR), 500M51 (in tolyl-label kidney at 12.4% TRR), and 500M67 (in kidney at 7.8-13.0% TRR and in milk at 2.1-2.8% TRR). Several additional metabolites were identified in milk, kidney, and liver, each at <6% TRR, see Figure 2 (Attachment 11) for the chemical structures of identified metabolites.
8d. Nonextractable residues in kidney and liver were further characterized by pronase digestion and acid hydrolysis. Pronase digestion released -50% TRR in liver and 10- 17% TRR in kidney. In general, higher levels of residue were released by refluxing with hydrochloric acid. Acid hydrolysis released -60% TRR in liver and -20% TRR in kidney. The bound residues in chlorophenyl-label kidney and liver were converted to chlorophenylpyrazole derivatives with acid hydrolysis.
9a. -: The submitted hen metabolism study adequately delineates the nature of the residue in poultry. Following oral administration of ['4C]pyraclostrobin, labeled in either the chlorophenyl ring or the tolyl ring, to laying hens for 7 consecutive days at a feeding level of 12-13 pprn (35-36x the maximum theoretical dietary burden for poultry), the TRR were 0.002-0.037 pprn in eggs, 0.007 and 0.009 pprn in muscle, 0.065 and 0.083 pprn in fat, and 0.3 17 and 0.474 pprn in liver. Residue levels were comparable for the two labels. Residues in eggs gradually increased during the study and had not reached a plateau at the time of sacrifice.
9b. Approximately 55-99% of the TRR were characterizedlidentified in eggs, fat, and liver; muscle samples were not analyzed because TRR levels were 10.010 ppm. The parent,
pyraclostrobin, was identified in eggs (8.5-8.8% TRR, 0.002-0.003 ppm) and fat (10.2- 15.2% TRR, 0.008-0.010 ppm) but was not identified in liver. Metabolite 500M07 (BF 500-3) was a major metabolite identified in eggs (8.3-1 1.2% TRR, 0.003 ppm) and fat (27.3-38.9% TRR, 0.022-0.025 ppm); it was not identified in liver. The major metabolite identified in liver was 500M32, a glucuronide conjugate, at 10.9-13.1% TRR (0.035- 0.062 ppm); this metabolite was not identified in eggs or fat. Several additional metabolites were identified in eggs, fat, and liver, each at 4 0 % TRR, see Figure 2 (Attachment 11) for the chemical structures of identified metabolites.
9c. In liver, a large portion of the TRR remained bound after initial extractions (4348% TRR). A significant portion of this radioactivity (15-21% TRR) was released following pronase digestion, indicating that a large portion of the nonextractable residues were protein bound. HPLC analysis of the digestate (chlorophenyl label) indicated the presence of 500M04 and 500M64; however, no quantitative data were provided.
10. The HED MARC discussed the metabolism of pyraclostrobin in livestock on September 20,2001 and concluded that the residues of concern in livestock commodities consist of pyraclostrobin and its metabolites convertible to 1-(4-chlorophenyl)-1H-pyrazol-3-ol and 1-(4-chloro-2-hydroxypheny1)-1H-pyrazol-3-o1 for tolerance and risk assessment (D278044, L. Cheng, October 9,2001).
OPPTS GLN 860.1340: Residue Analytical Method - Plant Commodities
1 la. The petitioner has proposed two tolerance enforcement methods for the determination of residues of pyraclostrobin and its desmethoxy metabolite (BF 500-3) idon plant commodities: LCIMSIMS method D9808 (U.S.) or 42110 (Germany), and HPLCNV method D9904. The validated method limits of quantitation (LOQs) for pyraclostrobin and BF 500-3 for both the LCIMSIMS or HPLCIUV methods are 0.02 ppm for each analyte in plant matrices. Adequate independent method validation and radiovalidation data have been submitted for both methods. LCIMSIMS method D9808 and HPLClLiV method D9904 have been forwarded to ACBBEAD for petition method validation (D269850, L. Cheng, November 8,2000). The petitioner must modify the proposed enforcement methods to include any modifications made by the EPA laboratory during the Agency laboratory validation.
1 lb. Based on the submitted concurrent method validation data, the LCIMSIMS method is adequate for data collection of residues of pyraclostrobin and BF 500-3 idon almond (nutrneat and hulls); banana; barley (hay, grain, and straw); bean (dry and snap); blueberry (highbush); cabbage (with and without wrapper leaves); dry field pea (hay, vine, and seed); cantaloupe; carrot; cherry (tart); cucumber; grape; grapefruit; grass (forage, hay, straw, and seed screenings); lemon; lentil (seed); onion (dry bulb and green); orange; peach; peanut (hay and nutmeat); pecan (nutmeat); pepper (bell and chili); pistachio; potato; plum; radish (roots and tops); raspberry (red); rye (grain and straw); squash (summer); strawberry; sugar beet (roots and tops); tomato; wheat (forage, hay,
grain, straw, and aspirated grain fractions); and the processed commodities of grapes, oranges, peanuts, plums, sugar beets, tomatoes, and wheat.
OPPTS GLN 860.1340: Residue Analytical Methods - Livestock Commodities
12a. The petitioner has proposed two tolerance enforcement methods for ruminant commodities: HPLCKJV method 43910 and Method 446, consisting of GCIMS method 44610 and LCNSiMS method 44611. The HPLCKJV method determines residues of pyraclostrobinper se. Method 446 has a hydrolysis step and determines residues of pyraclostrobin and its metabolites as BF 500-5 and BF 500-8; see Figure 3 (Attachment 111) for the chemical structures of these analytes. The validated method LOQs for BF 500-5 type residues, in parent equivalents, are 0.01 ppm for milk and 0.05 ppm for tissues, and the validated LOQs for BF 500-8 type residues, in parent equivalents, are 0.01 ppm for milk and 0.05 ppm for tissues. Independent method validation data for the HPLCIUV and LCIMSIMS methods are acceptable. Radiovalidation data submitted for the GCiMS and LClMSiMS methods are adequate for liver and milk, and marginal for muscle. Method 446 has been forwarded to ACBIBEAD for petition method validation. The petitioner must modify the proposed enforcement method to include any modifications made by the EPA laboratory during the Agency laboratory validation.
12b. The petitioner has proposed Method D9902 as an enforcement method for poultry commodities. The method contains a hydrolysis step and determines residues of pyraclostrobin and its metabolites as BF 500-5 and BF 500-9 in poultry commodities; see Figure 3 (Attachment 111) for the chemical structures of these analytes. The validated method LOQs for BF 500-5 type residues and for BF 500-9, in parent equivalents, are 0.05 ppm each for eggs and tissues.
12c. Independent validation and radiovalidation data were not submitted for Method D9902. These data are not relevant for the current petition since tolerances on poultry and eggs are not needed (see Conclusion 54b). These data may be required in the future when tolerances on poultry and eggs need to be established.
12d. The proposed enforcement methods were used for data collection in the ruminant and poultry feeding studies. The concurrent method validation recoveries demonstrate that the methods are adequate for data collection.
OPPTS GLN 860.1360: Multiresidue Method
13. Pyraclostrobin was successfully evaluated through several of the FDA protocols, while recovery of BF 500-3 was unsuccessful in all protocols. Pyraclostrobin was completely recovered through Protocol D (in grape) and E (in grape), and partially recovered through Protocol F (in peanut). Metabolite BF 500-3 had poor peak shape and inadequate sensitivity with Protocol C columns and therefore was not further analyzed under
Protocols D, E, and F. The results of the multiresidue testing for pyraclostrobin will be forwarded to FDA for inclusion in PAM Volume I.
OPPTS GLN 860.1380: Storage Stability Data
14a. Plant commodities: The submitted storage stability data indicate that residues of vvraclostrobin and its metabolite BF 500-3 are relativelv stable under frozen storage - conditions idon fortified samples of grape juice, sugar beet tops and roots, tomatoes, and wheat grain and straw for up to 25 months, and idon fortified samples of peanut nutmeat and processed oil for up to 19 months. The plant commodities chosen for the storage stability study are representative of all crops: an oilseed (peanut nutmeat), a non-oily grain (wheat grain), a leafy vegetable (sugar beet tops), a root crop (sugar beet roots), a hitlfiuiting vegetable (tomatoes), a dry feed (wheat straw), and processed oil (peanut) and juice (grape) commodities.
14b. The available storage stability data support the storage intervals (I 19 months) of the samples of almond nutmeat and hulls, banana, barley hay, straw, and grain, bean (dry and snap), blueberry, cabbage, cantaloupe, carrot, cherry (sweet and tart), cucumber, grape and grape juice and raisin, grapehit, grass forage, hay, straw, and seed screenings, lemon, lentils, onion (bulb and green), orange, orange processed commodities, dry pea hay, vine, and seed, peach, peanut hay and nutmeat, peanut processed commodities, pecan, pepper (bell and chili), pistachio, plum and its processed commodity prune, potato, radish roots and tops, raspberry (red), rye grain and straw, squash (summer), strawberry, sugar beet (roots and tops), sugar beet processed commodities, tomato, tomato processed commodities, wheat forage, hay, grain, aspirated grain fractions, and straw, and wheat processed commodities from the submitted field trial, field rotational crop, and processing studies.
15a. Livestock commodities: Cow commodity samples from the submitted ruminant feeding studies were stored frozen from collection to analysis for up to 3 months for whole and skim milk, 6.1 months for milk fat, 6.5 months for fat, 5.7 months for liver, 5.4 months for kidney, and 5 months for muscle. The submitted interim storage stability data indicate that residues of pyraclostrobin and its metabolite BF 500-10 (the latter representing the type of metabolites hydrolyzable to BF 500-8) are relatively stable under frozen storage conditions idon fortified samples of cow milk, liver, and muscle for up to 90 days (-3 months). The submitted storage stability data are adequate to support the storage conditions and intervals of the whole and skim milk samples from the ruminant feeding study; however, additional storage stability data are required to support the storage conditions and intervals of the milk fat and tissue samples from the ruminant feeding study. When the final report of the ruminant storage stability study becomes available, RAB3 will validate the stability of pyraclostrobin and its metabolites in milk and cow tissues stored under the conditions and in t e~a l s of the ruminant feeding study.
15b. Hen commodity samples from the submitted poultry feeding study were stored frozen from collection until analysis for up to 5 months for eggs, 4 months for fat, 3 months for liver, and 6 months for muscle. The submitted storage stability data indicate that residues of pyraclostrobin and its metabolite BF 500-16 (the latter representing the type of metabolites hydrolyzable to BF 500-9) are relatively stable under frozen storage conditions in/on fortified samples of eggs for up to 7 months. The submitted storage stability data for eggs are adequate to support the storage conditions and intervals of the egg samples from the poultry feeding study. The petitioner has referenced the ruminant storage stability data to support the storage conditions and intervals of the remaining poultry matrices. The storage stability data for ruminant commodities can be translated to poultry commodities.
OPPTS GLN 860.1500: Crop Field Trials
Root Vegetables (Except Sugar Beet) - Crop Subgrouv 1-B: 16. Carrot and Radish: The petitioner has provided adequate residue data reflecting the
maximum proposed use pattem for pyraclostrobin on carrots and radishes, the representative commodities of the root vegetables (except sugar beet) subgroup. The combined residues of pyraclostrobin and its metabolite BF 500-3 did not exceed the proposed tolerance level of 0.4 ppm idon carrots and radish roots harvested immediately (0-day PHI) following the last of three foliar applications of the WDG formulation at 0.20-0.21 lb ai/A/application for a total seasonal application rate of 0.59-0.62 lb ai/A (- lx the maximum proposed seasonal application rate). The combined residues were <0.04-10.26 ppm idon 12 treated samples of carrots and <0.06-<0.33 ppm idon 10 treated samples of radish roots; residues of BF 500-3 were below the LOQ idon all samples.
Tuberous and Corm Vegetable - Crov Subgroup 1-C: 17a. m: The petitioner has provided adequate residue data reflecting the maximum
proposed use pattem of pyraclostrobin on potato, the representative commodity of the tuberous and corm vegetables subgroup. The combined residues of pyraclostrobin and its metabolite BF 500-3 did not exceed the proposed tuberous and corm vegetables (crop subgroup I-C) tolerance level of 0.04 ppm idon potatoes harvested 3 days following the last of six foliar applications of the WDG formulation at 0.18-0.22 lb ailA/application for a total seasonal application rate of 1.24 lb ai/A (- lx the maximum proposed seasonal rate). The combined residues were <0.04 ppm (below the LOQ) idon all (34) samples of potatoes grown in the US., including residue decline samples.
17b. In the Canadian trials, the combined residues of pyraclostrobi~l and BF 500-3 were <0.04 ppm idon all samples of potatoes harvested 3 days following the last of: (i) four foliar applications of the WDG formulation at 0.20-0.21 lb ai/A/application for a total seasonal application rate of 0.80-0.82 lb ai/A; (ii) four foliar applications of the EC formulation at 0.19-0.21 lb ai/A/application for a total seasonal application rate of 0.80-0.81 lb ai/A; or (iii) four foliar applications of a tank mix of pyraclostrobin (WDG)
at 0.19-0.21 lb ai/A/application plus metiram (WDG) at 1.55-1.66 lb ailAlapplication for total seasonal application rates of 0.79-0.81 lb ai1A pyraclostrobin and 6.34-6.50 lb ai/A metiram.
Sugar Beet: 18. The petitioner has provided adequate residue data reflecting the maximum proposed use
pattern of pyraclostrobin on sugar beet roots. The combined residues of pyraclostrobin and its metabolite BF 500-3 did not exceed the proposed tolerance level of 0.2 ppm idon sugar beet roots harvested 7-8 days following the last of four foliar applications of the 2 lb/gal EC formulation at 0.16-0.21 lb ai/Alapplication for a total seasonal application rate of 0.75-0.81 lb ai/A (- lx the maximum proposed seasonal application rate). The combined residues were <0.04-0.15 pprn idon 24 samples of sugar beet roots.
Leaves of Root and Tuber Vegetables
19. Radish tops: The petitioner has submitted adequate residue data reflecting the maximum proposed use pattern of pyraclostrobin on radish tops. The combined residues of pyraclostrobin and its metabolite BF 500-3 did not exceed the proposed tolerance level of -. A
16.0 pprn idon radish tops harvested immediately (0-day PHI) following the last of three foliar applications of the 20% WDG formulation at 0.20-0.21 lb ai/A/application for a
A A - - total seasonal application rate of 0.59-0.0.62 lb ai/A (- lx the maximum proposed seasonal application rate). The combined residues were 7.17-15.8 pprn idon 10 samples of radish tops.
20. Sugar beet tovs: The petitioner has submitted adequate residue data reflecting the maximum proposed use pattern of pyraclostrobin on sugar beet tops. The combined residues of pyraclostrobin and its metabolite BF 500-3 did not exceed the proposed tolerance level of 8.0 ppm idon sugar beet tops harvested 7-8 days following the last of four foliar applications of the 2 lblgal EC formulation at 0.16-0.21 lb ailAIapplication for a total seasonal application rate of 0.75-0.81 lb ai1A (- l x the maximum proposed seasonal application rate). The combined residues were 0.42-7.37 pprn idon 24 samples of sugar beet tops.
Bulb Vegetables: 21. Dry Bulb and Green Onion: The petitioner has provided adequate residue data reflecting ~.
the maximum proposed use pattern of pyraclostrobin and its metabolite BF 500-3 on dry bulb onions and green onions, the representative commodities of the bulb vegetable crop - group. The combined residues of pyraclostrobin and BF 500-3 idon dry bulb and green onions harvested seven days following the last of six broadcast foliar applications of the WDG formulation at 0.15-0.16 lb ailA/application for a total seasonal application rate of 0.90-0.91 lb aiIA (- l x the maximum proposed seasonal application rate) were <0.04-0.15 pprn idon bulb onions (12 samples) and <0.05-0.65 pprn idon green onions (6 samples) treated with the WDG formulation. RAB3 recommends that the bulb vegetables (crop group) tolerance be proposed at 0.9 ppm. A revised Section F is required.
Dried Shelled Pea and Bean (Except Soybean) - Subgroup 6C: 22a. Pea. dw. seed: The petitioner has not provided adequate residue data for field pea in
support of the subgroup crop tolerance. Three field pea trials should be conducted in Region 11 reflecting application of the 2 lblgal WDG formulation according to the maximum proposed use pattern. Because Canadian trials were conducted in RegiodZone 14 which does not border Region 11, these data cannot be translated to the U.S. registration.
22b. The submitted U.S. field pea field trial data indicate that combined residues of pyraclostrobin and its metabolite BF 500-3 are <0.04 ppm idon field pea seed harvested 30 days following the last of two foliar applications of the EC formulation at 0.2 lb ailNapplication for a total seasonal application rate of -0.4 lb ai/A (- 1 . 5 ~ the maximum proposed seasonal rate). The combined residues were 0.05-0.37 ppm idon field pea seed grown in Canada treated with the EC formulation at 1 . 5 ~ the maximum proposed use pattern.
22c. m: The petitioner has not provided adequate residue data on lentil seed because the submitted field trials were conducted at twice the proposed maximum application rate. The petitioner should conduct trials at the lx rate in Region 11 to support the proposed subgroup crop tolerance for dry shelled pea and bean (except soybean).
23. Bean. dm and snag: The petitioner has provided adequate residue data reflecting the maximum proposed use pattern of pyraclostrobin on dry bean. The combined residues of pyraclostrobin and its metabolite BF 500-3 did not exceed 0.21 ppm idon dry bean (20 samples) and snap bean (18 samples) harvested 21 and 7 days, respectively following the last of two foliar applications of the EC formulation at 0.19-0.20 lb aiIAlapplication for a total seasonal application rate of 0.39-0.42 lb ai/A (- 1 . 5 ~ the maximum proposed seasonal application rate for dry bean).
24. To establish a tolerance for the dried shelled pea and bean (except soybean) subgroup, the petitioner should conduct the three field pea trials or lentil field trials described above. The submitted residue data support a tolerance of 0.3 ppm for the combined residues of pyraclostrobin and its metabolite BF 500-3 iidon dry bean. A revised Section F deleting the tolerance proposed for this crop subgroup 6C and proposing a tolerance at 0.3 ppm iidon dry bean must be submitted.
25. Pending submission of a proposed label specifying application rates and PHI, the residue data may support the proposed tolerance of 0.3 ppm idon snap bean (bean, succulent).
Foliage of Legume Vegetables Except Soybeans: 26a. The petitioner has not provided adequate residue data reflecting the maximum proposed
use pattern of pyraclostrobin on field pea vines and hay because geographic representation of data is inadequate. Three trials of field pea reflecting application of the 2 lblgal WDG formulation according to the maximum proposed use pattern in Region 11
are required. Because Canadian trials were conducted in RegiodZone 14 which does not border Region 11, these data cannot be translated to the U.S. registration.
26b. The submitted U.S. field pea field trial data indicate that combined residues of pyraclostrobin and its metabolite BF 500-3 were 4.90-25.2 pprn inion field pea hay and 0.37-9.50 pprn idon pea vines harvested 0-2 days following the last of two foliar applications of the EC formulation at 0.2 lb ailA1application for a total seasonal application rate of 0.4 lb ai/A (- 1 . 5 ~ the maximum proposed seasonal rate). The combined residues were 6.92-21.6 pprn idon field pea hay and 4.28-7.75 pprn idon field pea vines grown in Canada treated with the EC formulation at 1 . 5 ~ the maximum proposed use pattern.
27. For establishment of the subgroup foliage of legume vegetables except soybeans subgroup (7A) tolerance, the petitioner would be required to conduct three field pea trials and three field trials on a cultivar of bean (cowpea is the preferred commodity) reflecting the maximum proposed use pattern for the 2 lblgal WDG formulation on field pea and a bean.
Fruiting Vegetables (Exceot Cucurbits): 28a. Peover (Bell and Non-bell) and Tomato: The petitioner has provided adequate residue
data reflecting the maximum proposed use pattern of pyraclostrobin on peppers (bell and non-bell) and tomatoes, representative commodities of the fruiting vegetables crop group. The results of the pepper and tomato field trials indicate that the combined residues of pyraclostrobin and its metabolite BF 500-3 inlon peppers and tomatoes harvested on the day (0-day PHI) of the last of six foliar applications of either the WDG (peppers) or EC (tomatoes) formulation at -0.2 lb ai1Alapplication for a total seasonal application rate of - 1.2 lb ai/A (- l x the maximum proposed seasonal application rate) were <0.04-<0.30 ppm idon bell peppers (12 samples), <0.14-0.99 pprn idon non-bell (chili) peppers (6 samples), and <0.08-<0.25 ppm idon tomatoes (30 samples). RAB3 recommends that a fruiting vegetables (crop group) tolerance of 1.4 pprn be proposed. A revised Section F is required.
28b. In side-by-side tomato field trials conducted to compare the use of the EC and WDG formulations, tomatoes were harvested on the day (0-day PHI) of the last of six foliar applications of either the EC or WDG formulation at -0.2 lb ailAlapplication for a total seasonal application rate of - 1.2 lb ai/A (- l x the maximum proposed seasonal application rate). The combined residues were <0.08-0.20 ppm following applications of the EC formulation and <0.08-<0.15 pprn following applications of the WDG formulation. These data indicate that there were no significant differences in residue levels between tomato samples treated with the EC formulation and the WDG formulation.
Cucurbit Vegetables:
29a. Cucumber. Muskmelon (Cantalouve'l. and Summer Squash: The petitioner has provided adequate residue data reflecting the maximum proposed use pattern of pyraclostrobin on cucumber, muskmelon (cantaloupe), and summer squash, the representative commodities of the cucurbit vegetables crop group. The results of the cucurbit field trials indicate that the combined residues of pyraclostrobin and its metabolite BF 500-3 did not exceed the proposed cucurbit vegetables (crop group) tolerance level of 0.5 pprn idon cantaloupes, cucumbers, and summer squash harvested on the day (0-day PHI) of the last of six foliar applications of the EC formulation at -0.2 lb ailNapplication for a total seasonal application rate of - 1.2 lb ailA (- l x the maximum proposed seasonal application rate). The combined residues were <0.08-0.16 pprn inion cantaloupes (12 samples), <0.04- <0.43 pprn idon cucumbers (16 samples), and <0.07-<0.22 pprn idon summer squash (1 0 samples).
29b. In side-by-side cucurbit field trials conducted to compare the use of the EC and WDG formulations, cantaloupes, cucumbers, and summer squash were harvested on the day (0- day PHI) of the last of six foliar applications of either the EC or WDG formulation at -0.2 lb aiINapplication for a total seasonal application rate of - 1.2 lb ai/A (- lx the maximum proposed seasonal application rate). The combined residues were 10.15-10.16 pprn idon cantaloupe, 10.14-10.15 pprn idon cucumber, and 10.04-10.05 ppm idon summer squash following applications of the EC formulation and <0.08-<0.12 pprn idon cantaloupe, <0.15-G0.16 pprn idon cucumber, and <0.04-<0.06 pprn idon summer squash following applications of the WDG formulation. These data indicate that there were no significant differences in residue levels idon cucurbit vegetable samples treated with the EC formulation or the WDG formulation.
Citrus Fruits (Citrus Spp.. Fortunella Spp.): 30a. The available citrus field trial data are adequate to support the proposed crop group
tolerance (0.7 ppm) because the three bridging studies (conducted with tomato, cucurbits, and grape) indicate no significant difference in the residue levels between the use of the - . .
WDG formulation or the^^ formulation. The field trial data reflecting application of the WDG formulation can be extrapolated to project the residue levels for the EC formulation
"
for which use on citrus is proposed.
30b. The combined residues of pyraclostrobin and its metabolite BF 500-3 were <0.08-0.28 pprn idon grapefruit (12 samples), <0.13-0.45 pprn idon lemons (10 samples), and <0.11-0.61 pprn idon oranges (26 samples) harvested 13-14 days following the last of four foliar applications of the WDG formulation at -0.15 lb ai1Napplication (first and second applications) and -0.25 lb aiINapplication (third and fourth applications) for a total seasonal application rate of -0.8 lb ai/A (- lx the maximum proposed seasonal application rate).
30c. In addition, the pulp and peel were analyzed separately in selected samples of grapefruit and oranges. These data indicate that combined residues were <0.04 pprn inlon 6 citrus pulp samples and <0.08-0.54 pprn idon 6 citrus peel samples.
30d. Trials conducted with dilute and concentrate sprays did not indicate that higher residues were likely to result from either type of application. Combined residues for concentrate and dilute spray applications were, respectively, 10.08-<0.24 pprn and <0.09-0.28 ppm idon grapefruit; <0.13-0.45 pprn and <0.21-0.35 pprn idon lemons; and <0.11-0.61 pprn and 10.19-0.46 pprn idon oranges.
Stone Fruits: 31a. Chew (Sweet and Tart). Peach, and Plum: The petitioner has provided adequate residue
data reflecting the maximum proposed use pattern of pyraclostrobin on cherries (sweet and tart), peaches, and plums, the representative commodities of the stone h i t s crop group. The combined residues of pyraclostrobin and its metabolite BF 500-3 idon cherries (sweet and tart), peaches, and plums harvested immediately (0-day PHI) following the last of five foliar applications of the WDG formulation at -0.12 lb ai/A/application for a total seasonal application rate of -0.6 lb aiiA (- l x the maximum proposed seasonal application rate) were <0.27-<0.44 pprn idon sweet cherries (6 samples), 0.45-0.67 pprn idon tart cherries (6 samples), <0.09-<0.33 pprn idon peaches (18 samples), and 10.04-<0.21 pprn idon plums (12 samples). RAB3 recommends that a stone fruits (crop group) tolerance of 0.9 pprn (as opposed to 0.7 ppm) be proposed. A revised Section F is required.
31b. Trials conducted with dilute and concentrate spray volumes did not indicate that higher residues were likely to result from either type of application. Combined residues were <0.27-0.53 pprn and <0.29-0.67 pprn idon cherries, 10.09-<0.28 pprn and <0.10- <0.33 pprn idon peaches, and <0.04-10.21 ppm and <0.04-<0.15 pprn idon plums treated with concentrate or dilute sprays, respectively.
a: 32. Bluebew and Ras~berrv: The petitioner has provided adequate residue data reflecting
the maximum proposed use pattern of pyraclostrobin on blueberries and raspberries, the representative commodities of the berries crop group. The combined residues of pyraclostrobin and its metabolite BF 500-3 were <0.12-0.69 pprn idon highbush blueberries (12 samples) and <0.46-0.97 ppm idon red raspberries (6 samples) harvested immediately (0-day PHI) following the last of four foliar applications of the WDG formulation at -0.18 lb ai/A/application for a total seasonal application rate of -0.72 lb ai/A (- l x the maximum proposed seasonal application rate). RAB3 recommends that the tolerance in berries (crop group) be proposed at 1.3 ppm.
Tree Nuts: 33a. The petitioner has provided adequate residue data reflecting the maximum proposed use
pattern of pyraclostrobin on almonds and pecans, the representative commodities of the tree nuts crop group.
33b. Almond and Pecan nutmeat: The combined residues of pyraclostrobin and its metabolite BF 500-3 did not exceed the proposed tree nuts (crop group) tolerance level of 0.04 pprn
idon almonds (10 samples) harvested 108-148 days and pecans (10 samples) harvested 14 days following the last of four foliar applications of the WDG formulation at -0.12 lb aiIAlapplication for a total seasonal application rate of -0.48 lb ai/A (- l x the maximum proposed seasonal application rate). The combined residues were 10.04 ppm idon all samples of almond and pecan nutmeat.
33c. Trials conducted with dilute and concentrate sprays did not indicate that higher residues were likely to result from either type of application. Combined residues idon almond and pecan nutmeat were <0.04 ppm in all samples whether treated with concentrate or dilute sprays.
33d. Almond hulls: The combined residues of pyraclostrobin and BF 500-3 did not exceed the proposed almond hulls tolerance level of 1.6 ppm idon almond hulls harvested 108-148 days following the last of four foliar applications of the WDG formulation at -0.12 lb ai/Napplication for a total seasonal application rate of -0.48 lb ai/A (- l x the maximum - - proposed seasonal application rate). The combined residues were <0.04 ppm to 0.67 ppm idon almond hulls sampled at normal harvest. The maximum combined residue (1.59 ppm) was detected in an almond hull sample from the decline study harvested 148 days following the last application.
33e. Trials conducted with dilute and concentrate spray volumes did not indicate that higher residues were likely to result from either type of application. Combined residues were <0.04-0.56 ppm idon almond hulls treated with concentrate sprays, and <0.04-0.67 ppm idon almond hulls treated with dilute sprays.
Pistachio: 34a. The petitioner has provided adequate data reflecting the maximum proposed use pattern
of pyraclostrobin on pistachios. The combined residues of pyraclostrobin and its metabolite BF 500-3 did not exceed the proposed tolerance level of 0.5 ppm idon pistachios harvested 14-1 5 days following the last of four foliar applications of the WDG formulation at 0.12-0.21 lb ai/A/application for a total seasonal application rate of 0.72- 0.81 lb ai/A (-lx the maximum proposed seasonal application rate). The combined residues were <0.04-0.48 ppm idon pistachios (6 samples). RAB3 recommends that the tolerance in pistachio be proposed at 0.7 ppm.
34b. Trials conducted with dilute and concentrate sprays did not indicate that higher residues were likely to result from either type of application. Combined residues were 10.04- 10.46 pprn idon pistachios treated with concentrate sprays, and <0.04-0.48 ppm idon pistachios treated with dilute sprays.
Small Grains: w: 35a. The petitioner has provided adequate residue data reflecting the maximum proposed use
pattern of pyraclostrobin on barley.
35b. Barley hay: The combined residues of pyraclostrobin and BF 500-3 support the proposed tolerance level of 25.0 ppm idon barley hay harvested 9-16 days following the last of two foliar applications of the 2 iblgal EC formulation at 0.20-0.29 lb ai/A/application for a total seasonal application rate of 0.40-0.49 lb ai/A (- lx the maximum proposed seasonal application rate). The combined residues were 1.06-25 pprn idon 24 samples of barley hay grown in the U.S. and 0.80-5.51 pprn idon 26 samples of barley hay grown in Canada.
35c. Barley grain: The combined residues of pyraclostrobin and its metabolite BF 500-3 did not exceed the proposed tolerance level of 0.4 pprn idon barley grain harvested 38-70 days following the last of two foliar applications of the 2 lblgal EC formulation at 0.20- 0.29 lb aiiAlapplication for a total seasonal application rate of 0.40-0.49 lb ai/A (- lx the maximum proposed seasonal application rate). The combined residues were <0.04- 0.19 ppm idon 24 samples of barley grain grown in the U.S. and <0.04-0.33 ppm idon 26 samples of barley grain grown in Canada.
35d. Barlev straw: The combined residues of pyraclostrobin and BF 500-3 did not exceed the proposed tolerance level of 6.0 pprn idon barley straw harvested 38-70 days following the last of two foliar applications of the 2 lblgal EC formulation at 0.20-0.29 lb ailAlapplication for a total seasonal application rate of 0.40-0.49 lb ailA (- lx the maximum proposed seasonal application rate). The combined residues were <0.04- 3.17 ppm idon 24 samples of barley straw grown in the U.S. and 0.26-5.55 ppm idon 26 samples of barley straw grown in Canada.
QG 36a. The petitioner has provided adequate residue data reflecting the maximum proposed use
pattern of pyraclostrobin on rye.
36b. Rve grain: The combined residues of pyraclostrobin and its metabolite BF 500-3 did not exceed the ~roposed tolerance level of 0.04 ppm idon rye grain harvested 58-66 days
A A
following the last of two foliar applications bf the 2 lbl&il EC formulation at 0.20-0.21 ib ai/A/application for a total seasonal application rate of 0.40-0.414 lb ai/A (- lx the maximum proposed seasonal application rate). The combined residues were 10.04 ppm idon 10 samples of rye grain.
36c. Rye straw: The combined residues of pyraclostrobin and BF 500-3 did not exceed the proposed tolerance level of 0.5 pprn idon rye straw harvested 55-66 days following the last of two foliar applications of the 2 lblgal EC formulation at 0.20-0.21 lb ailA/application for a total seasonal application rate of 0.40-0.41 lb ai/A (- l x the maximum proposed seasonal application rate). The combined residues were 0.13- 0.43 pprn idon 10 samples of rye straw.
36d. Rye forage: The petitioner did not provide residue data or propose a tolerance for rye forage because applications are made after the growth stages at which rye is foraged.
Based on the proposed use pattern, the Agency will not require residue data or a tolerance for rye forage.
m: 37a. The petitioner has provided adequate residue data reflecting the maximum proposed use
pattern of pyraclostrobin on wheat in the U.S. Adequate field trial data were submitted supporting applications made to wheat at the earlier growth stage (applications made at flag leaf and 50% head emergence) and applications made to wheat at later growth stages with a shorter PHI (applications made at full head emergence and the end of anthesis; expanded use application schedule) for control of Fusariurn head blight.
37b. Wheat grain: The combined residues of pyraclostrobin and its metabolite BF 500-3 did not exceed the proposed tolerance level of 0.2 pprn idon wheat grain following earlier and later (expanded use) application schedules to wheat. In the early treatment schedule, wheat grain was harvested 40-57 days following the last of two foliar applications of the 2 lblgal EC formulation at 0.19-0.22 lb aiINapplication for a total seasonal application rate of 0.39-0.43 Ib ailA (- l x the maximum proposed seasonal application rate). The combined residues following the earlier application schedule were <0.04 pprn idon 44 samples of wheat grain grown in the U.S. and <0.04-<0.05 pprn idon 22 samples of wheat grain grown in Canada. In the later application schedule, wheat grain was harvested 24-60 days following the last of two foliar applications of the 2 lblgal EC formulation at 0.19-0.21 lb ailNapplication for a total seasonal application rate of 0.39-0.41 lb ai1A (- Ix the maximum proposed seasonal application rate). The combined residues following later application schedules were 10.04-0.16 pprn idon 34 samples of wheat grain grown in the U.S. and 10.04-0.09 pprn idon 22 samples of wheat grain grown in Canada.
37c. Wheat hay: The combined residues of pyraclostrobin and BF 500-3 did not exceed the proposed tolerance level of 6.0 pprn inton wheat hay following earlier application schedules to wheat. In the early treatment schedule, wheat hay was harvested 12-19 days following the last of two foliar applications of the 2 lblgal EC formulation at 0.19-0.22 lb ai1Napplication for a total seasonal application rate of 0.39-0.43 lb ailA (- lx the maximum proposed seasonal application rate). The combined residues following early application schedules were 0.21-5.95 pprn idon 44 samples of wheat hay grown in the U.S. and 0.90-4.3 pprn idon 22 samples of wheat hay grown in Canada.
37d. Wheat straw: The combined residues of pyraclostrobin and BF 500-3 did not exceed the proposed tolerance level of 8.5 pprn idon wheat straw following earlier and later (expanded use) application schedules to wheat. In the early treatment schedule, wheat straw was harvested 40-57 days following the last of two foliar applications of the 2 lblgal EC formulation at 0.19-0.22 lb ai1Napplication for a total seasonal application rate of 0.39-0.43 lb ai/A (- lx the maximum proposed seasonal application rate). The combined residues following early application schedules were <0.05-5.7 pprn idon 44 samples of wheat straw grown in the U.S. and 0.1 1-2.56 pprn idon 22 samples of
wheat straw grown in Canada. In the later treatment schedule, wheat straw was harvested 24-60 days following the last of two foliar applications of the 2 lblgal EC formulation at 0.19-0.21 lb ailNapplication for a total seasonal application rate of 0.39-0.41 lb ai/A (- lx the maximum proposed seasonal application rate). The combined residues following later application schedules were 0.65-8.23 ppm idon 34 samples of wheat straw grown in the U.S. and 0.21-6.31 ppm idon 22 samples of wheat straw grown in Canada.
37e. Wheat forage: The petitioner did not provide residue data or propose a tolerance for wheat forage because applications are made after the growth stages at which wheat is foraged. Based on the current proposed use patterns, the Agency will not require residue data or a tolerance for wheat forage.
Small grains - Eurovean trials: 38a. The submitted European field trial data indicate that combined residues of pyraclostrobin
and its metabolite BF 500-3 were <0.04 ppm to 0.15 ppm idon barley and wheat grain and 0.66-7.33 ppm idon barley and wheat straw harvested 33-64 days following treatment according to one of the following application patterns: (i) pyraclostrobin (250 g1L) formulated as an EC formulation and applied to barley and wheat plants as two spray applications at 194-265 g aihdapplication (0.17-0.24 lb ailNapplication for a total rate of 0.37-0.45 lb ai1A); (ii) pyraclostrobin (133 gL) and epoxiconazole (50 gL) formulated as an "SE" formulation and applied to barley and wheat plants as two spray applications at 21 1-285 g aiihalapplication (0.19-0.25 lb aiINapplication for a total rate of 0.39-0.46 lb ai/A); or (iii) pyraclostrobin (133 g/L), epoxiconazole (50 gIL), and kresoxim-methyl (67 g/L) formulated as an " S F formulation and applied to barley and wheat plants as two spray applications at 23 1-266 g ailhdapplication (0.21-0.24 lb ailNapplication for a total rate of 0.42-0.45 lb ai1A).
38b. Although small grain data from Europe are not required to support the subject petition, the submitted European field trial data are useful in demonstrating that combined residues of pyraclostrobin and BF 500-3 did not exceed the proposed U.S. tolerance levels of 0.2 ppm for wheat grain, 0.4 ppm for barley grain, 6.0 ppm for barley, and 8.5 ppm for wheat straw following treatment according to the use patterns utilized in the studies.
Grass (Grown for Seed): 39a. The petitioner has provided adequate residue data reflecting the maximum proposed use
pattern of pyraclostrobin on grasses grown for seed.
39b. Grass straw: The combined residues of pyraclostrobin and BF 500-3 did not exceed the proposed tolerance level of 14.0 ppm idon grass straw harvested 13-15 days following the last of two foliar applications of the EC formulation at 0.19-0.22 lb ailA1application for a total seasonal application rate of 0.39-0.42 lb ai/A (- Ix the maximum proposed seasonal application rate). Combined residues were 1.91-13.8 ppm idon grass straw.
39c. Grass seed screenings: The combined residues of pyraclostrobin and BF 500-3 did not exceed the proposed tolerance level of 27.0 ppm idon grass seed screenings harvested 13-15 days following the last of two foliar applications of the EC formulation at 0.19- 0.22 lb ailNapplication for a total seasonal application rate of 0.39-0.42 lb ai/A (- Ix the maximum proposed seasonal application rate). Combined residues were 1.6-26.6 ppm idon grass seed screenings.
39d. Grass forage: The combined residues of pyraclostrobin and its metabolite BF 500-3 did not exceed the proposed tolerance level of 10.0 ppm idon grass forage harvested 27- 11 5 days following the last of two foliar applications of the EC formulation at 0.19- 0.22 lb ai1Napplication for a total seasonal application rate of 0.39-0.42 lb ai/A (-lx the maximum proposed seasonal application rate). Combined residues were <0.04-9.29 ppm idon grass forage cut when the postharvest regrowth was approximately 2 to 5 inches in height.
39e. Grass hay: The combined residues of pyraclostrobin and BF 500-3 did not exceed the proposed tolerance level of 4.5 ppm idon grass hay harvested 27-1 15 days and field dried for 2-7 days following the last of two foliar applications of the EC formulation at 0.19- 0.22 lb ailNapplication for a total seasonal application rate of 0.39-0.42 lb ai/A (- lx the maximum proposed seasonal application rate). Combined residues were <0.04-4.3 ppm idon grass forage cut when the postharvest regrowth was approximately 2 to 5 inches in height.
Miscellaneous Commodities m: 40. The petitioner has provided adequate residue data reflecting the stated maximum
proposed use pattern for pyraclostrobin on imported bananas. The petitioner has indicated that the maximum seasonal rate is 800 g aiha; however, specimen labels were -
not included to confirm the proposed use patterns for pyraclostrobin on imported bananas. A sufficient number of field trials, reflecting the stated maximum proposed use pattern, were conducted in the major banana-growing regions of Central and South America. The combined residues of pyraclostrobin and its metabolite BF 500-3 did not exceed the proposed tolerance of 0.04 ppm idon imported bagged or unbagged bananas (whole fruit including peel) harvested immediately (0-day PHI) following the last of eight foliar applications of an EC formulation at 0.08-0.13 lb ailA/application (90.0-141 g aiha) for a total seasonal application rate of 0.66-0.80 1b aiIA (743-902 g ailha; - Ix the stated proposed maximum seasonal rate). The combined residues were <0.04 ppm idon all (24) samples of bagged and unbagged bananas.
b: 41a. The available grape field trial data are adequate to support the proposed tolerance because
the grape bridging study (as well as those conducted with tomato and cucurbits) indicates no significant difference in the residue levels between the use of the WDG formulation or the EC formulation. The field trial data reflecting application of the EC formulation can
be extrapolated to project the residue levels for the WDG formulation for which use on grape is proposed.
41b. The petitioner has provided residue data reflecting the maximum proposed use pattem of pyraclostrobin (for the WDG formulation) following application of the 2 lblgal EC formulation at lx on grapes. The combined residues of pyraclostrobin and its metabolite BF 500-3 did not exceed the proposed tolerance level of 2.0 pprn idon grapes harvested 14 days following the last of six foliar applications of the EC formulation at -0.15 lb ai/A/application for a total seasonal application rate of -0.9 lb ai/A (- lx the maximum proposed seasonal application rate). The combined residues were 0.23-1.92 pprn idon 50 samples of grapes. Data from trials conducted with dilute and concentrate sprays indicate that higher residues would be unlikely to result from different spray volumes. Combined residues were 0.23-1.66 pprn idon grapes treated with a concentrate spray and 10.35- 1.92 pprn idon grapes treated with a dilute spray.
41c. The petitioner also provided residue data reflecting application of the 20% WDG formulation at 0 . 6 ~ on grapes. The combined residues did not exceed the proposed grapes tolerance level of 2.0 pprn idon grapes harvested 14 days following the last of three foliar applications of the WDG formulation at -0.1 8 lb ailA1application for a total seasonal application rate of -0.54 lb ai/A ( - 0 . 6 ~ the maximum proposed seasonal application rate). The combined residues were 0.10-1.3 1 pprn inlon grapes treated with the WDG formulation at 0 . 6 ~ the maximum proposed seasonal application rate. Combined residues were 0.10-1.31 pprn inlon grapes treated with a concentrate spray and <0.12-1.0 pprn idon grapes treated with a dilute spray.
41d. In side-by-side bridging trials conducted to compare the use of the EC and WDG formulations, grapes were harvested 14-15 days following the last of three foliar applications of either the EC or WDG formulation at -0.18 lb ailAlapplication for a total seasonal application rate of -0.54 lb ai/A ( -0 .6~ the maximum proposed seasonal application rate). The combined residues were 0.24-1 .O1 pprn idon grapes following applications of the EC formulation and 0.32-0.83 pprn idon grapes following applications of the WDG formulation. These data indicate that there were no significant differences in residue levels between grape samples treated with the EC formulation and the WDG formulation.
m: 42a. The petitioner has provided adequate residue data reflecting the maximum proposed use
pattem of pyraclostrobin on peanuts.
42b. Peanut nutmeat: The combined residues of pyraclostrobin and its metabolite BF 500-3 did not exceed the vrooosed tolerance level of 0.05 vvm idon peanut nutmeat harvested
A .A
14-18 days following the last of five foliar applications of the EC formulation at 0.24- 0.27 lb ai/A/application for a total seasonal application rate of 1.24-1.28 lb aiIA (- lx the
maximum proposed seasonal application rate). The combined residues were <0.04- <0.045 ppm idon 24 samples of peanut nutmeat.
42c. Peanut hay: The submitted peanut hay field trial data indicate that combined residues of pyraclostrobin and BF 500-3 were 1.45-34.3 ppm inlon peanut hay harvested 14-18 days following the last of five foliar applications of the EC formulation at 0.24-0.27 lb ai/A/application for a total seasonal application rate of 1.24-1.28 lb ailA (- lx the maximum proposed seasonal application rate). These data are not adequate to support a tolerance for peanut hay because the moisture content was not provided for the peanut hay samples from the 1997 field trials and ranged 22.5-45.2% in peanut hay samples from the 1998 peanut field trials. According to Table 1 of OPPTS 860.1000, peanut hay consists of vines and leaves that have been sun-dried to a moisture content of 10 to 20 percent.
42d. A tolerance for peanut hay will not be required if the label for the EC formulation is amended to include the following feeding restriction: "Do not feed green immature growing plants to livestock or do not harvest for livestock feed." Alternatively, additional field trials will be required depicting residues of pyraclostrobin in peanut hay dried to <20% following application of the EC formulation at l x the maximum proposed use pattern.
Strawbemi: 43. The petitioner has provided adequate residue data reflecting the maximum proposed use
pattern of pyraclostrobin on strawberries. The combined residues of pyraclostrobin and its metabolite BF 500-3 did not exceed the proposed tolerance level of 0.4 ppm idon strawberries harvested immediately (O-day PHI) or one day following the last of five foliar applications of the WDG formulation at -0.18 lb ailMapplication for a total seasonal application rate of -0.9 lb ai/A (- lx the maximum proposed seasonal application rate). The combined residues were <0.07-<0.39 ppm idon 16 samples of strawberries.
Residue Decline Studies: 44. The petitioner conducted residue decline studies with carrot; potato; sugar beet (root and
tops); onion (dry bulb); peas, dry, seed; bean, dry; bean, snap; lentil seed; dry pea (hay and vine); tomato; cucumber; peach; plum; raspbeny; almond (nutmeat and hulls); barley (grain, hay, and straw); wheat (grain, hay, and straw); grape; peanut (nutmeat and hay); and strawbeny. These studies indicate that combined residues of pyraclostrobin and BF 500-3 do not increase with increasing posttreatment intervals.
OPPTS GLN 860.1520: Processed FoodEeed
Citrus Fruits: 45a. The submitted orange processing data are adequate for the purposes of this petition. No
concentration of residues of pyraclostrobin and BF 500-3 was observed in juice processed
from oranges bearing detectable residues. The data indicate that the combined residues of pyraclostrobin and its metabolite BF 500-3 concentrate 8.2-9.5~ in dried pulp and 5.3- 6.8, in oil processed from oranges bearing detectable residues.
45b. The highest average field trial (HAFT) residue of citrus treated at l x the maximum seasonal rate (0.8 lb aiiNseason; 14-day PHI) from the submitted citrus field trial studies was 0.505 ppm pyraclostrobin and 0.075 ppm BF 500-3. Based on the HAFT (0.58 ppm) and an average concentration factor of 8 . 9 ~ in dried pulp and 6 . 1 ~ in citrus oil, the maximum expected pyraclostrobin and BF 500-3 residues would be 5.16 pprn in dried pulp and 3.54 ppm in citrus oil. RAB3 recommends that the petitioner propose tolerances of 5.5 pprn for citrus, dry pulp and 4 pprn for citrus, oil. We note that the tolerances will have to be revised to be expressed for citrus commodities instead of orange commodities.
-: 46a. The submitted grape processing data are adequate for the purposes of this petition. No
concentration of residues of pyraclostrobin and BF 500-3 was observed in juice processed from grapes bearing detectable residues. The data indicate that the combined residues of pyraclostrobin and its metabolite BF 500-3 concentrate in raisins at 3 . 4 ~ .
46b. The HAFT residue of grape treated at lx the maximum seasonal rate (0.9 lb ai/A/season; 14-day PHI) from the submitted field trial studies was 1.71 pprn pyraclostrobin and 0.21 pprn BF 500-3 (1.92 pprn combined residues). Based on the HAFT (1.92 ppm) and a concentration factor of 3 . 4 ~ in raisin, the maximum expected pyraclostrobin and BF 500- 3 residues would be 6.53 ppm in raisin. Data from the processing study indicate that the proposed tolerance of 6.0 ppm for raisin is too low. RAB3 recommends that the petitioner propose a tolerance of 7 ppm for raisin.
-- -
47a. The submitted peanut processing data are adequate for the purposes of this petition. No concentration of residues of pyraclostrobin and BF 500-3 was observed in peanut meal
A - processed from peanut nutmeat bearing detectable residues of pyraclostrobin. The data indicate that the combined residues of pyraclostrobin and its metabolite BF 500-3
A - concentrate in peanut oil at 1 . 6 ~ and 2 . 2 ~ (average concentration factor of 1.9~).
47b. The HAFT residue of peanut nutmeat treated at l x the maximum seasonal rate (1.25 lb ailNseason; 14-day PHI) from the submitted peanut field trial studies was 0.0225 ppm pyraclostrobin and <0.02 ppm BF 500-3 (10.0425 ppm combined residues). Based on the HAFT (<0.0425 ppm) and an average concentration factor of 1.9x, the maximum expected pyraclostrobin and BF 500-3 residues in peanut oil would be 0.081 ppm. Data from the peanut processing study indicate that the proposed tolerance of 0.1 pprn for peanut oil is appropriate.
plum: 48a. The submitted plum processing data are adequate for the purposes of this petition. The
data indicate that the combined residues of pyraclostrobin and its metabolite BF 500-3 concentrate slightly in prunes at 1 . 2 ~ and 1 . 3 ~ .
48b. The HAFT residue of plums treated at lx the maximum seasonal rate (0.6 lb ai1Alseason; 0-day PHI) from the submitted plum field trial studies was 0.19 pprn pyraclostrobin and 10.02 pprn BF 500-3 (<0.21 ppm combined residues). Based on the HAFT (0.21 ppm) and an average concentration factor of 1.25x, the maximum expected pyraclostrobin and BF 500-3 residues in prunes would be 0.273 ppm, which is lower than the proposed RAC tolerance of 0.7 pprn for the stone fruits crop group. Therefore, a tolerance for pyraclostrobin residues in prunes is not warranted.
m: 49. The submitted potato processing data are adequate for the purposes of this petition. The
data indicate that the combined residues of pyraclostrobin and its metabolite BF 500-3 are below the LOQ (<0.04 ppm) inlon potato samples following treatment at 5x the maximum proposed rate. Therefore, no potato processing study or tolerances for potato processed commodities are required.
Sugar Beet: 50a. The submitted sugar beet processing data are adequate for the purposes of this petition.
No concentration of residues of pyraclostrobin and BF 500-3 was observed in molasses and refined sugar processed from sugar beet roots bearing detectable residues of pyraclostrobin. The data indicate that the combined residues of pyraclostrobin and its metabolite BF 500-3 concentrate in dried pulp at 6 . 9 ~ and 7 . 5 ~ (average concentration factor = 7.2~) .
50b. The HAFT residue of sugar beet roots treated at lx the maximum seasonal rate (0.8 lb ailA/season; 7-day PHI) from the submitted sugar beet field trial studies was 0.105 pprn pyraclostrobin and 0.03 pprn BF 500-3 (0.135 pprn combined residues). Based on the HAFT (0.135 ppm) and an average concentration factor of 7.2x, the maximum expected pyraclostrobin and BF 500-3 residues in dried pulp would be 0.972 ppm. Data from the sugar beet processing study indicate that the proposed tolerance of 1.6 pprn for dried sugar beet pulp is too high. RAB3 recommends that the petitioner propose a tolerance of 1 pprn for beet, sugar, dried pulp.
Tomato: 5 1 a. The submitted tomato processing data are adequate for the purposes of this petition. No
concentration of residues of pyraclostrobin and BF 500-3 was observed in tomato puree processed from whole tomatoes bearing detectable residues. The data indicate that the combined residues of pyraclostrobin and its metabolite BF 500-3 concentrate in tomato paste at 1 . 5 ~ and 2 . 6 ~ (average concentration factor = 2.1~) .
51b. The HAFT residue of tomatoes treated at lx the maximum seasonal rate (1.2 lb ai1Alseason; 0-day PHI) from the submitted tomato field trials was 0.21 pprn pyraclostrobin and <0.025 ppm BF 500-3 (0.235 ppm combined residues). Based on the HAFT (0.235 ppm) and an average concentration factor of 2.lx, the maximum expected pyraclostrobin and BF 500-3 residues in tomato paste would be 0.494 ppm, which is within the proposed RAC tolerance of 1.0 pprn for the fruiting vegetables crop group. A revised Section F deleting the proposed tolerance of 2.0 pprn inlon tomato paste is needed.
m: 52a. The submitted wheat processing data are adequate for the purposes of this petition. No
concentration of residues of pyraclostrobin and BF 500-3 is observed in flour, bran, middlings, shorts, and germ processed from wheat grain bearing detectable residues, except in bran from the expanded use application schedule. However, based on the HAFT (0.145 ppm) in wheat grain treated at l x the maximum proposed seasonal rate (expanded use; 36-day PHI) and a concentration factor of 1.3x, residues in processed wheat bran (0.189 ppm) are not expected to exceed the proposed tolerance for wheat grain (0.2 ppm). Based on the results of the processing studies, tolerances for residues of pyraclostrobin in the processed commodities of wheat are not required.
52b. Aspirated grain fractions: The combined residues of pyraclostrobin and its metabolite BF 500-3 do not exceed the proposed tolerance level of 2.5 pprn idon wheat aspirated grain fractions following application of pyraclostrobin at lx to wheat according to the earlier and later (expanded use) application schedules. Combined residues of pyraclostrobin and BF 500-3 are <0.067-0.445 pprn and 1.87-2.17 ppm idon aspirated grain fractions from wheat treated at the earlier and the expanded use application schedules, respectively.
52c. The petitioner must submit a revised Section F to change the proposed commodity definition from "Wheat (aspirated grain fractions)" to "Aspirated grain fractions." The Agency does not set tolerances for the aspirated grain fractions of individual crops.
OPPTS GLN 860.1480: Meat, Milk, Poultw. Eggs
53a. Ruminants: The submitted dairy cattle feeding data are adequate for the purpose of establishing tolerances for pyraclostrobin residues of concem in livestock commodities. Dairy cows were orally dosed twice daily for 28 consecutive days with pyraclostrobin at dose levels equivalent to 8.8 ppm, 27.2 pprn (mid dose), and 89.6 pprn (high dose), corresponding to =0.25x, -0.75x, and 2 . 5 ~ the maximum theoretical dietary burdens (MTDB) of pyraclostrobin for beef (36.3 ppm) and dairy (35.4 ppm) cattle. The HED MARC discussed the metabolism of pyraclostrobin in livestock on September 20,2001 and has concluded that the residues of concem in livestock commodities consist of pyraclostrobin and its metabolites hydrolyzable to BF 500-5 and BF 500-8 (D278044, L. Cheng, October 9,2001).
53b. The maximum combined residues of pyraclostrobin and its metabolites hydrolyzable to BF 500-5 and BF 500-8 were <0.02-<0.0235 pprn (mid dose) and <0.02-0.175 pprn (high dose) in whole milk, <0.02 pprn (mid dose) and 0.0393-0.102 pprn (high dose) in skim milk, and <0.02-10.0561 pprn (mid dose) and 0.131-0.258 pprn (high dose) in milk fat. These data suggest that the proposed tolerance of 0.03 pprn for milk is not adequate. RAB3 recommends that the registrant propose a tolerance of 0.1 pprn in milk.
53c. The maximum combined residues of pyraclostrobin and its metabolites hydrolyzable to BF 500-5 and BF 500-8 were 0.464-0.607 pprn (mid dose) and 2.06-2.78 pprn (high dose) in liver. These data suggest that the proposed tolerance of 0.6 pprn is not adequate. RAB3 recommends the registrant propose a tolerance of 1.5 pprn in liver.
53d. The maximum combined residues of pyraclostrobin and its metabolites hydrolyzable to BF 500-5 and BF 500-8 were <0.1 pprn (mid dose) and V.396 pprn (high dose) in kidney, and <0.1 pprn (mid dose) and <0.1 pprn (high dose) in fat and muscle. These data suggest that the proposed tolerance levels of 0.1 pprn for muscle and fat are adequate. However, the proposed tolerance of 0.1 pprn for kidney is not adequate and not appropriate. RAB3 recommends that the registrant propose a tolerance of 0.2 pprn in meat byproducts (except liver) to cover residues in kidney.
53e. The petitioner needs to submit a revised Section F for livestock commodity tolerances. The tolerance expression should be revised to residues of pyraclostrobin and its metabolites convertible to BF 500-5 and BF 500-8. In addition, tolerances for ruminant commodities in addition to cattle are required. Tolerances must be proposed for the fat, meat, and meat byproducts of goats, hogs, horses, and sheep; these tolerances should be set at the same levels as those for the cattle commodities.
53f. Overall, residues of pyraclostrobin increase in milk and tissues with the increase in the dose level. Residues in whole milk appear to plateau at Day 15 and do not significantly increase with subsequent doses. In tissues, residues were highest in liver. The depletion study (cows sacrificed 2 and 7 days following withdrawal from treatment) demonstrates that residues decline in milk and tissues once exposure is discontinued.
54a. m: The submitted poultry feeding data are adequate for the purpose of determining the potential for secondary transfer of pyraclostrobin residues of concern to poultry eggs and tissues. Laying hens were orally dosed once daily for 30 consecutive days with pyraclostrobin at dose levels equivalent to 0.28 ppm, 0.88 ppm, and 3.01 pprn ( 8 . 6 ~ the maximum theoretical dietary burden for poultry). The MTDB of pyraclostrobin for poultry is estimated to be 0.35 ppm. At the feeding level of 3.01 ppm, residues of pyraclostrobin and its metabolites hydrolyzable to BF 500-5 are less than the method LOQ (0.05 ppm) in all egg and tissue samples, except for one egg sample (Day 17) where residues of pyraclostrobin were detected at 0.064 pprn and <0.05 pprn upon re-analysis. Residue analysis of BF 500-8 was not conducted (the metabolism data show all metabolites hydrolyzable to BF 500-8 would be less than 10% TRR), but instead an
isomeric compound (BF 500-9) was measured. Levels of BF 500-9 also were all <0.05 ppm. Samples from the low and mid dose groups, and depletion samples from the high dose group were not analyzed.
54b. The poultry metabolism studies were conducted at doses equivalent to 35-36x the MTDB. When extrapolated to the lx burden, the TRRs in eggs, fat and liver would be at least 3 times below 0.05 ppm, which is the LOQ for BF 500-5 or BF 500-8. In combination with the poultry feeding data, RAB3 concludes that tolerances in poultry and eggs are not needed. A revised Section F in which the proposed tolerances for poultry commodities are deleted needs to be submitted.
OPPTS GLN 860.1 850: Confined Accumulation in Rotational Crovs
55a. Provided the petitioner submit additional information confirming that rotational crop -
samples were analyzed within the interval represented by the storage stability study, the submitted confined rotational crop study is adequate. In the RACs of radishes, lettuce, and wheat planted 30, 120, and 365 dais following soil treatment with [chlorophenyl- '4C]pyraclostrobin or [tolyl-L4C]pyraclostrobin at total application rates for each label of 0.8 lb ailA or 1.3 lb ai/A (-0.7~ and lx, respectively, the maximum proposed seasonal rate for annual crops), TRR (expressed as pyraclostrobin equivalents) accumulated at levels >0.01 ppm in samples of radish roots and tops, head lettuce, and wheat forage, straw and grain planted 30 days after treatment (DAT); 120-DAT radish tops, head lettuce, and wheat forage, straw, and grain; and 365-DAT radish roots and tops, head lettuce, and wheat forage straw, and grain.
55b. The petitioner successfully characterizedidentified -35-121% TRR in rotational crop commodities. Pyraclostrobin and its metabolite 500M07 (elsewhere named BF 500-3) were identified at 7.5-36.4% TRR (0.0017-0.0176 ppm) in 30-DAT rotational crop commodities except head lettuce and wheat grain, at 0.8-54.1% (0.0006-0.0013 ppm) TRR in 120-DAT wheat forage and straw, and at 1.4-3.3% TRR (0.0004-0.0023 ppm) in 365-DAT wheat forage and straw. Because TRR levels were low, additional extractable residues were characterized as polar, medium polar, or nonpolar fractions; of these fractions, the polar region is the most significant, accounting for up to 36.9% TRR, and the nonpolar region is the least significant. The petitioner also successfully demonstrated incorporation of '4C-residues into cellulose and lignin in all rotational crop commodities and incorporation into starch in wheat grain.
55c. The study indicates that metabolism of pyraclostrobin in rotated crops is similar but more extensive than that in primary crops, with pyraclostrobin undergoing demethoxylation to yield 500M07 (BF 500-3), followed by further degradation to medium polar and polar metabolites, and subsequent conjugation reactions and incorporation into natural products. The HED MARC at the September 20,2001 meeting concluded that the residues of concern in rotational crops consist of pyraclostrobin and its desmethoxy metabolite (D278044, L. Cheng, October 9,2001).
OPPTS GLN 860.1900: Field Accumulation in Rotational Crops
56a. The limited field rotational crop study is acceptable. Residues of pyraclostrobin and its metabolite BF 500-3 are each less than the method LOQ (10.02 ppm) idon rotational crop matrices (radish, roots and tops; cabbage, with and without wrapper leaves; and wheat forage, hay, and grain) planted 14 days following the last of six sequential foliar applications to the primary crop, cucumbers, of the 2 lbtgal EC formulation at 0.19- 0.20 lb ai1Alapplication (-Ix the maximum proposed seasonal rate for annual crops). Residues of pyraclostrobin idon one sample of wheat straw from the CA test site are at the LOQ (0.02 ppm), but residues of pyraclostrobin inlon a replicate sample from the same plot are below the LOQ (0.012 ppm) for an average residue of <0.02 ppm. Residues of metabolite BF 500-3 are nondetectable (<0.02 ppm) idon all samples of wheat straw.
56b. The submitted data indicate that a 14-day plantback interval (PBI) restriction for all crops that are not registered is required.
International Harmonization Issues
57. No Codex or Mexican maximum residue limits (MRLs) have been proposed or are established for residues of pyraclostrobin. Canadian MRLs have been proposed on a variety of raw agricultural commodities. An International Residue Limit Status sheet is attached.
RECOMMENDATIONS
RAB3 cannot recommend for the proposed tolerances for residues of pyraclostrobin and its desmethoxy metabolite inlon various plant and livestock commodities, expressed as the parent compound, for reasons given in Conclusions 2 (a,b), 1 la, 12a, 15a, 21,22a, 22c, 24,25,26a, 27, 28a, 31a, 32,34a, 42d, 45b, 46b, 50b, 51b, 52c, 53b, 53c, 53d, 53e, 54b, 55a, and 56b above.
Provided the petitioner submit a revised Section Bllabel and revised Section F and EPA's method validation is satisfactory (Conclusions 2, 1 la, 21,24,28a, 31a, 32, 34a, 45b, 46b, 51b, 52c, and 56b above), there will be no residue chemistry data requirements that would preclude the establishment of tolerances for the combined residues of pyraclostrobin and its desmethoxy -. metabolite, methyl 2-[[[1-(4-chlorophenyl)-lH-pyrazol-3-yl]oxy]methyl]phenylcarbamate, expressed as the parent compound, idon the following commodities at the indicated levels:
Almond, hulls . . . . . . . . . . . . . . . . . . . . . . . . . . . . . . . . . . . . . . . . . 1.6 ppm Aspirated grain fractions . . . . . . . . . . . . . . . . . . . . . . . . . . . . . . . . 2.5 ppm Banana . . . . . . . . . . . . . . . . . . . . . . . . . . . . . . . . . . . . . . . . . . . . . 0.04ppm Barley, grain . . . . . . . . . . . . . . . . . . . . . . . . . . . . . . . . . . . . . . . . . . 0.4 ppm
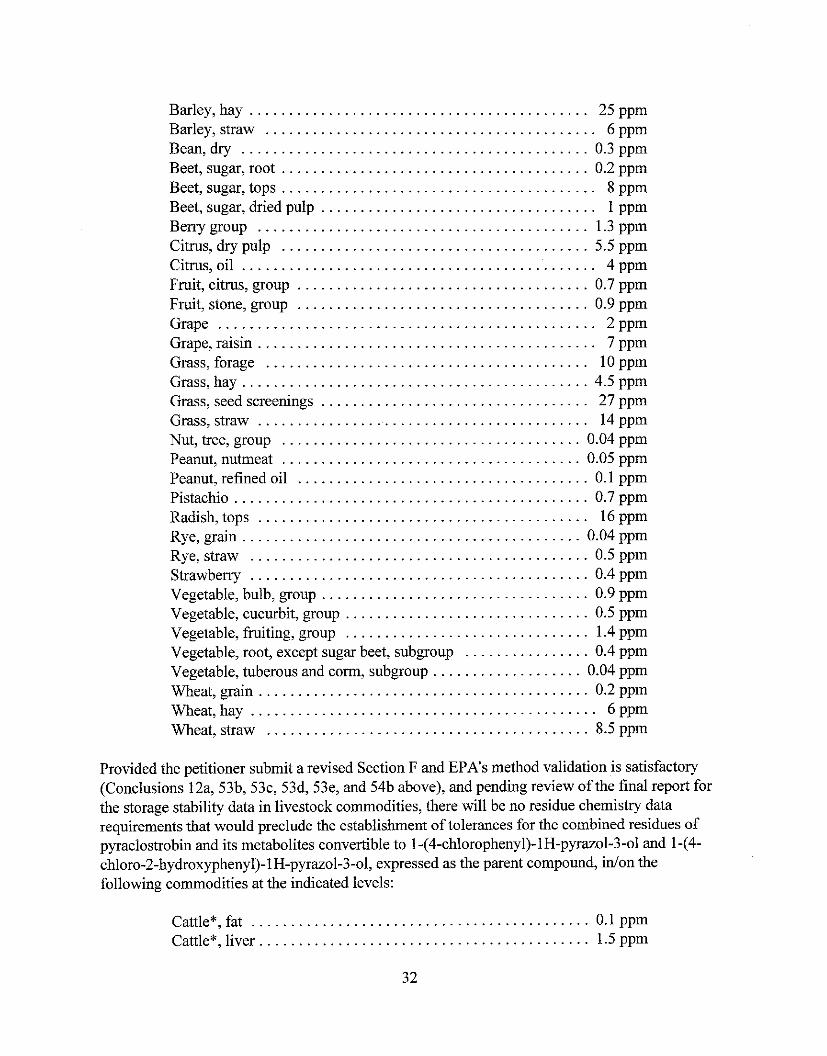
Barley, hay . . . . . . . . . . . . . . . . . . . . . . . . . . . . . . . . . . . . . . . . . . . 25 ppm Barley, straw . . . . . . . . . . . . . . . . . . . . . . . . . . . . . . . . . . . . . . . . . . 6 ppm Bean,dry . . . . . . . . . . . . . . . . . . . . . . . . . . . . . . . . . . . . . . . . . . . . 0.3ppm Beet, sugar, root . . . . . . . . . . . . . . . . . . . . . . . . . . . . . . . . . . . . . . . 0.2 ppm Beet, sugar, tops . . . . . . . . . . . . . . . . . . . . . . . . . . . . . . . . . . . . . . . . 8 ppm Beet, sugar, dried pulp . . . . . . . . . . . . . . . . . . . . . . . . . . . . . . . . . . . 1 ppm Berry group . . . . . . . . . . . . . . . . . . . . . . . . . . . . . . . . . . . . . . . . . . 1.3 ppm Citrus, dry pulp . . . . . . . . . . . . . . . . . . . . . . . . . . . . . . . . . . . . . . . 5.5 ppm Citrus,oil . . . . . . . . . . . . . . . . . . . . . . . . . . . . . . . . . . . . . . . . . . . . . 4ppm Fruit, citms, group . . . . . . . . . . . . . . . . . . . . . . . . . . . . . . . . . . . . . 0.7 ppm Fruit, stone, group . . . . . . . . . . . . . . . . . . . . . . . . . . . . . . . . . . . . . 0.9 ppm Grape . . . . . . . . . . . . . . . . . . . . . . . . . . . . . . . . . . . . . . . . . . . . . . . . 2 ppm . . Grape,raisin . . . . . . . . . . . . . . . . . . . . . . . . . . . . . . . . . . . . . . . . . . . 7ppm Grass, forage . . . . . . . . . . . . . . . . . . . . . . . . . . . . . . . . . . . . . . . . . 10 ppm Grass, hay . . . . . . . . . . . . . . . . . . . . . . . . . . . . . . . . . . . . . . . . . . . . 4.5 ppm Grass, seed screenings . . . . . . . . . . . . . . . . . . . . . . . . . . . . . . . . . . 27 ppm Grass, straw . . . . . . . . . . . . . . . . . . . . . . . . . . . . . . . . . . . . . . . . . . 14 ppm Nut, tree, group . . . . . . . . . . . . . . . . . . . . . . . . . . . . . . . . . . . . . . 0.04 ppm Peanut, nutmeat . . . . . . . . . . . . . . . . . . . . . . . . . . . . . . . . . . . . . . 0.05 ppm Peanut, refined oil . . . . . . . . . . . . . . . . . . . . . . . . . . . . . . . . . . . . . 0.1 ppm
. . . . . . . . . . . . . . . . . . . . . . . . . . . . . . . . . . . . . . . . . . . . . Pistachio 0.7 ppm Radish, tops . . . . . . . . . . . . . . . . . . . . . . . . . . . . . . . . . . . . . . . . . . 16 ppm
. . . . . . . . . . . . . . . . . . . . . . . . . . . . . . . . . . . . . . . . . . . Rye, grain 0.04 ppm Rye,straw . . . . . . . . . . . . . . . . . . . . . . . . . . . . . . . . . . . . . . . . . . . 0.5ppm
. . . . . . . . . . . . . . . . . . . . . . . . . . . . . . . . . . . . . . . . . . . Strawberry 0.4 ppm . . . . . . . . . . . . . . . . . . . . . . . . . . . . . . . . . . Vegetable, bulb, group 0.9 ppm
. . . . . . . . . . . . . . . . . . . . . . . . . . . . . . . Vegetable, cucurbit, group 0.5 ppm
. . . . . . . . . . . . . . . . . . . . . . . . . . . . . . . Vegetable, fruiting, group 1.4 ppm . . . . . . . . . . . . . . . . Vegetable, root, except sugar beet, subgroup 0.4 ppm
. . . . . . . . . . . . . . . . . . . Vegetable, tuberous and corm, subgroup 0.04 ppm . . . . . . . . . . . . . . . . . . . . . . . . . . . . . . . . . . . . . . . . . . Wheat, grain 0.2 ppm
. . . . . . . . . . . . . . . . . . . . . . . . . . . . . . . . . . . . . . . . . . . . Wheat, hay 6 ppm . . . . . . . . . . . . . . . . . . . . . . . . . . . . . . . . . . . . . . . . . Wheat, straw 8.5 ppm
Provided the petitioner submit a revised Section F and EPA's method validation is satisfactory (Conclusions 12a, 53b, 53c, 53d, 53e, and 54b above), and pending review of the final report for the storage stability data in livestock commodities, there will be no residue chemistry data requirements that would preclude the establishment of tolerances for the combined residues of pyraclostrobin and its metabolites convertible to 1-(4-chlorophenyl)-1H-pyrazol-3-o1 and 1 -(4- chloro-2-hydroxyphenyl)-1H-pyrazol-3-ol, expressed as the parent compound, inion the following commodities at the indicated levels:
. . . . . . . . . . . . . . . . . . . . . . . . . . . . . . . . . . . . . . . . . . . Cattle*, fat 0.1 ppm . . . . . . . . . . . . . . . . . . . . . . . . . . . . . . . . . . . . . . . . . Cattle*, liver. 1.5 ppm
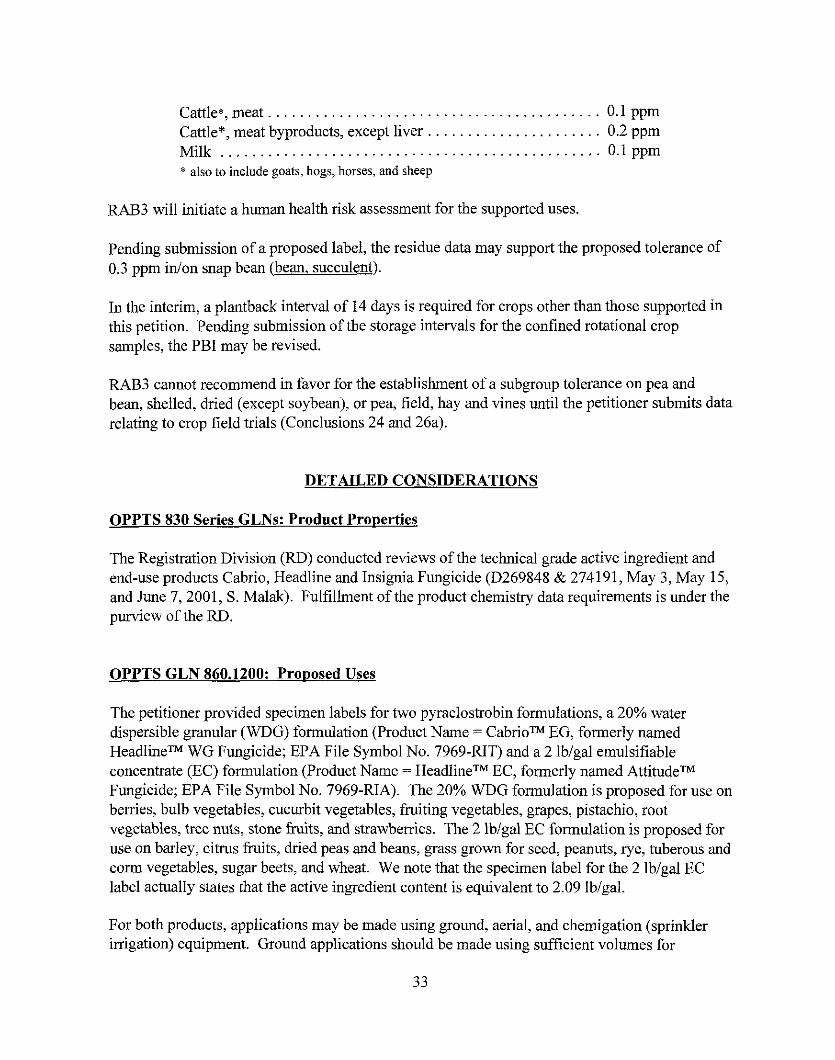
. . . . . . . . . . . . . . . . . . . . . . . . . . . . . . . . . . . . . . . . . . Cattle*, meat 0.1 ppm . . . . . . . . . . . . . . . . . . . . . . Cattle*, meat byproducts, except liver 0.2 ppm
Milk . . . . . . . . . . . . . . . . . . . . . . . . . . . . . . . . . . . . . . . . . . . . . . . . 0.lppm * also to include goats, hogs, horses, and sheep
RAB3 will initiate a human health risk assessment for the supported uses.
Pending submission of a proposed label, the residue data may support the proposed tolerance of 0.3 ppm inlon snap bean (bean, succulent).
In the interim, a plantback interval of 14 days is required for crops other than those supported in this petition. Pending submission of the storage intervals for the confined rotational crop samples, the PBI may be revised.
RAB3 cannot recommend in favor for the establishment of a subgroup tolerance on pea and bean, shelled, dried (except soybean), or pea, field, hay and vines until the petitioner submits data relating to crop field trials (Conclusions 24 and 26a).
DETAILED CONSIDERATIONS
OPPTS 830 Series GLNs: Product Properties
The Registration Division (RD) conducted reviews of the technical grade active ingredient and end-use products Cabrio, Headline and Insignia Fungicide (D269848 & 274191, May 3, May 15, and June 7,2001, S. Malak). Fulfillment of the product chemistry data requirements is under the purview of the RD.
OPPTS GLN 860.1200: Proaosed Uses
The petitioner provided specimen labels for two pyraclostrobin formulations, a 20% water dispersible granular (WDG) formulation (Product Name = CabrioTM EG, formerly named HeadlineTM WG Fungicide; EPA File Symbol No. 7969-RIT) and a 2 lbigal emulsifiable concentrate (EC) formulation (Product Name = HeadlineTM EC, formerly named AttitudeTM Fungicide; EPA File Symbol No. 7969-RIA). The 20% WDG formulation is proposed for use on berries, bulb vegetables, cucurbit vegetables, fruiting vegetables, grapes, pistachio, root vegetables, tree nuts, stone fruits, and strawberries. The 2 lbigal EC formulation is proposed for use on barley, citrus fruits, dried peas and beans, grass grown for seed, peanuts, rye, tuberous and corm vegetables, sugar beets, and wheat. We note that the specimen label for the 2 lbigal EC label actually states that the active ingredient content is equivalent to 2.09 lbigal.
For both products, applications may be made using ground, aerial, and chemigation (sprinkler imgation) equipment. Ground applications should be made using sufficient volumes for
adequate coverage of foliage, bloom, and fruit; and aerial applications must be made in a minimum of 5 gal/A. An additive such as crop oil concentrate or methylated seed oil may be added to the spray volumes to improve coverage. Tank mixing with most recommended fungicides and insecticides is permitted. No rotational crop restrictions are specified.
The specimen labels contain two sets of resistance management options. Resistance management Option A consists of a general restriction for all crops: "Do not make more than two (2) applications of [the product] before alternating to a labeled non-strobilurin fungicide with a different mode of action for at least one application." Resistance management Option B consists of crop specific restrictions. The proposed use patterns for each formulation and the restrictions and limitations for resistance management are presented in Table 1.
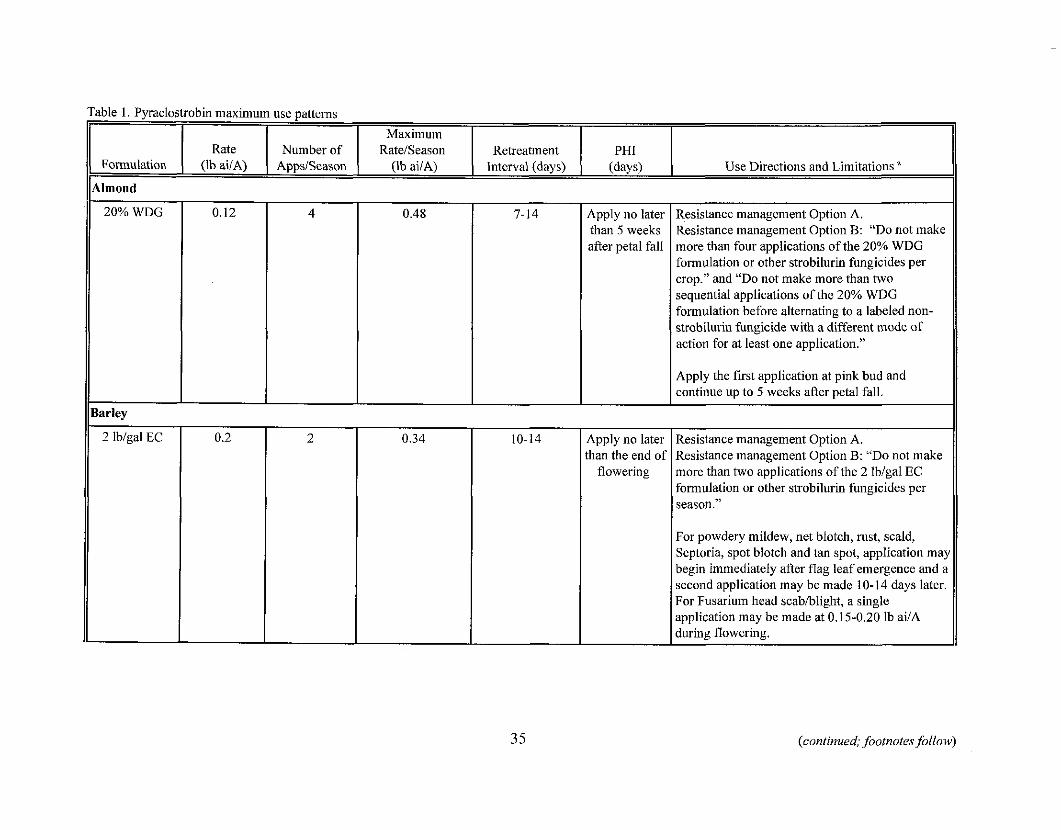
20% WDG
Table 1. Pyraclostrobin maximum use patterns
Formulation
Apply no later than 5 weeks after petal fall
For powdery mildew, net blotch, rust, scald, Septoria, spot blotch and tan spot, application ma! begin immediately after flag leaf emergence and i second application may be made 10-14 days later. For Fusarium head scabiblight, a single application may be made at 0.15-0.20 lb ailA durinr flowering.
Almond
Rate (lb ailA)
Resistance management Option A. Resistance management Option B: "Do not make more than four applications of the 20% WDG formulation or other strobilurin fungicides per crop." and "Do not make more than two sequential applications of the 20% WDG formulation before alternating to a labeled non- strobilurin fungicide with a different mode of action for at least one application."
Barley
2 lblgal EC
(continued; footnotes follow)
Number of AppslSeason
0.2
Maximum Ratelseason
(Ib ai1A)
2
Retreatment Interval (days)
0.34
PHI (days)
10-14
Use Directions and Limitations"
Apply no later than the end of
flowering
Apply the f ~ s t application at pink bud and continue up to 5 weeks after petal fall.
Resistance management Option A. Resistance management Option B: "Do not make more than two applications of the 2 lblgal EC formulation or other strobilwin fungicides per
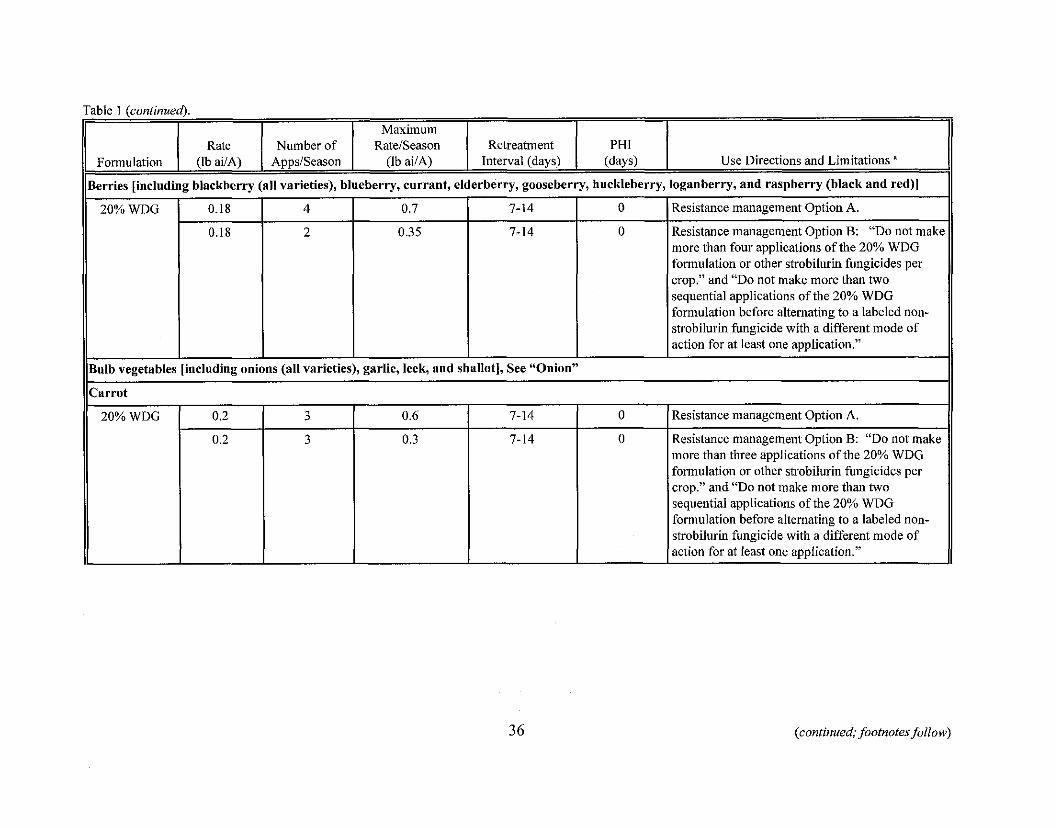
(continued; footnotes follow)
Table I (continued).
PHI (days) Formulation Use Directions and Limitations "
Maximum Ratelseason
(Ib ailA)
Berries [including blackberry (all varieties), blueberry, currant, elderberry, gooseberry, huckleberry, loganberry, and raspberry (black and red)]
Retreatment Interval (days)
Rate (Ib ailA)
Number of AppslSeason
7-14
7-14
0.7
0.35
4
2
20% WDG
- Bulb vegetables [including onions (all varieties), garlic, leek, and shallot], See "Onion" - Carrot
0
0
0.18
0.18
Resistance management Option A.
Resistance management Option B: "Do not make more than four applications of the 20% WDG formulation or other strobilurin fungicides per crop." and "Do not make more than two sequential applications of the 20% WDG formnlation before alternating to a labeled non- strobilurin fungicide with a different mode of action for at least one application."
7-14
7-14
0.6
0.3
20% WDG 0
0
0.2
0.2
Resistance management Option A.
Resistance management Option B: "Do not make Inore than three applications of the 20% WDG formulation or other strobilurin fungicides per crop." and "Do not make more than two sequential applications of the 20% WDG formnlation before alternating to a labeled non- strobilurin fungicide with a different mode of action for at least one application."
3
3
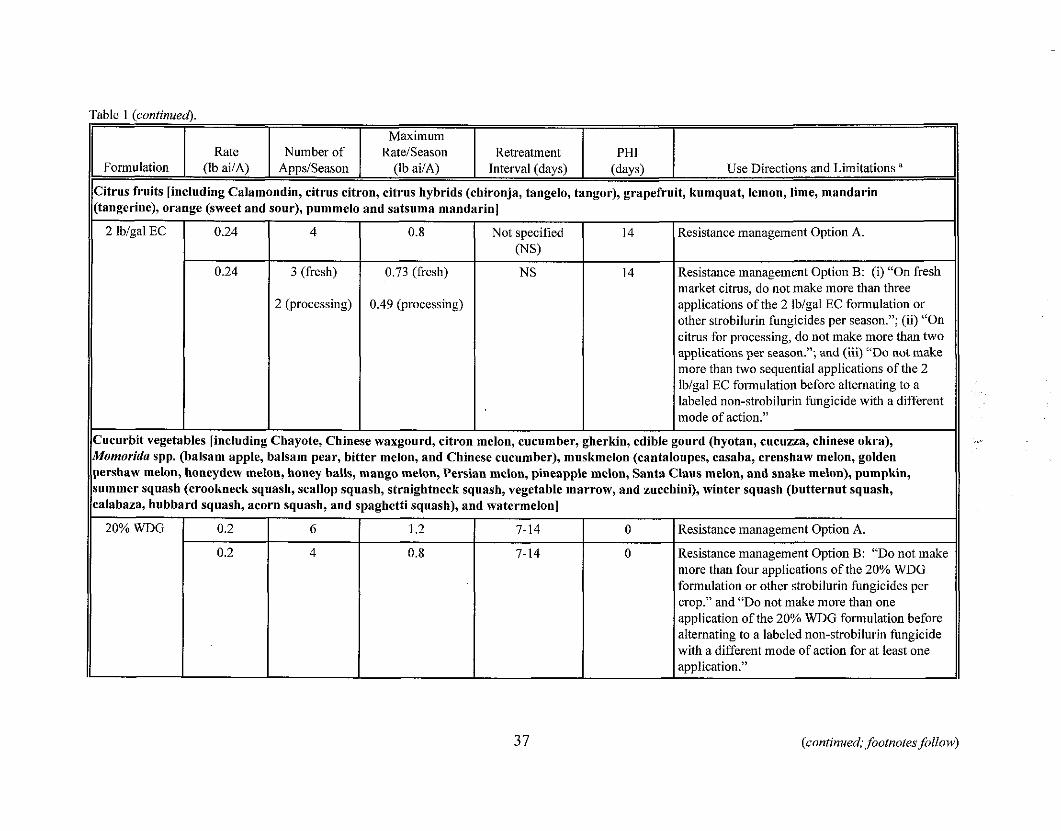
Table I (continued).
Formulation
0.24
Cucurbit vegetables [including Chayote, Chinese waxgourd, citron melon, cucumber, gherkin, edible gourd (hyotan, eucuzza, Chinese okra), Momorida spp. (balsam apple, balsam pear, hitter melon, and Chinese cucumber), muskmelon (cantaloupes, casaba, crenshaw melon, golden pershaw melon, honeydew melon, honey balls, mango melon, Persian melon, pineapple melon, Santa CIaus melon, and snake melon), pumpkin, summer squash (crookneck squash, scallop squash, straightneck squash, vegetable marrow, and zucchini), winter squash (butternut squash, calahaza, hubbard squash, acorn squash, and spaghetti squash), and watermelon]
14
Rate (lb ai/A)
3 (fresh)
2 (processing)
Resistance management Option B: (i) "On fresh market citrus, do not make more than three applications of the 2 lblgal EC formulation or other strobilurin fungicides per season."; (ii) "On citrus for processing, do not make more than two applications per season."; and (iii) "Do not make more than two sequential applications of the 2 lblgal EC formulation before alternating to a labeled non-strobilurin fungicide with a different mode of action."
(continued;, footnotes follow)
Citrus fruits [including Calamondin, citrus citron, citrus hybrids (chironja, tangelo, tangor), grapefruit, kumquat, lemon, lime, mandarin (tangerine), orange (sweet and sour), pummelo and satsuma mandarin]
0.73 (fresh)
0.49 (processing)
20% WDG
Number of AppsISeason
2 lbigal EC
0.2
0.2
Maxunum RateISeason
(Ib ailA)
0.24
G
4
4
Use Directions and Limitations " Retreatment
Interval (days)
1.2
0.8
PHI
(days)
0.8
7-14
7-14
Resistance management Option A. Not specified WS)
0
0
14
Resistance management Option A.
Resistance management Option B: "Do not make more than four applications of the 20% WDG formulation or other strobilurin fungicides per crop." and "Do not make more than one application of the 20% WDG formulation before alternating to a labeled non-strobilurin fungicide with a different mode of action for at least one application."
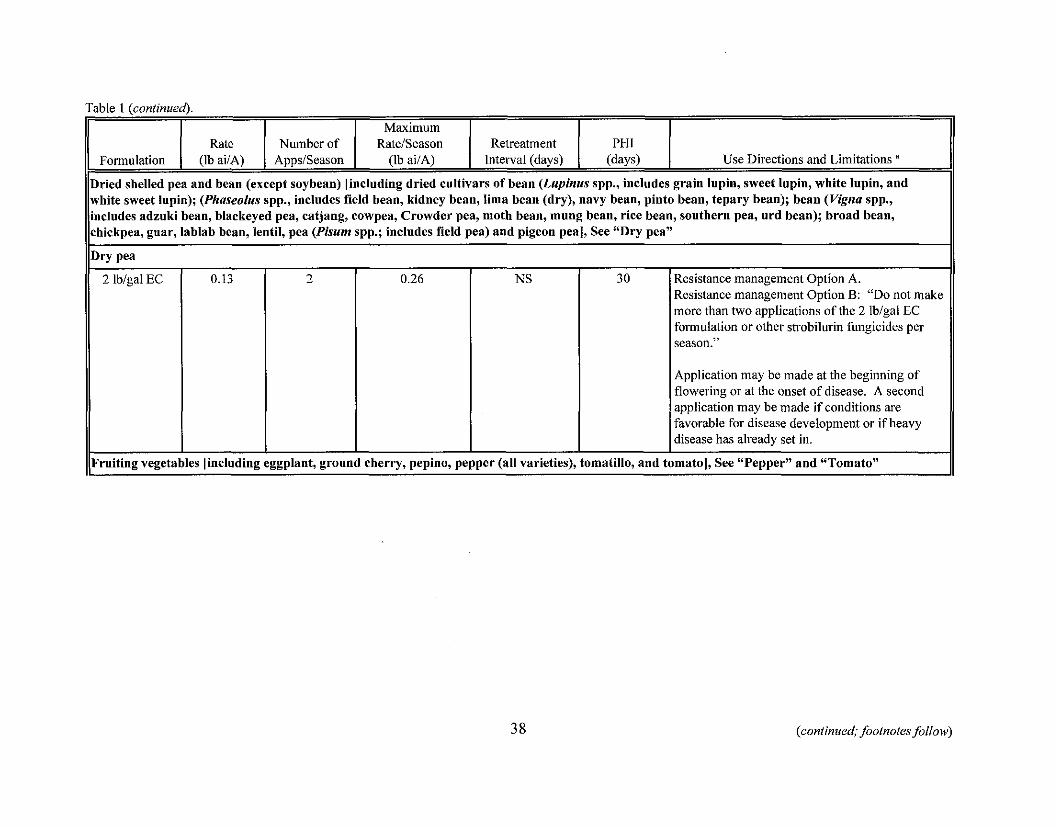
- . I I I Maximum I I I
11 1 Rate 1 Number of 1 Ratelseason 1 Retreatment 1 PHI 1 Formulation 1 (Ib ailA) I AppslSeason I (Ib ai1A) I Interval (days) 1 (days)
Application may be made at the beginning of flowering or at the onset of disease. A second application may be made if conditions are favorable for disease development or if heavy disease has already set in.
Use Directions and Limitations a
white sweet lupin); (Phaseolus spp., includes field bean, kidney bean, lima bean (dry), navy bean, pinto bean, tepary bean); bean (Vigna spp., includes adzuki bean, blackeyed pea, catjang, cowpea, Crowder pea, moth bean, mung bean, rice bean, southern pea, urd bean); broad bean, chickpea, guar, lablab bean, lentil, pea (Pisum spp.; includes field pea) and pigeon pea], See "Dry pea"
Dry pea
I I I I I I
Fruiting vegetables [including eggplant, ground cherry, pepino, pepper (all varieties), tornatillo, and tomato], See "Pepper" and "Tomato"
Dried shelled pea and bean (except soybean) [including dried cultivars of bean (Lupinus spp., includes grain lupin, sweet lupin, white lupin, and
(continued; footnotes follow)
2 lblgal EC 0.26 0.13 NS 2 30 Resistance management Option A. Resistance management Option B: "Do not make more than two applications of the 2 lblgal EC formulation or other shobilurin fungicides per
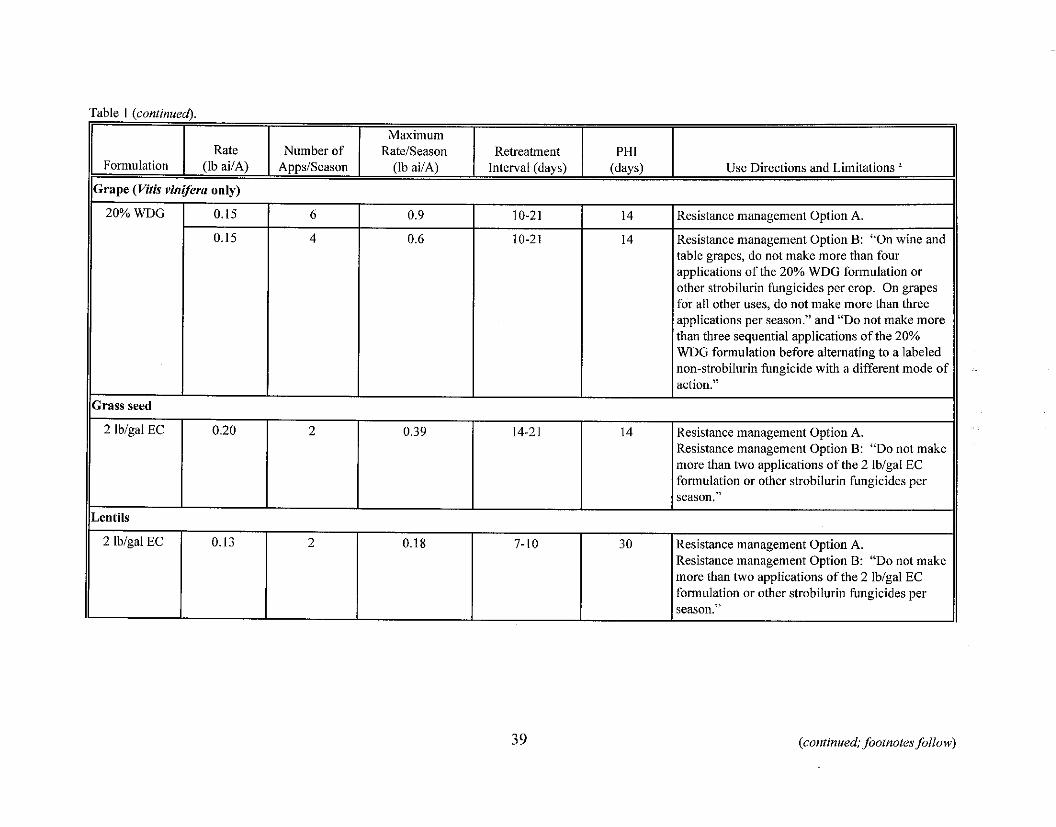
Table I (continued).
Rate I Formulation ( (lh ai/A) I AppsiSeason I (lb ai/A)
8 - . " ",
(continued; footnote.^ follow)
Number of
I ~ r a p e (Vitis vinifcra onlv) I Interval (days)
20% WDG I 0.15
Grass seed
2 lbigal EC
Lentils
2 lblgal EC
Maximum Ratelseason
(days)
6
0.15
0.20
0.13
Use Directions and Limitations " Retreatment
0.9
4
2
2
Ptll
10-21
0.6
0.39
0.18
14 I Resistance management Option A.
10-21
14-21
7-10
14
14
30
Resistance management Option B: "On wine and table grapes, do not make more than four applications of the 20% WDG formulation or other strobilurin fungicides per crop. On grapes for all other uses, do not make more than three applications per season." and "Do not make more than three sequential applications of the 20% WDG formulation before alternating to a labeled non-strobilurin fungicide with a different mode ot action."
Resistance management Option A. Resistance management Option B: "Do not make more than two applications of the 2 lhlgal EC formulation or other strobilurin fungicides per season."
Resistance management Option A. Resistance management Option B: "Do not make more than two applications of the 2 lblgal EC formulation or other strobilurin fungicides per season."
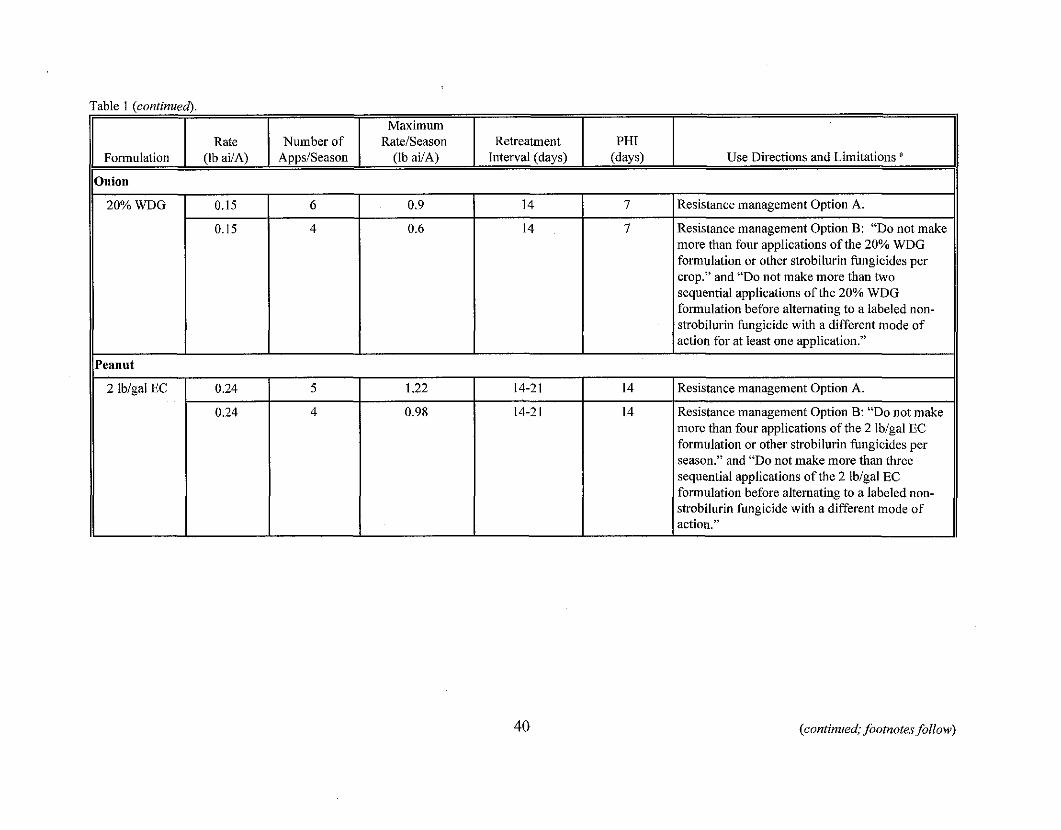
'able 1 (continued).
I I I Maximum I I
Formulation
Resistance management Option A. 2 lblgal EC
Resistance management Option B: "Do not make more than four applications of the 2 lblgal EC formulation or other strobilurin fungicides per season." and "Do not make more than three sequential applications of the 2 lblgal EC formulation before alternating to a labeled non- strobilurin fungicide with a different mode of action."
Rate (Ib aUA)
(continued; foofnote.~ follow)
Onion
0.24
0.24
Number of AppslSeason
Resistance management Option A.
Resistance management Option B: "Do not make more than four applications of the 20% WDG formulation or other shobilurin fungicides per crop." and "Do not make more than two sequential applications of the 20% WDG formulation before alternating to a labeled non- strobilurin fungicide with a different mode of action for at least one application."
5
4
Ratelseason (Ib ai/A)
1.22
0.98
14
14
20% WDG
Retreatment Interval (days)
7
7
6
4
0.15
0.15
0.9
0.6
PHI (days) Use Directions and Limitations a
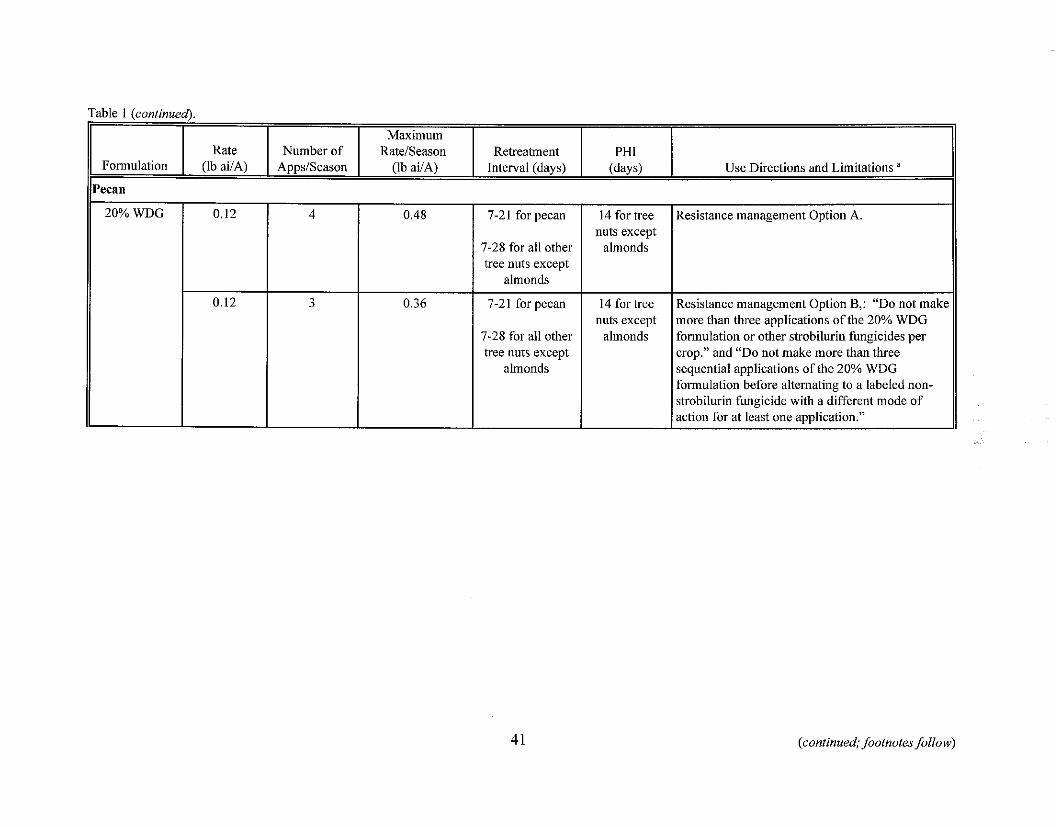
7-21 for pecan
rahle I (continued).
7-28 for all other tree nuts except
almonds
Formulation
(continued; footnotes follow)
Rate (Ib ailA)
14 for tree nuts except
almonds
Pecan
Resistance management Option B,: "Do not makt more than three applications of the 20% WDG formulation or other strobilurin fungicides per crop." and "Do not make more than three sequential applications of the 20% WDG formulation before alternating to a labeled non- strobilurin fungicide with a different mode of action for at least one application."
Number of AppsISeason
20% WDG
Maximum RateISeason
(Ih ai/A)
0.12
Retreatment Interval (days)
4
PHI (days)
0.48
Use Directions and Limitations "
7-21 for pecan
7-28 for all other tree nuts except
almonds
14 for tree nuts except
almonds
Resistance management Option A.
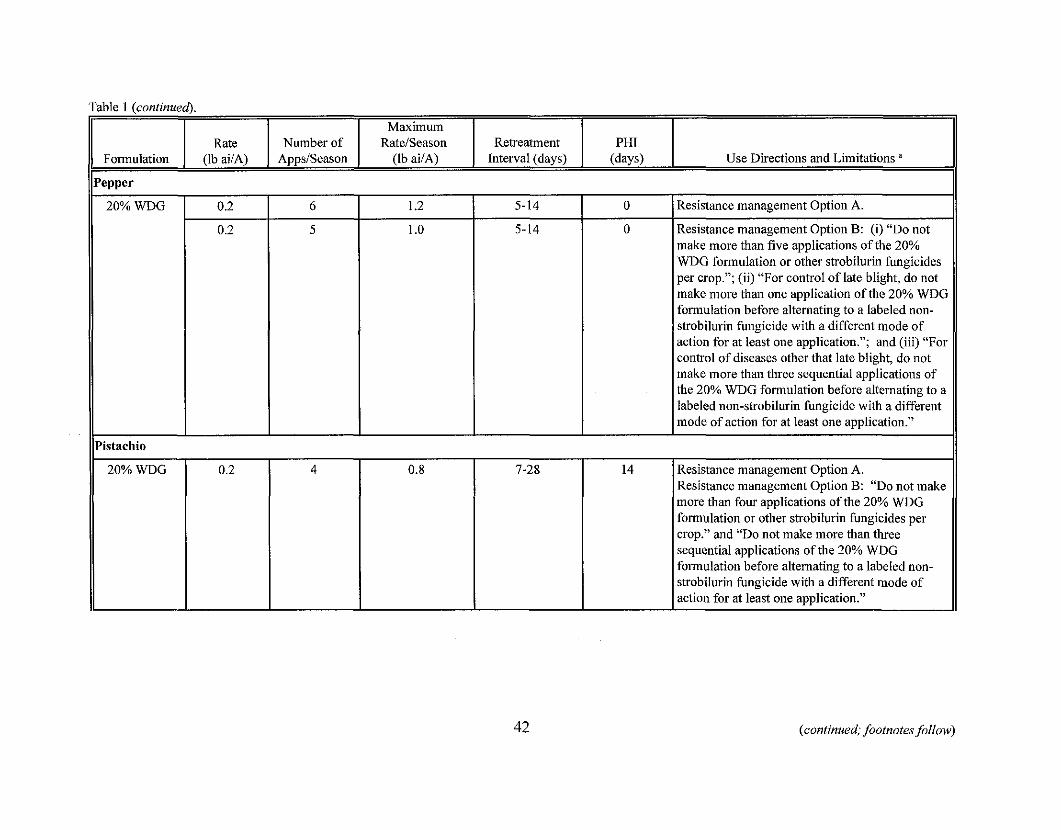
(continued; footnotes follow)
Table 1 (continued).
Formulation Use Directions and Limitations " Number of
AppsISeason Retreahnent
lnterval (days) Rate
(Ib ailA)
Maximum Ratelseason
(Ib aiIA) PHI
(days)
Resistance management Option A.
Resistance management Option B: (i) "Do not make more than five applications of the 20% WDG formulation or other strobilurin fungicides per crop."; (ii) "For control of late blight, do not make more than one application of the 20% WDG formulation before alternating to a labeled non- strobilurin fungicide with a different mode of action for at least one application."; and (iii) "For control of diseases other that late blight, do not make more than three sequential applications of the 20% WDG formulation before alternating to a labeled non-strobilurin fungicide with a different mode of action for at least one application."
Resistance management Option A. Resistance management Option B: "Do not make more than four applications of the 20% WDG formulation or other strobilurin fungicides per crop." and "Do not make more than three sequential applications of the 20% WDG formulation before alternating to a labeled non- strobilurin fungicide with a different mode of action for at least one application."
5-14
5-14
7-28
Pepper
0
0
14
6
5
20% WDG 1.2
1 .O
0.2
0.2
Pistachio
4 20% WDG 0.8 0.2
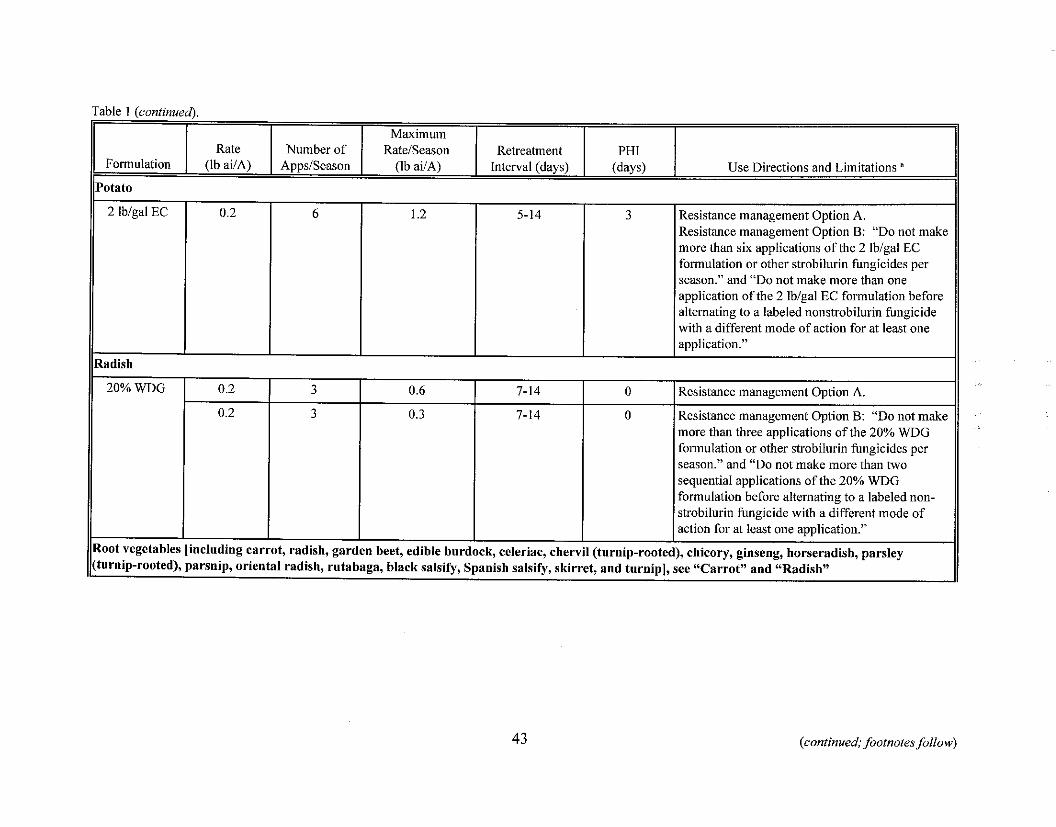
Table 1 (continued).
action for at least one application."
Root vegetables [including carrot, radish, garden beet, edible burdock, celeriac, chervil (turnip-rooted), chicory, ginseng, horseradish, parsley (turnip-rooted), parsnip, oriental radish, rutabaga, black salsify, Spanish salsify, skirret, and turnip], see "Carrot" and "Radish"
Formulation
2 Iblgal EC
(continued; footnotes fullow)
Potato
Rate (lb ailA)
0.2
Number of AppsISeason
6
Radish
3
3
20% WDG
Maximum Ratelseason
(Ib aVA)
1.2
0.2
0.2
0.6
0.3
Retreahnent Interval (days)
5-14
7-14
7-14
PHI (days)
3
Use Directions and Limitations "
Resistance management Option A. Resistance management Option B: "Do not make more than six applications of the 2 lblgal EC formulation or other strobilurin fungicides per season." and "Do not make more than one application of the 2 Iblgal EC formulation before alternating to a labeled nonstrobilurin fungicide with a different mode of action for at least one application."
0
0
Resistance management Option A.
Resistance management Option B: "Do not make more than three applications of the 20% WDG fonnulation or other strobilurin fungicides per season." and "Do not make more than two sequential applications of the 20% WDG formulation before alternating to a labeled non- strobilurin fungicide with a different mode of
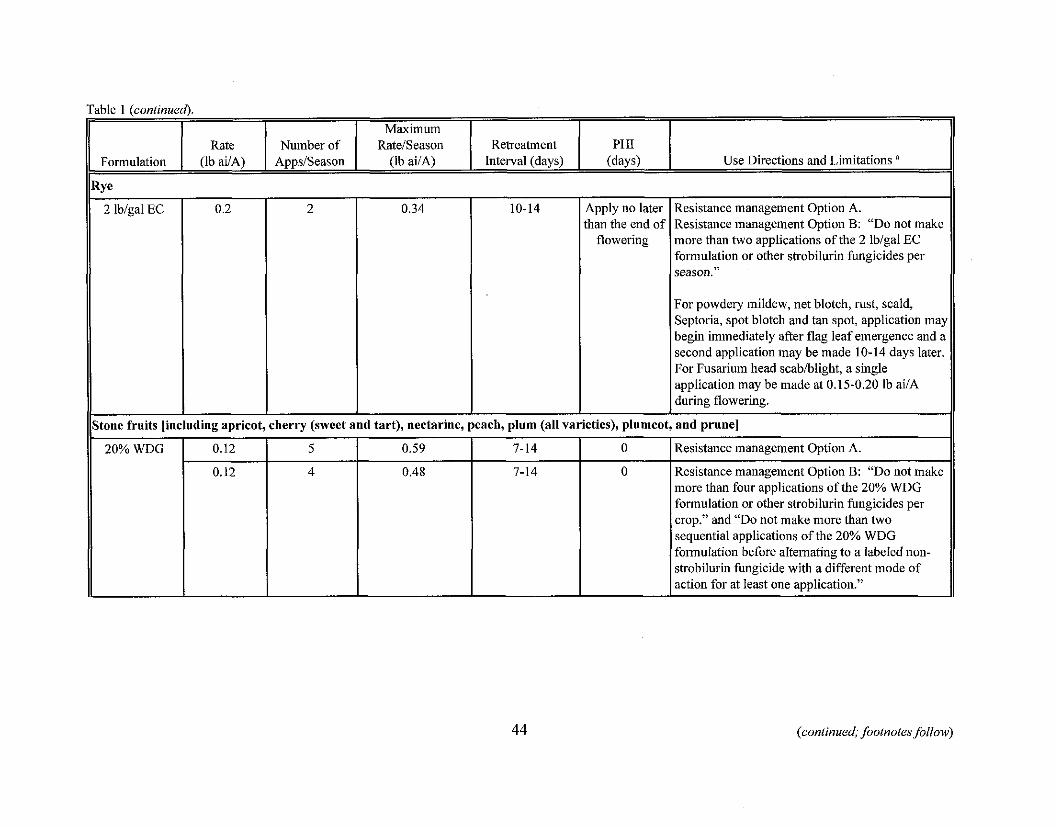
Table l (continued)
(continued; footnotes follow)
Retreatment Interval (days)
Maximum Ratelseason
(lb ai1A) Formulation - PHI
(days) Rate
(Ib ai/A) Use Directions and Limitations Number of
AppsISeason
Apply no later than the end of
flowering
Rye Resistance management Option A. Resistance management Option B: "Do not make more than two applications of the 2 lbigal EC formulation or other strobilurin fungicides per season."
For powdely mildew, net blotch, rust, scald, Septoria, spot blotch and tan spot, application may begin immediately after flag leaf emergence and a second application may be made 10-14 days later. For Fusarium head scabblight, a single application may be made at 0.15-0.20 lb ailA during flowering.
0.34 2 lblgal EC 10-14 0.2
varieties), plumcot, and prune]
2
and tart), nectarine, peach, plum (all
0
0
cherry (sweet
5
4
0.59
0.48
Resistance management Option A.
Resistance management Option B: "Do not make more than four applications of the 20% WDG formulation or other strobilurin fungicides per crop." and "Do not make more than two sequential applications of the 20% WDG formulation before alternating to a labeled non- strobilurin fungicide with a different mode of action for at least one application."
Stone fruits [including apricot,
7-14
7-14
20% WDG 0.12
0.12
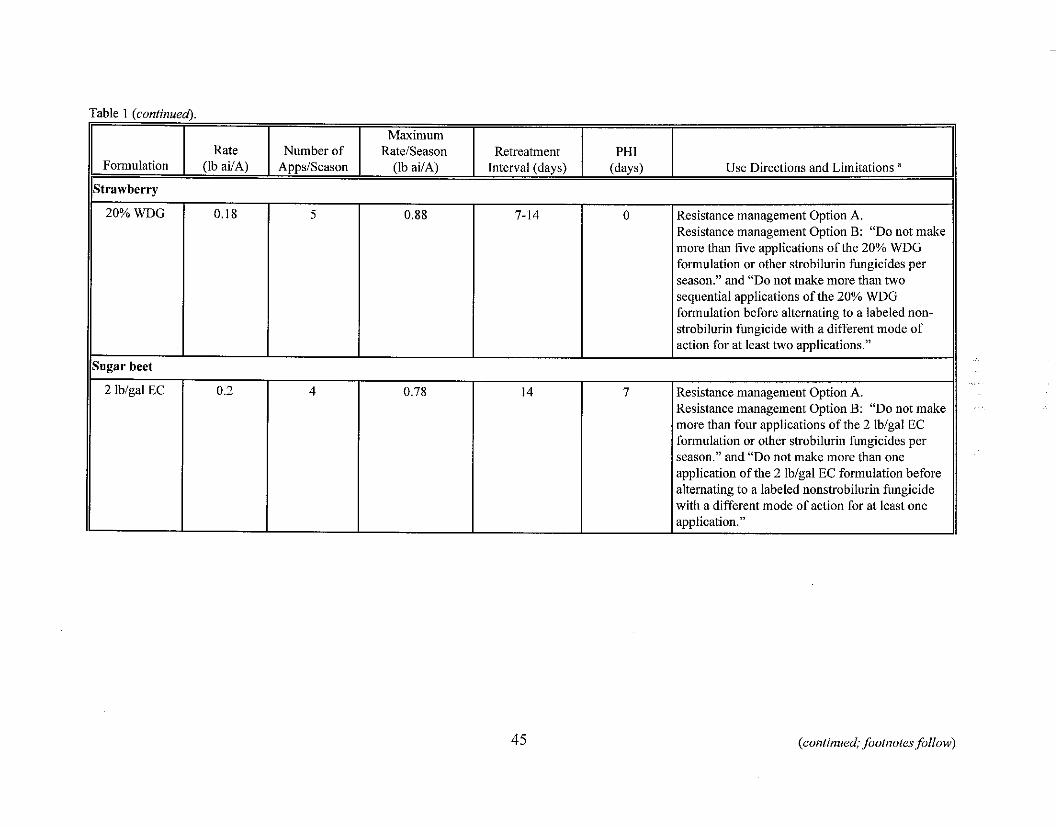
Resistance management Option A. Resistance management Option B: "Do not make more than four applications of the 2 Iblgal EC formulation or other strobilurin fungicides per season." and "Do not make more than one application of the 2 lblgal EC formulation before alternating to a labeled nonstrobilurin fungicide with a different mode of action for at least one
fable 1 (continued).
1 application." II
Formulation
(continued; footnotes,follow)
Rate (Ib aUA)
Strawberry
Number of AppsISeason
20% WDG
Maximum RateISeasou
(Ib ai1A)
Sugar beet
0.18
Retreatment Interval (days)
5
PHI (days)
0.88
Use Directions and Limitations "
7-14 0 Resistance management Option A. Resistance management Option B: "Do not make more than five applications of the 20% WDG formulation or other strobilurin fungicides per season." and "Do not make more than two sequential applications of the 20% WDG formulation before alternating to a labeled non- strobilurin fungicide with a different mode of action for at least two applications."
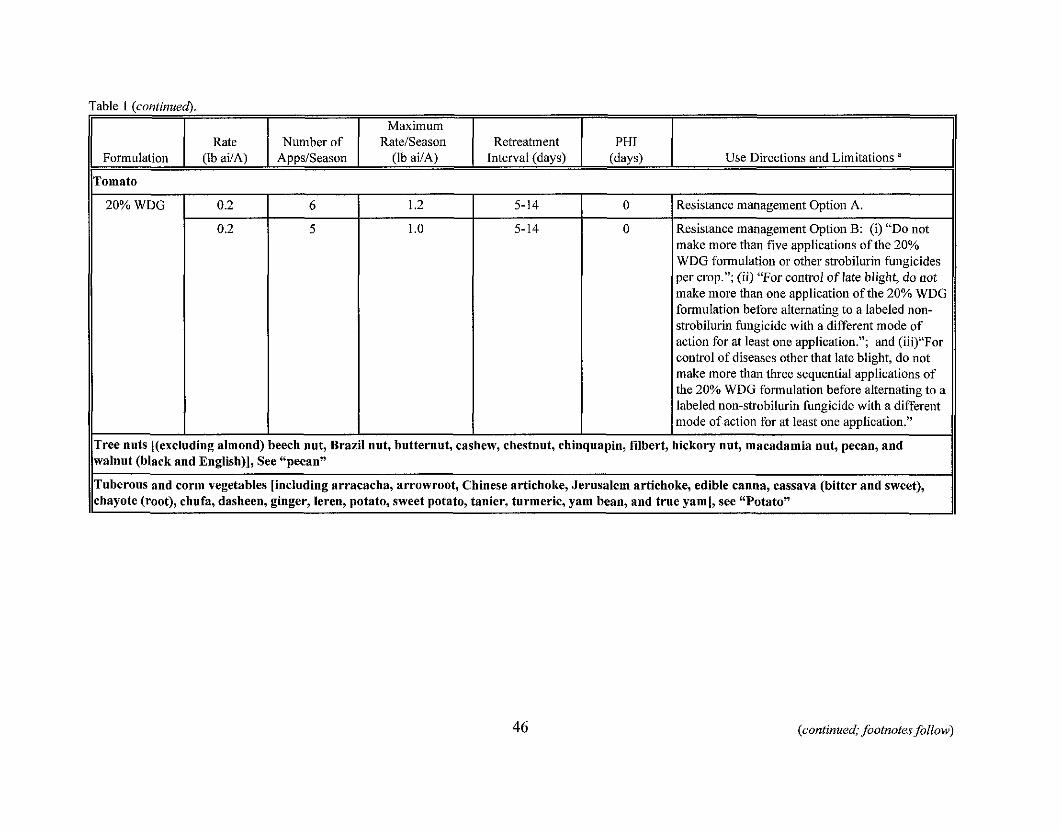
Table 1 (confinued).
I I I Maximum I I I 11 1 Rate I Number of 1 Ratelseason 1 Retreatment 1 PHI 1 11
Formulation I (Ib aiIA) I AppsISeason I (Ib aiIA) I Interval (days) I (days)
.I nut, butternut, ca
Use Directions and Limitations
0.2 5
II Tuberous and corm vegetables [including arracacha, arrowroot, Chinese artichoke, Jerusalem artichoke, edible canna, cassava (bitter and sweet), chayote (root), chufa, dasheen, ginger, leren, potato, sweet potato, tanier, turmeric, yam bean, and true yaml, see "Potato" 11
romato
rree nuts [(excluding almond) beech nut, BI walnut (black and English)], See "pecan"
5-14
(continued; footnotes follow)
0 I Resistance management Option A. 20%WDG I 0.2
lew, chestnut, chinquapin, filbert, hickory nut, macadamia nut, pecan, and
0 Resistance management Option B: (i) "Do not make more than five applications of the 20% WDG formulation or other strobilurin fungicides per crop."; (ii) "For control of late blight, do not make more tban one application of the 20% WDG formulation before alternating to a labeled non- strobilurin fungicide with a different mode of action for at least one application."; and (iii)"For control of diseases other that late blight, do not make more than three sequential applications of the 20% WDG formulation before alternating to a labeled non-strobilurin fungicide with a different mode of action for at least one application."
6 1.2 5-14
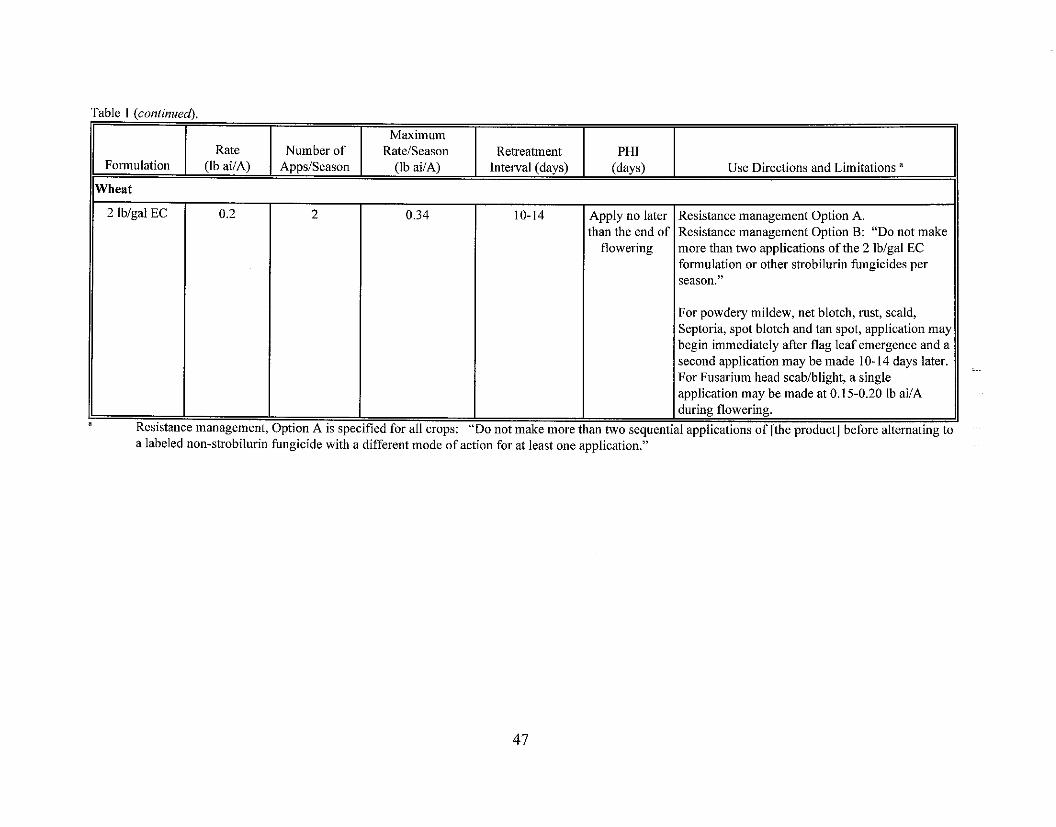
Table 1 (continued).
I Formulation
- I not make
I flowering more than two applications of the 2 lblgal EC formulation or other sti-obilurin fungicides per
I Maximum I I I
(1 2 lblgal EC / 0.2 2 0.34 10-14 Apply no later Resistance management Option A.
Wheat
Rate (Ib ailA)
I
For powdery mildew, net blotch, rust, scald, Septoria, spot blotch and tan spot, application may begin immediately after flag leaf emergence and a second application may be made 10-14 days later. For Fusarium head scablblight, a single application may be made at 0.15-0.20 lb ailA
Il
Number of AppslSeason
than the end of Resistance manarement Ovtion B: "Da
I
I
Ratelseason (Ib ailA)
I during flowering.
I
Resistance management, Option A is specified for all crops: "Do not make more than two sequential applications of [the product] before alternating to a labeled non-strobilurin fungicide with a different mode of action for at least one application."
Retreatment Interval (days)
I I I I season." II
PHI (days) Use Directions and Limitations "
Comments: The proposed use directions are adequate to allow RAB3 to make an assessment of whether residue data reflect the maximum residues likely to occur in food and livestock feeds for all crops for which use of pyraclostrobin is proposed except snap beans and imported bananas. Additional information is required to delineate the proposed use of pyraclostrobin on snap beans and imported bananas. The petitioner should submit a copy of the product label@), with English translation, for each pyraclostrobin product intended for use on bananas targeted for import to the U.S.
Because no data reflecting aerial applications to orchard crops were submitted, the label must be modified to specify that aerial applications to orchard crops be made in a minimum of 10 gaUA.
Based on the submitted data for barley and wheat hay, the petitioner must modify the proposed label to add a 14-day PHI for barley and wheat hay.
In addition, based on the submitted data for grass forage and hay, a pregrazing and prehaying interval of 27 days must be added to the label for the 2 lbigal EC formulation.
OPPTS GLN 860.1300: Nature of the Residue in Plants
The test substances for the plant metabolism studies were uniformly ring-labeled [chlorophenyl- '4C]pyraclostrobin (specific activity 4.34 MBqImg (260,400 dpmlpg); radiochemical purity >99%) and [tolyl-14C]pyraclostrobin (specific activity 4.5 MBqImg (270,000 dpmlpg); radiochemical purity >99%). The petitioner noted in the potato metabolism study that both radiolabeled test substances contained the desmethoxy metabolite 500M07 (or BF 500-3) as an impurity (at 5%). The presence of this impurity was not expected to influence the study results.
For all plant metabolism studies, the in-life and analytical phases of the study were conducted by BASF (BASF Agricultural Center, Limburgerhoff, Germany)
BASF submitted a grape metabolism study (citation listed below) in support of the current petition.
451 18430 Hamm, R.T. (1998) Metabolism of BAS-500 F in Grapes. Laboratory Project Identification No. 35507, 1998110988. Unpublished study submitted by BASF Corporation. 91 p.
The radioactive test substances, [chlorophenyl-14C]pyraclostrobin and [tolyl-14C]pyraclostrobin, were combined with EC formulation blank and diluted to volume with water. The formulated test substances (final specific activity unspecified) were each applied by hand sprayer to four established grape vines (-5 years old) as six foliar applications, with 16- to 19-day retreatment intervals, at 0.1 1-0.43 lb ailA/application (126-480 g aihalapplication). The total application
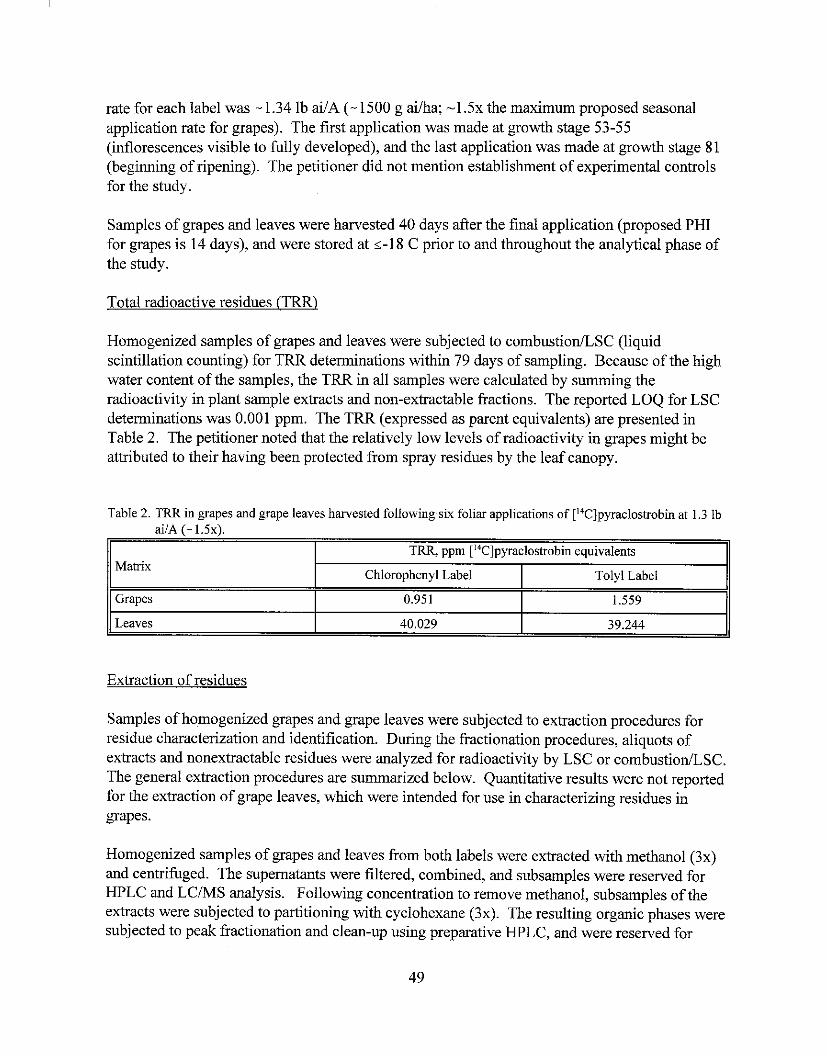
rate for each label was - 1.34 lb ai/A (- 1500 g aiiha; - 1 . 5 ~ the maximum proposed seasonal application rate for grapes). The first application was made at growth stage 53-55 (inflorescences visible to fully developed), and the last application was made at growth stage 81 (beginning of ripening). The petitioner did not mention establishment of experimental controls for the study.
Samples of grapes and leaves were harvested 40 days after the final application (proposed PHI for grapes is 14 days), and were stored at <-18 C prior to and throughout the analytical phase of the study.
Total radioactive residues (TRR)
Homogenized samples of grapes and leaves were subjected to combustionLSC (liquid scintillation counting) for TRR determinations within 79 days of sampling. Because of the high water content of the samples, the TRR in all samples were calculated by summing the radioactivity in plant sample extracts and non-extractable fractions. The reported LOQ for LSC determinations was 0.001 ppm. The TRR (expressed as parent equivalents) are presented in Table 2. The petitioner noted that the relatively low levels of radioactivity in grapes might be attributed to their having been protected from spray residues by the leaf canopy.
Table 2. TRR in grapes and grape leaves harvested following six foliar applications of IMClpyracloshobin at 1.3 lb . . . .. . aiIA (- 1.5~) .
Extraction of residues
Matrix
Grapes
Leaves
Samples of homogenized grapes and grape leaves were subjected to extraction procedures for residue characterization and identification. During the fractionation procedures. aliauots of - . . extracts and nonextractable residues were analyzed for radioactivity by LSC or combustion/LSC. The general extraction procedures are summarized below. Quantitative results were not reported for the extraction of grape leaves, which were intended for use in characterizing residues in grapes.
TRR, ppm ['4C]pyracloshobin equivalents
- ~
0.95 1
40.029
Homogenized samples of grapes and leaves from both labels were extracted with methanol (3x) and centrifuged. The supernatants were filtered, combined, and subsamples were reserved for HPLC and LCIMS analysis. Following concentration to remove methanol, subsamples of the extracts were subjected to partitioning with cyclohexane (3x). The resulting organic phases were subjected to peak fractionation and clean-up using preparative HPLC, and were reserved for
Chlorophenyl Label
1.559
39.244
Tolyl Label
LC/MS analysis. The aqueous phases were partitioned with ethyl acetate (3x). For grape leaves, the resulting aqueous and organic phases were subjected to further peak fractionation and clean- up. The organic and aqueous phases for grapes and leaves were reserved for HPLC and LC/MS analysis.
Nonextractable residues of grapes were extracted with water (chlorophenyl label) or ammonium hydroxide (tolyl label; details unspecified). The resulting aqueous phases were not further analyzed. Remaining nonextractable residues were subjected to base hydrolysis (10% NaOH for 3 hours at reflux).
The distribution of 14C-activity in the extracts of grapes are presented in Tables 3a (chlorophenyl label) and 3b (tolyl label).
Characterizatiodidentification of residues
The methanol extracts of grapes and leaves were analyzed by HPLC for isolation and identification of metabolites. Purified metabolites were identified by ion-spray LC/MS andlor LCIMSIMS. HPLC was conducted using a Spherisorb ODs I1 or Inertsil phenyl column and gradient mobile phases of water:formic acid (1000:5, v:v) and acetonitrile (ACN):formic acid (1000:5, v:v). The detector for nonradiolabeled standards was not identified (probably W, see discussions under potato and wheat studies). Metabolites were identified by cochromatography with radiolabeled reference standards for pyraclostrobin and BF 500-3 (elsewhere named 500M07), and with the following metabolites isolated from grape leaf extracts by MS: M54 (elsewhere named 500M54), M55, and M56. Chemical structures of identified metabolites are presented in Figure 2, Attachment 11.
Minor metabolites M54 (the tolylmethoxy derivative of BF 500-3), M55 (the scillabiose or glucosidorhamnose conjugate of the C1-phenyl pyrazol moiety), and M56 (the OH- pyrazolglycoside of M54) were isolated from the methanol extract of grape leaves and identified by LCIMS and LCIMSIMS. These metabolites were determined in grapes by HPLC cochromatography of the methanol extracts and cyclohexane and ethyl acetate phases with the metabolites isolated from grape leaves. The petitioner stated that further characterization of minor metabolites detected in the methanol extract (unknown peaks PI, P2, and P5) was not possible due to low radioactivity concentrations.
The petitioner stated that partitioning with cyclohexane and ethyl acetate was conducted to aid in characterization of pyraclostrobin metabolites as organosoluble or aqueous-soluble compounds. Quantitative results for HPLC analysis of the organic phases following partitioning were not reported; however, the petitioner stated that components in the organic and aqueous phases following partitioning were minor metabolites present at <0.05 ppm. Chromatograms provided for the tolyl label indicate that M54 was identified in the cyclohexane phase, and M56 was identified in the ethyl acetate phase by cochromatography.
The nonextractable residues were treated with water or ammonia and then subjected to 10% NaOH at reflux. The supernatant following NaOH reflux was adjusted to pH 1 with concentrated HC1, resulting in precipitation of "raw lignin", which accounted for 4.1% TRR (0.039 ppm) in the chlorophenyl-label grapes, and 4.6% TRR (0.071 ppm) in the tolyl-label grapes. The petitioner postulated that radioactivity remaining in the supernatants following precipitation was comprised of low molecular weight lignins. The nonextractable residue remaining following NaOH reflux was characterized as "raw cellulose". The petitioner noted that the lignin and cellulose residues probably resulted from grape stems homogenized with grape bunches since grapes themselves are comprised of primarily water (80%) and sugar (IS%), with only 2% fiber composition.
A summary of the characterized and identified I4C-residues in chlorophenyl- and tolyl-label grapes is presented in Table 4.
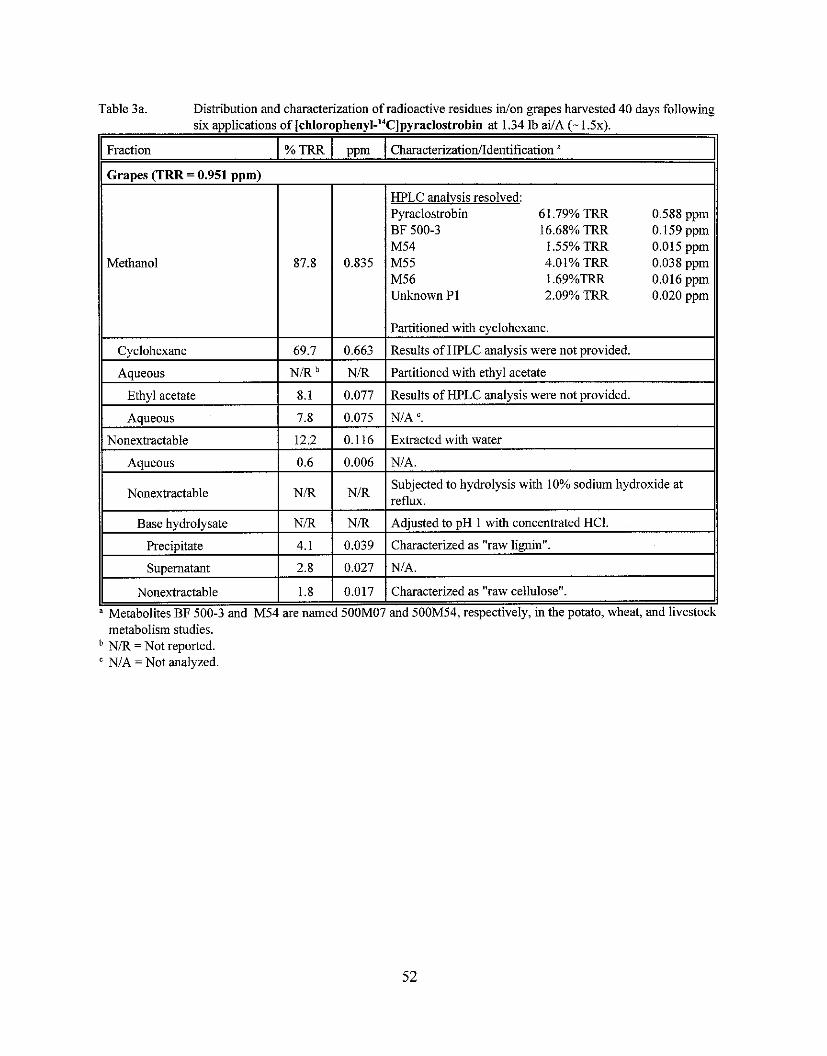
Methanol
Table 3a. Distribution and characterization of radioactive residues inlon grapes harvested 40 days following six applications of [chlorophenyl-"C]pyraclostrobin at 1.34 lb ai/A (- 1.5~).
HPLC analysis resolved: Pyraclostrobin 61.79% TRR 0.588 ppm BF 500-3 16.68% TRR 0.159 ppm M54 1.55% TRR 0.015 ppm M55 4.01% TRR 0.038 ppm M56 1.69%TRR 0.016 ppm Unknown PI 2.09% TRR 0.020 ppm
Fraction
Partitioned with cvclohexane.
I Graoes (TRR = 0.951 oom)
% TRR
Cyclobexane
Aqueous
Ethyl acetate
Aqueous
Nonextractable
Aaueous
ppm
II Subjected to hydrolysis with 10% sodium hydroxide at Nonextractable
Nonextractable 1 1.8 1 0.017 1 Characterized as "raw cellulose".
a Metabolites BF 500-3 and M54 are named 500M07 and 500M54, respectively, in the potato, wheat, and livestock
Characterizationildentification "
69.7
N R
8.1
7.8
12.2
0.6
I Base bydrolysate
Precipitate
supernatant
metabolism studies. NiR =Not reported.
V I A =Not analyzed.
0.663
N R
0.077
0.075
0.1 16
0.006
N R
4.1
2.8
Results of HPLC analysis were not provided.
Partitioned with ethyl acetate
Results of HPLC analysis were not provided.
NIA '. Extracted with water
NIA.
N R
0.039
0.027
Adjusted to pH 1 with concentrated HCI.
Characterized as "raw lignin".
NIA.
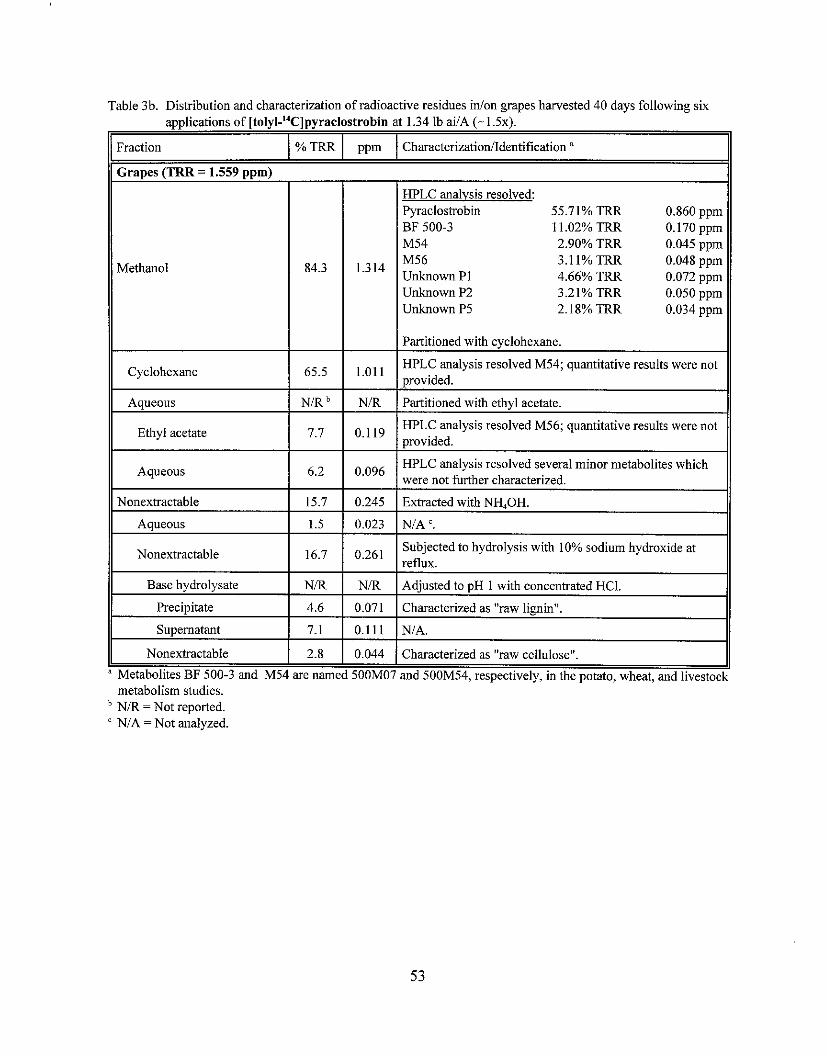
Table 3b. Distribution and characterization of radioactive residues inion gapes harvested 40 days following six applications of [tolyl-14C]pyraclostrobin at 1.34 lb aiiA (- 1.5~).
55.71% TRR 1 1.02% TRR
3.21% TRR
PLC analysis resolved M56; quantitative results were not
" Metabolites BF 500-3 and M54 are named 500M07 and 500M54, respectively, in the potato, wheat, and livestock metabolism studies. N/R = Not reported. N/A =Not analyzed.
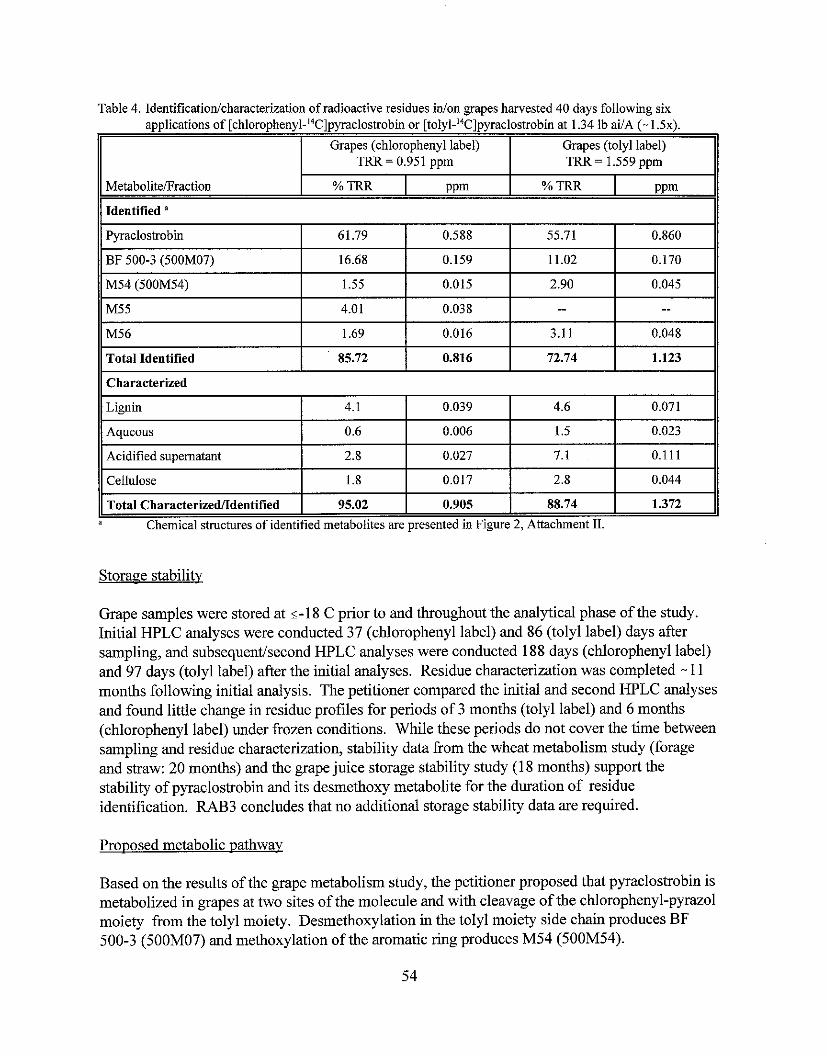
Table 4. Identificationlcharacterization of radioactive residues inion grapes harvested 40 days follow in^ six - . - applications of [chlorophenyl-'4C]pyraclostrobin or [tolyl-14C]pyraclostrobin at 1.34 lb ai1A (- 1.5~).
1 Grapes (chlorophenyl label)
MetaboliteiFraction
Grapes (tolyl label)
Pyraclostrobin
Identified a
TRR = 0.951 ppm
Total Identified
TRR = 1.559 ppm
61.79
Lignin
Aqueous
Acidified supernatant
Storage stabilitv
85.72
Cellulose
Grape samples were stored at <-I8 C prior to and throughout the analytical phase of the study. Initial HPLC analyses were conducted 37 (chlorophenyl label) and 86 (tolyl label) days after sampling, and subsequent/second HPLC analyses were conducted 188 days (chlorophenyl label) and 97 days (tolyl label) after the initial analyses. Residue characterization was completed - 11 months following initial analysis. The petitioner compared the initial and second HPLC analyses and found little change in residue profiles for periods of 3 months (tolyl label) and 6 months (chlorophenyl label) under frozen conditions. While these periods do not cover the time between sampling and residue characterization, stability data from the wheat metabolism study (forage and straw: 20 months) and the grape juice storage stability study (18 months) support the stability of pyraclostrobin and its desmethoxy metabolite for the duration of residue identification. RAB3 concludes that no additional storage stability data are required.
% TRR
0.588 I BF 500-3 (500M07)
Characterized
4.1
0.6
2.8
Proposed metabolic pathway
0.816 I
1.8
Based on the results of the grape metabolism study, the petitioner proposed that pyraclostrobin is metabolized in grapes at two sites of the molecule and with cleavage of the chlorophenyl-pyrazol moiety from the tolyl moiety. Desmethoxylation in the tolyl moiety side chain produces BF 500-3 (500M07) and methoxylation of the aromatic ring produces M54 (500M54).
PPm
55.71
16.68
0.039
0.006
0.027
0.860
72.74
0.017
1.372
% TRR
0.159
1.123
4.6
1.5
7.1
Chemical structures of identified metabolites are presented in Figure 2, Attachment 11.
Total Characterizedfldentified
PPm
0.071
0.023
0.111
2.8
0.905 95.02
11.02
0.044
88.74
0.170
Hydroxylation of M54 in the chlorophenyl pyrazol moiety, followed by glucosidation results in formation of M56, and cleavage of the moiety from the tolyl moiety results in formation of M55.
Studv summarv
Following treatment of established grape vines with six foliar applications of uniformly ring- labeled [chlorophenyl-14C]pyraclostrobin or [tolyl-L4C]pyraclostrobin at 0.1 1-0.43 lb ailAlapplication (126-480 g aiihdapplication) for a total application rate for each label of - 1.34 Ib aiIA (- 1500 g aiiha; - 1 . 5 ~ the maximum proposed seasonal application rate for grapes), grapes were harvested 40 days after the final application. Total radioactive residues (TRR) in grapes were 0.951 pprn (chlorophenyl label) and 1.559 pprn (tolyl label); TRR in grape leaves were 39-40 ppm.
Approximately 95% (chlorophenyl label) and 89% (tolyl label) TRR were characterized1 identified in grapes. Pyraclostrobin was the maior residue identified at 61.79% TRR (0.588 - A "
ppm) in chlorophenyl-label samples and 55.71% TRR (0.860 ppm) in tolyl-label samples. The desmethoxy-metabolite BF 500-3 (also referred to as 500M07) accounted for 16.68% TRR (0.159 ppm) and 1 1.02% TRR (0.170 ppm) in chlorophenyl- and tolyl-label grapes, respectively. The following minor metabolites were also identified at <5% TRR: M54 (also referred to as 500M54, both labels), M55 (chlorophenyl label only), and M56 (both labels).
Nonextractable residues comprised 12-16% TRR (0.1 16-0.245 ppm) following initial extraction. Data indicate that lignin accounted for 4.1-4.6 % TRR and cellulose accounted for 1.8-2.8% TRR from both labels. The petitioner attributed the lignin and cellulose residues to grape stem that was homogenized with the grape bunches.
The submitted grape metabolism study is acceptable.
BASF submitted a potato metabolism study (citation listed below) in support of the current petition. We note that extraction efficiency data included in the subject MRID are presented in the Residue Analytical Method section under Radiovalidation.
45 1 1843 1 Bross, M. and Mackenroth, C. (1 999) The Metabolism of I4C-BAS 500 F in Potato. Laboratory Project Identification No. 3575 1; 199911 141 9. Unpublished study submitted by BASF Corporation. 175 p.
The radioactive test substances, [chlorophenyl-14C]pyraclostrobin and [tolyl-14C]pyraclostrobin, were combined with EC formulation blank and diluted to volume with water. The formulated test substances (final specific activity unspecified) were each applied by hand sprayer to young potato plants in pots as six foliar applications, with 6- to 10-day retreatment intervals, at 0.27 lb ailAlapplication (300 g aiihdapplication), except for the fourth application, which was made at
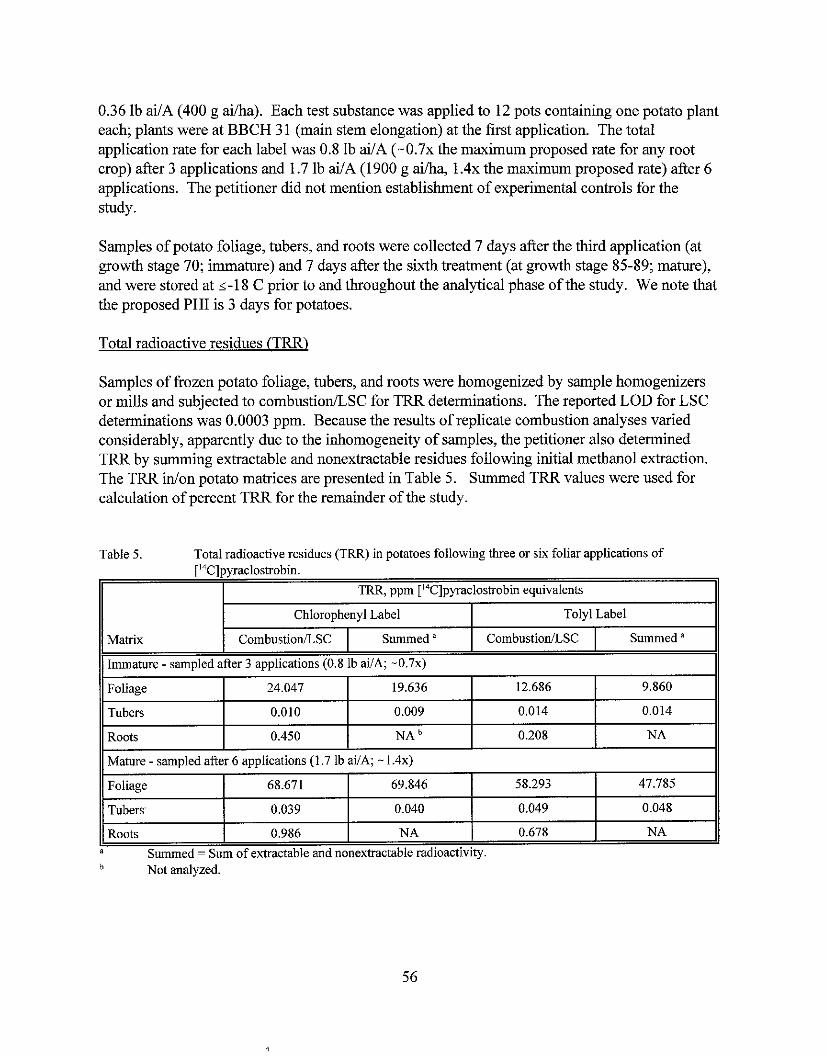
0.36 lb ai/A (400 g ailha). Each test substance was applied to 12 pots containing one potato plant each; plants were at BBCH 3 1 (main stem elongation) at the first application. The total application rate for each label was 0.8 lb ai/A ( -0 .7~ the maximum proposed rate for any root
A - crop) after 3 applications and 1.7 lb ai/A (1900 g ailha, 1 . 4 ~ the maximum proposed rate) after 6 applications. The petitioner did not mention establishment of experimental controls for the study.
Samples of potato foliage, tubers, and roots were collected 7 days after the third application (at growth stage 70; immahue) and 7 days after the sixth treatment (at growth stage 85-89; mature), and were stored at s-18 C prior to and throughout the analytical phase of the study. We note that the proposed PHI is 3 days for potatoes.
Total radioactive residues (TRR)
Samples of frozen potato foliage, tubers, and roots were homogenized by sample homogenizers or mills and subjected to combustion/LSC for TRR determinations. The reported LOD for LSC determinations was 0.0003 ppm. Because the results of replicate combustion analyses varied - -
considerably, apparently due to the inhomogeneity of samples, the petitioner also determined TRR by summing extractable and nonextractable residues following initial methanol extraction. The TI& inlon potato matrices are presented in Table 5. Summed TRR values were used for calculation of percent TRR for the remainder of the study.
Table 5. Total radioactive residues (TRR) in potatoes following three or six foliar applications of ['4C]pyraclostrobin.
Matrix
. . Immature - sampled after 3 applications (0.8 lb ai1A; -0 .7~ )
TRR, ppm ['4C]pyraclostrobin equivalents
9.860
0.014
NA
Chlorophenyl Label
12.686
0.014
0.208
Tolyl Label
19.636
0.009
NA
Foliage
Tubers
Roots
24.047
0.010
0.450
Mature - sampled after 6 applications (1.7 lb ail&, - 1 . 4 ~ )
Summed = Sum of extractable and nonextractable radioactivity. Not analyzed.
58.293
0.049
0.678
CombustionLSC
47.785
0.048
N A
69.846
0.040
N A
Foliage
: Tubers i I Roots
Combustion/LSC Summed "
68.671
0.039
0.986
Summed '
The petitioner stated that the TRR determination for potato roots was conducted for purposes of determining any translocation pattern in potatoes. No further extraction or analysis was conducted on potato roots.
Extraction and hvdrolvsis of residues
Samples of homogenized immature and mature potato foliage and tubers from each label were subiected to extraction vrocedures for residue characterization and identification. After each extraction step, samples were centrifuged. The resulting supernatants were filtered and analyzed by LSC, then combined prior to the next extraction step. The petitioner indicated that beakers and flasks were cooled with methanoydry ice or waterlice mixtures during extraction to reduce degradation during extraction. During the fractionation procedures, aliquots of extracts and nonextractable residues were analyzed for radioactivity by LSC or combustion/LSC. The general extraction procedures are summarized below.
Homogenized samples of potato foliage and tubers were extracted with methanol (3x), and the resulting extracts were combined and reduced by evaporation. The dried residue was resuspended in water:methanol(70: 10, v:v) and centrifuged. The resulting supernatant was reserved for HPLC analysis, and the pellet was dissolved in methanol andlor water and reserved for HPLC analysis. Following evaporation to remove methanol, subsamples of selected combined methanol extracts were also subjected to sequential partitioning with iso-hexane (3x), DCM (3x), and ethyl acetate (3x). Respective organic and aqueous phases were combined and reserved for HPLC analysis.
Nonextractable residues generated from methanol extraction of a second subsample of tolyl-label mature tubers (summed TRR = 0.50 ppm) were subjected to extraction with ammonia (concentration unspecified) to release bound residues. The resulting ammonia extract was reserved for HPLC analysis.
The distribution of I4C-activity in the extracts of potatoes is presented in Tables 6a (chlorophenyl label) and 6b (tolyl label).
Characterizatiodidentification of residues
Methanol extracts and the organic and aqueous phases of potato foliage and tubers were analyzed by reversed-phase HPLC. HPLC was conducted using an Inertsil phenyl or Spherisorb ODs-2 column with gradient mobile phases of water:formic acid (1000:5, v:v) and ACN:formic acid (1000:5, v:v). An HPLC system using a Hypersil Green ENV column with gradient mobile phase of water:ACN:formic acid (900:lOO: 1, v:v:v) and water:ACN:formic acid (100:900:1, v:v:v) was used for confirmation of parent and 500M07 (BF 500-3) quantitations. All systems were equipped with UV (230 nm) and radioactivity detectors and fraction collectors. Metabolites were identified by retention time comparisons with the following reference standards or metabolites isolated from foliage: pyraclostrobin, BF 500-3 (also referred to as 500M07), BF 500-5 (also referred to as 500M04), methyl-N-[[[l-(4-chlorophenyl)-pyrazol-3-yl]oxy]-o-tolyl]-
N-hydroxy carbamate, N-(2-[[1-(4-chlorophenyl)-pyrazol-3-yl]oxy]-o-tolyl)-hydroxyl-amine, 1-(4-chlorophenyl)-2-methyl-1,2-dihydro-pyrazol-3-one, 1-(4-chloropheny1)-3-(2- nitrobenzy1oxy)-1H-pyrazole, and '4C-L-tryptophan (500M72). In HPLC analyses of chlorophenyl-label samples, metabolites 500M68 and 500M04 shared a common peak. Chemical structures of identified metabolites are presented in Figure 2, Attachment 11.
The methanol extract, DCM, and EA phases of chlorophenyl-label mature foliage were used for the isolation of metabolites for identification by LCNS. Metabolites were fractionated by preparative HPLC on an Inertsil phenyl column. Following isolation, relevant fractions were subjected to ion-spray LCMS analysis. Metabolites 500M68,500M04, and 500M54 were identified in the DCM phase by LCNS, and pyraclostrobin, 500M07, and 500M79 were identified in the ethyl acetate phase. The petitioner stated that HPLC quantitation (using the ENV column) confirmed that 500M07 was formed by metabolism of pyraclostrobin in potatoes, and was not present merely as an impurity of the radiolabeled test substances. Metabolite 500M72 (L-tryptophan) was identified by retention time comparison and MS analysis in the wheat metabolism study (see below), and identification in potato tubers was confirmed by HPLC retention time comparison with the isolated metabolite. The petitioner attributed the reduced extractability of tolyl-label tuber residues to the presence of L-tryptophan, which is not readily extractable by methanol.
Following partitioning with organic solvents, it was observed that most of the metabolites in foliage were detected in the organic phases. For tubers, the majority of radioactivity from chlorophenyl-label samples partitioned into the organic phases, and the majority of radioactivity from tolyl-label samples partitioned into the aqueous phases. This pattern was again attributed to the presence of tryptophan, which is water soluble, in tolyl-label tubers.
The petitioner made only one attempt to characterize bound residues in potato tubers. L-Tryptophan was identified by HPLC analysis of the ammonia extract of tolyl-label mature tubers; however, even after ammonia extraction, a significant portion of the nonextractable residues remained unextractable (38.5% TRR, 0.019 ppm).
A summary of the characterized and identified I4C-residues in potato foliage and tubers is presented in Tables 7a (chlorophenyl label) and 7b (tolyl label).
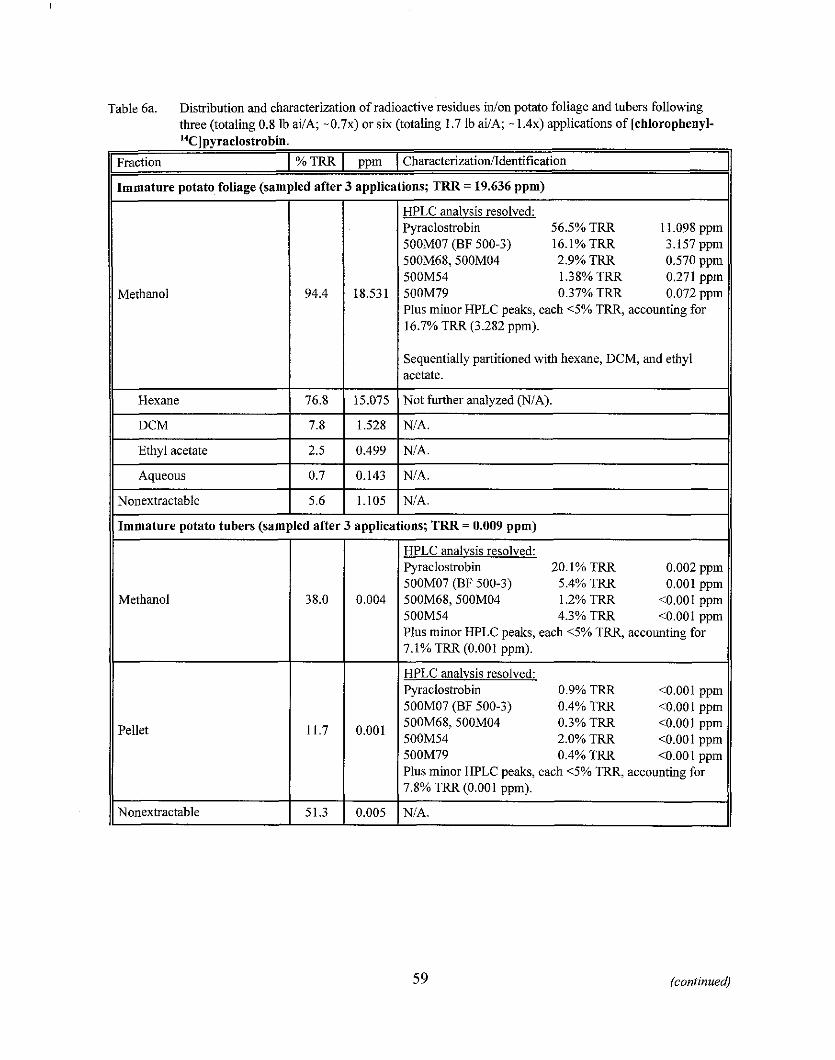
Table 6a. Distribution and characterization of radioactive residues inlon potato foliage and tubers following three (totaling 0.8 lb ailA; - 0 . 7 ~ ) or six (totaling 1.7 lb aVA; - 1 . 4 ~ ) applications of [chlorophenyl- '4C]p!.raclostrobin.
I tracrion I " O TRR I ppln ( Charactcri/ation Identification 1 11 Immature potato foliage (sampled after 3 applications; TRR = 19.636 ppm) 11
Methanol
HPLC analvsis resolved. Pyraclostrobin 56.5% TRR 11.098 ppm 500M07 (BF 500-3) 16.1%TRR 3.157 ppm 500M68,500M04 2.9% TRR 0.570 ppm
1 500M54 1.38% TRR 0.271 ppm 1 500M79 0.37% TRR 0.072 ppm ' Plus minor HPLC peaks, each 6 % TFG3, accounting for
16.7% TRR (3.282 ppm).
I Sequentially partitioned with hexane, DCM, and ethyl acetate.
Hexane 76.8
11 Nonextractahle 1 5.6 1 1.105 1 NIA. 11 II
15.075
Ethyl acetate
I I I . .
HPLC analvsis resolved: Pyraclostrobin 0.9% TRR <0.001 ppm
Not further analyzed (NIA). I DCM 1 7.8 1 1.528 I NIA.
Immature potato tubers (sampled after 3 applications; TRR = 0.009 ppm)
I I I 500M07 (BF 500-3) 0.4% TRR <0.001 i i m
I 2.5
Methanol
Pellet
Aqueous 1 0.7 1 0.143 1 NIA.
I
Nonextractable 1 51.3
0.499 I
38.0
NIA.
0.005 1 NIA.
0.004
0'001
(continued)
HPLC analvsis resolved: Pyraclostrobin 20.1% TRR 0.002 ppm 500M07 (BF 500-3) 5.4% TRR 0.001 ppm 500M68,500M04 1.2% TRR <0.001 ppm 500M54 4.3% TRR <0.001 ppm Plus minor HPLC peaks, each <5% TRR, accounting for 7.1% TRR (0.001 ppm).
. . 500M68,500M04 0.3% TRR <0.00 1 ppm 500M54 2.0% TRR <0.001 ppm 500M79 0.4% TRR <0.001 ppm Plus minor HPLC peaks, each 15% TRR, accounting for 7.8% TRR (0.001 ppm).
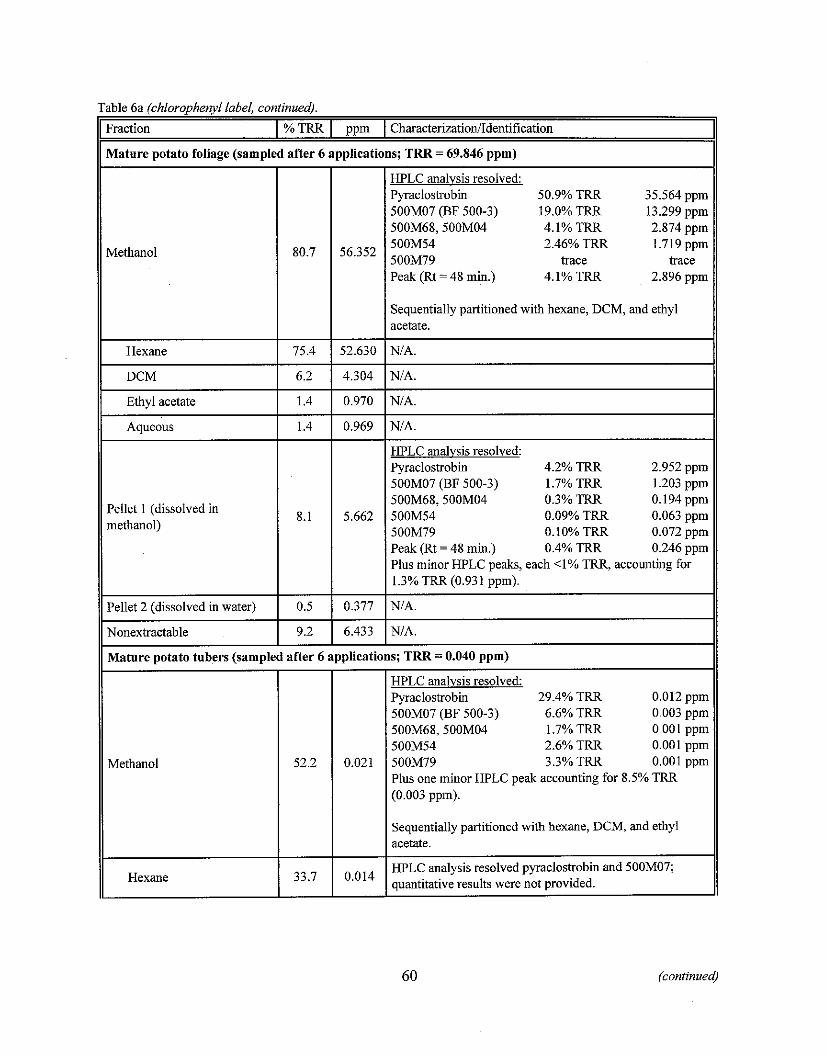
Table 6a (chlorophenyl label, continued).
11 Fraction I % TRR I oom I CharacterizationIIdentification 11 . . I/ Mature potato foliage (sample; after 6 ~pp l i c a t i u~s ; TRR = 69.846 ppm) - - - - -
HPLC analysis resolved: Pyraclostrobin 50.9% TRR 35.564 ppm
I I I 500M07 (BF 500-3) 19.0% TRR 13.299 ppm 500M68.500M04 4.1% TRR 2.874 oom
Methanol 500M54 2.46% TRR 1.719 i m 50011179 trace trace Peak @t = 48 min.) 4.1% TRR 2.896 ppm
Hexane
Aqueous
Pellet 1 (dissolved in methanol)
6.2
NIA.
HPLC analysis resolved: Pyraclostrobin 4.2% TRR 2.952 ppm 500M07 (BF 500-3) 1.7% TRR 1.203 ppm 500M68,500M04 0.3% TRR 0.194 ppm 500M54 0.09% TRR 0.063 ppm 500M79 0.10% TRR 0.072 ppm Peak (Rt = 48 min.) 0.4% TRR 0.246 ppm Plus minor HPLC peaks, each <1% TRR, accounting for 1.3% TRR (0.931 ppm).
75.4
4.304
52.630
NIA.
Ethyl acetate
1 DCM
1 1.4 1 0.970 INIA.
Pellet 2 (dissolved in water) 0.5 0.377
-++z! Hexane
Sequentially partitioned with hexane, DCM, and ethyl acetate.
NIA.
I
NIA.
Mature potato tubers (sampled after 6 applications; TRR = 0.040 ppm)
Sequentially partitioned with hexane, DCM, and ethyl acetate.
HPLC analysis resolved pyraclostrobin and 500M07; quantitative results were not provided.
Nonextractable 1 9.2 1 6.433 1 NIA.
HPLC analysis resolved: Pyraclostrobin 29.4% TRR 0.012 ppm 500M07 (BF 500-3) 6.6% TRR 0.003 ppm 500M68,500M04 1.7% TRR 0.001 ppm 500M54 2.6% TRR 0.001 ppm 500M79 3.3% TRR 0.001 ppm Plus one minor HPLC peak accounting for 8.5% TRR
Methanol
I
52.2 0.021
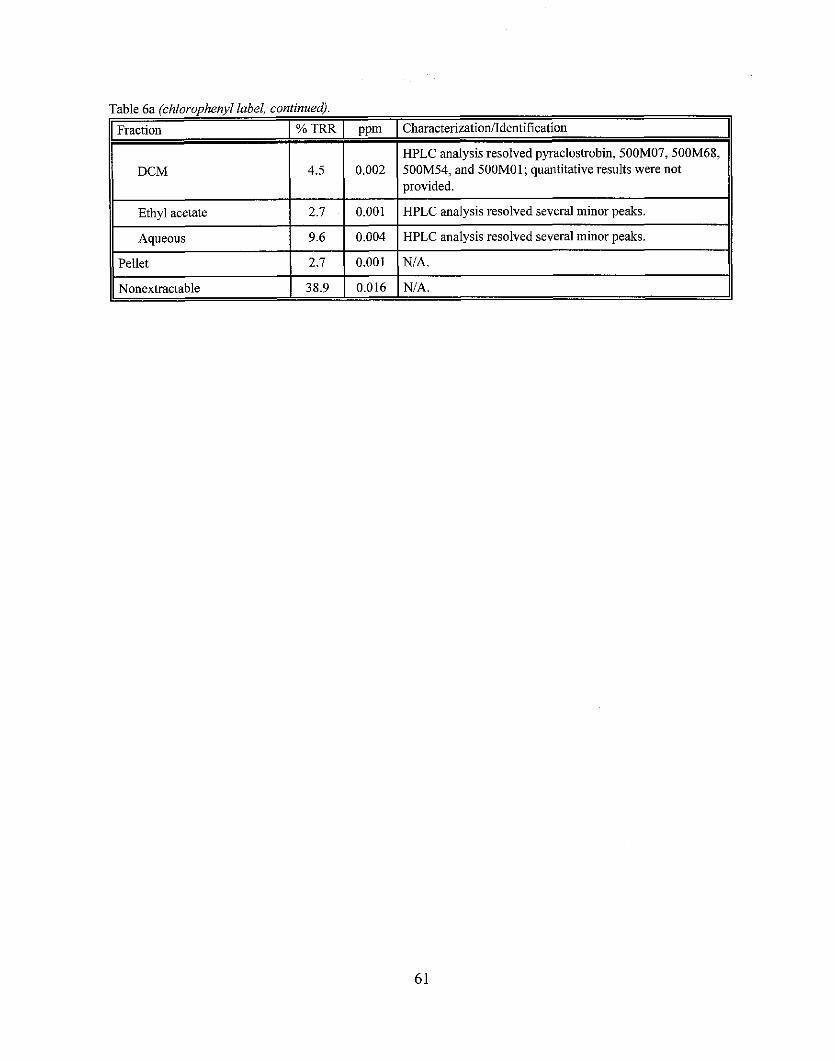
Table 6a (chlorophenyl label, continued).
11 Fraction I % TRR I oum
Ethyl acetate
Aqueous
Pellet 2.7 0.001
1 Nonextractable 1 38.9 1 0.016
HPLC analysis resolved pyraclostrobin, 500M07,500M68, 11 500M54, and 500MOl; quantitative results were not provided.
HPLC analysis resolved several minor peaks.
HPLC analysis resolved several minor peaks.
NIA.
NIA.
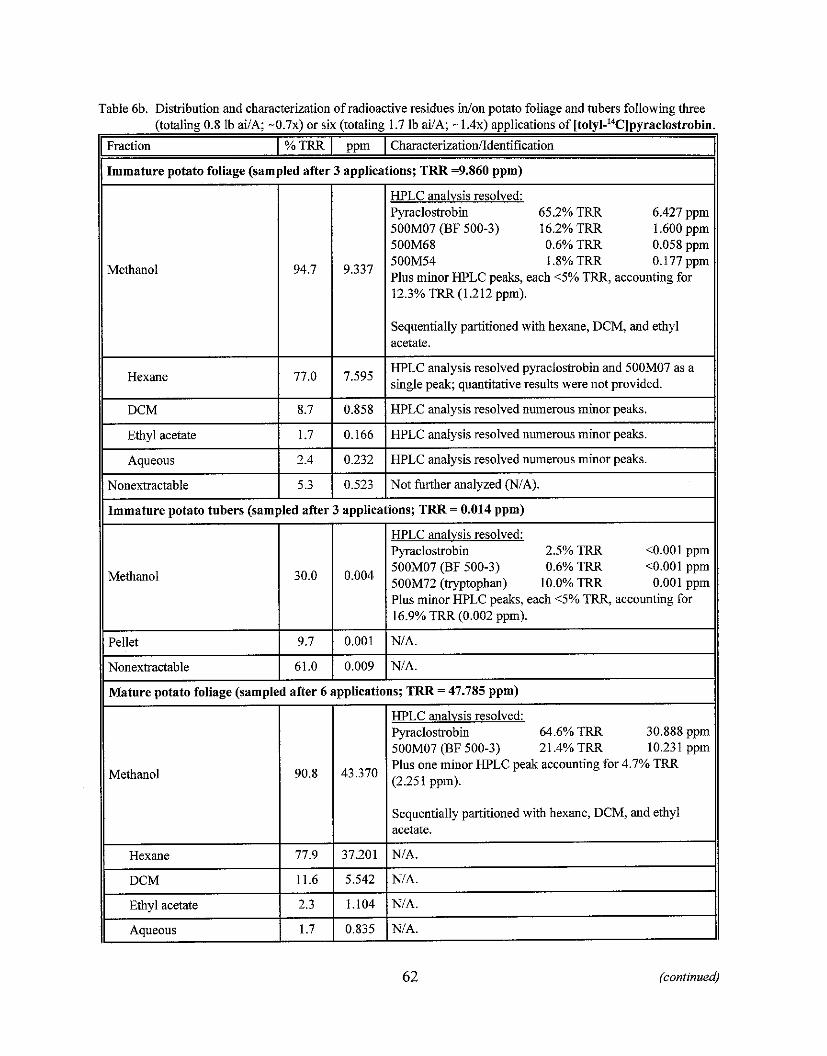
Table 6b. Distribution and characterization of radioactive residues inion potato foliage and tubers following three - - (totaling 0.8 lb ai1.4: -0 .7~) or six (totaling 1.7 lb ai/A: - 1 . 4 ~ ) awwlications of Itolvl-14Clnvraclostrobin.
11 Immature potato foliage (sampled after 3 applications; TRR =9.860 ppm) 11 HPLC analvsis resolved: Pyraclostrobin 65.2% TRR 6.427 ppm 500M07 (BF 500-3) 16.2% TRR 1.600 ppm 500M68 0.6% TRR 0.058 ppm 500M54 1.8% TRR 0.177 ppm Plus minor HPLC peaks, each 4 % TRR, accounting for 12.3% TRR (1.212 ppm).
I l l Sequentially partitioned with hexane, DCM, and ethyl acetate.
77'0
8.7
11 Immature potato tubers (sampled after 3 applications; TRR = 0.014 ppm) 11
Ethyl acetate
Aqueous
Nonextractable
II ~. - -
HPLC analysis resolved: Pyraclostrobin 2.5% TRR <0.00 1 ppm
7'595
0.858
500M07 (BF 500-3) 0.6% TRR <0.001 ppm 500M72 (tryptophan) 10.0% TRR Plus minor HPLC weaks. each <5% TRR, accounting for
HPLC analysis resolved pyraclostrobin and 500M07 as a single peak; quantitative results were not provided.
HPLC analysis resolved numerous minor peaks.
1.7
2.4
5.3
I I 1 16.9% TRR (0.00; ppmj.
0.166
0.232
0.523
I I I
Mature potato foliage (sampled after 6 applications; TRR = 47.785 ppm)
HPLC analvsis resolved: Pyracloshobin 64.6% TRR 30.888 ppm 500M07 (BF 500-3) 21.4% TRR 10.231 ppm
HPLC analysis resolved numerous minor peaks.
HPLC analysis resolved numerous minor peaks.
Not further analvzed INIA).
9.7
I/ Methanol I 90.8 I 43.370 / Plus one minor HPLC peak accounting for 4.7% TRR (2.251 ppm).
- - II
0.001 NIA.
Nonextractable 1 61.0 1 0.009 1 NIA. I
Hexane
DCM
Ethyl acetate
77.9
II 11.6
2.3
37.201
I I I I
Sequentially partitioned with hexane, DCM, and ethyl acetate.
NIA.
5.542
1.104
NIA.
NIA.
NIA. 0.835 Aqueous 1.7
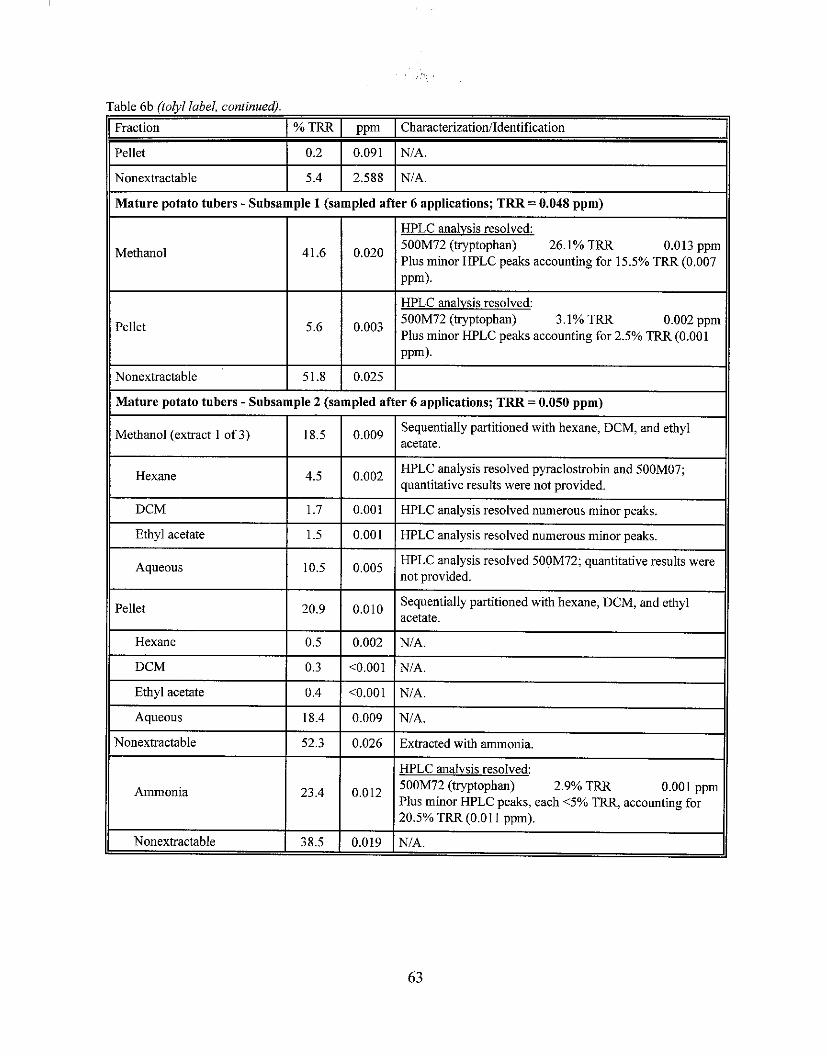
Tahle 6h (told lahel. continued)
Fract~on ( "'0 TRR I ppm I Chd~.ictr.~~t.it~un Ident~tic.it~on I
11 Pellet 1 0.2 1 0.091 1 NIA. 11 11 Nonextractahle 1 5.4 1 2.588
11 I I I HPLC analvsis resolved: 11
Mature potato tubers - Subsample 1 (sampled after 6 applications; TRR = 0.048 ppm)
500M72 (hyptophan) 3.1% TRR Plus minor HPLC peaks accounting for 2.5% TRR (0.001
Methanol
Nonextractahle 51.8 0.025
Mature potato tubers - Subsample 2 (sampled after 6 applications; TRR = 0.050 ppm)
41'6
I Hexane HPLC analysis resolved pyraclostrohin and 500M07; quantitative results were not provided. 11
0'020
I - -
HPLC analvsis resolved: 500M72 (tlyptophan) 26.1% TRR 0.013 ppm Plus minor HPLC peaks accounting for 15.5% TRR (0.007 P P ~ ) .
Methanol (extract 1 of 3)
I Aqueous
1.7
I 10.5 1 0.005 1 HPLC analysis resolved 500M72; quantitative results were not orovided.
18.5
Pellet
Hexane
0.001
0.009
HPLC analysis resolved numerous minor peaks.
Ethyl acetate I DCM 1 1.5 1 0.001 1 HPLC analysis resolved numerous minor peaks.
Sequentially partitioned with hexane, DCM, and ethyl acetate.
I
0.3
Ammonia
<0.001
Aqueous
Ethyl acetate I DCM 1 0.4 1 <0.001
Sequentially partitioned with hexane, DCM, and ethyl acetate.
NIA.
Nonextractahle 1 52.3 1 0.026
18.4
Nonextractable
NIA. 0.009
Extracted with ammonia.
HPLC analvsis resolved: 50011172 (tryptophan) 2.9% TRR 0.001 ppm Plus minor HPLC peaks, each 15% accounting for 20.5% TRR (0.011 ppm).
38.5 NIA. 0.019
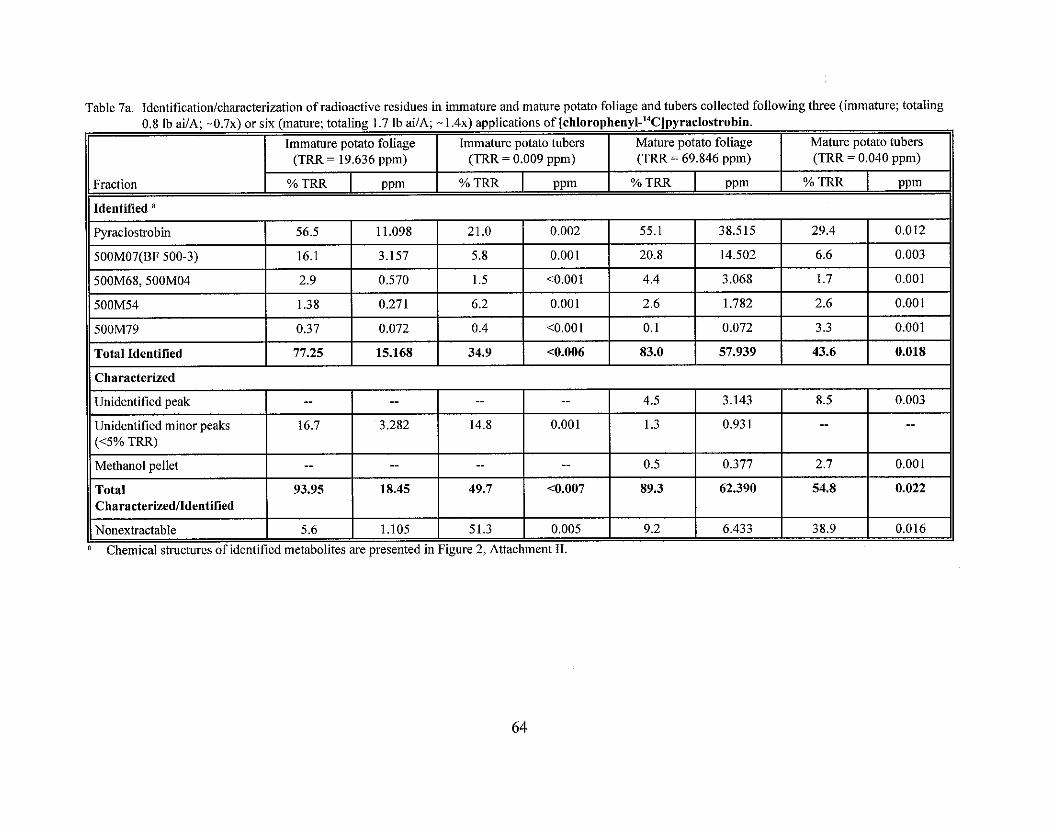
Table 7a. Identificationlcharacterization of radioactive residues in immature and mature potato foliage and tubers collected following three (immature; totaling 0.8 lh ai ,\; - 0 . 7 ~ ) or si\: (~ndture: totaling 1 7 lb ai A; . I . A \ ) applic.nion~ o i ~ ~ h l o r ~ ~ ~ ~ l i e n ~ l - ' ~ C ~ p y r n ~ I o s t r ~ ~ h i n .
1 I I~n~nan~rc. powto foliaxe I Immature potato tuber\ I Mature potato foliage hlaturc pot.110 tubers
11 Characterized 11
Fraction
Unidentified minor peaks
"Chemica l structures of identified metabolites are presented in Figure 2, Attachment 11.
(TRR = i9.636 ppm) (TRR = 0.009 ppm) (TRR =-69.846 ppm) (TRR = 0.040 ppm)
% TFm P P ~ % TRR P P ~ I %TRR I PPm PPm % TFm
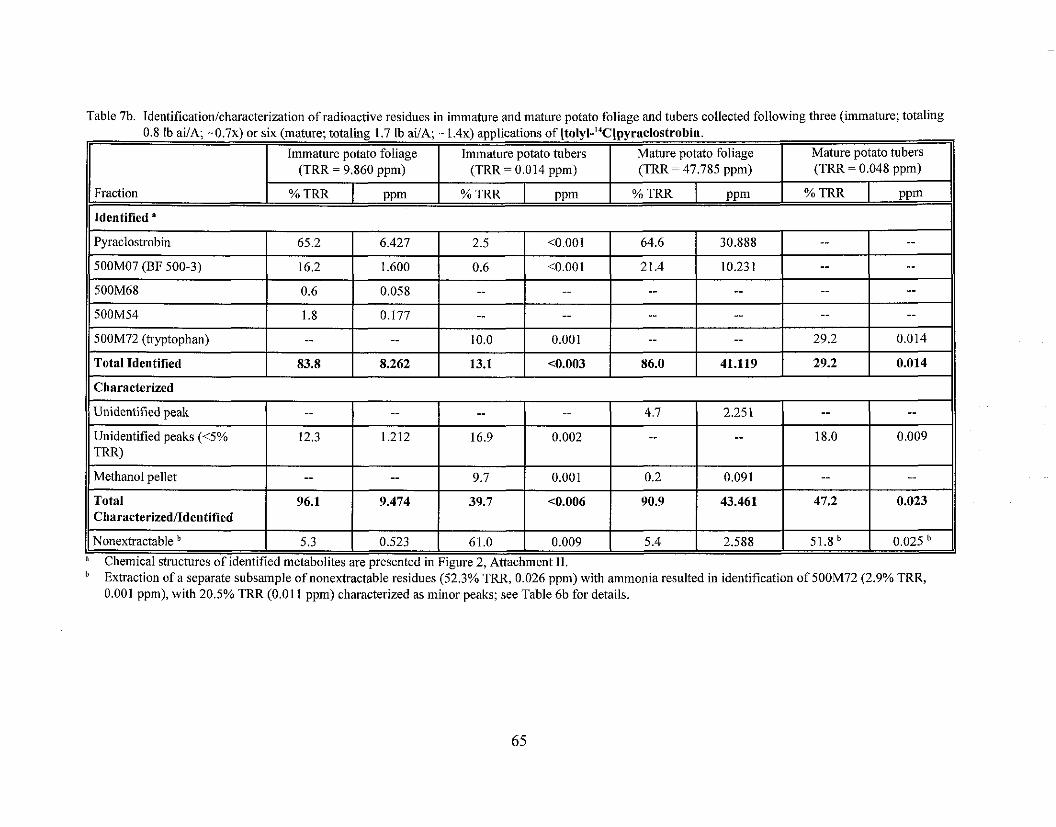
Table 7b. Identification/characterization of radioactive residues in immature and mature votato foliage and tubers collected following three (immature; totaling - .
0.8 lb auk, - 0 . 7 ~ ) or six (mature; totaling 1.7 lb aiik, - 1 . 4 ~ ) applications of [tolyl-'4C~pyraclostrobin.
1 I Immature potato foliage I Immature potato tubers I Mature potato foliage Mature potato tubers
Fraction
Pyraclostrobin
500M07 (BF 500-3) - 500M68
Identified "
(TRR = 9.860 ppm)
500M54
500M72 (tryptophan) - Total Identified
65.2
16.2
0.6
Characterized
11 Nonextractable 5.3 0.523 61.0 0.009 5.4 2.588 I 51.8 1 0.025 I( a Chemical structures of identified metabolites are oresented in Figure 2. Attachment 11.
(TRR= 0.014 ppm)
1.8
--
83.8
Methanol pellet
Total Characterizedfldentified
- "xtraction of a separate subsample of nonextractable residues (52.3% TRR, 0.026 ppm) with ammonia resulted in identification of 500M72 (2.9% TRR,
0.001 ppm), with 20.5% TRR (0.01 1 ppm) characterized as minor peaks; see Table 6b for details.
6.427
1.600
0.058
Unidentified peak
Unidentified peaks (<5% TRR)
(TRR = 47.785 ppm)
PPm
0.177
.-
8.262
--
18.0
--
96.1
(TRR = 0.048 ppm)
% TRR
2.5
0.6
--
--
0.009
PPm I %TRR I PPm % TRR
--
10.0
13.1
--
12.3
--
9.474
PPm I %TRR
<0.001
<0.001
..
--
0.001
<0.003
2.251
-- --
1.212
..
0.002
9.7
39.7
64.6
21.4
--
--
16.9
4.7
--
-- --
86.0
0.001
<0.006
30.888
10.23 1
-- -- --
41.119
0.2
90.9
-- -- --
-- -- --
--
29.2
29.2
0.091
43.461
--
0.014
0.014
--
47.2
--
0.023
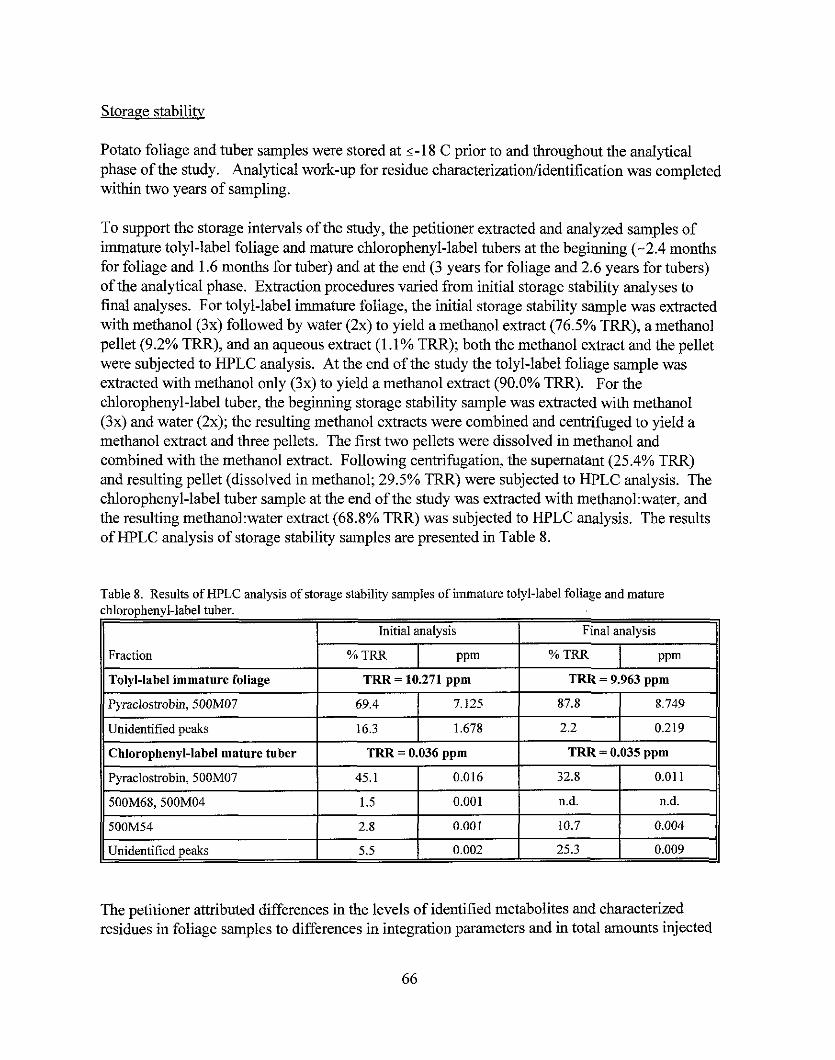
Storage stabilitv
Potato foliage and tuber samples were stored at 2-18 C prior to and throughout the analytical phase of the study. Analytical work-up for residue characterization/identification was completed within two years of sampling.
To support the storage intervals of the study, the petitioner extracted and analyzed samples of immature tolyl-label foliage and mature chlorophenyl-label tubers at the beginning (-2.4 months for foliage and 1.6 months for tuber) and at the end (3 years for foliage and 2.6 years for tubers) of the analytical phase. Extraction procedures varied from initial storage stability analyses to final analyses. For tolyl-label immature foliage, the initial storage stability sample was extracted with methanol (3x) followed by water (2x) to yield a methanol extract (76.5% TRR), a methanol pellet (9.2% TRR), and an aqueous extract (1.1% TRR); both the methanol extract and the pellet were subjected to HPLC analysis. At the end of the study the tolyl-label foliage sample was extracted with methanol only (3x) to yield a methanol extract (90.0% TRR). For the chlorophenyl-label tuber, the beginning storage stability sample was extracted with methanol (3x) and water (2x); the resulting methanol extracts were combined and centrifuged to yield a methanol extract and three pellets. The first two pellets were dissolved in methanol and combined with the methanol extract. Following centrifugation, the supernatant (25.4% TRR) and resulting pellet (dissolved in methanol; 29.5% TRR) were subjected to HPLC analysis. The chlorophenyl-label tuber sample at the end of the study was extracted with methanol:water, and the resulting methano1:water extract (68.8% TRR) was subjected to HPLC analysis. The results of HPLC analysis of storage stability samples are presented in Table 8.
Table 8. Results of HPLC analysis of storage stability samples of immature tolyl-label foliage and mature chlorophenyl-label tuber.
Initial analysis Final analysis
Fraction % TRR PPm
The petitioner attributed differences in the levels of identified metabolites and characterized residues in foliage samples to differences in integration parameters and in total amounts injected
Tolyl-label immature foliage TRR = 10.271 ppm TRR = 9.963 ppm I Pyraclostrobin, 500M07 69.4 I 7.125 87.8 8.749
into the HPLC system. For tubers, differences in the metabolite profile were attributed to the different extraction solvents. Based on the frozen storage stability conducted on sugar beet root (18 months for pyraclostrobin and its desmethoxy metabolite), RAB3 concludes that the metabolites remained stable during frozen storage over the course of the study. The petitioner is advised for future storage stability determinations to standardize as many aspects of the extraction and analysis procedures as possible to eliminate the influence of such factors on the analytical results.
Metabolic vathwav
Based on the results of the potato metabolism study, the petitioner proposed that pyraclostrobin is metabolized in potatoes by three key transformation steps. As was observed in the grape metabolism study, desmethoxylation in the side chain of the tolyl moiety produces 500M07 (BF 500-3), which in turn may undergo methoxylation of the aromatic ring to produce 500M54. Hydroxylation followed by glucosylation led to formation of 500M68. Also, as observed in grapes, ether cleavage between the chlorophenylpyrazole and the tolyl moieties was observed leading to formation of the chlorophenylpyrazolol metabolite, 500M04, which was subsequently glucosylated to 500M79. One difference in the pathway observed following cleavage in the molecule in potatoes versus grapes was the production of the amino acid tryptophan (500M72) from an anthranilic acid intermediate (500M24) via the shikimate pathway. The petitioner stated that L-tryptophan accumulated in potato tubers as the free amino acid and as a component of the storage protein.
Study summary
Following treatment of young potato plants with three or six foliar applications of uniformly ring-labeled [~hlorophen~l-14C]pyraclostrobin or [tolyl-14C]pyraclostrobin at 0.27 lb-0.36 aiIAiapplication (300-400 g ai/hdapplication), potatoes were harvested 7 days after three applications (immature; total application rate for each label of 0.8 lb aiIA; -0 .7~) or 7 days after six applications (mature; total application rate for each label of 1.7 lb ai/A; 1 . 4 ~ the maximum proposed rate for any tuberous and corm crop). In chlorophenyl-label samples, TRR were 19.636 pprn and 0.009 ppm in immature foliage and tubers, respectively, and 69.846 pprn and 0.040 pprn in mature foliage and tubers. In tolyl-label samples, TRR were 9.860 pprn and 0.014 ppm in immature foliage and tubers, respectively, and 47.785 pprn and 0.048 ppm in mature foliage and tubers.
Approximately 40-55% TRR and 89-96% TRR were characterizedlidentified in potato tubers and foliage, respectively from both labels. Pyraclostrobin was the major residue identified in all matrices except tolyl-label tubers. Pyraclostrobin accounted for 21 .O% and 29.4% TRR (0.002 ppm and 0.012 ppm) in immature and mature chlorophenyl-label tubers, but for only 2.5% TRR (<0.001 ppm) in immature tolyl-label tubers; residues were nondetectable in mature tolyl-label tubers. In potato foliage, pyraclostrobin accounted for 56.5% and 55.1% TRR (1 1.098 and 38.515 ppm) in chlorophenyl-label foliage (mature and immature) and 65.2% and 64.6% TRR (6.427 and 30.888 ppm) in mature and immature tolyl-label foliage. The following metabolites
were also detected in chlorophenyl-label tubers (mature and immature, respectively): the desmethoxy metabolite, 500M07 (BF 500-3), at 5.8% and 6.6% TRR; metabolite 500M54 at 6.2% and 2.6% TRR, the glucose conjugate of pyraclostrobin, 500M68, together with the chlorophenyl pyrazolol metabolite, 500M04, at 1.5% and 1.7% TRR; and the cleavage product, 500M79, at 0.4% and 3.3% TRR. These same metabolites were identified in chlorophenyl-label immature and mature foliage. In tolyl-label tubers, the major identified residue was the amino acid L-tryptophan, 500M72, which accounted for 10.0% TRR (0.001 ppm) and 29.2% TRR (0.014 ppm) in immature and mature tubers, respectively; L-tryptophan was also identified at 2.9% TRR (0.001 ppm) in the nonextractable residues of tolyl-label mature tubers following extraction with ammonia. One additional metabolite, 500M07, was identified at 0.6% TRR in immature tubers. In tolyl-label foliage, metabolite 500M07 was identified at 16.2% TRR (immature) and 21.4% TRR (mature). Metabolites 500M68 and 500M54 were also identified in immature tolyl-label foliage at 0.6% and 1.8% TRR, respectively.
The submitted potato metabolism study is acceptable.
BASF submitted a wheat metabolism study (citation listed below) in support of the current petition.
451 18428 Reinhard, K. (1999) Metabolism of '4C-BAS-500 F in Wheat. Laboratory Project IdentificationNo. 199911 1137. Unpublished study submitted by BASF Corporation. 216 p.
The radioactive test substances, [chlorophenyl-'4C]pyraclostrobin and [tolyl-'4C]pyraclostrobin, were combined with EC formulation blank and diluted to volume with water. The formulated test substances (final specific activity unspecified) were each applied by hand sprayer to summer wheat plants in pots as two foliar applications, with 24- to 25-day retreatment intervals, at 0.27 lb ai/A/application (300 g aiihalapplication) for a total application rate for each label of 0.54 lb ai/A (600 g ai/ha; - 1 . 6 ~ the maximum proposed application rate for the cereal grain crops wheat, rye, and barley). Each test substance was applied to 60 pots containing one wheat plant each; plants had been transplanted to the pots fiom an outdoor test site and were maintained in the greenhouse for the duration of the study. Applications were made at growth stages BBCH 32 and BBCH 61. The petitioner did not mention establishment of experimental controls for the study.
Wheat samples were collected 0,3 1, and 41 days following the second application. Wheat forage was collected at the 0- and 3 1-day sampling intervals; mature wheat plants (BBCH 89) were collected 41 days after treatment (DAT) and were separated into straw, grain, and chaff. Samples were stored at 2-18 C prior to and throughout the analytical phase of the study.
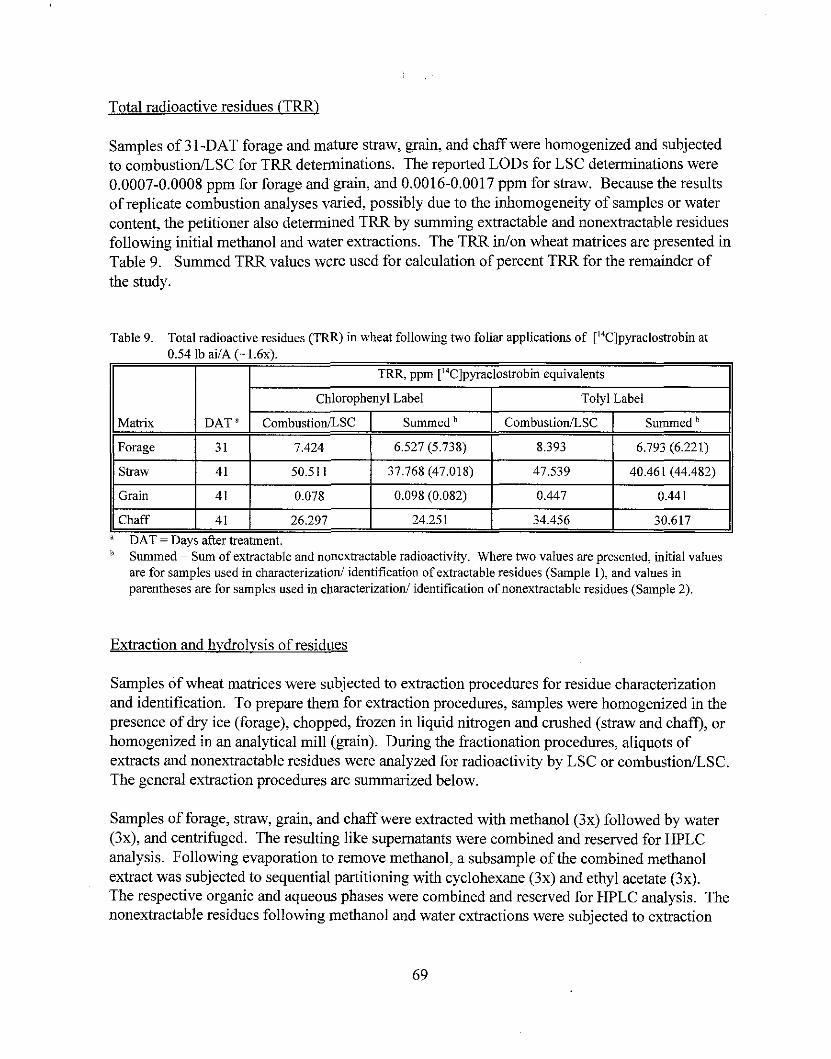
Total radioactive residues (TRR)
Samples of 31-DAT forage and mature straw, grain, and chaff were homogenized and subjected to combustion/LSC for TRR determinations. The reported LODs for LSC determinations were 0.0007-0.0008 ppm for forage and grain, and 0.0016-0.0017 ppm for straw. Because the results of replicate combustion analyses varied, possibly due to the inhomogeneity of samples or water content, the petitioner also determined TRR by summing extractable and nonextractable residues following initial methanol and water extractions. The TRR inlon wheat matrices are presented in Table 9. Summed TRR values were used for calculation of percent TRR for the remainder of the study.
Summed = Sum of extractable and nonextractable radioactivity. Where two values are presented, initial values are for samples used in characterization/ identification of extractable residues (Sample I), and values in parentheses are for samples used in characterization/ identification of nonextractable residues (Sample 2).
Table 9. Total radioactive residues (TRR) in wheat following two foliar applications of ['"C]pyraclostrobin at 0.54 lb aiIA (- 1.6~).
Extraction and hvdrolvsis of residues
Matrix
Forage
Straw
Grain
Chaff
Samples of wheat matrices were subjected to extraction procedures for residue characterization and identification. To prepare them for extraction procedures, samples were homogenized in the presence of dry ice (forage), chopped, frozen in liquid nitrogen and crushed (straw and chaff), or homogenized in an analytical mill (grain). During the fractionation procedures, aliquots of extracts and nonextractable residues were analyzed for radioactivity by LSC or combustion/LSC. The general extraction procedures are summarized below.
Samples of forage, straw, grain, and chaff were extracted with methanol (3x) followed by water (3x), and centrifuged. The resulting like supernatants were combined and reserved for HPLC analysis. Following evaporation to remove methanol, a subsample of the combined methanol extract was subjected to sequential partitioning with cyclohexane (3x) and ethyl acetate (3x). The respective organic and aqueous phases were combined and reserved for HPLC analysis. The nonextractable residues following methanol and water extractions were subjected to extraction
"AT =Days after treatment.
DAT
31
4 1
4 1
41
TRR, ppm ["C]pyraclostrobin equivalents
Cblorophenyl Label
~ o m b u s t i o n i L S C
7.424
50.51 1
0.078
26.297
Tolyl Label
Summed
6.527 (5.738)
37.768 (47.018)
0.098 (0.082)
24.251
CombustiodLSC
8.393
47.539
0.447
34.456
Summed
6.793 (6.221)
40.461 (44.482)
0.441
30.617
with 0.5% aqueous ammonia at 40 C for 1.5 hours. The ammonia extract was reserved for HPLC analysis. Samples from this work-up are referred to hereafter as Sample 1 for each matrix.
For characterization of nonextractable residues, separate samples of forage, straw, and grain (referred to hereafter as Sample 2 for each matrix) were subjected to the extraction procedures described above, except that the methanol extracts of straw were partitioned with ethyl acetate only, and the methanol extracts of chlorophenyl-label grain and tolyl-label forage were not subjected to any partitioning. The resulting ammonia extracts were reserved for HPLC analysis, and the nonextractable residues following ammonia extraction were reserved for further procedures to characterize cellulose and lignin. In general, Sample 2 work-up was conducted within 7-9 months of Sample 1 work-up for forage and straw, and within 14-19 months for grain.
The distribution of 14C-activity in the extracts of wheat matrices is presented in Tables 1Oa (chlorophenyl label) and lob (tolyl label). We note that the flow chart depicting extraction procedures for chlorophenyl-label chaff was omitted from the MRID; however, because chaff is not identified as a significant RAC in Table 1 (OPPTS 860.1000), no action is required by the petitioner.
Characterization/identification of residues
Methanol, water, and ammonia extracts, as well as the organic and aqueous phases following partitioning of wheat forage, straw, and grain were analyzed by reversed-phase HPLC. For the extracts, HPLC was conducted using an Inertsil phenyl column or an ODS I1 column (confirmatory analysis for methanol extracts) with gradient mobile phases of water:formic acid (1000:5, v:v) and ACN:formic acid (1000:5, v:v). Another HPLC system using a Hypersil Green ENV column with gradient mobile phases of water:ACN:formic acid (90:10:0.1, v:v:v) and water:ACN:formic acid (10:90:0.1, v:v:v) was used to separate the parent and 500M07 metabolite. Organic and aqueous phases were also analyzed using an Inertsil phenyl column and mobile phases of water:formic acid and ACN:formic acid. All systems were equipped with UV (230 nrn) and radioactivity detectors and fraction collectors. Metabolites were identified by retention time comparisons with the following radiolabeled reference standards: pyraclostrobin, tryptophan, and 500M24 (isolated and identified fiom the rat metabolism study). In HPLC analyses of chlorophenyl-label samples, metabolites later identified as 500M68 and 500M04 (see below) eluted at similar retention times.
The following fractions resulting from the Sample 2 extraction procedures were used for the isolation of metabolites for identification and qualitative confirmation by LCIMSIMS: the cycIohexane phase of chlorophenyl-label forage, the ethyl acetate phases of chlorophenyl- and tolyl-label straw, and the water extract and the aqueous phase following ethyl acetate partitioning of tolyl-label grain. To isolate extractable, organosoluble radioactivity from natural products, the fractions were subjected to various purification procedures including extraction and partitioning steps, silica gel column cleanup, gel permeation chromatography, acetylation with acetic anhydride, andlor methylation with diazomethane. The purified extracts were then subjected to preparative HPLC (on an Inertsil-phenyl or Shandon Hypercarb column), and the fractions
containing significant radioactivity were analyzed by HPLC, ion-spray LCMSMS, andlor GCMS analysis.
The following metabolites were identified by LCIMS andlor LCIMSMS in wheat forage and straw: pyraclostrobin; 500M07 (BF 500-3); 500M54; the glucosides 500M68, 500M70, and 500M71; 500M76; 500M04; and 500M34. The petitioner noted that, for a number of metabolites which were identified by LCIMSMS from a single chromatographic peak, it was impossible to quantify individual compounds. Therefore, for certain metabolites, calculated values were reported as follows: Metabolite 500M76 was quantitated in Sample 2 chlorophenyl- label straw by HPLC (Shandon Hypercarb column); the % TRR value determined was subsequently applied to Sample l~hlorophenyl-label and tolyl-label straw based on the assumption that, because of its structure, the relative amounts of 500M76 would be similar for the twb labels. For the glucosides 500M68, -M70, and -M7l, which shared peak 15 in HPLC analysis with 500M76, the petitioner calculated the glucoside summed % TRR by subtracting the % TRR of 500M76 in tolyl-labeled straw from the total peak value for peak 15. The calculated value for the glucosides was then transferred directly to chlorophenyl-label straw. For metabolite 500M04. which due to its structure would be detected only in chlorophenyl-label samples, the petitioner calculated the difference between the amount of 500M76 plus the summed glucosides and the total radioactivity in peak 15. Analogous calculations were applied to quantitation of these metabolites in forage.
Chemical structures of identified metabolites are presented in Figure 2, Attachment 11.
In wheat grain, the parent and 500M07 (BF 500-3) were confirmed by comparison with forage and straw chromatograms and metabolites 500M72 (tryptophan) and 500M24 were identified by LCMS and LCIMSIMS in tolyl-label grain. Metabolite 500M24 in grain was confirmed by methylation with diazomethane and HPLC and GCMS analysis. A peak (4.3% TRR, 0.004 ppm) in chlorophenyl-label grain was considered most likely 500M04, because it did not appear in the tolyl-label grain; however, insufficient material was available to further characterizelidentify the peak.
The petitioner utilized three separate procedures to characterize radioactivity associated with lignin and cellulose in the bound residues of Sample 2 wheat forage and straw. To isolate lignin and cellulose, the petitioner subjected the nonextractable residues following ammonia extraction to hydrolysis with 10% NaOH at reflux for 3 hours. Following filtration, the filter cake was washed with 10% NaOH at 80 C followed by water at 25 C. Lignin was precipitated by adjusting the filtrate and individual wash solutions to pH 1 with concentrated HC1. The petitioner characterized the remaining filter cake as cellulose. To characterize cellulose and hemicelluloses, the nonextractable residues following ammonia extraction were subjected to enzyme hydrolysis with a mixture of cellulase and Macerozyme, a mixture of cellulase, hemicellulase, and pectinase (in sodium acetate buffer, pH 4.7, at 37 C for 20 hours). To characterize lignin, the nonextractable residues following ammonia extraction were subjected to hydrolysis with 66% sulfuric acid for 48 hours with gentle shaking. The mixture was then
diluted with water and filtered. The filter cake was washed and subjected to hydrolysis with 0.5% HC1 at reflux for 8 hours. Following filtration, the remaining filter cake was characterized as Iignin. Cellulose was also characterized in straw by the treatment of nonextractable residues with Schweizer's reagent (saturated solution of Cu(OH), in 25% ammonia) at room temperature for 16 hours. Following centrifugation, the supernatant was adjusted to pH 5 with concentrated HCl to precipitate cellulose.
For characterization of nonextractable residues in grain, the nonextractable residues following ammonia extraction were extracted with DMS0:water (9:1, v:v; 2x) at room temperature overnight. Following centrifugation, the DMS0:water extracts were combined with ethanol to precipitate starch. For tolyl-label grain, the nonextractable residues remaining following DMS0:water extraction were heated in water at reflux for 3 hours and centrifuged. The resulting supernatant was checked for starch with I,/KI solution, and the nonextractable residues were subjected to hydrolysis with 10% NaOH at reflux for 3 hours.
The ammonia extract of tolyl-label grain was also subjected to further procedures to precipitate grain protein. The extract was adjusted to pH 4.2 with phosphoric acid, and the resulting precipitate was subjected to digestion with protease in 0.2 M TRIS-HCl buffer, pH 7.2, overnight at 37 C. Following centrifugation, the resulting supernatant was subjected to HPLC analysis using an ODS I1 column and a gradient mobile phase of phosphate buffer, pH 5.4:methanol (20:80 and 80:20, v:v).
A summary of the characterized and identified 14C-residues in wheat forage, grain, and straw is presented in Tables 1 l a (chlorophenyl label) and 1 l b (tolyl label).
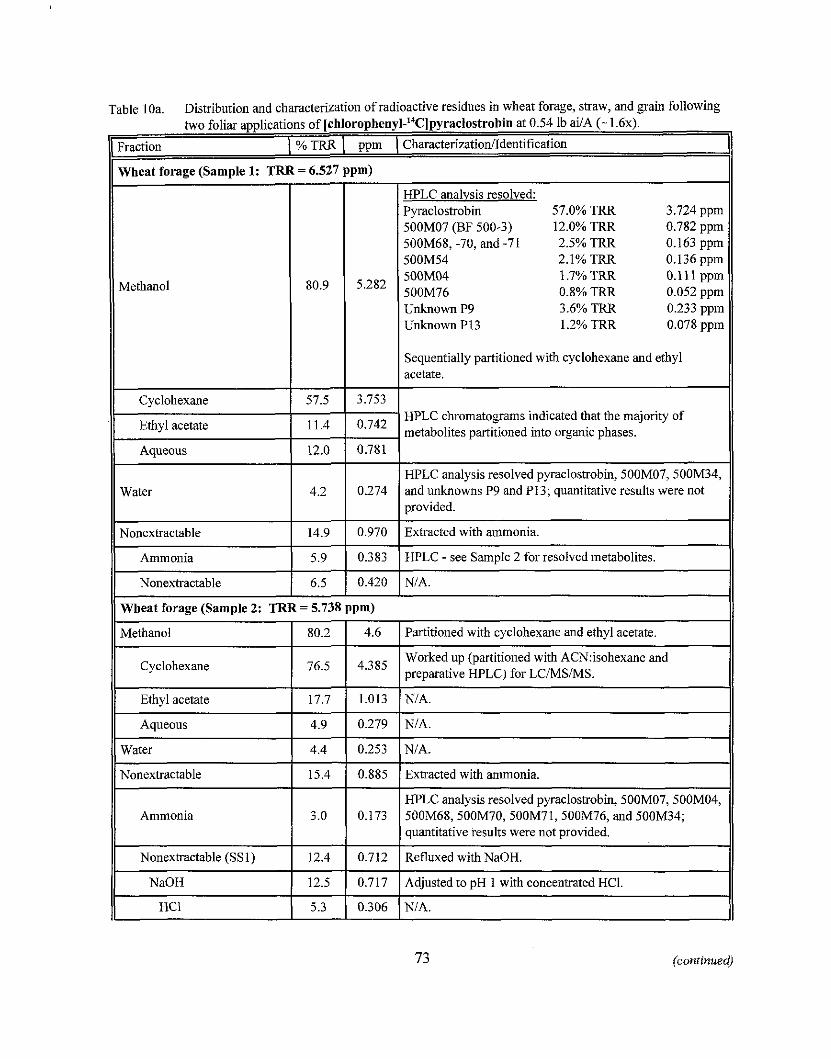
Tahle 10a. Distribution and characterization of radioactive residues in wheat forage, straw, and grain following -...~.
two foliar applications of [chlorophenyl-"C]pyrac~ostrohin at 0.54 lb ai/A (- 1 .6~ ) .
Fraction \ % TRR I ppm I Cbaracterization/ldentification
Wheat forage (Sample 1: TRR = 6.527 ppm)
HPLC analysis resolved: Pyraclostrobin 57.0% TRR 3.724 ppm 500M07 (BF 500-3) 12.0% TRR 0.782 ppm 500M68, -70, and -71 2.5% TRR 0.163 ppm 500M54 2.1% TRR 0.136 ppm
Methanol 80.9
Cyclohexane
Ethyl acetate
Aqueous
Water
5.282
Nonextractable
11 Methanol 1 80.2 1 4.6 1 Partitioned with cyclohexane and ethyl acetate. 11
500M04 1.7% TRR 0.111 ppm 500M76 0.8% TRR 0.052 ppm Unknown P9 3.6% TRR 0.233 ppm Unknown P13 1.2% TRR 0.078 ppm
57.5
12.0
4.2
Nonextractable
Ammonia 1 5.9 1 0.383 1 HPLC - see Sample 2 for resolved metabolites. 11 14.9
I I . -
1) ~ t h y l acetate 1 17.7 1 1.013 I NIA. 11
3.753
0'742
0.781
0.274
6.5
II I I I
Worked up (partitioned with ACN:isohexane and Cyclohexane I 765 I 4385 I preparative HPLC) for LC~MSMS.
Sequentially partitioned with cyclohexane and ethyl acetate.
HPLC chromatograms indicated that the majority of metabolites partitioned into organic phases.
HPLC analysis resolved pyracloshobin, 500M07,500M34, and unknowns P9 and P13; quantitative results were not provided.
0.970
Wheat forage (Sample 2: TRR = 5.738 ppm)
I
Extracted with ammonia.
0.420 I
II
NIA.
Aqueous
Nonextractable
Ammonia
11 HC1 1 5.3 1 0.306 1 NIA. 11
4.9
15.4
3.0
Nonexhactable (SS1)
Water 1 4.4 ( 0.253 (NIA.
NaOH 1 12.5 1 0.717 1 Adjusted to pH 1 with concentrated HCI.
12.4 0.712
0.279 I 0.885
0.173
Refluxed with NaOH.
NIA.
Extracted with ammonia.
HPLC analysis resolved pyraclostrobin, 500M07, 500M04, 500M68,500M70,500M71,500M76, and 500M34; quantitative results were not provided.
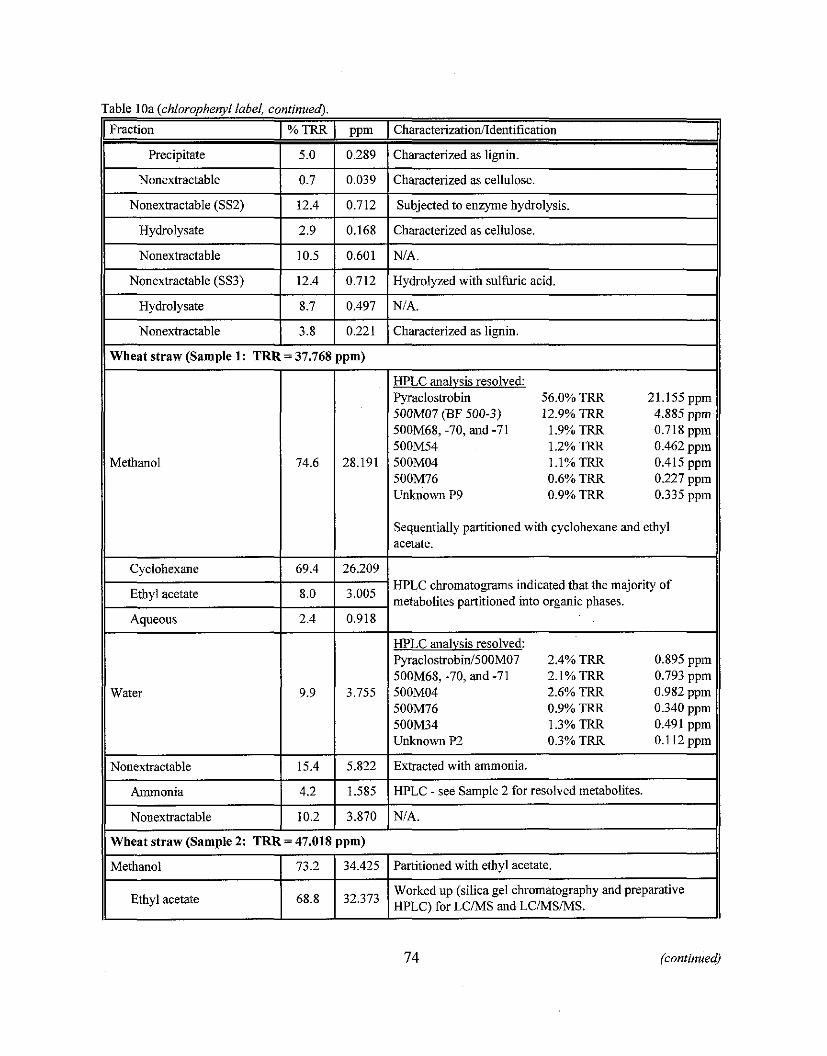
Table IOa (chloropheryl label, continued).
Fraction I % TRR 1 ppm I CharacterizatiodIdentification I) Precipitate
Nonextractable (SS2)
Hydrolysate
Nonextractable
11 Nonextractable / 3.8 1 0.221 1 Characterized as lienin. 11
Nonextractable ( 0.7 1 0.039 1 Characterized as cellulose. 1 1 5.0
II 11 Wheat straw (Sample 1: TRR = 37.768 ppm) 11
12.4
2.9
10.5
Nonextractable (SS3)
Methanol
0.289
HPLC analvsis resolved: Pyraclostrobin 56.0% TRR 21.155 ppm 500M07 (BF 500-3) 12.9% TRR 4.885 ppm
Characterized as lignin.
0.712
0.168
0.601
0.712
- -
500M68, -70, and -71 1.9% TRR 0.718 ppm 500M54 1.2% TRR 0.462 ppm 500M04 l.l%TRR 0.415 ppm 500M76 0.6% TRR 0.227 ppm Unknown P9 0.9% TRR 0.335 ppm
-
Subjected to enzyme hydrolysis.
Characterized as cellulose.
NIA.
Hydrolyzed with sulfuic acid.
Hydrolysate I 8.7 1 0.497 1 NIA.
I Sequentially partitioned with cyclohexane and ethyl acetate.
I
Nonextractable 15.4 5.822
Ammonia 1 4.2 1 1.585
Cyclohexane
Ethyl acetate
Aaueous
HPLC analvsis resolved: Pyraclostrobin/500MO7 2.4% TRR 0.895 ppm 500M68, -70, and -71 2.1% TRR 0.793 ppm 500M04 2.6% TRR 0.982 ppm 500M76 0.9% TRR 0.340 ppm 500M34 1.3% TRR 0.491 ppm Unknown P2 0.3% TRR 0.112 ppm
Extracted with ammonia.
HPLC - see Samole 2 for resolved metabolites
69.4
8.0
2.4
74 (continued)
26.209
3.005
0.918
Nonextractable
HPLC chromatograms indicated that the majority of metabolites partitioned into organic phases.
10.2
Wheat straw (Sample 2: TRR = 47.018 ppm)
3.870 NIA.
Partitioned with ethyl acetate.
Worked up (silica gel chromatography and preparative HPLC) for LCIMS and LCIMSIMS.
34.425
32'373
Methanol
Ethyl acetate
73.2
68.8
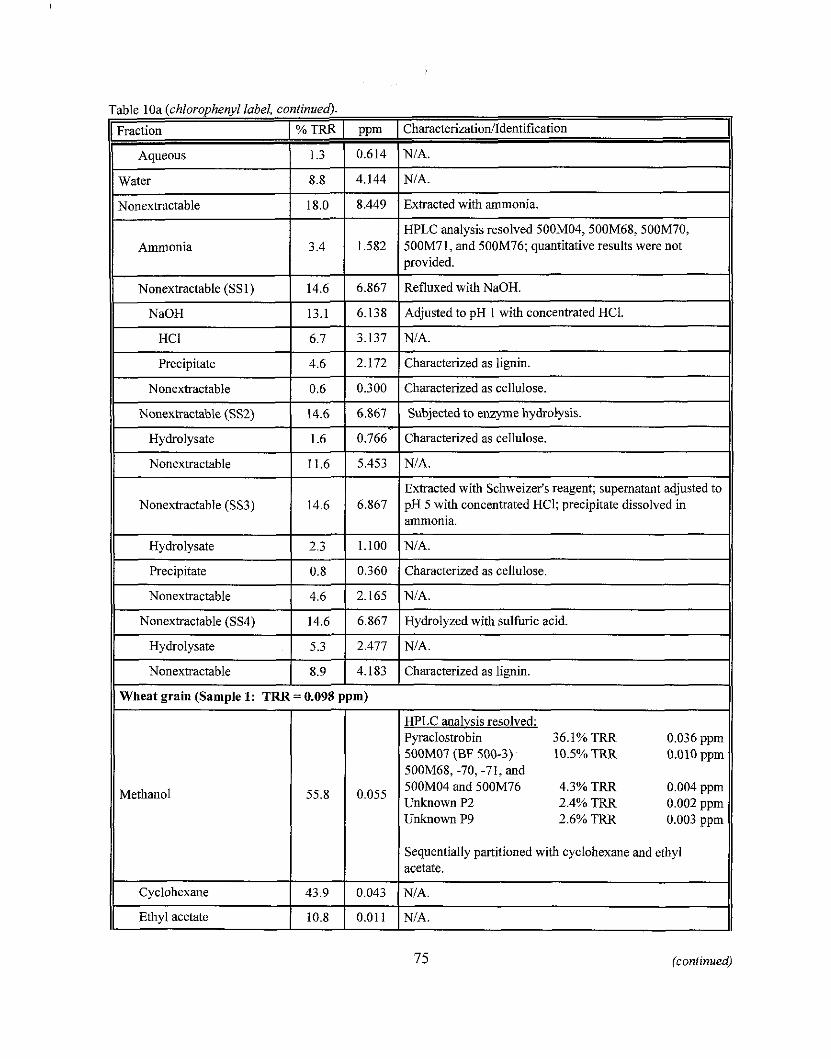
Table 1Oa (chlorophenyl label, continued).
Fraction
\ Aoueous 1 1.3 1 0.614 I N I A . - - ~ 1 ~ ~ -
Water
Nonextractable
Ammonia
Nonextractable (SS1)
NaOH
HCI
Precipitate
Nonextractable
8.8
18.0
Nonextractable (SS2)
Nonextractable (SS3) I 1 6867
3.4
14.6
13.1
6.7
4.6
0.6
Y
4.144
8.449
14.6 6.867
Nonextractable NIA.
Extracted with Schweizer's reagent; supernatant adjusted to pH 5 with concentrated HC1; precipitate dissolved in ammonia.
NIA.
NIA.
Extracted with ammonia.
1.582
6.867
6.138
3.137
2.172
0.300
Subjected to enzyme hydrolysis.
Hydrolysate 1 1.6 1 0.766 1 Characterized as cellulose.
(1 Hydrolysate I I
HPLC analysis resolved 500M04,500M68, 500M70, 500M71, and 500M76; quantitative results were not provided.
Refluxed with NaOH.
Adjusted to pH 1 with concentrated HC1.
NIA.
Characterized as lignin.
Characterized as cellulose.
I I I
11.6
1 2 . 3
5.453
1.100
Y 11 Nonextractable I 8.9 I 4.183 I Characterized as lignin. 11
Precipitate
Nonextractable (SS4)
1) Wheat grain (Sample 1: TRR = 0.098 ppm) 11 -
HPLC analvsis resolved: Pyraclostrobin 36.1% TRR 0.036 ppm 500M07 (BF 500-3) 10.5% TRR 0.010 ppm 500M68, -70, -71, and 500M04 and 500M76 4.3% TRR 0.004 ppm Unknown P2 2.4% TRR 0.002 ppm Unknown P9 2.6% TRR 0.003 ppm
0.8
14.6
I Sequentially partitioned with cyclohexane and ethyl acetate.
Nonextractable 1 4.6 ( 2.165 1 NIA.
Hydrolysate 1 5.3 1 2.477 1 NIA.
0.360 I 6.867 I
75 (continued)
Characterized as cellulose.
Hydrolyzed with sulfuric acid.
Cyclohexane 43.9 0.043 ~~
NIA.
Ethyl acetate 10.8 0.011 N/A.
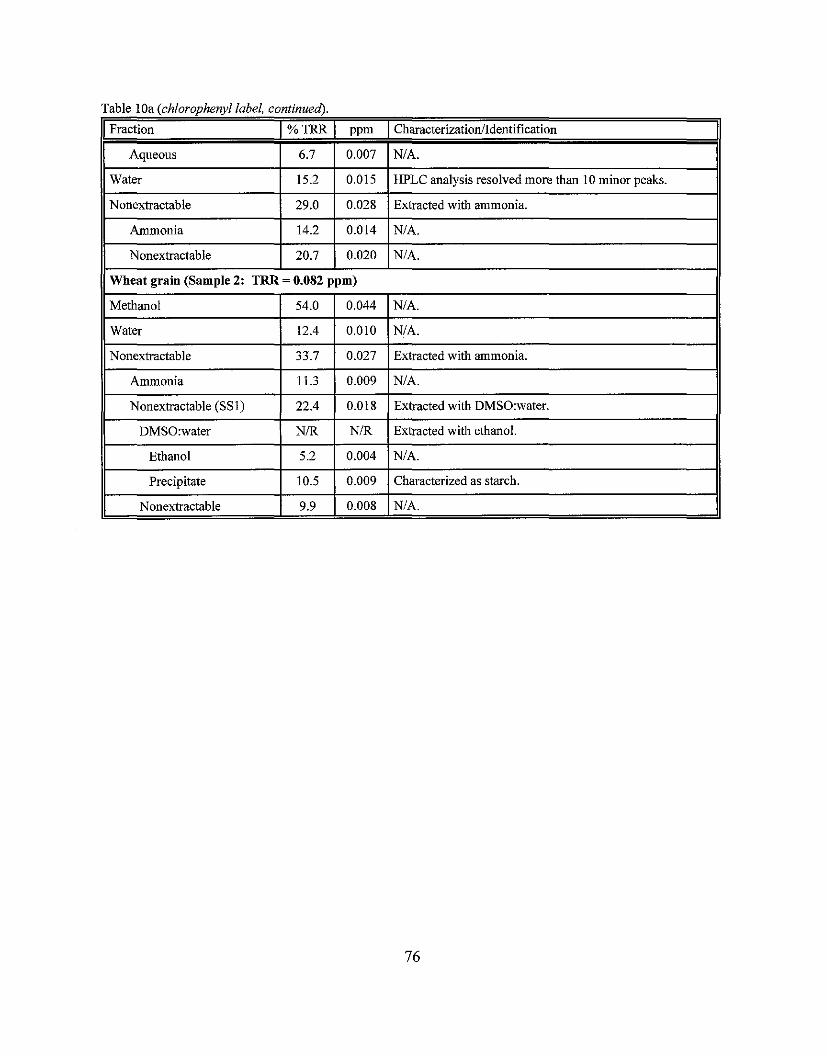
11 Nonextractahle 1 29.0 1 0.028 1 Extracted with ammonia
Table 1Oa (chlorophenyl label, continued).
Fraction
Aqueous
Water
Ammonia
Nonextractable
ppm
0.007
0.015
% TRR
6.7
15.2
Wheat grain (Sample 2: TRR = 0.082 ppm)
11 DMS0:water I N R I N R 1 Extracted with ethanol
Characterization/Identification
NIA.
HPLC analysis resolved more than 10 minor peaks.
14.2
20.7
Methanol
Water
Nonextractable
Ammonia
11 Ethanol I I I
1 5.2 1 0.004 1 NIA.
11 Precipitate I I I
1 10.5 1 0.009 1 Characterized as starch.
0.014
0.020
54.0
12.4
33.7
Nonextractable (SSI) 1 22.4 1 0.018 I Extracted with DMS0:water.
11.3
Nonextractable 1 9.9 1 0.008 I NIA.
NIA.
NIA.
0.044
0.010
0.027
0.009
NIA.
NIA.
Extracted with ammonia.
NIA.
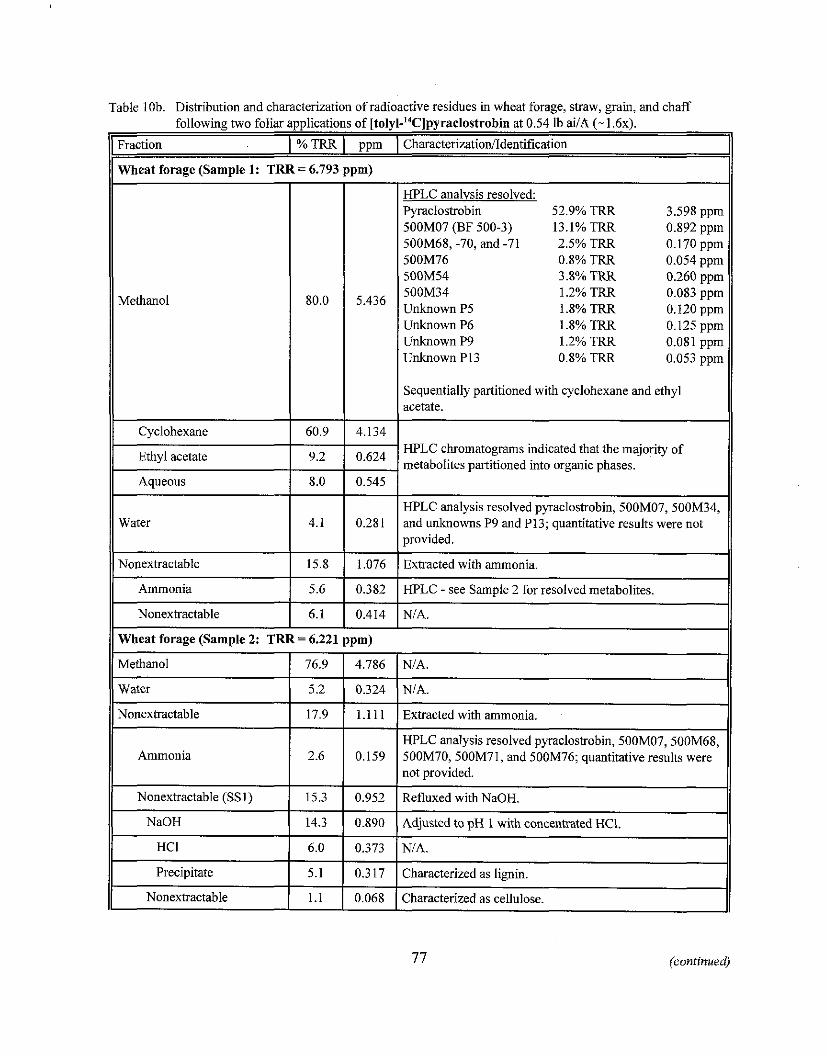
Table lob. Distribution and characterization of radioactive residues in wheat forage, straw, grain, and chaff following two foliar applications of [tolyl-"C]pyraclostrobin at 0.54 lb ai/A (- 1 .6~) .
Fraction 1 % TRR 1 ppm 1 CharacterizatiodIdentification
Wheat forage (Sample 1: TRR = 6.793 ppm)
HPLC analvsis resolved: qiraclostrobin 52.9% TRR 3.598 ppm 500M07 (BF 500-3) 13.1% TRR 0.892 ppm 500M68, -70, and -71 2.5% TRR 0.170 ppm SOOM76 0.8% TRR 0.054 ppm 500M54 3 3 % TRR 0.260 ppm
Methanol 80'0
Water
Cyclohexane
Ethyl acetate
Aqueous
5.436 500M34 1.2% TRR 0.083 i i m Unknown P5 1.8% TRR 0.120 ppm Unknown P6 1.8% TRR 0.125 ppm Unknown P9 1.2% TRR 0.081 ppm Unknown P13 0.8% TRR 0.053 ppm
60.9
9'2
8.0
4.1
Nonextractable
11 Methanol 1 76.9 1 4.786 I NIA. 11
4.134
0.624
0.545
0.28 1
I I
Sequentially partitioned with cyclobexane and ethyl acetate.
HPLC chromatograms indicated that the majority of metabolites partitioned into organic phases.
HPLC analysis resolved pyraclostrobin, 500M07, 500M34, and unknowns P9 and P13; quantitative results were not provided.
15.8
Nonextractable
Ammonia
Ammonia 1 5.6 1 0.382 1 HPLC - see Sample 2 for resolved metabolites.
Water
1.076 I Wheat forage (Sample 2: TRR = 6.221 ppm)
6.1
Extracted with ammonia.
Nonextractable 1 17.9 1 1.1 11 1 Extracted with ammonia.
5.2
2.6 0.159
0.414
HPLC analysis resolved pyraclostrobin, 500M07, 50011168, 500M70,500M71, and 500M76; quantitative results were not provided.
Nonextractable (SSI)
NaOH
HCI
Precipitate
Nonextractable
NIA.
0.324 NIA.
15.3
14.3
6.0
5.1
1.1
0.952
0.890
0.373
0.3 17
0.068
Refluxed with NaOH.
Adjusted to pH 1 with concentrated HC1.
NIA.
Characterized as lignin.
Characterized as cellulose.
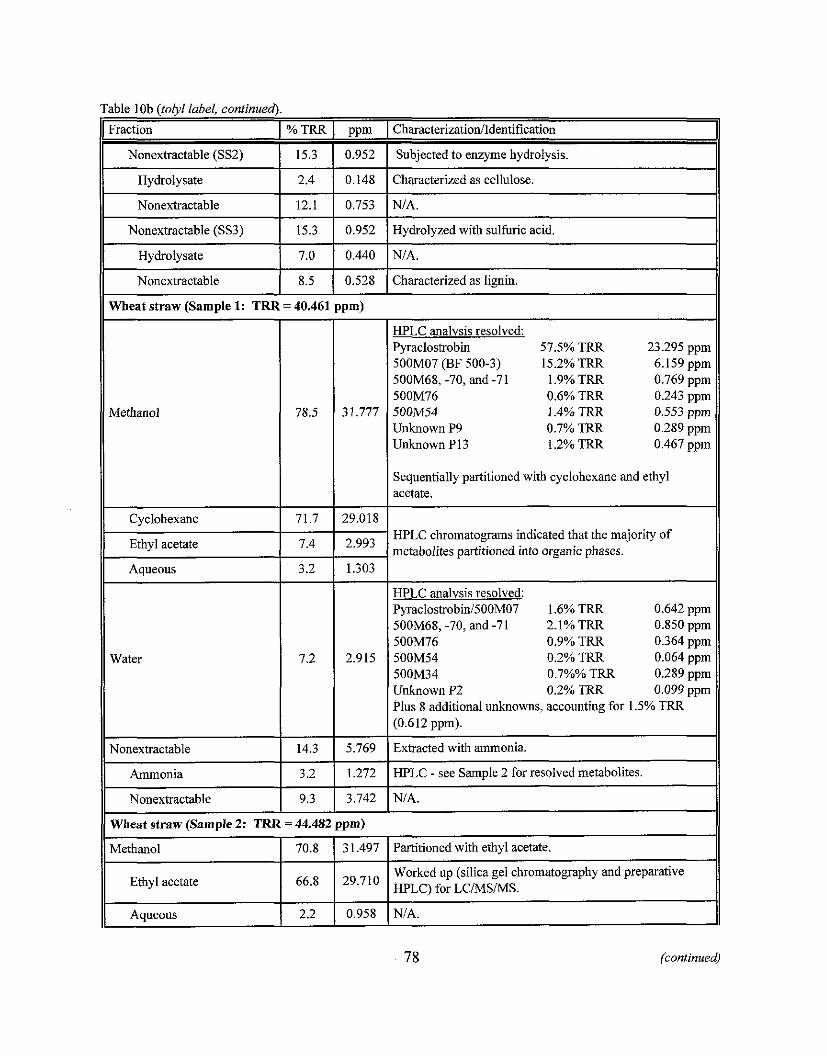
Table lob (tolyl label, continued).
Fraction I % TRR I ppm 1 Characterizationfldentification
11 Nonextractable 1 12.1 1 0.753 1 NIA. 11
Nonextractable (SS2) 15.3
11 Uoncxrracr3ble (SS3) I I I
I 15.3 1 0.952 1 Hydroly/crlu ith sulfuric acid.
Hydrolysate 1 2.4 1 0.148 1 Characterized as cellulose.
I 11 Hydrolysate
I I I
1 7.0 1 0.440 1 NIA.
Methanol
0.952 I I
Nonextractable
HPLC analvsis resolved: Pvraclostrobin 57.5% TRR 23.295 nom
Subjected to enzyme hydrolysis.
'. 5 6 0 ~ 0 7 (BF 500-3) 15.2% TRR 6.159 ppm 500M68, -70, and -71 1.9% TRR 0.769 ppm 500M76 0.6% TRR 0.243 ppm 500M54 1.4% TRR 0.553 ppm Unknown P9 0.7% TRR 0.289 ppm Unknown P13 1.2% TRR 0.467 ppm
0.528
Sequentially partitioned with cyclohexane and ethyl acetate.
Characterized as lignin.
Wheat straw (Sample 1: TRR = 40.461 ppm) I
Aqueous * Cyclohexane
Water
71.7 HPLC chromatograms indicated that the majority of metabolites partitioned into organic phases. Ethyl acetate 1 7.4
HPLC analysis resolved: Pyraclostrobinl500MO7 1.6% TRR 0.642 ppn 500M68, -70, and -71 2.1% TRR 0.850 ppn 50011176 0.9% TRR 0.364 ppn 500M54 0.2% TRR 0.064 ppn 500M34 0.7%% TRR 0.289 ppn Unknown P2 0.2% TRR 0.099 ppn Plus 8 additional unknowns, accounting for 1.5% TRR (0.612 pprn).
Nonextractable
Nonextractable
14.3
Ammonia 1 3.2 1 1.272 1 HPLC - see Sample 2 for resolved metabolites.
9.3
5.769 I Wheat straw (Sample 2: TRR = 44.482 ppm)
Extracted with ammonia.
3.742 NIA.
Partitioned with ethyl acetate.
Worked up (silica gel chromatography and preparative HPLC) for LC~MSMS.
NIA.
3 1.497
29.710
0.958
Methanol
Ethyl acetate
Aqueous
70.8
66.8
2.2
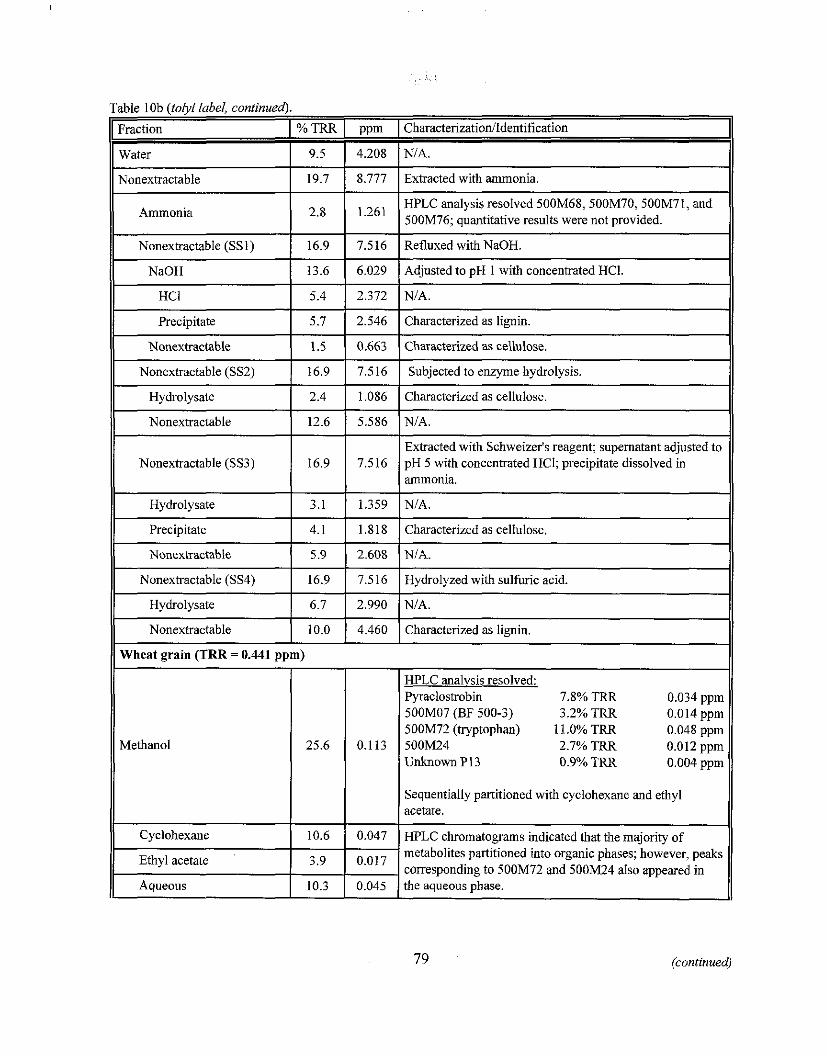
Table lob (tolyl label, continued).
Fraction I % TRR I ppm I CharacterizatiodIdentification 1 water 1 9.5 1 4.208 I NIA.
It Nonextractable I I I
1 19.7 ( 8.777 1 Extracted with ammonia. 11 I Ammonia 1 2.8 1 1.261 I HPLC analysis resolved 500M68,500M70,500M71, and
500M76; quantitative results were not provided.
Nonextractable (SS1)
HCI
11 Hydrolysate 1 2.4 1 1.086 1 Characterized as cellulose. 11
16.9
Nonextractable
11 NaOH 1 13.6 1 6.029 1 Adjusted to pH 1 with concentrated HCI.
5.4
7.516 1 Precipitate 1 5.7 1 2.546 1 Characterized as lignin.
1.5
Nonextractable
Nonextractable (SS3)
Hydrolysate
Refluxed with NaOH.
2.372 I Nonextractable (SS2) 1 16.9 1 7.516 1 Subjected to enzyme hydrolysis.
Precipitate
NIA.
0.663 I 12.6
16.9
3.1
Nonextractable (SS4)
Methanol
Characterized as cellulose.
4.1
Nonextractable
HPLC analysis resolved: Pyraclostrobin 7.8% TRR 0.034 ppm 500M07 (BF 500-3) 3.2% TRR 0.014 ppm 500M72 (tryptophan) 11.0% TRR 0.048 ppm 500M24 2.7% TRR 0.012 ppm Unknown P13 0.9% TRR 0.004 ppm
5.586
7.516
1.359
Nonextractable ( 5.9 ( 2.608 ( NIA.
16.9
I Sequentially partitioned with cyclohexane and ethyl acetate.
NIA.
Extracted with Schweizer's reagent; supernatant adjusted to pH 5 with concentrated HCI; precipitate dissolved in ammonia.
NIA.
1.818 1 Hydrolysate 1 6.7 1 2.990 ( NIA.
10.0
Cyclohexane HPLC chromatograms indicated that the majority of
Ethyl acetate metabolites partitioned into organic phases; however, peaks corresponding to 50011172 and 500M24 also appeared in
Aqueous the aqueous phase.
Characterized as cellulose.
7.516 I Wheat grain (TRR = 0.441 ppm)
Hydrolyzed with sulfuric acid.
4.460 I Characterized as lignin.
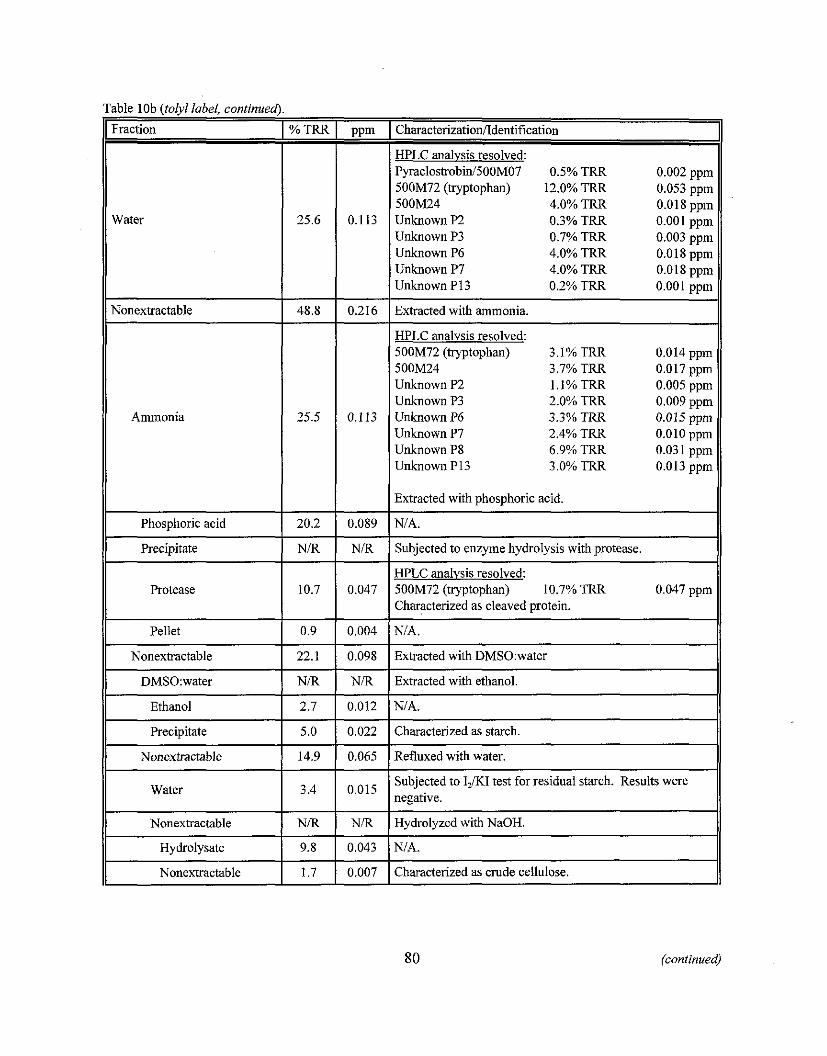
11 I I 1 500M72 (tryptophan) 12.0% TRR 0.053 ppm 11
Table lob (tolyl label, continued).
Water
Fraction
500M24 4.0% TRR 0.018&xn Unknown P2 0.3% TRR 0.001 ppm Unknown P3 0.7% TRR 0.003 ppm Unknown P6 4.0% TRR 0.0 18 ppm Unknown P7 4.0% TRR 0.018 vvm Unknown PI3 0.2% TRR 0.001 ppm
Nonextractable 1 48.8 1 0.216 1 Extracted with ammonia.
% TRR
Ammonia
HPLC analvsis resolved: 500M72 (tryptophan) 500M24 Unknown P2 Unknown P3 Unknown P6 Unknown P7 Unknown P8 Unknown PI3
ppm
3.1% TRR 3.7% TRR I.l%TRR 2.0% TRR 3.3% TRR 2.4% TRR 6.9% TRR 3.0% TRR
Characterizationfidentiiication
HPLC analysis resolved: Pyraclostrobini500MO7 0.5% TRR 0.002 ppm
0.014 ppm 0.017 pprn 0.005 ppm 0.009 ppm 0.015 pprn 0.010 ppm 0.03 1 pprn 0.013 pprn
Extracted with phosphoric acid.
Phosphoric acid 1 20.2 1 0.089 I NIA.
Precipitate
Protease
Subjected to enzyme hydrolysis with protease. 11
(1 Pellet I I
HPLC analvsis resolved: 500M72 (tryptophan) 10.7% TRR 0.047 ppm
0.9
Characterized as cleaved protein. 11 0.004 NIA. 11
Nonextractable
11 Nonexkactable I 14.9 1 0.065 I Refluxed with water. 11 II
22.1
Ethanol
11 Nonextractable I I I -
] NIR I N R I Hydrolyzed withNaOH. 11
DMS0:water ( N R I N R 1 Extracted with ethanol.
0.098 I 2.7
I I I
II I
80 (continued)
Extracted with DMS0:water
Precipitate 1 5.0 1 0.022 1 Characterized as starch.
II
0.012 I Water
Hydrolysate
NIA.
0.015 3.4 Subjected to I,/KI test for residual starch. Results were negative.
9.8 0.043 I NIA.
Nonextractable 0.007 1.7 Characterized as crude cellulose.
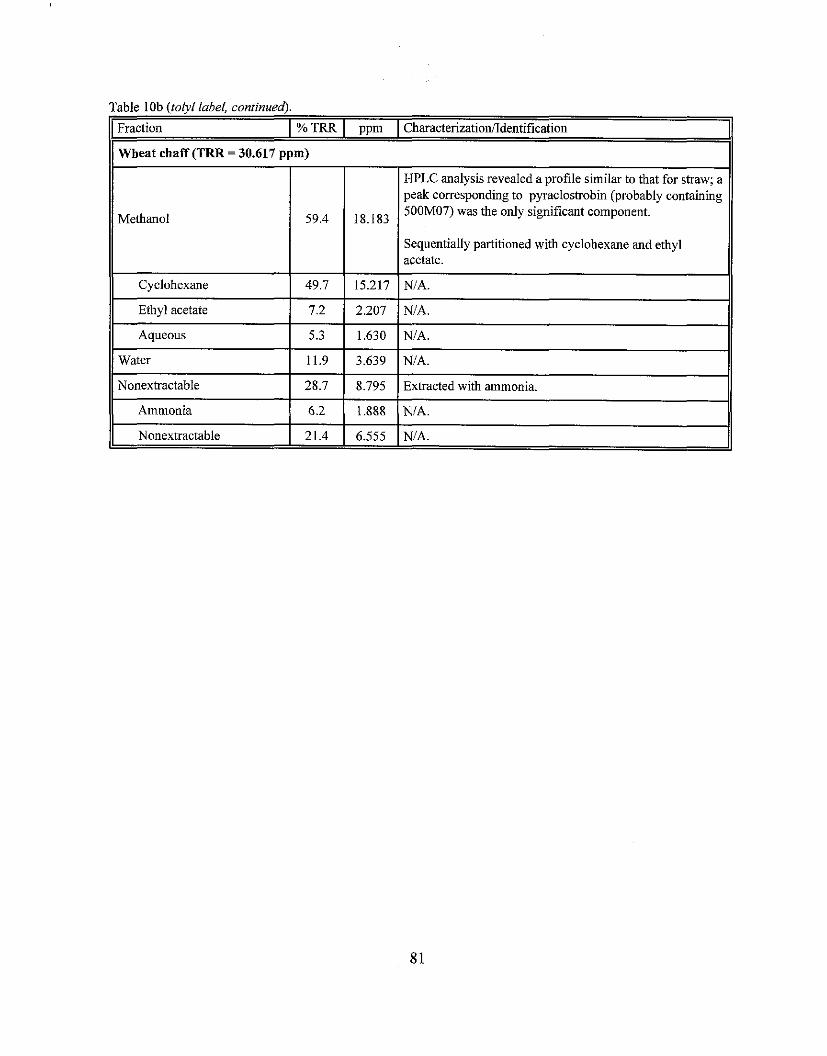
Table lob (tolyl label, continued).
1 Fraction I % TRR I ppm I CharacterizationlIdentification
Wheat chaff (TRR = 30.617 ppm)
Methanol
Cyclohexane
Ethyl acetate
Aqueous
59.4
Water
49.7
7.2
5.3
Ammonia 6.2
18.183
11.9
HPLC analysis revealed a profile similar to that for straw; a peak corresponding to pyraclostrobin @robably containing 500M07) was the only significant component.
15.217
2.207
1.630
Nonextractable I 28.7 1 8.795 1 Extracted with ammonia.
Nonextractable 1 21.4 1 6.555 1 NIA.
1.888
Sequentially partitioned with cyclohexane and ethyl acetate.
NIA.
NIA.
NIA.
3.639 I NIA.
NIA.
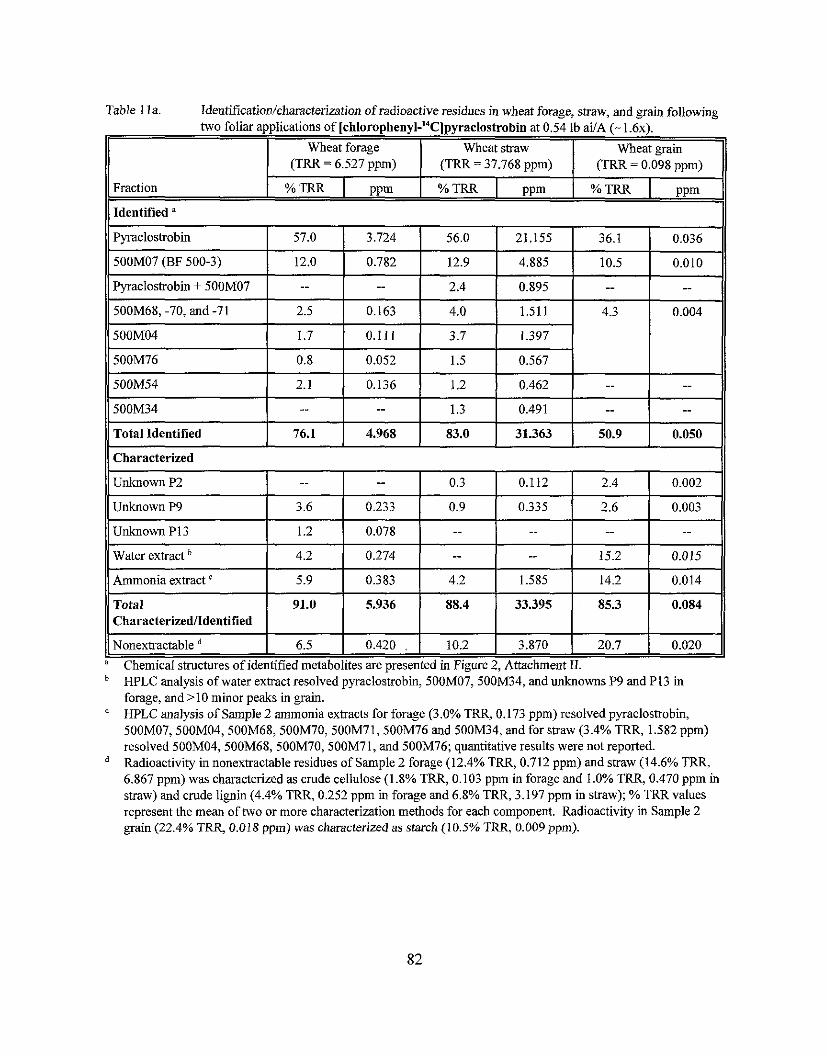
Table I la. Identificationlcharacterization of radioactive residues in wheat forage, straw, and grain follow in^ - two foliar applications of [chlorophenyl-'~]pyraclostrobin at 0.54 lb aiIA (-I.&).
11 Total Identified 1 76.1 1 4.968 1 83.0 1 31.363 1 50.9 1 0.050 11
Wheat forage (TRR = 6.527 ppm)
Fraction
11 Characterized
Wheat straw (TRR = 37.768 ppm)
1 - -
Wheat grain (TRR = 0.098 ppm)
%TRR I PPm I %TRR I PPm
Identified "
Unknown P9
1 Nonextractable 6.5 1 0.420 . I 10.2 1 3.870 1 20.7 1 0.020 " Chemical stmctures of identified metabolites are oresented in Ficure 2. Attachment 11.
Pyraclostrobin
500M07 (BF 500-3)
Pyraclostrohin + 500M07
500M68, -70, and -71
500M04
50011176
Water extract
Ammonia extract
Total Characterizedndentified
- HPLC analysis of water extract resolved pyraclostrobin, 500M07,500M34, and unknowns P9 and PI3 in forage, and >10 minor peaks in grain. HPLC analysis of Sample 2 ammonia extracts for forage (3.0% TRR 0.173 ppm) resolved pyraclostrobin, 500M07,500M04,500M68,500M70,500M71,500M76 and 500M34, and for straw (3.4% TRR, 1.582 ppm) resolved 500M04,500M68, 500M70, 500M71, and 500M76; quantitative results were not reported. Radioactivity in nonextractable residues of Sample 2 forage (12.4% TRR, 0.712 ppm) and straw (14.6% TRR, 6.867 ppm) was characterized as crude cellulose (1.8% TRR, 0.103 pprn in forage and 1.0% TRR, 0.470 pprn in straw) and crude lignin (4.4% TRR, 0.252 pprn in forage and 6.8% TRR, 3.197 ppm in straw); % TRRvalues represent the mean of two or more characterization methods for each component. Radioactivity in Sample 2 grain (22.4% TRR, 0.018 ppm) was characterized as starch (10.5% TRR, 0.009 pprn).
% TRR
3.6
PPm
57.0
12.0
--
2.5
1.7
0.8
Unknown P13 I 1.2 1 0.078 1 -- -- 4.2
5.9
91.0
0.233
3.724
0.782
--
0.163
0.111
0.052
..
0.274
0.383
5.936
0.9
..
56.0
12.9
2.4
4.0
3.7
1.5
--
4.2
88.4
0.335 2.6
21.155
4.885
0.895
1.511
1.397
0.567
0.003
--
1.585
33.395
36.1
10.5
--
4.3
15.2
14.2
85.3
0.036
0.010
--
0.004
0.015
0.014
0.084
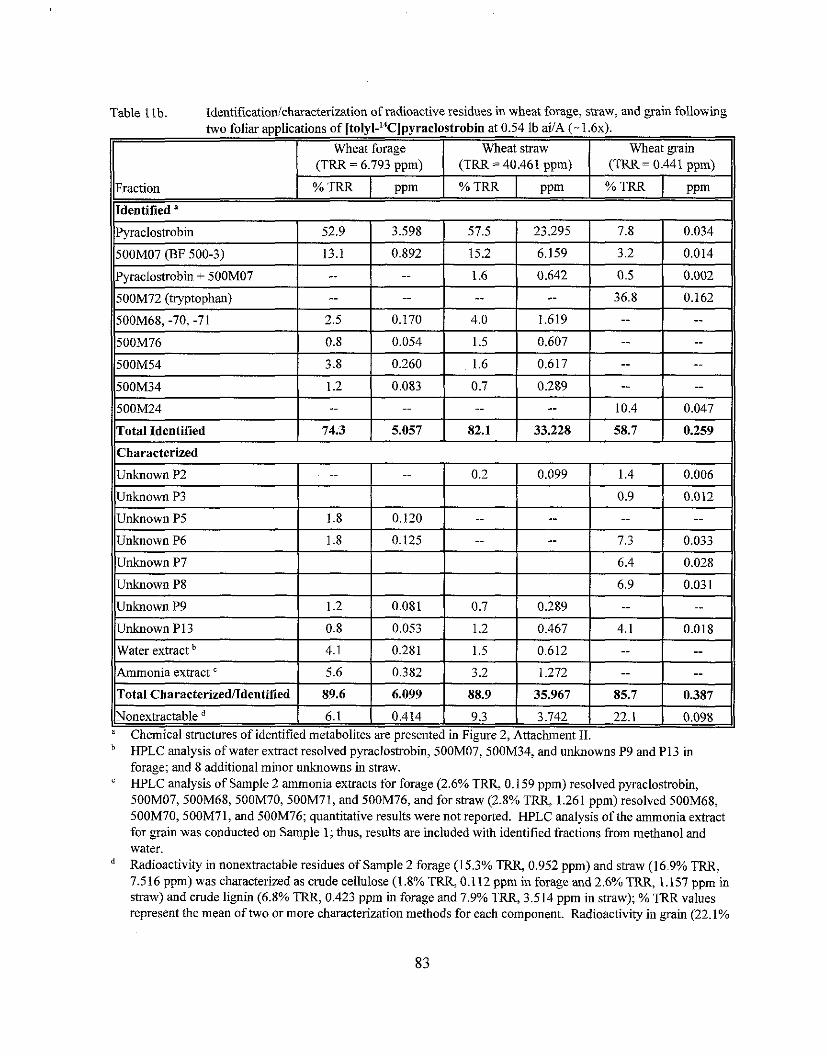
Table I lb. Identificatiodcharacterization of radioactive residues in wheat forage, straw, and grain following two foliar applications of [tolyl-'4C]pyraclostrobin at 0.54 lb aiIA (- 1 .6~) .
"Chemical stmctures of identified metabolites are presented in Figure 2, Attachment 11. HPLC analysis of water extract resolved pyraclostrobin, 500M07, 500M34, and unknowns P9 and P13 in forage; and 8 additional minor unknowns in straw.
' HPLC analysis of Sample 2 ammonia extracts for forage (2.6% TRR, 0.159 ppm) resolved pyraclostrobin, 500M07,500M68,500M70,500M71, and 50011176, and for straw (2.8% TRQ 1.261 ppm) resolved 500M68, 500M70, 500M71, and 500M76; quantitative results were not reported. HPLC analysis of the ammonia extract for grain was conducted on Sample 1; thus, results are included with identified fractions from methanol and water. * Radioactivity in nonextractable residues of Sample 2 forage (15.3% TRR, 0.952 ppm) and straw (16.9% TRR, 7.516 ppm) was characterized as cmde cellulose (1.8% TRR, 0.112 ppm in forage and 2.6% TRR, 1.157 ppm in straw) and crude lignin (6.8% TRR, 0.423 ppm in forage and 7.9% TRQ 3.514 ppm in straw); % TRR values represent the mean of two or more characterization methods for each component. Radioactivity in grain (22.1%
Characterized
Unknown P2 0.2 ..
Unknown P3 I I 1 .. 0.099
1 0.9 1 0.012
1.4 0.006
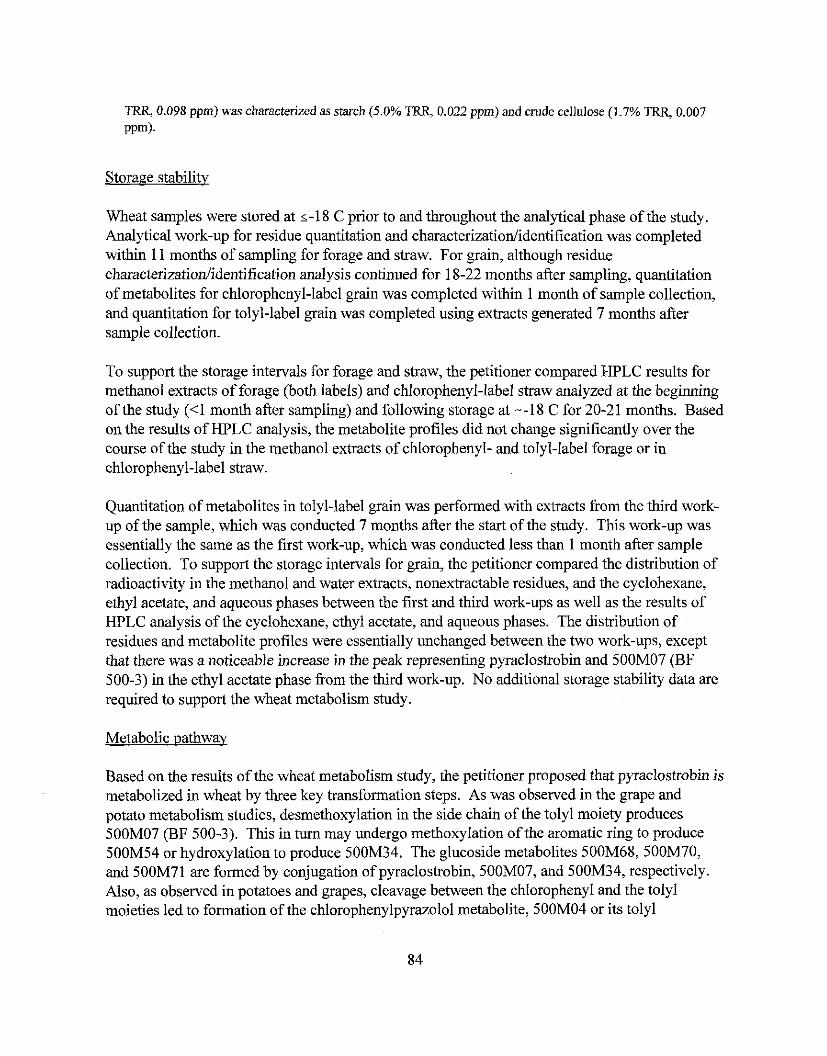
TRR, 0.098 ppm) was characterized as starch (5.0% TRR, 0.022 ppm) and crude cellulose (1.7% TRR, 0.007
P P ~ .
Storage stabilitv
Wheat samples were stored at s-18 C prior to and throughout the analytical phase of the study. Analytical work-up for residue quantitation and characterization/identification was completed within 11 months of sampling for forage and straw. For grain, although residue characterizationlidentification analysis continued for 18-22 months after sampling, quantitation of metabolites for chlorophenyl-label grain was completed within 1 month of sample collection, and quantitation for tolyl-label grain was completed using extracts generated 7 months after sample collection.
To support the storage intervals for forage and straw, the petitioner compared HPLC results for methanol extracts of forage (both labels) and chlorophenyl-label straw analyzed at the beginning of the study ( 4 month after sampling) and following storage at --I8 C for 20-21 months. Based on the results of HPLC analysis, the metabolite profiles did not change significantly over the course of the study in the methanol extracts of chlorophenyl- and tolyl-label forage or in chlorophenyl-label straw.
Quantitation of metabolites in tolyl-label grain was performed with extracts from the third work- up of the sample, which was conducted 7 months after the start of the study. This work-up was essentially the same as the first work-up, which was conducted less than 1 month after sample collection. To support the storage intervals for grain, the petitioner compared the distribution of radioactivity in the methanol and water extracts, nonextractable residues, and the cyclohexane, ethyl acetate, and aqueous phases between the first and third work-ups as well as the results of HPLC analysis of the cyclohexane, ethyl acetate, and aqueous phases. The distribution of residues and metabolite profiles were essentially unchanged between the two work-ups, except that there was a noticeable increase in the peak representing pyraclostrobin and 500M07 (BF 500-3) in the ethyl acetate phase from the third work-up. No additional storage stability data are required to support the wheat metabolism study.
Metabolic pathway
Based on the results of the wheat metabolism study, the petitioner proposed that pyraclostrobin is metabolized in wheat by three key transformation steps. As was observed in the grape and potato metabolism studies, desmethoxylation in the side chain of the tolyl moiety produces 500M07 (BF 500-3). This in turn may undergo methoxylation of the aromatic ring to produce 500M54 or hydroxylation to produce 500M34. The glucoside metabolites 500M68,500M70, and 500M71 are formed by conjugation of pyraclostrobin, 500M07, and 500M34, respectively. Also, as observed in potatoes and grapes, cleavage between the chlorophenyl and the tolyl moieties led to formation of the chlorophenylpyrazolo1 metabolite, 500M04 or its tolyl
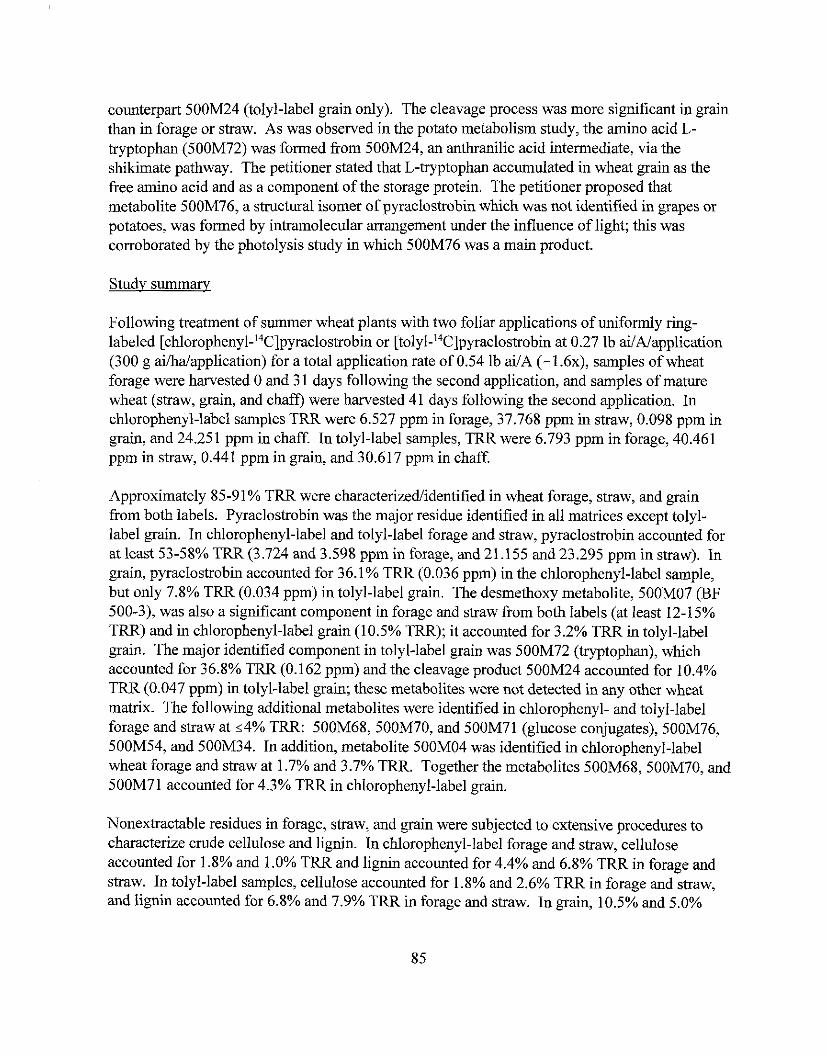
counterpart 500M24 (tolyl-label grain only). The cleavage process was more significant in grain than in forage or straw. As was observed in the potato metabolism study, the amino acid L- tryptophan (500M72) was formed from 500M24, an anthranilic acid intermediate, via the shikimate pathway. The petitioner stated that L-tryptophan accumulated in wheat grain as the free amino acid and as a component of the storage protein. The petitioner proposed that metabolite 500M76, a structural isomer of pyraclostrobin which was not identified in grapes or . ~ - .
potatoes, was formed by intramolecular arrangement under the influence of light; this was corroborated by the photolysis study in which 500M76 was a main product.
Studv summary
Following treatment of summer wheat plants with two foliar applications of uniformly ring- labeled [chlorophenyl-L4C]pyraclostrobin or [tolyl-'4C]pyraclostrobin at 0.27 lb ai/A/application (300 g aihalapplication) for a total application rate of 0.54 lb ai/A (- 1.6x), samples of wheat forage were harvested 0 and 3 1 days following the second application, and samples of mature wheat (straw, grain, and chaff) were harvested 41 days following the second application. In chlorophenyl-label samples TRR were 6.527 pprn in forage, 37.768 ppm in straw, 0.098 pprn in grain, and 24.251 pprn in chaff. In tolyl-label samples, TRR were 6.793 pprn in forage, 40.461 pprn in straw, 0.441 pprn in grain, and 30.617 pprn in chaff.
Approximately 85-91% TRR were characterizedlidentified in wheat forage, straw, and grain from both labels. Pyraclostrobin was the major residue identified in all matrices except~tolyl- label grain. In chlorophenyl-label and tolyl-label forage and straw, pyraclostrobin accounted for at least 53-58% TRR (3.724 and 3.598 pprn in forage, and 21.155 and 23.295 pprn in straw). In grain, pyraclostrobin accounted for 36.1% TRR (0.036 ppm) in the chlorophenyl-label sample, but only 7.8% TRR (0.034 ppm) in tolyl-label grain. The desmethoxy metabolite, 500M07 (BF 500-3), was also a significant component in forage and straw from both labels (at least 12-15% TRR) and in chlorophenyl-label grain (10.5% TRR); it accounted for 3.2% TRR in tolyl-label grain. The major identified component in tolyl-label grain was 500M72 (tryptophan), which accounted for 36.8% TRR (0.162 ppm) and the cleavage product 500M24 accounted for 10.4% TRR (0.047 ppm) in tolyl-label grain; these metabolites were not detected in any other wheat matrix. The following additional metabolites were identified in chlorophenyl- and tolyl-label forage and straw at ~ 4 % TRR: 500M68,500M70, and 500M71 (glucose conjugates), 500M76, 500M54, and 500M34. In addition, metabolite 500M04 was identified in chlorophenyl-label wheat forage and straw at 1.7% and 3.7% TRR. Together the metabolites 500M68, 500M70, and 500M71 accounted for 4.3% TRR in chlorophenyl-label grain.
Nonextractable residues in forage, straw, and grain were subjected to extensive procedures to characterize crude cellulose and lignin. In chlorophenyl-label forage and straw, cellulose accounted for 1.8% and 1.0% TRR and lignin accounted for 4.4% and 6.8% TRR in forage and straw. In tolyl-label samples, cellulose accounted for 1.8% and 2.6% TRR in forage and straw, and lignin accounted for 6.8% and 7.9% TRR in forage and straw. In grain, 10.5% and 5.0%
TRR were characterized as starch in chlorophenyl- and tolyl-label grain, and 1.7% TRR in tolyl- label grain were characterized as cellulose.
The submitted wheat metabolism study is acceptable.
Translocation study
BASF submitted a study (citation listed below) depicting translocation of ['4C]pyraclostrobin in wheat. The study was conducted by BASF (BASF Agricultural Center, Limburgerhof, Germany).
451 18429 Hofhann, M. (1998) Translocation Study with BAS 500 F and Wheat. Supplementary Study. Study code: 45503, Document No. 199811 1205. Unpublished study submitted by BASF Corporation. 28 p.
Uniformly ring-labeled [tolyl- 14C]pyraclostrobin (specific 4.55 MBqImg, radiochemical purity >99%) formulated as an EC was applied by hand sprayer to spring wheat plants grown in pots as two foliar applications at 0.22 lb aiiAlapplication (250 g aiihalapplication); two separate formulated test substances (made with different formulation blanks) were used for each application. The first application was made to wheat plants at growth stage BBCH 32/33 (second leaf completely developed; flag leaf still incompletely rolled up in sheaf of second leaf). The second application was made to wheat plants at growth stage BBCH 43147 (ear formed but contained within closed sheath of flag leaf). Wheat plants were harvested 11 and 15 days after the first and second applications, respectively.
To investigate the translocation behavior of pyraclostrobin in wheat, the petitioner subjected selected entire plants to autoradiography. In addition, the following individual plant parts were analyzed by combustion/LSC: from the first application, the flag leaf (untreated) and the second and third leaves (directly treated); and from the second application the wheat ear (untreated) and the first and second leaves (directly treated).
Autoradiograms corroborated the absence of translocation. The results of LSC analysis are presented in Table 12, and confirm that very little radioactivity translocated from the treated leaves to the untreated plant parts.
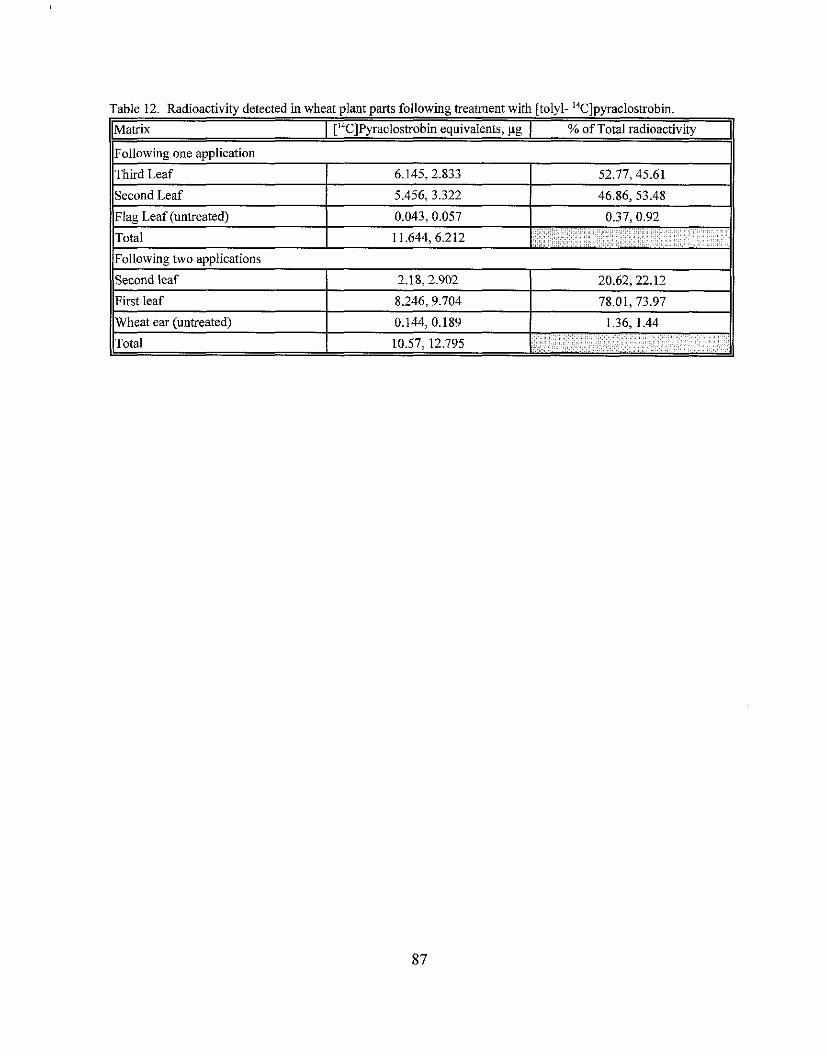
rahlz 12 Kadioacti\ it? detected in \vlicat plant pans follow~ng rrcatlnenr lvi th [rul! I- "C]pyraclostrobin.
lhatrih I I"ClP\rdclosrrohin euuivalcn~s. .I: I O O ofrowl radioacti\.it\ il Following one application
Thiid Leaf
Second Leaf
llFollowing two at?olications 11
-
Second leaf I 2.18,2.902 20.62,22.12 First leaf 8.246.9.704 I 78.01. 73.97
6.145.2.833
Flag Leaf (untreated) 1 0.043. 0.057 1 0.37.0.92
5.456, 3.322
Total
52.77. 45.61
46.86, 53.48
11.644. 6.212 Y
OPPTS GLN 860.1300: Nature of the Residue in Livestock
Ruminants
BASF has submitted a study (citations listed below) pertaining to the metabolism of [L4C]pyraclostrobin in lactating goats. The in-life portion of the study was performed at BASF Aktiengesellschaft, Department of Toxicology, Ludwigshafen, Germany, and the analytical phase was conducted at BASF Agricultural Center, Limburgerhof, Germany.
451 18432 Bross, M.; Tilting, N. (2000) Investigation of the Metabolism of 14C-BAS 500 F in the Goat. Laboratory Project Identification No. 35634; 20001100004. Unpublished study submitted by BASF Corporation. 216 p.
451 18433 Leibold, E.; Hoffmann, H.; and Hildebrand, B. (1998) I4C 500 F - Absorption, Distribution and Excretion After Repeated Oral Administration in Lactating Goats. Laboratory Project Identification No. 02B03631966010; 1998110636. Unpublished study submitted by BASF Corporation. 63 p.
The study was conducted using pyraclostrobin labeled in either the chlorophenyl ring or the tolyl ring. In addition, a low dose (nominally 12 ppm) and a high dose (nominally 50 ppm) were used for each label. For the low dose studies, the test substances were [chlorophenyl-u- 14C]pyraclostrobin [specific activity 4.34 Mbqlmg (260,400 dpdpg), radiochemical purity SO%] and [t~l~l-U-~~C]pyraclostrobin [specific activity 4.5 Mbqlmg (270,000 dpdpg), radiochemical purity SO%]. The petitioner stated that the low dose test substances decomposed radiolytically (to 80% radiochemical purity; this was not observed until after dosing), and that approximately 15% of the radioactivity, after decomposition consisted of the N-desmethoxy derivative of pyraclostrobin. Because the petitioner conducted full characterizationiidentification determinations with the samples from the high dose goats as well as the low dose goats, the relatively low radiochemical purity of the test substance for the low dosing level will not be considered to have a negative impact on the study as a whole.
For the high dose studies, the test substances were [chlorophenyl-U-14C]pyraclostrobin [specific activity 4.14 Mbqlmg (248,400 dpmlpg), radiochemical purity >98%] and [tolyl-U- 14C]pyraclostrobin [specific activity 4.46 Mbqlmg (267,600 dpdpg), radiochemical purity >98%]. The test substances were isotopically diluted with non-labeled pyraclostrobin to final specific activities of 52,620 d p d p g and 166,842 d p d p g for the low and high dose studies, respectively, with the chlorophenyl label, and 55,380 dpmlpg and 146,622 d p d p g for the low and high dose studies, respectively, with the tolyl label. For each label, two goats received five daily doses of the test substance at 12.2 ppm (low dose) in the feed and one goat received five daily doses at 78 (chlorophenyl label) or 70 (tolyl label) ppm (high dose); dosing was conducted via capsules for the low dose or by gavage for the high dose. The low dose was -0.34~ the maximum theoretical dietary burden to beef cattle (MTDB; 36.3 ppnl) and to dairy cattle (MTDB
35.4 ppm). The high dose was -1.9-2.2~ the MTDB for beef cattle and dairy cattle; see "Meat, Milk, Poulby, Eggs" for calculation of dietary burden.
During the study, the goats were fed a commercial pelleted feed ad libitum and apples and hay once per day; water was provided ad libitum. The petitioner provided sufficient descriptions of preparation of dose capsules and animal husbandry practices, as well as data concerning daily feed intake, body weights, and milk production.
Milk was collected twice daily, in the morning prior to dosing and in the afternoon. The animals were sacrificed 23 hours after the last dose, and samples of liver, kidney, muscle (back and leg), and fat (kidney and intraperitoneal) were collected. Samples were stored frozen at -18 C prior to transport to the analytical laboratory, where samples were stored frozen prior to analysis.
Total radioactive residues (TRR)
Total radioactive residues (TRR) in milk samples were determined by LSC directly. Fat samples were solubilized (using tissue solubilizer at 50 C overnight) and liver, kidney, and muscle samples were combusted prior to LSC determination. The TRR in milk and tissues are presented in Table 13. The LODs for the radioassay were 0.0002 ppm for milk and kidney, 0.0018 ppm for liver, 0.0022 ppm for muscle, and 0.0029 ppm for fat.
Although the petitioner determined the TRR in individual samples of tissues from each of the goats in the low dose studies, pooled samples of these tissues were prepared and the pooled samples were used for all further analyses. Therefore, the TRR for the pooled samples are presented in Table 13. The petitioner prepared pooled milk samples for characterization and identification purposes; the TRR in these pooled samples are also presented in Table 13. For the low dose study, milk samples from 36-120 hours were pooled. For the high dose study, milk samples from all sampling intervals were pooled for the chlorophenyl label, and milk samples from 36-96 hours were pooled for the tolyl label.
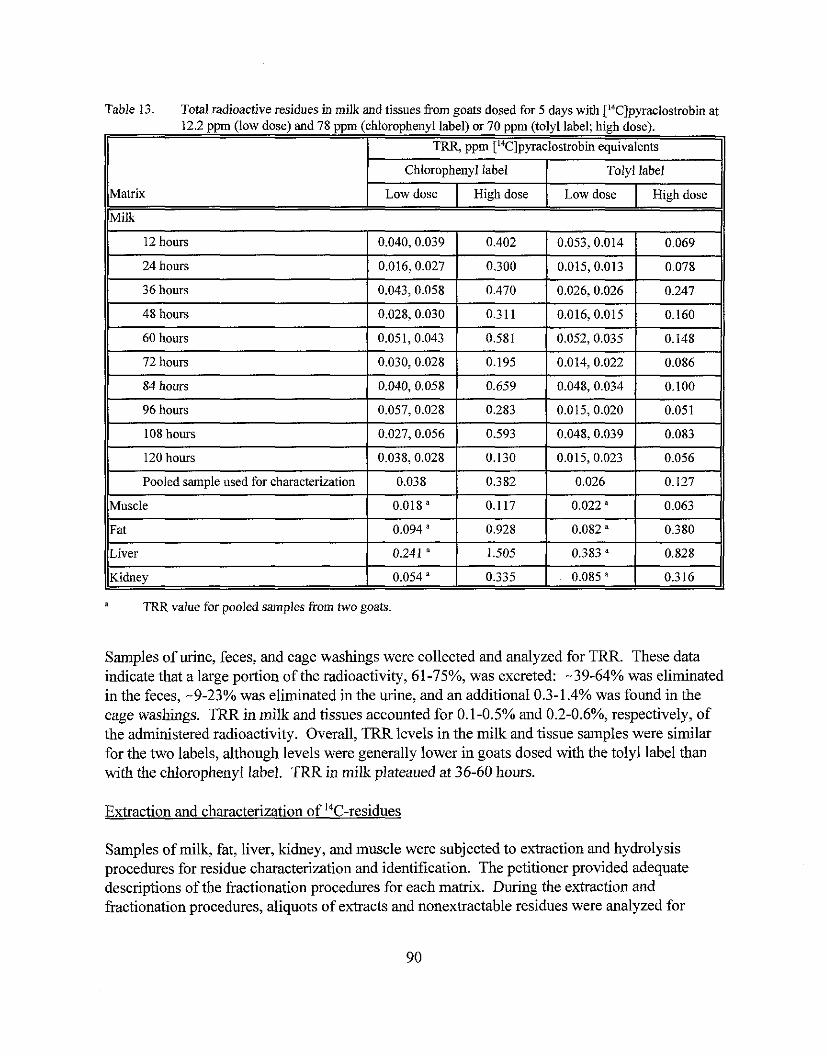
Table 13. Total radioactive residues in milk and tissues from goats dosed for 5 days with ['4C]pyraclostrobin at 12.2 ppm (lo\\. dose) and 78 ppm (chlorophen) l label) or 70 ppm (tol! 1 label: liigh dose).
1 I TIM, ppm I"Clp\raclosrrobin equi\alcnts 11
Mahix
12 hours
24 hours
36 hours
48 hours
Milk
.. . -..
60 hours
72 hours
84 hours
96 hours
Chlorophenyl label
0.040, 0.039
0.016,0.027
0.043, 0.058
0.028, 0.030
108 hours
120 hours
Pooled sample used for characterization
Muscle
V R R value for pooled samples from two goats.
Tolyl label
0.051,0.043
0.030, 0.028
0.040, 0.058
0.057,0.028
-
Samples of urine, feces, and cage washings were collected and analyzed for TRR. These data indicate that a large portion of the radioactivity, 61-75%, was excreted: -39-64% was eliminated in the feces, -9-23% was eliminated in the urine, and an additional 0.3-1.4% was found in the cage washings. TRR in milk and tissues accounted for 0.1-0.5% and 0.2-0.6%, respectively, of the administered radioactivity. Overall, TRR levels in the milk and tissue samples were similar
0.402
0.300
0.470
0.311
0.027,0.056
0.038,0.028
0.038
0.018 "
for the two labels, although levels were generally lower in goats dosed with the tolyl label than with the chlorophenyl label. TRR in milk plateaued at 36-60 hours.
Low dose
0.581
0.195
0.659
0.283
Fat
Liver
Kidney
Extraction and characterization of 14C-residues
0.053, 0.014
0.015, 0.013
0.026,0.026
0.016,0.015
0.593
0.130
0.382
0.117
Samples of milk, fat, liver, kidney, and muscle were subjected to extraction and hydrolysis procedures for residue characterization and identification. The petitioner provided adequate descriptions of the fractionation procedures for each matrix. During the extraction and fractionation procedures, aliquots of extracts and nonextractable residues were analyzed for
High dose
0.069
0.078
0.247 - 0.160
0.052,0.035
0.014, 0.022
0.048, 0.034
0.015,0.020
0.094 ' 0.241 "
0.054 "
0.148
0.086
0.100
0.051
0.048, 0.039
0.015, 0.023
0.026
0.022 a
Low dose
0.083
0.056
0.127
0.063
0.928
1.505
0.335
High dose
0.082 "
0.383 "
0.085 a
0.380
0.828
0.316
radioactivity by LSC or combustion/LSC. The general extraction and fractionation procedures are summarized below.
Milk samples were extracted with hexane and ACN, and centrifuged. The aqueous phase was evaporated to dryness and dissolved in ACN. The hexane phase was combined with the nonextractable residues and extracted with ACN. The ACN extracts were combined, evaporated to dryness and dissolved in methanol for HPLC analysis.
Fat samples were extracted with hexane and ACN (2-3x), and the hexane extract was partitioned with ACN. The ACN extracts were combined and reserved for HPLC analysis.
Muscle samples were extracted with methanol (3x), and the extracts were isolated by centrifugation. The methanol extracts were combined and concentrated for HPLC analysis. For samples from the low dose goats, a precipitate formed when the methanol extract was concentrated. This precipitate was isolated and extracted with water. For the tolyl-label low- dose sample, the methanol extract was evaporated to dryness and partitioned between hexane and ACN.
Kidney and liver samples were sequentially extracted with methanol (3x) and water. The methanol extracts of the low dose samples were each concentrated (which resulted in the formation of a precipitate), then combined, evaporated to dryness, and partitioned between hexane and ACN. The methanol extracts of the high dose samples were combined without concentration and partitioned between hexane and ACN. The ACN phases were reserved for HPLC analysis.
For the high-dose kidney samples from both labels, the extraction procedures were repeated with three subsamples. With the second subsample, the methanol extract was subjected to acid hydrolysis (extract evaporated to dryness and dissolved in HC1, heated at reflux for 2 h) and the hydrolysate was partitioned with ethyl acetate (EtOAc). The nonextractable residues of the second subsample were also separately subjected to acid hydrolysis (as described above) and pronase digestion (TRIS buffer, pH 7.0, overnight at 39 C); in both cases the hydrolysate was partitioned with EtOAc. The remaining aqueous phase, after partitioning of the pronase digestate with EtOAc, was subjected to acid hydrolysis as described above. The ethyl acetate phases following acid hydrolysis were reserved for HPLC analysis.
For the third subsample of kidney, the methanol extract was mixed with water, the mixture was concentrated to remove methanol, and the resulting aqueous phase was sequentially extracted with hexane, dichloromethane (DCM), DCM with formic acid (ratio not specified), and EtOAc. The nonextractable residues of the third subsample were subjected to pronase digestion as described above. The digestate was then acidified and applied to a C 18 column which was washed with water and eluted with methanol and methano1:formic acid (24:1, v:v).
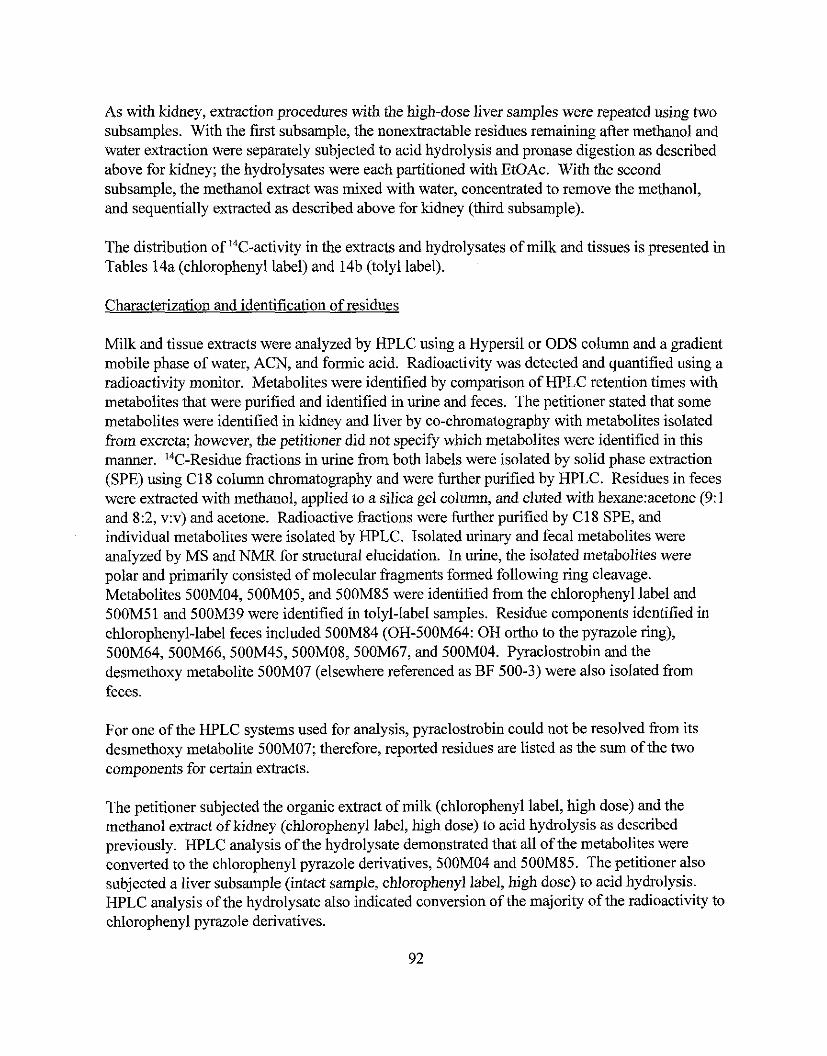
As with kidney, extraction procedures with the high-dose liver samples were repeated using two subsamples. With the first subsample, the nonextractable residues remaining after methanol and . . - water extraction were separately subjected to acid hydrolysis and pronase digestion as described above for kidney; the hydrolysates were each partitioned with EtOAc. With the second subsample, the methanol extract was mixed with water, concentrated to remove the methanol, and sequentially extracted as described above for kidney (third subsample).
The distribution of I4C-activity in the extracts and hydrolysates of milk and tissues is presented in Tables 14a (chlorophenyl label) and 14b (tolyl label).
Characterization and identification of residues
Milk and tissue extracts were analyzed by HPLC using a Hypersil or ODs column and a gradient mobile phase of water, ACN, and formic acid. Radioactivity was detected and quantified using a radioactivity monitor. Metabolites were identified by comparison of HPLC retention times with metabolites that were purified and identified in urine and feces. The petitioner stated that some metabolites were identified in kidney and liver by co-chromatography with metabolites isolated from excreta; however, the petitioner did not specify which metabolites were identified in this manner. 14C-Residue fractions in urine from both labels were isolated by solid phase extraction (SPE) using C18 column chromatography and were further purified by HPLC. Residues in feces were extracted with methanol, applied to a silica gel column, and eluted with hexane:acetone (9:l and 8:2, v:v) and acetone. Radioactive fractions were further purified by C18 SPE, and individual metabolites were isolated by HPLC. Isolated urinary and fecal metabolites were analyzed by MS and NMR for structural elucidation. In urine, the isolated metabolites were polar and primarily consisted of molecular fragments formed following ring cleavage. Metabolites 500M04,500M05, and 500M85 were identified from the chlorophenyl label and 500M5 1 and 500M39 were identified in tolyl-label samples. Residue components identified in chlorophenyl-label feces included 5OOM84 (OH-500M64: OH ortho to the pyrazole ring), 500M64,500M66,500M45,500M08,500M67, and 500M04. Pyraclostrobin and the desmethoxy metabolite 500M07 (elsewhere referenced as BF 500-3) were also isolated from feces.
For one of the HPLC systems used for analysis, pyraclostrobin could not be resolved from its desmethoxy metabolite 500M07; therefore, reported residues are listed as the sum of the two components for certain extracts.
The petitioner subjected the organic extract of milk (chlorophenyl label, high dose) and the methanol extract of kidney (chlorophenyl label, high dose) to acid hydrolysis as described previously. HPLC analysis of the hydrolysate demonstrated that all of the metabolites were converted to the chlorophenyl pyrazole derivatives, 500M04 and 500M85. The petitioner also subjected a liver subsample (intact sample, chlorophenyl label, high dose) to acid hydrolysis. HPLC analysis of the hydrolysate also indicated conversion of the majority of the radioactivity to chlorophenyl pyrazole derivatives.
A summary of the characterized and identified 14C-residues in matrices from high-dose goats is presented in Tables 15a (chlorophenyl label) and 15b (tolyl label).
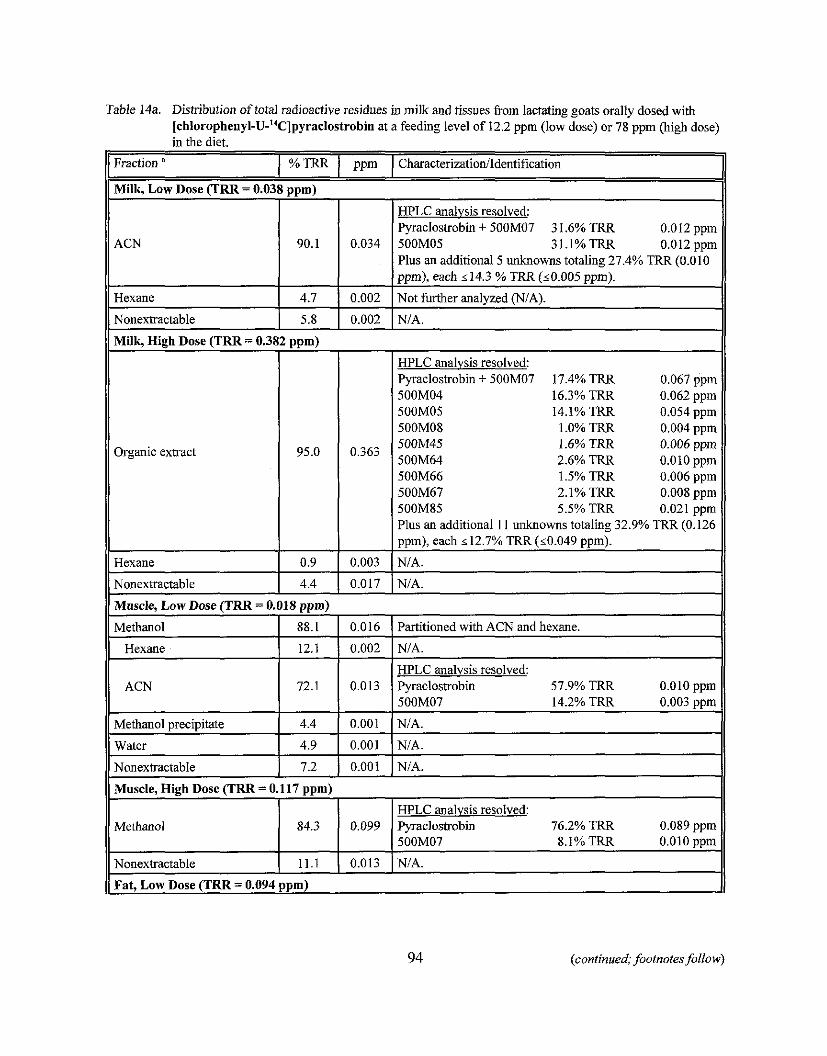
Table 14a. Distribution of total radioactive residues in milk and tissues from lactating goats orally dosed with [chlorophenyl-U-r'C]pyraclostrobin at a feeding level of 12.2 ppm (low dose) or 78 pprn (high dose) in the diet.
1 Fraction a I % TRR I ppm 1 Characterization/Identification
l i M i 4 LOW Dose ( T m = 0 . 0 4 ppm) ' I
il ACN
HPLC analysis resolved: F'yraclostrobin + 500M07 3 1.6% TRR 0.012 ppm 500M05 31.1%TRR 0.012 ppm Plus an additional 5 unknowns totaling 27.4% TRR (0.010
11 Nonextractable 1 5.8 1 0.002 1 NIA. II
1 pprn), each 114.3 % TRR (10.005 ppm).
Milk, High Dose (TRR = 0.
Organic extract
Hexane
- --
HPLC analysis resolved: F'yraclostrobin + 500M07 17.4% TRR 0.067 ppm 500M04 16.3% TRR 0.062 ppm 500M05 14.1% TRR 0.054 ppm 500M08 1 .O% TRR 0.004 ppm 500M45 1.6% TRR 0.006 ppm 500M64 2.6% TRR 0.010 ppm 500M66 1.5% TRR 0.006 ppm 500M67 2.1%TRR 0.008 ppm 500M85 5.5% TRR 0.021 ppm Plus an additional 11 unknowns totaling 32.9% TRR (0.126
4.7
Nonextractable 1 4.4 1 0.017 1 NIA.
Muscle, Low Dose (TRR = 0.018 ppm)
Methanol I 88.1 1 0.016 ( Partitioned with ACN and hexane.
0.002
I ppm), each s 12.7% TRR (10.049 ppm).
Not further analyzed (NIA).
Hexane
Hexane
ACN
Methanol precipitate
Water
Nonextractable ( 11.1 ( 0.013 ~ N I A .
Fat, Low Dose (TRR = 0.094 ppm)
0.9
Nonextractable 1 7.2 1 0.001 1 NIA.
Muscle, High Dose (TRR = 0.117 ppm)
94 (continued; footnotes follow)
12.1
72.1
4.4
4.9
0.003
Methanol
NIA.
0.002
0.013
0.001
0.001
0.099 84.3
NIA.
HPLC analysis resolved: Pyraclostrobin 57.9% TRR 0.010 ppm 500M07 14.2% TRR 0.003 ppm
NIA.
NIA.
HPLC analysis resolved: Pyraclostrobin 76.2% TRR 0.089 ppm 500M07 8.1%TRR 0.010 ppm
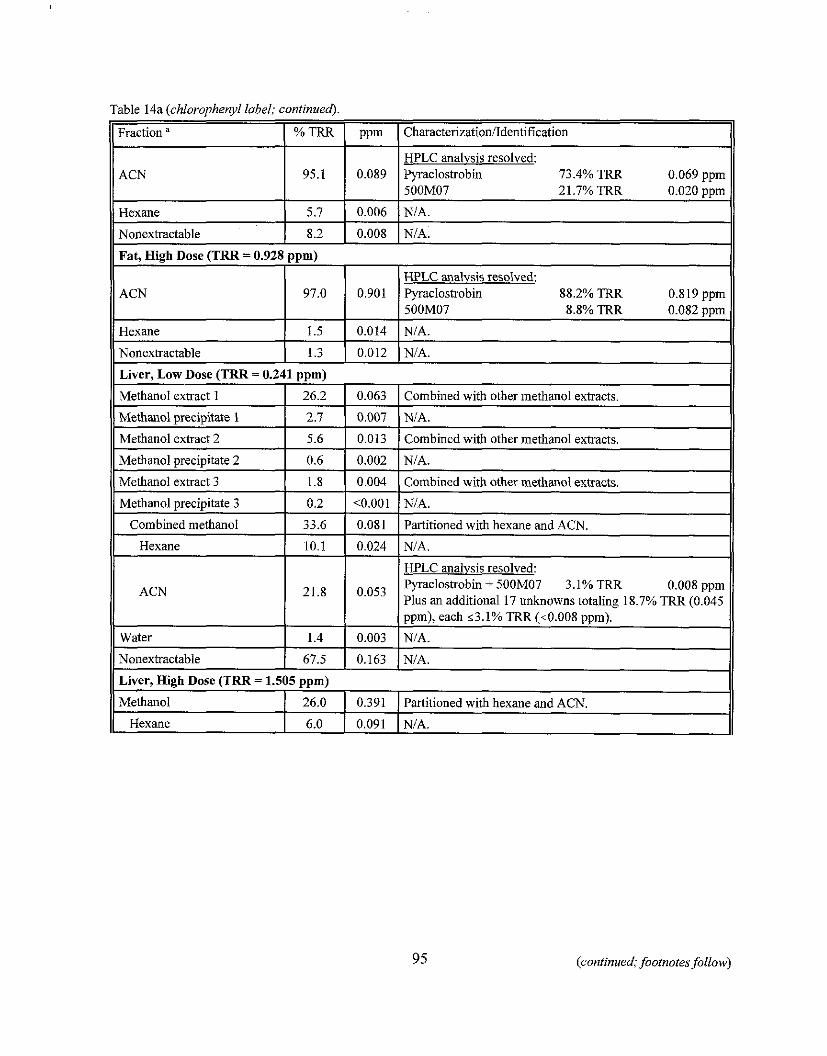
Table 14a (chlorophenyl label; continued).
I Fraction " I % TRR 1 ppm I Characterizationfldentification
ACN
Hexane
Nonextractable
Fat, High Dose (TRR = 0.928
ACN
Hexane
Nonextractable 1 1.3 1 0.012 INIA.
Liver, Low Dose (TRR = 0.241 ppm)
95.1
5.7
8.2
ppm)
97.0
1.5
Methanol extract 1
Methanol precipitate 1
Methanol extract 2
Methanol precipitate 2
Methanol extract 3
Methanol precipitate 3
Combined methanol
Hexane
ACN
Water
(continued; footnotes follow)
0.089
0.006
0.008
0.901
0.014
26.2
2.7
5.6
0.6
1.8
0.2
33.6
10.1
Nonextractable ( 67.5 1 0.163 1 NIA.
Liver, High Dose (TRR = 1.505 ppm)
HPLC analysis resolved: Pyraclostrobin 73.4% TRR 0.069 ppm 500M07 21.7% TRR 0.020 ppm
NIA.
NIA.
HPLC analysis resolved: Pyraclostrobin 88.2% TRR 0.819 ppm 500M07 8.8% TRR 0.082 ppm - NIA.
21'8
1.4
Methanol
0.063
0.007
0.013
0.002
0.004
<0.001
0.081
0.024
Combined with other methanol extracts.
NIA.
Combined with other methanol extracts.
NIA.
Combined with other methanol extracts.
NIA.
Partitioned with hexane and ACN.
NIA.
0'053
0.003
Hexane 1 6.0 ( 0.091 INIA.
26.0
HPLC analysis resolved: Pyraclostrobin + 500M07 3.1% TRR 0.008 ppm Plus an additional 17 unknowns totaling 18.7% TRR (0.045 ppm), each ~ 3 . 1 % TRR (~0 .008 ppm).
NIA.
0.391 1 Partitioned with hexane and ACN.
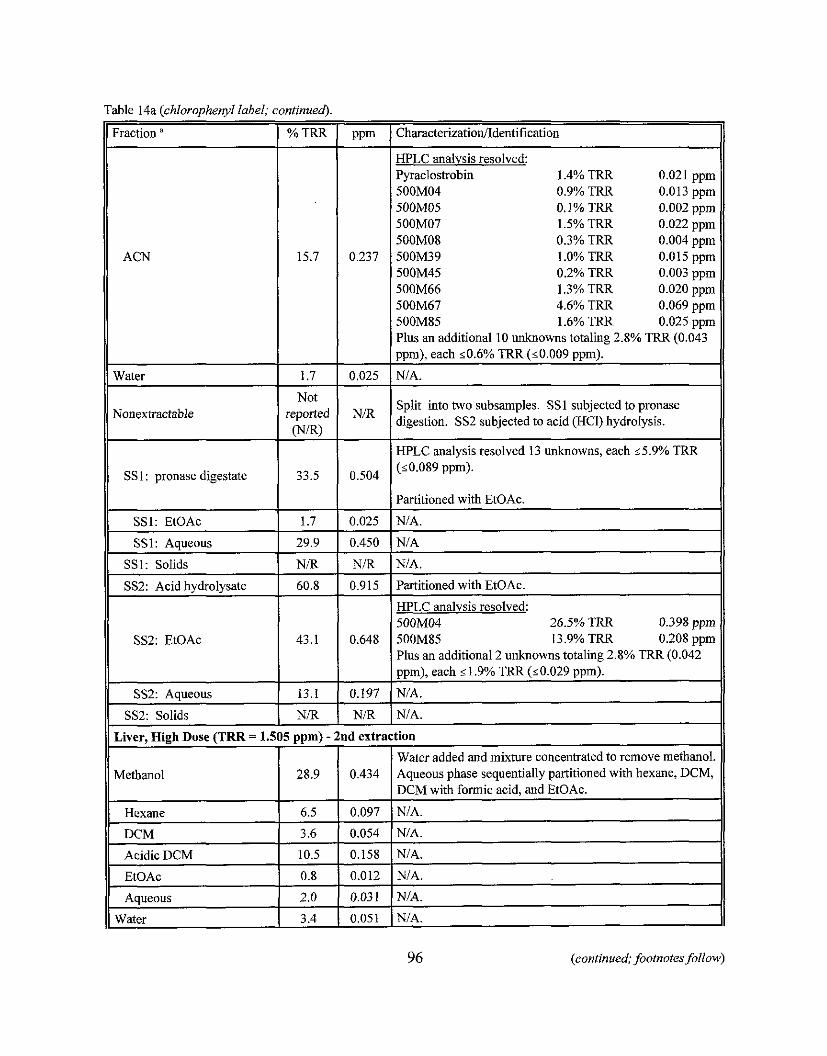
'able 14a (chlorophenyl label; continued).
Fraction " 1 % TRR I ppm ] Characterizationfldentification
ACN
Water
Nonextractable
SS1: pronase digestate
SS1: EtOAc
SS1: Aaueous
1.7
Not reported (NR)
SS1: Solids I NIR I NIR I NIA.
SS2: Acid hydrolysate 1 60.8 1 0.915 1 Partitioned with EtOAc.
0.237
0.025
NR
0.504
0.025
0.450
SS2: EtOAc
HPLC analysis resolved: Pyraclostrobin 1.4% TRR 0.021 ppm 500M04 0.9% TRR 0.013 ppm 500M05 O.l%TRR 0.002 ppm 500M07 1.5% TRR 0.022 ppm 500M08 0.3% TRR 0.004 ppm 500M39 1 .O% TRR 0.015 ppm 500M45 0.2% TRR 0.003 ppm 500M66 1.3% TRR 0.020 ppm 500M67 4.6% TRR 0.069 ppm 50011185 1.6% TRR 0.025 ppm Plus an additional 10 unknowns totaling 2.8% TRR (0.043 pprn), each ~ 0 . 6 % TRR (~0 .009 pprn).
NIA.
Split into two subsamples. SS1 subjected to pronase digestion. SS2 subjected to acid (HCI) hydrolysis.
HPLC analysis resolved 13 unknowns, each 15.9% TRR (~0.089 ppm).
Partitioned with EtOAc.
NIA.
NIA
SS2: Aqueous
SS2: Solids
I I HPLC analysis resolved: 500M04 26.5% TRR 0.398 oom
Liver, High Dose (TRR = 1.505 ppm) - 2nd extraction
1 I I Water added and mixture concenh-ated to remove methanol.
43.1
13.1
N
Methanol 1 28.9
Hexane 1 6.5
DCM 1 3.6
0.648
0.197
NIR
500M85 13.9% TRR 0.208 ipm Plus an additional 2 unknowns totaling 2.8% (0.042 ppm), each <1.9% TRR (10.029 pprn).
NIA.
NIA.
0.434
0.097
96 (continued; footnotes follow)
Aqueous phase sequentially partitioned with hexane, DCM, DCM with formic acid, and EtOAc.
NIA.
Acidic DCM
EtOAc
Aqueous
Water
10.5
0.8
2.0
3.4
0.158
0.012
0.031
0.051
NIA.
NIA.
NIA.
NIA.
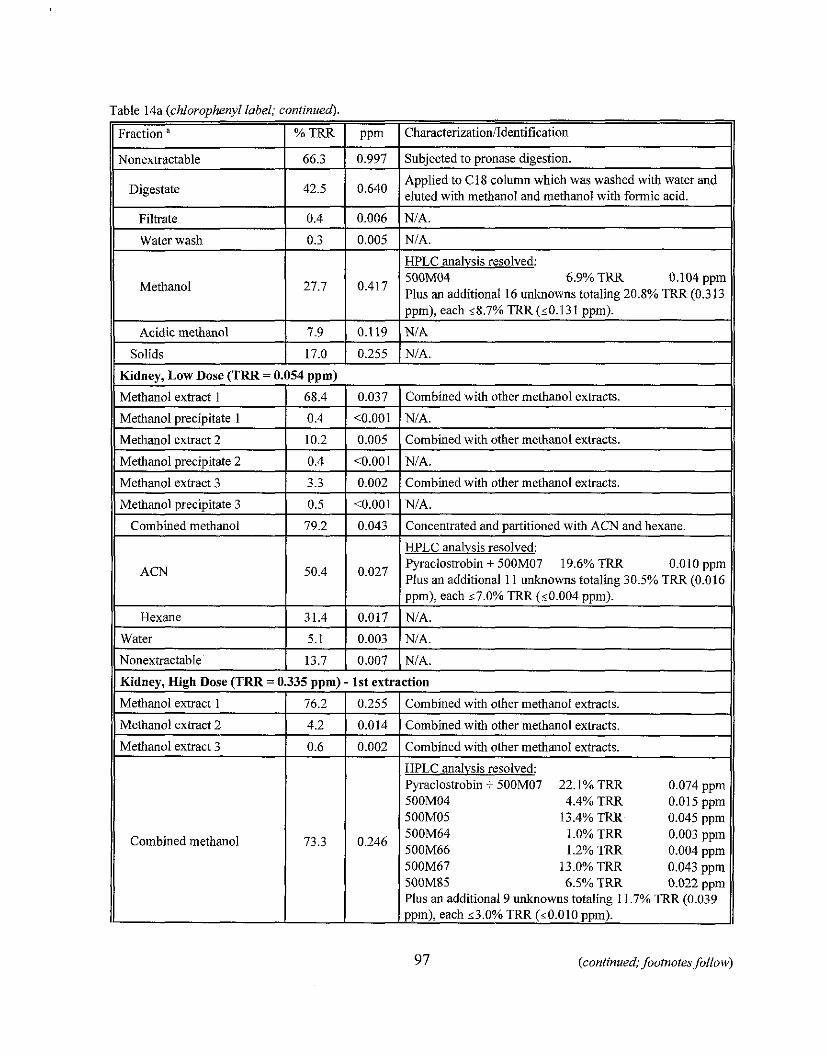
'able 14a (chlorophenyl label; continued).
Fraction ' I % TRR 1 ppm I Characterization/Identification
Methanol
Nonextractable
Digestate
Filtrate
Water wash
I
Acidic methanol 7.9
66.3
42'5
0.4
0.3
I ppm), each 18.7% TRR (10.131 ppm).
0.417
Solids 1 17.0 1 0.255 1 NIA.
Kidney, Low Dose (TRR = 0.054 ppm)
Methanol extract 1 1 68.4 1 0.037 1 Combined with other methanol extracts.
0.997
0'640
0.006
0.005
HPLC analysis resolved: 500M04 6.9% TRR 0.104 pprr Plus an additional 16 unknowns totaling 20.8% TRR (0.313
Methanol precipitate 1 1 0.4 1 <0.001 1 NIA.
Methanol extract 2 ( 10.2 ( 0.005 ( Combined with other methanol extracts.
Subjected to pronase digestion.
Applied to CIS column which was washed with water and eluted with methanol and methanol with formic acid.
NIA.
NIA.
Methanol ureciuitate 2 1 0.4 1 <0.001 1 NIA
I Combined methanol 1 79.2 1 0.043
I I
. .
1 ACN
Methanol extract 3
Concentrated and partitioned with ACN and hexane.
HPLC analvsis resolved: Pyraclostrobin + 500M07 19.6% TRR 0.010 pprr Plus an additional 1 1 unknowns totaling 30.5% TRR (0.016 oomi. each 17.0% TRR ( ~ 0 . 0 0 4 onmi.
3.3 1 0.002 1 Combined with other methanol extracts.
I Hexane 1 31.4 1 0.017 1 ~ 1 ~ .
I Water 1 5.1 1 0.003 1 NIA.
I Methanol oreci~itate 3 1 0.5 1 <0.001 1 NIA.
1 Methanol extract 2
Methanol extract 3
Nonextractable ( 13.7 ( 0.007 (NIA.
Kidney, High Dose (TRR = 0.335 ppm) - 1st extraction
Combined methanol
Methanol extract 1
Combined with other methanol extracts
Combined with other methanol extracts.
HPLC analvsis resolved: Pyraclostrobin + 500M07 22.1% TRR 0.074 ppm
76.2
- -
500M04 4.4% TRR 0.015 ppm 500M05 13.4% TRR 0.045 ppm 500M64 1.0% TRR 0.003 ppm 500M66 1.2% TRR 0.004 ppm 50011167 13.0% TRR 0.043 ppm 500M85 6.5% TRR 0.022 ppm Plus an additional 9 unknowns totaling 11.7% TRR (0.039 ppm), each ~ 3 . 0 % TRR (~0 .010 ppm).
97 (continued; footnotes follow)
0.255 Combined with other methanol extracts.
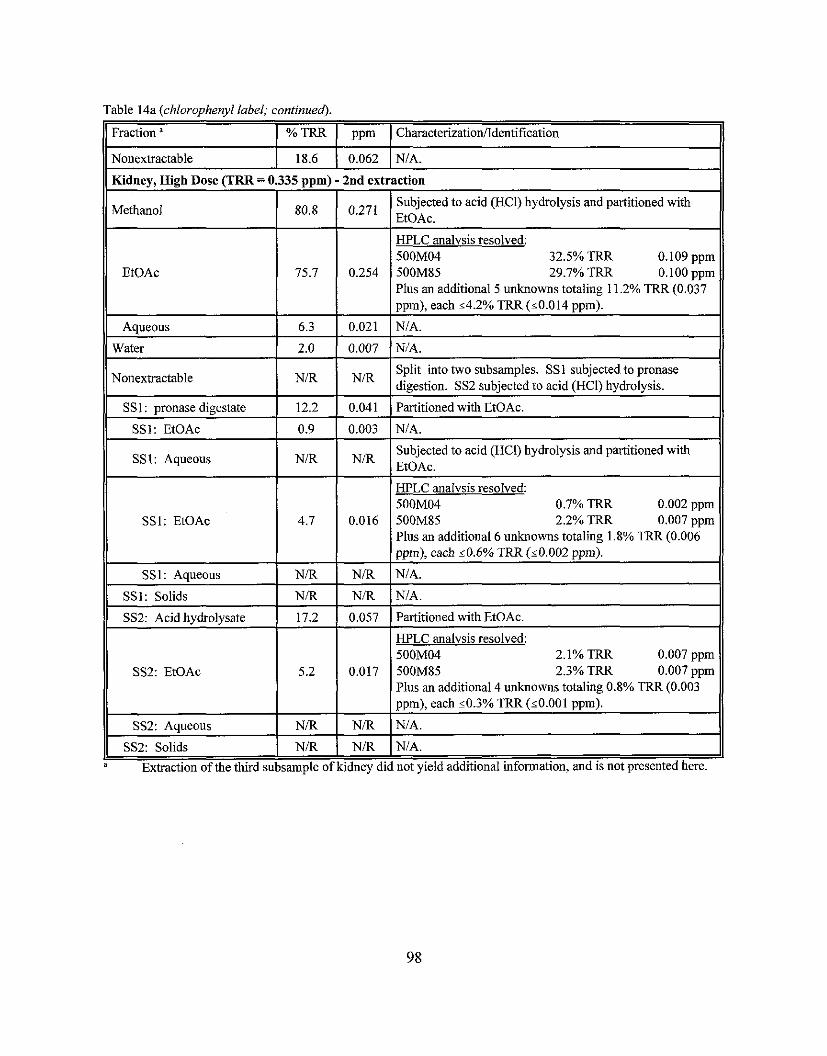
rahle 14a (chlorophenyl label; continued).
Fraction a I % TRR 1 ppm I Cbaracterizationfidentification
Nonextractable 1 18.6 1 0.062 1 NIA.
EtOAc
Kidney, High Dose (TRR = 0.335 ppm) - 2nd extraction
Methanol
0.254
0.271 80.8 -
HPLC analvsis resolved: 500M04 32.5% TRR 0.109 pprr 500M85 29.7% TRR 0.1OOpplr Plus an additional 5 unknowns totaling 11.2% TRR (0.037 oom). each 24.2% TRR (~0.014 uuml
Aqueous
Subjected to acid (HCI) hydrolysis and partitioned with F,+Oar
6.3 1 0.021 1 NIA.
Nonextractahle
I I HPLC analvsis resolved: 500M04 0.7% TRR 0.002 num
SS1: pronase digestate
SSl: EtOAc
SS1: Aqueous
Water
NIR
1 SS2: Acid hydrolysate
1 SS2: EtOAc
2.0 ( 0.007 1 N/A.
12.2
0.9
NIR
SS1: EtOAc
I
SS1: Aqueous
SSl: Solids
NR
SS2: Aqueous I NiR I NiR 1 NIA.
SS2: Solids 1 N R 1 N R I NIA. Extraction of the third subsample of kidney did not yield additional information, and is not presented here.
Split into two suhsamples. SSI subjected to pronase digestion. SS2 subjected to acid (HC1) hydrolysis.
0.041
0.003
N/R
4.7
N R
N R
0.057
0.017
Partitioned with EtOAc.
NIA.
Subjected to acid (HCI) hydrolysis and partitioned with EtOAc.
Partitioned with EtOAc.
HPLC analvsis resolved: 500M04 2.1% TRR 0.007 pplr 500M85 2.3% TRR 0.007 pprr Plus an additional 4 unknowns totaling 0.8% TRR (0.003 nvml each ~ 0 . 3 % TRR (~0.001 ovml.
0.016
NiR
N R
. . 500M85 2.2% TRR 0.007 pprr Plus an additional 6 unknowns totaling 1.8% TRR (0.006 ppm), each ~ 0 . 6 % TRR (~0.002 ppm).
NIA.
NIA.
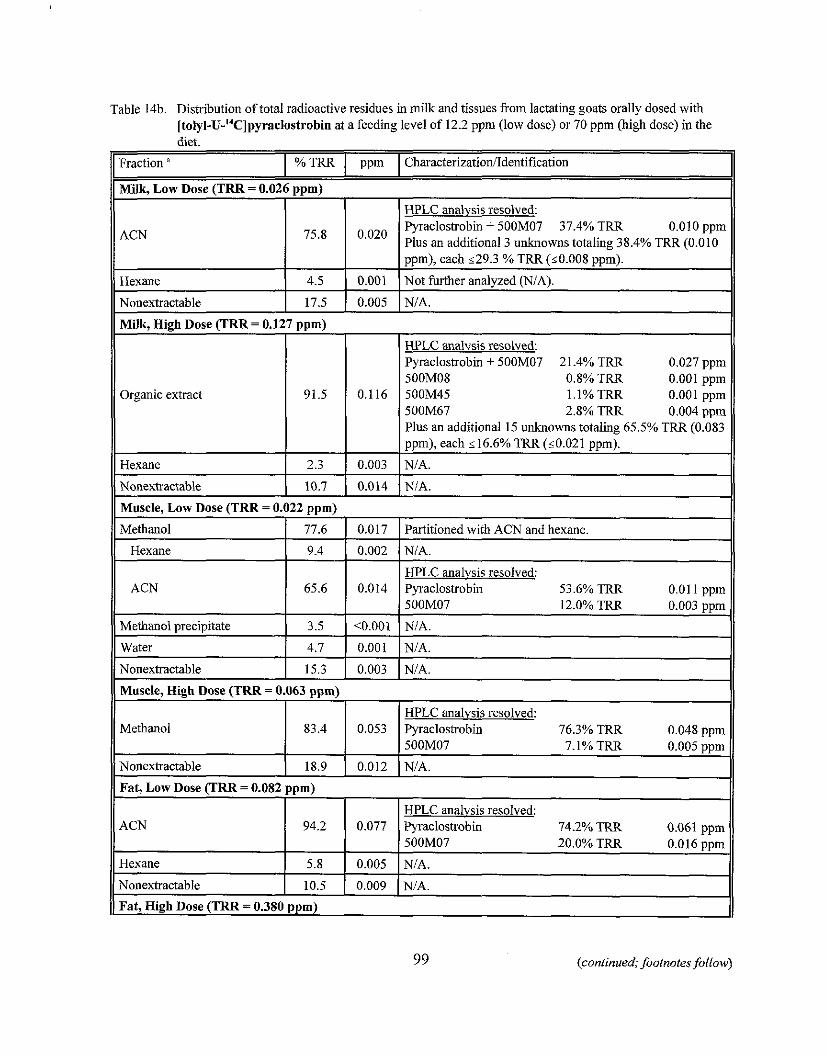
Bble 14b. Distribution of total radioactive residues in milk and tissues from lactating goats orally dosed with [totyl-U-'4C]pyraclostrohin at a feeding level of 12.2 pprn (low dose) or 70 pprn (high dose) in the diet.
Fraction " I % TRR 1 ppm 1 CharacterizatiodIdentification
Milk, Low Dose (TRR = 0.026 ppm)
i Hexane 1 ;;; Nonextractable
Muscle. Low Dose (TRR = 0.022 oum)
ACN
Hexane 1 4.5 1 0.001 1 Not further analyzed (NIA).
HPLC analvsis resolved: Pyraclostrobin + 500M07 21.4% TRR 0.027 pplr 500M08 0.8% TRR 0.001 pplr 50011145 I.I%TRR 0.001 ppm 500M67 2.8% TRR 0.004 ppm Plus an additional 15 unknowns totaling 65.5% TRR (0.083 ppm), each s 16.6% TRR (10.021 ppm).
75'8
Nonextractable
Milk, High Dose (TRR = 0.127 pprn)
17.5 0.005
Methanol ( 77.6 1 0.017 1 Partitioned with ACN and hexane.
Water ( 4.7 1 0.001 1 NIA.
Nonextractable 1 15.3 1 0.003 1 NIA.
0'020
NIA.
Hexane
ACN
Methanol precipitate
HPLC analysis resolved: Pyraclostrobin + 500M07 37.4% TRR 0.010 pprr Plus an additional 3 unknowns totaling 38.4% TRR (0.010 oom). each ~ 2 9 . 3 % TRR (~0.008 oom).
Nonextractable 1 18.9 1 0.012 1 NIA.
Fat. Low Dose (TRR = 0.082 uoml
9.4
65.6
3.5
Muscle, High Dose (TRR = 0.063 ppm)
Methanol
0.002
0.014
<0.001
ACN
Hexane
99 (continued; footnotes follow)
NIA.
HPLC analvsis resolved: Pyraclostrobin 53.6% TRR 0.01 1 ppm 500M07 12.0% TRR 0.003 ppm
NIA.
83.4
Nonextractable 1 10.5 1 0.009
94.2
5.8
NIA.
0.053
Fat, High Dose (TRR = 0.380 ppm)
HPLC analvsis resolved: F'yraclostrobin 76.3% TRR 0.048 ppm 500M07 7.1% TRR 0.005 ppm
0.077
0.005
- -
HPLC analvsis resolved: Pyraclostrobin 74.2% TRR 0.061 ppm 500M07 20.0% TRR 0.016 ppm
NIA.
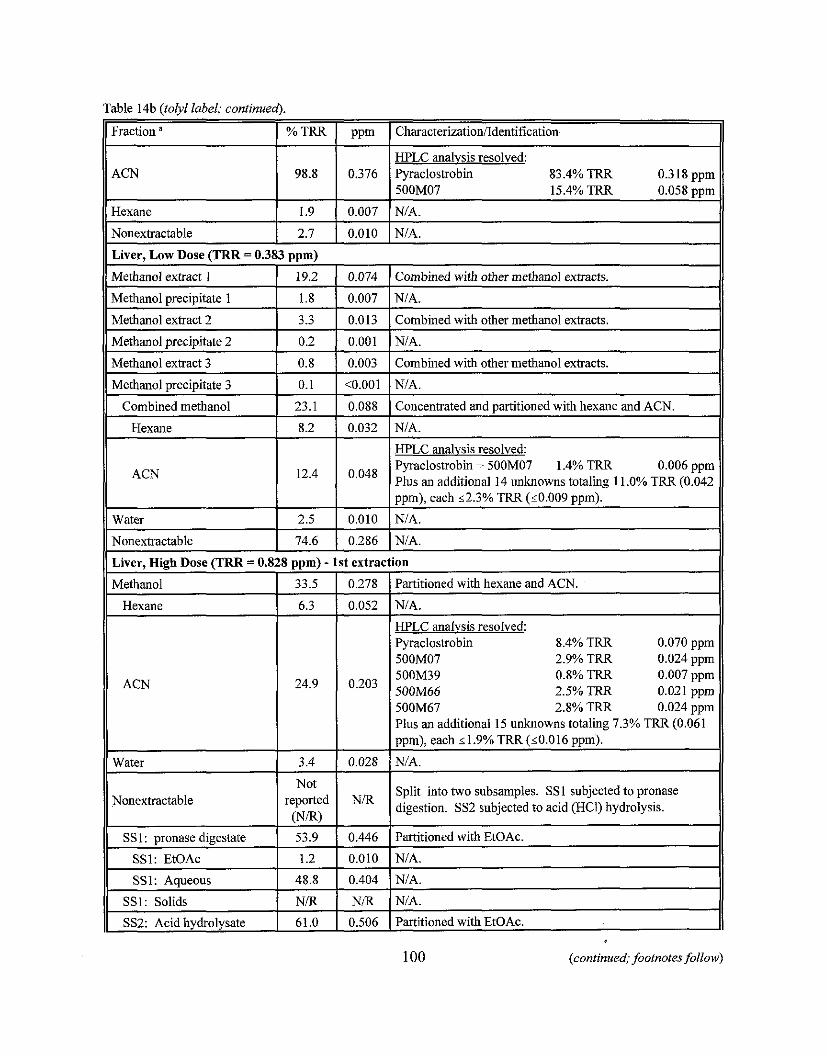
rable 14b (toiyl label; continued).
Fraction ' I % TRR I ppm 1 CharacterizationiIdentiiication
ACN 1 98.8 1 0.376 HF'LC analvsis resolved: F'yraclostrobin 83.4% TRR 0.318 ppm 11 500M07 15.4% TRR 0.058 nnm
Hexane ( 1.9 ( 0.007 ( NIA.
Nonextractable 1 2.7 1 0.010 1 NIA.
Liver, Low Dose (TRR = 0.383 ppm)
Methanol extract 1 1 19.2 1 0.074 1 Combined with other methanol extracts.
Methanol precipitate 1 I 1.8 1 0.007 1 NIA. H Methanol extract 2 1 3.3 1 0.013 1 Combined with other methanol extracts. 11
Methanol orecioitate 3 I 0.1 1 <0.001 1 NIA. 11
Methanol precipitate 2 1 0.2 1 0.001 1 NIA.
Methanol extract 3 I 0.8 1 0.003 1 Combined with other methanol extracts.
Combined methanol 1 23.1 1 0.088 1 Concentrated and partitioned with hexane and ACN.
Hexane 1 8.2 1 0.032 1 NIA.
I HPLC analvsis resolved: Pvraclostrobin + 500M07 1.4% TRR 0.006 oum
ACN pius an additional 14 unknowns totaling 11.0% TRR (0:642 ppm), each 12.3% TRR (10.009 ppm).
Water 1 2.5 1 0.010 ~ N I A . 11
12.4
Nonextractable 1 74.6 ( 0.286
Liver, High Dose (TRR = 0.828 ppm) - 1st extra1
0.048
Methanol 1 33.5 1 0.278
i ACN
Water I I
3.4 0.028
1 Not I 1 Nonextractable I reported I N R
I (NR) I I SSI : oronase digestate 1 53.9 10.446
SS1: EtOAc 0.010
SSl: Aqueous
SS1: Solids
SS2: Acid hydrolysate 61.0 0.506
NIA.
ion
Partitioned with hexane and ACN. I1 NiA. II HPLC analvsis resolved: F'yracloshobin 8.4% TRR 0.070 ppm 500M07 2.9% TRR 0.024 pplr 500M39 0.8% TRR 0.007 pplr 500M66 2.5% TRR 0.02 1 ppn: 500M67 2.8% TRR 0.024 ppm Plus an additional 15 unknowns totaling 7.3% TRR (0.061 ppm), each ~ 1 . 9 % TRR (10.016 ppm).
N/A
Split into two subsamples. SS1 subjected to pronase digestion. SS2 subjected to acid (HC1) hydrolysis. I Partitioned with EtOAc. 11
I NiA.
Partitioned with EtOAc.
(continued; footnotes follow)
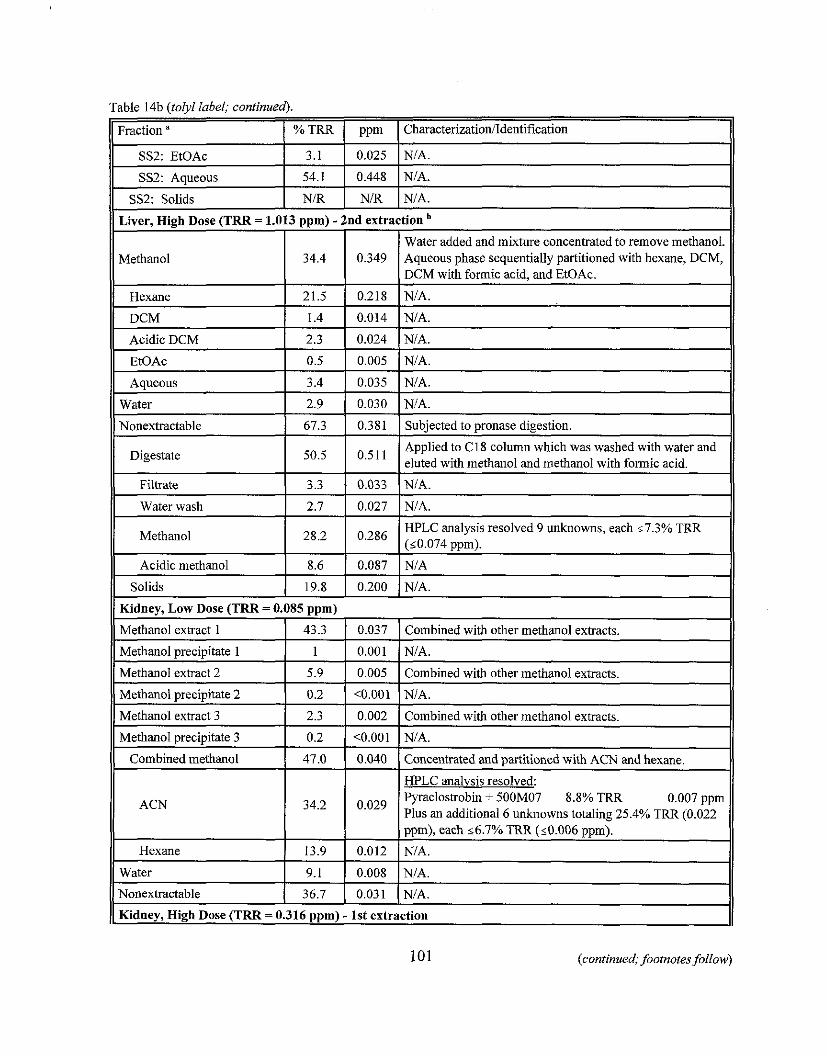
I l ~ G e r . High Dose (TRR = 1.013 nnm) - 2nd extraction 11
Table 14b (tolyl label; continued).
11 Methanol Water added and mixture concentrated to remove methanol.
0.349 Aqueous phase sequentially partitioned with hexane, DCM, I 344 I I DCM with formic acid. and EtOAc. I
Fraction "
SS2: EtOAc
SS2: Aqueous
SS2: Solids
ppm
0.025
0.448
NIR
% TRR
3.1
54.1
NIR
CharacterizatiodIdentification
NIA.
NIA.
NIA.
Hexane
DCM
Acidic DCM
11 water 1 2.9 1 0.030 1 NIA. 11
EtOAc 1 0.5 1 0.005 1 NIA.
21.5
1.4
2.3
Aqueous
Nonextractable
Digestate
Filtrate
0.218
0.014
0.024
3.4
Water wash
Methanol
Acidic methanol
11 Methanol extract 1 1 43.3 1 0.037 1 Combined with other methanol extracts. 11
NIA. ---- NIA.
NIA.
67.3
50'5
3.3
Solids 1 19.8 1 0.200 1 NIA.
Kidney, Low Dose (TRR = 0.085 pprn)
101 (continued; footnotes follow)
0.035
2.7
28'2
8.6
I
NIA.
0.381
0'5
0.033
Subjected to pronase digestion.
Applied to C18 column which was washed with water and eluted with methanol and methanol with formic acid.
NIA.
0.027
0'286
0.087
NIA.
HPLC analysis resolved 9 unknowns, each 67.3% TRR (s0.074 ppm).
NIA
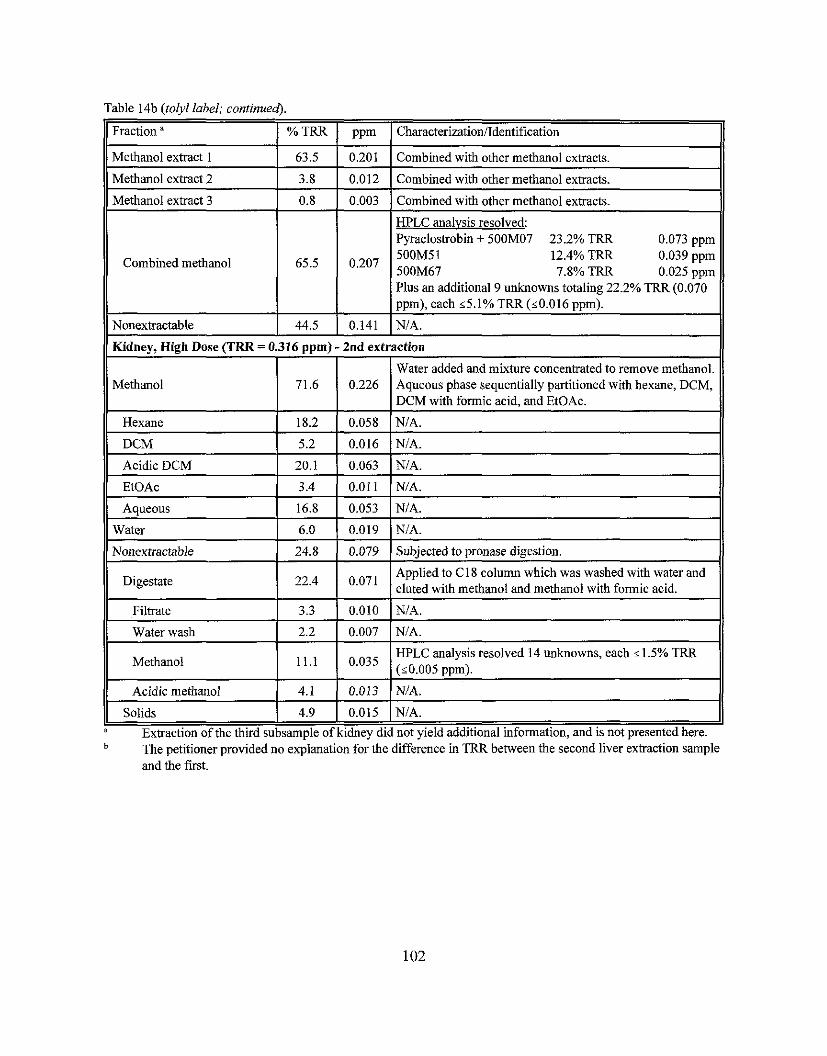
Table 14b (tolyl label; continued).
11 Fraction " I % TRR I ppm 1 Characterizationfldentification 11 Methanol extract 1 1 63.5 1 0.201 1 Combined with other methanol extracts.
Methanol extract 2 I 3.8 1 0.012 1 Combined with other methanol extracts. 1 Methanol extract 3
Combined methanol
11 Kidnev. Hieh Dose (TRR = 0.316 oom) - 2nd extraction 11
0.8
I Methanol
65.5
I I ppm), each 4 . 1 % TRR(s0.016 ppm).
Water added and mixture concentrated to remove methanol. 0.226 Aqueous phase sequentially partitioned with hexane, DCM, 1 71,6 1 / DCM with formic acid. and EtOAc. I
0.003
Nonextractable
Combined with other methanol extracts.
HPLC analvsis resolved: Pyraclostrobin + 500M07 23.2% TRR 0.073 uvm
0.207
44.5 1 0.141 1 NIA.
11 Acidic DCM 1 20.1 1 0.063 1 NIA. 11
. . 5 0 0 ~ 5 1 12.4% TRR 0.039 ppm 500M67 7.8% TRR 0.025 ppm Plus an additional 9 unknowns totaling 22.2% TRR (0.070
Hexane 1 18.2 10 .058 (NIA. I DCM 5.2 1 0.016 1 NIA.
W E~OAC ( 3.4 ( 0.011 (NIA.
Aoueous 1 16.8 1 0.053 1 NIA. 11 I
Water
Nonextractable
Digestate
Filtrate
Water wash
Methanol
The petitioner provided no explanation for the difference in TRR between the second liver extraction sample and the first.
6.0
24.8
22.4
Acidic methanol
3.3
2.2
11"
4.1 1 0.013 1 N/A.
0.019
0.079
0'07'
Solids ( 4.9 1 0.015 1 NIA.
A x t r a c t i o n of the third subsample of kidney did not yield additional information, and is not presented here.
NIA.
Subjected to pronase digestion.
Applied to C18 column which was washed with water and eluted with methanol and methanol with formic acid.
0.010
0.007
0.035
NIA.
NIA.
HPLC analysis resolved 14 unknowns, each s 1.5% TRR (10.005 nom).
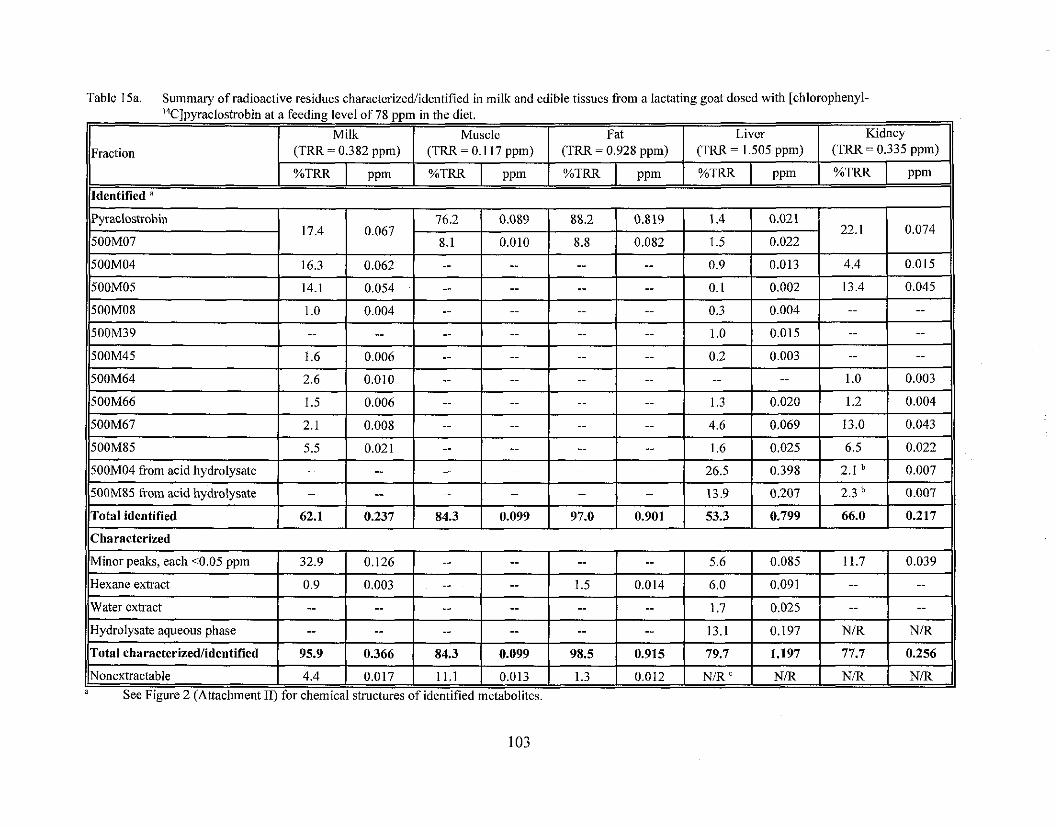
Table 15a. Summaw of radioactive residues characterizedlidentified in milk and edible tissues from a lactating goat dosed with ichloro~henvl- - - . - "C]pyraclostrobin at a feeding level of 78 ppm in the diet.
a See Figure 2 (Attachment 11) for chemical structures of identified metabolites.
Fraction
Kidney 1 Milk 1 Muscle I Fat Liver
Identified "
(TRR = 0.382 ppm) I (TRR = 0.117 ppm) I (TRR = 0.928 ppm) I (TRR = 1.505 ppm) I (TRR = 0.335 ppm)
PPln %TRR PPm %TRR PPm %TRR PPm %TRR PPm %TRR
Acid hydrolysate of nonextractable residues from SS2 sample. " NIR = Not repoeed.
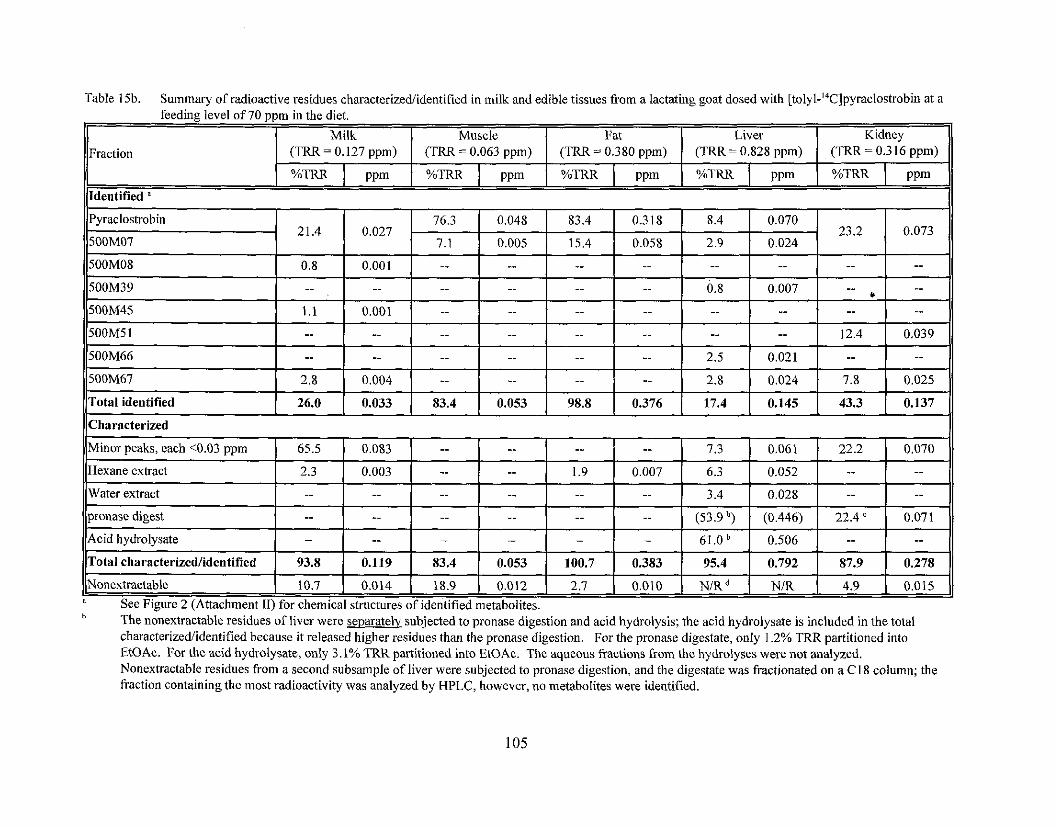
Table 15b. Summaty of radioactive residues characterizediidentified in milk and edible tissues from a lactating goat dosed with [tolyl-"C]pyraclos@obin at a feeding level of 70 ppm in the diet.
1 Milk I Muscle I Fat 1 Liver 1 Kidney
, I I I I I I
500M67 2.8 0.004 -. -. .. -. 2.8 0.024 7.8 0.025
Total identified 1 26.0 1 0.033 1 83.4 1 0.053 1 98.8 1 0.376 1 17.4 1 0.145 1 43.3 1 0.137
Fraction
Y e e Figure 2 (Attachment 11) for chemical structures of identified metabolites. b The nonextractable residues of liver were separately subjected to pronase digestion and acid hydrolysis; the acid hydrolysate is included in the total
characterizediidentified because it released higher residues than the pronase digestion. For the pronase digestate, only 1.2% TRR partitioned into EtOAc. For the acid hydrolysate, only 3.1% TRR partitioned into EtOAc. The aqueous fractions from the hydrolyses were not analyzed. Nonexlractable residues from a second subsample of liver were subjected to pronase digestion, and the digestate was fractionated on a C l 8 column; the fraction containing the most radioactivity was analyzed by HPLC, however, no metabolites were identified.
Identified "
(TRR = 0.127 ppm) (TRR = 0.063 ppm) (TRR = 0.380 ppm)
PPm %TRR
(TRR = 0.828 ppm) (TRR = 0.316 ppm)
%TRR PPm %TRR PPm %TRR PPm %TRR PPm
Pronase digestate resulting from a second subsample of kidney. The digestate was fractionated on a C l 8 column, and the fraction containing the most radioactivity was analyzed by HPLC; however, no metabolites were identified.
V N I R = Not reported.
Storage stability
Milk and tissue sample analyses were completed within 4-7 months of sample collection. Residues in milk from both labels were initially extracted and submitted for HPLC analysis <60 days after collection, and the extract was reanalyzed after -5 months; HPLC patterns from the two analyses were similar. For high dose tolyl-label kidney, similar HPLC patterns were observed in the methanol extract obtained within 64 days of sampling and in that same extract after -5 months of storage. In addition, the kidney sample was re-extracted and reanalyzed after 8.5 months of frozen storage; the HPLC analysis of the storage stability extract indicated that the metabolite profile was stable over the 8.5-month storage interval. These data are sufficient to support the storage intervals and conditions of samples from this study.
Provosed metabolic vathwav in ruminants
Based on the results of the metabolism study, the petitioner proposed that pyraclostrobin may be metabolized in goats via three steps: (i) loss of the N-methoxy group yielding 500M07 (elsewhere referenced as BF 500-3); (ii) hydroxylation of the chlorophenyl, pyrazole, and/or tolyl ring system (500M08,500M39,500M45,500M64,500M66, and 500M67); and (iii) cleavage of the ether linkage (500M04 and 500M51) and subsequent oxidation of the resulting components (500M05).
Studv summary
The submitted goat metabolism study adequately delineates the nature of the residue in ruminants. Following oral administration of ['4C]pyraclostrobin, labeled in either the chlorophenyl ring or the tolyl ring, to lactating goats for 5 consecutive days at a feeding level of 12.2 ppm (-0.34~ the maximum theoretical dietary burden, MTDB, for beef cattle and dairy cattle), the TRR were 0.013-0.058 pprn in milk, 0.018 and 0.022 pprn in muscle, 0.082 and 0.094 ppm in fat, 0.054 and 0.085 pprn in kidney, and 0.241 and 0.383 pprn in liver.
Following oral administration of ['4C]pyraclostrobin to lactating goats for 5 consecutive days at feeding levels of 70 pprn (tolyl label) or 78 pprn (chlorophenyl label) ( - 2 . 2 ~ the MTDB for beef cattle and dairy cattle), TRR were 0.051-0.659 pprn in milk, 0.063 and 0.1 17 pprn in muscle, 0.380 and 0.928 pprn in fat, 0.3 16 and 0.335 ppm in kidney, and 0.828 and 1.505 ppm in liver. Residue levels were generally comparable for the two labels. Residues in milk plateaued around 36 hours of the first dose (tolyl label).
Approximately 79-101% of the TRR were characterizedlidentified in the milk and tissues from the high-dose group. The parent, pyraclostrobin, was the major residue identified in muscle and fat, at 76.2-88.2% TRR (0.048-0.819 pprn). The parent was also identified in liver (1.4-8.4% TRR, 0.021-0.070 ppm) and in milk and kidney (17.4-23.2% TRR, 0.027-0.074 ppm). However, in milk and kidney, the parent was not resolved from the desmethoxy metabolite, 500M07 (elsewhere referenced as BF 500-3). Metabolite 500M07 was also identified in muscle, fat, and
liver, at 1.5-15.4% TRR (0.005-0.082 ppm). Additional major metabolites identified were 500M04 (in chlorophenyl-label milk at 16.3% TRR and in chlorophenyl-label kidney at 4.4% TRR), 500M05 (in chlorophenyl-label milk at 14.1% TRR and in chlorophenyl-label kidney at 13.4% TRR), 500M51 (in tolyl-label kidney at 12.4% TRR), and 500M67 (in kidney at 7.8- 13.0% TRR and in milk at 2.1-2.8% TRR). Several additional metabolites were identified in milk, kidney, and liver, each at <6% TRR; see Figure 2 (Attachment 11) for the chemical structures of identified metabolites.
Nonextractable residues in kidney and liver were further characterized by pronase digestion and acid hydrolysis. Pronase digestion released -50% TRR in liver and -20% TRR in kidney. In general, higher levels of residue were released by refluxing with hydrochloric acid. Acid hydrolysis released -60% TRR in liver and - 17% TRR in kidney. The bound residues in chlorophenyl-label kidney and liver were converted to chlorophenylpyrazole derivatives with acid hydrolysis.
BASF has submitted a study (citations listed below) pertaining to the metabolism of [14C]pyraclostrobin in hens. The in-life phase of the study was performed at BASF Aktiengesellschaft, Department of Toxicology, Ludwigshafen, Germany, and the analytical phase was conducted at BASF Agricultural Center, Limburgerhof, Germany.
451 18434 Hafemann, C. and Knoell, K. (1999) Metabolism of I4C-BAS-500 F in Laying Hens. Laboratory Project IdentificationNo. 35635; 199911 1480. Unpublished study submitted by BASF Corporation. 13 1 p.
451 18435 Leibold, E.; Hoffmann, H.; and Hildebrand, B. (1998) I4C-BAS-500 F - Absorption, Distribution and Excretion After Repeated Oral Administration to Laying Hens. Laboratory Project Identificatiqn No. 02B03631966023; 1998110637. Unpublished study submitted by BASF Corporation. 46 p.
The study was conducted using [chlorophenyl-U-14C]pyraclostrobin [specific activity 4.14 Mbqlmg (248,400 dpmlpg) and radiochemical purity >98%] and [tolyl-U-'4C]pyraclostrobin [specific activity 4.46 Mbqlmg (267,600 dpdpg) and radiochemical purity >98%]. The test substances were isotopically diluted with non-labeled pyraclostrobin to final specific activities of 45,870 dpmlpg for the chlorophenyl label and 53,652 d p d p g for the tolyl label. For each label, 11 hens were dosed orally (by gavage) once a day, following morning egg collection. for 7 consecutive days. The dosing rates were equivalent to 12.14 ppm (chlorophenyl label) and 12.72 ppm (tolyl label) in the diet, based on actual feed consumption. The feeding levels are equivalent to 35-36x the maximum theoretical dietary burden (0.30 ppm) to poultry; see "Meat, Milk, Poultry, Eggs" for calculation of dietary burden. The petitioner did not mention establishment of experimental controls (untreated hens) for the study.
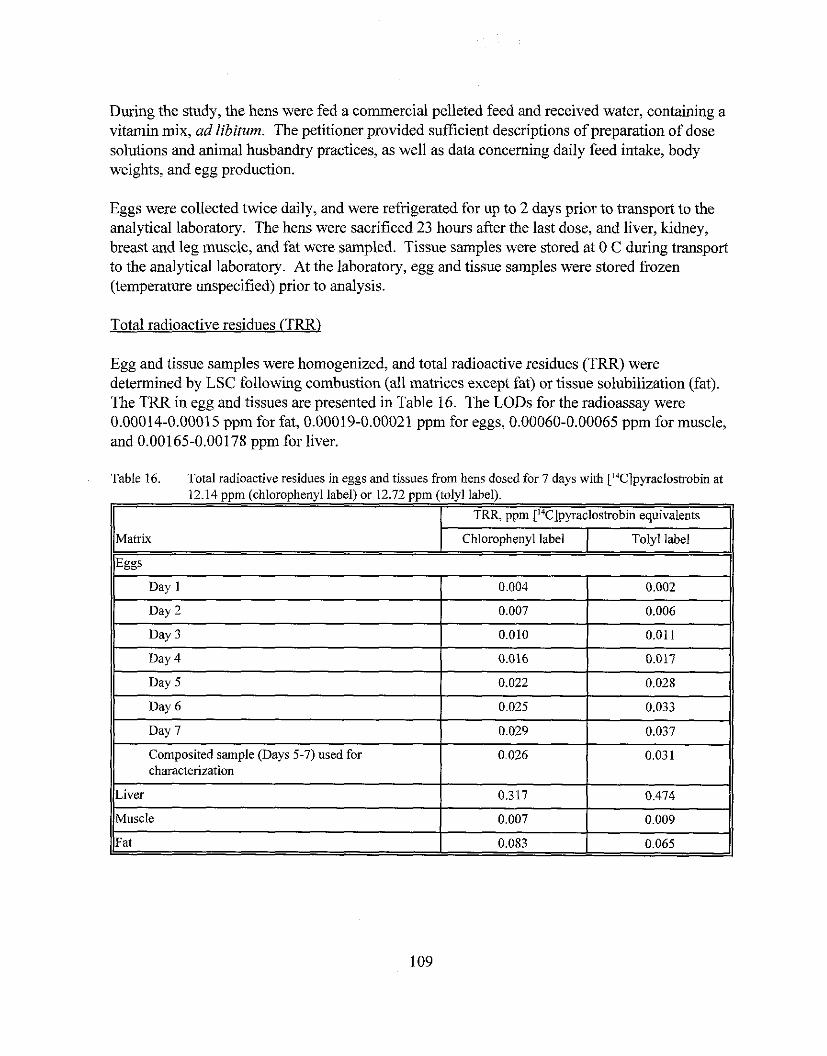
During the study, the hens were fed a commercial pelleted feed and received water, containing a vitamin mix, ad libitum. The petitioner provided sufficient descriptions of preparation of dose solutions and animal husbandry practices, as well as data concerning daily feed intake, body weights, and egg production.
Eggs were collected twice daily, and were refrigerated for up to 2 days prior to transport to the analytical laboratory. The hens were sacrificed 23 hours after the last dose, and liver, kidney, breast and leg muscle, and fat were sampled. Tissue samples were stored at 0 C during transport to the analytical laboratory. At the laboratory, egg and tissue samples were stored frozen (temperature unspecified) prior to analysis.
Total radioactive residues (TRR)
Egg and tissue samples were homogenized, and total radioactive residues (TRR) were determined by LSC following combustion (all matrices except fat) or tissue solubilization (fat). The TRR in egg and tissues are presented in Table 16. The LODs for the radioassay were 0.00014-0.00015 pprn for fat, 0.00019-0.00021 pprn for eggs, 0.00060-0.00065 pprn for muscle, and 0.00165-0.00178 pprn for liver.
Table 16. Total radioactive residues in eggs and tissues from hens dosed for 7 days with ['4CC]pyraclostrohin at 12.14 pprn (chlorophenyl label) or 12.72 pprn (tolyl label).
Matrix
Day I
Day 2
Day 3
Day 4
Day 5
Day 6
Day 7
Composited sample (Days 5-7) used for characterization
Liver
Muscle
Fat
Eggs
TRR, pprn [14C]p~aclostrohin equivalents
0.004
0.007
0.010
0.016
Chlorophenyl label
0.002
0.006
0.011
0.017
0.022
0.025
0.029
0.026
0.317
0.007
0.083
Tolyl label
0.028
0.033
0.037
0.03 1
0.474
0.009
0.065
TRR in eggs did not reach a plateau during the study. The highest levels of radioactivity were found in liver, at 0.317 and 0.474 ppm, respectively, for the chlorophenyl and tolyl labels. Overall, the TRR concentrations were comparable for the two labels.
Composite samples of excreta were collected during the study. Radioactivity determinations on these samples indicated that a large portion of the dosed radioactivity was excreted: 93.3% for the chlorophenyl label and 86.59% for the tolyl label.
Extraction and characterization of I4C-residues
Samples of liver, fat, and eggs were subjected to extraction and hydrolysis procedures for residue characterization and identification. Muscle samples were not extracted because the TRR were <0.010 ppm. The petitioner provided adequate descriptions of the fractionation procedures for each matrix. During the extraction and fractionation vrocedures. aliauots of extracts and - ,
nonextractable residues were analyzed for radioactivity by LSC or combustion/LSC. The general extraction and fractionation procedures are summarized below.
Radioactive residues in liver were sequentially extracted with ACN (3x) and water (Zx), and centrifuged. The ACN phase was partitioned with hexane, and the resulting hexane phase was back-partitioned with ACN. The ACN phases were combined and reserved for HPLC analysis. Nonextractable residues were subjected to digestion with pronase (in TRIS, pH 7.3, at 37 C for 16.25 h), and the solubilized residues were applied to an XAD-4 column which was sequentially eluted with water, methanol, 1% formic acid in methanol, and methano1:formic acid (1 :1, v:v). The water and methanol eluates were separately combined and reserved for HPLC analysis.
Residues in eggs (composite of samples from Days 5-7) were extracted with ACN, and the ACN phase was partitioned (3x) with hexane. The ACN phases were combined and reserved for HPLC analysis.
Residues in fat were sequentially extracted with ACN:hexane (1 :1, v:v; 3x), ACN (lx), and water (2x). The ACN, hexane, and water extracts were separately combined, and the ACN extract was reserved for HPLC analysis.
The distribution of '4C-activity in the extracts and hydrolysates of eggs and tissues is presented in Tables 17a (chlorophenyl label) and 17b (tolyl label).
Characterization and identification of residues
Egg, liver, and fat extracts were analyzed by HPLC using a PRPl or ODS column and a gradient mobile phase of water, ACN, and formic acid, or water, methanol, and formic acid. Radioactivity was detected and quantified using a radioactivity monitor. Metabolites were identified by comparison of retention times andor co-chromatography with radioactive standards of pyraclostrobin and 500M07 (elsewhere referenced as BF 500-3) or with components identified
from excreta (500M04, 500M64, 500M66, and 500M77). Residues were extracted from excreta with methanol and ACN and fractionated by HPLC. Radioactive fractions were purified by HPLC, and the structures of the isolated compounds were elucidated using HPLCIMS and HPLCIMSIMS. NMR spectroscopy was used to verify the MS results and to determine the position of hydroxy substituents. Additional elucidation was obtained by NMR analysis of molecular fragments formed during acid reflw of residues in the excreta.
Metabolites 500M39,500M83, and 500M06 were isolated from liver extracts (tolyl label) and identified by MS. Metabolite 500M32, a glucuronic acid conjugate, was isolated from liver slices incubated with [tolyl-'4C]pyraclostrobin and identified by HPLCIMS and HPLCIMSIMS.
In an attempt to further characterize bound liver residues, nonextractable residues (containing 34.6% TRR, 0.1 10 ppm) obtained from a second subsample of chlorophenyl-label liver were hydrolyzed with 5 M HC1 (at reflux for 2 h). Hydrolysis released 26.3% TRR (0.083 ppm), of which 1 1.4% TRR (0.036 ppm) could be partitioned into EtOAc. HPLC analysis of the EtOAc extract indicated the presence of l-(4-hydroxy-3-chlorophenyl)-3-hydroxypyrazol (BF500-9), suggesting residues were covalently linked to proteins.
A summary of the characterized and identified I4C-residues in poultry matrices is presented in Tables 18a (chlorophenyl label) and 18b (tolyl label).
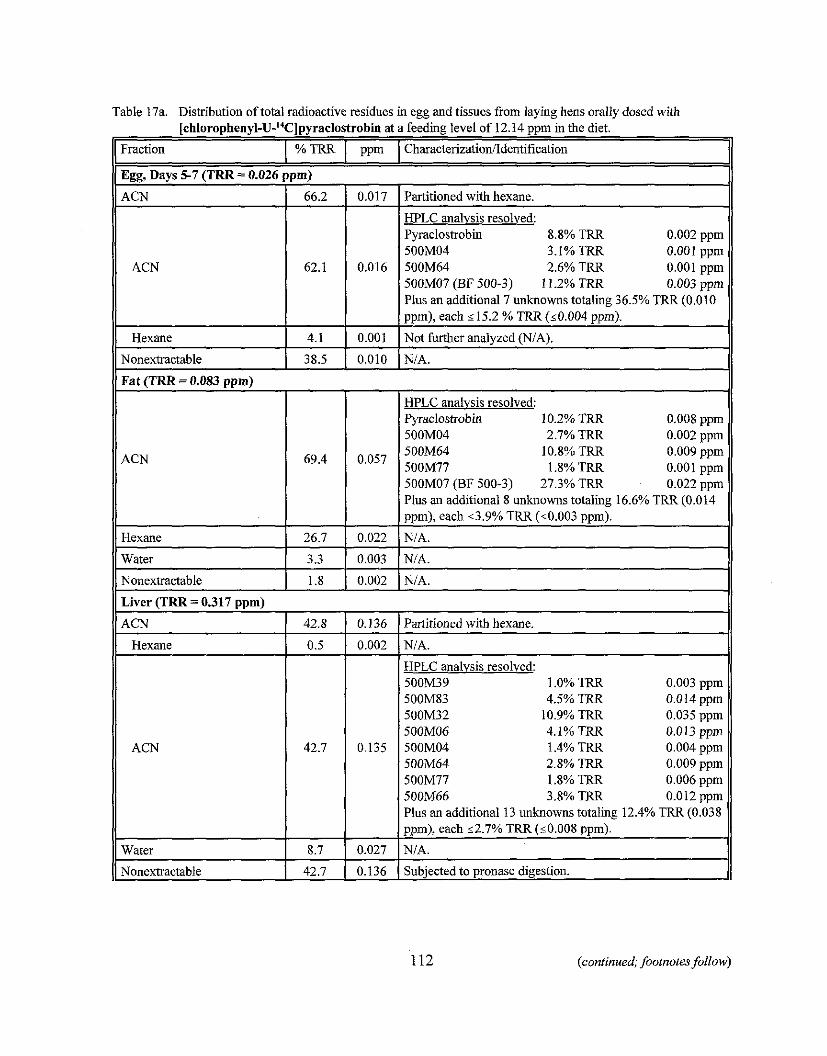
Table 17a. Distribution of total radioactive residues in egg and tissues from laying hens orally dosed with [chlorophenyl-U-"C]pyraelostrobin at a feidiog level of 12.14 ppm-in the diet.^
11 Fraction I % TRR 1 ppm I Characterization/Identification 11
ACN 0.017
0.016
Fat (TRR = 0.083 v ~ m ) 11
Partitioned with hexane.
HPLC analvsis resolved: Pyraclostrobin 8.8% TRR 0.002 ppm 500M04 3.1% TRR 0.001 ppm 500M64 2.6% TRR 0.001 ppm 500M07 (BF 500-3) 11.2% TRR 0.003 ppm Plus an additional 7 unknowns totaling 36.5% TRR (0.010 oam). each s 15.2 % TRR (~0.004 oom).
HPLC analvsis resolved: Pyraclostrobin 10.2% TRR 0.008 ppm 500M04 2.7% TRR 0.002 oom
I Hexane 1 4.1 1 0.001 1 Not further analyzed (NIA).
Nonextractable
ACN
Hexane
Water
Nonextractable
Hexane --+
NIA. 38.5
69.4
Liver (TRR = 0.317 ppm)
0.010
26.7
3.3
1.8
1 42.8
0.057
0.136 1 Partitioned with hexane.
0.002
0.135
11 Nonextractable 1 42.7 ( 0.136 ( Subjected to pronase digestion. 11
. . 500M64 10.8%TRR 0.009 ppm 500M77 1.8% TRR 0.001 ppm 500M07 (BF 500-3) 27.3% TRR 0.022 ppm Plus an additional 8 unknowns totaling 16.6% TRR (0.014 ppm), each ~ 3 . 9 % TRR (~0.003 ppm).
0.022
0.003
0.002
NIA.
HPLC analysis resolved: 500M39 1.0% TRR 0.003 ppm 500M83 4.5% TRR 0.014 ppm 500M32 10.9% TRR 0.035 ppm 500M06 4.1% TRR 0.013 ppm 500M04 1.4%TRR 0.004 ppm 500M64 2.8% TRR 0.009 ppm 500M77 1.8% TRR 0.006 ppm 500M66 3.8% TRR 0.012 ppm Plus an additional 13 unknowns totaling 12.4% TRR (0.038
112 (continued; footnotes follow)
NIA. - NIA. - NIA.
I 1 ppm), each ~ 2 . 7 % TRR (<0.008 pprn).
Water 8.7 0.027 NIA.
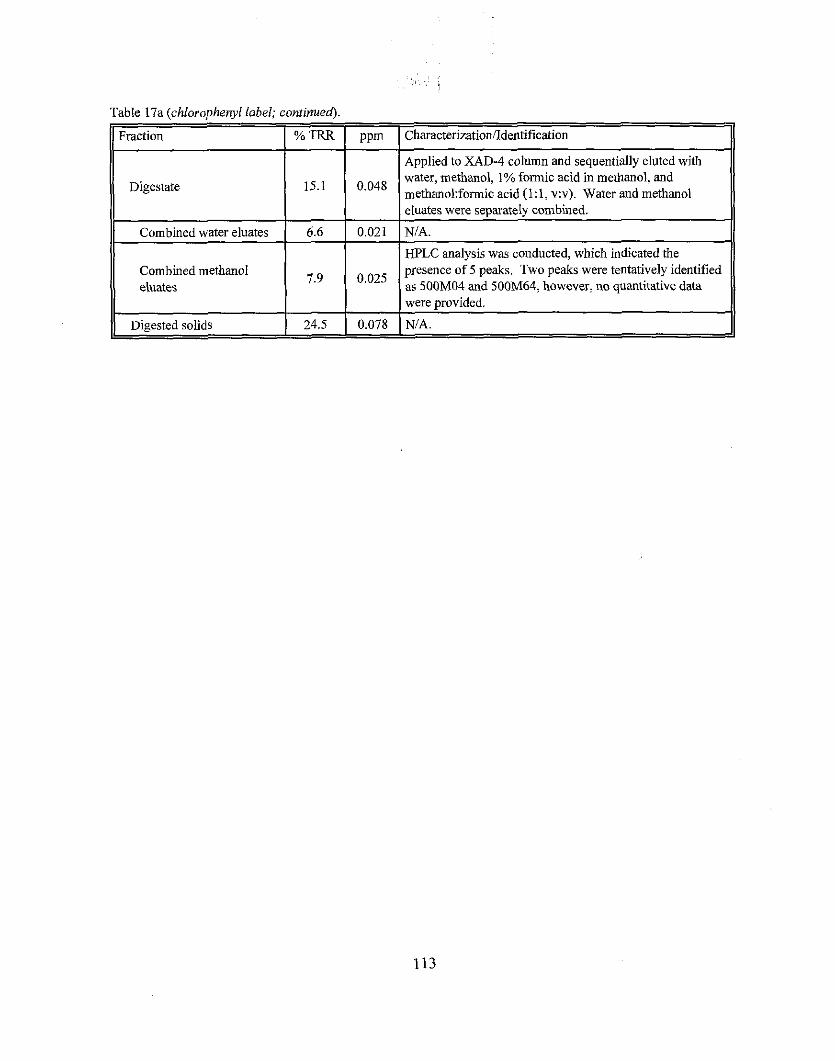
Table 17a (chlorophenyl label; confiflued).
1 Fraction I % TRR I ppm I Characterization/Identification
Digestate 0.04'
Applied to XAD-4 column and sequentially eluted with water, methanol, 1% formic acid in methanol, and rnethano1:fonnic acid (l:l, v:v). Water and methanol
Combined methanol eluates
1 were provided.
7.9
Digested solids
O'OZ5
24.5 0.078
HPLC analysis was conducted, which indicated the presence of 5 peaks. Two peaks were tentatively identified as 500M04 and 500M64, however, no quantitative data
NIA.
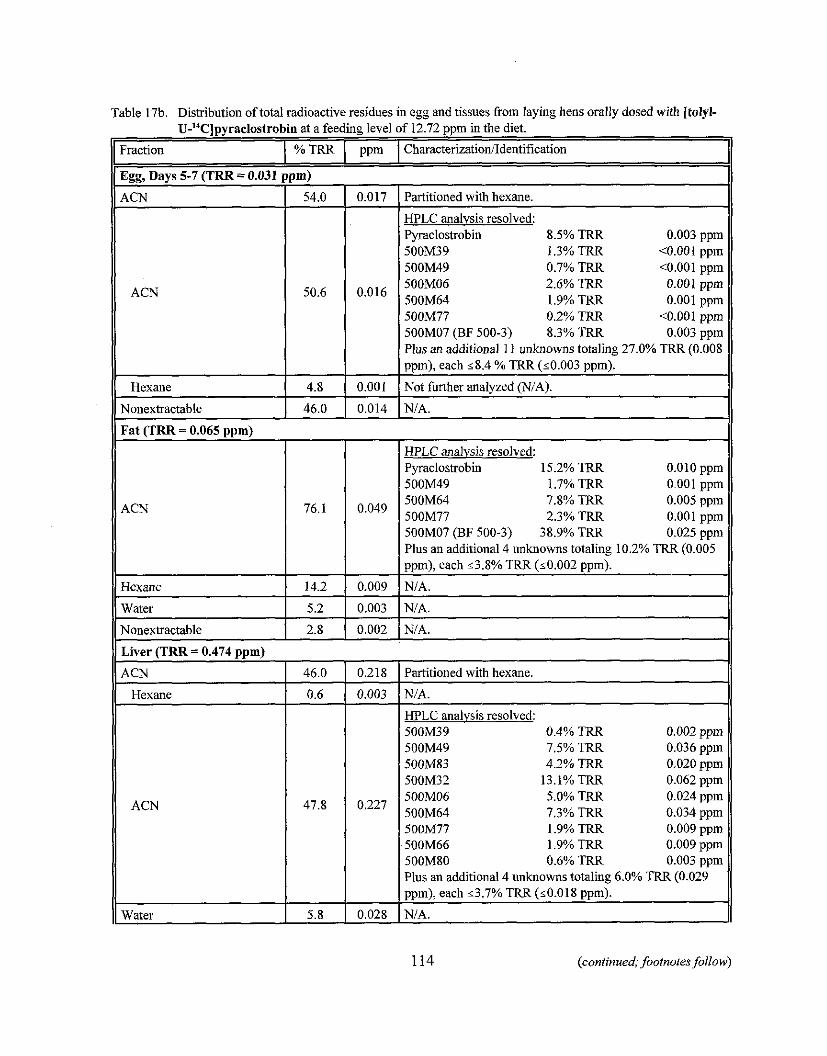
Table 17b. Distribution of total radioactive residues in egg and tissues fiom laying hens orally dosed with rtolyl-
Fat (TRR = 0.065 ppm)
I HPLC analysis resolved:
-- . . U-'T]pyraelostrobin at a feeding level of 12.72 pprn in the diet.
I l l Pyraclostrobin 15.2% TRR 0.010 ppm 500M49 1.7%TRR 0.001 v-pm
Fraction
Hexane 1 14.2 1 0.009 1 NIA.
Water 1 5.2 1 0.003 1 NIA. 11
ppm % TRR
ACN
Nonextractable I 2.8 ( 0.002 1 N/A. II
Characterization/Identification
Egg, Days 5-7 (TRR = 0.031 ppm)
Liver (TRR = 0.474 ppm)
ACN 1 46.0 1 0.218 1 Partitioned with hexane.
76.1
Hexane 1 0.6
ACN
ACN
Hexane
Nonextractable
A Water
0.017
0.016
0.001
0.014
54.0
50.6
4.8
46.0
0.049
Partitioned with hexane.
HPLC analysis resolved: Pyraclostrobin 8.5% TRR 0.003 ppm 500M39 1.3%TRR <O.OO 1 ppm 500M49 0.7% TRR <0.001 ppm 500M06 2.6% TRR 0.001 ppm 500M64 1.9% TRR 0.001 ppm 50011.177 0.2% TRR <O.OOl ppm 500M07 (BF 500-3) 8.3% TRR 0.003 ppm Plus an additional 1 1 unknowns totaling 27.0% TRR (0.008 ppm), each ~ 8 . 4 % TRR (10.003 pprn).
Not further analyzed (NIA). - NIA.
500M64 7.8% TRR 0.005 him 500M77 2.3% TRR 0.001 ppm 500M07 (BF 500-3) 38.9% TRR 0.025 ppm Plus an additional 4 unknowns totaling 10.2% TRR (0.005 ppm), each ~ 3 . 8 % TRR (10.002 ppm).
114 (continued; footnotes follow)
0.003
0'227
0.028
N/A.
HPLC analysis resolved: 500M39 0.4% TRR 0.002 ppm 500M49 7.5% TRR 0.036 ppm 500M83 4.2% TRR 0.020 ppm 500M32 13.1% TRR 0.062 ppm 500M06 5.0% TRR 0.024 ppm 500M64 7.3% TRR 0.034 ppm 500M77 1.9% TRR 0.009 ppm 500M66 1.9% TRR 0.009 ppm 500M80 0.6% TRR 0.003 ppm Plus an additional 4 unknowns totaling 6.0% TRR (0.029 ppm), each ~ 3 . 7 % TRR (~0.018 ppm).
NIA.
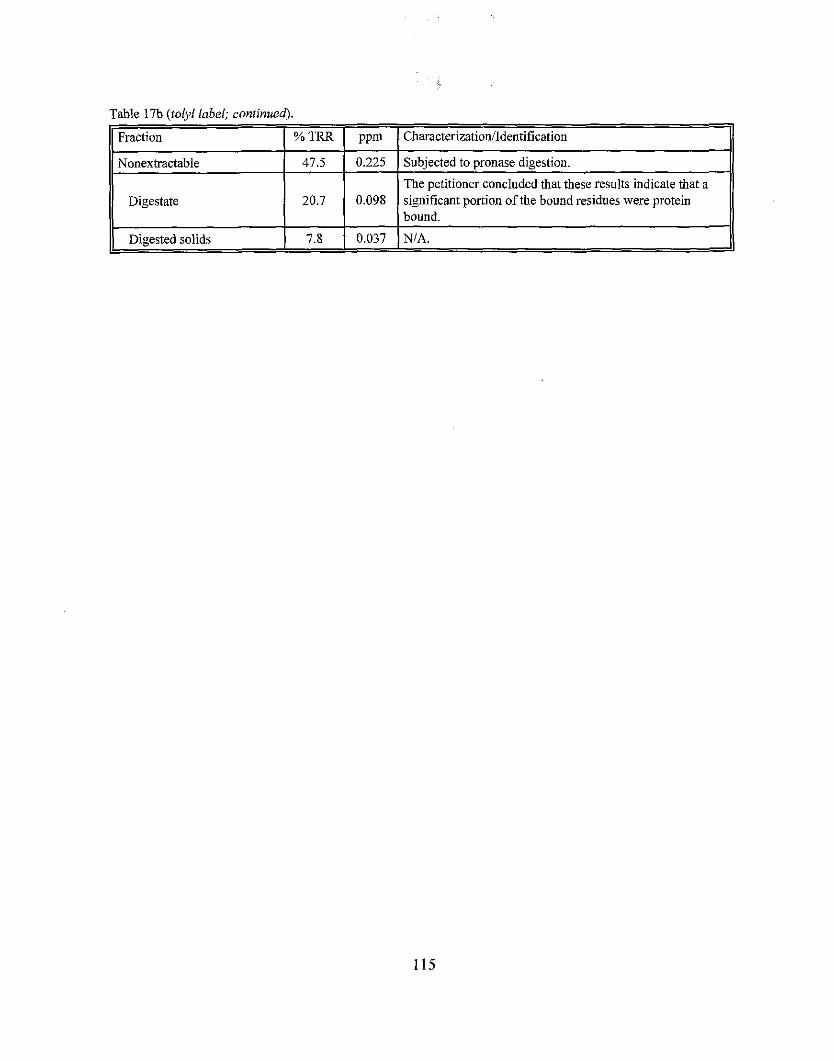
Table 17b (folyl label; continued).
11 Fraction I % TRR I ppm 1 Chai-acterizationmdentification
Nonextractable ( 47.5 ( 0.225 1 Subjected to pronase digestion.
1 The petitioner concluded that these results indicate that a
Digested solids 1 7.8 1 0.037 1 NIA. I
Digestate I 20.7 0.098 significant portion of the hound residues were protein bound.
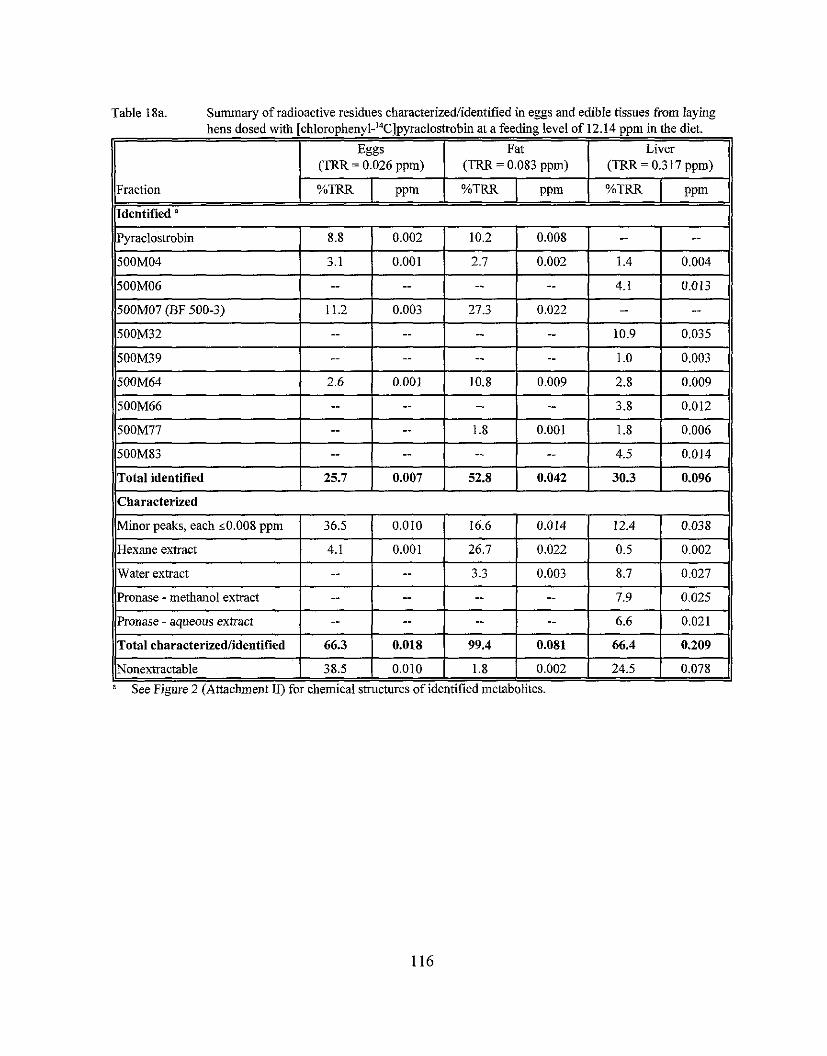
"ee Figure 2 (Attachment 11) for chemical structures of identified metabolites.
Table 18a. Summary of radioactive residues characterized/identified in eggs and edible tissues from laying hens dosed with [chlorophenyl-14C]pyraclostrobin at a feeding level of 12.14 ppm in the diet.
Fraction
500M83 -- -- -- -- 4.5 0.014
Total identified 25.7 0.007 52.8 0.042 30.3 0.096
Eggs (TRR = 0.026 ppm)
Fat (TRR = 0.083 ppm)
%TRR %TRR
Liver (TRR = 0.3 17 ppm)
PPm P P ~ %TRR PPm
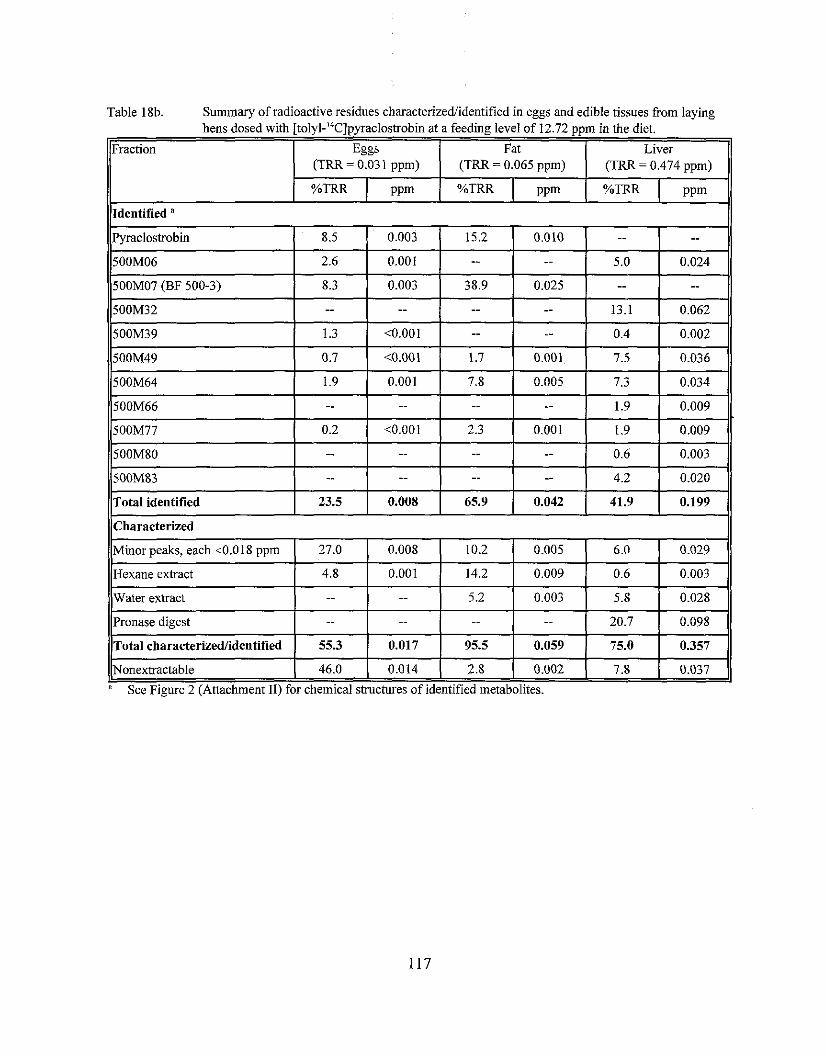
Table 18b. Summary of radioactive residues characterizedlidentified in eggs and edible tissues kom laying hens dosed with [tolyl-'TC]pyraclostrobin at a feeding level of 12.72 ppm in the diet.
Characterized
Minor peaks, each ~0.018 ppm - Hexane extract
Water extract
Pronase digest - Total characterized/identified
Nonextractable
27.0
4.8
--
" See Figure 2 (Attachment 11) for chemical structures of identified metabolites.
--
55.3
46.0
0.008
0.001
.-
.-
0.017
0.014
10.2
14.2
5.2
..
95.5
2.8
0.005
0.009
0.003
..
0.059
0.002
6.0
0.6
5.8
20.7
75.0
7.8
0.029
0.003
0.028
0.098
0.357
0.037
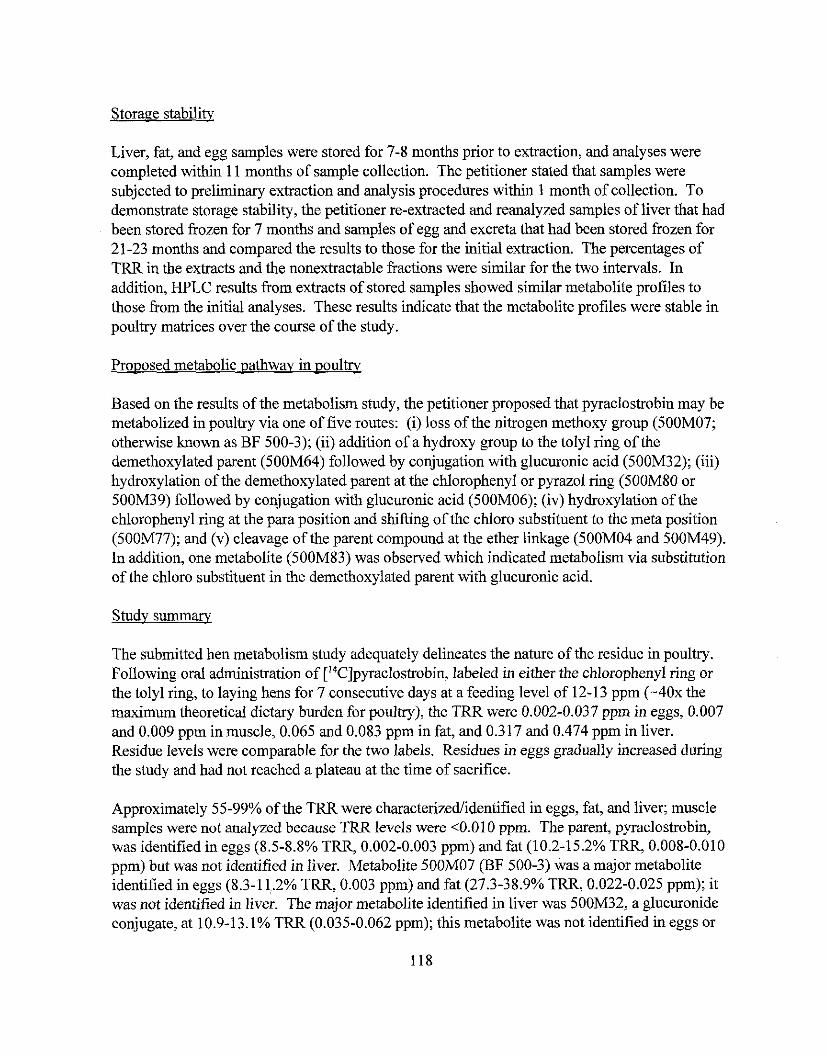
Storage stability
Liver, fat, and egg samples were stored for 7-8 months prior to extraction, and analyses were completed within 11 months of sample collection. The petitioner stated that samples were subjected to preliminary extraction and analysis procedures within 1 month of collection. To demonstrate storage stability, the petitioner re-extracted and reanalyzed samples of liver that had been stored frozen for 7 months and samples of egg and excreta that had been stored frozen for 21-23 months and compared the results to those for the initial extraction. The percentages of TRR in the extracts and the nonextractable fractions were similar for the two intervals. In addition, HPLC results from extracts of stored samples showed similar metabolite profiles to those from the initial analyses. These results indicate that the metabolite profiles were stable in poultry matrices over the course of the study.
Provosed metabolic pathway in voultrv
Based on the results of the metabolism study, the petitioner proposed that pyraclostrobin may be metabolized in poultry via one of five routes: (i) loss of the nitrogen methoxy group (500M07; otherwise known as BF 500-3); (ii) addition of a hydroxy group to the tolyl ring of the demethoxylated parent (500M64) followed by conjugation with glucuronic acid (500M32); (iii) hydroxylation of the demethoxylated parent at the chlorophenyl or pyrazol ring (500M80 or 500M39) followed by conjugation with glucuronic acid (500M06); (iv) hydroxylation of the chlorophenyl ring at the para position and shifting of the chloro substituent to the meta position (500M77); and (v) cleavage of the parent compound at the ether linkage (500M04 and 500M49). In addition, one metabolite (500M83) was observed which indicated metabolism via substitution of the chloro substituent in the demethoxylated parent with glucuronic acid.
Studv summary
The submitted hen metabolism study adequately delineates the nature of the residue in poultry. Following oral administration of [14C]pyraclostrobin, labeled in either the chlorophenyl ring or the tolyl ring, to laying hens for 7 consecutive days at a feeding level of 12-13 pprn (-40x the maximum theoretical dietary burden for poultry), the TRR were 0.002-0.037 pprn in eggs, 0.007 and 0.009 pprn in muscle, 0.065 and 0.083 pprn in fat, and 0.317 and 0.474 pprn in liver. Residue levels were comparable for the two labels. Residues in eggs gradually increased during the study and had not reached a plateau at the time of sacrifice.
Approximately 55-99% of the TRR were characterizedlidentified in eggs, fat, and liver; muscle samples were not analyzed because TRR levels were <0.010 ppm. The parent, pyraclostrobin, was identified in eggs (8.5-8.8% TRR, 0.002-0.003 ppm) and fat (10.2-15.2% TRR, 0.008-0.010 ppm) but was not identified in liver. Metabolite 500M07 (BF 500-3) was a major metabolite identified in eggs (8.3-1 1.2% TRR, 0.003 ppm) and fat (27.3-38.9% TRR, 0.022-0.025 ppm); it was not identified in liver. The major metabolite identified in liver was 500M32, a glucuronide conjugate, at 10.9-13.1% TRR (0.035-0.062 pprn); this metabolite was not identified in eggs or
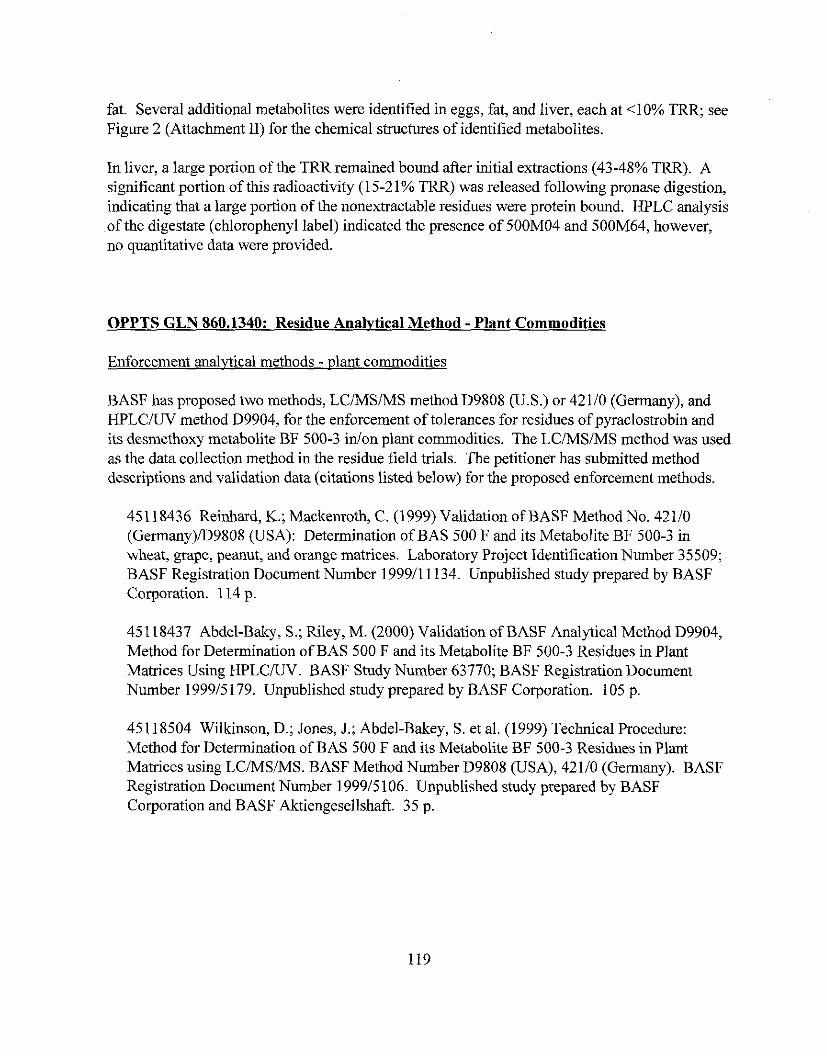
fat. Several additional metabolites were identified in eggs, fat, and liver, each at 4 0 % TRR, see Figure 2 (Attachment 11) for the chemical structures of identified metabolites.
In liver, a large portion of the TRR remained bound after initial extractions (43-48% TRR). A significant portion of this radioactivity (1 5-2 1% TRR) was released following pronase digestion, indicating that a large portion of the nonextractable residues were protein bound. HPLC analysis of the digestate (chlorophenyl label) indicated the presence of 500M04 and 500M64, however, no quantitative data were provided.
OPPTS GLN 860.1340: Residue Analytical Method -Plant Commodities
Enforcement analytical methods - plant commodities
BASF has proposed two methods, LC/MS/MS method D9808 (U.S.) or 42110 (Germany), and HPLCKJV method D9904, for the enforcement of tolerances for residues of pyraclostrobin and its desmethoxy metabolite BF 500-3 idon plant commodities. The LC/MS/MS method was used as the data collection method in the residue field trials. The petitioner has submitted method descriptions and validation data (citations listed below) for the proposed enforcement methods.
451 18436 Reinhard, K.; Mackenroth, C. (1999) Validation of BASF Method No. 42110 (Germany)lD9808 (USA): Determination of BAS 500 F and its Metabolite BF 500-3 in wheat, grape, peanut, and orange matrices. Laboratory Project Identification Number 35509; BASF Registration Document Number 199911 1134. Unpublished study prepared by BASF Corporation. 114 p.
451 18437 Abdel-Baky, S.; Riley, M. (2000) Validation of BASF Analytical Method D9904, Method for Determination of BAS 500 F and its Metabolite BF 500-3 Residues in Plant Matrices Using HPLCKJV. BASF Study Number 63770; BASF Registration Document Number 199915179, Unpublished study prepared by BASF Corporation. 105 p.
451 18504 Wilkinson, D.; Jones, J.; Abdel-Bakey, S. et al. (1999) Technical Procedure: Method for Determination of BAS 500 F and its Metabolite BF 500-3 Residues in Plant Matrices using LC/MS/MS. BASF Method Number D9808 (USA), 42110 (Germany). BASF Registration Document Number 199915 106. Unpublished study prepared by BASF Corporation and BASF Aktiengesellshaft. 35 p.
451 18505 Jones, J.; Abdel-Bakey, S. (1999) Technical Procedure: Method for Determination of BAS 500 F and its Metabolite BF 500-3 Residues in Plant Matrices using HPLCKJV. BASF Method Number D9904. BASF Registration Document Number 199915185. Unpublished study prepared by BASF Corporation. 27 p.
For the LCNSIMS method, homogenized crop samples (except peanut nutmeat and oil samples) are extracted with methano1:water (7:3, v:v) and filtered. An aliquot of the extract is removed, diluted with water, and concentrated to complete dryness. Residues are redissolved in methano1:water (7:3, v:v) and subjected to C18 Polar Plus@ micro-column chromatography. Residues are eluted from the C18 micro-column with dichloromethane (DCM) under vacuum and the eluates are evaporated to complete dryness. If further cleanup is required, the dried residues are then reconstituted in DCM:hexane (23, v:v) and applied to a micro silica column. Residues are eluted from the micro silica column with ethyl acetate:DCM (2:98, v:v) under vacuum, and the eluate is evaporated to complete dryness. Residues are dissolved in methano1:buffer solution (99.9% 4 mM ammonium formate in water and 0.1% formic acid) (8:2, v:v) for LCMSIMS analysis.
Peanut nutmeat samples are initially homogenized with acetonitrile (ACN), hexane is added, and the mixture is homogenized again. Following filtration of the extract. the filtrate is transferred to - - - a separatory funnel. The hexane phase is discarded, and the ACN phase is partitioned again with additional hexane. The ACN phase is evaporated to comvlete drvness and reconstituted in methano1:water (7:3, v:v) for C18 micro-column cleanup as described above.
For oil crop matrices, residues are partitioned between hexane and ACN. The hexane phase is discarded, and the ACN phase is partitioned with additional hexane. The ACN phase is evaporated to complete dryness and reconstituted in methano1:water (7:3, v:v) for C18 micro- column cleanup as described above.
The petitioner recommends that the following matrices be subjected to both C18 and silica micro-column chromatography for cleanup of residues: forage (barley, dry pea, and wheat), hay (barley, peanut, and wheat), straw (barley and wheat), orange, onion, and peanut (nutmeat and oil). All other plant matrices (barley and wheat grain, grape, raisins, grape juice, dry pea and lentil seeds, tomato, potato, cucurbits, sugarcane, and banana) typically only require cleanup using the CIS micro-column. For quantitation, the productldaughter ion for the transition d z 388 - 194 for pyraclostrobin and m/z 358 - 164 for BAS 500-3 are measured. The reported method LOQs for pyraclostrobin and BF 500-3 are 0.02 ppm each for all plant matrices.
For the HPLC/UV method, plant matrices are extracted and cleaned up by C18 micro-column andlor silica micro-column chromatography as described above for the LCiMSiMS method, and residues of pyraclostrobin and its metabolite BF 500-3 are quantitated by HPLC/UV with column switching. HPLC analysis is conducted using a UV detector at 276 nrn and one of two systems: a Luna phenyl hexyl column with a gradient mobile phase of ACN:methanol:water, and a Betasil 5 C18 column with an isocratic mobile phase of ACN:methanol:water (45:10:45, v:v:v). The
reported LOQs are 0.02 ppm each for residues of pyraclostrobin and BF 500-3 in plant matrices. The petitioner stated that residues determined using one HPLC system may be confirmed using the other system.
Method validations of the LCMSMS and HPLCNV methods were conducted on six representative plant matrices: grape, orange, peanut (nutmeat), and wheat forage, grain, and straw. Samples of untreated grape, orange, peanut nutmeat, and wheat forage, grain, and straw, obtained commercially for validation of the LCMSIMS method and obtained from U.S. field trials for validation of the HPLCAJV method, were fortified with pyraclostrobin and BF 500-3 each at 0.02 ppm (LOQ), 0.2 ppm (lox LOQ), andlor 2.0 ppm (100x LOQ). Unfortified and fortified samples were analyzed using either the LCIMSIMS method D9808 (42110) or H P L C m method D9904. Method validation recoveries are reported in Table 19; method recoveries were corrected for interferences from matrix compounds. Apparent residues of pyraclostrobin and BF 500-3 were each less than the method LOQ (<0.02 ppm) inion two samples each of unfortified grape, orange, peanut nutmeat, and wheat forage. grain, and straw analyzed by the LCIMSIMS method. Apparent residues of pyraclostrobin and BF 500-3 were each less than the method LOQ (10.02 ppm) idon two samples each of unfortified grape, orange, peanut nutmeat, and wheat forage, grain, and straw analyzed by the HPLC/W method. (Inspection of the chromatograms for the controls used in the HPLCiUV and D9808 methods showed negligible background or interfering peaks.)
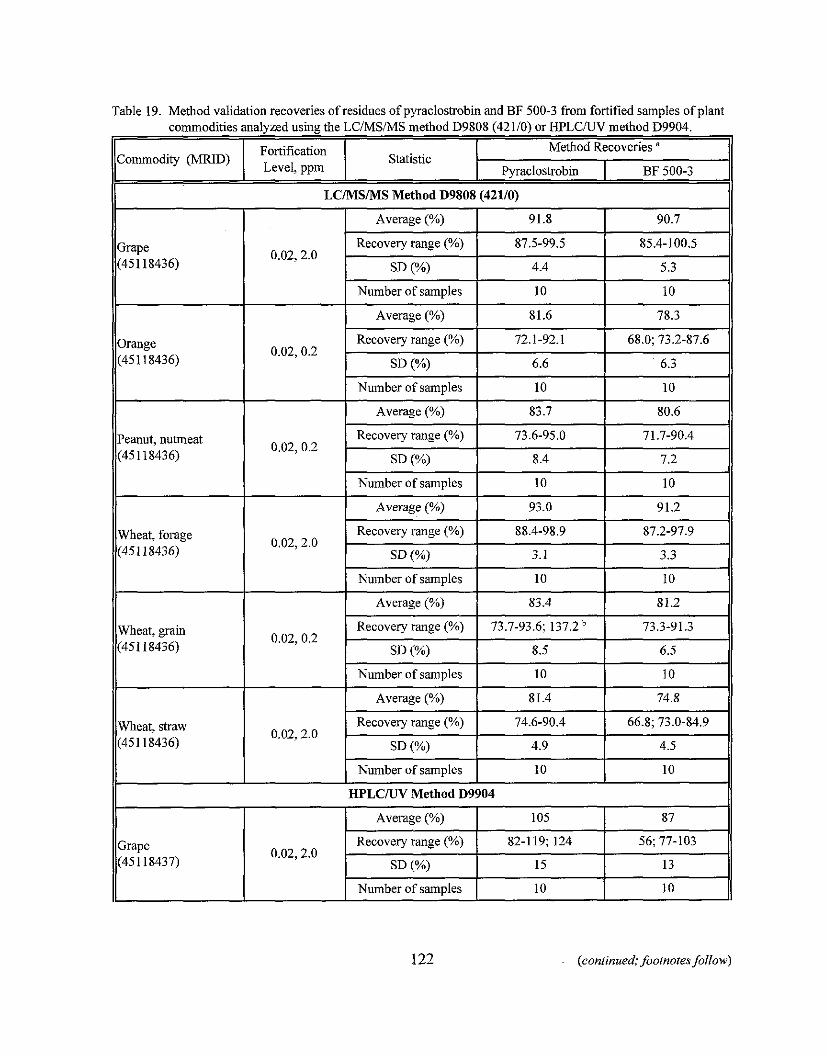
Table 19. Method validation recoveries of residues of pyraclostrobin and BF 500-3 from fortified samples of plant commodities analyzed using the LCiMSIMS method D9808 (42110) or HPLCiW method D9904.
I
ti LCMSMS Method D9808 (42110) it Fortification I Statistic Level, ppm
Grape (451 18436)
Method Recoveries "
Pvraclostrobin I BF 500-3 11 Average (%)
Recovery range (%) 87.5-99.5 85.4-100.5 0.02,2.0
SD (s!)
Number of samples
Orange (451 18436)
Peanut, nutmeat (45118436)
0.02,0.2
Wheat, forage (451 18436)
Average (%)
Recovery range (%)
SD (s/,)
Number of samples
0.02, 0.2
Wheat, grain (451 18436)
81.6
72.1-92.1
6.6
10
Average (%)
Recovery range (%)
SD (?YO)
Number of samples
0.02,2.0
0.02,0.2
Number of samples
78.3
68.0; 73.2-87.6
6.3
10
Wheat, straw (45 11 8436)
83.7
73.6-95.0
8.4
10
Average (%)
Recovery range (%)
SD (%)
Number of samples
80.6
71.7-90.4
7.2
10
Number of samples I 10 10 11
93.0
88.4-98.9
3.1
10
0.02,2.0
11 HPLCNV Method D9904 11
91.2
87.2-97.9
3.3
10
Average (%)
Recovery range (%)
SD (%)
122 (continued; footnoresjbllow)
81.4
74.6-90.4
4.9
Grape (45 11 8437)
74.8
66.8; 73.0-84.9
4.5
105
82-119; 124
15
10
87
56; 77-103
13
10
0.02,2.0
Average (%)
Recovery range (%)
SD (Oh)
Number of samples
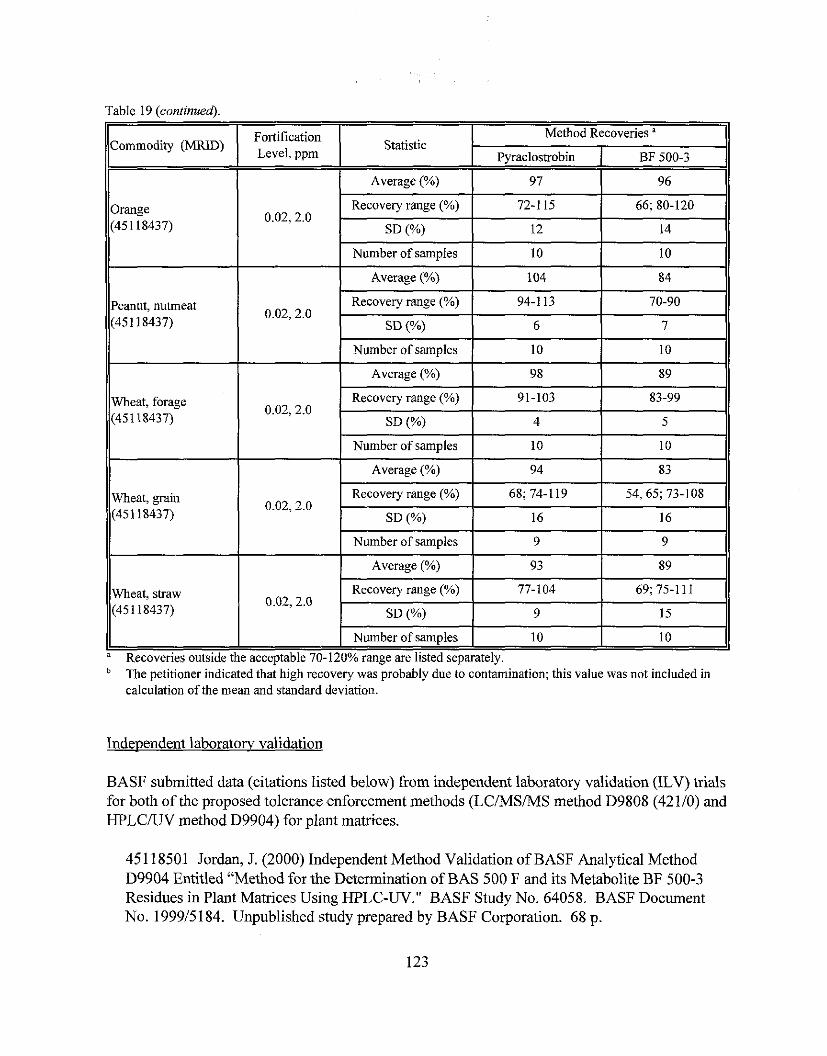
Table 19 (continued).
"ecoveries outside the acceptable 70-120% range are listed separately. The petitioner indicated that high recovery was probably due to contamination; this value was not included in calculation of the mean and standard deviation.
Independent laboratow validation
BASF submitted data (citations listed below) from independent laboratory validation (ILV) trials for both of the proposed tolerance enforcement methods (LCIMSNS method D9808 (42110) and HPLCRJV method D9904) for plant matrices.
451 18501 Jordan, J. (2000) Independent Method Validation of BASF Analytical Method D9904 Entitled "Method for the Determination of BAS 500 F and its Metabolite BF 500-3 Residues in Plant Matrices Using HPLC-UV." BASF Study No. 64058. BASF Document No. 199915184, Unpublished study prepared by BASF Corporation. 68 p.
451 18503 Perez, R.; Perez, S. (2000) Independent Method Validation of BASF Method Numbers D9808 (USA) and 42110 (Germany) Entitled "Method for Determination of BAS 500 F and its Metabolite BF 500-3 Residues in Plant Matrices Using LCJMSMS." BASF Study No. 63832. Unpublished study prepared by BASF Corporation. 96 p.
The ILV of the LCMSIMS method was performed by ADPEN Laboratories, Inc. (Jacksonville, FL), and the ILV of the HPLCLJV method was performed by BASF, Agricultural Products Center (APC; Research Triangle Park, NC) by chemists unfamiliar with the method or its development. Untreated homogenized samples of grapes and wheat straw supplied by BASF were used for both studies; grapes and wheat straw were chosen as representative difficult matrices. Five subsamples each of untreated grape and wheat straw were fortified with pyraclostrobin and BF 500-3 each at the LOQ (0.02 ppm) and at the proposed tolerance levels of 2.0 ppm for grapes and 6.0 pprn for wheat straw; we note that the proposed tolerance for wheat straw has since been increased to 8.5 ppm. Fortified and unfortified grape and wheat straw samples were analyzed for residues of pyraclostrobin and BF 500-3 using either the LC/MS/MS method D9808 (42110) or HPLCIUV method D9904 (described above).
Using the LC/MS/MS method, acceptable validation recoveries were obtained with the first attempt for pyraclostrobin and BF 500-3 in grapes at both fortification levels; however, unacceptable validation recoveries were obtained with the first attempt for pyraclostrobin and BF 500-3 in wheat straw. Following communication between ADPEN Laboratories and BASF, it was concluded that low and variable recoveries were probably due to poor extraction efficiency. Wheat straw samples were subsequently extracted with a larger volume of methanol:water, and two to three methano1:water rinses were made to the pellet remaining following filtration. In addition, because signal suppression had been reported for pyraclostrobin and BF 500-3, the laboratory included a suppression check sample with the second attempt; a control sample was run through the extraction procedure and fortified with standard at the final dilution step. Recoveries were better for both pyraclostrobin and BF 500-3 with the second attempt; however, recoveries were still not acceptable at the LOQ (0.02 ppm) fortification level. Signal suppression effects due to the matrix were determined to be the cause; a 10-fold dilution of the samples and standards eliminated the interference. Acceptable recoveries were obtained fiom re-injection of the second attempt samples (fortified at the LOQ) following a 10-fold dilution. The results of the ILV study are shown in Table 20. Apparent residues of pyraclostrobin and BF 500-3 were less than the method LOQ (0.006 ppm or less) in control samples of grape and wheat straw from all trials. The laboratory indicated that 8 person hours were required to extract one complete set of 12 samples. Representative sample calculations and chromatograms were provided.
Using the HPLC/UV method, acceptable validation recoveries were obtained with the first attempt for pyraclostrobin and BF 500-3 in grapes and wheat straw at both fortification levels. To represent a worse case, both grape and wheat straw samples were subjected to C18 SPE micro-column & silica SPE micro-column chromatography for clean-up. The laboratory noted that washing down the sides of the flask in the final step to ensure quantitative transfer of residues, and the calibratiodadjustment of the column switching window were critical steps of
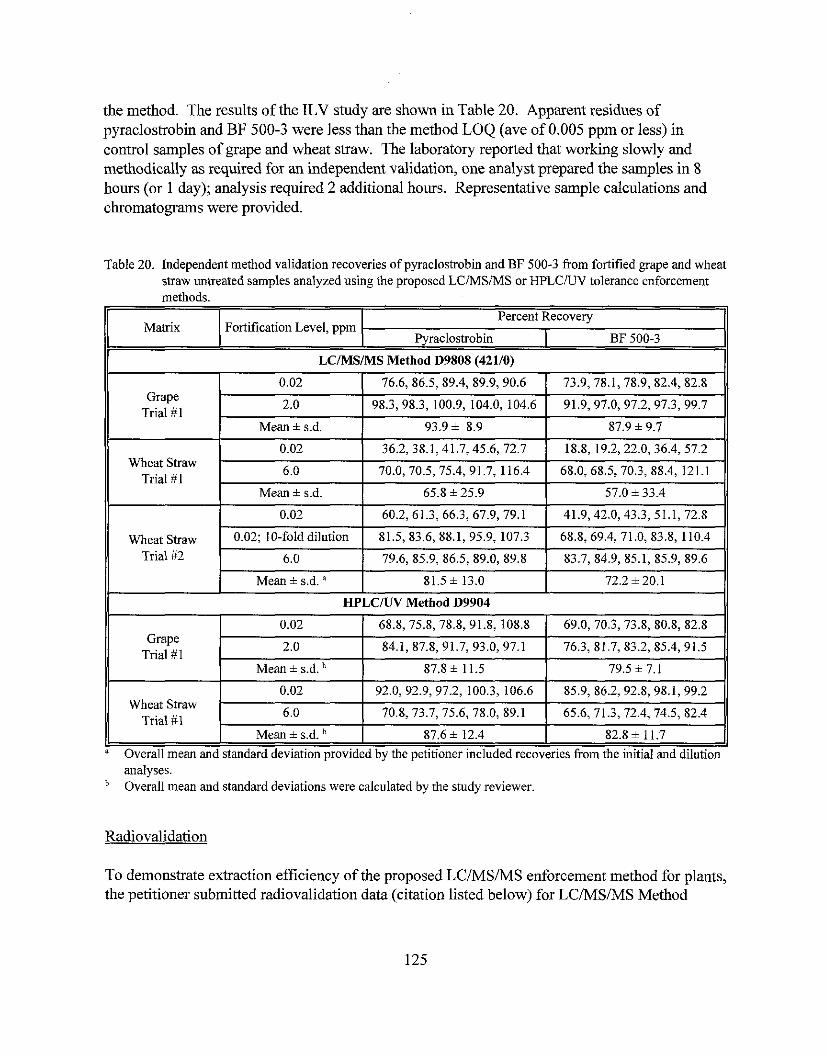
the method. The results of the ILV study are shown in Table 20. Apparent residues of pyraclostrobin and BF 500-3 were less than the method LOQ (ave of 0.005 ppm or less) in control samples of grape and wheat straw. The laboratory reported that working slowly and methodically as required for an independent validation, one analyst prepared the samples in 8 hours (or 1 day); analysis required 2 additional hours. Representative sample calculations and chromatograms were provided.
Table 20. Independent method validation recoveries of pyraclostrobin and BF 500-3 from fortified grape and wheat straw untreated samples analyzed using the proposed LCIMSMS or HPLCNV tolerance enforcement methods. -
-
Wheat Straw Trial #1
Wheat Straw Trial #2
Radiovalidation
Matrix
0.02
6.0
Mean + s.d.
0.02
Grape Trial #1
Wheat Straw Trial #I
To demonstrate extraction efficiency of the proposed LCMSIMS enforcement method for plants, the petitioner submitted radiovalidation data (citation listed below) for LCMS/MS Method
HPLCNV Method D9904
0.02;lO-folddilution
6.0
Mean + s.d. "
Fortification Level, ppm
36.2, 38.1, 41.7,45.6, 72.7
70.0, 70.5, 75.4, 91.7, 116.4
65.8 * 25.9
60.2, 61.3, 66.3, 67.9,79.1
"verall mean and standard deviation provided by the petitioner included recoveries from the initial and dilution analyses. Overall mean and standard deviations were calculated by the study reviewer.
0.02
2.0
Mean + s.d.
0.02
6.0
Mean + s.d.
LCMSIMS Method D9808 (42110)
18.8, 19.2, 22.0, 36.4, 57.2
68.0, 68.5, 70.3, 88.4, 121.1
57.0 + 33.4
41.9,42.0,43.3,51.1, 72.8
81.5,83.6,88.1,95,9,107.3
79.6, 85.9, 86.5, 89.0, 89.8
81.5 + 13.0
Percent Recovery
Grape Trial #1
68.8,69.4,71.0,83.8,110.4
83.7, 84.9, 85.1, 85.9, 89.6
72.2 + 20.1
68.8,75.8, 78.8,91.8: 108.8
84.1, 87.8,91.7, 93.0,97.1
87.8 i- 11.5
92.0, 92.9, 97.2, 100.3, 106.6
70.8,73.7, 75.6,78.0, 89.1
87.6 * 12.4
Pyraclosh-ohin
69.0, 70.3, 73.8, 80.8, 82.8
76.3, 81.7, 83.2, 85.4, 91.5
79.5 + 7.1
85.9, 86.2, 92.8, 98.1, 99.2
65.6, 71.3,72.4,74.5, 82.4
82.8 + 11.7
BF 500-3
0.02
2.0
Mean i s.d.
76.6, 86.5, 89.4, 89.9,90.6
98.3,98.3, 100.9, 104.0, 104.6
93.9 + 8.9
73.9, 78.1,78.9, 82.4, 82.8
91.9,97.0, 97.2, 97.3, 99.7
87.9 * 9.7
42110 using 14C-labeled samples fiom the grape and wheat metabolism studies. The radiovalidation study was conducted by BASF Aktiengesellschaft (Germany).
451 18502 Reinhard, K.; Mackenroth, C. (1999) Extractability of I4C-BAS 500 F Residues from Wheat and Grape Matrices with Aqueous Methanol (according to Method No. 42110). Laboratory Project Identification No. 3551 2; BASF Registration Document No. 199911 1138. Unpublished study prepared by BASF Corporation. 24 p.
Extraction efficiency data submitted with the potato metabolism study (MRID 45 11 843 1) are also reviewed below.
Samples of chlorophenyl-label grapes, chlorophenyl- and tolyl-label potato tubers, and chlorophenyl-label wheat forage, grain, and straw fiom the plant metabolism studies were used to demonstrate the extraction efficiency of the proposed enforcement method. TRR in these samples were determined in the metabolism studies by LSC or combustionLSC following extraction with methanol (grapes, potatoes) or methanol followed by water (wheat matrices). For the radiovalidation study and for determination of extraction efficiency in the potato metabolism study, the metabolism samples were extracted with methano1:water (7:3, v:v) as required for the residue method. The TRR were determined by LSC or combnstion/LSC for the extractable and nonextractable fractions, and the percent TRR was calculated based on the sum of the extractable and nonextractable residues. Results of the radiovalidation study and the potato extraction efficiency study are presented in Table 21; percent TRR values were similar for grapes, potato tubers, and wheat matrices using the extraction procedures of the metabolism studies and the extraction method of the residue method. We note that these results are applicable to the proposed HPLCIUV enforcement method as well because the extraction and clean-up procedures are identical.
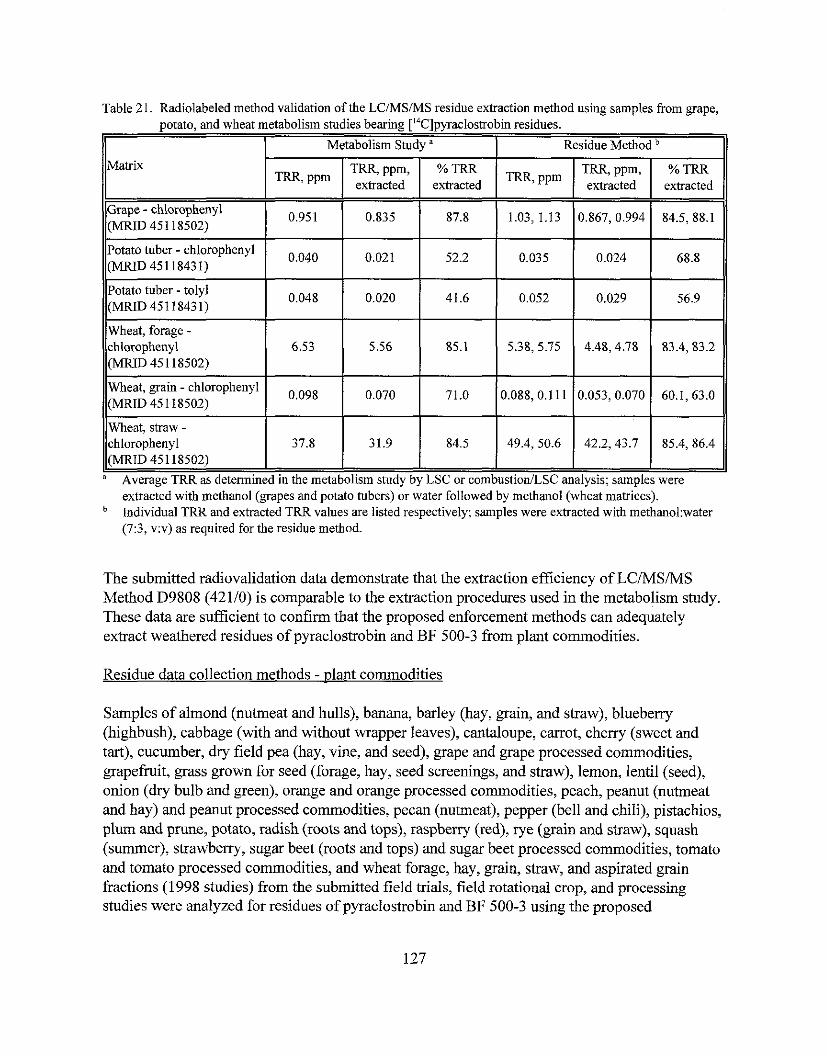
Table 21. Radiolabeled method validation of the LCIMSIMS residue extraction method using samples from grape,
extracted with methanol (grapes and potato tubers) or water followed by methanol (wheat matrices). Individual TRR and extracted TRR values are listed respectively; samples were extracted with methano1:water (7:3, v:v) as required for the residue method.
- - . . potato, and wheat metabolism studies bearing [14C]pyraclostrobin residues.
The submitted radiovalidation data demonstrate that the extraction efficiency of LCiMSMS Method D9808 (42110) is comparable to the extraction procedures used in the metabolism study. These data are sufficient to confirm that the proposed enforcement methods can adequately extract weathered residues of pyraclostrobin and BF 500-3 from plant commodities.
Matrix
Residue data collection methods - vlant commodities
Samples of almond (nutmeat and hulls), banana, barley (hay, grain, and straw), bluebeny (highbush), cabbage (with and without wrapper leaves), cantaloupe, carrot, cherry (sweet and tart), cucumber, dry field pea (hay, vine, and seed), grape and grape processed commodities, grapefruit, grass grown for seed (forage, hay, seed screenings, and straw), lemon, lentil (seed), onion (dry bulb and green), orange and orange processed commodities, peach, peanut (nutmeat and hay) and peanut processed commodities, pecan (nutmeat), pepper (bell and chili), pistachios, plum and prune, potato, radish (roots and tops), raspberry (red), rye (grain and straw), squash
Metabolism Study "
Wheat, straw - chlorophenyl (MRID 45 118502)
(summer), strawbeny, sugar beet (roots and tops) and sugar beet processed commodities, tomato
Residue Method
and tomato processed commodities, and wheat forage, hay, grain, straw, and aspirated grain fractions (1998 studies) from the submitted field trials, field rotational crop, and processing studies were analyzed for residues of pyraclostrobin and BF 500-3 using the proposed
%TRR extracted TRR' ppm TRR' ppm
" Average TRR as determined in the metabolism study by LSC or combustion/LSC analysis; samples were
37.8
TRQ ppm, extracted
TRR, ppm, extracted
31.9
%TRR extracted
84.5 49.4, 50.6 42.2,43.7 85.4, 86.4
enforcement method (LC/MS/MS BASF Method Number D9808). Samples of wheat grain and straw and wheat processed commodities from the 2000 field trials and processing studies were analyzed for residues of pyraclostrobin and BF 500-3 using a similar LCMSMS method, BASF Method Number D9908. Method D9908 used an alternate extraction option: wheat matrices were extracted with methanol:water:2 N HC1(7:2.5:0.5) instead of methano1:water (7:3; v:v). Samples from the European crop field trial studies were analyzed for residues of pyraclostrobin and BF 500-3 using LCIMSMS 42110. Only rye, barley, and wheat straw samples from the field trial studies required additional cleanup using micro silica column chromatography. The method limit of quantitation was 0.02 ppm for each analyte (pyraclostrobin and BF 500-3) idon all crop matrices.
The petitioner included concurrent method recovery data for the LCIMSIMS method. Samples of untreated commodities from the field and processing studies were fortified with pyraclostrobin and BF 500-3 and were analyzed concurrently with the field trial and processing samples. The concurrent method recoveries are presented in Table 22.
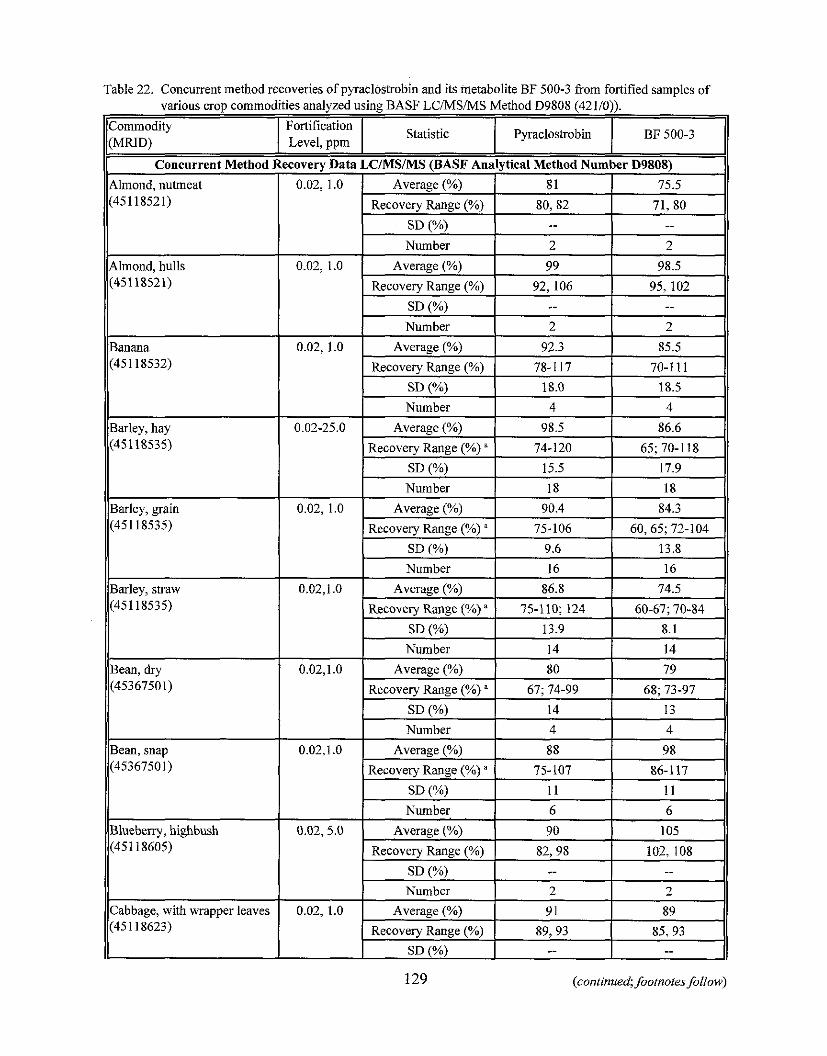
Table 22. Concurrent method recoveries of pyraclostrobin and its metabolite BF 500-3 from fortified samvles of
1 Concurrent Rlethod decovery.~ata LCIMSIMS (BASF Ana'lytical Mcthod Vurnker D98U8) I\
various crop commodities analyzed using BASF LCIMSIMS Method D9808 (42110)).
Almond, nutmeat
129 (continued; footnotes follow)
Commodity (MRID)
Fortification Level, ppm BF 500-3 Statistic Pyraclostrobin
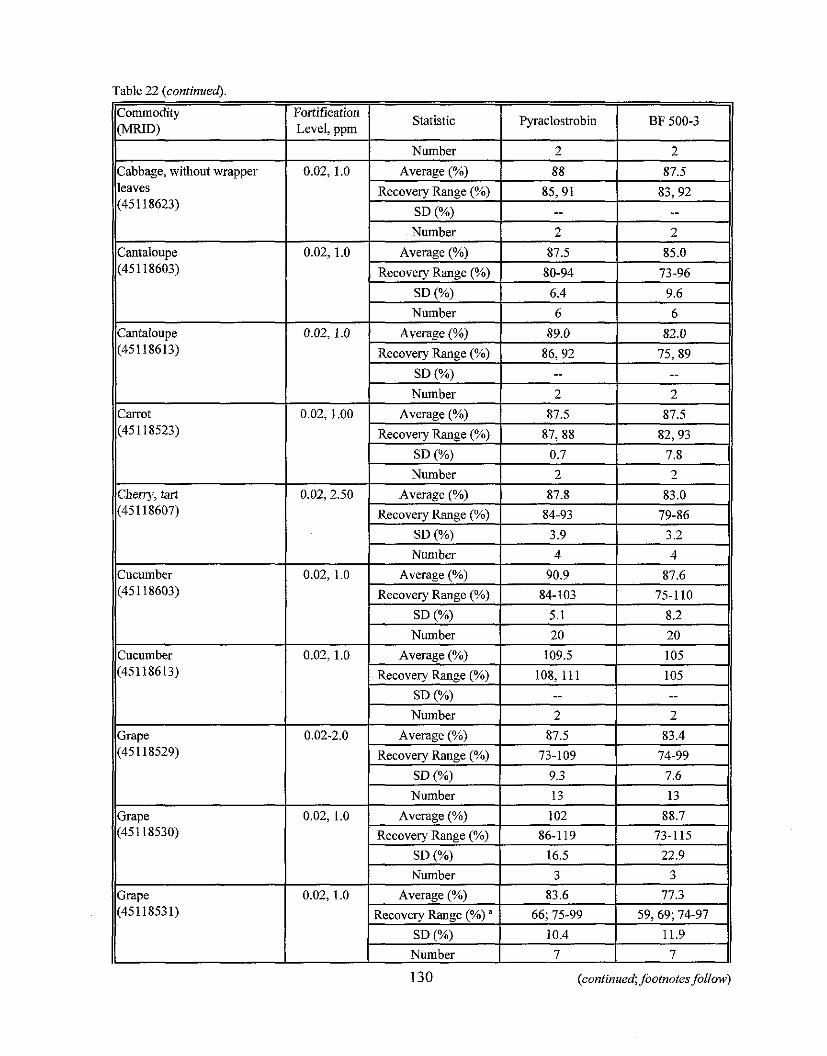
Table 22 (continued).
Commodity (MRID)
leaves (45 1 18623)
(45118523)
Cheny, tart (45 1 18607)
Cucumber (45 1 18603)
Cucumber (45118613)
(45 1 18529)
Grape (451 18530)
(45118531)
Fortification Level, ppm
0.02, 1.0
Statistic
Recovery Range (%) I 85,91 83,92 11
I I
Pyraclostrobin
Number
BF 500-3
SD (.A)
2
Average (%)
2
Average (%)
Number I 2 1 2
--
Recovery Range (%)
SD (%) Number
--
11 87.5
Average (%)
88
85.0
80-94
6.4
6
Recovery Range (%) I 86,92
87.5
73-96
9.6 6
11 89.0
SD (%)
Number
Average (%)
Recovely Range (%)
SD (%)
82.0
-- I
Number
Numher I 4 1 4 11
2
87.5
87,88
0.7
Average (YO) Recovery Range (%)
SD (%)
2
87.5
82,93
7.8
II 2
Recovery Range (%) I 84-103 1 75-110
SD (%) 1 5.1 8.2
2
87.8
84-93
3.9
Average (%)
83.0
79-86
3.2
II 90.9
Number
87.6
20
Recovery Range (%)
SD (%) Number
Average (%)
Average (%)
108, 111 -- 2
Recovery Range (%)
SD (Yo)
Number
105 -- 2
II 87.5
Average (%)
u . ,
Reco\el? Range ( " 0 ) ' I 66: 75-99 i 59.69; 71-97 11
109.5
83.4
73-109
9.3
13
102
SD (%) Number
Average I%)
Number 7 7 11 130 (continued; footnotes follow)
105
74-99
7.6
13
Recovery Range (%) 1 86-119 I 73-115
16.5
3
83.6
22.9
3
77.3
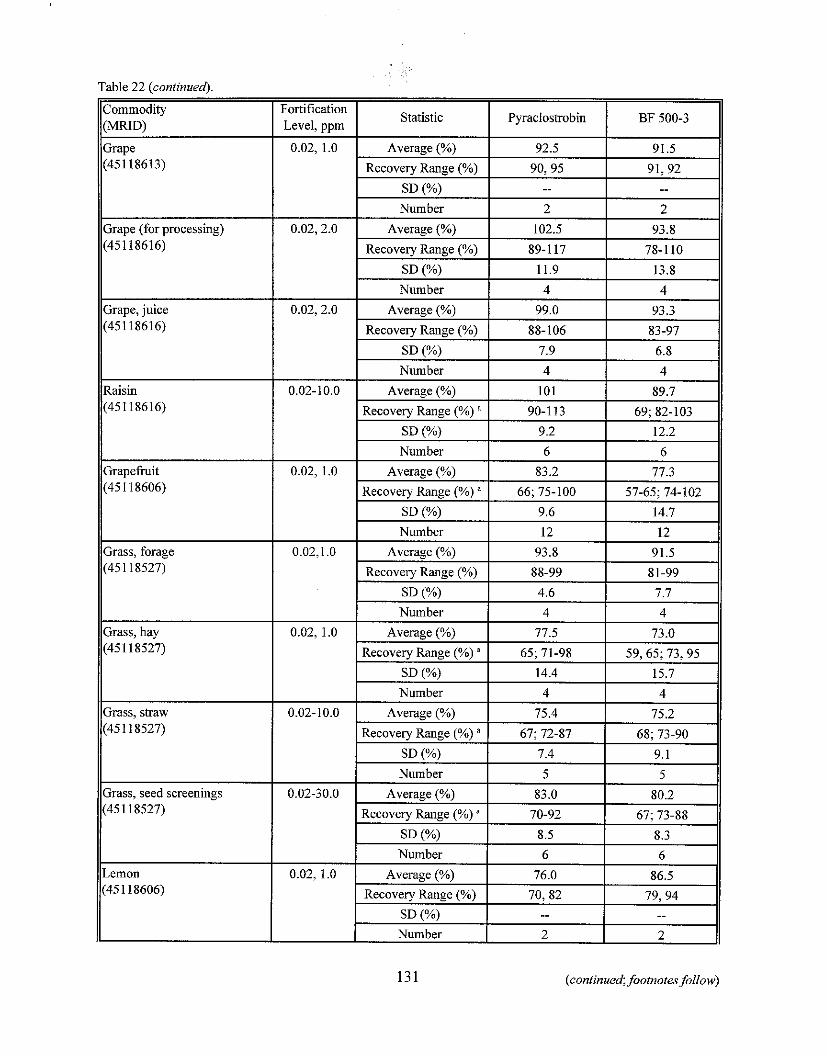
iortification Statistic
Level, ppm Pyracloshobin BF 500-3
0.02, 1.0 Average (%) 92.5 91.5
Recovery Range (%) 90,95 91,92
SD (%) -- -- Number 2 2
0.02, 2.0 Average (%) 102.5 93.8
Recovery Range (%) 89-117 78-110
SD (%) 11.9 13.8
Number 4 4
0.02, 2.0 Average (%) 99.0 93.3
Recovery Range (%) 88-106 83-97
SD (?A) 7.9 6.8 Number 4 4
0.02-10.0 Average (%) 101 89.7
Recovery Range (%) a 90-113 69; 82-103
SD (%) 9.2 12.2
Number 6 6
0 02, 1.0 Average (%) 83.2 77.3
Recovery Range (%) " 66; 75-100 57-65; 74-102
SD (%) 9.6 14.7
131 (continued; footnotes follow)
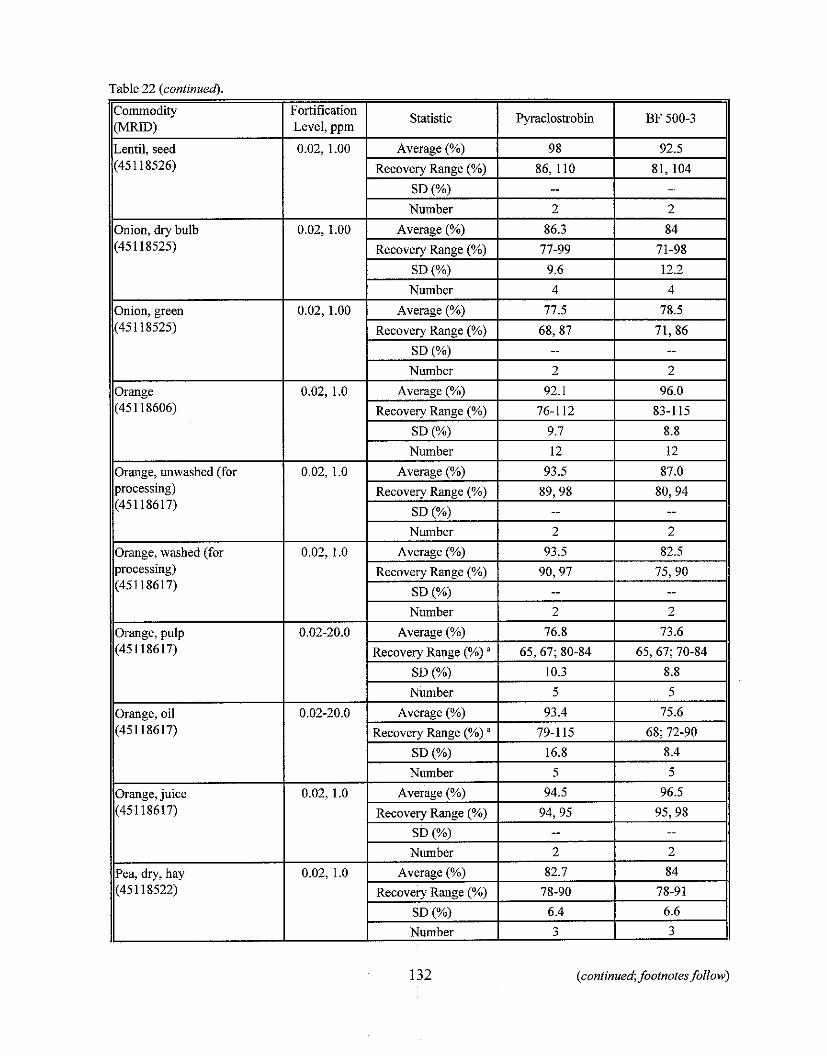
Table 22 (continued).
132 (continued; footnotes follow)
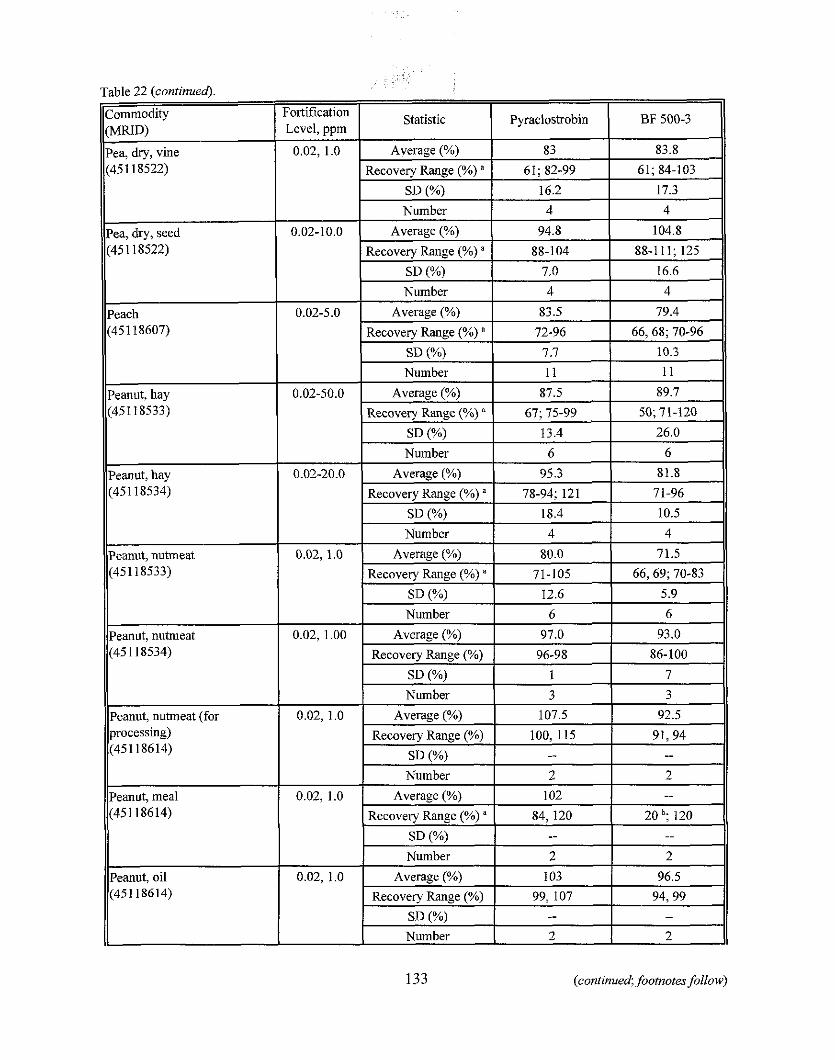
Table 22 (continued).
Ibmmodity MRID)
.lea, dry, vine (45 11 8522)
(451 18522)
Peach (451 18607)
II~eanut, hay
JJ~eanut, hay
Peanut, nutmeat (451 18533)
processing) (45118614)
Peanut, oil (451 18614)
0.02, 1.0 I Average (%) 83 83.8 11 BF 500-3 Pyraclostrobin 'ortification
Level. uum
Recovery Range (%) ' I 61; 82-99
Statistic
61; 84-103
Number
SD I%) I 16.2 17.3 11
0.02-5.0
0.02-50.0
II 4
0.02-20.0
4
Number
Average (%)
Recovery Range (%) " SD (%) Number
Average (%)
Recovery Range (%) "
SD (%)
0.02, 1.0
Number
Average (%)
Recovery Range (%) '
0.02, 1.00
4
83.5
72-96
7.7
11
87.5
67; 75-99
l j .4
Number
Average (%)
Recovery Range (%) " <
0.02, 1.0
4
79.4
66,68; 70-96
10.3
11
89.7
50; 71-120
26.0
6
95.3
78-94; 121
Number
Average (%)
Recovery Range (%)
0.02, 1.0
6
81.8
71-96
4
80.0
71-105
Number
Average (%)
Recovery Range (%)
0.02, 1.0
133 (continued; footnotes follow)
4
71.5
66,69; 70-83
6
97.0
96-98
Number
Average (%)
Recovery Range (%) "
SD (??I
6
93.0
86-100
--
3
107.5
100, 115
SD (%) Number
Average (%)
Recovery Range (%)
3
92.5
91,94
2
102
84, 120
--
2 --
20 b; 120 -- 2
103
99,107 -
.-
2
96.5
94,99
I Number 2 I 2
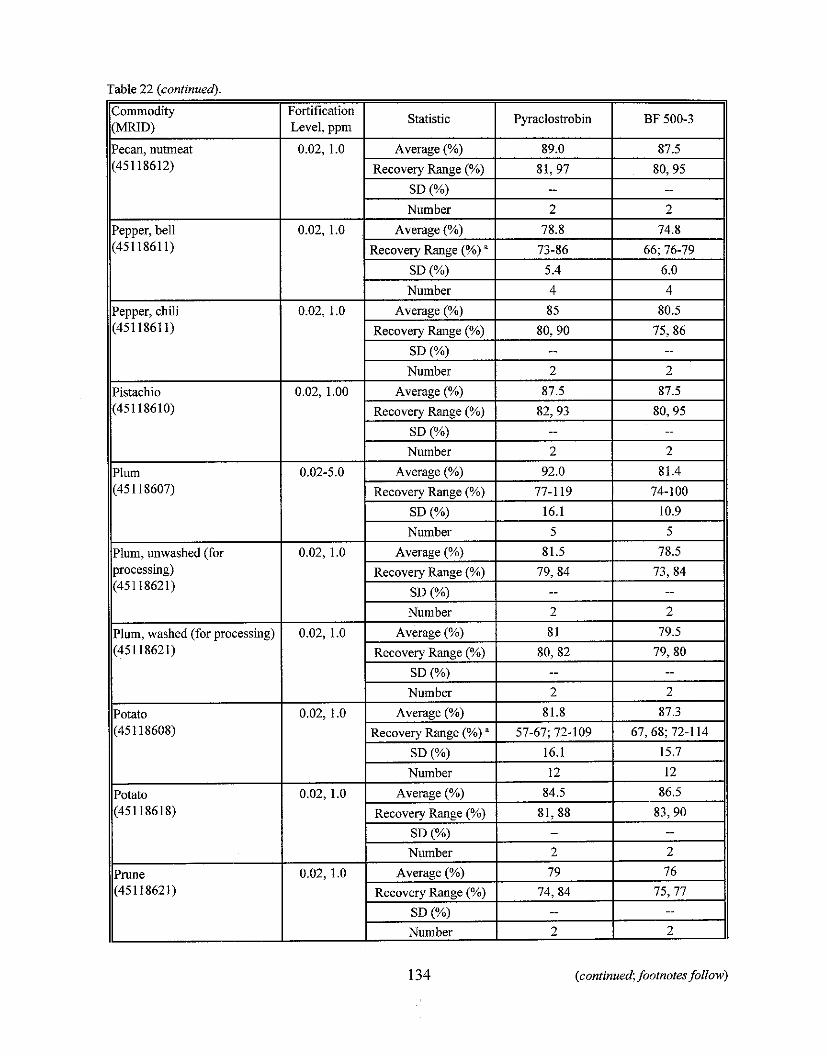
Table 22 (continued).
134 (coniinued; footnotes follow)
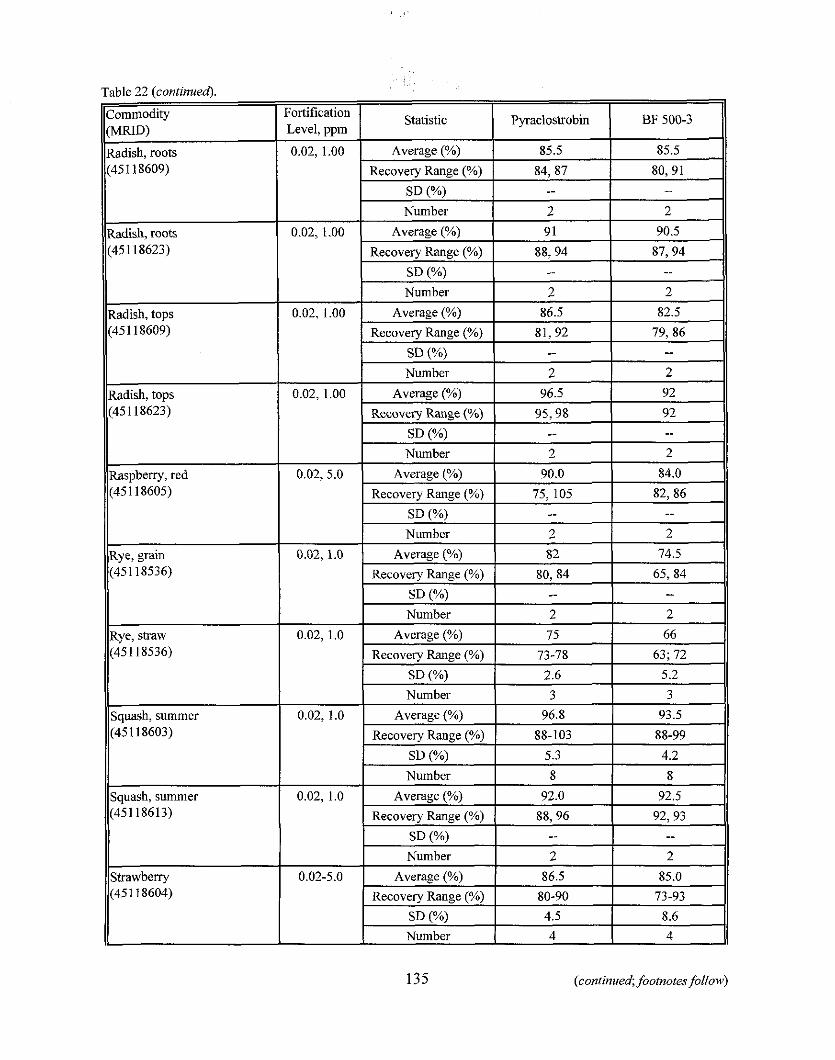
Table 22 (continued).
Commodity
Radish, roots
Radish, roots (45 1 18623)
Radish, tops (45 1 18609)
Radish, tops (45 118623)
Rye, straw (451 18536)
(45 1 18603)
Squash, summer (451 18613)
0.02, 1.00 Average (%) 85.5
Recovery Range (%) 1 84,87 80,91
BF 500-3 Pyraclostrobii :ortification Level. uum
0.02, 1.00
Statistic
0.02, 1.00
Number
Average (%)
Recovery Range (%)
0 02,S.O
Number
Average (%)
Recovery Range (Oh)
0.02, 1.0
2 9 1
88,94
Number
Average (%)
Recovery Range (%)
0.02-5.0
135 (continued; footnotes fol/ow)
2
90.5
87,94
2
96.5
95,98
Number
Average (%)
Recovery Range (%)
SD (%)
2
92
92
-
2
90.0
75, 105
SD (%) Number
Average (%)
Recovery Range (%)
2
84.0
82,86
2
82
80,84
4.5
2
74.5
65,84
-- 2
86.5
80-90
8.6
Number
-- 2
85.0
73-93
4 4
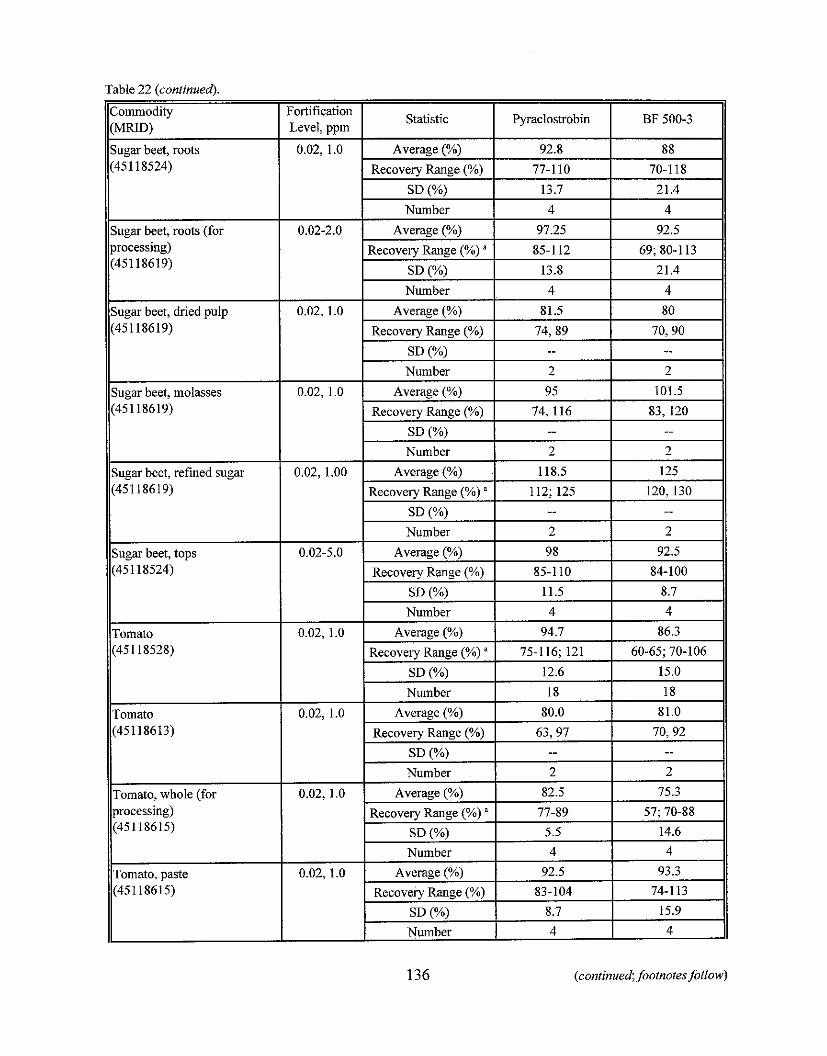
Table 22 (continued).
Commodity RVIRID)
ll~ugar beet, roots
Sugar beet, roots (for processing) (45118619)
Sugar beet, tops (451 18524)
Tomato (451 18528)
Tomato (45118613)
processing) (45118615)
:ortification Level, ppm . .
Statistic Pyraclostrobin
0.02-2.0
BF 500-3
0.02, 1.0
Recovery Range (%) ' I 85-1 12
92.8 Average (%)
Recovery Range (%)
SD (%) Number
Average (%)
69; 80-1 13
~,
88
Number
0.02, 1.0
77-110
13.7
4
97.25
SD (%)
Average (%)
Recovery Range (%)
SD (%'I
70-118
21.4
4
92.5
13.8 I 21.4
4
Average (%)
Recovery Range (%)
SD (.A) Number
Number
Average (%)
Recovery Range (%) "
SD (%) Number
Average (%)
136 (continued; footnotes follow)
4
95
74, 116 --
0.02, 1.0
0.02, 1.0
81.5
74,89 -- 2
101.5
83, 120 -.
2
118.5
112; 125 -- 2
98
80
70,90 -- 2
2
125
120, 130 -- 2
92.5
Recovery Range (%)
SD (%) Number
Average (%)
Recovery Range (%) "
SD (%) Number
Average (%)
85-110
11.5
4
94.7
75-1 16; 121
12.6
18
80.0
84-100
8.7
4
86.3
60-65; 70-106
15.0
18
81.0
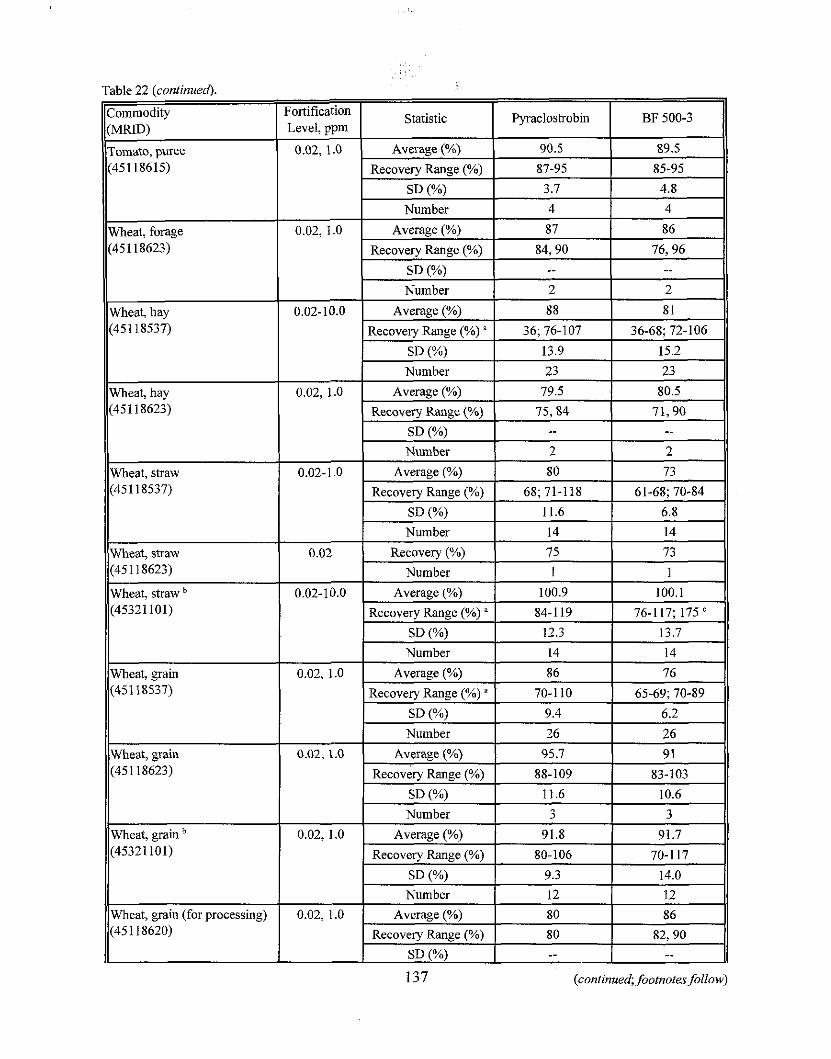
Table 22 (continued).
Commodity
Tomato, puree
Wheat, forage (451 18623)
(451 18537)
(451 18623)
Wheat, straw (451 18537)
, ,
137 (continued; footnotes follow)
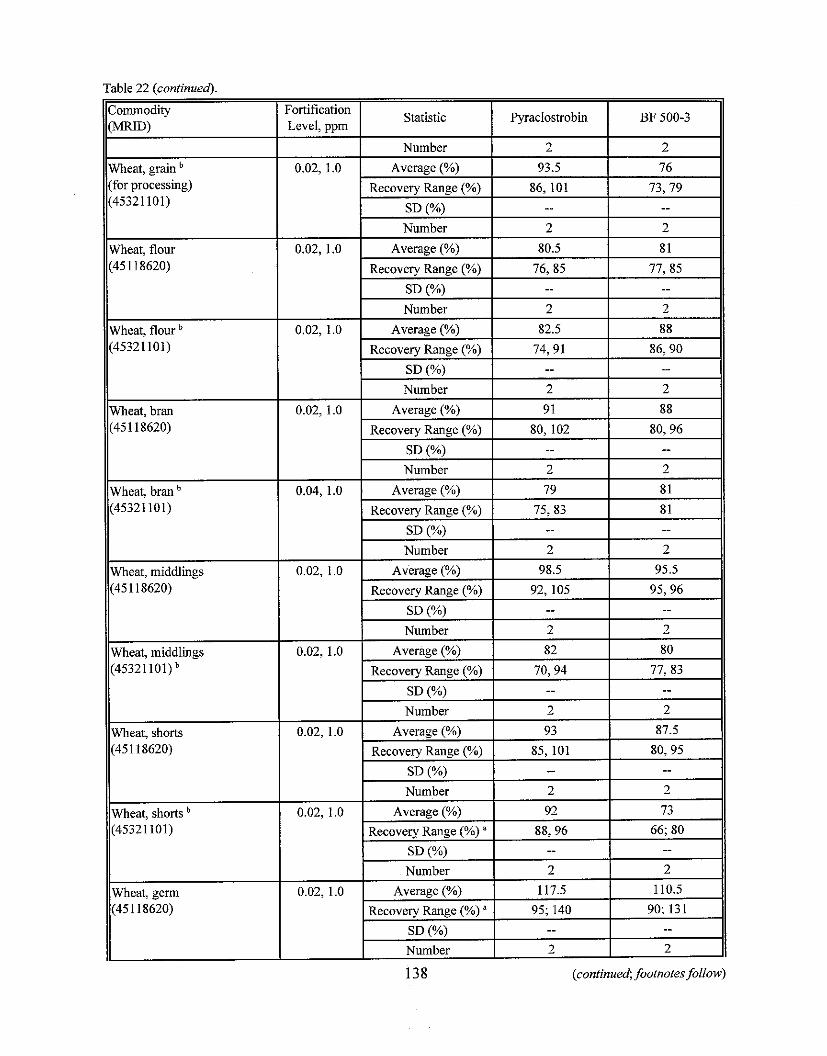
Table 22 (continued).
Commodity
(for processing) (45321101)
Wheat, flour (45321 101)
Wheat, bran (45 1 18620)
(45321 101)
Wheat, shorts (45 1 18620)
Wheat, shorts (45321 101) t
138 (continued;footnotes follow)
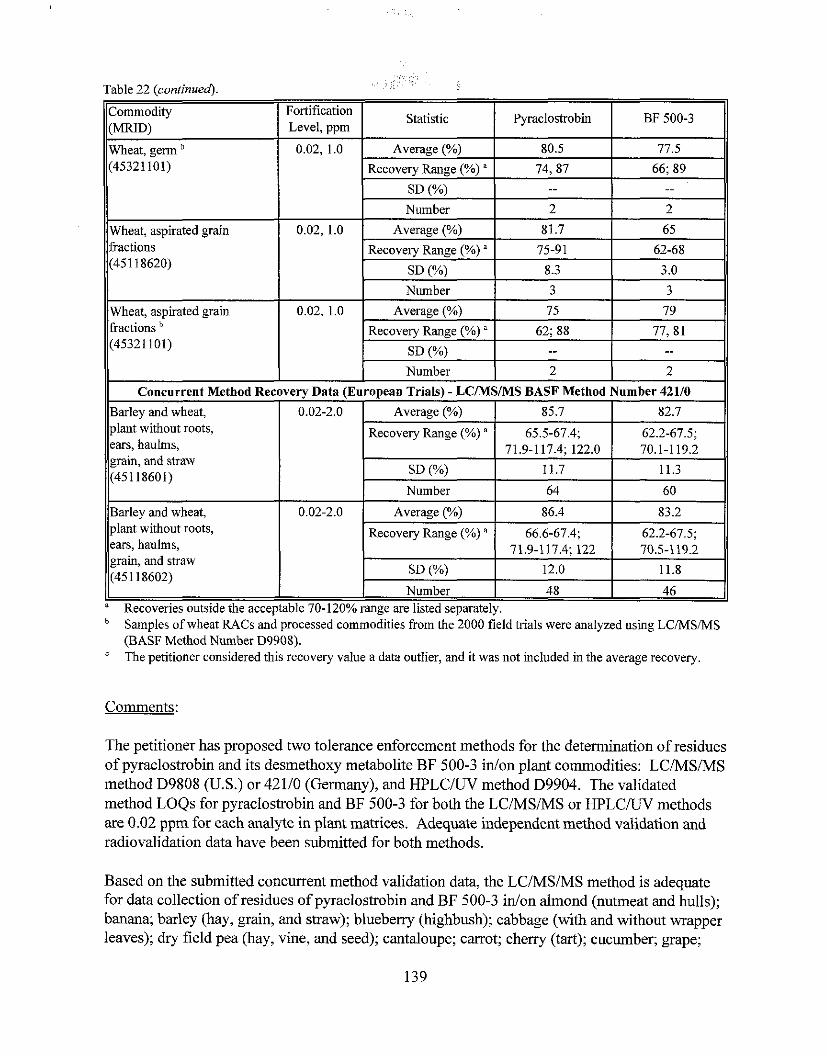
Table 22 (continued).
Wheat, aspirated grain fractions (45321101)
plant without roots, ears, haulms, grain, and straw (45118601)
I Recovery Range (%) " 1 65.5-67.4; 1 62.2-67.5; 11
0.02, 1.0
I Concurrent Method Recovery Data (European Trials) - LCNSMS BASF Method Number 42110
Barlev and wheat. 1 0.02-2.0 1 Average (%)
Comments:
Average 1%) Recovery Range (%) "
SD (%) Number
Barley and wheat, plant without roots, ears, haulms, grain, and straw (45 1 18602)
The petitioner has proposed two tolerance enforcement methods for the determination of residues of pyraclostrobin and its desmethoxy metabolite BF 500-3 inlon plant commodities: LCIMSIMS method D9808 (U.S.) or 42110 (Germany), and HPLCiUV method D9904. The validated method LOQs for pyraclostrobin and BF 500-3 for both the LCIMSIMS or HPLC/UV methods are 0.02 ppm for each analyte in plant matrices. Adequate independent method validation and radiovalidation data have been submitted for both methods.
85.7
Based on the submitted concurrent method validation data, the LCIMSIMS method is adequate for data collection of residues of pyraclostrobin and BF 500-3 inlon almond (nutmeat and hulls); banana; barley (hay, grain, and straw); blueberry (highbush); cabbage (with and without wrapper leaves); dry field pea (hay, vine, and seed); cantaloupe; carrot; cherry (tart); cucumber; grape;
75
62; 88 -- 2
82.7
" Recoveries outside the acceptable 70-120% range are listed separately. Samples of wheat RACs and processed commodities from the 2000 field trials were analyzed using LCiMSiMS (BASF Method Number D9908).
9 e petitioner considered this recovely value a data outlier, and it was not included in the average recovery.
0.02-2.0
79
77,Xl -- 2
Number
Average (%)
Recovery Range (%) a
SD ('?A) Number
64
86.4
66.6-67.4; 71.9-117.4; 122
12.0
48
60
83.2
62.2-67.5; 70.5-119.2
11.8
46
grapefruit; grass (forage, hay, straw, and seed screenings); lemon; lentil (seed); onion (dry bulb and green); orange; peach; peanut (hay and nutmeat); pecan (nutmeat); pepper (bell and chili); pistachio; potato; plum; radish (roots and tops); raspberry (red); rye (grain and straw); squash (summer); strawbeny; sugar beet (roots and tops); tomato; and wheat (forage, hay, grain, straw, and aspirated grain fractions), and the processed commodities of grapes, oranges, peanuts, plums, sugar beets, tomatoes, and wheat. Although some recoveries of pyraclostrobin and BF 500-3 were outside the acceptable range, average recoveries were generally within the acceptable range.
LCMSIMS method D9808 and HPLCKJV method D9904 have been forwarded to ACBBEAD for petition method validation (D269850, L. Cheng, 11/812000). The petitioner must modify the proposed enforcement methods to include any modifications made by the EPA laboratory during the Agency laboratory validation.
OPPTS GLN 860.1340: Residue Analvtical Method - Livestock commodities
Enforcement analytical methods - livestock commodities
BASF has proposed three methods, HPLCKJV method 43910, Method 446 (GCIMS and LCIMSIMS method), and LCIMSMS method D9902, for the enforcement of tolerances for residues of pyraclostrobin and its desmethoxy metabolite BF 500-3 idon livestock commodities. The proposed enforcement methods were used as the data collection methods in the ruminant and poultry feeding studies. HPLCKJV method 43910 is for the determination of the parentpev se in livestock commodities. Method 446, which consists of GCMS method 44610 and LCIMSMS method 44611, is a common moiety method for the analysis of ruminant commodities for residues of the parent and its metabolites which are hydrolyzable to BF 500-5 and BF 500-8; see Figure 3 (Attachment 111) for the chemical structures of these compounds. LCIMSIMS Method D9902 is a common moiety method for the analysis of poultry commodities for residues of the parent and its metabolites hydrolyzable to BF 500-5 and BF 500-9 (see Figure 3).
The petitioner has submitted method descriptions and validation data (citations listed below) for the proposed enforcement H P L C m , GCMS, and LCIMSIMS methods for livestock commodities.
451 18506 Tilting, N.; Lehman, W. (2000) Validation of Analytical Method No. 446: Determination of BAS 500 F (Reg. No. 304428) in Sample Material of Animal Origin. Laboratory Project Identification Number 35636; BASF Registration Document Number 1999/11075. Unpublished study prepared by BASF Corporation. 112 p.
451 18508 Malinsky, D.; Riley, M. (2000) Method Validation of BASF Analytical Method D9902, "Method for Determination of Residues of BAS 500 F and its Metabolite BF 500-16 in Hen Tissues Using LCIMSIMS. BASF Study Number 60916; BASF Registration Document Number 200015004. Unpublished study prepared by BASF Corporation. 73 p.
451 18509 Malinsky, D.; Trumbly, R. (2000) Technical Procedure: Method for Determination of Residues of BAS 500 F and its Metabolite BF 500-16 in Hen Tissues using LCIMSIMS. BASF Method Number D9902. BASF Registration Document Number 200015003. Unpublished study prepared by BASF Corporation. 27 p.
451 18510 Tilting, N.; Lehmann, W. (1999) LC-MS/MS Method of Determination of Reg. No. 304428 (BAS 500 F) and its Metabolites (BF 500-10) in Matrices of Animal Origin. BASF Registration Document Number 200015 139. Unpublished study prepared by BASF Corporation. 32 p.
451 1851 1 Kampke-Thiel, K.; Tilting, N. (1999) Method of Determination of Reg. No. 304428 (BAS 500 F) in matrices of animal origin. BASF Registration Document Number 200015138. Unpublished study prepared by BASF Corporation. 21 p.
45 1 185 13 Kampke-Thiel, K. (1999) Validation of BASF Method 43910 for the Determination of BAS 500 F (as Parent Compound) in Matrices of Animal Origin. Laboratory Project Identification No. 53018; BASF Registration Document Number 199911 1079. Unpublished study prepared by BASF Corporation. 45 p.
For the HPLCAJV method 43910, animal samples (muscle, fat, liver, kidney, milk, and eggs) are homogenized with ACN:iso-hexane (2:1, v:v) and filtered. After phase separation, the ACN phase is partitioned with iso-hexane; egg and fat samples are partitioned twice. The aqueous phase is extracted (3x) with DCM and filtered. The DCM phase is evaporated to dryness and redissolved in 5% ethyl acetate for micro-silica column cleanup. Residues are eluted from the silica column with 1% ethyl acetate in DCM. The eluate is evaporated to dryness and redissolved in iso-octane:methanol:iso-propano1:water (99:0.5:0.5:0.0025, v:v:v:v) for HPLC analysis. The normal phase HPLC system utilizes two columns; a silica pre-column, with an isocratic mobile phase of iso-octane:methanol:iso-propano1:water (99:0.5:0.5:0.0025, v:v:v:v), and an alumina analytical column, with an isocratic mobile phase of iso-octane:methanol:iso- propano1:water (90:5:5:0.0025, v:v:v:v). Residues of pyraclostrobin are quantitated using a UV detector at 270 nm. The method LOQs for residues of pyraclostrobin were reported as 0.01 ppm for milk and 0.05 ppm for tissue and egg samples. The petitioner stated that a reversed-phase column may be used for confirmation of residues.
Method 446 was initially developed using GCMS in milk (Method 44610), but has been replaced with the shorter LCIMSIMS detection method (Method 44611). For the GCIMS method 44610, milk samples are first homogenized with iso-hexane:ACN (1 : 1, v:v), filtered, and the ACN phase is collected and evaporated to dryness. Residues are then heated with 2.5 M sodium hydroxide and sodium chloride at reflux to produce the hydroxypyrazole derivatives, BF 500-5 and BF 500- 8. The derivatized extracts of milk are cooled, acidified with 5 M HCI, and partitioned with ethyl acetate. Silica gel is added to an aliquot of the ethyl acetate phase, and the mixture is evaporated to dryness. The dried silica gellresidues are subjected to silica gel column chromatography; residues are eluted from the silica gel column with iso-hexane:acetone (7:3, v:v) and evaporated
to dryness. Residues are redissolved in acetone, and powdered potassium carbonate is added. Next, residues are methylated with methyl iodide at reflux, filtered and evaporated to dryness. Residues are then redissolved in iso-hexane and subjected to sequential SPE column (silica and ENV) cleanup; residues are eluted with iso-hexane:DCM (75:25, v:v). The purified residues are concentrated for GCIMS analysis. BF 500-5 residues are determined as its methyl ether, MMP (monitoring m/z 193, 139, 179), and BF 500-8 residues are determined as its methyl ether, DMP (monitoring m/z 238, 179, 126). Each are then converted to parent equivalents using molecular weight ratios. The method LOQs are 0.01 ppm each for BF 500-5 residues and BF 500-8 residues in milk.
For the LCIMSMS method 44611, ruminant fat and milk samples are first homogenized with iso-hexane:ACN (1 : 1, v:v), filtered, and the ACN phase is collected and evaporated to dryness. Milk and fat dried residues and other ruminant tissue samples (muscle, liver, and kidney) are then hydrolyzed with 2.5 M sodium hydroxide and sodium chloride at reflux to produce the hydroxypyrazole derivatives BF 500-5 and BF 500-8). After hydrolysis, 5 N HC1 and methanol are added to the hydrolysate. Fat samples require less cleanup than the other matrices; therefore, the hydrolyzed fat extract is extracted (2x) with ethyl acetate, and an aliquot of the organic phase is evaporated to dryness and redissolved in ACN for LCIMSIMS analysis. The derivatized extracts of milk and the remaining tissues are partitioned (3x) with DCM. Silica gel is added to an aliquot of the DCM phase, and the mixture is evaporated to dryness. The dried silica gellresidues are subjected to silica gel column chromatography; residues are eluted from the silica gel column with isohexane:acetone (7:3, v:v) and evaporated to dryness. Residues are redissolved in iso-hexane and partitioned (2x) with HCl. The acid phases are combined, sodium hydroxide is added (pH paper is used to ensure that the mixture remains acidic), and the mixture is partitioned with DCM. The DCM phase is dried with anhydrous sodium sulfate, then evaporated to dryness, and residues are redissolved in ACN for LCIMSIMS analysis. For quantitation, the productJdaughter ion for the transition m/z 195 - 153 for BF 500-5 and m/z 21 1 - 194 for BAS 500-8 are measured. Molecular weight conversion is used to convert all residues to parent equivalents. The reported method LOQs for each analyte are 0.01 ppm for milk and 0.05 ppm for ruminant tissues.
LC/MS/MS method D9902 for poultry eggs and tissues is similar to LCIMSIMS method 44611 for ruminant commodities. Samples of homogenized egg, and ground poultry liver and muscle are hydrolyzed in 2.5 N sodium hydroxide to produce the hydroxypyrazole derivatives (BF 500-5 or BF 500-9). After hydrolysis, 5 N HC1 and methanol are added to the hydrolysate, and the samples are precipitated overnight in a refrigerator and filtered. The extract is mixed with methano1:water (1: 1, v:v), and an aliquot is diluted with water for sequential ENV and silica SPE column cleanup. Residues are eluted from the ENV column with DCM:ethyl acetate (1:2, v:v), evaporated to complete dryness, and residues are redissolved in ethyl acetate and hexane for silica column cleanup. Residues are eluted from the silica column with ethyl acetate:hexane (35:65, v:v), evaporated to dryness, and residues are redissolved in methano1:water (9:1, v:v) for LCIMSIMS analysis. As for ruminant fat samples, poultry fat samples are initially extracted with hexane:ACN (1:1, v:v) prior to hydrolysis with 2.5 N sodium hydroxide. Following
hydrolysis, 5 N HC1 and water are added to the hydrolysate, and the derivatized extracts are then partitioned with ethyl acetate. The ethyl acetate phase is filtered and evaporated to complete dryness. Residues are redissolved in methano1:water (9:1, v:v) for LCMSIMS analysis. For quantitation, the productidaughter ion for the transition m/z 195 - 153 for BF 500-5 and m/z 21 1 - 169 for BAS 500-9 are measured. Molecular weight conversion is used to convert residues to parent equivalents. The reported method LOQs for each analyte are 0.05 ppm for eggs and poultry tissues.
Method validations of the HPLCNV and LCMS/MS methods were conducted on representative animal matrices. Untreated samples of cow milk, fat, kidney, liver, and muscle, and hen eggs, obtained commercially for validation of the HPLCIUV method, were fortified with pyraclostrobin at the LOQ (0.01 ppm for milk and 0.05 ppm for tissues and eggs) and lox the LOQ. Untreated samples of cow milk, fat, kidney, liver, and muscle, obtained commercially for validation of LCIMSIMS method 44611, were fortified with pyraclostrobin (representative of compounds hydrolyzable to BF 500-5) and compound BF 500-10 (representative of compounds hydrolyzable to BF 500-8; see Figure 3) each at the LOQ (0.01 ppm for milk and 0.05 ppm for tissues) and lox the LOQ; the fortified milk sample was also analyzed by GC/MS method44610. Untreated samples of hen eggs, fat, liver, and muscle, obtained from the hen feeding study for validation of the LC/MSiMS method D9902, were fortified with pyraclostrobin (representative of compounds hydrolyzable to BF 500-5) and metabolite BF 500-16 (representative of compounds hydrolyzable to BF 500-9; see Figure 3) each at the LOQ (0.05 ppm) and 2x the LOQ.
Unfortified and fortified samples were analyzed using either HPLCNV method 43910, GCIMS method 44610, or LCMSIMS method 44611 or D9902. Method validation recoveries are reported in Table 23; method recoveries were corrected for interferences from matrix compounds. Apparent residues of pyraclostrobin were not reported for the HPLCIUV method 43910 and GCMS method 44610, but representative chromatograms of the control samples were included demonstrating negligible background or baseline noise. Apparent residues of pyraclostrobin and BF 500-10 using LCiMS/MS method 44611 were each less than the method LOQ (0.01 ppm for milk and 0.05 ppm for tissues; inspection of the control chromatograms showed negligible background or interfering peaks) in two samples each of untreated cow milk, fat, kidney, liver, and muscle. Apparent residues of pyraclostrobin and BF 500-16 using LCiMSIMS method D9902 were each less than the method LOQ (0.05 ppm; inspection of the control chromatograms showed negligible background or interfering peaks) in four samples each of untreated poultry egg, fat, liver, and muscle.
The petitioner noted that lower recoveries were obtained for residues of BF 500-10 (55.5-85.6%) in ruminant commodities using LC/MS/MS method 44611 and for residues of BF 500-16 (58- 71%) in poultry commodities using LC/MS/MS method D9902, but that the standard deviations
were low within each analytical series demonstrating good repeatability. The petitioner therefore considered the recoveries acceptable for the minor metabolites.
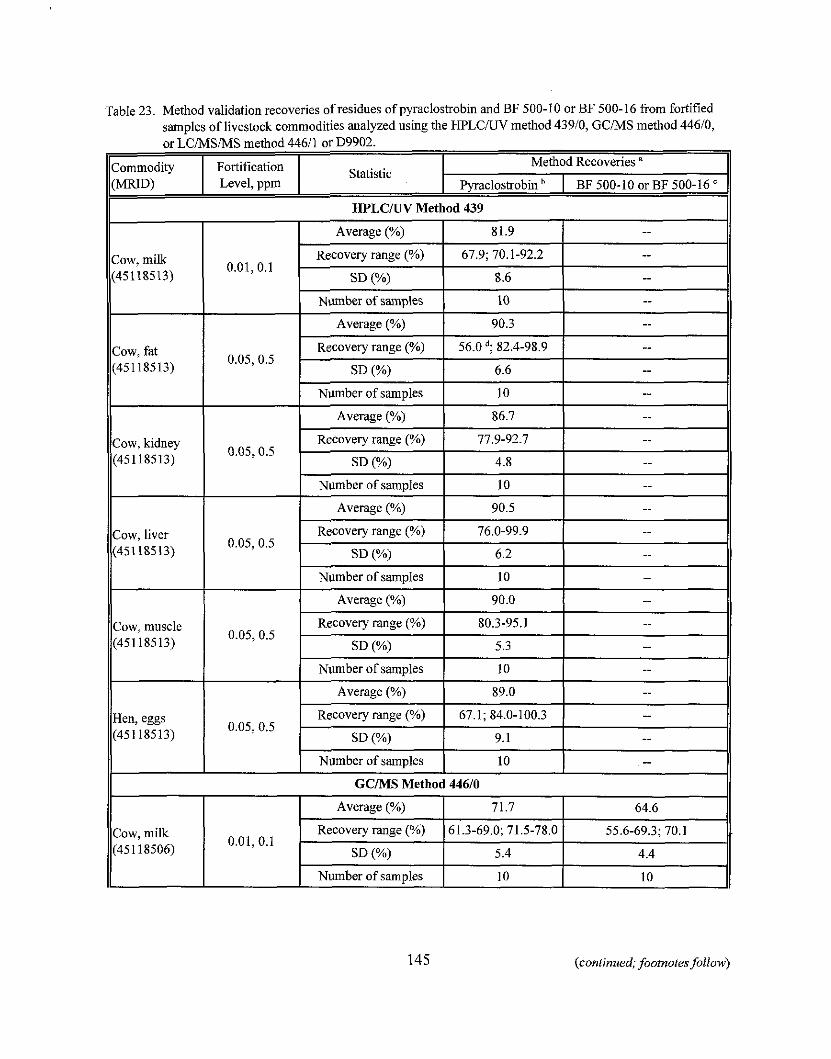
145 (continued; footnotes follow)
Table 23. Method validation recoveries of residues of pyraclostrobin and BF 500-10 or BF 500-16 from fortified samples of livestock commodities analyzed using the HPLCiCTV method 43910, GCMS method 44610, or LC/MS/MS method 44611 or D9902.
Method Recoveries "
Pyraclostrobin I BF 500-10 or BF 500-16
HPLCIUV Method 439
I I Average (%) 81.9 1
Statistic Commodity (MRID)
Fortification Level, ppm
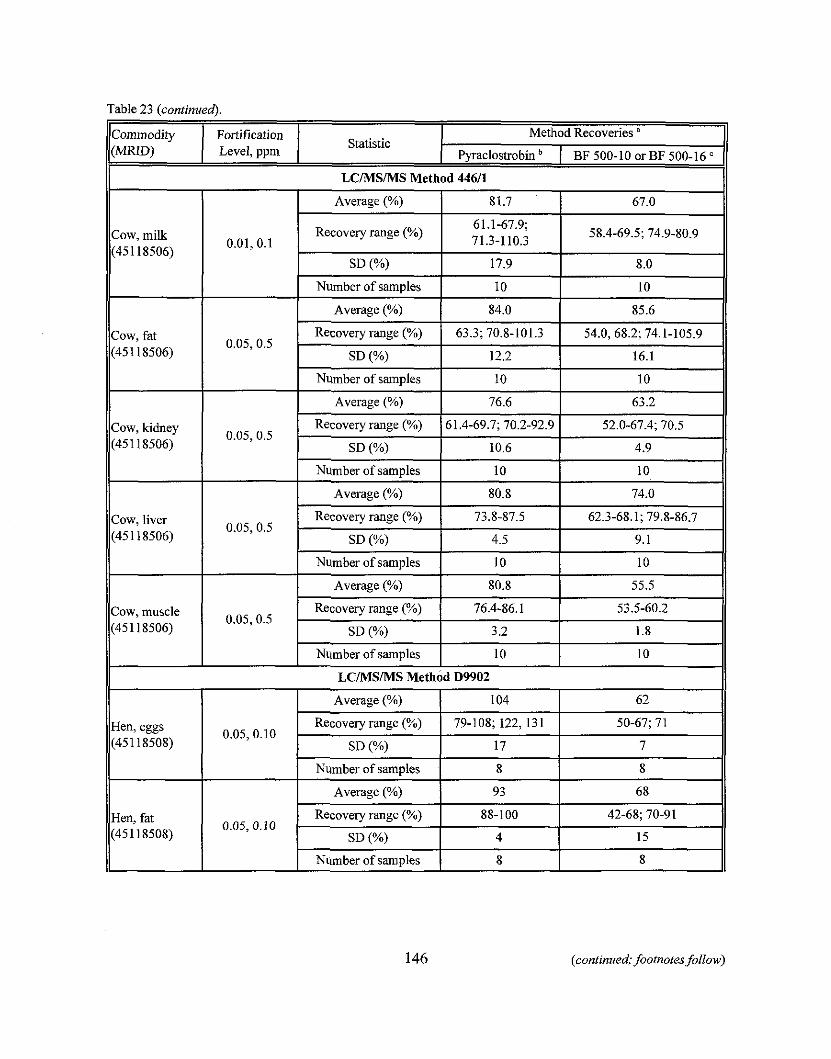
Table 23 (continued).
(continued: footnotes follow)
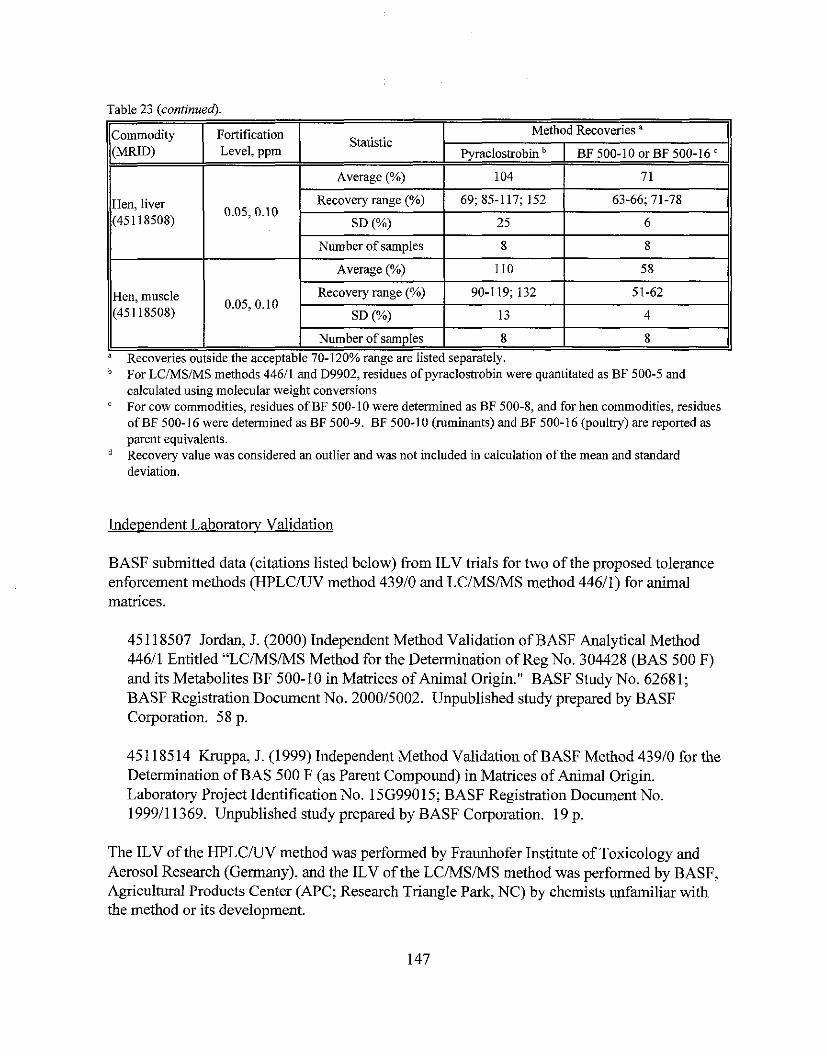
Table 23 (continued)
Qecoveries outside the acceptable 70-120% range are listed separately. For LCiMSIMS methods 44611 and D9902, residues of pyracloshobin were quantitated as BF 500-5 and calculated using molecular weight conversions For cow commodities, residues of BF 500-10 were determined as BF 500-8, and for hen commodities, residues of BF 500-16 were determined as BF 500-9. BF 500-10 (mminants) and BF 500-16 (poultry) are reported as parent equivalents. Recovery value was considered an outlier and was not included in calculation of the mean and standard deviation.
Independent Laboratow Validation
BASF submitted data (citations listed below) from ILV trials for two of the proposed tolerance enforcement methods (HPLCILTV method 43910 and LCIMSIMS method 44611) for animal matrices.
451 18507 Jordan, J. (2000) Independent Method Validation of BASF Analytical Method 44611 Entitled "LCIMS/MS Method for the Determination of Reg No. 304428 (BAS 500 F) and its Metabolites BF 500-10 in Matrices of Animal Origin." BASF Study No. 62681; BASF Registration Document No. 200015002. Unpublished study prepared by BASF Corporation. 58 p.
451 18514 Kruppa, J. (1999) Independent Method Validation of BASF Method 43910 for the Determination of BAS 500 F (as Parent Compound) in Matrices of Animal Origin. Laboratory Project Identification No. 15699015; BASF Registration Document No. 199911 1369. Unpublished study prepared by BASF Corporation. 19 p.
The ILV of the HPLCILTV method was performed by Fraunhofer Institute of Toxicology and Aerosol Research (Germany), and the ILV of the LCIMSMS method was performed by BASF, Agricultural Products Center (APC; Research Triangle Park, NC) by chemists unfamiliar with the method or its development.
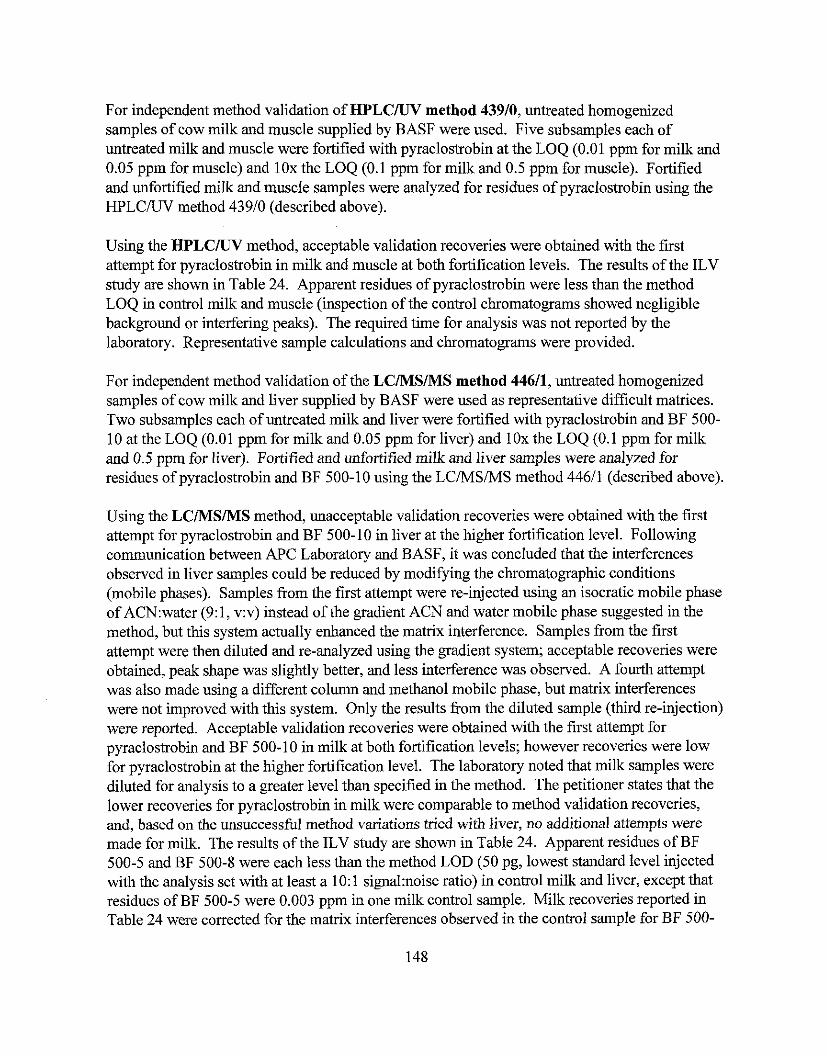
For independent method validation of HPLClLTV method 43910, untreated homogenized samples of cow milk and muscle supplied by BASF were used. Five subsamples each of untreated milk and muscle were fortified with pyraclostrobin at the LOQ (0.01 pprn for milk and 0.05 pprn for muscle) and lox the LOQ (0.1 pprn for milk and 0.5 pprn for muscle). Fortified and unfortified milk and muscle samples were analyzed for residues of pyraclostrobin using the HPLCNV method 43910 (described above).
Using the HPLCRJV method, acceptable validation recoveries were obtained with the first attempt for pyraclostrobin in milk and muscle at both fortification levels. The results of the ILV study are shown in Table 24. Apparent residues of pyraclostrobin were less than the method LOQ in control milk and muscle (inspection of the control chromatograms showed negligible background or interfering peaks). The required time for analysis was not reported by the laboratory. Representative sample calculations and chromatograms were provided.
For independent method validation of the LCMSMS method 44611, untreated homogenized samples of cow milk and liver supplied by BASF were used as representative difficult matrices. Two subsamples each of untreated milk and liver were fortified with pyraclostrobin and BF 500- 10 at the LOQ (0.01 pprn for milk and 0.05 pprn for liver) and lox the LOQ (0.1 pprn for milk and 0.5 pprn for liver). Fortified and unfortified milk and liver samples were analyzed for residues of pyraclostrobin and BF 500-10 using the LCIMSIMS method 44611 (described above).
Using the LCMSMS method, unacceptable validation recoveries were obtained with the first attempt for pyraclostrobin and BF 500-10 in liver at the higher fortification level. Following communication between APC Laboratory and BASF, it was concluded that the interferences observed in liver samples could be reduced by modifying the chromatographic conditions (mobile phases). Samples from the first attempt were re-injected using an isocratic mobile phase of ACN:water (9:1, v:v) instead of the gradient ACN and water mobile phase suggested in the method, but this system actually enhanced the matrix interference. Samples from the first attempt were then diluted and re-analyzed using the gradient system; acceptable recoveries were obtained, peak shape was slightly better, and less interference was observed. A fourth attempt was also made using a different column and methanol mobile phase, but matrix interferences were not improved with this system. Only the results from the diluted sample (third re-injection) were reported. Acceptable validation recoveries were obtained with the first attempt for pyraclostrobin and BF 500-10 in milk at both fortification levels; however recoveries were low for pyraclostrobin at the higher fortification level. The laboratory noted that milk samples were diluted for analysis to a greater level than specified in the method. The petitioner states that the lower recoveries for pyraclostrobin in milk were comparable to method validation recoveries, and, based on the unsuccessful method variations tried with liver, no additional attempts were made for milk. The results of the ILV study are shown in Table 24. Apparent residues of BF 500-5 and BF 500-8 were each less than the method LOD (50 pg, lowest standard level injected with the analysis set with at least a 10:l signal:noise ratio) in control milk and liver, except that residues of BF 500-5 were 0.003 pprn in one milk control sample. Milk recoveries reported in Table 24 were corrected for the matrix interferences observed in the control sample for BF 500-
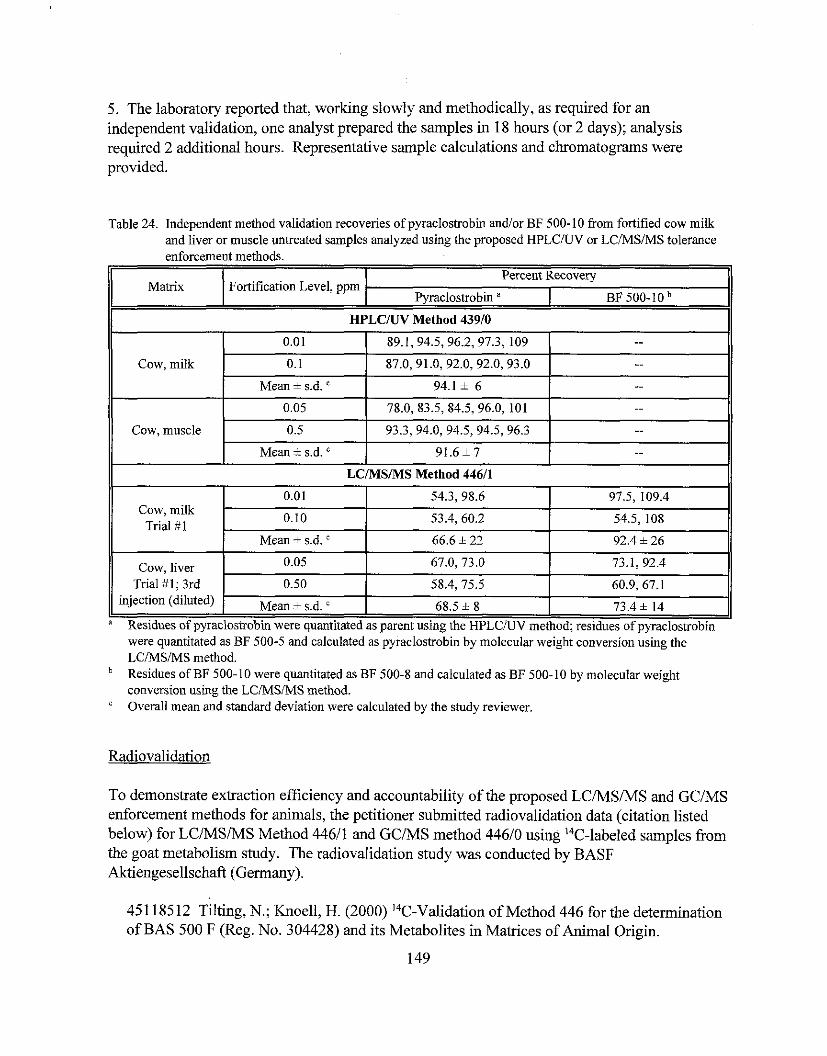
5. The laboratory reported that, working slowly and methodically, as required for an independent validation, one analyst prepared the samples in 18 hours (or 2 days); analysis required 2 additional hours. Representative sample calculations and chromatograms were provided.
Table 24. Independent method validation recoveries of pyraclostrobin andlor BF 500-10 from fortified cow milk and liver or muscle untreated samples analyzed using the proposed HPLCiIJV or LCIMSIMS tolerance enforcement methods. -
I
LC/MS/MS Method 44611
Cow, milk Trial # 1
I
Radiovalidation
Matrix
Cow, liver Trial #I: 3rd
injection (diluted)
To demonstrate extraction efficiency and accountability of the proposed LCMSIMS and GCIMS enforcement methods for animals, the petitioner submitted radiovalidation data (citation listed below) for LCIMSIMS Method 44611 and GCMS method 44610 using I4C-labeled samples from the goat metabolism study. The radiovalidation study was conducted by BASF Aktiengesellschaft (Germany).
0.01 - 0.10
Mean + s.d.
451 18512 Tilting, N.; Knoell, H. (2000) I4C-Validation of Method 446 for the determination of BAS 500 F (Reg. No. 304428) and its Metabolites in Matrices of Animal Origin.
149
Percent Recovery Fortification Level, ppm
0.05
Qesidues of pyraclostrobin were quantitated as parent using the HPLCRTV method; residues of pyraclostrobin were quantitated as BF 500-5 and calculated as pyraclostrobin by molecular weight conversion using the LCNSMS method. Residues of BF 500-10 were quantitated as BF 500-8 and calculated as BF 500-10 by molecular weight conversion using the LCIMSIMS method.
V v e r a l l mean and standard deviation were calculated by the study reviewer.
I I
Pyraclostrobin "
HPLCRTV Method 43910
54.3,98.6
53.4, 60.2
66.6 i 22
67.0,73.0 73.1, 92.4
Mean + s.d. '
BF 500-10
Cow, milk
Cow, muscle
97.5, 109.4
54.5, 108
92.4 + 26
0.50 1 58.4. 75.5 I 60.9. 67.1
68.5 + 8
0.01
0.1
Mean + s.d.
0.05
0.5
Mean s.d.
73.4 + 14
89.1, 94.5,96.2, 97.3, 109
87.0,91.0, 92.0,92.0,93.0
94.1 + 6
78.0, 83.5, 84.5, 96.0, 101
93.3,94.0, 94.5, 94.5, 96.3
91.6+7
-- -.
-.
..
-- --
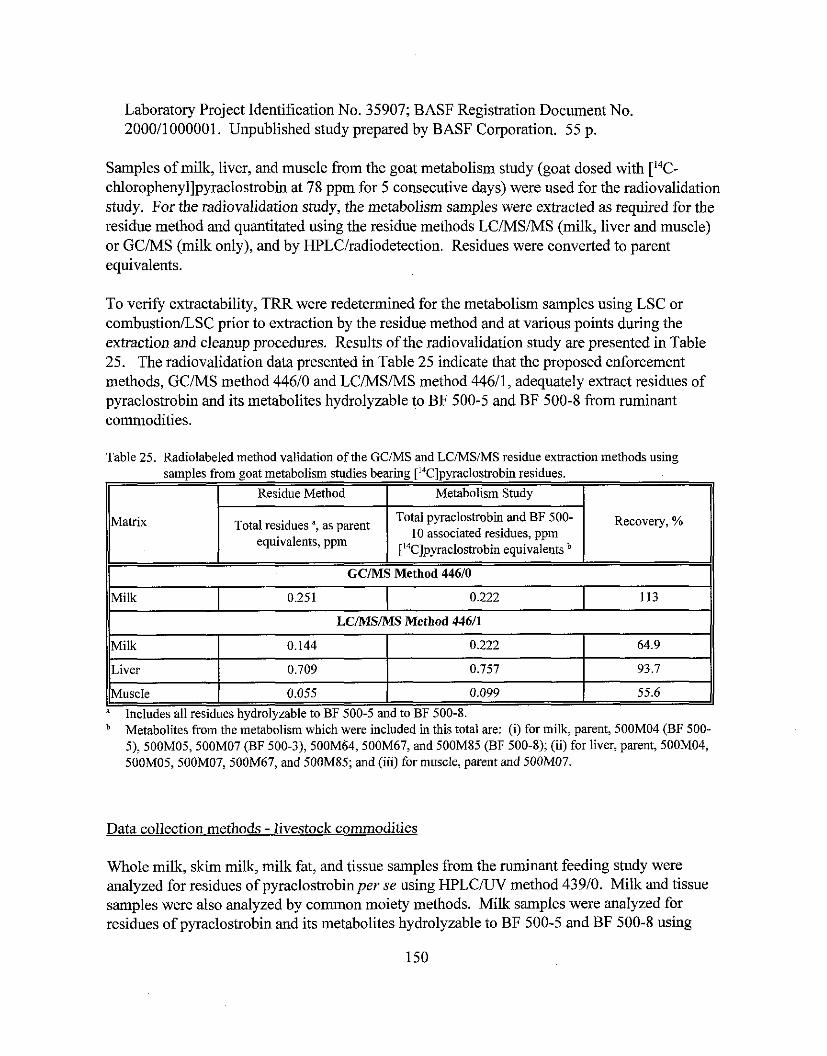
Laboratory Project Identification No. 35907; BASF Registration Document No. 200011000001. Unpublished study prepared by BASF Corporation. 55 p.
Samples of milk, liver, and muscle from the goat metabolism study (goat dosed with [14C- chlorophenyl]pyraclostrobin at 78 ppm for 5 consecutive days) were used for the radiovalidation study. For the radiovalidation study, the metabolism samples were extracted as required for the residue method and quantitated using the residue methods LCIMSIMS (milk, liver and muscle) or GCMS (milk only), and by HPLCIradiodetection. Residues were converted to parent equivalents.
To verify extractability, TRR were redetermined for the metabolism samples using LSC or combustion/LSC prior to extraction by the residue method and at various points during the extraction and cleanup procedures. Results of the radiovalidation study are presented in Table 25. The radiovalidation data presented in Table 25 indicate that the proposed enforcement methods, GCIMS method 44610 and LCMSIMS method 44611, adequately extract residues of pyraclostrobin and its metabolites hydrolyzable to BF 500-5 and BF 500-8 from ruminant commodities.
Table 25. Radiolabeled method validation of the GCIMS and LCMSMS residue extraction methods using - samples from goat metabolism studies bearing ['4C]pyraclostrobin residues.
11 LC/MS/MS Method 44611 11
I Residue Method
Matrix
Metabolism Study I
( ~ u s c l e 0.055 0.099 I 55.6 " Includes all residues hydrolyzable to BF 500-5 and to BF 500-8.
GC/MS Method 44610
Total residues ", as parent equivalents, ppm
Metabolites from the metabolism which were included in this total are: (i) for milk, parent, 500M04 (BF 500- 5), 500M05, 500M07 (BF 500-3), 500M64, 500M67, and 500M85 (BF 500-8); (ii) for liver, parent, 500M04, 500M05,500M07,500M67, and 500M85; and (iii) for muscle, parent and 500M07.
64.9
Data collection methods - livestock commodities
Total pyracloshobin and BF 500- 10 associated residues, ppm
['4C]pyraclostrobin equivalents
0.222 Milk
Whole milk, skim milk, milk fat, and tissue samples from the ruminant feeding study were analyzed for residues of pyraclostrobinper se using HPLClLTV method 43910. Milk and tissue samples were also analyzed by common moiety methods. Milk samples were analyzed for residues of pyraclostrobin and its metabolites hydrolyzable to BF 500-5 and BF 500-8 using
Recovery, %
0.144
93.7 0.757 Liver 0.709
GCMS method 44610. Tissue samples were analyzed for residues of pyraclostrobin and its metabolites hydrolyzable to BF 500-5 and BF 500-8 using LCIMSMS method 44611. For all methods, the reported method LOQs for BF 500-5 and BF 500-8 (in parent equivalents) were each 0.01 pprn in milk and 0.05 pprn in tissues.
Egg and tissue samples from the poultry feeding study were analyzed for residues of pyraclostrobin and its metabolites hydrolyzable to BF 500-3 and BF 500-9 using a common moiety method, LCIMSIMS method D9902. The reported method LOQs for BF 500-5 and BF 500-9 (in parent equivalents) were 0.05 pprn each in eggs and tissues.
The analytical methods used in the feeding studies for data collection are the same as those proposed for enforcement purposes and have been described above. Concurrent method validations were performed in conjunction with the ruminant and poultry feeding studies. For the ruminant feeding study, untreated samples of whole and skim milk, milk fat, fat, kidney, liver, and muscle were fortified with pyraclostrobin at the method LOQ (0.01 pprn for milk and 0.05 pprn for tissues) and lox the LOQ, and analyzed with the treated samples using the HPLCNV method 43910. In addition, untreated samples of whole and skim milk, and milk fat were fortified with pyraclostrobin (representative of compounds hydrolyzable to BF 500-5) and BF 500-10 (representative of compounds hydrolyzable to BF 500-8) at the method LOQ (0.01 ppm) and lox the LOQ, and analyzed with the treated samples using the GCIMS method 44610. Untreated samples of fat, kidney, liver, and muscle were fortified with pyraclostrobin and BF 500-10 at the method LOQ (0.05 pprn for tissues), lox the LOQ, and 2.0 pprn (liver only), and analyzed with the treated samples using the LCIMSIMS method 44611. For the poultry feeding study, untreated samples of eggs, fat, liver, and muscle were fortified with pyraclostrobin and BF 500-16 (representative of compounds hydrolyzable to BF 500-9) at the method LOQ (0.05 pprn each analyte). Fortified poultry samples were analyzed with the treated samples using the LCMSMS method D9902. Concurrent method recoveries of fortified ruminant and poultry samples are reported in Table 26.
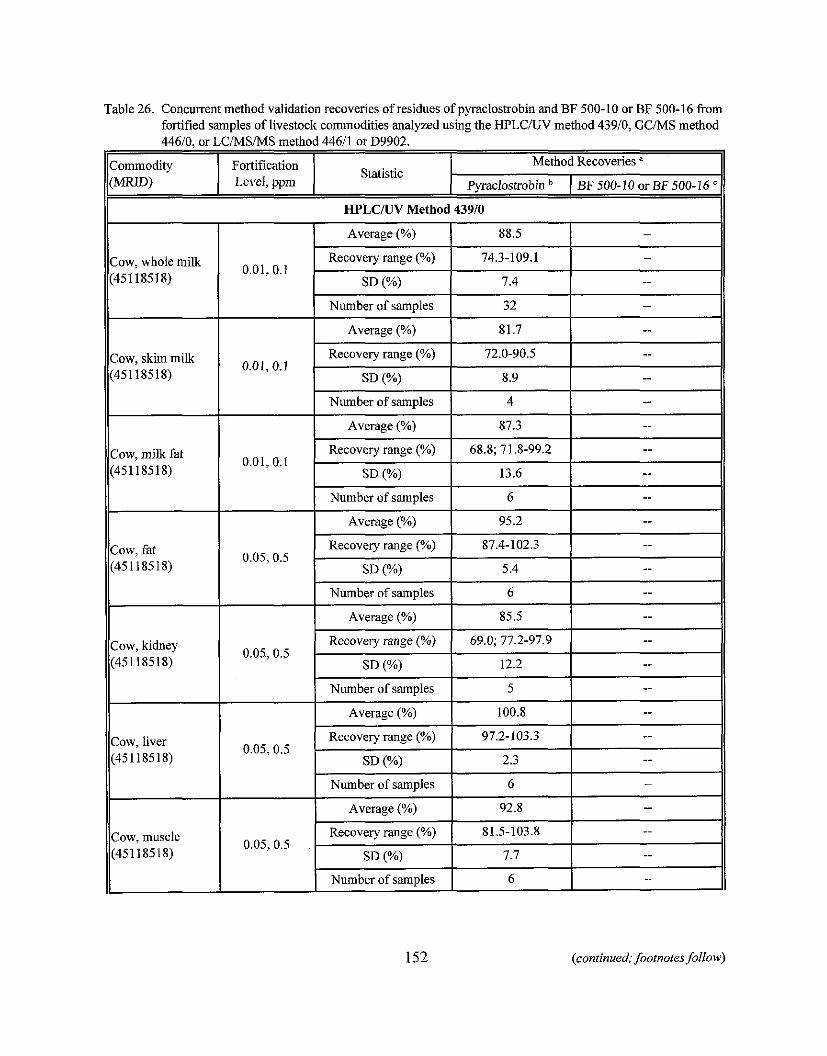
152 (continued; footnotes follow)
Table 26. Concurrent method validation recoveries of residues of pyraclostrobin and BF 500-10 or BF 500-16 &om fortified samples of livestock commodities analyzed using the HPLCAJV method 43910, GCIMS method 44610, or LCiMSiMS method 44611 or D9902.
Commodity Fortification Method Recoveries a
(MMD) Statistic Level, ppm F'yracloshobin 1 BF 500-10 or BF 500-16
Cow, muscle (45118518)
0.05,0.5
Number of samples
Average (%)
Recovery range (%)
SD (%)
Number of samples
6
92.8
81.5-103.8
7.7
6
-
-- - -.
-- -
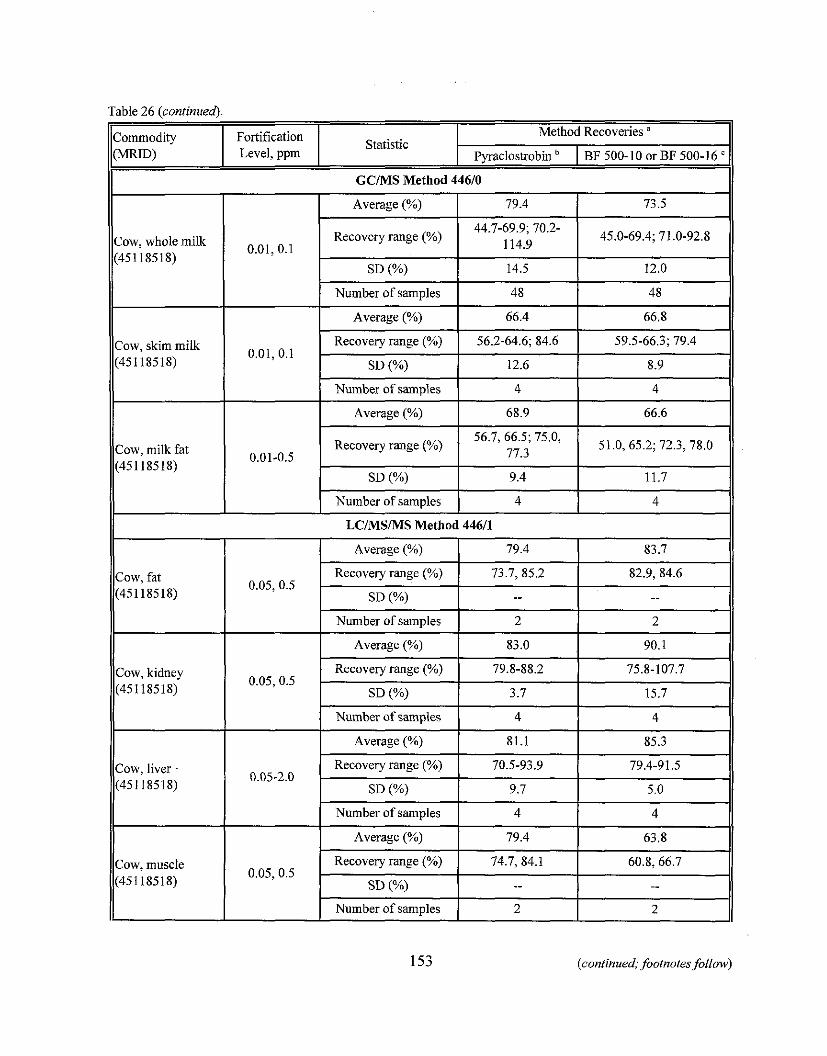
Table 26 (continued).
Recovery range (%) 45.0-69.4; 71.0-92.8
Recovery range (%) 51.0, 65.2; 72.3, 78.0
LC/MS/MS Method 44611 11
Cow, fat (45118518)
-
Average (Oh) 79.4 83.7
Recovery range (%) 73.7,85.2 82.9, 84.6 0.05,0.5
SD (%) -- .-
I Number ofsamples I 2 I 2 11
Cow, kidney (45118518)
Cow, liver . (45118518)
Cow, muscle (45118518)
Average (%) 83.0 90.1
Recovery range (%) 79.8-88.2 75.8-107.7 0.05, 0.5
SD (Oh) 3.7 15.7
Number of samples 4 4
Average (%) 81.1 85.3
Recovery range (%) 70.5-93.9 79.4-91.5 0.05-2.0 -
SD (%) 9.7 5.0
Number of samples 4 4
Average (%) 79.4 63.8
Recovery range (%) 74.7, 84.1 60.8, 66.7 0.05,0.5
SD ("A) -- .-
Number of samples 2 2
153 (continued; footnotes follow)
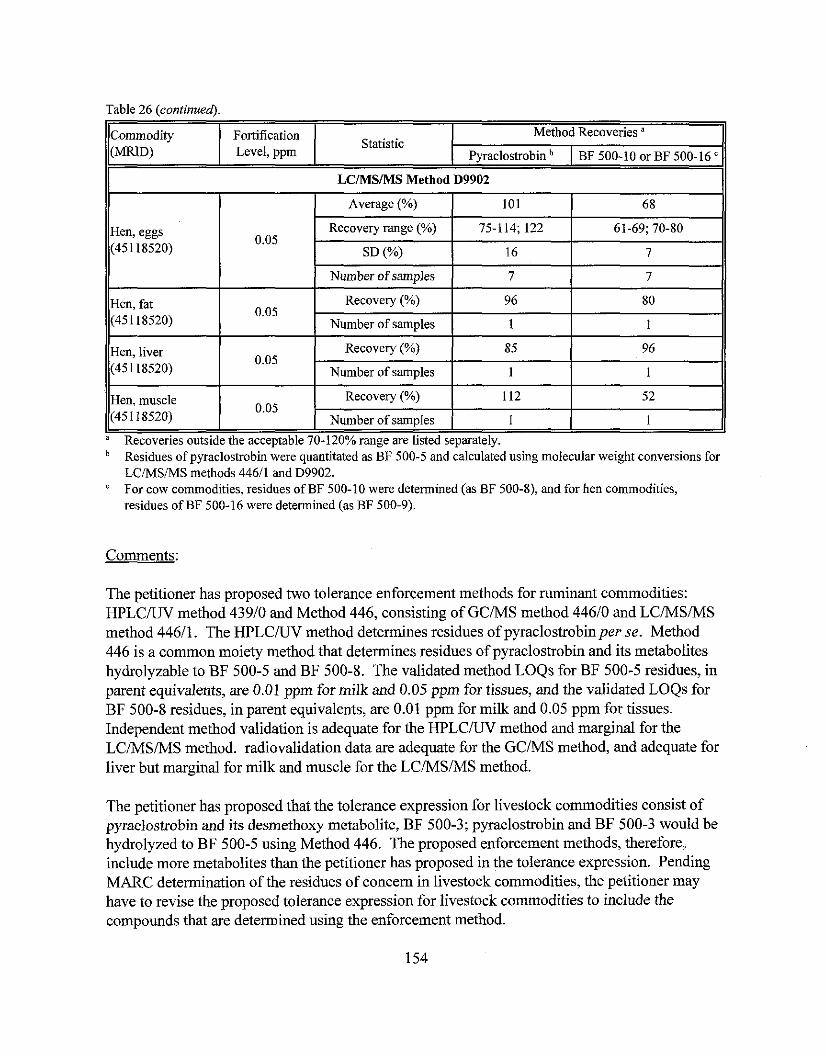
Hen, eggs (451 18520)
Table 26 (continued).
Commodity (MMD)
0.05
LC/MS/MS Method D9902
Fortification Level, ppm
Recovery (%)
Average (%)
Recovery range (%)
SD (%)
Number of samples
Hen, liver (45 1 18520)
Residues of pyraclostrobin were quantitated as BF 500-5 and calculated using molecular weight conversions for LCiMSiMS methods 44611 and D9902. For cow commodities, residues of BF 500-10 were determined (as BF 500-8), and for hen commodities, residues of BF 500-16 were determined (as BF 500-9).
Statistic
96
Hen, muscle (45 I 18520)
Comments:
Method Recoveries ' Pyraclostrobin I BF 500-10 or BF 500-16 '
101
75-114; 122
16
7
80
Number of samoles I 1 I 1
0.05
The petitioner has proposed two tolerance enforcement methods for ruminant commodities: H P L C M method 43910 and Method 446, consisting of GCMS method 44610 and LC/MS/MS method 44611. The HPLCNV method determines residues of pyraclostrobinper se. Method 446 is a common moiety method that determines residues of pyraclostrobin and its metabolites hydrolyzable to BF 500-5 and BF 500-8. The validated method LOQs for BF 500-5 residues, in parent equivalents, are 0.01 ppm for milk and 0.05 ppm for tissues, and the validated LOQs for BF 500-8 residues, in parent equivalents, are 0.01 ppm for milk and 0.05 ppm for tissues. Independent method validation is adequate for the HPLCNV method and marginal for the LC/MS/MS method. radiovalidation data are adequate for the GCIMS method, and adequate for liver but marginal for milk and muscle for the LCMSiMS method.
68
61-69; 70-80
7
7
I
" Recoveries outside the acceptable 70-120% range are listed separately.
0.05
The petitioner has proposed that the tolerance expression for livestock commodities consist of pyraclostrobin and its desmethoxy metabolite, BF 500-3; pyraclostrobin and BF 500-3 would be hydrolyzed to BF 500-5 using Method 446. The proposed enforcement methods, therefore, include more metabolites than the petitioner has proposed in the tolerance expression. Pending MARC determination of the residues of concern in livestock commodities, the petitioner may have to revise the proposed tolerance expression for livestock commodities to include the compounds that are determined using the enforcement method.
Recovery (%)
Number of samples
Recovery (%)
Number of samples
85
1
96
1
112
1
52
1
The petitioner has proposed tolerances for eggs and poultry tissues, and has included method validation data for the LC/MS/MS method D9902, a common moietv method which is used to quantitate residues of pyraclostrobin and its metabolites hydrolyzable to BF 500-9 in poultry matrices. No indeoendent laboratorv validation or radiovalidation data have been submitted in support of the method. Since Method D9902 is very similar to Method 446, g.il&*dy% . ., , ,..,, ,
l&fait@ly , , , ,y&&&$gyqI;gagfiq$t&. . . ,,,
The proposed enforcement methods were used for data collection in the ruminant and poultry feeding studies. The concurrent method validation recoveries demonstrate that the methods are adequate for data collection.
Method 446 has been forwarded to ACBBEAD for petition method validation, because adequate method validation (~&~,:for.,ZL%~~~:~+iW&d@~n) , , , , , , , . . , ,,,, , . . . , , , , data have been submitted. The petitioner must modify the proposed enforcement method to include any modifications made by the EPA laboratory during the Agency laboratory validation.
OPPTS GLN 860.1360: Multiresidue Method
The petitioner has submitted data (citation listed below) pertaining to the multiresidue methods testing of pyraclostrobin and its desmethoxy metabolite, BF 500-3.
451 18515 Fomenko, J. (2000) Evaluation of BAS 500 F Through the FDA Multiresidue Methods. Lab Project Number: A0080.84. BASF Protocol Number: 97136. BASF Reg. Doc. Number: 200015015. Unpublished study prepared by Maxim Technologies, Inc. 106 p.
Pyraclostrobin was successfully evaluated through several of the FDA protocols, while recovery of BF 500-3 was unsuccessful in all protocols. Neither pyraclostrobin nor BF 500-3 were evaluated by Protocol A or B because they do not contain N-methylcarbarnate, or carboxylic or phenol structures. Under Protocol C, pyraclostrobin demonstrated good chromatography with DB-I columnIECD, and was completely recovered through Protocol D (in grape) and E (in grape), and partially recovered through Protocol F (in peanut) with the mixed ether elution system; pyraclostrobin was not recoverable from Florisil using the methylene chloride elution system. Metabolite BF 500-3 had poor peak shape and inadequate sensitivity with Protocol C columns and therefore was not further analyzed under Protocols D, E, and F. The results of the multiresidue testing for pyraclostrobin will be forwarded to FDA for inclusion in PAM Volume I.
OPPTS GLN 860.1380: Storage Stabilitv Data
Plant samvle storage conditions and intervals
The RAC samples from the submitted field trial and field rotational crop studies, except bananas, were frozen soon after collection and were shipped frozen to BASF APC for analysis. Samples of bananas from the Central and South American field trials, which were shipped at ambient conditions and were frozen within 3-7 days of harvest once received at APC. Samples were stored under frozen conditions (<-lo C) at the analytical laboratory until preparation for analysis.
Grape samples from a processing study were stored in temperature-monitored coolers, and were shipped at ambient temperature to National Food Laboratories (Dublin, CA) the day for processing. Samples were stored frozen at the National Food Laboratories for 4 days prior to processing. Processed commodities were stored frozen following processing, and RAC and processed samples were shipped frozen to BASF APC for analysis.
Orange samples from a processing study were collected and shipped the day after harvest at ambient conditions to the Citrus Research and Education Center, University of Florida (Lake Alfred, FL) for processing. Samples were stored under ambient conditions for 3 days at the University of Florida until processing. Processed commodities were stored frozen following processing, and RAC and processed samples were shipped frozen to BASF APC for analysis.
Whole peanut samples from a processing study were collected, threshed, placed into bags, and stored in an air conditioned room for 5 hours until being shipped at ambient conditions to Texas A&M, Food Protein Research and Development Center (Bryan, TX) for processing. Samples were stored frozen for 8 days until processing. Processed commodities were stored frozen following processing, and RAC and processed samples were shipped frozen to BASF APC for analysis.
Plums samples from a processing study were collected, placed into bags, and shipped at ambient conditions to National Food Laboratories (Dublin, CA) the same day for processing. Following processing, washed plums and prunes were stored frozen, and RAC and processed samples (washed plums and prunes) were shipped frozen to BASF APC for analysis.
Whole potato samples from a processing study were placed into bags and cardboard boxes for shipment to Englar Food Laboratories, Inc. (Moses Lake, CA). Before delivery to the processor, a RAC subsample was collected from the larger sample and shipped directly to BASF APC for residue screening prior to processing. Upon receipt RAC samples were frozen (<-lo C) prior to analysis.
Sugar beet root samples from a processing study were collected by hand, lightly brushed to remove excess dirt, placed into bags, and shipped at ambient conditions to Englar Food Laboratories, Inc. (Moses Lake, CA) within 24 hours of harvest. Samples were stored frozen for 18-22 days at the Englar Food Laboratories until processing. Processed commodities were stored frozen following processing, and RAC and processed samples were shipped frozen to BASF APC for analysis.
Whole tomato samples from a processing study were collected and shipped fresh to National Food Laboratories, Inc. (Dublin, CA) on the day of harvest. Samples were stored in a cooler for 1-2 days at the National Food Laboratories until processing. Processed commodities (tomato paste and puree) were stored frozen following processing, and RAC and processed samples were shipped frozen to BASF APC for analysis.
Wheat grain samples from processing studies were each collected from the l x and 5x treatment plots. Samples from the 1998 study were shipped at ambient conditions to Englar Food Laboratories, Inc. (Moses Lake, WA) on the day of harvest. Samples were stored frozen at Englar Food Laboratories prior to processing. Samples from the 2000 study were shipped frozen to the Food Protein Research and Development Center (Bryan, TX) within 14 days of harvest. Samples were stored frozen at the processor prior to processing, and processing was completed within 53 days of harvest. Processed commodities were stored frozen following processing, and RAC and processed samples were shipped frozen to BASF APC for analysis.
The total storage intervals between harvest and analysis for RAC and vrocessed commoditv - samples from the submitted field trial, processing, and field rotational crop studies are reported in Table 27.
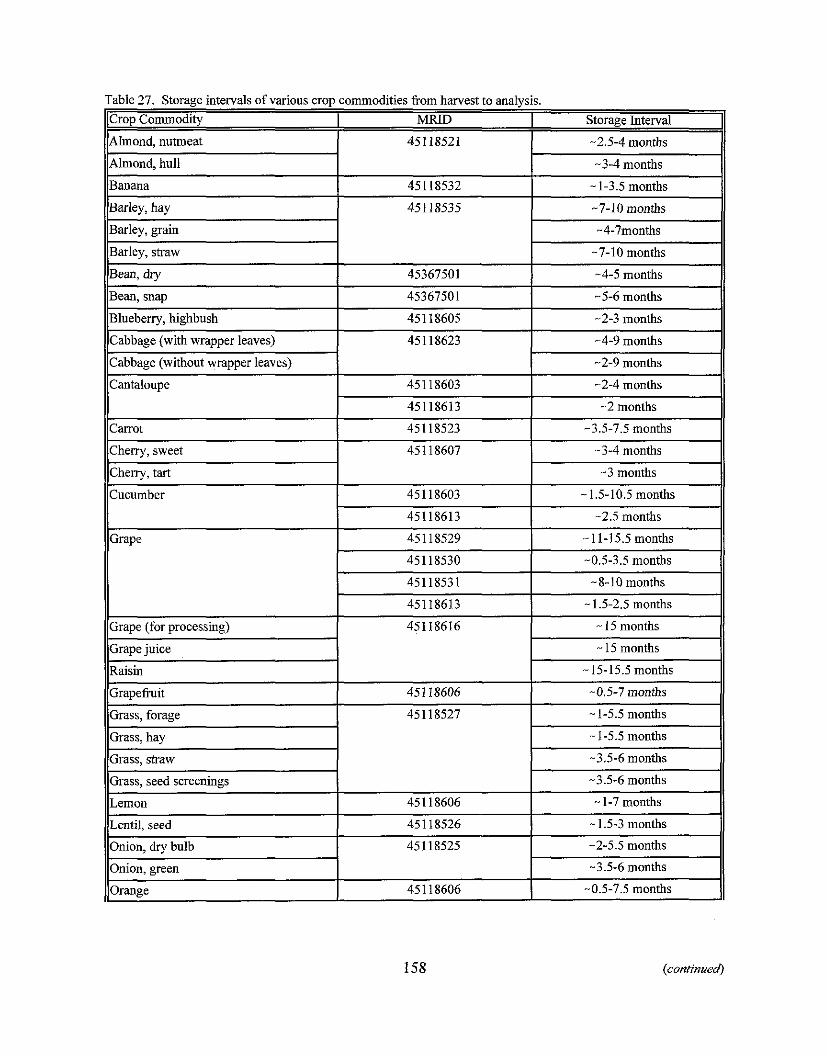
Table 27. Storage intervals of various crop commodities from harvest to analysis. lcrop Commodity I MRID I Storage Interval
Almond, nutmeat
Almond, hull
Banana
Barley, hay
Barley, grain
Barley, shaw
Bean, dry Bean, snap
45118521
451 18532
Blueberry, highbush
Cabbage (with wrapper leaves)
Cabbage (without wrapper leaves)
Cantaloupe
Carrot
Cherry, sweet
Chew, tart
-2.5-4 months
-3-4 months
- 1-3.5 months
451 18535
45367501
45367501
Cucumber
Grape
Grape (for processing)
Grape juice
Raisin
-7-10 months
-4-7months
-7-10 months
-4-5 months
-5-6 months
451 18605
45118623
45118603
45118613
45118523
45 1 18607
Grapefiuit
p~
-2-3 months
-4-9 months
-2-9 months
-2-4 months
-2 months
-3.5-7.5 months
- 3-4 months
-3 months
45 118603
45118613
451 18529
45118530
45118531
45118613
45118616
, - Grass, hay
Grass, shaw
Grass, seed screenings
Lemon
- 1.5-10.5 months
-2.5 months
-11-15.5 months
-0.5-3.5 months
-8-10 months
- 1.5-2.5 months
- 15 months
- 15 months
-15-15.5 months
Grass. forage I 45 11 8527 I - 1-5.5 months 1 451 18606
IILentil, seed I I
(continued)
-0.5-7 months
45118606
45118526
Onion, dry bulb
Onion, green
Orange
- 1-5.5 months
-3.5-6 months
-3.5-6 months
- 1-7 months
- 1.5-3 months
45118525
45 1 18606
-2-5.5 months
-3.5-6 months
-0.5-7.5 mouths
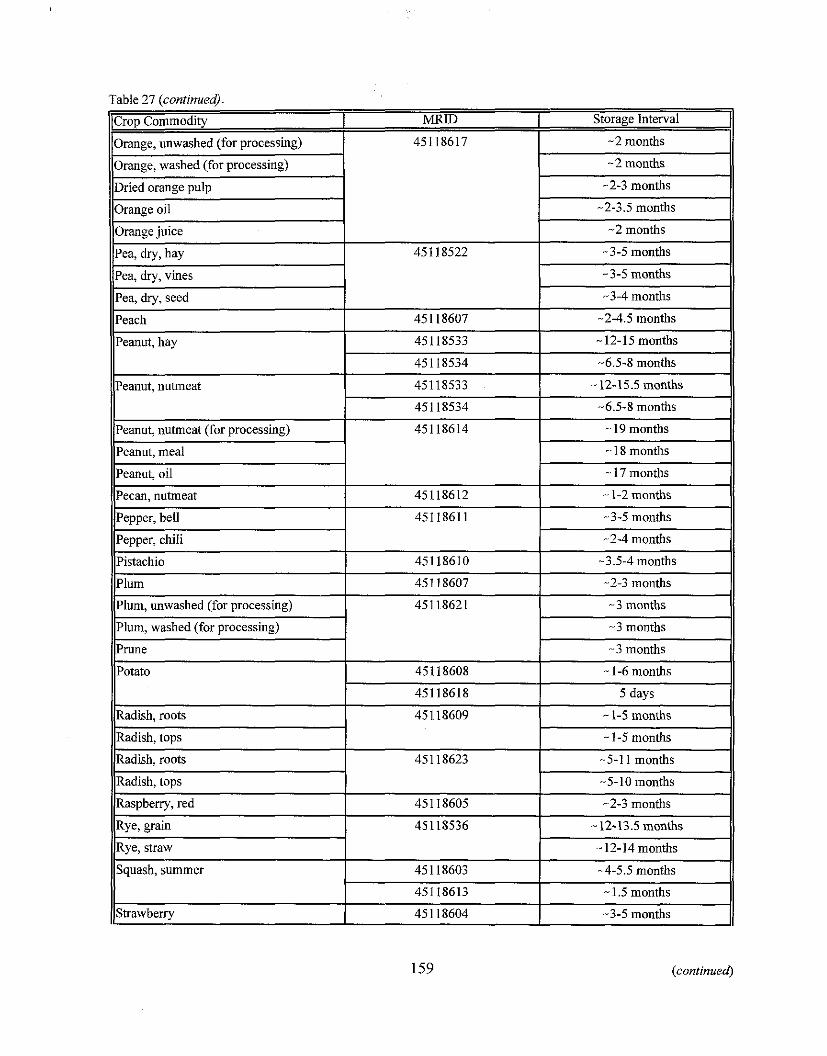
Table 27 (continued).
II~epper, bell 45118611 -3-5 months
Pepper, chili -2-4 months
Pistachio 1 45118610 I -3.5-4 months
Plum
Plum, unwashed (for processing)
Plum, washed (for processing)
Prune
Potato
Radish, roots
Radish, tops
Radish, roots
Radish, tops
451 18607
45118621
45118608
45118618
159 (continued)
-2-3 months
- 3 months
-3 months
-3 months
- 1-6 months
5 days
45118609
45118623
-2-3 months
- 12-13.5 months
-12-14 months
-4-5.5 months
Raspberry, red
Rye, grain
Rye, straw
Squash, summer I
- 1-5 months
- 1-5 months
-5-1 1 months
-5-10 months
45118605
45118536
45 118603
45118613 - 1.5 months
451 18604 -3-5 months
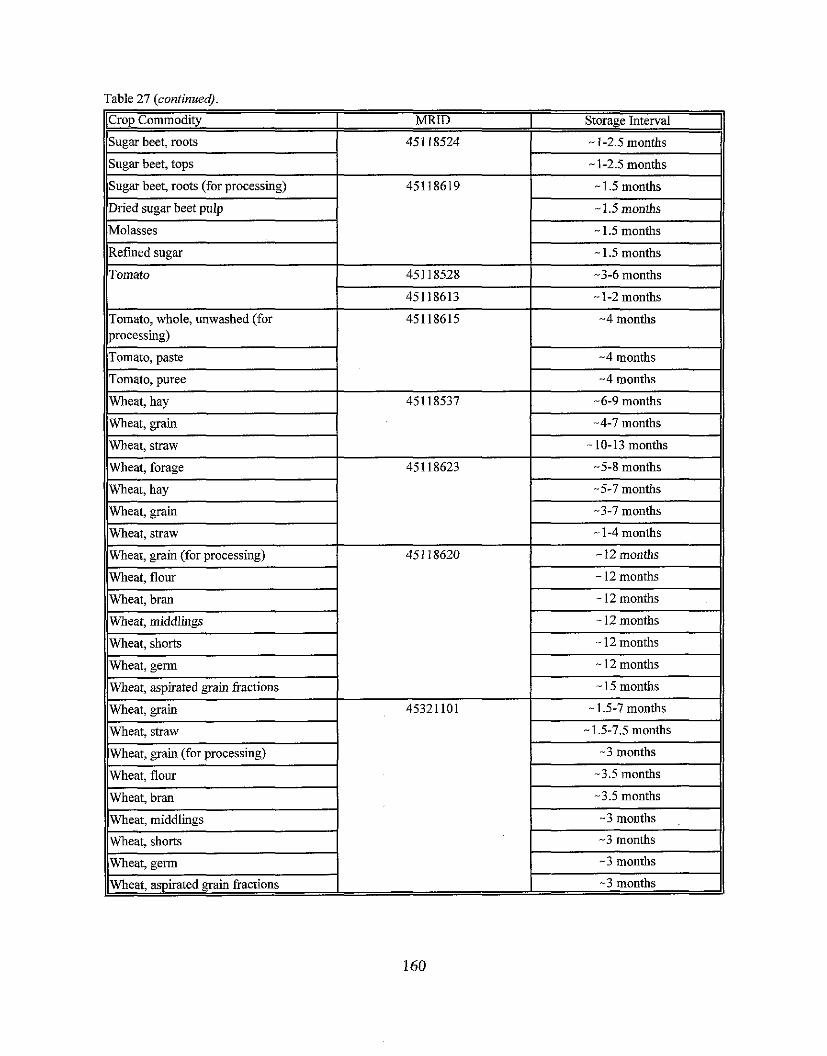
Table 27 (continued) -
(crop Commodity I MRID I Storage Interval 11 Sugar beet, roots
Sugar beet, tops
Sugar beet, roots (for processing)
Dried sugar beet pulp - - . llhlolasses
45 1 18524
45118619
- 1.5 months 11 ll~efined sugar
IITomato, whole, unwashed (for I I
45118615 -4 months
- 1-2.5 months
- 1-2.5 months
- 1.5 months
- 1.5 months
- 1.5 months 11 45 1 18528
H Wheat, hay
Wheat. erain
-3-6 months
45118613 I - 1-2 months 1
45118537
Wheat, hay
Wheat. grain
-6-9 months
-4-7 months 11 . - Wheat, straw - 10-13 months
//Wheat, grain (for processing) I 451 18620 I - 12 months II , -
I I~hea t , straw - 1-4 months 11
Wheat, bran
Wheat. as~irated main fractions
I Wheat, forage
II~heat. flour
I - 12 months I I - 12 months II
- 15 months
45118623
, . - !Wheat, main
I
45321101 - 1.5-7 months 11
-5-8 months
IIWheat, straw I
II Wheat, grain (for processing)
Wheat. flour
- 1.5-7.5 months
-3.5 months
-3.5 months
-3 months
IlWheat: germ 1 - 3 months 11 . - Wheat, aspirated grain fractions -3 months
Plant storage stability data
In support of the storage intervals and conditions of samples from the field trial and processing studies, BASF has submitted storage stability data (citations listed below) for various plant commodities. Diverse plant commodities were chosen to represent all crops: an oilseed (peanut nutmeat), a non-oily grain (wheat grain), a leafy vegetable (sugar beet tops), a root crop (sugar beet roots), a fruitlfmiting vegetable (tomatoes), a dry feed (wheat straw), and processed oil (peanut) and juice (grape) commodities.
45118516 Abdel-Baky, S.; Riley, M. (1999) Freezer Storage Stability of BAS 500 F and BF 500-3 in Various Plant Commodities Including Processed Commodities: Interim Report for up to 6 Months of Freezer Storage. BASF Study No. 90001419; BASF Registration Document No. 199915064. Unpublished study prepared by BASF Corporation. 80 p.
45272801 Abdel-Baky, S. (2000) Storage Stability of BAS 500 F and BF 500-3 in Various Plant Commodities Including Processed Commodities For Up to 19 Months of Freezer Storage. BASF Study No. 90001419; BASF Registration Document No. 2000/5248. Unpublished study prepared by BASF Corporation. 96 p.
45429901 Abdel-Baky, S. (2001) FINAL REPORT Freezer Storage Stability of BAS 500 F and BF 500-3 in Plant Matrices Including Processed Commodities. BASF Study No. 66414; BASF Registration Document No. 200115000232. Unpublished study prepared by BASF Corporation. 62 p.
Untreated samples of grape juice, peanut nutmeat and processed oil, sugar beet tops and roots, tomatoes, and wheat grain and straw from field trial and processing studies were fortified with pyraclostrobin and its metabolite BF 500-3 each at 0.5-2.0 ppm (typically 1.0 ppm), and stored frozen (5-10 C). Samples were analyzed at the 0-, 1-, 3-, 6-, 14-, 18- or 19-, and 25-month storage intervals. The 18-19 month storage stability data support the longest storage intervals incurred in the field trial, processing, and field rotational crop studies.
Residues of pyraclostrobin and BF 500-3 were determined using the LC/MS/MS method D9808. Control samples were fortified with pyraclostrobin and BF 500-3, each at 1.0 ppm, at the time of analysis for concurrent recoveries; control samples of peanut nutmeat, sugar beet roots, and wheat grain at the 3-month interval were fortified with pyraclostrobin and BF 500-3, each at 0.50 ppm, and control samples of peanut oil were fortified with each analyte at 2.0 ppm at the 1- month interval. Apparent residues of pyraclostrobin and BF 500-3 were each less than the method LOQ (10.02 ppm) idon six antreated samples each of grape juice, peanut nutmeat and refined oil, sugar beet tops and roots, tomatoes, and wheat grain and straw. The results of the storage stability studies are presented in Table 28.
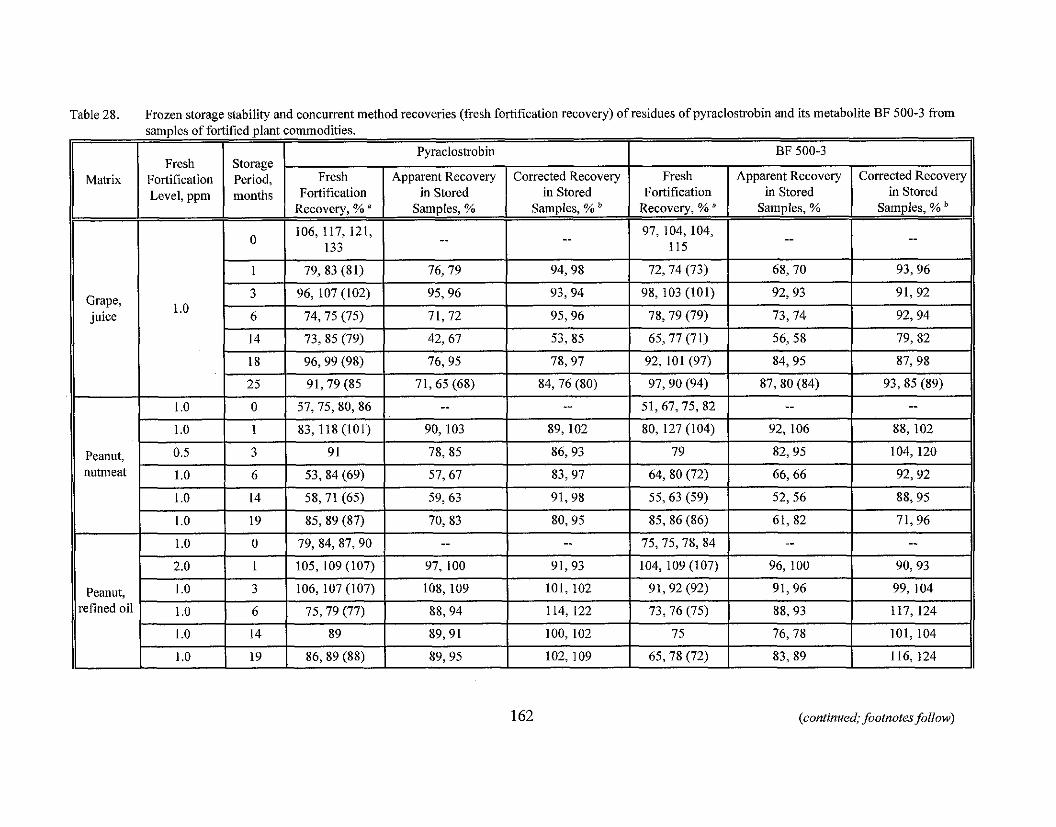
Table 28. Frozen storage stability and concurrent method recoveries (fresh fortification recovery) of residues of pyraclostrobin and its metabolite BF 500-3 from
Matrix C Grape, juice
Peanut, nutmeat
Peanut, refined o
samples of fortified plant commodities.
162 (continued; footnotes follow)
I I Pvraclostrohin Fresh
Fortification Level, ppm
BF 500-3 Storage Period, months
Fresh Fortification
Recovery, % "
Corrected Recovery in Stored
Samples, %
Fresh Fortification
Recovery, % "
Apparent Recovery in Stored
Samples, %
Apparent Recovery in Stored
Samples, %
Corrected Recovery in Stored
Samples, % "
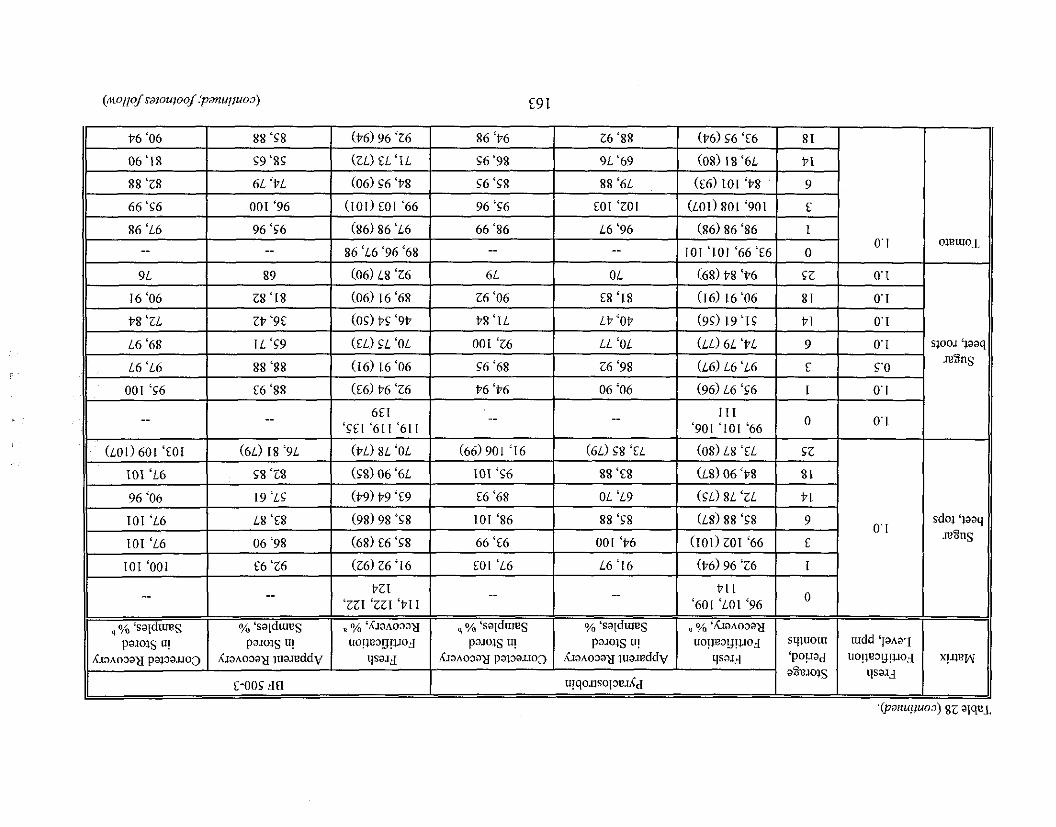
-- -- 6EI -- -- I11 ' ~ € 1 '611 '611 '901 ' I 01 '66
( ~ 0 1 ) 601 '£01 ( 6 ~ ) 18 '9L (PL) 8L 'OL (66) 901 '16 (6L) 58 'EL (08) 18 'EL
101 'L6 58 '28 (58) 06 '6L 101 '56 88 '£8 (L8) 06 'tr8
96 '06 19 'LS (P9) i79 'E9 E6 '68 OL 'L9 (sL) 8L 'ZL
101 'L6 L8 'E8 (98) 98 'S8 101 '86 88 'S8 ( ~ 8 ) 88 '58
101 'L6 06 '98 (68) £6 '58 66 'E6 001 'i76 (101) ZOI '66
101 '001 £6 '26 (26) 26 '16 €01 'L6 L6 '16 (i76) 96 '26
-- -- PZI -- -- PI I 'ZZI 'ZZ I 'PI I '601 'LO1 '96
, % ' s a ~ d m s % 'saldrues % ' X ~ a ~ o 3 a x , % 'saldmtrs % 'safdmtrs % 'Ala~o3ax
palojs u! P ~ J O I S u! UO!lR3rJ!UOJ palots u! pa~ots o! UO!W3IJ!,lOJ h a ~ o 3 a x papano3 L ~ a ~ o 3 a a luamddv qsaJiI h a ~ o 3 a x p a l 3 a ~ ~ o 3 h a ~ o 3 a x lua~eddt, TaJJ
E-oos ~ . 1 8 U!~O.QSO[~€?JL~
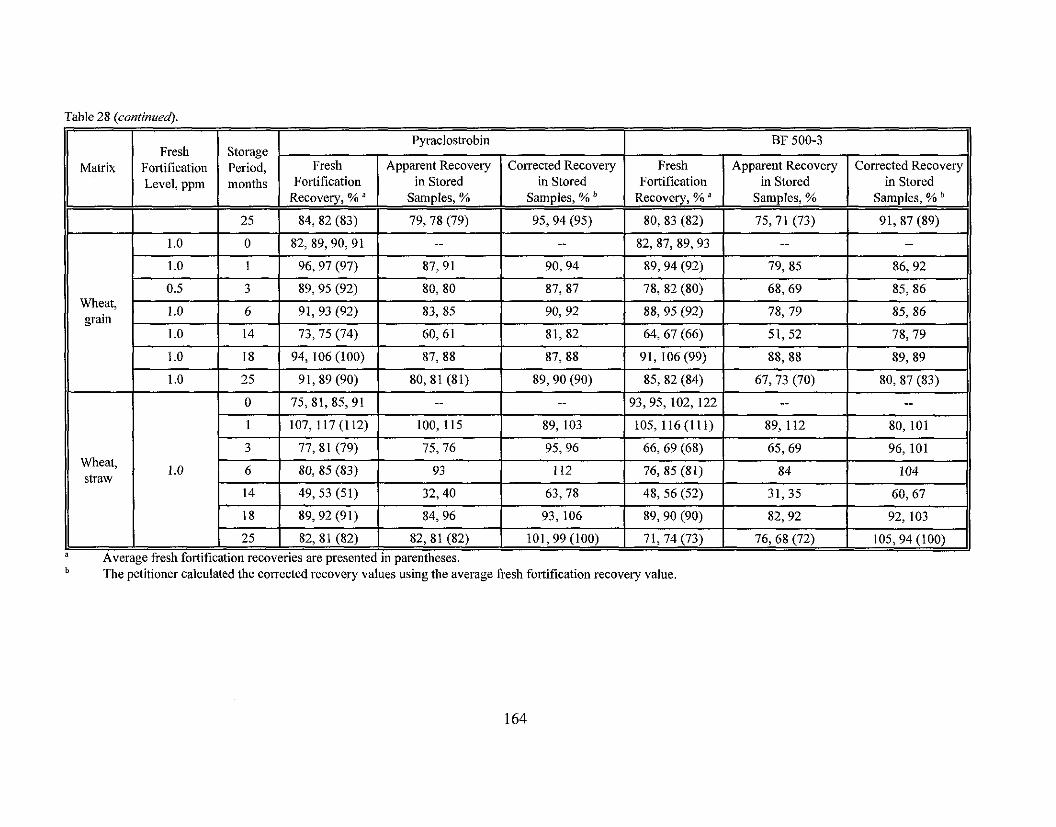
Table 28 (continued)
V v e r a g e fresh fortification recoveries are presented in parentheses. The petitioner calculated the corrected recovery values using the average fresh fortification recovery value.
Comments:
The submitted storage stability data indicate that residues of pyraclostrobin and its metabolite BF 500-3 are stable under frozen storage conditions idon fortified samples of grape juice, sugar beet tops and roots, tomatoes, and wheat grain and straw for up to 25 months, and idon fortified samples of peanut nutmeat and processed oil for up to 19 months. The plant commodities chosen for the storage stability study are representative of all crops: an oilseed (peanut nutmeat), a non- oily grain (wheat grain), a leafy vegetable (sugar beet tops), a root crop (sugar beet roots), a hitlfruiting vegetable (tomatoes), a dry feed (wheat straw), and processed oil (peanut) and juice (grape) commodities.
The available storage stability data support the storage intervals ( s 19 months) of the samples of almond nutmeat and hull, banana, barley hay, straw, and grain, blueberry, cabbage, cantaloupe, carrot, cherry (sweet and tart), cucumber, grape, grape juice, raisin, grapefruit, grass forage, hay, straw, and seed screenings, lemon, lentils, onion (bulb and green), orange, orange processed commodities, dry pea hay, vine, and seed, peach, peanut hay and nutmeat, peanut processed commodities, pecan, pepper (bell and chili), pistachio, plum and its processed commodity prune, potato, radish roots and tops, raspberry (red), rye grain and straw, squash (summer), strawberry, sugar beet (roots and tops), sugar beet processed commodities, tomato, tomato processed commodities, wheat forage, hay, grain, aspirated grain fractions, and straw; and wheat processed commodities from the submitted field trial, field rotational crop, and processing studies.
Animal samvle storage conditions and intervals
Samples of cow milk from the ruminant feeding study were composited by day (a.m. and p.m.) and frozen. Subsamples of milk collected on Day 26 were separated into milk fat and skim milk by centrifugation and frozen. Milk samples were shipped twice during the study by freezer van to BASF for analysis. Tissue samples (liver, kidney, fat, and muscle) were chopped, frozen, and shipped to BASF for analysis. Milk and tissue samples were stored frozen (-18 C) at BASF prior to analysis. The maximum storage intervals from collection until analysis were 92 days (3 months) for whole milk, 81 days (2.7 months) for skim milk, 185 days (-6 months) for milk fat, 197 days (6.5 months) for fat, 172 days (5.7 months) for liver, 165 days (5.4 months) for kidney, and 153 days (5 months) for muscle.
Egg and tissue samples from the poultry feeding study were frozen after collection; tissue samples were homogenized with liquid nitrogen and frozen. Egg and tissue samples were shipped frozen via express mail to BASF for analysis, where all egg and tissue samples were stored frozen (<-I0 C) prior to analysis. The maximum storage intervals from collection until analysis were 149 days (-5 months) for eggs, 126 days (-4 months) for fat, 92 days (-3 months) for liver, 174 days (- 6 months) for muscle.
Animal storage stabilitv data
In support of the storage intervals and conditions of samples from the ruminant and poultry feeding studies, BASF has submitted interim storage stability data for ruminant commodities and final storage stability data for eggs (citations listed below).
451 18517 Tilting, N.; Knoell, H. (2000) Investigation of the Stability of Residues of BAS 500 F (Reg. No. 304428) in Sample Materials of Animal Origin Under Usual Storage Conditions. Laboratory Project Identification No. 35913; BASF Registration Document No. 200011000002. Unpublished study prepared by BASF Corporation. 41 p.
45274901 Malinsky, D. (2000) Freezer Storage Stability of BAS 500 F and its Metabolite BF 500-16 in Eggs. Laboratory Project Identification No. 61 117; BASF Registration Document No. 200015047. Unpublished study prepared by BASF Corporation. 47 p.
Untreated samples of cow milk, liver, and muscle from the feeding study were fortified with pyraclostrobin and/or its metabolite BF 500-10 each at 0.5 pprn (liver and muscle) or 0.1 pprn (milk) and stored frozen (-20 C). Samples were analyzed at 0-, 30-, 60-, and 90-day storage intervals (MRID 45 11 85 17); a final report will be submitted to include data from the 240-day (-8 month) storage interval.
For ruminant samples fortified with only the parent, residues of pyraclostrobin were determined using HPLCIIIV method 43910. For samples fortified with both the parent and BF 500-10, residues of pyraclostrobin and BF 500-10 were determined as BF 500-5 and BF 500-8, respectively, using LCIMSIMS method 44611. Control samples were fortified with pyraclostrobin and/or BF 500-10 at the same level as the stored samples at the time of analysis for concurrent recoveries. Apparent residues of pyraclostrobin were less than the method LOQ (10.01 pprn for milk and <0.05 pprn for tissues) in/on one untreated sample each of cow milk, liver, and muscle using HPLCIUV method 43910. Apparent residues of pyraclostrobin and BF 500-10 were each less than the method LOQ (<0.01 pprn for milk and <0.05 pprn for tissues) inion one untreated sample each of cow milk, liver, and muscle using LCIMSIMS method 44611. The results of the storage stability studies are presented in Table 29.
Untreated samples of eggs obtained from a local grocery were fortified with pyraclostrobin and BF 500-16 each at 0.10 pprn and stored frozen (<-I0 C). Samples were analyzed at 0-, I-, 3-, and 7-month storage intervals (MRID 45274901).
For egg samples, residues of pyraclostrobin and BF 500-16 were determined as BF 500-5 and BF 500-9, respectively, using LCIMSMS method D9902. Control samples were fortified with pyraclostrobin and/or BF 500-1 6 at the same level (0.10 ppm) as the stored samples at the time of analysis for concurrent recoveries; the 1-month fresh recovery samples were mistakenly fortified at the 0.05 pprn level. Apparent residues of pyraclostrobin and BF 500-16 were each
less than the method LOQ (<0.05 ppm) idon four untreated samples of eggs using LCIMSIMS method D9902. The results of the storage stability studies are presented in Table 29.
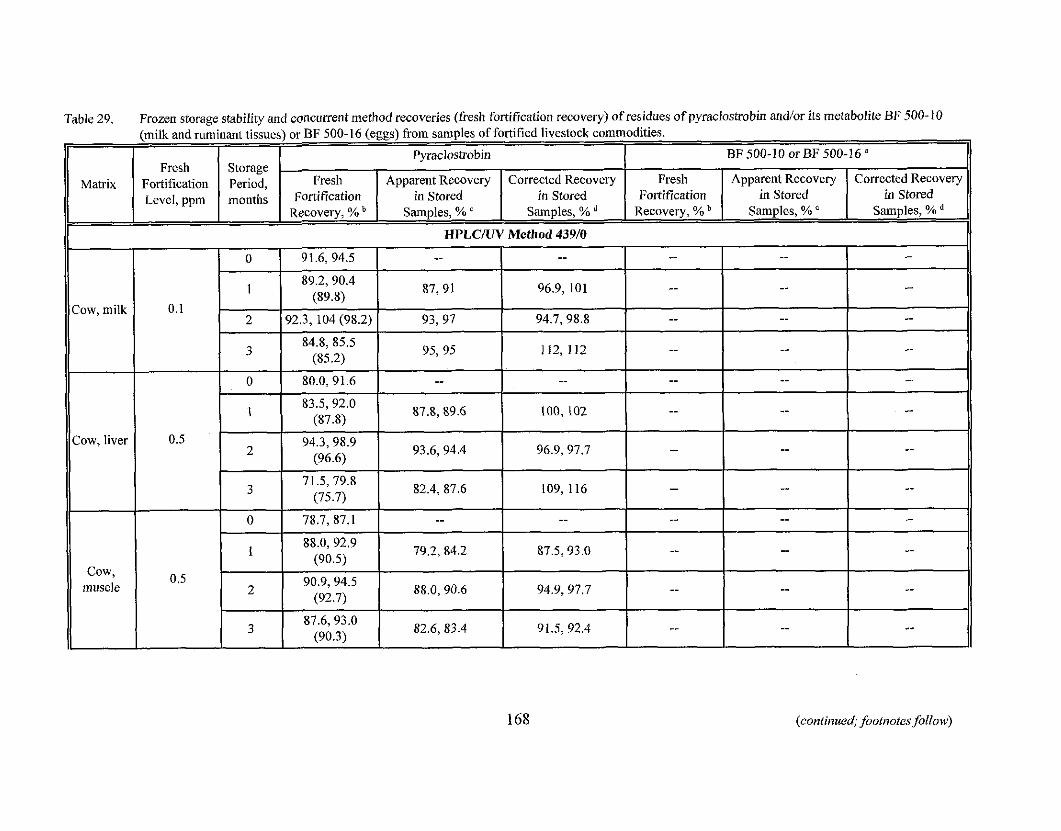
Table 29. Frozen storage stability and concurrent method recoveries (fkesh fortificatic.. . . . - .., , ,n recoverv) of residues of ovraclostrobin and/or its metabolite BF 500-10 - (milk and ruminant tissues) or BF 500-16 (eggs) from samples of fortified livestock commodities.
11 I I I Pvraclnstrobin 1 BF 500-10 or BF 500-16 " 1 -,----~- -~
Fresh 1 Storage 1 I 11 11 Matrix 1 Fortificati~m D - ~ ~ ~ ~ Fresh I Auuarent Recover ,.. , y Corrected Recovery I i i o r e d p Apparent Recovery Corrected Recovery
I ,,,+L, 1 Fortification 1 " in Stored 1 Fo2;:tion 1 in Stored I VlStored 11 I Level, pp~,. ..., ..... ., - I Recovery, % I samples, % Samples, % " I Recovery, % I Samples, % " samples, % 1 HPLCRTV Method 43910 1
(continued; footnotes follow)
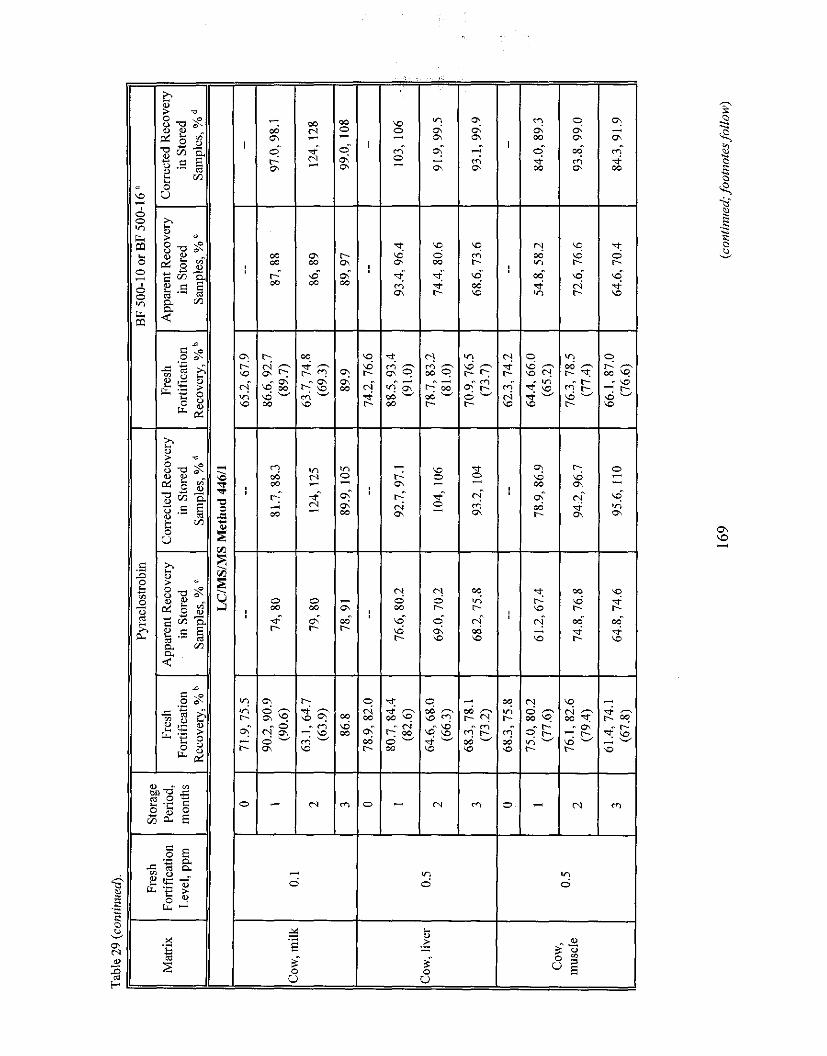
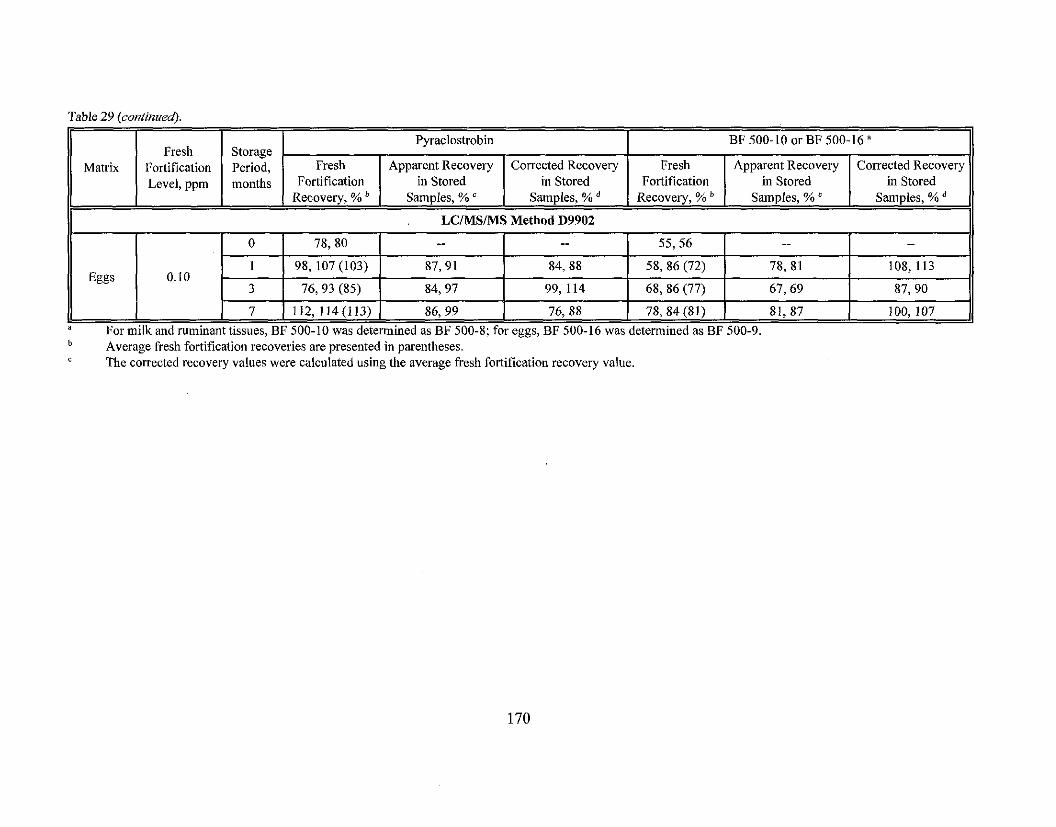
Table 29 (continued).
-. Average fresh fortification recoveries are presented in parentheses. The corrected recovery values were calculated using the average fresh fortification recovery value
Matrix
II 7 1 112, 114(113) 1 86,99
LClMSlMS Method D9902
Fresh Fortification Level, ppm
For milk and ruminant tissues, BF 500-10 was determined as BF 500-8; for eggs, BF 500-16 was determined as BF 500-9. 76,88 1 78, 84 (81) 1 81,87 100,107
Storage Period, months
BF 500-10 orBF 500-16"
Fresh Fortification
Recovery, %
Pyraclostrobin
Fresh Fortification
Recovery, %
Apparent Recovery in Stored
Samples, %
Apparent Recovery in Stored
Samples, % '
Corrected Recovery in Stored
Samples, %
Corrected Recovery in Stored
Samples, %
Comments:
Cow commodity samples from the submitted ruminant feeding studies were stored frozen from collection to analysis for up to 3 months for whole and skim milk, 6.1 months for milk fat, 6.5 months for fat, 5.7 months for liver, 5.4 months for kidney, and 5 months for muscle. The submitted interim storage stability data indicate that residues of pyraclostrobin and its metabolite BF 500-10 are stable under frozen storage conditions idon fortified samples of cow milk, liver, and muscle for up to 90 days (-3 months). The submitted storage stability data are adequate to support the storage conditions and intervals of the whole and skim milk samples from the ruminant feeding study; however, additional storage stability data are required to support the storage conditions and intervals of the milk fat and tissue samples from the ruminant feeding study. When the final report of the ruminant storage stability study becomes available, RAB3 will validate the stability of pyraclostrobin and its metabolites in milk and cow tissues stored under the conditions and intervals of the ruminant feeding study.
Hen commodity samples from the submitted poultry feeding study were stored frozen from collection until analysis up to 5 months for eggs, 4 months for fat, 3 months for liver, and 6 months for muscle. The submitted storage stability data indicate that residues of pyraclostrobin and its metabolite BF 500-16 are relatively stable under frozen storage conditions idon fortified samples of eggs for up to 7 months. The submitted storage stability data for eggs are adequate to support the storage conditions and intervals of the egg samples from the poultry feeding study. The petitioner has referenced ruminant storage stability data to support the storage conditions and intervals of the remaining poultry matrices. The storage stability data for ruminant commodities may be translated to poultry commodities, pending MARC'S decision on the residues of concern in livestock commodities.
OPPTS GLN 860.1500: Crov Field Trials
Root and Tuber Vegetables
Root Vegetables (Except Sugar Beet) - Crop Subgrouv 1-B
BASF Corporation submitted carrot and radish field trial data (citations listed below) to support the establishment of a tolerance for residues of pyraclostrobin and BF 500-3 inlon Root Vegetables (Crop Subgroup 1-B) at 0.4 ppm. Data pertaining to radish tops are presented in the Leaves of Root and Tuber Vegetables section.
451 18523 Versoi, P.; Abdel-Baky, S.; Riley, M. (2000) Magnitude of BAS 500 F Residues in Carrots: Lab Project Number: 199915155: 46743:99180. Unpublished study prepared by BASF Corporation. 61 p.
451 18609 Versoi, P.; Abdel-Baky, S.; Riley, M. (2000) The Magnitude of BAS 500 F Residues in Radishes: Lab Project Number: 199915149: 61658. Unpublished study prepared by Florida Pesticide Research, Inc., Crop Management Strategies, Inc. and California Agricultural Research, Inc. 59 p.
A total of eight field trials were conducted during the 1999 growing season in CA(4), FL(l), ID(I), MN(I), and TX(1). In six trials conducted in CA(4), ID(I), and MN(I), mature carrots were harvested on the day of the last of three broadcast foliar applications of the 20% WDG formulation at 0.20-0.21 lb aiIAlapplication, made at 5- to 8-day retreatment intervals. The total seasonal application rates were 0.60-0.61 lb ai/A (- l x the maximum proposed seasonal application rate). In two trials conducted in FL(1) and TX(l), mature carrots were harvested on the day of the last of six broadcast foliar applications of the 20% WDG formulation at 0.08-0.09 Ib ailMapplication, made at 6- to 7-day retreatment intervals. The total seasonal application rates were 0.49 lb ai/A ( 0 . 8 ~ the maximum proposed seasonal application rate). The petitioner stated that these trials had commenced before the decision was made to pursue a crop subgroup tolerance for root vegetables. Applications were made in 13.17-40.07 gal/A using ground equipment with a non-silicone spray adjuvant added to the spray mixture. In one trial (CA), additional carrot samples were collected at 5,9, 15, and 20 days following treatment to evaluate residue decline. A separate plot at each trial site was left untreated to provide control samples.
A single untreated sample and duplicate treated samples of mature carrots were collected from each test site. The cmot tops were removed, and the collected samples were then frozen. All samples were shipped frozen to the BASF Agricultural Products Center (APC; Research Triangle Park, NC) where they were analyzed for residues of pyraclostrobin and BF 500-3 using Method D9808. Apparent residues of pyraclostrobin and BF 500-3 were each less than the LOQ (<0.02
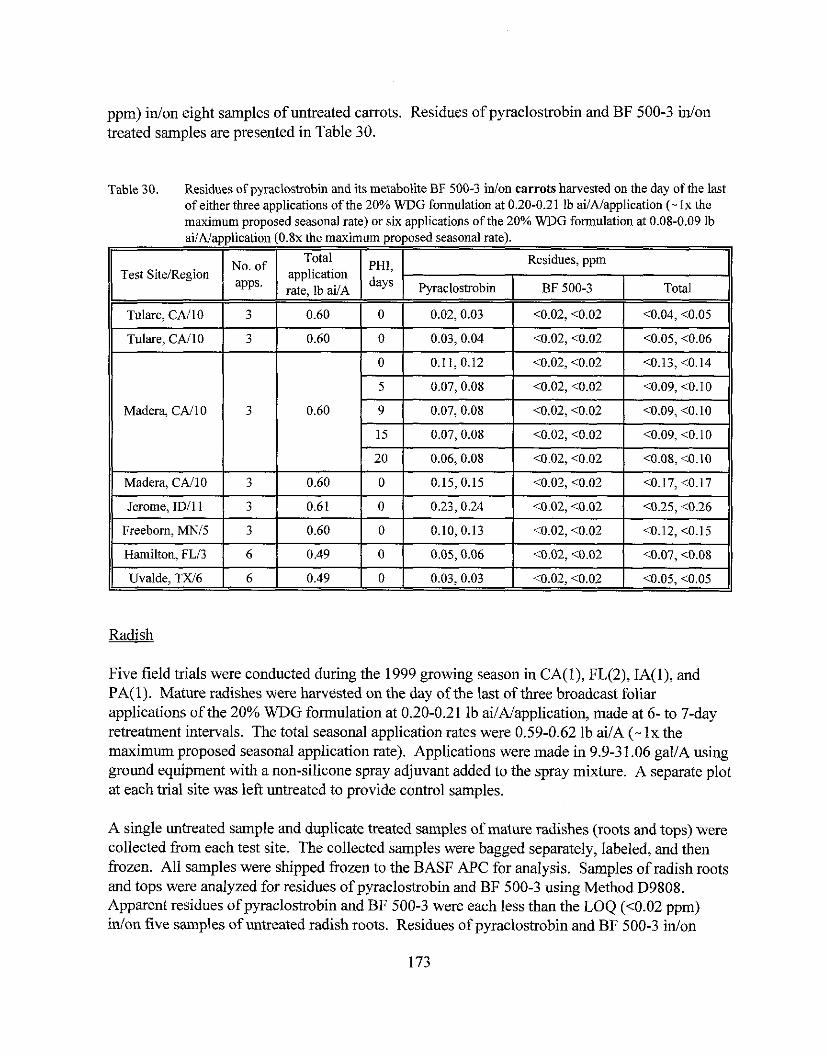
ppm) idon eight samples of untreated carrots. Residues of pyraclostrobin and BF 500-3 idon treated samples are presented in Table 30.
Table 30. Residues of pyraclostrobm and its metabolite BF 500-3 inion carrots harvested on the day of the last of either three applications of the 20% WDG formulation at 0.20-0.21 lb ai/A/application (- Ix the maximum proposed seasonal rate) or six applications of the 20% WDG formulation at 0.08-0.09 lb aiiAiapplication ( 0 . 8 ~ the maximum proposed seasonal rate).
Madera, CAI10
Tulare, CAI10
Tulare, CAI10
(1 Madera, CAI10 / 3 0.60 1 0 1 0.15, 0.15 ( <0.02, <0.02 1 <0.17, <0.17
Test SiteIRegion application rate, lb ai/A
No. of
3
3
Jerome, ID11 1
Freeborn, MNI5
Hamilton, FL/3
Five field trials were conducted during the 1999 growing season in CA(l), FL(2), IA(l), and PA(1). Mature radishes were harvested on the day of the last of three broadcast foliar applications of the 20% WDG formulation at 0.20-0.21 lb ailNapplication, made at 6- to 7-day retreatment intervals. The total seasonal application rates were 0.59-0.62 lb ai/A (- l x the maximum proposed seasonal application rate). Applications were made in 9.9-3 1.06 gaUA using ground equipment with a non-silicone spray adjuvant added to the spray mixture. A separate plot at each trial site was left untreated to provide control samples.
PHI, days
0.60
0.60
Uvalde, TXl6 I 6
A single untreated sample and duplicate treated samples of mature radishes (roots and tops) were collected from each test site. The collected samples were bagged separately, labeled, and then frozen. All samples were shipped frozen to the BASF APC for analysis. Samples of radish roots and tops were analyzed for residues of pyraclostrobin and BF 500-3 using Method D9808. Apparent residues of pyraclostrobin and BF 500-3 were each less than the LOQ (10.02 ppm) idon five samples of untreated radish roots. Residues of pyraclostrobin and BF 500-3 idon
3
3
6
Residues, ppm
0
0
0
0.49
F'yaclostrobin
0.61
0.60
0.49
0.02, 0.03
0.03,0.04
0.11,0.12
0
BF 500-3
0
0
0
0.03,0.03 1 <0.02, <0.02 1 <0.05, <0.05
Total
<0.02, <0.02
<0.02, <0.02
<0.02,<0.02
<0.04, <0.05
<0.05, <0.06 -
<0.13, <0.14
0.23,0.24
0.10,0.13
0.05,0.06
<0.02, <0.02
10.02, <0.02
<0.02, <0.02
<0.25, <0.26
<0.12, cO.15
<0.07, c0.08
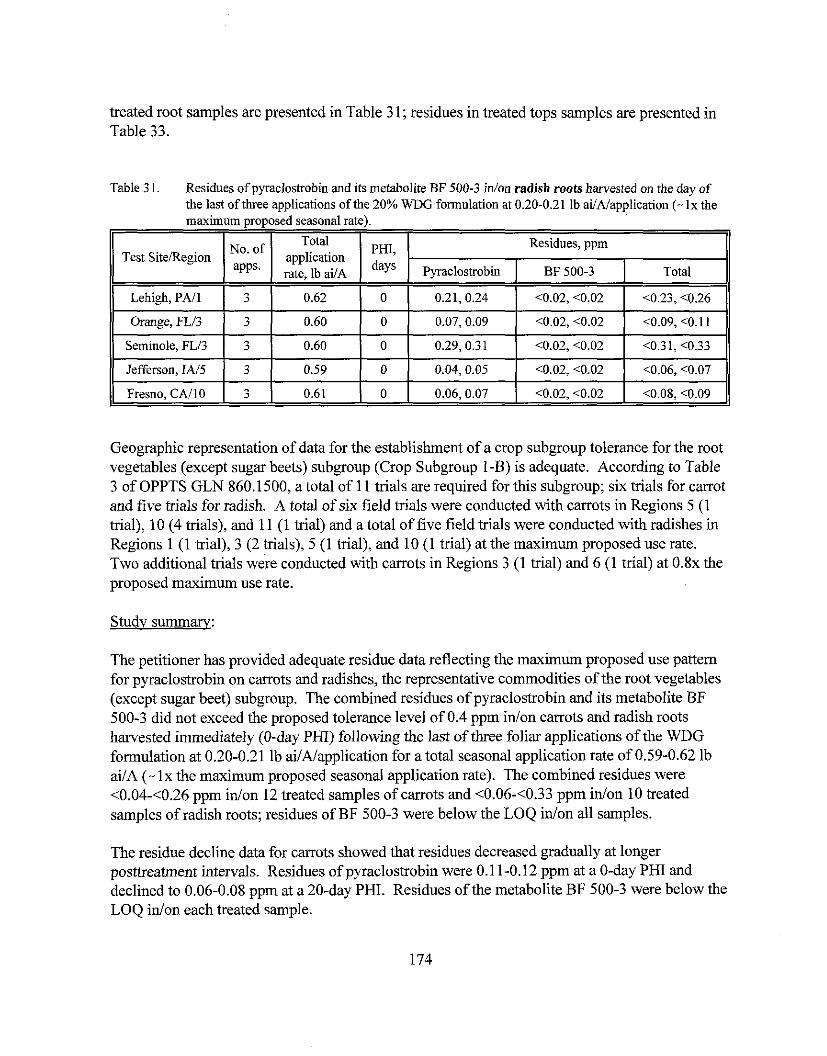
treated root samples are presented in Table 3 1; residues in treated tops samples are presented in Table 33.
Table 3 1. Residues of pyraclostrobin and its metabolite BF 500-3 idon radish roots harvested on the day of the last of three applications of the 20% WDG formulation at 0.20-0.21 ib aiiA1application (- lx the maximum ~ r o ~ o s e d seasonal rate).
A .
Geographic representation of data for the establishment of a crop subgroup tolerance for the root vegetables (except sugar beets) subgroup (Crop Subgroup I-B) is adequate. Accordillg to Table 3 of OPPTS GLN 860.1500, a total of 11 trials are required for this subgroup; six trials for carrot and five trials for radish. A total of six field trials were conducted with carrots in Regions 5 (1 trial), 10 (4 trials), and 11 (1 trial) and a total of five field trials were conducted with radishes in Regions 1 (1 trial), 3 (2 trials), 5 (1 trial), and 10 (1 trial) at the maximum proposed use rate. Two additional trials were conducted with carrots in Regions 3 (1 trial) and 6 (1 trial) at 0 . 8 ~ the proposed maximum use rate.
Test SiteiRegion
Lehigh, PA11
Orange, FLI3
Seminole, FLl3
Jefferson, IA/5
Fresno, CNlO
Studv summary:
The petitioner has provided adequate residue data reflecting the maximum proposed use pattern for pyraclostrobin on carrots and radishes, the representative commodities of the root vegetables (except sugar beet) subgroup. The combined residues of pyraclostrobin and its metabolite BF 500-3 did not exceed the proposed tolerance level of 0.4 ppm idon carrots and radish roots harvested immediately (0-day PHI) following the last of three foliar applications of the WDG formulation at 0.20-0.21 lb ailA1application for a total seasonal application rate of 0.59-0.62 lb ai/A (- l x the maximum proposed seasonal application rate). The combined residues were 10.04-10.26 ppm idon 12 treated samples of carrots and 10.06-<0.33 ppm idon 10 treated samples of radish roots; residues of BF 500-3 were below the LOQ infon all samples.
No. of
3
3
3
3
3
The residue decline data for carrots showed that residues decreased gradually at longer posttreatment intervals. Residues of pyraclostrobin were 0.1 1-0.12 ppm at a 0-day PHI and declined to 0.06-0.08 ppm at a 20-day PHI. Residues of the metabolite BF 500-3 were below the LOQ idon each treated sample.
Total application rate, lb aVA
0.62
0.60
0.60
0.59
0.61
PHI, days
0
0
0
0
0
Residues, ppm
0.29,0.31
0.04, 0.05
0.06, 0.07
Pyraclostrohin
0.21, 0.24
0.07,0.09
10.02, <0.02
<0.02, <0.02
<0.02, <0.02
BF 500-3
<0.02, <0.02
<0.02, <0.02
10.3 1, <0.33
c0.06, <0.07
<0.08, <0.09
Total
<0.23, <0.26
<0.09, <0.11
Tuberous and Corm Vegetable - Croo Suberour, 1 -C
BASF Corporation submitted potato field trial data (citation listed below) to support the establishment of a tolerance for residues of pyraclostrobin and BF 500-3 inlon Tuberous and Corm Vegetables (Crop Subgroup 1-C) at 0.04 ppm.
451 18608 Versoi, P.; Abdel-Baky, S.; Riley, M. (2000) The Magnitude of BAS 500 F Residues in Potatoes: Lab Project Number: 199915148: 46325. Unpublished study prepared by Southeast Ag Research, Inc., Ag-Quest, Inc. and Marbicon, Inc. 97 p.
A total of 23 field trials were conducted during the 1999 growing season. Seventeen of these field trials were conducted in the U.S. in CA(l), C0(1), FL(l), ID(5), MN(3), NJ(l), OR(l), PA(2), VA(l), and WI(1). Six field trials were conducted in Canada in AB(l), BC(l), MB(l), NS(l), PE(l), and QC(1). In the U.S. trials, potatoes were harvested 3 and 13-14 days following the last of six foliar applications, made at 6- to 9-day retreatment intervals, of the 20% WDG formulation at 0.18-0.22 lb aiiNapplication. Total seasonal application rates were 1.18-1.24 lb ailA (- l x the maximum proposed seasonal rate). Applications were made in 16.27-40.7 gallA of water using ground equipment with a spray adjuvant added to the spray solution. In two trials (MN and PA), additional potato samples were harvested 23,33, and 43 days following treatment to evaluate residue decline.
In the Canadian trials, potatoes were harvested 3 and 13-14 days following the last of four foliar applications, made at 6- to 9-day retreatment intervals, of the 20% WDG formulation at 0.20- 0.21 lb ailA/application. Total seasonal application rates were 0.80-0.82 lb ailA. Applications were made in 21.1-33.4 gal1A of water using ground equipment with a spray adjuvant added to the spray solution.
In two Canadian trials (MB and NS), three additional treatment plots were established in support of formulation bridging and to include metiram as a tankmix partner. For the bridging study, potatoes were harvested 3 and 14 days following the last of four foliar applications, made at 6- to 9-day retreatment intervals, of the 2 lblgal EC formulation at 0.19-0.21 lb ai/A/application. Total seasonal application rates were 0.80-0.81 1b ailA. For the tankmix study, potatoes were harvested 3 and 14 days following the last of four foliar applications, made at 6- to 9-day retreatment intervals, of either a tank mix of pyraclostrobin (20% WDG) at 0.19-0.21 lb ai/A/application plus metiram (72.1% WDG ) at 1.55-1.66 lb ai/Alapplication or metiram (72.1% WDG ) alone at 1.52-1.67 lb ai1Napplication. Total seasonal application rates were 0.79-0.81 lb ailA for pyraclostrobin and 6.337-6.495 lb ai/A for metiram. All applications were made in 20.4- 23.9 gal1A of water using ground equipment with a spray adjuvant added to the spray solution.
A single unb.eated sample and duplicate treated samples of mature potatoes were collected from each test site. The collected samples were bagged separately, labeled, and then frozen. All
samples were shipped frozen to the BASF APC for analysis. Samples of potatoes from the 3-day PHI were analyzed for residues of pyraclostrobin and BF 500-3 using Method D9808; samples from the tank mix study were not analyzed for metiram. Apparent residues of pyraclostrobin and BF 500-3 were each less than the LOQ (<0.02 ppm) idon 23 untreated samples of potato tubers. Residues of pyraclostrobin and BF 500-3 were each less than the LOQ idon all treated potato tuber samples: 3-day PHI samples treated with the WDG formulation from the U.S. and Canadian trials (n=46), treated samples collected to evaluate residue decline (n=20), and 3-day PHI samples from the Canadian trials treated with the EC formulation or the WDG formulation as a tank mix with metiram (n=S). Since residues were below the LOQ at the 3-day PHI, samples collected at the 13- to 14-day PHI were not analyzed.
Geographic representation of potato data is adequate for the purposes of this petition. According to Table 3 of OPPTS 860.1500, a total of 16 potato trials are required for this subgroup. Seventeen potato field trials were conducted in the U.S. in Regions 1 (3 trials), 2 (1 trial), 3 (1 trial), 5 (4 trials), 9 (1 trial), 10 (1 trial), and 11 (6 trials). In addition, six potato field trials were conducted in Canada in Regions 1A (2 trials), 5B (1 trial), 7A (1 trial), 12 (1 trial), and 14 (1 trial).
Studv summary:
The petitioner has provided adequate residue data reflecting the maximum proposed use pattern of pyraclostrobin on potato, the representative commodity of the tuberous and corm vegetables subgroup. The combined residues of pyraclostrobin and its metabolite BF 500-3 did not exceed the proposed tuberous and corm vegetables (crop subgroup 1-C) tolerance level of 0.04 ppm idon potatoes harvested 3 days following the last of six foliar applications of the WDG formulation at 0.18-0.22 lb ailNapplication for a total seasonal application rate of 1.24 lb ai/A (- lx the maximum proposed seasonal rate). The combined residues were <0.04 ppm (below the LOQ) idon all samples of potatoes grown in the US., including residue decline samples.
In the Canadian trials, the combined residues of pyraclostrobin and BF 500-3 were <0.04 ppm in/on all samples of potatoes harvested 3 days following the last of: (i) four foliar applications of the WDG formulation at 0.20-0.21 lb ai/Napplication for a total seasonal application rate of 0.80-0.82 lb ai/A; (ii) four foliar applications of the EC formulation at 0.19-0.21 lb ai1Napplication for a total seasonal application rate of 0.80-0.81 lb ai/A; or (iii) four foliar applications of a tank mix of pyraclostrobin (WDG) at 0.19-0.21 Ib ai/A/appIication plus metiram (WDG) at 1.55-1.66 lb ailNapplication for total seasonal application rates of 0.79-0.81 Ib ai/A pyraclostrobin and 6.34-6.50 lb ai/A metiram.
Sugar Beet
BASF Corporation submitted sugar beet field trial data (citation listed below) to support the establishment of a tolerance for residues of pyraclostrobin and BF 500-3 idon sugar beet (root) at 0.2 ppm. Data pertaining to sugar beet tops are presented in the Leaves of Root and Tuber Vegetables section.
451 18524 Haughey, D.; Abdel-Baky, S.; Riley, M. (2000) The Magnitude of BAS 500 F Residues in Sugarbeets: Lab Project Number: 199915 157: 55 185:99229. Unpublished study prepared by BASF Corporation. 74 p.
Twelve field trials were conducted during the 1999 growing season in CA(2), C0(1), ID(2), MI(l), MN(2), ND(2), TX(l), and WI(1). Mature sugar beets were harvested 7-8 days following the last of four broadcast foliar applications of the 2 lbtgal EC formulation at 0.16-0.21 lb aiIAlapplication, made at 13- to 15-day retreatment intervals. The total seasonal application rates were 0.75-0.81 lb ai/A (- l x the maximum proposed seasonal application rate). Applications were made in 14.9-30.4 galiA using ground equipment with a non-silicone spray adjuvant added to the spray mixture. In one trial (MN), additional sugar beet samples were collected at 0, 14,21, and 28 days following treatment to evaluate residue decline. A separate plot at each trial site was left untreated to provide control samples.
A single untreated sample and duplicate treated samples of mature sugar beets (roots and tops) were collected from each test site. The collected samples were then bagged separately, labeled, and frozen. All samples were shipped frozen to the BASF APC for analysis. Samples of sugar beet roots and tops were analyzed for residues of pyraclostrobin and BF 500-3 using Method D9808. Apparent residues of pyraclostrobin and BF 500-3 were each less than the LOQ (<0.02 ppm) idon 12 samples of untreated sugar beet roots. Residues of pyraclostrobin and BF 500-3 idon treated root samples are presented in Table 32; residues in treated tops samples are presented in Table 34.
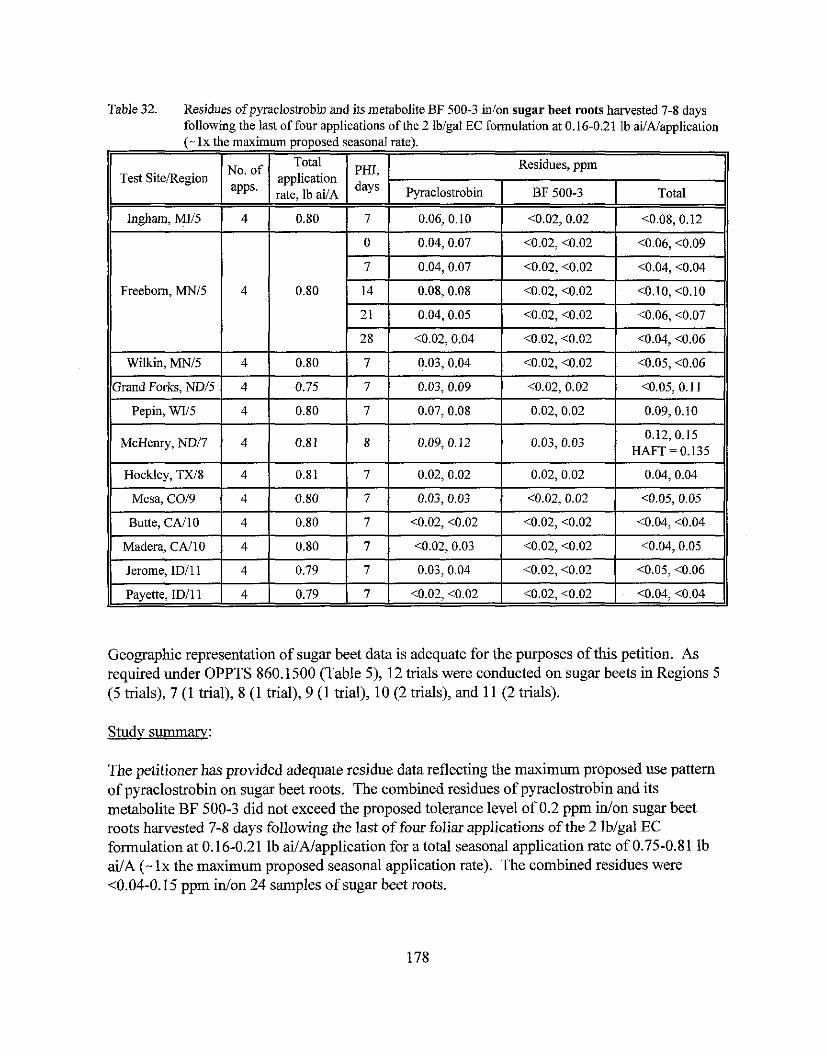
Table 32. Residues of pyraclostrobin and its metabolite BF 500-3 inlon sugar beet roots harvested 7-8 days following the last of four applications of the 2 lblgal EC formulation at 0.16-0.21 lb ailNapplicatior (- lx the maximum proposed seasonal rate).
Geographic representation of sugar beet data is adequate for the purposes of this petition. As required under OPPTS 860.1500 (Table 5), 12 trials were conducted on sugar beets in Regions 5 (5 trials), 7 (1 trial), 8 (1 trial), 9 (1 trial), 10 (2 trials), and 11 (2 trials).
Test SiteIRegion
Mesa, C019
Butte, CAI10
Madera, CN10
Jerome, ID11 1
Payette, ID11 1
Study summary:
The petitioner has provided adequate residue data reflecting the maximum proposed use pattern of pyraclostrobin on sugar beet roots. The combined residues of pyraclostrobin and its metabolite BF 500-3 did not exceed the proposed tolerance level of 0.2 ppm inion sugar beet roots harvested 7-8 days following the last of four foliar applications of the 2 lb/gal EC formulation at 0.16-0.21 lb ailMapplication for a total seasonal application rate of 0.75-0.81 lb ai/A (- l x the maximum proposed seasonal application rate). The combined residues were 10.04-0.15 ppm idon 24 samples of sugar beet roots.
No. of
4
4
4
4
4
application rate, lb ailA
0.80
0.80
0.80
0.79
0.79
PHI, days
7
7
7
7
7
Residues, ppm
0.03, 0.03
<0.02, <0.02
<0.02, 0.03
0.03, 0.04
<0.02, <0.02
Pyracloshobin
<0.02, 0.02
10.02, <0.02
10.02, <0.02
<0.02, <0.02
10.02, <0.02
BF 500-3
c0.05, 0.05
10.04, <0.04
<0.04, 0.05
<0.05, <0.06
<0.04, <0.04
Total
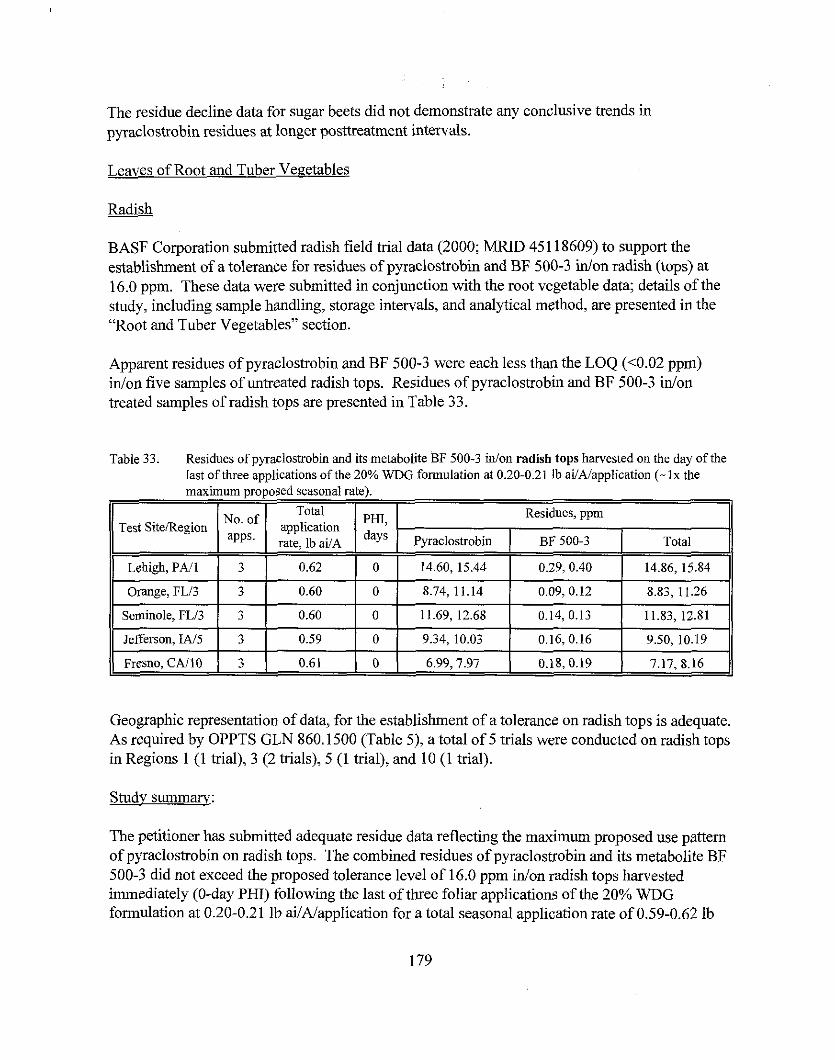
The residue decline data for sugar beets did not demonstrate any conclusive trends in pyraclostrobin residues at longer posttreatment intervals.
Leaves of Root and Tuber Vegetables
BASF Corporation submitted radish field trial data (2000; MRID 45 11 8609) to support the establishment of a tolerance for residues of pyraclostrobin and BF 500-3 idon radish (tops) at 16.0 ppm. These data were submitted in conjunction with the root vegetable data; details of the study, including sample handling, storage intervals, and analytical method, are presented in the "Root and Tuber Vegetables" section.
Apparent residues of pyraclostrobin and BF 500-3 were each less than the LOQ (<0.02 ppm) idon five samples of untreated radish tops. Residues of pyraclostrobin and BF 500-3 idon treated samples of radish tops are presented in Table 33.
Table 53. Residues of pyraclostrobin and its metabolite BF 500-3 inion radish tops harvested on the day of the last of three applications of the 20% WDG formulation at 0.20-0.21 lb ai/A/application (- Ix the maximum proposed seasonal rate).
Geographic representation of data, for the establishment of a tolerance on radish tops is adequate. As required by OPPTS GLN 860.1500 (Table 5), a total of 5 trials were conducted on radish tops in Regions 1 (1 trial), 3 (2 trials), 5 (1 trial), and 10 (1 trial).
Studv summary:
The petitioner has submitted adequate residue data reflecting the maximum proposed use pattern of pyraclostrobin on radish tops. The combined residues of pyraclostrobin and its metabolite BF 500-3 did not exceed the proposed tolerance level of 16.0 ppm idon radish tops harvested immediately (0-day PHI) following the last of three foliar applications of the 20% WDG formulation at 0.20-0.21 lb ai/A/application for a total seasonal application rate of 0.59-0.62 lb
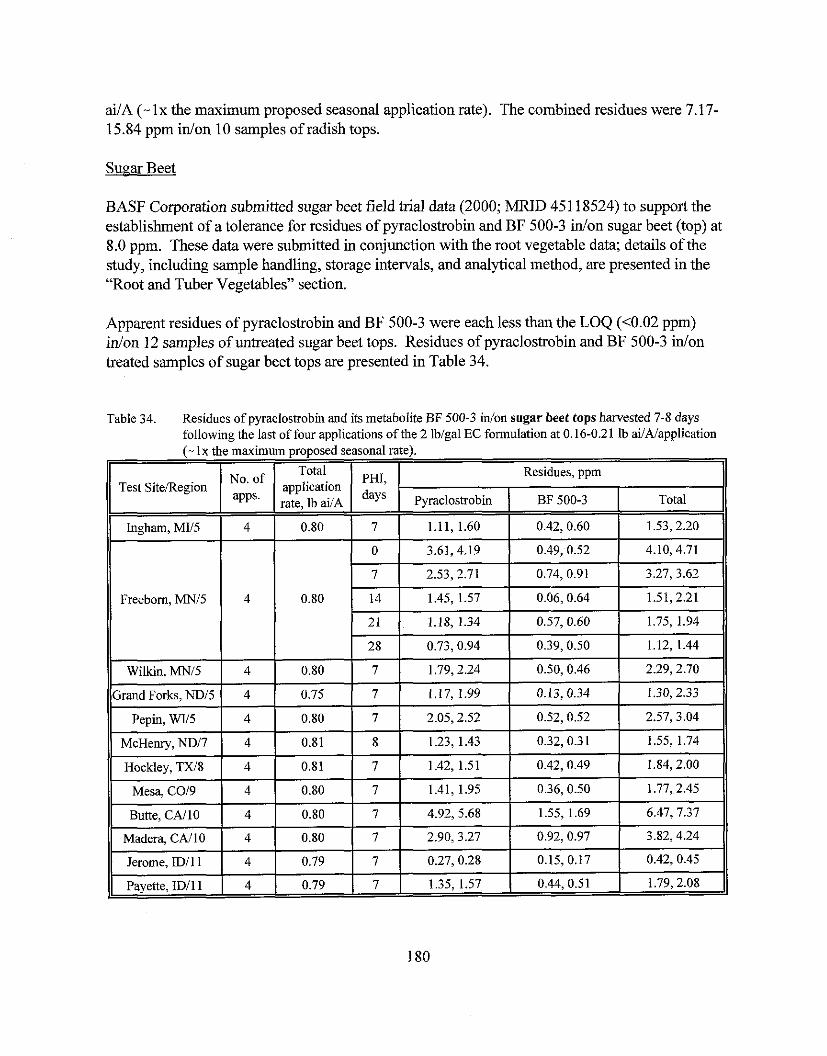
ai/A (- l x the maximum proposed seasonal application rate). The combined residues were 7.17- 15.84 ppm idon 10 samples of radish tops.
Sugar Beet
BASF Corporation submitted sugar beet field trial data (2000; MRID 451 18524) to support the establishment of a tolerance for residues of pyraclostrobin and BF 500-3 inlon sugar beet (top) at 8.0 ppm. These data were submitted in conjunction with the root vegetable data; details of the study, including sample handling, storage intervals, and analytical method, are presented in the "Root and Tuber Vegetables" section.
Apparent residues of pyraclostrobin and BF 500-3 were each less than the LOQ (10.02 ppm) idon 12 samples of untreated sugar beet tops. Residues of pyraclostrobin and BF 500-3 inlon treated samples of sugar beet tops are presented in Table 34.
Table 34. Residues of pyraclostrobin and its metabolite BF 500-3 in/on sugar beet tops harvested 7-8 days following the last of four applications of the 2 lblgal EC formulation at 0.16-0.21 lb ailAlapplication
Freeborn, MN15
(- Ix the maximum proposed seasonal rate).
1 Wilkin, MNIS
Test SiteIRegion
Ingham, MI15
Residues, ppm
Grand Forks, NDl5
Pepin, WIl5
McHenry, NDI7
Hockley, W 8
Mesa. C019
application rate, lb ai/A
0.80
No' of
4
Butte, CAI10
Madera, CAI10
Jerome, ID11 1
Payette, ID11 1
PHI, days
7
0
7
Total
1.53,2.20
4.10,4.71
3.27, 3.62
Pyraclostrobin
1.11, 1.60
3.61,4.19
2.53,2.71
4
4
4
4
4
BF 500-3
0.42,0.60
0.49, 0.52
0.74, 0.91
4
4
4
4
0.75
0.80
0.81
0.81
0.80
0.80
0.80
0.79
0.79
7
7
8
7
7
7
7
7
7
0.13,0.34
0.52,0.52
0.32, 0.3 1
0.42,0.49
0.36, 0.50
1.17, 1.99
2.05,2.52
1.23, 1.43
1.42, 1.51
1.41, 1.95
1.30,2.33
2.57,3.04
1.55, 1.74
1.84,2.00
1.77,2.45
4.92,5.68
2.90,3.27
0.27,0.28
1.35, 1.57
1.55, 1.69
0.92, 0.97
0.15,0.17
0.44, 0.51
6.47, 7.37
3.82, 4.24
0.42, 0.45
1.79,2.08 -
Geographic representation of sugar beet data is adequate for the purposes of this petition. As required under OPPTS 860.1500 (Table 5), a total of 12 trials were conducted on sugar beet tops in Regions 5 (5 trials), 7 (1 trial), 8 (1 trial), 9 (1 trial), 10 (2 trials), and 1 l (2 trials).
Study summary:
The petitioner has submitted adequate residue data reflecting the maximum proposed use pattern of pyraclostrobin on sugar beet tops. The combined residues of pyraclostrobin and its metabolite BF 500-3 did not exceed the proposed tolerance level of 8.0 pprn idon sugar beet tops harvested 7-8 days following the last of four foliar applications of the 2 lbigal EC formulation at 0.16-0.2 1 lb ailAiapplication for a total seasonal application rate of 0.75-0.81 lb ai/A (- l x the maximum proposed seasonal application rate). The combined residues were 0.42-7.37 pprn idon 24 samples of sugar beet tops.
The residue decline data for sugar beet tops showed that residues decreased gradually at longer posttreatment intervals. ~ e s i d i e s of pyraclostrobin were 3.61-4.19 pprn at the 0-day PHI and declined to 0.73-0.94 ppm at the 28-day PHI. Residues of the metabolite BF 500-3 were 0.49- 0.52 pprn at the O-dayAP~l and declined to 0.39-0.50 pprn at the 28-day PHI.
Bulb Vegetables
BASF Corporation submitted dry bulb and green onion field trial data (citation listed below) to support the establishment of a tolerance for residues of pyraclostrobin and BF 500-3 idon Bulb vegetables (crop group) at 0.7 ppm.
451 18525 Versoi, P.; Abdel-Baky, S.; Riley, M. (2000) The Magnitude of BAS 500 F Residues in Dry Bulb and Green Onions: Lab Project Number: 199915158: 46694:99171. Unpublished study prepared by BASF Corporation. 64 p.
Dm Bulb and Green Onion
A total of nine field trials were conducted during the 1999 growing season. Six trials were conducted on dry bulb onions grown in CA(2), PA(l), OR(l), and TX(2) and three trials were conducted on green onions grown in CA(2) and TX(1). Mature onions (dry bulb and green) were harvested seven days following the last of six broadcast foliar applications of the 20% WDG formulation at 0.15-0.16 lb ailA/application, made at 13- to 15-day retreatment intervals. The total seasonal application rates were 0.90-0.91 lb ai1A (- lx the maximum proposed seasonal application rate). Applications were made in 2 1.4-3 1.3 galtA using ground equipment with a non-silicone spray adjuvant added to the spray mixture. In one trial (CA), additional dry bulb onion samples were collected at 0, 14,21, and 28 days following treatment to evaluate residue decline. A separate plot at each trial site was left untreated to provide control samples.
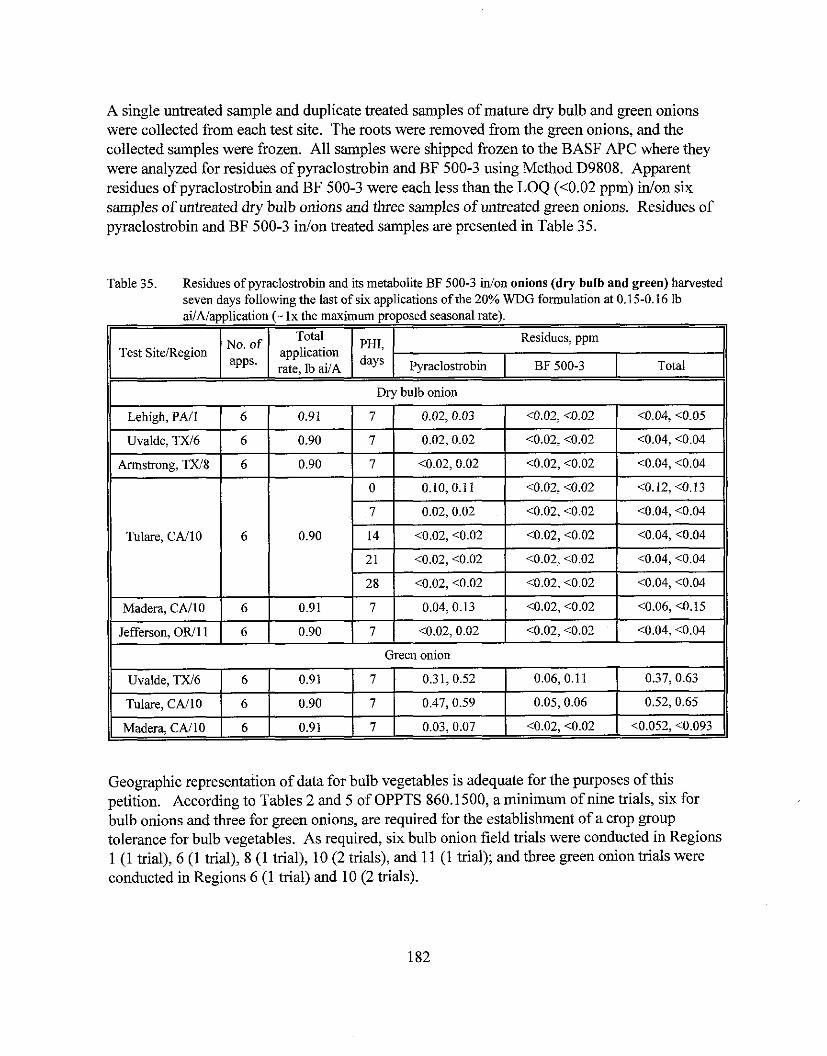
A single untreated sample and duplicate treated samples of mature dry bulb and green onions were collected from each test site. The roots were removed from the green onions, and the collected samples were frozen. All samples were shipped frozen to the BASF APC where they were analyzed for residues of pyraclostrobin and BF 500-3 using Method D9808. Apparent residues of pyraclostrobin and BF 500-3 were each less than the LOQ (<0.02 ppm) inlon six samples of untreated dry bulb onions and three samples of untreated green onions. Residues of pyraclostrobin and BF 500-3 inlon treated samples are presented in Table 35.
Table 35. Residues of pyraclostrobin and its metabolite BF 500-3 idon onions (dry bulb and green) harvested seven days following the last of six applications of the 20% WDG formulation at 0.15-0.16 lb
11 Drv bulb onion 11
- . . ailAlapplication (- lx the maximum proposed seasonal rate).
Geographic representation of data for bulb vegetables is adequate for the purposes of this petition. According to Tables 2 and 5 of OPPTS 860.1500, a minimum of nine trials, six for bulb onions and three for green onions, are required for the establishment of a crop group tolerance for bulb vegetables. As required, six bulb onion field trials were conducted in Regions 1 (1 trial), 6 (1 trial), 8 (1 trial), 10 (2 trials), and 11 (1 trial); and three green onion trials were conducted in Regions 6 (1 trial) and 10 (2 trials).
Test SiteRegion
Green onion
No. of apps'
application rate, ib ai/A
0.37,0.63
0.52, 0.65
<0.052, <0.093
PHI, dayS
Residues, ppm
Pyracloshobin I BF 500-3
0.31,0.52
0.47,0.59
0.03, 0.07
Uvalde, TXI6
Tulare, CAI10
Madera, CAI1 0
Total
0.06, 0.11
0.05,0.06
<0.02, <0.02
0.91
0.90
0.91
6
6
6
7
7
7
Study summary:
The petitioner has provided adequate residue data reflecting the maximum proposed use pattern of pyraclostrobin and its metabolite BF 500-3 on dry bulb onions and green onions, the representative commodities of the bulb vegetable crop group. The combined residues of pyraclostrobin and BF 500-3 idon dry bulb and green onions harvested seven days following the last of six broadcast foliar applications of the WDG formulation at 0.15-0.16 lb ailA/application for a total seasonal application rates of 0.90-0.91 lb ailA (- lx the maximum proposed seasonal application rate) were <0.04-0.15 pprn idon bulb onions and <0.05-0.65 ppm idon green onions treated with the WDG formulation. RAB3 recommends that the bulb vegetables (crop group) tolerance be proposed at 0.9 ppm.
The residue decline data for dry bulb onions showed that residues decreased gradually at longer posttreatment intervals. Residues of pyraclostrobin were 0.10-0.1 1 ppm at the 0-day PHI and declined to <0.02 ppm at the 28-day PHI. Residues of the metabolite BF 500-3 were below the LOQ idon each treated sample.
Legume Vegetables (Succulent or Dried)
Dried Shelled Pea and Bean (Except Soybean) - Subgroup 6C
BASF Corporation submitted dry field pea, lentil, and dry bean (and snap bean) field trial data (citations listed below) to support the establishment of a tolerance for residues of pyraclostrobin and BF 500-3 idon the dried shelled pea and bean crop group (except soybean) at 0.5 ppm. Data pertaining to pea hay and vines are presented in the "Foliage of Legume Vegetables" section.
451 18522 Versoi, P.; Abdel-Baky, S.; Riley, M. (2000) Magnitude of BAS 500 F Residues in Dry Field Peas: Lab Project Number: 199915154: 46591: 99216. Unpublished study prepared by BASF Corporation. 76 p.
451 18526 Versoi, P.; Abdel-Baky, S.; Riley, M. (2000) Magnitude of BAS 500 F Residues in Lentils: Lab Project Number: 199915159: 46590: 99224. Unpublished study prepared by BASF Corporation. 55 p.
45367501 Haughey, D.; Abdel-Baky, S. (2001) Magnitude of BAS 500 F Residues in Dry Beans and Snap Beans: Lab Project Number: 2001/5000906: 77915. Unpublished study prepared by BASF Corporation. 73 p.
Pea, dry, seed
A total of eight dry pea field trials were conducted during the 1999 growing season. Two trials were conducted in the U.S. in MN; and six trials were conducted in Canada in AB(2), MB(2),
and SK(2). Pea vines and hay were cut 0-2 days (when pods began forming), and dry field pea seed was harvested 29-34 days following the last of two foliar applications of the 2 lb/gal EC formulation at 0.20-0.21 lb ai/A/application, made at 6- to 8-day retreatment intervals. Total seasonal application rates were 0.40-0.41 lb ai/A (- 1 . 5 ~ the maximum proposed seasonal rate). Applications were made in 10.6-99.1 gal/A of water using ground equipment with a spray adjuvant added to the spray solution. In one trial (MN), additional pea vine and hay samples were cut at 3,6,9, and 12 days, and dry pea seed samples were harvested 25,30,40, and 46 days following treatment to evaluate residue decline. A separate plot at each trial site was not treated for control samples.
Samples of treated and untreated dry field pea vine, hay, and mature seed were collected fiom each test site; hay samples were dried in the field for 4-7 days before collection. The moisture content of hay, vines, and seed was determined to be 29-70%, 77-93%, and 14-35%, respectively. All samples were transferred to freezers as soon as possible after collection and then shipped frozen to the BASF APC for analysis. All samples remained frozen during shipment except for pea seed samples from one test site (AB), which were received very cold but not frozen. Samples were analyzed for residues of pyraclostrobin and BF 500-3 using Method D9808. Apparent residues of pyraclostrobin and BF 500-3 were each less than the LOQ (<0.02 ppm) idon eight samples of untreated dry field pea seed. Residues of pyraclostrobin and BF 500-3 idon treated dry field pea seed samples are presented in Table 36a; residues in field pea vines and hay are presented in Table 38.
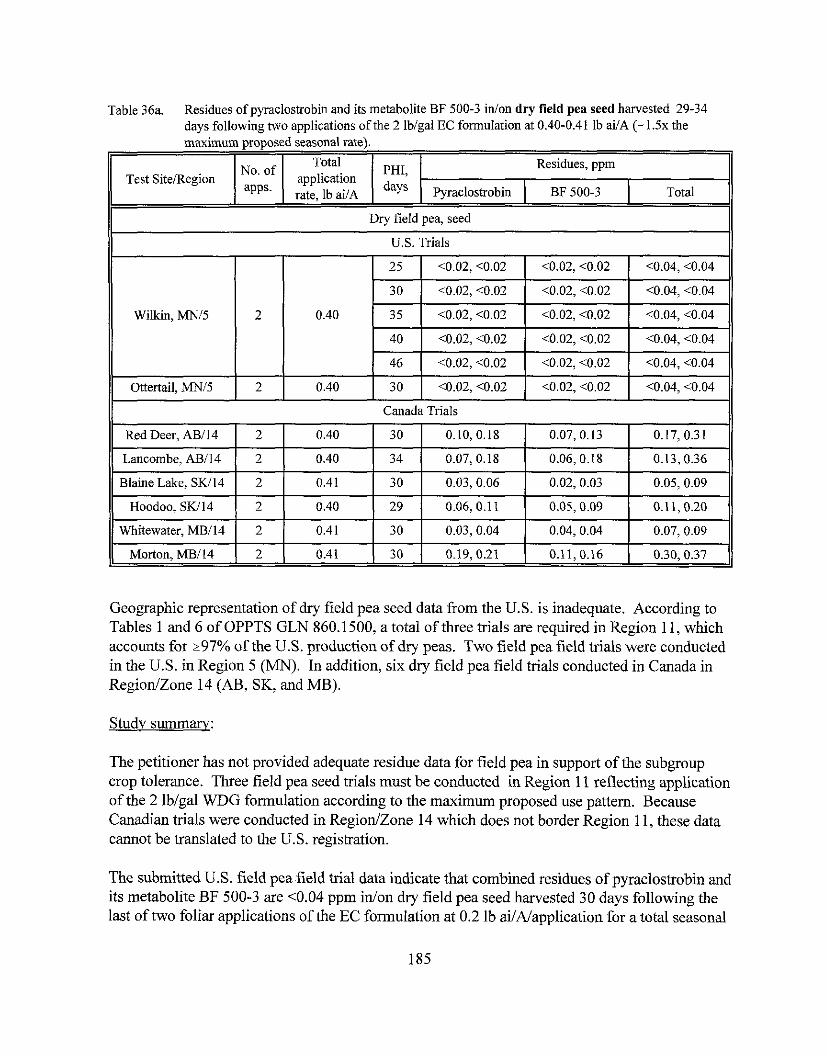
Table 36a. Residues of pyracloshobin and its metabolite BF 500-3 idon dry field pea seed harvested 29-34 days following Mio applications of the 2 lblgal EC formulation at 0.40-0.41 lb ai/A (- 1 . 5 ~ the
11 U.S. Trials
maximum proposed seasonal rate).
Ottertail, MNl5
11 Canada Trials 11
Test SiteIRegion
11 Red Deer. ABl14 1 2 1 0.40 1 30 1 0.10.0.18 1 0.07.0.13 0.17. 0.31 11
Dry field pea, seed
PHI, days
No' of Total
application rate, lb ai/A
Residues, ppm
Lancombe, ABl14
Blaine Lake, SW14
Geographic representation of dry field pea seed data from the U.S. is inadequate. According to Tables 1 and 6 of OPPTS GLN 860.1500, a total of three trials are required in Region 11, which accounts for 297% of the U.S. production of dry peas. Two field pea field trials were conducted in the U.S. in Region 5 (MN). In addition, six dry field pea field trials conducted in Canada in RegionIZone 14 (AB, SK, and MB).
Pyraclostrohin BF 500-3
Hoodoo, SW14
Whitewater, MBl14
Morton, MBI 14
Studv summary:
Total
2
2
The petitioner has not provided adequate residue data for field pea in support of the subgroup crop tolerance. Three field pea seed trials must be conducted in Region 11 reflecting application of the 2 lbtgal WDG formulation according to the maximum proposed use pattern. Because Canadian trials were conducted in RegionJZone 14 which does not border Region 11, these data cannot be translated to the U.S. registration.
2
2
2
The submitted U.S. field pea field trial data indicate that combined residues of pyraclostrobin and its metabolite BF 500-3 are <0.04 ppm inlon dry field pea seed harvested 30 days following the last of two foliar applications of the EC formulation at 0.2 lb ailNapplication for a total seasonal
0.40
0.41
0.40
0.41
0.41
34
30
29
30
30
0.07,0.18
0.03,0.06
0.06,O.ll
0.03,0.04
0.19,0.21
0.06,0.18
0.02, 0.03
0.13,0.36
0.05, 0.09
0.05, 0.09
0.04, 0.04
0.11, 0.16
0.11,0.20
0.07, 0.09
0.30, 0.37
application rate of -0.4 lb ai/A (- 1 . 5 ~ the m&~imum proposed seasonal rate). The combined residues were 0.05-0.37 ppm idon dry field pea seed grown in Canada treated with the EC formulation at 1 . 5 ~ the maximum proposed use pattern.
The residue decline data for dry field pea seed did not demonstrate any conclusive trends in pyraclostrobin residues at longer posttreatment intervals; the combined residues of pyraclostrobin and BF 500-3 are <0.04 ppm at each harvest interval.
A total of five field trials were conducted during the 1999 growing season. Three field trials were conducted in the U.S. in MT(1) and ND(2), and two field trials were conducted in Canada in AB(1) and MB(1). Mature dry lentil seeds were harvested 29-33 days following the last of two foliar applications of the 2 lblgal EC formulation at 0.19-0.20 lb aiIAlapplication, made at 6- to 8-day retreatment intervals. Total seasonal application rates were 0.39-0.41 lb ai/A (-2x the maximum proposed seasonal rate). Applications were made in 1 1.2-20.4 gal/A of water using ground equipment with a spray adjuvant added to the spray solution. In one trial (ND), additional lentil seed samples were harvested 26,35,40, and 45 days following treatment to evaluate residue decline. A separate plot at each trial site was not treated for control samples.
A single untreated sample and duplicate treated samples of mature lentil seed were collected from each test site and were frozen. The moisture content of lentil seed was determined to be 13- 46%. All samples were shipped frozen to the BASF APC where they were analyzed for residues of pyraclostrobin and BF 500-3 using Method D9808. Apparent residues of pyraclostrobin and BF 500-3 were each less than the LOQ (<0.02 ppm) idon five samples of untreated lentil seed. Residues of pyraclostrobin and BF 500-3 idon treated samples are presented in Table 36b.
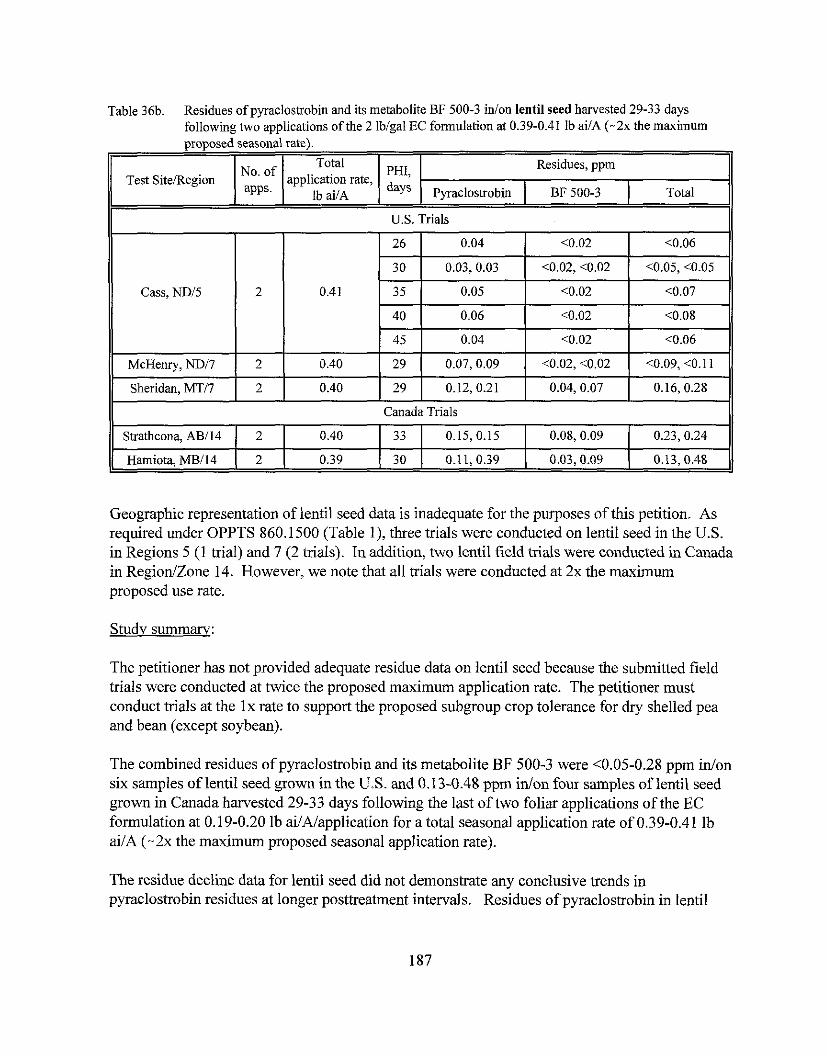
Table 36b. Residues of pyraclostrobin and its metabolite BF 500-3 inlon lentil seed harvested 29-33 days following two applications ofthe 2 lblgal EC formulation at 0.39-0.41 lb ailA (-2x the maximum
11 U.S. Trials 11
. - proposed seasonal rate).
Geographic representation of lentil seed data is inadequate for the purposes of this petition. As required under OPPTS 860.1500 (Table I), three trials were conducted on lentil seed in the U.S. in Regions 5 (1 trial) and 7 (2 trials). In addition, two lentil field trials were conducted in Canada in RegionIZone 14. However, we note that all trials were conducted at 2x the maximum proposed use rate.
PHI, days
Total application rate,
Ih ailA Test SiteKegion
Sheridan, MTI7
Studv summarv:
No' of aPPs.
<0.02
<0.02, <0.02
<0.02
<0.02
<0.02
<0.02, <0.02
Cass, NDl5
McHenry, NDl7
The petitioner has not provided adequate residue data on lentil seed because the submitted field trials were conducted at twice the proposed maximum application rate. The petitioner must conduct trials at the 1x rate to support the proposed subgroup crop tolerance for dry shelled pea and bean (except soybean).
Residues, pprn
<0.06
<0.05, <0.05
<0.07 -
<0.08
<0.06
<0.09, <0.11
2
2
Canada Trials
Strathcona, ABl14 1 2 1 0.40 1 33 1 0.15,0.15 ( 0.08,0.09 ( 0.23, 0.24
2
The combined residues of pyraclostrobin and its metabolite BF 500-3 were c0.05-0.28 ppm idon six samples of lentil seed grown in the U.S. and 0.13-0.48 ppm idon four samples of lentil seed grown in Canada harvested 29-33 days following the last of two foliar applications of the EC formulation at 0.19-0.20 lb ai/A/application for a total seasonal application rate of 0.39-0.41 lb ai/A (-2x the maximum proposed seasonal application rate).
Pyraclostrobin I BF 500-3
0.04
0.03,0.03
0.05
0.06
0.04
0.07,0.09
0.41
0.40
The residue decline data for lentil seed did not demonstrate any conclusive trends in pyraclostrobin residues at longer posttreatment intervals. Residues of pyraclostrobin in lentil
Total
26
30
35
40
45
29
0.40 29 0.12,0.21 0.04,0.07 0.16,0.28
seed remained low ranging 0.03-0.06 ppm at the 26- to 45-day PHIS; residues of BF 500-3 were less than the LOQ in all samples.
Drv Beans and Snav Beans
A total of nineteen field trials were conducted during the 2000 growing season. Ten trials were conducted on dry beans grown in the CA, CO, ID, MN, ND (3), TX, WI, and AB (Canada); and nine trials were conducted on snap beans in CA, GA, ID, MN, PA, WI in the US, and NS, QC (2) in Canada. Mature dry bean plants were cut at 21 days after the last of two foliar applications of the 2 lbigal EC formulation at 0.20-0.21 lb ai/A/application (and then allowed to dry in the field or at the test facility for 0-15 days), made at 4- to 8-day retreatment intervals, and snap beans were harvested 7 days following the last of two foliar applications of the 2 lbigal EC formulation at 0.20-0.21 lb ai/A/application, made at 6- to 8-day retreatment intervals. Total seasonal application rates were 0.39-0.42 lb ai/A (- lx the maximum proposed seasonal rate). Applications were made in 1 1-38 gal/A of water using ground equipment with a spray adjuvant added to the spray solution. At the WI site, additional bean plant samples were cut at 0,7, 14, and 28 days and allowed to dry for 2-4 days, and snap bean samples were harvested 0,3, 10, and 14 days following treatment to evaluate residue decline. A separate plot at each trial site was not treated for control samples.
Samples of treated and untreated dry bean and snap bean were collected from each test site. All samples were transferred to freezers as soon as possible after collection and then shipped frozen to the BASF APC for analysis. All samples remained frozen during shipment. Samples were analyzed for residues of pyraclostrobin and BF 500-3 using Method D9908 (identical to D9808 using methanol:water:2N HCl instead of methano1:water for extraction). Apparent residues of pyraclostrobin and BF 500-3 were each less than the LOQ (<0.02 ppm) inion untreated samples. Residues of pyraclostrobin and BF 500-3 idon treated dry bean and snap bean samples are presented in Table 37.
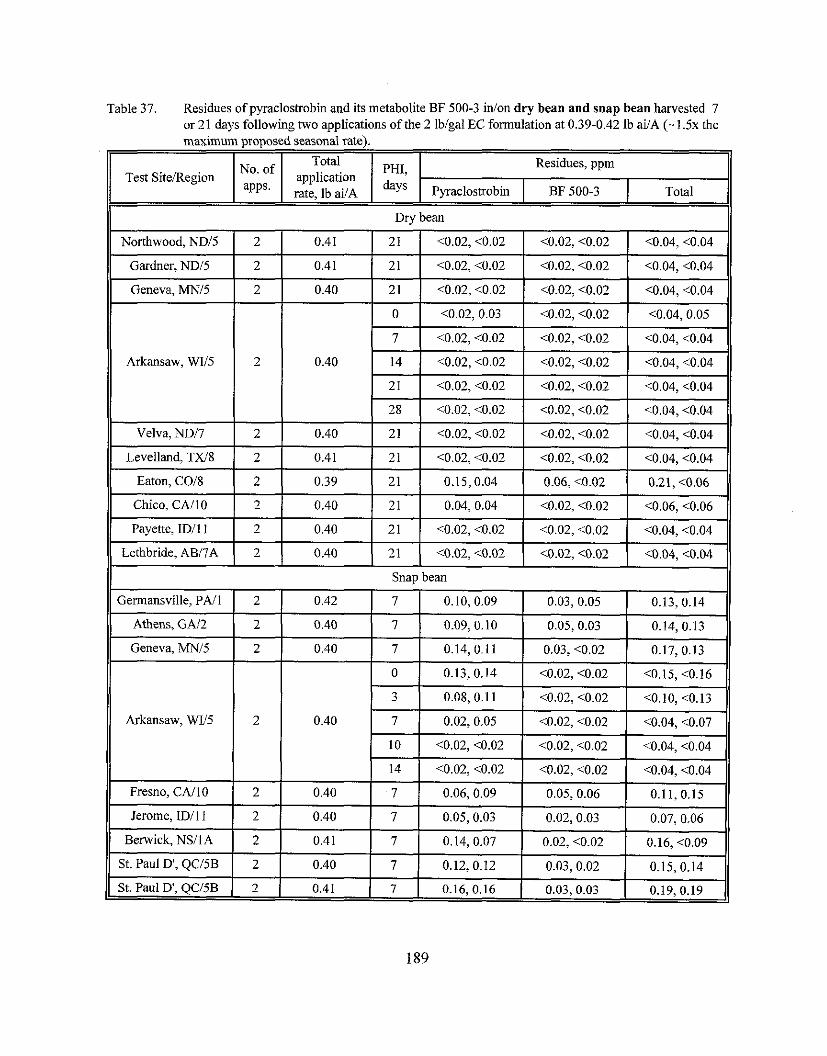
Arkansaw, W 5
Table 37. Residues of pyraclostrobin and its metabolite BF 500-3 inlon dry bean and snap bean harvested 7 or 21 days following two applications of the 2 lblgal EC formulation at 0.39-0.42 lb aiiA (- 1 .Sx the maximum proposed seasonal rate).
Test SiteIRegion
Dry bean
Residues, ppm No. of
Pyraclostrobin I BF 500-3 Total
Total application rate, lb ai/A
PHI, days
Geographic representation of dry bean and snap bean data is adequate for the purposes of this petition. As required under OPPTS 860.1500 (Table I), nine trials were conducted on dry bean in the U.S. in Regions 5 (4 trials), and 7, 8,9, 10 and 1 1 (1 trial in each region), and one dry bean field trial was conducted in Canada in RegionIZone 7A. In addition, six trials were conducted on snap bean in the U.S. in Regions 1,2, 10, and 11 (1 trial in each region) and 5 (two trials), and three snap bean field trials were conducted in Canada in RegiodZone 1A and 5B (two trials).
Study surnmarv:
The petitioner has provided adequate residue data reflecting the maximum proposed use pattern of pyracloslrobin on dry bean (and may be adequate for snap bean pending submission of a proposed 1abeliSection B). The combined residues of pyraclostrobin and its metabolite BF 500-3 did not exceed 0.21 pprn idon dry bean and snap bean harvested 21 and 7 days following the last of two foliar applications of the EC formulation at 0.19-0.20 lb ailNapplication for a total seasonal application rate of 0.39-0.42 lb ai/A (- 1 . 5 ~ the maximum proposed seasonal application rate for dry bean).
The residue decline data for dry bean did not demonstrate any conclusive trends in pyraclostrobin residues at longer posttreatment intervals; those in snap bean declined at longer posttreatment intervals. Residues of pyraclostrobin in dry bean and snap bean remained low ranging <0.02 to 0.16 pprn at the 21- and 7-day PHIS; residues of BF 500-3 were less than 0.02 to 0.06 pprn in all samples.
To establish a tolerance for the dried shelled pea and bean (except soybean) subgroup, the petitioner should conduct the five field pea trials or side-by-side lentil field trials as described above. The submitted residue data support a tolerance of 0.3 pprn for the combined residues of pyraclostrobin and its metabolite BF 500-3 idon dry bean.
Pending submission of a proposed label, the residue data may support the proposed tolerance of 0.3 pprn inlon snap bean (bean, succulent).
Foliage of Legume Vegetables Exceut Soobeans
BASF Corporation submitted field trial data (2000; MRID 45 1 18522) for field pea hay and vines in conjunction with the dry field pea seed data to support the establishment of tolerances for residues of pyraclostrobin and BF 500-3 idon field pea hay at 26.0 pprn and vines at 10.0 ppm. Details of the study, including sample handling, storage intervals, and analytical method, are presented in the "Legume Vegetables" section.
Apparent residues of pyraclostrobin and BF 500-3 were each less than the LOQ (<0.02 ppm) in/on eight samples each of untreated field pea hay and vines. Residues of pyraclostrobin and BF 500-3 idon treated samples of field pea hay and vines are presented in Table 38.
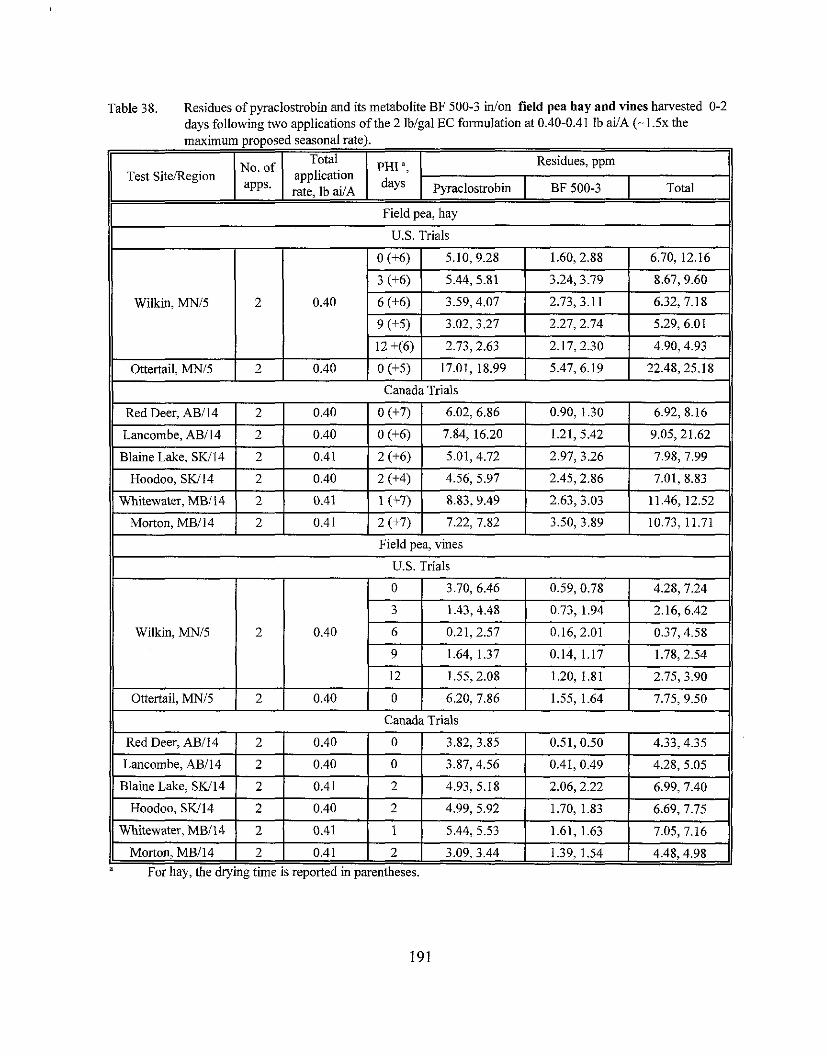
Table 38. Residues of pyraclostrobin and its metabolite BF 500-3 inlon field pea hay and vines harvested 0-2 days following two applications of the 2 lblgal EC formulation at 0.40-0.41 lb ailA (- 1 . 5 ~ the
II Field pea, hay
U.S. Trials
maximum proposed seasonal rate).
Canada Trials
11 Canada Trials
Test SiteRegion Residues, ppm
" For hay, the drying time is reported in parentheses.
Total application rate, lb a i / ~
No' of
Pyraclostrobin I BF 500-3
1.60, 2.88
3.24,3.79
2.73,3.11
2.27, 2.74
2.17, 2.30
5.47,6.19
Wilkin, MNl5
Ottertail, MNI5
=, days Total
6.70, 12.16
8.67,9.60
6.32,7.18
5.29, 6.01
4.90, 4.93
22.48,25.18
0.40
0.40
2
2
0 (+6)
3 (t6)
6 (+6)
9 (i5)
12 +(6)
0 (+5)
5.10,9.28
5.44,5.81
3.59,4.07
3.02, 3.27
2.73,2.63
17.01, 18.99
Geographic representation of field pea hay and vine data is inadequate for the purposes of this petition. According to Table 3 of OPPTS GLN 860.1500, a total of six trials of which three are for field pea in Region 11 are required; Region 1 1 accounts for 297% of the U.S. production of field pea. Two field pea field trials were conducted in the U.S. in Region 5 (MN). In addition, six field pea field trials were conducted in Canada in RegiodZone 14 (AB, SK, and MB).
Studv sumrnarv:
The petitioner has not provided adequate residue data on field pea vines and hay because geographic representation of data is inadequate. Five additional pea hay and vine trials must be conducted in Region 11 reflecting application of the 2 lblgal WDG formulation according to the maximum proposed use pattem. Because Canadian trials were conducted in RegiodZone 14 which does not border Region 11, these data cannot be translated to the U.S. registration.
The submitted U.S. field pea field trial data indicate that combined residues of pyraclostrobin and its metabolite BF 500-3 were 4.90-25.18 pprn idon field pea hay and 0.37-9.50 ppm idon pea vines harvested 0-2 days following the last of two foliar applications of the EC formulation at 0.2 Ib ai/Alapplication for a total seasonal application rate of 0.4 lb ai1A (- 1 . 5 ~ the maximum proposed seasonal rate). The combined residues were 6.92-21.62 ppm idon field pea hay and 4.28-7.75 pprn idon field pea vines grown in Canada treated with the EC formulation according to 1 . 5 ~ the maximum proposed use pattem.
The residue decline data for field pea hay and vines showed trends in decreasing residues at longer posttreatment intervals in pea hay and vines. For hay, the combined residues were 6.70- 12.16 pprn at the 0-day PHI and declined to 4.90-4.93 pprn at the 12-day PHI. For vines, the combined residues were 4.28-7.24 pprn at the 0-day PHI and declined to 2.75-3.90 pprn at the 12-day PHI.
Based on the proposed use of the 2 lblgal EC formulation on dried shelled peas and beans (except soybeans), establishment of a tolerance for the foliage of legume vegetables except soybeans subgroup (7A) would be appropriate. For establishment of the subgroup tolerance, the petitioner would be required to conduct three field pea trials and three field trials on a cultivar of bean (cowpea is the preferred commodity) reflecting the maximum proposed use pattern for the 2 lblgal WDG formulation.
Fruiting Vegetables (Except Cucurbits)
BASF Corporation submitted pepper (bell and chili) and tomato field trial data (citations listed below) to support the establishment of a tolerance for residues of pyraclostrobin and BF 500-3 - - idon Fruiting vegetables (crop group) at 1.0 ppm.
451 1861 1 Versoi, P.; Abdel-Baky, S.; Riley, M. (2000) The Magnitude of BAS 500 F Residues in Bell and Chili Peppers: Lab Project Number: 61 659: 199915 15 1. Unpublished study prepared by BASF Corporation. 64 p.
451 18528 Wofford, J.; Abdel-Baky, S.; Riley, M. (1999) Magnitude of BAS 500 F Residues in Tomatoes: Lab Project Number: 199915084: 98023. Unpublished study prepared by BASF Corporation. 79 p.
Pepper (Bell and Chili)
A total of nine field trials were conducted during the 1999 growing season. Six trials were conducted on bell peppers grown in CA(2), FL(l), GA(l), IA(l), and OK(1) and three trials were conducted on chili peppers grown in NM(l), OK(1) and TX(1). Mature peppers @ell and chili) were harvested on the day of the last of six broadcast foliar applications of the 20% WDG formulation at 0.19-0.22 lb aiIAlapplication, made at 6- to 9-day retreatment intervals. The total seasonal application rates were 1.19-1.24 lb ai/A (- lx the maximum proposed seasonal application rate). Applications were made in 14.2-40.8 gal1A using ground equipment with a non-silicone spray adjuvant added to the spray mixture. A separate plot at each trial site was left untreated to provide control samples.
A single untreated sample and duplicate treated samples of mature bell and chili peppers were collected from each test site and were frozen. All samples were shipped frozen to the BASF APC where they were analyzed for residues of pyraclostrobin and its metabolite BF 500-3 using Method D9808. Apparent residues of pyraclostrobin and BF 500-3 were each less than the LOQ (<0.02 ppm) idon six samples of untreated bell peppers and three samples of untreated chili peppers. Residues of pyraclostrobin and BF 500-3 idon treated samples are presented in Table 39.
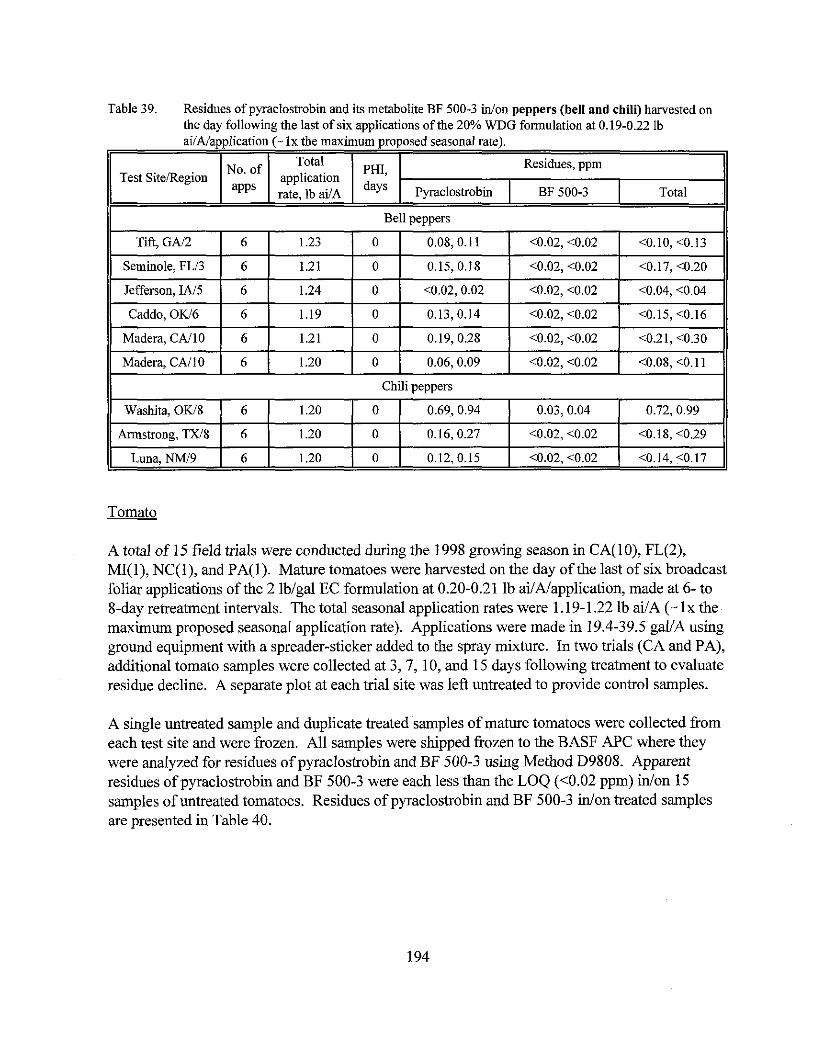
Table 39. Residues of pyraclostrobin and its metabolite BF 500-3 inlon peppers (bell and chili) harvested on the day following the last of six applications of the 20% WDG formulation at 0.19-0.22 ib ai/Aiapplication (- Ix the maximum proposed seasonal rate).
I, I Total
No. of PHI, Residues, ppm Test SitelRegion application 1 P s 1 . I / A 1 y S 1 Pyraclos~obin I BF 500-3 Total I
Bell peppers il
Tomato
Armstrong, TX/8
A total of 15 field trials were conducted during the 1998 growing season in CA(10), FL(2), MI(l), NC(l), and PA(1). Mature tomatoes were harvested on the day of the last of six broadcast foliar applications of the 2 lblgal EC formulation at 0.20-0.21 lb aili\lapplication, made at 6- to 8-day retreatment intervals. The total seasonal application rates were 1.19-1.22 lb ai/A (- lx the maximum proposed seasonal application rate). Applications were made in 19.4-39.5 gal/A using ground equipment with a spreader-sticker added to the spray mixture. In two trials (CA and PA), additional tomato samples were collected at 3,7, 10, and 15 days following treatment to evaluate residue decline. A separate plot at each trial site was left untreated to provide control samples.
A single untreated sample and duplicate treated samples of mature tomatoes were collected from each test site and were frozen. All samples were shipped frozen to the BASF APC where they were analyzed for residues of pyraclostrobin and BF 500-3 using Method D9808. Apparent residues of pyraclostrobin and BF 500-3 were each less than the LOQ (<0.02 ppm) idon 15 samples of untreated tomatoes. Residues of pyraclostrobin and BF 500-3 idon treated samples are presented in Table 40.
6
Luna,NM/9 1 6 1 1.20 0
1.20
0.12, 0.15 1 <0.02, <0.02 ( <0.14,<0.17
0 0.16, 0.27 <0.02,<0.02 <0.18, <0.29
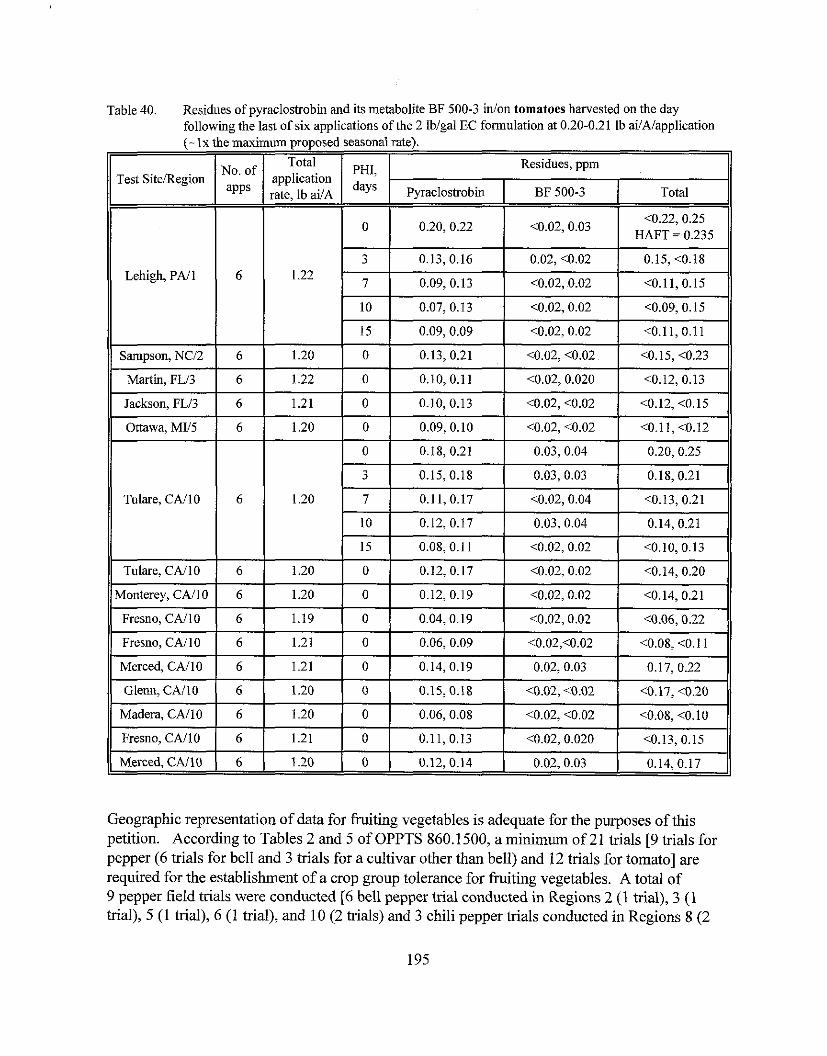
Table 40. Residues of pyraclostrobin and its metabolite BF 500-3 idon tomatoes harvested on the day following the last of six applications of the 2 Iblgal EC formulation at 0.20-0.21 lb ailAlapplication (- lx the maximum proposed seasonal rate).
0.20, 0.22 <0.02, 0.03 <0.22, 0.25
HAFT = 0.235
0.13,0.16 0.02, <0.02 0.15, <0.18 Lehigh, PA11 6 1.22 0.09, 0.13 <0.02,0.02 <0.11, 0.15
Test SiteiRegion
Geographic representation of data for fruiting vegetables is adequate for the purposes of this petition. According to Tables 2 and 5 of OPPTS 860.1500, a minimum of 21 trials [9 trials for pepper (6 trials for bell and 3 trials for a cultivar other than bell) and 12 trials for tomato] are required for the establishment of a crop group tolerance for fruiting vegetables. A total of 9 pepper field trials were conducted [6 bell pepper trial conducted in Regions 2 (1 trial), 3 (1 trial), 5 (1 trial), 6 (1 trial), and 10 (2 trials) and 3 chili pepper trials conducted in Regions 8 (2
Of
apps
Sampson, NCR
Total application rate, lb
6
PHI, days
1.20
Residues, ppm
15
0
Pyraclostrobin I BF 500-3 Total
<0.11,0.11
<O. 15, <0.23
I
0.09,0.09 <0.02, 0.02
0.13,0.21 1 <0.02, <0.02
trials) and 9 (1 trial)]. Fifteen tomato trials were conducted in Regions 1 (1 trial), 2 (1 trial), 3 (2 trials), 5 (1 trial), and 10 (10 trials).
Bridging Study
BASF Corporation submitted a bridging study (citation listed below) comparing the use of the WDG and EC formulations of pyraclostrobin on tomato, cucurbits, and grape.
451 18613 Haughey, D.; Abdel-Baky, S.; Riley, M. (2000) A Bridging Study Comparing Two Formulations of BAS 500 F in Tomatoes, Cucurbits, and Grapes: Lab Project Number: 199915145: 59472. Unpublished study prepared by Crop Management Strategies, Excel Research Services, Inc. and Agriscope, LLC. 74 p.
A total of nine field trials were conducted during the 1999 growing season in CA(3), GA(l), NC(l), NY(l), PA(l), and WA(1). Three trials each were conducted on tomatoes grown in CA, NC, and PA, cucurbits (cantaloupe, cucumber, and summer squash) grown in CA, GA, and PA, respectively, and grapes grown in CA, NY, and WA. Each trial site consisted of three plots: (i) an untreated control plot; (ii) a treatment plot reflecting use of the 2 lblgal EC formulation; and (iii) a treatment plot reflecting use of the 20% WDG formulation. Mature tomatoes and cucurbits were harvested on the day of the last of six broadcast foliar applications of either the 2 lblgal EC formulation or the 20% WDG formulation at 0.19-0.21 lb ailtVapplication, made at 6- to 8-day retreatment intervals. The total seasonal application rates were 1.18-1.22 lb aiiA (- lx the maximum proposed seasonal application rate). Applications were made in 19.9-41.2 g d A using ground equipment with a non-silicone spray adjuvant added to the spray mixture. Mature grapes were harvested 14-15 days following the last of three broadcast foliar applications of either the 2 lbigal EC formulation or the 20% WDG formulation at 0.18 lb ailNapplication, made at 14-day retreatment intervals. The total seasonal application rates were 0.54 lb aiIA ( - 0 . 6 ~ the maximum - proposed seasonal application rate). Applications were made in 100.0-184.6~al /~ using ground equipment with a non-silicone spray adjuvant added to the spray mixture.
A single untreated sample and duplicate treated samples of mature cucurbits, grapes, and tomatoes were collected from each test site and were frozen. All samples were shipped frozen to the BASF APC where they were analyzed for residues of pyraclostrobin and BF 500-3 using Method D9808. Apparent residues of pyraclostrobin and BF 500-3 were each less than the LOQ (10.02 ppm) idon three samples of untreated tomatoes. Residues of pyraclostrobin and BF 500- 3 idon treated tomato samples are presented in Table 41 ; bridging data for the cucurbits (cantaloupe, cucumber, and summer squash) and grapes are presented in the respective sections "Cucurbit Vegetables" and "Grape."
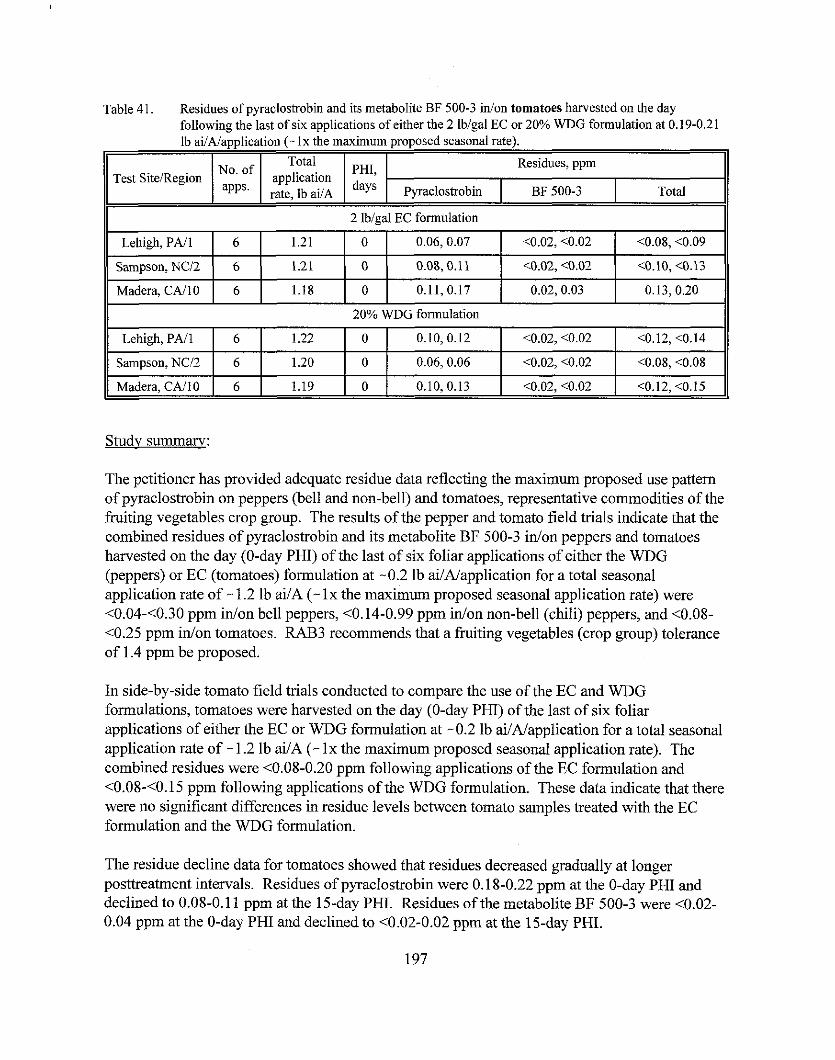
Table 41. Residues of pyraclostrobin and its metabolite BF 500-3 idon tomatoes harvested on the day following the last of six applications of either the 2 lblgal EC or 20% WDG formulation at 0.19-0.21 Ih ailAlannlication (- lx the maximum nrouosed seasonal ratel. -- - - ~~
\ .
The petitioner has provided adequate residue data reflecting the maximum proposed use pattern of pyraclostrobin on peppers (bell and non-bell) and tomatoes, representative commodities of the fruiting vegetables crop group. The results of the pepper and tomato field trials indicate that the combined residues of pyraclostrobin and its metabolite BF 500-3 idon peppers and tomatoes harvested on the day (0-day PHI) of the last of six foliar applications of either the WDG (peppers) or EC (tomatoes) formulation at -0.2 lb ailMapplication for a total seasonal application rate of - 1.2 lb ai/A (- l x the maximum proposed seasonal application rate) were <0.04-<0.30 pprn idon bell peppers, <0.14-0.99 pprn idon non-bell (chili) peppers, and <0.08- <0.25 pprn idon tomatoes. RAB3 recommends that a fruiting vegetables (crop group) tolerance of 1.4 pprn be proposed.
Test SitelRegion
Lehigh, PA11
Sampson, NC12
Madera, CAI1 0
Lehigh, PA11
Sampson, NCI2
Madera, CAI1 0
In side-by-side tomato field trials conducted to compare the use of the EC and WDG formulations, tomatoes were harvested on the day (0-day PHI) of the last of six foliar applications of either the EC or WDG formulation at -0.2 lb aiIMapplication for a total seasonal application rate of - 1.2 lb ai/A (- l x the maximum proposed seasonal application rate). The combined residues were 10.08-0.20 pprn following applications of the EC formulation and <0.08-<0.15 ppm following applications of the WDG formulation. These data indicate that there were no significant differences in residue levels between tomato samples treated with the EC formulation and the WDG formulation.
2 lblgal EC formulation
PHI, days
20% WDG formulation
0
0
0
The residue decline data for tomatoes showed that residues decreased gradually at longer posttreatment intervals. Residues of pyraclostrobin were 0.18-0.22 ppm at the 0-day PHI and declined to 0.08-0.1 1 pprn at the 15-day PHI. Residues of the metabolite BF 500-3 were 10.02- 0.04 pprn at the 0-day PHI and declined to <0.02-0.02 pprn at the 15-day PHI.
Of
6
6
6
6
6
6
application rate, lb ailA
Residues, pprn
0.06, 0.07
0.08,O.ll
0.11, 0.17
1.21
1.21
1.18
Pyraclostrobin
1.22
1.20
1.19
c0.02, <0.02
<0.02, <0.02
0.02,0.03
BF 500-3
<0.08, <0.09
<0.10, <0.13
0.13,0.20
0
0
0
Total
0.10, 0.12
0.06,0.06
0.10, 0.13
10.02, <0.02
<0.02, <0.02
<0.02, <0.02
<0.12, <0.14
<0.08, <0.08
<0.12,<0.15
Cucurbit Vegetables
BASF Corporation submitted cantaloupe, cucumber, and summer squash field trial data (citation listed below) to support the establishment of a tolerance for residues of pyraclostrobin and BF 500-3 inlon Cucurbit vegetables (crop group) at 0.5 ppm.
451 18603 Wofford, J.; Abdel-Baky, S.; Riley, M. (1999) Magnitude of BAS 500 F Residues in Cucurbits: Lab Project Number: 98022: 199915083, Unpublished study prepared by BASF Corporation. 92 p.
A total of 19 field trials were conducted during the 1998 growing season. Six trials were conducted on cantaloupe grown in AL(I), CA(3), MI(l), and OK(I), eight trials were conducted on cucumber grown in CA(l), FL(I), GA(2), MI(I), SC(l), TX(l), and WI(I), and five trials were conducted on summer squash grown in CA(l), FL(I), NC(1), PA(1) and WI(1). Mature cantaloupe, cucumber, and summer squash were harvested on the day (0-day PHI) of the last of six broadcast foliar applications of the 2 lb/gal EC formulation at 0.19-0.21 lb ai/A/application, made at 6- to 10-day retreatment intervals. The total seasonal application rates were 1.19-1.23 lb ai/A (- Ix the maximum proposed seasonal application rate). Applications were made in 12.1- 30.1 gal/A using ground equipment with a spreader sticker added to the spray mixture. In two cucumber trials (CA and GA), additional samples were collected at 3,7, 10, and 15 days following treatment to evaluate residue decline. A separate plot at each trial site was left untreated to provide control samples.
A single untreated sample and duplicate treated samples of mature cantaloupe, cucumber, and squash were collected from each test site and were frozen. All samples were shipped frozen to the BASF APC where they were analyzed for residues of pyraclostrobin and BF 500-3 using Method D9808. Apparent residues of pyraclostrobin and BF 500-3 were each less than the LOQ - - - ~
(<0.02 ppm) idon six samples of untreated cantaloupe, eight samples of untreated cucumber, and five samples of untreated summer squash. Residues of pyraclostrobin and BF 500-3 idon treated samples are presented in Table 42.
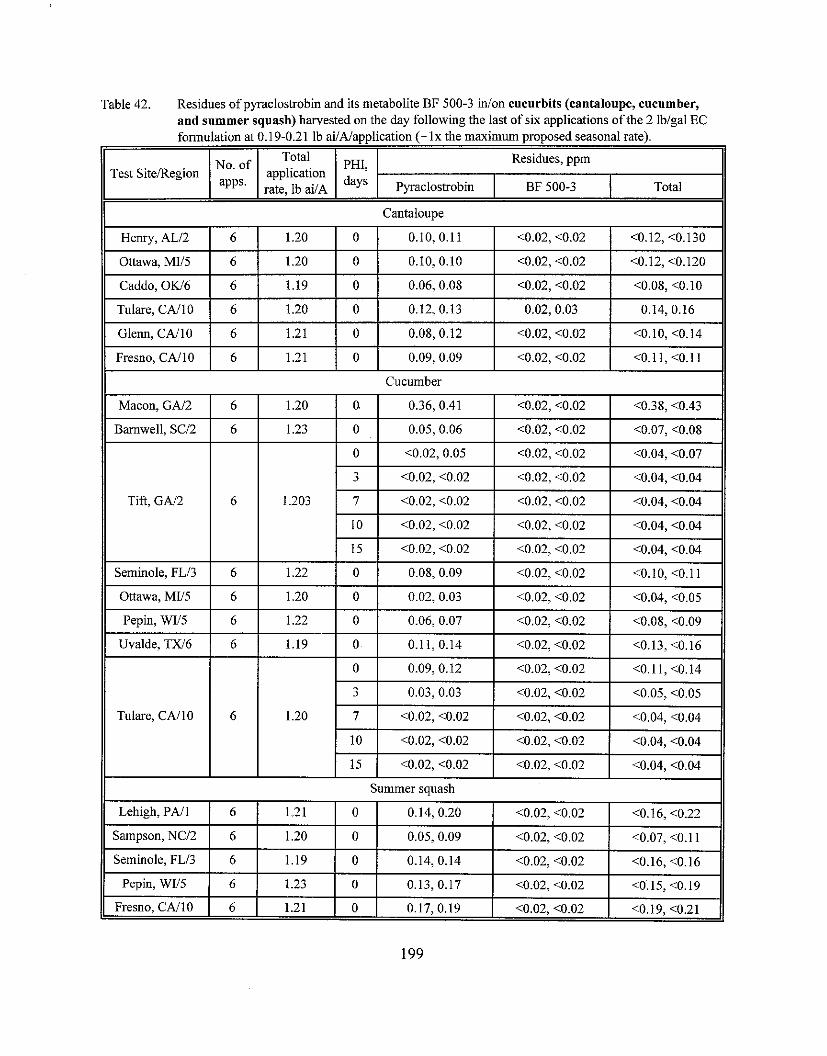
Table 42. Residues of pyraclostrobin and its metabolite BF 500-3 inlon cucurbits (cantaloupe, cucumber, and summer squash) harvested on the day following the last of six applications of the 2 lblgal EC formulation at 0.19-0.21 lb aiiNapplication (- Ix the maximum proposed seasonal rate).
I, - . I
11 Summer squash 11
Test SiteIRegion No. of
'l'otal application rate, lb ai/A
PHI, days
Residues, ppm
F'yraclostrobin BF 500-3 Total
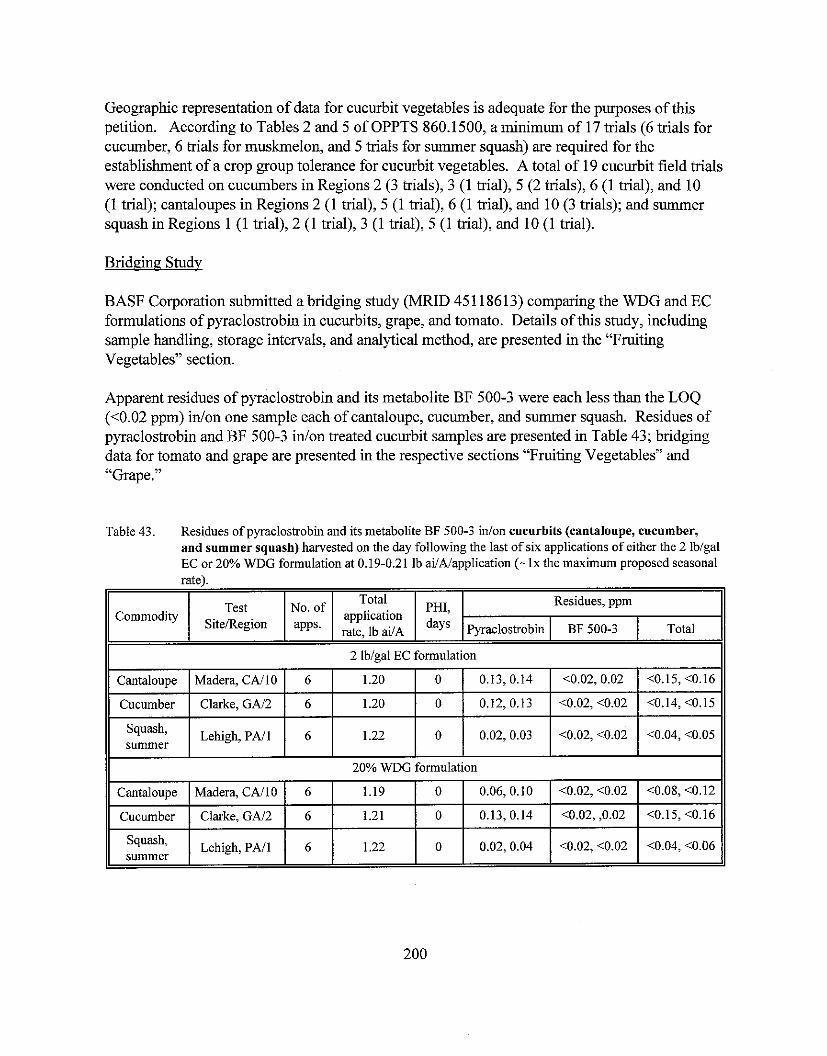
Geographic representation of data for cucurbit vegetables is adequate for the purposes of this petition. According to Tables 2 and 5 of OPPTS 860.1500, a minimum of 17 trials (6 trials for cucumber, 6 trials for muskmelon, and 5 trials for summer squash) are required for the establishment of a crop group tolerance for cucurbit vegetables. A total of 19 cucurbit field trials were conducted on cucumbers in Regions 2 (3 trials), 3 (1 trial), 5 (2 trials), 6 (1 trial), and 10 (1 trial); cantaloupes in Regions 2 (1 trial), 5 (1 trial), 6 (1 trial), and 10 (3 trials); and summer squash in Regions 1 (1 trial), 2 (1 trial), 3 (1 trial), 5 (1 trial), and 10 (1 trial).
Bridging Study
BASF Corporation submitted a bridging study (MRID 45 11 8613) comparing the WDG and EC formulations of pyraclostrobin in cucurbits, grape, and tomato. Details of this study, including sample handling, storage intervals, and analytical method, are presented in the "Fruiting Vegetables" section.
Apparent residues of pyraclostrobin and its metabolite BF 500-3 were each less than the LOQ (<0.02 ppm) idon one sample each of cantaloupe, cucumber, and summer squash. Residues of pyraclostrobin and BF 500-3 idon treated cucurbit samples are presented in Table 43; bridging data for tomato and grape are presented in the respective sections "Fruiting Vegetables" and "Grape."
Table 43. Residues of pyraclostrobin and its metabolite BF 500-3 inlon cucurbits (cantaloupe, cucumber, and summer squash) harvested on the day following the last of six applications of either the 2 lblgal EC or 20% WDG formulation at 0.19-0.21 lb ai/A/application (- l x the maximum proposed seasonal rate).
Studv summary:
The petitioner has provided adequate residue data reflecting the maximum proposed use pattern of pyraclostrobin on cucumber, muskmelon (cantaloupe), and summer squash, the representative commodities of the cucurbit vegetables crop group. The results of the cucurbit field trials indicate that the combined residues of pyraclostrobin and its metabolite BF 500-3 did not exceed the proposed cucurbit vegetables (crop group) tolerance level of 0.5 pprn idon cantaloupe, cucumber, and summer squash harvested on the day (0-day PHI) of the last of six foliar applications of the EC formulation at -0.2 lb ai/A/application for a total seasonal application rate of - 1.2 lb ailA (- lx the maximum proposed seasonal application rate). The combined residues were <0.08-0.16 pprn idon cantaloupe, <0.04-<0.43 ppm idon cucumber, and <0.07-<0.22 pprn idon summer squash.
In side-by-side cucurbit field trials conducted to compare the use of the EC and WDG formulations, cantaloupes, cucumbers, and summer squash were harvested on the day (0-day PHI) of the last of six foliar applications of either the EC or WDG formulation at -0.2 lb ailNapplication for a total seasonal application rate of - 1.2 lb ai1A (- lx the maximum proposed seasonal application rate). The combined residues were <0.15-<0.16 ppm idon cantaloupe, <0.14-<0.15 pprn idon cucumber, and <0.04-<0.05 pprn inlon summer squash following applications of the EC formulation and <0.08-<0.12 pprn idon cantaloupe, <0.15-10.16 ppm idon cucumber, and 10.04-<0.06 pprn idon summer squash following applications of the WDG formulation. These data indicate that there were no significant differences in residues levels idon cucurbit vegetable samples treated with the EC formulation or the WDG formulation.
The residue decline data for cucumbers showed that residues decreased gradually at longer posttreatment intervals. Residues of pyraclostrobin were <0.02-0.12 pprn at the 0-day PHI and declined to <0.02 ppm at the 15-day PHI. Residues of the metabolite BF 500-3 were below the LOQ idon each treated sample.
Citrus Fruits (Citrus Spp., Fortunella Spp.)
BASF Corporation submitted grapefruit, lemon, and orange field trial data (citation listed below) to support the establishment of a tolerance for residues of pyraclostrobin and BF 500-3 idon Citrus fruits (crop group) at 0.7 ppm.
451 18606 Wofford, J.; Abdel-Baky, S.; Riley, M. (2000) Magnitude of BAS 500 F Residues in Citrus: Lab Project Number: 54766: 199915144, Unpublished study prepared by BASF Corporation. 106 p.
Only the specimen label for the 2 lblgal EC formulation lists proposed uses on citrus fruits; however, all the citrus field trial data submitted in support of this petition reflect application of the 20% WDG formulation. The guidelines for conducting field trials (OPPTS GLN 860.1500) state that for pesticides used in late-season foliar applications (as is the case with pyraclostrobin)
separate residue trials or bridging data are needed to support registration of different formulations.
A total of 24 citrus fruit field trials were conducted during the 1999 growing season. Six trials were conducted on grapefruit grown in CA(2), FL(3), and TX(l), five trials were conducted on lemons grown in CA(4) and FL(l), and thirteen trials were conducted on oranges grown in CA(4), FL(8), and TX(1). Samples of grapefruit, lemons, and oranges were harvested 13-14 days following the last of four broadcast foliar applications of the 20% WDG formulation at 0.14-0.16 lb ai1Alapplication (first and second applications) and 0.25-0.26 lb ailAlapplication (third and fourth applications), were made at 9- to 11 -day retreatment intervals. The total seasonal application rates were 0.79-0.83 lb d A (- lx the maximum proposed seasonal application rate). Applications were made in either 63.2-95.8 gal1A (concentrate spray volume) or 133-356.6 gaUA (dilute spray volume) using ground equipment with a non-silicone spray adjuvant added to the spray mixture. In one trial (FL), additional orange samples were collected at 0 and 7 days following treatment to evaluate residue decline; however, these samples were not analyzed. A separate plot at each trial site was left untreated to provide control samples.
A single untreated sample and duplicate treated whole fruit samples of mature grapefmit, lemons, and oranges were collected from each test site and were frozen. All samples were shipped frozen to the BASF APC for analysis. A portion of the whole fruit samples from six sites was separated into peel and pulp samples. Whole fruit, peel, and pulp samples were analyzed for residues of pyraclostrobin and BF 500-3 using Method D9808. Apparent residues of pyraclostrobin and BF 500-3 were each less than the LOQ (<0.02 ppm) idon six samples of untreated grapefruit, five samples of untreated lemons, and thirteen samples of untreated oranges. Residues of pyraclostrobin and BF 500-3 idon treated samples are presented in Table 44.
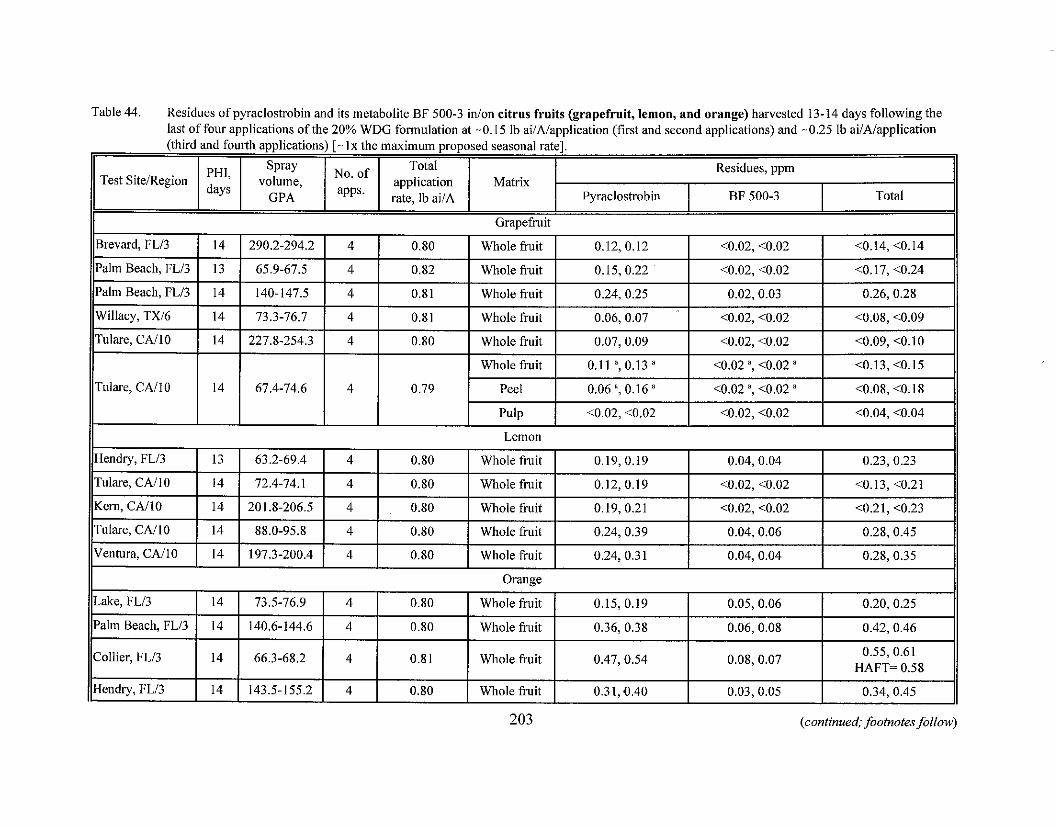
Table 44. Residues of pyraclostrobin and its metabolite BF 500-3 inlon citrus fruits (grapefruit, lemon, and orange) harvested 13-14 days following the last of four applications of the 20% WDG formulation at -0.15 lb ailAlapplication (first and second applications) and -0.25 lh ailAlapplication
Orange
Lake, FLl3
Palm Beach, FLI3
Collier, FLI3
Hendry, FLl3
203 (continued; footnotes f o h
14
14
14
14
73.5-76.9
140.6-144.6
66.3-68.2
143.5-155.2
4
4
4
4
0.80
0.80
0.81
0.80
Whole fruit
Whole fruit
Whole fruit
Whole fruit
0.15, 0.19
0.36,0.38
0.47, 0.54
0.31,0.40
0.05, 0.06
0.06, 0.08
0.08,0.07
0.03, 0.05
0.20,0.25
0.42, 0.46
0.55, 0.61 HAFT= 0.58
0.34, 0.45
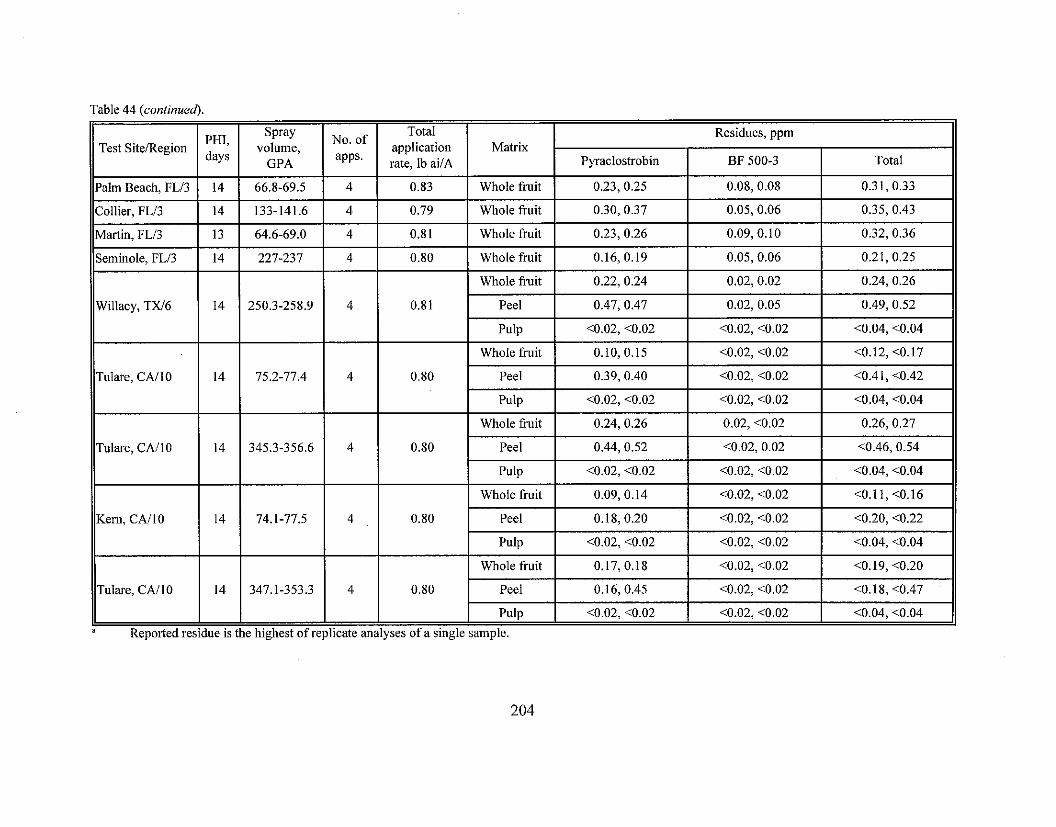
Table 44 (continued).
0.80 I Whole fruit 1 0.16, 0.19 1 0.05,0.06 1 0.21,0.25 11
Total application rate. Ib ai/A
0.83
0.79
0.81
Matrix Residues, ppm
0.80 I Peel 1 0.39,0.40 1 c0.02, 10.02 1 <0.41, <0.42 11
Pyraclostrobin
Whole fruit
Whole fruit
Whole fruit
0.81
BF 500-3
0.23, 0.25
0.30, 0.37
0.23,0.26
Whole fruit
Peel
Pulp
Whole fruit
0.80
Total
0.80
0.08,0.08
0.05,0.06
0.09, 0.10
0.22, 0.24
0.47, 0.47
<0.02, c0.02
0.10, 0.15
Pulp
Whole fruit
Peel
Pulp
Whole Cuit
0.80
0.31, 0.33
0.35, 0.43
0.32,0.36
Peel
Pulp
Whole fruit
Peel 0.16,0.45 <0.02, c0.02 <0.18, <0.47 11
0.02,0.02
0.02, 0.05
<0.02, <0.02
<0.02, c0.02
<0.02, <0.02
0.24, 0.26
0.44,0.52
<0.02, <0.02
0.09,0.14
Pulp
0.24, 0.26
0.49, 0.52
<0.04,<0.04
<0.12, <0.17
0.18,0.20
<0.02, <0.02
0.17,0.18
lyses of a single sample.
<0.02, <0.02 <0.02, <0.02
<0.02, <0.02
0.02, <0.02
<0.02,0.02
c0.02, <0.02
<0.02, <0.02
<0.04,<0.04
<0.04, <0.04
0.26, 0.27
<0.46, 0.54
<0.04,<0.04
<0.11, <0.16
<0.02, <0.02
<0.02, <0.02
<0.02, <0.02
<0.20, <0.22
10.04, <0.04
<0.19, <0.20
Geographic representation of citrus fruit data is adequate for the purposes of this petition. The Agency (Tables 2 and 5 of OPPTS 860.1500) requires a total of 23 trials for the establishment of a crop group tolerance on citrus h i t s ; 12 trials on oranges, 5 trials on lemons, and 6 trials on grapefruit. Twenty-four citrus field trials were conducted on grapefmit in Regions 3 (3 trials), 6 (1 trial), and 10 (2 trials); on lemons in Regions 3 (1 trial) and 10 (4 trials); and on oranges in Regions 3 (8 trials), 6 (1 trial), and 10 (4 trials).
Studv summarv:
The available citrus field trial data are adequate to support the proposed crop group tolerance because the three bridging studies (conducted with tomato, cucurbits, and grape) indicated no significant difference in the residue levels between the use of the WDG formulation or the EC formulation. The field trial data reflecting application of the WDG formulation can be extrapolated to project the residue levels for the EC formulation for which use on citrus is proposed.
The combined residues of pyraclostrobin and its metabolite BF 500-3 were <0.08-0.28 pprn idon grapefruit, c0.13-0.45 pprn idon lemons, and <0.11-0.6 1 pprn idon oranges harvested 13-14 days following the last of four foliar applications of the WDG formulation at -0.15 lb ailNapplication (first and second applications) and -0.25 1b ailNapplication (third and fourth applications) for a total seasonal application rate of -0.8 lb ai/A (- l x the maximum proposed seasonal application rate). These residue levels did not exceed the proposed tolerance level of 0.7 pprn idon citrus.
In addition, the pulp and peel were analyzed separately in selected samples of grapefruit and oranges. These data indicate that combined residues were 10.04 pprn idon citrus pulp samples (n = 6) and <0.08-0.54 pprn idon citrus peel samples (n = 6).
Trials conducted with dilute and concentrate spray volumes did not indicate that higher residues were likely to result fiom either type of application. Combined residues for concentrate and dilute spray applications were, respectively, 10.08-<0.24 pprn and 10.09-0.28 pprn idon grapefruit; c0.13-0.45 pprn and c0.21-0.35 pprn idon lemons; and <0.11-0.61 pprn and <0.19- 0.46 pprn idon oranges.
Stone Fruits
BASF Corporation submitted cheny (sweet and tart), peach, and plum field trial data (citation listed below) to support the establishment of a tolerance for residues of pyraclostrobin and BF 500-3 idon Stone fruits (crop group) at 0.7 ppm.
451 18607 Wofford, J.; Abdel-Baky, S.; Riley, M. (2000) The Magnitude of BAS 500 F Residues in Stonefruit: Lab Project Number: 46867: 199915146, Unpublished study prepared by BASF Corporation. 92 p.
A total of 21 stone h i t field trials were conducted during the 1999 growing season. Six trials were conducted on cherries grown in CA(l), MI(3), NY(I), and WA(I), nine trials were conducted on peaches grown in CA(3), GA(2), MI(l), PA(]), SC(I), and TX(I), and six trials were conducted on plums grown in CA(4), MI(l), and OR(1). Samples of cherries (sweet and tart), peaches, and plums were harvested immediately (0-day PHI) following the last of five broadcast foliar applications of the 20% WDG formulation at 0.12 lb aiINapplication, made at 6- to 8-day retreatment intervals. The total seasonal application rates were 0.59-0.60 lb ailA (- lx the maximum proposed seasonal application rate). Two separate plots at each site were treated with concentrated (20-1 00 g d A ) or dilute (100-400 gal1A) spray volumes. Applications were made in either 49.4-101.5 g d A (concentrate spray volume) or 107.2-282.3 gal1A (dilute spray volume) using growid equipment with a non-silicone spray adjuvant added to the spray mixture. In two trials (GA and MI), additional peach and plum samples were collected at 7, 14,21, and 28 days following treatment to evaluate residue decline. A separate plot at each trial site was left untreated to provide control samples.
A single untreated sample and a single treated sample from each treatment group (concentrate spray volume and dilute spray volume) of mature cherries (sweet and tart), peaches, and plums were collected from each test site and were frozen. All samples were shipped frozen to the BASF APC where they were analyzed for residues of pyraclostrobin and BF 500-3 using Method D9808. Apparent residues of pyraclostrobin and BF 500-3 were each less than the LOQ (<0.02 ppm) inlon six samples each of untreated cherries and plums and ten samples of untreated peaches. Residues of pyraclostrobin and BF 500-3 inion treated samples are presented in Table 45.
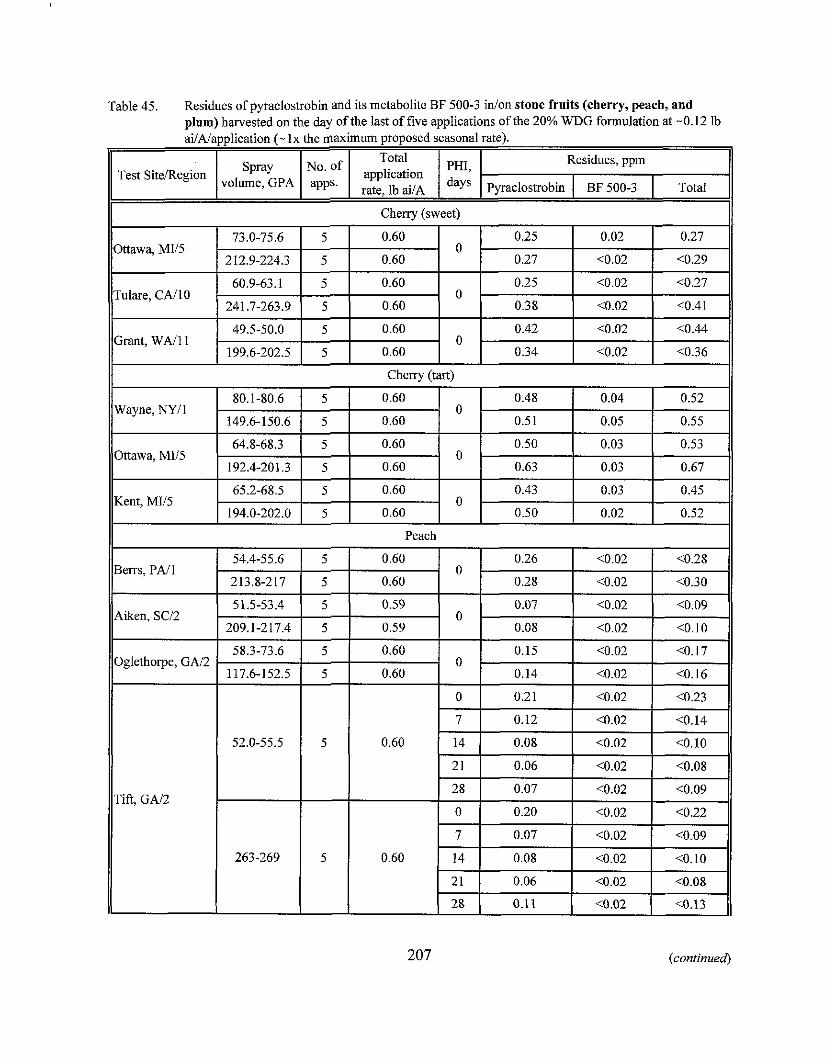
Table 45. Residues of pyracloshohin and its metabolite BF 500-3 idon stone fruits (cherry, peach, and plum) harvested on the day of the last of five applications of the 20% WDG fornulation at -0.12 lh ailAlapplication (- l x the nlaximum proposed seasonal rate).
Peach
54.4-55.6 5 0.60 0.26 <0.02 <0.28 Berrs, PA11 0
213.8-217 1 5 1 0.60 0.28 1 <0.02 1 <0.30
51.5-53.4 5 0.59 0.07 <0.02 i0.09 Aiken, SCl2 0
209.1-217.4 1 5 1 0.59 0.08 1 <0.02 1 <0.10
Tift, GAI2
Oglethorpe, GAl2
207 (continued)
58.3-73.6 5 0.60
0.60 0
117.6-152.5
0.15
0.14 5
<0.02
10.02
<0.17
<0.16
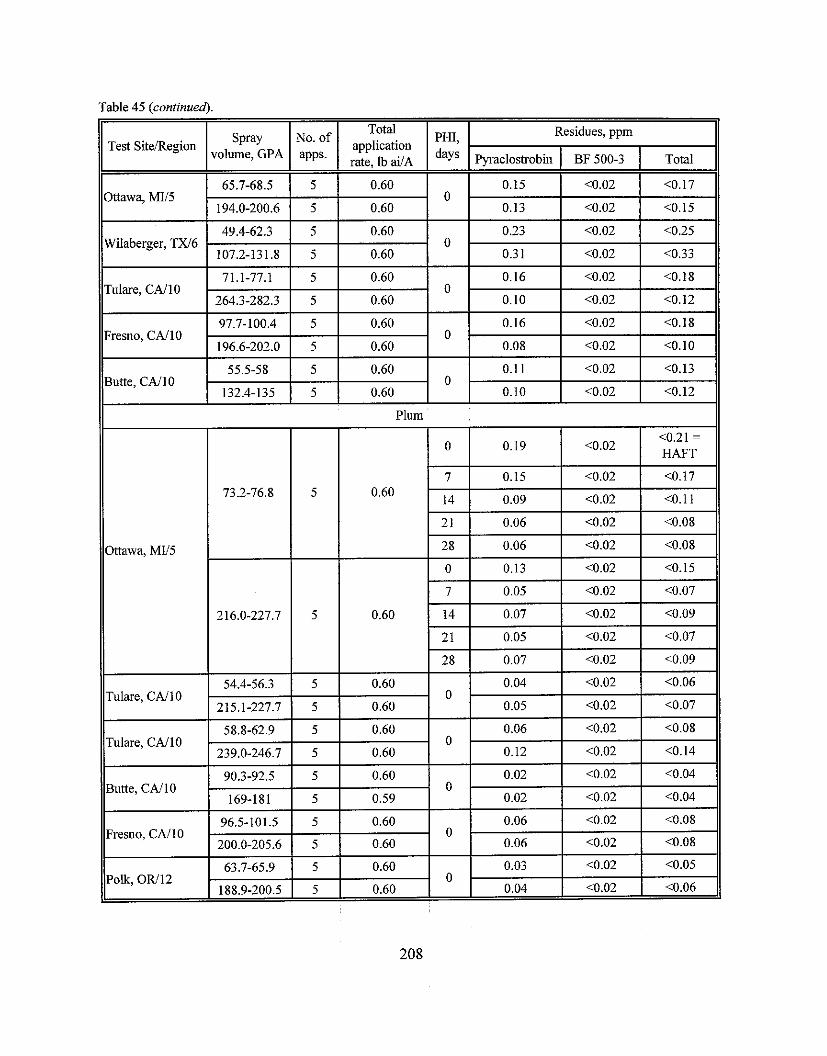
Table 45 (continued).
Spray No. of PHI, Residues, ppm
Test SiteiRegion volume, GPA apps. days application rate, ib Pyraclostrobin I BF 500-3 1 Total
Butte, CNlO I 0 I I
132.4-135 5 0.60 0.10 <0.02 <0.12
Plum
Ottawa, MU5
Tulare, CAI1 0
Tulare, CAI10
Butte, CN10
Fresno, CAI10
Polk, OR112
Geographic representation of stone h i t data is adequate for the purposes of this petition. The Agency (Tables 2 and 5 of OPPTS 860.1500) requires a total of 21 trials for the establishment of a crop group tolerance on stone fruits; six trials on cherries (sweet or tart), nine trials on peaches, and six trials on plums. As required, twenty-one stone fruit field trials were conducted on cherries in Regions 1 (1 trial), 5 (3 trials), 10 (1 trial), and 11 (1 trial); on peaches in Regions 1 (1 trial), 2 (3 trials), 5 (1 trial), 6 (1 trial), and 10 (3 trials); and on plums in Regions 5 (1 trial), 10 (4 trials), and 11 (1 trial).
The petitioner has provided adequate residue data reflecting the maximum proposed use pattern of pyraclostrobin on cherries (sweet and tart), peaches, and plums, the representative commodities of the stone h i t s crop group. The combined residues of pyraclostrobin and its metabolite BF 500-3 idon cherries (sweet and tart), peaches, and plums harvested immediately (0-day PHI) following the last of five foliar applications of the WDG formulation at -0.12 lb ailA1application for a total seasonal application rate of -0.6 lb ai/A (- l x the maximum proposed seasonal application rate) were <0.27-<0.44 pprn idon sweet cherries, 0.45-0.67 pprn idon tart cherries, <0.09-<0.33 pprn idon peaches, and <0.04-10.21 pprn idon plums. RAB3 recommends that a stone fruits (crop group) tolerance of 0.9 pprn be proposed.
Trials conducted with dilute and concentrate spray volumes did not indicate that higher residues were likely to result from either type of application. Combined residues were <0.27-0.53 pprn and <0.29-0.67 ppm idon cherries, <0.09-<0.28 pprn and <0.10-<0.33 pprn idon peaches, and <0.04-10.21 pprn and 10.04-<0.15 pprn idon plums treated with concentrated or dilute spray volumes, respectively.
The residue decline data for peaches and plums showed that residues decreased gradually at longer posttreatment intervals. For peaches, residues of pyraclostrobin were 0.20-0.21 ppm at the 0-day PHI and declined to 0.07-0.1 1 ppm at the 28-day PHI. For plums, residues of pyraclostrobin were 0.13-0.19 pprn at the 0-day PHI and declined to 0.06-0.07 pprn at the 28-day PHI. For both peaches and plums, residues of the metabolite BF 500-3 were below the LOQ inlon each treated sample.
BASF Corporation submitted bluebeny and raspbeny field trial data (citation listed below) to support the establishment of a tolerance for residues of pyraclostrobin and BF 500-3 inlon Berries (crop group) at 1.0 ppm.
451 18605 Versoi, P.; Abdel-Baky, S.; Riley, M. (1999) The Magnitude of BAS 500 F Residues in Red Raspberries and Highbush Blueberries: Lab Project Number: 4691 1 : 199915143, Unpublished study prepared by BASF Corporation. 64 p.
A total of nine berry field trials were conducted during the 1999 growing season. Three trials were conducted on red raspberries grown in NY(1 trial) and OR(2), and six trials were conducted on highbush blueberries grown in GA(2), NY(l), OR(l), and WI(2). Samples of blueberries and raspberries were harvested immediately (0-day PHI) following the last of four broadcast foliar applications of the 20% WDG formulation at 0.18-0.19 lb ai/A/application at 6- to 7-day retreatment intervals. The total seasonal application rates were 0.72-0.74 lb ai/A (- Ix the maximum proposed seasonal application rate). Applications were made in 49.6-102.2 galIA using ground equipment with a non-silicone spray adjuvant added to the spray'mixture. In one trial (NY), additional raspberry samples were collected at 2,4,6, and 8 days following treatment to evaluate residue decline. A separate plot at each trial site was left untreated to provide control samples.
A single untreated sample and duplicate treated samples of mature blueberries and raspberries were collected from each test site and were frozen. All samples were shipped frozen to the BASF APC where they were analyzed for residues of pyraclostrobin and BF 500-3 using Method D9808. Apparent residues of pyraclostrobin and BF 500-3 were each less than the LOQ (<0.02 ppm) inlon six samples of untreated blueberries and three samples of untreated raspberries. Residues of pyraclostrobin and BF 500-3 inlon treated samples are presented in Table 46.
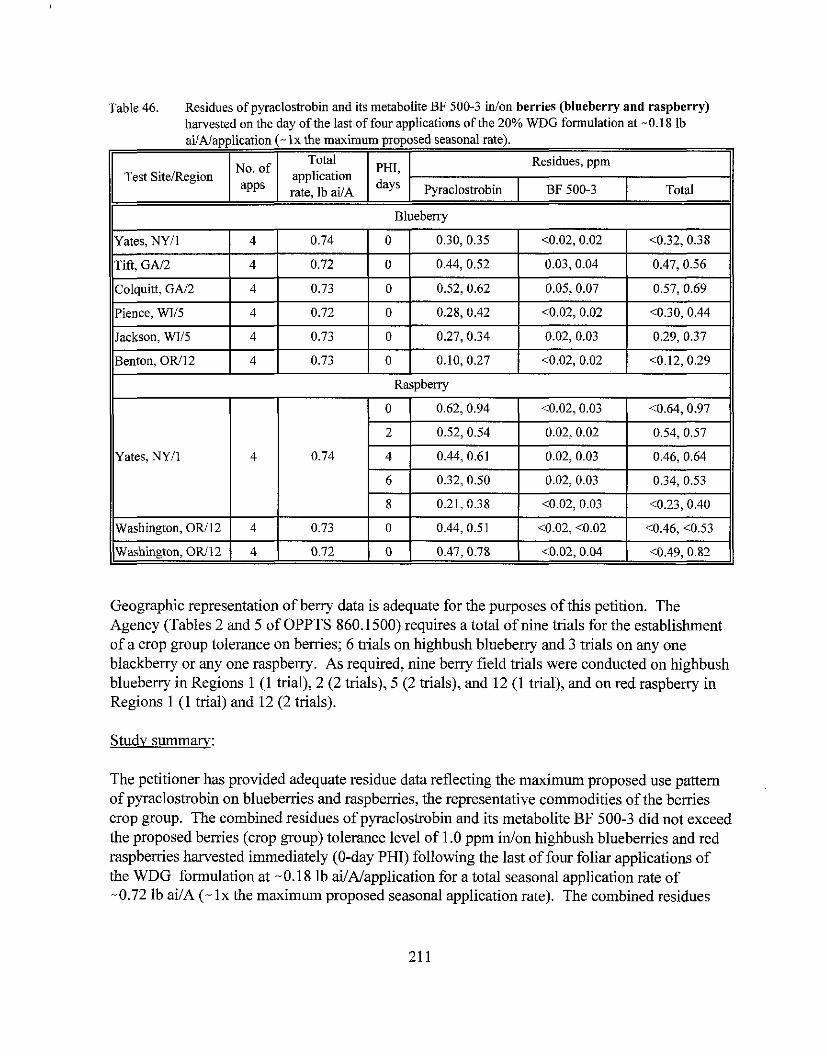
Table 46. Residues of pyracloshobin and its metabolite BF 500-3 d o n berries (blueberry and raspberry) harvested on the day of the last of four applications of the 20% WDG formulation at -0.18 ib . . aiikiapplication (- lx the maximum proposed seasonal rate).
-
Geographic representation of berry data is adequate for the purposes of this petition. The Agency (Tables 2 and 5 of OPPTS 860.1500) requires a total of nine trials for the establishment of a crop group tolerance on berries; 6 trials on highbush blueberry and 3 trials on any one blackberry or any one raspberry. As required, nine berry field trials were conducted on highbush blueberry in Regions 1 (1 trial), 2 (2 trials), 5 (2 trials), and 12 (1 trial), and on red raspberry in Regions 1 (1 trial) and 12 (2 trials).
-
Colquitt, GN2
Pience, WIl5
Jackson, WIl5
Studv summarv:
Test SiteiRegion
The petitioner has provided adequate residue data reflecting the maximum proposed use pattern of pyraclostrobin on blueberries and raspberries, the representative commodities of the berries crop group. The combined residues of pyraclostrobin and its metabolite BF 500-3 did not exceed the proposed berries (crop group) tolerance level of 1.0 ppm idon highbush blueberries and red raspberries harvested immediately (0-day PHI) following the last of four foliar applications of the WDG formulation at -0.18 lb ai/A/application for a total seasonal application rate of -0.72 lb ai/A (- lx the maximum proposed seasonal application rate). The combined residues
application rate, lh ai/A
No. Of
4
4
4
PHI, days
0.73
0.72
0.73
Residues, ppm
0
0
0
Total Pyraclostrobin
0.52, 0.62
0.28, 0.42
0.27, 0.34
BF 500-3
0.05, 0.07
<0.02,0.02
0.02, 0.03
0.57,0.69
<0.30,0.44
0.29,0.37
were <0.12-0.69 pprn inlon highbush blueberries and c0.46-0.97 pprn idon red raspberries. RAB3 recommends that the tolerance in beny crop group be proposed at 1.3 ppm.
The residue decline data for raspberries showed that residues decreased gradually at longer posttreatment intervals. Residues of pyraclostrobin were 0.62-0.94 pprn at the 0-day PHI and declined to 0.21-0.38 pprn at the 8-day PHI. Residues of the metabolite BF 500-3 were below the LOQ (<0.02 ppm) to 0.03 pprn at each interval.
Tree Nuts
BASF Corporation submitted almond and pecan field trial data (citations listed below) to support the establishment of a tolerance for residues of pyraclostrobin and BF 500-3 idon Tree nuts (crop group) at 0.04 pprn and almond hulls at 1.6 ppm.
451 18521 Haughey, D.; Abdel-Baky, S.; Riley, M. (2000) The Magnitude of BAS 500 F Residues in Almonds: Lab Project Number: 47727: 199915161, Unpublished study prepared by BASF Corporation. 64 p.
45118612 Haughey, D.; Abdel-Baky, S.; Riley, M. (2000) The Magnitude of BAS 500 F Residues in Pecans: Lab Project Number: 61660: 199915 152. Unpublished study prepared by BASF Corporation. 56 p.
Almond
A total of five almond field trials were conducted in CA during the 1999 growing season. Samples of almond nutmeat and hulls were harvested 108-148 days following the last of four broadcast foliar applications of the 20% WDG formulation at 0.12 lb ailAiapplication made at 6- to 8-day retreatment intervals. Total seasonal application rates were 0.47-0.48 lb ai1A (- lx the maximum proposed seasonal application rate). Two separate plots at each site were treated with concentrated (50-100 gallA) or dilute (100-400 gallA) spray volumes. Applications were made in either 67.5-100.8 gal/A (concentrate spray volume) or 157.9-256.9 gallA (dilute spray volume) using ground equipment with a spray adjuvant added to the spray mixture. In one trial, additional almond nutmeat and hull samples were collected at 127, 134, 148, and 155 days following treatment to evaluate residue decline. A separate plot at each trial site was left untreated to provide control samples.
A single untreated sample and a single treated sample from each treatment group (concentrate spray volume and dilute spray volume) of mature almond (nutmeat and hulls) were collected from each test site and were frozen. The moisture content of hulls was determined to be 24-83%. All samples were shipped frozen to the BASF APC where they were analyzed for residues of pyraclostrobin and BF 500-3 using Method D9808. Apparent residues of pyraclostrobin and BF 500-3 were each less than the LOQ (<0.02 ppm) idon five samples of untreated almond nutmeat and four samples of untreated almond hulls. Residues of pyraclostrobin and BF 500-3 were each
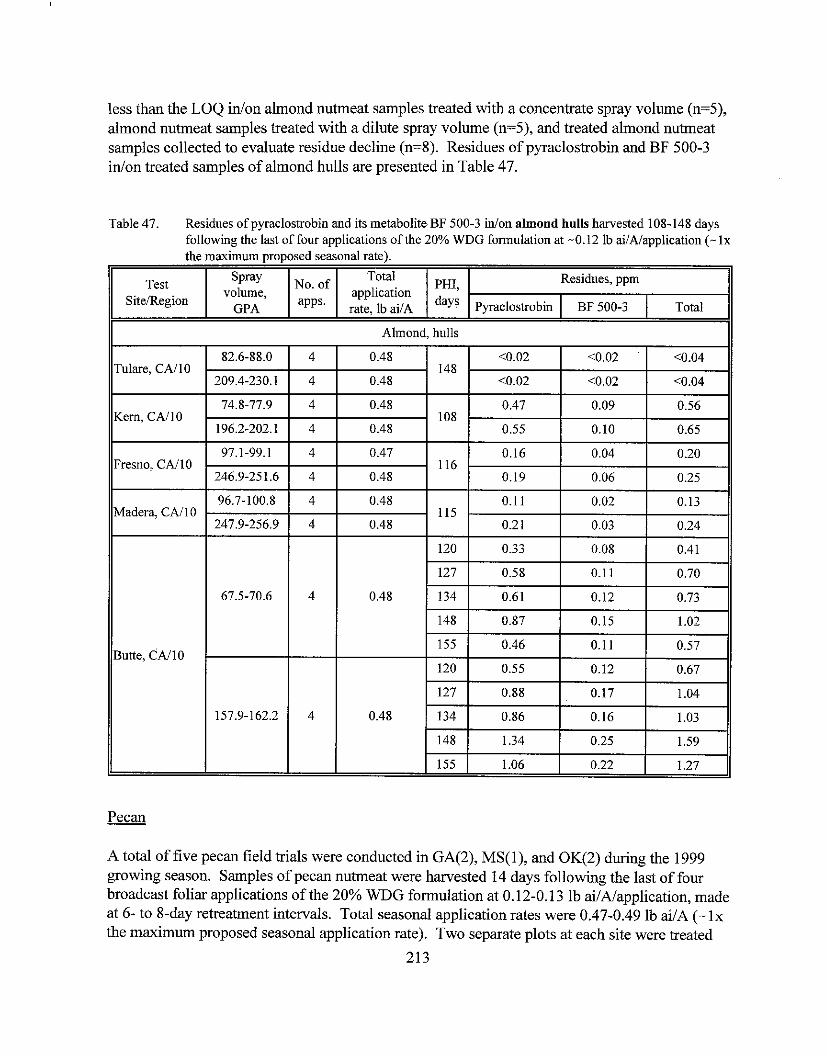
less than the LOQ idon almond nutmeat samples treated with a concentrate spray volume (n=5), almond nutmeat samples treated with a dilute spray volume (n=5), and treated almond nutmeat samples collected to evaluate residue decline (n=8). Residues of pyraclostrobin and BF 500-3 inlon treated samples of almond hulls are presented in Table 47.
Butte, CAI1 0
Table 47. Residues of pyraclostrobin and its metabolite BF 500-3 inton almond hulls harvested 108-148 days following the last of four applications of the 20% WDG formulation at -0.12 lb ai1Alapplication (- lx the maximum proposed seasonal rate).
A total of five pecan field trials were conducted in GA(2), MS(l), and OK(2) during the 1999 growing season. Samples of pecan nutmeat were harvested 14 days following the last of four broadcast foliar applications of the 20% WDG formulation at 0.12-0.13 lb ai/A/application, made at 6- to 8-day retreatment intervals. Total seasond application rates were 0.47-0.49 lb ai/A (- lx the maximum proposed seasonal application rate). Two separate plots at each site were treated
213
Test SiteRegion
Almond, hulls
Spray volume,
GPA
No. of Total
application rate, lb ailA
PHI, days
Residues, ppm
Pyraclostrobin I BF 500-3 1 Total
with concentrate (50-1 00 gal/A) or dilute (1 00-400 gal/A) spray volumes. Applications were made in either 63.6-88.6 galIA (concentrate spray volume) or 136.2-205 gal/A (dilute spray volume) using ground equipment with a non-silicone spray adjuvant added to the spray mixture. A separate plot at each trial site was left untreated to provide control samples.
A single untreated sample and a single treated sample from each treatment group (concentrate spray volume and dilute spray volume) of mature pecan nutmeat were collected from each test - . site &d were frozen. All samples were shipped frozen to the BASF APC where they were analyzed for residues of pyraclostrobin and BF 500-3 using Method D9808. Apparent residues of pyraclostrobin and BF 500-3 were each less than the LOQ (10.02 ppm) idon five samples of untreated pecan nutmeat. Residues of pyraclostrobin and BF 500-3 were each less than the LOQ idon five samples each of pecan nutmeat treated with a concentrate spray volume and pecan nutmeat treated with a dilute spray volume.
Geographic representation of tree nuts data is adequate for the purposes of this petition. The Agency (Tables 2 and 5 of OPPTS 860.1500) requires a total of 10 trials for the establishment of a crop group tolerance on tree nuts; 5 trials each on almonds and pecans. As required, five trials were conducted on almonds in Region 10, and five trials were conducted on pecans in Regions 2 (2 trials), 4 (1 trial), 6 (1 trial), and 8 (I trial).
Studv sumrnani:
The petitioner has provided adequate residue data reflecting the maximum proposed use pattern of pyraclostrobin on almonds and pecans, the representative commodities of the tree nuts crop group.
Almond andpecan nutmeat: The combined residues of pyraclostrobin and its metabolite BF 500-3 did not exceed the proposed tree nuts (crop group) tolerance level of 0.04 ppm idon almonds harvested 108-148 days and pecans harvested 14 days following the last of four foliar applications of the WDG formulation at -0.12 lb ai/A/application for a total seasonal application rate of -0.48 lb aiiA (- lx the maximum proposed seasonal application rate). The combined residues were <0.04 ppm idon all samples of almond and pecan nutmeat.
Trials conducted with dilute and concentrate spray volumes did not indicate that higher residues were likely to result from either type of application. Combined residues idon almond and pecan nutmeat were <0.04 ppm in all samples whether treated with concentrate or dilute spray volumes.
The residue decline data for almond nutmeat did not demonstrate any conclusive trends in pyraclostrobin residues at longer posttreatment intervals. Residues were less than the LOQ in all nutmeat samples.
Almond hulls: The combined residues of pyraclostrobin and BF 500-3 did not exceed the proposed tolerance level of 1.6 ppm idon almond hulls harvested 108-148 days following the
last of four foliar applications of the WDG formulation at -0.12 lb ailAlapplication for a total seasonal application rate of -0.48 lb ai1A (- l x the maximum proposed seasonal application rate). The combined residues were <0.04 ppm to 0.67 ppm idon almond hulls sampled at normal harvest. The maximum combined residue (1.59 ppm) was detected in an almond hull sample from the decline study harvested 148 days following the last application.
Trials conducted with dilute and concentrate spray volumes did not indicate that higher residues were likely to result from either type of application. Combined residues were <0.04-0.56 ppm idon almond hulls treated with concentrate spray volumes, and <0.04-0.67 ppm idon almond hulls treated with dilute spray volumes.
The residue decline data for almond hulls did not demonstrate any conclusive trends in decreasing residues at longer posttreatment intervals. The petitioner indicated that the higher residues detected in the almond hull samples from the decline study were possibly due to dusty field conditions that worsened at each sampling interval.
Pistachio
BASF Corporation submitted pistachio field trial data (citation listed below) to support the establishment of a tolerance for residues of pyraclostrobin and BF 500-3 idon pistachio at 0.5 PPm.
451 18610 Haughey, D.; Abdel-Baky, S.; Riley, M. (2000) The Magnitude of BAS 500 F Residues in Pistachios: Lab Project Number: 61661 : 199915150, Unpublished study prepared by BASF Corporation. 54 p.
Three pistachio field trials were conducted in CA during the 1999 growing season. Samples of pistachios were harvested 14-15 days following the last of four broadcast foliar applications of the 20% WDG (formulation at 0.12-0.21 lb ai1Alapplication at 6- to 8-day retreatment intervals for a total seasonal application rate of 0.72-0.81 lb ai/A (- l x the maximum proposed seasonal application rate). Two separate plots at each site were treated with concentrated (50-100 g d A ) or dilute (100-400 gal1A) spray volumes. Applications were made in either 61.3-102.4 gal/A (concentrate spray volume) or 144-199.9 gal/A (dilute spray volume) using ground equipment with a non-silicone spray adjuvant added to the spray mixture. A separate plot at each trial site was left untreated to provide control samples.
A single untreated sample and a single treated sample from each treatment group (concentrate and dilute spray volumes) of mature pistachios were collected from each test site and were frozen. All samples were shipped frozen to the BASF APC where they were analyzed for residues of pyraclostrobin and BF 500-3 using Method D9808. Apparent residues of pyraclostrobin and BF 500-3 were each less than the LOQ (<0.02 ppm) idon three samples of untreated pistachios. Residues of pyraclostrobin and BF 500-3 inlon treated samples are presented in Table 48.
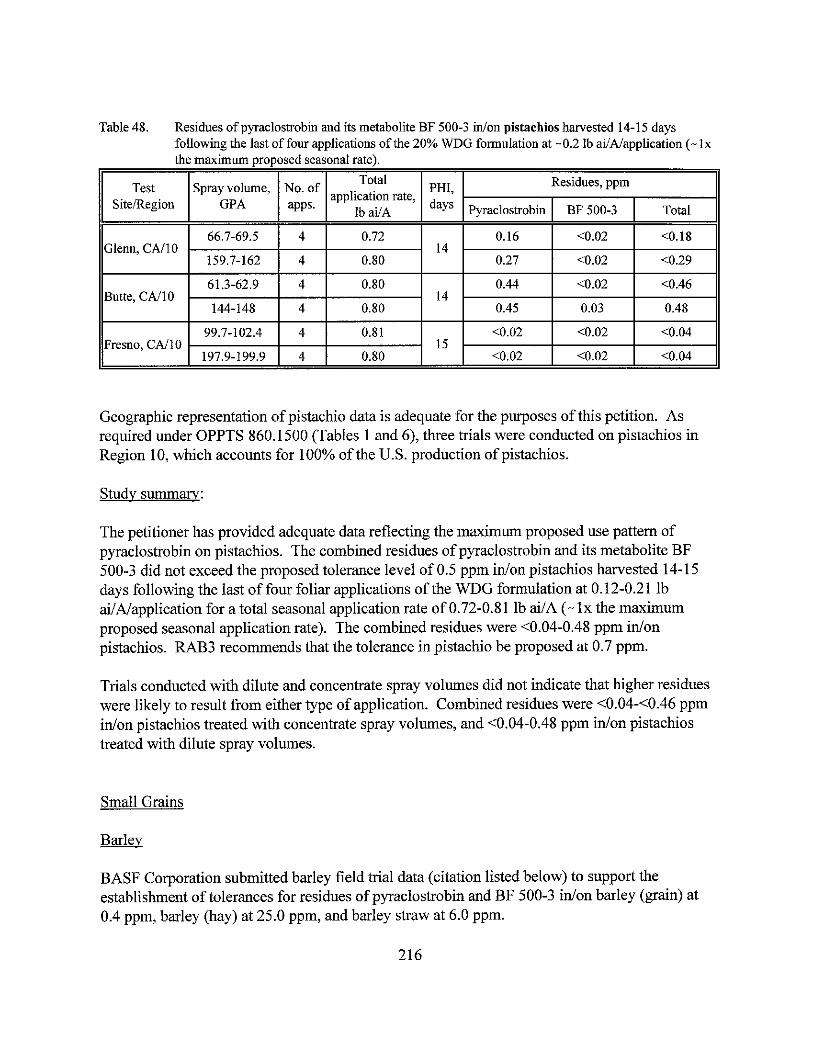
Table 48. Residues of pyraclostrobin and its metabolite BF 500-3 idon pistachios harvested 14-15 days following the last of four applications of the 20% WDG formulation at -0.2 lb ai1Alapplication (- Ix the maximum orooosed seasonal rate).
Test SiteiRegion
Glenn, CAI10
Geographic representation of pistachio data is adequate for the purposes of this petition. As required under OPPTS 860.1500 (Tables 1 and 6), three trials were conducted on pistachios in Region 10, which accounts for 100% of the U.S. production of pistachios.
Spray volume, GPA
Butte, CAI1 0
Fresno, CAI10
Study summary:
66.7-69.5
The petitioner has provided adequate data reflecting the maximum proposed use pattern of pyraclostrobin on pistachios. The combined residues of pyraclostrobin and its metabolite BF 500-3 did not exceed the proposed tolerance level of 0.5 ppm idon pistachios harvested 14-15 days following the last of four foliar applications of the WDG formulation at 0.12-0.21 lb ai/A/application for a total seasonal application rate of 0.72-0.81 lb ai/A (- lx the maximum
No. of aPPs.
61.3-62.9
144-148
99.7-102.4
197.9-199.9
A A . .
proposed seasonal application rate). The combined residues were 10.04-0.48 ppm idon pistachios. RAB3 recommends that the tolerance in pistachio be proposed at 0.7 ppm.
4
Trials conducted with dilute and concentrate spray volumes did not indicate that higher residues were likely to result from either type of application. Combined residues were <0.04-<0.46 ppm inlon pistachios treated with concentrate spray volumes, and <0.04-0.48 ppm idon pistachios treated with dilute spray volumes.
Total application rate,
lb a i / ~
4
4
4
4
Small Grains
0.72 -
BASF Corporation submitted barley field trial data (citation listed below) to support the establishment of tolerances for residues of pyraclostrobin and BF 500-3 idon barley (grain) at
PHI, days
14 159.7-162
0.80
0.80
0.81
0.80
-.
0.4 ppm, barley (hay) at 25.0 ppm, and barley straw at 6.0 ppm.
216
Residues, ppm
Pyraclostrobin I BF 500-3 1 Total
0.16
4 0.27
14
15
<0.02
0.80
iO.18
<0.02
0.44
0.45
<0.02
<0.02
10.29
<0.02
0.03
<0.02
<0.02
10.46
0.48
<0.04
<0.04
451 18535 Versoi, P.; Abdel-Baky, S.; Riley, M. (1999) Magnitude of BAS 500 F Residues in Barley: Lab Project Number: 199915079: 98209. Unpublished study prepared by BASF Corporation. 117 p.
A total of 25 field trials were conducted during the 1998 growing season. Twelve of these field trials were conducted in the U.S. in CA(l), C0(1), ID(l), MN(3), ND(3), PA(l), SD(I), and WA(1). Thirteen field trials were conducted in Canada in AB(6), SK(2), MB(4), and QC(1). Barley hay was cut 9-16 days (allowed to dry for 3-7 days before collection) and barley grain and straw were harvested 38-70 days following the last of two foliar applications, made at 3- to 17- day retreatment intervals, of the 2 lblgal EC formulation at 0.20-0.29 lb ai/A/application. The first application was made when the flag leaf was just visible, and the second application was applied at 50-100% head emergence, inflorescence completely emerged, head fully extended, or early head emergence, not less than 40 days prior to graidstraw harvest. Total seasonal application rates were 0.40-0.49 lb ai/A (- lx the maximum proposed seasonal rate). Applications were made in 10.0-32.9 gaWA using ground equipment with a spray adjuvant added to the spray solution. In two trials (MN and SK), additional barley hay samples were cut at 18- 19,23-24,28-29, and 32-34 days, and additional barley grain and straw samples were harvested 47-49,54-57,61-63, and 68-70 days following treatment to evaluate residue decline. A separate plot at each trial site was left untreated to provide control samples.
Samples of treated and untreated barley hay, grain, and straw were collected from each test site; hay samples were allowed to dry in the field for 3-7 days (12-47% moisture) before collection. All samples were frozen and then shipped frozen to the BASF APC where they were analyzed for residues of pyraclostrobin and BF 500-3 using Method D9808. Apparent residues of pyraclostrobin and BF 500-3 were each less than the LOQ (<0.02 ppm) idon 25 samples each of untreated barley hay, grain, and straw. Residues of pyraclostrobin and BF 500-3 idon treated samples are presented in Table 49.
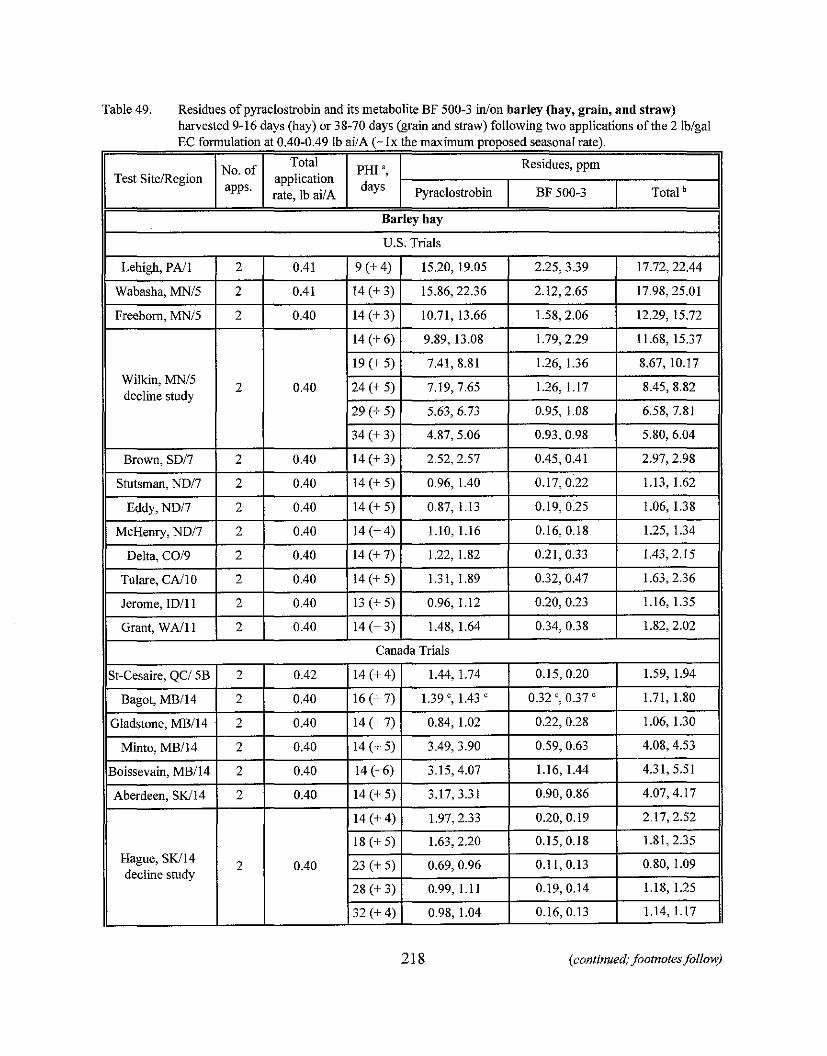
Table 49. Residues of pyraclostrobin and its metabolite BF 500-3 inlon barley (hay, grain, and straw) bawested 9-16 days (hay) or 38-70 days (grain and straw) following two applications of the 2 lbigal EC formulation at 0.40-0.49 ib ai/A (- lx the maximum proposed seasonal rate).
I, I
I I
Barley hay il I No. of Total PHI =, Residues, ppm
Test SiteRegion application 1 P s 1 , A 1 Y s I Pyraclostrobin I BF 500-3 Total I
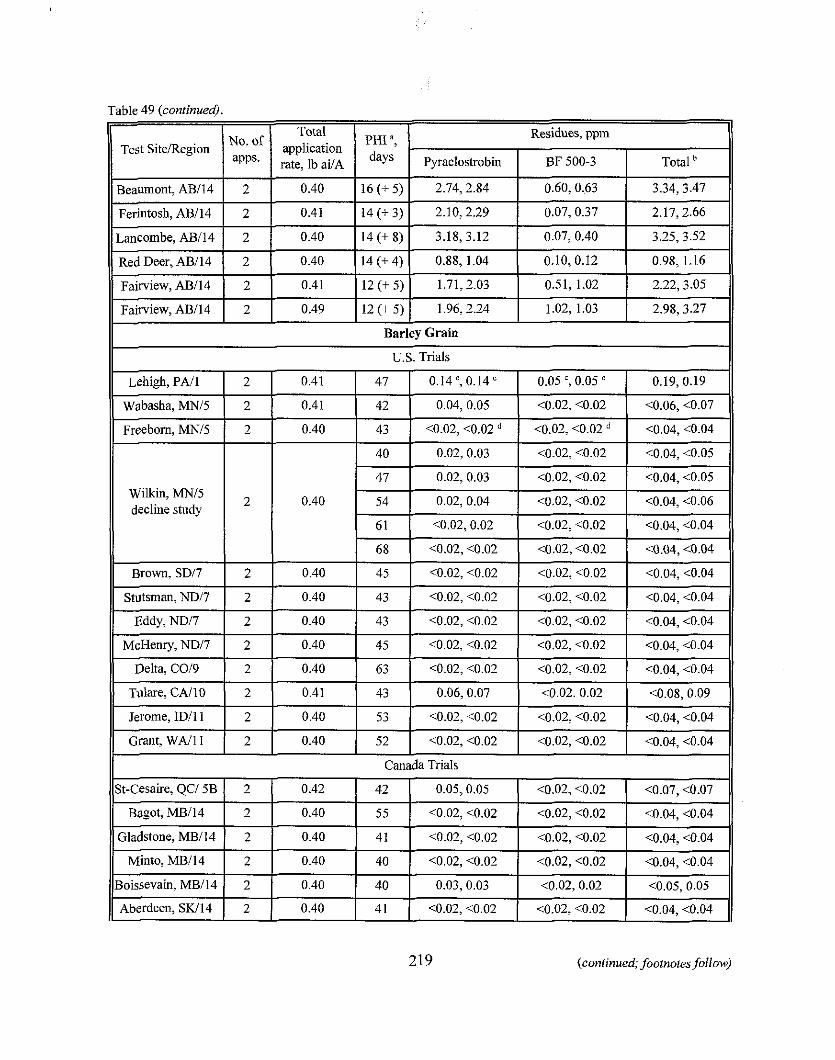
Table 49 (continued).
U.S. Trials
I) Freeborn, MNi5 i 2 i 0.40 1 43 1 10.02, <0.02 d I <0.02,<0.02 j <0.04, d0.04 11
219 (continued; footnotes follow)
0.19,0.19
Wabasha, MNl5 1 2 1 0.41 1 42 1 0.04, 0.05 1 <0.02, <0.02 1 <0.06, d0.07
Lehigh, PAil 47 2 0.14", 0.14' 0.41 0.05 ', 0.05 "
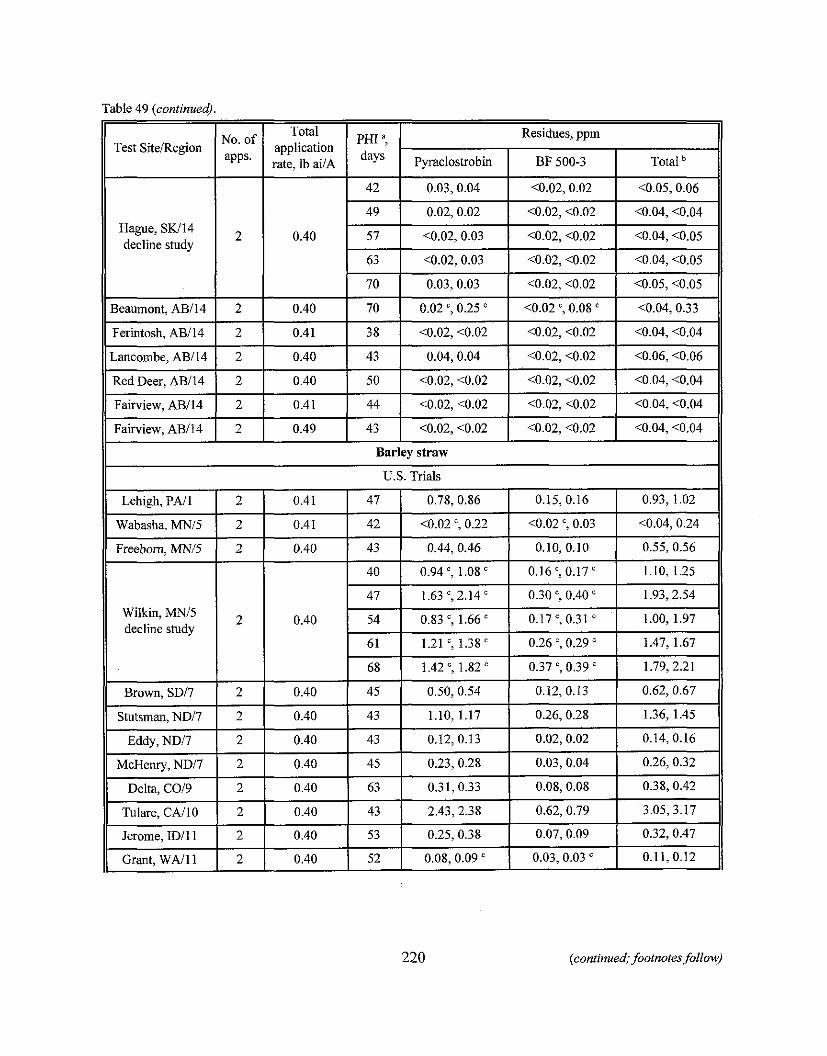
Table 49 (continued),
II Test SiteiRegion
Hague, SW14 decline study
Fairview, ABI14
- - No. of aPPs.
Total application rate, lb aUA
PHI ', Residues, ppm
BF 500-3 Total
0.03,0.04 1 <0.02, 0.02 1 10.05, 0.06
Barley straw 11 U.S. Trials 11
(continued; footnotes follow)
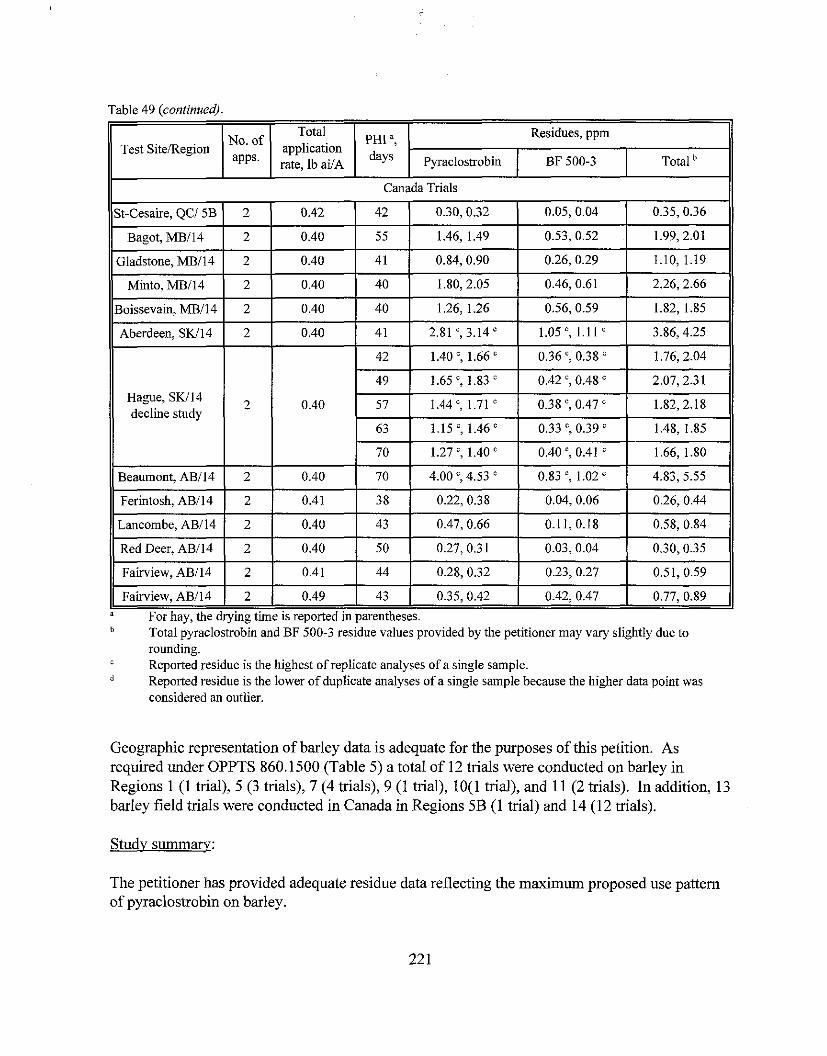
Table 49 (continuedi.
I Total PHI a, Residues, ppm Test SiteRegion No. Of application I apps I rate, ib a l / ~ I days / Pyraclostrobiin I BF 500-3 Total
Red Deer, AB/14
Total pyraclostrobin and BF 500-3 residue values provided by the petitioner may vary slightly due to rounding.
' Reported residue is the highest of replicate analyses of a single sample. * Reported residue is the lower of duplicate analyses of a single sample because the higher data point was
considered an outlier.
I I I I I I
Geographic representation of barley data is adequate for the purposes of this petition. As required under OPPTS 860.1500 (Table 5) a total of 12 trials were conducted on barley in Regions 1 (1 trial), 5 (3 trials), 7 (4 trials), 9 (1 trial), 10(1 trial), and 11 (2 trials). In addition, 13 barley field trials were conducted in Canada in Regions 5B (1 trial) and 14 (12 trials).
2
The petitioner has provided adequate residue data reflecting the maximum proposed use pattern of pyraclostrobin on barley.
0.77, 0.89 Fairview, ABI14 1 2 1 0.49 1 43 1 0.35, 0.42
0.40 50 1 Fairview, ABIl4 1 2 1 0.41 1 44 1 0.28, 0.32
" For hay, the drying time is reported in parentheses.
0.42, 0.47
0.27,0.31
0.23, 0.27 0.51, 0.59
0.03,0.04 0.30,0.35
Barley hay: The combined residues of pyraclostrobin and BF 500-3 support the proposed tolerance level of 25.0 pprn inlon barley hay harvested 9-16 days following the last of two foliar applications of the 2 lblgal EC formulation at 0.20-0.29 lb ai/A/application for a total seasonal application rate of 0.40-0.49 lb ailA (- lx the maximum proposed seasonal application rate). The combined residues were 1.06-25.01 pprn idon 24 samples of barley hay grown in the U.S. and 0.80-5.51 pprn idon 26 samples of barley hay grown in Canada. The petitioner must modify the proposed label to add a 14-day PHI for barley hay.
Barley grain: The combined residues of pyraclostrobin and its metabolite BF 500-3 did not exceed the proposed tolerance level of 0.4 pprn idon barley grain harvested 38-70 days following the last of two foliar applications of the 2 lblgal EC formulation at 0.20-0.29 lb ai/A/application for a total seasonal application rate of 0.40-0.49 lb ailA (- l x the maximum proposed seasonal application rate). The combined residues were <0.04-0.19 pprn idon 24 samples of barley grain grown in the U.S. and <0.04-0.33 pprn idon 26 samples of barley grain grown in Canada.
Barley straw: The combined residues of pyraclostrobin and BF 500-3 did not exceed the proposed tolerance level of 6.0 pprn idon barley straw harvested 38-70 days following the last of two foliar applications of the 2 lblgal EC formulation at 0.20-0.29 lb ai/A/application for a total seasonal application rate of 0.40-0.49 lb ai/A (- lx the maximum proposed seasonal application rate). The combined residues were <0.04-3.17 pprn idon 24 samples of barley straw grown in the U.S. and 0.26-5.55 pprn inlon 26 samples of barley straw grown in Canada.
The residue decline data for barley hay, grain and straw did not demonstrate any conclusive trends in decreasing residues at longer posttreatment intervals. Residues in hay decreased slightly with increased harvest intervals; residues in grain remained consistent at or near the LOQ, and residues in straw were variable and most likely dependent on the moisture content of the straw.
BASF Corporation submitted rye field trial data (citation listed below) to support the establishment of tolerances for residues of pyraclostrobin and BF 500-3 idon rye grain at 0.04 pprn and rye straw at 0.5 ppm.
451 18536 Haughey, D.; Riley, M. (1999) The Magnitude of BAS 500 F Residues in Rye: Lab Project Number: 199915107: 98010. Unpublished study prepared by BASF Corporation. 63 p.
A total of five field trials were conducted during the 1998 growing season in KS(l), ND(2), SD(l), and VA(1). Rye grain and straw were harvested 55-66 days following the last of two foliar applications, made at 9- to 19-day retreatment intervals, of the 2 lblgal EC formulation at 0.20-0.21 lb ailA/application. The first application was made when the flag leaf was just visible
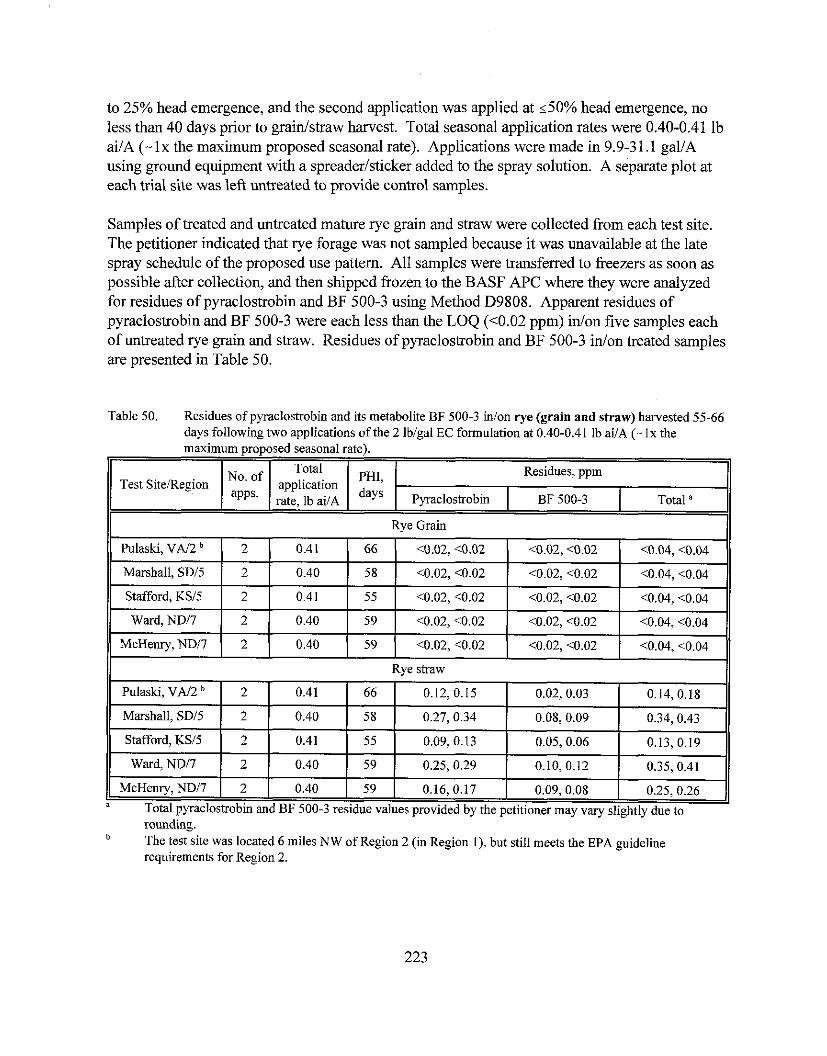
to 25% head emergence, and the second application was applied at ~ 5 0 % head emergence, no less than 40 days prior to graidstraw harvest. Total seasonal application rates were 0.40-0.41 lb ai1A (- lx the maximum proposed seasonal rate). Applications were made in 9.9-3 1.1 gallA using ground equipment with a spreaderlsticker added to the spray solution. A separate plot at each trial site was left untreated to provide control samples.
Samples of treated and untreated mature rye grain and straw were collected from each test site. The petitioner indicated that rye forage was not sampled because it was unavailable at the late spray schedule of the proposed use pattern. All samples were transferred to freezers as soon as possible after collection, and then shipped frozen to the BASF APC where they were analyzed for residues of pyraclostrobin and BF 500-3 using Method D9808. Apparent residues of pyraclostrobin and BF 500-3 were each less than the LOQ (<0.02 ppm) idon five samples each of untreated rye grain and straw. Residues of pyraclostrobin and BF 500-3 idon treated samples are presented in Table 50.
Table 50. Residues of pyraclostrobin and its metabolite BF 500-3 inlon rye (grain and straw) hamested 55-66 days following two applications of the 2 Iblgal EC formulation at 0.40-0.41 lb ai/A (- lx the maximum proposed seasonal rate).
I,
rounding. The test site was located 6 miles NW of Region 2 (in Region I), but still meets the EPA guideline requirements for Region 2.
Test SiteIRegion No. of apps.
Total application rate, ib a i / ~
PHI, days
Residues, ppm
Pyraclostrobin I BF 500-3 Total "
Geographic representation of rye data is adequate for the purposes of this petition. As required under OPPTS 860.1500 (Table 5) a total of 5 trials were conducted on rye in Regions 2 (1 trial), 5 (2 trials), and 7 (2 trials).
The petitioner has provided adequate residue data reflecting the maximum proposed use pattem of pyraclostrobin on rye.
Rye grain: The combined residues of pyraclostrobin and its metabolite BF 500-3 did not exceed the proposed tolerance level of 0.04 ppm idon rye grain harvested 58-66 days following the last of two foliar applications of the 2 lblgal EC formulation at 0.20-0.21 lb ai/A/application for a total seasonal application rate of 0.40-0.414 lb d A (- l x the maximum proposed seasonal application rate). The combined residues were <0.04 ppm idon 10 samples of rye grain.
Rye straw: The combined residues of pyraclostrobin and BF 500-3 did not exceed the proposed tolerance level of 0.5 ppm idon rye straw harvested 55-66 days following the last of two foliar applications of the 2 lblgal EC formulation at 0.20-0.21 lb ailA/application for a total seasonal application rate of 0.40-0.41 lb ai/A (- Ix the maximum proposed seasonal application rate). The combined residues were 0.13-0.43 ppm idon 10 samples of rye straw.
Rye forage: The petitioner did not provide residue data or propose a tolerance for rye forage because applications are made after the growth stages at which rye is foraged. Based on the proposed use pattern, the Agency will not require residue data or a tolerance for rye forage.
BASF Corporation submitted wheat field trial data (citations listed below) to support the establishment of tolerances for residues of pyraclostrobin and BF 500-3 idon wheat (grain) at 0.20 ppm, wheat (hay) at 6.0 ppm, and wheat (straw) at 8.5 ppm. Data pertaining to aspirated grain fractions submitted in conjunction with the 2000 field trial data will be addressed in the "Processed FoodiFeed" section.
451 18537 Versoi, P.; Riley, M. (1999) Magnitude of BAS 500 F Residues in Wheat: Lab Project Number: 199915096: 98032: 98175. Unpublished study prepared by BASF Corporation. 173 p.
45321 101 Versoi, P.; Abdel-Baky, S. (2001) The Magnitude of BAS 500 F Residues in Wheat and Wheat Processed Fractions - Year 2000 Field Project (Data Supporting a Later Spray Schedule for Fusarium Control). Lab Project Number: 200015283: 64146. Unpublished study prepared by BASF Corporation. 167 p.
Field trials conducted in 1998 provided data supporting foliar applications made at earlier growth stages, when the flag leaf was visible and at 50% head emergence. The petitioner subsequently expanded the proposed use of pyraclostrobin to target control of Fusariurn head scab, a later- onset disease in wheat. The petitioner indicated that the expanded use requires a later spray schedule. The first spray is made at 100% grain head emergence and the second spray is made at the end of anthesis, with the result that the preharvest interval (PHI) may decrease from - 14-15 days to possibly -3-14 days for wheat hay, and from -40-57 days to approximately -25-40 days for wheat grain and straw. Additional field trials were conducted in 2000 reflecting application of pyraclostrobin to wheat according to the expanded use pattern.
In support of the 2000 wheat field trials, BASF Corporation submitted a report (citation listed below) requesting a reduction in the number of field trials required for the expanded use pattern (later applications with a shorter PHI) on wheat.
451 18624 Versoi, P.; Burkey, J. (2000) Request for Reduced Count of Magnitude of the Residue Field Trials with BAS 500 F Fungicide for NAFTA Registration on Wheat: Lab Project Number: 200015105. Unpublished study prepared by BASF Corporation. 8 p.
In the Request for Reduced Count of Magnitude of the Residue Field Trials, the petitioner proposed to conduct a total of 20 wheat field trials distributed within the U.S. (15 trials) and Canada (5 trials). The petitioner indicated that the proposed distribution of the 20 field trials was based on the acreage data (1991 Census), and that the regions represented within the 20 field trials represented 96% of the total production acres in the NAFTA area. The proposed and actual distribution of the 2000 wheat field trials conducted according to region is presented in Table 5 1.
The request for a reduced number of wheat field trials was evaluated by R. Loranger of HED (e- mail communication dated 6/22/2000; MRID 45321 101) who agreed that data from the 15 U.S. trials, together with data from three Canadian trials conducted in southern Alberta (Region 7A, 1 trial) and southern Manitoba (Region 14,2 trials), should be sufficient to support the new use pattern, provided residue levels in wheat grain were consistently low.
Following review of the subject report by EPA and PMRA, the petitioner added two U.S. trials (Region 7) and six Canadian trials (Region 14) to the 2000 study to bring the total number of trials relevant to U.S. application to 20.
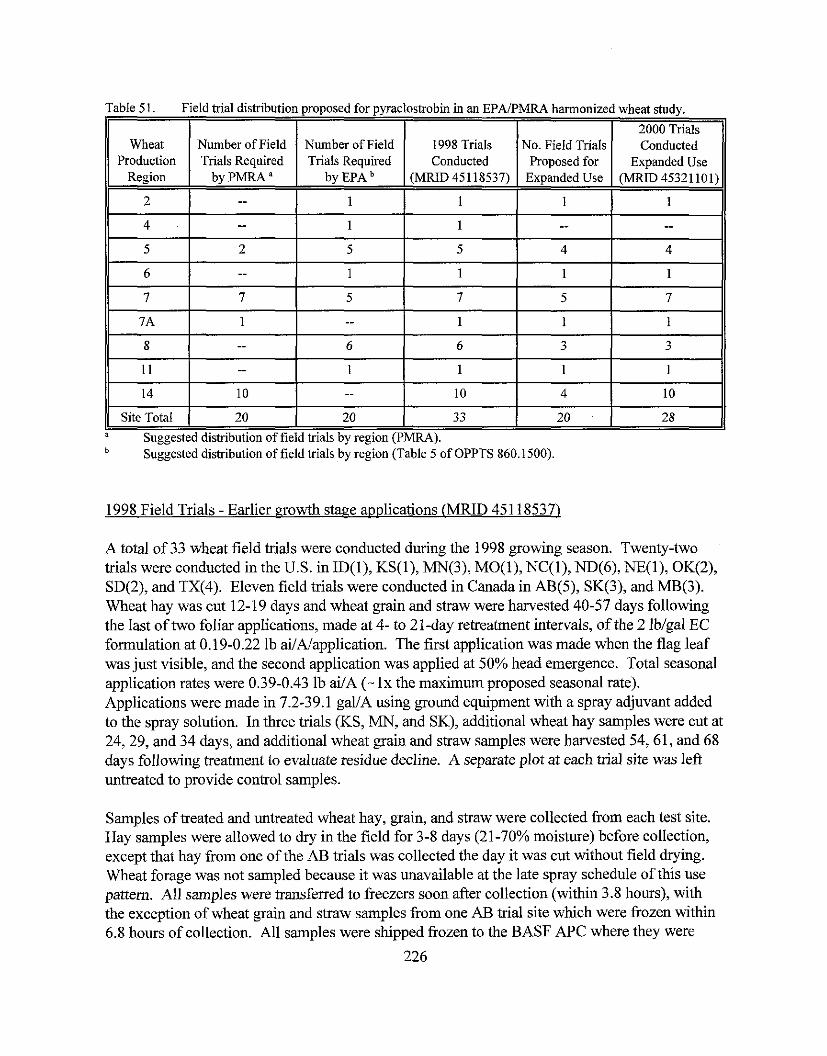
Table 51. Field trial distribution proposed for pyraclostrobin in an EPAPMRA harmonized wheat study.
I I I I I I 2000 Trials 11 Wheat
Production Region
2
. - suggested distribution of field trials by region (Table 5 of OPPTS 860.1500)
8
11
14
Site Total
1998 Field Trials - Earlier growth stage avvlications (MRID 451 18537)
Number of Field Trials Required
by PMRA ' --
A total of 33 wheat field trials were conducted during the 1998 growing season. Twenty-two trials were conducted in the U.S. in ID(l), KS(l), MN(3), M0(1), NC(l), ND(6), NE(l), OK(2), SD(2), and TX(4). Eleven field trials were conducted in Canada in AB(5), SK(3), and MB(3). Wheat hay was cut 12-19 days and wheat grain and straw were harvested 40-57 days following the last of two foliar applications, made at 4- to 21-day retreatment intervals, of the 2 lb/gal EC formulation at 0.19-0.22 lb ai/A/application. The first application was made when the flag leaf was just visible, and the second application was applied at 50% head emergence. Total seasonal application rates were 0.39-0.43 lb ai/A (- lx the maximum proposed seasonal rate). Applications were made in 7.2-39.1 gal/A using ground equipment with a spray adjuvant added to the spray solution. In three trials (KS, MN, and SK), additional wheat hay samples were cut at 24,29, and 34 days, and additional wheat grain and straw samples were harvested 54,61, and 68 days following treatment to evaluate residue decline. A separate plot at each trial site was left
P u g g e s t e d distribution of field trials by region (PMRA).
-- --
10
20
untreated to provide control samples.
Number of Field Trials Required
by EPA
1
Samples of treated and untreated wheat hay, grain, and straw were collected from each test site. Hay samples were allowed to dry in the field for 3-8 days (21-70% moisture) before collection, except that hay from one of the AB trials was collected the day it was cut without field drying. Wheat forage was not sampled because it was unavailable at the late spray schedule of this use pattern. All samples were transferred to freezers soon after collection (within 3.8 hours), with the exception of wheat grain and straw samples from one AB trial site which were frozen within 6.8 hours of collection. All samples were shipped frozen to the BASF APC where they were
226
6
1
--
20
1998 Trials Conducted
(MRID 45118537)
1
6
1
10
33
No. Field Trials Proposed for
Expanded Use
1
--
Conducted Expanded Use
(MRID 45321 101)
1
3
1
4
20
3
1
10
28
analyzed for residues of pyraclostrobin and BF 500-3 using Method D9808. Apparent residues of pyraclostrobin and BF 500-3 were each less than the LOQ (<0.02 ppm) inlon 33 samples each of untreated wheat hay and wheat grain, and 32 samples of untreated wheat straw. Detectable pyraclostrobin residues were found in one sample of untreated wheat straw (duplicate analyses; 0.069 and 0.103 ppm); BF 500-3 residues were 0.021 ppm and less than the LOQ in this sample. No explanation for detectable residues in the untreated sample was provided by the petitioner. Residues of pyraclostrobin and BF 500-3 idon treated samples are presented in Table 52.
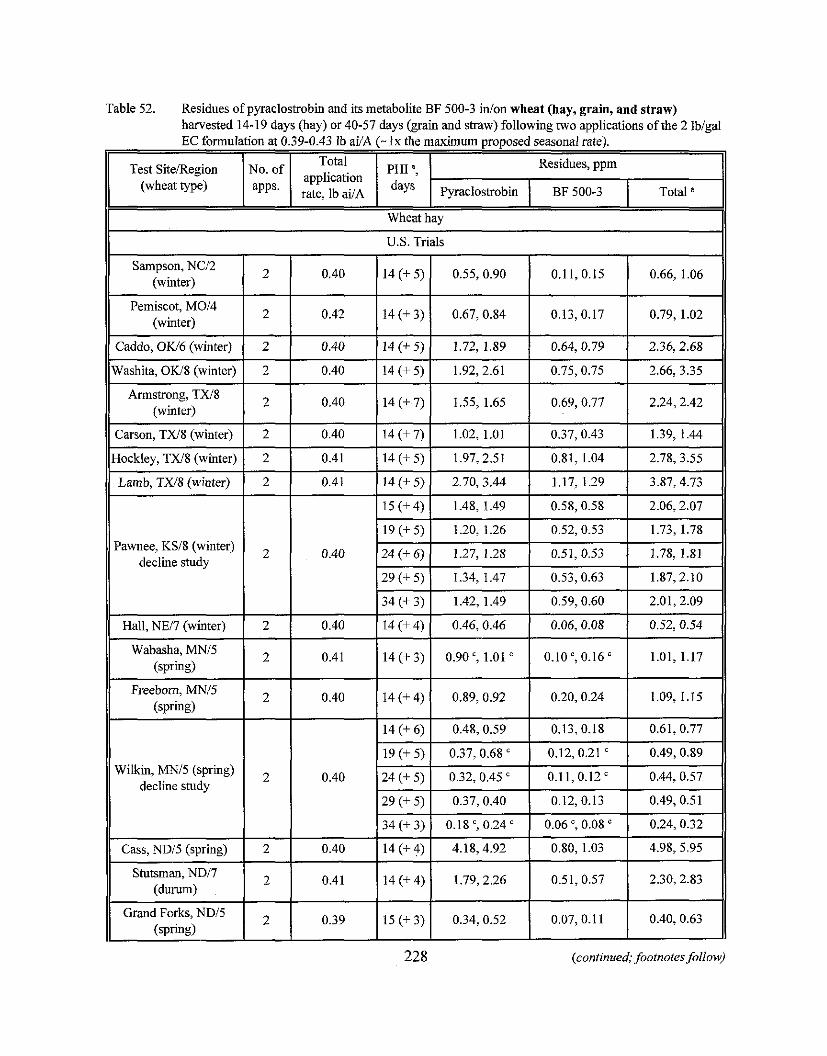
11 U.S. Trials 11
Table 52. Residues of pyraclostrobin and its metabolite BF 500-3 inion wheat (hay, grain, and straw) harvested 14-19 days (hay) or 40-57 days (grain and straw) following two applications of the 2 lblgaf EC fornulation at 0.39-0.43 lb ai/A (- l x the ~naximum proposed seasonal rate).
Pemiscot, M014 I:
Test SiteIRegion (wheat type)
Caddo, OK16 (winter)
Armstrong, TW8 ILL-
Wheat hay
No. of
Carson, TW8 (winter)
1) Lamb, TX18 (winter)
Total application rate, lb ai/A
Wabasha. MNI5
Wilkin, MNI5 (spring) decline study
PHI a,
days
Stutsman, NDI7 (durum)
Grand Forks, NDI5 I (spring)
Residues, ppm
228 (continued; footnotes follow)
Pyraclostrobin BF 500-3 Total a
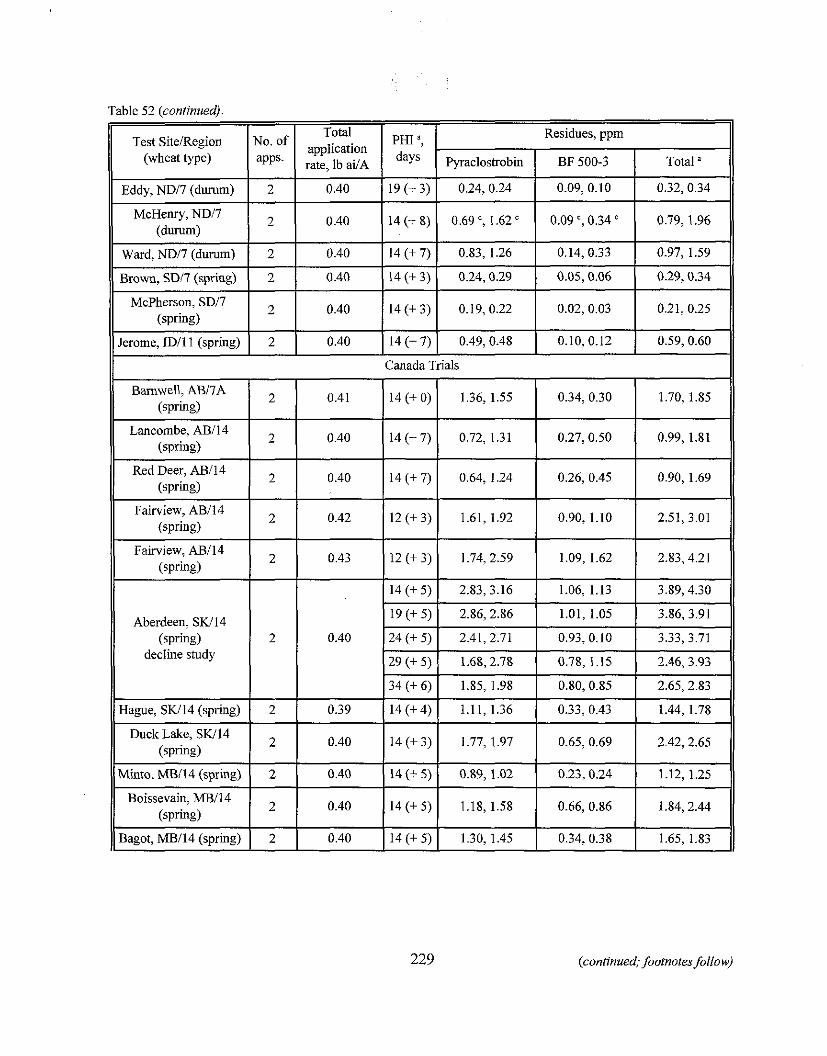
I I t I !
Eddy, NDl7 (durum) 2 0.40 19 (+ 3) 0.24, 0.24 0.09, 0.10 0.32, 0.34
. -. . . . - ,-
11 Ward, NDI7 (durum) / 2 / I I
0.40 1 14 (+ 7) 1 0.83, 1.26 1 0.14,0.33 1 0.97, 1.59 11 I I I t I I
Brown, SD17 (spring) 2 0.40 14 (+ 3) 0.24,0.29 0.05,0.06 0.29,0.34
PHI a, Residues, ppm
days Pyraclosh-obin I BF 500-3 I Total ' Test SiteRegion
(wheat type) No. of
- - I I I I
Total application rate, lb aiiA
Lancombe, ABl14 (spring)
Red Deer, ABl14 (spring)
Fairview, AB114 (spring)
Fairview, ABl14 (spring)
0.10,0.12 Jerome, ID11 1 (spring)
2
Aberdeen, SW14 (spring)
decline study
0.40 0.59,0.60 2
Canada Trials
2
2
Hague, SW14 (spring)
Duck Lake, SIU14 (spring)
(continued; footnotes follow)
0.40
0.40
2
Minto, MBI14 (spring)
Boissevain, MBl14 (spring) -
Bagot, MBl14 (spring)
14 (+ 7)
1.70, 1.85
0.42
0.43
2
0.49,0.48
Bamwell, ABI7A (spring)
14 (+ 7)
14 (+ 7)
0.40
2
2
2
1.36, 1.55
12(+3)
12 (+ 3)
0.39
0.40
0.34, 0.30 2
0.72, 1.31
0.64, 1.24
19 (+ 5)
24 (+ 5)
29 (+ 5)
34 (+ 6)
0.40
0.40
0.40
1.61,1.92
1.74,2.59
14(+4)
14 (+3)
0.41
0.27, 0.50
0.26, 0.45
2.86,2.86
2.41,2.71
1.68,2.78
1.85, 1.98
14 (1- 5)
14 (+ 5)
14 (+ 5)
14 (+ 0)
0.99, 1.81
0.90, 1.69
0.90, 1.10
1.09, 1.62
1.11, 1.36
1.77, 1.97
2.51,3.01
2.83,4.21
1.01, 1.05
0.93,O.lO
0.78, 1.15
0.80,0.85
0.89, 1.02
1.18, 1.58
1.30, 1.45
3.86, 3.91
3.33, 3.71
2.46,3.93
2.65,2.83
0.33, 0.43
0.65, 0.69
1.44, 1.78
2.42,2.65
0.23, 0.24
0.66, 0.86
0.34, 0.38
1.12, 1.25
1.84, 2.44
1.65, 1.83
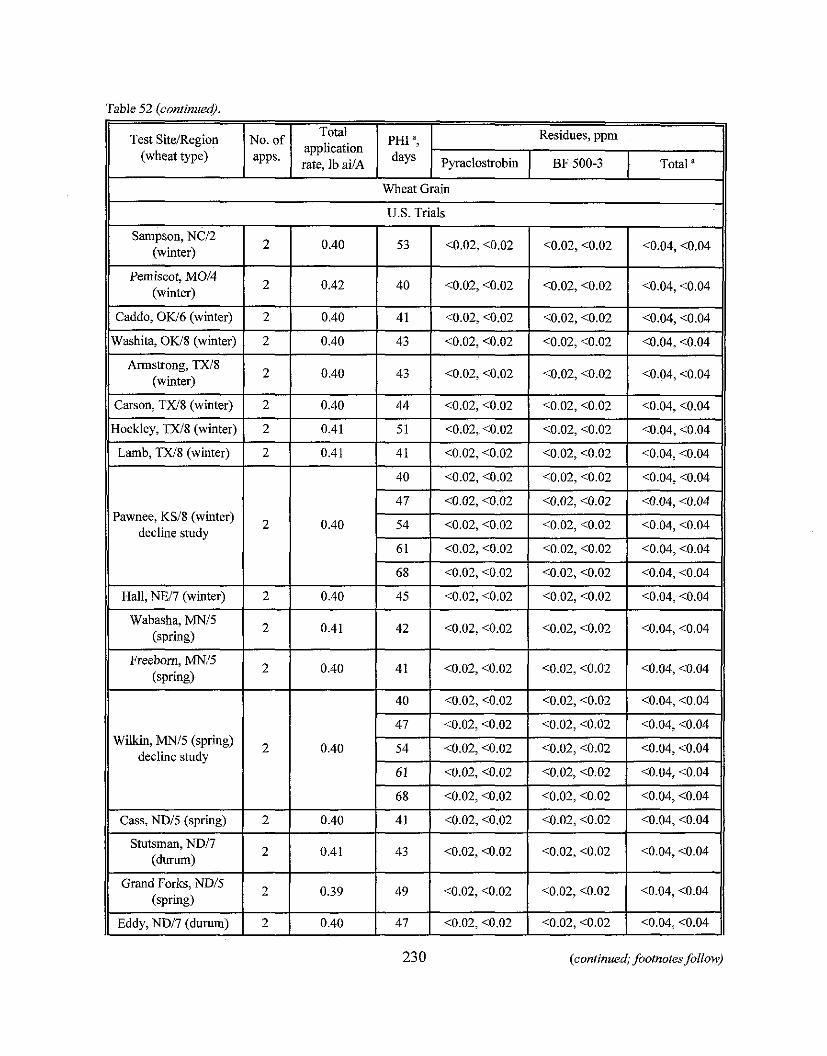
Table 52 (continued).
Test SiteRegion (wheat type)
Carson, TXi8 (winter)
Hockley, W 8 (winter)
Pawnee, KS18 (winter) decline study
I I I I I I
Wheat Grain
U.S. Trials
No. of
2
2
Lamb, W 8 (winter)
Wilkin, MNI5 (spring) decline study
11 Cass,NDI5 (spring) 1 2 1 0.40 1 41 1 <0.02, <0.02 1 <0.02,<0.02 1 <0.04, <0.04 11
application rate, lb ailA
0.40
0.41
1 40 1 <0.02. <0.02 1 <0.02. <0.02 1 <0.04. <0.04
2
Wabasha, MNI5 (spring)
Freeborn, MNl5 (spring)
0.41 41 10.02, <0.02 <0.02, C0.02 <0.04, <0.04
<0.02, <0.02
<0.02,<0.02
230 (continued; footnotes follow)
PHI ", days
44
5 1
10.04, <0.04
@.04,@.04
2
2
Stutsman, NDl7 (durnm)
Grand Forks, NDl5 (spring)
Eddy, NDI7 ( d u r n )
Residues, ppm
<0.02, <0.02
<0.02,<0.02
0.41
0.40
2
2
Pyraclostrobin 1 BF 500-3 Total '
<0.02,<0.02
<0.02,<0.02
42
41
0.41
0.39
0.40
<0.04, <0.04
<0.04,<0.04
<0.02, <0.02
<0.02,<0.02
43
49
47
<0.02, <0.02
<0.02,<0.02
<0.02, <0.02
<0.02, <0.02
<0.02,<0.02
~0 .02 , <0.02
<0.04, <0.04
<0.04,<0.04 -
10.04, <0.04
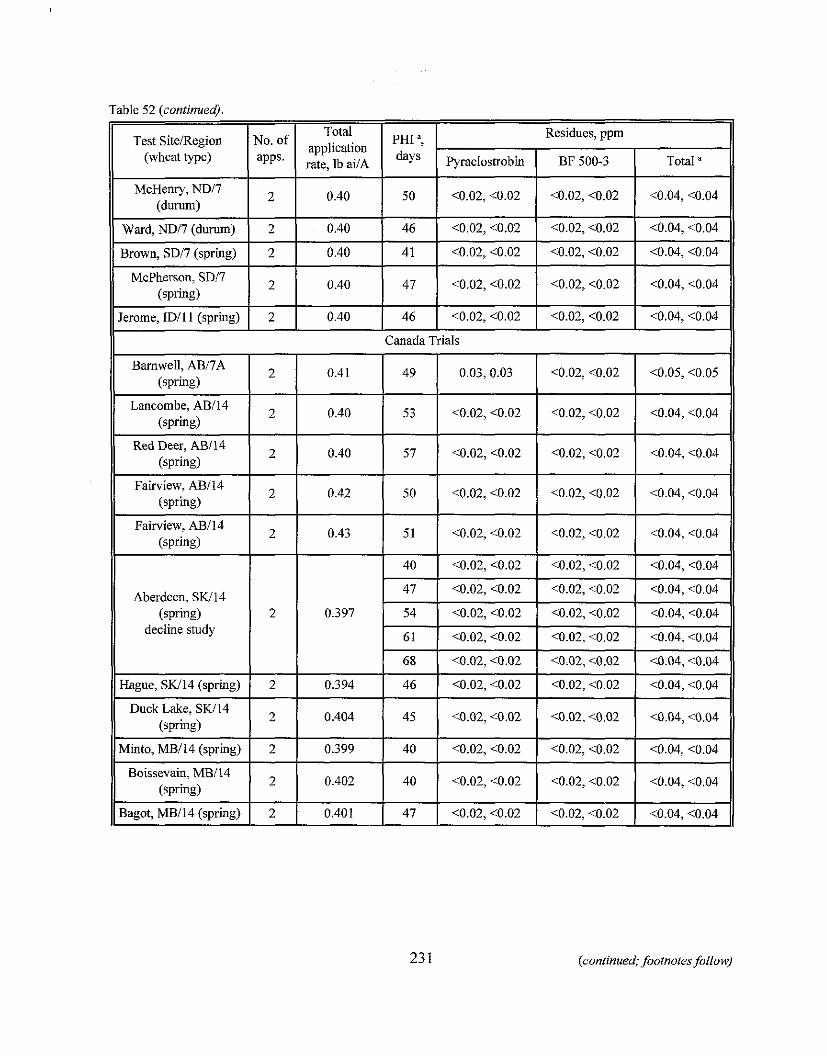
Table 52 (continued),
Barnwell, AB/7A I - Lancombe, ABll4 * Red Deer, ABI14 + Fairview, ABl14
Fairview, AB/14 (spring)
Aberdeen, SW14 (spring) 2
decline study
(spring)
dinto, MBll4 (spring)
Boissevain, MBl14
3agot, MBI14 (spring) 2
(continued; footnotes follow)
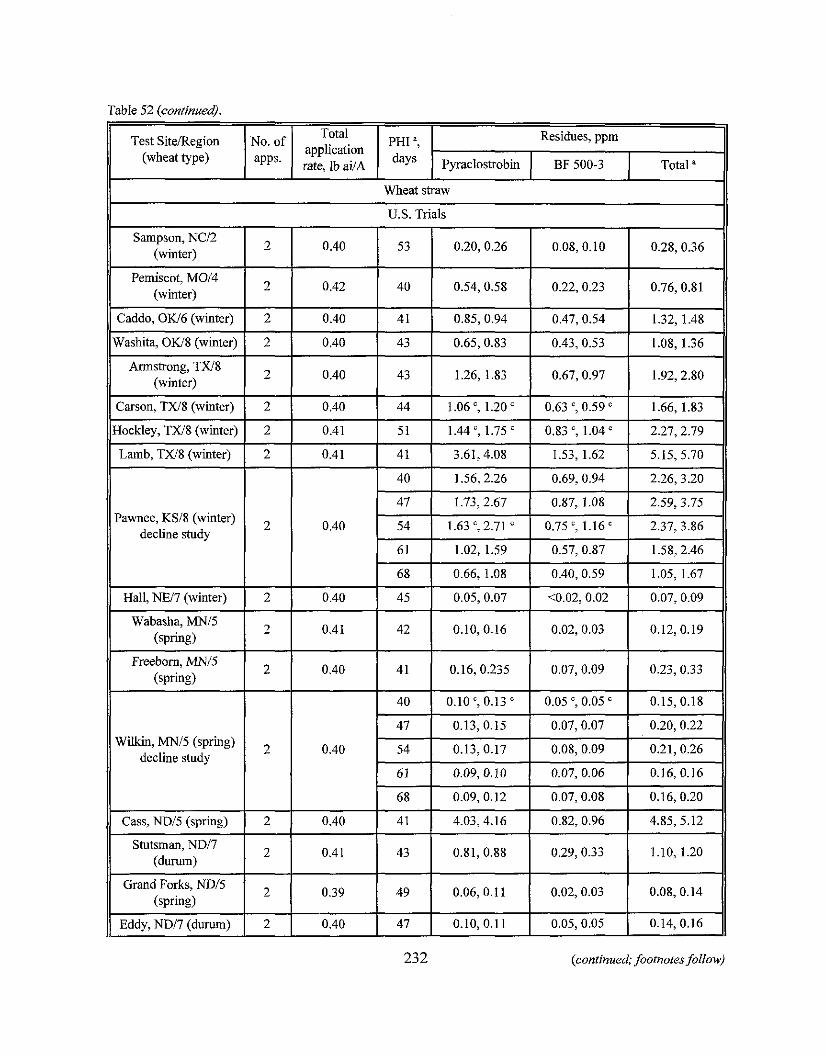
rable 52 (continued).
I I I I I I Wheat straw 11
Test Sitemegion No. of I otal PHI ", Residues, ppm
application (wheat type) I I rate, Ib ai/A I I Pyr.iios*obin 1 BP 500-3 I Total '
U.S. Trials 11
I Sampson, NCI2
(winter)
Pemiscot, M0/4 (winter)
Caddo, OW6 (winter)
Washita, OW8 (winter)
Armstrong, TW8 (winter)
Wabasha, MNI5 ( sphg )
Freeborn, MN/5 (spring)
2
2
2
2
2
Wilkin, MNI5 (spring) decline study
Eddy, ND17 (durum) 1 2 1 0.40 1 47 1 0.10, 0.11 1 0.05,0.05 1 0.14,0.16 11
2
2
Cass, NDI5 (spring)
Stutsman, NDI7 (durum)
Grand Forks, NDl5 (spring)
232 (continued; footnotes follow)
0.40
0.42
0.40
0.40
0.40
0.40
0.41
0.40
2
2
53
40
41
43
43
40
47
54
61
68
42
4 1
0.40
0.41
0.39
0.20, 0.26
0.54, 0.58
0.85,0.94
0.65, 0.83
1.26, 1.83
0.10 ', 0.13 "
0.13, 0.15
0.13,0.17
0.09, 0.10
0.09, 0.12
0.10, 0.16
0.16, 0.235
41
43
49
0.08,O.lO
0.22,0.23
0.47, 0.54
0.43,0.53
0.67, 0.97
0.05 ', 0.05
0.07,0.07
0.08, 0.09
0.07, 0.06
0.07, 0.08
- 0.28,0.36
0.76,0.81
1.32, 1.48
1.08, 1.36
1.92,2.80
0.02, 0.03
0.07,0.09
0.15, 0.18
0.20, 0.22
0.21, 0.26
0.16, 0.16
0.16,0.20
4.03, 4.16
0.81,0.88
0.06, 0.1 l
0.12,0.19
0.23, 0.33
0.82,0.96
0.29,0.33
0.02,0.03
4.85,5.12
1.10, 1.20
0.08, 0.14
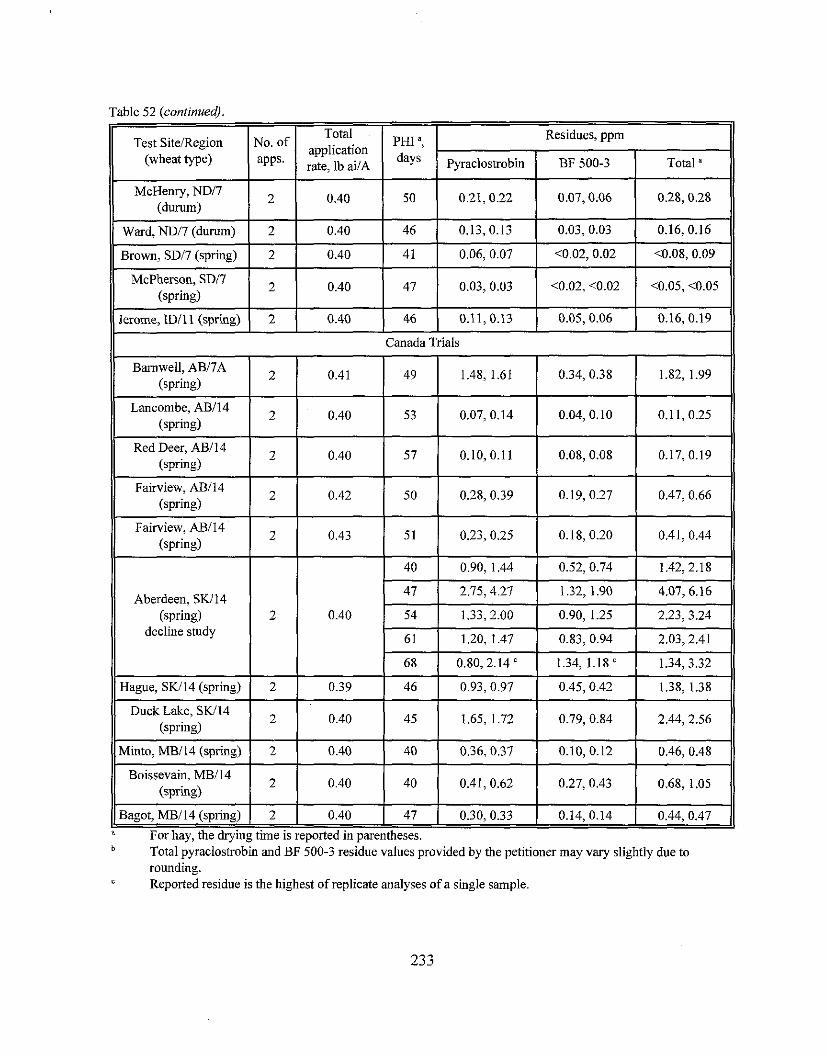
Table 52 (continued).
Aberdeen, SW14
"or hay, the dryiig time is reported in parentheses. Total pyraclostrobin and BF 500-3 residue values provided by the petitioner may vary slightly due to rounding. Reported residue is the highest of replicate analyses of a single sample.
2000 Field Trials - Later growth stage applications (MRID 45321 101)
A total of 28 wheat field trials were conducted during the 2000 growing season. Seventeen trials were conducted in the U.S. in ID(I), MN(2), NC(I), ND(6), NE(2), OK(2), TX(2), and WI(1). Eleven field trials were conducted in Canada in AB(5), SK(2), and MB(4). Mature wheat grain and straw were harvested 24-60 days following the last of two foliar applications of the 2 lbigal EC formulation at 0.19-0.21 Ib ailA/application, made at 5- to 14-day retreatment intervals. The first application was made at full head emergence and the second application was made at the end of anthesis. Total seasonal application rates were 0.39-0.41 lb ai/A (- l x the maximum proposed seasonal rate). Applications were made in 10-31 gal/A using ground equipment with a spray adjuvant added to the spray solution. In two trials (MN and NE), additional wheat grain and straw samples were harvested 35-42,42-48,49-55, and 56-62 days following treatment to evaluate residue decline. A separate plot at each trial site was left untreated to provide control samples.
Exaggerated rates were applied to a separate plot of wheat in one of the ND trials to obtain samples for processing. Mature wheat grain was harvested 39 days following the last of two foliar applications of the 2 Iblgal EC formulation at 1.0 lb ailMapplication, for a total rate of 2.0 lb aiiA (-5x the maximum proposed seasonal application rate). Bulk samples of lx and 5x treated wheat grain were collected from the ND trial site for generation of aspirated grain fractions (AGF) and processed commodities, respectively. These data will be addressed in the "Processed FoodIFeed" section with the 1998 AGF and processed commodity data.
A single untreated and duplicate treated samples of wheat grain and straw were collected from each test site. Wheat forage and hay were not sampled because forage was unavailable at the late - spray schedule of this use pattern, and data were available for hay harvested at a 14-day PHI from the 1998 field trials. All sam~les were transferred to freezers soon after collection (time unspecified) and were shipped frozen to the BASF APC for analysis. Bulk grain samples for processing were shipped frozen directly to the Food Protein Research and Development Center (Bryan, TX). Samples were analyzed for residues of pyraclostrobin and BF 500-3 using Method D9908. Apparent residues of pyraclostrobin i d BF 500-3 were each less than the LOQ (<0.02 ppm) idon 28 samples each of untreated wheat grain and straw. Residues of pyraclostrobin and BF 500-3 idon treated samples are presented in Table 53.
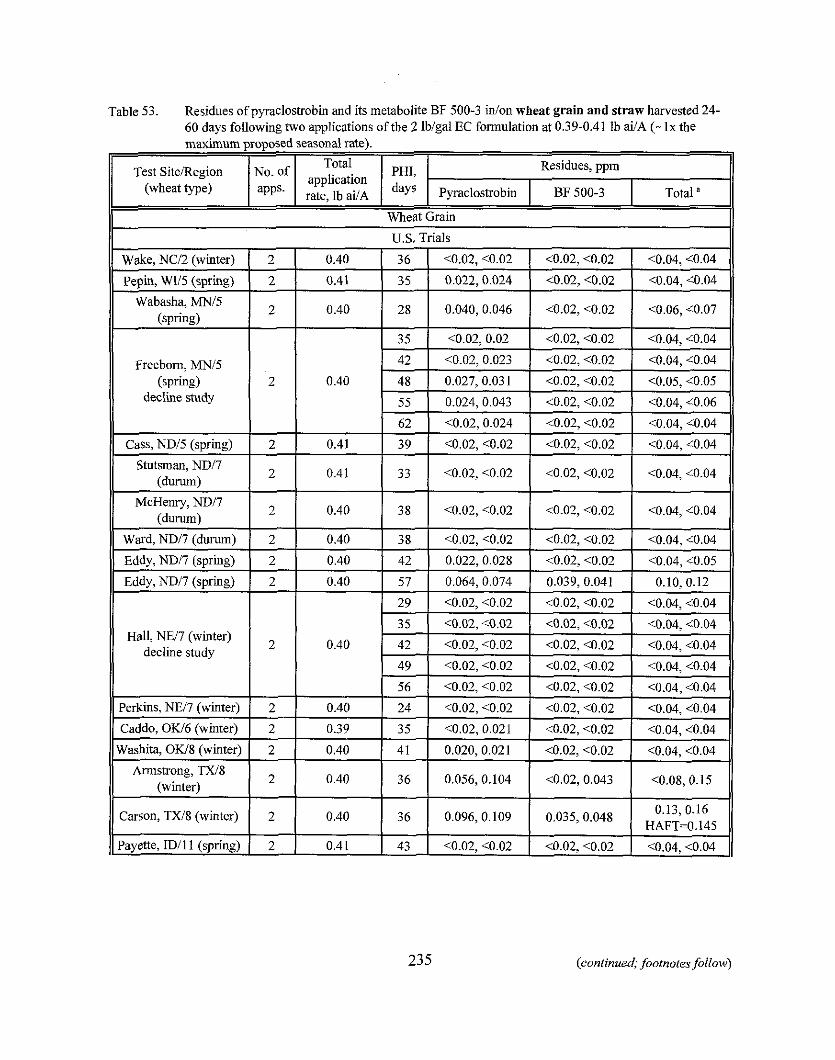
Table 53. Residues of pyraclos'obin and its metabolite BF 500-3 in/on wheat grain and straw harvested 24- 60 days following two applications of the 2 lblgal EC fornulation at 0.39-0.41 lb ai/A (- lx the maximum proposed seasonal rate).
Hall, NEl7 (winter)
(continued; footnotes follow)
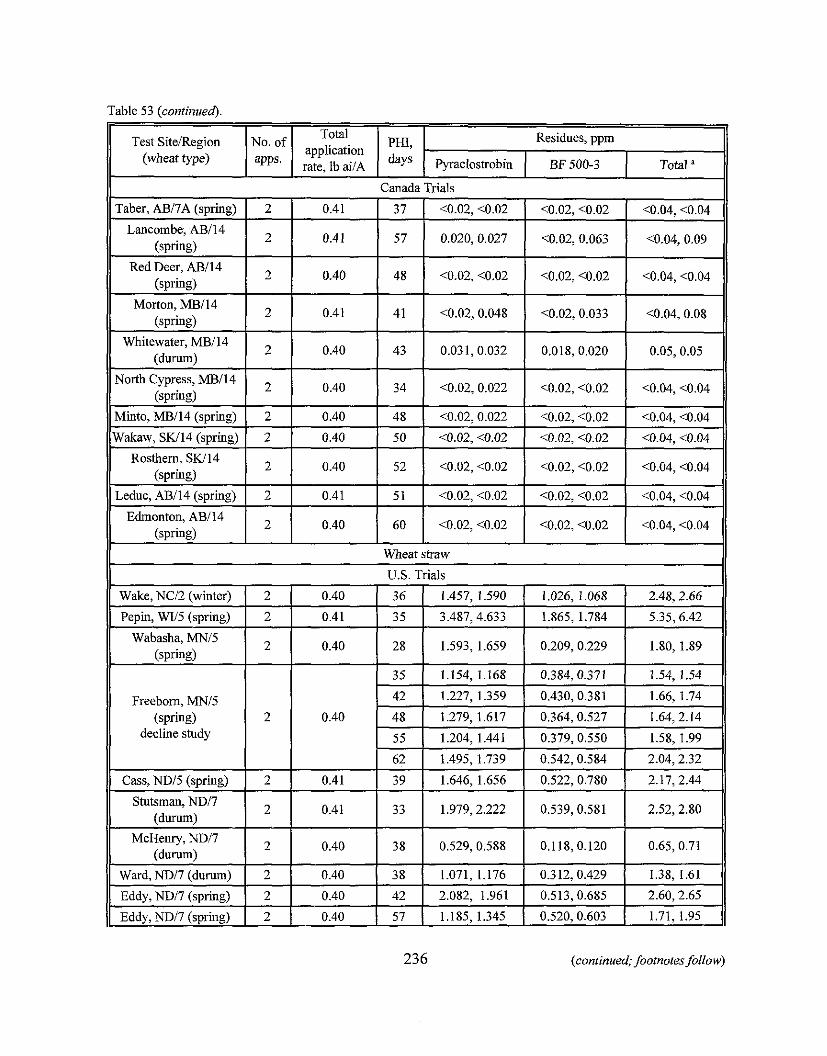
Table 53 (continued).
236 (continued; footnotes follow)
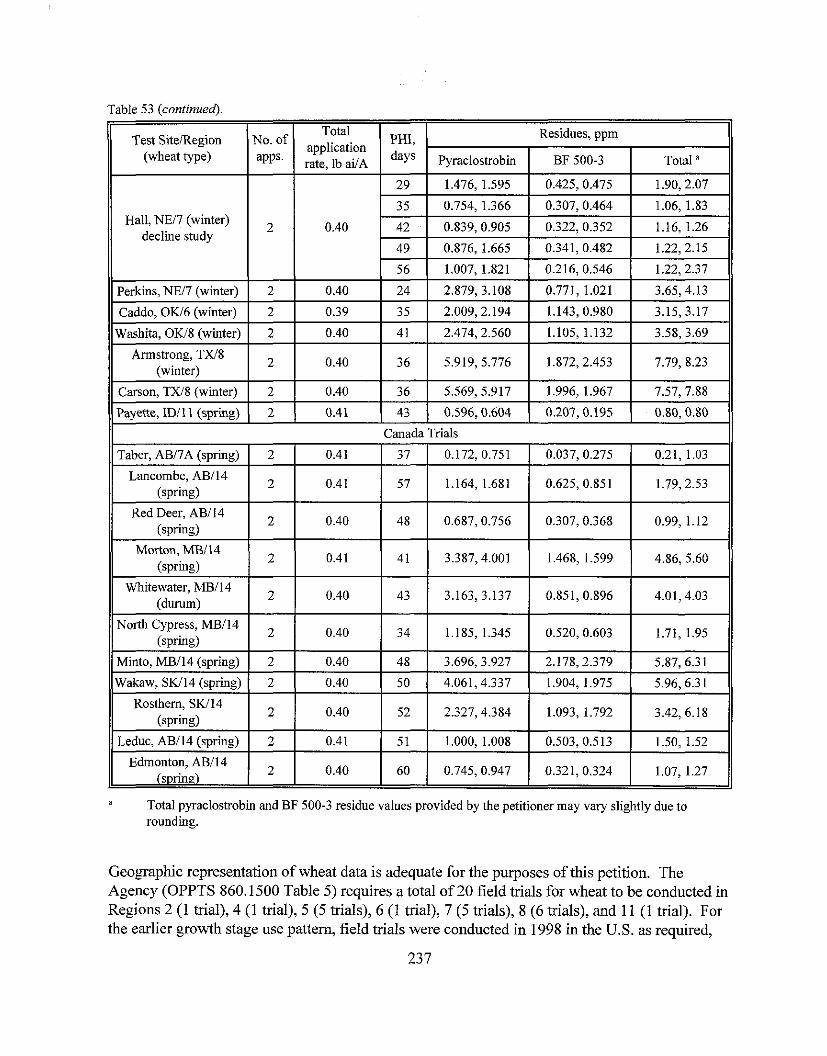
Table 53 (continued)
" Total pyraclostrobin and BF 500-3 residue values provided by the petitioner may vary slightly due to rounding.
Geographic representation of wheat data is adequate for the purposes of this petition. The Agency (OPPTS 860.1500 Table 5) requires a total of 20 field trials for wheat to be conducted in Regions 2 (1 trial), 4 (1 trial), 5 (5 trials), 6 (1 trial), 7 (5 trials), 8 (6 trials), and 11 (1 trial). For the earlier growth stage use pattern, field trials were conducted in 1998 in the U.S. as required,
237
with two additional field trials conducted in Region 7. In addition, 11 wheat field trials were conducted in Canada in 1998 in Regions 7A (1 trial) and 14 (10 trials). For the later growth stage use pattern, 17 trials were conducted in 2000 in the U.S. in Regions 1 (1 trial), 5 (4 trials), 6 (1 trial), 7 (7 trials), 8 (3 trials), and 11 (1 trial), and 11 wheat trials were conducted in Canada in Regions 7A (1 trial) and 14 (10 trials). The Agency had previously concluded that data from the 2000 U.S. trials, together with data from three Canadian trials conducted in southern Alberta (Region 7A, 1 trial) and southern Manitoba (Region 14,2 trials), should be sufficient to support the new use pattern.
Study summarv:
The petitioner has provided adequate residue data reflecting the maximum proposed use pattern of pyraclostrobin on wheat in the U.S. Adequate field trial data were submitted supporting applications made to wheat at the earlier growth stage (applications made at flag leaf and 50% head emergence) and applications made to wheat at later growth stages with a shorter PHI (applications made at full head emergence and the end of anthesis) for control of Fusarium head blight.
Wheat p i n : The combined residues of pyraclostrobin and its metabolite BF 500-3 did not exceed the proposed tolerance level of 0.2 ppm idon wheat grain following earlier and later (expanded use) application schedules to wheat. In the early treatment schedule, wheat grain was harvested 40-57 days following the last of two foliar applications of the 2 lblgal EC formulation at 0.19-0.22 lb ailNapplication for a total seasonal application rate of 0.39-0.43 lb ai/A (- l x the maximum proposed seasonal application rate). The combined residues following the earlier application schedule were <0.04 ppm idon 44 samples of wheat grain grown in the U.S. and <0.04-<0.05 ppm idon 22 samples of wheat grain grown in Canada. In the later application schedule, wheat grain was harvested 24-60 days following the last of two foliar applications of the 2 lblgal EC formulation at 0.19-0.21 lb ailNapplication for a total seasonal application rate of 0.39-0.41 lb ailA (- l x the maximum proposed seasonal application rate). The combined residues following later application schedules were <0.04-0.16 ppm idon 34 samples of wheat grain grown in the U.S. and <0.04-0.09 ppm idon 22 samples of wheat grain grown in Canada.
Wheat hay: The combined residues of pyraclostrobin and BF 500-3 did not exceed the proposed tolerance level of 6.0 ppm idon wheat hay following earlier application schedules to wheat. In the early treatment schedule, wheat hay was harvested 12-19 days following the last of two foliar applications of the 2 lblgal EC formulation at 0.19-0.22 lb ailNapplication for a total seasonal application rate of 0.39-0.43 lb aiIA (- lx the maximum proposed seasonal application rate). The combined residues following early application schedules were 0.2 1-5.95 ppm idon 44 samples of wheat hay grown in the U.S. and 0.90-4.3 ppm idon 22 samples of wheat hay grown in Canada. The petitioner indicated that wheat hay was not sampled from the later treatment schedule study because hay was harvested at a 14-day PHI in the 1998 study. The petitioner must modify the proposed label to add a 14-day PHI for wheat hay.
Wheat straw: The combined residues of pyraclostrobin and BF 500-3 did not exceed the proposed tolerance level of 8.5 ppm idon wheat straw following earlier and later (expanded use) application schedules to wheat. In the early treatment schedule, wheat straw was harvested 40- 57 days following the last of two foliar applications of the 2 lblgal EC formulation at 0.19- 0.22 lb dA1application for a total seasonal application rate of 0.39-0.43 lb ai/A (- lx the maximum proposed seasonal application rate). The combined residues following early application schedules were <0.05-5.70 ppm idon 44 samples of wheat straw grown in the U.S. and 0.1 1-6.17 ppm idon 22 samples of wheat straw grown in Canada. In the later treatment schedule, wheat straw was harvested 24-60 days following the last of two foliar applications of the 2 lblgal EC formulation at 0.19-0.21 lb ailAlapplication for a total seasonal application rate of 0.39-0.41 lb d A (- Ix the maximum proposed seasonal application rate). The combined residues following later application schedules were 0.65-8.23 ppm inlon 34 samples of wheat straw grown in the U.S. and 0.21-6.31 ppm idon 22 samples of wheat straw grown in Canada.
The residue decline data for wheat hay, grain, and straw did not demonstrate any conclusive trends in decreasing residues at longer posttreatment intervals. Residues were variable in hay and straw, and residues in grain were consistently near or below the LOQ.
Wheat forage: The petitioner did not provide residue data or propose a tolerance for wheat forage because applications are made after the growth stages at which wheat is foraged. Based on the current proposed use patterns, the Agency will not require residue data or a tolerance for wheat forage.
Small grains - European trials
BASF Corporation submitted two volumes of European small grain field trial data (citations listed below) to support the establishment of the proposed tolerance for residues of pyraclostrobin and BF 500-3 idon wheat grain at 0.20 ppm. These data will not be considered in the assessment of the proposed U.S. tolerance, but are presented for informational purposes.
451 18601 Beck, J. (1999) Study on the Residue Behavior of BAS 500 F, Epoxiconazole and Kresoxim-methyl in Cereals after Treatment with BAS 512 OOF under Field Conditions in Belgium, France, Germany, Great Britain, Spain, Sweden and the Netherlands, 1998: Lab Project Number: 199911 1509: EU/FR/01/98. Unpublished study prepared by BASF Aktiengesellschaft. 57 p.
451 18602 Meumann, H.; Benz, A,; Mackenroth, C. (1999) Evaluation of the Residue Behavior of BAS 500 F after Application of BASF 500 01 F in Cereals under Field Conditions in Germany, France, and Sweden, 1998: Lab Project Number: NEU/FR/06/98: 199911 1825. Unpublished study prepared by BASF Aktiengesellschaft. 25 p.
In the first study (MRID 451 18601), 13 field trials were conducted on barley (5 trials) and wheat (8 trials) during the 1998 growing season in Belgium(1 trial), France(2), Germany(2), Great
Britain(3), Spain(3), Sweden(l), and the Netherlands(1). At each site, three separate plots were treated as follows: (i) pyraclostrobin (250 glL) was formulated as an EC formulation and was applied to barley and wheat plants as two spray applications at 193.9-265.1 g aiihalapplication (0.17-0.24 lb ailNapplication for a total rate of 0.37-0.45 lb ai1A); (ii) pyraclostrobin (133 &) and epoxiconazole (50 giL) were formulated as an "SE" formulation and applied to barley and wheat plants as two spray applications at 21 1.3-284.8 g aiihdapplication (0.19-0.25 lb ailNapplication for a total rate of 0.39-0.46 lb ailA); or (iii) pyraclostrobin (133 g L ) , epoxiconazole (50 gL), and kresoxim-methyl(67 g/L) were formulated as an " S F formulation and applied to barley and wheat plants as two spray applications at 231.3-265.6 g aihalapplication (0.21-0.24 lb ai/A/application for a total rate of 0.42-0.45 lb ai/A). Applications were made at BBCH growth stages 37-47 and 59-72 (early-dough stage; beginning of ripening); retreatment intervals were 11-50 days. Applications were made in 235-332 Liha (25-35 g d A ) using ground equipment.
Samples of barley and wheat (whole plant without roots) were collected within 3 hours of the second application. In addition, samples of ears and haulms were collected 20-22 and 32-37 days posttreatment, and samples of grain and straw were collected 33-35,40-44, and 49-51 days postreatment. Samples were frozen (within 6 hours of collection) and either shipped directly to the analytical laboratory (BASF Agricultural Center Limburgerhof, Germany) or placed in intermediate frozen storage prior to being sent to Limburgerhof.
Samples were analyzed for residues of pyraclostrobin and BF 500-3 using Method 42110. Apparent residues of pyraclostrobin and BF 500-3 were each less than the LOQ (<0.02 ppm) idon all collected samples of untreated barley plant without roots (1 sample), wheat plant without roots (3 samples), barley grain (1 sample), wheat grain (1 sample), barley straw (3 samples), wheat straw (2 samples), barley ears (1 sample), wheat ears (4 samples), barley haulms (plant stems) (3 samples), and wheat haulms (2 samples). Residues of pyraclostrobin and BF 500-3 idon treated samples are presented in Table 54.
In the second study (MRID 45 1 18602), five field trials were conducted on barley (2 trials) and wheat (3 trials) during the 1998 growing season in France, Germany, and Sweden. Field trials were conducted using pyraclostrobin (250 g/L) formulated as an EC formulation which was applied to barley and wheat plants as two spray applications at 232.0-261.4 g aiihdapplication (0.21-0.23 lb ai/i\lapplication; total rate of 0.43-0.46 lb ai/A). Applications were made at BBCH growth stages 37-39 and 59-69; retreatment intervals were 12-23 days. Applications were made in 281-317 Liha (30-34 gal/A) using ground equipment.
Samples of barley and wheat (whole plant without roots) were collected within 3 hours of the second application. In addition, samples of ears and haulms were collected 21-22,35-36, and 41-42 days posttreatment, and samples of grain and straw were collected 35,41-43, and 64 days postreatment. Samples were frozen (within 6 hours of collection) and either shipped within 48 hours to the analytical laboratory (BASF Agricultural Center Limburgerhof, Germany) or placed in intermediate frozen storage prior to being sent to Limburgerhof.
Samples were analyzed for residues of pyraclostrobin and BF 500-3 using Method 42110. Apparent residues of pyraclostrobin and BF 500-3 were each less than the LOQ (<0.02 ppm) idon d l collected samples of untreated barley plant without roots (1 sample), wheat plant without roots (1 sample), barley grain (1 sample), wheat grain (1 sample), barley straw (1 sample), wheat straw (2 samples), barley ears (1 sample), wheat ears (2 samples), barley haulms (1 sample), and wheat haulms (2 samples). Residues of pyraclostrobin and BF 500-3 idon treated samples are presented in Table 54.
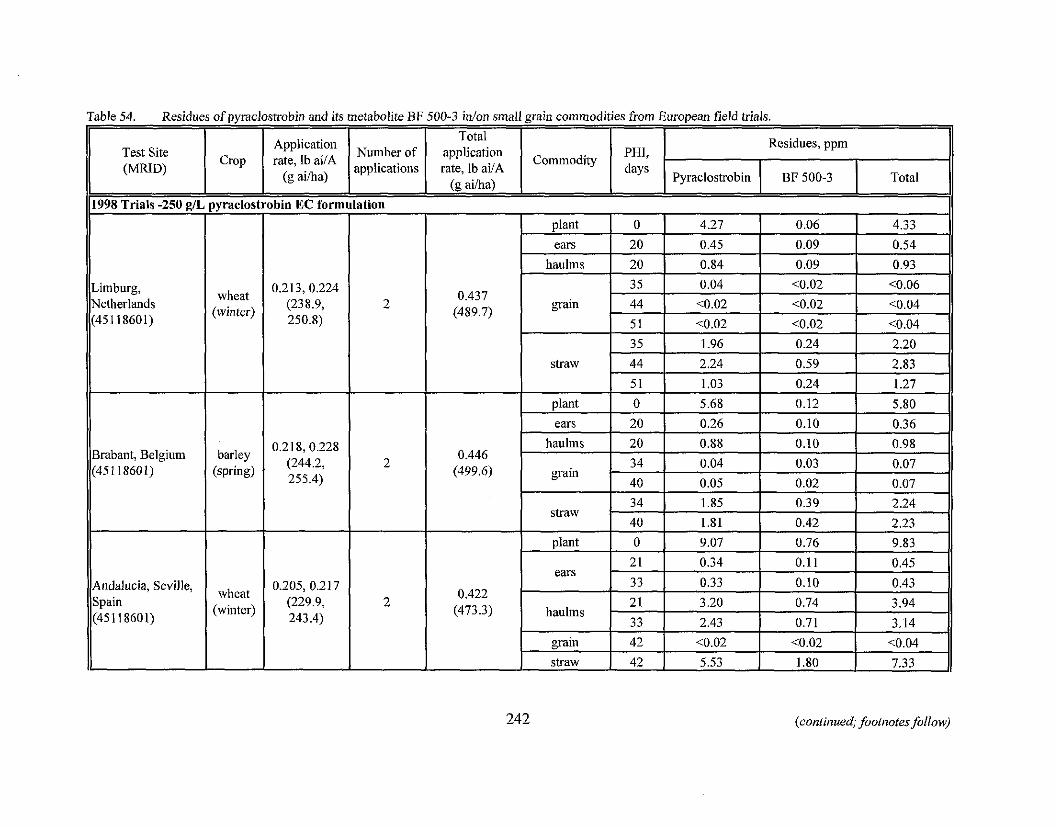
242 (continued; footnotes follow)
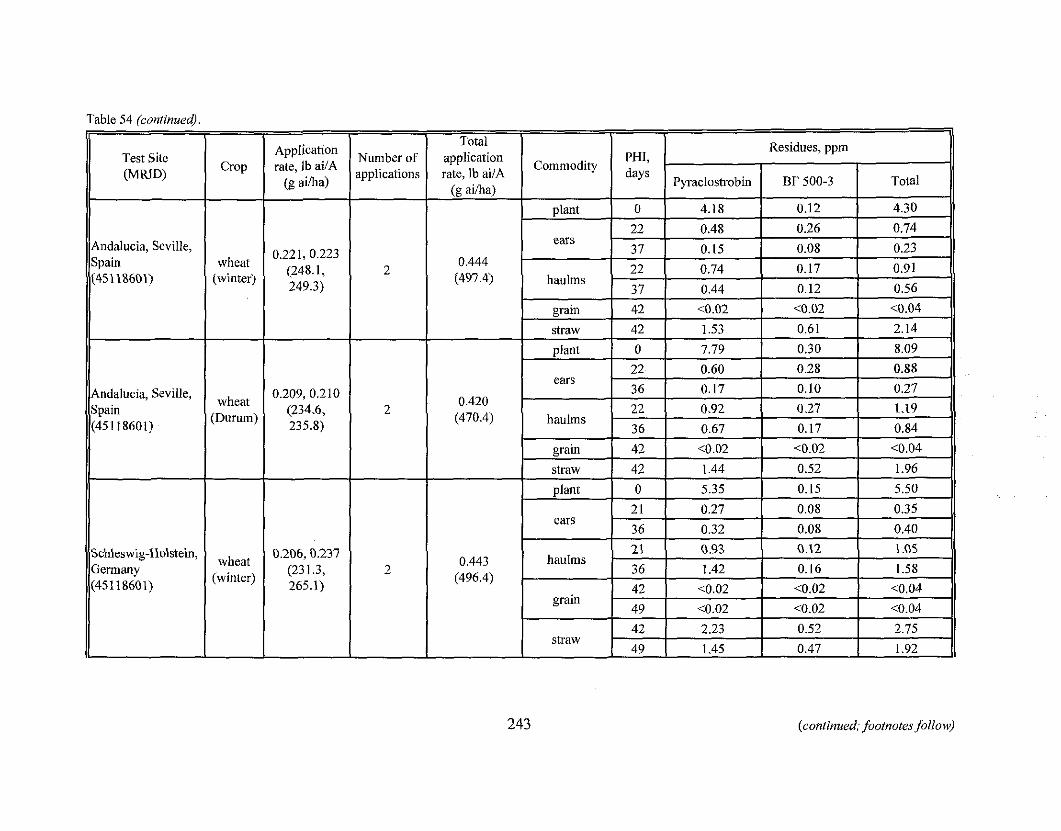
Table 54 fcontinued).
243 (continued; footnotes follow)
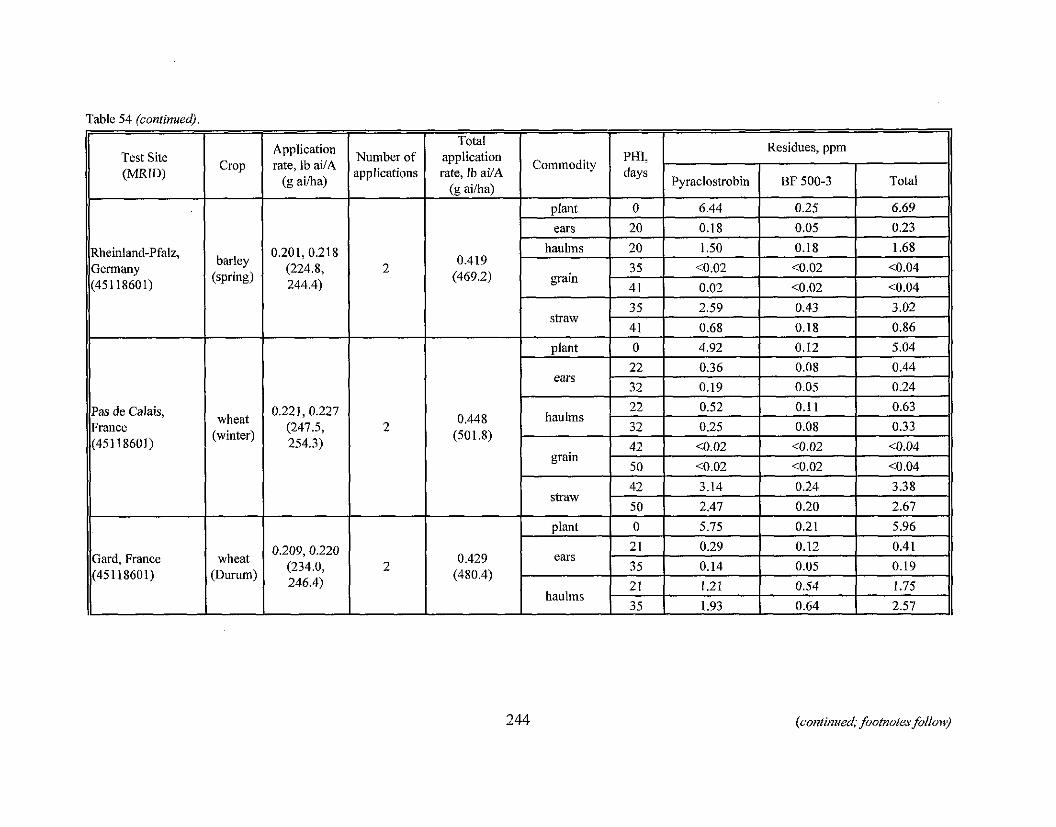
Table 54 (conrinuedJ.
Test Site (MRID)
Rheinland-Pfalz, Germany (45118601)
Pas de Calais, France (451 18601)
Gard, France (45118601)
-
Crop
-
barley (spring)
wheat (winter)
-
wheat (Durum)
-~ - -
Application rate, lb ai1A
(g ailha)
(continued; footnotes follow)
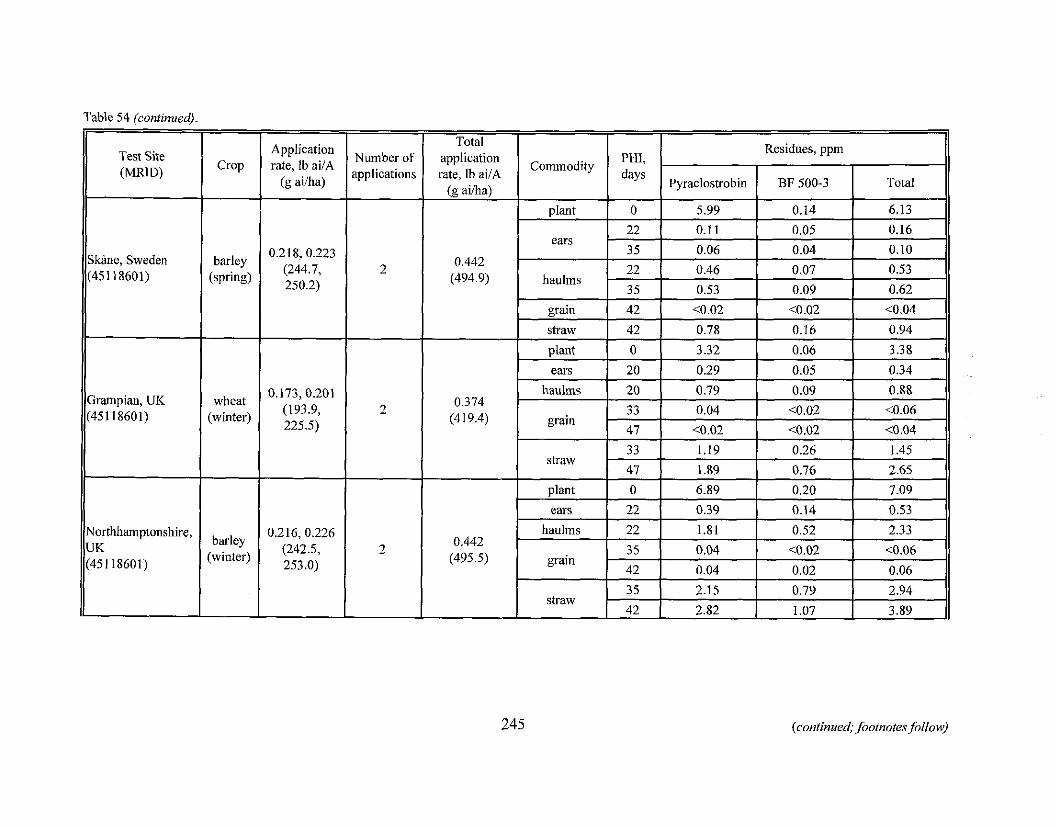
Table 54 /continued).
(continued; footnotes follow)
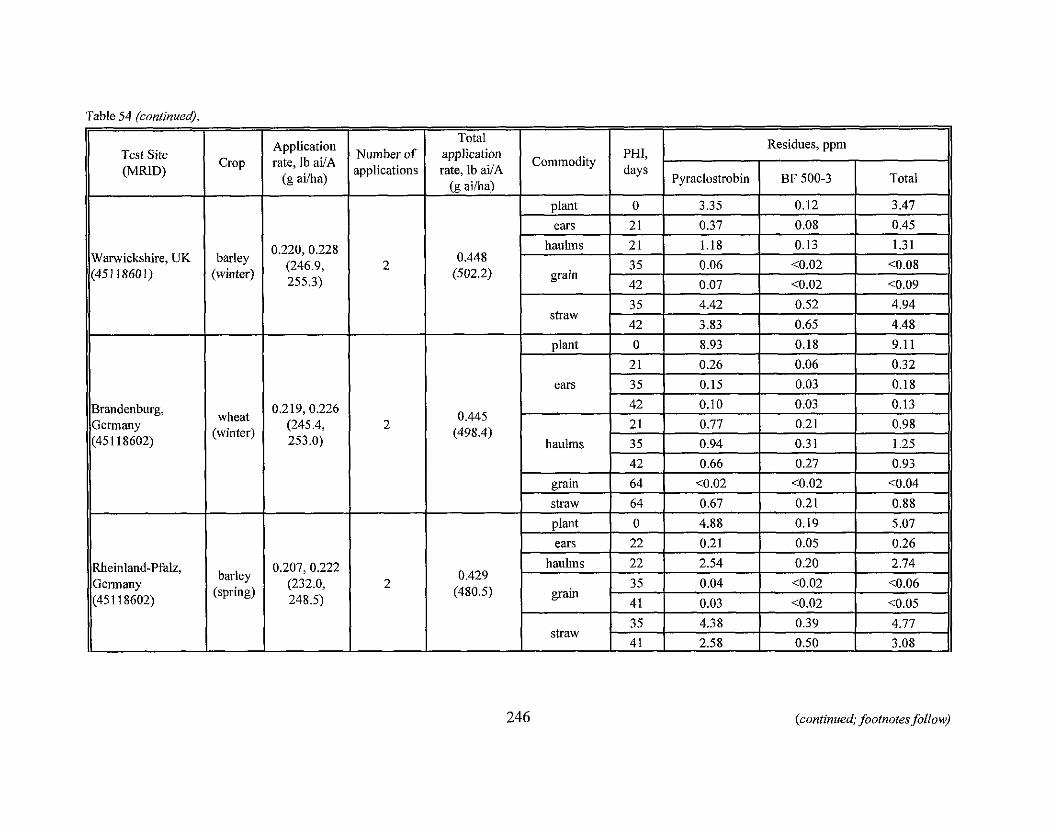
Table 54 (continued).
Test Site (MRID)
Warwickshire, UK (451 18601)
Brandenburg, Germany (451 18602)
Rheinland-Pfalz, Germany (45 1 18602)
-
Crop
barley 'winter)
wheat :winter)
-
barley [spring)
-
Application rate, lb ai/A
(g afia)
'Jumber of pplications
2
plant 1 0 1 8.93 0.18 9.11 11
0.445 .... ..
grain 1 64 1 <0.02 <0.02 <0.04 11
(49x8.)
ears
haulms
straw
plant
ears
haulms
straw 41 1 2.58 0.50 3.08 11
35
42
2 1
grain
246 (continued; footnotes follow)
I 1 . 5 a 35 1 0.94
64
0
22
22
0.15
0.10
0.77
0.31
35
41
35
0.67
4.88
0.21
2.54
0.03
0.03
0.21
0.04
0.03
4.38
0.18
0.13
0.98
0.27 0.93 42
0.21
0.19
0.05
0.20
0.66
0.88
5.07
0.26
2.74
<0.02
<0.02
0.39
c0.06
<0.05
4.77
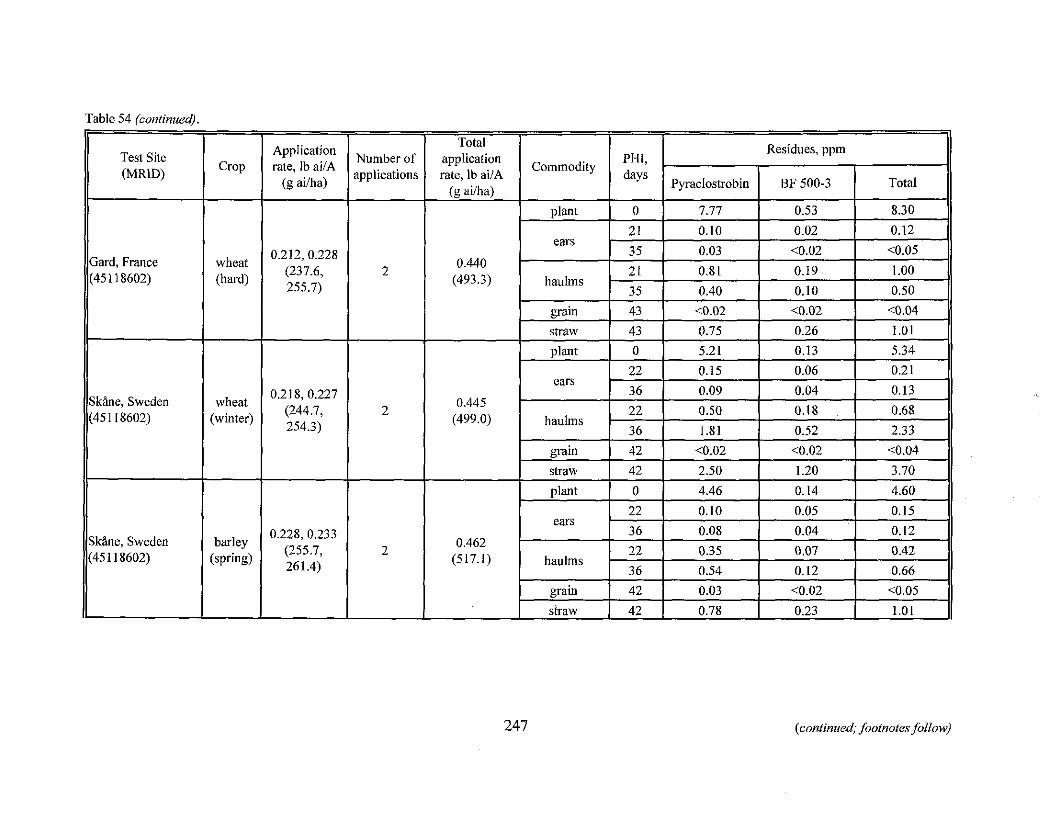
Table 54 (continueaJ
(continued; foo tno te s~ow)
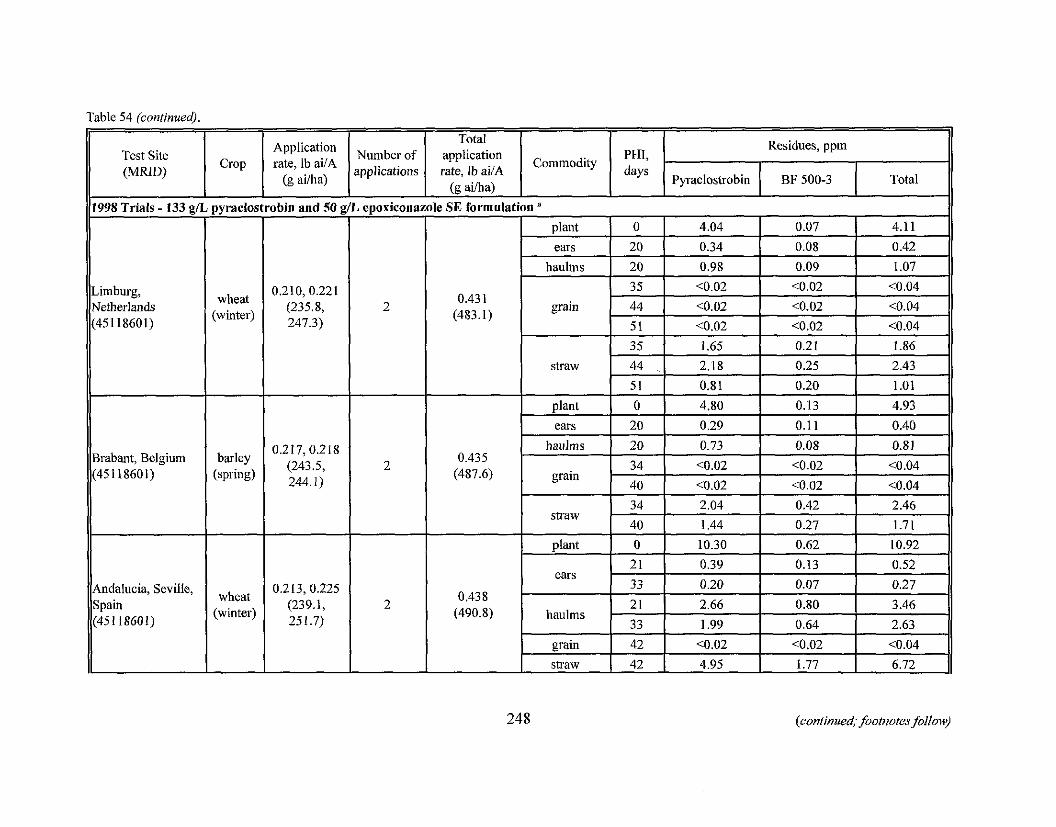
Table 54 lcontinued).
248 (conlinued; footnotes fob)
PHI, days
Test Site (MMD)
Crop Application
rate' (g ailha) lh
Residues, ppm Total application rate, lb ai/A
(g afia) 1998 Trials - 133 g/L
Limburg, Netherlands (45118601)
Number of applications
Pyraclostrobin
4.04
0.34
0.98
<0.02
<0.02
10.02
1.65
2.18
0.81
4.80
0.29
Commodity
pyraclostrobin
wheat (winter)
and 50
0.210,0.221 (235.8, 247.3)
BF 500-3
0.07
0.08
0.09
<0.02
<0.02
<0.02
0.21
0.25
0.20
0.13
0.11
SE formulation
0.43 1 (483.1)
g/L epoaicorlazole
2
Total
4.11
0.42
1.07
<0.04
<0.04
<0.04
1.86
2.43
1.01
4.93
0.40
plant
ears
haulms
grain
straw
plant
ears
0
20
20
35
44
5 1 35
44
5 1
0
20
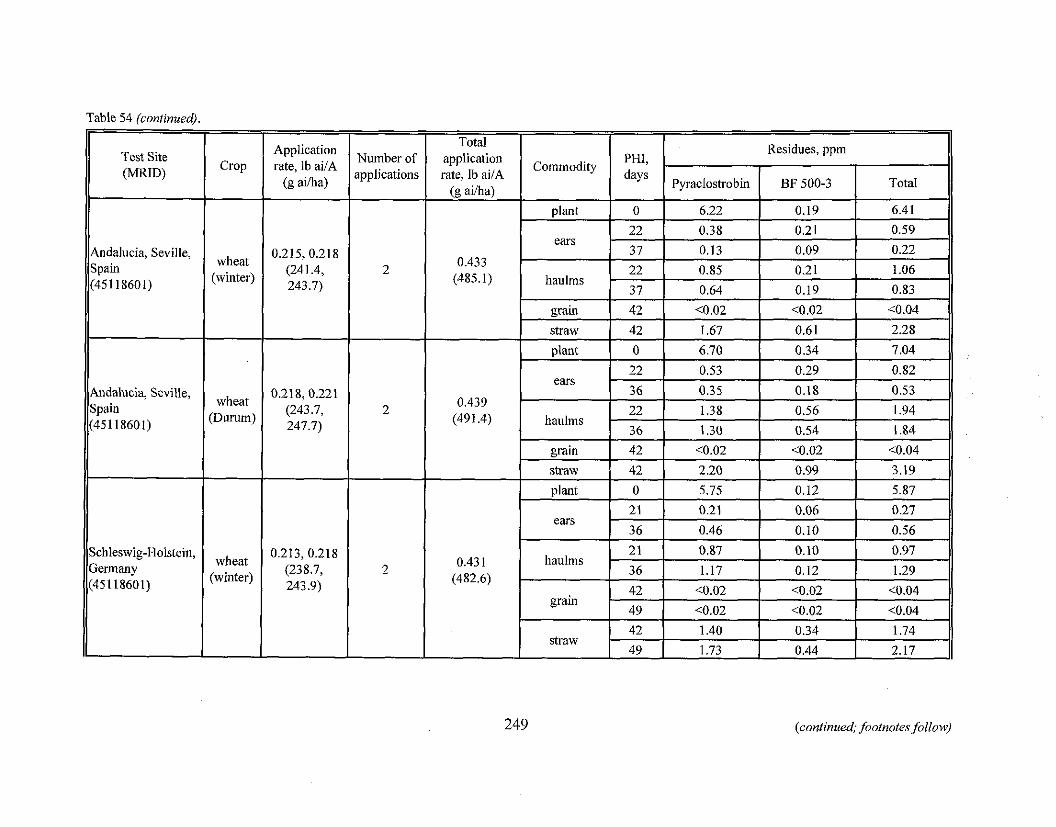
Table 54 (continued)
Andalucia, Seville,
Andalucia, Seville,
Schleswig-Holstein,
249 (continued; footnotes follow)
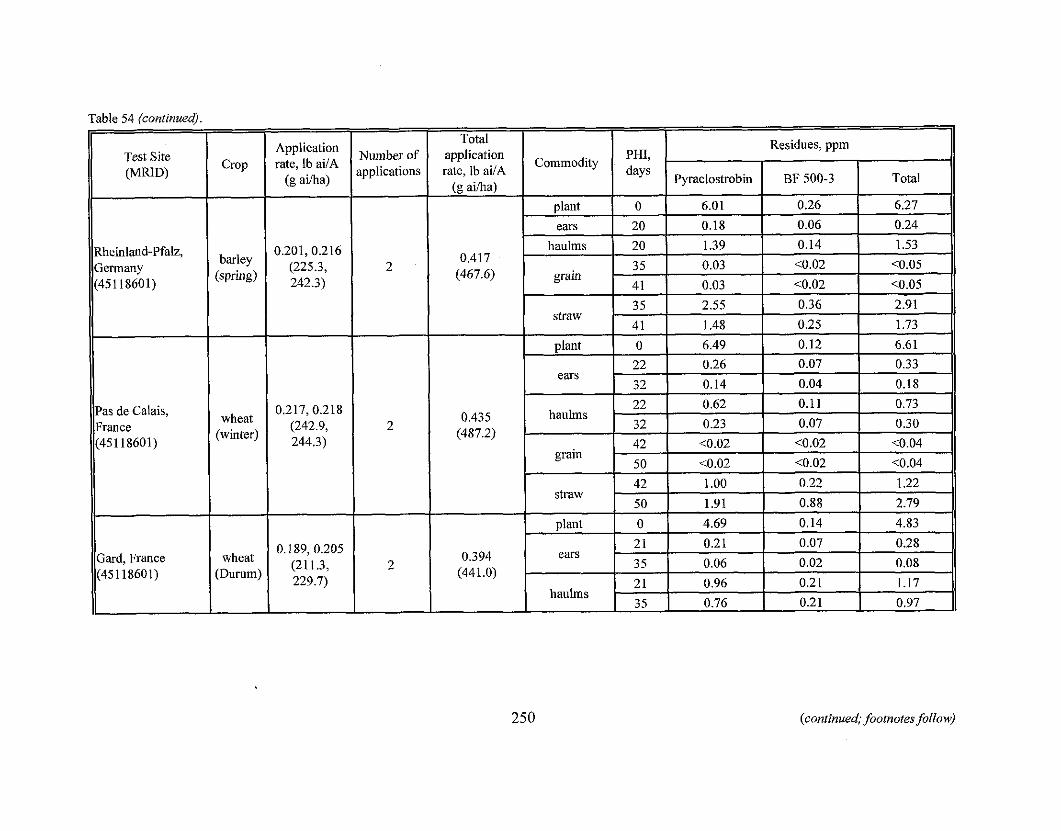
Table 54 (continud.
Test Site (MMD)
Rheinland-Pfalz, Germany (45118601)
Pas de Calais, France (451 18601)
Gad , France (45118601)
-
Crop
barley (spriw)
-
wheat (winter)
wheat (Durum)
Application rate, lb ailA (g ailha)
(continued; footnotes follow)
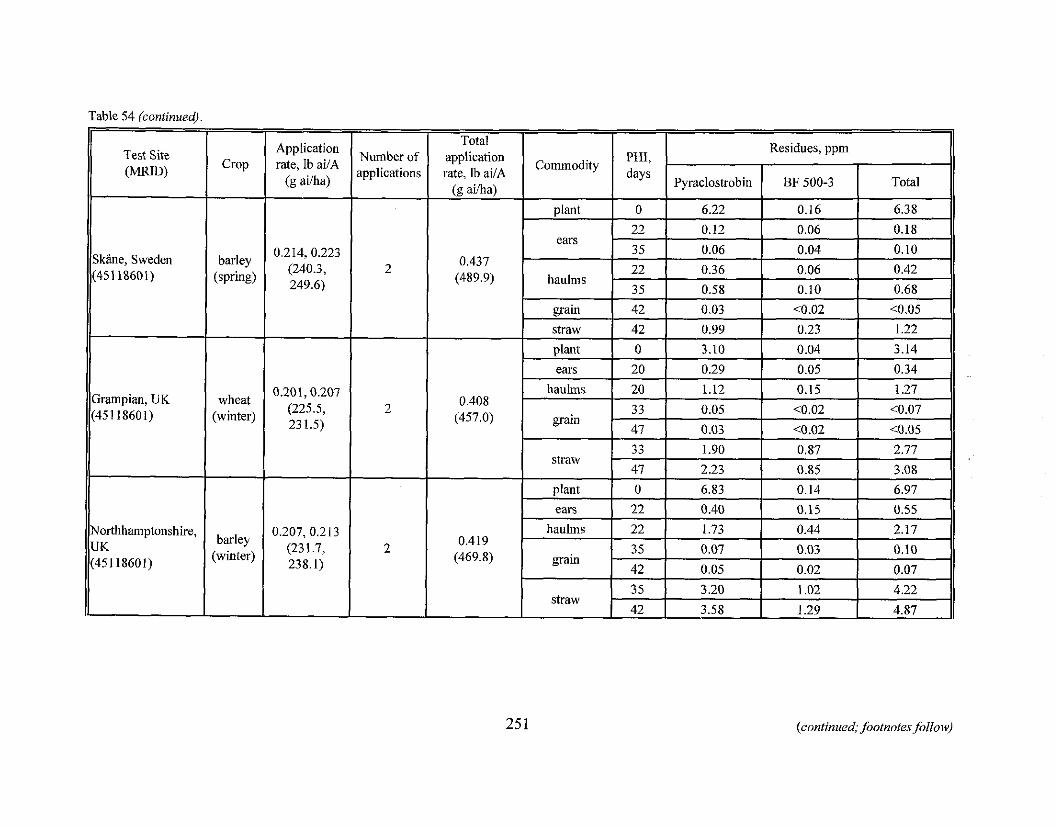
(continued; foolnotes follow)
Table 54 (continuedj.
Test Site (MRID)
Skhe, Sweden (451 18601)
Northhamptonshire,
Crop
barley (spring)
Application rate, lb ailA
(g ailha)
0.214, 0.223 (240.3, 249,6)
Number of applications
2
Total application rate, lb ailA
(g ailha)
0.437 (489.9)
Commodity
plant
ears -
haulms
PHI, days
0
22
35
22
35
Residues, ppm
Total
6.38
0.18
0.10 - 0.42
0.68
Pyraclostrobin
6.22
0.12
0.06
0.36
0.58
BF 500-3
0.16
0.06
0.04
0.06
0.10
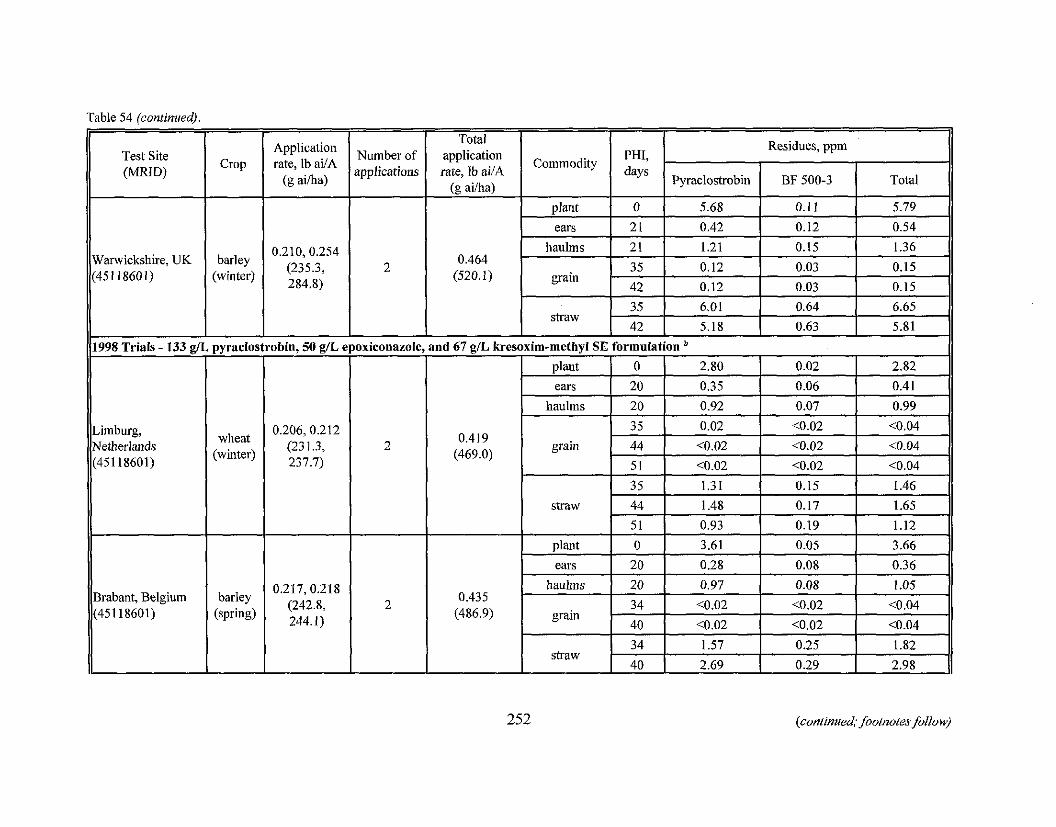
Table 54 (continued),
252 (continue& footnotes follow)
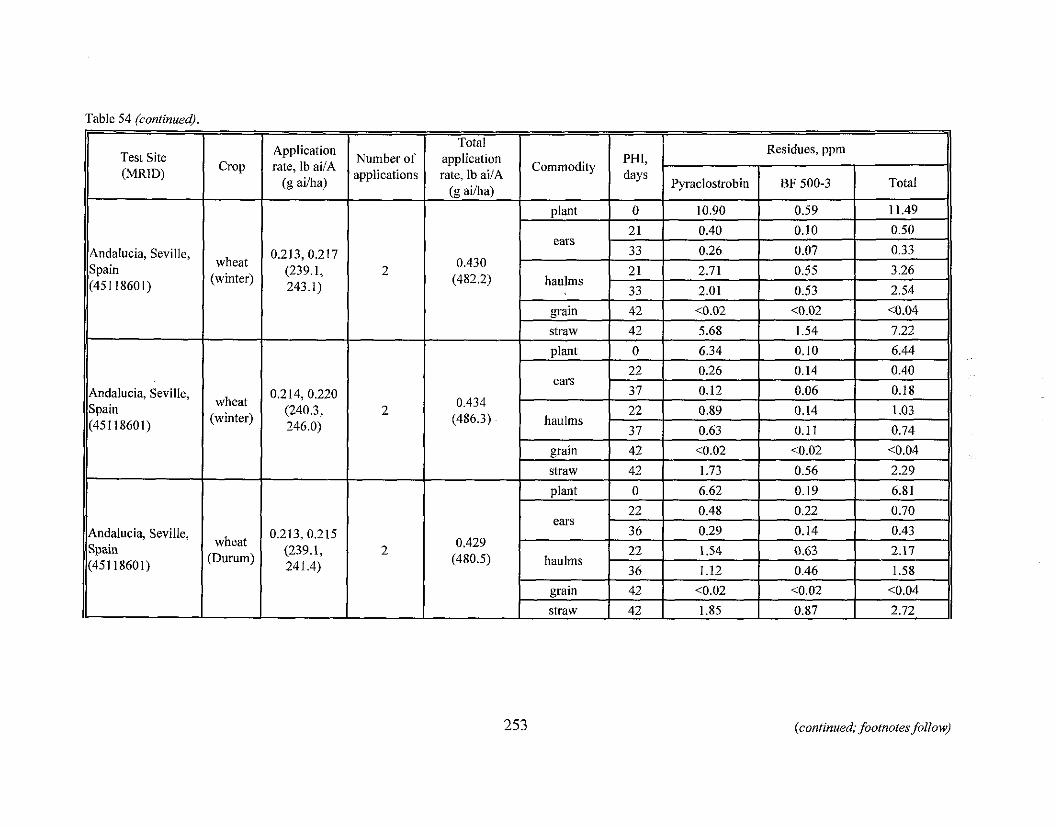
Table 54 (continuec$
(continued; footnotes follow)
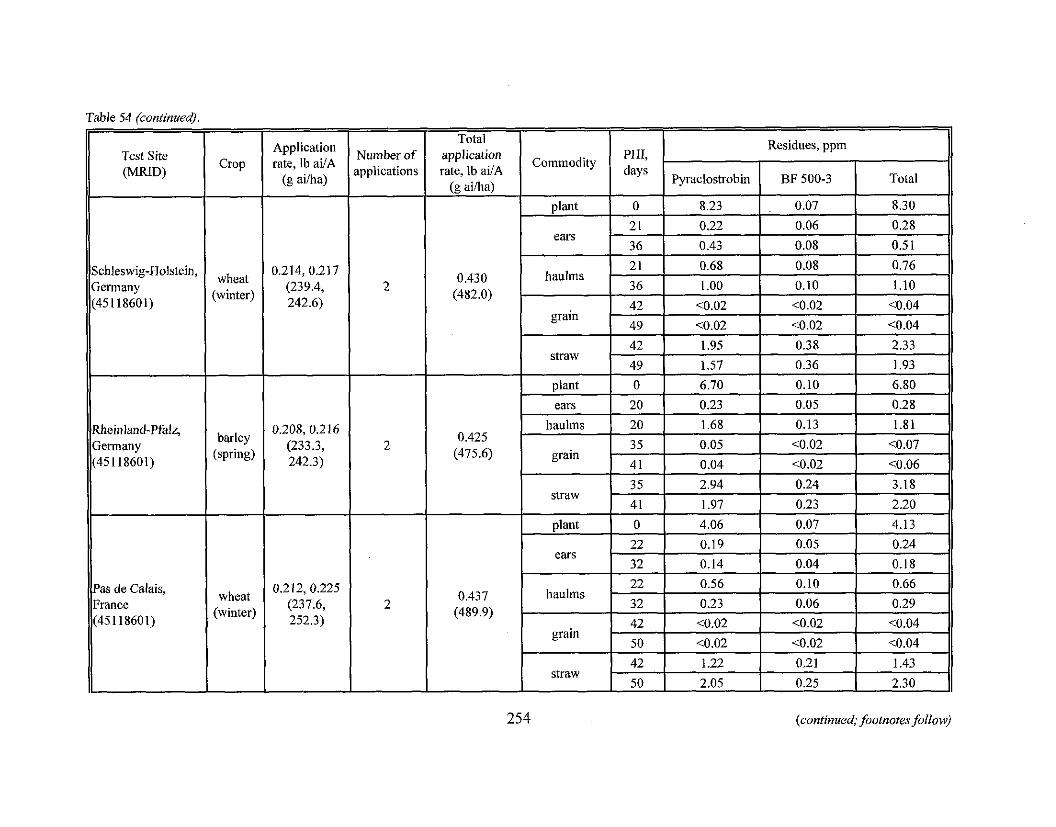
Table 54 (continueq.
Test Site (MRID)
Schleswig-Holstein, Germany (451 18601)
Rheinland-Pfalz, Gennany (45118601)
Pas de Calais, France (45118601)
-
Crop
wheat (winter)
-
barley (spring)
wheat (winter)
Application rate, lb ai/A
(g aiiha)
Vumber of pplications
254 (continued; footnotes follow)
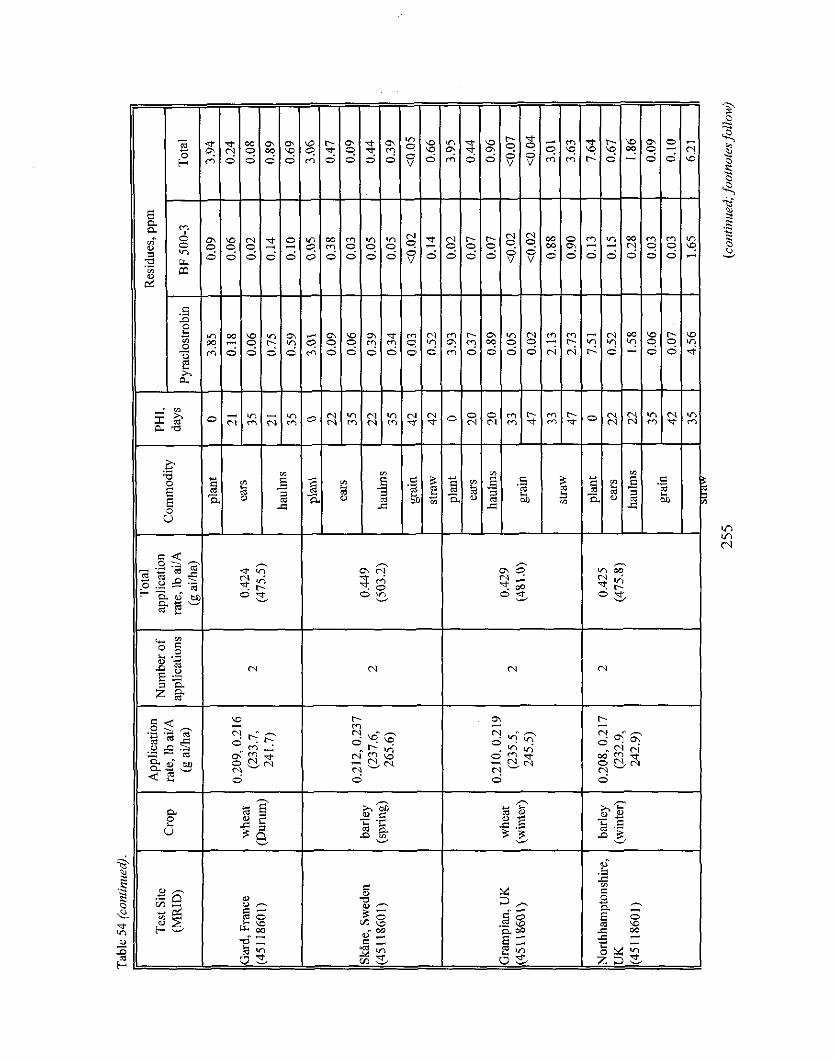
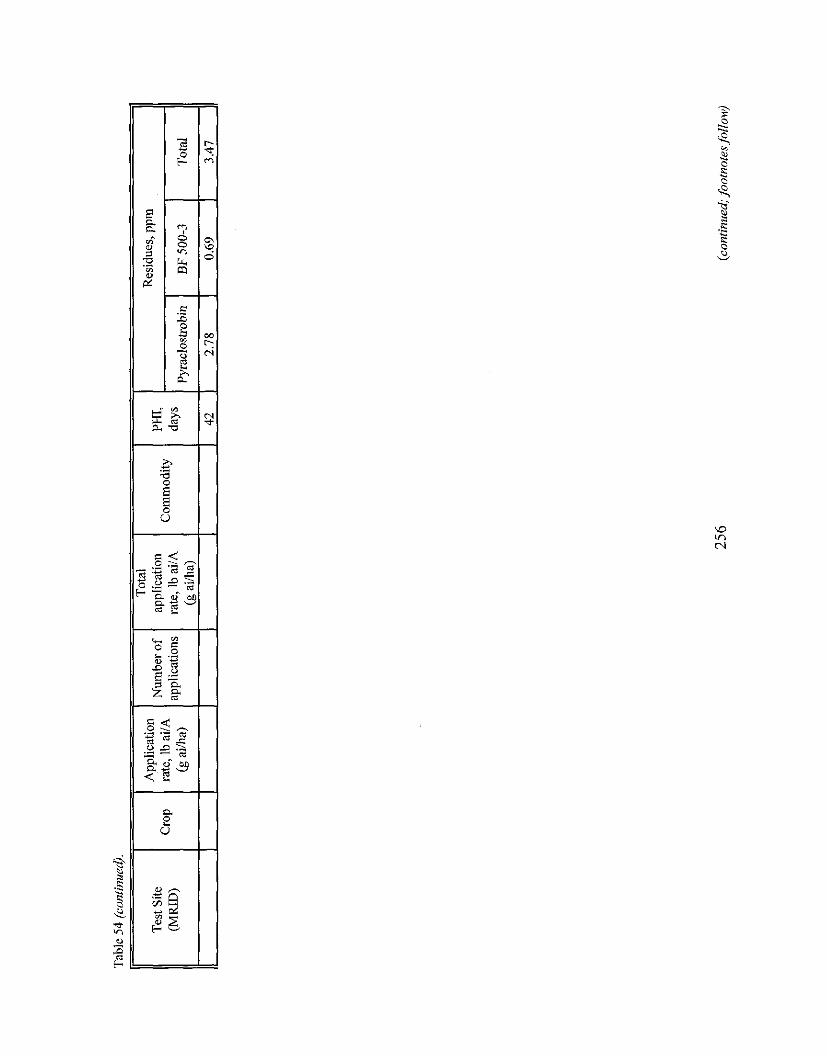
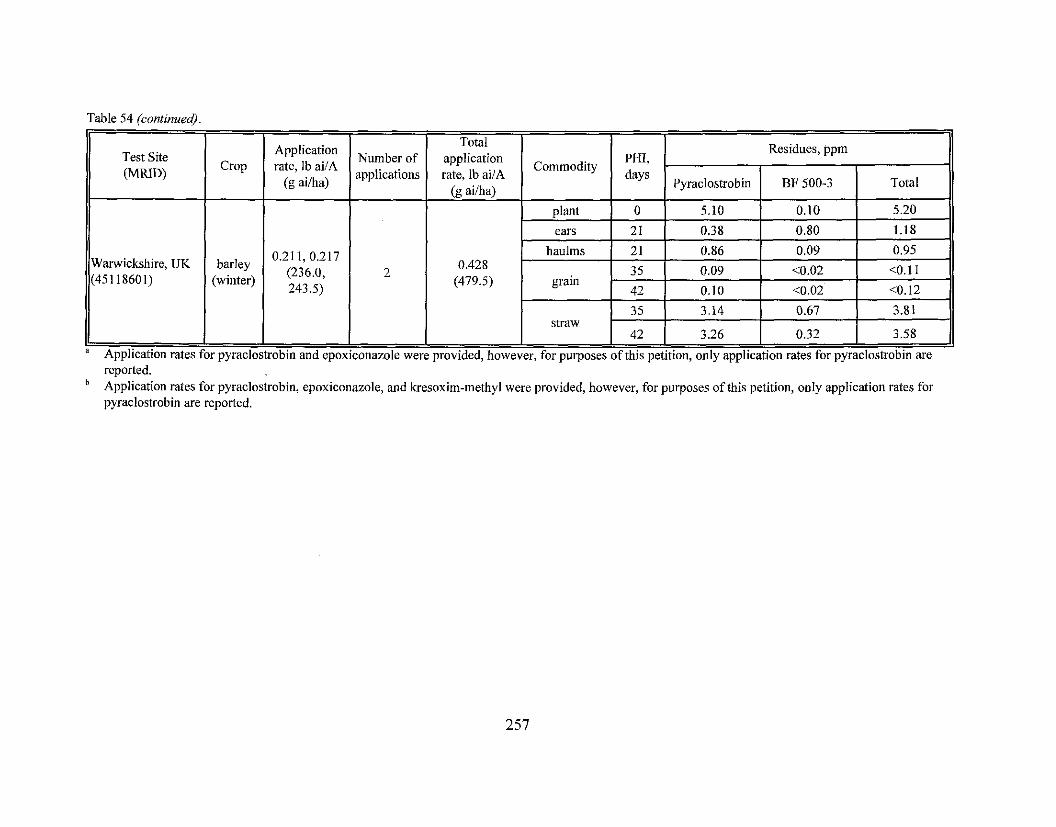
Table 54 (continuodl ~ -~ , - - 1 -
"pplication rates for pyraclostrobin and epoxiconazole were provided, however, for purposes of this petition, only application rates for pyraclostrobin are reported. Application rates for pyraclostrobin, epoxiconazole, and kresoxim-methyl were provided, however, for purposes of this petition, only application rates for pyraclostrobin are reported.
Study summarv:
The submitted European field trial data indicate that combined residues of pyraclostrobin and its metabolite BF 500-3 were <0.04 ppm to 0.15 ppm inton barley and wheat grain and 0.66-7.33 ppm inlon barley and wheat straw harvested 33-64 days following treatment according to one of the following application patterns: (i) pyraclostrobin (250 g/L) formulated as an EC formulation and applied to barley and wheat plants as two spray applications at 193.9-265.1 g aiihalapplication (0.17-0.24 lb ai1Aiapplication for a total rate of 0.37-0.45 lb ai/A); (ii) pyraclostrobin (I33 g L ) and epoxiconazole (50 giZ) formulated as an "SE" formulation and applied to barley and wheat plants as two spray applications at 21 1.3-284.8 g ai/ha/application (0.19-0.25 lb ailAiapplication for a total rate of 0.39-0.46 lb ai1A); or (iii) pyraclostrobin (133 g/L), epoxiconazole (50 gk) , and kresoxim-methyl(67 g/L) formulated as an " S E formulation and applied to barley and wheat plants as two spray applications at 231.3-265.6 g aiihalapplication (0.21-0.24 lb aiiAlapplication for a total rate of 0.42-0.45 lb aiIA).
Although small grain data from Europe are not required to support the subject petition, the submitted European field trial data are useful in demonstrating that combined residues of pyraclostrobin and BF 500-3 did not exceed the proposed U.S. tolerance levels of 0.2 ppm for wheat grain, 0.4 ppm for barley grain, 6.0 ppm for barley, and 8.5 ppm for wheat straw following treatment according to the use patterns utilized in the studies.
Grass Forage. Fodder. and Hay
Grass (Grown for Seed)
BASF Corporation submitted field trial data (citation listed below) for grass grown for seed to support the establishment of tolerances for residues of pyraclostrobin and BF 500-3 iidon grass (seed screenings) at 27 ppm, grass (straw) at 14 ppm, grass (forage) at 10 ppm, and grass @ay) at 4.5 ppm.
451 18527 Versoi, P.; Abdel-Baky, S.; Riley, M. (2000) Magnitude of BAS 500 F Residues in Cool Season Grasses Grown For Seed: Lab Project Number: 199915160: 59473. Unpublished study prepared by BASF Corporation. 94 p.
A total of 12 field trials were conducted during the 1999 growing season idon grass grown for seed; grass varieties included Kentucky bluegrass, bromegrass, chewing fescue, tall fescue, perennial ryegrass, timothy, and wheatgrass. Field trials were conducted in ID(1 trial), MN(2), MT(I), NE(2), OR(5), and WA(1). Grass seed screenings and straw were harvested 13-15 days and grass forage and hay were cut from regrowth 27-1 15 days following the last of two foliar applications of the 2.12 lb/gal EC formulation at 0.19-0.22 lb ailAiapplication, made at 13- to 15- day retreatment intervals. Total seasonal application rates were 0.39-0.42 lb ai1A (-lx the maximum proposed seasonal rate). Applications were made in 8.9-46.1 gallA using ground equipment with a non-silicone spray adjuvant added to the spray solution. In one trial (OR), additional grass seed screenings and straw samples were collected 4,8, 19, and 24 days
258
following treatment to evaluate residue decline. A separate plot at each trial site was left untreated to provide control samples.
Samples of treated and untreated grass forage, hay, straw, and seed screenings were collected from each test site. Grass straw and seed screening samples were collected 13-15 days after the last application. Grass forage and hay samples were collected 27-1 15 days after the last application, when the postharvest regrowth was approximately 2 to 5 inches in height. Hay samples were allowed to dry in the field for 2-7 days before collection. The moisture content in grass samples was determined to be 14-32% in straw, 25-81% in forage, and 18-68% in dried hay. All samples were transferred to freezers as soon as possible after collection and then shipped frozen to the BASF APC where they were analyzed for residues of pyraclostrobin and BF 500-3 using Method D9808. Apparent residues of pyraclostrobin and BF 500-3 were each less than the LOQ (<0.02 ppm) idon 12 samples each of untreated grass forage, hay, straw, and seed screenings. Residues of pyraclostrobin and BF 500-3 idon treated samples are presented in Table 55.
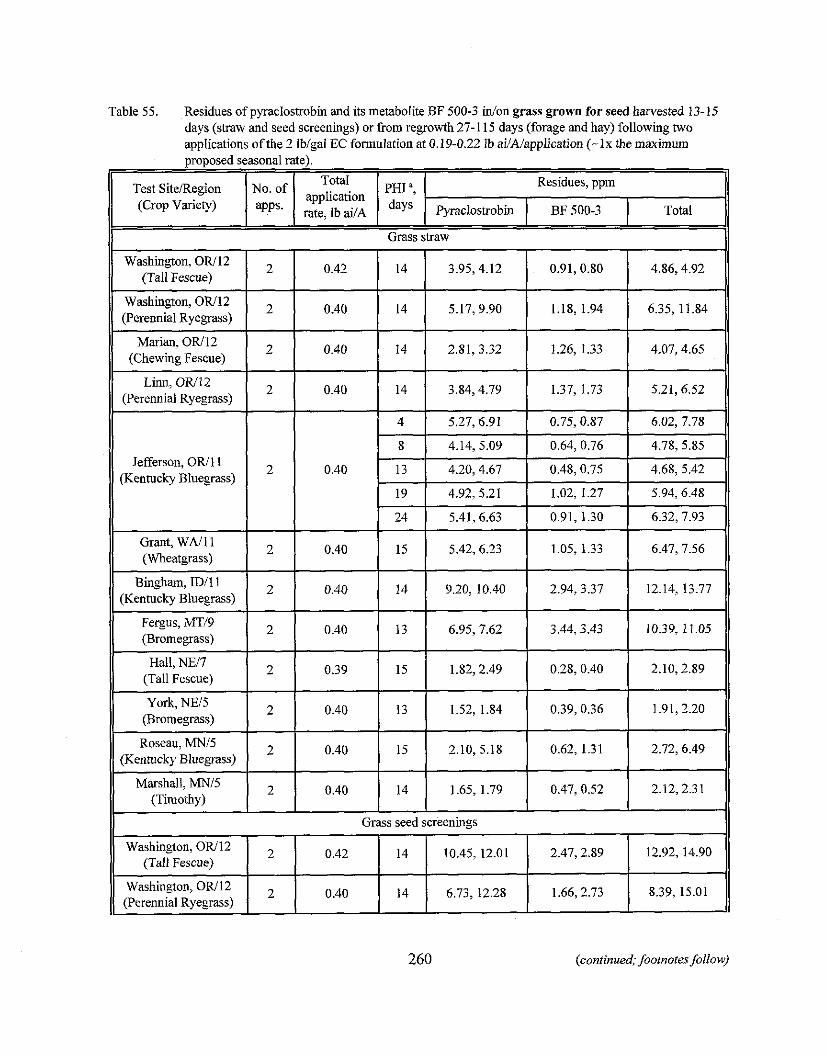
Table 55. Residues of pyraclostrobin and its metabolite BF 500-3 in/on grass grown for seed harvested 23-15 days (straw and seed screenings) or from regrowth 27-1 15 days (forage and hay) following two applications of the 2 lb/gal EC formulation at 0.19-0.22 lb ailNapplication (- Ix the maximum nronnsed seasonal rate).
Jefferson, OW1 1 (Kentucky Bluegrass)
r--r... ~~ ~ . - - ~ ~ ~ ~ , ~
260 (continued; footnotes follow)
Test SiteiRegion (Crop Variety)
Total application rate. Ib ai/A
No. of PHIa, days
Residues, ppm
Pyraclostrobin 1 BF 500-3 Total
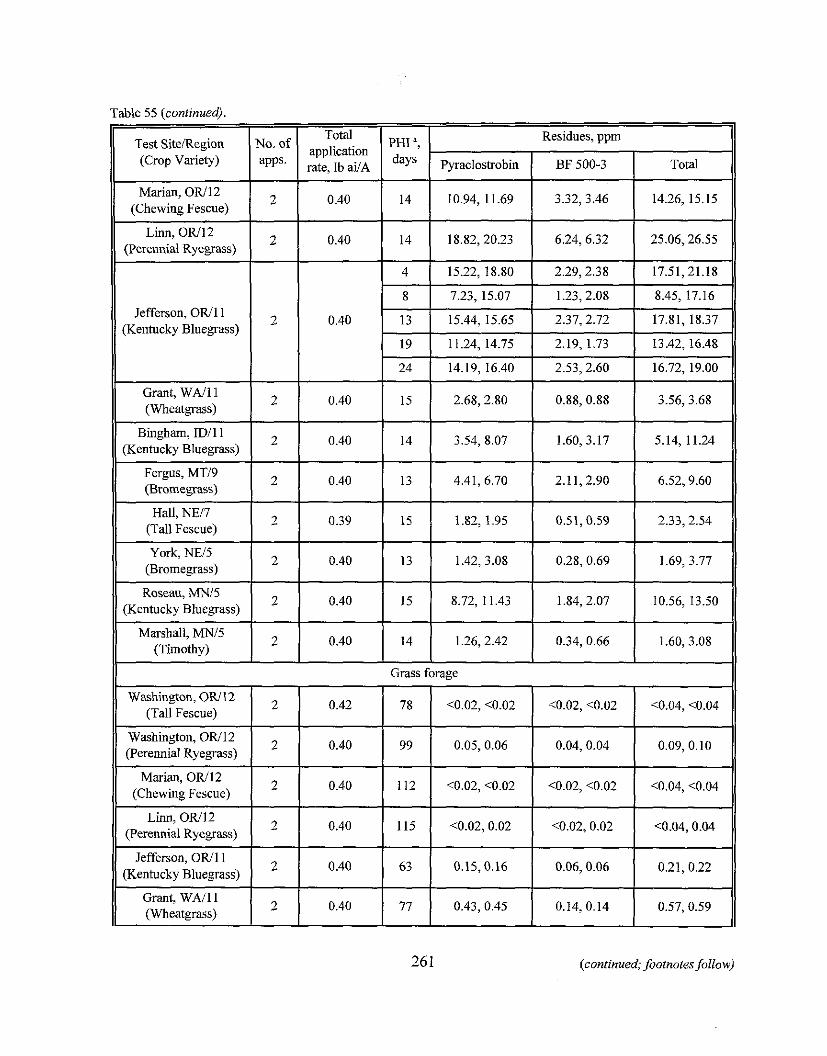
Table 55 (continued),
(Kentucky Bluegrass)
26 1 (continued; footnotes follow)
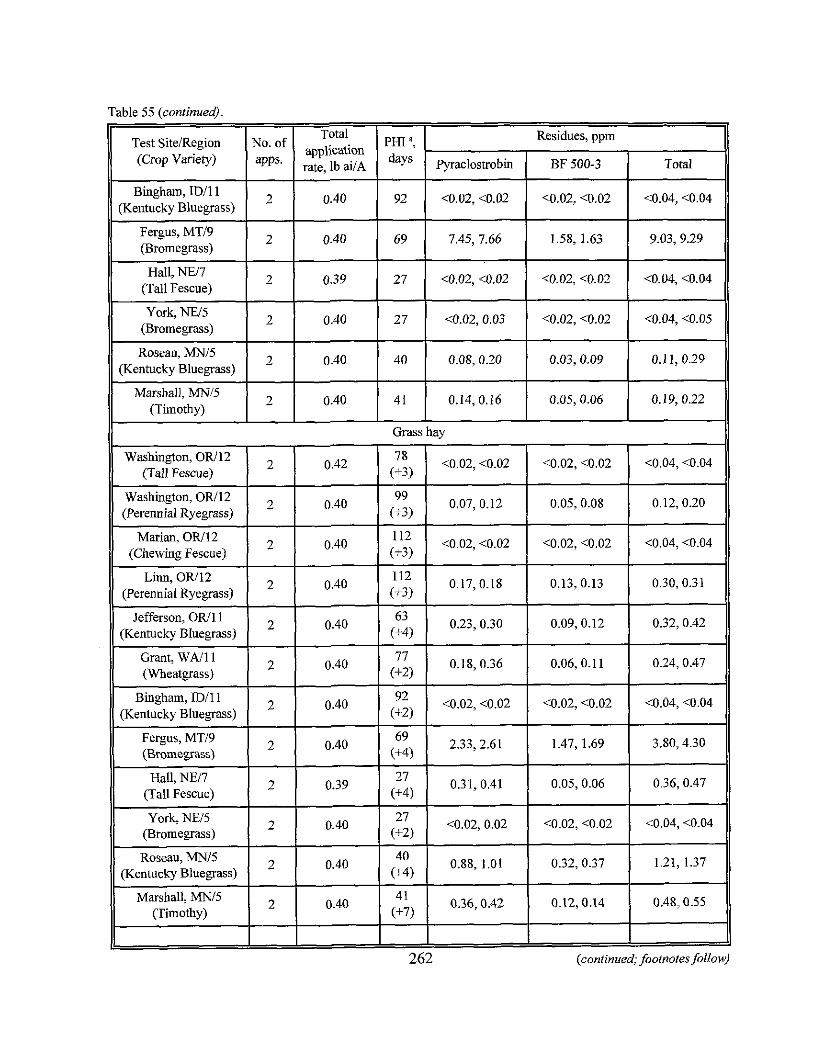
Table 55 (continued).
11 Grass hay
Roseau, MNl5 (Kentucky Bluegrass) -
Marshall, MN/5 (Timothy)
262 (continued; footnotes follow)
2
2
0.40
0.40
40
4 1
0.08,0.20
0.14,0.16
0.03,0.09
0.05,0.06
0.1 1,0.29
0.19,0.22
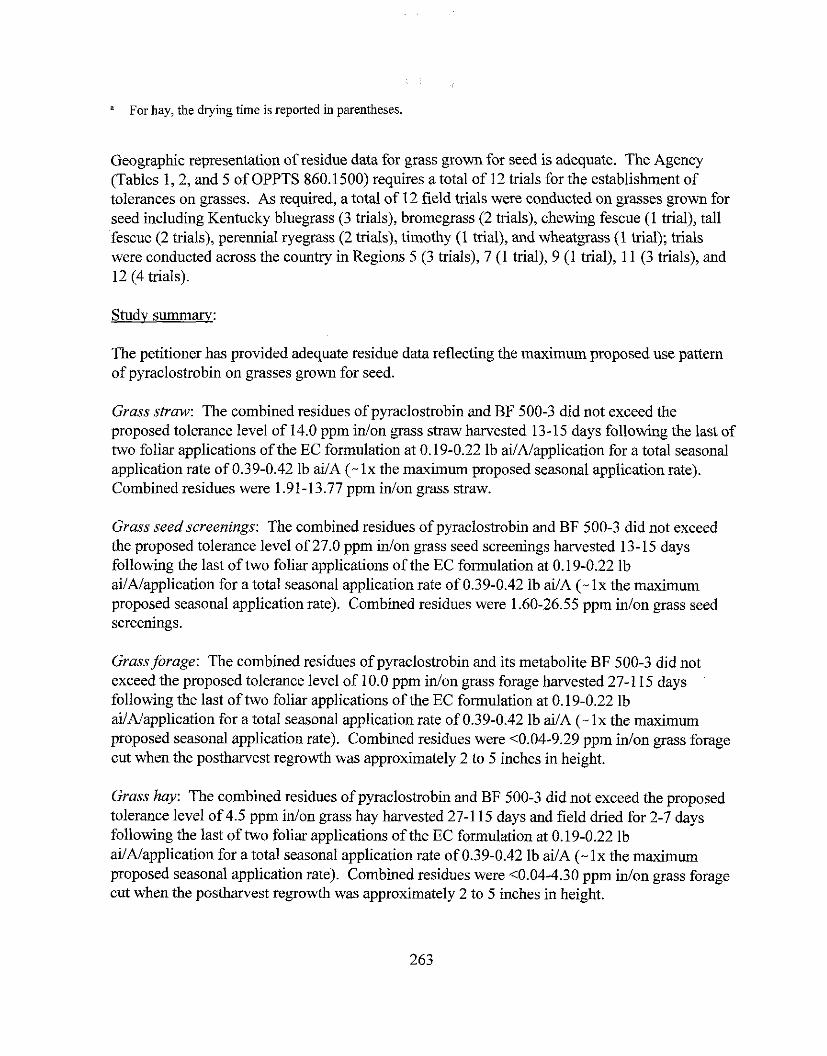
" For hay, the drying time is reported in parentheses.
Geographic representation of residue data for grass grown for seed is adequate. The Agency (Tables l ,2 , and 5 of OPPTS 860.1500) requires a total of 12 trials for the establishment of tolerances on grasses. As required, a total of 12 field trials were conducted on grasses grown for seed including Kentucky bluegrass (3 trials), bromegrass (2 trials), chewing fescue (1 trial), tall fescue (2 trials), perennial ryegrass (2 trials), timothy (1 trial), and wheatgrass (1 trial); trials were conducted across the country in Regions 5 (3 trials), 7 (1 trial), 9 (1 trial), 11 (3 trials), and 12 (4 trials).
The petitioner has provided adequate residue data reflecting the maximum proposed use pattern of pyraclostrobin on grasses grown for seed.
Grass straw: The combined residues of pyraclostrobin and BF 500-3 did not exceed the proposed tolerance level of 14.0 pprn idon grass straw harvested 13-15 days following the last of two foliar applications of the EC formulation at 0.19-0.22 lb ailNapplication for a total seasonal application rate of 0.39-0.42 lb ai/A (- lx the maximum proposed seasonal application rate). Combined residues were 1.91-13.77 pprn idon grass straw.
Grass seed screenings: The combined residues of pyraclostrobin and BF 500-3 did not exceed the proposed tolerance level of 27.0 pprn idon grass seed screenings harvested 13-15 days following the last of two foliar applications of the EC formulation at 0.19-0.22 lb ai1Napplication for a total seasonal application rate of 0.39-0.42 lb ailA (- l x the maximum proposed seasonal application rate). Combined residues were 1.60-26.55 pprn idon grass seed screenings.
Grass forage: The combined residues of pyraclostrobin and its metabolite BF 500-3 did not exceed the proposed tolerance level of 10.0 ppm inlon grass forage harvested 27-1 15 days following the last of two foliar applications of the EC formulation at 0.19-0.22 lb ai/A/application for a total seasonal application rate of 0.39-0.42 lb ai/A (- lx the maximum proposed seasonal application rate). Combined residues were <0.04-9.29 pprn idon grass forage cut when the postharvest regrowth was approximately 2 to 5 inches in height.
Grass hay: The combined residues of pyraclostrobin and BF 500-3 did not exceed the proposed tolerance level of 4.5 pprn idon grass hay harvested 27-1 15 days and field dried for 2-7 days following the last of two foliar applications of the EC formulation at 0.19-0.22 lb ai/A/application for a total seasonal application rate of 0.39-0.42 lb ailA (- lx the maximum proposed seasonal application rate). Combined residues were <0.04-4.30 ppm inlon grass forage cut when the postharvest regrowth was approximately 2 to 5 inches in height.
Based on the submitted data for grass forage and hay, a pregrazing and prehaying interval of 27 days must be added to the label for the 2 lblgal EC formulation.
The residue decline data for grass straw did not demonstrate any conclusive trends in decreasing residues at longer posttreatment intervals. Combined residues were 4.68-7.93 ppm idon grass straw and 8.45-21.18 ppm idon grass seed screenings over the various sampling intervals.
Miscellaneous Commodities
BASF Corporation submitted field trial data (citation listed below) for bananas to support the establishment of an import tolerance for residues of pyraclostrobin and BF 500-3 idon bananas at 0.04 ppm.
451 18532 Wofford, J.; Abdel-Baky, S.; Riley, M. (1999) Magnitude of BAS 500 F Residues in Bananas For Import Tolerance: Lab Project Number: 199915095: 98027. Unpublished study prepared by BASF Corporation. 74 p.
A total of 12 banana field trials were conducted during the 1998 and 1999 growing season in Colombia (2 trials), Costa Rica (3), Ecuador (3), Guatemala (I), Martinique (2), and Mexico (1). Mature whole bagged and unbagged bananas were harvested immediately (0-day PHI) following the last of eight foliar applications of a 250 g/L EC formulation at 0.08-0.13 lb aiiAiapplication (90.0-141.2 g ai/ha), made at 12- to 14-day retreatment intervals. Total seasonal application rates were 0.66-0.80 lb ailA (742.6-901.9 g aiiha; the petitioner stated that the maximum seasonal rate is 800 g ailha). Applications were made in 2.1-3.6 gal/A (19.6-34.3 L/ha) using ground equipment to simulate aerial application; a spreader sticker was added to the spray solution, except in the two trials in Martinique, where applications were made using spray oil as a carrier.
A single treated and untreated samples of whole bagged and unbagged mature bananas were collected from each test site and shipped at ambient temperature by air to the BASF APC for analysis. Samples arrived within 3-7 days of collection. Upon arrival samples were placed in cardboard boxes and frozen (<-lo C) until analysis. Samples were analyzed for residues of pyraclostrobin and BF 500-3 using Method D9808. Apparent residues of pyraclostrobin and BF 500-3 were each less than the LOQ (<0.02 ppm) idon 12 samples of untreated bananas. In treated banana samples, residues of pyraclostrobin and BF 500-3 were each less than the LOQ idon 12 samples each of unbagged and bagged bananas.
The geographic representation and number of field trials are adequate for the establishment of an import tolerance for bananas. A total of 12 banana field trials reflecting application at l x the stated maximum proposed seasonal application rate were conducted in Colombia (2), Costa Rica (3), Ecuador (3), Guatemala (I), Martinique (2), and Mexico (1). The current Agency guidance on import tolerances (65 FR 35069-35090,611100) requires that 12 banana field trials be conducted in Colombia (2), Costa Rica (3), Ecuador (3), Guatemala (I), Honduras (2) and
264
Mexico (1). No field trials were conducted in Honduras; however, the petitioner noted that the two trials conducted in Martinique would also satisfy European Import Tolerance requirements.
The petitioner has provided adequate residue data reflecting the stated maximum proposed use pattern for pyraclostrobin on imported bananas. The petitioner has indicated that the maximum seasonal rate is 800 g aika; however, specimen labels were not included to confirm the proposed use patterns for pyraclostrobin on imported bananas. A sufficient number of field trials, reflecting the stated maximum proposed use pattern, were conducted in the major banana- growing regions of Central and South America. The combined residues of pyraclostrobin and its metabolite BF 500-3 did not exceed the proposed tolerance of 0.04 ppm inlon imported bagged or unbagged bananas (whole fruit including peel) harvested immediately (0-day PHI) following the last of eight foliar applications of an EC formulation at 0.08-0.13 Ib aiiNapplication (90.0- 141.2 g ailha) for a total seasonal application rate of 0.66-0.80 lb ai/A (742.6-901.9 g aiiha; - lx the stated proposed maximum seasonal rate). The combined residues were <0.04 ppm inlon all samples of bagged and unbagged bananas.
BASF Corporation submitted grape field trial data (citations listed below) to support the establishment of a tolerance for residues of pyraclostrobin and BF 500-3 inlon grapes at 2.0 ppm.
451 18529 Wofford, J.; Abdel-Baky, S.; Riley, M. (1999) Magnitude of BAS 500 F Residues in Grapes, 1997 Field Trials: Lab Project Number: 97044: 199915010. Unpublished study prepared by BASF Corporation. 67 p.
451 18530 Haughey, D.; Abdel-Baky, S.; Riley, M. (2000) The Magnitude of BAS 500 F Residues in Grapes: Lab Project Number: 46649: 199915153. Unpublished study prepared by BASF Corporation. 66 p.
451 1853 1 Wofford, J.; Riley, M. (1999) Magnitude of BAS 500 F Residues in Grapes, 1998 Field Trials: Lab Project Number: 98025: 199915092, Unpublished study prepared by BASF Corporation. 69 p.
We note that only the specimen label for the 20% WDG formulation lists proposed use on grapes; however, 1997 and 1998 grape field trials were conducted using the 2 Iblgal EC formulation at lx the maximum proposed use rate, and 1999 grape field trials were conducted using the 20% WDG formulation at 0 . 6 ~ the maximum proposed use rate.
A total of 13 field trials were conducted on grapes. Six grape field trials (MRID 451 18529) were conducted during the 1997 growing season in CA(4), NY(l), and OR(1), and seven grape field trials (MRID 451 1853 1) were conducted during the 1998 growing season in CA(4), NY(I), OR(l), and WA(1). Samples of grapes were harvested 14 days following the last of six
265
broadcast foliar applications of the 2 lbigal EC forrndation at 0.15-0.16 lb ai/A/application, made at 6- to 15-day retreatment intenrals. The total seasonal application rates were 0.90-0.91 lb ailA (- l x the maximum proposed seasonal application rate). Two separate plots at each site were treated using concentrated (-50 gaVA) or dilute (-250 gal/A) spray volumes. Applications were made in either 45.2-53.4 gallA (concentrate spray volume) or 234.7-294.0 gallA (dilute spray volume) using ground equipment with a spreader sticker added to the spray mixture. In two trials (one 1997 and 1998 CA), additional grape samples were collected at 0,7,21, and 28 (1998 only) days following treatment to evaluate residue decline. A separate plot at each trial site was left untreated to provide control samples.
In a third stndy (MRID 451 18530), twelve grape field trials were conducted during the 1999 growing season in CA(8), NY(2), and WA(2). Samples of grapes were harvested 14 days following the last of three broadcast foliar applications of the 20% WDG formulation at 0.18- 0.19 lb ailA/application at 13- to 14-day retreatment intervals. The total seasonal application rates were 0.53-0.55 lb ailA ( -0 .6~ the maximum proposed seasonal application rate). Applications were made in either 50.2-78.8 gal/A (concenGate spray volume) or 100.3-159 gal/A (dilute spray volume) using ground equipment with a non-silicone spray adjuvant added to the spray mixture. In one trial (CA), additional grape samples were collected at 0,7,21, and 28 days following treatment to evaluate residue decline. A separate plot at each trial site was left untreated to provide control samples.
For the 199711 998 EC trials, a single untreated sample and a single treated sample from each treatment group (concentrate spray volume and dilute spray volume) of mature grapes were collected from each test site and placed in coolers with blue ice, then transferred to freezers. For the 1999 WDG trials, a single untreated sample and duplicate treated samples of mature grapes were collected from each test site and were frozen. All samples were shipped frozen to the
A >
BASF APC where they were analyzed for residues of pyraclostrobin and BF 500-3 using Method D9808. Apparent residues of pyraclostrobin and BF 500-3 were each less than the LOQ (<0.02 ppm) inlon 16 samples of untreated grapes from the 199711998 EC trials, and idon 12 samples of untreated grapes from the 1999 WDG trials. Residues of pyraclostrobin and BF 500-3 inlon treated samples are presented in Table 56.
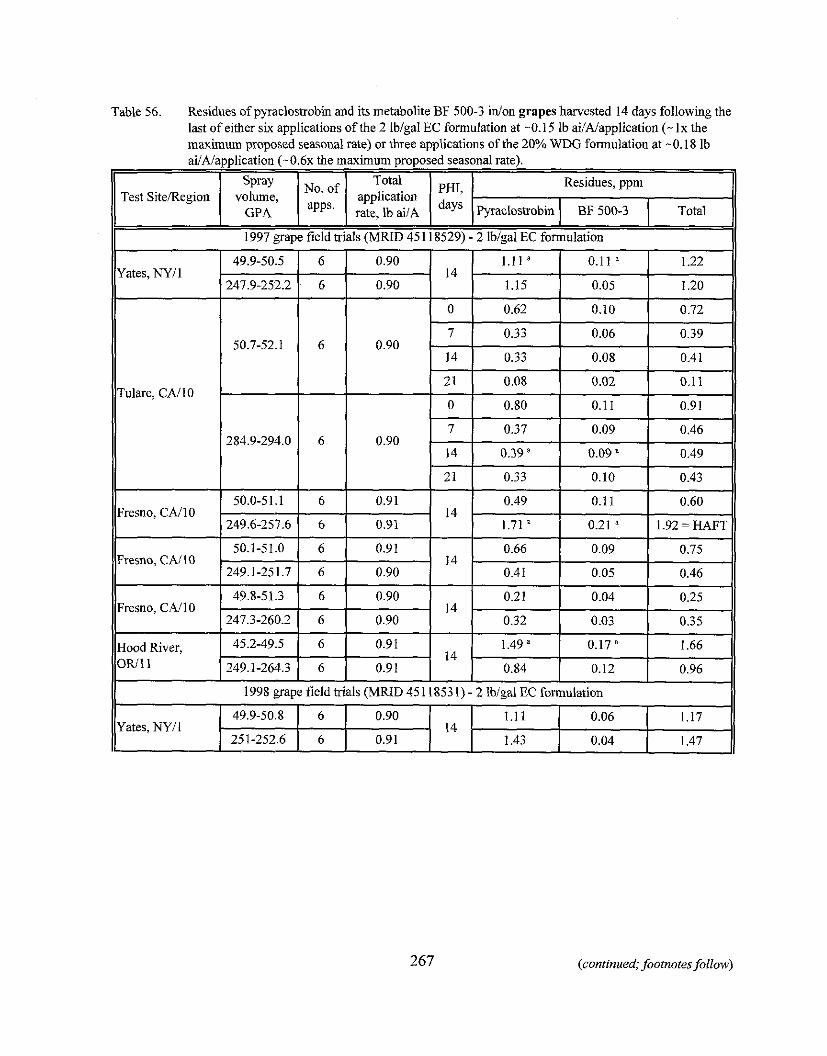
(continued; footnotes follow)
Table 56. Residues of pyraclostrobm and its metabolite BF 500-3 inion grapes harvested 14 days following the last of either six applications of the 2 lblgal EC formulation at -0.15 lb ai/A/application (- lx the maximum proposed seasonal rate) or three applications of the 20% WDG formulation at -0.18 lb ai/Alapplication ( - 0 . 6 ~ the maximum proposed seasonal rate).
Test SiteIRegion
1997 grape field trials (MRID 45 118529) - 2 lblgal EC formulation
No. of apPs
Spray volume,
GPA
Total application rate, ib ai/A
PHI, days
Residues, ppm
Fyraclostrobin 1 BP 500-3 I Total
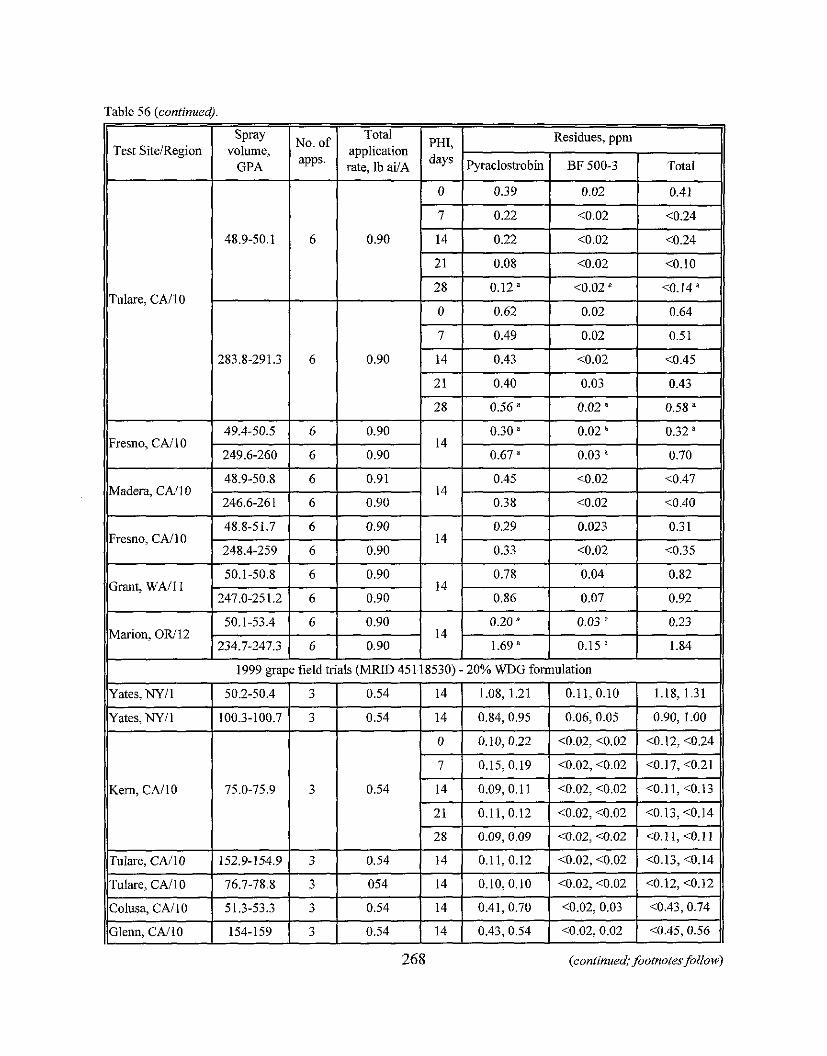
Table 56 (continued)
268 (continued;footnotes follow)
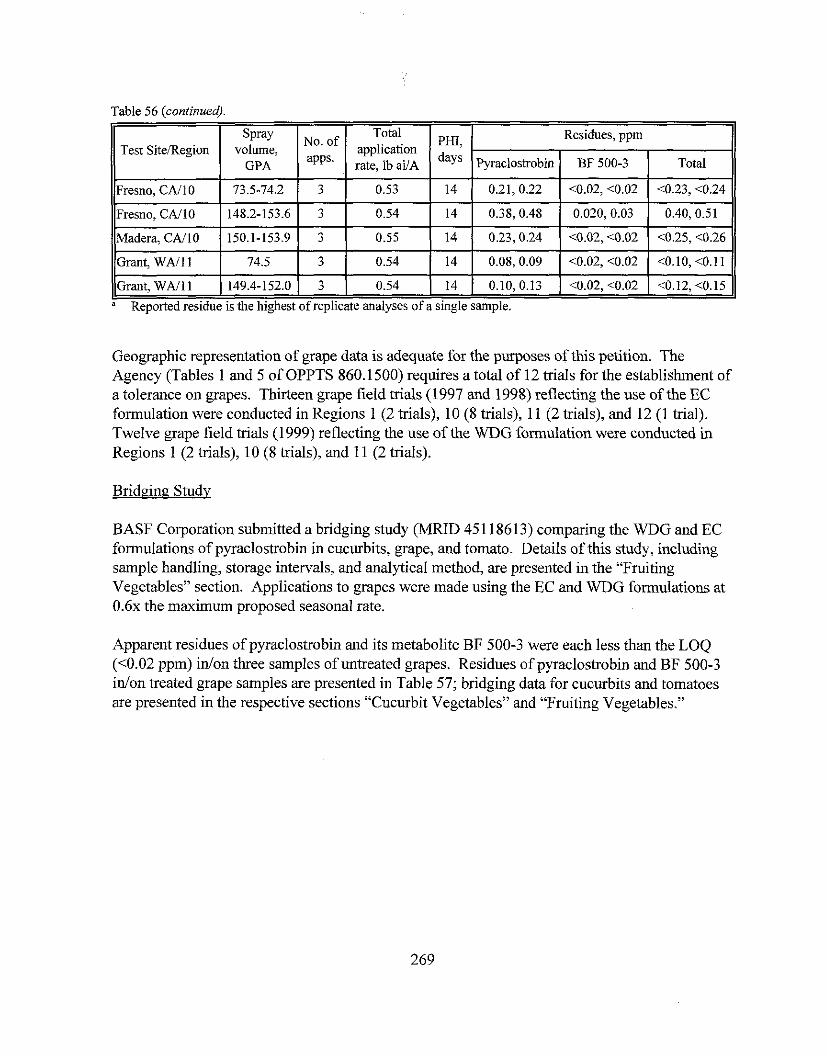
Table 56 (continued).
"eported residue is the highest of replicate analyses of a single sample.
Geographic representation of grape data is adequate for the purposes of this petition. The Agency (Tables 1 and 5 of OPPTS 860.1500) requires a total of 12 trials for the establishment of a tolerance on grapes. Thirteen grape field trials (1997 and 1998) reflecting the use of the EC formulation were conducted in Regions 1 (2 trials), 10 (8 trials), 11 (2 trials), and 12 (1 trial). Twelve grape field trials (1 999) reflecting the use of the WDG formulation were conducted in Regions 1 (2 trials), 10 (8 trials), and 11 (2 trials).
Bridging Studv
BASF Corporation submitted a bridging study (MRID 451 18613) comparing the WDG and EC formulations of pyraclostrobin in cucurbits, grape, and tomato. Details of this study, including sample handling, storage intervals, and analytical method, are presented in the "Fruiting Vegetables" section. Applications to grapes were made using the EC and WDG formulations at 0 . 6 ~ the maximum proposed seasonal rate.
Apparent residues of pyraclostrobin and its metabolite BF 500-3 were each less than the LOQ (10.02 ppm) inlon three samples of untreated grapes. Residues of pyraclostrobin and BF 500-3 idon treated grape samples are presented in Table 57; bridging data for cucurbits and tomatoes are presented in the respective sections "Cucurbit Vegetables" and "Fruiting Vegetables."
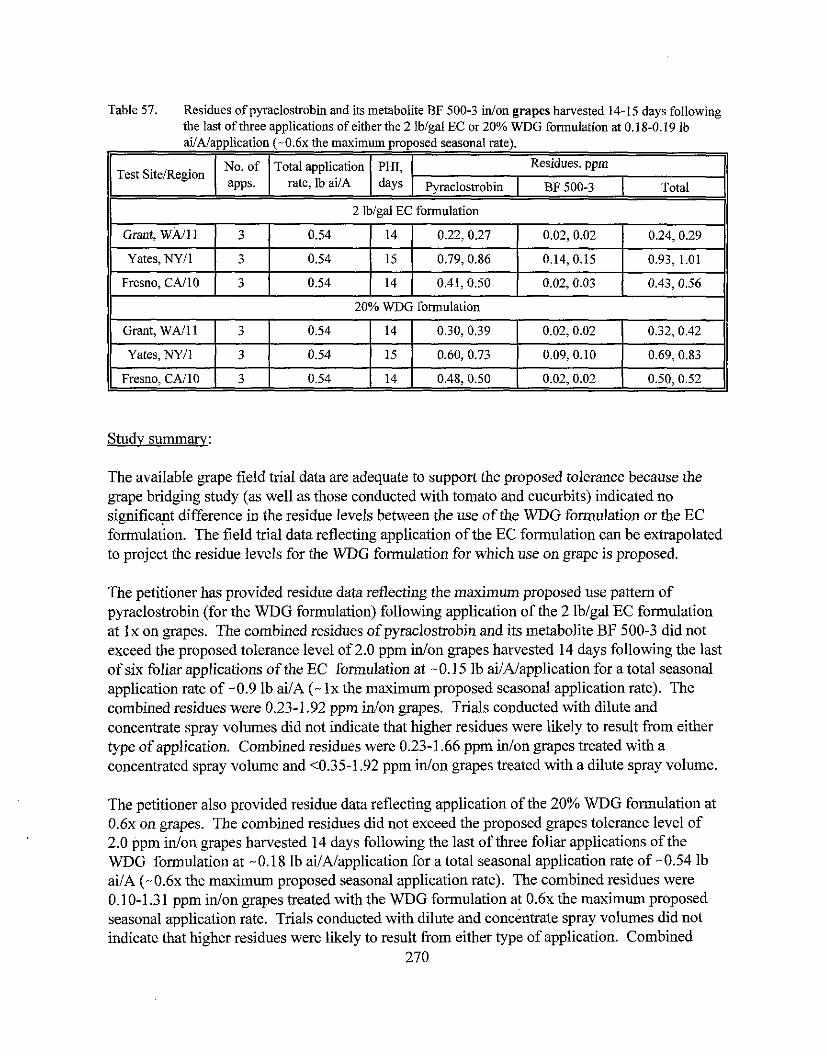
Table 57. Residues of pyraclostrobin and its metabolite BF 500-3 idon grapes harvested 14-15 days following the last ofthree applications of either the 2 lbigal EC or 20% WDG formulation at 0.18-0.19 ib
11 2 Iblgal EC formulation 11
ailAlapplication (-0.6~ the maximum proposed seasonal rate).
Test SiteRegion
Study summary:
No. of apps.
Grant, WNI I
Yates, NYIl - Fresno, CN10
Grant, WAI11
Yates, NYII
Fresno, CAI10 -
The available grape field trial data are adequate to support the proposed tolerance because the grape bridging study (as well as those conducted with tomato and cucurbits) indicated no significant difference in the residue levels between the use of the WDG formulation or the EC formulaion. The field trial data reflecting application of the EC formulation can be extrapolated to project the residue levels for the WDG formulation for which use on grape is proposed.
20% WDG formulation
3
3
3
0.54
0.54
0.54
The petitioner has provided residue data reflecting the maximum proposed use pattern of pyraclostrobin (for the WDG formulation) following application of the 2 lblgal EC formulation at lx on grapes. The combined residues of pyraclostrobin and its metabolite BF 500-3 did not exceed the proposed tolerance level of 2.0 ppm idon grapes harvested 14 days following the last of six foliar applications of the EC formulation at -0.15 ib ailMapplication for a total seasonal application rate of -0.9 lb aiiA (- Ix the maximum proposed seasonal application rate). The combined residues were 0.23-1.92 ppm idon grapes. Trials conducted with dilute and concentrate spray volumes did not indicate that higher residues were likely to result from either type of application. Combined residues were 0.23-1.66 ppm idon grapes treated with a concentrated spray volume and <0.35-1.92 ppm idon grapes treated with a dilute spray volume.
Total application rate, ib ailA
3
3
3
The petitioner also provided residue data reflecting application of the 20% WDG formulation at 0 . 6 ~ on grapes. The combined residues did not exceed the proposed grapes tolerance level of 2.0 ppm idon grapes harvested 14 days following the last of three foliar applications of the WDG formulation at -0.18 lb aiiAlapplication for a total seasonal application rate of -0.54 lb ai/A ( -0 .6~ the maximum proposed seasonal application rate). The combined residues were 0.10-1.3 1 ppm idon grapes treated with the WDG formulation at 0 . 6 ~ the maximum proposed seasonal application rate. Trials conducted with dilute and concentrate spray volumes did not indicate that higher residues were likely to result from either type of application. Combined
270
14
15
14
PHI, days
0.54
0.54
0.54
0.22.0.27
0.79,0.86
0.41, 0.50
Residues, ppm
14
15
14
pyraclostrobin I BF 500-3
0.02,0.02
0.14, 0.15
0.02,0.03
Total
0.24,0.29
0.93, 1.01
0.43,0.56
0.30,0.39
0.60, 0.73
0.48,O.SO
0.02,0.02
0.09,O.lO
0.02,0.02
0.32, 0.42
0.69, 0.83
0.50, 0.52
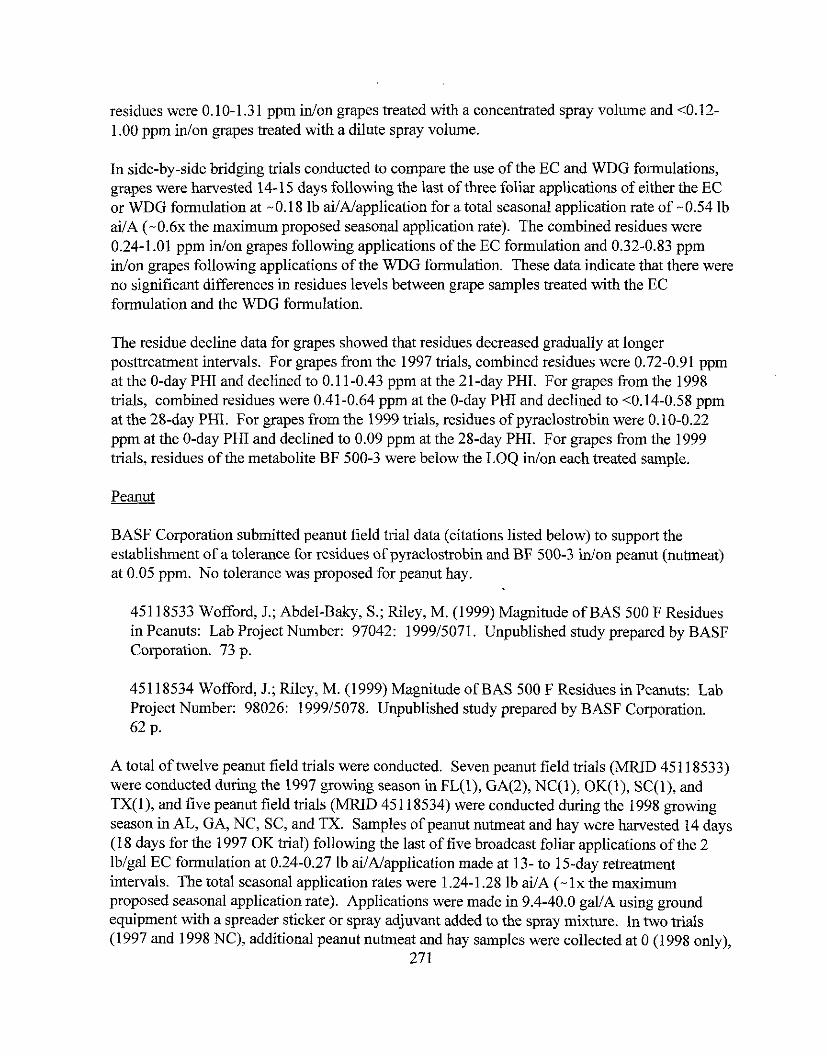
residues were 0.10-1.3 1 ppm idon grapes treated with a concentrated spray volume and <0.12- 1.00 ppm idon grapes treated with a dilute spray volume.
In side-by-side bridging trials conducted to compare the use of the EC and WDG formulations, grapes were harvested 14-1 5 days following the last of three foliar applications of either the EC or WDG formulation at -0.18 lb ailNapplication for a total seasonal application rate of -0.54 lb ailA ( - 0 . 6 ~ the maximum proposed seasonal application rate). The combined residues were 0.24-1.01 ppm idon grapes following applications of the EC formulation and 0.32-0.83 ppm idon grapes following applications of the WDG formulation. These data indicate that there were no significant differences in residues levels between grape samples treated with the EC formulation and the WDG formulation.
The residue decline data for grapes showed that residues decreased gradually at longer posttreatment intervals. For grapes from the 1997 trials, combined residues were 0.72-0.91 ppm at the O-day PHI and declined to 0.1 1-0.43 ppm at the 21 -day PHI. For grapes from the 1998 trials, combined residues were 0.41-0.64 ppm at the O-day PHI and declined to 10.14-0.58 ppm at the 28-day PHI. For grapes from the 1999 trials, residues of pyraclostrobin were 0.10-0.22 ppm at the O-day PHI and declined to 0.09 ppm at the 28-day PHI. For grapes from the 1999 trials, residues of the metabolite BF 500-3 were below the LOQ idon each treated sample.
BASF Corporation submitted peanut field trial data (citations listed below) to support the establishment of a tolerance for residues of pyraclostrobin and BF 500-3 idon peanut (nutmeat) at 0.05 ppm. No tolerance was proposed for peanut hay.
451 18533 Wofford, J.; Abdel-Baky, S.; Riley, M. (1999) Magnitude of BAS 500 F Residues in Peanuts: Lab Project Number: 97042: 199915071. Unpublished study prepared by BASF Corporation. 73 p.
451 18534 Wofford, J.; Riley, M. (1999) Magnitude of BAS 500 F Residues in Peanuts: Lab Project Number: 98026: 199915078, Unpublished study prepared by BASF Corporation. 62 p.
A total of twelve peanut field trials were conducted. Seven peanut field trials (MRID 451 18533) were conducted during the 1997 growing season in FL(l), GA(2), NC(l), OK(l), SC(l), and TX(l), and five peanut field trials (MRID 451 18534) were conducted during the 1998 growing season in AL, GA, NC, SC, and TX. Samples of peanut nutmeat and hay were harvested 14 days (1 8 days for the 1997 OK trial) following the last of five broadcast foliar applications of the 2 lblgal EC formulation at 0.24-0.27 lb ailNapplication made at 13- to 15-day retreatment intervals. The total seasonal application rates were 1.24-1.28 lb ai/A (- l x the maximum proposed seasonal application rate). Applications were made in 9.4-40.0 gallA using ground equipment with a spreader sticker or spray adjuvant added to the spray mixture. In two trials (1 997 and 1998 NC), additional peanut nutmeat and hay samples were collected at 0 (1 998 only),
271
7,21, and 28 days following treatment to evaluate residue decline. A separate plot at each trial site was left untreated to provide control samples.
A single untreated sample and duplicate treated samples of mature peanut nutrneat and hay were collected from each test site and were either placed in coolers with blue ice and transferred to freezers (within 2.5 hours) or placed directly in transport freezers and then storage freezers. All samples were shipped frozen to the BASF APC for analysis. The moisture content in 1998 peanut hay samples was determined to be 22.5-45.2%; the petitioner did not indicate if the moisture content in peanut hay samples was determined for the 1997 trials. Samples were analyzed for residues of pyraclostrobin and BF 500-3 using Method D9808. Apparent residues of pyraclostrobin and BF 500-3 were each less than the LOQ (10.02 ppm) inlon fifteen samples each of untreated peanut nutmeat and hay. Residues of pyraclostrobin and BF 500-3 inlon treated samples are presented in Table 58.
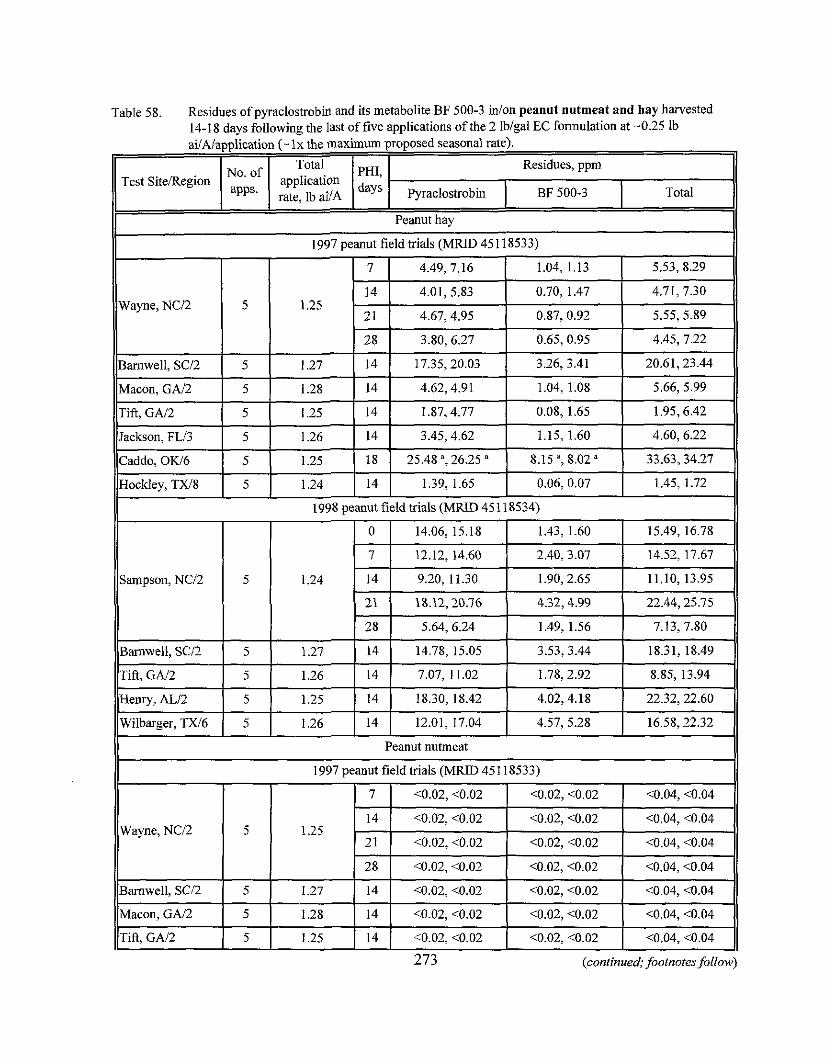
Table 58. Residues ofpyraclostrobin and its metabolite BF 500-3 inlon peanut nutmeat and hay harvested 14-18 davs followine the last of five applications of the 2 lblgal EC formulation at -0.25 lb
Peanut nutmeat 11
273 (continued; footnotes follow)
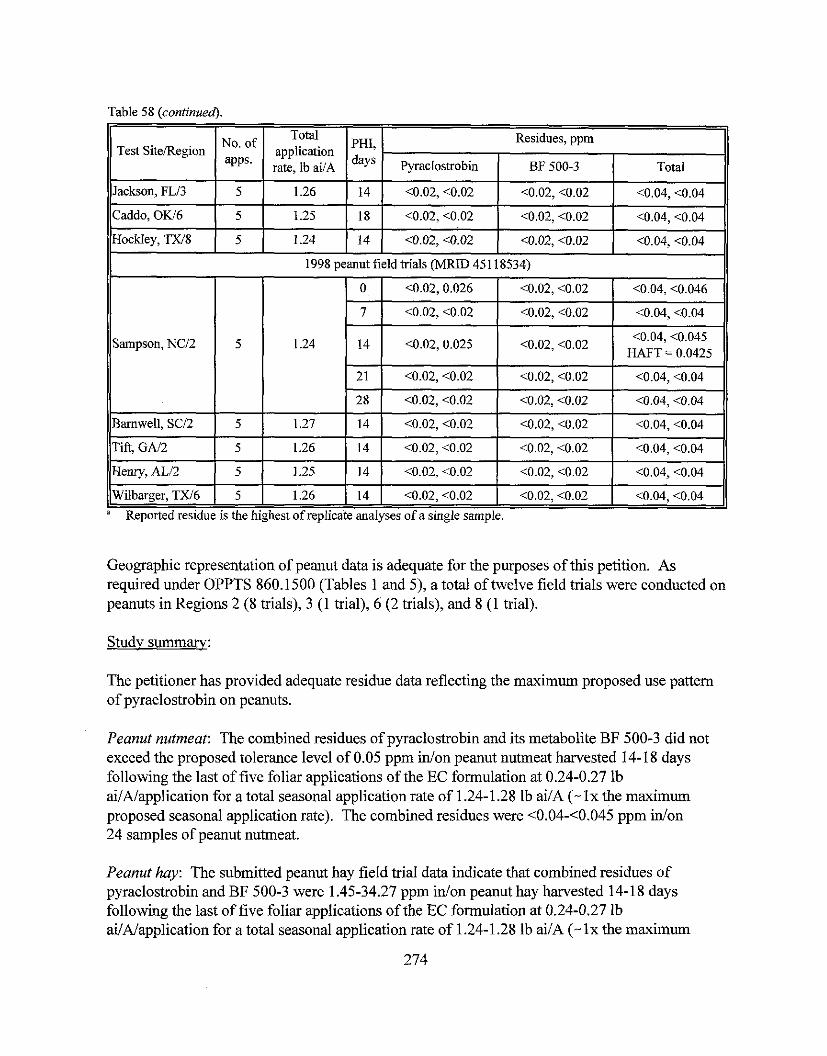
Table 58 (continued).
-- - - -
)wilbarger, TX/6 1 5 1 1.26 ( 14 1 <0.02,<0.02 1 <0.02,<0.02 1 <0.04,<0.04 1 V e p o r t e d residue is the highest of replicate analyses of a single sample.
Geographic representation of peanut data is adequate for the purposes of this petition. As required under OPPTS 860.1500 (Tables 1 and 5), a total of twelve field trials were conducted on peanuts in Regions 2 (8 trials), 3 (1 trial), 6 (2 trials), and 8 (1 trial).
Studv summary:
The petitioner has provided adequate residue data reflecting the maximum proposed use pattern of pyraclostrobin on peanuts.
Peanut nutmeat: The combined residues of pyraclostrobin and its metabolite BF 500-3 did not exceed the proposed tolerance level of 0.05 ppm inlon peanut nutmeat harvested 14-18 days following the last of five foliar applications of the EC formulation at 0.24-0.27 lb ai/A/application for a total seasonal application rate of 1.24-1.28 lb ai/A (- Ix the maximum proposed seasonal application rate). The combined residues were 10.04-<0.045 ppm idon 24 samples of peanut nutrneat.
Peanut hay: The submitted peanut hay field trial data indicate that combined residues of pyraclostrobin and BF 500-3 were 1.45-34.27 ppm inlon peanut hay harvested 14-18 days following the last of five foliar applications of the EC formulation at 0.24-0.27 lb ai/A/application for a total seasonal application rate of 1.24-1.28 lb ai/A (- lx the maximum
proposed seasonal application rate). These data are not adequate to support a tolerance for peanut hay because the moisture content was not provided for the peanut hay samples from the 1997 field trials and ranged from 22.5-45.2% in peanut hay samples from the 1998 peanut field trials. According to Table 1 of OPPTS 860.1000, peanut hay consists of vines and leaves that have been sun-dried to a moisture content of 10 to 20 percent.
A tolerance for peanut hay will not be required if the label for the EC formulation is amended to includc the follo\\ing feeding rz5triction: "L)o not feed green immature growing plants to li\,estock or do not hancst for livestock kcd." Alternatively. additional field trials \\.ill be rcquircd depicting rcsiduss of p!.raclostrobin in peanut hay dried to .:20% follo\\.ing application of thc EC f'ormulation at Is the maximum proposd use pattern.
The residue decline data for peanut nutmeat did not demonstrate any conclusive trends in decreasing residues at longer posttreatment intervals because the residues were at or below the LOQ. The residue decline data for peanut hay showed trends that residues decreased gradually at longer posttreatment intervals. For peanut hay from the 1997 trials, combined residues were 5.53-8.29 pprn at the 7-day PHI and declined to 4.45-7.22 pprn at the 28-day PHI. For peanut hay from the 1998 trials, combined residues were 15.49-16.78 pprn at the 0-day PHI and declined to 7.13-7.80 pprn at the 28-day PHI. One exception occurred at the 21-day PHI where combined residues (22.44-25.75 ppm) exceeded residues at the 0-day PHI. The petitioner indicated that moisture determinations were performed and the moisture levels were not a contributing factor to the higher residues found in the peanut hay samples from the 21-day PHI.
Strawbemi
BASF Corporation submitted strawberry field trial data (citation listed below) to support the establishment of a tolerance for residues of pyraclostrobin and BF 500-3 idon strawberry at 0.4 ppm.
45 118604 Haughey, D.; Abdel-Baky, S.; Riley, M. (1999) Magnitude of BAS 500 F Residues in Strawberries: Lab Project Number: 55223: 199915140. Unpublished study prepared by BASF Corporation. 67 p.
A total of eight strawberry field trials were conducted during the 1999 growing season in CA(3), FL(l), MI(l), NC(l), OR(l), and PA(1). Samples of strawberries were harvested immediately (0-day PHI) or one day (OR trial only) following the last of five broadcast foliar applications of the 20% WDG formulation at 0.17-0.19 lb ailNapplication, made at 6- to 8-day retreatment intervals. The total seasonal application rates were 0.88-0.92 lb ai/A (- l x the maximum proposed seasonal application rate). Applications were made in 24.8-100.4 gal/A using ground equipment with a spreader-sticker added to the spray mixture. In one trial (CA), additional strawberry samples were collected at 7, 14,21, and 28 days following treatment to evaluate residue decline. A separate plot at each trial site was left untreated to provide control samples.
A single untreated sample and duplicate treated samples of mature strawberries were collected from each test site and were frozen. All samples were shipped frozen to the BASF APC where they were analyzed for residues of pyraclostrobin and BF 500-3 using Method D9808. Apparent residues of pyraclostrobin and BF 500-3 were each less than the LOQ (10.02 ppm) idon eight samples of untreated strawberries. Residues of pyraclostrobin and BF 500-3 inlon treated samples are presented in Table 59.
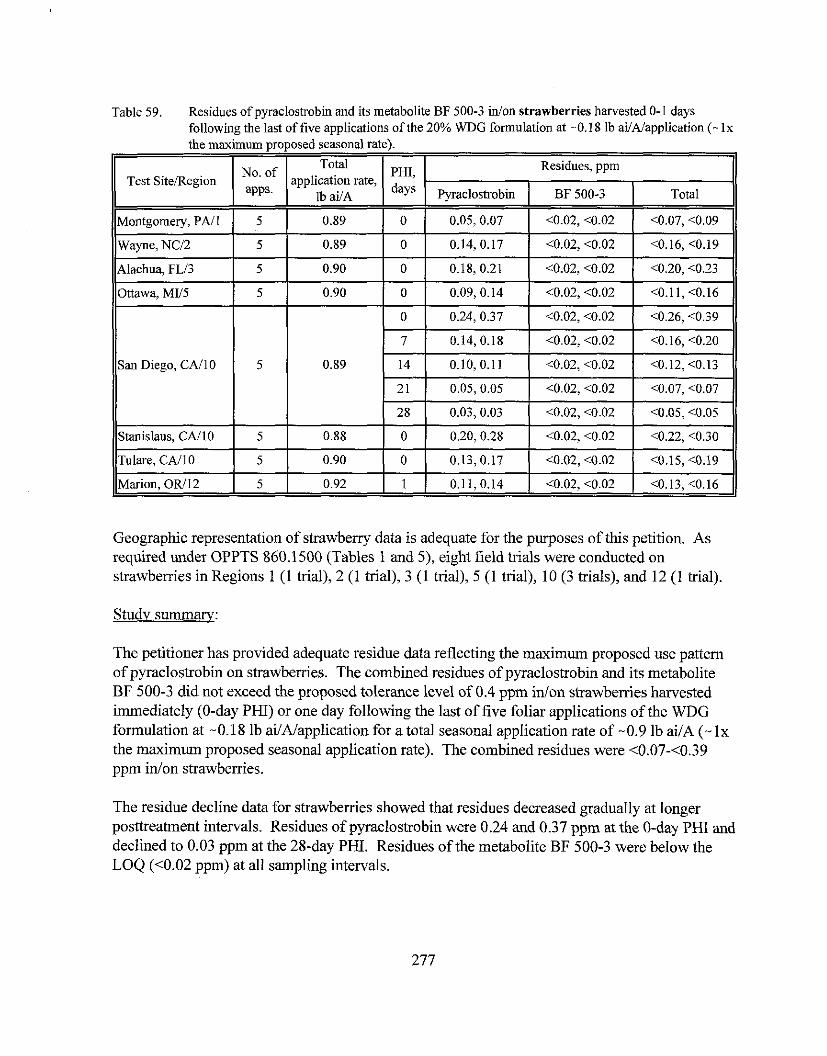
Table 59. Residues of pyraclostrobin and its metabolite BF 500-3 in/on strawberries harvested 0-1 days following the last of five ap~lications of the 20% WDG formulation at -0.18 lb ailAiapplication (- lx - . . . .
the maximum proposed seasonal rate).
Geographic representation of strawberry data is adequate for the purposes of this petition. As required under OPPTS 860.1500 (Tables 1 and 5), eight field trials were conducted on strawberries in Regions 1 (1 trial), 2 (1 trial), 3 (1 trial), 5 (1 trial), 10 (3 trials), and 12 (1 trial).
Studv summary:
The petitioner has provided adequate residue data reflecting the maximum proposed use pattern of pyraclostrobin on strawberries. The combined residues of pyraclostrobin and its metabolite BF 500-3 did not exceed the proposed tolerance level of 0.4 ppm idon strawberries harvested immediately (0-day PHI) or one day following the last of five foliar applications of the WDG formulation at -0.18 lb ailA/application for a total seasonal application rate of -0.9 lb ai/A (- l x the maximum proposed seasonal application rate). The combined residues were <0.07-10.39 ppm idon strawberries.
The residue decline data for strawbemes showed that residues decreased gradually at longer posttreatment intervals. Residues of pyraclostrobin were 0.24 and 0.37 ppm at the 0-day PHI and declined to 0.03 ppm at the 28-day PHI. Residues of the metabolite BF 500-3 were below the LOQ (<0.02 ppm) at all sampling intervals.
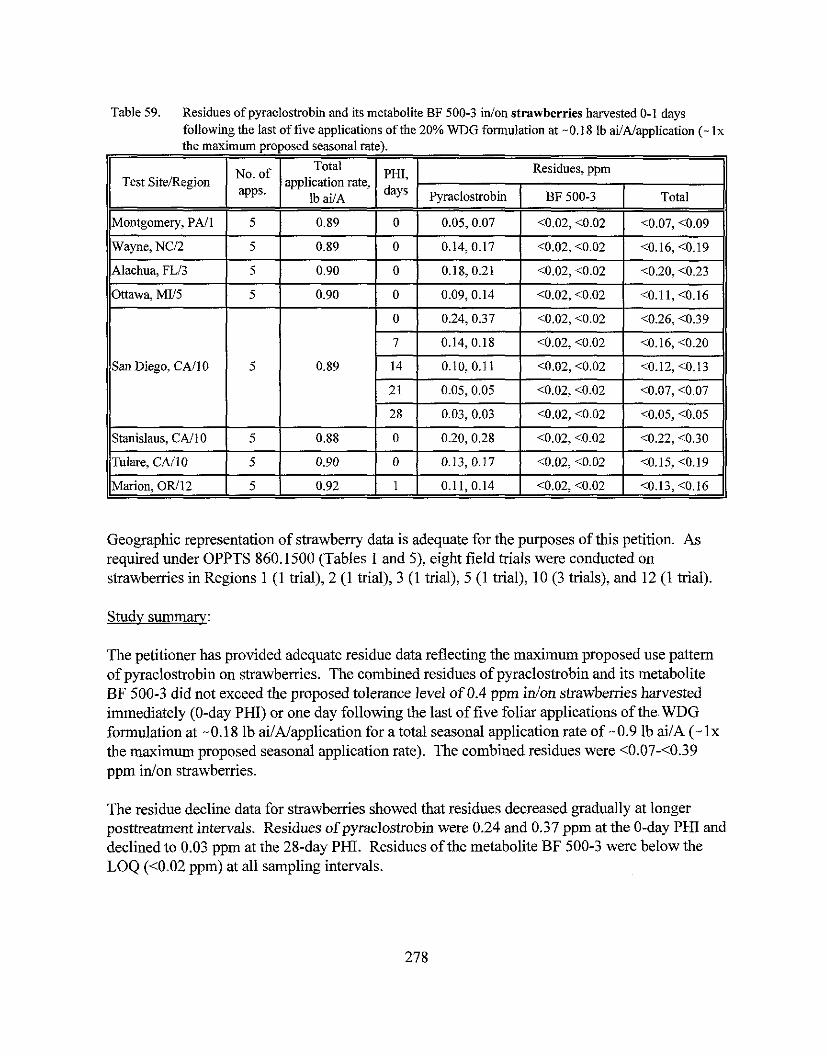
Table 59. Residues of pyraclostrobin and its metabolite BF 500-3 in/on strawberries harvested 0-1 days following the last of five applications of the 20% WDG formulation at -0.18 lb ai/A/application (- lx the maximum proposed seasonal rate).
1,
Test SiteIRegion
Montgomery, PA11
Wayne, NCI2
Alachua, FLI3
Geographic representation of strawbeny data is adequate for the purposes of this petition. As required under OPPTS 860.1500 (Tables 1 and S), eight field trials were conducted on strawberries in Regions 1 (1 trial), 2 (1 trial), 3 (1 trial), 5 (1 trial), 10 (3 trials), and 12 (1 trial).
No. of aPPs.
Stanislaus, CAI10
Tulare, CAI10
Marion, OR112
Studv summaw:
5
5
5
The petitioner has provided adequate residue data reflecting the maximum proposed use pattern of pyraclostrobin on strawberries. The combined residues of pyraclostrobin and its metabolite
Total application rate,
lb aUA
5
5
5
BF 500-3 did not exceed the proposed tolerance level of 0.4 ppm idon strawberries harvested immediately (0-day PHI) or one day following the last of five foliar applications of the- WDG formulation at -0.18 lb ailNapplication for a total seasonal application rate of -0.9 lb ai1A (- lx the maximum proposed seasonal application rate). The combined residues were <0.07-<0.39 ppm idon strawberries.
0.89
0.89
0.90
The residue decline data for strawberries showed that residues decreased gradually at longer posttreatment intervals. Residues of pyraclostrobin were 0.24 and 0.37 ppm at the 0-day PHI and declined to 0.03 ppm at the 28-day PHI. Residues of the metabolite BF 500-3 were below the LOQ (<0.02 ppm) at all sampling intervals.
PHI, days
0.88
0.90
0.92
0
0
0
Residues, ppm
0
0
1
Pyracloshobin ( BF 500-3
0.05,0.07
0.14, 0.17
0.18, 0.21
Total
0.20,0.28
0.13, 0.17
0.11, 0.14
<0.02, <0.02
<0.02, <0.02
10.02, <0.02
<0.07, <0.09
<0.16, <0.19
<0.20, <0.23
<0.02, <0.02
<0.02, <0.02
<0.02, <0.02
<0.22, <0.30
<0.15, <0.19
c0.13, <0.16
OPPTS GLN 860.1520: Processed Foodmeed
Citrus Fruits
BASF Corporation submitted data from a study (citation listed below) depicting the potential for concentration of residues of pyraclostrobin in the processed commodities of oranges.
451 18617 Wofford, J.; Abdel-Baky, S.; Riley, M. (1999) The Magnitude of BAS 500 F Residues in Orange Process Fractions: Lab Project Number: 55165: 199915120. Unpublished study prepared by BASF Corporation. 119 p.
A single orange field trial was conducted during the 1999 growing season in Palm Beach County, FL using Valencia oranges. The trial consisted of three treated plots in which treatments differed according to application rates. Four broadcast foliar applications of the 2 lblgal EC formulation were made to orange trees, with 10- to 1 1 -day retreatment intervals. For the three treatment plots, the application rates were as follows: (i) two applications at 0.16 lb ailNapplication plus two applications at 0.25-0.26 lb aiiMapplication for a total rate of 0.83 lb d A (- lx the maximum proposed seasonal rate); (ii) two applications at 0.48 lb ailAlapplication plus two applications at 0.75-0.76 lb ai/A/application for a total rate of 2.47 lb d A (-3x the maximum proposed seasonal rate); or (iii) two applications at 0.80 lb ailNapplication plus two applications at 1.24-1.25 lb ai1Napplication for a total rate of 4.09 lb ai1A (-5x the maximum proposed seasonal rate). Applications were made in 140.1-146.7 g d A using ground equipment with a non-silicone spray adjuvant (Latron B-1956) added to the spray solution. A separate plot was left untreated for control samples. Since no phytotoxicity was observed at the 5x rate, oranges treated at the l x and 3x rates were not harvested, processed, or analyzed. Mature oranges treated at the 5x rate were harvested by hand 14 days following the final application; untreated samples were harvested 11 days following the final application.
One sample of untreated and two samples of treated mature oranges were collected and shipped the day after harvest at ambient conditions to the Citrus Research and Education Center, University of Florida (Lake Alfied, FL) for processing. Samples were stored under ambient conditions for 3 days at the University of Florida until processing. Oranges were processed into washed oranges, dried pulp, oil, and juice using simulated commercial processing procedures. A subsample of whole, unwashed oranges (RAC) was placed in frozen storage prior to processing. Processed commodities were stored frozen following processing, and RAC and processed samples were shipped frozen to BASF APC for analysis. The petitioner submitted adequate descriptions of the processing procedures and material balance information.
Samples of oranges and orange processed commodities were analyzed for residues of pyraclostrobin and BF 500-3 using Method D9808. Apparent residues of pyraclostrobin and BF 500-3 were each less than the LOQ (<0.02 ppm) inlon one sample each of untreated oranges (unwashed), oranges (washed), and processed dried pulp, juice, and oil. The results of the orange processing study are presented in Table 60.
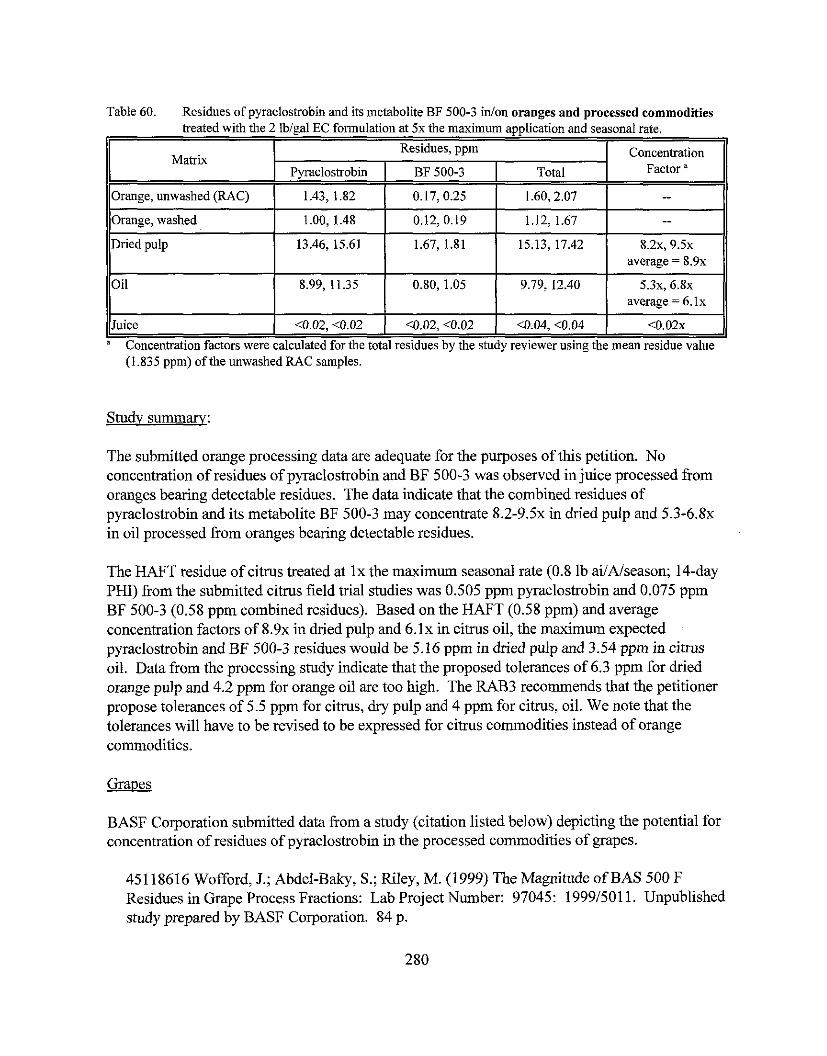
Table 60. Residues of pyraclostrobin and its metabolite BF 500-3 d o n oranges and processed commodities
(1.835 ppm) of the unwashed RAC samples,
- treated with the 2 Iblgal EC formulation at 5x the maximum application and seasonal rate.
Studv summary:
Matrix
Orange, unwashed (RAC)
Orange, washed
Dried pulp
Oil
Juice
The submitted orange processing data are adequate for the purposes of this petition. No concentration of residues of pyraclostrobin and BF 500-3 was observed in iuice processed from
A.
oranges bearing detectable residues. The data indicate that the combined residues of pyraclostrobin and its metabolite BF 500-3 may concentrate 8.2-9.5~ in dried pulp and 5.3-6.8~ in oil processed from oranges bearing detectable residues.
" Concentration factors were calculated for the total residues by the study reviewer using the mean residue value
The HAFT residue of citrus treated at l x the maximum seasonal rate (0.8 lb ai/A/season; 14-day PHI) from the submitted citrus field trial studies was 0.505 pprn pyraclostrobin and 0.075 pprn BF 500-3 (0.58 pprn combined residues). Based on the HAFT (0.58 ppm) and average concentration factors of 8 . 9 ~ in dried pulp and 6 . 1 ~ in citrus oil, the maximum expected pyraclostrobin and BF 500-3 residues would be 5.16 ppm in dried pulp and 3.54 pprn in citrus oil. Data from the processing study indicate that the proposed tolerances of 6.3 pprn for dried orange pulp and 4.2 pprn for orange oil are too high. The RAB3 recommends that the petitioner propose tolerances of 5.5 ppm for citrus, dry pulp and 4 ppm for citrus, oil. We note that the tolerances will have to be revised to be expressed for citrus commodities instead of orange commodities.
Concentration Factor a
-- --
8.2x, 9 . 5 ~ average = 8 . 9 ~
5.3x, 6 . 8 ~ average = 6. lx
<0.02x
Residues, ppm
BASF Corporation submitted data from a study (citation listed below) depicting the potential for concentration of residues of pyraclostrobin in the processed commodities of grapes.
Pyraclostrobin
1.43, 1.82
1.00, 1.48
13.46, 15.61
8.99, 11.35
<0.02, <0.02
451 18616 Wofford, J.; AbdeI-Baky, S.; Riley, M. (1999) The Magnitude of BAS 500 F Residues in Grape Process Fractions: Lab Project Number: 97045: 19991501 1. Unpublished study prepared by BASF Corporation. 84 p.
BF 500-3
0.17,0.25
0.12,0.19
1.67, 1.81
0.80, 1.05
<0.02, <0.02
Total
1.60,2.07
1.12, 1.67
15.13, 17.42
9.79, 12.40
~0.04, <0.04
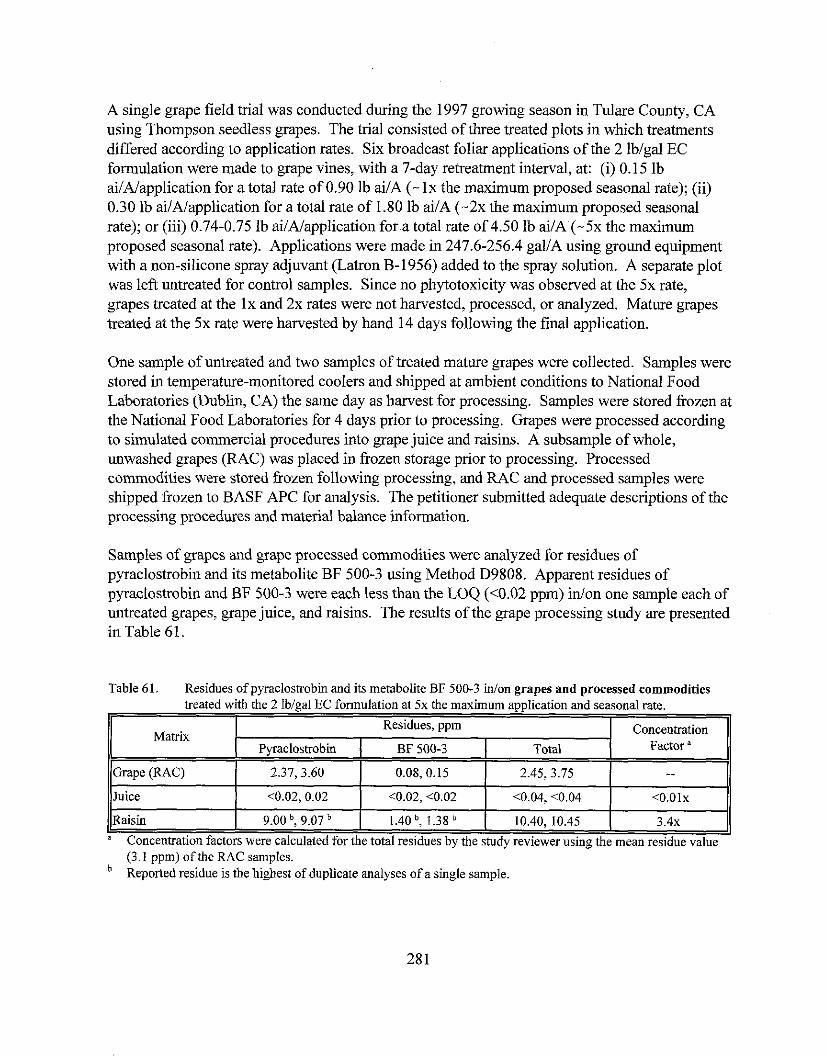
A single grape field trial was conducted during the 1997 growing season in Tulare County, CA using Thompson seedless grapes. The trial consisted of three treated plots in which treatments differed according to application rates. Six broadcast foliar applications of the 2 lblgal EC formulation were made to grape vines, with a 7-day retreatment interval, at: (i) 0.15 lb ailA/application for a total rate of 0.90 lb ai/A (- lx the maximum proposed seasonal rate); (ii) 0.30 lb ai1Alapplication for a total rate of 1.80 lb ai/A (-2x the maximum proposed seasonal rate); or (iii) 0.74-0.75 lb ailA/application for a total rate of 4.50 lb ai/A (-5x the maximum proposed seasonal rate). Applications were made in 247.6-256.4 gal/A using ground equipment with a non-silicone spray adjuvant (Latron B-1956) added to the spray solution. A separate plot was left untreated for control samples. Since no phytotoxicity was observed at the 5x rate, grapes treated at the lx and 2x rates were not harvested, processed, or analyzed. Mature grapes treated at the 5x rate were harvested by hand 14 days following the final application.
One sample of untreated and two samples of treated mature grapes were collected. Samples were stored in temperature-monitored coolers and shipped at ambient conditions to National Food Laboratories (Dublin, CA) the same day as harvest for processing. Samples were stored frozen at the National Food Laboratories for 4 days prior to processing. Grapes were processed according to simulated commercial procedures into grape juice and raisins. A subsample of whole, unwashed grapes (RAC) was placed in frozen storage prior to processing. Processed commodities were stored frozen following processing, and RAC and processed samples were shipped frozen to BASF APC for analysis. The petitioner submitted adequate descriptions of the processing procedures and material balance information.
Samples of grapes and grape processed commodities were analyzed for residues of pyraclostrobin and its metabolite BF 500-3 using Method D9808. Apparent residues of pyraclostrobin and BF 500-3 were each less than the LOQ (<0.02 ppm) inlon one sample each of untreated grapes, grape juice, and raisins. The results of the grape processing study are presented in Table 61.
Table 61. Residues of pyraclostrobin and its metabolite BF 500-3 inton grapes and processed commodities treated with the 2 lblgal EC formulation at 5x the maximum application and seasonal rate.
(3.1 ppm) of the RAC samples. Reported residue is the highest of duplicate analyses of a single sample.
Matrix
Grape (RAC)
I , I I
Raisin
Concentration Factor '
--
Residues, ppm
Pyraclostrobin I BF 500-3 I Total
"oncentration factors were calculated for the total residues by the study reviewer using the mean residue value
9.00 b, 9.07
2.37,3.60
1.40 b, 1.38
0.08,O.lS 2.45,3.75
10.40, 10.45 3.4s
Studv summary:
The submitted grape processing data are adequate for the purposes of this petition. No concentration of residues of pyraclostrobin and BF 500-3 was observed in juice processed from grapes bearing detectable residues. The data indicate that the combined residues of pyraclostrobin and its metabolite BF 500-3 concentrated in raisins at 3 . 4 ~ .
The HAFT residue of grape treated at lx the maximum seasonal rate (0.9 lb aiIAfseason; 14-day PHI) from the submitted field trial studies was 1.71 pprn pyraclostrobin and 0.21 pprn BF 500-3 (1.92 pprn combined residues). Based on the HAFT (1.92 ppm) and a concentration factor of 3 . 4 ~ in raisin, the maximum expected pyraclostrobin and BF 500-3 residues would be 6.53 pprn in raisin. Data fivm the processing study indicate that the proposed tolerances of 6.0 pprn for raisin is too low. RAB3 recommends that the petitioner propose a tolerance of 7 pprn for raisin.
BASF Corporation submitted data from a study (citation listed below) depicting the potential for concentration of residues of pyraclostrobin in the processed commodities of peanuts.
451 18614 Wofford, J.; Abdel-Baky, S.; Riley, M. (1999) The Magnitude of BAS 500 F Residues in Peanut Process Fractions: Lab Project Number: 97043: 199915072, Unpublished study prepared by BASF Corporation. 72 p.
A single peanut field trial was conducted during the 1997 growing season in Wayne County, NC. The trial consisted of three treated plots in which treatments differed according to application rates. Five broadcast foliar applications of the 2 lblgal EC formulation were made to peanut plants, with 14-day retreatment intervals, at: (i) 0.25 lb ai1Alapplication for a total rate of 1.25 lb ai1A (- l x the maximum proposed seasonal rate); (ii) 0.74-0.76 lb ai/A/application for a total rate of 3.75 lb ai1A (-3x the maximum proposed seasonal rate); or (iii) 1.25-1.26 lb ailNapplication for a total rate of 6.26 lb ai/A (-5x the maximum proposed seasonal rate). Applications were made in 9.9-10.2 gal/A using ground equipment with a non-silicone spray adjuvant added to the spray solution. A separate plot was left untreated for control samples. Since no phytotoxicity was observed at the 5x rate, peanuts treated at the lx and 3x rates were not harvested, processed, or analyzed. Peanut plants treated at the 5x rate were dug and inverted 7 days following the last application and were allowed to dry in the field for 7 days prior to collection (14-day PHI).
One sample of untreated and two samples of treated whole mature peanuts were collected. Samples of whole peanuts were threshed, placed into bags, and shipped at ambient conditions to Texas A&M. Food Protein Research and Development Center (Bryan, TX) on the day of . .
collection for processing. Samples were stored frozen for 8 days until processing. Samples were vrocessed according to simulated commercial procedures into peanut meal and oil. Processed - commodities were stored frozen following processing, and RAC and processed samples were
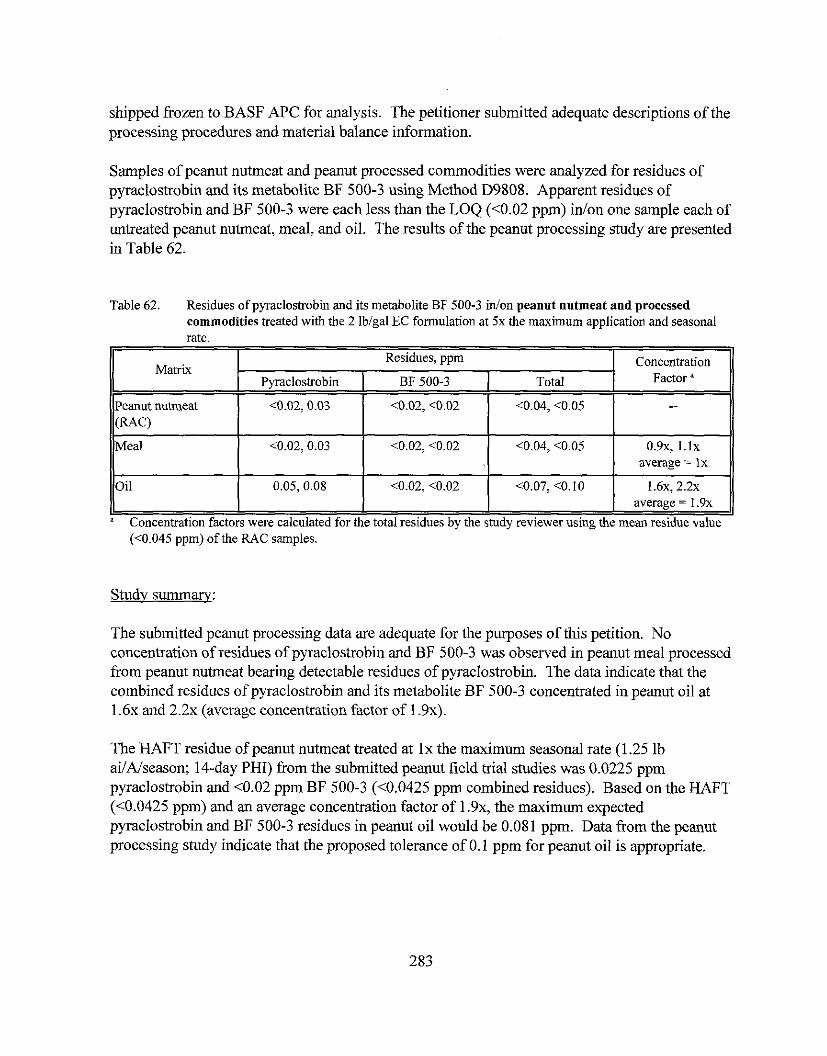
shipped frozen to BASF APC for analysis. The petitioner submitted adequate descriptions of the processing procedures and material balance information.
Samples of peanut nutmeat and peanut processed commodities were analyzed for residues of pyraclostrobin and its metabolite BF 500-3 using Method D9808. Apparent residues of pyraclostrobin and BF 500-3 were each less than the LOQ (10.02 ppm) idon one sample each of untreated peanut nutmeat, meal, and oil. The results of the peanut processing study are presented in Table 62.
I average = 1 . 9 ~
"oncentration factors were calculated for the total residues by the study reviewer using the mean residue value (<0.045 ppm) of the RAC samples.
Table 62. Residues of pyraclostrobin and its metabolite BF 500-3 d o n peanut nutmeat and processed commodities treated with tbe 2 lblgal EC formulation at 5x the maximum application and seasonal rate.
Study summary:
Matrix
Peanut nutmeat (RAC)
Meal
Oil
The submitted peanut processing data are adequate for the purposes of this petition. No concentration of residues of pyraclostrobin and BF 500-3 was observed in peanut meal processed from peanut nutmeat bearing detectable residues of pyraclostrobin. The data indicate that the combined residues of pyraclostrobin and its metabolite BF 500-3 concentrated in peanut oil at 1 . 6 ~ and 2 . 2 ~ (average concentration factor of 1 .9~) .
The HAFT residue of peanut nutmeat treated at lx the maximum seasonal rate (1.25 lb ai/A/season; 14-day PHI) from the submitted peanut field trial studies was 0.0225 ppm pyraclostrobin and <0.02 ppm BF 500-3 (<0.0425 ppm combined residues). Based on the HAFT (<0.0425 ppm) and an average concentration factor of 1.9x, the maximum expected pyraclostrobin and BF 500-3 residues in peanut oil would be 0.081 ppm. Data from the peanut processing study indicate that the proposed tolerance of 0.1 ppm for peanut oil is appropriate.
Concentration Factor '
--
0.9x, 1 . 1 ~ average = lx
1.6x, 2 . 2 ~
Residues, ppm
Pyraclostrobin
c0.02, 0.03
c0.02, 0.03
0.05, 0.08
BF 500-3
<0.02, c0.02
c0.02, <0.02
<0.02, c0.02
Total
<0.04, <0.05
<0.04, <0.05
<0.07, <0.10
Plum -
BASF Corporation submitted data from a study (citation listed below) depicting the potential for concentration of residues of pyraclostrobin in prunes, the only processed commodity of plums.
451 18621 Wofford, J.; Abdel-Baky, S.; Riley, M. (2000) Magnitude of the Residues of BAS 500 F in Plum Processed Fractions: Lab Project Number: 55359: 199915147, Unpublished study prepared by BASF Corporation. 77 p.
A single plum field trial was conducted during the 1999 growing season in Tulare County, CA. The trial consisted of three treated plots in which treatments differed according to application rates. Four or five broadcast foliar applications of the 2 lblgal EC formulation were made to plum trees with a 7-day retreatment interval. For the three treatment plots, the application rates were as follows: (i) five applications at 0.12 lb ailA/application for a total rate of 0.6 lb aiIA (-lx the maximum proposed seasonal rate); (ii) four applications at 0.35-0.36 lb ailNapplication for a total rate of 1.43 lb ailA ( - 2 . 4 ~ the maximum proposed seasonal rate); or (iii) five applications at 0.59-0.60 lb ailNapplication for a total rate of 2.99 lb d A (-5x the maximum proposed seasonal rate). Applications were made in 240.5-251.7 gallA using ground equipment with a non-silicone spray adjuvant (Latron B-1956) added to the spray solution. A separate plot was left untreated for control samples. Since no phytotoxicity was observed at the 5x rate, plums treated at the l x and 3x rates were not harvested, processed, or analyzed. Mature plums treated at the 5x rate were harvested by hand immediately (0-day PHI) following the final application.
One sample of untreated and two samples of treated mature plums were collected, placed into bags, and shipped at ambient conditions to National Food Laboratories (Dublin, CA) the same day for processing. Samples were processed according to simulated commercial procedures into prunes. A subsample of whole, unwashed plums (RAC) was placed in frozen storage prior to processing. Following processing, washed plums and prunes were stored frozen, and RAC and processed samples (washed plums and prunes) were shipped frozen to BASF APC for analysis. The petitioner submitted adequate descriptions of the processing procedures and material balance information.
Samples of plums (unwashed and washed) and prunes were analyzed for residues of pyraclostrobin and its metabolite BF 500-3 using Method D9808. Apparent residues of pyraclostrobin and BF 500-3 were each less than the LOQ (<0.02 ppm) idon one sample each of untreated unwashed plums, washed plums, and prunes. The results of the plum processing study are presented in Table 63.
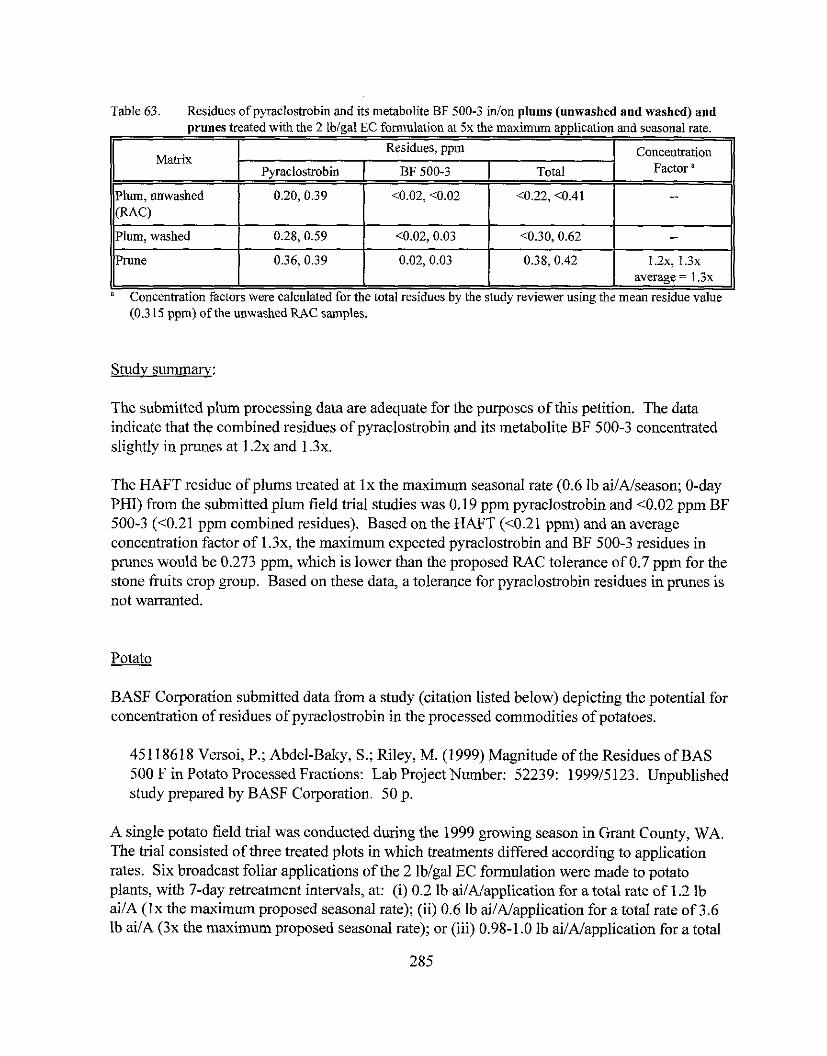
Table 63. Residues of pyraclostrobin and its metabolite BF 500-3 inlon plums (unwashed and washed) and prunes treated with the 2 lblgal EC formulation at 5x the maximum application and seasonalrate.
I I average = 1 . 3 ~
Voncenha t ion factors were calculated for the total residues bv the studv reviewer usine the mean residue value
Matrix
Plum, unwashed W C )
Plum, washed
Prune
- (0.3 15 ppm) of the unwashed RAC samples.
Studv summarv:
The submitted plum processing data are adequate for the purposes of this petition. The data indicate that the combined residues of pyraclostrobin and its metabolite BF 500-3 concentrated slightly in prunes at 1 . 2 ~ and 1 . 3 ~ .
Concentration Factor "
--
--
1.2x, 1 . 3 ~
Residues, ppm
The HAFT residue of plums treated at l x the maximum seasonal rate (0.6 lb ailNseason; 0-day PHI) from the submitted plum field trial studies was 0.19 ppm pyraclostrobin and <0.02 pprn BF 500-3 (<0.21 ppm combined residues). Based on the HAFT (<0.21 ppm) and an average concentration factor of 1.3x, the maximum expected pyraclostrobin and BF 500-3 residues in prunes would be 0.273 ppm, which is lower than the proposed RAC tolerance of 0.7 pprn for the stone fmits crop group. Based on these data, a tolerance for pyraclostrobin residues in prunes is not warranted.
BASF Corporation submitted data fiom a study (citation listed below) depicting the potential for concentration of residues of pyraclostrobin in the processed commodities of potatoes.
Total
<0.22, <0.41
<0.30,0.62
0.38, 0.42
Pyracloshobin
0.20, 0.39
0.28, 0.59
0.36, 0.39
451 18618 Versoi, P.; Abdel-Baky, S.; Riley, M. (1999) Magnitude of the Residues of BAS 500 F in Potato Processed Fractions: Lab Project Number: 52239: 199915123. Unpublished study prepared by BASF Corporation. 50 p.
BF 500-3
<0.02, <0.02
<0.02, 0.03
0.02, 0.03
A single potato field bial was conducted during the 1999 growing season in Grant County, WA. The trial consisted of three treated plots in which treatments differed according to application rates. Six broadcast foliar applications of the 2 Iblgal EC formulation were made to potato plants, with 7-day retreatment intervals, at: (i) 0.2 lb ai/A/application for a total rate of 1.2 lb ai/A (Ix the maximum proposed seasonal rate); (ii) 0.6 lb ai/A/application for a total rate of 3.6 lb ailA (3x the maximum proposed seasonal rate); or (iii) 0.98-1.0 lb ai1Napplication for a total
rate of 5.98 lb ailA (5x the maximum proposed seasonal rate). Applications were made in 35.0- 35.9 gal1A using ground equipment with a non-silicone spray adjuvant added to the spray solution. A separate plot was left untreated for control samples. Since phytotoxicity was not observed at the 5x rate, potatoes treated at the lx and 3x rates were not harvested, processed, or analyzed. Mature potatoes treated at the 5x rate were harvested by hand three days following the final application.
One sample of untreated and two samples of treated mature potatoes were collected, and placed into bags and cardboard boxes for shipment to Englar Food Laboratories, Inc. (Moses Lake, CA) for processing. A RAC subsample was also shipped directly to BASF APC for residue screening prior to processing. Samples of potato RAC were analyzed for residues of pyraclostrobin and its metabolite BF 500-3 using Method D9808. Apparent residues of pyraclostrobin and BF 500-3 were each less than the LOQ (c0.02 ppm) idon one saniple of untreated potato tuber. Combined residues were below the analytical method LOQ (<0.04 ppm) idon two samples treated potato tuber samples. Because residues of pyraclostrobin and BF 500-3 were below the LOQ in whole potato RAC samples treated at an exaggerated rate (5x), potato samples were not processed and no further analyses were required.
The submitted potato processing data are adequate for the purposes of this petition. The data indicate that the combined residues of pyraclostrobin and its metabolite BF 500-3 were below the LOQ (<0.04 ppm) idon potato samples following treatment at 5x the maximum proposed rate. Therefore, no potato processing study or tolerances for potato processed commodities are required.
Sugar Beet
BASF Corporation submitted data from a study (citation listed below) depicting the potential for concentration of residues of pyraclostrobin in the processed commodities of sugar beets.
451 18619 Haughey, D.; Abdel-Baky, S.; Riley, M. (2000) The Magnitude of BAS 500 F Residues in Sugar Beet Process Fractions: Lab Project Number: 55187: I999/5156. Unpublished study prepared by BASF Corporation. 81 p.
A single sugar beet field trial was conducted during the 1999 growing season in Payette County, ID. The trial consisted of three treated plots in which treatments differed according to application rates. Four broadcast foliar applications of the 2 lblgal EC formulation were made to sugar beet plants, with 14-day retreatment intervals, at: (i) 0.20 lb aiJMapplication for a total rate of 0.80 lb ailA (- lx the maximum proposed seasonal rate); (ii) 0.60-0.61 lb ailAiapplication for a total rate of 2.41 lb ai/A (-3x the maximum proposed seasonal rate); or (iii) 1.00-1.02 lb dAlapplication for a total rate of 4.04 1b ai/A (-5x the maximum proposed seasonal rate). Applications were made in 29.8-30.8 gal/A using ground equipment with a non-silicone spray
286
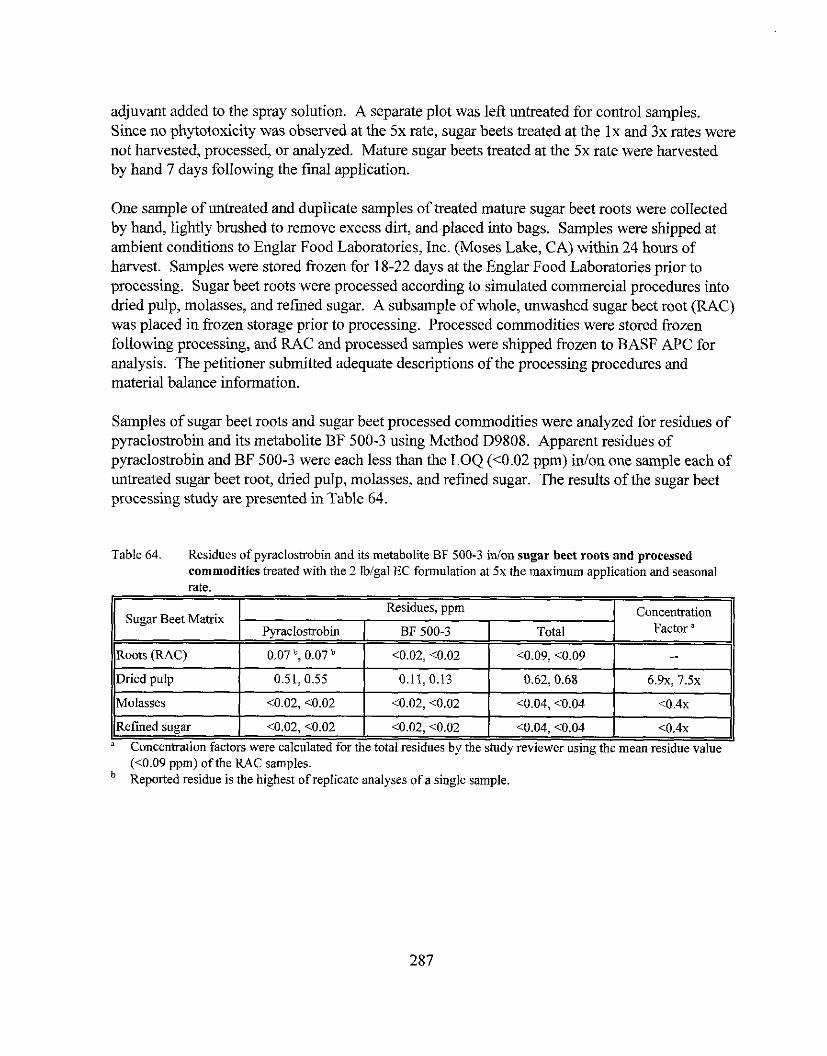
adjuvant added to the spray solution. A separate plot was left untreated for control samples. Since no phytotoxicity was observed at the 5x rate, sugar beets treated at the lx and 3x rates were not harvested, processed, or analyzed. Mature sugar beets treated at the 5x rate were harvested by hand 7 days following the final application.
One sample of untreated and duplicate samples of treated mature sugar beet roots were collected by hand, lightly brushed to remove excess dirt, and placed into bags. Samples were shipped at ambient conditions to Englar Food Laboratories, Inc. (Moses Lake, CA) within 24 hours of harvest. Samples were stored frozen for 18-22 days at the Englar Food Laboratories prior to processing. Sugar beet roots were processed according to simulated commercial procedures into dried pulp, molasses, and refined sugar. A subsample of whole, unwashed sugar beet root (RAC) was placed in frozen storage prior to processing. Processed commodities were stored frozen following processing, and RAC and processed samples were shipped frozen to BASF APC for analysis. The petitioner submitted adequate descriptions of the processing procedures and material balance information.
Samples of sugar beet roots and sugar beet processed commodities were analyzed for residues of pyraclostrobin and its metabolite BF 500-3 using Method D9808. Apparent residues of pyraclostrobin and BF 500-3 were each less than the LOQ (<0.02 ppm) inton one sample each of untreated sugar beet root, dried pulp, molasses, and refined sugar. The results of the sugar beet processing study are presented in Table 64.
Table 64. Residues of pyraclostrobin and its metabolite BF 500-3 inion sugar beet roots and processed commodities treated with the 2 lhlgal EC formulation at 5x the maximum application and seasonal
(10.09 ppm) of the RAC samples. Reported residue is the highest of replicate analyses of a single sample.
rate.
Sugar Beet Matrix
Roots (RAC)
Dried pulp
Molasses
Refmed sugar - " Concentration factors were calculated for the total residues by the study reviewer using the mean residue value
Concentration Factor "
--
6.9x, 7 . 5 ~
1 0 . 4 ~
1 0 . 4 ~
Residues, ppm
Pyraclostrohin
0.07 ', 007
0.51, 0.55
10.02, <0.02
10.02, <0.02
BF 500-3
10.02, 10.02
0.11,0.13
d0.02, 10.02
10.02, 10.02
Total
<0.09, <0.09
0.62,0.68
c0.04, <0,04
10.04, 10.04
The submitted sugar beet processing data are adequate for the purposes of this petition. No concentration of residues of pyraclostrobin and BF 500-3 was observed in molasses and refined -. sugar processed from sugar beet roots bearing detectable residues of pyraclostrobin. The data indicate that the combined residues of pyraclostrobin and its metabolite BF 500-3 concentrated in dried pulp at 6 . 9 ~ and 7 . 5 ~ (average concentration factor = 7.2~) .
The HAFT residue of sugar beet roots treated at lx the maximum seasonal rate (0.8 lb ai1Nseason; 7-day PHI) from the submitted sugar beet field trial studies was 0.105 ppm pyraclostrobin and 0.03 ppm BF 500-3 (0.135 ppm combined residues). Based on the HAFT (0.135 ppm) and an average concentration factor of 7.2x, the maximum expected pyraclostrobin and BF 500-3 residues in dried pulp would be 0.972 ppm. Data from the sugar beet processing study indicate that the proposed tolerance of 1.6 ppm for dried sugar beet pulp is too high. RAB3 recommends that the petitioner propose a tolerance of 1.0 ppm for beet, sugar, dried pulp.
Tomato
BASF Corporation submitted data from a study (citation listed below) depicting the potential for concentration of residues of pyraclostrobin in the processed commodities of tomatoes.
451 18615 Wofford, J.; Abdel-Baky, S.; Riley, M. (1999) The Magnitude of BAS 500 F Residues in Tomato Process Fractions: Lab Project Number: 98024: 199915085, Unpublished study prepared by BASF Corporation. 77 p.
A single tomato field trial was conducted during the 1998 growing season in Kings County, CA. The trial consisted of three treated plots in which treatments differed according to application - - - rates. Six broadcast foliar applications of the 2 lblgal EC formulation were made to tomato plants, with 7-day retreatment intervals, at: (i) 0.2 lb ai/A/application for a total rate of 1.2 lb ai1A (Ix the maximum proposed seasonal rate); (ii) 0.6 lb ai/A/application for a total rate of 3.6 lb ai/A (3x the maximum proposed seasonal rate); or (iii) 0.99-1.01 lb ailNapplication for a total rate of 6.00 lb ai/A (5x the maximum proposed seasonal rate). We note that details of the field trial information were provided for the Sx treatment only. Applications were made in 24.4-25.3 gaUA using ground equipment with a non-silicone spray adjuvant added to the spray solution. A separate plot was left untreated for control samples. Since phytotoxicity was not observed at the 5x rate, tomatoes treated at the lx and 3x rates were not harvested, processed, or analyzed. Mature tomatoes treated at the 5x rate were harvested immediately (0-day PHI) following the final application.
One sample of untreated and two samples of treated mature tomatoes were collected and shipped fresh to National Food Laboratories, Inc. (Dublin, CA) on the day of harvest. Samples were stored in a cooler for 1-2 days at the National Food Laboratories until processing. Samples were processed according to simulated commercial procedures into paste and puree. A subsample of whole, unwashed tomatoes (RAC) was placed in frozen storage prior to processing. Processed
288
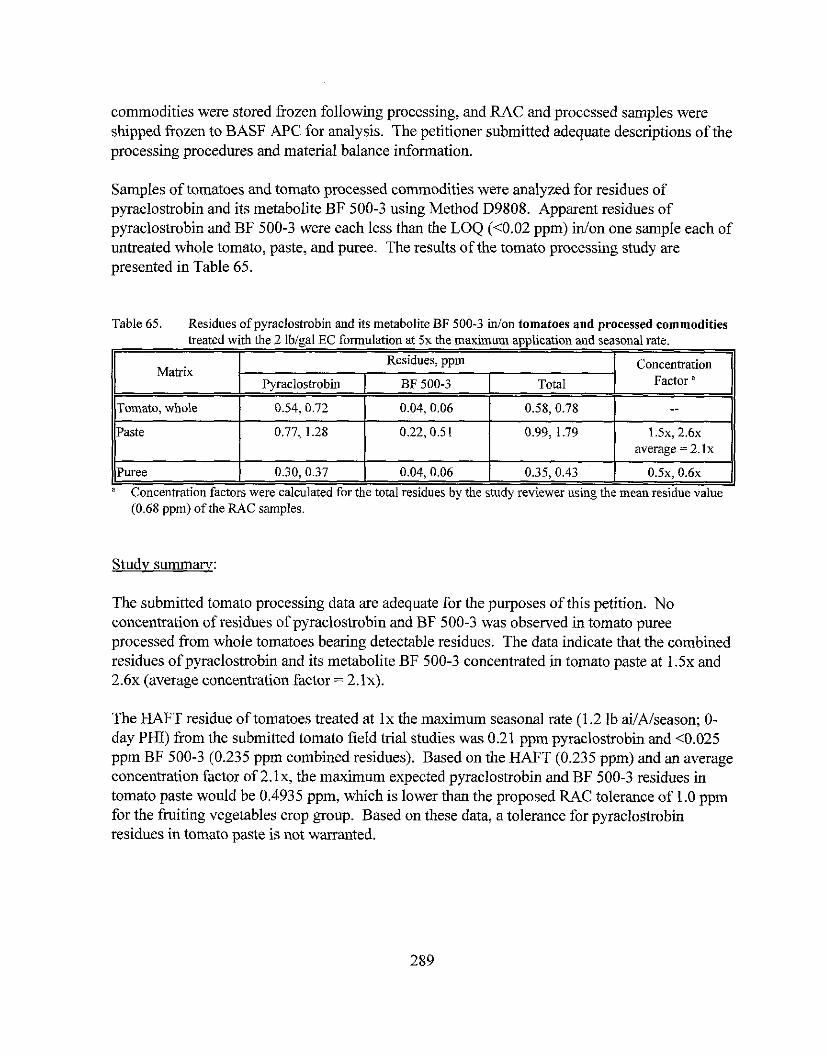
commodities were stored frozen following processing, and RAC and processed samples were shipped frozen to BASF APC for analysis. The petitioner submitted adequate descriptions of the processing procedures and material balance information.
Samples of tomatoes and tomato processed commodities were analyzed for residues of pyraclostrobin and its metabolite BF 500-3 using Method D9808. Apparent residues of pyraclostrobin and BF 500-3 were each less than the LOQ (10.02 ppm) idon one sample each of untreated whole tomato, paste, and puree. The results of the tomato processing study are presented in Table 65.
- (0.68 ppm) of the RAC samples.
Table 65. Residues of pyraclostrobin and its metabolite BF 500-3 inlon tomatoes and processed commodities treated with the 2 lblgal EC formulation at 5x the maximum application and seasonal rate.
The submitted tomato processing data are adequate for the purposes of this petition. No concentration of residues of pyraclostrobin and BF 500-3 was observed in tomato puree processed from whole tomatoes bearing detectable residues. The data indicate that the combined residues of pyraclostrobin and its metabolite BF 500-3 concentrated in tomato paste at 1 . 5 ~ and 2 . 6 ~ (average concentration factor = 2.1~) .
Matrix
Tomato, whole
Paste
Puree
The HAFT residue of tomatoes treated at lx the maximum seasonal rate (1.2 lb ailMseason; 0- day PHI) from the submitted tomato field trial studies was 0.21 pprn pyraclostrobin and <0.025 pprn BF 500-3 (0.235 pprn combined residues). Based on the HAFT (0.235 ppm) and an average concentration factor of 2.1x, the maximum expected pyraclostrobin and BF 500-3 residues in tomato paste would be 0.4935 ppm, which is lower than the proposed RAC tolerance of 1.0 pprn for the fruiting vegetables crop group. Based on these data, a tolerance for pyraclostrobin residues in tomato paste is not warranted.
" Concentration factors were calculated for the total residues bv the studv reviewer using the mean residue value
- Concentration
Factor "
-- 1.5x, 2 . 6 ~
average = 2. 1x
0.5x, 0 . 6 ~
Residues, ppm
Total
0.58, 0.78
0.99, 1.79
0.35, 0.43
Pyraclostrobin
0.54, 0.72
0.77, 1.28
0.30, 0.37
BF 500-3
0.04, 0.06
0.22,0.51
0.04,0.06
BASF Corporation submitted data from studies depicting the potential for concentration of residues of pyraclostrobin in the processed commodities of wheat. A 1998 study (citation listed below) was submitted demonstrating concentration of residues in processed commodities following earlier treatment schedules.
451 18620 Versoi, P.; Abdel-Baky, S.; Riley, M. (1999) Magnitude of BAS 500 F Residues in Wheat Process Fractions and Aspirated Grain Fraction: Lab Project Number: 98033: 199915122. Unpublished study prepared by BASF Corporation. 98 p.
In addition, data were submitted in conjunction with the 2000 wheat field trials (MRID 45321 101) demonstrating concentration of residues in processed commodities following expanded use (treatment at later growth stages closer to grain harvest) for control of fusarium head blight.
Early growth stage avplications (MRID 45 I 18620)
A single wheat field trial was conducted during the 1998 growing season in Grant County, WA. The trial consisted of three treated plots in which treatments differed according to application rates. Two broadcast foliar applications of the 2 lblgal EC formulation were made to wheat plants, with a 10-day retreatment interval, at: (i) 0.2 lb ai/Alapplication for a total rate of 0.4 lb ai1A (- l x the maximum proposed seasonal rate); (ii) 0.6 lb ailAiapplication for a total rate of 1.2 lb d A (-3x the maximum proposed seasonal rate); or (iii) 1.0 lb ailAlapplication for a total rate of 2.0 lb ailA (-5x the maximum proposed seasonal rate). The first application was made when the flag leaf was just visible, and the second application was made at 50% head emergence. Applications were made in 19.9-20.2 gallA using ground equipment with a spray adjuvant added to the spray solution. A separate plot was left untreated for control samples. Mature wheat grain treated at the lx and 5x rate was harvested 52 days following the final application; wheat grain treated at the 3x rate was not harvested, processed, or analyzed. Wheat grain from the l x rate plot was harvested to produce RAC samples to process into aspirated grain fractions and grain from the 5x rate plot was harvested to produce RAC samples for processing into wheat flour, bran, middlings, shorts, and germ.
One sample of untreated and duplicate samples of treated mature wheat grain were each collected from the lx and 5x treatment plots and shipped at ambient conditions to Englar Food Laboratories, Inc. (Moses Lake, WA) on the day of harvest. Samples were stored frozen at the Englar Food Laboratories prior to processing and processing was completed within 41-42 days of harvest. Wheat grain samples from the 5x treatment plot were processed according to simulated industrial procedures into flour, bran, middlings, shorts, and gem. A subsample of wheat grain (RAC) was placed in frozen storage prior to processing. Processed commodities were stored frozen following processing, and RAC and processed samples were shipped frozen to BASF APC for analysis. The petitioner submitted adequate descriptions of the processing procedures and material balance information.
290
In addition, wheat grain samples from the lx treatment plot were processed according to simulated industrial procedures into aspirated grain fractions. Processing was completed within 41 days of harvest. Briefly, grain was abraded and cleaned to remove grain dust and small debris using a seed cleaner and aspirator. The aspirated material was collected and screened. The aspirated grain fractions were separated by a sieving process into four fractions based on particle size using 2000- to 2380-pm, 1190- to 2000-pm, 841- to 1190-pm, and 420- to 841-pm mesh screens. Samples were frozen following generation and shipped frozen to BASF APC. The aspirated grain fractions were combined at BASF APC to generate one sample for analysis.
Later growth stage apvlications (MRID 45321 101)
A single wheat field trial was conducted during the 2000 growing season in Cass County, ND. The trial consisted of two treated plots in which treatments differed according to application rates. Two broadcast foliar applications of the 2 lblgal EC formulation were made to wheat plants, with a 6-day retreatment interval, at 0.20-0.21 lb aiINapplication for a total rate of 0.41 Ib ai/A (- l x the maximum proposed seasonal rate) or at 0.99-1 .O1 lb aWapplication for a total rate of 2.00 lb ai/A (-5x the maximum proposed seasonal rate). The first application was made at full head emergence and the second application at the end of anthesis. Applications were made in 9.9-10.3 gal/A using ground equipment with a spray adjuvant supplied by BASF added to the spray solution. A separate plot was left untreated for control samples. Mature wheat grain treated at the l x and 5x rate was harvested 39 days following the final application. Wheat grain from the lx rate plot was harvested to produce RAC samples to process into aspirated grain fractions, and grain from the 5x rate plot was harvested for processing into wheat flour, bran, middlings, shorts, and germ.
Bulk samples of untreated and treated mature wheat grain were each collected from the ix and 5x treatment plots and frozen. Samples were shipped frozen to the Food Protein Research and Development Center (Bryan, TX) within 14 days of harvest. Samples were stored frozen at the processor prior to processing and processing was completed within 53 days of harvest. Wheat grain samples from the 5x treatment plot were processed according to simulated commercial procedures into flour, bran, middlings, shorts, and germ. A subsample of wheat grain (RAC) was placed in frozen storage prior to processing. Processed commodities were stored frozen following processing, and RAC, and processed samples were shipped frozen to BASF APC for analysis. The petitioner submitted adequate descriptions of the processing procedures and material balance information.
In addition, wheat grain samples from the l x treatment plot were processed according to simulated industrial procedures into aspirated grain fractions as described above. The ASPIRATED GRAIN FRACTIONS were separated by a sieving process into six fractions based on particle size using 425,850,1180,2030, and 2540 pm mesh screens; aspirated grain fractions less than 2540 pm were recombined to generate one sample for analysis. Samples were frozen following generation and were shipped frozen to BASF APC for analysis.
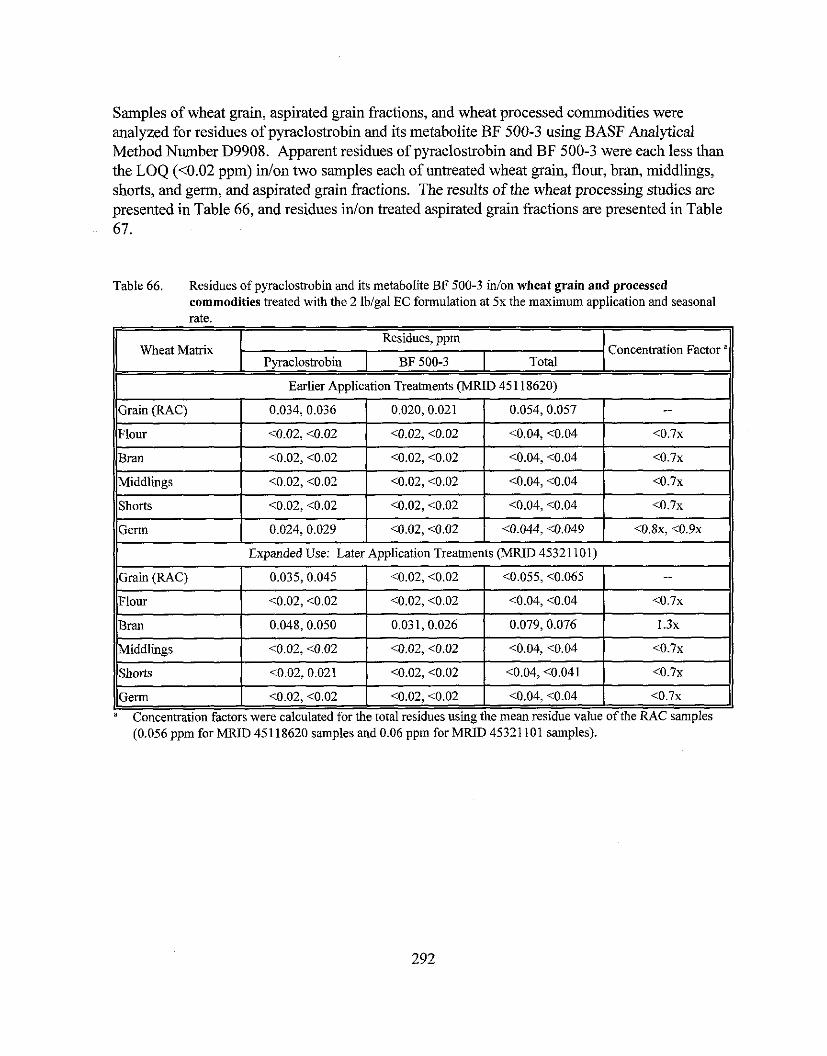
Samples of wheat grain, aspirated yain fractions, and wheat processed commodities were analyzed for residues of pyraclostrobin and its metabolite BF 500-3 using BASF Analytical Method Number D9908. Apparent residues of pyraclostrobin and BF 500-3 were each less than the LOQ (<0.02 ppm) idon two samples each of untreated wheat grain, flour, bran, middlings, shorts, and germ, and aspirated grain fractions. The results of the wheat processing studies are presented in Table 66, and residues idon treated aspirated grain fractions are presented in Table 67.
(0.056 ppm for MRID 451 18620 samples and 0.06 ppm for MRlD 45321 101 samples).
Table 66. Residues of pyraclostrobin and its metabolite BE 500-3 inlon wheat grain and processed commodities treated with the 2 lblgal EC formulation at 5x the maximum application and seasonal rate.
Concentration Factor ' Residues, ppm
Wheat Matrix Pyraclostrobin I BF 500-3 Total
Middlings
Shorts
Genn - " Concentration factors were calculated for the total residues using the mean residue value of the RAC samples
<0.02, <0.02
<0.02,0.021
<0.02, <0.02
<0.02, <0.02
<0.02, <0.02
<0.02, <0.02
<0.04, ~ 0 . 0 4
<0.04, <0.041
<0.04, c0.04
<0.7x
<0.7x
<0.7x
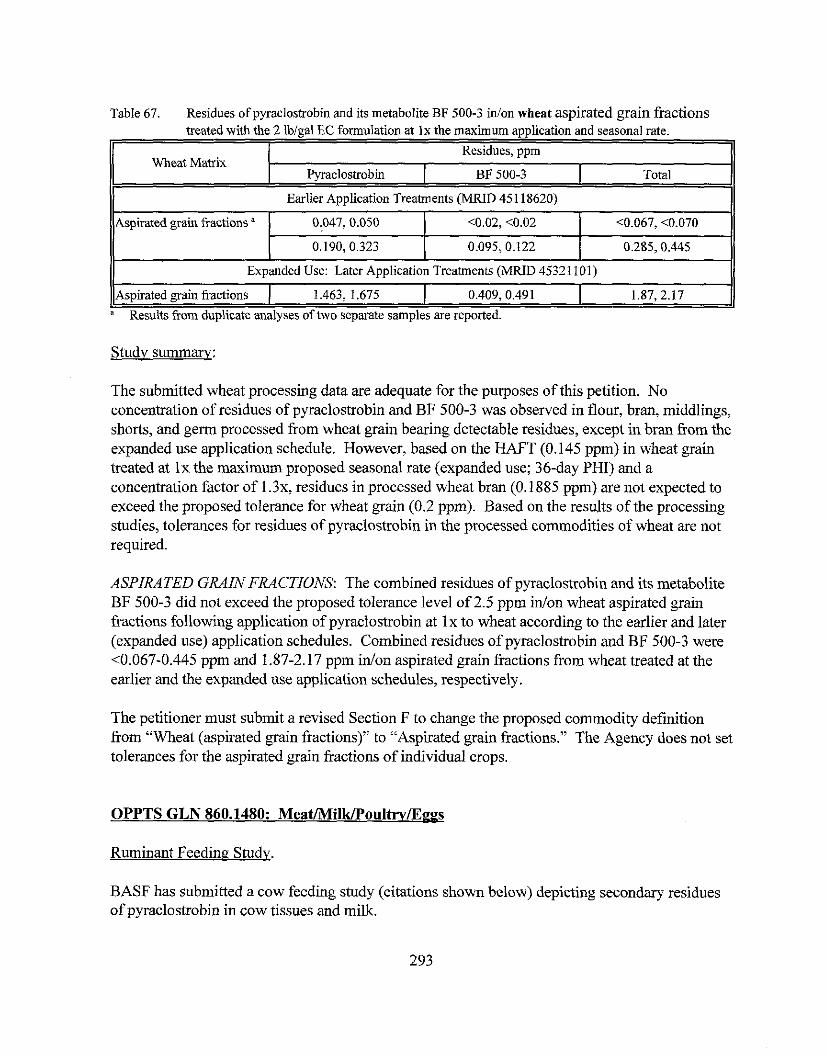
Table 67. Residues of pyraclostrobin and its metabolite BF 500-3 idon wheat aspirated grain fractions treated with the 2 lblgal EC formulation at l x the maximum application and seasonal rate.
Wheat Matrix
Aspirated grain fractions '
Study summary:
Aspirated grain fractions 1 1.463, 1.675
The submitted wheat processing data are adequate for the purposes of this petition. No concentration of residues of pyraclostrobin and BF 500-3 was observed in flour, bran, middlings, shorts, and germ processed from wheat grain bearing detectable residues, except in bran from the expanded use application schedule. However, based on the HAFT (0.145 ppm) in wheat grain treated at l x the maximum proposed seasonal rate (expanded use; 36-day PHI) and a concentration factor of 1.3x, residues in processed wheat bran (0.1885 ppm) are not expected to exceed the proposed tolerance for wheat grain (0.2 ppm). Based on the results of the processing studies, tolerances for residues of pyraclostrobin in the processed commodities of wheat are not required.
Earlier Application Treatments (MRID 45 1 18620)
Residues, ppm
Expanded Use: Later Application Treatments (MRID 45321 101)
0.047,0.050
ASPIRATED GRAIN FRACTIONS: The combined residues of pyraclostrobin and its metabolite BF 500-3 did not exceed the proposed tolerance level of 2.5 pprn idon wheat aspirated grain fractions following application of pyraclostrobin at l x to wheat according to the earlier and later (expanded use) application schedules. Combined residues of pyraclostrobin and BF 500-3 were <0.067-0.445 pprn and 1.87-2.17 pprn idon aspirated grain fractions from wheat treated at the earlier and the expanded use application schedules, respectively.
Pyraclostrobin
" Results from duplicate analyses of two separate samples are reported.
0.409,0.491
The petitioner must submit a revised Section F to change the proposed commodity definition from "Wheat (aspirated grain fractions)" to "Aspirated grain fractions." The Agency does not set tolerances for the aspirated grain fractions of individual crops.
<0.02, <0.02
1.87, 2.17
OPPTS GLN 860.1480: Meat/Milk/Poultw/E~vs
BF 500-3
<0.067, <0.070
0.190,0.323
Ruminant Feeding Study.
Total
0.095, 0.122 I 0.285,0.445
BASF has submitted a cow feeding study (citations shown below) depicting secondary residues of pyraclostrobin in cow tissues and milk.
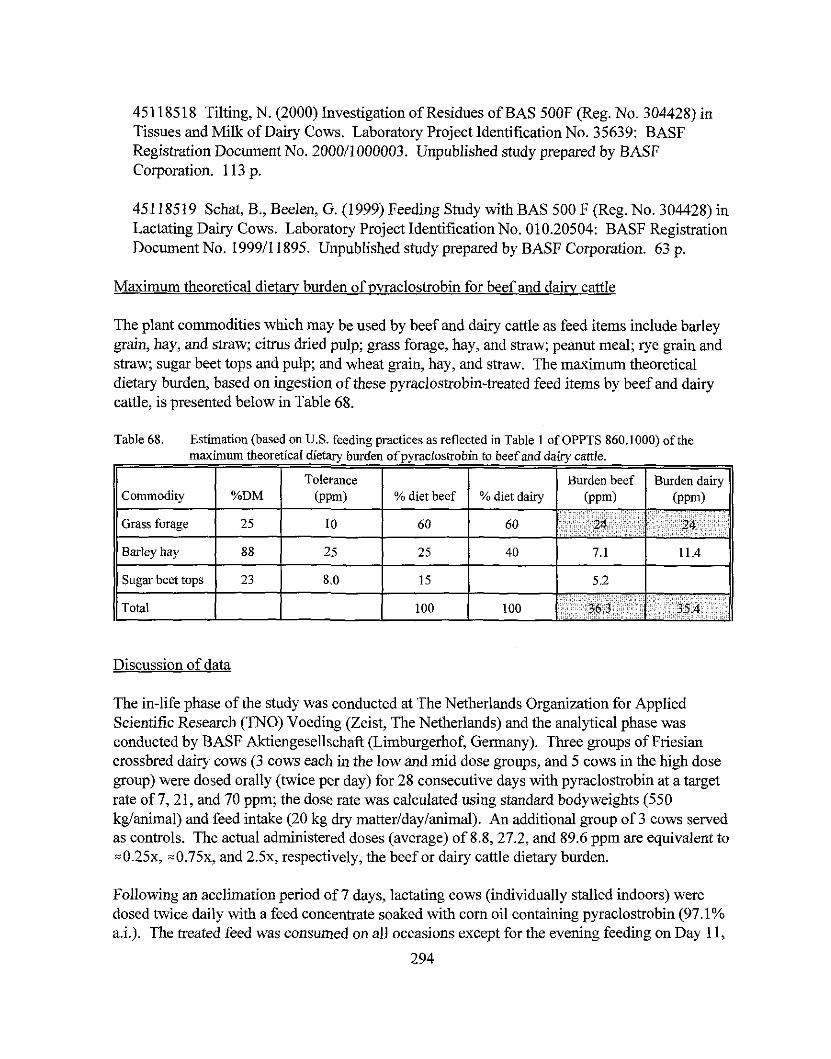
451 18518 Tilting, N. (2000) Investigation of Residues of BAS 500F (Reg. No. 304428) in Tissues and Milk of Dairy Cows. Laboratory Project Identification No. 35639: BASF Registration Document No. 2000/1000003. Unpublished study prepared by BASF Corporation. 113 p.
451 18519 Schat, B., Beelen, G. (1999) Feeding Study with BAS 500 F (Reg. No. 304428) in Lactating Dairy Cows. Laboratory Project Identification No. 010.20504: BASF Registration Document No. 1999/11895. Unpublished study prepared by BASF Corporation. 63 p.
Maximum theoretical dietary burden of ~vraclostrobin for beef and daiw cattle
The plant commodities which may be used by beef and dairy cattle as feed items include barley grain, hay, and straw; citrus dried pulp; grass forage, hay, and straw; peanut meal; rye grain and straw; sugar beet tops and pulp; and wheat grain, hay, and straw. The maximum theoretical dietary burden, based on ingestion of these pyraclostrobin-treated feed items by beef and dairy cattle, is presented below in Table 68.
Table 68. Estimation (based on U.S. feeding practices as reflected in Table 1 of OPPTS 860.1000) of the maximum theoreticaI dietary burden of pyraclostrobin to beef and dairy cattle.
Tolerance Burden beef Burden dairy % diet beef % diet dairy
Grass forage 25 10 60 60 t 24
//Barley hay 88 25 25 40 7.1 11.4 1)
Discussion of data
The in-life phase of the study was conducted at The Netherlands Organization for Applied Scientific Research (TNO) Voeding (Zeist, The Netherlands) and the analytical phase was conducted by BASF Aktiengesellschaft (Limburgerhof, Germany). Three groups of Friesian crossbred dairy cows (3 cows each in the low and mid dose groups, and 5 cows in the high dose - A - group) were dosed orally (twice per day) for 28 consecutive days with pyraclostrobin at a target rate of 7,21, and 70 ppm; the dose rate was calculated using standard bodyweights (550 - - kglanimal) and feed Intake (20 kg dry matter/day/anirnal). An additional group of 3 cows served as controls. The actual administered doses (average) of 8.8,27.2, and 89.6 ppm are equivalent to =0.25x, =0.75x, and 2.5x, respectively, the beef or dairy cattle dietary burden.
Following an acclimation period of 7 days, lactating cows (individually stalled indoors) were dosed twice daily with a feed concentrate soaked with corn oil containing pyraclostrobin (97.1% a.i.). The treated feed was consumed on all occasions except for the evening feeding on Day 11,
294
in which one cow from the low-dose group which did not eat all of the offered feed. During the treatment period, cows were additionally fed grass silage (41.3% dry matter) and water was provided ad libitum. The petitioner submitted adequate information pertaining to body weights, daily food consumption, milk production, and general health of the test animals.
Cows were milked twice daily; a.m. and subsequent p.m. samples were composited for each animal for each sampling day and stored frozen. Subsamples of milk collected on Day 26 were separated into milk fat and skim milk by centrifugation and frozen. Milk samples were shipped twice during the study by freezer van to BASF for analysis. Animals were sacrificed within 23 hours of the final dose; two cows from the high-dose group were sacrificed 2 and 7 days after the final dose to determine residue levels post dosing (residue depletion). Samples of liver, kidney, fat, and muscle (left thigh) were collected after sacrifice. Tissue samples were chopped, frozen, and shipped to BASF for analysis. Tissue samples were ground with dry ice; all milk and tissue samples were stored frozen (-18 C) at BASF prior to analysis. The maximum storage intervals from collection until analysis were 92 days (3 months) for whole milk, 81 days (2.7 months) for skim milk, 185 days (6.1 months) for milk fat, 197 days (6.5 months) for fat, 172 days (5.7 months) for liver, 165 days (5.4 months) for kidney, and 153 days (5 months) for muscle.
Whole milk, skim milk, milk fat, and tissue samples were analyzed for residues of pyraclostrobin per se using the HPLC/UV method 439, with LOQs of 0.01 pprn for milk and 0.05 pprn for tissues. Milk and tissue samples were also analyzed by the common moiety methods GCIMS method 44610 and LCIMSIMS method 44611. For these methods, the reported LOQs were 0.01 pprn in milk and 0.05 pprn in tissues for pyraclostrobin compounds hydrolyzable to BF 500-5 and 0.01 pprn in milk and 0.05 pprn in tissues for pyraclostrobin compounds hydrolyzable to BF 500-8.
Apparent residues of pyraclostrobin were below the respective LOQ (0.01 pprn for milk and 0.05 pprn for tissues) in all untreated samples of whole milk (n= 16), skim milk (n=2), milk fat (n=3), fat (n=3), liver (n=3), kidney (n=3), and muscle (n=3) analyzed using HPLC/UV. Apparent residues of pyraclostrobin compounds hydrolyzable to BF 500-5 and BF 500-8 were each below the LOQ (0.01 ppm) in untreated whole milk (n=24), skim milk (n=2), and milk fat (n=2) samples analyzed by GCIMS. Apparent residues of pyraclostrobin compounds hydrolyzable to BF 500-5 and BF 500-8 were each below the LOQ (0.05 ppm) in all untreated liver (n=2), kidney (n=l), muscle (n=l), and fat (n=l) samples analyzed by the LCIMSIMS method. Residues of pyraclostrobin and/or its metabolites in milk and tissue samples from the mid and high dose groups are presented in Tables 69 (mid dose) and 70 (high dose); residues of pyraclostrobin and its metabolites were less than the method LOQs in all milk and tissue samples from the low dosing level. Residue values were not corrected or adjusted for method recoveries.
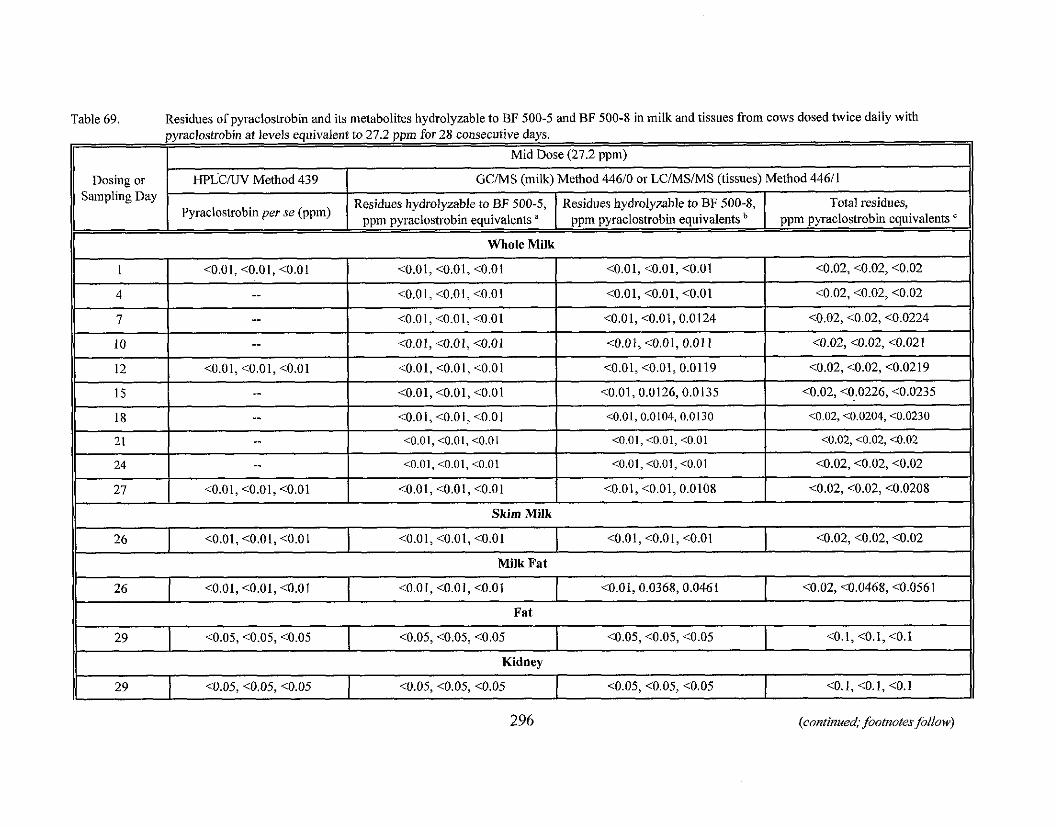
~
-
II~PP powan (sanss!~) SWSW~~ lo OI~PP PO~I~ML ('t~!m) SWI~ Kga Zu!1dm12~
(mdd) as dad ~qoJls0~3I21~d
(mdd Z'LZ) asoa prn ,sLsp an1~n3asuo3 82 IOJ mdd ~LZ 01 ]ua[e~!nba slanar 112 u!qoqso[3mLd
ql!~ L1!12p a3!w pasop SMO~ mog sanss!] pm ypm u! 8-005 dg pa S-005 da 01 a[qezK1o~pLq saI!loqelam sl! puv u!qoqso~3erLdjo sanp!sax '69 alTL
6EP POPN ~n137rn
. s~ualen~nba mqoi1so13erLd urdd '5-00s $a ox a[qezL~o.[pLq sanp!sax
, sma[e~!nba u!qoasopeliCd mdd 'sanp~sa~ [e~o~
JO au!soa
, s)ualen!nba mqoaso13e~Ld mdd '8-005 sa m a[qezLlorpLq sanpcsax
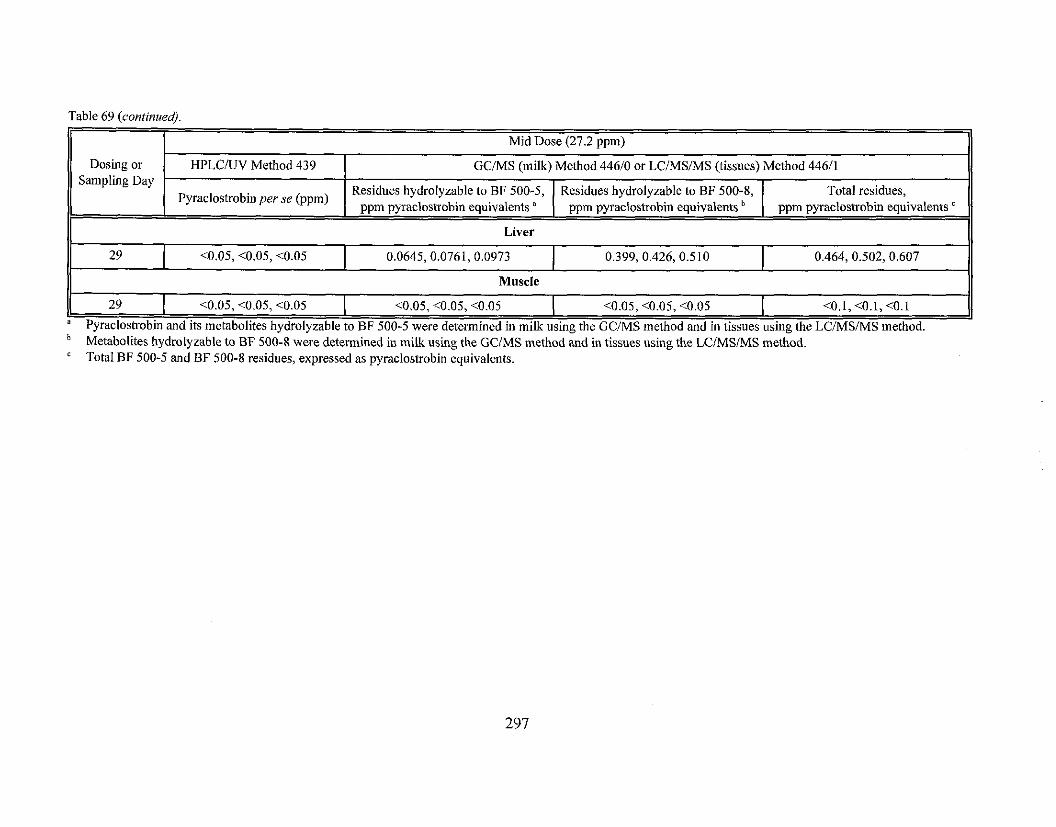
Table 69 (continued).
Mid Dose (27.2 ppm)
Dosing or Sampling Day
Muscle
HPLCNV Method 439
Pyraclostrobin per se (ppm)
29
Liver
GCIMS (milk) Method 44610 or LCIMSIMS (tissues) Method 44611
29
Vyraclostrobin and its metabolites hydrolyzable to BF 500-5 were determined in milk using the GCIMS method and in tissues using the LCIMSIMS method. Metabolites hydrolyzable to BF 500-8 were determined in milk using the GCIMS method and in tissues using the LCIMSIMS method. Total BF 500-5 and BF 500-8 residues, expressed as pyraclostrobin equivalents.
<0.05,<0.05, <0.05
Total residues, ppm pyraclostrobin equivalents '
Residues hydrolyzable to BF 500-5, ppm pyraclostrobin equivalents a
<0.05, <0.05,<0.05
<0.05, <0.05, <0.05
Residues hydrolyzable to BF 500-8, ppm pyraclostrobin equivalents
0.0645, 0.0761, 0.0973
<0.05, <0.05, c0.05 <0.1,<0.1, <0.1
0.399, 0.426, 0.510 0.464, 0.502, 0.607
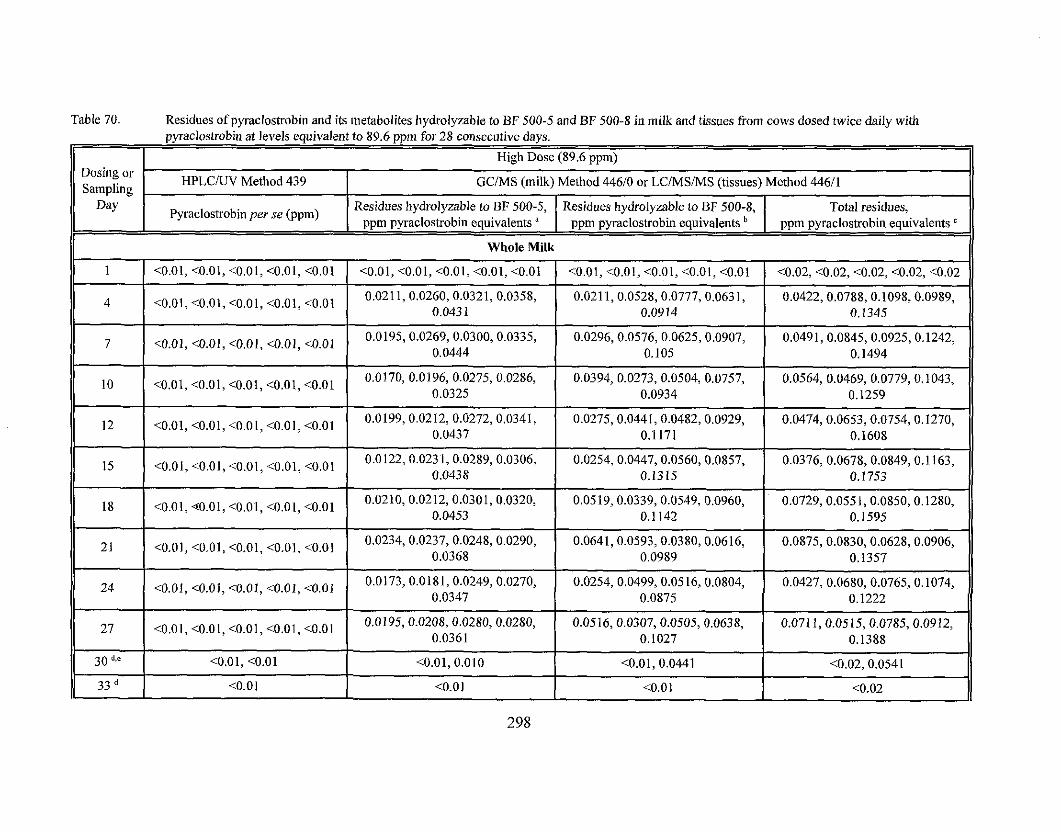
Table 70. Residues of pyraclostrobin and its metabolites hydrolyzable to BF 500-5 and BF 500-8 in milk and tissues from cows dosed twice daily with pyraclostrobin at levels equivalent to 89.6 ppm for 28 consecutive days.
High Dose (89.6 ppm)
I1 Dosing or Sampling
Whole Milk It I I <0.01, c0.01, <O.Ol, co.01, -0.01 , co.01, a . 0 1 , co.01, i0.01, <o.o1 I <O.Ol, <O.Ol, co.01, <O.OI, co.01 I r0.02, <o,02, <0.02, c0.02, co.02 ll
. .
HPLCAJV Method 439 I GCIMS (milk) Method 44610 or LCIMSIMS (tissues) Method 44611
Pyraclostrobinper se @pm) Residues hydrolyzable to BF 500-5, ppm pyraclostrobin equivalents a
Residues hydrolyzable to BF 500-8, ppm pyraclostrobin equivalents
Total residues, "pm pyraclostrobin equivalents
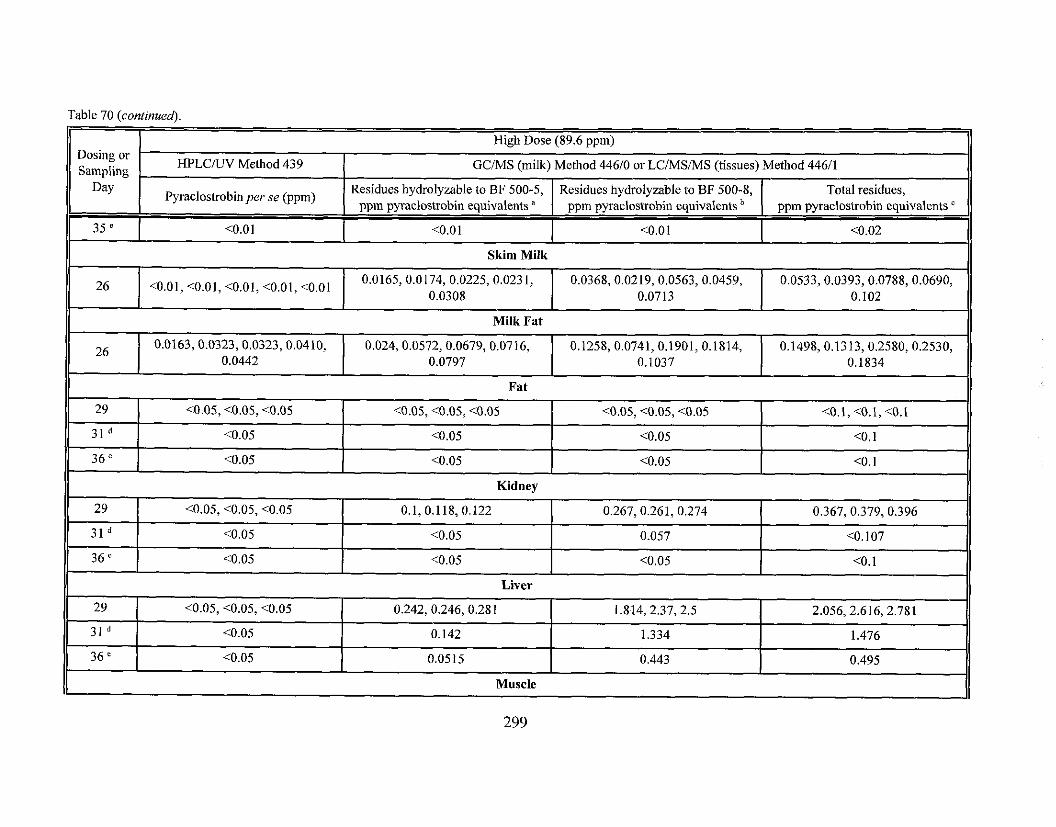
S6b'O
9LP'I
18L'Z '919'~ '9SO'z
I 'O>
1'02
I'O> 'l'o> 'l'O>
EbP'O
bEE'1
S'Z 'LE'Z 'PIX'I
--
lea YI!W
aaAg
SO'O>
SO'O>
SO'O> 'SO'O> 'SO'O>
ZOI'O '0690'0 '88LO'O 'E6EO'O 'EESO'O
, I - --
SISO'O
Zb1.0
I SZ'O '9PZ'O 'ZbZ'O
I 'O>
LO [ 'O>
96E'O '6LE'O 'L9E'O
bE8I'O 'OESZ'O '08SZ'O 'EIEI'O '86PI.O
, sluale~!nba u!qollso[3elLd add 'sanpfsal [elo~
SO'O>
SO'O>
SWO> 'SO'O> 'S0'0>
EI LO'O '6SbO'O 'E9S0'0 '61ZO'O '89EO0O
SO'O>
SO'O>
SO'O> 'SO'O> 'SWO>
Laup!x
SO'O>
LSO'O
bLZ'0 '19Z.O 'L9Z'O
LEOI'O 'PlSI'O '1061'0 'IbLO'O '8SZI'O
". , swale~!nba u!qo~lsa[3a.tKd mdd
'8-00s dB 03 a[q~zLlolpi(q sanp!sax
a9E
P IE
6Z
50'02
SO'O>
SO'O> 'SO'@ 'S0'0>
80E0'0 'IEZO'O 'SZZO'O 'b~10.0 '5910'0
SO'O>
SO'O>
ZZI'O'811'0 '1'0
.9E
PIE
62
L6LO'O '9 1 LO'O '6L90'0 'ZLSO'O 'bZ0'0
. sluale&\nba u!qo1$~0[3e~Kd mdd 's-00s dg 03 a[qezL[oIpLq sanpLsa2
IO'O> '10'0s '10'0> '10'0> '10'0>
SO'O>
SO'O>
SO'O> 'SO'O> 'SO'O>
ZPPO'O 'OIbO'O 'EZEO'O 'EZEO'O 'E910'0
9z
(add) as dad u!qo~lsope.t&
.9E
PIE
62
9z
Lea
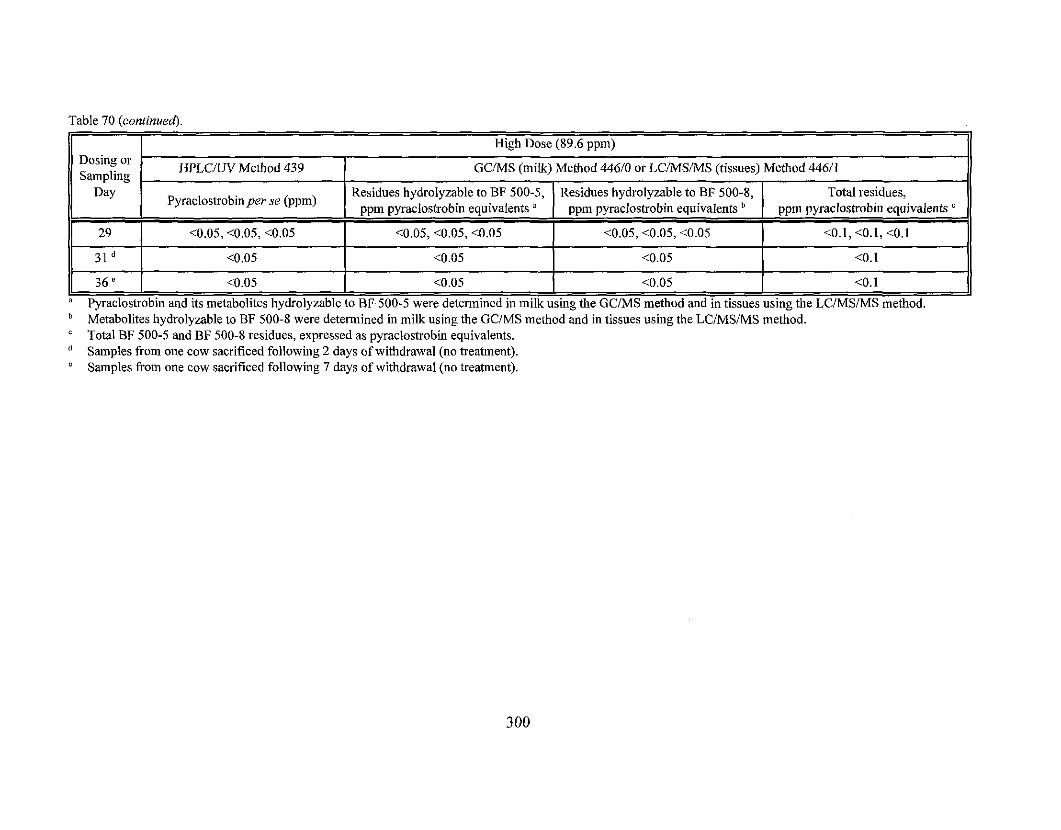
Table 70 (coniinueal
High Dose (89.6 ppm)
36 ' c0.05 <0.05 <0.05 <0.1 " Pyraclostrobin and its metabolites hydrolyzable to BF 500-5 were determined in milk using the GCIMS method and in tissues using the LCIMSIMS method.
Metabolites hydrolyzable to BF 500-8 were determined in milk using the GCIMS method and in tissues using the LCIMSIMS method. Total BF 500-5 and BF 500-8 residues, expressed as pyraclostrobin equivalents. Samples from one cow sacrificed following 2 days of withdrawal (no treatment). Samples from one cow sacrificed following 7 days of withdrawal (no treatment).
Dosing or Sampling
Day
HPLCiW Method 439
Pyraclostrobinper se (ppm)
GUMS (milk) Method 44610 or LC/MS/MS (tissues) Method 44611
Residues hydrolyzable to BF 500-5, oom ovraclostrobin eauivalents
Residues hydrolyzable to BF 500-8, oum owaclostrobin eauivalents
Total residues, uom ovraclostrobin eauivalents
Study summarv:
The submitted dairy cattle feeding data are adequate for the purpose of establishing tolerances for pyraclostrobin residues of concern in livestock commodities. Dairy cows were orally dosed twice daily for 28 consecutive days with pyraclostrobin at dose levels equivalent to 8.8 ppm, 27.2 ppm, and 89.6 ppm. The anticipated maximum dietary burdens of pyraclostrobin for beef and dairy cattle are tentatively estimated to be 36.3 pprn and 35.4 ppm, respectively. Assuming that pyraclostrobin residues of concern in ruminant commodities are pyraclostrobin and its metabolites hydrolyzable to BF 500-5 and BF 500-8, RAB3 offers the following conclusions and recommendations based on the maximum residues found at the feeding level of 27.2 pprn (mid dose) and 89.6 pprn (high dose) (30 .75~ and 2 . 5 ~ the anticipated maximum dietary burden for beef or dairy cattle).
Maximum combined residues of pyraclostrobin and its metabolites hydrolyzable to BF 500-5 and BF 500-8 were <0.02-<0.0235 ppln and <0.02-0.175 ppm, respectively for the mid dose and the high dose groups in whole milk, <0.02 pprn and 0.0393-0.102 pprn in skim milk, and <0.02- 10.0561 pprn and 0.131-0.258 pprn in milk fat. These data suggest that the proposed tolerance of 0.1 pprn for milk is adequate.
Maximum combined residues of pyraclostrobin and its metabolites hydrolyzable to BF 500-5 and BF 500-8 were 0.464-0.607 pprn and 2.06-2.78 pprn in liver, respectively for mid dose and high dose groups. These data suggest that the proposed tolerance of 1.5 pprn for liver is adequate.
Maximum combined residues of pyraclostrobin and its metabolites hydrolyzable to BF 500-5 and BF 500-8 were (for respective mid dose and high dose groups) <0.1 pprn and 0.396 pprn in kidney, and <0.1 pprn and <0.1 pprn in fat and muscle. These data suggest that the proposed tolerance levels of 0.1 pprn for muscle and fat are adequate. However, the proposed tolerance of 0.1 pprn for kidney is not adequatz; we recommend a tolerance of 0.2 pprn instead.
The petitioner needs to submit a revised Section F for livestock commodity tolerances. The tolerance expression must be revised to reflect the compounds that are determined using the proposed enforcement methods. In addition, tolerances for ruminant commodities in addition to '
cattle are required. Tolerances must be proposed for the fat, meat, and meat byproducts of cattle, goats, hogs, horses, and sheep.
Overall, residues of pyraclostrobin increased in milk and tissues with the increase in the dose level. Residues in whole milk appeared to plateau at Day 15 and did not significantly increase with subsequent doses (mid dose data). In tissues, residues were highest in liver. The depletion study (cows sacrificed 2 and 7 days following withdrawal from treatment) demonstrated that residues declined in milk and tissues once exposure was discontinued.
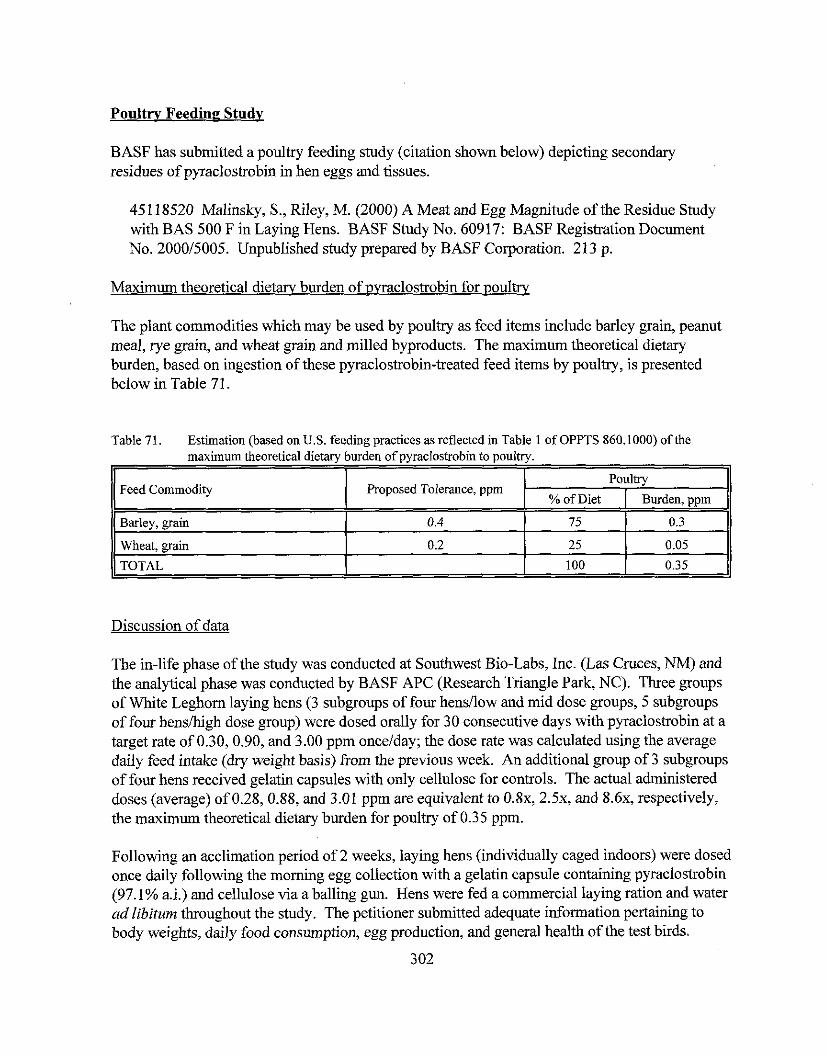
Poultrv Feeding Studv
BASF has submitted a poultry feeding study (citation shown below) depicting secondary residues of pyraclostrobin in hen eggs and tissues.
451 18520 Malinsky, S., Riley, M. (2000) A Meat and Egg Magnitude of the Residue Study with BAS 500 F in Laying Hens. BASF Study No. 60917: BASF Registration Document No. 200015005. Unpublished study prepared by BASF Corporation. 213 p.
Maximum theoretical dietaw burden of vvraclostrobin for voultry
The plant commodities which may be used by poultry as feed items include barley grain, peanut meal, rye grain, and wheat grain and milled byproducts. The maximum theoretical dietary burden, based on ingestion of these pyraclostrobin-treated feed items by poultry, is presented below in Table 71.
Table 71. Estimation @ased on U.S. feeding practices as reflected in Table 1 of OPPTS 860.1000) of the maximum theoretical dietary burden of pyraclostrobin to poultry.
Discussion of data
Feed Commodity
Barley, grain
Wheat, grain
The in-life phase of the study was conducted at Southwest Bio-Labs, Inc. (Las Cruces, NM) and the analytical phase was conducted by BASF APC (Research Triangle Park, NC). Three groups of White Leghorn laying hens (3 subgroups of four hensilow and mid dose groups, 5 subgroups of four henshigh dose group) were dosed orally for 30 consecutive days with pyraclostrobin at a target rate of 0.30, 0.90, and 3.00 ppm oncelday; the dose rate was calculated using the average daily feed intake (dry weight basis) from the previous week. An additional group of 3 subgroups of four hens received gelatin capsules with only cellulose for controls. The actual administered doses (average) of 0.28,0.88, and 3.01 ppm are equivalent to 0.8x, 2.5x, and 8.6x, respectively, the maximum theoretical dietary burden for poultry of 0.35 ppm.
Following an acclimation period of 2 weeks, laying hens (individually caged indoors) were dosed once daily following the morning egg collection with a gelatin capsule containing pyraclostrobin (97.1 % a.i.) and cellulose via a balling gun. Hens were fed a commercial laying ration and water ad libitum throughout the study. The petitioner submitted adequate information pertaining to body weights, daily food consumption, egg production, and general health of the test birds.
7
Proposed Tolerance, ppm
0.4
0.2
TOTAL
- Poultry
% ofDiet I Burden, ppm
25
75
0.05
100
0.3
0.35
Eggs were collected twice daily; p.m. and subsequent a.m. samples were composited for each subgroup for each sampling day and stored frozen. Hens were sacrificed within 6.5 hours of the final dose; two subgroups from the high-dose level were sacrificed 3 and 7 days after the final dose to determine residue levels post dosing (residue depletion). Samples of fat (composite of mesenteric and peripheral), liver, and muscle (composite) were collected after sacrifice. Tissue samples were pooled by subgroup, homogenized with liquid nitrogen, and frozen (<-I5 C). Egg and tissue samples were shipped frozen to BASF for analysis. All egg and tissue samples were stored frozen (<-lo C) at BASF prior to analysis. The maximum storage intervals from collection until analysis were 149 days (-5 months) for eggs, 126 days (-4 months) for fat, 92 days (-3 months) for liver, 174 days (-6 months) for muscle.
Egg and tissue samples were analyzed for residues of pyraclostrobin and its metabolites hydrolyzable to BF 500-5 and BF 500-9 using common moiety method LCMSIMS method D9902. For these methods, the reported LOQs were 0.05 ppm in eggs and tissues for pyraclostrobin compounds hydrolyzable to BF 500-5 and 0.05 ppm in eggs and tissues for pyraclostrobin compounds hydrolyzable to BF 500-9.
Apparent residues of pyraclostrobin its metabolites hydrolyzable to BF 500-5 and BF 500-9 were each below the LOQ (0.05 ppm) in all untreated egg (n=13), fat (n=l), liver (n=l), and muscle (n=l) samples. Residues of pyraclostrobin and its metabolites hydrolyzable to BF 500-5 and BF 500-9 in egg and tissue samples from the high dosing levels are presented in Table 72. Because residues at the high-dose level (8 .6~) were below the method LOQ in all samples except one egg sample (which upon reanalysis was determined to be below the LOQ), samples from the low- and mid-level dose groups, and samples from the depletion study at the high-dose level were not analyzed.
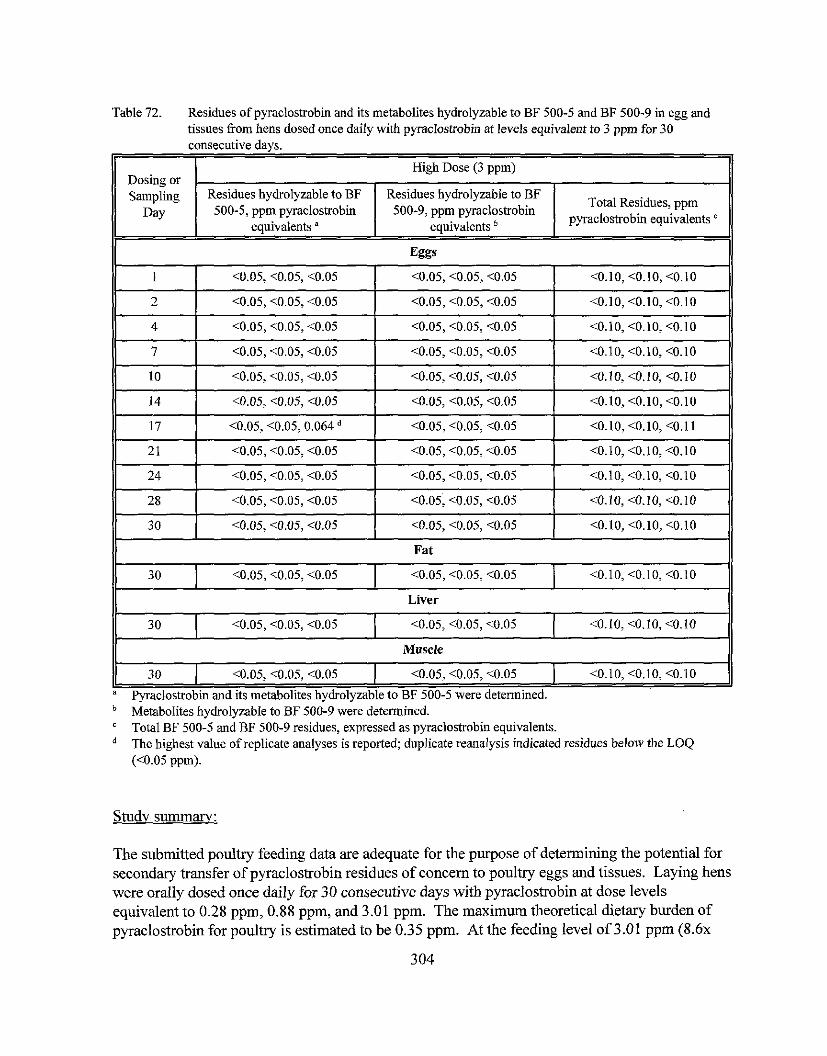
Table 72. Residues of pyraclostrobin and its metabolites hydrolyzable to BF 500-5 and BF 500-9 in egg and tissues from hens dosed once daily with pyracloslrobin at levels equivalent to 3 pprn for 30 consecutive days.
Dosing or Sampling
Day
II I
II--- - - -
- -
Muscle
<0.05,<0.05, <0.05
30
Eggs
High Dose (3 ppm)
. . Metabolites hydrolyzable to BF 500-9 were determined. Total BF 500-5 and BF 500-9 residues, expressed as pyraclostrobin equivalents. * The highest value of replicate analyses is reported; duplicate reanalysis indicated residues below the LOQ (<0.05 ppm).
Residues hydrolyzable to BF 500-5, ppm pynclostrobin
equivalents '
<0.05, <0.05, C0.05
<0.05, C0.05, <0.05
I 30
The submitted poultry feeding data are adequate for the purpose of determining the potential for secondary transfer of pyraclostrobin residues of concern to poultry eggs and tissues. Laying hens were orally dosed once daily for 30 consecutive days with pyraclostrobin at dose levels equivalent to 0.28 ppm, 0.88 ppm, and 3.01 ppm. The maximum theoretical dietary burden of pyraclostrobin for poultry is estimated to be 0.35 ppm. At the feeding level of 3.01 pprn ( 8 . 6 ~
<0.10, <0.10, <0.10
Fat
Liver
<0.05, C0.05, <0.05
Residues hydrolyzable to BF 500-9, ppm pynclostrobin
equivalents
I <0.05, <0.05, C0.05
Total Residues, pprn pyraclostrobin equivalents
<0.10, <0.10, <0.10
30
" Pvraclostrobin and its metabolites hvdrolvzable to BF 500-5 were determined.
<0.05,<0.05, C0.05
<0.05, <0.05, C0.05 <0.05, c0.05, <0.05
<0.10, <0.10, <0.10
<0.10, <0.10, <0,10
the maximum theoretical dietary burden for poultry), residues of pyraclostrobin and its metabolites hydrolyzable to BF 500-5 were less than the method LOQ (0.05 ppm) in all egg and tissue samples, except for one egg sample (Day 17) where residues of pyraclostrobin were detected at 0.064 ppm and <0.05 ppm upon re-analysis. Residue analysis of BF 500-8 was not conducted (the metabolism data show all metabolites hydrolyzable to BF 500-8 would be less than 10% TRR), but instead an isomeric compound (BF 500-9) was measured. Levels of BF 500-9 also were all <0.05 ppm. Samples from the low and mid dose groups, and depletion samples from the high dose group were not analyzed.
The poultry metabolism studies were conducted at doses equivalent to 35-36x the MTDB. When extrapolated to the lx burden, the TRRs in eggs, fat and liver would be at least 3 times below 0.05 ppm, which is the LOQ for BF 500-5 or BF 500-8. In combination with the poultry feeding data discussed above, RAB3 concludes that tolerances in poultry and eggs are not needed. A revised Section F in which tolerances for the poultry commodities are deleted needs to be submitted.
OPPTS GLN 860.1850: Confined Accumulation in Rotational Crops
BASF submitted data from a study (citation listed below) investigati~lg the metabolism of ['4CJpyraclostrobin in rotational crops (radish, lettuce, and wheat). The field and analytical phases of the study were conducted at BASF Agricultural Center, Limburgerhof, Germany.
451 18622 Veit, P. (2000) Confined Rotational crop Study with '4C-BAS-500 F. Laboratory Project Identification No. 35510, 199911 1829. Unpublished study submitted by BASF Corporation. 277 p.
The radioactive test substances, uniformly rinplabeled [chlorophenyl-'4C]pyraclostrobin (specific activity 4.34 Mbqlmg, radiochemical purity 199%) and [tolyl-14C]pyraclostrobin (specific activity 4.5 Mbqlmg, radiochemical purity >99%), were dissolved in acetone and separately applied to sandy soil (89% sand, 6% silt, and 5% clay, 0.8% organic matter, pH 6.4, cation exchange capacity 5.3 mVa11100 g) to create soil premixes at total application rates for each label of 0.8 lb aiiA (900 g aiiha) or 1.3 lb ai/A (1500 g aiiha). The soil premixes were spread in 1-cm layers on top of untreated soil in polyethylene containers, and the soil was lightly watered. At 30, 120, and 365 days following application, ploughing was simulated by removing the top 20 cm of soil from each container and mixing in a concrete mixer. After the soil was returned to the containers. radish, head lettuce, and wheat were planted to the pots at each of the plantback intervals. Plants were maintained in growth chambers or greenhouses for the duration of the study. The lower application rate is -1x the proposed seasonal rate for onions, strawberries, and sugar beets, -2x the maximum proposed rate for barley, rye, wheat, and grasses (for seed), and -3x the maximum proposed rate for peas; the higher application rate is -1x the maximum proposed rate for cucurbits, peanuts, peppers, potatoes, and tomatoes.
Samples of immature radish plants from the 30-day plantback interval were harvested 33-34 days after planting (DAP), immature lettuce plants from all intervals were harvested 33-48 DAP, and wheat forage was harvested 75-85 DAP. Samples of mature radish were harvested 47-65 DAP, lettuce heads were harvested 60-76 DAP, and wheat was harvested 152-167 DAP. Radishes were pulled from the soil and separated into roots and tops, and mature wheat was harvested by cutting plants just above the soil line and separating them into straw, grain, and chaff. Samples were stored at --I8 C prior to and throughout the analytical phase of the study.
Total radioactive residues (TRR)
Samples of rotational crop matrices were homogenized along with dry ice using a blender or a mill, and were subjected to combustioniLSC for TRR determination. As in the plant metabolism studies, TRR were also calculated for rotational crop commodities by summing extractable and nonextractable residues following initial extractions. Because combustion values were used for all further TRR calculations, the calculated values are not presented. The TRR in rotational crop commodities are presented in Table 73. The petitioner reported LOQs (all < 1 ppb) for LSC determinations of 0.00093 and 0.00096 ppm for wheat forage and 0.00059 and 0.00061 ppm for wheat straw.
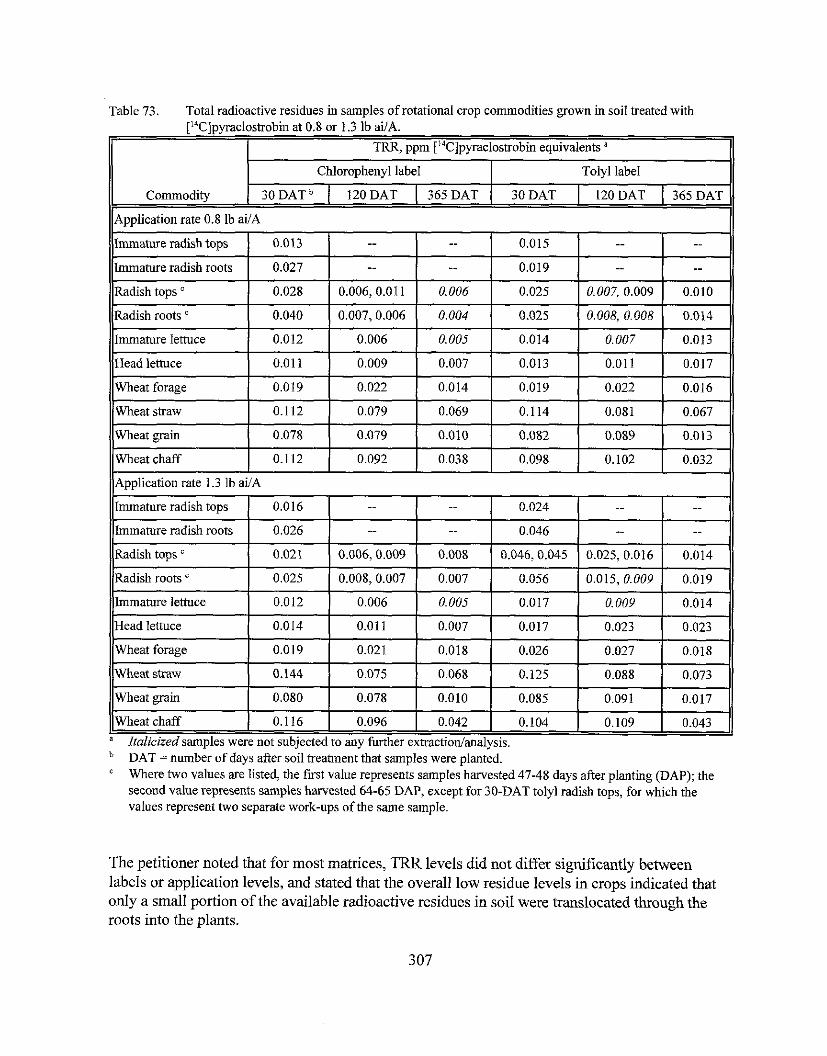
Table 73. Total radioactive residues in samples of rotational crop commodities grown in soil treated with [14C]pyraclostrobin at 0.8 or 1.3 lb ailA.
1 1 TRR, vvm I"C1vvraclostrobin eauivalents ' 11 ... - -.. Chlorophenyl label Tolyl label 11
11 Commodity 30DATb I I20 DAT ( 365 DAT I 3ODAT I 120 DAT / 365 DAT I Application rate 0.8 ih ai/A
(/Head lettuce I I I I I I 1 0.011 0.009 1 0.007 1 0.013 0.01 1 1 0.017 11
Immature radish tops 0.013
Radish tops '
Radish roots '
Immature lettuce
IlWheat forage 1 0.019 1 0.022 1 0.014 1 0.019 1 0.022 1 0.016 11
--
0.028
0.040
0.012
I)~p~licat ion rate 1.3 lb ai1A 11
-
Wheat straw
Wheat grain
Wheat chaff
--
Immature radish roots 1 0.027
0.006, 0.01 1
0.007, 0.006
0.006
0.112
0.078
0.112
Immature radish tops
Immature radish roots
Radish tops '
Radish roots '
0.015 -- I --
0.006
0.004
0.005
Immature lettuce
Head lettuce
Wheat forage
Wheat straw
The petitioner noted that for most matrices, TRR levels did not differ significantly between labels or application levels, and stated that the overall low residue levels in crops indicated that only a small portion of the available radioactive residues in soil were translocated through the roots into the plants.
--
0.079
0.079
0.092
0.016
0.026
0.021
0.025
--
0.025
0.025
0.014
0.012
0.014
0.019
0.144
Wheat grain
0.069
0.010
0.038
-- --
0.006, 0.009
0.008, 0.007
Wheat chaff 1 0.116 0.096 1 0.042 1 0.104 0.109 1 0.043
Vtal ic ized samples were not subjected to any further extraction/analysis. DAT =number of days after soil treatment that samples were planted. Where two values are listed, the fixst value represents samples harvested 47-48 days after planting (DAP); the second value represents samples harvested 64-65 DAP, except for 30-DAT tolyl radish tops, for which the values represent two separate work-ups of the same sample.
0.080 0.078
0.019
0.007, 0.009
0.008, 0.008
0.007
0.006
0.011
0.021
0.075
0.010
0.014
0.013
0.114
0.082
0.098
-.
..
0.008
0.007
0.010
--
0.005
0.007
0.018
0.068
--
0.081
0.089
0.102
0.024
0.046
0.046, 0.045
0.056
0.085
0.067
0.013
0.032
0.017
0.017
0.026
0.125
0.091 1 0.017
-- -.
0.025, 0.016
0.015, 0.009
-- --
0.014 - 0.019
0.009
0.023
0.027
0.088
0.014 - 0.023
0.018
0.073
Extraction and hvdrolvsis of residues
Samples of homogenized rotational crop commodities were subjected to extraction procedures for residue characterization and identification. During the fractionation procedures, aliauots of - .
e extracts and nonextractable residues were analyzed for radioactivity by LSC or combustionkSC. The general extraction procedures are summarized below.
Homogenized samples of rotational crop commodities were variously extracted with methanol; methanol and water; or methanol, water, and ammonia (selected tolyl-label samples). Following extractions, the respective methanol, water, andlor ammonia extracts were collected by centrifugation or filtration and combined. Methanol extracts or combined methanol and water extracts for most matrices were reserved for HPLC analysis. Aliquots of selected methanol extracts were concentrated to aqueous and subjected to partitioning with cyclohexane (3x) and ethyl acetate or with ethyl acetate alone. Depending on the total radioactivity, certain organic phases were reserved for HPLC analysis.
In general, nonextractable residues with TRR >0.010 ppm following methanol or methanol and water extractions were extracted with aqueous ammonia at 40 C and centrifuged. The remaining nonextractable residues were reserved for further characterization procedures.
The distribution of I4C-activity in the extracts of rotational crop commodities is presented in Tables 74a (chlorophenyl label, 0.8 lb ai/A), 74b (chlorophenyl label, 1.3 lb ai/A), 74c (tolyl label, 0.8 lb ailA) and 74d (tolyl label, 1.3 lb ai1A).
Extracts andor hydrolysates of rotational crop commodities were analyzed by HPLC using an Inertsil phenyl column. Separate systems were used for analysis of chlorophenyl- and tolyl-label extracts. Both systems were equipped with UV detectors (270 nm for chlorophenyl-label samples; 230 nm for tolyl-label samples), radioactivity detectors, and fraction collectors; gradient mobile phases of water and acetonitrile, each containing formic acid at 0.5%, were used. Pyraclostrobin and metabolite 500M07 (elsewhere named BF 500-3) were identified by co- chromatography using reference standards. Because overall radioactive residue levels were low, the petitioner did not attempt further identification by co-chromatography; instead, radioactivity was defined by region based on retention times and polarity, with each region containing one or more peaks. Five different regions were defined: a polar region, medium polar regions a, b, and c, and a nonpolar region. The petitioner stated that nonpolar metabolites identified in the soil degradation studies were not observed in any of the rotational crop commodities.
Certain extracts of chlorophenyl-label samples were also subjected to normal-phase TLC analysis on 60F254 plates. Plates were developed in an automated multiple development (AMD) chamber using the following solvent systems: methano1:ACN:formic acid (40:40:1, v:v:v); ACN; ACN:dichloromethane (DCM; 40:40, v:v); DCM; di-isopropylether; and di- isopropy1ether:n-heptane (40:40, v:v). In general, TLC results confirmed HPLC findings, and
308
better separation was achieved between pyraclostrobin and 500M07 (BF 500-3) with TLC than with HPLC analysis.
Following partitioning of the methanol extracts of various matrices with cyclohexane and/or ethyl acetate, the petitioner observed that in 30-DAT radish root and wheat straw samples, residue levels were higher in the organic phases than in the aqueous phase; for 30- and 120-DAT lettuce and 30-DAT wheat grain, the concentration in the aqueous phase was equal to or higher than concentration in the organic phases; for 120-DAT wheat straw and grain, a ratio of 1.3:l was observed for partitioning of residues into the organic vs aqueous phases; and for 365-DAT wheat straw the ratio was 2.3:l for the 0.8 lb ai/A application and 1.6:l for the 1.3 lb aiIA application. HPLC analysis of selected organic and aqueous phases confirmed that other more polar metabolites occurred in addition to pyraclostrobin. Pyraclostrobin and 500M07 (BF 500-3) tended to remain in the cyclohexane phase or partition into ethyl acetate; the more polar metabolites tended to partition into the aqueous phase.
The petitioner utilized three separate procedures to characterize radioactivity associated with lignin and cellulose in rotational crop commodities. To isolate lignin and cellulose, primarily in wheat straw, chaff, and grain, the petitioner subjected the nonextractable residues following ammonia extraction to hydrolysis with 10% NaOH at reflux for 3 hours. Following filtration, the filter cake was washed with 10% NaOH at 80 C followed by water. Lignin was precipitated by acidifying the combined filtrate and wash solutions with concentrated HCl; the petitioner characterized the remaining nonextractable residues as cellulose. To characterize natural products, such as cellulose and hemicelluloses, in radish tops and roots, lettuce, wheat forage, and selected wheat straw and grain samples, the nonextractable residues following ammonia extraction were subjected to enzyme hydrolysis with a mixture of cellulases and Macerozyme, a mixture of cellulase, hemicellulase, and pectinase (in sodium acetate buffer, pH 4.7, at 37 C for 20 hours). Selected hydrolysates were partitioned with ethyl acetate and/or reserved for HPLC analysis using a Resex FWM column. Enzyme hydrolysis with pronase (in tris-buffer, pH 7.3, ovemight at 37 C) was also used in some cases for characterization of nonextractable residues in radish tops and roots, lettuce, and wheat forage and straw. The petitioner further noted that the low extractability of residues into aqueous ammonia suggested that residues remaining following methanol and water extractions were most likely not associated with proteins.
To characterize starch in wheat grain, the nonextractable residues following ammonia extraction were extracted with DMS0:water (9: 1, v:v; 2x) at room temperature or refrigeration ovemight. Following centrifugation, the DMS0:water extracts were combined with ethanol to precipitate starch. To further characterize the starch fraction in tolyl-label samples, the precipitate was redissolved in 0.05 M potassium phosphate buffer containing a- &d P-amylasesand amyloglucosidases, and was incubated overnight at 40 C.
A summary of the characterized and identified I4C-residues in selected rotational crop commodities is presented in Tables 75a (chlorophenyl label, 0.8 lb ai/A), 75b (chlorophenyl label, 1.3 lb ai/A), 75c (tolyl label, 0.8 lb ai/A), and 75d (tolyl label, 1.3 lb ai/A). Examples of those mature edible commodities for which significant further characterizationianalysis attempts
309
were made were selected by the study reviewer for inclusion in these tables; for characterization of residues in the remaining matrices, refer to the distribution tables.
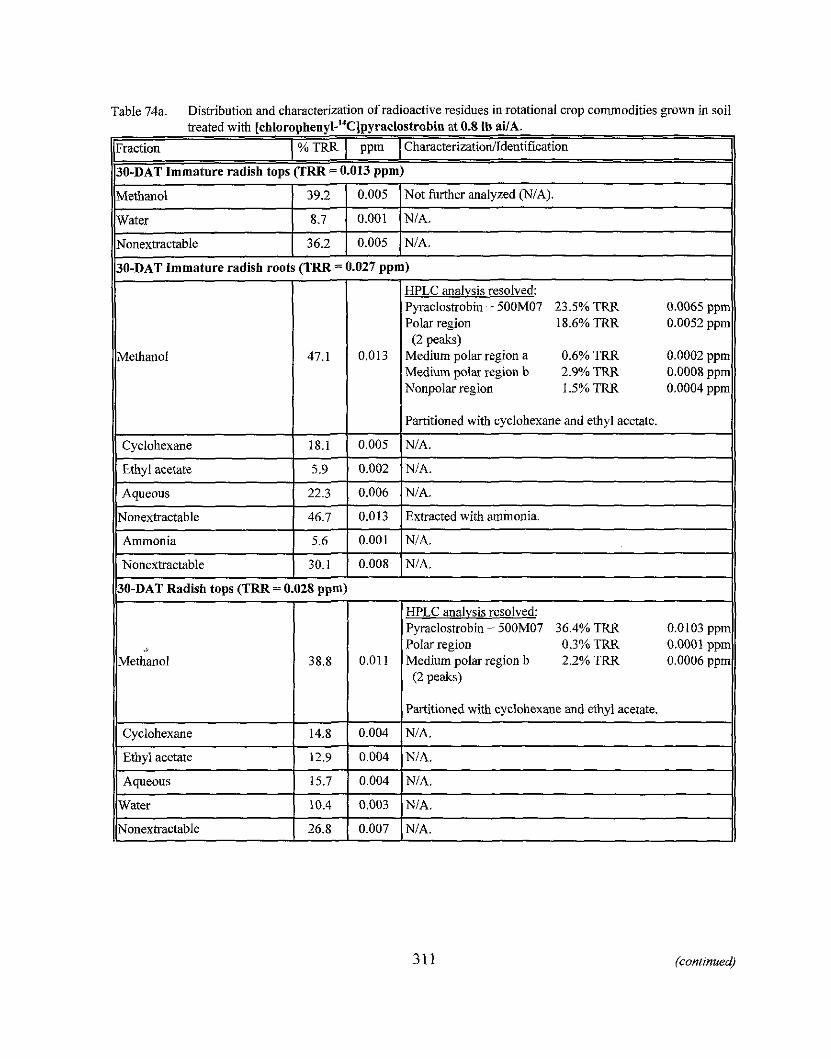
Table 74a. Distribution and characterization of radioactive residues in rotational crop commodities grown in soil treated with [~hloro~hen~l-'~C]~yraclostrobiu at 0.8 ib ai/A.
Fraction ( % TRR I ppm I CharacterizatiodIdentification
130-DAT Immature radish tops (TRR = 0.013 ppm)
Methanol
HPLC analysis resolved: Pyaclostrobin + 500M07 23.5% TRR 0.0065 ppm Polar region 18.6% TRR 0.0052 ppm
Methanol
Water
Nonextractable
30-DAT Immature radish roots (TRR = 0.027 ppm)
0.005
0.001
0.005
39.2
8.7
36.2
11 I 1 I Partitioned with cyclohexane and ethyl acetate. 11
Not further analyzed (NIA).
NIA.
NIA.
47.1 0.013
Cyclohexane
Ethyl acetate
Aqueous
(2 peaks) Medium polar region a 0.6% TRR 0.0002 ppm Medium polar region b 2.9% TRR 0.0008 ppm Nonpolar region 1.5% TRR 0.0004 ppm
Nonextractable
Ammonia
Nonextractable
11 Aqueous 1 15.7 1 0.004 1 ~ 1 ~ . 11
18.1
5.9
22.3
Cyclohexane
Ethyl acetate
46.7
5.6
30.1
0.005
0.002
0.006
30-DAT Radish tops (TRR = 0.028 ppm)
14.8
12.9
NIA.
NIA.
NIA.
0.013
0.001
0.008
Extracted with ammonia.
NIA.
NIA.
Methanol
0.004
0.004
0.01 1 38.8
Partitioned with cyclohexane and ethyl acetate.
NIA.
NIA.
HPLC analysis resolved: Pyraclostrobin + 500M07 36.4% TRR 0.0103 ppn Polar region 0.3% TRR 0.0001 ppn Medium polar region b 2.2% TRR 0.0006 ppn (2 peaks)
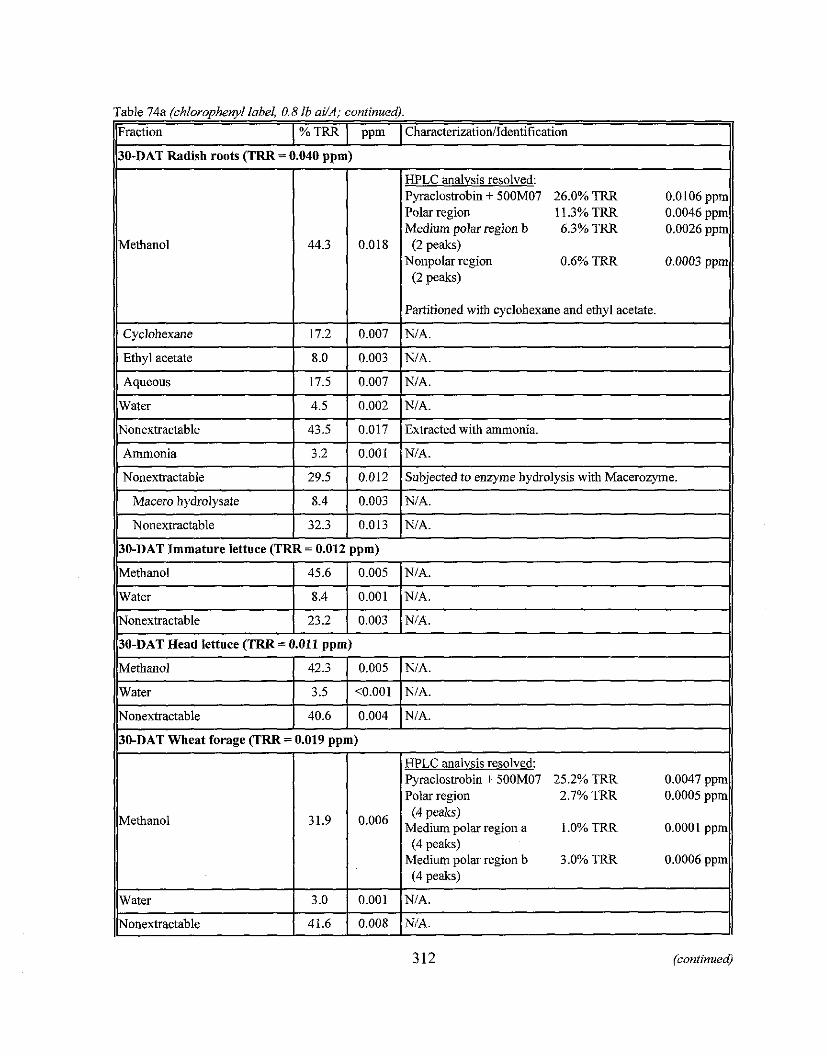
Table 74a (chlorophenyl label, 0.8 lb ai/A; continued).
7 25.2% TRR
312 (continue4
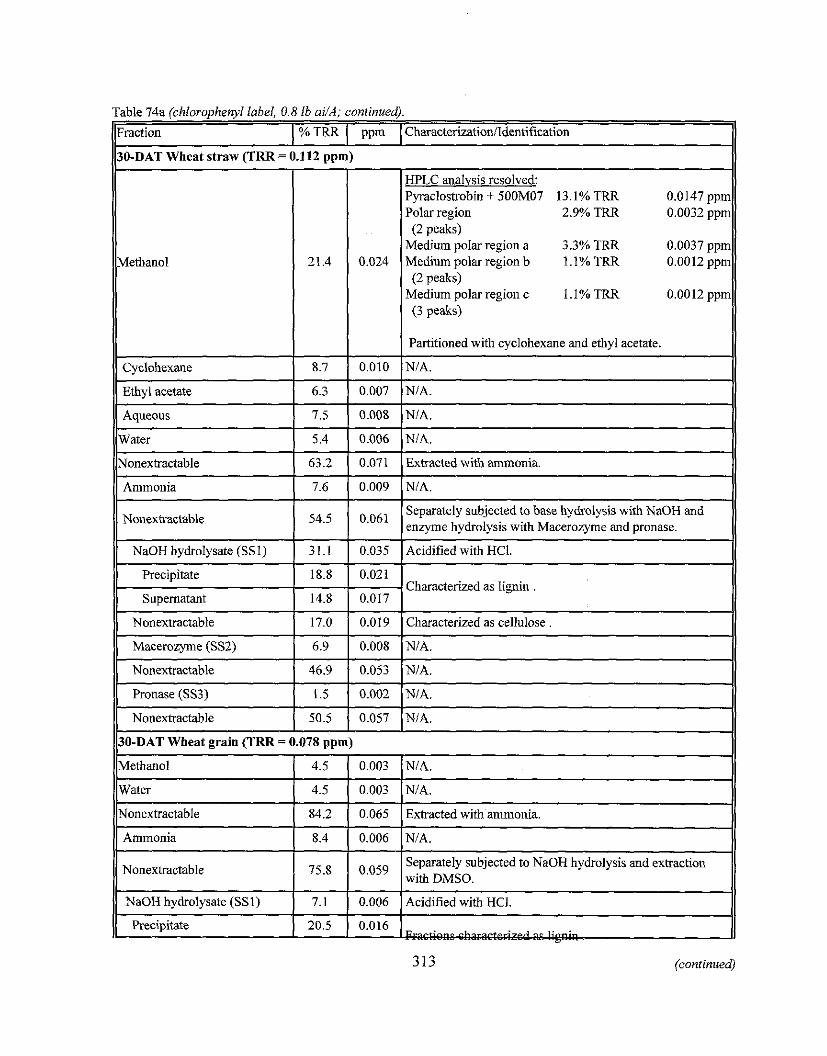
Table 74a (chlorophenyl label, 0.8 lb ai/A; continued).
edium polar region c 1.1% TRR
Characterized as lipin .
313 (continued)
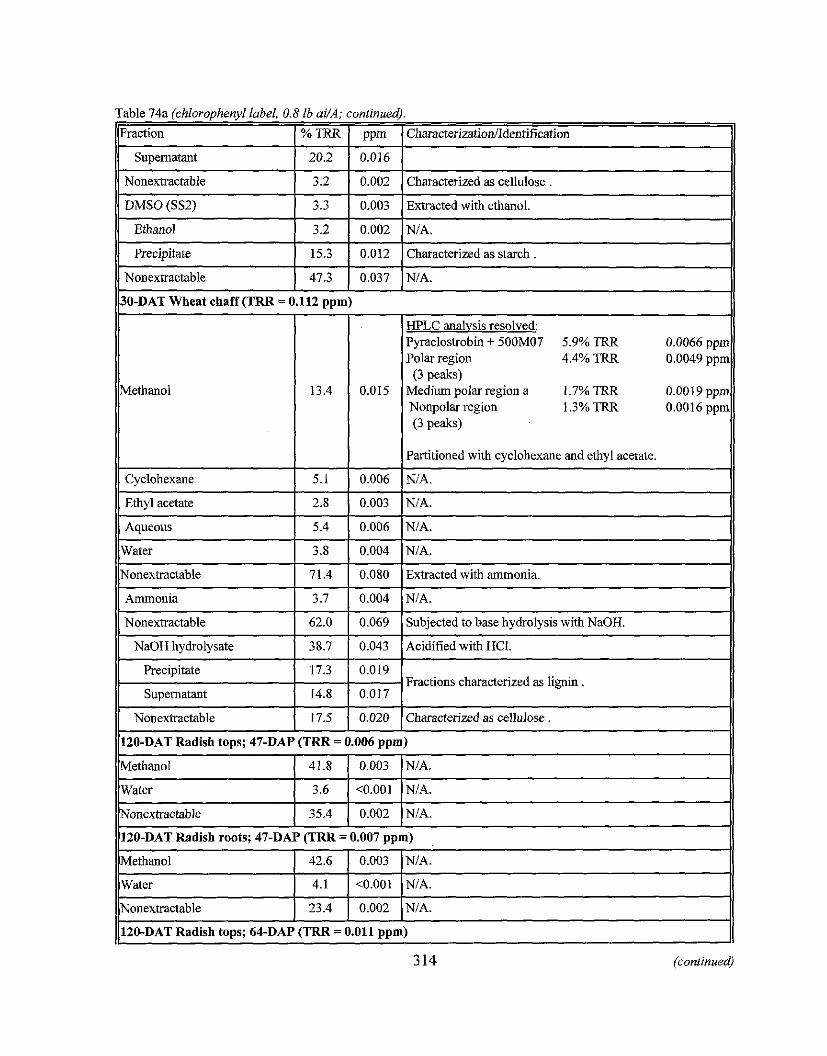
Table 74a (chloropheql label, 0.8 lb ailA; continued).
Il~raction ( % TRR I ppm 1 CharacterizationRdentification
supernatant
Nonextractable
DMSO (SS2)
Ethanol
Methanol
Precipitate
Nonextractable
20.2
3.2
3.3
3.2
II Cyclohexane 5.1 0.006 NIA.
30-DAT Wheat chaff (TRR = 0.112 ppm)
15.3
47.3
13.4
0.016
0.002
0.003
0.002
I I ~ ~ o - D A T Radish tops; 64-DAP (TRR = 0.011 ppm) I1
Characterized as cellulose .
Extracted with ethanol.
NIA.
0.012
0.037
0.015
Fractions characterized as lignin .
314 (continued)
Characterized as starch .
NIA.
HPLC analvsis resolved: Pyraclostrobin + 500M07 5.9% TRR 0.0066 pprn Polar region 4.4% TRR 0.0049 ppm
(3 peaks) Medium polar region a 1.7% TRR 0.0019 pprn Nonpolar region 1.3% TRR 0.0016 ppm (3 peaks)
Partitioned with cyclohexane and ethyl acetate.
Nonextractable 0.002 35.4 NIA.
120-DAT Radish roots; 47-DAP (TRR = 0.007 pprn)
Methanol
Water
Nonextractable
0.003
<0.001
0.002
42.6
4.1
23.4
NIA. - NIA.
NIA.
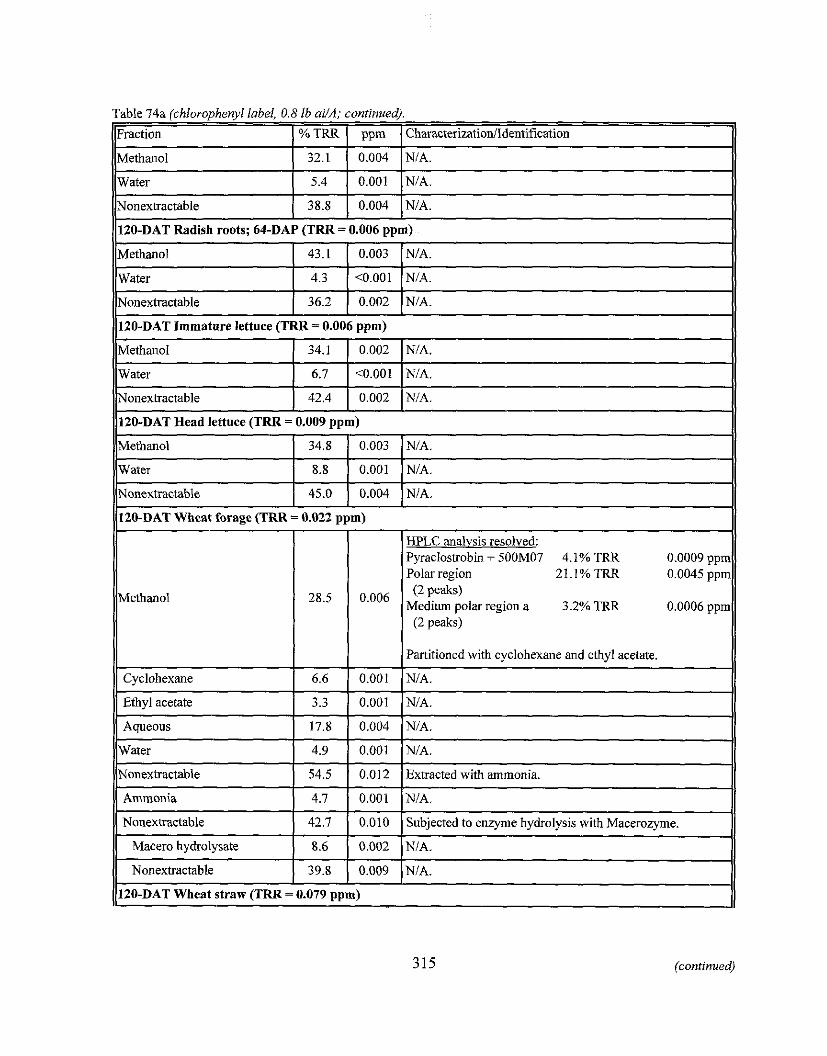
Table 74a (chlorophenyl label, 0.8 lb aiJA; continued).
ll~raction I % TRR ( ppm 1 CharacterizatiodIdentification 11 Methanol
Water
Nonextractable
11120-DAT Immature lettuce (TRR = 0.006 ppm) 11
Methanol
Water
Nonextractable
120-DAT Radish roots; 64-DAP (TRR = 0.006 ppm)
32.1
5.4
38.8
11120-DAT Head lettuce (TRR = 0.009 ppm) 11
43.1
4.3
36.2
- -
0.004
0.001
0.004
Methanol
Water
Nonextractable
(I120-DAT Wheat forage (TRR = 0.022 ppm) 11
N/A.
NIA.
NIA.
0.003
<0.001
0.002
- -
Nonextractable 39.8 0.009 NIA.
120-DAT Wheat straw (TRR = 0.079 ppm)
N!A.
NIA.
NIA.
34.1
6.7
42.4
Methanol
Water
Nonextractable
(continued)
0.002
<0.001
0.002
34.8
8.8
45.0
N!A.
NIA.
NIA.
0.003
0.001
0.004
NIA.
N!A.
NIA.
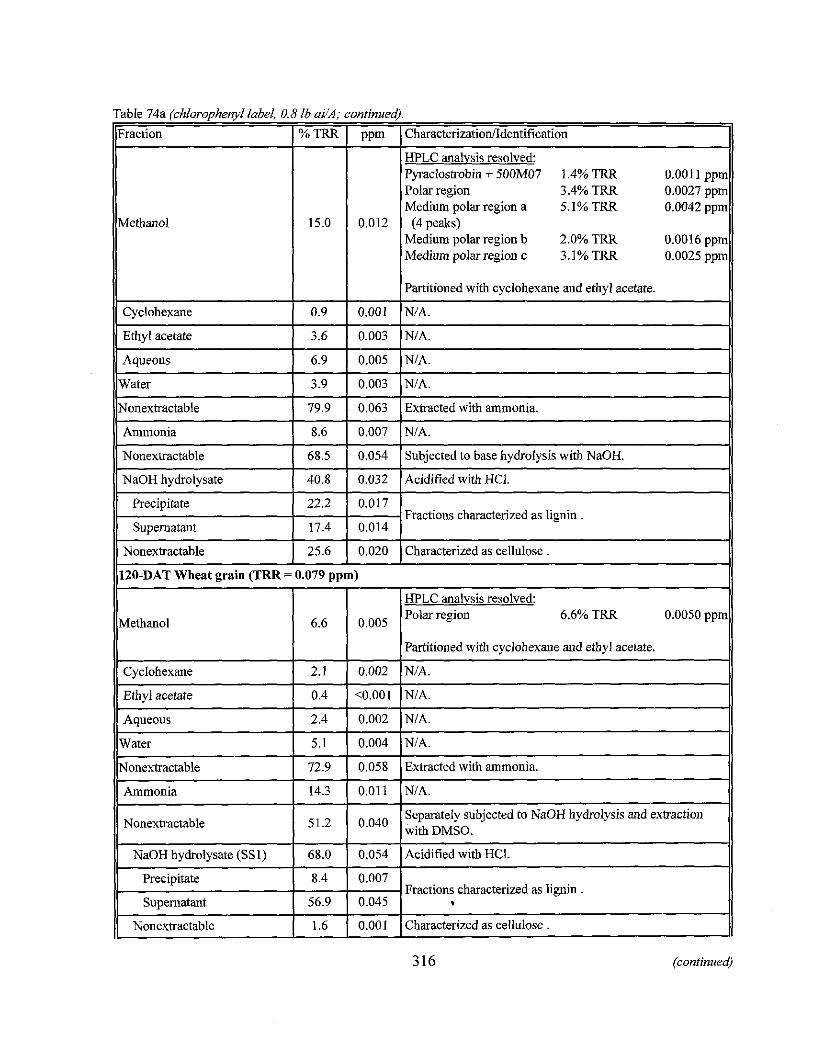
Table 74a (chlarophe~gd label, 0.8 lb ai/A; continued).
ll~raction I % TRR I ppm 1 CharacterizationlIdentification
Methanol
HPLC analysis resolved: Pyaclostrobin + 500M07 1.4% TRR 0.001 1 ppm Polar region 3.4% TRR 0.0027 ppm Medium polar region a 5.1% TRR 0.0042 ppm
(4 peaks) Medium polar region b 2.0% TRR 0.0016 ppm Medium polar region c 3.1 % TRR 0.0025 ppm
Cyclohexane
Ethyl acetate
Aqueous
(1 NaOH hydrolysate 1 40.8 1 0.032 1 ~cidif ied with HCI.
Water
Nonextractable
Ammonia
Nonextractable
0.9
3.6
6.9
I(~ZO-DAT Wheat grain (TRR = 0.079 ppm) 11
3.9
79.9
8.6
68.5
Precipitate
Supernatant
Nonextractable
Methanol
0.001
0.003
0.005
HPLC analysis resolved: Polar region 6.6% TRR 0.0050 ppm I
Partitioned with cyclohexane and ethyl acetate.
NiA.
NIA.
NIA.
0.003
0.063
0.007
0.054
22.2
17.4
25.6
Partitioned with cyclohexane and ethyl acetate. 11
NiA.
Extracted with ammonia.
NiA.
Subjected to base hydrolysis with NaOH.
0.017
0.014
0.020
Fractions characterized as lignin .
Characterized as cellulose .
Cyclohexane
Ethyl acetate
Aqueous
Water
Nonextractable
11 NaOH hydrolysate (SSI) I
( 68.0 1 0.054 l~c id i f ied with HCI. 11
2.1
0.4
2.4
5.1
72.9
I II I 1 I
Fractions characterized as lignin . I1
0.002
c0.001
0.002
0.004
Ammonia 1 14.3 1 0.011 1 ~ 1 ~ .
Precipitate
Supernatant
Nonextractable Characterized as cellulose . 11
NiA.
NIA.
NIA.
NiA.
0.058 I Nonextractable
(continued)
Extracted with ammonia.
0.040 51.2
8.4
56.9
1.6
Separately subjected to NaOH hydrolysis and extraction withDMSO,
0.007
0.045
0.001
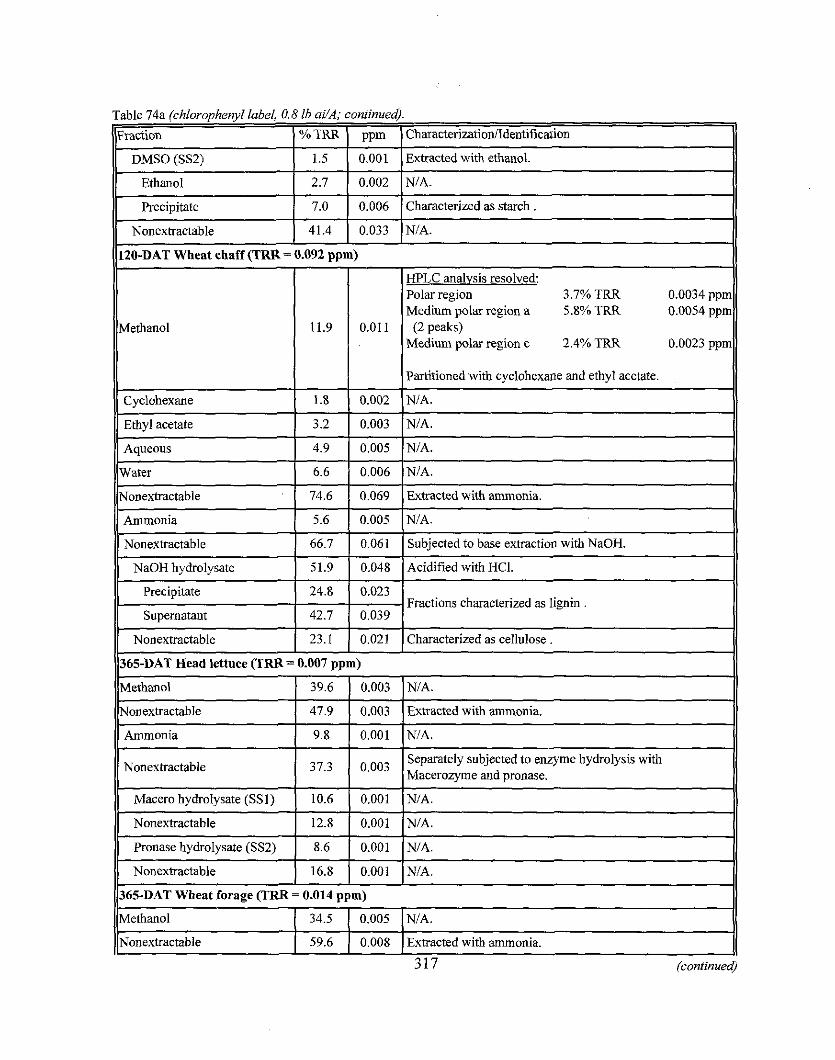
Table 74a (chlorophenyl label, 0.8 lb ai/A; continued).
((~raction 1 % TRR 1 ppm 1 CharacterizationiIdentification !I
h20-DAT Wheat chaff (TRR = 0.092 ppm) 11
- ~-
DMSO (SS2)
Ethanol
Precipitate
- - .
W L C analysis resolved: Polar region 3.7% TRR 0.0034 ppm Medium polar region a 5.8% TRR 0.0054 ppm 1 11.9 1 0011 1 (2 peks) Medium polar region c 2.4% TRR 0.0023 ppm II
1.5
2.7
7.0
1 I (Partitioned with cyclohexane and ethyl acetate. 11
0.001
0.002
0.006
Fractions characterized as lignin .
Extracted with ethanol.
NIA.
Characterized as starch.
7 ~
Cyclohexane
Ethyl acetate
Aqueous
Water
1.8
3.2
4.9
6.6
Methanol
Nonextractable
Ammonia
. . . , )I Nonextractable 1 I
1 12.8 1 0.001 (NIA.
Nonexhactable
Macero hvdrolvsate (SSI)
11 Pronase hydrolysate (ss2) j 8.6 j 0.001 ~NIA. I1
0.002
0.003
0.005
0.006
39.6
47.9
9.8
NIA.
NIA.
NIA.
NIA.
37.3
10.6
0.003
0.003
0.001
Nonextractable
317 (continued)
NIA.
Extracted with ammonia.
NIA.
O'Oo3
0.001
Il I I I
Separately subjected to enzyme hydrolysis with Macerozyme and pronase.
NIA.
365-DAT Wheat forage (TRR = 0.014 ppm)
Methanol 1 34.5 1 0.005 1 ~ 1 ~ .
16.8
Nonextractable
0.001
a 59.6
NIA.
0.008 Extracted with ammonia.
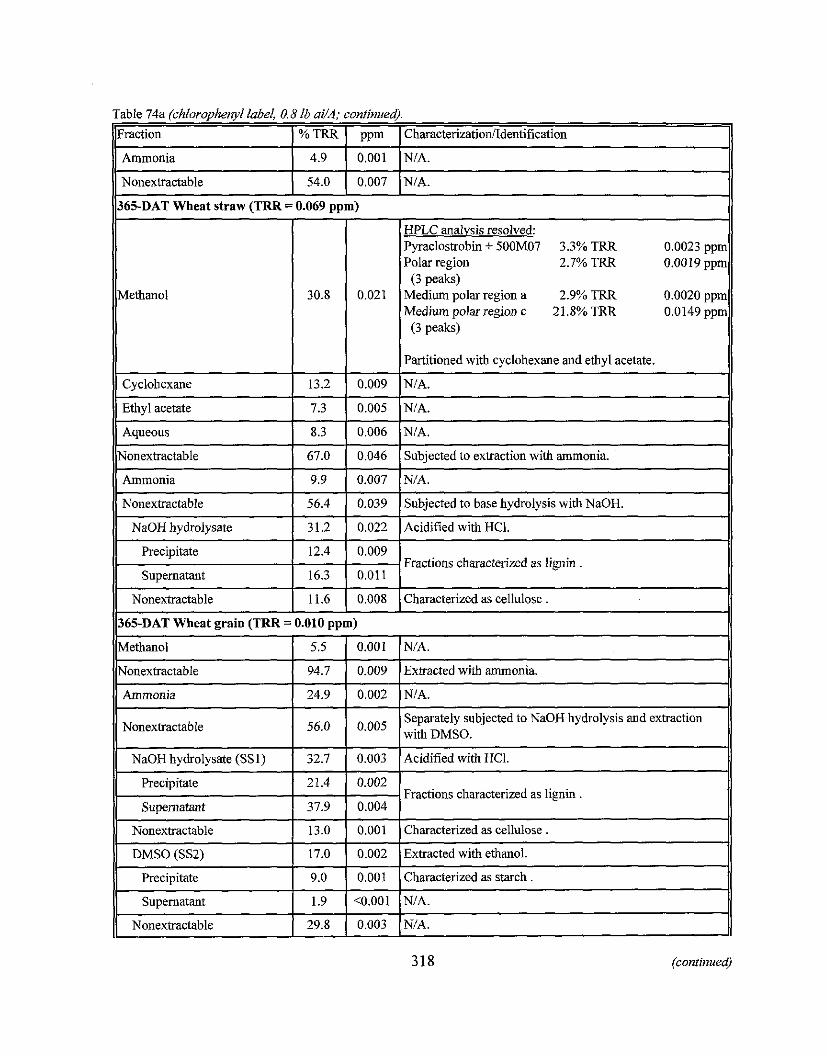
Table 74a (cPIiorophenyi label, 0.8 ib ai/A; confinue4.
1 % TRR 1 ppm I CharacterizationIIdentification
lostrobin + 500M07 3.3% TRR
Fractions characterized as lignin .
Ammonia 4.9
Nonextractable
0.001 NIA.
365-DAT Wheat straw (TRR = 0.069 pprn)
54.0 0.007 NIA.
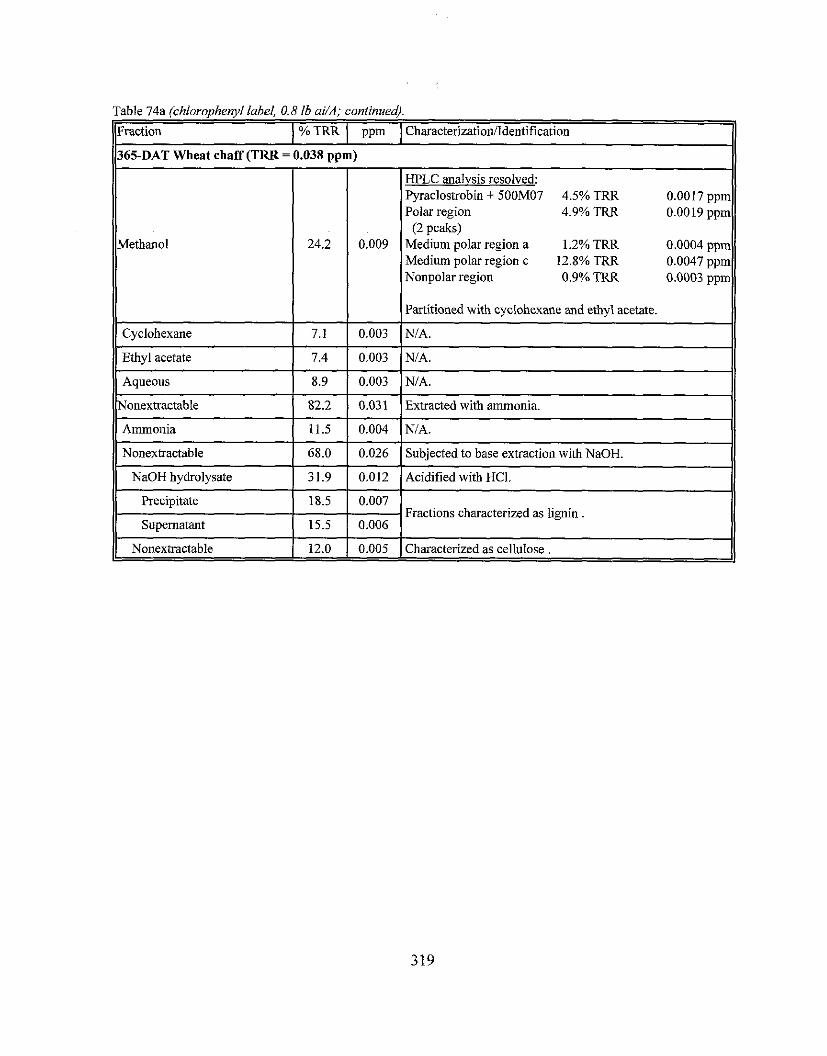
11 1 1 (Partitioned with cyclohexane and ethyl acetate.
Table 74a (chlorophenyl label, 0.8 lb ai/A; continued)
Fraction 1 % TRR 1 ppm 1 CharacterizationfIdentification 365-DAT Wheat chaff (TRR = 0.038 pprn)
Methanol
Cyclohexane
Ethyl acetate
Aqueous
Nonexhactable
24.2
Ammonia
Nonextractable
NaOH hydrolysate
Precipitate
Supernatant
Nonextractable
7.1
7.4
8.9
82.2
0.009
11.5
68.0
3 1.9
18.5
15.5
12.0
HPLC analvsis resolved: Pyraclostrobin + 500M07 4.5% TRR 0.0017 ppn Polar region 4.9% TRR 0.0019 ppn (2 peaks)
Medium polar region a 1.2% TRR 0.0004 pprr Medium polar region c 12.8% TRR 0.0047 ppn Nonpolar region 0.9% TRR 0.0003 ppn
0.003
0.003
0.003
0.031
NIA.
NIA.
NIA.
Extracted with ammonia.
0.004
0.026
0.012
0.007 - 0.006
0.005
NIA.
Subjected to base extraction with NaOH.
Acidified with HCI.
Fractions characterized as lignin .
Characterized as cellulose.
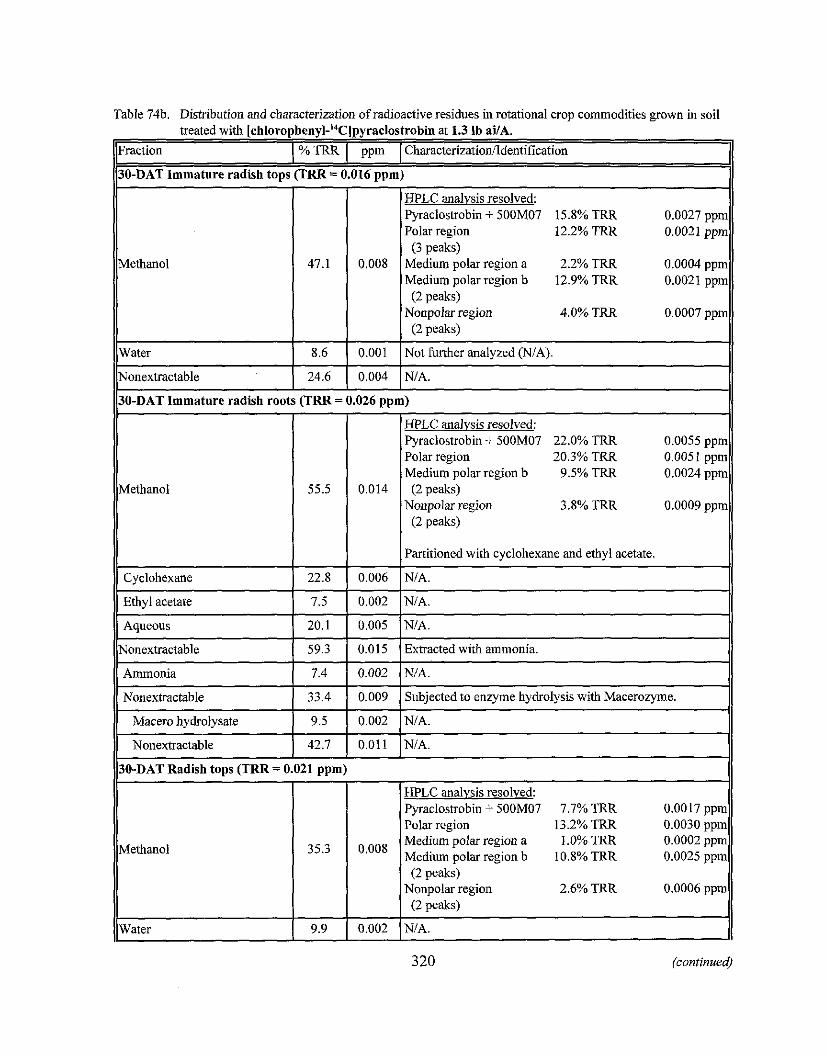
Table 74b. Distribution and characterization of radioactive residues in rotational crop commodities grown in soil treated with [chlorophenyl-14C]pyraclostrobin at 1.3 lb ai/A.
Il~raction I % TRR I ppm 1 Characterization/Identification 11
1 8.6 1 0.001 1 Not further analyzed (NIA).
. . I
(TRR = 0.016 ppm)
47.1
HPLC analysis resolved: Pyraclostrobin + 500M07 22.0% TRR 0.0055 ppm Polar region 20.3% TRR 0.0051 ppm Medium polar region b 9.5% TRR 0.0024 ppm
(2 peaks) Nonpolar region 3.8% TRR 0.0009 ppm
Nonextractable
0.008
HPLC analysis resolved: Pyraclostrobin + 500M07 15.8% TRR 0.0027 ppn Polar region 12.2% TRR 0.0021 ppn
(3 peaks) Medium polar region a 2.2% TRR 0.0004 ppn Medium polar rexion b 12.9% TRR 0.0021 ppn
(2 peaks) Nonpolar region 4.0% TRR 0.0007 ppn
(2 peaks)
30-DAT Immature radish roots (TRR = 0.026 aom)
24.6
Cyclohexane
Ethyl acetate
Aqueous
Nonextractable
Ammonia
Nonextractable
320 (continued)
0.004
22.8
7.5
Macero hydrolysate
NIA.
20.1
59.3
7.4
33.4
0.006
0.002
9.5
Partitioned with cyclohexane and ethyl acetate. - NIA.
NIA.
0.005
0.015
0.002
0.009
Nonextractable
NIA.
Extracted with ammonia.
N/A.
Subjected to enzyme hydrolysis with Macerozyme.
0.002 NIA.
42.7
30-DAT Radish tops (TRR = 0.021 ppm)
0.011
Methanol
Water
NIA.
35.3
9.9
0'008
0.002
HPLC analysis resolved: Pyraclostrobin + 500M07 7.7% TRR 0.0017 ppm Polar region 13.2% TRR 0.0030 ppm Medium polar region a 1 .0% TRR 0.0002 ppm Medium polar region b 10.8% TRR 0.0025 ppm
(2 peaks) Nonpolar region 2.6% TRR 0.0006 ppm
(2 peaks)
NIA.
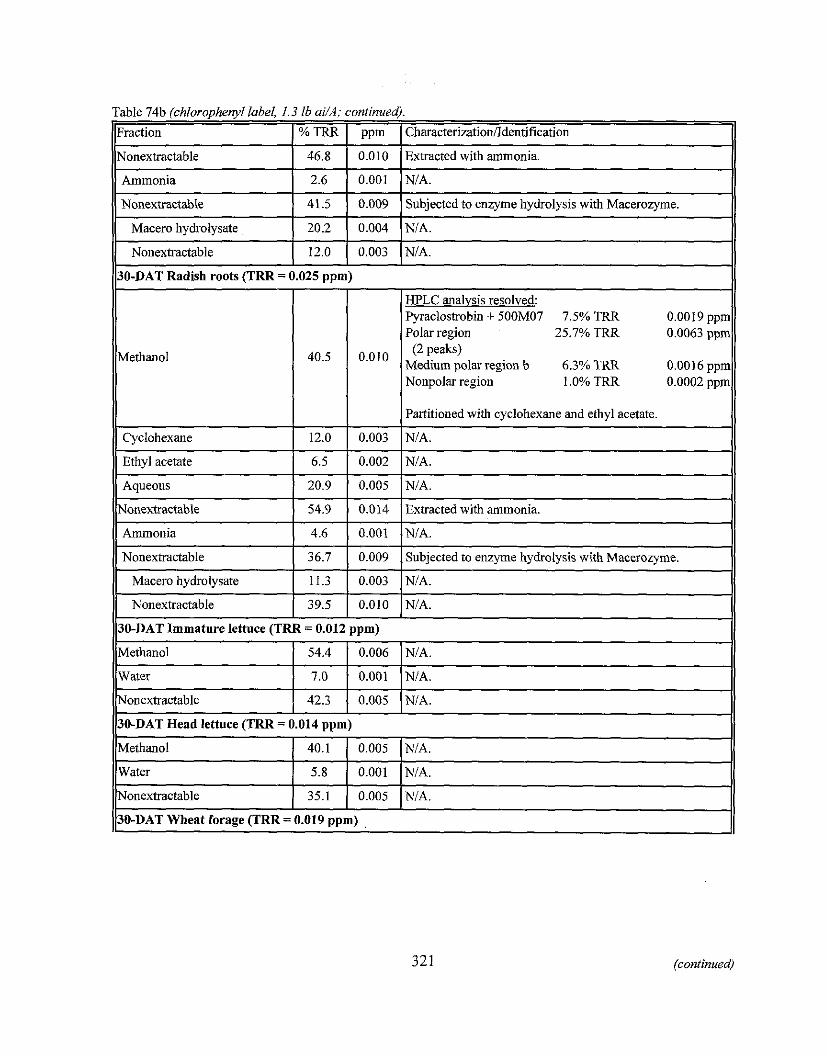
(1 Ammonia 1 2.6 1 0.001 ~NIA.
Table 74b (chlorophenyl label, 1.3 lb aUA; continue^. Fraction
I ~ ~ O - D A T Radish roots (TRR = 0.025 ppm) 11
Nonextractable
Macero hydrolysate
Nonextractable
Methanol
Nonextractable 1 46.8 1 0.010 (Extracted with ammonia.
% TRR
HPLC analysis resolved: Pyraclostrobin + 500M07 7.5% TRR 0.0019 ppm Polar region 25.7% TRR 0.0063 ppm
41.5
20.2
12.0
(2 peaks) Medium polar region b 6.3% TRR 0.0016 ppm Nonpolar region 1 .O% TRR 0.0002 ppm
ppm
Partitioned with cyclohexane and ethyl acetate. 11
Characterizationildentification
0.009
0.004
0.003
Subjected to enzyme hydrolysis with Macerozyme.
NIA.
NIA.
NIA. 11 NIA.
NIA.
Extracted with ammonia. 11
I
30-DAT Wheat forage (TRR = 0.019 ppm)
Ammonia
Nonextractahle
Macero hydrolysate
Nonextractable
4.6
36.7
11.3
39.5
0.001
0.009
0.003
0.010
NIA.
Subjected to enzyme hydrolysis with Macerozyme.
NIA.
NIA.
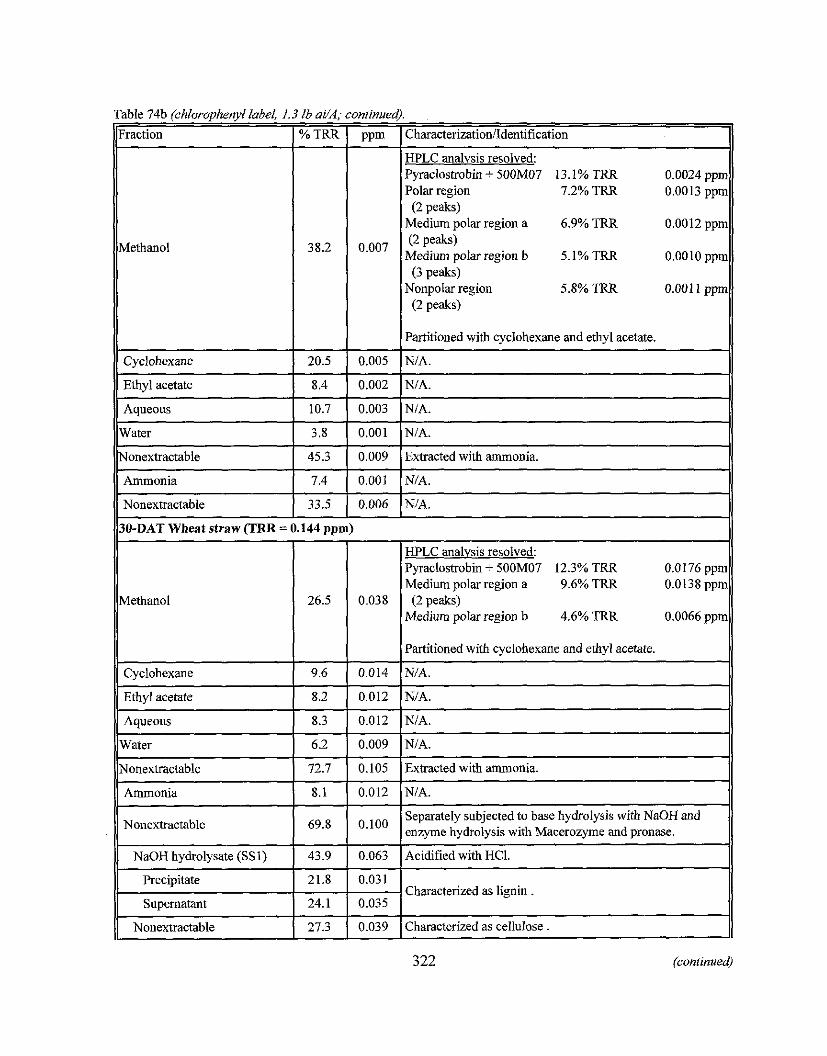
Table 74b (chlorophenyl label, 1.3 ib aYA; continued).
Il~raction I % TRR ( ppm 1 Characterization/Identification
Methanol
HPLC analvsis re\olved: P\rncloitrobin - 500M07 13.1'0 TKR Polar region 7.2% TRR
(2 peaks) Medium polar region a 6.9% TRR (2 peaks)
Medium polar region b 5. I % TRR (3 peaks)
Nonpolar region 5.8% TRR (2 peaks)
Partitioned with cyclohexane and ethyl acetate.
0.0024 ppn 0.0013 ppn
0.0012 ppn
0.0010 ppn
0.001 1 ppn
Cyclobexane
Ethyl acetate
Aqueous
Water
Methanol
Nonextractable
Ammonia
Nonextractable
Cyclohexane
Ethyl acetate
20.5
8.4
10.7
3.8
HPLC analysis resolved: Pyraclostrobin + 500M07 12.3% TRR 0.0176 ppm Medium polar region a 9.6% TRR 0.0138 ppm (2 peaks)
Medium polar region b 4.6% TRR 0.0066 ppm
30-DAT Wheat straw (TRR = 0.144 ppm)
45.3
7.4
33.5
Partitioned with cyclohexane and ethyl acetate.
NJA. I
0.005
0.002
0.003
0.001
1) Aqueous 1 8.3 1 0.012 INIA. 11
NIA.
NIA.
NiA.
NIA.
0.009
0.001
0.006
322 (continued)
Extracted with ammonia.
NiA.
NJA.
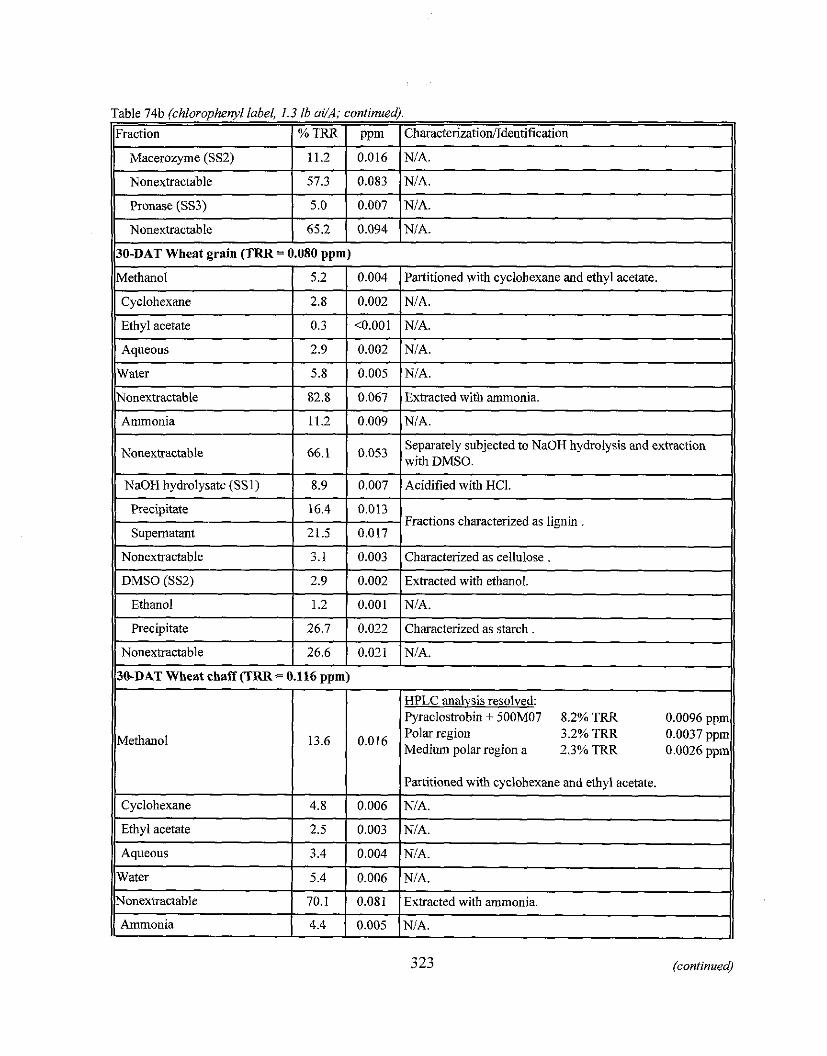
Table 74h (chloropheiyl label, 1.3 lb ai/A; continueg.
ll~raction I % TRR I ppm 1 CharacterizatiodIdentification
Ib0-DAT Wheat grain (TRR = 0.080 ppm) 11
- -
Nonextractahle - Pronase (SS3)
Nonexhactable
57.3
5.0
65.2
ethanol Cyclohexane
Ethyl acetate
Nonexhactable
Aqueous
Water
Nonexhactable
Ammonia
I 66.1 I 0.053 I Separately subjected to NaOH hydrolysis and extraction with DMSO.
0.083
0.007
0.094
5.2
2.8
0.3
I I I
NaOH hydrolysate (SSI) 1 8.9 1 0.007 I~cidified with HCl.
NIA.
NIA.
NIA.
2.9
5.8
82.8
11.2
0.004
0.002
<0.001
Partitioned with cyclohexane and ethyl acetate.
NIA.
NIA.
0.002
0.005
0.067
0.009
Precipitate
Ethanol
NIA.
NIA.
Exhacted with ammonia.
NIA.
Nonextractable
DMSO (SS2)
16.4
323 (continued)
0.013
Supernatant 1 21.5 1 0.017
3.1
2.9
Precipitate
Fractions characterized as lignin
0.003
0.002
26.7
Characterized as cellulose . Extracted with ethanol.
0.022
Nonexhactahle 26.6
30-DAT Wheat chaff (TRR = 0.116 ppm)
Characterized as starch .
Methanol
0.021 NIA.
13'6 0.016
HPLC analysis resolved: Pyraclostrohin + 500M07 8.2% TRR 0.0096 ppm Polar region 3.2% TRR 0.0037 ppm Medium polar region a 2.3% TRR 0.0026 ppm
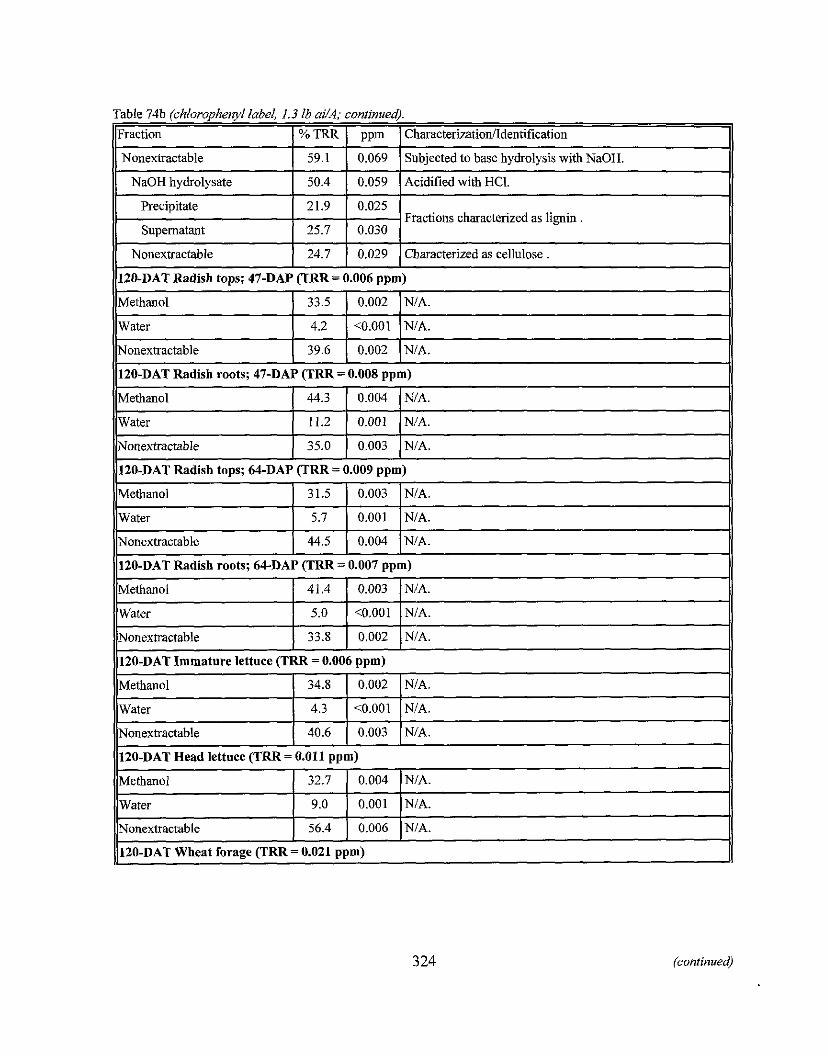
Table 74b (chlorophegd label, 1.3 lb aiLA; continuedj.
Fractions characterized as lignin .
(continued)
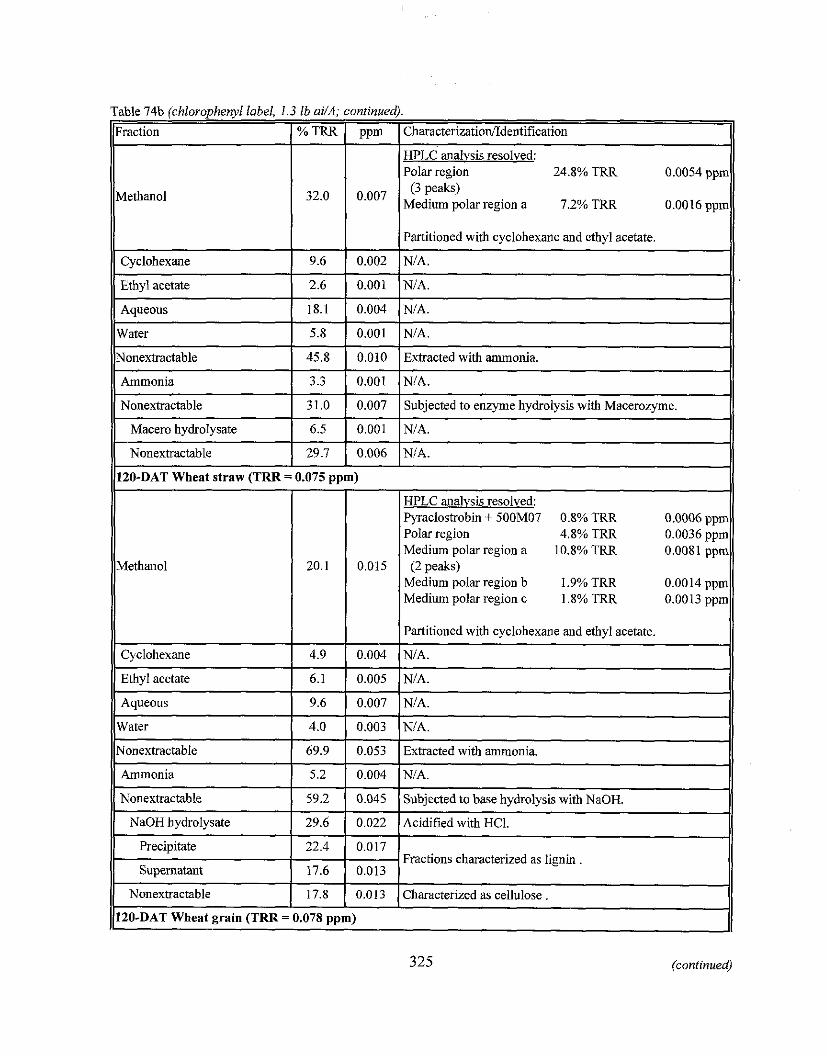
Table 74b (chloropheql label, 1.3 lb ai/A; continued).
7 0.8% TRR
edium polar region b 1.9% TRR edium polar region c 1.8%
325 (continued)
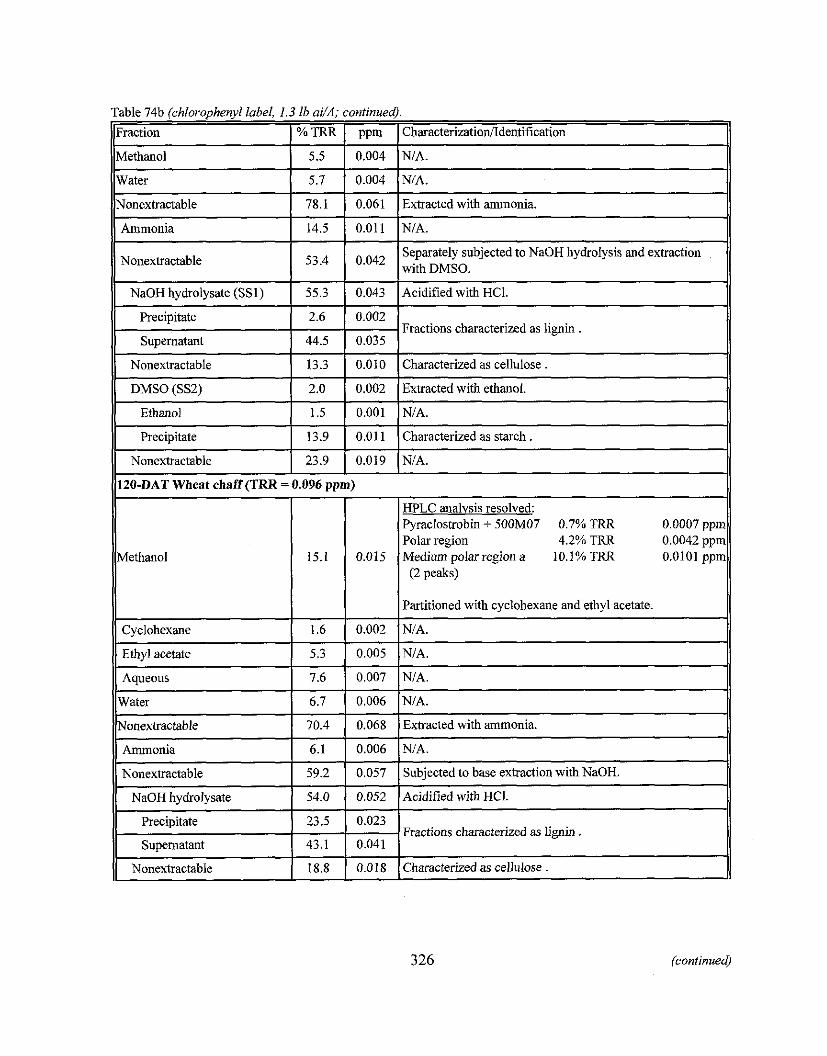
Table 74b (chlorophenyl label, 1.3 lb ai/A; continued).
h~raction I % TRR I vvm 1 CharacterizationiIdentification 11
Nonextractable 78.1 0.061 Extracted with ammonia.
Ammonia 1 14.5 1 0.011 ~NIA. I I I
Separately subjected to NaOH hydrolysis and extraction Nonextractable 1 534 1 Iwith DMSO.
- N ~ H hydrolysate ( s s~ )
Precipitate
supernatant
Nonextractable
DMSO (SS2)
Ethanol
Precipitate
55.3
2.6
44.5
Nonextractable
13.3
2.0
1.5
13.9
~yclohexane
Ethyl acetate
Aqueous
0.043
0.002
0.035
23.9
~o&xtra$able
Ammonia
Nonextractable
NaOH hydrolysate
- - --
326 (continued)
Acidified with HCI.
Fractions characterized as lignin .
0.010
0.002
0.001
0.01 1
120-DAT Wheat chaff (TRR = 0.096 ppm)
1.6
5.3
7.6
Precipitate
Supernatant
Nonextractable
Characterized as cellulose.
Extracted with ethanol.
NIA.
Characterized as starch .
0.019
Methanol
70.4
6.1
59.2
54.0
NIA.
0.002
0.005
0.007
23.5
43.1
18.8
15.1
NIA.
NIA.
NIA.
0.068
0.006
0.057
0.052
Extracted with ammonia.
NIA.
Subjected to base extraction with NaOH.
Acidified with HCI.
0.023
0.041
0.01 8
0.015
Fractions characterized as lignin .
Characterized as cellulose .
HPLC analysis resolved: Pyraclostrobin + 500M07 0.7% TRR 0.0007 ppm Polar region 4.2% TRR 0.0042 ppm Medium polar region a 10. I% TRR 0.0101 ppm
(2 peaks)
Partitioned with cyclobexane and ethyl acetate.
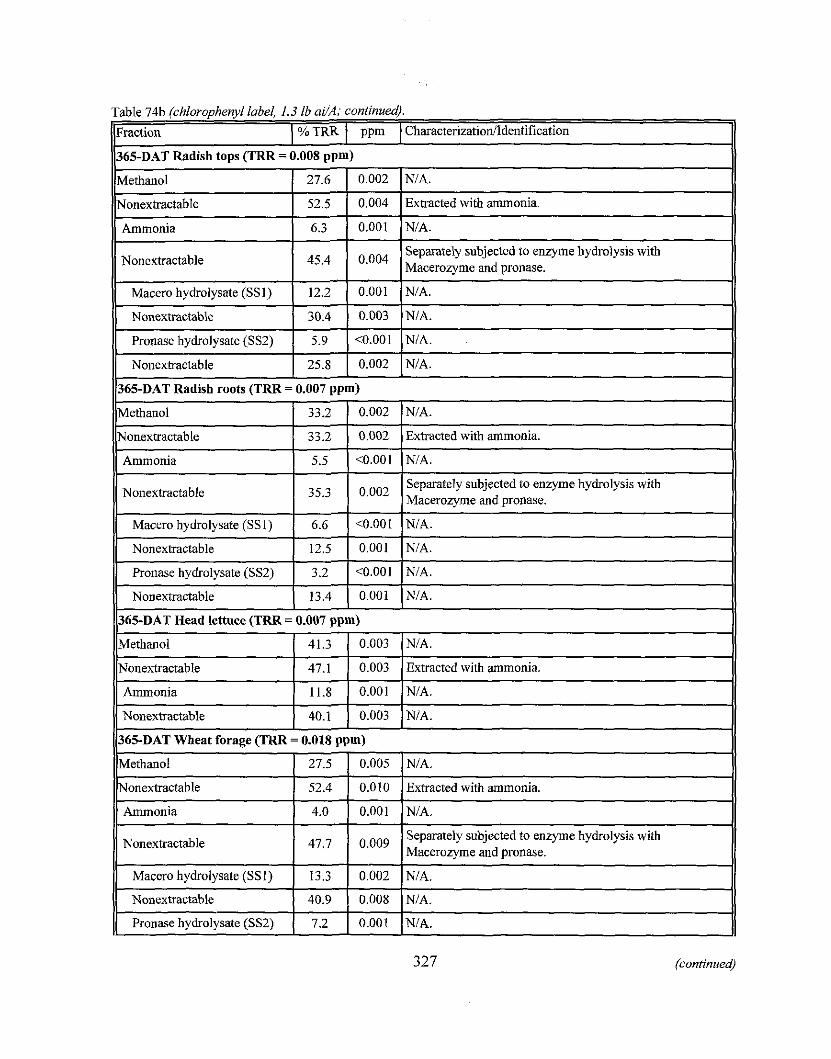
Table 74b (chloropheryl label, 1.3 lb ai/A; continued). Fraction 1 % TRR ppm 1 Characterizationildentification 365-DAT Radish tops (TRR = 0.008 ppm) 11 Methanol
Nonextractable
Ammonia - Nonextractable
Macero hydrolysate (SSl)
Nonextractable
1 1 3 6 5 - ~ ~ ~ Head lettuce (TRR = 0.007 ppm) 11
Pronase hydrolysate (SS2)
Nonextractable -
(continued)
27.6
52.5
6.3
45'4
12.2
30.4
365-DAT Radish roots (TRR = 0.007 pprn)
Methanol 1 33.2 1 0.002 1 ~ 1 ~ .
0.002
0.004
0.001
0.001
0.003
NIA.
NIA.
5.9
NIA.
Extracted with ammonia.
NIA.
Separately subjected to enzyme hydrolysis with Macerozyrne and pronase.
NIA.
NIA.
<0.001
25.8 0.002
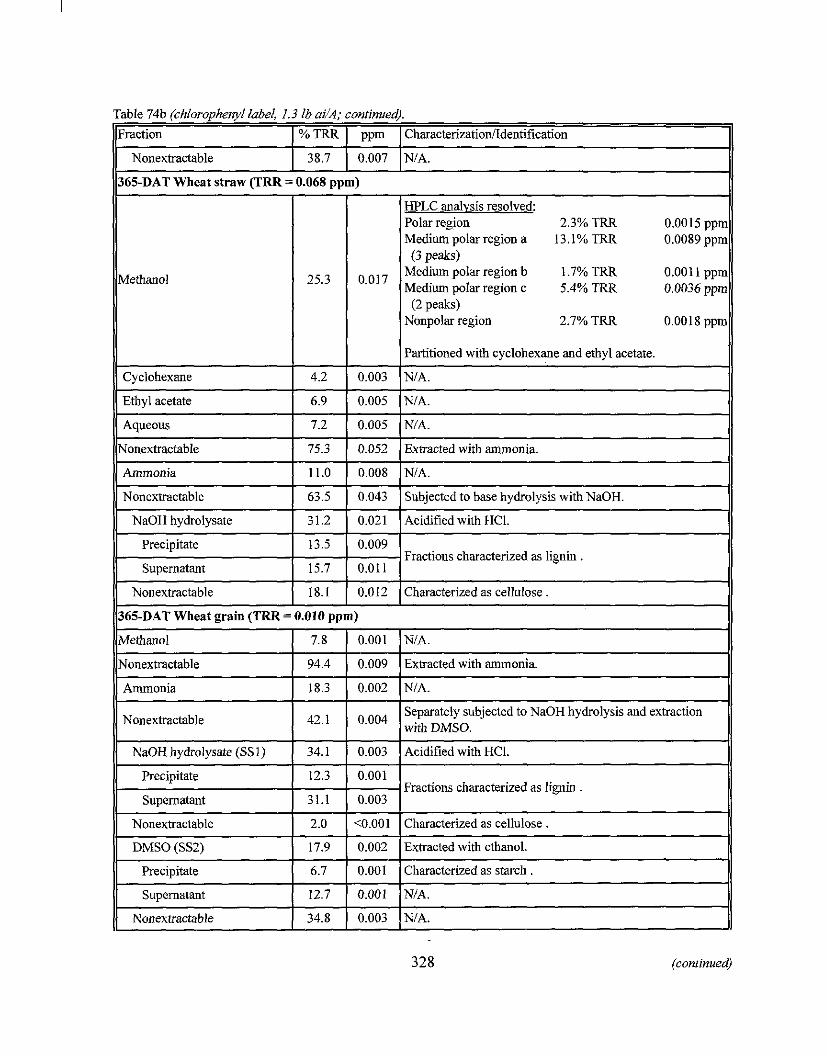
Table 74b (chlorophe~zyl label, 1.3 lb ai/A; continued).
Il~raction I % TRR I ppm I CharacterizatiodIdentification
HPLC analvsis resolved: Polar region 2.3% TRR Medium polar region a 13.1% TRR (3 peaks)
Medium polar region b 1.7% TRR Medium polar region c 5.4% TRR
(2 peaks) Nonpolar region 2.7% TRR
Nonextractable
0.0015 ppn 0.0089 ppn
0.001 1 ppn 0.0036 ppn
365-DAT Wheat straw (TRR = 0.068 ooml
38.7
0.0018 ppn
0.007 NIA.
Cyclohexane
Ethyl acetate
Aqueous
Nonextractable
Ammonia
Nonestractable
NaOH hydrolysate
4.2
6.9
7.2
Precipitate
75.3
11.0
63.5
31.2
I I I
I I I
Separately subjected to NaOH hydrolysis and extraction Nonextractable I 1 O o o 4 lwith DMSO.
0.003
0.005
0.005
13.5
Nonextractable
Nonextractable
Partitioned with cyclohexane and ethyl acetate.
NIA.
NIA.
N/A.
0.052
0.008
0.043
0.021
0.009
Supernatant 1 15.7 10.011
11 Nonestractable 1 2.0 1 <0.001 1 Characterized as cellulose. 11
Extracted with ammonia
NIA.
Subjected to base hydrolysis with NaOH.
Acidified with HC1.
Fractions characterized as lignin
- 365-DAT Wheat grain (TRR = 0.010 ppm)
18.1
94.4
NaOH hydrolysate (SSI)
Precipitate
Supernatant
11 DMSO (SS2) 1 17.9 1 0.002 1 Extracted with ethanol. 11
Ammonia 1 18.3 1 0.002 1 ~ 1 ~ .
0.012
0.009 I 34.1
12.3
31.1
328 (continued)
Characterized as cellulose .
Extracted with ammonia.
Precipitate
Supernatant
Nonextractable
0.003
0.001
0.003
Acidified with HCl.
Fractions characterized as lignin .
6.7
12.7
34.8
0.001
0.001
0.003
Characterized as starch . N/A. - NIA.
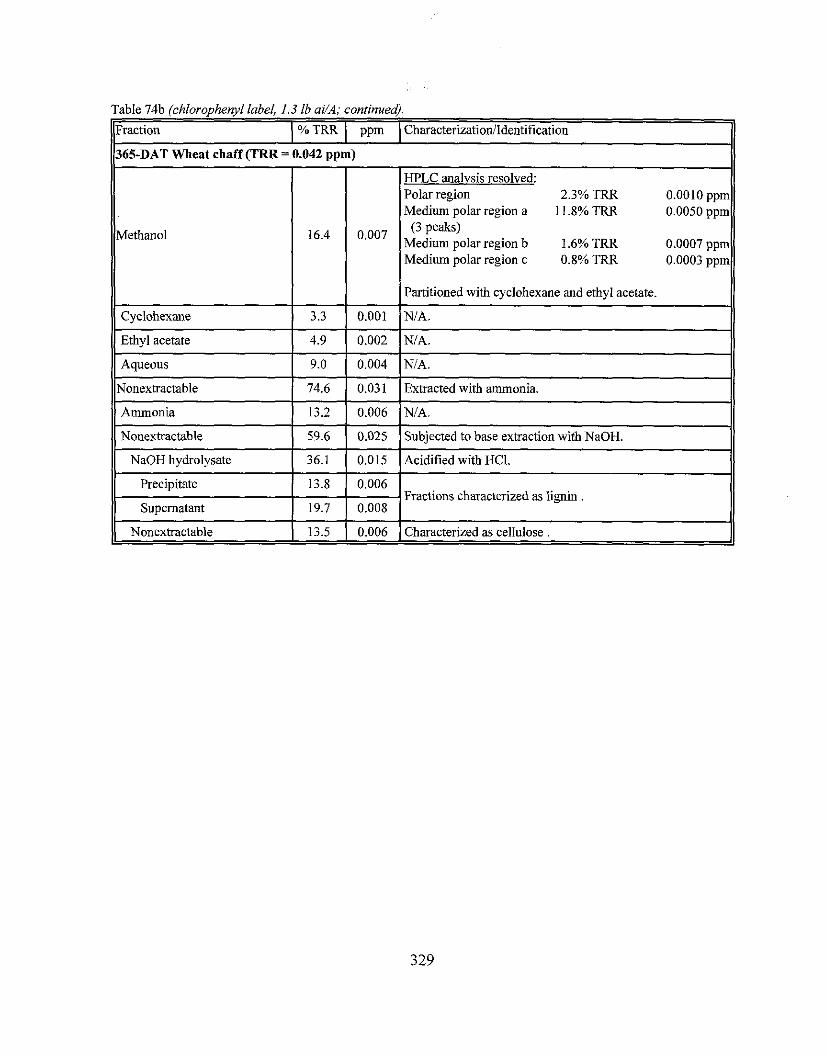
Table 74b (chlorophenyl label, 1 3 lb adA, contmued)
Il~raction ( % TRR ( ppm 1 CbaracterizatiodIdentification 11 1 ) 3 6 5 - ~ ~ ~ Wheat chaff (TRR = 0.042 ppm) 11 - - .
Methanol
Cyclohexane
Ethyl acetate
Aqueous
Nonextractable
Ammonia
Nonextractable
Nonextractable 1 13.5 1 0.006 1 Characterized as cellulose .
16.4
3.3
4.9
NaOH hydrolysate
Precipitate
Supernatant
9.0
74.6
13.2
59.6
O'Oo7
0.001
0.002
36.1
13.8
19.7
HPLC analysis resolved: Polar region 2.3% TRR 0.0010 ppm Medium polar region a 1 1.8% TRR 0.0050 ppm
(3 peaks) Medium polar region b 1.6% TRR 0.0007 ppm Medium polar region c 0.8% TRR 0.0003 ppm
Partitioned with cyclohexane and ethyl acetate.
NIA.
NIA.
0.004
0.031
0.006
0.025
NIA.
Extracted with ammonia.
NIA.
Subjected to base extraction with NaOH.
0.015
0.006 .
0.008
Acidified with HCI.
Fractions characterized as lignin .
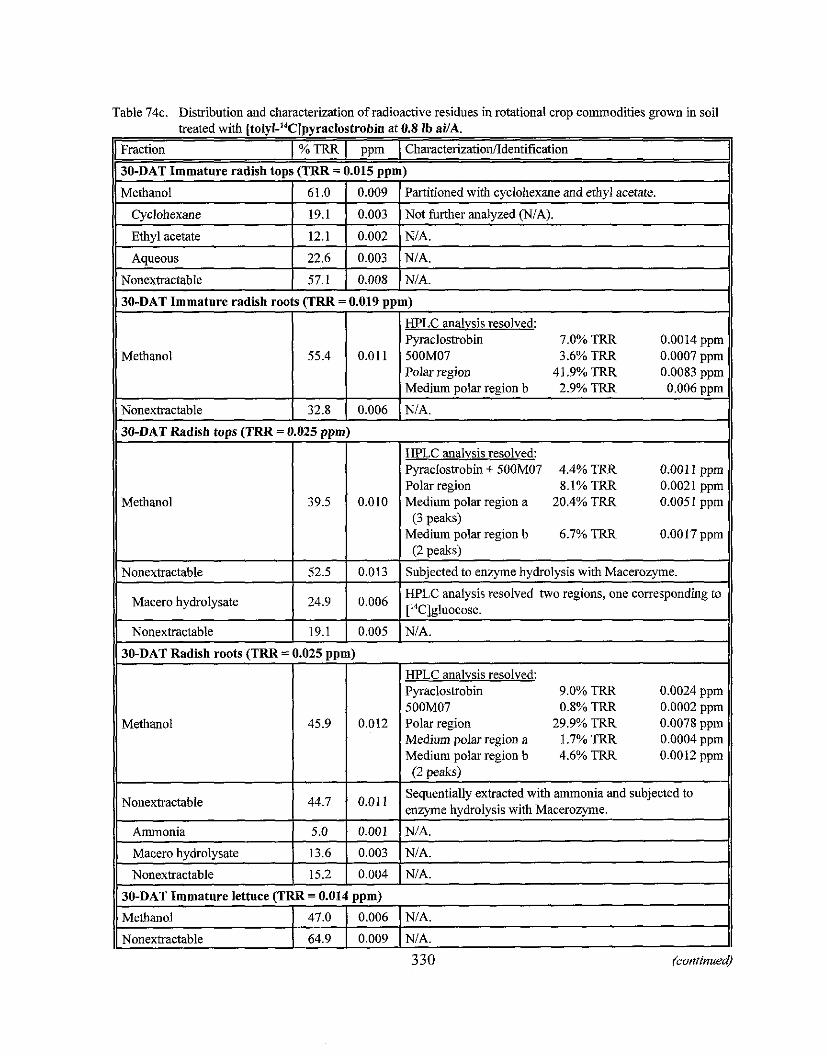
Table 74c. Distribution and characterization of radioactive residues in rotational crop commodities grown in soil - treated with Itolvl-'4Clavraclostrobin at 0.8 lb ai/A. . . .."
1 Fraction I % TRR I ppm ( Characterization/Identification
130-DAT Immature radish toos (TRR = 0.015 oom)
11 Aaueous 1 22.6 1 0.003 1 NIA
Methanol
Cyclohexane
Ethvl acetate
Nonextractable 1 57.1 1 0.008 1 NIA.
30-DAT Immature radish roots (TRR = 0.019 ppm)
61.0
19.1
12.1
Methanol
Methanol
- Nonextractable
I I I HPLC analysis resolved: Pvraclostrohin + 500M07 4.4% TRR 0.001 1 oum
0.009
0.003
0.002
Partitioned with cyclohexane and ethyl acetate.
Not further analyzed (NIA).
NIA.
30-DAT Radish toos (TRR = 0.025 oom)
55.4
32.8
39.5
Medium polar region a 1.7% TRR Medium polar region b 4.6% TRR
330 fcontinued)
0.011
0.006
Nonextractable - Macero bydrolysate
Nnnevhartahle
HPLC analysis resolved: Pyraclostrobin 7.0% TRR 0.0014 ppm 500M07 3.6% TRR 0.0007 ppm Polar region 41.9%TRR 0.0083 ppm Medium polar region b 2.9% TRR 0.006 ppm
NIA.
0.010
. . Polar region 8.1% TRR 0.0021 ppm Medium polar region a 20.4% TRR 0.0051 ppm
(3 peaks) Medium polar region b 6.7% TRR 0.0017 ppm
(2 oeaksi
52.5
24.9
19.1
0.013
0.0°6
0.005
Subjected to enzyme hydrolysis with Macerozyme.
HPLC analysis resolved two regions, one col~esponding to [14~~g~uocose .
NIA.
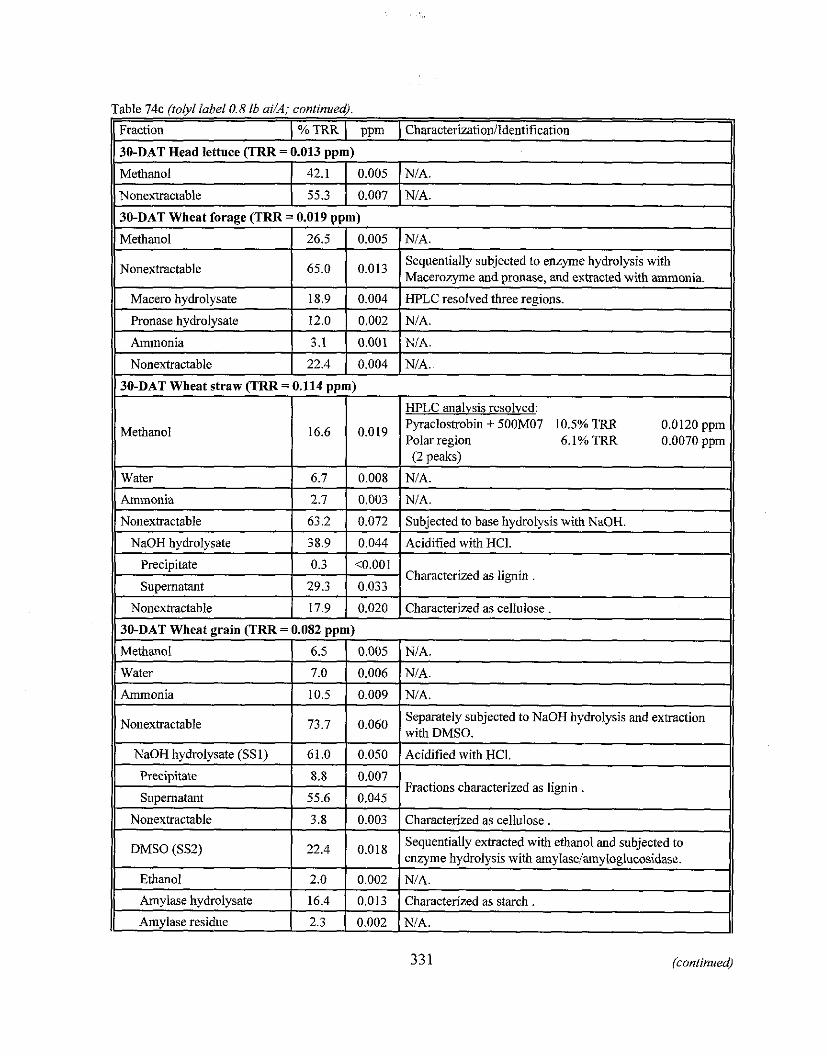
Table 74c (tolyl label 0.8 1b ai/A; continued).
aclostrobin + 500M07 10.5% TRR
Characterized as lignin .
Nonextractable
331 (continued)
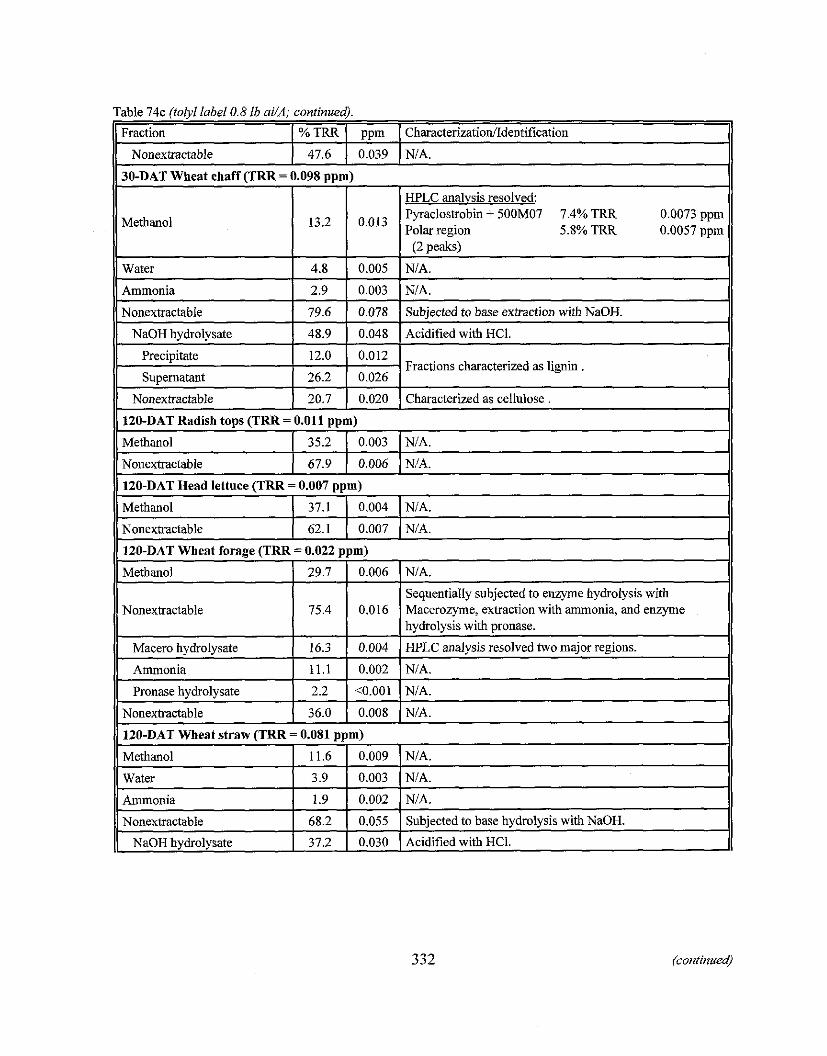
Nonextractable ( 67.9 1 0.006 1 NIA.
120-DAT Head lettuce (TRR = 0.007 ppm) H 11 Methanol 1 37.1 1 0.004 1 NIA. 11
Nonextractable ( 62.1 ( 0.007 ( N/A.
120-DAT Wheat forage (TRR = 0.022 ppm)
Methanol
Nonextractable
- Macero hydrolysate
Ammonia
Pronase hydrolysate
Nonextractahle
120-DAT Wheat straw (TRR
Methanol - Water
Ammonia
Nonextractable
NaOH hydrolysate
29.7
75.4
16.3
11.1
2.2
36.0
= 0.081
11.6
3.9
1.9
68.2
37.2
0.006
0.016
0.004
0.002
NIA.
Sequentially subjected to enzyme hydrolysis with Macerozyme, extraction with ammonia, and enzyme hydrolysis with pronase.
HPLC analysis resolved two major regions.
NIA.
<0.001 (NIA.
0.008 NIA.
pprn) 0.009
0.003
0.002
0.055
0.030
NIA.
NIA.
NJA.
Subjected to base hydrolysis with NaOH.
Acidified with HCI.
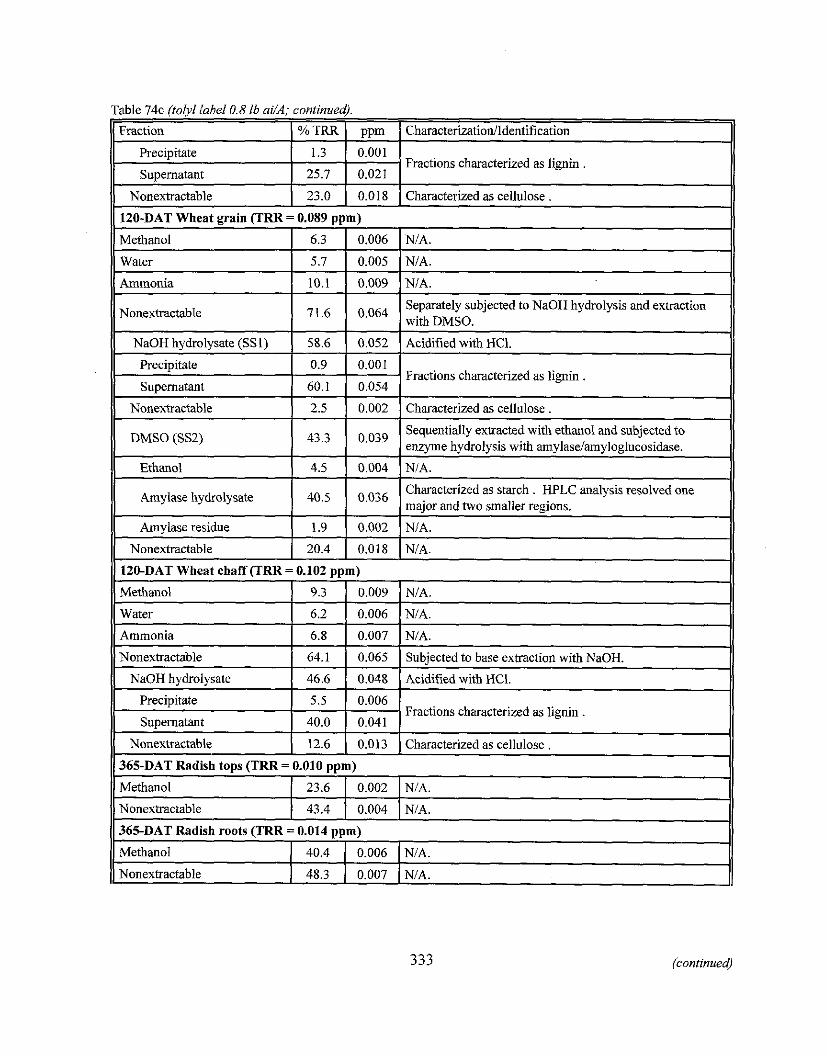
rable 74c ftolvl iahel0.8 lh aUA: continued).
Fraction 1 O.o'IRR 1 ppm 1 (:haraclerizatio~i Identification
Precipitate 1 1.3 10 .001 Fractions characterized as lignin
Suvernatant 1 25.7 1 0.021
Water
Ammonia
Nonextractable
NaOH hydrolysate (SS1)
Precipitate
Supernatant
, Nonextractable
5.7
10.1
71'6
58.6
DMSO (SS2) !
0.9
60.1
2.5
I Ethanol
! Amylase hydrolysate
Amvlase residue
0.005
0.009
0'064
0.052
I 43'3
I Nonextractable
NIA.
NIA.
Separately subjected to NaOH hydrolysis and extraction with DMSO.
Acidified with HCI.
0.001
0.054
0.002
4.5
40.5
1.9
Water
I Ammonia
' Nonextractable
Nonextractable 1 12.6 1 0.013 1 Characterized as cellulose . 365-DAT Radish tops (TRR = 0.010 ppm)
Methanol 1 23.6 1 0.002 I NIA.
Fractions characterized as lignin .
Characterized as cellulose .
0'039
! 120-DAT Wheat chaff (TRR = 0.102 ppm)
, Methanol 1 9.3 1 0.009 1 NIA.
20.4
NaOH hydrolysate
Precipitate
Suuernatant
Nonextractahle 1 48.3 1 0.007 ( NIA.
Sequentially extracted with ethanol and subjected to enzyme hydrolysis with amylaseiamyloglucosidase.
0.004
0.036
0.002
0.018 1 NIA.
6.2
6.8
64.1
NIA.
Characterized as starch . HPLC analysis resolved one major and two smaller regions.
NIA.
46.6
5.5
40.0
0.006
0.007
0.065
NIA.
NIA.
Subjected to base extraction with NaOH.
0.048
0.006
0.041
Acidified with HC1.
Fractions characterized as lignin .
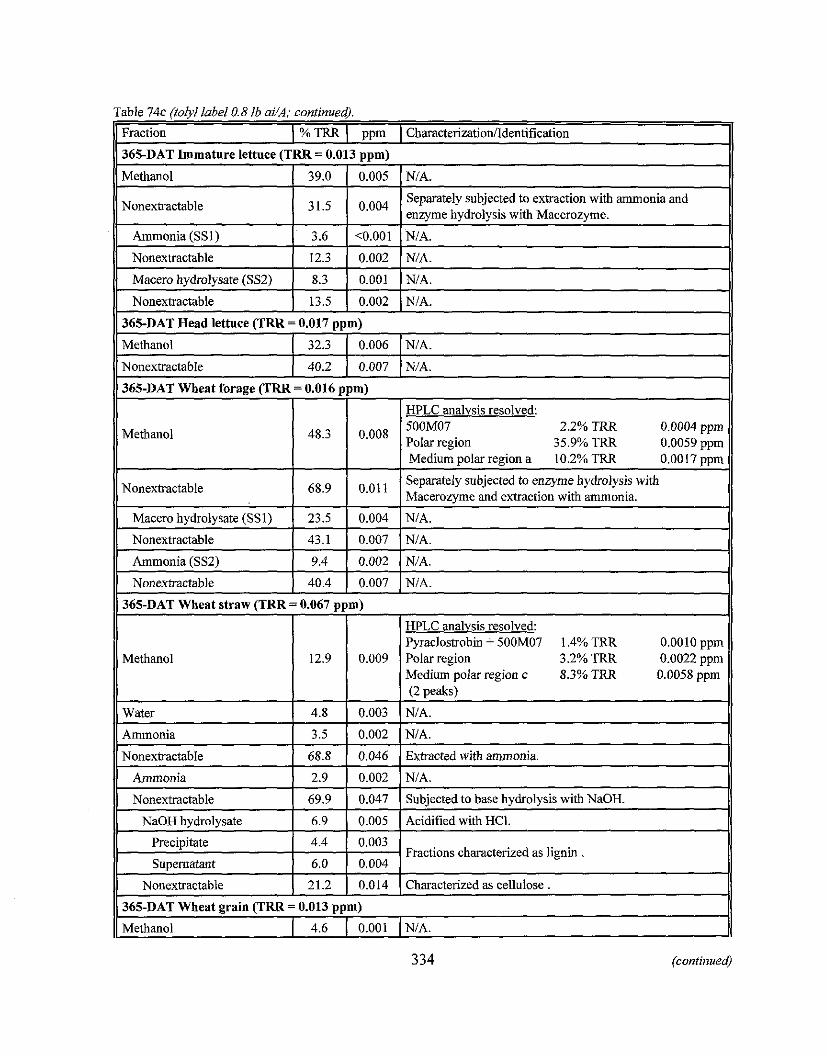
Table 74c (toIyI label 0.8 lb ai/A; continued).
334 (continued)
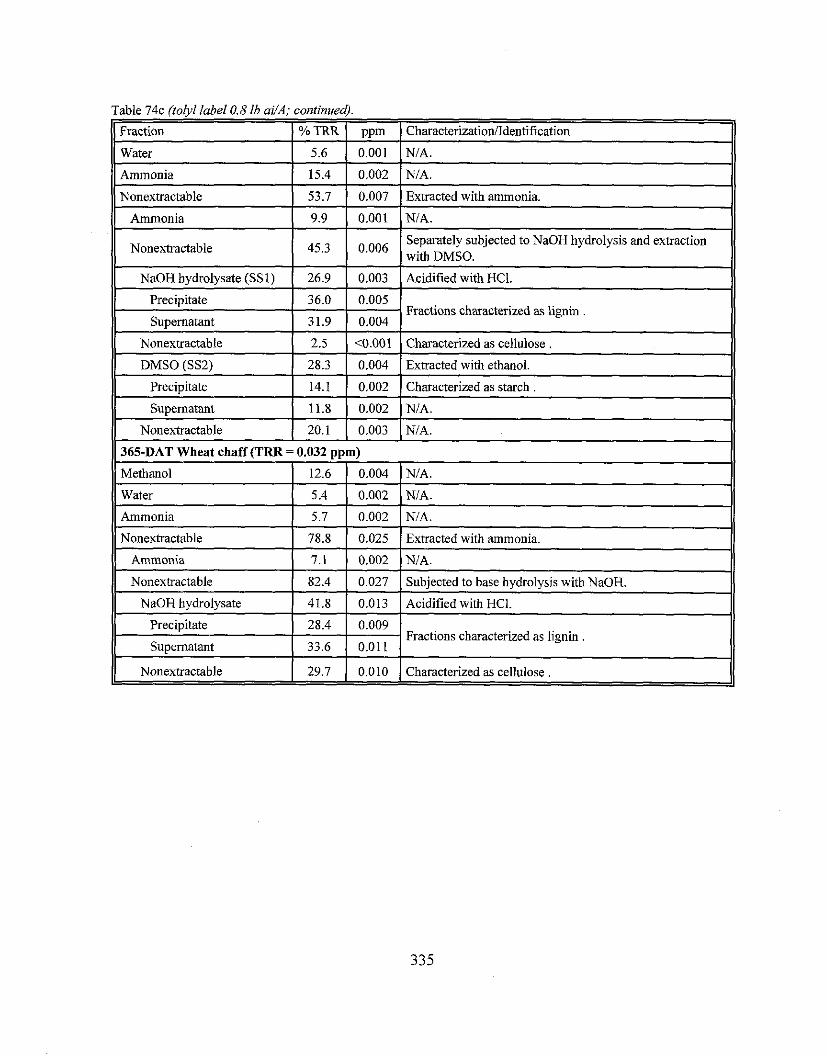
Table 74c (tolyl label 0.8 lb aYA; continued).
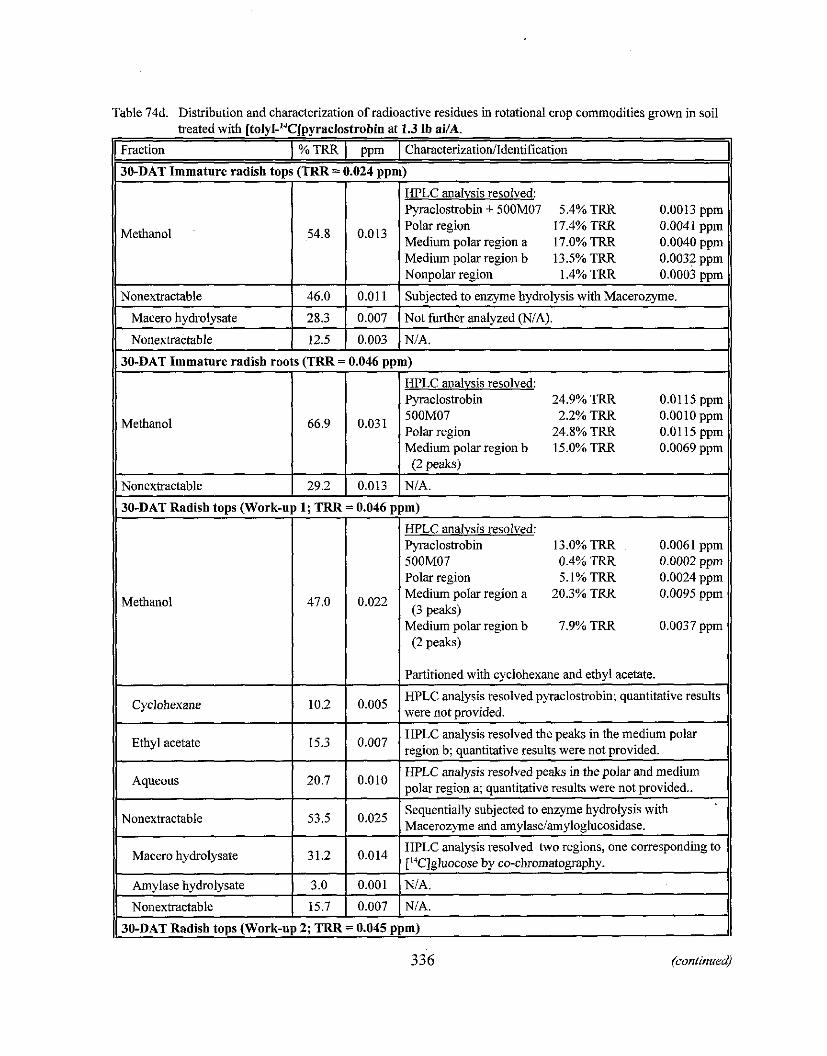
Table 74d. Distribution and characterization of radioactive residues in rotational crop commodities grown in soil treated with Itolvl-14Cl~vraclostrobin at 1.3 lb ai/A. . " .. .
Fraction 1 TRR 1 ppm I Characterization Identification
11 30-DAT Immature radish tons (TRR = 0.024 ooml
Methanol
I I I -
Medium polar region b 13.5% TRR 0.0032 &m Nonnolar region 1.4% TRR 0.0003 nnm
54.8
11 Nonextractable / 46.0 1 0.01 1 1 Subiected to enzyme hydrolvsis with Maceromme
HPLC analvsis resolved: Pyraclostrobin + 500M07 5.4% TRR 0.0013 ppm Polar region 17.4% TRR 0.004 1 ppm Medium polar region a 17.0% TRR 0.0040 ppm
a Macero hydrolysate ( 28.3 1 0.007 ( Not further analyzed (N/A).
Nonextractable 1 12.5 1 0.003 I NIA.
11 30-DAT Immature radish roots (TRR = 0.046 ~ p m )
Methanol
Methanol
Nonextractable
I l l HPLC analysis resolved: Pyraclostrobin 13.0% TRR 0.0061 ppm 500M07 0.4% TRR 0.0002 DDm
30-DAT Radish t o ~ s (Work-UD 1: TRR = 0.046 D D ~ )
66.9
29.2
Nonextractable
47.0
11 30-DAT Radish tops (Work-up 2; TRR = 0.045 ppm)
336 (continue,
0.031
0.013
HPLC analvsis resolved: Pyraclostrobin 24.9% TRR 0.0115 ppm 500M07 2.2% TRR 0.0010 ppm Polar region 24.8% TRR 0.0115 ppm Medium polar region b 15.0% TRR 0.0069 ppm (2 peaks)
NIA.
0.022
. . Polar region 5.1% TRR 0.0024 ppm Medium polar region a 20.3% TRR 0.0095 ppm
(3 peaks) Medium polar region b 7.9% TRR 0.0037 ppm
(2 peaks)
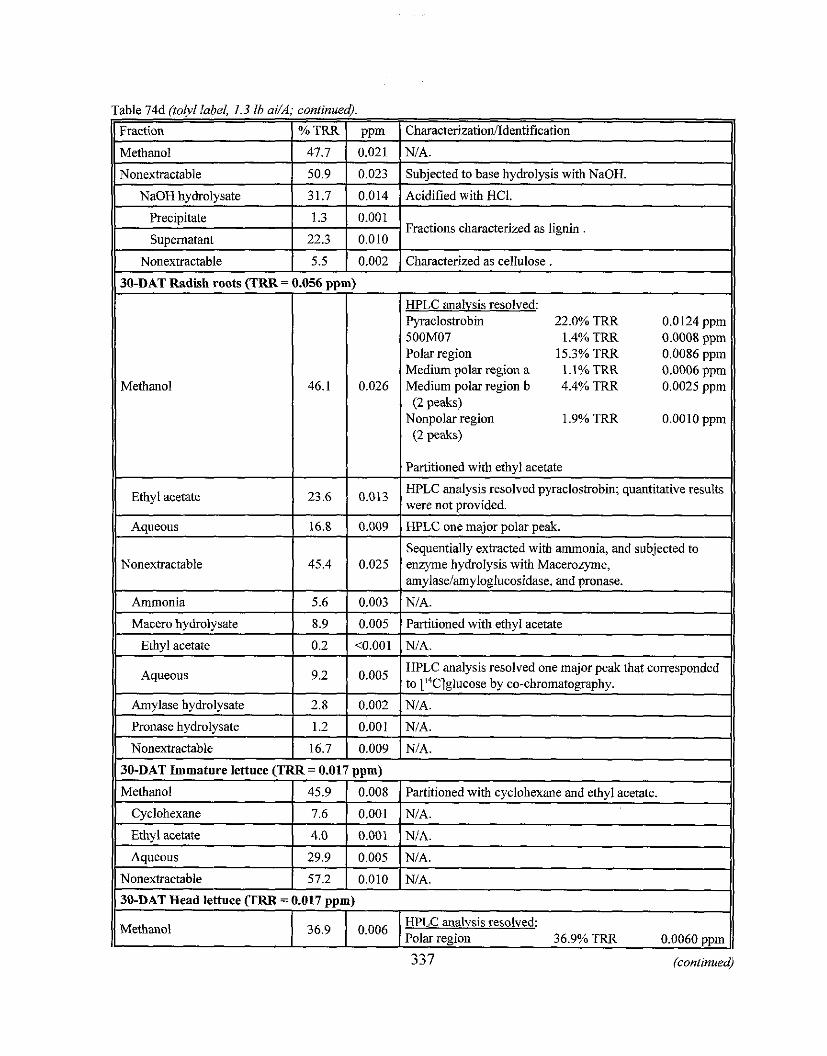
Table 74d ( t ow label, 1.3 lb ai/A; continued).
Noneaactable
337 (continued)
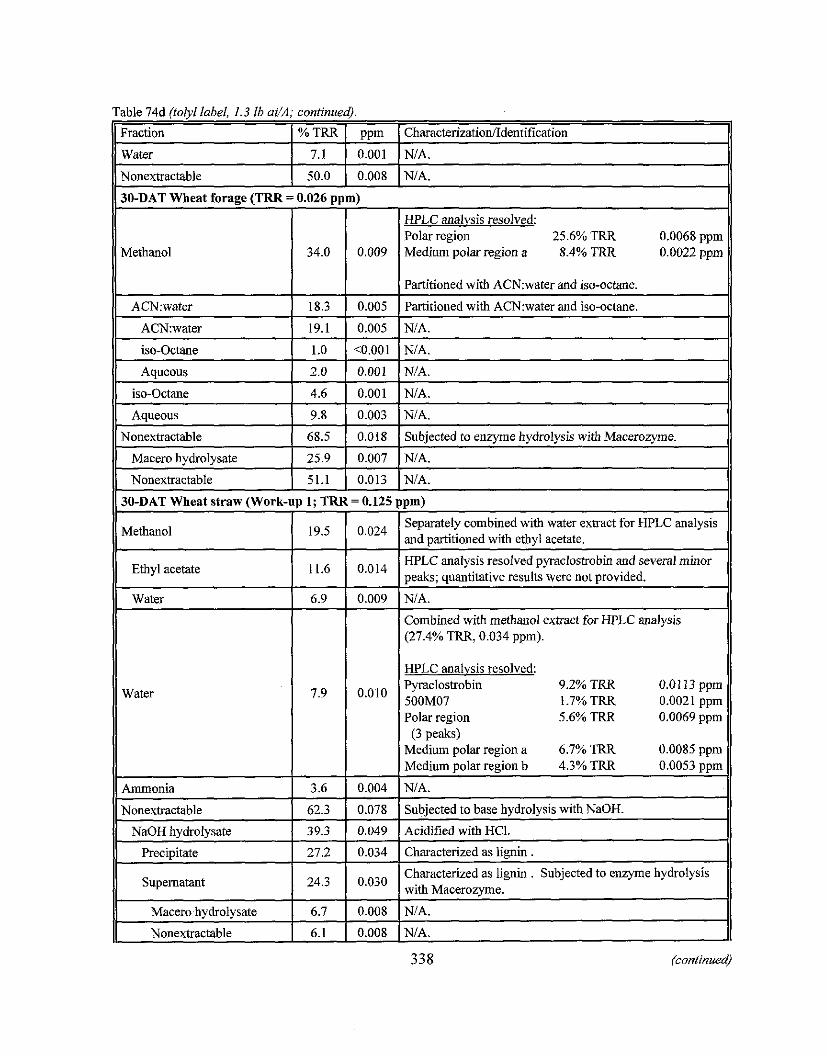
Table 74d (tolyl label, 1.3 lb ai/A; continued).
338 (continued)
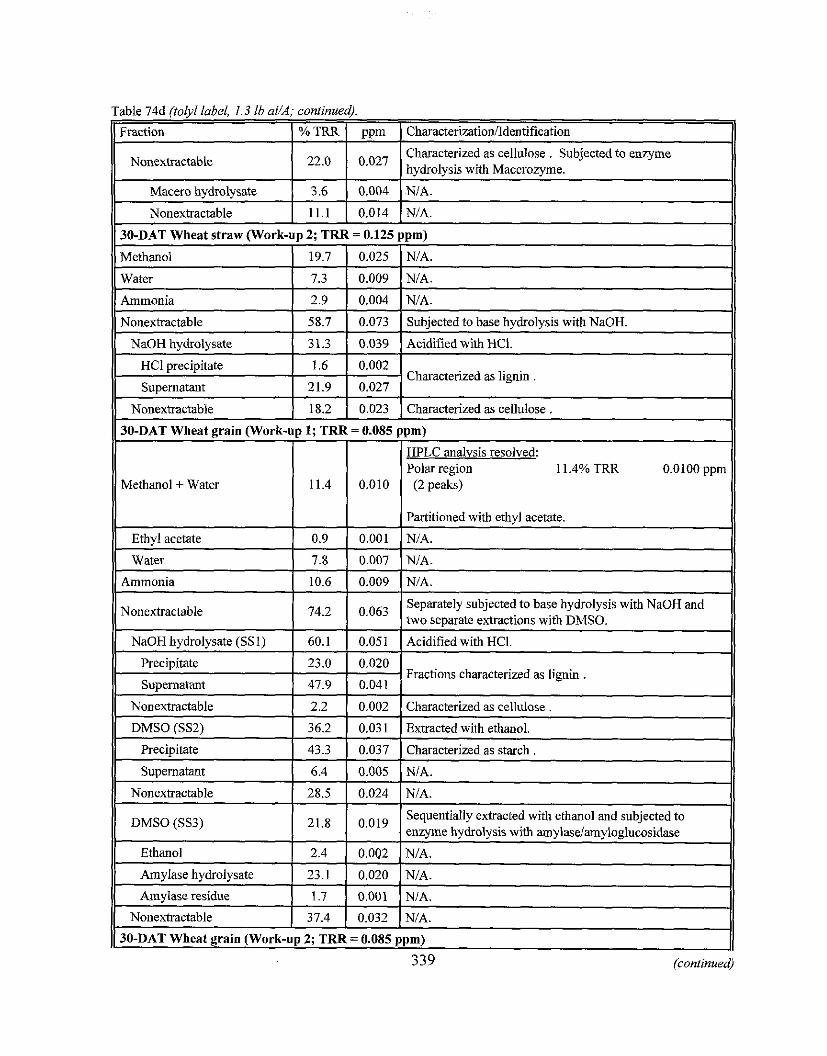
Methanol + Water
339 (continued)
Table 74d (tolyl label, 1.3 ib ai/A; continued).
Characterizationlldentification
Characterized as cellulose . Subjected to enzyme hydrolysis with Macerozyme.
NIA.
NIA.
Fraction
Nonextractable
Macero hydralysate
Nonextractable
% TRR
22.0
3.6
11.1
ppm
0'027
0.004
0.014
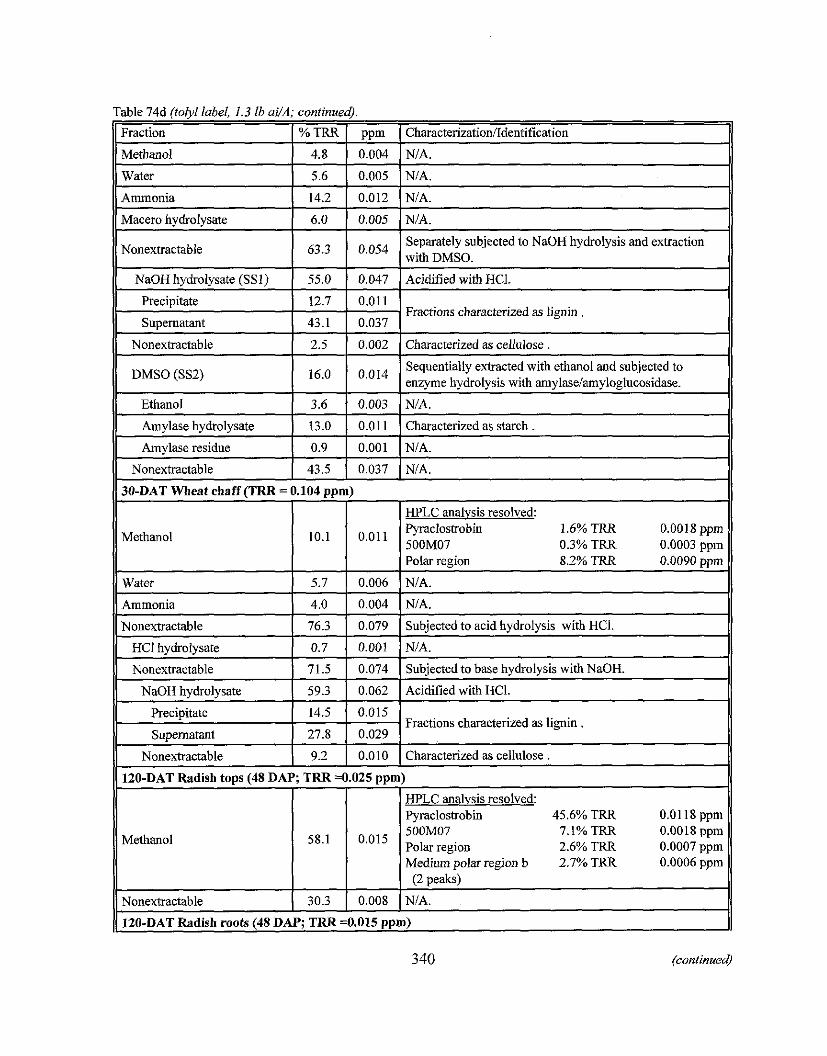
Table 74d (tolyl label, 1.3 ib ai/A; continue@).
11 1 1 I Polar region 8.2% TRR 0.0090 &m
30-DAT Wheat chaff(TRR = 0.104 ppm)
II Water ) 5.7 1 0.006 1 NIA.
Ammonia 1 4.0 1 0.004 1 NIA.
Methanol 10.1
Nonextractable - HCI hydrolysate
Nonextractable
NaOH hydrolysate
Precipitate
supernatant
Nonextractable ( 30.3 1 0.008 (NIA.
120-DAT Radish roots (48 D M ; TRR =0.015 ppm)
0.011
76.3
0.7
71.5
Nonextractahle 1 9.2 1 0.010 1 Characterized as cellulose . 120-DAT Radish tops (48 D M ; TRR =0.025 ppm)
340 (continued)
HPLC analvsis resolved: Pyraclostrobin 1.6% TRR 0.0018 ppm 500M07 0.3% TRR 0.0003 ppm
59.3
14.5
27.8
0.079
0.001
0.074
Methanol
Subjected to acid hydrolysis with HCI.
NIA.
Subiected to base hvdrolvsis with NaOH.
0.062
0.015 - 0.029
0'015 58.1
Acidified with HCI.
Fractions characterized as lignin .
HPLC analysis resolved: Pyraclostrobin 45.6% TRR 0.0118 ppm 500M07 7.1% TRR 0.0018 ppm polar region 2.6% TRR 0.0007 ppm Medium polar region b 2.7% TRR 0.0006 ppm
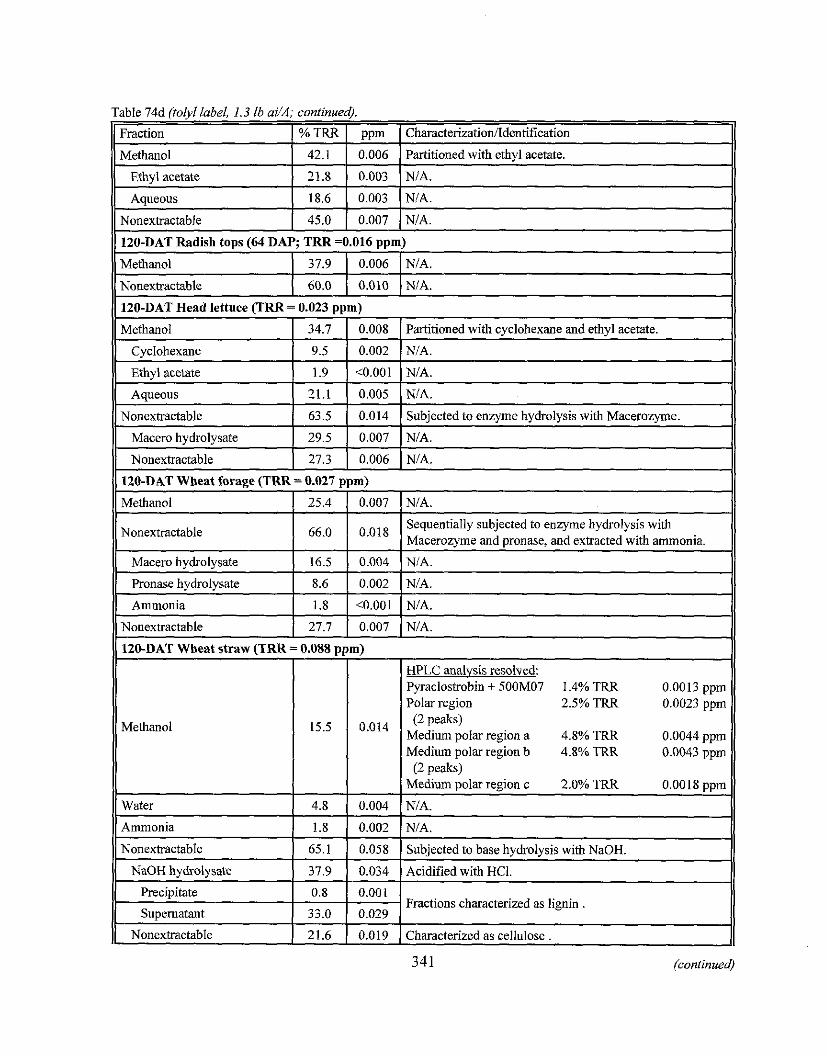
Table 74d (tolyl label, 1.3 lb ai/A; continued).
Mediurn polar region b 4.8% TRR
341 (continued)
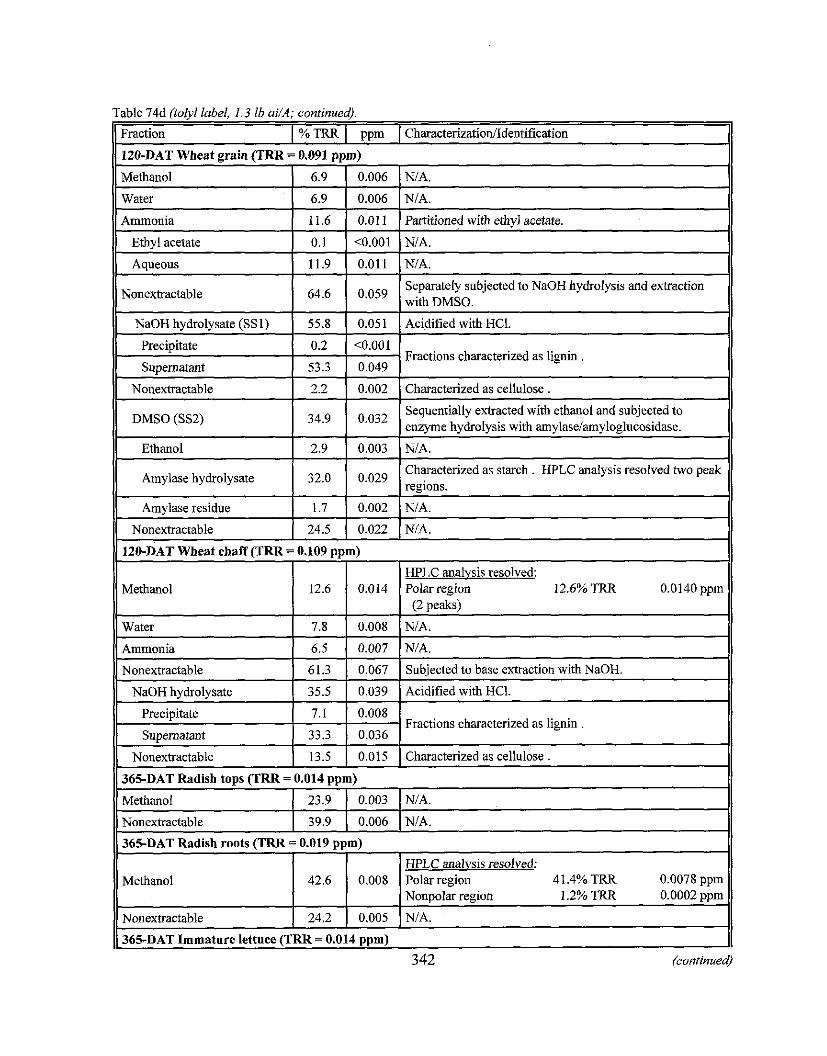
Table 74d (tolyl label, 1.3 lb ai/A; continued).
Fractions characterized as lignin .
Fractions characterized as lignin .
342 (continue4
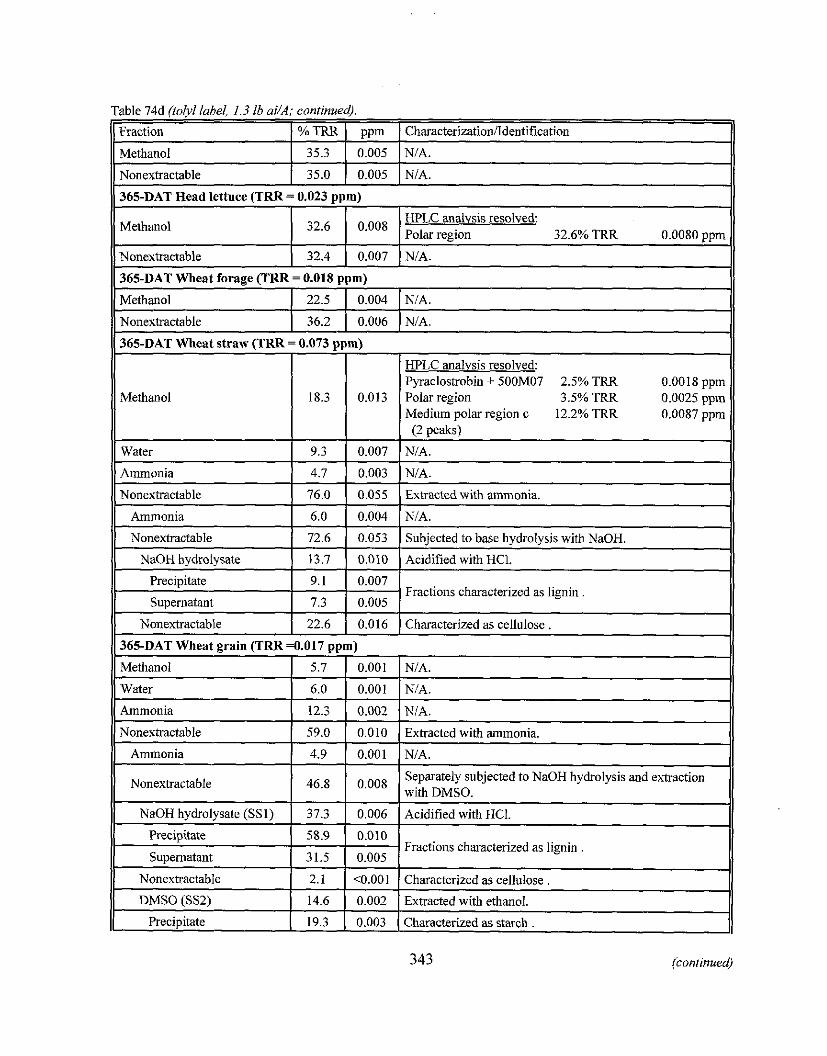
Table 74d (tolyl label, 1.3 16 aYA; continued).
Fraction I % TRR 1 ppm 1 CharacterizatiodIdentification
II Methanol 1 35.3 ( 0.005 1 NIA.
Nonextractable 1 35.0 1 0.005 I NIA.
Pyraclostrobin + 500M07 2.5% TRR
Fractions characterized as lignin .
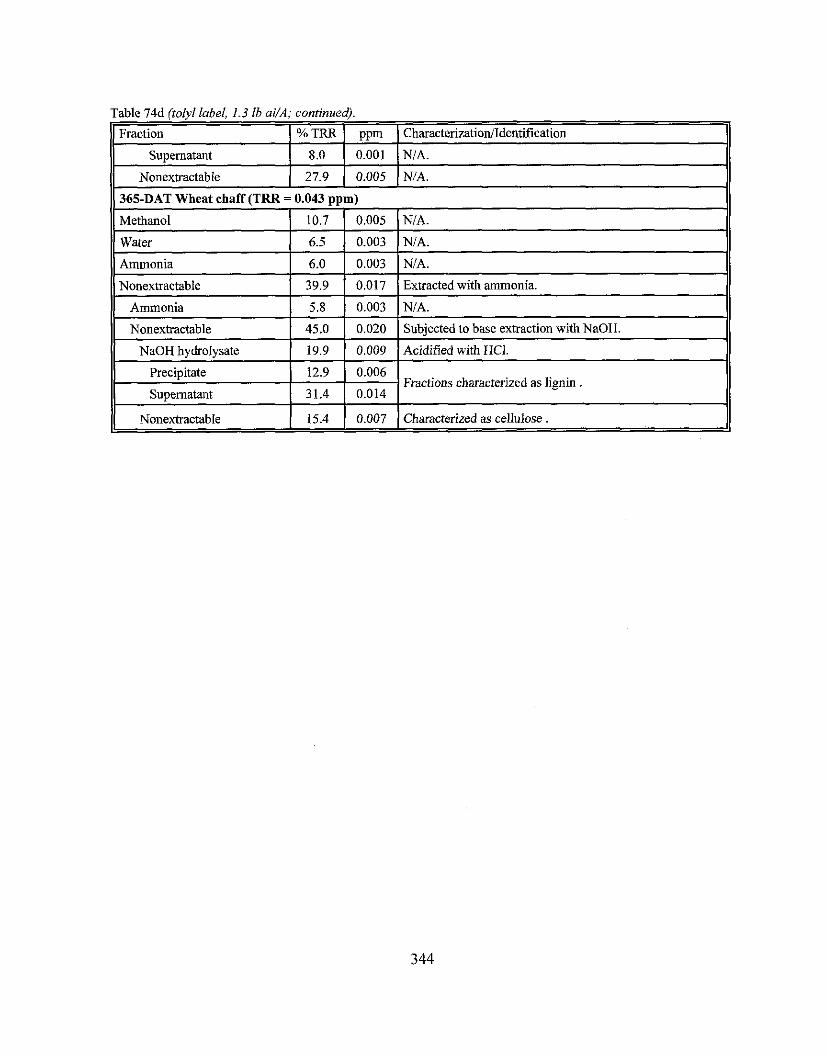
Table 74d (tolyl label, 1.3 lb ai/A; continue$.
Fractions characterized as lignin .
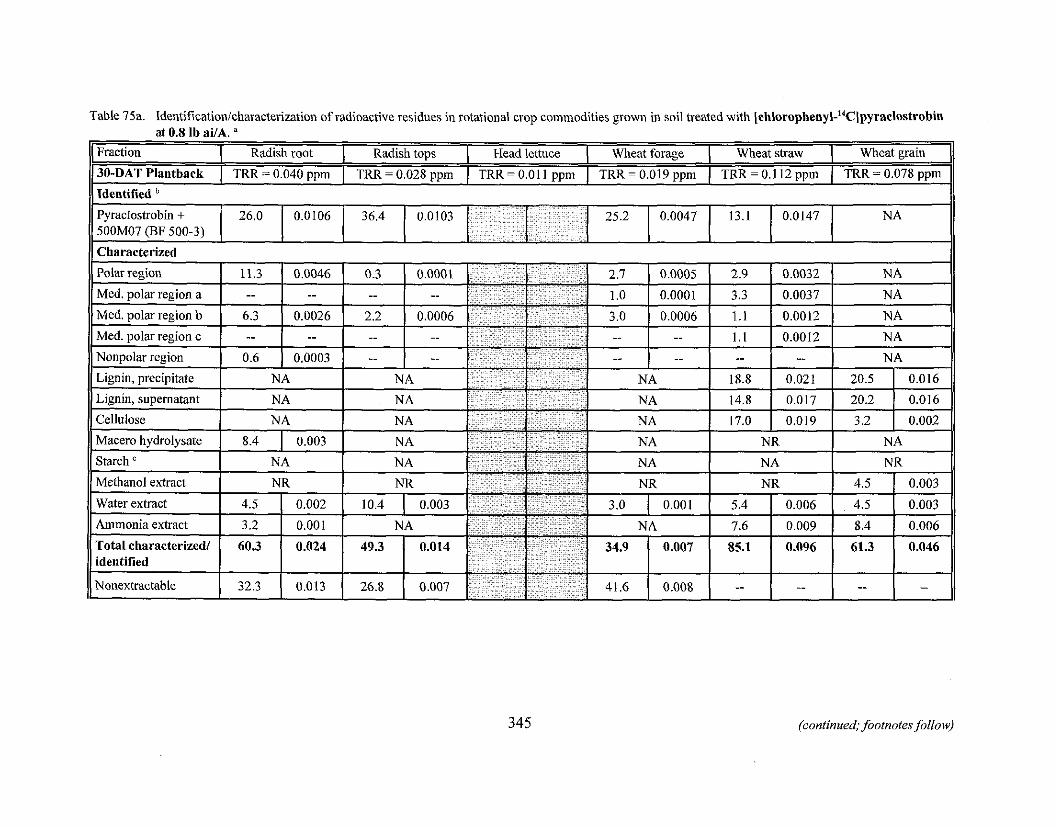
Table 7%. Identificationicharacterization of radioactive residues in rotational crov commodities grown in soil treated with Ichloro~henvl-"Clp~raclostrobin
Polar region 1 11.3 0.0046
Med. polar region a I -- --
- . - .-. at 0.8 lb ai/A. a
' Mcd. polar rcgion h I 0.3 1 0.11026
hled. ~ ~ o l a r rccio~i o I .- 1 --
I Lignin, supernatant I NA Cellulose I N A
Wheat grain Fraction
Macero hydrolysate 1 8.4 1 0.003
Starch I N A
30-DAT Plantback 1 TRR = 0.040 ppm I TRR = 0.028 ppm 1 TRR = 0.01 1 ppm I TRR = 0.01 9 ppm I TRR = 0.112 ppm ( TRR = 0.078 ppm
Identified
Methanol extract NR
Water extract 1 4.5 1 0.002
Radish root
Ani~noni;~ extract 1 3.2 1 0.001
' h t a l characteriredl 1 60.3 1 0.024 identified I I
Radish tops
Nonextractable 1 32.3 ( 0.013
(continued; footnotes.follow)
Head lettuce ( Wheat forage Wheat straw
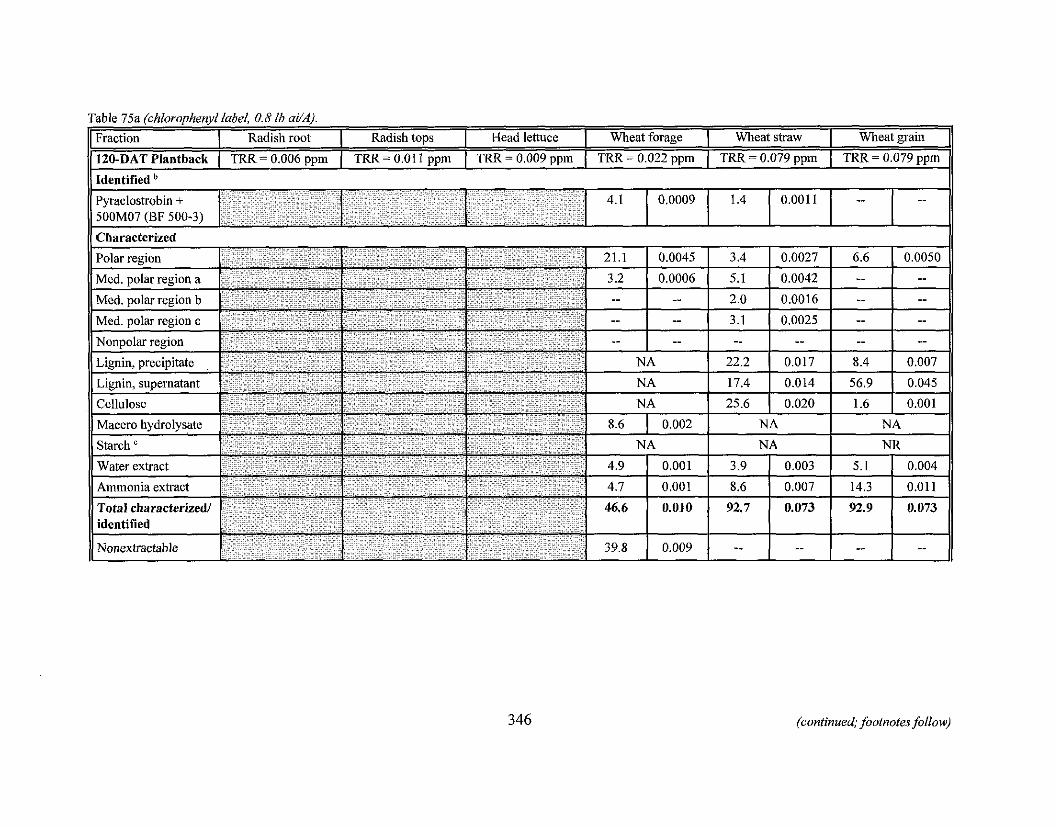
11 Identified 11
Table 75a (chlorophenyl label, 0.8 ib ai/A).
(continued; footnotes follow)
Wheat grain
120-DAT Plantback ( TRR = 0.006 ppm ( TRR = 0.01 1 ppm I TRR = 0.009 ppm ( TRR = 0.022 pprn ( TRR = 0.079 ppm ( TRR = 0.079 ppm
Fraction Radish tops Radish root Head lettuce I Wheat forage Wheat straw
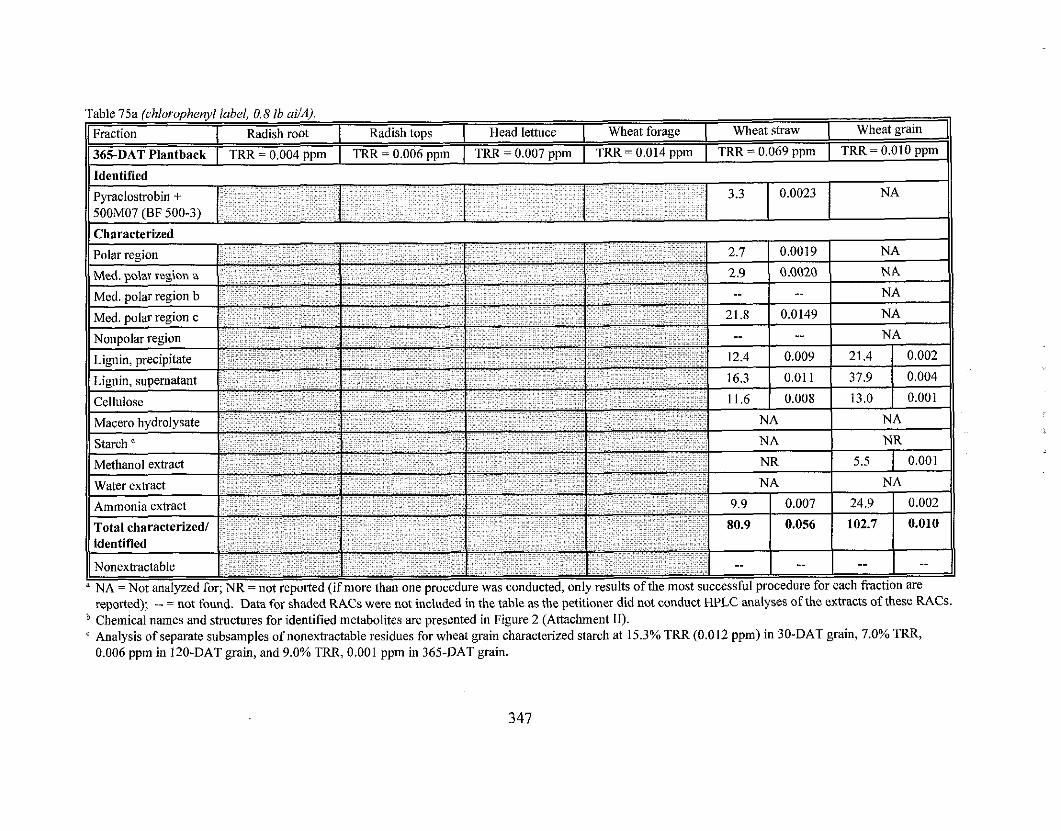
Table 75a (chlorophenyl label, 0.8 lb adAj. Wheat straw
' chemical names and structures for identified metabolites are presented in Figure 2 (Attachment 11). ' Analysis of separate subsamples of nonextractable residues for wheat grain characterized starch at 15.3% TRR (0.012 ppm) in 30-DAT grain, 7.0% TRR,
0.006 ppm in 120-DAT grain, and 9.0% TRR, 0.001 ppm in 365-DAT grain.
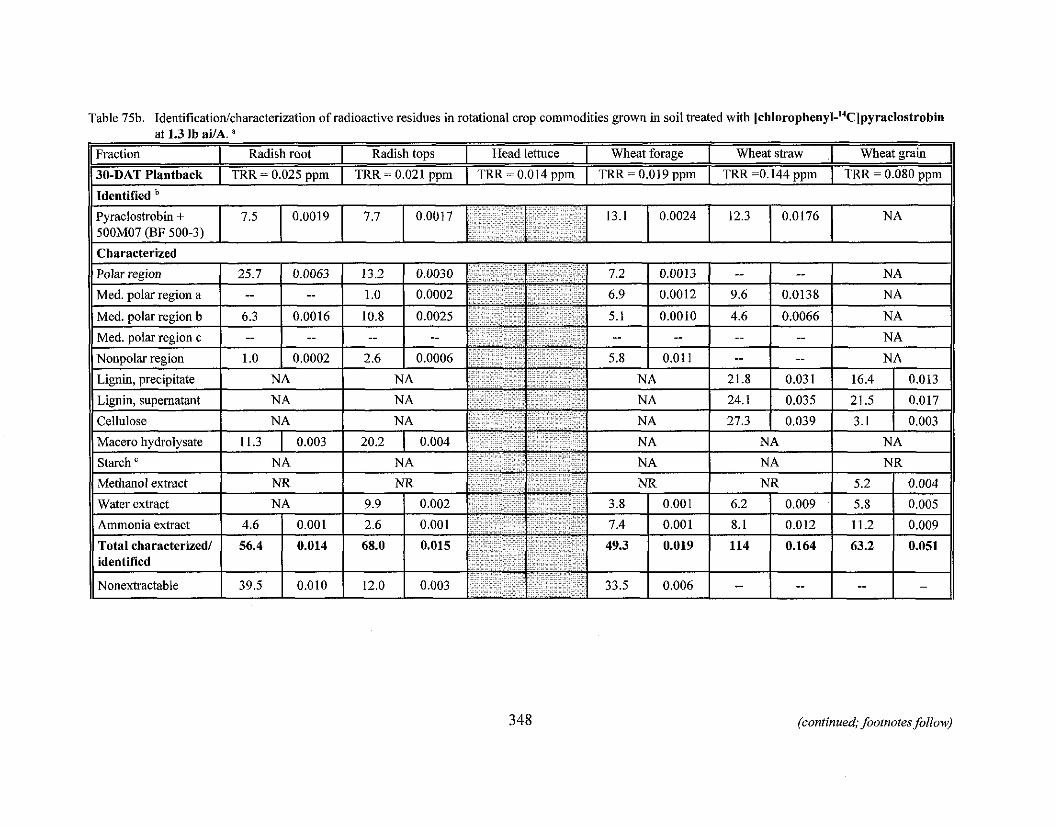
Table 75b. Identificationlcharacterization of radioactive residues in rotational crop commodities grown in soil heated with lchlorophenyl-"C]pyraclostrobin at 1.3 lh ai/A.
(continued; footnotes follow)
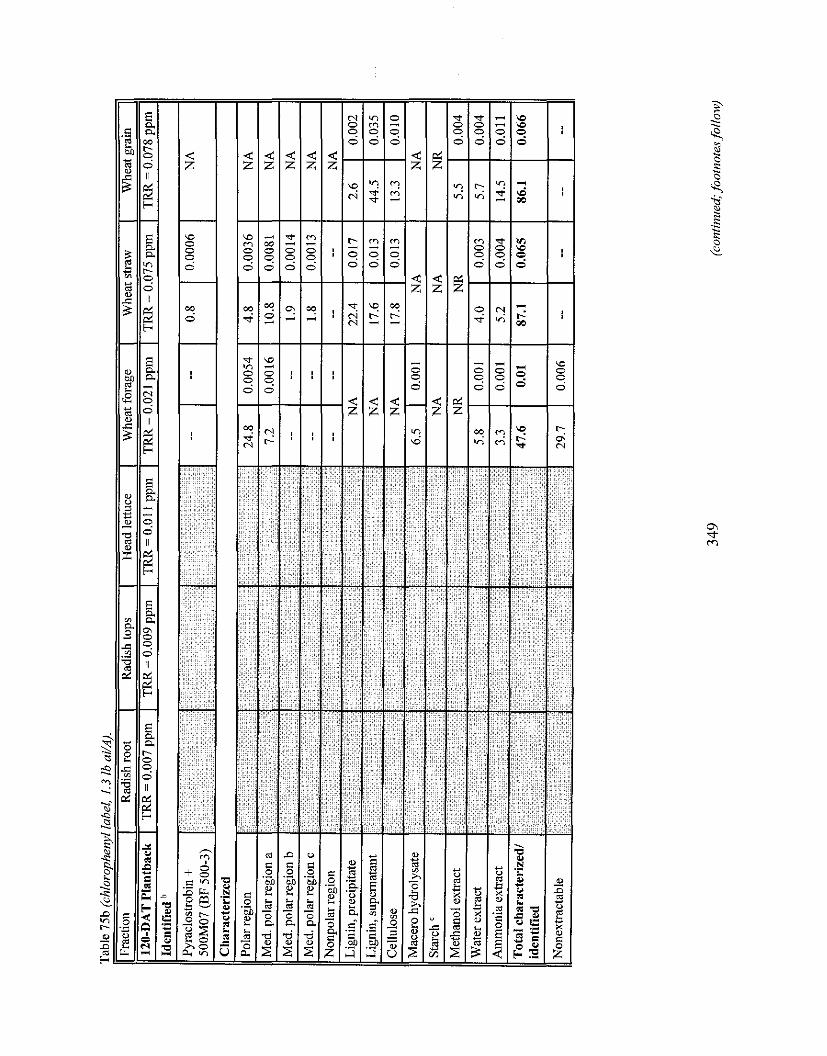
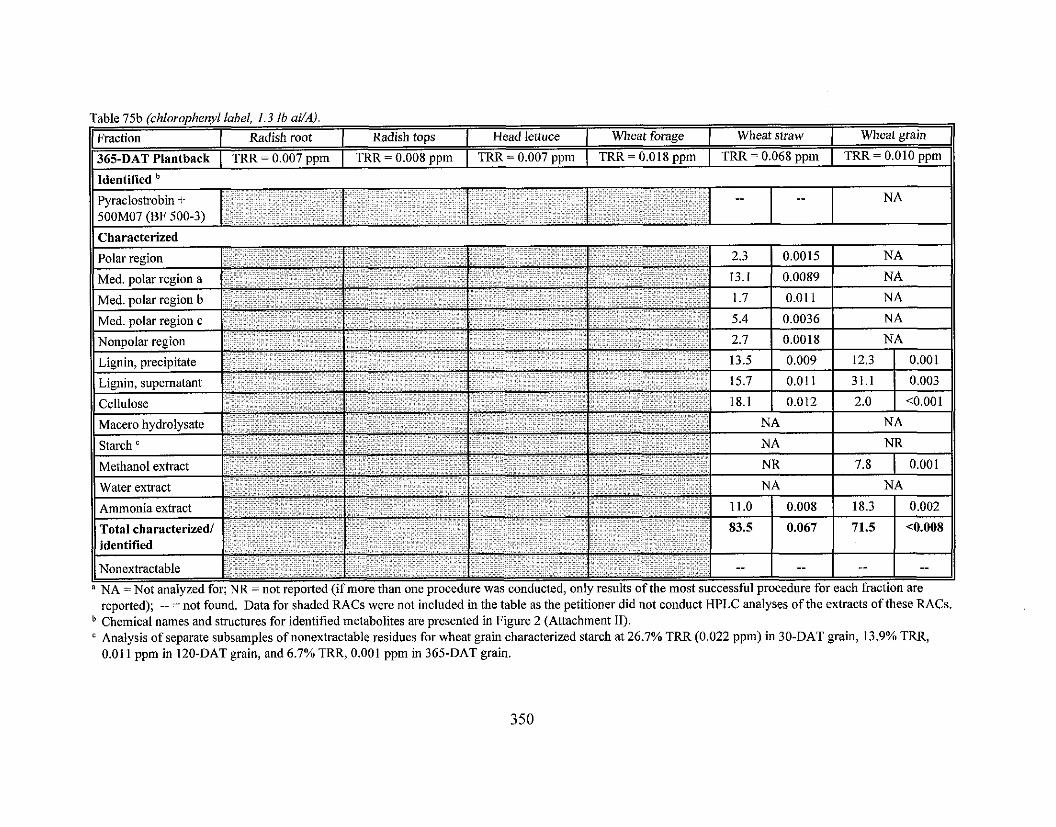
Table 75b (chlouophenyl label, 1.3 lb ai/A). 11 Fmctinn 1 Radish root 1 Radish toos I Head lettuce 1 Wheat forage 1 Wheat straw 1 Wheat grain 11 . . - - .- - -- ~ - Ii Plantback i TRR = 0.007 PPm j TRR = 0.008 ppm i TRR = 0.007 ppm i m = 0.018 ppm i TRR = 0,068 ppm i m x = o. i io ppm 11
"A - Not nn>lvrcd for: UK - not rr'norted ( i f more tliiili o ~ i c n r ~ i c d ~ ~ r e \\'as conducted. unl! ruults of the Inost wccesbful nr(>ccdurr: tor edch tiilction are - -~ ~ , . . reported); -- =not found. Data for shaded RACs were not included in the table as the petitioner did not conduct HPLC analyses of the extracts of these RACs. Chemical names and structures for identified metabolites are presented in Figure 2 (Attachment 11). Analysis of separate subsamples of nonextractable residues for wheat grain characterized starch at 26.7% TRR (0.022 ppm) in 30-DAT grain, 13.9% TRR, 0.01 1 ppm in 120-DAT grain, and 6.7% TRR, 0.001 ppm in 365-DAT grain.
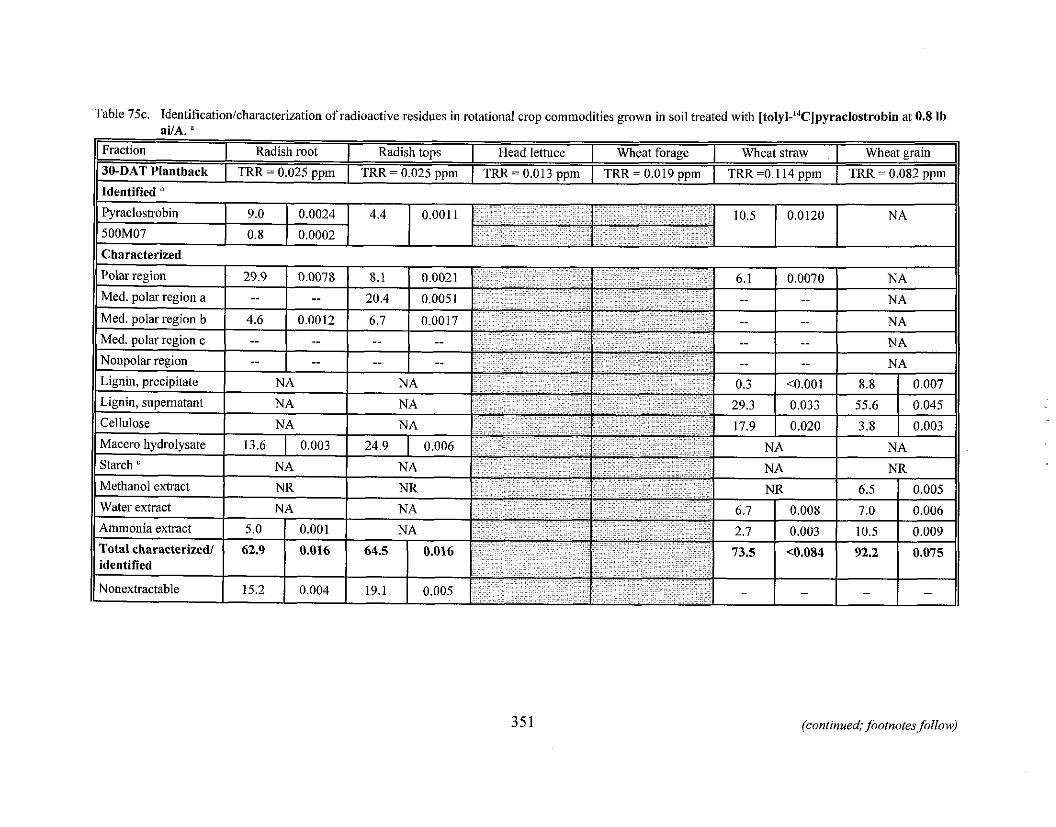
Table 75c. Identificationlcharacterization of radioactive residues in rotational crop commodities grown in soil treated with [tolyl-14CCjpyraclostrobin at 0.8 lb ai/A
Fraction Radish root Radish tops Head lettuce I Wheat forage Wheat straw Wheat grain
30-DAT Plantback I TRR = 0.025 ppm I TRR = 0.025 ppm I TRR = 0.013 ppm I TRR = 0.019 ppm I TRR =O. 114 ppm I TRR = 0.082 ppm Identifierl
H Polar rtgion 29 9 0.1)078 8.1 0.0021 6.1 iJ.0070
II - I I I - I I I I . . . . . . . . .. .
Med. polarrcgi~n b -1.6 0.00 12 6.7 0.001 7 -- -- A,, II II Med. nolar reeion c I -- I -- I -- I .- N A II
II Starch ' I NA 1 N A NA I NR 11 . .. . Methanol cxtr;ict N I1 NR N R 6.5 0.0Uj
Wdter cutract A A ii .4 6.7 0.0OX 7.0 0.006
.\ninlonia <xtr;~ct 5.0 0.00 I N,\ 2.7 0.003 10.5 0.009
l'otul charucteri~~edl 62.9 U.016 61.5 0.016 73.5 <0.081 92.2 0.075 identified
Y I I I I t I I I I
Nonextractable 15.2 0.004 19.1 0.005 - - - i - ll
(continued; footnotes follow)
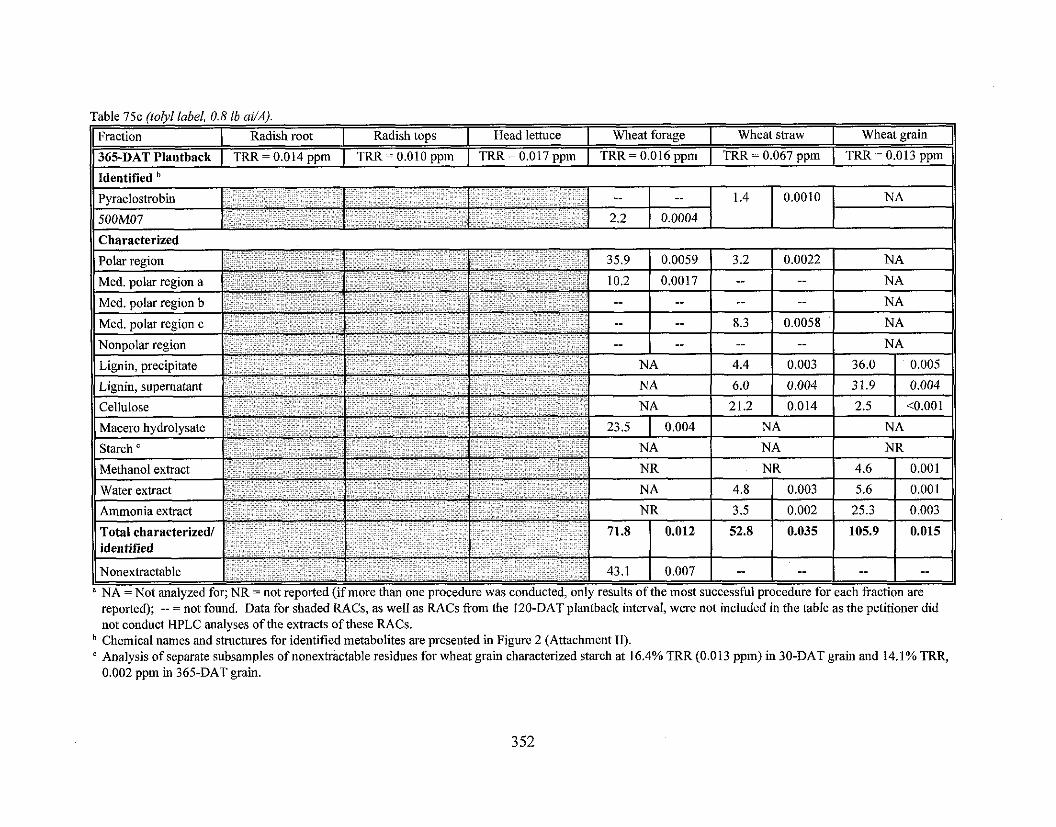
. . reported); -- =not found. Data for shaded RACs, as well as RACs from the 120-DATplantback interval, were not included in the table as the petitioner did not conduct HPLC analyses of the extracts of these RACs. Chemical names and structures for identified metabolites are presented in Figure 2 (Attachment 11).
"nalysjs of separate subsamples of nonextractable residues for wheat grain characterized starch at 16.4% TRR (0.013 ppm) in 30-DAT gain and 14.1% TRR, 0.002 ppm in 365-DAT grain.
Table 75c (iolyl label, 0.8 lb ai/A).
) 365-DAT Plantback I TRR = 0.014 ppm I TRR = 0.010 ppm I TRR= 0.017 ppm I TRR = 0.016 ppm I = 0.067 ppm I TRR = 0.013 ppm
Wheat straw Head lettuce I Wheat forage Fraction Wheat grain Radish root Radish tops
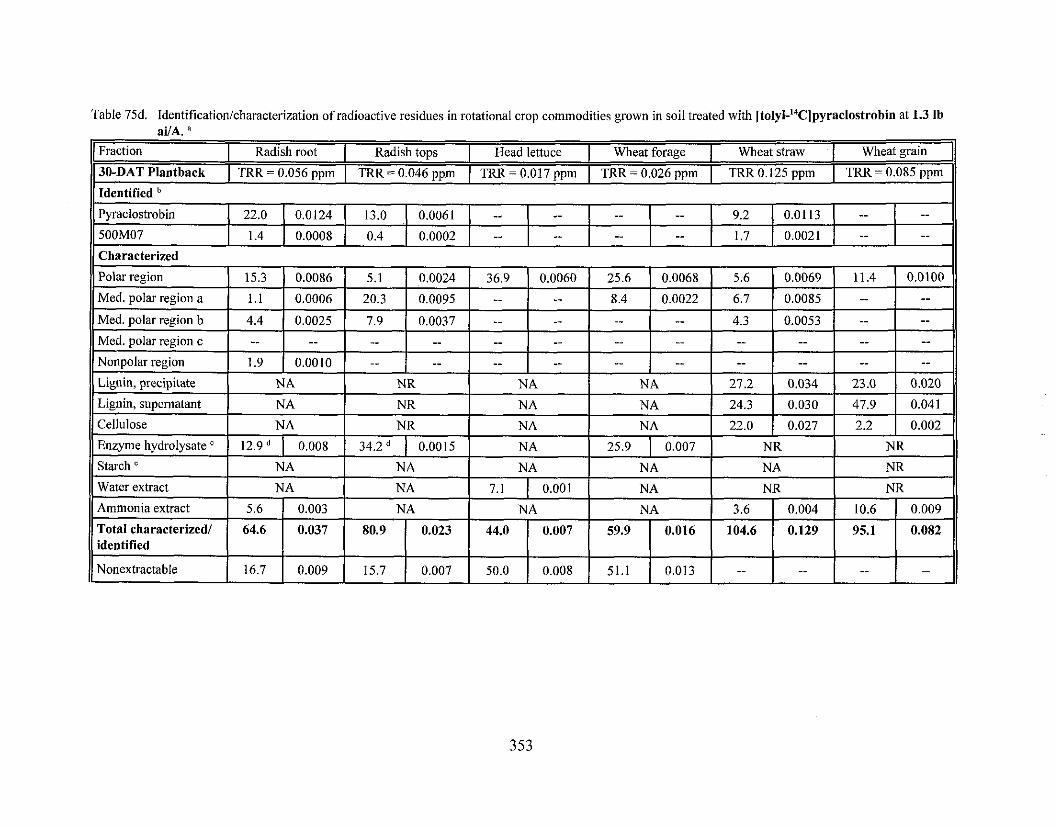
Table 75d. Identificationicharacterization of radioactive residues in rotational crop commodities grown in soil treated with [tolyl-"C]pyraclostrobin at 1.3 lb aVA. a
11 Fraction I Radish root I Radish toos I Head lettuce I Wheat forage I Wheat straw 1 Wheat grain I I - -
30-DAT Plantback I TRR = 0.056 ppm I TRR = 0.046 ppm I TRR = 0.017 ppm I TRR = 0.026 ppm I TRR 0.125 ppm I TRR = 0.085 ppm
Identified b 11 11 Characterized 11
-- Pyraclostrobin 22.0
500M07
-- 0.0124 13.0 -- 1.4
0.0061
0.0008
-- -- 0.4
9.2 0.0113 -- 0.0002
-- --
-- -- -- -- 1 . 7 1 0.0021
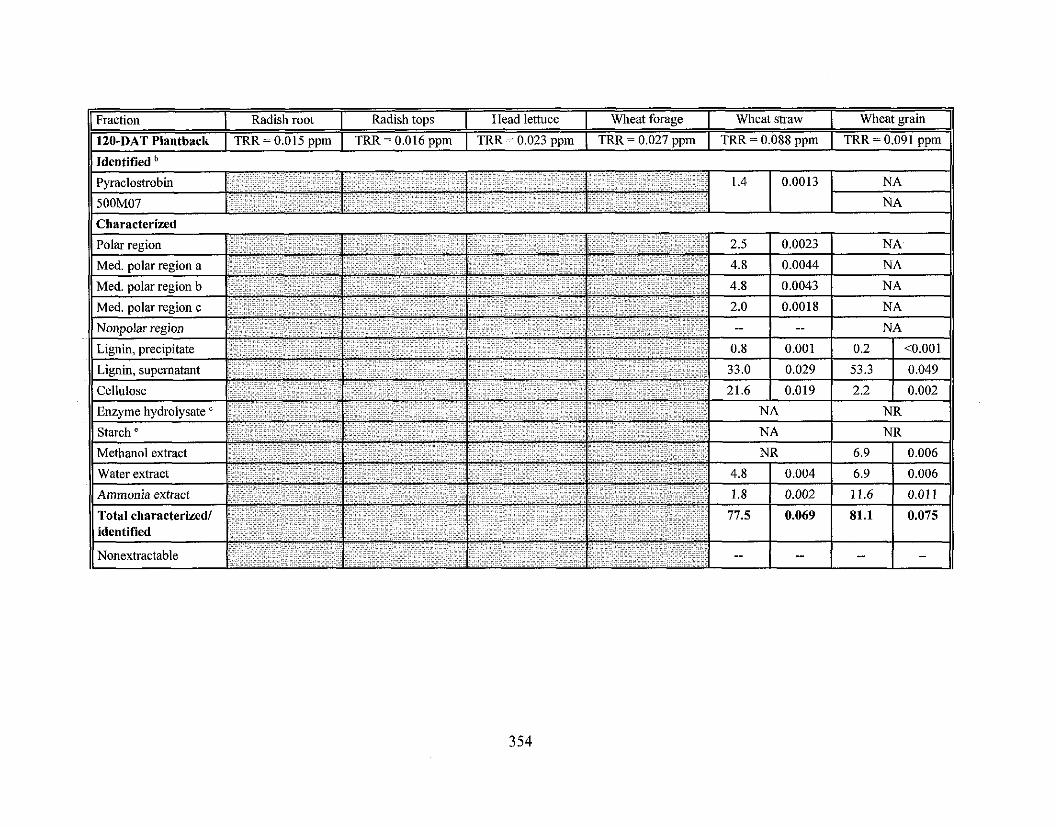
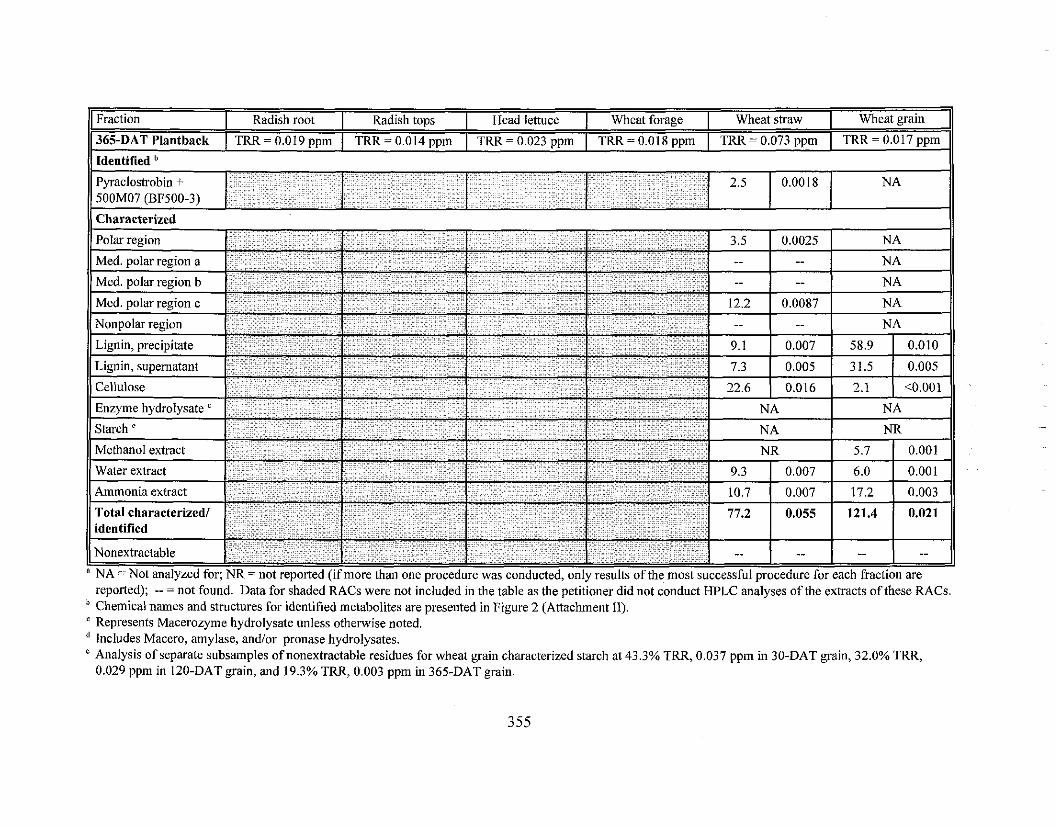
1 Fraction Radish root Radish tops Head lettuce I Wheat forage Wheat straw Wheat grain
1365-DAT Plantback I TRR = 0.019 nom I TRR = 0.014 unm I TRR = 0.023 onm I TRR = 0.018 nnm I TRR = 0.073 wum I TRR = 0.017 wpm 1 1 Identified 11
reported); --=not found. Data for shaded RACs were not included in the table as the petitioner did not conduct HPLC analyses of the extracts of these RACs Chemical names and structures for identified metabolites are presented in Figure 2 (Attachment 11).
" Represents Macerozyme hydrolysate unless otherwise noted. Includes Macero, amylase, andlor pronase hydrolysates. Analysis of separate subsamples of nonextractable residues for wheat grain characterized starch at 43.3% TRR, 0.037 ppm in 30-DAT grain, 32.0% TRR, 0.029 ppln in 120-DAT grain, and 19.3% TRR, 0.003 ppm in 365-DAT grain.
Storage stabilitv
Samples of rotational crop commodities were stored at --I8 C prior to and throughout the analytical phase of the study. Although sample collection dates were provided, dates were not provided for completion of analyses or the conclusion of the experimental portion of the study.
To demonstrate the stability of the test materials under frozen storage conditions, the petitioner compared HPLC results for methanol extracts of 30-DAT radish roots (chlorophenyl label, 0.8 lb ai1A) and head lettuce (tolyl label, 1.3 lb ai/A) analyzed at the beginning of the study (<3 months after sampling) and following storage of subsamples and extracts at --I8 C for -22 months. Based on the results of HPLC analysis, the metabolite profiles did not change significantly for 22 months. For radish roots, the metabolite profiles for the stored methanol extract and the methanol extract generated following extraction of stored radish root were identical to the metabolite profile generated at the beginning of the study. For head lettuce, although pyraclostrobin was undetected in the first analysis of the methanol extract and was detected on reanalysis following storage, the petitioner noted that its detection was probably the result of the use of a newer column and different column batches; for both head lettuce analyses, the majority of the radioactivity was found in the very polar region.
Provided the petitioner submits additional information confirming that rotational crop samples were analyzed within the interval represented by the storage stability study, no additional storage stability data are required to support the confined rotational crop study.
Studv summary
In the RACs of radishes, lettuce, and wheat planted 30, 120, and 365 days following soil treatment with [chlorophenyl-14C]pyraclostrobin or [tolyl-14C]pyraclostrobin at total application rates for each label of 0.8 lb ai/A or 1.3 lb ai/A (-0.7~ and lx, respectively, the maximum proposed seasonal rate for annual crops), total radioactive residues (TRR), expressed as pyraclostrobin equivalents, accumulated at levels >0.01 ppm in samples of radish roots and tops, head lettuce, and wheat forage, straw and grain planted 30 days after treatment (DAT); 120-DAT radish tops, head lettuce, and wheat forage, straw, and grain; and 365-DAT radish roots and tops, head lettuce, and wheat forage, straw, and grain.
The petitioner successfully characterizedlidentified -35%-121% TRR in rotational crop commodities. Pyraclostrobin and its metabolite 500M07 (elsewhere named BF 500-3) were identified at 7.5%-36.4% TRR (0.0017-0.0176 ppm) in 30-DAT rotational crop commodities except head lettuce and wheat grain, at 0.8%-4.1% (0.0006-0.0013 ppm) TRR in 120-DAT wheat forage and straw, and at 1.4-3.3% TRR (0.0004-0.0023 ppm) in 365-DAT wheat forage and straw. Because TRR levels were low, additional extractable residues were characterized as polar, medium polar, or nonpolar fractions; of these fractions, the polar region was the most significant, accounting for up to 36.9% TRR, and the nonpolar region was the least significant. The
petitioner also successfully demonstrated incorporation of I4C-residues into cellulose and lignin in all rotational crop commodities and incorporation into starch in wheat grain.
The study indicates that metabolism of pyraclostrobin in rotated crops is similar but more extensive than in primary crops, with pyraclostrobin undergoing demethoxylation to yield 500M07 (BF 500-3), followed by further degradation to medium polar and polar metabolites, and subsequent conjugation reactions and incorporation into natural products.
The HED MARC concluded that the residues of concern in rotational crops consist of pyraclostrobin and its desmethoxy metabolite (D278044, L. Cheng, October 9,2001).
OPPTS GLN 860.1900: Field Accumulation in Rotational Croos
BASF Corporation submitted data (citation shown below) depicting residues of pyraclostrobin inlon representative rotational crops from limited field studies.
451 18623 Wofford, J.; Abdel-Baky, S.; Riley, M. (1999) Limited Rotational Crop Study for the Use of BAS 500 F in Cucurbits: Lab Project Number: 98067: 199915126. Unpublished study prepared by BASF Corporation. 78 p.
Six rotational field trials were conducted between 1998 and 1999 in CA(3 trials) and GA(3). Each trial site consisted of one untreated control plot (Plot 1) and one treatment plot (Plot 2). Treatment plots received six sequential foliar applications of the 2 lblgal EC formulation to the primary crop (cucumbers) at 0.19-0.20 lb aiiAlapplication (- l x the maximum proposed seasonal rate; cucumbers are representative of crops with higher proposed application rates), made at 6- to 8-day retreatment intervals. Applications were made using ground equipment in 9.7-30.5 gal/A with a spreader sticker added to the spray volume. Cucumbers from the control and treated plots were harvested at maturity (PHI not specified).
Rotational crops were planted following harvest of the primary crop; one rotational crop was planted at each of the CA and GA trials. Representative crops of leafy vegetable (cabbage), root crop (radish), and cereal grains (winter wheat) were planted back 14,30, and 45 days after the final application of pyraclostrobin to cucumbers. Crop information pertaining to the growing conditions, irrigation, and maintenance pesticides was not provided.
Duplicate untreated and treated samples of the various RACs for each rotational crop were harvested from each plot. Radish samples were harvested at maturity 36-49 days after planting (DAP) for the GA plots and 112-1 18 DAP for the CA plots, and were separated into roots and tops. Cabbage samples (with and without wrapper leaves) were collected 90-104 DAP for the GA plots and 143-207 DAP for the CA plots. Wheat forage was collected when wheat was 6-8 inches tall (50-85 DAP for GA plots and 11 5-127 DAP for CA plots); wheat hay was sampled between the early flower (boot) and soft dough stage (141-150 DAP for GA plots and 168-199
DAP for CA plots), and field dried for 5-7 days in GA and 21-24 days in CA. Wheat grain and straw were collected at maturity (174-205 DAP for GA plots and 204-235 DAP for CA plots).
Rotational crop samples were transferred to freezers as soon as possible after collection (time unspecified) and were shipped frozen to BASF APC for analysis. Samples were analyzed for residues of pyraclostrobin and its metabolite BF 500-3 using BASF Analytical Method Number D9808. The LOQs for pyraclostrobin and its metabolite BF 500-3 were each 0.02 ppm. Apparent residues of pyraclostrobin and its metabolite BF 500-3 were each less than the LOQ idon two samples each of untreated radish roots and tops, cabbage (with and without wrapper leaves), and wheat forage, hay, grain, and straw.
Residues of pyraclostrobin and its metabolite BF 500-3 were each less than the method LOQ (<0.02 ppm) idon rotational crop matrices (radish, roots and tops; cabbage, with and without wrapper leaves; wheat forage, hay, and grain) from the 14-day PBI plots. Residues of pyraclostrobin idon one sample of wheat straw from the CA test site were detected at the LOQ (0.02 ppm), but residues of pyraclostrobin idon a replicate sample from the same plot were found to be <LOQ (actual residues of 0.012 ppm); the petitioner concluded that the average residues were <0.02 ppm. Residues of metabolite BF 500-3 were below LOQ (<0.02 ppm) idon all samples of wheat straw. Because combined residues of pyraclostrobin and its metabolite BF 500-3 were below the LOQ (10.04 ppm) idon all rotational crop samples from the 14-day PBI, samples from the 30- and 45-day PBI were not analyzed.
Studv summary:
Residues of pyraclostrobin and its metabolite BF 500-3 were each less than the method LOQ (<0.02 ppm) idon rotational crop matrices (radish, roots and tops; cabbage, with and without wrapper leaves; and wheat forage, hay, and grain) planted 14 days following the last of six sequential foliar applications to the primary crop, cucumbers, of the 2 lblgal EC formulation at 0.19-0.20 lb ai1Napplication (- lx the maximum proposed seasonal rate for annual crops). Residues of pyraclostrobin idon one sample of wheat straw from the CA test site were at the LOQ (0.02 ppm), but residues of pyraclostrobin idon a replicate sample from the same plot were below the LOQ (0.012 ppm) for an average residue of 10.02 ppm. Residues of metabolite BF 500-3 were nondetectable (<0.02 ppm) idon all samples of wheat straw.
The limited field rotational crop study is acceptable. The submitted data indicate that a 14-day PBI restriction for all crops that are not registered is required.
No Codex or Mexican MRLs have been proposed or are established for residues of pyraclostrobin. An International Residue Limit Status sheet, which includes pending Canadian MRLs, is attached.

List of Attachments I. International Residue Limit Status Sheet 11. Figure 2: Chemical names and structures of pyraclostrobin and its metabolites identified in
plant and livestock metabolism studies. 111. Figure 3: Chemical names and structures of compounds used in livestock commodity
analytical methods.
ATTACHMENT I
International Residue Limit Status Form
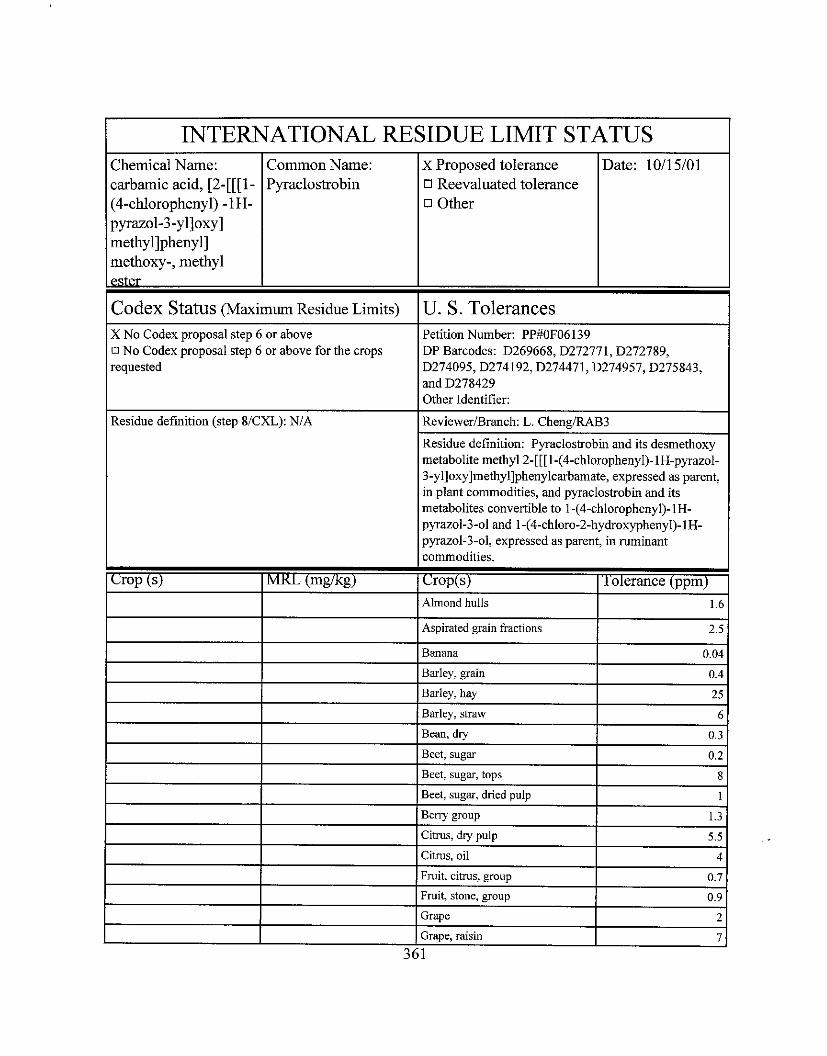
INTERNATIONAL RESIDUE LIMIT STATUS Chemical Name: carbamic acid, [2-[[[I- (4-chlorophenyl) - 1 H- pyrazol-3-ylloxy] methyl]phenyl] methoxy-, methyl ester
Common Name: Pyraclostrobin
Codex Status (Maximum Residue Limits)
X No Codex proposal step 6 or above No Codex proposal step 6 or above for the crops
requested
Residue defmition (step 81CXL): NIA
U. S. Tolerances Petition Number: PP#OF06139 DP Barcodes: D269668, D272771, D272789, D274095, D274192, D274471, D274957, D275843, and D278429 Other Identifier:
ReviewerBranch: L. ChengiRAB3
Residue definition: Pyraclostrobin and its desmethoxy metabolite methyl 2-[[[l-(4-chloropheny1)-1H-pyrazol- 3-yl]oxy]methyl]phenylcarbamate, expressed as parent, in plant commodities, and pyraclostrobin and its metabolites convertible to 1-(4-chloropheny1)-1H- pyrazol-3-01 and 1-(4-chloro-2-hydroxyphenyl)-1H- pyrazol-3-01, expressed as parent, in ruminant commodities.
x Proposed tolerance Reevaluated tolerance Other
Date: 1011 5101
Citrus, oil
Fruit, citrus, group
Fruit stone, group Grape
Grape, raisin
4
0.7
0.9
2
7
361
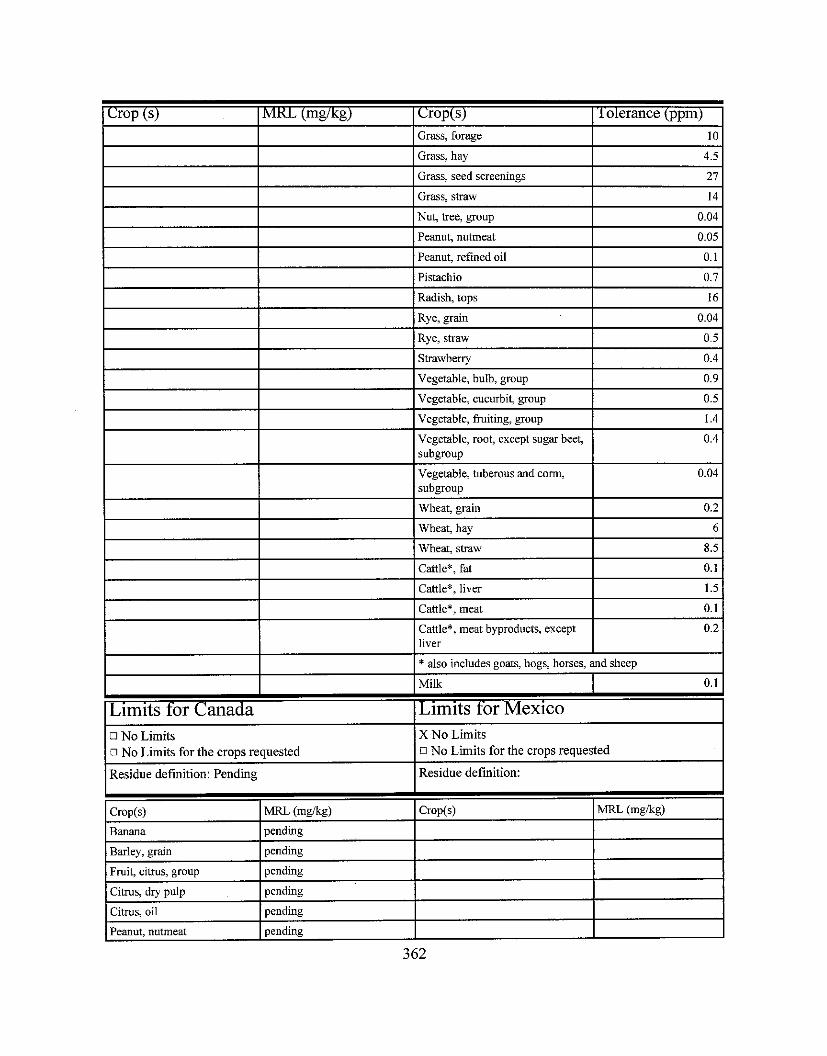
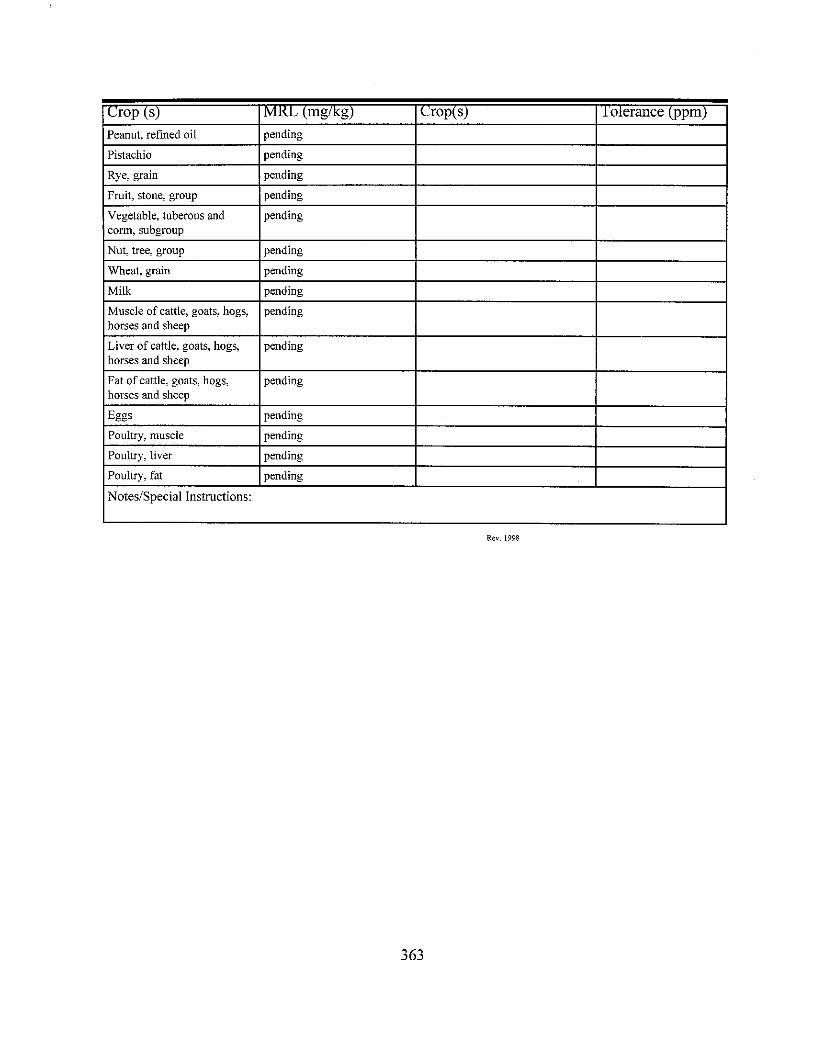
ATTACHMENT I1
Figure 2: Chemical names and structures of pyraclostrobin and its metabolites identified in plant and animal metabolism studies and confined rotational crop studies.
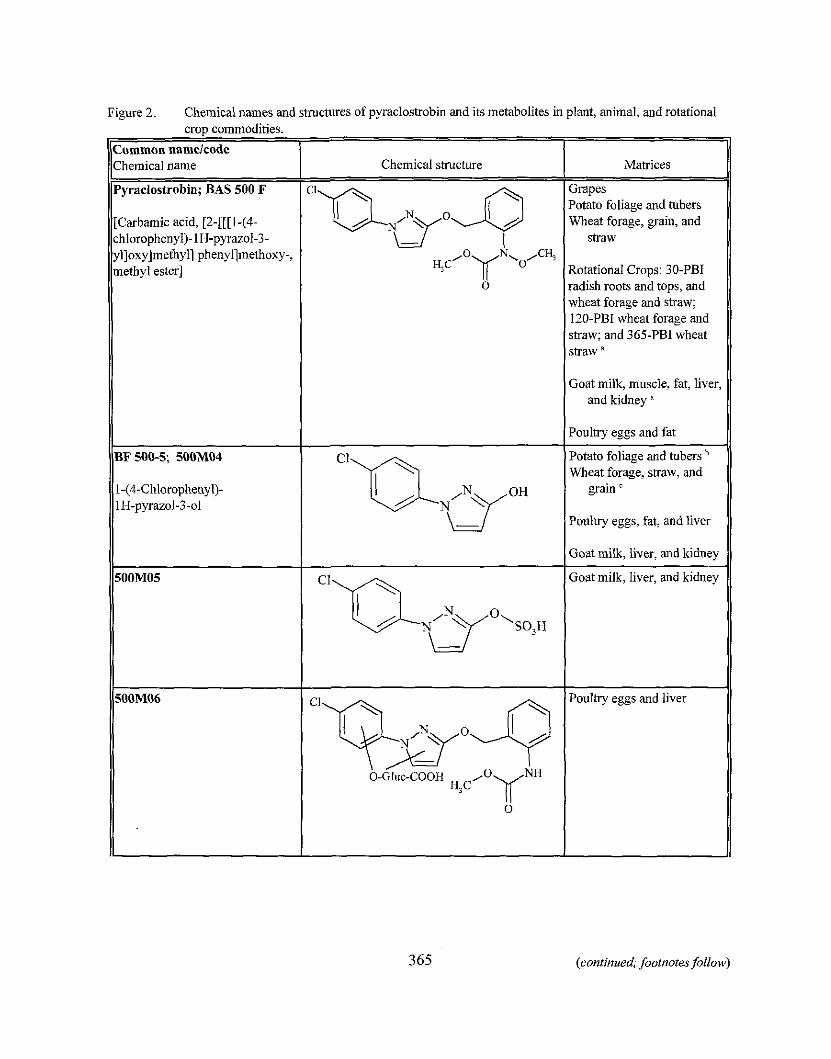
(continued; footnotes fdow)
plant, animal, and rotational
Matrices
Grapes Potato foliage and tubers Wheat forage, grain, and
straw
Rotational Crops: 30-PBI radish roots and tops, and wheat forage and straw; 120-PBI wheat forage and straw; and 365-PBI wheat straw a
Goat milk, muscle, fat, liver, and kidney '
Poultry eggs and fat
Potato foliage and tubers Wheat forage, straw, and
grain
Poultry eggs, fat, and liver
Goat milk, liver, and kidney
Goat milk, liver, and kidney
Poultry eggs and liver
Figure 2. Chemical names and crop commodities.
Common nameicode Chemical name
Pyraclostrobin; BAS 500 F
[Carbamic acid, [2-[[[I-(4- chloropheny1)-lH-pyrazol-3- yl]oxy]methyl] phenyl]methoxy-, methyl ester]
BF 500-5; 500M04
I-(4-Chloropheny1)- 1H-pyrazol-3-01
500M05
500M06
structures of pyraclostrobii and its metabolites in
Chemical structure --- CI
3&yoq N -
yc'O~N'O'C"
0
C1
DNpJoH -
C1
D N 3 O \ - S0,H
C1 qsq -
0-GIuc-COOH H j d O y N H
0
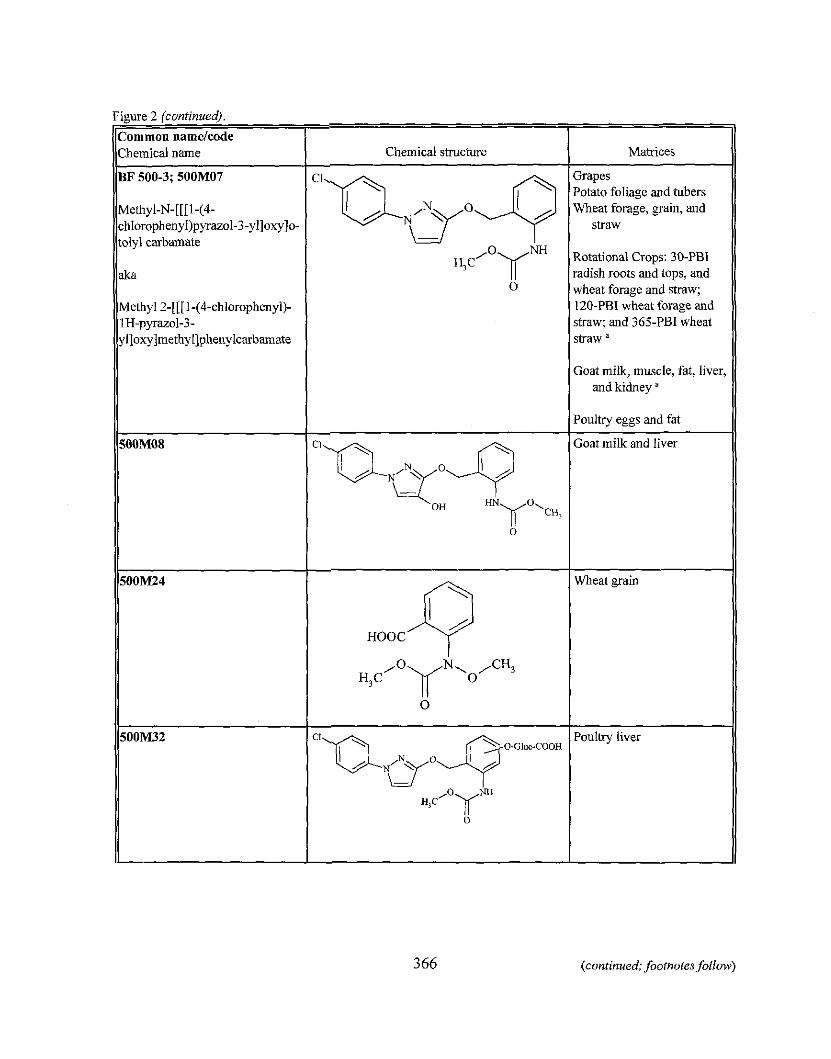
(continued; footnotes follow)
Matrices
Potato foliage and tubers Grapes Wheat straw forage, grain, and
Rotational Crops: IO-PBI radish roots and tops, and wheat forage and straw; 120-PBI wheat forage and straw; and 365-PBI wheat straw "
Goat milk, muscle, fat, liver, and kidney "
Poultry eggs and fat
Goat milk and liver
Wheat grain
Poultry liver
Figure 2 (contmuedj.
Common namelcode Chemical name
BF 500-3; 500M07
Methyl-N-[[[I-(4- chlorophenyl)pyrazol-3-ylloxylo- tolyl carbarnate
aka
Methyl 2-[[[I-(4-chloropheny1)- IH-pyrazol-3- yl]oxy]methyl]phenylcarbamate
500M08
500M24
50011132
Chemical structure
C1
nNFq -
H,C/OKNH
0
CI n20q N - \
OH HN ~ " ' o i ,
0
HOOC q N, ,CH,
" . C / O y 0
0
CI
QN30+ -G1uc-cOOH
H , C / O ~ M i
0
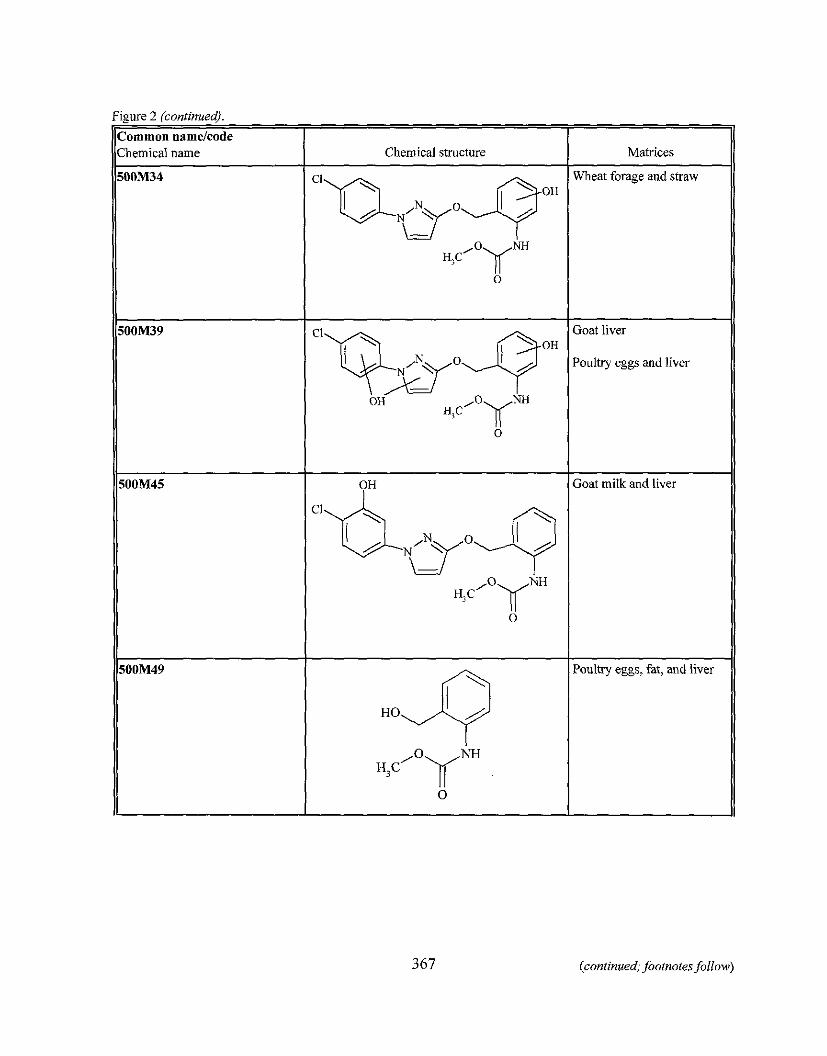
(continued; footnotes follow)
Figure 2 (continued).
Common namelcode Chemical name
500M34
50011139
500M45
500M49
Chemical structure
c1
DN30+
H 3 C / ' y m
0
CI
~ a o ~ O H - OH Hid0)(""
0
OH
CI d N 3 O 4
H3C/0)(NH
0
HO 4 H 3 d 0 y N H
0
Matrices
Wheat forage and straw
Goat liver
Paul.; eggs and liver
Goat mik and liver
-
Poultry eggs, fat, and liver
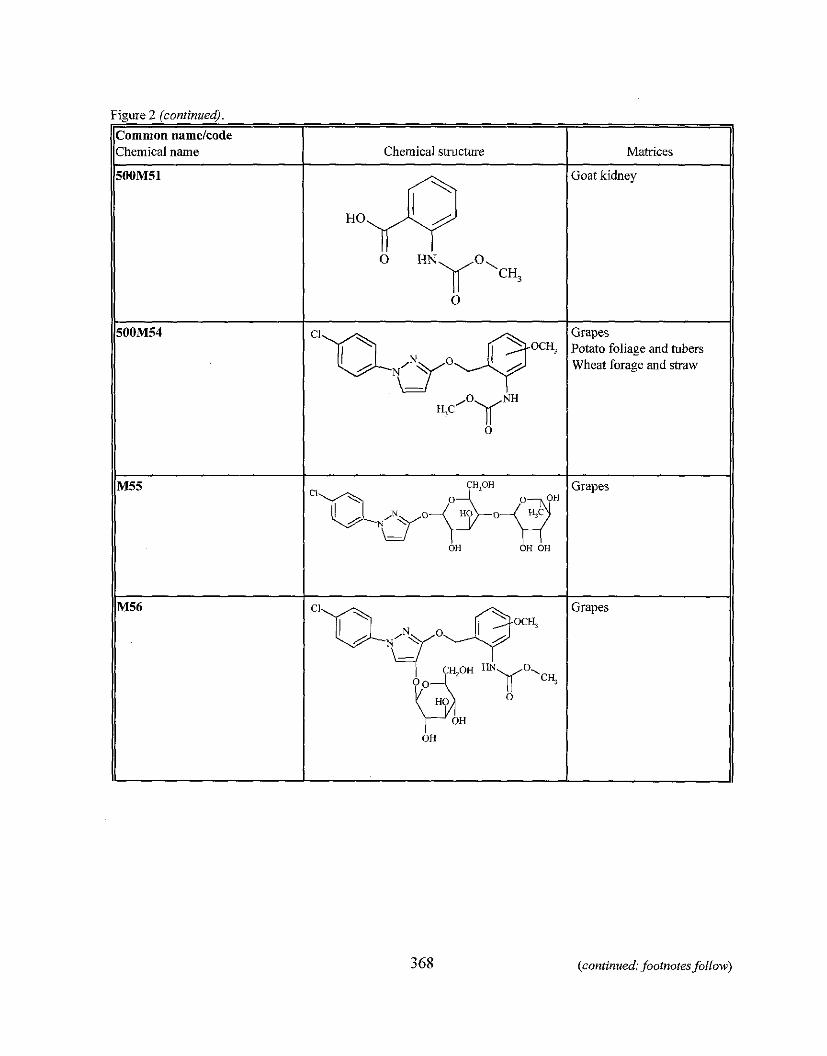
~emical name Chemical structure Matrices
;oat kidney
;rapes 'otato foliage and tubers Wheat forage and straw
(continued; footnotes follow)
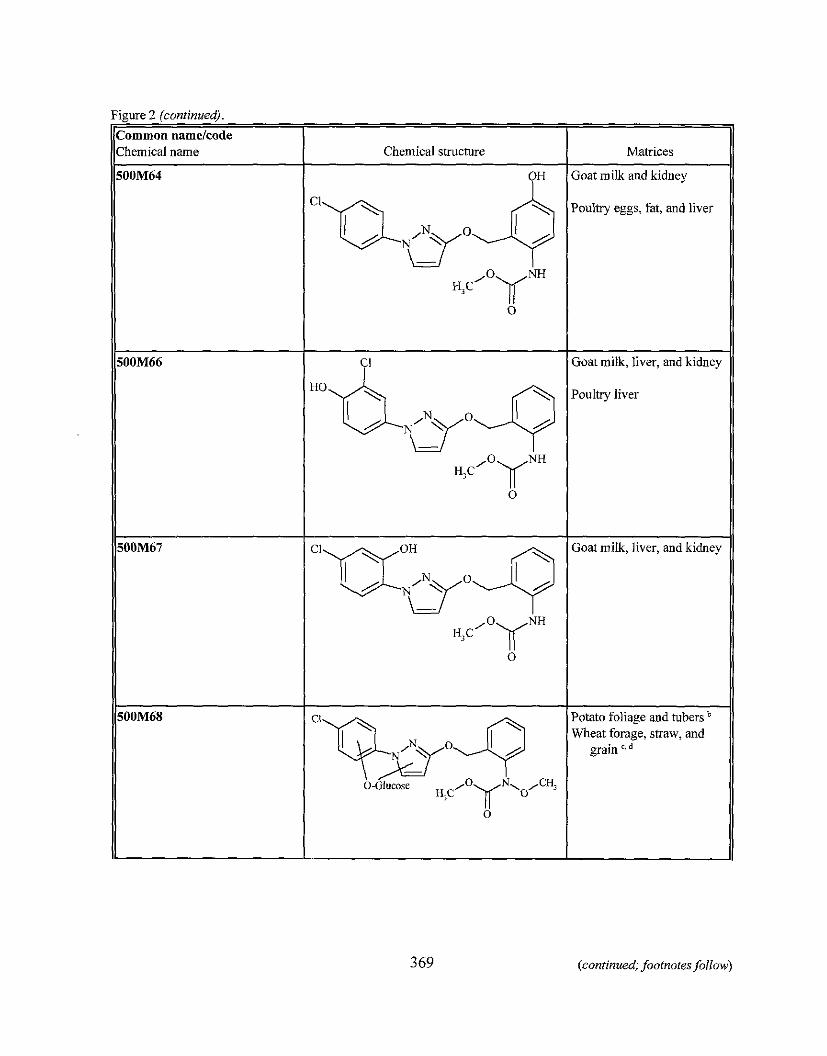
;urc ? Iconlit~~dcl/.
ommon namelcode iemical name Chemical structure Matrices
ioat milk and kidney
oultry eggs, fat, and liver
ioat milk, liver, and kidney
oultry liver
ioat milk, liver, and kidney
otato foliage and tubers Jheat forage, straw, and
grain ',
(continued; footnotes follow)
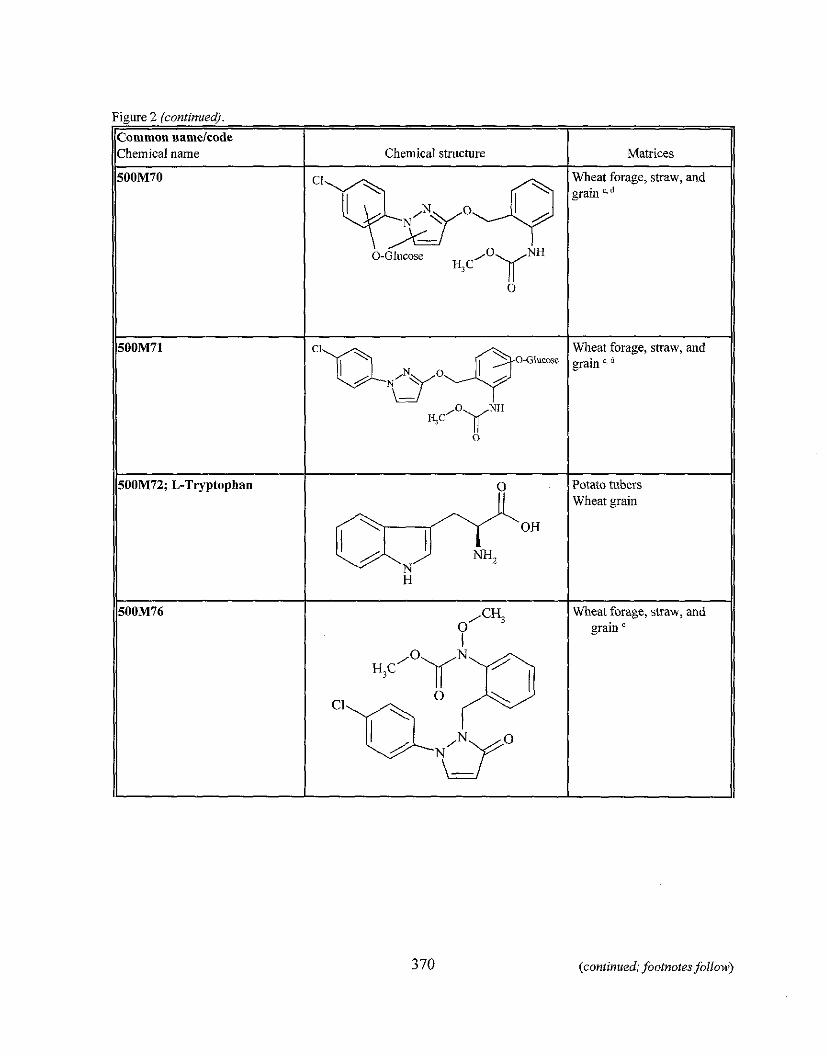
(continued;footnotes follow)
Figure 2 (contmuedj.
Common namelcode Chemical name
500M70
500M71
500M72; LTryptophan
- 500M76
Chemical structure
CI psJ-+ -
0-Glucose H 3 C ' " y M
0
CI
N \ -
% C / O y N H
0
&OH /
N NH2
H
/CH, 0 I
CI 0
Matr~ces
Wheat forage, straw, and
Wheat forage, straw, and grain
Potato tubers Wheat grain
Wheat forage, straw, and grain '
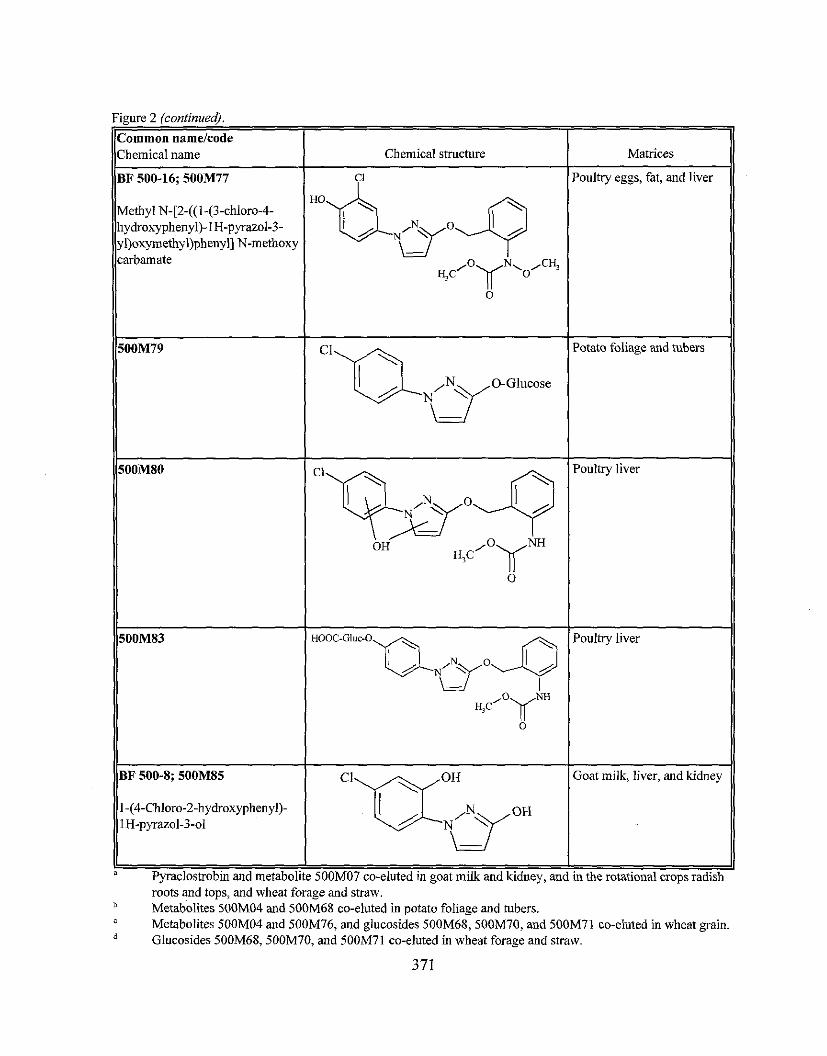
Figwe 2 (contznued).
Common namelcode Chemical name
BF 500-16; 500M77
Methyl N-[Z-((1-(3-chloro-4- hydroxypheny1)-lH-pyrazol4- yl)oxymethyl)phenyl] N-methoxy carbarnate
500M79
500M80
500M83
BF 500-8; 500M85
1-(4-Chloro-2-hydroxypheny1)- 1H-pyrazol-3-01
p a c l o s t r o b i n and metabolite roots and tops, and wheat Metabolites 500M04 and 500M68 co-eluted in potato foliage and tubers.
"etabolites 500M04 and 500M76, and glucosides 500M68, 500M70, and 500M71 co-eluted in wheat grain. Glucosides 50011168,500M70, and 500M71 co-eluted in wheat forage and straw.
Chemical structure
c1
HO
~ c ' O ~ N ' O ' c " 0
C1 nN3 - 0-Glucose
C1 Fa.;+ -
OH Hi'0)(""
0
HOOC-GIUC-0 T & o q N - '\
% c / O y R I
0
CI my3OH -
500M07 co-eluted in goat milk and kidney, and forage and straw.
Matrices
Poultry eggs, fat, and liver
Potato foliage and tubers
Poultry liver
Poultry liver
Goat milk, liver, and kidney
in the rotational crops radish
ATTACHMENT 111
Figure 3: Chemical names and structures of compounds used in animal commodity analytical methods.
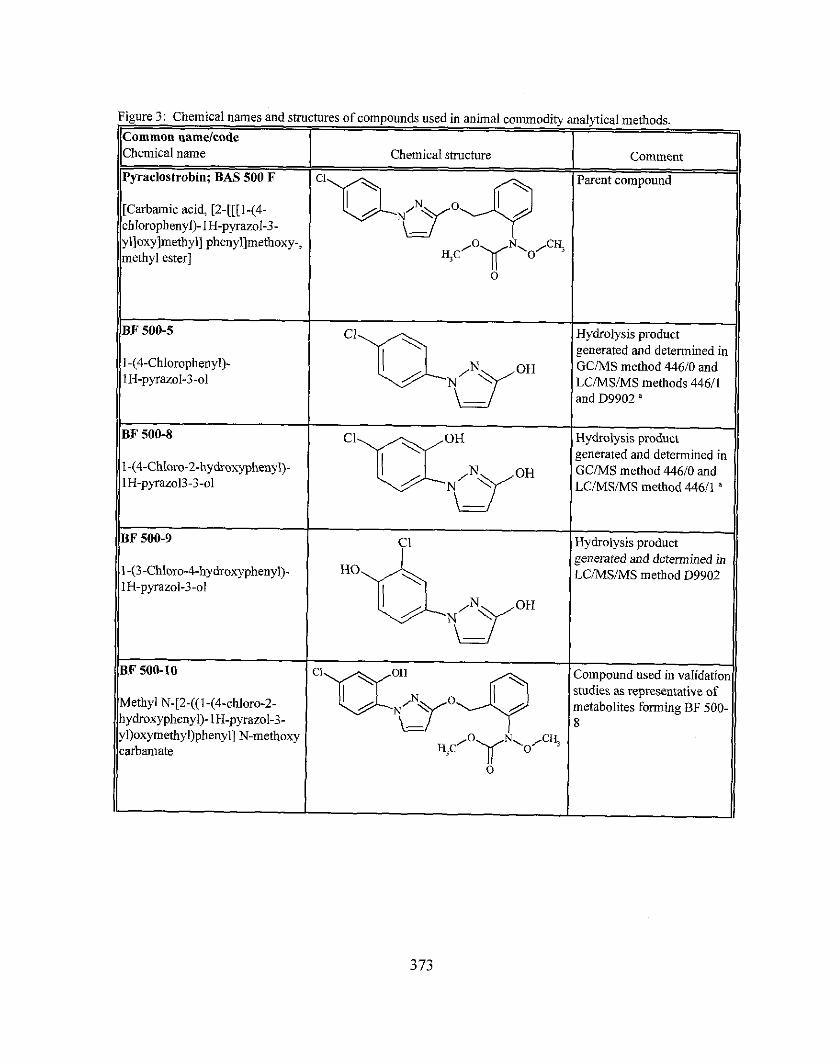
Figure 3: Cl1cmi~al113mes and strucnlr?s oicotnpounds uscd in ilnirn:~l colnmodit! anal) tical nlcthod>.
( ~ ~ o m m o n namclcodc 1 1 Chemical name
Pyraclostrobin; BAS 500 F
[Carbamic acid, [2-[[[I-(4- chIoropheny1)-lH-pyrazol-3- yl]oxy]methyl] phenyllmethoxy-, methyl ester]
BF 500-5
1-(4-Chloropheny1)- IN-pyrazol-3-01
Chemical structure
C1
nNa04 " F ' O K ~ \ O / ~ ~
0
BF 500-8
1-(4-Chloro-2-hydroxypheny1)- 1H-pyrazol3-3-01
BF 500-9
1-(3-Chloro-4-hy droxypheny1)- 1H-pyrazol-3-01
BF 500-10
Methyl N-[2-((1-(4-chloro-2- hydroxypheny1)-lH-pyrazol-3- yl)oxymethyl)phenyl] N-methoxy carbamate
Comment
Parent compound
CI Hydrolysis product generated and determined in GCMS method 44610 and LCiMSIMS methods 44611 and D9902 '
C1
CI
HO
bN30H -
C1 aO&oq N \ -
N\ ,C% % C Y 0 ~ 0
0
Hydrolysis product generated and determined in GCIMS method 44610 and LCIMSIMS method 44611 a
Hydrolysis product generated and determined in LC/MS/MS method D9902
Compound used in validatior metabolites studies as representative forming BF 500- of
8
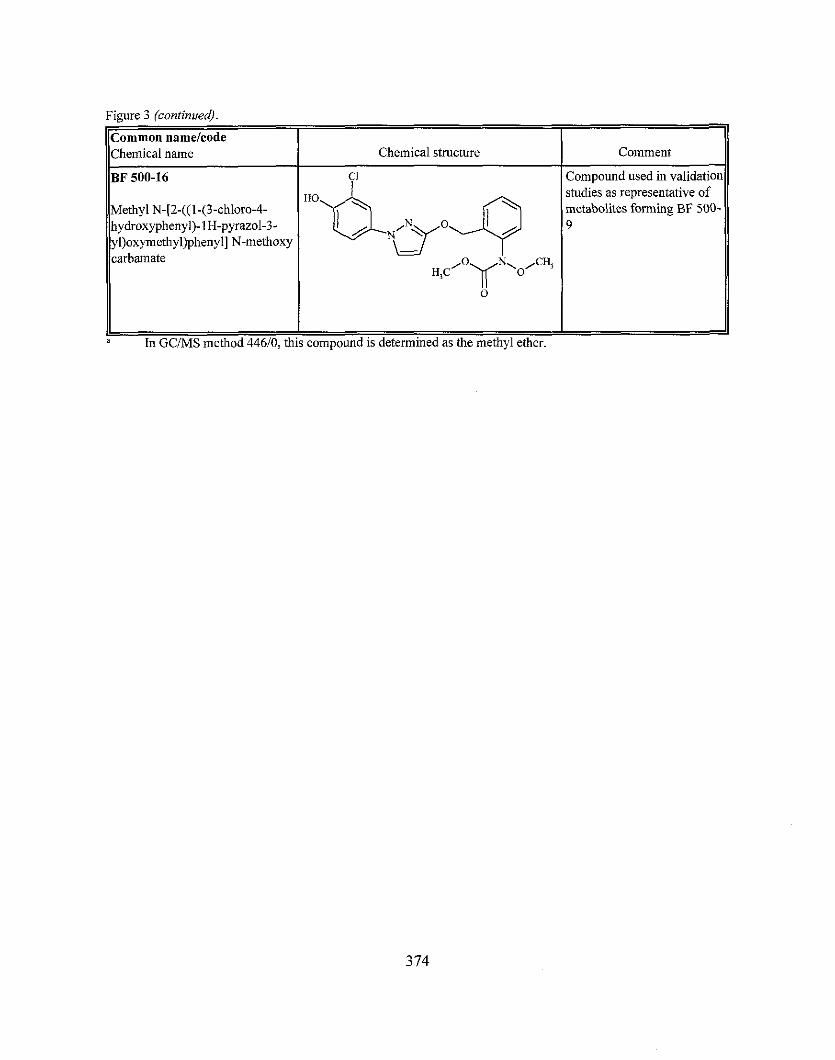
I1 I I " In GCIMS method 44610, this compound is determined as the methyl ether.
Figure 3 (continued).
Comment
Compound used in validatior studies as representative of metabolites forming BF 500- 9
Common nametcode Chemical name
BF 500-16
Methyl N-[Z-((1-(3-chloro-4- hydroxypheny1)-lH-pyrazol-3- yl)oxymethyl)phenyl] carbarnate N-methoxy
Chemical structure
c1
HO
I&y+ N - N, /C%
","OY O
0