towards green computing application for measuring the sustainability of data centers: an analytical...
TRANSCRIPT
Towards Green Computing Application for Measuring the Sustainability of Data
Centers: an Analytical Survey
Zohreh Gandomi and Salmiah Binti Amin
Asia Pacific University of Technology and Innovation
Kuala Lumpur, Malaysia
[email protected], [email protected]
ABSTRACT
Green computing is a new term which is defined to
make computing systems such as data centers more
energy efficient. Using various methods to prepare a
green networks and help CO2 reduction has been a
major issue for climate change in recent years. This
research work is designed to help admins to make a
green data centers by using an analytical survey and
new tool. The results in this research shows making
data centers green is a major concern for data
admins, however some of them have limited
information about the energy efficiency methods.
Finally, Green Data Center (GDC), use case design
and graphical user interface recommended for
future works in order to assist network
administrators to make their data centers green.
This research expected to provide analytical survey
towards green computing application for measuring
the sustainability of data centers.
KEYWORDS
Data centers; green metrics; energy efficiency;
power usage effectiveness; green networks.
1 INTRODUCTION
In recent years green computing term is
defined to make computer systems such as data
centers more efficient and more
environmentally friendly. In order to evaluate
the green index of data centers, some green
metrics such as Power Usage Effectiveness
(PUE) and Data Center infrastructure
Efficiency (DCIE) are defined. Power
consumption measurement and calculation of
energy cost and carbon footprint are extra
features that can assist data center
administrators to monitor the energy usage.
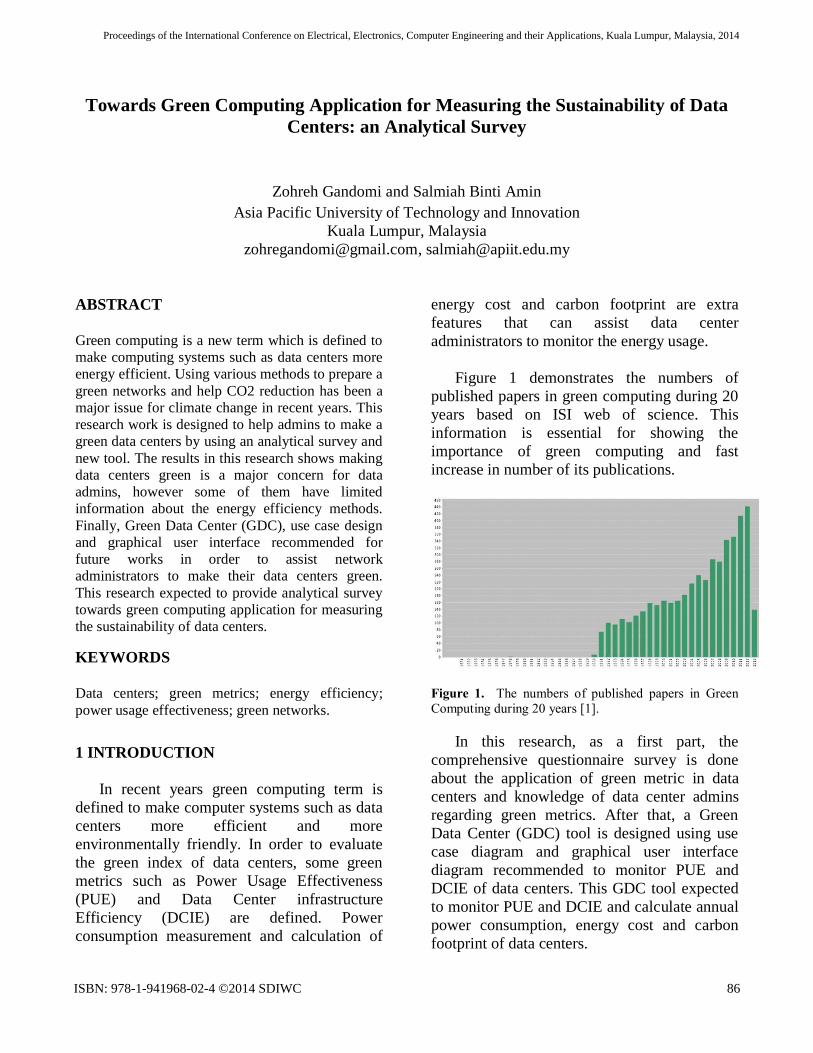
Figure 1 demonstrates the numbers of
published papers in green computing during 20
years based on ISI web of science. This
information is essential for showing the
importance of green computing and fast
increase in number of its publications.
Figure 1. The numbers of published papers in Green
Computing during 20 years [1].
In this research, as a first part, the
comprehensive questionnaire survey is done
about the application of green metric in data
centers and knowledge of data center admins
regarding green metrics. After that, a Green
Data Center (GDC) tool is designed using use
case diagram and graphical user interface
diagram recommended to monitor PUE and
DCIE of data centers. This GDC tool expected
to monitor PUE and DCIE and calculate annual
power consumption, energy cost and carbon
footprint of data centers.
ISBN: 978-1-941968-02-4 ©2014 SDIWC 86
Proceedings of the International Conference on Electrical, Electronics, Computer Engineering and their Applications, Kuala Lumpur, Malaysia, 2014
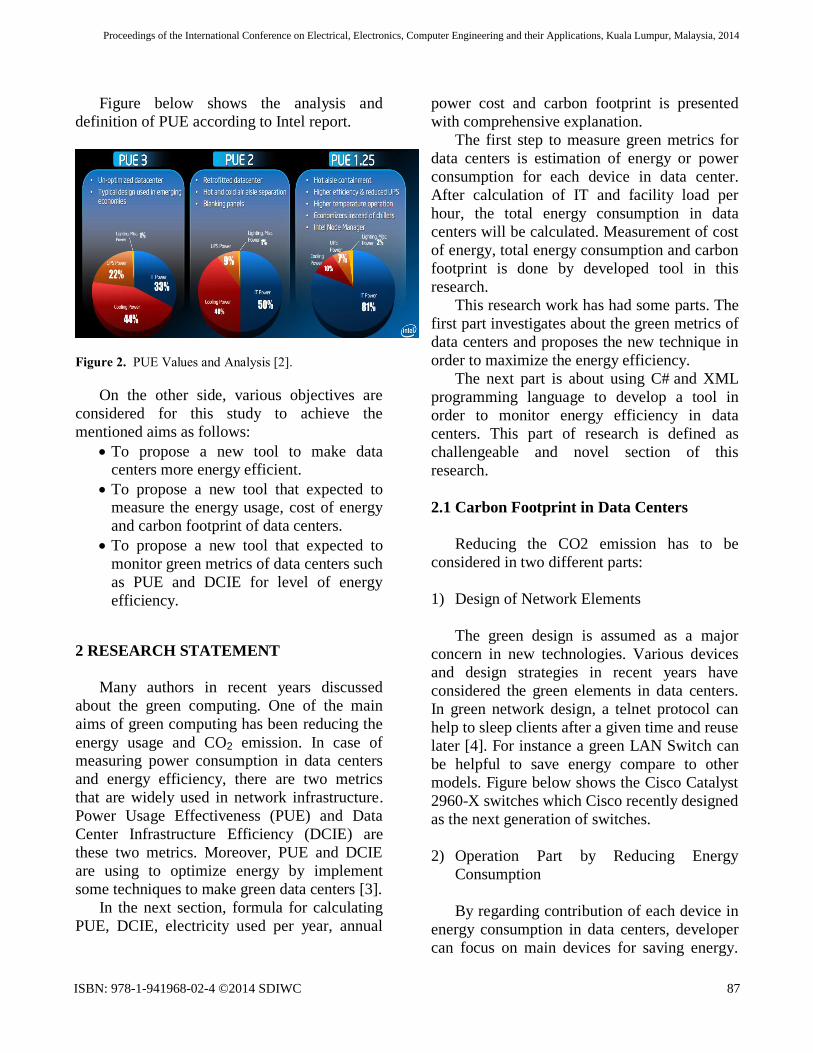
Figure below shows the analysis and
definition of PUE according to Intel report.
Figure 2. PUE Values and Analysis [2].
On the other side, various objectives are
considered for this study to achieve the
mentioned aims as follows:
To propose a new tool to make data centers more energy efficient.
To propose a new tool that expected to measure the energy usage, cost of energy
and carbon footprint of data centers.
To propose a new tool that expected to
monitor green metrics of data centers such
as PUE and DCIE for level of energy
efficiency.
2 RESEARCH STATEMENT
Many authors in recent years discussed
about the green computing. One of the main
aims of green computing has been reducing the
energy usage and CO2 emission. In case of measuring power consumption in data centers
and energy efficiency, there are two metrics
that are widely used in network infrastructure.
Power Usage Effectiveness (PUE) and Data
Center Infrastructure Efficiency (DCIE) are
these two metrics. Moreover, PUE and DCIE
are using to optimize energy by implement
some techniques to make green data centers [3].
In the next section, formula for calculating
PUE, DCIE, electricity used per year, annual
power cost and carbon footprint is presented
with comprehensive explanation.
The first step to measure green metrics for
data centers is estimation of energy or power
consumption for each device in data center.
After calculation of IT and facility load per
hour, the total energy consumption in data
centers will be calculated. Measurement of cost
of energy, total energy consumption and carbon
footprint is done by developed tool in this
research.
This research work has had some parts. The
first part investigates about the green metrics of
data centers and proposes the new technique in
order to maximize the energy efficiency.
The next part is about using C# and XML
programming language to develop a tool in
order to monitor energy efficiency in data
centers. This part of research is defined as
challengeable and novel section of this
research.
2.1 Carbon Footprint in Data Centers
Reducing the CO2 emission has to be
considered in two different parts:
1) Design of Network Elements
The green design is assumed as a major
concern in new technologies. Various devices
and design strategies in recent years have
considered the green elements in data centers.
In green network design, a telnet protocol can
help to sleep clients after a given time and reuse
later [4]. For instance a green LAN Switch can
be helpful to save energy compare to other
models. Figure below shows the Cisco Catalyst
2960-X switches which Cisco recently designed
as the next generation of switches.
2) Operation Part by Reducing Energy
Consumption
By regarding contribution of each device in
energy consumption in data centers, developer
can focus on main devices for saving energy.
ISBN: 978-1-941968-02-4 ©2014 SDIWC 87
Proceedings of the International Conference on Electrical, Electronics, Computer Engineering and their Applications, Kuala Lumpur, Malaysia, 2014
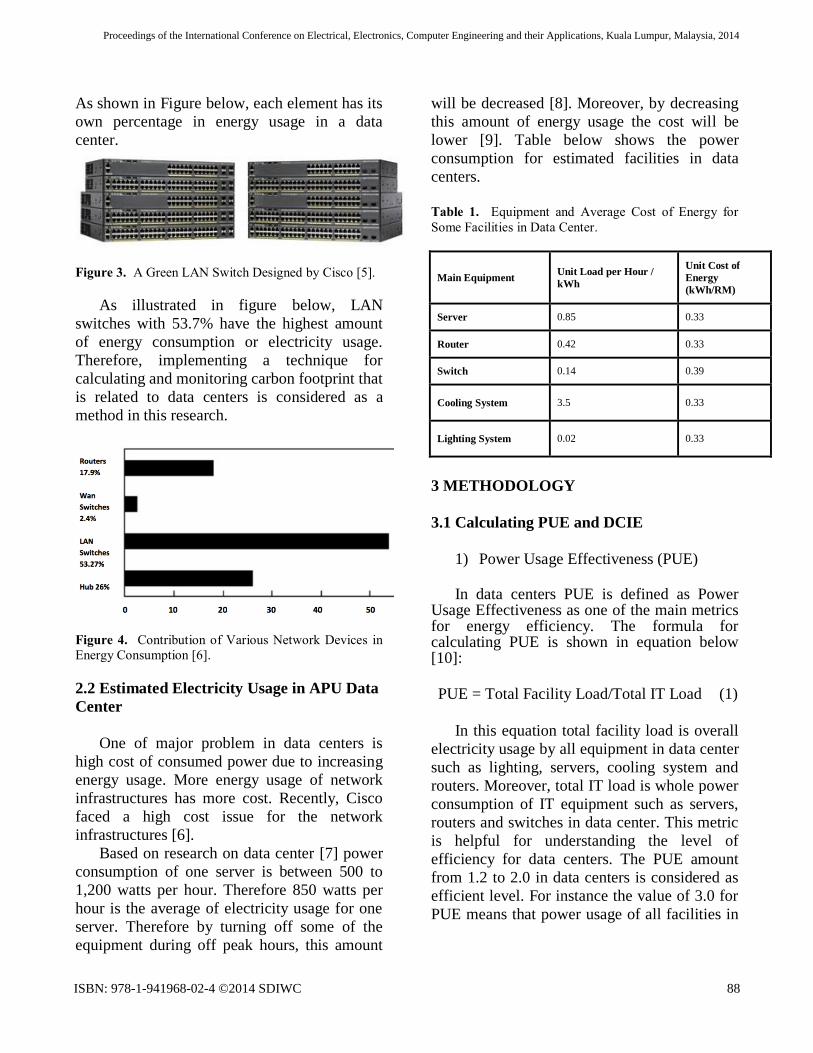
As shown in Figure below, each element has its
own percentage in energy usage in a data
center.
Figure 3. A Green LAN Switch Designed by Cisco [5].
As illustrated in figure below, LAN
switches with 53.7% have the highest amount
of energy consumption or electricity usage.
Therefore, implementing a technique for
calculating and monitoring carbon footprint that
is related to data centers is considered as a
method in this research.
Figure 4. Contribution of Various Network Devices in
Energy Consumption [6].
2.2 Estimated Electricity Usage in APU Data
Center
One of major problem in data centers is
high cost of consumed power due to increasing
energy usage. More energy usage of network
infrastructures has more cost. Recently, Cisco
faced a high cost issue for the network
infrastructures [6].
Based on research on data center [7] power
consumption of one server is between 500 to
1,200 watts per hour. Therefore 850 watts per
hour is the average of electricity usage for one
server. Therefore by turning off some of the
equipment during off peak hours, this amount
will be decreased [8]. Moreover, by decreasing
this amount of energy usage the cost will be
lower [9]. Table below shows the power
consumption for estimated facilities in data
centers.
Table 1. Equipment and Average Cost of Energy for
Some Facilities in Data Center.
Main Equipment Unit Load per Hour /
kWh
Unit Cost of
Energy
(kWh/RM)
Server 0.85 0.33
Router 0.42 0.33
Switch 0.14 0.39
Cooling System 3.5 0.33
Lighting System 0.02 0.33
3 METHODOLOGY
3.1 Calculating PUE and DCIE
1) Power Usage Effectiveness (PUE)
In data centers PUE is defined as Power
Usage Effectiveness as one of the main metrics for energy efficiency. The formula for calculating PUE is shown in equation below [10]:
PUE = Total Facility Load/Total IT Load (1)
In this equation total facility load is overall
electricity usage by all equipment in data center
such as lighting, servers, cooling system and
routers. Moreover, total IT load is whole power
consumption of IT equipment such as servers,
routers and switches in data center. This metric
is helpful for understanding the level of
efficiency for data centers. The PUE amount
from 1.2 to 2.0 in data centers is considered as
efficient level. For instance the value of 3.0 for
PUE means that power usage of all facilities in
ISBN: 978-1-941968-02-4 ©2014 SDIWC 88
Proceedings of the International Conference on Electrical, Electronics, Computer Engineering and their Applications, Kuala Lumpur, Malaysia, 2014

data center is three times greater than energy
usage of IT equipment [11].
2) Data Center Infrastructure Efficiency
(DCIE).
Another metric which indicate the level of
efficiency in data centers is Data Center
Infrastructure Efficiency or DCIE. In IT
industry DCIE is calculated as below [12]:
DCIE = (Total IT Load/Total Facility Load) x
100 (2)
This efficiency metric is useful to measure
the performance of green data centers and
demonstrate the percentage of efficiency level.
Furthermore, it represents a reverse value of
PUE multiply by 100. For instance the value of
33% for DCIE metric, demonstrate that the
level of efficiency in data center is very
inefficient [13].
3.2 Quantitative Research
In terms of research methods, there are two
types of quantitative and qualitative methods.
In this research quantitative research method is
discussed. This method can be helpful to
provide large, representative samples of desired
information [14].
For data collection, the primary source in
this research is assumed to be based on survey
questionnaire of Green Data Centers. This task
is done by giving questionnaire to network
administrators about green networking in data
centers infrastructures and collect information
by their answers. This material is about number
of servers, energy consumption of equipment in
data centers, green metrics, etc.
Questions for this survey are designed in
three different parts to conclude desired result.
1) Part 1
In this section the objective of five
questions is to know what network
administrators think about importance of
energy efficiency and CO2 emission in data
centers.
The finding of this part is considered to be
the level of knowledge of data administrators
about energy efficiency, CO2 emission and
electricity usage in data centers and how much
these factors are significant.
2) Part 2
The objective of information gathering from
questions number 6, 7, 8 and 9 is that how
many servers the specific data center has. Also
network administrator is asked about metrics
and tools to save power in data centers and
make data center greener.
The result of these questions is how large
the exact data center is. Moreover, the fact that
how much information the network
administrator of data center has about metrics
and tools for saving power is the main finding
of this part.
3) Part 3
The principal aim of questions number 10
to 15 is collect information that how much
network administrators are enthusiast about
Green Network and energy efficiency in data
centers.
As main conclusion of these six questions is
interest level of managers and network
administrators to use Green Grid in their data
centers. Moreover it is examined that weather
network administrators are ready to pay extra
cost to make their data centers Green or not.
4 RESULTS AND DISCUSSION
The internet based questionnaire has filled
up by 15 network administrator through online
form. The questions sent by email to more than
20 network administrators and 15 results
achieved. The paper based questionnaire is
ISBN: 978-1-941968-02-4 ©2014 SDIWC 89
Proceedings of the International Conference on Electrical, Electronics, Computer Engineering and their Applications, Kuala Lumpur, Malaysia, 2014
done by other three data administrators. The
results are discuses as follows:
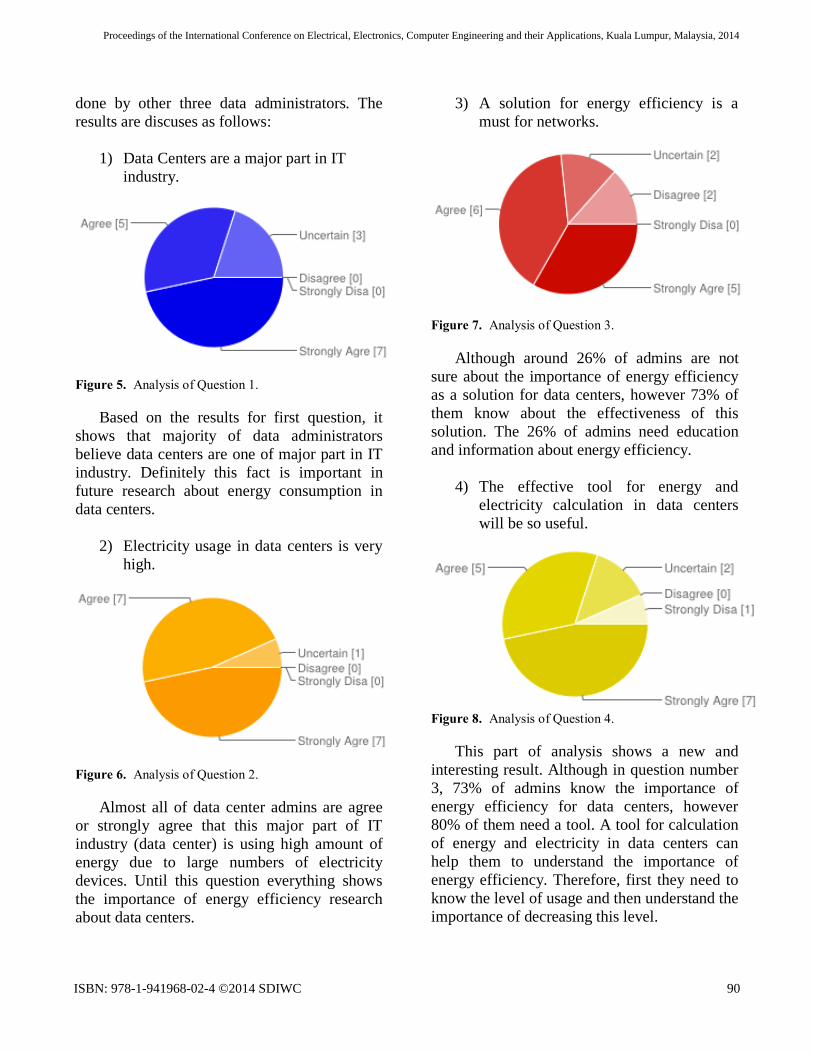
1) Data Centers are a major part in IT
industry.
Figure 5. Analysis of Question 1.
Based on the results for first question, it
shows that majority of data administrators
believe data centers are one of major part in IT
industry. Definitely this fact is important in
future research about energy consumption in
data centers.
2) Electricity usage in data centers is very
high.
Figure 6. Analysis of Question 2.
Almost all of data center admins are agree
or strongly agree that this major part of IT
industry (data center) is using high amount of
energy due to large numbers of electricity
devices. Until this question everything shows
the importance of energy efficiency research
about data centers.
3) A solution for energy efficiency is a
must for networks.
Figure 7. Analysis of Question 3.
Although around 26% of admins are not
sure about the importance of energy efficiency
as a solution for data centers, however 73% of
them know about the effectiveness of this
solution. The 26% of admins need education
and information about energy efficiency.
4) The effective tool for energy and
electricity calculation in data centers
will be so useful.
Figure 8. Analysis of Question 4.
This part of analysis shows a new and
interesting result. Although in question number
3, 73% of admins know the importance of
energy efficiency for data centers, however
80% of them need a tool. A tool for calculation
of energy and electricity in data centers can
help them to understand the importance of
energy efficiency. Therefore, first they need to
know the level of usage and then understand the
importance of decreasing this level.
ISBN: 978-1-941968-02-4 ©2014 SDIWC 90
Proceedings of the International Conference on Electrical, Electronics, Computer Engineering and their Applications, Kuala Lumpur, Malaysia, 2014
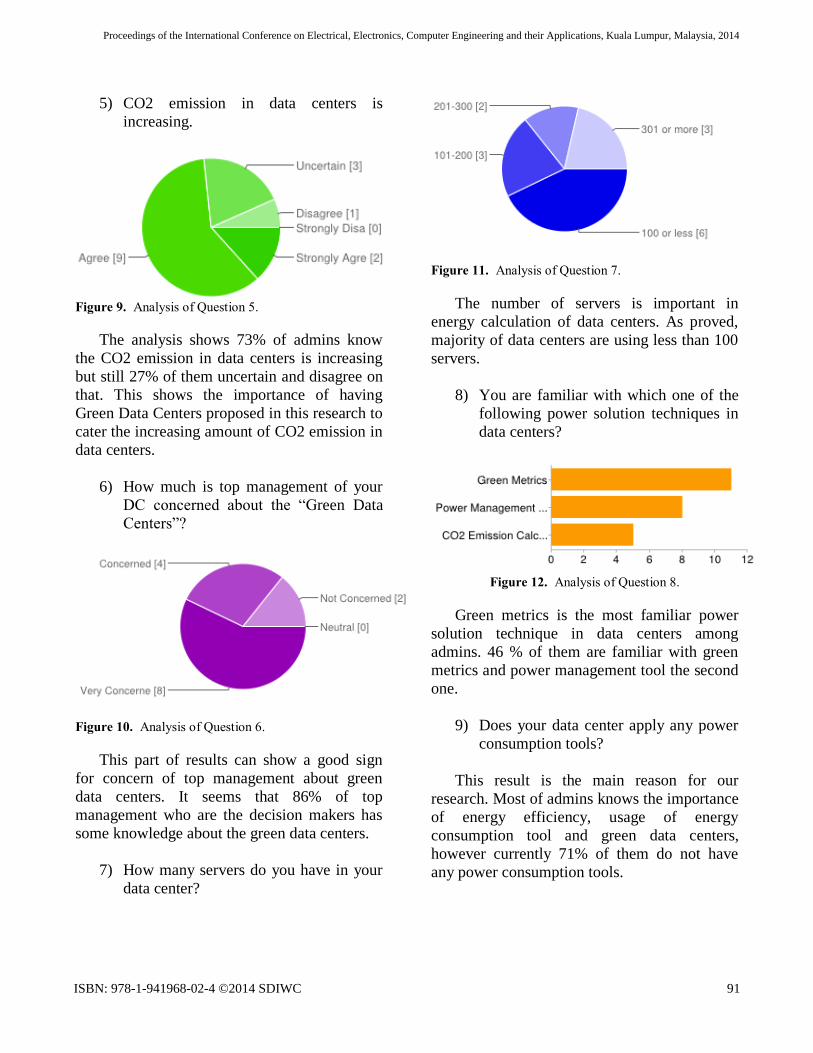
5) CO2 emission in data centers is
increasing.
Figure 9. Analysis of Question 5.
The analysis shows 73% of admins know
the CO2 emission in data centers is increasing
but still 27% of them uncertain and disagree on
that. This shows the importance of having
Green Data Centers proposed in this research to
cater the increasing amount of CO2 emission in
data centers.
6) How much is top management of your
DC concerned about the “Green Data
Centers”?
Figure 10. Analysis of Question 6.
This part of results can show a good sign
for concern of top management about green
data centers. It seems that 86% of top
management who are the decision makers has
some knowledge about the green data centers.
7) How many servers do you have in your
data center?
Figure 11. Analysis of Question 7.
The number of servers is important in
energy calculation of data centers. As proved,
majority of data centers are using less than 100
servers.
8) You are familiar with which one of the
following power solution techniques in
data centers?
Figure 12. Analysis of Question 8.
Green metrics is the most familiar power
solution technique in data centers among
admins. 46 % of them are familiar with green
metrics and power management tool the second
one.
9) Does your data center apply any power
consumption tools?
This result is the main reason for our
research. Most of admins knows the importance
of energy efficiency, usage of energy
consumption tool and green data centers,
however currently 71% of them do not have
any power consumption tools.
ISBN: 978-1-941968-02-4 ©2014 SDIWC 91
Proceedings of the International Conference on Electrical, Electronics, Computer Engineering and their Applications, Kuala Lumpur, Malaysia, 2014
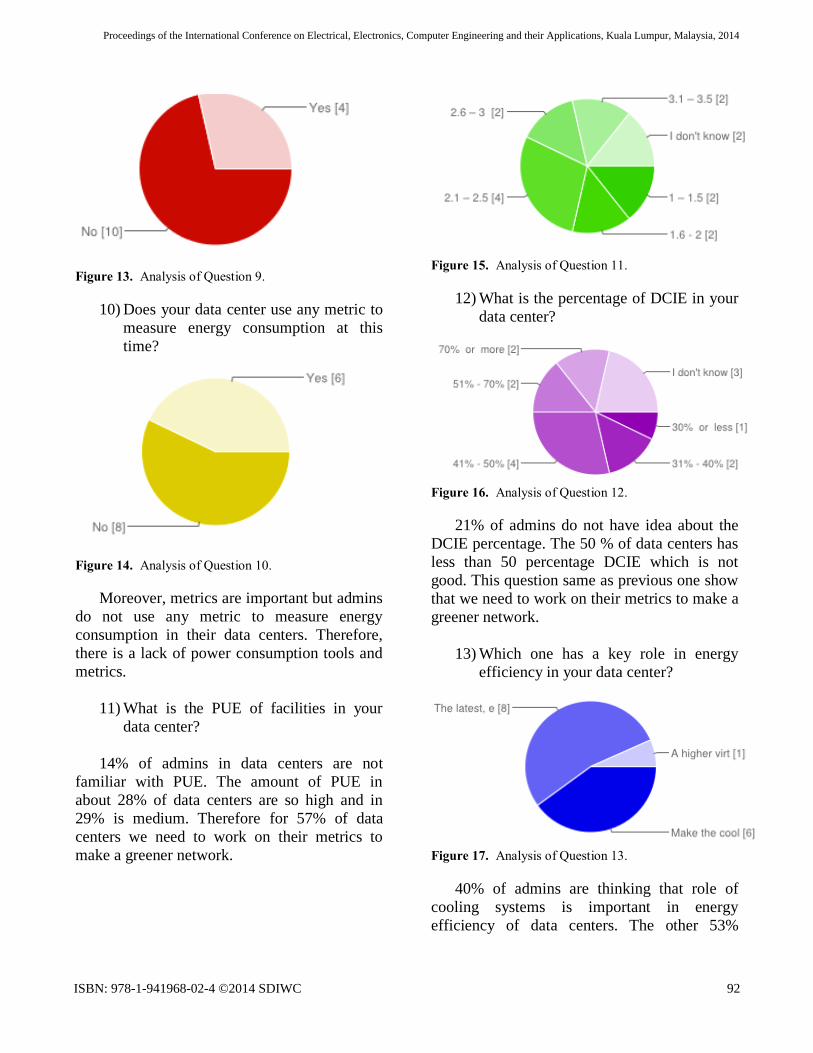
Figure 13. Analysis of Question 9.
10) Does your data center use any metric to
measure energy consumption at this
time?
Figure 14. Analysis of Question 10.
Moreover, metrics are important but admins
do not use any metric to measure energy
consumption in their data centers. Therefore,
there is a lack of power consumption tools and
metrics.
11) What is the PUE of facilities in your
data center?
14% of admins in data centers are not
familiar with PUE. The amount of PUE in
about 28% of data centers are so high and in
29% is medium. Therefore for 57% of data
centers we need to work on their metrics to
make a greener network.
Figure 15. Analysis of Question 11.
12) What is the percentage of DCIE in your
data center?
Figure 16. Analysis of Question 12.
21% of admins do not have idea about the
DCIE percentage. The 50 % of data centers has
less than 50 percentage DCIE which is not
good. This question same as previous one show
that we need to work on their metrics to make a
greener network.
13) Which one has a key role in energy
efficiency in your data center?
Figure 17. Analysis of Question 13.
40% of admins are thinking that role of
cooling systems is important in energy
efficiency of data centers. The other 53%
ISBN: 978-1-941968-02-4 ©2014 SDIWC 92
Proceedings of the International Conference on Electrical, Electronics, Computer Engineering and their Applications, Kuala Lumpur, Malaysia, 2014
believe that energy efficient method for servers
is more important.
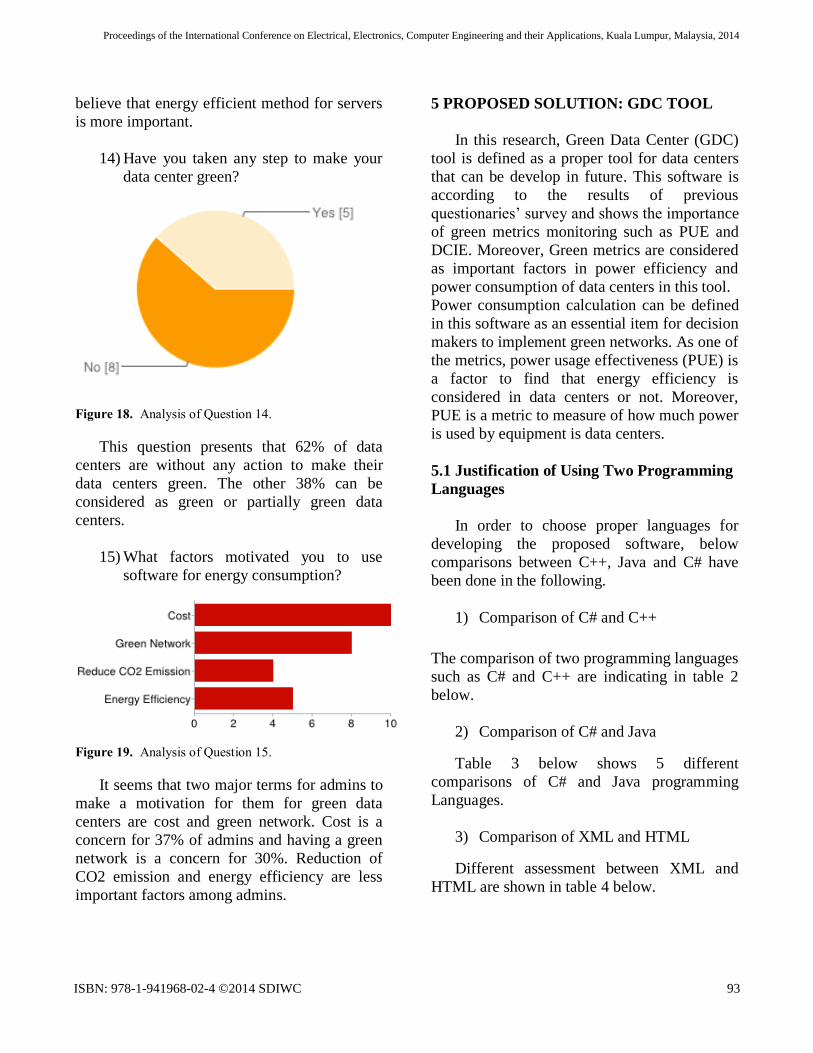
14) Have you taken any step to make your
data center green?
Figure 18. Analysis of Question 14.
This question presents that 62% of data
centers are without any action to make their
data centers green. The other 38% can be
considered as green or partially green data
centers.
15) What factors motivated you to use
software for energy consumption?
Figure 19. Analysis of Question 15.
It seems that two major terms for admins to
make a motivation for them for green data
centers are cost and green network. Cost is a
concern for 37% of admins and having a green
network is a concern for 30%. Reduction of
CO2 emission and energy efficiency are less
important factors among admins.
5 PROPOSED SOLUTION: GDC TOOL
In this research, Green Data Center (GDC)
tool is defined as a proper tool for data centers
that can be develop in future. This software is
according to the results of previous
questionaries’ survey and shows the importance
of green metrics monitoring such as PUE and
DCIE. Moreover, Green metrics are considered
as important factors in power efficiency and
power consumption of data centers in this tool.
Power consumption calculation can be defined
in this software as an essential item for decision
makers to implement green networks. As one of
the metrics, power usage effectiveness (PUE) is
a factor to find that energy efficiency is
considered in data centers or not. Moreover,
PUE is a metric to measure of how much power
is used by equipment is data centers.
5.1 Justification of Using Two Programming
Languages
In order to choose proper languages for
developing the proposed software, below
comparisons between C++, Java and C# have
been done in the following.
1) Comparison of C# and C++
The comparison of two programming languages
such as C# and C++ are indicating in table 2
below.
2) Comparison of C# and Java
Table 3 below shows 5 different
comparisons of C# and Java programming
Languages.
3) Comparison of XML and HTML
Different assessment between XML and
HTML are shown in table 4 below.
ISBN: 978-1-941968-02-4 ©2014 SDIWC 93
Proceedings of the International Conference on Electrical, Electronics, Computer Engineering and their Applications, Kuala Lumpur, Malaysia, 2014
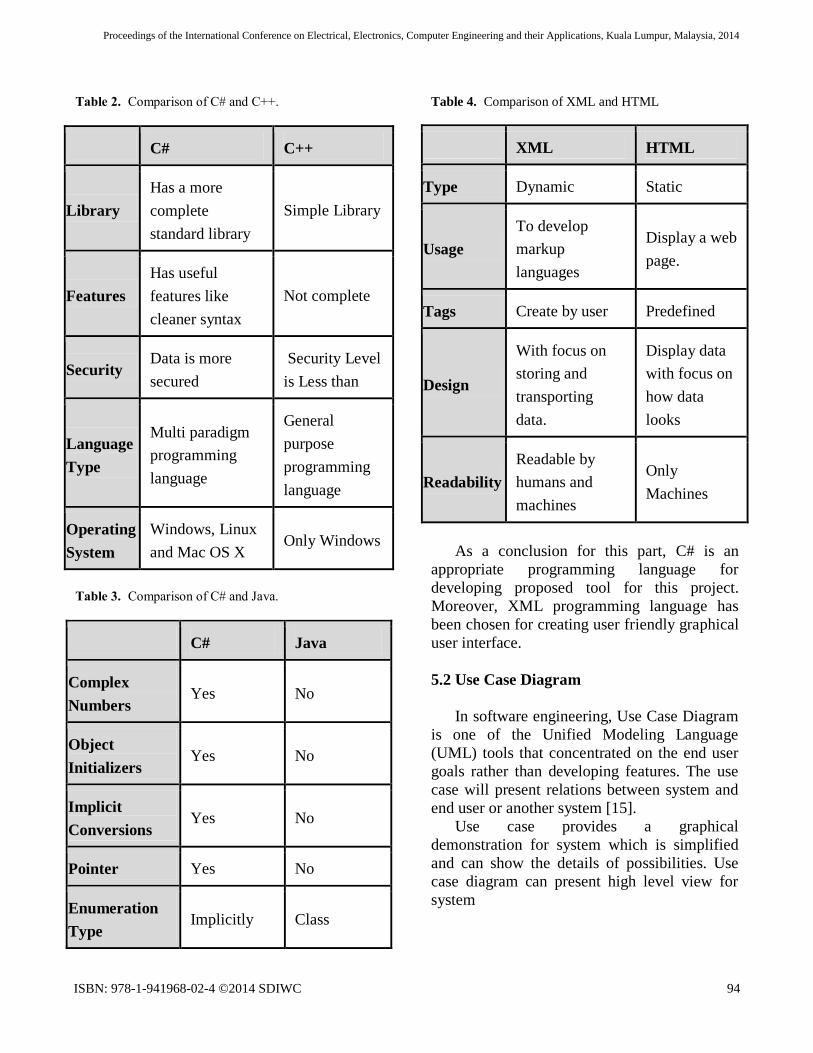
Table 2. Comparison of C# and C++.
C# C++
Library
Has a more
complete
standard library
Simple Library
Features
Has useful
features like
cleaner syntax
Not complete
Security Data is more
secured
Security Level
is Less than
Language
Type
Multi paradigm
programming
language
General
purpose
programming
language
Operating
System
Windows, Linux
and Mac OS X Only Windows
Table 3. Comparison of C# and Java.
C# Java
Complex
Numbers Yes No
Object
Initializers Yes No
Implicit
Conversions Yes No
Pointer Yes No
Enumeration
Type Implicitly Class
Table 4. Comparison of XML and HTML
XML HTML
Type Dynamic Static
Usage
To develop
markup
languages
Display a web
page.
Tags Create by user Predefined
Design
With focus on
storing and
transporting
data.
Display data
with focus on
how data
looks
Readability
Readable by
humans and
machines
Only
Machines
As a conclusion for this part, C# is an
appropriate programming language for
developing proposed tool for this project.
Moreover, XML programming language has
been chosen for creating user friendly graphical
user interface.
5.2 Use Case Diagram
In software engineering, Use Case Diagram
is one of the Unified Modeling Language
(UML) tools that concentrated on the end user
goals rather than developing features. The use
case will present relations between system and
end user or another system [15].
Use case provides a graphical
demonstration for system which is simplified
and can show the details of possibilities. Use
case diagram can present high level view for
system
ISBN: 978-1-941968-02-4 ©2014 SDIWC 94
Proceedings of the International Conference on Electrical, Electronics, Computer Engineering and their Applications, Kuala Lumpur, Malaysia, 2014
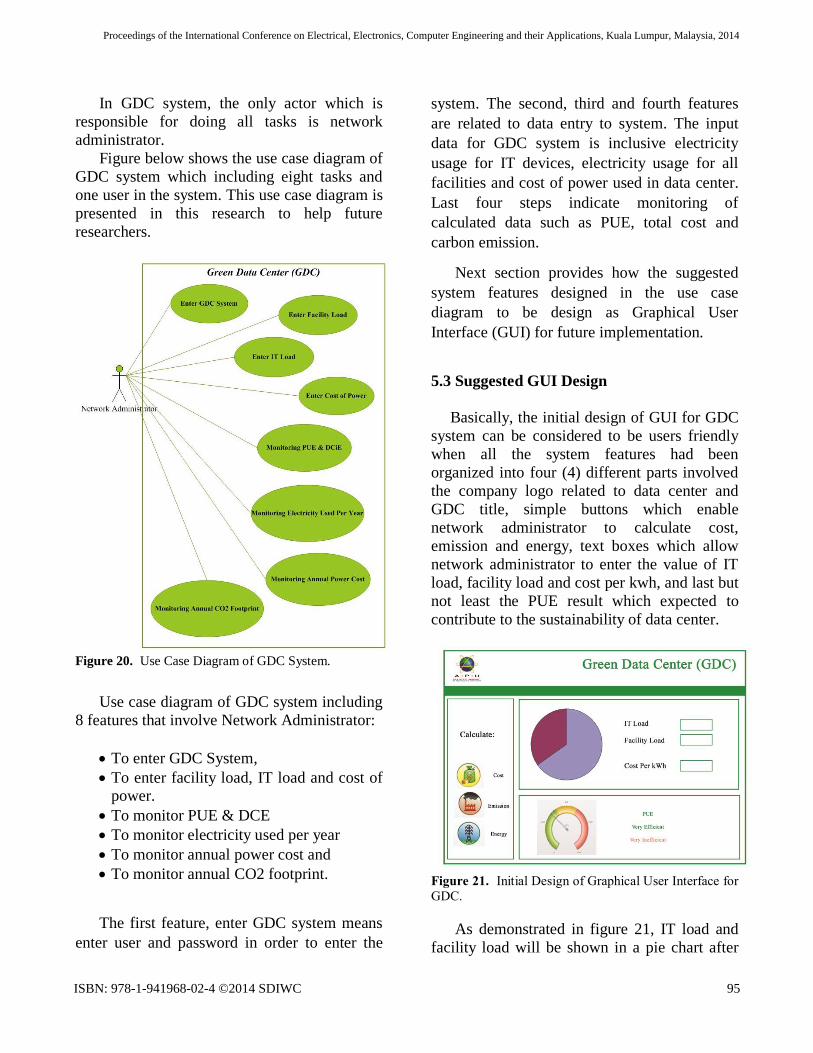
In GDC system, the only actor which is
responsible for doing all tasks is network
administrator.
Figure below shows the use case diagram of
GDC system which including eight tasks and
one user in the system. This use case diagram is
presented in this research to help future
researchers.
Figure 20. Use Case Diagram of GDC System.
Use case diagram of GDC system including
8 features that involve Network Administrator:
To enter GDC System,
To enter facility load, IT load and cost of power.
To monitor PUE & DCE
To monitor electricity used per year
To monitor annual power cost and
To monitor annual CO2 footprint.
The first feature, enter GDC system means
enter user and password in order to enter the
system. The second, third and fourth features
are related to data entry to system. The input
data for GDC system is inclusive electricity
usage for IT devices, electricity usage for all
facilities and cost of power used in data center.
Last four steps indicate monitoring of
calculated data such as PUE, total cost and
carbon emission.
Next section provides how the suggested
system features designed in the use case
diagram to be design as Graphical User
Interface (GUI) for future implementation.
5.3 Suggested GUI Design
Basically, the initial design of GUI for GDC
system can be considered to be users friendly
when all the system features had been
organized into four (4) different parts involved
the company logo related to data center and
GDC title, simple buttons which enable
network administrator to calculate cost,
emission and energy, text boxes which allow
network administrator to enter the value of IT
load, facility load and cost per kwh, and last but
not least the PUE result which expected to
contribute to the sustainability of data center.
Figure 21. Initial Design of Graphical User Interface for
GDC.
As demonstrated in figure 21, IT load and
facility load will be shown in a pie chart after
ISBN: 978-1-941968-02-4 ©2014 SDIWC 95
Proceedings of the International Conference on Electrical, Electronics, Computer Engineering and their Applications, Kuala Lumpur, Malaysia, 2014
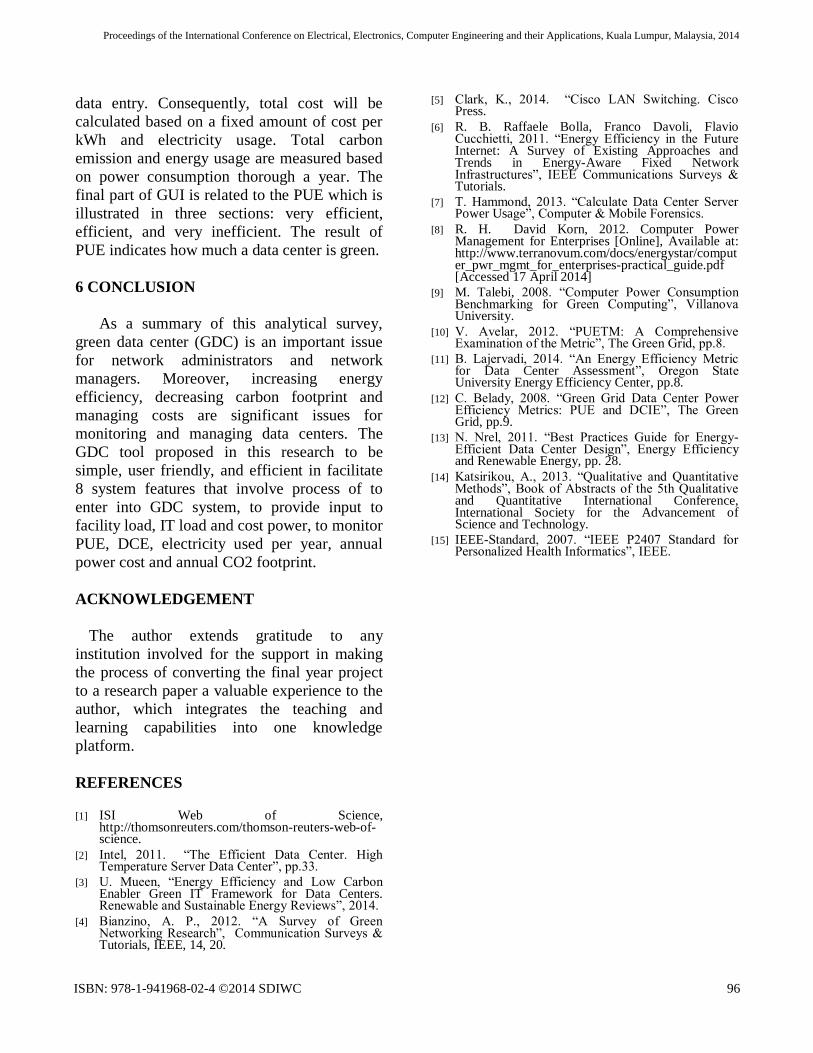
data entry. Consequently, total cost will be
calculated based on a fixed amount of cost per
kWh and electricity usage. Total carbon
emission and energy usage are measured based
on power consumption thorough a year. The
final part of GUI is related to the PUE which is
illustrated in three sections: very efficient,
efficient, and very inefficient. The result of
PUE indicates how much a data center is green.
6 CONCLUSION
As a summary of this analytical survey,
green data center (GDC) is an important issue
for network administrators and network
managers. Moreover, increasing energy
efficiency, decreasing carbon footprint and
managing costs are significant issues for
monitoring and managing data centers. The
GDC tool proposed in this research to be
simple, user friendly, and efficient in facilitate
8 system features that involve process of to
enter into GDC system, to provide input to
facility load, IT load and cost power, to monitor
PUE, DCE, electricity used per year, annual
power cost and annual CO2 footprint.
ACKNOWLEDGEMENT
The author extends gratitude to any
institution involved for the support in making
the process of converting the final year project
to a research paper a valuable experience to the
author, which integrates the teaching and
learning capabilities into one knowledge
platform.
REFERENCES
[1] ISI Web of Science,
http://thomsonreuters.com/thomson-reuters-web-of-science.
[2] Intel, 2011. “The Efficient Data Center. High Temperature Server Data Center”, pp.33.
[3] U. Mueen, “Energy Efficiency and Low Carbon Enabler Green IT Framework for Data Centers. Renewable and Sustainable Energy Reviews”, 2014.
[4] Bianzino, A. P., 2012. “A Survey of Green Networking Research”, Communication Surveys & Tutorials, IEEE, 14, 20.
[5] Clark, K., 2014. “Cisco LAN Switching. Cisco Press.
[6] R. B. Raffaele Bolla, Franco Davoli, Flavio Cucchietti, 2011. “Energy Efficiency in the Future Internet: A Survey of Existing Approaches and Trends in Energy-Aware Fixed Network Infrastructures”, IEEE Communications Surveys & Tutorials.
[7] T. Hammond, 2013. “Calculate Data Center Server Power Usage”, Computer & Mobile Forensics.
[8] R. H. David Korn, 2012. Computer Power Management for Enterprises [Online], Available at: http://www.terranovum.com/docs/energystar/computer_pwr_mgmt_for_enterprises-practical_guide.pdf [Accessed 17 April 2014]
[9] M. Talebi, 2008. “Computer Power Consumption Benchmarking for Green Computing”, Villanova University.
[10] V. Avelar, 2012. “PUETM: A Comprehensive Examination of the Metric”, The Green Grid, pp.8.
[11] B. Lajervadi, 2014. “An Energy Efficiency Metric for Data Center Assessment”, Oregon State University Energy Efficiency Center, pp.8.
[12] C. Belady, 2008. “Green Grid Data Center Power Efficiency Metrics: PUE and DCIE”, The Green Grid, pp.9.
[13] N. Nrel, 2011. “Best Practices Guide for Energy-Efficient Data Center Design”, Energy Efficiency and Renewable Energy, pp. 28.
[14] Katsirikou, A., 2013. “Qualitative and Quantitative Methods”, Book of Abstracts of the 5th Qualitative and Quantitative International Conference, International Society for the Advancement of Science and Technology.
[15] IEEE-Standard, 2007. “IEEE P2407 Standard for Personalized Health Informatics”, IEEE.
ISBN: 978-1-941968-02-4 ©2014 SDIWC 96
Proceedings of the International Conference on Electrical, Electronics, Computer Engineering and their Applications, Kuala Lumpur, Malaysia, 2014