topology and strategy for supply network robustness
TRANSCRIPT
Topology and strategy for supply network robustness
A. Brintrup, T. Kito, E. López, S. New, F. Reed-Tsochas Saïd Business School, University of Oxford, UK
Abstract Qualitative prescriptions for the robustness of supply networks provides individual firms with useful heuristics, but the focus on specific firms and their immediate supplier relationships means that systemic effects that arise in the larger, complex network cannot be taken into account. In this paper we contribute concepts from network theory to relate topological properties of supply networks to the robustness of the system as a whole. To do so, we model a network that has been validated by two companies with global supply chains, and use computer simulations to explore the extent to which firm failures disrupt the network. Our results show that outsourcing, adaptive capacity, and redundant capability have positive effects on robustness whereas alignment of manufacturing strategies does not. We also find that when supply chains are formed through preferential attachment they become more vulnerable to the failure of firms with many links, but they also become more robust financially, as forecasting becomes more accurate. Further research needs to focus on cross-validation with empirical data including observations of temporary production re-allocation, so that we can move beyond models in which we are restricted to a binary choice between failure and optimality. Keywords: Supply chain management, robustness, complex network, topology. 1. Introduction
The marriage between network theory and supply network analysis creates a new and promising arena for
operations management, which can draw on concepts that have been developed to understand a wide range of systems and processes, from food webs in ecology, to disease propagation in epidemiology. The characteristics of complex networks encountered in different contexts and fields exhibit many common features, but clearly the application of network techniques to supply chains requires a detailed understanding of how the firms in such a network operate and interact.
Supply Chains (SC) consist of a network of organisations, which acquire raw materials, transform them into products and deliver them to other organisations or end-customers. In this network, nodes represent suppliers, and links represent commercial relationships among the nodes. We can view nodes as self-interested agents aiming to gather necessary raw materials from the best suppliers in a timely and efficient manner to supply their demand and optimise their profit. Although individual organisations pay considerable attention to the supplier relationships that they form and sustain directly, the larger-scale network that results from these individual decisions is not usually centrally designed or controlled. It has been shown that supply network interactions are governed by firm-to-firm level rules, procedures, and norms and that there are no overall network level rules (Choi 2001). In this context it is not possible for any one firm to impose its rules and norms on the whole of a supply network, and it is also not possible for any one firm to design the network by selecting suppliers for other suppliers. As a result firms typically know their first tier suppliers but do not have a wider grasp of who supplies the first tier and beyond, and who deals with whom within the network.
It is this incomplete frame of information in which firms select other suppliers, and configure their own demand and production. The resulting supply network is one whose topology continuously changes with each firm adapting to changing offers, prices, quality, and reliability of other firms, by re-distributing its links.
While recent work on networks examines static topological properties of networks and their impact on robustness, much less attention has been paid to robustness properties of networks where the strategic behaviour of nodes lead to dynamic changes in topology. On the other hand operations management literature on supply network robustness often presents descriptive case studies and does not consider topology. Propositions such as “increased cooperation generates increased robustness”, or “redundant manufacturing capability is beneficial for robustness of supply network in the long run”, have been inferred from observations of real life supply networks that are assumed to be robust. Toyota’s quick revamp after the Aisin fire (Nishiguchi 1997), Nokia’s win out against Ericsonn after the loss of the microchip factory in continental US are frequently cited examples of such robustness (Latour 2001). While the propositions that arise out of these cases reflect reasonable intuition, the extent of their validity has not been tested in any systematic manner. In addition, research applying network analysis to supply chains has been quite limited. In this paper we aim to take an exploratory step towards closing this gap by providing a critical review
CA
BD
yN W
orki
ng P
aper
# 2
011-
07-0
13 R
ecei
ved
1st J
uly
2011

of topological, dynamic, strategic robustness (Section 2), reviewing propositions for increasing supply network robustness through industrial input (Section 3), and testing them through a computational model (Section 4). Variables, which form the decision space in our model, are validated through two industrial partners, both of whom have complex, multi-national production chains. The model allows us to observe network topologies resulting from the interaction of strategic, goal-driven, selfish agents who adapt their behaviour over time, and to carry out systematic what-if analysis which would not be possible to carry out in real-life. 2. What makes a supply chain robust?
When we direct our attention to the operations literature, we find five main strategies for incorporating robustness in supply networks. In addition to extracting propositions from literature, we have conducted a series of interviews in two large multi-national companies. The interviewees consisted of the director of supply chain management at Company A, and two members of the management team at research and development in supply chain management at Company B. The interviews were semi-structured, lasted one hour each and consisted of questions regarding descriptions of the company’s supply network, exemplary occurrences of disturbances, strategies the company developed in advance of disruptions, and how they handled disruptions. Company A is a large confectionary manufacturer with 250 thousand employees, major operational centres in Europe, South East Asia, and South America, and has a turnover of $103 million in 2009. Company B is a large aerospace parts manufacturer, with over 100 thousand employees, with operational centres in 70 countries. The following analysis draws both on literature and our industrial interviews. Cooperation: Robustness generated by cooperative behaviour can manifest itself in many ways. Sharing excess capacity, sharing know-how and substituting manufacturing capability in the face of disaster are some examples that come to mind. Sharing excess capacity occurs when suppliers of the same tier form hard ties, by exchanging goods and equity, often for substitution of goods they do not have the capacity to deliver upstream (Borgatti and Foster 2003). (Lomi and Pattison 2006) found evidence in the Fiat supply network that firms that serve the same customer are likely to develop equity links with one another. In this respect outsourcing means that goods can be channelled through alternative paths upon disturbances, which implies a cooperative relationship among same network suppliers. The exchange of know-how though intra-organisational social connections characterise soft ties (Ahmadjian et al 2001, Sako 1996) which may, over time, support hard ties. Capability substitution may occur in extreme circumstances. For example. describing the emergence of a new network in the Toyota supply chain during the Aisin fire, (Nishiguchi 1997) asserts the key role cooperation plays in the formation of a response upon disruption. Many of Toyota’s supplier firms devoted existing manufacturing capability to produce the key component lost in the fire collaboratively, with Aisin facilitating knowledge exchange on design and production. Cooperation ultimately increased robustness as it increased the number of alternative paths of delivery possible in the network. Similarly, (Lee 2004) pointed out the importance of collaboration to redesign processes and products when dealing with disturbances, giving the example of Nokia and Ericsonn. When a microchip supplier failed to deliver due to a fire, Nokia contacted back up suppliers with slight changes in designs. Ericsonn however, could not, as they have been “weeding out” their supplier base to increase competitiveness, which meant they had fewer numbers of suppliers willing to cooperate with them.
During our interviews, the director of supply chain management at Company A agreed that cooperation plays an important role in achieving a robust supply network, but the realisation of this suggestion in the field would very much depend on competition. In the past Company A outsourced excess capacity to other suppliers, as a result of which their network could cope with unexpected events and shifts in demand. Similarly, they suggest to their suppliers that they should develop links with their competitors. They would not, however, consider sharing core business products with their competitors even if there were a disruption and they could not supply demand. Company B also stated that they would not consider sharing core products under any circumstances, since they are in a competitive market. However, they would like their suppliers to cooperate in the case of emergencies, and would act as an intermediary for such exchanges. Both companies explained their reluctance not only by competition, but also by the diminishing returns of cooperation, caused by the costs of excess capacity, which should not occur at the first place i.e. their view was that if sharing excess capacity occurs, it is a result of overproduction waste. This evidence points to a trade off between robustness achieved though cooperation that occurs in the form of excess capacity share, and costs of doing so. An interesting question is then what circumstances should foster such cooperation, and to what extent. Inventory: In his work, (Nishiguchi 1997) found the alignment of production philosophy to be a factor in ensuring robustness in the network, despite the observation that supply chain wide JIT presents vulnerability to unexpected events (Rice and Caniato 2003, Snyder et al 2006). He argued that the alignment of production philosophy made the transfer of know-how easier. In the Toyota case, once the new production network emerged and technical problems
CA
BD
yN W
orki
ng P
aper
# 2
011-
07-0
13 R
ecei
ved
1st J
uly
2011
were resolved, firms devoted their energy to Kaizen activities so that production volume could be increased, which could only have been possible with a common production philosophy. An important factor to bear in mind though is the congestion impact of the alignment of production strategies. A mix of pull and push based systems might have different and possibly less predictable levels of inventory than pure pull or pure push supply chains. If a firm has excessive inventory at hand and has to withhold production due to a disruption upstream, it will incur inventory costs until the problem is solved. If on the other hand, there is buffer inventory to keep the production going until the problem is resolved, then the network has proved to be robust. (Yu and Li 2000, Bish et al 2005, for a review please see Mula et al 2006) examined the problem from an optimisation perspective, many suggesting that there exists a trade off between costs of safety inventory and robustness that safety inventory brings. Many authors urge firms to keep redundant inventory at hand to mitigate unexpected problems (Rice and Caniato 2003, Snyder et al 2006), but firms are reluctant to do so. We suspect the answer could be a trade off. When asked about inventory policies and its impact on robustness Company A replied: “We cannot and should not dictate inventory policies or manufacturing strategies to our suppliers. We do want them to be profitable, and take their own decisions, which means they will be more reliable. A solution we found is to implement simple vendor managed inventory policies, such as asking them to always keep a certain amount of finished goods for us at bay.” Company B had a similar opinion and said although they do not share information on inventory with their suppliers, they work with the expectation that the supplier will respect the min-max levels of inventory they set aside for them. The min-max contract is only pursued for important items although ideally all items should follow this strategy for robustness.
The question arises then how much extra inventory should a network carry to be robust, when robustness is a trade off between being profitable, yet filling orders when there is disruption.
Adaptation: Adaptation in a supply network can occur in two ways: first, adaptation that reconfigures the supply chain topology and second, adaptation to the market. With respect to the former, firms change their suppliers downstream, and their cooperators at the same tier. (Nam et al 2009) propose an optimisation model for determining the number of suppliers for effective risk management. (Lee 2004) exemplifies the competitive advantage Microsoft gained over Sony by putting location before pricing when it configured its XBox chain in time for Christmas sales in 2001. When Sony reduced the prices of its Playstation product in response, Microsoft was still ahead as it re-configured its supply chain by shifting to cheaper Chinese suppliers. With respect to the latter, one could think about price and inventory adaptation. For instance Seven Eleven Convenience stores in Japan and Tesco in the UK, reallocate inventory and shelving several times in a day to cater to varying demand.
When we asked Company A what strategies they used for robustness, we found adaptation to be at the heart of their plans. Through their automated information system, the company participates in continuous information exchange with their clients and suppliers. They update their inventory and pricing policy on a weekly basis. The company suggested that the most likely disruptions in their supply network were not one-off disasters but rather, degradations or congestions of supply and demand at individual manufacturers, which required continuous communication and planning. Another point mentioned by Company A was diversification for robustness: “In the past cost was the main factor for our supplier decisions. We now include risk in the equation and work on a total cost basis. We identify risky suppliers, and diversify our base, not taking one optimised supply chain for granted. It is tricky because we want to also develop long term relations with our suppliers, but not rely on a single supplier too much.” Company A gave the example of a recent incident when they found out their product containers were contaminated and products had to be recalled. Because of their dependence on a single supplier, they had to stop production and could not replace recalled products, as a result of which they faced not only recall costs but also loss of future sales. They then slightly changed their container design, and used other container producers within the UK. The flexibility in supplier changes allowed them to get back to the market faster. Company B responded similarly: “We need to be able to dual-source every item, and need to make a case if this is not possible. Sometimes we go to great lengths to ensure dual-sourcing. For example in the past we financed company start-ups by disadvantaged groups, which was a win-win as the government helped us and we had our dual-sourcing box ticked.” It therefore seems that adaptation in network topology and to the market contribute to robustness. Our model will explore the combined effect of these two mechanisms.
Manufacturing capability: According to (Nishiguchi 1997) the successful response to the Aisin fire would not be possible without the flexible manufacturing capability present in Toyota’s supplier base. (Lee 2004) also mentions flexibility in production to be a key success factor, and suggests this to be through product design. More manufacturing capability would translate into extra resources, and therefore the potential for increased alternative paths to form an output, at the expense of sustaining that extra resource. (Graves and Tomlin 2003) examine sales in suppliers that produce multiple products and those that do not, finding that the latter to cope better with disruptions. In manufacturing planning, we have many advocates of modular design and process flexibility. While modular
CA
BD
yN W
orki
ng P
aper
# 2
011-
07-0
13 R
ecei
ved
1st J
uly
2011
design has a profound impact on robustness as we have seen in the case of Nokia against Ericsonn, its investigation is beyond the scope of this study. There is also a strand of literature which discusses facility location models to minimise risk and cost, which also are beyond the scope of this investigation, but need to undoubtedly be considered in future investigation to gain a comprehensive understanding of supply network dynamics (for an excellent review of these, please see Snyder et al 2006).
Local and global objectives: (Lee 2004) proposes the alignment of incentives among supply chain partners so that players are able to maximise their own returns while at the same time maximising overall return in the chain. The argument extends to inventory as well. When all individuals in the supply network try to keep inventory to a minimum, without taking into account the actual overall demand, interests are not aligned, and demand can not be met even with small disruptions.
Company A takes the proposition regarding the alignment of objectives with a grain of salt, suggesting that individual companies will always aim at maximising their own profit. “Values within the organisation are shifting though. When an overseas operations centre cannot handle demand, in the past we would first satisfy our own demand and then ship excess to that centre. Now, our objectives are more aligned, and we would work with demand priorities rather than location priorities.” While the company does not believe global profit can be a shared objective, order fulfilment at the top tier may act as a global objective, although it requires that information is shared across the network.
One therefore needs to consider access to information in order to align interests as well. As (Robins 2002) and (Choi 2001) point out, supply chain actors base their decisions on information obtained from their local neighbourhood. The natural question is then how global objectives can be ensured, if we do not know how and to what extent local behaviour impacts globally. (Lee 2004) uses the example of Saturn, an automotive manufacturer, who manages supplier inventory centrally and ensures every party’s access to full information, which prevents the amplification of demand across the chain and helps respond to discrepancies faster. While this case is illuminating, it is not obvious how large and complex supply chains can ensure transparency and distribution of information. We shall test whether local or global objectives lead to robustness, under the assumption that if global objectives are followed, information to do so is available to companies.
The operations management perspective presents us with powerful observations from real life case studies. The qualitative nature of these observations, as well as the high number of propositions makes it rather challenging to distinguish between the impacts of various variables affecting the robustness of a supply network. For example, will cooperative order fulfilment in Tier 1 make the system sufficiently robust? Will a low level forecast driven inventory be more robust than a pull system? In addition, literature in this domain largely advises strategies for robustness from individual firm perspectives and at most investigates dyadic relationships, ignoring that firms act in a network, and strategy may impact not only dyads but the whole ecosystem of firms. In the next section we will review what topology might mean for supply chains and how it may influence robustness. 3. Robustness and network topology
In network terms a supply chain would consist a set of nodes that represent suppliers and links that connect pairs of nodes, representing commercial relations between suppliers. Links are directional in the sense that goods and demand information travel in one direction at a given time. (Lomi and Pattison 2006) found empirical evidence that suppliers are likely to have multiple relationships both upstream and downstream. In addition to commercial links occur as well as cooperative links where two suppliers that have similar capabilities join forces to satisfy demand at the upper tier. Each supplier node may be viewed as a proactive and strategic agent that responds to changes in its state and in the network, by exhibiting strategic goal directed behaviour via forward planning and action. As we have reviewed in the previous section, nodes can strategically choose:
• their sub-tier suppliers and upper-tier customers (i.e. the sum of which correspond to a node’s degree), • to compete or cooperate with other nodes on the same tier, • how much to cooperate by forming weak or strong links, • load handling strategies , • the goals to pursue.
The above characteristics impact the functioning of a network in a multitude of ways. The choice of customers
and suppliers impacts the formation of the network topology itself. Cooperation translates into additional links and load distribution. Load handling strategies impact congestion. The choice of goals impacts the ability of the network to respond to disturbances. Hence the topology of the network dynamically changes with top tier assemblers
CA
BD
yN W
orki
ng P
aper
# 2
011-
07-0
13 R
ecei
ved
1st J
uly
2011

choosing suppliers, which in turn choose their own suppliers downstream, outsourcing partners at the same tier, and develop social links across tiers (Fig. 1).
Figure 1. Exemplary supply network. Black solid lines represent supply relations, dotted lines represent cooperative
relations. Each supplier node has an agent, which decides on its strategies based on its profit and order fulfillment objectives.
When we turn to the literature on complex networks we find that a network topology has significant impact
on its structural robustness, where robustness is measured by the persistence of paths connecting any two nodes in the network as nodes or links are removed. In random networks where there is a significant probability that two nodes are connected by a link, failure at randomly chosen nodes can lead to a fragmentation of the network. If we consider how hubs are distributed across nodes, as reflected by the degree distribution, then for random networks this corresponds to a Poisson distribution. However, for an important class of networks where the degree distribution follows a power law, rare but highly connected hubs dominate network behaviour. For these scale-free networks, random failure does not lead to rapid network fragmentation but failure of a hub has severe consequences. Hence scale-free networks are robust to the failure of random nodes, but vulnerable to failure at hubs. A simple growth mechanism that can give rise to scale-free networks is preferential attachment (Albert et al 2000), where the probability that a node is connected to a node already in the network is linearly proportional to the number of links that each incumbent node already has.
In the context of organisational structures, random networks may not appear to be the most sensible starting point, and hierarchical networks (Radner 1993) correspond more closely to the stylised representation of organisations. Hierarchies are formed by a branching process, where branches on the same level cannot connect to one another, and each node has the same number of links, except the root and base nodes. (Dodds and Watts 2003) start from strictly hierarchical networks representing paths along which information can flow subject to capacity constraints at the nodes. The show that the addition of only a few random shortcuts to the pure hierarchy significantly enhances the network’s robustness to becoming disconnected and to congestion a property they define as ultrarobustness.
But what is the most appropriate network representation for a supply chain? Within the operations management literature the standard assumption is that supply chains are hierarchical while analogies with other types of complex networks might suggest a scale-free structure (Gafiychuk 2000, Thadakamalla et al 2004, Zhao 2009). Indeed it can be argued that preferential attachment is a mechanism underlying the growth of supply chains since higher status suppliers will have greater visibility and hence better chances of securing new business. Following (Podolny 1993) the number of links a given supplier has may be used as a proxy for that supplier’s reliability, so that the chances of attracting new links is proportional to the number of links a supplier already has.
Reliability however, while a significant factor in decision-making, is only one criterion in selecting a supplier. Companies use various criteria to select suppliers, ranging from costs, to whether suppliers are owned by minorities. Another important point to bear in mind is the non-visibility of business relations across the network. Typically only the top assembly manufacturer will have the power to investigate relations among the network, and even then, will neither have a complete overview nor the power to enforce business links other than its own. Lower tier suppliers will typically have information on their local neighbourhood, which includes competitors, C
AB
DyN
Wor
king
Pap
er #
201
1-07
-013
Rec
eive
d 1s
t Jul
y 20
11
collaborators, customers and their own suppliers. As a result, empirical evidence is almost entirely absent from this domain, and that which exists does not have sufficient scale to conclude on the topology of supply chains.
The fact that supply network topologies are not static complicates matters further but little research exists in the supply chain management literature that investigates the dynamics of network formation and evolution (Pathak 2007). Most studies of network robustness explore how the removal of links and nodes impact network cohesiveness, under the assumption that the components of the network that remain cannot be reconfigured, this static picture can be misleading because most networks will adapt when confronted with local failure. Research in a variety of domains from wireless sensor networks to food webs, showed that robustness can increase through real time topological changes (Brose 2005, Staniczenko et al 2010, Keyani et al 2002, Zweig and Zimmerman 2008). A relevant study on the robustness of supply networks has been (Saveedra et al 2008)’s generalised model explaining the contraction process behind the New York Garment Industry. They showed that an asymmetric disassembly process for contraction with a preferential attachment process for regrowth matches empirical findings closely, and results in robustness, as connectivity is largely preserved in the network. The apparent absence of further empirical studies on dynamic rewiring and strategic design of rewiring models in supply networks may be due to the difficulty in accessing to empirical and exhaustive data and the complexity of modelling growth or shrinkage in real life supply networks.
Finally, we note that studies on network robustness usually do not allow scope for nodes in the network to make strategic decisions. While (Thadakamalla et al 2004)’s model linked robustness to preferential attachment, (Hamichi et al 2009) showed that strategic decisions of agents lead to the emergence of stable business clusters and maturation of the market. A related strand of work include the study of agent incentives in network formation using game theoretic constructs (please see Galeotti et al 2009 for a review). For example (Bala and Goyal 2000) developed a non-cooperative model of how individuals form wheel-shaped or centralised networks depending on who bears cost of link formation. This work assumed that the choice for connection was equally probable, when agents had no budget constraints, were perfectly rational and had complete information. Although cooperative decisions in supply chains can be modelled in this way, it is unrealistic to assume complete information, as the dealings of a firm’s suppliers with one another are usually unknown, and the information becomes even less available as one descends down its supply tiers. Such cognitive constraints at firm level not only result in bounded rationality, but also generate information asymmetry in the network, making game theoretic constructs difficult to apply. In addition, in a supply network, both competition and cooperation may occur, objectives may change, and the inclusion of other types of agent decisions such as load handling strategies or price adjustments would very much obscure the impact of individual variables. The analytical frame used in a game theoretic construct would need the trim down of these real-life decisions, potentially over-simplifying the network.
One can then deduce that while topological network analysis on link shapes, types of links and nodes, have helped researchers probe into supply chain and robustness, studies are limited in this arena and the topology of supply chains is unknown. As a consequence, the interplay between node agency, topology and robustness remains unexplored. Operations literature examined robustness as a series of strategies from the perspectives of individual firms, which ignored topology. In what follows we aim to bring the strategic view and the topological view together through a computational model and test existing propositions on supply chain robustness. 4. Definitions and Experimental Setting
Our supply chain model consists of set of nodes that represent suppliers and links that connect pairs of nodes, representing various relations between suppliers, which might be in the form of supply goods exchange or cooperative goods exchange. Here, we assume that between all pairs of nodes there is at most one link from each link type, and nodes cannot be connected to themselves. Production links can be formed between hierarchical tiers whereas cooperative goods exchange (i.e. cooperation links) occur between suppliers residing on the same tier, when a given supplier cannot satisfy an order, and outsources the order in exchange for a commission from its profit. Nodes are weighted in the sense that an upper tier node will form a production link with a downstream supplier given its characteristics. Production and cooperation links are directional in the sense that goods travel in one direction at a given time. Number of production links possible is given by:
Lp = nTii=1
k−1
∑ nTi−1 (1)
CA
BD
yN W
orki
ng P
aper
# 2
011-
07-0
13 R
ecei
ved
1st J
uly
2011
where nTi is the number of nodes in tier Ti and k is the total number of tiers in the supply network. Similarly the
number of cooperation links possible, is given by Lc = nTinTi −1
2i=1
k
∑
(2)
The number of total links possible then becomes: L = Lp + Lc
(3)
Another set of measures of interest is the proportion of production links that are formed in the network over the total number of production links possible. We call this measure the production coefficient.
Cp =l p
Lp
, where pl is the existing number of production links (4)
Similarly we can obtain the cooperation coefficient as:
Cc =l c
Lc
, where cl is the existing number of production links (5)
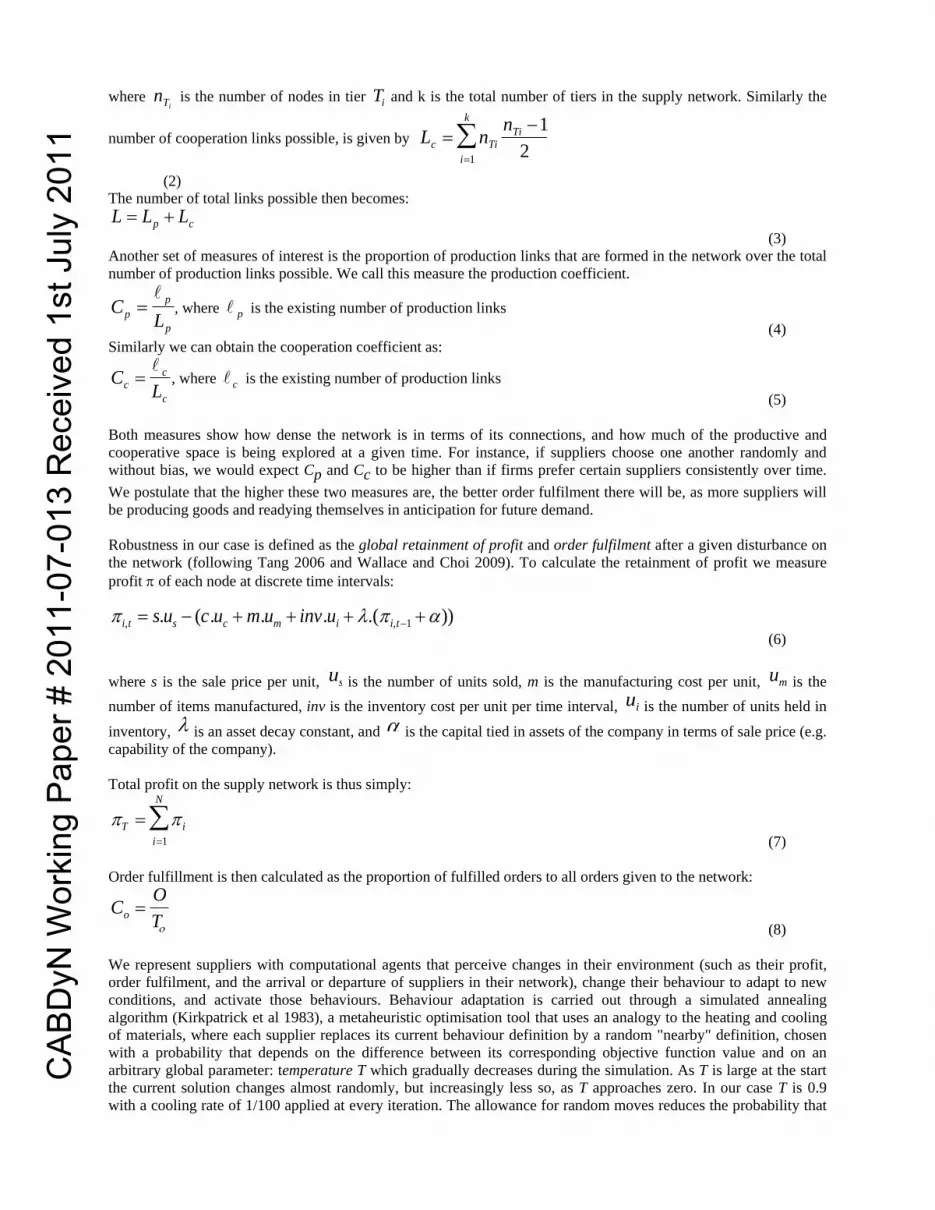
Both measures show how dense the network is in terms of its connections, and how much of the productive and cooperative space is being explored at a given time. For instance, if suppliers choose one another randomly and without bias, we would expect Cp and Cc to be higher than if firms prefer certain suppliers consistently over time. We postulate that the higher these two measures are, the better order fulfilment there will be, as more suppliers will be producing goods and readying themselves in anticipation for future demand. Robustness in our case is defined as the global retainment of profit and order fulfilment after a given disturbance on the network (following Tang 2006 and Wallace and Choi 2009). To calculate the retainment of profit we measure profit π of each node at discrete time intervals: π i,t = s.us − (c.uc +m.um + inv.ui + λ.(π i,t−1 +α))
(6)
where s is the sale price per unit, us is the number of units sold, m is the manufacturing cost per unit, um is the number of items manufactured, inv is the inventory cost per unit per time interval, ui is the number of units held in
inventory, λ is an asset decay constant, and α is the capital tied in assets of the company in terms of sale price (e.g. capability of the company). Total profit on the supply network is thus simply:
πT = π ii=1
N
∑ (7)
Order fulfillment is then calculated as the proportion of fulfilled orders to all orders given to the network:
Co =OTο (8)
We represent suppliers with computational agents that perceive changes in their environment (such as their profit, order fulfilment, and the arrival or departure of suppliers in their network), change their behaviour to adapt to new conditions, and activate those behaviours. Behaviour adaptation is carried out through a simulated annealing algorithm (Kirkpatrick et al 1983), a metaheuristic optimisation tool that uses an analogy to the heating and cooling of materials, where each supplier replaces its current behaviour definition by a random "nearby" definition, chosen with a probability that depends on the difference between its corresponding objective function value and on an arbitrary global parameter: temperature T which gradually decreases during the simulation. As T is large at the start the current solution changes almost randomly, but increasingly less so, as T approaches zero. In our case T is 0.9 with a cooling rate of 1/100 applied at every iteration. The allowance for random moves reduces the probability that
CA
BD
yN W
orki
ng P
aper
# 2
011-
07-0
13 R
ecei
ved
1st J
uly
2011
the algorithm is trapped in locally optimal solutions. We chose simulated annealing to form an analogy to the seemingly stochastic behaviour of agents that act on local information.
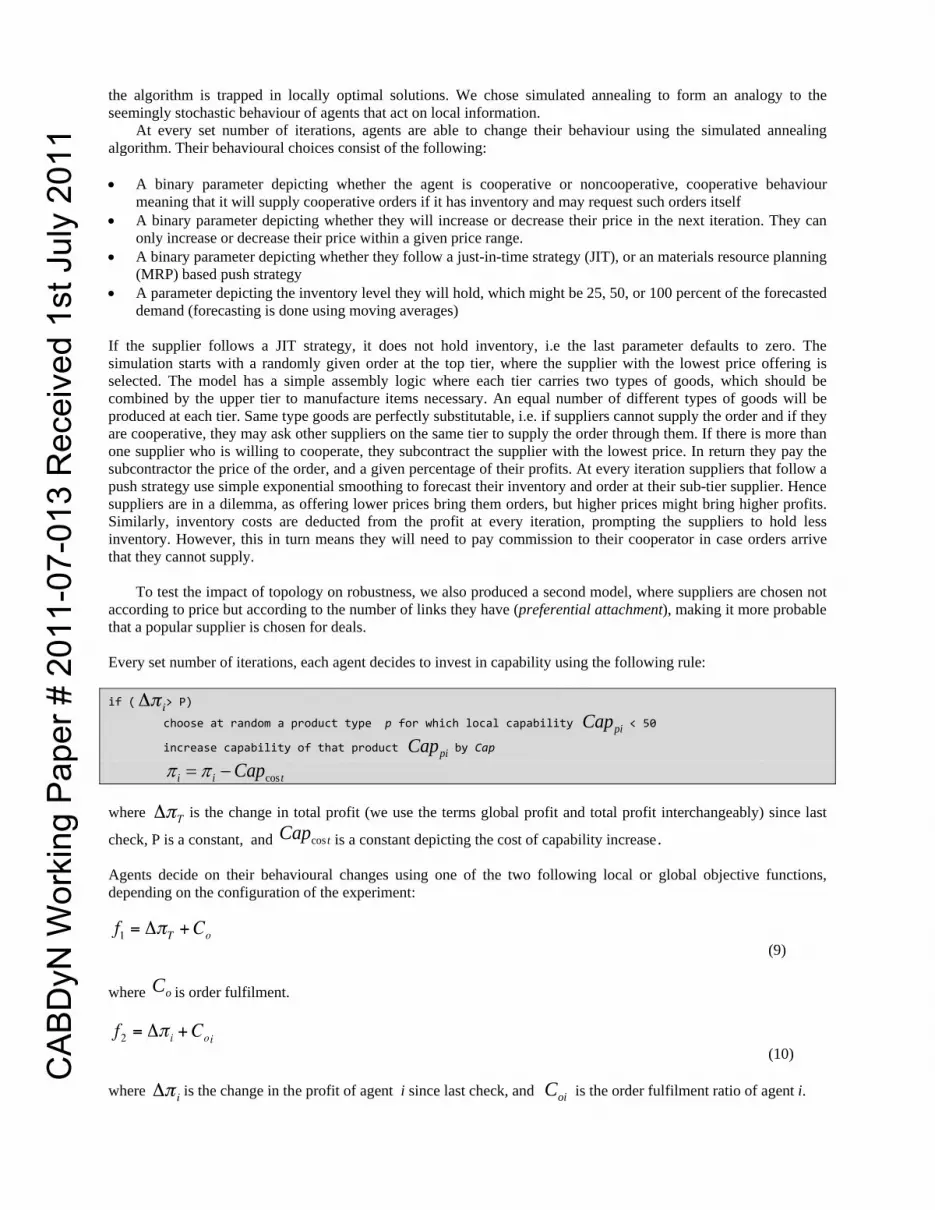
At every set number of iterations, agents are able to change their behaviour using the simulated annealing algorithm. Their behavioural choices consist of the following: • A binary parameter depicting whether the agent is cooperative or noncooperative, cooperative behaviour
meaning that it will supply cooperative orders if it has inventory and may request such orders itself • A binary parameter depicting whether they will increase or decrease their price in the next iteration. They can
only increase or decrease their price within a given price range. • A binary parameter depicting whether they follow a just-in-time strategy (JIT), or an materials resource planning
(MRP) based push strategy • A parameter depicting the inventory level they will hold, which might be 25, 50, or 100 percent of the forecasted
demand (forecasting is done using moving averages) If the supplier follows a JIT strategy, it does not hold inventory, i.e the last parameter defaults to zero. The simulation starts with a randomly given order at the top tier, where the supplier with the lowest price offering is selected. The model has a simple assembly logic where each tier carries two types of goods, which should be combined by the upper tier to manufacture items necessary. An equal number of different types of goods will be produced at each tier. Same type goods are perfectly substitutable, i.e. if suppliers cannot supply the order and if they are cooperative, they may ask other suppliers on the same tier to supply the order through them. If there is more than one supplier who is willing to cooperate, they subcontract the supplier with the lowest price. In return they pay the subcontractor the price of the order, and a given percentage of their profits. At every iteration suppliers that follow a push strategy use simple exponential smoothing to forecast their inventory and order at their sub-tier supplier. Hence suppliers are in a dilemma, as offering lower prices bring them orders, but higher prices might bring higher profits. Similarly, inventory costs are deducted from the profit at every iteration, prompting the suppliers to hold less inventory. However, this in turn means they will need to pay commission to their cooperator in case orders arrive that they cannot supply.
To test the impact of topology on robustness, we also produced a second model, where suppliers are chosen not
according to price but according to the number of links they have (preferential attachment), making it more probable that a popular supplier is chosen for deals. Every set number of iterations, each agent decides to invest in capability using the following rule: if ( > P)
choose at random a product type p for which local capability Cappi < 50
increase capability of that product Cappi by Cap
π i = π i −Capcos t where is the change in total profit (we use the terms global profit and total profit interchangeably) since last
check, P is a constant, and Capcos t is a constant depicting the cost of capability increase. Agents decide on their behavioural changes using one of the two following local or global objective functions, depending on the configuration of the experiment:
(9)
where Co is order fulfilment.
(10)
where is the change in the profit of agent i since last check, and Coi is the order fulfilment ratio of agent i.
CA
BD
yN W
orki
ng P
aper
# 2
011-
07-0
13 R
ecei
ved
1st J
uly
2011
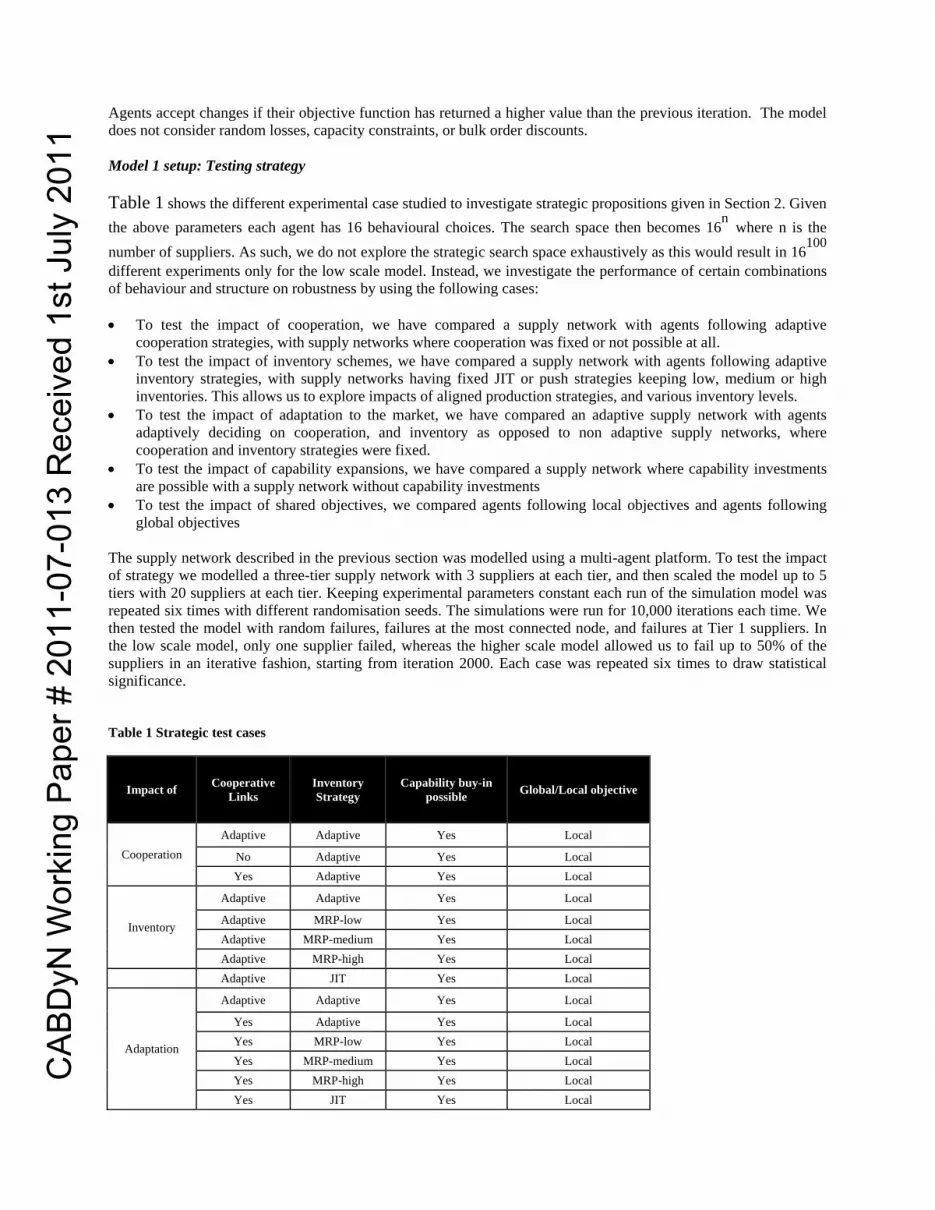
Agents accept changes if their objective function has returned a higher value than the previous iteration. The model does not consider random losses, capacity constraints, or bulk order discounts. Model 1 setup: Testing strategy Table 1 shows the different experimental case studied to investigate strategic propositions given in Section 2. Given the above parameters each agent has 16 behavioural choices. The search space then becomes 16n where n is the number of suppliers. As such, we do not explore the strategic search space exhaustively as this would result in 16100
different experiments only for the low scale model. Instead, we investigate the performance of certain combinations of behaviour and structure on robustness by using the following cases: • To test the impact of cooperation, we have compared a supply network with agents following adaptive
cooperation strategies, with supply networks where cooperation was fixed or not possible at all. • To test the impact of inventory schemes, we have compared a supply network with agents following adaptive
inventory strategies, with supply networks having fixed JIT or push strategies keeping low, medium or high inventories. This allows us to explore impacts of aligned production strategies, and various inventory levels.
• To test the impact of adaptation to the market, we have compared an adaptive supply network with agents adaptively deciding on cooperation, and inventory as opposed to non adaptive supply networks, where cooperation and inventory strategies were fixed.
• To test the impact of capability expansions, we have compared a supply network where capability investments are possible with a supply network without capability investments
• To test the impact of shared objectives, we compared agents following local objectives and agents following global objectives
The supply network described in the previous section was modelled using a multi-agent platform. To test the impact of strategy we modelled a three-tier supply network with 3 suppliers at each tier, and then scaled the model up to 5 tiers with 20 suppliers at each tier. Keeping experimental parameters constant each run of the simulation model was repeated six times with different randomisation seeds. The simulations were run for 10,000 iterations each time. We then tested the model with random failures, failures at the most connected node, and failures at Tier 1 suppliers. In the low scale model, only one supplier failed, whereas the higher scale model allowed us to fail up to 50% of the suppliers in an iterative fashion, starting from iteration 2000. Each case was repeated six times to draw statistical significance. Table 1 Strategic test cases
Impact of Cooperative Links
Inventory Strategy
Capability buy-in possible Global/Local objective
Cooperation Adaptive Adaptive Yes Local
No Adaptive Yes Local Yes Adaptive Yes Local
Inventory
Adaptive Adaptive Yes Local
Adaptive MRP-low Yes Local Adaptive MRP-medium Yes Local Adaptive MRP-high Yes Local
Adaptive JIT Yes Local
Adaptation
Adaptive Adaptive Yes Local
Yes Adaptive Yes Local Yes MRP-low Yes Local Yes MRP-medium Yes Local Yes MRP-high Yes Local Yes JIT Yes Local
CA
BD
yN W
orki
ng P
aper
# 2
011-
07-0
13 R
ecei
ved
1st J
uly
2011

No Adaptive Yes Local No MRP-low Yes Local No MRP-medium Yes Local No MRP-high Yes Local No JIT Yes Local
Manufacturing capability
Adaptive Adaptive Yes Local Adaptive Adaptive No Local
Local and global
objective
Adaptive Adaptive Yes Local
Adaptive Adaptive Yes Global
Model 2 setup: Testing topology
To test the impact of topology on robustness, we used the second model, where suppliers are chosen not according to price but according to the number of links they have. A node's chance of being selected is directly proportional to the number of connections it already has. Consequently, pricing was discounted from the behavioural choices an agent has. The model consists of 72 suppliers, which was then scaled up to 720 and then to 7200. High number of nodes was necessary for the network topology to have an impact on robustness. Due to a higher number of nodes and computational limitations, iterations were capped at 40. The behavioural choices were kept adaptive, and local, to reflect a real-life complexity in the model. Table 2 shows the cases studied for testing topology. To investigate topological robustness, we subjected the model to a procedure called percolation, during which one removes supplier nodes and observes the threshold when the network forms into disconnected clusters. The procedure is explained in Section 5.2 in detail.
Table 2 Topological test cases
Impact of Supplier Choice Cooperation Inventory Capability buy-in
possible Global/Local objective
Preferential attachment
Based on number of
links Adaptive Adaptive Adaptive Local
Random hierarchical
topology Random Adaptive Adaptive Adaptive Local
5. Results and Discussion 5.1 Strategic and dynamic robustness
Our first model to test strategic impact on robustness, results in dynamic yet evolutionary behaviour, where the individual actions of the firms determine the network topology, and at times we observe the network converge into certain behavioural traits.
We first start by testing the impact of cooperation, which suggests positive correlation between cooperative behaviour between competitors and robustness. At iteration 40, we find that in the normal case, as in the random and Tier 1 failure case, adaptive cooperation yields best results followed by forced cooperation. Nodes suffer most when cooperation is not possible at all. It is interesting that forced cooperation does not result in a more robust network but optional cooperation does. In Figure 2 we observe a “sweet spot”, or a trade off range, in profit attainment in terms of the portion of goods traded on cooperation links over the number of goods traded. The range seems equally applicable in all failure types. The trade off points are less clear in order attainment and seem to point to first a lower range and second to the same percentage as the profit attainment trade off.
It is interesting to recall (Hanaki & Watts 2007)’s assessment “networks in which ties cost, and local topology is largely absent tend to generate higher levels of cooperation than in which ties are made easily”, as our results have been similar. Runs with nodes following local objectives i.e. runs in which ties were in direct contrast to profit objectives of the nodes, generated higher amounts of cooperation than runs where nodes follow global objectives. Higher levels of cooperation, however, did not help in the face of failures as weaker links faired better under failures. At this point we recall the famous observation of (Granovetter 1973) in a very different context: that
CA
BD
yN W
orki
ng P
aper
# 2
011-
07-0
13 R
ecei
ved
1st J
uly
2011
of social networks, as he points the greater use of weak links in complex settings than strong links. That is not to say observations in social networks are equally applicable to operational networks, but rather to highlight the need to question the role of weaker links in supply chain management, also posed by (Lazzarini et al 2001) and (Choi et al 2001). When we observe the real life supply networks of Nokia and Toyota, we see the similar pattern of supply relations on mutual “stand by” that could be called upon disturbances and wonder its impact on successful recovery.
CA
BD
yN W
orki
ng P
aper
# 2
011-
07-0
13 R
ecei
ved
1st J
uly
2011
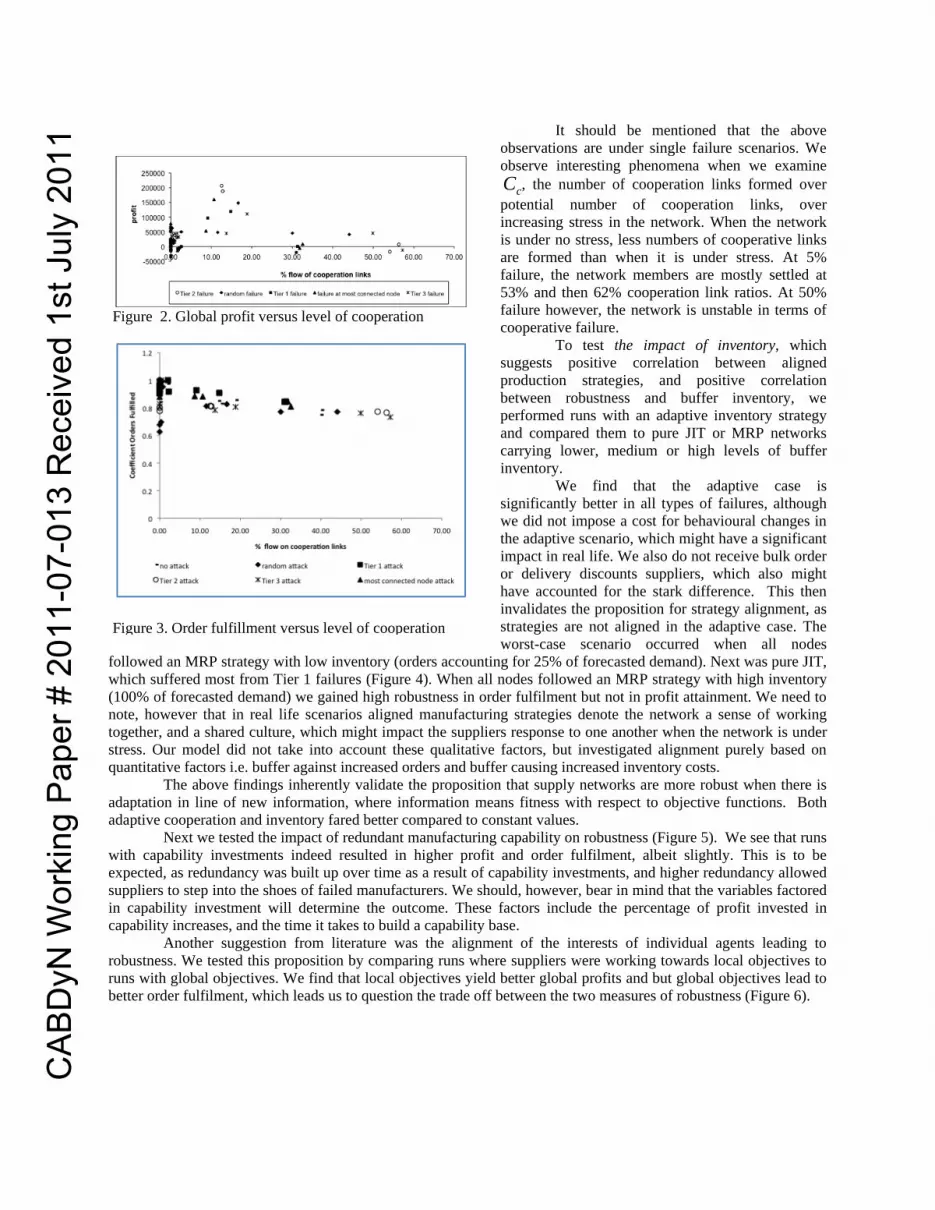
It should be mentioned that the above observations are under single failure scenarios. We observe interesting phenomena when we examine Cc, the number of cooperation links formed over potential number of cooperation links, over increasing stress in the network. When the network is under no stress, less numbers of cooperative links are formed than when it is under stress. At 5% failure, the network members are mostly settled at 53% and then 62% cooperation link ratios. At 50% failure however, the network is unstable in terms of cooperative failure.
To test the impact of inventory, which suggests positive correlation between aligned production strategies, and positive correlation between robustness and buffer inventory, we performed runs with an adaptive inventory strategy and compared them to pure JIT or MRP networks carrying lower, medium or high levels of buffer inventory.
We find that the adaptive case is significantly better in all types of failures, although we did not impose a cost for behavioural changes in the adaptive scenario, which might have a significant impact in real life. We also do not receive bulk order or delivery discounts suppliers, which also might have accounted for the stark difference. This then invalidates the proposition for strategy alignment, as strategies are not aligned in the adaptive case. The worst-case scenario occurred when all nodes
followed an MRP strategy with low inventory (orders accounting for 25% of forecasted demand). Next was pure JIT, which suffered most from Tier 1 failures (Figure 4). When all nodes followed an MRP strategy with high inventory (100% of forecasted demand) we gained high robustness in order fulfilment but not in profit attainment. We need to note, however that in real life scenarios aligned manufacturing strategies denote the network a sense of working together, and a shared culture, which might impact the suppliers response to one another when the network is under stress. Our model did not take into account these qualitative factors, but investigated alignment purely based on quantitative factors i.e. buffer against increased orders and buffer causing increased inventory costs.
The above findings inherently validate the proposition that supply networks are more robust when there is adaptation in line of new information, where information means fitness with respect to objective functions. Both adaptive cooperation and inventory fared better compared to constant values.
Next we tested the impact of redundant manufacturing capability on robustness (Figure 5). We see that runs with capability investments indeed resulted in higher profit and order fulfilment, albeit slightly. This is to be expected, as redundancy was built up over time as a result of capability investments, and higher redundancy allowed suppliers to step into the shoes of failed manufacturers. We should, however, bear in mind that the variables factored in capability investment will determine the outcome. These factors include the percentage of profit invested in capability increases, and the time it takes to build a capability base.
Another suggestion from literature was the alignment of the interests of individual agents leading to robustness. We tested this proposition by comparing runs where suppliers were working towards local objectives to runs with global objectives. We find that local objectives yield better global profits and but global objectives lead to better order fulfilment, which leads us to question the trade off between the two measures of robustness (Figure 6).
Figure 2. Global profit versus level of cooperation
Figure 3. Order fulfillment versus level of cooperation
CA
BD
yN W
orki
ng P
aper
# 2
011-
07-0
13 R
ecei
ved
1st J
uly
2011
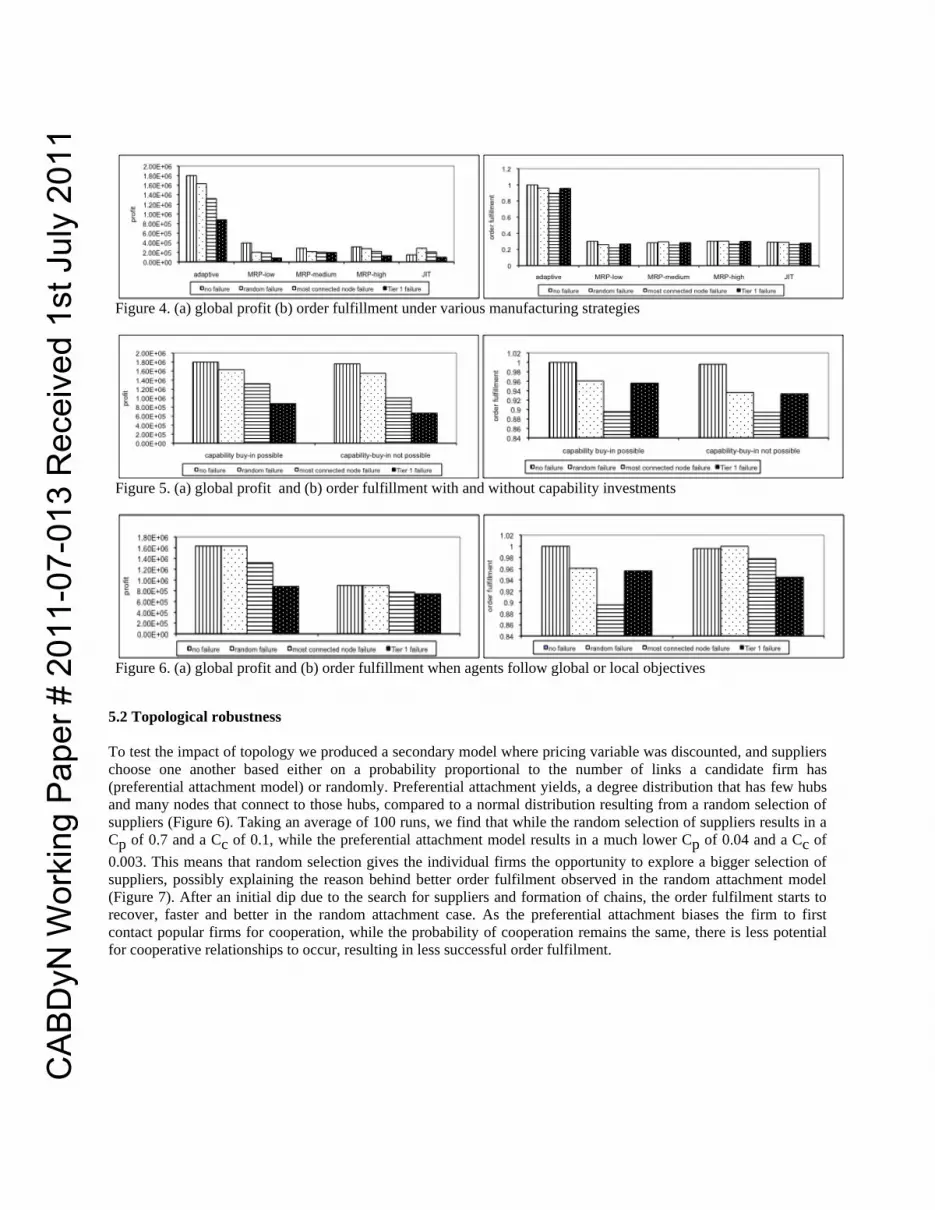
5.2 Topological robustness To test the impact of topology we produced a secondary model where pricing variable was discounted, and suppliers choose one another based either on a probability proportional to the number of links a candidate firm has (preferential attachment model) or randomly. Preferential attachment yields, a degree distribution that has few hubs and many nodes that connect to those hubs, compared to a normal distribution resulting from a random selection of suppliers (Figure 6). Taking an average of 100 runs, we find that while the random selection of suppliers results in a Cp of 0.7 and a Cc of 0.1, while the preferential attachment model results in a much lower Cp of 0.04 and a Cc of 0.003. This means that random selection gives the individual firms the opportunity to explore a bigger selection of suppliers, possibly explaining the reason behind better order fulfilment observed in the random attachment model (Figure 7). After an initial dip due to the search for suppliers and formation of chains, the order fulfilment starts to recover, faster and better in the random attachment case. As the preferential attachment biases the firm to first contact popular firms for cooperation, while the probability of cooperation remains the same, there is less potential for cooperative relationships to occur, resulting in less successful order fulfilment.
Figure 4. (a) global profit (b) order fulfillment under various manufacturing strategies
Figure 5. (a) global profit and (b) order fulfillment with and without capability investments
Figure 6. (a) global profit and (b) order fulfillment when agents follow global or local objectives
CA
BD
yN W
orki
ng P
aper
# 2
011-
07-0
13 R
ecei
ved
1st J
uly
2011

To investigate topological robustness, we subjected the model to a procedure called percolation, during which one removes supplier nodes and observes the threshold when the network forms into disconnected clusters. Although this classical percolation procedure may give us a general idea of vulnerabilities based on the network shape, it is obvious that a supply chain essentially functions with an inherent dependency tree based on production bills of materials and therefore a more complete failure analysis would need to include such dependencies, which we considered. Based on the product dependency information the percolation process is carried out as follows:
1. A supplier node is removed randomly and the degrees of all associated product types are reduced by one, 2. Any nodes, which had the node deleted in Step 1 as their only customer or their only supplier, are deleted,
going back to Step 1, 3. If any product type in the product dependency tree is lost as a result, the procedure terminates. Otherwise
we go back to step 1. We investigate behaviour under increasing numbers of suppliers. To allow for initial steady state, the percolation procedure starts at the 10th iteration and continues until the production dependency is compromised. In all cases we observe an increase in cooperation when the network is under stress. The random removal of suppliers impacts the random attachment model more than the preferential attachment model. As a result, while the random attachment model yields higher levels of cooperative and productive link exploration, and thus higher order fulfillment also when under stress, repeated random failures impact it more severely, causing it to be more vulnerable.
Figure 6. Degree distribution with (a) random attachment, (b) preferential attachment
Figure 7. Order fulfillment (a) with steady state, and (b) under percolation
CA
BD
yN W
orki
ng P
aper
# 2
011-
07-0
13 R
ecei
ved
1st J
uly
2011
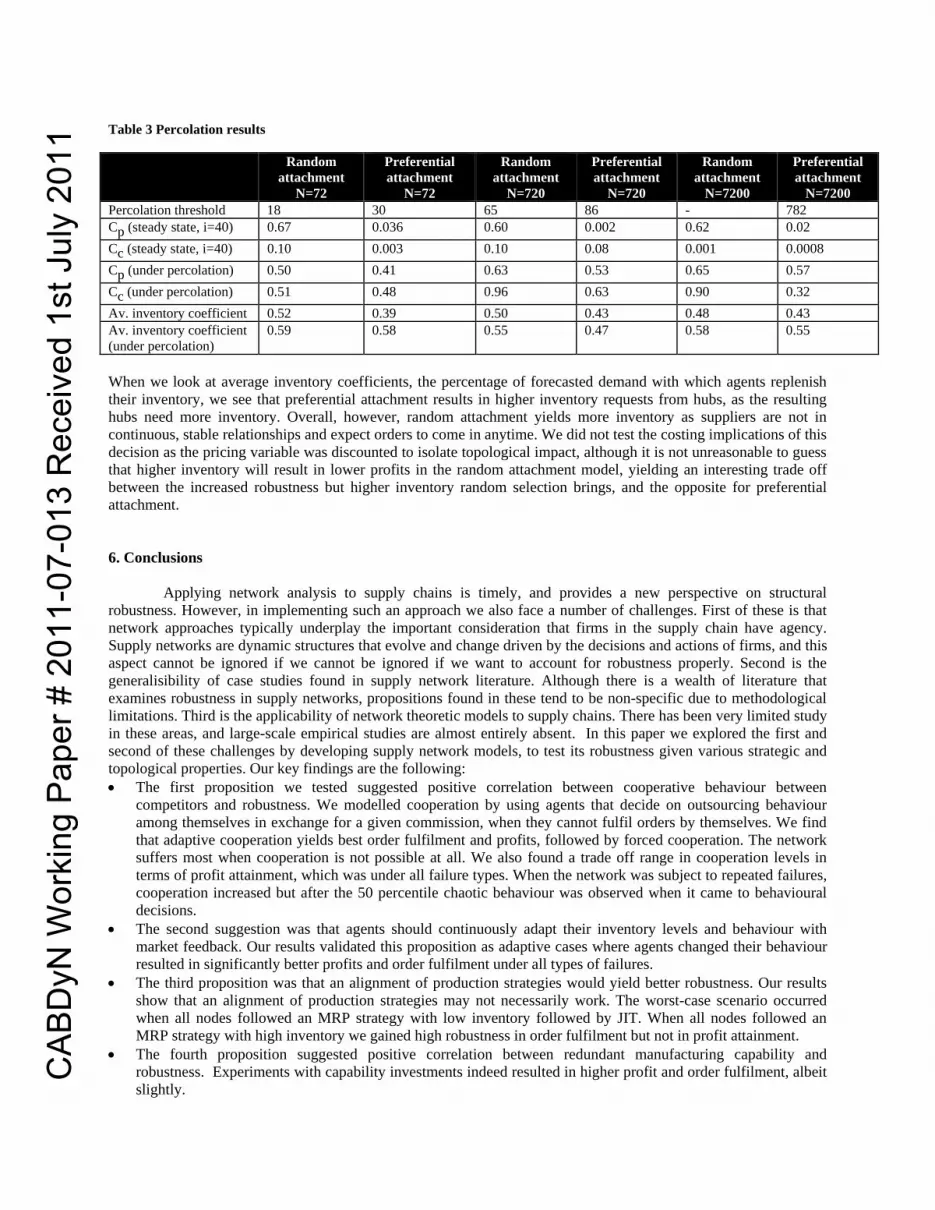
Table 3 Percolation results
Random attachment
N=72
Preferential attachment
N=72
Random attachment
N=720
Preferential attachment
N=720
Random attachment
N=7200
Preferential attachment
N=7200 Percolation threshold 18 30 65 86 - 782 Cp (steady state, i=40) 0.67 0.036 0.60 0.002 0.62 0.02 Cc (steady state, i=40) 0.10 0.003 0.10 0.08 0.001 0.0008 Cp (under percolation) 0.50 0.41 0.63 0.53 0.65 0.57 Cc (under percolation) 0.51 0.48 0.96 0.63 0.90 0.32 Av. inventory coefficient 0.52 0.39 0.50 0.43 0.48 0.43 Av. inventory coefficient (under percolation)
0.59 0.58 0.55 0.47 0.58 0.55
When we look at average inventory coefficients, the percentage of forecasted demand with which agents replenish their inventory, we see that preferential attachment results in higher inventory requests from hubs, as the resulting hubs need more inventory. Overall, however, random attachment yields more inventory as suppliers are not in continuous, stable relationships and expect orders to come in anytime. We did not test the costing implications of this decision as the pricing variable was discounted to isolate topological impact, although it is not unreasonable to guess that higher inventory will result in lower profits in the random attachment model, yielding an interesting trade off between the increased robustness but higher inventory random selection brings, and the opposite for preferential attachment. 6. Conclusions
Applying network analysis to supply chains is timely, and provides a new perspective on structural robustness. However, in implementing such an approach we also face a number of challenges. First of these is that network approaches typically underplay the important consideration that firms in the supply chain have agency. Supply networks are dynamic structures that evolve and change driven by the decisions and actions of firms, and this aspect cannot be ignored if we cannot be ignored if we want to account for robustness properly. Second is the generalisibility of case studies found in supply network literature. Although there is a wealth of literature that examines robustness in supply networks, propositions found in these tend to be non-specific due to methodological limitations. Third is the applicability of network theoretic models to supply chains. There has been very limited study in these areas, and large-scale empirical studies are almost entirely absent. In this paper we explored the first and second of these challenges by developing supply network models, to test its robustness given various strategic and topological properties. Our key findings are the following: • The first proposition we tested suggested positive correlation between cooperative behaviour between
competitors and robustness. We modelled cooperation by using agents that decide on outsourcing behaviour among themselves in exchange for a given commission, when they cannot fulfil orders by themselves. We find that adaptive cooperation yields best order fulfilment and profits, followed by forced cooperation. The network suffers most when cooperation is not possible at all. We also found a trade off range in cooperation levels in terms of profit attainment, which was under all failure types. When the network was subject to repeated failures, cooperation increased but after the 50 percentile chaotic behaviour was observed when it came to behavioural decisions.
• The second suggestion was that agents should continuously adapt their inventory levels and behaviour with market feedback. Our results validated this proposition as adaptive cases where agents changed their behaviour resulted in significantly better profits and order fulfilment under all types of failures.
• The third proposition was that an alignment of production strategies would yield better robustness. Our results show that an alignment of production strategies may not necessarily work. The worst-case scenario occurred when all nodes followed an MRP strategy with low inventory followed by JIT. When all nodes followed an MRP strategy with high inventory we gained high robustness in order fulfilment but not in profit attainment.
• The fourth proposition suggested positive correlation between redundant manufacturing capability and robustness. Experiments with capability investments indeed resulted in higher profit and order fulfilment, albeit slightly.
CA
BD
yN W
orki
ng P
aper
# 2
011-
07-0
13 R
ecei
ved
1st J
uly
2011

• Finally, a fifth proposition suggested that global objectives would yield to higher robustness. We tested this by setting agents objectives to local profit and order fulfilment and then to global profit and order fulfilment. Local objectives led to better global profits and but global objectives lead to better order fulfilment, which leads us to question the trade off between these two measures of robustness.
• We have found that Tier1 failures have the largest negative impact in terms of order fulfilment and profitability followed by failures to the most connected node.
We then tested the impact of topology by using two distinct network topologies both of which have been attributed to supply chains (Thadakamalla et al 2004, Gafiychuk 2000). The random topology, which connects suppliers based on random choice, resulted in higher vulnerability to random failures then the preferential attachment topology, which makes highly connected suppliers more probable to be selected for link formation. However, before failure, random attachment resulted in better order fulfilment, as higher levels of cooperative and production link search that occurs in the random selection model. This in turn, prompted the suppliers to hold more inventory than the preferential attachment model, in which suppliers are engaged in more stable continuous relationships and forecasting if more accurate. It is important to note that a key limitation of our simplified model is the lack of costs associated with supplier and manufacturing strategy changes. We have also simplified our experimentation by not taking lead times into account. Of course, due to these simplifications, the results obtained should be regarded as relative trends, rather than absolute values. An important point raised by our work is that different strategies of supplier agents results in varied robustness properties, and different topological properties also result in different robustness as well as impacting strategy in turn. It is this complex interaction that should be taken into account when studying the robustness properties of similar types of networks. It is also important to recognize that generic network growth and failure models in network studies need careful customisation before their applicability can be truly investigated. Existing models investigate random failure of a node or a targeted failure at the most connected node (Albert et al 2000). There exist also various models that show how the failure of a single node results in a chain reaction where the failure propagates with each node attempting to take on part of the load that was handled by the previously failed node, thereby exceeding its own load constraints and failing to deliver all together (Fujiwara and Aoyama 2008). One can imagine intelligent attacks to be rare but plausible in supply networks, especially to those owned by military organisations. A more common occurrence will be temporary stoppage on production lines due to machine failures. Since supply networks may have dependency paths in them, the tier in which the failure occurs might be of prime importance, as effects of failures in higher tiers, might be felt faster by the upper tier. Mid-tiers will have more connections and therefore disrupt operations of more numbers of companies. The failure of more than one company at a time will be very rare, perhaps due to an environmental catastrophe, but individual failures might cascade along the supply net with demand being shifted across the network and companies not being able to handle production altogether due to excessive load. Similarly, modelling the linkage pattern among suppliers may need more than a preferential attachment index, as it is not hard to imagine having too many clients could effect the selection process in quite the opposite way. In our future work, we aim to analyse empirical data from complex supply networks, and investigate the relevance of generic network growth, shrinkage and failure models. We are also interested in the correlations between robustness and reallocation dynamics where clients shift a portion of their allocations rather than changing suppliers altogether. 7. Acknowledgements We acknowledge the Engineering and Physical Sciences Research Council, UK, who has funded our work under the SATURN TSB programme TS/H001832/1. 8. References
1. Ahmadjian C. L. and Lincoln J. R. (2001), Keiretsu, Governance, and Learning: Case Studies in Change from the Japanese Automotive Industry, Organization Science 12:683-701.
2. Albert R., Jeong H., Barabasi A.L. (2000), Error and failure tolerance of complex networks. Nature, 406:378– 382.
3. Bala V. and Goyal S. (2000), A noncooperative model of network formation, Econemetrica, 68(5):1181-1129. C
AB
DyN
Wor
king
Pap
er #
201
1-07
-013
Rec
eive
d 1s
t Jul
y 20
11

4. Borgatti S. P., Foster P. C. (2003), The network paradigm in organization research: A review and topology, Journal of Management, 29(6): 991-1013
5. Brose U., Berlow E.L., Martinez N.D. (2005) Scaling up keystone effects from simple to complex ecological networks. Ecol. Lett., 8, 1317-1325.
6. Choi T.Y., Dooley K.J., Rungtusanatham M. (2001), Supply networks and complex adaptive systems: control versus emergence. Journal of Operations Management, 19(3):351-366.
7. Dodds P., Watts D., Sabel C. (2003), Information exchange and the robustness of organizational networks, PANS 100:21 12516-12521
8. Gafiychuk V., Lubashevsky I., Stosyk A. (2000), Remarks on scaling properties inherent to the systems with hierarchically organized supplying network, nlin/0004033, arxiv.org
9. Granovetter M. (1973) The Strength of Weak Ties, American Journal of Sociology 78(6):1360-80. 10. Graves S. C., Tomlin B. T., (2003) Process flexibility in supply chains. Management Science 49(7):907–
919. 11. Fujiwara Y. and Aoyama H. (2008), Large-scale topology of a nation-wide production network,
arXiv:0806.4280 12. Hamichi S., Bree D., Guessoum Z., Mangalagiu D. (2009), A Multi-Agent System of Adaptive Production
Networks, Proc of the 8th Int conf Autonomous Agents and Multiagent Systems, Budapest, Hungary, 1311-1312.
13. Hanaki and Watts (2007), Cooperation in evolving social networks, Management Science 53(7): 1036-1050 14. Keyani P., Larson B., Senthil M. (2002), Web Engineering and Peer-to-Peer Computing, Peer Pressure:
Distributed Recovery from Failures in Peer-to-Peer Systems, 306– 320. Springer Berlin/Heidelberg 15. Kirkpatrick, S., Gelatt, C. D., Vecchi M. P. (1983), Optimization by Simulated Annealing, Science. New
Series 220 (4598): 671–680. 16. Latour A. (2001) Trial by fire: A blaze in Albuquerque sets off major crisis for cell-phone giants— Nokia
handles supply chain shock with aplomb as Ericsson of Sweden gets burned—Was Sisu the difference? Wall Street Journal (Jan. 29) A1.
17. Lazzarini S.G., Chaddad F.R., Cook M.L. (2001), Integrating Supply Chain and Network Analyses: The Study of Netchains, Journal of Chain and Network Science, 1(1):7-22
18. Lee (2004), The Triple-A Supply Chain, Harvard Business Review, 82(10):102-112. 19. Lomi A., Pattison P. (2006), Manufacturing relations: an empirical study of the organization of production
across multiple networks, Organization Science, 17(3): 313-332 20. Mula J., Poler R., Garcia-Sabater J.P. and Lario F.C. (2006), Models for production planning under
uncertainty: a review, International Journal of Production Economics 103 (1): 271–285. 21. Nam S.H., Vitton J., Kurata H. (2009), Robust supply base management: Determining the optimal number
of suppliers utilized by contractors, International Journal of Production Economics, DOI: 10.1016/j.ijpe.2009.11.010.
22. Nishiguchi (1997), The Toyota Group and the Aisin Fire, SLOAN Management Review 40(1):49. 23. Pathak S.D. (2007), “On the Evolutionary Dynamics of Supply Network Topologies, IEEE Trans.
Engineering management, 54(4): 662-672. 24. Pathak S.D., Day J.M., Nair A., Sawaya W.J., Kristal M.M. (2007) Complexity and Adaptivity in Supply
Networks: Building Supply Network Theory Using a Complex Adaptive Systems Perspective, Decision Sciences, 38(4)
25. Podolny J. M. (1993), A Status-Based Model of Market Competition, The American Journal of Sociology, 98(4): 829-872
26. Radner R. (1995) The organization of decentralized information processing, Econometrica 61(5): 1109-1146.
27. Rice J. B. and Caniato F. (2003). Building a secure and resilient supply network. Supply Chain Management Review 7(5):22–30.
28. Sako M. (1996), Suppliers' Associations in the Japanese Automobile Industry: Collective Action for Technology Diffusion, Cambridge Journal of Economics 20:651-671.
29. Saveedra S., Reed-Tsochas F., Uzzi B. (2008) Asymmetric disassembly and robustness in declining networks, PNAS 105(43):16466-16471.
30. Snyder L., Scaparra M., Daskin M., Church R. (2006): Planning for Disruptions in Supply Chain Networks, Tutorials in Operations Research, INFORMS, 234-257
31. Staniczenko P., Lewis O., Jones N., Reed-Tsochas F. (2010) Topological Dynamics and robustness of food webs, Ecol. Lett., doi: 10.1111/j.1461-0248.2010.01485.x
32. Tang C.S. (2006), Perspectives in supply chain risk management, International Journal of Production Economics 103 (2) : 451–488
CA
BD
yN W
orki
ng P
aper
# 2
011-
07-0
13 R
ecei
ved
1st J
uly
2011

33. Thadakamalla H.P., Raghavan U.N., Kumara S., Albert R. (2004), Survivability of multiagent-based supply networks: A topological perspective, IEEE Intelligent Sys, 24-31
34. Wallace S.W., Choi T.-M.(2009), Flexibility, information structure, options, and market power in robust supply chains, International Journal of Production Economics, In Press, DOI: 10.1016/j.ijpe.2009.11.002.
35. Yu C.S. and Li H.L. (2000), A robust optimization model for stochastic logistic problems, International Journal of Production Economics 64 (1–3) : 385–397.
36. Zhao D. 2009, The research on supply chain modelling based on the improved complex network theory, Int. Conf. on AI and Computational Intelligence, 172-175.
37. Zweig K. A. and Zimmerman K. (2008), Wanderer between the worlds-self-organized network stability in failure and random failure scenarios, Proc of the 2nd IEEE Int Conf Self-Adaptive and Self-Organizing Systems.
CA
BD
yN W
orki
ng P
aper
# 2
011-
07-0
13 R
ecei
ved
1st J
uly
2011