top-down control of diesel-degrading prokaryotic communities
TRANSCRIPT

ENVIRONMENTAL MICROBIOLOGY
Top-Down Control of Diesel-Degrading Prokaryotic Communities
Caroline Sauret1,2 & Daniela Böttjer3 & Agathe Talarmin4& Catherine Guigue4 &
Pascal Conan1,2& Mireille Pujo-Pay1,2 & Jean-François Ghiglione1,2
Received: 29 July 2014 /Accepted: 8 March 2015# Springer Science+Business Media New York 2015
Abstract Biostimulation through the addition of inorganicnutrients has been the most widely practiced bioremediationstrategy in oil-polluted marine waters. However, little atten-tion has so far been paid to the microbial food web and theimpact of top-down control that directly or indirectly influ-ences the success of the bioremediation. We designed amesocosm experiment using pre-filtered (<50 μm) surfaceseawater from the Bay of Banyuls-sur-Mer (North-WesternMediterranean Sea) and examined the top-down effect exertedby heterotrophic nanoflagellates (HNF) and virus-like parti-cles (VLP) on prokaryotic abundance, activity and diversity inthe presence or absence of diesel fuel. Prokaryotes, HNF andVLP abundances showed a predator–prey succession, with aco-development of HNF and VLP. In the polluted system, weobserved a stronger impact of viral lysis on prokaryotic
abundances than in the control. Analysis of the diversity re-vealed that a bloom of Vibrio sp. occurred in the pollutedmesocosm. That bloom was rapidly followed by a less abun-dant and more even community of predation-resistant bacte-ria, including known hydrocarbon degraders such asOleispiraspp. and Methylophaga spp. and opportunistic bacteria suchas Percisivirga spp., Roseobacter spp. and Phaeobacter spp.The shift in prokaryotic dominance in response to viral lysisprovided clear evidence of the ‘killing the winner’ model.Nevertheless, despite clear effects on prokaryotic abundance,activity and diversity, the diesel degradation was not impactedby top-down control. The present study investigates for thefirst time the functioning of a complex microbial network(including VLP) using a nutrient-based biostimulation strate-gy and highlights some key processes useful for tailoringbioremediation.
Keywords Grazing . Viral lysis . Biostimulation .
Biodegradation .Microbial ecotoxicology
Introduction
Bioremediation of hydrocarbon-contaminated marine waters,which exploits the ability of microorganisms to degrade and/or detoxify organic contamination, has proven to be an effec-tive method for cleaning up residual oil in a variety of coastalenvironments [1, 2]. While hydrocarbons are an excellentsource of carbon and energy for microbes, they significantlylack other nutrients, such as nitrogen (N) and phosphorus (P)[3]. Because many marine waters are oligotrophic, nutrientsbecome rapidly limiting for microbial growth, i.e. the so-called ‘bottom-up control’ [4]. Nutrient-assisted biostimula-tion has provided convincing evidence of its effectiveness inthe depollution of oil spills in marine environments [5]. For
Electronic supplementary material The online version of this article(doi:10.1007/s00248-015-0596-5) contains supplementary material,which is available to authorized users.
* Jean-François [email protected]
1 UPMC Univ Paris 06, UMR 7621, Laboratoire d’OcéanographieMicrobienne, Observatoire Océanologique, Sorbonne Universités,66650 Banyuls-sur-mer, France
2 Laboratoire d’Océanographie Microbienne, UMR 7621,Observatoire Océanologique, CNRS, Avenue Fontaulé, Banyuls-sur-Mer 66650, France
3 Department of Oceanography and Center for MicrobialOceanography: Research and Education, University of Hawaii atMãnoa, Honolulu, HI 96822, USA
4 Campus de Luminy, Centre d’Océanologie de Marseille, MarseilleCedex 9 13 288, France
Microb EcolDOI 10.1007/s00248-015-0596-5

example, hydrocarbon degradation was enhanced by a factorof 8.6 during one of the largest biostimulation treatments,involving approximately 50,000 kg of N and 5000 kg of Pthat were added over successive summers following theExxon Valdez spill [6].
Current knowledge of marine bioremediation is based onstudies focusing almost exclusively on the microbial degrada-tion of the contaminants and on the effect of contaminants onprokaryotic community structure. The addition of oil generallyresults in a dramatic decrease of prokaryotic diversity, due to astrong selection for hydrocarbon-degrading species such asCycloclasticus sp. [7], and Alcanivorax sp. [8], Galaecimonas[9], Marinobacter [10], Neptunomonas [11], Oleiphilus [12]and Oleispira [13], Planomicrobium [14] and Thalassolitus[15] that are mostly present in low abundance when carbonsou r c e s a r e i n a s t e ady - s t a t e [ 16–18 ] . Wh i l ehydrocarbonoclastic bacteria generally dominate the communi-ty after oil addition, it has been established that heterogeneouscommunities are required to degrade the mix of hydrocarbonspresent in most oil spills [19, 20, 17].
In contrast of the abundance of works on the oil-degradingprokaryotes, very little is known about the influence of graz-ing and viral lysis (so-called ‘top-down control’) on prokary-otic community changes after the addition of oil or on theprokaryotic efficiency of oil biodegradation. The few dataavailable so far showed that both heterotrophic nanoflagellates(HNF) and virus-like particles (VLP) can survive during oilpollution and sometimes even increase their abundance, there-by shaping prokaryotic abundances [21–23]. High abun-dances of HNF and VLP in nutrient rich areas have raisedthe idea that top-down control not only impacts prokaryoticabundance, but also influences prokaryotic community struc-ture [24–26], particularly because HNF and viruses can beextremely prey-specific [27, 25, 28]. The probability of en-counter between a predator (virus or HNF) and its prey(prokaryote) is proportional to their relative abundances. Ac-cording to the ‘killing the winner’ theory, abundant species aremore likely to be exposed to predation than rare species andtheir elimination by grazing and/or lysis would lead to drasticchanges in prokaryotic community structure [29, 30, 4]. Theimpact of predation and viral lysis on prokaryotic activity ismore complex. On the one hand, both processes prevent pro-karyotes from entering into stationary phase, and thus, main-tain their metabolic activity [31]. On the other hand, predationor viral lysis of the most active prokaryotes select for somedormant and resistant cells, causing a decrease in the activityof the total prokaryotic community [32]. Except for somestudies showing that HNF increased the remineralization ofsome polycyclic aromatic hydrocarbons [33, 34], the actualimpact of HNF or VLP on prokaryotic oil degradation has todate been largely ignored.
Here, we designed a diesel contamination experiment withlarge volumes of seawater (400 l) to investigate the effect of
top-down control on prokaryotic communities under non-limiting nutrient conditions. For 14 days, we monitored dailychanges in the abundance of prokaryotes, HNF and VLP inresponse to the addition of diesel oil and compared those to anunamended control. Grazing experiments together with esti-mates of viral-induced prokaryotic mortality allowed us toevaluate how these processes impacted prokaryotic assem-blages in terms of their diversity, metabolic capabilities anddegradation of diesel oil. Changes in prokaryotic communitystructure over the time course of the experiment were assessedby coupling molecular fingerprinting and pyrosequencing ap-proaches. To the best of our knowledge, this is the first studyexamining the simultaneous effects of HNF and VLP on pro-karyotic metabolic activities, diversity and bioremediation ca-pabilities in diesel-perturbed assay.
Materials and Methods
Mesocosms Design
Surface seawater (800 l) was collected from the bay ofBanyuls-sur-Mer (North-Western Mediterranean Sea), fil-tered through a 50-μm nylon membrane to remove largerorganisms and gently transferred into two 500-l resintanks. Each tank contained 400 l of seawater: one servedas the biotic control (no oil added) and the other one wasperturbed with 50 ml of diesel. Both mesocosms wereincubated for 14 days at in situ temperature (16 °C) in atemperature controlled room (in the lab) and kept in thedark (tight and opaque cover) to avoid phytoplankton de-velopment and eventual degradation of diesel oil by UVlight. Aquarium pumps were used to ensure a continuousmixing with constant air bubbling, preventing stratifica-tion and hypoxia within each tank. Inorganic nutrientssuch as nitrate (NO3
−), nitrite (NO2−) ammonium (NH4
+)and phosphate (PO4
3−) were quantified daily (in the mid-dle of each afternoon) using a Bran Luebbe IIIautoanalyser according to Tréguet and LeCorre [35]. Nu-trients were adjusted daily (end of each afternoon after thequantification) to a constant N to P ratio of 8:1 [5] inorder to prevent nutrient-limitation. Particulate organiccarbon, phosphate and nitrogen (POC, POP and PON,respectively) were collected onto precombusted glass fi-ber filters (Whatman GF/F, 25 mm) and analysed on aCHN Perkin Elmer 2400 as previously described [36]. Cto N to P ratios were calculated as an indicator of partic-ulate organic matter (POM) quality. The duration of theexperiment, the optimal concentration of diesel oil addedand the nutrient adjustments over the time course of theexperiment were adapted from previous mesocosm studiesthat tested various N to P ratios and diesel oil concentra-tion [37, 5].
C. Sauret et al.

Oil Hydrocarbon Analysis
One liter of seawater was sampled from the sub-surfaceof the diesel-contaminated mesocosm at days 0, 3, 8, 12and 17. Oil hydrocarbon composition was analysed ac-cording to [38]. Briefly, hydrocarbons were extracted byliquid-liquid extraction and extracts were purified onsilica columns to separate aliphatic hydrocarbons(AHs) from polycyclic aromatic hydrocarbons (PAHs).Concentrations of AHs consisted of a series of resolvedcompounds, i.e. the sum of a series of n-alkanes (linearhydrocarbon chains) and 2 isoprenoids, pristane andphytane. For PAHs, we determined the concentrationsof 16 priority compounds listed by the European Unionand the US Environmental Protection Agency. Deuterat-ed standard mixtures were introduced prior to extractionto assess the recoveries of analytical procedures and toperform quantification accuracy. All solvents were oforganic trace analysis quality (Rathburn, Interchim).AHs and PAHs we r e a n a l y s e d u s i n g a g a schromatograph-flame ionization detector (GC-FID;AutoSystem XL, Perkin Elmer, USA) equipped with aHP-5 column (25 m×0.32 mm×0.52 μm, J&W Scien-tific, Agilent Technologies, USA). To distinguish be-tween physical removal and biodegradation, hydrocar-bons concentrations were normalized relative to pristane,a known biodegradation-resistant compound present inpetroleum.
Abundances of Prokaryotes, Virus-Like Particles (VLP)and Heterotrophic Nanoflagellates (HNF)
Triplicate samples for the enumeration of prokaryotes,VLP and HNF were col lec ted dai ly f rom bothmesocosms. For prokaryotes, 2 ml of collected seawaterwere preserved with 2 % formaldehyde and kept for atleast 1 h at 4 °C before freezing until the analysis. Pro-karyotic cell counts were determined with SYBR Green Istaining and using a FACSCalibur flow cytometer (BectonDickinson, San Jose, CA) as previously described in theMével and collaborators’ protocol [39]. Samples for VLP(1 ml) were preserved with glutaraldehyde (2 % final con-centration) and enumerated by epifluorescence microsco-py using the Noble and Fuhrman’s SYBR Green method[40]. For the analysis of HNF, 50 ml of seawater sampleswere fixed with glutaraldehyde (1 % final concentration)and stored in the dark at 4 °C. Within <10 days, thesesamples were stained with DAPI (4′, 6-diamidino-2-phenylindole; 0.01 % final concentration) and filtered on-to black polycarbonate filters (0.8 μm). Filters were ex-amined at ×1,000 magnification with an epifluorescencemicroscope (Olympus Provis AX70).
Prokaryotic Diversity, Community Structureand Taxonomic Composition by CapillaryElectrophoresis-Single Strand ConformationPolymorphism (CE-SSCP) and Pyrosequencing
One liter of seawater was sampled every day, filtered onto a0.2-μm-pore-size filter (47 mm, PC, Nucleopore) and frozenat −80 °C. DNA and RNA were extracted as previously de-scribed [41]. Briefly, samples were treated by enzymatic reac-tion, the DNA were extracted by the DNeasy Tissue kit(Qiagen) and the RNAwere extracted by the SV Total RNAIsolation kit (Promega) according to the manufacturer’s in-structions. Reverse transcription of 16S rRNA into 16ScDNA, PCR amplification of the variable V3 region of the16S rRNA gene on both DNA and cDNA fractions, and mo-lecular fingerprinting by CE-SSCP using the ABI 310 GeneticAnalyzer (Applied Biosystems) were performed according toAbboudi and collaborators [42]. Briefly, electrophoresis wascarried out at 15 kV for 30 min per sample at 30 °C and datawere collected with ABI PRISM 310 collection software (Ap-plied Biosystems). In order to normalize motilities from dif-ferent runs, all electrophoregrams were calibrated by fixingthe positions of peaks produced by a size standard and byusing a second-order least square curve (i.e. linear regression)to provide the best interlane comparison (Genescan analysissoftware, Applied Biosystems). Electrophoregrams were thentransferred to the software SAFUM (INRA,Narbonne), whichrender a profile of fluorescence intensity as a function of re-tention time per sample taking therefore into account the pres-ence and intensity of each individual signal. The number andarea of CE-SSCP peaks were normalized across samples forfurther statistical analysis.
DNAs from selected samples were used for further pro-karyotic tag-encoded FLX amplicon pyrosequencing(Roche 454 FLX) at the Research and Testing Laboratory( Lubbo c k , TX ) u s i n g RTL p r o t o c o l s (www.researchandtesting.com) with primers designed to spanthe 16S variable regions V1–V3 using Gray28F andGray519r primers [43]. Sequences were processed andanalysed using the Qiime software [44]. Briefly, sampleswere denoised using the AmpliconNoise program andchecked for chimeric sequences using Perseus [45]. Theresulting clean sequences of >300 bp were clustered byoperational taxonomic units (OTUs) at a 97 % sequenceidentity level using the UCLUST algorithm [46]. A rep-resentative sequence from each OTU was taxonomicallyclassified using the Ribosomal Database Project (RDP)classifier [47] using the Greengenes training set. To nor-malize the number of sequences per sample, they wererandomly resampled to the sample with the fewest se-quences (9,492 sequences) using Daisychopper v. 0.6[14]. All OTU-based and diversity analyses were per-formed on the re-sampled datasets.
Top-Down Control of Diesel-Degrading Prokaryotic Communities
Prokaryotic Activity by 3H-Leucine and Leu-MCAIncorporation
Measurements of prokaryotic production (PP) and pro-karyot ic ectoenzymatic aminopept idase act ivi ty(AMPase) were performed every day in triplicate fromboth mesocosms. PP was estimated using the 3H-leucineincorporation technique coupled with the centrifugationmethod, as previously described [41]. Briefly, samples(2.5 ml in triplicate) were added to a sterile polystyrenesnap cap tubes (5 ml), containing 8 nM 3H-leucine (spe-cific activity 117 Ci mmole−1, Perkin Elmer) and 32 nMof unlabeled leucine. One killed control was prepared foreach assay by adding 250 ml of 50 % trichloroacetic acid(TCA), 15 min before the addition of leucine. Tubes wereincubated in the dark at the in situ temperature for 1 h onan orbital shaker. The reaction was terminated by trans-ferring replicate of 1 ml samples from each tube inmicrocentrifuge tubes containing 100 ml of 50 % TCA.Samples were stored for at least 1 h at 4 °C and thencentrifuged for 15 min at 12,000×g. The precipitates wererinsed with 5 % TCA, resuspended in liquid scintillationcocktail (FilterCount, Perkin Elmer) and radioactivity de-termined by liquid scintillation counter (LS 5000CEBeckman).
Ectoenzymatic aminopeptidase activity (AMPase) wasmeasured fluorometrically, using L-leucine-7amido-4-methylcoumarin (Leu-MCA) as a fluorometric substrate, witha protocol in microplate adapted from Hoppe [48]. Samples(380μl in triplicate) were added to a sterile 48-well microplate(2 ml) , conta ining 20 μ l Leu-MCA prepared inmethylcellosolve for a final concentration of 200 μM. Onefixed control was prepared for each assay by adding 50 μl of20% sodium dodecyl sulfate (SDS), 5 min before the additionof Leu-MCA. Themicroplate was also incubated in the dark atthe in situ temperature for 1 h on an orbital shaker. The reac-tion was terminated by adding 50 μl of 20 % SDS in eachsample. Immediately, the microplate was frozen at −20 °Cuntil analysis. The fluorescence of the products of AMPaseactivity (methylcoumarin—MCA) was measured at 380 nmexcitation and 440 nm emission in a microplate spectrofluo-rometer (VICTOR, PerkinElmer) calibrated with standards ofMCA solutions diluted in <0.2 μm filtered seawater. For mea-surements, the samples were first heated at 50 °C until thedissolution of the SDS and 550 μl of borate buffer(pH 10) were added to each sample. The optimal concen-tration of Leu-MCA and the time of incubation were cho-sen according to previous concentration (from 2 to500 μM final) and time (from 15 min to 8 h of incuba-tion) curves. Fluorescence was corrected for non-enzymatic activity and background fluorescence of thesubstrate analogue by subtracting the fluorescence of con-trol samples at time zero.
Predation on Prokaryotes
The removal of prokaryotes was estimated using a modifiedseawater dilution technique by Landry and Hasset [49]. Ex-periments were carried out with seawater from both the con-trol (days 0, 3, 5, 8 and 12) and the diesel amended (days 0, 3,10 and 14) mesocosms. 15 l of seawater was sampled fromeach tank and gently filtered through a 20-μmmesh into acid-washed 20 l polycarbonate carboys. Immediately after collec-tion, the carboys were transferred to a temperature-controlledroom (adjusted to 16 °C=in situ temperature of the mesocosmtanks) where subsequent incubations were carried out. Ap-proximately half of the collected 15 l seawater was kept whilethe other half was filtered through a filter capsule (0.8/0.2 μm;Pall Life Science) and further passed through a 30-kDa tan-gential flow filtration system (Pall Omega PES membrane) tocreate virus-free filtered seawater. Subsequently, different pro-portions of unfiltered (<20 μm) and filtered (<30 kDa) seawa-ter were prepared with the following ratios of filtered to unfil-tered seawater: 100, 75, 50 and 25 %, and distributed into 1 lpolycarbonate bottles (in triplicates per dilution). Bottles wereincubated for 24 h at 16 °C and rotated end over end at 0.5 rpmin order to keep predators and prey in suspension. Samples toestimate prey (prokaryotes) and predator (in this case, HNF)abundances were taken from each bottle at the beginning (at0 h=T0) and end (after 24 h=T24) of the incubation and treatedas described above (Section 2.3). Removal rates of prokary-otes were calculated using the exponential growth model asdescribed in Landry and Hasset [49]; instantaneous rate coef-ficients of prokaryotic mortality (g) and growth (k) were ob-tained from the linear regression of the apparent growth rate(l/t×ln (CT/C0)=k−g) plotted against the dilution factor. Be-cause we used grazer plus virus-free diluent in the presentexperiment, k at each dilution level was the product of theinstantaneous growth rate and density dependant viral plusgrazing mortality components. Therefore, the estimated kand g values were used to calculate the percentage of potentialprokaryotic production removed by the HNF (and viruses)following the equations provided by Verity and the collabora-tors [50].
Viral-Induced Prokaryotic Mortality (VIPM)
Samples for the determination of VIPM were collected inparallel to the grazing experiment. Thirty milliliters of seawa-ter samples was preserved with glutaraldehyde (EM grade;2 % final concentration) and stored at −20 °C. Subsequently,the samples were centrifuged (30 min at 11 °C at 25,000 rpm),the pellets were transferred onto grids, stained (10 s with0.5 % uranyl acetate, destained 3×10 s in purified water)and analysed under a transmission electron microscope, aspreviously described [9]. For each sample, close to 1,000 pro-karyotic cells in randomly chosen microscopic fields were
C. Sauret et al.
examined for the enumeration of infection and prokaryoteswere scored as infected when they contained at least five in-tracellular VLP. The frequency of infected cells (FIC) wasestimated from the frequency of visibly infected cells(FVIC) applying the conversion factors of Proctor and thecollaborators [51] with the Binder’s model [52]. VIPB wasderived by applying the following equation [52]:VIMB=(FIC+0.6FIC2)/(1–1.2FIC).
Statistical Analysis
We used the non-parametric Mann–Whitney U test (StatElsoftware, Ad Science) to test the hypothesis of significantdifferences between the two treatments (control vs. polluted)or the temporal phases within each treatments (phase A vs.phase B in control and polluted treatments) for prokaryotic,VLP and HNF abundance, PP and AMPase.
From the re-sampled 454-sequencing data, we usedSPADE (Species Prediction and Diversity Estimation; http://chao.stat.nthu.edu.tw/) to calculate non-parametric speciesrichness estimators ACE and Chao1 values (3 % distancelevel between tag sequences) that predict richness if the pop-ulations are exhaustively sampled. PAST was used (PAleon-tological STatistics v 1.19; http://folk.uio.no/ohammer/past/)to generate rarefaction curves based on the re-sampled dataset.Species diversity was calculated using Simpson index λ=Σ(pi2), Shannon index H’=−Σ pi ln (pi) (where pi is the pro-portion of the ith OTU) and Pielou’s evenness index J’=H’/H’max (where H’ is the number derived from Shannon diver-sity index and H’max=lnS with S the total number of species)using PRIMER 6 software (PRIMER-E, Ltd., UK). Venn di-agrams were drawn using Venn diagram generator software(Bioinformatics and Research Computing) to evaluate thenumber of consistent OTUs shared between treatments at thedifferent time points.
Ordination of Bray-Curtis similarities among normalizedCE-SSCP sample profiles or from relative OTU abundanceof re-sampled 454-sequences was used to build dendrogramsby unweighted-pair-group method with arithmetic averages(UPGMA) using PRIMER 6 software (PRIMER-E, Ltd.,UK).
Results
Patterns of Prokaryotic, HNF and VLPAbundances
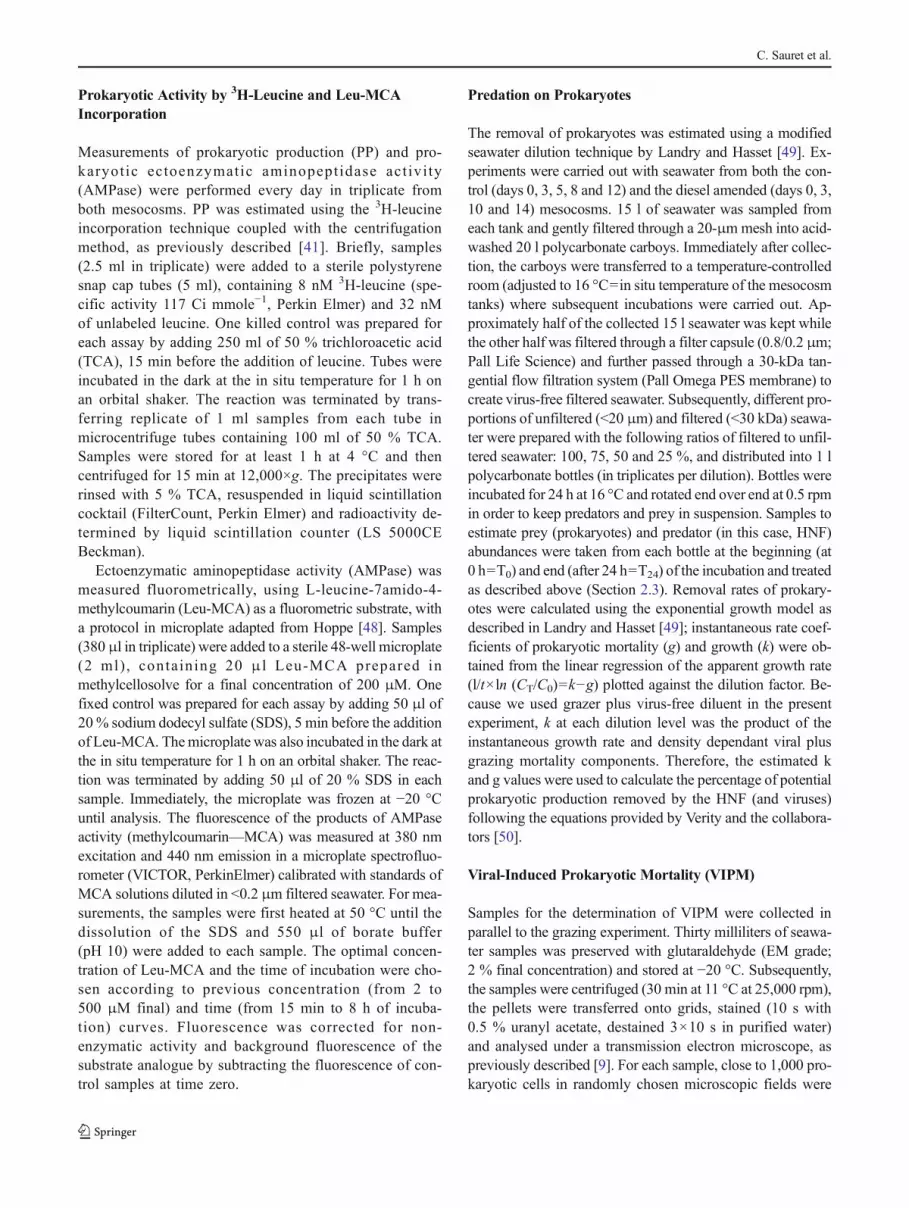
In both the control and diesel polluted mesocosms, we ob-served a primary peak in prokaryotic abundances (furthercalled ‘phase A’), followed by secondary peaks in the abun-dances of their predator (HNF) and of VLP (further called‘phase B’) (Fig. 1a). In both mesocosms, the decrease of pro-karyotic abundance occurred in the same time of the growth of
HNF and VLP. Overall, abundances of prokaryotes, HNF andVLP were higher and peaked later in the polluted compared tothe control mesocosms (days 7 and 5 for prokaryotes, days 11and 10 for HNF and days 14 and 10 for VLP, respectively).Abundance peaked at 1.2x10⁷ (SD=1.0×10⁶) and 4.4×10⁶
(SD=2.6×10⁵) cells ml−1 for prokaryotes, 5.6×10⁴ (SD=2.6×10³) and 9.1×10³ (SD=5.6×10²) cells ml−1 for HNFand 4.4×10⁸ (SD=2.7×10⁷) and 5.0×10⁷ (SD=9.9×10⁵)VLP ml−1 in the polluted and control conditions, respectively.After the first succession in prokaryotic and HNF abundancespeaks, prokaryotes started a second phase of growth (betweendays 10 and 14) in the two mesocosm. Mann–Whitney U testshowed significant differences between paired means in phaseA and phase B in both control and polluted mesocosms forprokaryotic, HNF and VLP abundances (p<0.05, except forprokaryotic abundances in the polluted mesocosms wherep<0.1).
Nutrient Consumption and Elemental Stoichiometry
Inventories of inorganic nutrients (NO3, NO2, NH4 and PO4)were adjusted each day to a constant N to P ratio of 8:1 in bothmesocosms. Daily uptake of nitrogen and phosphorus wasmore than 10 times higher in the polluted mesocosm com-pared to the control (7.8 and 0.6 μmol N l−1 day−1 or 0.77and 0.08 μmol P l−1 day−1, respectively, during the experi-ment). In both mesocosms, nutrient consumption increasedsignificantly (p<0.001) from phase A to phase B (Suppl. Ta-ble 1), except for the phosphate uptake in the control whichremained relatively constant over the experiment. These in-creases between the two phases corresponded to a relativehigher consumption of N compared to P as shown by thevariations of the N to P ratio from 3.2 and 2.6 during phaseA to 14.4 or 12.4 during phase B in control and pollutedmesocosms, respectively. Differences between the twomesocosms in the N to P ratios were not significant(p>0.05) during either phase.
Finally, the elemental stoichiometry (C to N to P) of par-ticulate organic matter (POM) showed little change in thecontrol mesocosms. However, cells in the polluted mesocosmwere enriched in carbon compared to the control since thecarbon content was twice higher in the former compared tothe latter (Suppl. Table 1). For both mesocosms, the evolutionfrom phase A to phase B was a slight decrease in carbonconcentration compared to N and P (70:11:1 to 58:13:1 forcontrol and 180:13:1 to 101:12:1 for polluted, cf Suppl.Table 1).
Prokaryotic Activities
In both the control and diesel polluted mesocosms, cell-normalized PP and ectoenzymatic aminopeptidase activity(AMPase) showed very similar trends during the experiment
Top-Down Control of Diesel-Degrading Prokaryotic Communities

(Fig. 1b). After a slight increase of the activity in the earlystage of the experiment (phase A), the PP and AMPase activ-ities peakedwhen prokaryotic abundances were at their lowestlevel concomitantly to HNF and VLP increase (phase B). Thedecrease of prokaryotic activities occurred when prokaryoticabundances started to increase at the end of the Phase B.Highest activities were reached at day 10 for the AMPase(3.2×10⁻¹⁶ mol leu cell−1 h−1; SD=5.6×10⁻¹⁷) or day 11 forthe PP (7.3×10⁻¹⁸ mol leu cell−1 h−1; SD=9.7×10⁻²⁰) in thepolluted mesocosm and at day 8 for the control mesococosmwith PP at 9.36×10⁻¹⁸ mol leu cell−1 h−1 (SD=3.7×10⁻¹⁹)and AMPase at 4.6×10⁻¹⁶ mol leu cell−1 h−1 (SD=4.7×10⁻¹⁷). Mann–Whitney U test showed significant differencesbetween paired means in phase A and phase B in both controland polluted mesocosms for PP and AMPase (p<0.05, exceptfor AMPase in the polluted mesocosms where p<0.1).
Diesel Oil Degradation
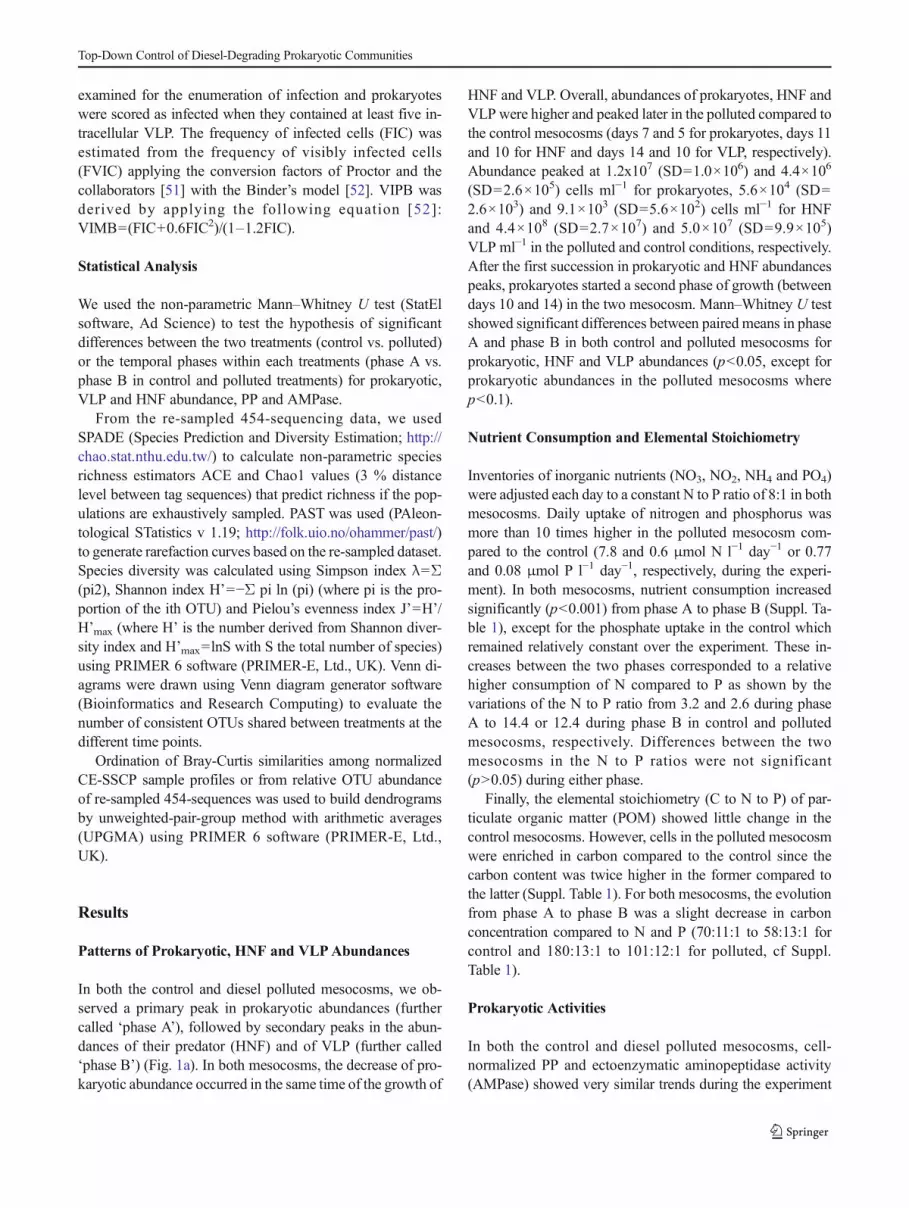
Chemical analysis of the remaining oil residues revealed thatdiesel oil was continuously degraded along the time course ofthe experiment. The aliphatic hydrocarbons (19.3 %) weredegraded at day 17. The PAHs were not degraded during thefirst 6 days and then decreased constantly to the end of theexperiment with a total degradation of 22.5 % (Fig. 2). Theproportion of each compounds within the aliphatic andpolyaromatic hydrocarbons remained stable during the courseof the experiment.
Prokaryotic Community Structure and Composition
Overall, CE-SSCP fingerprintings showed two major clusters(Fig. 3), which correspond to the two successive phases ofprokaryotic growth (phase A) and HNF/VLP abundancepeaks (phase B) observed in the control and pollutedmesocosms. The two clusters were found in both the 16SrDNA-based (total prokaryotes) and 16S rRNA-based (meta-bolically active prokaryotes) fractions, with a drastic shift after
CONTROL POLLUTED
A: A
BU
ND
AN
CE
S
0
100
200
300
400
500
600
0
20
40
60
80
100
120
140
0 2 4 6 8 10 12 14
Prok
aryo
tes
(x10
5ce
lls.m
L-1)
HNF
0
100
200
300
400
500
600
0
20
40
60
80
100
120
140
0 2 4 6 8 10 12 14
HN
F (x
101
cell.
mL-1
) an
d V
LP
(x10
5un
its.m
L-1
)
0
200
400
600
800
1000
1200
0 2 4 6 8 10 12 14
Leu
cine
(x1
0- 12
M..h
-1.c
ell-1
)
0
200
400
600
800
1000
1200
0 2 4 6 8 10 12 14
Days Days
production
Aminopeptidase
B: P
RO
KA
RY
OT
IC A
CT
IVIT
IES
Phase A Phase B Phase A Phase B
PROKARYOTES
Prokaryotic
VLP
Fig. 1 Evolution of bacterial,HNF and viral abundances,bacterial production andaminopeptidase activity duringthe time course of the experiment
1900
2200
2500
2800
020406080
100
0 3 8 12 17Days
Hyd
roca
rbon
conc
entr
atio
n (µ
gl-1
)
AHs
PAHs
Fig. 2 Evolution of aliphatic hydrocarbons (AHs) and polycyclicaromatic hydrocarbons (PAHs) quantities during the time course of theexperiment. The data were normalized by the concentration of pristane inthe same samples
C. Sauret et al.

5 or 6 days in the control mesocosms (for RNA- and DNA-based profiles, respectively) and after 9 days in the pollutedmesocosm (for both RNA- and DNA-based profiles). Alongwith the seawater sampled at the start of the experiment (i.e.T0), one representative sample of each cluster was chosen forfurther analysis using 454 pyrosequencing, corresponding tomaxima and minima in prokaryotic abundances in both thecontrol (days 5 and 8) and in diesel polluted tank (days 7 and10). For the selected samples, 16S rRNA sequences showedthat dissimilarities between phase A and phase B were moremarked in the polluted than in the control mesocosms (Sup-plemental Fig. 1). Venn diagrams showed that the sample T0
presented 45.6 % of shared OTUs with the OTUs found incontrol and polluted mesocosms in phases A and B. Theshared OTUs between the two phases represented between26.4 and 29.5 % of the total number of OTUs found in thepolluted and control mesocosms, respectively (SupplementalFig. 1).
The initial prokaryotic community was mainly composed ofAlphaproteobacteria (69.5 %), Gammaproteobacteria (14.4 %),and Flavobacteria (7.2 %; Fig. 4). Within Alphaproteobacteria,79.2 % were represented by the Pelagibacter genus, 43.7 % ofthe Gammaproteobacteria were Marinimicrobium sp. and themajority (87.6 %) of the Flavobacteria was represented byFlavobacterium sp. In the control mesocosm, the prokaryoticcommunity found after 5 days of incubation (‘phase A’, Fig. 4)was dominated by the same classes of organisms as at T0, but in
different proportions and with different dominant representa-tives. Alphaproteobacteria represented 32.9 % (dominated byRoseobacter sp. by 56.4 %), Gammaproteobacteria represented32.9 % (dominated by Vibrio sp. by 79.2 %) and Flavobacteriarepresented 33.4 % (dominated by Flavobacterium sp. by58.1 %, Fig. 4). During ‘phase B’, a drastic change of theprokaryotic community was observed. After 8 days of incuba-tion, Alphaproteobacteria represented 90.3 % of the total pro-karyotic community, and were dominated by Rhodobacterales(98.1 %) including mainly Sulfitobacter sp., Roseovarius sp.and Roseobacter sp. (Fig. 4). The Chao1 estimator of prokary-otic richness varied from 795 OTUs at the beginning of theexperiment to 709 during the peak of prokaryotic abundanceand 898 OTUs when prokaryotic abundance decreased(Table 1). In addition, the Pielou index showed higher evennessafter 5 and 8 days compared to the initial seawater, similar toresults obtained with the Shannon and Simpson indices(Table 1).
We calculated that the sequencing effort by 9492 re-sampled sequences per sample revealed between 50.2 and60.9 % of the diversity estimated by Chao1 index (Table 1and supplemental Fig. 2). In the diesel contaminatedmesocosm, prokaryotic richness decreased drastically after7 days of incubation (P7, when prokaryotic abundanceshowed its maximum) from 795 to 391 OTUs (estimated byChao1 index) but then increased after 10 days (when prokary-otic abundance decreased) to 530 OTUs (Table 1). Further-more, the Pielou, Simpson and Shannon indices all showed alower evenness after 7 days and higher evenness close to thevalues from the beginning of the experiment after 10 days(Table 1). Accordingly, Vibrio sp. was prevailing (67.0 % ofthe total community) at day 7 where Gammaproteobacteriarepresented 77.4 % of the community (dominated by Vibriosp. at 86.6 %), Alphaproteobacteria 18.4 % (dominated byRoseobacter sp. at 44.6 %) and Flavobacteria 3.9 % (domi-nated by Persicivirga sp. at 47.9 %; Fig. 4). The decrease inprokaryotic abundance after 10 days (‘phase B’) resulted in ashift in the prokaryotic community (Figs. 3 and 4).Flavobacteria then represented 48.3 % (dominated byPersicivirga sp. at 87.6 %), Gammaproteobacteria 29.9 %(dominated by Oleispira sp., Methylophaga sp. and
DNA RNA
T11
T14T12T9
T10T8T7T6T5T4T2T3T1T0
40 60 80 100T14T12T11T10T9T7T6T8T5T4T3T2T1T0
50 60 70 80 90 100
Similarity (%)
T14T12T11T10T9T8T7T6T5T4T3T2T1T0
20 40 60 80 100
T14T12T11T10 T7T6T5T4T3T2T1T9T8 T0
40 60 80 100
CO
NT
RO
LPO
LL
UT
ED
*
*
*
*
Fig. 3 UPGMA dendrograms based on Bray–Curtis similarities (inpercentage) generated from the DNA- and RNA-based CE-SSCPpatterns of bacterial communities originated from control and pollutedmesocosms. The times of sampling (in days) during the time course ofthe experiment are indicated by Tx. A sample name followed by anasterisk refers to samples chosen for further pyrosequencing analysis
Table 1 Number of OTUs and Chao1, ACE, Pielou (J’), Shannon andSimpson diversity indexes after pyrosequencing for the selected samplesfrom control and polluted mesocosms
OTU Chao1 ACE J′ Shannon (log2) Simpson (1−λ)
T0 399 795 780 0.39 2.72 0.79
C5T 424 709 720 0.47 3.25 0.91
C8T 547 898 967 0.45 3.14 0.87
P7T 209 391 404 0.26 2.63 0.85
P10T 313 530 540 0.42 2.93 0.88
Top-Down Control of Diesel-Degrading Prokaryotic Communities

Marinomonas sp.) and Alphaproteobacteria 19.7 % (dominat-ed by Roseobacter sp. at 46.7 %) of the community. At thistime point, abundances of Vibrio spp. were as low as at T0
(<0.2 % of the community).According to the successive phases of the experiment, four
different OTU-based patterns were found, based on their rela-tive abundance among the control and the polluted mesocosms(Fig. 5). A first group was composed of OTUs belonging toFlavobacterium, Roseobacter, Polaribacter and Ruegeria gen-era that increased proportionally among the total community inthe control but not in the pollutedmesocosm during the phaseAand decreased during the phase B in both conditions (Fig. 5a).A second group was composed of OTUs belonging toSulfitobacter, Roseovarius and Loktanella that became particu-larly abundant in the control mesocosm during the phase B butnot in the polluted tank (Fig. 5b). The third group was com-posed of OTUs belonging to Pseudoalteromonas, Phaeobacterand Alteromonas that were predominant only during the phaseA and decreased during the phase B in the polluted mesocosm,but remain very few in the control (Fig. 5c). The fourth groupwas composed of OTUs belonging to Percisivirga, Oleispiraand Methylophaga that were mostly found in the pollutedmesocosm during phase B and remained very few in the control(Fig. 5d).
Prokaryotic Mortality
Overall, the virus-like particle to prokaryote ratio (VPR), FICand frequency of visibly infected cells (FVIC) presented sim-ilar trends, peaking according to the decrease of prokaryoticabundance (‘phase B’ in Fig. 1 and Table 2). In the control
mesocosm, peaks occurred at day 8 with 178.4, 0.7 % and0.05 for VPR, FVIC and FIC, respectively. Higher valueswere found for the polluted mesocosms, with 232.4, 7.4 %and 0.40 for VPR, FVIC and FIC at day 10, respectively(Table 2). A close correlation between VPR and VIPM wasobserved during several occasions; however, the overall sys-tematic relationship between those two measurements wasrelatively weak (R2=0.37; data not shown). The peak of thepercentage of the number of prokaryotes removed due to virallysis was much higher in the polluted compared to controlconditions, with 77.7 % at day 10 versus 8.1 % at day 8,respectively. In contrast, the HNF+VLP induced prokaryoticmortality assessed with the dilution technique was alwayslower, being less than 3 % at any time in the control or pol-luted mesocosm (Table 2). At the peak of prokaryotic mortal-ity, viral lysis (assessed via VIPM) affected the prokaryoticabundance ∼4 times more in the control and∼45 times more inthe pollutedmesocosms compared to the removal byHNF andVLP estimated in the dilution incubations (Table 2).
Discussion
Prokaryotic Dynamic Under Non-Limiting NutrientConditions
One of the originality of this paper was our ability to distin-guish a pure top-down control by removing bottom-up limi-tation using daily addition of nutrients in our mesocosms. Weare aware that such non-limiting nutrient conditions are notrealistic to what happen in the natural environment, especially
Alphaproteobacteria_AgrobacteriumGammaproteobacteria_AlteromonasGammaproteobacteria_AmphriteaFlavobacteria_CellulophagaFlavobacteria_FlavobacteriumAlphaproteobacteria_LoktanellaGammaproteobacteria_MarinimicrobiumGammaproteobacteria_MarinomonasGammaproteobacteria_MethylophagaGammaproteobacteria_OleispiraAlphaproteobacteria_PelagibacterAlphaproteobacteria_PelagicolaFlavobacteria_PersicivirgaFlavobacteria_PolaribacterAlphaproteobacteria_RoseovariusAlphaproteobacteria_PhaeobacterCyanobacteria (class)_ProchlorococcusGammaproteobacteria_PseudoalteromonasGammaproteobacteria_PsychrobacterAlphaproteobacteria_RhodobiumAlphaproteobacteria_RoseobacterAlphaproteobacteria_RuegeriaSphingobacteria_SphingobacteriumAlphaproteobacteria_SulfitobacterFlavobacteria_TenacibaculumAlphaproteobacteria_ThalassobacterGammaproteobacteria_VibrioOthers (<1%)
T0
C5 P7
C8 P10
Fig. 4 Taxonomic distribution(Class_Genus) for sequences thatrepresentedmore than 1% of totalcommunities in control (C) anddiesel polluted (P) mesocosms;the remaining tag sequences aregrouped in ‘others’
C. Sauret et al.

in oligotrophic regions such as the Mediterranean Sea [53].However, our approach has been rarely used so far and pro-vided a uniqueway of assessing pure top-down control. Undernon-limiting nutrient conditions, prokaryotic abundance
peaked 2 days later in the polluted compared to the controlmesocosm but was 3 times higher due to the diesel fuel addi-tion. The initial increase in prokaryotic abundance is a typicalresponse to oil pollution, even if the amplitude of the peak of
0
1
2
3
4
0 5 100
50
100
0 5 10
0
5
10
0 5 10
0
2
4
6
8
0 5 100
1
2
3
0 5 10
0
20
40
60
80
0 5 10
0
5
10
15
20
0 5 10
0
5
10
0 5 10
0
20
40
60
0 5 10
0
10
20
30
0 5 10
0
10
20
30
40
0 5 10
0
5
10
15
20
0 5 10
0
2
4
6
0 5 10
0
10
20
30
0 5 10
0
5
10
0 5 10
Pelagibacter
Vibrio
Flavobacterium RuegeriaRoseobacter Polaribacter
Sulfitobacter Roseovarius Loktanella
Pseudoalteromonas Phaeobacter Alteromonas
Percisivirga Oleispira Methylophaga
% in
the
tota
l nu
mbe
rof
OT
Us
Days
ControlPolluted
(A)
(B)
(C)
(D)
Fig. 5 Relative abundance of Pelagibacter over the total number ofOTUs in comparison to relative abundances of 4 groups of OTUs withsimilar evolution during the time course of the experiment: (a) OTUsincreasing during phase a only in the control mesocosm and decreasing
in phase b, (b) OTUs increasing only during phase b in the controlmesocosm, (c) OTUs increasing during phase a only in the pollutedmesocosm and decreasing during phase b and (d) OTUs increasingonly during phase b in the polluted mesocosm
Table 2 Impact of virus-likeparticles (VLP) and heterotrophicnanoflagellates (HNF) onprokaryotic abundances
Sample VPR BS FVIC (%) FIC VIPM Viral lysis (%) HNF grazinga (%)
Control
T0 24.5 8–12 0.58 0.04 0.06 6.4 1.1
T3 4.6 10–16 0.60 0.04 0.07 6.7 1.5
T5 4.3 7–22 0.57 0.04 0.06 6.3 2.9
T8 178.4 6–15 0.73 0.05 0.08 8.1 1.9
T12 27.3 8–19 0.33 0.02 0.04 3.7 2.9
Polluted
T0 24.5 8–12 0.58 0.04 0.06 6.4 1.1
T3 8.8 12–21 0.48 0.03 0.05 5.3 0.8
T8 11.7 9–27 2.58 0.17 0.29 28.9 1.2
T10 232.4 12–38 7.39 0.40 0.78 77.7 1.7
T14 156.3 8–24 0.52 0.04 0.06 5.8 1.7
VPR virus-like particles-to-prokaryote ratio, BS burst size, FVIC frequency of visible infected cells, FIC frequen-cy of infected cells, VIPM viral-induced prokaryotic mortalitya Note that bacterial removal in dilution experiments is due to the presence of HNF and VLP
Top-Down Control of Diesel-Degrading Prokaryotic Communities

abundances can vary significantly depending on the type ofoil, as well as nutrient amendment strategies [54, 55, 37]. Wetook special care in the nutrient amendment strategy in thepresent study and followed recommendations from previousexperiments in the study area using enrichment bioassays [56]or oil biostimulation [57, 58]. The consumption of nutrientsover time is rarely taken into account in oil biostimulationassays. Most of the time, a unique addition of nutrients invariable ratios at the beginning of the experiment is per-formed. This results in a further limitation of growth by somenutrients due to their rapid consumption when carbon sourcessuch as hydrocarbons are added. In the present study, amountsof nutrients were adjusted daily to keep a constant concentra-tion and a constant N to P ratio of 8:1 during the entire courseof the experiment. It has been recognized since the seminalstudy of Atlas and Bartha [59] that not only the quantities of Nand P but also N to P supply ratios are determinant fornutrient-based bioremediation success. Typically, nutrientamendments used in previous studies had N to P supply ratiosbetween 5:1 and 10:1 by moles (see review by Head andSwanell [11]). Under these conditions, daily consumption ofnitrogen and phosphorus during the development of the bio-mass was high, being 10 times higher in the polluted relativeto the control mesocosm. The fact that we also measured asignificant consumption of nitrate associated with low con-centration of ammonium before daily addition was an indica-tion that prokaryotes had higher nitrogen requirements whenan additional carbon source was present. The relative constan-cy in the elemental composition of the POM and the timecourse of nutrient consumptions along the experiment provedthat prokaryotic growth was a priori not nutrient-limited, i.e.that a ‘bottom up’ control of the prokaryotic community waseffectively avoided. This meant that the evolution from phaseA to phase B was not due to nutritive limitation in eithermesocosm.
We observed the rapid emergence of a new prokaryoticcommunity after the addition of diesel, with a drastic decreasein diversity indices, both in term of richness and evenness.The decrease in prokaryotic diversity indices after oil contam-ination is a general trend observed in many occasions, inde-pendent of the type of oil or environmental or experimentalcondition (see review of Head and collaborators [16]). In ourexperiment, the detrimental effect of petroleum was particu-larly obvious in the contribution ofFlavobacterium,Ruegeria,Roseobacter and Polaribacter genera to the total community,which only decreased during phase A in the pollutedmesocosm. The resulting prokaryotic community was domi-nated by Vibrio spp., which represented 67 % of the commu-nity at the peak of prokaryotic abundance. This result is inaccordance with the dominance of Vibrio spp. in one of thevery rare studies keeping a stable N to P ratio in nutrient-enriched mesocosms [60]. It has been shown that these marinebacteria can survive carbon starvation and can grow very
rapidly at high carbon substrate concentration.Vibrio spp. alsogrew rapidly in the control mesocosm, but represented asmaller fraction of the community (21 %) along with othergroups, such as Roseobacter spp. and Flavobacterium spp.These results suggest that the fast-growing Vibrio spp. was asuccessful competitor during the initial growth of prokaryoteswhen nutrients were not limiting due to a constant N to P ratio,in particular in the diesel contaminated mesocosm where theybloomed and dominated the prokaryotic community. Thephase Awas also marked by an increasing proportion of somespecific OTUs such as Pseudoalteromonas, Phaeobacter andAlteromonas, that certainly took advantage of the diesel addi-tion [61, 62, 21, 63]. Such dominant OTUs and particularlythe Vibrio genus exhibited low cell-normalized activity whenprokaryotic abundances reached their maximum. However theactive prokaryotic community structures (RNA-based CE-SSCP profiles, Supplemental Fig. 3) were relatively similarto the total prokaryotic community structures (DNA-basedCE-SSCP profiles, Supplemental Fig. 3). This implied thatdespite their low metabolic activity, the OTUs that were thedominant OTUs among the communities were also the mostactive. Our results reinforced the hypothesis according towhich the addition of oil together with the confinement effectinduced a redistribution of the prokaryotic community struc-ture by an increase in active opportunist prokaryotes and aninactivation of other sensitive prokaryotes [64–66, 16].
Synergistic Predation by Flagellates and Viral Lysis asKey Factors for Changes in Prokaryotic Abundance,Diversity and Activity
After the initial increase in prokaryotes within the first 5–7 days (phase A), their abundances decreased rapidly to valuessimilar to the beginning of the experiment (phase B). Con-comitantly with the decrease in prokaryotic abundance, HNFand VLP abundances increased. Because both types of organ-isms target the same prey, exploitative competition betweenHNF and VLP is generally expected, with the outcome largelyinfluencing the flow of organic matter to either higher trophiclevels (via HNF predation) or the dissolved organic pool (viaviral lysis) [67]. Toyoda and collaborators [68] found adver-sary effects of viral lysis and HNF grazing on prokaryoticabundances, depending on the chemical nature of the oiladded (kerosene or bunker-A oil). The authors found that byadding kerosene, prokaryotes were controlled by VLP; where-as, the addition of bunker-A oil resulted in HNF grazing as themajor prokaryotes loss process. Ortmann and the collaborators[69] showed exclusive HNF-driven top-down control after theaddition ofMC 252 crude oil (from the Deepwater Horizon oilspill); they found no evidence for viral lysis. In our study, wefound a coexistence of VLP and HNF, both increasing afterthe peak of prokaryotic abundance. Coexistence of HNF andVLP has been observed in numerous naturally occurring
C. Sauret et al.

communities [70], but our study represents the first evidenceof this co-occurrence under oil-polluted conditions. The ap-parent synergism between HNF and VLP may becounterbalanced by the decrease in HNF abundance towardsthe end of the experiment, while VLP abundances kept in-creasing. Moreover, the collapse of the prokaryotic bloom,high viral abundances and VPR ratio as well as the high VIPM(suggesting a removal of >3 of the prokaryotic biomass) allclearly demonstrated that VLP played a key role in the declineof prokaryotes, especially in the diesel-perturbed treatment.
VLP and protozoan grazers are known to influence pro-karyotic abundance, but their indirect impact on hydrocarbonbiodegradation is more controversial. One study showed thatpredation by HNF was capable of indirectly slowing downbioremediation attempts by decreasing the number of prokary-otes growing on hydrocarbons [71]. Another study demon-strated that HNF could considerably stimulate prokaryoticdegradation of toluene and benzene [33]. Rosenberg and col-laborators [72] found phages to have either a positive or neg-ative effect on bioremediation. However, very few studiesusing large volume incubations over weeks investigated si-multaneously the effect of HNF grazing and viral lysis afteroil pollution. Here, we observed a constant degradation oftotal hydrocarbons and n-alkanes during the time course ofthe experiment and the degradation of PAH even started afterthe prokaryotic bloom, meaning that the degradation of hy-drocarbons was not impacted by the predation in our experi-ment. In addition, we noted an increase in dissolved organicmatter (DOM) after the peak of viral-induced prokaryotic celllysis (day 10). Compounds released by cell lysis are generallymore labile compared to the bulk DOM or complex hydrocar-bons and therefore were utilized by heterotrophic prokaryotes,which was reflected in temporarily enhanced prokaryotic pro-duction and ectoenzyme activities. Our findings are in agree-ment with the ‘stimulation of production’ hypothesis resultingthrough the ‘virus shunt’ [23]. Beyond that, we assumed thatthe release of labile organic matter by viral lysis may havepromoted the degradation of hydrocarbons via the increasein prokaryotic activity, so called ‘priming effect’ [73]. Theimprovement of the degradation of refractory organic matter(such as PAHs) by addition of easily degradable product iswell known in soil studies [74]. However, until now, this effectwas not really investigated in aquatic environments. Recently,Guenet et al. [73] examined a large amount of studies showingindirectly ‘priming effect’ in seawater experiments andsuspected this effect to be prevalent in aquatic environments.Our results suggested that such mechanisms could also beavailable in the biodegradation of recalcitrant hydrocarbonin seawater.
Viral lysis also impacted the prokaryotic community struc-ture. Phages typically do not trespass genus boundaries andinfection rates are density-dependent [30]. Therefore, they areexpected to limit competitive dominant species, allowing less
competitive types to survive [75, 76]. Our results support thishypothesis known as the ‘killing the winner’ model [4], sincethe bloom of the fast-growing Vibrio spp. (67 % of the com-munity) decreased rapidly and their abundances reverted tosimilar values that were estimated at the beginning of theexperiment (less than 0.1 % of the community). Although,this study is one of the rare where such a model is clearlyobserved. Vibrio spp. was not the only OTU that decreasedbut also some predation-sensit ive OTUs such asFlavobacterium, Roseobacter and Polaribacter in the controland Pseudoalteromonas and Phaeobacter in the pollutedmesocosm. In contrast, viral-induced mortality increased thespecies evenness of the prokaryotic community in the diesel-polluted condition, and showed little similarity with the com-munity at the peak of prokaryotic abundance. The predation-resistant bacteria such as Percisivirga, Oleispira andMethylophaga that emerged in the diesel polluted conditionpresented low similarity with the predation-resistant bac-t e r i a f rom the con t ro l mesocosm (Lok tane l la ,Sulfitobacter and Roseovarius as examples), thus indicat-ing that the prokaryotic community structure was influ-enced at this point both by top-down control and by thecarbon and toxic substances supplied by the diesel fueladdition. In addition, the major OTUs of the total com-munity (DNA-based CE-SSCP profile, SupplementalFig. 3) were not the most represented OTUs in the activefraction (RNA-based CE-SSCP profile, SupplementalFig. 3) and we suspected that such predation-resistantbacteria presented low metabolic activity, what in turnmight explain their resistance to predation [77, 78].Among the group of predation-resistant bacteria in thepolluted mesocosm, Oleispira spp. are obligatehydrocarbonoclastic bacteria previously found in dieselpolluted conditions [79]. This genus has a preference foraliphatic hydrocarbons [18] that is typical of marinehydrocarbonoclastic microorganisms such as Alcanivorax,Marinobacter and Oleiphilus that were present at verylow abundance (less than 0.02 % of the community) inthe present study. The presence of the Methylophaga ge-nus was not too surprising either as a recent paperhighlighted its role in the degradation of long-chain al-kanes [80]. Other predation-resistant bacteria such asPercisivirga spp. are not attested hydrocarbon-degradingbacteria, but they might have developed an opportunisticstrategy by benefiting from the release of organic com-pounds originated from diesel fuel degradation or fromeither lysis or grazing [81]. Future work should focus onsuch predation-resistant bacteria in oil polluted environ-ments as they may play a key role in the biodegradationof hydrocarbons under predation pressure while othercommon and known degrading bacteria such asPseudoalteromonas [63] may be eliminated by theirpredators.
Top-Down Control of Diesel-Degrading Prokaryotic Communities

Conclusions
To date, biostimulation studies have largely focused on theeffect of nutrient additions on prokaryotic assemblages thatenhance oil degradation, but the resulting effects on the eco-system functioning has rarely been taken into account. Thepresent study provides evidence of a predominant role of theviral lysis on the regulation of prokaryotic abundance, activityand diversity under biostimulation conditions. Little attentionhas been paid so far on the synergistic or antagonistic effect ofviral lysis and HNF grazing on hydrocarbon-degrading pro-karyotes and its consequences on the hydrocarbon biodegra-dation. The study reported here was carried out at a mesocosmscale allowing a realistic view of the complex ecological net-work that underpins hydrocarbon degradation under biostim-ulation conditions. Further studies are needed to generalizehow nutrient-based and other biostimulation strategies maybe affected by all the actors of the microbial loop.
Acknowledgments This study was part of the IBISCUS project,funded by the Continental and Coastal Ecosphere (EC2CO) programfrom the Centre National de la Recherche Scientifique (CNRS) andInstitut des Sciences de l’Univers (INSU). We would like to thank C.Aria-Casters and M.P.A. Guigui for their contributions to the manuscript.
References
1. RölingWFM,Milner MG, Jones DM, Fratepietro F, Swannell RPJ,Daniel F, Head IM (2004) Bacterial community dynamics and hy-drocarbon degradation during a field-scale evaluation of bioreme-diation on a mudflat beach contaminated with buried oil. ApplEnviron Microbiol 70:2603
2. Swannell RP, Lee K, McDonagh M (1996) Field evaluations ofmarine oil spill bioremediation. Microbiol Mol Biol Rev 60:342–365
3. Prince RC (1993) Petroleum spill bioremediation in marine envi-ronments. Crit Rev Microbiol 19:217–240
4. Thingstad TF, Lignell R (1997) Theoretical models for the controlof bacterial growth rate, abundance, diversity and carbon demand.Aquat Microb Ecol 13:19–27
5. Ubalua AO (2011) Bioremediation strategies for oil pollutedmarineecosystems. Aust J Agr Eng 2:160–168
6. Bragg JR, Prince RC, Harner EJ, Atlas RM (1994) Effectiveness ofbioremediation for the Exxon Valdez oil spill. Nature 368:413–418
7. Dyksterhouse SE, Gray JP, Herwig RP, Lara J, Staley JT (1995)Cycloclasticus pugetii gen. nov., sp. nov., an aromatic hydrocarbon-degrading bacterium from marine sediments. Int J Syst Bacteriol45:116–123
8. Yakimov MM, Golyshin PN, Lang S, Moore ERB, Abraham WR,Lünsdorf H, Timmis KN (1998) Alcanivorax borkumensis gen.nov., sp. nov., a new, hydrocarbon-degrading and surfactant-producing marine bacterium. Int J Syst Bacteriol 48:339–348
9. Rodriguez-Blanco A, Vetion G, Escande ML, Delille D, GhiglioneJF (2010) Gallaecimonas pentaromativorans gen. nov., sp. nov., abacterium carrying 16S rRNA gene heterogeneity and able to de-grade high-molecular-mass polycyclic aromatic hydrocarbons. Int JSyst Evol Micr 60:504–509
10. Grimaud R, Ghiglione J-F, Cagnon C, Lauga B, Vaysse P-J,Rodriguez-Blanco A, Mangenot S, Cruveiller S, Barbe V, Duran
R (2012) Genome sequence of the marine bacteriumMarinobacterhydrocarbonoclasticus SP17, which forms biofilms on hydropho-bic organic compounds. J Bacteriol 194:3539–3540
11. Head IM, Swannell RPJ (1999) Bioremediation of petroleum hy-drocarbon contaminants in marine habitats. Curr Opin Biotech 10:234–239
12. Golyshin PN, Chernikova TN, AbrahamWR (2002) Oleiphilaceaefam. nov., to include Oleiphilus messinensis gen. nov., sp. nov., anovel marine bacterium that obligately utilizes hydrocarbons. Int JSyst Evol Micr 52:901–911
13. Yakimov MM, Giuliano L, Gentile G, Crisafi E, Chernikova TN,Abraham WR, Lünsdorf H, Timmis KN, Golyshin PN (2003)Oleispira antarctica gen. nov., sp. nov., a novel hydrocarbonoclasticmarine bacterium isolated from Antarctic coastal sea water. Int J SystEvol Micr 53:779–785
14. Ghiglione J, Murray A (2012) Pronounced summer to winter dif-ferences and higher wintertime richness in coastal Antarctic marinebacterioplankton. Environ Microbiol 14:617–629
15. Yakimov MM, Giuliano L, Denaro R, Crisafi E, Chernikova TN,Abraham W-R, Luensdorf H, Timmis KN, Golyshin PN (2004)Thalassolituus oleivorans gen. nov., sp. nov., a novel marine bac-terium that obligately utilizes hydrocarbons. Int J Syst Evol Micr54:141–148
16. Head IM, Jones DM, Röling WF (2006) Marine microorganismsmake a meal of oil. Nat Rev Microbiol 4:173–182
17. Röling WFM, Milner MG, Jones DM, Lee K, Daniel F, SwannellRJP, Head IM (2002) Robust hydrocarbon degradation and dynam-ics of bacterial communities during nutrient-enhanced oil spill bio-remediation. Appl Environ Microbiol 68:5537–5548
18. Yakimov MM, Timmis KN, Golyshin PN (2007) Obligate oil-degrading marine bacteria. Curr Opin Biotech 18:257–266
19. Atlas RM (1981) Microbial degradation of petroleum hydrocar-bons: an environmental perspective. Microbiol Rev 45:180–209
20. McKew BA, Coulon F, Osborn AM, Timmis KN, McGenity TJ(2007) Determining the identity and roles of oil-metabolizing ma-rine bacteria from the Thames estuary, UK. Environ Microbiol 9:165–176
21. Gertler C, Gerdts G, Timmis KN, Yakimov MM, Golyshin PN(2009) Populations of heavy fuel oil-degrading marine microbialcommunity in presence of oil sorbent materials. J Appl Microbiol107:590–605
22. Weinbauer MG, Fuks D, Peduzzi P (1993) Distribution of virusesand dissolved DNA along a coastal trophic gradient in the northernAdriatic Sea. Appl Environ Microbiol 59:4074–4082
23. Wilhelm SW, Suttle CA (1999) Viruses and nutrient cycles in thesea. Bioscience 49:781–788
24. Bouvier T, Del Giorgio PA (2007) Key role of selective viral in-duced mortality in determining marine bacterial community com-position. Environ Microbiol 9:287–297
25. Jurgens K, Pernthaler J, Schalla S, Amann R (1999) Morphologicaland compositional changes in a planktonic bacterial community inresponse to enhanced protozoan grazing. Appl Environ Microbiol65:1241–1250
26. Pernthaler J (2005) Predation on prokaryotes in the water columnand its ecological implications. Nat Rev Microbiol 3:537–546
27. Gonzalez JM, Sherr EB, Sherr BF (1990) Size-selective grazing onbacteria by natural assemblages of estuarine flagellates and ciliates.Appl Environ Microbiol 56:583–589
28. Weinbauer MG, Rassoulzadegan F (2004) Are viruses driving mi-crobial diversification and diversity? Environ Microbiol 6:1–11
29. Beardsley C, Pernthaler J, Wosniok W, Amann R (2003) Are read-ily culturable bacteria in coastal North Sea waters suppressed byselective grazingmortality? Appl EnvironMicrobiol 69:2624–2630
30. Thingstad TF (2000) Elements of a theory for the mechanismscontrolling abundance, diversity, and biogeochemical role of lytic
C. Sauret et al.

bacterial viruses in aquatic systems. Limnol Oceanogr 45:1320–1328
31. del Giorgio PA, Gasol JM, Vaqué D, Mura P, Agustí S, Duarte CM(1996) Bacterioplankton community structure: protists control netproduction and the proportion of active bacteria in a coastal marinecommunity. Limnol Oceanogr 41:1169–1179
32. Hahn MW, Höfle MG (2001) Grazing of protozoa and its effect onpopulations of aquatic bacteria. FEMS Microbiol Ecol 35:113–121
33. Mattison RG, Taki H, Harayama S (2005) The soil flagellateHeteromita globosa accelerates bacterial degradation ofalkylbenzenes through grazing and acetate excretion in batch cul-ture. Microb Ecol 49:142–150
34. Tso SF, Taghon GL (2006) Protozoan grazing increases minerali-zation of naphthalene in marine sediment. Microb Ecol 51:460–469
35. Tréguer P, Le Corre P (1975) Manuel d’analyse des sels nutritifsdans l’eau de mer. Laboratoire d’Océanographie Chimique,Université de Bretagne Occidentale, Brest 110
36. Pujo-Pay M, Conan P, Oriol L, Cornet-Barthaux V, Falco C,Ghiglione JF, Goyet C,Moutin T, Prieur L (2011) Integrated surveyof elemental stoichiometry (C, N, P) from the western to easternMediterranean Sea. Biogeosciences 8:883–899
37. Smith VH, Graham DW, Cleland DD (1998) Application ofresource-ratio theory to hydrocarbon biodegradation. Environ SciTechnol 32:3386–3395
38. Tedetti M, Guigue C, Goutx M (2010) Utilization of a submersibleUV fluorometer for monitoring anthropogenic inputs in theMediterranean coastal waters. Marine Pollut Bull 60:350–362
39. Mével G, Vernet M, Goutx M, Ghiglione JF (2008) Seasonal tohour variation scales in abundance and production of total andparticle-attached bacteria in the open NW Mediterranean Sea (0–1000 m). Biogeosciences 5:1573–1586
40. Noble RT, Fuhrman JA (1998) Use of SYBR Green I for rapidepifluorescence counts of marine viruses and bacteria. AquatMicrob Ecol 14:113–118
41. Ghiglione JF, Conan P, Pujo-Pay M (2009) Diversity of total andactive free-living vs. particle-attached bacteria in the euphotic zoneof the NW Mediterranean Sea. FEMS Microbiol Lett 299:9–21
42. Abboudi M, Jeffrey WH, Ghiglione JF, Pujo-Pay M, Oriol L,Sempéré R, Charrière B, Joux F (2008) Effects of photochemicaltransformations of dissolved organic matter on bacterial metabo-lism and diversity in three contrasting coastal sites in theNorthwestern Mediterranean Sea during summer. Microb Ecol55:344–357
43. Ortega-Retuerta E, Joux F, JeffreyWH,Ghiglione JF (2012) Spatialvariability of particle-attached and free-living bacterial diversity insurface waters from the Mackenzie river to the beaufort Sea(Canadian arctic). Biogeosci Discuss 9:17401–17435
44. Caporaso JG, Kuczynski J, Stombaugh J, Bittinger K, BushmanFD, Costello EK, Fierer N, Pena AG, Goodrich JK, Gordon JI(2010) QIIME allows analysis of high-throughput community se-quencing data. Nat Methods 7:335–336
45. Quince C, Lanzen A, Davenport RJ, Turnbaugh PJ (2011)Removing noise from pyrosequenced amplicons. BMCBioinformatics 12:38
46. Edgar RC (2010) Search and clustering orders of magnitude fasterthan BLAST. Bioinformatics 26:2460–2461
47. Wang Q, Garrity GM, Tiedje JM, Cole JR (2007) Naive Bayesianclassifier for rapid assignment of rRNA sequences into the newbacterial taxonomy. Appl Environ Microbiol 73:5261–5267
48. Hoppe HG (1983) Significance of exoenzymatic activities in theecology of brackish water: measurements by means ofmethylumbelliferyl-substrates. Mar Ecol Prog Ser 11:299–308
49. Landry M, Hassett R (1982) Estimating the grazing impact of ma-rine micro-zooplankton. Mar Biol 67:283–288
50. Verity P, Redalje D, Lohrenz S, Flagg C,Hristov R (2002) Couplingbetween primary production and pelagic consumption in temperate
ocean margin pelagic ecosystems. Deep Sea Res Pt II 49:4553–4569
51. Proctor LM, Okubo A, Fuhrman JA (1993) Calibrating estimates ofphage-induced mortality in marine bacteria: ultrastructural studiesof marine bacteriophage development from one-step growth exper-iments. Microb Ecol 25:161–182
52. Binder B (1999) Reconsidering the relationship between virallyinduced bacterial mortality and frequency of infected cells. AquatMicrob Ecol 18:207–215
53. d’Ortenzio F, Ribera d’Alcalà M (2009) On the trophic regimes ofthe Mediterranean Sea: a satellite analysis. Biogeosciences 6:139–148
54. Gertler C, Näther DJ, Cappello S, Gerdts G, Quilliam RS, YakimovMM, Golyshin PN (2012) Composition and dynamics ofbiostimulated indigenous oil-degrading microbial consortia fromthe Irish, North and Mediterranean Seas: a mesocosm study.FEMS Microbiol Ecol 81:520–536
55. Kasai Y, Kishira H, Sasaki T, Syutsubo K, Watanabe K, HarayamaS (2002) Predominant growth of Alcanivorax strains in oil-contaminated and nutrient-supplemented sea water. EnvironMicrobiol 4:141–147
56. Van Wambeke F, Ghiglione JF, Nedoma J, Mével G, Raimbault P(2009) Bottom up effects on bacterioplankton growth and compo-sition during summer-autumn transition in the open NWMediterranean Sea. Biogeosciences 6:705–720
57. Rodríguez-Blanco A, Antoine V, Pelletier E, Delille D, GhiglioneJF (2010) Effects of temperature and fertilization on total vs. activebacterial communities exposed to crude and diesel oil pollution inNW Mediterranean Sea. Environ Poll 158:663–673
58. Sauret C, Christaki U, Moutsaki P, Hatzianestis I, Gogou A,Ghiglione J-F (2012) Influence of pollution history on the responseof coastal bacterial and nanoeukaryote communities to crude oiland biostimulation assays. Mar Environ Res 79:70–78
59. Atlas RM, Bartha R (1972) Degradation and mineralization of pe-troleum in seawater: limitation by nitrogen and phosphorus.Biotechnol Bioeng 14:309–317
60. Øvreas L, Bourne D, Sandaa R-A, Casamayor EO, Benlloch S,Goddard V, Smerdon G, Heldal M, Thingstad TF (2003)Response of bacterial and viral communities to nutrient manipula-tions in seawater mesocosms. Aquat Microb Ecol 31:109–121
61. Al-MallahM, GoutxM,Mille G, Bertrand JC (1990) Production ofemulsifying agents during growth of a marine Alteromonas in seawater with eicosane as carbon source, a solid hydrocarbon. OilChem Pollut 6:289–305
62. Gertler C, Gerdts G, Timmis KN, Golyshin PN (2009) Microbialconsortia in mesocosm bioremediation trial using oil sorbents,slow-release fertilizer and bioaugmentation. FEMS MicrobiolEcol 69:288–300
63. Hedlund BP, Staley JT (2006) Isolation and characterization ofPseudoalteromonas strains with divergent polycyclic aromatic hy-drocarbon catabolic properties. Environ Microbiol 8:178–182
64. Bordenave S, Goñi-UrrizaMS, Caumette P, Duran R (2007) Effectsof heavy fuel oil on the bacterial community structure of a pristinemicrobial mat. Appl Environ Microbiol 73:6089–6097
65. Cappello S, Caruso G, Zampino D, Monticelli L, Maimone G,Denaro R, Tripodo B, Troussellier M, Yakimov M, Giuliano L(2007) Microbial community dynamics during assays of harbouroil spill bioremediation: a microscale simulation study. J ApplMicrobiol 102:184–194
66. Coulon F, McKew BA, Osborn AM, McGenity TJ, Timmis KN(2007) Effects of temperature and biostimulation on oil-degradingmicrobial communities in temperate estuarine waters. EnvironMicrobiol 9:177–186
67. Riemann L, Middelboe M (2002) Viral lysis of marinebacterioplankton: implications for organic matter cycling and bac-terial clonal composition. Ophelia 56:57–68
Top-Down Control of Diesel-Degrading Prokaryotic Communities

68. Toyoda K, Shibata A, Wada M, Nishimura M, Nomura H, YoshidaA, Okamoto K, Yamada M, Takada H, Kogure K (2005) Trophicinteractions among marine microbes in oil-contaminated seawateron a mesocosmic scale. Microbes Environ 20:104–109
69. Ortmann AC, Anders J, Shelton N, Gong L, Moss AG, Condon RH(2012) Dispersed oil disrupts microbial pathways in pelagic foodwebs. PLoS One 7:e42548
70. Miki T, Jacquet S (2008) Complex interactions in the microbialworld: underexplored key links between viruses, bacteria and pro-tozoan grazers in aquatic environments. Aquat Microb Ecol 51:195–208
71. Kota S, Borden RC, Barlaz MA (1999) Influence of protozoangrazing on contaminant biodegradation. FEMS Microbiol Ecol29:179–189
72. Rosenberg E, Bittan Banin G, Sharon G, Shon A, Hershko G, LevyI, Ron EZ (2010) The phage driven microbial loop in petroleumbioremediation. Microb Biotechnol 3:467–472
73. Guenet B, Danger M, Abbadie L, Lacroix G (2010) Priming effect:bridging the gap between terrestrial and aquatic ecology. Ecology91:2850–2861
74. Fontaine S, Mariotti A, Abbadie L (2003) The priming effect oforganic matter: a question of microbial competition? Soil BiolBiochem 35:837–843
75. Fuhrman JA, Suttle CA (1993) Viruses in marine planktonic sys-tems. Oceanography 6:51–63
76. Thingstad TF, Heldal M, Bratbak G, Dundas I (1993) Are virusesimportant partners in pelagic fend webs? Trends Ecol Evol 8:209–213
77. Lenski RE (1988) Dynamics of interactions between bacteria andvirulent bacteriophage. In: Adv Microb Ecol. Springer, pp 1–44
78. Middelboe M (2000) Bacterial growth rate and marine virus–hostdynamics. Microb Ecol 40:114–124
79. Golyshin PN, Ferrer M, Chernikova TN, Golyshina OV, YakimovMM (eds) (2010) Oleispira, vol Part 19. Handb Hydrocarb LipidMicrobiol. Springer, Verlag Berlin Heidelberg
80. Mishamandani S, Gutierrez T, Aitken MD (2014) DNA-based sta-ble isotope probing coupled with cultivation methods implicatesMethylophaga in hydrocarbon degradation. Frontiers Microbiol 5:76
81. Kirchman DL (2002) The ecology of Cytophaga–Flavobacteria inaquatic environments. FEMS Microbiol Ecol 39:91–100
C. Sauret et al.