connected gene neighborhoods in prokaryotic
TRANSCRIPT

2212–2223 Nucleic Acids Research, 2002, Vol. 30, No. 10
Connected gene neighborhoods in prokaryoticgenomesIgor B. Rogozin, Kira S. Makarova, Janos Murvai, Eva Czabarka, Yuri I. Wolf,Roman L. Tatusov, Laszlo A. Szekely1 and Eugene V. Koonin*
National Center for Biotechnology Information, National Library of Medicine, National Institutes of Health, Bethesda,MD 20894, USA and 1Department of Mathematics, University of South Carolina, Columbia, SC 29208, USA
Received December 28, 2001; Revised March 7, 2002; Accepted March 22, 2002
ABSTRACT
A computational method was developed for delineatingconnected gene neighborhoods in bacterial andarchaeal genomes. These gene neighborhoods are nottypically present, in their entirety, in any singlegenome, but are held together by overlapping, partiallyconserved gene arrays. The procedure was applied tocomparing the orders of orthologous genes, whichwere extracted from the database of Clusters of Ortholo-gous Groups of proteins (COGs), in 31 prokaryoticgenomes and resulted in the identification of 188clusters of gene arrays, which included 1001 of2890 COGs. These clusters were projected onto actualgenomes to produce extended neighborhoodsincluding additional genes, which are adjacent to thegenes from the clusters and are transcribed in the samedirection, which resulted in a total of 2387 COGs beingincluded in the neighborhoods. Most of the neighbor-hoods consist predominantly of genes united by acoherent functional theme, but also include a minorityof genes without an obvious functional connection tothe main theme. We hypothesize that although some ofthe latter genes might have unsuspected roles, othersare maintained within gene arrays because of theadvantage of expression at a level that is typical of thegiven neighborhood. We designate this phenomenon‘genomic hitchhiking’. The largest neighborhoodincludes 79 genes (COGs) and consists of overlapping,rearranged ribosomal protein superoperons; apparentgenome hitchhiking is particularly typical of thisneighborhood and other neighborhoods that consistof genes coding for translation machinery components.Several neighborhoods involve previously undetectedconnections between genes, allowing new functionalpredictions. Gene neighborhoods appear to evolve viacomplex rearrangement, with different combinations ofgenes from a neighborhood fixed in different lineages.
INTRODUCTION
Operons, groups of adjacent, co-expressed genes that encodefunctionally linked proteins, are the principal form of gene
co-regulation in prokaryotes (1–3). Certain operons, particularlythose that encode subunits of multiprotein complexes, such asribosomal proteins, are conserved in phylogenetically distantbacterial genomes or even between archaea and bacteria (4,5).This is due, in part, to conservation of these operons over longstretches of evolutionary time, perhaps even since the lastuniversal common ancestor of all modern life forms, and, inpart, to horizontal spread of operons among prokaryotes.Operons are often thought of as ‘selfish’ in the sense thathorizontal transfer of an entire operon is favored by selectionover transfer of individual genes because, in the former case,gene co-expression and co-regulation are preserved (6,7).More detailed comparisons of sequenced prokaryotic genomeshave shown that operons tend to undergo multiple rearrangementsduring evolution (8). Gene order at a level above operons ispoorly conserved, and genome comparison diagonal plots, inwhich points indicate orthologs, appear completely disorderedeven for species that belong to the same prokaryotic lineage,for example Escherichia coli and Haemophilus influenzae, twomembers of the γ-subdivision of Proteobacteria (4,9). A recentdetailed analysis of gene order conservation among prokaryotesshowed that only 5–25% of the genes in bacterial and archaealgenomes belong to gene strings (probable operons) shared by atleast two genomes, once closely related species are excluded (10).
The evolutionary fluidity of operons makes comparativeanalysis of gene orders in general and operon prediction inparticular non-trivial tasks. Several methods have beenproposed for comparing gene orders in pairs of genomes and inmultiple genomes and detecting local gene order conservation;these methods differ in the amount of gene insertion/deletionand local rearrangement that they allow (10–14). Applicationof these and other methods for gene order comparisonproduced a wealth of functional and evolutionary informationthat has been interpreted within the more general framework ofgenome context analysis (15–17). Bork and co-workersproposed the concept of ‘über-operon’, a set of genes whosefunctional and regulatory contexts tend to be conserved despitenumerous rearrangements (18). The conglomerate of operonsencoding ribosomal proteins, the largest group of genes whoseorder is partially conserved in all prokaryotic genomes, is theparagon of an über-operon. It has to be emphasized that anüber-operon does not necessarily portray the arrangement of thegiven set of genes in any extant or ancestral genome; instead, thecomposition and order of genes included in an über-operonseem to reflect multiple, alternative pathways of evolution.
*To whom correspondence should be addressed. Tel: +1 301 435 5913; Fax: +1 301 435 7794; Email: [email protected]

Nucleic Acids Research, 2002, Vol. 30, No. 10 2213
We sought to expand the über-operon concept by delineatingextended gene neighborhoods on the basis of the results of thecomparison of gene orders in multiple prokaryotic genomes.The idea underlying this approach is that different genomescontain different, overlapping parts of evolutionarily and func-tionally connected gene neighborhoods and, by generating a‘tiling path’ through these overlaps, we should be able toreconstruct the entire neighborhood. Examination of theseneighborhoods might help not only in interpreting context-basedfunctional prediction, but also in elucidating the evolutionaryforces that govern the evolution of operons and über-operons.
MATERIALS AND METHODS
Sequence data
The sequences of the proteins encoded in complete prokaryoticgenomes were extracted from the Genome division of the Entrezretrieval system (http:www.ncbi.nlm.nih.gov:80/PMGifs/Genomes/org.html) (19). The analyzed genomes includedthose of 23 bacteria: Aquifex aeolicus (Aae), Bacillus halodurans(Bha), Bacillus subtilis (Bsu), Borrelia burgdorferi (Bbu),Campylobacter jejunii (Cje), Chlamydia trachomatis (Ctr),Chlamydophila pneumoniae (Cpn), Deinococcus radiodurans(Dra), E.coli (Eco), H.influenzae (Hin), Helicobacter pylori(Hpy), Mycoplasma genitalium (Mge), Mycoplasma pneumoniae(Mpn), Mycobacterium tuberculosis (Mtu), Neisseria meningitidis(Nme), Pseudomonas aeruginosa (Pae), Rickettsia prowazekii(Rpr), Synechocystis PCC6803 (Syn), Thermotoga maritima(Tma), Treponema pallidum (Tpa), Vibrio cholerae (Vch),Xylella fastidiosa (Xfa) and Ureaplasma urealyticum (Uur);and eight archaea: Aeropyrum pernix (Aer), Archaeoglobusfulgidus (Afu), Halobacterium sp. (Hsp), Methanobacteriumthermoautotrophicum (Mth), Methanococcus jannaschii(Mja), Pyrococcus horikoshii (Pho), Pyrococcus abyssi (Pab)and Thermoplasma acidophilum (Tac).
Conserved pairs of genes
The Clusters of Orthologous Groups of proteins (COGs) databasewas used as the source of information on orthologous genes inprokaryotic genomes (20,21). A pair of genes from two COGswas considered to be conserved if the respective genes weretranscribed in the same direction and were separated byzero, one or two genes in at least three of the comparedgenomes; the order of the genes was taken into account(5′…COG_A→COG_B…3′ and 5′…COG_B→COG_A…3′were counted as two different pairs). Conservation of genepairs in groups of closely related species, namely V.cholerae–E.coli–H.influenzae, C.trachomatis–C.pneumoniae, P.horikoshii–P.abyssi, U.urealyticum–M.genitalium–M.pneumoniae,T.pallidum–B.burgdorferi and B.subtilis–B.halodurans, wasdisregarded: if a gene pair was found in two or three closelyrelated species, it was counted only once.
The probability of random occurrence of ‘conserved’unidirectional gene pairs was assessed using Monte Carlosimulations. For each of 100 repetitions, random permutationsof the gene order in each genome were generated, and the setof conserved pairs was produced using the procedure describedabove.
Procedure for identifying gene arrays
In order to develop a procedure for constructing arrays ofgenes from conserved gene pairs, we represent the problem ingraph-theoretical terms (22,23), with each gene involved in aconserved gene pair corresponding to a vertex ai and the pairitself corresponding to a directed edge aiaj.Definition 1: a directed graph (digraph) consists of a set ofvertices connected with directed edges.Definition 2: a vertex sequence a1a2a3…an is a trail if aiai+1 isan edge of the digraph for each j:1≤j<n, and no edge occurs inthe trail more than once. (Note that vertices are allowed torepeat.) The length of the trail a1a2a3…an is the number ofedges in the trail, which is equal to n–1 (one less than thenumber of vertices).Definition 3: a triplet is a trail of length 2.Definition 4: aiajak is an allowable triplet if the genes ai, aj andak are present in this order in at least one of the analyzedgenomes.Definition 5: we call a trail a1a2a3…an allowable if ajaj+1aj+2 isan allowable triplet for each j:1≤j<n–1.Definition 6: we call an allowable trail b1b2b3…bm an extensionof the allowable trail a1a2a3…an if each of the ajs appearamongst the bis in the same order. In other words, b1b2b3…bmcan be generated a1a2a3…an by applying the following operations:(i) replacing the edge ajaj+1 by a trail that starts on aj and endson aj+1, and (ii) appending a trail to the beginning or the end ofa1a2a3…an. (Note that, by definition, each trail is an extensionof itself.)Definition 7: we call an allowable trail a1a2a3…an maximal ifit has no extension other than itself.Definition 8: we call an allowable trail a1a2a3…an end-maximal if its only extensions start on a1 and end on an. Inother words, all possible extensions can be obtained from thetrail by the repeated operation of replacing the edge ajaj+1 by atrail that starts on aj and ends on aj+1.Problem: Given a digraph and all of its allowable triplets, findall maximal allowable trails.
Algorithm
Input: vertices, edges, allowable triplets of the digraph. Output:a list of all maximal allowable trails. We make a list of the(possible) maximal allowable trails found so far. The list isinitially empty. For each edge of the digraph, we do thefollowing: sequentially find all allowable trails starting fromthe given edge that are not extendable at their endpoint and, ifthe trail is not extendable backward at the starting point, checkit against the list of possible maximal allowable trails found sofar. Compare it with each trail in the list. There are two possiblecases: (i) if a trail is found in the list that is an extension of the newtrail, the new trail is discarded and the checking is stopped;(ii) if a trail is found in the list that is extended by the new trail,the trail is removed from the list, and the checking is continuedagainst the next trail. If we reach the end of the list and stillhave not eliminated the new trail, it is added to the list. At theend, output the list of all maximal allowable trails.
A detailed description of the algorithm accompanies the programEM_TRAILS, which is available at ftp://ncbi.nlm.nih.gov/pub/koonin/gene_neighborhoods.

2214 Nucleic Acids Research, 2002, Vol. 30, No. 10
Clustering of gene arrays
Overlapping gene arrays were merged using single-linkageclustering. Gene arrays were merged in a cluster if they sharedat least three genes (for arrays containing four or more genes)or at least two genes (for three-gene arrays). This implies thatany trail and its extension are in the same cluster, which is oneof the reasons why it is not necessary to find trails that are notmaximal. The resulting clusters were projected on genomes. Ineach genome, all unidirectional strings of genes with shortspacers (directons) (24) that include conserved COG pairscomprising the projected cluster were identified. Themaximum allowed spacer length in a directon was defined foreach genome separately as the 95% quantile of the distributionof the actual spacer lengths between all unidirectional adjacentgenes from the COGs in a given genome.
RESULTS AND DISCUSSION
Delineation of connected gene neighborhoods
Conserved gene pairs. The present analysis is based on thenotion of a conserved gene pair (Fig. 1). Conserved pairs weredefined using the information on orthologous genes inprokaryotic genomes that is contained in the COGs database
(21). A pair of genes from two COGs was considered to beconserved if the respective genes were transcribed in the samedirection and separated by zero, one or two genes in at leastthree of the genomes compared (closely related genomesexcluded; see Materials and Methods). This relaxed definitionof a conserved gene pair was adopted because numerousrearrangements, deletions and insertions have been found inoperons whose characteristic size is three to five genes (8,10).The presence of a gene pair in at least three genomes wasrequired to ensure that such pairs are indeed conserved duringevolution and not just shared by chance. A Monte Carlosimulation showed that, on average, only 12 conserved genepairs were found in three or more genomes by chance. For genepairs shared by two genomes, the average value was 318,which corresponds to approximately two conserved gene pairsper genome pair. In an independent study, it has been estimatedthat conserved gene pairs have an ∼0.98 probability ofbelonging to the same operon (25). Although, taken together,these observations show that most of the gene pairs that areconserved even in two genomes are only evolutionarily andprobably functionally relevant, only pairs conserved in three ormore genomes were used for the construction of gene arrays toavoid proliferation of false positives.
Altogether, 1505 conserved gene pairs including 1337 COGswere detected. The majority of these pairs are present in asmall number of genomes; ∼90% of the conserved pairs arefound in three to thirteen genomes. As described elsewhere,the distribution of the conserved gene pairs by the number ofgenomes in which they are represented closely fits thegeometric model, with the exception of the tail that corre-sponds to highly conserved pairs (26). Only 21 gene pairs werepresent in all compared genomes; all these invariant pairsconsist of genes for ribosomal proteins and RNA polymerasesubunits.
Among the highly conserved gene pairs present in seven ormore genomes, a substantial majority include genes coding forproteins from the same functional category (as defined in theCOG database; http://www.ncbi.nlm.nih.gov/COG/) (Fig. 2).In contrast, and somewhat unexpectedly, among the gene pairsthat are only conserved in three to five genomes do themajority consists of genes from different categories (Fig. 2).The evolutionary conservation of the analyzed gene pairs andthe results of the Monte Carlo simulations strongly suggest that
Figure 1. A flow chart of the procedure for construction of arrays and clustersfrom conserved gene pairs. Colored arrows indicate COGs that form conservedpairs and open arrows indicate COGs or non-COG genes that do not formconserved pairs, but are allowed to insert between genes in a pair.
Figure 2. Representation of COGs of the same functional category and ofdifferent functional categories in conserved gene pairs.

Nucleic Acids Research, 2002, Vol. 30, No. 10 2215
most, if not all, of these pairs are non-random and, by inference,functionally relevant. The juxtaposition of genes fromdifferent functional categories might, in part, be due to certainfeatures of the functional classification employed: for example,a pair of genes that consists of a transcriptional regulator and theregulated gene will be classified as representing different categories(transcription and whatever category the regulated genebelongs to). However, the major underlying reason is probablythe ‘genome hitchhiking’ phenomenon discussed below.
The observed distribution of conserved gene pairs amonggenomes indicates that although a small fraction of the pairsare strongly supported by selection, the majority are relativelyunstable during evolution and prone to rearrangement andhorizontal transfer. This emphasizes the need to employapproaches that go beyond straightforward genome alignmentor local similarity search, to extract maximum informationfrom prokaryotic gene order.
Arrays of conserved gene pairs. The next step in the identificationof connected gene neighborhoods involved construction ofarrays of conserved gene pairs on the basis of overlaps betweengene pairs in different genomes (Fig. 1). Given two pairs ofCOGs, COG_A–COG_B and COG_B–COG_C, present intwo genomes, it can be inferred that the corresponding genepairs are fragments of a longer, possibly ancestral arrayCOG_A–COG_B–COG_C. However, this type of reconstruc-tion may be rendered erroneous by the presence of paralogs insome of the COGs. If, in the pairs COG_A–COG_B andCOG_B–COG_C from two different genomes, COG_B isrepresented by paralogs, there might be no direct evolutionaryor functional connection between these gene strings. Thus, inorder to ensure the evolutionary relevance of merging pairsCOG_A–COG_B and COG_B–COG_C, the presence of thearray COG_A–COG_B–COG_C in at least one genome wasrequired. Accordingly, among the reconstructed arrays, allthose with three genes are necessarily represented in the gene
order in at least one genome (with possible one to two geneinserts, given the above relaxed definition of a gene pair),whereas larger arrays may or may not be directly representedin any genome.
The problem of array reconstruction can be formalized assearch of a trail in a digraph in which each conserved gene(COG) pair is represented by two vertices connected with anedge (Fig. 3). The search for maximal trails in these graphs isan NP-complete problem due to the presence of circuits, whichprecludes the use of dynamic programming. Therefore a recursivealgorithm for finding maximal trails was developed (see Materialsand Methods) and the program EM_TRAILS implementingthis algorithm was used to reconstruct 1280 gene arrays.Among these, 337 arrays were present in one or more genomes,whereas the remaining 943 arrays were not represented in any ofthe genomes in their entirety. That a substantial majority ofgene arrays were not detected in any actual genomes was anexpected feature of the procedure employed, which involvedsearching for arrays of maximal length.
Clusters of gene arrays and gene neighborhoods. The procedurediscussed above resulted in numerous, overlapping genearrays, which is explained by the pervasiveness of local generearrangements, even in generally conserved operons, inprokaryotic genome evolution. In order to merge all arrays thatare parts of the same genomic neighborhood, we used single-linkage clustering, which produced 188 gene clusters, with thenumber of arrays in a cluster varying from 464 to 1, the numberof COGs varying from 79 to 2 (neighborhoods with only twoCOGs were found because the same COG may be representedtwice in an array), and the number of species involved varyingfrom 31 (all analyzed genomes) to 3 (the minimal number ofgenomes that was required to recognize a conserved gene pair).Of the 2890 COGs used in this analysis, 1001 (~35%) wererepresented in clusters of gene arrays. Figure 4 shows thedistribution of the clusters by the number of genes and species
Figure 3. A cluster of gene arrays presented as a directed graph. Nodes correspond to COGs, the COG numbers are indicated inside the circles. The edges showconserved gene pairs and the direction of transcription of the corresponding genes is shown by arrows. The blue circles and red arrows show the depicted cluster.The open circles and black arrows show genes and gene pairs that are linked to individual COGs in the given cluster, but did not join it under the procedureemployed. The number of genomes in which the given pair is represented is given for each edge, and the thickness of the edge is roughly proportional to thisnumber. This example shows cluster 14. The rank of the cluster (neighborhood) in this and other figures was determined by the descending order of the number ofgenes (COGs) in the core cluster as shown in Table 1. COG0130, pseudouridine synthase; COG0184, ribosomal protein S15P/S13E; COG0195, transcription elongation/anti-termination factor (NusA); COG0196, FAD synthase; COG0532, translation initiation factor 2 (GTPase); COG0612, predicted Zn-dependent peptidase;COG0779, uncharacterized conserved protein; COG0858, ribosome-binding factor A; COG1185, polyribonucleotide nucleotidyltransferase; COG2740, uncharac-terized conserved protein.

2216 Nucleic Acids Research, 2002, Vol. 30, No. 10
they include. The number of clusters decays steeply with theincrease of the gene number, with several large clustersforming the tail of the distribution (Fig. 4A). The distributionof the number of clusters by the number of genomes representedis quite different, with a clear maximum at eight genomes (thenumber of analyzed archaeal species) and additional, localmaxima at 13 genomes (not readily interpretable; these clustersinclude variable sets of bacterial and archaeal genomes) and 23genomes (the complete number of analyzed bacterial species).Thus, this distribution, at least in part, reflects a trend towardconservation of distinct gene clusters in specific, major lineagesof prokaryotes.
The final step in the reconstruction of connected gene neighbor-hoods involved projection of clusters of gene arrays ontoactual genomes. All unidirectional strings of genes with shortspacers (directons) (24) that included COGs comprising theprojected cluster were identified in each genome. These directonsmay be considered first approximations of actual operons (24),which can be refined through case by case analysis. Thisprocedure resulted in the number of genes associated withdetected gene neighborhoods increasing from 1001 (number ofCOGs in clusters; note that the remainder of the 1337 COGsthat formed conserved gene pairs did not belong to any of the
clusters) to 6611, including 2387 of the 2890 COGs analyzed(~83%). Thus, a substantial majority of highly conservedprokaryotic genes (COGs) are associated with the neighbor-hoods identified, but for more than half this associationappears to be evolutionarily unstable (seen in only one or twogenomes) and its functional relevance remains to be investigated.
The approach to the analysis of connected neighborhoods inprokaryotic genomes developed here is related to the über-operonanalysis procedure described by Lathe et al. (18) andimplemented in the STRING server (27), but more general inthat a large collection of genomes was analyzed simultaneouslyand the neighborhoods were detected comprehensively andautomatically.
Connected gene neighborhoods: functional and evolutionaryimplications. The gene neighborhoods delineated using theprotocol described above do not directly represent conservation ofgene order in any particular genome and, generally, are notreconstructions of the organization of ancestral genomes,although their composition certainly depends on the level ofconservation of gene arrays, of which they are composed.Instead, these neighborhoods comprise more or less completerepertories of links between (predicted) operons that can berevealed by multiple genome comparison. Each neighborhoodconsists of a core, i.e. the cluster of gene arrays that was usedto generate the neighborhood, and the unique additions thatbelong to the same directons (potential operons) with the corearrays (Table 1; see also ftp://ftp.ncbi.nih.gov/pub/koonin/gene_neighborhoods/clusters.htm). Both the conserved andunique parts of gene neighborhoods are likely to be function-ally relevant, but some of the added genes might belong todirectons by chance, whereas the relevance of the core clustersis supported by evolutionary conservation of the constituentgene pairs and, in part, arrays (see above). Therefore, in thefollowing discussion, we address genes that belong to the coreclusters of the neighborhoods.
The larger neighborhoods include numerous alternativeconfigurations of varying evolutionary stability that haveevolved in different lineages. Indeed, by definition, each genearray in a neighborhood is such an alternative gene configurationand some of the larger neighborhoods include over 100arrays (Table 1; see also ftp://ftp.ncbi.nih.gov/pub/koonin/gene_neighborhoods/clusters.htm). In terms of digraphs, suchalternative configurations correspond to distinct trails thatshare subsets of common vertices (Fig. 3). The large neighbor-hoods are not represented by a contiguous gene string (array)in any one particular genome; moreover, the longest arraytypically does not even include the majority of the genes thatcomprise the neighborhood (Table 1). One COG may belong totwo or more neighborhoods, which represent alternativegenomic contexts for the given gene. The majority of COGsincluded in the neighborhoods belong to only one neighborhood,but 106 COGs (11%) were found in two to eight neighborhoods.
Even those parts of a neighborhood that are not directlyconnected in any particular genome might have similar levelsof expression and similar regulatory patterns. Indeed, the‘tiling’ construction principle of gene arrays suggests a degreeof transitivity such that, in a gene array A-B-C-D, where A-B,B-C and C-D are conserved pairs and the triplets A-B-C andB-C-D are present in at least one genome each, some concord-ance might exist between the expression levels and regulatory
Figure 4. Distribution of clusters of gene arrays by the number of genes (A) andspecies (B).

Nucleic Acids Research, 2002, Vol. 30, No. 10 2217
Table 1. Gene neighborhoods in prokaryotic genomes (examples)a
aThe complete information for all 188 neighborhoods is available at ftp://ftp.ncbi.nih.gov/pub/koonin/gene_neighborhoods/.bThe rank of a neighborhood is determined by the descending order of the number of COGs in the core cluster (third column).cCodes for functional categories (from the COG database): J, translation, ribosomal structure and biogenesis; K, transcription; L, DNA replication, recombinationand repair; D, cell division and chromosome partitioning; O, molecular chaperone functions; M, cell envelope and outer membrane structure and biogenesis; N, cellmotility and secretion; P, inorganic ion transport; T, signal transduction; C, energy production and conversion; G, carbohydrate metabolism and transport; E,amino acid metabolism and transport; F, nucleotide metabolism and transport; H, coenzyme metabolism; I, lipid metabolism; R, general functional predictiononly (biochemical activity but not biological role predicted); S, function unknown.
Rankb Numberof genearrays
Numberof genes(COGs)in thecore cluster
Totalnumberof genes
Numberof species
Longest array:number ofgenes (species)
Functionalcompositionc
Principal function(s):theme(s)
Additional functions:variations
1 146 79 574 31 45 (B.subtilis) J=51 K=8 C=4 N=3F=3 R=2 S=2 D=1O=1 G=1 E=1 H=1I=1
Translation: ribosomalproteins, translation factors,RNA modification, RNAprocessing (RNase P),preprotein translocation.Transcription: five RNApolymerase subunits,terminator NusA,antiterminator NusG
Energy conversion(cytochromes b, c1, RieskeFe-S protein, lactatedehydrogenase), centralmetabolism (enolase),nucleotide metabolism(adenylate, citidylate kinases),lipid metabolism (mevalonatekinase), cell division (FtsZ)
2 99 50 805 30 12 (E.coli,V.cholerae)
I=15 E=11 R=9 J=4K=4 L=3 C=3 H=2S=2 M=1 N=1 P=1G=1 F=1
Lipid metabolism,amino acid metabolism
Translation (ribosomalproteins L32, S17E; ribosomalprotein L11 methylase),transcription (transcriptionalregulators), replication(DNA polymerase III δ′subunit), coenzymemetabolism (O-succinylbenzoate synthase)
5 80 22 236 23 14 (D.radiodurans,E.coli,M.tuberculosis,N.meningitidis,X.fastidiosa)
C=16 P=5 S=1 Energy conversion, iontransport: NADH:ubi-quinone oxidoreductase andmultisubunit sodium/proton-antiporter
None
7 1 15 254 23 15 (E.coli,V.cholerae)
M=6 I=4 J=3 L=1F=1
Membrane biogenesis,lipid biosynthesis
Translation (ribosomal proteinS2, ribosome recycling factor,elongation factor Ts),replication (RNase HII),nucleotide metabolism(uridylate kinase)
10 4 14 154 18 9 (E.coli,P.aeruginosa,V.cholerae)
G=7 R=3 J=1 K=1M=1 S=1
Carbohydrate metabolism Translation (ribosome-associated protein Y/Psrp-1),transcription (RNApolymerase σ54 subunit),membrane biogenesis(sugar phosphate isomeraseinvolved in capsule synthesis)
11 2 11 80 14 10 (T.maritima,E.coli and severalotherproteobacteria)
E=10 J=1 Histidine biosynthesis,including histidyl-tRNAsynthetase
Translation (histidyl-tRNAsynthetase), but link tohistidine biosynthesis isobvious
13 5 11 131 19 6 (E.coli,P.aeruginosa,V.cholerae)
R=4 N=2 K=1 L=1T=1 C=1 H=1
Secretion? RNA processing (RNase III),DNA repair (RecO)
17 7 10 245 25 5 (V.cholerae) R=6 L=2 P=2 M=1G=1 E=1
Membrane transport DNA replication (DNApolymerase III δ subunit)
20 1 9 133 22 6 (E.coli,,P.aeruginosa,V.cholerae)
L=3 N=3 J=2 S=1 Protein secretion, DNArecombination/repair(Holliday junctionresolution)
tRNA modification(queuine/archaeosinetRNA-ribosyltransferase)
24 9 9 376 23 4 (many bacteria) E=4 T=3 K=2 C=1H=1 R=1
Amino acid transport,signal transduction(two-component system)
Energy conversion(alcohol dehydrogenase)

2218 Nucleic Acids Research, 2002, Vol. 30, No. 10
patterns of genes A and D, although they never belong to thesame operon.
Functionally, the gene neighborhoods tend to show a ‘themewith variations’ pattern: the majority of genes typically belongto the same functional category, whereas the minority encodeproteins with different, in some cases unrelated functions(Table 1). This is compatible with the observation that aconsiderable number of gene pairs, largely those present in arelatively small number of genomes, consist of genes fromdifferent functional categories (Fig. 2). Juxtaposition of genesin genomes leading to prediction of previously undetectedoperons is most often regarded as an opportunity for predictionof the functions of uncharacterized genes on the basis of thenotion that genes in the same operon should be functionallyconnected (15,17,28). The present analysis of gene neighbor-hoods also offers this possibility. The most notable case offunctional prediction produced using this approach, of a novelthermophile-specific DNA repair system, is presented in detailelsewhere (29).
More unexpectedly, however, it was noticed that, on manyoccasions, the ‘theme’ and ‘variations’ in a neighborhood hadno obvious functional links. In such cases, two alternativeinterpretations seem possible: (i) the genes in the neighbor-hood only appear to be functionally unrelated whereas inreality the variation genes have additional, as yet undiscoveredfunctions that connect them to the theme; and (ii) although nospecific functional connection (such as being parts of the samepathway or functional system) exists between the theme andthe variations, the latter gene products are required in roughlythe same amounts and under the same conditions as the former,hence the advantage of co-regulation. We call the latter hypo-thetical phenomenon of co-expression of genes that are notknown to be involved in direct functional interactions‘genomic hitchhiking’, whereby unrelated genes occasionally‘hitch a ride’, e.g. with highly expressed genes, such as thosecoding for ribosomal proteins. In the several examplesdiscussed below, we concentrate mostly on the more unexpectedphenomenon of apparent genomic hitchhiking, although somefunctional predictions are also considered.
Ribosomal protein operons, which comprise the largest ofthe identified neighborhoods (Table 1), often include add-itional genes coding for proteins that do not appear to be directlyfunctionally linked to translation, ribosomal biogenesis or RNAmodification, e.g. central metabolic enzymes such as enolase,and enzymes involved in energy production and conversionsuch as cytochromes and Fe-S-cluster oxidoreductases (Fig. 5Aand B). In each of these cases, the juxtaposition of geneswithout an apparent functional connection is conserved in aphylogenetically coherent group of microbes (euryarchaeotaand a subset of proteobacteria, respectively), which is compatiblewith a single origin of each of these configurations. Althoughthe evolutionary range of conservation was relatively narrowin each of these cases, the presence of the gene strings in questionin multiple genomes could not be explained by chance (see thediscussion of Monte Carlo simulations above). Interestingly, ithas been shown that E.coli enolase has a second function as a(probable) structural component of the degradosome, a multi-protein complex that contains several RNases and a helicaseand has a major role in bacterial RNA degradation (30,31).Although archaea do not have a degradosome and insteadappear to possess an evolutionary predecessor of the eukaryotic
exosome (32), a role for enolase in archaeal RNA metabolism,which is likely to be directly coupled to translation, cannot beruled out. Should that be the case (which is currently a purelyspeculative possibility), the presence of enolase in the samepredicted operon with ribosomal proteins would seem to be aborderline case between co-regulation stemming from a directfunctional association and genomic hitchhiking because,although RNA degradation and translation might be coupled,ribosomal proteins are not directly involved in the former. Inthe case of electron-transfer chain enzymes, there is noevidence of a functional connection with translation, so thisappears to be a case of genomic hitchhiking that was conservedin proteobacteria due to the selective advantage of high-levelexpression of the genes for these enzymes, commensurate withthe expression level of ribosomal protein genes. This advan-tage might also extend to a similar pattern of regulation of theexpression of ribosomal protein genes and genes for metabolicenzymes by the abundance of metabolites. In contrast, theassociation of genes for the SspA and SspB proteins, which areinvolved in stringent starvation response, with ribosomaloperons (Fig. 5B) seems to suggest a direct functional connection,which is supported by the ribosomal association of SspB andits role in the degradation of incomplete proteins (33).
Figure 6 shows a gene neighborhood that consists of genescoding for three functionally distinct sets of proteins: (i) threesubunits of the Holliday junction resolvasome (RuvABC),
Figure 5. Fragments of the ribosomal protein gene neighborhood 1 containingapparent hitchhiker genes. Colored arrows indicate the COGs that belong tothe ribosomal protein gene neighborhood; open arrows indicate inserted genes.(A) The gene for the glycolytic enzyme enolase is part of the ribosomal proteingene cluster in Euryarchaeota. COG0102, large subunit ribosomal protein L13;COG0103, small subunit ribosomal protein S9; COG1644, DNA-directedRNA polymerase, subunit N; COG1758, DNA-directed RNA polymerase, sub-unit K; COG0148, enolase. (B) Proteobacterial ribosomal protein clusterincludes genes for stringent starvation response proteins, which appear to befunctionally linked to translation, and genes for electron transfer chain compon-ents, probable hitchhikers. COGs absent in (A): COG0723, Rieske Fe-S clusterprotein; COG1290, cytochrome b subunit of the bc complex; COG2857, cyto-chrome c1; COG0625, stringent starvation protein A (glutathione S-trans-ferase); COG2969, stringent starvation protein B; COG0583, transcriptionalregulator; COG0327, uncharacterized conserved protein.

Nucleic Acids Research, 2002, Vol. 30, No. 10 2219
(ii) three subunits of protein membrane translocase (SecDF,YajC) and (iii) two distinct forms of a tRNA-modificationenzyme, queuine-tRNA-ribosyltransferase (QueA and Tgt).This example illustrates how neighborhoods are held togethervia a tiling path (compare with the graph representation in Fig. 3).The relevance, in terms of co-regulation, of the juxtapositionof the genes for the tRNA modification enzymes and the genesfor translocase subunits is strongly supported by the conservationof this gene arrangement in several bacterial genomes (Fig. 6)and is compatible with the proposal that these genes form anoperon in E.coli (34). There is no direct juxtaposition of thegenes for resolvasome subunits and those for the translocasesubunits in any genome, but the former belong to the sameputative operon with the genes for one or both of the queuine-tRNA-ribosyltransferases in distant bacteria, such as Bacillus,Borrelia and Helicobacter. Furthermore, in Bacillus this putativeoperon also includes translocase subunit (YajC). Thus, thethree groups of genes appear to be reliably linked into agenomic neighborhood and might have similar expressionpatterns. Since there is no indication of any specific functionalinteractions between the products of the three groups of genesin this neighborhood, it appears likely that the selective advan-tage of keeping different combinations of these genes in thesame operon lies in maintaining approximately the same leveland temporal pattern of expression. It is hard to decide, in thiscase, which group of genes is the ‘driver’ and which one is the‘hitchhiker’ because the groups of genes are of approximately
the same size and there is no single obvious functional themein the neighborhood. This example illustrates a more equitablerelationship between distinct functional groups of genes,perhaps making an association with ‘car-pooling’ more rele-vant than that with ‘hitchhiking’. The neighborhood alsoincludes an uncharacterized gene (COG0217) that is conservedin all bacteria and is linked to the genes for resolvasome subunitsin proteobacteria (Fig. 6). A detailed analysis of the sequencesof the proteins in COG0217 failed to detect any relationshipswith structurally or functionally characterized proteins(E.V.Koonin, unpublished observations). Under the paradigmof context analysis, it might have been predicted that theprotein encoded by this gene directly interacts with theresolvasome; however, the common occurrence of apparentgenomic hitchhiking in various neighborhoods and in thisneighborhood in particular makes this a viable alternative tothe direct functional interpretation.
The neighborhood shown in Figure 7A has a well-definedtheme, translation and RNA modification, which is representedby two translation factors, a ribosomal protein and the pseudo-uridine synthase TruB. The gene for transcription elongationfactor NusA and the polynucleotide phosphorylase gene seemto join this theme because, in bacteria, transcription, translationand RNA degradation are coupled, and the advantages of co-regulating the corresponding genes are obvious (35). The genefor an uncharacterized conserved protein (COG0779) is almostinseparable from the nusA gene and, as already predicted
Figure 6. Neighborhood 20: unexpected connection between the Holliday junction resolvasome and protein translocase. COG0217, uncharacterized conservedprotein; COG0817, endonuclease subunit of the resolvasome; COG2255, helicase subunit of the resolvasome; COG0809, queuine-tRNA-ribosyltransferase(QueA); COG0343, queuine-tRNA-ribosyltransferase (Tgt); COG1862, COG0342, COG0341, subunits of protein translocase (the Sec complex); COG0425,predicted regulator of disulfide bond formation; COG3158, potassium transporter; COG1826, component of a Sec-independent protein secretion pathway; COG0805,component of a Sec-independent protein secretion pathway.

2220 Nucleic Acids Research, 2002, Vol. 30, No. 10
previously (10), is likely to be a direct functional partner ofNusA. In addition, the neighborhood includes an apparenthitchhiker, the gene for FAD synthase. The association of theFAD synthase gene with this neighborhood is not as tight asthe connections between the genes belonging to the theme, butis seen in bacteria from different major lineages, such as twospecies of Bacillus, T.maritima, D.radiodurans and the myco-plasmas. This pattern is compatible with an ancient fusion thatwas subsequently disrupted in many bacteria. Notably, inanother distinct set of bacterial genomes the FAD synthasegene belongs to another smaller neighborhood, which includestwo translation-related genes, those for Ile-RS and a differenttype of pseudouridine synthase (Fig. 7B). The apparentlyindependent incorporation of the FAD synthase gene in twodistinct translation-associated neighborhoods suggests an asyet not understood requirement for tight expressional couplingof this gene with translation system components; the alternativepossibility of an unknown second function of FAD synthase,
which might be specifically linked to translation, cannot be ruledout either. The neighborhood shown in Figure 7B additionallyincludes the genes for lipoprotein signal peptidase and twoother membrane proteins. In this case, the cause of the associationof these genes with those for translation components might bedirect coupling between translation and protein secretion.
At face value, the gene neighborhood shown in Figure 8 doesnot seem to have one or two clearly defined functional themes.However, the presence of a conserved gene module thatincludes the genes for the phosphate starvation-inducedATPase PhoH, a predicted metal-dependent hydrolase(COG0319) and a CBS domain-containing protein (COG1253)seems to suggest the theme of signal transduction. Thesecondary theme could be, once again, translation and RNAdegradation as suggested by the presence of the genes for theribosome-associated Era GTPase (36) and RNase III. Thisneighborhood emerges as a particularly notable example ofapparent genomic hitchhiking/car-pooling, with genes of
Figure 7. Probable gene hitchhiking: independent incorporation of the FAD synthase gene in two translation-related neighborhoods. (A) Neighborhood 14: Thelist of COGs is as in Figure 3. (B) Neighborhood 50: COG0728, uncharacterized membrane protein; COG0196, FAD synthase; COG0060, isoleucyl-tRNAsynthetase; COG0597, lipoprotein signal peptidase; COG1047, FKBP-like peptidyl-prolyl cis–trans isomerase; COG0761, membrane protein, penicillin tolerancedeterminant.

Nucleic Acids Research, 2002, Vol. 30, No. 10 2221
various functions combined in overlapping arrays, possiblyreflecting similar patterns of co-regulation. It is also notablethat this neighborhood consists of two distinct modules(LepA–PdxJ and FeS-cluster oxidoreductase–CBS domain-containing protein). The two modules are held together by thePhoH–COG1480–COG0319-Era array, which is conservedamong Gram-positive bacteria (Fig. 8).
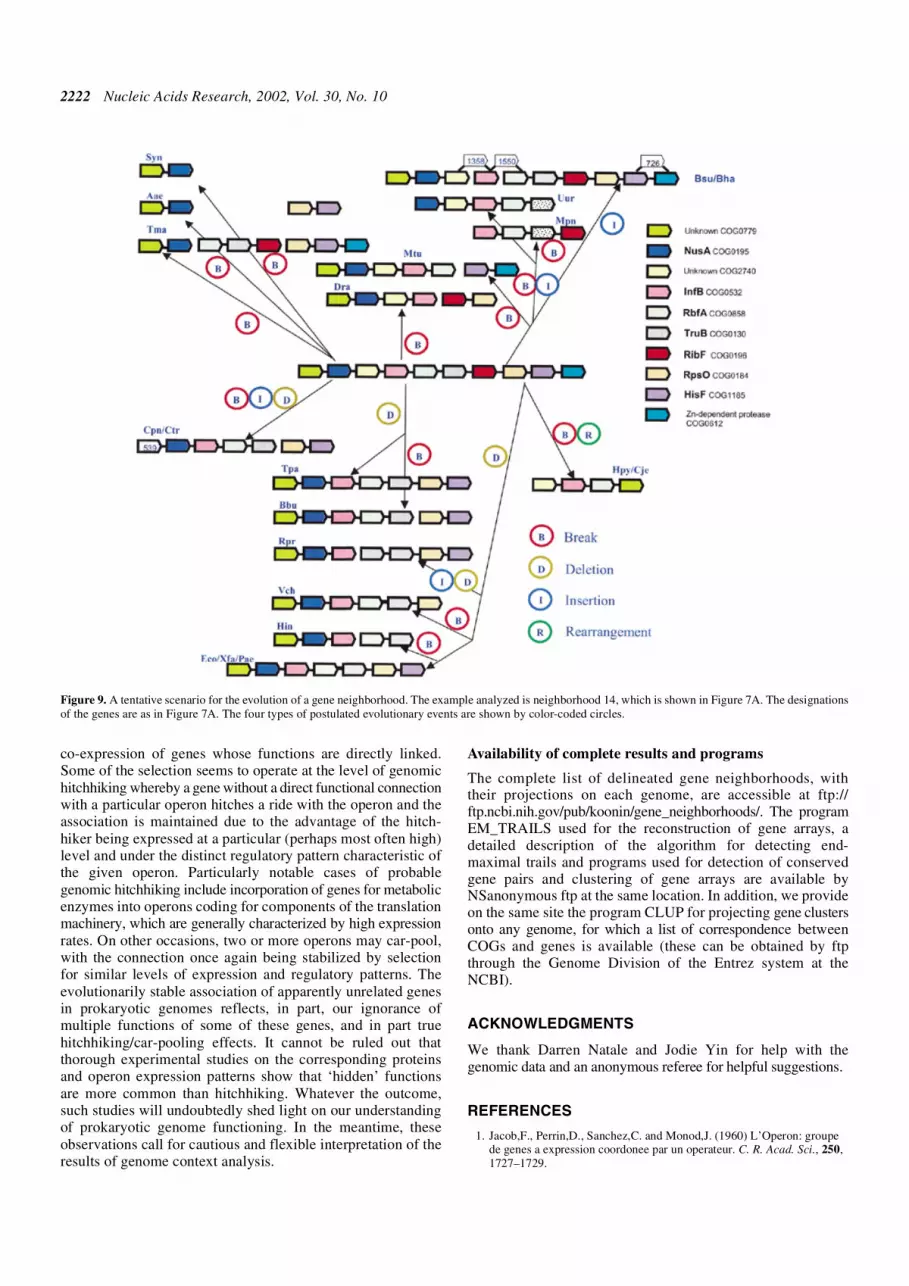
Developing algorithms for the reconstruction of optimalevolutionary scenarios for the larger genomic neighborhoodsidentified with the present approach is an extremely complextask (37), which is beyond the scope of the present work.However, for small to moderate size neighborhoods, plausiblescenarios can be easily constructed manually. Figure 9 showssuch a scenario for neighborhood 14, which is depicted inFigure 7A. Here we postulate that the ancestral form of thisneighborhood resembled the most complete version seen inextant genomes, those of the two Bacillus species. Under thisassumption, the evolution of this neighborhood in differentlines of descent can be easily represented by postulating fourtypes of events: break of gene arrays, gene deletion, gene insertionand rearrangement of arrays (Fig. 9). In this particularscenario, breaks of arrays dominate among the postulatedevolutionary events, but this is determined, in part, by ourassumption that the ancestral form resembled the largestknown array consisting of genes from this neighborhood. If adifferent ancestral state was assumed, the relative contributions ofdifferent types of events could differ substantially.
DISCUSSION AND CONCLUSIONS
The comparative genomic approach used in this work wasdeliberately inclusive and aimed at the detection of large,complex gene neighborhoods. Accordingly, many of theresulting objects are complicated conglomerates of numerousoverlapping gene arrays. Most of these arrays, let alone thelarger neighborhoods, are not represented in their entirety inany particular genome. The very fact that the neighborhoodsdetected are branched structures consisting of overlappinggene arrays indicates that they are neither reconstructions of anancestral gene order nor functional domains (regulons) in anyparticular genome, although some of the constituent genearrays might meet each of these objectives. Taken as a whole,each neighborhood represents the repertory of alternativeconfigurations of genes within a distinct gene set, which formvarious (predicted) operons. Overlapping portions of theseneighborhoods are, to a varying extent, conserved duringevolution, which confers functional relevance on the entireneighborhoods.
The sets of genes comprising a neighborhood can typicallybe viewed as a theme with variations in terms of the functionsof the encoded proteins (smaller neighborhoods are less likelyto include any variations, and in a few neighborhoods it may bedifficult to define a clear theme; see Table 1 and above). Thetheme with variations pattern suggests that there might be moreto the evolution of gene order in prokaryotes than selection for
Figure 8. Apparent operon car-pooling: association of diverse functional themes (neighborhood 13). COG0481, membrane-associated GTPase; COG0681, signalpeptidase; COG0571, RNase III; COG1159, ribosome-associated GTPase; COG1381, recombinational repair pathway component; COG0854, enzyme of pyridoxalphosphate biosynthesis; COG0621, 2-methylthioadenine synthetase; COG1702, predicted ATPase involved in phosphate regulon regulation; COG1480, predictedhydrolase of the HD family; COG0319, predicted metal-dependent hydrolase; COG1253, CBS-domain-containing protein; COG0818, diacylglycerol kinase;COG0295, cytidine deaminase.
2222 Nucleic Acids Research, 2002, Vol. 30, No. 10
co-expression of genes whose functions are directly linked.Some of the selection seems to operate at the level of genomichitchhiking whereby a gene without a direct functional connectionwith a particular operon hitches a ride with the operon and theassociation is maintained due to the advantage of the hitch-hiker being expressed at a particular (perhaps most often high)level and under the distinct regulatory pattern characteristic ofthe given operon. Particularly notable cases of probablegenomic hitchhiking include incorporation of genes for metabolicenzymes into operons coding for components of the translationmachinery, which are generally characterized by high expressionrates. On other occasions, two or more operons may car-pool,with the connection once again being stabilized by selectionfor similar levels of expression and regulatory patterns. Theevolutionarily stable association of apparently unrelated genesin prokaryotic genomes reflects, in part, our ignorance ofmultiple functions of some of these genes, and in part truehitchhiking/car-pooling effects. It cannot be ruled out thatthorough experimental studies on the corresponding proteinsand operon expression patterns show that ‘hidden’ functionsare more common than hitchhiking. Whatever the outcome,such studies will undoubtedly shed light on our understandingof prokaryotic genome functioning. In the meantime, theseobservations call for cautious and flexible interpretation of theresults of genome context analysis.
Availability of complete results and programs
The complete list of delineated gene neighborhoods, withtheir projections on each genome, are accessible at ftp://ftp.ncbi.nih.gov/pub/koonin/gene_neighborhoods/. The programEM_TRAILS used for the reconstruction of gene arrays, adetailed description of the algorithm for detecting end-maximal trails and programs used for detection of conservedgene pairs and clustering of gene arrays are available byNSanonymous ftp at the same location. In addition, we provideon the same site the program CLUP for projecting gene clustersonto any genome, for which a list of correspondence betweenCOGs and genes is available (these can be obtained by ftpthrough the Genome Division of the Entrez system at theNCBI).
ACKNOWLEDGMENTS
We thank Darren Natale and Jodie Yin for help with thegenomic data and an anonymous referee for helpful suggestions.
REFERENCES
1. Jacob,F., Perrin,D., Sanchez,C. and Monod,J. (1960) L’Operon: groupede genes a expression coordonee par un operateur. C. R. Acad. Sci., 250,1727–1729.
Figure 9. A tentative scenario for the evolution of a gene neighborhood. The example analyzed is neighborhood 14, which is shown in Figure 7A. The designationsof the genes are as in Figure 7A. The four types of postulated evolutionary events are shown by color-coded circles.

Nucleic Acids Research, 2002, Vol. 30, No. 10 2223
2. Jacob,F. and Monod,J. (1961) Genetic regulatory mechanisms in thesynthesis of proteins. J. Mol. Biol., 3, 318–356.
3. Miller,J.H. and Reznikoff,W.S.E. (1978) The Operon. Cold SpringHarbor Laboratory Press, Cold Spring Harbor, NY.
4. Mushegian,A.R. and Koonin,E.V. (1996) Gene order is not conserved inbacterial evolution. Trends Genet., 12, 289–290.
5. Dandekar,T., Snel,B., Huynen,M. and Bork,P. (1998) Conservation ofgene order: a fingerprint of proteins that physically interact.Trends Biochem. Sci., 23, 324–328.
6. Lawrence,J.G. and Roth,J.R. (1996) Selfish operons: horizontal transfermay drive the evolution of gene clusters. Genetics, 143, 1843–1860.
7. Lawrence,J. (1999) Selfish operons: the evolutionary impact of geneclustering in prokaryotes and eukaryotes. Curr. Opin. Genet. Dev., 9,642–648.
8. Watanabe,H., Mori,H., Itoh,T. and Gojobori,T. (1997) Genome plasticityas a paradigm of eubacteria evolution. J. Mol. Evol., 44, S57–S64.
9. Tatusov,R.L., Mushegian,A.R., Bork,P., Brown,N.P., Hayes,W.S.,Borodovsky,M., Rudd,K.E. and Koonin,E.V. (1996) Metabolism andevolution of Haemophilus influenzae deduced from a whole-genomecomparison with Escherichia coli. Curr. Biol., 6, 279–291.
10. Wolf,Y.I., Rogozin,I.B., Kondrashov,A.S. and Koonin,E.V. (2001)Genome alignment, evolution of prokaryotic genome organization andprediction of gene function using genomic context. Genome Res., 11,356–372.
11. Overbeek,R., Fonstein,M., D’Souza,M., Pusch,G.D. and Maltsev,N.(1998) Use of contiguity on the chromosome to predict functionalcoupling. In Silico Biol., 2, 93–108.
12. Overbeek,R., Fonstein,M., D’Souza,M., Pusch,G.D. and Maltsev,N.(1999) The use of gene clusters to infer functional coupling. Proc. NatlAcad. Sci. USA, 96, 2896–2901.
13. Fujibuchi,W., Ogata,H., Matsuda,H. and Kanehisa,M. (2000) Automaticdetection of conserved gene clusters in multiple genomes by graphcomparison and P-quasi grouping. Nucleic Acids Res., 28, 4029–4036.
14. Kolesov,G., Mewes,H.W. and Frishman,D. (2001) SNAPping upfunctionally related genes based on context information: a colinearity-freeapproach. J. Mol. Biol., 311, 639–656.
15. Galperin,M.Y. and Koonin,E.V. (2000) Who’s your neighbor? Newcomputational approaches for functional genomics. Nat. Biotechnol., 18,609–613.
16. Huynen,M., Snel,B., Lathe,W. and Bork,P. (2000) Exploitation of genecontext. Curr. Opin. Struct. Biol., 10, 366–370.
17. Huynen,M., Snel,B., Lathe,W.,III and Bork,P. (2000) Predicting proteinfunction by genomic context: quantitative evaluation and qualitativeinferences. Genome Res., 10, 1204–1210.
18. Lathe,W.C.,III, Snel,B. and Bork,P. (2000) Gene context conservation ofa higher order than operons. Trends Biochem. Sci., 25, 474–479.
19. Tatusova,T.A., Karsch-Mizrachi,I. and Ostell,J.A. (1999) Completegenomes in WWW Entrez: data representation and analysis.Bioinformatics, 15, 536–543.
20. Tatusov,R.L., Koonin,E.V. and Lipman,D.J. (1997) A genomicperspective on protein families. Science, 278, 631–637.
21. Tatusov,R.L., Natale,D.A., Garkavtsev,I.V., Tatusova,T.A.,Shankavaram,U.T., Rao,B.S., Kiryutin,B., Galperin,M.Y., Fedorova,N.D.and Koonin,E.V. (2001) The COG database: new developments inphylogenetic classification of proteins from complete genomes.Nucleic Acids Res., 29, 22–28.
22. Yellen,J. and Gross,J.L. (1998) Graph Theory and its Applications. CRCPress, Boca Raton, FL.
23. West,D.B. (2001) Introduction to Graph Theory, 2nd Edn. Prentice Hall,New York.
24. Salgado,H., Moreno-Hagelsieb,G., Smith,T.F. and Collado-Vides,J.(2000) Operons in Escherichia coli: genomic analyses and predictions.Proc. Natl Acad. Sci. USA, 97, 6652–6657.
25. Ermolaeva,M.D., White,O. and Salzberg,S.L. (2001) Prediction ofoperons in microbial genomes. Nucleic Acids Res., 29, 1216–1221.
26. Wolf,Y.I., Rogozin,I.B., Grishin,N.V., Tatusov,R.L. and Koonin,E.V.(2001) Genome trees constructed using five different approaches suggestnew major bacterial clades. BMC Evol. Biol., 1, 8.
27. Snel,B., Lehmann,G., Bork,P. and Huynen,M.A. (2000) STRING:a web-server to retrieve and display the repeatedly occurringneighbourhood of a gene. Nucleic Acids Res., 28, 3442–3444.
28. Huynen,M.A. and Snel,B. (2000) Gene and context: integrativeapproaches to genome analysis. Adv. Protein Chem., 54, 345–379.
29. Makarova,K.S., Aravind,L., Grishin,N.V., Rogozin,I.B. and Koonin,E.V.(2002) A DNA repair system specific for thermophilic archaea andbacteria predicted by genomic context analysis. Nucleic Acids Res., 30,482–496.
30. Py,B., Higgins,C.F., Krisch,H.M. and Carpousis,A.J. (1996)A DEAD-box RNA helicase in the Escherichia coli RNA degradosome.Nature, 381, 169–172.
31. Kuhnel,K. and Luisi,B.F. (2001) Crystal structure of the Escherichia coliRNA degradosome component enolase. J. Mol. Biol., 313, 583–592.
32. Koonin,E.V., Wolf,Y.I. and Aravind,L. (2001) Prediction of the archaealexosome and its connections with the proteasome and the translation andtranscription machineries by a comparative-genomic approach.Genome Res., 11, 240–252.
33. Levchenko,I., Seidel,M., Sauer,R.T. and Baker,T.A. (2000)A specificity-enhancing factor for the ClpXP degradation machine.Science, 289, 2354–2356.
34. Reuter,K., Slany,R., Ullrich,F. and Kersten,H. (1991) Structure andorganization of Escherichia coli genes involved in biosynthesis of thedeazaguanine derivative queuine, a nutrient factor for eukaryotes.J. Bacteriol., 173, 2256–2264.
35. Lupski,J.R. and Godson,G.N. (1989) DNA–DNA and DNA–RNA–protein: orchestration by a single complex operon. Bioessays, 10,152–157.
36. Sayed,A., Matsuyama,S. and Inouye,M. (1999) Era, an essentialEscherichia coli small G-protein, binds to the 30S ribosomal subunit.Biochem. Biophys. Res. Commun., 264, 51–54.
37. Pevzner,P.A. (2000) Computational Molecular Biology. An AlgorithmicApproach. MIT Press, Cambridge, MA.