titan's inventory of organic surface materials
TRANSCRIPT

1
Titan’s Inventory of Organic Surface Materials
Ralph D. Lorenz1,*, Karl L. Mitchell2, Randolph L. Kirk3, Alexander G. Hayes4, OdedAharonson4, Howard A. Zebker5, Phillipe Paillou6, Jani Radebaugh7, Jonathan I. Lunine8,Michael A. Janssen2, Stephen D. Wall2, Rosaly M. Lopes2, Bryan Stiles2, Steve Ostro2,
Giuseppe Mitri2, Ellen R. Stofan9 and the Cassini RADAR Team
1 Johns Hopkins University Applied Physics Laboratory, Laurel, MD 20723,2Jet Propulsion Laboratory, California Institute of Technology, Pasadena, CA 91109.3 U. S. Geological Survey, Flagstaff, AZ 86001.4 Geological and Planetary Sciences, California Institute of Technology, Pasadena, CA5 Stanford University , Stanford CA 943056 OASU-L3AB UMR 5804, BP 89, 33270 Floirac, France7 Department of Geological Sciences, Brigham Young University, Provo, UT.8 Lunar and Planetary Laboratory, University of Arizona, Tucson, AZ 857219 Proxemy Research, Rectortown, VA 20140
Submitted 21 September 2007 to Geophysical Research Letters
Revised version 2007GL032118R Accepted 20th November 2007
hal-0
0261
487,
ver
sion
1 -
18 M
ar 2
008
Author manuscript, published in "Geophysical Research Letters 35 (2008) 02206" DOI : 10.1029/2007GL032118

2
Abstract
Cassini RADAR observations now permit an initial assessment of the inventory of two classes,
presumed to be organic, of Titan surface materials: polar lake liquids and equatorial dune sands.
Several hundred lakes or seas have been observed, of which dozens are each estimated to contain
more hydrocarbon liquid than the entire known oil and gas reserves on Earth. Dark dunes cover
some 20% of Titan’s surface, and comprise a volume of material several hundred times larger
than Earth’s coal reserves. Overall, however, the identified surface inventories (>3x10⁴ km3 of
liquid, and >2x10⁵ km3 of dune sands) are small compared with estimated photochemical
production on Titan over the age of the solar system. The sand volume is too large to be
accounted for simply by erosion in observed river channels or ejecta from observed impact
craters. The lakes are adequate in extent to buffer atmospheric methane against photolysis in the
short term, but do not contain enough methane to sustain the atmosphere over geologic time.
Unless frequent resupply from the interior buffers this greenhouse gas at exactly the right rate,
dramatic climate change on Titan is likely in its past, present and future.
hal-0
0261
487,
ver
sion
1 -
18 M
ar 2
008
3
1. Introduction
It has been long realized (e.g. Hunten, 1973) that thick deposits of photochemical materials may
have accumulated on Titan’s surface. Prior to the arrival of Cassini-Huygens, some 20 different
organic molecules had been identified in Titan’s atmosphere (e.g. Lorenz and Mitton, 2002), but
the composition and extent of surface deposits was unknown. In this paper we report an
assessment of the volume of liquid and solid organic materials from radar imaging data over
~20% of Titan’s surface.
Two principal surface carbon reservoirs are considered: lakes and dunes. There may be
considerable deposits of other organic materials, for example in Titan’s midlatitudes where
neither of these feature types are seen, and indeed global measurements of Titan’s dielectric
constant (Elachi et al., 2005) suggest that porous and/or organic materials make up much of the
surface. This interpretation is not unique, nor can we assess any potential subsurface reservoirs
such as an aquifer system that may hydraulically connect the lakes. We restrict the present
analysis to areas where we can make morphological identification of aeolian sediment and
liquids in lakes. Compositions have not been measured directly, but can be inferred to be
predominantly carbon-bearing as follows.
Only methane, ethane and propane are liquids at Titan’s surface conditions, but propane is
produced in photochemical models only 1/40th as abundantly as ethane (e.g. Yung and DeMore,
1999). Some organic solids may be dissolved as traces (Raulin, 1987) up to a few per cent and
in equilibrium with the atmosphere about 5% dissolved nitrogen is present, but for brevity we
consider the lakes as an ethane/methane mix.
The dune sand is known to be radar-dark, as well as dark at near-infrared window wavelengths
between 0.94 and 5 microns since the radar-determined sand seas correspond (Lorenz et al.,
2006a) to regions seen to be dark in near-infrared groundbased observations and dunes were seen
in Huygens images (Soderblom et al., 2007).. These factors suggest, but do not prove, an organic
component, such as the photochemical 'tholin' material produced in laboratory simulations, rather
than pure water ice.
hal-0
0261
487,
ver
sion
1 -
18 M
ar 2
008

4
2. Lakes
Although a surface reservoir of hydrocarbon liquids was long expected on Titan, convincing
evidence for such liquids was not found until radar imaging covered high latitude areas (Stofan
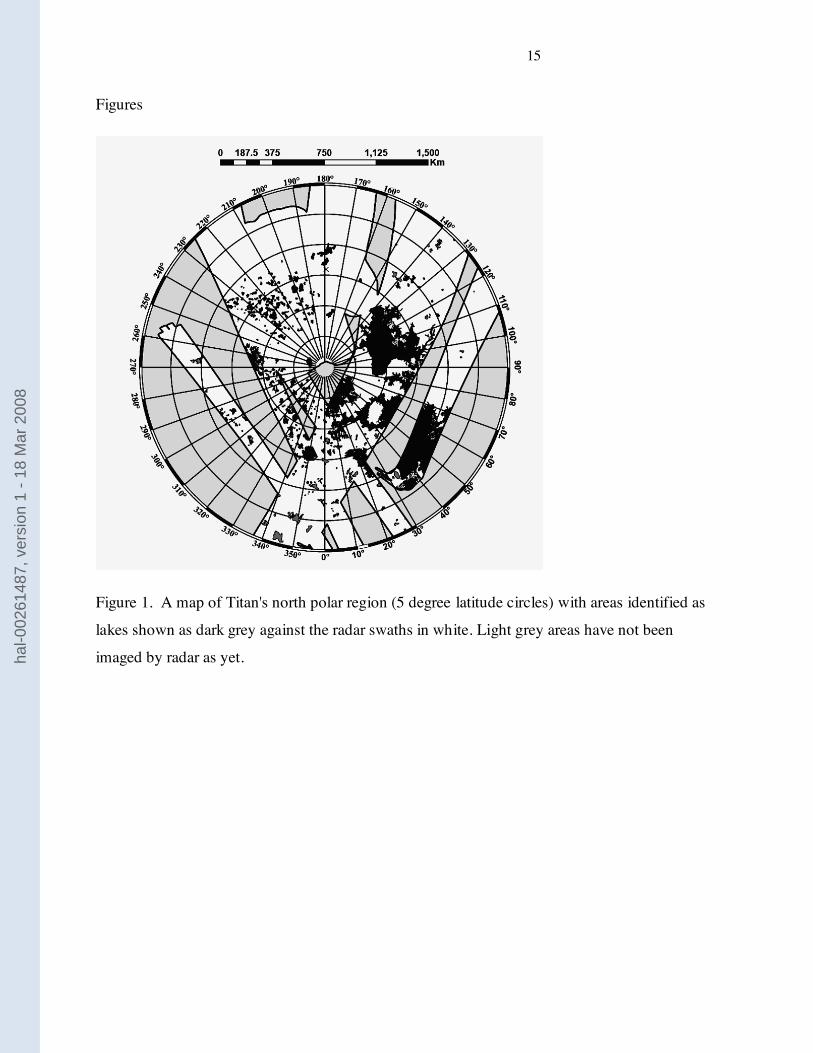
et al., 2007.) Above 55oN, radar observations have now (through T30 – May 2007) covered
55.4% of the terrain : of this, some 10% (~400,000km2, or 0.5% of Titan's surface) is identified
as covered by lakes or seas – see figure 1. A variety of lake morphologies imply diverse
formation mechanisms that may include terrain flooding and karst dissolution (Mitchell et al., in
preparation). Features range in size from a few kilometers (the smallest recognizable in our best
data of ~300m/pixel) to several hundred km. The combination of low radar reflectivity and high
microwave emissivity plus the feature morphology and association with channels together point
to present-day liquid.
To determine the lake depth we use terrestrial analogs as a guide. A brief survey of terrestrial
lakes (see figure 2) indicates that a convenient and reasonably effective estimate is that a lake has
an aspect ratio of 1/1000 (i.e. the average depth d=0.0010 X, where the lake area is X^2, or
equivalently its depth in meters equals the size in kilometers.) A least-squares linear fit to the
world’s 20 largest lakes yields d=0.0015 X + 66. In practice, the diverse lake formation settings
– from deep rift, fault or glacial lakes to shallow playas - lead to variations of an order of
magnitude about these values. A survey (Hayes et al., in preparation – see also figure 1) of the
Titan lakes indicates a median area of 100km2, and thus a depth of ~10m and a volume of 1km3.
However, a ‘similar-shape’ model like this will find the liquid volume dominated by the largest
lake – so far the largest lake or sea imaged is a 400x200km (80,000km2) section of what is
presumably a rather larger (as yet unnamed) feature at 70oN, 315oW, which would
correspondingly be ~300m deep, or have a total volume of some ~25,000km3, even without
allowing for unobserved areas of this feature (which near-infrared imaging shows to be part of a
large, irregular optically-dark feature with an area of some 340,000km2 (Turtle et al., 2007)).
Another metric is the height of nearby topography. Terrestrial examples suggest that average
lake depth is often a factor of 10 less than the height of the highest nearby terrain, although again
there are extremes (e.g. Lake Baikal, Earth’s deepest lake at 1600m, has mountains of ~3400m
nearby, whereas the Great Salt Lake has a depth of only a few m but has nearby km-high
hal-0
0261
487,
ver
sion
1 -
18 M
ar 2
008

5
mountains – i.e. the depth/terrain ratio can vary from about 2 to several hundred.) Altimetry and
other data show that there is relief of ~700m or more in Titan's North polar lakeland terrain, as
in a few other areas on Titan. Thus a characteristic depth of 70m would be implied, in good
agreement with the 10-300m range suggested by area scaling above.
A final, and completely independent, measure is radiometric. The darkest parts of some lakes,
generally the largest ones, are ‘black holes’, offering no measureable radar return down to the
instrument noise floor of ~ -26 dB (Stofan et al., 2007). This requires not only that the surface
reflection be very small (consistent with a smooth surface of a low dielectric constant material,
such as a liquid hydrocarbon surface unroughened by waves) but also requires that the liquid be
deep and/or lossy enough to suppress a bottom reflection. Lake bottoms with sediment density
increasing smoothly with depth could also suppress bottom reflections via gradient-index
impedance matching : however, there are morphological indications such as dark channels
incised in almost-as-dark lakes that suggest that at least in some places bottom reflections are
seen. Assuming then that such lakebed features are being hidden in ‘black’ areas by column
absorption, a minimum depth can be inferred : the lower the assumed loss tangent !, the deeper
the lake must be. Clean liquid hydrocarbons have !~10-4 to 10-3 (Sen et al., 1992; Rodriguez et
al., 2003) although suspended or dissolved polar molecules such as nitriles and small tholin
particles could increase these values. A penetration depth (1/e one-way absorption – see e.g.
similar calculations elsewhere in the Saturnian system, Ostro et al., 2006) of "/2#!$%&'with " the
radar wavelength of 2.2cm and %'the real part of the dielectric constant (~2), would therefore be
2-20m – lakes with nonzero reflectivity or visible lakebed features are therefore likely shallower
than this range.
In summary, several lines of evidence point towards smaller lakes on Titan (~100km2) having a
depth of the order of 10m, and the handful of large ‘seas’ having depths ten or more times
greater. It is noteworthy, that dozens of Titan's lakes individually contain ~200km3 of liquid
methane/ethane, an amount equal to the ~130 billion tonnes of proven natural gas reserves on
Earth. Indeed, Titan’s total inventory of liquids exceeds terrestrial oil and gas reserves by a
factor of several hundred (~400-500 GT or ~800-1000 km3, Falkowski et al., 2000; BP 2007).
hal-0
0261
487,
ver
sion
1 -
18 M
ar 2
008

6
Taking a conservative average depth of 20m, and a total lake area of ~400,000km2 gives an
observed inventory of some 8000 km3, although if the larger lakes or seas have larger depths, an
inventory of the order of 5-10 times this is likely. This is the inventory that has been directly
observed by radar to date. If we make the assumption that the unobserved 45% of terrain north of
55oN has a similar coverage, we double the inventory. A further doubling arises if we assume
that southern polar areas have a similar inventory to the North, leading to a likely inventory of
3x10⁴ – 3x10⁵ km3 of liquid. Radar imaging of the southern polar region is planned for Cassini's
extended mission, but a lake-shaped, optically-dark region (Turtle et al., 2007) is already known
('Lacus Ontario', area ~40,000km2).
3. Dunes
Some 40% of Titan’s equatorial areas (up to 30o latitude) are covered in 1-2km wide longitudinal
sand dunes (Lorenz et al, 2006a; Radebaugh et al., 2007), correlating with areas seen to have a
distinct dark near-infrared spectral type (e.g. Soderblom et al., 2007), although very few are
found poleward of 30o . As on Earth, a range of dune size and interdune sand depth is observed.
First, when the radar illumination is broadside-on to large dunes and interdune sand is thick
enough that the intrinsic radar albedo of the surface is uniform, topographic shading is the major
contributor to brightness variation in the scene. This permits a radarclinometric estimate of dune
height of the largest dunes of ~150m (Lorenz et al., 2006a). The typical dune width to interdune
distance ratio is 1-4, so we can assign an area-average sand dune thickness (assuming a
triangular cross-section with height) of 15-50m. To this must be added the thickness of sand in
the interdune areas, estimated below as ~5m, and thus we adopt a typical area-averaged sand
thickness for thick-sand areas of 30m.
More typically, with off-broadside observations, smaller dune height and especially with thinner
interdune sand, the duneform is seen only as a dark streak, against a brighter exposed or thinly-
covered interdune background (as for many radar observations of dunes on Earth). In these cases,
radarclinometric measurement of height is impossible. However, field data of Earth dunes show
(Lancaster, 1995) that longitudinal dunes have height:width of 0.01-0.2, implying Titan dune
heights of 10-400m (similar heights result from considering the height:spacing ratios).
hal-0
0261
487,
ver
sion
1 -
18 M
ar 2
008

7
We can also apply a radiometric constraint, namely that the dunes appear dark against the bright
interdune material by obscuring it. Rodriguez et al. (2003) determine loss tangent ! of tholin of
between 0.001 and .05. The corresponding penetration depths as above (~"()*!+ are 2m and
0.04m. Thus a minimum thickness of dark streaks (and dark interdune areas where topographic
shading is seen) of a meter or so seems likely, although is in this case less constraining than the
morphological similarity range of >10m above. Again adopting a local dune coverage fraction
of 20-50%, we therefore find an area-average sand thickness of 2-200m and adopt 10m as a
working value.
Assuming roughly equal areas of thick and thin sand (noting that particular resolution and
viewing azimuth is needed to identify the former – although dark streaks are more commonly
seen in data so far, better imagery of the same areas might show topographic shading), the sand
seas (i.e. 40% of the half of Titan:s surface that lies between ±30o latitude) have an average sand
depth of 20m, which corresponds to a to a total inventory of some 3.2x10⁵ km3 of material. This
corresponds to about 400 times the ~900 billion tonnes of proven coal reserves on Earth (BP,
2007), a material which has some superficial similarities with the likely dune sand on Titan. The
figure above is perhaps more likely to underestimate the inventory than to overestimate it : a
reasonable range is therefore 2-8x10⁵ km3.
4. Discussion and Conclusions
The results reported here must be considered preliminary, not least since they are based on only
20% coverage of Titan’s surface, of which most is in the northern hemisphere and the equatorial
regions. However, the hemispheres would have to be very different to give results that diverge
widely from the estimates presented here. The inventory is substantial, exceeding in absolute
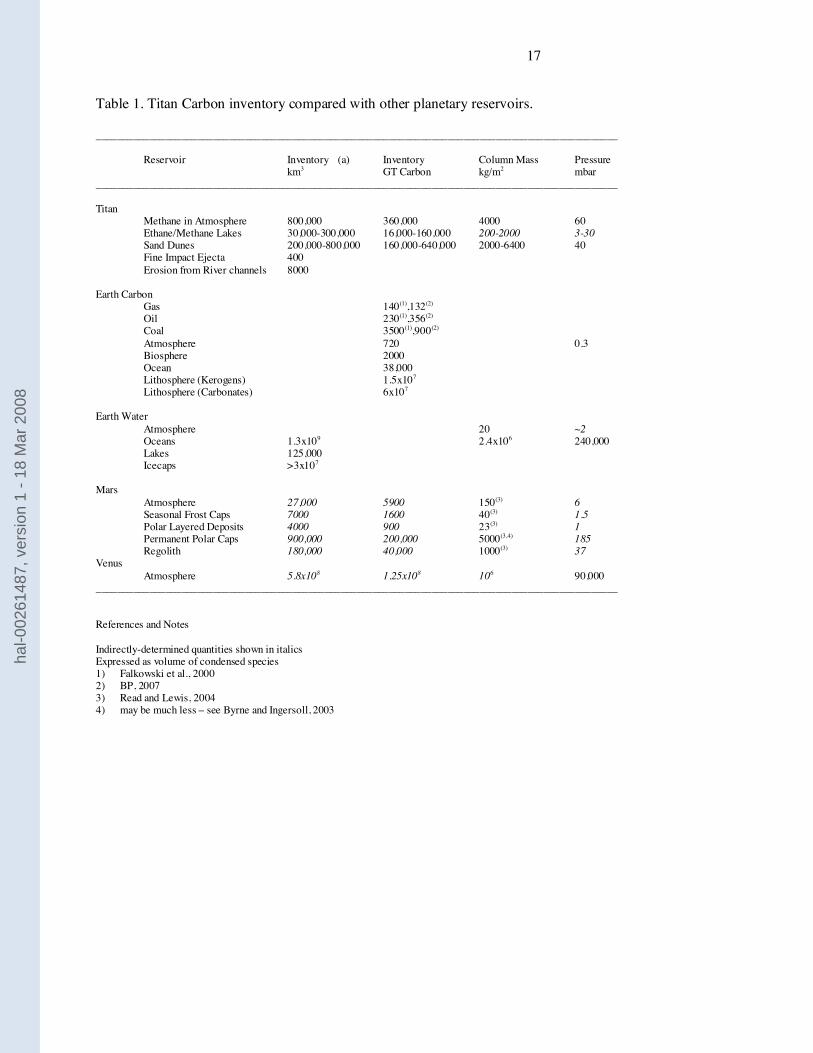
terms the biospheric, oceanic and fossil fuel reservoirs on Earth – see table 1. In terms of
column abundance (mass/area) Titan’s carbon inventory may approach Earth’s non-carbonate
reservoirs.
The total inventory we measure is substantially smaller than the reservoir estimated to be
produced throughout the age of the solar system if methane photoloysis were to have occurred
hal-0
0261
487,
ver
sion
1 -
18 M
ar 2
008
8
continuously at its present rate. The apparent dearth of material (compared to these model
predictions – a summary is given in Lorenz and Lunine (1995), of several hundred meters
thickness, or ~107-108 km3) may indicate one or more of four things. First, other undetected
organic materials are present, but not morphologically distinct. It is commonly assumed on the
basis of bulk cosmological abundance that Titan’s bedrock is dominated by water ice, but the
near-surface may in fact be dominated by organic material.. Furthermore, even at the low
latitudes dominated by arid landforms like dunes, the Huygens probe indicated that at least some
surface materials are moistened by liquid methane (Lorenz et al., 2006b; Niemann et al., 2005)
so some amount of liquid is present (perhaps in very large amounts) beyond the obvious
lakeforms. Second, the photochemical models may not correctly predict the ultimate yields of
surface deposits (c.f. the relative yields of solids and liquids – see next paragraph). Thirdly,
photochemical production may have been interrupted for long periods in Titan’s past if the
delivery of methane to the surface was episodic and led to occasional methane depletion. The
identification of cryovolcanic features on the surface (Sotin et al., 2005, Lopes et al., 2007)
supports such a picture. A final more speculative possibility is that some process has destroyed
or subducted the deposits, such that they no longer exist at the surface.
Note that the volume of sand considerably exceeds the amount of sand-sized material produced
in impact ejecta for the known craters. Applying the sediment productions in Lorenz et al. (1995)
for the known Titan craters yields only ~500km3 of mm-sized material. It is possible that the
larger volumes of bigger ejecta particles could have been broken down into sand by other
processes. The observed river channels, covering perhaps 0.1% of the surface and having
incision depths of 100m or less, are only able to account for ~104km3 of material. In sum,
geological processes cannot account simply for the large volume of sand-sized material on Titan,
supporting a photochemical origin for much of it (Lorenz et al., 2006a).
The uncertainty in lake volume compared to dune volume spans a liquid:solid ratio of 0.03-1.
Allowing for half of the liquid to be methane (e.g. see the ocean:atmosphere equilibrium
discussion in Lunine et al., 1983; Lorenz et al., 1999), solid materials must dominate over liquid
ethane. This contrasts with the predictions of photochemical models which indicated a converse
relationship, that acetylene and other solids would amount to less than a third of the amount of
liquid ethane (e.g. the acetylene:ethane production in three models reviewed in Lorenz and
hal-0
0261
487,
ver
sion
1 -
18 M
ar 2
008

9
Lunine 1995 ranged from 0.2 to 0.8). Unless strong assumptions are made about the relative
amounts of unobserved material such as subsurface ethane aquifers, models of photochemical
production (and perhaps subsequent chemical processing in lakes) need to explain the
predominance of solid materials. We note in this context that a major surprise from Cassini has
been the complexity of the organic species formed, even in the ionosphere. Benzene has been
detected in some abundance even at 1000km altitude and some polycyclic aromatic
hydrocarbons (PAHs) like anthracene and its derivatives have been inferred (Waite et al., 2007).
This unexpectedly rapid synthesis of heavy (solid) organics may be the reason there is more sand
than liquid.
Finally, the liquid inventory, while extending over a large enough area to permit evaporative
fluxes to match photochemical depletion on short timescales (Mitri et al., 2007), is not enough in
volume terms to sustain the concentration of this greenhouse gas in the atmosphere on geological
timescales. Put another way, there is an order of magnitude less liquid in the lakes than there is
methane in the atmosphere, and photochemical models predict that inventory to be depleted in
~10 Myr. This makes the present climatic situation somewhat precarious – the observed surface
reservoir, even if mostly methane, is unable to buffer the atmospheric methane for long, and
unless volcanic resupply matches methane loss at just the right rate, significant climate change is
likely in the future and by implication in the past (Lorenz et al., 1997; 1999). Stronger volcanic
fluxes of methane might lead to wetter conditions, perhaps producing flood features that cannot
be readily explained in the present climate. Periods without resupply might lead initially to
conditions dryer than present, but then (as the greenhouse warming of methane is lost) cooling
and condensation of some of the nitrogen atmosphere onto the surface – a partial collapse
(Lorenz et al., 1997).
The apparent ocean-atmosphere equilibrium is very different on Earth, where the condensable
greenhouse gas (water) in the air has a global equivalent depth of only ~2 cm, tiny compared to
the ~2.4km global average depth of its surface reservoir. The situation on Mars may be
intermediate (table 1) – if the permanent polar caps and regolith contain tens of times the
atmospheric inventory of CO2 (Read and Lewis, 2004), but recent work (e..g Byrne and
Ingersoll, 2003) suggests the caps have only a veneer of a few m of CO2 ice, making Mars rather
like Titan from a volatile inventory perspective. On Titan, if the liquid in the lakes participates in
hal-0
0261
487,
ver
sion
1 -
18 M
ar 2
008

10
a seasonal cycle (e.g. Stevenson and Potter, 1986; Mitri et al., 2007), it has only a small
influence on the overall meteorology and climate, since the liquid inventory (~200 kgm-2, or 3
mbar or perhaps a few times higher than this) is small compared with the ~60mbar of methane
in the atmosphere, in contrast to the ~30% Mars seasonal pressure cycle. Further study would be
needed to consider how the methane reservoir could influence seasonal changes in cloud patterns
(e.g. Mitchell et al., 2006; Rannou et al., 2006).
Future Cassini observations will help make a more complete inventory, notably in the Southern
hemisphere, and indications of surface composition from near-infrared spectroscopy will be
useful to understand the chemical species involved in the global carbon cycles. Indirectly, the
changing patterns of methane clouds on Titan, especially in the equinox period 2009-2011 during
Cassini’s proposed extended mission may show the participation of surface methane moisture in
the climate system. Beyond this, important goals for a possible future mission might be to assess
sediment and liquid depths directly with ground-penetrating radar, and to search in-situ for
isotopic and other indications of chemical processing and volatile release from the interior.
hal-0
0261
487,
ver
sion
1 -
18 M
ar 2
008
11
Acknowledgement
This work was supported by the Cassini Project, managed by the Jet Propulsion Laboratory,
California Institute of Technology, under a contract with the National Aeronautics and Space
Administration.
References
BP, Statistical Review of World Energy, June 2007. BP PLC, London, UK, 2007.
Byrne, S. and A. P. Ingersoll, A Sublimation Model for Martian South Polar Ice Features,
Science, 299, 1051-1053, 2003
Elachi, C. and 34 co-authors, Cassini Radar Views the Surface of Titan Science, 308, 970-974,
2005.
Falkowski, P. and 16 co-authors, The Global Carbon Cycle: A Test of Our Knowledge of Earth
as a System, Science, 290, 291-296, 2007.
Lancaster, N. Geomorphology of Desert Dunes, Routledge, London, 1995.
Lopes, R. M. and 43 co-authors. Cryovolcanic features on Titan’s surface as revealed by the
Cassini Titan Radar Mapper. Icarus, 186, 395-412, 2007.
Lorenz, R. D. and J.I.Lunine, Erosion on Titan : Past and Present, Icarus, 122, 79-91, 1996
Lorenz, R. D. and J. Mitton, Lifting Titan’s Veil, Cambridge University Press, 2002
hal-0
0261
487,
ver
sion
1 -
18 M
ar 2
008

12
Lorenz, R. D., C. P. McKay and J. I. Lunine, Photochemically-Driven Collapse of Titan's
Atmosphere, Science, 275, 642-644, 1997
Lorenz, R. D. , C. P. McKay, and J. I. Lunine, Analytic Stability of Titan’s Climate : Sensitivity
to Volatile Inventory, Planetary and Space Science, 47, 1503-1515, 1999
Lorenz, R. D. and 39 co-authors, The Sand Seas of Titan : Cassini RADAR observations of
Longitudinal Dunes, Science, 312, 724-727, 2006a
Lorenz, R. D., H. Niemann, D. Harpold, J. Zarnecki, Titan’s Damp Surface : Constraints on
Titan Surface Thermal Properties from the Temperature Evolution of the Huygens GCMS inlet,
Meteoritics and Planetary Science. 41, 1405-1414, 2006b
Lunine, J.I., Stevenson, D.J. and Yung, Y.L. Ethane ocean on Titan. Science 222, 1229-1230,
1983.
Mitchell, J. L., R. T. Pierrehumbert, D. M. W. Frierson and R. Caballero, The Dynamics behind
Titan’s methane clouds, Proceedings of the National Academy of Sciences, 103, 18421-18426,
2006
Mitri, G. , A. P. Showman, J. I. Lunine, and R. D. Lorenz, Hydrocarbon lakes on Titan,
Icarus, 186, 385-394, 2007
Niemann, H. and 17 co-authors. 2005. Huygens Probe Gas Chromatograph Mass Spectrometer:
The Atmosphere and Surface of Titan, Nature, 438, 779-784, 2005
Ostro, S. J.and 18 co-authors, Cassini RADAR Observations of Enceladus, Tethys, Dione, Rhea,
Iapetus, Hyperion, and Phoebe, Icarus, 183, 479-490, 2006
hal-0
0261
487,
ver
sion
1 -
18 M
ar 2
008

13
Radebaugh, J., R. Lorenz, J. Lunine, S. Wall, G. Boubin, E. Reffet, R. Kirk, R. Lopes, E. Stofan,
L. Soderblom, M. Allison, M. Janssen, P. Paillou, P. Callahan and the Cassini Radar Team,
Dunes on Titan observed by Cassini Radar, Icarus, in revision, 2007.
Rannou, P., Montmessin, F., Hourdin, F. and S. Lebonnois, The Latitudinal Distribution of
Clouds on Titan, Science, 311, 201-205, 2006.
Raulin, F. Organic Chemistry in the Oceans of Titan, Advances in Space Research, 7, 71-81,
1987
Read, P. L. and S. R. Lewis, The Martian Climate Revisited : Atmosphere and Environment of a
Desert Planet, Praxis-Springer, Chichester, UK 2004
Rodriguez, S., P. Paillou, M. Dobrijevic,G. Ruffié, P. Coll, J.M. Bernard, and P. Encrenaz.
Impact of aerosols present in Titan’s atmosphere on the CASSINI radar experiment, Icarus, 164,
213-227, 2003.
Sen, A. D., V. G. Anicich and T. Arakelian, Dielectric constant of liquid alkanes and
hydrocarbon mixtures, Journal of Physics D: Applied Physics 25, 516-521, 1992.
Soderblom, L. and 26 co-authors. Correlations between Cassini VIMS spectra and RADAR
SAR images: Implications for Titan’s surface composition and the character of the Huygens
Probe landing site. Planetary and Space Science, in press.
Stevenson, D.J. and Potter, B. E. Titan's latitudinal temperature distribution and seasonal cycle.
Geophys. Res. Letters 13, 93-96, 1986.
Stofan, E.R and 37 co-authors, The Lakes of Titan, Nature, 441, 61-64, 2007.
Turtle, E. P., J. E. Perry, A. S. McEwen, R. A. West, D. D. Dawson, C. C. Porco and S. Fussner,
Cassini Imaging Science Subsystem Observations of Titan's High-Latitude Lakes, Abstract
hal-0
0261
487,
ver
sion
1 -
18 M
ar 2
008
14
#6063 in Ices, Oceans and Fire: satellites of the Outer Solar System Workshop, Boulder, CO,
August 11-13, 2007.
Waite, J. H., D. T. Young, T. E. Cravens, A. J. Coates, F. J. Crary, B. Magee, and J. Westlake,
The Process of tholin formation in Titan’s upper atmosphere, Science, 316, 870–876, 2007.
Yung, Y. L. and W. D. DeMore, Photochemistry of Planetary Atmospheres, Oxford University
Press, 1999
hal-0
0261
487,
ver
sion
1 -
18 M
ar 2
008
15
Figures
Figure 1. A map of Titan's north polar region (5 degree latitude circles) with areas identified as
lakes shown as dark grey against the radar swaths in white. Light grey areas have not been
imaged by radar as yet.hal-0
0261
487,
ver
sion
1 -
18 M
ar 2
008

16
Figure 2. Lake size/depth correlation for the Earth's 20 largest lakes.
hal-0
0261
487,
ver
sion
1 -
18 M
ar 2
008
17
Table 1. Titan Carbon inventory compared with other planetary reservoirs.
__________________________________________________________________________________________________
Reservoir Inventory (a) Inventory ColumnMass Pressurekm3 GT Carbon kg/m2 mbar
__________________________________________________________________________________________________
TitanMethane in Atmosphere 800,000 360,000 4000 60Ethane/Methane Lakes 30,000-300,000 16,000-160,000 200-2000 3-30Sand Dunes 200,000-800,000 160,000-640,000 2000-6400 40Fine Impact Ejecta 400Erosion from River channels 8000
Earth CarbonGas 140(1),132(2)Oil 230(1),356(2)Coal 3500(1),900(2)Atmosphere 720 0.3Biosphere 2000Ocean 38,000Lithosphere (Kerogens) 1.5x10⁷Lithosphere (Carbonates) 6x10⁷
Earth WaterAtmosphere 20 ~2Oceans 1.3x10⁹ 2.4x10⁶ 240,000Lakes 125,000Icecaps >3x10⁷
MarsAtmosphere 27,000 5900 150(3) 6Seasonal Frost Caps 7000 1600 40(3) 1.5Polar Layered Deposits 4000 900 23(3) 1Permanent Polar Caps 900,000 200,000 5000(3,4) 185Regolith 180,000 40,000 1000(3) 37
VenusAtmosphere 5.8x10⁸ 1.25x10⁸ 106 90,000
__________________________________________________________________________________________________
References and Notes
Indirectly-determined quantities shown in italicsExpressed as volume of condensed species1) Falkowski et al., 20002) BP, 20073) Read and Lewis, 20044) may be much less – see Byrne and Ingersoll, 2003
hal-0
0261
487,
ver
sion
1 -
18 M
ar 2
008