stream inventory project
TRANSCRIPT

San Francisco Estuary Institute, 1996 Revised 3/8/2010 Low Flow (Thalweg) Protocol -Page 1
Stream Inventory Project Low Flow Channel (Thalweg) Profile
0BImportance
Major watershed features are determined by a variety of physical processes operating within a stream channel, associated riparian areas, and adjacent floodplain. This parameter was developed to capture basic information on stream gradient and bank condition for assessment, long-term monitoring of stream conditions and changes over time. This protocol will also help establish special study areas within a watershed for more detailed assessment.
1BMethod
Teams will establish in-channel longitudinal transects, referenced by permanent benchmarks, to establish channel crossections, low flow channel longitudinal profile, and bank characteristics. Standard survey methodologies will be employed along with field maps of channel features.
2BEquipment
• Automatic level and tripod • Telescoping survey rod • Engineering field notebook • Cloth measuring tape (300’) • Hand-held Calculator • Pocket level • Small sledge • Wire flags (3 colors) • Rebar stakes (2’ long) • Fluorescent paint • Survey tape (pink) • Indelible makers • Stream Channel Reference Sites: An Illustrated Guide to Field Techniques
by Cheryl Harrelson, C.L. Rawlins and John P. Potyondy. U.S.D.A. Forest Service General Technical Report RM-245. This report contains a much more thorough treatment of various field survey techniques for stream process delineation and is highly recommended for teams conducting using this protocol.
3BConstraints
Many creeks will be difficult to access within the channel because of dense vegetation, fallen trees, and private property.
Tier
2
San Francisco Estuary Institute, 1996 Revised 3/8/2010 Low Flow (Thalweg) Protocol -Page 2
4BQuality Assurance
The primary method for insuring accuracy is to perform a “closed” survey. This process is described fully below, but in essence, entails surveying back to the original starting point to assess the degree of additive error in profile readings.
5BData Value
Information gathered from the low flow channel profile provides essential information on the natural processes of channel maintenance. The low flow channel profile also provides data on the location and interval of pools, riffles, and debris jams; important parameters for evaluation of fisheries and amphibian habitat.
San Francisco Estuary Institute, 1996 Revised 3/8/2010 Low Flow (Thalweg) Protocol -Page 3
6BStarting Point for Channel SurveyF
1
If the entire stream is being surveyed, the starting point for all data gathering should be the upstream extent of tidal inundation or the nearest upstream point at which the low flow channel (thalweg) is exposed. If a shorter portion of the stream is to be surveyed, begin surveys at the downstream end and proceed upstream.
It is best to conduct a thalweg survey during periods of minimal flow (preferably when the stream is dry) to avoid damage to the aquatic ecosystem and to insure safety of volunteers. UDo not attempt this protocol during high flow periods.
7BEstablishing Starting Point
A basic field survey establishes the horizontal and/or vertical location of a series of points in relation to a starting point (called a benchmark). The benchmark is the original reference point for the survey. The U.S. Geological Survey (USGS) and various city and county public works departments have established a network of reference points throughout the Bay Area. If possible, contact your local public works department for a listing of benchmark locations within the vicinity of the creek you are surveying. If you are working in an urban area, it is possible that a surveyed benchmark is located near your starting point.
In many cases, however, you will need to establish a new benchmark. The elevation of this benchmark may be assumed (100 is normally used; but if the survey will ultimately extend further downstream, a higher number should be used) or tied into a project datum or mean sea level at a later date.
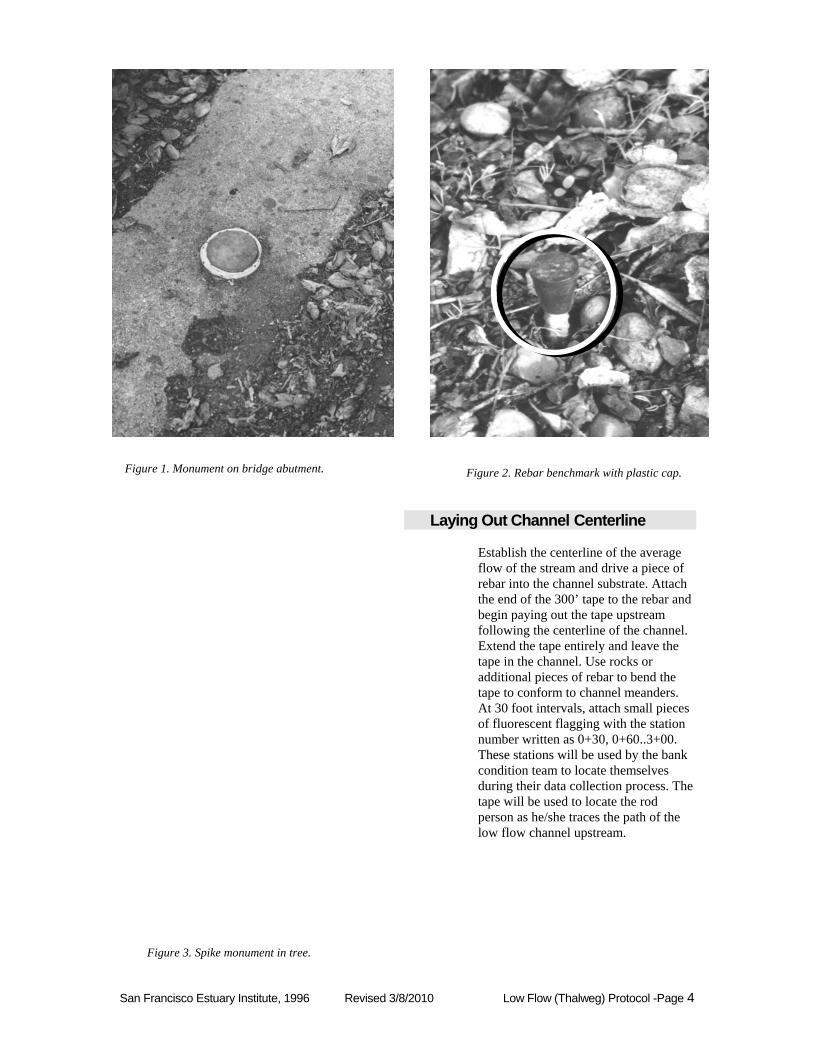
Locate the benchmark outside the channel (and floodplain, if possible) yet near enough to be clearly visible. The best placement is on a permanent natural feature of the site, such as an outcropping of bedrock, the highest point of a boulder, a bridge abutment or other substantial manmade structure (Figure 1). Other methods include driving a 3-4’ long 1/2” diameter piece of “rebar” vertically into the ground to within 1/2” of the ground surface (Figure 2). Cover the exposed end with a rebar cap for safety. A spike monument in a healthy large-diameter tree can also be used. This method consists of a 40-80 penny nail driven into the base of a tree (parallel to the ground) with enough of the head exposed to allow the rod to rest securely on the nail (Figure 3). It is also advisable to establish backup benchmarks in case the primary benchmark is moved or destroyed.
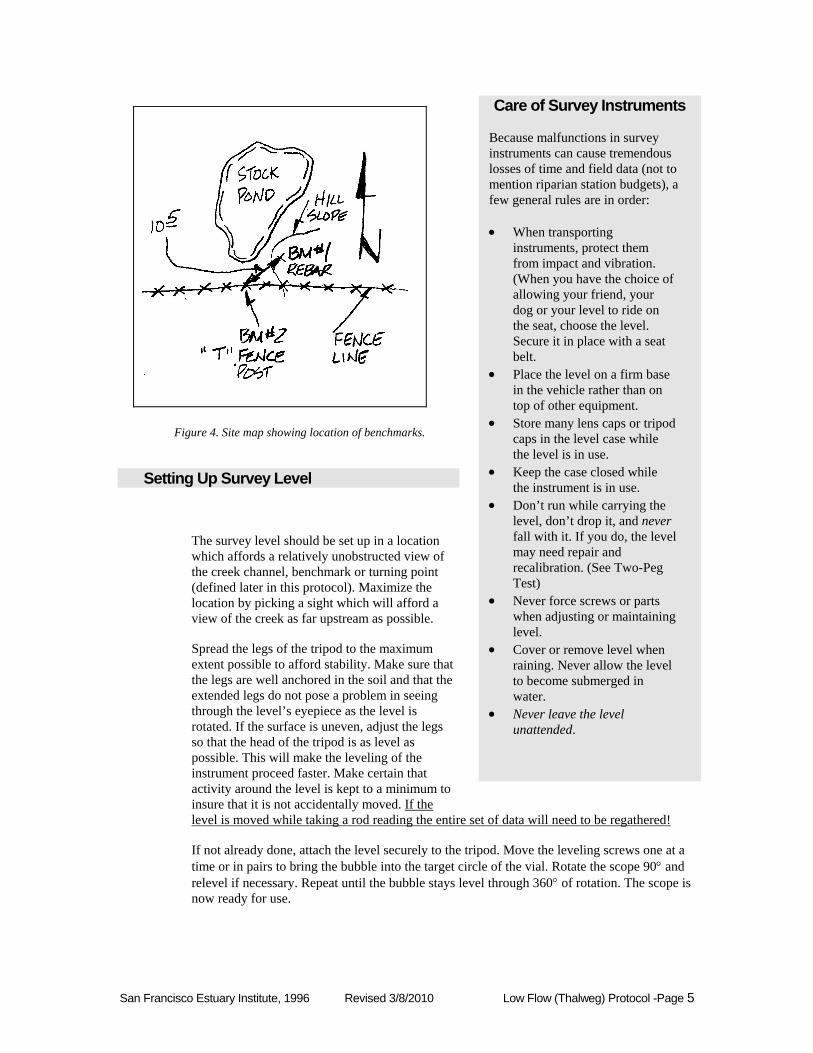
In the field notebook, draw a detailed map of the pertinent site features which will allow relocation of the benchmark(s) (Figure 4).
1 This protocol draws heavily upon the survey methodology described in the U.S. Forest Service publication Stream Channel Reference Sites: An Illustrated Guide to Field Technique, by Cheryl Harrelson, C.L. Rawlins and John Potyondy (General Technical Report RM-245). Many of the data illustrations are from this report. It is highly recommended that this publication be used as an important supplement to this protocol since it contains more detailed information on protocol elements.
San Francisco Estuary Institute, 1996 Revised 3/8/2010 Low Flow (Thalweg) Protocol -Page 4
8BLaying Out Channel Centerline
Establish the centerline of the average flow of the stream and drive a piece of rebar into the channel substrate. Attach the end of the 300’ tape to the rebar and begin paying out the tape upstream following the centerline of the channel. Extend the tape entirely and leave the tape in the channel. Use rocks or additional pieces of rebar to bend the tape to conform to channel meanders. At 30 foot intervals, attach small pieces of fluorescent flagging with the station number written as 0+30, 0+60..3+00. These stations will be used by the bank condition team to locate themselves during their data collection process. The tape will be used to locate the rod person as he/she traces the path of the low flow channel upstream.
Figure 2. Rebar benchmark with plastic cap.Figure 1. Monument on bridge abutment.
Figure 3. Spike monument in tree.
San Francisco Estuary Institute, 1996 Revised 3/8/2010 Low Flow (Thalweg) Protocol -Page 5
9BSetting Up Survey Level
The survey level should be set up in a location which affords a relatively unobstructed view of the creek channel, benchmark or turning point (defined later in this protocol). Maximize the location by picking a sight which will afford a view of the creek as far upstream as possible.
Spread the legs of the tripod to the maximum extent possible to afford stability. Make sure that the legs are well anchored in the soil and that the extended legs do not pose a problem in seeing through the level’s eyepiece as the level is rotated. If the surface is uneven, adjust the legs so that the head of the tripod is as level as possible. This will make the leveling of the instrument proceed faster. Make certain that activity around the level is kept to a minimum to insure that it is not accidentally moved. UIf the level is moved while taking a rod reading the entire set of data will need to be regathered!
If not already done, attach the level securely to the tripod. Move the leveling screws one at a time or in pairs to bring the bubble into the target circle of the vial. Rotate the scope 90° and relevel if necessary. Repeat until the bubble stays level through 360° of rotation. The scope is now ready for use.
Care of Survey Instruments
Because malfunctions in survey instruments can cause tremendous losses of time and field data (not to mention riparian station budgets), a few general rules are in order:
• When transporting instruments, protect them from impact and vibration. (When you have the choice of allowing your friend, your dog or your level to ride on the seat, choose the level. Secure it in place with a seat belt.
• Place the level on a firm base in the vehicle rather than on top of other equipment.
• Store many lens caps or tripod caps in the level case while the level is in use.
• Keep the case closed while the instrument is in use.
• Don’t run while carrying the level, don’t drop it, and never fall with it. If you do, the level may need repair and recalibration. (See Two-Peg Test)
• Never force screws or parts when adjusting or maintaining level.
• Cover or remove level when raining. Never allow the level to become submerged in water.
• Never leave the level unattended.
Figure 4. Site map showing location of benchmarks.
San Francisco Estuary Institute, 1996 Revised 3/8/2010 Low Flow (Thalweg) Protocol -Page 6
10BDifferential Leveling
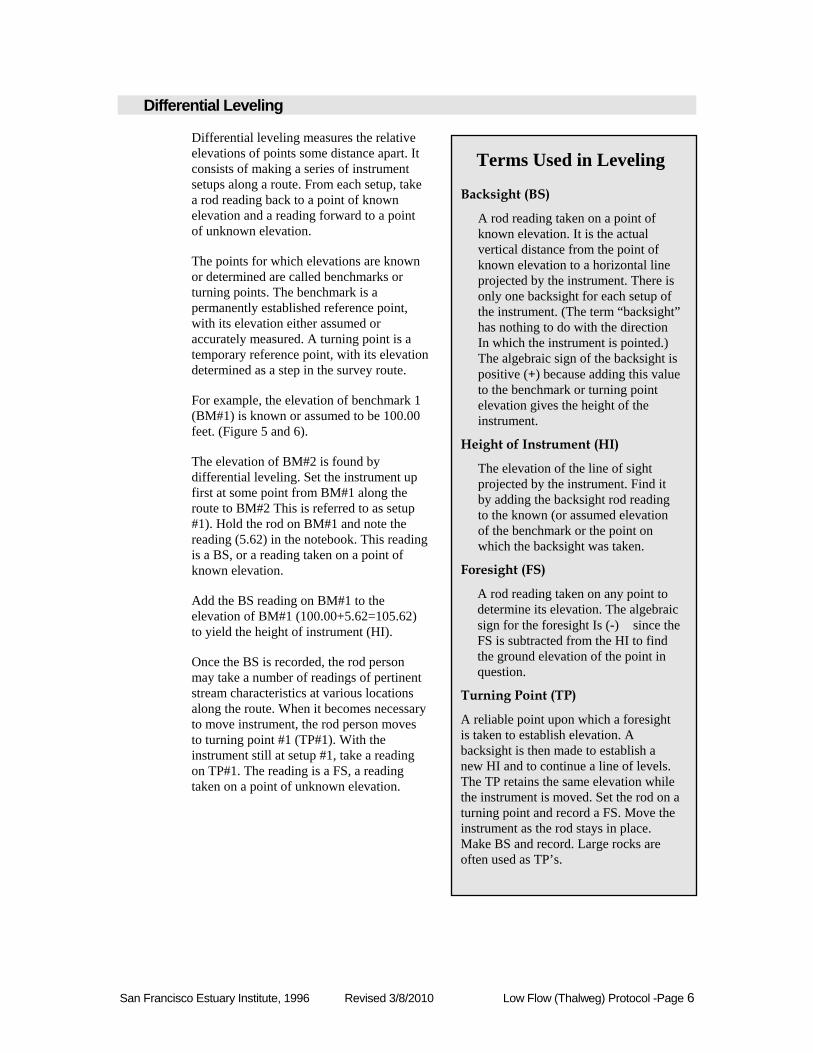
Differential leveling measures the relative elevations of points some distance apart. It consists of making a series of instrument setups along a route. From each setup, take a rod reading back to a point of known elevation and a reading forward to a point of unknown elevation.
The points for which elevations are known or determined are called benchmarks or turning points. The benchmark is a permanently established reference point, with its elevation either assumed or accurately measured. A turning point is a temporary reference point, with its elevation determined as a step in the survey route.
For example, the elevation of benchmark 1 (BM#1) is known or assumed to be 100.00 feet. (Figure 5 and 6).
The elevation of BM#2 is found by differential leveling. Set the instrument up first at some point from BM#1 along the route to BM#2 This is referred to as setup #1). Hold the rod on BM#1 and note the reading (5.62) in the notebook. This reading is a BS, or a reading taken on a point of known elevation.
Add the BS reading on BM#1 to the elevation of BM#1 (100.00+5.62=105.62) to yield the height of instrument (HI).
Once the BS is recorded, the rod person may take a number of readings of pertinent stream characteristics at various locations along the route. When it becomes necessary to move instrument, the rod person moves to turning point #1 (TP#1). With the instrument still at setup #1, take a reading on TP#1. The reading is a FS, a reading taken on a point of unknown elevation.
Terms Used in Leveling Backsight (BS)
A rod reading taken on a point of known elevation. It is the actual vertical distance from the point of known elevation to a horizontal line projected by the instrument. There is only one backsight for each setup of the instrument. (The term “backsight” has nothing to do with the direction In which the instrument is pointed.) The algebraic sign of the backsight is positive (+) because adding this value to the benchmark or turning point elevation gives the height of the instrument.
Height of Instrument (HI)
The elevation of the line of sight projected by the instrument. Find it by adding the backsight rod reading to the known (or assumed elevation of the benchmark or the point on which the backsight was taken.
Foresight (FS)
A rod reading taken on any point to determine its elevation. The algebraic sign for the foresight Is (-) since the FS is subtracted from the HI to find the ground elevation of the point in question.
Turning Point (TP)
A reliable point upon which a foresight is taken to establish elevation. A backsight is then made to establish a new HI and to continue a line of levels. The TP retains the same elevation while the instrument is moved. Set the rod on a turning point and record a FS. Move the instrument as the rod stays in place. Make BS and record. Large rocks are often used as TP’s.
San Francisco Estuary Institute, 1996 Revised 3/8/2010 Low Flow (Thalweg) Protocol -Page 7
Enter the FS (3.21) in the notebook opposite TP#1. Compute the elevation of TP#1 by subtracting the FS on TP#1 from the HI (105.02-3.21=102.41) and enter this elevation in the notebook. TP#1 now becomes a point of known elevation. The rod person remains a TP#1 while the instrument is moved to setup #2. From here take another BS on TP#1 and determine the HI at setup #2.
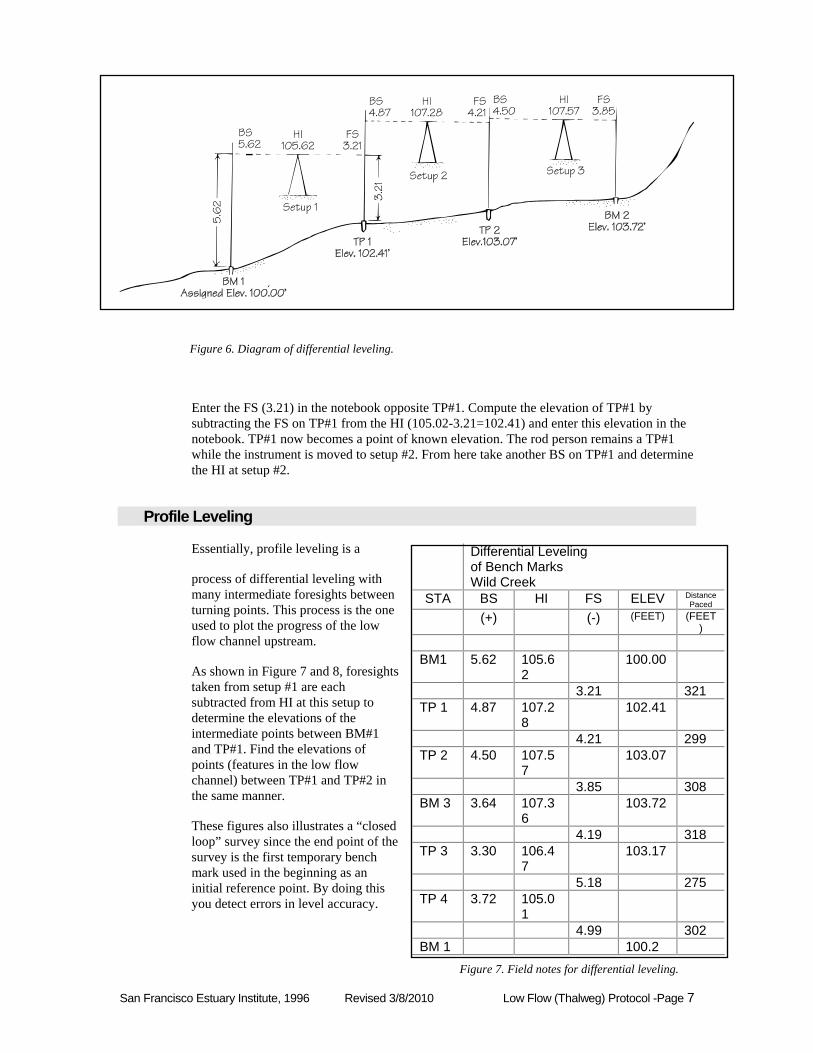
11BProfile Leveling
Essentially, profile leveling is a
process of differential leveling with many intermediate foresights between turning points. This process is the one used to plot the progress of the low flow channel upstream.
As shown in Figure 7 and 8, foresights taken from setup #1 are each subtracted from HI at this setup to determine the elevations of the intermediate points between BM#1 and TP#1. Find the elevations of points (features in the low flow channel) between TP#1 and TP#2 in the same manner.
These figures also illustrates a “closed loop” survey since the end point of the survey is the first temporary bench mark used in the beginning as an initial reference point. By doing this you detect errors in level accuracy.
Figure 6. Diagram of differential leveling.
Differential Leveling of Bench Marks Wild Creek
STA BS HI FS ELEV Distance Paced
(+) (-) (FEET) (FEET)
BM1 5.62 105.6
2 100.00
3.21 321 TP 1 4.87 107.2
8 102.41
4.21 299 TP 2 4.50 107.5
7 103.07
3.85 308 BM 3 3.64 107.3
6 103.72
4.19 318 TP 3 3.30 106.4
7 103.17
5.18 275 TP 4 3.72 105.0
1
4.99 302 BM 1 100.2
Figure 7. Field notes for differential leveling.
San Francisco Estuary Institute, 1996 Revised 3/8/2010 Low Flow (Thalweg) Protocol -Page 8
It is also essential that data be plotted while still in the field. This helps to catch errors and gives you a better sense of the stream processes at work.
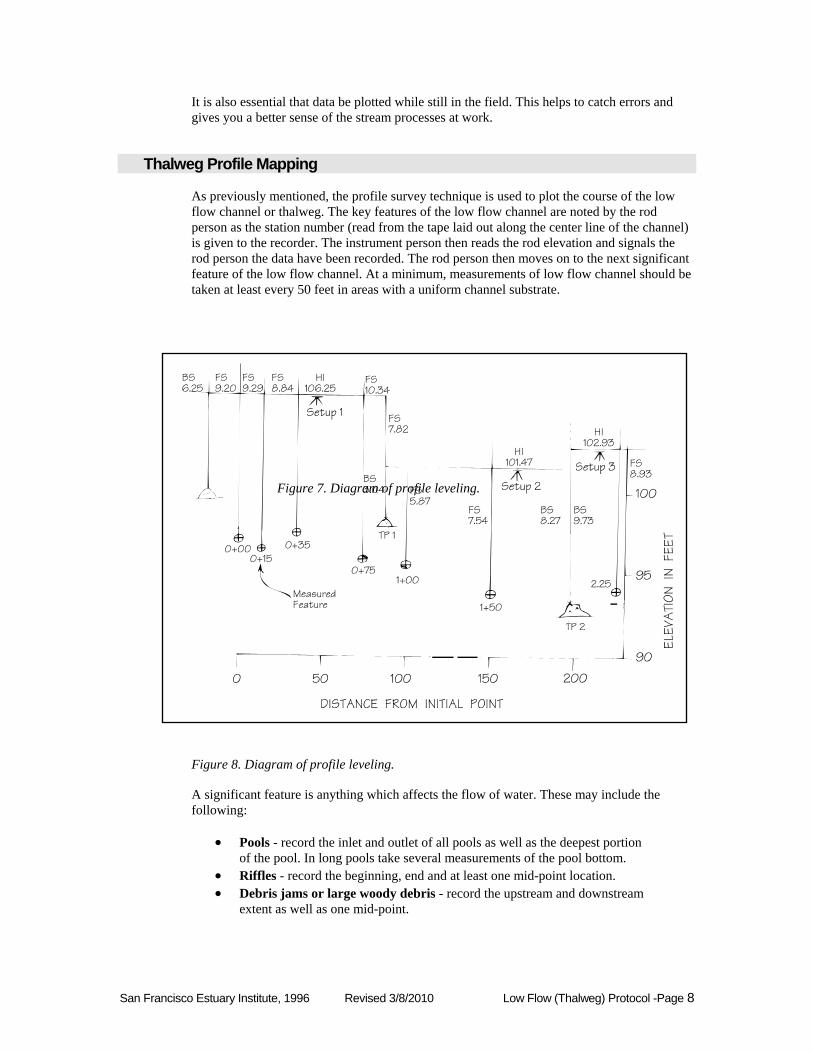
12BThalweg Profile Mapping
As previously mentioned, the profile survey technique is used to plot the course of the low flow channel or thalweg. The key features of the low flow channel are noted by the rod person as the station number (read from the tape laid out along the center line of the channel) is given to the recorder. The instrument person then reads the rod elevation and signals the rod person the data have been recorded. The rod person then moves on to the next significant feature of the low flow channel. At a minimum, measurements of low flow channel should be taken at least every 50 feet in areas with a uniform channel substrate.
Figure 8. Diagram of profile leveling.
A significant feature is anything which affects the flow of water. These may include the following:
• Pools - record the inlet and outlet of all pools as well as the deepest portion of the pool. In long pools take several measurements of the pool bottom.
• Riffles - record the beginning, end and at least one mid-point location. • Debris jams or large woody debris - record the upstream and downstream
extent as well as one mid-point.
Figure 7. Diagram of profile leveling.

San Francisco Estuary Institute, 1996 Revised 3/8/2010 Low Flow (Thalweg) Protocol -Page 9
• Man-made structures - record the base and maximum height of the feature if the slope is constant. If the slope is not constant, record enough values to plot the profile of the feature.
Remember that the low-flow channel may abruptly shift from one side of the stream to the other. The rod person needs to be acutely aware of the location of the low flow channel especially in abraded channels where it may be difficult to determine which of the several channels is actually the lowest. Sometimes the occurrence of algal mats or changes in bed material will help establish the location of the active low flow channel.
Profile Leveling - Wild Creek Thalweg profile STA BS HI FS ELEV
(+) (-) (Feet) BM 1 6.25 106.25 100.00 9.20 0+00 97.05 9.29 0+15 96.96 8.84 0+35 97.41 10.34 0+75 95.91 7.82 TP 1 3.04 101.47 98.43 5.87 1+00 95.60 7.54 1+50 93.93 8.27 TP 2 9.73 102.93 93.20 8.93 2+25 94.00 2.93 BM 1 100.00
Figure 9. Profile leveling data
San Francisco Estuary Institute, 1996 Revised 3/8/2010 Low Flow (Thalweg) Protocol -Page 10
Bank Condition
13BMethod
A separate team of at least two people will follow after the low flow channel survey team to record bank condition. This team will use the markers placed by the channel survey team to determine their location in the field.
14BEquipment
• Cloth measuring tape (300’) • Pocket rod for determining bankfull height • Pocket level • Engineering field notebook
15BBankfull Height Determination
The most important determination to be made by this team is height of bankfull discharge. This measurement is crucial because it represents the flow of water which transports the largest amount of sediment over the long-term and is therefore indicative of the flow which sculpts the channel’s features.
For this portion of the protocol, delineating this height as accurately as possible is key to understanding the features of the channel bank which will be recorded next. Finding indicators of bankfull stage in the field may be difficult. Where floodplains (the flat depositional surfaces adjacent to many stream channels) are absent or poorly defined, other features may serve as indicators of bankfull stage. The utility of these indicators varies widely depending upon the basic stream type. Several indicators should be used to determine bankfull stage; use as many as can be found. Some useful indicators include:
• the height of depositional materials (especially the top of a pointbar, which defines the lowest possible level of bankfull stage);
• a change in vegetation (especially the lower limit of perennial species); • slope or topographic break along the bank; • a change in the particle size of bank material, such as the boundary between
coarse cobble or gravel with fine grained san or silt; • undercuts in the bank, which usually reach an interior elevation slightly
below bankfull stage; and, • stain lines or lower extent of lichens on boulders.
The manual entitled Stream Channel Reference Sites provides and excellent pictorial and verbal description of bankfull stage indicators.
San Francisco Estuary Institute, 1996 Revised 3/8/2010 Low Flow (Thalweg) Protocol -Page 11
16BBankfull Height
Once bankfull stage is determined by the team, wire flags should be inserted in the bank at bankfull stage as the team proceeds upstream from the beginning marker for a distance of 300 feet. A minimum of five markers should be established.
At each of the five locations, find the average (estimated) channel bottom. Using the pocket rod and level, “shoot” the base of the flag and record the height in the notebook along with notes describing each of the five sites. After recording these height measurements, calculate the average height. This average bankfull height will be used when recording bank conditions.
17BRecording Bank Conditions
At the beginning point of the survey, lay out the 300 foot tape along the approximate centerline of the channel. Make certain that the tape matches the location of the survey tape markers left in place by the low flow channel team.
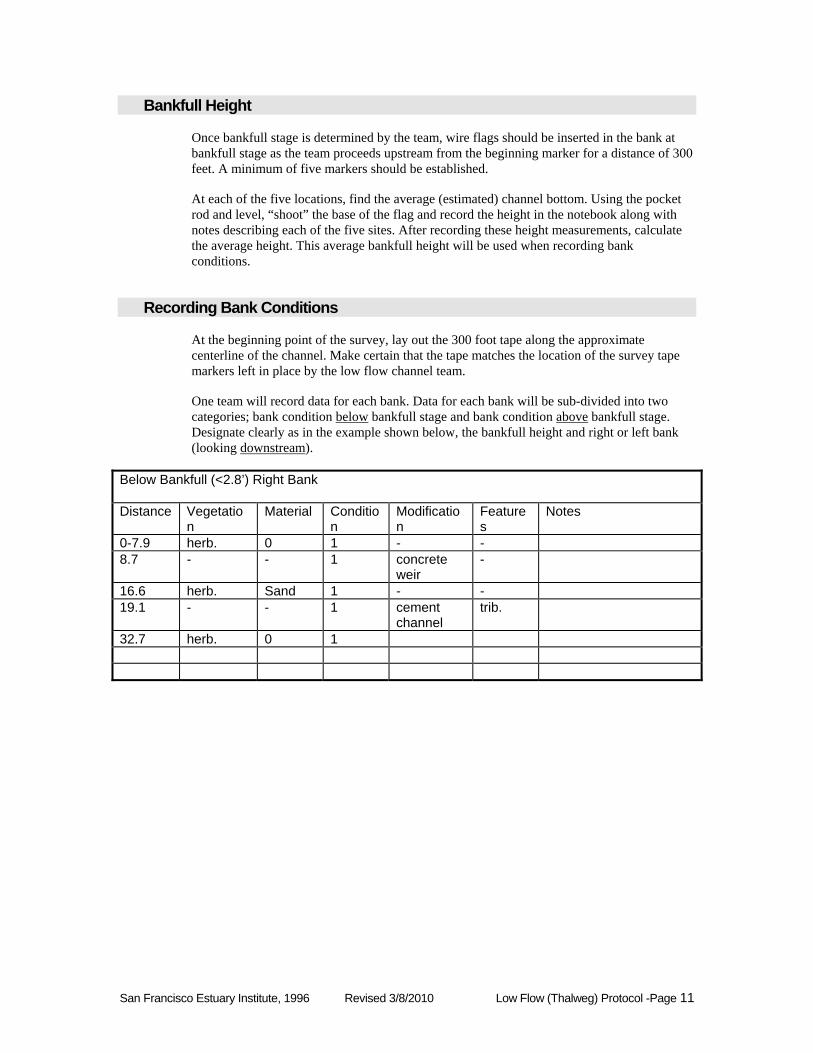
One team will record data for each bank. Data for each bank will be sub-divided into two categories; bank condition Ubelow U bankfull stage and bank condition UaboveU bankfull stage. Designate clearly as in the example shown below, the bankfull height and right or left bank (looking UdownstreamU).
Below Bankfull (<2.8’) Right Bank Distance Vegetatio
n Material Conditio
n Modification
Features
Notes
0-7.9 herb. 0 1 - - 8.7 - - 1 concrete
weir -
16.6 herb. Sand 1 - - 19.1 - - 1 cement
channel trib.
32.7 herb. 0 1