inventory management and financial
TRANSCRIPT
i
INVENTORY MANAGEMENT AND FINANCIAL PERFORMANCE IN
SUPPLY CHAIN INSTITUTIONS IN RWANDA
CASE STUDY OF MEDICAL PROCUREMENT AND PRODUCTION
DIVISION
DIANE TUGIRAMAHORO
MBA/3947/13
Research Project Submitted in Partial Fulfillment for the Award of a
Degree in Master of Business Administration (Finance and Accounting
Option) of Mount Kenya University
JULY 2015

ii
DECLARATION
This research study is my original work and has not been presented to any other institution.
No part of this research should be reproduced without the authors‟ consent or that of Mount
Kenya University.
Students Name: DIANE TUGIRAMAHORO
Sign ____________________ Date _____________
Declaration by the supervisor
This research has been submitted with our approval as The Mount Kenya University
Supervisor.
Name: RUSIBANA CLAUDE
Sign ____________________ Date _____________

iii
DEDICATION
I dedicate this research to my husband Jules RUTIKANGA and my parents Mr. Ignace
KALISA and Ms. Ezeulie MUKANGANGO who stood by side during the entire time that I
was undergoing my learning.

iv
ACKNOWLEDGEMENT
I would like to acknowledge the following people for their contribution towards my
education. I am very grateful to my family especially my husband for the outstanding support
they offered throughout my career. To RUSIBANA Claude, my supervisor, thank you for
sparing time and giving me good and professional ideas that enabled me to successfully
complete my project. Thank you for being so flexible amidst your busy schedule. Thank you
for your parental guidance and great contribution, I truly appreciate. To all my friends who
were always there for me spiritually, emotionally and socially, thanks pals. Lastly I
appreciate my colleagues the finance and accounting class especially those in the discussion
group, for being there for me in this journey and for all discussions held in the course of my
career.
v
ABSTRACT
Inventory is any idle resource that is held for future use whenever the input or the output of a
company is not used as available. Nowadays, the field of inventory is ignored by managers
of the company. This study focused on Inventory management and performance of the
company was conducted in Medical Procurement and Production Division (MPPD). The
general objective of this study was to assess the contribution of inventory management on
financial performance of supply institutions in Rwanda. Specific Objectives were to assess
the techniques used by Medical Procurement and Production Division during inventory
management; to examine the factors that affect Medical Procurement and Production
Division performance through inventory management and to establish the relationship
between inventory management and performance in Medical Procurement and Production
Division. The findings of this study should provide literature that is important for the
individuals, public and private institutions. This research was designed under case study;
secondary data were obtained from financial statements of MPPD. The target population of
this study was 128 employees of Medical Procurement and production Division, from this
target population, the research determines the sample size using Yamane formula, where n =
79.Primary data was gotten from the questionnaires administered to the respondents. This
study used both correlational and descriptive statistics to through SPSS program to analyze
data and profitability ratios to analyze level of performance of MPPD. Inventory
management techniques in MPPD have been discussed where, 83.8% respondents confirmed
that MPPD focused on inventory control techniques as a tool of its performance, 72.2%
perceived that MPPD focused on Economic Order Quantity technique during inventory
control, 83.3% of respondents perceived that MPPD focused on ABC control system during
inventory control and 97.3% respondents confirmed that MPPD also used VMI. The
researcher found that 86.1% respondents confirmed savings of tax revenue is among of the
factors that affect the performance of MPPD. The study also found that 73.6 % respondents
confirmed that availability of goods and services in MPPD influence its performance. Finally
73.6% respondents confirm that transfer from treasury influence the performance of MPPD.
The researcher used Pearson correlation coefficient and found a correlation of 0.893 (89.3
%); this implies there is strong and positive relationship between inventory control and
performance in MPPD. This study recommended that The MPPD should practice many
techniques of inventory management rather than ABC system and Economic Order Quantity
(EOQ), this is due to the fact that each technique carries its own different advantages which
would be beneficial to the company and it helps in cutting down some costs related with
inventory.
vi
TABLE OF CONTENTS
DECLARATION..................................................................................................................... ii
DEDICATION........................................................................................................................ iii
ABSTRACT ............................................................................................................................. v
TABLE OF CONTENTS ...................................................................................................... vi
LIST OF TABLES .................................................................................................................. x
LIST OF FIGURES .............................................................................................................. xii
LIST OF ACRONYMNS AND ABBREVIATIONS ........................................................ xiii
DEFINITION OF KEY TERMS ........................................................................................ xiv
CHAPTER ONE: INTRODUCTION ................................................................................... 1
1.0 Introduction ......................................................................................................................... 1
1.1 Background of the Study .................................................................................................... 1
1.2 Problem Statement .............................................................................................................. 3
1.3 Objectives of the Study ....................................................................................................... 4
1.3.1 General Objective ............................................................................................................ 4
1.3.2 Specific Objectives .......................................................................................................... 4
1.4 Research Questions ............................................................................................................. 5
1.5 Significance of the Study .................................................................................................... 5
1.6 Limitations of the Study...................................................................................................... 6
1.7 Scope of the Study .............................................................................................................. 6
vii
1.8 Organization of the Study ................................................................................................... 7
CHAPTER TWO: REVIEW OF RELATED LITERATURE ........................................... 8
2.0 Introduction ......................................................................................................................... 8
2.1 Theoretical Literature .......................................................................................................... 8
2.1.1 Inventory Management Overview ................................................................................... 8
2.1.2 Types of Inventory ......................................................................................................... 11
2.1.3 Inventory Management Approaches .............................................................................. 13
2.1.4 Factors Influencing Inventory Management .................................................................. 18
2.1.5 Overview of Organizational Performance ..................................................................... 21
2.1.6 Techniques of Organizational Performance Analysis .................................................... 22
2.1.7 Measurements of Organizational Performance .............................................................. 23
2.1.8 Inventory Management and Organizational Performance ............................................. 25
2.2 Empirical Literature .......................................................................................................... 26
2.3 Critical Review and Research Gap Identification ............................................................. 29
2.4 Theoretical Framework ..................................................................................................... 30
2.4.1 Theory of Constraints .................................................................................................... 30
2.4.2 Learning Curve Theory .................................................................................................. 31
2.5. Conceptual Framework .................................................................................................... 32
CHAPTER THREE: RESEARCH METHODOLOGY ................................................... 33
viii
3.0 Introduction ....................................................................................................................... 33
3.1 Research Design................................................................................................................ 33
3.2 Target Population .............................................................................................................. 33
3.3 Sample Design .................................................................................................................. 33
3.3.1 Sample Size Determination............................................................................................ 34
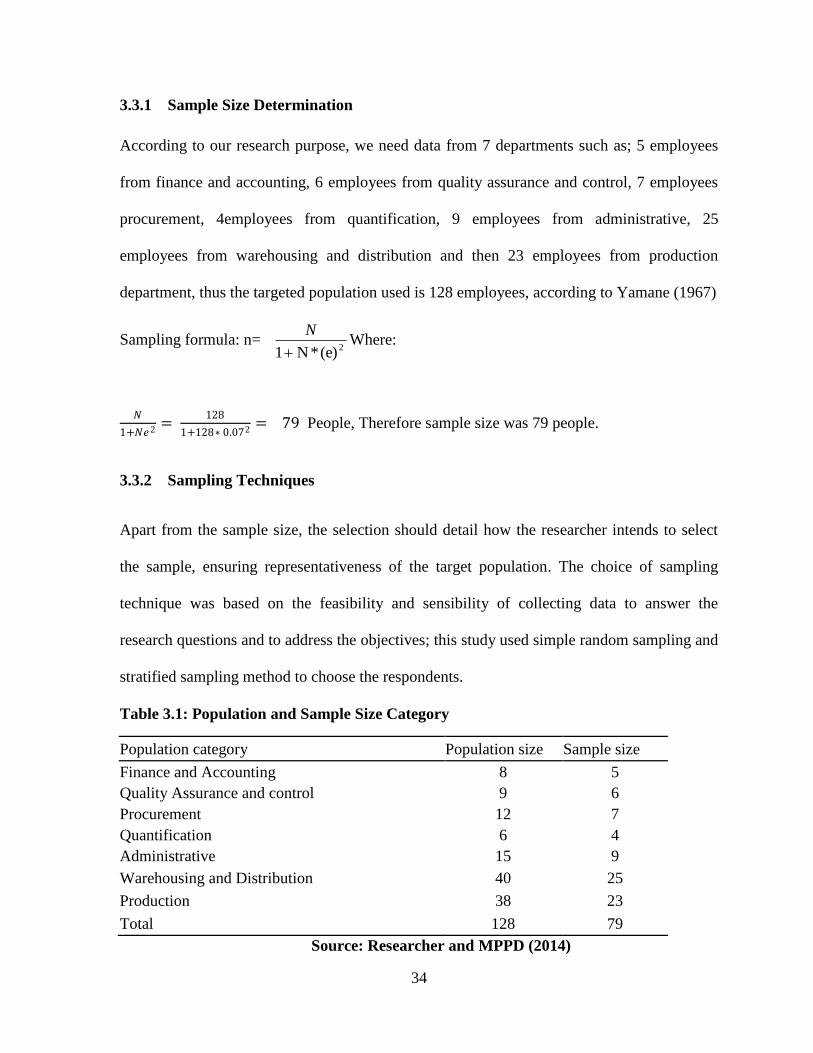
3.3.2 Sampling Techniques ..................................................................................................... 34
3.4 Data Collection Methods .................................................................................................. 35
3.4.1Data Collection Instrument ............................................................................................. 35
3.4.2 Administration of Data Collection Instrument .............................................................. 35
3.4.3 Reliability and Validity .................................................................................................. 36
3.5 Data Analysis Procedures ................................................................................................. 36
3.6 Ethical consideration ......................................................................................................... 37
CHAPTER FOUR: RESEARCH FINDINGS AND DISCUSSION ................................ 38
4.0 Introduction ....................................................................................................................... 38
4.1. Demographic Characteristics of Respondents ................................................................. 38
4.2 Presentation of Findings ................................................................................................... 42
4.2.1The Techniques Used by MPPD during Inventory Management ................................... 42
4.2.2 The Factors that Affect MPPD Performance through Inventory Management ............. 48
4.2.3 Correlation between Inventory Management and Performance in MPPD .................... 55
ix
CHAPTER FIVE: SUMMARY, CONCLUSIONS AND RECOMMENDATIONS ...... 58
5.0 Introduction ....................................................................................................................... 58
5.1 Summary of Findings ........................................................................................................ 58
5.1.1 The Inventory Control Techniques Used in MPPD ....................................................... 58
5.1.2 The Level of Performance of MPPD from 2010 – 2013 ............................................. 59
5.1.3 Relationship between Inventory Management Techniques and Organizational
Performance ............................................................................................................................ 59
5.2. Conclusion ....................................................................................................................... 60
5.3 Recommendations ............................................................................................................. 61
5.4 Suggestions for Further Study .......................................................................................... 61
REFERENCES ...................................................................................................................... 62
APPENDICES ....................................................................................................................... 65
AUTHORIZATION LETTER ............................................................................................ 66
BLANK QUESTIONNAIRE ............................................................................................... 69
x
LIST OF TABLES
Table 3.1: Population and Sample Size Category ................................................................... 34
Table 4.2: Distribution of Respondents by Gender ................................................................ 38
Table 4.3: Distribution of Respondents by Age Group .......................................................... 39
Table 4.4: Distribution of Respondents by Marital Status ...................................................... 40
Table 4.5: Distribution of Respondents by Experience .......................................................... 40
Table 4.6: Distribution of Respondents by Occupation in MPPD .......................................... 41
Table 4.7: Respondents‟ Views on Inventory Management Techniques in MPPD ............... 42
Table 4.8: Respondents‟ Views on J I T Technique during Inventory Management ............. 43
Table 4.9: Respondents‟ Views about Economic Order Quantity Technique during Inventory
Management ............................................................................................................................ 44
Table 4.10: Respondents „Views about ABC Control System during Inventory Management
................................................................................................................................................. 45
Table 4.11: Respondents‟ Views on Vendor Managed Inventory during Inventory
Management ............................................................................................................................ 46
Table 4.12: Respondents‟ Views on Inventory Staff has Opportunities that helped them to
well Manage Inventory ........................................................................................................... 47
Table 4.13: Perception on the Management of Raw Materials in MPPD ............................... 47
Table 4.14: Perception on savings of tax revenue ................................................................. 48
Table 4.15: Perception on Performance, Availability of Goods and Service ......................... 49
Table 4.16: Perception on Transfers from Treasury and Performance of MPPD ................... 49
Table 4.17: Perception on Operating Expenses used in MPPD .............................................. 50
xi
Table 4.18: Correlation between Inventory Management and Financial Performance in
MPPD ...................................................................................................................................... 56
Table 4.19: Analysis of Financial Performance of MPPP ...................................................... 57
xii
LIST OF FIGURES
Figure 2.1: Conceptual framework ......................................................................................... 32
Figure 4.2: Perception on Optimization of the Total Operating and the Needs of MPPD ..... 51
Figure 4.3: Perception on Lead Time and the Productivity of MPPD .................................... 52
Figure 4.4: Perception on Adequate Quantities and the Productivity of MPPD .................... 53
Figure 4.5: Perception on Good Qualities and the Productivity of MPPD ............................. 54
Figure 4.6: Perception on Optimal Cost of Suppliers and the Productivity of MPPD ........... 55
xiii
LIST OF ACRONYMNS AND ABBREVIATIONS
CVP Cost Volume Profit
EOQ: Economic Order Quantity
ICP: Inventory conversion period
JIT: Just In Time
MPPD: Medical Procurement and Production Division
ROA: Return on Assets
ROE: Return on Equity
ROIC: Return on invested capital
VMI: Vendor Management Inventory
VOI: Vendor Owner Inventory
xiv
DEFINITION OF KEY TERMS
Inventory
Inventory is defined as stock of products that a firm is manufacturing for sale, or else the
components that make up the products. Inventory is composed by useful resource that is held
for future use whenever the input or the output of a company is not used as available.
Inventory Management
Inventory management is pivotal in effective and efficient organization. It is also vital in the
control of materials and goods that have to be held for later use in the case of production or
later exchange activities in the case of services. Inventory management is a process of
ensuring adequate quantities, good qualities, at a low cost is procured.
Financial Performance
Financial performance of supply chain institutions is a subjective measure of how well
supply chain institutions use assets from its primary mode of business and generate revenues.
This term is also used as a general measure of a firm's overall financial health over a given
period of time, and can be used to compare similar firms across the same industry or to
compare industries or sectors in aggregation.
Medical Supply
Medical supply is an items deemed necessary for the treatment of an illness or injury,
medical supplies refers to the non-durable disposable health care materials ordered or
prescribed by a physician, which is primarily and customarily used to serve a medical
purpose
1
CHAPTER ONE: INTRODUCTION
1.0 Introduction
This chapter focuses on background of the study, problem statement, objectives of the study,
research questions, significance of the study, limitations, scope of the study and organization
of the study.
1.1 Background of the Study
Inventory management has been of concern for many years to business firms worldwide.
Inventory management systems play a crucial role in enhancing effectiveness and efficiency
in handling inventory of business firms (Imeokparia, 2013). Efficient inventory management
facilitates to invest minimum funds in inventory maintaining continuity in business activity,
increases the size of the business activities by increasing total sales consequently increasing
recycling of funds and generating higher performance (Irungu, & Wanjau, 2011). As against
this, if management proves inefficient in inventory management, it results into higher
inventory conversion period, high costs of inventory, leading to reduced recycling of
funds, ultimately effecting performance and liquidity of the enterprises (Katsiaryna,
2004).
Inventory management is pivotal in effective and efficient organization. It is also vital in the
control of materials and goods that have to be stored for later use in the case of production or
later exchange activities in the caseof services (Anichebe & Agu, 2013).Companies have
been continually in search for sources of sustainable competitive advantage in their
operations.
2
Therefore, there is need for business enterprises to embrace effective Inventory management
practices in order to improve their competitiveness (Rajeev, 2008).Public institutions are
viewed as an essential element of a healthy and vibrant economy in developing countries.
Public institutions are believed to provide a momentum to the economic progress of
developing countries and its importance is gaining widespread recognition. According to
Byoungho (2004), it is neither physically possible nor economically justifiable to wait for the
stock to arrive at the time when they are actually required. Therefore, keeping of inventory is
a must for the efficient working of a business unit. Raw materials represent goods kept by a
manufacturing firm prior to their being utilized in the production process. Supplies generally
include tools and consumables which are consumed in the production of goods and services.
According to Kotabo (2002), inventory costs include: carrying costs such as storage and
insurance; ordering costs like transporting and store placement; and stock out costs like
redundancy and loss of sales. A company cannot achieve an outstanding performance
without proper and efficient control of materials.
Materials are as much as cash itself and any theft, wastage and excessive use of materials are
of immediate financial loss and leads to poor performance of a company. Every company
strives to improve profitability countless hours are spent in meetings devising ways to lower
operating costs while increasing sales and gross margins. In the quest to maximize return on
investment many organizations fail to scrutinize their investment in inventory. This is
unfortunate because improving the way you control and manage your inventory may have the
greatest potential for improving your organization‟s bottom line (Schreibfeder, 2004).
3
Distributors often simultaneously suffer from conflicting complaints concerning their
inventory. They have too much of the wrong products and not enough of the products
necessary to provide a high level of customer service. Furthermore the company‟s
warehouse(s) may not be designed and organized to minimize the cost of filling customer
orders(Brackus, 2000).The success of a firm or company is measured in terms of
performances level; poor inventory management can lead to decrease of performances in
organizations. In spite of Medical Procurement and Production Division (MPPD) elaborate
efforts in inspection, store keeping, coding and stock taking in the procurement department
the company has continued to incur high inventory costs which could be affecting the
performance levels. This research discusses several ideas to help managers to improve the
performance and productivity of their investment in stock inventory.
1.2 Problem Statement
In this fast moving and rapid changing business environment, inventory that keeps in the
warehouse brings significant effect on the daily business operation. Inventory management
involves many levels of the organization, starting from the shop floor workers to the top
management commitment. Therefore, it encounters various problems in the implementation.
Literature on supply chain management and firm‟s operational performance indicate
increased need for improved quality of operations. According to Mogere, Oloko and Okibo
(2013)processing firms face problems of fluctuating inventories, inaccurate forecasts and
low utilization of inventories due to inadequate coordination of operations. Managers do not
focus on Inventory management, whereby inventory is a central process in manufacturing
and merchandized industry.
4
Rwanda Public Institutions is spending much money in medical services; working capital is
very high; in order to achieve the vision of government of Rwanda, which is Vision 2020,
unfortunately the production and performance are still inadequate. Even if government of
Rwanda has that problem; the awareness on Inventory management is still low in Rwanda
public institutions and studies carried out on Inventory management in Rwanda are still few.
Thus, it is against the above problem, the researcher intends to carry out this study on the
case of Medical Procurement and Production Division, in Gasabo District.
1.3 Objectives of the Study
The objectives of this research are divided into two categories, such as the general objective
of the study and three specific objectives of the study.
1.3.1 General Objective
The general objective of this study is to assess the contribution of inventory management on
financial performance of supply chain institutions in Rwanda.
1.3.2 Specific Objectives
i. To assess the techniques used by Medical Procurement and Production Division
during inventory management;
ii. To examine the factors that affect Medical Procurement and Production Division
financial performance through inventory management;
iii. To establish the relationship between inventory management and financial
performance in Medical Procurement and production Division
5
1.4 Research Questions
i. What are the techniques used by Medical Procurement and production Division
during inventory management;
ii. What are the factors that affect Medical Procurement and production Division
performance through inventory management?
iii. Is there any relationship between inventory management and performance in Medical
Procurement and production Division?
1.5 Significance of the Study
The findings of this study should provide literature that is important for the individuals,
public and private institutions.
The study is beneficial to the researcher herself; this is because the researcher will be able to
understand properly, how inventory management can be used to influence public institutions
performance. This study is also beneficial to the researcher because it provides to her with
the knowledge on how to evaluate the performance of public institution.
Regarding individuals, the information collected and analyzed after the study should be
added to the existing literature which should assisted other researchers more specifically
students writing their projects in the same or related area. As far as the public institution is
concerned, the research should be beneficial in that the recommendations and suggestion
given if followed, they would help decision makers to improve their decision making
process. The research could help the public to be aware of the progress of the institution and
its contribution made to the well-being of the society, especially in the field of medical.
6
1.6 Limitations of the Study
This study intends to meet with the limitations of fewer resources like journal, books and
short-time. This research met with the challenges in collecting the data because the public
institutions don‟t like to provide their information. The respondents should quietly refuse to
answer some questions as they think that the weakness was identified.
Despite all of the above problems the researcher developed the strategies to de-limit the
above impediment for the smooth and successful execution of the intended purpose of the
study. This includes the massive and extensive reading in order to be familiarized with the
sites which were convenient to retrieve relevant data without wasting more time. The
researcher presented the cover letter to the governing body under study in order for them to
realize that the purpose of the researcher is purely for academic purpose but not to investigate
their organization.
1.7 Scope of the Study
In order to achieve the research objectives and be more specific to the research area, this
subsection is divided into three scope, such as content scope, geographical scope and time
scope. The research focused on the effect of inventory management on performance of public
institutions. This research focused on this area, because the level of managing inventory in
public institutions is still low. Hence, there is a need to carry out a research in this area.
The research was conducted to the fiscal period of 4 years from 2010 to 2013.The researcher
has chosen this period because, it is in this period where by MPPD faced problems of
fluctuating inventory, inaccurate forecasts and low utilization of inventory.
This research undertook a case study of MPPD that is located in Kigali city, Gasabo District,
near Rwanda National Police Headquarter.
7
The researcher has chosen MPPD as case of study, because is the one of the Rwandan Public
Institutions which uses to distribute products day to day.
1.8 Organization of the Study
The first chapter is composed of introduction to the study, background to the study, problem
statement, objectives of the study, research questions, significance of the study, limitations of
the study, scope of the study and then organization of the study. The second chapter is
composed of introduction to literature review, theoretical literature, empirical literature,
critical review and research gap identification, conceptual framework and then summary of
literature review. The third chapter is composed of introduction to the research methodology,
research design, target population, sample design, sample size, sampling techniques data
collection methods, data analysis procedures and then ethical consideration.
The fourth chapter is composed of the presentation of research findings and discussion,
demographic characteristics of respondents and then presentation of findings.
The fifth chapter is summary of research findings, conclusion, recommendations and
suggestion for further researchers.
8
CHAPTER TWO: REVIEW OF RELATED LITERATURE
2.0 Introduction
This chapter introduces in details the keys concept and is mainly concerned with other
researchers and scholars have said about the key concepts mentioned related to the research
conducted. The purpose of this chapter is to review literature and theoretical framework of
inventory management. The submissions and thoughts of various authors on inventory,
Inventory management, organization performance, and the benefits of inventory management
in organization profitability were reviewed. This study provides clear meaning of terms and
concepts and also reviews the findings of the previous researchers. This helps to clearly
identify the gap and therefore justify the need of doing the study on the role of Inventory
management on organization performance.
2.1 Theoretical Literature
In this sub-section the researcher focuses on different philosophy and techniques regarding
Inventory management and organization profitability. The researcher focuses on past studies,
journals, and books focused on concept of inventory profitability.
2.1.1 Inventory Management Overview
According to Byoungho (2004) inventory management is the process of managing inventory
in order to meet customer demand at the lowest possible cost and with a minimum of
investment.
9
A successfully implemented Inventory management program takes into account such things
as purchasing goods commensurate with demand, seasonal variation, changing usage
patterns, and monitoring for pilferage. A preliminary step in the process of Inventory
management is to determine the approximate costs of carrying inventory. Inventory
management is a vital function to help insure the success of manufacturing and distribution
companies (Langabeer &Stoughton, 2001). The effectiveness of inventory management
systems is directly measurable by how successful a company is in providing high levels of
customer service, low inventory investment, maximum throughput and low costs. The
challenge of productive inventory management is to support an upward trend in sales while
keeping the investment at the lowest level consistent with adequate customer service
(Imeokparia, 2013).
Inventory management involves the coordinating of materials availability, controlling,
utilization and procuring of materials. Inventory management is the direction of activities
with the purpose of getting the right inventory in the right place at the right time and in the
right quantity and it‟s directly linked to production function of any organization which
implies that the inventory management system operated will affect the profitability of an
organization directly and indirectly (Alm, 2000).
According to Kotabo (2002), inventory management refers to all the activities involved in
developing and managing the inventory levels of raw materials, semi-finished materials
(working-progress) and finished good so that adequate supplies are available and the costs of
over or under stocks are low. The nature of inventory depends upon the type of activity
carried on.
10
In the case of a manufacturing unit, inventory will generally include all types of
inventories mentioned above, while in the case of a trading concern, it will comprise
only finished goods or stock -in-trade owned by it for sale to customers in the normal course
of business. Inventory needs proper control as it is one of the largest assets of a business
(Deloof, 2003).
Inventories should neither be excessive nor inadequate. If inventories are kept at a high level,
higher interest and storage costs would be incurred; on the other hand, a low level of
inventories may result in frequent interruption in the production schedule resulting in under-
utilization of capacity and lower sales (Falope & Ajilore, 2009). The objective of inventory
management is therefore to determine and maintain the optimum level of investment in
inventories which help in achieving the required objective.
Inventories are the stock of raw materials, work in progress, finished goods and supplies held
by a business organization to facilitate operations in the production process (Pandey,
1995).Also if the company fails to manage its inventory efficiently, it is likely to face
profitability problems (Block &Hirt, 1987).The goal of inventory management therefore is to
provide the inventories required to sustain operations at minimum costs (Brackus, 2000).
According to Krishna and Yew (2010), inventory is the stock stored that has a resale value in
order to gain profit. It represents the largest cost of the company especially for the trading
firms, wholesalers and retailers. It is mentioned as “piles of money” on the shelf.
Therefore, the inventory should be properly managed in order to facilitate the company
operation. Inventory control is primarily about specifying the shape and percentage of
stocked goods.
11
It is required at different locations within a facility or within many locations of a supply
network to precede the regular and planned course of production, trading and stock of
materials. Inventory conversion period is the average amount of time that a business
holds its inventory (Shin & Soenen,1998). It is the time required to obtain materials for a
product, manufacture it and sell it. The inventory conversion period is essentially the time
period during which a business must invest cash while it converts materials into a sale
(Kotabo, 2002).
2.1.2 Types of Inventory
According Swanson to (2008), there are two basic types of inventory such as merchandising
and manufacturing. Manufacturing is further divided into three more components: raw
material, work in process and finished goods.
If you buy items from other producers to sell in your own gallery or shop, you'll have a
merchandise inventory. A merchandising business is one that buys and sells goods in order to
make a profit. The goods that a company buys in order to resell are known as merchandise.
Merchandise may be accounted for under one of two inventory methods; perpetual inventory
and periodic inventory. Merchandise inventory is an inventory of retailers or wholesalers
(Swanson, 2008).
According to inventory management is pivotal in effective and efficient organization. It is
also vital in the control of materials and goods that have to be held (or stored) for later use in
the case of production or later exchange activities in the case of services. The principal goal
of inventory management involves having to balance the conflicting economics of not
wanting to hold too much stock.
12
If you make your own arts and crafts, you'll have a manufacturing inventory. The term
manufacturing might not seem to fit a hand crafted type of business, but a quick review of the
classifications within the term, will make the relationship clearer (Adeniyi, 2004).
The raw material inventory only includes items that have not yet been put into the production
process. Raw material is very important in various aspects. It is one of the most decisive
factors for the quality of a product (Lange, 2004). Roughly speaking, half of the quality of a
product is determined by the characteristics of raw materials in the current production
technology. Use of proper raw material is critical for producing product of high quality at a
minimal cost. Technologically, the raw material sets a fair starting point for industries. Raw
materials of high quality are in the market, and are equally available for all users for their
disposal. Proper selection of raw powders and their post-treatment is critical for successful
competition in the market. A variety of factors affects the characteristics of raw powders
(Brackus, 2000).
Information on the product specification as well as their production method is very important
in the proper selection of raw materials. Post-treatments such as grinding, mixing and
classification also have critical effects on the characteristics (Alm, 2000). In addition to the
raw materials, the work in process inventory includes the cost of the labor directly doing the
work and manufacturing overhead. Finished goods; the finished goods inventory also
consists of the cost of raw materials, labor and manufacturing overhead, now for the entire
product. Inventory is probably one of the largest costs for merchandising and manufacturing
businesses. Find out how to account for inventory regardless if you are a retailer or
manufacturer (Lange, 2004). When the good is completed as to manufacturing but not yet
sold or distributed to the end-user, it is called a "finished good”.
13
Finished goods are goods that have completed required manufacturing process and are
waiting to be fitted/mixed/processed with final product or final product itself could also be
called finished goods (Deloof, 2003).
2.1.3 Inventory Management Approaches
There are different types of systems that are used in inventory management, companies need
to control the type of materials they purchase, plan which products are to be produced and in
what quantities and ensure that they are able to meet current and future customer demand, all
at the lowest cost possible. Thus a good inventory management system is vital in the
operations of a firm. Graman and Magazine (2006), argued that today, the cost of holding
inventory, extensive product proliferation and the risk of obsolescence, especially in rapidly
changing markets, make the expense of holding large inventories of finished goods excessive
and that high demand items naturally have safety stock assigned to them, But in many
organizations there are so many very-low-demand items that keeping any stock of these
items is unreasonably expensive, so they argue that companies must now provide good
service while maintaining minimal inventories. Therefore, inventory management approaches
are essential aspects of any organization.
2.2.3.1 The Economic Order Quantity (EOQ)
The EOQ has been previously defined by Dervitsiotis (1981), Monks (1996), Lucey (1992),
and Schroeder (2000) as the ordering quantity which minimizes the balance of cost between
inventory holding cost and re-order costs. EOQ technique assumes constant demand and that
inventory is depleted at affixed rate until it reaches a specific level where the inventory is
refilled to bring it to its beginning level, the model assumes instantaneous replacement.
14
Basing on the above, EOQ has been criticized, to some extent is not applicable to developing
countries in the following ways (Lyson, 2006). The demand for a product cannot be known
with certainty, demands of products keep changing depending on the number of factors for
instance price of the product, quality and others.
This method entails a complex analysis and attempts to determine the minimum amount of
products needed to do the job and still keep the cost of inventory as low as possible. Order
quantity is at the point where ordering cost is equal to holdings cost at the minimum level of
total cost (Kakuru, 2000). Economic order quantity is the number of units that a company
should add to inventory with each order to minimize the total cost of inventory, such as
holding costs, ordering costs and stock out costs (Imeokparia, 2013).
EOQ model is a formula to determine the ordering quantity that will minimize total inventory
costs that is ordering and carrying costs. He continues to say that carrying cost rises with
large orders because the more inventories that are ordered the larger the amount of inventory
held by the company. Ordering costs on the other hand decline with large orders.
2.2.3.2 Vendor Managed Inventory
This approach presupposes transfer of responsibility of managing and controlling inventory
from the purchasing organization to the supplier upon agreed terms ( Adeyemi & Salami,
2010). The purchasing organization has legal ownership of the goods, but the goods after
purchase keep with the supplier and delivered at the buyer‟s premises on basis of ordered
quantity.
15
On the other hand modern development have seen the emergence of (VOI) vendor owned
inventory where the inventory is kept in the buyers premises and the buyer pays for what has
been used (Asheroft, 2005).
Vendor Managed Inventory (VMI) is where the manufacturer is given responsibility for
manufacturing and controlling inventory level at the retailer‟s distribution centre and in some
instances at the retail store level as well (Baily, Farmer, Barry, Jessop& David, 2008). VMI
is a process that falls under the „push‟ stock management processes. These are processes that
can be triggered by a tea processing firm‟s interpretation of an expected demand in inventory
and supply is scheduled to meet this demand (Irungu& Wanjau, 2011).
A well designed and developed approach to VMI can lead not only to reductions in inventory
level in the supply chain, but also to secondary savings arising from simplification of systems
and procedures (Rushton, Croucher, & Baker, 2011).
Failure to achieve supply on time may slow down the cash to cash cycle, thus reducing the
organization‟s efficiency or profitability .VMI provides the opportunity to develop a much
close relationship and binding relationship among the retailers and the manufacturers as well
as giving a much better visibility of the real demand. The supplier takes the responsibility for
operational management of the inventory within a mutually agreed framework of
performance targets which are constantly monitored and updated to create an environment of
continuous improvement. Users receive improved service levels, and cash flows, and vendors
enjoy better visibility of changing demand and greater customer loyalty (Emmett &
Granville, 2007). Reduced administrative costs due to elimination of the need to monitor
levels, paper to computer entries and reduced re-ordering costs (Farrington & Lysons, 2006).
16
2.2.2.3 Just In Time (JIT)
This is defined as an Inventory management philosophy whose goal is to maintain just
enough material in just the right time to make just enough amount of product. It‟s the exact
adjustment of production of quantity and time held. JIT is a demand pull system where the
demand for the product dictates the production requirement. It looks at inventory as a waste
and should be eliminated as much as possible. JIT has a benefit on reduction of inventories,
lead time reduction, and costs savings. Adoption of JIT has led to reduced inventory costs
and firms have experienced a high turnover rates (Biggart, 2002).
The philosophy of just in time refers to inventory as waste, it exposes hidden cost of holding
inventory, just in time system focuses on having the right materials at the right time at the
right place and in the exact amount. Liker, (2003) criticizes just in time operations and he
says it‟s risky because it leaves suppliers and downstream consumers open to supply shock
due to large demand changes. He uses an analogy of lowering the water in the river to expose
the rocks to explain how removing inventory from a firm interrupted the production flow.
Just in time policy is very unrealistic, customers demand constantly changes and shortages
due to stock out cost can cause huge losses on profits.
On addition just in time is criticized because it does not embrace the quantity discount model
which provide the lowest total cost for the firm, this means that when inventory is bought in
large quantities there is a discount and this reduces the total cost of inventory, therefore just
in time exposes the business to these dangers and its highly criticized.
17
Two things must happen for JIT to work. All parts must arrive where they are needed, when
they are needed and in the exact quantity needed (Eroglu & Hofe, 2011).
2.2.2.4 ABC Inventory Management Model
Inventory management usually involves a large number of items ranging in price from
relatively expensive, possibly very expensive units. Since inventory itself represent idle
capital, it‟s natural that Inventory management can be exercised on items that are
significantly responsible for the increase in capital cost (Farrington & Lysons, 2006).
ABC is a model that items are classified. Group A normally constitute of all the items that
are expensive and most valued in the organization and sometimes the items with high usage
rate, so if they ran out of stock the customers will be so disappointed. These items are
normally few but high impact. Group B items are those with moderate impact to the company
most of the items fall under this category moderate control is employed.
The remaining items constitute of class C which is low value goods and less concerns and
emphasis are taken. Class A represents small quantities of expensive value and must be
subject to tight Inventory management. Class B is next in order where a moderate form of
inventory can be applied. Class C items should be given the lowest priority. ABC analysis is
usually the first step that must be applied in an Inventory management to be able to decide on
the ideal on the way of controlling inventory (Eroglu & Hofer, 2011).
18
2.2.2.5 Fixed Order Point System or Two Bin System
In this method, inventory is tracked until it reaches a pre-determined point, when its low the
company makes an order to push the stock back to the desirable level the same amount is
ordered in each occasion therefore it is fit to be called continuous review system (Howard J
wells).
This is a system that is designed to track the remaining of an item each time a withdrawal is
made to determine whether its time to reorder, in this system demand is random and fixed
lead time costs which is involved. In this method the stock is segregated into two bins, stock
is first taken from the first bin; the requisition is placed when the stock in the first bin is over.
(Madaba,2005).Gerson, (1998), continue to explain about the periodic review system and he
says that in this method the inventory level is checked at fixed intervals this could be done
weekly or monthly it is known as time triggered system or fixed order. The periodic review
could be weekly, monthly, or any other specific time established by the firm, this method is
also known as economic order internal systems. He says that this is a system for placing
orders of inventories regular intervals and inventory is replenished up to as specified
inventory level.
2.1.4 Factors Influencing Inventory Management
There is several factors influence Inventory management but; because of limited time; the
researcher focuses on product type, product cost, lead time, cost of goods sold, stock level
and technological change. The type of product greatly influences the Inventory management
policies assigned to manage the product. For example, products with short shelf lives, such as
perishable foods, require a different policy.
19
Short shelf life products must rotate based on expiration date (Lucey , 2002). A major factor
that affects Inventory management policies is product lead time; the time from receipt of an
order to the time of delivery. Some industries and products have extraordinarily long lead
times .The increased amount of inventory also increases the workload associated with
managing the inventory, such as cycle counting, yearly physical inventory and general
warehouse maintenance (Irungu &Wanjau, 2011).
Many companies employ additional Inventory management policies for high-value products.
For example, many warehouses that inventory expensive audio-video equipment keep some
of the most expensive equipment; only a few of the warehouse personnel have access to this
equipment. Along with having the products caged, most companies require a signature from
authorized personnel before high-value products move from one location within a facility to
another (Gupta & Boyd, 2008). Companies cost is determined by adding up all the money
spent to buy the materials needed to produce the products this may be simply the money used
to purchase the wholesale products that are put on shelves and sold as stock.
A company‟s cost of goods directly affect the profits since the money used to produce the
products is ultimately deducted from the money taken from the sales , therefore it‟s important
for a firm to shop around for the best deal on products in order to reduce the cost of goods
and increase on the profits (Mutikani,2010). Another aspect of profitability is the degree of
cost, increase in costs will decrease the level of profits, this could include labor, raw
materials costs and rent.
20
On the other hand devaluation of the exchange rate would increase cost and imports and
therefore importing companies would face increase in costs which leads to decrease in
profits. Alternatively a firm with high fixed costs will need to produce a lot of benefits from
economies in order to maintain their profits levels (Kumar).
Maintaining stock levels affect the profits of a firm indirectly in many businesses. If a
company if a company stocks too much of a product, selling a small percentage of the total
products purchased in a given period of time the cost of goods may outweigh the total sales.
On the other hand ordering too few of an item could mean that the cost is reduced of a
product and it‟s easy to miss out sales that could have been made. This also will reduce the
level of profits (Benetts, 1990). Firms that hold high levels of inventory, this affect their level
of profits because stock is idle resources, the more stock a firm holds the more resources is
spend on this stock (Lysons, 2006).
Cost per unit of stock increases this reduces the level of profits due to this, many firms strive
to reduce their inventory costs, during times of price increase, this allows them to maintain
their current pricing levels. When inventory level rises it reduces the level of profits, but
firms try to reduce the cost by taking advantage of the supplier‟s discounts and negotiating
lower prices with their vendors in order to maintain the high level of profitability of a firm
(Lysons, 2005).
Changes in the technological sector have affected the way many firms carryout their
businesses this changes include, e-commerce, smart phones transactions, these technologies
trend enables customers to access goods and services faster. This ability to tap into customers
and the improvement in technology trends means possibly improvement in profits.
21
Technological knowhow and education level of people are so significant and this factor
affects business. Changes in technology has affected the level of profits, due to illiteracy
levels of workers in a firm and the rigidity level of workers in most firms, when the
technology improves this improves the profit level because there is efficiency in production
compared to poor technology where production is low and inefficient (Renuka,2001).
2.1.5 Overview of Organizational Performance
According to Main, (2000), the word profitability is composed of two words, namely; profit
and ability. The term profit has already been discussed at length in detail. The term ability
indicates the power of a firm to earn profits. The ability of an enterprise also denotes its
earning power or operating performance. Financial performance is the ability to earn profit
from all the activities of an enterprise. Business is conducted primarily to earn profits. The
amount of profit earned measures the efficiency of a business. The greater the volume of
profit, the higher is the efficiency of the concern.
The profit of a business may be measured and analyzed by studying the profitability of
investments attained by the business (Newbery & Mayer, 2007).
It indicates how well management of an enterprise generates earnings by using the resources
at its disposal (Storey, Emberson, Godsell & Harrison, 2006). In the other words the ability
to earn profit e.g. profitability, it is composed of two words profit and ability. The word
profit represents the absolute figure of profit but an absolute figure alone does not give an
exact ideas of the adequacy or otherwise of increase or change in performance as shown in
the financial statement of the enterprise (Deloof, 2003).
22
The word „ability‟ reflects the power of an enterprise to earn profits, it is called earning
performance. Earnings are an essential requirement to continue the business. Profitability is a
measure of evaluating the overall efficiency of the business (Main, 2000). The best possible
course for evaluation of business efficiency may be input-output analysis. Profitability can be
measured by relating output as a proportion of input or matching it with the results of other
firms of the same industry or results attained in the different periods of operations.
Profitability of a firm can be evaluated by comparing the amount of capital employed i.e. the
input with income earned i.e. the output (Rajeev, 2008).
This is popularly known as return on investment or return on capital employed. Along with
the economic objective of earning profits, a business is also required to perform a large
number of social objectives. Besides providing better quality of goods and services, it
provides big employment opportunities to the people, better condition of work, fulfill
community needs, conserves resources (Deloof, 2003).
2.1.6 Techniques of Organizational Performance Analysis
A financial analyst can adopt one or more of the following techniques or tools of profitability
analysis. Comparative Financial Statements, Cost volume Profit Analysis and ratio analysis
etc; because of limited time, the researcher is going to focus on ration analysis methods
especially profitability ratio only. According to Friends Consult Ltd (2012), Profitability
ratios are financial performance indicators that indicate how well an institution‟s
resources have been utilized to generate returns. The ratios indicate an institution‟s ability to
generate profits. Under this study, the researcher focuses on: Return on Assets (ROA),
Return on Equity (ROE), and return on invested capital (net profit ratio & turnover ratio).
Gross profit margin is found by subtracting the cost of goods sold from, net sales and then
dividing this amount (gross margin) by net sales.
23
The gross profit margin is an important operating ratio. A small change in the gross margin
has a tremendous impact on local savings. It indicates the cooperative‟s pricing policy and
cost of goods offered for sale (Katsiaryna, 2004)
2.1.7 Measurements of Organizational Performance
Adjusted margin is similar to gross margin in that annual profit dollars are divided by annual
sales dollars.
But to attain a more meaningful and comprehensive profitability measurement, the adjusted
margin calculation subtracts the annual cost of carrying the average inventory investment
from the gross profit dollars. The general formula is Adjusted Margin = [Annual Gross
Margin Dollars – (Annual Carrying Cost % x Average Inventory Investment)] ÷ Annual
Sales Dollars.
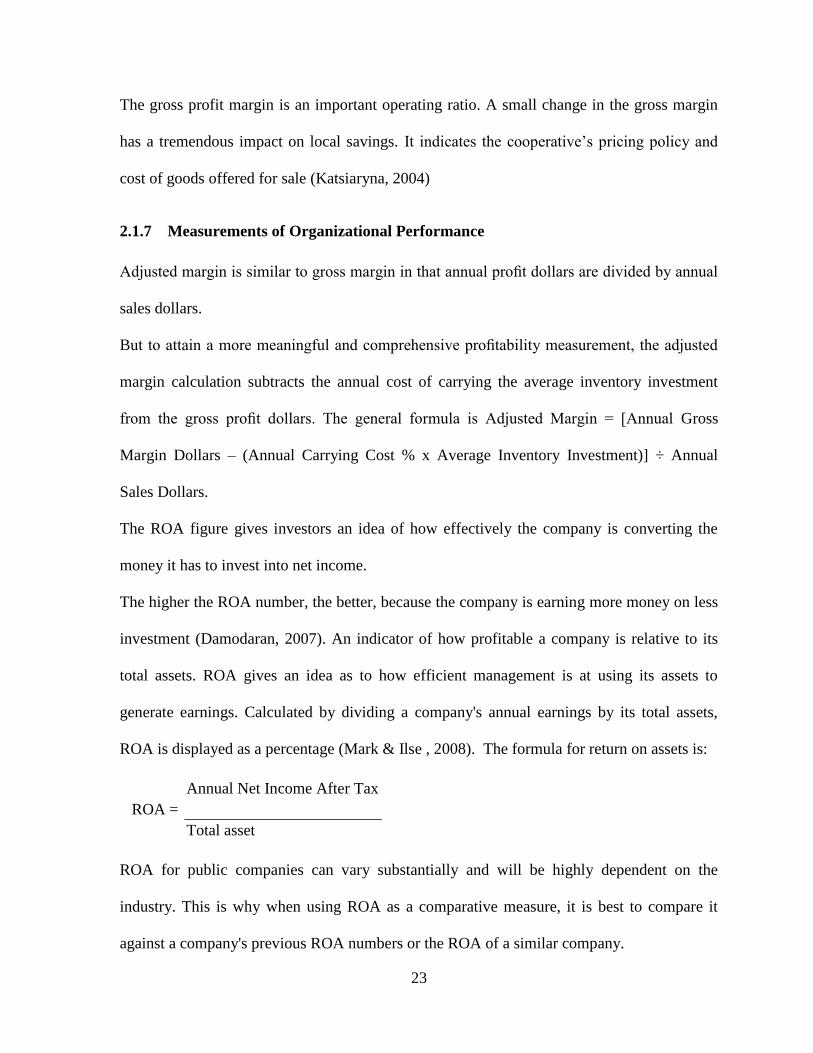
The ROA figure gives investors an idea of how effectively the company is converting the
money it has to invest into net income.
The higher the ROA number, the better, because the company is earning more money on less
investment (Damodaran, 2007). An indicator of how profitable a company is relative to its
total assets. ROA gives an idea as to how efficient management is at using its assets to
generate earnings. Calculated by dividing a company's annual earnings by its total assets,
ROA is displayed as a percentage (Mark & Ilse , 2008). The formula for return on assets is:
ROA =
Annual Net Income After Tax
Total asset
ROA for public companies can vary substantially and will be highly dependent on the
industry. This is why when using ROA as a comparative measure, it is best to compare it
against a company's previous ROA numbers or the ROA of a similar company.
24
Investors should compare the ROE of different companies and also check the trend in ROE
over time. However, relying solely on ROE for investment decisions is not safe. It can be
artificially influenced by the management, for example, when debt financing is used to
reduce share capital there will be an increase in ROE even if income remains constant(Mark
& Ilse, 2008).
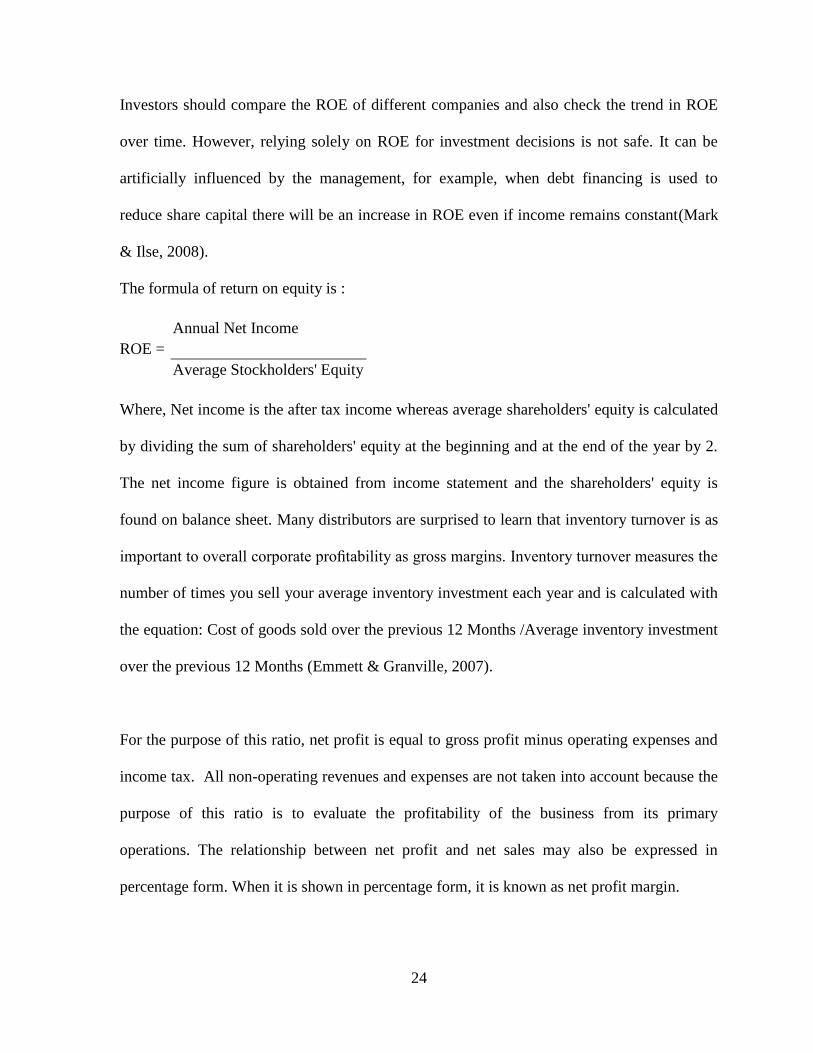
The formula of return on equity is :
ROE =
Annual Net Income
Average Stockholders' Equity
Where, Net income is the after tax income whereas average shareholders' equity is calculated
by dividing the sum of shareholders' equity at the beginning and at the end of the year by 2.
The net income figure is obtained from income statement and the shareholders' equity is
found on balance sheet. Many distributors are surprised to learn that inventory turnover is as
important to overall corporate profitability as gross margins. Inventory turnover measures the
number of times you sell your average inventory investment each year and is calculated with
the equation: Cost of goods sold over the previous 12 Months /Average inventory investment
over the previous 12 Months (Emmett & Granville, 2007).
For the purpose of this ratio, net profit is equal to gross profit minus operating expenses and
income tax. All non-operating revenues and expenses are not taken into account because the
purpose of this ratio is to evaluate the profitability of the business from its primary
operations. The relationship between net profit and net sales may also be expressed in
percentage form. When it is shown in percentage form, it is known as net profit margin.
25
Turnover ratio showing how many times a company's inventory is sold and replaced over a
period. The days in the period can then be divided by the inventory turnover formula to
calculate the days it takes to sell the inventory on hand or inventory turnover days. Inventory
turnover ratio measures company's efficiency in turning its inventory into sales (Byoungho,
2004). Average inventory should be used for inventory level to minimize the effect of
seasonality. This ratio should be compared against industry averages.
A low turnover rate can indicate poor liquidity, possible overstocking, and obsolescence, but
it may also reflect a planned inventory buildup in the case of material shortages or in
anticipation of rapidly rising prices (Eroglu & Hofer, 2011). Return on invested capital
(ROIC) is always calculated as a percentage. Invested capital can be in buildings, projects,
machinery, other companies etc. One downside of return on capital is that it tells nothing
about where the return is being generated. For example, it does not specify whether it is from
continuing operations or from a one-time event, such as a gain from foreign currency
transactions (Mark & Ilse, 2008).
2.1.8 Inventory Management and Organizational Performance
Inventory management helps organization to establish the proper inventory levels through the
economic order quantity; and to keep track of this level through Inventory management
system which may be manual such as two bin method and red line method, or computerized
Inventory management systems. Proper Inventory managements also require an organization
to undertake stocking and use appropriate method to value stock so as not to under or over
state profits (Kotabo, 2002). Inventory management can be done through introduction of
different measures so as to prevent the company from incurring unnecessary losses made by
different departments (Namusoke, 2011).
26
Capital and operating costs usually are reduced as a distributor‟s investment in inventory
decreases. After all, not as much money is tied up in stock, there isn‟t as much inventory to
keep track of, and less material is subject to shrinkage and obsolescence. Adjusted margin is
similar to gross margin in that annual profit dollars are divided by annual sales dollars
(Schreibfeder, 2004).
Inventory is stored in a warehouse or other storage facility before it is used to fill customer
orders. The efficiency with which this inventory is stored directly affects corporate
profitability, because receiving material as well as processing and filling customer orders are
costs of doing business. While a single warehouse cost factor might not have a significant
effect on corporate profitability, the total extra cost a firm incurs from having inefficient
warehouse operations can have a significant effect on overall corporate profitability
(Schreibfeder, 2004).
Inventory problems of too great or too small quantities on hand can cause business failures. If
a manufacturer experiences stock-out of a critical inventory item, production halts could
result. Moreover, a shopper expects the retailer to carry the item wanted. If an item is not
stocked when the customer thinks it should be, the retailer loses a customer not only on that
item but also on many other items in the future (Adeyemi & Salami, 2010). The conclusion
one might draw is that effective inventory management can make a significant contribution
to company‟s profit as well as increase its return on total assets.
2.2 Empirical Literature
Imeokparia (2013) analyzed Inventory Management System and Performance of Food and
Beverages Companies in Nigeria”, he explored the relationship between inventory
management and control and performance and Food and Beverages companies in Nigeria.
27
Secondary data were obtained from annual financial reports and accounts of Food and
Beverages companies listed on the Nigerian Stock Exchange. The data obtained were
analyzed using simple and multiple regression models. The results show that there significant
relationship between inventory management and control and the performance of Food and
Beverages companies in Nigeria.
The multiple regression correlation coefficient (R) =0.996, R2=0.990 and p-value
=0;00<0.05 The results also show the relative importance of the inventory management
decisions made by the organization, and the implications these decisions have on the
consumer. The findings show that the three key qualities that are essential in inventory
management decisions for manufacturing organization from the perspective of the third party
logistics provider are customer satisfaction, on time delivery and order fulfillment.
Anichebe and Agu (2013) investigated the effect of Inventory Management on
Organisational Effectiveness. The objectives of the study were to analyze the effects of
inventory management on Organizational Effectiveness in selected organizations in
Enugu, and to asses the impact of proper inventory management on organizational
performances in Emenite.Descriptive research method, especially survey and case study were
employed in carrying out the study. The population of the study is six hundred and fifty eight
(658). A sample size of two hundred and fouthy eight (248), was derived using the Taro
Yamene formula for sample size determination from a finite population. Data were generated
using questionnaire, oral interviews, observations.The Findings indicate that there is
significant relationship between good inventory management and organizational
effectiveness. Inventory management has a significant effect on organizational productivity.
28
There is highly positive correlation between good inventory management and organizational
profitability. The study concluded that Inventory Management is very vital to the success and
growth of organizations.
Kennedy, Margaret and Walter (2013), tea processing firms face problems of fluctuating
inventories, inaccurate forecasts and low utilization of inventories due to inadequate
coordination of operations, They indicated that not all Inventory management systems were
necessarily best for application in given firms. The purpose of this study was to assess the
effect of Inventory management systems on operational performance of tea processing firms
with a focus on Gianchore tea factory. Objectives of the study were to: Determine the effect
of material requirement planning on operational performance, establish the influence of
continuous replenishment on operational performance, and establish the extent to which
distribution resource planning influence operational performance and the effect of vendor
managed inventory on operational performance of Gianchore Tea Factory. The study target
population was 119 respondents consisting of one (1) factory manager, sixteen (16) middle
level managers, thirty six(36) factory supervisors and sixty six (66) employees working at
Gianchore tea factory. Purposive sampling and stratified random sampling techniques were
applied to select a sample of fifty five (55) respondents for this study. The main data
collection instrument was a structured questionnaire. Quantitative data was analyzed using
descriptive and inferential statistics, and regression analysis to assess the association between
the variables in the study.
29
2.3 Critical Review and Research Gap Identification
Imeokparia (2013) carrid entitled “Inventory Management System and Performance of Food
and Beverages Companies in Nigeria”, he explored the relationship between inventory
management and control and performance and Food and Beverages companies in Nigeria.
Secondary data were obtained from annual financial reports and accounts of Food and
Beverages companies listed on the Nigerian Stock Exchange.
The data obtained were analyzed using simple and multiple regression models. The results
show that there significant relationship between inventory management and control and the
performance of Food and Beverages companies in Nigeria.
Even if Imeokparia (2013) carried out his research on inventory management, he focused on
Food and Beverages Companies rather medical supply. Kennedy, Margaret and Walter
(2013), tea processing firms face problems of fluctuating inventories, inaccurate forecasts
and low utilization of inventories due to inadequate coordination of operations, they
indicated that not all Inventory management systems were necessarily best for application in
given firms. The purpose of this study was to assess the effect of Inventory management
systems on operational performance; Quantitative data was analyzed using descriptive and
inferential statistics, and regression analysis to assess the association between the variables in
the study. Although Kennedy, Margaret and Walter (2013) carried out their research related
to inventory management, they focused on tea processing firms face problems of fluctuating
inventories and inadequate coordination of operations, they did not focus on the failed of
medical supply during their research process.
30
Hence, from the above critics this research found a gap whereby, the above studies did not
focus on the field of medical supply by assessing the techniques used by organization during
inventory management; the factors that affect organization performance through inventory
management; the level of performance effectiveness in organization and the relationship
between inventory management and performance of organization using profitability ratios,
descriptive and correlation statistics.
2.4 Theoretical Framework
2.4.1 Theory of Constraints
This study will be guided by the theory of constraints is a management idea that needs to
increase performance of companies throughput efficiency or system performance measured
by sales through the identification of those processes that are constraining the production
system. Theory of constraints is based on the principle that a chain is only as strong as the
weakest link or constraint and to elevate and manage the constraint as necessary. The
difficulties in the theory of constraints are: very long lead times, large number of unfulfilled
orders or they are executed with much extra effort (overtimes), high level of unnecessary
inventories or lack of relevant inventories, wrong materials order, large number of
emergency orders and expedition levels, high levels of devolution, lack of key customers
engagement, frequent changes or absence of control related to priority orders, which implies
on schedule conflicts of the resources. These are the bottlenecks tea factories are likely to
face warranting their application of inventory control systems in order to enhance their
operations to meet the projected operational performance.
31
The theory is founded on the belief that an organization that maximizes the output of every
machine will not perform as well as one that ensures optimization of the flow of materials
and value created through its operational performance (Kennedy,Margaret & Walter, 2013).
Therefore, the theory of constraint facilitated the study to link inventory management and
financial performance of supply chain institutions.
2.4.2 Learning Curve Theory
This study will rely on learning curve theory; according to Adeniyi (2004), the origin of the
learning curve theory was developed in 1920; learning is the process by which an individual
acquires skill, knowledge and ability. When a new product or process is started, performance
of worker is not at its best and learning phenomenon takes place. As the experience is gained,
the performance of worker improves, time taken per unit reduces and thus his productivity
goes up. This improvement in productivity of workers is due to learning effect. Cost
predictions especially those relating to direct labor must allow for the effect of learning
process. This technique is a mathematical technique. It is a graphical technique used widely
to predict cost. Learning curve is a geometrical progression, which reveals that there is
steadily decreasing cost for the accomplishment of a given repetitive operation, as the
identical operation is increasingly repeated. The amount of decrease will be less and less with
each successive unit produced. The slope of the decision curve is expressed as a percentage.
This implies that, as long as the inventory management experience improved the cost of
managing inventory reduced.
32
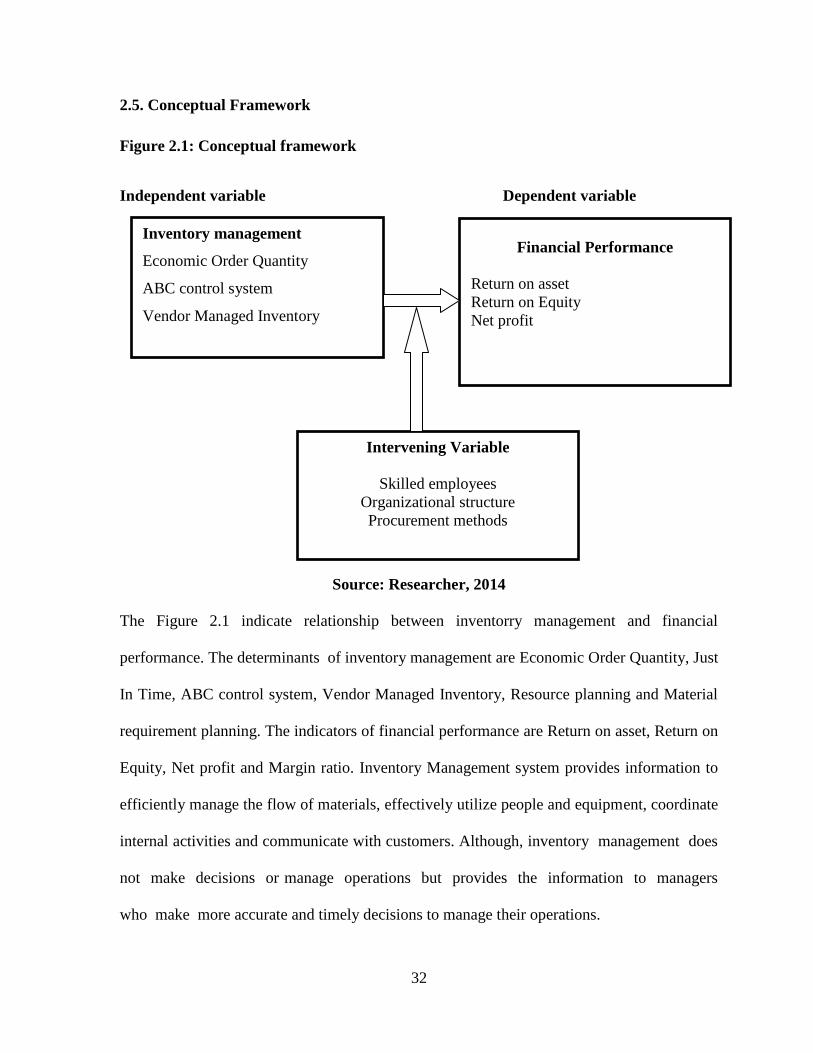
2.5. Conceptual Framework
Figure 2.1: Conceptual framework
Independent variable Dependent variable
Source: Researcher, 2014
The Figure 2.1 indicate relationship between inventorry management and financial
performance. The determinants of inventory management are Economic Order Quantity, Just
In Time, ABC control system, Vendor Managed Inventory, Resource planning and Material
requirement planning. The indicators of financial performance are Return on asset, Return on
Equity, Net profit and Margin ratio. Inventory Management system provides information to
efficiently manage the flow of materials, effectively utilize people and equipment, coordinate
internal activities and communicate with customers. Although, inventory management does
not make decisions or manage operations but provides the information to managers
who make more accurate and timely decisions to manage their operations.
Inventory management
Economic Order Quantity
ABC control system
Vendor Managed Inventory
Financial Performance
Return on asset
Return on Equity
Net profit
Intervening Variable
Skilled employees
Organizational structure
Procurement methods
33
CHAPTER THREE: RESEARCH METHODOLOGY
3.0 Introduction
This chapter sets out and describes the methodology that was used to investigate and
determine the contribution of Inventory management to organizational performance. It
includes the design of the study, the target population, sample design, data collection
procedures and instruments, data processing procedures and data analysis.
3.1 Research Design
This research was designed under case study using both descriptive and correlation research
with the aim of getting all the required qualitative and quantitative information. This design
helped to describe the relationship between the Inventory management and organizational
performance.
3.2 Target Population
The target population of this study was 128 employees of Medical Procurement and
production Division [MPPP, 2014]. The population under study is summarized into Table 3.1
according to the department.
3.3 Sample Design
A sample is a subset or portion of the total population under study. This part concerns the
sample size and sampling procedures used to come up with the sample size.
34
3.3.1 Sample Size Determination
According to our research purpose, we need data from 7 departments such as; 5 employees
from finance and accounting, 6 employees from quality assurance and control, 7 employees
procurement, 4employees from quantification, 9 employees from administrative, 25
employees from warehousing and distribution and then 23 employees from production
department, thus the targeted population used is 128 employees, according to Yamane (1967)
Sampling formula: n=2(e)*N1
NWhere:
𝑁
1+𝑁𝑒2 = 128
1+128∗ 0.072 = 79 People, Therefore sample size was 79 people.
3.3.2 Sampling Techniques
Apart from the sample size, the selection should detail how the researcher intends to select
the sample, ensuring representativeness of the target population. The choice of sampling
technique was based on the feasibility and sensibility of collecting data to answer the
research questions and to address the objectives; this study used simple random sampling and
stratified sampling method to choose the respondents.
Table 3.1: Population and Sample Size Category
Population category Population size Sample size
Finance and Accounting 8 5
Quality Assurance and control 9 6
Procurement 12 7
Quantification 6 4
Administrative 15 9
Warehousing and Distribution 40 25
Production 38 23
Total 128 79
Source: Researcher and MPPD (2014)
35
3.4 Data Collection Methods
In this research, the researcher used both primary and secondary data. The researcher also
used both quantitative and qualitative to make sure that the accurate data was obtained.
However, it is an important topic since the type of scale used in taking measurements directly
impinges on the statistical techniques which can legitimately be used in the analysis.
3.4.1Data Collection Instrument
The sources of data collected were mainly primary and secondary data. Primary data was
collected at the first hand when the researcher went to the field to collect raw data from
MPPD using questionnaires, observations and group discussion, however secondary data
were obtained from MPPD in the sources that have been previously published. In respect to
primary data, this research used questionnaire. Questionnaires were used as technique of
collecting primary data, in order to complete and increase the reliability of data; the
questionnaires were given to the targeted organization which is MPPD‟s employees. The
questionnaire focused on respondents‟ profile, techniques of Inventory management and
level of performance in MPPD.
3.4.2 Administration of Data Collection Instrument
The researcher designed the questionnaires according to the research objectives and
questions. The distribution of the questionnaires was done by the researcher and their
collection was done after they were filled. The researcher explained to the respondents the
purpose of the research which was academic only and also requested them to completely
answer the questionnaires.
36
After five days, the questionnaires were returned and analyzed by the researcher. The
researcher distributed 79 questionnaires and only 7(8.86%) did not return.
3.4.3 Reliability and Validity
The validity of this study was constructed by the use of sources of evidence during the data
collection, the establishment of a chain of evidence which was based on the principle of
allowing the external observer to follow the source of any evidence from initial research
questions to the conclusions of the case study. The validity of the data collection instrument
was based on the intervention of external experts. In order to make sure that the research is
reliable, the researcher did a test -pretest. The researcher carried out a pilot research to test
reliability using Croanbach coefficient (Alpha). Where Croanbach coefficient was 78.3%,
therefore, questionnaire was reliable.
3.5 Data Analysis Procedures
The primary data was collected in a way that facilitates its analysis. Consequently, data from
completed questionnaires were edited, categorized and entered into statistical packaging for
social sciences and summarized using the percentage of respondents for analysis. In this
study, during data processing the researcher focused on editing, coding, classification and
tabulation. The researcher classified the data according to their sources; both primary and
secondary data were classified according to the study variables under study and its
objectives. The data was analyzed using SPSS software, where the study will use descriptive
statistics to establish frequencies and percentages. The researcher also used correlation
coefficient, whereby Pearson correlation coefficient was used to establish relationship
between inventory management and organizational performance.
37
The researcher intends used the financial ratio analysis to certify the percentage of
correlation whereby, she focused on return on asset, return on equity, and net profit.
3.6 Ethical consideration
The following ethical issues, though not exhaustive, has been identified by various authors as
important to be considered during any research: Informed consent, avoidance of harm,
violation of privacy, anonymity and confidentiality, deceiving respondents or concealing of
information, respect for human dignity that include right for full disclosure, debriefing
respondents and presentation and interpretation of data. With regard to this study, the aims
and objectives were conveyed to all the relevant authorities during the process of acquiring
permission to do research, and to the employees and managers involved during the data
collection stage. Respondent‟s participation were voluntary and they had the right to
withdraw from the study at any time if they will so wish. Anonymity and confidentiality were
promised and ensured, by providing a self-addressed return envelope with each questionnaire
and by requesting respondents not to write their names on the questionnaire. In addition, a
covering letter which explained the aim and objectives of the study was accompanied each
questionnaire.
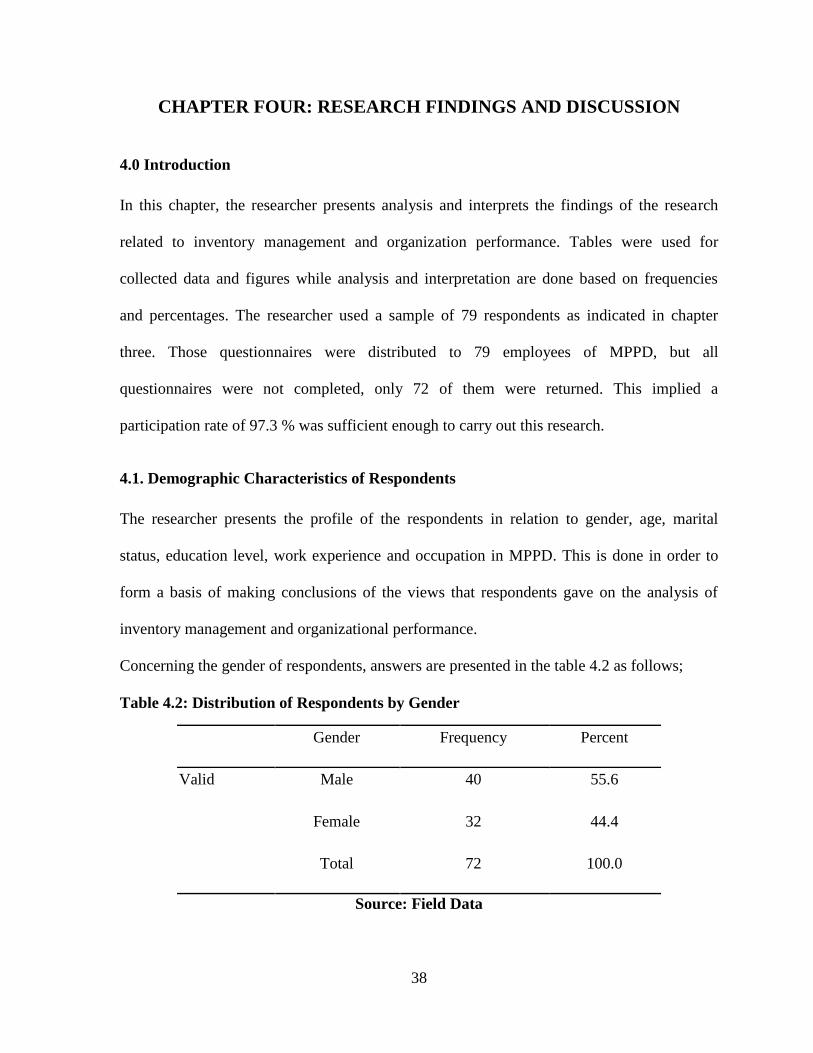
38
CHAPTER FOUR: RESEARCH FINDINGS AND DISCUSSION
4.0 Introduction
In this chapter, the researcher presents analysis and interprets the findings of the research
related to inventory management and organization performance. Tables were used for
collected data and figures while analysis and interpretation are done based on frequencies
and percentages. The researcher used a sample of 79 respondents as indicated in chapter
three. Those questionnaires were distributed to 79 employees of MPPD, but all
questionnaires were not completed, only 72 of them were returned. This implied a
participation rate of 97.3 % was sufficient enough to carry out this research.
4.1. Demographic Characteristics of Respondents
The researcher presents the profile of the respondents in relation to gender, age, marital
status, education level, work experience and occupation in MPPD. This is done in order to
form a basis of making conclusions of the views that respondents gave on the analysis of
inventory management and organizational performance.
Concerning the gender of respondents, answers are presented in the table 4.2 as follows;
Table 4.2: Distribution of Respondents by Gender
Gender Frequency Percent
Valid Male 40 55.6
Female 32 44.4
Total 72 100.0
Source: Field Data
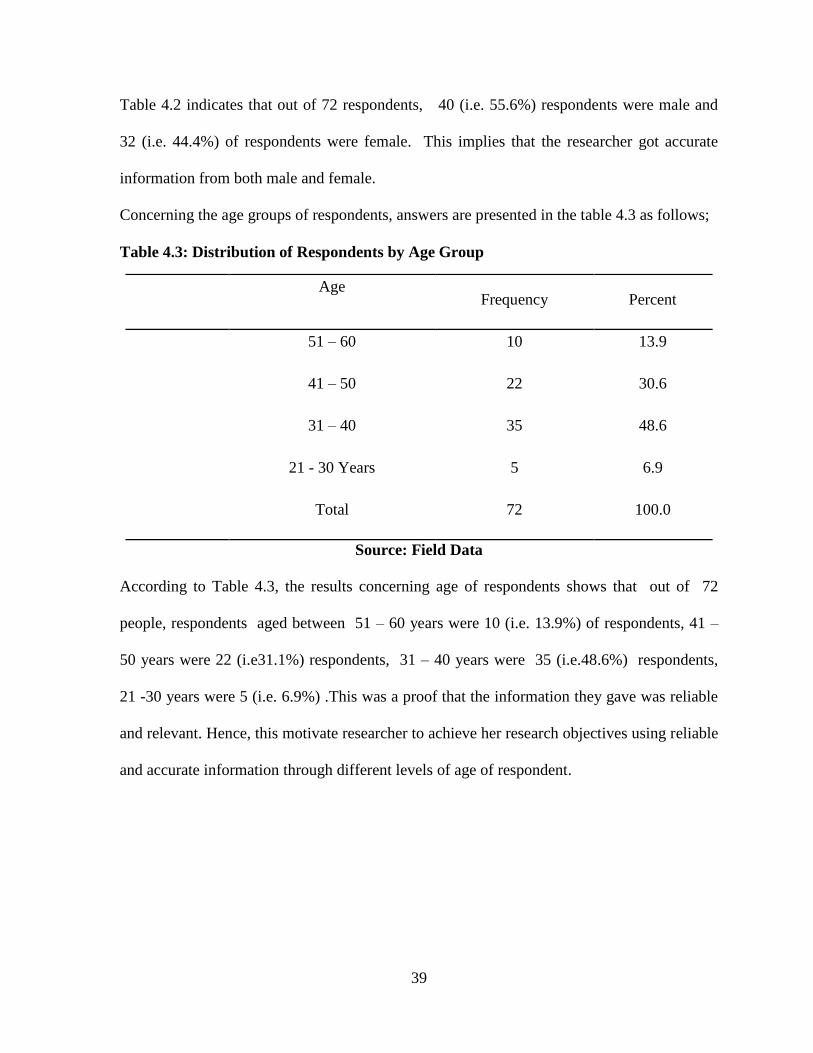
39
Table 4.2 indicates that out of 72 respondents, 40 (i.e. 55.6%) respondents were male and
32 (i.e. 44.4%) of respondents were female. This implies that the researcher got accurate
information from both male and female.
Concerning the age groups of respondents, answers are presented in the table 4.3 as follows;
Table 4.3: Distribution of Respondents by Age Group
Age Frequency Percent
51 – 60 10 13.9
41 – 50 22 30.6
31 – 40 35 48.6
21 - 30 Years 5 6.9
Total 72 100.0
Source: Field Data
According to Table 4.3, the results concerning age of respondents shows that out of 72
people, respondents aged between 51 – 60 years were 10 (i.e. 13.9%) of respondents, 41 –
50 years were 22 (i.e31.1%) respondents, 31 – 40 years were 35 (i.e.48.6%) respondents,
21 -30 years were 5 (i.e. 6.9%) .This was a proof that the information they gave was reliable
and relevant. Hence, this motivate researcher to achieve her research objectives using reliable
and accurate information through different levels of age of respondent.
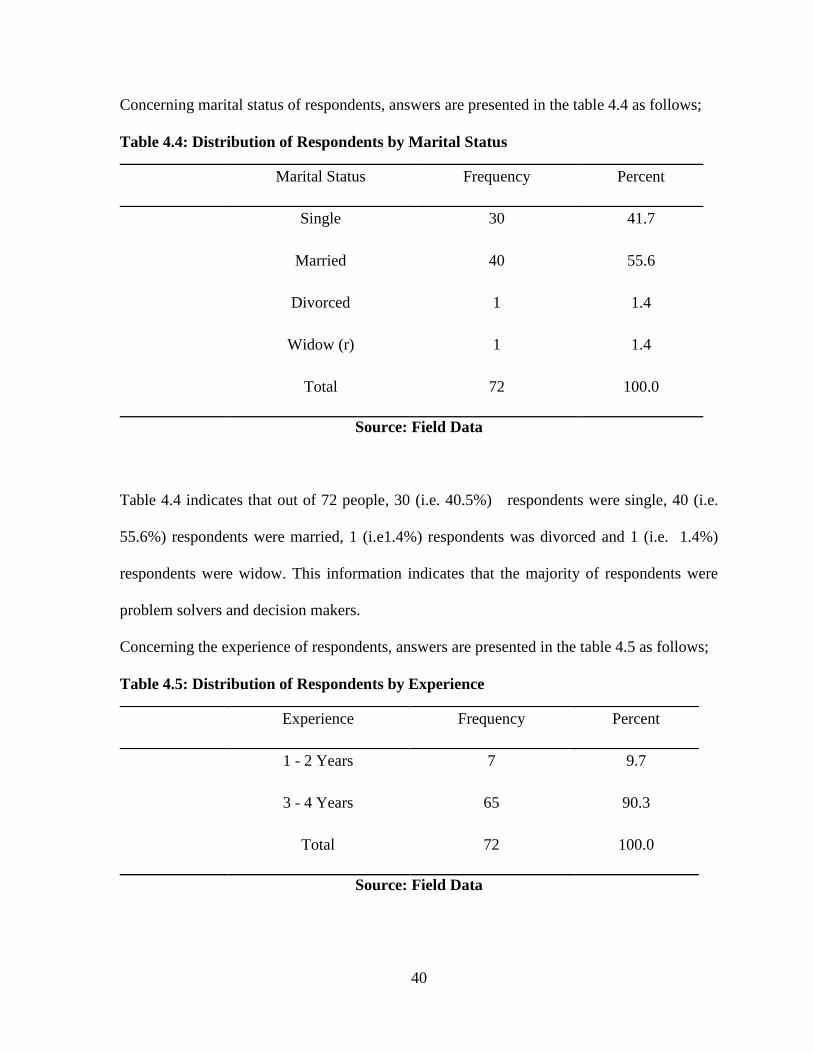
40
Concerning marital status of respondents, answers are presented in the table 4.4 as follows;
Table 4.4: Distribution of Respondents by Marital Status
Marital Status Frequency Percent
Single 30 41.7
Married 40 55.6
Divorced 1 1.4
Widow (r) 1 1.4
Total 72 100.0
Source: Field Data
Table 4.4 indicates that out of 72 people, 30 (i.e. 40.5%) respondents were single, 40 (i.e.
55.6%) respondents were married, 1 (i.e1.4%) respondents was divorced and 1 (i.e. 1.4%)
respondents were widow. This information indicates that the majority of respondents were
problem solvers and decision makers.
Concerning the experience of respondents, answers are presented in the table 4.5 as follows;
Table 4.5: Distribution of Respondents by Experience
Experience Frequency Percent
1 - 2 Years 7 9.7
3 - 4 Years 65 90.3
Total 72 100.0
Source: Field Data
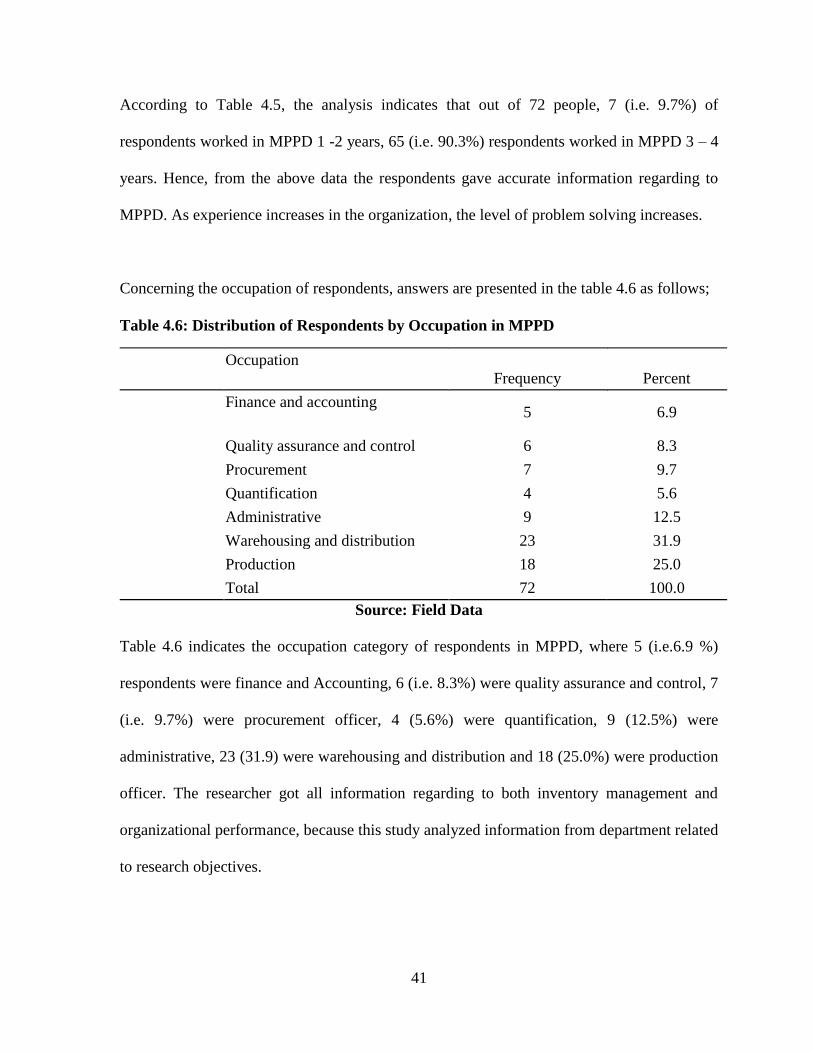
41
According to Table 4.5, the analysis indicates that out of 72 people, 7 (i.e. 9.7%) of
respondents worked in MPPD 1 -2 years, 65 (i.e. 90.3%) respondents worked in MPPD 3 – 4
years. Hence, from the above data the respondents gave accurate information regarding to
MPPD. As experience increases in the organization, the level of problem solving increases.
Concerning the occupation of respondents, answers are presented in the table 4.6 as follows;
Table 4.6: Distribution of Respondents by Occupation in MPPD
Occupation
Frequency Percent
Finance and accounting 5 6.9
Quality assurance and control 6 8.3
Procurement 7 9.7
Quantification 4 5.6
Administrative 9 12.5
Warehousing and distribution 23 31.9
Production 18 25.0
Total 72 100.0
Source: Field Data
Table 4.6 indicates the occupation category of respondents in MPPD, where 5 (i.e.6.9 %)
respondents were finance and Accounting, 6 (i.e. 8.3%) were quality assurance and control, 7
(i.e. 9.7%) were procurement officer, 4 (5.6%) were quantification, 9 (12.5%) were
administrative, 23 (31.9) were warehousing and distribution and 18 (25.0%) were production
officer. The researcher got all information regarding to both inventory management and
organizational performance, because this study analyzed information from department related
to research objectives.
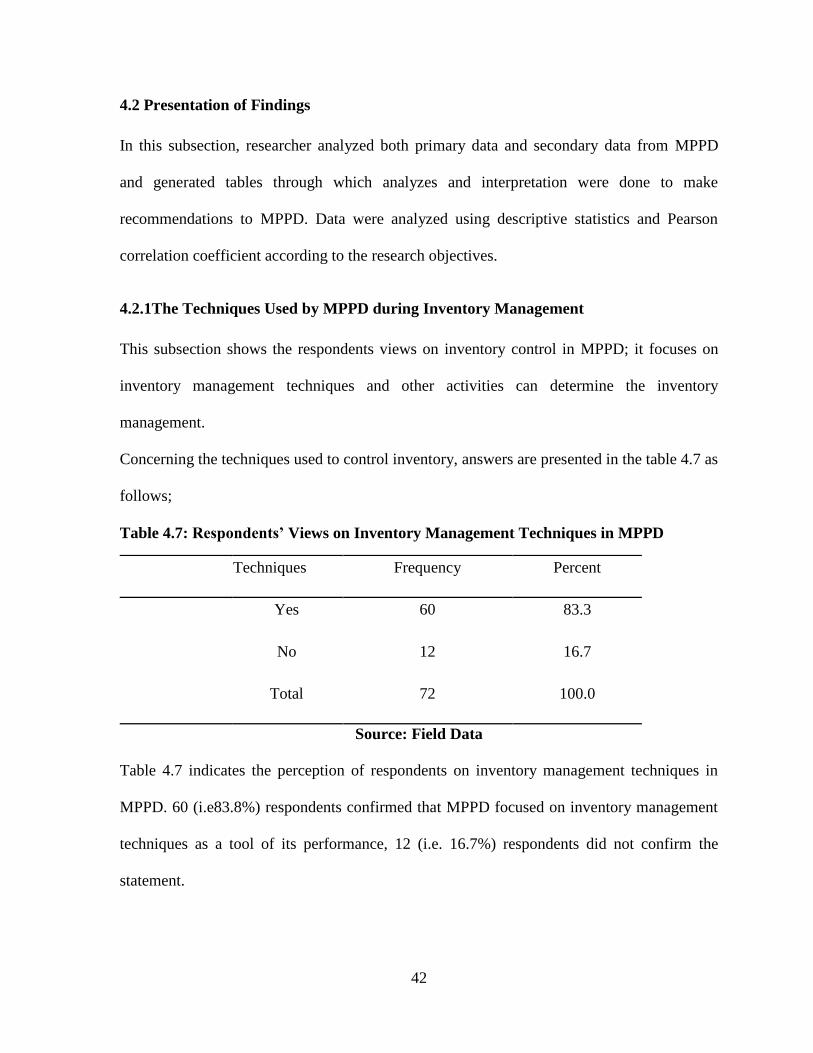
42
4.2 Presentation of Findings
In this subsection, researcher analyzed both primary data and secondary data from MPPD
and generated tables through which analyzes and interpretation were done to make
recommendations to MPPD. Data were analyzed using descriptive statistics and Pearson
correlation coefficient according to the research objectives.
4.2.1The Techniques Used by MPPD during Inventory Management
This subsection shows the respondents views on inventory control in MPPD; it focuses on
inventory management techniques and other activities can determine the inventory
management.
Concerning the techniques used to control inventory, answers are presented in the table 4.7 as
follows;
Table 4.7: Respondents’ Views on Inventory Management Techniques in MPPD
Techniques Frequency Percent
Yes 60 83.3
No 12 16.7
Total 72 100.0
Source: Field Data
Table 4.7 indicates the perception of respondents on inventory management techniques in
MPPD. 60 (i.e83.8%) respondents confirmed that MPPD focused on inventory management
techniques as a tool of its performance, 12 (i.e. 16.7%) respondents did not confirm the
statement.
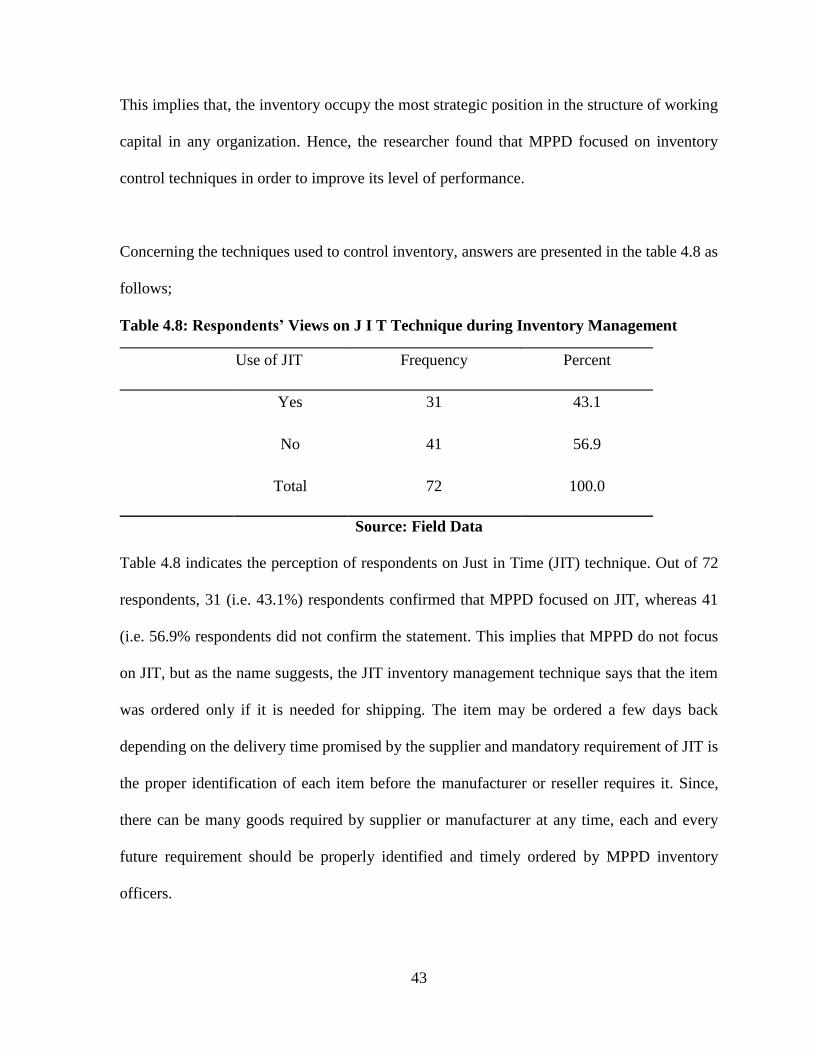
43
This implies that, the inventory occupy the most strategic position in the structure of working
capital in any organization. Hence, the researcher found that MPPD focused on inventory
control techniques in order to improve its level of performance.
Concerning the techniques used to control inventory, answers are presented in the table 4.8 as
follows;
Table 4.8: Respondents’ Views on J I T Technique during Inventory Management
Use of JIT Frequency Percent
Yes 31 43.1
No 41 56.9
Total 72 100.0
Source: Field Data
Table 4.8 indicates the perception of respondents on Just in Time (JIT) technique. Out of 72
respondents, 31 (i.e. 43.1%) respondents confirmed that MPPD focused on JIT, whereas 41
(i.e. 56.9% respondents did not confirm the statement. This implies that MPPD do not focus
on JIT, but as the name suggests, the JIT inventory management technique says that the item
was ordered only if it is needed for shipping. The item may be ordered a few days back
depending on the delivery time promised by the supplier and mandatory requirement of JIT is
the proper identification of each item before the manufacturer or reseller requires it. Since,
there can be many goods required by supplier or manufacturer at any time, each and every
future requirement should be properly identified and timely ordered by MPPD inventory
officers.
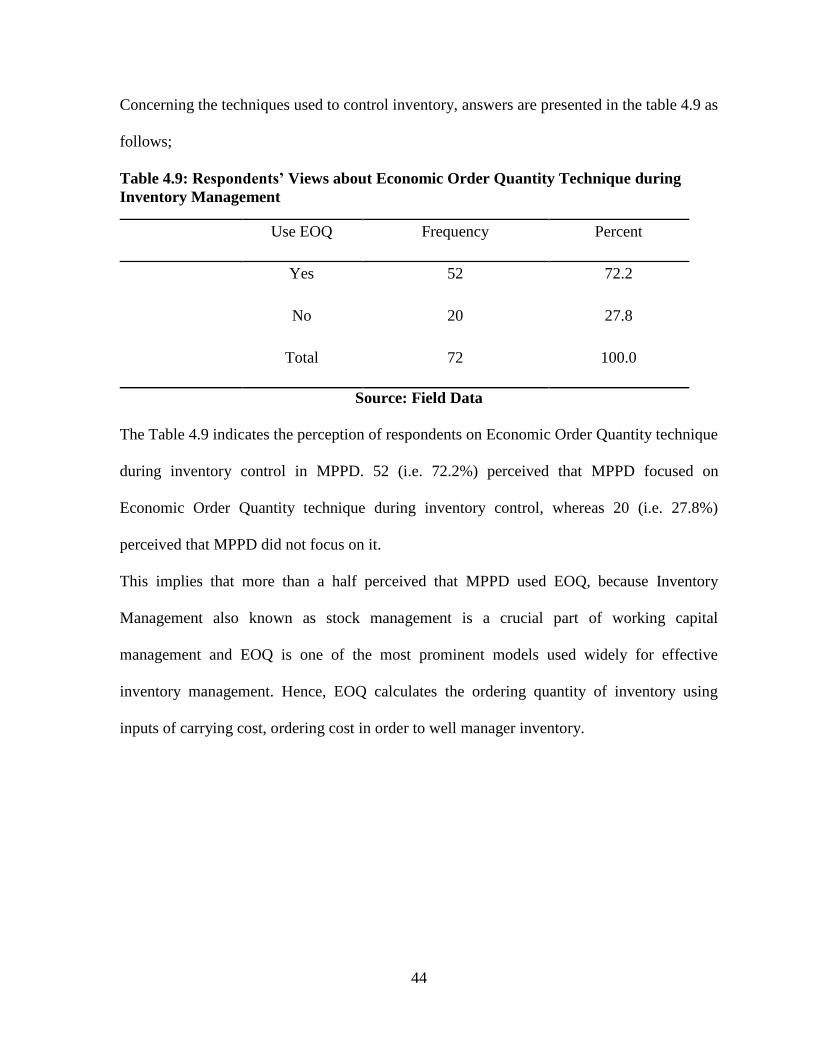
44
Concerning the techniques used to control inventory, answers are presented in the table 4.9 as
follows;
Table 4.9: Respondents’ Views about Economic Order Quantity Technique during
Inventory Management
Use EOQ Frequency Percent
Yes 52 72.2
No 20 27.8
Total 72 100.0
Source: Field Data
The Table 4.9 indicates the perception of respondents on Economic Order Quantity technique
during inventory control in MPPD. 52 (i.e. 72.2%) perceived that MPPD focused on
Economic Order Quantity technique during inventory control, whereas 20 (i.e. 27.8%)
perceived that MPPD did not focus on it.
This implies that more than a half perceived that MPPD used EOQ, because Inventory
Management also known as stock management is a crucial part of working capital
management and EOQ is one of the most prominent models used widely for effective
inventory management. Hence, EOQ calculates the ordering quantity of inventory using
inputs of carrying cost, ordering cost in order to well manager inventory.
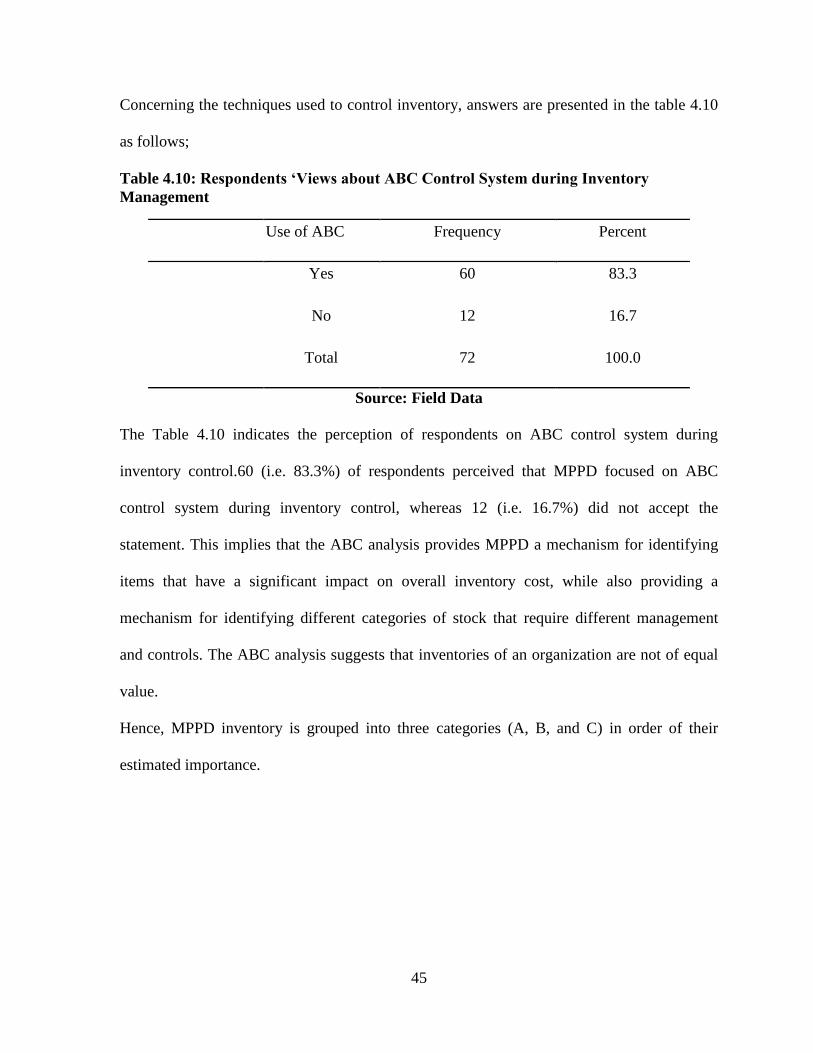
45
Concerning the techniques used to control inventory, answers are presented in the table 4.10
as follows;
Table 4.10: Respondents ‘Views about ABC Control System during Inventory
Management
Use of ABC Frequency Percent
Yes 60 83.3
No 12 16.7
Total 72 100.0
Source: Field Data
The Table 4.10 indicates the perception of respondents on ABC control system during
inventory control.60 (i.e. 83.3%) of respondents perceived that MPPD focused on ABC
control system during inventory control, whereas 12 (i.e. 16.7%) did not accept the
statement. This implies that the ABC analysis provides MPPD a mechanism for identifying
items that have a significant impact on overall inventory cost, while also providing a
mechanism for identifying different categories of stock that require different management
and controls. The ABC analysis suggests that inventories of an organization are not of equal
value.
Hence, MPPD inventory is grouped into three categories (A, B, and C) in order of their
estimated importance.
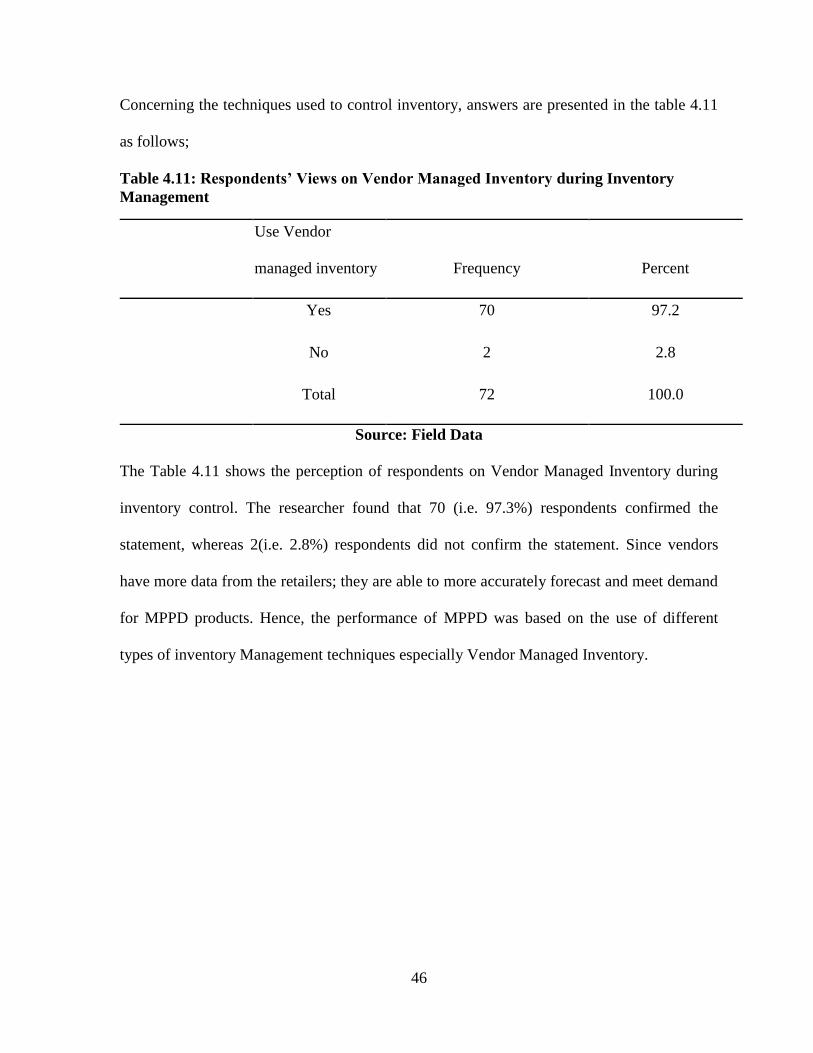
46
Concerning the techniques used to control inventory, answers are presented in the table 4.11
as follows;
Table 4.11: Respondents’ Views on Vendor Managed Inventory during Inventory
Management
Use Vendor
managed inventory Frequency Percent
Yes 70 97.2
No 2 2.8
Total 72 100.0
Source: Field Data
The Table 4.11 shows the perception of respondents on Vendor Managed Inventory during
inventory control. The researcher found that 70 (i.e. 97.3%) respondents confirmed the
statement, whereas 2(i.e. 2.8%) respondents did not confirm the statement. Since vendors
have more data from the retailers; they are able to more accurately forecast and meet demand
for MPPD products. Hence, the performance of MPPD was based on the use of different
types of inventory Management techniques especially Vendor Managed Inventory.
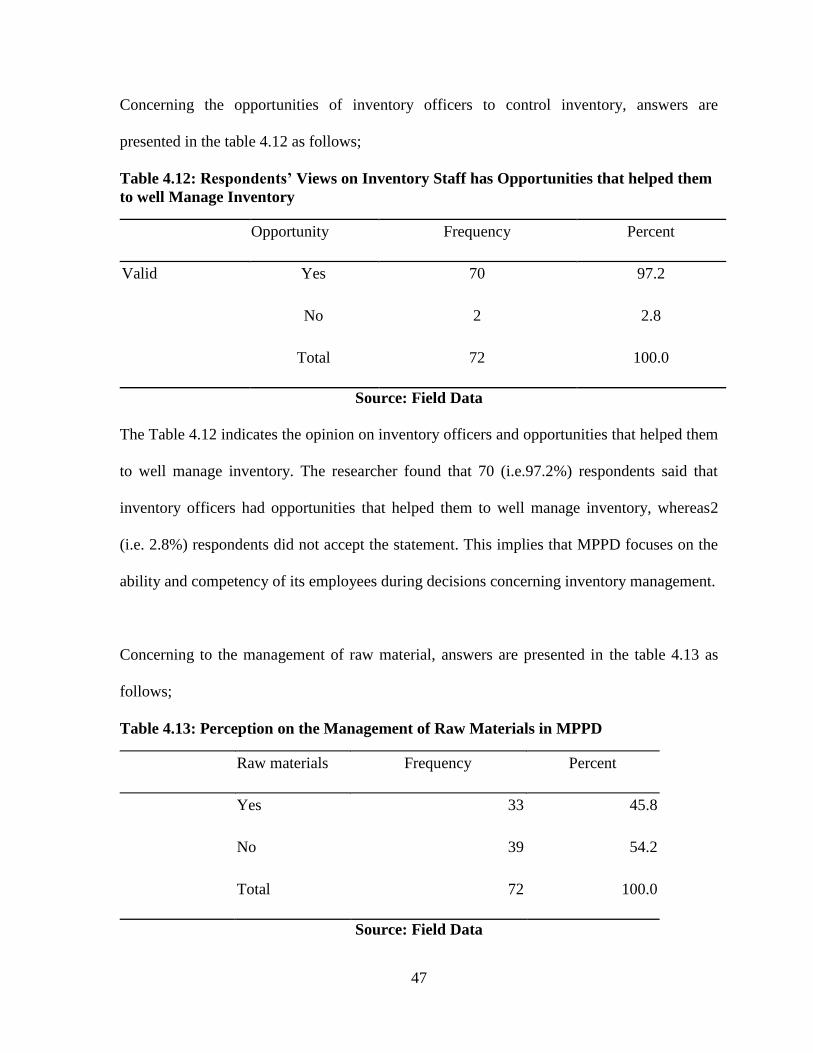
47
Concerning the opportunities of inventory officers to control inventory, answers are
presented in the table 4.12 as follows;
Table 4.12: Respondents’ Views on Inventory Staff has Opportunities that helped them
to well Manage Inventory
Opportunity Frequency Percent
Valid Yes 70 97.2
No 2 2.8
Total 72 100.0
Source: Field Data
The Table 4.12 indicates the opinion on inventory officers and opportunities that helped them
to well manage inventory. The researcher found that 70 (i.e.97.2%) respondents said that
inventory officers had opportunities that helped them to well manage inventory, whereas2
(i.e. 2.8%) respondents did not accept the statement. This implies that MPPD focuses on the
ability and competency of its employees during decisions concerning inventory management.
Concerning to the management of raw material, answers are presented in the table 4.13 as
follows;
Table 4.13: Perception on the Management of Raw Materials in MPPD
Raw materials Frequency Percent
Yes 33 45.8
No 39 54.2
Total 72 100.0
Source: Field Data

48
Table 4.13 indicates the perception of respondents on the management of raw material in
MPPD.
The study found that 33 (45.8%) respondents confirmed the statement and 39 (54.2%)
respondents did not accept the statement. This implies that MPPD did not focus on the
management of raw materials, as other public institutions MPPD focuses on buying finished
goods and service delivery rather producing products.
Concerning the challenges of inventory staff to control inventory, answers are presented in
Table 4.14 as follows;
4.2.2 The Factors that Affect MPPD Performance through Inventory Management
Concerning the savings of tax revenue, answers are presented in the table 4.14 as follows;
Table 4.14: Perception on savings of tax revenue
Savings of tax Frequency Percent
Yes 62 86.1
No 10 13.9
Total 72 100.0
Source: Field Data
Table 4.14 indicates the perception on savings of tax revenue since 2010 up to 2013 in
MPPD. The researcher found that 62 (i.e. 86.1%) respondents confirmed savings of tax
revenue is among of the factors that affect the performance of MPPD, 10 (i.e. 13.9%)
respondents did not confirm the statement.
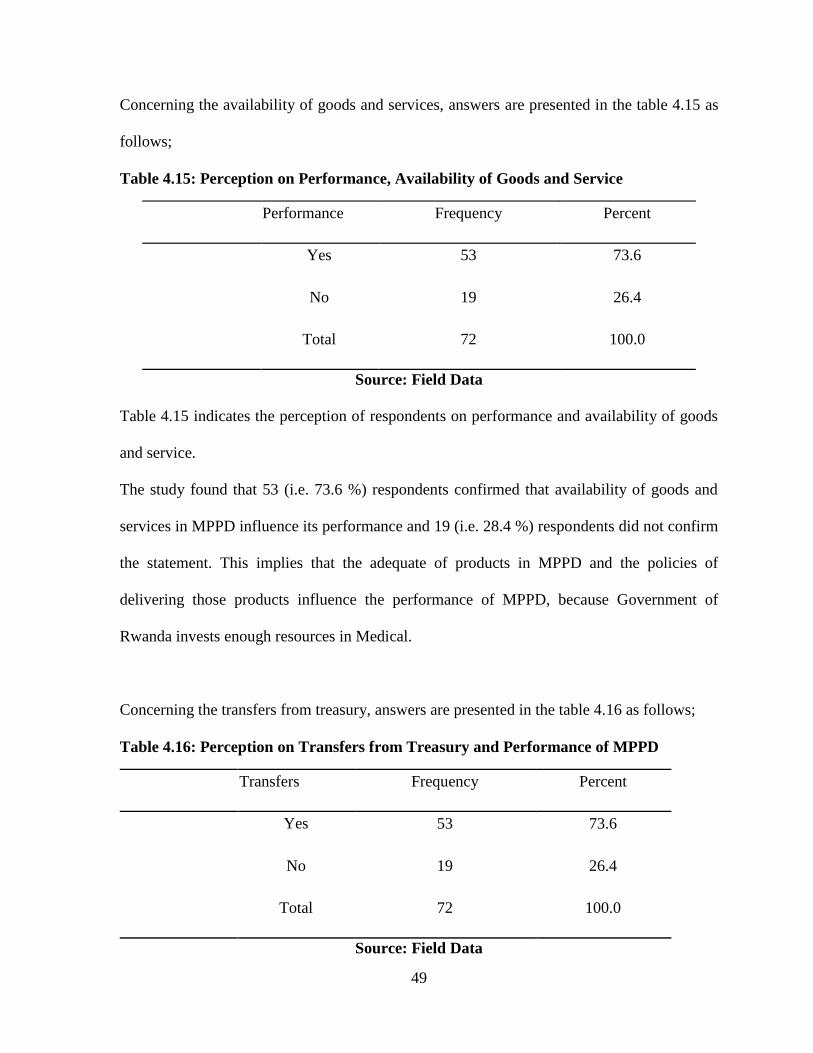
49
Concerning the availability of goods and services, answers are presented in the table 4.15 as
follows;
Table 4.15: Perception on Performance, Availability of Goods and Service
Performance Frequency Percent
Yes 53 73.6
No 19 26.4
Total 72 100.0
Source: Field Data
Table 4.15 indicates the perception of respondents on performance and availability of goods
and service.
The study found that 53 (i.e. 73.6 %) respondents confirmed that availability of goods and
services in MPPD influence its performance and 19 (i.e. 28.4 %) respondents did not confirm
the statement. This implies that the adequate of products in MPPD and the policies of
delivering those products influence the performance of MPPD, because Government of
Rwanda invests enough resources in Medical.
Concerning the transfers from treasury, answers are presented in the table 4.16 as follows;
Table 4.16: Perception on Transfers from Treasury and Performance of MPPD
Transfers Frequency Percent
Yes 53 73.6
No 19 26.4
Total 72 100.0
Source: Field Data
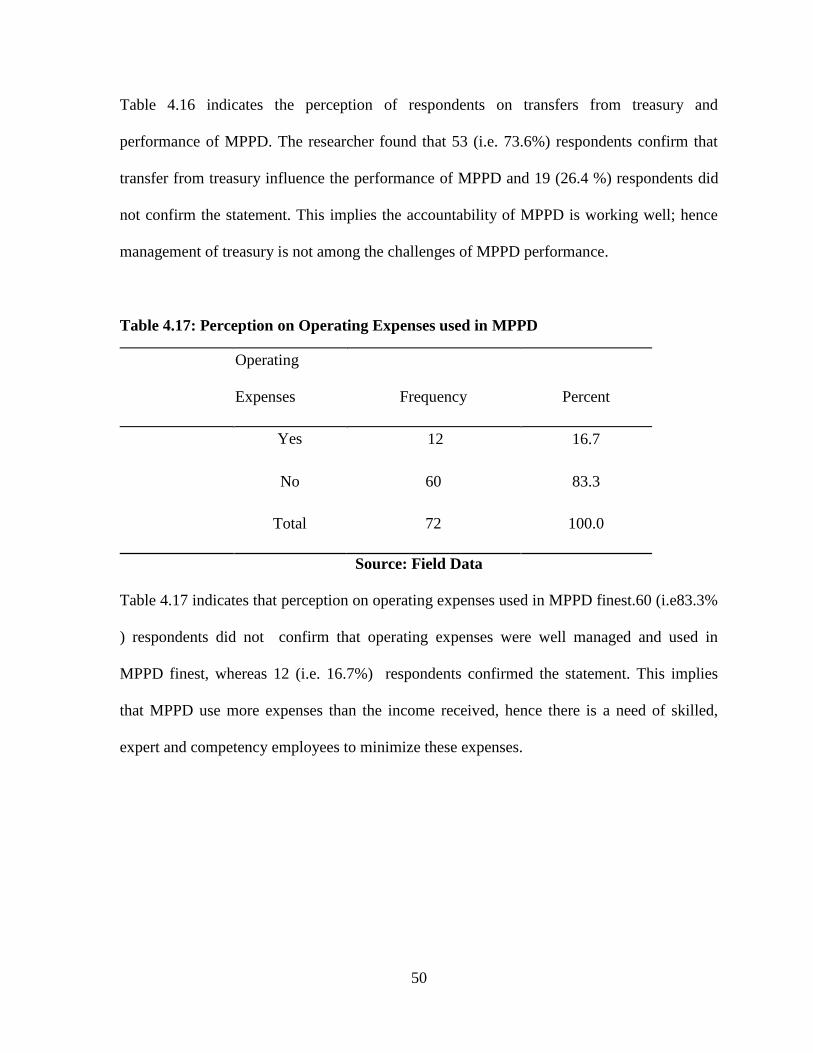
50
Table 4.16 indicates the perception of respondents on transfers from treasury and
performance of MPPD. The researcher found that 53 (i.e. 73.6%) respondents confirm that
transfer from treasury influence the performance of MPPD and 19 (26.4 %) respondents did
not confirm the statement. This implies the accountability of MPPD is working well; hence
management of treasury is not among the challenges of MPPD performance.
Table 4.17: Perception on Operating Expenses used in MPPD
Operating
Expenses Frequency Percent
Yes 12 16.7
No 60 83.3
Total 72 100.0
Source: Field Data
Table 4.17 indicates that perception on operating expenses used in MPPD finest.60 (i.e83.3%
) respondents did not confirm that operating expenses were well managed and used in
MPPD finest, whereas 12 (i.e. 16.7%) respondents confirmed the statement. This implies
that MPPD use more expenses than the income received, hence there is a need of skilled,
expert and competency employees to minimize these expenses.
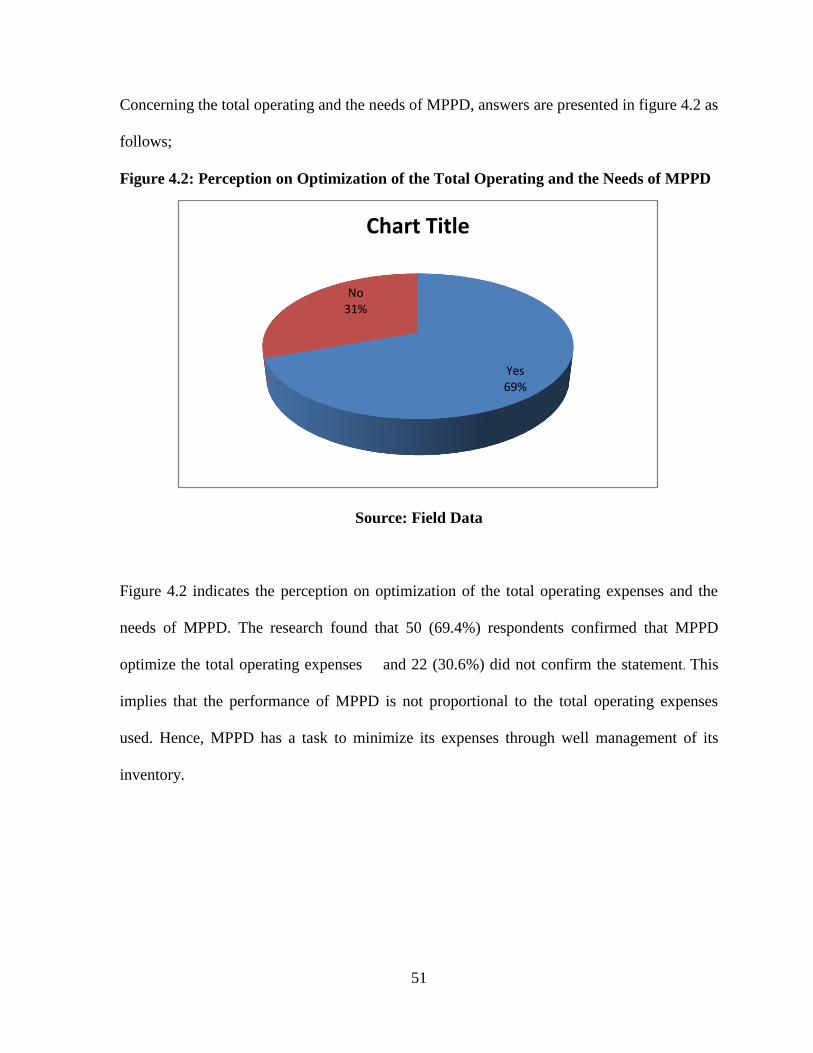
51
Concerning the total operating and the needs of MPPD, answers are presented in figure 4.2 as
follows;
Figure 4.2: Perception on Optimization of the Total Operating and the Needs of MPPD
Source: Field Data
Figure 4.2 indicates the perception on optimization of the total operating expenses and the
needs of MPPD. The research found that 50 (69.4%) respondents confirmed that MPPD
optimize the total operating expenses and 22 (30.6%) did not confirm the statement. This
implies that the performance of MPPD is not proportional to the total operating expenses
used. Hence, MPPD has a task to minimize its expenses through well management of its
inventory.
Yes69%
No31%
Chart Title
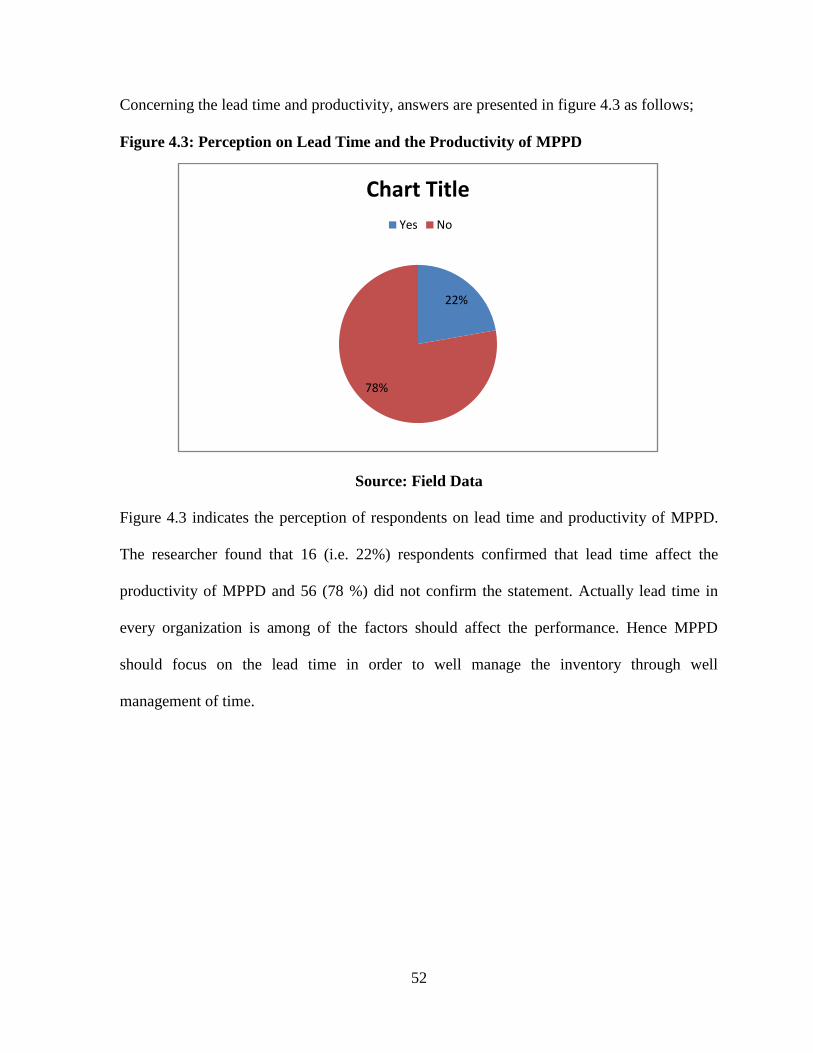
52
Concerning the lead time and productivity, answers are presented in figure 4.3 as follows;
Figure 4.3: Perception on Lead Time and the Productivity of MPPD
Source: Field Data
Figure 4.3 indicates the perception of respondents on lead time and productivity of MPPD.
The researcher found that 16 (i.e. 22%) respondents confirmed that lead time affect the
productivity of MPPD and 56 (78 %) did not confirm the statement. Actually lead time in
every organization is among of the factors should affect the performance. Hence MPPD
should focus on the lead time in order to well manage the inventory through well
management of time.
22%
78%
Chart Title
Yes No
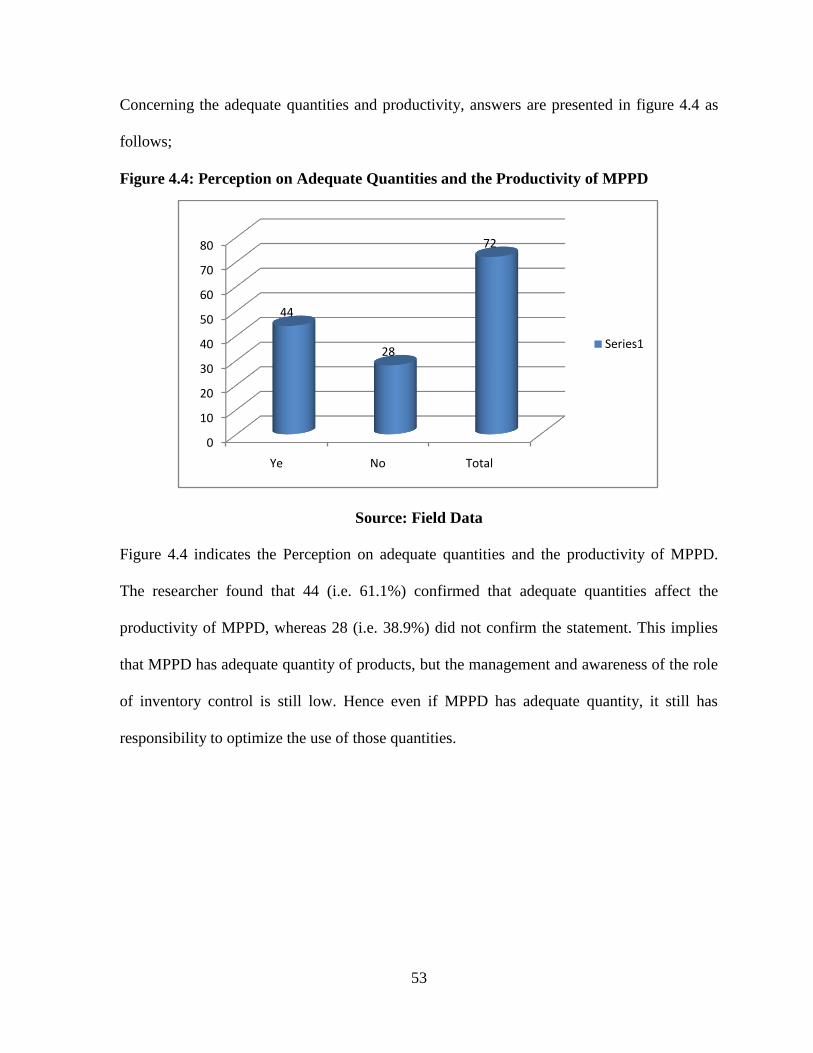
53
Concerning the adequate quantities and productivity, answers are presented in figure 4.4 as
follows;
Figure 4.4: Perception on Adequate Quantities and the Productivity of MPPD
Source: Field Data
Figure 4.4 indicates the Perception on adequate quantities and the productivity of MPPD.
The researcher found that 44 (i.e. 61.1%) confirmed that adequate quantities affect the
productivity of MPPD, whereas 28 (i.e. 38.9%) did not confirm the statement. This implies
that MPPD has adequate quantity of products, but the management and awareness of the role
of inventory control is still low. Hence even if MPPD has adequate quantity, it still has
responsibility to optimize the use of those quantities.
0
10
20
30
40
50
60
70
80
Ye No Total
44
28
72
Series1
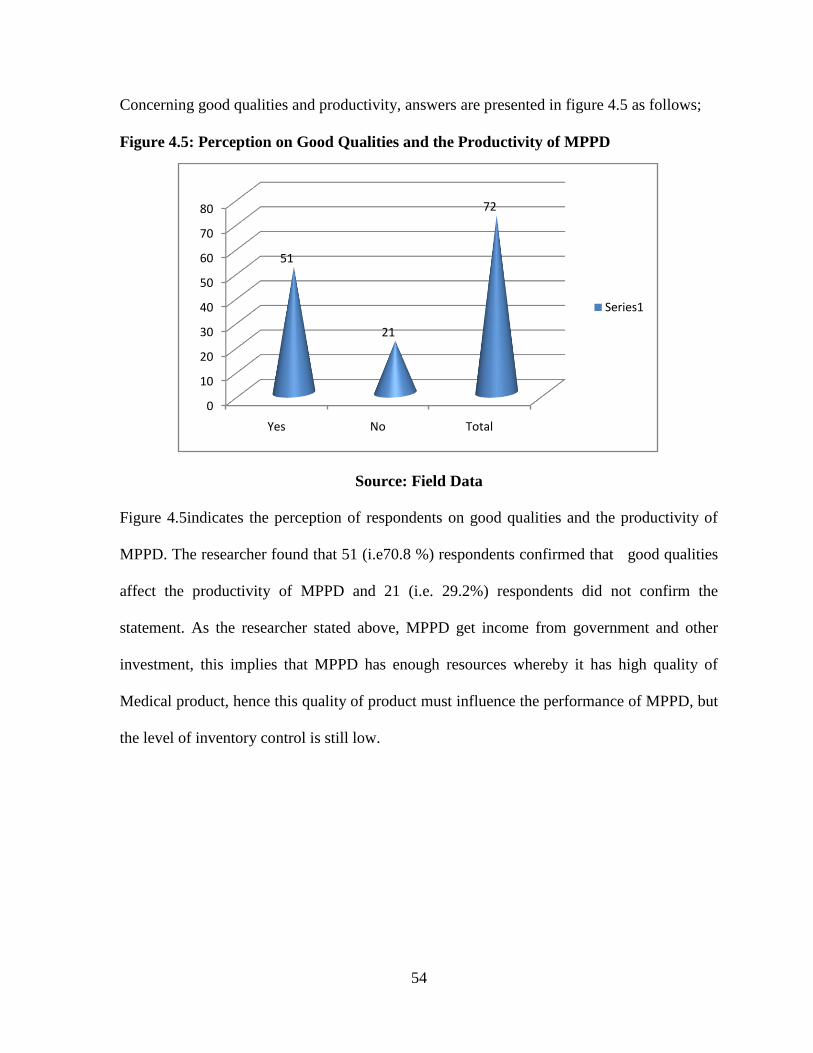
54
Concerning good qualities and productivity, answers are presented in figure 4.5 as follows;
Figure 4.5: Perception on Good Qualities and the Productivity of MPPD
Source: Field Data
Figure 4.5indicates the perception of respondents on good qualities and the productivity of
MPPD. The researcher found that 51 (i.e70.8 %) respondents confirmed that good qualities
affect the productivity of MPPD and 21 (i.e. 29.2%) respondents did not confirm the
statement. As the researcher stated above, MPPD get income from government and other
investment, this implies that MPPD has enough resources whereby it has high quality of
Medical product, hence this quality of product must influence the performance of MPPD, but
the level of inventory control is still low.
0
10
20
30
40
50
60
70
80
Yes No Total
51
21
72
Series1
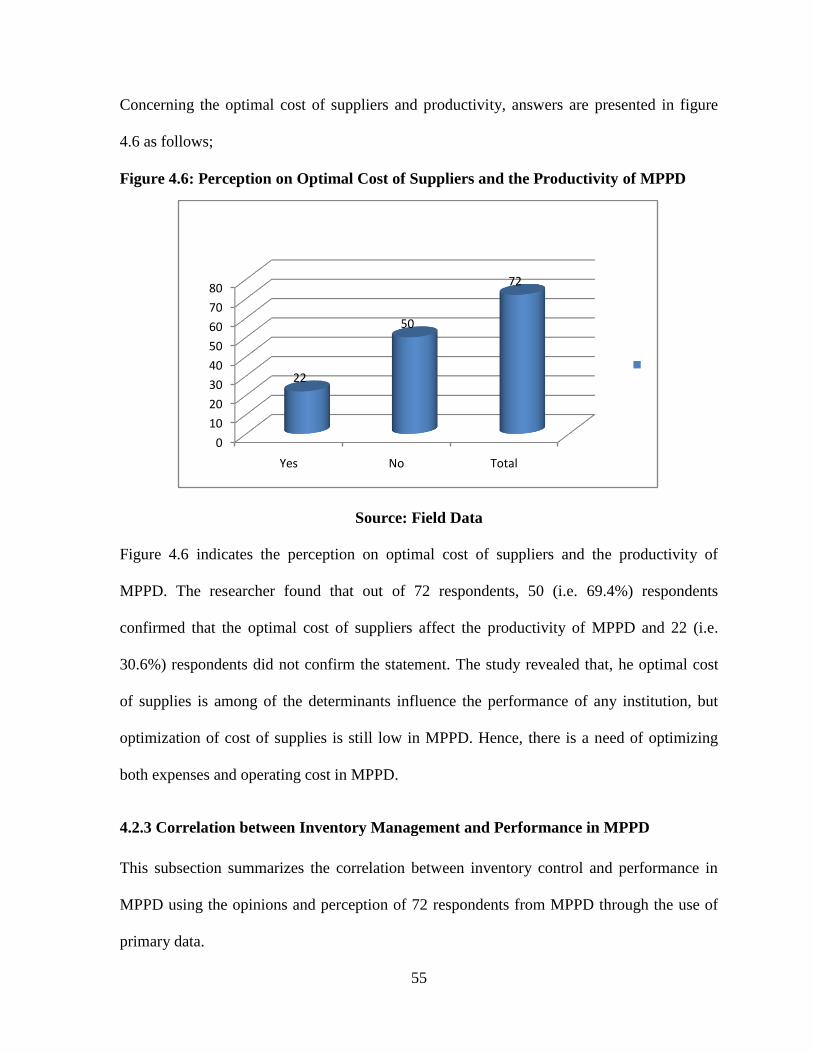
55
Concerning the optimal cost of suppliers and productivity, answers are presented in figure
4.6 as follows;
Figure 4.6: Perception on Optimal Cost of Suppliers and the Productivity of MPPD
Source: Field Data
Figure 4.6 indicates the perception on optimal cost of suppliers and the productivity of
MPPD. The researcher found that out of 72 respondents, 50 (i.e. 69.4%) respondents
confirmed that the optimal cost of suppliers affect the productivity of MPPD and 22 (i.e.
30.6%) respondents did not confirm the statement. The study revealed that, he optimal cost
of supplies is among of the determinants influence the performance of any institution, but
optimization of cost of supplies is still low in MPPD. Hence, there is a need of optimizing
both expenses and operating cost in MPPD.
4.2.3 Correlation between Inventory Management and Performance in MPPD
This subsection summarizes the correlation between inventory control and performance in
MPPD using the opinions and perception of 72 respondents from MPPD through the use of
primary data.
0
10
20
30
40
50
60
70
80
Yes No Total
22
50
72
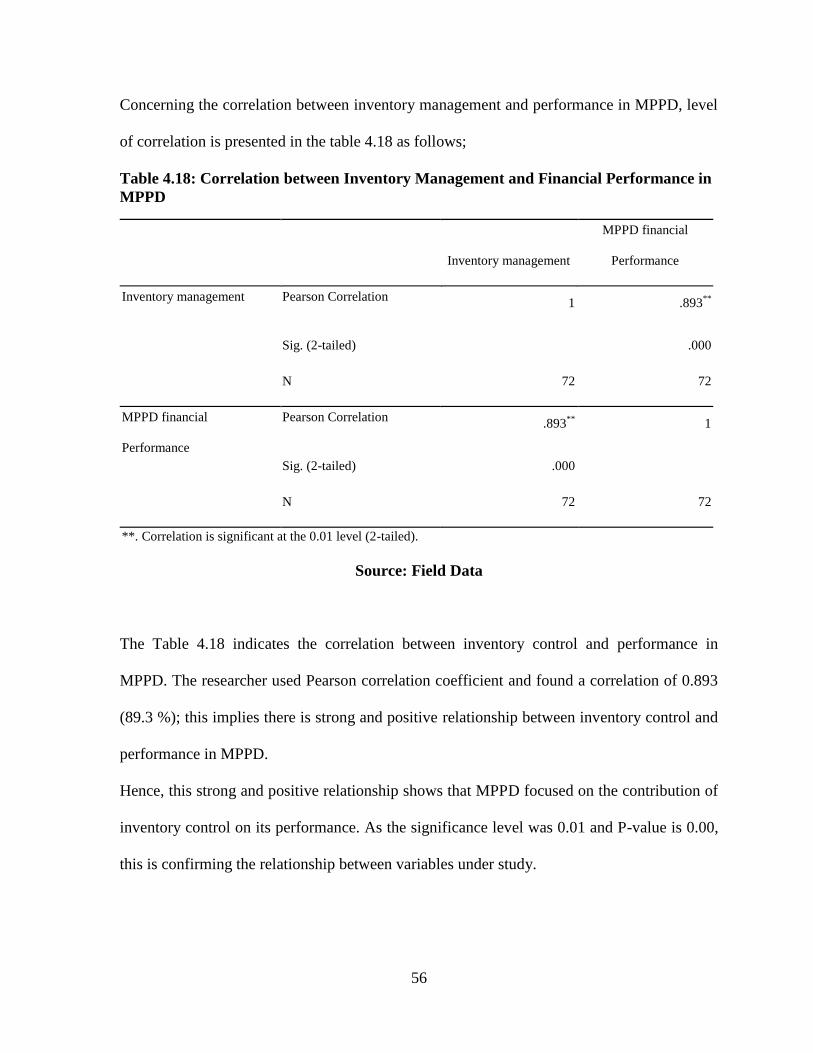
56
Concerning the correlation between inventory management and performance in MPPD, level
of correlation is presented in the table 4.18 as follows;
Table 4.18: Correlation between Inventory Management and Financial Performance in
MPPD
Inventory management
MPPD financial
Performance
Inventory management Pearson Correlation 1 .893
**
Sig. (2-tailed) .000
N 72 72
MPPD financial
Performance
Pearson Correlation .893
** 1
Sig. (2-tailed) .000
N 72 72
**. Correlation is significant at the 0.01 level (2-tailed).
Source: Field Data
The Table 4.18 indicates the correlation between inventory control and performance in
MPPD. The researcher used Pearson correlation coefficient and found a correlation of 0.893
(89.3 %); this implies there is strong and positive relationship between inventory control and
performance in MPPD.
Hence, this strong and positive relationship shows that MPPD focused on the contribution of
inventory control on its performance. As the significance level was 0.01 and P-value is 0.00,
this is confirming the relationship between variables under study.
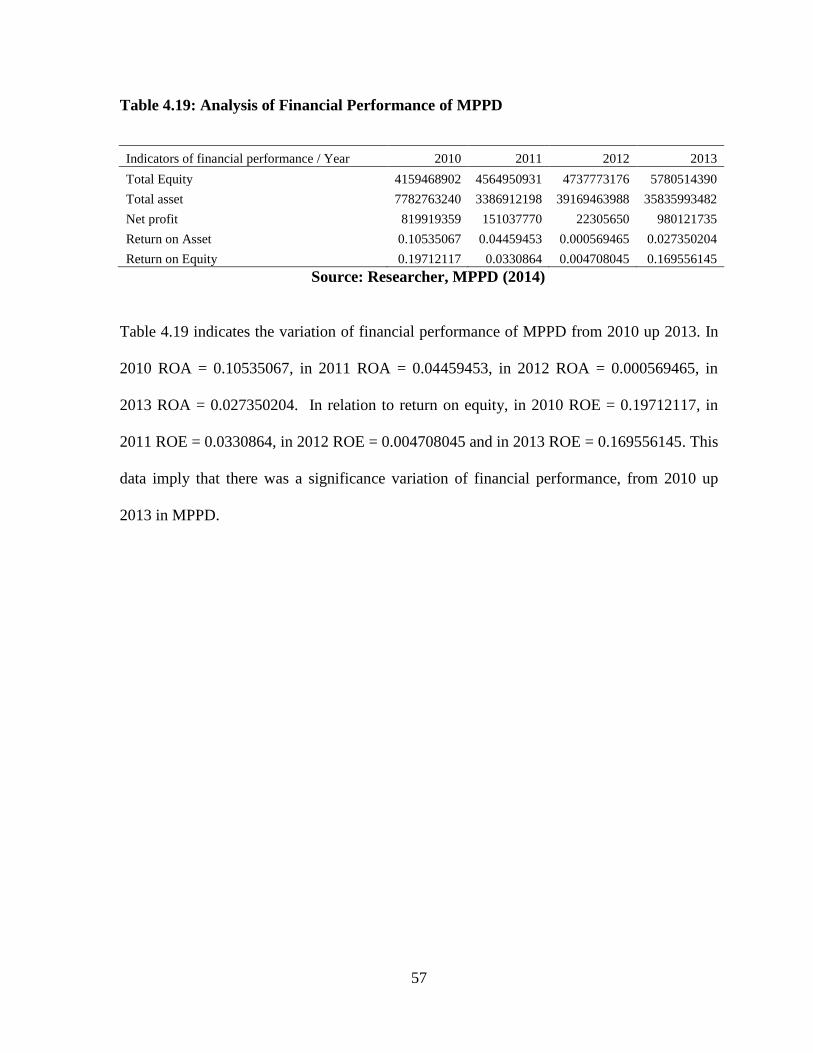
57
Table 4.19: Analysis of Financial Performance of MPPD
Indicators of financial performance / Year 2010 2011 2012 2013
Total Equity 4159468902 4564950931 4737773176 5780514390
Total asset 7782763240 3386912198 39169463988 35835993482
Net profit 819919359 151037770 22305650 980121735
Return on Asset 0.10535067 0.04459453 0.000569465 0.027350204
Return on Equity 0.19712117 0.0330864 0.004708045 0.169556145
Source: Researcher, MPPD (2014)
Table 4.19 indicates the variation of financial performance of MPPD from 2010 up 2013. In
2010 ROA = 0.10535067, in 2011 ROA = 0.04459453, in 2012 ROA = 0.000569465, in
2013 ROA = 0.027350204. In relation to return on equity, in 2010 ROE = 0.19712117, in
2011 ROE = 0.0330864, in 2012 ROE = 0.004708045 and in 2013 ROE = 0.169556145. This
data imply that there was a significance variation of financial performance, from 2010 up
2013 in MPPD.
58
CHAPTER FIVE: SUMMARY, CONCLUSIONS AND RECOMMENDATIONS
5.0 Introduction
This chapter contains the summary conclusions and recommendations of the study. The
whole summary focuses on the findings of the study.
5.1 Summary of Findings
This research assessed the inventory management and performance of public institutions in
MPPD. The data was presented, analyzed and interpreted in chapter four according to
research objectives. Hence, summary of findings according to research objectives is below.
5.1.1 The Inventory Control Techniques Used in MPPD
The first research objective was to identify the inventory control techniques used in MPPD
from 2010-2013. Inventory management techniques in MPPD have been discussed where,
83.8% respondents confirmed that MPPD focused on inventory control techniques as a tool
of its performance, 72.2% perceived that MPPD focused on Economic Order Quantity
technique during inventory control, 83.3% of respondents perceived that MPPD focused on
ABC control system during inventory control and 97.3% respondents confirmed that MPPD
also used VMI.
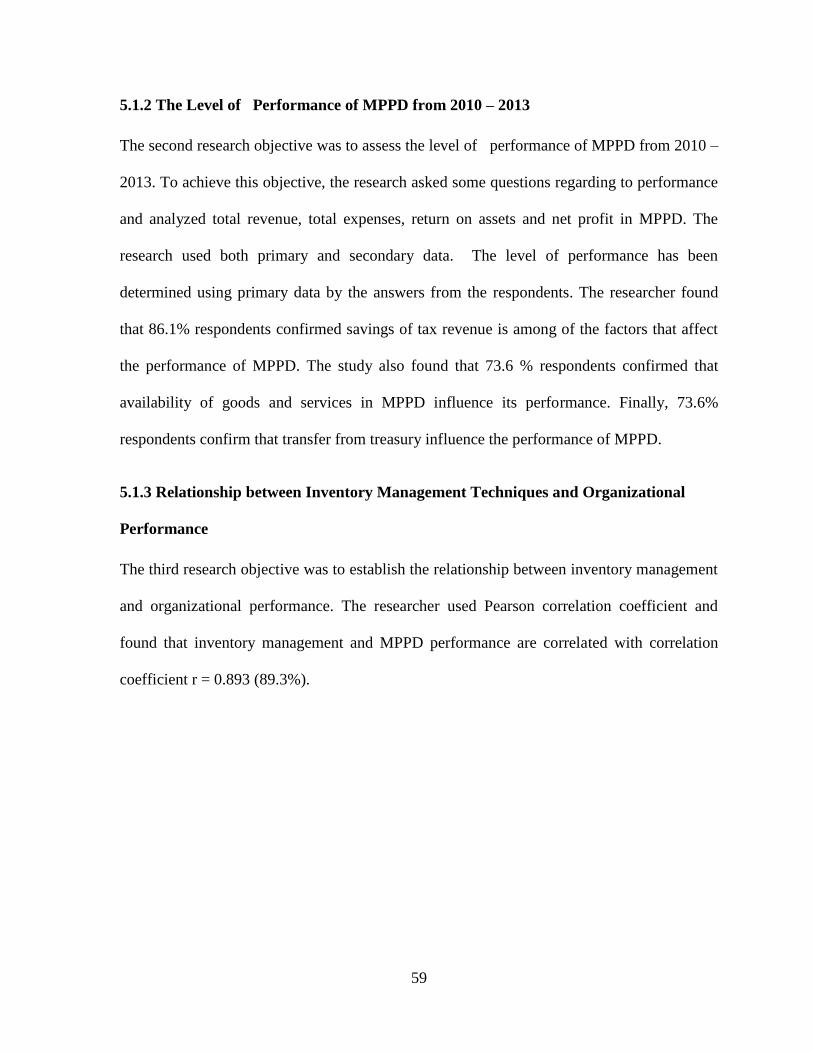
59
5.1.2 The Level of Performance of MPPD from 2010 – 2013
The second research objective was to assess the level of performance of MPPD from 2010 –
2013. To achieve this objective, the research asked some questions regarding to performance
and analyzed total revenue, total expenses, return on assets and net profit in MPPD. The
research used both primary and secondary data. The level of performance has been
determined using primary data by the answers from the respondents. The researcher found
that 86.1% respondents confirmed savings of tax revenue is among of the factors that affect
the performance of MPPD. The study also found that 73.6 % respondents confirmed that
availability of goods and services in MPPD influence its performance. Finally, 73.6%
respondents confirm that transfer from treasury influence the performance of MPPD.
5.1.3 Relationship between Inventory Management Techniques and Organizational
Performance
The third research objective was to establish the relationship between inventory management
and organizational performance. The researcher used Pearson correlation coefficient and
found that inventory management and MPPD performance are correlated with correlation
coefficient r = 0.893 (89.3%).
60
5.2. Conclusion
According to the research questions and the above findings, the research concluded that;
According to the first research question, the findings indicate that MPPD used techniques of
inventory management, especially, ABC system and Economic Order Quantity.
The findings also indicated that inventory management in MPPD is effective, the research
revealed that majority of the staff of MPPD are satisfied with the inventory management
system used in MPPD.
According to the second research question, the research revealed other factors that affect the
performance level of a firm apart from inventory management. These include tax revenue,
sales volume, compensation for employees, and product type. The findings of this researcher
revealed that some factors are major and have a significant effect on the performance levels
of the firm and other factors are minor and the effects are minor too. In this study the
findings indicated that tax revenue and quality of good are the major factors, whereby the
researcher found that the performance of MPPD was good.
According to the third research question was the relationship between inventory management
and performance in MPPD. This study found the correlation between inventory management
and performance in MPPD. The researcher used Pearson correlation coefficient and found a
correlation of 0.893 (89.3%), this implies there is a strong and positive relationship between
inventory management and performance in MPPD. Hence, inventory management affects the
performance of MPPD at the rate of 89.3%.
61
Hence, the inventory management of MPPD was found out to be effective as revealed by the
respondents who were members of staff of MPPD. This was due to the results got after the
respondents answering the questions in the questionnaires about the situations that MPPD
find itself in. The findings declared that there are minimal issues of stock out, customer
delay, and overstocking and all this indicate bad inventory management systems.
5.3 Recommendations
The MPPD should practice many techniques of inventory management rather than ABC
system and Economic Order Quantity (EOQ), this is due to the fact that each technique
carries its own different advantages which would be beneficial to the company and it helps in
cutting down some costs related with inventory. This enable the company to resolve some
issues likes stock out; this is because all the staff responsible in different departments was
able to report in case of any change.
5.4 Suggestions for Further Study
Future researchers should also look into other attributes of performance in the institution
other than inventory management. Future researcher should also look into the benefits that
accrue from increased inventory management. This provides the institution with valid
reasons for striving to increase. The researcher suggested the following areas as necessary for
future research in order to exhaust the field related to inventory management and
organizational performance. Future researchers should look into other areas in which
inventory management is important to the organization other than concentrating on
competitiveness of the institution.
62
REFERENCES
Alm, N. (2000). Bank Management (4th Ed ed.). Fort Worth: Dryden Press.
Anichebe, N. A. & Agu, O. A. (2013). Effect of Inventory Management on Organisational
Effectiveness. Journal of Information and Knowledge Management, Vol.3(8), PP.92 -
100.
Baily, P., Farmer, D., Barry, C., Jessop, D., & David, J. (2008). Procurement principles and
management. Harlow: pearson Education.
Brackus, D. (2000). A Model of US financial and Non – financial economic Bahaviour.
journal of money, vol.12, pp. 259-293.
Byoungho, J. (2004). Achieving an Optimal Global Versus Domestic Sourcing Balance
under Demand Uncertainty. International. Journal of Operations and Production
Management, Vol.24(11), PP. 1282- 1292.
Damodaran, A. (2007). Return on Capital (ROC). Lagos, Nigeria: School of business.
Emmett, S., & Granville, D. (2007). Excellence in inventory management. Cambridge:
Cambridge Academic.
Eroglu, C., & Hofer, C. (2011). Lean, leaner, too lean? The inventory -performance link
revisited. Journal of operations, PP.356-369.
Farrington, B., & Lysons, K. (2006). purchasing and supply chain management. London:
Pearson Education.
Feinberg, S. E., & Keane, M. P. (2006). Accounting for the growth of MNC-Based trade
using a structural model of US. American Economy review, Vol.96, PP.1515-1558.
63
Graman, G.A. & Magazine, M.J. (2006). Implementation issues influencing the decision to
adopt postponement. International Journal of Operations & Production Management,
Vol.26, PP.4-10.
Green, K. W., & Inman, R. A. (2005). Using a JIT selling strategy to strenthen supply chain
linkages. International of production research, Vol.43, PP.3437-3453.
Hardgrave, W. C., Langford, S., & Waller, M. A. (2007). Measuring the impact of RFID on
out of stocks t Wal-Mart. MIS quarterly executive, Vol.7, PP.181-192.
Imeokparia, L. (2013). Inventory Management System and Performance of Food and
Beverages Companies in Nigeria . Journal of Mathematics, Vol.6(1), PP 24-30.
Irungu, B. K., & Wanjau, L. I. (2011). Effectiveness of vendor managed inventory systems in
retail. International journal of business and public management, Vol.1(2), PP.85-89.
Katsiaryna,S. (2004). Financial ratio adjustment process: A case study of Ucraine. Ucraine:
National University Kyvin-Mohila Academy.
Kennedy, M.M.,Margaret, O. & Walter, O. (2013). Effect Of Inventory Control Systems On
Operational Performance Of Tea Processing Firms: A Case Study Of Gianchore Tea
Factory,Nyamira County, Kenya. The international journal of business management,
Vol.1(5), PP.12 - 27.
Kotabo, K. (2002). Management of Finance Company (Sixth Edition ed.). London:
International Thomson Business Press.
Kros, J. F., Falasca, M., & Nadler, S. S. (2006). Impact of JIT inventory systems on OEM
suppliers. Journal of industrial management and data systems, Vol.106, PP.224-241.
64
Langabeer, J. & Stoughton, T. (2001). Demand planning and forecasting in the high
technology industry. The Journal of Business Forecasting Methods & Systems,
Vol.20(1), PP.7-4.
Mark A.& Ilse S. (2008). Modeling of Banking Profit via Return-on-Assets and Return-on-
Equity. New York: Proceedings of the World Congress .
Medical Procurement And Production Division [Mppd]. (2014). Medical Procurement And
Production Division Structure 2014. Kigali - Rwanda: MPPD.
Rajeev, N. (2008). an evaluation of inventory management in indian machine tool SMEs: An
exploratory. Thailand: Bank of Thailand.
Rushton, A., Croucher, P., & Baker. (2011). The handbook of logistics and Distribution
management. London: Kogan page ltd.
Schreibfeder, J. (2004). Inventory Management : Analyzing Inventory To Maximize
Profitability. New-York / USA: Jon Schreibfeder, Effective Inventory Management,
Inc.
Yamane, T. (1967). Statistics: An Introductory Analysis. New York: Harper and Row.

65
APPENDICES

66
AUTHORIZATION LETTER
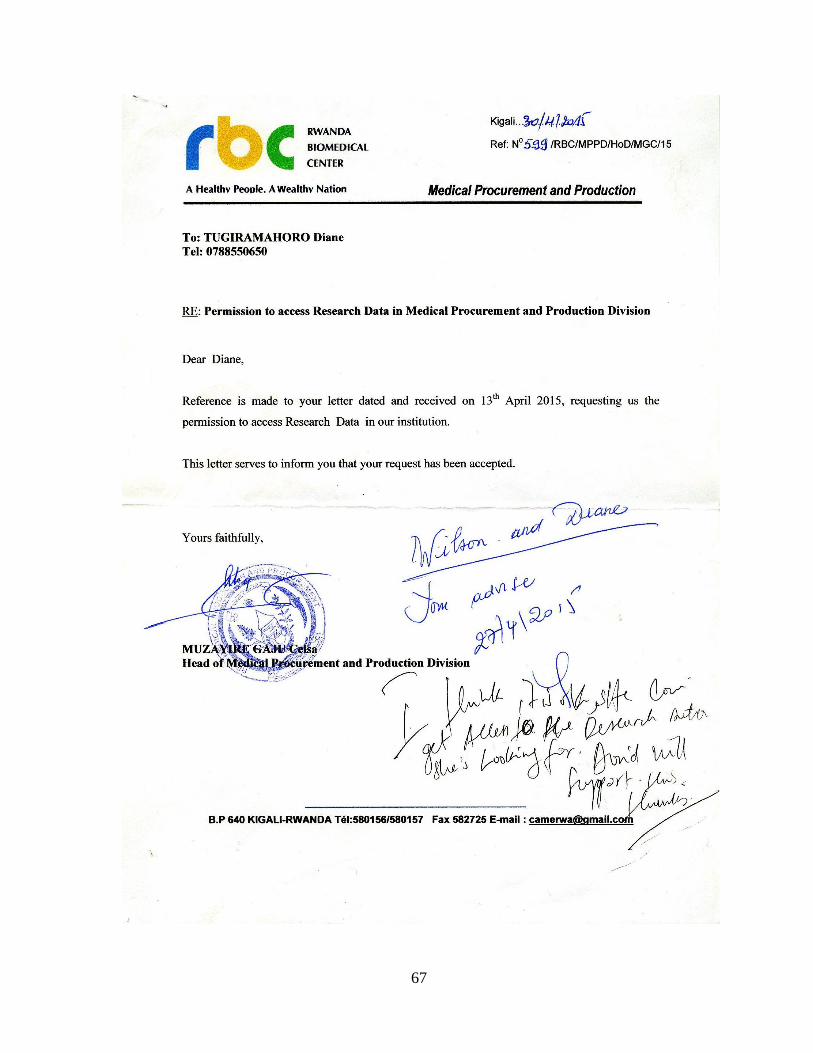
67
68
Appendix one: Questionnaire
Dear Respondents,
RE: QUESTIONNAIRE ON THE EFFECT OF INVENTORY MANAGEMENT ON
ORGANIZATION PERFORMANCE:
THE CASE STUDY OF MPPD (2010 – 2013)
My name is Ms. DIANE TUGIRAMAHORO pursuing a Master‟s of Business
Administration. The following is a set of questions targeting your views, options and
recommendations toward Inventory management and organization performance. I therefore
request that you provide information trustfully so as to aid in proper analysis and reporting.
The research findings purely be used for academic purposes.
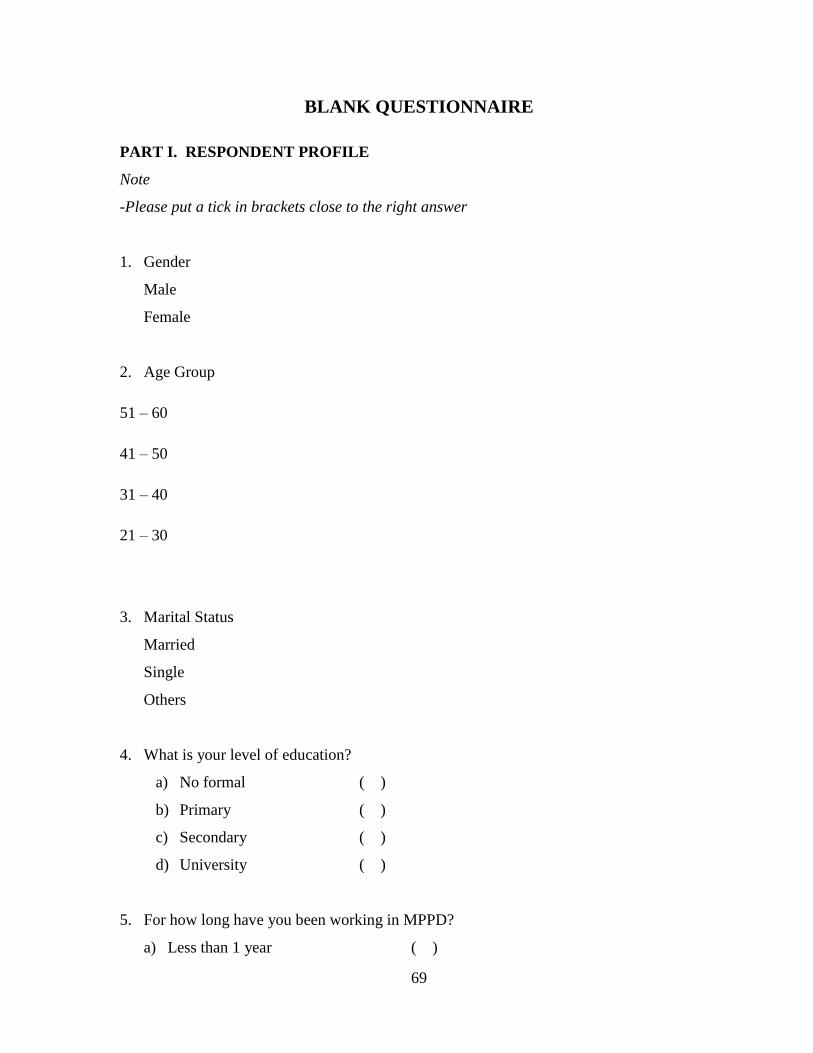
69
BLANK QUESTIONNAIRE
PART I. RESPONDENT PROFILE
Note
-Please put a tick in brackets close to the right answer
1. Gender
Male
Female
2. Age Group
51 – 60
41 – 50
31 – 40
21 – 30
3. Marital Status
Married
Single
Others
4. What is your level of education?
a) No formal ( )
b) Primary ( )
c) Secondary ( )
d) University ( )
5. For how long have you been working in MPPD?
a) Less than 1 year ( )
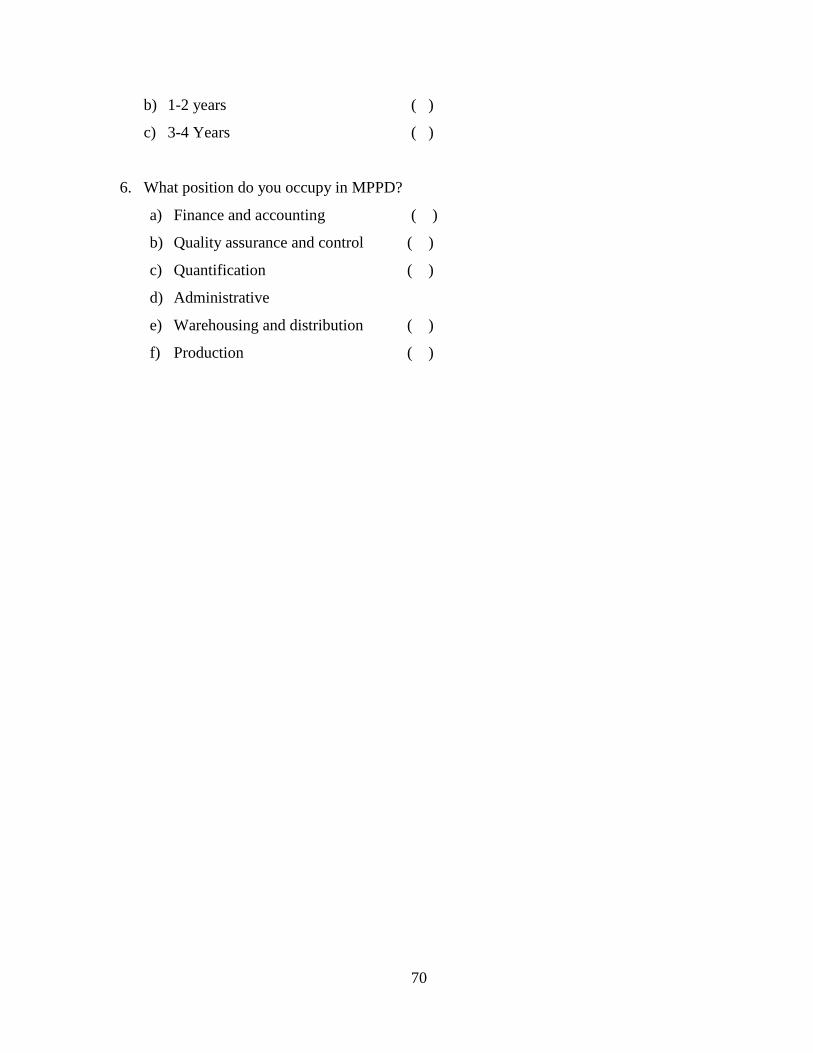
70
b) 1-2 years ( )
c) 3-4 Years ( )
6. What position do you occupy in MPPD?
a) Finance and accounting ( )
b) Quality assurance and control ( )
c) Quantification ( )
d) Administrative
e) Warehousing and distribution ( )
f) Production ( )
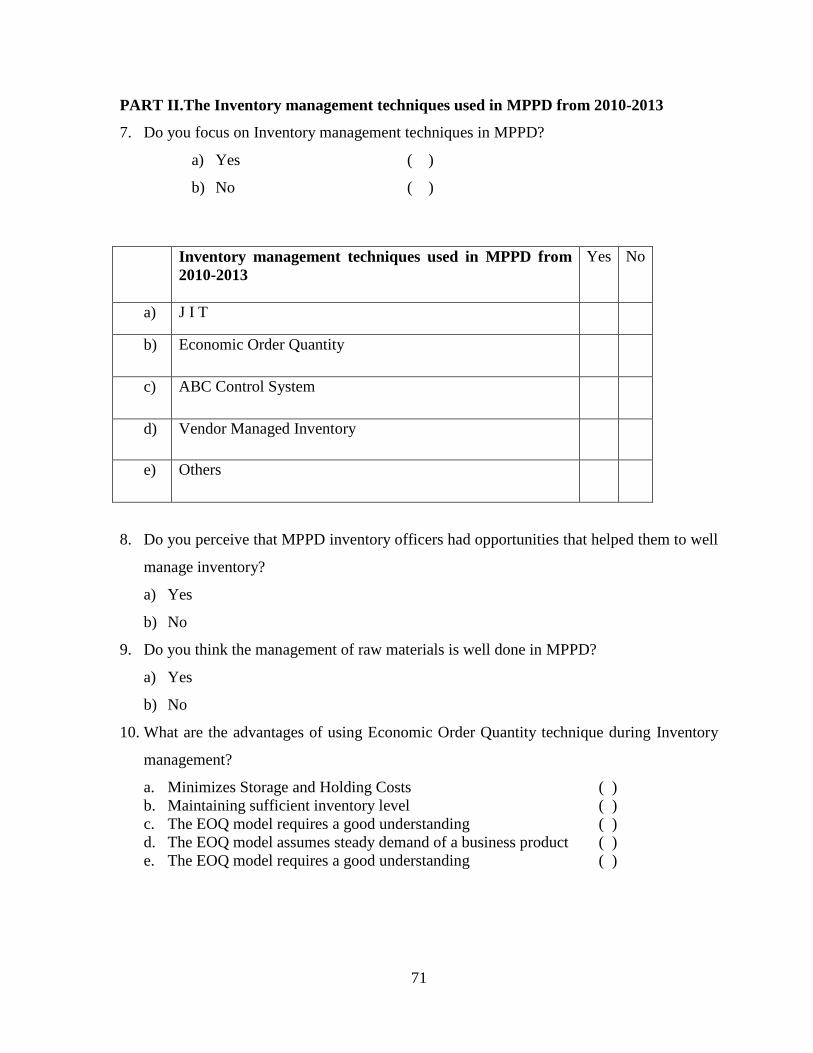
71
PART II.The Inventory management techniques used in MPPD from 2010-2013
7. Do you focus on Inventory management techniques in MPPD?
a) Yes ( )
b) No ( )
Inventory management techniques used in MPPD from
2010-2013
Yes No
a) J I T
b) Economic Order Quantity
c) ABC Control System
d) Vendor Managed Inventory
e) Others
8. Do you perceive that MPPD inventory officers had opportunities that helped them to well
manage inventory?
a) Yes
b) No
9. Do you think the management of raw materials is well done in MPPD?
a) Yes
b) No
10. What are the advantages of using Economic Order Quantity technique during Inventory
management?
a. Minimizes Storage and Holding Costs ( )
b. Maintaining sufficient inventory level ( )
c. The EOQ model requires a good understanding ( )
d. The EOQ model assumes steady demand of a business product ( )
e. The EOQ model requires a good understanding ( )
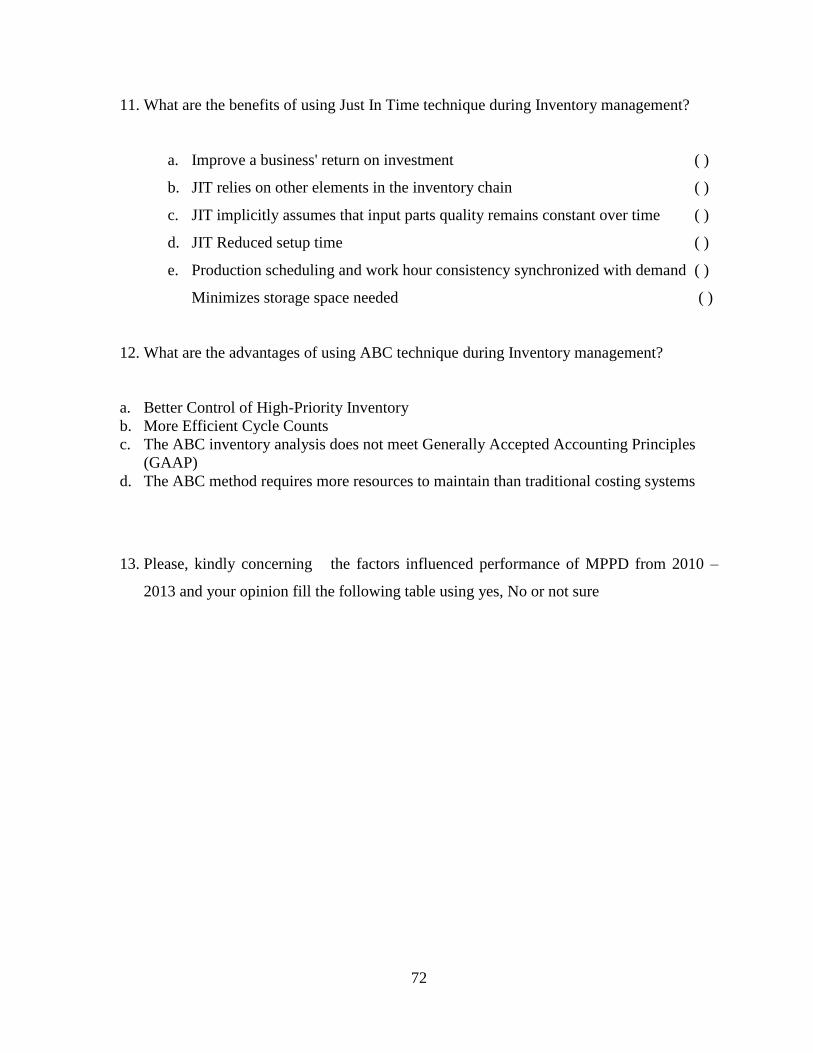
72
11. What are the benefits of using Just In Time technique during Inventory management?
a. Improve a business' return on investment ( )
b. JIT relies on other elements in the inventory chain ( )
c. JIT implicitly assumes that input parts quality remains constant over time ( )
d. JIT Reduced setup time ( )
e. Production scheduling and work hour consistency synchronized with demand ( )
Minimizes storage space needed ( )
12. What are the advantages of using ABC technique during Inventory management?
a. Better Control of High-Priority Inventory
b. More Efficient Cycle Counts
c. The ABC inventory analysis does not meet Generally Accepted Accounting Principles
(GAAP)
d. The ABC method requires more resources to maintain than traditional costing systems
13. Please, kindly concerning the factors influenced performance of MPPD from 2010 –
2013 and your opinion fill the following table using yes, No or not sure
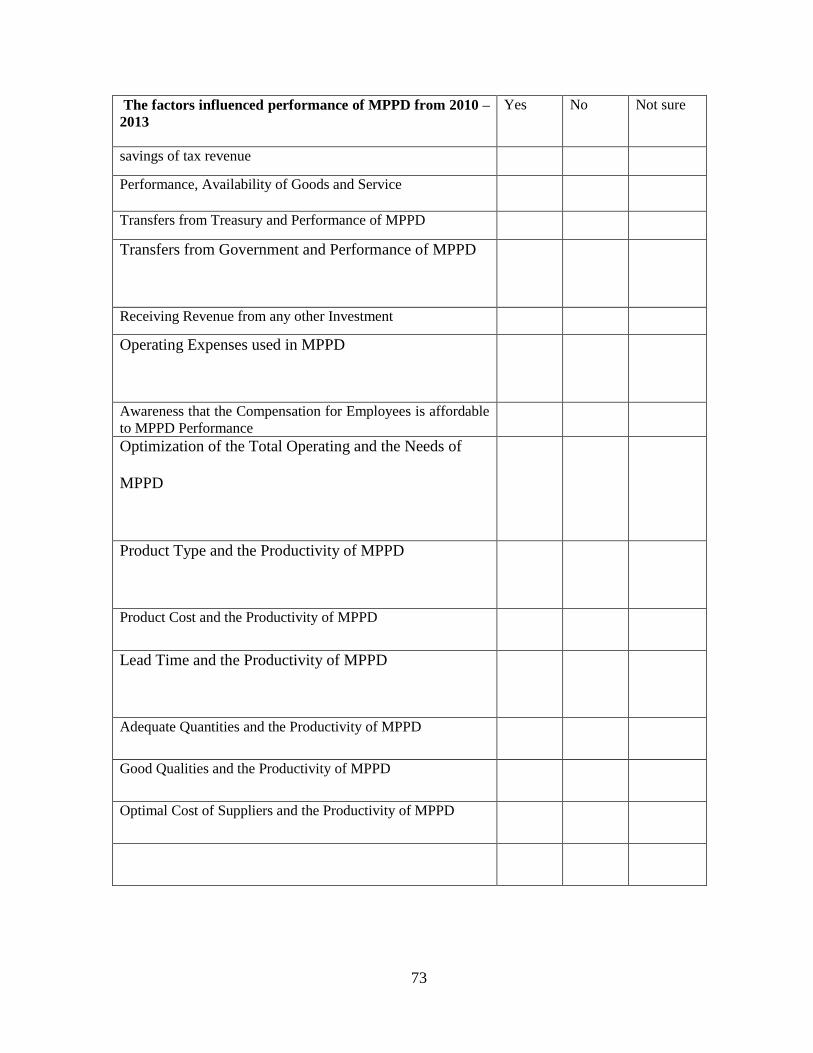
73
The factors influenced performance of MPPD from 2010 –
2013
Yes No Not sure
savings of tax revenue
Performance, Availability of Goods and Service
Transfers from Treasury and Performance of MPPD
Transfers from Government and Performance of MPPD
Receiving Revenue from any other Investment
Operating Expenses used in MPPD
Awareness that the Compensation for Employees is affordable
to MPPD Performance
Optimization of the Total Operating and the Needs of
MPPD
Product Type and the Productivity of MPPD
Product Cost and the Productivity of MPPD
Lead Time and the Productivity of MPPD
Adequate Quantities and the Productivity of MPPD
Good Qualities and the Productivity of MPPD
Optimal Cost of Suppliers and the Productivity of MPPD
74
15. Apart from the above mentioned factors influenced performance of MPPD from 2010 –
2013, is there any other factor?
1.
2.
3.
4.
5.
Thank you and God bless you