time-resolved imaging of fluorescent inclusions in optically turbid medium — phantom study
TRANSCRIPT
Time-resolved imaging of fluorescent inclusions in optically turbidmedium – phantom study
M. KACPRZAK*, A. LIEBERT, P. SAWOSZ, N. ŻOŁEK, D. MILEJ, and R. MANIEWSKI
Institute of Biocybernetics and Biomedical Engineering, 4 Trojdena Str., 02−109 Warsaw, Poland
We present results of application of a time−resolved optical system for imaging of fluorescence excited in an inclusion contain−ing indocyanine green (ICG), and located in optically turbid medium. The developed imaging system enabled simultaneous ac−quisition of fluorescence and diffusive reflectance. Eight independent time−resolved measurement channels based on time−cor−related single photon counting technique were applied. In four of these channels, used for the fluorescence detection, sets of fil−ters were applied in order to block the excitation light. Fast optomechanical switches allowed us to illuminate sequentially ninedifferent spots on the surface of the studied object and finally 4×4 pixels maps at excitation and emission wavelengths were ob−tained. A liquid phantom used in this study consists of the fish tank filed with a solution of milk and water with black ink added toobtain optical properties in the range of the optical properties typical for the living tissue. A gel ball of a diameter of 5 mm withprecisely controlled concentration of ICG was immersed in the liquid. The measurements were performed for inclusion locatedat different depths and for various ICG concentrations in the gel ball and in the surrounding liquid. The recorded distributionsof times of arrival (DTA) of fluorescence photons and times of flight (DTOF) of diffusely reflected photons were analyzed by cal−culation of their statistical moments. We observed specific changes in moments of the measured DTAs as a function of depth ofimmersion of the fluorescent inclusion in the medium. We noted also that the changes of moments depend significantly onconcentration of the dye in the fluorescence inclusion as well as in the surrounding liquid.
Keywords: time−of−flight measurements, fluorescence imaging, photon migration in turbid media.
1. Introduction
Fluorescence spectroscopy is an electromagnetic spectrumanalysis method which as complementary to absorptionspectroscopy can be utilized for diagnosis of the living tis−sue [1–3]. Several properties of an intrinsic or extrinsicfluorophore in the tissue, like concentration, mean lifetimeof fluorescence or quantum yield, can be analyzed.
The small quantum yields of the intrinsic fluorophorescause that the detection of fluorescence excited in differentorgans is possible only after exposing the surface of the in−vestigated tissue. Quantum yield of exogenous dyes whichcan be utilized in in−vivo studies is very limited as well.Studies in which fluorescence light was detected after its ex−citation in deep tissues were performed on physical phan−toms and canine breast [4].
Fluorophore concentration in homogeneous, optically tur−bid medium was studied by many authors using instrumenta−tion based on attenuation of continuous wave (CW) light[5–8]. Analysis of depth−dependent fluorophore concentra−tions is possible by application of spatially−resolved CW mea−surements [9]. Unfortunately, these studies are limited to shortinteroptode distances (up to 10 mm) and in consequence to su−perficial tissue compartments. Frequency domain [10] andtime−domain methods [11] were proposed for tomographic re−
construction of the concentration of the dye distributednon−homogeneously in specific regions of the body. Applica−tion of frequency−domain or time−resolved techniques allowsfor analysis of fluorescence lifetime which may be utilized forinvestigation of molecular environment of the considered dyein the tissue [4,10,12–18]. The algorithm for evaluation of thedepth of fluorescence inclusion into the liquid phantom wasalso proposed by Hall et al. [19]. The authors proposed an al−gorithm for assessment of concentration and depth of smallinclusion in the liquid phantom by the calculation of thetemporal position of the point−spread function maximum.
Recently, feasibility of fluorescence measurements and3D imaging of breast cancer using optical contrast agentwere demonstrated [20]. In several in vivo imaging studiesapplication of fluorescence−labelled molecular probes wasreported [21,22] demonstrating the potential to image tu−mours and tumour−related processes in small animals [23].
In applications of fluorescence for imaging of humantissue in−vivo, the measurements were restricted so far to tis−sues with easily accessible surface [24,25], like skin [25,26]and the mucosa of internal hollow organs [25,27].
Recently, in a time−resolved experimental study, non−in−vasive excitation and recording of fluorescence through theskull and scalp of the adult human head was reported[24,28]. These studies suggest that the time−resolved mea−surements and analysis of fluorescence can be promising
Opto−Electron. Rev., 18, no. 1, 2010 M. Kacprzak 37
OPTO−ELECTRONICS REVIEW 18(1), 37–47
DOI: 10.2478/s11772−009−0027−6
*e−mail: [email protected]
technique for blood flow assessment in the brain tissue ordetection of blood brain barrier damage.
In the present paper we analyzed feasibility of time−re−solved imaging of light originating from fluorescence inclu−sions located deeply in optically turbid medium simulatinga human brain tissue. As a fluorophore, indocyanine green(ICG) was used which is non specific and relatively nontoxic, clinically approved dye used routinely during ophthal−mology procedures [29], but also utilised for brain perfusionevaluation [30,31]. The fluorescence quantum yield of ICGin water is about 4% [32] and is even less in blood [33]. Thisvalue is relatively low in comparison to specific dyes testedin−vitro in animals [34]. The multichannel time−resolved brainimager described in detail elsewhere [35] was reconstructed insuch a way that it allows for fast acquisition of distributions oftimes of arrival of fluorescence (DTA) photons and distribu−tions of times of flight (DTOF) of diffusely reflected photonsat multiple source−detector pairs located on the surface of thestudied tissue phantom. It was shown in recent studies that theanalysis of moments of DTAs and DTOFs allows for assess−ment of brain hemodynamics. In particular changes of oxy−and deoxy−hemoglobin concentration in the brain tissueas wellas cortex perfusion [30] can be assessed.
We present validation of the proposed methodology inseries of experiments carried out on optically non−homoge−neous physical phantoms.
2. Methods
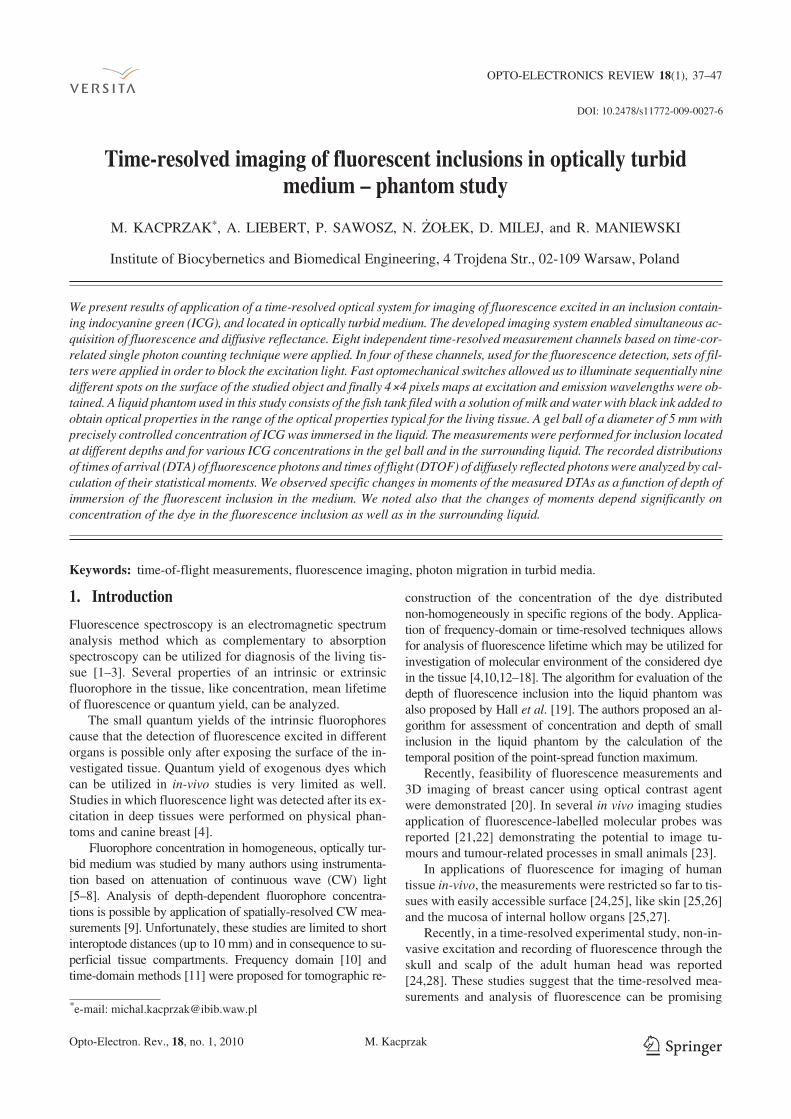
2.1. InstrumentationThe time resolved fluorescence imager is presented inFig. 1. Its construction is based on the multichannel time−re−solved brain imager used for monitoring of reflectance at
two wavelengths [37]. A laser diode driver (PDL 808 Sepia,PicoQuant, Germany) and semiconductor laser head operat−ing at a wavelength of 784 nm were applied. Light pulsesare generated with the repetition rate of 80 MHz. The lightpulses are delivered sequentially to nine locations on thesurface of the phantom using optomechanical switch(Piezojena, Germany) controlled with PCI board NI−DAQ6221 (National Instruments, USA) at switching frequencyof 10 Hz. The switching time is shorter than 5 ms.
The fluorescence and diffusely reflected light was deliv−ered to the detectors using 1.5−m long bifurcated fiber bun−dles with a diameter of 4 mm and NA = 0.54 (Loptek, Ger−many). Eight photomultiplier tubes (R7400U−02, Hama−matsu Photonics, Japan) were located separately in the elec−trically shielded box, together with the high voltage unit andpreamplifier. In four channels used for the fluorescence de−tection, sets of filters were applied in order to block the exci−tation light. Two types of filters were used in each fluores−cence channel, interference filters 793 RLP (TFI Technolo−gies, USA) and two long−pass glass filters 780 LP and 830 LP(Edmund Optics, Germany). The intensity of the light deliv−ered to photomultipliers was adjusted by the neutral densityfilters located in the front of photomultipliers applied influorescence channels as well as in reflectance channels.
Eight independent PCI boards with time−correlated sin−gle photon counting electronics (SPC−134, Becker&Hickl,Germany) were applied for acquisition of DTOFs of dif−fusely reflected photons and DTAs of fluorescence photons.Recording of DTOFs was triggered by the 10 Hz generatorwhich synchronously controlled optical switch. To avoiddata acquisition during the switching period, the trigger sig−nal from the generator was delayed by 5 ms. The LabViewv.7 (National Instruments, USA) software was used formeasurement control and for data acquisition.
Time−resolved imaging of fluorescent inclusions in optically turbid medium – phantom study
38 Opto−Electron. Rev., 18, no. 1, 2010 © 2010 SEP, Warsaw
Fig. 1. Time−resolved system for fluorescence and reflectance imaging: LH – laser head (784 nm), SW – optomechanical switch, PMT –photomultiplier tubes, AMP – preamplifiers, TCSPC – PCI boards for time correlated single photon counting.
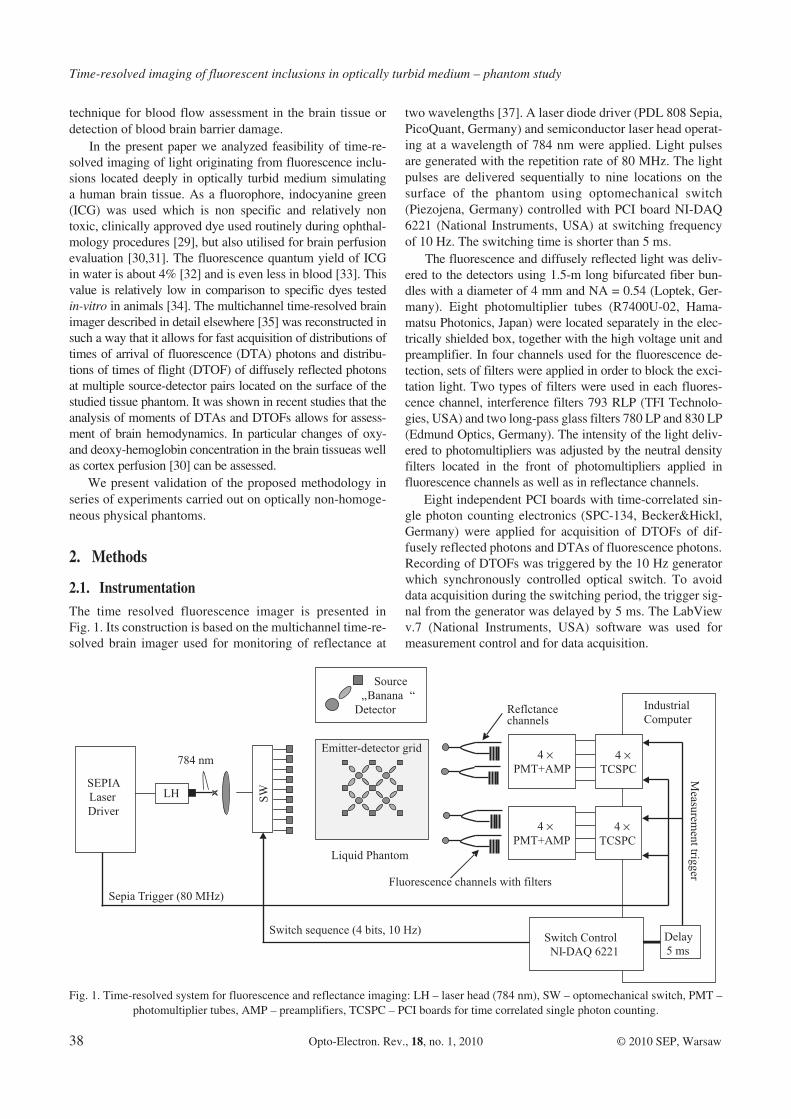
Described above instrument was used for two series ofmeasurements with different geometry of sources and detec−tors positioning. First, optical fibers holder allows for mea−surement of DTOFs and DTA in multidistance arrangementwith source−detector separations of 1 cm, 2 cm, 3 cm, and4 cm. Second, holder was reconstructed for measurementsof DTOFs and DTAs in 16 positions on the surface of thephantom. The tips of fibers from the switch were positionedin 3×3 grid together with 4 detecting bifurcated fiber bun−dles. This setup, shown in Fig. 1, allows for acquisition oftime−resolved data in a 4×4 grid of source−detector pairs atexcitation and emission wavelengths. For every source−−detector pair, the interoptode distance was 3 cm.
2.2. Liquid phantoms
Two kinds of liquid phantoms were developed. Their con−struction was based on a fish tank filed with a solution ofmilk and water (3:1) and with small amount of black ink(Rotring, Germany) added to obtain optical properties of theliquid in the range of the optical properties typical for theliving tissue. As a fluorophore, the indocyanine green – ICG(Pulsion, Germany) was applied. This relatively non−toxicdye [38] is used frequently in medical practice, i.e., in oph−thalmology [29,39] and to test a liver function [40,41]. Theabsorption and emission spectra of the ICG are located innear−infrared region [32]. All optical fibers and fiber bun−dles were placed on the surface of the phantoms to providemeasurements in semi−infinite geometry.
For the preparation of the liquid phantoms, the 1 mg ofthe powder of ICG (Pulsion, Germany) was diluted in 50 mlof distilled water. Such solution was used to obtain concen−trations which are near the range of concentrations esti−mated in the brain tissue after injection of the day bolus intoforearm [24].
In the first series of experiments, two−layered phantomwas used as presented in Fig. 2. Such construction repre−sents a simple model of head structure. It consisted of twocompartments separated with 50 μm thin Mylar foil [42].Superficial layer, corresponding to extra−cerebral tissuecompartment, had a thickness of 0.8 cm. The much largerdeeper compartment (15−cm thick) represents the intra−cere−bral tissues of the head. Construction of the phantom allowsfor easy change of ICG concentration separately in bothcompartments. The lowest concentration of ICG used inlayered phantom was 2.5 μM. This value is near to the con−centration estimated in the brain tissue after the injection ofICG (1.7 μM) . The concentration of ICG in the phantomwas increased in order to observe the saturation effect of flu−orescence light intensity caused by the re−absorption of thefluorescence photons by the dye. During the experiments,four detection bundles were applied for simultaneous acqui−sition of diffusely reflected photons and fluorescence pho−tons at four source−detector separations (1 cm, 2 cm, 3 cm,and 4 cm). Preliminary test measurements on the phantomcontaining liquid of the same optical properties in both
compartments showed that the influence of the separatingMylar foil on the measured DTOFs can be neglected.
In the second series of experiments, the homogeneousphysical phantom with small fluorescence inclusion im−mersed in the liquid phantom was used. The set of nineemitting fibers and four detector bundles was mounted onthe front surface of the phantom as shown in Fig. 3. Thisconfiguration allowed for simultaneous data acquisitionfrom 16 “banana” volumes located between the source−de−tector pairs. All optical fibers and fiber bundles were locatednot closer than 10 cm apart from the side and bottom wallsof a fish tank.
As an inhomogeneity inclusion, a gel ball with diameterof 5 mm was used. The ball was produced by mixing gelatinpowder with a solution of milk and water (3:1) and with
Opto−Electron. Rev., 18, no. 1, 2010 M. Kacprzak 39
Fig. 2. Two−layered tissue phantom for measurements in semi−infi−nite geometry with multidistance optode setup. CICG – concentra−tion of indiocyanine green (ICG) in liquid phantom; �a and �s’– ab−
sorption and reduced scattering coefficient of the liquid.
Fig. 3. Homogenous physical phantom with ICG fluorescence in−clusion immersed in liquid phantom.
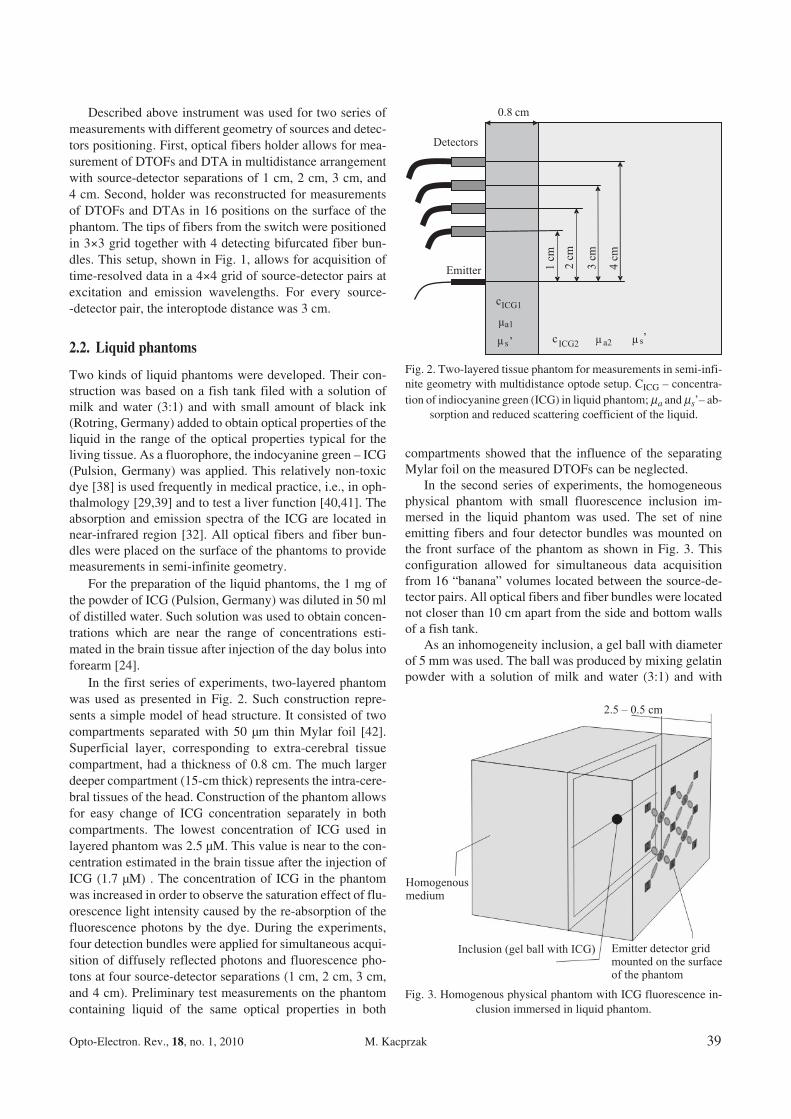
black ink and indocyanine green added. The constructedmould [Fig. 4(a)] allowed us to obtain a set of five gel ballswith different concentrations of the ICG. The gel ball waspositioned in respect to the emitter−detector grid using a thinfish line (thickness of 0.2 mm) [see Fig. 4(b)] and was im−mersed in the liquid. Measurements were carried out for in−clusion located at different depths between the source fiberand detecting fiber bundle. Moreover different ICG concen−trations in the gel ball and in the surrounding liquid were ap−plied. This experiment was carried out for simulation of thelocal increase in the concentration of the dye (i.e., forbrain−blood barrier damage). Higher concentrations of ICGwere used in this case, then in experiment in the layeredphantom because we assumed that the accumulation of dyein the inclusion may lead to much higher concentration ofICG. The concentration of ICG in gel ball inclusion was17 μM, 103 μM, 170 μM, and 343 μM.
Measurements on physical phantoms were carried outafter 2 h warm−up time of the system which is necessary toavoid the low frequency drift in obtained data. Multidis−tance recordings on layered phantom and imaging of fluo−rescence inclusion were carried out after about 1.5−hwarm−up when the drift of the recorded signals did notexceed 10% per hour.
2.3. Data analysis
Application of the time correlated single photon counting(TCSPC) electronics allows us to measure time betweensingle photon peaks from the photodetectors and synchroni−zation pulses from the laser source. This time is related totime of flight of individual photons in the studied medium.In case of fluorescence, these times of arrival of photonsdepend on:� time of flight of excitation photons to the point where
they are absorbed by fluorophore molecule,� fluorescence lifetime,� time of flight of fluorescence photons from the position
of emission to the detector [24].
After collecting a large number of pulses correspondingto single photons (ca. 106), the distributions of times of ar−rival (DTA) of fluorescence photons and times of flight(DTOF) of diffusely reflected photons can be obtained. Forevery source position, the measured DTAs and DTOFs wererecorded in eight separate files on the hard drive of the in−dustrial computer. Subsequently, the recorded DTOFs andDTAs were decomposed into 2 sets of 16 signals which cor−respond to 16 emitter−detector pairs forming 4×4 pixelgrids.
In the present study, the recorded DTAs and DTOFswere analyzed by calculation of their statistical moments[43]. After subtracting background and correcting for differ−ential nonlinearity of the TCSPC electronics, the statisticalmoments of measured distributions were calculated
N N t t N Ntot kk
M
k k totk
M� �
� �� �
1 1
, , (1)
where the Ntot is the total number of photons, <t> is themean time of arrival photons, Nk is the number of photons inthe kth time channel of the measured distribution which con−sisted of M time channels.
Following changes in these moments were investigated
N N N t t tR NORM tot tot R_ ,� � �0 0� , (2)
N N N t t tF NORM tot tot F_ ,� � �0 0� , (3)
where NF_NORM and NR_NORM are the normalized numbers offluorescence and diffusely reflected photons and the suffix 0indicates the moment measured in a homogeneous medium.
For the data acquired in the two−layered liquid phantom,the changes of the moments of DTAs were evaluated for dif−ferent concentrations of ICG in lower and upper compart−ment of the model.
Changes of moments of DTAs and DTOFs for differentconcentrations of ICG in inclusion located at various depthswere presented as 4×4 pixel maps in which the pixels corre−spond to the different source−detector pairs.
Time−resolved imaging of fluorescent inclusions in optically turbid medium – phantom study
40 Opto−Electron. Rev., 18, no. 1, 2010 © 2010 SEP, Warsaw
Fig. 4. Constructed mould for gel balls manufacturing with precisely defined concentration of ICG (a) and gel ball positioned in a liquidphantom using thin fish line (b).
3. Results and discussion
Two series of experiments were curried out, namely mea−surements on two−layered phantom with variable source−de−tector separations and imaging of fluorescence inclusion lo−cated at different depths in homogeneous liquid phantom.
3.1. Multidistance measurements on two-layeredphantom
In order to evaluate the changes in statistical moments ofDTA as a function of concentration of the fluorescence dyein selected layers of the liquid phantom, measurements forfour emitter−detector separations (1, 2, 3, and 4 cm) werecarried out, as shown in Fig. 2. Emitting fiber and detectingbundles were positioned on the surface of the phantom inthe reflectance geometry. The concentration of the fluores−cence dye was changed separately, first in superficial andthen in the deeper layer of the phantom with the same stepof 2.5 μM and in the same range, from 2.5 μM to 64.5 μM.
Initially, concentration of the ICG was the same in the bothlayers (2.5 μM). The results of experiments are shown inFig. 5.
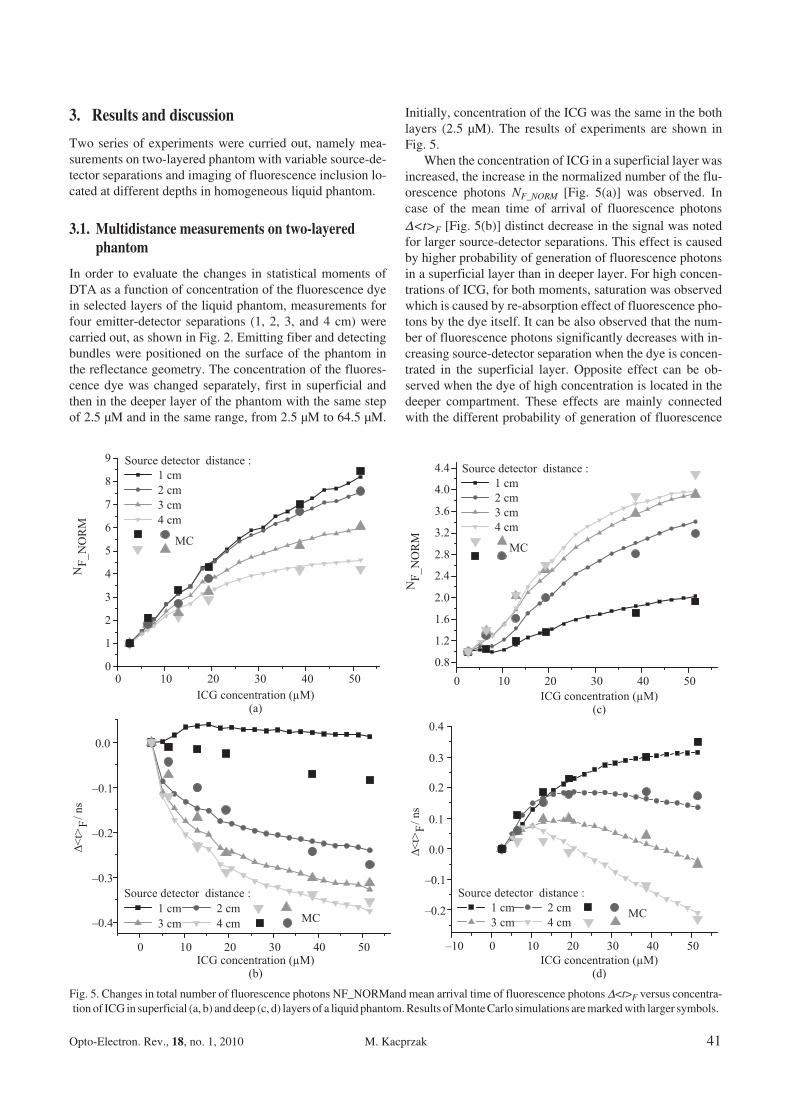
When the concentration of ICG in a superficial layer wasincreased, the increase in the normalized number of the flu−orescence photons NF_NORM [Fig. 5(a)] was observed. Incase of the mean time of arrival of fluorescence photons�<t>F [Fig. 5(b)] distinct decrease in the signal was notedfor larger source−detector separations. This effect is causedby higher probability of generation of fluorescence photonsin a superficial layer than in deeper layer. For high concen−trations of ICG, for both moments, saturation was observedwhich is caused by re−absorption effect of fluorescence pho−tons by the dye itself. It can be also observed that the num−ber of fluorescence photons significantly decreases with in−creasing source−detector separation when the dye is concen−trated in the superficial layer. Opposite effect can be ob−served when the dye of high concentration is located in thedeeper compartment. These effects are mainly connectedwith the different probability of generation of fluorescence
Opto−Electron. Rev., 18, no. 1, 2010 M. Kacprzak 41
Fig. 5. Changes in total number of fluorescence photons NF_NORMand mean arrival time of fluorescence photons �<t>F versus concentra−tion of ICG in superficial (a, b) and deep (c, d) layers of a liquid phantom. Results of Monte Carlo simulations are marked with larger symbols.
photons for these two situations. When the dye is concen−trated in the deeper compartment, the chance that the fluo−rescence photons will be generated increases with theinteroptode distance. For the dye concentrated in the super−ficial layer, the decreased number of fluorescence photonsreemitted at large source−detector separations is influencedstrongly by the scattering properties of the medium andreabsorption effects.
In Figs. 5(c) and 5(d), the courses of changes in the DTAmoments versus the ICG concentration in deeper layer arepresented. In this case, distinct increase of NF_NORM as afunction of ICG concentration [Fig. 5(c)] was observed. Thenumber of photons increases also with source−detector sepa−ration which can be explained by the fact that for largersource−detector distances, the light penetrates deeper in theliquid through the second layer where the concentration ofICG is higher. In changes of the mean time of arrival of flu−orescence photons �<t>F [Fig. 5(d)] for low concentrationof ICG, increase in the signal with increase in concentrationwas observed. When the ICG is concentrated in deeperlayer, the probability of generation of fluorescence photonsis higher in deeper layer than in a superficial one. Thus, ave−rage pathlengths of the detected fluorescence photons be−come longer and the mean time of photons arrival is longertoo. However, when the concentration of ICG in deeperlayer is very high, an effect of re−absorption of the fluores−cence photons starts to dominate which leads to decrease inthe probability of arrival of fluorescence photons fromdeeper regions. In this case, photons generated in a superfi−cial layer dominate which causes decrease in the mean timeof arrival of fluorescence photons �<t>F.
Additionally, Monte Carlo simulations were performedfor measurement conditions of the phantom experiments.Reflection geometry with two parallel layers parallel to thesurface of the medium was used. Superficial layer had athickness of 0.8 cm, deeper layer was infinite. Refractive in−dex of the medium was fixed at n = 1.4. Radial symmetry al−lowed us to treat detection areas as rings around the emis−sion point. Photon bundles were collected at the distancesup to 4 cm from an emission point. To simulate photon tra−jectories in the medium, weighted Monte Carlo algorithmreported in detail elsewhere was applied . Absorption spec−tra of ICG were taken from Ref. 45. Optical properties of themedium were calculated by fitting the solution of diffusionequation to the experimentally acquired distributions of thetimes of flight of photons to μs’ = 10 cm–1 and μa = 0.02cm–1. Monte Carlo simulations were carried out for opticalproperties corresponding to various ICG concentrations:2.5 μM, 6.4 μM, 13 μM, 19.3 μM, 38.7 μM, and 51.6 μM incase of both superficial and deep layer. Results of simula−tions were normalized to the results obtained for ICG con−centration equal to 2.5 μM. As shown in Fig. 5, a good cor−relation between results of Monte Carlo simulations and re−sults of phantom experiments was obtained. Trends ofchanges of statistical moments calculated theoretically
match well with trends of changes of moments obtainedfrom experimental data.
Significant discrepancy between results of Monte Carlosimulations and experimental data was observed only for�<t>F changes acquired at 1−cm source−detector separation[Fig. 5(b)]. At such short source−detector separations, thedifferences between theoretical model and measurementconditions are large and are connected with relatively largesize of the detector and emitter and non−ideal meeting ofboundary conditions during measurements.
3.2. Imaging of fluorescence inclusion inhomogeneous liquid phantom
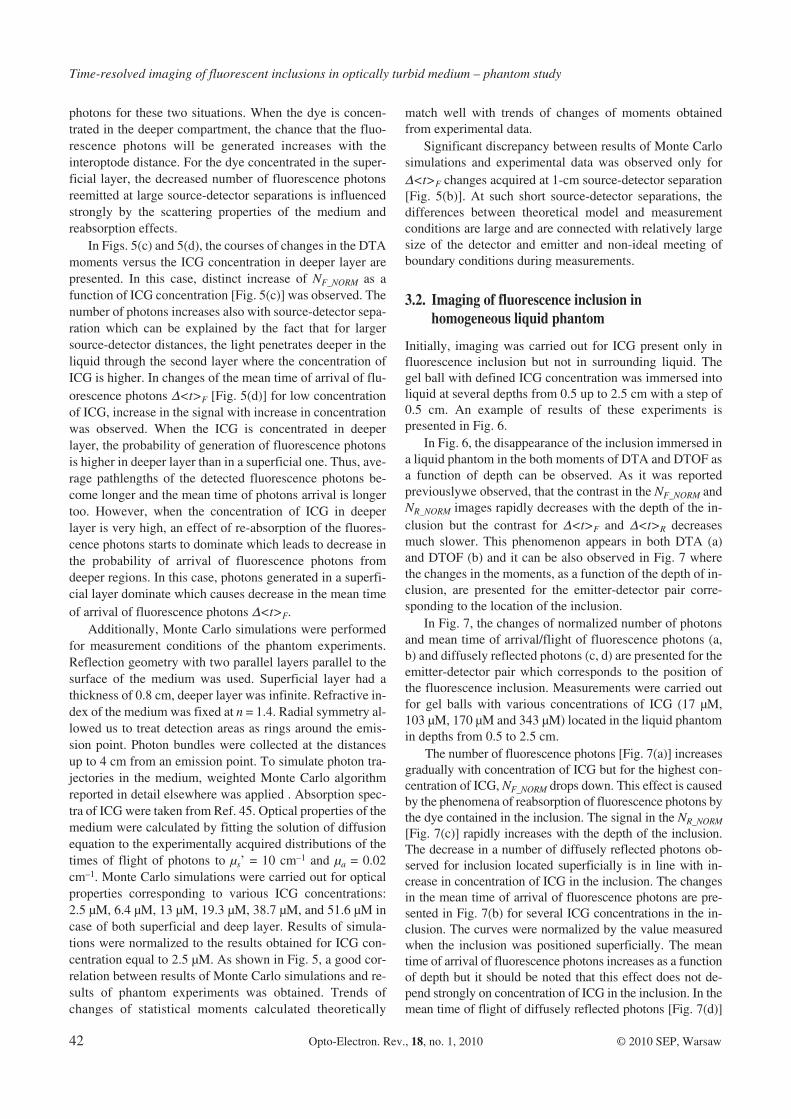
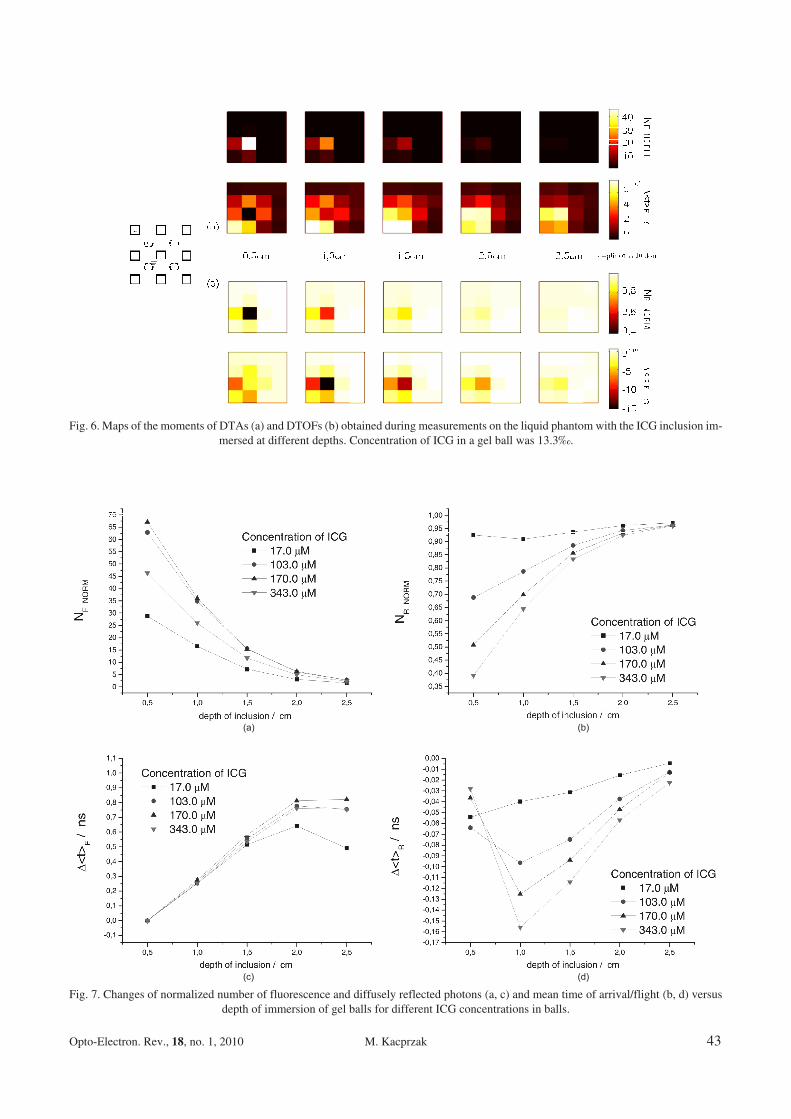
Initially, imaging was carried out for ICG present only influorescence inclusion but not in surrounding liquid. Thegel ball with defined ICG concentration was immersed intoliquid at several depths from 0.5 up to 2.5 cm with a step of0.5 cm. An example of results of these experiments ispresented in Fig. 6.
In Fig. 6, the disappearance of the inclusion immersed ina liquid phantom in the both moments of DTA and DTOF asa function of depth can be observed. As it was reportedpreviouslywe observed, that the contrast in the NF_NORM andNR_NORM images rapidly decreases with the depth of the in−clusion but the contrast for �<t>F and �<t>R decreasesmuch slower. This phenomenon appears in both DTA (a)and DTOF (b) and it can be also observed in Fig. 7 wherethe changes in the moments, as a function of the depth of in−clusion, are presented for the emitter−detector pair corre−sponding to the location of the inclusion.
In Fig. 7, the changes of normalized number of photonsand mean time of arrival/flight of fluorescence photons (a,b) and diffusely reflected photons (c, d) are presented for theemitter−detector pair which corresponds to the position ofthe fluorescence inclusion. Measurements were carried outfor gel balls with various concentrations of ICG (17 μM,103 μM, 170 μM and 343 μM) located in the liquid phantomin depths from 0.5 to 2.5 cm.
The number of fluorescence photons [Fig. 7(a)] increasesgradually with concentration of ICG but for the highest con−centration of ICG, NF_NORM drops down. This effect is causedby the phenomena of reabsorption of fluorescence photons bythe dye contained in the inclusion. The signal in the NR_NORM
[Fig. 7(c)] rapidly increases with the depth of the inclusion.The decrease in a number of diffusely reflected photons ob−served for inclusion located superficially is in line with in−crease in concentration of ICG in the inclusion. The changesin the mean time of arrival of fluorescence photons are pre−sented in Fig. 7(b) for several ICG concentrations in the in−clusion. The curves were normalized by the value measuredwhen the inclusion was positioned superficially. The meantime of arrival of fluorescence photons increases as a functionof depth but it should be noted that this effect does not de−pend strongly on concentration of ICG in the inclusion. In themean time of flight of diffusely reflected photons [Fig. 7(d)]
Time−resolved imaging of fluorescent inclusions in optically turbid medium – phantom study
42 Opto−Electron. Rev., 18, no. 1, 2010 © 2010 SEP, Warsaw
Opto−Electron. Rev., 18, no. 1, 2010 M. Kacprzak 43
Fig. 6. Maps of the moments of DTAs (a) and DTOFs (b) obtained during measurements on the liquid phantom with the ICG inclusion im−mersed at different depths. Concentration of ICG in a gel ball was 13.3‰.
Fig. 7. Changes of normalized number of fluorescence and diffusely reflected photons (a, c) and mean time of arrival/flight (b, d) versusdepth of immersion of gel balls for different ICG concentrations in balls.
it can be observed that with depth of the inclusion, the signaldrops down and then increases. This effect is connected withlower sensitivity of mean time of flight to absorptioninclusions located superficially and much higher to theinclusions positioned deeper [35].
The effects observed in this experiment confirm that thedepth of fluorescent dye inclusion influences significantlythe moments of DTA and DTOF. Especially, in the case ofthe mean time of arrival of fluorescent photons <t>F, thecontrast in the images is observed even for deep localizationof the inclusion.
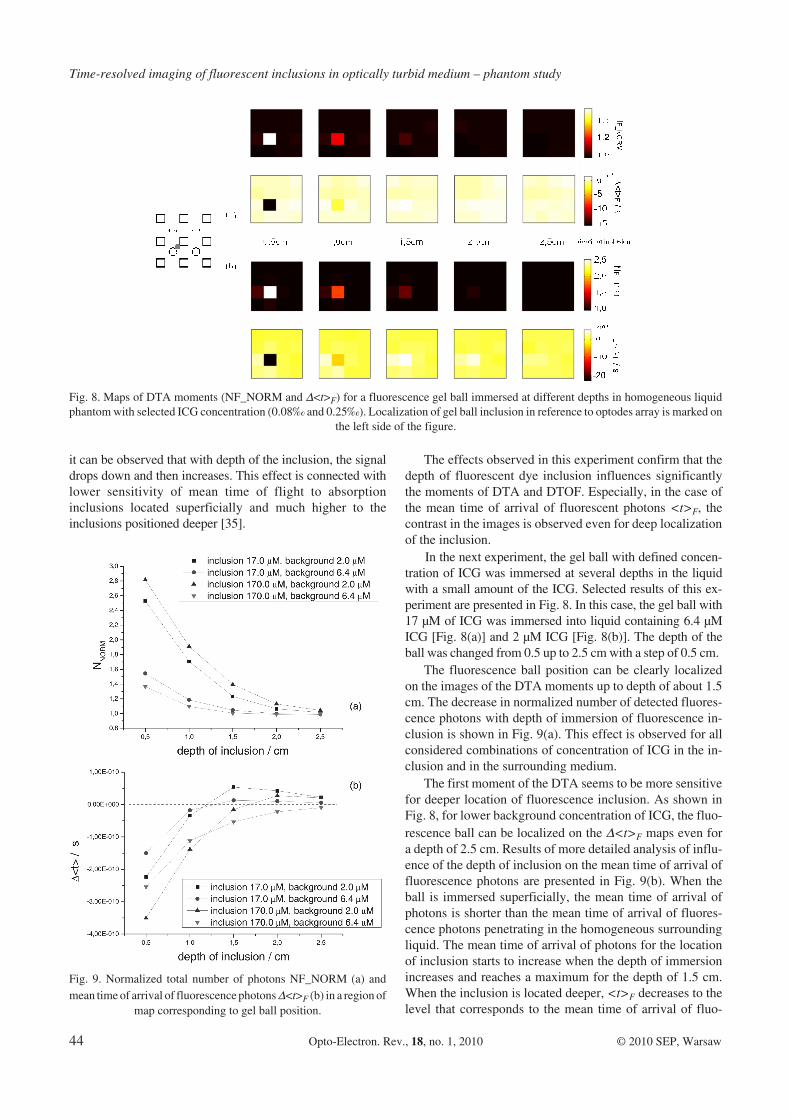
In the next experiment, the gel ball with defined concen−tration of ICG was immersed at several depths in the liquidwith a small amount of the ICG. Selected results of this ex−periment are presented in Fig. 8. In this case, the gel ball with17 μM of ICG was immersed into liquid containing 6.4 μMICG [Fig. 8(a)] and 2 μM ICG [Fig. 8(b)]. The depth of theball was changed from 0.5 up to 2.5 cm with a step of 0.5 cm.
The fluorescence ball position can be clearly localizedon the images of the DTA moments up to depth of about 1.5cm. The decrease in normalized number of detected fluores−cence photons with depth of immersion of fluorescence in−clusion is shown in Fig. 9(a). This effect is observed for allconsidered combinations of concentration of ICG in the in−clusion and in the surrounding medium.
The first moment of the DTA seems to be more sensitivefor deeper location of fluorescence inclusion. As shown inFig. 8, for lower background concentration of ICG, the fluo−rescence ball can be localized on the �<t>F maps even fora depth of 2.5 cm. Results of more detailed analysis of influ−ence of the depth of inclusion on the mean time of arrival offluorescence photons are presented in Fig. 9(b). When theball is immersed superficially, the mean time of arrival ofphotons is shorter than the mean time of arrival of fluores−cence photons penetrating in the homogeneous surroundingliquid. The mean time of arrival of photons for the locationof inclusion starts to increase when the depth of immersionincreases and reaches a maximum for the depth of 1.5 cm.When the inclusion is located deeper, <t>F decreases to thelevel that corresponds to the mean time of arrival of fluo−
Time−resolved imaging of fluorescent inclusions in optically turbid medium – phantom study
44 Opto−Electron. Rev., 18, no. 1, 2010 © 2010 SEP, Warsaw
Fig. 8. Maps of DTA moments (NF_NORM and �<t>F) for a fluorescence gel ball immersed at different depths in homogeneous liquidphantom with selected ICG concentration (0.08‰ and 0.25‰). Localization of gel ball inclusion in reference to optodes array is marked on
the left side of the figure.
Fig. 9. Normalized total number of photons NF_NORM (a) andmean time of arrival of fluorescence photons �<t>F (b) in a region of
map corresponding to gel ball position.
rescence photons penetrating the surrounding homogeneousliquid.
4. Conclusions
A time−resolved setup for simultaneous imaging of fluores−cence and reflectance was developed. It allows for themultidistance measurements of DTAs and DTOFs as well asfor measurements on large area on the phantom or on thehuman head in 16 points simultaneously with 1−s image ac−quisition time. In the previous study, the instrument wastested in healthy subjects during functional motor stimula−tion [35] as well as during monitoring of absorption changescaused by the inflow of the ICG dye into brain cortex. Con−sidering recent results of the fluorescence measurements onthe head [24,28], the instrument was reconstructed in orderto allow for fluorescence light detection. The sensitivity ofthe instrument was tested in phantom experiments. Twophantom configurations and various concentrations of thefluorophore in the phantom layers and in the gel ballinclusion were investigated.
An experiment on the layered physical phantom wasreported previously for validation of the estimationmethod of absorption coefficient changes as a function ofdepth [46]. In the present study we obtained the results ofthe time resolved fluorescence measurement, carried outon a layered physical liquid phantom, which show that theinflow of the dye into the deeper and superficial layers ofthe head could be also monitored by time resolved tech−nique based on monitoring of fluorescence. Analysis ofchanges in the moments of DTAs in particular increase inthe mean time of arrival of the fluorescence photons maybe useful in evaluation of appearance of the exogenous dyein a brain tissue.
In the second series of experiments we tried to show thatthe setup can be used in monitoring non−homogenous distri−bution of the dye in the brain tissue. Results of the experi−ments confirm that spatial position of the small gel ball, withlow concentration of ICG could be assessed precisely in re−spect to emitter−detector array. Obtained results suggest thatthe time resolved method may also allow for evaluation of thedepth of the inclusion. Potentially, the method proposed canbe used for detection of small dye accumulation regionswithin the brain tissue, for example, after dye extravasationscaused by leakage through brain−blood barrier [28].
Results of our phantom experiments are in line with theresults obtained in−vivo by Liebert et al. [24]. The authorsmeasured the fluorescence light originated from the exoge−nous ICG bolus in the brain tissue and suggest that inflow ofthe bolus into extra− and intra− cerebral tissue compartmentscould be evaluated separately using time−resolved tech−nique. Results of measurements carried out in the two−lay−ered phantom confirmed previously reported effect of in−crease in the mean time of arrival of fluorescence photonsoriginating from the deeper compartment.
Results of the physical phantom study suggest that thetime−resolved imager can be used for evaluation of fluores−
cence excited in the dye circulating in the brain in large tis−sue region and potentially with depth discrimination. Acqui−sition time of one map of about one second allows also formonitoring of the rapid changes in blood flow and tissueperfusion. Future in−vivo studies on patients with cerebro−vascular disorders, using fluorescence excited in a dye cir−culating in the brain, are needed in order to validate clinicalusefulness of the method.
The constructed time−resolved multichannel system isportable and can be used in clinical environment for bed−sidemonitoring of the brain function. It was reported previouslythat changes of optical properties of the brain tissue causedby functional motor stimulation [35] or by injection of ICG[30,31] can be monitored by the diffusive reflectance mea−surements. However, it is also possible to observe kinetics ofthe bolus as well as in the fluorescence signal [24,28]. Suchmeasurements give the possibility of significant increase insignal to noise ratio of the moments of DTAs in comparisonwith a diffusive reflectance signal [28]. Large changes in themoments of fluorescence signals with their specific depthsensitivity courses could lead us to a conclusion that the de−veloped fluorescence imager may be useful for brain perfu−sion assessment and could be used as modality for the detec−tion of contrast agents kinetics inside the brain cortex. It haspotential application for bed−side detection of the leakage ofblood with the dye through brain−blood barrier or monitoringreperfusion effect in a stroke area.
Acknowledgements
The study is supported by the Polish Ministry of Scienceand Higher Education within project P−N/012/2006 (bilat−eral German−Polish research projects in neurosciences) andpartly within the project 3T11E01530.
References
1. J. Lakowicz, Principles of Fluorescence Spectroscopy, 2nd
edition, Kluwe Academic/Plenum Publishers, 1999.2. V. Ntziachristos, J. Ripoll, L.V. Wang, and R. Weissleder,
“Looking and listening to light: the evolution of whole−bodyphotonic imaging”, Nat. Biotechnol. 23, 313–320 (2005).
3. R. Weissleder and V. Ntziachristos, “Shedding light ontolive molecular targets”, Nat. Med. 9, 123–128 (2003).
4. J.S. Reynolds, T.L. Troy, R.H. Mayer, A.B. Thompson, D.J.Waters, K.K. Cornell, P.W. Snyder, and E.M. Sevick−−Muraca, “Imaging of spontaneous canine mammary tumorsusing fluorescent contrast agents”, Photochem. Photobiol.70, 87–94 (1999).
5. B.W. Pogue and G. Burke, “Fiber−optic bundle design forquantitative fluorescence measurement from tissue”, Appl.Optics 37, 7429–7436 (1998).
6. R. Weersink, M.S. Patterson, K. Diamond, S. Silver, and N.Padgett, “Noninvasive measurement of fluorophore concen−tration in turbid media with a simple fluorescence/reflec−tance ratio technique”, Appl. Optics 40, 6389–6395 (2001).
7. K.R. Diamond, T.J. Farrell, and M.S. Patterson, “Measure−ment of fluorophore concentrations and fluorescence quan−
Opto−Electron. Rev., 18, no. 1, 2010 M. Kacprzak 45
tum yield in tissue−simulating phantoms using three diffu−sion models of steady−state spatially resolved fluorescence”,Phys. Med. Biol. 48, 4135–4149 (2003).
8. D.E. Hyde, T.J. Farrell, M.S. Patterson, and B.C. Wilson, “Adiffusion theory model of spatially resolved fluorescencefrom depth−dependent fluorophore concentrations”, Phys.Med. Biol. 46, 369–83 (2001).
9. D. Stasic, T.J. Farrell, and M.S. Patterson, “The use of spa−tially resolved fluorescence and reflectance to determine in−terface depth in layered fluorophore distributions”, Phys.Med. Biol. 48, 3459–3474 (2003).
10. R.H. Mayer, J.S. Reynolds, and E.N. Sevick−Muraca, “Mea−surement of the fluorescence lifetime in scattering media layfrequency−domain photon migration”, Appl. Optics 38, 4930–4938 (1999).
11. J. Wu, J. Wang, L. Perelman, I. Itzkan, R. Dasari, and F. Ms,“Time−resolved multichannel imaging of fluorescent objectsembedded in turbid media”, Opt. Lett. 20, 489–491 (1995).
12. D. Hattery, V. Chernomordik, M. Loew, I. Gannot, and A.Gandjbakhche, “Analytical solutions for time−resolved fluo−rescence lifetime imaging in a turbid medium such as tissue”,J. Opt. Soc. Am. A 18, 1523–1530 (2001).
13. D.Y. Paithankar, A.U. Chen, B.W. Pogue, M.S. Patterson,and E.M. Sevick−Muraca, “Imaging of fluorescent yield andlifetime from multiply scattered light reemitted from randommedia”, Appl. Optics 36, 2260–2272 (1997).
14. C.L. Hutchinson, T.L. Troy, and E.M. Sevick−Muraca, “Flu−orescence−lifetime determination in tissues or other scatter−ing media from measurement of excitation and emission ki−netics”, Appl. Optics 35, 2325–2332 (1996).
15. K. Vishwanath, B. Pogue, and M.A. Mycek, “Quantitativefluorescence lifetime spectroscopy in turbid media: compari−son of theoretical, experimental and computational meth−ods”, Phys. Med. Biol. 47, 3387–3405 (2002).
16. M. Patterson and B. Pogue, “Mathematical model for time−−resolved and frequency−domain fluorescence spectroscopyin biological tissues”, Appl. Optics 33, 1963–1974 (1994).
17. A.E. Cerussi, J.S. Maier, S. Fantini, M.A. Franceschini,W.W. Mantulin, and E. Gratton, “Experimental verificationof a theory for the time−resolved fluorescence spectroscopyof thick tissues”, Appl. Optics 36, 116–124 (1997).
18. M. Sadoqi, P. Riseborough, and S. Kumar, “Analytical mod−els for time resolved fluorescence spectroscopy in tissues”,Phys. Med. Biol. 46, 2725–2743 (2001).
19. D. Hall, G. Ma, F. Lesage, and Y. Wang, “Simple time−do−main optical method for estimating the depth and concentra−tion of a fluorescent inclusion in a turbid medium”, Opt. Lett.29, 2258–2260 (2004).
20. A. Corlu, R. Choe, T. Durduran, M. Rosen, M. Schweiger, S.Arridge, M. Schnall, A. Yodh, and R. Laing, “Three−dimen−sional in vivo fluorescence diffuse optical tomography ofbreast cancer in humans”, Opt. Express 15, 6696–6716(2007).
21. V. Ntziachristos, C.H. Tung, C. Bremer, and R. Weissleder,“Fluorescence molecular tomography resolves protease ac−tivity in vivo”, Nat. Med. 8, 757–760 (2002).
22. A. Becker, C. Hessenius, K. Licha, B. Ebert, U. Sukowski,W. Semmler, B. Wiedenmann, and C. Grotzinger, “Recep−tor−targeted optical imaging of tumors with near−infrared flu−orescent ligands”, Nat. Biotechnol. 19, 327–331 (2001).
23. R. Weissleder, “Scaling down imaging: Molecular mappingof cancer in mice”, Nat. Rev. Cancer 2, 11–18 (2002).
24. A. Liebert, H. Wabnitz, H. Obrig, R. Erdmann, M. Moller, R.Macdonald, H. Rinneberg, A. Villringer, and J. Steinbrink,“Non−invasive detection of fluorescence from exogenouschromophores in the adult human brain”, Neuroimage 31,600–608 (2006).
25. J.G. Fujimoto and D.L. Farkas, Biomedical Optical Imaging,Oxford University Press, 2009.
26. K. Svanberg, I. Wang, S. Colleen, I. Idvall, C. Ingvar, R.Rydell, D. Jocham, H. Diddens, S. Bown, G. Gregory, S.Montan, S. Andersson−Engels, and S. Svanberg, “Clinicalmulti−colour fluorescence imaging of malignant tumours−−initial experience”, Acta Radiol. 39, 2–9 (1998).
27. M.A. Ortner, B. Ebert, E. Hein, K. Zumbusch, D. Nolte, U.Sukowski, J. Weber−Eibel, B. Fleige, M. Dietel, M. Stolte, G.Oberhuber, R. Porschen, B. Klump, H. Hortnagl, H. Lochs,and H. Rinneberg, “Time gated fluorescence spectroscopy inBarrett's oesophagus”, Gut 52, 28–33 (2003).
28. J. Steinbrink, A. Liebert, H. Wabnitz, R. Macdonald, H.Obrig, A. Wunder, R. Bourayou, T. Betz, J. Klohs, U.Lindauer, U. Dirnagl, and A. Villringer, “Towards noninva−sive molecular fluorescence imaging of the human brain”,Neurodegener Dis. 5, 296–303 (2008).
29. J. Fishbaugh, “Retina: indocyanine green (ICG) angio−graphy”, Insight 19, 30–2 (1994).
30. A. Liebert, H. Wabnitz, J. Steinbrink, M. Moller, R. Macdon−ald, H. Rinneberg, A. Villringer, and H. Obrig, “Bed−side as−sessment of cerebral perfusion in stroke patients based on op−tical monitoring of a dye bolus by time−resolved diffusereflectance”, Neuroimage 24, 426–435 (2005).
31. M. Kacprzak, A. Liebert, J. Maczewska, P. Sawosz, L.Krolicki, and R. Maniewski, “Monitoring of contrast agentinflow into human brain by multichannel time−resolved dif−fuse reflectometry”, Proc. Biomedical Optics/Digital Holog−raphy and Three−Dimensional Imaging/Laser Applicationsto Chemical, Security and Environmental Analysis The Opti−cal Society of America, Washington, DC, 2008, St.Petersburg, Florida, CD−ROM, 2008.
32. T. Desmettre, J.M. Devoisselle, and S. Mordon, “Fluores−cence properties and metabolic features of indocyanine green(ICG) as related to angiography”, Surv. Ophthalmol. 45,15–27 (2000).
33. R.C. Benson and H.A. Kues, “Fluorescence properties ofindocyanine green as related to angiography”, Phys. Med.Biol. 23, 159–163 (1978).
34. J. Pauli, T. Vag, R. Haag, M. Spieles, M. Wenzel, W. A. Kai−ser, U. Resch−Genger, and I. Hilger, “An in vitro character−ization study of new near infrared dyes for molecular imag−ing”, Eur. J. Med. Chem. 44 (2009).
35. M. Kacprzak, A. Liebert, P. Sawosz, N.S. Zolek, and R.Maniewski, “Time−resolved optical imager for assessment ofcerebral oxygenation”, J. Biomed. Opt. 12, 034019(1–14)(2007).
36. R. Maniewski, A. Liebert, M. Kacprzak, and A. Zbiec, “Se−lected applications of near infrared optical methods in medi−cal diagnosis”, Opto−Electron. Rev. 12, 255–262 (2004).
37. M. Kacprzak, P. Sawosz, A. Liebert, and R. Maniewski,“Multichannel time−correlated single photon counting instru−ment for imaging of brain oxygenation”, Nat. Conf. on Elec−tron. Tech., Cracow, 2007.
38. M. Hope−Ross, L.A. Yannuzzi, E.S. Gragoudas, D.R. Guyer,J.S. Slakter, J.A. Sorenson, S. Krupsky, D.A. Orlock, and
Time−resolved imaging of fluorescent inclusions in optically turbid medium – phantom study
46 Opto−Electron. Rev., 18, no. 1, 2010 © 2010 SEP, Warsaw
C.A. Puliafito, “Adverse reactions due to indocyaninegreen”, Ophthalmology 101, 529–533 (1994).
39. R.W. Flower, “Simple adaptors for fast conversion of a fun−dus camera for rapid−sequence ICG fluorescence choroidalangiography”, J. Biol. Photogr. Assoc. 45, 43–47 (1977).
40. Y. Ishigami, M. Masuzawa, E. Miyoshi, M. Kato, K.Tamura, M. Kanda, K. Awazu, K. Taniguchi, M. Kurita, N.Hayashi, S. Kawano, H. Fusamoto, and T. Kamada, “Clinicalapplications of ICG Finger Monitor in patients with liver dis−ease”, J. Hepatol. 19, 232–240 (1993).
41. O. Okochi, T. Kaneko, H. Sugimoto, S. Inoue, S. Takeda,and A. Nakao, “ICG pulse spectrophotometry for periopera−tive liver function in hepatectomy”, J. Surg. Res. 103,109–113 (2002).
42. S. Del Bianco, F. Martelli, F. Cignini, G. Zaccanti, A. Pifferi,A. Torricelli, A. Bassi, P. Taroni, and R. Cubeddu, “Liquidphantom for investigating light propagation through layereddiffusive media”, Opt. Express 12, 2102–2111 (2004).
43. A. Liebert, H. Wabnitz, D. Grosenick, M. Moller, R. Mac−donald, and H. Rinneberg, “Evaluation of optical propertiesof highly scattering media by moments of distributions oftimes of flight of photons”, Appl. Optics 42, 5785–5792(2003).
44. A. Liebert, H. Wabnitz, N. Zolek, and R. Macdonald,“Monte Carlo algorithm for efficient simulation of time−re−solved fluorescence in layered turbid media”, Opt. Express16, 13188–202 (2008).
45. http://omlc.ogi.edu/spectra/icg.46. A. Liebert, H. Wabnitz, J. Steinbrink, H. Obrig, M. Moller,
R. Macdonald, A. Villringer, and H. Rinneberg, “Time−re−solved multidistance near−infrared spectroscopy of the adulthead: intracerebral and extracerebral absorption changesfrom moments of distribution of times of flight of photons”,Appl. Optics 43, 3037–3047 (2004).
Opto−Electron. Rev., 18, no. 1, 2010 M. Kacprzak 47