time-resolved changes in equatorial x-ray diffraction and stiffness during rise of tetanic tension...
TRANSCRIPT

Time-resolved changes in equatorial x-ray diffraction and stiffnessduring rise of tetanic tension in intact length-clamped singlemuscle fibers
G. Cecchi,* P. J. Griffiths,' M. A. Bagni,* C. C. Ashley,t and Y. MaedaEuropean Molecular Biology Laboratory, Hamburg Outstation, Deutsches Elektronen-Synchrotron, W-2000 Hamburg 52,Germany; *Dipartmento di Scienze Fisiologiche, Universita degli Studi di Firenze, Florence 1-50134, Italy; 'University Laboratory ofPhysiology, Oxford OX1 3PT, United Kingdom
ABSTRACT We report the first time-resolved x-ray diffraction studies on tetanized intact single muscle fibers of the frog. The 10, 1 1,20, 21, 30, and Z equatorial reflections were clearly resolved in the relaxed fiber. The preparation readily withstood 100 1 -s duration(0.4-s beam exposure) tetani at 40C (<4% decline of force and no deterioration in the 10,11 equatorial intensity ratio at rest orduring activation).
Equatorial intensity changes (10 and 1 1) and fiber stiffness led tension (t,,2 lead 20 ms at 40C) during the tetanus rise and laggedduring the isometric phase of relaxation. These findings support the existence of a low force cross-bridge state during the rise oftetanic tension and isometric relaxation that is not evident at the tetanus plateau.
In "fixed end" tetani lattice expansion occurred with a time course similar to stiffness during the tetanus rise. During relaxation,lattice spacing increased slightly, while the sarcomere length remained isometric, but underwent large changes after the"shoulder" of tension. Under length clamp control, lattice expansion during the tetanus rise was reduced or abolished, andcompression (2%) of the lattice was observed. A lattice compression is predicted by certain cross-bridge models of forcegeneration (Schoenberg, M. 1980. Biophys. J. 30:51-68; Schoenberg, M. 1980. Biophys. J. 30:69-78).
INTRODUCTION
The development of active tension in skeletal muscle isbelieved to involve the formation of transient mechani-cal connections (cross-bridges) between actin and myo-sin filaments (Hanson and Huxley, 1955; Huxley, 1957).During a tetanus, single intact frog muscle fibers showan increase in instantaneous stiffness consistent with theformation of parallel elastic linkages between actin andmyosin (Huxley and Simmons, 1971), while the interpre-tation of the equatorial x-ray diffraction pattern ofactivated whole sartorius from the frog implies a transferof mass from the region of the myosin to the actinfilaments compared with the relaxed state (Haselgroveand Huxley, 1973) as would be expected from thecross-bridge model for force development, within theframework of the sliding filament mechanism (Huxleyand Niedergerke, 1954; Huxley and Hanson, 1954).The time course of changes in stiffness and equatorial
reflection intensity (I,, and I,,) differ from that of force.Both stiffness and equatorial intensity changes leadforce during the tetanus rise, and lag during relaxation(Cecchi et al., 1982; Ford et al., 1986; Huxley andHaselgrove, 1977). During the tetanus rise, this couldresult from initial formation of cross-bridges occurringsubstantially before tension generation, but alterna-tively, the lead of stiffness over tension could be ex-
plained if stiffness of an individual cross-bridge variedbetween different attached intermediates of the cross-
bridge cycle. It is also not proven that x-ray data andstiffness measurements are detecting the same attached
state at the start of a tetanus. To distinguish betweenthese possibilities, we have compared the time course ofchanges in stiffness, I1o and I,, in the same preparation.In addition, to obtain the highest quality mechanicaldata and to eliminate population and variable sarcomerelength effects on the x-ray reflections, we have devel-oped a technique which permits the use of an intactsingle fiber preparation in conjunction with synchrotronradiation (X = 0.15 nm) for time-resolved x-ray diffrac-tion studies. The use of this preparation also permits us
to apply the "length clamp" technique based upon
instantaneous sarcomere length measurement to main-tain isometric conditions during the rise of tetanictension.
In addition to permitting direct comparison of time-resolved x-ray diffraction data with intact single fibermechanics, these experiments on the intact single fiberpreparation provide a framework for the evaluation oftime-resolved x-ray diffraction studies on skinned fiberpreparations, where the mechanical and x-ray diffrac-tion conditions are more similar to the intact single fiberpreparation than to whole muscle. The present resultsare the first time-resolved x-ray diffraction studies to bereported from an activated intact single muscle fiberpreparation from a vertebrate under length clamp con-
trol.Here we report time-resolved changes in lattice spac-
ing during tetani obtained both under fixed-end andlength-clamped conditions, and provide evidence in
Biophys. J. c Biophysical SocietyVolume 59 June 1991 1273-1283
0006-3495/91106/1273/11 $2.00 12730006-3495/91/06/1273/11 $2.00 1273
support of previous reports of a low force attachedcross-bridge state.
Position-sensing photodiode 4 O
Collimating lens
METHODS
1. Muscle fibersSingle muscle fibers were dissected from tibialis anterior muscles ofRana temporaria. Aluminum clips were attached to the tendons asclose as practically possible to the ends of the cell to reduce tendoncompliance. Attachment of the preparation to the length motor andthe force transducer was achieved by small hooks on these devices,which were inserted into holes in the aluminum clips. Fiber length wastypically 6-7 mm, and fibers were eliptical in cross-section, having amaximum diameter up to 300 ,um and a minimum of 120 ,um. Carewas taken during mounting to remove any twists in the fiber so as toavoid rotational movement during tetani. Where possible, fibers wereorientated with the minor diameter in the plane of the laser beam,since this gave rise to a better quality laser diffraction pattern.Throughout the dissection and the experiment, fibers were bathed inRinger's solution of composition (in millimolar): NaCl, 115; KCI, 2.5;CaCl2, 1.8; Na2HPO4, 2.15; NaH2PO4, 0.85 (Adrian, 1956). pH wasadjusted to 7.00 ± 0.02, temperature 4.0 ± 0.2°C.
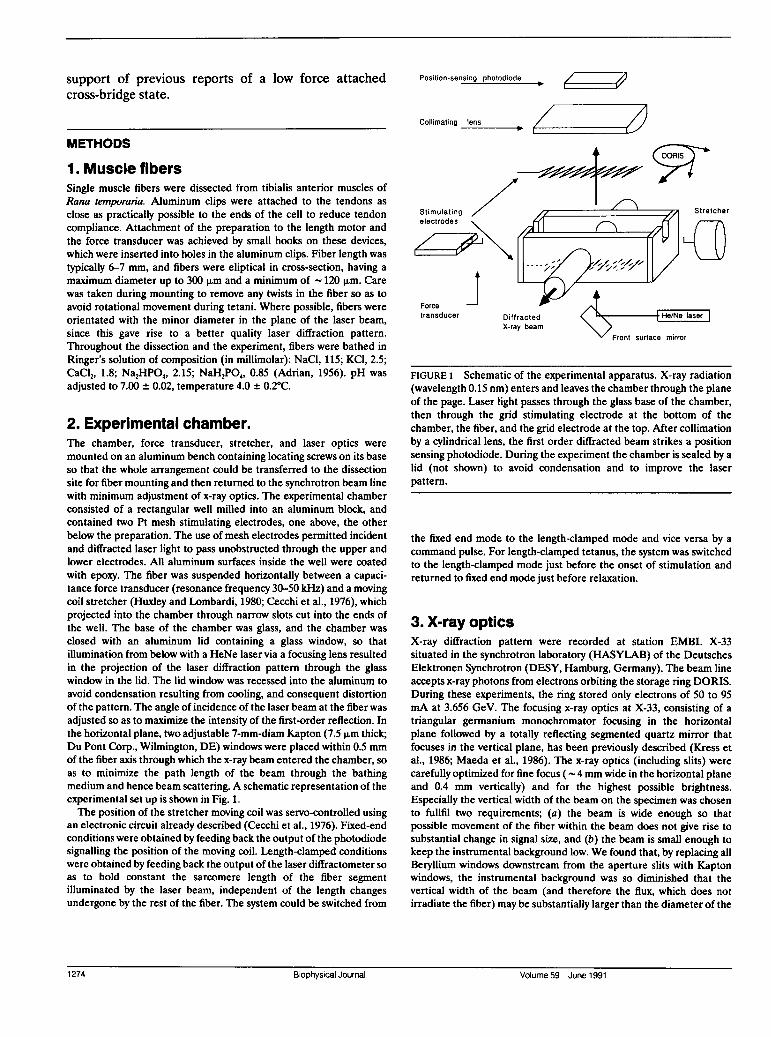
2. Experimental chamber.The chamber, force transducer, stretcher, and laser optics weremounted on an aluminum bench containing locating screws on its baseso that the whole arrangement could be transferred to the dissectionsite for fiber mounting and then returned to the synchrotron beam linewith minimum adjustment of x-ray optics. The experimental chamberconsisted of a rectangular well milled into an aluminum block, andcontained two Pt mesh stimulating electrodes, one above, the otherbelow the preparation. The use of mesh electrodes permitted incidentand diffracted laser light to pass unobstructed through the upper andlower electrodes. All aluminum surfaces inside the well were coatedwith epoxy. The fiber was suspended horizontally between a capaci-tance force transducer (resonance frequency 30-50 kHz) and a movingcoil stretcher (Huxley and Lombardi, 1980; Cecchi et al., 1976), whichprojected into the chamber through narrow slots cut into the ends ofthe well. The base of the chamber was glass, and the chamber wasclosed with an aluminum lid containing a glass window, so thatillumination from below with a HeNe laser via a focusing lens resultedin the projection of the laser diffraction pattern through the glasswindow in the lid. The lid window was recessed into the aluminum toavoid condensation resulting from cooling, and consequent distortionof the pattern. The angle of incidence of the laser beam at the fiber wasadjusted so as to maximize the intensity of the first-order reflection. Inthe horizontal plane, two adjustable 7-mm-diam Kapton (7.5 ,um thick;Du Pont Corp., Wilmington, DE) windows were placed within 0.5 mmof the fiber axis through which the x-ray beam entered the chamber, soas to minimize the path length of the beam through the bathingmedium and hence beam scattering. A schematic representation of theexperimental set up is shown in Fig. 1.The position of the stretcher moving coil was servo-controlled using
an electronic circuit already described (Cecchi et al., 1976). Fixed-endconditions were obtained by feeding back the output of the photodiodesignalling the position of the moving coil. Length-clamped conditionswere obtained by feeding back the output of the laser diffractometer soas to hold constant the sarcomere length of the fiber segmentilluminated by the laser beam, independent of the length changesundergone by the rest of the fiber. The system could be switched from
Front surface mirror
FIGURE 1 Schematic of the experimental apparatus. X-ray radiation(wavelength 0.15 nm) enters and leaves the chamber through the planeof the page. Laser light passes through the glass base of the chamber,then through the grid stimulating electrode at the bottom of thechamber, the fiber, and the grid electrode at the top. After collimationby a cylindrical lens, the first order diffracted beam strikes a positionsensing photodiode. During the experiment the chamber is sealed by alid (not shown) to avoid condensation and to improve the laserpattern.
the fixed end mode to the length-clamped mode and vice versa by a
command pulse. For length-clamped tetanus, the system was switchedto the length-clamped mode just before the onset of stimulation andreturned to fixed end mode just before relaxation.
3. X-ray opticsX-ray diffraction pattern were recorded at station EMBL X-33situated in the synchrotron laboratory (HASYLAB) of the DeutschesElektronen Synchrotron (DESY, Hamburg, Germany). The beam lineaccepts x-ray photons from electrons orbiting the storage ring DORIS.During these experiments, the ring stored only electrons of 50 to 95mA at 3.656 GeV. The focusing x-ray optics at X-33, consisting of a
triangular germanium monochromator focusing in the horizontalplane followed by a totally reflecting segmented quartz mirror thatfocuses in the vertical plane, has been previously described (Kress etal., 1986; Maeda et al., 1986). The x-ray optics (including slits) werecarefully optimized for fine focus ( - 4mm wide in the horizontal planeand 0.4 mm vertically) and for the highest possible brightness.Especially the vertical width of the beam on the specimen was chosento fullfil two requirements; (a) the beam is wide enough so thatpossible movement of the fiber within the beam does not give rise tosubstantial change in signal size, and (b) the beam is small enough tokeep the instrumental background low. We found that, by replacing allBeryllium windows downstream from the aperture slits with Kaptonwindows, the instrumental background was so diminished that thevertical width of the beam (and therefore the flux, which does notirradiate the fiber) may be substantially larger than the diameter of the
1274 Biophysical Journal Volume59 June19911274 Biophysical Journal Volume 59 June 1991
preparation. This helped us to reduce the movement artifact associ-ated with contraction.
4. X-ray detector, data aquisitionsystemX-ray equatorial reflection intensities were recorded with a one-dimensional position counter of the wire-by-wire type (Hendrix et al.,1982) at 3.8 m from the specimen. The detector was operated at 4.7 kVfilled with 80:20 Xenon/CO2 mixture, which was maintained at apressure of 2.6 atm. The overall efficiency of the system was almost100%. The detector was placed on the equator behind a slit 10 mmwide that limits the axial aperture either side of the equator, acceptingthe full axial width of the reflections.The data aquisition system including the program was previously
described (for further references, see Maeda et al., 1986). In brief, a
LSI 11/2 auxiliary crate controller controls the data aquisition of bothx-ray spectra and analogue data such as sarcomere length (see below).The data are stored in local memory, and subsequently dumped to a
VAX 11/750 computer.
5. Sarcomere length and stiffnessmeasurementAfter mounting of the chamber at the beam line, the laser beam was
aligned so as to illuminate the center of the part of the fiber that wasirradiated by the x-ray beam. Above the fiber was mounted a positionsensing photodiode that detected the position of the first order laserdiffraction band, collimated to a spot by a cylindrical lens. The signalfrom the photodiode was then converted to sarcomere length using an
analogue computer, and was used to drive the stretcher to maintain a
constant sarcomere length. Stiffness measurements were made duringfixed end contractions by exposure of the fiber to low amplitude( 0.1% fiber length) high frequency sinusoidal oscillations (4 kHz)when not subjected to length clamp at one end of the fiber, andmeasurement of the force at the other. The stiffness was then taken tobe the ratio of the amplitude of force to length change. At very lowforces a phase shift was sometimes detected between length and forcesignals. This has been explained in terms of fiber resonance (Ford etal., 1978; Cecchi et al., 1986; Eason, 1989), and under such circum-stances the oscillation frequency was reduced slightly until the phaseshift disappeared.
6. Experimental protocolTo optimize the position of the fiber within the beam, the integratedintensity resting pattern of the fiber was measured as the fiber was
raised or lowered by an electric motor until an optimum position wasfound. During this procedure, the beam was attenuated by aluminumfoil so as to reduce fiber exposure. Occasionally even during lengthclamp some variation of the position of the fiber in the beam occurred,so that the intensities of the reflections contained a movementcomponent. This was evident as a change in total intensity of thediffraction pattern. As a compensation for this effect, integratedintensity of subsequent time frames was normalized to that of the firstframe. This was justified by the observation that in fibers showing littleshortening during activation, integrated intensity from the x-ray
detector was constant within 2%, although there is no theoreticalrestriction that keeps the integrated intensity constant. Data setshaving a movement artifact of 10% or more of the integrated restingintensity were rejected. The fiber was tetanically stimulated at 3-minintervals for 1 s duration using the minimum frequency to obtain a
fused tetanus (typically 20 Hz). To obtain a statistically satisfactorydata set at 10 ms resolution, it was necessary to average 60 to 100tetani, depending on fiber size. During this period the fiber showed no
sign of deterioration, tension declining by <4% during the course ofan experiment. After each 10 tetani, a resting pattern was recordedfrom the fiber, and examined to determine fiber condition andpositioning in the x-ray beam. In addition, each tetanus was recordedon a digital oscilloscope and compared with the previous response todetect any fiber deterioration.
7. Data analysisBecause of the high time resolution required in the stiffness measure-ments, force, and length oscillations required a separate data acquisi-tion system, and were therefore recorded by a Nicolet Explorer 2090digital scope and stored on floppy disks. Initial estimates of equatorialintensity changes were made by subtraction of background scatterunder the peaks. This background scatter was estimated either by a
polynomial fit to the regions of the diffraction pattern containing no
reflections, or by eye using a segment of an exponential curve.
Subsequently it was found that data scatter was usually reduced if totalarea of peaks, including background, was used, and this method hasbeen adopted for the figures presented here. In all experiments,however, the time course of intensity changes was calculated by bothmethods, with negligible difference between the two observed. Through-out the figures in which 10 intensity is displayed, the changes inintensity of this reflection have been reversed so as to change in thesame direction as stiffness and 11 intensity.
Lattice spacing (the center to center distance between adjacentmyosin filaments in the myofilament lattice) was calculated by firstsubtracting a function representing background scatter which gave an
adequate fit by eye to the data. The remaining peak, now on a flat baseline, was then treated as though each detector channel (128 in total)were divisible into 40 parts. The 40 divisions were then assigned valuesappropriate to a linear extrapolation between adjacent channelcounts, and the total counts (real plus extrapolated) summed over therange of the peak. The point at which the summed counts equaled 50%of the total was determined and taken to be the position of the peak ofthat particular reflection. This was performed for both 11 and 10reflections on either side of the zero order reflection, and the latticespacing calculated according to
2L 2L 1a-=-
Xii X1o V3(1)
where L is the camera constant for a particular experiment (typically5.907 x 10-`0 m2, and xl0 and xl, are the separations of the 10 and 11reflections, respectively, from the center of the x-ray diffractionpattern. Owing to the broadening of the 11 reflection which accompa-
nied activation, and which caused overlap of this reflection with the Zand the 20 reflections, the lattice spacing calculated from thisreflection has not been used in preparation of data presented in thispaper.The x-ray camera was calibrated for the meridional reflection at
1/14.34 nm-' (Haselgrove, 1975), which was recorded on the same setup from the same fiber with the detector rotated onto the meridian.Throughout the text, dimensions associated with the filament latticeare given in nanometers.Data obtained from initial experiments performed without sarco-
mere length recording have not been included in the data presentedhere.
Cecie l -a n tffesSuisi uce17Cecchi et al. X-Ray and Stiffness Studies in Muscle 1275
RESULTS
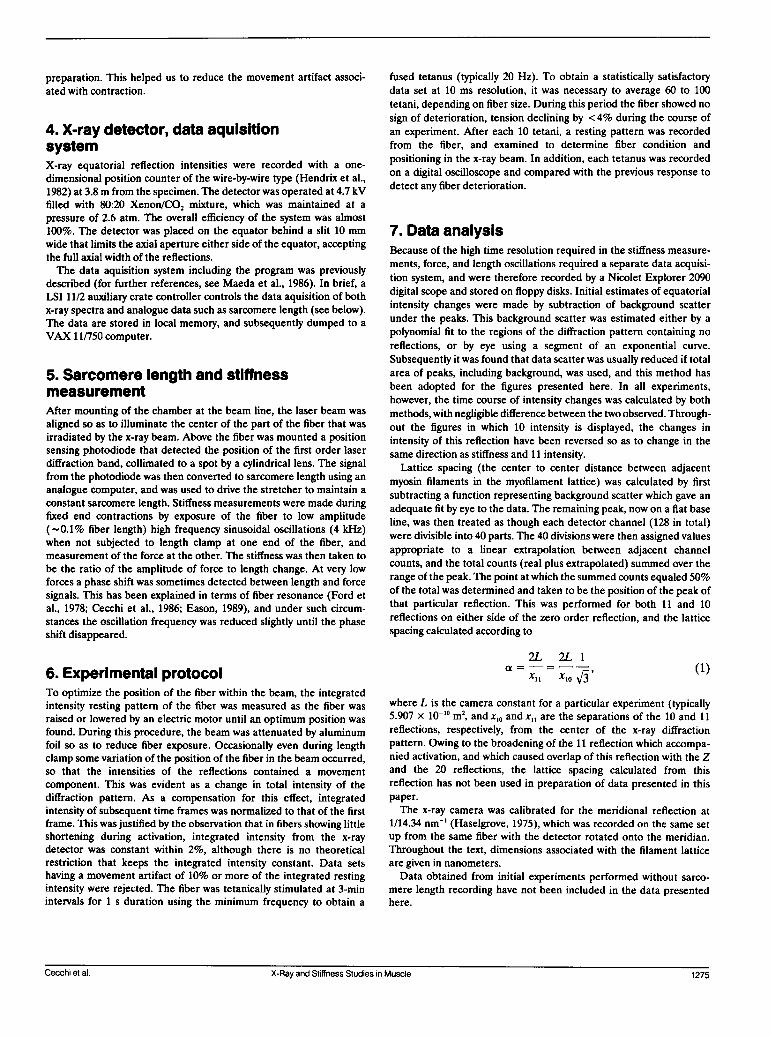
1. Equatorial x-ray diffraction patternsfrom the resting fiber and at thetetanus plateauFig. 2 a shows the resting equatorial diffraction patternfrom the intact single fiber recorded during a 3-sexposure to the beam. The general features of the 11and 10 reflections are similar to those described forwhole muscle (Yu et al., 1977), but both reflections are
clearly defined so that it is possible to identify additional20, 21, and 30 reflections on the pattern that are notalways well resolved in whole muscle work. The smallreflection lying immediately outside the 11 peaks in therelaxed spectrum (the Z reflection) arises from the
30000
250007 A
20000
2'15000
10000 l
20 40 601 100 120
Channel
30000
250007 B
20000
3) 150001
square actin filament lattice arrangement at the Z line(Yu et al., 1977).
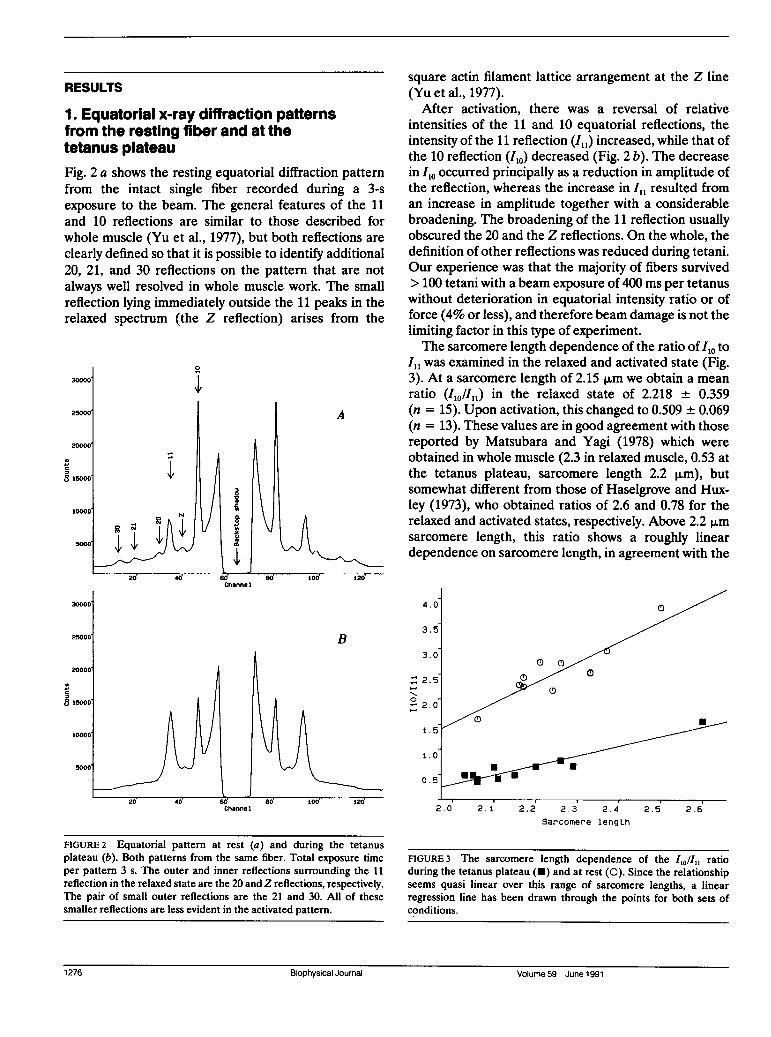
After activation, there was a reversal of relativeintensities of the 11 and 10 equatorial reflections, theintensity of the 11 reflection (I,,) increased, while that ofthe 10 reflection (I,o) decreased (Fig. 2 b). The decreasein I10 occurred principally as a reduction in amplitude ofthe reflection, whereas the increase in I,, resulted froman increase in amplitude together with a considerablebroadening. The broadening of the 11 reflection usuallyobscured the 20 and the Z reflections. On the whole, thedefinition of other reflections was reduced during tetani.Our experience was that the majority of fibers survived> 100 tetani with a beam exposure of 400 ms per tetanuswithout deterioration in equatorial intensity ratio or offorce (4% or less), and therefore beam damage is not thelimiting factor in this type of experiment.The sarcomere length dependence of the ratio of I10 to
ill was examined in the relaxed and activated state (Fig.3). At a sarcomere length of 2.15 pum we obtain a meanratio (IloII,,) in the relaxed state of 2.218 + 0.359(n = 15). Upon activation, this changed to 0.509 + 0.069(n = 13). These values are in good agreement with thosereported by Matsubara and Yagi (1978) which wereobtained in whole muscle (2.3 in relaxed muscle, 0.53 atthe tetanus plateau, sarcomere length 2.2 p,m), butsomewhat different from those of Haselgrove and Hux-ley (1973), who obtained ratios of 2.6 and 0.78 for therelaxed and activated states, respectively. Above 2.2 p,msarcomere length, this ratio shows a roughly lineardependence on sarcomere length, in agreement with the
4.0
3.0
- 2.5
0
H' 2.0
1.5
1.0
0.5
C C
U U
*
2.0 2.1 2.2 2.3 2.4 2.5Sarcomere length
2.6
FIGURE 2 Equatorial pattern at rest (a) and during the tetanusplateau (b). Both patterns from the same fiber. Total exposure timeper pattern 3 s. The outer and inner reflections surrounding the 11reflection in the relaxed state are the 20 and Z reflections, respectively.The pair of small outer reflections are the 21 and 30. All of thesesmaller reflections are less evident in the activated pattern.
FIGURE 3 The sarcomere length dependence of the I ratioduring the tetanus plateau (-) and at rest (0). Since the relationshipseems quasi linear over this range of sarcomere lengths, a linearregression line has been drawn through the points for both sets ofconditions.
126BIp--- JunlVoue5 Jn191 276 Biophysical Journal Volume 59 June 1991
findings for whole muscle (Elliott et al., 1963; Huxleyand Haselgrove, 1973). The ratio in activated fibers as afunction of sarcomere length is a roughly constantfraction of the relaxed ratio over the range of sarcomerelengths studied.
2. Intensity changes during activationInitially these experiments were performed withoutservo-control of sarcomere length (fixed end tetani), andtetanic tension development was accompanied by asarcomere shortening of the order of 2-3%. Subse-quently the development of the servosystem for use atthe beamline permitted reduction of sarcomere lengthchanges during the tetanus rise to <0.3%, and suchresidual shortening as occurred was completed beforeforce reached 0.1 P0. Table 1 shows the relative halftimesfor changes in stiffness, equatorial intensities and ten-sion for unclamped ("fixed end") and length clamped(isometric) tetani. Because the servo system was unableto follow accurately the small amplitude, high frequencyvibrations required for stiffness measurement, thesewere performed without sarcomere length control. How-ever, previous experiments have shown that under iden-tical conditions of fiber preparation, the ratio of stiffnessto tension under clamped conditions did not significantlydiffer from unclamped conditions (Cecchi et al., 1987).In whole muscle, Kress et al. (1986) reported a t,, for theincrease in I,, of 27 ms during the tetanus rise. Thecorresponding t112 for force in their experiments was 38ms. This is somewhat faster than the halftime for forcethat we obtained (Table 1). However, it seems that therise of tension in fibers used for study of the time courseof equatorial intensity changes by Kress et al. (1986) wasanomalously fast compared with the other fibers used intheir study, whose time course for the rise of tetanictension accords much more closely with the values wereport here. Taking into account the difference in
TABLE 1 Halftimes of the change in various parametersduring the rise of tetnic tension measured under Isometricor fixed-end conditions
t1r2
Mode of 10 11contraction Tension Stiffness Intensity Intensity
msFixed-end
(n = 5) 49.4 ± 11.4 36.3 ± 8.8 33.2 ± 16.6 27.6 ± 12.1Isometric
(n = 8) 45.4 ± 16.1 31.2 ± 15.4* 27.0 ± 10.7 23.4 ± 11.5
All values measured from the time of the first stimulus. Meanhalftimes are given ± SD.*Measured under fixed-end conditions.
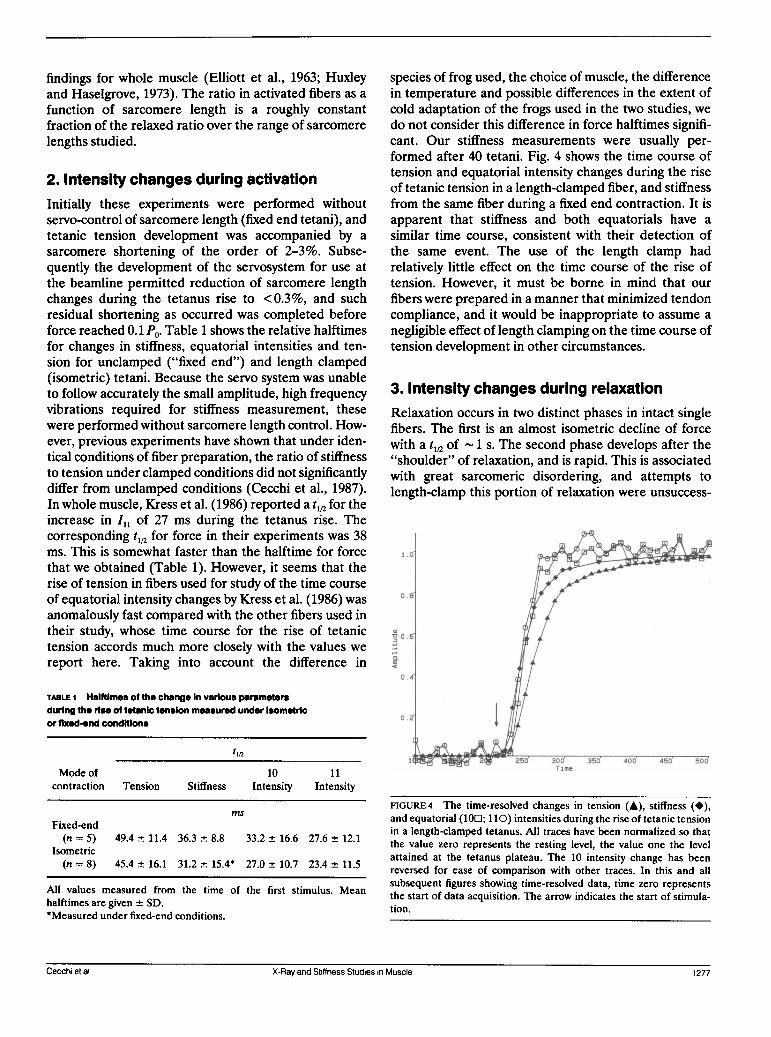
species of frog used, the choice of muscle, the differencein temperature and possible differences in the extent ofcold adaptation of the frogs used in the two studies, wedo not consider this difference in force halftimes signifi-cant. Our stiffness measurements were usually per-formed after 40 tetani. Fig. 4 shows the time course oftension and equatorial intensity changes during the riseof tetanic tension in a length-clamped fiber, and stiffnessfrom the same fiber during a fixed end contraction. It isapparent that stiffness and both equatorials have a
similar time course, consistent with their detection ofthe same event. The use of the length clamp hadrelatively little effect on the time course of the rise oftension. However, it must be borne in mind that our
fibers were prepared in a manner that minimized tendoncompliance, and it would be inappropriate to assume a
negligible effect of length clamping on the time course oftension development in other circumstances.
3. Intensity changes during relaxationRelaxation occurs in two distinct phases in intact singlefibers. The first is an almost isometric decline of forcewith a t1,2 of 1 s. The second phase develops after the"shoulder" of relaxation, and is rapid. This is associatedwith great sarcomeric disordering, and attempts tolength-clamp this portion of relaxation were unsuccess-
Time
FIGURE 4 The time-resolved changes in tension (A), stiffness (*),and equatorial (100; 110) intensities during the rise of tetanic tensionin a length-clamped tetanus. All traces have been normalized so thatthe value zero represents the resting level, the value one the levelattained at the tetanus plateau. The 10 intensity change has beenreversed for ease of comparison with other traces. In this and allsubsequent figures showing time-resolved data, time zero representsthe start of data acquisition. The arrow indicates the start of stimula-tion.
Cecie l -a n tffesSuisi uce17Cecchi et al. X-Ray and Stiffness Studies in Muscle 1 277
ful. As a result, the relaxation of the fiber was studied inthe absence of a length clamp, since sarcomere lengthduring the slow isometric phase remained constant even
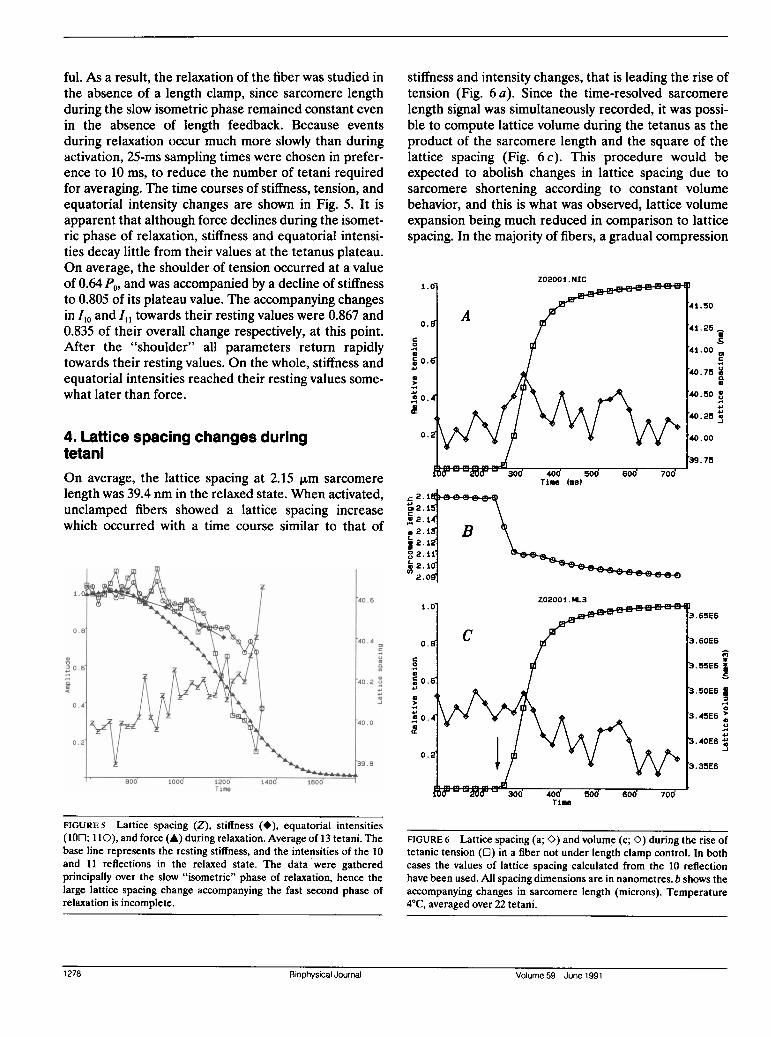
in the absence of length feedback. Because eventsduring relaxation occur much more slowly than duringactivation, 25-ms sampling times were chosen in prefer-ence to 10 ms, to reduce the number of tetani requiredfor averaging. The time courses of stiffness, tension, andequatorial intensity changes are shown in Fig. 5. It isapparent that although force declines during the isomet-ric phase of relaxation, stiffness and equatorial intensi-ties decay little from their values at the tetanus plateau.On average, the shoulder of tension occurred at a valueof 0.64 P0, and was accompanied by a decline of stiffnessto 0.805 of its plateau value. The accompanying changesin Iio and I,, towards their resting values were 0.867 and0.835 of their overall change respectively, at this point.After the "shoulder" all parameters return rapidlytowards their resting values. On the whole, stiffness andequatorial intensities reached their resting values some-what later than force.
4. Lattice spacing changes duringtetaniOn average, the lattice spacing at 2.15 ,um sarcomerelength was 39.4 nm in the relaxed state. When activated,unclamped fibers showed a lattice spacing increasewhich occurred with a time course similar to that of
x,06,,,4'40.4
Li ~~~~~~~~~~~~~~~~~~0.2o
Time
stiffness and intensity changes, that is leading the rise oftension (Fig. 6 a). Since the time-resolved sarcomere
length signal was simultaneously recorded, it was possi-ble to compute lattice volume during the tetanus as theproduct of the sarcomere length and the square of thelattice spacing (Fig. 6 c). This procedure would beexpected to abolish changes in lattice spacing due tosarcomere shortening according to constant volumebehavior, and this is what was observed, lattice volumeexpansion being much reduced in comparison to latticespacing. In the majority of fibers, a gradual compression
Z0200 1.NIC1.0o
1.25
0~~~~~~~~~~~~~~~~~~~1 0.0/40.
,sl 39~~~~~~~~~~~4.75
f :om B 2900 400 '
Time (me)
D 2.15 \,~~~~~~~3C 2'd 5d Bo 70d
°2. ft ( e
t2. i
2C C
0 2.11f
1020
cn2.0OS
FIGURE 5 Lattice spacing (Z), stiffness (*), equatorial intensities(100; 110), and force (A) during relaxation. Average of 13 tetani. Thebase line represents the resting stiffness, and the intensities of the 10and 11 reflections in the relaxed state. The data were gatheredprincipally over the slow "isometric" phase of relaxation, hence thelarge lattice spacing change accompanying the fast second phase ofrelaxation is incomplete.
FIGURE 6 Lattice spacing (a; O) and volume (c; O) during the rise oftetanic tension (El) in a fiber not under length clamp control. In bothcases the values of lattice spacing calculated from the 10 reflectionhave been used. All spacing dimensions are in nanometres. b shows theaccompanying changes in sarcomere length (microns). Temperature4°C, averaged over 22 tetani.
1278 Biophysical Journal Volume 59 June19911278 Biophysical Journal Volume 59 June 1991
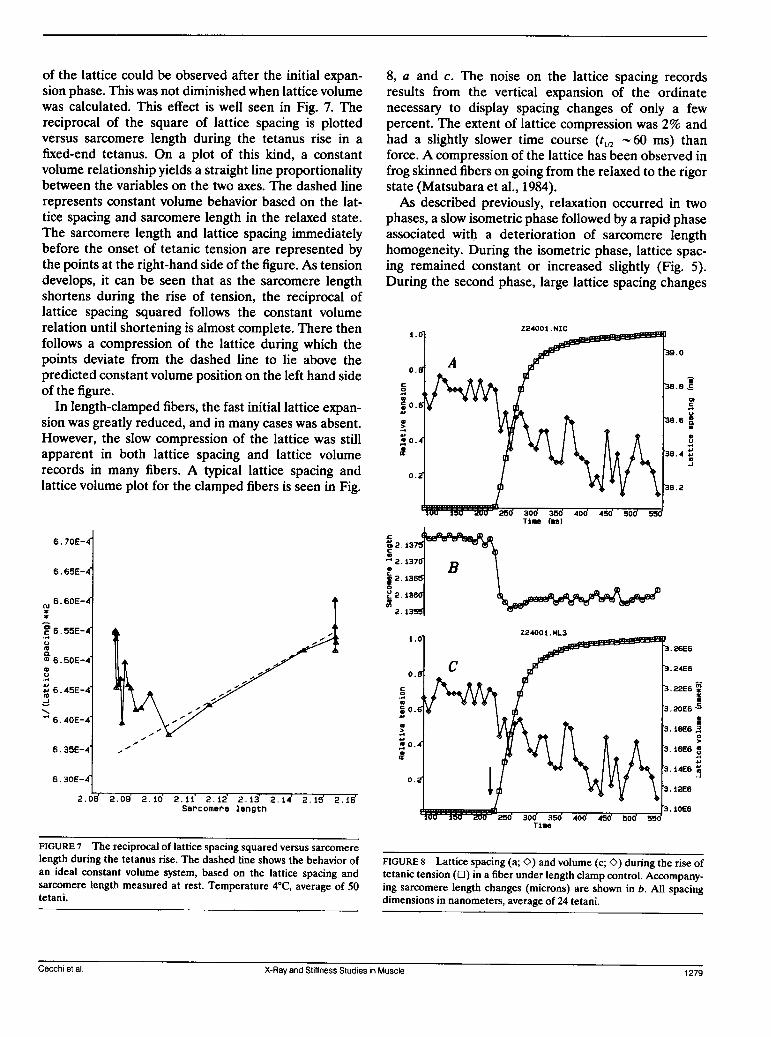
of the lattice could be observed after the initial expan-sion phase. This was not diminished when lattice volumewas calculated. This effect is well seen in Fig. 7. Thereciprocal of the square of lattice spacing is plottedversus sarcomere length during the tetanus rise in afixed-end tetanus. On a plot of this kind, a constantvolume relationship yields a straight line proportionalitybetween the variables on the two axes. The dashed linerepresents constant volume behavior based on the lat-tice spacing and sarcomere length in the relaxed state.The sarcomere length and lattice spacing immediatelybefore the onset of tetanic tension are represented bythe points at the right-hand side of the figure. As tensiondevelops, it can be seen that as the sarcomere lengthshortens during the rise of tension, the reciprocal oflattice spacing squared follows the constant volumerelation until shortening is almost complete. There thenfollows a compression of the lattice during which thepoints deviate from the dashed line to lie above thepredicted constant volume position on the left hand sideof the figure.
In length-clamped fibers, the fast initial lattice expan-sion was greatly reduced, and in many cases was absent.However, the slow compression of the lattice was stillapparent in both lattice spacing and lattice volumerecords in many fibers. A typical lattice spacing andlattice volume plot for the clamped fibers is seen in Fig.
8, a and c. The noise on the lattice spacing recordsresults from the vertical expansion of the ordinatenecessary to display spacing changes of only a fewpercent. The extent of lattice compression was 2% andhad a slightly slower time course (t1,2 60 ms) thanforce. A compression of the lattice has been observed infrog skinned fibers on going from the relaxed to the rigorstate (Matsubara et al., 1984).As described previously, relaxation occurred in two
phases, a slow isometric phase followed by a rapid phaseassociated with a deterioration of sarcomere lengthhomogeneity. During the isometric phase, lattice spac-ing remained constant or increased slightly (Fig. 5).During the second phase, large lattice spacing changes
1.0
O.Eac
0
.4)
e- 0.1r01
Z24001 .NIC
c1-i1
.C
S
.4 4
4J
2.09 2.10 2.11 2.12 2.13- 2.14 2.15 2.16Sarcomere length
3. 26E6
3. 24E6
3. 22E6 ,,1K
3.20E6I
3. lIE6 m
3. 16E641
3. 14E6 a-J
3. 12E6
3. lOE6
Time
FIGURE 8 Lattice spacing (a; O) and volume (c; K) during the rise oftetanic tension (E) in a fiber under length clamp control. Accompany-ing sarcomere length changes (microns) are shown in b. All spacingdimensions in nanometers, average of 24 tetani.
- -a i. St.f .S
6. 70E-4
6. 65E-4
N 6.60E-4
la
c 6. 55E-4...
uCL
6. 50E-4
.,.-W
4 6. 45E-4-J
" 6.40E-4
6. 35E-4
6. 30E-4
2.0E
FIGURE 7 The reciprocal of lattice spacing squared versus sarcomerelength during the tetanus rise. The dashed line shows the behavior ofan ideal constant volume system, based on the lattice spacing andsarcomere length measured at rest. Temperature 4°C, average of 50tetani.
.1 - --l .-I .. -l -1 '. -- r3
CGecchi et al. X-Ray and Stiffness Studies in Muscle 1 279
occurred, which could either be an expansion or compres-sion of the lattice.
DISCUSSION
Single muscle fibers offer a mechanically superior systemfor the study of muscle contraction. They permit moreprecise description of sarcomere and fiber lengths, andare suitable for length-clamping. They may also bedissected so as to minimize the effects of series compli-ance and optimize fiber orientation. Previous mechani-cal studies of the single fiber preparation have concen-trated on the tibialis anterior muscle ofRana temporaria,so to relate the data presented here to previous findingsas closely as possible, we have chosen to use thispreparation for these x-ray diffraction studies. Many ofthe advantages of the single fiber for mechanical studiesare also valid when applied to x-ray diffraction work. Inparticular, the single fiber preparation avoids the prob-lems associated with the effects of a population of fiberspresent in whole muscle, wherein homogeneous kineticsof both mechanical and structural events can occur, aswell as in terms of sarcomere length and activation. Inaddition, the viability of the preparation is evident andcapable of being accessed throughout the experiment.Visual inspection of the fiber at the end of the experi-ments reported here showed no sign of beam damage,and the laser diffraction pattern from the fiber did notalter during the course of an experiment. We concludethat electrical or mechanical failure of the fiber preceedsfailure due to beam damage. In whole muscle work,beam damage is indicated by a gradual decline in tetanictension, whereas the single fiber preparation showed nomore than a few percent change in tetanic tensionduring the course of an experiment. Thus the provenviability of the single fiber preparation during x-raydiffraction studies (as opposed to whole muscle) showsits suitability for further studies of structural eventsaccompanying contraction. We have found that al-though the x-ray diffraction pattern from the single fiberis weaker than that from whole muscle because of thesmaller mass available to scatter the beam, the definitionof individual reflections is better than that obtainedeither from whole muscle or from skinned fibers, and itssurvivability in the beam is excellent.The relaxed pattern from a single fiber shows features
which are not clearly observed in the whole musclepreparation. In particular, the Z-line reflection and the20 reflection are well defined on either side of the 11peak. This suggests a high degree of ordering within thestructure of the fiber. During activation, these reflec-tions become masked by the broadening of the 11
reflection. The 10:11 intensity ratio obtained in thisstudy is quite similar to that reported by Matsubara andYagi (1978). The slightly smaller value of the ratio at thetetanus plateau in our experiments (0.50) may be due toa more complete stimulation of our preparation than ispossible with whole muscle, where some fibers may notbe stimulated and therefore tend to cause the ratio to besomewhat higher than expected. Haselgrove and Huxley(1973) were aware of this problem, and corrected theirdata accordingly, but still obtained a higher ratio (0.78)than that reported here for the tetanus plateau. Simi-larly, the sarcomere length of the activated whole musclepreparation cannot be so precisely defined as in thesingle fiber preparation.Some of our experiments have been performed under
length-clamped conditions in contrast to all earlierstudies of time-resolved x-ray diffraction changes duringcontraction, where sarcomere length changes were notmonitored and certainly not controlled during activa-tion. Why is it necessary to clamp sarcomere lengthduring such time-resolved studies as these? Changes insarcomere length during the tetanus rise are known toreduce the rate of tension development, produce changesin lattice spacing, and may introduce an isotonic equato-rial intensity distribution into the equatorial patternobserved during the tetanus rise. In addition, the equato-rial intensity has a static dependence on sarcomere
length, as shown in Fig. 3. In healthy fibers, at sarcomerelengths on the plateau of the length-tension relation-ship, and with suitable precautions to reduce tendoncompliance, sarcomere length changes during the teta-nus rise may be reduced to 2-3%. However, length-clamping permits this change of sarcomere length dur-ing activation to be reduced by 90%, and hence theinfluence of sarcomere length changes to be minimized,and the conditions of measurement more preciselydefined. The effectiveness of the length clamp can bejudged in the reduction of lattice expansion during thetetanus rise that is observed under length clamp control(see Figs. 6 and 8).Under length clamp, the time course of intensity
changes during the tetanus rise is similar for 10 and 11reflections. Initial experiments suggested a lead of 10over 11 in some fibers, but subsequently it was foundthat under length-clamped conditions no such phenome-non could be identified within the resolution of our
measurements (10 ms). As described earlier, Kress et al.(1986) obtained a mean difference in halftimes betweenIl increase and tension of 11 ms during the tetanus risein whole muscle, whereas mechanical measurements byCecchi et al. (1982) showed a 15-ms lead of stiffness overtension, also during the tetanus rise, but in the singlefiber preparation. We report here a somewhat larger
128 B.pya Jora Voum 59 June1991280 Biophysical Journal Volume 59 June 1991
difference in halftimes for the equatorial changes andforce, 20 ms in length-clamped fibers. Inspection of Fig.5 of Matsubara and Yagi (1978) shows a similar lead ofintensity changes over tension. On average we foundintensity changes lead stiffness, but given the timeresolution of our present measurements and the factthat stiffness measurements were performed underfixed-end conditions, we believe the time course of theintensity changes and stiffness rise can be regarded as
effectively identical. The onset of tension developmentand of the changes in stiffness and equatorial intensitiesseemed comparable, within the limits of our samplingrate (10 ms). It would therefore be reasonable to assumethat they represent the same event, i.e., cross-bridge(Si) attachment. Furthermore, if the reflection intensi-ties are proportional to the number of attached bridges,then the parallel time course of stiffness and tensionsuggests that the stiffness of the attached, low-forcecross-bridge is the same as that of the attached bridgesat the tetanus plateau, and supports the view, at least inthe intact fiber, that stiffness is proportional to thenumber of attached cross-bridges. It has been proposedthat the lead of stiffness over tension results from a
stronger binding of "weakly bound" cross-bridge states(Brenner, 1990). However Schoenberg (1988) has re-ported that in relaxed skinned fibers at physiologicalionic strength, the proportion of attached weakly boundbridges is unlikely to be >5% in frog. More recently,Schoenberg (1991. Biophys. J. 59:51a) suggests that2-kHz stiffness measurements should detect 88% of thestiffness due to weakly bound bridges in the relaxedstate. We calculate that at 4 kHz (the frequency of ourlength sinusoid) the fraction detected should be 92%,and therefore a slowing of rate constants governing theequilibrium between bound and unbound states at aconstant affinity would not result in a marked increase instiffness. Hence, to account for our lead of stiffness overtension, a substantial increase in affinity of the bindingof weak states in the presence of calcium ions would berequired. Some groups have measured such an increase(Wagner and Stone, 1983), whereas others report amore modest effect (Chalovich and Eisenberg, 1986).El-Saleh and Potter (1985), working at physiologicalionic strength, found essentially no increase in bindingaffinity of the weakly bound states to actin in thepresence of calcium ions. Furthermore, since the changein the equatorial reflections on the formation of weakbridges in frog muscle occurs primarily in the 11 reflec-tion at low ionic strength (Xu et al., 1986) while our datashows a parallel change in 11 and 10 reflections, webelieve that the lead of stiffness during the tetanus risearises principally from the formation of a low force,strongly bound cross-bridge state. Several more detailed
explanations of the existence of low-force bridges havebeen offered in the past (Ford et al., 1986; Bagni et al.,1988) which cannot be distinguished in terms of the datapresented here.
Relaxation occurs in two phases, a slow isometricphase followed by a rapid phase of sarcomeric disorder.The slow phase occurs with little decline in stiffness orreversal of equatorial intensities. Such change as doesoccur has a time course much slower than force. Theevent that limits the rate of relaxation under isometricconditions is now known. The dissociation rate constantof calcium from troponin is relatively fast (200 s-'), atleast from the low-affinity calcium-binding sites, whichare thought to be responsible for regulation. In contrast,the decline of tension occurs with a rate constant morelike 1 s-'. The decline of the aequorin light transient atthe end of a tetanus occurs very quickly, but there issome evidence of a tailing of this response, suggestingthat the true levels of free calcium may be approachedrather more slowly (Cannell, 1986). The presence ofparvalbumins in frog muscle in appreciable amounts (1mM) has been proposed to influence the rate of relax-ation, though this action is controversial and may berather complex (Gillis, 1982; Griffiths et al., 1990).Alternatively, the relaxation rate constant is not dissimi-lar to the cross-bridge cycling rate, and may thereforeindicate that inhibition of actin-myosin interaction of anindividual bridge can only occur after that bridge hasreturned to the start of its cycle. However, both the x-raydata and the stiffness measurements indicate an ele-vated level of cross-bridge attachment compared withforce during isometric relaxation, which implies thatonce again there is a shift in the population of attachedcross-bridges towards a low force but strongly bindingcross-bridge state.
Lattice spacing changes in the unclamped fiber agreereasonably well with sarcomere length changes to yieldconstant volume behavior during the development oftetanic tension. The lead of lattice expansion overtension during the tetanus rise in unclamped fiberswould be expected if some exponential series compli-ance were present in the system since the bulk of theextension of the exponential compliance would occurover a low force range, and hence in the earlier part ofthe tetanus rise. That the lattice expansion is muchreduced when expressed as lattice volume supports thisview. Under length-clamped conditions, such an expan-
sion was generally absent. A compression of the latticewas frequently observed of much slower time course
than the expansion, and was not reduced when ex-pressed in terms of lattice volume. The compressionamounted to 2% of the resting lattice spacing andoccurred with a t,/ of - 60 ms. If the distance between
r,ecnI; e+ a1 X-H and S Studies iL;eccni et al. X-Ray and Stiffness Studies in Muscle 1281
the core of the myosin and adjacent actin filaments is3-1/2 times the myosin spacing, and if this is 39 nm, then a2% compression represents a 0.5-nm approach of actinand myosin filaments. The lattice compression, observedunder length-clamp control, represents the first directobservation of the lattice compression expected from aradial compression component of cross-bridge force,predicted by certain models of attached cross-bridgestructure (Schoenberg, 1980a, b). In skinned fibers, acompression of the filament lattice has been reportedduring the development of active tension (Brenner andYu, 1983, 1985). However, a similar degree of latticecompression was observed in skinned fibers on enteringthe rigor state (Matsubara et al., 1984) where cross-bridge attachment would be close to 100% but longitudi-nal tension would be small. A more detailed descriptionof this lattice compression will be presented in a subse-quent publication dealing with the response of the fiberto rapid length changes.
The authors are indebted to the staff of the EMBL outstation for theirassistance in this project.
Supported by EMBO, NIH, and MRC.
REFERENCES
Adrian, R. H. 1956. The effect of internal and external potassiumconcentration on the membrane potential of frog muscle. J. Physiol.(Lond.). 133:631-658.
Bagni, M. A., G. Cecchi, and M. Schoenberg. 1988. A model of forceproduction that explains the lag between cross-bridge attachmentand force after electrical stimulation of striated muscle fibers.Biophys. J. 54:1105-1114.
Brenner, B. 1990. Muscle mechanics and biochemical kinetics. Top.Mol. Struct. Bio. 13:77-150.
Brenner, B., and L. C. Yu. 1983. Equatorial x-ray diffraction fromsingle skinned rabbits psoas fibers during various degrees of activa-tion. Biophys. J. 41:257a. (Abstr.)
Brenner, B., and L. C. Yu. 1985. Evidence for a radial cross-bridgecompliance with equilibrium position at 380 A. Biophys. J. 47:382a.(Abstr.)
Cannell, M. B. 1986. Effect of tetanus duration on the free calciumduring relaxation of frog skeletal muscle fibers. J. Physiol. (Lond.).376:203-218.
Cecchi, G., F. Colomo, and V. Lombardi. 1976. A loudspeakerservo-system for determination of mechanical characteristics ofisolated muscle fibres. Bol. Soc. ItaL BioL Sper. 52:733-736.
Cecchi, G., P. J. Griffiths, and S. R. Taylor. 1982. Muscular contrac-tion: kinetics of cross-bridge attachment studied by high frequencystiffness measurements. Science (Wash. DC). 217:70-72.
Cecchi, G., P. J. Griffiths, and S. R. Taylor. 1986. Stiffness and force inactivated frog skeletal muscle fibers. Biophys. J. 49:437-451.
Cecchi, G., F. Colomo, V. Lombardi, and G. Piazzesi. 1987. Stiffness offrog muscle fibres during rise of tension and relaxation in fixed-endor length-clamped tetani. PfluegersArch. Eur. J. Physiol. 409:39-46.
Chalovich, J. M., and E. Eisenberg. 1986. The effect of troponin-tropomyosin on the binding of heavy meromyosin to actin in thepresence of ATP. J. Biol. Chem. 261:5088-5093.
Eason, G. 1989. On the impulsive loading of muscle fibres. J. SoundVib. 133:163-171.
Elliott, G. F., J. Lowy, and C. R. Worthington. 1963. An X-ray andlight diffraction study of the filament lattice of striated muscle in theliving state and in rigor. J. Mol. Bio. 6:295-305.
El-Saleh, S. C., and J. D. Potter. 1985. Calcium-insensitive binding ofheavy meromyosin to regulated actin. Interaction under physiologi-cal ionic strength. J. BioL Chem. 259:11014-11021.
Ford, L. E., A. F. Huxley, and R. M. Simmons. 1978. Tensionresponses to sudden length changes in stimulated frog muscle fibresnear slack length. J. Physiol. (Lond.). 269:441-515.
Ford, L. E., A. F. Huxley, and R. M. Simmons. 1986. Tensiontransients during rise of tetanic tension in frog muscle fibres. J.Physiol. 372:595-609.
Gillis, J. M., D. Thomason, J. Lefevre, and R. H. Kretsinger. 1982.Parvalbumins and muscle relaxation: a computer simulation study.
Griffiths, P. J., J. J. Duchateau, Y. Maeda, J. D. Potter, and C. C.Ashley. 1990. Mechanical characteristics of skinned and intactmuscle fibres from the giant barnacle, Balanus nubilus. PfluegersArch. Eur. J. PhysioL 415:554-565.
Hanson, J., and H. E. Huxley. 1955. The structural basis of contractionin striated muscle. Symp. Soc. Exp. Biol. 9:228-269.
Haselgrove, J. C. 1975. X-ray evidence for conformational changes inthe myosin filaments of vertebrate striated muscle. J. Mol. Bio.92:113-143.
Haselgrove, J. C., and H. E. Huxley. 1973. X-ray evidence for radialcross-bridge movement and for the sliding filament model in activelycontracting skeletal muscle. J. Moi. Bio. 77:549-568.
Hendrix, J., H. Fuerst, B. Hartfiel, and D. Dainton. 1982. A wire perwire detector system for high counting rate X-ray experiments. Nucl.Instr. Methods. 201:139-144.
Huxley, A. F. 1957. Muscle structure and theories of contraction. Prog.Biophys. 7:255-318.
Huxley, A. F., and V. Lombardi. 1980. A sensitive force transducerwith resonant frequency 50 kHz. J. Physiol. (Lond.). 305:15-16P.
Huxley, A. F., and R. Niedergerke. 1954. Structural changes in muscleduring contraction: interference microscopy of living muscle fibres.Nature (Lond.). 173:971-973.
Huxley, A. F., and R. M. Simmons. 1971. Proposed mechanism of forcegeneration in striated muscle. Nature (Lond.). 213:533-538.
Huxley, H. E., and J. Hanson. 1954. Changes in the cross-striations ofmuscle during contraction and stretch and their structural interpre-tation. Nature (Lond.). 173:973-976.
Huxley, H. E., and J. C. Haselgrove. 1977. The structural basis ofcontraction in muscle and its study by rapid X-ray diffractionmethods. In Myocardial Failure. G. Riecker, A. Weber, and J.Goodwin, editors. 4-15.
Kress, M., H. E. Huxley, A. R. Faruqi, and J. Hendrix. 1986. Structuralchanges during activation of frog muscle studied by time-resolvedX-ray diffraction. J. MoL Biol. 188:325-342.
Maeda, Y., C. Boulin, A. Gabriel, I. Sumner, and M. H. J. Koch. 1986.Intensity increases of actin layer-lines on activation of the Limulusmuscle. Biophys. J. 50:1035-1042.
Matsubara, I., and N. Yagi. 1978. A time-resolved X-ray diffractionstudy of muscle during twitch. J. Physiol. (Lond.). 278:297-307.
1282 Biophysical Journal Volume 59 June 1991
Matsubara, I., Y. E. Goldman, and R. M. Simmons. 1984. Changes inthe lateral filament spacing of skinned muscle fibers when cross-bridges attach. J. Mol. Bio. 173:15-33.
Schoenberg, M. 1980a. Geometrical factors influencing muscle forcedevelopment. 1. The effect of filament spacing upon axial forces.Biophys. J. 30:51-68.
Schoenberg, M. 1980b. Geometrical factors influencing force develop-ment: 2. Radial forces. Biophys. J. 30:69-78.
Schoenberg, M. 1988. Characterization of the myosin adenosinetriphosphate (M.ATP) cross-bridge in rabbit and frog skeletalmuscle fibres. Biophys. J. 54:135-148.
Schoenberg, M. 1991. Mechanical detection of weakly-binding M-ATPcrossbridges. Biophys. J. 59:51a. (Abstr.)
Wagner, P. D., and D. B. Stone. 1983. Calcium-sensitive binding ofheavy meromyosin to regulated actin requires light chain 2 and thehead-tail junction. Biochemistry. 22:1334-1342.
Xu, S., M. Kress, and H. E. Huxley. 1987. X-ray diffraction studies ofthe structural state of crossbridges in skinned frog sartorius muscleat low ionic strength. J. Muscle Res. Cell Motil. 8:39-54.
Yu, L. C., R. W. Lymn, and R. Podolsky. 1977. Characterization of anonindexible equatorial X-ray reflection from frog sartorius muscle.J. Mol. Biol. 115:455-464.
Cecchi et al. X-Ray and Stiffness Studies in Muscle 1283