recent climate regimes in the equatorial andes
TRANSCRIPT

Recent Climate Regimes in the Equatorial Andes
Gregory Knapp University of Texas at Austin
Paper presented at the 2010 Meeting, Conference of Latin American Geographers
Bogota, Colombia My first academic publication (Knapp 1980) was based on a class on climatology with John Kutzbach at the University of Wisconsin. We were studying climatic “teleconnections” and most of the students were focusing on El Niño connections. I became interested in another global phenomenon, the North Atlantic Oscillation as desribed by Van Loon and Rogers (1978), Sanchez and Kutzbach (1974), and Namias (1963). The North Atlantic Oscillation refers to changing regimes of planetary wind systems between situations of relatively cold north European temperatures and warm temperatures in Greenland (GA, Namias 2, low NAO Index) and the reverse (GB, Namias 1, high NAO Index) (Hurrell 1995). These changes are associated with long standing planetary waves in the atmosphere, and changes in the surface westerlies across the north Atlantic. The NAO does not seem to be closely correlated with ENSO events , and its relationship with Greenhouse gas forcing seems unclear (Hurrell 1995).


Figures 1 and 2. Source for these two pictures: http://www.whoi.edu/page.do?pid=12455&tid=282&cid=10146
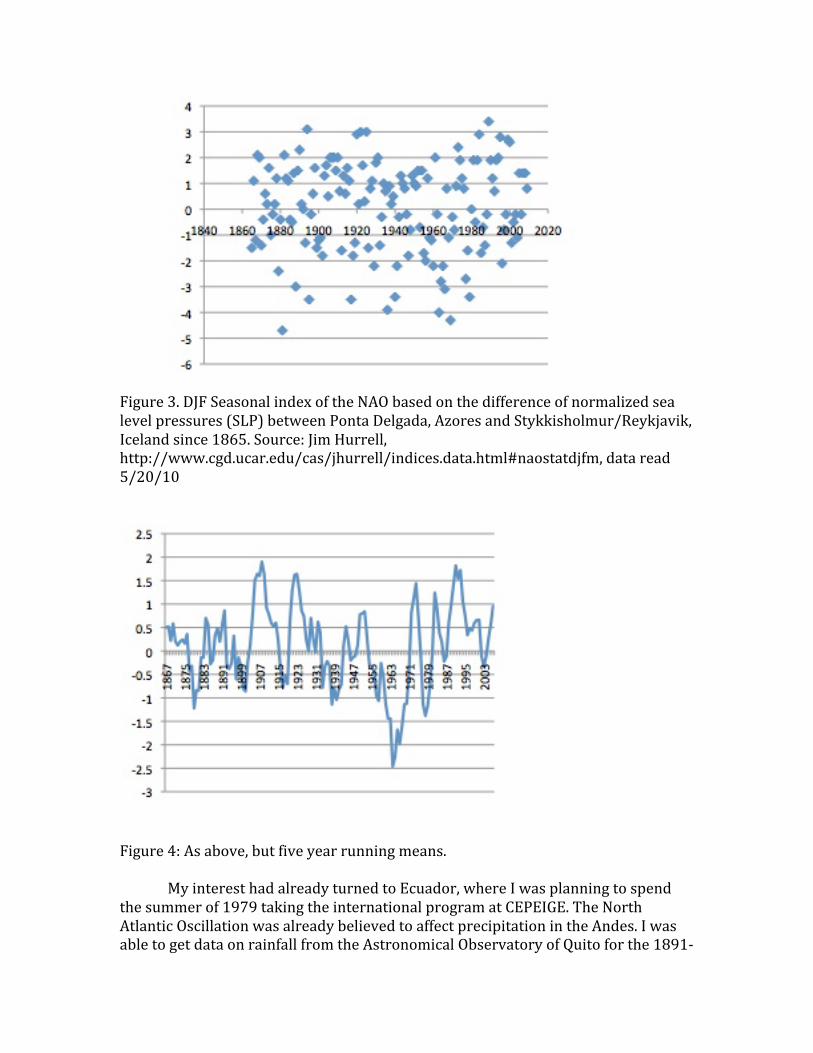
Figure 3. DJF Seasonal index of the NAO based on the difference of normalized sea level pressures (SLP) between Ponta Delgada, Azores and Stykkisholmur/Reykjavik, Iceland since 1865. Source: Jim Hurrell, http://www.cgd.ucar.edu/cas/jhurrell/indices.data.html#naostatdjfm, data read 5/20/10
Figure 4: As above, but five year running means.
My interest had already turned to Ecuador, where I was planning to spend the summer of 1979 taking the international program at CEPEIGE. The North Atlantic Oscillation was already believed to affect precipitation in the Andes. I was able to get data on rainfall from the Astronomical Observatory of Quito for the 1891-‐

1979 period, thanks to help from PRONAREG in Quito (Roberto Cruz Astudillo and Oscar Robelio). This analysis showed that during years with low index winters (DJF), Jan-‐May precipitation was 20 per cent less than years with high index winters (610 mm versus 720 mm)., and that this difference was significant at the 95% confidence level (small sample t test). Furthermore, precipitation was more variable during low NAO index events.
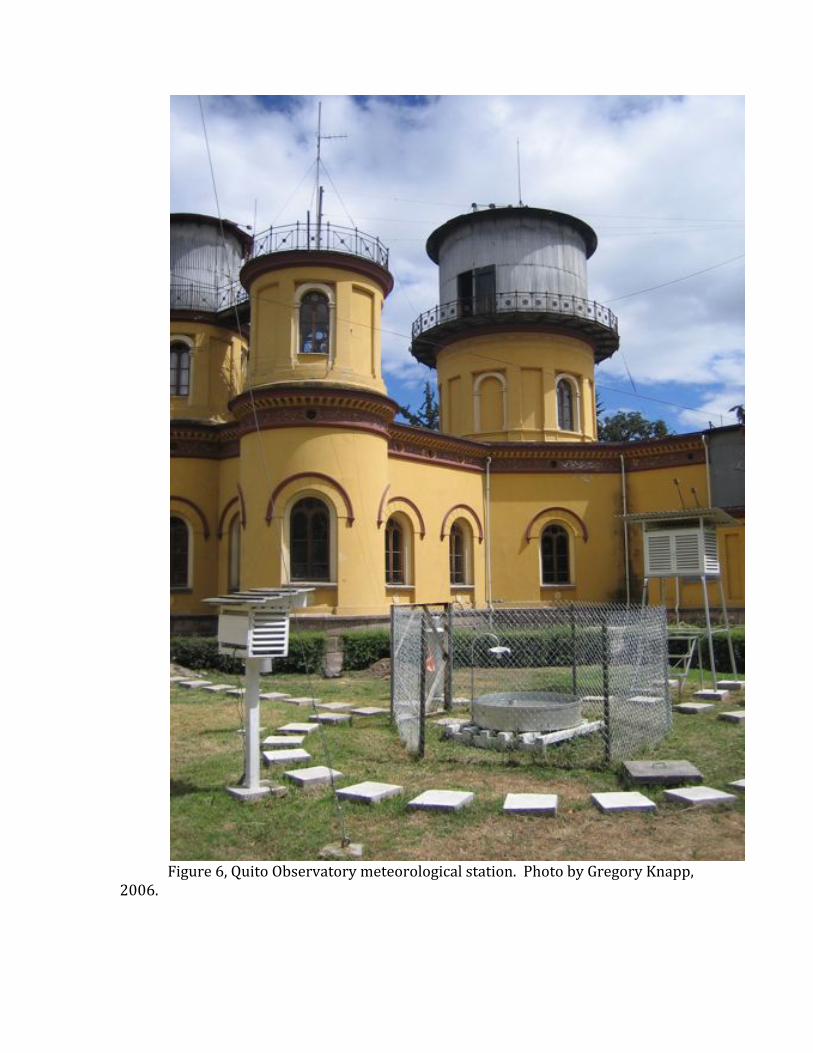
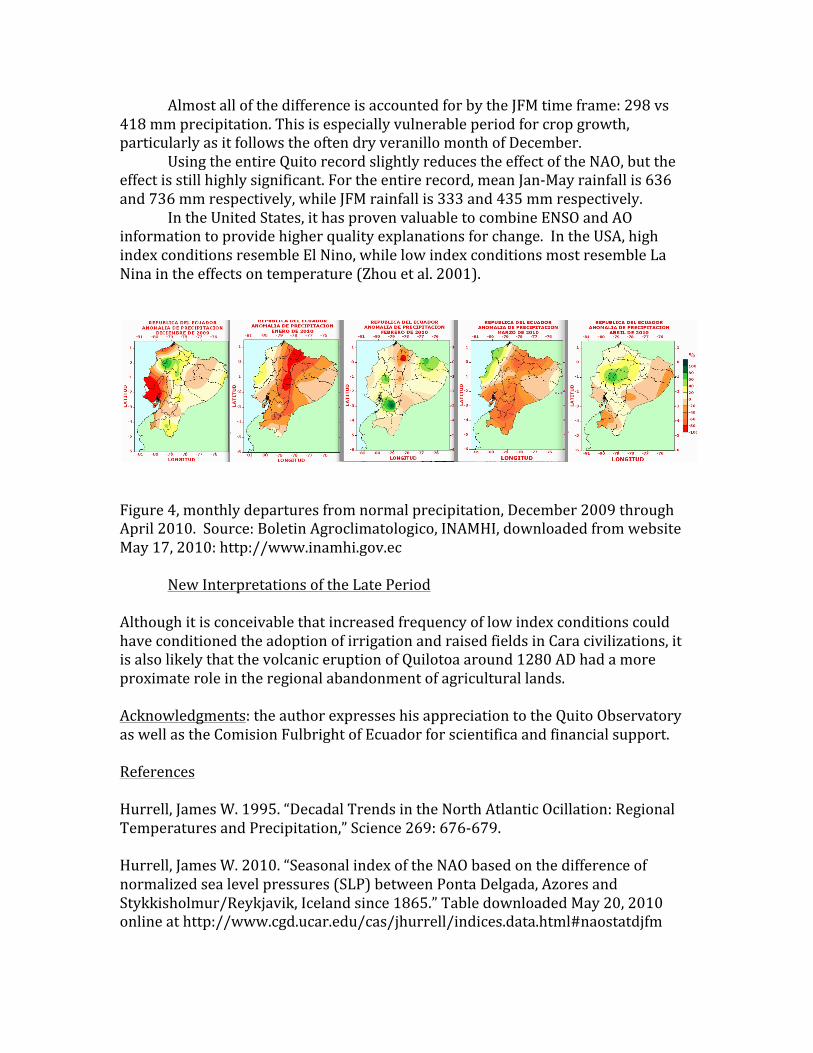
Figure 6, Quito Observatory meteorological station. Photo by Gregory Knapp,
2006.


The 1958-‐1969 period had no fewer than 7 low index winters and no high
index winters, making this a period of very low NAO. The GB pattern appeared

however to be coming back, with the 1975-‐1979 period having 2 low index winters and 2 high index winters.
In writing up these results for publication in Ecuador, I speculated that the little ice age had been marked by more frequent low index conditions in the North Atlantic Oscillation, and that this meant drier and more variable winters in the Ecuadorian highlands, perhaps helping explain the rise of tola-‐building chiefdoms with elaborate raised field and irrigation systems during the Late Period (c. 1250-‐1525 AD).
This little paper has had surprising longevity. It has been cited by French geographers working on Ecuadorian environmental history, and I have received recent requests for it from researchers beginning new projects on the impact of climate change on Ecuadorian agriculture.
For the purpose of this meeting, I wanted to briefly revisit the paper and its arguments, including some more recent data on the North Atlantic Oscillation and precipitation data from Quito Observatory. This is a work in progress, so there are still many gaps; I hope to continue working on this topic.
New Interpretations of the Northern Oscillation
By 1995 (Hurrell 1995) it had become clear that the NAO had shifted to a strongly high index state, with 1983, 1989, and 1990 being particularly high. Much recent research has also focused on the Arctic Oscillation (AO) which, although defined with different data, shows similar trends during the winter-‐spring period to the NAO (Zhou et al. 2001). The NAO and AO time series shows that, since 1995, the index has shown a gradual weakening, with a great drop in the winter of 2010.
New Precipitation Data
The NAO plunged to its lowest values in 60 years in the winter of 2010. During this period Ecuador experienced several months of dry weather (Figure 3), but has bounced back to wet conditions. This has also been a period of Niño conditions, which sometimes brings rain to the Ecuadorian coast, but not apparently this time. I reanalyzed available Quito observatory data from 1950 to 2005, comparing January-‐May rainfall in low index years to high index years. For the purposes of this analysis I used DJF NAO data from Hurrell (2010), based on . The Quito precipitation data included corrected data I obtained previously from PRONAREG, as well as more recent data obtained directly from the Quito Observatory in 2006. The results showed the average rainfall in low NAO Jan-‐May periods (DJF index -‐1 or less) was 587 mm, 18 per cent less than the average of 718 mm in high NAO Jan-‐May periods (index 1 or higher). The value of t is 2.7, suggesting the results are significant at the 99% level of confidence. These values were close to those (610, 720) I had previously obtained for GA and GB winters using a different methodology.
Almost all of the difference is accounted for by the JFM time frame: 298 vs 418 mm precipitation. This is especially vulnerable period for crop growth, particularly as it follows the often dry veranillo month of December. Using the entire Quito record slightly reduces the effect of the NAO, but the effect is still highly significant. For the entire record, mean Jan-‐May rainfall is 636 and 736 mm respectively, while JFM rainfall is 333 and 435 mm respectively.
In the United States, it has proven valuable to combine ENSO and AO information to provide higher quality explanations for change. In the USA, high index conditions resemble El Nino, while low index conditions most resemble La Nina in the effects on temperature (Zhou et al. 2001).
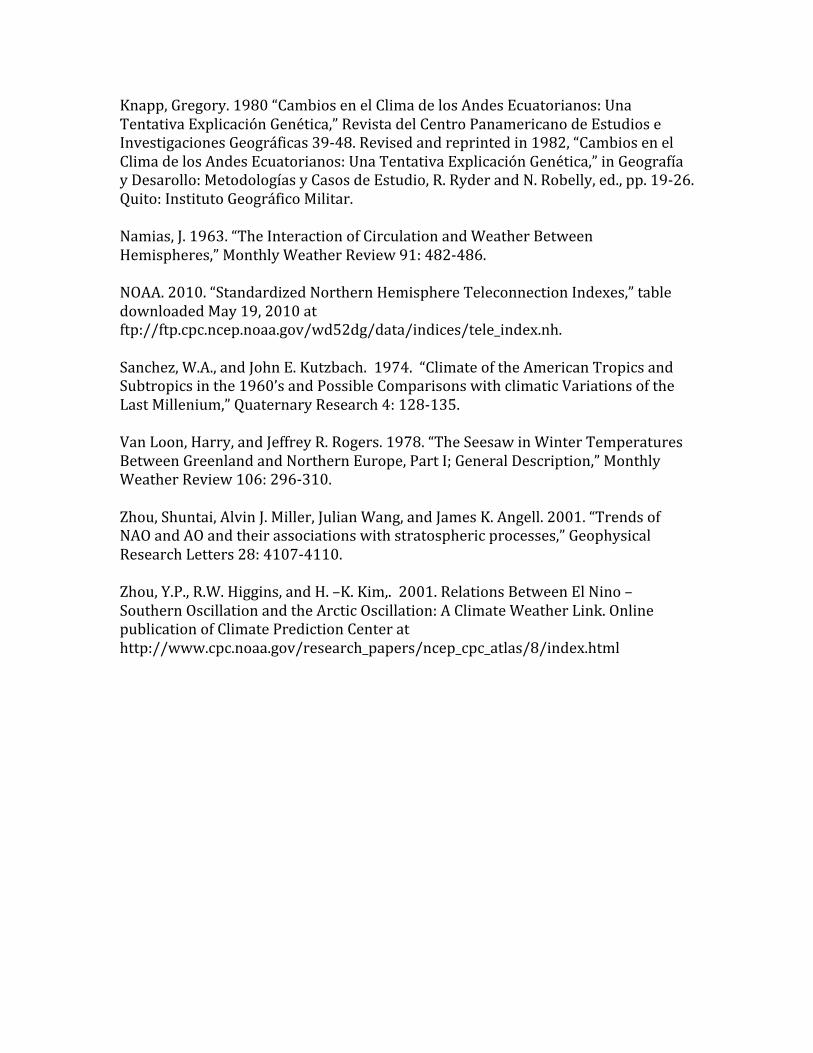
Figure 4, monthly departures from normal precipitation, December 2009 through April 2010. Source: Boletin Agroclimatologico, INAMHI, downloaded from website May 17, 2010: http://www.inamhi.gov.ec
New Interpretations of the Late Period Although it is conceivable that increased frequency of low index conditions could have conditioned the adoption of irrigation and raised fields in Cara civilizations, it is also likely that the volcanic eruption of Quilotoa around 1280 AD had a more proximate role in the regional abandonment of agricultural lands. Acknowledgments: the author expresses his appreciation to the Quito Observatory as well as the Comision Fulbright of Ecuador for scientifica and financial support. References Hurrell, James W. 1995. “Decadal Trends in the North Atlantic Ocillation: Regional Temperatures and Precipitation,” Science 269: 676-‐679. Hurrell, James W. 2010. “Seasonal index of the NAO based on the difference of normalized sea level pressures (SLP) between Ponta Delgada, Azores and Stykkisholmur/Reykjavik, Iceland since 1865.” Table downloaded May 20, 2010 online at http://www.cgd.ucar.edu/cas/jhurrell/indices.data.html#naostatdjfm
Knapp, Gregory. 1980 “Cambios en el Clima de los Andes Ecuatorianos: Una Tentativa Explicación Genética,” Revista del Centro Panamericano de Estudios e Investigaciones Geográficas 39-‐48. Revised and reprinted in 1982, “Cambios en el Clima de los Andes Ecuatorianos: Una Tentativa Explicación Genética,” in Geografía y Desarollo: Metodologías y Casos de Estudio, R. Ryder and N. Robelly, ed., pp. 19-‐26. Quito: Instituto Geográfico Militar. Namias, J. 1963. “The Interaction of Circulation and Weather Between Hemispheres,” Monthly Weather Review 91: 482-‐486. NOAA. 2010. “Standardized Northern Hemisphere Teleconnection Indexes,” table downloaded May 19, 2010 at ftp://ftp.cpc.ncep.noaa.gov/wd52dg/data/indices/tele_index.nh. Sanchez, W.A., and John E. Kutzbach. 1974. “Climate of the American Tropics and Subtropics in the 1960’s and Possible Comparisons with climatic Variations of the Last Millenium,” Quaternary Research 4: 128-‐135. Van Loon, Harry, and Jeffrey R. Rogers. 1978. “The Seesaw in Winter Temperatures Between Greenland and Northern Europe, Part I; General Description,” Monthly Weather Review 106: 296-‐310. Zhou, Shuntai, Alvin J. Miller, Julian Wang, and James K. Angell. 2001. “Trends of NAO and AO and their associations with stratospheric processes,” Geophysical Research Letters 28: 4107-‐4110. Zhou, Y.P., R.W. Higgins, and H. –K. Kim,. 2001. Relations Between El Nino – Southern Oscillation and the Arctic Oscillation: A Climate Weather Link. Online publication of Climate Prediction Center at http://www.cpc.noaa.gov/research_papers/ncep_cpc_atlas/8/index.html