tie channel sedimentation rates, oxbow formation age and
TRANSCRIPT

OSL analysis in oxbow lakes 1161
Copyright © 2005 John Wiley & Sons, Ltd. Earth Surf. Process. Landforms 30, 1161–1179 (2005)
Earth Surface Processes and LandformsEarth Surf. Process. Landforms 30, 1161–1179 (2005)Published online in Wiley InterScience (www.interscience.wiley.com). DOI: 10.1002/esp.1268
Tie channel sedimentation rates, oxbow formationage and channel migration rate from opticallystimulated luminescence (OSL) analysis offloodplain depositsJoel C. Rowland,1* Kenneth Lepper,2,3 William E. Dietrich,1 Cathy J. Wilson3 and R. Sheldon3
1 Department of Earth and Planetary Science, University of California, Berkeley, CA 94720, USA2 Optical Dating and Dosimetry Laboratory, Department of Geosciences, North Dakota State University, Fargo, ND 58105, USA3 Environmental Dynamics Group, Earth and Environmental Science Division, Los Alamos National Laboratory, EES-2, MS J495, Los Alamos,NM 87545, USA
AbstractUsing optically stimulated luminescence (OSL) analysis we obtained depositional ages rang-ing from 25 ±±±±± 10 to 928 ±±±±± 144 years before present for sediments deposited in oxbow lakesalong three lowland river systems. The dated sediments were collected from the banks of tiechannels along the Lower Mississippi River, the Fly River in Papua New Guinea, and BirchCreek along the Yukon River in Alaska. Tie channels connect the oxbow lakes to the mainstem river and allow the exchange of water and suspended sediment between the two. Thebanks consist of fine sand and sandy silt beds interlayered with silt and clay. OSL sampleswere collected both horizontally from exposed banks and vertically by coring through leveecrests; sample collection was targeted at beds containing appreciable quantities of fine sand.OSL ages were determined using single-grain or in some cases single-aliquot techniques anddose distribution analysis. Samples were first collected along the Lower Mississippi tie chan-nel to compare OSL dates with historical data sources and test the applicability of OSL inthese settings; the OSL dates agreed closely with historical data. In all three river systems,OSL dating allowed the determination of vertical accretion rates, tie channel advancementrates, and oxbow lake ages. In Papua New Guinea, OSL sampling also provides an estimateof lateral migration rates of the Fly River and allows a comparison of modern mine-influenced deposition rates with natural background rates over the last 1000 years. Resultsfrom Papua New Guinea and the Mississippi River suggest that the advancement rateof tie channels responds directly to changes in the sediment load of the main stem river.Copyright © 2005 John Wiley & Sons, Ltd.
Keywords: tie channels; optically stimulated luminescence (OSL); single grain laser lumi-nescence (SGLL); batture channels; oxbow lake sedimentation
*Correspondence to:J. C. Rowland, Department ofEarth and Planetary Science,307 McCone Hall,University of California,Berkeley, CA 94720, USA.E-mail: [email protected]
Received 1 September 2004;Revised 28 February 2005;Accepted 17 March 2005
Introduction
In many lowland river systems narrow channels connect the main stem river to lakes on the floodplain (Figure 1).Depending on the relative water elevations of the river and lakes, flow through these channels may be into or awayfrom the river. Blake and Ollier (1971) first applied the term ‘tie channels’ to these bi-directional channels on the FlyRiver in Papua New Guinea. On the Mississippi River, identical features have long been known as ‘batture’ channels.At present 65 per cent of floodplain lakes along the Middle Fly River receive water and sediment through tie channelsand a similar percentage of lakes along the Lower Mississippi possessed tie channel before levee construction andother river modifications reduced that number to a handful today. Furthermore, a review of maps and aerial photo-graphs reveals the presence of tie channels on rivers across the globe; however, the mention of these channels in thegeological literature is limited to a few isolated studies.

1162 J. C. Rowland et al.
Copyright © 2005 John Wiley & Sons, Ltd. Earth Surf. Process. Landforms 30, 1161–1179 (2005)
Figure 1. The Raccourci Old River tie channel located on the Lower Mississippi River. (A) The tie channel enters the oxbow lakefrom the Mississippi River (top of photo) and has advanced approximately 9 km since lake formation in 1850. Also visible is theupstream limb of the oxbow lake which is filled with sediment but no active tie channel is visible. Photo source: 2002 Landsat TMimage courtesy of www.atlas.lsu.edu. (B) Enlargement of the tie channel region of the lake. OSL sampling locations are labelled(RIOSL1, RIOSL2 and RIOSL4) as is the approximate location of the tie channel terminus c. 1991. The original junction of the tiechannel and the Mississippi River is approximately at the top of the photograph; the river has been migrating toward the lakeduring the last 30 years. Channel advancement rates were calculated by measuring the distance between the marked locations anddividing by the time interval between deposition of sediments at each location. Note the jet of sediment-laden water entering thelake at the time of the photograph. The photo was taken in 1998 and is supplied courtesy of the USGS.
OSL analysis in oxbow lakes 1163
Copyright © 2005 John Wiley & Sons, Ltd. Earth Surf. Process. Landforms 30, 1161–1179 (2005)
Where present, tie channels represent the dominant mechanism for lake infilling. The character and distribution oflake fills in lowland floodplains influence rate and pattern of river migration (Fisk, 1947), have important geotechnicalimplications for engineering on floodplains (Saucier, 1994), and represent a key component of the alluvial stratigraphicrecord (Hooke, 1995). Despite this importance, Saucier (1994) notes a general absence of detailed sedimentologicaldata regarding these deposits and Hooke (1995) observes that direct measurements of the rates and patterns ofsedimentation in these environments are largely lacking.
In addition to the transfer of water and suspended sediment, tie channels transport contaminants into lakes, allowfor the exchange of carbon and provide a critical ecological link between the river and lakes which serve as essentialsites of refuge and breeding for many fish species (Pringle et al., 2000). Finally, geomorphologically, tie channelsrepresent a unique example of a deltaic self-formed channel. Presently, no mechanistic theory exists that explains howsuch a channel arises and propagates from sediment-laden jets entering still water.
To quantify the role of tie channels in the processes discussed above necessitates the ability to answer the questions:How quickly do tie channels form and advance? How long do individual tie channels last? What controls the rate atwhich tie channels develop and introduce sediment into lakes? In this paper we present results from optically stimu-lated luminescence (OSL) sampling focused on determining these rates.
The age, location and nature of tie channel deposits present a challenge for determining depositional ages. Depositsassociated with active tie channels range in age from the present day to potentially several thousand years. Historicaldocumentation (maps and aerial photographs) is often limited in both time and geographical breadth. Dendrochronologyhas proven successful for dating oxbow lakes within a few decades of formation along the Gulf Coast region of thesouthern USA (Shankman, 1991), but may have limited utility in many tie channel settings due to logging after lakeformation, bank failure removing trees along tie channel banks, and limitations of dendrochronology in tropical andarctic climates (Stockton et al., 1985). Few geochronological dating methods are well suited for tie channel deposits.The use of radiocarbon dating becomes complicated by the potential for remobilization and reburial of organics inlowland fluvial settings (Olley et al., 2004; Stanley and Hait, 2000) and the limited distribution of in-situ organicmatter whose age definitively coincides with the deposition age of sediments. While an increasingly promisingtechnique for floodplain settings, 210Pb resolves deposition only over the past 100 years (Goodbred and Kuehl, 1998;Walling and He, 1998). Because of these limitations we chose to attempt to obtain depositional ages using OSL.
A review of OSL dating in fluvial studies, including very young deposits (<10 years), can be found in Wallinga(2002). In general, these studies have met with mixed results. Early successful applications of OSL in dating veryyoung deposits (e.g. Murray et al., 1995; Olley et al., 1998) relied upon expert knowledge to interpret ages. Theseanalysis techniques could not be readily extended to other sites. More recent analytical tools such as Lepper’s ‘leadingedge’ (Lepper and McKeever, 2002) and Galbraith’s ‘zero age model’ (Galbraith et al., 1999) claim to provide a moreobjective age analysis, independent of geographic or depositional setting.
An objective of this work was also to test the depositional conditions under which pairing of single-grain datacollection and leading-edge analysis can provide robust results for very young samples. For this research OSLequivalent doses were determined from quartz sand extracts using primarily single grain laser luminescence (SGLL)techniques capable of deriving age data from individual sand grains. In some cases single aliquot regeneration (SAR)techniques, in which age data can be collected from small sub-samples (containing c. 400–1000 sediment grains peraliquot) were also used. These methods allow hundreds of ages to be determined relatively quickly and convenientlyfor each field sample. The resulting distribution of ages guides the selection of a more accurate representative age foreach sample. Various methodological aspects and evaluations of SGLL are available in the literature (Duller, 1994,2000; Duller et al., 2000; Murray and Roberts, 1997; Olley et al., 1999), but until recently few applications of SGLLdating were published, a notable exception being work at Jinmium Rock Shelter, north Australia (Roberts et al., 1998).
Despite their youthfulness (<1000 years), two characteristics of tie channel deposits favour the application of OSL.First, sediment entering tie channels is transported in suspension both in the main stem and tie channel, favouringbleaching and resetting of quartz grain luminescence. Second, tie channel levees tend to contain coarser sediments (siltand fine sand) than the surrounding lake deposits, the presence of sand favouring the use of single grain analysis(Wallinga, 2002).
In 2002 and 2003 we collected OSL samples from the levees of four separate tie channels on three river systems:the Lower Mississippi River, the Middle Fly River in Papua New Guinea, and Birch Creek, a small tributary to theYukon River in Alaska. To test the application of OSL in these fluvial settings our initial sampling focused on one ofthe few remaining functioning tie channels along the Lower Mississippi River for which historical documentationexists, to provide independent age control.
The Mississippi sampling proved successful with OSL dates within error of historical estimates for sedimentsranging in age from 25 ± 10 to 143 ± 12 years before present (BP) (age ± standard error (se)). We then collected andanalysed OSL samples from tie channels of unknown age in both Alaska and Papua New Guinea. The results of the

1164 J. C. Rowland et al.
Copyright © 2005 John Wiley & Sons, Ltd. Earth Surf. Process. Landforms 30, 1161–1179 (2005)
OSL sampling allowed the determination of vertical accretion rates, tie channel advancement rates, and minimumoxbow lake ages. Furthermore, in Papua New Guinea, OSL sampling yielded a constraint on lateral migration ratesof the Fly River and provided data to compare modern mine-influenced deposition rates with natural backgrounddeposition rates. Results from Papua New Guinea and the Lower Mississippi River suggest that the advancement rateof tie channels responds directly to changes in the sediment load of the main stem river.
Field Settings
Lower Mississippi RiverThe Mississippi River drains over 3·2 million km2 of North America with a mean annual discharge of 18 400 m3 s−1
(Mossa, 1996). In our study reach it is a low gradient (5·2 × 10−5) (Biedenharn et al., 2000) river with a bed dominatedby fine sand and an average suspended sediment concentration of 420 mg l−1 (measured between 1950 and 1991)(Mossa, 1996). Kesel et al. (1992) estimate that a 70 per cent decrease in the Mississippi River suspended load hasoccurred since peak concentrations in the 1850s. Significant decreases began in the 1930s with the introduction of soilconservation measures across the Mississippi River catchment; additional decreases have been documented since the1950s in response to dam construction on major tributaries (Mossa, 1996).
We collected a series of OSL samples along a tie channel located at river mile 297 approximately 65 km upstreamof Baton Rouge, Louisiana (Figure 1). This oxbow lake, the Raccourci Old River, was formed following a man-madecutoff in 1848 (Gagliano and Howard, 1984). Since that time a tie channel has advanced approximately 9 km up thedownstream limb of the lake. Repeated Mississippi River Commission and Army Corps of Engineers hydrographicsurveys dating to 1883 and more recent aerial photographs provide detailed documentation of this lakeward advance.At its widest near the river, the channel is approximately 95 m wide and 12 m deep and progressively decreases in sizetowards the lake at which point it is 36 m wide and 8 m deep.
The Raccourci tie channel levees consist of interlayered massive beds of silty fine sand separated by layers ofsilt with up to 15 per cent clay by volume. Individual beds vary in thickness from a few up to tens of centimetres(Figure 2). We have observed the interlayering of coarse and fine beds in all tie channel settings.
Birch Creek, AlaskaOne tie channel was sampled along a lowland section of Birch Creek, a tributary to the Yukon River, locatedapproximately 10 km northeast of Circle, Alaska (65°53.78′ N, 144°18.07′ W) (Figure 3). The drainage area of this
Figure 2. Photographs showing the characteristic interlayered stratigraphy of tie channel deposits from the Raccourci Old Rivertie channel along the Lower Mississippi River in Louisiana. (A) View of tie channel bank showing nearly horizontal layers ofalternating sand and mud deposits. The total height of the visible bank is approximately 5 m. (B) Close-up view of tie channeldeposits at sampling location RIOSL2-135. Visible are alternating sand-rich beds and mud-dominated beds. The circle in the centreof the photo is the capped end of the sample tube which was driven horizontally into the bank. The tube is 5 cm in diameter.
OSL analysis in oxbow lakes 1165
Copyright © 2005 John Wiley & Sons, Ltd. Earth Surf. Process. Landforms 30, 1161–1179 (2005)
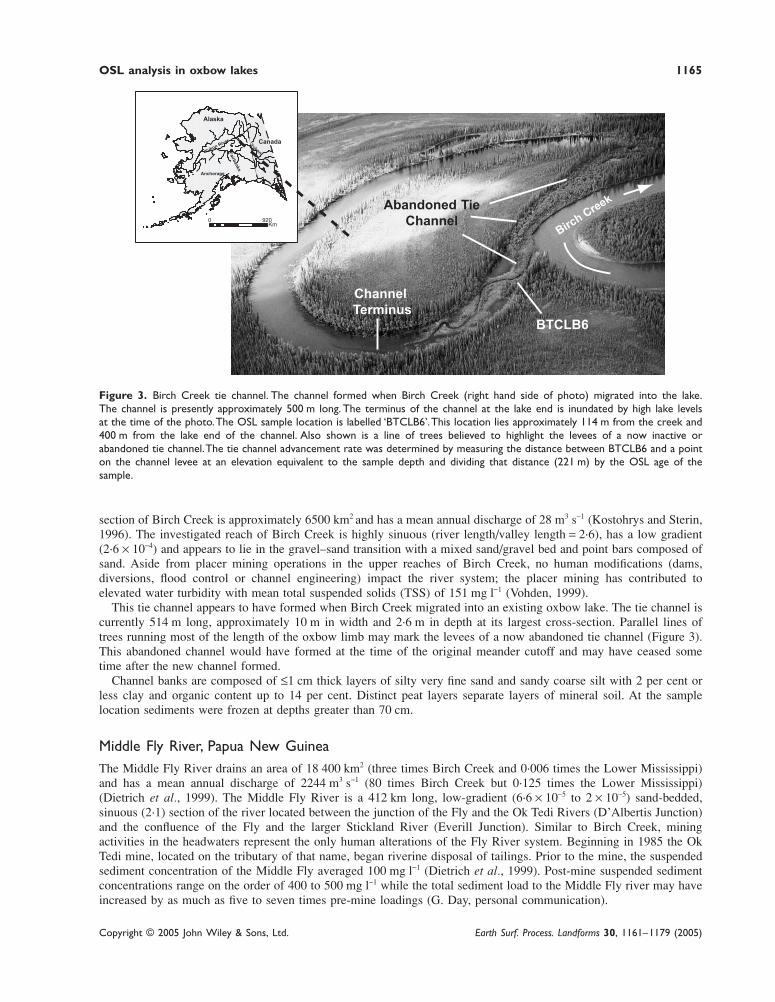
Figure 3. Birch Creek tie channel. The channel formed when Birch Creek (right hand side of photo) migrated into the lake.The channel is presently approximately 500 m long. The terminus of the channel at the lake end is inundated by high lake levelsat the time of the photo. The OSL sample location is labelled ‘BTCLB6’. This location lies approximately 114 m from the creek and400 m from the lake end of the channel. Also shown is a line of trees believed to highlight the levees of a now inactive orabandoned tie channel. The tie channel advancement rate was determined by measuring the distance between BTCLB6 and a pointon the channel levee at an elevation equivalent to the sample depth and dividing that distance (221 m) by the OSL age of thesample.
section of Birch Creek is approximately 6500 km2 and has a mean annual discharge of 28 m3 s−1 (Kostohrys and Sterin,1996). The investigated reach of Birch Creek is highly sinuous (river length/valley length = 2·6), has a low gradient(2·6 × 10−4) and appears to lie in the gravel–sand transition with a mixed sand/gravel bed and point bars composed ofsand. Aside from placer mining operations in the upper reaches of Birch Creek, no human modifications (dams,diversions, flood control or channel engineering) impact the river system; the placer mining has contributed toelevated water turbidity with mean total suspended solids (TSS) of 151 mg l−1 (Vohden, 1999).
This tie channel appears to have formed when Birch Creek migrated into an existing oxbow lake. The tie channel iscurrently 514 m long, approximately 10 m in width and 2·6 m in depth at its largest cross-section. Parallel lines oftrees running most of the length of the oxbow limb may mark the levees of a now abandoned tie channel (Figure 3).This abandoned channel would have formed at the time of the original meander cutoff and may have ceased sometime after the new channel formed.
Channel banks are composed of ≤1 cm thick layers of silty very fine sand and sandy coarse silt with 2 per cent orless clay and organic content up to 14 per cent. Distinct peat layers separate layers of mineral soil. At the samplelocation sediments were frozen at depths greater than 70 cm.
Middle Fly River, Papua New GuineaThe Middle Fly River drains an area of 18 400 km2 (three times Birch Creek and 0·006 times the Lower Mississippi)and has a mean annual discharge of 2244 m3 s−1 (80 times Birch Creek but 0·125 times the Lower Mississippi)(Dietrich et al., 1999). The Middle Fly River is a 412 km long, low-gradient (6·6 × 10−5 to 2 × 10⁻⁵) sand-bedded,sinuous (2·1) section of the river located between the junction of the Fly and the Ok Tedi Rivers (D’Albertis Junction)and the confluence of the Fly and the larger Stickland River (Everill Junction). Similar to Birch Creek, miningactivities in the headwaters represent the only human alterations of the Fly River system. Beginning in 1985 the OkTedi mine, located on the tributary of that name, began riverine disposal of tailings. Prior to the mine, the suspendedsediment concentration of the Middle Fly averaged 100 mg l−1 (Dietrich et al., 1999). Post-mine suspended sedimentconcentrations range on the order of 400 to 500 mg l−1 while the total sediment load to the Middle Fly river may haveincreased by as much as five to seven times pre-mine loadings (G. Day, personal communication).
1166 J. C. Rowland et al.
Copyright © 2005 John Wiley & Sons, Ltd. Earth Surf. Process. Landforms 30, 1161–1179 (2005)
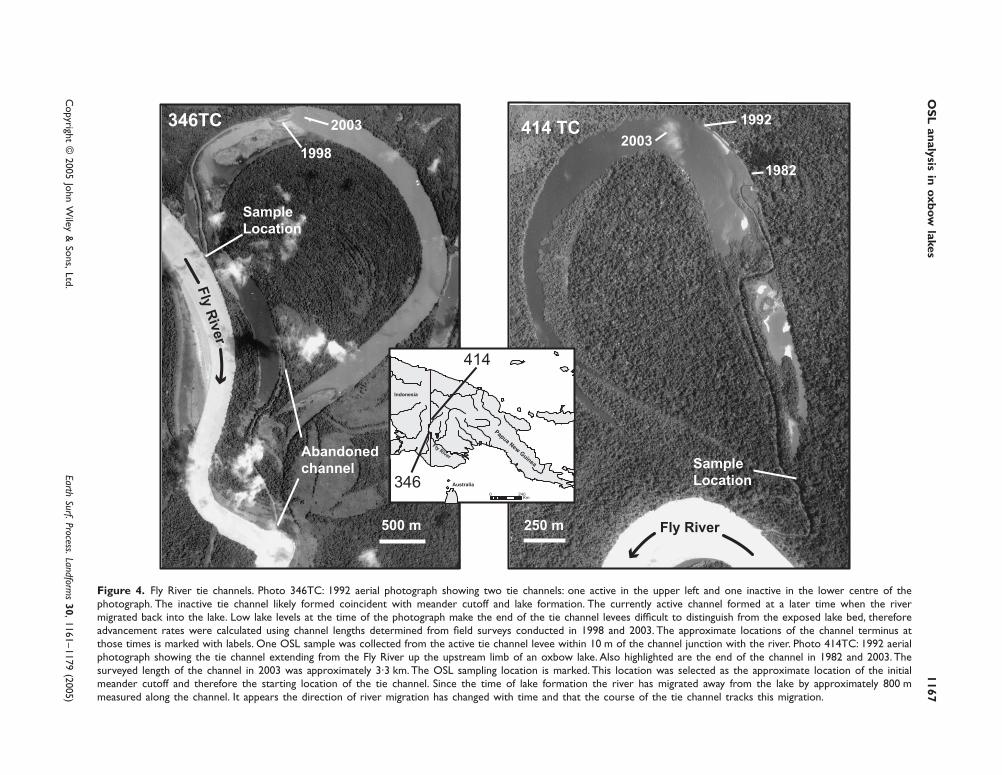
OSL samples were collected from two tie channels along the Middle Fly River located at 22 and 90 river milesdownstream from D’Albertis Junction (Figure 4). One channel, identified as ARM 414 (ARM standing for adoptedriver mileage above the delta), enters the upstream limb of an oxbow lake and appears to have formed coincident withmeander cutoff. In 2003, the channel measured 3·3 km in length and ranged in width from 26 m at the river to 10 m atthe lake end of the channel. The second channel, located at ARM 346, enters the lake where the Fly River hasmigrated back into the lake, a setting similar to Birch Creek. The original, but no longer active, tie channel thatformed at the time of meander cutoff remains clearly visible on aerial photographs. The active channel is 2·5 km longand displays a consistent width of approximately 26 m.
Deposits of both channels consist of 1 to several cm thick beds of silty sand and sandy silt and mud. Clay contentin the mud beds reaches maxima of approximately 20 per cent.
Conceptual Basis of OSL
OSL dating is based on solid-state dosimetric properties of natural mineral grains. The sediment grains themselvesrecord their exposure to ionizing radiation, which can then be ‘read’ in the laboratory and used as a clock. Ionizingradiation, from naturally occurring radioactive isotopes in sediments, creates charge pairs/carriers (e−, h+) in mineralcrystals. The charge carriers are mobile within the crystals, but can become localized, or trapped, at lattice defects andheld there over geologically significant timescales. Over time, the number of segregated, or trapped, charge carriersbuilds up in a way that can be described by a saturating exponential function. Exposure to heat, light or high pressurescan release charge carriers from trapping sites and permit recombinations. This detrapping resets the system within themineral grains. It is this exposure to sunlight during sediment transport that resets the clock and it is also why an OSLdate is considered a depositional age. Similarly, it is exposure to visible wavelengths of light, in a prescribed manner,that initiates the laboratory measurement process and gives the method its name. The intensity of light measured isproportional to the trapped charge population – which is proportional to absorbed radiation dose – which is propor-tional to time elapsed since deposition.
The simplest form of the OSL age equation is:
tD
DOSL
e =′
(1)
where tOSL = age, De = total absorbed dose (Gy = Gray; 1 Gy = 1 J kg−1) and D′ = natural environmental dose rate(Gy ka−1; ka = 1000 years).
The accuracy of OSL ages is primarily dependent on the intensity and duration of the grains’ exposure to sunlightduring transport, often referred to as ‘resetting’ or ‘bleaching’. In the past, sediments deposited from fluvial systemshave been among the most challenging to date via OSL methods due to the light-filtering effect of turbid water, whichleads to variable resetting between grains in a given sediment packet. These poorly bleached grains will provide olderages than the true age of the deposit. Conversely, in very young deposits, individual, well-bleached sand grains mayemit very few photons under optical stimulation, resulting in a weak signal. This is particularly problematic whenusing the single grain OSL technique.
Methods
Sampling techniqueAll OSL samples were collected using aluminium tubes, 30·5 cm long by 5·08 cm diameter, to minimize exposureto sunlight. Along the Raccourci tie channel the tubes were hammered horizontally into individual sand layerson freshly exposed channel banks and then extracted using a shovel. In Alaska and Papua New Guinea wecored vertically through the levee crests and collected the samples using a split spoon sampler into which thealuminium tubes were placed. The split spoon corer was driven into the deposits with a 4·5 kg slide hammer attachedvia threaded rods. Immediately following sample collection any void spaces in the ends of the tubes were filledwith paper towels to prevent sample movement and the tubes were capped with opaque plastic caps and sealedwith heavy tape. Sample identification including depth and orientation of the sample were marked on the exteriorof the tube. The latitude and longitude of each sample location was recorded using a hand-held global positioningsystem (GPS).
OS
L analysis in oxbow
lakes1167
Copyright ©
2005 John Wiley &
Sons, Ltd.Earth Surf. Process. Landform
s 30, 1161–1179 (2005)
Figure 4. Fly River tie channels. Photo 346TC: 1992 aerial photograph showing two tie channels: one active in the upper left and one inactive in the lower centre of thephotograph. The inactive tie channel likely formed coincident with meander cutoff and lake formation. The currently active channel formed at a later time when the rivermigrated back into the lake. Low lake levels at the time of the photograph make the end of the tie channel levees difficult to distinguish from the exposed lake bed, thereforeadvancement rates were calculated using channel lengths determined from field surveys conducted in 1998 and 2003. The approximate locations of the channel terminus atthose times is marked with labels. One OSL sample was collected from the active tie channel levee within 10 m of the channel junction with the river. Photo 414TC: 1992 aerialphotograph showing the tie channel extending from the Fly River up the upstream limb of an oxbow lake. Also highlighted are the end of the channel in 1982 and 2003. Thesurveyed length of the channel in 2003 was approximately 3·3 km. The OSL sampling location is marked. This location was selected as the approximate location of the initialmeander cutoff and therefore the starting location of the tie channel. Since the time of lake formation the river has migrated away from the lake by approximately 800 mmeasured along the channel. It appears the direction of river migration has changed with time and that the course of the tie channel tracks this migration.

1168 J. C. Rowland et al.
Copyright © 2005 John Wiley & Sons, Ltd. Earth Surf. Process. Landforms 30, 1161–1179 (2005)
Sample site selectionIn oxbow lake settings, tie channels most commonly form immediately following cutoff as bedload sedimentationbegins to fill the abandoned limbs and hydrologically separate the old meander bend from the active river. Thesecoarser bed sediments progressively shrink the cutoff cross-section focusing flow through narrow zones typically nearthe margins of the lake. The coarser fraction of the suspended sediment conveyed through these areas rapidly settles inthe still waters beyond the bedload plug and leads to tie channel formation. Over time tie channel deposition creates anarrow leveed channel that progressively advances across the oxbow lake. When the main stem river migrates awayfrom the newly formed oxbow lake, the tie channel will also lengthen in the direction of migration by maintaining itsconnection to the river through the newly deposited lateral accretion deposits of the floodplain. Figure 5 presents anillustration of this process along with conceptual depiction of the stratigraphy along the banks of a tie channel. Inother, rarer, instances tie channels form when the main stem migrates back into the limb of an existing oxbow lake;the formation process is probably very similar to the one described above.
Three criteria guided sample location selection in all three field settings: (1) the presence of significant (>40 percent estimated by touch) fine to medium sand in sample layer; (2) deposits undisturbed by slumping and bank failure;and (3) sample depths that corresponded in elevation to the end of the channel entering the lake. Criterion 3 wasbased on the observation that tie channel levees slope lakeward and at the lake the levees grade to the lakebed. Todetermine the distance advanced by the channel in a given period of time it is necessary to collect OSL samples atelevations that are stratigraphically equivalent to that of the active channel terminus. Depositional ages of sedimentssampled at elevations above the active terminus represent both the elapsed time of terminus advancement and the timetaken to vertically aggrade. On Birch Creek a survey of the channel long profile allowed an assessment of relativeelevations. Water surface elevations in the tie channels provided a rough estimate of relative elevations for samplingon the Fly and Mississippi Rivers. Figure 5 illustrates OSL sampling locations and explains how ages from thesesamples provide the rates discussed below.
Additional site-specific goals guided sample location selection at the three sites. On the Lower Mississippi multiplelocations were sampled in order to: (1) test the viable minimum age range for OSL; (2) assess changes in the channeladvancement rates with time; and (3) determine vertical accretion rates. In Alaska a single sample was collected toconstrain the age of the channel, and estimate progradation and vertical accretion rates. Papua New Guinea samplingfocused on locations near the original oxbow cutoff to determine: (1) the age of the lakes; (2) the long-term pre-mineprogradation rates; (3) the long-term vertical accretion rates; and, where possible (4) the lateral migration of the riveraway from the oxbow lakes.
Uncertainty and errorsWe used historical data, aerial photographs, historical hydrographic surveys and field surveys to locate samplesites, document historical changes and measure channel lengths. In reporting data from these sources to determinedepositional ages, distances and rates, we have attempted to incorporate all known errors. In the case of distance dataobtained from maps and aerial photographs, repeated measurements allowed the calculation of the standard error.For field surveys and depth measurements, however, only a single measurement may have been made and thestandard error reported represents a conservative estimate given the precision of the method used. We have alsoincorporated an estimated error for historical ages obtained from hydrographic surveys of the Lower MississippiRiver site. This error arises from the uncertainty in the water level of the lake at the time of the survey. High lakelevels can obscure a portion of the channel and the date of the survey will not precisely reflect the age associated withchannel length measured. A standard error was assigned to these ages based on consistency between surveys and datafrom other maps and aerial photographs. All errors reported in the text and tables represent measured or estimatedstandard errors.
Laboratory sample preparationSamples collected for OSL dating remained shielded from sunlight at all times. In the light-controlled LuminescenceGeochronology Laboratory at Los Alamos National Laboratory the exterior light-exposed portion of the samples wasdiscarded and the geochronologically intact interior was size separated. For this research, sand in the grain size classes90–150 µm and 150–250 µm were used for SAR and SGLL, respectively.
After size separation the samples were chemically treated to extract pure quartz grains. Organic matter was digestedin a 30 per cent hydrogen peroxide (H2O2) solution for a minimum of 30 min or until the reaction ceased. Then thesand separates were digested for 45 min in reagent grade (48 per cent) hydrofluoric acid (HF). This treatment breaks
OSL analysis in oxbow lakes 1169
Copyright © 2005 John Wiley & Sons, Ltd. Earth Surf. Process. Landforms 30, 1161–1179 (2005)
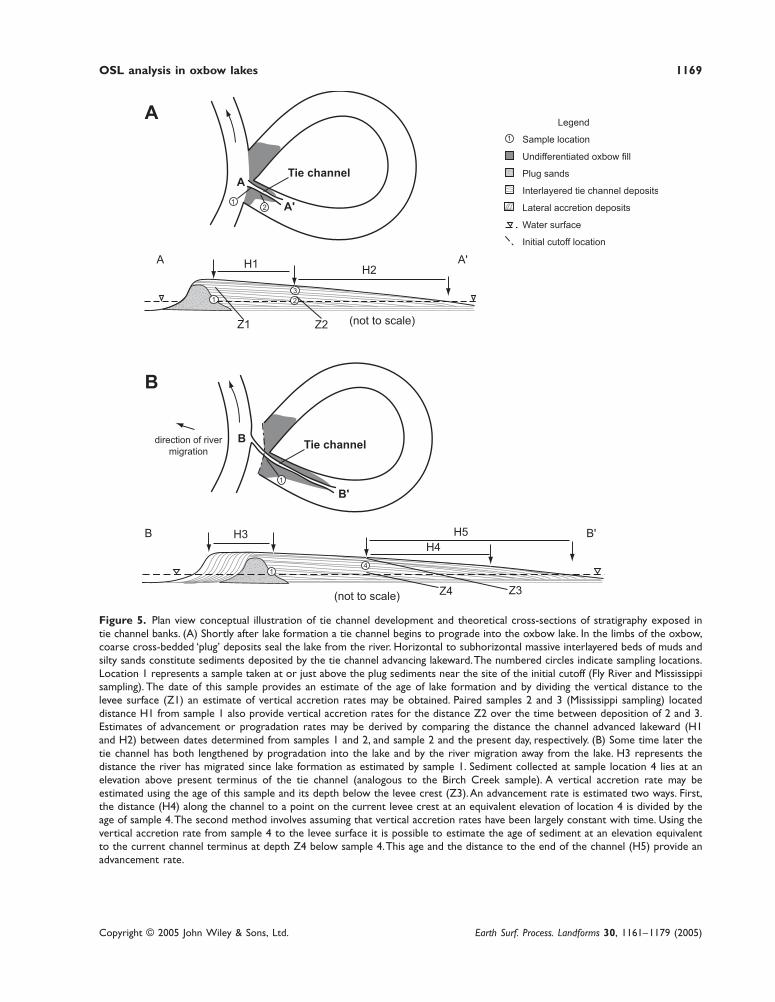
Figure 5. Plan view conceptual illustration of tie channel development and theoretical cross-sections of stratigraphy exposed intie channel banks. (A) Shortly after lake formation a tie channel begins to prograde into the oxbow lake. In the limbs of the oxbow,coarse cross-bedded ‘plug’ deposits seal the lake from the river. Horizontal to subhorizontal massive interlayered beds of muds andsilty sands constitute sediments deposited by the tie channel advancing lakeward. The numbered circles indicate sampling locations.Location 1 represents a sample taken at or just above the plug sediments near the site of the initial cutoff (Fly River and Mississippisampling). The date of this sample provides an estimate of the age of lake formation and by dividing the vertical distance to thelevee surface (Z1) an estimate of vertical accretion rates may be obtained. Paired samples 2 and 3 (Mississippi sampling) locateddistance H1 from sample 1 also provide vertical accretion rates for the distance Z2 over the time between deposition of 2 and 3.Estimates of advancement or progradation rates may be derived by comparing the distance the channel advanced lakeward (H1and H2) between dates determined from samples 1 and 2, and sample 2 and the present day, respectively. (B) Some time later thetie channel has both lengthened by progradation into the lake and by the river migration away from the lake. H3 represents thedistance the river has migrated since lake formation as estimated by sample 1. Sediment collected at sample location 4 lies at anelevation above present terminus of the tie channel (analogous to the Birch Creek sample). A vertical accretion rate may beestimated using the age of this sample and its depth below the levee crest (Z3). An advancement rate is estimated two ways. First,the distance (H4) along the channel to a point on the current levee crest at an equivalent elevation of location 4 is divided by theage of sample 4. The second method involves assuming that vertical accretion rates have been largely constant with time. Using thevertical accretion rate from sample 4 to the levee surface it is possible to estimate the age of sediment at an elevation equivalentto the current channel terminus at depth Z4 below sample 4. This age and the distance to the end of the channel (H5) provide anadvancement rate.
1170 J. C. Rowland et al.
Copyright © 2005 John Wiley & Sons, Ltd. Earth Surf. Process. Landforms 30, 1161–1179 (2005)
down feldspars and surface etches the quartz grains, which is important for dosimetric concerns. After HF the sampleswere rinsed with hydrochloric acid (HCl) to remove any fluorite precipitates that may have formed, and then rinsed ina weak dispersant solution to remove particulates and residues from the feldspar digestion. Between each chemicaltreatment the samples were rinsed three times in deionized (DI) water. The final step was a rinse in methanol and thesands were transferred to drying dishes.
After drying, SAR samples were attached in approximately a monolayer to stainless steel substrates using a non-luminescent medical adhesive. Substrates for SGLL measurement contain an array of regularly spaced indentationsand do not require adhesives. Purity of the processed quartz was verified by examination under an optical microscopeand infrared screening of randomly selected aliquots (Spooner and Questiaux, 1989).
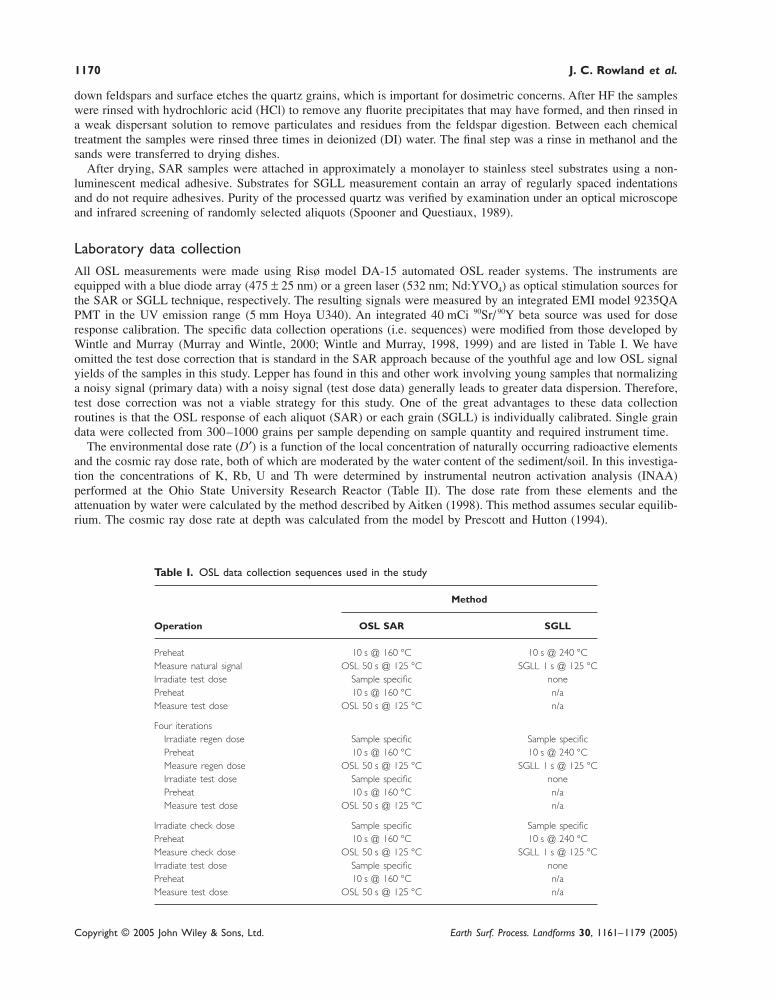
Laboratory data collectionAll OSL measurements were made using Risø model DA-15 automated OSL reader systems. The instruments areequipped with a blue diode array (475 ± 25 nm) or a green laser (532 nm; Nd:YVO4) as optical stimulation sources forthe SAR or SGLL technique, respectively. The resulting signals were measured by an integrated EMI model 9235QAPMT in the UV emission range (5 mm Hoya U340). An integrated 40 mCi 90Sr/ 90Y beta source was used for doseresponse calibration. The specific data collection operations (i.e. sequences) were modified from those developed byWintle and Murray (Murray and Wintle, 2000; Wintle and Murray, 1998, 1999) and are listed in Table I. We haveomitted the test dose correction that is standard in the SAR approach because of the youthful age and low OSL signalyields of the samples in this study. Lepper has found in this and other work involving young samples that normalizinga noisy signal (primary data) with a noisy signal (test dose data) generally leads to greater data dispersion. Therefore,test dose correction was not a viable strategy for this study. One of the great advantages to these data collectionroutines is that the OSL response of each aliquot (SAR) or each grain (SGLL) is individually calibrated. Single graindata were collected from 300–1000 grains per sample depending on sample quantity and required instrument time.
The environmental dose rate (D′) is a function of the local concentration of naturally occurring radioactive elementsand the cosmic ray dose rate, both of which are moderated by the water content of the sediment/soil. In this investiga-tion the concentrations of K, Rb, U and Th were determined by instrumental neutron activation analysis (INAA)performed at the Ohio State University Research Reactor (Table II). The dose rate from these elements and theattenuation by water were calculated by the method described by Aitken (1998). This method assumes secular equilib-rium. The cosmic ray dose rate at depth was calculated from the model by Prescott and Hutton (1994).
Table I. OSL data collection sequences used in the study
Method
Operation OSL SAR SGLL
Preheat 10 s @ 160 °C 10 s @ 240 °CMeasure natural signal OSL 50 s @ 125 °C SGLL 1 s @ 125 °CIrradiate test dose Sample specific nonePreheat 10 s @ 160 °C n/aMeasure test dose OSL 50 s @ 125 °C n/a
Four iterationsIrradiate regen dose Sample specific Sample specificPreheat 10 s @ 160 °C 10 s @ 240 °CMeasure regen dose OSL 50 s @ 125 °C SGLL 1 s @ 125 °CIrradiate test dose Sample specific nonePreheat 10 s @ 160 °C n/aMeasure test dose OSL 50 s @ 125 °C n/a
Irradiate check dose Sample specific Sample specificPreheat 10 s @ 160 °C 10 s @ 240 °CMeasure check dose OSL 50 s @ 125 °C SGLL 1 s @ 125 °CIrradiate test dose Sample specific nonePreheat 10 s @ 160 °C n/aMeasure test dose OSL 50 s @ 125 °C n/a
OSL analysis in oxbow lakes 1171
Copyright © 2005 John Wiley & Sons, Ltd. Earth Surf. Process. Landforms 30, 1161–1179 (2005)
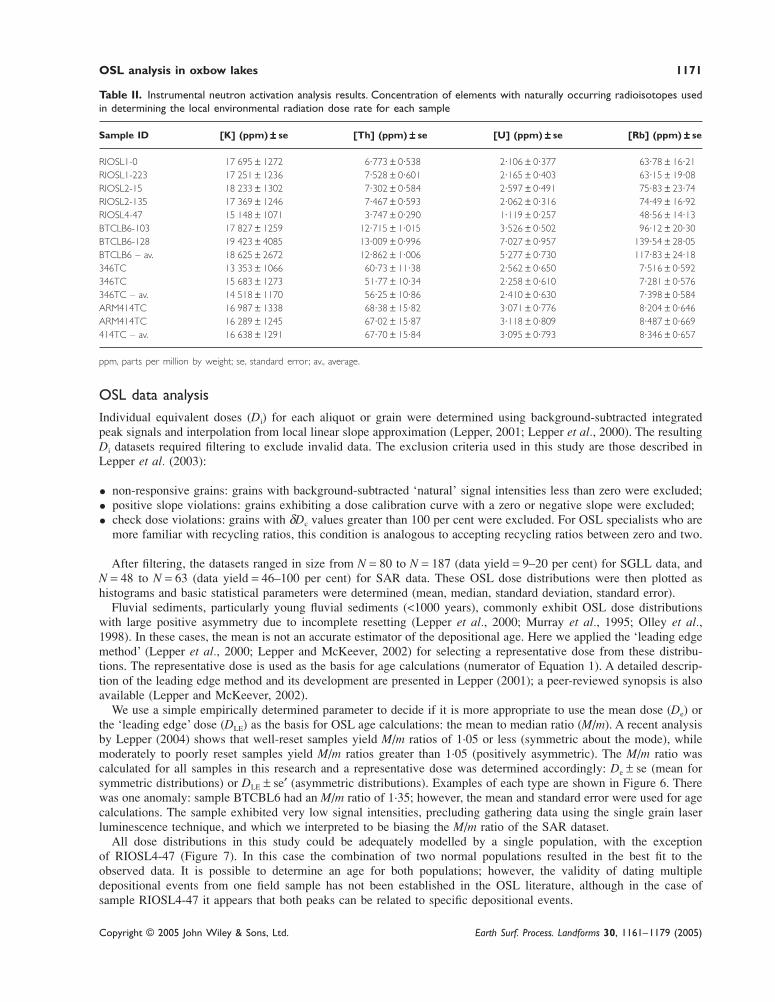
Table II. Instrumental neutron activation analysis results. Concentration of elements with naturally occurring radioisotopes usedin determining the local environmental radiation dose rate for each sample
Sample ID [K] (ppm) ±±±±± se [Th] (ppm) ±±±±± se [U] (ppm) ±±±±± se [Rb] (ppm) ±±±±± se
RIOSL1-0 17 695 ± 1272 6·773 ± 0·538 2·106 ± 0·377 63·78 ± 16·21RIOSL1-223 17 251 ± 1236 7·528 ± 0·601 2·165 ± 0·403 63·15 ± 19·08RIOSL2-15 18 233 ± 1302 7·302 ± 0·584 2·597 ± 0·491 75·83 ± 23·74RIOSL2-135 17 369 ± 1246 7·467 ± 0·593 2·062 ± 0·316 74·49 ± 16·92RIOSL4-47 15 148 ± 1071 3·747 ± 0·290 1·119 ± 0·257 48·56 ± 14·13BTCLB6-103 17 827 ± 1259 12·715 ± 1·015 3·526 ± 0·502 96·12 ± 20·30BTCLB6-128 19 423 ± 4085 13·009 ± 0·996 7·027 ± 0·957 139·54 ± 28·05BTCLB6 – av. 18 625 ± 2672 12·862 ± 1·006 5·277 ± 0·730 117·83 ± 24·18346TC 13 353 ± 1066 60·73 ± 11·38 2·562 ± 0·650 7·516 ± 0·592346TC 15 683 ± 1273 51·77 ± 10·34 2·258 ± 0·610 7·281 ± 0·576346TC – av. 14 518 ± 1170 56·25 ± 10·86 2·410 ± 0·630 7·398 ± 0·584ARM414TC 16 987 ± 1338 68·38 ± 15·82 3·071 ± 0·776 8·204 ± 0·646ARM414TC 16 289 ± 1245 67·02 ± 15·87 3·118 ± 0·809 8·487 ± 0·669414TC – av. 16 638 ± 1291 67·70 ± 15·84 3·095 ± 0·793 8·346 ± 0·657
ppm, parts per million by weight; se, standard error ; av., average.
OSL data analysisIndividual equivalent doses (Di) for each aliquot or grain were determined using background-subtracted integratedpeak signals and interpolation from local linear slope approximation (Lepper, 2001; Lepper et al., 2000). The resultingDi datasets required filtering to exclude invalid data. The exclusion criteria used in this study are those described inLepper et al. (2003):
• non-responsive grains: grains with background-subtracted ‘natural’ signal intensities less than zero were excluded;
• positive slope violations: grains exhibiting a dose calibration curve with a zero or negative slope were excluded;
• check dose violations: grains with δDc values greater than 100 per cent were excluded. For OSL specialists who aremore familiar with recycling ratios, this condition is analogous to accepting recycling ratios between zero and two.
After filtering, the datasets ranged in size from N = 80 to N = 187 (data yield = 9–20 per cent) for SGLL data, andN = 48 to N = 63 (data yield = 46–100 per cent) for SAR data. These OSL dose distributions were then plotted ashistograms and basic statistical parameters were determined (mean, median, standard deviation, standard error).
Fluvial sediments, particularly young fluvial sediments (<1000 years), commonly exhibit OSL dose distributionswith large positive asymmetry due to incomplete resetting (Lepper et al., 2000; Murray et al., 1995; Olley et al.,1998). In these cases, the mean is not an accurate estimator of the depositional age. Here we applied the ‘leading edgemethod’ (Lepper et al., 2000; Lepper and McKeever, 2002) for selecting a representative dose from these distribu-tions. The representative dose is used as the basis for age calculations (numerator of Equation 1). A detailed descrip-tion of the leading edge method and its development are presented in Lepper (2001); a peer-reviewed synopsis is alsoavailable (Lepper and McKeever, 2002).
We use a simple empirically determined parameter to decide if it is more appropriate to use the mean dose (De) orthe ‘leading edge’ dose (DLE) as the basis for OSL age calculations: the mean to median ratio (M/m). A recent analysisby Lepper (2004) shows that well-reset samples yield M/m ratios of 1·05 or less (symmetric about the mode), whilemoderately to poorly reset samples yield M/m ratios greater than 1·05 (positively asymmetric). The M/m ratio wascalculated for all samples in this research and a representative dose was determined accordingly: De ± se (mean forsymmetric distributions) or DLE ± se′ (asymmetric distributions). Examples of each type are shown in Figure 6. Therewas one anomaly: sample BTCBL6 had an M/m ratio of 1·35; however, the mean and standard error were used for agecalculations. The sample exhibited very low signal intensities, precluding gathering data using the single grain laserluminescence technique, and which we interpreted to be biasing the M/m ratio of the SAR dataset.
All dose distributions in this study could be adequately modelled by a single population, with the exceptionof RIOSL4-47 (Figure 7). In this case the combination of two normal populations resulted in the best fit to theobserved data. It is possible to determine an age for both populations; however, the validity of dating multipledepositional events from one field sample has not been established in the OSL literature, although in the case ofsample RIOSL4-47 it appears that both peaks can be related to specific depositional events.

1172 J. C. Rowland et al.
Copyright © 2005 John Wiley & Sons, Ltd. Earth Surf. Process. Landforms 30, 1161–1179 (2005)
Figure 6. Dose distribution histograms for a nearly symmetric sample (a) and a positively asymmetric sample (b). Note thedifference in vertical scale and M/m ratio.
Figure 7. Population analysis for sample RIOSL4-47. The two normal populations in (b) more accurately represent the experimentaldata, particularly for lower values, which is important to age accuracy. Some negative values are expected for young samples dueto normal measurement error.
OSL analysis in oxbow lakes 1173
Copyright © 2005 John Wiley & Sons, Ltd. Earth Surf. Process. Landforms 30, 1161–1179 (2005)
Results
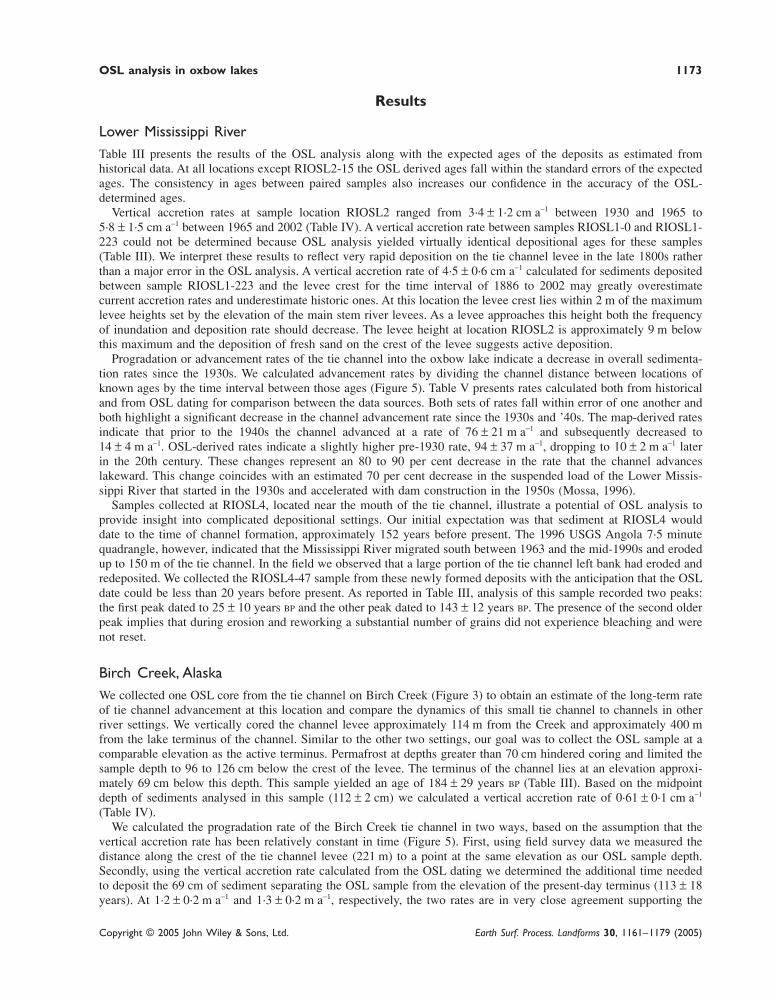
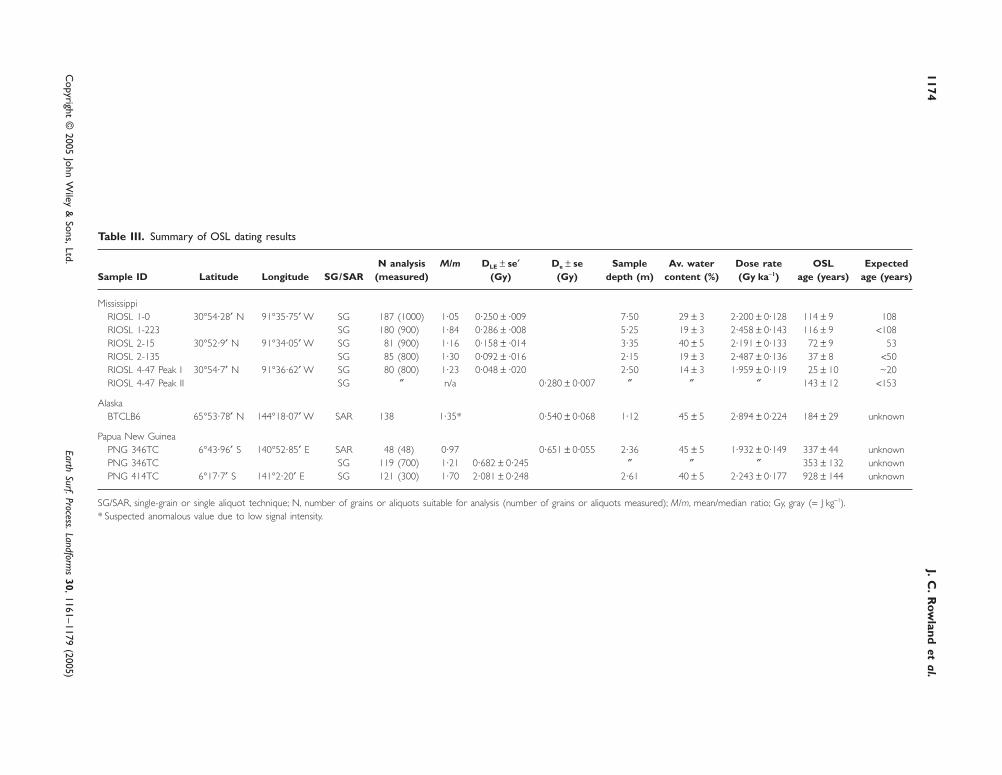
Lower Mississippi RiverTable III presents the results of the OSL analysis along with the expected ages of the deposits as estimated fromhistorical data. At all locations except RIOSL2-15 the OSL derived ages fall within the standard errors of the expectedages. The consistency in ages between paired samples also increases our confidence in the accuracy of the OSL-determined ages.
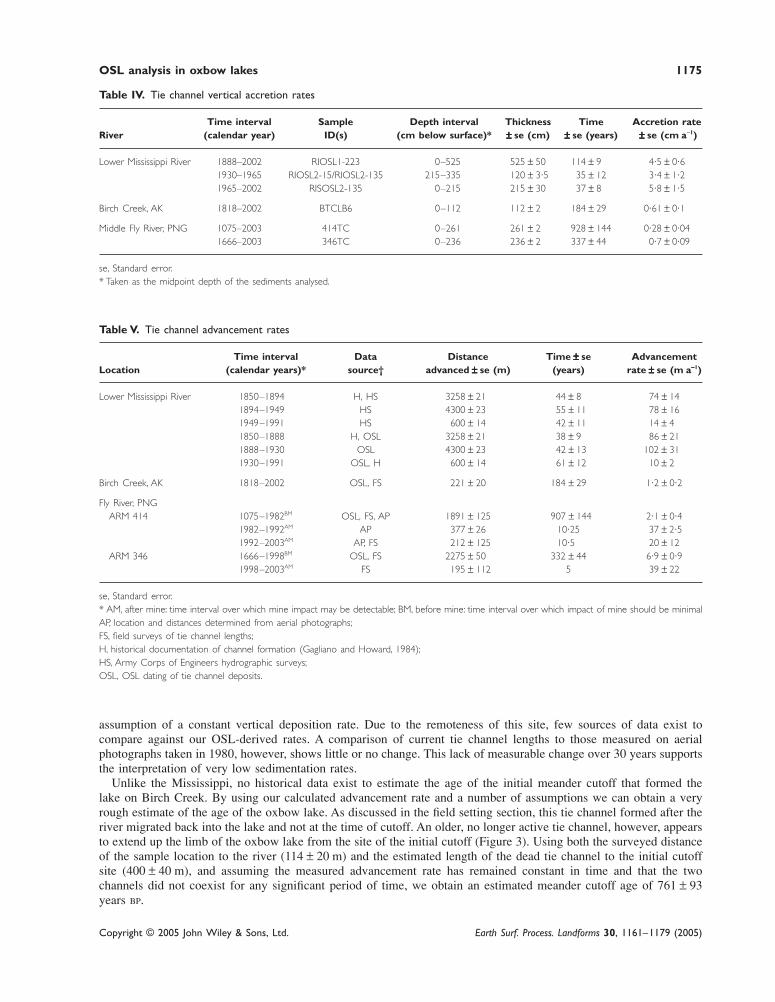
Vertical accretion rates at sample location RIOSL2 ranged from 3·4 ± 1·2 cm a−1 between 1930 and 1965 to5·8 ± 1·5 cm a−1 between 1965 and 2002 (Table IV). A vertical accretion rate between samples RIOSL1-0 and RIOSL1-223 could not be determined because OSL analysis yielded virtually identical depositional ages for these samples(Table III). We interpret these results to reflect very rapid deposition on the tie channel levee in the late 1800s ratherthan a major error in the OSL analysis. A vertical accretion rate of 4·5 ± 0·6 cm a−1 calculated for sediments depositedbetween sample RIOSL1-223 and the levee crest for the time interval of 1886 to 2002 may greatly overestimatecurrent accretion rates and underestimate historic ones. At this location the levee crest lies within 2 m of the maximumlevee heights set by the elevation of the main stem river levees. As a levee approaches this height both the frequencyof inundation and deposition rate should decrease. The levee height at location RIOSL2 is approximately 9 m belowthis maximum and the deposition of fresh sand on the crest of the levee suggests active deposition.
Progradation or advancement rates of the tie channel into the oxbow lake indicate a decrease in overall sedimenta-tion rates since the 1930s. We calculated advancement rates by dividing the channel distance between locations ofknown ages by the time interval between those ages (Figure 5). Table V presents rates calculated both from historicaland from OSL dating for comparison between the data sources. Both sets of rates fall within error of one another andboth highlight a significant decrease in the channel advancement rate since the 1930s and ’40s. The map-derived ratesindicate that prior to the 1940s the channel advanced at a rate of 76 ± 21 m a−1 and subsequently decreased to14 ± 4 m a−1. OSL-derived rates indicate a slightly higher pre-1930 rate, 94 ± 37 m a−1, dropping to 10 ± 2 m a−1 laterin the 20th century. These changes represent an 80 to 90 per cent decrease in the rate that the channel advanceslakeward. This change coincides with an estimated 70 per cent decrease in the suspended load of the Lower Missis-sippi River that started in the 1930s and accelerated with dam construction in the 1950s (Mossa, 1996).
Samples collected at RIOSL4, located near the mouth of the tie channel, illustrate a potential of OSL analysis toprovide insight into complicated depositional settings. Our initial expectation was that sediment at RIOSL4 woulddate to the time of channel formation, approximately 152 years before present. The 1996 USGS Angola 7·5 minutequadrangle, however, indicated that the Mississippi River migrated south between 1963 and the mid-1990s and erodedup to 150 m of the tie channel. In the field we observed that a large portion of the tie channel left bank had eroded andredeposited. We collected the RIOSL4-47 sample from these newly formed deposits with the anticipation that the OSLdate could be less than 20 years before present. As reported in Table III, analysis of this sample recorded two peaks:the first peak dated to 25 ± 10 years BP and the other peak dated to 143 ± 12 years BP. The presence of the second olderpeak implies that during erosion and reworking a substantial number of grains did not experience bleaching and werenot reset.
Birch Creek, AlaskaWe collected one OSL core from the tie channel on Birch Creek (Figure 3) to obtain an estimate of the long-term rateof tie channel advancement at this location and compare the dynamics of this small tie channel to channels in otherriver settings. We vertically cored the channel levee approximately 114 m from the Creek and approximately 400 mfrom the lake terminus of the channel. Similar to the other two settings, our goal was to collect the OSL sample at acomparable elevation as the active terminus. Permafrost at depths greater than 70 cm hindered coring and limited thesample depth to 96 to 126 cm below the crest of the levee. The terminus of the channel lies at an elevation approxi-mately 69 cm below this depth. This sample yielded an age of 184 ± 29 years BP (Table III). Based on the midpointdepth of sediments analysed in this sample (112 ± 2 cm) we calculated a vertical accretion rate of 0·61 ± 0·1 cm a−1
(Table IV).We calculated the progradation rate of the Birch Creek tie channel in two ways, based on the assumption that the
vertical accretion rate has been relatively constant in time (Figure 5). First, using field survey data we measured thedistance along the crest of the tie channel levee (221 m) to a point at the same elevation as our OSL sample depth.Secondly, using the vertical accretion rate calculated from the OSL dating we determined the additional time neededto deposit the 69 cm of sediment separating the OSL sample from the elevation of the present-day terminus (113 ± 18years). At 1·2 ± 0·2 m a−1 and 1·3 ± 0·2 m a−1, respectively, the two rates are in very close agreement supporting the
1174J. C
. Row
land et al.
Copyright ©
2005 John Wiley &
Sons, Ltd.Earth Surf. Process. Landform
s 30, 1161–1179 (2005)
Table III. Summary of OSL dating results
N analysis M/m DLE ± se′ De ± se Sample Av. water Dose rate OSL ExpectedSample ID Latitude Longitude SG/SAR (measured) (Gy) (Gy) depth (m) content (%) (Gy ka−1) age (years) age (years)
MississippiRIOSL 1-0 30°54·28′ N 91°35·75′ W SG 187 (1000) 1·05 0·250 ± ·009 7·50 29 ± 3 2·200 ± 0·128 114 ± 9 108RIOSL 1-223 SG 180 (900) 1·84 0·286 ± ·008 5·25 19 ± 3 2·458 ± 0·143 116 ± 9 <108RIOSL 2-15 30°52·9′ N 91°34·05′ W SG 81 (900) 1·16 0·158 ± ·014 3·35 40 ± 5 2·191 ± 0·133 72 ± 9 53RIOSL 2-135 SG 85 (800) 1·30 0·092 ± ·016 2·15 19 ± 3 2·487 ± 0·136 37 ± 8 <50RIOSL 4-47 Peak I 30°54·7′ N 91°36·62′ W SG 80 (800) 1·23 0·048 ± ·020 2·50 14 ± 3 1·959 ± 0·119 25 ± 10 ~20RIOSL 4-47 Peak II SG ″ n/a 0·280 ± 0·007 ″ ″ ″ 143 ± 12 <153
AlaskaBTCLB6 65°53·78′ N 144°18·07′ W SAR 138 1·35* 0·540 ± 0·068 1·12 45 ± 5 2·894 ± 0·224 184 ± 29 unknown
Papua New GuineaPNG 346TC 6°43·96′ S 140°52·85′ E SAR 48 (48) 0·97 0·651 ± 0·055 2·36 45 ± 5 1·932 ± 0·149 337 ± 44 unknownPNG 346TC SG 119 (700) 1·21 0·682 ± 0·245 ″ ″ ″ 353 ± 132 unknownPNG 414TC 6°17·7′ S 141°2·20′ E SG 121 (300) 1·70 2·081 ± 0·248 2·61 40 ± 5 2·243 ± 0·177 928 ± 144 unknown
SG/SAR, single-grain or single aliquot technique; N, number of grains or aliquots suitable for analysis (number of grains or aliquots measured); M/m, mean/median ratio; Gy, gray (= J kg−1).* Suspected anomalous value due to low signal intensity.
OSL analysis in oxbow lakes 1175
Copyright © 2005 John Wiley & Sons, Ltd. Earth Surf. Process. Landforms 30, 1161–1179 (2005)
Table IV. Tie channel vertical accretion rates
Time interval Sample Depth interval Thickness Time Accretion rateRiver (calendar year) ID(s) (cm below surface)* ±±±±± se (cm) ±±±±± se (years) ±±±±± se (cm a−1)
Lower Mississippi River 1888–2002 RIOSL1-223 0–525 525 ± 50 114 ± 9 4·5 ± 0·61930–1965 RIOSL2-15/RIOSL2-135 215–335 120 ± 3·5 35 ± 12 3·4 ± 1·21965–2002 RISOSL2-135 0–215 215 ± 30 37 ± 8 5·8 ± 1·5
Birch Creek, AK 1818–2002 BTCLB6 0–112 112 ± 2 184 ± 29 0·61 ± 0·1
Middle Fly River, PNG 1075–2003 414TC 0–261 261 ± 2 928 ± 144 0·28 ± 0·041666–2003 346TC 0–236 236 ± 2 337 ± 44 0·7 ± 0·09
se, Standard error.* Taken as the midpoint depth of the sediments analysed.
Table V. Tie channel advancement rates
Time interval Data Distance Time ±±±±± se AdvancementLocation (calendar years)* source† advanced ±±±±± se (m) (years) rate ±±±±± se (m a−−−−−1)
Lower Mississippi River 1850–1894 H, HS 3258 ± 21 44 ± 8 74 ± 141894–1949 HS 4300 ± 23 55 ± 11 78 ± 161949–1991 HS 600 ± 14 42 ± 11 14 ± 41850–1888 H, OSL 3258 ± 21 38 ± 9 86 ± 211888–1930 OSL 4300 ± 23 42 ± 13 102 ± 311930–1991 OSL, H 600 ± 14 61 ± 12 10 ± 2
Birch Creek, AK 1818–2002 OSL, FS 221 ± 20 184 ± 29 1·2 ± 0·2
Fly River, PNGARM 414 1075–1982BM OSL, FS, AP 1891 ± 125 907 ± 144 2·1 ± 0·4
1982–1992AM AP 377 ± 26 10·25 37 ± 2·51992–2003AM AP, FS 212 ± 125 10·5 20 ± 12
ARM 346 1666–1998BM OSL, FS 2275 ± 50 332 ± 44 6·9 ± 0·91998–2003AM FS 195 ± 112 5 39 ± 22
se, Standard error.* AM, after mine: time interval over which mine impact may be detectable; BM, before mine: time interval over which impact of mine should be minimalAP, location and distances determined from aerial photographs;FS, field surveys of tie channel lengths;H, historical documentation of channel formation (Gagliano and Howard, 1984);HS, Army Corps of Engineers hydrographic surveys;OSL, OSL dating of tie channel deposits.
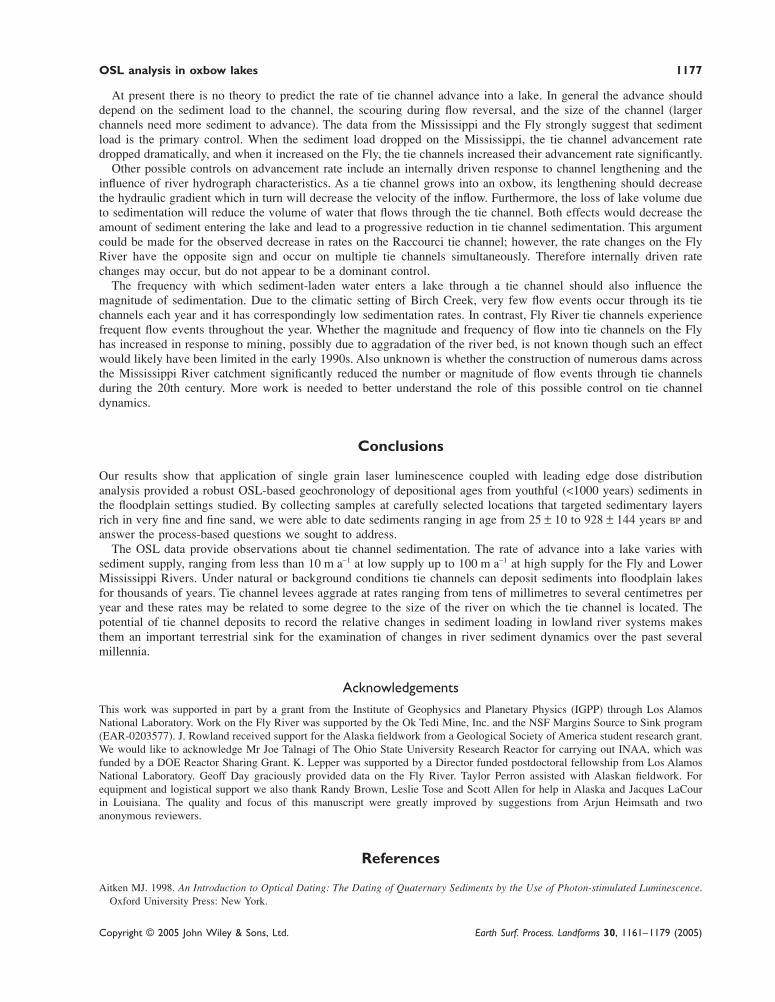
assumption of a constant vertical deposition rate. Due to the remoteness of this site, few sources of data exist tocompare against our OSL-derived rates. A comparison of current tie channel lengths to those measured on aerialphotographs taken in 1980, however, shows little or no change. This lack of measurable change over 30 years supportsthe interpretation of very low sedimentation rates.
Unlike the Mississippi, no historical data exist to estimate the age of the initial meander cutoff that formed thelake on Birch Creek. By using our calculated advancement rate and a number of assumptions we can obtain a veryrough estimate of the age of the oxbow lake. As discussed in the field setting section, this tie channel formed after theriver migrated back into the lake and not at the time of cutoff. An older, no longer active tie channel, however, appearsto extend up the limb of the oxbow lake from the site of the initial cutoff (Figure 3). Using both the surveyed distanceof the sample location to the river (114 ± 20 m) and the estimated length of the dead tie channel to the initial cutoffsite (400 ± 40 m), and assuming the measured advancement rate has remained constant in time and that the twochannels did not coexist for any significant period of time, we obtain an estimated meander cutoff age of 761 ± 93years BP.

1176 J. C. Rowland et al.
Copyright © 2005 John Wiley & Sons, Ltd. Earth Surf. Process. Landforms 30, 1161–1179 (2005)
Fly River, Papua New GuineaField surveys beginning in the 1990s and aerial photographs taken over the past 20 years provide short-term estimatesof tie channel advancement on the Fly River. To determine oxbow lake ages, vertical accretion rates and pre-mineadvancement rates, we collected one sample each from two tie channels (Figure 4). Table III presents the ages of thetwo samples PNG 414TC and PNG 346TC collected from tie channels located at ARMs 414 and 346, respectively.The ages calculated for sample 346TC by both the SAR and SGLL method are consistent to within ± one standarddeviation. Therefore the SAR age (337 ± 44 years) will be the basis for further analysis and interpretation because ofits greater precision.
Vertical accretion rates range between the two sites from 0·25 ± 0·04 cm a−1 at ARM 414 to 0·7 ± 0·09 cm a−1
at ARM 346 (Table IV). Post-mine deposition rates for these two specific sites are not available; however, typicalpost-mine values along channel levees of the Middle Fly River range between 2 and 3 cm a−1 (G. Day, personalcommunication). We also determined both pre- and post-mine channel advancement rates based on OSL dates, fieldsurveys and aerial photographs for tie channel ARM 414 and on OSL and field surveys for tie channel ARM 346.These rates, presented in Table V, suggest that advancement rates have increased by as much at 6 to 17 times sincethe early 1980s to mid-1990s. The location of the sample PNG 414TC was estimated to correspond to the site of theoriginal meander cutoff that formed the lake. Our sampling indicates that the lake is at least 928 ± 144 years oldand during this entire time the tie channel has been active. Additionally, the river has since migrated approximately800 m, as measured along the tie channel, from this location with an average migration rate of 0·86 ± 0·2 m a−1.Dietrich et al. (1999) used maps and aerial photographs to document a long-term average migration rate of 1–2 m a−1.Dietrich et al. (1999) also suggested that oxbows would take a minimum of 870 years to infill. The OSL dates agreewell with these analyses.
The tie channel at ARM 346 formed following the migration of the river into an existing oxbow lake, similar to theBirch Creek setting. Despite an age of 337 ± 44 years BP for the active tie channel, the age of the oxbow lake isunknown. Using the length of the now inactive original tie channel (Figure 4) and our calculated advancement rate itwould be possible to estimate a total age of the lake; however, the assumption that the two channels did not coexist fora significant period of time appears less justified at this location. The 1992 aerial photographs (Figure 4) clearly showthis channel extending to the river and containing water, suggesting that even if it were not active, significant infillinghad not yet occurred.
Discussion
Our results illustrate the utility of OSL in calculating the rates and timing of fluvial processes in lowland riversettings from youthful sediments. In particular, the coupled SGLL and leading edge dating system provide ages thatcorresponde very well with observed historical data. In this study successful application of the SGLL techniquedepends on the fact that tie channel levees sampled were composed of relatively coarse materials deposited fromsuspension, and represent a favourable depositional environment for SGLL analysis. Only one sample in the entiresample suite (Alaska) could not be dated using the SGLL technique, and that was due to the low signal intensity fromindividual sediment grains: a limitation imposed by the sample not the technique. For the Alaska sample, SAR wasused to collect luminescence data. A collection of grains (400–1000) was illuminated at the same time to provide astrong enough signal for age determination.
Even though the tie channel levees provide a depositional environment advantageous for OSL dating, high (>1·05)M/m ratios indicate partial resetting to be an issue in all three systems. The need to collect sand-rich sedimentsdid not pose a constraint for selecting sample locations on the Lower Mississippi, where thick sand-rich bedsoccurred in abundance, but along the smaller, finer grained Fly River and Birch Creek, thinner beds with lowersand content proved a limitation in some instances. Additionally, lower sand contents necessitated greater samplevolumes for analysis which in turn reduced the precision of dating for cores collected vertically. Despite theselimitations we determined depositional ages ranging from 25 ± 10 to 928 ± 144 years BP and discriminated betweensediments deposited less than 40 years apart at the same location. These results allowed for the calculation of processrates occurring over the past millennium providing a more detailed understanding of the controls on tie channeldevelopment.
Comparing calculated rates across the three river systems shows that the largest rates are recorded on the largestriver system, the Lower Mississippi River. The magnitude of the differences, even comparing maxima on the LowerMississippi to minima on the Fly and Birch Creek, however, are far less than the differences in river size measured interms of both drainage area and discharge.
OSL analysis in oxbow lakes 1177
Copyright © 2005 John Wiley & Sons, Ltd. Earth Surf. Process. Landforms 30, 1161–1179 (2005)
At present there is no theory to predict the rate of tie channel advance into a lake. In general the advance shoulddepend on the sediment load to the channel, the scouring during flow reversal, and the size of the channel (largerchannels need more sediment to advance). The data from the Mississippi and the Fly strongly suggest that sedimentload is the primary control. When the sediment load dropped on the Mississippi, the tie channel advancement ratedropped dramatically, and when it increased on the Fly, the tie channels increased their advancement rate significantly.
Other possible controls on advancement rate include an internally driven response to channel lengthening and theinfluence of river hydrograph characteristics. As a tie channel grows into an oxbow, its lengthening should decreasethe hydraulic gradient which in turn will decrease the velocity of the inflow. Furthermore, the loss of lake volume dueto sedimentation will reduce the volume of water that flows through the tie channel. Both effects would decrease theamount of sediment entering the lake and lead to a progressive reduction in tie channel sedimentation. This argumentcould be made for the observed decrease in rates on the Raccourci tie channel; however, the rate changes on the FlyRiver have the opposite sign and occur on multiple tie channels simultaneously. Therefore internally driven ratechanges may occur, but do not appear to be a dominant control.
The frequency with which sediment-laden water enters a lake through a tie channel should also influence themagnitude of sedimentation. Due to the climatic setting of Birch Creek, very few flow events occur through its tiechannels each year and it has correspondingly low sedimentation rates. In contrast, Fly River tie channels experiencefrequent flow events throughout the year. Whether the magnitude and frequency of flow into tie channels on the Flyhas increased in response to mining, possibly due to aggradation of the river bed, is not known though such an effectwould likely have been limited in the early 1990s. Also unknown is whether the construction of numerous dams acrossthe Mississippi River catchment significantly reduced the number or magnitude of flow events through tie channelsduring the 20th century. More work is needed to better understand the role of this possible control on tie channeldynamics.
Conclusions
Our results show that application of single grain laser luminescence coupled with leading edge dose distributionanalysis provided a robust OSL-based geochronology of depositional ages from youthful (<1000 years) sediments inthe floodplain settings studied. By collecting samples at carefully selected locations that targeted sedimentary layersrich in very fine and fine sand, we were able to date sediments ranging in age from 25 ± 10 to 928 ± 144 years BP andanswer the process-based questions we sought to address.
The OSL data provide observations about tie channel sedimentation. The rate of advance into a lake varies withsediment supply, ranging from less than 10 m a−1 at low supply up to 100 m a−1 at high supply for the Fly and LowerMississippi Rivers. Under natural or background conditions tie channels can deposit sediments into floodplain lakesfor thousands of years. Tie channel levees aggrade at rates ranging from tens of millimetres to several centimetres peryear and these rates may be related to some degree to the size of the river on which the tie channel is located. Thepotential of tie channel deposits to record the relative changes in sediment loading in lowland river systems makesthem an important terrestrial sink for the examination of changes in river sediment dynamics over the past severalmillennia.
AcknowledgementsThis work was supported in part by a grant from the Institute of Geophysics and Planetary Physics (IGPP) through Los AlamosNational Laboratory. Work on the Fly River was supported by the Ok Tedi Mine, Inc. and the NSF Margins Source to Sink program(EAR-0203577). J. Rowland received support for the Alaska fieldwork from a Geological Society of America student research grant.We would like to acknowledge Mr Joe Talnagi of The Ohio State University Research Reactor for carrying out INAA, which wasfunded by a DOE Reactor Sharing Grant. K. Lepper was supported by a Director funded postdoctoral fellowship from Los AlamosNational Laboratory. Geoff Day graciously provided data on the Fly River. Taylor Perron assisted with Alaskan fieldwork. Forequipment and logistical support we also thank Randy Brown, Leslie Tose and Scott Allen for help in Alaska and Jacques LaCourin Louisiana. The quality and focus of this manuscript were greatly improved by suggestions from Arjun Heimsath and twoanonymous reviewers.
References
Aitken MJ. 1998. An Introduction to Optical Dating: The Dating of Quaternary Sediments by the Use of Photon-stimulated Luminescence.Oxford University Press: New York.

1178 J. C. Rowland et al.
Copyright © 2005 John Wiley & Sons, Ltd. Earth Surf. Process. Landforms 30, 1161–1179 (2005)
Biedenharn DS, Thorne CR, Watson CC. 2000. Recent morphological evolution of the Lower Mississippi River. Geomorphology 34(3–4):227–249.
Blake DH, Ollier CD. 1971. Alluvial plains of the Fly River, Papua. Zeitschrift fur Geomorphologie Suppl. bd 12: 1–17.Dietrich WE, Day G, Parker G. 1999. The Fly River, Papua New Guinea: inferences about river dynamics, floodplain sedimentation and fate
of sediment. In Varieties in Fluvial Form, Miller AJ, Gupta A (eds). International Association of Geomorphologists, John Wiley & Sons:New York; 345–376.
Duller GAT. 1994. Luminescence dating using single aliquots: new procedures. Quaternary Science Reviews 13: 149–156.Duller GAT. 2000. Dose distributions determined from measurements of single quartz grains. In Luminescence and its Applications, Murthy
K et al. (eds). Luminescence Society of India: Baroda, India; 78–85.Duller GAT, Bøtter-Jensen L, Murray AS. 2000. Optical dating of single sand-sized grains of quartz: sources of variability. Radiation
Measurements 32: 453–457.Fisk HN. 1947. Fine-Grained Alluvial Deposits and Their Effects on Mississippi River Activity. War Department Corps of Engineers
Mississippi River Commission: Vicksburg.Gagliano SM, Howard PC. 1984. The neck cutoff oxbow lake cycle along the lower Mississippi River. In River Meandering: Proceedings of
the Conference Rivers ’83, Elliot CM (eds). American Society of Civil Engineers: New Orleans; 1036.Galbraith RF, Roberts RG, Laslett GM, Yoshida H, Olley JM. 1999. Optical dating of single and multiple grains of quartz from Jinmium
rock shelter, Northern Australia: Part I, Experimental Design and Statistical Models. Archaeometry 41(2): 339–364.Goodbred SL, Kuehl SA. 1998. Floodplain processes in the Bengal Basin and the storage of Ganges-Brahmaputra river sediment: an
accretion study using Cs-137 and Pb-210 geochronology. Sedimentary Geology 121(3–4): 239–258.Hooke JM. 1995. River channel adjustment to meander cutoffs on the River Bollin and River Dane, northwest England. Geomorphology
14(3): 235–253.Kesel RH, Yodis EG, McCraw DJ. 1992. An approximation of the sediment budget of the Lower Mississippi River prior to major human-
modification. Earth Surface Processes and Landforms 17(7): 711–722.Kostohrys J, Sterin BBG. 1996. Water Resources of Birch Creek National Wild River, Alaska: Stream Gaging Data from 1989 to 1994. US
Bureau of Land Management: Anchorage.Lepper K. 2001. Development of an objective dose distribution analysis method for luminescence dating and pilot studies for planetary
applications. PhD, Oklahoma State University, Stillwater.Lepper K. 2004. The minimum expectation of s*. 3rd New World Luminescence Dating Workshop Abstract Volume: 28.Lepper K, McKeever SWS. 2002. An objective methodology for dose distribution analysis. Radiation Protection Dosimetry 101: 349–352.Lepper K, Larsen NA, McKeever SWS. 2000. Equivalent dose distribution analysis of Holocene eolian and fluvial quartz sands from Central
Oklahoma. Radiation Measurements 32(5–6): 603–608.Lepper K, Wilson C, Gardner JN, Reneau SL, Lavine A. 2003. Comparison of SAR techniques for luminescence dating of sediments derived
from volcanic tuff. Quaternary Science Reviews 22: 1131–1138.Mossa J. 1996. Sediment dynamics in the lowermost Mississippi River. Engineering Geology 45(1–4): 457–479.Murray A, Wintle AG. 2000. Luminescence dating of quartz using an improved single-aliquot regenerative-dose protocol. Radiation Meas-
urements 32: 57–73.Murray AS, Roberts RG. 1997. Determining the burial time of single grains of quartz using optically stimulated luminescence. Earth and
Planetary Science Letters 152(1–4): 163–180.Murray AS, Olley JM, Caitcheon GG. 1995. Measurement of equivalent doses in quartz from contemporary water-lain sediments using
optically stimulated luminescence. Quaternary Science Reviews 14: 365–371.Olley J, Caitcheon G, Murray A. 1998. The distribution of apparent dose as determined by optically stimulated luminescence in small
aliquots of fluvial quartz: Implications for dating young sediments. Quaternary Science Reviews 17(11): 1033–1040.Olley JM, Caitcheon GG, Roberts RG. 1999. The origin of dose distributions in fluvial sediments and the prospect of dating single grains
from fluvial deposits using optically stimulated luminescence. Radiation Measurements 30: 207–217.Olley JM, Pietsch T, Roberts RG. 2004. Optical dating of Holocene sediments from a variety of geomorphic settings using single grains of
quartz. Geomorphology 60(3–4): 337–358.Prescott JR, Hutton JT. 1994. Cosmic ray contributions to dose rates for luminescence and ESR dating: large depths and long-term time
variations. Radiation Measurements 23: 497–500.Pringle CM, Freeman MC, Freeman BJ. 2000. Regional effects of hydrologic alterations on riverine macrobiota in the New World: Tropical-
temperate comparisons. Bioscience 50(9): 807–823.Roberts R, Bird M, Olley J, Galbraith R, Lawson E, Laslett G, Yoshida H, Jones R, Fullagar R, Jacobsen G, Hua Q. 1998. Optical and
radiocarbon dating at Jinmium rock shelter in northern Australia. Nature 393: 358–362.Saucier RT. 1994. Geomorphology and quaternary geologic history of the lower Mississippi valley, Volume 1. US Army Corps of Engineers:
Vicksburg.Shankman D. 1991. Botanical evidence for the age of oxbow lakes: a test of Harper’s hypothesis. Southeastern Geographer 31(2): 67–74.Spooner NA, Questiaux DG. 1989. Optical dating – Achenheim beyond the Eemian using green and infrared stimulation. In Long and Short
Range Limits in Luminescence Dating. Occasional Publication 9. Research Laboratory for Archaeology and History of Art: Oxford.Stanley DJ, Hait AK. 2000. Deltas, radiocarbon dating, and measurements of sediment storage and subsidence. Geology 28(4): 295–298.Stockton CW, Boggess WR, Meko DM. 1985. Climate and tree rings. In Paleoclimate Analysis and Modeling, Hecht AD (eds). Wiley: New
York; 71–161.

OSL analysis in oxbow lakes 1179
Copyright © 2005 John Wiley & Sons, Ltd. Earth Surf. Process. Landforms 30, 1161–1179 (2005)
Vohden J. 1999. Hydrologic and Water Quality Investigations Related to Placer Mining in Interior Alaska; Summer 1998. State of AlaskaDepartment of Natural Resources: Fairbanks, Alaska; 99–22.
Walling DE, He Q. 1998. The spatial variability of overbank sedimentation on river floodplains. Geomorphology 24(2–3): 209–223.Wallinga J. 2002. Optically stimulated luminescence dating of fluvial deposits: a review. Boreas 31(4): 303–322.Wintle AG, Murray AS. 1998. Towards the development of a preheat procedure for OSL dating of quartz. Radiation Measurements 29(1):
81–94.Wintle AG, Murray A. 1999. Luminescence sensitivity changes in quartz. Radiation Measurements 30: 107–118.