sedimentation rates, basin analysis and regional correlations
TRANSCRIPT
ELSEVIER Sedimentary Geology 120 (1998) 225–256
Sedimentation rates, basin analysis and regional correlations of threeNeoarchaean and Palaeoproterozoic sub-basins of the Kaapvaal craton
as inferred from precise U–Pb zircon ages from volcaniclasticsediments
Wladyslaw Altermann a,Ł, David R. Nelson ba Institut fur Allgemeine und Angewandte Geologie, Ludwig-Maximilians-Universitat, Luisenstraße 37, D-80333 Munchen, Germany
b Geological Survey of Western Australia, Department of Mines, 100 Plain Street, Perth, W.A., Australia
Received 29 April 1997; accepted 26 June 1997
Abstract
Calculation of sedimentation rates of Neoarchaean and Palaeoproterozoic siliciclastic and chemical sediments coveringthe Kaapvaal craton imply sedimentation rates comparable to their modern facies equivalents. Zircons from tuff bedsin carbonate facies of the Campbellrand Subgroup in the Ghaap Plateau region of the Griqualand West basin, TransvaalSupergroup, South Africa were dated using the Perth Consortium Sensitive High Resolution Ion Microprobe II (SHRIMPII). Dates of 2588 š 6 Ma and 2549 š 7 Ma for the middle and the upper part of the Nauga Formation indicate thatthe decompacted sedimentation rate for the peritidal flat to subtidal below-wave-base Stratifera and clastic carbonatefacies, southwest of the Ghaap Plateau at Prieska, was of up to 10 m=Ma, when not corrected for times of erosion andnon-deposition. Dates of 2516 š 4 Ma for the upper Gamohaan Formation and 2555 š 19 for the upper MontevilleFormation, indicate that some 2000 m of carbonate and subordinate shale sedimentation occurred during 16 Ma to62 Ma on the Ghaap Plateau. For these predominantly peritidal stromatolitic carbonates, decompacted sedimentationrates were of 40 m=Ma to over 150 m=Ma (Bubnoff units). The mixed siliciclastic and carbonate shelf facies of theSchmidtsdrif Subgroup and Monteville Formation accumulated with decompacted sedimentation rates of around 20 B. Forthe Kuruman Banded Iron Formation a decompacted sedimentation rate of up to 60 B can be calculated. Thus, for theentire examined deep shelf to tidal facies range, Archaean and Phanerozoic chemical and clastic sedimentation rates arecomparable. Four major transgressive phases over the Kaapvaal craton, followed by shallowing-upward sedimentation,can be recognized in the Prieska and Ghaap Plateau sub-basins, in Griqualand West, and partly also in the Transvaalbasin, and are attributed to second-order cycles of crustal evolution. First-order cycles of duration longer than 50 Macan also be identified. The calculated sedimentation rates reflect the rate of subsidence of a rift-related basin and can beascribed to tectonic and thermal subsidence. Comparison of the calculated sedimentation rates to published data from otherArchaean and Proterozoic basins allows discussion of general Precambrian basin development. Siliciclastic and carbonatesedimentation rates of Archaean and Palaeoproterozoic basins equivalent to those of younger systems suggest that similarmechanical, chemical and biological processes were active in the Precambrian as found for the Phanerozoic. Particularlyfor stromatolitic carbonates, matching modern and Neoarchaean sedimentation rates are interpreted as a strong hint of asimilar evolutionary stage of stromatolite-building microbiota. The new data also allow for improved regional correlationsacross the Griqualand West basin and with the Malmani Subgroup carbonates in the Transvaal basin. The Nauga Formation
Ł Corresponding author. E-mail: [email protected]
0037-0738/98/$ – see front matter 1998 Elsevier Science B.V. All rights reserved.PII S 0 0 3 7 - 0 7 3 8 ( 9 8 ) 0 0 0 3 4 - 7
226 W. Altermann, D.R. Nelson / Sedimentary Geology 120 (1998) 225–256
carbonates in the southwest of the Griqualand West basin are significantly older than the Gamohaan Formation in theGhaap Plateau region of this basin, but are in part, correlatives of the Oaktree Formation in the Transvaal and of parts ofthe Monteville Formation on the Ghaap Plateau. 1998 Elsevier Science B.V. All rights reserved.
Keywords: basin analysis; sedimentation rates; Archaean; Proterozoic; Kaapvaal craton; SHRIMP
1. Introduction
In the absence of biostratigraphic markers, high-precision isotopic data on the age and duration ofsedimentation are essential aspects of the study ofArchaean and Proterozoic sedimentary basins. Pre-cambrian siliciclastic basins containing thousandsof metres of sedimentary fill are often bracketedby rare and imprecise stratigraphic data, and lat-eral lithostratigraphic correlations lack argumentsother than similar facies development. As a conse-quence, poorly constrained basin models and equiv-ocal tectonic interpretations are commonly presentedfor Precambrian sediments. Precambrian carbonatebasin-fills are equally vulnerable. More particularly,the carbonate sedimentary processes and the mech-anism of carbonate precipitation are generally notwell understood for the Archaean (see discussionsby Grotzinger, 1989, 1990; Sumner and Grotzinger,1996). Although stromatolites and microbial remainsare known from older deposits, the earliest large car-bonate platforms apparently developed in intracra-tonic basins, following cratonic stabilization. Thiswas until recently ascribed to the Palaeoprotero-zoic, around 2.5–2.0 Ma ago (Grotzinger, 1989).With the development of new dating techniques,it has now become apparent that the earliest largecarbonate platforms developed during the Neoar-chaean, between 2700 Ma and 2500 Ma (Jahn etal., 1990; Arndt et al., 1991; Hassler, 1993; Bartonet al., 1994). Consequently, the time span betweencratonization and subsequent carbonate basin devel-opment is now believed to be shorter, with less than1.0 billion years separating the formation of granite–greenstone terranes at around 3.5 Ga to 3.0 Ga fromthe formation of huge stromatolitic platforms in theNeoarchaean (Beukes, 1986; Altermann and Her-big, 1991; Jahn and Simonson, 1995; Altermann andSiegfried, 1997). The rise of these platforms wasmade possible by the widespread absence of clas-tic input during periods of tectonic quiescence and
volcanic indolence. These two conditions are basicprerequisites for chemical or bio-chemical precipi-tation. In the presence of clastic detritus, microbialorganisms that facilitate carbonate precipitation canbe buried or swept away from the sediment surfaceand from the water column, and inorganic precipita-tion is hindered by the attachment of metal ions likeCa and Fe to mineral grains. The scarcity of clasticdetritus thus also allows purely chemical precipi-tates like Banded Iron Formations (BIF) to develop.It is certainly not coincidental, that large Precam-brian BIF provinces are often underlain by carbonateplatforms. Hence, the conspicuous carbonate (shale)and BIF association must be explained not only interms of palaeoenvironmental atmospheric and hy-drospheric evolution (Eriksson et al., 1998), but alsoas a function of basin development (Simonson andHassler, 1997). Comparisons of sedimentation andsubsidence rates of clastic and chemical sedimen-tary basins of the Precambrian and Phanerozoic, asattempted here, may reveal important aspects of tec-tonic history, rates of erosion and sediment transport,genesis of mineral deposits and the evolution ofcarbonate precipitating microbiota.The Kaapvaal craton of southern Africa hosts
three major Archaean to Palaeoproterozoic sub-basins, in which clastic and chemical sedimentsand igneous rocks accumulated. The Transvaal basinin the Transvaal geographic region, the GriqualandWest basin in the Northern Cape Province of SouthAfrica and the Kanye basin of Botswana sharelithostratigraphically similar deposits which uncon-formably cover the 2.7 Ga old volcanic VentersdorpSupergroup (Armstrong et al., 1991). In this con-tribution the Kanye basin is not discussed and theGriqualand West basin is subdivided into the Prieskasub-basin and Ghaap Plateau sub-basin, because oftheir different development. Carbonates are volumet-rically dominant rocks in the Prieska, Ghaap Plateauand Transvaal sub-basins and, together with thin,lowermost siliciclastic rocks, form the base of the
W. Altermann, D.R. Nelson / Sedimentary Geology 120 (1998) 225–256 227
Transvaal Supergroup, being overlain by BIF de-posits. The iron-rich chemical precipitates are in turnoverlain by a thick sequence of predominantly clasticsediments. Similar volcano-sedimentary basin devel-opment can be deduced in other Archaean cratonicterranes, but especially well on the Pilbara craton ofWestern Australia, where the lithostratigraphic suc-cession is strikingly similar to that of the Kaapvaalcraton (Cheney, 1996).At first glance, the three sub-basins discussed
here host mainly chemical sediments, and thus mightappear unsuitable for a special volume on Precam-brian clastic depositional systems. Nevertheless, wefeel that the sediments discussed herein impressivelydemonstrate the interplay of clastic and chemicalsedimentation and its appearance in the geologicrecord of the Precambrian. Moreover, the over-whelming presence of the chemical sediments inthe discussed sections is misleading. As our calcula-tions and age data demonstrate, clastic sedimentationplayed a major role at different times in differ-ent sub-basins. In some areas pelitic sedimentationdominated the environment for periods longer than50 m.y., with only short intervals occupied by car-bonate sediments. Because of different compactionbehaviour, however, carbonates apparently dominatethe sedimentary record. Upon decompaction, silici-clastic sediments would make up between one thirdand half of the sedimentary section below the BIF.The discussion of the development of the intracra-
tonic Griqualand West–Transvaal basin is based onnew age data presented herein, and on novel faciesinterpretation of the sediments in question (Alter-mann, 1997; Altermann and Siegfried, 1997). Subse-quently, we argue the possible processes responsiblefor the basin development and the widespread accu-mulation of siliciclastic, biochemical and chemicalsediments. We also compare our data and inter-pretation to other Precambrian examples from theliterature in an attempt to elaborate the principalaspects of sediment accumulation for chemical andclastic deposits during the Precambrian. Throughoutthis contribution we use the detailed stratigraphicsubdivision of Beukes (1980a), but with some mod-ifications for the Prieska sub-basin of GriqualandWest. A detailed discussion of various depositionaland stratigraphic models for the Griqualand Westand Transvaal carbonates is presented in Altermann
and Wotherspoon (1995) and in Altermann (1997).General stratigraphy is shown in Figs. 1–3 and 7.
2. Regional geology and stratigraphy ofGriqualand West
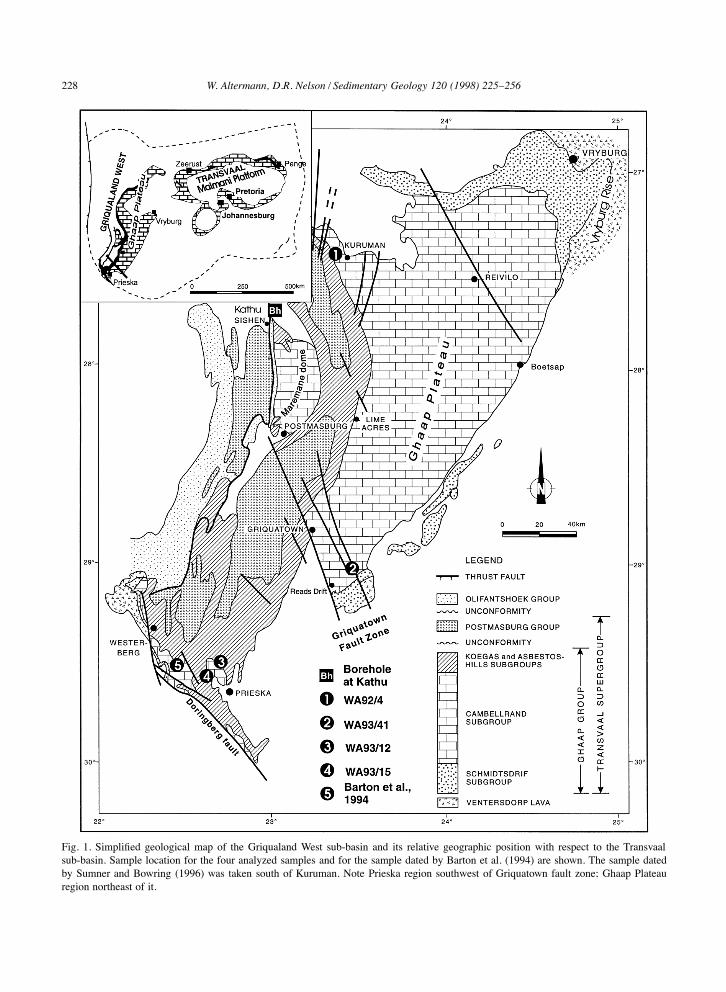
The Vryburg Formation of the Schmidtsdrif Sub-group (Beukes, 1979) of the Ghaap Group (Fig. 1)is the lowest stratigraphic unit above the unconfor-mity cutting into the 2709 Ma (Armstrong et al.,1991) Ventersdorp Supergroup lavas in GriqualandWest. This formation consists of shales, quartzites,siltstones and lava. According to the South AfricanCommittee for Stratigraphy (SACS, 1980), it cor-relates with the Black Reef Quartzite Formation inTransvaal (Fig. 7). A lava in the Vryburg Formationwas dated by Walraven et al. (in press) at 2642 š 3Ma. Stromatolitic carbonates of the upper Schmidts-drif and succeeding Campbellrand Subgroups con-formably cover the Vryburg Formation. A tuff bandin the upper part of the Gamohaan Formation, atthe top of the Campbellrand Subgroup (Figs. 1, 3and 7), was dated by Sumner and Bowring (1996)at 2521 š 3 Ma, giving a good approximation ofthe minimum age of the Ghaap Plateau carbonates.The carbonates are overlain by shales and subse-quently by the Kuruman and Griquatown BIF of theAsbestos Hills Subgroup (Fig. 1). The GriquatownBIF has an age of 2432 š 31 Ma (Trendall et al.,1990). The Koegas Subgroup of mainly siliciclasticdeposits is conformably superimposed on the BIFsediments, and is covered by the Makganyene glacialdeposits of the Postmasburg Group with a regionalunconformity (Figs. 1 and 7). Again unconformably,the 2222š 13 Ma old (Cornell et al., 1996) Ongelukbasaltic andesite formation covers the glacial tillite(Altermann and Halbich, 1991).The only continuous section through the
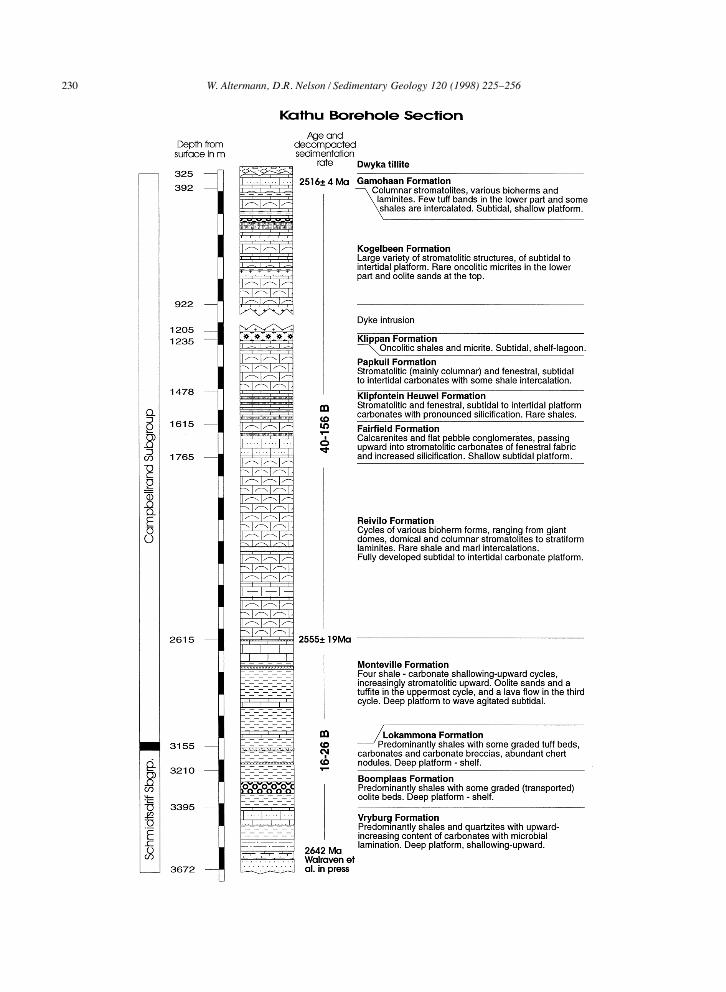
Schmidtsdrif and Campbellrand strata is preserved inthe Kathu drillcore. Altermann and Siegfried (1997)give a detailed description and facies interpretationof the sediments in the drillcore (Fig. 3). The entireArchaean sediment pile, in the core, with a totalthickness of almost 3000 m, exceeds by far the 1900m thickness deduced from outcrops (Beukes, 1980a).This thickness increase is attributed to lateral faciesvariation and to differing sedimentary conditions, butalso to a minor extent, to faulting and folding and
228 W. Altermann, D.R. Nelson / Sedimentary Geology 120 (1998) 225–256
Fig. 1. Simplified geological map of the Griqualand West sub-basin and its relative geographic position with respect to the Transvaalsub-basin. Sample location for the four analyzed samples and for the sample dated by Barton et al. (1994) are shown. The sample datedby Sumner and Bowring (1996) was taken south of Kuruman. Note Prieska region southwest of Griquatown fault zone; Ghaap Plateauregion northeast of it.
W. Altermann, D.R. Nelson / Sedimentary Geology 120 (1998) 225–256 229
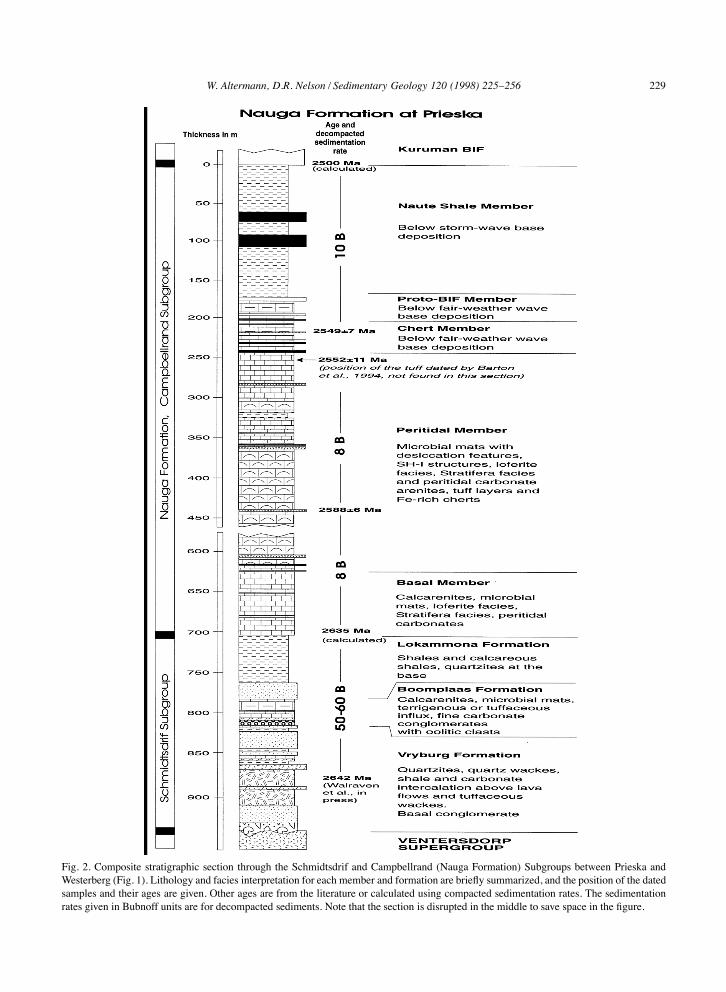
Fig. 2. Composite stratigraphic section through the Schmidtsdrif and Campbellrand (Nauga Formation) Subgroups between Prieska andWesterberg (Fig. 1). Lithology and facies interpretation for each member and formation are briefly summarized, and the position of the datedsamples and their ages are given. Other ages are from the literature or calculated using compacted sedimentation rates. The sedimentationrates given in Bubnoff units are for decompacted sediments. Note that the section is disrupted in the middle to save space in the figure.
230 W. Altermann, D.R. Nelson / Sedimentary Geology 120 (1998) 225–256
W. Altermann, D.R. Nelson / Sedimentary Geology 120 (1998) 225–256 231
to the difficulty of thickness measurements in poorlyoutcropping formations.In a facies distribution model developed by
Beukes (1980a), for the Campbellrand Subgroupcarbonates, two different facies realms in the south-western and northeastern part of the GriqualandWest basin are separated by a synsedimentary hinge,the Griquatown growth fault. North of this fault,the Reivilo to the Kogelbeen Formations form the‘Ghaap Plateau Facies’ sequence of stromatoliticcarbonate platform sediments (Beukes, 1980a). TheMonteville and Gamohaan Formations, respectively,at the base and at the top of the Campbellrand Sub-group, north of the fault zone (Figs. 1, 3 and 7), wereinterpreted as basinal, shelf, or endoclastic basinalfacies framing the platform. South of the Griquatownfault zone, these formations pass into the basinalNauga Formation (compare Figs. 2, 3 and 7), whichincludes the entire carbonate section of the Camp-bellrand Subgroup accumulated south of the fault.A thick sequence of shales (Naute Shale Member)with some chert beds of great lateral continuity cov-ers the Nauga Formation carbonates. The differencein thickness between the basinal carbonates southof the Griquatown fault (600 m) and the platformnorth of the fault (1600 m on the Ghaap Plateau) isstriking. Together with Beukes’ (1980a) depositionalmodel, this difference tempted Grotzinger (1989) tohypothesize a possible relief of 950 m between thebase and the top of the Campbellrand platform, atthe time of its terminal drowning.Altermann and Herbig (1991) proposed an alter-
native model in which the intracratonic GriqualandWest basin experienced its highest subsidence ratesin its central parts, north of the Griquatown fault. Thesubsidence was matched by stromatolitic growth andcarbonate accumulation (building the Ghaap Plateau)and thus, shallow marine conditions prevailed. Southof the Griquatown fault, peritidal flats often exposedto erosion prevented the accumulation of a thickpile of carbonate strata. The decline in carbonatesedimentation was accompanied by siliciclastic in-
Fig. 3. Brief lithological description and stratigraphic subdivision (Altermann and Siegfried, 1997) of the borehole drilled at Kathu,Sishen (Fig. 1). The ages of the formations were dated on samples from outcrops remote from Kathu, and are thus tentatively correlatedhere on lithostratigraphic grounds. The sedimentation rates given in Bubnoff units are for decompacted sediments. Note that the sectionis disrupted in the upper part (thick dyke intrusion) to save space.
flux, evident from the increase in shale content. Thisincrease culminated in the deposition of the NauteShales, followed by precipitation of BIF of the As-bestos Hills Subgroup, which date between around2500 and 2432 Ma (Trendall et al., 1990, 1995;Barton et al., 1994).The detailed sedimentology, geochemistry and
petrography of tuffs from the Campbellrand Sub-group are described by Altermann (1996a). Separa-tion of fine and coarse grains in tholeiitic tuffs of theNauga Formation carbonates suggests deposition inshallow water, perhaps a few metres to 40 m depth.A tuff layer close to the top of the Nauga Formationcarbonates was dated by the SHRIMP U–Pb methodon zircons, at 2552 š 11 Ma (Barton et al., 1994).Proximal tuffs were found within the Nauga Forma-tion, near Prieska. The tuffs thin out and becomefiner-grained towards the north and away from theperitidal flats described by Altermann and Herbig(1991). Altermann (1996a) suggested that the vol-canic centres were located along the southwesternmargin of the Transvaal sea, to the south and south-west of the present margin of the Kaapvaal craton.Volcanoes might have formed islands and the cratonand the epeiric basin probably extended farther tothe southwest, into areas now occupied by youngerProterozoic mobile belts (Altermann and Halbich,1991). Zircons collected from these tuffs are thesource for the new age data presented herein.New investigations of the Nauga Formation show
rapid lateral and vertical facies changes within thelower part of this formation. Vertically, the NaugaFormation can be subdivided into five informal mem-bers, as illustrated in Fig. 2 (Kiefer et al., 1995;Altermann, unpubl. data).(1) A mixed siliciclastic and carbonate clastic
member at the base of the formation.(2) A peritidal member, consisting of widespread
tufted Stratifera-like mats with abundant palisadestructures intercalated with loferite beds and tidalchannel carbonate sand bodies.(3) A chert member follows, in which the tidal flat
232 W. Altermann, D.R. Nelson / Sedimentary Geology 120 (1998) 225–256
features give way to deep lagoonal platy dolmicrites,dolarenites and microbial laminites. Three laterallypersistent chert marker horizons are intercalated.(4) An overlying proto-BIF member consists
mainly of carbonates with some coiled thin micro-bial mats (Kiefer et al., 1995) resembling those in thechert member. It comprises three laterally persistentBIF-like horizons (proto-BIF of Button, 1976).(5) The approximately 150 m thick Naute Shale
member covers the carbonates. These finely lami-nated shales, intercalated with rare thin tuffites andprominent chert beds, represent deposition on theshelf, probably below the storm wave-base.
2.1. Correlation to Malmani Subgroup in theTransvaal
No continuous outcrops exist between the sedi-ments of the preserved Transvaal basin and of theGriqualand West basin, although the two sub-basinsshare the same basement of Ventersdorp Supergroupvolcanics (Fig. 1). The Black Reef Quartzite Forma-tion (Fig. 7) is generally accepted as the Transvaalbasin equivalent of the 2642 Ma old Vryburg Forma-tion (lower Schmidtsdrif Subgroup) in GriqualandWest, for both formations unconformably cover theVentersdorp Supergroup (compare Figs. 2, 3 and 7;SACS, 1980). The upper Schmidtsdrif Subgroup iscommonly correlated with the Oaktree Formationat the base of the Malmani Subgroup in Transvaal(Altermann and Wotherspoon, 1995). Tuffs in theupper Oaktree Formation were dated at 2550š 3 Ma(U–Pb on zircons) by Walraven and Martini (1995).Like the Ghaap Plateau facies, the Malmani Sub-group carbonates also consist of several formations.These formations were grouped into genetic unitsand attributed by Clendenin (1989) to transgression–regression cycles. The first two transgressive cy-cles are documented in the lower Monte ChristoFormations of the lower Malmani sediments. Theupper three formations of the Malmani carbonates(Lyttelton, Eccles and Frisco Formations) reflect to-gether the third major transgression, followed by thedeposition of the Penge Iron Formation (fourth trans-gressive cycle) which correlates with the KurumanBIF in Griqualand West.Beukes (1986) correlated the Campbellrand Sub-
group with the Malmani Subgroup in the Transvaal,
by defining stratigraphic units on the basis of stroma-tolite morphology and on carbonate facies and pet-rography. Such a lithostratigraphic approach is onlyapplicable if the cyclicity and hydrodynamic condi-tions were uniform across the entire basin. In this cor-relation, the Gamohaan Formation, at the top of theCampbellrand Subgroup, passes northeastward intothe Frisco Formation, at the top of the Malmani Sub-group carbonates in Transvaal. The Monteville andReivilo Formations of Griqualand West interfingerwith the Oaktree andMonte Christo Formations at thebase of the Malmani Subgroup (Beukes, 1986, fig. 7).
3. Sample localities and description
Four samples were processed for zircon dating.The sampling sites are shown in Fig. 1.(1) Sample WA92=4 was collected from the up-
permost tuff bed of the Gamohaan Formation, atthe Kuruman Kop peak, north of the town Kuru-man (Fig. 1). This stratigraphic level was correlatedby Beukes (1980a) with the stratigraphic position ofthe sample dated by Barton et al. (1994) and of thesample WA93=12 described below. The stratigraphicsection through the Kuruman Kop was recorded anddepicted in detail by Halbich et al. (1992, fig. 10).The sample is from the upper Gamohaan Formation,from lithofacies ‘e’ (microbial laminites, grainstonesand shales) of Halbich et al. (1992), and lies ap-proximately 40 m below the nearly 30 m thick Tsi-neng member (Beukes, 1980b), which represents atransition from carbonate to BIF sedimentation. Thestratigraphic thickness to the massive Kuruman IFproper is around 75 m. It is probably the same tuffbed as that dated by Sumner and Bowring (1996) at2521š3 Ma. The horizon is 45 cm thick and consistsof three graded, fine lapilli to ash tuff intervals withthin dolarenitic interlayers, and with some tuffaceousadmixture. The pure tuff beds are interpreted as fall-out tuffs, as they are normally graded, lack Bouma in-tervals and there is a general absence of layers resem-bling turbidites within this facies (Altermann, 1996a).Over 50 zircons were recovered from about 7
kg of rock. The zircons are morphologically ho-mogeneous, short- to long-prismatic (100–150 µm),idiomorphic, pink and clear. Rare inclusions arepresent in some of the zircons.(2) Sample WA93=41 was collected from an out-
W. Altermann, D.R. Nelson / Sedimentary Geology 120 (1998) 225–256 233
crop along the road from Douglas to Niekerkshoop,on the farm Suiversfontein and is from the upperMon-teville Formation, Ghaap Plateau, adjacent to the Gri-quatown fault. The carbonate facies at the samplingarea is of cross-bedded and finely laminated dolaren-ites. The volcaniclastic band in these dolarenites is 20cm thick. A few thin shale beds are intercalated in thelower part of the outcrop, together with three promi-nent Fe-rich chert beds, that are brecciated in placesalong aminor fault (approximately 10mbelow the tuffband). The breccia exhibits weak Pb (galena) miner-alization. Above the tuff band, cross-bedded dolaren-ites pass upward into stromatolitic mats. The micro-bial lamination builds lateral linkage between smallconical to sub-conical columns. Abundant, cm-largefenestral cavities filled by calcite and rarely by quartz,are irregularly distributed in the columns and betweenthe laminae. The bioherms resemble thyssagetaceanstromatolites, as described by Hofmann and Masson(1994). The overall facies is interpreted as shallowing-upward, entirely subtidal, but with upward decreasinghydrodynamic energy. The volcaniclastic bed itselfshows no internal sedimentary structures apart froma faint lamination. Because different zircon popula-tions were found in this sample, it may represent areworked sediment, such as a tuffite. This interpreta-tion is consistent with the nature of the cross-beddeddolarenites directly above and below the tuffite.About 25 zircons were recovered from 8.5 kg of
sample material. The sample was rich in pyrite. Twoof the zircons were well rounded and abraded andof orange-brown colour. These were not analyzed.Other zircons were broken, long- or short-prismatic,xenomorphic, between 50 and 100 µm long, andsome of them were abraded (subangular to sub-rounded). They exhibit common inclusions and allwere pink and turbid.(3) Sample WA93=12 was collected on the farm
Kliphuis, at Prieska, from the uppermost tuff bedin the carbonates, below the Naute Shales. It comesfrom the top of the chert member, 10 m above thethree prominent chert marker horizons of the NaugaFormation. In the measured section, it is located 48m below the Naute Shale member and almost at thesame stratigraphic level as the sample dated by Bar-ton et al. (1994). However, the sample dated by Bar-ton et al. (1994) from the farm Nauga, approximately30 km northwest of the farm Kliphuis and approx-
imately 60 m below the Naute Shale member, wastaken 6 m below the three prominent chert markerhorizons of the chert member (Figs. 1 and 2). Thesethree chert horizons are very uniformly distributedbetween Nauga and Kliphuis. The tuff band dated byBarton et al. (1994) pinches out and is not presentin the Kliphuis area. On the farm Klein Naute, mid-way between Nauga and Kliphuis (Fig. 1), 28 m ofsedimentary section separate these two tuff horizons.About 30 zircons were recovered from 7.35 kg
of rock. The zircons are morphologically similar,equant to long-prismatic, idiomorphic, 100–200 µmlong, pink and dim. Rare inclusions are present insome of the zircons.(4) Sample WA93=15 was collected on the farm
Engelwildgeboomfontain, at Prieska, close to theKliphuis farm boundary. It is from the same sec-tion as WA93=12 and stratigraphically about 230m below it, within the peritidal member of theNauga Formation. The section (shown in Fig. 2)does not outcrop continuously and has been as-sembled from several shorter sections, measured by‘Jacob’s staff’, and only a few tens to hundreds ofmetres apart. This was necessitated by folds andfaults displacing the measured sections of strata rel-ative to each other. Approximately 10 m of strata,judged from detailed mapping, are missing betweenthe measured sections from the Engelwildgeboom-fontain and Kliphuis farms, and are probably of shalethat makes no outcrops. The tuff bed sampled here isonly 5 cm thick and roughly correlative of Beukes’(1980a) ‘tuff 4’ from the ‘Central Dolomite Zone’(Beukes, 1980a, fig. 22). This zone is characterizedby microbial laminites with Stacked Hemispheroids-Inverted (SH-I) structures and interpreted as peritidalto supratidal Stratifera-like biostromes (compare Al-termann and Herbig, 1991).Over 100 zircons were recovered from 5.0 kg
of rock. The zircons are equant to long-prismatic,idiomorphic, 100–150 µm long, pink and clear, withsome inclusions.
4. Analytical procedures
Samples were crushed in a jaw crusher and bro-ken to <2 mm particle size in a cylindrical rollingmill, and then passed through a 180 µm sieve. Thesieved fraction was processed using a Wilfley ta-
234 W. Altermann, D.R. Nelson / Sedimentary Geology 120 (1998) 225–256
ble. The heavy mineral fraction was further purifiedusing a Frantz magnetic separator and methylene io-dine. Zircons were hand picked from the resultingmineral fraction, mounted in epoxy and sectionedapproximately in half, and the mount surface wasthen polished to expose the grain interiors.U–Th–Pb measurements were made using the
ion microprobe SHRIMP-II at Curtin University ofTechnology, employing operating and data-process-ing procedures similar to those described by Comp-ston et al. (1984) and Williams et al. (1984). Pb=Uratios were determined relative to that of the stan-dard Sri Lanka zircon CZ3, which has been assigneda 206Pb=238U value of 0.0914 corresponding to anage of 564 Ma. Reproducibility of the Pb=U ratio ofthe standard was better than š1:6%; this uncertaintyis included in the quoted analytical errors. Errorsgiven on individual analyses are based on countingstatistics and are at the 1¦ level; those given onpooled analyses are at 2¦; or 95% confidence. Agescited are based on weighted mean 207Pb=206Pb ratios.Features such as zircon morphology (size, shape,
zonation, etc.) and chemistry (U and Th contents,Th=U ratios), degree of discordance of each analy-sis and evidence of radiogenic Pb loss were taken intoaccount in the assessment of the validity of pooledanalyses. Dates were determined using the mean207Pb=206Pb ratios determined from pooled analyses.Individual analyses were weighted according to theinverse square of the individual analytical error (basedon counting statistics) of the analysis, for the de-termination of the weighted mean 207Pb=206Pb ratioof pooled analyses. Analyses more than š2¦ fromthe weighted mean value were treated as outliers anddeleted from the pool, and the weighted mean valuethen recalculated. This process was repeated until allpooled analyses were within š2¦ of the weightedmean value and the remaining pooled data were nor-mally distributed about the mean. Where there wasno obvious justification (based on zircon morpho-logical or chemical differences) for deletion of out-liers and their deletion did not significantly affectthe age and error obtained, the outliers were retainedwithin the pooled population used to determine theweighted mean date and error. A chi-square test wasapplied to grouped analyses in order to assess the rel-ative effects of analytical sources of error, such ascounting statistics, and geological sources of error,
such as that arising from the inclusion of analyses ofslightly older xenocryst zircons or zircons that mayhave lost small amounts of radiogenic Pb. Chi-squarevalues for grouped analyses of less than or equal tounity indicate that scatter about the weighted meanvalue determined for the grouped analyses can be ac-counted for by analytical sources of error alone. Achi-square value significantly greater than unity indi-cates that analyses are not normally distributed aboutthe weighted mean value and that other (geologi-cal) sources of error are present within the groupedpopulation. In these cases, the 95% confidence erroris based on the observed scatter about the weightedmean 207Pb=206Pb ratio of pooled analyses.
5. Analytical results
5.1. WA92=4
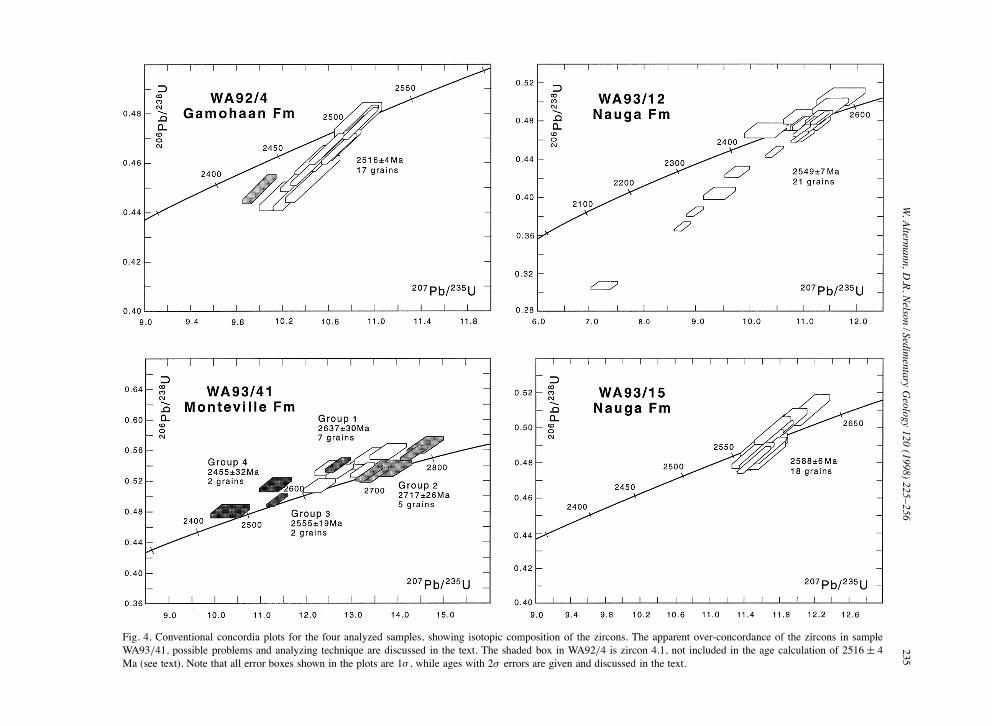
Analytical data are summarized in Table 1 andshown on a conventional concordia plot in Fig. 4.All analyses plot within the error of the concordia,or are only slightly discordant. Sixteen analyses of16 zircons gave a 207Pb=206Pb age of 2516 š 4 Ma(95% confidence). This is regarded as the crystalliza-tion age of the zircons and the age of the tuff layer.One analysis (4.1) had a slightly lower 207Pb=206Pbratio corresponding to an age of 2476 š 9 (1¦ )Ma. This analysis is probably of a zone which hasexperienced some post-crystallization loss of radio-genic Pb. Cathodoluminescence imaging of the zir-con growth zones reveals no abnormalities at theanalyzed site. If this analysis is included in the sta-tistical calculations, the weighted mean 207Pb=206Pbage is 2513 š 4 Ma, and thus insignificantly differ-ent from the calculated age of 2516 š 4 Ma. Oneanalysis (3.1), indicated an early Palaeozoic age andis believed to be a contaminant introduced duringsample preparation, and is not discussed further.
5.2. WA93=41
A total of sixteen analyses were obtained on four-teen zircons. The analyses fall into four statisticallydistinguishable age groups (Fig. 4).Group 1, consisting of seven spots on five zir-
cons (0.1, 3.1, 3.2, 4.1, 6.1, 6.2, 8.1), has a pooledweighted mean 207Pb=206Pb age of 2637 š 30 Ma.
W.Alterm
ann,D.R.Nelson
/Sedimentary
Geology
120(1998)225–256
235
Fig. 4. Conventional concordia plots for the four analyzed samples, showing isotopic composition of the zircons. The apparent over-concordance of the zircons in sampleWA93=41, possible problems and analyzing technique are discussed in the text. The shaded box in WA92=4 is zircon 4.1, not included in the age calculation of 2516š 4Ma (see text). Note that all error boxes shown in the plots are 1¦ , while ages with 2¦ errors are given and discussed in the text.
236W.Alterm
ann,D.R.Nelson
/Sedimentary
Geology
120(1998)225–256
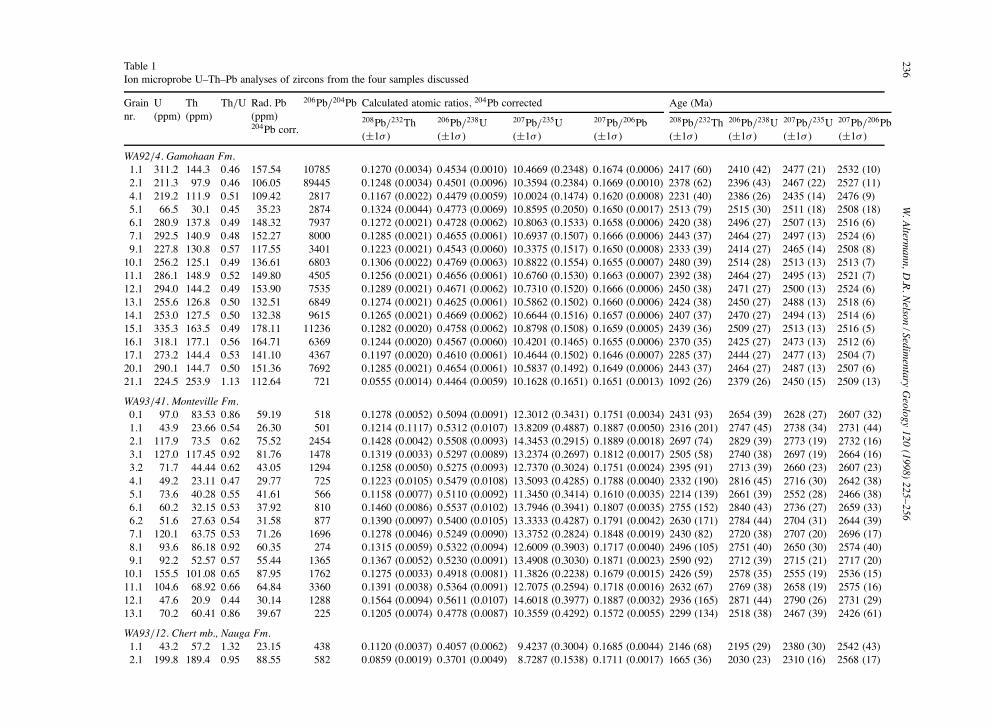
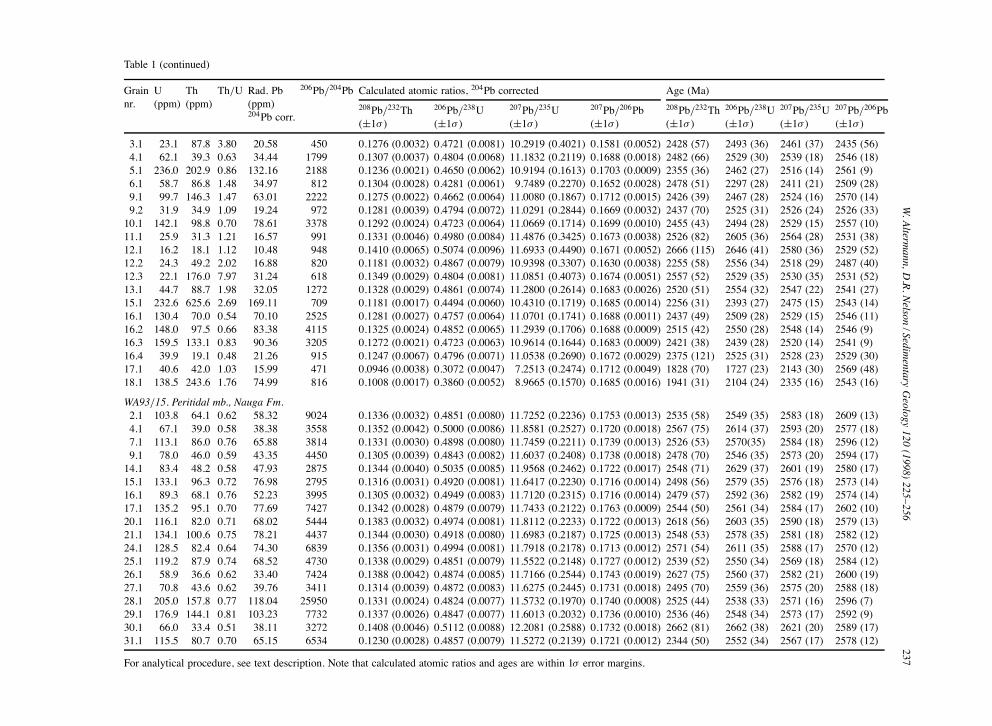
Table 1Ion microprobe U–Th–Pb analyses of zircons from the four samples discussed
Grain U Th Th=U Rad. Pb 206Pb=204Pb Calculated atomic ratios, 204Pb corrected Age (Ma)nr. (ppm) (ppm) (ppm)
204Pb corr.208Pb=232Th 206Pb=238U 207Pb=235U 207Pb=206Pb 208Pb=232Th 206Pb=238U 207Pb=235U 207Pb=206Pb(š1¦ ) (š1¦ ) (š1¦ ) (š1¦ ) (š1¦ ) (š1¦ ) (š1¦ ) .š1¦ /
WA92=4. Gamohaan Fm.1.1 311.2 144.3 0.46 157.54 10785 0.1270 (0.0034) 0.4534 (0.0010) 10.4669 (0.2348) 0.1674 (0.0006) 2417 (60) 2410 (42) 2477 (21) 2532 (10)2.1 211.3 97.9 0.46 106.05 89445 0.1248 (0.0034) 0.4501 (0.0096) 10.3594 (0.2384) 0.1669 (0.0010) 2378 (62) 2396 (43) 2467 (22) 2527 (11)4.1 219.2 111.9 0.51 109.42 2817 0.1167 (0.0022) 0.4479 (0.0059) 10.0024 (0.1474) 0.1620 (0.0008) 2231 (40) 2386 (26) 2435 (14) 2476 (9)5.1 66.5 30.1 0.45 35.23 2874 0.1324 (0.0044) 0.4773 (0.0069) 10.8595 (0.2050) 0.1650 (0.0017) 2513 (79) 2515 (30) 2511 (18) 2508 (18)6.1 280.9 137.8 0.49 148.32 7937 0.1272 (0.0021) 0.4728 (0.0062) 10.8063 (0.1533) 0.1658 (0.0006) 2420 (38) 2496 (27) 2507 (13) 2516 (6)7.1 292.5 140.9 0.48 152.27 8000 0.1285 (0.0021) 0.4655 (0.0061) 10.6937 (0.1507) 0.1666 (0.0006) 2443 (37) 2464 (27) 2497 (13) 2524 (6)9.1 227.8 130.8 0.57 117.55 3401 0.1223 (0.0021) 0.4543 (0.0060) 10.3375 (0.1517) 0.1650 (0.0008) 2333 (39) 2414 (27) 2465 (14) 2508 (8)10.1 256.2 125.1 0.49 136.61 6803 0.1306 (0.0022) 0.4769 (0.0063) 10.8822 (0.1554) 0.1655 (0.0007) 2480 (39) 2514 (28) 2513 (13) 2513 (7)11.1 286.1 148.9 0.52 149.80 4505 0.1256 (0.0021) 0.4656 (0.0061) 10.6760 (0.1530) 0.1663 (0.0007) 2392 (38) 2464 (27) 2495 (13) 2521 (7)12.1 294.0 144.2 0.49 153.90 7535 0.1289 (0.0021) 0.4671 (0.0062) 10.7310 (0.1520) 0.1666 (0.0006) 2450 (38) 2471 (27) 2500 (13) 2524 (6)13.1 255.6 126.8 0.50 132.51 6849 0.1274 (0.0021) 0.4625 (0.0061) 10.5862 (0.1502) 0.1660 (0.0006) 2424 (38) 2450 (27) 2488 (13) 2518 (6)14.1 253.0 127.5 0.50 132.38 9615 0.1265 (0.0021) 0.4669 (0.0062) 10.6644 (0.1516) 0.1657 (0.0006) 2407 (37) 2470 (27) 2494 (13) 2514 (6)15.1 335.3 163.5 0.49 178.11 11236 0.1282 (0.0020) 0.4758 (0.0062) 10.8798 (0.1508) 0.1659 (0.0005) 2439 (36) 2509 (27) 2513 (13) 2516 (5)16.1 318.1 177.1 0.56 164.71 6369 0.1244 (0.0020) 0.4567 (0.0060) 10.4201 (0.1465) 0.1655 (0.0006) 2370 (35) 2425 (27) 2473 (13) 2512 (6)17.1 273.2 144.4 0.53 141.10 4367 0.1197 (0.0020) 0.4610 (0.0061) 10.4644 (0.1502) 0.1646 (0.0007) 2285 (37) 2444 (27) 2477 (13) 2504 (7)20.1 290.1 144.7 0.50 151.36 7692 0.1285 (0.0021) 0.4654 (0.0061) 10.5837 (0.1492) 0.1649 (0.0006) 2443 (37) 2464 (27) 2487 (13) 2507 (6)21.1 224.5 253.9 1.13 112.64 721 0.0555 (0.0014) 0.4464 (0.0059) 10.1628 (0.1651) 0.1651 (0.0013) 1092 (26) 2379 (26) 2450 (15) 2509 (13)
WA93=41. Monteville Fm.0.1 97.0 83.53 0.86 59.19 518 0.1278 (0.0052) 0.5094 (0.0091) 12.3012 (0.3431) 0.1751 (0.0034) 2431 (93) 2654 (39) 2628 (27) 2607 (32)1.1 43.9 23.66 0.54 26.30 501 0.1214 (0.1117) 0.5312 (0.0107) 13.8209 (0.4887) 0.1887 (0.0050) 2316 (201) 2747 (45) 2738 (34) 2731 (44)2.1 117.9 73.5 0.62 75.52 2454 0.1428 (0.0042) 0.5508 (0.0093) 14.3453 (0.2915) 0.1889 (0.0018) 2697 (74) 2829 (39) 2773 (19) 2732 (16)3.1 127.0 117.45 0.92 81.76 1478 0.1319 (0.0033) 0.5297 (0.0089) 13.2374 (0.2697) 0.1812 (0.0017) 2505 (58) 2740 (38) 2697 (19) 2664 (16)3.2 71.7 44.44 0.62 43.05 1294 0.1258 (0.0050) 0.5275 (0.0093) 12.7370 (0.3024) 0.1751 (0.0024) 2395 (91) 2713 (39) 2660 (23) 2607 (23)4.1 49.2 23.11 0.47 29.77 725 0.1223 (0.0105) 0.5479 (0.0108) 13.5093 (0.4285) 0.1788 (0.0040) 2332 (190) 2816 (45) 2716 (30) 2642 (38)5.1 73.6 40.28 0.55 41.61 566 0.1158 (0.0077) 0.5110 (0.0092) 11.3450 (0.3414) 0.1610 (0.0035) 2214 (139) 2661 (39) 2552 (28) 2466 (38)6.1 60.2 32.15 0.53 37.92 810 0.1460 (0.0086) 0.5537 (0.0102) 13.7946 (0.3941) 0.1807 (0.0035) 2755 (152) 2840 (43) 2736 (27) 2659 (33)6.2 51.6 27.63 0.54 31.58 877 0.1390 (0.0097) 0.5400 (0.0105) 13.3333 (0.4287) 0.1791 (0.0042) 2630 (171) 2784 (44) 2704 (31) 2644 (39)7.1 120.1 63.75 0.53 71.26 1696 0.1278 (0.0046) 0.5249 (0.0090) 13.3752 (0.2824) 0.1848 (0.0019) 2430 (82) 2720 (38) 2707 (20) 2696 (17)8.1 93.6 86.18 0.92 60.35 274 0.1315 (0.0059) 0.5322 (0.0094) 12.6009 (0.3903) 0.1717 (0.0040) 2496 (105) 2751 (40) 2650 (30) 2574 (40)9.1 92.2 52.57 0.57 55.44 1365 0.1367 (0.0052) 0.5230 (0.0091) 13.4908 (0.3030) 0.1871 (0.0023) 2590 (92) 2712 (39) 2715 (21) 2717 (20)10.1 155.5 101.08 0.65 87.95 1762 0.1275 (0.0033) 0.4918 (0.0081) 11.3826 (0.2238) 0.1679 (0.0015) 2426 (59) 2578 (35) 2555 (19) 2536 (15)11.1 104.6 68.92 0.66 64.84 3360 0.1391 (0.0038) 0.5364 (0.0091) 12.7075 (0.2594) 0.1718 (0.0016) 2632 (67) 2769 (38) 2658 (19) 2575 (16)12.1 47.6 20.9 0.44 30.14 1288 0.1564 (0.0094) 0.5611 (0.0107) 14.6018 (0.3977) 0.1887 (0.0032) 2936 (165) 2871 (44) 2790 (26) 2731 (29)13.1 70.2 60.41 0.86 39.67 225 0.1205 (0.0074) 0.4778 (0.0087) 10.3559 (0.4292) 0.1572 (0.0055) 2299 (134) 2518 (38) 2467 (39) 2426 (61)
WA93=12. Chert mb., Nauga Fm.1.1 43.2 57.2 1.32 23.15 438 0.1120 (0.0037) 0.4057 (0.0062) 9.4237 (0.3004) 0.1685 (0.0044) 2146 (68) 2195 (29) 2380 (30) 2542 (43)2.1 199.8 189.4 0.95 88.55 582 0.0859 (0.0019) 0.3701 (0.0049) 8.7287 (0.1538) 0.1711 (0.0017) 1665 (36) 2030 (23) 2310 (16) 2568 (17)
W.Alterm
ann,D.R.Nelson
/Sedimentary
Geology
120(1998)225–256
237
Table 1 (continued)
Grain U Th Th=U Rad. Pb 206Pb=204Pb Calculated atomic ratios, 204Pb corrected Age (Ma)nr. (ppm) (ppm) (ppm)
204Pb corr.208Pb=232Th 206Pb=238U 207Pb=235U 207Pb=206Pb 208Pb=232Th 206Pb=238U 207Pb=235U 207Pb=206Pb(š1¦ ) (š1¦ ) (š1¦ ) (š1¦ ) (š1¦ ) (š1¦ ) (š1¦ ) .š1¦ /
3.1 23.1 87.8 3.80 20.58 450 0.1276 (0.0032) 0.4721 (0.0081) 10.2919 (0.4021) 0.1581 (0.0052) 2428 (57) 2493 (36) 2461 (37) 2435 (56)4.1 62.1 39.3 0.63 34.44 1799 0.1307 (0.0037) 0.4804 (0.0068) 11.1832 (0.2119) 0.1688 (0.0018) 2482 (66) 2529 (30) 2539 (18) 2546 (18)5.1 236.0 202.9 0.86 132.16 2188 0.1236 (0.0021) 0.4650 (0.0062) 10.9194 (0.1613) 0.1703 (0.0009) 2355 (36) 2462 (27) 2516 (14) 2561 (9)6.1 58.7 86.8 1.48 34.97 812 0.1304 (0.0028) 0.4281 (0.0061) 9.7489 (0.2270) 0.1652 (0.0028) 2478 (51) 2297 (28) 2411 (21) 2509 (28)9.1 99.7 146.3 1.47 63.01 2222 0.1275 (0.0022) 0.4662 (0.0064) 11.0080 (0.1867) 0.1712 (0.0015) 2426 (39) 2467 (28) 2524 (16) 2570 (14)9.2 31.9 34.9 1.09 19.24 972 0.1281 (0.0039) 0.4794 (0.0072) 11.0291 (0.2844) 0.1669 (0.0032) 2437 (70) 2525 (31) 2526 (24) 2526 (33)10.1 142.1 98.8 0.70 78.61 3378 0.1292 (0.0024) 0.4723 (0.0064) 11.0669 (0.1714) 0.1699 (0.0010) 2455 (43) 2494 (28) 2529 (15) 2557 (10)11.1 25.9 31.3 1.21 16.57 991 0.1331 (0.0046) 0.4980 (0.0084) 11.4876 (0.3425) 0.1673 (0.0038) 2526 (82) 2605 (36) 2564 (28) 2531 (38)12.1 16.2 18.1 1.12 10.48 948 0.1410 (0.0065) 0.5074 (0.0096) 11.6933 (0.4490) 0.1671 (0.0052) 2666 (115) 2646 (41) 2580 (36) 2529 (52)12.2 24.3 49.2 2.02 16.88 820 0.1181 (0.0032) 0.4867 (0.0079) 10.9398 (0.3307) 0.1630 (0.0038) 2255 (58) 2556 (34) 2518 (29) 2487 (40)12.3 22.1 176.0 7.97 31.24 618 0.1349 (0.0029) 0.4804 (0.0081) 11.0851 (0.4073) 0.1674 (0.0051) 2557 (52) 2529 (35) 2530 (35) 2531 (52)13.1 44.7 88.7 1.98 32.05 1272 0.1328 (0.0029) 0.4861 (0.0074) 11.2800 (0.2614) 0.1683 (0.0026) 2520 (51) 2554 (32) 2547 (22) 2541 (27)15.1 232.6 625.6 2.69 169.11 709 0.1181 (0.0017) 0.4494 (0.0060) 10.4310 (0.1719) 0.1685 (0.0014) 2256 (31) 2393 (27) 2475 (15) 2543 (14)16.1 130.4 70.0 0.54 70.10 2525 0.1281 (0.0027) 0.4757 (0.0064) 11.0701 (0.1741) 0.1688 (0.0011) 2437 (49) 2509 (28) 2529 (15) 2546 (11)16.2 148.0 97.5 0.66 83.38 4115 0.1325 (0.0024) 0.4852 (0.0065) 11.2939 (0.1706) 0.1688 (0.0009) 2515 (42) 2550 (28) 2548 (14) 2546 (9)16.3 159.5 133.1 0.83 90.36 3205 0.1272 (0.0021) 0.4723 (0.0063) 10.9614 (0.1644) 0.1683 (0.0009) 2421 (38) 2439 (28) 2520 (14) 2541 (9)16.4 39.9 19.1 0.48 21.26 915 0.1247 (0.0067) 0.4796 (0.0071) 11.0538 (0.2690) 0.1672 (0.0029) 2375 (121) 2525 (31) 2528 (23) 2529 (30)17.1 40.6 42.0 1.03 15.99 471 0.0946 (0.0038) 0.3072 (0.0047) 7.2513 (0.2474) 0.1712 (0.0049) 1828 (70) 1727 (23) 2143 (30) 2569 (48)18.1 138.5 243.6 1.76 74.99 816 0.1008 (0.0017) 0.3860 (0.0052) 8.9665 (0.1570) 0.1685 (0.0016) 1941 (31) 2104 (24) 2335 (16) 2543 (16)
WA93=15. Peritidal mb., Nauga Fm.2.1 103.8 64.1 0.62 58.32 9024 0.1336 (0.0032) 0.4851 (0.0080) 11.7252 (0.2236) 0.1753 (0.0013) 2535 (58) 2549 (35) 2583 (18) 2609 (13)4.1 67.1 39.0 0.58 38.38 3558 0.1352 (0.0042) 0.5000 (0.0086) 11.8581 (0.2527) 0.1720 (0.0018) 2567 (75) 2614 (37) 2593 (20) 2577 (18)7.1 113.1 86.0 0.76 65.88 3814 0.1331 (0.0030) 0.4898 (0.0080) 11.7459 (0.2211) 0.1739 (0.0013) 2526 (53) 2570(35) 2584 (18) 2596 (12)9.1 78.0 46.0 0.59 43.35 4450 0.1305 (0.0039) 0.4843 (0.0082) 11.6037 (0.2408) 0.1738 (0.0018) 2478 (70) 2546 (35) 2573 (20) 2594 (17)14.1 83.4 48.2 0.58 47.93 2875 0.1344 (0.0040) 0.5035 (0.0085) 11.9568 (0.2462) 0.1722 (0.0017) 2548 (71) 2629 (37) 2601 (19) 2580 (17)15.1 133.1 96.3 0.72 76.98 2795 0.1316 (0.0031) 0.4920 (0.0081) 11.6417 (0.2230) 0.1716 (0.0014) 2498 (56) 2579 (35) 2576 (18) 2573 (14)16.1 89.3 68.1 0.76 52.23 3995 0.1305 (0.0032) 0.4949 (0.0083) 11.7120 (0.2315) 0.1716 (0.0014) 2479 (57) 2592 (36) 2582 (19) 2574 (14)17.1 135.2 95.1 0.70 77.69 7427 0.1342 (0.0028) 0.4879 (0.0079) 11.7433 (0.2122) 0.1763 (0.0009) 2544 (50) 2561 (34) 2584 (17) 2602 (10)20.1 116.1 82.0 0.71 68.02 5444 0.1383 (0.0032) 0.4974 (0.0081) 11.8112 (0.2233) 0.1722 (0.0013) 2618 (56) 2603 (35) 2590 (18) 2579 (13)21.1 134.1 100.6 0.75 78.21 4437 0.1344 (0.0030) 0.4918 (0.0080) 11.6983 (0.2187) 0.1725 (0.0013) 2548 (53) 2578 (35) 2581 (18) 2582 (12)24.1 128.5 82.4 0.64 74.30 6839 0.1356 (0.0031) 0.4994 (0.0081) 11.7918 (0.2178) 0.1713 (0.0012) 2571 (54) 2611 (35) 2588 (17) 2570 (12)25.1 119.2 87.9 0.74 68.52 4730 0.1338 (0.0029) 0.4851 (0.0079) 11.5522 (0.2148) 0.1727 (0.0012) 2539 (52) 2550 (34) 2569 (18) 2584 (12)26.1 58.9 36.6 0.62 33.40 7424 0.1388 (0.0042) 0.4874 (0.0085) 11.7166 (0.2544) 0.1743 (0.0019) 2627 (75) 2560 (37) 2582 (21) 2600 (19)27.1 70.8 43.6 0.62 39.76 3411 0.1314 (0.0039) 0.4872 (0.0083) 11.6275 (0.2445) 0.1731 (0.0018) 2495 (70) 2559 (36) 2575 (20) 2588 (18)28.1 205.0 157.8 0.77 118.04 25950 0.1331 (0.0024) 0.4824 (0.0077) 11.5732 (0.1970) 0.1740 (0.0008) 2525 (44) 2538 (33) 2571 (16) 2596 (7)29.1 176.9 144.1 0.81 103.23 7732 0.1337 (0.0026) 0.4847 (0.0077) 11.6013 (0.2032) 0.1736 (0.0010) 2536 (46) 2548 (34) 2573 (17) 2592 (9)30.1 66.0 33.4 0.51 38.11 3272 0.1408 (0.0046) 0.5112 (0.0088) 12.2081 (0.2588) 0.1732 (0.0018) 2662 (81) 2662 (38) 2621 (20) 2589 (17)31.1 115.5 80.7 0.70 65.15 6534 0.1230 (0.0028) 0.4857 (0.0079) 11.5272 (0.2139) 0.1721 (0.0012) 2344 (50) 2552 (34) 2567 (17) 2578 (12)
For analytical procedure, see text description. Note that calculated atomic ratios and ages are within 1¦ error margins.
238 W. Altermann, D.R. Nelson / Sedimentary Geology 120 (1998) 225–256
Group 2, consisting of five spots on five zircons(1.1, 2.1, 7.1, 9.1, 12.1), has a pooled weighted mean207Pb=206Pb age of 2718š 26 Ma.Group 3, two spots on two zircons (10.1, 11.1),
has a pooled weighted mean 207Pb=206Pb age of2555š 19 Ma.Group 4, consisting of analyses 5.1 and 13.1, has a
pooled weighted mean 207Pb=206Pb age of 2455š 32Ma.All analyses plot within error of the concordia or
are slightly reverse discordant (Fig. 4). Groups 1 and2 are interpreted to provide the ages of older for-mations eroded and redeposited within this reworkedvolcanic layer. The age of 2555 š 19 Ma (95% con-fidence) is regarded as the best approximation ofthe age of deposition of the tuffite layer. This agehas been reported as 2555 š 11 Ma by Altermann(1996b, 1997) and Altermann and Nelson (1996); re-calculation of the pooled weighted mean 207Pb=206Pbage, however, results in 2555 š 19 Ma. Analysesbelonging to Group 4 may reflect some post-crystal-lization loss of radiogenic Pb in these two zircons.Alternatively, these zircons may be contaminants.
5.3. WA93=12
Twenty-two analyses were obtained on sixteengrains from this sample. The results are summarizedin Table 1 and shown on a concordia plot in Fig. 4.Some analyses were discordant, indicating recentloss of radiogenic Pb. Twenty-one analyses of fifteengrains gave an age of 2549š7 Ma (95% confidence).This is the best estimate of the crystallization age ofthe zircons in the tuff and is equivalent to the deposi-tional age of the tuff. One analysis (14.1) indicated aPalaeozoic age and this zircon is interpreted to be acontaminant.The age of 2549š7 Ma determined for WA93=12
from the uppermost tuff of the Nauga Formationat Prieska, is within error of the age of 2552 š 11Ma determined by Barton et al. (1994), using theSHRIMP I in Canberra, for a tuff from a similarstratigraphic level from Nauga Farm (see discus-sion below). The two samples are taken about 30km apart. They are vertically separated by approxi-mately 30 m of chert and carbonate sediments, withWA93=12 being the stratigraphically higher sampleand from the chert member of the Nauga Formation.
5.4. WA93=15
The analytical data obtained for this sample aresummarized in Table 1 and shown on a concordiaplot in Fig. 4. Eighteen analyses on eighteen grainsgave an age of 2588š 6 Ma (95% confidence). Thisis interpreted as the deposition age of the tuff.
6. Regional interpretation of age-dated samples
Sample WA92=4, from the uppermost tuff layerat the Kuruman Kop peak, was dated at 2516 š 4Ma. This tuff band is therefore at least 22 Ma, andup to 44 Ma younger than the uppermost tuff layerin the carbonates at Prieska, some 250 km south ofKuruman (sample WA93=12; 2549š7 Ma). This agedifference indicates that the Gamohaan Formation is,at least in its uppermost part, significantly youngerand therefore not correlative of the Nauga Formationcarbonates, but of the Naute Shale member, thatwas deposited between 2549 š 7 Ma and the 2500Ma Kuruman BIF. From the discussion below, itbecomes clear that the stromatolitic formations of theGhaap Plateau facies below the Gamohaan and abovethe Monteville Formation (WA93=41, 2555š19 Ma)must also largely fall into the time of the depositionof Naute Shale member.The age of 2516š 4 Ma on WA92=4 is within an-
alytical error of the 2521 š 3 Ma date acquired for atuff band sampled south of Kuruman, probably fromthe same stratigraphic position within the GamohaanFormation (Sumner and Bowring, 1996). The strati-graphic thickness between the WA92=4 sample andthe Kuruman BIF is around 75 m (Halbich et al.,1992, fig. 10) and it can be speculated that, witha bulk sedimentation rate of 2 m=Ma to 4 m=Ma(Barton et al., 1994) for a carbonate, shale and BIFsuccession, the Kuruman BIF sedimentation in thisarea started about 2500 Ma to 2480 Ma ago. Thisis consistent with the calculations by Barton et al.(1994), for the onset of BIF sedimentation in thePrieska area, and with the zircon age data of Trendallet al. (1995).Sample WA93=41 yielded different morphologi-
cal and age populations of partly abraded and brokenzircons, consistent with its interpretation as a possi-bly reworked tuffaceous sediment (i.e. tuffite). Thecomplex age structure is difficult to interpret. The
W. Altermann, D.R. Nelson / Sedimentary Geology 120 (1998) 225–256 239
sample is from the upper Monteville Formation,the lowest formation of the Campbellrand Subgroupcarbonates on the Ghaap Plateau, and according toAltermann and Siegfried (1997) in their study of theKathu borehole, this unit is about 2000 m belowthe top of the Gamohaan Formation. The Campbell-rand Subgroup sediments total 2460 m thickness inthe borehole and the Monteville Formation is 540m thick, while the upper Gamohaan Formation hasbeen removed by erosion (compare Fig. 3).The oldest age group in this sample, 2718 š 26
Ma, coincides with the age of the Ventersdorp Super-group (2714š 8 and 2709š 4 Ma; Armstrong et al.,1991). Zircons of this age group are therefore inter-preted as sedimentary detritus from the Ventersdorpvolcanics. The Ventersdorp lavas underlie uncon-formably the Schmidtsdrif Subgroup and were alsolocally exposed to erosion during the time of deposi-tion of the Monteville Formation. Alternatively, thesezircons may have been deposited in the Schmidts-drif Subgroup and subsequently redeposited in theMonteville Formation.The age of 2637 š 30 Ma is very close to the age
of 2642 š 3 Ma determined for the Vryburg lavas(Walraven et al., in press) and is, therefore, too oldto represent the Monteville Formation. Thus, mostlikely, this age group also reflects the age of somesource area of siliciclastic debris. If VentersdorpSupergroup rocks were exposed during Montevilletimes, then the Vryburg Formation may also havebeen exposed in the vicinity. This age may thusindicate the existence of a locally developed uncon-formity between the Monteville Formation and theSchmidtsdrif Subgroup. A possible source area forthis detritus can be inferred in the Vryburg rise,northeast of the sampling site.The age group of 2555 š 19 Ma in the sample
WA93=41 is interpreted as providing the depositionalage for this upper Monteville Formation tuffite. It is,however, based on two zircons only. It is youngerthan the age of 2642 š 3 Ma of the Schmidtsdriflavas below the carbonates, as dated by Walraven etal. (in press), and older than sample WA92=4 fromthe Gamohaan Formation. This interpretation is alsosupported by a similar age obtained by Jahn et al.(1990), for stromatolitic carbonates approximately atthe same stratigraphic level (2557 š 49 Ma, Pb–Pbon carbonate). The age of 2555š 19 Ma is within the
error margins of the Oaktree Formation age (2550š3Ma; Walraven and Martini, 1995), at the base of theMalmani Subgroup, in an identical litho-stratigraphicposition, in the Transvaal basin (Beukes, 1986). Thisage is also within the error margins of the 2549 š 7Ma age of sample WA93=12 from the top of the chertmember of the Nauga Formation (compare Figs. 2and 7). On the basis of this result, the CampbellrandSubgroup carbonates on the Ghaap Plateau abovethe Monteville Formation accumulated within a timespan of about 50 Ma, as did the Naute Shales in thePrieska area.Sample WA93=12 from the chert member of the
upper Nauga Formation was dated at 2549 š 7 Ma.Sample WA93=15 from the middle Nauga Formationwas dated at 2588š 6 Ma. Prior to this time, almosthalf of the peritidal Nauga Formation carbonateshad been accumulated (Fig. 2). As the upper NaugaFormation is thus only slightly younger than the up-per Monteville Formation (Fig. 3), the older Naugacarbonates cannot be correlated with the Campbell-rand Subgroup on the Ghaap Plateau. As the upperOaktree Formation in the Transvaal basin was datedat 2550 š 3 Ma (Walraven and Martini, 1995), thecarbonate formations there between the Oaktree andthe BIF units must also be younger than the NaugaFormation carbonates, and are thus rather correlativeof the Naute Shales, assuming an age for the BIF inall basins of 2500 Ma (Trendall et al., 1995).
7. Implications for depositional rates of Archaeansediments
Various types of calculation of depositional rateshave been made by different authors for variablePrecambrian formations. Barton et al. (1994) definedthe sediment accumulation rate as the amount of sed-iment vertically accumulated over a given period oftime, irrespective of possible unconformities. Gener-ally, however, sediment accumulation rate (SAR) isdefined as:
SAR D Ws
.A Ð t/where Ws is the weight of sediment deposited duringtime t , over an area A.Sedimentation rate (SR) is defined as:
SR D ht
240 W. Altermann, D.R. Nelson / Sedimentary Geology 120 (1998) 225–256
where h is the uncompacted thickness of the sed-imentary section and t is the duration of its de-position. Hence, sedimentation rate is calculated inBubnoff units (B D mm ka$1 or m Ma$1) and ac-cumulation rate is expressed in g m$2 a$1 or t m$2
Ma$1 (Einsele, 1992).Workers such as Arndt et al. (1991), Barton et
al. (1994), Walraven and Martini (1995) and Barleyet al. (1997) did not correct the sedimentation ratesfor compaction, but discussed the possible alterationof the sedimentary record by intraformational ero-sional gaps or by times of non-deposition, and thepossible effects of compaction. Archaean and Pro-terozoic sedimentation rates may thus be calculatedfor compacted sediment, defined here as compactedsedimentation rate (cSR):
cSR D h.x/
twhere h.x/ equals the thickness of the sedimentcolumn, irrespective of post- and syn-depositionalalteration, and t is the time period during which thecolumn formed.Thickness correction for compaction and other
diagenetic influences is complex and can only beestimated for maximum values in the present case.Chemical crystallization in pore space and recrystal-lization of sediment particles, but especially of car-bonates, during diagenesis, can increase the sedimentthickness. This occurs, for instance, when aragoniteis transformed to calcite. On the other hand, pres-sure dissolution may result in a thickness decrease.The amount of such changes, however, is very dif-ficult to quantify, and can be judged only from thinsections, which cannot be examined for every partof the sediment column. Such detailed informationdoes not exist yet for the rocks under discussion.Stylolitization is, however, visible virtually in everyoutcrop and thin section examined. Pressure dissolu-tion can result in up to 20–35% thickness reductionin carbonates and therefore must be assumed alsofor the rocks under consideration. In the followingcalculations we compensate, however, only for aconservative estimate of 5% of thickness reductionby pressure dissolution, as applicable to the GhaapGroup carbonates in Griqualand West because of alack of any quantitative investigations.Although mechanical compaction in stromatolitic
carbonates is probably negligible, as evidenced bythe excellent form preservation of stromatolites andmicrofossils, carbonate muds and arenites undergoconsiderable mechanical compaction, mainly in thefirst 200 to 300 m of burial. Thickness reductionin carbonate muds can exceed up to 50%, and incarbonate sands, up to 30%, within this overburdenrange (Goldhammer, 1997). Here, for the reason oflack of quantitative data, we conservatively estimatea thickness reduction of only 20% for carbonatemuds and sands. Our conservative estimate is sup-ported by manifold signs of early lithification, foundby many authors (Klein et al., 1987; Altermann andHerbig, 1991; Altermann and Wotherspoon, 1995;Sumner and Grotzinger, 1996). In this estimate wehave also summarized carbonate muds and sandsinto one category to facilitate the calculations. Thisseems reasonable because the mud-to-sand ratio isfairly high (probably >5 : 1; Altermann and Herbig,1991; Altermann and Siegfried, 1997) and becausecarbonate sands tend to lithify more readily due totheir greater initial porosity.Siliciclastic pelitesmay compact from>80% orig-
inal porosity to about 10%, arenites (and coarsetuffs) compact from about 45% porosity to 20%, butthese values can increase significantly with increasingamounts of pelitic matrix. Considering the high over-burden of thousands of metres of sediment, of in partvery high density (average density of BIF approxi-mates 3100 kg m$3), we assume 70% compaction forshales and 25% compaction for sandstones.Silicified carbonates (cherts) can be treated as
carbonates sensu lato. Early silicification leads toexcellent preservation of the stromatolite morphol-ogy and of microfossils, and therefore compactionis probably negligible. Late diagenetic or post-dia-genetic silicification usually does not alter the mor-phology of bioherms significantly. Therefore, silici-fied carbonates are treated here as uncompacted. Theamount of compaction in other silicified sedimentscannot be ascertained because the processes and tim-ing of silicification were not investigated in detail.Several periods of silicification are known, however,for the sediments in question, most of them probablyof very late, post-diagenetic stage (Altermann andWotherspoon, 1995).Compaction in BIF and primary cherts is most
difficult to substantiate. The literature does not offer
W. Altermann, D.R. Nelson / Sedimentary Geology 120 (1998) 225–256 241
any standard figures for BIF compaction, althoughcompaction is clearly evident in structures such aspods, pillows, billows and macules (Trendall andBlockley, 1970; Trendall and Morris, 1983; Findlay,1994). Siliceous oozes contain up to 80% water, butlithify faster than muds, and therefore probably com-pact less. The Red Sea siliceous, Fe-rich oozes, and,in some respects, BIF-like silica-rich ore sludge canhave pore water contents in excess of 70–90% (We-ber-Diefenbach, 1977). Therefore, for the KurumanBIF, we assume up to 90% compaction. This is inaccordance with Trendall and Blockley (1970), whoassumed compaction of up to 95% for generationof genetic models based on deposition of seasonalvarves for the Hamersley BIF. This implies that 300m of BIF represents a thickness of about 3000 m oforiginal sediment, but reflects a much lower subsi-dence, assuming BIF deposition at roughly 100 m to200 m water depth (Klein and Beukes, 1989).In all calculations of basin subsidence, the amount
of compaction must be taken into consideration.Hence, decompacted sedimentation rates do not di-rectly reflect the rate of subsidence, but are rather afunction of compaction and subsidence. Compactionas assumed above reflects the final stage of lithifica-tion, disregarding gradual thickness decrease relatedto a growing overburden, and concomitant dewater-ing or dissolution. For a proper basin analysis, back-stripping of the sedimentary pile, where the gradualchanges of sediment and water column over the layerare restored step by step, is necessary. However, be-cause of the lack of data on periods of exposureand of age data within the sedimentary column, anddata on the burial and thermal history for these Ar-chaean to Proterozoic sub-basins (Altermann, 1997),our attempts to backstrip the sedimentary columnswere unreliable. The sedimentation and subsidencerates given here are thus probably in the lower rangeof the real figures, and should be regarded as mini-mum calculations based on conservative estimates ofcompaction.The preservation potential of sediment varies with
its composition and with the depositional environ-ment. Evidently, shallow water, peritidal environ-ments are predisposed to frequent erosion and non-deposition, while deep water sediments are usuallyexposed only during pronounced sea-level low standsor periods of tectonic uplift. In modern shallow water
carbonates, the rapid freshwater cementation, how-ever, drastically increases the resistance of these sed-iments to erosion and thus, shallow water carbonatesbehave in this respect very differently to siliciclas-tic rocks (Dravis, 1997). Cherts and BIF depositsare resistant to erosion and their chance of expo-sure is less due to the generally deeper depositionalenvironment, although their lithification is orders ofmagnitudes slower than that of peritidal carbonates.In most depositional environments, the estimated
sedimentation rate, when calculated over a long pe-riod of time (>100 ka), will only approximate theactual sedimentation (SR) or sediment accumula-tion (SAR) rate. In the Precambrian, because of the‘poor’ time resolution of ¾5 Ma and greater, thisdifference is of major importance, especially in tidalflat or other marginal marine to fluvial deposits,which are typically sites of discontinuous sedimen-tation. In fossil tidal flats, for example, generallyonly less than 50% of the actual sedimentation isrecorded. About 60% to 90% of the time coveredby a sediment column is characterized by erosionand=or non-deposition (Drummond and Wilkinson,1993; Osleger, 1994). Therefore, by implication, thepreserved sediments reflect only a fraction of theobserved time span, and corrections are necessaryfor times of erosion and non deposition. In pre-vegetational depositional systems, exposed horizonsand times of non-deposition are especially difficultto recognize because of the lack of typical environ-mental markers. The sedimentation rate, as definedabove, is rather a direct function of the average basinsubsidence rate and sediment supply within the giventime limits. Wider time limits covering broader fa-cies variation result in an average rate that is remotefrom the true rates of deposition for the particularsedimentary units.
7.1. The Nauga Formation and SchmidtsdrifSubgroup in the Prieska sub-basin
7.1.1. Sedimentation rates for the Naute Shale, theproto-BIF and chert members of the NaugaFormationBarton et al. (1994) calculated sedimentation rates
of 2–4 m=Ma (cSR) for this carbonate, shale andBIF succession. About 180 m of sedimentary rock,consisting of 50 m of carbonate (mainly muds) and
242 W. Altermann, D.R. Nelson / Sedimentary Geology 120 (1998) 225–256
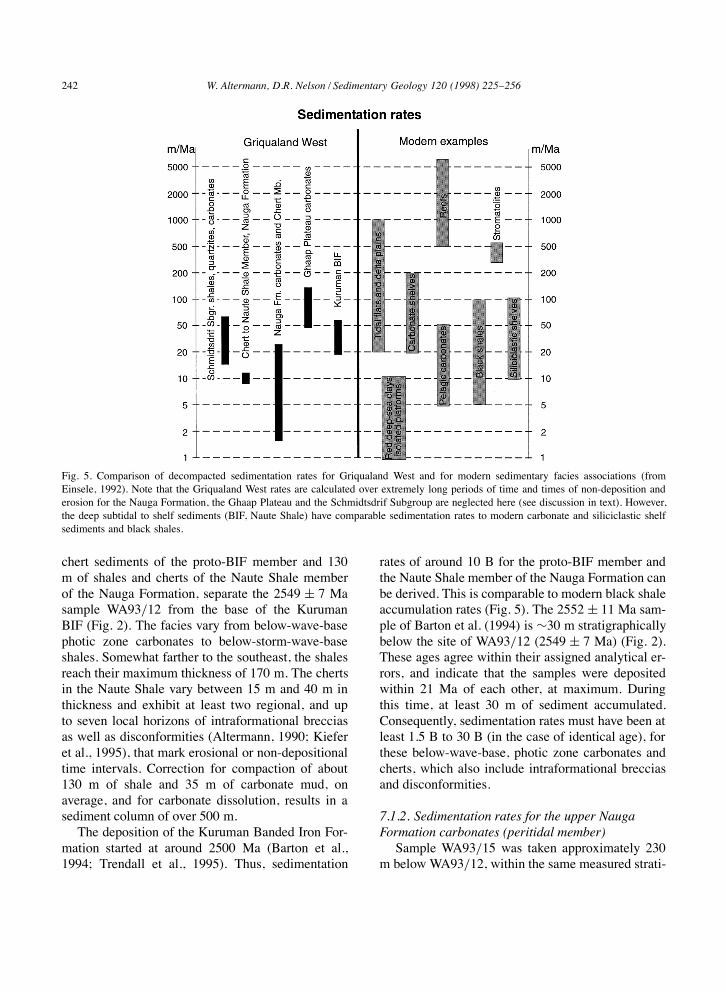
Fig. 5. Comparison of decompacted sedimentation rates for Griqualand West and for modern sedimentary facies associations (fromEinsele, 1992). Note that the Griqualand West rates are calculated over extremely long periods of time and times of non-deposition anderosion for the Nauga Formation, the Ghaap Plateau and the Schmidtsdrif Subgroup are neglected here (see discussion in text). However,the deep subtidal to shelf sediments (BIF, Naute Shale) have comparable sedimentation rates to modern carbonate and siliciclastic shelfsediments and black shales.
chert sediments of the proto-BIF member and 130m of shales and cherts of the Naute Shale memberof the Nauga Formation, separate the 2549 š 7 Masample WA93=12 from the base of the KurumanBIF (Fig. 2). The facies vary from below-wave-basephotic zone carbonates to below-storm-wave-baseshales. Somewhat farther to the southeast, the shalesreach their maximum thickness of 170 m. The chertsin the Naute Shale vary between 15 m and 40 m inthickness and exhibit at least two regional, and upto seven local horizons of intraformational brecciasas well as disconformities (Altermann, 1990; Kieferet al., 1995), that mark erosional or non-depositionaltime intervals. Correction for compaction of about130 m of shale and 35 m of carbonate mud, onaverage, and for carbonate dissolution, results in asediment column of over 500 m.The deposition of the Kuruman Banded Iron For-
mation started at around 2500 Ma (Barton et al.,1994; Trendall et al., 1995). Thus, sedimentation
rates of around 10 B for the proto-BIF member andthe Naute Shale member of the Nauga Formation canbe derived. This is comparable to modern black shaleaccumulation rates (Fig. 5). The 2552 š 11 Ma sam-ple of Barton et al. (1994) is ¾30 m stratigraphicallybelow the site of WA93=12 (2549 š 7 Ma) (Fig. 2).These ages agree within their assigned analytical er-rors, and indicate that the samples were depositedwithin 21 Ma of each other, at maximum. Duringthis time, at least 30 m of sediment accumulated.Consequently, sedimentation rates must have been atleast 1.5 B to 30 B (in the case of identical age), forthese below-wave-base, photic zone carbonates andcherts, which also include intraformational brecciasand disconformities.
7.1.2. Sedimentation rates for the upper NaugaFormation carbonates (peritidal member)Sample WA93=15 was taken approximately 230
m below WA93=12, within the same measured strati-
W. Altermann, D.R. Nelson / Sedimentary Geology 120 (1998) 225–256 243
graphic section. The age of 2588š6 Ma is on average39 Ma older than the 2549 š 7 Ma date determinedfor WA93=12 (Fig. 2). The resulting sedimentationrate (cSR) for the carbonates separating the two sam-ples is between approximately 4 B and 9 B, withan average of 6 B. When corrected for compactionand dissolution and for the intercalated shales, whichtogether constitute less than 10% of the stratigraphicsection, the total decompacted sediment thicknessincreases to around 300 m and the SR to about8 Bubnoff, on average. This is extremely low forcarbonates. The lower facies are peritidal, passingupward, within the uppermost 20 m, into subtidal,below-wave-base carbonate deposits with condensedsedimentation (Fig. 2). It can be assumed that, inthe peritidal member, up to 90% of the time repre-sented by this sediment section is not recorded in thebeds, but in the contacts between the sedimentarylayers. Erosional surfaces and desiccation featureswere described by Altermann and Herbig (1991) inthese deposits. However, even if corrected for 90%of missing record (thus, assuming the extreme casethat the 300 m of sediment represent only 10% ofthe time of 39 Ma, and multiplying the sedimentcolumn by 10), a sedimentation rate of only 60 B toaround 115 B is achieved. This is at least ten timeslower than the growth rate of modern carbonate reefs(Fig. 5) and about four times lower than the 400B reported for Holocene stromatolites at Shark Bay(Chivas et al., 1990). This discrepancy is probablycaused by the long time interval covered by the sec-tion and by the presence of condensed sediments inits upper part. The assumption that 90% of the timeis represented by layer boundaries is necessary forcomparison to modern growth rates of stromatoliticcarbonates, which are observed and calculated formuch shorter time intervals than dealt with in thepresent case. The above example, when compared toPhanerozoic deposits, for instance, represents the du-ration of the entire Triassic system. The compactedsedimentation rates of below 10 B are comparable tothe classic Jurassic carbonate sedimentation in Ger-many, when calculated for the total thickness of theentire system (compare with Bosscher and Schlager,1993).
7.1.3. Sedimentation rates for the lower NaugaFormation (basal to lower peritidal member)There are no continuous outcrops from the mea-
sured section containing the samples WA93=15 andWA93=12 down to the base of the Nauga Forma-tion. The section measured through the SchmidtsdrifSubgroup and the overlying lower Nauga Formation(Fig. 2) was assembled from several shorter sectionsnorthwest of Prieska and correlated with the helpof tuff horizons. It represents the average lithologyand sediment thickness, which may differ substan-tially locally. The lavas encountered at the base ofthis section (Vryburg Formation) are presumably, onlithostratigraphic grounds, time equivalent to the lavadated by Walraven et al. (in press), at 2642 š 3 Ma.The base of the Nauga Formation carbonates is some280 m below the 2588 š 6 Ma tuff bed. Using theabove cSR of 6 B on average, calculated for peritidalcarbonates, this base must be around 2635 Ma old.Because the facies and the lithologies are largelysimilar below and above the dated tuff bed, such anapproach seems reasonable. The decompacted sedi-mentation, including 10% of shale in the section, iscalculated to be 350 m of sediment and an SR ofabout 8 B is indicated, or 80 B assuming 90% of thetime as representing non-deposition and erosion.
7.1.4. Sedimentation rates for the SchmidtsdrifSubgroup at PrieskaThe sediments of the Schmidtsdrif Subgroup
above the Vryburg lava consist of around 40 mof carbonate, 80 m of shale and 40 m of coarser sili-ciclastics (Fig. 2). When corrected for compaction,this accounts for around 375 m to 400 m of sedi-ment (depending on the locally varying proportionsof sediment type) deposited in roughly 7 Ma, onaverage .2642 š 3–2635), and gives a SR of 50–60B. Again, correction for times of non-deposition anderosion, which are common in this facies, should beallowed, resulting in possible figures of up to 600Bubnoff, in good agreement with modern tidal todeltaic sediments (Fig. 5). The total thickness of thesedimentary pile between the 2588 š 6 Ma sampleand the Vryburg lavas approximates 450 m (Fig. 2)and covers a time span of 65 Ma to 51 Ma. Anaverage cSR of 8 m=Ma can be calculated for thissection of peritidal carbonates and marginal marineto fluvial siliciclastic rocks.
244 W. Altermann, D.R. Nelson / Sedimentary Geology 120 (1998) 225–256
7.2. The Campbellrand and Schmidtsdrif Subgroupsin the Ghaap Plateau sub-basin
7.2.1. Sedimentation rates for the platformalcarbonates of the Campbellrand SubgroupLess than 1600 m of predominantly stromatolitic
platform carbonates separate the Monteville Forma-tion (2555š19 Ma) from the 2516š4 Ma uppermostGamohaan Formation in field outcrops on the GhaapPlateau. The minimum time for deposition is thus 16Ma and the maximum time available, 62 Ma. Thisimplies sedimentation rates between approximately26 B and 100 B (cSR). However, in the Kathu bore-hole, the Campbellrand Subgroup is 2460 m thick,with the upper part of the Gamohaan Formationremoved during Palaeozoic erosion, and it is thussignificantly thicker than estimated from outcrops(Fig. 2). The general facies association, nonethe-less, does not differ significantly from that observedin outcrops (compare Beukes, 1980a; SACS, 1980;Altermann and Siegfried, 1997). The Reivilo, Fair-field, Klipfontein Heuwel, Papkuil, Klippan, Kogel-been and Gamohaan Formations of the Campbell-rand Subgroup in the borehole consist of severalgenerally shallowing-upward cycles, of various stro-matolitic carbonate facies and some shale, chert andrare tuff intercalations (Fig. 3). These formations(the age of 2555š19 Ma is for the uppermost part ofthe Monteville Formation; Fig. 3) total around 2000m in thickness, only about 5% of this being shaleand an equally small portion of the carbonates beingnon-stromatolitic calcareous mudstones and aren-ites (Fig. 3). The decompacted thickness estimate isabout 2500 m, and implies sedimentation rates of40 B to 156 B. Sedimentation rates in this rangeare known from Phanerozoic tidal flats and, althoughwithin the lower limits thereof (Fig. 5), are in goodagreement with sites of low subsidence rate (Scholleet al., 1983; Einsele, 1992). The section is continu-ous and no evidence for exposure or disconformitieswas recognized in the drillcore; however, they shouldbe expected, at least, in the peritidal facies of thissection, and have been described in outcrop (Eriks-son and Truswell, 1974; Beukes, 1986). Correctionfor up to 90% of the time in the peritidal faciesbeing of non-deposition or erosion, results in sedi-mentation rates from 400 B to more than 1500 B, inagreement with modern growth rates of stromatolitic
carbonate platforms (Chivas et al., 1990) and reefs(Fig. 5).
7.2.2. Sedimentation rates for the SchmidtsdrifSubgroup in the Kathu boreholeThe Vryburg Formation in the Kathu core is at
least 277 m thick (the base was not reached bythe drill) and consists of shales and quartzites, withsubordinate dolarenites and shaly dolomites (Fig. 3).These are interpreted as shallow shelf to deep la-goonal deposits. In outcrop, the Vryburg Formationis at most 100 m thick and consists of wavy-lami-nated, intertidal stromatolitic dolomites and calc- anddolarenites, which interfinger with, and pass upwardinto siliciclastic facies. The overlying BoomplaasFormation is 185 m thick in the Kathu borehole.It consists of black shales, transported oolite bedsand crypt-microbial laminites, and is thus interpretedas upper shelf facies, deeper than the platformalcarbonates and in situ oolites observed in surfaceoutcrops, where this formation is no more than 100m thick. The overlying Lokammona Formation is55 m thick in the borehole (Fig. 3) and comprisesblack shales with minor tuff and dolomite interca-lations. The thickness and lithology of the Lokam-mona Formation in outcrop are very similar. In bothcore and outcrop, the Lokammona is interpreted asa transgressive phase over the Boomplaas platform(Beukes, 1979; Altermann and Siegfried, 1997). Theoverlying Campbellrand Subgroup starts with theMonteville Formation, which in the Kathu boreholeis 540 m thick and contains domal stromatolites,thick pyritic shale intercalations, a lava flow a fewmetres thick and, in the upper part, small columnarstromatolites, dolarenites and oolites. A shallowing-upward platformal carbonate association was inter-preted for this borehole section by Altermann andSiegfried (1997). The Monteville Formation is sig-nificantly thinner and of overall shallower platformalcharacter in surface outcrops (Beukes, 1980a).Using the age of 2555 š 19 Ma for the upper
Monteville Formation and the age of 2642 š 3 Mafor the Vryburg lavas (Walraven et al., in press),109 Ma to 65 Ma separated the deposition of thelower Schmidtsdrif and the lower CampbellrandSubgroups. Only 250 m of sedimentary rocks onthe Ghaap Plateau (SACS, 1980) separate the top ofthe Vryburg Formation from the top of the Mon-
W. Altermann, D.R. Nelson / Sedimentary Geology 120 (1998) 225–256 245
teville Formation. The same stratigraphic interval isrepresented by a nearly 800 m thick sediment pile atKathu. For the borehole section, a sedimentation rate(cSR) of 7 B to 12 B results and for the outcrops,2 B to 4 B are calculated. When decompacted, theshelf sediments in the Kathu borehole (340 m ofshales, only a few metres of quartzite, and 460 m ofcarbonate with a high proportion of mudstones anddolarenites; Altermann and Siegfried, 1997) reflectapproximately 1700 m of sediment and concomi-tant sedimentation rates of 16 to 26 B; these arecomparable to modern black shale and carbonateshelf deposits (Fig. 5). This section in the borehole(Boomplaas, Lokammona and Monteville Forma-tions) is interpreted as entirely subtidal, reflectingmainly below-wave-base shelf facies and, thus, timesof non-deposition were probably negligible. For the277 m thick Vryburg Formation in the borehole,decompacted thickness accounts for around 650 m,including 5% quartzites, 50% shales and 45% car-bonate muds. However, because the hole did notreach the base of the formation, and as the time ofinitiation of the sedimentation is not known, sedi-mentation rates for the complete section cannot becalculated.
7.3. The Malmani Subgroup and Black ReefFormation in the Transvaal sub-basin:sedimentation rates
Walraven and Martini (1995) dated the upperOaktree Formation, at the base of the Malmani Sub-group in the Transvaal sub-basin, at 2550 š 3 Ma,and calculated a cSR of 8 m=Ma for the Nauga For-mation carbonates and of 17 m=Ma for the GhaapPlateau carbonates. They estimated the base of theMalmani Subgroup in the central Transvaal sub-basin to be 2556 Ma, and thus 86 Ma younger thanthe correlated Vryburg and Black Reef Formations(Fig. 7). The top of the Chuniespoort Group (carbon-ates and BIFs) was estimated to be between 2472and 2400 Ma, depending on the varying thicknessof the preserved sediments. Two possible explana-tions were given by Walraven and Martini (1995) forthe very low sedimentation rates of the quartzites ofthe Black Reef Formation: (a) the formation is nota correlative of the Vryburg Formation, but signif-icantly younger; (b) there is a significant period of
non-deposition between the Black Reef and the datedOaktree tuff. The suggestion, that a significant periodof non-deposition is partly responsible for the lowBubnoff numbers, may also be true for the NaugaFormation of Griqualand West, where brecciatedcherts are present within the Naute Shales, betweenthe carbonate and BIF sediments (Altermann, 1990).For the five peritidal carbonate formations of the
1500 m to 1800 m thick sequence of Malmani Sub-group carbonates (Button, 1972), a cSR of 26 B to 32B results, when the base of the Malmani Subgroup isassumed to be 2556 Ma and the base of the succeed-ing BIF is taken as 2500 Ma (Trendall et al., 1995).When decompacted, sedimentation rates comparableto those calculated for the Ghaap Plateau, in theorder of <100 B result.
7.4. Banded iron formations in the Transvaal andGriqualand West sub-basins: sedimentation rates
Sedimentation rates for the Kuruman and overly-ing Griquatown BIF of the Asbestos Hills Subgroupare difficult to determine, because suitable age deter-minations are not available. Additionally, folding andthrusting complicates correlation of BIF units acrossthe Griqualand West basin (Altermann and Halbich,1991). The base of the Kuruman BIF in GriqualandWest and of its Transvaal correlative, the Penge BIF,is around 2500 Ma (Trendall et al., 1995), whereasthe base of the Griquatown BIF in Griqualand Westis 2432š31 Ma (Trendall et al., 1990). The thicknessof BIF between the two dated tuffaceous horizons isestimated to be 210 m (Beukes, 1980b; Barton et al.,1994). This implies sedimentation rates of 2 B to 6B, as were calculated by Arndt et al. (1991) and Bar-ton et al. (1994) for a mixed lithological successionof carbonates, shales, BIF and chert. Upon decom-paction, the BIF sediments reflect a thickness of2100 m and sedimentation rates of 20 B to 60 B, thelatter thus being comparable to uncompacted pelagicsediments (Fig. 5) (Muller and Mangini, 1980).More recently, Barley et al. (1997) published new
age data for volcanic rocks within the HamersleyRange of the Pilbara craton in Western Australia,and derived sedimentation rates (SR) of 30 B andmore, for the BIF and shales included in this suc-cession. This is an order of magnitude higher thanprevious calculations of sedimentation rates (3–4 B)
246 W. Altermann, D.R. Nelson / Sedimentary Geology 120 (1998) 225–256
for a BIF, volcanic, shale and carbonate rock succes-sion from the same region (Arndt et al., 1991), orfrom South Africa (Barton et al., 1994), and in goodagreement with the results presented here for thedecompacted Kaapvaal craton BIF. However, if assuggested by Barley et al. (1997), this sedimentationwas related to enormous volcanic and hydrother-mal activity in the Hamersley basin, differences inintensity of volcanism may explain divergent BIFaccumulation rates in other basins.Earlier calculations of the sedimentation rate of
BIF resulted in higher figures than presented above.Trendall and Blockley (1970, p. 298) arrived atbasin subsidence rates of 2000 to 6000 years perone foot (50 m to 150 m in one million years) forthe Fortescue and Hamersley Group basins of thePilbara craton. Their calculations for the compactedsedimentation rate for BIF were based on microbandcounting (varve model) and the inferred quantitiesof annual Fe deposition in the basin. For the DalesGorge member BIF, a cSR of 20 B to 70 B can bededuced from Trendall and Blockley’s (1970, p. 262)calculation of 2000 to 3000 years of deposition timefor one Knox or Calamina cyclothem (a commoncyclic sequence of banding types in the BIF, andon average 7 cm and 14 cm thick, respectively,in the above calculation). This cSR is an order ofmagnitude higher than the calculations based onisotopic age data, as presented here.For the Kuruman BIF, a weighted average mi-
croband thickness of 0.58 mm was calculated byKlein and Beukes (1989, p. 1772), and consideredto represent an annual varve. Under this assumptiona compacted sedimentation rate (cSR) of 570 B wasderived. However, with such a high cSR, the 210 mof Kuruman BIF separating the two dated horizonsof 2500 Ma and 2432 š 31 Ma would have beendeposited within less than 0.5 m.y. At Prieska, wherethe Kuruman BIF approximates 750 m thickness, thetime of deposition would be less than 1.5 m.y., whendisregarding possible tectonic duplication suggestedby Altermann and Halbich (1991).
8. Basin history and tectonic interpretation
The correlation of the Naute Shale member of thePrieska sub-basin (Figs. 1 and 2) with the Reiviloto Gamohaan Formations of the Ghaap Plateau sub-
basin (Fig. 3), and of the upper Nauga Formationcarbonates at Prieska with the Monteville Forma-tion on the Ghaap Plateau and Oaktree Formationin the Transvaal (Fig. 7), requires a new sedimen-tation scheme and a new model for basin develop-ment. The Boomplaas Formation above the VryburgFormation established the first carbonate platformbetween 2642 and 2588 Ma ago. This was subse-quently transgressed by the Lokammona Formationshales (Beukes, 1979) and followed, on the GhaapPlateau, by the Monteville Formation when platfor-mal conditions returned at around 2555 Ma. Before2588 š 6 Ma, almost half of the tidal flat carbonatesin the Prieska area had already accumulated. In theTransvaal basin and in the Ghaap Plateau sub-basin,the Oaktree and Monteville carbonate sedimenta-tion commenced only prior to 2550 Ma and 2555Ma, respectively. There is as yet no evidence forcontinuous and stable carbonate basin developmentin the Transvaal sub-basin prior to about 2556 Ma(Walraven and Martini, 1995). This suggests a trans-gression, progressing from the west or southwesttowards the east or northeast.The major transgressive step at around 2550 Ma
drowned the tidal flats in the southwest and shiftedthe main site of carbonate sedimentation to the northand east. At the time of the subtidal and below-wave-base carbonate sedimentation at Prieska, car-bonate sediments of the Monteville and OaktreeFormations had accumulated under platform con-ditions. Continuous subsidence in the basin centrewas matched by stromatolitic growth (Altermannand Herbig, 1991) under predominantly subtidalconditions, locally passing into supratidal settings(Eriksson and Truswell, 1974). An area of crustalupdoming like the Maremane or Ganyesa Domescould have served as the source for clastic sedimentsintercalated with the Ghaap Plateau carbonates, andalso may have been a barrier between the intracra-tonic basins. Smith et al. (1990) investigated Sm–Ndisotopes in shales at the base of the Griqualand Westand Transvaal basin sequences, and found profounddifferences in the geochemistry and isotopic char-acteristics of the sediments in the two sub-basins.These differences probably reflect different sourceareas for the Vryburg and Black Reef shales (Smithet al., 1990; Barton and Hallbauer, 1996).Carbonate deposition on the Ghaap Plateau and
W. Altermann, D.R. Nelson / Sedimentary Geology 120 (1998) 225–256 247
in the Transvaal lasted for at least 30 m.y. longerthan in the Prieska area, where the Naute Shaleswere deposited between roughly 2550 Ma and 2500Ma. The source area for the mud influx must havebeen located farther to the south or west. Otherwise,the large amount of pelitic detritus would have over-whelmed the stromatolitic platform carbonates in thenorth and east, if not derived from this SW direction.As demonstrated by Altermann (1996a), the tuffs inthe Nauga Formation originated in the southwest.However, it is now clear that the tuffs in the upperCampbellrand Subgroup, on the Ghaap Plateau, areyounger and not correlative of tuffs in the periti-dal member of the Nauga Formation. Volcanism inthe southwestern Griqualand West sub-basin couldhave accompanied rifting and thermal uplift. Erosionin these parts of the basin could have exposed thesource area required for derivation of the more than100 m of Naute Shale member, and for the occa-sional shale intercalations accumulated on the GhaapPlateau.From about 2500 Ma to 2432 Ma, BIFs of the
Kuruman and Penge Formations were deposited at>100 m depth, following a substantial deepeningof the basin, to below storm wave-base (Klein andBeukes, 1989). During deposition of the GriquatownBIF, a shallowing-upward cycle commenced (Beukesand Klein, 1990). In southwestern Griqualand West,the BIFs are conformably followed by the KoegasSubgroup, a succession mainly comprising shales,cherts and arkoses, with minor BIF and carbonatedeposits. These shallow marine to deltaic sedimen-tary rocks are locally over 600 m thick and are cov-ered, above a low angular unconformity (Altermannand Halbich, 1991), by glaciogenic tillites in turndisconformably followed by the 2222 Ma Ongeluklavas (Cornell et al., 1996). In the Transvaal, thePenge BIF is unconformably covered by the PretoriaGroup siliciclastic rocks, with a hiatus of perhapsmore than 100 Ma. Thus, sedimentation rates fordeposits younger than the BIF cannot be calculated.It seems certain, however, that between the 2350 Maold Bushy Bend lavas (F. Walraven, pers. commun.,in Eriksson et al., 1995) at the base of the Preto-ria Group of the Transvaal and the 2222 Ma oldHekpoort–Ongeluk lavas, at least 400 to 800 m ofmudrock and subordinate sandstones were laid downin a deep periglacial turbiditic basin, with some distal
deltaic intercalations (Eriksson and Reczko, 1998).The cSR for these sediments thus ranges between 3B and 7 B, but decompacted sedimentation rate is inrange of 20 B, assuming a shale to sandstone ratioof 5 : 1 (Eriksson et al., 1995). Despite including aregional unconformity, these sedimentation rates arecomparable with those of modern deltas and delta-front shales and turbidites (Fig. 5).The decompacted sediment thickness of the var-
ious age-bracketed sections of the Schmidtsdrif andCampbellrand Subgroups are plotted against theirupper age boundaries, in order to obtain a sedimen-tation curve (Fig. 6). The diagrams in Fig. 6A andFig. 6B are based on time-level plots, as proposedby Friend et al. (1989), but modified to suit ourpurposes. These curves are not subsidence curves,because back-stripping has not been carried out, butwhen compared to estimated depth of deposition,subsidence can be deduced easily from these dia-grams. The Prieska area (Fig. 6A) and the Kathuborehole (Fig. 6B) are treated separately. The es-timated depth of deposition for the Naute Shalesand BIF is below storm wave-base, in water depthgreater than 100 m. The maximum depth is difficultto determine but could be greater than the 200 massumed. The sedimentation rates (SR) for both ar-eas are plotted against their upper age boundaries inFig. 6C. Although in both areas the density of agedata is different and our decompaction data are cer-tainly imprecise, the different shapes of the curvesin Fig. 6A and Fig. 6B can only be interpreted asreflecting differing depositional histories for the twoareas. This is even more apparent in Fig. 6C, wherethe discrepancy in sedimentation rates between 2550Ma and 2500 Ma is striking. This difference is due tovarying lithology of highly compactible, slowly ac-cumulating shales versus poorly compactible, rapidlygrowing carbonates, and due to different absoluteamounts of subsidence.When evaluating the subsidence in both areas, a
similarity in timing becomes apparent. For the timeperiod between 2550 and 2500 Ma, subsidence ap-pears to be greatest in both Fig. 6A and Fig. 6B.Two concave-upward parts of the curve connect-ing the bars of estimated depth of deposition arerecognizable in Fig. 6A. This curve shape can beinterpreted as typical of a rift basin or passive con-tinental margin. For the Kathu borehole (Fig. 6B),
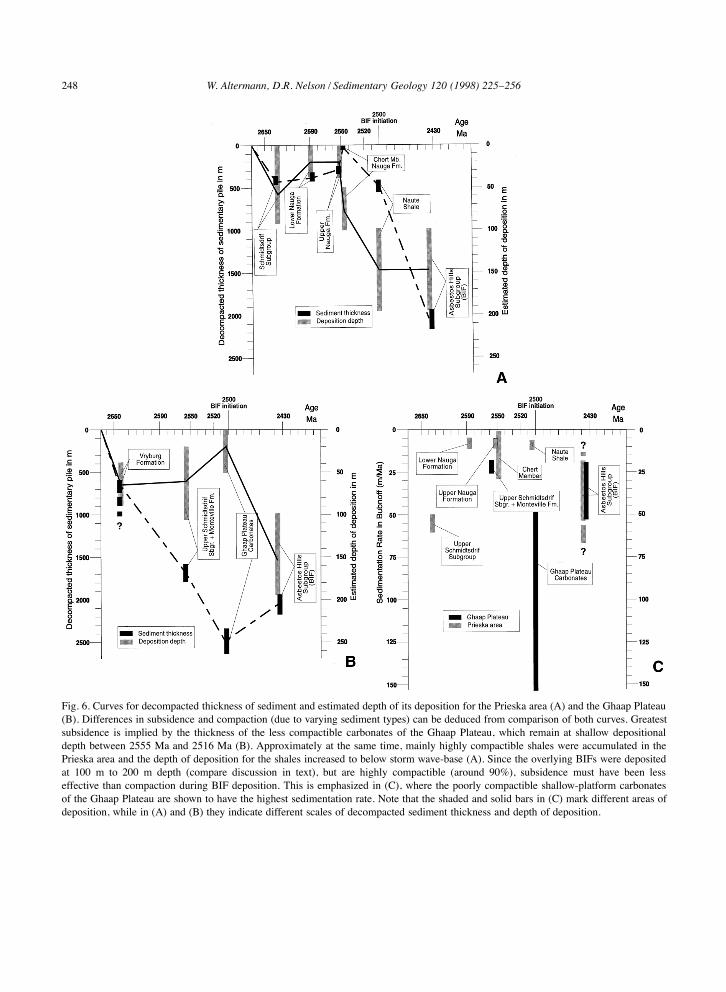
248 W. Altermann, D.R. Nelson / Sedimentary Geology 120 (1998) 225–256
Fig. 6. Curves for decompacted thickness of sediment and estimated depth of its deposition for the Prieska area (A) and the Ghaap Plateau(B). Differences in subsidence and compaction (due to varying sediment types) can be deduced from comparison of both curves. Greatestsubsidence is implied by the thickness of the less compactible carbonates of the Ghaap Plateau, which remain at shallow depositionaldepth between 2555 Ma and 2516 Ma (B). Approximately at the same time, mainly highly compactible shales were accumulated in thePrieska area and the depth of deposition for the shales increased to below storm wave-base (A). Since the overlying BIFs were depositedat 100 m to 200 m depth (compare discussion in text), but are highly compactible (around 90%), subsidence must have been lesseffective than compaction during BIF deposition. This is emphasized in (C), where the poorly compactible shallow-platform carbonatesof the Ghaap Plateau are shown to have the highest sedimentation rate. Note that the shaded and solid bars in (C) mark different areas ofdeposition, while in (A) and (B) they indicate different scales of decompacted sediment thickness and depth of deposition.
W. Altermann, D.R. Nelson / Sedimentary Geology 120 (1998) 225–256 249
a single rift-related curve shape extends for an ad-ditional 100 m.y. backwards in time. The curve,however, is based on less age-data, which may bethe reason for this divergent behaviour. Rift basinor passive continental margin-related subsidence istypically a slow and long-lasting activity (McCabe,1991). Interpretation of a rift basin–passive marginanalogue for the Griqualand West basin is suggestedby the marked scarcity of clastic debris, other thansuspension deposits in the Campbellrand and As-bestos Hills Subgroups, and also supported by thepresence of basaltic volcanism within the carbon-ates (Altermann, 1996a). Passive margins are thepreferred site of formation of carbonate platforms.The acceleration of subsidence during the period of2550 Ma to 2500 Ma might be due to overlappingmechanical and thermal subsidence. Usually, the ini-tial mechanical subsidence is accompanied by higherheat flow due to stretching, which is then followedby thermal subsidence due to cooling of the stretchedasthenosphere (Einsele, 1992). Where both processesoverlap, faster subsidence would be expected.
9. Implications for sediment deposition in theNeoarchaean
From the calculations above, it is difficult to un-derstand why the growth of stromatolitic carbonateplatforms was incapable of continuing after ma-jor transgressions. A paradox of drowned carbonateplatforms like that postulated for many modern andPhanerozoic carbonates (Schlager, 1981) can be de-tected also in the Neoarchaean. Modern carbonateaccumulation can match subsidence rates or relativesea-level increases of up to 500 m=Ma (Aigner et al.,1989; Bosellini, 1989; Chivas et al., 1990; Bosscherand Schlager, 1993). Over short duration, the accu-mulation rates of carbonates may be even higher,in excess of 1000 m=Ma. The drowning of carbon-ate platforms in the Phanerozoic requires subsidencerates or sea-level rise in excess of 4000 m=Ma, atleast for a short period of time, until the basin floorsinks below the zone of euphotic activity (Schlager,1989). Sedimentation rates in the order of a fewmetres per million years are typical of Phanerozoicoceanic pelagic deposits that lack terrigenous sedi-ment influx and which are fed only by planktonicrain. Sediment deposition in the order of a few tens
of metres per million years, as calculated for the de-posits of the Kaapvaal craton, are known from youngtidal flats and carbonate shelves of low subsidencerate (Scholle et al., 1983; Einsele, 1992).Because of the calculated sedimentation rates and
the conspicuous lack of coarse-clastic sedimentaryrocks in the entire Griqualand West and Transvaalsub-basin successions, the subsidence rates reflectedin the major transgression episodes and follow-ing sedimentation cycles must have been moder-ate. It is evident that stromatolitic growth-rates un-der favourable conditions should have been ableto match the subsidence rate. Archaean stroma-tolites and carbonates, however, differ from theirNeoproterozoic and Phanerozoic counterparts in thescarcity of coarse pelletal carbonate sands, due pre-sumably to the lack of organisms producing suchpellets or carbonate skeletons, that could be wornto produce carbonate arenites (Grotzinger, 1989).Therefore, Archaean stromatolites are mainly finelylaminated and trap rare carbonate detritus betweenthe column branches, whereas younger stromatolitestend to trap and bind carbonate sands also alongthe microbial lamination. This may lead to the de-velopment of finer lamination and slower growthin Archaean stromatolites. Klein et al. (1987) andAltermann and Schopf (1995) demonstrated the con-spicuous lack of detrital grains in microfossiliferousstromatolites of the Campbellrand Subgroup. Addi-tionally, in the photomicrographs presented by Kleinet al. (1987), minute aragonite needles can be ob-served in the Siphonophycus transvaalensismats andfilaments, evidence that such microbiota, after decay,could contribute only to the production of micrite.Grotzinger (1989) proposed that carbonate precipi-tation could also have been triggered indirectly byphotosynthetic decrease of the CO2 content of theseawater, in the presence of cyanobacterial bioherms.Such ‘chemical’ precipitation might be the reasonfor the slow sedimentation rates of Archaean car-bonates compared to modern reefs (Fig. 5). Sumnerand Grotzinger (1996) proposed a purely chemicalsubtidal precipitation of carbonate in a saturated ma-rine environment for parts of the Griqualand Westand other Precambrian deposits, which would prob-ably account for even lower sedimentation rates.On the other hand, there is ample evidence, forthe cyanobacterial and bacterial communities, that
250 W. Altermann, D.R. Nelson / Sedimentary Geology 120 (1998) 225–256
their metabolism was similar to that observed today(Schopf and Klein, 1992; Schopf, 1993). In supportof this, Lanier (1986) calculated organic productionrates for microfossils from the Malmani Subgroupstromatolites in the range of modern microbial mats,and thus the growth rates of Precambrian and modernstromatolites should be comparable, provided that asimilar sediment binding or precipitation mechanismoperated. The calculated decompacted sedimentationrates of over 150 B for the stromatolitic carbonates ofthe Ghaap Plateau also support comparable growthrates for modern and Precambrian stromatolites.The apparent slow drowning may be due to an
inability of the microbial organisms secreting or fa-cilitating the precipitation of carbonate to cope withpossible climatic changes or changes in the chemicalenvironment. The latter could have been influencedby increased hydrothermal activity, as suggested byBIF geochemistry (Klein and Beukes, 1989). Forthe climate, it can be speculated that the fixation ofCO2 in the first giant carbonate platforms of Africa,Australia, northern America and India reduced thegreenhouse effect and led to lower temperatures, asdiscussed for the Upper Precambrian by many in-vestigators (e.g. Eriksson et al., 1998). As no higherorganisms directly secreting carbonate were present,growth rates comparable to those of coral reefs, forexample, seem unlikely in the Early and Middle Pre-cambrian. The drowning of the carbonate platformswas thus probably facilitated by the developmentof unfavourable conditions for stromatolitic growth.The drowning of the carbonates of the Nauga For-mation (2549 Ma) and of the Gamohaan carbonateplatform (2516 Ma) coincide with two ‘events’, re-spectively: the introduction of pelitic sediment intothe basin from the southwest, and the increase of Siand Fe content in the sediments and by inference inthe seawater, from volcanic and hydrothermal activ-ity (Klein and Beukes, 1989; Barley et al., 1997).As no thick shales separate the Gamohaan Forma-tion from the Kuruman BIF, shale sedimentationalone cannot be responsible for the drowning of thecarbonate platforms. Other factors, such as climaticchanges may thus have hastened the end of carbon-ate deposition. The increasing Fe and Si content ledfinally to precipitation of BIF when pelitic sedimentdeposition was insignificant. During pelitic (and car-bonate) sedimentation, the Fe dissolved in the water
must have been bound by clay or carbonate mineralsand no BIFs were precipitated. Halbich et al. (1992),have demonstrated that the shales of the carbonate–BIF transition have comparable Fe contents to theBIF units.
10. Conclusions
Long periods of non-deposition and erosion havebeen assumed for peritidal and associated silici-clastic and carbonate facies deposits of the Kaap-vaal craton. Decompacted sedimentation rates werenonetheless calculated using conservative estimatesof compaction and dissolution, and no back-strip-ping was performed. The results obtained probablyunderestimate the true sedimentation rates. They aregenerally comparable to Phanerozoic deposits, whenobserved over similarly long periods of time, and,with consideration of times of non-deposition, tomodern sedimentation rates.Four long-term (millions of years) transgression–
regression cycles can be recognized in the Griqua-land West sub-basin and can be partly correlated toTransvaal sub-basin deposits. (1) The Vryburg For-mation and the Boomplaas carbonate platform sedi-ments represent, respectively, the first transgressionand a succeeding long-duration shallowing-upwardcycle in Griqualand West. (2) The second transgres-sive step is marked by the Lokammona shales and theoverlying shallowing-upward (regressive) cycle rep-resented by the lower Nauga Formation. (3) The up-per Nauga Formation (chert member) together withthe Monteville and Oaktree Formations mark thethird transgressive phase, followed by a long-termshallowing-upward regressive cycle with the devel-opment of a stromatolitic carbonate platform thatformed the Campbellrand and Malmani Subgroups.(4) The fourth transgressive step is the developmentof the Kuruman and Penge BIF-pelagic basin in allprovinces. The Griquatown BIF and the overlyingKoegas siliciclastics mark the fourth regressive cy-cle, not preserved in the Transvaal sub-basin, due toa possibly 100 m.y. long period of erosion before thePretoria Group sediments were laid down (Erikssonet al., 1995).An attempt to correlate these four cycles in the
Prieska, Ghaap Plateau and Transvaal areas is sum-marized in Fig. 7. In this figure, the transgression–
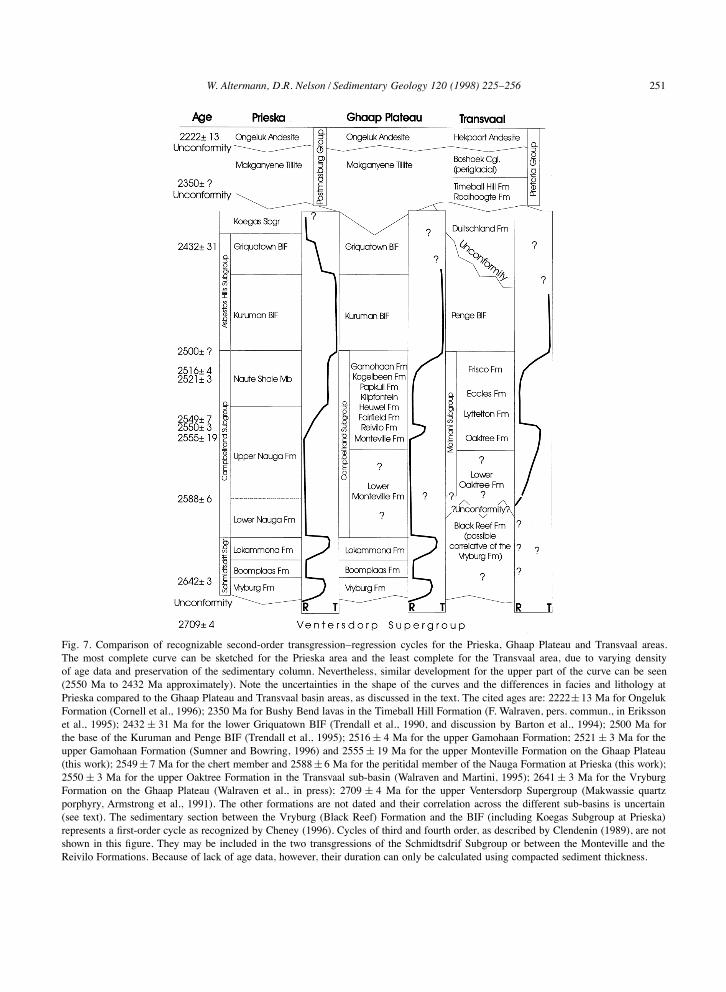
W. Altermann, D.R. Nelson / Sedimentary Geology 120 (1998) 225–256 251
Fig. 7. Comparison of recognizable second-order transgression–regression cycles for the Prieska, Ghaap Plateau and Transvaal areas.The most complete curve can be sketched for the Prieska area and the least complete for the Transvaal area, due to varying densityof age data and preservation of the sedimentary column. Nevertheless, similar development for the upper part of the curve can be seen(2550 Ma to 2432 Ma approximately). Note the uncertainties in the shape of the curves and the differences in facies and lithology atPrieska compared to the Ghaap Plateau and Transvaal basin areas, as discussed in the text. The cited ages are: 2222š 13 Ma for OngelukFormation (Cornell et al., 1996); 2350 Ma for Bushy Bend lavas in the Timeball Hill Formation (F. Walraven, pers. commun., in Erikssonet al., 1995); 2432 š 31 Ma for the lower Griquatown BIF (Trendall et al., 1990, and discussion by Barton et al., 1994); 2500 Ma forthe base of the Kuruman and Penge BIF (Trendall et al., 1995); 2516š 4 Ma for the upper Gamohaan Formation; 2521š 3 Ma for theupper Gamohaan Formation (Sumner and Bowring, 1996) and 2555š 19 Ma for the upper Monteville Formation on the Ghaap Plateau(this work); 2549š 7 Ma for the chert member and 2588š 6 Ma for the peritidal member of the Nauga Formation at Prieska (this work);2550š 3 Ma for the upper Oaktree Formation in the Transvaal sub-basin (Walraven and Martini, 1995); 2641š 3 Ma for the VryburgFormation on the Ghaap Plateau (Walraven et al., in press); 2709 š 4 Ma for the upper Ventersdorp Supergroup (Makwassie quartzporphyry, Armstrong et al., 1991). The other formations are not dated and their correlation across the different sub-basins is uncertain(see text). The sedimentary section between the Vryburg (Black Reef) Formation and the BIF (including Koegas Subgroup at Prieska)represents a first-order cycle as recognized by Cheney (1996). Cycles of third and fourth order, as described by Clendenin (1989), are notshown in this figure. They may be included in the two transgressions of the Schmidtsdrif Subgroup or between the Monteville and theReivilo Formations. Because of lack of age data, however, their duration can only be calculated using compacted sediment thickness.
252 W. Altermann, D.R. Nelson / Sedimentary Geology 120 (1998) 225–256
regression cycles 1 and 2, as described above, are notrecognized in the Transvaal sub-basin due to the lackof age data, and due to the uncertain age and cor-relation of the Black Reef Formation. For the samereason, the third cycle (the Oaktree Formation trans-gression) cannot be separated from the Black Reef.The role of the Black Reef Formation in this scenarioand its possible correlation to the Vryburg Forma-tion are equivocal and require further confirmation(see discussion by Walraven and Martini, 1995). Theupper Black Reef encompasses a transgressive shalecover, which grades into the overlying carbonates ofthe Oaktree Formation (Clendenin, 1989). Shallowplatform carbonates are developed above the Oak-tree and Monteville Formations. Only at Prieska,did deposition of the Naute Shale member remainpredominantly below the wave-base, perhaps withthe exception of the silicified and brecciated inter-vals, which may correlate with some regressions inthe Monte Christo Formation and below the Lyttel-ton Formation in Transvaal (Clendenin, 1989). Thefourth cycle leading to the deposition of banded ironformations, is recognizable in all three sub-basins.The shape of the transgression–regression curves inFig. 7 is inferred because the duration of these eventsand their relative intensity (i.e. the amount of relativesea-level rise or fall) are not known. Slow transgres-sions followed by rapid regressions are, however,typical of Phanerozoic sea-level fluctuations (Cloet-ingh et al., 1985).These four large-scale transgressive–regressive
(shallowing-upward) cycles are in the order of tensof millions of years duration, and must thereforebe attributed to second-order sequences of crustalevolution (Vail et al., 1991). They represent ma-jor regional transgressions and regressions and buildsequence cycles that can be subdivided into se-quences comprising third-order system tracts, andinto fourth-order parasequences. Cyclicity above thesecond-order (duration of less than 3 m.y.) can be de-duced from lithological columns, such as the Kathuborehole, and differ regionally in their facies, ascomparisons to adjacent realms demonstrate (e.g. onthe Ghaap Plateau: Altermann, 1997, Altermann andSiegfried, 1997; or in the Transvaal basin: Clen-denin, 1989). More detailed facies work and preciseage data are needed for identification and correlationof system tracts, parasequences and Milankovitch
cycles in Archaean and Palaeoproterozoic basins.For example, the conspicuous stromatolite cyclic-ity observed in many formations of the TransvaalSupergroup (Eriksson and Truswell, 1974) may beattributed to fourth- and fifth-order cycles, of 0.1–0.5 m.y. and 0.02–0.1 m.y. duration, respectively(Mitchum and van Wagoner, 1991).Comparison of the Transvaal Supergroup depos-
itories with other Archaean and Palaeoproterozoicbasins is hindered by the lack of sufficient data. Theonly basin equally well investigated as the Kaap-vaal craton sub-basins, is the Hamersley basin ofthe Pilbara craton, Western Australia. Both basinsare of comparable age, contain comparable sedi-mentary fills, and have even been considered to beparts of the same original cratonic depositional sys-tem (Trendall, 1968; Button, 1976; Cheney, 1996).First-order cycles (>50 Ma), on the Kaapvaal cra-ton, can be identified in the four sequences recog-nized by Cheney (1996). In his interpretation, thelower Transvaal Supergroup (>2432 Ma) is the sec-ond first-order cycle, the first being represented bysedimentary and volcanic rocks of the VentersdorpSupergroup. Based on our interpretation presentedhere, we would rather extend this second first-ordertectonically driven cycle to include the Koegas Sub-group of Griqualand West, and thus to have an upperage limit of <2432 Ma (Griquatown BIF) for thissecond cycle. However, as Cheney (1996) correctlystated, with more data the sequences will have to beredefined in the future, and the boundaries will shiftwith the identification of other sequences. The lasttwo first-order cycles recognized in the TransvaalSupergroup, the Pretoria and the Rooiberg Groups,are not discussed here, but it should be emphasizedthat Cheney (1996) was also able to identify threeof the four unconformity-bounded sequences on thePilbara craton of Western Australia. Thus, our sec-ond-order cycles identified herein may be found alsowithin the Hamersley Group, if Cheney (1996) iscorrect. From published data (Trendall et al., 1990,1995; Arndt et al., 1991; Barley et al., 1997) it is,however, evident that sedimentation rates and lithos-tratigraphic sequences of both cratonic basins aresimilar across the Archaean–Proterozoic boundary.Analyses of subsidence and sedimentation rates
for Precambrian sedimentary basins are still an ex-ception, compared to the much more regularly pub-
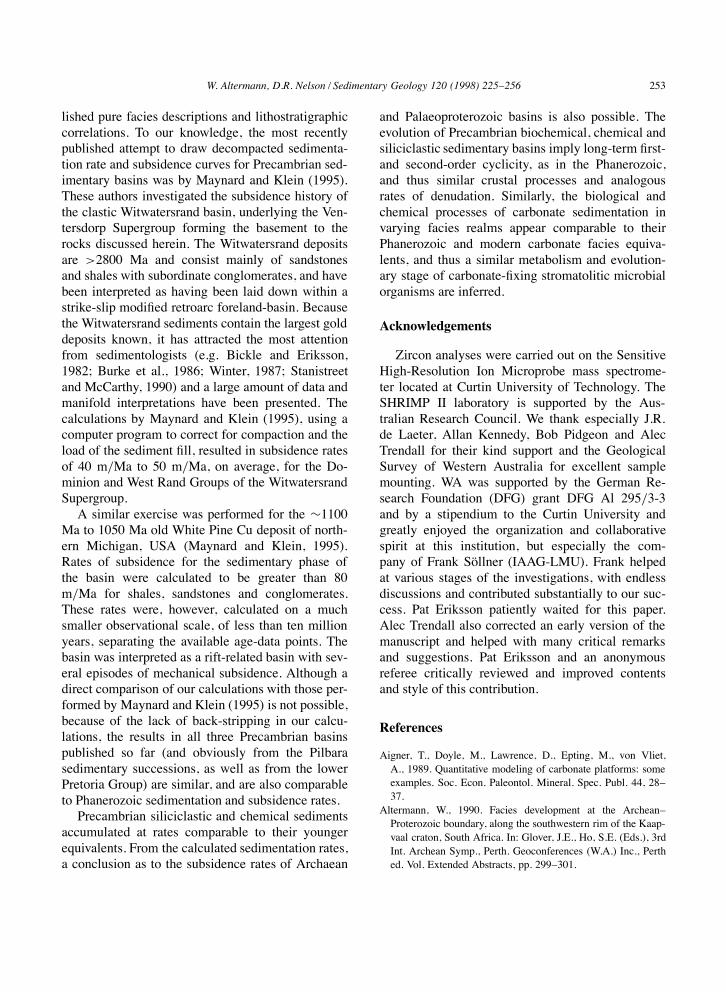
W. Altermann, D.R. Nelson / Sedimentary Geology 120 (1998) 225–256 253
lished pure facies descriptions and lithostratigraphiccorrelations. To our knowledge, the most recentlypublished attempt to draw decompacted sedimenta-tion rate and subsidence curves for Precambrian sed-imentary basins was by Maynard and Klein (1995).These authors investigated the subsidence history ofthe clastic Witwatersrand basin, underlying the Ven-tersdorp Supergroup forming the basement to therocks discussed herein. The Witwatersrand depositsare >2800 Ma and consist mainly of sandstonesand shales with subordinate conglomerates, and havebeen interpreted as having been laid down within astrike-slip modified retroarc foreland-basin. Becausethe Witwatersrand sediments contain the largest golddeposits known, it has attracted the most attentionfrom sedimentologists (e.g. Bickle and Eriksson,1982; Burke et al., 1986; Winter, 1987; Stanistreetand McCarthy, 1990) and a large amount of data andmanifold interpretations have been presented. Thecalculations by Maynard and Klein (1995), using acomputer program to correct for compaction and theload of the sediment fill, resulted in subsidence ratesof 40 m=Ma to 50 m=Ma, on average, for the Do-minion and West Rand Groups of the WitwatersrandSupergroup.A similar exercise was performed for the ¾1100
Ma to 1050 Ma old White Pine Cu deposit of north-ern Michigan, USA (Maynard and Klein, 1995).Rates of subsidence for the sedimentary phase ofthe basin were calculated to be greater than 80m=Ma for shales, sandstones and conglomerates.These rates were, however, calculated on a muchsmaller observational scale, of less than ten millionyears, separating the available age-data points. Thebasin was interpreted as a rift-related basin with sev-eral episodes of mechanical subsidence. Although adirect comparison of our calculations with those per-formed by Maynard and Klein (1995) is not possible,because of the lack of back-stripping in our calcu-lations, the results in all three Precambrian basinspublished so far (and obviously from the Pilbarasedimentary successions, as well as from the lowerPretoria Group) are similar, and are also comparableto Phanerozoic sedimentation and subsidence rates.Precambrian siliciclastic and chemical sediments
accumulated at rates comparable to their youngerequivalents. From the calculated sedimentation rates,a conclusion as to the subsidence rates of Archaean
and Palaeoproterozoic basins is also possible. Theevolution of Precambrian biochemical, chemical andsiliciclastic sedimentary basins imply long-term first-and second-order cyclicity, as in the Phanerozoic,and thus similar crustal processes and analogousrates of denudation. Similarly, the biological andchemical processes of carbonate sedimentation invarying facies realms appear comparable to theirPhanerozoic and modern carbonate facies equiva-lents, and thus a similar metabolism and evolution-ary stage of carbonate-fixing stromatolitic microbialorganisms are inferred.
Acknowledgements
Zircon analyses were carried out on the SensitiveHigh-Resolution Ion Microprobe mass spectrome-ter located at Curtin University of Technology. TheSHRIMP II laboratory is supported by the Aus-tralian Research Council. We thank especially J.R.de Laeter, Allan Kennedy, Bob Pidgeon and AlecTrendall for their kind support and the GeologicalSurvey of Western Australia for excellent samplemounting. WA was supported by the German Re-search Foundation (DFG) grant DFG Al 295=3-3and by a stipendium to the Curtin University andgreatly enjoyed the organization and collaborativespirit at this institution, but especially the com-pany of Frank Sollner (IAAG-LMU). Frank helpedat various stages of the investigations, with endlessdiscussions and contributed substantially to our suc-cess. Pat Eriksson patiently waited for this paper.Alec Trendall also corrected an early version of themanuscript and helped with many critical remarksand suggestions. Pat Eriksson and an anonymousreferee critically reviewed and improved contentsand style of this contribution.
References
Aigner, T., Doyle, M., Lawrence, D., Epting, M., von Vliet,A., 1989. Quantitative modeling of carbonate platforms: someexamples. Soc. Econ. Paleontol. Mineral. Spec. Publ. 44, 28–37.
Altermann, W., 1990. Facies development at the Archean–Proterozoic boundary, along the southwestern rim of the Kaap-vaal craton, South Africa. In: Glover, J.E., Ho, S.E. (Eds.), 3rdInt. Archean Symp., Perth. Geoconferences (W.A.) Inc., Perthed. Vol. Extended Abstracts, pp. 299–301.
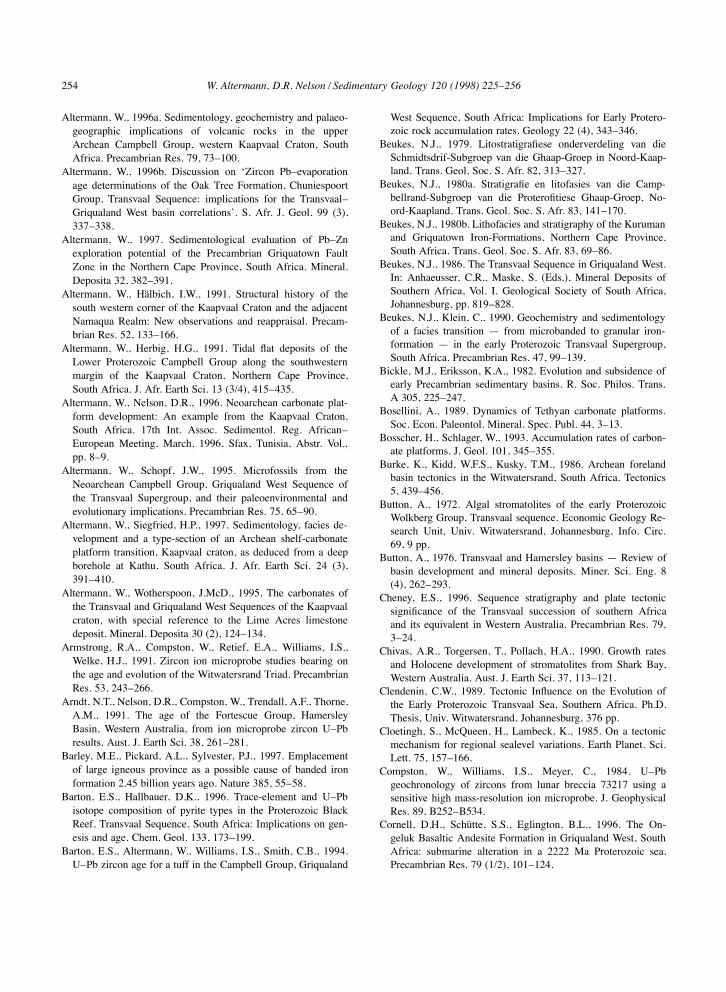
254 W. Altermann, D.R. Nelson / Sedimentary Geology 120 (1998) 225–256
Altermann, W., 1996a. Sedimentology, geochemistry and palaeo-geographic implications of volcanic rocks in the upperArchean Campbell Group, western Kaapvaal Craton, SouthAfrica. Precambrian Res. 79, 73–100.
Altermann, W., 1996b. Discussion on ‘Zircon Pb–evaporationage determinations of the Oak Tree Formation, ChuniespoortGroup, Transvaal Sequence: implications for the Transvaal–Griqualand West basin correlations’. S. Afr. J. Geol. 99 (3),337–338.
Altermann, W., 1997. Sedimentological evaluation of Pb–Znexploration potential of the Precambrian Griquatown FaultZone in the Northern Cape Province, South Africa. Mineral.Deposita 32, 382–391.
Altermann, W., Halbich, I.W., 1991. Structural history of thesouth western corner of the Kaapvaal Craton and the adjacentNamaqua Realm: New observations and reappraisal. Precam-brian Res. 52, 133–166.
Altermann, W., Herbig, H.G., 1991. Tidal flat deposits of theLower Proterozoic Campbell Group along the southwesternmargin of the Kaapvaal Craton, Northern Cape Province,South Africa. J. Afr. Earth Sci. 13 (3/4), 415–435.
Altermann, W., Nelson, D.R., 1996. Neoarchean carbonate plat-form development: An example from the Kaapvaal Craton,South Africa. 17th Int. Assoc. Sedimentol. Reg. African–European Meeting, March, 1996, Sfax, Tunisia, Abstr. Vol.,pp. 8–9.
Altermann, W., Schopf, J.W., 1995. Microfossils from theNeoarchean Campbell Group, Griqualand West Sequence ofthe Transvaal Supergroup, and their paleoenvironmental andevolutionary implications. Precambrian Res. 75, 65–90.
Altermann, W., Siegfried, H.P., 1997. Sedimentology, facies de-velopment and a type-section of an Archean shelf-carbonateplatform transition, Kaapvaal craton, as deduced from a deepborehole at Kathu, South Africa. J. Afr. Earth Sci. 24 (3),391–410.
Altermann, W., Wotherspoon, J.McD., 1995. The carbonates ofthe Transvaal and Griqualand West Sequences of the Kaapvaalcraton, with special reference to the Lime Acres limestonedeposit. Mineral. Deposita 30 (2), 124–134.
Armstrong, R.A., Compston, W., Retief, E.A., Williams, I.S.,Welke, H.J., 1991. Zircon ion microprobe studies bearing onthe age and evolution of the Witwatersrand Triad. PrecambrianRes. 53, 243–266.
Arndt, N.T., Nelson, D.R., Compston, W., Trendall, A.F., Thorne,A.M., 1991. The age of the Fortescue Group, HamersleyBasin, Western Australia, from ion microprobe zircon U–Pbresults. Aust. J. Earth Sci. 38, 261–281.
Barley, M.E., Pickard, A.L., Sylvester, P.J., 1997. Emplacementof large igneous province as a possible cause of banded ironformation 2.45 billion years ago. Nature 385, 55–58.
Barton, E.S., Hallbauer, D.K., 1996. Trace-element and U–Pbisotope composition of pyrite types in the Proterozoic BlackReef, Transvaal Sequence, South Africa: Implications on gen-esis and age. Chem. Geol. 133, 173–199.
Barton, E.S., Altermann, W., Williams, I.S., Smith, C.B., 1994.U–Pb zircon age for a tuff in the Campbell Group, Griqualand
West Sequence, South Africa: Implications for Early Protero-zoic rock accumulation rates. Geology 22 (4), 343–346.
Beukes, N.J., 1979. Litostratigrafiese onderverdeling van dieSchmidtsdrif-Subgroep van die Ghaap-Groep in Noord-Kaap-land. Trans. Geol. Soc. S. Afr. 82, 313–327.
Beukes, N.J., 1980a. Stratigrafie en litofasies van die Camp-bellrand-Subgroep van die Proterofitiese Ghaap-Groep, No-ord-Kaapland. Trans. Geol. Soc. S. Afr. 83, 141–170.
Beukes, N.J., 1980b. Lithofacies and stratigraphy of the Kurumanand Griquatown Iron-Formations, Northern Cape Province,South Africa. Trans. Geol. Soc. S. Afr. 83, 69–86.
Beukes, N.J., 1986. The Transvaal Sequence in Griqualand West.In: Anhaeusser, C.R., Maske, S. (Eds.), Mineral Deposits ofSouthern Africa, Vol. I. Geological Society of South Africa,Johannesburg, pp. 819–828.
Beukes, N.J., Klein, C., 1990. Geochemistry and sedimentologyof a facies transition — from microbanded to granular iron-formation — in the early Proterozoic Transvaal Supergroup,South Africa. Precambrian Res. 47, 99–139.
Bickle, M.J., Eriksson, K.A., 1982. Evolution and subsidence ofearly Precambrian sedimentary basins. R. Soc. Philos. Trans.A 305, 225–247.
Bosellini, A., 1989. Dynamics of Tethyan carbonate platforms.Soc. Econ. Paleontol. Mineral. Spec. Publ. 44, 3–13.
Bosscher, H., Schlager, W., 1993. Accumulation rates of carbon-ate platforms. J. Geol. 101, 345–355.
Burke, K., Kidd, W.F.S., Kusky, T.M., 1986. Archean forelandbasin tectonics in the Witwatersrand, South Africa. Tectonics5, 439–456.
Button, A., 1972. Algal stromatolites of the early ProterozoicWolkberg Group, Transvaal sequence. Economic Geology Re-search Unit, Univ. Witwatersrand, Johannesburg, Info. Circ.69, 9 pp.
Button, A., 1976. Transvaal and Hamersley basins — Review ofbasin development and mineral deposits. Miner. Sci. Eng. 8(4), 262–293.
Cheney, E.S., 1996. Sequence stratigraphy and plate tectonicsignificance of the Transvaal succession of southern Africaand its equivalent in Western Australia. Precambrian Res. 79,3–24.
Chivas, A.R., Torgersen, T., Pollach, H.A., 1990. Growth ratesand Holocene development of stromatolites from Shark Bay,Western Australia. Aust. J. Earth Sci. 37, 113–121.
Clendenin, C.W., 1989. Tectonic Influence on the Evolution ofthe Early Proterozoic Transvaal Sea, Southern Africa. Ph.D.Thesis, Univ. Witwatersrand, Johannesburg, 376 pp.
Cloetingh, S., McQueen, H., Lambeck, K., 1985. On a tectonicmechanism for regional sealevel variations. Earth Planet. Sci.Lett. 75, 157–166.
Compston, W., Williams, I.S., Meyer, C., 1984. U–Pbgeochronology of zircons from lunar breccia 73217 using asensitive high mass-resolution ion microprobe. J. GeophysicalRes. 89, B252–B534.
Cornell, D.H., Schutte, S.S., Eglington, B.L., 1996. The On-geluk Basaltic Andesite Formation in Griqualand West, SouthAfrica: submarine alteration in a 2222 Ma Proterozoic sea.Precambrian Res. 79 (1/2), 101–124.
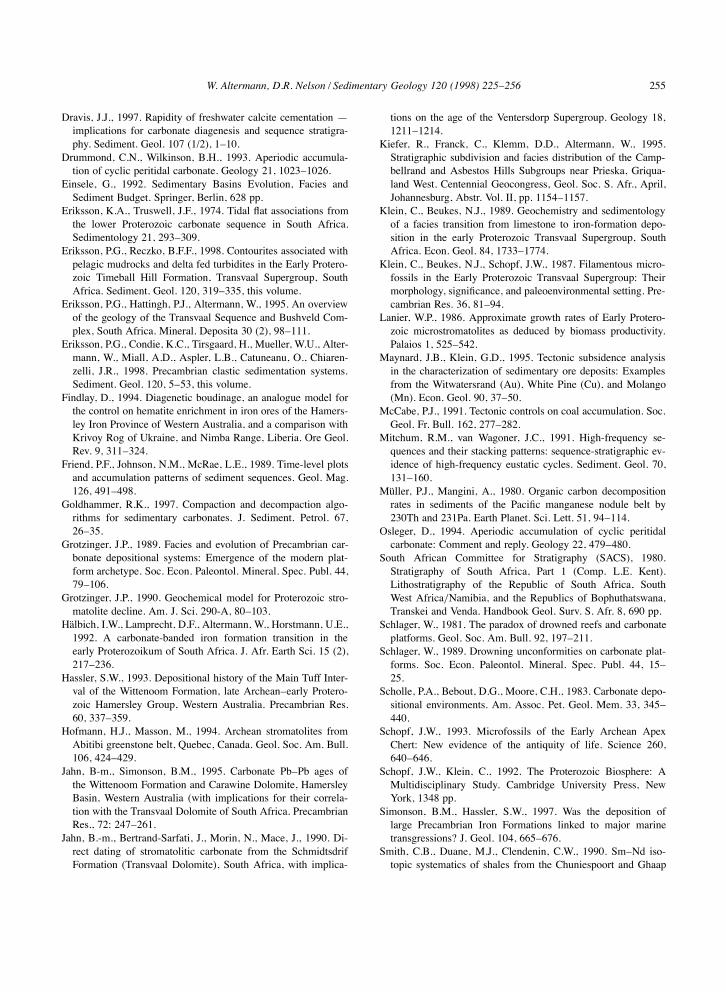
W. Altermann, D.R. Nelson / Sedimentary Geology 120 (1998) 225–256 255
Dravis, J.J., 1997. Rapidity of freshwater calcite cementation —implications for carbonate diagenesis and sequence stratigra-phy. Sediment. Geol. 107 (1/2), 1–10.
Drummond, C.N., Wilkinson, B.H., 1993. Aperiodic accumula-tion of cyclic peritidal carbonate. Geology 21, 1023–1026.
Einsele, G., 1992. Sedimentary Basins Evolution, Facies andSediment Budget. Springer, Berlin, 628 pp.
Eriksson, K.A., Truswell, J.F., 1974. Tidal flat associations fromthe lower Proterozoic carbonate sequence in South Africa.Sedimentology 21, 293–309.
Eriksson, P.G., Reczko, B.F.F., 1998. Contourites associated withpelagic mudrocks and delta fed turbidites in the Early Protero-zoic Timeball Hill Formation, Transvaal Supergroup, SouthAfrica. Sediment. Geol. 120, 319–335, this volume.
Eriksson, P.G., Hattingh, P.J., Altermann, W., 1995. An overviewof the geology of the Transvaal Sequence and Bushveld Com-plex, South Africa. Mineral. Deposita 30 (2), 98–111.
Eriksson, P.G., Condie, K.C., Tirsgaard, H., Mueller, W.U., Alter-mann, W., Miall, A.D., Aspler, L.B., Catuneanu, O., Chiaren-zelli, J.R., 1998. Precambrian clastic sedimentation systems.Sediment. Geol. 120, 5–53, this volume.
Findlay, D., 1994. Diagenetic boudinage, an analogue model forthe control on hematite enrichment in iron ores of the Hamers-ley Iron Province of Western Australia, and a comparison withKrivoy Rog of Ukraine, and Nimba Range, Liberia. Ore Geol.Rev. 9, 311–324.
Friend, P.F., Johnson, N.M., McRae, L.E., 1989. Time-level plotsand accumulation patterns of sediment sequences. Geol. Mag.126, 491–498.
Goldhammer, R.K., 1997. Compaction and decompaction algo-rithms for sedimentary carbonates. J. Sediment. Petrol. 67,26–35.
Grotzinger, J.P., 1989. Facies and evolution of Precambrian car-bonate depositional systems: Emergence of the modern plat-form archetype. Soc. Econ. Paleontol. Mineral. Spec. Publ. 44,79–106.
Grotzinger, J.P., 1990. Geochemical model for Proterozoic stro-matolite decline. Am. J. Sci. 290-A, 80–103.
Halbich, I.W., Lamprecht, D.F., Altermann, W., Horstmann, U.E.,1992. A carbonate-banded iron formation transition in theearly Proterozoikum of South Africa. J. Afr. Earth Sci. 15 (2),217–236.
Hassler, S.W., 1993. Depositional history of the Main Tuff Inter-val of the Wittenoom Formation, late Archean–early Protero-zoic Hamersley Group, Western Australia. Precambrian Res.60, 337–359.
Hofmann, H.J., Masson, M., 1994. Archean stromatolites fromAbitibi greenstone belt, Quebec, Canada. Geol. Soc. Am. Bull.106, 424–429.
Jahn, B-m., Simonson, B.M., 1995. Carbonate Pb–Pb ages ofthe Wittenoom Formation and Carawine Dolomite, HamersleyBasin, Western Australia (with implications for their correla-tion with the Transvaal Dolomite of South Africa. PrecambrianRes., 72: 247–261.
Jahn, B.-m., Bertrand-Sarfati, J., Morin, N., Mace, J., 1990. Di-rect dating of stromatolitic carbonate from the SchmidtsdrifFormation (Transvaal Dolomite), South Africa, with implica-
tions on the age of the Ventersdorp Supergroup. Geology 18,1211–1214.
Kiefer, R., Franck, C., Klemm, D.D., Altermann, W., 1995.Stratigraphic subdivision and facies distribution of the Camp-bellrand and Asbestos Hills Subgroups near Prieska, Griqua-land West. Centennial Geocongress, Geol. Soc. S. Afr., April,Johannesburg, Abstr. Vol. II, pp. 1154–1157.
Klein, C., Beukes, N.J., 1989. Geochemistry and sedimentologyof a facies transition from limestone to iron-formation depo-sition in the early Proterozoic Transvaal Supergroup, SouthAfrica. Econ. Geol. 84, 1733–1774.
Klein, C., Beukes, N.J., Schopf, J.W., 1987. Filamentous micro-fossils in the Early Proterozoic Transvaal Supergroup: Theirmorphology, significance, and paleoenvironmental setting. Pre-cambrian Res. 36, 81–94.
Lanier, W.P., 1986. Approximate growth rates of Early Protero-zoic microstromatolites as deduced by biomass productivity.Palaios 1, 525–542.
Maynard, J.B., Klein, G.D., 1995. Tectonic subsidence analysisin the characterization of sedimentary ore deposits: Examplesfrom the Witwatersrand (Au), White Pine (Cu), and Molango(Mn). Econ. Geol. 90, 37–50.
McCabe, P.J., 1991. Tectonic controls on coal accumulation. Soc.Geol. Fr. Bull. 162, 277–282.
Mitchum, R.M., van Wagoner, J.C., 1991. High-frequency se-quences and their stacking patterns: sequence-stratigraphic ev-idence of high-frequency eustatic cycles. Sediment. Geol. 70,131–160.
Muller, P.J., Mangini, A., 1980. Organic carbon decompositionrates in sediments of the Pacific manganese nodule belt by230Th and 231Pa. Earth Planet. Sci. Lett. 51, 94–114.
Osleger, D., 1994. Aperiodic accumulation of cyclic peritidalcarbonate: Comment and reply. Geology 22, 479–480.
South African Committee for Stratigraphy (SACS), 1980.Stratigraphy of South Africa, Part 1 (Comp. L.E. Kent).Lithostratigraphy of the Republic of South Africa, SouthWest Africa=Namibia, and the Republics of Bophuthatswana,Transkei and Venda. Handbook Geol. Surv. S. Afr. 8, 690 pp.
Schlager, W., 1981. The paradox of drowned reefs and carbonateplatforms. Geol. Soc. Am. Bull. 92, 197–211.
Schlager, W., 1989. Drowning unconformities on carbonate plat-forms. Soc. Econ. Paleontol. Mineral. Spec. Publ. 44, 15–25.
Scholle, P.A., Bebout, D.G., Moore, C.H., 1983. Carbonate depo-sitional environments. Am. Assoc. Pet. Geol. Mem. 33, 345–440.
Schopf, J.W., 1993. Microfossils of the Early Archean ApexChert: New evidence of the antiquity of life. Science 260,640–646.
Schopf, J.W., Klein, C., 1992. The Proterozoic Biosphere: AMultidisciplinary Study. Cambridge University Press, NewYork, 1348 pp.
Simonson, B.M., Hassler, S.W., 1997. Was the deposition oflarge Precambrian Iron Formations linked to major marinetransgressions? J. Geol. 104, 665–676.
Smith, C.B., Duane, M.J., Clendenin, C.W., 1990. Sm–Nd iso-topic systematics of shales from the Chuniespoort and Ghaap
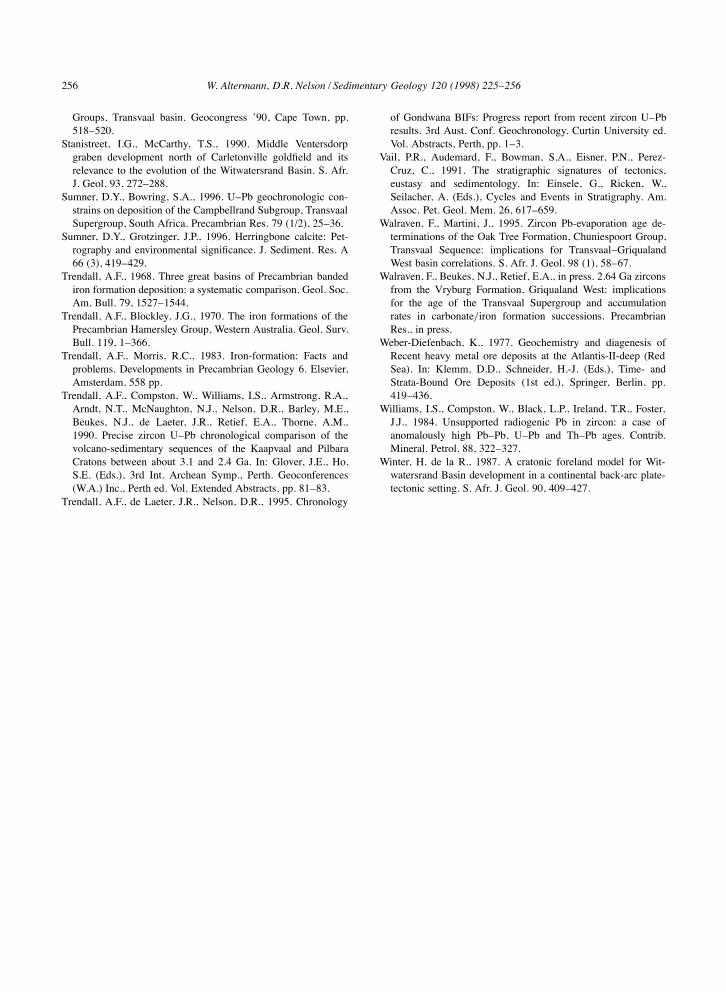
256 W. Altermann, D.R. Nelson / Sedimentary Geology 120 (1998) 225–256
Groups, Transvaal basin. Geocongress ’90, Cape Town, pp.518–520.
Stanistreet, I.G., McCarthy, T.S., 1990. Middle Ventersdorpgraben development north of Carletonville goldfield and itsrelevance to the evolution of the Witwatersrand Basin. S. Afr.J. Geol. 93, 272–288.
Sumner, D.Y., Bowring, S.A., 1996. U–Pb geochronologic con-strains on deposition of the Campbellrand Subgroup, TransvaalSupergroup, South Africa. Precambrian Res. 79 (1/2), 25–36.
Sumner, D.Y., Grotzinger, J.P., 1996. Herringbone calcite: Pet-rography and environmental significance. J. Sediment. Res. A66 (3), 419–429.
Trendall, A.F., 1968. Three great basins of Precambrian bandediron formation deposition: a systematic comparison. Geol. Soc.Am. Bull. 79, 1527–1544.
Trendall, A.F., Blockley, J.G., 1970. The iron formations of thePrecambrian Hamersley Group, Western Australia. Geol. Surv.Bull. 119, 1–366.
Trendall, A.F., Morris, R.C., 1983. Iron-formation: Facts andproblems. Developments in Precambrian Geology 6. Elsevier,Amsterdam, 558 pp.
Trendall, A.F., Compston, W., Williams, I.S., Armstrong, R.A.,Arndt, N.T., McNaughton, N.J., Nelson, D.R., Barley, M.E.,Beukes, N.J., de Laeter, J.R., Retief, E.A., Thorne, A.M.,1990. Precise zircon U–Pb chronological comparison of thevolcano-sedimentary sequences of the Kaapvaal and PilbaraCratons between about 3.1 and 2.4 Ga. In: Glover, J.E., Ho,S.E. (Eds.), 3rd Int. Archean Symp., Perth. Geoconferences(W.A.) Inc., Perth ed. Vol. Extended Abstracts, pp. 81–83.
Trendall, A.F., de Laeter, J.R., Nelson, D.R., 1995. Chronology
of Gondwana BIFs: Progress report from recent zircon U–Pbresults. 3rd Aust. Conf. Geochronology. Curtin University ed.Vol. Abstracts, Perth, pp. 1–3.
Vail, P.R., Audemard, F., Bowman, S.A., Eisner, P.N., Perez-Cruz, C., 1991. The stratigraphic signatures of tectonics,eustasy and sedimentology. In: Einsele, G., Ricken, W.,Seilacher, A. (Eds.), Cycles and Events in Stratigraphy. Am.Assoc. Pet. Geol. Mem. 26, 617–659.
Walraven, F., Martini, J., 1995. Zircon Pb-evaporation age de-terminations of the Oak Tree Formation, Chuniespoort Group,Transvaal Sequence: implications for Transvaal–GriqualandWest basin correlations. S. Afr. J. Geol. 98 (1), 58–67.
Walraven, F., Beukes, N.J., Retief, E.A., in press. 2.64 Ga zirconsfrom the Vryburg Formation, Griqualand West: implicationsfor the age of the Transvaal Supergroup and accumulationrates in carbonate=iron formation successions. PrecambrianRes., in press.
Weber-Diefenbach, K., 1977. Geochemistry and diagenesis ofRecent heavy metal ore deposits at the Atlantis-II-deep (RedSea). In: Klemm, D.D., Schneider, H.-J. (Eds.), Time- andStrata-Bound Ore Deposits (1st ed.), Springer, Berlin, pp.419–436.
Williams, I.S., Compston, W., Black, L.P., Ireland, T.R., Foster,J.J., 1984. Unsupported radiogenic Pb in zircon: a case ofanomalously high Pb–Pb, U–Pb and Th–Pb ages. Contrib.Mineral. Petrol. 88, 322–327.
Winter, H. de la R., 1987. A cratonic foreland model for Wit-watersrand Basin development in a continental back-arc plate-tectonic setting. S. Afr. J. Geol. 90, 409–427.