ram pressure correlations for - citeseerx
TRANSCRIPT

RAM PRESSURE CORRELATIONS FOR
ASPIRATED CYLINDERS
by
ZACHARY JAMES SCHOLZ, B.S.M.E.
A THESIS
IN
MECHANICAL ENGINEERING
Submitted to the Graduate Faculty of Texas Tech University in
Partial Fulfillment of the Requirements for
the Degree of
MASTER OF SCIENCE
IN
MECHANICAL ENGINEERING
Approved
Chairperson of the Conraiittee
Accepted
• j - y .1 - . 1 I I . • • • • . — • - — I I M >i
Dean of the Graduate School
May, 2004

ACKNOWLEDGEMENTS
I would like to take this opportunity to thanl< the people that have been influential
in my life and aided me in this publication. To Dr. Walt Oler, who is a valuable asset to
the Engineering program at Texas Tech, thank you for believing in me and allowing me
to pursue this project with your expert guidance.
To my committee members, Dr. Siva Parameswaran, and Dr. Timothy Maxwell,
for your classes and extraordinary leadership are a testament to the engineering reputation
of this university.
To Ford Motor Company for your generous fmancial support, without which, I
would not have been able to pursue this advanced degree.
Last but not least, to my fiancé, and both of our families, for your support in this
venture speaks volumes about your commitment to those you love.

TABLE OF CONTENTS
ACKNOWLEDGEMENTS ii
ABSTRACT iv
LISTOFTABLES vi
LIST OF FIGURES vii
NOMENCLATURE ix
CHAPTER
I. INTRODUCTION 1
IL LITERATURE REVIEW 3
m. TECHNICAL APPROACH 15
3.1 Ram Coefficients for Individual Openings 15
3.2 Ram Coefficients for Combined Openings 21
IV. EXPERIMENTAL SETUP 25
4.1 WindTunnel 26 4.2 Model Parameters 26
4.3 Data Acquisition 29
V. RESULTS AND DISCUSSION 33
5.1 Zero FIow Rate Measurement 33 5.2 Ram Coefficients for Individual Openings 37
5.3 Ram Coefficients for Multiple Openings 46
VI. CONCLUSIONS AND RECOMMENDATIONS 57
6.1 Conclusions 57
6.2 Recommendations 58
REFERENCES 60
APPENDIX
A. LABVIEW VI SCREENSHOTS 61
B. RAM COEFFICIENTS FOR SINGLE OPENINGS TABULAR DATA 64
C. RAM COEFFICIENTS FOR MULTIPLE OPENINGS TABULAR DATA.. 71
ni

ABSTRACT
Design of automobile cooling systems involves tradeoffs in the sizing of grille
openings to provide adequate cooling airflow and the tendency to reduce grille opening
size to decrease vehicle cooling drag and produce aesthetically pleasing designs. Air that
enters the cooling system of an automobile is driven by two major sources, the freestream
dynamic pressure resulting from the forward motion of the vehicle and the intemal
vacuum created by the underhood fan. The flow fields associated with both sources must
be considered when assessing the cooling performance of a new automobile design. The
current investigation focuses on characterizing the external or dynamic pressure induced
flow through a parameter known as the ram coefficient.
The investigation utilized an aspirated cylinder in cross-flow as an idealized
representation of an automobile front end with grille openings. The pressure distribution
on the upstream side of the cylinder model includes a stagnation point and a significant
surface pressure gradient similar to those of an actual automobile front end fascia.
Various sized openings machined into the side of the cylinder model simulated the grille
openings in an automobile. A flexible hose connecting one end of the cylinder to a shop
vacuum provided a simulation of the cooling air flow induced by a radiator fan. The
primary advantage of the cylinder model is a dramatic reduction in the number of
experimental influences on the ram coefficient. The elimination of the various under-
hood components simplifies the investigation process down to the most basic
components, yielding accurate, repeatable results.
IV

Primary results are that the cylinder does provide a useful representation of
automobile front end. These results verify the general trends seen in previous full scale
model tests. Additionally, it was found that ram coefficients for single openings are
determined by opening size and location relative to the external surface pressure
distribution. It was also found that ram coefficients for combinations of openings can be
predicted from knowledge of the performance characteristics of the individual openings.

LIST OF TABLES
5.1: Cp,Q and k^ at Various Values of Cp 44
5.2: Model Test Itinerary 47
B.l: TabuIarData-SingIeOpening-Cp= 1.0 65
B.2: Tabular Data- Single Opening- Cp= 0.7 67
B.3: TabuIarData-SingIeOpening-C;,= 0.4 69
C.l: TabuIarData-MuItiple Openings- 19.05 {Cp= 1.0) and 8.73 (10 deg. Offset).... 72
C.2: Tabular Data - Multiple Openings - 19.05 {Cp = 1.0) and 8.73 (20 deg. Offset).... 74
C.3: Tabular Data- Multiple Openings - 19.05 (Cp= 1.0) and 7.14 (10 deg. Offset).... 76
C.4: Tabular Data- Multiple Openings - 19.05 {Cp= 1.0) and 7.14 (20 deg. Offset).... 78
C.5: Tabular Data- Multiple Openings - 8.73 {Cp= 1.0) and 19.05 (10 deg. Offset).... 80
C.6: Tabular Data- Multiple Openings - 8.73 {Cp= 1.0) and 19.05 (20 deg. Offset).... 82
C.7: TabuIarData-MultipIeOpenings-8.73 {Cp= 1.0) and 7.14 (10 deg. Offset) 84
C.8: TabuIarData-MuItipIeOpenings-8.73 {Cp= 1.0) and 7.14 (20 deg. Offset) 86
C.9: Tabular Data-Multiple Openings-7.14 {Cp= 1.0) and 19.05 (10 deg. Offset).... 88
C.IO: Tabular Data- Multiple Openings - 7.14 {Cp= 1.0) and 19.05 (20 deg. Offset).. 90
C.I I: Tabular Data - Multiple Openings - 7.14 (C;,= 1.0) and 8.73 (10 deg. Offset).... 92
C.12: Tabular Data- Multiple Openings - 7.14 (C;,= 1.0) and 8.73 (20 deg. Offset).... 94
C.13: TabuIarData-MuItipIeOpenings-8.73 {Cp= 1.0) and 8.73 (lOdeg. Offset)....96
C.14: Tabular Data- Multiple Openings - 7.14 {Cp= 1.0) and 7.14 (10 deg. Offset).... 98
VI

LIST OF FIGURES
2.1: Streamtube comparison (Schaub and Charles, 1980) 4
2.2: Screenshot of ttu_CooI® 6
3.1: Pressure changes from Freestream to Underbody 17
4.1: Wind Tunnel Schematic 25
4.2: Specimen Vacuum Connection 27
4.3: Model Schematic 28
4.4: shop'vac® 2.0 peak HP Wet/Dry Vacuum 28
4.5: Generic Ball Valve 29
4.6: TSI4000 Series FIow Meter 30
4.7: Top View of Model in the Test Section 32
5.1: Cylinder Pressure Curve 35
5.2: Cp,i versus qr/qO at C^ = 1.0 39
5.3: Complete Cp,, versus ^/go at Cp = 1.0 40
5.4: Cp, versus q/qodiXCp^ 1.0 42
5.5: Cp,, versus qj/qo at Cp = 0.7 43
5.6: Cp,i versus qt/qo at Cp = 0.4 44
5.8: Combined 19.05 {Cp= 1.0) and 8.73 (10 Deg. Offset) C ,, Coefficients 50
5.9: Combined 19.05 {Cp = 1.0) and 8.73 (20 Deg. Offset) Cpj Coefficients 50
5.10: Combined 19.05 {Cp= 1.0) and 7.14 (10 Deg. Offset) Cp,, Coefficients 51
5.11: Combined 19.05 (Cp= 1.0) and 7.14 (20 Deg. Offset) Cp,, Coefficients 51
vu

5.12: Combined 8.73 (C,,= 1.0) and 19.05 (10 Deg. Offset) C ,, Coefficients 52
5.13: Combined8.73(Cp=I.0)and 19.05 (20 Deg. Offset) C ,, Coeffícients 52
5.14: Combined 8.73 (Cp= 1.0) and 7.14 (10 Deg. Offset) Cpj Coefficients 53
5.15: Combined 8.73 {Cp= 1.0) and 7.14 (20 Deg. Offset) Cp,, Coefficients 53
5.16: Combined 7.14 {Cp = 1.0) and 19.05 (10 Deg. Offset) Cpj Coefficients 54
5.17: Combined 7.14 {Cp= 1.0) and 19.05 (20 Deg. Offset) Cpj Coefficients 54
5.18: Combined 7.14 {Cp = I.O) and 8.73 (10 Deg. Offset) Cpj Coefficients 55
5.19: Combined 7.14 {Cp= 1.0) and 8.73 (20 Deg. Offset) Cpj Coefficients 55
5.20: Combined 8.73 {Cp = 1.0) and 8.73 (10 Deg. Offset) Cpj Coefficients 56
5.21: Combined 7.14 {Cp = I.O) and 7.14 (10 Deg. Offset) C ,, Coefficients 56
A.l: LabVIEW Virtual Instrument (vi) Written for Data Acquisition (Front End) 62
A.2: LabVIEW Virtual Instrument (vi) Written for Data Acquisition (Diagram) 63
vui

NOMENCLATURE
AP^ Contraction pressure drop
p„ Freestream air density
Aj Inlet area
A^ Internal area
Cp Coefficient of pressure
k^ Experimentally determined coefficient - proportionality constant between
the ram coeffícient and inlet area ratio
K^ Wind tunnel contraction calibration coefficient
Kg Grille coefficient
^ram Rãm coefficient
K,^ Underbody coefficient
m Mass flow rate
P^ Freestream pressure
P, Inlet pressure
P^ Intemal pressure
Pj. Total pressure
Pj.^^^ Ram pressure
q^ Freestream dynamic pressure
q^ Inlet dynamic pressure
IX

q^ Internal dynamic pressure
V„ Freestream velocity
V- Volumetric flow rate

CHAPTERI
INTRODUCTION
Design of automobile cooling systems involves tradeoffs in the sizing of grille
openings to provide adequate cooling airflow and the tendency to reduce grille opening
size to decrease vehicle cooling drag and produce aesthetically pleasing designs. Air that
enters the cooling system of an automobile is driven by two major sources, the freestream
dynamic pressure resulting from the forward motion of the vehicle, and the intemal
vacuum created by the underhood fan. The flow fields associated with both sources must
be considered when assessing the cooling performance of a new automobile design. The
current investigation focuses on characterizing the extemal or dynamic pressure induced
flow through a parameter knowoi as the ram coefficient.
The ram coefficient has proven to be a meaningful way of characterizing the
influence of grille openings on cooling system performance, as seen in wind tunnel
research by Roseberry (1990), Crafton (1992), and Nguy (1992). Because the ram
coefficient is simply a fiinction of intemal static pressure normalized by freestream
dynamic pressure, it can be helpful in determining whether a new cooling design meets
the desired criteria, or whether further modifications should be made.
The investigation utilized an aspirated cylinder in cross-flow as an idealized
representation of an automobile front end with grille openings. The pressure distribution
on the upstream side of the cylinder model includes a stagnation point and a signifícant
surface pressure gradient similar to those of an actual automobile front end fascia.
Various sized openings machined into the side of the cylinder model simulated the grille
1

openings in an automobile. A flexible hose connecting one end of the cylinder to a shop
vacuum provided a simulation of the cooling air flow induced by a radiator fan. Because
the cylinder model is considerably smaller than the previous automobile models, it can be
tested inexpensively in a small wind tunnel. The elimination of the various under-hood
components simplifies the investigation process down to the most basic components,
yielding accurate, repeatable results.
Primary results are that the cylinder does provide a useful representation of the
idealized automobile front end. These results verify the general trends seen in previous
fiill scale model tests. Additionally, it was found that ram coefficients for single
openings are determined by opening size and location relative to the extemal surface
pressure distribution. It was also found that ram coefficients for combinations of
openings can be predicted from knowledge of the performance characteristics of the
individual openings.

CHAPTER II
LITERATURE REVIEW
The first major step in research that replaced the trial and error method for cooling
system design was taken in the mid-1970s. Olson (1976) attempted to quantify the total
grille airflow by performing full-scale wind tunnel tests. By traversing a system of
anemometers mounted behind the radiator, Olson was able to measure the cooling air
flow and to identify some of the effects of various grille opening confígurations. This
process, however, proved to be somewhat inaccurate because of the poor flow
measurement techniques used in processing.
Hawes (1976) argued that configuration of intemal cooling system components,
and not size of the openings alone determined the best method of engine cooling. He
argued that overly large frontal intake areas only increased drag coefficients, and power
requirements, which reduced overall vehicle efficiency.
Schaub and Charles (1980) focused their study on the interaction between the
intemal and extemal airflows. They noted that the upstream capture area for a
streamtube containing the cooling airflow is infínitely large when the vehicle is not
moving with the radiator fan running. However, this capture area can decrease to less
than one square foot in cases where the vehicle is moving at rapid rates (Figure 2.1). The
extreme variation in extemal flows associated with ram or freestream dynamic pressure
driven flow or fan induced flow was used as an explanation for the widely variable
pressure drop for the flow through the grille openings. Schaub and Charles used a
method similar to Olson in collecting data. Using a system of traversing anemometers

mounted behind the radiator, they measured internal velocities on both fuU-scale wind
tunnel tests and road tests. Schaub and Charles were also able to investigate the effect of
the radiator fan on the cooling system performance. This investigation was important
because it was the first technique that allowed for griUe pressure drop measurements over
a range of fan induced vacuum rates and freestream velocities.
WiUiams (1985) used the term grille open area when describing the amount of
grille area that can be projected onto the radiator. WiIIiams stated that the grille open
area was not a feature that could, alone, be used to accurately determine the performance
of an engine cooling system. After aerodynamic and environmental wind tunnel tests, it
was ascertained that other factors were involved in determining the cooling performance
of the system.
(a) Stationary Vehiole
(b) Moving Vehicle
Figure 2.1: Streamtube comparison (Schaub and Charles, 1980)

Renn and Gilhaus (1986) discussed the importance of providing a system that
ducts the incoming air through the cooling components, thereby increasing the
component effectiveness, and preventing backflow. This process controlled the airflow
over the radiator and condenser, which reduced hot air recirculation. They deduced that
aerodynamic improvements need not necessarily interfere with cooling requirements.
Automotive engineers commonly use Computational Fiuid Dynamics (CFD) in
the design of an engine cooling system for an automobile. Typical CFD results include
highly detailed distributions of velocity and pressure which are presented in the form of
intuitive graphical presentations superposed on the vehicle geometry. With adequate care
to assure the accuracy of the calculations, CFD predictions may, in many cases, be
substituted for traditional wind turmel experiments. However, this approach is not
without its disadvantages, as CFD modeling requires a great deal of time to formulate the
computational grid due to complicated external and internal geometries. Any time the
model is changed, the entire grid must be reformulated for alternate configurations.
Additionally, many of the design parameters that the CFD model requires may not be
available during the early stages of the design process.
In an altemate approach to predicting overall cooling system performance, a
multiple streamtube concept was used to create a computational cooling system model,
ttu_Cool® at Texas Tech University (Oler and Jordan 1988). ttu_CooI® was later
expanded to predict heat rejection parameters by Dr. Walt Oler and Dr. Duane Jordan
(1990), with ftanding from Ford Motor Company. This model uses basic thermodynamic

principles in an iterative process to predict the overall cooling performance under specifíc
operating conditions (Figure 2.2).
Vehicle Speed
Road Grade
AmbîentTemp
Ambicnt Prcs í
-Jjcat Rejcctían-
jÊngine Power
Engínc Hcat
Trans Heat
Radiator Hcat
Coolant nowrate
CondcnscrHeat
Refrigerant Flowrate
Trans Cooicr Heat f
Trans Oii Rowrale
*9B.G :
L\../ .' 20.0
íêm/h
%
C
0.59
"! m . kW
kW
" " " k W
kg/s
kV/
kW
k9/&
-System Performance
Rad.MaGsriow 1.295 íg/f
Rad. ExitVol. Fiow
Top-V/ater Terrip.
AírExitTcmp.
AC Head nres.
64.65 ACMM
^n.íj c
20.'i c
kPa »„,
jFan Parameters,-
(rpml
Fan»1
Fan S2
Fan 83
1800.0
«Powcr'
^^atts)
236.72
- '„/^'/„„
Figure 2.2: Screenshiot of ttu_Cool°
With the current investigation, research at Texas Tech University into the
aerodynamics associated with the air flow through an automobile cooling system has
come full circle. Utilizing a small scale, highly abstracted representation of a vehicle
front end, Roseberry (1990) evaluated the efficiency of a grille configuration in terms of
a grille coefficient and revealed the basic relationships describing its variation with
vehicle speed, flow rate, and grille opening size. Crafton (1992), Nguy (1992), and
Vemer (2000) utilized slightly altered full-scale vehicles to demonstrate that the same
concepts applied to the much more complicated geometries and processes. In the present

investigation, another highly abstracted representation of a vehicle front-end, a simple
cylinder in cross flow, is applied to further reveal the fundamental physics associated
with the induction of air through the cooling system of an automotive vehicle.
Roseberry (1990) measured the change in total pressure for the flow through grille
and bottom openings on an idealized one fifth-scale automobile front-end. The front of
the box shaped model was fitted with a rounded fiberglass shell that included a grille
opening on the front and a bottom opening ahead of an underbody air dam. The size of
both the grille and bottom openings could be adjusted or closed completely. The rear of
the box was connected by a flexible hose to the inlet of a blower which simulated the
effect of a fan and provided a controlled flow rate through the model. A laminar flow
element mounted at the blower exhaust was used for flow rate measurement. The
presence of a radiator was simulated by honeycomb and screen mesh flow straighteners
placed across the model interior a short distance behind the grille and bottom openings.
An average static pressure was sensed with a manifold of static pressure taps just aft of
the honeycomb and screen. The incremental static pressure losses due to the honeycomb
and screen mesh were eliminated during the data reduction process to obtain the desired
static pressure ahead of the radiator (simulated by the honeycomb and screen) and behind
the inlets. With static pressure and flow rate measurements, it was possible to quantify
an interior total pressure based on the average velocity across the face of the honeycomb.
Roseberry defíned a grille loss coeffícient on the basis of the change in total
pressure across the grille opening,

^,„,=(p.+\pV:)-(Pr+^PV')
^ ^^,n„e ^ Pr.,.,.+-2PV'
'"'"• ^PV^ ^oV' 2 h"^ •X, 2 r'' X (1 \\
where the subscript /• indicates average conditions at the front face of the simulated
radiator. A corresponding grille coeffícient was based on the interior total pressure
behind the grille and underbody openings.
K _Pr.,a,.+\pV^ JpVl-^P^,,,
'"'"' \PV1 " {pV^
= ^-^ioss- (2.2)
The grille coeffícient represents the fraction of the freestream total pressure (relative to
the fi-eestream static pressure) delivered through the grille and underbody openings. As
defíned, the maximum value of the grille coefficient is one, corresponding to an interior
total pressure equal to the freestream total pressure. The ram coefficient may take on
negative values if the blower-aided flow rate is sufficiently high for the total pressure
drop through the grille to exceed the freestream dynamic pressure.
Roseberry's measurements demonstrated that, when tested individually, the grille
coeffícients for the grille and bottom openings are a unique ftinction of the ratio of
average velocity through the inlet F, to the freestream velocity,
^grille ~ ^gO + ^g\ 'v^
V , (2.3)

(AA 2
[yj
Alternatively, the ram recovery coeffícients may be expressed as a function of the ratio of
an average velocity at the face of the radiator to the freestream velocity and the ratío of
the radiator face area to the inlet area,
^grille ~ '^gO + . ^g l
(2.4)
Roseberry also found that the grille coefficient resulting from the combinatíon of
grille and bottom openings could be predicted by assuming that the relative flow rates
through the two openings must be such that both are operating at the same grille
coeffícient, i.e., producing the same total pressure within the model. For a given grille
coeffícient, the individual correlations for the grille and underbody openings were solved
for the corresponding inlet velocity ratios thereby leading to the flow rate through each
opening. Thus, the total flow rate for the combination of openings operating at a
particular grille coeffícient could be determined from the sum of the individual flow
rates.
After Roseberry's thesis, the question was whether a real automobile with the
geometric and physical complications of a bumper, griUe, radiator, and fan would exhibit
the same behavior. Crafton's (1992) wind tunnel test of a mid-size sedan (Ford Taurus)
andNguy's (1992) test of a light truck (Ford F150) demonstrated that, indeed, the same
physics apply to full-size vehicles. In both tests, the vehicle front ends were replaced
with a fiberglass fascia which had the same general shape as the actual vehicle.
Interchangeable panels with a variety of opening sizes could be placed on the fiberglass
front ends at the same relative locations of the grille and bottom openings on the actual

vehicles. The cavity behind the grille openings was fully sealed so that all air flow
through the grille and underbody openings was forced to pass through the radiator. Low
profíle pinwheel anemometers mounted on the back of the radiator were used to quantífy
the flow rate. Because of the strong turbulence expected immediately behind the
openings, the static pressure was sensed behind the radiator. The desired static pressure
ahead of the radiator was obtained by subtracting the radiator pressure drop which was
known from a separate flow stand test. GriIIe coefficients obtained by Crafton for the
sedan and Nguy for the light truck are qualitatively identical to those obtained by
Roseberry.
Crafton and Nguy both noted that the freestream dynamic pressure also affects the
cooling air flow rate through a reduction in the pressure beneath the vehicle and
effectively, a reduction in the back pressure on the cooling system. The underbody
pressure reduction is the result of a venturi effect on the air as it is channeled and
accelerated beneath the vehicle. The reduction in underbody pressure is characterized by
an underbody pressure coeffícient
j ^ _Px-Pu
'pVl IP'^ (2.5)
Noting that both the grille coeffícient and the underbody coefficient scale with the
freestream dynamic pressure, Crafton and Nguy introduced the ram coefficient parameter
to represent the combined effects of the freestream dynamic or ram pressure.
Í : _ =K+K... ram g (2.6)
10

^ram ' ^ r + ^r\ V^j
The underbody pressure required for the underbody pressure coefficient and ram
coeffícient calculations was inferred from the static pressure measurements on the back
of the radiator. By adding the pressure jump across the fan and assuming a negligible
pressure drop through the engine bay, the desired underbody pressure was obtained. The
fan pressure jtmip at a particular flow rate and fan speed was estimated from correlations
of data obtained in a flow stand test of the fan.
ft was found that variations of the ram coefficients for the Taurus and F150 with
flow rate, vehicle speed and opening size are similar to the grille coefficient and are well
correlated by
= K,.n + ,., — — Â V
V^/ ; \.''-'J (2.7)
As for the griUe coeffícient, the correlation coeffícients for the ram coeffícient are
dependent upon the location and combination of the grille openings for a particular front
end confíguration.
Vemer (2000) introduced a new procedure for experimentally determining the
ram pressure and ram coeffícient that is not reliant on the diffícult static pressure
measurements between the radiator and the fan. Working with Crafton's (1992) wind
ttrnnel data from the Taurus, she noted that the energy required to overcome the net
pressure drop for flow through the underhood cooling package (heat exchangers and fan)
must come from the freestream dynamic pressure. Based on a flow stand evaluation of
the cooling package pressure drop as a fiinction of fan speed and flow rate, the net ram
11

pressure on the cooling package could be determined from a flow rate measurement
alone.
K..^... = ram
_ ^ram _ ^P conJen.ur + ^P radiaior + ^P/a,
' \pvl \pv: ^^ " (2.8)
It is assumed that changes in the average dynamic pressure through the cooling package
are negligible so that the change in total pressure is equivalent to the change in statíc
pressure. The revised procedure yielded a much higher degree of correlatíon in the ram
coefficient measurements and more clearly discernable trends in the results.
Vemer also provided a simple theoretícal explanatíon for the grille losses
associated with a single grille opening. The flow through the grille openings was divided
into two processes. First, for the flow from the freestream to the plane of the inlet, it was
assumed that the process is reversible so that pressure and velocity changes are easily
related by BemouUi's equation. Second, it was assumed that all of the grille losses occur
between the grille opening and the first heat exchanger and are a result of having zero
static pressure recovery associated with the deceleration and expansion of the flow
between the inlet and heat exchangers. With this representation of the grille losses and
approximation of the engine bay and underbody pressure changes with simple pressure
coefficients, the overall ram pressure coeffícient for a vehicle with a single grille opening
should follow an expression of the form
/ A \
^ram ~ .'^O + ^A fv^
A + ^bay
'v^ V.j (2.9)
12

The correlation coeffícients KQ and KA are unique to a particular opening style and
location but relatively insensitive to the size of the opening. By contrast, the engine bay
pressure drop coeffícient Kbay is characteristic of the underhood confíguration for the
vehicle and should not be dependent on the layout of the grille openings or underbody air
dam. Verner applied a unifíed least squares curve fítting procedure in which the KQ and
KA coefficients for an individual above bumper opening, bumper opening, below bumper
or chin opening, and bottom opening were determined simultaneously along with a single
characteristic engine bay coeffícient Kbay.
For configurations with multiple openings, Vemer applied the same concept as
Roseberry (1990), Crafton (1992), and Nguy (1992). It was assumed that the flow rates
through the individual openings are such that each opening is operating at the same grille
coefficient. On the basis of the simple model of the griUe loss mechanism, this implies
that wãth zero static pressure recovery dovmstream of the openings, the average static
pressures at the inlet planes of the particular combination of openings are equal. In this
way, the ram coefficient for any combination of the sizes and locatíons of the grille
openings may be predicted.
The data reductíon and correlation procedures developed by Verner (2000), may
be applied to predict the ram coefficient for any combination of grille and underbody
openings on a mid-sized sedan that is geometrically similar to the 1991 Ford Taurus. For
dissimilar geometries, an equivalent series of wind tunnel tests is required to determine
the base set of inlet and engine bay correlation coefficients. Unfortunately, the cost and
time associated with this effort is prohibitive in a typical production vehicle design cycle.
13

It would be very useful if the required correlatíon coeffícients could be estímated on the
basis of the measured or CFD determined pressure distribution on an unbroken, i.e.,
without grille openings, front fascia of a new vehicle.
The primai-y goal of the current research is to establish a relatíonship between the
pressure distribution on the generic front fascia shape of a new vehicle and the
corresponding grille correlatíon coeffícients. For this purpose, an aspirated cylinder in
cross flow was taken as an idealized representation of a vehicle front end. Intermediate
objectives for the research were to evaluate the realism of the cylinder model, determine
grille coeffícient correlations for grille openings (holes in the cylinder wall) of various
size and location with respect to the base surface pressure distribution, and to fiirther
evaluate the procedure first outlined by Roseberry (1990) for predicting the grille
coeffícient for combinations of openings based on correlations obtained for individual
openings.
14

CHAPTER III
TECHNICAL APPROACH
3.1 Ram Coeffícients for Individual Openings
Consider a sfreamtube that originates in the freestream far upstream of a single
grille opening of an automobile. As the streamtube enters the automobile, it passes
through the grille opening, condenser, radiator, and radiator fan untíl it reaches the
underbody. This study focuses on the freestream total pressure and the total pressure loss
through the grille opening, and does not consider the other streamtube pressure drops and
rises that occur between the front face of the first heat exchanger and the underbody.
Air passing through the inlets of an automobile grille expands from the inlet area
to the frontal area of the heat exchangers. If it is assumed that the flow is approximately
uniform over the exchanger area, this area may be taken as an intemal reference area A^.
With this definition for the reference area, a corresponding average velocity Vr and
dynamic pressure q^ may be calculated. For the cylinder model of a vehicle grille, the
intemal reference area is defíned to be the intemal flow area or simply the intemal cross-
sectional area of the cylinder. This area is used for the calculation of average intemal
velocity and dynamic pressures.
ft is also reasonable to assume that the static pressure disttibution over the heat
exchanger face area is approximately uniform and will be denoted as Pr- Similarly, it is
assumed that the intemal pressure on the cylinder model is uniform and will be taken as
the intemal reference static pressure.
15

In the development of a simple theoretical model of the loss mechanism
associated with flow through a grille opening, Verner (2000) assumed that there are no
losses in the freestream flow to the inlet openings. As shown below, this assumption is
only true in the case where the opening is located at what would be the stagnation point
on a front-end fascia without openings. At all other opening locations, losses occurring
in the exterior flow from the freestream to the inlet should be included. Verner also
assumed that because the change from inlet area to the heat exchanger flow area is
abrupt, there is no significant static pressure recovery associated with change in velocity
from the inlet at F, to the final internal velocity V^. That assumption is also applied for
the current study.
Developing a relationship for the ram pressure coefficient requires consideration
of the changes in the exterior and interior flow. Total pressure at the cylinder interior is
analogous to the ram pressure behind the grille openings on a real vehicle. As described
earlier, these intemal reference conditions are analogous to the average pressure and
velocity across the radiator area in an automobile. For the cylinder, it is assumed that the
static pressure is uniform and the average velocity and dynamic pressure may be found
from the cross-sectional area.
The ram pressure or total pressure behind the grille openings is expressed in terms
of the freestream total pressure and the total pressure loss associated with flow through
the grille opening
P - P -AP (•^•^'' ^Tr - ^T«= ^Tgrille •
16

The grille total pressure drop is divided into components which occur upstream and
downstream of the grille inlet
P , , = P , „ - [ A P , „ , + A P , , J . (3.2)
Consider, first, the exterior loss in total pressure. The pressure and velocity
change associated with the change in streamtube area from the freestream to the inlet can
be seen in Figure 3.1. Relative to the freestream static pressure, the freestream total
pressure is
^TX — Q<X, 5
while the total pressure at the plane of an inlet is,
PTi=Pi.g+^r
(3.3)
(3.4)
A^
PT^ = E
p<. ãD CD
_- --- ''~'"'~^^ —
. ^ " ^
PTt=P.,+^t
Tes Pipe
— ''j^
A.,
Pjr = Pj^ — ^Tiriik
Pr f-:
Figure 3.1: Pressure clianges from Freestream to Underbody
The change in total pressure from the freestream to the inlet may be written as
^T.e.=PT.-PTi=q.-(P,g+(l,)
^T.e.=PTx-PTi=-P,,g+^x-^i- (3-5)
17

The static pressure at the cylinder inlet can be written in terms of an inlet pressure
coefficient, Cpj,
P:,=^Sp., (3.6)
where
P -P P C ., = ^ ^ = - ^ . (3.7)
When the flow rate is zero, the inlet pressure coefficient is approximately equal to the
surface pressure coefficient on an unbroken fascia at the same relative location as the
opening. As the fiow rate increases, it is assumed that the inlet pressure P^g decreases as
a function of the ratio of inlet to freestream dynamic pressures. This dependence on the
ratio of dynamic pressures can be seen by considering an opening located at the
stagnation point. For isentropic flow through the opening,
C = ^ = i-l^. (3.8)
Equation (3.8) is generalized for an arbitrary opening location by expressing the inlet
pressure coefficient as
r -^''^ -C -k ^ (3-9)
where
C 0 = zero flow rate pressure coefficient
k^ = experimentally determined proportionality constant.
18

Rewriting Equation (3.6) in terms of the zero flow rate pressure coeffícient and the
experimentally determined proportionality constant.
P..g = 9»
/ \ C -k ^
\ 9«y (3.10)
Substituting this expression for the static pressure at the inlet into the equation for
the loss in external total pressure yields
/ ^T.e.,=PTx-Pn=-CI.
\
AP, T.e.xl — ^m (l-C,,o) + /
r -k -í^ V ^ o o y
UA-A
+ qx-q.
(3.11)
Arranging AP,^, in this way illustrates the effects of Cpo and k^ on the extemal pressure
losses. When the inlet opening is located at the stagnation point on an unbroken fascia,
the value of Cp,o is equal to one, k^ is equal to one, and there are no extemal losses. At all
other inlet opening locations, the zero flow rate pressure coefficient is less than one,
indicating that the inlet pressure is less than the stagnation pressure at zero flow rate and
that there are fínite exteraal losses. The expression for the change in external total
pressure will be used later in the defínition of the intemal total pressure or ram pressure.
It should be emphasized that the defínition of external total pressure loss is
specifícally for conditions within the grille inlet opening. In the limit as the flow rate
goes to zero, the dynamic pressure there goes to zero. However, in the exterior flow
immediately above the inlet, the pressure and velocity at zero flow rate are as they would
be for an unbroken fascia and are related to the freestteam conditions approximately by
19

assuming zero losses and simply applying BernouIIi's equation. The derivation here is
for conditions within the inlet rather than the flow just above the inlet.
Consider the interior loss in total pressure. Defíning the interior loss as the
change in total pressure from the inlet to the interior of the cylinder,
^TM=PTi-PTr ={P,+q,)-(Pr+qr)- (3-12)
Because the change in area from the inlet to the internal flow area is abmpt, it is assumed
that there is negligible static pressure recovery associated with the change in dynamic
pressure. Thus, P^ = P,., and the change in dynamic pressure has no direct effect on P^.
^T.in\=PT,-PTr=q,-qr- (3-13)
Substituting the expressions for external and intemal total pressure losses,
Equations (3.11) and Equation (3.13), respectively, Equation (3.1) can be written as,
PTr=q^-[qÁ^-Cp.o)+{kA-'^)q,+qi-qr]^ (3-i4)
or
PTr=qSp.o-kAq,+qr- (3^i5)
Normalizing the interior total pressure by the freestream dynamic pressure yields
the ram coefficient.
V -£iL-r -k -^ ^ram ~ ~ ^p,0 '^A
q^ V .q^J
Recalling Equation (3.9), the ram coefficient may be written as
^ram = ^ p^, +9,-
+ q,. (3.16)
(3.17)
20

With the assumption of zero interior static pressure recovery, there is no
interaction between the internal dynamic pressure and static pressure. Instead, the
intemal static pressure is determined entirely by conditions at the inlet. Therefore, in the
experimental results presented in Chapter V, the primary focus will be on the inlet
pressure coefficient and its variations with respect to size and location of an inlet and the
ratio of inlet to freestream dynamic pressures. As suggested by Equation 3.17, it is
expected that these variations in the inlet pressure coefficient Cpj may be correlated in
terms of an inlet zero fiow rate pressure coefficient Cp,o and an inlet loss coefficient k^.
3.2 Ram Coeffícients for Combined Openings
FoIIowing the approach introduced by Roseberry (1990), it is possible to make
predictions for the ram coeffîcients of multiple openings based on correlations for the
individual inlet openings. The key assumption required for the predictions is that the
combined fiow from the inlets mixes to a uniform interior pressure and velocity. Again
assuming negligible interior static pressure recovery, it follows that each of the openings
must be operating at the same inlet pressure coefficient. This does not imply, however,
that the inlet velocities are equal. The openings will have unique zero flow rate pressure
coeíficients and inlet loss coeffícients, thereby leading to different ratios of the inlet and
freestream dynamic pressures for a specifíc inlet pressure coeffícient.
Consider two openings Aa and Ab, from Equation (3.15), the unique ram pressure
correlation for the openings can be written as
^ram.a = ^ M ^ p O . o " " '^^,0^1,0 + ^r
21

^™„,,ft =qSpo.h -i^A.hq,,i,+qr- (3-i8)
Using the assumption that both openings are producing the same ram pressure, it follows
that
qSp0.a-kA.aq,.a = ^SpO.h ^ ^,1,^i.b- (3-19)
Dividing through by the freestream dynamic pressure, Equation (3.19) can be rewritten as
q^ q^
Applying conservation of mass,
ArVr-A/,+A,V,. (3.21)
Dividing through by A^Vr,
l = M± + (3.22) ArVr A,V,
Defining
^ = a, then ^ = l - a (3-23) 4n ^rVr
where a is the fraction of the total flow passing through opening a, and (1 - a) is the
fraction passing through the opening h.
It follows that
Ay, , qr,a qr J ' V =a—^—^ and = — «
A, q^ q^ \Aa J
(3.24)
Similarly,
22

A,. V,={l-a)^ and ^ = l ^ ( i _ a ) ^
' q. q. ^
( A \
\Ah j
(3.25)
Substituting Equation (3.24) and Equation (3.25) into Equation (3.20) yields
C -k ^a'-^pO,a I^A.a " A.. q«, \^a J
Rearranging and collecting terms
Cpo.h-kA,^{l-ay q^
'A.^
\Ah j
0 = aa^ +ba + c
where
a = U.^'
A.b \Ab J
-k U.-^'
A.a \^h J
b = -2k,,^ í A \
^-^h J
( A \
^ — ^pO.a ^p0.h + '^A.b A
q^ A.j
The solution for a is then
a -b±^b^ -Aac
2a
(3.26)
(3.27)
(3.28)
(3.29)
(3.30)
(3.31)
It is important to note than when a equals one, the left side of Equation (3.26)
equals C^Q^ . For the prediction to be valid, it is necessary to fulfill the assumption that
both openings must be operating at the same ram pressure (Equation 3.19). This
condition cannot be satisfied in the limit as the flow rate goes to zero; therefore, a
23

minimum value of q, /q,^ must be established. Assuming for demonstration purposes that
opening a is the dominant opening, the minimum internal dynamic pressure ratio where
both openings are operating at the same ram pressure can be defined as
_ y-^pO.a -^pO.hj 'q,'
Vq 00 J
A.a
pO.I
\Aa J
(3.32)
In summary, consider a pair of inlet openings which have been individually tested
to determine their respective values of Cp,o and k^. For a specific total flow rate at a
particular freestream velocity, the corresponding ratio q,. fq^ is applied to Equations
(3.28) to (3.30) to obtain a solution to Equation (3.27). The inlet pressure coefficients for
the openings are equal and may be found from
C. qr „2 'A.-^' - ^pO.a '^A.a '^ .
oo yAj
= Cp,,-k,,^{l-ay q^
( A \
\Ah j (3.33)
24

CHAPTER IV
EXPERIMENTAL SETUP
The aerodynamics laboratory at Texas Tech University contains two wind
tunnels, the smaller of which was used for this experiment. This closed-circuit wind
tunnel has a top speed of approximately 25 m/sec with an overall length of 7.62 meters
and test section dimensions of 0.40 meters wide by 0.30 meters high by 1.06 meters long.
The model was placed in the test section, just downstream of the wind tunnel contraction.
The flow through the model was generated by a shop»vac and regulated with a generic
ball valve and a TSI hot fílm flow meter. This setup is illustrated in Figure 4.1.
E cctric Fan
WindTimiid ContractioD
TSI2 4000 Scries Flow Meter
Generic BaU \'évc
Figure 4.1: Wind Tunnel Scliematic
shop*vac©
25

4.1 WindTunnel
The freestream dynamic pressure was derived from pressure taps on the inlet and
exit of the wind tunnel contraction. At the upstream pressure tap, the cross-sectional area
of the contraction is large and the static pressure is approximately equal to the stagnation
pressure. At the exit of the contraction, the cross-sectional area is equal to the test section
area so that the pressure is equal to the test section static pressure. The pressure
differential between tiie contraction inlet and exit is approximately equal to the
freesfream dynamic pressure. Because the upstream pressure taps do not sense the tme
stagnation pressure, a calibration constant was introduced to determine the actual
freestieam dynamic pressure,
q.=K,AP,. (4.1)
Equation (4.1) contains the wind tunnel contraction calibration coeffícient, Kc, and the
contraction pressure drop, AP^..
4.2 Model Parameters
In this study, a cylindrical model was used to simulate the front end fascia and
grille openings of an automobile. The test cylinder has an easily evaluated and repeatable
characteristic surface pressure distribution thereby facilitating the evaluation of the effect
of opening locations with respect to the pressure distribution.
The cylindrical model, shown in Figure 4.2, was constmcted from steel pipe with
an outside diameter of 53.34 mm and a 1.27 mm wall thickness. Circular openings with
diameters of 19.05 mm, 8.73 mm, 7.14 mm, and 6.35 mm were machined into the side of
26

tiie cylinder model to simulate the griUe openings in an automobile. The openings were
spaced such tiiat they could be closed with vinyl tape so that openings could be tested
individually or in pairs without interference caused by the other openings. The effect of
changing the location of the openings was accomplished simply by rotating the model.
This confíguration is shown in Figure 4.3. As illustrated, five holes of different
diameters were evenly spaced along the length of the cylinder with approximately 10
degree arc length separations. The opposite side contains two evenly spaced openings
separated by 20 degree arc length separations. This arrangement allowed a wide variety
of two opening combinations for testing.
The model was closed at both ends with caps that fit into bushings in the floor and
ceiling of the tuimel test section. A pressure tap in the top cap was used to sense the
intemal pressure. A fitting in the lower cap allowed attachment of a 25 mm diameter
flexible hose. The hose connected the cylinder model to a filter, a TSI hot film flow
meter, a ball valve, and a conventional shop vacuum. The flow induced through the
cylinder sidewall openings by the shop vacuum provided a simulation of the flow
induction provided by an automobile radiator fan.
27

-*7 .14n
Figure4.3; Model Schematic
Figure 4.4: shop'vac"'2.0 pealc HP Wet/Dry Vacuum
28

Figure 4.5: Generic Ball Valve
4.3 Data Acquisition
For data acquisition, several components were needed to obtain useftil results.
Two pressure tiansducers were needed to evaluate the pressure differential across the
wind tunnel contraction and the cylinder intemal pressure. A hot film flow meter was
used to quantify the flow rate through the cylinder, and a computer was used to collect all
of this data.
Data acquisition was performed with a Dell Optiplex GXl computer running
National Instruments LabVIEW 6.0. A National Instruments CB-68LP data acquisition
(DAQ) board was installed in the computer to sample the voltage outputs from the
pressure transducers. A serial interface was used to link LabVIEW with the flow meter.
A LabVIEW Virttial Instrument (vi) was written to acquire 1000 data points over fíve
29

seconds from each data source and output the corresponding numerical averages. Front
end screenshots as well as diagram views of the LabVIEW vi can be seen in Appendix A.
Figure 4.6: TSI4000 Series Flow Meter
An Omega differential pressure transducer (Model Number - 9948482) was
cormected between the pressure taps mounted at the inlet and exit of the wind tunnel
contraction. This transducer has an input range of ± 2.48 kPa with a corresponding
output voltage of ± 1.00 V. The differential pressures resulting from wind tunnel test
speeds of 20 to 25 m/s were approximately 120 to 230 Pa. As described earlier, the
pressure differential across the contraction is only approximately equal to the freestream
dynamic pressure. It is easily shown that if Reynolds number effects are neglected, the
required correction is a function of only the contraction ratio or a constant, i.e..
^ . A P . (4.2)
30

The dynamic pressure correction was determined by taking the average of the
ratio of the dynamic pressure obtained from a conventional pitot-static probe and the
confraction pressure differential over the range of velocities which were utilized in the
tests. The result value found was K,. = 1.04.
A second Omega differential pressure transducer (Model Number - 9948482) was
connected between the cylinder internal pressure tap and the static ports at the end of the
contraction. This arrangement yields the cylinder internal gage pressure.
The mass flow rate through the cylinder model was obtained in standard liters per
minute with a by a TSI® 4000 Series flow meter with a digital display (Figure 4.6) and
serial interface to the data acquisitions system. Ambient temperature and pressure were
obtained manually from a standard thermometer and barometer, respectively. Data taken
from the flow meter allowed for the computation of the average dynamic pressure
through the inlets and in the interior of the cylinder.
1 , , 2 1 qr=-pVr =-p
( • \ ^ 1 / _ . . \ ^
m \PArJ Ip
m \Ar J
(4.3)
where
p = —. (4.4) RT
The expression for the ram pressure coeffícient in Equation (3.16) can be
characterized by the values of Æ and Cp,o found for the different confígurations. These
values can be determined from a least squares curve fít of all opening sizes, flow rates,
and freestream velocities at a fíxed orientation. Orientation will be selected based on
zero flow rate values of Cp. Controlling the direction of the cylinder with respect to Cp
31

instead of angle will effectively remove any error that may have occurred in creating the
test sample. As \he samples were not created using high precision machinery, there could
be slight discrepancies in the exact location of the opening. Since Cp is sensitive to
orientation, testing at a specifíc value of Cp is the most accurate way of determining the
orientation of the sample. Additionally, selecting orientation based on Cp will provide a
prediction on where the '-intercept will lie. Noting that Cpj at zero flow rate is, by
defmition, Cp,o, provides a clear representation of the j/-intercept value for the Cpj
Coefficient plots shown in Chapter V.
Different values of Cp correspond to different angles, thus rotating the model to
specific angles was an important aspect of the test procedure. This was accomplished by
placing a protractor below the Plexiglas test section. By marking the center of the
openings on the bottom end cap, placement of the pipe with respect to the freestream can
be recorded in the LabVIEW vi developed for this experiment. A top view of the model
in the test section can be seen in Figure 4.7.
Figure 4.7: Top View of Model in the Test Section
32

CHAPTER V
RESULTS AND DISCUSSION
The goals of this experiment were to determine generalized ram pressure
correlations for single openings and combinations of openings in a cylinder model which
could serve as a guide for analogous correlations for automobile grille openings. The
correlations should also provide a better understanding of the effects of several grille
related variables influencing cooling system performance. These variables include the
size and location of the grille openings, as well as the vehicle speed and the vacuum
produced by the underhood radiator fan. This experiment differs from prior studies in
that the ram pressure correlations were evaluated with a circular cylinder model instead
of an automobile model.
This chapter contains the evaluations of ram coefficients for both individual and
combined cylinder openings. The individual opening data is used to form general
correlations of the effects of grille inlet position and size, freestream velocity, and
intemal flow rate on the ram pressure coefficients. The results for individual openings
are used as the basis for predicting the ram pressure coeffícient behavior of combined
openings. Measured ram pressure coefficients for combined openings data are used for
comparison with the predicted data in order to show the validity of the method used.
5.1 Zero FIow Rate Measurement
A basic objective for the current investigation was to establish the relationship
between the ram pressure coeffícient for a single grille opening and the pressure
33

distribution on the unbroken front end fascia of an automobile. It is suspected that
knowledge of the pressure distribution can be useful in guiding the selection of locations
for grille openings. This is particularly appealing in that determination of the pressure
disfribution on the unbroken fascia is a relatively straightforward and accurate CFD
calculation.
For the ctirrent investigation, utilizing a cylinder in cross-flow, the pressure
disfribution was determined by evaluating the cylinder internal pressure with zero flow
rate as a single opening was rotated to various positions on the front half of the cylinder.
With the location of the stagnation point defíned as the zero angular position, each
opening was tested from -90 degrees through 90 degrees, at 5 degree increments.
Normalizing the cylinder intemal pressure taken at each position by the freestream
dynamic pressure yields the surface pressure coeffícient,
C , = ^ . (5.1)
The Cp distributions produced with the various opening sizes are presented in
Figure 5.1. The impact of opening size on the surface pressure coefficient Cp can be seen
on this graph. It is noted that the results from the 6.35, 7.14, and 8.73 mm openings are
essentially equivalent. In contrast, the pressure distiibution obtained with the 19.05 mm
opening is inconsistent with the others. A pressure coefficient approximately equal to
one, indicating stagnation pressure, is obtained for a signifícantly broader range of
angular positions near zero for the 19.05 mm opening than the others. At angular
34

positions greater tiian ± 15 degrees, the pressure coefficient for the 19.05 mm opening is
consistently higher than the others.
Q .
o
1.5
1,0
0.5
0.0
-0.5
-1.0
-1.5
-2.0
• d = 19.05 mm
• d = 8.73 mm
A d = 7.14 mm
X d = 6.35 mm . 3á
.u*'^'*'
• ^
• *
• ^
V
• ^ 'K • n
X
í • •
^ •
•
• • •
-90 30 60 -60 -30 0
Degrees away from the location of the stagnation point if the cylinder fascia was unbroken
90
Figure 5.1: Cylinder Pressure Curve
Two possible explanations for the discrepancy between the surface pressure
results obtained with the 19.05 mm opening and those obtained with the smaller openings
are suggested.
For the first, it is noted that the pressure variation on the cylinder is relatively
large over the area spanned by the 19.05 mm opening. The opening covers
approximately 42% of the total circumference of the 53.34 mm diameter cylinder or an
35

arc of 12°. Taking the distributions obtained from the smaller openings as a guide, for
angular positions between 18° to 30°, the actual surface pressure coeffícient distribution
varies from 0.6 to 0.25 or equivalently, there is a pressure variation of 35% of the
freesfream dynamic pressure. Although it might be intuitively suspected that for a
specific opening, the internal pressure is equal to an average or approximately equal to
the surface pressure at the center of the opening, it appears that the internal pressure is
actually determined by the maximum surface pressure over the area spanned by the
opening.
A second explanation for the discrepancy between the internal pressure
coefficients obtained with 19.05 mm opening and the other smaller openings is also
related to the size of the opening relative to the diameter of the cylinder. The large
opening creates a significant change in the surface contour and should be expected to
cause a signifícant variation in the fíow streamlines over the opening. Furthermore, it is
possible that although the flow rate through the cylinder is zero, the flow over the
opening could induce an intemal circulatory flow which interacts with the extemal flow
in a manner similar to the classic case of flow over a cavity.
Regardless of the explanation for the discrepancy between pressure coeffícients
obtained with the 19.05 mm opening and the other smaller openings, it is apparent that
the flow over the large opening is signifícantly different. As will be illusttated in the
following section, it is not surprising that the effects of opening size on the ram
coefficient for the largest opening do not correlate well with the results obtained for the
smaller openings.
36

5.2 Ram Coefficients for Individual Openings
Measurement and correlation results for the ram coeffícients for individual
openings are presented in the current section. It is desired that the correlations include
the effects of variations of opening size and location plus the variable effects due to flow
rate and freesfream velocity or dynamic pressure. Recalling from Equation (3.16), the
simple theory suggests that the ram coeffícient may be correlated with an expression of
the form.
K =^ = C -k ^' ^^ram pO "^ A
q^
+ qr- (ref3.16) q^j
With the ram pressure coeffícient given by
Cp.i=^ = C^,-k,^, (ref3.9) q^ q^
the ram coefficient may be written as
Kram=C,,+qr. (rcf 3.17)
AIso recalling that with the assumption of negligible intemal static pressure
recovery, there is no coupling between the ram pressure coefficient Cpj and the intemal
dynamic pressure q^. Furthermore, the internal dynamic pressure is determined simply by
the flow rate and the choice of intemal reference area and is small compared to the
freestream dynamic pressure. Consequently, only the measurement results obtained for
the ram pressure coefficient Cp,j are presented herein.
As indicated in Equation (3.19), the ram pressure coeffícient is expected to be
linear with respect to the ratio of inlet to freestream dynamic pressures with an intercept
37

nominally equal to the surface pressure coefficient Cp. Cleariy, by definition, the ram
pressure coeffícient at a zero dynamic pressure ratio is equal to the surface pressure
coefficient. However, due to the effects of least squares curve fitting over the entire
specfrum of measured dynamic pressure ratios, the actual intercept obtained may be
different from the surface pressure coefficient and is designated with Cp. as the zero flow
rate or zero dynamic pressure ratio, pressure coefficient. Rather than specifying the
position of the openings in terms of angular position, the locations will be defined in
terms of the corresponding surface pressure coeffícients. This section describes the data
taken at all opening sizes and at Cp= 1.0, Cp= 0.7, and Cp= 0.4. The correlation results
are displayed in graphical format in this section and are discussed below. Tabular results
can be found in Appendix B.
The variation of ram pressure coefficient with the ratio of internal to freestream
dynamic pressures for an opening at the stagnation point or Cp= 1.0 is illustrated in
Figure 5.2. For these measurements, the freestream velocity was set at approximately 20
and 25 m/s. At each freestream velocity, the flow rate was varied from zero to the
maximum achievable with the throttling valve wide open. This gave a range of
maximum flow rates of 1.93E-03 kg/s for the 6.34 mm opening to 3.0E-03 kg/s for the
19.05 mm opening.
In Figure 5.2, it is observed that the effects of variations in freestream velocity
and flow rate on the ram pressure for each opening are well correlated by plotting the ram
pressure coeffícient against the ratio of internal to freestream dynamic pressures. It is
ftirther noted that the variation in opening size results in a distinctly unique curve for
38

4.0 .
2.0
0.0
O.COÔ\\ " ^ 0 . 0 0 1 0. 2
-2.0 -
-4.0
-6.0
-8.0 . -
-10.0
-12.0
-14.0
-16 0 .
-18.0
- - • % • -
\ \ \ \ \ \
O.
^
\ \ . : A \
i \
\ \ \ \
\>^x
03 o.q 04 o.Qos o.c 0.C07 0.008 0.(
• 19.05 mm Opening
• 8.73 mm Opening
A 7.14 mm Opening
X 6.35 mm Opening
Cp,i = 0.9879-85.11 (qr/qO)
Cp,i = 1.1675-2601.5 (qr/qO)
Cp,i = 0.8541 - 4223.6 (qr/qO)
Cp,i = 0.4276 - 5335.6 (qr/qO)
09
qr/qO
Figure 5.2: Cp,, versus qr/qO at C^ = 1.0
each opening. Stated differently, the effects of opening size are not correlated by
transforming the ram pressure data to the form of pressure coefficient as a function of
intemal to freestream dynamic pressure ratio.
In Figure 5.3, the ram pressure data is presented as the ram pressure coefficient
versus the inlet to freestream dynamic pressure ratio. Here, it is noted that the effects of
variations in opening size, flow rate, and freestream velocity on the ram pressure are
normalized such that all data collapse to essentially a single curve. This result
substantially verifies the assumption of negligible static pressure recovery within the
39

cylinder or behind the grille openings of an automobile. The ram pressure is determined
by conditions at the inlet and not by processes behind the opening. Furthermore, the
basic functional fomi of the ram pressure coefficient correlation given by Equation (3.16)
is seen to be appropriate for the data presented in Figure 5.3.
0
-2.0 .
-6 .0 .
-8.0 •
-10.0 -
-12.0 -
-1/1 n .
V 0 < 1 | 0 2
A • ^ X
•
0 3
A
4
1 0 4
• • - X • >
0 5
A
0 6l0
* 19.05 mm Opening
• 8.73 mm Opening
A 7 . 1 4 mm Opening
X6.35 mm Opening
é.
A X
7
>«<
X
0 8 0
qi/qO
Figure 5.3: Complete Q,,, versus q/qo at Cp - 1.0
Because this study focuses primarily on ram pressure coefficients for use in
automotive cooling system applications, data corresponding to flows that are primarily
ram dominated are of interest. The conditions automotive designers are interested in for
grille inlet design occur when Cpj is positive. The physical representation is an
40

automobile at high velocity with relatively low velocity through the heat exchangers.
Only the data obtained at test conditions where the cooling flow is primarily ram
dominated are presented in the remainder of the chapter. An example of this restricted
sample of the data in Figure 5.3 is shown in Figure 5.4.
Figures 5.4, 5.5, and 5.6 illustrate ram pressure coefficient results for openings at
locations corresponding to surface pressure coefficients Cp = 1.0, 0.7, and 0.4. From
these figures, it is noted that the ram pressure coefficients obtained with the 19.05 mm
opening are consistent with the smaller openings at C^ = 1.0 but are significantly different
at Cp = 0.7 and 04. From the surface pressure coefficient variation presented in Figure
5.1, the pressures across each of the openings are approximately uniform and equal for
the zero degree or stagnation point location. At other angular positions, it was noted that
the pressure varied significantly across the surface covered by the 19.05 mm opening and
that the variation of interior pressure coefficient was significantly different relative to the
smaller openings. Consequently, it is not surprising that the ram pressure coefficient
curve for the 19.05 mm opening is similar to the others at Cp = \ .0 but significantly
different at Cp = 0.7 and 0.4. Consequently, data from the large opening was excluded
from the curve fits at Cp = 0.7 and 0.4.
41

0.8 .
0.6 .
0.4 .
0.2 -
' 0.0 . O
0
-0.2 .
-0 4 .
-0 6 -
-0 8 H
-1.0 -
0
X ^ X
> < A
I 0,2 0]4
• 19.05 mm Opening
• 8.73 mm Opening
A 7 14 mm Opening
X 6.35 mm Opening
Cp,l = 0.9993 -1,7146 (qi/qO)
0 1
\ s ^ A
•
•
8 1
\ -
•
0
ql/qO
Figure 5.4: Cpj versus q/qo at Cp = 1.0
42

qi/qO
Figure 5.5: C„/ versus ^/^o at C^ = 0.7
43

1.0
0.8
0.6
• 19.05 mm Openlng
• 8.73 mm Opening
A 7.14 mm Opening
X 6.35 mm Opening
Cp,i = 0.3245 - 3.231 5 (qi/qO)
qi/qO
Figure 5.6: Cp., versus q/qo at Cp = 0.4
A least squares fit of the ram pressure coefficients Cpj yield curve fit coeffícients
which are the zero flow rate pressure coeffícient, Cp,o, and inlet loss proportionality
constant, k^. A summary of the values found for Cp,o and k^ are presented in Table 5.1.
Table 5.1: Cpo and k^ at Various Values of Cp
Cp= 1.0
Cp = 0.7
Cp = 0.4
Co.O
0.9993
0.6137
0.3245
kA
1.7146
2.7092
3.2315
i^A.corrected
1.71
2.39
2.42
44

As expected, the zero flow rate pressure coefficients are approximately equal to
the stu:face pressure coeffícients on the unbroken cylinder surface at points corresponding
to the opening locations. Generalizing the results for application to full scale vehicle
design, for inlets near the stagnation point of an unbroken fascia, selecting Cp,o equal to
Cp is a very good approximation. For inlets located away from the stagnation point, it is
remains reasonable to select Cp,o equal to Cp with the understanding that the resulting ram
pressure and ram coefficients will be somewhat overestimated.
The values of k^ vary as well when Cp decreases from 1.0. The general trend of
kA shows an increase in negative slope as Cp decreases. Crafton (1992) and Nguy (1992)
have suggested that inlet area effects may be more accurately correlated if the frontally
projected area of the openings is considered rather than the opening area itself This
effect on the current measurements may be evaluated by considering the influence of the
change in frontally projected area on the average inlet velocity and dynamic pressure.
The ram pressure coeffícient was given previously as
r -r -k -^ ' l o o
^"^'•"'''k (5.2)
where
y^A_ (5.3)
' pAi •
Assuming that a more appropriate average inlet velocity should be based on projected
area.
45

V =_A_-Ji / .corivcfcíl pA^cosO cos6
K = ÍVc™,vcVn/COS^. ( 5 . 4 )
substituting
Cpj = Cpo -k^^ cos e—— . (5.5)
Taking 6= 0, 20°, 30° at Cp = 1.0, 0.7, 0.4 yields the adjusted values for the inlet loss
coefficient k^ shovm in Table 5.1. Although not perfect, the consistency of the
coefficients appears to be improved by utilizing the frontally projected area concept. Due
to the significant difference in the details of the inlets on the simple cylinder compared to
a full scale vehicle, it is not expected that the values for k^ reported herein are directly
applicable to vehicle design. Results from equivalent full scale tests should be applied.
5.3 Ram Coeffícients for Multiple Openings
In order to add some practicality to this study, it is important to investigate the
impact multiple openings has on the ram coeffícient, as most common passenger vehicles
have multiple griUe openings. The equations used to predict the behavior of multiple
openings are Equation (3.18) through Equafion (3.32). These equafions were included in
the data reduction of the raw data taken, and solved to display the predicted values. The
experimental data taken with multiple openings was used only for comparison with the
predicted values. The results of this study are presented in graphical format and are
46

m discussed below. A tabular presentation of the data shown in this section is included i
Appendix C.
Table 5.2 shows the multiple opening combinations which were tested. In each
case, one opening was positioned at the zero degree or stagnation point location. The
second opening was positioned with a 10 or 20 degree offset with respect to the
stagnafion point location. The variations in offset and opening sizes provided ample
range of test confígurations to draw meaningful conclusions with respect to the accuracy
of the prediction method.
Table5.2: Model Test Itinerary
Stagnation Opening
19.05 (mm) 19.05 (mm) 19.05 (mm) 19.05 (mm) 8.73 (mm) 8.73 (mm) 8.73 (mm) 8.73 (mm) 7.14 (mm) 7.14 (mm) 7.14 (mm) 7.14 (mm) 8.73 (mm) 7.14 (mm)
Offset Opening
8,73 (mm) 8.73 (mm) 7.14 (mm) 7.14 (mm) 19.05 (mm) 19.05 (mm) 7.14 (mm) 7.14 (mm) 19.05 (mm) 19.05 (mm) 8.73 (mm) 8.73 (mm) 8.73 (mm) 7.14 (mm)
Degree Offset
10 20 10 20 10 20 10 20 10 20 10 20 10 10
When testing multiple openings, it is necessary to identify which opening
dominates the intemal flow. In all cases, with the exception of when the 19.05 mm
opening is involved, the opening that faces the stagnation point remained dominant. In
the case of the 19.05 mm opening, it remained the dominant opening when it was at the
47

10 degree offset position. At the 20 degree offset position, the opening that faces the
stagnation point maintained dominance.
For all of the fígures shown in this section, the measured and predicted ram
pressure coeffícients are plotted versus the dynamic pressure ratio based on the average
velocity for the total inlet area of the combinafions of openings (Figures 5.8-5.21). The
plots reveal that the method used to predict the ram pressure coeffícients for multiple
openings is relafively accurate. It is diffícuh to determine how well the predictíon
method worked for openings involving the 19.05 mm opening, as there is only a slight
overlap of data that can be used as a comparison. The range of measured data was
limited by the maximum flow rate which could be quantified by the TSI hot film
anemometer. For combinations of openings with similar size openings, it is easy to see
that the prediction method is valid.
It is important to note that the ram pressure coefficient for a combination of
opening always lies between the coefficients for the two individual openings at the same
dynamic pressure ratio. The combined opening ram pressure coefficient values serve as a
weighted average of sorts for the two individual openings tested.
The predictions of the smaller openings seem to be better than those involving the
19.05 mm openings. Figure 5.15 is an example of this. The individual opening data
predicts almost exactly what the combined openings will do. This prediction method,
however, is not without errors. When the 19.05 mm opening is offset to 20 degrees, there
seems to be a breakdown in the theory. Again, this could be due to the exposed frontal
area of the opening, which is signifícantly decreased at the 20 degree posifion.
48

A possible physical effect that has been left out of the theory could be the
influence of the surface roughness on the streamtube entering the openings. As the
openings are turned away from the stagnation point, air must pass over a sectíon of the
cylinder before reaching the opening. Surface roughness effects have not been taken into
account for this experiment, so without further testing, it is impossible to say whether
making the cylinder very smooth or very rough would increase or decrease the ram
coefficients.
Automobile grille openings are also more like nozzles in the respect that they ease
the change from the freestream air flow to the inlet air flow before they open into an
underhood plenum. This is unlike the testing in this experiment. The openings in the
models are sharp edged, and perhaps with the addition of more sophisticated nozzle inlets
on the cylinders even more accurate results can be obtained.
49

-1.0 qi/qO
Figure 5.8: Combined 19.05 {Cp= 1.0) and 8.73 (10 Deg. Offset) C ,, Coefficients
0.8
0.6
0.4
0.2
§ 0.0 C
-0.2
-0.4
-0.6
-0.8
-1.0
V^^^
v ^^^-^^\.
• ^
0 0
->* >v
2 \ . 0
•
, 1
>»
• 19.05 mm Opening Only
• 8.73 mm Opening Only
A Combined Openings
Predicted Values
Linear (1 9.05 mm Opening Only)
Linear{8.73 mm Opening Only)
>.
4 ^l>
^ \ B
> \
^ 0
>*. >*
" ^ - . .
\ . •
8 1
> k
>.
>.
0
•
qi/qO
Figure 5.9: Combined 19.05 {Cp = 1.0) and 8.73 (20 Deg. Offset) C ,, Coefficients
50

1,0
qi/qO
Figure 5.10: Combined 19.05 {Cp= 1.0) and 7.14 (10 Deg. Offset) Cp,, Coeffícients
1.0
qi/qO
Figure 5.11: Combined 19.05 {Cp = 1.0) and 7.14 (20 Deg. Offset) Cp, Coefficients
51

qi/qO
Figure 5.12: Combined 8.73 (Cp= 1.0) and 19.05 (10 Deg. Offset) Cp., Coefficients
a o
1.0 '
0.8 -í
0.6 -
0.4 -
0.2 -
0.0 -
0
-0.2 -
-0.4 -
-0.6 -
-0.8
-1.0
\ \ \ \ \ ^ L \ \ \ \ \
\ \ \ \
• \ A \
0 \ \ 0
-\ -—- — \ \ \ \ \ \ \ ^
" \ \ \ \ \ \ \ :
\ A ^
J 1
- A — \ l \ \
2 0
1
^ " ^ . •
•
4 0
8.73 mm Opening Only
19.05 mm Opening Only
Combined Open
— Predicted Values
— Linear(8.73 mm — Linear(19.05 mr
6 ^ \ ^ ^ 0
•
ngs
Opening Only)
n Opening Only)
8 1 (
• ^ ^
qi/qO
Figure 5.13: Combined 8.73 (C , . 1.0) and 19.05 (20 Deg. Offset) C„ Coefficients
52

8 73 mm Opening Only
7,14 mm Opening Only
Combined Openings
- Predicted \/alues
-L inear (8.73 mm Openmg Only)
-L lnear (7.14 mm Openlng Only)
-1.0 qi/qO
Figure 5.14: Combined 8.73 (Cp= 1.0) and 7.14 (10 Deg. Offset) Cp, Coefficients
qi/qO
Figure 5.15: Combined 8.73 {Cp= 1.0) and 7.14 (20 Deg. Offset) Cp, Coefficients
53

0 8
0.6
0.4
0.2
g 0.0
C
-0.2
-0.4 •
-0.6
-0.8
-1.0
T ^ ^ \ ^
0 0
\ N \ . N. N
\ N
^^ ^ \ N
\ N \ N
\ \ \ 2 0
^ v j i
N 4 ""N 0
N N^
N
N N
\
• 19,05 mm Openíng Only
• 7.14 m m Opening Only
A Combined Openings
Predicted Values
L lnear(7.14 m m Opening OnJy)
6 \ ^ 0
N
N
N N
N N
'V
N N
N \
m Opening Only)
—
— 8 1 0
\ ^
qi/qO
Figure 5.16: Combined 7.14 {Cp = 1.0) and 19.05 (10 Deg. Offset) Cp, Coefficients
-0.2
-1.0 qi/qO
Figure 5.17: Combined 7.14 {Cp= 1.0) and 19.05 (20 Deg. Offset) Cp, Coeffícients
54

-1.0
qi/qO
Figure 5.18: Combined 7.14 {Cp = 1.0) and 8.73 (10 Deg. Offset) Cp, Coefficients
Æ 0.0
-1.0
0
' • ^ • ^
•^ ^ *
X "V
\ , " '&v • \ "N
• \ . ^
0 0
S. N,
' \ ^ ^^>.
2 \ . 0
í .__.._ _. ...J ._ „..._ • 7,14 mm Opening Only
• 8.73 mm Opening Only
A Combined Openings
L inear(8.73 mm C
N
4 ^ X ^ 0
•N N.
\ - \ ^ N__
\ , •
6 ^ ^ ^ 0
^ N ^ ^
Dpening Only)
8 1
• ^
^ ^ A
0
ql/qO
Figure 5.19: Combined 7.14 {Cp = 1.0) and 8.73 (20 Deg. Offset) C^, Coefficients
55

1.0 -fr
-1.0
qi/qO
Figure 5.20: Combined 8.73 {Cp = 1.0) and 8.73 (10 Deg. Offset) Cp,, Coefficients
1.0 s-
-1.0 qi/qO
Figure 5.21: Combined 7.14 {Cp = 1.0) and 7.14 (10 Deg. Offset) Cp,, Coefficients
56

CHAPTER VI
CONCLUSIONS AND RECOMMENDATIONS
Air entering the cooling system of an automobile stems from two major sources,
the air forced inside from the forward motion of the vehicle, and air pulled in by the
intemal vacuum of the radiator fan. The interaction between these two flow fields occurs
at the griUe inlets, and is closely related to the determination of the ram pressure
coefficient. Both of these systems must be considered when assessing the cooling
requirements of a new automobile design.
The scope of this study is to simulate these systems by fmding analogous ram
pressure coefficients for aspirated cylinders. The single opening test results yield a set of
correlation equations that describe the variations of the ram pressure coefficient with
respect to size of the opening, location, freestream velocity, and intemal flow rate. The
multiple opening test results show how varied openings behave in the determination of
ram pressure coefficients. Findings from this study confirmed a prediction method that
modeled this interaction. Both correlations can be related to the automotive industry, and
these results can be incorporated into ttuCooI® for further use.
6.1 Conclusions
The ram pressure correlations for all opening sizes were evaluated directly from
the raw data per Equation 3.9, and fit to a linear curve fit described in Equation 3.16. The
resulting values of the curve fít yielded Cp,o and kx values that fit the data to 96% or
better. This does not include data from the 19.05 mm opening for Cp values other than
57

1.0. This exclusion was necessary as it was observed that the fundamental flow behavior
for the large opening was different from the smaller openings. The results of the various
curve fits can be seen in Table 5.1. The effects of the various positions were reflected in
the variations on intercept, Cp and slope, k^. These correlations can be applied over a
wdde range of areas for each location.
The general correlations for the multiple openings were developed from the
individual openings with a method described in Section 3.1, and tested accordingly. In
general, this method yielded accurate results. The only significant discrepancies
occurred with the 19.05 mm opening in combination with other smaller openings.
6.2 Reconmiendations
Further research is necessary to reveal the effects of large opening sizes on ram
pressure coefficients. It appears that variation of the surface pressure coefficient over the
area covered by an opening has a significant effect on the ram coefficient correlation,
particularly on the value oík^. This effect requires further exploration
Studies involving the interaction of three or more openings can be made to further
increase the practicality of this study. As automobile designs continue to improve the
aerodynamics of the overall vehicle, front end grille openings will invariably change.
Investigations of this type will certainly benefit automobile cooling system designers in
their quest to keep up with the changing front end layouts of new automobiles.
58

Finally, incorporation of these results into ttu_CooI® would prove to be useful in
the evaluation of multiple grille openings, as this study confirmed a reliable system of
equations to model this phenomena.
59

REFERENCES
Hawes, S.P. "Improved Passenger Car Cooling Systems." SAE Paper 760114 Febmarv 1976 - '
Oler, J.W. and J.W. Crafton. "GriIIe Coefficient Measurements for a Ford Taurus." TechnicaIReportTR-FMC-92-3. September, 1992.
Oler, J.W., Roseberry, C.M., Jordan, D.P. and T.T. Maxwell. "Ram Recovery Coefficient Correlafions." Technical Report TR-FMC-90-1. December, 1991.
Olson, M.E. "Aerodynamic Effects of Front-end Design on Automobile Engine Cooling Systems." SAE Paper 760188. February, 1976.
Renn, V. and A. Gilhaus. "Aerodynamics of Vehicle Cooling Systems." Journal of WindEngineenng andIndustrial Aerodynamics. Vol. 22:339-346. 1986.
Schaub, U.W. and H.N. Charles. "Ram Air Effects on the Air Side Cooling System Performance of a Typical North American Passenger Car." SAE Paper 800032. Febmary, 1980.
Vemer, D. "General Ram Correlations for Automobiles." Master's Thesis, Texas Tech University. May, 2000.
Williams, J. "An Automotive Front-End Design Approach for Improved Aerodynamics andCooIing." SAEPaper 850281. 1985.
60

APPENDIX A
LABVIEW VI SCREENSHOTS
61

Ble £dit Qperate Tools Browse Window He^
|<>|<g>| | i r | I 13pl Appkaton Font ' l o '
Transduær Calibration Slope
CMflidenb. ; i i 2 . 0 i 2 r Intercept
i)|.6.9174
Atnnapherjc Pressure Atmosphehc Temp Kc Correction Factor
/årí.ão , 1129.99
Degree Angle
í.lj .O
Hole Sre On)
; Í 0 . 3 ^ 3 8
Average Conlraction V - AJT Vekxity
Pressure Drop Cm. H20) i " ^
lO.OOOO
,_)11.0^78
Inputjnlteratlons
tiO - Free Stream Dynamic Pressure
!o.oo
ZeroFlowCp
jo.oooo
Average Pipe Static qt - Pipc Dynamíc Pressure Pr^ure&i .H20) (, ^
lo.oooo
Cllck to A o H ^ Data
<Thfi lo.oooo
Current Iteralion
Save D rectory
]C:V)oajments snd Settíngs\zachPesktDp\
mJBseconds/samplel Gas| Gas|
> ComPortl
1 Sli 1
FigureA.l: LabVIEW Virtual Instrument (vi) Written for Data Acquisition (Front End)
62

Figure A.2: LabVIEW Virtual Instrument (vi) Written for Data Acquisition (Diagram)
63

APPENDIX B
RAM COEFFICIENTS FOR SINGLE OPENINGS TABULAR DATA
64

Tambs
Pamb =
rho amb =
di =
Al =
Ar =
L di =
Ai =
TableB. l :
72
29.93
1,196
F
.iHcL.,,,. „. kgím"3
0.75
0,01905
2.850E-04
2
o.oW 2 . 0 2 7 E - 0 3
0 .3438
6.0087325 5 . 9 8 9 E - 0 5
in
m
in
m
in
m
m-2
295.4
101354.4'
,,.
Tabular Data -
Pa
Raw Dd(íi
dPc
[in H2 '|
.4579_
0,458Í
0.4580
0.4584
0.4573
0,4577
0.4616
0.4596
0.4579
0.4583
0I553" 0 .8856
0 .8858
0 .8848
" o ! 8 8 3 3 '
0 ,8803
0 .8830
0 .8882
0 .8833
0 .8868
0 .8862
0.8813
0 .4537
0 .4540
0 .4578
0 .4583
0 .4569
0 .4599
0 .4596
0 ,4585
0 .4575
6.4555 0 .4579
O.syzã
0 .8825
0.8951
0 .8909
0 .8896
0.8910
0 .8942
0.8319
0 .8884
0 .8888
.8853
í in H2Û)
0 .4803
'0 .47 ' l9
0 .4575
0 .3930
0,3115
0 1 5 9 7
0,1639
0,3212
0.4106
0.4612
0.4710
0.9238
0.9116
0 .8997
0,8461
0 ,7669
0 ,5962
0,6021
- "a75ÍT~ 0.8435
0,8950
0,9085
0,4850
0,4136
0,1530
l j , 7 4 8 5 ^
~ - '2 .7616'
-5 .7976
-5 .7995
-2 .3280
-1.0639
-0 ,0084
0 .4308
0.9333
0.S656
0 .4873
-0 .4493
-2.1558
-5.4157
-5.4014
-2 .4390
-0 .5769
0.4521
0.8521
Q J_SCFM1
0.000
17.388
35.358
78 .209
108.538
146 794
146.336
105.104
69 ,233
31.916
15,048
0,000
19.263
3 0 9 7 7
_ e 7 . 2 4 6
100!644
148,925
148 723
106.989
70 .257
36 ,723
17.120
Ô. OO
13.773
30 .684
56 .983
' 88.310
118.426
118.819
89.463
62 .384
37.Í51
12.239
0.005
12.694
35 .977
60 563
86.5S0
121013
120.676
90.913
62 .839
37.124
14.533
Single Opening - Cp=\.0
D.3U 'w'ith Cr.rreiMfd qO and
Unit Con'.'ersion
qO=dPi;
(P.E,)
119.71
119.74
119.73
119.83
119.55
119 65
120.66
120.13
119.70
113,80
119,02
231.50
231.56
231.30
230.90
230.11
230.62
232.20
230.91
231.81
231.63
230 38
120.18
118.67
119.67
119.82
119.44
120.22
120.13
119Ã
119.53
119,06
119.69
233.40
230.69
233.98
232.89
232.56
232.92
233,75
233,15
232.24
232.33
Pr.g
(P i )
119.29
117.20
ii3,ei 97,60
'77.3'6
39.66
40.69
79.77
101,96
114,54
116,97
229.42
226.40
223 .44
ZÚ9JÍZ
148.06
ns 53
186.57
209,47
222,27
225,62
120.45
102.71
38,01
"-i ' ss -685.81
•1439.79
-1440.25
-727.13
-264,22
-2.09
106,98
231,78
214.96
121,q2_
-'ií sg'" -535.38
-1344.95
-1341,38
-605.71
-143.26
112.27
231.44 1 211.62
0. ÍKgh]
O.OO E«O
3.550E-04
7.219E-04
1.597E-03
2.2ieE-03
2.997E- 3
2.939E-03
2.146E-03
1.414E-03
6.516E-04
3.072E- 4
O. 0OE»OO
Î.333E-04
e.324E- 4
^ 1.373E-03
" 2.055E- 3
3.041E- 3
3. 36E-03
2.184E-03
1.434E-03
7.438E-04
3 495E- 4
0 OE» O
2,813E- 4
6.2e5E- 4
1.ie4E- 3
1.8 3E-03
2.41SE-03
2.426E-03
1.827E-03
1.274E- 3
7.585E-04
2.511E- 4
1.021E-07
2.592E- 4
7.345E-04
1,23eE-03
1,768E-03
2 471E-03
2.4e4E-03
l.'35eE-03
1.2S3E-03
7.580E- 4
2.9e7E-04
1 i -'- i' — -
^
Da'a fí
qi (Pa)
0.000
0.649
2.683
13.125
25.279
46.233
45.988
23.704
10,285
2,186
0.486
.OO
0.796
2.058
9.703
21.736
47.591
47.462
24.562
10.532
2.894
0.629
O.OO
3.227
45.756
157.832
378.994
681.563
686.034
388.955
189.132
67,074
7,351
0.000
7.831
62.900
178.249
364.290
711.666
707.708
401.665
191.898
66.978
10.265
edu tion Results
qiíqO
0.0000
0.0054
. 224
0.1Û95
0.2114
0.3864
0.3812
0.1973
0,0859
0.0182
0.0041
0.0000
0.0034
0.0089
0.0420
0.0945
0^2062
0.2044
0.1064
0.0457
0,0125
0.0027
O. OO
0.0777
0.3823
1,3173
1.5815
0,5634
0,0614
0,0000
0,2688
0.7654
1.5664^
1.7227
0.8263
0.2883
0.0444
K'r
1,0
i,o 0,9
0.8
0,6
0.3
0.3
0.7
0,9
1,0
1,0
1,0
1,0
1,0
0,9
0.8
0.6
0.6
0.8
0.9
1.0
1.0
1.0
0,9
0.3
-1,6
-2,2 _
0,0 "
0,9
1.0
0.5
-0.5 •2,3
-26
•0.6
0.5
0.9
65

Table B. 1: Tabular Data - Single Opening - C, = 1.0 continued
Tambs Pamb =
——._,,
72
J 29.93
di =
Ai =
F ! ?9Kd
.[•intia. . l . .J i35+ '' ltgím"3
0.0071374 m
di = 0.25
Ai =
0.00635
3.167E-05
in
m m-2
i
^K
Pí
Râw Dâta
dPc
(in H201
0 4564
0,4528
0.4599
0,4582
0.4570
0.4573
0.4572
0 4582
0,4550
0.4541
0.8802
0,8860
" 6!887e 0,8S34
0,8849
0.8865
0,8342
0,8894
0,8899
0,8870
0,8813
0,4577
0,4560
0,4585
0,4588
0.4586
0,4591
0.4571
0,4585
0,4567
0,4578
0.4563
0,8366
0,8914
0.8912
0,8359
0,8972
0,8356
0,9002
0,8879
0.8324
0.8913
0,8949
Pr.g (in H2 1
0.4841
0 3991
0,1390
-0.6808 -3,6232
-6.9842
-6 9842
•4.2806
•0.1422
0.2413
0.9231
0.6340
-0,1249
-1,3372
-3,8351
„„-6-9,842
-6,9840
-3.1829
-1.0488
0.2950
0,8230
0.4831
0.3513'
0.0950
""•13650
-5.0498
-6,3842
_-6,3841_ ... _-~ ^ —
., • . • ' •393Z.
""-'o':79'Í3
0.2229
0.3242
0.8274
-0,0353
-2.8023
-5,5644
-6.9838
-6,9842
-5,8222
-13363
-0.0888
0.7741
Q (SCFMl
0 000
10.824
22.052
39.508
71.293
103.040
103.171
74.515
55.702
29.447
13.649
0,007
18,930
3S.469
54.526
77,675
104.696
104.631
70.674
51.615
23.903
f2.t66
0,000
10.938
19.013
40.375
66.095
_91,555
J93.293 "62.902
40.509
'33.694
15.558
0.003
3.512
30.530
56.197
_71550
"ãi'e^e 94.314
72.658
' 49.778
30.266
12.083
• •
Data '';/itli Correijtftd qO and
Unit Con'.iersions
qO--dP.;
(P^a)
119.31
118.36
119.11
120.24
119.77
119.47
119.54
113.51
119.77
113.95
118.70
250.10
231.61
232.02
230.94
231.33
231.73
231.14
232.51
232.62
231,88
230,39
119,65
119.20
119.86
119.94
119 83
120.01
119.49
113.87
119.33
119.67
119.27
231.76
233.01
232.36
231.53
234 55
234.12
235.32
23211 "
232.39
233.94
Pr.g
(^•3)
120.23
99.13
34.52
-169.07
-899.80
-1734.48
-1734.47
-1063.06
-486.63
-35.3n
59.93
229,25
163,37
-31,03
-332,08
-352,41
-1734:47
-1734.42
-790.44
-260.47
J3.27
204.33
119.96
87.39
23.59
-338.33
-1254.09
-1734.47
•1734.46
-1113.21
-346.11
-196.52
55.35
229.52
205.49
-23 8'"'
-636.06
-13S1.8S
-1734.37
-17,34.46
-1445.91
-480.36
-22.06
192.24
Q
íi:.qí )
O.OOOE.OO
2.210E-04
4.502E-04
8.066E-04
1456E- 3
2.1 4E-03
2.106E-03
1.521E-03
1.137E-03
6ni2E-04
3.808E-04
1.429E-07
3.865E-04
7.854E- 4
1.113E- 3
1.5S6E-03
2.133E- 3
2.137E-03
1.443E-03
1.054E-03
e.10eE-04
2.4S4E- 4
0.000E>00
2.233E-04
3 SS2E- 4
8.243E-04
1.349E-03
1.8e9E-03
1.305E-03
1.284E-03
8.271E-04
6.879E-04
3.176E-04
6.125E-0S
1.942E-04
6.233E-04
1.147E- 3
1.461E-n3
1.932E-03
1.32eE-03
1.4S3E-03
I.OieE-03
6.179E-04
2.467E- 4
1 1 r 1 — — . — —
Datâ Reduction Results
qi iPa)
0.000
12 758
52.355
169.973
1156 171
1159.115
604.641
337.368
94.426
37 372
0 000
161.151
323.756
657.011
m'i.f/sz 1193..518
543.909
290.110
97.404
16.118
0 nno
20.795
62.831
283.335
759.299
1456,333
1512,773
687 709
285.219
' 197.324
42.071
0.000
15.726
162.005
543.911
839.305
1556.299
1546.065
917.577
430.676
159.216
25.378
qiíqO
0.0000
0.1078
0.4446
1,4137
0,7938
0 3191
oono 0 1685
0.6945
1.4019
1.2471
0.4201
0.0700
0.0000
0.1744
0.5242
1.6489"
0.3527
0 0000
0.0675
0,6954
1.8463
0.6834
0.1085
K'r
1.0
0.8
J),3 " " : Í , 4 '
-0.3 '
0,5
1.0
0.7
-01
•1,4
-1.1
0 3
0.3
1.0 0.7
0.2
" '-'í.'6 0.5
1.0
0.9
-0.1
"•2,1
•0,1
0,8
66

Table B.2: Tabular Data- Single Opening- C„= 0.7
Tâmb =
Pamb =
rho amb =
• •
. , „
di =
J2_ 2~ 9.93
1,196
t 0.75
;, 0.01905 Ai =
di =
1 2.850E.04
0.343S
F
l„i,n,Hg kgím-3
in
m
m~2
in
r o , 687325' m
Ai= 5.989E.05 m-2
1 295,4
101364,4 Pâ
Râw Dât-a
dPo
(in H20)
0,4436
0,4475
0,'4476
0,4479
0,4465
0,4474
0,4448
qMes " 0"4482
0.4464
0.4432
0.8838
0 8871
0,8810
0,8783
0.8781
0.8726
0.8776
0,8753
0,8774
0.8882
0.8812
0.4673
0.4682
0.4665
0.4708
0.4633
0.4713
' 0.4725
0.4703
0.4682
0.4:646
0.4656
0.3125
0.3087
0,3132
0,3123
" 0,3135
0,9071
0.9161
0.9107
0.3131
0.9124
0.9118
Pr.g
(in H2 )
0.3325
0.2572
0.0838
•0.3097
•0.7617
•1.4115
-1,4083
•"•^^si
•02486
0.1272
0.2954
0.6595
0.6105
0.3470
-0,2382
•0,3413
•1,3631
•1,8699
-0,9833
-0,3490
0,4370
0.6019
0.3336
0,0588
-0,2622
-1,3772
-3,6864
-5,3882
-5.3316
-3.6363
.:1-5059
-6.2662
0.1144
0.6613
0.4710
0.0334
-1,2830
-3,4066
-6.0622
-6.0673
-2.3718
-1.2857
-0.0828
0.3250
0
(SCFM)
0.005
17.326
38.218
68.411
93.280
133.863
139,033
37,067
eí^s'í'" 33.940
13.363
0.000
13.S11
36.433
71.389
101 481
139682
139.193
103.671
75.330
29,360
14.872
0.008
18.432
30.644
57.553
92.497
118.068
118.201
32,314
59.677
30.665
15.790
.OOO
12.134
2S.143
57 .339
83 .565
117.456
117.278
84.531
58 .020
31.795
18.611
D-iU ''í.''itfi Correi-. i ted qO ând
Unit Coni.'ersi n
qO=dPc
(Pa)
117.52
116.99
117.00
117.10
116.72
116.95
116,27
117,26
117.16
116.70
117.42
231.04
231.91
230.31
229.59
229.55
228.11
229,41
223,97
229,37
232.19
230.35
122.17
122 39
121.96
123.07
122.42
123.36
123.52
123,08
122 J g '
121.45
121.72
23S.54
237.54
238.71
238.48
238.79
237.13
239,49
238,07
238.71
238.52
233.36
Pr.g
fPa)
82.57
63 33 . _ _ „ .
-76,92
-139,17
-350.53
-349.83
•186.03
-61.73
31.53
73.37
163.77
151.62
36.18
-53,15
-233.83
-464.13
-464.37
-244.19
-86.63
' 108.52'""
149.47
S2.35
14.59
-6512
-342.02
-915.48
-1487.12
-1487.37
-315.62
-373.38
-66,11
28,40
ie4,'22
116,36
3.79
-318.62
-845.99
-150549
-1506.78
-738.02
-319.29
-20.57
80.72
Q
(^.qís)
1 21E-07
3 f;eOE-n4
7.803E-04
1.397E-03
2.007E-03
2.835E-03
2.S39E^03
1.9S2E^03
1.319E-03
6.929E-04
2.728E-04
O.OO0E»OO
2.820E- 4
7.43SE-04
1 458E-03
2. 72E-03
2.852E- 3
2.S42E-03
2.117E- 3
1.538E-03
6.117E-04
3.03eE- 4
1.e33E-07
3.773E-04
6.256E-04
1.175E- 3
1.8S8E-03
2.411E-03
2.413E-03
1.8S5E-03
1.21SE-03
6.261E- 4
3,224E-04
O.O OE.
2.477E^04
5.746E-04
1.1S4E-03
1.823E-03
2.33SE-03
2.394E-03
1.72SE-03
1.185E-03
6.431E-04
3.80 E-04
: Dâta Reduction Results
qi ÍPa]
0 000
0.690
3:i34
10.043
20.726
41.330
41,479
20,218
8,951
2,472
0.333
0,000
0.403
2.84S
10.336
22.098
41.867
41.575
23,062
' " l 2 " l 77 " " '
1,926
0,475
0,000
16,600
45.636
160.971
415 7S4
677.449
673.377
414.144
173.072
45,698
12,116
0.000
7.155
38 .430
163.475
389 .842
670 .444
ees.414
347.251
163.594
49.128
16.833
qiíqO
0.0000
0.0059
0 0268
0.0858
0.1776
0.3533
0.3567
0,1724
0.0764
00212
0.0033
0.0000
. 018
0.0124
0.0476
0.0963
0.1835
0.1812
0.1007
' 0:0531
0.0033
0.0021
0.0000
0.1356
0.3742
1.3030
1.4140
0,3763
0,0395
0.0000
0.0301
0.1612
0.6855
i :6326
1.4536
0.6853
0 2 0 6 0
0 0706
K'r
0.7
05
02
-0.7
-1.6
-3.0
•3.0
•1,6
-0.5
0.3
0.6
0.7
0.7
04
-0.3
-1.0
-2.0
-2.0
-1.1
-0,4
0,5_
'o'e" 0,7
0^1
_ - 0 ^ 5
" " " - 2 , 3 " " '
-3,1
-0,5
0,2
0.7
0.5
0.0
•1.3
•3.5
•3.1
•0.1
0.3
67

Table B.2: Tabular Data - Single Opening - C„= 0.7 continued
Tamb =
Pamb =
rho amb =
dl =
Ai =
di =
Ai =
72
29.93
1.136
' 6 281
0,0071374
4.0 1E.Û5
0,25
F
.LnHg . kgilm*3
m m'2
in 0,00635 m
3,167E-05 m'2
295.4
101354.4
dPc
íin H201
0.4566
0,4518
0,4543
0,4530
0,4552
0.4555
0.4570
0.4533
0.4434
0,4531
0.3871
0.8812
0.8852
0,8841
0,3347
0,3332
0.8796
0,3861
'0.8826
6.8813
0.3730
0.4532
0.4540
0.4543
0,4572
0,4537
0.4590
0.4600
0.4566
0.4575
0.4573
0.4547
0.8820
0,8843
0,8354
0.8866
_ 0,8350
'"ô.'ss'^'i 0.8307
'"6.3881
0,3335
0.8813
0.8787
K
Pa
Râw Data
Pr.g
(in H20)
-0,0598
-0.3333
-2.3685
•5 4359
•6 9S41
-6.9842
-4.7896
-25964
-0,4208
0,1426
0.6491
0.3711
-0.4322
-2,2643
-4,3648
-6.9838
-6.3841
-5.3243
-2.0250
-0.2255
0.1783
0.3551
-0.0590
-0.9130
-2,1978
-5,7830
-6.9840
-6.9841
-5,0356
-3.1282
-0.8233
-0.0884
0.6613
_ 0.4111
'-'0.2399
-2.2165
-5.0523
-6.3840
-6.3840
"•;6,9842_
' -4 .5624"
-1.1931
0.1020
Q CSCFM)
0.010
16.445 35.032
52.613
80.022
100.765
100.885
73.129
55.000
24.61S
9,851
0,000
11,239
28,577
__52.110_
697753"
Í01,087
101.066
73.789
49.695
24.780
16.463
0.006
15.383
29.696
43,633
68,282
32.739
92.565
64.137
51,743
23.456
16.023
" 0.000
9.371
22.664
44.743
64.427
93.454
93.479
. . ^.^•'Sl
"61,223
35.240
17.443
Dat.=i 'v.'ith Corr' cted qO and
Unit Con'.'6'rsions
qOrdPc
(Pa)
118,78
119,37 118.11
118.75
118.41
119.01
119.06
119.46
118.63
117.49
118.46
231.88
230.35
231.40
23111
231.27
230.88
223.34
231.65
230.56
230 38
229.73
118.47
118.68
118.83
119,51
120,18
119,99
120,25
119,36
119.58
119,55
118,37
230.56
231.32
23145
231.76
231.35
231.12
232.84
232.15_
232.52
230.39
229.69
Pr.g
(Pa)
8161
-14,86 -246.63
-588.21
•1364,87
•1734.44
•1734.46
•1183.47
•644.81
•104 50
35.42
16120
32.16
"""167.33 '
•562.33
•1083.96
-1734.36
-1734.45
-1322.37
-502.90
-56.00
44.29
83.20
-14.65
-22673
-545,31
-1439,88
-1734,43
-1734,45
-1250,54
-776.87
-205,71
-21,95
164,22
102.0S
-59.59
-550.46
-1254.81
-1734.42
-1734.43
-1734.47
-1118.13
-296.23
—i2±:—1.
0 íy.gls)
2.042E-07
3.358E-04
7.152E-04
1.074E-03
1.634E-03
2 057E- 3
2.060E-03
1.493E- 3
1.123E-03
5. 2eE-04
2.ni1E-04
O.OOOE-00
2,235E- 4
5834E^04
1064E^03
1.424E-03
2. 64E-03
2.n63E-03
1.e03E- 3
1 015E- 3
5.059E- 4
3.361E-04
1.225E-07
3.141E-04
e 063E-04
8.320E^ 4
1.394E^03
1.S33E-03
1.890E-03
1.30SE-03
1.056E- 3
5.810E-04
3.271E^ 4
.OOOE.O
2. 36E-04
4.627E^ 4
9.13eE^04
1315E-03
1.908E-03
1.3n3E-03
J.575E-03
"1250E-03
7.195E-04
3.561E-04
Data Rsduction Results
V (Pa)
0.000
23 450
133 641
301.437
697.315
1105.681
1108.316
582.3.56
329.409
65 936
10.567
0,000
13.755
88.929
295701
523.905
1112.751
1112.296
67S.992
268.928
66.867
29.515
0.000
41130
153.275
331762
810,373
1494.856
1489.255
714.978
465355
140.742
44.623
0.000
17.280
89.282
343.047
721.453
1517.993
1518.311
1034.570
651.613
215.848
52.383
qiíq
0,0000
0 2467
0.5617
0.0832
.O OO
0.0597
0.3843
12795
11664 '
0,2903
0,1285
0.0000
0.3466
1.2333
1.1772
0.3754
0.0000
0,0747
0.3857
1.5018
0.3363
0.2302
K'r
0.7
-0.3
0 3
0.7
0.4
-0.5
-2.4
-2,2
-0.2
0.2
0.7
-01
-1.3
-17 -0.2
" 0 7
0,4
•0.3
•2.4
•13
6.1
68

Table B.3: Tabular Data - Single Opening - C„ = 0.4
Tamb =
Pamb =
rho amb =
di =
Ai =
_,_„., _... . ..
di =
Al =
72
29.93
1196
0.75
0.01905
2.350E-04
o.sí's's'
F
.b.Hfl kgím*3
in m m-2
in 0.0087325 m
5.989E-05 m-2
1 295.4
101354,4
K
Pa
Raw Data
dPc
(in H201
0 4451
0,4501
0.4479
0,4468
0.4453
0.4458
0.4474
0,4457
0,4459
0.4454
0,4536
0,8740
0.8735
0:'87'5'5""
0.3616
0.8627
0.S682
0,8665
0,8634
0.8660
0:'8'765
0.3713
0.4652
0.4613
0.4622
0.4665
0.4670
0.4636
0.4677
0.4654
0,4660
0,4678
0.4631
0.9033
0.8334
0.8387
0.3022
0.3010
0.8385
0.8335
0,3001
0,8388
0,S956
0,9011
Pr.g
(in H2 1
0.1770
0.1030
_ - ,J830_ -"6 8864 " -1,4847
-2.5532
•2.5656
-1,5661
-0,8076
•0 2277
0,0306
0.3796
0:3204
... " •0842
~ -0.7323
-1.sn;31
-3,2346
-3,2238
-2.0278
:p,8355
- ^6050 0,2689
0.2049
•0.0196
-0.6032
-1,4398
-3,8275
-6,2553
-6.2563
-3,5693
"^2.'66e5 -0.5122
-0.0525
0.4179
0.1032
-0.6882
-21605
-4.5574
-6.5275
-6.5286
-3.7507
-1.83S5
-0.7719
-0.0031 1
Q
(SCFM)
0.031
14.087
40,471
76,321
98 284
136.436
136.750
101.880
72,515
43,179
17,915
0.000
12.034
28.716
67.375
'39,145
134.883
135.147
105033
70,330
34.152
15.235
0.Û 1
13.386
34.021
52,827'
89.251
115.449
"1Í5:483 86,297
6"3.25Í
31.407
15.575
0.004
15.416
36,301
63,183
35,430
115.171
114.619
85.942
5S.450
33.813
19.132
Datã Vnh CorrectS'd qO and
Unit Conuersions
qO=dPc
ÍP^a)
1ie,.34
117 66
117.09
116.81
116.42
116.53
116.94
116.52
116.55
116.43
113.58
223.47
22S 33
228.87
225.24
225.52
226.36
226.52
225.63
226.37
229.12
227.90
121.60
120.72
120.81
121.34
122.07
122.75
122.27
121.66
12181
122.23
122.63
236.14
234.S4
234.92
235.33
235.52
234.37
235 13
2353
234.95
234.12
235.57
Pr.g
(Pa)
43.97
26 83
;4545^
'"ãi Tí'" -368,72
-635.56 -637.14
-388.32
-200.57
-5R54
20.01
94.28
73.58
20.90
-196.75
-443.02
J03.30 -302.10"
-503.53
-222.33
-124
66.78
50.88
-4.S8
•143.73
-357.51
•950.53
-1553.61
•1553.71
_J36.4
""-"5T3.I9
-127.20
•13.05
103.79
25.64
•170.91
•536.55
•1131S0
-162105
-1621 31
-33146
-456.57
-191.70
-0.76
Q í>:-gís)
6.329E- 7
S.263E-04
1,55SE-03
2 007E-03
2.786E-03
2.792E-03
2.030E-03
1.481E-03
8.816E-04
3.658E-04
O.OOOE.OO
2.457E-04
5.863E-04
1 37eE- 3
2.024E- 3
2.754E-03
2 753E-n3
2.146E-03
1449E-03
e.973E- 4
3.110E- 4
2.042E-08
2.S55E-04
6.34eE-04
1.079E-03
1.322E-03
2.357E-03
2.35SE-03
1 762E- 3
1.291E-03
6.412E-04
3.180E^04
8.ie7E-08 "
3.147E-04
7.514E- 4
1,290E-03
1,348E-03
2.351E-03
2.340E- 3
1.755E-03
1193E- 3
7.324E-04
3.916E-04 1
Datã Reduction Results
. .V (Pa)
0.000
3.515
12.499
20.728
39.944
40.128
22:272
11284
4.001
0.689
O. O
0.311
17R9
9.741
21.033
39.040
39 193
23.702
10.811
2.503
0.498
0.000
9.506
66.248
135.620
337.113
647.728
643.109
361.912
194.423
47.936
11.789
0.000
11.549
65.816
134,005
442570
644.613
638.448
353.941
166.028
73.209
17.881
qiíqO
O.O OO
0.0300
0 1070
0.1780
0 3428
0 3431
0.1311"
0.0963
0 0344
0 0058
0.0000
0.0014
0 0077
0.0432
0.0935
0.1720
0.1730
0.1050
0.047S
0.0109
0.0022
0 nnoo 0.0787
0.4656
11122
1.5961
0.3920
00961
0.0000
0.0492
0,2302
0,8226
18791
1,5255
0.7067
0.3127
0.0759
K'r
04
-0.4
-1.9
-3.2
-5.5
-5 4
ZJ:Í?Z -l'f""" -0.5
02
0.4'
03
0.1
-0.9
-20
-3.5
-3.5
-2.2
-10
0.0
0.3
0.4 n.
-1.2
-2.9
-4.2
-1.0
-0.1
0.4
0.1
-0,7
-2,3
-4,3
-4,0
-1.9
-0.8
0.0
69

Table B.3: Tabular Data - Single Opening Cp= 0.4 continued
Tamb =
Pambs
fho amb =
di =
Ai =
72 29.33
1.196
0.28V
0,0071374
F 295.4
inHq 101354.4
kqím'~3
K Pa
in m
4.001E- 5 .m-2
;
di = 0.25 in ' 0.00635'm
Ai= ' 3.ie7E-05 m-2
1
dPc
(in H2 )
0.4552
0.4543
0.4555
0.4536
0.4523
0.4595
0.4577
0.4565
0.4575
.4561
0.4519
0.8787
0.8768
0,8816
'"'6:87"82 0.3774
0.3850
0.8811
0.8792
0.8761
0.8763
0.8833
0.4602
0.4572
0.4559
0,4624
0,4656
0,4633
0,4623
0.4655
0.4624
0,4627
0,4621
0,8313
0,8885
0.8337
0.8362
0.3382
0.3964
0.8973
0.8950
0.8933
0.8940
0.88S1
Raw Dat-a
Pr.g
(inH20)
0,1990
-0,3576
-1,0625
-2,5384
-5.2134
-6 9340
-6.9S41
-5.5207
-2.7330
-0.6434
-0.1129
0.4000
-0.2317
-1.0339
-2.6950
-5,7278
-6.9340
-6.3340
-5.3432
-2.6014
-0,9036
-0.2571
0.1327
- .126S
-0.6442
-2.9043
-6.9844
-6.9841
-6.3840
_-6.3842
"" -'3'l'779
-0.3851
-0.4216
0.3877
-0.0410
-0 6362
-2.5555
-6.9833
•6.9839
•6.9840
•6.9341
•4.1978
•0 5767
•0.0534
Q (SCFMl
0.000
18,644
31.699
50 280
73.112
99.673
99.243
74.7"31
52.948
24.331
12.429
0,002
17,953
31,466
50,631
76.317
99.148
98.760
72.365
43,313
29,393
18,500
0.000
11.111
21.146
46.077
74.769
92.020
91.351
75.495
4S:589
26.321
17,465
0,012
11.367
22.566
42.780
71.420
31.333
31,526'
71.663
54.968
20.990
12.222
Dâtâ''í/ ithCorrect
Unit Con'.'&rs
qOrdPc
(Pa)
118,98
118,76
119,08
118.59
118.23
120.12
119 66
113.35
119.59
119.23
118.12
229.70
229.22
230.46
223.58
229 35
23134
230,32
229,33
"223.6 " 229.q7_
"'"'2'3Í.'03
120.29
113.53
113.18
120 S7
121.71
121.12
120.84
121.68
120.37
120.95
120.79
232.93
232.27
233.62
234.28
234.79
234.34
234.56
233.35
233.67
233.71
232.17
Pr.g
ÍPa)
43,42
-88,81
•263,36
•630.39
•1234,70
•1734.43
•1734.45
•1371.02
•691.15
-159.78
99.34
-57,54 '
-256,75
•669.29
•1422,45
-1734.43
-1734.43
-1326.34
-646,04
-224,39
"'-es.'sí" 47.S6
-3148
-159.38
-721.25
-1734.51
-1734.44
-1734.41
-1734.46
-789.19
-244.65
-104.71
96:27
-10.17
-172.90
•634 64
•1734.40
-1734.40
'"-Í734.'42"
-1734.44
•1042.50
•143.23
•13.27
"•• ™ ™ "
?d qO and
ons
Q (kgís)
O.OOOE.OO
3.806E^04
6.472E-04
1.027E^03
1.493E^03
2.035E^03
2.026E^03
1.52eE-03
1.0S1E-03
4.3eSE-04
2 53SE^04
3.403E-08
3.6e5E-04
e424E-04
1.035E-03
1.558E-03
2.024E-03
2,016E-03
l,477E-03
1019E-03
6,001E-04
3,777E-04
O.OOOE. O
2.2eSE-04
4.317E-04
3.4n7E-04
1.527E- 3
1.873E-03
1.875E-03
1.541E-03
9.920E-04
5.374E-04
3.56eE-04
2.45 E-07
2.443E-04
4.607E-04
3.734E- 4
1.45SE- 3
iseeE^os 1869E^03
1.463E-03
1.122E- 3
4.285E- 4
2.495E-n4
1
,. Dai:a Rs'duction Results
qi íPa)
0.000
37.852
103.421
275.297
582.087
1081846
1072.532
608.152
305.288
64.466
16 822
0.000
35.038
107.313
279.816
634.239
1070.479
1062.117
570.253
271.2"96
94.082
37.270
0.000
21.458
77.720
363.010
971.670
1471770
1466.369
990.631
410.347
120.416
5'3":6Í7' O. OO
24.891
88.508
318.095
886.575
1451658
1456.011
332.613
525.160
76.577
25.963
qiíqO
0.0000
0.3187
0.3189
0.5407
0.1424
0.0000
0.1531
0.4678
1,2138"
1,1846
0.4107
0.1613
O. OO
01795
0.6521
0.3356
0.4383
0.0000
0.1072
0 3788
13578
0.3277_
0.ÍÍ18
K'r
0.4
-0.7
-2.2
-1.3
-0.2
0,4
•0.3
•1.1
-2.9
-2.3
-1.0
-0.3
0.4
-0.3
-13
-2,0
-0,9
0,4
' "ã'o"~ " -0.7
:2.7
-0,6
-0.1
70

APPENDIX C
RAM COEFFICIENTS FOR MULTIPLE OPENINGS TABULAR DATA
71

Table C.l: Tabular Data - Multiple Openings - 19.05 {Cp= 1.0) and 8.73 (10 deg. Offset)
Tambs
Pamb = tho amb =
q^oorreodon =
71
30.04 1.202
F
inHq
kgím~3
1,053
i Openinq 1
d1 =
-Al =
kAl =
CpU
kAriArí A i r2 =
C d2 =
A2 = kA2 = Cp2 =
kA2'(Arí A2)"2 =
0.75) in 0.01905
2.850E-04
1.5473
0.967
m
m'"2
2.27
(10 deg sep)
Dpenin'3 2
0,3438 in
0.00373252: m
i 5.989E-05 1.6804
0.3565
1 55.73
m-2
1
.
1
284,8
101726.9
K
Pa
Raw Dsií
dPc
in H2 1
0.4744 0.4736 0.4761 0.4733 0.4769 04741 04713 0.4736 0.4760 0,4744 0,4755 0,9198 0.9173 0.9154 0.9138 0.9129 0.9204 0.9142 03187 09155 0.3158 0.9132
0.4511
0,4518
0.4547
0.4553
0.4497
0.4511
04512
0.4510
0.4490
0.4487
0.4503
0.8901
0.8304
0.3302
0.8948
0,8326
0.8.934
0.8340
0.3936
0.3350
0.8834
0.8327
Pr.g [inH2i:i|
0.4855 0.4749 0.4567 0.4100 0,3431 0,1311 0,1388 0.3483 0.4151 0.4611 0.4783 03463 0.3356 0,9135 0.8611 0.7691 0.6337 0.6283 0.7796 0.3615 0.9136 0.3332
0.4211
03943
0.2710
0.1542
-0.0277
-0.2787
•0,6760
-0,3256
-1.1764
-0.3335
-0.7394
0.8549
0,8231
0.7773
0.6886
0.4591
0.2136
•0.0743
-0.4481
-0.3179
-1.2497
-2.2006
Q (SCFMl
OOÛ 19.459 43.372 73.418 102.762 148.010 148.479 101.498 71.137 38.135 18.373 0.002 14.740 33.153 70.871 109.603 151.032 150.966 107.823 71.157 33.283 13.930
0.000 5,757 19 322 26,932 35,842 45.693 58.280 64.267 72.011 64,632 60.907 0,000 6.379 11.052 18.804 31.478 41.433 51,267 61.432 71.993 81.117 97.617
Eiat.3 Virh Corrected qO and Unit Con';er£Íons
q =dPc
iPaJ
124 07
123.32
124.50
123.89
124.70
123.97
123 39 123 85
124.47 124.06 124.35
240 53
239 88
233.33 233.36
233.72 240 70 233.06
240.24 233 33
233.48
238.81
117.96 113.14 118.90 113.03 117.53 117.96
113.00
117.93
117.42
117.33 117.91
232 76
232.35
232.79
234.00
233.42
23.3.61
233.63
234 05
232.57 233.44
Prg
iPâJ
120 57
117.35
113.41 101.82
85 20
47.46 46,90
36.50 103.09
114.50
11378 235 16
232.35
228.11 213.85
191.00 167 37 156.17
193.62 213.95
226.39
231.74
104.59 98,08
67 30
38.30
-6 83 -63.20
-167.38 -223.37 -23214
-233.33 -136.05 212.30
204.40
133.04
17102
114.02
54.29
-18.45
-11128 -203.12
-310.35
-546.50
IJ
(kg/5|
0 O OE. O
3.373E-04 8.855E-04
1499E-0J
2. 98E-03
3. 22E- 3
3.0JtE- 3 2. 72E-03 1454E- 3 7,736E- 4 3.751E-04
4. 83E- 8
3. 3E-04
6.769E-04 1 447E-03
2.238E-03 3. 84E-03 3. 82E-03
2.201E-03 1 453E-03
7.S16E-04
2.844E- 4
O.O OE.OO 1175E-04
3.345E-04 5.499E-04
7 318E- 4 3.329E- 4
1.13 E-03 1.312E-03 1.470E-03
1.320E-03 1.244E-03 O.OOOE.
1221E-04
2 25eE-04
3.833E-04
6.427E-04
8 459E- 4
1.047E- 3
1.254E-03
1.470E-03 1656E-03
1.933E-05
„ . ^ . _
— - 4 '
DatãRedijctionRe;ijlt
qi (Pa|
0 000 0.808 4 014
11502
22.534
46.748
47 045 21.363 10 317 3.103 0.720
0 000
0.464
2.345
10 718 25 637 48.676 43.633
24.311 10.305
3.123 0.414
O. O
1.602
18.043
35.054
62,035
100.904
164 150
199.608
250.610
201.831
179.232
O. OO
1.728
5.303
17.088
47.387
32 965
127 021
182.337
250.485
317.338
460.521
qi(q
OO
0.0065
.0322
0.0328
0.1807
0.3771
0 3813
01775
0.0363
.0250'
0.0053
.OO
0.0013
0.0098
0.0449
0 1074
0.2022
0.2034
0.1033
0.0451
0.0131
0.0017
O.O
0.0136
0.1518
0.2344
0.5280
0.8554
1,3911
1.6926
2.1344
1.7207
1.5204
.O O
0.0074
0.0254
0.0730
0.2051
0.3551
0.5433
0 7305
1.0702_
1.3G73
1.3728
Cp.i
1.0 1.0 0.9 08 0.7 0.4 0.4
0.7 03 0.3
10 10 10 1.0
0.3 03 0.7 0 7 0.8 OJi 0.3
1.0
0.3 0.3 0.6
0.3
-0,1
-0,1 _,
0.9
0.3
0.3
0.7
0.5
02
•0.1
-05
.-...J>í.ZI.
72
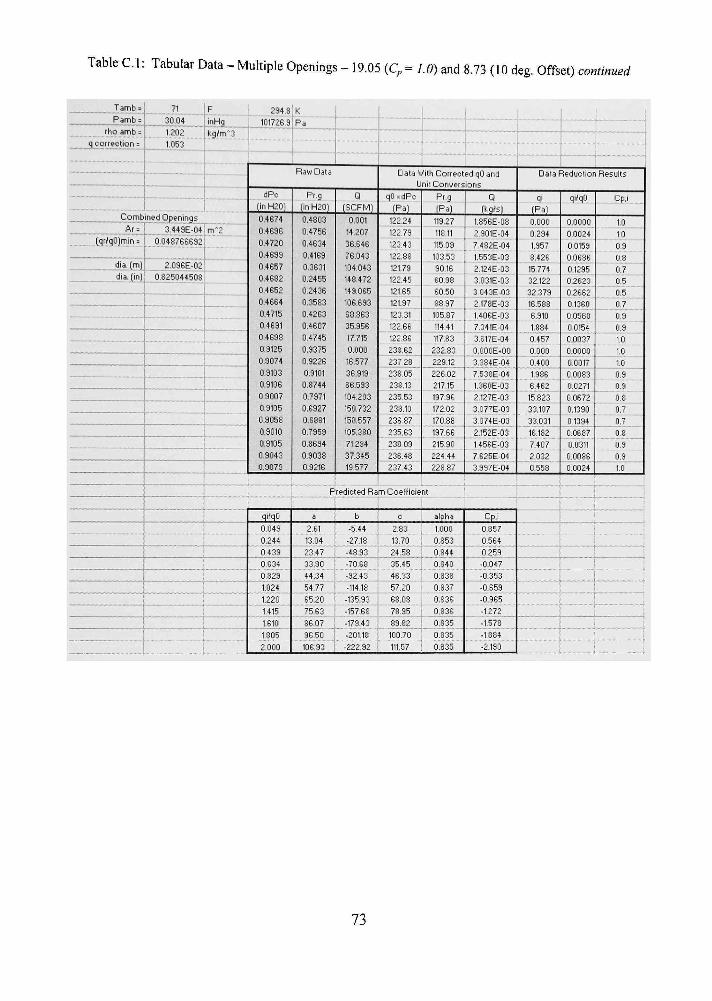
Table C.l: Tabular Data - Multiple Openings - 19.05 (C, = I.O) and 8.73 (10 deg. Offset) continued
Tamb»
Pamb =
tho amb =
71
30,04
1.202
F 234.8 K
'"^^a i _ l 1726,9 Pa kgím"3 j
1
! 1 Combined Ogenings
à r r j 3.443E-04 [qr'íq )min = i Ô.Ô4S766632
*?.:M. dia. (]nj
2.036E-0;
0.825044508
m-2
Raw Data
dPc
^inH2 l
0.4674 0.4636 0.472 0.4639 0.4667 0.4632 0.4652 0.4664 0.4715 0.4691 0.4693 0.9125 0.3074 0.9103 0.9106 0.9007 09105 0.3058 0.9010 0.9105 0.3043 0.3073
Pr.g
(inH2 l
0.4303 0.4756 0.4634 0.4163 0.3631 0.2455 0.2436 0.3533 0.4263 0.4607 0.4745 0,3375 0,3226 0.3101 0.8744 0.7971 0.6927 0.6881 0.7359 08694 0.3038 0.9216
' P
qifq
0.043
0.244
0.433
0.634 0.823
1024
1.220
1415 1610 1.805
2000
a
2.61
13,04
23,47
33,30 44,34
54.77
65.20
75 63
86.07
36.50
Q (SCFM)
0.001 14.207 36,646 76,043 104.043 143.472 149.065 106.633 68.863 35.356 17.715 O. 16.577 36.913 66.533 104.203 150732 150.557 105.380 71.294 37.345 19.577
Eiala V/ith Correct Unit Con'jers
q =dPc (Pal
122.24
122 79
123.43 122.88 121.79
122.45
12165
121.97 123.31
122.66
122.86
233.62
237 23
238.05 238.13 235.53
23310
236 37
235.63 233 03
236.43 237 43
Pr.g
fPa)
119,27
11811
115.03 103.53
30.16
60.38 60.50
33.97 10537
11441
117.33
232.83 229.12
226.02 21715
137.96
172.02
170.88
197.66
215.90 224 44
228 67
ed qO and ons
Q
1.356E-03
2 901E-04
7 4S2E- 4
1.553E- 3
2.124E- 3 3031E-03 3 043E- 3
2178E-03 1406E- 3 7.341E-i:i4 3.617E-04 O.O OE.OO
3.384E-04 7.533E-04 1.360E-03
2.127E-03
3. 77E-03
3 074E-03
2.152E-03 1 456E-03
7 625E-04 3.397E-04
" í "
Data Reduction Re ult
qi (Pa)
0.000 0 294
1.957
8.426
15 774 32.122 32.373 16.538 6.310 1884 0.457 0,000 0,400
1.336 6.462 15 823
33.107
33.031
16,132 7.407 2 032 0Í558
. tídicted Ra
b
-5.44
-27,13
-43,33
-70,68 -'o'Ss •114.18
-135.93
-157.68
' -179.43
-201.18
-222.92
m Coeffície nt
0 alpha
2.83 i 1.000
13.70 ' i ' 0.85:3
24.58 j 0.844
35.45 i 0.840 46.33
57.20
63.08
78.95
0.833 0.837
0.836
0.836
89.32 i 0.335
100.70 \ 0.335
111.57 ' 0.835
Cp,í
0.857
0,564 0253
-0,047 -0,353
-0653
-0.965
-1 272
-1.578
-1834
•2.130
qi qO
0.0000
0 0024
0 0153 0 0686
0.1235 0.2623 0.2662
01360 0.0560
0 0154
0.0037 0.0000 0,0017
0.0033 0,0271 0.0672
0.1330
0 1394 0.0687 0.0311 0.0086 0.0024
Cp,i
10
10
0.3
0.3
0.7 0.5 0.5 0.7
'" 'o','3" " ' 0 9
1.0
10
1.0
0.9 0.9
0.8
0.7
0.7
08 0.3 0.3 10
1 í 1 i ' \
;
- I 1 1 1
í
73

Table C.2: Tabular Data- Multiple Openings - 19.05 (C,= 1.0) and 8.73 (20 deg. Offset)
Tamb =
Pamh=
rhoamb =
q (îotre'Ction =
71 30.04 inHg
1202 kgím-3
1.053
294.81 K 101726.9iPa
Openingl
0.75 in
A1 =
kAU
. Cp1 = kA r iA r í A1)"2 =
0 01905
2 S50E.04
1.5473
0.367
2.27
i
m
m~2
\
í
' (20 deg sep)
Openinq 2
d 2 = | 0.3433 iin
! 0.0037325 m
A2= : 5.3S3E. 5 m-2
kA2 =
Cp2 =
2.3053
0.5934
k.A2"(AríA2)~2 = i 76.46
}
i
—
• • • -
i i
í
Raw Data
,...„'JP'= (in H201
0.4744
0.4735
0.4761
0,4738
0,4769
0.4741
0.4713
0,4736
0.4760
0.4744
0.4755
0,3193
0,3173
0,3154
0,3138
0.3123
0,9204
0,9142
0.9187
0.9155
0.9158
0.3132
0.4546
0.4536
0.4570
0,4551
0.4437
0.4554
0.4525
0.4518
0.4528
0,4530
0,4546
0,3074
0.9013
0.3358
0,3343
0.8383
0,3873
0,3363
0,8373
0,3350
0.3308
o.aai3
P'9 (in H20)
0.4855
0.4743
0.4567
0,4100
0,3431
01311
0,1338
0,3483
0,4161
0.4611
0.4783
0.3463
09356
0.3135
0.8611
0.7681
0.6337
0,6233
0.7796
0.8615
0.9136
0.9332
(5CFM)
0.3162
0.2081
0,0650
-0,1805
-0.4296
-0,3172
-1.1151
-1.4551
-0.3795
-0.5913
-0.2737
0.6533
0.5416
0.4040
0.0620
•0.3552
-06383
-1.1738
-1.5310
-1.8663
•25632
-3.0381
0.000
13.459
43,372
73,413
102.762
143.010
143.479
101493
71137
33.135
18.373
0002
14.740
33.153
70.371
103.609
151.032
150.966
107.328
71.157
33.233
13.330
Data With Corrected qO and IJnit Con'jersi n s
'qO=dPo
(Pa)
0,001
11.719
20.935
31997
41.160
53.387
61.261
69.221
55.182
46,436
35,960
0,000
10.340
18,163
31.234
43.568
51373
63.812
71.563
73.256
31.230
93.493
124,07
123.32
124.50
123.39
124.70
123 97
123.39
123.85
124.47
124.06
124.35
240.53
239.38
233.33
238.36
233.72
240,70
239,06
240,24
233,39
239,48
238,81
Pr.g
(Pa)
118.83
' 118 62
119.50
119.01
117.59
119.03
118.33
113.15
118.42
118.47
113.37
237.29
235.85
234.26
233 87
235 06
232.18
234.38
234.65
234.04
'232.95'
233.20
120.57
117.95
113.41
10182
35.20
47.46
46.90
86.50
103.03
114.50
113.73
235.15
232.35
228.11
213.85
191 00
157 37
15617
193 62
213.95
0
226,33
23174
78.62
51.68
16.14
•44.33
•106.69
•202.94
-276.93
-361.36
-213.41
-146.33
-63.22
163 62
134.51
100.33
15.33
-83 20
-171.07
-23151
-392.64
-463.47
-636.54
-754.50
O.OOOE.OO 3.373E-04 8.855E-04 1.439E-03 2.093E-03 3 022E-03 3.031E-03 2 072E-03 1454E-03 7,786E-04 3,751E-04
4 083E-03
3,0 3E-04
6.763E-04
1.447E-03
2.238E-03
3.084E^ 3
3.082E^03
2.201E-03
1.453E-03
X8ÍeE- 4 "
2,844E-04
Data Reduction Results
qi
EåL 0,000
0,803
4,014
11,502
22,534
46 748
47,045
21.383
10.817
J.103
qí/qO
2,042E-03
2 393E- 4
4,236E^ 4
6 533E^04
8 404E-04
1,030E^03
1251E-03
1 413E-03
1.127E-03
3,481E- 4^
7.342Í-04
.OOOE.OO
J.111E-04
"3'7Í0E-04
6 339E-04
8395E-04
1.061E-03
1.3 3E-03
1461E-03
1 613E-03
1.8e4E-03
2.031E-03
0,000
0.464
2.346
10 713
25.637
43.676
48.633
24.311
JÍ0.8 5
0,414
0,000 6,637 21303' 49,473
81,875
137 744
131372
231,567
147,162
_ 1 4,2J2
62,4?r 0^000
——^ 47 329
91,735
130,546
196,791
247.543
303.575
402.673
478.443
0.0000
0.0065
0.0322
0.0328
0 1307
0 3771
0.3813
0.1775
0.0369
0.0250^
] M58 "o.oooo' 0,0013
0,0038
0,0443
0.1074
0.2022
02034
0.1033
0,0451
"0T0I31"
Cp,i
0,0017
0,0000
0.0560
6,1783 0,4158
0.6963
1,Í567
15328
1.9600
12427
0.3736
0.5257
0,0000
I0JID213
'o.ôi'oT 0.2024
0.3903
0.5623 0.3396;
1.0549
12371
1.7236
2.0516
' • . 0 .
10 0.3 0,8 0 7 04 0,4 0,7 0,3 0,9
w . - . ,
1,0
1,0
0,3
08
0 7
0,7
0.8
0,3 J|,3 'i'. " ' 0.7
0.4
; 0.1
'-04
-0.3
01
0.6 ""0.4
0.1
-0.4
"-0,7"
74

Table C.2: Tabular Data - Multiple Openings - 19.05 {Cp= 1,0) and 8.73 (20 deg. Offset) continued
Tamb =
Pâmb=L
tho âmb =
q^oorrection =
71 30,04
1.202
1.053
Comblned Openings
. ^ r= i 3,449E-04'
(qr>qO)min = ^ 0,162232,
....
nHg It'g7m'3
m"2
j
i-
234,8
101726,9
K Pa " t
Raw Data
dPc
i;in H201
0.4765
0.4733
0.4318
0,4741
0,4697
0.4746
0.4715
0.4713
0.4765
0.4788
0.4778
0,3343
0,3234
0,9256
0.3324
0.3282
0.3135
0,9306
0,9262
0,9274
0.9265
0.9304
qiíqO
^•162..,
0,346
0,530
0 714
0.337
1.081
1.265
1.449
1632
1,816
" " " " 2 , 0 0 0
Fr.g (in H201
0,4730
0,4686
0,4567
0,3982
0,3318
0,2353
0,2260
0,3334
0,4004
0.4550
0,4702
0.3419
0,3211
0.3390
0.8473
0,7714
0.6423
0.6534
0.7723
0.3233
0,8957
0,9229
F
a 1204
25.67
3931 52 34
66 5"
80 21
93 34 107 48 12111
134 75
148,38
Q (SCFM)
0,000
16,356
32,478
72,977
105.357
148.541
143.346
105,711
70.739
31.116
15,492
0.000
13.506
38.732
66,823
103,574
150.507
150,653
101878
75,443
34,267
14,823
I
i
' Dâta Vith Corrected qO and
Uriit Con\;ei ions
qO=dPc
(Pa)
124,60
125,07
125,99
123,98
122,82
124,11
123,31
123,25
124,61
125,21
124,95
244,32
242,73
242.04
243.83
242.73
240.46
243.36
242.21
242.53
242.23
243.31
Pr.g
(Pa)
113.70
116.37
113.41
98.90
82.40
58.44
56,13
82,73 33,44
113,00
116,73
233.91 223.74
220.77
210.57
131.57
15352
162.26
191.30
206.08
222.44
229.20
=redicted R
b
-24.81
1 -52^91
' -3101
l d l l
r r . i 11-' c
.43 6..
277 72
1 -305,83
0
(Kgís)
O.OOOE-O
3.339E- 4
6.631E-04
1.43 E- 3
2.163E-03
3. 33E-Û3
3.023E-03
2.158E-03
1.444E-03
e.353E-04
3.163E-04
0 0 E»00
2.757E-04
7.918E-04
1 364E-03
2.115E-03
3 073E- 3
3.076E-03
2.0S0E-03
1540E-03
6.99eE-04
3.028E-04
am Coefficient |
c alpha
12 77 I.OUO
26.32 0.900
40.87 0.382 54 32 ' 0.874 63 37 0.869 33.03 0.367
111.13 0.863
125.13 0 362
133.23 i 0.361
i 153 28 1 0.860
Cp.i
0.593
0.333
0.034
•0 263
-0.570
-0,873
-1175
•1,478
-1.781
•2,034
•2,387
DataF
qi (Pa)
0.000
0.390
1637
7 760
16.360
32.152
32,063
16.234
7.232
1.411
0.350
0 000
0 266
1 2 . 1 3 2 _
5,503 1 15.'632
33 003
33.075
15124
8.295
_ 1,711
0,320
• " !
eduction Result
qiíq
0.0000
0.0031
0.0122
0.0626
0.1332
0.2531
0.2601
0.1321
0.0585
0.0113
0.0028 . OO
0 0011
0.0031
0.0267
0,0644
0.1373
0.1353
0.0624
0.0342
0,0071
0.0013
Cp.i
1.0
0.9
0.9
0.7
05
0.5
07
0,9
0^3
1,0
0,9
0,9
0,3 0,8
' ' 7
0,7
0 3
0.3
0.9
0.9
1
75

Table C.3: Tabular Data - Multiple Openings - 19.05 (C, = 1.0) and 7.14 (10 deg. Offset)
Tamb =
Pambí
ihoamb =
q^cottection =
30.04 IF
1202 kgiim-3
1 1.053 J
í j
-~~~ ™ ^.. _ .
1
Openinql
d1 =
Al =
ltA1 =
Cp1 =
0.75|in
2.â50E-L"i4 1.5473
0.967
^ i.Ul ;, ^ „ ..„
j _
i (10 deg sep)
m"2
Opening 2
d2 = 1 0.281
1 0.0071374
in
m
A2 = ' 4.001E.05 !T,'2
ltA2 =
Cp2 =
15433
0.8235
fcA2'(AríA2JJ = ! 101.89
1
1 294je|K
1
dPc
(in H201
0.4744
0.4735
0.4761
0.4738
0.4763
0.4741
0.4713
0.4736
04760
0.4744
0.4755
03198
0.3173
0.3154
0.3138
0.3129
0.3204
0.9142
0.3187
0.3155
0.3158
0.9132
0.4555
0.4516
0.4534
0.4513
0.4537
0.4561
0.4536
0.4514
0.4549
0.4538
0.4530
0.3368
0.8340
0.8327
0.8328
0.8937
0,8935
0.8373
0.3875
0,8325
0.8388
0.8325
1 1 1
„„„
Raw Data
Pr.g
(in H20)
0.4855
0,4743
0,4567
0.4100
0.3431
0.1311
0.1838
0.3483
0,4151
0,4611
0,4783
0.3463
0.9356
0.3185
0,8611
0,7631
0.6337
0.6233
0.7736
0.8615
0,9136
0.9332
0.4124
0,3655
0,3115
0.1752
•0.1214
-0.4372
-0.7536
-1.0493
-0.7737
-0,3638
-0,2091
0,3230
0,7802
0,6864
0,5131
0,1433
-0,3633
-1,0432
-1,5216
-1,9905
-1.6133
-11551
Q
(SCFM)
0.000
19.459
43.372
73.413
102.762
148.010
143.473
101438
71137
38.135
13,373
0,002
14.740
33.153
70.371
103.609
151032
150.366
107.328
71.167
33.283
13.330
0.000
5.533
10.202
17.243
27.433
35.531
41.371
47,371
42.535
45.328
23.873
OOO
5,843
11,777
19,030
30.134
41436
52,674
59,043
64,390
60,058
54,304
1
— — • - - " .
f
Data With Corrected qO and UnitConversions
qO=dPc
(Pa)
124,07
123 82
12450
123,33
124,70
12397
123,33
123,35
124,47
124.06
124.35
24053
239.88
239.38
238.96
238.72
240.70
239.06
240.24
239.39
233.48 238 81
119.11
113,09
118,56
113.01
113.65
113.26
118.62
113,05
113,37
118,68
113,46 '
231,30
233,79
233,44
233,48
233 71
233.66
232.13
232.07
233.38
232.43
233.40
Pr,3
(Pal
120.57
117.35
113.41
101.82
35.20
47.46
46.90
86.50 103 i"i9
114.50
118.78
235.15
23235
223.11
213.35
131.00
157 37
156.17
133 62
213.35
226.33
23174
102.43
90.76
77Í36
43.51 •30.14
-108,57
-137,13
-260,59
-193,37
-233.36
" -51,92"
205.37
133.77
17046
123 66
36 35
-91.86
-260.31
-377.87
-494.32
-400.31
-286.36
Q
íkg's)
O.OOOE.OO
3.973E-04
3.865E- 4
1433E-03
2. 33E-03
3.022E-03
3.031E- 3
2.072E-03
1454E-03 7.786E-04
_ 3 75IE-04
4,083E-08
3.0 3E-04
6.7e9E- 4
1.447E-03
2.23SE-03
3 0S4E^03
3.032E^03
2.201E- 3
1.453E- 3
7.316E- 4
2.844E-04
O.OOOE-00
1.130E-04
2.083E-04
3.521E-04
5.611E-04
7.2e7E-04
8 563E-04
3.672E-04
S.684E^04 3.357E^04
6.099E^04
0 OO E-00
1.133E-04
2.404E-04
3 S9eE-04
6.152E-04
8.460E-04
1.076E-03
1205E-03
1.315E- 3
122eE-03
1.1 9E-03
Data
__..<1i
( P a )
. OO
0.308
4 014
11502
22534
46 748
47.045
21.333
10.317
3,103
0,720
0,000
0.464
2.346
10 718
48.676
43 633
24.811
10.805
3.128
0.414
.o o
3.315
11.271 32 193
81.795
137.177
130.765
243.010
195.326
227.437
36.640
0.000
3.697
15.020
39.424
33 336
185.332
300.464
377.617
443.390
390.608
319.347
^eduction Result
_ _qi'q
0.0000
0.0065
0.0322
0.0323
0.1.307
0 3771
0.3813
0.1775
0.0363
0.0250
0,0058 0,0000
0 0019
0,0093
0,0449
0,1074
0.2022
0.2034
0.1033
0.0451
0.0131
0.0017
0.0000
0.0281
0.0951
0.2723
0.6334
1.1502
1.6082
2.0536
1.6463
1.3164
0,8158
0.0000
0.0153
0.0643
0.1683
O4208
0.7353
1.2941
16267
1.9233
1.6805
1.3633
Cp.i
10
10
0,9
0.3
0 7
0.4
0.4
0.7
0.3
1.0
1.0
1.0
1.0
0.9
0,8
0.7
0.7
03
0.3
03
1.0
03
0.3
07 04
-0.3
-0.3
-0.4
09
0,8
, ^ O J ' ~
0,6
0 2
-04
76

Table C.3: Tabular Data - Multiple Openings - 19.05 (C^ = /,0) and 7.14 (10 deg. Offset) continued
Tâtnb = i
Pamh =
ihoamb =
qoorrection= j
Combin
.Ar=!
(qrfqO)min =
71 i F
30 04 : inHg
1,202 i kgím'3
1,063 1
294,8| 1 1 ! 101726,9; Pâ i
>i Openings
3 25Ô -04im-2
0 0633333
Raw Eiata
dPc
(in H201
0,4701
0,4722
0,4721
0,4704
0,4703
0,4684
0,4698
0.4717
0.4707
0.4722
0.4708
0.3090
0.9082
0.3120
0.3166
0.9158
0.3126
0.9103
0.3103
0,3114
0,3125
0,9135
' : • • -
qiíqO
0,068
0,262
0.455
_ 0.643
0.841
1034
1227
1.421
1.614
1807
2.000
Pr.g
(in H201
0.4310
0.4713
0,4610
0,4158
0,3608
0.2383
0.2335
0.3625
0.4213
0.4608
0.4733
0.9328
0.9186
0.9036
0.8636
0.8109
0.6761
0.6743
0.7369
0.3595
0,9107
0,9252
F
a
6,33
26,12
45,41
64 70
34,00
103.23
122.53
141.8S
16117
180.46
133.76
Q (5CFM)
0.001
20.593
36.073
71743
103.108
148.407
143.260
102216
63.324
36.059
15.871
0.000
17,526
34,772
75,510
102.132
143.338
150.467
110.560
74.338
33.342
19,735
'redicted R-
b
-13,33
-53,23
-92,65
• 132 02
-171,33
-210,74
-250,11
-233,47
-328,84
-363,20
-407,56
i 1
r _t r "!
Data With Corrected qO and Unit Conuei ion
qO=dPc
[Pal
122.94
123.48
123,47
123,00
122.99
12249
122.35
123.36
123.09
123 43
123.11
237.71
237.43
233.49
239.71
239.43
233.65
233 13
238.17
238 34
233.63
238.89
mCoefdcie
Pr.g
(Pa)
113.44
117.19
114.49
103 27
83.59
59 34
53.24
90.03 10477
114.44
117.53
231 66
223.13
225.83
214.47
201,38
l'67'e6 '
167.58
' 135 42
213,44
226,16
223.76
nt
c aipha
710 1.000
26.78
46.46
0,837
0.368
66.15 0 834
35 33 .SS3
105.51 0.382
125.13 0.331
144.87 0.330
164.56 0.380
184 24 .S79
203.92 0.873
Q
Ms)
2.042E-08
4.205E- 4
7.3e6E- 4
1465E-03
2.105E-03
3 030E- 3
3.047E-03
2 0S7E-03
1335E-03
7.362E-04
3.240E-04
0 OOOE.OO
3 57SE-04
7.099E-04
1542E-03
'2.036E-03
3.062E-03
3 072E- 3
2 257E-03
152SE-03 6.8 7E-04
4.033E-04
Cp.i
0.823
0.544
0.246
•0.053 '
-0 351
•0.650
•0.943
-1.248 -1.546
-1845
-2.144
Data Reduction Reîults
qi ÍPa)
.OO
0.636
2.135
3.447
' 17.445
36.141
36 557
17.144
7 660
2.134
0.413
0 000
0.504
1.334
3.356
17.133
36.913
37.151
20.05S
3.130
1.324
0.642
qi(qO
0.0000
0.0066
0,0173
0,0687
01418
0.2350
0.2376
0.1390
0.0622
0.0173_
0/^034"'
0 0000
0.0021
0.0033
0.0330
0.0715"
0.1547
0.1560
0.0842
0 0386
0.0076
0.0027
--
c _,-J . -_ -
1
Cp,i
1.0
09
0,3
0.3
0.7
0 5
0,5
0,7
0 9
0.3 _ _ - , ; g - ~ -
1.0
1.0
0.3
0.3
0.8
0.7
0.8
0.9
0.9
1.0
:z£ |__ í
„_!_„ , „ , . .
, . ! J 1
77

Table C,4: Tabular Data- Multiple Openings - 19,05 (C^= 1.0) and 7.14 (20 deg. Offset)
Tímb = l 71 Pamb =' 30,04
tho amb = 1.202
.jJMirreotion = , 1.053
inHg
kgi'm'S
.-î enínq 1
0.76 in
Al: k..' 1 =
J.AJJAríA1]-2j
0,01905 m
2,850E-04 m'2
1,5473 0,967
2.01
(20 deg sepj
Qpeninq
d2 =
A2 =
kA2 =
j : p 2 j
kA2'(ArW2] '2 =
0,281 in
0 0071374 m
4. 01E-05 m-2
2.0724
0.5314
136,771
294,_8
Î 7269" Pa
Raw Data
dPc
(in H20)
0,4744
0.4735
0.4761
0,4733
04763
0,4741
0,4713
0,4736
0,4760
0.4744
0.4755
0 9133
0.9173
0,3164
0,3138
0,9123
0,9204
0,9142
0,9137
0.9155
0,3153
0.9132
0.4543
0.4552
0.4534
0.4661
0.4556
0.4559
0.4560
0,4538
0,4568
0.4576
0.4555
0.8364
0.3336
0.8962
0 8977
0.8977
P'-9 (inH201
0.4356
0,4743
0,4567
0.4100
0.3431
0.1311
0,1883
0,3483
0.4151
0.4611
0,4733
0.3463
0.9356
0.3185
0,8611
0.7691
0,6337
0,6239
0.7796
0.8615
0.9136
0.9332
Q (SCFMl
0.3146
0.0380
-0,6810
-1,7647
-1.1364
-1,2434
-0.5053
-0.2906
-0.1455
0.0168
0.1323
0.6537
0.5705
0.4032
0 0526
-0,7354
0.000
13.459
43.372
73.413
102.762
143.010
148,479
101,493
71,197
38,135
13,373
0,002
14,740
33,153
70,871
103609
151,032
150966
107.823
71157
33,283
13,930
0,000
13.454
34.508
52,037
42.668
44.523
30.563
25.213
21.233
16.132
11.432
0.000
5.44S
12,368
22,847
33,722
Dati Vi'ith Corrected qO and Unit Conyersions
qO=dPc
(Pal
124,07
123,32
124,60
123,39
124,70
123 97
123,39
123,35
124,47
124,06
124,35
240 53
239,88
239,33
233,36
238,72
240,70
233,06 240,24 233,33 _ 239,43'
233 81
Pr,g
(Pa)
113,80
113,04
118 67
113 26
11,9,14
119,22
11923
119 97
119,47
119,67
119,12
234,42 235,26 234,37 234,75 234,74
120,57
117 95
113 41
101,82
35 20
47,46
46,90
86,50
103,09
114,50
113,78
235,15
232,35
223,11
213 85
191,00
157,37
156 17
133,62
2Í3!35
226,89
231.74
73,12
21,85
-169,12
-435,77
-232^22
-303,80
J25,50
' -72.'16'
-36.13
,_4.J8
'~33.0'Ô"
162.35
141.63
101.63
13.07
-195 06
Q
0 OOOE.O
3,973E- 4
8,365E-04
1433E-03
2.Û38E-03
3 022E-03
3.031E- 3
2.072E-03
1.454E-03
7.736E-04
3.751E-n4 "
4 33E-03
Í.003E-04
6.769E-04
1,447E-03
2,23SE- 3
3,0S4E-03
3,032E-03
2,201E- 3
1453E-03_
"^SeE- i 2.344E-04
0.000E*00
2.747E-04
7 045E-04
1064E-03
S.711E-04
9.091E-04
e.240E-04
5.14SE-04
4.343E- 4
3.3 6E-04
Data Reduction Re ults
qi (Pa)
0.000
0.808
4.014
11.502
22,534
46 743
47.045
21983
10.817
3,103'
qiíqO
0,720
2,334E-04
O.OOOE.OO
1.112E-04
2.525E-04
4 665E- 4
8.110E- 4
0.000
0.464
2.345
10718
25 637
48.676
46.633
24.311
10.805
""ri28
0.0000
0 0066
0.0322
0.0328
0.1807
0.3771
0.3813
0.1775
0. S63
0,0260
Cp,i
0,0058
0,414
0.000
13.602
128.955
233.317
197.153
214.717
101.166
63.341
43127
28.333
14.153
0.000
3,214
16,565
56 527
170.863
0,0000
0,0013
0,0033
0,0443
0,1074
0,2022
0,2034
0,1033
0.0451
0,0131
0,0017
10 1,0
0,3
" 0 , 3 '
0 7
0 4
04
0,7
0,3
0,3
0,0000
0,1647
1,0876'
2,4645 16548" 1,8010
0,8434
0,5733 0,4112
0,2373
0,1188
0,0000
0,0137'
0,0707
0 2408
0 7273
JJ5_ " i'o
10
1,0
0,3
0,8
0 7 "
0,8
03
1,0 0,7
0,2
-0,6
-03
0.0
0.3 "
0.7
0,6
'0,4
0.1
-08
78

Table C.4: Tabular Data - Multiple Openings - 19.05 {Cp= 1.0) and 7.14 (20 deg. Offset) continued
Tâmb =
Pamb =
rhoamb =
qcorrection =
_ Combir
,Ai =
[gríqOJmin =
dia, (m)
dia. [inl
—-
-
71 IF 1 294,8! K 30.04 linHg [ 1ÔÍ726.9P3
1.202 k'3Ím-3 i
1.053
ed Openlnqi:
3 250E-04 m'2
0 1366619
2.034E-02
8009E-01
j j
i
1 1 i
Raw Data
dPc
(in H20)
0.4707
0,4726
0,4678
0.4671
0.4633
0.4653
0,4693
0,4633
0.4654
0.4670
0,4703
0.9164
0.9064
0,3433
0.3032
0.9083
0.9118
0.9124
0.9056
0.9101
0.9053
0.9077
Pr.g
(in H20)
0.4743
0.4660
0.4413
0,4042
0,3288
0,1336
0,1377
0,3274
0.3849
0.4446
0.4664
0.9285
0.9034
0.9283
0.8277
0 7527
0,6320
0,6329
0,7711
0.8551
0.3327
0,9103
qiíqO
0.137
0.368
0,543 0,731
0.312
1033
1,275
1,456
1637
1,313
2000
P
a
25,15
49,53
74,03
98,46
122,30
147.33
171.77
136,21
220.64
245.03
263,51
Q (SCFM)
0.000
16.473
37.503
64,688
107,272
147,310
147,440
105,776
77.070
33,701
12,522
0.000
18.734
33,322
73,664
108 437
143.809
149.645
99.779
58.423
35,917
13,452
redicted Ra
5
-6106
-looee -150,26
•199,86
-249,47
-299,07
-343,67
-393,27
-447,87
-497,48
-547,03
Dâta With Corrected qO and Unit Conveisions
q =dPc
ÍPa)
123,08
123 53
122,34
122.16
122.72
121.34
122.38
122.72
121.69
122.13
122.99
233.65
237.03
248.24
237.49
237.51 "
233.45
238.53
236.81
238.00
236.73
237.38
Pr.g
(Pa)
117.92
115.72
109.61
100.37
31.65
43.09
43.09
3131
95.60
110.41'
116.82
230.60
224.35
230.53
205.56
186.34
156.96
157.18
19143
21237
219,22
226,06
m Coefficient
c alpha
25.31
50.71
1000
0,928
75.51 0.315
100.31 0.3 S
125.11
149.91
0,905
0,303
174.71 0.301
133.51 0.900
224.31 .S99
243.11 0.898
273.91 0.333
Q
0, 0nE.00
3,3e3E- 4
7,668E-04
1,32'lE-03'
2,130E-03
3,Û20E-03
3. 10E-03
2.160E-03
1.574E-03
e.S81E-04
2.557E-04
O. O E- O
3.S35E-04
6.326E-04
1.604E- 3
2.215E-03
3. 63E-03
3.065E-03
2 037E-03
1193E-03
7.333E- 4
2.746E-04
j
Data
ÍPa)
0.000
0.445
2.309
6.866
1S.332
35.833
35.671
13.353
3.747
1864
0.257
0.000
0.573
1.S88
8.304
13.312
36.326
36.746
16.337
5.601
2.117
0.237
1 -
Cp,i
0.-531
o!323
_ 0,043 _
-0.536
-0.826
-1.115
-l'405
-1.635
-1.985
-2.276
1
t, ., . i !
1 ^eduction Result
qi(q
0.0000
0 0036
0.0189
0.0562
0.1539
02346
O2303
0,1496
0.0301
0.0153
0. 021
0.0000
0.0024
0.0076
0.0375
0.0S13
0,1544'
0,1540
0.0630
0.0235
0.0039
0.0013
Cp,i
1,0
0,9
0 3
0,3
0,7
0,4
0.4
0,7
0 3
0,3
Í9
1,0
0,9
0,3
0,9
0.3
0.7
0.7
0 8
0,3
0.9
1.0
..... -
79

Table C.5: Tabular Data - Multiple Openings - 8.73 (C,= 1.0) and 19.05 (10 deg. Offset)
Tamb = í 73 JF 1 295,9
q^correction =
0
1 1,063
(10 deg sep]
leninql
dl= 1 0.75
A1 =
l(..A1 =
..--... Cpl = KA1XAríAJ)"2 =
0.01905
in
m
2.860E-04 m-2
2,5548
0,9674
3,74
; (Upstream)
Opening 2
d2 =
A2 =
kA2 =
Cp2 =
kA2'(Arí A2]-2 =
0,3438 |in
0.0087325 m
5.389E-05 rTí-2
16369
1,0102 54.29
IUÍ:IÍUI',L>
j Pa
[
1 i
dPc
i;in H201
0.4543
0.4511
0.4556
0.4515
0.4574
0.4530
0.4543
0.4572
0.4551
0.4529
0.4552
0.3326
0.3902
0.8313
0.8370
0.3327
0.8346
0.8343
0.8324
0.8342
0.8830
0.8942
0.4741
0.4726
0.4727
0.4759
0.4713
0,4722
0,4701
0.4695
0.4722
0.4745
0.4735
0.9139
0,8157
0,9171
0.3151
0.9079
Rai,v' Data
Pr.g
(In H20)
0.4730
0.4593
0.4522
0,4229
0.3577
0.2401
0.0035
0.1337
0.3081
0.3334
0.4424
0.9234
0.3970
0.8694
0.7336
0.6556
0.3943
0.5787
0.7355
0.8040
0.8472
0.8325
0.4996
0,4861
0.4200
0.2211
0.0250
-0.3330
-0.6635
-1.0630
-1,3223
-0.8461
0.4506
0.3655
0.9294
0.8331
0.6600
0.3253
Q (SCFM)
0.000
16.990
26.372
42634
70.646
102.049
145.940
123.260
36.901
60.216
33.424
0.000
13312
37.437
70.127
104.183
147.738
120 31
86.231
66.158
47.333
26.353
0.000
5.334
16262
30.584
33.410
52.566
53,432
67,278
71,747
63,034
13,070
0002
10,142
21187
31946
45,377
! 1
Data Vlth Corrected qO and UnitCon'jersions
q =dPc
(Pa)
113.30
117.37
113.13
113.08
119.62
118 48
113 94
119.66
119 02
118.44
119 03
233.43
232.73
233.23
234.53
233.44
233.35
234.02
233 33
233.34
232.46
233 33
123.93
123.53
123.62
124.46
123 25
123.47
122.94
12277
123 47
124 03
123.S1
240.31
233.47
233^84
239.30
237.42
Pr.g
[Pí:]
118.70
114.06
112.30
105.03
88.83
53,63
2.35
33.20
76 51
95 21
109.83
223 32
222.75
215.31
137.08
162.81
97 31
143 72
182.66
133,67
210,40 22164
124.04
120.71
104.31
54.31
6.22
-35.10
-166.27
-265.24
-.328.53
-203.38
111,90
233.73
230.81
206.83
163.30
80.92
Q
(hq/s)
O.OOOE-00
3.4e9E-04
5 4S6E-04
8.717E- 4
1442E-03
2 0S4E-03
2.3S E-03
2.617E- 3
1774E- 3
1.223E-03
6.S24E-04
.OOOE.OO
4.045E-04
7.643E-04
1.432E-03
2127E-03
3. 1SE- 3
2.452E-03
1.761E-03
1.361E-03
3 f:75E-n4
6.380E- 4
0.000E»00 1212E-04 3 320E-04 6.244E- 4
3.046E-04
1.073E-03
1,213E-03
1,374E-03
1465E-03
1.237E-03
2668E- 4
4.083E-08
2.071E-04
4,326E- 4
e.622E-04
3.264E-04
Data
qi ÍPa)
0.000
0.613
1.633
3.871
10.533
22116
45.229
32.264
16.037
7.700
2.372
0.000
0.834
2.976
10.443
23.052
46.333
30 626
16.731
9.295
4.763
1475
0.000
1.694 12.713
44 386
74 637
132.391
169.876
217.690
247,671
191092
8,216
0.000
4.347
21.639
743.032 ' 93.023
T'"- • --
Heduct ion Resu l t s
qí/q
O. OO
0.0062
0.0123
0.0328
.osse 0.1867
0.3303
0.2633
0 1347
0 0660
0.0199
0.0000
0.0036
0.0128
0.0445
0.0338
0.1983
0.1303
0.0677
0.0337
0.0205
0.0063
0.0000
0.0137
0.1023
0.3615
0.6060
1.0763
1.3318'
17732
2.0050
1.5400
00664
0.0000
0.0207
0.0900
0.2051
0.4171
Cp,i
1.0
1.0
09
0.9
0 7
0.5
0.0
0,3
0.8
0.9
1.0
1.0
0.9
'ã's " 0.7
0.4
0.6
0.8
0.9
0,9
09
1.0
10
0.8
0.4
0.1
; .8
0.3
1.0
1.0
0.3
0.7
03
80

Table C.5: Tabular Data - Multiple Openings - 8.73 {Cp= 1.0) and 19.05 (10 deg. Offset) continued
1 amD 3 ; rs 11-Pamh = 1 30.3 1 inlHq
rho amb = 1.208 ' kg(m'3
qcorrection =
Combir
Ar =
(qríqOJmin =
dia. (m)
dia. (in)
1.053
i (10 deg sep)l
ed Openings
3.443E-04
-0.0114388
1 2.6'96E'-02
m-2
3250E-01
235.9 102607.3
dPc
[in H20)
0,4707
0,4726
0.4678
0.4671
0.4633
0.4659
0,4699
0,4693
0,4654
0,4670
0,4703
0.9164
0.9064
0,9433
0.3032
0.3083
0.3118
0.9124
0.9056
0.3101
0.3053
0.9077
K
Pa
Raw Data
Pr.g
(in H20)
0,4743
0.4660
0.4413
0.4042
0.3238
0.1336
0,1377
0.3274
0.3343
0.4446
0,4664
0.9235
0.3034
0.3283
0.3277
0 7527
0.6320
0.6323
0.7711
0.3551
0.8827
0.9103
qiíqO
-0.011
0.130
0,331
0.592
0.793
0,994
1,195
1397
1,593
'Í733
2.000
P
a
-0.58
3.59
19.76
29.92
40.03
50.26
60 43
70 59
30 76
90 93
10109
Q (SCFM)
0.000
16.473
37.509
64.683
107.272
147.910
147.440
105.776
77.070
33.701
12.622
0.000
13.734
33.822
73.664
103.437
143.809
143,645
93,773
58,423
35,917
13,452
Data V'ith Corrected qO and Unit Con^jersions
qO=dPc
(Pa)
123.08
125 59
122.34
122.16
122.72
121.84
122.38
12272
121.63
122.13
122.99
239.66
237.03
248.24
237.49
237.51
233.45
233.53
236.81
238.00
236.73
237.38
Pr.g
[P<y\
117.92
116.72
109,61
100^37
3165
48 03
43.03
31.31
95.60
110.41
Í16.82
230.60
224.35
230.53
205.56
13694
156.36
157.18
131,48 21237
21322
226.06
redicted Ra
h
1.24
-20.60
-42,44 1
•64,28 '
-86,12
-107.36
-129.80
-15164
-173.47
-135.31
-217 15
Ti Coefíicient
c alpha
-0.66 1.143
10.26 0.734
21.18 0.783
32.10 0 790
43 02
53.'94 ,
0.730
0.731
64,86 0,791
75.77 0.791
36.63 0 791
97.61 0.731
108.53 : 0.791
Q
(kgi's) O.O OE.OO
3,3e3E-04
7 653E04
132tE-03
2.130E-03
3.020E-03
3.01 E- 3
2.160E-03
1.674E-03
e.881E- 4
2.567E-04
OOOOE-00
3.S35E- 4
e.326E- 4
1.604E-03
2 2t5E-03
3.069E-03
3 055E- 3
2. 37E-03
1.193E-03
7.333E-04
2.746E-04
Cp,l
1024
0,531
0,059
-0,413
-0.385
-1.357
-1830
•2 302
-2.774 •3.246
•3.713
Data Reduction Results
(Pa)
0.000
0,394
2 040
6.063
16.637
31725
31.624
16.225
8.613
1647
0.227 '
0.000
0.512
1.669
7.863
17.067
32 545
32.474
14.437
4.350
1.871
0,262
" •• 1
1
qi/q
0.0000
0 0032
0 0167
0.0497
0.1360
0.2604
0.2565
0.1322
0.0703
0.0135
0.0018
0.0000
0.0022
0.0067
0.0331
0.0719
0.1365
0.1361
0.0610
0.0203
0.0079
0,0011
i
EZ 1 ' i
Cp,i
10
03
0 9
0.3
0.7
0.4
0.4
0.7
o.s 09
09
10
09
0.3
0.3
0.3
0,7
0,7
0.8
03
0,9
1.0
^
;
_, i i
81

Table C.6: Tabular Data - Multiple Openings - 8.73 {Cp= 1.0) and 19.05 (20 deg. Offset)
_ _Tâmb_=
Pâmbs rho âmb =
73
29 99
1196 '
q ootreotion = 1053
— ---
' (Upslream)
O p e n i n q l
d l =
Al = k,' 1 =
„C,pl„=_ kAr(Arí A r 2 =
£,.... 1 295.9
inHg : 101557.5
kg im"3
0,3438 | i n
0 ,0037325 m
5 333E-05
1,5676
1.0071
51.99
(20 deq sep
m'2
i Openinq2
d2 = 0,75 | i n
0,01906 m
A2= 2,S50E-04 m-2
k,A2 =
C p 2 =
20.015
0,7227
1
{
1
i
K
Pa
Rau' Data
dPc
(in H20)
0,4571
0.4603
0.4558
0.4575
0.4579
0.4605
0.4531
0.4576
0.4613
0.4532
0,4615
0.9003
0.9010
0.9062
0.9029
0.9035
0.3041
0.9031
0.8971
0.8973
0.8904
0.8907
0.4532
0.4464
0.4486
0.4513
0,4498
0,4460
0,4492
0,4432
0,4472
0.4482
0.4446
0.3820
0,8785
0,3751
0,8826
n fiftnn
Pr.g
(in H20)
0.4841
0.4791
0.4074
0,2926
0.1061
-0.2184
-0.4730
-0.3537
-1.3603
-1.0363
-0,7310
0,9430
0.9233
0.3322
0.7402
0.5632
0.3149
-0.1702
-0.5229
-1.1333
•1.7432
-1,9266
0,3733
0.3133
0.2036
-0.0271
-0.3250
-0.6317
-0.8077
-10335
-1.2731
-1.3645
-1,4364
0.7262
0.6042
0,3743
0,0459
.n djp.ri
Q (SCFM)
0,000
4.700
16.055
25,560
35,962
43,366
55,841
64,236
76,316
63.121
61,831
0.001
6.001
14,340
26,295
36,346
46,295
60,620
68,272
81,523
90,745
93,691
0,000
18,382
30.176
50.212
68.310
36.584
95,637
111,745
123.105
128,527
133285
0,003
20,734
37,242
52,154
70 459
' Data With Corrected qO and
Unit Convetsions
.qO=.JPc
iPa)
113 54
120.37
11313
113.63
113.75
120.41
113.30
119.66
120.78
119.83
120.63
235.44
235.61
236,36
236,12
236,26
236.43
236.13
234.60
234.64
232.34
232.32
118.51
116.73
117.31
118.02
117 62
116 63
117.47
117 20
116.95
117 21
116.27
230.64
229.74
228.84
230.81
23012
Pr.q (Pa)
120.23
113.33
101.18
72.67_
26.34 '
-54 24
-117.47
-212.00
-337.34
-257.35
-181.63
234.17
230.55
213.03
133 33
133.36
78.20
-42.26
-123 85
-231.56
-432.31
-473.46
92.33
73.43
^ '50.5'7
-6.73
-80.72 -156.37
-200.53
•271.56
-316.15
-333.35
-356.72
130,36
150.06
92.96
1140
-105 79
Q (Kqís)
O.OOOE.OO
9.53eE- 5
3.278E- 4
5.213E-04
7.342E-04
3 375E-04
1.14 E-03
1311E-03
155SE- 3
139tE-03
12e4E-03
2 042E-08
1.225E-04
3. 30E-04
5.3e3E- 4
7.421E-04 9.452E-04
1.233E- 3
1.394E-03
1.6e4E-03
1.853E-03
1.913E- 3
O.OOOE.OO
3.875E-04
6 t6tE-04
t. 25E-03
1.395E- 3
1.768E-03
1.354E-03
2.2S1E- 3
2513E-03
2.624E-03 2.S23E-03
1.833E-07
4233E-04
7.604E:04
1.065E- 3
l Data Reduction Results
qi (PaJ
0.000
1073
12.525
^ ' • ^ . . .
62.841
113.668
151.513
200.500
283.002
226 486
186.123
0.000
1.750
10.701
33.537
64.131
104.142
178.563
226.437
322.933
400.132
426.534
0.000
0.773
1,954
5,403
10.012
16.035
13.644
26.791
32516
35.443
41.029
0.000
0.322
2.976
5.336
10.651
qi(qO
0.0000
0.0033
0.1061
0.2654
0.5243
0.9440
12647
1.6756
2,3431
13817
15423
0 0000
0.0074
0.0462
0.1423
0.2717
0 4405
0.7561
0.3664
13763
17186
13313
0.0000
0,0066
0.0167
0,0458
0,0351
04373
0,1672
0.2236
0.27S0
0.3024_
0.3529"
O.O O
0.0040
0,0130
0.0263
Cp.i
1.0
1,0
0 3
0.6
0 2
-0.5
-1.0
1.0
10
0.9
0.6
06 0 3
-0,2
-0.6
03
0.7
0.4
-0.1
-0,7
0,8
0.7
0.4 O
-U.3 _
82

Table C.6: Tabular Data - Multiple Openings - 8.73 {Cp = 1.0) and 19.05 (20 deg. Offset) continued
_ ,_ . Tâmb = [ 73 JF 1 295,9|K | ! ! Pamh =
rhoamb =
q^cotrection =
29 99 inHg ' 101557.5''Pa
1196 kgiim-S 1053
(Upstream)
Combined Openings
Ar = ! 3.449E-Ô4
(qríqOjmin = 0.0054703 m'2
_ dia. (m) 2.096E-02
dia. [in) S,25 E-01
!
1 t
!
!
i
j
!
i
Raw Data
dPc
(in H201
0,4456
0,4450
0,4473
0,4446
0,4475
0,4483
0,4511
0,4444
04450
0,4487
0,4457
0,3880
0,8860
0,3851
0,8856
0,3765
0,8845
0,8800
0,8733
0,8788
0,3802
0,8802
Fr,3
(in H20)
0,3333
0,3614
0,2301
0.1263
-0,2722
-0,4282
-0,6544
-0,8810
-0,7797
-0,5406
-0,3592
0.7651
0.7136
0.6768
0.4613
-0,1505
-0,7032
-03917
-0,8622
-0.6732
-0.1588
0.0551
qi qO
0,005
0.205
0,404
0.604
0,303
1,003
1.202
1,402
1601
1801
2,000
Q (SCFM)
0.000
21.208
44.537
61.756
86.121
104.017
123.611
142162
133.358
114.586
35.330
0.002
23.210
40.283
63.450
92.316
116.663
143.307
131.062
114.309
93.163
36.397
T •
i Dâta Vith Corrected qO and
Unit Conwersions
qO=dPc
(Pa)
116.53
116.37
116.97
116.27
117 02
117 39
117.95
116.21
116.38
117.35
116.54
231.70
23147
23159
229.21
231.30
230.13
229.82
229.S1_
230J3^r 230.16"""
Pr.3
(Pa)
33.17
83.75
72,04
31,37
-67 53
-106.34
-162.51
-218.79
-193.63
-134.25
-S9.13
190.00
173 72
168.07
114.71
-37.37
-174.63
-246.23
•2Í4.12
-167.13
'"-'33'45
13,63
î
Q (kgi's)
0 OOOE.OO
4,330E-04
9,105E.04
1,261E- 3
1753E-03
2,124E-03
2,524E- 3
2,902E-03
2,723E-03
2,333E-03
1,ã46E-n3
4 OS3E-08
4,739E-04
S.224E-04
1.39SE- 3
1.897E-03
2.360E-03
2.926E- 3
2.676E-03
2344E-03
1.302E- 3
1.764E- 3
Dafa
(Pa)
0 000
0.653
2.314
5.588
10.867
15.852
22337
23.610
26.056
13.237
13.315
0.000
0.7S9
2.377
6.365
12.643
13.568
30.033
25. 67
' 13,312 '
12,716
10.336
Predicted Ram Coeííicient
a
-0.12
-4.65
" "-9.17""'
Ji§5_, •18.22
-22.74
-27,27
-3179
-36.31
"-40.84
-45.36
b
•0.32
-12.01
" -23,70
-35,40
-47.09
-58,73
-70,47
-32,17
-93,86
-105.55
-117.24
c alpha
0.44 1000
6.23 0447
12.14 0.438
17.38 i 0.435
23,83 ; 0,433
29.67 • 0.432
35.52 \ 0.432
41.37 : 0.431
47,21 ! 53.06
53.30
0,431
0 431
0,431
Cp.i
0.723
-1.117
-3.023
-4.930
-6,837
-8.743
-10,650
-12,557
-^•*64 -16,372 -18,273
Reduction Results
qííqO
0.0000
0.0057
0.0249
0.0481
0.0323
0.1350
0.1893
0.2548
0.2239
01639
0.1142
0.0000
0 0034
0.0103
0.0296
0.0552
0.0846
0.1307
0.1095
0. S40
0.0552
0.0475
Cp.i
0.9
0.8
0.6
0.3
-0.6
-0.3
-0.3 0.3
0 8
0.7
0.5
-0.2
-03
-0.9
-07
-0.2
0,1
" :
l 1
1 1
83

Table C.7: Tabular Data - Muitipie Openings - 8,73 (C^= 1.0) and 7.14 (10 deg. Offset)
„ .Ti!í ),'> = 73
Pamb = 30 3
F
inHq rhoâmb= 1,203 k,gím~3
qcorrection= 1,053
,
.,. ,. j. !
Openinq 1
d l = | 0,3433 lin
A l =
kAl =
cpi =
0.0037325 m
5.9S9E-n5 m-2
1,6369
1.0102 k.Ar(AríA1)~2 = 4,55
i
-
i 1 i
(lOdegsep)^
Opening 2
d 2 = | 0,281 !in
00071374 m
A2= 4.0 1E-05 ^ " 2
kA2 =
. -.^CP2.=-
1,8821
0.3163
kA2'(AríA2)-2 = : 1173;
! i
— 'i "
i \
i ;
1 :
295.3 102607.3
dPc
(in H20)
0.4741
0.4726
0.4727
0.4763
0.4713
0.4722
0.4701
0,4635
0,4722
0,4745
0,4735
0.3133
0,3157
0,3171
0,9151
0,3079
0 3116
03121
0.3140
0.3033
0.3179
0.9112
0.4610
0.4614
0.4640
0.4647
0.4670
0.4613
0.4634
0.4611
0.4613
0.4669
0.4614
0.9105
0.3133
0.3083
0.3133
n 915?
• ! <
Pa
Raw Data
Pr.g
(in H20)
0.4996
0.4361
0.4200
0,2211
0,0260
-0,3830
-0,6636
•1,0680
-13229
-08451
0,4506
0,3655
0,3294
0,8331
0,6600
0,3258
0.1195
-0.2291
-10431
-1.5441
-2.2009
•2,2350
0,4632
0,4023
0,2131
•0,0370
-0 6223
-14622
-1,0463
•0.6235
-0.3174
0,0452
0,2455
0,3170
0,3666
0,6322
0.2977
-fi-2'7«!-
0
(SCFM)
0.000
5,934
16.262
30,534
33.410
52.566
53.432
67,278
71747
63,034
13.070
0.002
10.142
21,187
31.346
45.377
52.054
60.838
73.767
86,335
34,853
96179
0.000
7.039
16,607
25,722
37.024
43,306
43,660
36.925
30.834
21334
15.262
0.000
5.288
16398
25.932
37,65»
!
Data With Correoted qO and Unit Con'versions
q =dPc
(Pa)
123.93
123.53
123.62
124.46
123.25
123.47
122.94
122.77
123.47
124.08
123.81
240.31
239.47
239.84
233.30
237.42
23S.,33
239,01
237,73
240.04
238.29
120.56
120.66
121.35
121.52
122.13
120.64
121.17
120.57
120.63
122.08
120,65
233,11
233,35
237,52
240.15
239 34
Pt'J (Pa)
124.04
120,71
104,31
54.31
6.22
-95 tO
-166.27
-26524
-328.53
-209.88
111.90
239.78
230.S1
206,33
163,30
80.32 " 29.67
-56.33
-259.04
-383.47
-546.57
-569.34
116.23
100.03
52.31
-24.09
-154.66
'-36343
-259.83
-154,85
-78^32
1123
60,96
227,72
216,22
157.00
73 94
-63.53
Q
(l<.q/s)
O.OO E.OO
1.212E-04
3.320E- 4
e.244E-04
S.IJ46E-04
1. 73E- 3
1.2t3E-03
1.374E-03
1.465E-Û3
1.2S7E-03
2 668E-04
4 S3E- 8
2.071E-04
4.32eE-04
e.522E-04
9.2e4E-04
1063E-03
1.242E-03
1.608E-03
1.7e3E-n3
).937E- 3
1.9e4E-03
O.OO E.OO
t.437E-04
3.331E-04
5.252E- 4
7,659E- 4
1.0 7E-03
8.3t4E- 4
7.533E-04
6.295E-04
4.4e8E-04
3.116E-04
O.OOOE.OO
1030E-04
3.34SE-04
5.234E- 4
7.689E- 4
1 i
( •
Data Reduction Results
qi
(Pa)
0.000
1.694
12.713
44.986
74 637
132.831
163.376
217.680
247 571
191.032
S.216
. O
4.947
21.539
49.032
33.023
130.317
178.003
298.338
353.431
432.753
444.89Ô '
0.000
5,340
23,722 71,302
147,726
261333
205.427
146.337
102.461
51,611
25,102
0,000
3,014
28,977
72.471
152.323
qiiiqO
aoooo 0.0137
0.1023
0.3615
0.6060
10763
1.3818
1.7732
2.0050
1.5400
. 664
0.0000
0.0207
0.0900
0.2051
04171
0.5467
0.7463
1.2484
1.5076
1.3023
0,0000
0,0443
0,24't3'
0.5367
1.2095
2.1717
16953
1.21S7
0.8434
0.4228
0.2081
0.0000
0.0126
0.1220
0.3013
06385
Cpj
1.0
1.0
o.s 0.4
o.t
-0.8
0.3
10
1.0
0.3
07
0.3
01
-0.2
10
_ 0.8
0.4
-0.2
-0.7
01
0.5
1.0
0.3
0.7
0 3'
-03
84
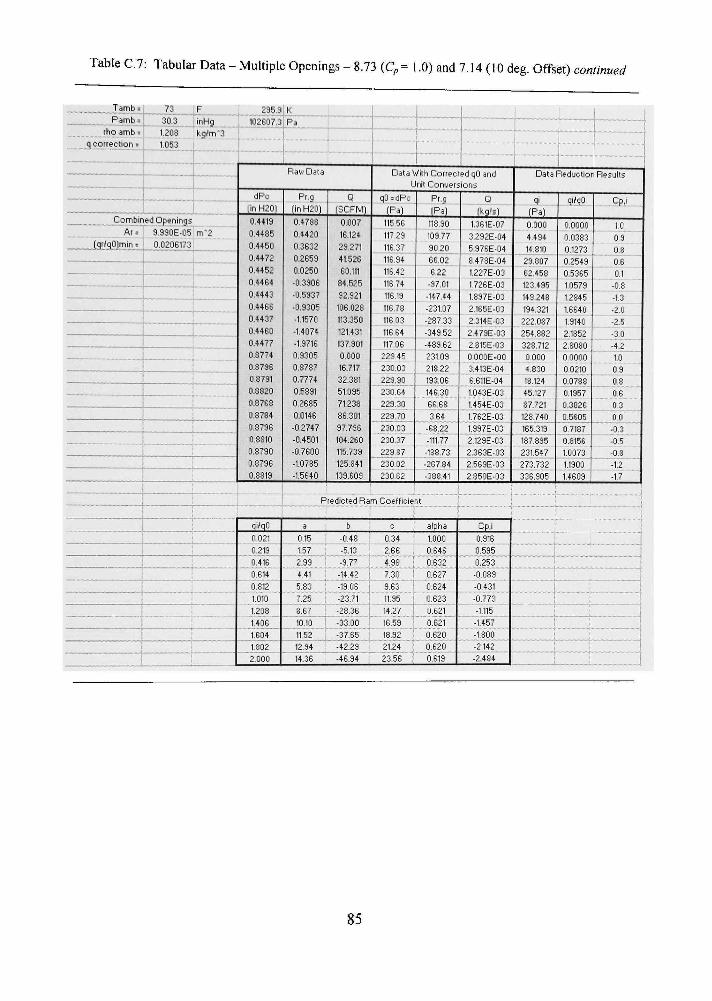
TabIeC.7: Tabular Data-Multiple Openings-8.73 (C^= I.O) and 7.14 (10 deg. Offset) co«/(«weí/
, _ _ _ Tambs
Pâmh =
rho amb = qcorrection =
73 !F
30,3 • inÍHg
1,203 kgím~3
„ .
Combir
Ar =
_(grígO)min =
ed Openings
9.99 E-05 m'2
^ 0.0206173/
295,9
102607,3
dPc
(in H201
0,4419
0,4435
0,4450
0,4472
0.4452
0,4464
0,4443
0,4466
0,4437
0,4460
0,4477
0,3774
0,8736
0,3731
0.8820
0,8763
0,3784
0,8736
0,8810
0.8730
0,8796
0,8813
1 1 Pâ ' i
!
Raw Data
Pr.g
(In H20)
0.4738
0.4420
0.3632
0.2653
0.0250
-0.3306
-0.5337
-0.9305
-1.1570
-1.4074
-1.9716
0.9306
03737
0,7774
0,5831
0,2635
0,0146
-02747
-0,4501
-0,7600
-1,0735
-1,5640
Q
(SCFM)
0.007
16.124
23.271
41526
60.111
84.525
32.921
106.023
113.350
121431
137,901
0.000
16.717
32.381
51.095
71.238
86.301
97.796
104.260
115.733
125.341
133,603
Data Vith Corrected qO and Unit Con'jersions
q =dPo
ÍPa)
115 66
117 23
116.37
116.94
11642
116 74
116.13
116.78
116 03
116 64
117.06
223 45
230.03
229.90
230.64
229.30
229.70
230.03
230.37
223 37
230.02
230.62
, F redictedRa m Coel^ficie
Pr ' ; (Pa)
118.90
103.77
90.20
66.02"
e.22
•37.01
-147.44
-231.07
-237.33
-343 52
-483.62
231 09
218.22
193.06
Î46.30
66.68
3 64
-63.22
-111.77
-138.73
-267.S4
-388.41
-it
i 1 f qlíqO
0.021
0.213
0.416
0.614
0.812
1,010
1.208
1.406
1604
1802
2.000
a
0.16
1,57
2.99
4,41
5.83
7.25
8.67
10.10
11,52 _ ,
1234
14,36
h
-0,43
-5,13
-9,77
-14,42
-19,06
-23,71 ^
-28.36
-33,00 j
-37,65 -42,23
-46,94
0 ; alpha
0.34 1000
2,66 í 0,646
4 33 ' 0 632
7 30 '
9 63
1195
14,27
16,59
18,32
0 627
o :4 U623
0.621
0.621
0.620
21,24 "• 0,620
23.56 l 0.613
0
(kgís)
1.361E-07
3.232E- 4
5 376E-04
S.478E-04
1.227E-03
t726E-03
1.397E-03
2.165E-03
2.314E-03
2.479E-03
2.815E-03
OOO E.OO
3.413E-04
6,611E- 4
l,043E-03
l,4.54E-03
r762E- 3
l,997E-03
2,129E- 3 2.3e3E-03
2.569E-03
2360E-03
1
Data Reduction Results
(Pa)
0,000
4.434
14.310
29,807
62.458
123 435
143.243
194.321
222.037
254.882
323,712 0 000
4.330
13.124
45.127
S7.721
128.740
165.313
187.335
231.547
273.732
336.905
qiíqO
0,0000
0,0333
0.1273
0.2543
0.5365
10573
1.2345
16640
1.9140
2.1352
2.3080 0.0000
0 0210
.07S3
0.1957
0.3326
0.5605
0 7187
.S156 10073
1.1900
1.4603
Cp.i
0.916
0.596
0,253
-0.083
-0 431
-0,773
-1,115
-1,457
-1,800 -2142
-2,434
í
L_. í
1 E
1
Cp.i
10
0 3
o.s û.e 01
-0.3
-1.3
-2.0
-2.5
•3.0
-4.2
1.0
0 3
0,8
0,6
0,3
0,0
-0,3
-05
-03
-1,2
•1,7
, , f ; ' 1 s
i '<
1
85

Table C,8: Tabular Data - Multiple Openings - 8,73 (C„= 1.0) and 7.14 (20 deg. Offset)
3 3
iho •amb =
q cotrection =
—~ __—
d1 =
A1 =
kA1 =
C,p1 =
lî,Ar(AriiA1)-2 =
73
29,9
1,192
Í.053
,..-..
F
inHg
kgím'3
1 0.3433! in
_l 0.0087325
5.9S3E-05
1.6592
10305
4.62
m
' "?
l^u aeg sepj Opening 2
d2 =
A2 =
kA2 =
Cp2 =
kA2'(AríA2)"2 =
0.28l! in
0 0071374 m 4.001E-05 m"2
23965
0.6435
14.94i
295,9 K
101252.8 Pa
dPc
(in H20)
0.4426
0.4485
0.4473
0,4463
0,4453
0.4480
0.4468
0,4464
0,4450
0.4441
0.4453
0.3832
0.8837
0.3824
0.8811
0.8833
0.8823
0,8739
0,8803
0,8764
0,87S4
0,8754
0,4494
0,4478
0,4486
0,4439
0.4473
0,4432
0,4474
0.4501
0.4503
0.4515
0,4520
0,3876
0.8344
0,3334
0,8353
08317
Raw Data
Pr.g
(in H20)
0.4736
0.4621
0.4039
0,2967
0.1125
-0.1267
-0,5381
-1.1863
-0.3216
-04495
-O0962
0.3375
0.3233
0,8707
0,7860
0,6234
0.4300
0.1218
-0.2319
-0.7643
-13106
-2.0791
03542
0,2902
0.1632
-o.otes -0,1348
-05775
-0.3663
-1,2323
-15301
-0,3280
-04027
0.7007
0.5332
0.4763
0.2807
0,1048
Q
(SCFM)
0,000
8,412
15,733
24.715
34.537
43.663
55.613
69.383
61.538
53.308
42,784
0,000
6,733
14,332
22,327
31.334
40.805
50,671
60,311
71,993
79,543
92,834
0,000
4,807
10,357
16.833
21223
23.648
36.416
40.692
45.212
35.371
26,220
0.000
5 961
10.661
16.328
mfeifl
Data Vith Cortec Unit Con'^er
'qO=dPc
ÍPa)
116,74
117.27
117.10
116.71
116 44
117.15
116.34
116.74
116,37
116.14
116 62
230.37
232.67
230.75
250.93
230 34
223.33
230.34
223.17
223.72
223 33
117.52
117.03
117 32
117 40
117.11
117.20
117.00
' l Í770
117.91
118.06
118.20
232.11
23127
2-3259
231.52 73319 1
Pr.'J
(Pa)
113.86
114.76
101.80
73!63
27.34
-31.45
-133.64
-294.61
-204.04 -111.62
•23.89
232.32
230.79
216.23
156.31
106.77
30.25
•70.00
-139.80
-325.48
-516.33
87.36
72,08
40,52
-4,18
-45,38
-143,41
;233.93
-306.04
-394.90
-230 45
-100.01
174.02
147,31
118,03
69,72 ?f; r\í.
led qO and 5Íons
Q
(kgí5)
O.OO E.OO
1.717E-04
3.224E-04
5.04eE-04
7 051E-04
8.916E-04
1.135E-03
l,417E-03
1,257E-03 1, S8E- 3
3 735E-04
0, 00E.O0
1375E- 4
3,06.9E-04
4 553E-04
6.532E-04 3.331E-04
1. 35E-03
1.244E-03
1.470E-03
1.624E-03
1.335E-03
. OOE.O
3814E-05
2.2t7E- 4
3 438E- 4
4 333E-04
6.053E-04
7.435E-04
3.3 SE-04
9.231E-04
7.324E-04
5.353E-04
0 OOOE.OO
1.2t7E-04
2177E-04
3 334E-04 i 'AílP.M 1
Data
qi
0,000
3.443
12.156
29,770
53134
32 342
150.733
234.623
134.366
138.500
83,213
o.O
2.203
10,340
24,235
43 883
81.150
125.137
130 324
252.606
303.367
420.028
O.O
2.624
12.873
30.363
49.190
95.937
144.826
180.334
223.233
140523
75,081
0,000
3,831
12412 29,116
ík í'.-r\ 1
-j
Reduction Results
qi/q
0.0000
0.0294
01038
0.2551
0.4993
0.7333
1.290Í
2.0093 1 58S6
1.1326
0.7650 0,0000
0,0095
0,0474
0,1054 0 2160 0 3516
0.5445
0,7850
11023
1,3424
18347
0,0000
0,0216
01097
0.2637
0.4200
0.3131
12373
15364
1.3933
11302
0,6352
0,0000
0,0168
0,0534 0,1253 n ^•5'3i
Cp.i
1.0
1.0
0.9
0.6
0,2
-0 3
-10
-0.2
1,0
1,0
0,3
^ • 3
0,7 115
0,1
-0,3
-0 3
07
0,6
03
0 0
-0,4
-0,3
0.1
0,6
0,5'
'oF_ n 1
86

TableC.8: Tabular Data-Multiple Openings-8.73 (C^= 1.0) and 7,14 (20 deg, Offset) co«//«Meí/
. Tâmb.=i 73 iF 1 295.9 Pâtrib:
iho amb =
q (îoitection =
^ 29,9 inHq < 101252.8 1192 |í.gím"3
1053
- , i í 1
CombinedOpeninqs
At =
(giíqOJmin =
9.990E-05
0.0S253 5
m"2
dPc
(in H201
0.4432
0.4478
0.4498
0.4517
0.4498
0.4513
0.4503
0.4438
0.4479
0.4491 0,4514 0.8346
0,8843
0,8322
0,8351
0.8365
0.8844
0,8346
0,8876
0,3813
0,3334
0.8839
K
Pa
Raw Data
Pr.g
(inH2 t
0.4435
0.4272
0.3381
02693
0.1353
0.0342
-00713
-0.2538
-05155
-06604
-1.4685
08762
0.8032
0.7302
0.6156
0.4255
0.1538
•0.0792
-0.3681
-0.6845
-0.9414
-1.7227
i-J (SCFM)
0,000
5.325
14.526
33.053
40,771
43.246
60.316
70.623
S4.610
90.853
118.602
0.000
12.771
23,709
38,076
53,406
63,318
82,205
34, S4
105,559
114,840
137,703
! Data Vith i:;orreoted qO and
Unit Con',/ersions
q =dPc
(Pa)
117,20
117 09
117.62
118.12
117.62
113.03
117.83
117.62
117.12
117.44
118.05
23134
231.24
230.71
23146
231.82
231,27"
231.32
232.10
230.47
231.03
231.13
• '•
i I
i
qiíqO
0,033
0,274
0,466 0,653
0 350
1,041
1.233 1425
1.617
1808
2,000
P
a
0.35
2.33
4,81
6,73
8,77
10,76
12,73
14.71
16.69 i
18,67 '
20,65 :
redicted Ra
b
-2,47
-3,20
-13,33
-13,66 "
-25,39
-31,12
-36,35
.42^8 !
-48,31 \ -54,04 i
-53,77
m Coefficíe
Pr,3
ÍPa)
111,64
106,03
36,33
67,02
43.66
23.39
-17 83
-64.51
-12801
-164 01
-362.21
217.60
139.47
13134
15233
105.67
38.21
-13.68
-3141
-163.38
-233.79
-427.32
Q
(k,qís)
O.O OE.OO
1.037E-04
2.966E-04
6.743E-04
8.324E-04
1005E- 3
1231E- 3
1,442E-03
1,727E-03
1855E-03
2.421E- 3
0 OOE.O
2 6 7E-04
4.841E-04
7.774E04
1.030E-03
1.407E- 3
1.673E- 3
1.321E- 3
2.165E-03
2.345E-03
2.S12E-03
1
; 1
Data Reduction Results
(Pa)
0,000
0,497
3.696
19.137
23.113
42 480
63.724
37.366
125.393
144 603
246.338
0.000
2.357
3.346
25336
49960
33.139
118.372
155.054
136.133
231.014
332.178
-it
c alpha
1.61
4,43 1
7.34 1
10,21 '
1.000
0.731
. . 0 ^ 3 + ^ 0.673
13,07 0.670
15.94 ,
18.80 •
0.665
0.662
21.67 ! 0,659
24,53 1 0.657
27,40 1 0,656
30,26 ! 0,654
Cp.i
0,650
0,353
-omA _ ^ ' -0,367
-0.731
-1036
-1.461
-1.826
-2.131
-2,557
-2,322
qi|iqO
0.0000
0.0042
0 0314
0.1620
0.2475
0 3539
0.5406
0.7428
1.0707
12313
2.0S72 0.0000
0.0124
0.0427
0.1097
0.2155
0.353S
0.5117
0.6680
0.3463
10000
1.4372
Cp,i
10
09
0.3
0.6
04
0 2
-0.2
-05
•1.1
-1.4
-3.1
0.9
0.9
0.3
0.7
0.5
0 2
-0.1
-0.4
-0.7
-1.0
-19
1" ' ,
87

TableC,9: Tabular Data-Multiple Openings-7.14 (C^= 1.0)and 19.05 (10 deg. Offset)
1 âmb = 1 73 Pamb = • 30 3
F 1 295,9 inHn in^ftn7 •!
rhoamb= 1206 kqiim'3 q^correotion = j 1053 i |
" 1 1 ••-" í ~
(10 deq sep)
Openinq 1
0,01905
kA1 =
Cpl =
kAr(AtíA1)-2 =
25543
0,3674
I„ in
m
m*2
, 1
lupstreamj • Openinq 2
d 2 = | 0,28l|in
1 0,0071374
A2 = : 4,001E-05
kA2 =
Cp2 =
16133
1.0213
m
m*2
kA2^(AríA2)-2 = ' 106,871
i • \
dPc
(in H20)
0,4543
04511
0,4555
0,4515
0,4574
0,4530
0,4543
0,4572
0,4551
0.4523
0.4552
0.8326
0.3302
0.3919
0,8370
0,8327
0,8346
0,8943
0.8924
0,8942
0,8890
0,8342
0.4513
O4510
0,4532
0,4541
0.4535
0,4626
0,4437
0,4532
0,4523
0,4434
0,4529
0.3935
0.8957
0,3922
0,8345
K
Pa
Raw Data
Prg
(inH2 )
0.4780
0.4593
0.4522
04229
0.3577
0.2401
00095
0.1337
0.3081
0,3834
0,4424
0.9234
0.8970
0.3634
0.7336
0.6,556
0,3943
0,5737
07355
0,8040
0,3472
0,8325
0,4848
0,4625
0,3631
0,2755
01516
-0.0172
-04165
-0.7424
•1.0911
-0,7296
-04757
0.3361
0.9177
0.7976
0.4970
Q
(SCFM)
0.000
16,990
26.872
42694
70.646
102049
146.940
123.260
86.301
60.216
33,424
0.000
13.812
37,437
70,127
104.183
147.738
120,031
86.231
66.158
47,389
26,353
0,000
5,656
13,756
17,941
22,279
27,135
36,846
41777
46,452
41.491
37,161
0,000
6,664
14,774
25,671 1
D a t a Vitt-i C o r r e o t e d qO and
Unit Conuers ion^s
'qO=dPc
(Pa)
113,80
117,97
11313
118,03
113,62
113 46
118,94
119,56
119,02
118 44
119 03
233 43
232,78
233.23
234.53
233.44
233.35
234.02
233.38
233.34
232.46
2.33.33
118.01
117.93
113.51
118.76
113.53
113.34
117.33
118.50
118.23
117.53
113.'>3
233!e5
234.24
233.32
233.31
Pr .g
(Pa)
118.70
114.06
112,30
105,03
83.33
53.63
2.35
33.20
7f: 51
36.21
103.38
229.32
222.75
215.91
197.08
162.81
97,91
143.72
182 65
133.67
210,40
22164
120.40
114.86
30.16
63.42
37.64
-4.26
-103.44
-184.37
-270,97
-18113
-118.13
232,43
227 31
198,06
123,43
Q
m%\ 0 O OE.OO
3,469E-04
5 486E-04
8 717E-04
1442E-03
2 034E-I.I3
2,930E-03
2,517E-03
1774E- 3
l ,229E-03
6,324E-04
, 0 0 E . 0 0
4,045E-04
7,e43E-04
1,432E-03
2,127E- 3
3 01SE-03
2,452E- 3
1.7eiE-03
1.351E-03
3.675E^04
5.3S0E-04
O.OOOE.O
1155E-04
2.S 9E-04
3 663E-04
4 549E- 4
5 652E-04
7.319E- 4
3.523E-04
3.434E-04
8 471E- 4
7.5S7E-04
O.OOOE.OO
1.156E-04
3.016E-04
5 241E- 4
Da ta
(Pa)
O.O
0.613
1 533
3.S71
10.538
22115
45.229
32.264
16 037
7 700
2372
0.000
0.834
2.376
10.443
23.052
46.3S3
30626
15.731
9.295
4.769
1.475
0.000
3.448
20393
34 638
53.491
73.702
138.475
183.090
232.639
185.523
148.821
0,000
3,457
23,523
71020
Reduction Reîults
qiíqO
0,0000
0.0052
0.0129
0.0323
0.0836
0.1867
.3S03
0.2699 0.1347
0 0650
0 0199 0.0000
0.0036
0.0123
0.0445" 0.0983
01333
0.1303
0.0677
0.0397
0,0205
0,0063
0,0000
0.0292
0.1721
0.2921
0.4510
0 6735
1.1302
15872
1.3653
1,5786
12566
0.0000
0.0148
0.1008
0,3036
Cp.i
1.0
10
0.3
0.3
07
0 5
0.0
0,3
0 6
0 8
0,3 1
10
1,0
0,3
~Ô.3 07
0 4
0,6
0,8
0,3
0,3
03
1,0
10
0,3
fie
0,3
0,0
-03
-1,0
10
10
0,3
05
88

TableC.9: Tabular Data-Multiple Openings-7.14 (C/,= 1.0) and 19.05 (lOdeg. Offset) continued
_.., ._ Tamb = l 73 :F Pamb = 30 3 ini-i.-'
rho amb = 1 208
q oorrection = i 1.053 I
—
kg/m'3
1
' (10 deq sep)
Combined Openlngs ,Ar =
[qríqOlmin = 3.250E-04
^-6,0162232 j . - - • • -
dia. (inj 80Û9E-01
{
m-2
295,9
dPc
(in H20)
0.4492
0.4514
0.4629
0.4509
0.4533
0.4512
0.4551
0.4543
0.4523
0.4542
0.4501
0.8903
0.8894
0.3393
0.3313
08831
0.8856
0.8361
0.3351
0.8363
0.8873
0.8901
í
K
Raw Data
Pr.g
(in H201
0.4746
0.4679
0.4540
0,4340
0,4034
0,3693
0,3470
0,3005
0,2486
0.2041
0,1234
0.9243
03141
0.3354
0.8749
0.3333
0.8090
0.7790
0.7128
0.6307
0.6239
0,5520
- \-^
Q (SCFM)
0.000
13.055
30,538
45,797
65,403
81.609
91499
105.373
119.437
130.416
146.332
0.000
12.424
28,709
45,444
66,103
78,854
89,724
110,133
113,002
130,513
147,296
i
Data V'ith Cotrect Unit Con'jers
'qO=dPc
ÍPa)
11747
118.03
113.43
117 32
iis.ee 117 93
113.01
113.34
118.43
118.78
117.71
232.81
232.58
232.56
233.07
232.50
23153^"
23172
231.47
231.33
232.17
232.75
Pr.g
(Pa)
117.86
116.20
112.74
107.78
100.13
31.72
86.16
74.62
6173
50.70
30.65 223.67
227.01
22J._36
217.27 "
206.35
200.90
193.47
177.03
169.06
156.44
137,03 j
ed qO and ons
Q (kq/s)
0 OOOE.O
2.665E,04
6 235E-04
9.350E-04
1.335E-03
1 66eE- 3
1868E-03
2.162E-03
2 439E-03
2.ee3E-03
2.999E-03
.OO E.OO
2.537E-04
5.861E-04
3.273E-04
1.350E-03
16t E- 3
1.332E- 3
2.250E-03
2 430E-03
2.665E- 3
3. 07E- 3
DataReductionRe ult
(Pa)
0.000
0.273
1523
3.425
6 985
10 876
13.671
18.304
23 294
27.774
35 235
0.000
0.252
1346
3.372
7.135
10,154
13146
19,825
23,125
27,815
35.429
qiíqO
0.0000
0.0024
0 0129
0.0230
0.0589
0 0922
0.1149
0.1533
0.1967
0.2338
0.2993 0.0000
0 0011
0.0058
0,0145
0.0307
0.0438
0,0567
0,0856
0.0997
0.1133
0.1522
Cp.i
1.0
10
1.0
0.3
0.3
0 3
0.7
0.6
0.5
0.4
0.3
10
10
1.0
0.3
0,9
0.9
0.3
08
0,7
0.7
0.6
89

Table C.IO: Tabular Data - Multiple Openings - 7,14 (Cp= 1.0) and 19.05 (20 deg. Offset)
,. Tamb = !
Pamb =
iho amb =
q eottection =
,. Of dl =
A1 =
kA l =
Cp1 =
kAl ' íArí A i r 2 =
73 F
29.9 inHg
1.192 kqím'3
1053
(Upstream)
eninq 1
0.2Sl|in
0.0071374 m
4.001E-05 m-2
15626
1.0157
103.12
1
! : (20 deq sep
Opening 2
d2 =
A2 =
kA2 =
Cp2 =
KA2'(AríA2)"2 =
0 75|in
0.01905 m
2.850E-04 ^ " 2
19 955
0.7227
25.95
• - ^ ;
i
295.9]
101252.8
K
Pa
Ra'.s' Data
dPc
i;in H20)
0.4677
0.4641
0.4671
0,4634
0.4677
0.4652
0.4666
0.4665
0.4672
0.4653
0.4644
0.9103
0.9063
0.9036
0.3105
0.9131
0.8992
0,9073
0.3062
0,3039
0,9037
0.9006
0.4532
0.4464
0.4436
0,4513
0.4438
0.4460
0.4492
0,4482
0.4472
0,4482
0,4446
0,8820
0,8785
0,8751
0,8326
n flRnri
Pi.g
(in H201
0,4990
0,4751
0,4236
0,2983
0.0953
-0.3426
•0.6728
-0.9393
-10730
-0.4308
0.0533
0.9631
0.9323
0.3886
0.7839
0.6412
0.4023
0.1749
-0.3276
-0.8270
-1,3921
-2.4360
0.373S
0.3193
0.2036
-0.0271
-O3250
-0,6317
-0,3077
-1,0935
-12731
-13645
-1,4364
0,7262
0,6042
0.3743
0.0453
.0 4?Rn
Q
(SCFM)
0.000
5.301
10.238
17.551
24.441
36.179
40,950
45,061
47.091
36.810
25.636
0.030
5.553
10.536
16.612
22.202
28.416
34.216
43.563
50,443
57,501
67.215
0.000
13.332
30.176
50.212
68.310
86.584
36,687
111,745
123,105
123,527
138,235
0.009
20.734
37.242
52,154
1 70,453
Datd V,'ith Coiieot IJnit Con'.'er
qO=dPc
ÍPa)
122.31
121.37
122.14
122^3''
122 30
121.65
122.03
121.93
122.16
12167
121.45
233.06
237.01
237.69
233.10
238.78
235.16
237.39
236.98
237.68
237.62
235.50
118.51
116.73
117.31
118.02
117 62
116.63
117.47
117.20
116.35
117.21
116.27
230.64
229 74
228.84
230.81
230.12
Pt.g
(Pa)
123.33
117.99
106.63
74.21" '
23,67
-85 08
-167,09
-233.42
-267,72
-106,39
13,40
239,13
23166
220,63
134,67
153,23
33,90
43,43
-31 33
-205,37
-345.71
"-e 4?96"
32.83
79,43
50,57
-6,73
•80.72
-156.37
-200.53
-271.56
-316,15
-333.85
-356,72
130,35
150 06
92.96
1140
"d qO and '3ns
Q (kgís)
O.OOOE.OO
1.0S2E-04
2.090E04
0.633E^ 4
4.990E- 4
7 182E-04
8.361E-04
3.200E-04
3614E-04
7!615E-04
5.234E- 4
6 125E-07
1.135E-04
2.161E-04
3.332E-04
4.533E-04
5.301E-04
6 3S6E-04
3.395E-04
1.030E-03
1.174E-03
1.372E- 3
O.O OE.OO
3.375E-04
6.ieiE-04
1.025E-03
1.335E-03
1.7e3E-03
1.954E- 3
2.231E-03
2513E-03
2.624E-03
2.S23E- 3
1.83SE-07
4 233E-04
7.604E-04
1066E-03
' • ;
Data Reduction Resuíls
qí (Pa)
0.000
3.063
11447
33.641 65.233
135.154
133.134
221.750
242.130
147,377
71,768
0 000
3,374
12,123
30,137
53,834
38,177
127.856
207,303
277,834
361,088
493..334
0.000
0.775
1.360
5.426
10.042
16J33
13.704
26.872
32613
35.549
41152
0.000
0.925
2.985 ' ' 5.854
qi/qO
0.0000
0.0253
0.0337
o'.^^^e 0 5334
1.1110
1.5003
1.3173
19324
1,2162
0,5909
0,0000
0.0142
0.0510
0.1266
0.2255
0.3750
0.5386
0.8743
11692
1.5196
2.0951
0.0000
0.0066
0 0167
0.0460
.085'(
0.1333
0.1677
0.2233
0.2783
0.3033
0.3539
O.O O
0.0040
0,0130
0,0254
0,0464
Cp.i
1,0
10
0 9
0,6
02
-0,7
-0,3
" 0,1
10
10
0,9
0,3
0,7
0.4 0,2
-0,3
-0,9
0,3
0,7
0,4
-0.1
-0.7
0.8
07
0.4
00
-05
90

Table C.IO: Tabular Data - Multiple Openings - 7.14 (C,,= 1.0) and 19.05 (20 deg. Offset) continued
Tâmb =
tho âmb =
q correotlon =
73 29.9
1.192 1.053
.F 1 295,9 JnHg • mÚ.ê
kqím"3
^[Ups(reâmj_
Comblned Openinqs
Al = 3.250E-04
(qríqO)min» 0.0028412
diâjmj^
dia. (in) 2.034É-02
8,009E-0t
m 2
i i 1
Pa
Raw Data
dPc
(in H201
0,4444
0,4463
0.4427
0.4463
0.4464
0.4468
0,4463
0,4457
0,4453
0,4428
0,4426
0.3784
0.3765
0,3750
0,8763
0.8821
0.8765
0.3761
0.8781
0.8763
03714
0.8767
qiíqO
0.003
0.203
0,402
0.602 0.802
1.001
1,201
1.401
1.601 1300
2,000
Pi.g
(in H20)
0.3303
0.3433
0.2501
0.0351
-0.2322
-05614
•0.7336
•0.8703
-10416
-0.4308
-0.6913
0.7646
0.7046
0.6250
0.4476
-0.3233
-0.3087
-11914
-1.4987
-1.3634
-1.0253
•0.5325
P
a
-0.22
-15.63
-31.05
-46.46
-61.87
-77.28
-92,70
-108,11 í
-123.52 i
-13334
-154 }5
Q ÍSCFM)
0.000
24.638
44.672
53.015
82.823
103.603
116.933
127.747
141227
37.673
114.210
0.000
24.836
44,267
58,580
85.184
104.532
121.237
140.772
130.302
112.093
90,687
lediotedRa
b
-015
-1051
-20,88 ^
-31,24
-4l,ê 1 -5137
-62,34
-72,71
-83,07
-93.44
-103,80 :
Data Vith Coirec
IJnit Con' je i :
qO=dP';
(Pa)
116.21
116 71
116.76
116 71
116.74
116.83
11646
116 56
116 45
115.S1
116.72
223 70
228.96
223.81
223.32
230.63
223.20
223.11
229.62
223.30
227^87
229.26
Pi.'q (Pâ)
97.03
86.74
62.10
23.62
•70.07
-139 42
-182.16
•216.14
-258.67
-12183
•171.63
183.33
174.37
155.22
11115
-3029
-225 66
•295 37
-372.20
-338.53
-254.75
-132.24
m Coeffioie
1 -|t
c ' alptiâ
0.37 1.000
5.55 î 0.343
10.73 i 0,341
5,31 l
21,10 i
26.28 '
31.46
36.65 ;
41.83 ;
47.01 ;
5219 ;
0.339
0.338
0,337
0,336
0,336
0,336
0.336
0335
ed qO and \oris
0
(Míî) 0 OOOE.OO
5 040E-04
3.121E-04
1.134E-03
1.691E-03
2 115E-03
2.337E-03
2,608E-03
2 883E-03
1.934E-03
2.332E-03
0 OO E.O
5.0S3E- 4
9033E-04
119eE-0J
1.733E-03
2.135E-03
2.475E-03
2.374E-03
2.e71E-03
2.2S3E- 3
1.852E-03
Cp.i
0.723
-1513
-3,810
-6,108
-8.406
-10,705
-13,003
-15,301
-17,600
-13,338
•22,136
!
Data Reduction Results
ÍPaj
0,000
1.003
3.302
5.570
11.353
17 762
22.627
27.005
33 005
15.787
21.585
0.000
1026
3.243
5.673
12.008
18,039
24.323
32.793
23.312
20 792
13.609
qiíq
0.0000
0.0036
0.0285
0.0477
0.0372
0.1520
01343
02317
0.2S34
0.1363
0.1865
0.0000
0.0045
0.0142
0,0243
0.0521
0,0730
0.1062
0.1428
0.1235
0.0312
0.0534
Cp,
03
0.7
0 5
02
' ã'e T2 -1.6
-19
-2 2
-11
-15
0 3
0.8
0.7
05
-0,3
-1,0 -13
-1.6
-1.5
•11
-0,6
'
91
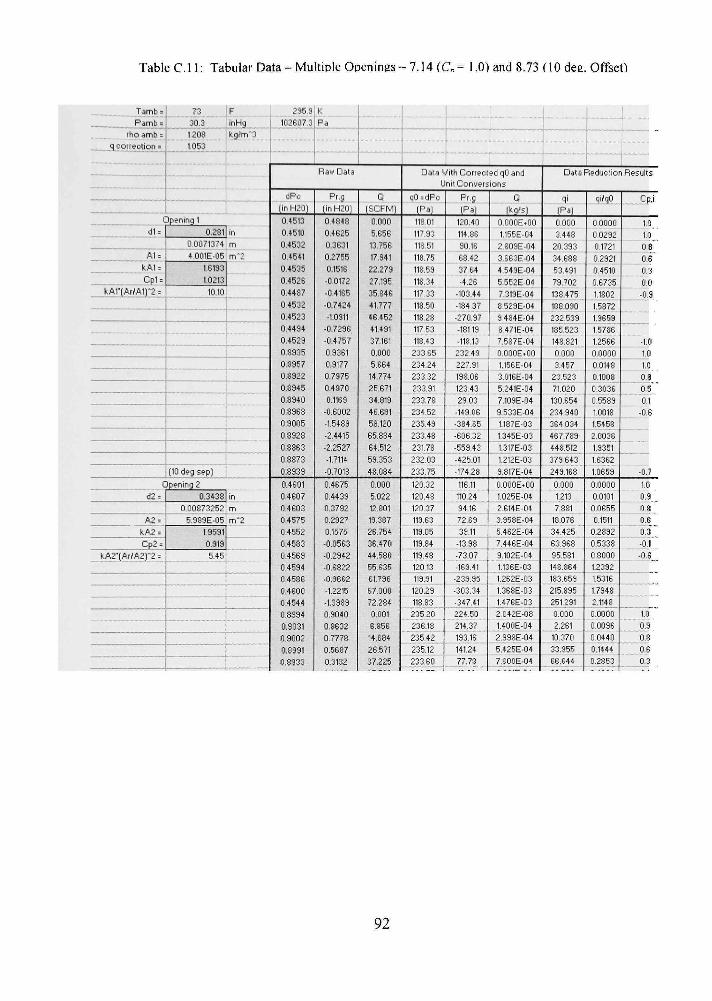
Table C l l : Tabular Data- Multiple Openings - 7.14 (C„= 1.0) and 8.73 (10 dea. Offset)
Tambn Pamb =
iho amb =
SL SÍ I OSÍSSUILJ
73 1F 295,9 30.3
1203
1,053
inHq kgím"3
peninq 1
dl =
A1 = kM--Cp1 =
ltA1-(AríAir2'=
0,2Sl l ín
0 0071374 m
4 001E-05 m"2
16133
10213
1Û.1Û
(10 deg sep )
Qpenin'] 2
d2 =
A2 = kA2 =
Cp2 = kA2-(Ai(A2)-2 =
0,3438
0 00373252
in m
5,383E-05 m - 2
19591
0.913
5,45
102607,3 K Pa
Raw Data
dPc
(in H2 1
0 4513 0,4510 0.4532 0.4541 0.4535 0.4526 0.44S7 0 4532 0.4523 0.4494 0.4529 0.8935 0.8957 0,8922 0,8845 0,3940 0.3968 0.9005 0.8928 0.8863 0.3873 0.8339
0.4601 0.4607 0.4603 0,4575 0.4552 0.4583 0.4569 0.4594 0.4536 0.4600 0.4544 0.3394 0.9031 0.3002 08331 0,3333
Pi.q (in H201
0.4343 0.4626 0.3631 0.2765 0.1516 •0.0172 -0.4165 •0.7424 -1.0311
•0.7236 -0,4767 0.9361 0.9177 0.7976 0.4370 0.1163
-0.6002 -1.5433 -2.4415 -2,2527 -1,7114 -0,7018
0,4675 0,4433 0,3792 0,2327 0.1575 -0.0563 -0.2342 -0.6322 -0.3662 -12215 -13333 0.3040 0.8632 0.7778 0,5637 0,3132
Q ISCFM)
0.000 5.656 13.766 17.341 22.279 27.196 35.346 41.777 46.452 41491 37.161 0.000 5,664 14,774 25.671 34.313 46.631 53.120 65.884 64.512 53.353 48.084
0.000 5.022 12.301 13.387 26.754 36.470 44.530 55.636 61.736 67.000 72.284 0.001 6.856 14.684 26.571 37,225
Data With Corieoted q and Unit Con'jeisions
qO=dPc (Pa)
118 01
117 93
118 61
113.75
113.53
11334
117 33
113.50
118 23
117 53
118.43
233 65
234.24
233,32
233.31
233.73
234.52
236.49
233.48
231.78
233.75
120.32
120.43
120 37
11363 119.05 119.34 119.43 120 13 119.91
120.23
113.33
2 3 5 2 0
236.13
235.42
236.12
233.60
Pi.g iPa)
120.40
114.86 30.16 63.42
37 64 -4.26
-103.44 -13437 -270.97 -13119 -113.13 232 49 227.31 133.06 123 43 23 03
•143.06 -334.65 -606.32
-559.43 -425.01
•174.23
116.11 110.24 94 16 72.69 33.11
-13.33 -73.07 -169.41 -233.35 -303.34 •547.41 224.50
214.37 193.16 141.24 77.73
0 (kg/ )
OO OE. O l.t55E-04
2 S03E-04 3,663E-04
4.543E-04 5.552E- 4
7.313E-04 8 629E-04 9 484E-04 8 471E-04 7.5S7E-04
. OE. O 1.156E-04 3.016E- 4 5.241E-04 7.109E-04 9 533E- 4 1137E-03
1 345E-03 1.3t7E-03 1.212E-03
3.S17E-04
aoooE.oo 1.025E-04
2.6t4E-04
3,35SE-04
6,462E- 4
7,446E- 4
9,1 2E-04
1136E- 3
1,262E- 3
l ,363E-03
1476E-03
2 42E-DS
l,4 0E-04
2,3SSE-04
5,426E-04
7,eO E-04
Da ta Reduo t l o r
qi
IPaJ
0,000
3,448
20,333
•34,688
53,431
73,702
13S475
1SS 090
232,539
185,523
148,321
0,000
3,457
23,623
71.020
130.664
234.940
364 034
467.789
44S.512
379 643
249.163
0.000
1.213
7.831
13.076
34.426
63.363
35.581
14S.S64
183.653
215.335
251 291
0.000
2.261
10.370
33.356
66.644
qi/qO
0 0000
0 0292
01721
0 2321
0.4510
0.6736
1.1302
15872
1.9653
1 5736
1.2566
O. OO
0.0143
0.1003
0 3036
0.5533
1.001S
1.545S
2.0036
1.3351'
16362
1.0653
0.0000
0.0101
0.0655
0,1511
0.2892
0.5338
0.8000
1.2332
1.5316
1.7343
2.1143
.OOO
0.0036
0.0440^
0.1444
0.2S53'
:-í
Result
cp.i
1.0
1.0 0 8
0.6 0.3
0.0
-0.9
•10 1.0 10
0.3 05 01
-0.6
-0.7
1.0 03 0 3
0.6 0.3 -0,1
-0,6
10
0,3 0.8
0.6 0.3
92
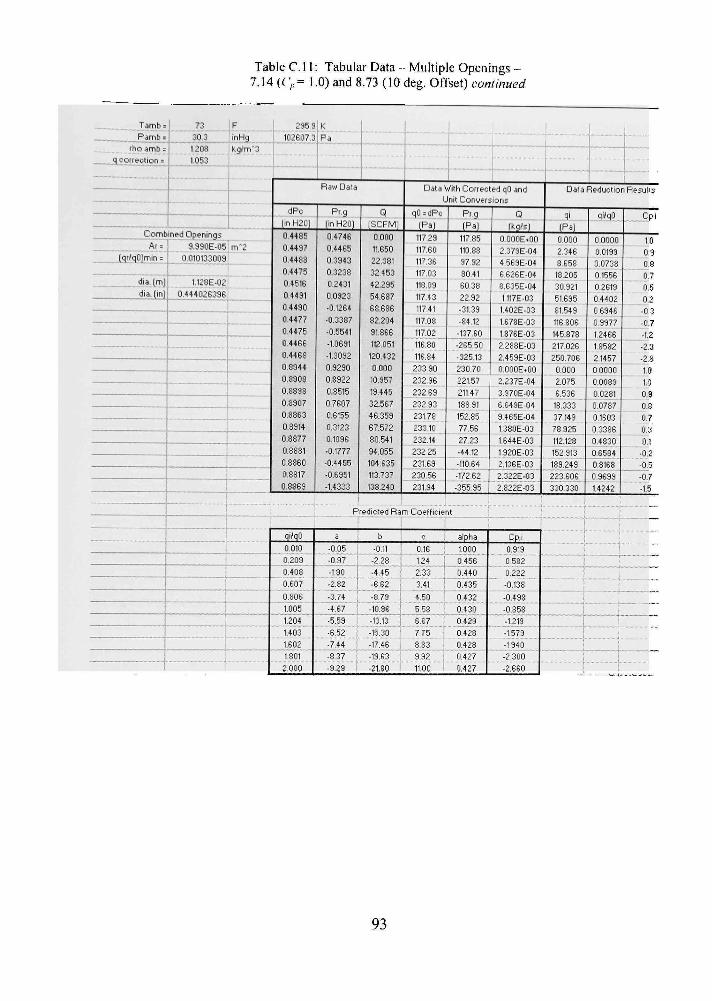
Table C. 11; Tabular Data - Multiple Openings -7.14 (C',,= 1.0) and 8.73 (10 deg. Offset) continued
Tamb»
_ _ Pamb = rho amb =
___g.correction =
Comb Ar =
Jgríg Jrnln =
dla. (mj dla. (in)
73 30.3 1.208 1,053
IF
J,nHa.,. . kgím"3
Ined Openlngs
3,990E-05 m'2
0.010133009
1,128E-02
0.444626336
1 2959
102607.3
dPc
|in H201
0.4435
0.4437
0,4488
0,4475
0,4516
0,4491
0,4430
0,4477
0,4475
0,4466
0.4468
0.8344
0.3908
0,3893
0.3307
0.8863
0.3314
0.3877
08881
0.8860
0.3817
0,8863
' i
1 1
qiíqO
0,010
0,209
0,403
0,607
0,306
1.005 1,204
1,403
1,602
1,801
2,000
K
Pa '""'
Raw Data
Pi.'q tin H2Û)
0,4746
0.4465
0.3943
0.3233
0.2431
0.0923
-0.1264
-0.3337
-0.5541
-1.0631
-13032
09290
0.3322
08515
0.7607
0,6155
03123
01096
-0,1777
-0,4455
•0.6951
-14333
P
a
-0.05
-0,97
-1,90
-2,82
-3,74
-4767
-5,59 1
•6,52 ]
-7,44 J -8.37 1 -3,29 1
Q (SCFM)
0000
11,650
22,331
32,453
42,295
54,637
63,636
32204
91,366
112.051
120.432
0.000
10.957
19.445
32567
46,359
67,572
80.541
94.055
104.635
113.737
138.240
edicted Ra
b
-0,11 1 -228
-4,45 !
-6,62 i
,J.79 [
-13,13 \
-15.30
-17,46
•19,63 , -21311 1
-
Data With Cotiec Unit Con'jei
qO=dPc
iPa^
117 23
117.60
117.36
117.03 11S.09
117.43
117 41
117.03
117.02
116,80
116,34
233 30
232.36
232.63
232 93
231.7S
233 10
232.14
232 26
231.69
230.56
231.94
Ti Coefficíe
Pi.g
IPa)
117 35
110.33
37.32
8041 60.38
22.92
-31.39
•84.12
•137.60
-265.50
-325.13
230.70
221.57
21147
188 31
152.85
77 56
27.23 -44.12
-110.64 •172 62
-355,95
ít
: c alpha
0.16 1000 1,24
2,33
0456
0440
3,41 ! 0,435
4,50 0,432
5J3 ['""o^^s 6,67 : 0429 775
.3
0 42'"
0 4..6 9 92 1 0 4w7
11 "0 n427
edqOand rionî
M íkg.'Jl
0 OOOE. O
2.373E-n4
4563E- 4 6 626E-04
S.e36E-04
1117E-03
t.402E- 3
1.678E-03
1.376E-03
2.2SSE-03
2.463E-03
O.OOOE. O
2.237E-04
3.970E-04
e.643E-04
9.465E- 4
1330E-03
1 644E-03
1320E- 3
2J3eE-03 2.322E- 3
2322E-03
J
Cp.i
0.313 0582
0.222
-0.138
-0,498
-1219 -1573
-1340
-2 300
-2.660
- • - - - —
Data
iPi] 0 000
2 346
8 653
13.205
30.321
51.636
31.549
116306
145.378
217.026
250 7ri6 O.
2076
6.536
13.333
37 149
78 925
112.128
152 913 189.249
223.606
330 330
í E f
l
1
t
1
• - . • . - •
,,
--"— -"""-
Reducticn Result
qi|iqO__
0 0000
0,0139
01556
0,2619
0,4402
6946
0 3377
12466
1 S5S2
21457
0 0000
0,0033
0.0281
0.0737
01603
0 3336
0 4330
0 6584
0.8163
0 9633
14242 1
i
JiP'i
10
0.9
07 " 05
0.2 -0 3
•0.7
•12
•2.3
-2 8
10
10
03
.S 0.7 0 3
0,1
•0.2 " -0.5
-0.7
-1.6
93

Table C.12: Tabular Data - Multiple Openings - 7.14 (Cp= 1.0) and 8.73 (20 deg. Offset)
Tamb » Pamb =
tho amb =
iooireot lon =
73 23.9 1192
1,053
F 285,3 InHci kgím'3
Openinq 1
d1 =
A1 =
kA1 =
Cpl =
kAi;íAríAr!;2_=j
0,281lin 00071374 m
4 001E-Û5
1,5339
10186
a.88
m"2
i
; (20 deg sep)
Openln'5 2
d2 =
A2 =
kA2 =
Cp2 =
kfi2^Mfi.2]-2 =
0,3433
000373252
5,989E-05
2.5542
0,7396
7.11
in . m
m-2
- •
_ - . -
!
101252,8
K
Pa
Raw Data
dPc
(in H201
0.4383
0.4391
0.4386
0.4337
0.4393
0.4360
0.4360
0.4372
0.4372
0.4400
0.4364
0.8649
0.8653
0.8532
0.8632
0.8645
08613
0.8645
0.8638
0.8617
0.8632
0.8674
0.4367
0.4374
0,4334
0,4370
0,4373
0,4360
0,4367
0,4397
0,4372
0,4380
0,4381
0,3631
0,3692
0,8664
0,3706
0,8733
Pi.a tin H2Û1
0.4721
0.4544
0,3762
0,1104
- .1S36
-0.6754
-1.0026
•0.4023
-0.0663
0.3800
0.1863
0.3043
0,3333
0,8227
0.7305
0.6135
0.4837
-0.0055
-Û.515
-11114
•1.3312
-1.9298
0.3719
0.3210
0.2100
0,0752
-0,0959
-0.2665
-0,5217
-0,6346
-0,3403
-13714
-1,5723
0.7374
0.6653
0.5121
0,2336
-0,0303
Q tSCFM)
0.000
5.057
12.034
22.914
30,781
40.325
44.383
36.336
27.337
11.888
20.536
0.011
4.368
11.440
16.650
21.020
25.032
36.511
44.327
52356
66.385
61.366
0,000
6,645
15.348
22.046
29.379
35,654
44,033
48,729
56011
64,670
69.309
0.000
6.941
16,621
25,309
33.110
Data With Coiiected q and IJnit Con'.'ei ionî
qO=dPc
(Paj
114.63
114.83
114.70
114.71
114.87
114.01
114 03
114 3 3
114.33
115.07
114.13
226.17
226.28
224.63
225.73
226 06
225 33
226.03
225 90
225 33
225.74
226.34
114,20
114,33
114 31
114,27
114.35
114,02 114,20
11493
114 32
114.55
114.56
227.01
227.30
22657
227.66
223.54
Pi.g
tPa)
117.25
112.84
33 43
27,43
-46,60
-167,73
-243,98
-99,91
-16,53
94,37
46 26
224,72
22197
204.31
13141
153.S5 12012
-136
-127.83
-276,01
-345,43
-479.26
92.36
79.73 6214
18,63
-23,81
-66,17 •123,65
-170.02
-233.52
-340.57
-330.61 133,12
165.36
127.13
7167
•22,55
u
tl<3's| 0 O OE.OO
1, 32E-04 2.467E-04
4.e7SE- 4
e.234E-04
8.233E-04
9.164E-04
7 225E-04
5.716E-04
2 427E-04
4.193E-04
2.24eE- 7
3.339E-06
2.33eE-04
3 339E-04
4.292E-04
5 121E-04
7.454E-04
9.152E-04
l. 8tE- 3
1.151E-03
1.253E-03
O.OO E-
1.357E-04
3.134E-04
4.501E-04
5.998E-04 7.279E-04
a930E-04
9.949E-04
t.t44E-03
1.320E-03 t.415E-03 aO OE- O
1417E-04
3.393E-04
5.ie7E-04
7.781E-04 •3 fl i F . n i
Data Reduction Result
^i (Pa)
0 000
2733
15.815
57.341
103.473
177,587
220,002
136.749
85 602
15 434
46.052
0.000
2.5SS
14.293
30 275
48.253
63.705
145.580 219.453
306.261 347.207
411.261
0.000
2.162 11.481
23.683
42 066
61956
94.497 115.728 152.902 203.331 234.122
0.000
2.343
13.464
31.213 70,785 11'iS<!R
...sêM...
0 0000
0.0243
01379
0,4999
0.9003
15676
13234
11361
0 74S3
01341
0.4035
0.0000
0.0114
0.0636
01341
0.2135
0 3048
0.6433
0 9715
1.3532
1.5381
1.3130
0.0000
0.0138
0.0393
0.2073
0.3673
0 5434
0.S274
10064
13375
17734
2.0436
O. O
O0103
0.0534
0,1371
0,3097
n R n m
Cp.i
10
10
0,8
0,2
• ' ' • *
•0,9
•0.1
o"8
0,4
1.0
'" "1.0 0,9
0,8
07
0,6 0,0 •0.6
0,8
"Ã 05 0,2 -0,2
-_o._e
0,8
0,7
0-6
0,3
-0.1
-n5
94

Table C.12: Tabular Data - Multiple Openings -7.14 iCp= 1.0) and 8.73 (20 deg. Offset) continued
T a m b »
P â m b =
iho amb =
qoottection =
Comb Ai =
JgtígOJmln =
dla. [m) dla. (in)
73 29.3 i,'Í32 1,053
F InHg
kg ím~3
n e d Open ings
3.990E-05 m*2
0.02825313
1,128E-02
0 .444026336
296.9
101252,8
K
Pa
! : Raw Data
dPc
(in H2Û)
0.4360
0.4363
0.4364
0.4367
0.4337
0.4372
0.4357
04410
0.4370
0.4382
0.4382
0.S679
0.3726
0,3703
0.3723
0.8700
0.8721
0.8674
0.3676
0.8733
0.8662
0.8707
qiíqO
0.023
0,225
0,423
0,620
0.817
1,014
1211
1408
1,606
1.803
2000
Pi.q (in H2 )
0.4200
0.3331
0.3124
0.2310
0.1544
0.0423
-0.1428
-0.2969
-0.5322
-0.9166
-1,2242
0.8257
0.7795
07093
0.5755
0.4529
0.2361
0.0538
-0.1409
-0.5208
-0.3023
-1.7301
F
Q (SCFM)
. 1
9.786
22.143
32.387
40.541
43,238
61,120
71,840
83,319
39,219
110,380
0,000
3.871
21017
35,501
45,411
56,661
63,816
80,177
35,646
105,872
137,453
ledlcted R i
Data Vith Coiiect IJnit C nvet
qO=dPc
(Pa)
114.01
114.26
114.12
114.19
114.38
114.32
113.34
11532
114 23
114.53 114.60
226 37
228.19
227 53
225 24
227.52
223.07 _
226 8 2 "
226 88 223.54
226.62
227.63
Pr.g
tPa)
104.29
95.14
77.59
57.36
33 33
10.60
-35.47
-73,73
-132,16
-227,37
-304,03
205.06 133.69 176.14
142.92
11247
73.53
13.35
-35,00 -129 33
•133.33
-444.55
mCoefliclent
* Y —|— • T a
-0.08
-0,62
-117
-1,72
-2,26
-2,31
-3,35
-3.90
-4,44
-4,99
-5,54
b c alpha
-0 40 0 48 1000
-3,20
1 -6,01
-8.81
-11.61
-14,41
-17,22
-20.02
133
: 3.28
4,63
6,03
, 7,49
1 3,33
0.532
0.498
0,486 0,479
0,475
0,473
10 29 0471
-22.82 , 11.69
-25.62
-23.43
1 13,03
t 1443
0,463
1 0,468
1 o^'^ê?
fd qO and ons
Q (kq^;!
2,042E-0S
1998E-04
4.622E-04
6.612E-04 8.277E-04
1.006E-03
1.24SE-03
14e7E-03
1713E-03
2 026E- 3
2.2e4E- 3
0 OOE.OO
2 15E-04 4231E- 4 7.24SE- 4
9.27tE-04
lt57E- 3
1 405E-03
1.637E-03
1.953E- 3
2.162E-03
2.S0eE-03
Cp.i
0.740
0,389
-0,017
-0,425
-0.835
-1,244
-1654
-2,064
-2,474
-2,384
-3,234
Data Redijcnoi
qi (Pa)
0,000
1,677
3.593
18.374 28,790
42,553
65,436
30,403
123.360
172441
215.357
0 000
1.707
7.737
22,077
36.122
56.237
82 953
112.603 160.245
196.342
330.977
qiíq
0.0000
0.0147
0.0753
0 1603
0.2504 0 3722
0 5743
0.7340
1.0735
15043
1.3732
0 0000
0.0075
0 0340 0.0367
01533
0.2466
0^657
0.4363
0.7012
0.8668 1.4536
Result
Cp.i
0.9
O.S
07
0.5 0.3
0.1
-0.3
•0.6
-1.2
-2.0 -27 0.9
O.S
0,8
06 0.5
0.3
0.1
-0.2 -0,6
•O-S -2.0
r— i
95
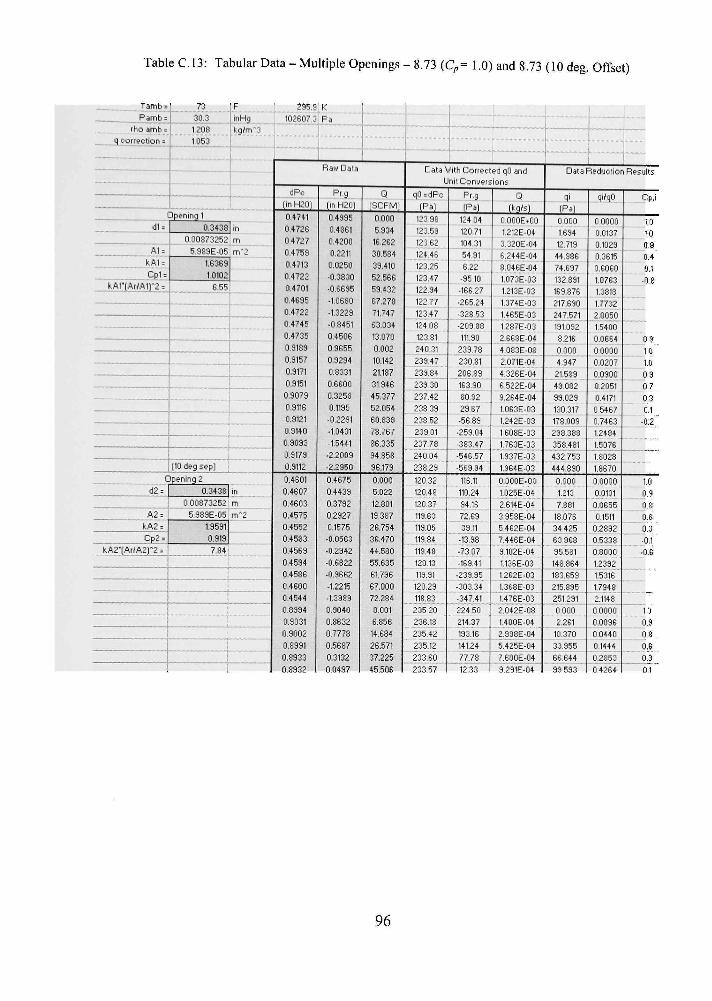
Table C, 13; Tabular Data - Multiple Openings - 8,73 iCp= 1.0) and 8.73 (10 deg. Offset)
Tamb = Pamb =
rho amb =
q correction =
73 30.3
1.208 1 1053
F
BHJ,. kgím"3
,- - „
L„„ í Openlnq 1
d1 =
A1 =
kA1 =
Cp1 =
líArtAri A1V2 =
c d2 =
A2 =
kA2 =
Cp2 =
kA2'(AiíA2)"2 =
0,3438 |in
1 0,00373262
5,3S9E-05
1,6369
1 0102
6,55
(10 deg sep)
Jpenin'j 2
0,3438
0 00373252
5 939E-06
1,9591
0,919
7.84
m
m*2
in
m
m"2
i
i
295.9
102607,3
dPc
(inH2 )
04741
0,4726
0 4727
0,4753
0.4713
0,4722
O4701
0,4635
0,4722
0,4746
0,4735
0,9189
09157
0,9171
09161
0,9079
0,9116
0,9121
09140
0.9093
0,9173
0,9112
04601
0.4607
0.4603
0.4575
0.4552
0.4533
0.4569
0.4534
0.4536
0.4600
0.4544
0.8994
0.9031
0.3002
0.8331
0,8933
0.8932
K
Pa 1
1 '
Raw Data
Pi.a (m H2 )
0.4995
0.4861
0.4200
0.2211
0.0250
-0.3330
-0.6695
-10680
-1.3229
•0.8451
0.4506
0.9655
0.9294
08331
0.6600
0.3258
0.1195
-0.2291
•1.0431
-15441
•2.2003
-2,2350
0,4675
0.4439
0,3732
0,2927
0,1576
-0,0563
-0,2942
-0.6822
-0.9662
-1.2216
-1,3933
0,3040
0,3632
0.7778
05637
0.3132
0.0497
Q (SCFM)
.o
5.334
16.262
30.634
33.410
52.566
53.432
67.273
71.747
63.034
13.070
0.002
10.142
21137
31.346
45.377
52.054
60.833
78.767
36.336
94.853
36.179
0.000
5,022
12,801
13,387
26.764
36.470
44.530
55.635
61.736
67.000
72.284
0.001
6.356
14.634
26.571
37.225
45.506
•ata Vith Coriected qO and Ijnit Con'jersions
qO='JPc
(Pa)
123 38
123.53
123,62
124,46
123.26
123.47
122.94 122 77
12347
124 03
123.81
240.31
239.47
233.34 "
239 30"
237.42
233 33
238 52
233 01
237.78
240.04
233.23
120.32 12 .4S 120.37 113.63 11305 113.84 119.43
120.13
119.31
120.29
113.83 ' 235 20
236.13
235.42
236.12
J33.60 233 57
Pr.g
(Pa|
124 04
12071
104.31
54,91 6.22
-3510 -166 27
-265.24 -328 53
-203 88
111.90
233.78
230.31
206.39 _
' íe'ís ' 80.92
29 67
-66 89
•259.04
-363.47
-646.57
-563.34
116.11
110.24 34.16
72.69 33.11
-13.33
-7307 -169.41
-233.35
-303.34
-347.41
224.50
214.37
193.16
141.24
77.73 Î233
Q IMís l
OOOOEí O
1212E-04
3.32 E-04
6,244E-04
8, 4eE-04
1. 73E- 3 1.213E- 3
1.374E-03
14e5E-03
1 237E-03
2.e6SE-04
4 083E-0S
2,071E-04 4.32:6Í-04 6'522E-04
9.2e4E-04
1.063E-03
1.242E- 3
1603E- 3
17e3E-03
1.937E-03
1.964E-03
O.O E.OO
1.025E-04
2.614E-04
3.95SE-04
5 462E-04 7.44eE-04
3.1 2E-n4
1.136E-03
1,262E-03
1,368E-03 1476E-03
2042E-03
1,400E-04
2,993E-04
6.425E-04
7^600E-04 3,291E- 4
Data Reduction Results
qi IPa)
0 000
1.634 12.713
44.386
74,637
132 331
169.376
217.690 247.571
191092
3.216
0.000
4.947
21.533
43.032
33.029 130.317
178.009
233.338
353.481 432 753
444.890
0.000
1.213
7.SS1
18.076 34 425
63.363
95.531
148.864
133.659
215,335 261 231 0 000
2,261
10.370
33.955
66.644 99 593
qi/qO
0 0000
0.0137 0.1029
0.3616
.eoeo 1 0763
1.3313
17732
2.0050 1.5400"
0.0664
0 0000
0.0207
0.0300
0.2051
0.4171 0 6467
0.7463 1.2434 1.5076'
1.8028
18670
0.0000
aot t
0.0655
0.1511
0.2892 0 5338
O.S OO
12332
1,5316"
1,7343 2,1143
0,0000
0.0036
0.0440
0.1444
0.2353 0 4264
Cp,i
10
10
0.4
0 9
10
09 0 7
0.3 0.1
-0 2
~
1.0
0.9
0 6
0.6
0.3 -0.1
-06
10
0.9
0.3
0,6
0,3 01
96

TableC,13: Tabular Data - Multiple Openings -8.73 (C„= 1.0) antd 8.73 (10 deg. Offset) continued
Tamb » Pamb =
tho amb =
q correction =
73 30.3 1.208
1053
F inHq kgím"3
295.9 K 102607.3 iPa
Comblned Openlnjjs
Ã't = (atígO]mln =
dia, (mj
dia. (in)
1.198E-04 0.013923768
1235E-02 6.486206623
m*2
dPc
(in H2 )
04501
0.4432
0.4480
0,4461
0,4476
0.4434
0.4430
0.4451
0.4449
0.4470
0.4473
0.8861
0.3340
0.8802
0.8330
0.8780
0.8808
0.3S16
0.8739
0.S7S3
0.8842
0.8767
qiíqO
0.014
0.213
0,411
0,610
0,808
1.007
1,206
1.404
1603
1301
2000
Raw Dála
Pr,q |inH2 )
04817
0,4541
0,4033
0,2868
0.1413
-0,0363
•0,1363
•0,3603
-0,5391
-0,8446
-1,2634
0,3303
0,3776
0,8215
0,6567
0,4033
0,3050
0.0812
-0.1308
-0.3043
•0.5007
•o.seoi
F
Q (SCFM)
0,000
12.373
26.240
45.265
60.329
77,254
83,402
97,216
110,281
123,009
139,183
0,002
13.203
29.378
52.886
76,039
33,461
96,353
103.707
117,593
126.313
141,629
Unit C:on',/eision£
q =dPc
(Pa)
117.63
117.20
117.15
116.66
117.11
116.36
117.43
116,40
116,34
116.33 116.93
231.71
231.13 230.13
230.90
229,61
230,33
230,54
223,84 229,69
23121
229,00
Pr.g
tPa|
113.62
112,77 100 16
70,97 35,24
-9.13
-48,76
-86,98
-146,23
-203 76
•312 76
23103 217,34
204 00
163,08
100,31
75,73
20,16
-32,47
-75,71
•124,34 •213,53
ledicted Ram Coefficlent i
a
0.02
0.27
0,53
Ô,73 1,04
1,30
1,55
1.81 2.07
2,32
' ' 2,58
b
-0,22
-3,33
-6,44
-9,56
-12.67
-15.78
-18.83
-22,01
-25,12
-28,23
c , alplia
0,20 1000
176
3,31
4.87
6,43
7,98
0,552 0,538
0,533
r 0,530
0,529
3.54 ! 0.628
11.03
12.65
0527
0.526
14.21 0 526
15.76 0.526
0
(kgi's)
O.OOOE.O
2e29E-04
5.357E-04 9.240E-04
1 242E-03
1577E-03
1805E-03
1.985E-03
2.252E-03
2.611E-03
2S42E- 3
4. S,3E- S 3.717E-04
e.lOOE-04
1. S0E-03
1.653E-03
1.704E-03
1.973E- 3
2.213E-03
2,401E- 3
2573E-03 2332E-03
Data Reduction Results
IPa)
0.000
1.334
8.279 24625
44.433
71.759 33 363
113.634
146.229
131.331 232,335
.OO
3.336
10.733 33 629
69.611
33.733
113.020
142.035 166.263
131.335
241177
qi/qO
00 00
0.0170 0 0707
0.2111
0 3799
06188 .3002
0.3762
12563
16565
19912
0 0000 172
0.0466
0.1466
0 3032
0.3635
0.4902
0.6132
0.7239 0 3237
10532
, Cp.i
1.0
1.0 0.9
0.6
0 3 -01
-0 4
-0.7 -13
•18
•2.7
1.0 0.3
0.9 0.7
0.4
0.3
0.1
-0.1 -0.3
-0.5 •0.3
- r~~"" Cp.i
0,913
0.685
0.231
-0.124
-0.478
; .333
-1.188
-1543
-1.893
-2253
-2608
1
--
\ i \ .
1
97

Table C.14: Tabular Data-Multiple Openings-7.14 (Cp= 1.0) and 7.14 (10 deg. Offset)
T .
Pamhs fho amb =
q oorrection =
30,3
1208
1 0 5 3
'
0
dl=
A1 =
kA1 =
C.pl =
kAr(AríAir2 =
OF d2=..
ÍnHS 1 Kgím"3
l e n l n q l
0.281
0.0071374
4.001E-05
1.6193
1.0213
,_ 6.48
in
m
m'2
j
- i i 1
(lOdegsep)i
enlng2
0.28l|in
0 0071374 m
A2 =
kA2 =
Cp2 =
k.A2'(AríA2)~2 =
4. i:i1E- 5
1.8821
0.9163
7.53
m ' ^
i
Si'eôí.s
dPc
(in H201
0.4613
0.4610
0.4632
0.4541
0.4535
0.4526
0.4437
0.4532
0.4523
0.4494
0.4523
0.8335
0.S357
0.8322
0.8345
0.8340
0.8968
0.9005
0.3323
0.8863
0.8873
0.8339
0.4610
0.4614
0.4640
0.4647
0,4670
0,4613
0.4634
0.4611
0.4613
0.4669
0.4614
0.9106
0.9138
0,9083
0.9183
0.9152
K
LP«
Raw Data
Pi.3 (in H201
0.4843
0.4626
0.3631
0.2765
0.1616
-0.0172
-04166
•0.7424
-1.0911
-0.7296
-0.4767
0.9361
0.9177
0.7975
0.4970
0.1169
•0.6002
-1.5439
-2.4415
-2 252?
•1,7114
-0,7018
0,4682
0.4023
02131
•0.0370
-0 6223
-1.4622
-1.0463
•0.6235
-0.3174
0.0452
0,2455
0.9170
0.8666
0,6322
0,2377
-0,2762
Q (SCFM)
0.000
5.656
13.756
17.941
22.279
27.195
35.846
41.777
46.452
41.491
37.161
0.000
6.664
14.774
25.671
34.819
46.691
58.120
65.884
64.512
53.363
48,084
0,000
7.033
16.607
25.722
37.024
49.306
43.660
36,925
30,834
21,884
15.262
0.000
5.288
16338
25.332
37.658
Data With Coirect Unit Con'jers
'qO=dPc
(Pa)
113.01
117.93
118.61
118.75
11853
11334
117.33
113.50
113.28
117.63
118.43
233.66
234.24
233.32
233.31 2.33.78 234.52 23549 233.48 23178
2J2 3
2^2 75
120 56
123 65
1J..6
12151
1221'
12iit4
1J17
120.57
120.63
122.08
120.65
23311
233.95
237.52
240.15
239.34
Pr.g
(Pal
120.40
114,86
90.16
63.42
37 64
-4 26
-103.44
-134.37
-270.37
-131.13
-118.13
232.43
227.31
138.06
123.43
23.03
-143.06
-384.65
-606,32
-553,43
-426,01
-174.28
11623
100.03
""~'6"2'3l" ""
•24.03
-154^66
-3S3 13
-253.83
•154A5
-73.82
1123
60.96
227.72
216 22
157 00
73.94
-68.59
"d qO and ons
Q
(tgísl
O.OOOE.OO
lt55E-rj4
2.303E-04
3.ee3E^04
4 549E-04
5 552E04
7.313E-04
3.529E-04
9.434E-04
3 471E-04
7.5S7E-04
0 OOOE.O
1.156E-i:i4
3. 16E-04
5241E-04
7.t03E-04 9 533E- 4
t.l87E-03
1.345E-03
1.317E-03
t.212E-03
9.317E-04
O.OOOE-00
1.437E-04
3.391E-04
6.252E-04
7 653E-04
1.007E-03
3.314E-04
7.539E-04
6.295E-04
4.463E-04
3.tieE-04
0 000E«00
1 080E-04 _
3.348E-04
5 234E-04
7.6S3E-04
Data Reduction
V (Pa)
0.000
3.448
20.333
34.633
53 491
73702
138.475
138.090
232.539
185.523
143.321
0.000
3.457
23.623
71.020
130 654
234.940 364.034
467.789
44S.512
379.643
249.163
0.000
5.340
23722
71.302
147.726
261.393
205.427
146.337
102.461
51611
25.102
0.000
3.014
23.377
72471
152,823
qiíqO
0,0000
0.0232
0,1721
0.2921
0.4510
0 6736
1.1802
1.6872
1,3653
1,5736
12566
OOOOO
0,0143
0,1008
0,3036
0.55S3
1.0018
15458
2;:i036
1 9351
1.6362
1.0653
0.0000
0.0443
0,2449
0,5367
1,2095
2,1717
16953
1.2187
0.3494
0.4223
0.2031
0.0000
0,0126
0,1220
0,3018
0,6385
C p,l
1,0 i n
n 0
3
f;
0.3
0 0
-0.3
-1
1
1
n 0
0
0.8
0.5
0
-0 .1
,6
-0.7
10
0.8
0.4
-C 2
-r c 0
,7
1
,5
10
c c c -
.3
.7
.3
).3
98
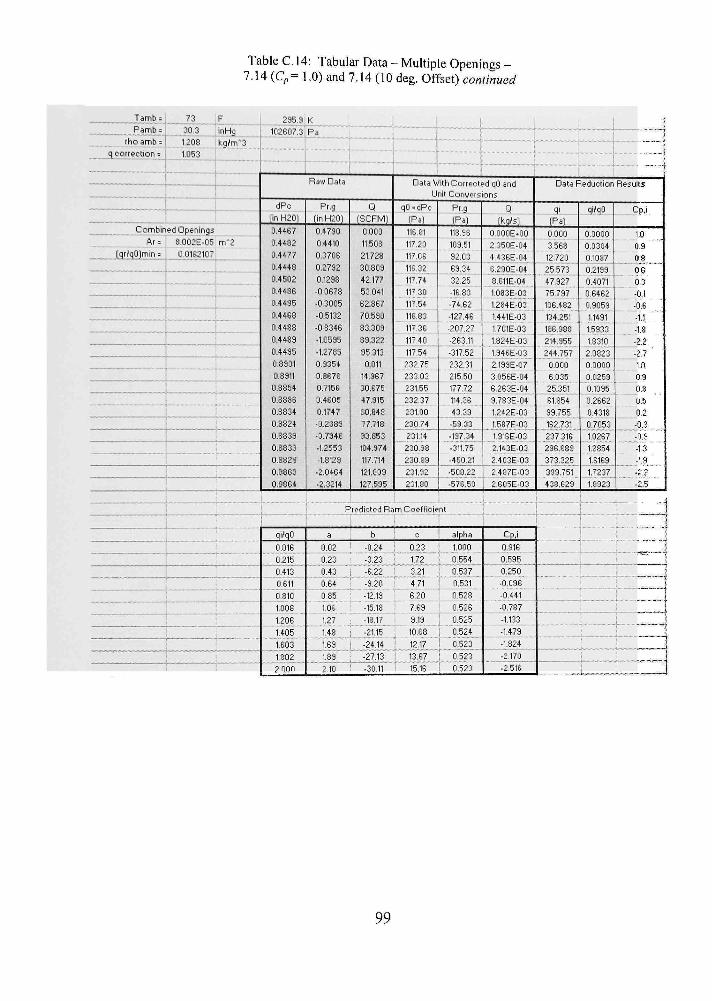
Table C. 14: Tabular Data - Multiple Openings -7.14 (Cp= 1.0) and 7.14 (10 deg. Offset) continued
Tamb = Pâmb =
73 [P 1 235.9
30 3 inHq 102607.3
iho amb = 1208 q coiiection = 1.063
k,giim*3
_ _ . Combined pening>
Ar = S.002E-n5
[qiíqOjmin = 0 0162107
- - • -
m~2
"î
'.
dPc
(in H20)
0.4467
0.4432
0.4477
0.4448
0.4502
0.4436
0.4435
0.4468
0.4483
0.4483
0.4495
0.8901
0.8311
0.8854
0.3336
0.3834
0.3824
0.8833
0,8833
0.8829
0,8869
0,8864
\
' "
\ i
qiriqO
0,016
0,215
0,413
0,611
0,810
1,003
1206
1,405 "
1603
1802
2000
K
Ph ^
1
Ra',',' Data
Pr.g
(in H201
0.4790
0.4410
0,3706
0,2792
0,1298
-0.0673
-O3005
-0.5132
-0.8346
-1.0535
-1.2785
0.9354
0.3678
0,7156
0,4605
0,1747
-0,2339
-07346
-12553
-13123
-2.0464
-23214
Q
ÍSCFMj
0.000
11.508
21728
30,809
42.177
53.041
62.367
70.590
83.309
89.322
35,313
0,011
14.967
30.675
47.915
60,843
77,718
33,863
104.374
117.714
121.809
127.595
Predicted R;
f
1 '' ': \
Data Vitt-i Coriected q and Unif Con'.'eisions
qO=dPc
(Pal 116 Sl
117.20
117.06
116.32
117.74
117 30
117.54
116.33
117.36
117 40
117.54
232.76
233.03
23165
232.37
231.00
230.74
231.14
230.98
230.89
23192
23130
Pi,g
IPa)
118,36
103.51
92.03
63.34
32.25
-16.33
-74.62
-127.46
•207.27
•263.11
-317.52
232.31
215.50
177.72
114.36
43,33
-59.33
-197.34
•311.75
-450.21
-508.22
-576.50
m Coefficient
a b ; 0 : âlpha
0.02
0.23
•0.24 0.23
- 1 2 3 _ j 1.72
0,43 i -6.22 0.64
0 85
-3.20
-12.13
1,06 -16,13
1.000
i 0,554
__ 3.21 1 0.537
4.71 ' 0.531
6.20 0.52S
7.63 0.526
1,27 -13,17 • 9.19 0.525
1.48 -21,15 j 10,63
Te'g i ' -24,14 1 12,Í7 1,89 i -27,13
210 ; •30.11
í 0.524
1 0.523
13.67 1 0,523
15.16 í 0,523
0
(Iqísl
0 O OE. O
2 35 E-04
4 43eE-04
e.2S0E-04
3.eilE- 4
1. 83E- 3
1.284E-03
1.441E- 3
1.701E-03
1.824E- 3
1.94eE-03
2193E-07
3. 56E- 4
e.2e3E-04
3,7S3E- 4
1.242E-03
1537E-03
13teE- 3
2.143E-03
2.403E-03
2.4S7E-03
2.605E^03
Cp.i
0.316
0.596
0.250
-0.096
-0.441
-0.737
-1133
-1.473
-1,824
-2,170
-2.516
Data Reductior
qi
(Pa)
0,000
3 563
12 720
25.573
47.927
75.737
106.482 '
134.251
186 933
214.956
244.757
0.000
6.036
25.351
61354
33.755
162.731
237.316
296 .'339"
373.325
333.751
438.629
qi(qO
0.0000
0.0304
0.10S7
0.2199
0.4071
0.6462
0,9059
1.1431
1.5933
1.3310
2.0323
0.0000
0.0253
0.1036
0.2662
04313
0.7053
10267
12354
1.6169
17237
18923
1
Re ult
10
0,9
0,8
06 0,3 -0,1
-o.e -1.1
-1.3
•2.2
-27
10
0,9
0,8
0.6
0.2
-0.3
-0.9
-1.3
-1.3
-2.2
-2,5
i
1
í
i
!
99

PERMISSION TO COPY
In presenting this thesis in partial fiilfillment of the requirements for a
master's degree at Texas Tech University or Texas Tech University Health Sciences
Center, I agree that the Library and my major department shall make it freely
available for research purposes. Permission to copy this thesis for scholarly purposes
may be granted by the Director of the Library or my major professor. It is
understood that any copying or pubHcation of this thesis for fmancial gain shall not
be allowed without my further written permission and that any user may be Hable for
copyright infringement.
Agree (Permission is granted.)
" ^ Date
Disagree (Permission is not granted.)
Student Signature Date