ram 01 2002
TRANSCRIPT

repo
rts
in a
pplie
d m
easu
rem
ent
Edit
ion
1/20
02
A new transducer for directly measuring the forces and moments which a skier transfers to the skis
The BELFA load application vehicle -measurement and loading techniques for the structural evaluation of bridges and sewers

Electrical strain gages, the essential features of which
were first developed in the nineteen-thirties, are today
counted among the most important sensors for the mea-
surement of mechanical quantities.
The property of electrical conductors to react to me-
chanical strain by changing their electrical resistance
forms the physical basis of such devices. However, their
success has only been made possible by spending many
years continuously developing strain gages themselves,
along with their associated measuring amplifiers and
software. HBM has made an important and significant
contribution to this process.
At the present time, those carrying out experiments in
stress analysis have at their disposal a rich variety of
strain gages in versions covering a multitude of applica-
tions. Transducers for mechanical quantities such as
force, mass and pressure are based on this technology
and operate to levels of precision that were inconceiv-
able just a few years ago. Powerful measuring amplifiers,
to an increasing extent controlled by complex software
systems, round out the range of available equipment.
However advanced the current state of development, it
does not automatically make errors of measurement and
analysis a thing of the past. As ever, the users of these
systems are the deciding factor and as such it is they who
are responsible for obtaining successful measurements.
It is their responsibility to select and use strain gages,
transducers, measuring amplifiers and software that suit
the problem under investigation, and to calculate and
evaluate the relevant mechanical quantities based on
the primary measurement results obtained. The latter
part of this process is often more difficult than the ac-
tual measurement, and can be guided by the manufac-
turer to only a limited extent.
Dear Readers,
”Reports in Applied Measurement” from HBM, in which
users report on interesting measurement and analysis
projects, help to publicize know-how and encourage the
exchange of experiences in this field of technology. In
line with the traditions of this journal, contributions are
drawn from widely differing areas and touch not only on
many topics of a practical nature, but also theoretical
aspects of metrology and engineering technology.
Above all it is our wish to publish interesting scientific
contributions which will help users to find a solution to
their own particular problems.
I hope you will thoroughly enjoy reading this issue of
”Reports in Applied Measurement”.
Sincerely,
Martin Stockmann
Dr. -Ing. habil. Martin Stockmann
Technical University of Chemnitz
Institute for Mechanics
Professorship in Experimental
Mechanics

3ram 1/2002
reports in applied measurement
IntroductionThe aim of the work is the design and manu-
facture of a transducer with six degrees of
freedom for measuring the forces and
moments transferred from a skier’s feet to
the skis (see Fig. 1).
Two possible configurations were analyzed
and tested in order to arrive at an optimal
solution. Both cases make use of sensors that
are fitted with strain gages arranged
between two aluminum plates. These sprung
elements are incorporated into the ski bind-
ing at the point where vibration absorbing
plates are normally found.
The first solution is based on the design spec-
ified by P. Jung in ”Reports in Applied
Measurement” [1].
The second variant represents an independent
development which is notable for having
fewer components and greater sensitivity in
measuring the six load components.
These sensors were used in the laboratory and
on the piste to test for the release of ski bind-
ings in accordance with national and interna-
tional standard specifications for insuring the
safety of ski bindings (ISO 9462) [2].
Initial observationsWith the aim of selecting the most suitable
configuration for the problem in hand, the
solutions known from published scientific
works were analyzed first. Special attention
was paid to monolithic sensors with three and
six degrees of freedom. These sensors are
noted for their compactness and for being
very sensitive to forces and moments.
One of the most commonly used designs is the
Maltese cross sensor [8]. Figures 2 and 3 show
Maltese cross configurations with three or six
degrees of freedom. In figure 2 the load acts
upon an inner flange (1) linked by four prism-
shaped struts (3) to an outer, circular flange
(2). A strain gage (4) is installed on the two
opposite sides of the x-y level of each strut. In
each case these strain gages form part of a
Wheatstone half bridge, which means there
are four half bridges in total.
A. Freddi, G. Olmi, D. Croccolo
DIEMInstitute for Machine BuildingUniversity of Bologna
Fig. 2: Maltese cross sensor with three degrees of freedom
Fig. 3: Maltese cross sensor with six degrees of freedom
x
y
z
M Z
M y
M x
F x
x
y
z
F Z
F y
1
2
3
4 z
y
x1
2
3
4
Fig. 1: The forces and moments which a skier transfersto the skis
reports in applied measurementramA new transducer for directly measuring the forces and moments which a skier transfers to the skis

The three axial forces (x, y, z) acting on the
inner flange can be determined by measuring
the tensile, compressive and bending defor-
mations of the prism-shaped struts. This con-
figuration makes it possible to compensate for
temperature, although four measurement
channels have to be used to analyze only
three axial forces. The transfer matrix there-
fore has a 4x3 structure and can be inverted
using the Moore algorithm.
To determine all six load components it is
necessary to use this particular Maltese cross
configuration (Fig. 3). Here the ends of the
struts (1) are connected to very thin mem-
branes (2) that are notable for their high radi-
al elasticity. Strain gages (4) are installed on
all four sides of the struts, requiring 16 strain
gages in all.
Here too, the strain gages installed on oppo-
site sides of the struts are interconnected in
half bridges. Thus there are eight half bridges,
though only six load components occur. For
calibration purposes the resulting transfer
matrix is 8x6 and this too can be inverted
with the aid of the Moore algorithm.
Another important configuration is the
Junyich sensor introduced in [4]. Its shape is
similar to the Maltese cross configuration,
but different wiring is used for the strain
gages in order to insure mechanical and elec-
trical decoupling and obtain a quadratic
form for the transfer/calibration matrix. The
diagram in figure 4 uses black points to show
that 16, 32 or 48 strain gages can be used.
The individual elements bij of transfer matrix
B=C-1 are set out in the following equations.
Here ε expresses the measured strain in
µm/m, where (εSG-number)Fi represents the
strain induced by the i-th load component
with F1=Fx, F2=Fy, F3=Fz, F4=Mx, F5=My,
F6=Mz (i=1-6).
(6)=b6i(ε11)Fi − (ε12)Fi + (ε15)Fi − (ε16)Fi
4
(5)=b5i(ε1)Fi + (ε7)Fi
2
(4)=b4i(ε4)Fi + (ε6)Fi
2
(3)=b3i(ε2)Fi + (ε3)Fi − (ε5)Fi − (ε8)Fi
4
(2)=b2i(ε13)Fi + (ε14)Fi
2
(1)=b1i(ε3)Fi + (ε10)Fi
2
4 ram 1/2002
Fig. 4: Junyich sensor, characterized by good decoupling and a quadratic calibration matrix
13b-
13-1
3a(1
5b-1
5-15
a)
14b-
14-1
4a(1
6b-1
6-16
a)
1b-1
-1a
(5b-
5-5a
) 4b-4-4a(8b-8-8a)
9b-9-9a(11b-11-11a)
2b-2-2a(6b-6-6a) 10b-10-10a
(12b-12-12a)
3b-3
-3a
(7b-
7-7a
)
SEZ. R -R
1 11
1
R R
SEZ. K -K
Fig. 5: Configuration of a Junyich sensor
y
xz

5ram 1/2002
reports in applied measurement
Regarding decoupling it should be noted that
when there is a combined torsion moment
and bending moment, the third bridge out-
put signal is zero (the SGs wired into the
opposite branches of the bridge are subject-
ed to the same strain). The same applies when
a vertical force is acting. Here the output sig-
nal from the fourth and fifth Wheatstone
bridge is theoretically zero, since the SGs on
opposing struts are subjected to opposite
strains. In order to increase measurement
precision, the number of strain gages can be
increased to 32. Then the bij-equations - with
the exception of
instead of
- have the same form.
Figure 5 shows how the cross element of a
Junyich sensor is designed with the inner
load flange and outer flange. At this point it
should be mentioned that roller bearings are
built in to prevent torsion of the struts under
the effect of torsion moments and bending
moments or tensile and compressive forces in
the event of longitudinal or transverse load-
ing. The sensors just described can be used
provided all forces and moments act upon
the inner load flange. However, in this partic-
ular application the load cell cannot be fitted
in a central position on the underside
because the vibration absorbing plates are
already located there. But since the underside
is mainly stretched in the longitudinal direc-
tion the above precondition is not fulfilled,
which would give rise to unacceptable mea-
surement errors and inaccuracies.
Using these sensors also leads to another
problem, which is a reduction in the stability
of the connection between the sensor and
the upper plate to which the ski binding is
fitted. International standards demand tests
which demonstrate that all adverse effects
on skiing and every risk of injury to the tester
are prevented.
Initial design and configuration fora transducerThe first design for a load cell, published in
[1], was fitted with seven separate sensors,
each sensor being loaded and relieved of its
load in a single direction. All sensors operate
as beam spring elements and have a load
imposed upon them by a force acting on two
diametrically opposed points (Fig. 6 und7).
The load is applied through a fork attached
to opposite ends of the struts, producing
decoupling in the other direction. The struc-
ture is isostatic. Four sensors measure the
vertical loads only (two moments and one
force). Two sensors measure the transverse
horizontal forces only (another moment or
force can be computed) and the seventh sen-
sor measures the horizontal loading in the
longitudinal direction only. Seven half
bridges were installed so as to obtain good
resolution and temperature compensation.
Calibration was carried out in the laboratory,
where each sensor was subjected to a series
of defined loads.
This process made it possible to determine
the mathematical relationship between the
measurement signals and the forces con-
cerned. The precision of the regression lines
to the measured values was found to be
between 99.9 % and 100 %.
(8)(εk)Fi
(7)(εka)Fi + (εkb)Fi
Fig. 7: ... and in cross-section
F
F
Fig. 6: Single-axis sensor in 3D view ...
F
F
L
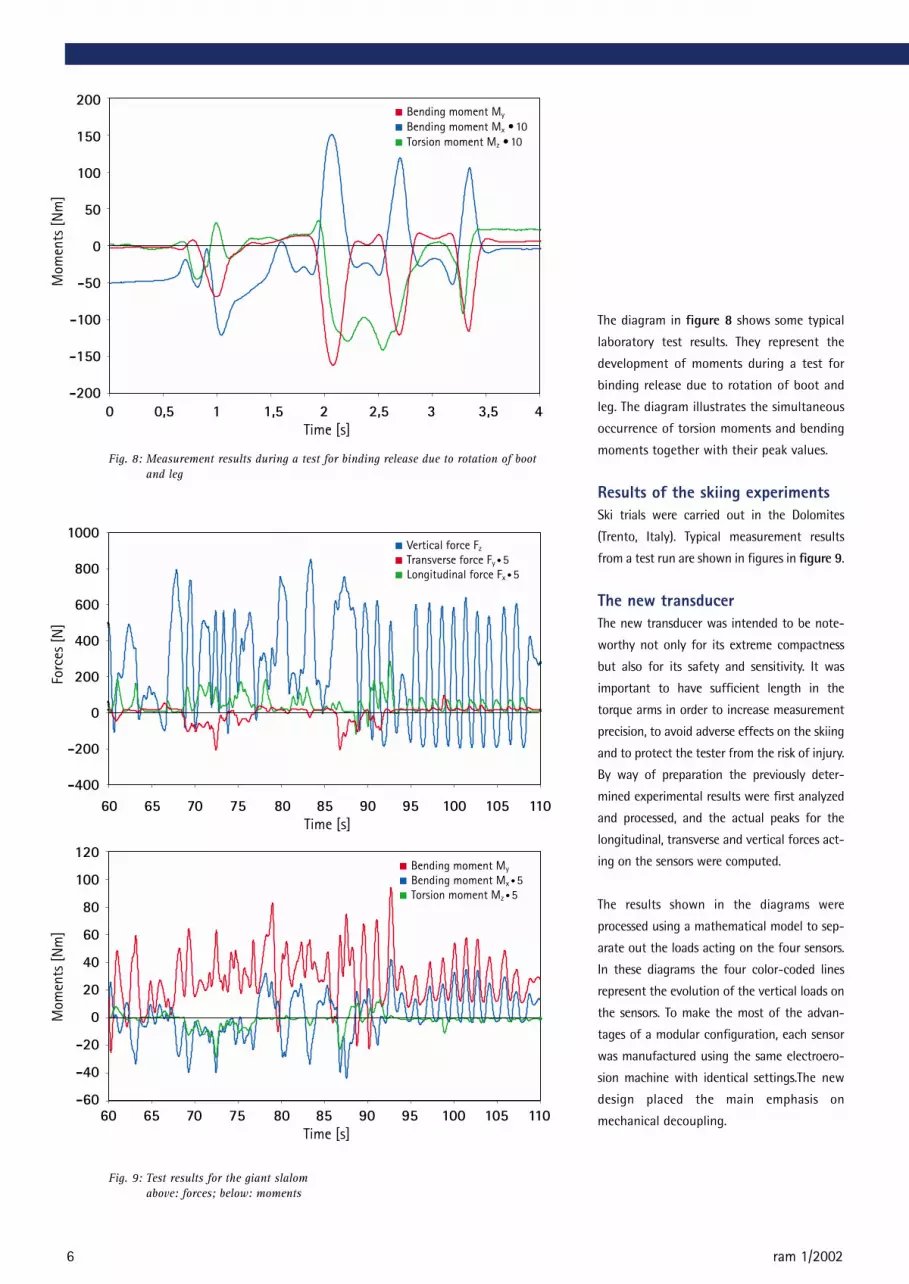
The diagram in figure 8 shows some typical
laboratory test results. They represent the
development of moments during a test for
binding release due to rotation of boot and
leg. The diagram illustrates the simultaneous
occurrence of torsion moments and bending
moments together with their peak values.
Results of the skiing experimentsSki trials were carried out in the Dolomites
(Trento, Italy). Typical measurement results
from a test run are shown in figures in figure 9.
The new transducerThe new transducer was intended to be note-
worthy not only for its extreme compactness
but also for its safety and sensitivity. It was
important to have sufficient length in the
torque arms in order to increase measurement
precision, to avoid adverse effects on the skiing
and to protect the tester from the risk of injury.
By way of preparation the previously deter-
mined experimental results were first analyzed
and processed, and the actual peaks for the
longitudinal, transverse and vertical forces act-
ing on the sensors were computed.
The results shown in the diagrams were
processed using a mathematical model to sep-
arate out the loads acting on the four sensors.
In these diagrams the four color-coded lines
represent the evolution of the vertical loads on
the sensors. To make the most of the advan-
tages of a modular configuration, each sensor
was manufactured using the same electroero-
sion machine with identical settings.The new
design placed the main emphasis on
mechanical decoupling.
6 ram 1/2002
Fig. 8: Measurement results during a test for binding release due to rotation of bootand leg
Fig. 9: Test results for the giant slalomabove: forces; below: moments
0 0,5 1 1,5 2 2,5 3 3,5 4Time [s]
200
150
100
50
0
-50
-100
-150
-200
Mom
ents
[Nm
]
1000
800
600
400
200
0
-200
-40060 65 70 75 80 85 90 95 100 105 110
Time [s]
Forc
es [N
]
120
100
80
60
40
20
0
-20
-40
-60
Mom
ents
[Nm
]
60 65 70 75 80 85 90 95 100 105 110Time [s]
Bending moment My
Bending moment Mx •10Torsion moment Mz •10
Vertical force Fz
Transverse force Fy • 5Longitudinal force Fx • 5
Bending moment My
Bending moment Mx • 5Torsion moment Mz • 5

7ram 1/2002
Fig. 12: View of the new sensors showing the configuration and wiring of the SGs
Fig. 11:Belleville springs placed under the headsof the screws that make the connectionbetween the sensor struts and the loadapplication device to prevent moments tobe transferred when the load is applied
Fig. 10: Three-dimensional view of the new sensor with three degrees of freedom
7
4 56
3
1 2
8
7
3(L)4(T)
1(L) 2(T)
6
5
V V V
2 3
1 4
Channel 1
6
5
Channel 2
8
7
Channel 3
reports in applied measurement
Fig. 10 shows a domed surface and a
tapped hole at the point where the loads
act. The strain gages are installed in three
areas to measure deformation. One measures
chiefly the vertical deformation , one the
longitudinal and another the transverse
. The four small tapped holes allow the
sensor to be screwed to the under plate,
while the fifth central hole is intended to
save weight.
Fig. 11 shows that Belleville springs are
placed under the plate and under the heads
of the screws that make the connection
between the sensor struts and the load appli-
cation device. This prevents a moment being
transferred to the transducer when the load
is applied. This degree of freedom is also
achieved by means of a gap between the
screw shank and the hole in the upper plate,
and by means of an elongated drill-hole at
the position of the Belleville springs. Wiring
as four half bridges and four full bridges
insures high resolution and provides temper-
ature compensation. The configuration of the
strain gages is illustrated in Fig. 12.
Strain gages 1 and 3 are sensitive in the
longitudinal direction (longitudinal arrange-
ment L) while SGs 2 and 4 are sensitive in
the transverse direction (transverse arrange-
ment T).
These SGs are wired to a full bridge. In con-
trast strain gages 5 and 6, which mainly sense
transverse forces, and strain gages 7 and 8
for vertical forces, are wired to half bridges.
In order to reduce the number of channels,
the double-grid strain gages for the longitu-
dinal forces (T rosettes) are installed on the
two forward sensors only. The strain gages
for transverse forces are installed on the
same side as the two front and two rear sen-
sors, and are wired to two full bridges. The
total number of channels then comes to
eight (four for vertical forces, two for trans-
verse forces and two for longitudinal forces).76
5
3
2
1

Rear
section
Front
section
Initial calibration of the newtransducerDuring initial calibration each sensor was
loaded with predefined forces and the mea-
surement signals related to the three bridges
(or two for heel sensors) were analyzed. The
measurement data was used in the appropri-
ate transfer matrix, where good linearity and
reproducibility were observed.
By way of example, Fig. 13 shows the regres-
sion curves for vertical forces as determined
by the calibration test.The calibration results
were used to define and normalize the trans-
fer matrices. Normalization was achieved by
multiplying each column with the measured
peak value for the force concerned.
Computation of the coupling coefficients CC
(by dividing each element of the normalized
transfer matrix cij by the sum of the elements
in this line) shows good sensor decoupling.
The transfer matrices were inverted for com-
putation of the calibration matrices. For the
purpose of determining the definitive 6x8
matrices that define the relationship
between the six degrees of freedom and the
eight load signals, the matrices were linked
as shown in Fig. 14a and b.
Global calibrationFor global calibration of the load cell, the four
sensors were interconnected with the aid of an
upper plate as shown in Fig. 16 and then
loaded with three forces and three moments.
In this special case eight Wheatstone bridges
were used, resulting in an 8x6 transfer matrix
B and a 6x8 calibration matrix C.
=c ij
Σ j c ij
(9)CC
0 50 100 150 200 250Vertical force [N]
2000
1500
1000
500
0
Stra
in [µ
m/m
]
TheroySensor 1Sensor 2Sensor 3Sensor 4
The number of rows in a transfer matrix is
equal to the number of measurement data
channels, whereas the number of columns
matches the degrees of freedom (load com-
ponents). In the case of the calibration matrix
the situation is reversed, since the mathemati-
cal relationship C=B+ can be represented as
C=B-1 when C and B are quadratic matrices.
Otherwise C is treated as pseudoinverted
matrix B and can be computed using the Moore
algorithm.
Calibration is carried out in the following
sequence: The upper plate is loaded with a
longitudinal force (e.g. 10 N) and the eight
measurement data channels are analyzed. The
force is then increased in steps until the peak
intensity value is reached. This loading
process must be repeated at least twice. The
mean values then have to be computed in
order to obtain a high degree of precision.
The procedure enables eight functions to be
FxFyFzMxMyMz
∆ε1∆ε2∆ε3∆ε4∆ε5∆ε6∆ε7∆ε8
=
3.148896088 0.020754301-2.551861142 0.04465757-0.572254861 0.004654152
3.222587 0.031136-2.54098-0.04447-0.56982 0.006982
-0.08143 0.0487 0.064283 4.51E-05 0.014415 0.010921
-0.000552593-0.000165641 0.172801372-0.003024024 0.038750708-3.7145E-05
-0.006260992-0.000907351 0.169897454 0.002973205 0.038099504-0.000203474
0 0.049743958 6.83397E-05-9.27603E-06-1.53252E-05-0.011155083
0-0.00061 0.165678-0.0029-0.03715 0.000138
0-0.00113 0.161563 0.002827-0.03623 0.000254
8 ram 1/2002
Fig. 13: Regression curves for vertical forces
Fig. 14b: Association of measured quantities
Fig. 14a: Computation of the load components from the measured strain
1
2
3
4
5
6
7
8
No. of the Wheatstone bridge
∆ε1
∆ε2
∆ε3
∆ε4
∆ε5
∆ε6
∆ε7
∆ε8
Output signal

9ram 1/2002
recorded. It also enables the computation of
eight regression curves which describe the
trend in the measurement data (measurement
data compensation) and which are character-
ized by the fact that they show an increase.
These coefficients are entered in the first col-
umn of the transfer matrix. They refer to the
first load component and represent the signal
for a 1 N loading.
The above procedure is then repeated using a
transverse force. The values determined in this
way are entered in the second column of the
transfer matrix. Finally this procedure is
repeated for all the other load components.
The last three columns of the transfer matrix
then contain the results arising from the out-
put signals from the Wheatstone bridges in the
case of the three loads with a moment of 1
[N·m].
In order to compute a calibration matrix the
transfer matrix then has to be inverted. Deter-
mining the calibration matrix is the most
important objective of this work, since compu-
tation of the six load components acting on
the newly developed load cell is directly
dependent upon it.
The equations for computing the strain from
the loading and for computing the loading
from the strain are as follows:
Multiplying by the BTmatrix gives
If the experimental or mathematical problem
is given the right conditions, the resulting B
is an 8x6 matrix of rank 6. Then BT B is a 6x6
matrix with full rank which can be easily
inverted as follows:
On comparing (11) and (9) it is noticeable that
the 6x8 matrix (BT B)-1 BT is identical to C
and represents the calibration matrix B+
which expresses the relationship between the
strain signals and the loads concerned.
(BT B)-1 BT ε=F (13)
BT ε=BT B F (12)
F=C ε (11)
ε=B F (10)
Fig. 16:above: Individual sensors;below: The complete trans-ducer; ready for global calibration
Fig. 15, right:Second generation sensorwith HBM strain gages, e.g. LY11 3/350
Longitudinal force on the front left sensor
Longitudinal force on the front right sensor
Transverse force at the toe
Vertical force on the front left sensor
Vertical force on the front right sensor
Transverse force at the heel
Vertical force on the rear left sensor
Vertical force on the rear right sensor
Measured quantity
reports in applied measurement

SummaryThis paper presented two transducers with six
degrees of freedom, suitable for measuring
the forces and moments that a skier transfers
to the skis.The first transducer was fully test-
ed in the laboratory, during calibration and
during skiing trials under real load condi-
tions.The second new and independently
developed transducer was designed to
increase compactness, safety, precision and
sensitivity in relation to the six loads.
At the same time satisfactory decoupling
effects were achieved in three ways:
- mechanically by means of the HBM
strain gages which are optimally tuned
to the geometry and stresses of the
sprung elements.
- electrically due to wiring the strain
gages in a special way to compensate for
unwanted signals.
- mathematically by computing the cali-
bration matrix.
The individual sensors in the new load cell
were fully calibrated. A global calibration
then has to be carried out in the laboratory,
during which forces and moments are simul-
taneously applied to the whole configuration
along the x, y and z axes (Fig. 16). Skiing tri-
als can then be carried out under real load
conditions.
References
[1] Peter Jung: Applying metrology to skis, Reports in
Applied Measurement, 11 (1975) Vol. 2, pp. 34-37,
Vol. 3, pp. 59-62
[2] Alpine ski-bindings, Safety requirements and test
methods, International Standard, ISO 9462
[3] Lu-Ping Chao, Ching-Yan Yin: The six-component
force sensor for measuring the loading of the feet in
locomotion, Materials and Design, 20 (1999) 237 –
244
[4] Lu-Ping Chao, Kuen-Tzong Chen: Shape optimal
design and force sensitivity evaluation of six-axis
force sensors, Sensors and Actuators A Physical, 63
(1997) 105 – 112
[5] Gab-Soon Kim, Dea-Im Kang, Se-Hun Ree: Design
and fabrication of a six-component force/moment
sensor, Sensors and Actuators A Physical, 77 (1999)
209 – 220
[6] Tom Boyd, M.L.Hull, D.Wootten: An improved accu-
racy six-load component pedal Dynamometer for
cycling, Journal of Biomechanics, 29 (1996) 1105 –
1110
[7] D. Gorinevsky, A. Formalsky, A.Schneider: Force
Control of Robotics Systems CRC Press, New York
10 ram 1/2002

11ram 1/2002
IntroductionTo demolish and rebuild road bridges that
have been found by calculation to be unable
to support heavy loads consumes resources
and disrupts traffic. With the aim of econo-
mizing on materials, and in order to rational-
ly perform loading experiments using the ex-
perimental load-bearing method known as
EXTRA on bridge structures and sewers, a
group of researchers at the Universities of
Bremen (team leaders), TU Dresden, HTWK
Leipzig and the Bauhaus University of Weimar
worked with the Eggers group and other com-
panies to develop a special vehicle that could
be used in flexible ways to apply loads to
structures. Known as BELFA, its name is an
acronym from the German word for this type
of vehicle (”Belastungsfahrzeug”).
BackgroundThe national and local road networks in
Germany include more than 80,000 bridges of
various kinds and some 300,000 km of sewers
of widely differing ages, some of which are in
doubtful condition. By way of comparison,
there are around 760,000 bridges throughout
Europe. About 90 % of the bridges are solid
structures, and around 70 % of these have sin-
gle spans of less than 18 meters [1]. A broad
estimate of the total cost of currently out-
standing repairs and maintenance to bridges
and sewers runs into double-figure billions of
euros.
The investment required to replace these
structures with new ones can only be brought
down to a sustainable level by successfully ex-
tending their useful life to a significant de-
gree despite further increases in traffic vol-
umes. This can only be achieved with objec-
tive, experimental proof of adequate load-
bearing capacity, especially in the case of
load-bearing structures that are already dam-
aged or have been singled out for some oth-
er reason, followed up as necessary with long-
term observation and monitoring.
The main ground rules for the experimental
analysis of present load-bearing performance
were acquired in recent years by cooperation
between the organizations mentioned above
in developing and testing the EXTRA method
on more than 300 bridges, major construc-
tions and sewers [2 ... 5]. The method con-
Marc Gutermann
Rolf Sommer
Klaus Steffens
Fig.1: Load testing with the aid of loading frames at Dassow, Germany (1993)
Fig. 2: BELFA on the road
reports in applied measurement
reports in applied measurementramBELFA load application vehicle -measurement and loading techniques forthe structural evaluation of bridges and sewers

cerned has since been given legal status in the
form of a guideline [6].
The experience gained from many of the ob-
jects investigated made it clear that the time
required for preparatory work and related
phases of the experiments, such as setting up
and dismantling the load application engi-
neering, represented some 70 % of the total
time needed for a typical object and was an
obstacle to wider application of the method.
In the case of bridges there was the associat-
ed factor of relatively lengthy disruption to
traffic (Fig. 1). The development, construction
and testing of the BELFA prototype is intend-
ed to meet the need to reduce investigation
costs and bring the disruption from road
works down to one or two days.
Operating principleThe vehicle is 2.75 meters wide and 3.50 me-
ters high. It consists of a towing vehicle, a
welded main chassis comprising two longitu-
dinal and 16 transverse girders, ballast water
tanks, and a deck crane with adjustable ex-
tension and height (Fig. 3 to 5).
Four hydraulically movable feet positioned
over the neutral abutments/pillars are used to
align the vehicle horizontally and vertically.
Five test rams with fittings on extending slides
generate the test loads. The rear-mounted
control cabin and associated diesel-electric
drive for the soundproofed hydraulic motor
complete the list of main elements. Before the
BELFA can be placed in the test position it has
to be pulled forward by the towing vehicle un-
til it is over the load-bearing structure that is
intended to be examined (Fig. 4 to 5). In this
situation the towing machine load can be re-
duced to the minimum 23 tonnes by tem-
porarily removing ballast so that it is even pos-
sible to cross load-bearing structures on class
12 bridges. The heavy five-axle trailer vehicle
at that point remains outside the test area. On
reaching the test position the vehicle is
- Ability to carry out loading investi-gations using the EXTRA method inone lane of bridge classes 12 to 60as defined in DIN 1072 (12.85); upto bridge class 30 this would involvenot using a back tie, that is notdrilling through the waterproof layerto install tie rods, and for bridgeclass 60 two back tie rods would beinstalled per abutment
- Ability to operate as a special vehiclewithout significantly restricting traf-fic (all-up weight 80 tonnes, axleloads ≤10.5 tonnes, turning circle D = 22 meters)
- Largely autonomous compliance withall requirements relating to the load-ing procedure and operating safetyin the course of preparing and exe-cuting the investigation
- Use of the self-locking loading prin-ciple when using hydraulic forcegeneration in connection with a rigidversion of the BELFA’s main chassis(max. f = 25 mm at a maximum testloading of 1.5 MN)
- Variable span adaptation where l =4.00 to 18.00 meters by means of in-finitely variable telescopic action
- Ballasting with 20 tonnes of masswith the aid of flexible water tanks
- Axle loads on towing vehicle to bekept down to ΣF = 230 kN whencrossing class 12 bridges
Following restricted tendering, the order for
construction including a target time for plan-
ning and construction (9 months) was award-
ed to Eggers Fahrzeugbau GmbH, vehicle-
builders, in 28816 Stuhr, Germany.
SpecificationsConstructing the load application vehicle involved a number of complex engineering
requirements, the most important of which were the following:
12 ram 1/2002
Fig. 3: BELFA at its premiere in Neu Kaliß, Germany

chocked and aligned vertically in the trans-
verse direction. The towing vehicle and trailer
are raised and trimmed with the aid of the bal-
last, increasing the available test dead weight
to 80 tonnes (or 100 tons using the water bal-
last). The weight is equally distributed over the
feet (Fig. 5 -6).
The test rams are then moved into their in-
tended positions and vertically aligned if nec-
essary. Three of the five rams represent the
three axles of a heavy goods vehicle (HGV) as
defined in DIN 1072, while the two outer rams
are used to apply a loading to the remaining
surfaces fore and aft of the HGV area.Each of
the last two rams mentioned can also be used
in a separate test for determining bearing
strength in the event of lateral forces in the
vicinity of the support structure. If the avail-
able dead weight of the BELFA is insufficient,
pre-tensionable back ties must be installed in
the abutment area using tie bolts fixed in the
abutment itself. The dead weight and pre-ten-
sioning of the back ties then form a total avai-
lable test load capacity of 1,500 kN, which is
adequate for g-fold loads up to bridge class
60.
Hydraulic loading unit and associ-ated monitoring equipment The hydraulic loading unit in the strictest
sense consists of five test rams, the hydraulic
motor complete with power generator and
the associated programmable controller. This
unit alone is responsible for the controlled
generation of the test load. All other essential
hydraulic functions, such as extending the
four feet, are specific to the motor vehicle and
are perceived by the various separate modules
as being independent of the loading unit.
Each test ram is linked to the main chassis of
the BELFA by an extensible positioning slide in
such a way that its axis is rigid in the trans-
verse direction and jointed in the longitudinal
direction, though lockable (Fig. 6). Not only do
the hydraulic rams each have a nominal force
of 500/250 kN (compression/traction) but
each ram is fitted with a 500 kN tensile/com-
pressive force transducer at the end of its pis-
ton rod.
All data streams, whether from the transduc-
ers installed on the load-bearing structures
under investigation or from the force and tilt
13ram 1/2002
Fig. 4, above:Extending the frame increases the usable length to 18 meters
Fig. 5, left:Views of the BELFA;above: in traffic; below: in test position
reports in applied measurement
measurements performed by the load appli-
cation vehicle, are brought together in the
rear test control point. The latter has a
dynaSax II PLC for analyzing the measurement
signals and a PC controlled UPM 100 multi-
point measuring device from HBM (Fig. 7).
When a test is in progress the PLC passes the
current force values from all test cylinders to
the multipoint measuring device. A down-
stream analysis program provides an online
Approach
Crossing
Test
l < 18m
Super-structure
W = 80 tL = 22,5m
W = 100 tL = 35,5m
SensorMeasuring
base
Fig. 6:Test ram with extensible positioning slide, force transducers and cross-beam
Integrated force measurement
Hydraulic ram2
1
1
2

14 ram 1/2002
Fig. 7, left:19" rack with PC, monitor and controller for load application and vehicle hydraulics, together with UPM100 multipoint mea-surement amplifier from HBM
display of the independently measured defor-
mations of the load-bearing structure and the
force/deformation functions. The test supervi-
sor and a metrologist in the control cabin are
provided with all the information they need re-
lating to the test in order to operate the BELFA.
For the sake of maintaining operating safety
the PLC monitors the behavior of the vehicle
throughout the test loading procedures. Not
only the forces acting upon the supports but
also the longitudinal and transverse tilt at both
ends of the main chassis are continuously
recorded and compared with threshold crite-
ria (Fig.9). If a warning is ignored and an abort
threshold is exceeded, the hydraulic motor
automatically cuts out. The test load is reduced
in the shortest possible time. In the process the
system monitors both absolute and relative
values.
The PLC automatically reduces threshold values
in accordance with the situation of the super-
structure, for instance in the event of pro-
nounced longitudinal tilt.
Experiences during initial imple-mentationSince BELFA first entered service in March 2001,
it has been used to examine the structures of a
total of eleven bridges in five German federal
states. Thanks to the experimental analysis car-
ried out on the load-bearing structures with
the aid of BELFA, it was possible to reclassify all
these bridges at least one class higher than
would have been possible using conventional
calculation methods. Thus these structures
meet the requirements out of today’s traffic
revenue and they were able to be cleared for
higher loads. The cost saving due to economiz-
ing on materials and continued use when com-
pared with new replacement structures was de-
clared by those in charge of construction to be
between € 250,000 and € 1 million. Disruption
on the bridges amounted to one or two days or
less, no more than half the amount of time
specified.
ProspectsOnce the research project is complete it is
intended to set up a scientifically-based
scheme to offer the services of the BELFA load
application vehicle. Current information can be
obtained from the web site www.belfa.de.
Acknowledgements The project presented above was kindly en-
couraged by the Federal German Ministry for
Training and Research, Bonn, and managed by
the Deutsche Zentrum für Luft- und
Raumfahrt e.V. (German Aerospace Center),
Bonn, under reference 01 RA 9901/0. Our spe-
cial thanks are owed to the participating
districs for providing the pilot objects and the
necessary infrastructure.
References
[1] Steffens, K. (Ed.): Experimentelle Tragsicherheitsbe-
wertung von Brücken in situ zur Substanzerhaltung
und zur Verminderung der Umweltbelastung; Koope-
ratives Forschungsprojekt 01-RA 9601/6 EXTRA II,
Abschlußbericht, Hochschule Bremen, Eigenverlag 1999
- A defined longitudinal or transversetilt is exceeded
- There is too great a difference be-tween each of the supports in a pair(right and left)
- The total load acting upon all sup-ports is too low (lifting/slipping)
A test procedure is aborted inthe following circumstances:
- A defined minimum force is not pre-sent in one of the supports(lifting/slipping due to excessive lon-gitudinal tilt)
Fig. 8: Extensible positioning slides
messtechnische briefe

Published by:Hottinger Baldwin Messtechnik GmbHIm Tiefen See 45D-64293 DarmstadtTel. +49 6151 8030Fax +49 6151 803 9100www.hbm.com
EditorDr.-Ing. habil. Martin StockmannTechnical University of Chemnitz
Please address any questions about RAM articles to the publisher.
Please address any questions about HBM products to your local HBM sales office.
CopyrightCopying is only permitted with theadvance written approval of the editorialoffice or the publisher. Copying or repro-duction in the form of photocopies,microfilm or other means for commercialpurposes is not permitted.
All rights reservedNo liability can be accepted for the pro-cedures and circuits described and thenames used in respect of the infringe-ment of patents or trademarks of thirdparties.
reports in applied measurement1/2002Issued: april 2002
“reports in applied measurement” is issued two times a year
Printing: 100% chlorine-free bleached paper has been used to protect the environment
imprint
Fig. 9:One of the two front supports with integrated force measurement
[Experimental in situ evaluation of the load-bearing
capacity of bridges for the purpose of economizing on
materials and reducing the environmental load;
Cooperative research project 01-RA 9601/6 EXTRA II,
final report, published University of Bremen 1999]
[2] Bellmer, H., H. Brandtl, J. Quade, G. Kapphahn,
P. Schwesinger, K. Steffens: Experimentell gestützte
Untersuchung des Trag- und Verformungsverhaltens
der Brücke über die Stepenitz im Zuge der B 105 in
Dassow; Bautechnik 71 (1994) H. 11, S. 782-791
[Experimental investigation of the load-bearing and
deformation behavior of the bridges over the
Stepenitz along the course of the B 105 in Dassow;
Bautechnik 71 (1994) Vol. 11, pp. 782-791]
[3] Bucher, Ch.; R. Ehmann, H. Opitz, J. Quade,
P. Schwesinger, K. Steffens: EXTRA II - Pilotobjekt
Weserwehrbrücke Drakenburg. Experimentelle Trag-
sicherheitsbewertung von Massivbrücken. Bautechnik
74 (1997) 5, S. 301 - 319 [EXTRA II - Pilot object,
Weser bridge Drakenburg. Experimental evaluation of
the load-bearing capacity of solid bridge structures.
Bautechnik 74 (1997) 5, pp. 301 - 319]
[4] Steffens, K.; Ch. Bucher, H. Opitz, J. Quade, and P.
Schwesinger: Experimentelle Tragsicherheitsbewer-
tung von Brücken. Bautechnik 76 (1999) 1, S. 1 - 15
[Experimental evaluation of the load-bearing capaci-
ty of bridges. Bautechnik 76 (1999) 1, pp. 1 - 15]
[5] Steffens, K. (Ed.): Experimentelle Tragsicherheitsbe-
wertung von Bauwerken: Grundlagen und Anwen-
dungsbeispiele. Bauingenieurpraxis, Ernst&Sohn
Verlag, Berlin November 2001, ISBN 3-433-01748-4
[Experimental evaluation of the load-bearing capaci-
ty of bridge structures: Basic features and typical
applications. Bauingenieurpraxis, Ernst&Sohn Verlag,
Berlin November 2001, ISBN 3-433-01748-4]
[6] Richtlinie für Belastungsversuche an
Betonbauwerken. Deutscher Ausschuss für
Stahlbeton, Fassung September 2000 [Guideline for
load tests on concrete structures. Deutscher
Ausschuss für Stahlbeton (German Committee for
Reinforced Concrete), September 2000]
ram 1/2002 15
You are invited to contribute an article or articles to RAM, and will receive anauthor’s fee if your article is published.
E-mail, editor: [email protected], HBM: [email protected]
Reply fax to the editor: +49 371 531 1471
Name
Company / Dept.
Street
Town, Postal code
Telephone
Fax
I am interested in having an article published in RAM and
would ask you to kindly contact me

Hottinger Baldwin Messtechnik GmbH
Im Tiefen See 4564293 DarmstadtGermany
Tel. +49 6151 8030Fax +49 6151 803 9100
E-mail: [email protected]: www.hbm.com