three software development gestalts
TRANSCRIPT

McMaster, Rague, Hadfield, and Anderson Fri, Nov 7, 10:30 - 10:55, Pueblo C
Three Software Development Gestalts
Kirby McMaster
Brian Rague
Computer Science, Weber State University Ogden, UT 84408
Steven Hadfield [email protected]
Computer Science, Air Force Academy USAFA, CO 80840
Nicole Anderson
[email protected] Computer Science, Winona State University
Winona, MN 55987
Abstract
Learning is more effective if topics are presented within an overall mental framework, or ges-
talt. But which gestalts are suitable for software development courses? This paper attempts to
characterize and measure three gestalts for software development—an object-oriented Pro-
gramming gestalt, a Database gestalt, and a Software Engineering gestalt. Our methodology
assumes that words used frequently in a book indicate the gestalt of the author. By comparing
word frequencies in Programming, Database, and Software Engineering books, we developed
three gestalt scales. Using these scales, we calculated gestalt scores for all sample books, and
plotted the distributions of these scores. We also examined relationships between the gestalt
scales. Our findings have relevance in designing ways to teach software development courses,
and in helping instructors choose appropriate textbooks for those courses.
KEYWORDS: gestalt, programming, OOP, database, software engineering, IS education.
1. INTRODUCTION
Do you want to make learning difficult for
your students? Try this approach:
1. Choose the topics to cover.
2. Randomly sequence the topics.
3. Teach each topic independently, with no
mention of relationships between topics.
Schemas, Paradigms, and Gestalts
How will this make learning difficult? Accord-
ing to Donald (2002), a course needs a
schema to enable understanding.
A schema ... is a data structure of generic con-cepts stored in memory and containing the net-work of relationships among the constituent parts.... If we are to understand the relationships between concepts, we need to know in what or-der and how closely concepts are linked and the character of the linkage.
Bain (2004) suggests that if a paradigm is
not available for a course, then students will
construct their own.
The students bring paradigms to the class that shape how they construct meaning. Even if they
Proc ISECON 2008, v25 (Phoenix): §2333 (refereed) c© 2008 EDSIG, page 1

McMaster, Rague, Hadfield, and Anderson Fri, Nov 7, 10:30 - 10:55, Pueblo C
know nothing about our subjects, they still use an existing mental model of something to build their knowledge of what we tell them.
An expression similar to schema or paradigm
is the concept of gestalt. Learning becomes
easier if the instructor provides a clear men-
tal framework, or gestalt, for a course. By
gestalt, we mean "a configuration or pattern
of elements so unified as a whole that it
cannot be described merely as a sum of its
parts" (www.thefreedictionary .com).
Gestalts for Software Development
Which gestalts are suitable for software de-
velopment? Which gestalts best correspond
to the expectations of students enrolled in
software development courses? We prefer
the term "gestalt" to "framework" because
"framework" has a more specific meaning in
software development (e.g. the .NET frame-
work).
Software development is a very broad field.
Our scope in this paper is limited to the de-
velopment of an Information System con-
sisting of a set of application programs that
access a database. In most Computer
Science and Information Systems (CIS) pro-
grams, software development principles are
taught in the following types of courses:
1. Programming, with an emphasis on ob-
ject-oriented constructs.
2. Databases and database management
systems.
3. Software Engineering, including systems
analysis and design.
Our primary goal in this paper is to charac-
terize gestalts for each type of course by
constructing measurement scales for Pro-
gramming, Database, and Software Engi-
neering gestalts. A brief synopsis of these
areas provides an initial picture of what top-
ics should be included in each gestalt. [Note:
key words are italicized.]
Donald Knuth (2008) gives a casual view of
programming as "teaching a computer how
to do something." A more extended Wikipe-
dia description is:
Computer programming ... is the process of writ-ing, testing, debugging/troubleshooting, and maintaining the source code of computer pro-grams.... The organization of a program depends on the features available in the chosen pro-gramming language. Current languages, which support object-oriented programming, allow
classes to be constructed and objects defined as instances of the classes. (en.wikipedia.org)
Ullman and Widom (2008) describe database
systems in the following way:
The term database refers to a collection of data that is managed by a DBMS [database man-agement system]. ... A DBMS is a powerful tool
for creating and managing large amounts of data efficiently and allowing it to persist over long pe-riods of time safely.
Database courses should introduce a layered
architecture in which application programs
interact with the database through the ser-
vices of a DBMS. Programs see data concep-
tually based on a data model, rather than
how the data is physically stored.
Software engineering is concerned with how
to effectively build large, complex software
systems. Software Engineering involves
more than programming. Sommerville
(2004) states:
Software engineering is an engineering discipline that is concerned with all aspects of software production from the early stages of system spe-cification to maintaining the system after it has gone into use.... Software engineering is not just concerned with the technical processes of soft-ware development but also with activities such as software project management and with the development of tools, methods, and theories to support software production.
Measuring Gestalts
In a previous study (McMaster, 2007) that
was motivated by Polya's (1945) How to
Solve It, we developed two scales for mea-
suring gestalts in Mathematics. Logical Math
gestalt emphasizes logical ordering in theo-
rems and proofs. Computational Math ges-
talt focuses on solving problems using mod-
els and algorithms. Our methodology for
developing these two Math gestalt scales
involved analyzing words in a broad sample
of Math books. Our assumption was that
words used frequently in a book reflect the
gestalt of the author.
In this research, we used a similar metho-
dology to develop three measurement scales
for gestalts in software development. We
selected a sample of object-oriented Pro-
gramming (OOP) books, Database (DB)
books, and Software Engineering (SE)
books. We then determined word counts in
these books and constructed a Programming
Proc ISECON 2008, v25 (Phoenix): §2333 (refereed) c© 2008 EDSIG, page 2

McMaster, Rague, Hadfield, and Anderson Fri, Nov 7, 10:30 - 10:55, Pueblo C
gestalt scale, a Database gestalt scale, and a
Software Engineering gestalt scale.
The main purpose of this study is to add
clarity to CIS education, especially Pro-
gramming, Database, and Software Engi-
neering courses. The measurement scales
highlight important words used in the three
gestalts. We show how the gestalt scales
relate to each other, and what it means
when a book exhibits more than one gestalt.
We also show how the scales can be used to
help instructors choose textbooks that rein-
force key ideas corresponding to specific
course objectives.
2. METHODOLOGY
The methodology used to develop measuring
instruments for our three Software Devel-
opment gestalts is described in this section.
We constructed a Programming scale (PGes-
talt), a Database scale (DGestalt), and a
Software Engineering scale (SGestalt). The
methodology involved the following steps.
Sampling
By design, a wide variety of Software Devel-
opment books were sought for our sample.
We selected books from the Amazon web
site that included a concordance (a list of
frequently used words). Our need for a con-
cordance limited our choice of books. Ama-
zon provides a concordance for many of its
books, so we were able to get a diverse
sample. Many of the books in our sample are
suitable to use as college textbooks, but
some are aimed at different markets.
Our sample of 110 Software Development
books was divided into three categories
based on words in the title and on content.
The resulting sample consisted of 37 Object-
Oriented Programming (OOP) books, 37 Da-
tabase (DB) books, and 36 Software Engi-
neering (SE) books. Most books were easy
to categorize, but there were a few excep-
tions, such as Zdonik's (1989) Readings in
Object-Oriented Database Systems (OOP or
DB?) and McConnell's (2004) Code Complete
(OOP or SE?).
A complete list of books in the sample, along
with their scores on the three gestalt scales,
can be obtained from the authors.
Data Collection
The Amazon concordance for a book pro-
vides a list of the 100 most frequently used
words. The Amazon concordances screen out
many (but not all) common English words,
such as "the" and "of". For each concordance
word, we recorded the book, word, and fre-
quency (Freq). Frequency is the actual num-
ber of times a word occurs in a book.
Convert Words to a Consistent Form
One problem with using words to build
scales is that words can take more than one
form. For example, nouns may be singular
or plural. To alleviate this problem, we con-
verted many words to a consistent form. We
did not want the scale contribution of a word
to depend on the particular form or tense an
author favored. The following types of word
conversions were performed:
a. Convert plural nouns to singular form
("elements" becomes "element").
b. Make verbs refer to plural subjects
("exists" becomes "exist").
c. Change verbs to present tense
("defined" becomes "define", "solving"
becomes "solve").
d. Remove endings such as "al" and "ly"
from some adjectives and adverbs
("computational" becomes "computation",
"finitely" becomes "finite")
Transform Frequencies
Word frequencies needed to be "standar-
dized" because books vary in their total
number of words. We rescaled word fre-
quencies within a concordance as follows:
a. We removed all words that are in the list
of Top 100 Common English Words (Fry,
1993). Fortunately, Amazon had already
removed most of these Top 100 words.
b. For the remaining words, we calculated
the average frequency (average Freq).
c. We then restated each word frequency
relative to the average frequency using
the formula:
StdFreq = 100*(Freq / average Freq)
With this calculation, a standard frequen-
cy (StdFreq) score of 100 represents the
transformed frequency for the "average
word" in the reduced concordance. A
word with a StdFreq value of 300 would
appear three times as often as the aver-
age concordance word in the same book.
Proc ISECON 2008, v25 (Phoenix): §2333 (refereed) c© 2008 EDSIG, page 3
McMaster, Rague, Hadfield, and Anderson Fri, Nov 7, 10:30 - 10:55, Pueblo C
Combine Synonyms into Word/Groups
Another problem in using words to build
scales is that different words can have the
same meaning. When relevant, we combined
two or more synonyms into a concatenated
word/group. For example, "method" and "al-
gorithm" become "method/algorithm". We
applied this step after standardizing word
frequencies (StdFreq) because we wanted
the average frequency for a concordance to
be based on individual words. When syn-
onyms were later combined into
word/groups, the StdFreq score for the
group was the sum of the StdFreq scores of
the individual words in the group.
Construct Gestalt Scales
Constructing the gestalt scales—PGestalt,
DGestalt, and SGestalt—was an iterative
process. We looked for words that are used
frequently within each book and consistently
across similar books.
First Iteration
1. Query all OOP books for the PGestalt
scale. Similarly, query the DB books for
the DGestalt scale, and query the SE
books for the SGestalt scale. Find all
words in which the average StdFreq, tak-
en across all books for that scale, is
above a predefined value (e.g. > 125 for
the first iteration). Select only those
words found in a predefined percentage
of the scale books (e.g. > 60% for the
first iteration). The choice of minimums
for average StdFreq and percent of books
is subjective. Order the words by de-
creasing average StdFreq. Because our
sample was diverse, we set our cutoff cri-
teria low for the first iteration and raised
the levels in later iterations.
2. For each word, we consider only the
amount its average StdFreq exceeds the
frequency for an average concordance
word. For this reason, subtract 100 from
the average StdFreq for each word se-
lected in Step 1. Then sum these differ-
ences.
3. The weight for a scale word is average
StdFreq - 100, restated as a percent of
the sum calculated in Step 2.
Weight = 100*(average StdFreq - 100) / (sum of differences)
The sum of the weights over all words
used in the scale is 100.
4. The PGestalt score for a book is a
weighted average of the StdFreq values
for all scale words. Calculate the scale
scores for each SE book using the formu-
la:
PGestalt scale = Sum[(Weight / 100) * StdFreq]
where the sum is across all words used in
the scale. The same formula applies to
the DGestalt and SGestalt scales.
Additional Iterations (repeat as necessary):
1. Check the PGestalt (or DGestalt or SGes-
talt) score for each book. Remove books
that have a (subjectively) low score on
their relevant scale.
2. Repeat the steps from Iteration 1 with
the remaining books to obtain a revised
list of words and weights for each scale,
plus a new set of scale scores for each
book. Note that the StdFreq value for
each word for a given book does not
change from iteration to iteration.
In this study, we started with 37 OOP books,
37 DB books, and 36 SE books. For each
scale, we performed several iterations until
the scale words and their rank order did not
change. The main decision variables at each
stage were the cutoff criteria for words (av-
erage StdFreq and percent of books) and the
choice of books used to determine the
weights. We chose books with the highest
scale scores, which reinforced the scale
words and weights in the next iteration. We
eventually obtained PGestalt, DGestalt, and
SGestalt scales from 27 OOP books, 27 DB
books, and 26 SE books, respectively.
3. GESTALT SCALES
Using the methodology outlined in the pre-
vious section, three gestalt scales for Soft-
ware Development were constructed. PGes-
talt measures Programming gestalt, DGestalt
measures Database gestalt, and SGestalt
measures Software Engineering gestalt.
Each scale consists of a list of word/groups
and weights.
Proc ISECON 2008, v25 (Phoenix): §2333 (refereed) c© 2008 EDSIG, page 4

McMaster, Rague, Hadfield, and Anderson Fri, Nov 7, 10:30 - 10:55, Pueblo C
Programming Gestalt
The Programming (PGestalt) scale consists
of 14 word/groups and weights. The details
of this scale are presented in Table 1.
Table 1: Programming Scale
PGestalt: Based on 27 OOP books
Word/Group Books Avg StdFreq
Weight
class/subclass 27 541.1 20.87
method/algorithm 23 391.2 13.78
object 27 317.5 10.29
code/program 27 314.3 10.14
function/procedure 18 268.9 7.99
value/variable 27 268.7 7.98
integer 21 203.3 4.89
public/private 24 201.7 4.81
type/datatype 26 186.2 4.08
string 24 180.3 3.80
statement/line 18 168.6 3.25
data/information 26 164.2 3.04
new 27 154.9 2.60
file 24 152.2 2.47
TOTAL 100.00
The most frequent word/group for the PGes-
talt scale is "class/subclass", having an av-
erage StdFreq value above 500. The
word/groups "method/algorithm", "object",
and "code/program" have average StdFreq
values above 300. This reflects the object-
oriented emphasis in the OOP texts.
The word/groups "class/subclass", "method/
algorithm" and "function/ procedure" are
organizational units within programs. The
usage of the words "method" and "function"
is language-dependent (e.g. Java vs. C++).
Several of the remaining words on this scale
refer to variables and data types.
We used a minimum average StdFreq value
of 150 for including words in the final itera-
tion of the PGestalt scale. If during the con-
struction of this scale, the cutoff point had
been 180, then the four word/groups after
"string" would be excluded from the scale.
The scale would consist of the remaining 10
word/groups, with revised weights.
Database Gestalt
The Database (DGestalt) scale consists of 14
words/groups and weights. The details of
this scale are presented in Table 2.
The two most frequent word/groups for the
DGestalt scale, each with average StdFreq
values above 400, are "data/information"
and "table/relation". The next most frequent
word is "database", which has an average
StdFreq value above 300.
Table 2: Database Scale
DGestalt: Based on 27 DB books
Word/Group Books Avg
StdFreq Weight
data/information 27 524.8 19.55
table/relation 27 438.1 15.56
database 27 335.3 10.83
query/sql 26 266.9 7.68
entity/relationship 18 257.0 7.23
attribute/column/field 25 234.7 6.20
key/primary/foreign 22 220.3 5.54
system/subsystem 25 206.2 4.89
object 21 197.5 4.49
model/modeling 22 195.1 4.38
user/client/customer 25 190.2 4.15
record/row/tuple 24 187.6 4.03
value/variable 27 164.8 2.98
type/datatype 27 154.5 2.51
TOTAL 100.00
Several of the scale words reflect the em-
phasis on relational databases in most DB
texts. One exception is the word "object",
which is also on the PGestalt scale. The ap-
pearance of this word on the DGestalt scale
implies that some object-oriented program-
ming concepts occurs in DB texts.
Two other word/groups shared with the
PGestalt scale are "value/variable" and
"type/datatype". All of these shared
word/groups have higher average StdFreq
values (and weights) on the PGestalt scale,
indicating that these words appear more of-
ten in OOP texts than DB texts.
We used a minimum average StdFreq value
of 150 for including words on the DGestalt
scale. If during the construction of this scale,
the cutoff point had been 180, then the two
word/groups after "record/row/tuple" would
be excluded from the scale.
Software Engineering Gestalt
The Software Engineering (SGestalt) scale
consists of 12 word/groups and weights. The
details of this scale are presented in Table 3.
The two word/groups for the SGestalt scale
having average StdFreq values above 400
are "software" and "system/subsystem". The
next two most frequent word/groups, with
average StdFreq values above 300, are "de-
velop/engineer" and "process".
Proc ISECON 2008, v25 (Phoenix): §2333 (refereed) c© 2008 EDSIG, page 5

McMaster, Rague, Hadfield, and Anderson Fri, Nov 7, 10:30 - 10:55, Pueblo C
Table 3: Software Engineering Scale
SGestalt: Based on 25 SE books
Word/Group Book
s Avg
StdFreq Weight
software 26 444.6 18.13
system/subsystem 26 401.3 15.85
process 26 304.8 10.77
data/information 26 265.1 8.69
code/program 24 231.8 6.93
requirement/ specification
25 229.5 6.81
test/testing 20 226.8 6.67
user/client/customer 23 223.3 6.49
dvelop/development 26 221.8 6.41
project 26 207.1 5.63
design/designer 26 175.6 3.98
model/modeling 25 169.1 3.64
TOTAL 100.00
Software engineering is concerned with
more than programming. This is reinforced
by other words on the scale such as "re-
quirement", "specification", "project", "test",
and "design".
Several of the SGestalt word/groups are also
on the PGestalt and/or DGestalt scales.
Word/groups "system/subsystem", "us-
er/client/customer", "model/modeling", and
"data/information" are shared with the
DGestalt scale. "Code/program" and "da-
ta/information" are on the PGestalt scale.
The word/groups "system/subsystem" and
"user/client/customer" have higher weights
on the SGestalt scale than the DGestalt
scale. All other SGestalt shared word/groups
have lower weights on the SGestalt scale.
We used a minimum average StdFreq value
of 150 for including words on the SGestalt
scale. If during the construction of this scale,
the cutoff point had been 180, then the two
word/groups after "project" would be ex-
cluded from the scale.
4. GESTALT SCORES
We calculated PGestalt, DGestalt, and SGes-
talt scores for all 110 books in the sample.
The gestalt scores are weighted averages of
the StdFreq values for scale words within a
book.
Programming Scores
The PGestalt scores for the 37 OOP books
ranged from a minimum of 101.1 to a max-
imum of 402.6, with a mean of 271.5. Four-
teen of the OOP books had a PGestalt score
above 300. A PGestalt score of 300 means
that scale words appear 3 times as often as
the "average concordance word." The distri-
bution of PGestalt scores for the OOP books
is shown in Figure 1.
0
2
4
6
8
10
12
0-49 50-99 100-
149
150-
199
200-
249
250-
299
300-
349
350-
399
400-
449
450+
PGestalt Score
OOP Books
Figure 1: PGestalt Scale Distribution
37 OOP books
The three OOP books having the highest
PGestalt scores are:
1. Craig (2000) – Interpretation of OOP
Languages (PGestalt = 402.6).
2. McMillan (2004) – OO Programming with
VB.NET (PGestalt = 394.1).
3. Lavin (2006) – Object–Oriented PHP
(PGestalt = 388.8).
Note that all of these books contain the word
"object-oriented" in the title. The context for
two of the books is a specific OOP language
(VB.NET, PHP).
We can learn a lot about a book from the
detailed calculation of its gestalt scores. The
calculations show which words contribute
most to the gestalt scores for a book.
1. The StdFreq value for a word indicates
how often the word is used in the book.
2. The Weight of a word as indicated in the
associated scale defines the importance
of the word for measuring gestalt.
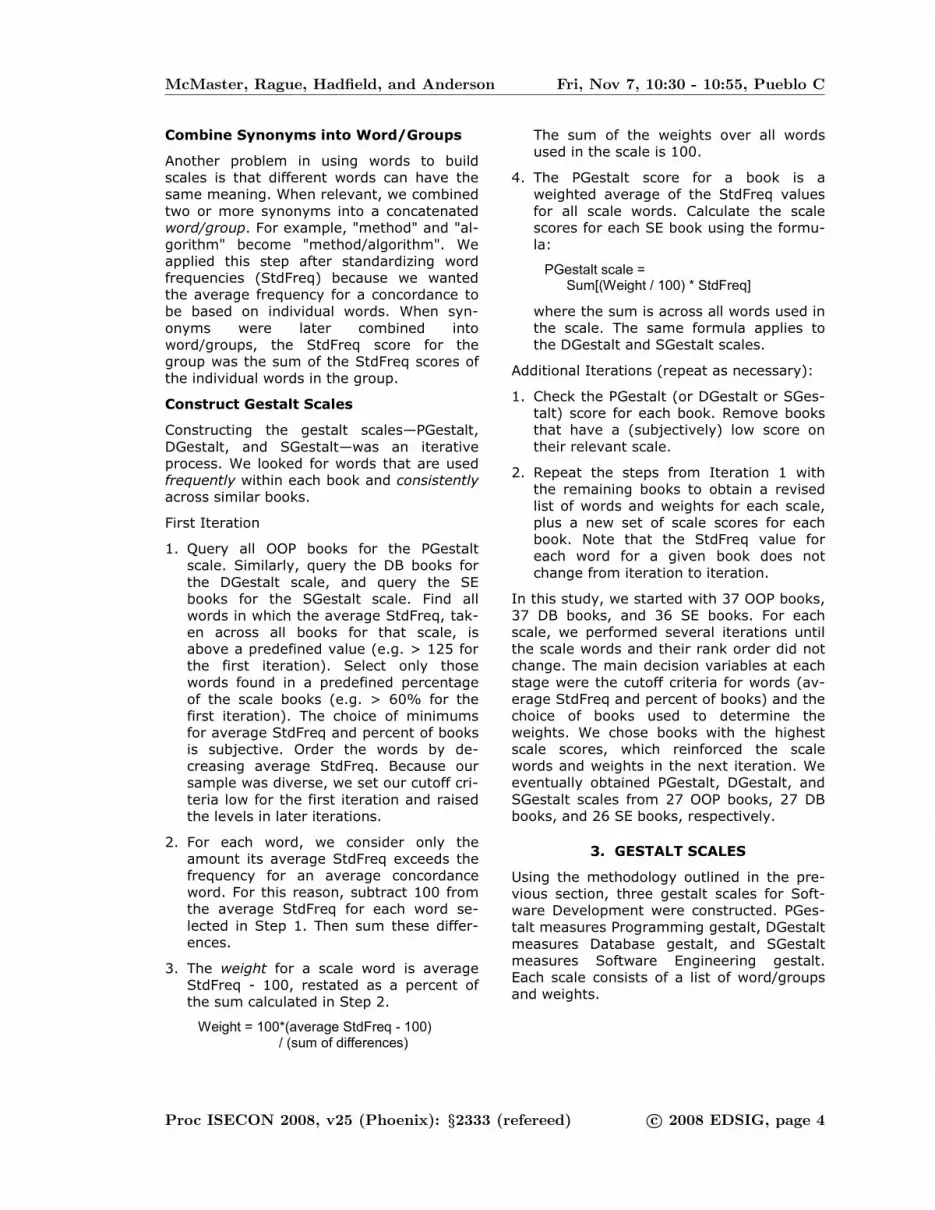
The PGestalt calculations for Craig's book,
which scored highest on this scale, are
shown in Table 4.
Only 10 of the PGestalt word/groups are in-
cluded in Craig's concordance. The three
most frequent word/groups are "class/ sub-
class", "method/algorithm", and "object",
each with a StdFreq value above 400. Two
other word/groups have StdFreq values
above 300. The PGestalt value of 402.6 can
be interpreted as follows: the weighted mix-
Proc ISECON 2008, v25 (Phoenix): §2333 (refereed) c© 2008 EDSIG, page 6
McMaster, Rague, Hadfield, and Anderson Fri, Nov 7, 10:30 - 10:55, Pueblo C
ture of scale words appears about 4.026
times more often than an average concor-
dance word in this book.
Table 4: PGestalt Calculations
Craig (2000) – Interpretation of OOP
Languages
Word/Group Weight StdFreq Scale
class/subclass 20.87 934.3 195.0
method/algorithm 13.78 544.3 75.0
object 10.29 400.4 41.2
code/program 10.14 202.5 20.5
function/procedure 7.99 315.2 25.2
value/variable 7.98 291.5 23.3
integer 4.89 -- --
public/private 4.81 44.1 2.1
type/datatype 4.08 380.9 15.5
string 3.80 -- --
statement/line 3.25 -- --
data/information 3.04 71.9 2.2
new 2.60 98.1 2.6
file 2.47 -- --
TOTAL 402.6
Because a gestalt score is a weighted aver-
age, two books with similar scores can have
different word frequency patterns. For ex-
ample, McMillan's book received the second
highest PGestalt score (394.1), even though
it included all 14 word/groups in its concor-
dance. The PGestalt calculations for this
book are shown in Table 5.
Table 5: PGestalt Calculations
McMillan (2004) – Object-Oriented
Programming with VB.NET
Word/Group Weight StdFreq Scale
class/subclass 20.87 765.5 159.8
method/algorithm 13.78 437.0 60.2
object 10.29 337.4 34.7
code/program 10.14 434.8 44.1
function/procedure 7.99 168.4 13.5
value/variable 7.98 248.2 19.8
integer 4.89 236.7 11.6
public/private 4.81 383.0 18.4
type/datatype 4.08 139.2 5.7
string 3.80 218.5 8.3
statement/line 3.25 128.8 4.2
data/information 3.04 314.3 9.6
new 2.60 131.0 3.4
file 2.47 36.3 0.9
TOTAL 394.1
The three most frequent word/groups used
by McMillan are "class/subclass", "method/
algorithm", and "code/ program", each with
a StdFreq value above 400. Three other
word/groups have StdFreq values above
300.
Craig's book has the same top two
word/groups as McMillan, but with larger
StdFreq values. Some word/groups in McMil-
lan's text have higher StdFreq values than
Craig, but the net effect is a slightly larger
PGestalt score for Craig.
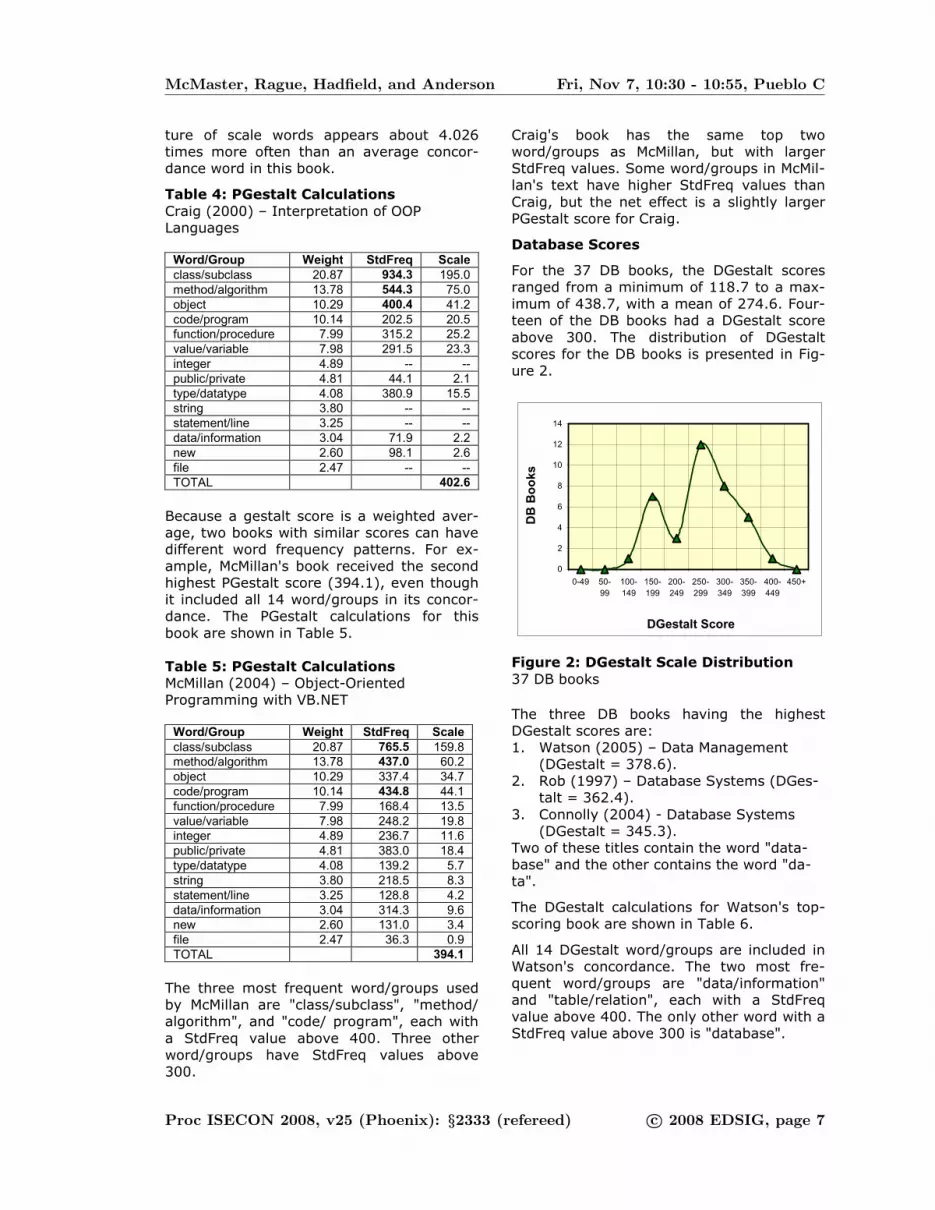
Database Scores
For the 37 DB books, the DGestalt scores
ranged from a minimum of 118.7 to a max-
imum of 438.7, with a mean of 274.6. Four-
teen of the DB books had a DGestalt score
above 300. The distribution of DGestalt
scores for the DB books is presented in Fig-
ure 2.
0
2
4
6
8
10
12
14
0-49 50-
99
100-
149
150-
199
200-
249
250-
299
300-
349
350-
399
400-
449
450+
DGestalt Score
DB Books
Figure 2: DGestalt Scale Distribution
37 DB books
The three DB books having the highest
DGestalt scores are:
1. Watson (2005) – Data Management
(DGestalt = 378.6).
2. Rob (1997) – Database Systems (DGes-
talt = 362.4).
3. Connolly (2004) - Database Systems
(DGestalt = 345.3).
Two of these titles contain the word "data-
base" and the other contains the word "da-
ta".
The DGestalt calculations for Watson's top-
scoring book are shown in Table 6.
All 14 DGestalt word/groups are included in
Watson's concordance. The two most fre-
quent word/groups are "data/information"
and "table/relation", each with a StdFreq
value above 400. The only other word with a
StdFreq value above 300 is "database".
Proc ISECON 2008, v25 (Phoenix): §2333 (refereed) c© 2008 EDSIG, page 7

McMaster, Rague, Hadfield, and Anderson Fri, Nov 7, 10:30 - 10:55, Pueblo C
Table 6: DGestalt Calculations
Watson (2005) – Data Management
Word/Group Weight StdFreq Scale
data/information 19.55 1115.6 218.1
table/relation 15.56 431.7 67.2
database 10.83 336.2 36.4
query/sql 7.68 237.5 18.2
entity/relationship 7.23 281.6 20.4
attribute/column/field 6.20 200.2 12.4
key/primary/foreign 5.54 267.9 14.8
system/subsystem 4.89 235.9 11.5
object 4.49 81.1 3.6
model/modeling 4.38 261.3 11.4
user/client/customer 4.15 227.8 9.5
record/row/tuple 4.03 217.4 8.8
value/variable 2.98 127.5 3.8
type/datatype 2.51 98.7 2.5
TOTAL 438.7
Software Engineering Scores
For the 36 SE books, the SGestalt scores
ranged from a minimum of 124.9 to a max-
imum of 394.7, with a mean of 257.2. Ten of
the SE books had an SGestalt score above
300. The distribution of SGestalt scores for
the SE books is shown in Figure 3.
0
2
4
6
8
10
12
0-49 50-
99
100-
149
150-
199
200-
249
250-
299
300-
349
350-
399
400-
449
450+
SGestalt Score
SE Books
Figure 3: SGestalt Scale Distribution
36 SE books
The three SE books having the highest
SGestalt scores are:
1. Thayer (2002) – Software Engineering,
Vol 1 (SGestalt = 394.7).
2. Bernstein (2005) – Trustworthy Systems
Through Quantitative Software Engineer-
ing (SGestalt = 370.7).
3. Hurley (1995) – Software Engineering
and Knowledge Engineering, Vol 4
(SGestalt = 364.6).
All of these titles include the words "software
engineering".
The SGestalt calculations for Thayer's book,
which scored highest on this scale, are
shown in Table 7.
Table 7: SGestalt Calculations
Thayer (2002) – Software Engineering,
Volume 1
Word/Group Weight StdFreq Scale
software 18.13 727.7 131.9
system/subsystem 15.85 550.8 87.3
process 10.77 190.0 20.5
data/information 8.69 263.0 22.9
code/program 6.93 382.3 26.5
requirement/ specification
6.81 419.3 28.6
test/testing 6.67 280.6 18.7
user/client/customer 6.49 219.2 14.2
develop/ development
6.41 296.7 19.0
project 5.63 124.3 7.0
design/designer 3.98 370.0 14.7
model/modeling 3.64 95.1 3.5
TOTAL 394.7
Thayer's concordance includes all 12 SGes-
talt scale word/groups. For Thayer, the most
frequent word/groups are "software", "sys-
tem/subsystem", and "requirement/ specifi-
cation", all with StdFreq values above 400.
Two additional word/groups have StdFreq
values above 300.
5. COMPARING GESTALTS
Each gestalt distribution was described in
Figures 1-3, but only for books in the cate-
gory used to construct the scale. That is, the
PGestalt distribution applied to OOP books,
DGestalt for DB books, and SGestalt for SE
books. In this section, we will examine the
gestalt distributions across all books, and
compare the gestalt scales with each other.
Comparing Scale Distributions
Table 8 presents mean values for each ges-
talt scale by book category and overall. For
example, the PGestalt scale for OOP books
had a mean of 294.8, whereas the PGestalt
means were much lower for DB books (mean
= 115.9) and SE books (mean = 95.6). The
mean scale values were largest when calcu-
lated for books in the relevant categories,
such as DGestalt for DB books and SGestalt
for SE books. Means for "non-relevant" book
categories were much lower.
Proc ISECON 2008, v25 (Phoenix): §2333 (refereed) c© 2008 EDSIG, page 8

McMaster, Rague, Hadfield, and Anderson Fri, Nov 7, 10:30 - 10:55, Pueblo C
Table 8: Gestalt Scale Distributions
Means by Book Category and Scale Type
Category PGestalt DGestalt SGestalt
OOP (37 books) 271.5 75.7 66.3
DB (37 books) 107.0 274.6 99.4
SE (36 books) 86.8 94.2 257.2
ALL (110 books) 155.7 148.6 139.9
The PGestalt scale for all 110 books had a
mean value of 155.7, whereas the DGestalt
mean was 148.6, and the SGestalt mean
was 139.9. One reason for the larger PGes-
talt mean is that object-oriented content
appears regularly in all book categories.
Not all books followed the pattern for their
category. There were six books that received
values greater than 200 on the "wrong"
scale. A summary of these special cases is
shown in Table 9.
Table 9: Gestalt Scale High Values
Count of books with scale values > 200.
Category PGestalt DGestalt SGestalt
OOP (37 books) 31 0 0
DB (37 books) 3 29 1
SE (36 books) 1 1 26
The six books with high values on the
"wrong" scale are:
1. Bancilhon (2006), Building an Object-
Oriented Database System. DB book.
DGestalt = 178.8, PGestalt = 305.3.
2. Zdonik (1989), Readings in Object-
Oriented Database Systems. DB book.
DGestalt = 262.3, PGestalt = 219.6.
3. Barry (1996), Object Database Hand-
book. DB book.
DGestalt = 196.6, PGestalt = 206.5.
4. Kimball (1998), Data Warehouse Life-
cycle Toolkit. DB book.
DGestalt = 334.7, SGestalt = 205.3.
5. Demeyer (2002), Object-Oriented Re-
engineering Patterns. SE book.
SGestalt = 219.7, PGestalt = 207.7.
6. Dennis (2005), Systems Analysis and
Design. SE book.
SGestalt = 292.7, DGestalt = 216.1.
These exceptions are instructive. Three of
the DB books and one of the SE books deal
with object-oriented concepts and applica-
tions. Bancilhon's DB book may have been
misclassified, but the other books with high
PGestalt scores demonstrate that object-
oriented principles extend beyond Program-
ming books.
Conversely, three OOP books had SGestalt
scores above 175. This suggests that Soft-
ware Engineering principles can be meaning-
fully integrated within a Programming text.
Correlations Between Scales
Correlation coefficients between pairs of ges-
talt scales are summarized in Table 10. For
each pair, two correlation values are
shown—one for all books and the other li-
mited to book categories "relevant" to either
scale.
For example, the correlation between PGes-
talt and DGestalt scores is –0.392 across the
entire sample of 110 books. If SE books are
omitted, the correlation increases in magni-
tude to –0.769, which is a much stronger
negative relationship. This correlation is
larger because most SE books have consis-
tently low PGestalt and DGestalt scores.
Table 10: Gestalt Scale Correlations
All books and selected categories.
Scale Pairs Books Correlation
PGestalt x DGestalt All -0.392
OOP+DB -0.769
PGestalt x SGestalt All -0.533
OOP+SE -0.775
DGestalt x SGestalt All -0.079
DB+SE -0.518
The correlation between PGestalt and DGes-
talt scores is displayed as a scatter plot in
Figure 4. The negative relationship between
the two scales is evident in the diagram. It is
also apparent why the relationship is strong-
er when the SE books are excluded. As a
side note, this plot shows the 3 DB books
and 1 SE book (mentioned earlier) that have
PGestalt scores above 200.
Scatter plots of PGestalt vs. SGestalt and
DGestalt vs. SGestalt show a pattern similar
to Figure 4. Again, low scores of the "nonre-
levant" category (DB or OOP) on both scales
reduce the size of the correlation when com-
puted across all books.
Proc ISECON 2008, v25 (Phoenix): §2333 (refereed) c© 2008 EDSIG, page 9
McMaster, Rague, Hadfield, and Anderson Fri, Nov 7, 10:30 - 10:55, Pueblo C
0
50
100
150
200
250
300
350
400
450
0 50 100 150 200 250 300 350 400 450
PGestalt
DGestalt
PG DB SE
Figure 4: PGestalt vs.DGestalt
Scatter plot of books by category.
Gestalt Mixtures
Scatter plots are usually intended to show
two-dimensional patterns in data. There are
several ways to display three scales simulta-
neously, including three-dimensional plots.
We prefer to show the pattern of gestalt
scores for each book in another way.
We can focus on which gestalt predominates
within a book by converting each of the
book's three gestalt scores to a percent, so
that the sum is 100. The three percentages
can be viewed as a mixture of the three ges-
talts for the book. For example, suppose the
gestalt scores for a book are PGestalt = 257,
DGestalt = 135, and SGestalt = 58 (sum =
450). Converting these gestalt scores to
percentages, we get the mixture PGestalt =
57.1%, DGestalt = 30.0%, and SGestalt =
12.9%. (Note that if the three gestalt scores
were doubled, the percentages would be
unchanged.)
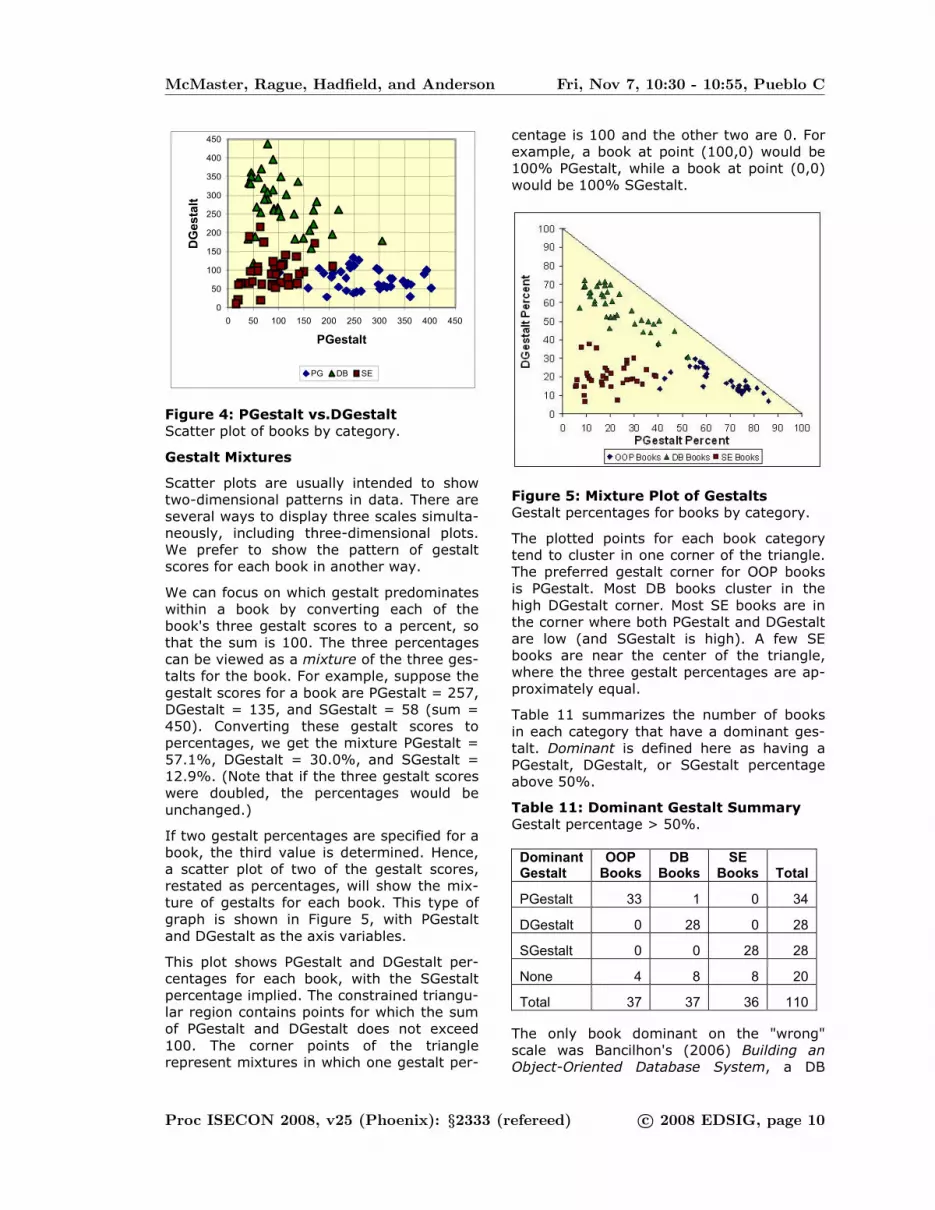
If two gestalt percentages are specified for a
book, the third value is determined. Hence,
a scatter plot of two of the gestalt scores,
restated as percentages, will show the mix-
ture of gestalts for each book. This type of
graph is shown in Figure 5, with PGestalt
and DGestalt as the axis variables.
This plot shows PGestalt and DGestalt per-
centages for each book, with the SGestalt
percentage implied. The constrained triangu-
lar region contains points for which the sum
of PGestalt and DGestalt does not exceed
100. The corner points of the triangle
represent mixtures in which one gestalt per-
centage is 100 and the other two are 0. For
example, a book at point (100,0) would be
100% PGestalt, while a book at point (0,0)
would be 100% SGestalt.
Figure 5: Mixture Plot of Gestalts
Gestalt percentages for books by category.
The plotted points for each book category
tend to cluster in one corner of the triangle.
The preferred gestalt corner for OOP books
is PGestalt. Most DB books cluster in the
high DGestalt corner. Most SE books are in
the corner where both PGestalt and DGestalt
are low (and SGestalt is high). A few SE
books are near the center of the triangle,
where the three gestalt percentages are ap-
proximately equal.
Table 11 summarizes the number of books
in each category that have a dominant ges-
talt. Dominant is defined here as having a
PGestalt, DGestalt, or SGestalt percentage
above 50%.
Table 11: Dominant Gestalt Summary
Gestalt percentage > 50%.
Dominant Gestalt
OOP Books
DB Books
SE Books
Total
PGestalt 33 1 0 34
DGestalt 0 28 0 28
SGestalt 0 0 28 28
None 4 8 8 20
Total 37 37 36 110
The only book dominant on the "wrong"
scale was Bancilhon's (2006) Building an
Object-Oriented Database System, a DB
Proc ISECON 2008, v25 (Phoenix): §2333 (refereed) c© 2008 EDSIG, page 10

McMaster, Rague, Hadfield, and Anderson Fri, Nov 7, 10:30 - 10:55, Pueblo C
book having a PGestalt percentage value of
52.4%. A total of 20 books were not domi-
nant on any scale.
Each book can be viewed as providing a mix-
ture of the three gestalts. For 90 of the
sample books, one gestalt is dominant.
Choosing a Textbook
An instructor choosing a textbook for a soft-
ware development course can use gestalt
scores as a tool to make the selection
process more efficient. The application is
similar to using a gas chromatograph to ana-
lyze an unknown substance to determine its
composition. In this case the textbook is the
unknown (since the title often provides only
a vague idea of the focus of the book), and
the scales are used to measure its gestalt
components.
As an example, suppose McConnell's (2004)
Code Complete is being considered for a
Software Engineering course. The SGestalt
score for this book is 185.4. The detailed
SGestalt calculations are shown in Table 12.
Table 12: SGestalt Calculations
McConnell (2004) – Code Complete
Word/Group Weight StdFreq Scale
software 18.13 183.1 33.2
system/subsystem 15.85 107.7 17.1
process 10.77 50.1 5.4
data/information 8.69 303.3 26.4
code/program 6.93 915.4 63.4
requirement/ specification
6.81 65.2 4.4
test/testing 6.67 223.6 14.9
user/client/customer 6.49 -- --
develop/ development
6.41 76.6 4.9
project 5.63 148.4 8.4
design/designer 3.98 185.2 7.4
model/modeling 3.64 -- --
TOTAL 185.4
Ten of the 12 SGestalt word/groups appear
in the concordance. The most frequent
word/group is "code/program", having a
StdFreq value of 915.4. This word/group is
on both the SGestalt and PGestalt scales.
Other SGestalt word/groups with StdFreq
values above 200 include "data/information"
and "test/testing". The word frequencies in
Table 12 indicate that this book places more
emphasis on the implementation stage of
software development than the analysis and
design stages.
Gestalt scores expressed as percentages are
PGestalt = 42.7%, SGestalt = 38.1%, and
DGestalt = 19.2%. This mixture does not
have a dominant gestalt, but it does exhibit
more Programming gestalt than Software
Engineering gestalt.
Using this analysis, we would not recom-
mend Code Complete as the primary text-
book for a Software Engineering course, but
it would provide worthwhile supplemental
reading.
6. SUMMARY AND CONCLUSIONS
The primary purpose of this study was to
develop measuring instruments for three
mental frameworks, or gestalts, in software
development. Programming Gestalt is based
on writing object-oriented programs. Data-
base Gestalt is based on designing, imple-
menting, and maintaining databases. Soft-
ware Engineering Gestalt is based on build-
ing large, complex software systems.
From a diverse sample of 37 object-oriented
programming (OOP) books, 37 database
(DB) books, and 36 software engineering
(SE) books, we examined the 100 most fre-
quently used words in each book. Weighted
combinations of selected word/groups were
used to form a Programming gestalt scale
(PGestalt), a Database gestalt scale (DGes-
talt), and a Software Engineering gestalt
scale (SGestalt).
Our PGestalt scale contains 14 word/groups,
including "class/subclass", "object", and
"method/algorithm". The DGestalt scale has
14 word/groups, including "table/relation",
"data/information", and "database". The
SGestalt scale consists of 12 word/groups,
including "software", "system/subsystem",
and "process".
We calculated PGestalt, DGestalt, and SGes-
talt scores for the sample books and ex-
amined the distributions of these values. The
PGestalt scores for the 37 OOP books ranged
from 101.1 to 402.6. The DGestalt scores for
the 37 DB books ranged from 118.7 to
438.7. For the 36 SE books, the SGestalt
scores ranged from 124.9 to 394.7.
Fourteen OOP books had a PGestalt score
above 300. The DGestalt scores for 14 DB
books and the SGestalt scores for 10 SE
books also exceeded 300. Six books had
high gestalt scores on the "wrong" scale,
Proc ISECON 2008, v25 (Phoenix): §2333 (refereed) c© 2008 EDSIG, page 11

McMaster, Rague, Hadfield, and Anderson Fri, Nov 7, 10:30 - 10:55, Pueblo C
indicating that at least one book may have
been misclassified, or that books can sup-
port more than one gestalt.
Correlations between pairs of gestalt scales
were negative. The size of a correlation was
increased substantially when books in the
"non-relevant" category were excluded from
the calculations (e.g. PGestalt x SGestalt
correlation = –0.775 for OOP and SE books).
Converting the gestalt scores to percentages
within a book allows the book to be viewed
as a mixture of gestalts. Ninety of the 110
books had a dominant gestalt, which (with
one exception) was on the scale relevant to
the book's category (e.g. PGestalt for OOP
books).
When choosing a textbook, it is important to
ensure that the dominant gestalt aligns with
the primary objectives of the course. Books
that contain an evenly balanced mixture of
PGestalt, DGestalt, and SGestalt may not be
suitable for courses focusing heavily on a
specific type of software development. How-
ever, these books may work well in seminar
settings or capstone courses that integrate
the different areas of software development.
The words used by an author in composing a
book about a specific subject reflect the
perspective, or predominant “mental model”,
of the author towards that subject. The
word/groups used in the gestalt scales of
this paper attempt to categorize the implicit
priorities that authors place on subtopics
within the broader subject area.
An instructor is best served by selecting
textbooks containing words that correspond
to the disciplines of enrolled students. In
this way, terminology employed during
classroom discussion will be supported by
words used in reading assignments, thus
reinforcing the development of the student’s
internal model of the subject matter.
Future Research
This paper introduced three measuring in-
struments for gestalts in software develop-
ment books, and presented an initial analy-
sis of statistical patterns for these measures.
In future research, we will focus on the
meaning of each gestalt for software devel-
opment courses and examine more closely
the relationships among scale words. We will
also explore different ways to visualize the
"whole" gestalt as more than the sum of the
individual words.
As part of our continuing research, we in-
tend to relate the PGestalt, DGestalt, and
SGestalt scales to the Logical Math and
Computational Math scales we developed in
a previous study (McMaster, 2007). One
reason for this comparison is to see which
Math gestalt is more "in tune" with mental
frameworks for software development.
A long-term goal is to establish ways to suc-
cessfully blend mathematical concepts into
software development courses. For example,
on the Computational Math scale, "method/
algorithm" is an important word/group. This
word/group has a large weight on the PGes-
talt scale. Therefore, a natural place to in-
troduce mathematical concepts in a Pro-
gramming course is when algorithms are
discussed.
7. REFERENCES
Bain, Ken (2004), What the Best College
Teachers Do. Harvard University Press.
Bancilhon, Francois, et al (2006), Building
and Object-Oriented Database System:
The Story of O2. Morgan Kaufmann.
Barry, Douglas (1996), Object Database
Handbook. Wiley.
Bernstein, Lawrence, and C. Yuhas (2005),
Trustworthy Systems Through Quantita-
tive Software Engineering. Wiley.
Connolly, Thomas, and Carolyn Begg (2004),
Database Systems. Addison-Wesley.
Craig, Iain (2000), The Interpretation of Ob-
ject-Oriented Programming Languages.
Springer.
DeMeyer, Serge, et al (2002), Object-
Oriented Reengineering Patterns. Morgan
Kaufmann.
Dennis, Alan, et al (2005), Systems Analysis
and Design. Wiley.
Donald, Janet (2002), Learning to Think.
Jossey-Bass.
Fry, Edward, et al (1993), The Reading
Teacher's Book of Lists (3rd ed). Center
for Applied Research in Education.
Hurley, W. (1995), Software Engineering
and Knowledge Engineering, Vol 4.
World Scientific.
Proc ISECON 2008, v25 (Phoenix): §2333 (refereed) c© 2008 EDSIG, page 12

McMaster, Rague, Hadfield, and Anderson Fri, Nov 7, 10:30 - 10:55, Pueblo C
Kimball, Ralph, et al (1998), Data Warehouse
Lifecycle Toolkit. Wiley.
Knuth, Donald (2008), "Donald Knuth: A
Life's Work Interrupted." Communications
of the ACM, Vol. 51, No. 8.
Lavin, Peter (2006), Object–Oriented PHP.
No Starch Press.
McConnell, Steve (2004), Code Complete.
Microsoft Press.
McMaster, Kirby, et al (2007), "Two Gestalts
for Mathematics: Logical vs. Computa-
tional." Proceedings of ISECON 2007,
Vol. 24.
McMillan, Michael (2004), Object-Oriented
Programming with Visual Basic .NET.
Cambridge University Press.
Polya, G. (1945), How To Solve It. Princeton
University Press.
Rob, Peter, and Carlos Coronel (1997), Data-
base Systems: Design, Implementation,
and Management. Course Technology.
Sommerville, Ian (2004), Software Engineer-
ing. Addison-Wesley.
Thayer, Richard, and Mark Christensen
(2002), Software Engineering: Volume 1.
Wiley.
Ullman, Jeffrey, and Jennifer Widom (2008),
A First Course in Database Systems.
Prentice Hall.
Watson, Richard (2005), Data Management:
Databases & Organizations. Wiley.
Zdonik, Stanley, and David Maier (1989),
Readings in Object-Oriented Database
Systems. Morgan Kaufmann.
Proc ISECON 2008, v25 (Phoenix): §2333 (refereed) c© 2008 EDSIG, page 13