this thesis has been submitted in fulfilment of the ... - core
TRANSCRIPT

This thesis has been submitted in fulfilment of the requirements for a postgraduate degree
(e.g. PhD, MPhil, DClinPsychol) at the University of Edinburgh. Please note the following
terms and conditions of use:
• This work is protected by copyright and other intellectual property rights, which are
retained by the thesis author, unless otherwise stated.
• A copy can be downloaded for personal non-commercial research or study, without
prior permission or charge.
• This thesis cannot be reproduced or quoted extensively from without first obtaining
permission in writing from the author.
• The content must not be changed in any way or sold commercially in any format or
medium without the formal permission of the author.
• When referring to this work, full bibliographic details including the author, title,
awarding institution and date of the thesis must be given.

Investigation of key non-coding and coding genes
in cutaneous melanomagenesis
Yan Xu
Thesis presented for the degree of PhD
The University of Edinburgh
2011

i
Declaration
I hereby declare that this thesis has been composed by me and it has not been
accepted in any previous applications for a degree at this time or at any other
university. The work described has been performed by me, except where expressly
indicated otherwise. All sources of information have been specifically
acknowledged.

ii
Acknowledgements
First and foremost, I would like to express my deepest and sincerest gratitude to my
first supervisor, Professor David Melton, for his immense knowledge and
enthusiasm. His great patience, understanding and encouragement have provided a
good basis for the present thesis. I have also been touched for his all-out efforts to
help me out of an unexpected circumstance. Moreover, I am truly grateful to my
second supervisor, Jim Selfridge, for his short but unforgettable teaching for the first
three months in my PhD life and for his constructive comments throughout this
work. The financial support from CSC is also acknowledged.
I would also like to thank the following people that have given me help generously:
Professor David Harrison and Susan Farrington who have given instructive
suggestions in my committee meetings, Thomas Brenn who helped to identify and
mark the specific area on FFPE samples which was very crucial for my PhD project,
Bob Morris and Helen Caldwell who helped greatly in sample sectioning, coring and
staining, Frances Rae for her experience in macrodissection, Rob Kitchen who
helped me to use R language. I owe a big thanks to all those in the Melton lab past
and present, particularly Ann-Marie Ritchie, Ewan Brown, Ewan McNeil, Liang
Song and Weiling Li who have helped me greatly with too many things to mention.
It is also a pleasure to thank but apologize to other IGMM researchers and laboratory
assistants not mentioned here specifically for their equally important help and
contributions. My many thanks are given to PhD students and friends as well for
making my life in Edinburgh more than colourful.
Finally, I am indebted to my family, especially to my beloved husband Kailai Yan
and my parents. Without their continued love and self-sacrifices it would not have
been possible for me to finish this thesis.

iii
Table of contents
DECLARATIONS…………………………………………………………………...i
ACKNOWLEDGEMENTS..…………………………………………………….....ii
TABLE OF CONTENTS..…………………………………………………………iii
LIST OF FIGURES……………………………………………………………….ix
LIST OF TABLES…………………………………………………………………xii
ABSTRACT………………………………………………………………………xiv
ABBREVIATIONS…………………………………………………………..........xvi
CHAPTER 1: INTRODUCTION…………………………………………………..1
1.1 Cutaneous melanoma…………………………………………………………….2
1.1.1 Introduction to melanocytes and effects of ultraviolet radiation………………2
1.1.2 Melanoma epidemiology, classification, aetiology, and prevention…………...6
1.1.3 Melanoma diagnosis and staging………………………………………………8
1.1.4 Diagnostic and prognostic markers in melanoma…………………………….11
1.1.5 Melanoma management……………………………………………………....12
1.1.5.1 Sentinel lymph node biopsy………………………………………………...12
1.1.5.2 Current treatment…………………………………………………………...13
1.1.6 Genetic and environmental interactions in melanoma progression…………..14
1.1.6.1 Mutations in MAPK pathway………………………………………………15
1.1.6.2 PI3K/AKT pathway………………………………………………………...18
1.1.6.3 MITF and melanocyte differentiation……………………………………….19
1.1.6.4 Cell adhesion and invasion…………………………………………………21
1.1.6.5 Other genes and signalling networks involved in melanoma………………22
1.1.7 Prospects for new therapies…………………………………………………..25
1.2 microRNAs……………………………………………………………………..26
1.2.1 General introduction to non-coding genes…………………………………....26
1.2.2 History and biogenesis of microRNAs……………………………………….28
1.2.3 Regulation of microRNAs……………………………………………………33

iv
1.2.3.1 microRNA editing………………………………………………...................33
1.2.3.2 microRNA and SNPs……………………………………………………......34
1.2.3.3 microRNA and epigenetics………………………………….........................34
1.2.4 Functions of microRNAs……………………………………………………...36
1.2.5 Detection of microRNAs……………………………………………………...37
1.2.6 Identification of microRNA targets…………………………………………...38
1.2.7 microRNA and cancer…………………………………………………………39
1.2.7.1 Association with genomic alterations……………………………………….39
1.2.7.2 microRNA related SNPs…………………………………………………….40
1.2.7.3 In epigenetics………………………………………………………………..41
1.2.7.4 Dysregulation in tumourigenic pathways…………………………………...42
1.2.7.5 In stem cell activation……………………………………………………….45
1.2.7.6 Clinical applications…………………………………………………………45
1.3 Summary and aims………………………………………………………………47
CHAPTER 2: MATERIALS AND METHODS……………………………….49
2.1 Materials………………………………………………………………………...50
2.1.1 General reagents and plastic consumables…………………………………….50
2.1.2 DNA isolation reagents………………………………………………………..50
2.1.3 RNA isolation reagents………………………………………………………..51
2.1.4 PCR reagents and oligonucleotides…………………………………………...51
2.1.5 Gel electrophoresis reagents…………………………………………………..53
2.1.6 Illumina microRNA microarray……………………………………………….54
2.1.7 Protein detection reagents and antibodies……………………………………..54
2.1.8 Mammalian cell lines and cell culture reagents……………………………….55
2.1.9 Human tissue samples…………………………………………………………59
2.1.10 Macrodissection reagents and materials……………………………………..60
2.1.11 Equipment and software……………………………………………………..60
2.2 Methods………………………………………………………………………….62
2.2.1 DNA isolation and DNA based experiments………………………………….62
2.2.2 RNA isolation and RNA based experiments………………………………….66
v
2.2.3 Protein extraction and protein detection………………………………………71
2.2.4 Cell culture and cell based experiments……………………………………….72
2.2.5 Statistics……………………………………………………………………….79
Chapter 3: EXPRESSION SCREEN FOR MELANOMA-SPECIFIC MICRO-
RNAS IN FFPE TISSUES…………………………………………………………81
3.1 Introduction……………………………………………………………………...82
3.2 Results…………………………………………………………………………...88
3.2.1 Pilot qRT-PCR in cultured cells and FFPE tissues……………………………88
3.2.2 High throughput screen of melanoma-specific microRNAs………………......90
3.2.2.1 Sample preparation and processing of Illumina microRNA microarray……90
3.2.2.2 Quality control of Illumina microRNA microarray…………………………92
3.2.2.3 Data analysis of Illumina microRNA microarray…………………………...95
3.2.2.4 Overview of hierarchical clustering…………………………………………97
3.2.2.5 Melanoma-specific microRNA expression profile………………………….99
3.2.3 TaqMan qRT-PCR verification………………………………………………105
3.2.3.1 Amplification efficiency of target microRNAs……………………………105
3.2.3.2 Verification of target microRNAs in FFPE melanocytic specimens………106
3.2.3.3 Expression of microRNAs in additional classes of melanocytic lesions…..108
3.3 Discussion……………………………………………………………………...111
CHAPTER 4: FUNCTIONAL STUDIES OF SPECIFIC MICRORNAS IN
MELANOMA CELLS……………………………………………………………119
4.1 Introduction…………………………………………………………………….120
4.1.1 Roles of microRNAs in cell proliferation and apoptosis…………………….120
4.1.2 Roles of microRNAs in tumour metastasis…………………………………..122
4.1.3 The miR-200 family, EMT and melanoma…………………………………..124
4.1.4 Roles of microRNAs in melanoma…………………………………………127
4.2 Results………………………………………………………………………….130
4.2.1 Physiological expression levels of microRNAs in cell lines………………...130
vi
4.2.2 Optimization of transfection efficiency……………………………………...132
4.2.3 Time course………………………………………………………….……….133
4.2.4 Functional studies for miR-205 and miR-200c…………….…………...……134
4.2.4.1 Expression level changes following transfection of miR-200c and miR-205
precursors…….………………………………………………………………….....134
4.2.4.2 Cell cycle assay………………………………………….………………....136
4.2.4.3 Cell proliferation assay………………………………………………….....137
4.2.4.4 Transwell migration assay………………………………………………....138
4.2.4.5 Methylcellulose colony formation ………………….…………...………...139
4.2.4.6 Study of miR-200c and miR-205 target genes……………………………..142
4.2.4.6.1 Validation experiment on qPCR assays for ZEB2, E-cadherin and N-
cadherin…………………………………………………………………………….142
4.2.4.6.2 ZEB2, E-cadherin and N-cadherin mRNA levels changes….…………...142
4.2.4.6.3 E-cadherin protein level changes………………………………………...146
4.2.4.7 Effects of miR-200c overexpression on sensitivity of melanoma cells to
cisplatin…………………………………………………………………………….147
4.2.5 Functional studies for miR-211……………………………………………...148
4.2.5.1 Expression level changes following transfection of miR-211 precursor…..148
4.2.5.2 Cell cycle assay…………………………………………………………….149
4.2.5.3 Cell proliferation assay…………………………………………………….149
4.2.5.4 Transwell migration assay…………………………………………………150
4.2.5.5 Methylcellulose colony formation assay…………………………………..152
4.2.6 Functional studies for miR-20b……………………………………………...154
4.2.6.1 Expression level changes following transfection of miR-20b inhibitor…...154
4.2.6.2 Cell cycle assay…………………………………………………………….155
4.2.6.3 Cell proliferation assay…………………………………………………….155
4.2.6.4 Transwell migration assay…………………………………………………156
4.2.6.5 Methylcellulose colony formation assay…………………………………..157
4.3 Discussion……………………………………………………………………...159

vii
CHAPTER 5: ROLE OF THE BRAF V600E MUTATION IN MELANOMA-
GENESIS………………………………………………………………………….164
5.1 Introduction…………………………………………………………………….165
5.2 Results………………………………………………………………………….168
5.2.1 BRAF V600E mutation frequency in melanoma tissues…………………….168
5.2.1.1 BRAF V600E mutation assay……………………………………………...168
5.2.1.2 Sensitivity of genotyping method………………………………………….170
5.2.1.3 Frequency of the BRAF V600E mutation in melanoma samples………….171
5.2.2 Statistical analysis of the BRAF V600E mutation in primary melanoma…...172
5.2.2.1 BRAF V600E mutation and age…………………………………………...172
5.2.2.2 BRAF V600E mutation and gender………………………………………..173
5.2.2.3 BRAF V600E mutation and Breslow thickness……………………………174
5.2.2.4 BRAF V600E mutation and ulceration…………………………………….175
5.2.2.5 BRAF V600E mutation and solar elastosis………………………………..176
5.2.2.6 BRAF V600E mutation and pigmentation…………………………………177
5.2.3 Prognostic evaluation of the BRAF V600E mutation………………………..178
5.2.3.1 Survival analysis…………………………………………………………...178
5.2.3.2 Time to melanoma relapse…………………………………………………179
5.3 Discussion……………………………………………………………………...181
CHAPTER 6: SUMMARY………………………………………………………186
6.1 General discussion…………………………………………………………….187
6.2 Future work……………………………………………………………………190
REFERENCES……………………………………………………………………192
APPENDIX 1……………………………………………………………………...227
APPENDIX 2……………………………………………………………………...229
APPENDIX 3……………………………………………………………………. .230

viii
APPENDIX 4……………………………………………………………………...235
APPENDIX 5………………………………………………...……………………238

ix
List of figures
Figure 1.1 The Clark model along with the relevant biological events and molecular
changes in melanoma progression…………………………………………………..17
Figure 1.2 Intersected functions of MAPK and PI3K signalling pathways…………19
Figure 1.3 Key signalling pathways in human melanoma pathogenesis…................24
Figure 1.4 Biogenesis of microRNAs……………………………………………….32
Figure 1.5 Epigenetic-microRNA regulatory circuit…………………………….....35
Figure 1.6 Structure of locked nucleic acid ………………...………………………38
Figure 2.1 The 3D confocal microscope scanning model…………………………78
Figure 3.1 The workflow of TaqMan qRT-PCR………………………………...….85
Figure 3.2 The workflow of the microRNA microarray……………………..……...92
Figure 3.3 Summary of Illumina microRNA microarray control data………….......94
Figure 3.4 miR-92 average signal intensities of all groups of cell and tissue samples
on the microarray………………………………………………………………........96
Figure 3.5 Hierarchical clustering of microRNA expression patterns in the micro-
array…………………………………………………………………………………98
Figure 3.6 Relationship between differentially expressed microRNAs shown in Table
3.3…………………………………………………………………………..............103
Figure 3.7 Expression of microRNAs in FFPE samples on the microarray...…….103
Figure 3.8 Different microRNA expression levels during melanoma progression.107
Figure 3.9 microRNA expression levels between non-recurrent and recurrent primary
melanoma samples………………………………………………………………108
Figure 3.10 Expression of microRNAs in various melanocytic lesions…………...110
Figure 4.1 The network of aberrant microRNAs and their target genes in cancer...122
Figure 4.2 The schematic model for a feedback loop between the miR-200 family
and ZEB1/ZEB2 in switching the EMT-MET process……………………………123
Figure 4.3 Chromosomal locations of the members in the miR-200 family in the
human genome……………………………………………………………………..125
Figure 4.4 The schematic model of ZEB1 binding sites for the miR-200c stem
loop………………………………………………………………………………...125
Figure 4.5 Expression levels of selected miRNAs in cell lines……………………130
x
Figure 4.6 Phenotypic comparison in negative control, scramble and miR-200c and
miR-205 precursor transfected A375 melanoma cells……………………………135
Figure 4.7 Comparison of cell growth in negative control, scramble and miR-200c
and miR-205 precursor transfected A375 melanoma cells………………………137
Figure 4.8 Comparison of invasive ability in negative control, scramble and miR-
200c and miR-205 precursor transfected A375 melanoma cells…………………138
Figure 4.9 Comparison of colony formation in negative control, scramble and miR-
200c and miR-205 precursor transfected A375 melanoma cells…………………140
Figure 4.10 Comparison of ZEB2 expression in negative control, scramble and miR-
200c and miR-205 precursor transfected A375 melanoma cells…………………143
Figure 4.11 Comparison of E-cadherin and N-cadherin expression in negative
control, scramble and miR-200c precursor transfected A375 melanoma cells…..145
Figure 4.12 E-cadherin protein levels in melanoma cells and melanocytes……….146
Figure 4.13 Cisplatin sensitivity of negative control, scramble and miR-200c
precursor transfected A375 melanoma cells……………………………………….147
Figure 4.14 Comparison of cell growth in negative control, scramble and miR-211
precursor transfected A375 melanoma cells……………………………………….150
Figure 4.15 Comparison of invasive ability in negative control, scramble and miR-
211 precursor transfected A375 melanoma cells…………………………………151
Figure 4.16 Comparison of colony formation in negative control, scramble and miR-
211 precursor transfected A375 melanoma cells…………………………………153
Figure 4.17 Comparison of cell growth in negative control, scramble and miR-20b
inhibitor transfected A375 melanoma cells………………………………………156
Figure 4.18 Comparison of invasive ability in negative control, scramble and miR-
20b inhibitor transfected A375 melanoma cells…………………………………157
Figure 4.19 Comparison of colony formation in negative control, scramble and miR-
20b inhibitor transfected A375 melanoma cells…………………………………158
Figure 5.1 BRAF PCR RFLP analysis…………………………………………….169
Figure 5.2 BRAF V600E RFLP assay…………………………………………….171
Figure 5.3 Comparison of the BRAF V600E mutation and overall survival in
melanoma patients…………………………………………………………………179

xi
Figure 5.4 Comparison of the BRAF V600E mutation and melanoma specific
survival in melanoma patients……………………………………………………..180
Figure 5.5 Comparison of the BRAF V600E mutation and melanoma relapse……180
xii
List of tables
Table 1.1 AJCC TNM staging system 7th edition (2010): TNM categories…………9
Table 1.2 AJCC TNM stage with 5 year and 10 year overall survival rates of
melanoma patients…………………………………………………………………..10
Table 1.3 Summary of simplified representation of ncRNAs and their roles……….28
Table 3.1 Expression of microRNAs in cultured cells…...........................................89
Table 3.2 Expression of microRNAs in primary FFPE melanoma tissues………….90
Table 3.3 Differentially expressed microRNAs in benign naevi, primary and
metastatic melanoma FFPE tissues………………………………………………...101
Table 3.4 Comparison of the standard curve method and the ΔΔCt method……105
Table 3.5 Summary of overlapping miRNAs between the literature and my array
results………………………………………………………………………………116
Table 4.1 Sequence alignment of microRNAs of the miR-200 family…………….125
Table 4.2 Summary of melanoma related microRNAs…………………………...128
Table 4.3 Optimization of transfection conditions………………………………132
Table 4.4 Decay of transfected microRNAs over a three-day time course………..133
Table 4.5 Comparison of microRNA expression in negative control, scramble and
miR-200c and miR-205 precursor transfected A375 melanoma cells……………..135
Table 4.6 Cell cycle comparison in negative control, scramble and miR-200c and
miR-205 precursor transfected A375 melanoma cells……………………………..136
Table 4.7 Comparison of microRNA expression in negative control, scramble and
miR-211 precursor transfected A375 melanoma cells……………………………..149
Table 4.8 Cell cycle comparison in negative control, scramble and miR-211
precursor transfected A375 melanoma cells……………………………………….149
Table 4.9 Comparison of microRNA expression in negative control, scramble and
miR-20b inhibitor transfected A375 melanoma cells……………………………...155
Table 4.10 Cell cycle comparison in negative control, scramble and miR-20b
inhibitor transfected A375 melanoma cells……………………………………….155
Table 5.1 BRAF V600E mutational status in melanoma samples…………………172
Table 5.2 Comparison of the BRAF V600E mutation and age in primary melanoma
patients……………………………………………………………………………..173

xiii
Table 5.3 Comparison of the BRAF V600E mutation and gender in primary
melanoma patients………………………………………………………………....174
Table 5.4 Comparison of the BRAF V600E mutation and melanoma lesion thickness
in primary melanoma patients……………………………………………………..174
Table 5.5 Comparison of the BRAF V600E mutation and ulceration in primary
melanoma patients…………………………………………………………………175
Table 5.6 Comparison of the BRAF V600E mutation and solar elastosis in primary
melanoma patients…………………………………………………………………176
Table 5.7 Comparison of the BRAF V600E mutation and pigmentation in primary
melanoma patients…………………………………………………………………177
Table 5.8 Data for survival and time to relapse analysis…………………..………178
Table 5.9 Summary of primary melanoma BRAF V600E mutation frequencies in
publications………………………………………………………………………...182
xiv
Abstract
Cutaneous melanoma is associated with significant morbidity and mortality
representing the most significant cutaneous malignancy. As it is known that early
diagnosis and treatment are the most efficient approaches to cure cutaneous
melanoma, an improved understanding of the molecular pathogenesis of melanoma
and exploration of more reliable molecular biomarkers are particularly essential. Two
different types of molecular biomarker for melanoma have been investigated in this
thesis.
microRNAs (miRNAs) are single-stranded RNA molecules of 20-23 nucleotides in
length that are found in both animal and plant cells. miRNAs are involved in the
RNA interference (RNAi) machinery to regulate gene expression
posttranscriptionally. miRNAs have important roles in cancer: by controlling the
expression level of their target genes they can affect cell signalling pathways and
have been shown to have both prognostic and therapeutic potential. Importantly for
melanoma research, reproducible miRNA expression profiles from formalin-fixed
paraffin-embedded (FFPE) tissues can be obtained that are comparable to those from
fresh-frozen samples.
The aims of the miRNA project were: first, to identify a melanoma-specific miRNA
expression profile; secondly, to investigate roles of some of the melanoma-specific
miRNAs identified in melanomagenesis. Using miRNA microarray on FFPE
samples, I obtained a melanoma-specific miRNA expression profile. 9 of these
differentially expressed miRNAs between benign naevi and melanomas (7
downregulated, 2 upregulated in malignancies) were verified by qRT-PCR and the
functions of four of these miRNAs were studied. Ectopic overexpression of miR-
200c and miR-205 in A375 melanoma cells inhibited colony forming ability in
methylcellulose, an in vitro surrogate assay for tumourigenicity. Moreover, elevation
of miR-200c resulted in increased expression levels of E-cadherin through negative
regulation of the zinc finger E-box-binding homeobox 2 (ZEB2) gene. Ectopic
overexpression of miR-211 in A375 melanoma cells repressed both colony formation

xv
in methylcellulose and migratory ability in matrigel, an in vitro surrogate assay for
invasiveness. These findings indicate that miR-200c, miR-205 and miR-211 act as
tumour suppressors in melanomagenesis.
The second biomarker investigated, mutated BRAF, has been seen in 50-70% of
spontaneous cutaneous melanoma. The commonest mutation in melanoma is a
glutamic acid for valine substitution at position 600 (V600E). Oncogenic BRAF
controls many aspects of melanoma cell biology. The aim of this part of the work
was: firstly, to study BRAF V600E mutation status in our melanoma tissue
microarray (TMA) panel; secondly, to correlate this mutation to various clinico-
pathological features and evaluate its prognostic value through statistical analyses.
BRAF V600E mutations were seen in 20% of the primary and 69% of the metastatic
melanomas, respectively. More BRAF V600E mutations were seen in males relative
to females. The mutation was also related to cell pigmentation, but not to age,
ulceration or solar elastosis. Melanoma patients with the BRAF V600E mutation
relapse earlier than patients without this mutation. However, no significant
association between the BRAF V600E mutation and overall survival and melanoma
specific survival was found.
xvi
Abbreviations
~ approximate
ºC degrees Celsius
ml millilitre
mg milligram
mm millimeter
ng nanogram
ul microlitre
ug microgram
um micrometer
v/v volume against volume
w/v weight against volume
6-4 PP 6-4 pyrimidone photoproducts
A Adenosine
ACTH Adrenocorticotropic hormone
ADARs Adenosine deaminases acting on RNAs
Ago2 Argonaute-2
AJCC American Joint Committee of Cancer
AM Acral melanoma
AMO Anti-miRNA oligonucleotides
AREs AU-rich elements
ASIP Agouti signalling peptide
bp Base pair
BRN2 POU domain, class 3, transcription factor 2
B-CLL B cell lymphocytic leukaemia
C Cytidine
Cadherin Calcium-dependent adhesion
CCND1 Cyclin D1
CD1 Cluster of differentiation 1
CDK2 Cyclin-dependent kinase 2
xvii
CDKN2A Cyclin-dependent kinase inhibitor 2A
CKI Cyclin-dependent kinase inhibitors
CPD Cyclobutane pyrimidine dimers
CREB cAMP response element-binding
DGCR8 DiGeorge critical region 8, or Pasha
dsRNA Double-stranded RNA
E-cadherin Epithelial cadherin
ECM Extracellular matrix
EMT Epithelial to mesenchymal transition
EORTC European Organisation for Research and Treatment of Cancer
ERK Extracellular-signal-regulated kinase
ET1 Endothelin-1
FACS Fluorescence-activated Cell Sorting
FAK Focal adhesion kinase
FC Fold change
FDA Food and Drug Administration
FFPE Formalin fixed paraffin embeded
FRET Förster Resonance Energy Transfer
FXR1 Fragile X mental retardation—related protein1
G Guanosine
GIST Gastrointestinal stromal tumours
GSK3 Glycogen synthase kinase-3
HCC Hepatocellular carcinoma
HD-IL2 High dose interleukin-2
HIF-1α Hypoxia inducible factor -1α
HOXD1 Homeobox protein Hox-D1
I Inosine
IHC Immunohistochemistry
ISH in-situ hybridization
JAK/STAT Janus kinase/signal transducer and activator of transcription
KEGG Kyoto Encyclopaedia of Genes and Genomes
LATS2 Large tumour suppressor homolog 2
xviii
LDH Lactate dehydrogenase
LMM Lentigo maligna melanoma
LNA Locked nucleic acid
lncRNA Long non-coding RNA
LOX Lysyl oxidase
MAPK Mitogen-activated protein kinase
MART-1 Melan-A/Melanoma Antigen Recognised by T cells
MC1R Melanocortin 1 receptor
MECP/MBD Methyl-CpG-binding domain proteins
MEK Mitogen-activated protein kinase kinase
MET Mesenchymal to epithelial transition
metastamiR Metastasis-related miRNA
MIB-1 Mindbomb homolog 1
miRNA microRNA
MITF Microphthalmia-associated transcription factor
MMP-2 Matrix metalloproteinase 2
MSH (R) Melanocyte-stimulating hormone (receptor)
MSO microRNA specific oligo
mTOR mammalian target of rapamycin
ncRNA non-coding RNA
N-cadherin Neural-cadherin
NCCs Neural crest cells
NER Nucleotide excision repair
NFAT5 Nuclear factor of activated T-cells 5
NF- κB Nuclear factor kappa B
NGS Next generation sequencing
NM Nodular melanoma
NO Nitric oxide
NSCLC Non-small cell lung cancer
nt Nucleotide
Oct3/4 Octamer-binding transcription factor 3/4
oncomiR Oncogenic miRNA
xix
OS Overall survival
PACT Protein activator of PKR
PAP Poly A polymerase
PASR Promoter-associated small RNAs
P-Cadherin Placental-cadherin
PCR Polymerase chain reaction
PI3K Phosphoinositide 3-kinase
piRNA PIWI-interacting RNAs
PKB Protein kinase B
pre-miRNA Precursor microRNA
pri-miRNA Primary microRNA
PPP2R2A Protein phosphatase 2 regulatory subunit B alpha isoform
PTEN Phosphatase and tensin homolog
RAS Rat Sarcoma
RFLP Restriction fragment length polymorphism
RHOC RAS homolog gene family member C
RISC RNA-induced silencing complex
RLC RISC loading complex
RNASEN RNase III enzyme Drosha
RNAi RNA interference
ROS Reactive oxygen species
SA-PMPs Streptavidin-conjugated paramagnetic particles
SE Solar elastosis
siRNA Small-interfering RNA
SLITRK1 SLIT and NTRK-like protein 1
SMG Scottish Melanoma Group
snoRNA Small nucleolar RNA
SNP Single nucleotide polymorphism
snRNA Small nuclear RNA
SOX2 Sex determining region Y-box 2
SRB Sulforhodamine B
SSM Superficial spreading melanoma
xx
ssRNA Single-standed RNA
STDEV Standard deviation
T Thymidine
T-ALL T cell acute lymphoblastic leukaemia
TCA Trichloracetic acid
TGF-ß Transforming growth factor beta
TIMPs Tissue inhibitor of metalloproteinases
tiRNA Transcription initiation RNAs
TMA Tissure microarray
TNF- α Tumour necrosis factor-α
TRBP Tar RNA binding protein
TRPM1 Melastatin 1
TWIST1 Twist homolog 1
UTR Untranslated region
UVR Ultraviolet radiation
VEGF Vascular endothelial growth factor
XP Xeroderma pigmentosum
XPO5 Exportin-5
ZEB1/2 Zinc finger E-box binding homeobox 1/2

Chapter 1: Introduction 1
Chapter 1: Introduction
Chapter 1: Introduction 2
1.1 Cutaneous melanoma
Melanoma is a malignant tumour of melanocytes, which are pigment producing cells
found predominantly in skin. Melanoma is one of the rare types of skin cancer, but
causes the majority of skin cancer related deaths. The underlying mechanism of
transformation of melanocytes to melanoma is a complex biological process
involving a large number of genetic and environmental factors.
1.1.1 Introduction to melanocytes and effects of ultraviolet radiation
The skin of all mammals is pigmented, and while the intensity and hue of this
pigmentation may vary with genetic and environmental factors, in all cases it results
from the accumulation of heterogeneous polycyclic polymers known as melanins.
The capacity to synthesize these compounds is restricted to ~5% of skin cells that
have a common embryological origin and a distinct morphology and are thus
considered to be a unique cell-type: the melanocytes [1]. During embryonic
development, an epithelial- mesenchymal transition (EMT) involving epithelial cells
of the neuroectoderm gives rise to migratory neural crest cells [2]. Neural crest cells
(NCCs) are a transient, multipotent migratory cell population and are unique to
vertebrates. The premigratory neural crest cells dissociate from the neural folds,
become motile, and disperse to the different parts of the embryo, where they undergo
further differentiation that gives rise to diverse cell lineages including melanocytes,
craniofacial cartilage and bone, smooth muscle, peripheral and enteric neurons and
glia. Melanocytes differentiate from their precursor cells—melanoblasts within the
neural crest. By week 8 in utero, human melanocytes begin to migrate first to the
dermis, and hence, to the stratum basale of the epidermis. Alternative paths also lead
them to hair follicles or to the uveal tract of the eye and the retina. Melanocytes are
relatively large, clear, dendritic cells that lack tonofilaments and desmosomes. They
are distinguishable by their many dense, membrane-bound, spherical or ovoid
organelles called melanosomes, occurring throughout the cytoplasm and associated
Chapter 1: Introduction 3
with a microtubule network extending into the dendritic arms. In some melanocytes,
the melanosomes remain static within the cell. In other types of melanocyte, the cell
can extend its surface as long pseudopodia carrying melanosomes away from the
centre of the cell and increasing the cell's effectiveness in absorbing light. This
extension happens slowly in dermal melanocytes in response to ultraviolet radiation
(UVR) as well as in the production of new melanosomes and increased “donation” of
melanosomes to adjacent keratinocytes. Keratinocytes may engulf the end of the
melanocyte pseudopodia, which contains many melanosomes. Cytoplasmic dynein
will carry the vesicles containing the melanin to the centre of the cell. This causes
melanosomes to become sequestered around the keratinocyte's nucleus, providing
optimal protection from UVR.
The skin relies on melanocytes to provide photoprotection and thermoregulation by
producing melanin. There are two main types of melanin: yellow/red pheomelanin
and brown/black eumelanin [3]. Both types of melanin derive from a common
tyrosinase-dependent pathway with the same precursor, tyrosine. Individual
melanocytes can produce both types of melanin with the ratio dependent on the
expression of pigment enzymes and the availability of tyrosine and sulphydral-
containing reducing agents in the cell [4]. Eumelanin is found in hair, areola, and
skin, and colours hair grey, black, and brown. In humans, it is more abundant in
people with dark skin. Pheomelanin is also found in hair and skin and is present in
both lighter-skinned and darker skinned humans. Pheomelanin imparts a pink to red
hue and, is found in particularly large quantities in red hair and freckled populations.
Eumelanin and pheomelanin differ not only chemically but also in their physical
properties. Pheomelanin is less efficient at protecting the skin against UVR-induced
DNA damage. When UV irradiated, pheomelanin also produces more free radicals
than those produced by eumelanin [5, 6]. Moreover, pheomelanin pigments have
been suggested to enhance intrinsic DNA damage in cells, particularly in response to
UVR [7, 8]. Therefore, pheomelanin may actually contribute to UV-induced skin
damage rather than merely produce less protection against UVR [5, 6].
Chapter 1: Introduction 4
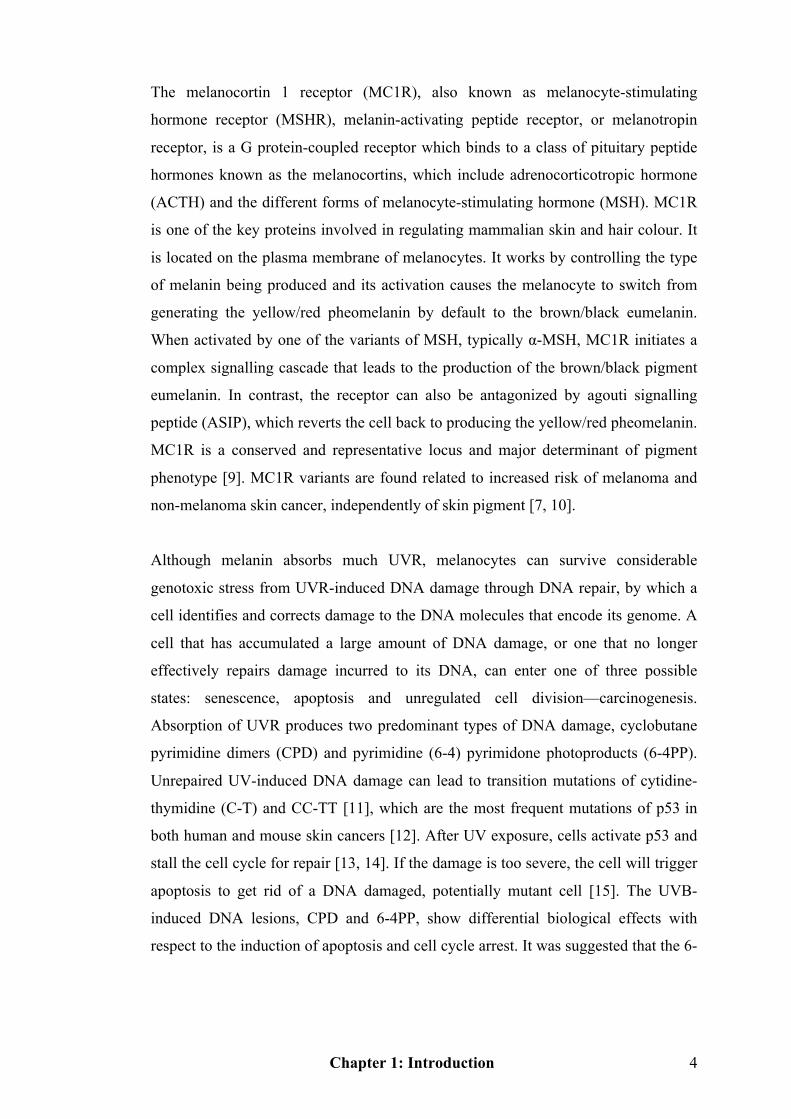
The melanocortin 1 receptor (MC1R), also known as melanocyte-stimulating
hormone receptor (MSHR), melanin-activating peptide receptor, or melanotropin
receptor, is a G protein-coupled receptor which binds to a class of pituitary peptide
hormones known as the melanocortins, which include adrenocorticotropic hormone
(ACTH) and the different forms of melanocyte-stimulating hormone (MSH). MC1R
is one of the key proteins involved in regulating mammalian skin and hair colour. It
is located on the plasma membrane of melanocytes. It works by controlling the type
of melanin being produced and its activation causes the melanocyte to switch from
generating the yellow/red pheomelanin by default to the brown/black eumelanin.
When activated by one of the variants of MSH, typically α-MSH, MC1R initiates a
complex signalling cascade that leads to the production of the brown/black pigment
eumelanin. In contrast, the receptor can also be antagonized by agouti signalling
peptide (ASIP), which reverts the cell back to producing the yellow/red pheomelanin.
MC1R is a conserved and representative locus and major determinant of pigment
phenotype [9]. MC1R variants are found related to increased risk of melanoma and
non-melanoma skin cancer, independently of skin pigment [7, 10].
Although melanin absorbs much UVR, melanocytes can survive considerable
genotoxic stress from UVR-induced DNA damage through DNA repair, by which a
cell identifies and corrects damage to the DNA molecules that encode its genome. A
cell that has accumulated a large amount of DNA damage, or one that no longer
effectively repairs damage incurred to its DNA, can enter one of three possible
states: senescence, apoptosis and unregulated cell division—carcinogenesis.
Absorption of UVR produces two predominant types of DNA damage, cyclobutane
pyrimidine dimers (CPD) and pyrimidine (6-4) pyrimidone photoproducts (6-4PP).
Unrepaired UV-induced DNA damage can lead to transition mutations of cytidine-
thymidine (C-T) and CC-TT [11], which are the most frequent mutations of p53 in
both human and mouse skin cancers [12]. After UV exposure, cells activate p53 and
stall the cell cycle for repair [13, 14]. If the damage is too severe, the cell will trigger
apoptosis to get rid of a DNA damaged, potentially mutant cell [15]. The UVB-
induced DNA lesions, CPD and 6-4PP, show differential biological effects with
respect to the induction of apoptosis and cell cycle arrest. It was suggested that the 6-
Chapter 1: Introduction 5
4 PP lesion is more potent in the induction of UV-induced apoptosis while the CPD
lesion appears to be more potent in the induction of cell cycle arrest [16]. Moreover,
You et al. have documented that CPD lesions account for the majority of UV-
induced mutations in mammalian cells. The more potent apoptosis-inducing activity
of 6-4PP lesions may induce apoptosis and eradicate the damaged cell, thus
removing its carcinogenic potential [17].
Nucleotide excision repair (NER) is one of the major repair systems for removal of
DNA lesions. The NER pathway mainly repairs UV-induced DNA damage, and is
also active against a broad range of endogenously generated oxidative lesions [18,
19]. Physiologically, the NER pathway excises damaged nucleotides, along with
adjacent undamaged DNA. Studies on the human inherited disease, xeroderma
pigmentosum (XP) identified NER deficiency as a dramatic genetic risk factor for
melanoma [20], and NER-deficient XP patients develop numerous skin cancers
under UV exposure, including a 2000-fold higher incidence of melanoma and non-
melanoma skin cancer as compared to repair-proficient individuals [21, 22].
UVR causes genetic changes in the skin, impairs cutaneous immune function,
increases the local production of growth factors, and induces the formation of DNA-
damaging reactive oxygen species that influence keratinocytes and melanocytes [23,
24]. The initial detection of genomic damage that occurs within the melanocytes is
termed direct sensitivity to DNA damage, while a response that is elicited from the
melanocyte via paracrine messaging is indirect sensitivity. In response to UVR,
keratinocytes produce larger amounts of endothelin-1 (ET1), α-MSH, and nitric
oxide (NO). The first stimulates nearby melanocytes to proliferate, and all three
stimulate melanogenesis [25-27]. NO also reduces the adhesion of melanocytes to
the extracellular matrix, an effect that may bear on the increased dendriticity seen,
and may also have implications for melanoma metastasis [28].
Chapter 1: Introduction 6
1.1.2 Melanoma epidemiology, classification, aetiology, and prevention
The incidence of cutaneous melanoma has continued to increase over the last 30
years in most white populations [29, 30]. In the UK in 2008, almost 11,800 cases of
malignant melanoma were diagnosed and melanoma is the 6th most common cancer
overall in the UK [31]. Within the UK, Scotland has the highest melanoma
incidence, surpassing incidence rates in the US. Unlike most cancers, melanoma has
a tendency for presentation at younger ages and is now the second most common
malignancy in young people aged 15-34 in the UK [32].
The mean age of presentation with melanoma is about 55 years, but this may vary
according to melanoma thickness and histological subtype [33]. Cutaneous
melanoma is usually divided into four clinico-pathological subtypes: Acral
melanoma (AM), Lentigo maligna melanoma (LMM), Nodular melanoma (NM) and
Superficial spreading melanoma (SSM) [34]. AM tends to be found on the palms of
the hands, the soles of the feet and in the nail bed and is not associated with UV
exposure. NM and LMM tend to affect older individuals, whereas SSM, is by far the
commonest form, is usually thinner and seen in younger individuals. The most
common sites for women and men are the legs and the trunk, respectively. Site
differences according to sex are likely to reflect genetic differences as naevi are also
differently distributed between boys and girls from an early age [35].
The major risks for cutaneous melanoma are thought to be the interplay between the
key environmental factor—sun exposure and genetic factors. To date, the risk factors
have been identified as: history and pattern of sun exposure, hair and skin colour,
multiple naevi, family history and hormonal factors.
Sunlight exposure represents the key environmental factor as described by the higher
incidence of melanoma in Australia and other sunny parts of the US and Europe [30].
Interestingly, a meta-analysis of melanoma case-control studies found low relative
risks associated with various measures of exposure to UVR, and the relation to
sunshine was not dose dependent [36]. In contrast to non-melanoma skin cancer

Chapter 1: Introduction 7
which is linked to total lifetime sun exposure, melanoma development is most
closely associated with intense, intermittent sun exposure [37]. Epidemiologic
observations suggest that chronic or low-grade exposures to UV induce protection
against DNA damage, whereas intense and intermittent exposures cause genetic
damage [24]. Moreover, the incidence of sunburn during early childhood is
particularly important [36]. Likewise, the link between sunbed usage and melanoma
is controversial [38-41]. However, it is recommended to avoid sunbed use to protect
against premature skin aging [41].
Light-skinned and red haired individuals exhibit higher risk of developing melanoma
than those with darker skin and hair. Polymorphisms in the MC1R gene have been
linked to fair skin and red hair and have been associated with an increased risk of
melanoma [42, 43].
Moreover, it is found that an individual who has more than 100 common naevi or
more than two atypical naevi has a 5-fold to 20-fold increased risk of melanoma [44],
indicating that a most powerful genetic risk factor for melanoma is the number of
naevi. 5% to 10% of melanoma patients have family history [45] and about 25%-
40% of all families with melanoma have been linked to mutations in the cyclin-
dependent kinase inhibitor, CDKN2A, gene on chromosome 9p21 [46].
Interestingly, women usually have thinner tumours and survive melanoma better than
men even after adjustment for Breslow thickness (also Breslow depth, see Page 8)
ulceration, and body site, which suggests that there may be X linked variable gene
expression or hormonal factors affecting melanoma survival [45].
In the 1980’s, health education campaigns aimed at primary prevention for
melanoma by reducing sun exposure to people commenced in Australia and were
soon adopted worldwide. There is as yet no direct evidence showing that reducing
sun exposure has an effect on melanoma incidence. On the contrary, drastic
reduction of sun exposure may be detrimental since it can prevent synthesis of
adequate levels of vitamin D in the skin, which protects against inflammation,

Chapter 1: Introduction 8
cancer, psychiatric and autoimmune diseases [45]. So an important message for
preventing melanoma would be to avoid sunburn and excessive sun exposure without
protection instead of keeping away from the sun altogether. More importantly,
secondary prevention—early identification and treatment, is a more efficient way, as
tumours are highly visible with a good prognosis if detected early [45].
1.1.3 Melanoma diagnosis and staging
Guidelines written by Roberts et al. suggested that suspicious melanocytic lesions
should be excised completely, with a clinical margin of 2mm of normal skin and a
cuff of fat [47] so that accurate pathological diagnosis can be made from the
examination of the entire lesion.
Primary melanoma staging is based on the histological features of the lesion.
Accurate staging allows more precise classification, determines more appropriate
treatment and improves the accuracy of predicting the likely prognosis and outcomes
for melanoma patients. The updated American Joint Committee of Cancer (AJCC)
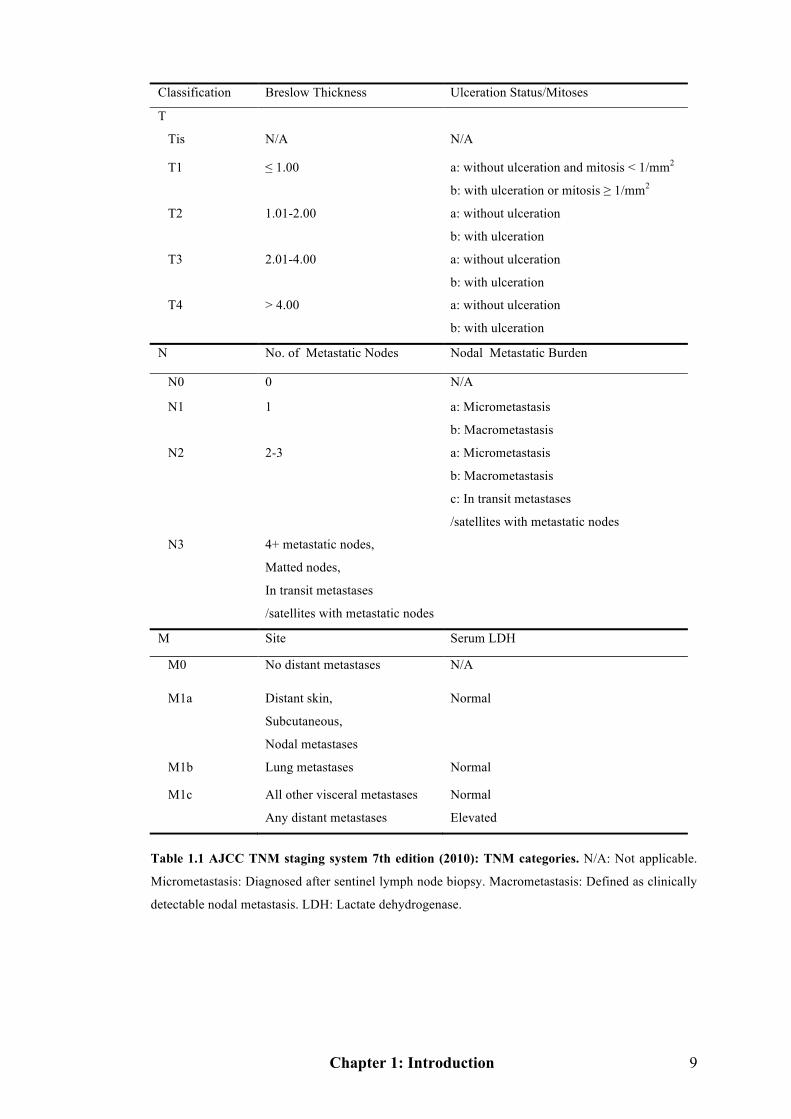
staging (2010, 7th edition) for cutaneous melanoma (Table 1.1) considers localized
melanoma, tumour thickness, the microscopic ulceration and rate of mitoses [48].
Breslow depth, used for describing tumour thickness, is used as a prognostic factor in
melanoma of the skin (Also discussed in Chapter 1.1.4). It is a description of how
deeply tumour cells have invaded. It is one of the cornerstones of the current AJCC
TNM staging of malignant melanoma. A large study validated the importance of
Breslow depth as one of the three most important prognostic factors in melanoma
(the others being T stage and ulceration) [49]. Breslow depth is also used to predict
the risk for lymph node metastasis, with deeper tumours being more likely to involve
the nodes [50]. Ulceration is found in 20-25% of all melanomas and is more
commonly seen in male patients. Mitotic rate was examined for the first time in the
new staging system [48]. The Melanoma Staging Committee recommended that
mitotic rate be determined by the “hot spot” approach and expressed as the number
of mitoses per mm2 of primary tumour [48].
Chapter 1: Introduction 9
Classification Breslow Thickness Ulceration Status/Mitoses
T
Tis N/A N/A
T1 ≤ 1.00 a: without ulceration and mitosis < 1/mm2
b: with ulceration or mitosis ≥ 1/mm2
T2 1.01-2.00 a: without ulceration
b: with ulceration
T3 2.01-4.00 a: without ulceration
b: with ulceration
T4 > 4.00 a: without ulceration
b: with ulceration
N No. of Metastatic Nodes Nodal Metastatic Burden
N0 0 N/A
N1 1 a: Micrometastasis
b: Macrometastasis
N2 2-3 a: Micrometastasis
b: Macrometastasis
c: In transit metastases
/satellites with metastatic nodes
N3
4+ metastatic nodes,
Matted nodes,
In transit metastases
/satellites with metastatic nodes
M Site Serum LDH
M0 No distant metastases N/A
M1a Distant skin,
Subcutaneous,
Nodal metastases
Normal
M1b Lung metastases Normal
M1c All other visceral metastases
Any distant metastases
Normal
Elevated
Table 1.1 AJCC TNM staging system 7th edition (2010): TNM categories. N/A: Not applicable.
Micrometastasis: Diagnosed after sentinel lymph node biopsy. Macrometastasis: Defined as clinically
detectable nodal metastasis. LDH: Lactate dehydrogenase.
Chapter 1: Introduction 10
There are some differences between the 6th (2002) edition and the 7th (2010) edition
of the melanoma staging system. Comparisons in staging for localized melanoma
(Stage I/ II), recommendations for using primary melanoma thickness and primary
tumour ulceration in TNM categories and stage groupings in the 7th edition remain
unchanged. Mitotic rate is first used in the new staging system. Multiple thresholds
of mitotic rate were identified and the most significant correlation with survival was
at a threshold of at least 1/mm2 [48]. Data from the AJCC Melanoma Staging
Database showed a highly significant correlation between increasing mitotic rate and
declining survival rates. In a multifactorial analysis of 10,233 patients with clinically
localized melanoma, mitotic rate was the second most powerful predictor of survival,
after tumour thickness [48]. In staging for regional metastatic melanoma (stage III),
immunohistochemical (IHC) detection of micrometastases is included in the new
system as it is considered acceptable to classify nodal metastases solely on the basis
of IHC staining of melanoma-associated markers (HMB-45, Melan-A/MART1).
Finally, in staging for distant metastatic melanoma (stage IV), the updated AJCC
staging system demonstrated that an elevated serum lactate dehydrogenase (LDH)
level is an independent and highly significant outcome predictor for stage IV disease.
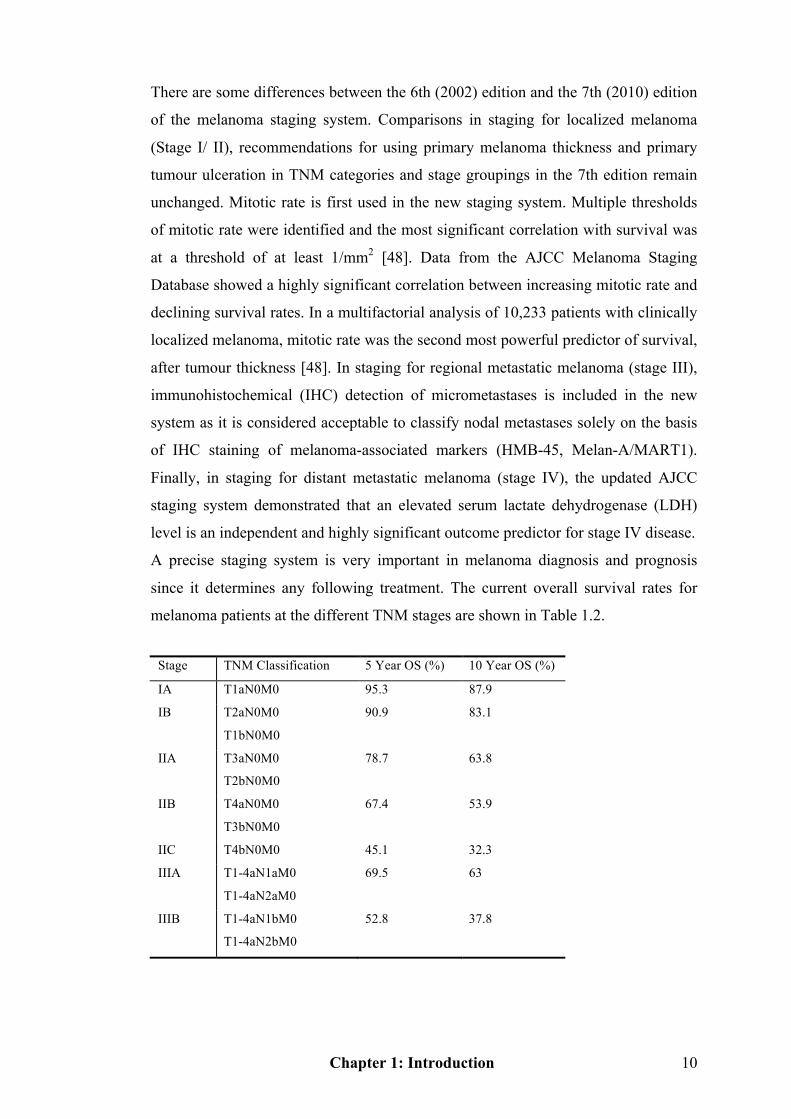
A precise staging system is very important in melanoma diagnosis and prognosis
since it determines any following treatment. The current overall survival rates for
melanoma patients at the different TNM stages are shown in Table 1.2.
Stage TNM Classification 5 Year OS (%) 10 Year OS (%)
IA T1aN0M0 95.3 87.9
IB T2aN0M0
T1bN0M0
90.9 83.1
IIA T3aN0M0
T2bN0M0
78.7 63.8
IIB T4aN0M0
T3bN0M0
67.4 53.9
IIC T4bN0M0 45.1 32.3
IIIA T1-4aN1aM0
T1-4aN2aM0
69.5 63
IIIB T1-4aN1bM0
T1-4aN2bM0
52.8 37.8
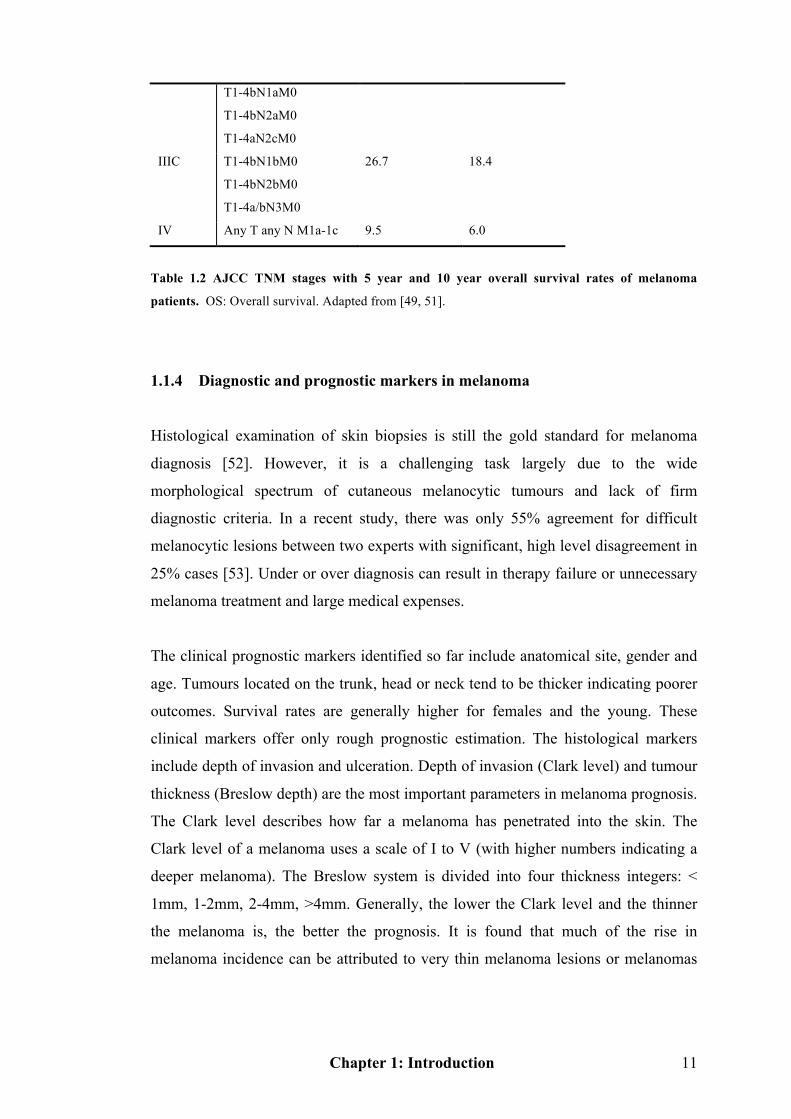
Chapter 1: Introduction 11
T1-4bN1aM0
T1-4bN2aM0
T1-4aN2cM0
IIIC T1-4bN1bM0
T1-4bN2bM0
T1-4a/bN3M0
26.7 18.4
IV Any T any N M1a-1c 9.5 6.0
Table 1.2 AJCC TNM stages with 5 year and 10 year overall survival rates of melanoma
patients. OS: Overall survival. Adapted from [49, 51].
1.1.4 Diagnostic and prognostic markers in melanoma
Histological examination of skin biopsies is still the gold standard for melanoma
diagnosis [52]. However, it is a challenging task largely due to the wide
morphological spectrum of cutaneous melanocytic tumours and lack of firm
diagnostic criteria. In a recent study, there was only 55% agreement for difficult
melanocytic lesions between two experts with significant, high level disagreement in
25% cases [53]. Under or over diagnosis can result in therapy failure or unnecessary
melanoma treatment and large medical expenses.
The clinical prognostic markers identified so far include anatomical site, gender and
age. Tumours located on the trunk, head or neck tend to be thicker indicating poorer
outcomes. Survival rates are generally higher for females and the young. These
clinical markers offer only rough prognostic estimation. The histological markers
include depth of invasion and ulceration. Depth of invasion (Clark level) and tumour
thickness (Breslow depth) are the most important parameters in melanoma prognosis.
The Clark level describes how far a melanoma has penetrated into the skin. The
Clark level of a melanoma uses a scale of I to V (with higher numbers indicating a
deeper melanoma). The Breslow system is divided into four thickness integers: <
1mm, 1-2mm, 2-4mm, >4mm. Generally, the lower the Clark level and the thinner
the melanoma is, the better the prognosis. It is found that much of the rise in
melanoma incidence can be attributed to very thin melanoma lesions or melanomas

Chapter 1: Introduction 12
in situ, neither of which are easily diagnosed [45]. Moreover, the Clark level is no
longer recommended as a staging criterion in the 7th AJCC staging system and has
prognostic significance only in patients with very thin (Breslow depth <1 mm)
melanomas [48]. No molecular biomarker is used in the 7th edition staging system.
Few biomarkers have been proven to have clinical significance in melanoma.
Proliferation markers, such as Mindbomb homolog 1 (MIB-1) and Cyclin D1
(CCND1), and tumour suppressors, such as p16INK4A and p53, as well as anti-
apoptotic proteins, such as Bcl-2, have been applied in the clinical setting [52].
However, these biomarkers have prognostic value rather than diagnostic benefit as
abnormalities of these proteins are seen only in a subset of melanomas and are most
pronounced only in advanced melanoma. Moreover, although most recently, the
presence of specific gene copy number changes or mutations have proved useful in
distinguishing between certain benign lesions and their malignant equivalents (e.g.
Spitz naevi from spitzoid melanoma by 7p gain and HRAS mutation), no single
genetic change has been informative over a wide range of lesion types [54].
Moreover, studies with such techniques are limited in their clinical application as
they are technically challenging, costly and reliable interpretation requires
experience and skill.
There is an urgent need for molecular biomarkers to assist histological diagnosis and
provide accurate prognosis. To be clinically useful, these markers need to be
technically easy and readily available for use on formalin-fixed and paraffin-
embedded (FFPE) tissue using routine methods, such as immunohistochemistry
(IHC) or in situ hybridization (ISH), which allow high throughput analysis.
1.1.5 Melanoma management
1.1.5.1 Sentinel lymph node biopsy
Sentinel lymph node biopsy is used in the staging of certain types of cancer to see if

Chapter 1: Introduction 13
they have spread to any lymph nodes, since lymph node metastasis is one of the most
important prognostic signs. The procedure offers powerful prognostic information.
Microscopic lymph node involvement is becoming an integral part of the AJCC
staging system [55]. The AJCC Melanoma Staging Committee recommends that
sentinel lymph node biopsy be performed as a staging procedure in patients for
whom the information will be useful in planning subsequent treatments and follow-
up regimens [48].
1.1.5.2 Current treatment
Treatment of melanoma that has not spread beyond the original area of growth
(especially if it is thin and has not invaded the primary dermis) is highly effective,
and most of these cancers can be cured mainly by surgery. However, therapy for
distant metastatic melanoma is usually unsatisfactory, reinforcing the importance of
early diagnosis and therapy.
By bearing in mind the clinical examination rules: Asymmetry of a lesion, Border
irregularity, Colour change and Diameter greater than 6mm, also called the ABCD
system of diagnosis [56], most melanomas can be identified from normal moles.
Standard treatment for early melanoma (Stage I) patients is to remove the tumour
tissue locally with or without wide local excision depending on the substage.
For medium melanoma (Stage II and III) patients with high risk of recurrence and
distant metastatic potential, adjuvant treatments, a combination of surgery,
chemo/radiotherapy and biological treatment, increase the chance of cure. However,
the only drug that has been shown reproducibly to have some effect on patient
outcome in large randomised trials is high dose intravenous interferon-α [57].
Preliminary results of the European Organisation for Research and Treatment of
Cancer (EORTC) showed a significant improvement in relapse-free survival but not
in distant metastasis-free survival or overall survival by interferon-α treatment for
stage III melanoma patients [58]. There is currently no accepted standard adjuvant
Chapter 1: Introduction 14
treatment in the UK including high dose of interferon, so melanoma patients are
referred instead to enter into clinical trials [59].
In the UK, only 7 to 19% patients whose melanoma has spread to distant lymph
nodes or other parts of the body will live for more than 5 years [60]. Patients with
metastases have a median survival of 6-9 months [55]. The treatment for these
advanced melanoma (Stage IV) patients is inefficient. So far, no intervention has
been shown to have significant effect on overall survival for these metastatic
melanoma patients. Darcarbazine and high dose interleukin-2 (HD-IL2) are the only
drugs approved by the Food and Drug Administration (FDA) in treating metastatic
melanoma patients [61]. However, the clinical response rates are only ~10% and
~16%, respectively and both have high toxicity [62, 63]. The combinatorial
approaches, including multiagent chemotherapy and bio/chemotherapy regimens,
have failed to improve outcomes for advanced melanoma patients [64]. Surgery is
used for treatment of local recurrences and for metastatic disease in regional lymph
nodes and can also be helpful for patients with surgically resectable disease in up to 3
visceral sites.
Advances in understanding the molecular pathology of melanoma and in
immunotherapeutics therefore provide hope for future enhancements in the treatment
of advanced melanoma and in the adjuvant setting for patients at a high risk of
recurrence.
1.1.6 Genetic and environmental interactions in melanoma progression
Although the tanning response to UVR appears dose-dependent, the nature of the
exposure is also a factor that is relevant to induction of cutaneous melanoma. It has
been interpreted that chronic and low-grade exposures to UVR induce protection
against DNA damage, whereas intense, intermittent exposures causes genetic
changes in melanoma pathogenesis [24]. The Clark model describes the histological
changes that accompany the progression from normal melanocytes to malignant
Chapter 1: Introduction 15
melanoma [65], although it is losing its prognostic value. To better illustrate the
alterations in molecular and environmental interactions, I show the Clark model
along with the phenotypic and relevant molecular changes (Figure 1.1). Through
Figure 1.1 it is clear that different biological activities and several key genetic
changes occur relative to individual phases of the Clark model. The following
discussions will focus on some of the key genes involved and their signalling
pathways. Figure 1.3 (see Page 24) is a simple map of the key regulators and
signalling pathways involved in melanomagenesis that offers a guide to the
signalling networks of melanoma.
1.1.6.1 Mutations in the MAPK pathway
In the Clark model, the first phenotypic alteration in melanocytes is the development
of benign naevi (Figure 1.1). The growth control in this stage is disrupted but growth
of naevi is also limited—a naevus rarely develops to cancer [65]. Most naevi are
growth arrested and express many markers of senescence. BRAF mutations (see next
paragraphs) are often already present in benign naevi. These activated oncogenes are
thought to trigger senescence (oncogene-induced senescence) [66]. The oncogene-
induced senescence is probably the reason for the absence of progression from
naevus to melanoma [67].
The RAS/RAF/MEK/ERK (the mitogen-activated protein kinase, MAPK) pathway
regulates most important biological programmes, including proliferation,
differentiation, angiogenesis and cell survival. In physiological situations, the MAPK
pathway is stimulated after the interaction of growth factors with surface receptors
and the transmission of these signals through the small GTPase, RAS [68]. RAS
activates a number of downstream effectors, one of which is the RAF family of
serine/threonine kinases. There are three isoforms of RAF, namely, ARAF, BRAF
and CRAF. Once activated, RAF stimulates the MAPK cascade, resulting in the
sequential activation of MEK1 and MEK2, which in turn activate ERK1 and ERK2
Chapter 1: Introduction 16
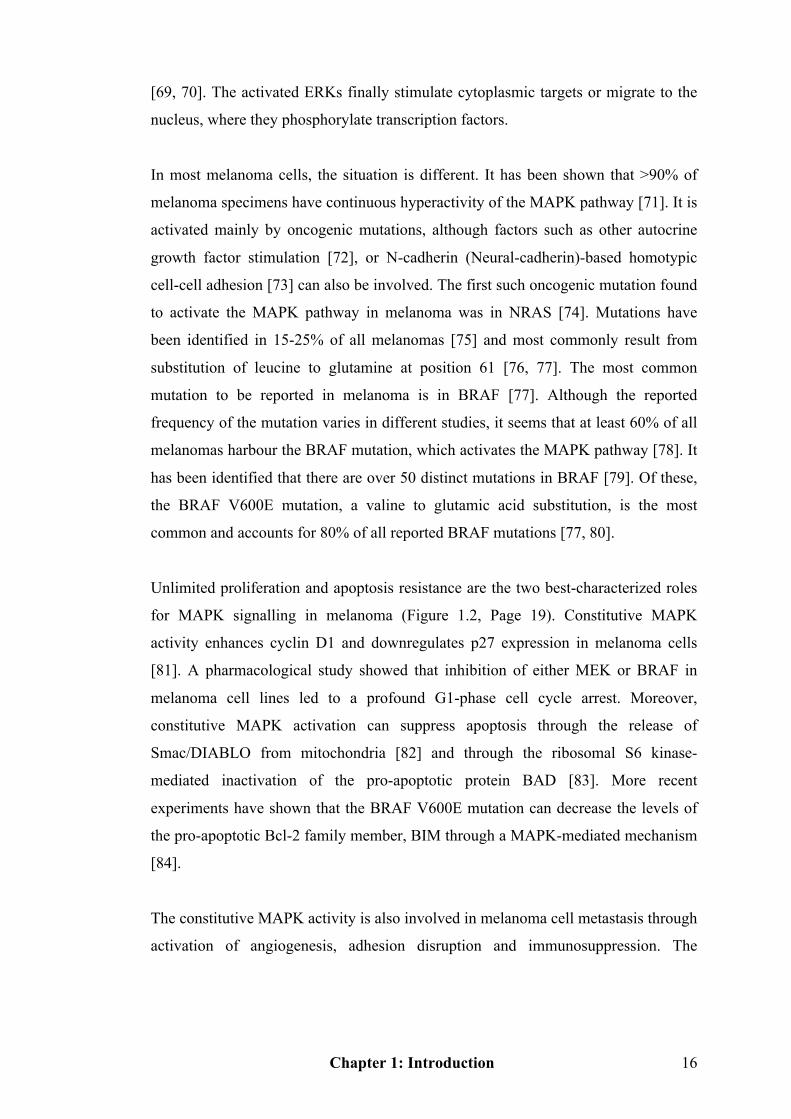
[69, 70]. The activated ERKs finally stimulate cytoplasmic targets or migrate to the
nucleus, where they phosphorylate transcription factors.
In most melanoma cells, the situation is different. It has been shown that >90% of
melanoma specimens have continuous hyperactivity of the MAPK pathway [71]. It is
activated mainly by oncogenic mutations, although factors such as other autocrine
growth factor stimulation [72], or N-cadherin (Neural-cadherin)-based homotypic
cell-cell adhesion [73] can also be involved. The first such oncogenic mutation found
to activate the MAPK pathway in melanoma was in NRAS [74]. Mutations have
been identified in 15-25% of all melanomas [75] and most commonly result from
substitution of leucine to glutamine at position 61 [76, 77]. The most common
mutation to be reported in melanoma is in BRAF [77]. Although the reported
frequency of the mutation varies in different studies, it seems that at least 60% of all
melanomas harbour the BRAF mutation, which activates the MAPK pathway [78]. It
has been identified that there are over 50 distinct mutations in BRAF [79]. Of these,
the BRAF V600E mutation, a valine to glutamic acid substitution, is the most
common and accounts for 80% of all reported BRAF mutations [77, 80].
Unlimited proliferation and apoptosis resistance are the two best-characterized roles
for MAPK signalling in melanoma (Figure 1.2, Page 19). Constitutive MAPK
activity enhances cyclin D1 and downregulates p27 expression in melanoma cells
[81]. A pharmacological study showed that inhibition of either MEK or BRAF in
melanoma cell lines led to a profound G1-phase cell cycle arrest. Moreover,
constitutive MAPK activation can suppress apoptosis through the release of
Smac/DIABLO from mitochondria [82] and through the ribosomal S6 kinase-
mediated inactivation of the pro-apoptotic protein BAD [83]. More recent
experiments have shown that the BRAF V600E mutation can decrease the levels of
the pro-apoptotic Bcl-2 family member, BIM through a MAPK-mediated mechanism
[84].
The constitutive MAPK activity is also involved in melanoma cell metastasis through
activation of angiogenesis, adhesion disruption and immunosuppression. The
Chapter 1: Introduction 17
activated MAPK pathway may regulate angiogenesis through the control of hypoxia
inducible factor -1α (HIF-1α) expression [85]. In addition, downregulation of V600E
BRAF with small-interfering RNA (siRNA) resulted in significant reduction of
vascular endothelial growth factor (VEGF) produced by melanoma cells, implicating
that melanoma-associated angiogenesis is partially mediated by the MAPK pathway.
There is also evidence that BRAF/MAPK signalling activity may contribute to
metastasis of melanoma through regulating ß3 integrins and matrix metalloproteinase
expression [86-89]. Finally, it has also been suggested that BRAF/MAPK may allow
melanoma cells to escape from immune surveillance through suppression of their
highly immunogenic melanocytic antigens, including Melan-A/Melanoma antigen
recognised by T cells (MART-1), gp-100 and tyrosinase [90].
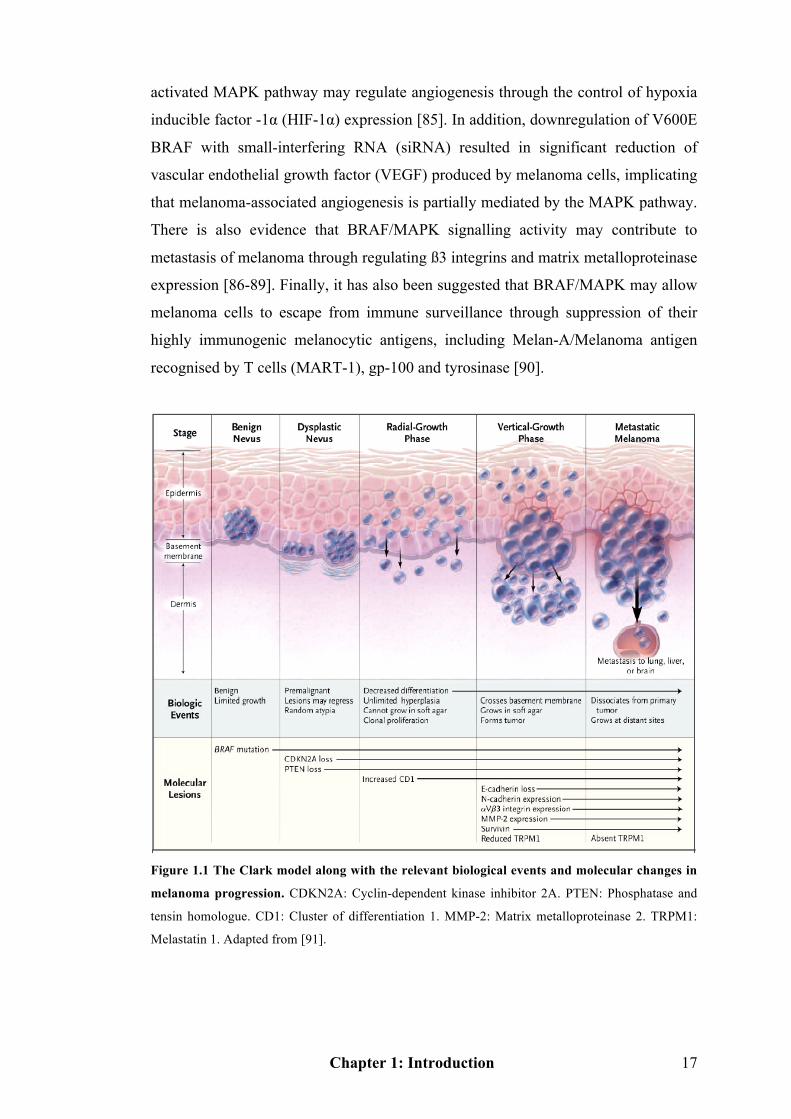
Figure 1.1 The Clark model along with the relevant biological events and molecular changes in
melanoma progression. CDKN2A: Cyclin-dependent kinase inhibitor 2A. PTEN: Phosphatase and
tensin homologue. CD1: Cluster of differentiation 1. MMP-2: Matrix metalloproteinase 2. TRPM1:
Melastatin 1. Adapted from [91].
Chapter 1: Introduction 18
1.1.6.2 PI3K/AKT pathway
Besides activation of the MAPK pathway, other signalling pathways may be equally
important in melanoma progression. The phosphoinositide 3-kinase (PI3K)/ protein
kinase B (PKB/AKT) pathway is one of the widely explored signalling pathways [92,
93]. PI3K plays a crucial role in effecting alterations in a broad range of cellular
functions in response to extracellular signals. A key downstream effector of PI3K is
the serine-threonine kinase AKT, which in response to PI3K activation,
phosphorylates and regulates the activity of a number of targets including kinases,
transcription factors and other regulatory molecules. Activation of the PI3K/AKT
pathway in melanoma is induced through either paracrine/autocrine growth factors,
or the loss of expression and/or mutation of negative pathway regulators. This
subsequently affects cell proliferation and apoptosis and intersects with the MAPK
pathway [78] (Figure 1.2). For example, the insulin-like growth factor-1 is known to
stimulate growth of early-stage melanoma cells, at least partially through activating
PI3K/AKT pathway.
One of the most vital regulators of AKT is the phosphatase and tensin homolog
(PTEN). The PTEN locus on chromosome 10 is a second chromosomal region that is
frequently affected by homozygous deletion in melanoma and other cancers [94-96].
In physiological situations, PTEN can prevent AKT activation through degrading the
products of PI3K. Although how the PI3K pathway is activated in melanoma is not
fully understood, loss of expression and function of PTEN and PTEN mutation
activate AKT. Loss of PTEN expression occurs in up to 30% of melanoma cell lines
and 10% of melanoma tissues [97].
There are three AKT members, AKT1-3 [98]. Different AKT members exhibit
different expression levels dependent on the cell type. 43-50% of melanomas have
selective constitutive activity of AKT3 [92]. AKT has critical roles in cancer
development in regulating apoptosis through the inhibition of BAD (pro-apoptotic
protein) and increasing cell proliferation by elevating CCND1 expression, and
activating the mammalian target of rapamycin (mTOR) pathway [78, 99, 100].
Chapter 1: Introduction 19
Stimulation of the mTOR pathway leads to increased protein translation and cell
proliferation [78]. Moreover, AKT effects many other pathways including the
stimulation of ribosomal S6 kinase, the suppression of forkhead signalling, and
inhibition of glycogen synthase kinase-3 (GSK3) [101, 102]. Other studies
demonstrated that AKT transformed melanocytes under hypoxic conditions through
the Notch signalling [103, 104].
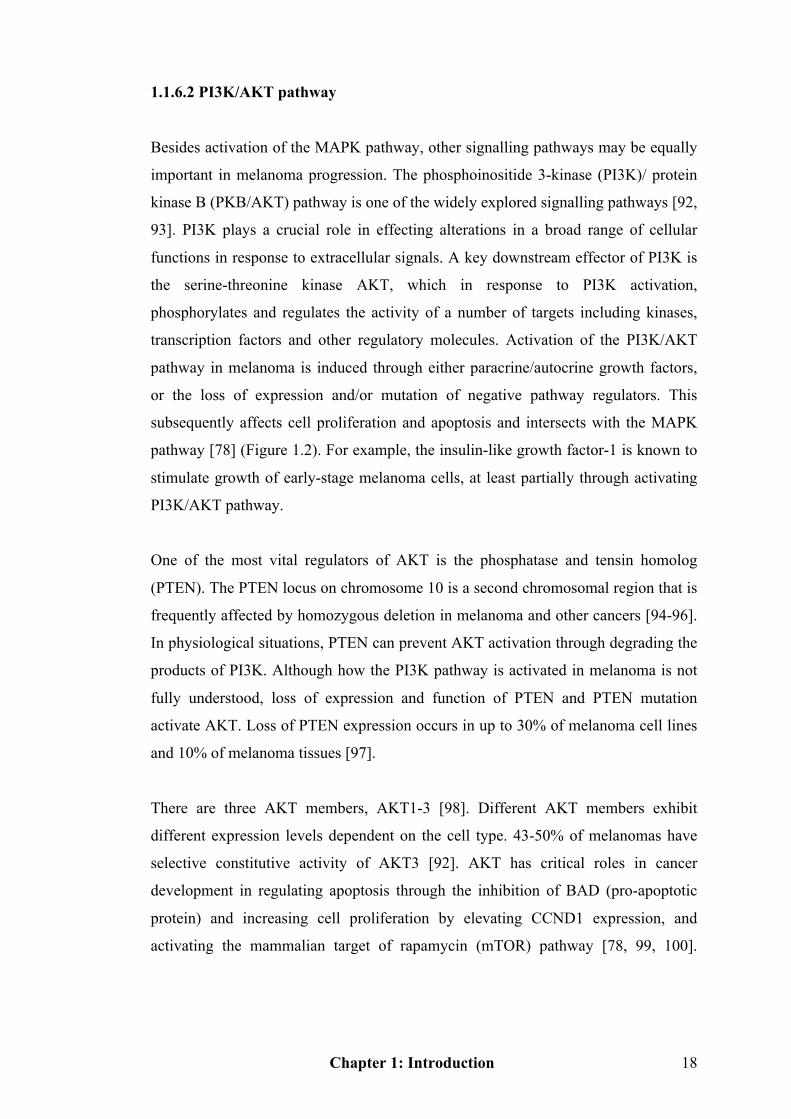
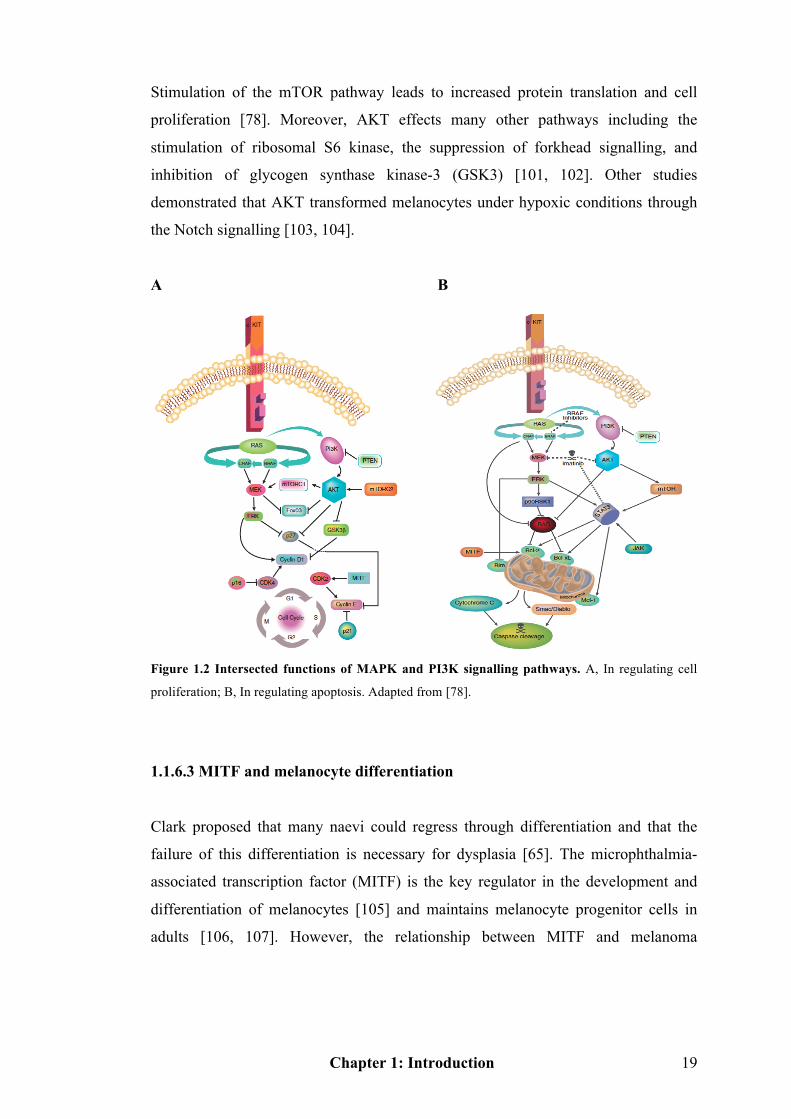
A B
Figure 1.2 Intersected functions of MAPK and PI3K signalling pathways. A, In regulating cell
proliferation; B, In regulating apoptosis. Adapted from [78].
1.1.6.3 MITF and melanocyte differentiation
Clark proposed that many naevi could regress through differentiation and that the
failure of this differentiation is necessary for dysplasia [65]. The microphthalmia-
associated transcription factor (MITF) is the key regulator in the development and
differentiation of melanocytes [105] and maintains melanocyte progenitor cells in
adults [106, 107]. However, the relationship between MITF and melanoma
Chapter 1: Introduction 20
development is complex.
On the one hand, MITF contributes to melanocyte differentiation by triggering cell
cycle exit through induction of the cell cycle inhibitors p16INK4a and p21Cip [108,
109]. High levels of MITF have differentiation and anti-proliferation functions in
melanoma cells, while low levels of MITF are found in invasive melanoma cells
[110, 111]. All the above evidence suggests that MITF must be downregulated for
melanoma progression.
On the other hand, MITF contributes to melanocyte survival by increasing the
expression of an anti-apoptotic gene, Bcl-2 [112] and cyclin-dependent kinase 2
(CDK2) [113]. In animal models, deficiencies of both MITF and Bcl-2 caused grey
hair because of a loss of differentiated melanocytes. The loss of melanocytes is due
to the apoptosis of melanocyte progenitor cells in the hair follicles [106]. In a
melanoma cell study, it was found that survival of malignant melanocytes was
dependent on Bcl-2 as decreased Bcl-2 induced cell death. Moreover, MITF also
functions in melanocyte pigmentation. α-MSH induced intracellular signalling via
MC1R subsequently elevates MITF expression, which in turn increases the
transcription of genes underlying melanin synthesis [114]. Furthermore, the MITF
gene is amplified in 10–15% of melanomas in which BRAF is mutated and
overexpression of both MITF and BRAF could transform primary cultures of human
melanocytes, indicating that MITF is an oncogene [115]. These studies support the
view that continued expression of MITF is essential in melanoma cells.
Marais’ group proposed that in melanoma cells oncogenic BRAF exerts exquisite
control over MITF on two levels: oncogenic BRAF downregulates MITF protein by
targeting it for degradation in an ERK-dependent manner and then counteracts this
by elevating MITF transcription through an octamer-binding transcription factor
BRN2-dependent manner [116]. Through these opposing mechanisms, oncogenic
BRAF ensures that the protein levels are permissive for melanoma cell survival and
proliferation.
Chapter 1: Introduction 21
1.1.6.4 Cell adhesion and invasion
In the Clark model, invasion commences in the vertical-growth phase when
melanoma cells grow intradermally as an expanding nodule (Figure 1.1). Whereas,
when tumour cells dissociate from the primary lesion, migrate through the
surrounding stroma, and invade blood vessels and lymphatics to form a tumour at a
distant site, the tumour is then called metastatic melanoma [117]. Apparently, the
formation of metastatic melanoma is also related to environmental alterations
surrounding primary melanoma cells. Cell adhesion is one of the major
environmental processes. Normally, it controls cell migration, tissue organization,
and organogenesis [118]. Disturbances in cell adhesion contribute to tumour
invasion, tumour-stroma interactions and tumour-cell signalling. Cadherins and
integrins are the most important structural protein superfamilies involved in cell
adhesion.
Cadherins (named for "calcium-dependent adhesion") are a class of type-1
transmembrane proteins that sustain cell-to cell contacts, form connections with the
actin cytoskeleton, and influence intracellular signalling. The extracellular domain of
cadherins binds to like cadherins on other cells in regions of cell contact called
adhesion junctions. There are three subtypes of cadherins, N-cadherin (Neural-
cadherin), E-cadherin (Epithelial-cadherin) and P-cadherin (Placental-cadherin). The
intracellular domain is associated with a larger protein complex that includes ß-
catenin and forms structural links with bundles of actin filaments. Progression from
radial-growth phase to vertical-growth phase of melanoma is marked by the loss of
E-cadherin and presence of N-cadherin [119, 120]. Additionally, besides the changes
in cell adhesion, decreased E-cadherin expression and aberrant N-cadherin
expression increase the survival of melanoma cells by stimulating ß-catenin
signalling [73, 121, 122].
The integrins are the cell membrane receptors of extracellular matrix (ECM) proteins.
Transition from radial to vertical-growth of melanoma is related to the expression of
Chapter 1: Introduction 22
αVß3 integrin [123], which induces expression of matrix metalloproteinase 2, an
enzyme that degrades the collagen in basement membrane [124-126].
1.1.6.5 Other genes and signalling networks involved in melanoma
CDKN2A (also called p16) is a tumour suppressor protein, which in humans is
encoded by the CDKN2A gene. CDKN2A plays an important role in regulating the
cell cycle, and mutations in CDKN2A increase the risk of developing a variety of
cancers, especially melanoma. This gene generates several transcript variants, which
differ in their first exons. Alternative splicing of various exons within CDKN2A
produces two distinct tumour suppressors: INK4A and alternate reading frame
protein (ARF, also called p14). These tumour suppressor proteins p16INK4A and
p14ARF are encoded by overlapping frames at the CDKN2A locus on chromosome
9p21. p16INK4A (an inhibitor of CDK4) blocks the cell cycle at the G1-S checkpoint
by inhibiting cyclin-dependent kinases, suppressing the proliferation of cells with
damaged DNA or activated oncogenes [127]. p14ARF acts as a tumour suppressor by
restraining the cell cycle or promoting cell death after DNA damage or aberrant
proliferation stimulated by various oncogenes. ARF participates in the key regulatory
process that controls the p53 protein level. Moreover, the studies done in vitro and in
vivo also suggest the low frequency of p53 mutations observed in melanoma is a
consequence of the frequent loss of CDKN2A (and ARF) [128-130], which
inactivates the p53 pathway [127].
In some melanoma samples with a low prevalence of BRAF mutation, DNA copy
number gains and mutations in c-KIT gene were characterized [131]. c-KIT, a
transmembrane tyrosine growth factor receptor, acts on a downstream signalling
cascade leading to key intracellular signals that control cellular proliferation and
survival. Three crucial pathways, MAPK, PI3K and STAT signalling, were initiated
by KIT activation [132]. c-KIT mutation frequency is very high in gastrointestinal
stromal tumours (GIST). In melanoma, c-KIT mutations were identified in 17% of
chronic sun-damaged cutaneous, 11% of acral and 21% of mucosal melanomas
Chapter 1: Introduction 23
[131]. In addition, KIT gene amplification was found in 6% of chronic sun-damaged,
7% of acral lentiginous and 8% of mucosal melanomas. In vitro studies demonstrated
that point mutations of c-KIT resulted in activation of c-KIT protein in melanoma
cells and therefore stimulated downstream proliferation and pro-survival signalling
pathways [132, 133].
Melanomas also exhibit constitutive activity in multiple other pathways, including
nuclear factor kappa B (NF- κB), Src, Janus kinase/signal transducer and activator of
transcription (JAK/STAT3), Wnt, Hedgehog and Notch [134-137]. Although most
studies have focused on the role of individual signalling pathways, these different
pathways in melanoma comprise a highly interconnected network. Multiple feedback
loops in the intercrossed network would increase the difficulty in treatment of
melanoma as inhibition of one pathway may activate a parallel pathway. For
example, inhibition of mTOR leads to a rebound increase in the MAPK pathway
through a PI3K-mediated mechanism [138]. These reciprocal interactions between
the signalling pathways active in melanoma require strongly combined targeted
therapy strategies.
Chapter 1: Introduction 24
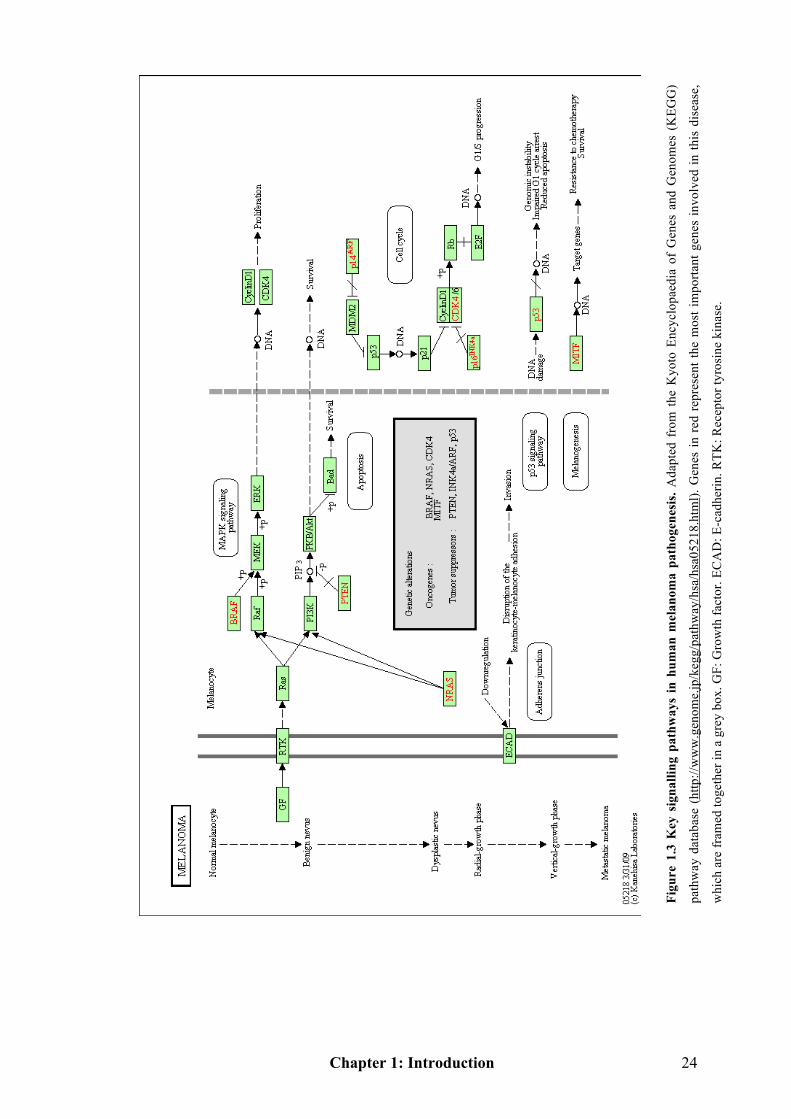
Figu
re 1
.3 K
ey s
igna
lling
pat
hway
s in
hum
an m
elan
oma
path
ogen
esis
. Ada
pted
fro
m t
he K
yoto
Enc
yclo
paed
ia o
f G
enes
and
Gen
omes
(K
EGG
)
path
way
dat
abas
e (h
ttp://
ww
w.g
enom
e.jp
/keg
g/pa
thw
ay/h
sa/h
sa05
218.
htm
l). G
enes
in r
ed r
epre
sent
the
mos
t im
porta
nt g
enes
invo
lved
in th
is d
isea
se,
whi
ch a
re fr
amed
toge
ther
in a
gre
y bo
x. G
F: G
row
th fa
ctor
. EC
AD
: E-c
adhe
rin. R
TK: R
ecep
tor t
yros
ine
kina
se.
Chapter 1: Introduction 25
1.1.7 Prospects for new therapies
Given the continuous rising incidence of cutaneous melanoma and inefficient
conventional treatments, especially for advanced and recurrent melanoma patients, a
wide range of studies are trying to find better molecular biomarkers and novel
therapeutic strategies. Cancer treatment is entering into a “targeted therapy” era and
this approach has shown extraordinary clinical benefits in several cancers. Specific
kinase inhibitors are now used as the standard treatments for chronic myelogenous
leukaemia, HER2/neu-amplified breast cancer, clear-cell renal cell carcinoma and
GIST [139]. However, the precondition to the success of using these approaches is
dependent on the identification of genetic aberrations in these diseases.
Accumulating evidence showed melanoma harbours genetic changes in key protein
kinase signalling pathways.
Sorafenib is a small molecule inhibitor of tyrosine kinase receptors, including wild
type BRAF, V600E BRAF and CRAF. Sorafenib inhibited the growth and survival
of BRAF-mutant human melanoma cells and slowed down the growth of melanoma
xenografts [140]. However, a randomized Phase III trial of sorafenib did not increase
the clinical response or disease control rate achieved by the chemotherapy agents
alone [141], although a nonrandomized trial of sorafenib in combination with
paclitaxel and carboplatin showed promising activity, with 26% clinical response rate
[142]. More excitingly, a V600E-mutant-specific BRAF inhibitor, PLX4032, shows
great effects on BRAF V600E positive melanoma patients. In the dose escalation
portion of the Phase I clinical trial in metastatic melanoma, 56% of patients with the
BRAF V600E mutation had a partial response and an additional 31% had a minor
response. No responses were seen in patients without a BRAF V600E mutation
[142]. Preliminary results from a dose expansion cohort of an extra 31 patients with
V600E-mutant BRAF reported that 70% achieved a clinical response [143].
There are also several case reports of individual melanoma patients with c-KIT
mutations who have achieved remarkable clinical responses to c-KIT small molecule
inhibitors, such as imatinib, sorafenib and dasatinib [144-147]. For example,
Chapter 1: Introduction 26
imatinib showed a 50% clinical response rate among 10 melanoma patients with c-
KIT mutations, but in none of the 10 patients with c-KIT amplification of the wild
type gene [143].
The promising results with PLX4032 and c-KIT inhibitors in melanoma patients with
BRAF and c-KIT mutations, respectively, add to the growing list of successful
clinical strategies targeting specific activating genetic events in cancer. Although
such studies to date have focused on the treatment of advanced melanoma, in the
future these molecular insights may lead to improved early diagnosis of the disease.
Personalized strategies of targeted therapies are likely the hope for melanoma
patients. Moreover, a novel class of non-coding genes—microRNAs (miRNAs), are
becoming a “hotspot” for cancer research including melanoma (Chapter 1.2).
Numerous studies have shown their potential not only act as biomarkers, but they
also play an important role in cancer therapy, including anti-drug resistance which is
also a common issue for targeted therapy.
1.2 microRNAs
1.2.1 General introduction to non-coding genes
Over the past decade an explosion in the number of genome-wide studies has
challenged the traditional view that most genes are protein-coding. Although
counter-intuitive it is now clear that the number of protein-coding genes of humans
and mice are close to those in the 1mm long Caenorhabditis elegans (C. elegans),
and that all multicellular organisms have fewer protein-coding genes than some
simple unicellar eukaryotes [148]. An explanation for the apparent paradox involves
non-protein-coding genes: whilst only 2% of the mammalian genome encodes
mRNAs the vast majority of the genome is transcribed as short and long non-coding
RNAs (ncRNAs) which contribute to biological complexity [149]. In the expanding
RNA world, the importance of thousands of regulatory ncRNAs including miRNAs,
small interfering RNAs (siRNAs), PIWI-interacting RNAs (piRNAs, PIWI originally
Chapter 1: Introduction 27
from P-element induced wimpy testis in Drosophila) [150] and various classes of
long ncRNAs (lncRNAs) is being increasingly recognized while new short
transcripts, such as promoter-associated small RNAs (PASRs) and transcription
initiation RNAs (tiRNAs) have recently been described [151, 152] .
The earliest demonstration of fundamental and general functions for regulatory RNA
in eukaryotic biology was the finding that double-stranded RNA (dsRNA) introduced
into C. elegans is cleaved into ~22 nucleotide (nt) small RNAs which cause
widespread and heritable gene silencing [153-155]. Although it was originally
thought to be restricted to exogenous dsRNAs, it is now clear that plants and animals
produce endogenous siRNAs, miRNAs and piRNAs [156-161]. Small regulatory
RNAs (siRNAs, miRNAs and piRNAs) guide effector Argonaute proteins to
genomic loci or target RNAs in a sequence specific manner. Unlike siRNAs and
miRNAs which are found ubiquitously, the longest small RNA class, piRNAs, which
are 25-30nt in length, are first produced by successive waves of Argonaute-cleavage
of long-non-coding transcripts arising from a Dicer-independent pathway and are
largely restricted to the germline [157, 158, 162]. For lncRNAs, it is known that at
least 80% of the transcription in the mammalian genome is exclusively in association
with lncRNAs [151]. They are frequently long, spliced and contain canonical
polyadenylation signals. lncRNA promoters are bound and regulated by transcription
factors, including octamer-binding transcription factor 3/4 (Oct3/4), cAMP response
element-binding (CREB), c-MYC, sex determining region Y-box 2 (Sox2), NF- κB,
p53 [163-166]. Interestingly, ncRNAs are pervasive in all complex genetic
phenomena in the eukaryotes (See Table 1.2). ncRNAs facilitate normal
development and physiology and, when dysfunctional, underpin disease. Many
intergenic regions associated with complex diseases express ncRNAs. Despite their
potential use as diagnostic markers and therapeutic targets, and although there has
been a near-exponential growth of manuscripts devoted to regulatory RNAs, their
precise mechanisms of biogenesis and roles in signalling are not fully understood
because of their natural complexity and diversification. Within the existing ncRNAs,
the miRNA family is the best-characterized class both in terms of its biogenesis and
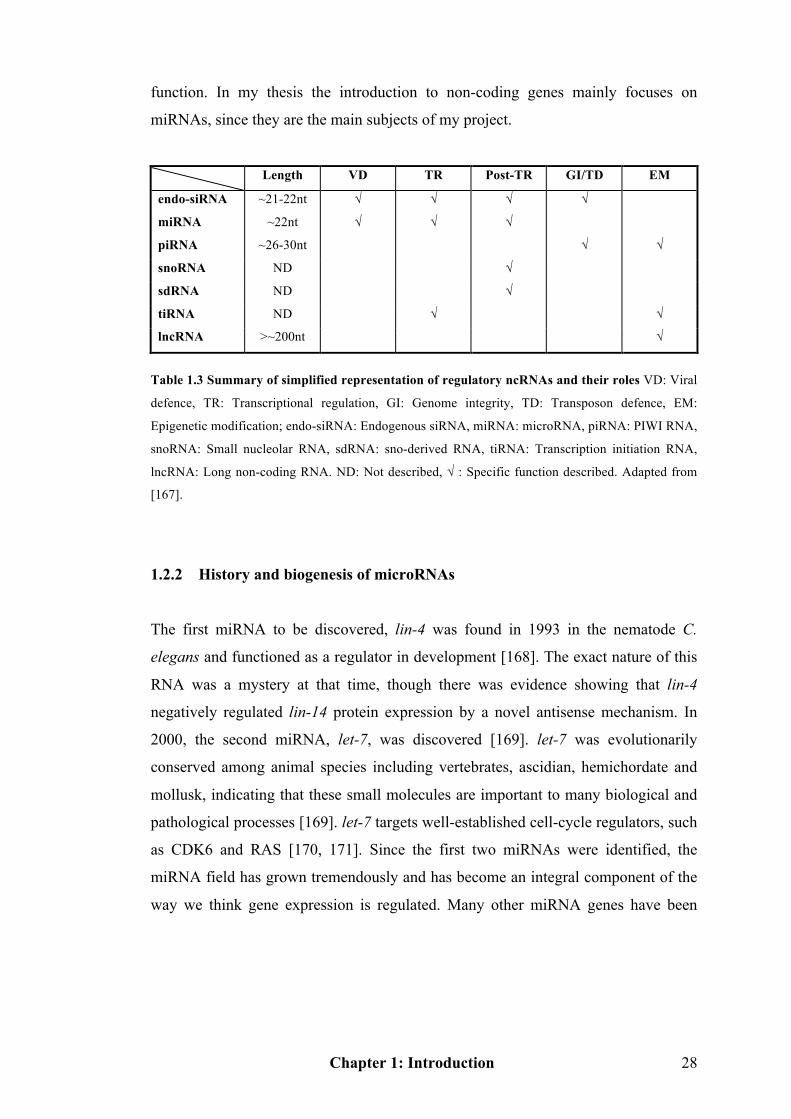
Chapter 1: Introduction 28
function. In my thesis the introduction to non-coding genes mainly focuses on
miRNAs, since they are the main subjects of my project.
Length VD TR Post-TR GI/TD EM
endo-siRNA ~21-22nt √ √ √ √
miRNA ~22nt √ √ √
piRNA ~26-30nt √ √
snoRNA ND √
sdRNA ND √
tiRNA ND √ √
lncRNA >~200nt √
Table 1.3 Summary of simplified representation of regulatory ncRNAs and their roles VD: Viral
defence, TR: Transcriptional regulation, GI: Genome integrity, TD: Transposon defence, EM:
Epigenetic modification; endo-siRNA: Endogenous siRNA, miRNA: microRNA, piRNA: PIWI RNA,
snoRNA: Small nucleolar RNA, sdRNA: sno-derived RNA, tiRNA: Transcription initiation RNA,
lncRNA: Long non-coding RNA. ND: Not described, √ : Specific function described. Adapted from
[167].
1.2.2 History and biogenesis of microRNAs
The first miRNA to be discovered, lin-4 was found in 1993 in the nematode C.
elegans and functioned as a regulator in development [168]. The exact nature of this
RNA was a mystery at that time, though there was evidence showing that lin-4
negatively regulated lin-14 protein expression by a novel antisense mechanism. In
2000, the second miRNA, let-7, was discovered [169]. let-7 was evolutionarily
conserved among animal species including vertebrates, ascidian, hemichordate and
mollusk, indicating that these small molecules are important to many biological and
pathological processes [169]. let-7 targets well-established cell-cycle regulators, such
as CDK6 and RAS [170, 171]. Since the first two miRNAs were identified, the
miRNA field has grown tremendously and has become an integral component of the
way we think gene expression is regulated. Many other miRNA genes have been
Chapter 1: Introduction 29
discovered in different species. In the latest release of miRBase 16, more than 1,100
mature miRNAs have been confirmed in human [172].
During the past few years studies on basic mechanisms of miRNA biogenesis and
functions have seen some surprising new discoveries in miRNA processing and post-
transcriptional regulation and the different processes between plants and animals.
Mammalian miRNAs are short and highly conserved molecules [173, 174] that seem
to have evolved independently of plant miRNAs as their sequences and biogenesis
pathways differ substantially [175]. The introduction to the biogenesis of miRNA
here focuses predominantly on the mammalian system and related information is also
cited from model systems, including the fruitfly Drosophila melanogaster and
nematode C. elegans.
Biogenesis can be divided into two major steps: miRNA processing in the nucleus
and subsequent miRNA maturation in the cytoplasm (Figure 1.4, Page 32).
1. miRNA processing in the nucleus (Figure 1.4-A)
1) Transcription of the pri-miRNA
A miRNA is processed from a primary miRNA (pri-miRNA), which is either
transcribed by RNA polymerase II or RNA polymerase III [176-178]. Because both
polymerases are regulated differently and can recognize specific promoters and
terminators, there exists a wide range of regulatory options [179]. Furthermore, each
miRNA located in the same genomic cluster can be transcribed and regulated
independently [180]. An average human pri-miRNA is usually composed of a 33
base pair (bp) hairpin stem, a terminal loop, and two single-stranded (ss) flanking
regions of several kilobases [181].
2) pri-miRNA cleavage by the Drosha-DGCR8 microprocessor complex
After transcription, the nuclear microprocessor complex formed by the RNase III
enzyme Drosha (RNASEN) and the DGCR8 (DiGeorge critical region 8, also known
as Pasha, Partner of Drosha) protein cut the pri-miRNA. 5' and 3' arms of the pri-
miRNA hairpin are cleaved by the two RNase domains of Drosha [182], whereas
Chapter 1: Introduction 30
Pasha interacts with the pri-miRNA and acts as a molecular ruler to determine the
precise cleavage site [183] that is located ~11bp away from the ssRNA/dsRNA
junction at the base of the hairpin stem. The resulting pre-miRNA (precursor
miRNA) is now generated comprising of a ~22bp stem and a terminal loop.
3) Pre-miRNA export mediated by Exportin-5-Ran-GTP
Thereafter, Exportin-5 (XPO5), a Ran-GTP-dependent dsRNA-binding protein,
transports the pre-miRNA from nucleus into cytoplasm [184]. XPO5 can also protect
the pre-miRNAs against nuclear degradation because knockdown of XPO5 only
induces a decrease of mature miRNAs but not nuclear accumulation of pre-miRNAs
[184-186]. XPO5 binding to a defined length of double-stranded stem and the 3'
overhangs ensures the export of only correctly processed pre-miRNAs [186-188].
2. miRNA maturation in the cytoplasm (Figure 1.4-B)
1) The RISC loading complex (RLC): Dicer, TRBP and PACT join Ago2
Prior to Dicer cleavage, the RISC (RNA-induced silencing complex) loading
complex (RLC) needs to be generated to provide a platform for RISC assembly and
cytoplasmic processing. RLC is composed of the RNase Dicer, the double-stranded
RNA-binding domain proteins TRBP (Tar RNA binding protein) and PACT (protein
activator of PKR) and associates to form a complex that is subsequently replenished
by the core component Argonaute-2 (Ago2) [189-193]. RISC contains a single-
stranded miRNA guiding it to its target mRNA while Ago2 also mediates RISC
effects on mRNA targets. Neither TRBP nor PACT is essential for Dicer-mediated
cleavage of pre-miRNA but they enhance RISC formation and participate in the
recruitment of Ago2 [191-193].
2) Two fates after nuclear export: Ago-2-mediated ac-pre-miRNA cleavage and
Dicer-mediated pre-miRNA cleavage
An additional endonucleolytic cleavage step occurs before Dicer-mediated cleavage:
for some highly complementary miRNAs, Ago2 cuts the 3' arm in the middle of the
hairpin to generate a nicked hairpin termed the ac-pre-miRNA, also regarded as the
prospective passenger strand [194]. Dicer can process this precursor as efficiently as
Chapter 1: Introduction 31
noncleaved pre-miRNAs. This additional step might explain the early association of
Ago2 with RLC, even before pre-miRNA [189-193]. Once the RLC is formed, the
RNase III Dicer cleaves off the loop of the pre-miRNA or the nicked ac-pre-miRNA
and generates a roughly ~22nt miRNA duplex [195]. One mature miRNA end in the
duplex is already determined by Drosha, Dicer cleavage defines the other mature
miRNA end with 2nt protruding overhangs [196, 197].
3) Unwinding the miRNA duplex into guide and passenger strand
Following Dicer cleavage, the miRNA duplex is separated into the functional guide
strand and the subsequently degraded passenger strand, while the ternary complex of
Dicer, TRBP and Ago2 dissociates [190].
4) Guide strand selection and passenger strand degradation
Both strands of the miRNA duplex could have given rise to two different mature
miRNAs. In fact, in a similar manner to siRNA duplexes, only one strand is usually
incorporated into the RISC and the other is degraded [198]. In mammals,
thermodynamic stability of the two terminal base pairs determines the functional
asymmetry: the miRNA strand with the less stable base pair at its 5' end in the duplex
is loaded into RISC, whereas the miRNA strand with the more stable base pair is
typically degraded [198, 199].
5) Silencing the target gene with help from Argonaute proteins
Finally, the mature miRNA incorporated into RISC triggers the target gene silencing
step with help from Argonaute proteins. At least three independent mechanisms of
miRNA-mediated mRNA silencing have been discovered so far: target cleavage,
translation repression, and mRNA decay [200, 201]. In situations of perfect
complementarity between mature miRNA and its target transcripts, the Ago2-RISC
cleaves the mRNA [202]. Translational inhibition is achieved via various
mechanisms: CAP structure dissociation with elongation factor, translation-
elongation blockage, or ribosome drop-off promoting premature dissociation of the
mRNA [203-205]. In addition, miRNAs trigger deadenylation and subsequent
decapping to initiate degradation of the mRNA target.
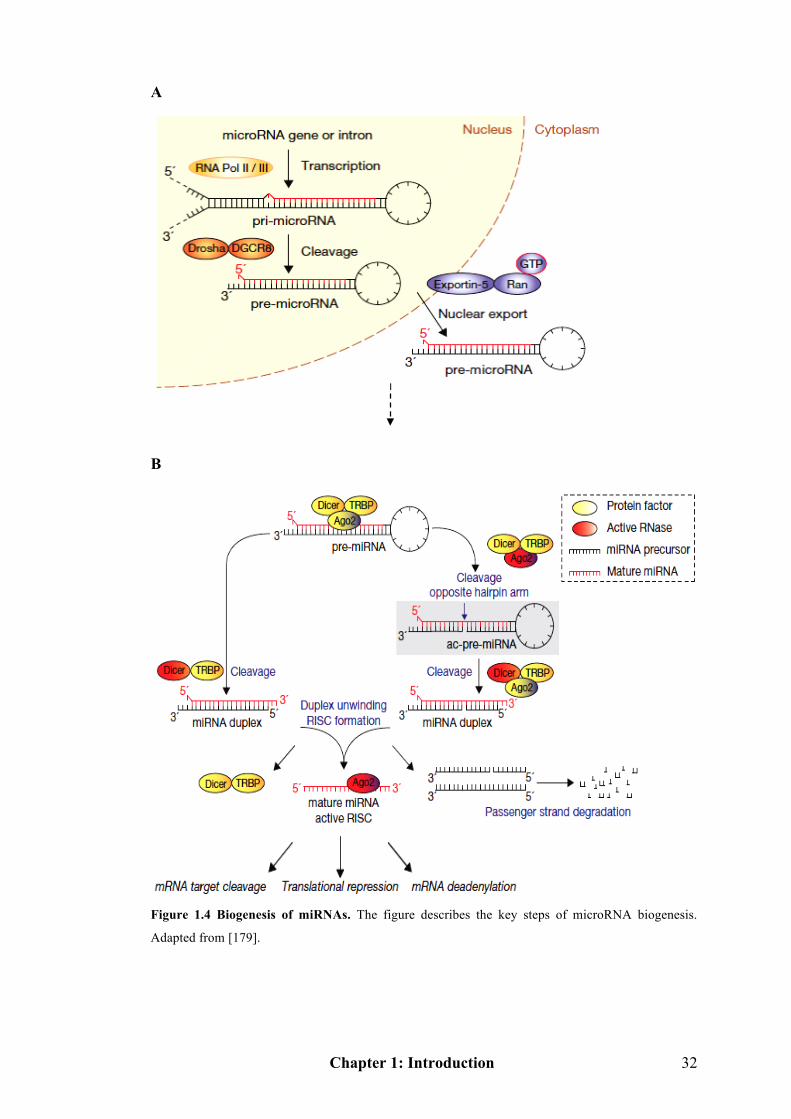
Chapter 1: Introduction 32
A
B
Figure 1.4 Biogenesis of miRNAs. The figure describes the key steps of microRNA biogenesis.
Adapted from [179].
Chapter 1: Introduction 33
1.2.3 Regulation of microRNAs
As described above, biogenesis of miRNA has been intensively studied and well
described. However, the regulation of miRNA expression remains largely unclear. In
early studies, promoter regions had been determined for only a small portion of
miRNAs [206]. Most of the predicted miRNA promoters were not confirmed in wet-
laboratory experiments [172], although several in silico studies predicted the
promoter regions of miRNAs [207-209]. According to whether the miRNA is
localized in a transcribed genome region (for a protein coding gene) or not, miRNAs
can be classified as ‘intragenic’ and ‘intergenic’. Localization of promoters for
intergenic and inversely-directed intragenic miRNAs is largely unknown, whereas
promoters for overlapping primary genes are considered to be promoters for the
intragenic miRNAs that are localized in the same direction as the primary gene.
However, the means by which miRNA expression is regulated appears complicated
and needs to be answered.
There is no single pathway universal to mature miRNA processing and it actually
appears to be a well-organized and regulated process. There are many common or
specific regulatory mechanisms operating throughout the whole activity to facilitate
and supervise the processing of individual miRNAs by regulation in both
transcriptional and posttranscriptional pathways. Here I discuss some common
regulatory mechanisms including miRNA editing, miRNA-related single nucleotide
polymorphism (SNP) and epigenetic regulation.
1.2.3.1 microRNA editing
RNA editing is an important process defined as a post-transcriptional change of RNA
sequences by deamination of adenosine (A) to inosine (I). It takes place either in the
nucleus or in the cytoplasm. The A to I editing of primary transcripts by ADARs
(adenosine deaminases acting on RNAs) was first described for miR-22 [210],
followed by a lot of other miRNAs such as miR-151, miR-197, mi-223, miR-376a,
Chapter 1: Introduction 34
miR-142 and miR-143 [211, 212]. Many pri-miRNAs and pre-miRNAs are targeted
by ADARs at different stages in their processing, and the modifications can affect
both Drosha-mediated and Dicer-mediated cleavage, and also prevent the export of
pre-miRNAs. For instance, in pri-miR-142, A to I editing inhibits its cleavage by
Drosha and contributes to its degradation by the nuclease Tudor-SN, which has
affinity for dsRNA containing inosine-uracil pairs [213]. For another example,
editing of pre-miR-151 prevents Dicer processing in the cytoplasm and results in
accumulation of pre-miR-151 [214]. However, whether miRNA editing is
predominantly in the nucleus (on the pri-miRNAs) or in the cytoplasm (on the pre-
miRNAs) needs to be established. In addition to alterations of miRNA processing,
miRNA editing can also have impact on miRNA target specificity. A single A to I
change in the seed sequence of miR-376-5p precursor redirects the mature miRNA to
a new target, resulting in altered protein expression in mice [215].
1.2.3.2 microRNA and SNPs
The first miRNA related SNP was found in the miR-189 binding site of SLIT and
NTRK-like protein 1 (SLITRK1), which was associated with Tourette’s syndrome
[216]. Since then, several other studies have identified SNPs in miRNA genes (pri-
miRNA, pre-miRNA and mature miRNA) using systematic sequencing and in silico
methods. Catalogues of SNPs in miRNAs have been created and made public [217-
219]. An example, a G-U SNP in miR-125a results in processing blockage and
consequently reduces the levels of mature miR-125a [218]. Most studies have tried to
associate SNP occurrence with susceptibility to cancer. (More information about
miRNAs and SNPs in cancer is discussed later in this Chapter—section 1.2.7.2.)
1.2.3.3 microRNA and epigenetics
Recently, many studies have focused on identification of the relationship between
regulation of miRNAs and epigenetics. The first study of this type established that
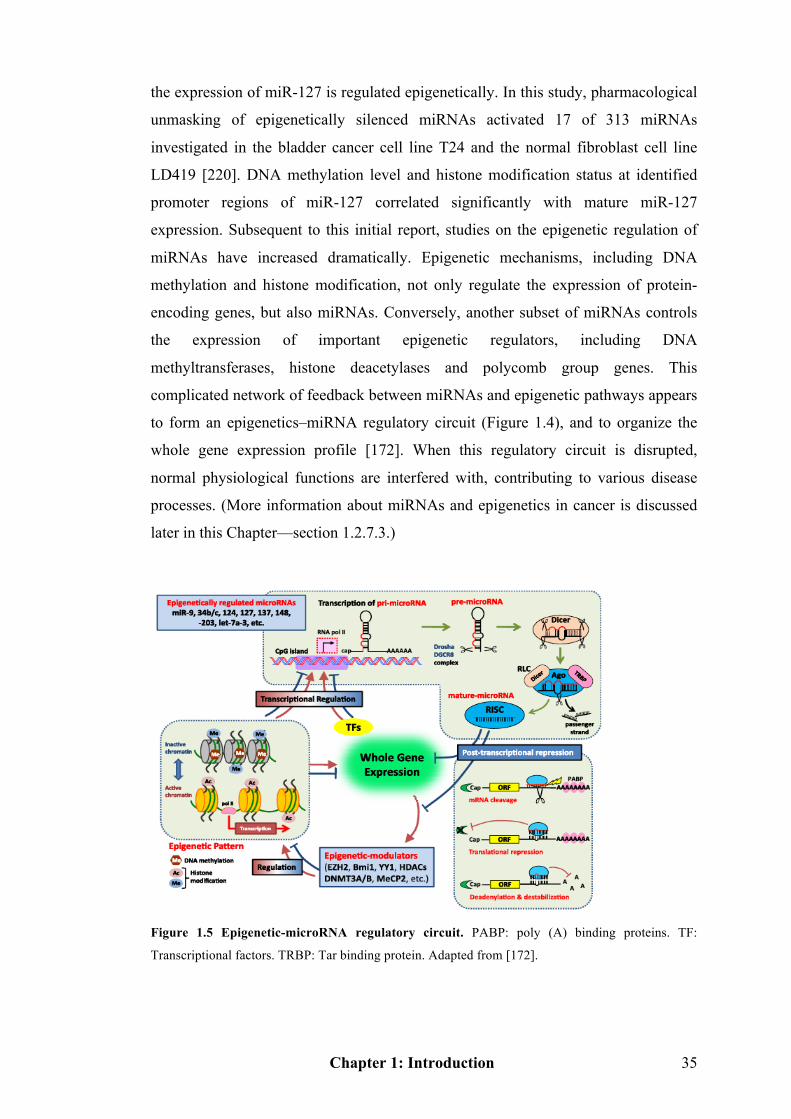
Chapter 1: Introduction 35
the expression of miR-127 is regulated epigenetically. In this study, pharmacological
unmasking of epigenetically silenced miRNAs activated 17 of 313 miRNAs
investigated in the bladder cancer cell line T24 and the normal fibroblast cell line
LD419 [220]. DNA methylation level and histone modification status at identified
promoter regions of miR-127 correlated significantly with mature miR-127
expression. Subsequent to this initial report, studies on the epigenetic regulation of
miRNAs have increased dramatically. Epigenetic mechanisms, including DNA
methylation and histone modification, not only regulate the expression of protein-
encoding genes, but also miRNAs. Conversely, another subset of miRNAs controls
the expression of important epigenetic regulators, including DNA
methyltransferases, histone deacetylases and polycomb group genes. This
complicated network of feedback between miRNAs and epigenetic pathways appears
to form an epigenetics–miRNA regulatory circuit (Figure 1.4), and to organize the
whole gene expression profile [172]. When this regulatory circuit is disrupted,
normal physiological functions are interfered with, contributing to various disease
processes. (More information about miRNAs and epigenetics in cancer is discussed
later in this Chapter—section 1.2.7.3.)
Figure 1.5 Epigenetic-microRNA regulatory circuit. PABP: poly (A) binding proteins. TF:
Transcriptional factors. TRBP: Tar binding protein. Adapted from [172].
Chapter 1: Introduction 36
1.2.4 Functions of microRNAs
Besides perfectly matched sequence complementarity only between the “seed”
region of the miRNA (~2-7nt of mature sequence) and its target gene, the miRNA
binds to the 3' UTR of its targets through imperfect base pairing [221]. Depending on
the precise nature of the binding, this induces degradation, destabilization, or
translational repression of the mRNA and consequently silences gene expression
[200]. Additionally, because of the imperfect complementarity of binding, a single
miRNA can influence a broad range of mRNAs and a whole miRNA family may
regulate thousands of target genes [222, 223]. The estimation that more than 30% of
protein-coding genes are regulated by miRNAs at the posttranscriptional or
translational level [224] indicates that almost all cellular pathways are directly or
indirectly affected by miRNAs. So far miRNAs are reported to have been involved in
94 diseases [225], ranging from psychiatric disorders [226], through diabetes [227],
to cancer [228] (More miRNA functions related to cancer are discussed in this
Chapter—section 1.2.7.).
Notably, there was a unique study that defined a novel role for miRNA that can
upregulate mRNA translation [229]. AU-rich elements (AREs) bind specific proteins
to regulate mRNA stability or translation in response to external and internal stimuli.
In a previous study, the same authors had already demonstrated that upon cell cycle
arrest, the ARE in the tumour necrosis factor-α (TNF-α) mRNA is transformed by
serum starvation into a translation activation signal, recruiting Ago and fragile X
mental retardation—related protein1 (FXR1). They found that the expression of miR-
369-3 is necessary for translation up-regulation of the ARE-containing reporter. A
siRNA directed against the loop region of pre-miR-369-3 prevented this translation
up-regulation under serum-starved conditions. The knockdown cell line was rescued
with synthetic miR-369-3 resistant to siRNA and the translation efficiency of the
ARE-containing receptor was increased five-fold. All the above results indicate that
miR-369-3 is specifically required for TNF-α ARE-mediated translation activation
under growth arrest conditions. Similarly, they also found let-7 and a synthetic
miRNA miRcxcr4 induced translation upregulation of target mRNAs on cell arrest,
Chapter 1: Introduction 37
although they repressed translation in proliferating cells. Therefore, they thought that
there is miRNA oscillation between repression and activation in coordination with
the cell cycle: in proliferating cells they repress translation, whereas in G1/G0 arrest
they activate translation.
1.2.5 Detection of microRNAs
The first method to quantify miRNA was northern blotting. However, it requires a
relatively large amount of RNA and is insensitive, especially for those miRNAs with
low expression levels. Thereafter, reflecting the need for greater precision and higher
throughput, miRNA real-time RT-PCR and miRNA microarray methods are
commonly used.
The real-time RT-PCR makes use of a stem loop reverse transcription primer to
generate cDNA templates, which are then amplified using specific primers and tested
with specific fluorescent probes. Currently four different chemistries, TaqMan®,
Molecular Beacons, Scorpions® and SYBR® Green, are available for real-time
PCR. All of these chemistries allow detection of PCR products via the generation of
a fluorescent signal. TaqMan probes, Molecular Beacons and Scorpions depend on
Förster Resonance Energy Transfer (FRET) to generate the fluorescence signal via
the coupling of a fluorogenic dye molecule and a quencher moiety to the same or
different oligonucleotide substrates. SYBR Green is a fluorogenic dye that exhibits
little fluorescence when in solution, but emits a strong fluorescent signal upon
binding to double-stranded DNA. The choice should be made according to individual
situation as each different chemistry method has its own advantages and
disadvantages.
Microarray for quantifying miRNA is optimal for the simultaneous analysis of
hundreds of miRNAs present in one sample or multiple samples. Recently, for better
understanding of miRNA roles in different diseases, determination of miRNA
expression in FFPE tissues has become of interest to researchers. Therefore, methods
have been developed to profile miRNAs from FFPE specimens and to localize
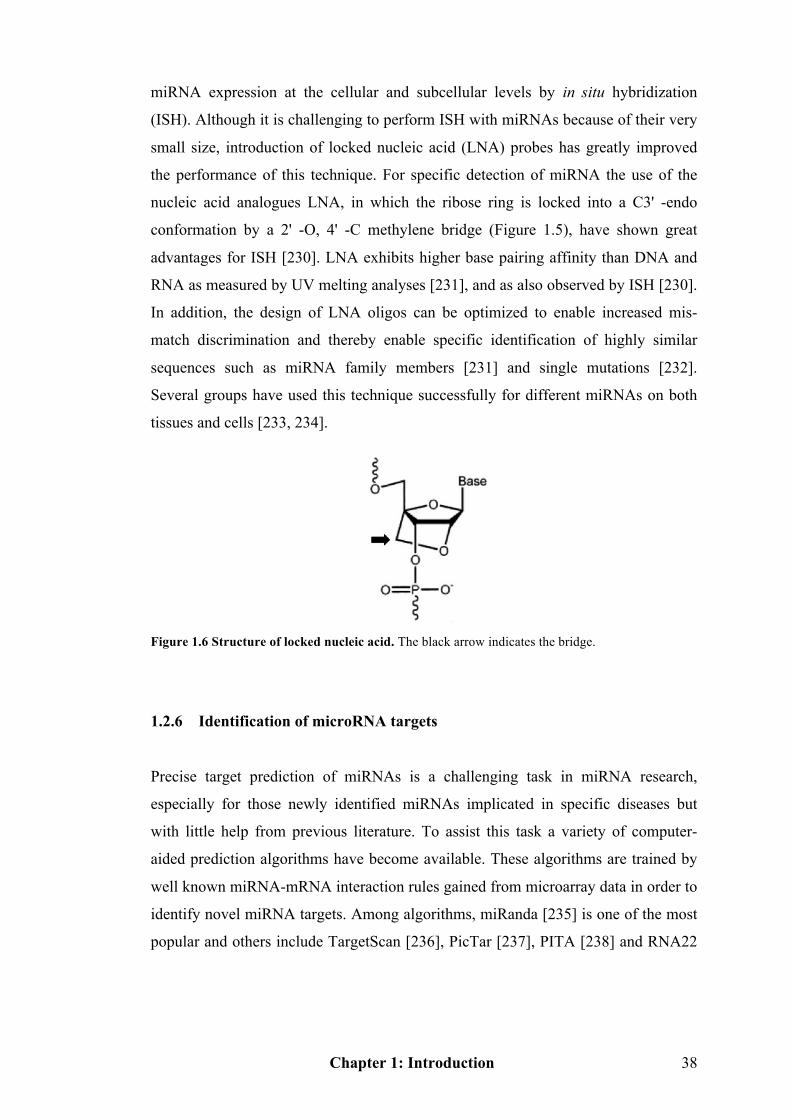
Chapter 1: Introduction 38
miRNA expression at the cellular and subcellular levels by in situ hybridization
(ISH). Although it is challenging to perform ISH with miRNAs because of their very
small size, introduction of locked nucleic acid (LNA) probes has greatly improved
the performance of this technique. For specific detection of miRNA the use of the
nucleic acid analogues LNA, in which the ribose ring is locked into a C3' -endo
conformation by a 2' -O, 4' -C methylene bridge (Figure 1.5), have shown great
advantages for ISH [230]. LNA exhibits higher base pairing affinity than DNA and
RNA as measured by UV melting analyses [231], and as also observed by ISH [230].
In addition, the design of LNA oligos can be optimized to enable increased mis-
match discrimination and thereby enable specific identification of highly similar
sequences such as miRNA family members [231] and single mutations [232].
Several groups have used this technique successfully for different miRNAs on both
tissues and cells [233, 234].
Figure 1.6 Structure of locked nucleic acid. The black arrow indicates the bridge.
1.2.6 Identification of microRNA targets
Precise target prediction of miRNAs is a challenging task in miRNA research,
especially for those newly identified miRNAs implicated in specific diseases but
with little help from previous literature. To assist this task a variety of computer-
aided prediction algorithms have become available. These algorithms are trained by
well known miRNA-mRNA interaction rules gained from microarray data in order to
identify novel miRNA targets. Among algorithms, miRanda [235] is one of the most
popular and others include TargetScan [236], PicTar [237], PITA [238] and RNA22
Chapter 1: Introduction 39
[239]. However, most of them suffer from either high false positive or false negative
rates due to insufficient specificity and sensitivity. To overcome these disadvantages,
other approaches have been developed. DIANA-microT [240] and DIANA-miRPath
[241] are gene set analysis based approaches. DIANA-miRPath software performs an
enriched analysis of multiple miRNA target genes comparing each set of miRNA
targets to all known Kyoto Encyclopaedia of Genes and Genomes (KEGG) pathways
[242, 243] and therefore it becomes a valuable tool for interpreting targets which are
affected by deregulated miRNAs. Since the prediction algorithms do not always offer
identical targets, using the intersected target lists from multiple algorithms serves to
narrow down the candidate targets with higher confidence. However,
computationally predicted targets still need to be verified through biochemical
identification to understand the mode of action of miRNAs and their functions.
1.2.7 microRNA and cancer
Given the fundamental role of miRNAs, it is no surprise that miRNAs have been
shown to be involved in a great spectrum of diseases, including cardiovascular [244],
infectious [245], neurologic [246] and metabolic diseases [247, 248]. Equally
interesting, miRNAs have been found important in tumourigenesis with more than
3,000 publications associating miRNAs with cancer to date. To further understanding
of the miRNA functions in malignancies, the following sections focus on miRNAs in
genomic organization, tumourigenic behaviours and pathways, epigenetics and
clinical applications.
1.2.7.1 Association with genomic alterations
Approximately 50% of annotated miRNA genes are located in cancer-associated
regions or fragile sites [249-251]. For example, the miRNA cluster 15a/16-1 is
located on 13q14, a frequently deleted genomic locus in chronic B cell lymphocytic
leukaemia (B-CLL) [249]. Other examples include deletion of let-7g/miR-135-1 in a
Chapter 1: Introduction 40
variety of human malignancies [250], amplification of the miR-17-92 cluster in
lymphoma [252], translocation of miR-17-92 in T cell acute lymphoblastic
leukaemia (T-ALL) [253] and amplification of miR-26a in glioblastoma [254]. In a
study with higher genomic resolution, 283 miRNA genes in 227 human ovarian,
breast, and melanoma cancer specimens were analyzed for copy number changes
[255]. Of all the analyzed miRNAs, 37.1% in ovarian cancer, 72.8% in breast cancer
and 85.9% in melanoma were located in genomic regions with gene copy number
changes. In all three cancers, the copy number of 26 particular miRNA genes
increased, whereas 15 decreased. This indicates that some miRNAs participate in the
generation of a “common” tumour phenotype while others are specific to a particular
cancer type.
1.2.7.2 microRNA related SNPs
miRNA related SNPs can occur in miRNA genes (specifically in “seed regions”) ,
miRNA binding sites of target genes and in miRNA-processing machinery.
SNPs in miRNA genes are thought to influence miRNA functions through the
transcription of primary transcript, through pri-miRNA and pre-miRNA processing,
and thirdly through effects on miRNA-mRNA interactions [256]. The first evidence
that point mutation in miRNA genes can have a functional effect and confer cancer
susceptibility comes from a seminal study by Carlo Croce’s group. A germline
mutation (C to T) in pri-miR-16-1 was found in familial chronic lymphocytic
leukaemia (CLL) and resulted in decreased miR-16-1 expression. A SNP in the
terminal loop of pre-miR-27a was associated with lessened advanced breast cancer
risk in families with a history of non-BRCA-related disease [257]. A unique example
of a functional miRNA SNP in pre-miR-146a (C to G), led to altered processing,
lower expression of mature sequence and susceptibility to papillary thyroid
carcinoma [258]. Individuals with a heterozygous genotype have a higher risk of
developing papillary thyroid carcinoma than homozygous populations.
Chapter 1: Introduction 41
The disruptive action of SNPs in the miRNA binding site of target mRNAs is similar
to seed region SNPs for altered gene expression in cancer. let-7 binds to the 3' UTR
of KRAS and negatively regulates KRAS’s expression [171]. Very low expression of
let-7 and elevated KRAS were found in lung cancer. Chin et al. sequenced the 3'
UTR of KRAS and identified ten let-7 complementarity sites. A new SNP (T to G) in
LCS6 was present in 20% of lung cancer cases and 5% of the control populations
[259].
Recent studies suggest that SNPs in the biogenesis machinery are also associated
with cancer risk, drug response and prognosis [256]. Low level of Drosha was related
to poor ovarian cancer survival [260]. XPO5 was decreased in bronchioloalveolar
carcinoma and stage I lung cancer [261] but increased in high-grade prostate cancer
[262].
1.2.7.3 In epigenetics
Genetic lesions cannot solely explain the complexity of the abnormalities that arise
in a cancer cell. Epigenetics offers an additional and equally important explanation
that, along with genetics, contributes to a better understanding of the whole
malignant process. It is now defined as the inheritance of changes in gene activity
that is independent of DNA sequence [263]. DNA methylation and histone
modifications are the two major events of epigenetics. Likewise for miRNA, not only
genetic alterations might cause the deregulation of subsets of miRNAs, but
epigenetic changes can also have an effect on miRNA expression.
It was hypothesized that miRNA genes with tumour suppressor features could be
hypermethylated in cancer in the same way as classic protein-coding genes [264,
265]. Two tumour-suppressor miRNAs, miR-127 and miR-124a that negatively
regulate the expression of oncogenes CDK6 and Bcl-6 were methylated in various
cancers [220, 265]. Some recent papers have demonstrated that the presence of CpG
island hypermethylation of miRNA genes is a widespread phenomenon in cancer, as
Chapter 1: Introduction 42
shown for miR-9-1, miR-193a, miR-137, miR-342, miR-203, miR-34b/c and miR-1
[266]. In addition, global DNA hypomethylation events can also affect miRNAs. The
human let-7a-3 gene is located on chromosome 22q13.31 and is embedded in a CpG
island. let-7a-3 was found hypomethylated in lung cancer cells relative to normal
lung cells [267]. For miRNA genes with histone modifications, DNA
hypermethylation interacts with histone modifications through precise crosstalk
mediated by the transcriptional repressor methyl-CpG-binding domain proteins
(MeCP/MBDs) [268]. miR-124 silencing by DNA methylation was accompanied by
the presence of the transcriptional repressors MeCP2 and MBD2, and absence of
active histone marks, such as acetylation of histone H3 and H4 [265].
Since more hypermethylated protein-coding genes and miRNA genes have been
discovered in cancer that are involved in invasion and metastasis, novel therapeutic
opportunities targeting such hypermethylation will present themselves in the future.
1.2.7.4 Dysregulation in tumourigenic pathways
Expression changes in miRNAs could drive tumourigenesis, through their roles as
tumour suppressors or oncogenes. Upregulated or downregulated miRNAs involved
in malignancies are respectively referred to as oncogenic miRNAs (also called
“oncomiRs”) or tumour-suppressor miRNAs. Functional studies performed in cancer
cell lines or mouse models of various cancers through overexpression or knockdown
of miRNAs have supported these different roles for miRNAs in tumourigenesis. For
example, the expression cluster miR-17-92 was increased in lung cancer, especially
in small-cell lung cancer [269]. Lung cancer cell growth was also increased by miR-
17-92 expression. In contrast to miR-17-92, Takamizawa et al. found that expression
levels of let-7 were often reduced in both in vivo and in vitro lung cancer studies
[270]. They also observed that overexpression of let-7 in A549 lung adenocarcinoma
cell lines inhibited cell growth. let-7 negatively regulates its target genes: RAS and
MYC [171]. It was also shown that lung tumour tissues display decreased levels of
let-7 and increased levels of RAS protein relative to normal lung tissue.
Chapter 1: Introduction 43
In both solid and haematological malignancies, many other miRNAs have expression
changes indicating that they function as oncogenes or tumour suppressors. The MYC
oncoprotein family has crucial roles in the pathogenesis of many human neoplastic
diseases through deregulating both cell growth and death check points and, in a
permissive environment, rapidly accelerating the affected clone through the
carcinogenic process. miR-155 expression has been correlated to MYC over-
expression in B-cell cancers, suggesting it may be playing a role in the regulation of
this oncogene [271]. Other studies showed that expression of miR-155 was
upregulated in pediatric Burkitt’s lymphoma, in Hodgkin’s lymphoma and large B-cell
lymphomas [272, 273] and also in breast, lung, colon, and thyroid cancers [274, 275].
The oncomiR, miR-221 is increased in glioblastoma [276], and tumour suppressors
like the miR-34 family in breast cancer [277], and miR-143/145 in colorectal neoplasia
are reduced relative to normal tissues [278].
Additionally, some miRNAs have been regarded as metastasis-related miRNAs (also
termed as “metastamiRs”) through cell line and xenograft experiments. For instance,
breast cancer related examples include miR-10b, miR-9, miR-31 and miR-335, either
as pro-metastatic regulators (the former two), or anti-metastatic effectors (the latter
two) [279].
The observed global deregulation of miRNA expression on tumour initiation,
maintenance or metastasis can be explained through studying miRNA targeted genes
and the pathways that they regulate. It is difficult to assign an individual miRNA or
miRNA cluster to a single or a certain type of tumourigenic pathway because there
are many hundreds of miRNAs and each miRNA can have hundreds of targets and
there are also signalling crosslinks between different pathways. As noted, miRNA
regulation is pervasive in almost all biological transductions in tumour-stromal
ecosystems involving cell adhesion, angiogenesis, proteolysis and cell signalling.
Metastasis of malignancies requires the loss of expression or function of E-cadherin.
E-cadherin regulates the actin cytoskeleton via its association with ß-catenin, which
is also a transcription factor involved in the Wnt signalling pathway. The E-cadherin/
Chapter 1: Introduction 44
ß-catenin system acts as a tumour suppressor of invasion and low E-cadherin
expression level is correlated to inverse patient survival and advanced histological
grade in colorectal cancer [280]. Interestingly, both E-cadherin and ß-catenin
mRNAs contain potential miRNA binding sites: miR-9 in E-cadherin and miR-139
and miR-200a in ß-catenin. Upregulated miR-9 has been reported in breast cancer
relative to normal tissues [281]. Integrins perform essential roles in cell adhesion to
the ECM. αVß3 integrin is upregulated in tumour cells at the invasion front as well
as acting as a marker of neovessels following activation of the angiogenic switch
[282]. The mRNAs for both integrin αV and ß3 subunits contain binding sites for
miRNA, such as miR-32 for integrin αV and let-7/miR-98 for integrin ß3 [283]. As
mentioned above altered expression of let-7 might contribute to the development of
lung cancer through regulating RAS [171]. Moreover, integrin ß1 was downregulated
on overexpression of miR-124 [284]. Similar to integrins, transcripts encoding the
cytoskeletal proteins paxillin and focal adhesion kinase (FAK) that are
downregulated in cancer have potential miRNA binding sites [285]. For FAK, miR-
32/92 binding sites are present, just as in integrins αV and α5. FAK also shares a
miR-199 site in common with fibronectin. Lysyl oxidase (LOX), involved in the
crosslinking of collagen and elastin, is one of the important regulators in the tumour
cell microenvironment. Elevated LOX expression is related to poor survival and
promotes tumour cell invasion via increased formation of focal adhesions. LOX
contains a binding site for miR-145, which is reduced in many cancers and has been
reported to be deleted in prostate cancer [281].
Tumour angiogenesis requires tumour cell factors, such as VEGF and is driven by
multiple mechanisms. The four tissue inhibitor of metalloproteinases (TIMPs) are
intriguing molecules for their having both pro- and anti-tumourigenic functions
[286]. TIMP3 is also antiangiogenic by blocking VEGF binding to VEGFR2 [287].
TIMP3 mRNA contains a large number of potential target sites for miRNA,
including miR-21 and miR-17/20/106 that are upregulated and strongly related to a
poor prognosis signature [275, 288]. Moreover, TIMP3 also has a site for miR-
221/222, which are upregulated in papillary thyroid cancer. All the above evidence
Chapter 1: Introduction 45
indicates deregulated miRNA expression could influence both angiogenesis and
proteolysis pathways, resulting in dysregulation in tumour invasion and metastasis.
1.2.7.5 In stem cell activation
Several studies have shown miRNAs are associated with the self-renewal of stem
cells. In mice and zebrafish, the absence of Dicer-1 results in lethality early in
development and loss of stem cell populations [289, 290]. Shcherbata et al reported
that in Drosophila melanogaster, the Dicer-1 mutation affects germline stem cells
showing delay in the G1 to S transition and indicating an important role of miRNAs
in the division of stem cells [291]. This suggests that miRNAs might be involved in
stem cell activation. However, which set of miRNAs are the crucial players for
normal stem cell maintenance and whether they are involved in cancer stem cells
needs to be elucidated.
1.2.7.6 Clinical applications
The miRNA family can be very useful in clinical applications since their expression
is specifically altered in different cancers, or between normal and malignant tissues.
miRNA expression profiling studies suggest miRNAs are superior biomarkers for
cancer subtype classification and prognostication [292-294]. On the other hand,
changing miRNA expression back to normal could be a potential therapeutic
strategy.
Two of the earliest reports have shown the utility of miRNAs expression profiles to
distinguish tumour from normal samples, identify tissue of origin for tumours of
unknown origin or in poorly differentiated tumours and to distinguish different
types/subtypes of tumours [295, 296]. Moreover, it is also elucidated that certain
alterations of miRNAs occur in patients at an early stage of cancer and thus may be
helpful for early detection. The availability of FFPE specimens for miRNA detection
Chapter 1: Introduction 46
[297] makes it feasible to use miRNAs for diagnostic purposes as biomarkers. More
excitingly, some new studies have also shown that miRNAs can be detected in serum
[298, 299]. Beyond the realm of diagnosis, a series of publications has shown that
miRNAs can act as useful indicators of clinical outcome [283, 300, 301] and can be
used for estimation of treatment efficiency [302].
General therapeutic strategies involving antisense-mediated inhibition of oncogenic
miRNAs and miRNA replacements with miRNA mimics or viral vector-encoded
miRNAs have been generated.
Application of 2'-O-methyl anti-miRNA oligonucleotides (AMOs) targeting the
oncomiR, miR-21 has been found to inhibit glioblastoma and breast cancer cell
growth in vitro and in an MCF-7 breast cancer xenograft mouse model [288, 303]. In
another AMO application, modified AMOs conjugated with cholesterol termed
“antagomiRs” were systematically delivered through intravenous injection to target
the liver-specific miR-122 in mice [247, 248]. Other miRNA reduction strategies
include miRNA sponges and construction of lentiviral vectors as anti-miRNA decoys
[304].
For overexpressing miRNA, viral or liposomal delivery mechanisms have been used
[305, 306]. Using adenovirus-associated virus in a hepatocellular carcinoma (HCC)
animal model, a successful elevation of a tumour suppressive miRNA, miR-26 in
HCC occurred and resulted in inhibition of cell proliferation and tumour-specific
apoptosis [307]. It is also thought that cationic liposomes or polymer-based
nanoparticle formulations can be developed to achieve the delivery of miRNA
mimics and tested for therapeutic efficacy [308]. Absence of vector-based toxicity is
the advantage of these mimics, indicating that these approaches might be promising
tools for future tumour therapy.
Finally, it has been reported that miRNA therapy can also enhance the response and
suppress resistance to anticancer chemo-/radio-therapy. miR-200c levels were
extremely low in poorly differentiated cancer cells and restoration of miR-200c
Chapter 1: Introduction 47
increases their sensitivity to microtubule-targeting agents by 85% [309]. Weidhaas et
al. showed that the let-7 family can radiosensitize A549 lung cancer cells, while
reducing let-7 levels causes radioresistance [310].
1.3 Summary and aims
Cutaneous melanoma is likely to become an increasingly important public issue due
to its continuous increase of incidence over the last 30 years. Inaccurate diagnosis
and prognosis, and extremely low efficiencies for therapy of metastatic melanoma
constitute the major barriers to curing melanoma. The objective of the studies in this
thesis is to lower these barriers by identifying key non-coding genes and coding
genes involved in melanomagenesis.
As has been explained miRNAs are crucial factors in almost all biological progresses
such as development, cell differentiation, proliferation, apoptosis and chemo-
resistance, so that any abnormality of functional miRNAs may affect the
development of organisms, lead to disease and influence therapeutic efficiency.
Moreover, miRNA analysis has a number of advantages compared to conventional
mRNA analysis. First, owing to its small size, it is less susceptible to degradation and
has been successfully extracted from 10 years old FFPE specimens [311]. Secondly,
the quality of miRNA expression data from FFPE specimens is equivalent to that
from fresh frozen ones [312]. Furthermore, an indication of the potential of miRNAs
in cancer diagnosis demonstrated that miRNA expression profiles can distinguish
between tumour and normal tissue and can also define the tissue of origin in tumours
of diagnostic uncertainty [313].
Given the unsolved issues of melanoma and the importance and advantages of
miRNA analysis, the objectives of Chapter 3 and Chapter 4 are:
1) To identify melanoma-specific miRNA diagnostic and prognostic markers.
2) To establish functional miRNAs in melanomagenesis and by connecting to their
downstream signalling pathways to begin to identify potential miRNA treatments.

Chapter 1: Introduction 48
Oncogenic BRAF mutations are frequent in cutaneous melanoma occurring at sites
with little or moderate, as opposed to high levels of sun-induced damage. BRAF is a
vital coding-gene in the MAPK pathway and a mutant BRAF inhibitor has shown
effective therapeutic function in melanoma. In our group we have melanoma Tissue
Microarray (TMA) samples available with full clinical records, from both sun-
exposed and non-exposed sites and at all pathological stages from naevus to
metastasis, as well as a mature method to genotype the V600E BRAF mutation.
Therefore, the aims of Chapter 5 are:
1) To genotype BRAF V600E mutation status in melanoma TMA samples.
2) To investigate possible correlation between BRAF mutation status and
clinicopathological features.
3) To evaluate whether the BRAF mutation has prognostic value.

Chapter 2: Materials and Methods 49
Chapter 2: Materials and Methods
Chapter 2: Materials and Methods 50
2.1 Materials
2.1.1 General reagents and plastic consumables
General laboratory chemicals were purchased from Fisher Scientific (absolute
alcohol, methanol, phenol, isopropanol, chloroform, xylene, Na2EDTA, isoamyl
alcohol, potassium acetate, sodium hydroxide, glycerol). Some commonly used
solutions were obtained from Medical Research Council, Human Genetics Unit stock,
including Dulbecco PBS, dH2O, 1M Tris pH7.5 and pH8.0, 5M NaCl, 20x TBE,
0.5M EDTA, 5M NaOH. All the general reagents were stored at room temperature
unless otherwise indicated.
General plastic consumables were purchased from Greiner Bio One.
2.1.2 DNA isolation reagents
For mammalian cells:
Tail buffer: 10mM Tris-HCl pH8.0, 400mM NaCl, 3mM Na2EDTA, 1% (w/v) SDS.
Stored at 4°C.
Proteinase K stock solution: 2mg/ml proteinase K (Sigma-Aldrich, P2308), 100mM
Na2EDTA, pH 7.5, 2% (w/v) SDS. Stored at -20°C.
PCA: 25 parts redistilled phenol, 24 parts chloroform, 1 part isoamyl alcohol. Stored
at 4°C.
CA: 24 parts chloroform, 1 part isoamyl alcohol. Stored at 4°C.
For FFPE samples:
QIAamp® DNA Micro isolation kit and QIAamp Mini Elute column (QIAGEN,
56304). Stored at room temperature/4°C.
Chapter 2: Materials and Methods 51
2.1.3 RNA isolation reagents
For mammalian cells:
RNA-Bee (AMSBIO, CS-1048-100ml). Stored at 4°C.
For formalin fixed paraffin embedded (FFPE) samples:
RecoverAll™ Total Nucleic Acid Isolation Kit (Applied Biosystems, AM1975).
Stored at room temperature/4°C.
2.1.4 PCR reagents and oligonucleotides
Nested PCR and restriction digestion reagents
Polymerase chain reaction (PCR) stock reagents: 5x Clear PCR buffer (Promega,
M890A), 25mM MgCl2 (Promega, A351H), 100mM dNTP set (GE Healthcare, 27-
203501), GoTaq Flexi DNA Polymerase (Promega, M8305). 5x Green GoTaq®
Flexi buffer (Promega, M891A). XbaI (New England Biolabs, R0145S). All stored at
-20 °C.
PCR Primers for genotyping BRAF V600E mutation
Custom oligonucleotides were purchased from Sigma-Genosys. Lyophilised
oligonucleotides were resuspended in sterile dH2O to 100pmol/ul stock solution and
stored at -20 °C. Working stocks were diluted to 25pmol/ul and stored at -20 °C.
Primer details are shown in the following.
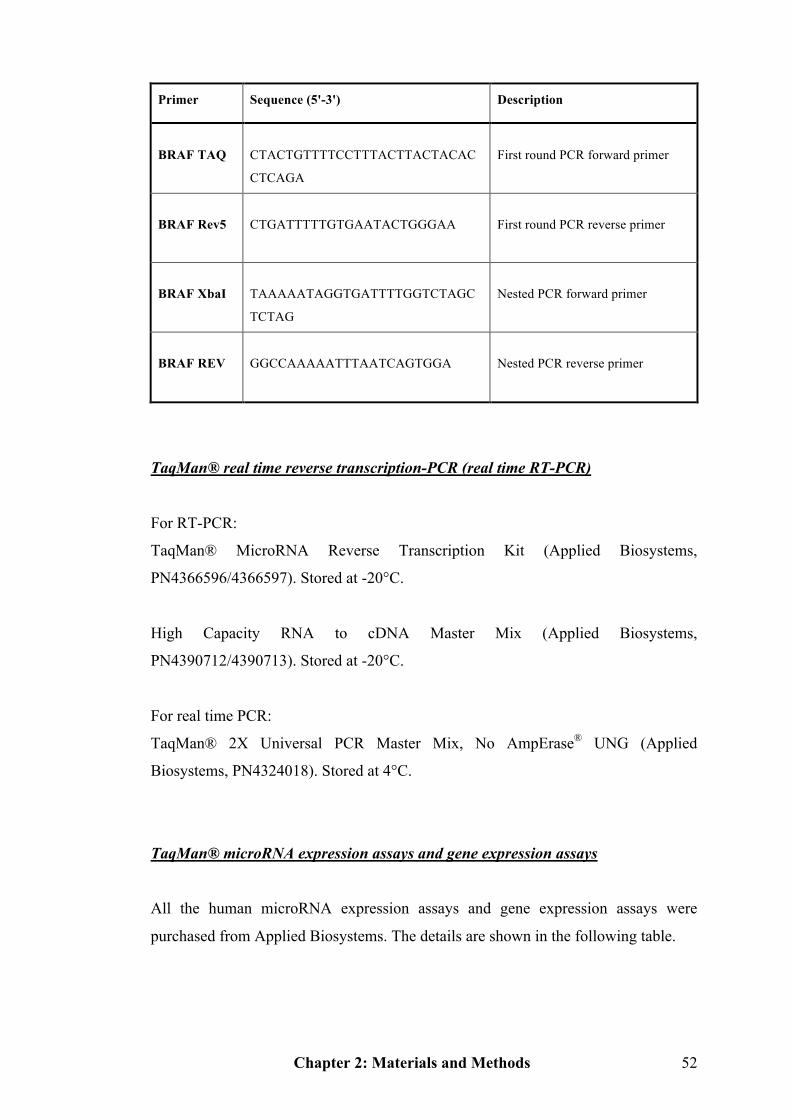
Chapter 2: Materials and Methods 52
Primer Sequence (5'-3') Description
BRAF TAQ
CTACTGTTTTCCTTTACTTACTACAC
CTCAGA
First round PCR forward primer
BRAF Rev5
CTGATTTTTGTGAATACTGGGAA
First round PCR reverse primer
BRAF XbaI
TAAAAATAGGTGATTTTGGTCTAGC
TCTAG
Nested PCR forward primer
BRAF REV
GGCCAAAAATTTAATCAGTGGA
Nested PCR reverse primer
TaqMan® real time reverse transcription-PCR (real time RT-PCR)
For RT-PCR:
TaqMan® MicroRNA Reverse Transcription Kit (Applied Biosystems,
PN4366596/4366597). Stored at -20°C.
High Capacity RNA to cDNA Master Mix (Applied Biosystems,
PN4390712/4390713). Stored at -20°C.
For real time PCR:
TaqMan® 2X Universal PCR Master Mix, No AmpErase® UNG (Applied
Biosystems, PN4324018). Stored at 4°C.
TaqMan® microRNA expression assays and gene expression assays
All the human microRNA expression assays and gene expression assays were
purchased from Applied Biosystems. The details are shown in the following table.
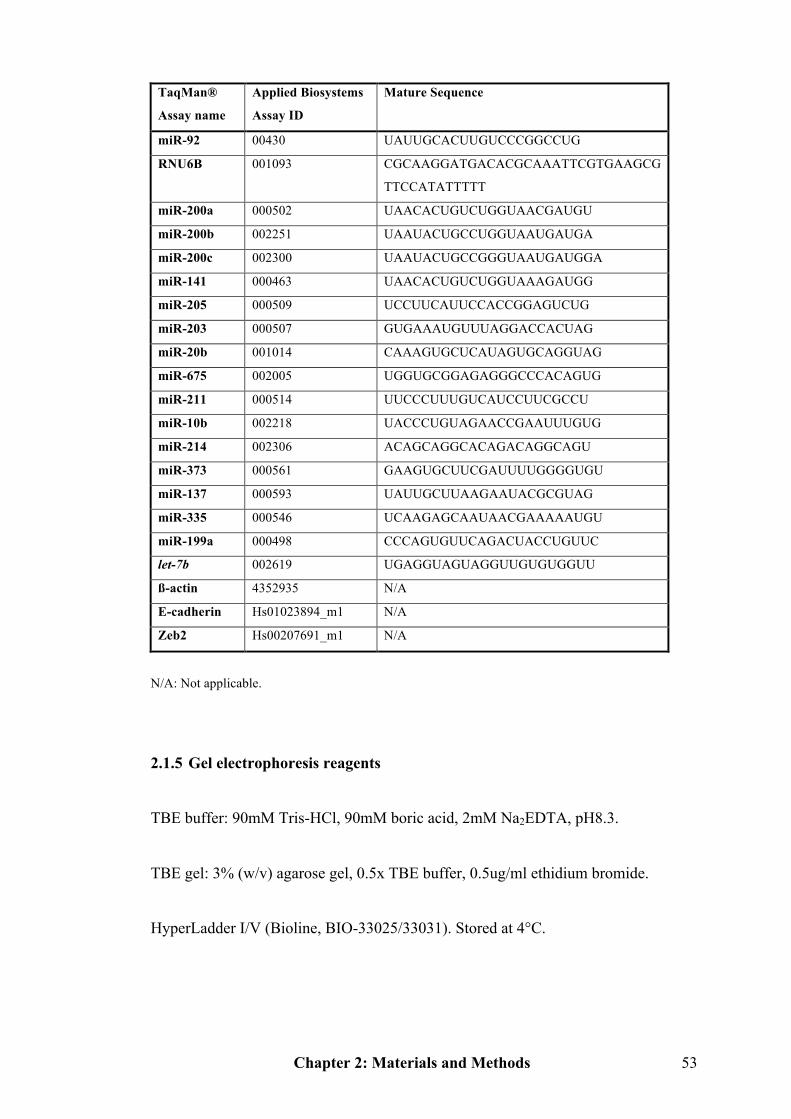
Chapter 2: Materials and Methods 53
TaqMan®
Assay name
Applied Biosystems
Assay ID
Mature Sequence
miR-92 00430 UAUUGCACUUGUCCCGGCCUG
RNU6B 001093 CGCAAGGATGACACGCAAATTCGTGAAGCG
TTCCATATTTTT
miR-200a 000502 UAACACUGUCUGGUAACGAUGU
miR-200b 002251 UAAUACUGCCUGGUAAUGAUGA
miR-200c 002300 UAAUACUGCCGGGUAAUGAUGGA
miR-141 000463 UAACACUGUCUGGUAAAGAUGG
miR-205 000509 UCCUUCAUUCCACCGGAGUCUG
miR-203 000507 GUGAAAUGUUUAGGACCACUAG
miR-20b 001014 CAAAGUGCUCAUAGUGCAGGUAG
miR-675 002005 UGGUGCGGAGAGGGCCCACAGUG
miR-211 000514 UUCCCUUUGUCAUCCUUCGCCU
miR-10b 002218 UACCCUGUAGAACCGAAUUUGUG
miR-214 002306 ACAGCAGGCACAGACAGGCAGU
miR-373 000561 GAAGUGCUUCGAUUUUGGGGUGU
miR-137 000593 UAUUGCUUAAGAAUACGCGUAG
miR-335 000546 UCAAGAGCAAUAACGAAAAAUGU
miR-199a 000498 CCCAGUGUUCAGACUACCUGUUC
let-7b 002619 UGAGGUAGUAGGUUGUGUGGUU
ß-actin 4352935 N/A
E-cadherin Hs01023894_m1 N/A
Zeb2 Hs00207691_m1 N/A
N/A: Not applicable.
2.1.5 Gel electrophoresis reagents
TBE buffer: 90mM Tris-HCl, 90mM boric acid, 2mM Na2EDTA, pH8.3.
TBE gel: 3% (w/v) agarose gel, 0.5x TBE buffer, 0.5ug/ml ethidium bromide.
HyperLadder I/V (Bioline, BIO-33025/33031). Stored at 4°C.
Chapter 2: Materials and Methods 54
2.1.6 Illumina microRNA microarray
Illumina microRNA microarray (Illumina, Catalog # MI 501-1001, Part # 11297743).
2.1.7 Protein detection reagents and antibodies
RIPA buffer: 150mM NaCl, 25mM Tris-HCl pH7.2, 0.1% SDS, 1% Triton X-100,
1% deoxycholate, 1mM Na2EDTA, 1x Protease inhibitor cocktail tablet (Roche
Complete)/25-50ml, 20mM NaF, 100uM orthovanadate.
Bicinchoninic acid (BCA) Assay Kit (Pierce Biotechnology, 23227).
Resolving buffer: 390mM Tris-HCl pH 8.8.
Resolving gel (8-12%): 8-12% acrylamide (40% stock, Severn Biotech Ltd, 2-2400-
05. Stored at 4°C.), 1x resolving buffer, 0.1% SDS (20% stock, National
Diagnostics, EC-874), 0.1% Ammonium persulphate (APS) (Sigma-Aldrich, 3678),
0.08% TEMED (Sigma-Aldrich, T2281-25ML). Prepared immediately prior to use.
Stacking buffer: 123mM Tris-HCl pH6.8.
Stacking gel (4-8%): 5% acrylamide, 1x stacking buffer, 0.1% SDS, 0.1% APS,
0.1% TEMED. Prepared immediately prior to use.
Running buffer: 192mM Glycine, 25mM Tris, 0.1% SDS pH8.3.
Transfer buffer: 192mM Glycine, 25mM Tris, pH 8.3.
5x Protein Sample buffer: 225mM Tris-HCl pH6.8, 5% SDS, 20% Glycerol, 0.05%
(w/v) Bromophenol Blue (Sigma-Aldrich, B-5525).
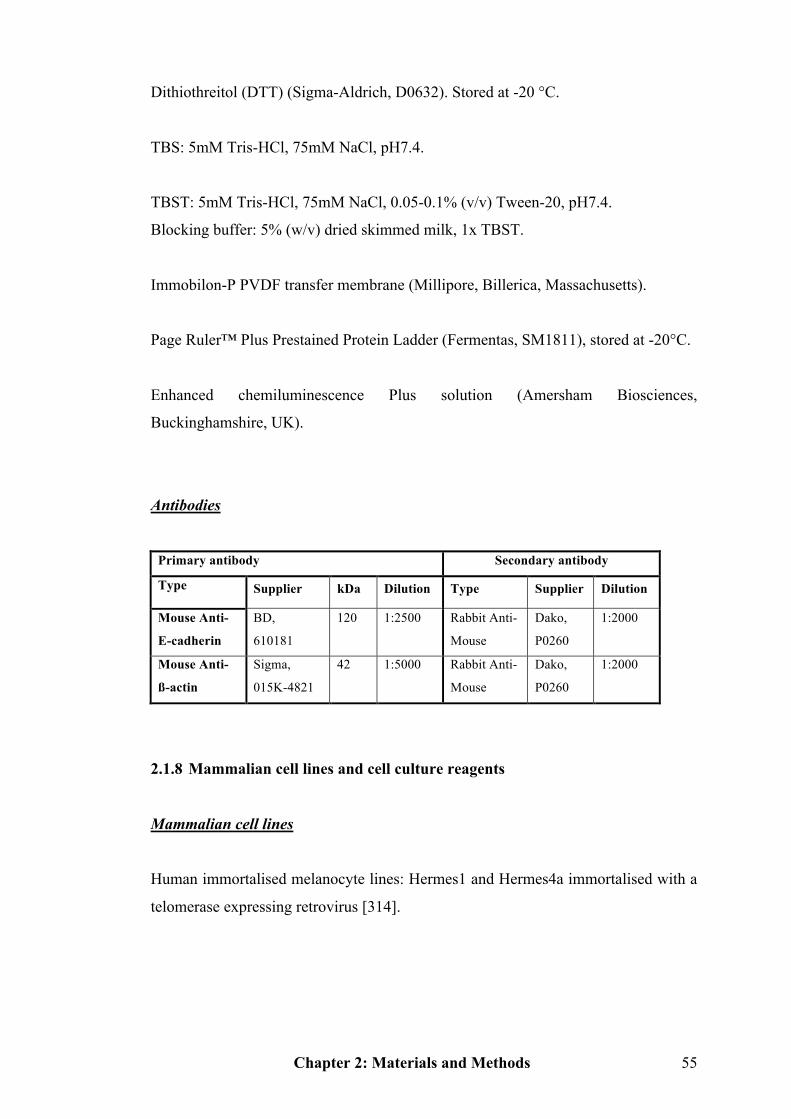
Chapter 2: Materials and Methods 55
Dithiothreitol (DTT) (Sigma-Aldrich, D0632). Stored at -20 °C.
TBS: 5mM Tris-HCl, 75mM NaCl, pH7.4.
TBST: 5mM Tris-HCl, 75mM NaCl, 0.05-0.1% (v/v) Tween-20, pH7.4.
Blocking buffer: 5% (w/v) dried skimmed milk, 1x TBST.
Immobilon-P PVDF transfer membrane (Millipore, Billerica, Massachusetts).
Page Ruler™ Plus Prestained Protein Ladder (Fermentas, SM1811), stored at -20°C.
Enhanced chemiluminescence Plus solution (Amersham Biosciences,
Buckinghamshire, UK).
Antibodies
Primary antibody Secondary antibody
Type Supplier kDa Dilution Type Supplier Dilution
Mouse Anti-
E-cadherin
BD,
610181
120 1:2500 Rabbit Anti-
Mouse
Dako,
P0260
1:2000
Mouse Anti-
ß-actin
Sigma,
015K-4821
42 1:5000 Rabbit Anti-
Mouse
Dako,
P0260
1:2000
2.1.8 Mammalian cell lines and cell culture reagents
Mammalian cell lines
Human immortalised melanocyte lines: Hermes1 and Hermes4a immortalised with a
telomerase expressing retrovirus [314].
Chapter 2: Materials and Methods 56
Human malignant melanoma cell lines: A375, C32, G361 and WM115 were obtained
from the European Collection of Cell Cultures (ECACC). HBL was obtained from
Gentaur (Brussels, Belgium). EDMEL3 was isolated by Ewan Brown from a
metastasis removed from a melanoma patient. EDMEL3 early passage cell line
(passage 2) and four EDMEL3 subclones and two EDMEL3 xenograft cell lines
were obtained and cultured in David Melton’s group.
Human ovarian cancer cell lines: PEA2, PEO1, PEO14 and PEO23 were donated by
Dr Grant Sellar, Cancer Research Centre, the University of Edinburgh. PEA2:
Cisplatin-resistant derivative of human ovarian cancer cell line—PEA1. PEO1:
Human ovarian cancer cell line. PEO14: Human ovarian cancer cell line. PEO23:
Cisplatin-resistant derivative of PEO14 [315].
General Mammalian cell culture media and reagents
Dulbecco’s Modified Eagle Medium (DMEM) (Invitrogen, GIBCO®, 41965).
Stored at 4°C.
Fetal Calf Serum (FCS) (Invitrogen, GIBCO®, 16170)
100x Non Essential Amino Acid (NEAA) (Invitrogen, GIBCO®, 11140). Stored at
4°C.
100mM Sodium Pyruvate (Invitrogen, GIBCO®, 11360). Stored at 4°C.
Penicillin-Streptomycin (P/S) liquid (Invitrogen, GIBCO®, 15070-063). Working
solution: 50U/ml Penicillin and 50ug/ml Streptomycin. Stored at -20°C.
200mM L-glutamine (100x) (Invitrogen, GIBCO®, 21051-040). Stored at -20°C.

Chapter 2: Materials and Methods 57
The working media were made according to the requirement of the specific
experiments.
PBS: 140mM NaCl, 3mM KCl, 2mM KH2PO4, 10nM Na2HPO4 pH7.4.
Trypsin-EDTA: 10x trypsin-EDTA (Invitrogen) diluted in PBS to 0.25% (w/v)
trypsin, 1mM Na2EDTA. Stored at -20°C.
Reverse transfection reagents
Opti-MEM® I Reduced Serum Medium (Invitrogen, GIBCO®, 31985-054). Stored
at 4°C.
siPORT™ NeoFX™ (Applied Biosystems, AM4510/4511). Stored at 4°C.
Ambion® Pre-miR™ microRNA precursors: hsa-miR-205 (Applied Biosystems,
PM11015), hsa-miR-200c (Applied Biosystems, PM11714), hsa-miR-211 (Applied
Biosystems, PM10168). Stored at -20°C.
Ambion® Anti-miR™ microRNA inhibitor: hsa-miR-20b (Applied Biosystems,
AM10975). Stored at -20°C.
FAM™ dye-labeled Anti-miR™ Negative Control #1 (Applied Biosystems,
AM17012). Stored at -70°C.
FAM™ dye-labeled Pre-miR™ Negative Control #1 (Applied Biosystems,
AM17121). Stored at -70°C.
Chapter 2: Materials and Methods 58
Cell cycle assay reagents
Citrate buffer stock solution: 2000mg trisodium citrate (BDH Laboratory Supplies,
301287F), 121mg Tris Base (Sigma-Aldrich, T1378), 1044mg spermine
tetrahydrochloride (Sigma-Aldrich, S2876), and 2ml nonidet NP40 (Sigma-Aldrich,
N3516), pH 7.6, in 2000ml dH2O. Stored at 4°C.
Solution A: 10mg trypsin type IX-S (Sigma-Aldrich, T0303) in 500ml dH2O, pH7.6.
Stored at 4°C.
Solution B: 250mg trypsin inhibitor (Sigma-Aldrich, T9253) and 50mg RNase A
(Sigma-Aldrich, R4875) in 500ml dH2O, pH 7.6. Stored at 4°C.
Solution C: 208mg propidium iodide (Sigma-Aldrich, 81845) and 500mg spermine
tetrahydrochloride (Sigma-Aldrich, S2876) in 500ml dH2O, pH 7.6. Stored at 4°C.
Sulforhodamine B (SRB) assay reagents
25% Trichloracetic acid (TCA) solution: by dilution of 100% TCA solution (Sigma-
Aldrich, T4885-500G). Stored at 4°C.
1% acetic acid solution: by dilution of 20ml of Glacial Acetic Acid (BDH, 10001 6x)
into distilled water to a final volume of 2 litre.
0.4% SRB solution: by dissolution of 2g of SRB (Sigma-Aldrich, S9012-5G) in 1%
acetic acid solution to a final volume of 500ml. Stored at 4°C.
10mM Tris solution pH 10.5: by dissolution of 1.21g of Tris base in water to a final
volume of 1 litre with addition of HCl to pH 10.5. Stored at 4°C.
Cisplatin (Faulding DBL, 100mg/100ml).

Chapter 2: Materials and Methods 59
Transwell migration assay materials
Matrigel™ Basement Membrane Matrix (BD Biosciences, 354234). Stored at -20°C.
Transwell inserts (Corning Inc, 3422).
Calcein-AM (Biotium, 30026). Stored at -20°C.
Colony formation assay reagents
2x Minimum Essential Medium (MEM) (Invitrogen, GIBCO®, 21935). Stored at
4°C.
2.8% (w/v) Methylcellulose (RD system, HSC001). Stored at -20°C.
UltraPure™ Agarose (Invitrogen, 15510-027).
2.1.9 Human tissue samples
For Chapter 3, 18 benign naevi (archived between 2005 and 2006) and 21 metastatic
melanoma samples (archived between 1993-1997) were cored (∅2mm cores) from
Formalin Fixed Paraffin Embedded (FFPE) blocks by Bob Morris. Primary
melanoma tissues (archived between 1992-1997) were obtained from
macrodissection of 10µm sections of FFPE blocks. All the tissue blocks were marked
by pathologist, Thomas Brenn.
For Chapter 5, 115 primary and 29 metastatic melanoma FFPE samples with
complete clinical records were obtained from Ewan Brown’s tissue microarray
(TMA) panel. Cores from the above sample blocks are ∅0.6mm.
Chapter 2: Materials and Methods 60
Clinicopathological data were collected using the Scottish Melanoma Group (SMG)
database. FFPE benign naevi, primary and metastatic melanoma specimens were
obtained with local ethics committee approval from the Pathology Department,
Royal Infirmary, Edinburgh.
2.1.10 Macrodissection reagents and materials
Plain glass slides without any charge or adhesive (VWR International).
Nuclear Fast Red stain (Sigma-Aldrich, N3030-100ml, 0.1% solution in 5%
aluminium sulphate).
Razor blades (Swann-Morton, Ref 0505).
RNaseZap (Applied Biosystems, AM-9780/9784).
Digestion buffer (Applied Biosystems, AM1975).
2.1.11 Equipment and software
Equipment
Bio-Rad PCR Thermal Cycler DNA Engine TETRAD2.
Stuart Orbital Shaker SSL1.
Whirlmixer™ Fisons SGP-202-010J.
Sanyo CO2 Incubator MCO-17A.

Chapter 2: Materials and Methods 61
Centrifuges: Eppendorf Germany 5415R and 5702, Hettich Mikro 20, Heraeus
Multifuge 3S-R, Sorvall® Microspin 24S.
Labtech Thermo Nanodrop 2000 spectrophotometer.
Grant Instrument (Cambridge) Ltd. Water Bath, TYPE JB1.
Grant Instrument (Cambridge) Ltd. Heat block, BT3.
Microscope: Leica TYPE 090-135.001 (Cell culture), Nikon Eclipse Ti.
HYBAID Oven, MINI 10.
SCIE-PLAS Electrophoresis system.
Bio-Rad Gel Doc 2000.
Bio-Rad Protein Mini-PROTEAN3™ electrophoresis system.
Beckman Coulter Counter Z series.
Thermo ELECTRON CORPORATION Multiskan Spectrum.
Fisher Scientific Bio-TEK plate reader, synergy HT.
Applied Biosystems HT7900.
Confocal Leica SP5 with Laser lines: 488nm, Objectives: 10x 0.4 N.A (ECRC).
GE Image Quant LAS 4000.
Heraeus HERAsafe Biological Safety Cabinet HS 12.
Chapter 2: Materials and Methods 62
Software
SDS 2.3/RQ manager 1.2 for real time PCR data analysis.
GenomeStudioTM Gene Expression Module v1.0 and R 2.9.2 for microarray data
analysis.
Cluster 3.0/TreeView for Hierarchical Clustering analysis.
Flow Jo 7.6.1 for cell cycle analysis.
Image J 1.43u for methylcellulose assay, transwell migration assay and western
immunoblotting quantification.
GraphPad Prism Version 4.0b for general statistics.
2.2 Methods
2.2.1 DNA isolation and DNA based experiments
DNA isolation from mammalian cell lines
Genomic DNA of all cultured mammalian cells was isolated using the same method.
Cells were plated in a 60-100mm dish prior to DNA isolation. When cells were ready,
the medium was discarded and cells were washed once with 10ml of PBS. Cells were
scraped from the dish in another 3ml of PBS and were transferred to two 2ml-
eppendorf tubes and cells were pelleted. Then 750ul of tail buffer and 15ul of
proteinase K (20mg/ml) were added to each tube and the mixture was incubated
overnight at 37°C. Protein and lipid were removed from the DNA solution by two
extractions with 750ul PCA, followed by a 750ul CA extraction. In each case the
phases were mixed by vigorous shaking, separated by centrifugation and the aqueous
Chapter 2: Materials and Methods 63
phase was transferred to a fresh tube without disturbing the interphase. The genomic
DNA was precipitated by adding 750ul of isopropanol and centrifuged at top speed
for 6 minutes. The DNA pellet was then washed twice with 70% ethanol, air-dried,
resuspended in sterile dH2O and stored at -20°C.
DNA isolation from FFPE samples
Primary and metastatic melanoma FFPE sample cores (2-3 cores/tube) were de-
paraffinised with 1ml xylene. Following centrifugation, the xylene was discarded and
the samples were washed with absolute alcohol and air-dried. DNA was extracted
from the deparaffinised tissue using the QIAamp® DNA Micro isolation kit and
following the manufacturer’s protocol. Briefly, samples were resuspended in 15ul
ATL (a buffer with proteinase K to lyse samples) buffer and 10ul proteinase K
solution supplied from the kit, mixed thoroughly and incubated at 56°C overnight.
25ul of ATL and 50ul of buffer AL (a buffer to allow optimal binding of DNA to the
membrane), followed with 50ul of absolute alcohol were added and after incubation
at room temperature for 5 minutes the samples were added to QIAamp MiniElute
columns and centrifuged at 6,000g for 60 seconds. The columns were washed by
500ul AW1 (washing buffer 1 for clean up of genomic DNA) and 500ul AW2
(washing buffer 2 for clean up of genomic DNA) buffers respectively and
centrifuged at 6,000g for 60 seconds again. DNA was eluted in 25ul sterile dH2O by
centrifugation at 20,000g for 60 seconds. (ATL, AL, AW1, AW2 supplied from the
kit).
Measurement of DNA concentration
DNA samples were measured using the Thermo Nanodrop spectrophotometer.
Sterile dH2O was used to blank the Nanodrop spectrophotometer and the DNA50
parameter was chosen. Then 1.5-2.0ul of each sample was added to the Nanodrop
spectrophotometer and the software gave the concentration of each sample and the
Chapter 2: Materials and Methods 64
OD260/280 ratio. The OD260/280 ratio provides a measure of the purity of nucleic
acid solutions and the extent of protein contamination. Ratios between 1.75 and 1.9
are regarded as acceptable for DNA. DNA50: for double stranded DNA, when
OD260=1, DNA concentration is 50ug/ml.
Nested PCR and restriction digestion for genotyping BRAF V600E mutation
Routine PCRs were prepared in a 50ul volume containing 5x PCR buffer, 25mM
MgCl2, 5mM dNTP, 1U Taq DNA polymerase, 25pmol/ul forward and reverse
primers and ~100ng genomic DNA template. A negative control containing no DNA
template was present each time. Nested PCR is a modification of the basic PCR
procedure intended to reduce the contamination in low abundance products due to
the amplification of unexpected primer binding sites. The specific nested PCR
programmes were as follows:
First round Second Round (nested)
Step1: 1x 94°C 4 minutes 1x 94°C 4 minutes Step2: 35x 94°C 30seconds 35x 94°C 30seconds 61°C 30seconds 58°C 30seconds 72°C 30seconds 72°C 30seconds Step3: 1x 72°C 5minutes 1x 72°C 5minutes Step4: 10°C ∞ 10°C ∞ Product: 275bp Product: 134bp XbaI restriction fragment length polymorphism (RFLP) analysis
Restriction digests contained 2-4U restriction enzyme per 1ug DNA and the XbaI
reaction buffer supplemented with 100ug/ml BSA. Restriction digests were
incubated at 37°C for a minimum of 2 hours.

Chapter 2: Materials and Methods 65
Cut control Uncut control PCR DNA 15ul PCR DNA 15ul 10X Buffer 3ul 10X Buffer 3ul XbaI 2ul dH2O 12ul dH2O 10ul Incubate at 37°C for 2 hours Product: 105bp if BRAF V600E mutation is present.
Digests, cut control (positive control) and uncut control (negative control) samples
were loaded onto a 2-3% agarose gel.
Assessment of sensitivity of genotyping method
A heterozygous BRAF V600E mutation positive melanoma cell line—G361 (mutant)
and a BRAF mutation negative ovarian cancer cell line—PEO1 (wild type) were
used to test the sensitivity of the assay. First, 1, 2 and 3ul of the two genomic DNAs
were run on a gel to confirm their relative DNA concentrations. Secondly, DNA
solutions of the two cell lines were diluted until they were at a similar concentration
to the DNA concentrations of the FFPE samples. Thirdly, different amount of DNA
from the BRAF V600E wild type cell line and from thr BRAF mutant cell line were
mixed in ratios 100:0, 90:10, 80:20, 50:50, 0:100 so that the total amount of DNA in
each mixture was the same. Finally, the nested PCR and restriction digestion assays
were run to see what was the lowest ratio of BRAF V600E containing DNA that
could be detected in the presence of wild type DNA.
Gel electrophoresis
DNA fragments were separated on 2-3% (w/v) agarose gels containing 0.5ug/ml
ethidium bromide and 0.5x TBE. DNA samples were mixed with sample buffer prior
to loading. Electrophoresis was carried out at 30-100V in 0.5x TBE buffer. DNA was
visualized by UV illumination and Hyperladder I/VTM was used as a size marker.
Chapter 2: Materials and Methods 66
2.2.2 RNA isolation and RNA based experiments
RNA isolation from mammalian cell lines
Prior to total RNA isolation, cells in plates/dishes were washed with PBS twice.
Total RNA was then isolated from cultured mammalian cell lines using the reagent
RNAzolTMB. Cultured cells were lysed directly in the culture dish by the addition of
RNAzolTMB (0.2ml/106 cells) and lysate was mixed by pipetting several times. The
RNA was extracted by the addition of 0.2ml chloroform/ml of RNAzolTMB followed
by vigorous shaking of the mixture for 30 seconds. The emulsion was then
centrifuged at 12,000g for 15 minutes at 4°C. The aqueous phase was transferred to a
fresh tube and an equal volume of isopropanol was added. RNA was allowed to
precipitate at room temperature for 10 minutes and was then pelleted by
centrifugation at 12,000g for 5 minutes. The RNA pellet was then washed in 70%
ethanol and centrifuged at 7500g for 5 minutes. The pellet was allowed to air dry
before being resuspended in 100-150ul of sterile dH2O for storage either at -20°C in
the short term, or at -70°C for longer periods.
Macrodissection
All the sections for macrodissection were cut, mounted and stained by Helen
Caldwell. The first three 3um sections were discarded from each block. Then 15
10um sections were cut with a 3um section between every three 10um sections. The
3um sections were used for H&E staining. 10um sections were stained using Nuclear
Fast Red for dissection. After sections were cut and mounted on glass slides and
stained either using H&E or Nuclear Fast Red, all slides were dried in an oven.
The specific area for dissection was marked by Thomas Brenn on the H&E slides.
The Nuclear Fast Red stained slides were placed on the microscope stage and the
melanocytic cells were scraped with a razor blade that had been slightly moistened
with Digestion buffer. Non-tumour elements, such as lymphocytes, blood vessels
Chapter 2: Materials and Methods 67
and connective tissues were avoided. The scrapings were removed with a fine sterile
pipette tip, and placed in a microfuge tube containing 100-200ul Digestion buffer.
The above scraping steps were repeated from additional 10um sections until the
Digestion buffer in the tube became pink in colour with the stained scrapings.
RNA isolation from melanocytic tissue samples
Melanocytic FFPE samples were isolated using the RecoverAll™ Total Nucleic Acid
Isolation Kit with the guidance of the protocol. The recovered nucleic acids with this
kit are suitable for downstream applications such as microarray analysis, quantitative
real-time RT-PCR, and mutation screening. Briefly, the FFPE samples (3-4 cores or
scrapings from 15 sections per tube) were de-paraffinised with 1ml 100% xylene,
mixed and incubated at 50°C for 3 minutes. Xylene was then discarded after
centrifugation at top speed for 2 minutes. The sample pellet was washed twice with
1ml absolute alcohol and air-dried. Digestion buffer and protease were added to the
pellet and incubated at 50°C for 15 minutes and then 80°C for 15 minutes. Isolation
additive/ethanol mixture was then added and mixed. The whole mixture was passed
through a Filter Cartridge and washed with 700ul of Wash1 and 500ul of Wash2/3.
After centrifugation to remove residual fluid, DNase solution was added to each
Filter Cartridge and incubated for 30 minutes at room temperature. The Cartridge
was then washed with Wash1 and Wash2/3 again and RNA was eluted in sterile
dH2O for storage either at -20°C in the short term, or at -70°C for longer periods.
Measurement of RNA concentration
RNA samples were measured using the Thermo Nanodrop spectrophotometer. Sterile
dH2O was used to blank the Nanodrop spectrophotometer and the RNA40 parameter
was chosen. Then 1.5-2.0ul of each sample was added to the Nanodrop
spectrophotometer and the software gave the concentration of each sample and the
OD260/280 ratio. The OD260/280 ratio provides a measure of the purity of nucleic
Chapter 2: Materials and Methods 68
acid solutions and the extent of protein contamination. Ratios between 1.8 and 2.0
are regarded as acceptable for RNA. RNA40: for single stranded RNA, when
OD260=1, RNA concentration is 40ug/ml.
TaqMan real time reverse transcription PCR (real time RT-PCR)
I used 10-100ng of total RNA per 15ul RT Reaction. All kit components and RNA
samples were allowed to thaw on ice.
1) RT-PCR
Each 15ul reaction consists of 7ul RT master mix (including 0.15ul dNTP, 1.00ul
reverse transcriptase, 1.50ul reverse transcriptase buffer, 0.19ul RNase inhibitor,
4.16ul Nuclease-free water), 3ul primer, and 5ul RNA sample. After the above
components were added into a 0.2ml polypropylene tube, the tube was sealed and
mixed gently. The solution was spun down to the bottom of the tube. Then the tube
was incubated on ice for 5mins and kept on ice until it was ready to load the thermal
cycler. The RT-PCR programme was as follows:
Step1: 16°C 30 minutes
Step2: 42°C 30 minutes
Step3: 85°C 5 minutes
Step4: 4°C ∞
2) Real time PCR
Each 20ul mixture consists of 1.00ul 20X TaqMan® MicroRNA and mRNA Assay,
1.33ul of RT product, 10.00ul of TaqMan® 2X Universal PCR Master Mix-No
AmpErase® UNG, 7.67ul of Nuclease-free water. To avoid pipetting many small
amount of components, a master mix sufficient for triplicate assays on all samples
was prepared, including 10% extra volume to account for pipetting losses, in the
same tube. The solution was mixed gently and centrifuged to the bottom of the tube.
Then the whole mixture, including primer and RT products, was added into a plate
Chapter 2: Materials and Methods 69
and sealed with an optical adhesive cover (Bio-Rad Microseal® ‘B’ Film,
MSO1001) followed with brief centrifugation of the plate and elimination of any air
bubbles. The plate was then loaded onto the real time PCR instrument (Applied
Biosystems HT7900). The real time PCR programme was as follows:
Step1: 1x 95°C 10 minutes
Step2: 40x 95°C 15 seconds
60°C 1 minutes
qPCR quantification method
There are two major methods to quantify changes in RNA levels using real time
PCR. One is absolute quantification and the other is relative quantification. The
former is better to accurately determine an unknown gene’s absolute amount.
Relative quantification is more suitable to compare expression of the same gene
between different samples.
In relative quantification, the standard curve method and comparative Ct method
(ΔΔCt method) are two commonly used strategies. In relative quantification, for
quantification normalized to an endogenous control, standard curves are prepared for
both the target and the endogenous reference. For each experimental sample, the
amount of target and endogenous reference is determined from the appropriate
standard curve. Then, the target amount is divided by the endogenous reference
amount to obtain a normalized target value. Again, one of the experimental samples
is the calibrator. Each of the normalized target values is divided by the calibrator
normalized target value to generate the relative expression levels. The standard curve
method is a time-consuming process and dilution must be accurate.
The comparative Ct method, another quantification approach, involves comparing
the Ct values of the samples of interest with a control or calibrator such as a non-
treated sample or RNA from normal tissue. The Ct values of both the calibrator and
Chapter 2: Materials and Methods 70
the samples of interest are normalized to an appropriate endogenous housekeeping
gene. The comparative Ct method is also known as the 2-ΔΔ
Ct method, where ΔΔCt =
ΔCt sample - ΔCt reference. Here, ΔCt sample is the Ct value for any sample normalized to
the endogenous housekeeping gene and ΔCt reference is the Ct value for the calibrator
also normalized to the endogenous housekeeping gene.
Validation of amplification efficiency for the ΔΔCt calculation
For the ΔΔCt calculation to be valid, the amplification efficiencies of the target and
the endogenous reference must be approximately equal. This can be established by
looking at how ΔCt varies with template dilution. If the plot of cDNA dilution versus
delta Ct is close to zero, it implies that the efficiencies of the target and endogenous
control genes are very similar. A slope in the plot of log input amount (RNA/DNA
dilution factor) versus ΔCt <0.1 passes this equivalent efficiency test [316]. This
method increases throughput and eliminates dilution errors. However, if an
endogenous control gene cannot be found whose amplification efficiency is similar
to the target, then the standard curve method is preferred.
In my study, amplification efficiency of various target miRNAs and mRNAs were
validated using the standard curve method with dilution factors of 2 and 4,
respectively.
Illumina microRNA microarray
The microRNA microarray was done in the Genetics Core of the Wellcome Trust
Clinical Research Facility, Western General Hospital by Lee Murphy. A brief
workflow is shown in Chapter 3.2.2.1.
Chapter 2: Materials and Methods 71
2.2.3 Protein extraction and protein detection
Protein extraction
Cells were first washed with cold PBS and then scraped into 1ml of cold PBS in a
1.5ml eppendorf tube, followed by centrifugation at 3,000rpm for 3 minutes to form
a pellet. The cell pellet was resuspended in 50-200ul RIPA lysis buffer and
maintained on ice for 15-30 minutes. The suspension was centrifuged at 13,000rpm
for 15 minutes at 4°C and the supernatant was collected and stored at -70°C.
Measurement of protein concentration
Protein concentrations were determined using the BCA™ Assay Kit in a 96-well
plate. The original lysates were diluted 10-fold in dH2O to a final volume of 25ul.
dH2O was used as a blank control. 200ul of working reagent from the kit was added
to each sample and incubated at 37°C for 30 minutes. The plate was then scanned
using a plate Spectrophotometer at 562nm. Concentrations of samples were
calculated using the standard curve generated from known BSA standards and the
dilution factor.
SDS polyacrylamide gel electrophoresis (SDS-PAGE)
Proteins with different molecular weight were separated by discontinuous SDS-
PAGE. The concentration of polyacrylamide in the resolving gel was determined by
the molecular weight of proteins. First, a 10-12% resolving gel (used for protein
weights between 30kDa-200kDa) was made to separate the proteins. The resolving
gel was overlaid with isopropanol to remove air bubbles and give an even gel surface
prior to polymerisation at room temperature. After the isopropanol was discarded the
stacking gel was added and a comb was inserted. The comb was removed after the
stacking gel was set and the gel cassette was assembled into the Mini-PROTEAN3™
Chapter 2: Materials and Methods 72
electrophoresis module and immersed in the running buffer. Appropriate amounts of
protein samples were mixed with 4x sample buffer and were heated at 95°C for 5
minutes before loading onto the gel along with a Prestained Protein Ladder. Proteins
were separated by electrophoresis at 80V for the stacking gel and 150V for the
resolving gel.
Western immunoblotting
Proteins were electrophoretically transferred onto an Immobilon-P PVDF transfer
membrane in transfer buffer according to the method of Towbin [317]. The transfer
was completed by using a Mini Trans-Blot system (Bio-Rad) at 100V, constant
voltage at 4°C with an ice block for 1 hour. Then the membrane was taken out and
rinsed in TBST for 5 minutes and subsequently was blocked in the blocking buffer
for 1 hour. The membrane was incubated overnight at 4°C with primary antibody
that had been diluted in the blocking buffer. After washing 3 times (5-10
minutes/wash) in TBST, the filter was incubated with secondary antibody at room
temperature for 1 hour. Unbound antibodies were washed away by 3 TBST rinses.
Finally, the membrane was overlaid with ECL Plus for 1 minute. Immunoreactive
bands were visualized either by autoradiography or using the ImageQuant LAS 4000
system (GE, ImageQuant) to make an electronic record.
2.2.4 Cell culture and cell based experiments
General culture conditions for mammalian cell lines
The cell culture medium was pre-warmed to 37°C before frozen stocks of
mammalian cells were defrosted. The frozen cell stock was then quickly thawed in a
37°C water bath. 5ml medium was added and mixed with a cell suspension. A cell
pellet was then formed by centrifugation at 1,300 rpm for 5 minutes. A single cell

Chapter 2: Materials and Methods 73
suspension was prepared in fresh medium and transferred to appropriate flasks for
culture. Flasks were incubated at 37°C in 5% CO2.
When the cells were confluent, the medium was removed and trypsin-EDTA was
added to the flasks (1ml/25cm2 flask) for 5 minutes. Trypsin is a serine protease that
can make adhesive cells detach from the culture surface. 4ml fresh medium was
added to the cell-trypsin suspension and the mixture was then centrifuged at 1,300
rpm for 5 minutes to form a cell pellet. The cell pellet was resuspended in an
appropriate volume of fresh medium, either for a future culture or for downstream
work. As commonly used mammalian adherent cell lines divide approximately once
every 24 hours, the cells were passaged to 12.5-25% confluency. Passaging was
routinely carried out once every 2-4 days.
Cryopreservation of cell lines
Cells were trypsinised and a cell pellet was made by centrifugation at 1,300 rpm for
5 minutes and was then resuspended in cell culture medium containing 10% (v/v)
DMSO and 20% FCS (cells from a 10cm diameter area were resuspended in 1ml
total volume). The use of DMSO increases the survival of cells during freezing and
thawing by minimising the formation of ice crystals within the cells. Prior to
transferring cell stocks to a liquid N2 cryostore for indefinite storage, the cell stocks
were stored at -20°C for 1 hour and then at -70°C overnight.
Cell counting
Cells were diluted 1:100 in isoton (Coulter Isoton® II dilents) and counted using the
Coulter Counter Z series.
Chapter 2: Materials and Methods 74
Lipid-based reverse transfection
In traditional transfection of adherent cells, the amount of exposed cell surface, and
not the number of transfection complexes, is the limiting factor to transfection
efficiency [318]. Reverse transfection is believed to increase cell exposure to
transfection complexes, often leading to greater transfection efficiency.
Reverse transfection (also called Neofection), developed by Ambion, is a more
streamlined transfection method. Reverse transfection involves simultaneously
transfecting and plating cells, much like products used for transfecting suspension
cells. siPORT NeoFX Transfection Agent and RNA are mixed, incubated, distributed
to culture wells, and overlaid with cells. The method produces equivalent or
improved transfection efficiency over the standard pre-plated method for many of the
cell types tested and saves an entire day in the process [318]. siPORT NeoFX
Transfection Agent is a lipid-based formulation that provides extremely high levels
of transfection without inducing cellular stresses common to other transfection
agents.
Prior to the specific experiments, the best transfection efficiency was assessed using
mixtures of different volumes of siPORT NeoFX and the negative control small
RNA. Assessment of transfection efficiency is described in the next section.
The brief procedure for the specific transfections in my project was as follows: I used
two types of tissue culture plate for transfection, 12-well and 6-well. First, melanoma
cells were trypsinised and diluted in normal growth medium to 105 cells/ml. Cells
were set aside at 37°C in the incubator while the transfection complexes were
prepared. Appropriate volumes of siPORT NeoFX were diluted in OPTI-MEM I
medium and incubated for 10 minutes at room temperature. Then appropriate
amounts of small RNAs (precursors and inhibitors of specific microRNAs) were
diluted into OPTI-MEM I medium. Diluted siPORT NeoFX and diluted small RNA
were mixed and incubated for 10 minutes at room temperature and dispensed into a
culture plate. Finally, the prepared cell suspensions were placed onto the siPORT
Chapter 2: Materials and Methods 75
NeoFX/small RNA complexes and the plates were put into the incubator. The
medium in each well was replaced daily with fresh normal culture medium.
Assessment of transfection efficiency
FAM™ dye-labeled Pre-miR™ Negative Control is a carboxyfluorescein (FAM™)-
labeled double-stranded RNA oligonucleotide designed for monitoring uptake of Pre-
miR™ microRNA precursors by fluorescence microscopy or flow cytometry.
FAM™ dye-labeled Anti-miR™ Negative Control is a carboxyfluorescein (FAM™)-
labeled RNA oligonucleotide designed for monitoring uptake of Anti- miR™
microRNA inhibitors by fluorescence microscopy or flow cytometry.
Different volumes for siPORT NeoFX and FAM dye negative control were
sequentially mixed and transfected to melanoma cells. Cells were examined using
Fluorescence-activated Cell Sorting (FACS) at several times (24-hour, 48-hour and
72-hour) after transfection to obtain the best match of siPORT NeoFX and small
RNA that produced the highest transfection efficiency. Results are shown in Chapter
4.2.1.
Final concentration of the small RNA used: 30nM for precursors, 150nM for
inhibitors. Final volumes of siPORT NeoFX: 8ul/well in 12-well plates, 16ul/well in
6-well plates.
Cells were transfected with small RNAs for 16-18 hours prior to the downstream
experiments, including cell proliferation, cisplatin sensitivity, methylcellulose
formation and transwell migration assay.
Chapter 2: Materials and Methods 76
Cell cycle
Cells were trypsinised and harvested as described above. The cell pellet was washed
with PBS and centrifuged. The new cell pellet was then resuspended in 100ul citrate
buffer and stored at -20°C until the day of the FACS assay. Prior to doing FACS, the
cell suspension in citrate buffer was first treated with an appropriate volume of
solution A for 2 minutes to lyse the cell membrane and then treated with an
appropriate volume of solution B for 10 minutes to stop the effect of solution A.
After a further 10 minutes of solution C treatment, the samples were ready for flow
cytometry. All the FACS assays were done by Elizabeth Freyer and I analysed the
data using Flow Jo software. 24-hour, 48-hour and 72-hour time courses were
examined after transfection.
Cell proliferation (SRB assay)
Cells were plated at a density of 1,000-1,500 cells/well in 96-well plates in normal
growth medium. Each experimental group had 16 replicates. The plates were assayed
over four days at 24-hour, 48-hour, 72-hour and 96-hour. For the assay, 50ul of 25%
(v/v) TCA was added to each well of the plates and incubated at 4°C for at least 1
hour. Plates were washed with slow-running tap water for 10 times and air-dried.
Then 50ul of 0.057% (w/v) SRB solution was added to the plates and incubated at
room temperature for 30 minutes, and then rinsed for four times with 1% (v/v) 150ul
of acetic acid to remove unbound dye and air-dried. 150ul of 10mM Tris solution
(pH 10.5) was then added to each well and the plates were incubated at room
temperature for 60 minutes with agitation to solubilise the protein-bound dye. Plates
were read using a plate reader at OD 510nm.

Chapter 2: Materials and Methods 77
Cisplatin sensitivity assay (SRB assay)
Prior to seeding cells to 96-well plates, different amounts of cisplatin were prepared
to make final concentrations at 0uM, 0.1uM, 0.3uM, 0.6uM, 1uM and 3uM. The
following procedures were the same as described in the cell proliferation SRB assay.
Cells were fixed at Day 5.
Transwell migration assay
An inverse invasion assay was used to test cell migration ability. The method is a
modified version of the one devised [319] by Margaret Frame’s group at the
Edinburgh Cancer Research Centre. In brief, an aliquot of Matrigel was thawed
slowly on ice. Ice-cold PBS and the Matrigel were mixed 1:1 and 100ul of the
mixture was added to each Transwell that was later inserted into a 24-well plate. The
plate was incubated for at least 30 minutes at 37°C to allow the Matrigel to set.
During this time, 105-4x10⁵/ml cell suspensions were prepared in their normal
growth medium. When the Matrigel was set, the Transwells were inverted on the lid
of the plate and 100ul of cell suspension were added onto the underside of the filter
of the each Transwell. The Transwells were carefully covered with the base of the
plate such that it contacted the droplet of the cell suspension. The inverted plate was
put into the incubator for 2-4 hours to allow the cells to attach to the filter. The plate
was turned right-side-up after incubation. Each Transwell was dipped sequentially
into 3x1ml serum free medium to wash away the unattached cells. The Transwells
were left in the third change of serum free medium and 100ul of normal growth
medium with serum were added into each Transwell on top of the Matrigel. (In this
case, there was DMEM with serum only in the Transwell not in the well-chamber.
Therefore, cells should migrate through the Matrigel towards the serum.) The plate
was then put back to the incubator for 5 days.
After 5 days of incubation, fixation and staining of the Transwells were done prior to
confocal microscope scanning. The procedure was as follows: For n Transwells,
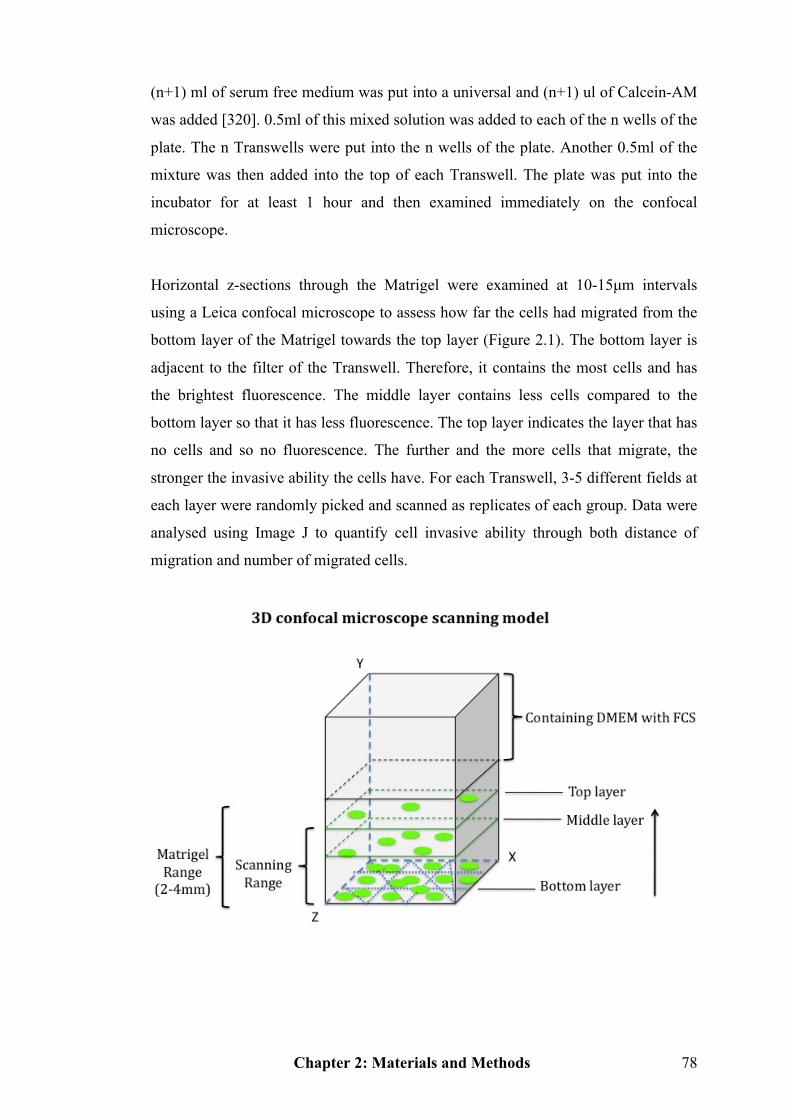
Chapter 2: Materials and Methods 78
(n+1) ml of serum free medium was put into a universal and (n+1) ul of Calcein-AM
was added [320]. 0.5ml of this mixed solution was added to each of the n wells of the
plate. The n Transwells were put into the n wells of the plate. Another 0.5ml of the
mixture was then added into the top of each Transwell. The plate was put into the
incubator for at least 1 hour and then examined immediately on the confocal
microscope.
Horizontal z-sections through the Matrigel were examined at 10-15µm intervals
using a Leica confocal microscope to assess how far the cells had migrated from the
bottom layer of the Matrigel towards the top layer (Figure 2.1). The bottom layer is
adjacent to the filter of the Transwell. Therefore, it contains the most cells and has
the brightest fluorescence. The middle layer contains less cells compared to the
bottom layer so that it has less fluorescence. The top layer indicates the layer that has
no cells and so no fluorescence. The further and the more cells that migrate, the
stronger the invasive ability the cells have. For each Transwell, 3-5 different fields at
each layer were randomly picked and scanned as replicates of each group. Data were
analysed using Image J to quantify cell invasive ability through both distance of
migration and number of migrated cells.
Chapter 2: Materials and Methods 79
Figure 2.1 The 3D confocal microscope scanning model. The cube represents a Transwell. X, Y, Z
represent the three dimensions respectively. The green round circles represent cells at different layers.
Bottom layer: lots of fluorescent cells; Middle layer: reduced number of fluorescent cells; Top layer:
very few fluorescent cells. Black arrow represents the scanning direction from bottom to top.
Colony formation assay
The methylcellulose assay was used to test the colony formation ability of tumour
cells. This is a recognised in vitro surrogate assay for in vivo tumourigenicity and has
been described to support colony formation of various human tumours [321]. In brief,
1.8% (w/v) agarose solution was made and boiled. The melted agarose solution was
diluted 1:1 in fresh 2x MEM medium supplemented with 10% FCS, NEAA, Sodium
Pyruvate, P/S and L-glutamine. 2ml of the mixture was then quickly poured into each
well of a 6-well plate and left aside until solid. During this time, 2.8%
Methylcellulose solution was prepared in MEM medium using 2x MEM with the
same supplements. An appropriate number of cells were mixed with the
methylcellulose solution and 2ml of the mixture was poured onto the bottom agarose
base. 5x10³-104 cells were seeded in each well. The 6-well tissue culture plates were
incubated at 37°C in 5% CO2 for 9-12 days.
Images of colonies were taken at Day1, Day3, Day6, Day9, Day12. About 30
colonies of each experimental group were used in calculation of colony size. Data
were analysed using Image J. Images of entire wells were also taken on the Gel Doc
so that colony number could be determined.
2.2.5 Statistics
All the statistical analysis was done using Prism except for analysis of microarray
results. T-test and One-way ANOVA for Chapters 3 and 4. Chi-square, Fisher’s
exact and Kaplan Meier survival for Chapter 5. P=0.05 was used as the significance

Chapter 2: Materials and Methods 80
level, except where the Bonferroni correction was applied. All the statistical tests are
two-sided.
Data analysis of microarray was done using R language and Cluster 3.0 and
TreeView. More information on statistical analysis of the microarray data is
described in Chapter 3.2.2.3.

Chapter 3: Expression screen for melanoma-specific microRNAs in FFPE tissues
81
Chapter 3: Expression screen for melanoma-specific microRNAs in FFPE tissues

Chapter 3: Expression screen for melanoma-specific microRNAs in FFPE tissues
82
3.1 Introduction
A study by Rosenfeld et al. showed that microRNAs (miRNAs) can accurately
identify cancer tissue origin [322], indicating that miRNA profiling in cancer
diagnosis may be superior to mRNA gene signatures. Besides its diagnostic
advantages, the miRNA expression profile is found to correlate with survival in
cancer patients. Given the tremendous regulatory potential of miRNAs and their
often tissue-specific and disease-specific expression patterns [295, 323], several
unique miRNA expression profiles have been found to be associated with bio-
molecular and prognostic characteristics of human lung cancer, chronic lymphocytic
leukemia and ovarian cancer [283, 293, 324], indicating that miRNA signatures
could be used to define biological or clinical features of human cancers.
When this study started there were only a very limited number of studies
investigating melanoma-specific miRNA expression patterns and their role in
cutaneous melanoma. The first two expression profiling studies identified a set of 17
miRNAs that were expressed significantly differently in eight melanoma cell lines
compared to other cancer cell lines [325, 326]. A following microarray-based
miRNA profiling studied, carried out only on melanocytes and melanoma cell lines
derived from either primary or metastatic melanomas, discovered a number of
miRNAs differentially expressed in melanoma cells compared to melanocytes [327].
However, the above differentially expressed miRNAs from the literature were
obtained from cell-based microarray, not from tissue profiling. Moreover, there was
no miRNA expression profile available based on tissue samples to interpret the roles
of these miRNAs in the progression of melanoma systematically and investigate their
prognostic value using different stages of melanocytic lesions. Therefore, the main
aims of this chapter are: first, to identify a melanoma-specific miRNA expression
profile on tissues; secondly, to obtain miRNA candidates as biomarkers of
melanoma; thirdly, to pinpoint potential miRNAs which might be acting in the key
regulatory pathways in the pathogenesis of cutaneous melanoma.
What is the best way to detect miRNA expression? What type of samples can bring
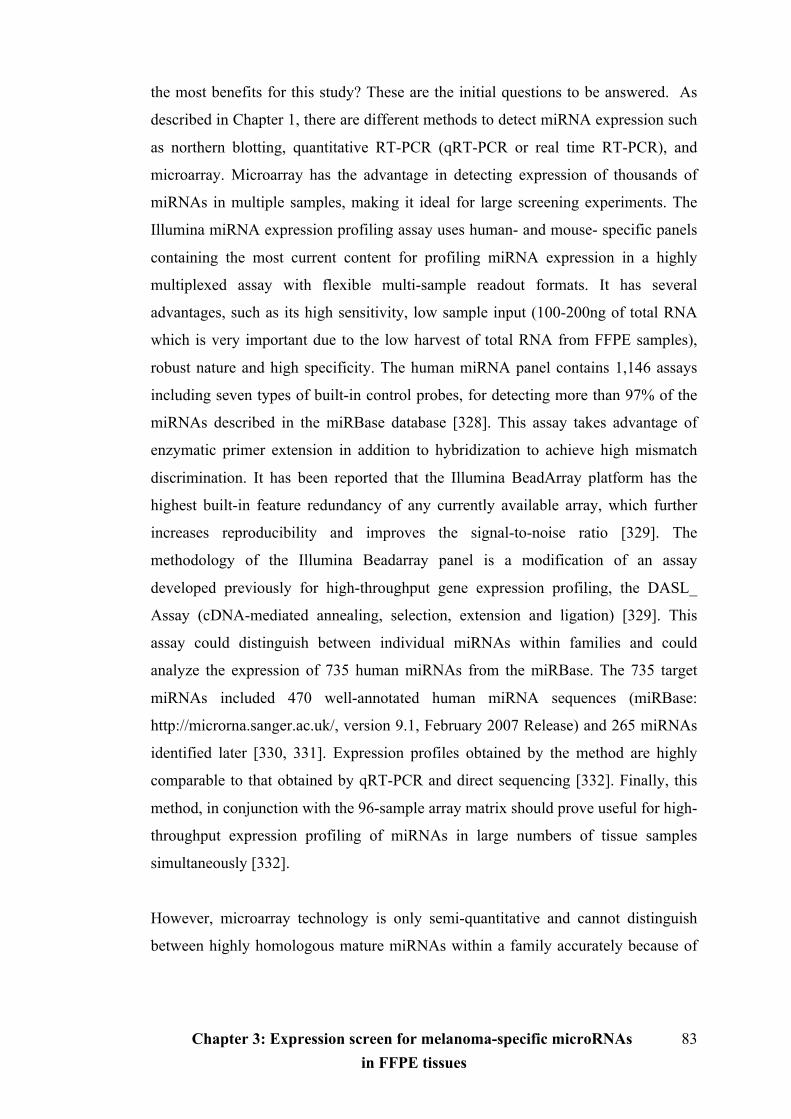
Chapter 3: Expression screen for melanoma-specific microRNAs in FFPE tissues
83
the most benefits for this study? These are the initial questions to be answered. As
described in Chapter 1, there are different methods to detect miRNA expression such
as northern blotting, quantitative RT-PCR (qRT-PCR or real time RT-PCR), and
microarray. Microarray has the advantage in detecting expression of thousands of
miRNAs in multiple samples, making it ideal for large screening experiments. The
Illumina miRNA expression profiling assay uses human- and mouse- specific panels
containing the most current content for profiling miRNA expression in a highly
multiplexed assay with flexible multi-sample readout formats. It has several
advantages, such as its high sensitivity, low sample input (100-200ng of total RNA
which is very important due to the low harvest of total RNA from FFPE samples),
robust nature and high specificity. The human miRNA panel contains 1,146 assays
including seven types of built-in control probes, for detecting more than 97% of the
miRNAs described in the miRBase database [328]. This assay takes advantage of
enzymatic primer extension in addition to hybridization to achieve high mismatch
discrimination. It has been reported that the Illumina BeadArray platform has the
highest built-in feature redundancy of any currently available array, which further
increases reproducibility and improves the signal-to-noise ratio [329]. The
methodology of the Illumina Beadarray panel is a modification of an assay
developed previously for high-throughput gene expression profiling, the DASL_
Assay (cDNA-mediated annealing, selection, extension and ligation) [329]. This
assay could distinguish between individual miRNAs within families and could
analyze the expression of 735 human miRNAs from the miRBase. The 735 target
miRNAs included 470 well-annotated human miRNA sequences (miRBase:
http://microrna.sanger.ac.uk/, version 9.1, February 2007 Release) and 265 miRNAs
identified later [330, 331]. Expression profiles obtained by the method are highly
comparable to that obtained by qRT-PCR and direct sequencing [332]. Finally, this
method, in conjunction with the 96-sample array matrix should prove useful for high-
throughput expression profiling of miRNAs in large numbers of tissue samples
simultaneously [332].
However, microarray technology is only semi-quantitative and cannot distinguish
between highly homologous mature miRNAs within a family accurately because of
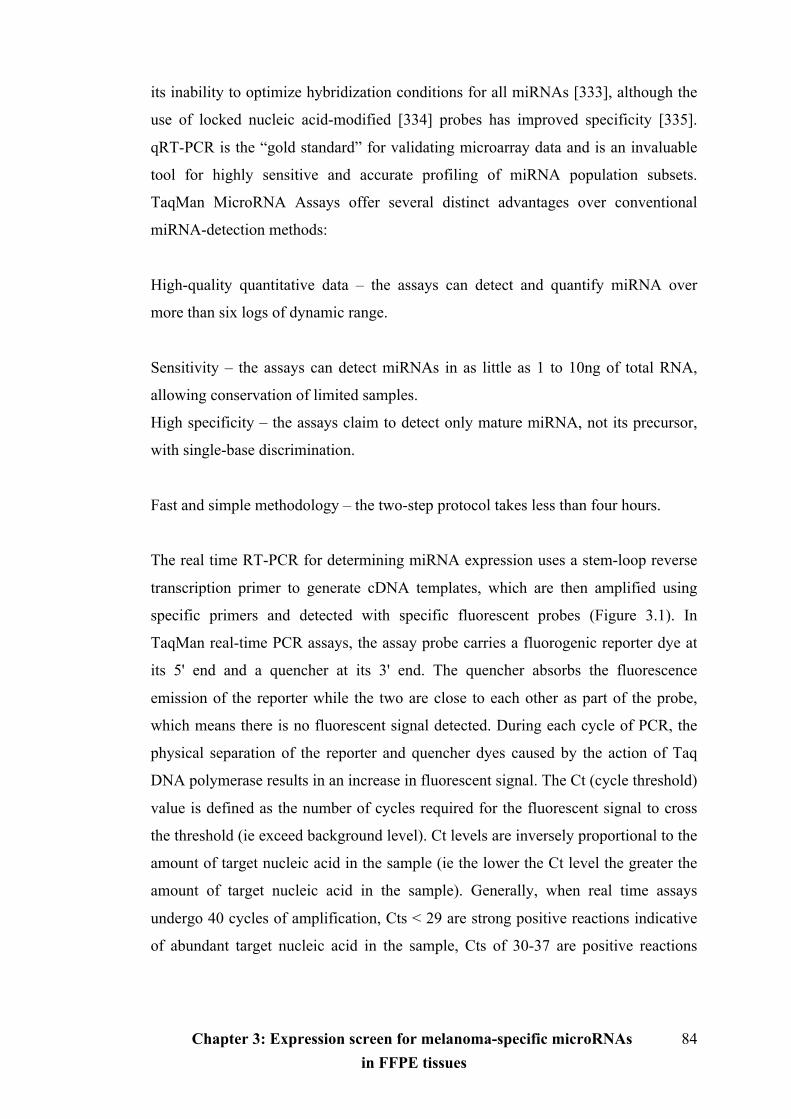
Chapter 3: Expression screen for melanoma-specific microRNAs in FFPE tissues
84
its inability to optimize hybridization conditions for all miRNAs [333], although the
use of locked nucleic acid-modified [334] probes has improved specificity [335].
qRT-PCR is the “gold standard” for validating microarray data and is an invaluable
tool for highly sensitive and accurate profiling of miRNA population subsets.
TaqMan MicroRNA Assays offer several distinct advantages over conventional
miRNA-detection methods:
High-quality quantitative data – the assays can detect and quantify miRNA over
more than six logs of dynamic range.
Sensitivity – the assays can detect miRNAs in as little as 1 to 10ng of total RNA,
allowing conservation of limited samples.
High specificity – the assays claim to detect only mature miRNA, not its precursor,
with single-base discrimination.
Fast and simple methodology – the two-step protocol takes less than four hours.
The real time RT-PCR for determining miRNA expression uses a stem-loop reverse
transcription primer to generate cDNA templates, which are then amplified using
specific primers and detected with specific fluorescent probes (Figure 3.1). In
TaqMan real-time PCR assays, the assay probe carries a fluorogenic reporter dye at
its 5' end and a quencher at its 3' end. The quencher absorbs the fluorescence
emission of the reporter while the two are close to each other as part of the probe,
which means there is no fluorescent signal detected. During each cycle of PCR, the
physical separation of the reporter and quencher dyes caused by the action of Taq
DNA polymerase results in an increase in fluorescent signal. The Ct (cycle threshold)
value is defined as the number of cycles required for the fluorescent signal to cross
the threshold (ie exceed background level). Ct levels are inversely proportional to the
amount of target nucleic acid in the sample (ie the lower the Ct level the greater the
amount of target nucleic acid in the sample). Generally, when real time assays
undergo 40 cycles of amplification, Cts < 29 are strong positive reactions indicative
of abundant target nucleic acid in the sample, Cts of 30-37 are positive reactions
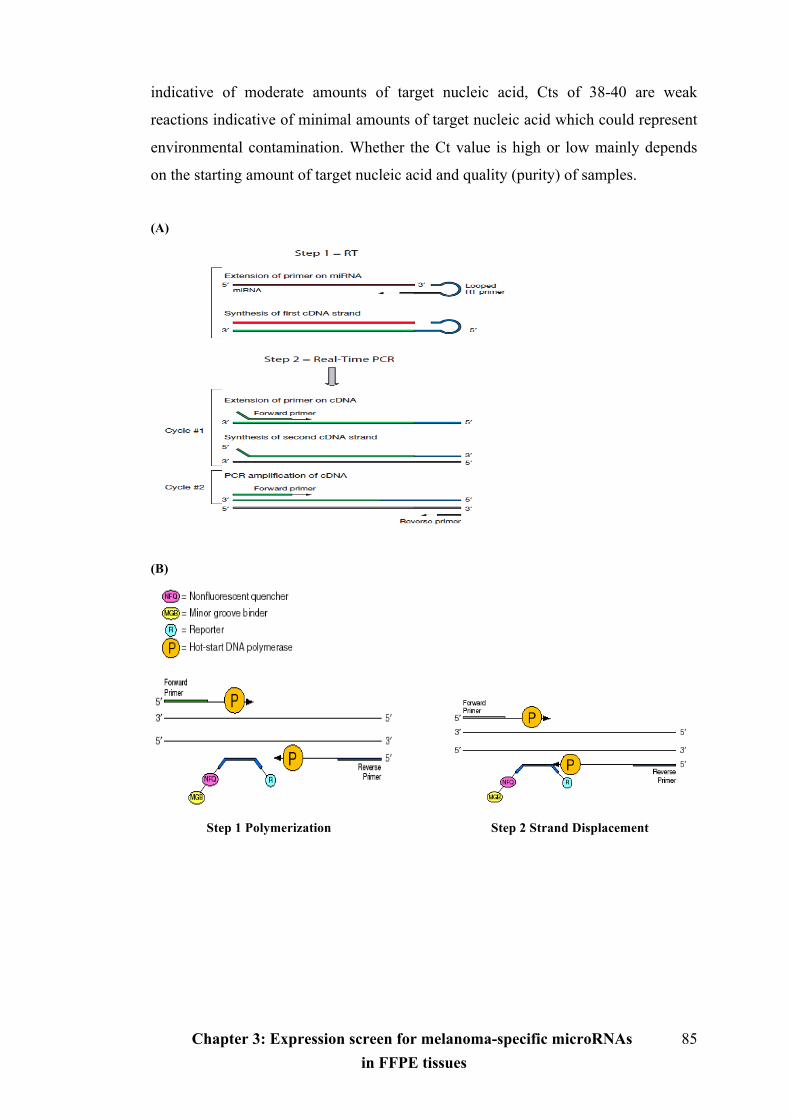
Chapter 3: Expression screen for melanoma-specific microRNAs in FFPE tissues
85
indicative of moderate amounts of target nucleic acid, Cts of 38-40 are weak
reactions indicative of minimal amounts of target nucleic acid which could represent
environmental contamination. Whether the Ct value is high or low mainly depends
on the starting amount of target nucleic acid and quality (purity) of samples.
(A)
(B)
Step 1 Polymerization Step 2 Strand Displacement
Chapter 3: Expression screen for melanoma-specific microRNAs in FFPE tissues
86
Step 3 Cleavage Step 4 Completion of Polymerization
Figure 3.1 The workflow of TaqMan qRT-PCR. (A) Two-step RT-PCR. (B) TaqMan MGB Probes
and their detection system in Real Time RT-PCR. Adapted from [336].
Fresh-frozen tissue has traditionally been the standard source for miRNA expression
profiling studies. Given the enormous amount of physiological information stored in
archived FFPE tissue and the abundance of clinical data retrievable in association
with it, it will prove invaluable if miRNA expression levels could be routinely and
systematically analyzed in FFPE tissues. Moreover, unlike the situation in other
tumours, the study of the molecular biology of melanomagenesis has been
constrained by a combination of small tumour specimens and unavailability of fresh
tissue. Numerous studies have documented that it is feasible and informative to
characterize miRNA from FFPE samples with qRT-PCR [311, 312], as well as
microarrays [322, 337, 338]. For melanocytic lesions, a study by Glud et al. showed
that high-quality miRNA can be extracted from FFPE naevi and that reproducible
and comparable miRNA expression profiles can be obtained from FFPE and fresh
frozen samples [339].
Taken together, Illumina miRNA Expression Profiling Human microarray (Version2)
and TaqMan MicroRNA Real Time PCR Assays were chosen to detect miRNA
expression in both cultured cells and FFPE samples. It was expected that the miRNA
candidates from archival FFPE tissues rather than cultured melanoma cells would be
the better source of miRNA biomarkers and miRNAs involved in melanomagenesis.
In melanoma research, morphological separation is particularly difficult for certain
types of melanocytic lesion such as dysplastic naevus, naevus of special sites, naevus

Chapter 3: Expression screen for melanoma-specific microRNAs in FFPE tissues
87
with dermal regression, recurrent naevus and Spitz naevus, as well as for specific
types of melanoma. Blue naevus and Spitz naevus are two types of melanocytic
naevus, which are uncommon and generally benign. Dysplastic naevus is an atypical
melanocytic naevus, a mole whose appearance is different from that of common
moles. Generally, it is believed that individuals with multiple dysplastic naevi are at
much higher risk for developing melanomas. However, whether the dysplastic
naevus represents a transition between benign naevus and melanoma is still
controversial.
The most difficult diagnostic problems in separating naevi from melanomas are
benign naevi showing clinical and/or histological features of malignancy and
melanomas mimicking benign naevi [340-342]. Superficial spreading melanoma is
the commonest melanoma subtype in adults, but it has significant clinical as well as
histological overlap with dysplastic naevi. Therefore, reliable separation is difficult
to make and is impossible in some cases. Benign acquired melanocytic naevi may
also show specific changes more classically associated with melanoma. Spitz naevi
are characterized by distinct cytological features, as well as atypia and mitotic
activity more usually associated with melanoma and distinction from melanoma is
notoriously difficult. These tumours most frequently present in childhood and
adolescence and misdiagnosis as childhood melanoma or underdiagnosis can result
in disastrous consequences for the patient. Similarly, naevi at special anatomical sites
may show an atypical clinical presentation and share many histological features with
invasive melanoma despite their benign behaviour. The most important sites include
the vulva, acral locations as well as the ear, areas where extensive surgery is difficult
and potentially mutilating. Finally, naevoid melanoma is characterized by
histological features reminiscent of a banal melanocytic naevus. This represents one
of the most challenging diagnoses in Dermatopathology and most cited cases have
only been diagnosed retrospectively following melanoma recurrence [342]. In
conclusion, there is an urgent need for adjuvant molecular markers to precisely
separate benign from malignant melanocytic disease.
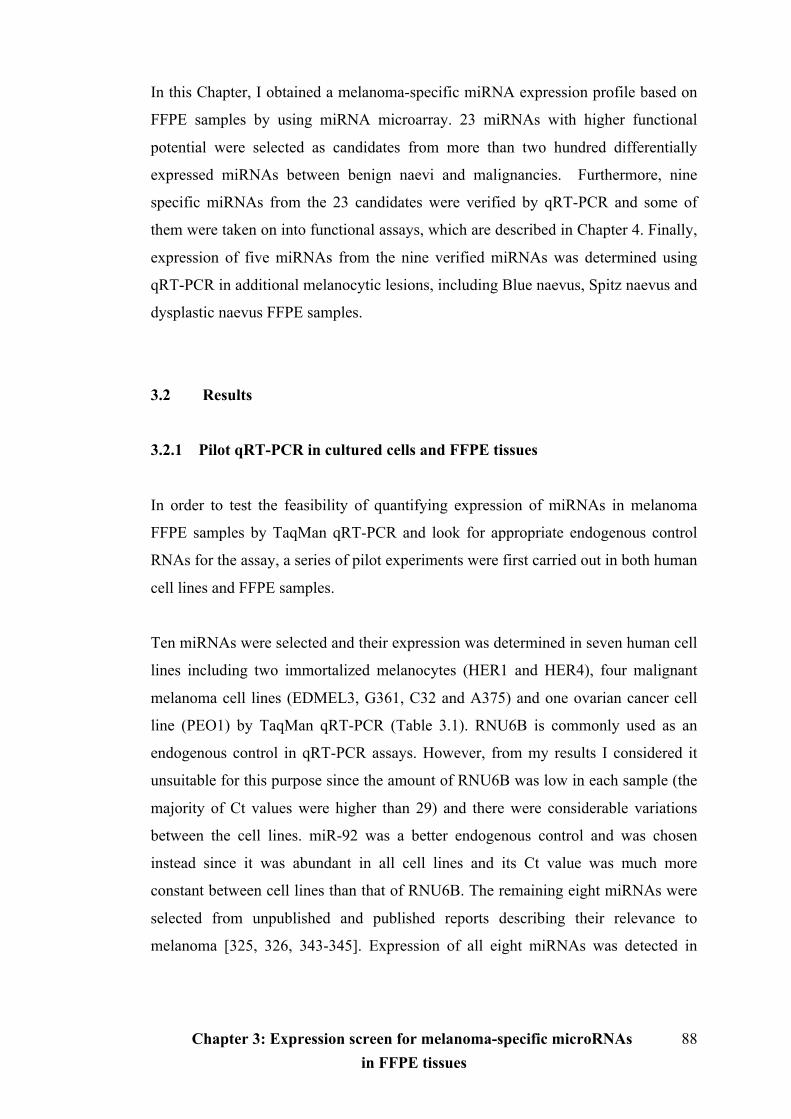
Chapter 3: Expression screen for melanoma-specific microRNAs in FFPE tissues
88
In this Chapter, I obtained a melanoma-specific miRNA expression profile based on
FFPE samples by using miRNA microarray. 23 miRNAs with higher functional
potential were selected as candidates from more than two hundred differentially
expressed miRNAs between benign naevi and malignancies. Furthermore, nine
specific miRNAs from the 23 candidates were verified by qRT-PCR and some of
them were taken on into functional assays, which are described in Chapter 4. Finally,
expression of five miRNAs from the nine verified miRNAs was determined using
qRT-PCR in additional melanocytic lesions, including Blue naevus, Spitz naevus and
dysplastic naevus FFPE samples.
3.2 Results
3.2.1 Pilot qRT-PCR in cultured cells and FFPE tissues
In order to test the feasibility of quantifying expression of miRNAs in melanoma
FFPE samples by TaqMan qRT-PCR and look for appropriate endogenous control
RNAs for the assay, a series of pilot experiments were first carried out in both human
cell lines and FFPE samples.
Ten miRNAs were selected and their expression was determined in seven human cell
lines including two immortalized melanocytes (HER1 and HER4), four malignant
melanoma cell lines (EDMEL3, G361, C32 and A375) and one ovarian cancer cell
line (PEO1) by TaqMan qRT-PCR (Table 3.1). RNU6B is commonly used as an
endogenous control in qRT-PCR assays. However, from my results I considered it
unsuitable for this purpose since the amount of RNU6B was low in each sample (the
majority of Ct values were higher than 29) and there were considerable variations
between the cell lines. miR-92 was a better endogenous control and was chosen
instead since it was abundant in all cell lines and its Ct value was much more
constant between cell lines than that of RNU6B. The remaining eight miRNAs were
selected from unpublished and published reports describing their relevance to
melanoma [325, 326, 343-345]. Expression of all eight miRNAs was detected in
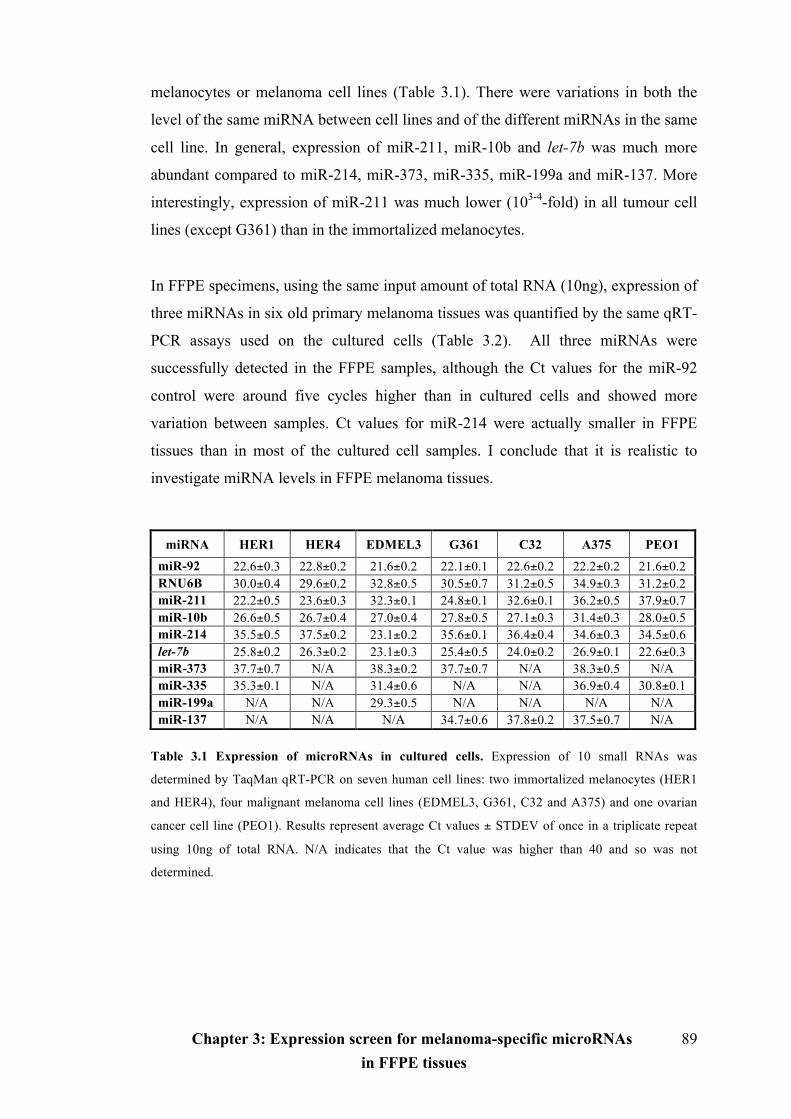
Chapter 3: Expression screen for melanoma-specific microRNAs in FFPE tissues
89
melanocytes or melanoma cell lines (Table 3.1). There were variations in both the
level of the same miRNA between cell lines and of the different miRNAs in the same
cell line. In general, expression of miR-211, miR-10b and let-7b was much more
abundant compared to miR-214, miR-373, miR-335, miR-199a and miR-137. More
interestingly, expression of miR-211 was much lower (103-4-fold) in all tumour cell
lines (except G361) than in the immortalized melanocytes.
In FFPE specimens, using the same input amount of total RNA (10ng), expression of
three miRNAs in six old primary melanoma tissues was quantified by the same qRT-
PCR assays used on the cultured cells (Table 3.2). All three miRNAs were
successfully detected in the FFPE samples, although the Ct values for the miR-92
control were around five cycles higher than in cultured cells and showed more
variation between samples. Ct values for miR-214 were actually smaller in FFPE
tissues than in most of the cultured cell samples. I conclude that it is realistic to
investigate miRNA levels in FFPE melanoma tissues.
Table 3.1 Expression of microRNAs in cultured cells. Expression of 10 small RNAs was
determined by TaqMan qRT-PCR on seven human cell lines: two immortalized melanocytes (HER1
and HER4), four malignant melanoma cell lines (EDMEL3, G361, C32 and A375) and one ovarian
cancer cell line (PEO1). Results represent average Ct values ± STDEV of once in a triplicate repeat
using 10ng of total RNA. N/A indicates that the Ct value was higher than 40 and so was not
determined.
miRNA HER1 HER4 EDMEL3 G361 C32 A375 PEO1 miR-92 22.6±0.3 22.8±0.2 21.6±0.2 22.1±0.1 22.6±0.2 22.2±0.2 21.6±0.2 RNU6B 30.0±0.4 29.6±0.2 32.8±0.5 30.5±0.7 31.2±0.5 34.9±0.3 31.2±0.2 miR-211 22.2±0.5 23.6±0.3 32.3±0.1 24.8±0.1 32.6±0.1 36.2±0.5 37.9±0.7 miR-10b 26.6±0.5 26.7±0.4 27.0±0.4 27.8±0.5 27.1±0.3 31.4±0.3 28.0±0.5 miR-214 35.5±0.5 37.5±0.2 23.1±0.2 35.6±0.1 36.4±0.4 34.6±0.3 34.5±0.6 let-7b 25.8±0.2 26.3±0.2 23.1±0.3 25.4±0.5 24.0±0.2 26.9±0.1 22.6±0.3 miR-373 37.7±0.7 N/A 38.3±0.2 37.7±0.7 N/A 38.3±0.5 N/A miR-335 35.3±0.1 N/A 31.4±0.6 N/A N/A 36.9±0.4 30.8±0.1 miR-199a N/A N/A 29.3±0.5 N/A N/A N/A N/A miR-137 N/A N/A N/A 34.7±0.6 37.8±0.2 37.5±0.7 N/A
Chapter 3: Expression screen for melanoma-specific microRNAs in FFPE tissues
90
miRNA No.4 No.5 No.6 No.7 No.8 No.9
miR-92 25.7±0.1 26.3±0.6 26.0±0.3 28.5±0.4 26.3±0.3 29.2±0.4
miR-211 31.7±0.2 31.6±0.2 30.1±0.6 32.4±0.4 32.4±0.6 34.9±0.3
miR-214 30.6±0.4 32.5±0.4 33.0±0.6 33.3±0.5 34.3±0.2 33.8±0.4 Table 3.2 Expression of microRNAs in primary FFPE melanoma tissues. Expression of miR-92, -
211 and -214 was determined by TaqMan qRT-PCR in six primary FFPE melanoma tissues (No.4-9).
Results represent average Ct values ± STDEV of once in a triplicate repeat using 10ng total RNA.
3.2.2 High throughput screen of melanoma-specific microRNAs
3.2.2.1 Sample preparation and processing of Illumina microRNA microarray
My array contained 80 samples, including 19 cell lines and 61 FFPE tissues. There
were two immortalized human melanocytes (HER1 and HER4), 13 human melanoma
cells (A375, C32, G361, WM115, HBL and the EDMEL3 series) and four ovarian
cancer cell lines (PEA2, PEO1, PEO14 and PEO23). The EDMEL3 malignant
melanoma cell line was isolated from a late-recurring distal metastasis of a primary
melanoma. Early and late passage samples of the cell line, as well as subclones with
different morphologies (epithelial, spindle cell, mixed) were available. In addition
cells retrieved back into culture from successful xenografts of EDMEL3 into mice
were also included. For FFPE tissues, there were 11 benign naevi (archived between
2005 and 2006), 29 primary (15 recurrent and 14 non-recurrent age and sex-matched
pairs) and 21 metastatic archival cutaneous melanoma tissues (archived between
1993-1997). Samples of benign naevi and metastatic melanomas were obtained from
∅2mm cores of FFPE blocks by Bob Morris. For the much smaller primary
melanomas, tumour samples were separated from adjacent non-tumour tissues by
macrodissection of 10µm sections of FFPE blocks. Suitable areas on all the tissue
blocks were marked by the pathologist, Thomas Brenn.
To perform Illumina miRNA Microarray, 100-200ng of total RNA were required.
Total RNA of FFPE samples were isolated using RecoverAll™ Total Nucleic Acid
Chapter 3: Expression screen for melanoma-specific microRNAs in FFPE tissues
91
Isolation Kit specialised for FFPE. Up to four 10um sections, or up to 35 mg of
unsectioned core samples, can be processed per reaction. It is optimized for isolation
of total nucleic acids, including miRNAs from FFPE tissue. Recovered nucleic acids
are suitable for qRT-PCR and microarray analyses. The yields of total RNA of the
FFPE samples were between 400ng and 9,000ng. The 260/280 ratios were 1.58-2.07.
The full total RNA yields and the ratio of 260/280 are shown in Appendix 1.
80 total RNA (200ng) samples were sent to the Genetics Core of the Wellcome Trust
Clinical Research Facility, Western General Hospital. Illumina miRNA microarrays
were performed using the Illumina 96-sample Universal Array Matrix by Lee
Murphy. This involves a 3-day programme, containing several steps. First, the assay
starts by polyadenylating 200ng total RNA with a Poly-A-Polymerase (PAP). The
polyadenylated RNA is converted to cDNA using a biotinylated oligo-dT primer
with a universal PCR sequence at its 5'-end. The miRNA assay monitors miRNA
expression by targeting sequences with chimeric oligos containing universal PCR
amplification primer sites. One miRNA-specific oligo is used to assay each miRNA.
In this process, the biotinylated cDNA is annealed to the query oligos (microRNA
specific oligos, MSOs). The mixture is bound to streptavidin-conjugated
paramagnetic particles (SA-PMPs) to select the cDNA/oligo complexes. cDNA
templates are hybridized with the set of MSOs that corresponds to all the targeted
miRNAs. After oligo annealing, mis-hybridized and non-hybridized oligos are
washed way. A polymerase is then added, causing the MSO to undergo extension.
Then a universal PCR is followed. The primer on the strand that is complementary to
the array is fluorescently labelled. After PCR amplification, the labelled, single-
stranded product is prepared for hybridization to the bead on the array containing the
complementary address sequence. The BeadArray Reader measures fluorescence
intensity at each addressed bead location. The intensity of the signal corresponds to
the quantity of respective miRNA in the original samples. Finally, the miRNA
expression data are obtained from the scanned microarray images collected from the
Illumina BeadArray Reader. The workflow scheme is shown in Figure 3.2.
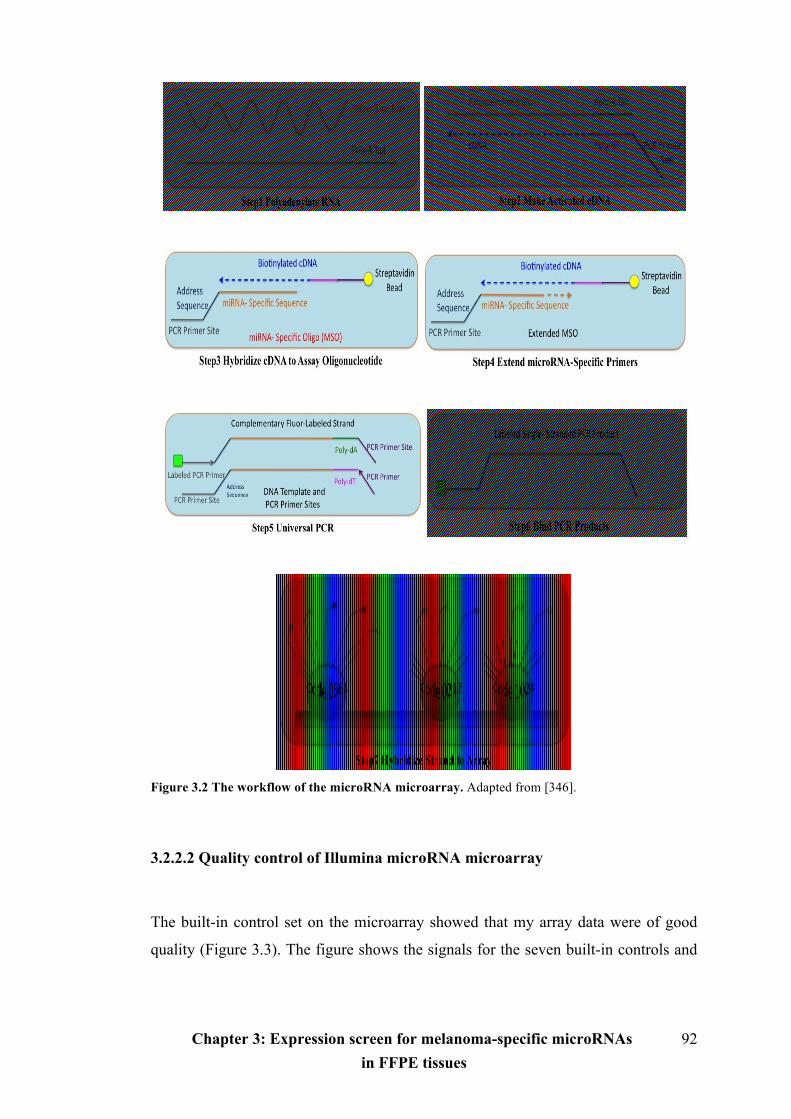
Chapter 3: Expression screen for melanoma-specific microRNAs in FFPE tissues
92
Figure 3.2 The workflow of the microRNA microarray. Adapted from [346].
3.2.2.2 Quality control of Illumina microRNA microarray
The built-in control set on the microarray showed that my array data were of good
quality (Figure 3.3). The figure shows the signals for the seven built-in controls and
Chapter 3: Expression screen for melanoma-specific microRNAs in FFPE tissues
93
the average miRNA signal intensity. The negative controls consist of query oligos
targeting 15 random sequences that do not appear in the human genome. Generally,
the mean signal intensity of these probes defines the system background. The
background is represented by both the imaging system background and by any signal
resulting from cross-hybridization or non-specific binding of dye. The BeadStudio
application uses the signals and signal standard deviation (STDEV) of these probes
to establish gene expression detection limits. The average miRNA signal intensity of
array samples was about ten times higher than that of the negative controls in my
array, which indicated that the array was well probed and emitted strong fluorescent
signals compared to the negative controls. Polyadenylation control oligos detect
transcripts of a set of highly expressed housekeeping genes that already contain a
stretch of poly-A sequence. These target sequences do not need a polyadenylation
process to add poly-A sequence to their 3'-ends. Therefore, even without the
polyadenylation process, these target sequences will show strong signals on the
array. In contrast, microRNA target sequences need a successful polyadenylation
process to add the poly-A sequence. If the polyadenylation process is ineffective,
they will not be amplified and will not show signal. In my polyadenylation step (PAP)
control, it was clear that successful polyadenylation of miRNA target sequences
occurred yielding decent miRNA signals. Annealing controls test the efficiency of
annealing MSOs with different melting temperatures (Tms) to the same cDNA target.
The MSO with higher Tm should always have a higher signal than the MSO with
lower Tm. My array annealing controls were consistent with this. The internal single
mismatch controls measure the specificity of extension in the second- strand cDNA
synthesis step by comparing the signal intensity of perfectly matched oligos versus
oligos with an internal mismatch. The extension controls (3' -mismatch) measure the
specificity of extension in the second-strand cDNA synthesis step by comparing the
signal intensity of perfectly matched oligos versus oligos with mismatch at the 3'-end.
As expected, my mismatch controls and extension controls both showed that the
perfectly matched query oligo had high signal while the mismatched oligo had
dramatically decreased signal. The intensity of the positive control was much higher
than that of the negative control in the contamination controls meaning my array
wasn’t contaminated with mouse miRNA (Illumina has human and mouse miRNA

Chapter 3: Expression screen for melanoma-specific microRNAs in FFPE tissues
94
profiling panels). Hybridization controls are the positive controls for hybridizing
PCR product to capture probes on the universal arrays. Both of my hybridization
controls showed the expected strong signals.
Figure 3.3 Summary of Illumina microRNA microarray control data. Negative Control:
Determination of background signal; PAP Control: Control for polyadenylation step; Annealing
Control: Control for MSO (miRNA specific oligo); Internal Single Mismatch: Stringency control;
Extension Control: Positive and negative control for extension reaction; Contamination Control:
Control for PCR contamination; Hybridization Control: Positive control for hybridization; miRNA
Intensity: Average signal intensity of miRNA samples.
Chapter 3: Expression screen for melanoma-specific microRNAs in FFPE tissues
95
3.2.2.3 Data analysis of Illumina microRNA microarray
The fundamental goal of microarray experiments is to identify genes that are
differentially expressed in the conditions being studied. Comparison statistics can be
used to help identify differential gene expression and cluster analysis can be used to
identify patterns of gene expression and to segregate a subset of genes based on these
patterns.
Illumina miRNA microarray was used as a preliminary screen for differentially
expressed miRNAs in certain stages of melanoma. To preserve as many differential
miRNAs as possible my miRNA microarray raw data were not background
subtracted and for calculation convenience it was also log2 transformed. The results
of many DNA microarray experiments are fluorescence ratios. Ratio measurements
are most naturally processed in log space. In log space (log2 for simplicity) the data
points become 0, 1.0, -1.0. With these values, 2-fold up and 2-fold down expression
changes are symmetric about 0. Although the raw data were not background
subtracted, a filter [Detection P Value <0.01 in at least 80% of samples for each
probe] was applied. Detection P Value is a statistical calculation that provides the
probability that the signal from a given probe is greater than the average signal from
the negative controls. The reason for using this filter instead of background
subtraction is because there may be some miRNA signals lower than the background
but still showing differences from negative controls. Among a total of 1,146 probes,
862 (75.2%) passed through the filter. Thereafter, operated data were analyzed using
R version 2.8.1 software and normalized using the Quantile method which is
recommended to normalize miRNA data as it works best in reducing non-biological
variations in miRNA expression values between array samples [347]. Quantile
normalization is a method used to make the distribution, median and mean of probe
intensities the same for every sample. Hierarchical clustering was performed using
Cluster 3.0 software and the TreeView programme was used to give interactive
graphical analysis of clustering results. In clustering array results, City block distance
(Manhattan distance) and complete linkage clustering methods were selected to
analyze log2-transformed data.
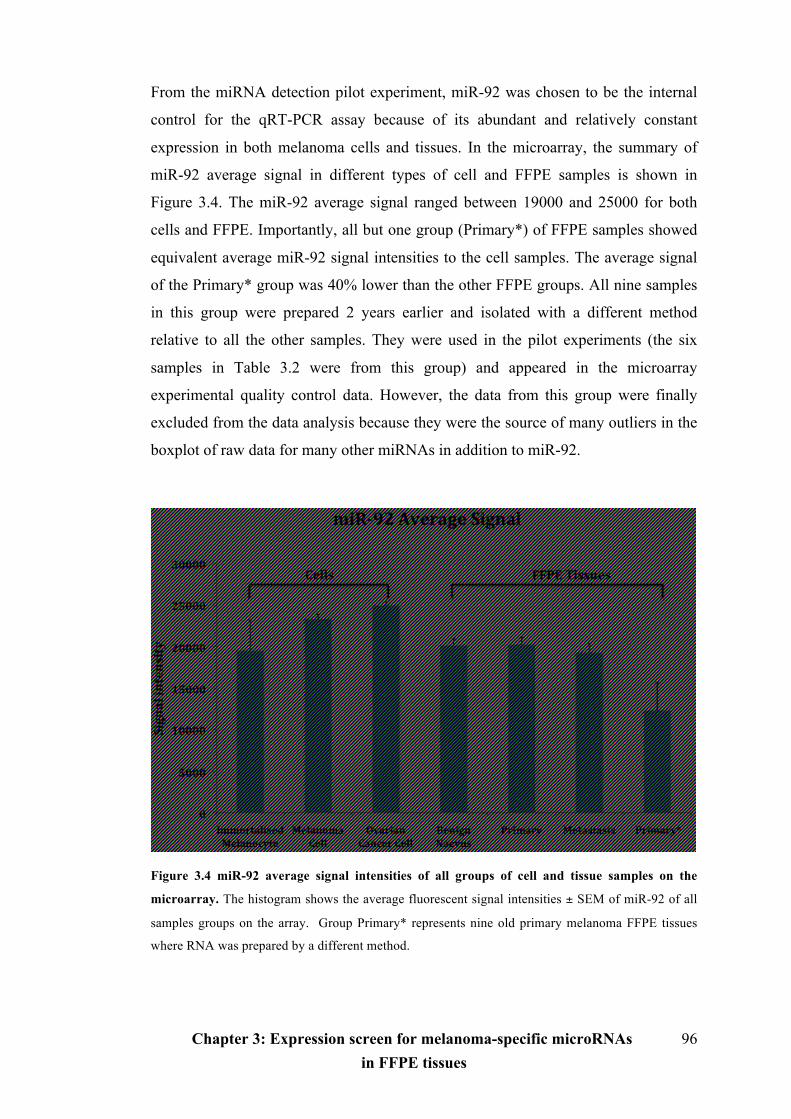
Chapter 3: Expression screen for melanoma-specific microRNAs in FFPE tissues
96
From the miRNA detection pilot experiment, miR-92 was chosen to be the internal
control for the qRT-PCR assay because of its abundant and relatively constant
expression in both melanoma cells and tissues. In the microarray, the summary of
miR-92 average signal in different types of cell and FFPE samples is shown in
Figure 3.4. The miR-92 average signal ranged between 19000 and 25000 for both
cells and FFPE. Importantly, all but one group (Primary*) of FFPE samples showed
equivalent average miR-92 signal intensities to the cell samples. The average signal
of the Primary* group was 40% lower than the other FFPE groups. All nine samples
in this group were prepared 2 years earlier and isolated with a different method
relative to all the other samples. They were used in the pilot experiments (the six
samples in Table 3.2 were from this group) and appeared in the microarray
experimental quality control data. However, the data from this group were finally
excluded from the data analysis because they were the source of many outliers in the
boxplot of raw data for many other miRNAs in addition to miR-92.
Figure 3.4 miR-92 average signal intensities of all groups of cell and tissue samples on the
microarray. The histogram shows the average fluorescent signal intensities ± SEM of miR-92 of all
samples groups on the array. Group Primary* represents nine old primary melanoma FFPE tissues
where RNA was prepared by a different method.
Chapter 3: Expression screen for melanoma-specific microRNAs in FFPE tissues
97
3.2.2.4 Overview of hierarchical clustering
miRNAs can be highly tissue-specific biomarkers [348-350] and have been linked to
the development of specific malignancies [351]. Previous studies have shown them
as promising candidates for the construction of a biologically driven classification
algorithm for identifying cancer tissue of origin [275, 313, 322]. Although specimens
in my array do not contain many different cancer types compared to the published
studies, it was still of great interest to explore the internal relationships between cells
and tissues of the same cancer, in particular the miRNA expression changes between
melanocytic benign lesions and malignancies, comparisons between different
melanoma cell lines and between derivatives of the same cell line.
To identify patterns of miRNA expression, a cluster analysis was done on both cell
lines and fixed tissues, except for the Primary* melanoma group. The entire
clustering heatmap is shown in Appendix 2. Describing the miRNA based tissue
classification on the whole data set is too complicated. Therefore, a simple example
is shown here to make the main points. The selected part of the heatmap shows
differentially expressed miRNAs in the EDMEL3 cell series relative to other samples
(Figure 3.5). Basically, the shorter the distance between the samples in the analysis,
the closer is their relationship. It is encouraging that the whole EDMEL3 cell series
were close to each other in the same cluster. Figure 3.5 shows the best illustration of
the EDMEL3 series cluster where the very high expression (yellow in the heatmap)
of these 22 miRNAs in this cluster is easily distinguished from the lower expression
in the other samples on the array. Generally, samples of the same origin were found
in the same cluster or in closely related clusters: First, cell lines were clustered
separately to FFPE tissues. Secondly, the EDMEL3 series were solely grouped in the
same cluster and close to the other metastatic melanoma cell lines. Ovarian cancer
cell lines were grouped in the same cluster, along with one metastatic melanoma cell
line. The remaining melanoma cell lines were adjacent to the EDMEL3 cell series,
but intermingled with two immortalised melanocytes lines. For tissues, the cluster
patterns were more complicated. Benign naevi were all grouped together, except N5
and N6, and were mixed with primary and metastatic melanomas. Moreover, the

Chapter 3: Expression screen for melanoma-specific microRNAs in FFPE tissues
98
metastatic melanoma tissue sample, ME (from where the EDMEL3 cell line was
isolated), was clustered with other metastases rather than with the EDMEL3 cell
series. However, it is clear from Figure 3.5 that expression in this group of 22
miRNAs is high in the ME metastasis as well as in the EDMEL3 cell series.
Figure 3.5 Hierarchical clustering of microRNA expression patterns in the microarray. The
clustering obtained for all 71 samples (19 cell lines and 52 FFPE specimens) is illustrated with 22
selected miRNAs in the array expressed above the threshold level. A colour key is shown above each
sample to identify the type of cell line or tissue sample. The selected heatmap of expression data for
the 22 miRNAs is shown vertically below each sample. The red ellipses illustrate the similarity
between the different members of the EDMEL3 melanoma cell line series and the ME metastasis from
which the EDMEL3 cell line was derived. The bottom two keys: Coloured squares and a black arrow
identify the types of sample. The blue-yellow colour log2 scale (0.0-14.0) depicts log2 expression
level of the miRNAs on the heatmap. Naevi: Benign naevi.
Chapter 3: Expression screen for melanoma-specific microRNAs in FFPE tissues
99
3.2.2.5 Melanoma-specific microRNA expression profile
It was impossible to do statistical analysis of cell lines to compare the miRNA
expression differences between melanocytes and melanoma cell lines because only
two immortalised melanocytes were available to go on the array. Moreover, since I
have shown that robust expression profiles can be generated with miRNAs isolated
from FFPE tissues and my clustering indicated major differences in expression
patterns between FFPE samples and cultured cells, I concluded that it was preferable
to analyze the FFPE data. Therefore, the following data analysis is only based on
FFPE samples. Differential expression analysis between benign naevus, primary
melanoma and metastatic melanoma groups was accomplished using R language.
Single miRNA comparisons between groups were done using the t-test (P value)
error model with adjusted P value used for multiple comparisons. The array contains
470 well-annotated human miRNA sequences denoted with hsa-miR-# and 265 new
identified miRNAs termed HS_ #. The rest are termed solexa-# as putative but as yet
unconfirmed miRNAs.
There were 82 well-annotated miRNAs (including HS and solexas the total was 113
miRNAs) differentially expressed in the comparison between primary melanomas
and benign naevi (adjusted P value <0.05). 28 of the 82 miRNAs were upregulated in
primary melanomas.
Comparing metastatic melanomas and benign naevi, 74 miRNAs (including HS and
solexas the total was 97 miRNAs) were differentially expressed (adjusted P value
<0.05). 30 of the 74 miRNAs were upregulated in metastatic melanomas.
In the comparison between metastatic and primary melanomas, 22 miRNAs
(including HS and solexas the total was 25 miRNAs) were differentially expressed
(adjusted P value <0.05). The expression of 12 miRNAs was increased in the
metastatic melanoma group. The full lists of the differentially expressed miRNAs in
the three comparisons are shown in Appendix 3.
Chapter 3: Expression screen for melanoma-specific microRNAs in FFPE tissues
100
In the above comparisons, there were too many differentially expressed candidates to
investigate further using qRT-PCR verification. Moreover, to investigate which
miRNAs are essential to melanomagenesis through functional studies and by looking
for miRNA target genes with the miRBase targets database is a big challenge
because each miRNA potentially has hundreds of targets. So to narrow the candidate
list, the more stringent criteria [log2 FC (fold change)>|2| and adjusted P value<
0.001] were added. 20 miRNAs were now selected in the primary melanoma versus
naevi comparison, 19 in the metastatic melanoma versus naevi comparison and only
two miRNAs (miR-203, miR-205) remained in the metastatic versus primary
melanoma comparison (Table 3.3 A-C). There was considerable overlap between
these three selected miRNA candidate lists (Figure 3.6). In the primary melanoma
versus benign naevi comparison, 7 miRNAs were increased and 13 miRNAs were
reduced in the primary melanoma. In the metastatic melanoma versus benign naevus
comparison, 7 miRNAs were upregulated and 12 miRNAs were downregulated in
the metastatic melanoma.
Only two miRNAs, miR-205 and miR-203 were present in all three comparisons and
both were downregulated in melanomas. Their expression was decreased from the
naevus through the primary melanoma and then to the metastatic melanoma group.
All five members of miR-200 family, miR-200a, b, c and 141, 429 were decreased in
the metastatic melanoma versus the benign naevus group and three of them (miR-
200a, b and 141) were also downregulated in the primary melanoma versus benign
naevus group. Expression of miR-20b and miR-675 was increased in the melanomas
in comparison of primary vs. benign naevi and metastatic vs. benign naevi. miR-211
was differentially downregulated in metastatic melanomas relative to benign naevi,
but was not in the top candidate lists (adjusted P value = 0.0087, log2FC = -2.4).
Although it did not pass through the adjusted P value < 0.001 filter, it was also
chosen for qPCR verification because of the huge expression difference detected
between melanocytes and most melanoma cells in the pilot qRT-PCR study.
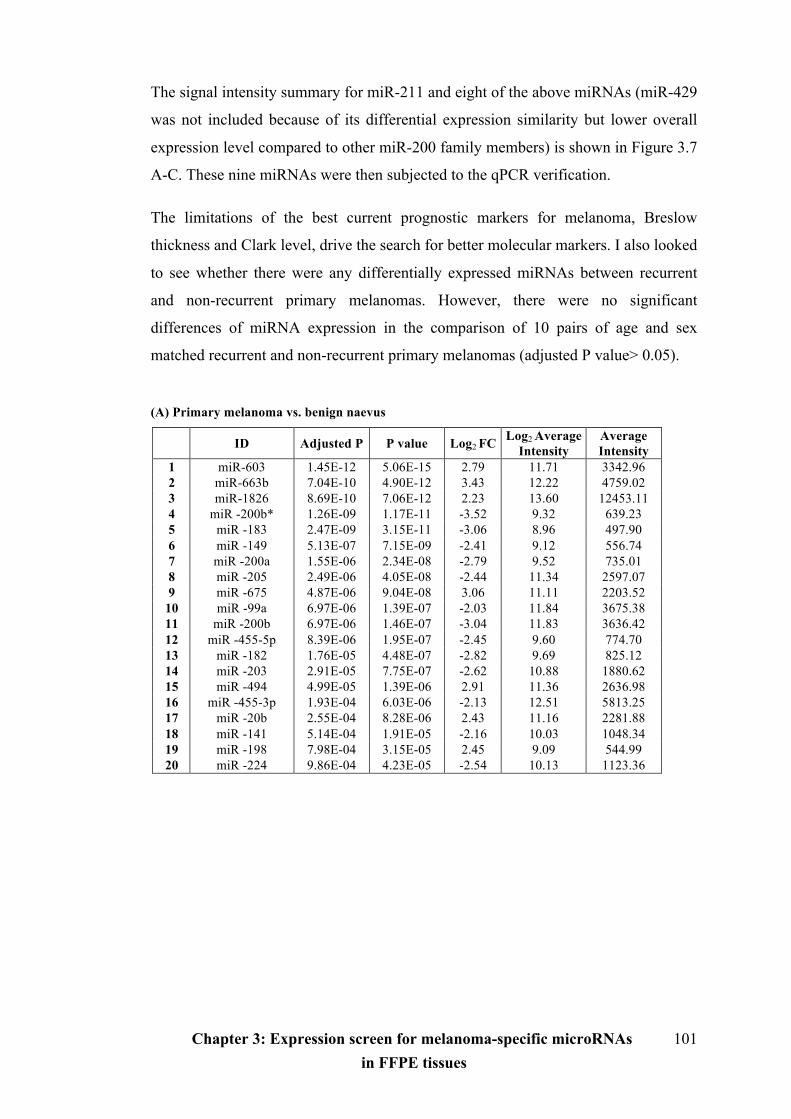
Chapter 3: Expression screen for melanoma-specific microRNAs in FFPE tissues
101
The signal intensity summary for miR-211 and eight of the above miRNAs (miR-429
was not included because of its differential expression similarity but lower overall
expression level compared to other miR-200 family members) is shown in Figure 3.7
A-C. These nine miRNAs were then subjected to the qPCR verification. The limitations of the best current prognostic markers for melanoma, Breslow
thickness and Clark level, drive the search for better molecular markers. I also looked
to see whether there were any differentially expressed miRNAs between recurrent
and non-recurrent primary melanomas. However, there were no significant
differences of miRNA expression in the comparison of 10 pairs of age and sex
matched recurrent and non-recurrent primary melanomas (adjusted P value> 0.05).
(A) Primary melanoma vs. benign naevus
ID Adjusted P P value Log2 FC Log2 Average Intensity
Average Intensity
1 miR-603 1.45E-12 5.06E-15 2.79 11.71 3342.96 2 miR-663b 7.04E-10 4.90E-12 3.43 12.22 4759.02 3 miR-1826 8.69E-10 7.06E-12 2.23 13.60 12453.11 4 miR -200b* 1.26E-09 1.17E-11 -3.52 9.32 639.23 5 miR -183 2.47E-09 3.15E-11 -3.06 8.96 497.90 6 miR -149 5.13E-07 7.15E-09 -2.41 9.12 556.74 7 miR -200a 1.55E-06 2.34E-08 -2.79 9.52 735.01 8 miR -205 2.49E-06 4.05E-08 -2.44 11.34 2597.07 9 miR -675 4.87E-06 9.04E-08 3.06 11.11 2203.52
10 miR -99a 6.97E-06 1.39E-07 -2.03 11.84 3675.38 11 miR -200b 6.97E-06 1.46E-07 -3.04 11.83 3636.42 12 miR -455-5p 8.39E-06 1.95E-07 -2.45 9.60 774.70 13 miR -182 1.76E-05 4.48E-07 -2.82 9.69 825.12 14 miR -203 2.91E-05 7.75E-07 -2.62 10.88 1880.62 15 miR -494 4.99E-05 1.39E-06 2.91 11.36 2636.98 16 miR -455-3p 1.93E-04 6.03E-06 -2.13 12.51 5813.25 17 miR -20b 2.55E-04 8.28E-06 2.43 11.16 2281.88 18 miR -141 5.14E-04 1.91E-05 -2.16 10.03 1048.34 19 miR -198 7.98E-04 3.15E-05 2.45 9.09 544.99 20 miR -224 9.86E-04 4.23E-05 -2.54 10.13 1123.36
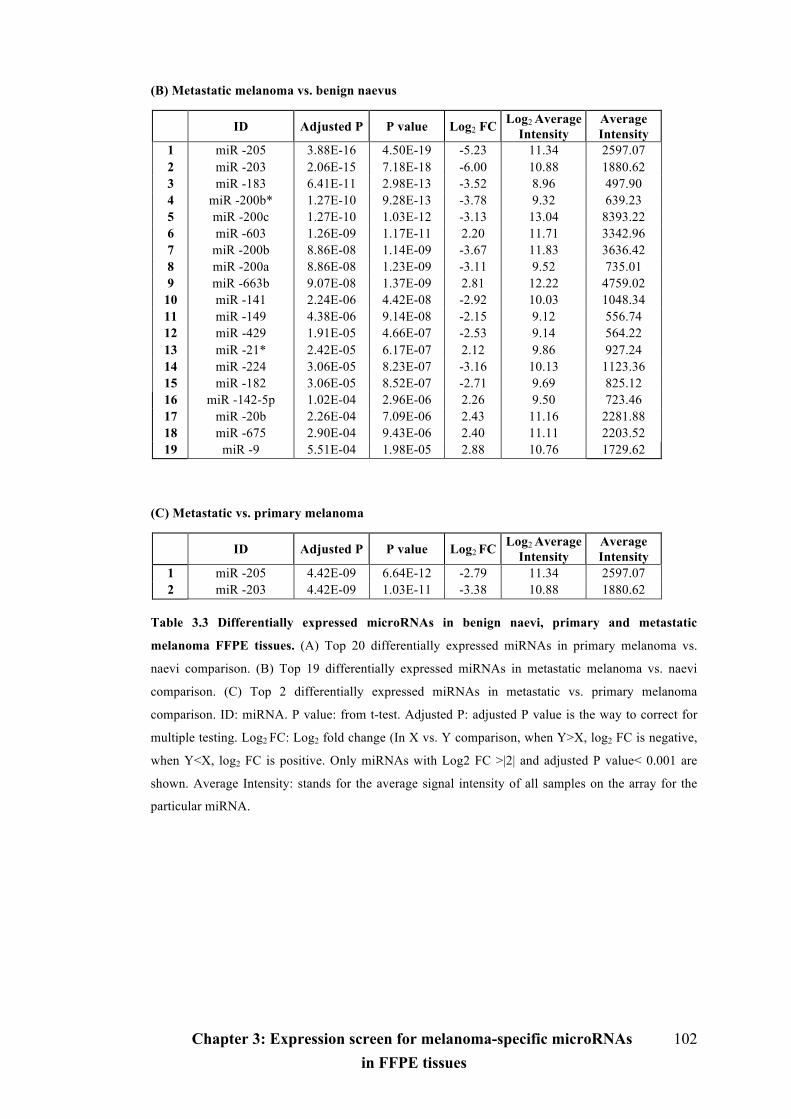
Chapter 3: Expression screen for melanoma-specific microRNAs in FFPE tissues
102
(B) Metastatic melanoma vs. benign naevus
ID Adjusted P P value Log2 FC Log2 Average Intensity
Average Intensity
1 miR -205 3.88E-16 4.50E-19 -5.23 11.34 2597.07 2 miR -203 2.06E-15 7.18E-18 -6.00 10.88 1880.62 3 miR -183 6.41E-11 2.98E-13 -3.52 8.96 497.90 4 miR -200b* 1.27E-10 9.28E-13 -3.78 9.32 639.23 5 miR -200c 1.27E-10 1.03E-12 -3.13 13.04 8393.22 6 miR -603 1.26E-09 1.17E-11 2.20 11.71 3342.96 7 miR -200b 8.86E-08 1.14E-09 -3.67 11.83 3636.42 8 miR -200a 8.86E-08 1.23E-09 -3.11 9.52 735.01 9 miR -663b 9.07E-08 1.37E-09 2.81 12.22 4759.02
10 miR -141 2.24E-06 4.42E-08 -2.92 10.03 1048.34 11 miR -149 4.38E-06 9.14E-08 -2.15 9.12 556.74 12 miR -429 1.91E-05 4.66E-07 -2.53 9.14 564.22 13 miR -21* 2.42E-05 6.17E-07 2.12 9.86 927.24 14 miR -224 3.06E-05 8.23E-07 -3.16 10.13 1123.36 15 miR -182 3.06E-05 8.52E-07 -2.71 9.69 825.12 16 miR -142-5p 1.02E-04 2.96E-06 2.26 9.50 723.46 17 miR -20b 2.26E-04 7.09E-06 2.43 11.16 2281.88 18 miR -675 2.90E-04 9.43E-06 2.40 11.11 2203.52 19 miR -9 5.51E-04 1.98E-05 2.88 10.76 1729.62
(C) Metastatic vs. primary melanoma
ID Adjusted P P value Log2 FC Log2 Average Intensity
Average Intensity
1 miR -205 4.42E-09 6.64E-12 -2.79 11.34 2597.07 2 miR -203 4.42E-09 1.03E-11 -3.38 10.88 1880.62
Table 3.3 Differentially expressed microRNAs in benign naevi, primary and metastatic
melanoma FFPE tissues. (A) Top 20 differentially expressed miRNAs in primary melanoma vs.
naevi comparison. (B) Top 19 differentially expressed miRNAs in metastatic melanoma vs. naevi
comparison. (C) Top 2 differentially expressed miRNAs in metastatic vs. primary melanoma
comparison. ID: miRNA. P value: from t-test. Adjusted P: adjusted P value is the way to correct for
multiple testing. Log2 FC: Log2 fold change (In X vs. Y comparison, when Y>X, log2 FC is negative,
when Y<X, log2 FC is positive. Only miRNAs with Log2 FC >|2| and adjusted P value< 0.001 are
shown. Average Intensity: stands for the average signal intensity of all samples on the array for the
particular miRNA.
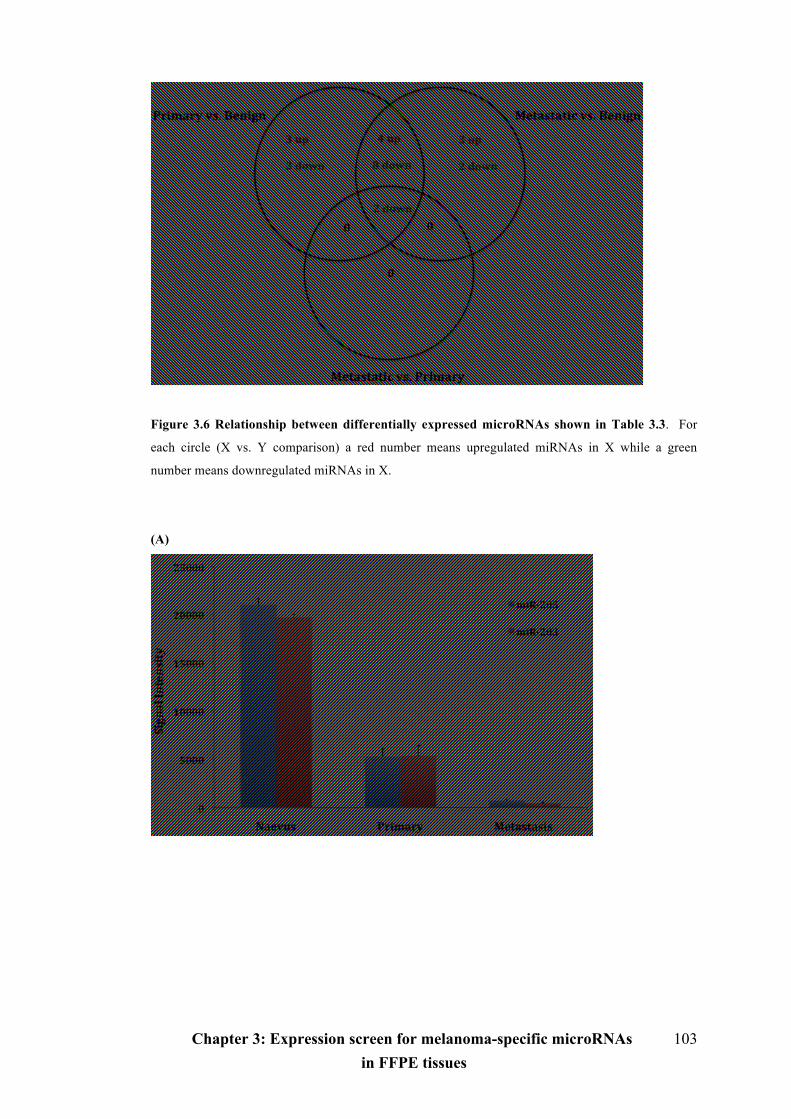
Chapter 3: Expression screen for melanoma-specific microRNAs in FFPE tissues
103
Figure 3.6 Relationship between differentially expressed microRNAs shown in Table 3.3. For
each circle (X vs. Y comparison) a red number means upregulated miRNAs in X while a green
number means downregulated miRNAs in X.
(A)
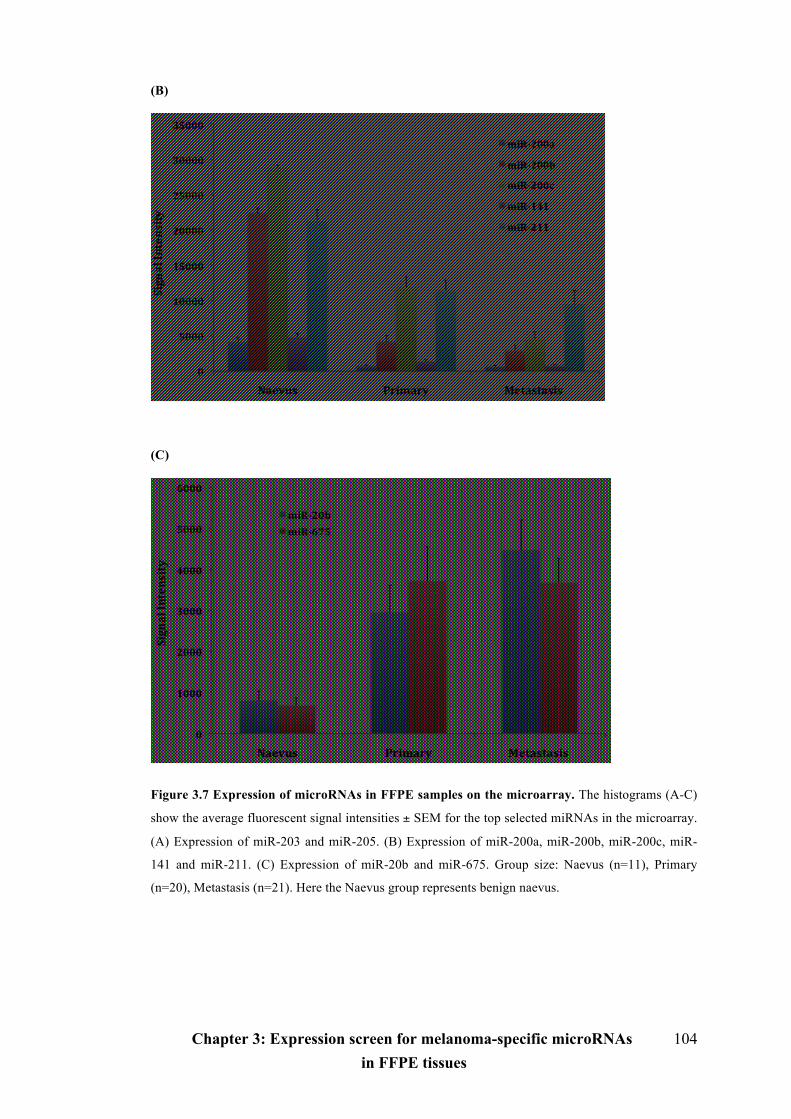
Chapter 3: Expression screen for melanoma-specific microRNAs in FFPE tissues
104
(B)
(C)
Figure 3.7 Expression of microRNAs in FFPE samples on the microarray. The histograms (A-C)
show the average fluorescent signal intensities ± SEM for the top selected miRNAs in the microarray.
(A) Expression of miR-203 and miR-205. (B) Expression of miR-200a, miR-200b, miR-200c, miR-
141 and miR-211. (C) Expression of miR-20b and miR-675. Group size: Naevus (n=11), Primary
(n=20), Metastasis (n=21). Here the Naevus group represents benign naevus.
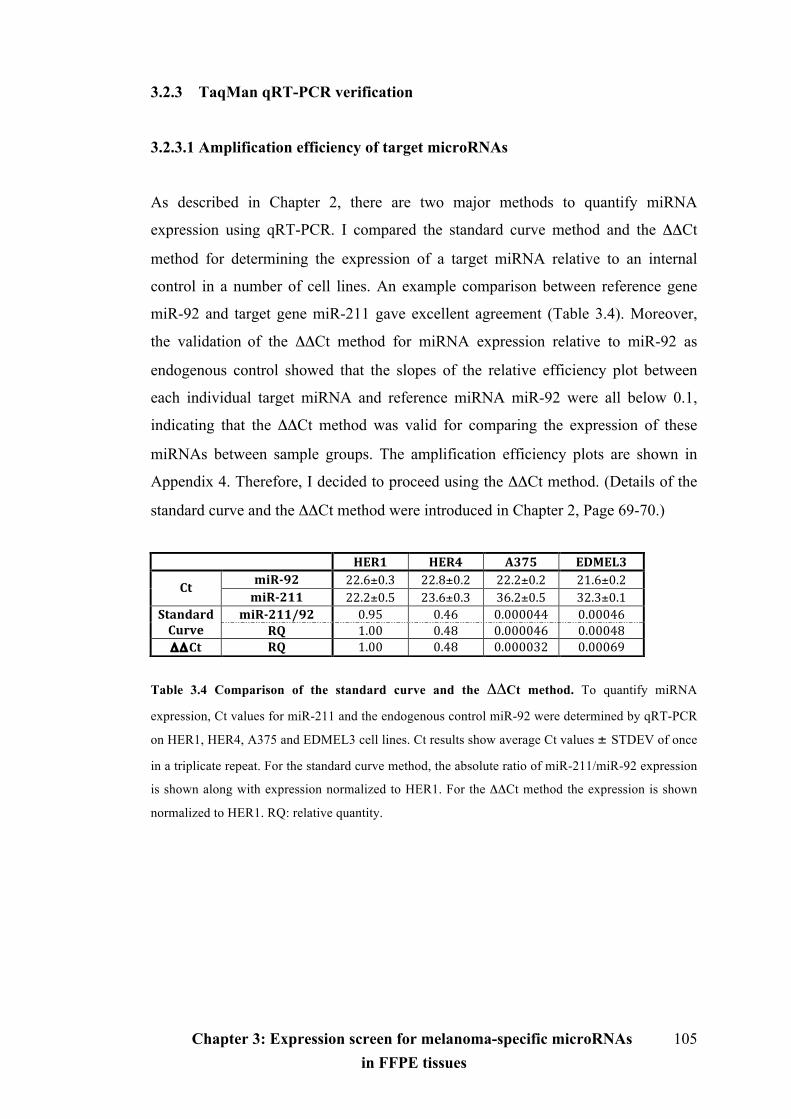
Chapter 3: Expression screen for melanoma-specific microRNAs in FFPE tissues
105
3.2.3 TaqMan qRT-PCR verification
3.2.3.1 Amplification efficiency of target microRNAs
As described in Chapter 2, there are two major methods to quantify miRNA
expression using qRT-PCR. I compared the standard curve method and the ΔΔCt
method for determining the expression of a target miRNA relative to an internal
control in a number of cell lines. An example comparison between reference gene
miR-92 and target gene miR-211 gave excellent agreement (Table 3.4). Moreover,
the validation of the ΔΔCt method for miRNA expression relative to miR-92 as
endogenous control showed that the slopes of the relative efficiency plot between
each individual target miRNA and reference miRNA miR-92 were all below 0.1,
indicating that the ΔΔCt method was valid for comparing the expression of these
miRNAs between sample groups. The amplification efficiency plots are shown in
Appendix 4. Therefore, I decided to proceed using the ΔΔCt method. (Details of the
standard curve and the ΔΔCt method were introduced in Chapter 2, Page 69-70.)
Table 3.4 Comparison of the standard curve and the ΔΔCt method. To quantify miRNA
expression, Ct values for miR-211 and the endogenous control miR-92 were determined by qRT-PCR
on HER1, HER4, A375 and EDMEL3 cell lines. Ct results show average Ct values ± STDEV of once
in a triplicate repeat. For the standard curve method, the absolute ratio of miR-211/miR-92 expression
is shown along with expression normalized to HER1. For the ΔΔCt method the expression is shown
normalized to HER1. RQ: relative quantity.
HER1 HER4 A375 EDMEL3 miR-92 22.6±0.3 22.8±0.2 22.2±0.2 21.6±0.2
Ct miR-211 22.2±0.5 23.6±0.3 36.2±0.5 32.3±0.1
miR-211/92 0.95 0.46 0.000044 0.00046 Standard Curve RQ 1.00 0.48 0.000046 0.00048 ΔΔCt RQ 1.00 0.48 0.000032 0.00069
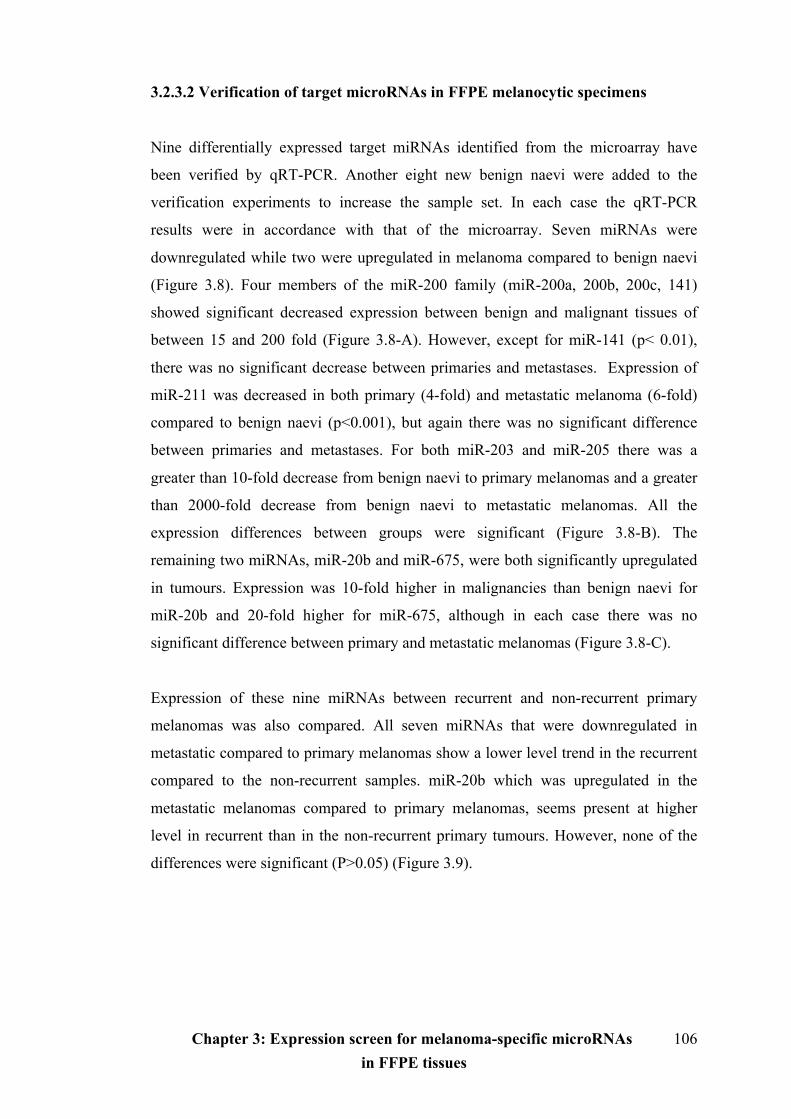
Chapter 3: Expression screen for melanoma-specific microRNAs in FFPE tissues
106
3.2.3.2 Verification of target microRNAs in FFPE melanocytic specimens
Nine differentially expressed target miRNAs identified from the microarray have
been verified by qRT-PCR. Another eight new benign naevi were added to the
verification experiments to increase the sample set. In each case the qRT-PCR
results were in accordance with that of the microarray. Seven miRNAs were
downregulated while two were upregulated in melanoma compared to benign naevi
(Figure 3.8). Four members of the miR-200 family (miR-200a, 200b, 200c, 141)
showed significant decreased expression between benign and malignant tissues of
between 15 and 200 fold (Figure 3.8-A). However, except for miR-141 (p< 0.01),
there was no significant decrease between primaries and metastases. Expression of
miR-211 was decreased in both primary (4-fold) and metastatic melanoma (6-fold)
compared to benign naevi (p<0.001), but again there was no significant difference
between primaries and metastases. For both miR-203 and miR-205 there was a
greater than 10-fold decrease from benign naevi to primary melanomas and a greater
than 2000-fold decrease from benign naevi to metastatic melanomas. All the
expression differences between groups were significant (Figure 3.8-B). The
remaining two miRNAs, miR-20b and miR-675, were both significantly upregulated
in tumours. Expression was 10-fold higher in malignancies than benign naevi for
miR-20b and 20-fold higher for miR-675, although in each case there was no
significant difference between primary and metastatic melanomas (Figure 3.8-C).
Expression of these nine miRNAs between recurrent and non-recurrent primary
melanomas was also compared. All seven miRNAs that were downregulated in
metastatic compared to primary melanomas show a lower level trend in the recurrent
compared to the non-recurrent samples. miR-20b which was upregulated in the
metastatic melanomas compared to primary melanomas, seems present at higher
level in recurrent than in the non-recurrent primary tumours. However, none of the
differences were significant (P>0.05) (Figure 3.9).
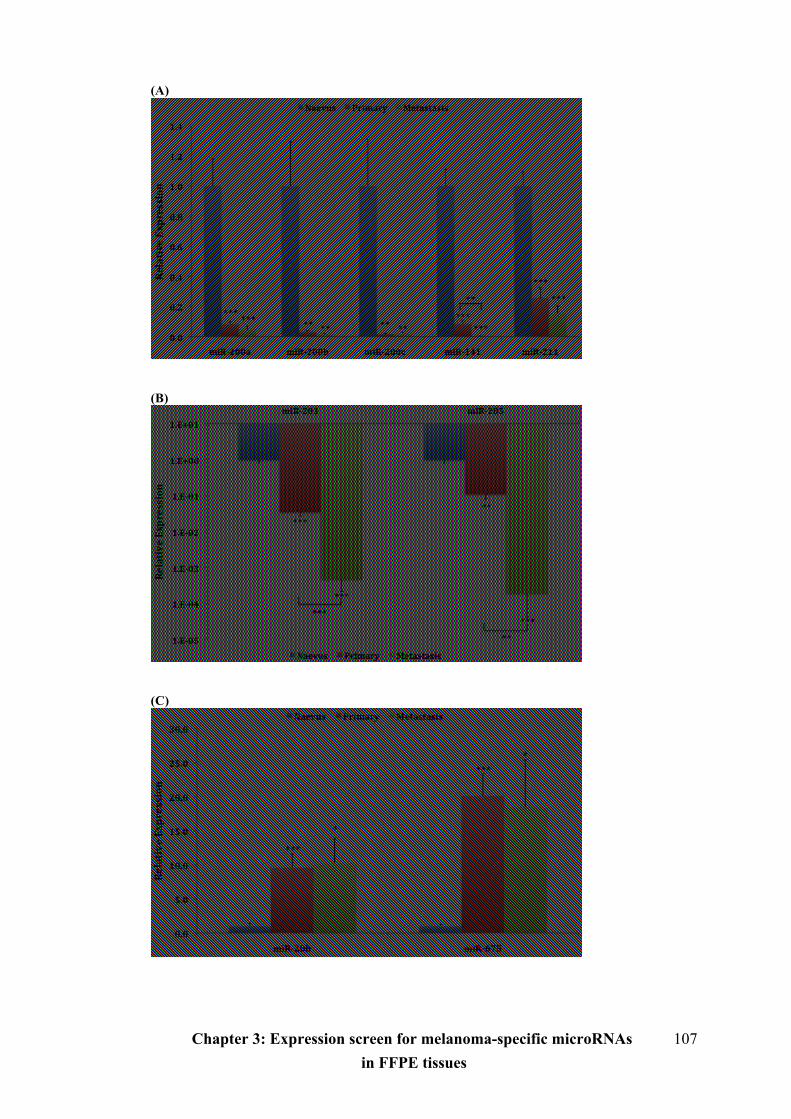
Chapter 3: Expression screen for melanoma-specific microRNAs in FFPE tissues
107
(A)
(B)
(C)
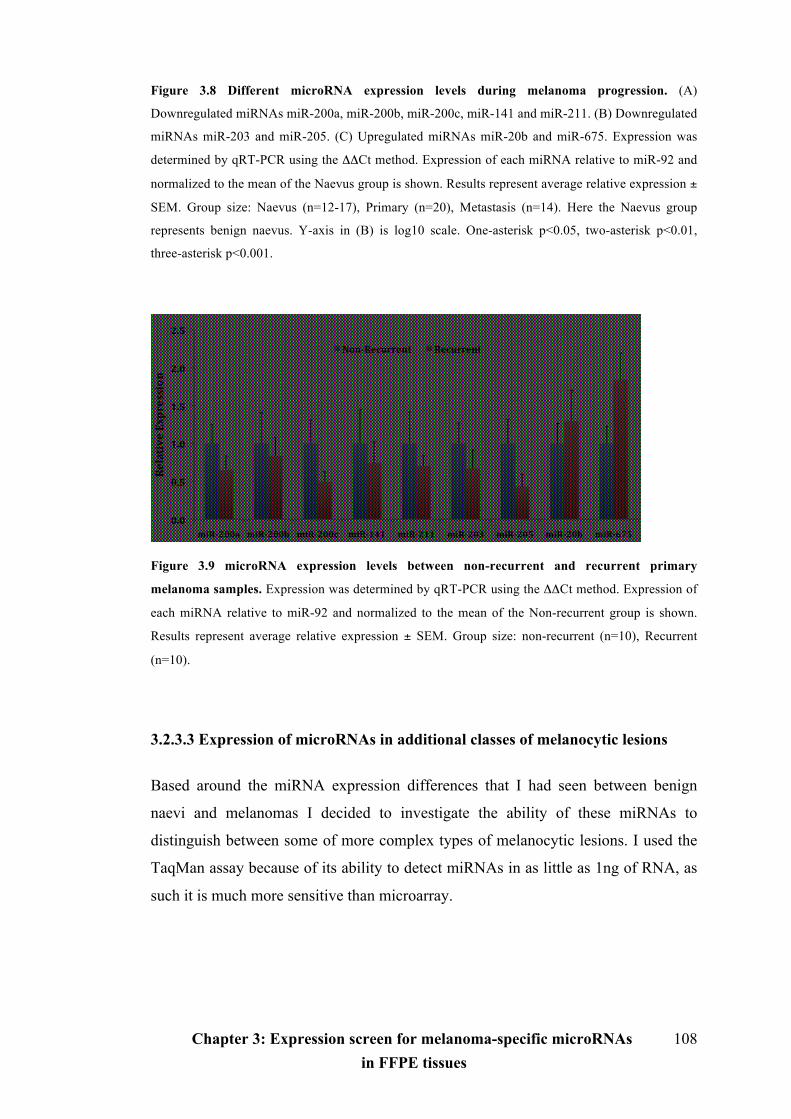
Chapter 3: Expression screen for melanoma-specific microRNAs in FFPE tissues
108
Figure 3.8 Different microRNA expression levels during melanoma progression. (A)
Downregulated miRNAs miR-200a, miR-200b, miR-200c, miR-141 and miR-211. (B) Downregulated
miRNAs miR-203 and miR-205. (C) Upregulated miRNAs miR-20b and miR-675. Expression was
determined by qRT-PCR using the ΔΔCt method. Expression of each miRNA relative to miR-92 and
normalized to the mean of the Naevus group is shown. Results represent average relative expression ±
SEM. Group size: Naevus (n=12-17), Primary (n=20), Metastasis (n=14). Here the Naevus group
represents benign naevus. Y-axis in (B) is log10 scale. One-asterisk p<0.05, two-asterisk p<0.01,
three-asterisk p<0.001.
Figure 3.9 microRNA expression levels between non-recurrent and recurrent primary
melanoma samples. Expression was determined by qRT-PCR using the ΔΔCt method. Expression of
each miRNA relative to miR-92 and normalized to the mean of the Non-recurrent group is shown.
Results represent average relative expression ± SEM. Group size: non-recurrent (n=10), Recurrent
(n=10).
3.2.3.3 Expression of microRNAs in additional classes of melanocytic lesions
Based around the miRNA expression differences that I had seen between benign
naevi and melanomas I decided to investigate the ability of these miRNAs to
distinguish between some of more complex types of melanocytic lesions. I used the
TaqMan assay because of its ability to detect miRNAs in as little as 1ng of RNA, as
such it is much more sensitive than microarray.

Chapter 3: Expression screen for melanoma-specific microRNAs in FFPE tissues
109
Previously, samples of benign naevi and metastatic melanomas were obtained from
Ø2mm cores of FFPE tissue blocks, while macrodissection on 10µm sections was
required to isolate the much smaller primary melanomas from adjacent non-tumour
tissues. The smaller size of the Blue, Spitz and dysplastic naevi available meant that
samples for RNA isolation were also obtained by macrodissection of 10µm sections.
Total RNA of these FFPE samples was isolated using the same kit as for previous
FFPE samples. In general, the yields of scrapings from macrodissection were smaller
than that from the cores. The 260/280 ratios of these total RNAs were similar to the
RNAs from the cores. The full yields and 260/280 ratios are shown in Appendix 1.
TaqMan qPCR expression data for five miRNAs in the original benign naevi,
primary and metastatic melanoma comparisons is shown in Figure 3.10, along with
the new data on Blue, Spitz and dysplastic naevi. Interpretation is compromised by
the small number of new samples assayed. However, for miR-203, miR-205 and
miR-200c the Blue, Spitz and dysplastic naevi appeared to group with the tumour
samples rather than with benign naevi. Expression of miR-203, 205 and 200c in
Blues was significantly lower than that in benign naevi (p<0.05), while the
expression difference between Blues and primary melanomas was not significant.
For miR-211 the Blue naevi had higher expression and grouped with the benign
naevi, while the Spitz and dysplastic naevi had lower expression closer to the
melanomas. Expression of miR-20b in the Spitz and dysplastic naevi was closer to
that in benign naevi than in melanomas. miR-20b expression was significantly higher
in Blues than that in benign naevi, while the expression difference between Blues
and primary melanomas was not significant.
Chapter 3: Expression screen for melanoma-specific microRNAs in FFPE tissues
110
Figure 3.10 Expression of microRNAs in various melanocytic lesions. Expression of miR-203,
miR-205, miR-200c, miR-211 and miR-20b was determined by qRT-PCR using the ΔΔCt method.
Expression of each miRNA relative to miR-92 and normalized to the mean of the Benign Naevus
group is shown on a log10 scale. Horizontal lines in all graphs indicate the means for each lesion
group. Individual data points for each sample in the group are also shown. Group size: Benign Naevus
(n=12-17), Blue Naevus (n=2-4), Spitz Naevus (n=2), Dysplastic Naevus (n=2), Primary (n=20) and
Metastasis (n=14).
Chapter 3: Expression screen for melanoma-specific microRNAs in FFPE tissues
111
3.3 Discussion
To date, three principal methods have been used to measure expression levels of
miRNAs: microarray hybridization, real-time PCR and next generation sequencing
(NGS) [352]. Northern blotting analysis was also adopted to study the expression of
miRNA genes [168, 353] and was used as a method for detecting miRNA expression
in cancer cells [269]. Due to the increasing demands for high-throughput analyses,
NGS, also known as high-throughput sequencing, is coming into wider use than
Northern blotting. All three methods comprehensively analyze miRNA expression,
with each option having advantages and disadvantages. The clear merit of NGS is its
ability to identify novel miRNAs, while qPCR is better used as a validation rather
than a discovery tool [352]. As with genomic DNA and RNA analysis, microarrays
are still the best choice for a standarized genome-wide assay that is amenable to
high-throughput applications. I believe the experimental strategy adopted in this
chapter—a combination of microarray and qRT-PCR—is most appropriate to
identify a reliable melanoma-specific miRNA expression profile.
In performing experiments for miRNA quantification, variation in the amount of
starting material, sample collection, RNA preparation and quality, and reverse
transcription (RT) efficiency can all contribute to quantification errors.
Normalization to an endogenous control is currently the most accurate method to
correct for potential RNA input or RT efficiency biases. For TaqMan MicroRNA
Assays, the chosen endogenous controls should share similar properties, such as
RNA stability and size. Small nuclear RNA (snRNA) and small nucleolar RNA
(snoRNA) are good choices as internal controls because their size is close to
miRNAs and they show constitutive and abundant expression across a large number
of tissues and cell lines. Undoubtedly, the consistency of expression should be
confirmed under the specific conditions of the experiment. In addition to use of
snRNA or snoRNA, some specific miRNAs themselves (including miR-92,
especially in tissue samples) that demonstrate the least variability can be an
alternative choice [354]. Therefore, given the evaluation of my pilot qRT-PCR
experiments and of my microarray, miR-92 was regarded as a better endogenous

Chapter 3: Expression screen for melanoma-specific microRNAs in FFPE tissues
112
control than the commonly used snRNA, RNU6B, for its stability of expression
across different types of melanocytic samples.
An early miRNA expression study revealed that 129 miRNAs were able to classify
human cancers into their tissue of origin solely on the basis of their miRNA
expression profile [313]. In addition, the miRNA profile can also reflect the
developmental lineage and differentiation state of tumours [355]. Analysing the
cluster patterns of my array work without sophisticated raw-data correction, the cell
lines and tissues were well separated although the classification within cell lines or
tissues was not ideal. The closely related EDMEL3 series of melanoma cell lines
were all classified in the same cluster and were adjacent to other metastatic
melanoma cell lines. Naevus tissues were also mostly grouped together in the same
cluster. However, the rest of the melanoma cell lines were intermingled with two
melanocytes lines. For another example, primary and metastatic melanoma tissues
did not cluster separately, but were mixed together along with some naevus tissues. It
seems that the cluster analysis of my miRNA microarray data here is more useful as
a tool in classifying tissue origin rather than in distinguishing melanomas from
benign melanocytic lesions, or primary tumours from metastatses. To obtain better
expression profiles, the following factors should be taken into account: tissue
heterogeneity, quantity and quality of total RNA input, quality control of the array,
heterozygosity of melanoma and using a panel containing all known and
uncharacterised miRNAs. I think tissue hererogeneity is the most crucial factor that
affects profiling results. Even under close supervision to ensure pure sample
collection, tumour tissues still contain multiple cell types, each with its specific gene
expression programme. Disease not only changes the expression programme of the
affected cell type but also its cell type composition. Therefore, to best separate these
effects in the profiling of heterogeneous tumour samples, it may be useful to profile
tumour cell lines and individual cell types that may be present in one tumour sample,
or define miRNA cellular localization by performing in situ hybridization (ISH).
However, my Illumina microarray has still identified a number of miRNAs whose
expression changes during melanoma progression. This conclusion is supported by
Chapter 3: Expression screen for melanoma-specific microRNAs in FFPE tissues
113
the verification results for the selected miRNAs from qRT-PCR, which were entirely
consistent with the Illumina array data.
The existence of unique miRNA expression profiles for different tumour histology
types and subtypes, due largely to the tissue specificity of miRNAs, appears to be a
useful adjuvant diagnostic tool when tumours cannot be accurately classified by
morphology and immunophenotype. Besides the diagnostic value of miRNA,
emerging evidence also manifests their role in cancer prognosis. Reduced let-7 and
high expression of miR-155 in human lung cancers was associated with poor survival
[270]. Aberrant miRNA expression features may reflect a tendency for early disease
relapse. Tong et al. looked for differentially expressed miRNAs through miRNA
expression profiling and qRT-PCR of 40 prostatectomy specimens from stage T2a/b,
early relapse and non-relapse cancer patients, to better understand the relationship
between miRNA dysregulation and prostate oncogenesis [356]. A > 40% difference
in expression between the relapse and non-relapse subsets was observed for miR-
135b and miR-194, although this trend of differential expression did not attain
statistical significance for the limited number of patients analyzed. I also looked for
any differentially expressed miRNAs between recurrent and non-recurrent primary
melanoma tissues. However, there were no miRNAs with significantly different
expression between the two categories of primary melanoma. Considering the small
number of highly differentially expressed miRNAs in the metastatic versus primary
melanoma comparison, I realize that it may be unrealistic to expect to see differences
between recurrent and non-recurrent primary melanomas in such a relatively small
sample set. Interestingly, the reduction in seven downregulated miRNAs and
elevation in two upregulated miRNAs verified by qRT-PCR (Figure 3.9) in recurrent
compared to non-recurrent primaries is compatible with the sequential transition
observed from benign naevus through primary to metastatic melanoma. It is possible
that the number of samples was not big enough to reveal a significant difference
between recurrent and non-recurrent primary melanomas. Looking for miRNAs with
prognostic value should ideally consider the actual length of survival and not just
whether or not the patients relapse. Some patients may still live a very long time with
recurrent tumours. This was not accomplishable with my data because the full

Chapter 3: Expression screen for melanoma-specific microRNAs in FFPE tissues
114
clinical records of the cases were not readily available. Two research groups have
studied melanoma survival associated with miRNA expression profiles. Segura’s
group identified 18 miRNAs (See Table 3.5, Page 116) whose overexpression in
melanoma metastases was significantly correlated with longer survival (≥ 18 months
post-recurrence survival) compared to shorter survival (< 18 months post-recurrence
survival) [357], such as miR-155 and miR-142-5p, which are upregulated in
malignancies in my differentially expressed miRNA candidates. Furthermore, low
expression of miR-191 and high expression of miR-193b in melanomas compared to
melanocyte cells were associated with poor melanoma-specific survival [358].
Firm diagnostic criteria based on histological features alone are difficult to establish
owing to the wide morphological range of melanocytic naevi and significant
morphological overlap of benign lesions and malignant melanoma leading to both
over-treatment as well as delayed treatment. Therefore, I decided to extend my study
of miRNA expression changes during melanoma progression to an additional set of
melanocytic lesions: Blue, Spitz and dysplastic naevi. However, the preliminary
study using five of my candidate miRNAs on a very small set did not allow me to
make any clear conclusions about miRNA expression patterns in these naevi.
Analysis of more samples would be required before differences of any useful
diagnostic miRNA between these expanded groups of melanocytic lesions could be
estimated. However, such an approach could still be helpful diagnostically if large
sample number could be linked to miRNA ISH to eliminate the need for RNA
extraction from very small lesions such as in-situ melanoma.
Up to ∼60% of human genes are putative targets of one or more miRNAs [359].
miRNAs play a role in all major biomolecular processes, including metabolism [360],
cell proliferation [361], apoptosis [362], development and morphogenesis [363, 364],
stem cell maintenance and tissue differentiation [365]. So any abnormality occurring
in the above programmes could induce diseases including cancer. Therefore, when
searching for biomarkers or looking for new treatment for cancers, it is important to
look for tumour-specific miRNA candidates, especially if they can be linked to one
or more key signalling pathway(s) in the cancer. Some miRNAs identified from my
Chapter 3: Expression screen for melanoma-specific microRNAs in FFPE tissues
115
array results have already been studied in some other cancers. For instance in breast
cancer, miR-9 promotes metastases by directly targeting E-cadherin [366] and miR-
155 regulates cell survival, growth and chemosensitivity by targeting FOXO3a [367].
In another instance in hepatocellular carcinoma, let-7c induces apoptosis through
inhibiting Bcl-xL [368] and miR-224 represses apoptosis by targeting the apoptosis
inhibitor-5 [369].
In melanoma miRNA research, besides my data other melanoma-specific miRNA
expression patterns have now been identified, based on both cell lines and tissues.
Table 3.5 summarises the miRNAs that are differentially expressed, either in
melanoma cells relative to other cancer cells, or between normal and malignant
cells/tissue samples from microarray profiling. The first two papers discussing
miRNA profiles on the NCI-60 cell panel identified 17 significantly differentially
expressed miRNAs in melanoma cell lines versus other cancer cell lines. 11 of these
miRNAs (miR-182, 183, 203, 224, 200b*, 200a, 200c, 141, 211, 204, 335)
overlapped with my full list of FFPE differentially expressed miRNAs and 8 of 11
appear in the refined lists. In Mueller’s study, an overview of differentially expressed
miRNAs with validated target genes and their impact on cellular functions in
malignant melanoma was summarized. Five miRNAs (miR-137 and miR-182, miR-
141, miR-183 and miR-200c) discussed were differentially expressed in my FFPE
array work. However, the above differentially expressed miRNAs from the literature
were obtained either from cell-based microarray or from tissue analysis, but not from
tissue profiling. Very few studies have systematically interpreted full miRNA
expression profiles by microarray on melanocytic FFPE samples. Among the above
profiles, only two studies (the last two in Table 3.5) included the different stages of
melanocytic lesions between naevi and malignant melanomas as in my array samples.
One of these two papers described 31 miRNAs (13 upregulated, 18 downregulated)
that were differentially expressed in metastatic melanomas relative to benign naevi
and 15 of them were verified by qRT-PCR [370]. The sample panel of this study
contained only 8 benign naevi and 8 metastatic melanomas, but no primary
melanomas. Another study correlating cell line-derived miRNA expression patterns
with melanoma patients included 3 benign naevi, 5 primary and 7 metastatic
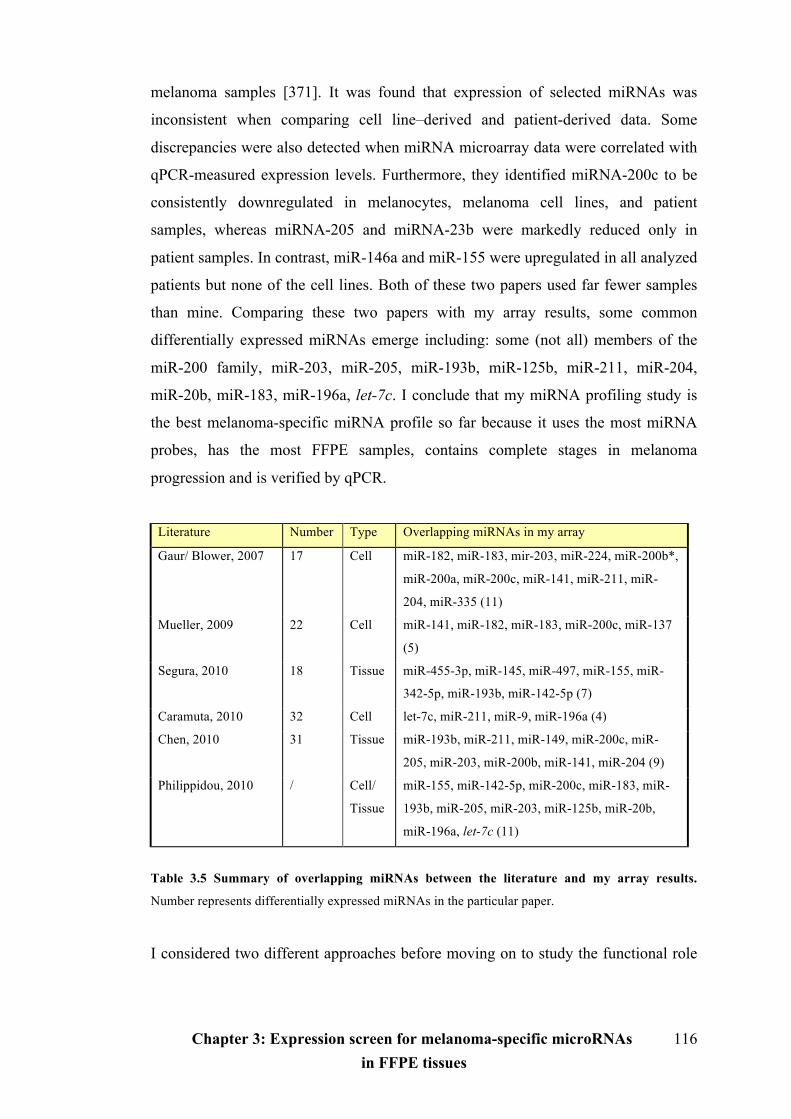
Chapter 3: Expression screen for melanoma-specific microRNAs in FFPE tissues
116
melanoma samples [371]. It was found that expression of selected miRNAs was
inconsistent when comparing cell line–derived and patient-derived data. Some
discrepancies were also detected when miRNA microarray data were correlated with
qPCR-measured expression levels. Furthermore, they identified miRNA-200c to be
consistently downregulated in melanocytes, melanoma cell lines, and patient
samples, whereas miRNA-205 and miRNA-23b were markedly reduced only in
patient samples. In contrast, miR-146a and miR-155 were upregulated in all analyzed
patients but none of the cell lines. Both of these two papers used far fewer samples
than mine. Comparing these two papers with my array results, some common
differentially expressed miRNAs emerge including: some (not all) members of the
miR-200 family, miR-203, miR-205, miR-193b, miR-125b, miR-211, miR-204,
miR-20b, miR-183, miR-196a, let-7c. I conclude that my miRNA profiling study is
the best melanoma-specific miRNA profile so far because it uses the most miRNA
probes, has the most FFPE samples, contains complete stages in melanoma
progression and is verified by qPCR.
Literature Number Type Overlapping miRNAs in my array
Gaur/ Blower, 2007 17 Cell miR-182, miR-183, mir-203, miR-224, miR-200b*,
miR-200a, miR-200c, miR-141, miR-211, miR-
204, miR-335 (11)
Mueller, 2009 22 Cell miR-141, miR-182, miR-183, miR-200c, miR-137
(5)
Segura, 2010 18 Tissue miR-455-3p, miR-145, miR-497, miR-155, miR-
342-5p, miR-193b, miR-142-5p (7)
Caramuta, 2010 32 Cell let-7c, miR-211, miR-9, miR-196a (4)
Chen, 2010 31 Tissue miR-193b, miR-211, miR-149, miR-200c, miR-
205, miR-203, miR-200b, miR-141, miR-204 (9)
Philippidou, 2010 / Cell/
Tissue
miR-155, miR-142-5p, miR-200c, miR-183, miR-
193b, miR-205, miR-203, miR-125b, miR-20b,
miR-196a, let-7c (11)
Table 3.5 Summary of overlapping miRNAs between the literature and my array results.
Number represents differentially expressed miRNAs in the particular paper.
I considered two different approaches before moving on to study the functional role

Chapter 3: Expression screen for melanoma-specific microRNAs in FFPE tissues
117
in melanoma of some of the differentially expressed miRNAs that I identified:
choose miRNAs that have never been studied and explore their targets blindly, or
select miRNAs with established connections in other cancers and with some known
human targets. After studying the top selected miRNA candidates, I found that about
10 have been shown to have roles in other cancers and so I chose the latter approach.
First, all five members of the miRNA-200 family (miR-200a, 200b, 200c, 141, and
429) were present in my refined lists of differentially expressed candidates. The
miRNA-200 family regulates PDGF-δ-mediated epithelial to mesenchymal transition
(EMT) in prostate cancer cells [372]. EMT facilitates tissue remodelling during
embryonic development and is viewed as an essential early step in tumour metastasis.
The role of the miRNA-200 family and miR-205 in EMT has been studied [373, 374]
(For more information see Chapter 4.1.2 and 4.1.3). Decreased expression of miR-
203 was identified in prostate, bladder, gastric, and colorectal cancers [375-377]. Li
et al. found overexpression of miR-203 significantly reduced cell proliferation and
survival, and induced cell apoptosis in the p53-mutated colon cancer cells. Moreover,
overexpressing miR-203 could increase the cytotoxic role of paclitaxel in the p53-
mutated colon cancer cells, but not in the p53 wild type cells [378]. Given the fact
that miR-205 and miR-203, two downregulated miRNAs, appeared in all three of my
comparisons, I verified them using qPCR as preparation for future functional study.
miR-20b and miR-675 were found to be functional in modulating c-MYC and RB
genes respectively [379, 380]. All the above miRNAs appear at the top of my
selected comparisons.
However, this doesn’t mean that the other differentially expressed miRNAs not in the
top lists can be ignored. One such is miR-211 with its large expression difference
between immortalised melanocytes and most of the malignant melanoma cell lines I
examined. Other published papers also showed that miR-211 was downregulated in
both melanoma tissues and melanoma cell lines compared to normal melanocytes
[381-383]. However, overexpression of miR-211 was found to be involved in poor
survival of oral carcinoma patients [384], indicating that there may be an oncogenic
potential for miR-211 in some tissue-specific functions. This seems quite common
with other miRNAs also having opposite expression patterns in different cancers.

Chapter 3: Expression screen for melanoma-specific microRNAs in FFPE tissues
118
There are also reports of the same miRNA having opposite expression patterns in the
same cancer. For example, miR-182 was found downregulated in melanoma samples
from my array results, whereas it was reported upregulated in other melanoma
samples [385].
The few functional studies reported on the role of these miRNAs in cutaneous
melanoma are discussed in detail in Chapter 4 where I go on to describe the results of
my own functional studies.

Chapter 4: Functional studies of microRNAs in melanoma cells 119
Chapter 4: Functional studies of microRNAs
in melanoma cells
Chapter 4: Functional studies of microRNAs in melanoma cells 120
4.1 Introduction
Besides the use of miRNA as diagnostic and prognostic markers in cancer, they have
important functional roles through their ability to regulate the expression of target
genes by binding with perfect or imperfect complementarity to the 3' UTRs of their
target mRNAs. About 61% of miRNA genes are located within intronic regions of
protein-coding genes, but they are also found in exons themselves and in intergenic
regions [355]. Moreover, more than 50% of miRNA genes can be found in cancer-
associated genomic regions or in fragile sites, suggesting that miRNAs play an
extremely important role in the pathogenesis of neoplasias [250]. This has been
confirmed by a great number of functional studies in various cancers. Generally,
dysregulated miRNAs participate in carcinogenesis through altered expression of
their targets, which are involved in cell proliferation, apoptosis and metastasis.
4.1.1 Roles of microRNAs in cell proliferation and apoptosis
Members of the Cip/Kip family of cyclin-dependent kinase inhibitors (CKIs) are well
characterized for their role as negative regulators of G1-phase cell-cycle progression
[386]. p21, p27 and p57 are members of this family. In gastric carcinogenesis,
several miRNAs have been found to be involved in altering the expression of CDK
inhibitors. Two clusters of miRNAs, miR-106b/93/25 and miR-221/222, are
upregulated in gastric cancer tissues and have been reported to inhibit CKIs [387].
miR-25 directly targets p57, and miR-106b/93 target p21. They both control their
targets through the 3' UTR, and subsequently induce cell proliferation. miR-221/222
have been reported to suppress both p27 and p57. Ectopic expression of these two
miRNAs enhances CDK2 activity and assists the G1-S transition. Enforced
expression of the miR-221/222 cluster also promotes the growth of gastric cancer
xenografts in nude mice. Furthermore, aberrant miRNAs have been shown to
regulate apoptosis by changing the expression of Bcl-2 family members in gastric
cancer as well. miR-15b, miR-16, miR-34 and miR-181b all directly target the
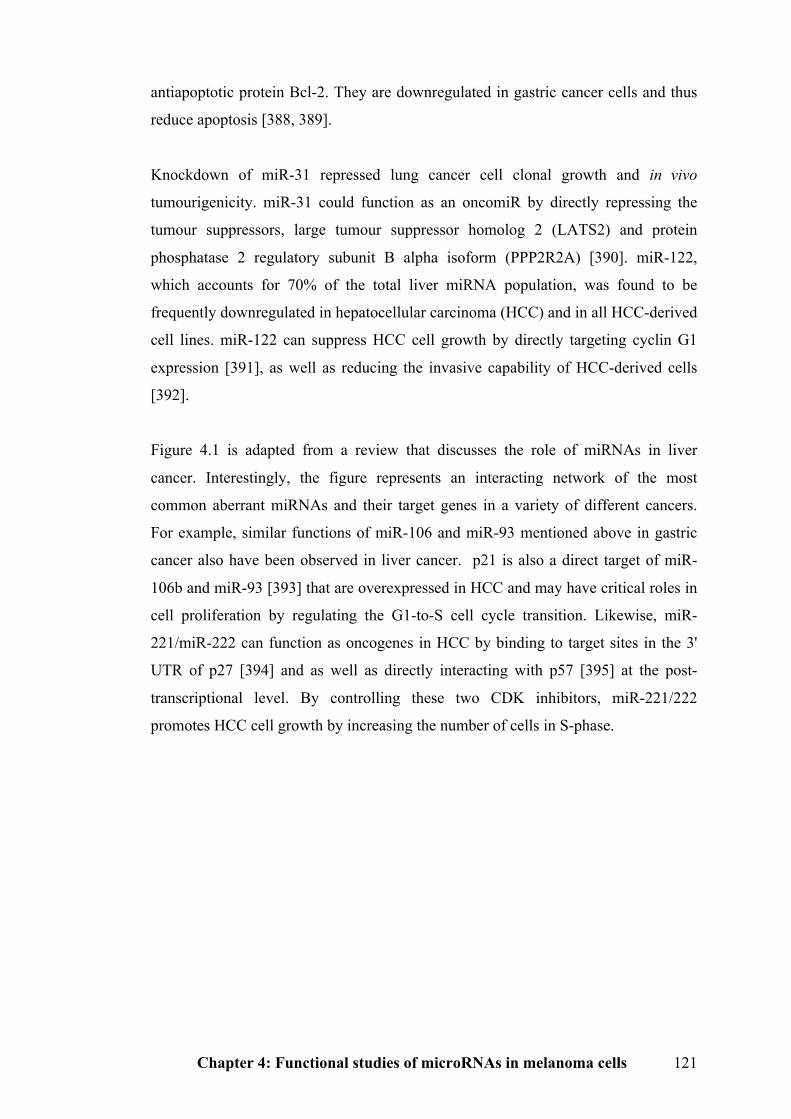
Chapter 4: Functional studies of microRNAs in melanoma cells 121
antiapoptotic protein Bcl-2. They are downregulated in gastric cancer cells and thus
reduce apoptosis [388, 389].
Knockdown of miR-31 repressed lung cancer cell clonal growth and in vivo
tumourigenicity. miR-31 could function as an oncomiR by directly repressing the
tumour suppressors, large tumour suppressor homolog 2 (LATS2) and protein
phosphatase 2 regulatory subunit B alpha isoform (PPP2R2A) [390]. miR-122,
which accounts for 70% of the total liver miRNA population, was found to be
frequently downregulated in hepatocellular carcinoma (HCC) and in all HCC-derived
cell lines. miR-122 can suppress HCC cell growth by directly targeting cyclin G1
expression [391], as well as reducing the invasive capability of HCC-derived cells
[392].
Figure 4.1 is adapted from a review that discusses the role of miRNAs in liver
cancer. Interestingly, the figure represents an interacting network of the most
common aberrant miRNAs and their target genes in a variety of different cancers.
For example, similar functions of miR-106 and miR-93 mentioned above in gastric
cancer also have been observed in liver cancer. p21 is also a direct target of miR-
106b and miR-93 [393] that are overexpressed in HCC and may have critical roles in
cell proliferation by regulating the G1-to-S cell cycle transition. Likewise, miR-
221/miR-222 can function as oncogenes in HCC by binding to target sites in the 3'
UTR of p27 [394] and as well as directly interacting with p57 [395] at the post-
transcriptional level. By controlling these two CDK inhibitors, miR-221/222
promotes HCC cell growth by increasing the number of cells in S-phase.
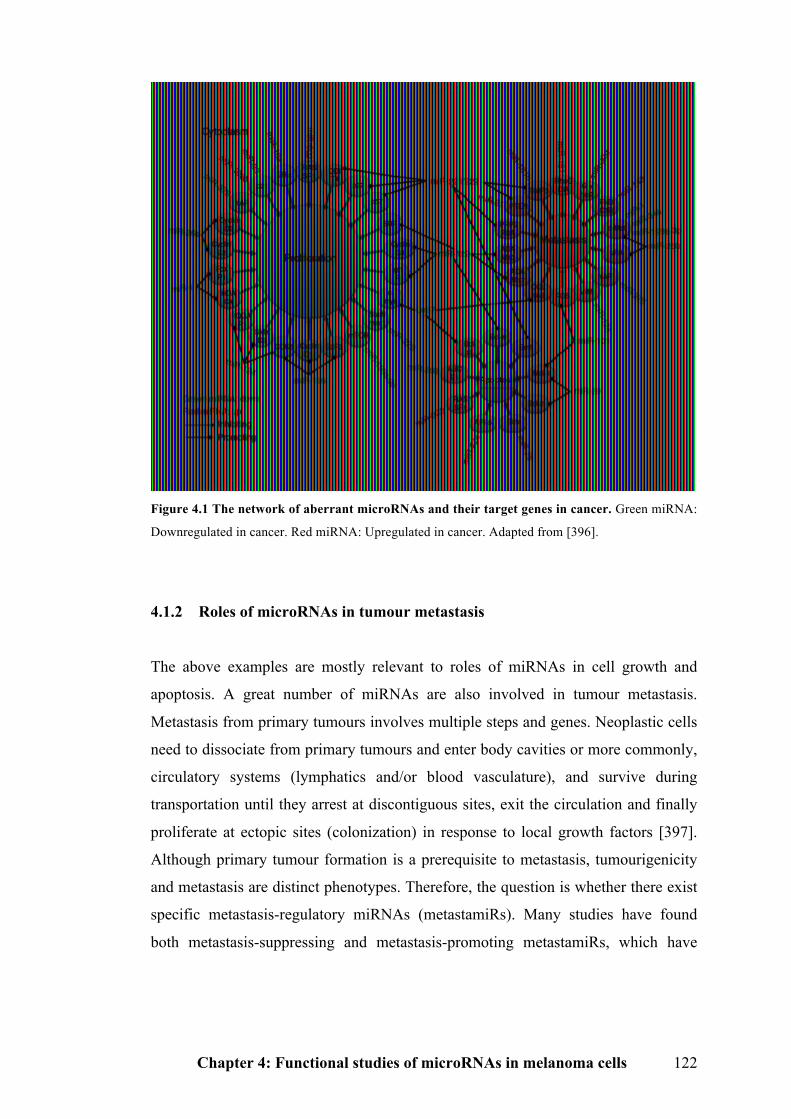
Chapter 4: Functional studies of microRNAs in melanoma cells 122
Figure 4.1 The network of aberrant microRNAs and their target genes in cancer. Green miRNA:
Downregulated in cancer. Red miRNA: Upregulated in cancer. Adapted from [396].
4.1.2 Roles of microRNAs in tumour metastasis
The above examples are mostly relevant to roles of miRNAs in cell growth and
apoptosis. A great number of miRNAs are also involved in tumour metastasis.
Metastasis from primary tumours involves multiple steps and genes. Neoplastic cells
need to dissociate from primary tumours and enter body cavities or more commonly,
circulatory systems (lymphatics and/or blood vasculature), and survive during
transportation until they arrest at discontiguous sites, exit the circulation and finally
proliferate at ectopic sites (colonization) in response to local growth factors [397].
Although primary tumour formation is a prerequisite to metastasis, tumourigenicity
and metastasis are distinct phenotypes. Therefore, the question is whether there exist
specific metastasis-regulatory miRNAs (metastamiRs). Many studies have found
both metastasis-suppressing and metastasis-promoting metastamiRs, which have
Chapter 4: Functional studies of microRNAs in melanoma cells 123
been discovered in the metastatic cascade including cell growth, EMT, adhesion,
migration, invasion, apoptosis and/or angiogenesis [279]. miR-10b was the first
metastasis-promoting miRNA described that was highly expressed only in metastatic
breast cancer cell lines [398]. miR-10b was found to enhance migration and invasion
in vitro and metastasis in vivo. miR-10b expression was elevated by Twist homolog 1
(TWIST1) and it directly targeted Homeobox protein Hox-D1 (HOXD1), leading to
increased expression of RAS homolog gene family member C (RHOC).
Members of the miR-200 family are very important metastasis-suppressing
metastamiRs that particularly aroused my attention, as they were all present in my
differentially expressed miRNA list. The miR-200 family was found to reverse the
EMT process needed for metastasis by driving a mesenchymal to epithelial transition
(MET) through directly targeting E-cadherin (CDH1) transcription repressors Zinc
finger E-box binding homeobox1/2—ZEB1 (δEF1)/ ZEB2 (SIP1) in various cancers
(Figure 4.2), including breast, pancreatic, colorectal and ovarian [399-404].
Moreover, miR-205, which also directly targeted both ZEB1 and ZEB2, was found
downregulated in cancer cells that had undergone EMT. In addition, upregulation of
the miR-200 family and miR-205 in EMT cell lines caused morphological change
from a spindle-shaped, mesenchymal form to a rounded, epithelial-like form [399].
Figure 4.2 The schematic model for feedback loop between the miR-200 family and ZEB1/ZEB2
in switching the EMT-MET process. In epithelial cells, a stable state is maintained by high levels of
miR-200, which inhibits ZEB1/SIP1 and increases the expression of ZEB-repressed epithelial genes
such as E-cadherin. The switch to a mesenchymal state can be induced by TGF-ß, which increases
ZEB1-SIP1 levels. This in turn triggers and maintains a mesenchymal state through ZEB1-SIP1
Chapter 4: Functional studies of microRNAs in melanoma cells 124
binding to ZEB-type E-boxes within the miR-200 family promoter and repressing miR-200
transcription. Together, this system forms a double-negative feedback loop, maintaining stable cellular
states depending upon the relative levels of ZEB1-SIP1 and miR-200, yet retaining the ability to
switch between these states, as exemplified by TGF-ß induced EMT. Figure is adapted from [401].
4.1.3 The miR-200 family, EMT and melanoma
The miR-200 family comprises five members: miR-200a, b, c, 141 and 429, which
are generated from two transcripts. Human miR-200a/b/429 are located on
chromosome 1 and miR-200c/141 are located on chromosome 12. The members of
this family are highly related in sequence, especially in the nucleotide 2-8 seed
region (Table 4.1 and Figure 4.3) that determines target specification, indicating that
they likely target a similar complement of mRNAs. Within the five members, miR-
200a and miR-141 have the same seed region, while the other three group together
with a different common seed region (Table 4.1).
EMT-like processes take place during embryonic development and wound healing
[405] and in carcinogenesis, as well as when cancer cells undergo a change from a
differentiated to a more invasive undifferentiated tumour [405, 406]. When an EMT-
like process is triggered, cells lose epithelial features and acquire mesenchymal
signatures. Cells become more invasive by expressing proteases that allow them to
pass through basement membrane and migrate. During EMT, cancer cells can
express various transcription factors in response to stimulation with soluble factors
that are present in the tumour environment, such as TGF-ß. The two E-box-binding
transcription factors—ZEB1 and ZEB2 are important regulators because they
negatively regulate the expression of E-cadherin and assist the EMT process [407-
409]. Figure 4.4 shows a schematic model of ZEB1 3' UTR regions with the miR-
200c stem-loop.
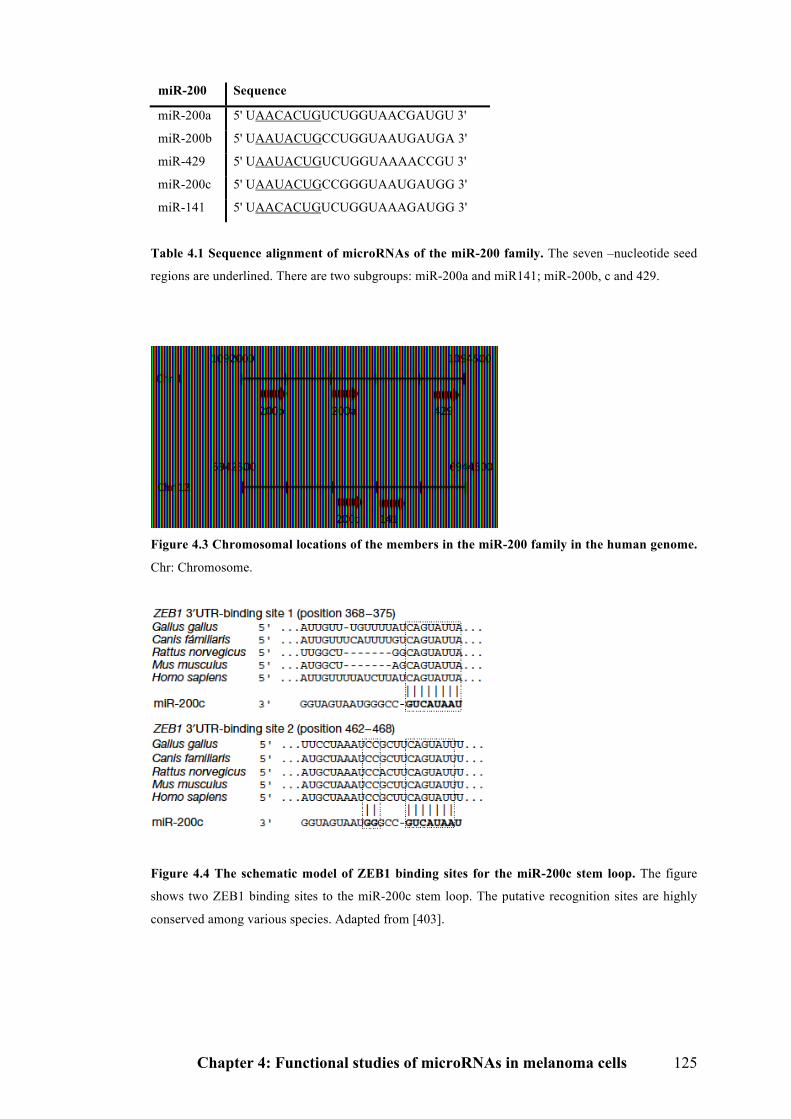
Chapter 4: Functional studies of microRNAs in melanoma cells 125
miR-200 Sequence
miR-200a 5' UAACACUGUCUGGUAACGAUGU 3'
miR-200b 5' UAAUACUGCCUGGUAAUGAUGA 3'
miR-429 5' UAAUACUGUCUGGUAAAACCGU 3'
miR-200c 5' UAAUACUGCCGGGUAAUGAUGG 3'
miR-141 5' UAACACUGUCUGGUAAAGAUGG 3'
Table 4.1 Sequence alignment of microRNAs of the miR-200 family. The seven –nucleotide seed
regions are underlined. There are two subgroups: miR-200a and miR141; miR-200b, c and 429.
Figure 4.3 Chromosomal locations of the members in the miR-200 family in the human genome.
Chr: Chromosome.
Figure 4.4 The schematic model of ZEB1 binding sites for the miR-200c stem loop. The figure
shows two ZEB1 binding sites to the miR-200c stem loop. The putative recognition sites are highly
conserved among various species. Adapted from [403].
Chapter 4: Functional studies of microRNAs in melanoma cells 126
The NCI-60 panel contains nine different cancers that can be genetically divided into
two major branches: subcluster 1 (SC1) cells have a mesenchymal gene signature
and subcluster 2 (SC2) cells have an epithelial gene signature [410]. As it is known
that E-cadherin is lost during cancer progression, Park et al. sorted all NCI-60 panel
cell lines from highest to lowest E-cadherin/Vimentin ratio using western blot
analysis [404]. Thus, NCI-60 cell lines were grouped into three: epithelial group
(with high E-cadherin, low Vimentin), undefined (either equal expression or no
expression of both) and mesenchymal group (with low E-cadherin, high Vimentin).
Expression of the miR-200 family was positively correlated with E-cadherin,
suggesting that the miR-200 family is a powerful marker for cell lines with an
epithelial nature. More interestingly, seven of eight melanoma cell lines in the NCI-
60 panel belonged to the mesenchymal group and one was in the undefined group.
This, combined with my microarray results, led me to ask whether the miR-200
family plays the same role in melanoma metastasis.
First, the question, whether EMT is relevant in melanoma needs, to be answered.
Looking back to EMT during embryonic development, primary EMT (that which
occurs in tissues that have never undergone a previous EMT) not only occurs at
gastrulation but also at neural crest formation. This is the cell lineage that gives rise
to melanocytes and changes in cadherin expression and cell-cell adhesion are crucial
to neural crest delamination. Besides the roles of EMT in the origin of melanocytes,
studies also identified a close relationship between EMT and melanoma. Melanoma
constitutively produces TGF-ß and its expression may be related to tumour
progression [411]. TGF-ß is involved in downregulation of E-cadherin in melanoma
[412]. It was also found that N-cadherin was directly regulated by E-cadherin and
loss of E-cadherin could induce NF-κB activity and N-cadherin expression in
tumourigenic EMT [413]. A high-throughput study using cutaneous melanoma
tissues suggested that EMT-related genes, including N-cadherin, contributed to the
promotion of the metastatic phenotype by supporting specific adhesive, invasive and
migratory properties [414]. In their study, increased N-cadherin was matched by loss
of cadherin 10 expression, a type II cadherin with near-equivalent binding strength to
that of E-cadherin [415]. To determine whether human melanoma cells have
Chapter 4: Functional studies of microRNAs in melanoma cells 127
decreased levels of E-cadherin, Tang et al. stained nine melanoma cell lines. Six of
them showed negative staining and the remaining three (SK-MEL-1, 2 and 28)
showed positive staining [416]. However, only SK-MEL-1 had E-cadherin at a
similar level to normal melanocytes, while the other two showed decreased E-
cadherin levels. Another study also showed the loss of E-cadherin expression and
high mesenchymal protein expression (N-cadherin, Vimentin and Fibronectin) in
melanoma cell lines. Moreover, after cytokine treatment, these mesenchymal
proteins were elevated further, indicating that malignant melanoma cell lines are
susceptible to EMT after cytokine treatment [417]. However, there has been no
report yet that focused on studying the relationship between the miR-200 family and
EMT in melanoma metastasis.
Chemotherapy-resistance is often observed in platinum-based chemotherapy,
currently the main regimen in non-small cell lung cancer (NSCLC) treatment [418],
and is a key cause of chemotherapeutic failure. A recent study investigated the
expression of miR-200c in a panel of NSCLC cell lines and a strong inverse
correlation with invasion was detected. Reintroduction of miR-200c into highly
invasive/aggressive NSCLC cells induced a loss of the mesenchymal phenotype by
restoring E-cadherin and reducing N-cadherin expression, and inhibited in vitro cell
invasion as well as in vivo metastasis formation. Moreover, they found
overexpression of miR-200c sensitized NCI-H1299 NSCLC cells to cisplatin and
cetuximab treatment [419]. This study indicates that the loss of miR-200c expression
can induce an aggressive, invasive, and chemoresistant phenotype. Therefore,
increasing miR-200c expression level might contribute to anti-carcinogenesis and
sensitize to chemotherapy.
4.1.4 Roles of microRNAs in melanoma
So far, studies of miRNAs related to melanoma have mainly involved two aspects:
expression and functions of miRNAs, impacts of epigenetic regulation of miRNAs.
The majority of the studies have focused on investigating aberrant miRNAs in
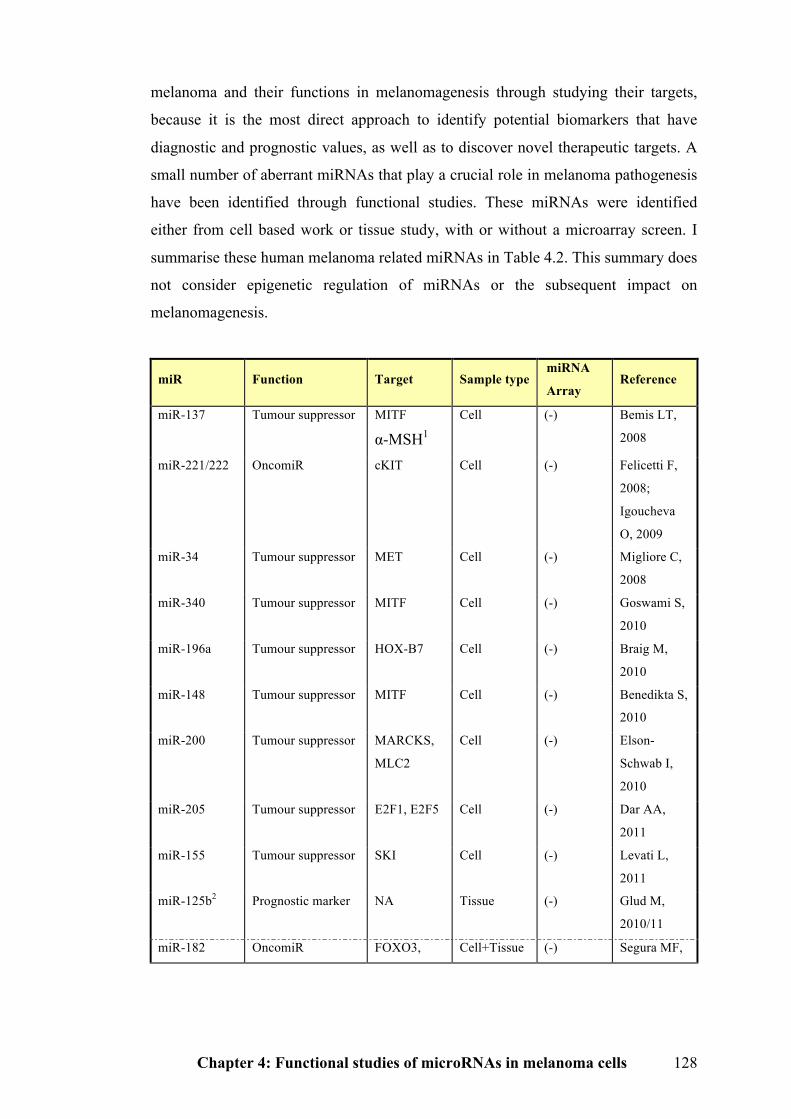
Chapter 4: Functional studies of microRNAs in melanoma cells 128
melanoma and their functions in melanomagenesis through studying their targets,
because it is the most direct approach to identify potential biomarkers that have
diagnostic and prognostic values, as well as to discover novel therapeutic targets. A
small number of aberrant miRNAs that play a crucial role in melanoma pathogenesis
have been identified through functional studies. These miRNAs were identified
either from cell based work or tissue study, with or without a microarray screen. I
summarise these human melanoma related miRNAs in Table 4.2. This summary does
not consider epigenetic regulation of miRNAs or the subsequent impact on
melanomagenesis.
miR Function Target Sample type miRNA
Array Reference
miR-137 Tumour suppressor MITF
α-MSH1
Cell (-) Bemis LT,
2008
miR-221/222 OncomiR cKIT Cell (-) Felicetti F,
2008;
Igoucheva
O, 2009
miR-34 Tumour suppressor MET Cell (-) Migliore C,
2008
miR-340 Tumour suppressor MITF Cell (-) Goswami S,
2010
miR-196a Tumour suppressor HOX-B7 Cell (-) Braig M,
2010
miR-148 Tumour suppressor MITF Cell (-) Benedikta S,
2010
miR-200 Tumour suppressor MARCKS,
MLC2
Cell (-) Elson-
Schwab I,
2010
miR-205 Tumour suppressor E2F1, E2F5 Cell (-) Dar AA,
2011
miR-155 Tumour suppressor SKI Cell (-) Levati L,
2011
miR-125b2 Prognostic marker NA Tissue (-) Glud M,
2010/11
miR-182 OncomiR FOXO3, Cell+Tissue (-) Segura MF,
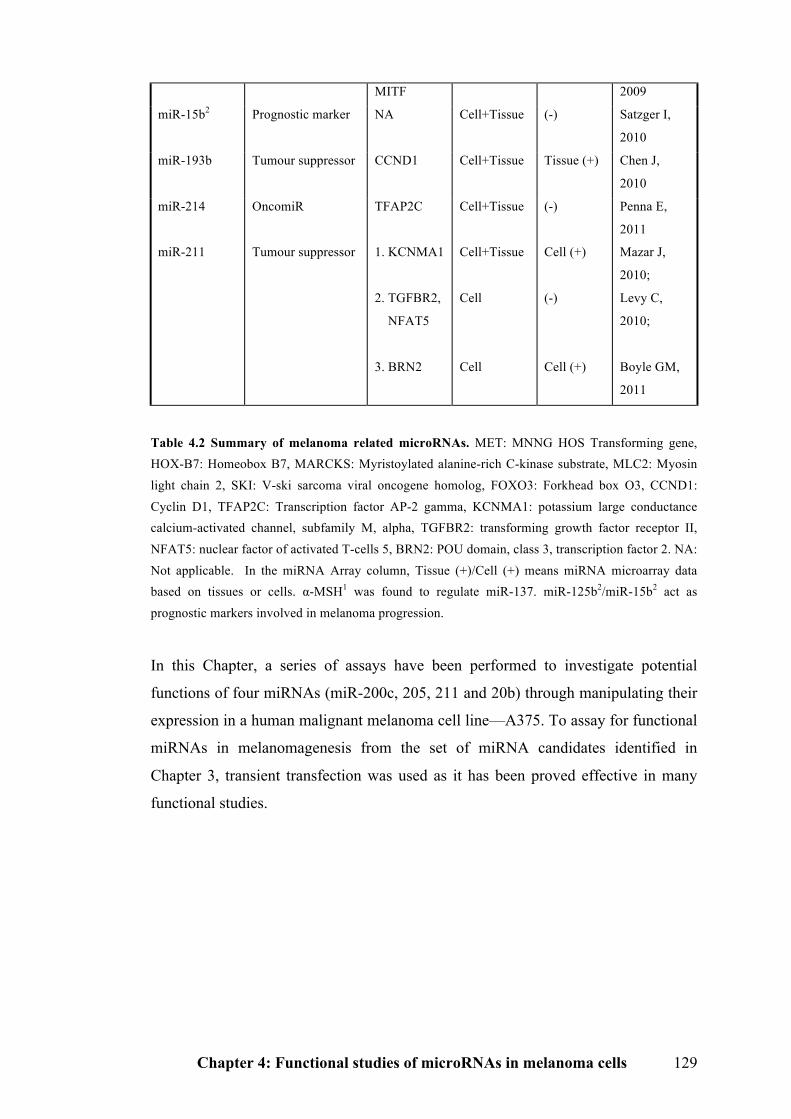
Chapter 4: Functional studies of microRNAs in melanoma cells 129
MITF 2009
miR-15b2 Prognostic marker NA Cell+Tissue (-) Satzger I,
2010
miR-193b Tumour suppressor CCND1 Cell+Tissue Tissue (+) Chen J,
2010
miR-214 OncomiR TFAP2C Cell+Tissue (-) Penna E,
2011
miR-211 Tumour suppressor 1. KCNMA1
2. TGFBR2,
NFAT5
3. BRN2
Cell+Tissue
Cell
Cell
Cell (+)
(-)
Cell (+)
Mazar J,
2010;
Levy C,
2010;
Boyle GM,
2011
Table 4.2 Summary of melanoma related microRNAs. MET: MNNG HOS Transforming gene, HOX-B7: Homeobox B7, MARCKS: Myristoylated alanine-rich C-kinase substrate, MLC2: Myosin light chain 2, SKI: V-ski sarcoma viral oncogene homolog, FOXO3: Forkhead box O3, CCND1: Cyclin D1, TFAP2C: Transcription factor AP-2 gamma, KCNMA1: potassium large conductance calcium-activated channel, subfamily M, alpha, TGFBR2: transforming growth factor receptor II, NFAT5: nuclear factor of activated T-cells 5, BRN2: POU domain, class 3, transcription factor 2. NA: Not applicable. In the miRNA Array column, Tissue (+)/Cell (+) means miRNA microarray data based on tissues or cells. α-MSH1 was found to regulate miR-137. miR-125b2/miR-15b2 act as prognostic markers involved in melanoma progression.
In this Chapter, a series of assays have been performed to investigate potential
functions of four miRNAs (miR-200c, 205, 211 and 20b) through manipulating their
expression in a human malignant melanoma cell line—A375. To assay for functional
miRNAs in melanomagenesis from the set of miRNA candidates identified in
Chapter 3, transient transfection was used as it has been proved effective in many
functional studies.
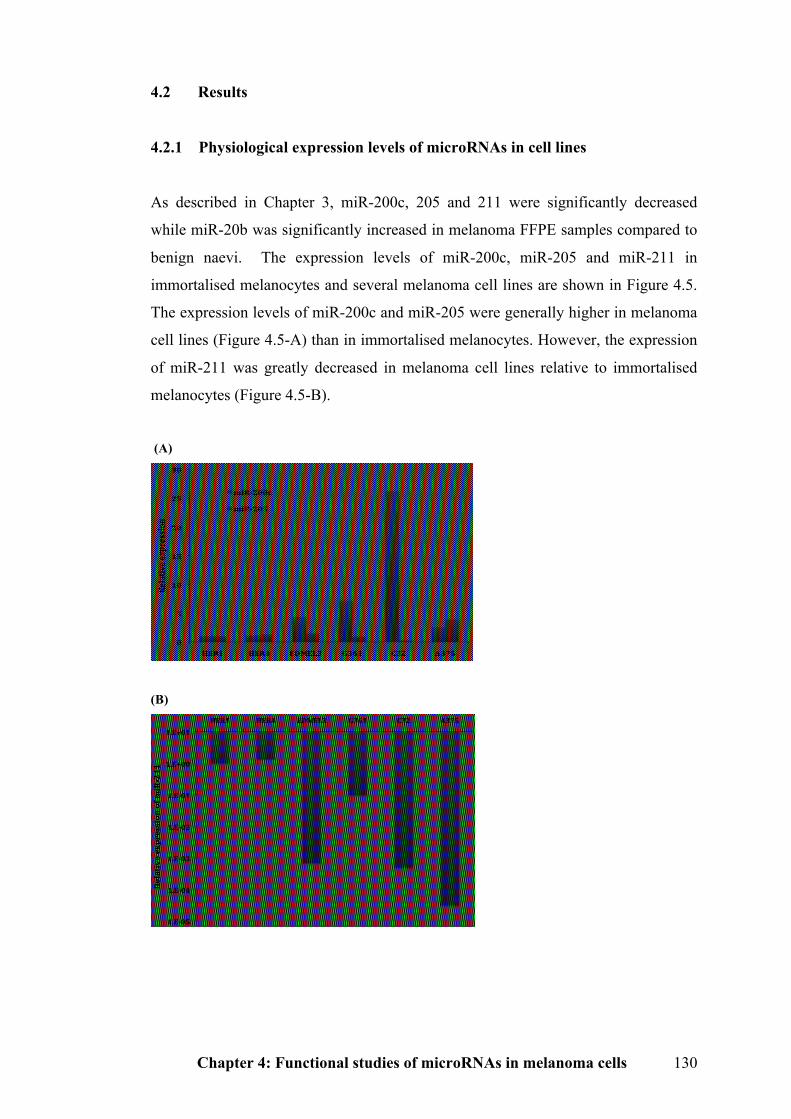
Chapter 4: Functional studies of microRNAs in melanoma cells 130
4.2 Results
4.2.1 Physiological expression levels of microRNAs in cell lines
As described in Chapter 3, miR-200c, 205 and 211 were significantly decreased
while miR-20b was significantly increased in melanoma FFPE samples compared to
benign naevi. The expression levels of miR-200c, miR-205 and miR-211 in
immortalised melanocytes and several melanoma cell lines are shown in Figure 4.5.
The expression levels of miR-200c and miR-205 were generally higher in melanoma
cell lines (Figure 4.5-A) than in immortalised melanocytes. However, the expression
of miR-211 was greatly decreased in melanoma cell lines relative to immortalised
melanocytes (Figure 4.5-B).
(A)
(B)
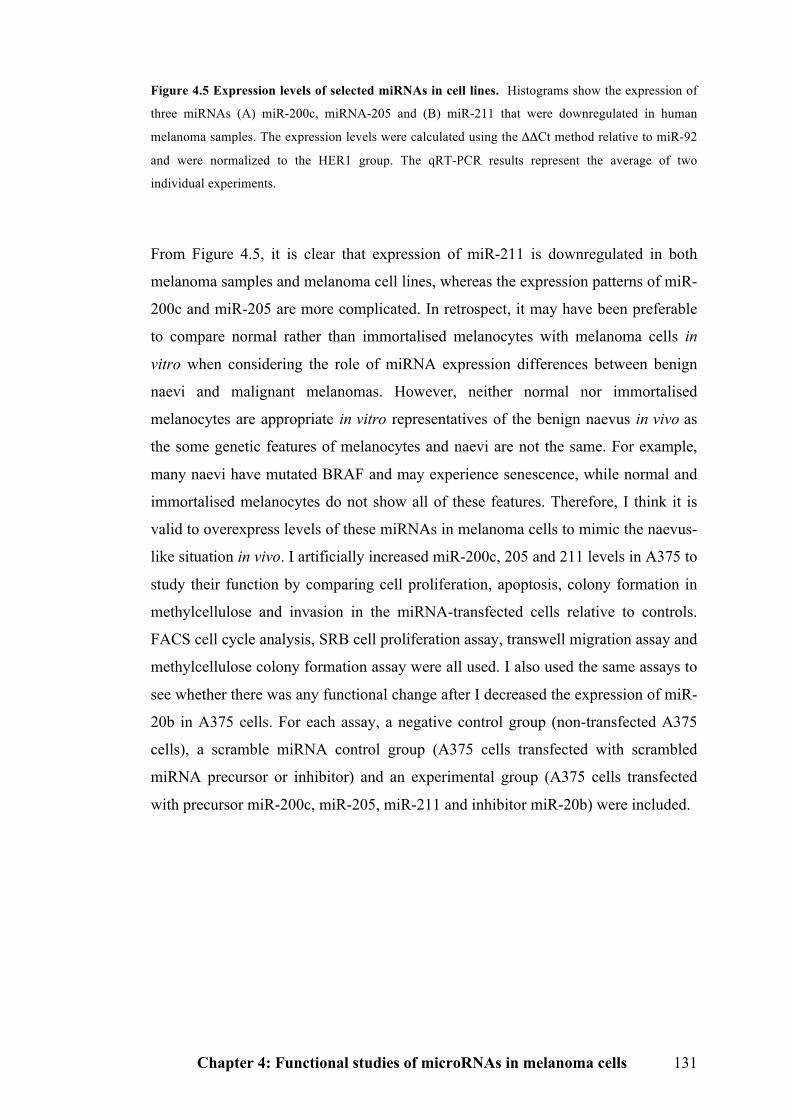
Chapter 4: Functional studies of microRNAs in melanoma cells 131
Figure 4.5 Expression levels of selected miRNAs in cell lines. Histograms show the expression of
three miRNAs (A) miR-200c, miRNA-205 and (B) miR-211 that were downregulated in human
melanoma samples. The expression levels were calculated using the ΔΔCt method relative to miR-92
and were normalized to the HER1 group. The qRT-PCR results represent the average of two
individual experiments.
From Figure 4.5, it is clear that expression of miR-211 is downregulated in both
melanoma samples and melanoma cell lines, whereas the expression patterns of miR-
200c and miR-205 are more complicated. In retrospect, it may have been preferable
to compare normal rather than immortalised melanocytes with melanoma cells in
vitro when considering the role of miRNA expression differences between benign
naevi and malignant melanomas. However, neither normal nor immortalised
melanocytes are appropriate in vitro representatives of the benign naevus in vivo as
the some genetic features of melanocytes and naevi are not the same. For example,
many naevi have mutated BRAF and may experience senescence, while normal and
immortalised melanocytes do not show all of these features. Therefore, I think it is
valid to overexpress levels of these miRNAs in melanoma cells to mimic the naevus-
like situation in vivo. I artificially increased miR-200c, 205 and 211 levels in A375 to
study their function by comparing cell proliferation, apoptosis, colony formation in
methylcellulose and invasion in the miRNA-transfected cells relative to controls.
FACS cell cycle analysis, SRB cell proliferation assay, transwell migration assay and
methylcellulose colony formation assay were all used. I also used the same assays to
see whether there was any functional change after I decreased the expression of miR-
20b in A375 cells. For each assay, a negative control group (non-transfected A375
cells), a scramble miRNA control group (A375 cells transfected with scrambled
miRNA precursor or inhibitor) and an experimental group (A375 cells transfected
with precursor miR-200c, miR-205, miR-211 and inhibitor miR-20b) were included.
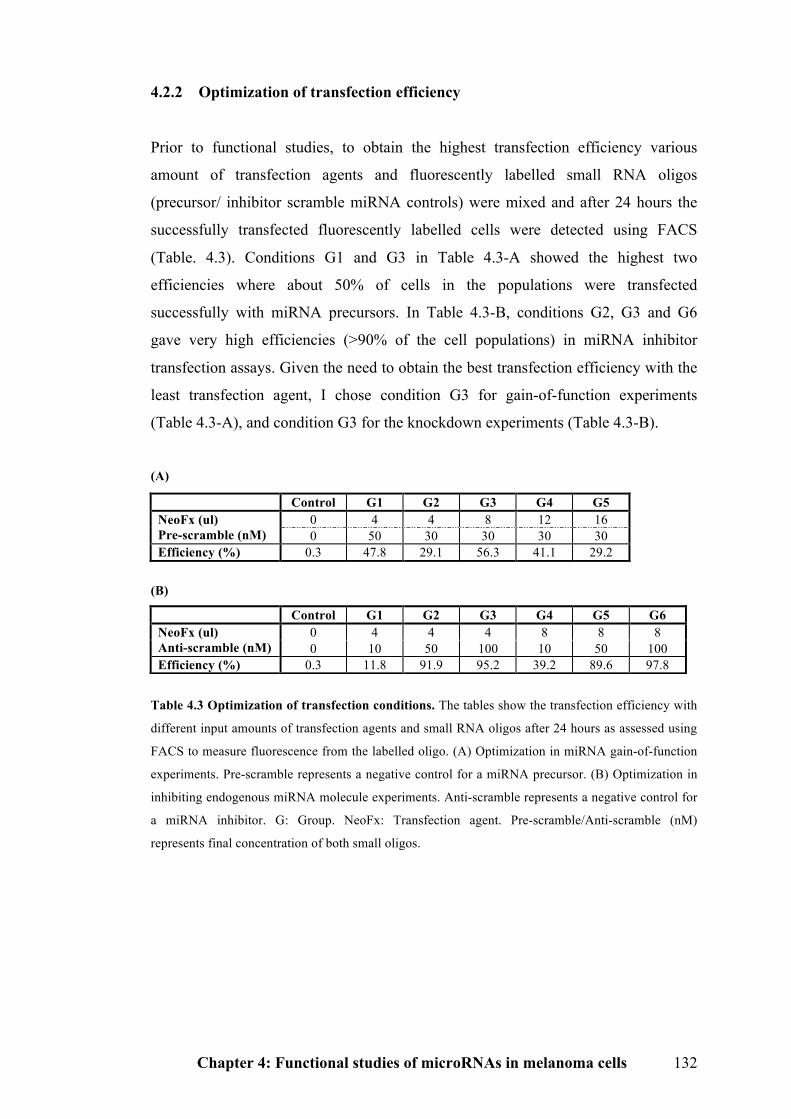
Chapter 4: Functional studies of microRNAs in melanoma cells 132
4.2.2 Optimization of transfection efficiency
Prior to functional studies, to obtain the highest transfection efficiency various
amount of transfection agents and fluorescently labelled small RNA oligos
(precursor/ inhibitor scramble miRNA controls) were mixed and after 24 hours the
successfully transfected fluorescently labelled cells were detected using FACS
(Table. 4.3). Conditions G1 and G3 in Table 4.3-A showed the highest two
efficiencies where about 50% of cells in the populations were transfected
successfully with miRNA precursors. In Table 4.3-B, conditions G2, G3 and G6
gave very high efficiencies (>90% of the cell populations) in miRNA inhibitor
transfection assays. Given the need to obtain the best transfection efficiency with the
least transfection agent, I chose condition G3 for gain-of-function experiments
(Table 4.3-A), and condition G3 for the knockdown experiments (Table 4.3-B).
(A)
(B)
Table 4.3 Optimization of transfection conditions. The tables show the transfection efficiency with
different input amounts of transfection agents and small RNA oligos after 24 hours as assessed using
FACS to measure fluorescence from the labelled oligo. (A) Optimization in miRNA gain-of-function
experiments. Pre-scramble represents a negative control for a miRNA precursor. (B) Optimization in
inhibiting endogenous miRNA molecule experiments. Anti-scramble represents a negative control for
a miRNA inhibitor. G: Group. NeoFx: Transfection agent. Pre-scramble/Anti-scramble (nM)
represents final concentration of both small oligos.
Control G1 G2 G3 G4 G5 0 4 4 8 12 16 NeoFx (ul)
Pre-scramble (nM) 0 50 30 30 30 30 Efficiency (%) 0.3 47.8 29.1 56.3 41.1 29.2
Control G1 G2 G3 G4 G5 G6 0 4 4 4 8 8 8 NeoFx (ul)
Anti-scramble (nM) 0 10 50 100 10 50 100 Efficiency (%) 0.3 11.8 91.9 95.2 39.2 89.6 97.8
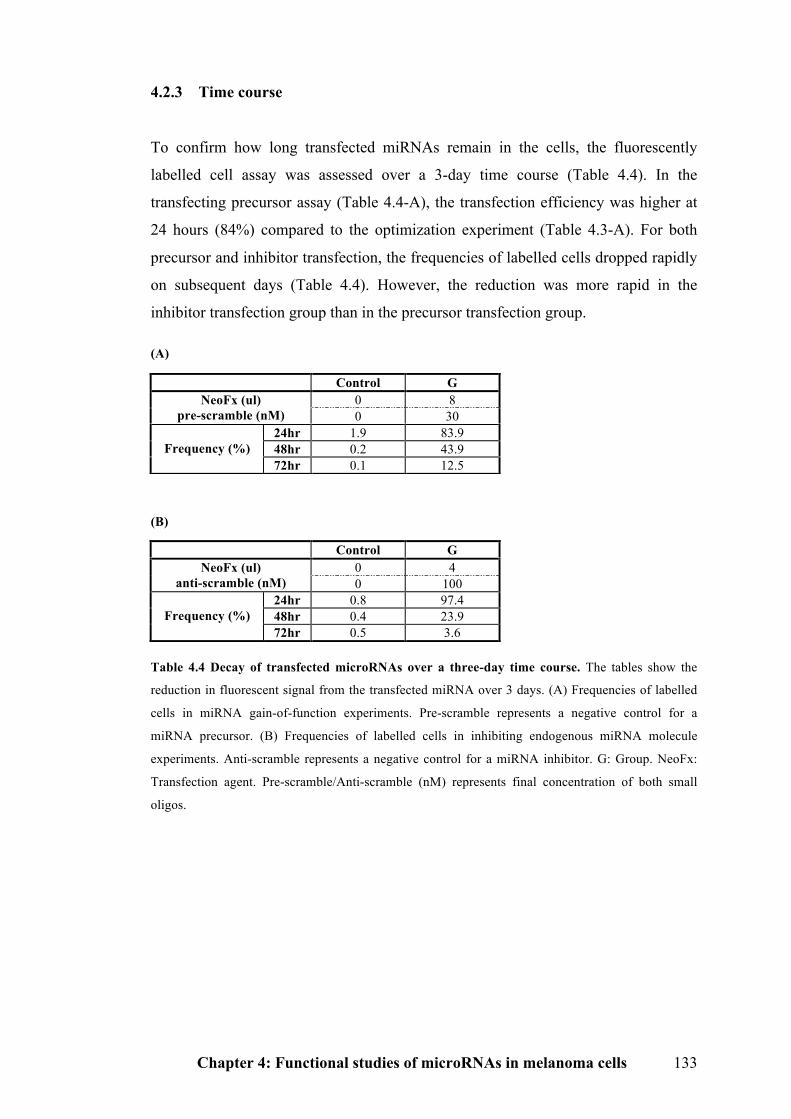
Chapter 4: Functional studies of microRNAs in melanoma cells 133
4.2.3 Time course
To confirm how long transfected miRNAs remain in the cells, the fluorescently
labelled cell assay was assessed over a 3-day time course (Table 4.4). In the
transfecting precursor assay (Table 4.4-A), the transfection efficiency was higher at
24 hours (84%) compared to the optimization experiment (Table 4.3-A). For both
precursor and inhibitor transfection, the frequencies of labelled cells dropped rapidly
on subsequent days (Table 4.4). However, the reduction was more rapid in the
inhibitor transfection group than in the precursor transfection group. (A)
(B)
Table 4.4 Decay of transfected microRNAs over a three-day time course. The tables show the
reduction in fluorescent signal from the transfected miRNA over 3 days. (A) Frequencies of labelled
cells in miRNA gain-of-function experiments. Pre-scramble represents a negative control for a
miRNA precursor. (B) Frequencies of labelled cells in inhibiting endogenous miRNA molecule
experiments. Anti-scramble represents a negative control for a miRNA inhibitor. G: Group. NeoFx:
Transfection agent. Pre-scramble/Anti-scramble (nM) represents final concentration of both small
oligos.
Control G 0 8 NeoFx (ul)
pre-scramble (nM) 0 30 24hr 1.9 83.9 48hr 0.2 43.9 Frequency (%) 72hr 0.1 12.5
Control G 0 4 NeoFx (ul)
anti-scramble (nM) 0 100 24hr 0.8 97.4 48hr 0.4 23.9 Frequency (%) 72hr 0.5 3.6
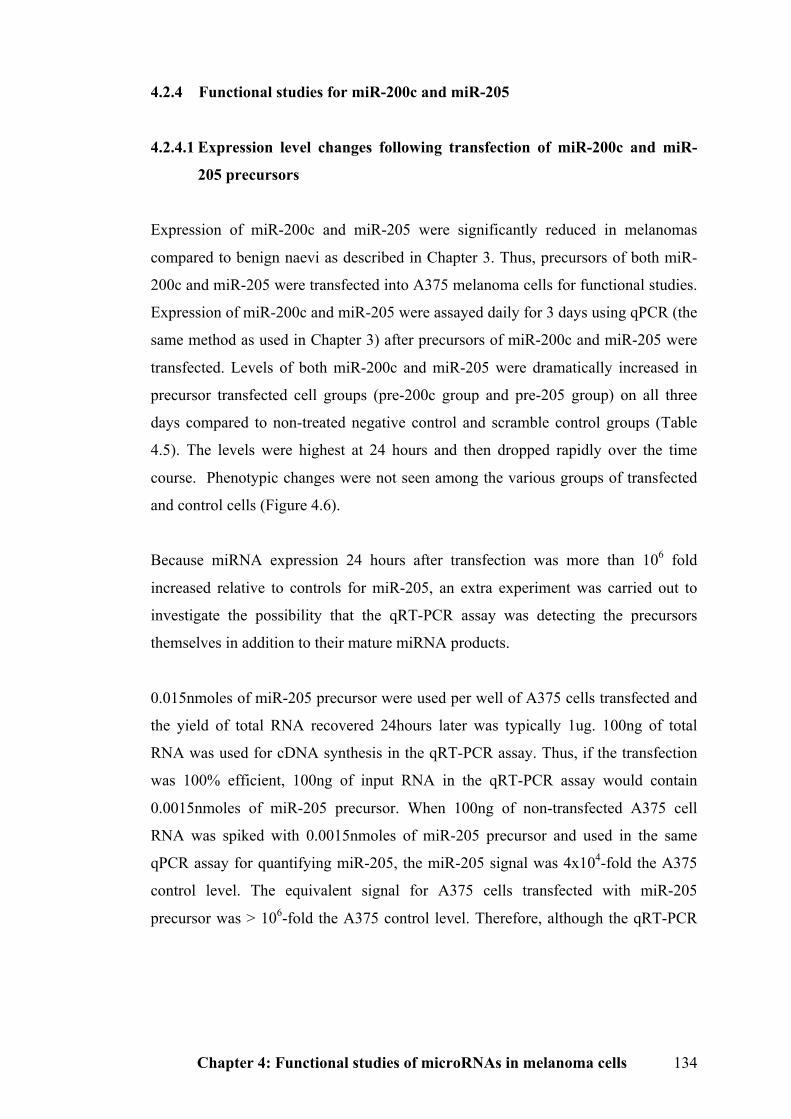
Chapter 4: Functional studies of microRNAs in melanoma cells 134
4.2.4 Functional studies for miR-200c and miR-205
4.2.4.1 Expression level changes following transfection of miR-200c and miR-
205 precursors
Expression of miR-200c and miR-205 were significantly reduced in melanomas
compared to benign naevi as described in Chapter 3. Thus, precursors of both miR-
200c and miR-205 were transfected into A375 melanoma cells for functional studies.
Expression of miR-200c and miR-205 were assayed daily for 3 days using qPCR (the
same method as used in Chapter 3) after precursors of miR-200c and miR-205 were
transfected. Levels of both miR-200c and miR-205 were dramatically increased in
precursor transfected cell groups (pre-200c group and pre-205 group) on all three
days compared to non-treated negative control and scramble control groups (Table
4.5). The levels were highest at 24 hours and then dropped rapidly over the time
course. Phenotypic changes were not seen among the various groups of transfected
and control cells (Figure 4.6).
Because miRNA expression 24 hours after transfection was more than 106 fold
increased relative to controls for miR-205, an extra experiment was carried out to
investigate the possibility that the qRT-PCR assay was detecting the precursors
themselves in addition to their mature miRNA products.
0.015nmoles of miR-205 precursor were used per well of A375 cells transfected and
the yield of total RNA recovered 24hours later was typically 1ug. 100ng of total
RNA was used for cDNA synthesis in the qRT-PCR assay. Thus, if the transfection
was 100% efficient, 100ng of input RNA in the qRT-PCR assay would contain
0.0015nmoles of miR-205 precursor. When 100ng of non-transfected A375 cell
RNA was spiked with 0.0015nmoles of miR-205 precursor and used in the same
qPCR assay for quantifying miR-205, the miR-205 signal was 4x10⁴-fold the A375
control level. The equivalent signal for A375 cells transfected with miR-205
precursor was > 106-fold the A375 control level. Therefore, although the qRT-PCR
Chapter 4: Functional studies of microRNAs in melanoma cells 135
assay does detect the miR-205 precursor, the great majority of the signal obtained is
from mature miR-205 rather than its precursor. (A) Expression of miR-200c
Negative Scramble pre-200c 24hr 1.00±0.23 3.71±2.33 21752±7810 48hr 1.00±0.12 0.92±0.11 5983±2225 72hr 1.00±0.25 0.88±0.19 2187±817
(B) Expression of miR-205
Negative Scramble pre-205 24hr 1.00±0.48 1.42±0.51 1392245±552660 48hr 1.00±0.56 0.97±0.10 521964±142580 72hr 1.00±0.34 1.50±0.59 179269±61807
Table 4.5 Comparison of microRNA expression in negative control, scramble and miR-200c and
miR-205 precursor transfected A375 melanoma cells. The two tables compare target miRNA
expression changes in negative control, scramble and miR-200c precursor (A) and miR-205 precursor
(B) treated A375 cells over 3 days by qRT-PCR using the ΔΔCt method. Expression of each miRNA
is shown relative to miR-92 and normalized to the mean of negative control group. Results represent
average relative expression ± SEM from three independent determinations, each with triplicate
samples. pre-200c: miR-200c precursor treated group, pre-205: miR-205 precursor treated group. The
abbreviated terms are used throughout the chapter.
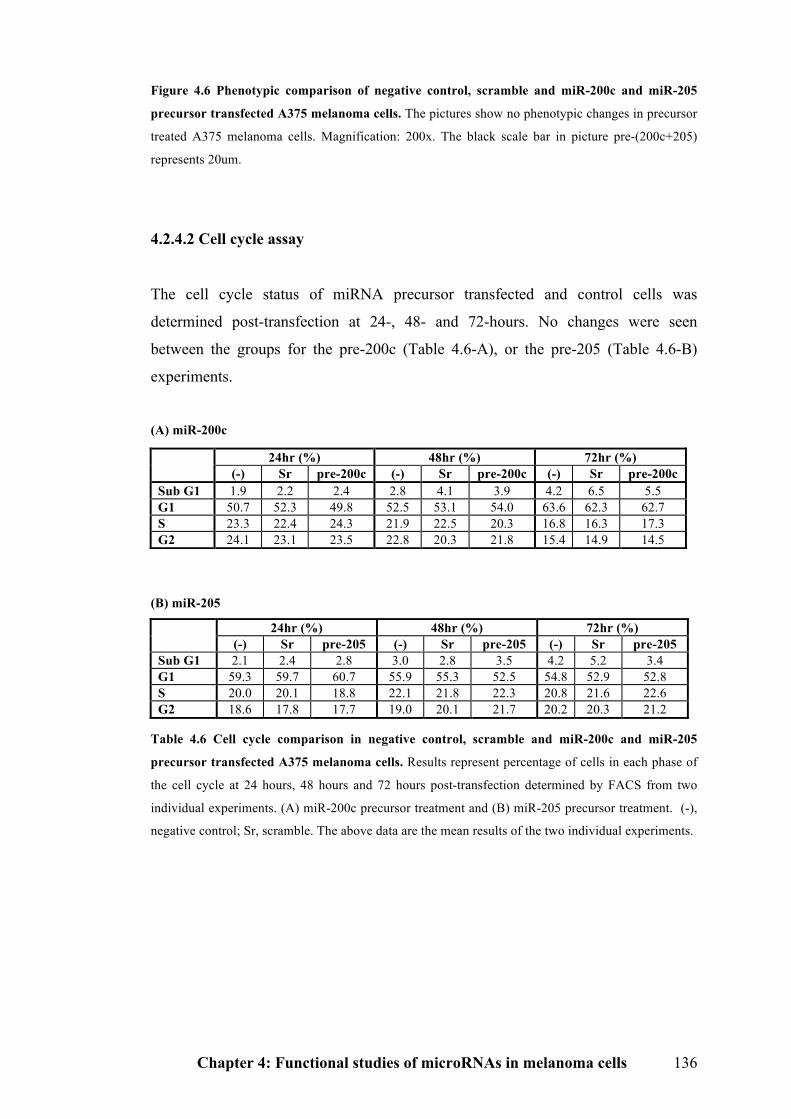
Chapter 4: Functional studies of microRNAs in melanoma cells 136
Figure 4.6 Phenotypic comparison of negative control, scramble and miR-200c and miR-205
precursor transfected A375 melanoma cells. The pictures show no phenotypic changes in precursor
treated A375 melanoma cells. Magnification: 200x. The black scale bar in picture pre-(200c+205)
represents 20um.
4.2.4.2 Cell cycle assay
The cell cycle status of miRNA precursor transfected and control cells was
determined post-transfection at 24-, 48- and 72-hours. No changes were seen
between the groups for the pre-200c (Table 4.6-A), or the pre-205 (Table 4.6-B)
experiments.
(A) miR-200c
(B) miR-205
24hr (%) 48hr (%) 72hr (%) (-) Sr pre-205 (-) Sr pre-205 (-) Sr pre-205
Sub G1 2.1 2.4 2.8 3.0 2.8 3.5 4.2 5.2 3.4 G1 59.3 59.7 60.7 55.9 55.3 52.5 54.8 52.9 52.8 S 20.0 20.1 18.8 22.1 21.8 22.3 20.8 21.6 22.6 G2 18.6 17.8 17.7 19.0 20.1 21.7 20.2 20.3 21.2
Table 4.6 Cell cycle comparison in negative control, scramble and miR-200c and miR-205
precursor transfected A375 melanoma cells. Results represent percentage of cells in each phase of
the cell cycle at 24 hours, 48 hours and 72 hours post-transfection determined by FACS from two
individual experiments. (A) miR-200c precursor treatment and (B) miR-205 precursor treatment. (-),
negative control; Sr, scramble. The above data are the mean results of the two individual experiments.
24hr (%) 48hr (%) 72hr (%) (-) Sr pre-200c (-) Sr pre-200c (-) Sr pre-200c
Sub G1 1.9 2.2 2.4 2.8 4.1 3.9 4.2 6.5 5.5 G1 50.7 52.3 49.8 52.5 53.1 54.0 63.6 62.3 62.7 S 23.3 22.4 24.3 21.9 22.5 20.3 16.8 16.3 17.3 G2 24.1 23.1 23.5 22.8 20.3 21.8 15.4 14.9 14.5
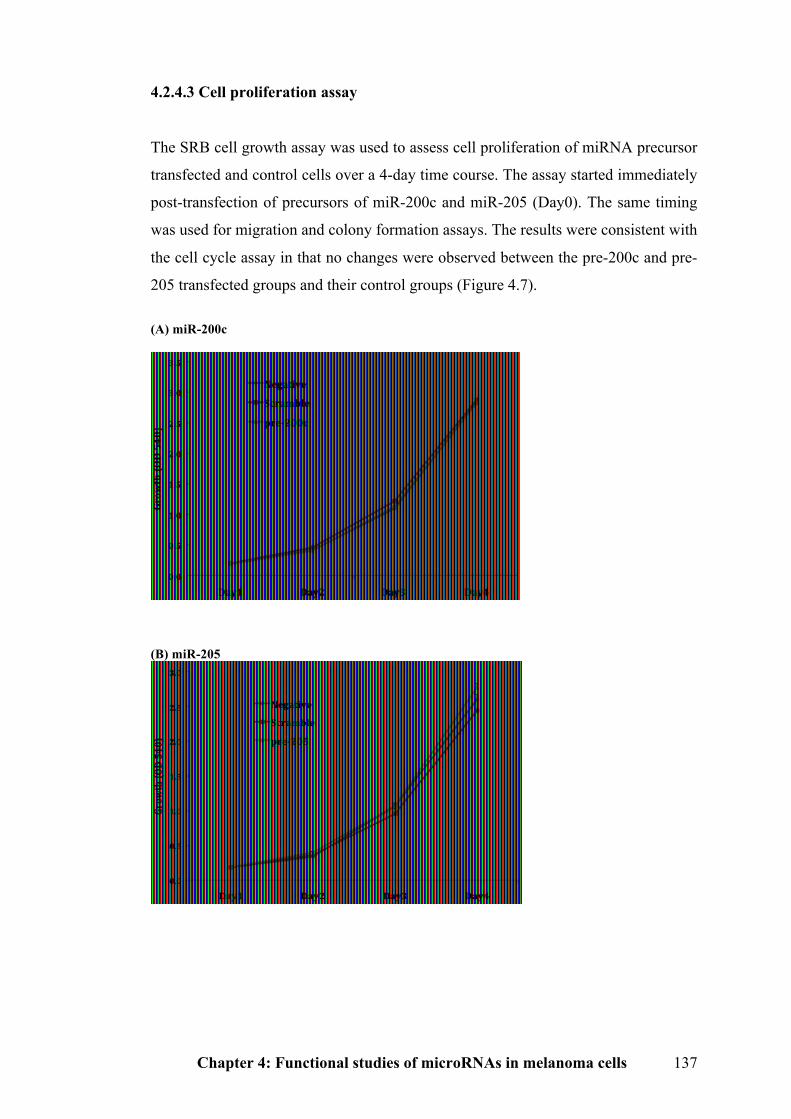
Chapter 4: Functional studies of microRNAs in melanoma cells 137
4.2.4.3 Cell proliferation assay
The SRB cell growth assay was used to assess cell proliferation of miRNA precursor
transfected and control cells over a 4-day time course. The assay started immediately
post-transfection of precursors of miR-200c and miR-205 (Day0). The same timing
was used for migration and colony formation assays. The results were consistent with
the cell cycle assay in that no changes were observed between the pre-200c and pre-
205 transfected groups and their control groups (Figure 4.7).
(A) miR-200c
(B) miR-205
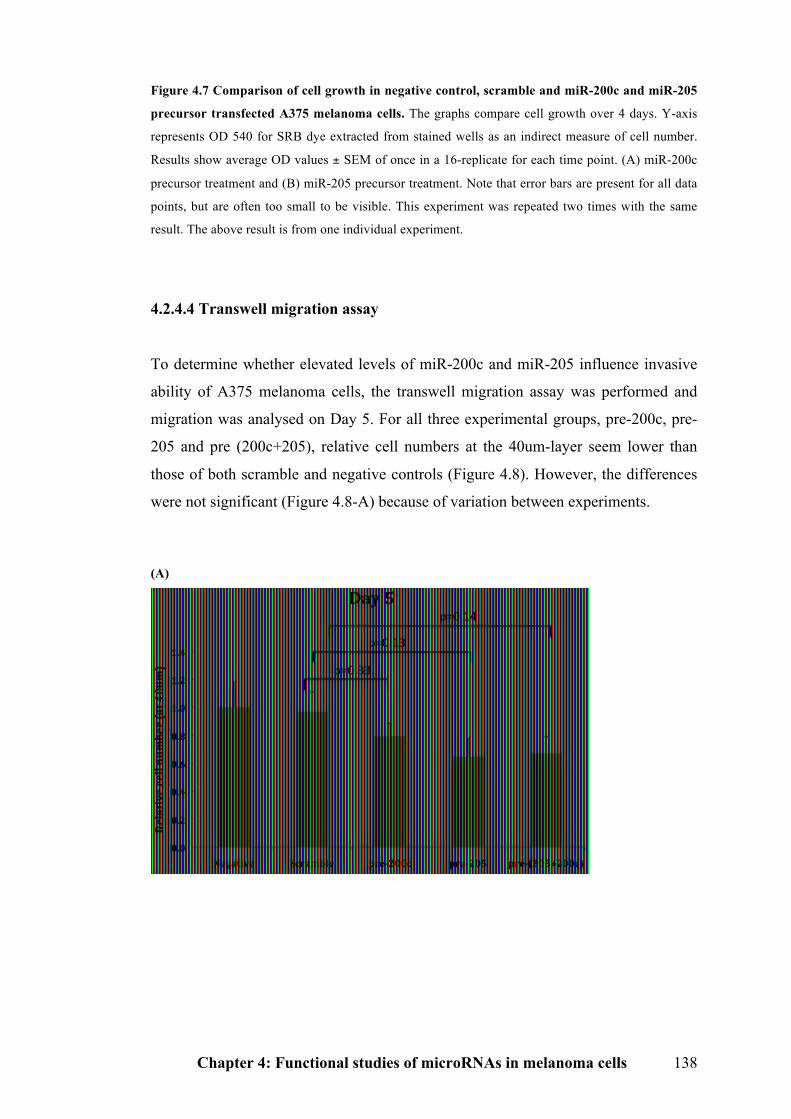
Chapter 4: Functional studies of microRNAs in melanoma cells 138
Figure 4.7 Comparison of cell growth in negative control, scramble and miR-200c and miR-205
precursor transfected A375 melanoma cells. The graphs compare cell growth over 4 days. Y-axis
represents OD 540 for SRB dye extracted from stained wells as an indirect measure of cell number.
Results show average OD values ± SEM of once in a 16-replicate for each time point. (A) miR-200c
precursor treatment and (B) miR-205 precursor treatment. Note that error bars are present for all data
points, but are often too small to be visible. This experiment was repeated two times with the same
result. The above result is from one individual experiment.
4.2.4.4 Transwell migration assay
To determine whether elevated levels of miR-200c and miR-205 influence invasive
ability of A375 melanoma cells, the transwell migration assay was performed and
migration was analysed on Day 5. For all three experimental groups, pre-200c, pre-
205 and pre (200c+205), relative cell numbers at the 40um-layer seem lower than
those of both scramble and negative controls (Figure 4.8). However, the differences
were not significant (Figure 4.8-A) because of variation between experiments.
(A)
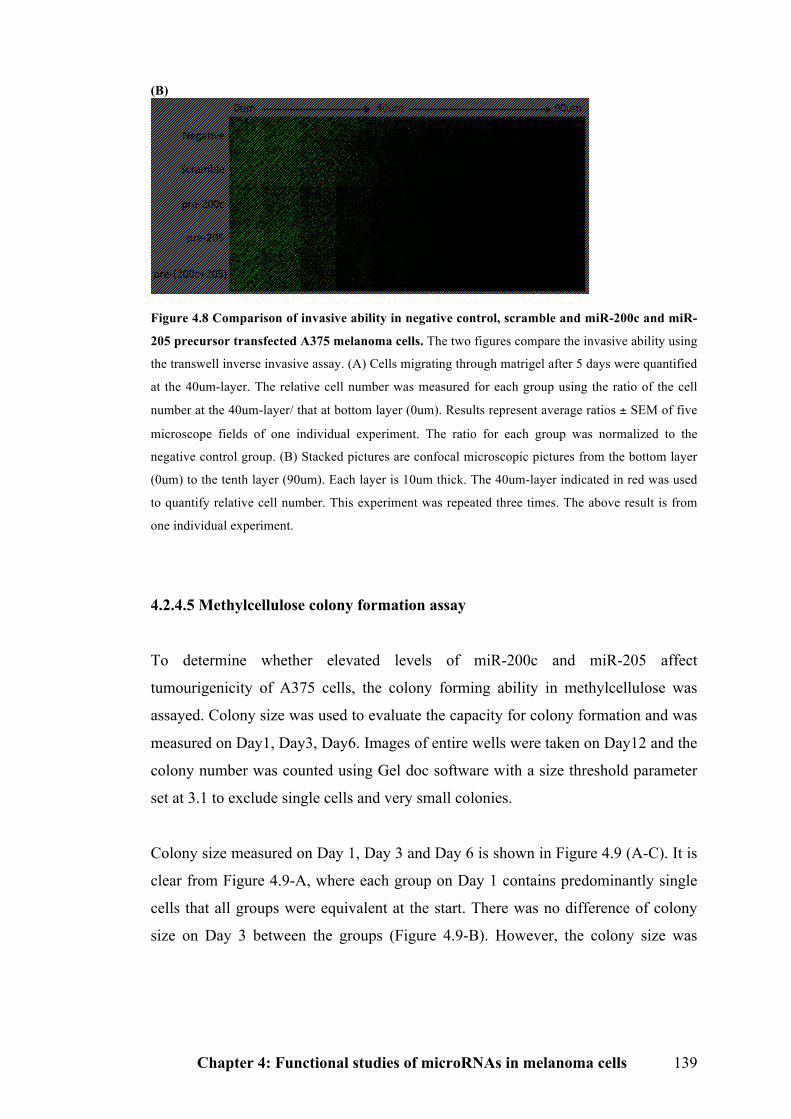
Chapter 4: Functional studies of microRNAs in melanoma cells 139
(B)
Figure 4.8 Comparison of invasive ability in negative control, scramble and miR-200c and miR-
205 precursor transfected A375 melanoma cells. The two figures compare the invasive ability using
the transwell inverse invasive assay. (A) Cells migrating through matrigel after 5 days were quantified
at the 40um-layer. The relative cell number was measured for each group using the ratio of the cell
number at the 40um-layer/ that at bottom layer (0um). Results represent average ratios ± SEM of five
microscope fields of one individual experiment. The ratio for each group was normalized to the
negative control group. (B) Stacked pictures are confocal microscopic pictures from the bottom layer
(0um) to the tenth layer (90um). Each layer is 10um thick. The 40um-layer indicated in red was used
to quantify relative cell number. This experiment was repeated three times. The above result is from
one individual experiment.
4.2.4.5 Methylcellulose colony formation assay
To determine whether elevated levels of miR-200c and miR-205 affect
tumourigenicity of A375 cells, the colony forming ability in methylcellulose was
assayed. Colony size was used to evaluate the capacity for colony formation and was
measured on Day1, Day3, Day6. Images of entire wells were taken on Day12 and the
colony number was counted using Gel doc software with a size threshold parameter
set at 3.1 to exclude single cells and very small colonies.
Colony size measured on Day 1, Day 3 and Day 6 is shown in Figure 4.9 (A-C). It is
clear from Figure 4.9-A, where each group on Day 1 contains predominantly single
cells that all groups were equivalent at the start. There was no difference of colony
size on Day 3 between the groups (Figure 4.9-B). However, the colony size was
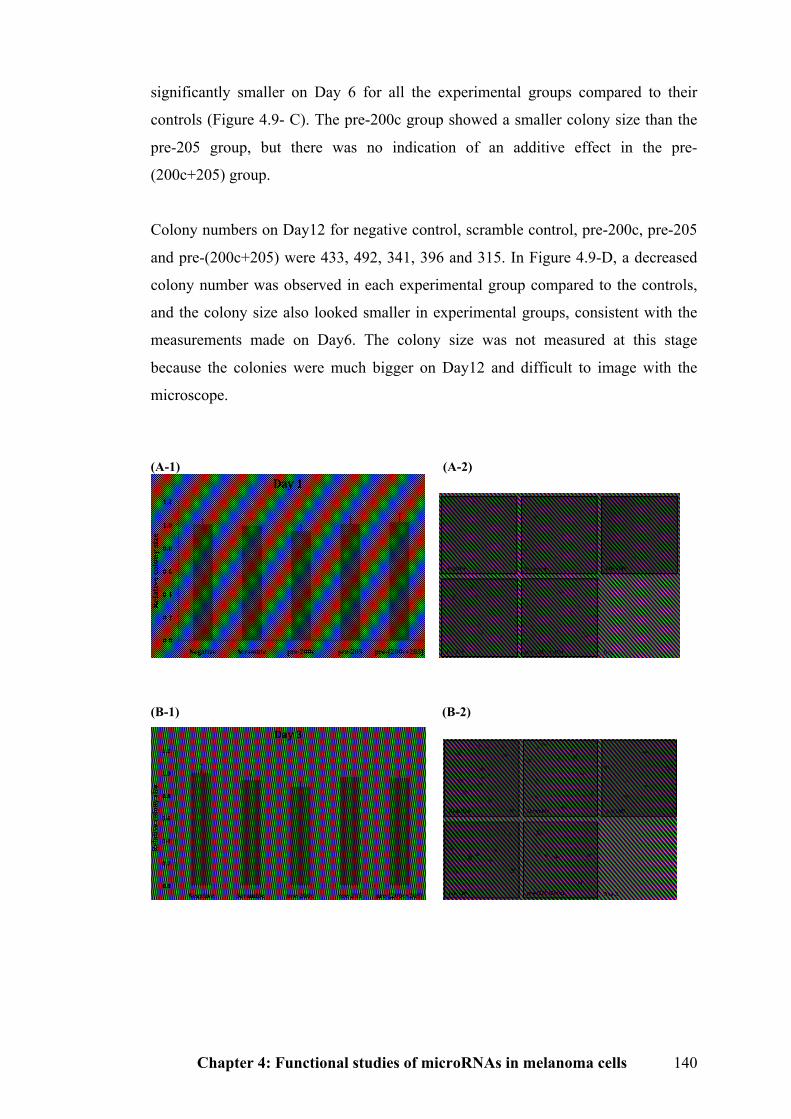
Chapter 4: Functional studies of microRNAs in melanoma cells 140
significantly smaller on Day 6 for all the experimental groups compared to their
controls (Figure 4.9- C). The pre-200c group showed a smaller colony size than the
pre-205 group, but there was no indication of an additive effect in the pre-
(200c+205) group.
Colony numbers on Day12 for negative control, scramble control, pre-200c, pre-205
and pre-(200c+205) were 433, 492, 341, 396 and 315. In Figure 4.9-D, a decreased
colony number was observed in each experimental group compared to the controls,
and the colony size also looked smaller in experimental groups, consistent with the
measurements made on Day6. The colony size was not measured at this stage
because the colonies were much bigger on Day12 and difficult to image with the
microscope.
(A-1) (A-2)
(B-1) (B-2)
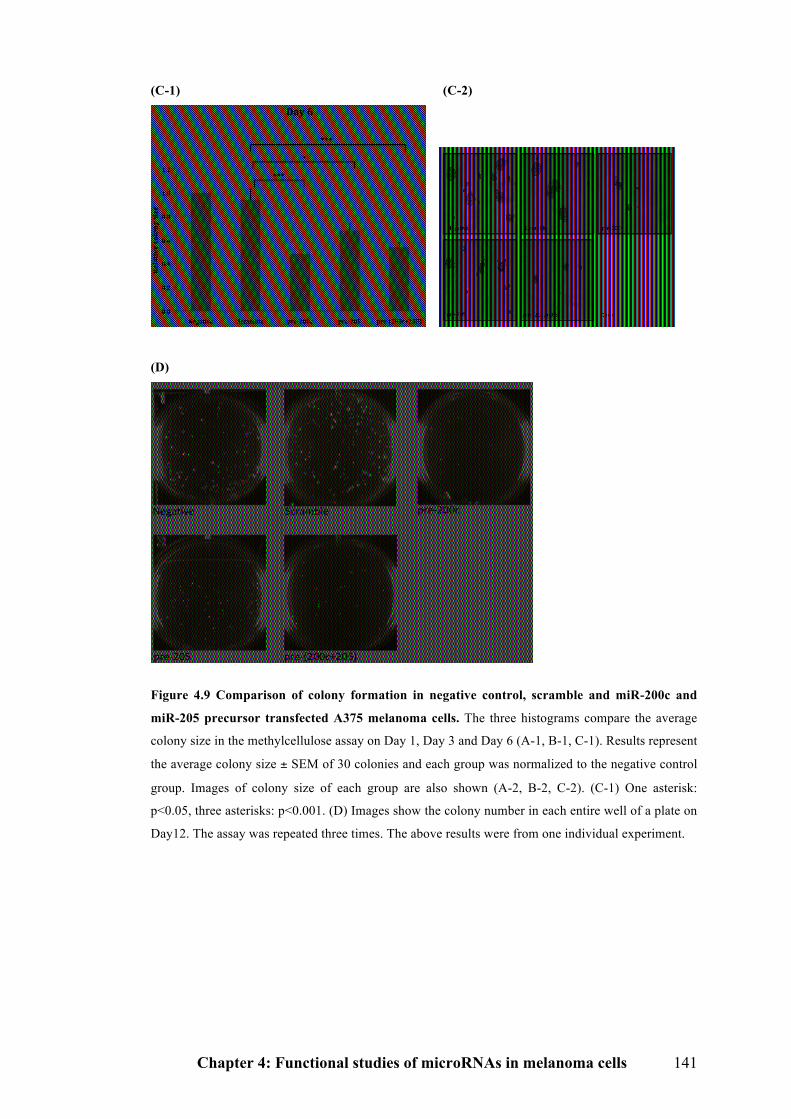
Chapter 4: Functional studies of microRNAs in melanoma cells 141
(C-1) (C-2)
(D)
Figure 4.9 Comparison of colony formation in negative control, scramble and miR-200c and
miR-205 precursor transfected A375 melanoma cells. The three histograms compare the average
colony size in the methylcellulose assay on Day 1, Day 3 and Day 6 (A-1, B-1, C-1). Results represent
the average colony size ± SEM of 30 colonies and each group was normalized to the negative control
group. Images of colony size of each group are also shown (A-2, B-2, C-2). (C-1) One asterisk:
p<0.05, three asterisks: p<0.001. (D) Images show the colony number in each entire well of a plate on
Day12. The assay was repeated three times. The above results were from one individual experiment.
Chapter 4: Functional studies of microRNAs in melanoma cells 142
4.2.4.6 Study of miR-200c and miR-205 target genes
ZEB1 and ZEB2 are predicted targets of both miR-200c and miR-205 and this has
been demonstrated experimentally in some epithelial cell cancers such as breast and
prostate cancer [399, 420]. On the Diana Lab webpage for miRNA target prediction,
ZEB2 ranks as the No.1 target of miR-200c (http://diana.cslab.ece.ntua.gr/microT/).
Moreover, as described in Section 4.1, E-cadherin is negatively regulated by ZEB2.
Therefore, mRNA and protein levels of ZEB2 and E-cadherin were detected using
qPCR and western blotting in transfected A375 melanoma cells with elevated levels
of miR-200c and miR-205. N-cadherin expression was also detected due to the
inverse correlation of E-cadherin and N-cadherin expression in the EMT process.
4.2.4.6.1 Validation experiment on qPCR assays for ZEB2, E-cadherin and N-cadherin mRNAs
As described in Chapter 2, when analyzing qPCR results using the ΔΔCt method,
validation experiments first need to be done to evaluate whether the amplification
efficiencies of target and reference are equal. For mRNA qPCR, beta-actin was used
as the internal control. The slopes of the relative efficiency plots between each
individual target mRNA and reference mRNA, beta-actin, were all below 0.1
(Figures are shown in Appendix 5), indicating that the ΔΔCt method was valid.
4.2.4.6.2 ZEB2, E-cadherin and N-cadherin mRNA levels changes
mRNA level changes of ZEB2, E-cadherin and N-cadherin were assayed daily in
A375 cells for a 3-day time course post-transfection. ZEB2 expression was
downregulated in the pre-200c group for all 3 days, and the reduction was significant
on Day1 (4.5-fold) and Day2 (2-fold) compared to the scramble control, indicating
that the inhibitory effect was reduced over the time course (Figure 4.10-A). The
expression level of ZEB2 was also reduced in the pre-205 group on Day1 but the
reduction was not significant (p=0.066) compared to the scramble control (Figure
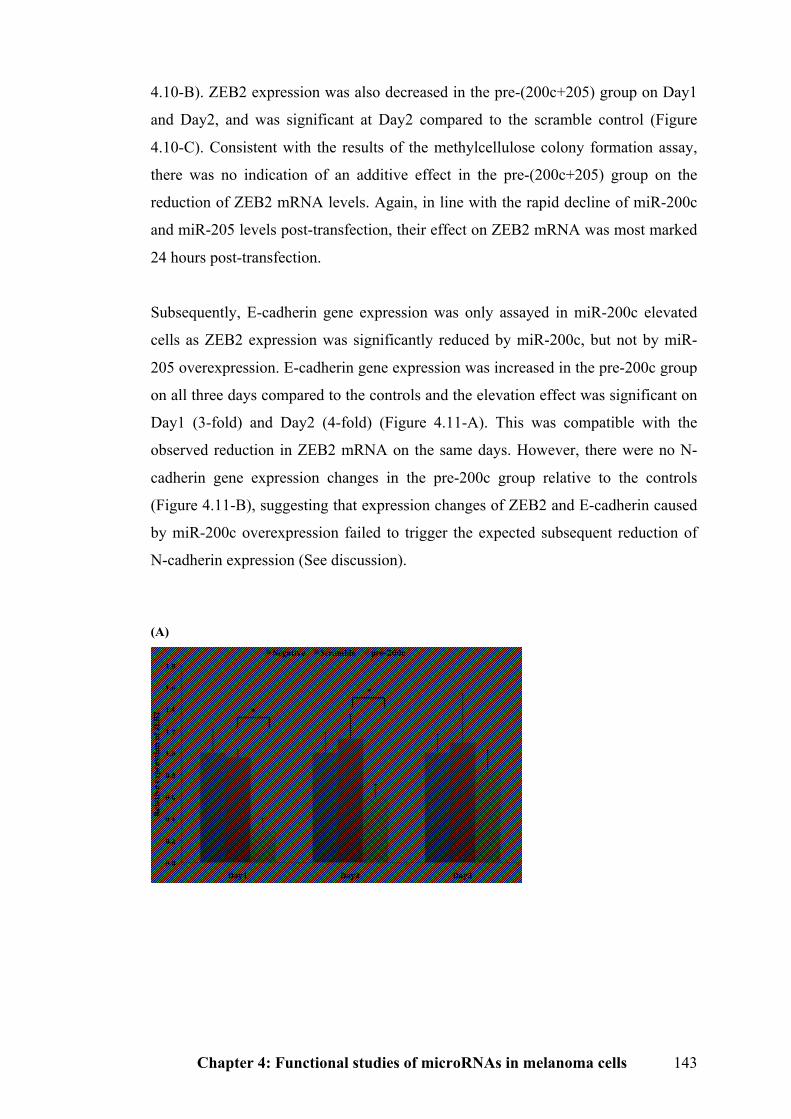
Chapter 4: Functional studies of microRNAs in melanoma cells 143
4.10-B). ZEB2 expression was also decreased in the pre-(200c+205) group on Day1
and Day2, and was significant at Day2 compared to the scramble control (Figure
4.10-C). Consistent with the results of the methylcellulose colony formation assay,
there was no indication of an additive effect in the pre-(200c+205) group on the
reduction of ZEB2 mRNA levels. Again, in line with the rapid decline of miR-200c
and miR-205 levels post-transfection, their effect on ZEB2 mRNA was most marked
24 hours post-transfection.
Subsequently, E-cadherin gene expression was only assayed in miR-200c elevated
cells as ZEB2 expression was significantly reduced by miR-200c, but not by miR-
205 overexpression. E-cadherin gene expression was increased in the pre-200c group
on all three days compared to the controls and the elevation effect was significant on
Day1 (3-fold) and Day2 (4-fold) (Figure 4.11-A). This was compatible with the
observed reduction in ZEB2 mRNA on the same days. However, there were no N-
cadherin gene expression changes in the pre-200c group relative to the controls
(Figure 4.11-B), suggesting that expression changes of ZEB2 and E-cadherin caused
by miR-200c overexpression failed to trigger the expected subsequent reduction of
N-cadherin expression (See discussion).
(A)
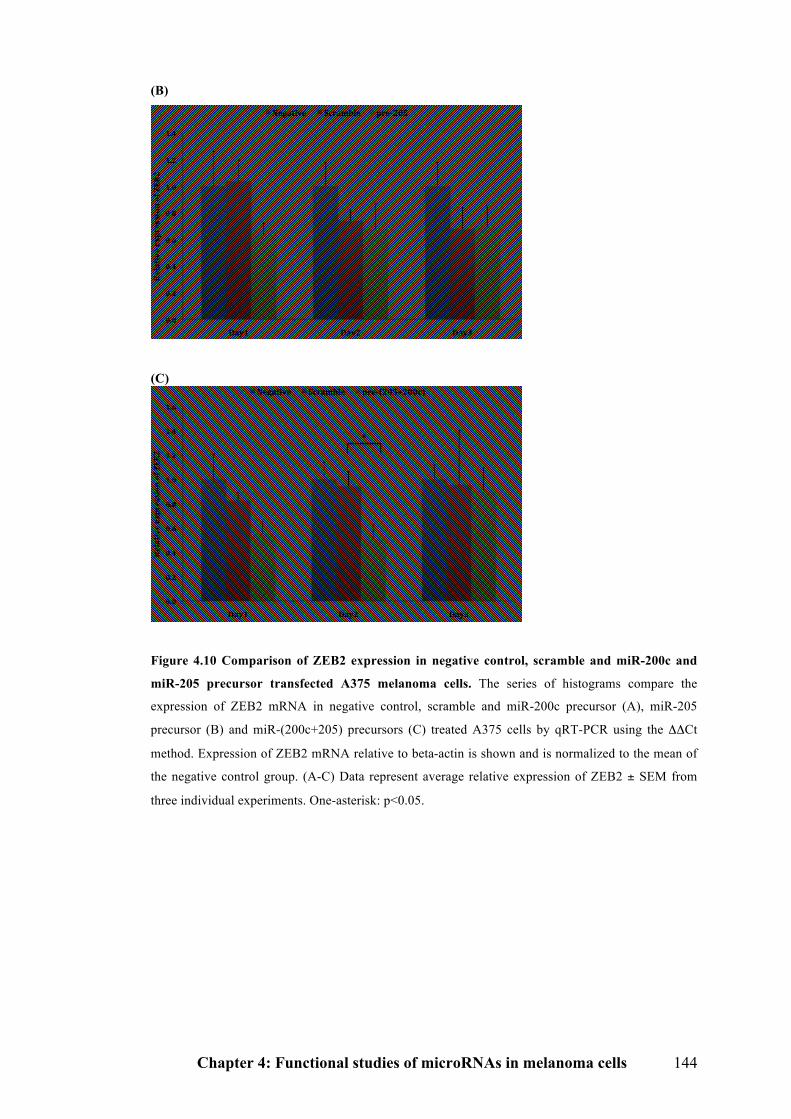
Chapter 4: Functional studies of microRNAs in melanoma cells 144
(B)
(C)
Figure 4.10 Comparison of ZEB2 expression in negative control, scramble and miR-200c and
miR-205 precursor transfected A375 melanoma cells. The series of histograms compare the
expression of ZEB2 mRNA in negative control, scramble and miR-200c precursor (A), miR-205
precursor (B) and miR-(200c+205) precursors (C) treated A375 cells by qRT-PCR using the ΔΔCt
method. Expression of ZEB2 mRNA relative to beta-actin is shown and is normalized to the mean of
the negative control group. (A-C) Data represent average relative expression of ZEB2 ± SEM from
three individual experiments. One-asterisk: p<0.05.
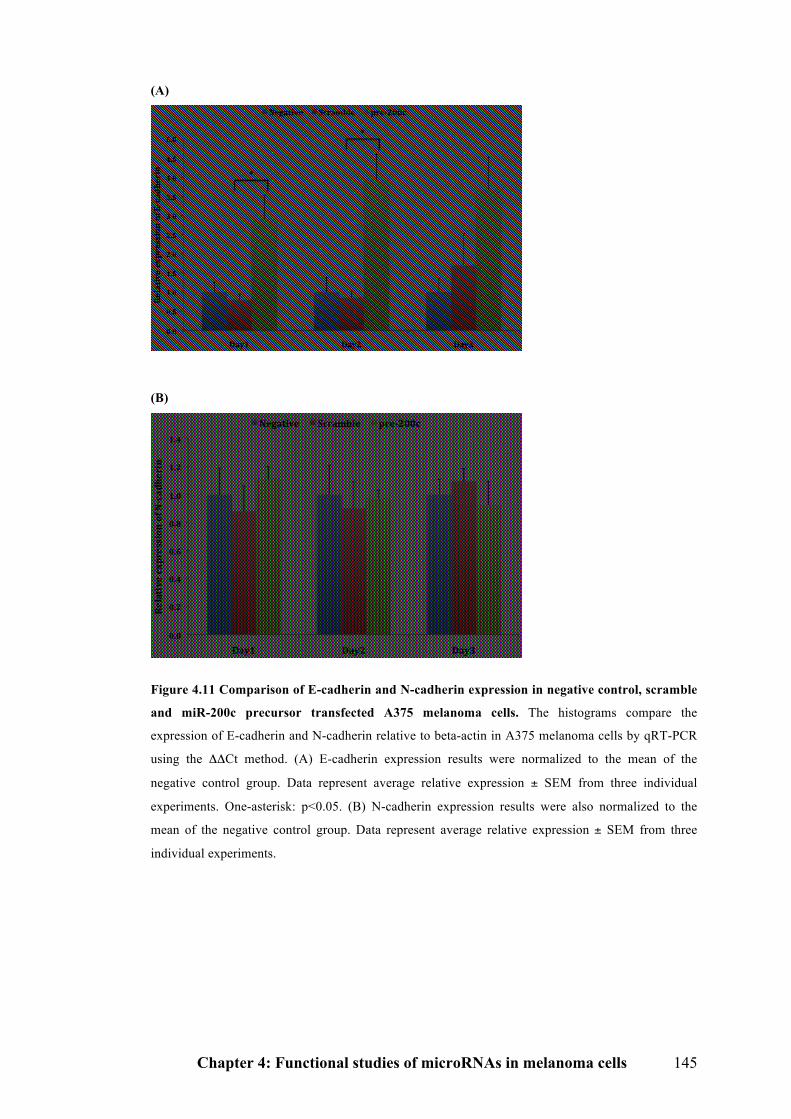
Chapter 4: Functional studies of microRNAs in melanoma cells 145
(A)
(B)
Figure 4.11 Comparison of E-cadherin and N-cadherin expression in negative control, scramble
and miR-200c precursor transfected A375 melanoma cells. The histograms compare the
expression of E-cadherin and N-cadherin relative to beta-actin in A375 melanoma cells by qRT-PCR
using the ΔΔCt method. (A) E-cadherin expression results were normalized to the mean of the
negative control group. Data represent average relative expression ± SEM from three individual
experiments. One-asterisk: p<0.05. (B) N-cadherin expression results were also normalized to the
mean of the negative control group. Data represent average relative expression ± SEM from three
individual experiments.
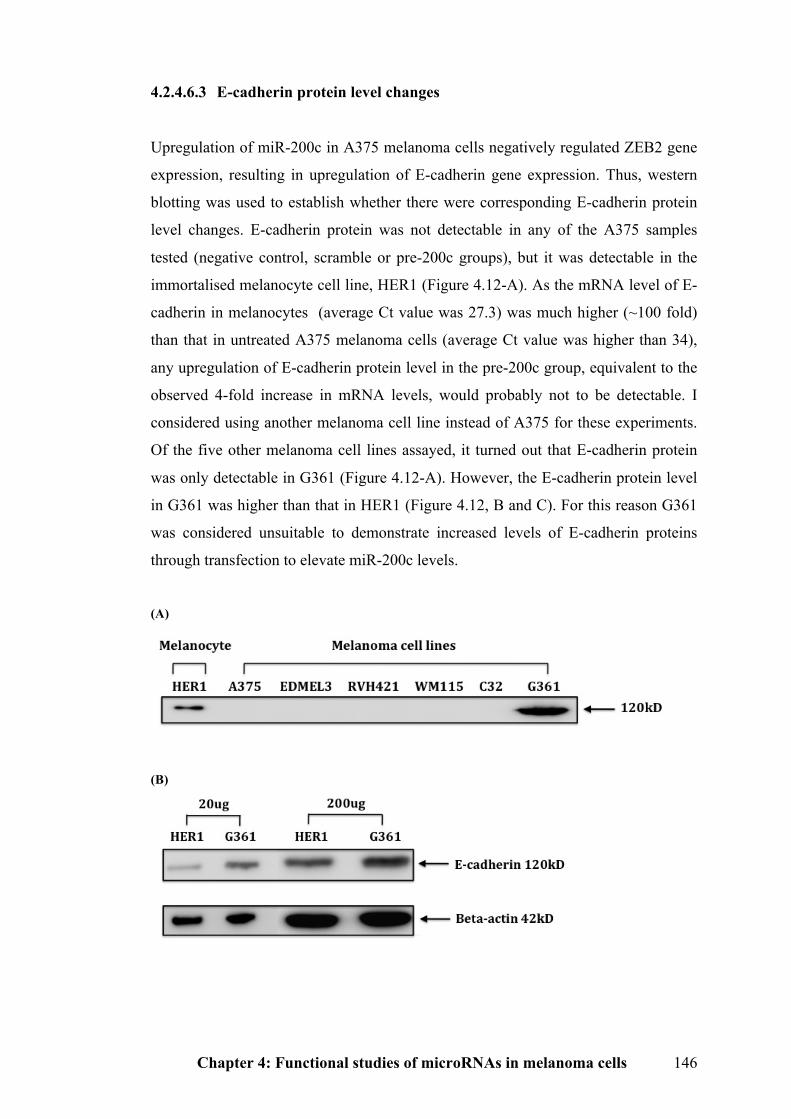
Chapter 4: Functional studies of microRNAs in melanoma cells 146
4.2.4.6.3 E-cadherin protein level changes
Upregulation of miR-200c in A375 melanoma cells negatively regulated ZEB2 gene
expression, resulting in upregulation of E-cadherin gene expression. Thus, western
blotting was used to establish whether there were corresponding E-cadherin protein
level changes. E-cadherin protein was not detectable in any of the A375 samples
tested (negative control, scramble or pre-200c groups), but it was detectable in the
immortalised melanocyte cell line, HER1 (Figure 4.12-A). As the mRNA level of E-
cadherin in melanocytes (average Ct value was 27.3) was much higher (~100 fold)
than that in untreated A375 melanoma cells (average Ct value was higher than 34),
any upregulation of E-cadherin protein level in the pre-200c group, equivalent to the
observed 4-fold increase in mRNA levels, would probably not to be detectable. I
considered using another melanoma cell line instead of A375 for these experiments.
Of the five other melanoma cell lines assayed, it turned out that E-cadherin protein
was only detectable in G361 (Figure 4.12-A). However, the E-cadherin protein level
in G361 was higher than that in HER1 (Figure 4.12, B and C). For this reason G361
was considered unsuitable to demonstrate increased levels of E-cadherin proteins
through transfection to elevate miR-200c levels.
(A)
(B)
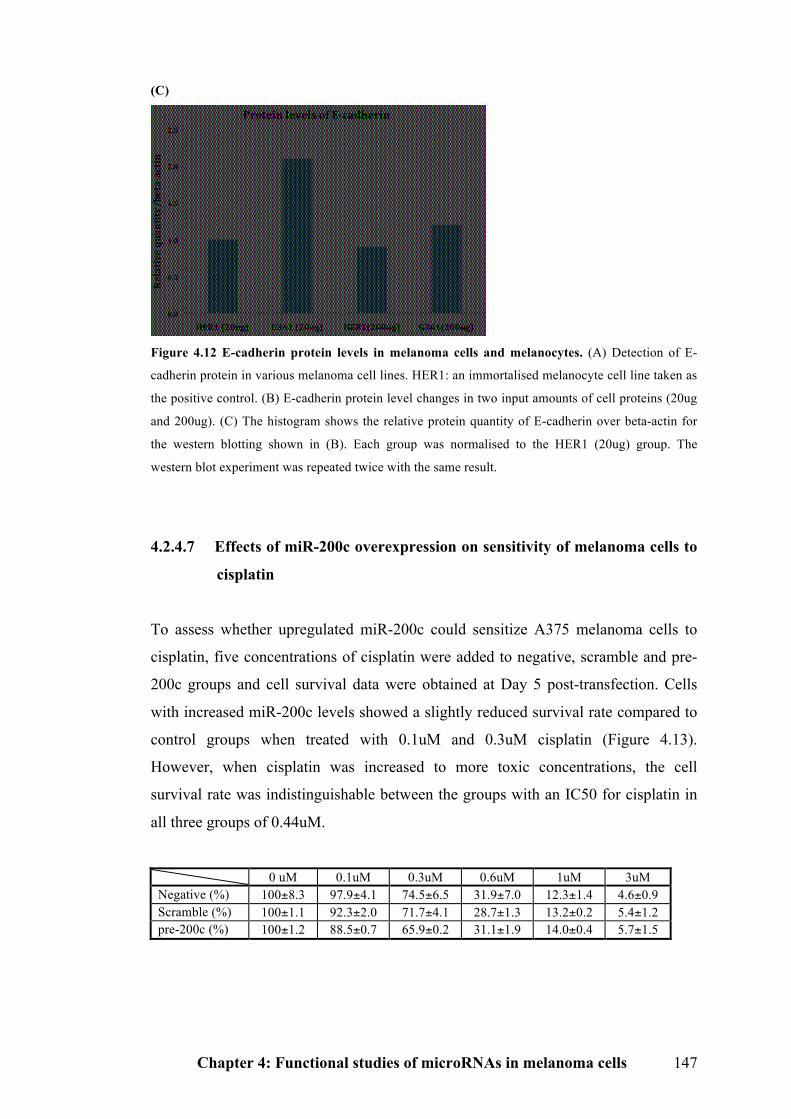
Chapter 4: Functional studies of microRNAs in melanoma cells 147
(C)
Figure 4.12 E-cadherin protein levels in melanoma cells and melanocytes. (A) Detection of E-
cadherin protein in various melanoma cell lines. HER1: an immortalised melanocyte cell line taken as
the positive control. (B) E-cadherin protein level changes in two input amounts of cell proteins (20ug
and 200ug). (C) The histogram shows the relative protein quantity of E-cadherin over beta-actin for
the western blotting shown in (B). Each group was normalised to the HER1 (20ug) group. The
western blot experiment was repeated twice with the same result.
4.2.4.7 Effects of miR-200c overexpression on sensitivity of melanoma cells to
cisplatin
To assess whether upregulated miR-200c could sensitize A375 melanoma cells to
cisplatin, five concentrations of cisplatin were added to negative, scramble and pre-
200c groups and cell survival data were obtained at Day 5 post-transfection. Cells
with increased miR-200c levels showed a slightly reduced survival rate compared to
control groups when treated with 0.1uM and 0.3uM cisplatin (Figure 4.13).
However, when cisplatin was increased to more toxic concentrations, the cell
survival rate was indistinguishable between the groups with an IC50 for cisplatin in
all three groups of 0.44uM.
0 uM 0.1uM 0.3uM 0.6uM 1uM 3uM Negative (%) 100±8.3 97.9±4.1 74.5±6.5 31.9±7.0 12.3±1.4 4.6±0.9 Scramble (%) 100±1.1 92.3±2.0 71.7±4.1 28.7±1.3 13.2±0.2 5.4±1.2 pre-200c (%) 100±1.2 88.5±0.7 65.9±0.2 31.1±1.9 14.0±0.4 5.7±1.5
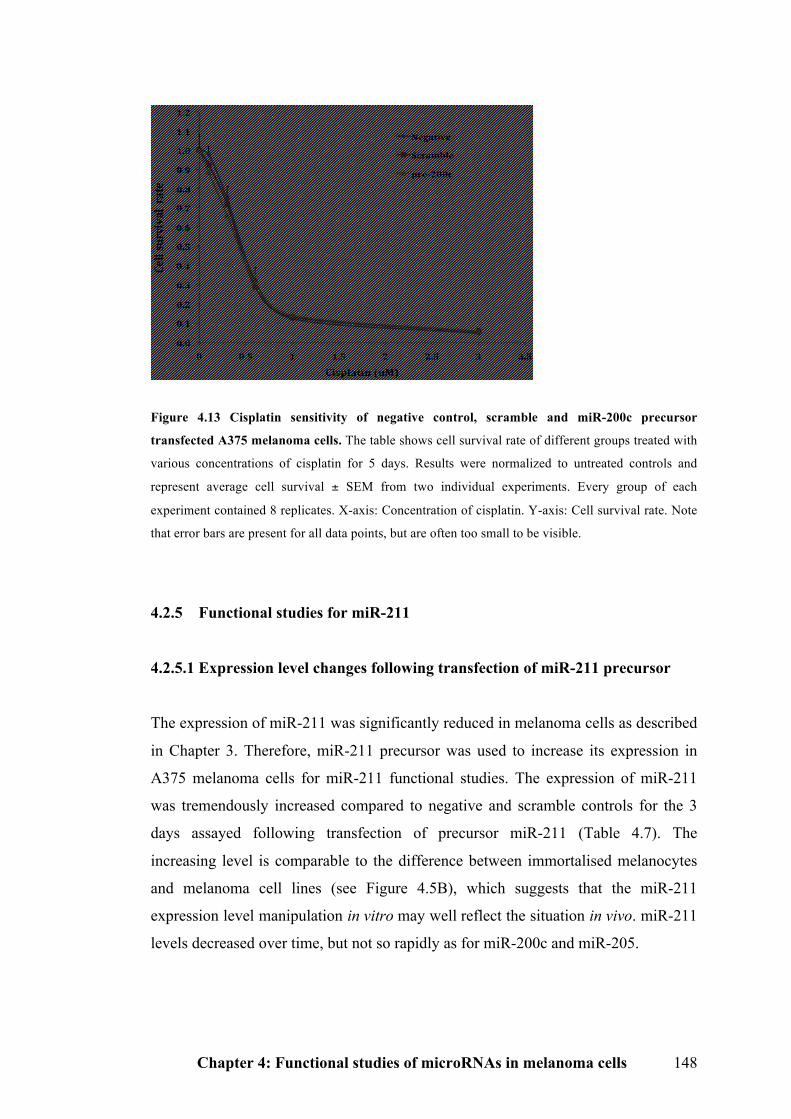
Chapter 4: Functional studies of microRNAs in melanoma cells 148
Figure 4.13 Cisplatin sensitivity of negative control, scramble and miR-200c precursor
transfected A375 melanoma cells. The table shows cell survival rate of different groups treated with
various concentrations of cisplatin for 5 days. Results were normalized to untreated controls and
represent average cell survival ± SEM from two individual experiments. Every group of each
experiment contained 8 replicates. X-axis: Concentration of cisplatin. Y-axis: Cell survival rate. Note
that error bars are present for all data points, but are often too small to be visible.
4.2.5 Functional studies for miR-211
4.2.5.1 Expression level changes following transfection of miR-211 precursor
The expression of miR-211 was significantly reduced in melanoma cells as described
in Chapter 3. Therefore, miR-211 precursor was used to increase its expression in
A375 melanoma cells for miR-211 functional studies. The expression of miR-211
was tremendously increased compared to negative and scramble controls for the 3
days assayed following transfection of precursor miR-211 (Table 4.7). The
increasing level is comparable to the difference between immortalised melanocytes
and melanoma cell lines (see Figure 4.5B), which suggests that the miR-211
expression level manipulation in vitro may well reflect the situation in vivo. miR-211
levels decreased over time, but not so rapidly as for miR-200c and miR-205.
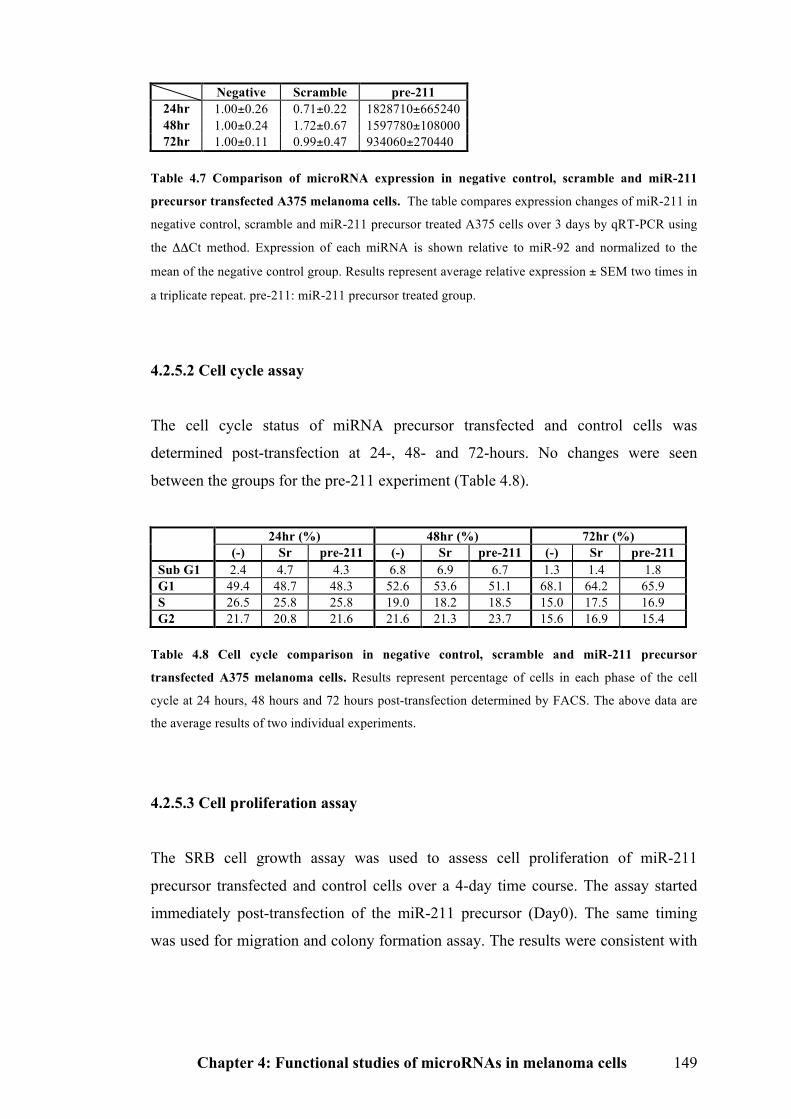
Chapter 4: Functional studies of microRNAs in melanoma cells 149
Negative Scramble pre-211 24hr 1.00±0.26 0.71±0.22 1828710±665240 48hr 1.00±0.24 1.72±0.67 1597780±108000 72hr 1.00±0.11 0.99±0.47 934060±270440
Table 4.7 Comparison of microRNA expression in negative control, scramble and miR-211
precursor transfected A375 melanoma cells. The table compares expression changes of miR-211 in
negative control, scramble and miR-211 precursor treated A375 cells over 3 days by qRT-PCR using
the ΔΔCt method. Expression of each miRNA is shown relative to miR-92 and normalized to the
mean of the negative control group. Results represent average relative expression ± SEM two times in
a triplicate repeat. pre-211: miR-211 precursor treated group.
4.2.5.2 Cell cycle assay
The cell cycle status of miRNA precursor transfected and control cells was
determined post-transfection at 24-, 48- and 72-hours. No changes were seen
between the groups for the pre-211 experiment (Table 4.8).
Table 4.8 Cell cycle comparison in negative control, scramble and miR-211 precursor
transfected A375 melanoma cells. Results represent percentage of cells in each phase of the cell
cycle at 24 hours, 48 hours and 72 hours post-transfection determined by FACS. The above data are
the average results of two individual experiments.
4.2.5.3 Cell proliferation assay
The SRB cell growth assay was used to assess cell proliferation of miR-211
precursor transfected and control cells over a 4-day time course. The assay started
immediately post-transfection of the miR-211 precursor (Day0). The same timing
was used for migration and colony formation assay. The results were consistent with
24hr (%) 48hr (%) 72hr (%) (-) Sr pre-211 (-) Sr pre-211 (-) Sr pre-211
Sub G1 2.4 4.7 4.3 6.8 6.9 6.7 1.3 1.4 1.8 G1 49.4 48.7 48.3 52.6 53.6 51.1 68.1 64.2 65.9 S 26.5 25.8 25.8 19.0 18.2 18.5 15.0 17.5 16.9 G2 21.7 20.8 21.6 21.6 21.3 23.7 15.6 16.9 15.4
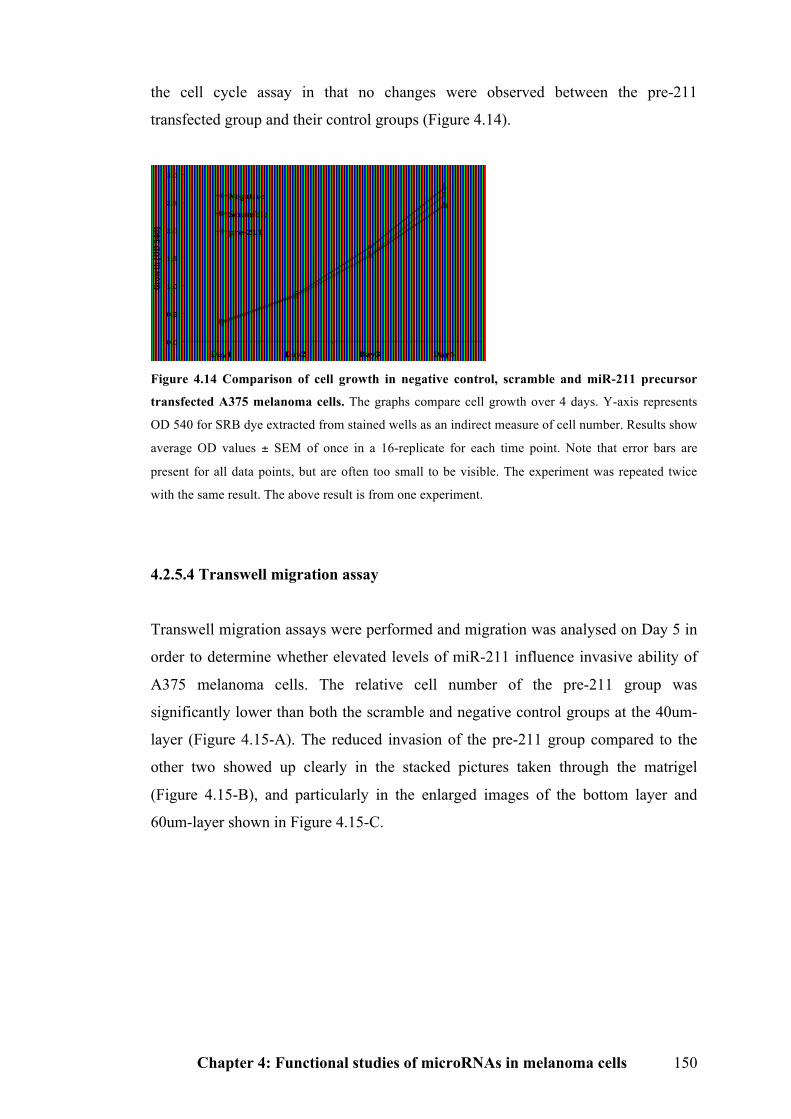
Chapter 4: Functional studies of microRNAs in melanoma cells 150
the cell cycle assay in that no changes were observed between the pre-211
transfected group and their control groups (Figure 4.14).
Figure 4.14 Comparison of cell growth in negative control, scramble and miR-211 precursor
transfected A375 melanoma cells. The graphs compare cell growth over 4 days. Y-axis represents
OD 540 for SRB dye extracted from stained wells as an indirect measure of cell number. Results show
average OD values ± SEM of once in a 16-replicate for each time point. Note that error bars are
present for all data points, but are often too small to be visible. The experiment was repeated twice
with the same result. The above result is from one experiment.
4.2.5.4 Transwell migration assay
Transwell migration assays were performed and migration was analysed on Day 5 in
order to determine whether elevated levels of miR-211 influence invasive ability of
A375 melanoma cells. The relative cell number of the pre-211 group was
significantly lower than both the scramble and negative control groups at the 40um-
layer (Figure 4.15-A). The reduced invasion of the pre-211 group compared to the
other two showed up clearly in the stacked pictures taken through the matrigel
(Figure 4.15-B), and particularly in the enlarged images of the bottom layer and
60um-layer shown in Figure 4.15-C.
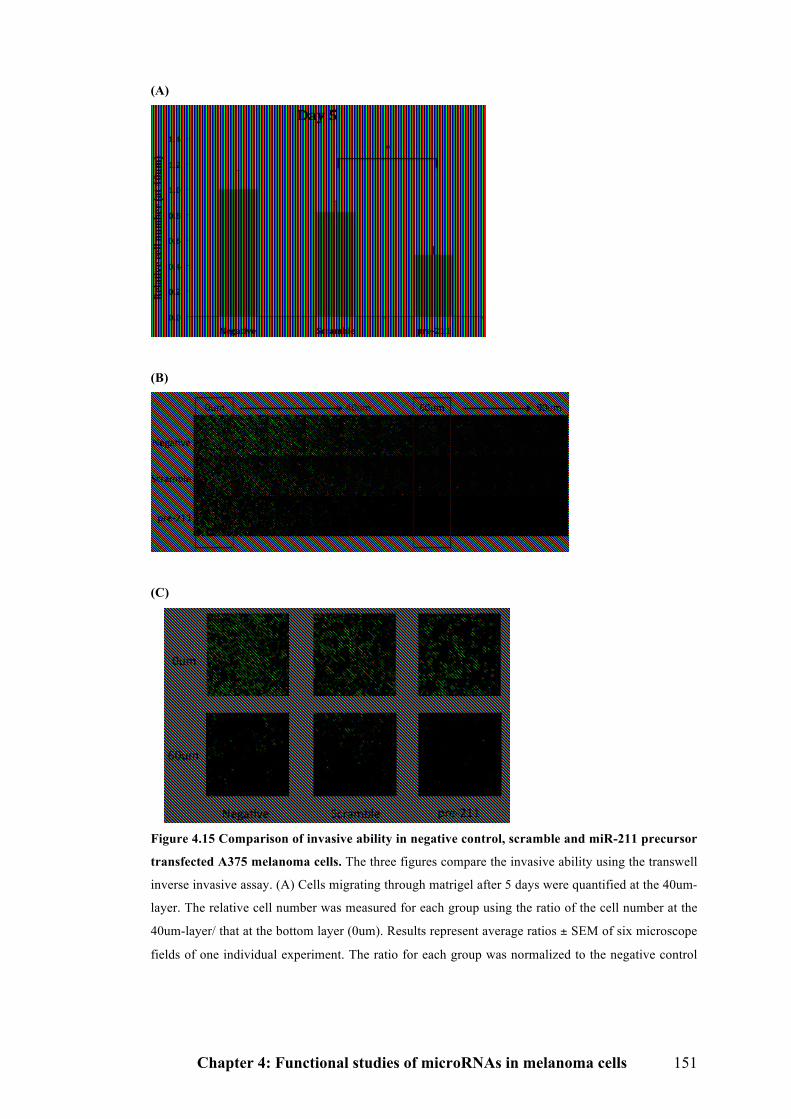
Chapter 4: Functional studies of microRNAs in melanoma cells 151
(A)
(B)
(C)
Figure 4.15 Comparison of invasive ability in negative control, scramble and miR-211 precursor
transfected A375 melanoma cells. The three figures compare the invasive ability using the transwell
inverse invasive assay. (A) Cells migrating through matrigel after 5 days were quantified at the 40um-
layer. The relative cell number was measured for each group using the ratio of the cell number at the
40um-layer/ that at the bottom layer (0um). Results represent average ratios ± SEM of six microscope
fields of one individual experiment. The ratio for each group was normalized to the negative control
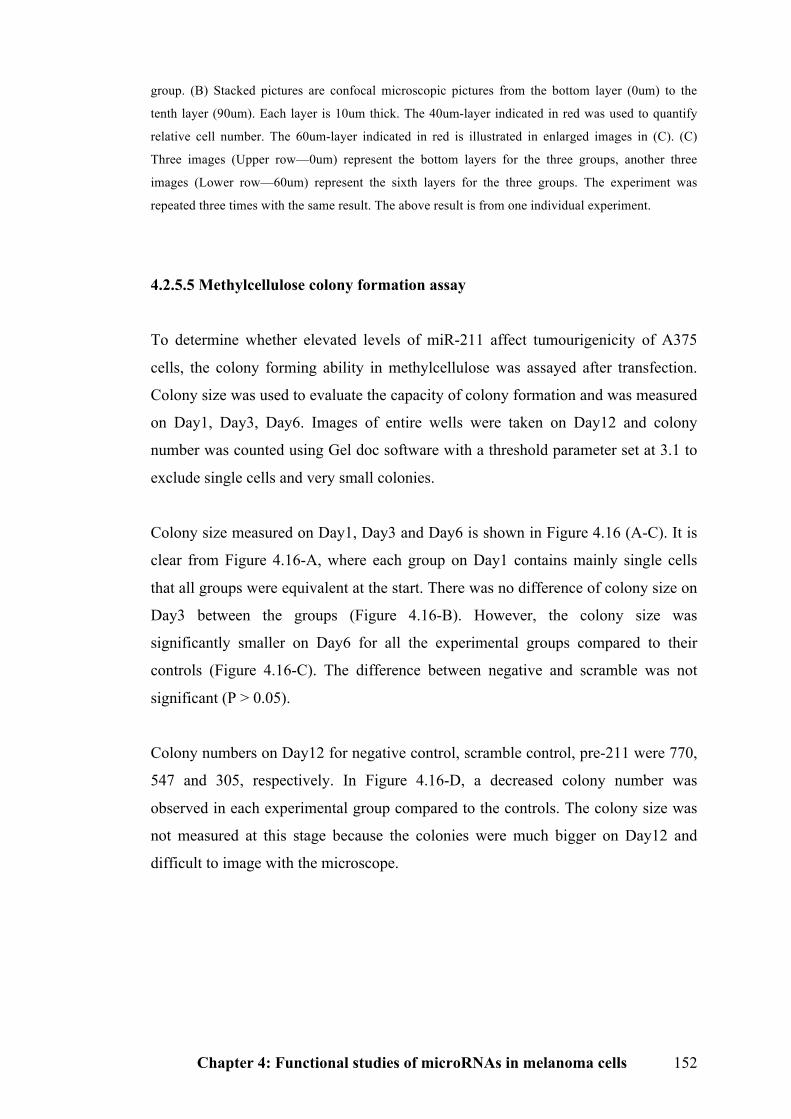
Chapter 4: Functional studies of microRNAs in melanoma cells 152
group. (B) Stacked pictures are confocal microscopic pictures from the bottom layer (0um) to the
tenth layer (90um). Each layer is 10um thick. The 40um-layer indicated in red was used to quantify
relative cell number. The 60um-layer indicated in red is illustrated in enlarged images in (C). (C)
Three images (Upper row—0um) represent the bottom layers for the three groups, another three
images (Lower row—60um) represent the sixth layers for the three groups. The experiment was
repeated three times with the same result. The above result is from one individual experiment.
4.2.5.5 Methylcellulose colony formation assay
To determine whether elevated levels of miR-211 affect tumourigenicity of A375
cells, the colony forming ability in methylcellulose was assayed after transfection.
Colony size was used to evaluate the capacity of colony formation and was measured
on Day1, Day3, Day6. Images of entire wells were taken on Day12 and colony
number was counted using Gel doc software with a threshold parameter set at 3.1 to
exclude single cells and very small colonies.
Colony size measured on Day1, Day3 and Day6 is shown in Figure 4.16 (A-C). It is
clear from Figure 4.16-A, where each group on Day1 contains mainly single cells
that all groups were equivalent at the start. There was no difference of colony size on
Day3 between the groups (Figure 4.16-B). However, the colony size was
significantly smaller on Day6 for all the experimental groups compared to their
controls (Figure 4.16-C). The difference between negative and scramble was not
significant (P > 0.05).
Colony numbers on Day12 for negative control, scramble control, pre-211 were 770,
547 and 305, respectively. In Figure 4.16-D, a decreased colony number was
observed in each experimental group compared to the controls. The colony size was
not measured at this stage because the colonies were much bigger on Day12 and
difficult to image with the microscope.
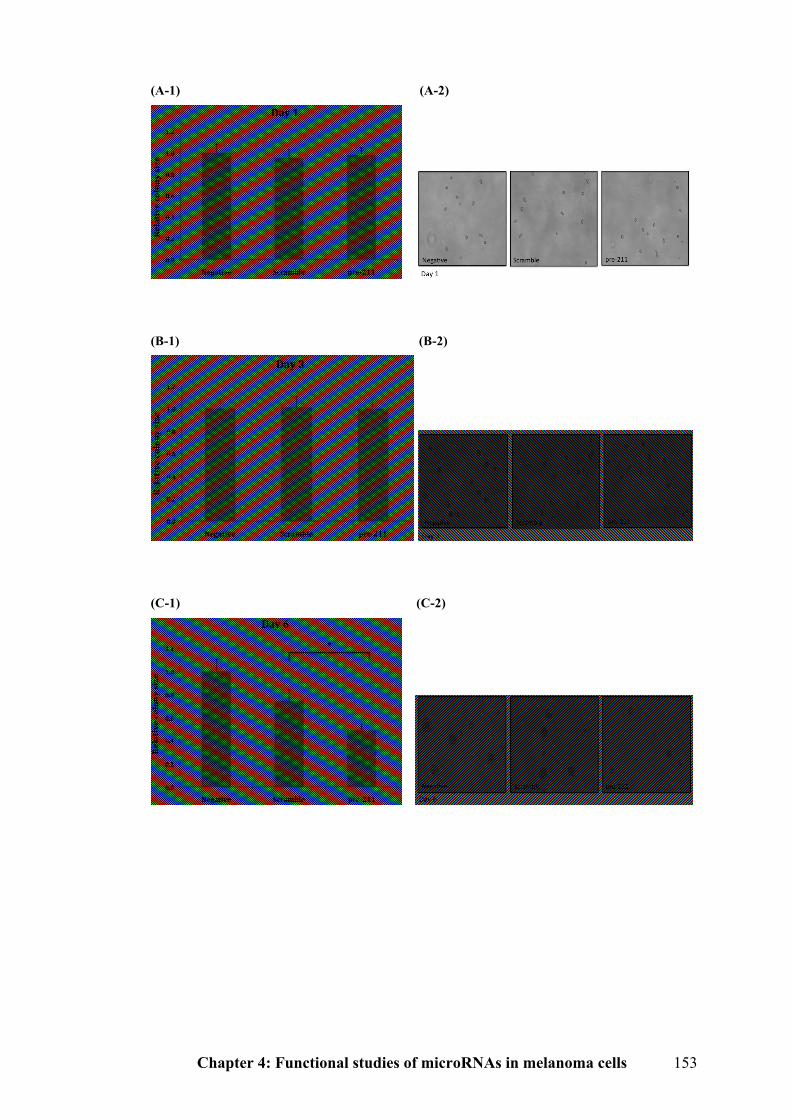
Chapter 4: Functional studies of microRNAs in melanoma cells 153
(A-1) (A-2)
(B-1) (B-2)
(C-1) (C-2)
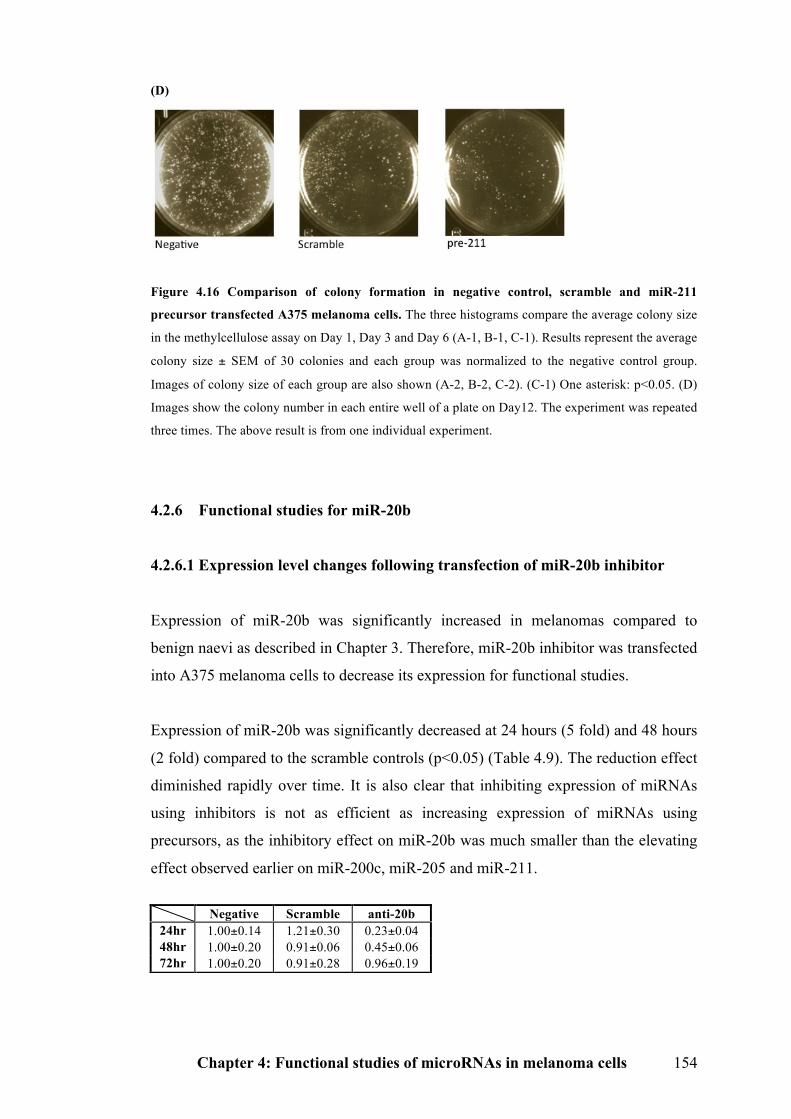
Chapter 4: Functional studies of microRNAs in melanoma cells 154
(D)
Figure 4.16 Comparison of colony formation in negative control, scramble and miR-211
precursor transfected A375 melanoma cells. The three histograms compare the average colony size
in the methylcellulose assay on Day 1, Day 3 and Day 6 (A-1, B-1, C-1). Results represent the average
colony size ± SEM of 30 colonies and each group was normalized to the negative control group.
Images of colony size of each group are also shown (A-2, B-2, C-2). (C-1) One asterisk: p<0.05. (D)
Images show the colony number in each entire well of a plate on Day12. The experiment was repeated
three times. The above result is from one individual experiment.
4.2.6 Functional studies for miR-20b
4.2.6.1 Expression level changes following transfection of miR-20b inhibitor
Expression of miR-20b was significantly increased in melanomas compared to
benign naevi as described in Chapter 3. Therefore, miR-20b inhibitor was transfected
into A375 melanoma cells to decrease its expression for functional studies.
Expression of miR-20b was significantly decreased at 24 hours (5 fold) and 48 hours
(2 fold) compared to the scramble controls (p<0.05) (Table 4.9). The reduction effect
diminished rapidly over time. It is also clear that inhibiting expression of miRNAs
using inhibitors is not as efficient as increasing expression of miRNAs using
precursors, as the inhibitory effect on miR-20b was much smaller than the elevating
effect observed earlier on miR-200c, miR-205 and miR-211.
Negative Scramble anti-20b 24hr 1.00±0.14 1.21±0.30 0.23±0.04 48hr 1.00±0.20 0.91±0.06 0.45±0.06 72hr 1.00±0.20 0.91±0.28 0.96±0.19
Chapter 4: Functional studies of microRNAs in melanoma cells 155
Table 4.9 Comparison of microRNA expression in negative control, scramble and miR-20b
inhibitor transfected A375 melanoma cells. The table compares miR-20b expression changes in
negative control, scramble and miR-20b inhibitor treated A375 cells by qRT-PCR using the ΔΔCt
method. Expression of miR-20b relative to miR-92 is shown and is normalized to the mean of the
negative control group. Results represent average relative expression ± SEM three times in a triplicate
repeat. Anti-20b: miR-20b inhibitor treated group.
4.2.6.2 Cell cycle assay
The cell cycle status of miRNA inhibitor transfected and control cells was
determined post-transfection at 24-, 48- and 72-hours. No changes were seen
between the groups for the anti-20b experiment (Table 4.10).
24hr (%) 48hr (%) 72hr (%) (-) Sr anti-20b (-) Sr anti-20b (-) Sr anti-20b
Sub G1 3.3 4.0 3.9 3.2 2.9 3.2 2.2 1.9 2.1 G1 52.2 53.7 53.5 59.3 59.8 59.4 59.4 58.3 59.2 S 24.3 23.8 23.4 21.4 20.7 20.0 20.4 21.0 20.4 G2 20.2 18.5 19.2 16.1 16.6 17.4 18.0 18.8 18.3
Table 4.10 Cell cycle comparison in negative control, scramble and miR-20b inhibitor
transfected A375 melanoma cells. Results represent percentage of cells in each phase of the cell
cycle at 24 hours, 48 hours and 72 hours post-transfection determined by FACS. The above data are
the average results of two individual experiments.
4.2.6.3 Cell proliferation assay
The SRB cell growth assay was used to assess cell proliferation of miR-20b inhibitor
transfected and control cells over a 4-day time course. The assay started immediately
post-transfection of the miR-20b inhibitor (Day0). The same timing was also used for
the migration and colony formation assays. The results were consistent with the cell
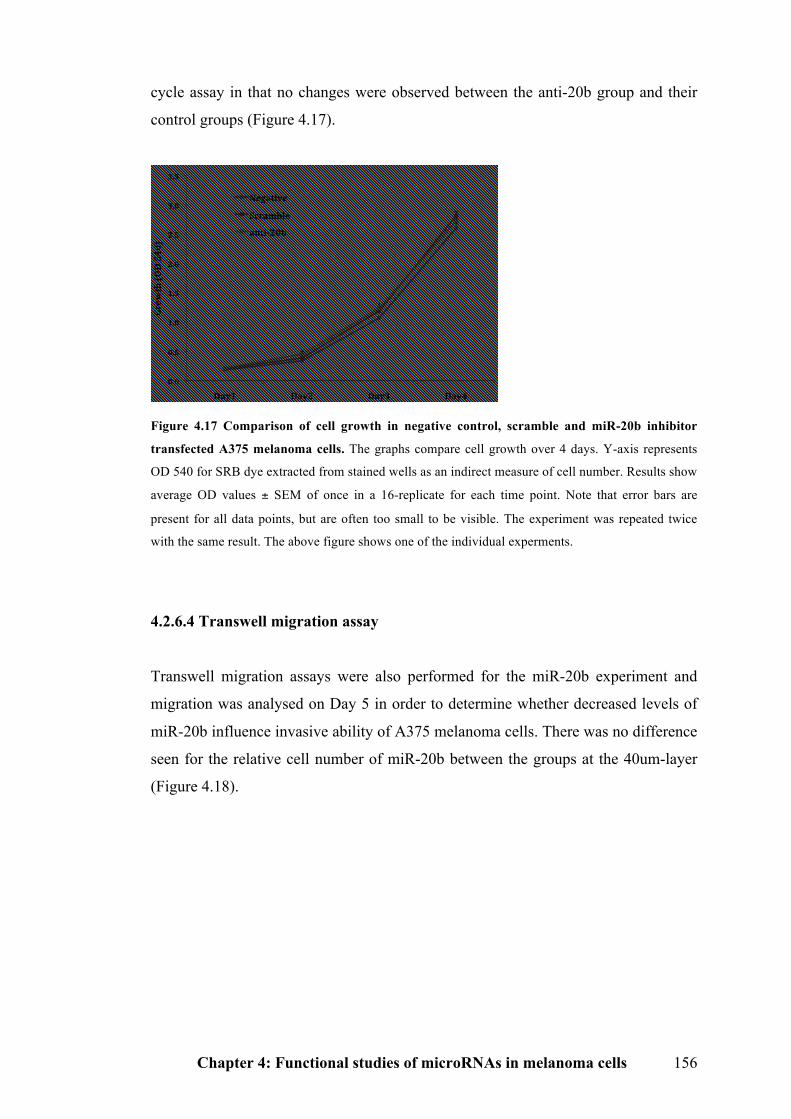
Chapter 4: Functional studies of microRNAs in melanoma cells 156
cycle assay in that no changes were observed between the anti-20b group and their
control groups (Figure 4.17).
Figure 4.17 Comparison of cell growth in negative control, scramble and miR-20b inhibitor
transfected A375 melanoma cells. The graphs compare cell growth over 4 days. Y-axis represents
OD 540 for SRB dye extracted from stained wells as an indirect measure of cell number. Results show
average OD values ± SEM of once in a 16-replicate for each time point. Note that error bars are
present for all data points, but are often too small to be visible. The experiment was repeated twice
with the same result. The above figure shows one of the individual experments.
4.2.6.4 Transwell migration assay
Transwell migration assays were also performed for the miR-20b experiment and
migration was analysed on Day 5 in order to determine whether decreased levels of
miR-20b influence invasive ability of A375 melanoma cells. There was no difference
seen for the relative cell number of miR-20b between the groups at the 40um-layer
(Figure 4.18).
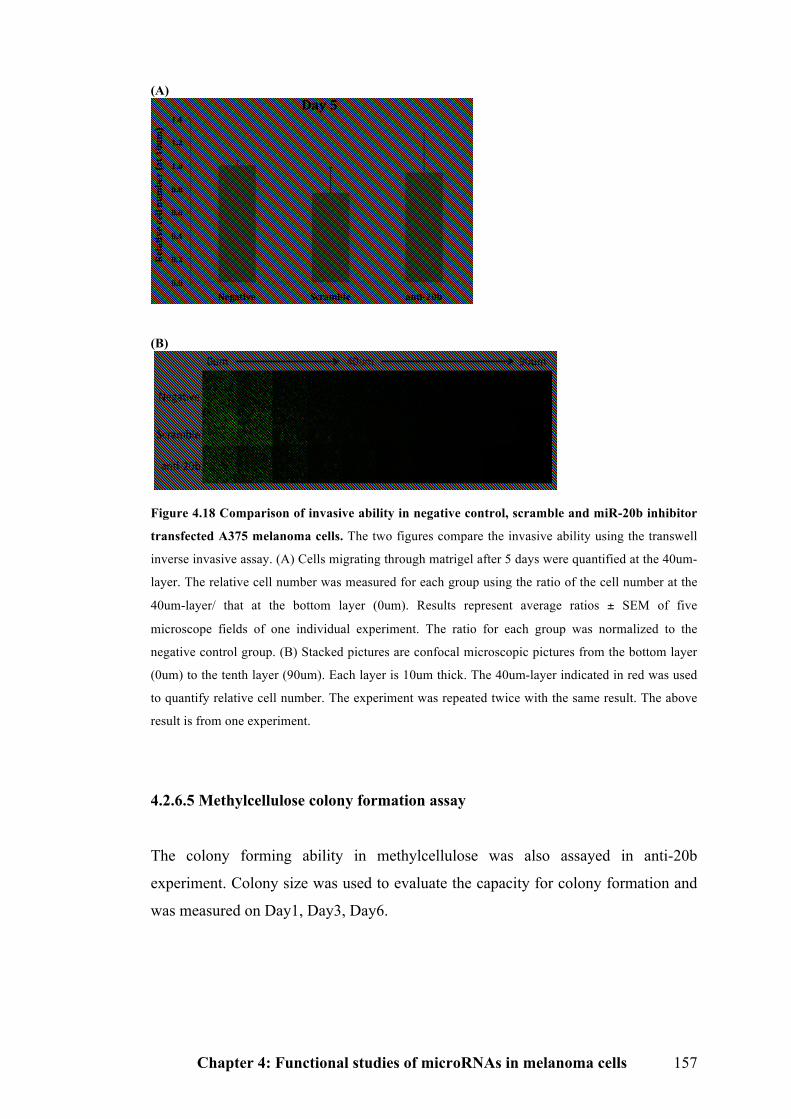
Chapter 4: Functional studies of microRNAs in melanoma cells 157
(A)
(B)
Figure 4.18 Comparison of invasive ability in negative control, scramble and miR-20b inhibitor
transfected A375 melanoma cells. The two figures compare the invasive ability using the transwell
inverse invasive assay. (A) Cells migrating through matrigel after 5 days were quantified at the 40um-
layer. The relative cell number was measured for each group using the ratio of the cell number at the
40um-layer/ that at the bottom layer (0um). Results represent average ratios ± SEM of five
microscope fields of one individual experiment. The ratio for each group was normalized to the
negative control group. (B) Stacked pictures are confocal microscopic pictures from the bottom layer
(0um) to the tenth layer (90um). Each layer is 10um thick. The 40um-layer indicated in red was used
to quantify relative cell number. The experiment was repeated twice with the same result. The above
result is from one experiment.
4.2.6.5 Methylcellulose colony formation assay
The colony forming ability in methylcellulose was also assayed in anti-20b
experiment. Colony size was used to evaluate the capacity for colony formation and
was measured on Day1, Day3, Day6.
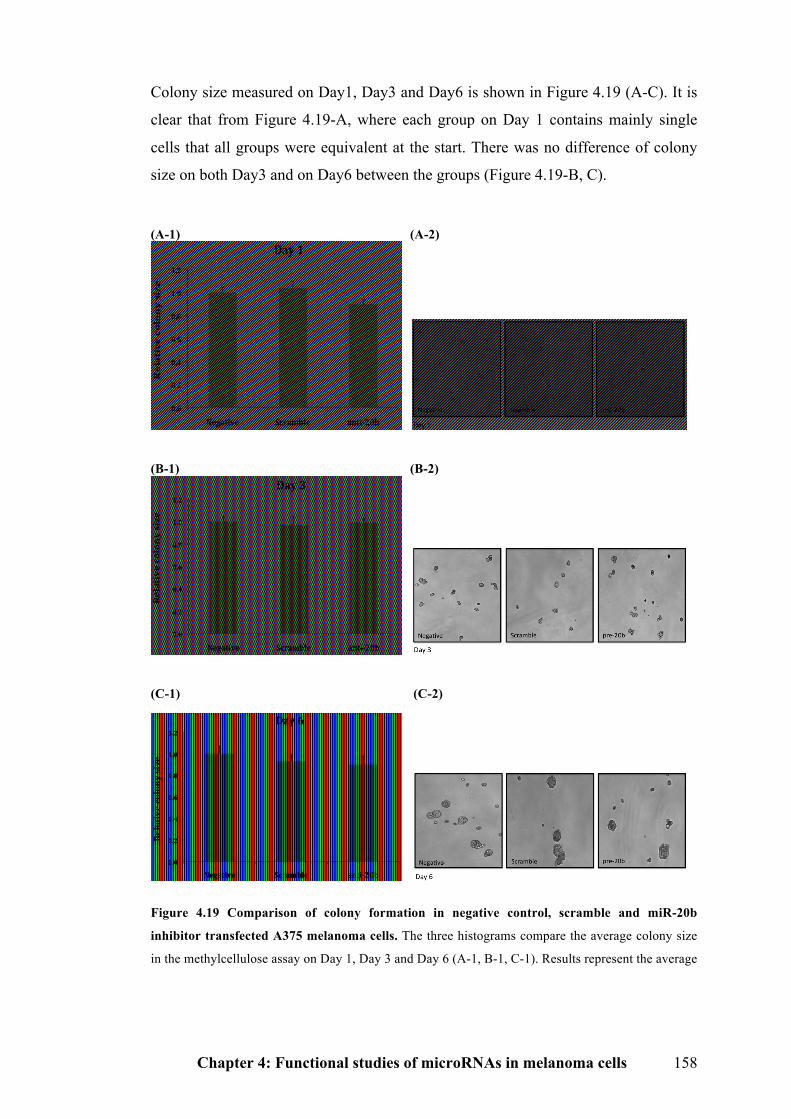
Chapter 4: Functional studies of microRNAs in melanoma cells 158
Colony size measured on Day1, Day3 and Day6 is shown in Figure 4.19 (A-C). It is
clear that from Figure 4.19-A, where each group on Day 1 contains mainly single
cells that all groups were equivalent at the start. There was no difference of colony
size on both Day3 and on Day6 between the groups (Figure 4.19-B, C).
(A-1) (A-2)
(B-1) (B-2)
(C-1) (C-2)
Figure 4.19 Comparison of colony formation in negative control, scramble and miR-20b
inhibitor transfected A375 melanoma cells. The three histograms compare the average colony size
in the methylcellulose assay on Day 1, Day 3 and Day 6 (A-1, B-1, C-1). Results represent the average
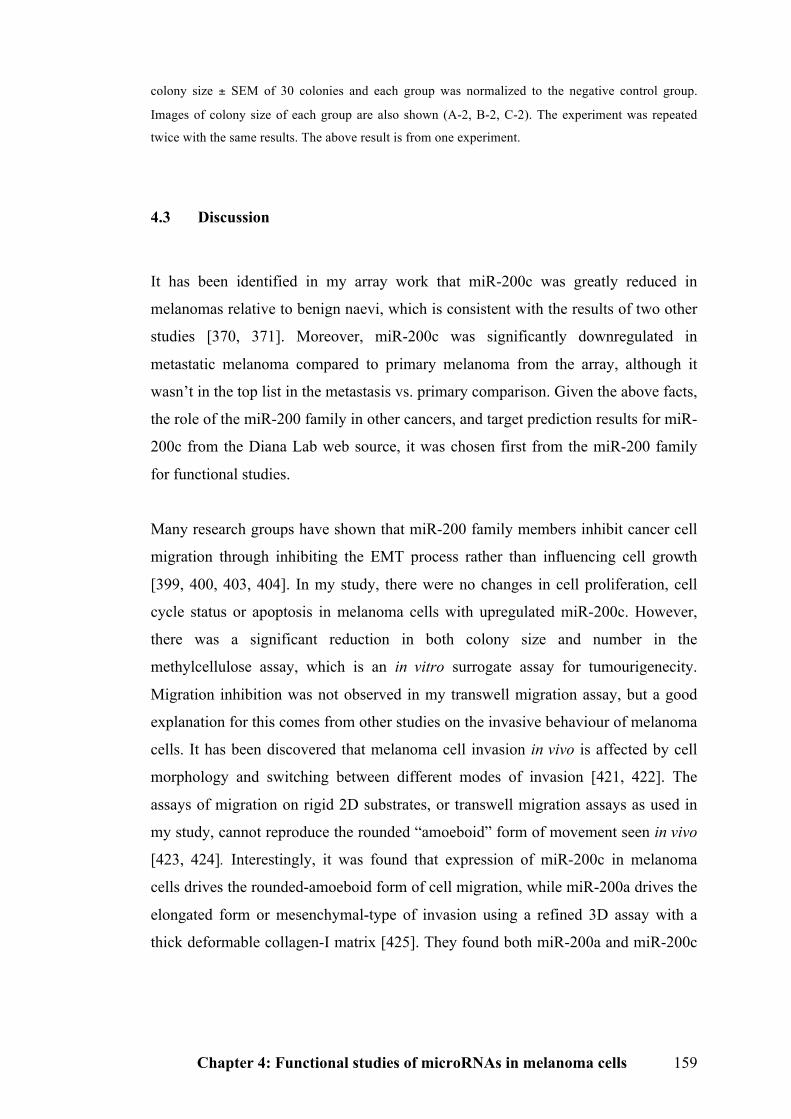
Chapter 4: Functional studies of microRNAs in melanoma cells 159
colony size ± SEM of 30 colonies and each group was normalized to the negative control group.
Images of colony size of each group are also shown (A-2, B-2, C-2). The experiment was repeated
twice with the same results. The above result is from one experiment.
4.3 Discussion
It has been identified in my array work that miR-200c was greatly reduced in
melanomas relative to benign naevi, which is consistent with the results of two other
studies [370, 371]. Moreover, miR-200c was significantly downregulated in
metastatic melanoma compared to primary melanoma from the array, although it
wasn’t in the top list in the metastasis vs. primary comparison. Given the above facts,
the role of the miR-200 family in other cancers, and target prediction results for miR-
200c from the Diana Lab web source, it was chosen first from the miR-200 family
for functional studies.
Many research groups have shown that miR-200 family members inhibit cancer cell
migration through inhibiting the EMT process rather than influencing cell growth
[399, 400, 403, 404]. In my study, there were no changes in cell proliferation, cell
cycle status or apoptosis in melanoma cells with upregulated miR-200c. However,
there was a significant reduction in both colony size and number in the
methylcellulose assay, which is an in vitro surrogate assay for tumourigenecity.
Migration inhibition was not observed in my transwell migration assay, but a good
explanation for this comes from other studies on the invasive behaviour of melanoma
cells. It has been discovered that melanoma cell invasion in vivo is affected by cell
morphology and switching between different modes of invasion [421, 422]. The
assays of migration on rigid 2D substrates, or transwell migration assays as used in
my study, cannot reproduce the rounded “amoeboid” form of movement seen in vivo
[423, 424]. Interestingly, it was found that expression of miR-200c in melanoma
cells drives the rounded-amoeboid form of cell migration, while miR-200a drives the
elongated form or mesenchymal-type of invasion using a refined 3D assay with a
thick deformable collagen-I matrix [425]. They found both miR-200a and miR-200c
Chapter 4: Functional studies of microRNAs in melanoma cells 160
can enhance invasion in some melanoma cell lines using the 3D assay. Thus, the
failure to see inhibition of migration in melanoma cells with increased levels of miR-
200c in my transwell migration assay is consistent with recent published results.
For the miR-200c target study, I took advantage of the report that the miR-200
family directly target ZEB1 and ZEB2 in other cancers. Therefore, I detected
expression of ZEB2 without using a luciferase report system. I detected significant
ZEB2 repression at the transcriptional level one day after transfection with the miR-
200c precursor and this was accompanied by a significant increase of E-cadherin
gene expression. Both effects reduced over time, most likely because the miR-200c
upregulating effect was transient. The expression of N-cadherin was not changed,
perhaps because the observation time was not long enough, or the increased E-
cadherin level was not sufficient to trigger the changes of N-cadherin. I conclude that
elevating expression of miR-200c in melanoma cells can inhibit tumourigenicity
through repressing colony forming ability in methylcellulose. Further studies would
be needed to see if this results in smaller melanoma size in vivo. Additionally,
although I was not able to evaluate E-cadherin protein level changes in miR-200c
increased melanoma cells, it is possible that EMT in melanoma may be reversed to
MET through upregulating miR-200c.
As mentioned in the introduction of this Chapter, miR-200c could sensitize NSCLC
cells to cisplatin treatment [419]. To investigate whether miR-200c expression is
correlated to chemoresistance in melanoma cells, a cell survival assay following
cisplatin treatment was performed. No significant change in the IC50 for cisplatin
was observed in miR-200c increased melanoma cells. On the contrary, a recent paper
has shown significantly increased miR-200c expression in cisplatin-resistant
oesophageal cancer cells compared with their parent cells [426]. Knockdown of miR-
200c expression resulted in reduced phosphorylation of AKT, indicating
overexpression of miR-200c induces cisplatin resistance through activating the AKT
signalling pathway. The above results indicate that the relationship between miR-
200c and chemoresistance is complicated and may be tissue-specific.
For miR-205, the results of functional studies were quite similar to miR-200c. No
Chapter 4: Functional studies of microRNAs in melanoma cells 161
changes occurred in cell proliferation or apoptosis post-transfection of the miR-205
precursor. Melanoma cells with overexpressed miR-205 showed slight inhibition in
migration assay, although the inhibition was not significant. Whether miR-205 has
the same effects on invasive behaviour as that of miR-200c needs to be studied.
Likewise, increased expression of miR-205 may also decrease melanoma size in vivo
as there was a significant reduction of colony size and colony number in the
methylcellulose assay. miR-205 and the miR-200 family share the common targets,
ZEB1 and ZEB2. However, unlike the inhibition of ZEB2 mRNA observed in
melanoma cells with increased miR-200c, no inhibition was observed in cells with
elevated miR-205. Moreover, upregulating miR-205 and miR-200c simultaneously
did not have a stronger effect than miR-200c alone, indicating that they do not
cooperate with each other. A very recent study identified that E2F1 and E2F5 were
direct targets of miR-205. It also elucidated that miR-205 negatively regulates the
AKT pathway through targeting these two transcription factors in C8161.9
melanoma cells [427]. Moreover, miR-205 were also involved in inhibiting cell
proliferation, inducing apoptosis and reducing colony formation in both transient and
stable miR-205 elevated C8161.9 melanoma cells. The inconsistency between the
results of the above study and my work is probably because of the different
melanoma cell lines used.
Another important miRNA—miR-211, showed a significant reduction in melanomas
compared to naevi. Notably, it also showed a thousand fold decrease in most of the
melanoma cell lines examined compared to immortalised melanocytes. In my
functional studies of miR-211, I found that ectopic expression of miR-211
significantly decreased colony forming ability in methylcellulose and inhibited cell
migration in melanoma cells. However, cell proliferation changes in normal media
were not observed. Three papers have been published recently that discussed the role
of miR-211 in melanomagenesis. There are both consistencies and inconsistencies
with my results.
The consistency is that the same expression pattern in both cells and tissues implies
miR-211 definitely acts as a tumour suppressor. The question is how? Mazer et al.
Chapter 4: Functional studies of microRNAs in melanoma cells 162
revealed that miR-211 inversely regulates KCNMA1 at both transcription and
protein levels. KCNMA1 encodes a component of a K+ exporting channel whose
function is modulated by Ca2+. It has been linked to tumour cell proliferation in
prostate cancer [428], cell migration in glioma [429], and antineoplastic drug
resistance in melanoma cells [430]. Levy et al. found that transforming growth factor
receptor II (TGFBR2) and nuclear factor of activated T-cells 5 (NFAT5) are the
direct targets of miR-211. Boyle et al. reported that BRN2 is the direct target of miR-
211. However, the discrepancy is that in Mazer et al.’s study, overexpression of miR-
211 inhibited both cell proliferation and migration of melanoma cells, while the other
two groups only showed changes in migration, which is consistent with my results.
Intriguingly, miR-211 is encoded within the sixth intron of TRPM1 (melastatin), a
candidate suppressor of melanoma metastasis. MITF is the transcription factor for
TRPM1. MITF coodinately regulates both miR-211 and TRPM1 expression [381].
High levels of MITF inhibit melanoma invasiveness and this is likely due to its
effects on miR-211 independent of melastatin, indicating that TRPM1 is not itself a
tumour suppressor, but is rather a marker of expression of the true melanoma tumour
suppressor at this locus, miR-211 [382, 383].
miR-20b was upregulated in melanoma tissues compared to the other three miRNAs
that I also conducted functional studies on. It has been reported to accumulate in
tumour cells and act as an oncogene in human T-cell leukemia and mouse breast
tumours [379, 431]. My functional studies for miR-20b did not show any changes in
melanoma cells with reduced miR-20b levels. A possible explanation could be that
the miR-20b reduction was too small to show significant functional differences, or
miR-20b functions in other carcinogenetic processes that were not assayed in my
work.
The roles of miR-20b in tumourigenesis are quite complicated. Two papers discussed
the role of miRNAs in angiogenesis under hypoxic condition, whereas none of my
studies were relevant to tumour angiogenesis. miR-20b was confirmed to regulate
oxygenation and two angiogenesis related regulators (hypoxia inducible factor 1 α
Chapter 4: Functional studies of microRNAs in melanoma cells 163
subunit—HIF-1α and vascular endothelial growth factor—VEGF) in several mouse
tumour cell lines, including a melanoma mouse cell line—B16 [432]. Both HIF-1α
and VEGF are the direct targets of miR-20b [432, 433] and HIF-1α can also
inversely regulate miR-20b expression [432]. Furthermore, VEGF can be
transcriptionally activated by HIF-1α [434]. Zhang et al. found differentially low
expression of miR-20b in hypoxia compared to the normoxic condition. Combined
with the fact that overexpression of HIF-1α leads to a decrease in the level of miR-
20b, it could explain why upregulation of miR-20b was established in my melanoma
tissues but the inhibition of cell growth was not seen after downregulation of miR-
20b in my cell based study. My hypothesis is: when tumour cells proliferate in
normoxia, the low level of HIF-1α regulates miR-20b and upregulation of miR-20b
is seen. When tumour cell proliferation reaches a hypoxic condition, HIF-1α
becomes upregulated and thus miR-20b becomes downregulated and low miR-20b
keeps high levels of HIF-1α until VEGF is upregulated to continue tumour
progression. The multiple relationship among miR-20b, HIF-1α and VEGF implies
their reciprocal action in allowing tumour cells to adapt to different oxygen
concentration and angiogenesis for survival. Therefore, oxygen condition should be
taken into account in functional studies on miR-20b.
Four miRNAs of the miRNA microarray profile were further studied through
functional assays. In this Chapter, it was found that expression of both miR-200c and
miR-205 reduced colony forming ability in methylcellulose. This Chapter also first
reported that miR-200c negatively regulated expression of ZEB2 and resulted in
upregulated E-cadherin at the transcriptional level in melanoma, indicating miR-200c
may contribute to the MET process through overexpression of E-cadherin. For miR-
211, ectopic expression inhibited colony formation and tumour cell migration. None
of these miRNAs influenced cell growth in normal culture conditions. To conclude,
miR-200c, miR-205 and miR-211 act as tumour suppressors in melanoma
pathogenesis. The functions of miR-20b need further investigation.

Chapter 5: Role of the BRAF V600E mutation in melanomagenesis 164
Chapter 5: Role of the BRAF V600E mutation in melanomagenesis
Chapter 5: Role of the BRAF V600E mutation in melanomagenesis 165
5.1 Introduction
Cutaneous melanoma is 10 times more frequently seen in white populations than in
black individuals, which indicates a protective role for melanin pigment [435]. The
major role of melanin is to protect against the harmful actions of solar radiation.
UVR represents a fraction of the solar radiation but it is responsible for the majority
of its carcinogenic effect. UVR is divided into UVC (200-280nm), UVB (280-
320nm) and UVA (320-400nm) [436]. The UVC spectrum rarely reaches the earth’s
surface while UVA and UVB wavelength represent 95% and 5% of the UV spectrum
reaching the earth’s surface. UVB is more efficiently absorbed by cellular molecules,
although it is about 20-fold less abundant than UVA [435]. The interaction of UVB
with DNA results in 6-4PP and CPD between adjacent pyrimidine sites. If 6-4PPs
and CPDs are not repaired, they can induce mutations in many genes. The most
abundant mutations after UVB are C to T and CC to TT transitions at bipyrimidine
sites or pyrimidine runs, called “UVB fingerprint mutations” [437]. UVB can also
induce reactive oxygen species (ROS). Recent studies reported that UVA is also an
important factor involved in photocarcinogenesis but through different mechanisms
to UVB [437]. UVA induces DNA damage indirectly through the absorption of
UVA photons by other cellular structures, such as chromophores, with formation of
ROS (H2O2). This can transfer the UVA energy to DNA via mutagenic oxidative
intermediates, such as 8-hydroxydeoxyguanosine. DNA damage by UVA radiation
typically consists of T to G transversions, called “UVA fingerprints”. It was found
that irradiation of melanocytes with UVA or UVB leads to alterations of different
intracellular proteins, indicating that UVA and UVB may trigger initiation of
melanoma via separate intracellular pathways [438].
The BRAF gene is a member of the RAF family which comprises three members:
ARAF, BRAF and CRAF. It encodes a serine-threonine protein kinase [439]. RAS is
a small G protein that is embedded in the plasma membrane of cells and is activated
downstream of growth factor receptor tyrosine kinases, cytokines and hormones.
RAF is activated following its recruitment to the plasma membrane by RAS and then
triggers the MAPK pathway, which regulates cell proliferation, differentiation,
Chapter 5: Role of the BRAF V600E mutation in melanomagenesis 166
senescence and survival [439].
BRAF is the only RAF protein to be frequently mutated in cancer. No ARAF
mutations have been identified so far [440, 441]. CRAF mutations are only rarely
found [440, 442], but the gene is overexpressed in some ovarian and pulmonary
carcinomas, indicating that CRAF can act as an oncogene [443]. Besides BRAF
mutations, NRAS mutations are found in all subtypes of melanoma, although the
overall mutation frequency (15-30%) is lower than that of BRAF. Generally, BRAF
and RAS (N, H, or K) mutations are mutually exclusive with only few exceptions.
Mutations in cKIT are most common in mucosal, acral or chronically sun-damaged
skin melanomas [131, 444, 445]. CCND1 is amplified most commonly in melanomas
without BRAF or RAS mutations, whereas melanomas with mutation in either of the
latter two genes display elevated Cyclin D1 levels [446, 447]. CDK4 amplifications
are more common in acral and mucosal melanomas and are also inversely correlated
with BRAF or RAS mutations or CCND1 amplifications [447]. From the above
evidence, it is clear that constitutive activation of the RAS/MEK/ERK pathway, by
oncogenic lesions in one of the pathway’s components, is an important step in
melanoma development. However, BRAF mutation is the most common among all
these mutations and aberrant gene expressions. More than 30 different BRAF mutations have been identified in a number of
malignancies including thyroid, ovarian, lung and colon cancer as well as melanoma
[448]. Among human cancers, BRAF mutations are most common in melanoma. The
prevalence of BRAF mutations varies substantially among the different types of
melanoma. The highest frequency (50% to 60%) is found in cutaneous melanoma
[447]. It is rare in mucosal, acral and conjunctival melanomas, and virtually absent
from uveal melanomas. Furthermore, within the group of cutaneous melanomas,
BRAF mutations are highest on sites of intermittently sun-exposed skin, rather than
on chronically sun-damaged or completely unexposed skin [447]. Cutaneous
melanomas on sites of chronically sun-damaged skin harbour wild type BRAF and
arise later in life [447, 449]. More intriguingly, the high frequency of BRAF
mutations is also seen in melanocytic naevi [450]. Within the BRAF mutations, the

Chapter 5: Role of the BRAF V600E mutation in melanomagenesis 167
most common one, which accounts for more than 90% of total BRAF mutations [77]
corresponds to a T>A transversion at position 1799, resulting in the substitution of
Valine by Glutamine at codon 600 (V600E BRAF mutation). The BRAF V600E
mutation displays increased kinase activity relative to the wild type protein and has
transforming capacity [77]. Cell lines expressing the BRAF V600E are dependent on
it for proliferation and survival [451-453] and most do not require RAS for
proliferation [77].
Cutaneous melanoma can vary significantly in clinical and histopathological
appearance, which has led to the development and refinement of morphologically
based classification systems. The standard classification for melanoma uses the
current World Health Organization (WHO) classification that distinguishes four main
types of melanoma as described in Chapter 1 (See Page 6). These distinctions are
related to clinical features such as anatomic site of the primary tumour, pace of
tumour evolution and the patient age. However, clinical management based only on
the above classifications is difficult. For example, a number of melanomas are
differentially classified by different observers, or classified as “ambiguous” because
these classifications are defined by multiple criteria [454]. On the other hand, genetic
alterations can serve as biomarkers for classification purposes even though the
complete profile of genetic factors is still not available. Viros et al. described that
combining the morphological appearance and the genetic changes could be clinically
useful for therapy stratification and for retrospective study of clinical trial data. They
found BRAF mutation status is strongly related to some phenotypic features such as
pigmentation, cell shape, size, and nesting of primary melanomas, which implies that
refined morphological classification of primary melanomas can be used to improve
existing melanoma classifications by integrating genetic and morphologic features
[455].
In our group, about 150 melanoma samples were available from a TMA panel
constructed by Dr Ewan Brown, containing primary and metastatic melanoma
samples with clinicopathological records. We have also developed a mature method
to genotype the BRAF V600E mutation. Potentially, we are able to perceive new
Chapter 5: Role of the BRAF V600E mutation in melanomagenesis 168
insights into the role of the BRAF mutation in melanomagenesis and melanoma
classifications by investigating the relationship between BRAF mutation status and
the clinicopathological signatures in our sample cohort. Moreover, we can also
associate BRAF mutation to patient survival.
Therefore, the objectives of this Chapter were: to genotype BRAF V600E mutations
in FFPE melanoma tissues from our TMA cohort; to identify the correlation between
the BRAF V600E mutation and the clinicopathological features; to assess the
prognostic value of the BRAF V600E mutation.
5.2 Results
5.2.1 BRAF V600E mutation frequency in melanoma tissues
5.2.1.1 BRAF V600E mutation assay
Genetic analysis by restriction fragment length polymorphism (RFLP) allows the
examination of nucleic acids for the presence of known sequence variants. A
segment that is to be searched for a mutation is amplified from genomic DNA,
digested by the appropriate restriction enzyme, and then separated by agarose gel
electrophoroesis. Although RFLP analysis is highly sensitive and relatively easy to
perform, many polymorphisms are the result of single-base substitutions that fail to
create or remove a restriction site and therefore cannot be genotyped by simple PCR
and RFLP analysis. A mismatch PCR primer can be used to overcome this as it
artificially creates a restriction site in the amplified product to allow the detection of
the presence of a base substitution by RFLP.
In order to associate the presence of the BRAF V600E mutation with history of UV
exposure and other available clinicopathological characteristics, an assay was
developed for detection of this mutation in melanoma samples. The assay used PCR
with a mismatch PCR primer and an XbaI RFLP, which is a method originally
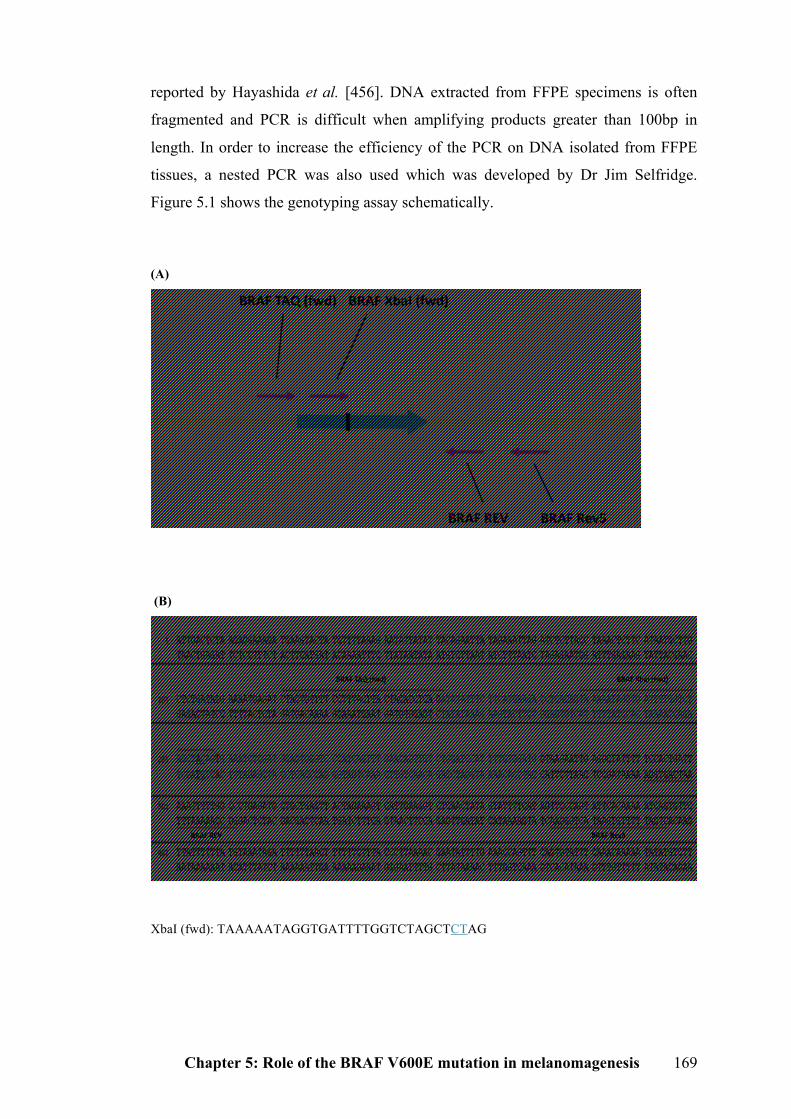
Chapter 5: Role of the BRAF V600E mutation in melanomagenesis 169
reported by Hayashida et al. [456]. DNA extracted from FFPE specimens is often
fragmented and PCR is difficult when amplifying products greater than 100bp in
length. In order to increase the efficiency of the PCR on DNA isolated from FFPE
tissues, a nested PCR was also used which was developed by Dr Jim Selfridge.
Figure 5.1 shows the genotyping assay schematically.
(A)
(B)
XbaI (fwd): TAAAAATAGGTGATTTTGGTCTAGCTCTAG
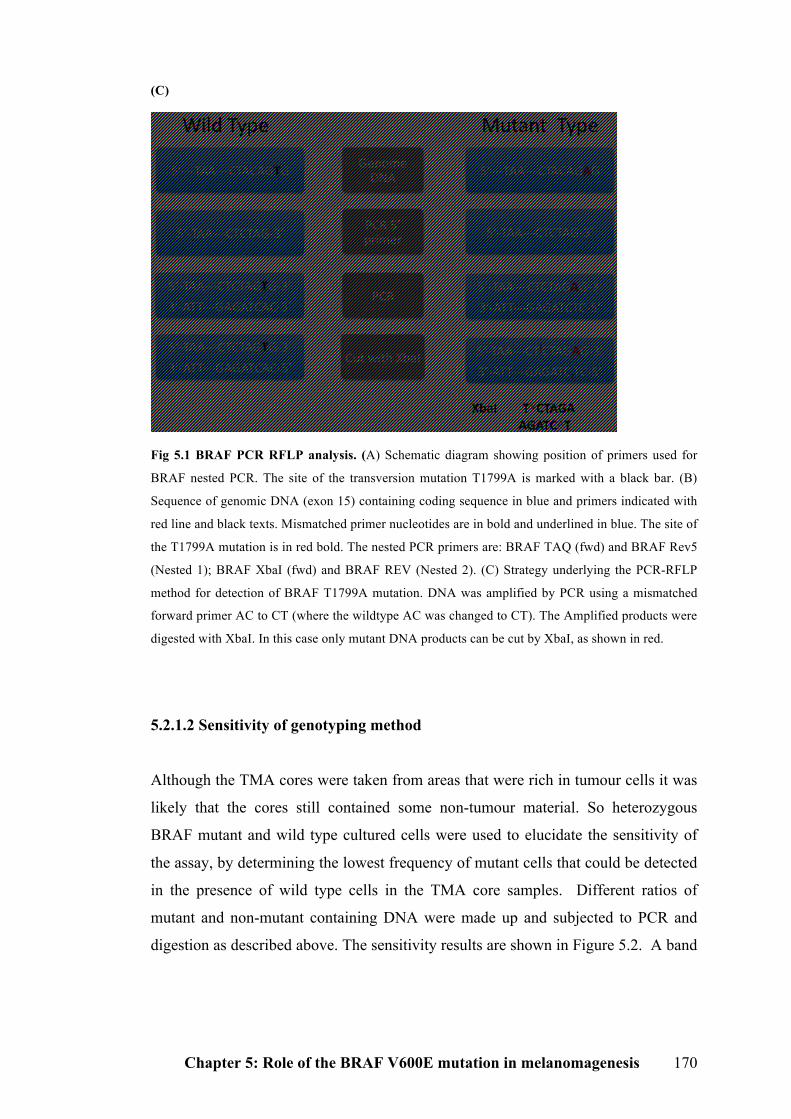
Chapter 5: Role of the BRAF V600E mutation in melanomagenesis 170
(C)
Fig 5.1 BRAF PCR RFLP analysis. (A) Schematic diagram showing position of primers used for
BRAF nested PCR. The site of the transversion mutation T1799A is marked with a black bar. (B)
Sequence of genomic DNA (exon 15) containing coding sequence in blue and primers indicated with
red line and black texts. Mismatched primer nucleotides are in bold and underlined in blue. The site of
the T1799A mutation is in red bold. The nested PCR primers are: BRAF TAQ (fwd) and BRAF Rev5
(Nested 1); BRAF XbaI (fwd) and BRAF REV (Nested 2). (C) Strategy underlying the PCR-RFLP
method for detection of BRAF T1799A mutation. DNA was amplified by PCR using a mismatched
forward primer AC to CT (where the wildtype AC was changed to CT). The Amplified products were
digested with XbaI. In this case only mutant DNA products can be cut by XbaI, as shown in red.
5.2.1.2 Sensitivity of genotyping method
Although the TMA cores were taken from areas that were rich in tumour cells it was
likely that the cores still contained some non-tumour material. So heterozygous
BRAF mutant and wild type cultured cells were used to elucidate the sensitivity of
the assay, by determining the lowest frequency of mutant cells that could be detected
in the presence of wild type cells in the TMA core samples. Different ratios of
mutant and non-mutant containing DNA were made up and subjected to PCR and
digestion as described above. The sensitivity results are shown in Figure 5.2. A band
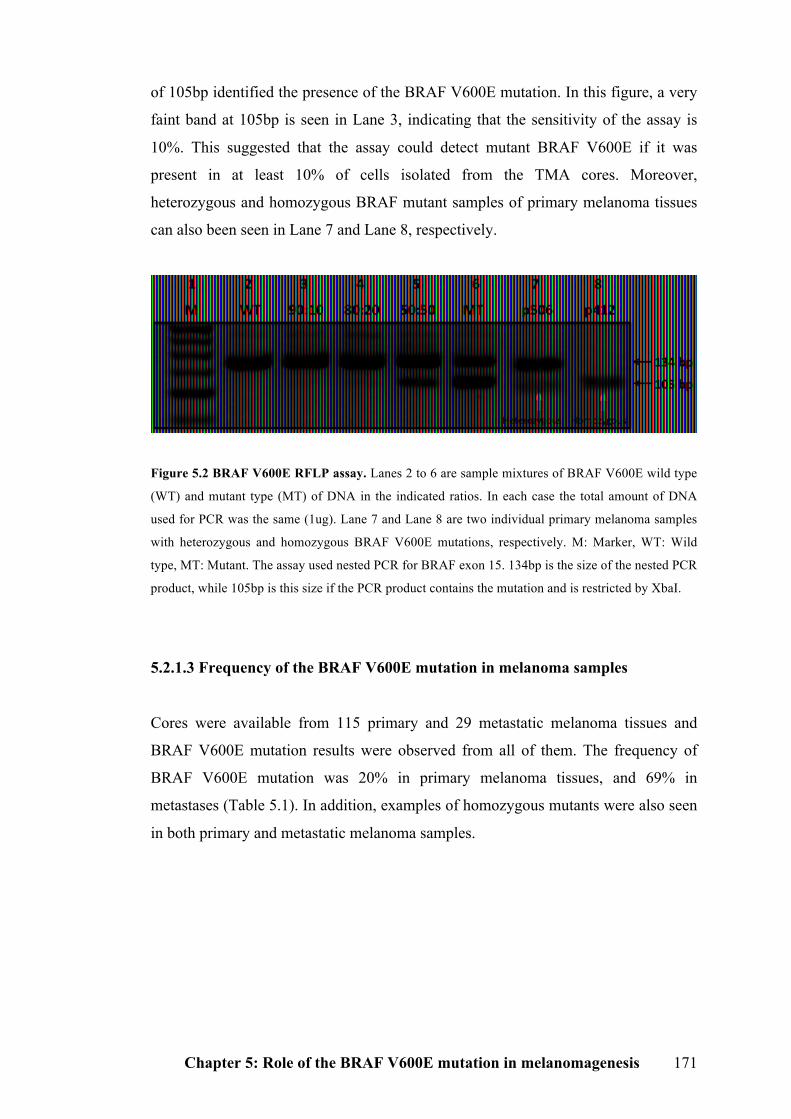
Chapter 5: Role of the BRAF V600E mutation in melanomagenesis 171
of 105bp identified the presence of the BRAF V600E mutation. In this figure, a very
faint band at 105bp is seen in Lane 3, indicating that the sensitivity of the assay is
10%. This suggested that the assay could detect mutant BRAF V600E if it was
present in at least 10% of cells isolated from the TMA cores. Moreover,
heterozygous and homozygous BRAF mutant samples of primary melanoma tissues
can also been seen in Lane 7 and Lane 8, respectively.
Figure 5.2 BRAF V600E RFLP assay. Lanes 2 to 6 are sample mixtures of BRAF V600E wild type
(WT) and mutant type (MT) of DNA in the indicated ratios. In each case the total amount of DNA
used for PCR was the same (1ug). Lane 7 and Lane 8 are two individual primary melanoma samples
with heterozygous and homozygous BRAF V600E mutations, respectively. M: Marker, WT: Wild
type, MT: Mutant. The assay used nested PCR for BRAF exon 15. 134bp is the size of the nested PCR
product, while 105bp is this size if the PCR product contains the mutation and is restricted by XbaI.
5.2.1.3 Frequency of the BRAF V600E mutation in melanoma samples
Cores were available from 115 primary and 29 metastatic melanoma tissues and
BRAF V600E mutation results were observed from all of them. The frequency of
BRAF V600E mutation was 20% in primary melanoma tissues, and 69% in
metastases (Table 5.1). In addition, examples of homozygous mutants were also seen
in both primary and metastatic melanoma samples.
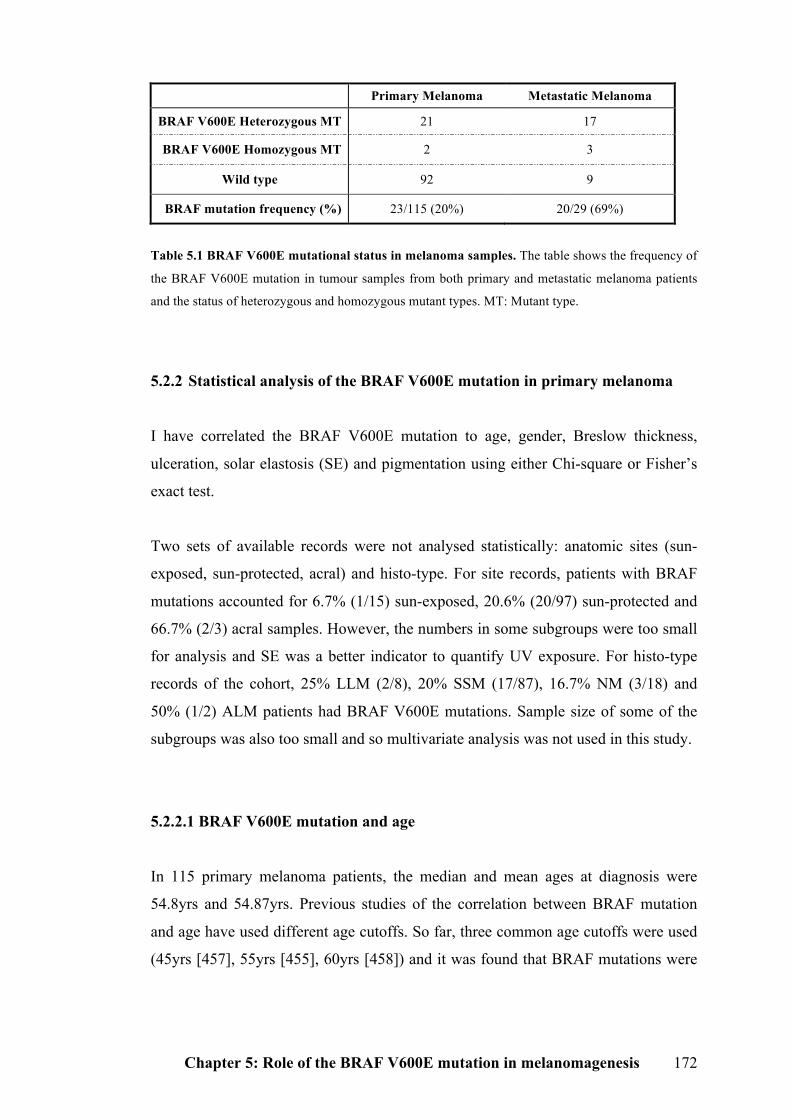
Chapter 5: Role of the BRAF V600E mutation in melanomagenesis 172
Primary Melanoma Metastatic Melanoma
BRAF V600E Heterozygous MT 21 17
BRAF V600E Homozygous MT 2 3
Wild type 92 9
BRAF mutation frequency (%) 23/115 (20%) 20/29 (69%)
Table 5.1 BRAF V600E mutational status in melanoma samples. The table shows the frequency of
the BRAF V600E mutation in tumour samples from both primary and metastatic melanoma patients
and the status of heterozygous and homozygous mutant types. MT: Mutant type.
5.2.2 Statistical analysis of the BRAF V600E mutation in primary melanoma
I have correlated the BRAF V600E mutation to age, gender, Breslow thickness,
ulceration, solar elastosis (SE) and pigmentation using either Chi-square or Fisher’s
exact test.
Two sets of available records were not analysed statistically: anatomic sites (sun-
exposed, sun-protected, acral) and histo-type. For site records, patients with BRAF
mutations accounted for 6.7% (1/15) sun-exposed, 20.6% (20/97) sun-protected and
66.7% (2/3) acral samples. However, the numbers in some subgroups were too small
for analysis and SE was a better indicator to quantify UV exposure. For histo-type
records of the cohort, 25% LLM (2/8), 20% SSM (17/87), 16.7% NM (3/18) and
50% (1/2) ALM patients had BRAF V600E mutations. Sample size of some of the
subgroups was also too small and so multivariate analysis was not used in this study.
5.2.2.1 BRAF V600E mutation and age
In 115 primary melanoma patients, the median and mean ages at diagnosis were
54.8yrs and 54.87yrs. Previous studies of the correlation between BRAF mutation
and age have used different age cutoffs. So far, three common age cutoffs were used
(45yrs [457], 55yrs [455], 60yrs [458]) and it was found that BRAF mutations were
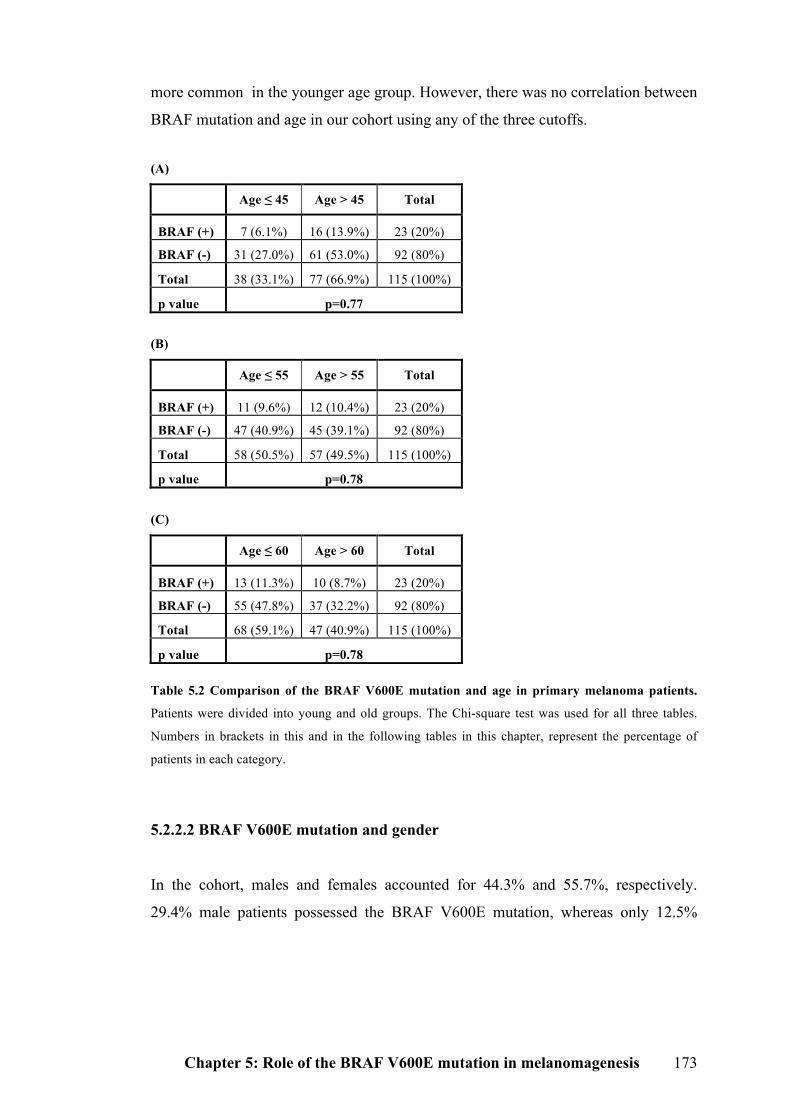
Chapter 5: Role of the BRAF V600E mutation in melanomagenesis 173
more common in the younger age group. However, there was no correlation between
BRAF mutation and age in our cohort using any of the three cutoffs.
(A)
Age ≤ 45 Age > 45 Total
BRAF (+) 7 (6.1%) 16 (13.9%) 23 (20%)
BRAF (-) 31 (27.0%) 61 (53.0%) 92 (80%)
Total 38 (33.1%) 77 (66.9%) 115 (100%)
p value p=0.77
(B)
Age ≤ 55 Age > 55 Total
BRAF (+) 11 (9.6%) 12 (10.4%) 23 (20%)
BRAF (-) 47 (40.9%) 45 (39.1%) 92 (80%)
Total 58 (50.5%) 57 (49.5%) 115 (100%)
p value p=0.78
(C)
Age ≤ 60 Age > 60 Total
BRAF (+) 13 (11.3%) 10 (8.7%) 23 (20%)
BRAF (-) 55 (47.8%) 37 (32.2%) 92 (80%)
Total 68 (59.1%) 47 (40.9%) 115 (100%)
p value p=0.78
Table 5.2 Comparison of the BRAF V600E mutation and age in primary melanoma patients.
Patients were divided into young and old groups. The Chi-square test was used for all three tables.
Numbers in brackets in this and in the following tables in this chapter, represent the percentage of
patients in each category.
5.2.2.2 BRAF V600E mutation and gender
In the cohort, males and females accounted for 44.3% and 55.7%, respectively.
29.4% male patients possessed the BRAF V600E mutation, whereas only 12.5%
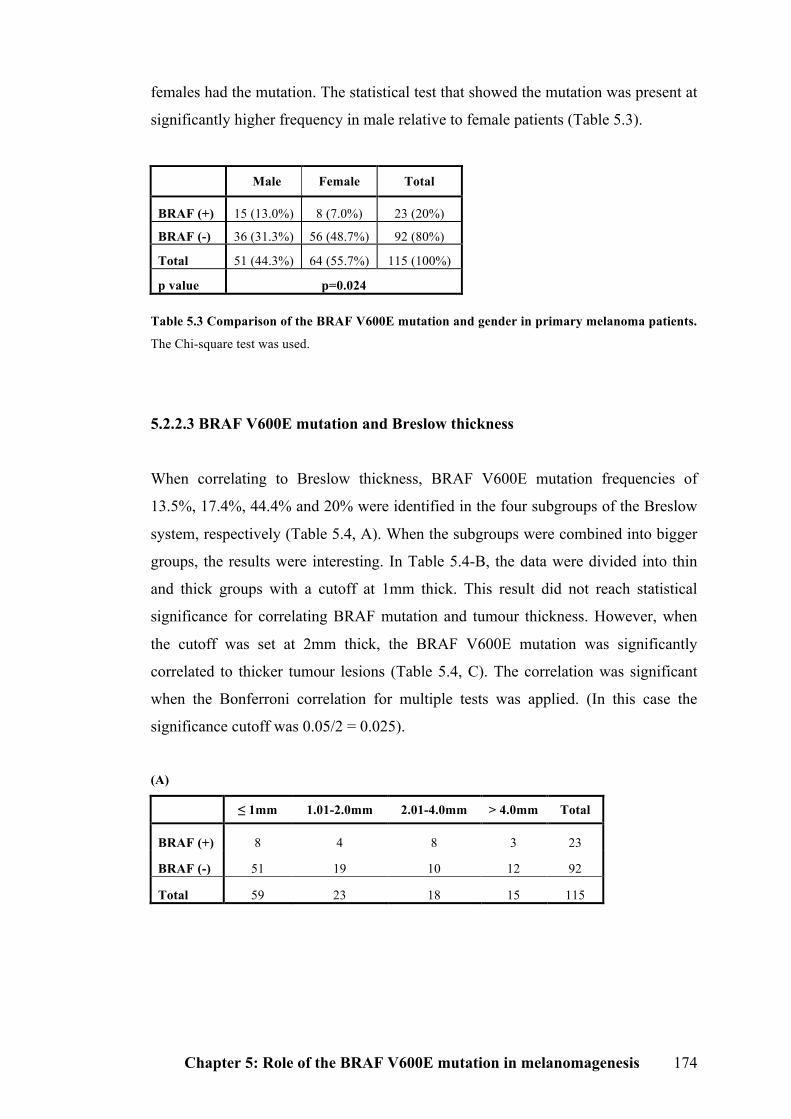
Chapter 5: Role of the BRAF V600E mutation in melanomagenesis 174
females had the mutation. The statistical test that showed the mutation was present at
significantly higher frequency in male relative to female patients (Table 5.3).
Male Female Total
BRAF (+) 15 (13.0%) 8 (7.0%) 23 (20%)
BRAF (-) 36 (31.3%) 56 (48.7%) 92 (80%)
Total 51 (44.3%) 64 (55.7%) 115 (100%)
p value p=0.024
Table 5.3 Comparison of the BRAF V600E mutation and gender in primary melanoma patients.
The Chi-square test was used.
5.2.2.3 BRAF V600E mutation and Breslow thickness
When correlating to Breslow thickness, BRAF V600E mutation frequencies of
13.5%, 17.4%, 44.4% and 20% were identified in the four subgroups of the Breslow
system, respectively (Table 5.4, A). When the subgroups were combined into bigger
groups, the results were interesting. In Table 5.4-B, the data were divided into thin
and thick groups with a cutoff at 1mm thick. This result did not reach statistical
significance for correlating BRAF mutation and tumour thickness. However, when
the cutoff was set at 2mm thick, the BRAF V600E mutation was significantly
correlated to thicker tumour lesions (Table 5.4, C). The correlation was significant
when the Bonferroni correlation for multiple tests was applied. (In this case the
significance cutoff was 0.05/2 = 0.025).
(A)
≤ 1mm 1.01-2.0mm 2.01-4.0mm > 4.0mm Total
BRAF (+) 8 4 8 3 23
BRAF (-) 51 19 10 12 92
Total 59 23 18 15 115
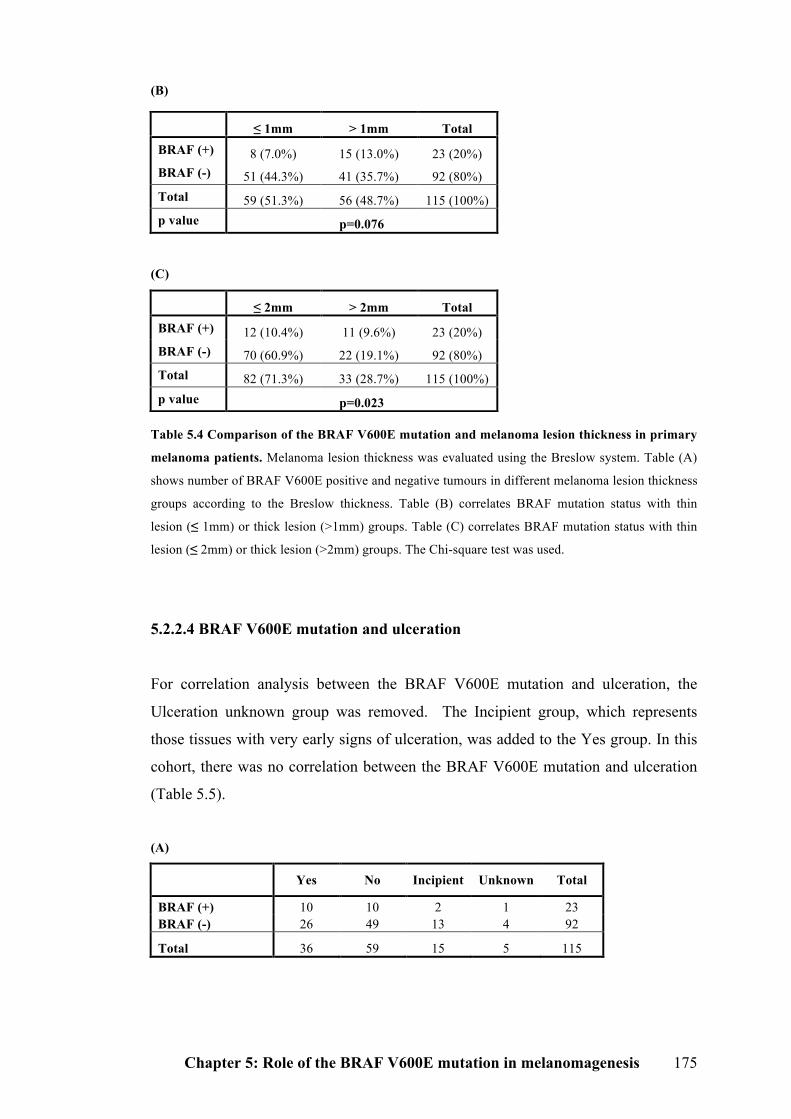
Chapter 5: Role of the BRAF V600E mutation in melanomagenesis 175
(B)
(C)
Table 5.4 Comparison of the BRAF V600E mutation and melanoma lesion thickness in primary
melanoma patients. Melanoma lesion thickness was evaluated using the Breslow system. Table (A)
shows number of BRAF V600E positive and negative tumours in different melanoma lesion thickness
groups according to the Breslow thickness. Table (B) correlates BRAF mutation status with thin
lesion (≤ 1mm) or thick lesion (>1mm) groups. Table (C) correlates BRAF mutation status with thin
lesion (≤ 2mm) or thick lesion (>2mm) groups. The Chi-square test was used.
5.2.2.4 BRAF V600E mutation and ulceration
For correlation analysis between the BRAF V600E mutation and ulceration, the
Ulceration unknown group was removed. The Incipient group, which represents
those tissues with very early signs of ulceration, was added to the Yes group. In this
cohort, there was no correlation between the BRAF V600E mutation and ulceration
(Table 5.5).
(A)
Yes No Incipient Unknown Total
BRAF (+) 10 10 2 1 23 BRAF (-) 26 49 13 4 92
Total 36 59 15 5 115
≤ 1mm > 1mm Total BRAF (+) 8 (7.0%) 15 (13.0%) 23 (20%) BRAF (-) 51 (44.3%) 41 (35.7%) 92 (80%) Total 59 (51.3%) 56 (48.7%) 115 (100%) p value p=0.076
≤ 2mm > 2mm Total BRAF (+) 12 (10.4%) 11 (9.6%) 23 (20%) BRAF (-) 70 (60.9%) 22 (19.1%) 92 (80%) Total 82 (71.3%) 33 (28.7%) 115 (100%) p value p=0.023
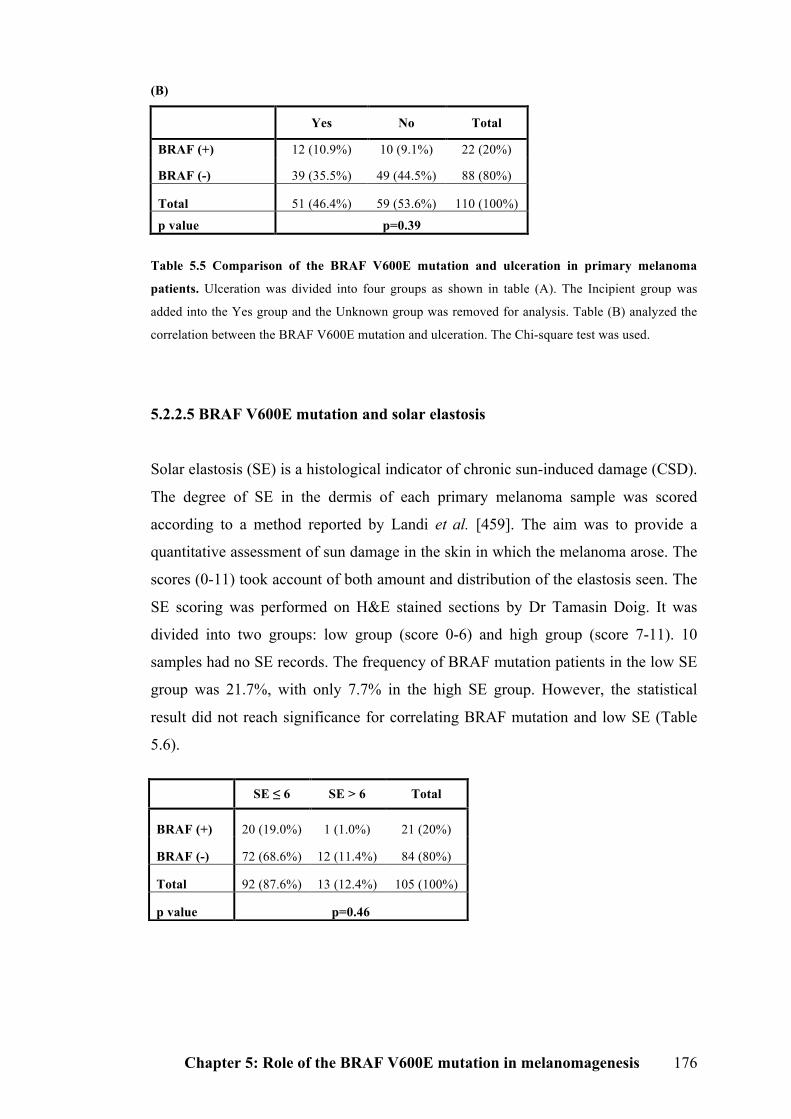
Chapter 5: Role of the BRAF V600E mutation in melanomagenesis 176
(B)
Yes No Total
BRAF (+) 12 (10.9%) 10 (9.1%) 22 (20%)
BRAF (-) 39 (35.5%) 49 (44.5%) 88 (80%)
Total 51 (46.4%) 59 (53.6%) 110 (100%)
p value p=0.39
Table 5.5 Comparison of the BRAF V600E mutation and ulceration in primary melanoma
patients. Ulceration was divided into four groups as shown in table (A). The Incipient group was
added into the Yes group and the Unknown group was removed for analysis. Table (B) analyzed the
correlation between the BRAF V600E mutation and ulceration. The Chi-square test was used.
5.2.2.5 BRAF V600E mutation and solar elastosis
Solar elastosis (SE) is a histological indicator of chronic sun-induced damage (CSD).
The degree of SE in the dermis of each primary melanoma sample was scored
according to a method reported by Landi et al. [459]. The aim was to provide a
quantitative assessment of sun damage in the skin in which the melanoma arose. The
scores (0-11) took account of both amount and distribution of the elastosis seen. The
SE scoring was performed on H&E stained sections by Dr Tamasin Doig. It was
divided into two groups: low group (score 0-6) and high group (score 7-11). 10
samples had no SE records. The frequency of BRAF mutation patients in the low SE
group was 21.7%, with only 7.7% in the high SE group. However, the statistical
result did not reach significance for correlating BRAF mutation and low SE (Table
5.6).
SE ≤ 6 SE > 6 Total
BRAF (+) 20 (19.0%) 1 (1.0%) 21 (20%)
BRAF (-) 72 (68.6%) 12 (11.4%) 84 (80%)
Total 92 (87.6%) 13 (12.4%) 105 (100%)
p value p=0.46
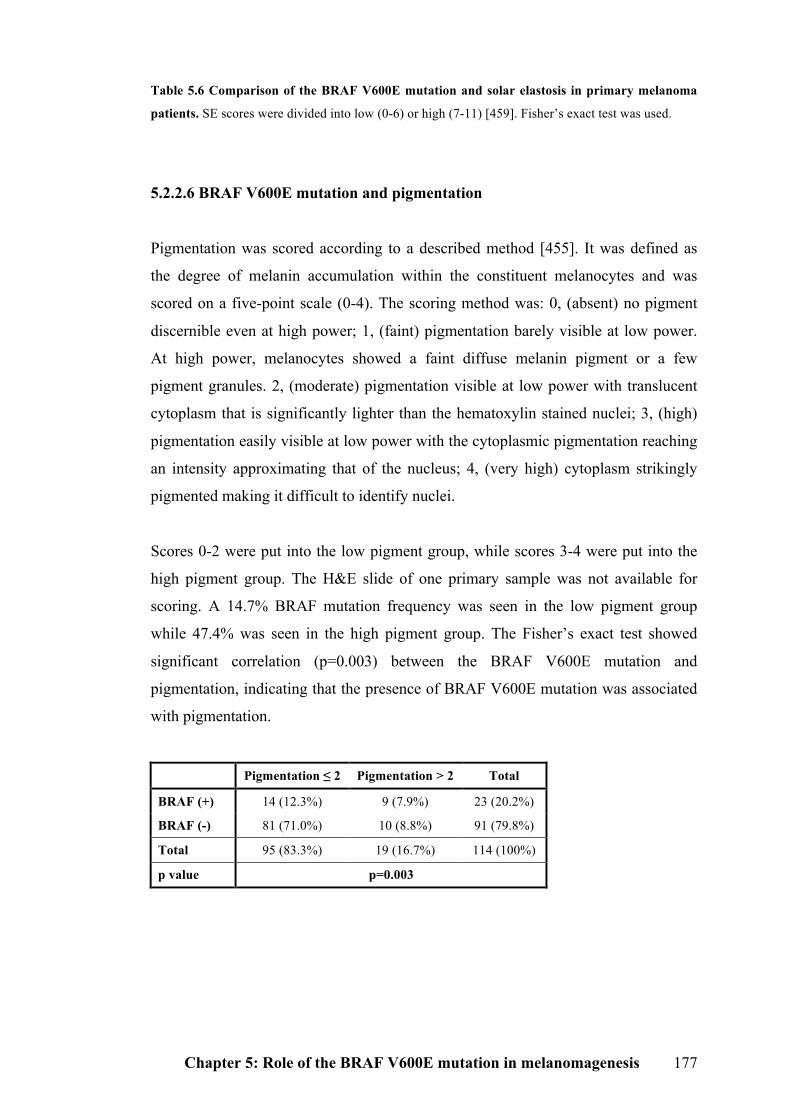
Chapter 5: Role of the BRAF V600E mutation in melanomagenesis 177
Table 5.6 Comparison of the BRAF V600E mutation and solar elastosis in primary melanoma
patients. SE scores were divided into low (0-6) or high (7-11) [459]. Fisher’s exact test was used.
5.2.2.6 BRAF V600E mutation and pigmentation
Pigmentation was scored according to a described method [455]. It was defined as
the degree of melanin accumulation within the constituent melanocytes and was
scored on a five-point scale (0-4). The scoring method was: 0, (absent) no pigment
discernible even at high power; 1, (faint) pigmentation barely visible at low power.
At high power, melanocytes showed a faint diffuse melanin pigment or a few
pigment granules. 2, (moderate) pigmentation visible at low power with translucent
cytoplasm that is significantly lighter than the hematoxylin stained nuclei; 3, (high)
pigmentation easily visible at low power with the cytoplasmic pigmentation reaching
an intensity approximating that of the nucleus; 4, (very high) cytoplasm strikingly
pigmented making it difficult to identify nuclei.
Scores 0-2 were put into the low pigment group, while scores 3-4 were put into the
high pigment group. The H&E slide of one primary sample was not available for
scoring. A 14.7% BRAF mutation frequency was seen in the low pigment group
while 47.4% was seen in the high pigment group. The Fisher’s exact test showed
significant correlation (p=0.003) between the BRAF V600E mutation and
pigmentation, indicating that the presence of BRAF V600E mutation was associated
with pigmentation.
Pigmentation ≤ 2 Pigmentation > 2 Total
BRAF (+) 14 (12.3%) 9 (7.9%) 23 (20.2%)
BRAF (-) 81 (71.0%) 10 (8.8%) 91 (79.8%)
Total 95 (83.3%) 19 (16.7%) 114 (100%)
p value p=0.003
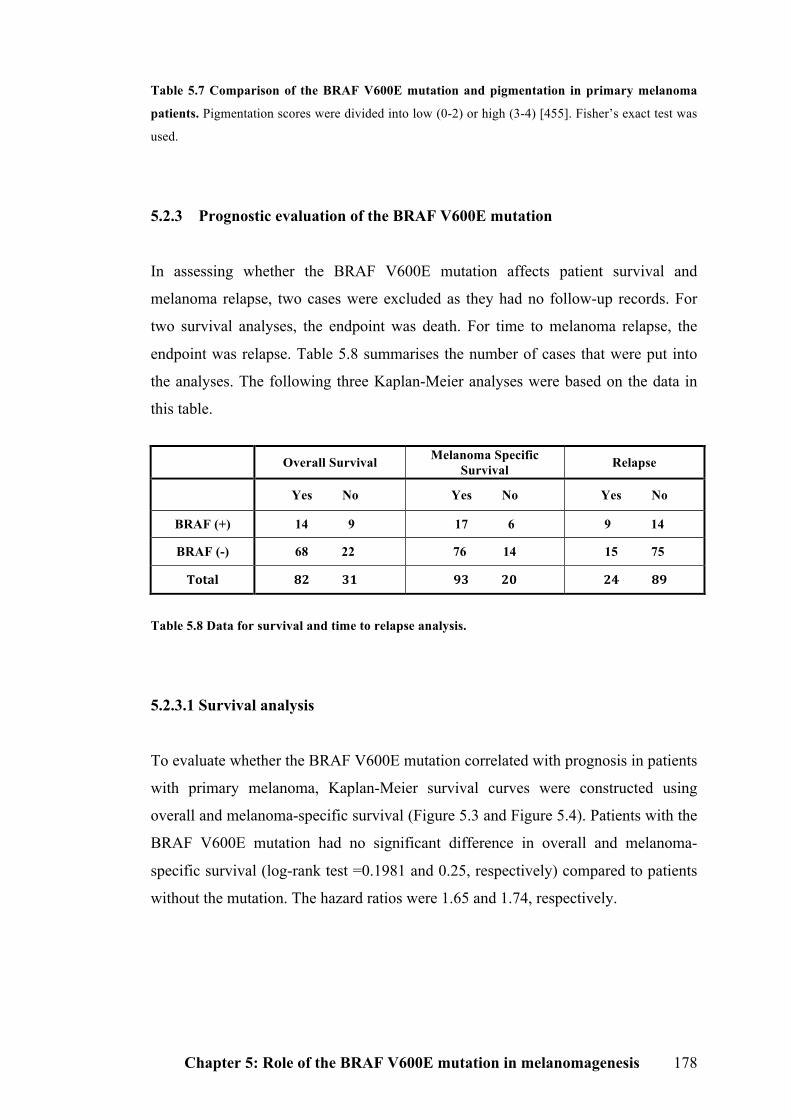
Chapter 5: Role of the BRAF V600E mutation in melanomagenesis 178
Table 5.7 Comparison of the BRAF V600E mutation and pigmentation in primary melanoma
patients. Pigmentation scores were divided into low (0-2) or high (3-4) [455]. Fisher’s exact test was
used.
5.2.3 Prognostic evaluation of the BRAF V600E mutation
In assessing whether the BRAF V600E mutation affects patient survival and
melanoma relapse, two cases were excluded as they had no follow-up records. For
two survival analyses, the endpoint was death. For time to melanoma relapse, the
endpoint was relapse. Table 5.8 summarises the number of cases that were put into
the analyses. The following three Kaplan-Meier analyses were based on the data in
this table.
Overall Survival Melanoma Specific
Survival Relapse
Yes No Yes No Yes No
BRAF (+) 14 9 17 6 9 14
BRAF (-) 68 22 76 14 15 75
Total 82 31 93 20 24 89
Table 5.8 Data for survival and time to relapse analysis.
5.2.3.1 Survival analysis
To evaluate whether the BRAF V600E mutation correlated with prognosis in patients
with primary melanoma, Kaplan-Meier survival curves were constructed using
overall and melanoma-specific survival (Figure 5.3 and Figure 5.4). Patients with the
BRAF V600E mutation had no significant difference in overall and melanoma-
specific survival (log-rank test =0.1981 and 0.25, respectively) compared to patients
without the mutation. The hazard ratios were 1.65 and 1.74, respectively.
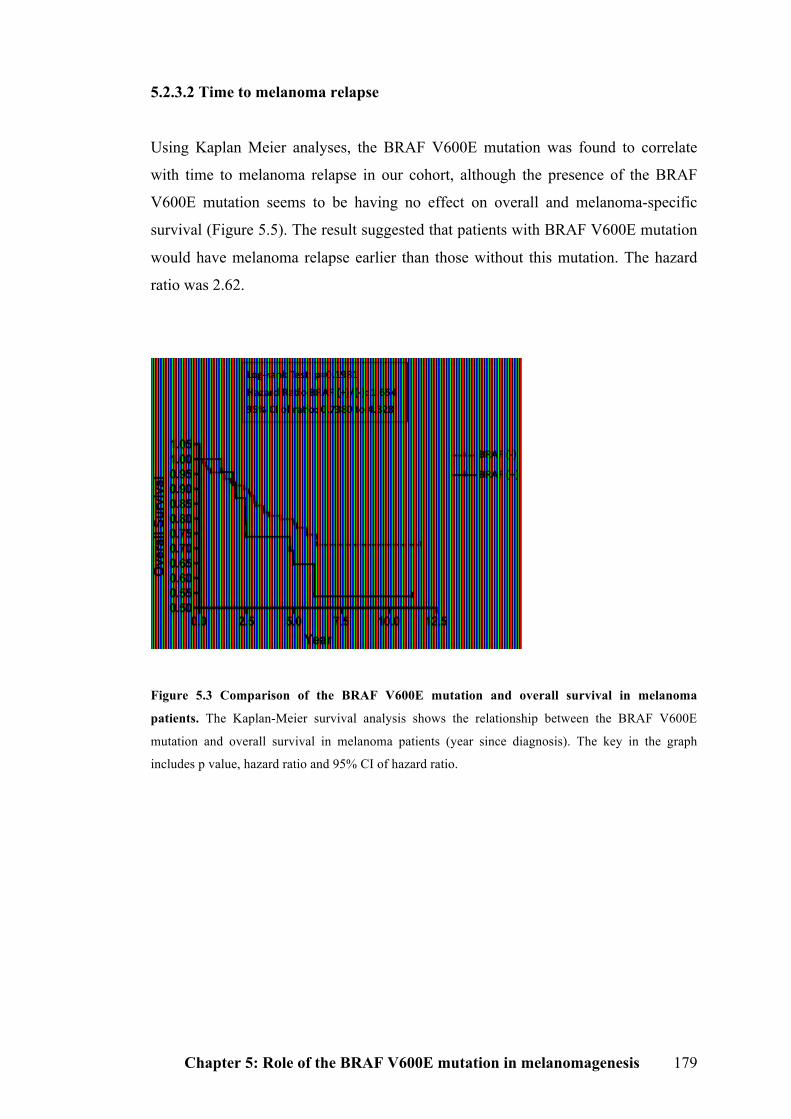
Chapter 5: Role of the BRAF V600E mutation in melanomagenesis 179
5.2.3.2 Time to melanoma relapse
Using Kaplan Meier analyses, the BRAF V600E mutation was found to correlate
with time to melanoma relapse in our cohort, although the presence of the BRAF
V600E mutation seems to be having no effect on overall and melanoma-specific
survival (Figure 5.5). The result suggested that patients with BRAF V600E mutation
would have melanoma relapse earlier than those without this mutation. The hazard
ratio was 2.62.
Figure 5.3 Comparison of the BRAF V600E mutation and overall survival in melanoma
patients. The Kaplan-Meier survival analysis shows the relationship between the BRAF V600E
mutation and overall survival in melanoma patients (year since diagnosis). The key in the graph
includes p value, hazard ratio and 95% CI of hazard ratio.
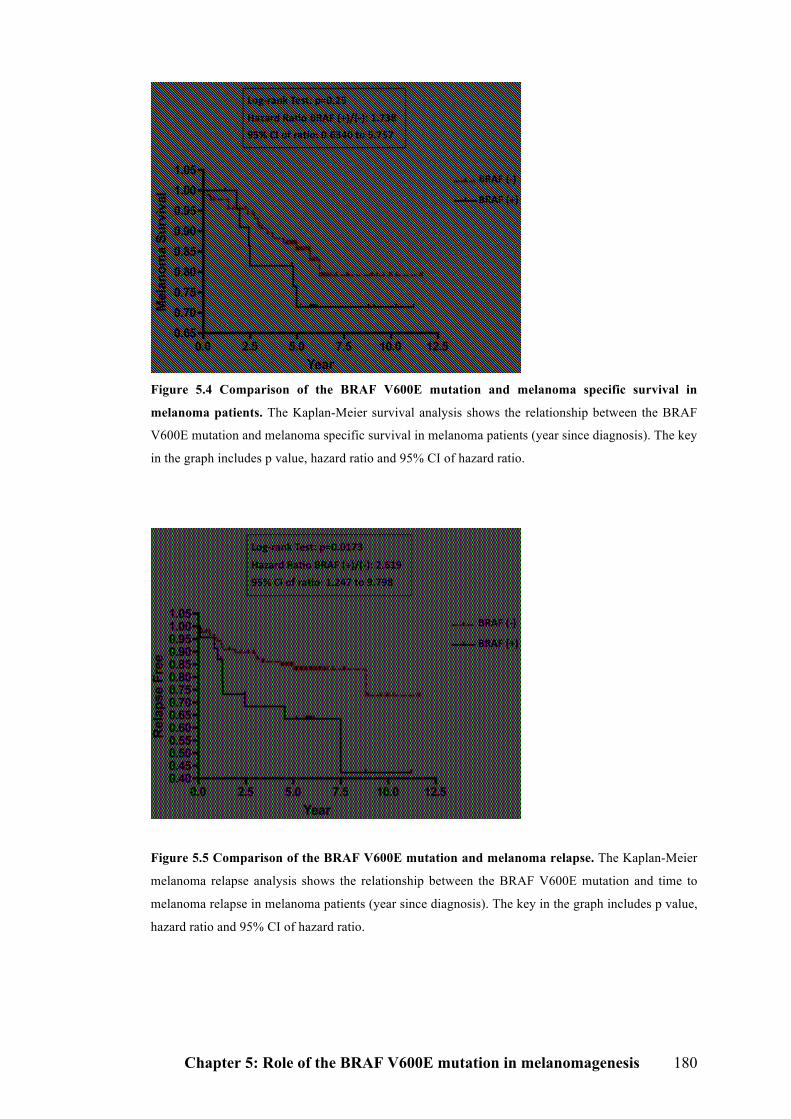
Chapter 5: Role of the BRAF V600E mutation in melanomagenesis 180
Figure 5.4 Comparison of the BRAF V600E mutation and melanoma specific survival in
melanoma patients. The Kaplan-Meier survival analysis shows the relationship between the BRAF
V600E mutation and melanoma specific survival in melanoma patients (year since diagnosis). The key
in the graph includes p value, hazard ratio and 95% CI of hazard ratio.
Figure 5.5 Comparison of the BRAF V600E mutation and melanoma relapse. The Kaplan-Meier
melanoma relapse analysis shows the relationship between the BRAF V600E mutation and time to
melanoma relapse in melanoma patients (year since diagnosis). The key in the graph includes p value,
hazard ratio and 95% CI of hazard ratio.

Chapter 5: Role of the BRAF V600E mutation in melanomagenesis 181
5.3 Discussion
In this Chapter, I showed that the frequency of the BRAF V600E mutation was 20%
using nested PCR-RFLP method in a 115-case primary melanoma cohort. The
frequency was 69% in metastatic melanoma samples. The presence of the BRAF
mutation was associated with gender and pigmentation. It was related to Breslow
thickness when the lesion was thicker than 2mm. In assessing the BRAF mutation’s
prognostic value, patients with BRAF V600E mutations seem to have melanoma
relapse earlier than those without the mutation. However, there was no evidence that
there was a correlation between the BRAF mutation and overall and melanoma-
specific survival in our sample panel.
To compare my results to others, I summarised the frequencies of the BRAF V600E
mutation in primary melanoma tissues from a number of published papers (Table
5.9). The prevalence of the BRAF V600E mutation observed in this study in
metastatic melanoma is consistent with reported frequencies in Pollock’s study [460],
while the frequency in primary melanomas was lower than in many published
reports, but was similar to that in most other large sample number studies (No.5, 12,
14 in Table 5.9). The reported incidence of the BRAF V600E mutation varies
between 20-80% in primary melanoma samples. The reasons why it varies so greatly
probably depend on the different types of samples analysed, the sample size and the
genotyping method used. BRAF mutations are more prevalent in superficial
spreading and nodular melanoma than in other types. Most of the published papers
did not mention the sensitivity of the genotyping assay. However, I showed that our
assay sensitivity is able to detect the mutation in small tumours when the cores
contain up to 90% non-tumour tissue.
Interestingly, there were two examples of homozygous BRAF mutation in primary
samples which is rare and has not been reported in other papers, although there is one
report of a possible homozygous mutation of BRAF in melanocytic lesions (benign
and atypical naevi) [461] .
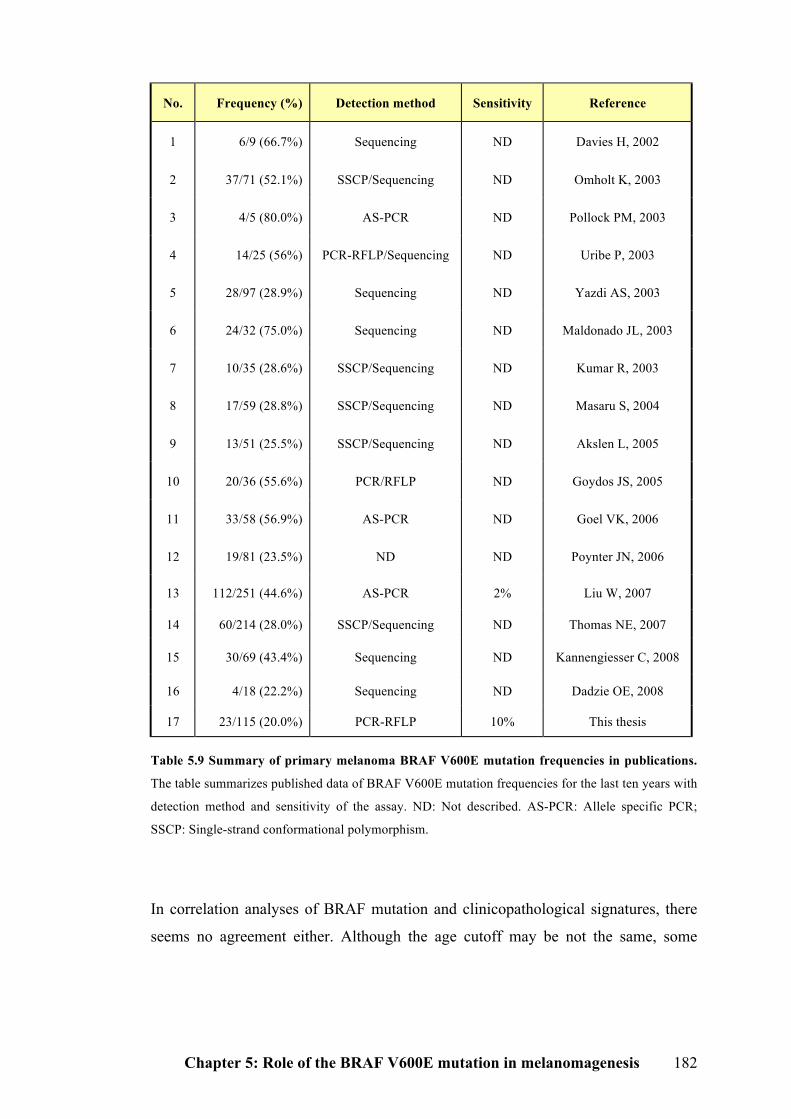
Chapter 5: Role of the BRAF V600E mutation in melanomagenesis 182
No. Frequency (%) Detection method Sensitivity Reference
1 6/9 (66.7%) Sequencing ND Davies H, 2002
2 37/71 (52.1%) SSCP/Sequencing ND Omholt K, 2003
3 4/5 (80.0%) AS-PCR ND Pollock PM, 2003
4 14/25 (56%) PCR-RFLP/Sequencing ND Uribe P, 2003
5 28/97 (28.9%) Sequencing ND Yazdi AS, 2003
6 24/32 (75.0%) Sequencing ND Maldonado JL, 2003
7 10/35 (28.6%) SSCP/Sequencing ND Kumar R, 2003
8 17/59 (28.8%) SSCP/Sequencing ND Masaru S, 2004
9 13/51 (25.5%) SSCP/Sequencing ND Akslen L, 2005
10 20/36 (55.6%) PCR/RFLP ND Goydos JS, 2005
11 33/58 (56.9%) AS-PCR ND Goel VK, 2006
12 19/81 (23.5%) ND ND Poynter JN, 2006
13 112/251 (44.6%) AS-PCR 2% Liu W, 2007
14 60/214 (28.0%) SSCP/Sequencing ND Thomas NE, 2007
15 30/69 (43.4%) Sequencing ND Kannengiesser C, 2008
16 4/18 (22.2%) Sequencing ND Dadzie OE, 2008
17 23/115 (20.0%) PCR-RFLP 10% This thesis
Table 5.9 Summary of primary melanoma BRAF V600E mutation frequencies in publications.
The table summarizes published data of BRAF V600E mutation frequencies for the last ten years with
detection method and sensitivity of the assay. ND: Not described. AS-PCR: Allele specific PCR;
SSCP: Single-strand conformational polymorphism.
In correlation analyses of BRAF mutation and clinicopathological signatures, there
seems no agreement either. Although the age cutoff may be not the same, some
Chapter 5: Role of the BRAF V600E mutation in melanomagenesis 183
research results showed that the BRAF mutation was more common in younger
patients [455, 457, 458, 462]. In Viros’ paper, age at diagnosis < 55yrs was described
as the single most predictive factor for BRAF mutation and the mutation showed a
significant decrease in survival when stratified by this age cutoff. However, this was
not seen in my study. BRAF mutation was correlated to male patients in our cohort,
which is consistent with the report from Uribe et al, indicating that mutation
frequencies may be related to hormonal influences in melanocyte biology [461].
Generally, the presence of the BRAF mutation has not been correlated to the key
prognostic indicator, Breslow thickness, except for Liu’s study that reported a
correlation with lower thickness [462]. However, my data indicated that BRAF
mutation was related to higher thickness when the cutoff was 2mm, which is
opposite to their results. Interestingly, both of our results showed significant
correlation between BRAF mutation and more frequent pigment production, which
was also seen in Viros’s study [455]. This evidence supports the finding that mutant
BRAF V600E activates the MAPK pathway and modulates MITF function and
melanocytes’ differentiation [462]. A relationship between BRAF mutation and
ulceration is rarely seen, but Akslen et al. reported that primary tumours with BRAF
mutation were more often ulcerated than wild type tumours [463].
Solar elastosis (SE) reflects cumulative UV exposure. Many studies showed an
inverse relationship between BRAF mutation and SE [449, 455, 457, 459, 462].
However, there was no correlation between SE and BRAF mutation in my study,
perhaps due to the small sample size. It still needs to be determined whether UVR
causes BRAF mutations since there are both arguments against and for this
association.
The arguments against the association are: first, the most common BRAF V600E
mutation results from a single base-pair substitution (T>A) while the typical
mutations caused by UVR are C>T/CC>TT; secondly, the BRAF mutation also
occurs frequently in other cancers, such as thyroid, ovarian and colon cancer, which
arise in the absence of UVR [448].
Chapter 5: Role of the BRAF V600E mutation in melanomagenesis 184
On the other hand, there are arguments that support the association that the BRAF
mutation is the result of UVR. It was proposed that T>A mutation could arise from
error-prone replication of UV-damaged DNA [458]. BRAF mutation is often seen in
cutaneous melanoma but not in uveal and mucosal melanomas indicating that it is
related to UVR. Moreover, BRAF mutation is common in sites that receive
intermittent UVR (trunk and extremities), whereas it is rarely seen in locations that
receive the lowest (mucosa) and highest (face) sun exposure. Other theories are:
BRAF mutations may result from reactive oxygen species, which may be produced
as a by-product of melanomagenesis or by pheomelanin absorption of UVA [458];
BRAF mutation is linked to inflammation that may result from sunburn; the fact that
melanocytic lesions have a high frequency of BRAF mutation may be explained by
UVR triggering a stronger proliferative response in melanocytes with an activating
BRAF mutation than in neighbouring cells with wild type BRAF, further promoting
melanoma progression in UV-exposed sites [464, 465].
Prior to my study, some studies correlated BRAF mutation to Clark level, a previous
prognostic marker. However, there was no evidence showing that the presence of
BRAF mutation affects survival [461, 466]. Using Kaplan Meier survival analysis,
my results showed melanoma patients with BRAF mutation had shorter trends of
overall survival and melanoma survival compared to patients without BRAF
mutation, although the difference was not significant. The analysis also showed that
patients with BRAF V600E mutation had significantly shorter melanoma-recurrence
free times than patients without BRAF mutation. However, if the patient survival had
been monitored over a longer period then the presence of the BRAF mutation may
have become significant.
As mentioned in Chapter 1, personalised therapy has become the hope for curing
cancer. Several strategies for inhibiting MAPK signalling, including RAF kinase
inhibitors and MEK inhibitors, are now being evaluated clinically in melanoma
therapy. The limited activity of sorafenib in tumours with BRAF mutation prompted
the development of second-generation RAF inhibitors with greater selectivity for
mutant BRAF. Vemurafinib (PLX4032) is a potent inhibitor of mutated BRAF. It has
Chapter 5: Role of the BRAF V600E mutation in melanomagenesis 185
marked antitumour effects against melanoma cell lines with the BRAF V600E
mutation, but not against cells with wild type BRAF [467]. Phase 1 and 2 clinical
trials with Vemurafinib have shown response rates of more than 50% in patients with
metastatic melanoma with the BRAF V600E mutation. A very recent report of the
drug in a Phase 3 trial showed that Vemurafinib improved rates of overall and
progression-free survival in patients with previously untreated melanoma with BRAF
V600E mutation compared to the Dacarbazine group [467]. Besides the most
common adverse events such as arthralgia, fatigue and photosensitive skin reactions
of grade 2 or 3 that were seen in 12% of the patients, 18% of patients developed at
least one squamous cell carcinoma of the skin or keratoacanthoma. One of the
suggested mechanisms was linked to the observation that drugs that selectively
inhibit BRAF drive RAS-dependent BRAF binding to CRAF and CRAF activation
and MEK-ERK signalling when BRAF is inhibited in the presence of oncogenic
RAS. Another problem that needs to be clarified is that melanomas become resistant
to Vemurafinib. Studies from several groups have indicated that the MAPK pathway
can be reactivated in resistant tumours, although the precise mechanisms of
reactivation are still being investigated.

Chapter 6: Summary 186
Chapter 6: Summary

Chapter 6: Summary 187
6.1 General discussion
My work presented in this thesis focused on two types of molecules: melanoma-
specific miRNAs and oncogenic BRAF. In Chapter 3, a melanoma-specific miRNA
expression profile was established and miRNA biomarker candidates were verified.
Studies in Chapter 4 identified three miRNAs acting as tumour suppressors in
melanomagenesis. The work in Chapter 5 determined the prevalence of BRAF
mutation based on our TMA panel and correlated it with clinicopathological
signatures and melanoma patient survival. The investigation of these key non-coding
and coding genes improves our understanding of the molecular pathogenesis of
cutaneous melanoma, identifies novel miRNA biomarker candidates in both
diagnosis and prognosis, and may help us to develop more effective therapeutic
interventions for cutaneous melanoma.
miRNAs are highly conserved, indicating their important roles in basic cellular
processes. miRNA alterations have been observed in all forms of cancer. High
throughput analyses identified specific miRNA expression patterns in various
cancers, suggesting that miRNA expression profiles are tissue-specific and possess
diagnostic value. Additionally, miRNA expression profiling can be utilized to
determine cancer prognosis. More importantly for studies on melanoma where access
to fresh frozen tissue is limited, reproducible miRNA expression profiles from FFPE
samples can be obtained that are comparable to those from fresh frozen samples.
Against this background, I carried out a miRNA microarray study. I consider my
miRNA profiling study to be the best melanoma-specific miRNA profile so far
because it detects the most miRNA probes, has the most FFPE samples, contains
complete stages in melanoma progression and is verified by qPCR. Through this, I
obtained a melanoma-specific miRNA expression profile based on FFPE samples.
This profile established a number of miRNAs that were differentially expressed
between benign naevi and melanomas and showed high potential in melanoma
diagnosis, where morphological separation is particularly difficult for certain types of
melanocytic lesion. Therefore, in a further study of miRNA diagnostic roles in
melanoma, expression of five miRNAs was determined using qRT-PCR in FFPE

Chapter 6: Summary 188
samples of additional types of these melanocytic lesions, including Blue naevus,
Spitz naevus and dysplastic naevus. Possibly due to the limitation of very small
sample size, I did not identify a miRNA that can separate the different melanocytic
lesions clearly. However, I believe that such an approach could still be helpful
diagnostically if large sample numbers are used and the use of miRNA in-situ
hybridization (ISH) for miRNA detection can be developed to eliminate the need for
RNA extraction from very small lesions such as in-situ melanoma. Moreover, in an
attempt to identify miRNAs with prognostic value, a comparison between non-
recurrent and recurrent primary melanoma was performed. Again, increasing sample
numbers will be needed to identify differentially expressed miRNAs. In addition,
retrieving the detailed survival records of the primary melanoma patients would be
needed for further analysis to correlate differentially expressed miRNAs with patient
survival.
One of the most important mechanisms of miRNA action is to stimulate mRNA
cleavage resulting in mRNA degradation. miRNAs have been shown to target both
tumour suppressors and oncogenes to influence cancer development. Some miRNAs
can have opposite effects in different cancers, or can switch between these two
functions and act as a tumour suppressor at one time and an oncogene at another
time. Thus, altering miRNA expression could to be a novel treatment for cancers.
23 miRNAs were identified as candidates for follow on functional studies from the
differentially expressed miRNAs between benign naevi and malignancies. Nine
miRNAs from the 23 candidates were verified by qRT-PCR and four of them were
taken on into functional assays. Interestingly, ectopic overexpression of miR-200c
and miR-205 in melanoma cells inhibited anchorage independent colony forming
ability. Moreover, elevation of miR-200c resulted in increased expression levels of
E-cadherin through negative regulation of the ZEB2 gene. Ectopic overexpression of
miR-211 in melanoma cells repressed both colony formation and migratory ability.
These findings indicate that miR-200c, miR-205 and miR-211 may act as tumour
suppressors in melanomagenesis, which could make these miRNAs potential targets
for melanoma therapy. Further studies, such as investigating more melanoma cell

Chapter 6: Summary 189
lines, constructing stable cell lines with ectopic expression of these miRNAs, and
animal models would be needed to confirm the above association between these
miRNAs and melanomagenesis, and would be useful to address additional questions
that I have not been able to answer. For example, in my transient expression assays,
mRNA level changes of N-cadherin were not observed and there was difficulty in
detecting a change in E-cadherin protein levels. However, using miR-200c precursor
transfected stable cell lines it may be possible to see decreased mRNA and protein
levels of N-cadherin, which would suggest that miR-200c influences the EMT
process through both mRNA and protein level changes of E-cadherin.
Oncogenic BRAF, which activates the MAPK pathway and results in tumour
development, has been well studied in recent years. BRAF mutations are common in
benign melanocytic naevi, primary and metastatic melanomas. The BRAF V600E
mutation accounts for the majority of BRAF mutations. Based on the samples from
our TMA panel, 20% and 69% BRAF V600E mutations were found in primary and
metastatic melanoma, respectively. The correlation between BRAF mutation and
clinicopathological features varies according to different reports. In our study, the
presence of BRAF mutation was associated with gender and pigmentation. It was
related to Breslow thickness when the lesion was thicker than 2mm. In assessing the
BRAF mutation’s prognostic value, patients with BRAF V600E mutations have
melanoma relapse earlier than those without the mutation. However, no evidence
showing that there was correlation between BRAF mutations and overall survival
and melanoma-specific survival was found in our sample panel. This additional study
is a useful supplement to further understanding of the role of the BRAF mutation in
melanoma.
In Caramuta’s study, miRNA expression profiles were associated with clinical
characteristics, patient survival, and mutational status for BRAF and NRAS [358].
Therefore, it would have been interesting to investigate whether there were
expression level differences for the melanoma-specific miRNAs I identified between
patients with mutated BRAF and patients with wild type BRAF and whether such
differences affected survival. However, there were only a very few samples in
Chapter 6: Summary 190
common between the miRNA and BRAF project and so no such analysis was
possible. This did not reflect bad experimental design, but rather that insufficient
material was available from the large number of thin primary melanomas in the TMA
study to also extract RNA for miRNA analysis and DNA for BRAF mutation
detection.
6.2 Future work
Following on from the work described in the thesis, especially for the miRNA
project, there remains a need for further research. First is to develop and use miRNA
ISH on our melanoma TMA panel. miRCURY LNA™ detection probes have been
successfully used in various types of samples, including FFPE tissues [468], although
it is a difficult work technically. I believe that miRNAs can be used in conjunction
with conventional histology to facilitate the diagnosis of melanocytic lesions.
Applying ISH on conventional FFPE patient samples to the best miRNA markers I
have identified by microarray and qRT-PCR is a feasible approach to achieve the
goal. Using miRNA ISH, it may be able to answer the questions: whether the
miRNA expression patterns I obtained by microarray and verified by qPCR are
supported by miRNA ISH expression patterns; whether using miRNA ISH can
discriminate between various type of melanocytic lesions; whether the best miRNA
biomarker candidates detected by miRNA ISH can be used as a routine diagnostic
tool clinically.
Secondly, functional studies using stable cell lines and research experiments in vivo
are necessary. The tumour suppressor functions of the two most interesting miRNAs,
miR-200c and miR-211, can be verified and further investigated using stable cell
lines transfected with miR-200c and miR-211 vectors. Long-term observations can
be made using the anchorage independent colony formation assay. Moreover, tumour
growth can be measured after stable cells are injected subcutaneously into nude mice.
miRNA target studies at both the mRNA and protein level can also be carried out for
longer time courses with a coupled luciferase assay that can confirm direct targets.
Chapter 6: Summary 191
The above work would be valuable and necessary to establish the case for using
miRNAs as future treatments for melanoma.
The studies I presented in the thesis were mostly directed to the downstream effects
of miRNAs. However, miRNA regulation is an important topic, which is crucial in
carcinogenesis. Epigenetic alterations are widely described as essential players in
cancer progression. Such epigenetic modification mainly results in aberrant gene
expression due to DNA methylation or histone deacetylation. Mis-expression of
miRNAs is partially dependent on epigenetic regulation. Therefore, it would be
essential to study methylation or histone deacetylation status of the miRNA gene
candidates from my miRNA expression profile. A most recent paper reported that the
miR-200 family, especially miR-200c and miR-205 loci, are specifically silenced and
gain promoter hypermethylation and repressive chromatin marks in muscle invasive
bladder tumours and undifferentiated bladder cell lines [469]. The questions of
whether these miRNA genes are silenced and methylated in melanoma and whether
correcting this is required for cure of melanoma need to be answered.
Other work would involve: target studies of aberrant miRNAs using gene expression
array or protein array on cells with ectopic miRNA expression; functional studies of
miR-675, miR-203 or other differentially expressed miRNAs; and further study on
miR-20b under different oxygen conditions. Moreover, it was found that miRNAs
are present in the circulation of humans and other animals [470]. miRNAs can be
used as biomarkers in blood and other biofluids, and the potential role of detecting
miRNA expression in body fluids could be an important non-invasive tool for early
cancer detection [471].
In conclusion, the investigation of both non-coding and coding genes improves our
understanding in cutaneous melanomagenesis. Established miRNA biomarker
candidates would be useful clinically in both diagnosis and prognosis. Finally, the
functional miRNA candidates may be the basis for future treatments for cutaneous
melanoma.

References 192
References

References 193
1. Vancoillie, G., J. Lambert, and J.M. Nayaert, Melanocyte biology and its implications for the clinician. Eur J Dermatol, 1999. 9(3): p. 241-51.
2. Duband, J.L. and J.P. Thiery, Appearance and distribution of fibronectin during chick embryo gastrulation and neurulation. Dev Biol, 1982. 94(2): p. 337-50.
3. Prota, G., Recent advances in the chemistry of melanogenesis in mammals. J Invest Dermatol, 1980. 75(1): p. 122-7.
4. Land, E.J. and P.A. Riley, Spontaneous redox reactions of dopaquinone and the balance between the eumelanic and phaeomelanic pathways. Pigment Cell Res, 2000. 13(4): p. 273-7.
5. Poh Agin, P., R.M. Sayre, and M.R. Chedekel, Photodegradation of phaeomelanin: an in vitro model. Photochem Photobiol, 1980. 31(4): p. 359-62.
6. Persad, S., I.A. Menon, and H.F. Haberman, Comparison of the effects of UV-visible irradiation of melanins and melanin-hematoporphyrin complexes from human black and red hair. Photochem Photobiol, 1983. 37(1): p. 63-8.
7. Scott, M.C., et al., Human melanocortin 1 receptor variants, receptor function and melanocyte response to UV radiation. J Cell Sci, 2002. 115(Pt 11): p. 2349-55.
8. Wenczl, E., et al., (Pheo)melanin photosensitizes UVA-induced DNA damage in cultured human melanocytes. J Invest Dermatol, 1998. 111(4): p. 678-82.
9. Rees, J.L., Genetics of hair and skin color. Annu Rev Genet, 2003. 37: p. 67-90.
10. Kennedy, C., et al., Melanocortin 1 receptor (MC1R) gene variants are associated with an increased risk for cutaneous melanoma which is largely independent of skin type and hair color. J Invest Dermatol, 2001. 117(2): p. 294-300.
11. Ananthaswamy, H.N., et al., Sunlight and skin cancer: inhibition of p53 mutations in UV-irradiated mouse skin by sunscreens. Nat Med, 1997. 3(5): p. 510-4.
12. Soehnge, H., A. Ouhtit, and O.N. Ananthaswamy, Mechanisms of induction of skin cancer by UV radiation. Front Biosci, 1997. 2: p. d538-51.
13. el-Deiry, W.S., et al., WAF1, a potential mediator of p53 tumor suppression. Cell, 1993. 75(4): p. 817-25.
14. Hermeking, H., et al., 14-3-3 sigma is a p53-regulated inhibitor of G2/M progression. Mol Cell, 1997. 1(1): p. 3-11.
References 194
15. Hill, L.L., et al., Fas ligand: a sensor for DNA damage critical in skin cancer etiology. Science, 1999. 285(5429): p. 898-900.
16. Lo, H.L., et al., Differential biologic effects of CPD and 6-4PP UV-induced DNA damage on the induction of apoptosis and cell-cycle arrest. BMC Cancer, 2005. 5: p. 135.
17. You, Y.H., et al., Cyclobutane pyrimidine dimers are responsible for the vast majority of mutations induced by UVB irradiation in mammalian cells. J Biol Chem, 2001. 276(48): p. 44688-94.
18. de Boer, J. and J.H. Hoeijmakers, Nucleotide excision repair and human syndromes. Carcinogenesis, 2000. 21(3): p. 453-60.
19. Wood, R.D., DNA damage recognition during nucleotide excision repair in mammalian cells. Biochimie, 1999. 81(1-2): p. 39-44.
20. Kraemer, K.H., et al., The role of sunlight and DNA repair in melanoma and nonmelanoma skin cancer. The xeroderma pigmentosum paradigm. Arch Dermatol, 1994. 130(8): p. 1018-21.
21. Stary, A. and A. Sarasin, The genetics of the hereditary xeroderma pigmentosum syndrome. Biochimie, 2002. 84(1): p. 49-60.
22. Spatz, A., et al., Association between DNA repair-deficiency and high level of p53 mutations in melanoma of Xeroderma pigmentosum. Cancer Res, 2001. 61(6): p. 2480-6.
23. Thompson, J.F., R.A. Scolyer, and R.F. Kefford, Cutaneous melanoma. Lancet, 2005. 365(9460): p. 687-701.
24. Gilchrest, B.A., et al., The pathogenesis of melanoma induced by ultraviolet radiation. N Engl J Med, 1999. 340(17): p. 1341-8.
25. Opdecamp, K., et al., Melanocyte development in vivo and in neural crest cell cultures: crucial dependence on the Mitf basic-helix-loop-helix-zipper transcription factor. Development, 1997. 124(12): p. 2377-86.
26. Sasaki, M., et al., Up-regulation of tyrosinase gene by nitric oxide in human melanocytes. Pigment Cell Res, 2000. 13(4): p. 248-52.
27. Suzuki, I., et al., Participation of the melanocortin-1 receptor in the UV control of pigmentation. J Investig Dermatol Symp Proc, 1999. 4(1): p. 29-34.
28. Ivanova, K., et al., Effect of nitric oxide on the adhesion of human melanocytes to extracellular matrix components. J Pathol, 1997. 183(4): p. 469-76.

References 195
29. Karim-Kos, H.E., et al., Recent trends of cancer in Europe: a combined approach of incidence, survival and mortality for 17 cancer sites since the 1990s. Eur J Cancer, 2008. 44(10): p. 1345-89.
30. Coory, M., et al., Trends for in situ and invasive melanoma in Queensland, Australia, 1982-2002. Cancer Causes Control, 2006. 17(1): p. 21-7.
31. About melanoma skin cancer- A Quick guide 2011, Cancer Research UK.
32. Cancer Research UK cancer stats, 2008.
33. Surveillance epidemiology and end results. Faststats. Available from: http://seer.cancer.gov/faststats.
34. Fecher, L.A., et al., Toward a molecular classification of melanoma. J Clin Oncol, 2007. 25(12): p. 1606-20.
35. Harrison, S.L., R.M. MacKie, and R. MacLennan, Development of melanocytic nevi in the first three years of life. J Natl Cancer Inst, 2000. 92(17): p. 1436-8.
36. Gandini, S., et al., Meta-analysis of risk factors for cutaneous melanoma: II. Sun exposure. Eur J Cancer, 2005. 41(1): p. 45-60.
37. Armstrong, B.K. and A. Kricker, The epidemiology of UV induced skin cancer. J Photochem Photobiol B, 2001. 63(1-3): p. 8-18.
38. Holly, E.A., et al., Cutaneous melanoma in women. I. Exposure to sunlight, ability to tan, and other risk factors related to ultraviolet light. Am J Epidemiol, 1995. 141(10): p. 923-33.
39. Westerdahl, J., et al., Use of sunbeds or sunlamps and malignant melanoma in southern Sweden. Am J Epidemiol, 1994. 140(8): p. 691-9.
40. Bataille, V., et al., A multicentre epidemiological study on sunbed use and cutaneous melanoma in Europe. Eur J Cancer, 2005. 41(14): p. 2141-9.
41. Autier, P., Cutaneous malignant melanoma: facts about sunbeds and sunscreen. Expert Rev Anticancer Ther, 2005. 5(5): p. 821-33.
42. Palmer, J.S., et al., Melanocortin-1 receptor polymorphisms and risk of melanoma: is the association explained solely by pigmentation phenotype? Am J Hum Genet, 2000. 66(1): p. 176-86.
43. Mossner, R., et al., Variations of the melanocortin-1 receptor and the glutathione-S transferase T1 and M1 genes in cutaneous malignant melanoma. Arch Dermatol Res, 2007. 298(8): p. 371-9.
44. Gandini, S., et al., Meta-analysis of risk factors for cutaneous melanoma: I. Common and atypical naevi. Eur J Cancer, 2005. 41(1): p. 28-44.

References 196
45. Bataille, V. and E. de Vries, Melanoma--Part 1: epidemiology, risk factors, and prevention. BMJ, 2008. 337: p. a2249.
46. Aitken, J., et al., CDKN2A variants in a population-based sample of Queensland families with melanoma. J Natl Cancer Inst, 1999. 91(5): p. 446-52.
47. Roberts, D.L., et al., U.K. guidelines for the management of cutaneous melanoma. Br J Dermatol, 2002. 146(1): p. 7-17.
48. Balch, C.M., et al., Final version of 2009 AJCC melanoma staging and classification. J Clin Oncol, 2009. 27(36): p. 6199-206.
49. Balch, C.M., et al., Prognostic factors analysis of 17,600 melanoma patients: validation of the American Joint Committee on Cancer melanoma staging system. J Clin Oncol, 2001. 19(16): p. 3622-34.
50. Rousseau, D.L., Jr., et al., Revised American Joint Committee on Cancer staging criteria accurately predict sentinel lymph node positivity in clinically node-negative melanoma patients. Ann Surg Oncol, 2003. 10(5): p. 569-74.
51. Balch, C.M., et al., An evidence-based staging system for cutaneous melanoma. CA Cancer J Clin, 2004. 54(3): p. 131-49; quiz 182-4.
52. Carlson, J.A., et al., Molecular diagnostics in melanoma. J Am Acad Dermatol, 2005. 52(5): p. 743-75; quiz 775-8.
53. Lodha, S., et al., Discordance in the histopathologic diagnosis of difficult melanocytic neoplasms in the clinical setting. J Cutan Pathol, 2008. 35(4): p. 349-52.
54. Blokx, W.A., M.C. van Dijk, and D.J. Ruiter, Molecular cytogenetics of cutaneous melanocytic lesions - diagnostic, prognostic and therapeutic aspects. Histopathology. 56(1): p. 121-32.
55. Balch, C.M., et al., Final version of the American Joint Committee on Cancer staging system for cutaneous melanoma. J Clin Oncol, 2001. 19(16): p. 3635-48.
56. Friedman, R.J., D.S. Rigel, and A.W. Kopf, Early detection of malignant melanoma: the role of physician examination and self-examination of the skin. CA Cancer J Clin, 1985. 35(3): p. 130-51.
57. Hersey, P., Adjuvant therapy for high-risk primary and resected metastatic melanoma. Intern Med J, 2003. 33(1-2): p. 33-43.
58. Eggermont, A., et al. EORTC 18991: Long-term adjuvant pegylated interferon-alpha2b (PEG-IFN) compared to observation in resected stage III

References 197
melanoma, final results of a randomized phase III trial in ASCO 2007 Journal of Clinical oncology.
59. Thirlwell, C. and P. Nathan, Melanoma--part 2: management. BMJ, 2008. 337: p. a2488.
60. http://www.cancerhelp.org.uk/type/melanoma/treatment/melanoma-statistics-and-outlook.
61. Davies, M.A. and Y. Samuels, Analysis of the genome to personalize therapy for melanoma. Oncogene, 2010. 29(41): p. 5545-55.
62. Atkins, M.B., et al., High-dose recombinant interleukin 2 therapy for patients with metastatic melanoma: analysis of 270 patients treated between 1985 and 1993. J Clin Oncol, 1999. 17(7): p. 2105-16.
63. Phan, G.Q., et al., Factors associated with response to high-dose interleukin-2 in patients with metastatic melanoma. J Clin Oncol, 2001. 19(15): p. 3477-82.
64. Tsao, H., M.B. Atkins, and A.J. Sober, Management of cutaneous melanoma. N Engl J Med, 2004. 351(10): p. 998-1012.
65. Clark, W.H., Jr., et al., A study of tumor progression: the precursor lesions of superficial spreading and nodular melanoma. Hum Pathol, 1984. 15(12): p. 1147-65.
66. Michaloglou, C., et al., BRAFE600-associated senescence-like cell cycle arrest of human naevi. Nature, 2005. 436(7051): p. 720-4.
67. Braig, M. and C.A. Schmitt, Oncogene-induced senescence: putting the brakes on tumor development. Cancer Res, 2006. 66(6): p. 2881-4.
68. Robinson, M.J. and M.H. Cobb, Mitogen-activated protein kinase pathways. Curr Opin Cell Biol, 1997. 9(2): p. 180-6.
69. Crews, C.M., A. Alessandrini, and R.L. Erikson, The primary structure of MEK, a protein kinase that phosphorylates the ERK gene product. Science, 1992. 258(5081): p. 478-80.
70. Kyriakis, J.M., et al., Raf-1 activates MAP kinase-kinase. Nature, 1992. 358(6385): p. 417-21.
71. Cohen, C., et al., Mitogen-actived protein kinase activation is an early event in melanoma progression. Clin Cancer Res, 2002. 8(12): p. 3728-33.
72. Nesbit, M., et al., Basic fibroblast growth factor induces a transformed phenotype in normal human melanocytes. Oncogene, 1999. 18(47): p. 6469-76.
References 198
73. Li, G., K. Satyamoorthy, and M. Herlyn, N-cadherin-mediated intercellular interactions promote survival and migration of melanoma cells. Cancer Res, 2001. 61(9): p. 3819-25.
74. Padua, R.A., N.C. Barrass, and G.A. Currie, Activation of N-ras in a human melanoma cell line. Mol Cell Biol, 1985. 5(3): p. 582-5.
75. Hocker, T. and H. Tsao, Ultraviolet radiation and melanoma: a systematic review and analysis of reported sequence variants. Hum Mutat, 2007. 28(6): p. 578-88.
76. Brose, M.S., et al., BRAF and RAS mutations in human lung cancer and melanoma. Cancer Res, 2002. 62(23): p. 6997-7000.
77. Davies, H., et al., Mutations of the BRAF gene in human cancer. Nature, 2002. 417(6892): p. 949-54.
78. Smalley, K.S., Understanding melanoma signaling networks as the basis for molecular targeted therapy. J Invest Dermatol, 2010. 130(1): p. 28-37.
79. Garnett, M.J. and R. Marais, Guilty as charged: B-RAF is a human oncogene. Cancer Cell, 2004. 6(4): p. 313-9.
80. Wan, P.T., et al., Mechanism of activation of the RAF-ERK signaling pathway by oncogenic mutations of B-RAF. Cell, 2004. 116(6): p. 855-67.
81. Bhatt, K.V., et al., Adhesion control of cyclin D1 and p27Kip1 levels is deregulated in melanoma cells through BRAF-MEK-ERK signaling. Oncogene, 2005. 24(21): p. 3459-71.
82. Zhang, X.D., et al., Activation of ERK1/2 protects melanoma cells from TRAIL-induced apoptosis by inhibiting Smac/DIABLO release from mitochondria. Oncogene, 2003. 22(19): p. 2869-81.
83. Eisenmann, K.M., et al., Mitogen-activated protein kinase pathway-dependent tumor-specific survival signaling in melanoma cells through inactivation of the proapoptotic protein bad. Cancer Res, 2003. 63(23): p. 8330-7.
84. Cartlidge, R.A., et al., Oncogenic BRAF(V600E) inhibits BIM expression to promote melanoma cell survival. Pigment Cell Melanoma Res, 2008. 21(5): p. 534-44.
85. Kumar, S.M., et al., Mutant V600E BRAF increases hypoxia inducible factor-1alpha expression in melanoma. Cancer Res, 2007. 67(7): p. 3177-84.
86. Woods, D., et al., Induction of beta3-integrin gene expression by sustained activation of the Ras-regulated Raf-MEK-extracellular signal-regulated kinase signaling pathway. Mol Cell Biol, 2001. 21(9): p. 3192-205.
References 199
87. Benbow, U., et al., High levels of MMP-1 expression in the absence of the 2G single nucleotide polymorphism is mediated by p38 and ERK1/2 mitogen-activated protein kinases in VMM5 melanoma cells. J Cell Biochem, 2002. 86(2): p. 307-19.
88. Ge, X., Y.M. Fu, and G.G. Meadows, U0126, a mitogen-activated protein kinase kinase inhibitor, inhibits the invasion of human A375 melanoma cells. Cancer Lett, 2002. 179(2): p. 133-40.
89. Huntington, J.T., et al., Overexpression of collagenase 1 (MMP-1) is mediated by the ERK pathway in invasive melanoma cells: role of BRAF mutation and fibroblast growth factor signaling. J Biol Chem, 2004. 279(32): p. 33168-76.
90. Kono, M., et al., Role of the mitogen-activated protein kinase signaling pathway in the regulation of human melanocytic antigen expression. Mol Cancer Res, 2006. 4(10): p. 779-92.
91. Miller, A.J. and M.C. Mihm, Jr., Melanoma. N Engl J Med, 2006. 355(1): p. 51-65.
92. Stahl, J.M., et al., Deregulated Akt3 activity promotes development of malignant melanoma. Cancer Res, 2004. 64(19): p. 7002-10.
93. Tsao, H., et al., Genetic interaction between NRAS and BRAF mutations and PTEN/MMAC1 inactivation in melanoma. J Invest Dermatol, 2004. 122(2): p. 337-41.
94. Li, J., et al., PTEN, a putative protein tyrosine phosphatase gene mutated in human brain, breast, and prostate cancer. Science, 1997. 275(5308): p. 1943-7.
95. Steck, P.A., et al., Identification of a candidate tumour suppressor gene, MMAC1, at chromosome 10q23.3 that is mutated in multiple advanced cancers. Nat Genet, 1997. 15(4): p. 356-62.
96. You, M.J., et al., Genetic analysis of Pten and Ink4a/Arf interactions in the suppression of tumorigenesis in mice. Proc Natl Acad Sci U S A, 2002. 99(3): p. 1455-60.
97. Lin, W.M., et al., Modeling genomic diversity and tumor dependency in malignant melanoma. Cancer Res, 2008. 68(3): p. 664-73.
98. Brazil, D.P., J. Park, and B.A. Hemmings, PKB binding proteins. Getting in on the Akt. Cell, 2002. 111(3): p. 293-303.
99. Wu, H., V. Goel, and F.G. Haluska, PTEN signaling pathways in melanoma. Oncogene, 2003. 22(20): p. 3113-22.
References 200
100. Cantley, L.C. and B.G. Neel, New insights into tumor suppression: PTEN suppresses tumor formation by restraining the phosphoinositide 3-kinase/AKT pathway. Proc Natl Acad Sci U S A, 1999. 96(8): p. 4240-5.
101. Datta, S.R., et al., Akt phosphorylation of BAD couples survival signals to the cell-intrinsic death machinery. Cell, 1997. 91(2): p. 231-41.
102. Robertson, G.P., Functional and therapeutic significance of Akt deregulation in malignant melanoma. Cancer Metastasis Rev, 2005. 24(2): p. 273-85.
103. Bedogni, B., et al., The hypoxic microenvironment of the skin contributes to Akt-mediated melanocyte transformation. Cancer Cell, 2005. 8(6): p. 443-54.
104. Bedogni, B., et al., Notch1 is an effector of Akt and hypoxia in melanoma development. J Clin Invest, 2008. 118(11): p. 3660-70.
105. Hodgkinson, C.A., et al., Mutations at the mouse microphthalmia locus are associated with defects in a gene encoding a novel basic-helix-loop-helix-zipper protein. Cell, 1993. 74(2): p. 395-404.
106. Nishimura, E.K., S.R. Granter, and D.E. Fisher, Mechanisms of hair graying: incomplete melanocyte stem cell maintenance in the niche. Science, 2005. 307(5710): p. 720-4.
107. Widlund, H.R. and D.E. Fisher, Microphthalamia-associated transcription factor: a critical regulator of pigment cell development and survival. Oncogene, 2003. 22(20): p. 3035-41.
108. Loercher, A.E., et al., MITF links differentiation with cell cycle arrest in melanocytes by transcriptional activation of INK4A. J Cell Biol, 2005. 168(1): p. 35-40.
109. Carreira, S., et al., Mitf cooperates with Rb1 and activates p21Cip1 expression to regulate cell cycle progression. Nature, 2005. 433(7027): p. 764-9.
110. Wellbrock, C. and R. Marais, Elevated expression of MITF counteracts B-RAF-stimulated melanocyte and melanoma cell proliferation. J Cell Biol, 2005. 170(5): p. 703-8.
111. Hoek, K.S., et al., In vivo switching of human melanoma cells between proliferative and invasive states. Cancer Res, 2008. 68(3): p. 650-6.
112. McGill, G.G., et al., Bcl2 regulation by the melanocyte master regulator Mitf modulates lineage survival and melanoma cell viability. Cell, 2002. 109(6): p. 707-18.
References 201
113. Du, J., et al., Critical role of CDK2 for melanoma growth linked to its melanocyte-specific transcriptional regulation by MITF. Cancer Cell, 2004. 6(6): p. 565-76.
114. Goding, C.R., Mitf from neural crest to melanoma: signal transduction and transcription in the melanocyte lineage. Genes Dev, 2000. 14(14): p. 1712-28.
115. Garraway, L.A., et al., Integrative genomic analyses identify MITF as a lineage survival oncogene amplified in malignant melanoma. Nature, 2005. 436(7047): p. 117-22.
116. Wellbrock, C., et al., Oncogenic BRAF regulates melanoma proliferation through the lineage specific factor MITF. PLoS One, 2008. 3(7): p. e2734.
117. Haass, N.K., et al., Adhesion, migration and communication in melanocytes and melanoma. Pigment Cell Res, 2005. 18(3): p. 150-9.
118. Johnson, J.P., Cell adhesion molecules in the development and progression of malignant melanoma. Cancer Metastasis Rev, 1999. 18(3): p. 345-57.
119. Danen, E.H., et al., E-cadherin expression in human melanoma. Melanoma Res, 1996. 6(2): p. 127-31.
120. Hsu, M.Y., et al., Shifts in cadherin profiles between human normal melanocytes and melanomas. J Investig Dermatol Symp Proc, 1996. 1(2): p. 188-94.
121. Gottardi, C.J., E. Wong, and B.M. Gumbiner, E-cadherin suppresses cellular transformation by inhibiting beta-catenin signaling in an adhesion-independent manner. J Cell Biol, 2001. 153(5): p. 1049-60.
122. Qi, J., et al., Transendothelial migration of melanoma cells involves N-cadherin-mediated adhesion and activation of the beta-catenin signaling pathway. Mol Biol Cell, 2005. 16(9): p. 4386-97.
123. Danen, E.H., et al., Emergence of alpha 5 beta 1 fibronectin- and alpha v beta 3 vitronectin-receptor expression in melanocytic tumour progression. Histopathology, 1994. 24(3): p. 249-56.
124. Brooks, P.C., et al., Localization of matrix metalloproteinase MMP-2 to the surface of invasive cells by interaction with integrin alpha v beta 3. Cell, 1996. 85(5): p. 683-93.
125. Felding-Habermann, B., et al., Involvement of tumor cell integrin alpha v beta 3 in hematogenous metastasis of human melanoma cells. Clin Exp Metastasis, 2002. 19(5): p. 427-36.
References 202
126. Hofmann, U.B., et al., Coexpression of integrin alpha(v)beta3 and matrix metalloproteinase-2 (MMP-2) coincides with MMP-2 activation: correlation with melanoma progression. J Invest Dermatol, 2000. 115(4): p. 625-32.
127. Sharpless, E. and L. Chin, The INK4a/ARF locus and melanoma. Oncogene, 2003. 22(20): p. 3092-8.
128. Sharpless, N.E., et al., The differential impact of p16(INK4a) or p19(ARF) deficiency on cell growth and tumorigenesis. Oncogene, 2004. 23(2): p. 379-85.
129. Kamijo, T., et al., Tumor suppression at the mouse INK4a locus mediated by the alternative reading frame product p19ARF. Cell, 1997. 91(5): p. 649-59.
130. Recio, J.A., et al., Ink4a/arf deficiency promotes ultraviolet radiation-induced melanomagenesis. Cancer Res, 2002. 62(22): p. 6724-30.
131. Curtin, J.A., et al., Somatic activation of KIT in distinct subtypes of melanoma. J Clin Oncol, 2006. 24(26): p. 4340-6.
132. Jiang, X., et al., Imatinib targeting of KIT-mutant oncoprotein in melanoma. Clin Cancer Res, 2008. 14(23): p. 7726-32.
133. Ashida, A., et al., Pathological activation of KIT in metastatic tumors of acral and mucosal melanomas. Int J Cancer, 2009. 124(4): p. 862-8.
134. Yang, J. and A. Richmond, Constitutive IkappaB kinase activity correlates with nuclear factor-kappaB activation in human melanoma cells. Cancer Res, 2001. 61(12): p. 4901-9.
135. Stecca, B., et al., Melanomas require HEDGEHOG-GLI signaling regulated by interactions between GLI1 and the RAS-MEK/AKT pathways. Proc Natl Acad Sci U S A, 2007. 104(14): p. 5895-900.
136. Niu, G., et al., Roles of activated Src and Stat3 signaling in melanoma tumor cell growth. Oncogene, 2002. 21(46): p. 7001-10.
137. Balint, K., et al., Activation of Notch1 signaling is required for beta-catenin-mediated human primary melanoma progression. J Clin Invest, 2005. 115(11): p. 3166-76.
138. Carracedo, A., et al., Inhibition of mTORC1 leads to MAPK pathway activation through a PI3K-dependent feedback loop in human cancer. J Clin Invest, 2008. 118(9): p. 3065-74.
139. Davies, M., B. Hennessy, and G.B. Mills, Point mutations of protein kinases and individualised cancer therapy. Expert Opin Pharmacother, 2006. 7(16): p. 2243-61.
References 203
140. Karasarides, M., et al., B-RAF is a therapeutic target in melanoma. Oncogene, 2004. 23(37): p. 6292-8.
141. Hauschild, A., et al., Results of a phase III, randomized, placebo-controlled study of sorafenib in combination with carboplatin and paclitaxel as second-line treatment in patients with unresectable stage III or stage IV melanoma. J Clin Oncol, 2009. 27(17): p. 2823-30.
142. Flaherty, K.T., et al., A phase I trial of the oral, multikinase inhibitor sorafenib in combination with carboplatin and paclitaxel. Clin Cancer Res, 2008. 14(15): p. 4836-42.
143. Fisher, D.E., et al., Melanoma from bench to bedside: meeting report from the 6th international melanoma congress. Pigment Cell Melanoma Res, 2010. 23(1): p. 14-26.
144. Antonescu, C.R., et al., L576P KIT mutation in anal melanomas correlates with KIT protein expression and is sensitive to specific kinase inhibition. Int J Cancer, 2007. 121(2): p. 257-64.
145. Hodi, F.S., et al., Major response to imatinib mesylate in KIT-mutated melanoma. J Clin Oncol, 2008. 26(12): p. 2046-51.
146. Quintas-Cardama, A., et al., Complete response of stage IV anal mucosal melanoma expressing KIT Val560Asp to the multikinase inhibitor sorafenib. Nat Clin Pract Oncol, 2008. 5(12): p. 737-40.
147. Woodman, S.E., et al., Activity of dasatinib against L576P KIT mutant melanoma: molecular, cellular, and clinical correlates. Mol Cancer Ther, 2009. 8(8): p. 2079-85.
148. Taft, R.J., M. Pheasant, and J.S. Mattick, The relationship between non-protein-coding DNA and eukaryotic complexity. Bioessays, 2007. 29(3): p. 288-99.
149. Taft, R.J., et al., Non-coding RNAs: regulators of disease. J Pathol. 220(2): p. 126-39.
150. Saito, K., et al., Specific association of Piwi with rasiRNAs derived from retrotransposon and heterochromatic regions in the Drosophila genome. Genes Dev, 2006. 20(16): p. 2214-22.
151. Kapranov, P., et al., RNA maps reveal new RNA classes and a possible function for pervasive transcription. Science, 2007. 316(5830): p. 1484-8.
152. Taft, R.J., et al., Tiny RNAs associated with transcription start sites in animals. Nat Genet, 2009. 41(5): p. 572-8.
References 204
153. Fire, A., et al., Potent and specific genetic interference by double-stranded RNA in Caenorhabditis elegans. Nature, 1998. 391(6669): p. 806-11.
154. Grishok, A., H. Tabara, and C.C. Mello, Genetic requirements for inheritance of RNAi in C. elegans. Science, 2000. 287(5462): p. 2494-7.
155. Voinnet, O., Non-cell autonomous RNA silencing. FEBS Lett, 2005. 579(26): p. 5858-71.
156. Voinnet, O., Origin, biogenesis, and activity of plant microRNAs. Cell, 2009. 136(4): p. 669-87.
157. Malone, C.D. and G.J. Hannon, Small RNAs as guardians of the genome. Cell, 2009. 136(4): p. 656-68.
158. Carthew, R.W. and E.J. Sontheimer, Origins and Mechanisms of miRNAs and siRNAs. Cell, 2009. 136(4): p. 642-55.
159. Ghildiyal, M. and P.D. Zamore, Small silencing RNAs: an expanding universe. Nat Rev Genet, 2009. 10(2): p. 94-108.
160. Hamilton, A.J. and D.C. Baulcombe, A species of small antisense RNA in posttranscriptional gene silencing in plants. Science, 1999. 286(5441): p. 950-2.
161. Hammond, S.M., et al., An RNA-directed nuclease mediates post-transcriptional gene silencing in Drosophila cells. Nature, 2000. 404(6775): p. 293-6.
162. Pal-Bhadra, M., U. Bhadra, and J.A. Birchler, RNAi related mechanisms affect both transcriptional and posttranscriptional transgene silencing in Drosophila. Mol Cell, 2002. 9(2): p. 315-27.
163. Loh, Y.H., et al., The Oct4 and Nanog transcription network regulates pluripotency in mouse embryonic stem cells. Nat Genet, 2006. 38(4): p. 431-40.
164. Impey, S., et al., Defining the CREB regulon: a genome-wide analysis of transcription factor regulatory regions. Cell, 2004. 119(7): p. 1041-54.
165. Cawley, S., et al., Unbiased mapping of transcription factor binding sites along human chromosomes 21 and 22 points to widespread regulation of noncoding RNAs. Cell, 2004. 116(4): p. 499-509.
166. Guttman, M., et al., Chromatin signature reveals over a thousand highly conserved large non-coding RNAs in mammals. Nature, 2009. 458(7235): p. 223-7.
167. Taft, R.J., et al., Non-coding RNAs: regulators of disease. J Pathol, 2010. 220(2): p. 126-39.
References 205
168. Lee, R.C., R.L. Feinbaum, and V. Ambros, The C. elegans heterochronic gene lin-4 encodes small RNAs with antisense complementarity to lin-14. Cell, 1993. 75(5): p. 843-54.
169. Pasquinelli, A.E., et al., Conservation of the sequence and temporal expression of let-7 heterochronic regulatory RNA. Nature, 2000. 408(6808): p. 86-9.
170. Johnson, C.D., et al., The let-7 microRNA represses cell proliferation pathways in human cells. Cancer Res, 2007. 67(16): p. 7713-22.
171. Johnson, S.M., et al., RAS is regulated by the let-7 microRNA family. Cell, 2005. 120(5): p. 635-47.
172. Sato, F., et al., MicroRNAs and epigenetics. FEBS J, 2011. 278(10): p. 1598-609.
173. Bartel, D.P., MicroRNAs: genomics, biogenesis, mechanism, and function. Cell, 2004. 116(2): p. 281-97.
174. Ibanez-Ventoso, C., M. Vora, and M. Driscoll, Sequence relationships among C. elegans, D. melanogaster and human microRNAs highlight the extensive conservation of microRNAs in biology. PLoS One, 2008. 3(7): p. e2818.
175. Chapman, E.J. and J.C. Carrington, Specialization and evolution of endogenous small RNA pathways. Nat Rev Genet, 2007. 8(11): p. 884-96.
176. Lee, Y., et al., MicroRNA genes are transcribed by RNA polymerase II. EMBO J, 2004. 23(20): p. 4051-60.
177. Cai, X., C.H. Hagedorn, and B.R. Cullen, Human microRNAs are processed from capped, polyadenylated transcripts that can also function as mRNAs. RNA, 2004. 10(12): p. 1957-66.
178. Borchert, G.M., W. Lanier, and B.L. Davidson, RNA polymerase III transcribes human microRNAs. Nat Struct Mol Biol, 2006. 13(12): p. 1097-101.
179. Winter, J., et al., Many roads to maturity: microRNA biogenesis pathways and their regulation. Nat Cell Biol, 2009. 11(3): p. 228-34.
180. Song, G. and L. Wang, MiR-433 and miR-127 arise from independent overlapping primary transcripts encoded by the miR-433-127 locus. PLoS One, 2008. 3(10): p. e3574.
181. Akbari, M.R., et al., Germline RAP80 mutations and susceptibility to breast cancer. Breast Cancer Res Treat, 2009. 113(2): p. 377-81.
182. Han, J., et al., The Drosha-DGCR8 complex in primary microRNA processing. Genes Dev, 2004. 18(24): p. 3016-27.
References 206
183. Han, J., et al., Molecular basis for the recognition of primary microRNAs by the Drosha-DGCR8 complex. Cell, 2006. 125(5): p. 887-901.
184. Yi, R., et al., Exportin-5 mediates the nuclear export of pre-microRNAs and short hairpin RNAs. Genes Dev, 2003. 17(24): p. 3011-6.
185. Bohnsack, M.T., K. Czaplinski, and D. Gorlich, Exportin 5 is a RanGTP-dependent dsRNA-binding protein that mediates nuclear export of pre-miRNAs. RNA, 2004. 10(2): p. 185-91.
186. Lund, E., et al., Nuclear export of microRNA precursors. Science, 2004. 303(5654): p. 95-8.
187. Lund, E. and J.E. Dahlberg, Substrate selectivity of exportin 5 and Dicer in the biogenesis of microRNAs. Cold Spring Harb Symp Quant Biol, 2006. 71: p. 59-66.
188. Zeng, Y. and B.R. Cullen, Structural requirements for pre-microRNA binding and nuclear export by Exportin 5. Nucleic Acids Res, 2004. 32(16): p. 4776-85.
189. Maniataki, E. and Z. Mourelatos, A human, ATP-independent, RISC assembly machine fueled by pre-miRNA. Genes Dev, 2005. 19(24): p. 2979-90.
190. Gregory, R.I., et al., Human RISC couples microRNA biogenesis and posttranscriptional gene silencing. Cell, 2005. 123(4): p. 631-40.
191. Haase, A.D., et al., TRBP, a regulator of cellular PKR and HIV-1 virus expression, interacts with Dicer and functions in RNA silencing. EMBO Rep, 2005. 6(10): p. 961-7.
192. Lee, Y., et al., The role of PACT in the RNA silencing pathway. EMBO J, 2006. 25(3): p. 522-32.
193. MacRae, I.J., et al., In vitro reconstitution of the human RISC-loading complex. Proc Natl Acad Sci U S A, 2008. 105(2): p. 512-7.
194. Diederichs, S. and D.A. Haber, Dual role for argonautes in microRNA processing and posttranscriptional regulation of microRNA expression. Cell, 2007. 131(6): p. 1097-108.
195. Carmell, M.A. and G.J. Hannon, RNase III enzymes and the initiation of gene silencing. Nat Struct Mol Biol, 2004. 11(3): p. 214-8.
196. Bernstein, E., et al., Role for a bidentate ribonuclease in the initiation step of RNA interference. Nature, 2001. 409(6818): p. 363-6.
197. Grishok, A., et al., Genes and mechanisms related to RNA interference regulate expression of the small temporal RNAs that control C. elegans developmental timing. Cell, 2001. 106(1): p. 23-34.
References 207
198. Schwarz, D.S., et al., Asymmetry in the assembly of the RNAi enzyme complex. Cell, 2003. 115(2): p. 199-208.
199. Khvorova, A., A. Reynolds, and S.D. Jayasena, Functional siRNAs and miRNAs exhibit strand bias. Cell, 2003. 115(2): p. 209-16.
200. Filipowicz, W., S.N. Bhattacharyya, and N. Sonenberg, Mechanisms of post-transcriptional regulation by microRNAs: are the answers in sight? Nat Rev Genet, 2008. 9(2): p. 102-14.
201. Eulalio, A., E. Huntzinger, and E. Izaurralde, Getting to the root of miRNA-mediated gene silencing. Cell, 2008. 132(1): p. 9-14.
202. Yekta, S., I.H. Shih, and D.P. Bartel, MicroRNA-directed cleavage of HOXB8 mRNA. Science, 2004. 304(5670): p. 594-6.
203. Kiriakidou, M., et al., An mRNA m7G cap binding-like motif within human Ago2 represses translation. Cell, 2007. 129(6): p. 1141-51.
204. Chendrimada, T.P., et al., MicroRNA silencing through RISC recruitment of eIF6. Nature, 2007. 447(7146): p. 823-8.
205. Maroney, P.A., Y. Yu, and T.W. Nilsen, MicroRNAs, mRNAs, and translation. Cold Spring Harb Symp Quant Biol, 2006. 71: p. 531-5.
206. Ozsolak, F., et al., Chromatin structure analyses identify miRNA promoters. Genes Dev, 2008. 22(22): p. 3172-83.
207. Wang, X., et al., High-resolution human core-promoter prediction with CoreBoost_HM. Genome Res, 2009. 19(2): p. 266-75.
208. Zhou, X., et al., Characterization and identification of microRNA core promoters in four model species. PLoS Comput Biol, 2007. 3(3): p. e37.
209. Corcoran, D.L., et al., Features of mammalian microRNA promoters emerge from polymerase II chromatin immunoprecipitation data. PLoS One, 2009. 4(4): p. e5279.
210. Luciano, D.J., et al., RNA editing of a miRNA precursor. RNA, 2004. 10(8): p. 1174-7.
211. Blow, M.J., et al., RNA editing of human microRNAs. Genome Biol, 2006. 7(4): p. R27.
212. Yang, W., et al., Modulation of microRNA processing and expression through RNA editing by ADAR deaminases. Nat Struct Mol Biol, 2006. 13(1): p. 13-21.
References 208
213. Scadden, A.D., The RISC subunit Tudor-SN binds to hyper-edited double-stranded RNA and promotes its cleavage. Nat Struct Mol Biol, 2005. 12(6): p. 489-96.
214. Kawahara, Y., et al., RNA editing of the microRNA-151 precursor blocks cleavage by the Dicer-TRBP complex. EMBO Rep, 2007. 8(8): p. 763-9.
215. Kawahara, Y., et al., Redirection of silencing targets by adenosine-to-inosine editing of miRNAs. Science, 2007. 315(5815): p. 1137-40.
216. Abelson, J.F., et al., Sequence variants in SLITRK1 are associated with Tourette's syndrome. Science, 2005. 310(5746): p. 317-20.
217. Saunders, M.A., H. Liang, and W.H. Li, Human polymorphism at microRNAs and microRNA target sites. Proc Natl Acad Sci U S A, 2007. 104(9): p. 3300-5.
218. Duan, R., C. Pak, and P. Jin, Single nucleotide polymorphism associated with mature miR-125a alters the processing of pri-miRNA. Hum Mol Genet, 2007. 16(9): p. 1124-31.
219. Wu, M., et al., Genetic variations of microRNAs in human cancer and their effects on the expression of miRNAs. Carcinogenesis, 2008. 29(9): p. 1710-6.
220. Saito, Y., et al., Specific activation of microRNA-127 with downregulation of the proto-oncogene BCL6 by chromatin-modifying drugs in human cancer cells. Cancer Cell, 2006. 9(6): p. 435-43.
221. Lewis, B.P., C.B. Burge, and D.P. Bartel, Conserved seed pairing, often flanked by adenosines, indicates that thousands of human genes are microRNA targets. Cell, 2005. 120(1): p. 15-20.
222. Baek, D., et al., The impact of microRNAs on protein output. Nature, 2008. 455(7209): p. 64-71.
223. Selbach, M., et al., Widespread changes in protein synthesis induced by microRNAs. Nature, 2008. 455(7209): p. 58-63.
224. Carthew, R.W., Gene regulation by microRNAs. Curr Opin Genet Dev, 2006. 16(2): p. 203-8.
225. Jiang, Q., et al., miR2Disease: a manually curated database for microRNA deregulation in human disease. Nucleic Acids Res, 2009. 37(Database issue): p. D98-104.
226. Barbato, C., et al., Thinking about RNA? MicroRNAs in the brain. Mamm Genome, 2008. 19(7-8): p. 541-51.
227. Hennessy, E. and L. O'Driscoll, Molecular medicine of microRNAs: structure, function and implications for diabetes. Expert Rev Mol Med, 2008. 10: p. e24.
References 209
228. Medina, P.P. and F.J. Slack, microRNAs and cancer: an overview. Cell Cycle, 2008. 7(16): p. 2485-92.
229. Vasudevan, S., Y. Tong, and J.A. Steitz, Switching from repression to activation: microRNAs can up-regulate translation. Science, 2007. 318(5858): p. 1931-4.
230. Kloosterman, W.P., et al., In situ detection of miRNAs in animal embryos using LNA-modified oligonucleotide probes. Nat Methods, 2006. 3(1): p. 27-9.
231. You, Y., et al., Design of LNA probes that improve mismatch discrimination. Nucleic Acids Res, 2006. 34(8): p. e60.
232. Denys, B., et al., A real-time polymerase chain reaction assay for rapid, sensitive, and specific quantification of the JAK2V617F mutation using a locked nucleic acid-modified oligonucleotide. J Mol Diagn, 2010. 12(4): p. 512-9.
233. Yamamichi, N., et al., Locked nucleic acid in situ hybridization analysis of miR-21 expression during colorectal cancer development. Clin Cancer Res, 2009. 15(12): p. 4009-16.
234. Pena, J.T., et al., miRNA in situ hybridization in formaldehyde and EDC-fixed tissues. Nat Methods, 2009. 6(2): p. 139-41.
235. John, B., et al., Human MicroRNA targets. PLoS Biol, 2004. 2(11): p. e363.
236. Ruby, J.G., et al., Evolution, biogenesis, expression, and target predictions of a substantially expanded set of Drosophila microRNAs. Genome Res, 2007. 17(12): p. 1850-64.
237. Lall, S., et al., A genome-wide map of conserved microRNA targets in C. elegans. Curr Biol, 2006. 16(5): p. 460-71.
238. Kertesz, M., et al., The role of site accessibility in microRNA target recognition. Nat Genet, 2007. 39(10): p. 1278-84.
239. Miranda, K.C., et al., A pattern-based method for the identification of MicroRNA binding sites and their corresponding heteroduplexes. Cell, 2006. 126(6): p. 1203-17.
240. Maragkakis, M., et al., DIANA-microT web server: elucidating microRNA functions through target prediction. Nucleic Acids Res, 2009. 37(Web Server issue): p. W273-6.
241. Papadopoulos, G.L., et al., DIANA-mirPath: Integrating human and mouse microRNAs in pathways. Bioinformatics, 2009. 25(15): p. 1991-3.
242. Kanehisa, M., The KEGG database. Novartis Found Symp, 2002. 247: p. 91-101; discussion 101-3, 119-28, 244-52.
References 210
243. Kanehisa, M., et al., From genomics to chemical genomics: new developments in KEGG. Nucleic Acids Res, 2006. 34(Database issue): p. D354-7.
244. Care, A., et al., MicroRNA-133 controls cardiac hypertrophy. Nat Med, 2007. 13(5): p. 613-8.
245. Chang, J., et al., Liver-specific microRNA miR-122 enhances the replication of hepatitis C virus in nonhepatic cells. J Virol, 2008. 82(16): p. 8215-23.
246. Mehler, M.F. and J.S. Mattick, Non-coding RNAs in the nervous system. J Physiol, 2006. 575(Pt 2): p. 333-41.
247. Esau, C., et al., miR-122 regulation of lipid metabolism revealed by in vivo antisense targeting. Cell Metab, 2006. 3(2): p. 87-98.
248. Krutzfeldt, J., et al., Silencing of microRNAs in vivo with 'antagomirs'. Nature, 2005. 438(7068): p. 685-9.
249. Calin, G.A., et al., Frequent deletions and down-regulation of micro- RNA genes miR15 and miR16 at 13q14 in chronic lymphocytic leukemia. Proc Natl Acad Sci U S A, 2002. 99(24): p. 15524-9.
250. Calin, G.A., et al., Human microRNA genes are frequently located at fragile sites and genomic regions involved in cancers. Proc Natl Acad Sci U S A, 2004. 101(9): p. 2999-3004.
251. Sevignani, C., et al., MicroRNA genes are frequently located near mouse cancer susceptibility loci. Proc Natl Acad Sci U S A, 2007. 104(19): p. 8017-22.
252. Tagawa, H. and M. Seto, A microRNA cluster as a target of genomic amplification in malignant lymphoma. Leukemia, 2005. 19(11): p. 2013-6.
253. Mavrakis, K.J., et al., Genome-wide RNA-mediated interference screen identifies miR-19 targets in Notch-induced T-cell acute lymphoblastic leukaemia. Nat Cell Biol, 2010. 12(4): p. 372-9.
254. Huse, J.T., et al., The PTEN-regulating microRNA miR-26a is amplified in high-grade glioma and facilitates gliomagenesis in vivo. Genes Dev, 2009. 23(11): p. 1327-37.
255. Zhang, L., et al., microRNAs exhibit high frequency genomic alterations in human cancer. Proc Natl Acad Sci U S A, 2006. 103(24): p. 9136-41.
256. Ryan, B.M., A.I. Robles, and C.C. Harris, Genetic variation in microRNA networks: the implications for cancer research. Nat Rev Cancer, 2010. 10(6): p. 389-402.
References 211
257. Yang, R., et al., Polymorphisms in BRCA2 resulting in aberrant codon-usage and their analysis on familial breast cancer risk. Breast Cancer Res Treat, 2009. 118(2): p. 407-13.
258. Jazdzewski, K., et al., Common SNP in pre-miR-146a decreases mature miR expression and predisposes to papillary thyroid carcinoma. Proc Natl Acad Sci U S A, 2008. 105(20): p. 7269-74.
259. Chin, L.J., et al., A SNP in a let-7 microRNA complementary site in the KRAS 3' untranslated region increases non-small cell lung cancer risk. Cancer Res, 2008. 68(20): p. 8535-40.
260. Merritt, W.M., et al., Dicer, Drosha, and outcomes in patients with ovarian cancer. N Engl J Med, 2008. 359(25): p. 2641-50.
261. Chiosea, S., et al., Overexpression of Dicer in precursor lesions of lung adenocarcinoma. Cancer Res, 2007. 67(5): p. 2345-50.
262. Chiosea, S., et al., Up-regulation of dicer, a component of the MicroRNA machinery, in prostate adenocarcinoma. Am J Pathol, 2006. 169(5): p. 1812-20.
263. Egger, G., et al., Epigenetics in human disease and prospects for epigenetic therapy. Nature, 2004. 429(6990): p. 457-63.
264. Lujambio, A. and M. Esteller, CpG island hypermethylation of tumor suppressor microRNAs in human cancer. Cell Cycle, 2007. 6(12): p. 1455-9.
265. Lujambio, A., et al., Genetic unmasking of an epigenetically silenced microRNA in human cancer cells. Cancer Res, 2007. 67(4): p. 1424-9.
266. Lujambio, A. and M. Esteller, How epigenetics can explain human metastasis: a new role for microRNAs. Cell Cycle, 2009. 8(3): p. 377-82.
267. Brueckner, B., et al., The human let-7a-3 locus contains an epigenetically regulated microRNA gene with oncogenic function. Cancer Res, 2007. 67(4): p. 1419-23.
268. Lopez-Serra, L. and M. Esteller, Proteins that bind methylated DNA and human cancer: reading the wrong words. Br J Cancer, 2008. 98(12): p. 1881-5.
269. Hayashita, Y., et al., A polycistronic microRNA cluster, miR-17-92, is overexpressed in human lung cancers and enhances cell proliferation. Cancer Res, 2005. 65(21): p. 9628-32.
270. Takamizawa, J., et al., Reduced expression of the let-7 microRNAs in human lung cancers in association with shortened postoperative survival. Cancer Res, 2004. 64(11): p. 3753-6.

References 212
271. Stahlhut Espinosa, C.E. and F.J. Slack, The role of microRNAs in cancer. Yale J Biol Med, 2006. 79(3-4): p. 131-40.
272. Kluiver, J., et al., BIC and miR-155 are highly expressed in Hodgkin, primary mediastinal and diffuse large B cell lymphomas. J Pathol, 2005. 207(2): p. 243-9.
273. Eis, P.S., et al., Accumulation of miR-155 and BIC RNA in human B cell lymphomas. Proc Natl Acad Sci U S A, 2005. 102(10): p. 3627-32.
274. He, H., et al., The role of microRNA genes in papillary thyroid carcinoma. Proc Natl Acad Sci U S A, 2005. 102(52): p. 19075-80.
275. Volinia, S., et al., A microRNA expression signature of human solid tumors defines cancer gene targets. Proc Natl Acad Sci U S A, 2006. 103(7): p. 2257-61.
276. Ciafre, S.A., et al., Extensive modulation of a set of microRNAs in primary glioblastoma. Biochem Biophys Res Commun, 2005. 334(4): p. 1351-8.
277. He, L., et al., microRNAs join the p53 network--another piece in the tumour-suppression puzzle. Nat Rev Cancer, 2007. 7(11): p. 819-22.
278. Michael, M.Z., et al., Reduced accumulation of specific microRNAs in colorectal neoplasia. Mol Cancer Res, 2003. 1(12): p. 882-91.
279. Hurst, D.R., M.D. Edmonds, and D.R. Welch, Metastamir: the field of metastasis-regulatory microRNA is spreading. Cancer Res, 2009. 69(19): p. 7495-8.
280. Hirohashi, S., Inactivation of the E-cadherin-mediated cell adhesion system in human cancers. Am J Pathol, 1998. 153(2): p. 333-9.
281. Iorio, M.V., et al., MicroRNA gene expression deregulation in human breast cancer. Cancer Res, 2005. 65(16): p. 7065-70.
282. Hood, J.D. and D.A. Cheresh, Role of integrins in cell invasion and migration. Nat Rev Cancer, 2002. 2(2): p. 91-100.
283. Yanaihara, N., et al., Unique microRNA molecular profiles in lung cancer diagnosis and prognosis. Cancer Cell, 2006. 9(3): p. 189-98.
284. Lim, L.P., et al., Microarray analysis shows that some microRNAs downregulate large numbers of target mRNAs. Nature, 2005. 433(7027): p. 769-73.
285. Dalmay, T. and D.R. Edwards, MicroRNAs and the hallmarks of cancer. Oncogene, 2006. 25(46): p. 6170-5.
References 213
286. Baker, A.H., D.R. Edwards, and G. Murphy, Metalloproteinase inhibitors: biological actions and therapeutic opportunities. J Cell Sci, 2002. 115(Pt 19): p. 3719-27.
287. Qi, J.H., et al., A novel function for tissue inhibitor of metalloproteinases-3 (TIMP3): inhibition of angiogenesis by blockage of VEGF binding to VEGF receptor-2. Nat Med, 2003. 9(4): p. 407-15.
288. Chan, J.A., A.M. Krichevsky, and K.S. Kosik, MicroRNA-21 is an antiapoptotic factor in human glioblastoma cells. Cancer Res, 2005. 65(14): p. 6029-33.
289. Bernstein, E., et al., Dicer is essential for mouse development. Nat Genet, 2003. 35(3): p. 215-7.
290. Wienholds, E., et al., The microRNA-producing enzyme Dicer1 is essential for zebrafish development. Nat Genet, 2003. 35(3): p. 217-8.
291. Shcherbata, H.R., et al., The MicroRNA pathway plays a regulatory role in stem cell division. Cell Cycle, 2006. 5(2): p. 172-5.
292. Calin, G.A., et al., MicroRNA profiling reveals distinct signatures in B cell chronic lymphocytic leukemias. Proc Natl Acad Sci U S A, 2004. 101(32): p. 11755-60.
293. Calin, G.A., et al., A MicroRNA signature associated with prognosis and progression in chronic lymphocytic leukemia. N Engl J Med, 2005. 353(17): p. 1793-801.
294. Metzler, M., et al., High expression of precursor microRNA-155/BIC RNA in children with Burkitt lymphoma. Genes Chromosomes Cancer, 2004. 39(2): p. 167-9.
295. Calin, G.A. and C.M. Croce, MicroRNA signatures in human cancers. Nat Rev Cancer, 2006. 6(11): p. 857-66.
296. Blenkiron, C. and E.A. Miska, miRNAs in cancer: approaches, aetiology, diagnostics and therapy. Hum Mol Genet, 2007. 16 Spec No 1: p. R106-13.
297. Hoshida, Y., et al., Gene expression in fixed tissues and outcome in hepatocellular carcinoma. N Engl J Med, 2008. 359(19): p. 1995-2004.
298. Lawrie, C.H., et al., Detection of elevated levels of tumour-associated microRNAs in serum of patients with diffuse large B-cell lymphoma. Br J Haematol, 2008. 141(5): p. 672-5.
299. Mitchell, P.S., et al., Circulating microRNAs as stable blood-based markers for cancer detection. Proc Natl Acad Sci U S A, 2008. 105(30): p. 10513-8.
References 214
300. Schetter, A.J., et al., MicroRNA expression profiles associated with prognosis and therapeutic outcome in colon adenocarcinoma. JAMA, 2008. 299(4): p. 425-36.
301. Jiang, J., et al., Association of MicroRNA expression in hepatocellular carcinomas with hepatitis infection, cirrhosis, and patient survival. Clin Cancer Res, 2008. 14(2): p. 419-27.
302. Ji, J., et al., MicroRNA expression, survival, and response to interferon in liver cancer. N Engl J Med, 2009. 361(15): p. 1437-47.
303. Si, M.L., et al., miR-21-mediated tumor growth. Oncogene, 2007. 26(19): p. 2799-803.
304. Ebert, M.S., J.R. Neilson, and P.A. Sharp, MicroRNA sponges: competitive inhibitors of small RNAs in mammalian cells. Nat Methods, 2007. 4(9): p. 721-6.
305. Chung, K.H., et al., Polycistronic RNA polymerase II expression vectors for RNA interference based on BIC/miR-155. Nucleic Acids Res, 2006. 34(7): p. e53.
306. Stegmeier, F., et al., A lentiviral microRNA-based system for single-copy polymerase II-regulated RNA interference in mammalian cells. Proc Natl Acad Sci U S A, 2005. 102(37): p. 13212-7.
307. Kota, J., et al., Therapeutic microRNA delivery suppresses tumorigenesis in a murine liver cancer model. Cell, 2009. 137(6): p. 1005-17.
308. Bhardwaj, A., S. Singh, and A.P. Singh, MicroRNA-based Cancer Therapeutics: Big Hope from Small RNAs. Mol Cell Pharmacol, 2011. 2(5): p. 213-219.
309. Cochrane, D.R., et al., MicroRNA-200c mitigates invasiveness and restores sensitivity to microtubule-targeting chemotherapeutic agents. Mol Cancer Ther, 2009. 8(5): p. 1055-66.
310. Weidhaas, J.B., et al., MicroRNAs as potential agents to alter resistance to cytotoxic anticancer therapy. Cancer Res, 2007. 67(23): p. 11111-6.
311. Xi, Y., et al., Systematic analysis of microRNA expression of RNA extracted from fresh frozen and formalin-fixed paraffin-embedded samples. RNA, 2007. 13(10): p. 1668-74.
312. Li, J., et al., Comparison of miRNA expression patterns using total RNA extracted from matched samples of formalin-fixed paraffin-embedded (FFPE) cells and snap frozen cells. BMC Biotechnol, 2007. 7: p. 36.
References 215
313. Lu, J., et al., MicroRNA expression profiles classify human cancers. Nature, 2005. 435(7043): p. 834-8.
314. Gray-Schopfer, V.C., et al., Cellular senescence in naevi and immortalisation in melanoma: a role for p16? Br J Cancer, 2006. 95(4): p. 496-505.
315. Langdon, S.P., et al., Characterization and properties of nine human ovarian adenocarcinoma cell lines. Cancer Res, 1988. 48(21): p. 6166-72.
316. User Bulletin #2--ABI PRISM 7700 Sequence Detection System.
317. Towbin, H., T. Staehelin, and J. Gordon, Electrophoretic transfer of proteins from polyacrylamide gels to nitrocellulose sheets: procedure and some applications. Proc Natl Acad Sci U S A, 1979. 76(9): p. 4350-4.
318. Ambion TechNotes 12 (1) Optimizing siRNA for RNAi.
319. Hennigan, R.F., K.L. Hawker, and B.W. Ozanne, Fos-transformation activates genes associated with invasion. Oncogene, 1994. 9(12): p. 3591-600.
320. Scott, L.A., et al., Invasion of normal human fibroblasts induced by v-Fos is independent of proliferation, immortalization, and the tumor suppressors p16INK4a and p53. Mol Cell Biol, 2004. 24(4): p. 1540-59.
321. Neumann, H.A., G.W. Lohr, and A.A. Fauser, Tumor colony formation from human spontaneous tumors in a methylcellulose monolayer system. Res Exp Med (Berl), 1984. 184(3): p. 137-43.
322. Rosenfeld, N., et al., MicroRNAs accurately identify cancer tissue origin. Nat Biotechnol, 2008. 26(4): p. 462-9.
323. Bargaje, R., et al., Consensus miRNA expression profiles derived from interplatform normalization of microarray data. RNA, 2010. 16(1): p. 16-25.
324. Dahiya, N., et al., MicroRNA expression and identification of putative miRNA targets in ovarian cancer. PLoS One, 2008. 3(6): p. e2436.
325. Gaur, A., et al., Characterization of microRNA expression levels and their biological correlates in human cancer cell lines. Cancer Res, 2007. 67(6): p. 2456-68.
326. Blower, P.E., et al., MicroRNA expression profiles for the NCI-60 cancer cell panel. Mol Cancer Ther, 2007. 6(5): p. 1483-91.
327. Mueller, D.W., M. Rehli, and A.K. Bosserhoff, miRNA expression profiling in melanocytes and melanoma cell lines reveals miRNAs associated with formation and progression of malignant melanoma. J Invest Dermatol, 2009. 129(7): p. 1740-51.
328. Illumina miRNA Expression Profiling Version2 panel guide, Illumina.
References 216
329. Fan, J.B., et al., A versatile assay for high-throughput gene expression profiling on universal array matrices. Genome Res, 2004. 14(5): p. 878-85.
330. Berezikov, E., et al., Many novel mammalian microRNA candidates identified by extensive cloning and RAKE analysis. Genome Res, 2006. 16(10): p. 1289-98.
331. Berezikov, E., et al., Diversity of microRNAs in human and chimpanzee brain. Nat Genet, 2006. 38(12): p. 1375-7.
332. Chen, J., et al., Highly sensitive and specific microRNA expression profiling using BeadArray technology. Nucleic Acids Res, 2008. 36(14): p. e87.
333. Zhang, W., J.E. Dahlberg, and W. Tam, MicroRNAs in tumorigenesis: a primer. Am J Pathol, 2007. 171(3): p. 728-38.
334. Molnar, V., et al., Changes in miRNA expression in solid tumors: an miRNA profiling in melanomas. Semin Cancer Biol, 2008. 18(2): p. 111-22.
335. Castoldi, M., et al., A sensitive array for microRNA expression profiling (miChip) based on locked nucleic acids (LNA). RNA, 2006. 12(5): p. 913-20.
336. TaqMan MicroRNA Assay protocol.
337. Nelson, P.T., et al., Microarray-based, high-throughput gene expression profiling of microRNAs. Nat Methods, 2004. 1(2): p. 155-61.
338. Szafranska, A.E., et al., Accurate molecular characterization of formalin-fixed, paraffin-embedded tissues by microRNA expression profiling. J Mol Diagn, 2008. 10(5): p. 415-23.
339. Glud, M., et al., MicroRNA expression in melanocytic nevi: the usefulness of formalin-fixed, paraffin-embedded material for miRNA microarray profiling. J Invest Dermatol, 2009. 129(5): p. 1219-24.
340. Massi, G., Melanocytic nevi simulant of melanoma with medicolegal relevance. Virchows Arch, 2007. 451(3): p. 623-47.
341. Elder, D.E., Precursors to melanoma and their mimics: nevi of special sites. Mod Pathol, 2006. 19 Suppl 2: p. S4-20.
342. Blokx, W.A., M.C. van Dijk, and D.J. Ruiter, Molecular cytogenetics of cutaneous melanocytic lesions - diagnostic, prognostic and therapeutic aspects. Histopathology, 2010. 56(1): p. 121-32.
343. Schultz, J., et al., MicroRNA let-7b targets important cell cycle molecules in malignant melanoma cells and interferes with anchorage-independent growth. Cell Res, 2008. 18(5): p. 549-57.
References 217
344. Worley, L.A., et al., Micro-RNAs associated with metastasis in uveal melanoma identified by multiplexed microarray profiling. Melanoma Res, 2008. 18(3): p. 184-90.
345. Bemis, L.T., et al., MicroRNA-137 targets microphthalmia-associated transcription factor in melanoma cell lines. Cancer Res, 2008. 68(5): p. 1362-8.
346. MicroRNA Expression Profiling Assay guide, Illumina.
347. A Comparison of Normalization Techniques for MicroRNA Microarray Data. 2008, Berkeley electronic press.
348. Baskerville, S. and D.P. Bartel, Microarray profiling of microRNAs reveals frequent coexpression with neighboring miRNAs and host genes. RNA, 2005. 11(3): p. 241-7.
349. Farh, K.K., et al., The widespread impact of mammalian MicroRNAs on mRNA repression and evolution. Science, 2005. 310(5755): p. 1817-21.
350. Landgraf, P., et al., A mammalian microRNA expression atlas based on small RNA library sequencing. Cell, 2007. 129(7): p. 1401-14.
351. He, L., et al., A microRNA polycistron as a potential human oncogene. Nature, 2005. 435(7043): p. 828-33.
352. Git, A., et al., Systematic comparison of microarray profiling, real-time PCR, and next-generation sequencing technologies for measuring differential microRNA expression. RNA, 2010. 16(5): p. 991-1006.
353. Wightman, B., I. Ha, and G. Ruvkun, Posttranscriptional regulation of the heterochronic gene lin-14 by lin-4 mediates temporal pattern formation in C. elegans. Cell, 1993. 75(5): p. 855-62.
354. Endogenous Controls for Real-Time Quantitation of miRNA Using TaqMan® MicroRNA Assays. 2008/2010, Applied Biosystems.
355. Drakaki, A. and D. Iliopoulos, MicroRNA Gene Networks in Oncogenesis. Curr Genomics, 2009. 10(1): p. 35-41.
356. Tong, A.W., et al., MicroRNA profile analysis of human prostate cancers. Cancer Gene Ther, 2009. 16(3): p. 206-16.
357. Segura, M.F., et al., Melanoma MicroRNA signature predicts post-recurrence survival. Clin Cancer Res, 2010. 16(5): p. 1577-86.
358. Caramuta, S., et al., MicroRNA expression profiles associated with mutational status and survival in malignant melanoma. J Invest Dermatol, 2010. 130(8): p. 2062-70.
References 218
359. Friedman, R.C., et al., Most mammalian mRNAs are conserved targets of microRNAs. Genome Res, 2009. 19(1): p. 92-105.
360. Krutzfeldt, J. and M. Stoffel, MicroRNAs: a new class of regulatory genes affecting metabolism. Cell Metab, 2006. 4(1): p. 9-12.
361. Bueno, M.J., I. Perez de Castro, and M. Malumbres, Control of cell proliferation pathways by microRNAs. Cell Cycle, 2008. 7(20): p. 3143-8.
362. Jovanovic, M. and M.O. Hengartner, miRNAs and apoptosis: RNAs to die for. Oncogene, 2006. 25(46): p. 6176-87.
363. Stefani, G. and F.J. Slack, Small non-coding RNAs in animal development. Nat Rev Mol Cell Biol, 2008. 9(3): p. 219-30.
364. He, X., J.K. Eberhart, and J.H. Postlethwait, MicroRNAs and micromanaging the skeleton in disease, development and evolution. J Cell Mol Med, 2009. 13(4): p. 606-18.
365. Shi, L., et al., The MicroArray Quality Control (MAQC) project shows inter- and intraplatform reproducibility of gene expression measurements. Nat Biotechnol, 2006. 24(9): p. 1151-61.
366. Khew-Goodall, Y. and G.J. Goodall, Myc-modulated miR-9 makes more metastases. Nat Cell Biol, 2010. 12(3): p. 209-11.
367. Kong, W., et al., MicroRNA-155 regulates cell survival, growth, and chemosensitivity by targeting FOXO3a in breast cancer. J Biol Chem, 2010. 285(23): p. 17869-79.
368. Shimizu, S., et al., The let-7 family of microRNAs inhibits Bcl-xL expression and potentiates sorafenib-induced apoptosis in human hepatocellular carcinoma. J Hepatol, 2010. 52(5): p. 698-704.
369. Wang, Y., et al., Profiling microRNA expression in hepatocellular carcinoma reveals microRNA-224 up-regulation and apoptosis inhibitor-5 as a microRNA-224-specific target. J Biol Chem, 2008. 283(19): p. 13205-15.
370. Chen, J., et al., MicroRNA-193b represses cell proliferation and regulates cyclin D1 in melanoma. Am J Pathol, 2010. 176(5): p. 2520-9.
371. Philippidou, D., et al., Signatures of microRNAs and selected microRNA target genes in human melanoma. Cancer Res, 2010. 70(10): p. 4163-73.
372. Kong, D., et al., miR-200 regulates PDGF-D-mediated epithelial-mesenchymal transition, adhesion, and invasion of prostate cancer cells. Stem Cells, 2009. 27(8): p. 1712-21.
References 219
373. Korpal, M. and Y. Kang, The emerging role of miR-200 family of microRNAs in epithelial-mesenchymal transition and cancer metastasis. RNA Biol, 2008. 5(3): p. 115-9.
374. Gregory, P.A., et al., MicroRNAs as regulators of epithelial-mesenchymal transition. Cell Cycle, 2008. 7(20): p. 3112-8.
375. Viticchie, G., et al., MiR-203 controls proliferation, migration and invasive potential of prostate cancer cell lines. Cell Cycle, 2011. 10(7): p. 1121-31.
376. Bo, J., et al., microRNA-203 suppresses bladder cancer development by repressing bcl-w expression. FEBS J, 2011. 278(5): p. 786-92.
377. Chiang, Y., et al., Aberrant expression of miR-203 and its clinical significance in gastric and colorectal cancers. J Gastrointest Surg, 2011. 15(1): p. 63-70.
378. Li, J., et al., miR-203 reverses chemoresistance in p53-mutated colon cancer cells through downregulation of Akt2 expression. Cancer Lett, 2011. 304(1): p. 52-9.
379. Sun, Y., et al., Expression profile of microRNAs in c-Myc induced mouse mammary tumors. Breast Cancer Res Treat, 2009. 118(1): p. 185-96.
380. Tsang, W.P., et al., Oncofetal H19-derived miR-675 regulates tumor suppressor RB in human colorectal cancer. Carcinogenesis, 2010. 31(3): p. 350-8.
381. Mazar, J., et al., The regulation of miRNA-211 expression and its role in melanoma cell invasiveness. PLoS One, 2010. 5(11): p. e13779.
382. Levy, C., et al., Intronic miR-211 assumes the tumor suppressive function of its host gene in melanoma. Mol Cell, 2010. 40(5): p. 841-9.
383. Boyle, G.M., et al., Melanoma cell invasiveness is regulated by miR-211 suppression of the BRN2 transcription factor. Pigment Cell Melanoma Res, 2011. 24(3): p. 525-537.
384. Chang, K.W., et al., Association between high miR-211 microRNA expression and the poor prognosis of oral carcinoma. J Dent Res, 2008. 87(11): p. 1063-8.
385. Segura, M.F., et al., Aberrant miR-182 expression promotes melanoma metastasis by repressing FOXO3 and microphthalmia-associated transcription factor. Proc Natl Acad Sci U S A, 2009. 106(6): p. 1814-9.
386. Sherr, C.J. and J.M. Roberts, CDK inhibitors: positive and negative regulators of G1-phase progression. Genes Dev, 1999. 13(12): p. 1501-12.
References 220
387. Kim, Y.K., et al., Functional links between clustered microRNAs: suppression of cell-cycle inhibitors by microRNA clusters in gastric cancer. Nucleic Acids Res, 2009. 37(5): p. 1672-81.
388. Xia, L., et al., miR-15b and miR-16 modulate multidrug resistance by targeting BCL2 in human gastric cancer cells. Int J Cancer, 2008. 123(2): p. 372-9.
389. Zhu, W., et al., miR-181b modulates multidrug resistance by targeting BCL2 in human cancer cell lines. Int J Cancer, 2010. 127(11): p. 2520-9.
390. Liu, A.M., R.T. Poon, and J.M. Luk, MicroRNA-375 targets Hippo-signaling effector YAP in liver cancer and inhibits tumor properties. Biochem Biophys Res Commun, 2010. 394(3): p. 623-7.
391. Gramantieri, L., et al., Cyclin G1 is a target of miR-122a, a microRNA frequently down-regulated in human hepatocellular carcinoma. Cancer Res, 2007. 67(13): p. 6092-9.
392. Fornari, F., et al., MiR-122/cyclin G1 interaction modulates p53 activity and affects doxorubicin sensitivity of human hepatocarcinoma cells. Cancer Res, 2009. 69(14): p. 5761-7.
393. Ivanovska, I., et al., MicroRNAs in the miR-106b family regulate p21/CDKN1A and promote cell cycle progression. Mol Cell Biol, 2008. 28(7): p. 2167-74.
394. le Sage, C., et al., Regulation of the p27(Kip1) tumor suppressor by miR-221 and miR-222 promotes cancer cell proliferation. EMBO J, 2007. 26(15): p. 3699-708.
395. Fornari, F., et al., MiR-221 controls CDKN1C/p57 and CDKN1B/p27 expression in human hepatocellular carcinoma. Oncogene, 2008. 27(43): p. 5651-61.
396. Huang, S. and X. He, The role of microRNAs in liver cancer progression. Br J Cancer, 2011. 104(2): p. 235-40.
397. Eccles, S.A. and D.R. Welch, Metastasis: recent discoveries and novel treatment strategies. Lancet, 2007. 369(9574): p. 1742-57.
398. Ma, L., J. Teruya-Feldstein, and R.A. Weinberg, Tumour invasion and metastasis initiated by microRNA-10b in breast cancer. Nature, 2007. 449(7163): p. 682-8.
399. Gregory, P.A., et al., The miR-200 family and miR-205 regulate epithelial to mesenchymal transition by targeting ZEB1 and SIP1. Nat Cell Biol, 2008. 10(5): p. 593-601.
References 221
400. Korpal, M., et al., The miR-200 family inhibits epithelial-mesenchymal transition and cancer cell migration by direct targeting of E-cadherin transcriptional repressors ZEB1 and ZEB2. J Biol Chem, 2008. 283(22): p. 14910-4.
401. Bracken, C.P., et al., A double-negative feedback loop between ZEB1-SIP1 and the microRNA-200 family regulates epithelial-mesenchymal transition. Cancer Res, 2008. 68(19): p. 7846-54.
402. Hurteau, G.J., et al., Overexpression of the microRNA hsa-miR-200c leads to reduced expression of transcription factor 8 and increased expression of E-cadherin. Cancer Res, 2007. 67(17): p. 7972-6.
403. Burk, U., et al., A reciprocal repression between ZEB1 and members of the miR-200 family promotes EMT and invasion in cancer cells. EMBO Rep, 2008. 9(6): p. 582-9.
404. Park, S.M., et al., The miR-200 family determines the epithelial phenotype of cancer cells by targeting the E-cadherin repressors ZEB1 and ZEB2. Genes Dev, 2008. 22(7): p. 894-907.
405. Savagner, P., Leaving the neighborhood: molecular mechanisms involved during epithelial-mesenchymal transition. Bioessays, 2001. 23(10): p. 912-23.
406. Fuchs, I.B., et al., The prognostic significance of epithelial-mesenchymal transition in breast cancer. Anticancer Res, 2002. 22(6A): p. 3415-9.
407. Eger, A., et al., DeltaEF1 is a transcriptional repressor of E-cadherin and regulates epithelial plasticity in breast cancer cells. Oncogene, 2005. 24(14): p. 2375-85.
408. Comijn, J., et al., The two-handed E box binding zinc finger protein SIP1 downregulates E-cadherin and induces invasion. Mol Cell, 2001. 7(6): p. 1267-78.
409. Shirakihara, T., M. Saitoh, and K. Miyazono, Differential regulation of epithelial and mesenchymal markers by deltaEF1 proteins in epithelial mesenchymal transition induced by TGF-beta. Mol Biol Cell, 2007. 18(9): p. 3533-44.
410. Ross, D.T., et al., Systematic variation in gene expression patterns in human cancer cell lines. Nat Genet, 2000. 24(3): p. 227-35.
411. Moretti, S., et al., Immunohistochemical evidence of cytokine networks during progression of human melanocytic lesions. Int J Cancer, 1999. 84(2): p. 160-8.
412. Herlyn, M., et al., Lessons from melanocyte development for understanding the biological events in naevus and melanoma formation. Melanoma Res, 2000. 10(4): p. 303-12.
References 222
413. Kuphal, S. and A.K. Bosserhoff, Influence of the cytoplasmic domain of E-cadherin on endogenous N-cadherin expression in malignant melanoma. Oncogene, 2006. 25(2): p. 248-59.
414. Alonso, S.R., et al., A high-throughput study in melanoma identifies epithelial-mesenchymal transition as a major determinant of metastasis. Cancer Res, 2007. 67(7): p. 3450-60.
415. Shimoyama, Y., et al., Identification of three human type-II classic cadherins and frequent heterophilic interactions between different subclasses of type-II classic cadherins. Biochem J, 2000. 349(Pt 1): p. 159-67.
416. Tang, A., et al., E-cadherin is the major mediator of human melanocyte adhesion to keratinocytes in vitro. J Cell Sci, 1994. 107 ( Pt 4): p. 983-92.
417. Mikesh, L.M., et al., Evaluation of molecular markers of mesenchymal phenotype in melanoma. Melanoma Res, 2010. 20(6): p. 485-95.
418. Seve, P. and C. Dumontet, Chemoresistance in non-small cell lung cancer. Curr Med Chem Anticancer Agents, 2005. 5(1): p. 73-88.
419. Ceppi, P., et al., Loss of miR-200c expression induces an aggressive, invasive, and chemoresistant phenotype in non-small cell lung cancer. Mol Cancer Res, 2010. 8(9): p. 1207-16.
420. Gandellini, P., et al., miR-205 Exerts tumor-suppressive functions in human prostate through down-regulation of protein kinase Cepsilon. Cancer Res, 2009. 69(6): p. 2287-95.
421. Sanz-Moreno, V., et al., Rac activation and inactivation control plasticity of tumor cell movement. Cell, 2008. 135(3): p. 510-23.
422. Pinner, S. and E. Sahai, PDK1 regulates cancer cell motility by antagonising inhibition of ROCK1 by RhoE. Nat Cell Biol, 2008. 10(2): p. 127-37.
423. Sahai, E. and C.J. Marshall, Differing modes of tumour cell invasion have distinct requirements for Rho/ROCK signalling and extracellular proteolysis. Nat Cell Biol, 2003. 5(8): p. 711-9.
424. Wolf, K., et al., Compensation mechanism in tumor cell migration: mesenchymal-amoeboid transition after blocking of pericellular proteolysis. J Cell Biol, 2003. 160(2): p. 267-77.
425. Elson-Schwab, I., A. Lorentzen, and C.J. Marshall, MicroRNA-200 family members differentially regulate morphological plasticity and mode of melanoma cell invasion. PLoS One, 2010. 5(10).
References 223
426. Hamano, R., et al., Overexpression of miR-200c Induces Chemoresistance in Esophageal Cancers Mediated Through Activation of the Akt Signaling Pathway. Clin Cancer Res, 2011. 17(9): p. 3029-38.
427. Dar, A.A., et al., miRNA-205 Suppresses Melanoma Cell Proliferation and Induces Senescence via Regulation of E2F1 Protein. J Biol Chem, 2011. 286(19): p. 16606-14.
428. Bloch, M., et al., KCNMA1 gene amplification promotes tumor cell proliferation in human prostate cancer. Oncogene, 2007. 26(17): p. 2525-34.
429. Aubert, B., et al., Observation of a new Ds meson decaying to DK at a mass of 2.86 GeV/c2. Phys Rev Lett, 2006. 97(22): p. 222001.
430. Gyorffy, B., et al., Analysis of gene expression profiles in melanoma cells with acquired resistance against antineoplastic drugs. Melanoma Res, 2006. 16(2): p. 147-55.
431. Landais, S., et al., Oncogenic potential of the miR-106-363 cluster and its implication in human T-cell leukemia. Cancer Res, 2007. 67(12): p. 5699-707.
432. Lei, Z., et al., Regulation of HIF-1alpha and VEGF by miR-20b tunes tumor cells to adapt to the alteration of oxygen concentration. PLoS One, 2009. 4(10): p. e7629.
433. Hua, Z., et al., MiRNA-directed regulation of VEGF and other angiogenic factors under hypoxia. PLoS One, 2006. 1: p. e116.
434. Forsythe, J.A., et al., Activation of vascular endothelial growth factor gene transcription by hypoxia-inducible factor 1. Mol Cell Biol, 1996. 16(9): p. 4604-13.
435. Slominski, A., et al., Melanin pigmentation in mammalian skin and its hormonal regulation. Physiol Rev, 2004. 84(4): p. 1155-228.
436. Slominski, A. and J. Pawelek, Animals under the sun: effects of ultraviolet radiation on mammalian skin. Clin Dermatol, 1998. 16(4): p. 503-15.
437. Agar, N.S., et al., The basal layer in human squamous tumors harbors more UVA than UVB fingerprint mutations: a role for UVA in human skin carcinogenesis. Proc Natl Acad Sci U S A, 2004. 101(14): p. 4954-9.
438. Zhang, H. and I. Rosdahl, Ultraviolet A and B differently induce intracellular protein expression in human skin melanocytes--a speculation of separate pathways in initiation of melanoma. Carcinogenesis, 2003. 24(12): p. 1929-34.
References 224
439. Gray-Schopfer, V.C., et al., Tumor necrosis factor-alpha blocks apoptosis in melanoma cells when BRAF signaling is inhibited. Cancer Res, 2007. 67(1): p. 122-9.
440. Emuss, V., et al., Mutations of C-RAF are rare in human cancer because C-RAF has a low basal kinase activity compared with B-RAF. Cancer Res, 2005. 65(21): p. 9719-26.
441. Lee, J.W., et al., Mutational analysis of the ARAF gene in human cancers. APMIS, 2005. 113(1): p. 54-7.
442. Zebisch, A., et al., Two transforming C-RAF germ-line mutations identified in patients with therapy-related acute myeloid leukemia. Cancer Res, 2006. 66(7): p. 3401-8.
443. McPhillips, F., et al., Raf-1 is the predominant Raf isoform that mediates growth factor-stimulated growth in ovarian cancer cells. Carcinogenesis, 2006. 27(4): p. 729-39.
444. Willmore-Payne, C., et al., Human malignant melanoma: detection of BRAF- and c-kit-activating mutations by high-resolution amplicon melting analysis. Hum Pathol, 2005. 36(5): p. 486-93.
445. Willmore-Payne, C., et al., BRAF and c-kit gene copy number in mutation-positive malignant melanoma. Hum Pathol, 2006. 37(5): p. 520-7.
446. Errico, M.E., et al., Expression of cyclin-D1 in uveal malignant melanoma. Anticancer Res, 2003. 23(3B): p. 2701-6.
447. Curtin, J.A., et al., Distinct sets of genetic alterations in melanoma. N Engl J Med, 2005. 353(20): p. 2135-47.
448. Anna, B., et al., Mechanism of UV-related carcinogenesis and its contribution to nevi/melanoma. Expert Rev Dermatol, 2007. 2(4): p. 451-469.
449. Maldonado, J.L., et al., Determinants of BRAF mutations in primary melanomas. J Natl Cancer Inst, 2003. 95(24): p. 1878-90.
450. Thomas, N.E., et al., Number of nevi and early-life ambient UV exposure are associated with BRAF-mutant melanoma. Cancer Epidemiol Biomarkers Prev, 2007. 16(5): p. 991-7.
451. Calipel, A., et al., Mutation of B-Raf in human choroidal melanoma cells mediates cell proliferation and transformation through the MEK/ERK pathway. J Biol Chem, 2003. 278(43): p. 42409-18.
452. Hingorani, S.R., et al., Suppression of BRAF(V599E) in human melanoma abrogates transformation. Cancer Res, 2003. 63(17): p. 5198-202.
References 225
453. Brummer, T., et al., Functional analysis of the regulatory requirements of B-Raf and the B-Raf(V600E) oncoprotein. Oncogene, 2006. 25(47): p. 6262-76.
454. Weyers, W., et al., Classification of cutaneous malignant melanoma: a reassessment of histopathologic criteria for the distinction of different types. Cancer, 1999. 86(2): p. 288-99.
455. Viros, A., et al., Improving melanoma classification by integrating genetic and morphologic features. PLoS Med, 2008. 5(6): p. e120.
456. Hayashida, N., et al., A rapid and simple detection method for the BRAF(T1796A) mutation in fine-needle aspirated thyroid carcinoma cells. Thyroid, 2004. 14(11): p. 910-5.
457. Bauer, J., et al., BRAF mutations in cutaneous melanoma are independently associated with age, anatomic site of the primary tumor, and the degree of solar elastosis at the primary tumor site. Pigment Cell Melanoma Res, 2011. 24(2): p. 345-51.
458. Thomas, N.E., M. Berwick, and M. Cordeiro-Stone, Could BRAF mutations in melanocytic lesions arise from DNA damage induced by ultraviolet radiation? J Invest Dermatol, 2006. 126(8): p. 1693-6.
459. Landi, M.T., et al., MC1R germline variants confer risk for BRAF-mutant melanoma. Science, 2006. 313(5786): p. 521-2.
460. Pollock, P.M., et al., High frequency of BRAF mutations in nevi. Nat Genet, 2003. 33(1): p. 19-20.
461. Uribe, P., Wistuba, II, and S. Gonzalez, BRAF mutation: a frequent event in benign, atypical, and malignant melanocytic lesions of the skin. Am J Dermatopathol, 2003. 25(5): p. 365-70.
462. Liu, W., et al., Distinct clinical and pathological features are associated with the BRAF(T1799A(V600E)) mutation in primary melanoma. J Invest Dermatol, 2007. 127(4): p. 900-5.
463. Akslen, L.A., et al., BRAF and NRAS mutations are frequent in nodular melanoma but are not associated with tumor cell proliferation or patient survival. J Invest Dermatol, 2005. 125(2): p. 312-7.
464. Lang, J. and R.M. MacKie, Prevalence of exon 15 BRAF mutations in primary melanoma of the superficial spreading, nodular, acral, and lentigo maligna subtypes. J Invest Dermatol, 2005. 125(3): p. 575-9.
465. Papp, T., et al., Mutational analysis of the BRAF gene in human congenital and dysplastic melanocytic naevi. Melanoma Res, 2005. 15(5): p. 401-7.
References 226
466. Saldanha, G., et al., Cutaneous melanoma subtypes show different BRAF and NRAS mutation frequencies. Clin Cancer Res, 2006. 12(15): p. 4499-505.
467. Chapman, P.B., et al., Improved survival with vemurafenib in melanoma with BRAF V600E mutation. N Engl J Med. 364(26): p. 2507-16.
468. Nuovo, G.J., et al., A methodology for the combined in situ analyses of the precursor and mature forms of microRNAs and correlation with their putative targets. Nat Protoc, 2009. 4(1): p. 107-15.
469. Wiklund, E.D., et al., Coordinated epigenetic repression of the miR-200 family and miR-205 in invasive bladder cancer. Int J Cancer, 2011. 128(6): p. 1327-34.
470. Weber, J.A., et al., The microRNA spectrum in 12 body fluids. Clin Chem, 2010. 56(11): p. 1733-41.
471. Edward R. Sauter, N.P., Body fluid micro(mi)RNAs as biomarkers for human cancer. 2011, Journal of Nucleic Acids Investigation
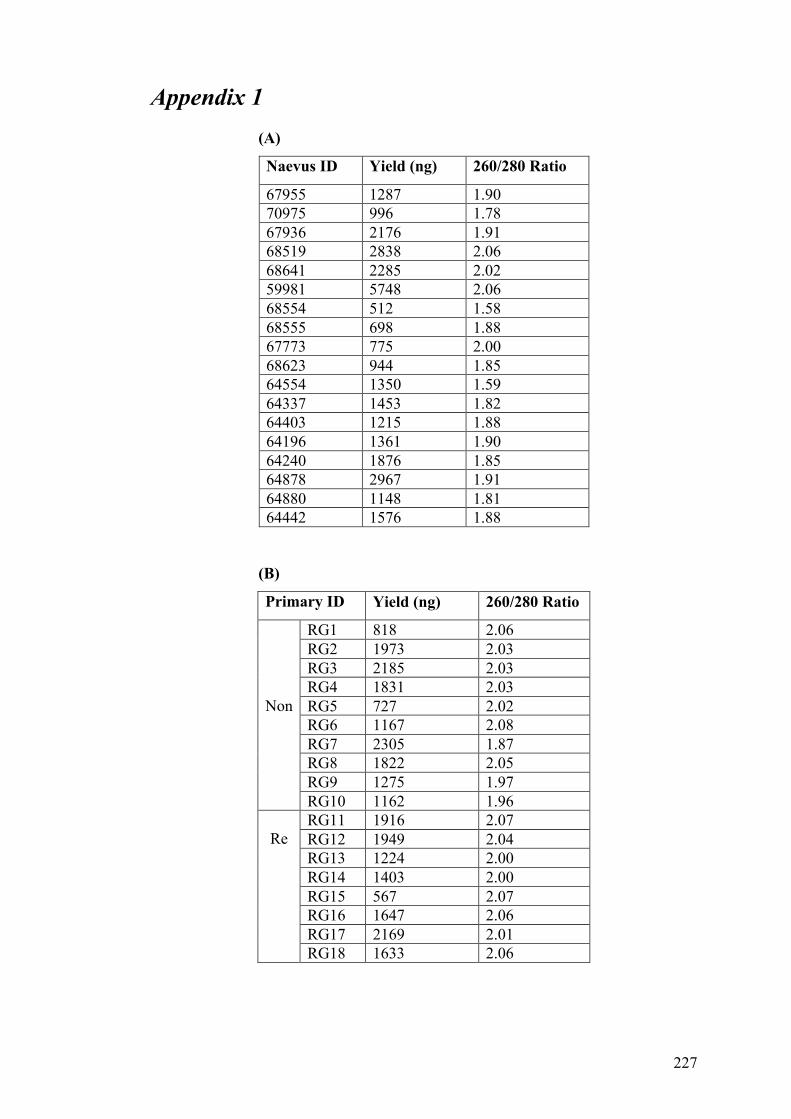
227
Appendix 1 (A)
Naevus ID Yield (ng) 260/280 Ratio
67955 1287 1.90 70975 996 1.78 67936 2176 1.91 68519 2838 2.06 68641 2285 2.02 59981 5748 2.06 68554 512 1.58 68555 698 1.88 67773 775 2.00 68623 944 1.85 64554 1350 1.59 64337 1453 1.82 64403 1215 1.88 64196 1361 1.90 64240 1876 1.85 64878 2967 1.91 64880 1148 1.81 64442 1576 1.88
(B)
Primary ID Yield (ng) 260/280 Ratio
RG1 818 2.06 RG2 1973 2.03 RG3 2185 2.03 RG4 1831 2.03 RG5 727 2.02 RG6 1167 2.08 RG7 2305 1.87 RG8 1822 2.05 RG9 1275 1.97
Non
RG10 1162 1.96 RG11 1916 2.07 RG12 1949 2.04 RG13 1224 2.00 RG14 1403 2.00 RG15 567 2.07 RG16 1647 2.06 RG17 2169 2.01
Re
RG18 1633 2.06
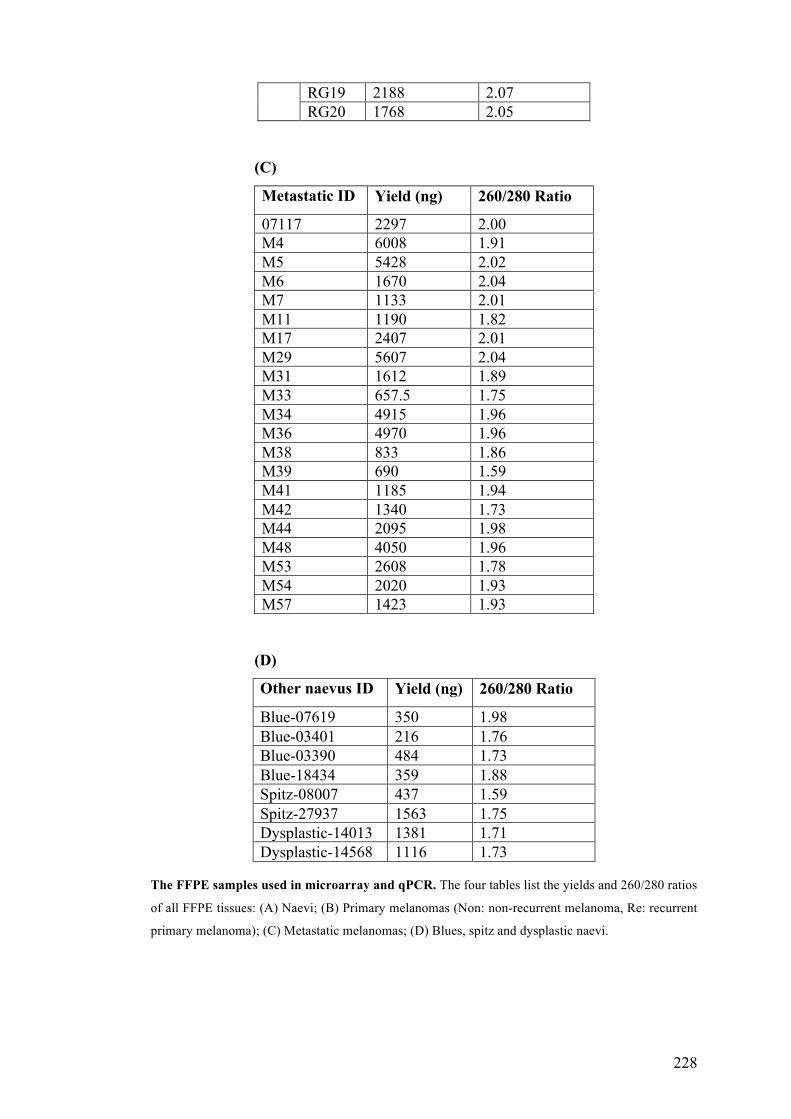
228
RG19 2188 2.07 RG20 1768 2.05
(C)
Metastatic ID Yield (ng) 260/280 Ratio
07117 2297 2.00 M4 6008 1.91 M5 5428 2.02 M6 1670 2.04 M7 1133 2.01 M11 1190 1.82 M17 2407 2.01 M29 5607 2.04 M31 1612 1.89 M33 657.5 1.75 M34 4915 1.96 M36 4970 1.96 M38 833 1.86 M39 690 1.59 M41 1185 1.94 M42 1340 1.73 M44 2095 1.98 M48 4050 1.96 M53 2608 1.78 M54 2020 1.93 M57 1423 1.93
(D)
Other naevus ID Yield (ng) 260/280 Ratio
Blue-07619 350 1.98 Blue-03401 216 1.76 Blue-03390 484 1.73 Blue-18434 359 1.88 Spitz-08007 437 1.59 Spitz-27937 1563 1.75 Dysplastic-14013 1381 1.71 Dysplastic-14568 1116 1.73
The FFPE samples used in microarray and qPCR. The four tables list the yields and 260/280 ratios
of all FFPE tissues: (A) Naevi; (B) Primary melanomas (Non: non-recurrent melanoma, Re: recurrent
primary melanoma); (C) Metastatic melanomas; (D) Blues, spitz and dysplastic naevi.
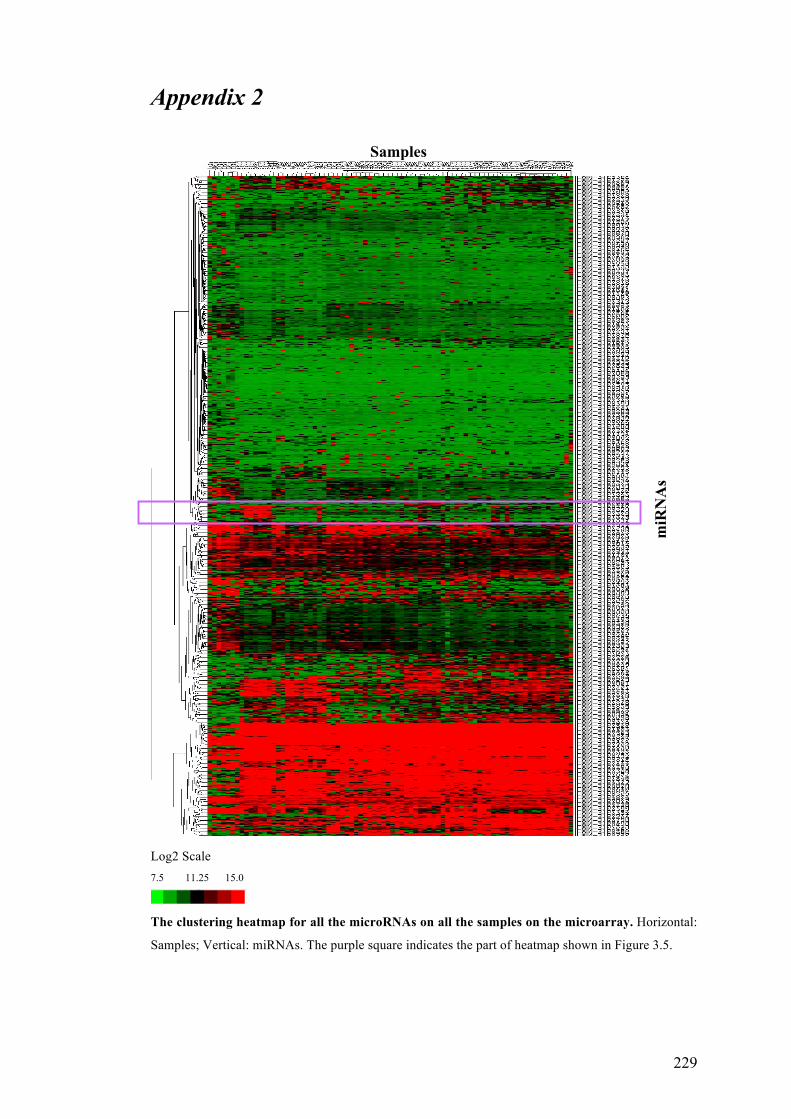
229
Appendix 2 Samples
Log2 Scale 7.5 11.25 15.0
The clustering heatmap for all the microRNAs on all the samples on the microarray. Horizontal:
Samples; Vertical: miRNAs. The purple square indicates the part of heatmap shown in Figure 3.5.
miR
NA
s
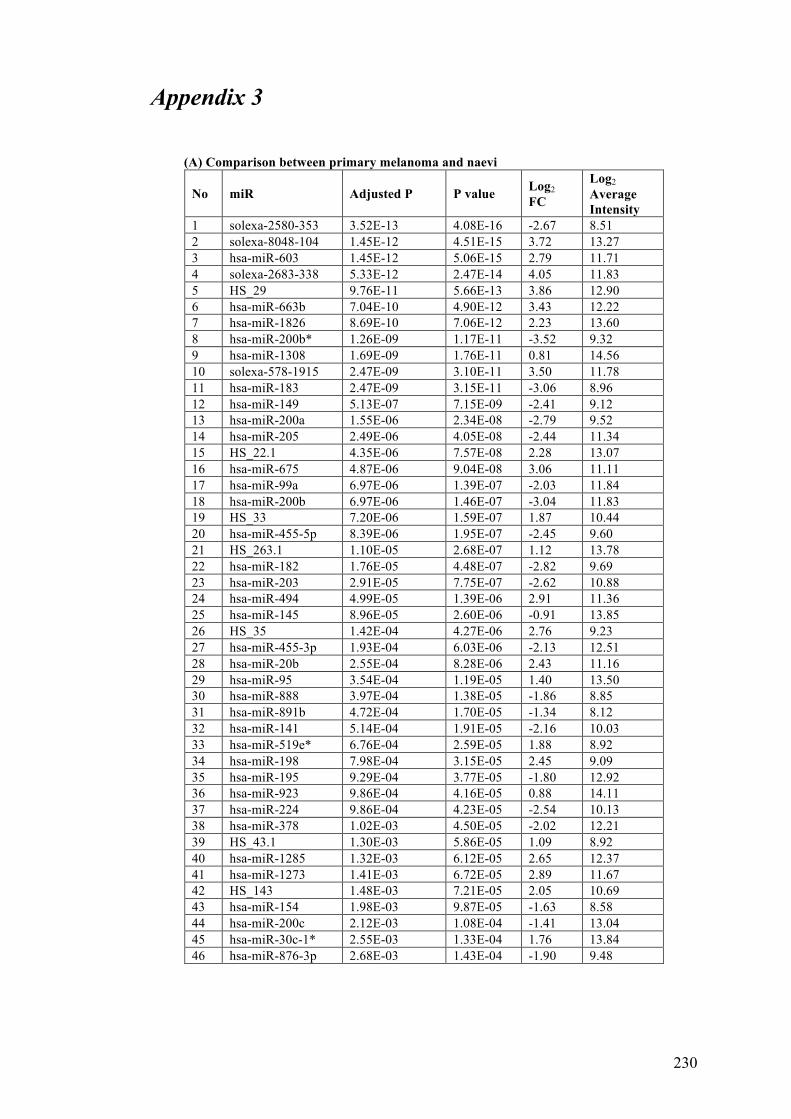
230
Appendix 3 (A) Comparison between primary melanoma and naevi
No miR Adjusted P P value Log2 FC
Log2 Average Intensity
1 solexa-2580-353 3.52E-13 4.08E-16 -2.67 8.51 2 solexa-8048-104 1.45E-12 4.51E-15 3.72 13.27 3 hsa-miR-603 1.45E-12 5.06E-15 2.79 11.71 4 solexa-2683-338 5.33E-12 2.47E-14 4.05 11.83 5 HS_29 9.76E-11 5.66E-13 3.86 12.90 6 hsa-miR-663b 7.04E-10 4.90E-12 3.43 12.22 7 hsa-miR-1826 8.69E-10 7.06E-12 2.23 13.60 8 hsa-miR-200b* 1.26E-09 1.17E-11 -3.52 9.32 9 hsa-miR-1308 1.69E-09 1.76E-11 0.81 14.56 10 solexa-578-1915 2.47E-09 3.10E-11 3.50 11.78 11 hsa-miR-183 2.47E-09 3.15E-11 -3.06 8.96 12 hsa-miR-149 5.13E-07 7.15E-09 -2.41 9.12 13 hsa-miR-200a 1.55E-06 2.34E-08 -2.79 9.52 14 hsa-miR-205 2.49E-06 4.05E-08 -2.44 11.34 15 HS_22.1 4.35E-06 7.57E-08 2.28 13.07 16 hsa-miR-675 4.87E-06 9.04E-08 3.06 11.11 17 hsa-miR-99a 6.97E-06 1.39E-07 -2.03 11.84 18 hsa-miR-200b 6.97E-06 1.46E-07 -3.04 11.83 19 HS_33 7.20E-06 1.59E-07 1.87 10.44 20 hsa-miR-455-5p 8.39E-06 1.95E-07 -2.45 9.60 21 HS_263.1 1.10E-05 2.68E-07 1.12 13.78 22 hsa-miR-182 1.76E-05 4.48E-07 -2.82 9.69 23 hsa-miR-203 2.91E-05 7.75E-07 -2.62 10.88 24 hsa-miR-494 4.99E-05 1.39E-06 2.91 11.36 25 hsa-miR-145 8.96E-05 2.60E-06 -0.91 13.85 26 HS_35 1.42E-04 4.27E-06 2.76 9.23 27 hsa-miR-455-3p 1.93E-04 6.03E-06 -2.13 12.51 28 hsa-miR-20b 2.55E-04 8.28E-06 2.43 11.16 29 hsa-miR-95 3.54E-04 1.19E-05 1.40 13.50 30 hsa-miR-888 3.97E-04 1.38E-05 -1.86 8.85 31 hsa-miR-891b 4.72E-04 1.70E-05 -1.34 8.12 32 hsa-miR-141 5.14E-04 1.91E-05 -2.16 10.03 33 hsa-miR-519e* 6.76E-04 2.59E-05 1.88 8.92 34 hsa-miR-198 7.98E-04 3.15E-05 2.45 9.09 35 hsa-miR-195 9.29E-04 3.77E-05 -1.80 12.92 36 hsa-miR-923 9.86E-04 4.16E-05 0.88 14.11 37 hsa-miR-224 9.86E-04 4.23E-05 -2.54 10.13 38 hsa-miR-378 1.02E-03 4.50E-05 -2.02 12.21 39 HS_43.1 1.30E-03 5.86E-05 1.09 8.92 40 hsa-miR-1285 1.32E-03 6.12E-05 2.65 12.37 41 hsa-miR-1273 1.41E-03 6.72E-05 2.89 11.67 42 HS_143 1.48E-03 7.21E-05 2.05 10.69 43 hsa-miR-154 1.98E-03 9.87E-05 -1.63 8.58 44 hsa-miR-200c 2.12E-03 1.08E-04 -1.41 13.04 45 hsa-miR-30c-1* 2.55E-03 1.33E-04 1.76 13.84 46 hsa-miR-876-3p 2.68E-03 1.43E-04 -1.90 9.48
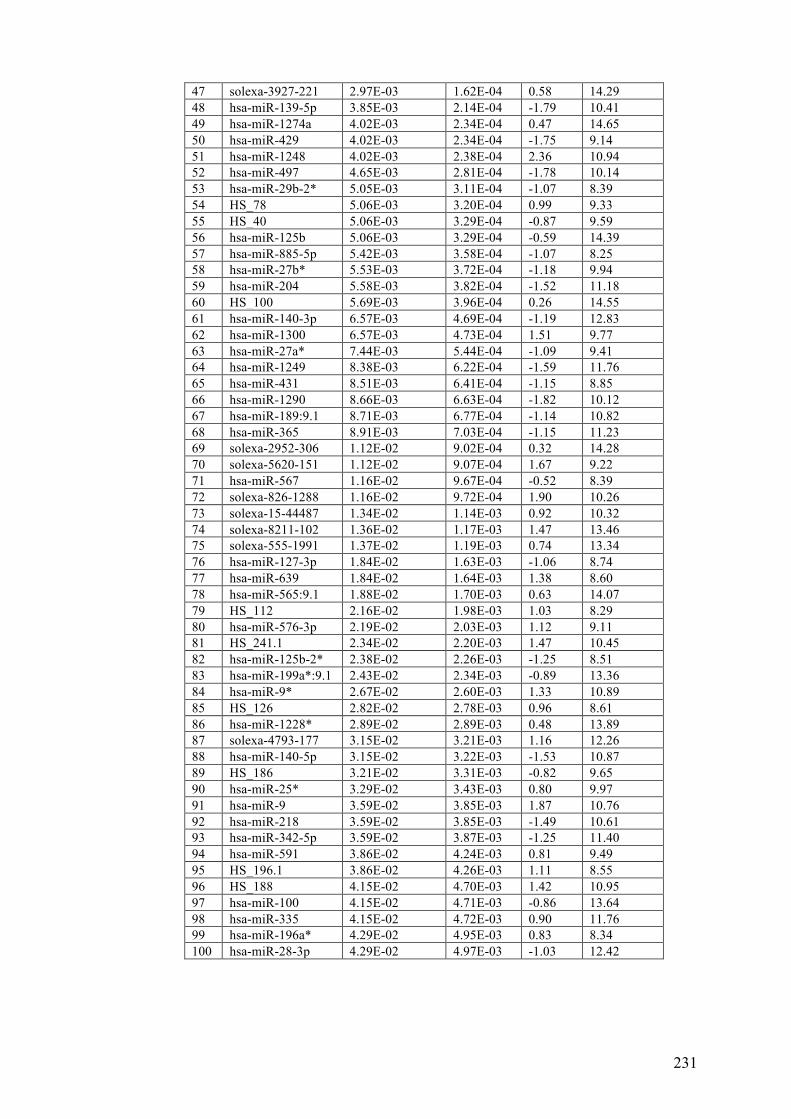
231
47 solexa-3927-221 2.97E-03 1.62E-04 0.58 14.29 48 hsa-miR-139-5p 3.85E-03 2.14E-04 -1.79 10.41 49 hsa-miR-1274a 4.02E-03 2.34E-04 0.47 14.65 50 hsa-miR-429 4.02E-03 2.34E-04 -1.75 9.14 51 hsa-miR-1248 4.02E-03 2.38E-04 2.36 10.94 52 hsa-miR-497 4.65E-03 2.81E-04 -1.78 10.14 53 hsa-miR-29b-2* 5.05E-03 3.11E-04 -1.07 8.39 54 HS_78 5.06E-03 3.20E-04 0.99 9.33 55 HS_40 5.06E-03 3.29E-04 -0.87 9.59 56 hsa-miR-125b 5.06E-03 3.29E-04 -0.59 14.39 57 hsa-miR-885-5p 5.42E-03 3.58E-04 -1.07 8.25 58 hsa-miR-27b* 5.53E-03 3.72E-04 -1.18 9.94 59 hsa-miR-204 5.58E-03 3.82E-04 -1.52 11.18 60 HS_100 5.69E-03 3.96E-04 0.26 14.55 61 hsa-miR-140-3p 6.57E-03 4.69E-04 -1.19 12.83 62 hsa-miR-1300 6.57E-03 4.73E-04 1.51 9.77 63 hsa-miR-27a* 7.44E-03 5.44E-04 -1.09 9.41 64 hsa-miR-1249 8.38E-03 6.22E-04 -1.59 11.76 65 hsa-miR-431 8.51E-03 6.41E-04 -1.15 8.85 66 hsa-miR-1290 8.66E-03 6.63E-04 -1.82 10.12 67 hsa-miR-189:9.1 8.71E-03 6.77E-04 -1.14 10.82 68 hsa-miR-365 8.91E-03 7.03E-04 -1.15 11.23 69 solexa-2952-306 1.12E-02 9.02E-04 0.32 14.28 70 solexa-5620-151 1.12E-02 9.07E-04 1.67 9.22 71 hsa-miR-567 1.16E-02 9.67E-04 -0.52 8.39 72 solexa-826-1288 1.16E-02 9.72E-04 1.90 10.26 73 solexa-15-44487 1.34E-02 1.14E-03 0.92 10.32 74 solexa-8211-102 1.36E-02 1.17E-03 1.47 13.46 75 solexa-555-1991 1.37E-02 1.19E-03 0.74 13.34 76 hsa-miR-127-3p 1.84E-02 1.63E-03 -1.06 8.74 77 hsa-miR-639 1.84E-02 1.64E-03 1.38 8.60 78 hsa-miR-565:9.1 1.88E-02 1.70E-03 0.63 14.07 79 HS_112 2.16E-02 1.98E-03 1.03 8.29 80 hsa-miR-576-3p 2.19E-02 2.03E-03 1.12 9.11 81 HS_241.1 2.34E-02 2.20E-03 1.47 10.45 82 hsa-miR-125b-2* 2.38E-02 2.26E-03 -1.25 8.51 83 hsa-miR-199a*:9.1 2.43E-02 2.34E-03 -0.89 13.36 84 hsa-miR-9* 2.67E-02 2.60E-03 1.33 10.89 85 HS_126 2.82E-02 2.78E-03 0.96 8.61 86 hsa-miR-1228* 2.89E-02 2.89E-03 0.48 13.89 87 solexa-4793-177 3.15E-02 3.21E-03 1.16 12.26 88 hsa-miR-140-5p 3.15E-02 3.22E-03 -1.53 10.87 89 HS_186 3.21E-02 3.31E-03 -0.82 9.65 90 hsa-miR-25* 3.29E-02 3.43E-03 0.80 9.97 91 hsa-miR-9 3.59E-02 3.85E-03 1.87 10.76 92 hsa-miR-218 3.59E-02 3.85E-03 -1.49 10.61 93 hsa-miR-342-5p 3.59E-02 3.87E-03 -1.25 11.40 94 hsa-miR-591 3.86E-02 4.24E-03 0.81 9.49 95 HS_196.1 3.86E-02 4.26E-03 1.11 8.55 96 HS_188 4.15E-02 4.70E-03 1.42 10.95 97 hsa-miR-100 4.15E-02 4.71E-03 -0.86 13.64 98 hsa-miR-335 4.15E-02 4.72E-03 0.90 11.76 99 hsa-miR-196a* 4.29E-02 4.95E-03 0.83 8.34 100 hsa-miR-28-3p 4.29E-02 4.97E-03 -1.03 12.42
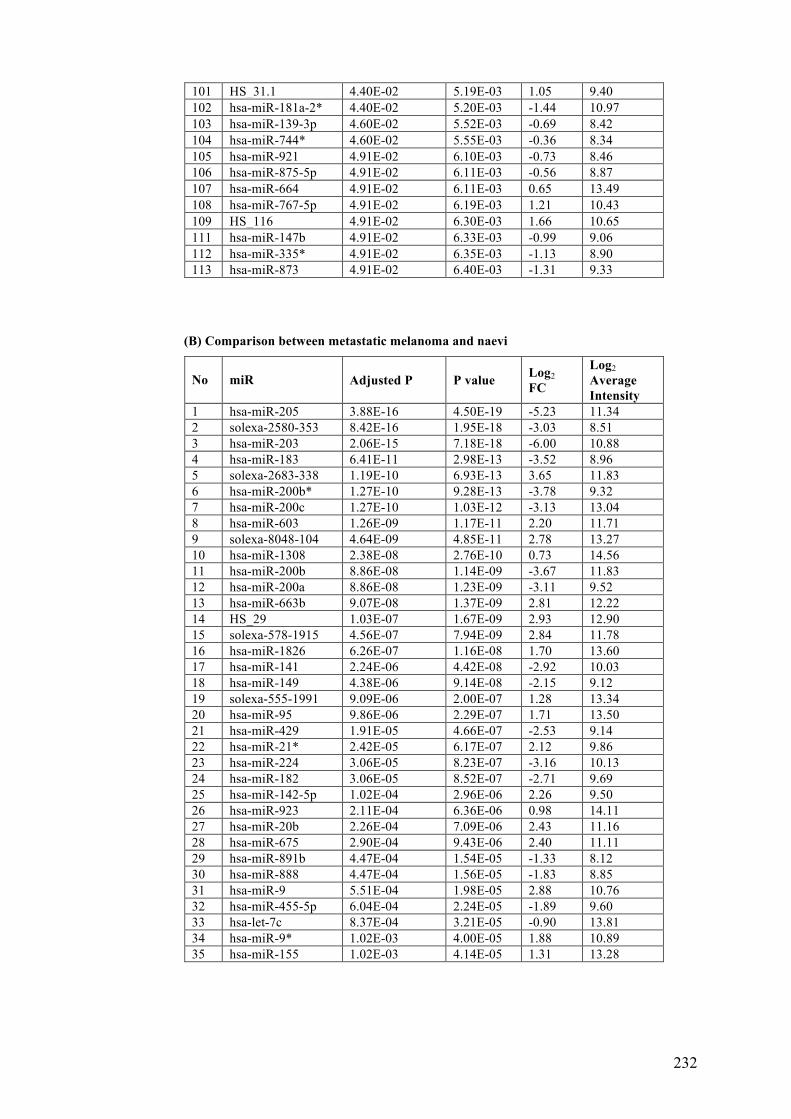
232
101 HS_31.1 4.40E-02 5.19E-03 1.05 9.40 102 hsa-miR-181a-2* 4.40E-02 5.20E-03 -1.44 10.97 103 hsa-miR-139-3p 4.60E-02 5.52E-03 -0.69 8.42 104 hsa-miR-744* 4.60E-02 5.55E-03 -0.36 8.34 105 hsa-miR-921 4.91E-02 6.10E-03 -0.73 8.46 106 hsa-miR-875-5p 4.91E-02 6.11E-03 -0.56 8.87 107 hsa-miR-664 4.91E-02 6.11E-03 0.65 13.49 108 hsa-miR-767-5p 4.91E-02 6.19E-03 1.21 10.43 109 HS_116 4.91E-02 6.30E-03 1.66 10.65 111 hsa-miR-147b 4.91E-02 6.33E-03 -0.99 9.06 112 hsa-miR-335* 4.91E-02 6.35E-03 -1.13 8.90 113 hsa-miR-873 4.91E-02 6.40E-03 -1.31 9.33
(B) Comparison between metastatic melanoma and naevi
No miR Adjusted P P value Log2 FC
Log2 Average Intensity
1 hsa-miR-205 3.88E-16 4.50E-19 -5.23 11.34 2 solexa-2580-353 8.42E-16 1.95E-18 -3.03 8.51 3 hsa-miR-203 2.06E-15 7.18E-18 -6.00 10.88 4 hsa-miR-183 6.41E-11 2.98E-13 -3.52 8.96 5 solexa-2683-338 1.19E-10 6.93E-13 3.65 11.83 6 hsa-miR-200b* 1.27E-10 9.28E-13 -3.78 9.32 7 hsa-miR-200c 1.27E-10 1.03E-12 -3.13 13.04 8 hsa-miR-603 1.26E-09 1.17E-11 2.20 11.71 9 solexa-8048-104 4.64E-09 4.85E-11 2.78 13.27 10 hsa-miR-1308 2.38E-08 2.76E-10 0.73 14.56 11 hsa-miR-200b 8.86E-08 1.14E-09 -3.67 11.83 12 hsa-miR-200a 8.86E-08 1.23E-09 -3.11 9.52 13 hsa-miR-663b 9.07E-08 1.37E-09 2.81 12.22 14 HS_29 1.03E-07 1.67E-09 2.93 12.90 15 solexa-578-1915 4.56E-07 7.94E-09 2.84 11.78 16 hsa-miR-1826 6.26E-07 1.16E-08 1.70 13.60 17 hsa-miR-141 2.24E-06 4.42E-08 -2.92 10.03 18 hsa-miR-149 4.38E-06 9.14E-08 -2.15 9.12 19 solexa-555-1991 9.09E-06 2.00E-07 1.28 13.34 20 hsa-miR-95 9.86E-06 2.29E-07 1.71 13.50 21 hsa-miR-429 1.91E-05 4.66E-07 -2.53 9.14 22 hsa-miR-21* 2.42E-05 6.17E-07 2.12 9.86 23 hsa-miR-224 3.06E-05 8.23E-07 -3.16 10.13 24 hsa-miR-182 3.06E-05 8.52E-07 -2.71 9.69 25 hsa-miR-142-5p 1.02E-04 2.96E-06 2.26 9.50 26 hsa-miR-923 2.11E-04 6.36E-06 0.98 14.11 27 hsa-miR-20b 2.26E-04 7.09E-06 2.43 11.16 28 hsa-miR-675 2.90E-04 9.43E-06 2.40 11.11 29 hsa-miR-891b 4.47E-04 1.54E-05 -1.33 8.12 30 hsa-miR-888 4.47E-04 1.56E-05 -1.83 8.85 31 hsa-miR-9 5.51E-04 1.98E-05 2.88 10.76 32 hsa-miR-455-5p 6.04E-04 2.24E-05 -1.89 9.60 33 hsa-let-7c 8.37E-04 3.21E-05 -0.90 13.81 34 hsa-miR-9* 1.02E-03 4.00E-05 1.88 10.89 35 hsa-miR-155 1.02E-03 4.14E-05 1.31 13.28
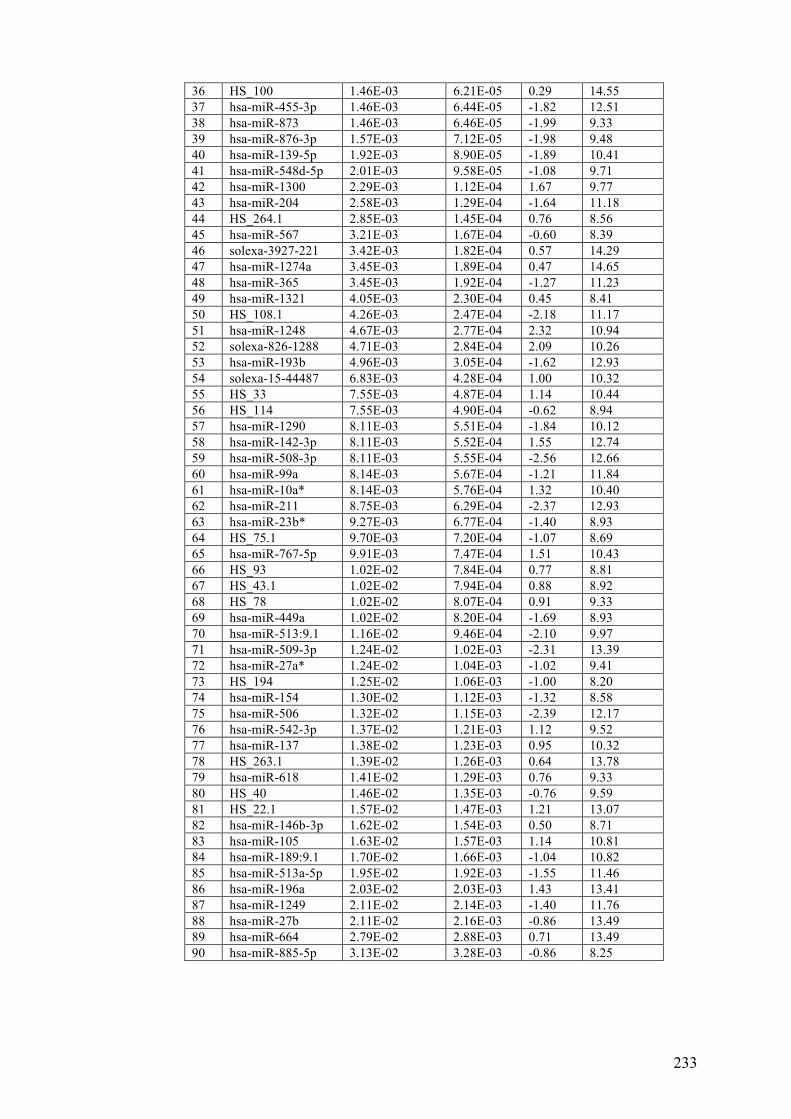
233
36 HS_100 1.46E-03 6.21E-05 0.29 14.55 37 hsa-miR-455-3p 1.46E-03 6.44E-05 -1.82 12.51 38 hsa-miR-873 1.46E-03 6.46E-05 -1.99 9.33 39 hsa-miR-876-3p 1.57E-03 7.12E-05 -1.98 9.48 40 hsa-miR-139-5p 1.92E-03 8.90E-05 -1.89 10.41 41 hsa-miR-548d-5p 2.01E-03 9.58E-05 -1.08 9.71 42 hsa-miR-1300 2.29E-03 1.12E-04 1.67 9.77 43 hsa-miR-204 2.58E-03 1.29E-04 -1.64 11.18 44 HS_264.1 2.85E-03 1.45E-04 0.76 8.56 45 hsa-miR-567 3.21E-03 1.67E-04 -0.60 8.39 46 solexa-3927-221 3.42E-03 1.82E-04 0.57 14.29 47 hsa-miR-1274a 3.45E-03 1.89E-04 0.47 14.65 48 hsa-miR-365 3.45E-03 1.92E-04 -1.27 11.23 49 hsa-miR-1321 4.05E-03 2.30E-04 0.45 8.41 50 HS_108.1 4.26E-03 2.47E-04 -2.18 11.17 51 hsa-miR-1248 4.67E-03 2.77E-04 2.32 10.94 52 solexa-826-1288 4.71E-03 2.84E-04 2.09 10.26 53 hsa-miR-193b 4.96E-03 3.05E-04 -1.62 12.93 54 solexa-15-44487 6.83E-03 4.28E-04 1.00 10.32 55 HS_33 7.55E-03 4.87E-04 1.14 10.44 56 HS_114 7.55E-03 4.90E-04 -0.62 8.94 57 hsa-miR-1290 8.11E-03 5.51E-04 -1.84 10.12 58 hsa-miR-142-3p 8.11E-03 5.52E-04 1.55 12.74 59 hsa-miR-508-3p 8.11E-03 5.55E-04 -2.56 12.66 60 hsa-miR-99a 8.14E-03 5.67E-04 -1.21 11.84 61 hsa-miR-10a* 8.14E-03 5.76E-04 1.32 10.40 62 hsa-miR-211 8.75E-03 6.29E-04 -2.37 12.93 63 hsa-miR-23b* 9.27E-03 6.77E-04 -1.40 8.93 64 HS_75.1 9.70E-03 7.20E-04 -1.07 8.69 65 hsa-miR-767-5p 9.91E-03 7.47E-04 1.51 10.43 66 HS_93 1.02E-02 7.84E-04 0.77 8.81 67 HS_43.1 1.02E-02 7.94E-04 0.88 8.92 68 HS_78 1.02E-02 8.07E-04 0.91 9.33 69 hsa-miR-449a 1.02E-02 8.20E-04 -1.69 8.93 70 hsa-miR-513:9.1 1.16E-02 9.46E-04 -2.10 9.97 71 hsa-miR-509-3p 1.24E-02 1.02E-03 -2.31 13.39 72 hsa-miR-27a* 1.24E-02 1.04E-03 -1.02 9.41 73 HS_194 1.25E-02 1.06E-03 -1.00 8.20 74 hsa-miR-154 1.30E-02 1.12E-03 -1.32 8.58 75 hsa-miR-506 1.32E-02 1.15E-03 -2.39 12.17 76 hsa-miR-542-3p 1.37E-02 1.21E-03 1.12 9.52 77 hsa-miR-137 1.38E-02 1.23E-03 0.95 10.32 78 HS_263.1 1.39E-02 1.26E-03 0.64 13.78 79 hsa-miR-618 1.41E-02 1.29E-03 0.76 9.33 80 HS_40 1.46E-02 1.35E-03 -0.76 9.59 81 HS_22.1 1.57E-02 1.47E-03 1.21 13.07 82 hsa-miR-146b-3p 1.62E-02 1.54E-03 0.50 8.71 83 hsa-miR-105 1.63E-02 1.57E-03 1.14 10.81 84 hsa-miR-189:9.1 1.70E-02 1.66E-03 -1.04 10.82 85 hsa-miR-513a-5p 1.95E-02 1.92E-03 -1.55 11.46 86 hsa-miR-196a 2.03E-02 2.03E-03 1.43 13.41 87 hsa-miR-1249 2.11E-02 2.14E-03 -1.40 11.76 88 hsa-miR-27b 2.11E-02 2.16E-03 -0.86 13.49 89 hsa-miR-664 2.79E-02 2.88E-03 0.71 13.49 90 hsa-miR-885-5p 3.13E-02 3.28E-03 -0.86 8.25
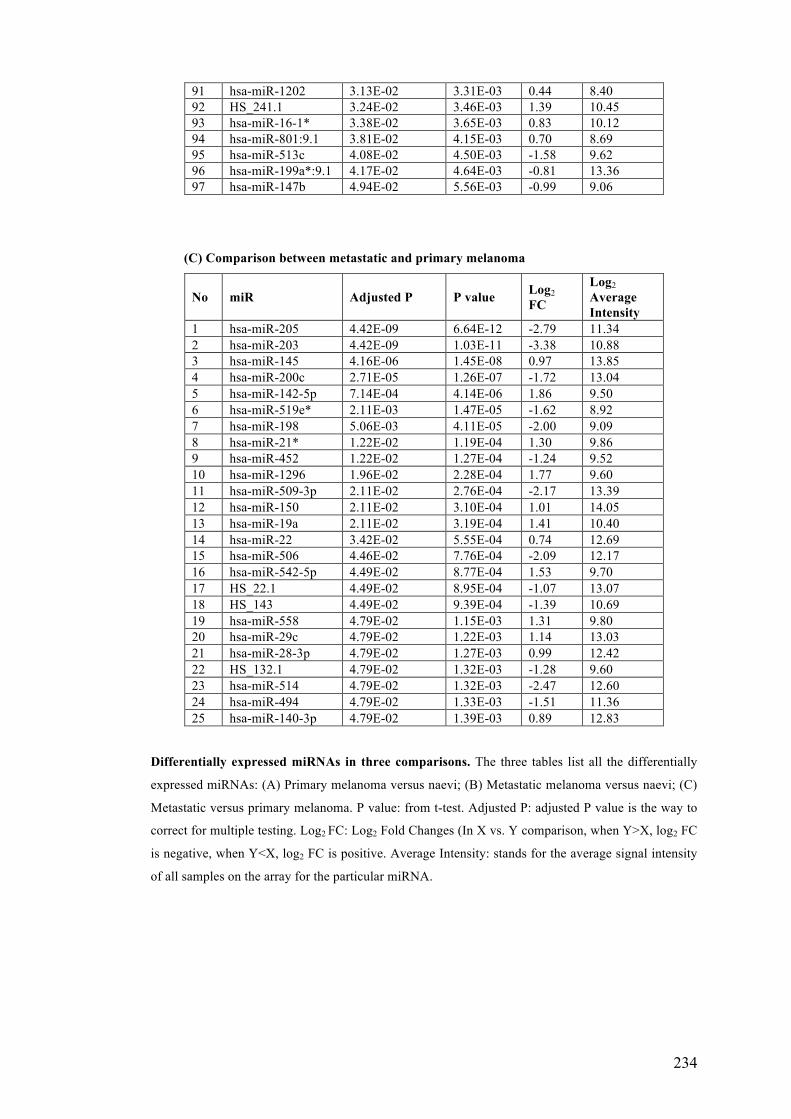
234
91 hsa-miR-1202 3.13E-02 3.31E-03 0.44 8.40 92 HS_241.1 3.24E-02 3.46E-03 1.39 10.45 93 hsa-miR-16-1* 3.38E-02 3.65E-03 0.83 10.12 94 hsa-miR-801:9.1 3.81E-02 4.15E-03 0.70 8.69 95 hsa-miR-513c 4.08E-02 4.50E-03 -1.58 9.62 96 hsa-miR-199a*:9.1 4.17E-02 4.64E-03 -0.81 13.36 97 hsa-miR-147b 4.94E-02 5.56E-03 -0.99 9.06
(C) Comparison between metastatic and primary melanoma
No miR Adjusted P P value Log2 FC
Log2 Average Intensity
1 hsa-miR-205 4.42E-09 6.64E-12 -2.79 11.34 2 hsa-miR-203 4.42E-09 1.03E-11 -3.38 10.88 3 hsa-miR-145 4.16E-06 1.45E-08 0.97 13.85 4 hsa-miR-200c 2.71E-05 1.26E-07 -1.72 13.04 5 hsa-miR-142-5p 7.14E-04 4.14E-06 1.86 9.50 6 hsa-miR-519e* 2.11E-03 1.47E-05 -1.62 8.92 7 hsa-miR-198 5.06E-03 4.11E-05 -2.00 9.09 8 hsa-miR-21* 1.22E-02 1.19E-04 1.30 9.86 9 hsa-miR-452 1.22E-02 1.27E-04 -1.24 9.52 10 hsa-miR-1296 1.96E-02 2.28E-04 1.77 9.60 11 hsa-miR-509-3p 2.11E-02 2.76E-04 -2.17 13.39 12 hsa-miR-150 2.11E-02 3.10E-04 1.01 14.05 13 hsa-miR-19a 2.11E-02 3.19E-04 1.41 10.40 14 hsa-miR-22 3.42E-02 5.55E-04 0.74 12.69 15 hsa-miR-506 4.46E-02 7.76E-04 -2.09 12.17 16 hsa-miR-542-5p 4.49E-02 8.77E-04 1.53 9.70 17 HS_22.1 4.49E-02 8.95E-04 -1.07 13.07 18 HS_143 4.49E-02 9.39E-04 -1.39 10.69 19 hsa-miR-558 4.79E-02 1.15E-03 1.31 9.80 20 hsa-miR-29c 4.79E-02 1.22E-03 1.14 13.03 21 hsa-miR-28-3p 4.79E-02 1.27E-03 0.99 12.42 22 HS_132.1 4.79E-02 1.32E-03 -1.28 9.60 23 hsa-miR-514 4.79E-02 1.32E-03 -2.47 12.60 24 hsa-miR-494 4.79E-02 1.33E-03 -1.51 11.36 25 hsa-miR-140-3p 4.79E-02 1.39E-03 0.89 12.83
Differentially expressed miRNAs in three comparisons. The three tables list all the differentially
expressed miRNAs: (A) Primary melanoma versus naevi; (B) Metastatic melanoma versus naevi; (C)
Metastatic versus primary melanoma. P value: from t-test. Adjusted P: adjusted P value is the way to
correct for multiple testing. Log2 FC: Log2 Fold Changes (In X vs. Y comparison, when Y>X, log2 FC
is negative, when Y<X, log2 FC is positive. Average Intensity: stands for the average signal intensity
of all samples on the array for the particular miRNA.
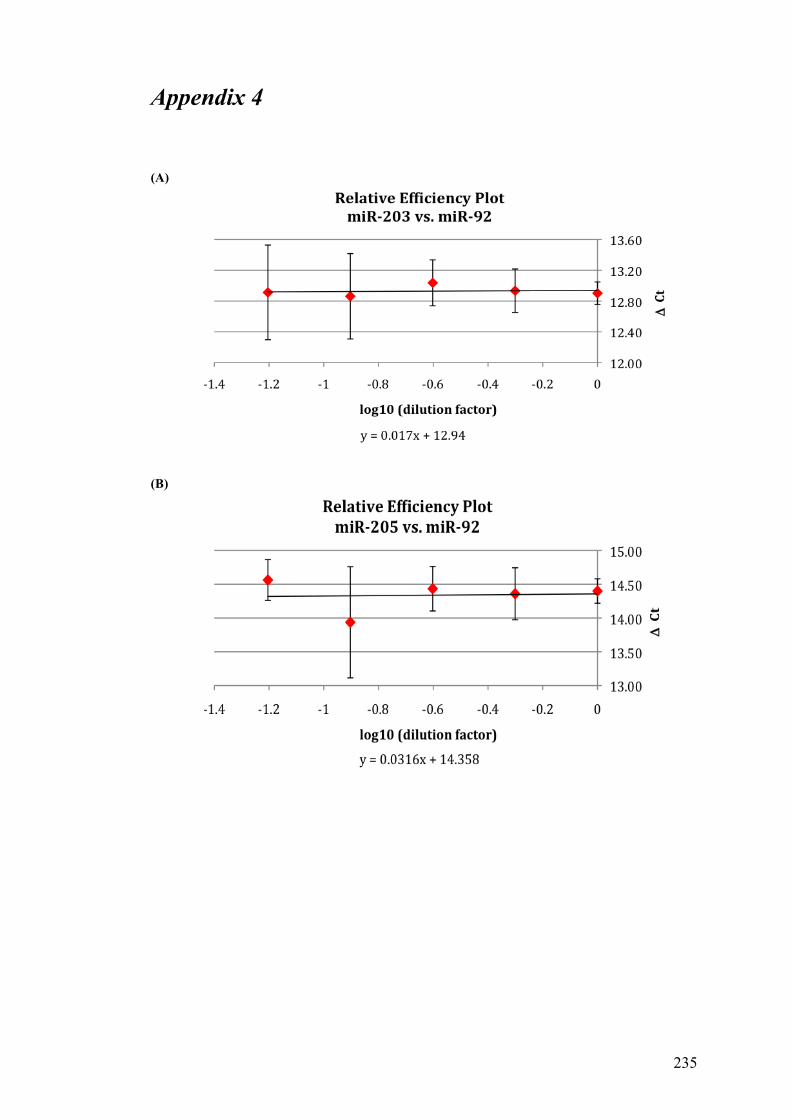
235
Appendix 4
(A)
(B)
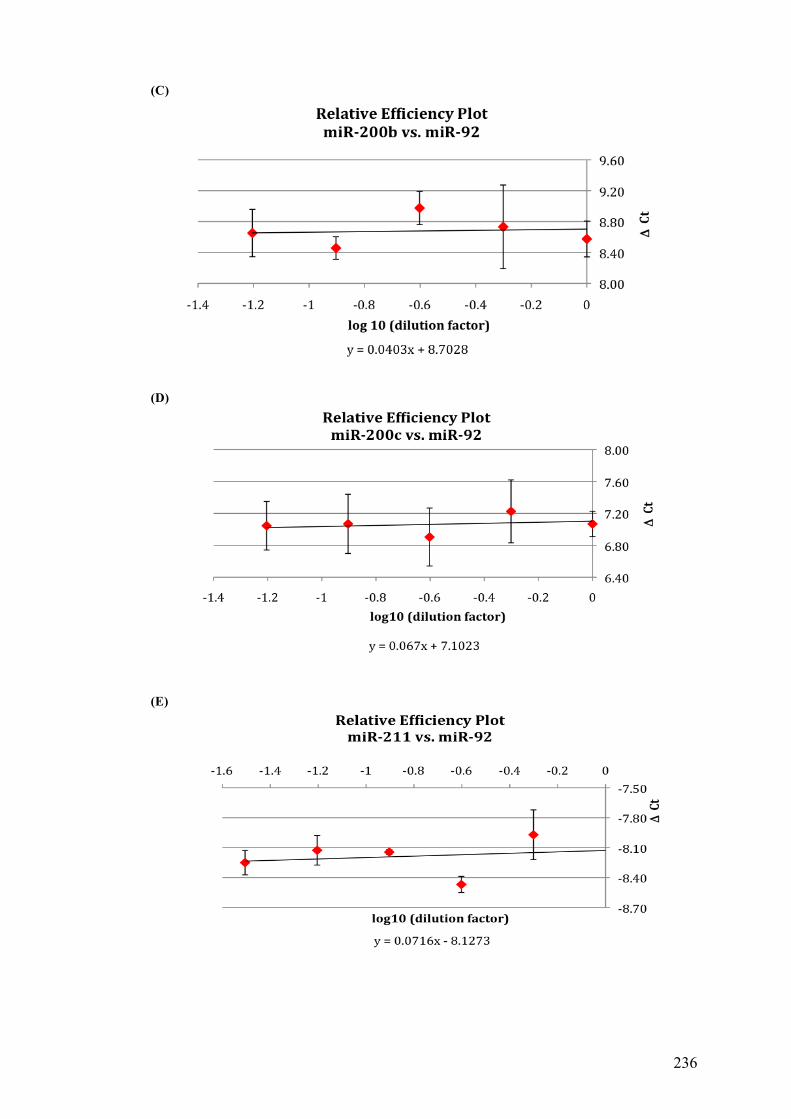
236
(C)
(D)
(E)
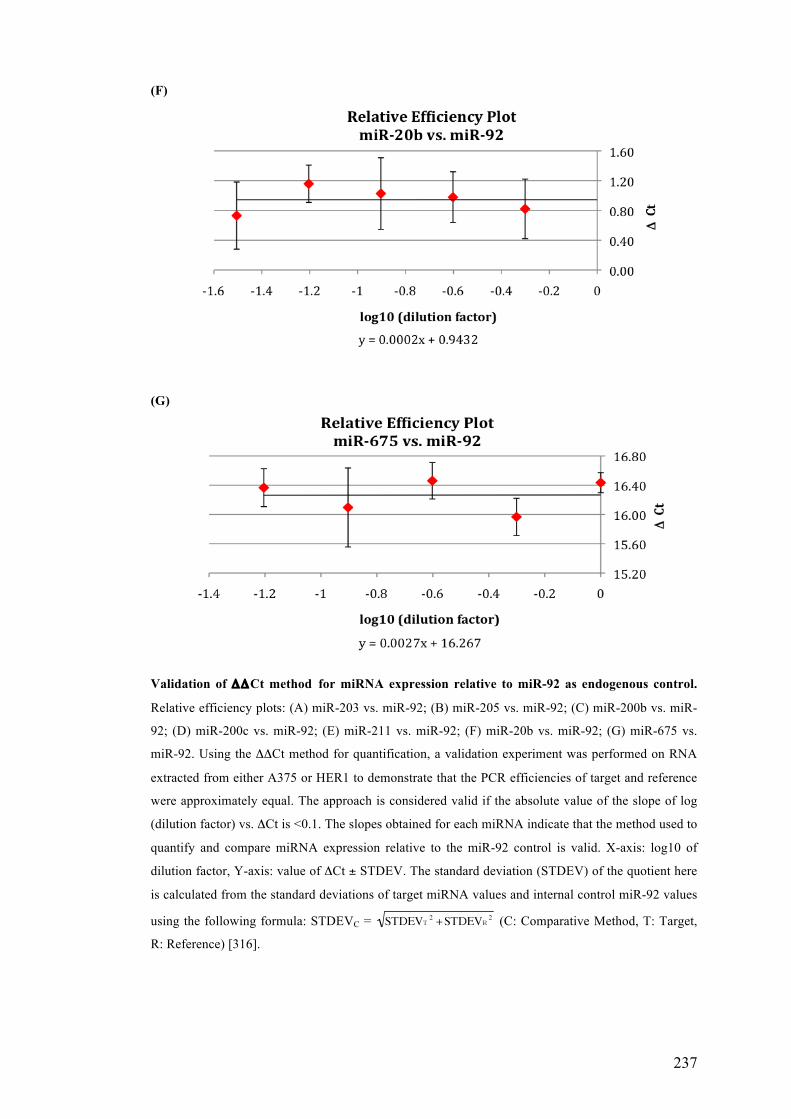
237
(F)
(G)
Validation of ΔΔCt method for miRNA expression relative to miR-92 as endogenous control.
Relative efficiency plots: (A) miR-203 vs. miR-92; (B) miR-205 vs. miR-92; (C) miR-200b vs. miR-
92; (D) miR-200c vs. miR-92; (E) miR-211 vs. miR-92; (F) miR-20b vs. miR-92; (G) miR-675 vs.
miR-92. Using the ΔΔCt method for quantification, a validation experiment was performed on RNA
extracted from either A375 or HER1 to demonstrate that the PCR efficiencies of target and reference
were approximately equal. The approach is considered valid if the absolute value of the slope of log
(dilution factor) vs. ΔCt is <0.1. The slopes obtained for each miRNA indicate that the method used to
quantify and compare miRNA expression relative to the miR-92 control is valid. X-axis: log10 of
dilution factor, Y-axis: value of ΔCt ± STDEV. The standard deviation (STDEV) of the quotient here
is calculated from the standard deviations of target miRNA values and internal control miR-92 values
using the following formula: STDEVC = (C: Comparative Method, T: Target,
R: Reference) [316].
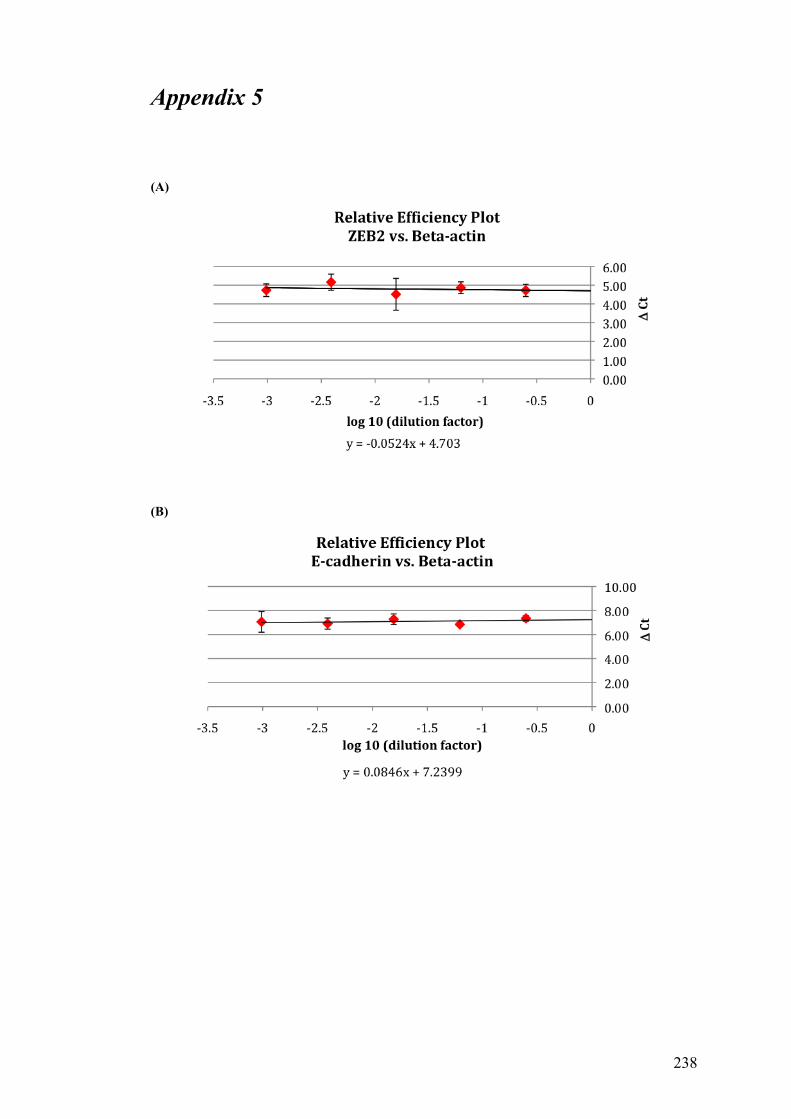
238
Appendix 5
(A)
(B)
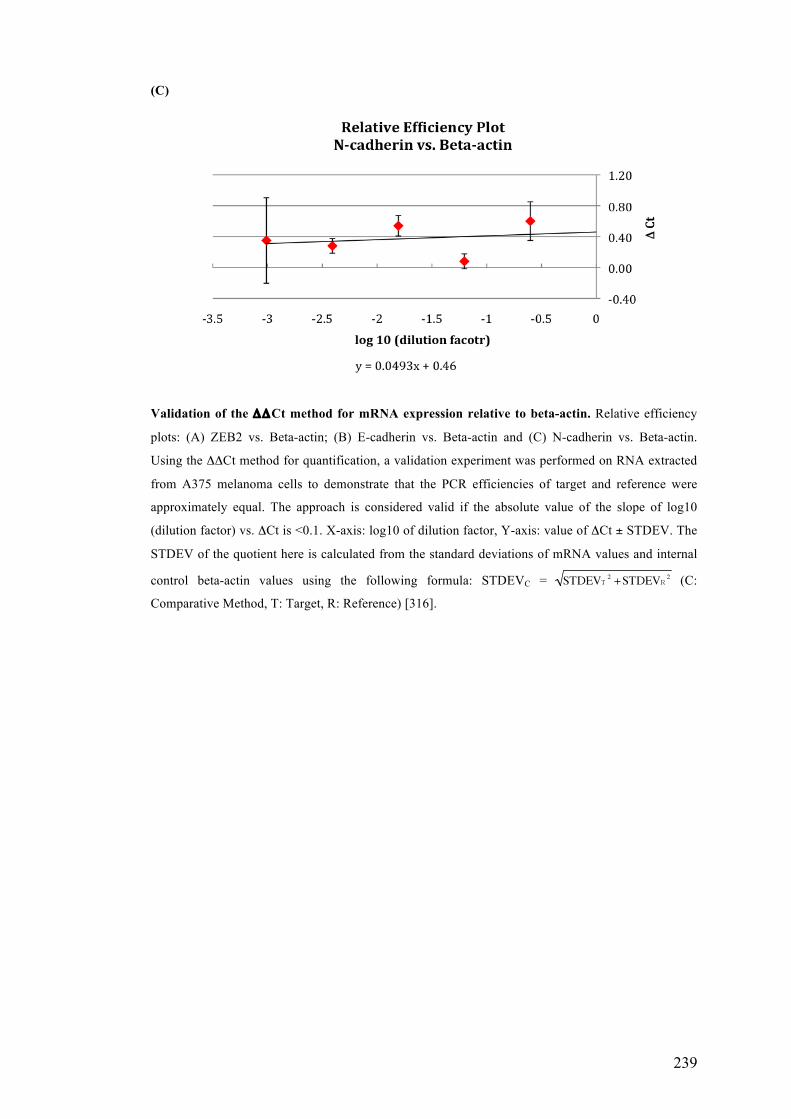
239
(C)
Validation of the ΔΔCt method for mRNA expression relative to beta-actin. Relative efficiency
plots: (A) ZEB2 vs. Beta-actin; (B) E-cadherin vs. Beta-actin and (C) N-cadherin vs. Beta-actin.
Using the ΔΔCt method for quantification, a validation experiment was performed on RNA extracted
from A375 melanoma cells to demonstrate that the PCR efficiencies of target and reference were
approximately equal. The approach is considered valid if the absolute value of the slope of log10
(dilution factor) vs. ΔCt is <0.1. X-axis: log10 of dilution factor, Y-axis: value of ΔCt ± STDEV. The
STDEV of the quotient here is calculated from the standard deviations of mRNA values and internal
control beta-actin values using the following formula: STDEVC = (C:
Comparative Method, T: Target, R: Reference) [316].