third quarter 2021 results
TRANSCRIPT
29 October 2021
THIRD QUARTER2021 RESULTS
Third quarter 2021 results | 2
Disclaimer
The figures included in this presentation are unaudited.
This presentation includes forward-looking statements based on current beliefs and expectations about future events. Forward-lookingstatements include financial projections and estimates and their underlying assumptions, statements regarding plans, objectives andexpectations with respect to future events, operations, products and services, and statements regarding future performance and synergies.Forward-looking statements are not guarantees of future performance and are subject to inherent risks, uncertainties and assumptions aboutBNP Paribas and its subsidiaries and investments, developments of BNP Paribas and its subsidiaries, banking industry trends, future capitalexpenditures and acquisitions, changes in economic conditions globally, in particular in the context of the Covid-19 pandemic, or in BNPParibas’ principal local markets, the competitive market and regulatory factors. Those events are uncertain; their outcome may differ fromcurrent expectations which may in turn significantly affect expected results. Actual results may differ materially from those projected or impliedin these forward looking statements. Any forward-looking statement contained in this presentation speaks as of the date of this presentation.
BNP Paribas undertakes no obligation to publicly revise or update any forward-looking statements in light of new information or future events. Itshould be recalled in this regard that the Supervisory Review and Evaluation Process is carried out each year by the European Central Bank,which can modify each year its capital adequacy ratio requirements for BNP Paribas.
The information contained in this presentation as it relates to parties other than BNP Paribas or derived from external sources has not beenindependently verified and no representation or warranty expressed or implied is made as to, and no reliance should be placed on, thefairness, accuracy, completeness or correctness of the information or opinions contained herein. Neither BNP Paribas nor its representativesshall have any liability whatsoever in negligence or otherwise for any loss however arising from any use of this presentation or its contents orotherwise arising in connection with this presentation or any other information or material discussed.
The sum of values contained in the tables and analyses may differ slightly from the total reported due to rounding.
Photo credits (cover page): Adobe Stock © Yakobchuk Olena, Adobe Stock © Maria Savenko, © 2020 BNP Paribas Sébastien Millier, Adobe Stock © zhu difeng
Third quarter 2021 results | 3
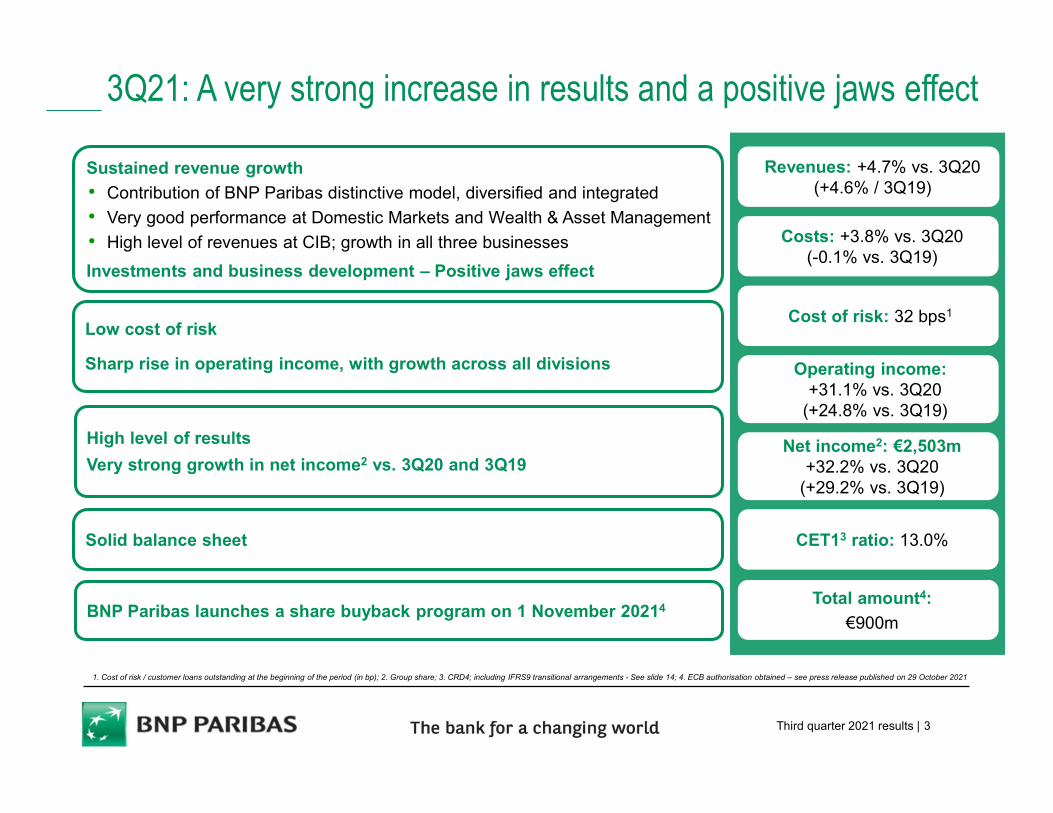
1. Cost of risk / customer loans outstanding at the beginning of the period (in bp); 2. Group share; 3. CRD4; including IFRS9 transitional arrangements - See slide 14; 4. ECB authorisation obtained – see press release published on 29 October 2021
3Q21: A very strong increase in results and a positive jaws effect
Sustained revenue growth
• Contribution of BNP Paribas distinctive model, diversified and integrated
• Very good performance at Domestic Markets and Wealth & Asset Management
• High level of revenues at CIB; growth in all three businesses
Investments and business development – Positive jaws effect
Revenues: +4.7% vs. 3Q20 (+4.6% / 3Q19)
Costs: +3.8% vs. 3Q20(-0.1% vs. 3Q19)
Low cost of risk
Sharp rise in operating income, with growth across all divisions
Cost of risk: 32 bps1
High level of results
Very strong growth in net income2 vs. 3Q20 and 3Q19Net income2: €2,503m
+32.2% vs. 3Q20(+29.2% vs. 3Q19)
Solid balance sheet CET13 ratio: 13.0%
Operating income:+31.1% vs. 3Q20
(+24.8% vs. 3Q19)
BNP Paribas launches a share buyback program on 1 November 20214Total amount4:
€900m
Third quarter 2021 results | 4
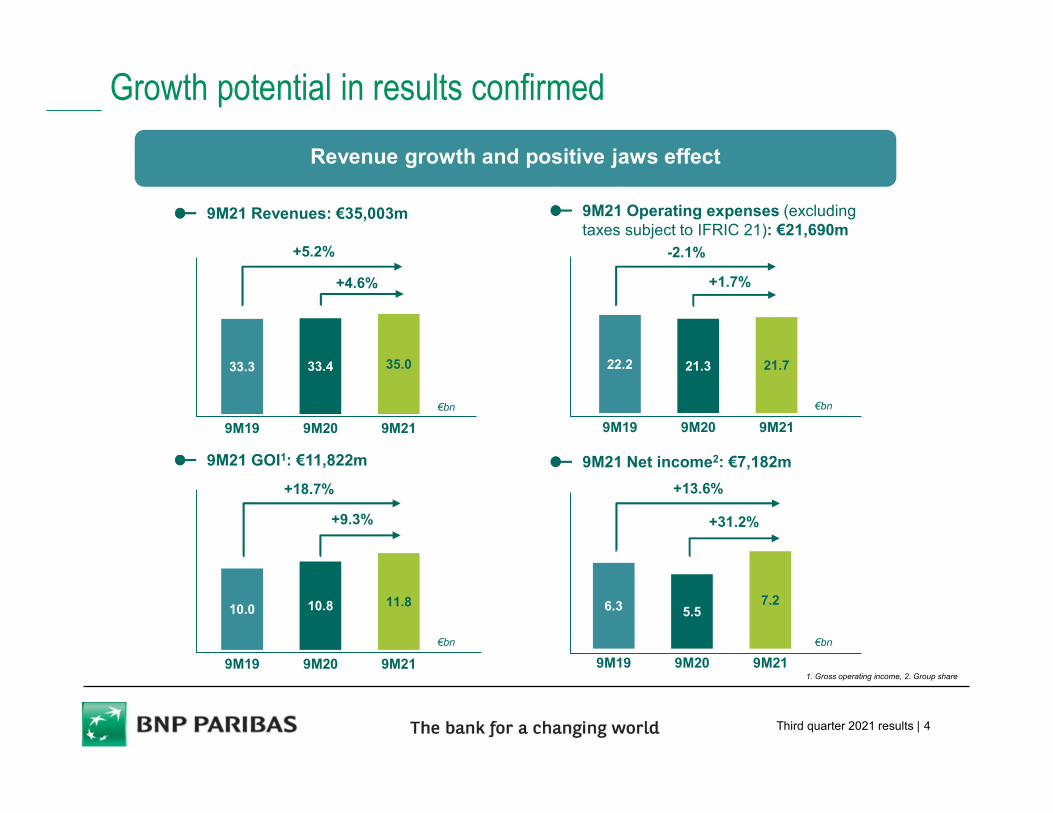
10.0 10.8 11.8
9M19 9M20 9M21
6.3 5.57.2
9M19 9M20 9M21
9M21 GOI1: €11,822m
€bn
9M21 Net income2: €7,182m
€bn
+13.6%+18.7%
+9.3% +31.2%
33.3 33.4 35.0
9M19 9M20 9M21
9M21 Revenues: €35,003m
€bn
+5.2%
+4.6%
22.2 21.3 21.7
9M19 9M20 9M21
9M21 Operating expenses (excluding taxes subject to IFRIC 21): €21,690m
€bn
-2.1%
+1.7%
Growth potential in results confirmed
Revenue growth and positive jaws effect
1. Gross operating income, 2. Group share
Third quarter 2021 results | 5
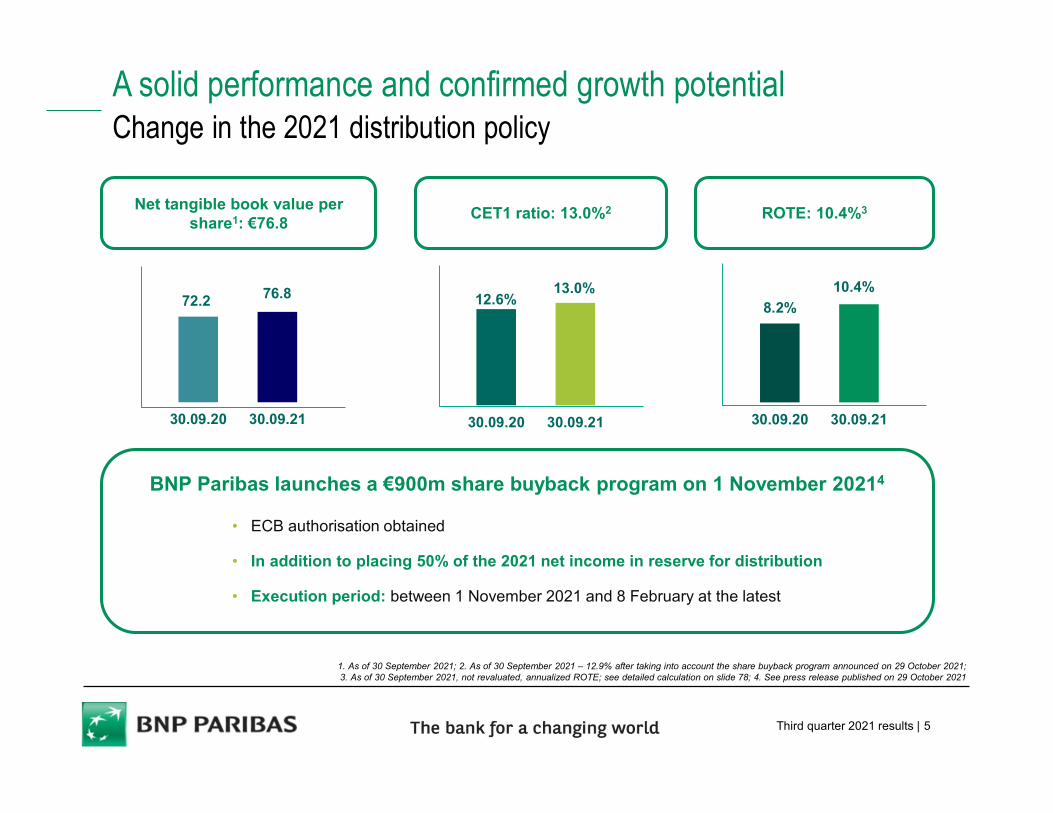
A solid performance and confirmed growth potentialChange in the 2021 distribution policy
Net tangible book value per share1: €76.8
1. As of 30 September 2021; 2. As of 30 September 2021 – 12.9% after taking into account the share buyback program announced on 29 October 2021; 3. As of 30 September 2021, not revaluated, annualized ROTE; see detailed calculation on slide 78; 4. See press release published on 29 October 2021
CET1 ratio: 13.0%2 ROTE: 10.4%3
30.09.20 30.09.21
12.6%13.0%
30.09.20 30.09.21
72.2 76.8
30.09.20 30.09.21
8.2%
10.4%
• ECB authorisation obtained
• In addition to placing 50% of the 2021 net income in reserve for distribution
• Execution period: between 1 November 2021 and 8 February at the latest
BNP Paribas launches a €900m share buyback program on 1 November 20214
CONCLUSION
9M21 DETAILED RESULTS
DIVISION RESULTS
APPENDICES
GROUP RESULTS
Third quarter 2021 results | 7
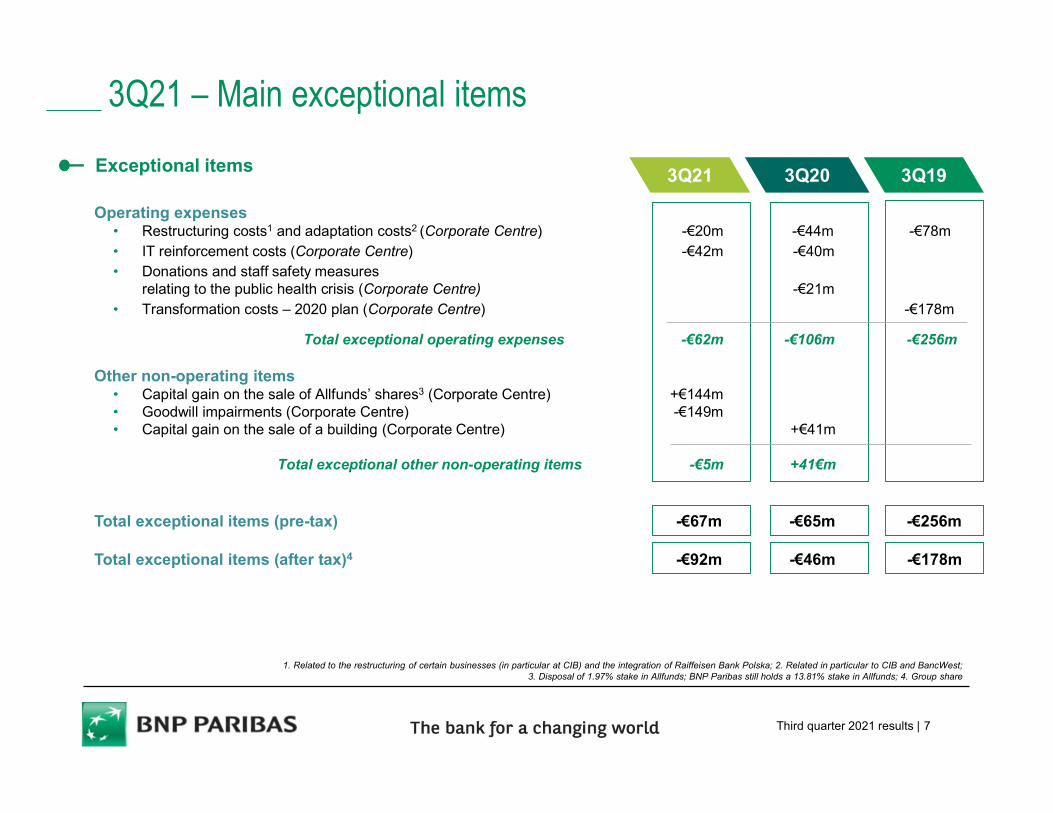
Operating expenses • Restructuring costs1 and adaptation costs2 (Corporate Centre) -€20m -€44m -€78m• IT reinforcement costs (Corporate Centre) -€42m -€40m• Donations and staff safety measures
relating to the public health crisis (Corporate Centre) -€21m• Transformation costs – 2020 plan (Corporate Centre) -€178m
Total exceptional operating expenses -€62m -€106m -€256m
Other non-operating items• Capital gain on the sale of Allfunds’ shares3 (Corporate Centre) +€144m• Goodwill impairments (Corporate Centre) -€149m• Capital gain on the sale of a building (Corporate Centre) +€41m
Total exceptional other non-operating items -€5m +41€m
Total exceptional items (pre-tax) -€67m -€65m -€256m
Total exceptional items (after tax)4 -€92m -€46m -€178m
3Q203Q21Exceptional items
1. Related to the restructuring of certain businesses (in particular at CIB) and the integration of Raiffeisen Bank Polska; 2. Related in particular to CIB and BancWest; 3. Disposal of 1.97% stake in Allfunds; BNP Paribas still holds a 13.81% stake in Allfunds; 4. Group share
3Q21 – Main exceptional items
3Q19
Third quarter 2021 results | 8
3Q21 3Q203Q21
vs. 3Q20 3Q19 3Q21vs. 3Q19
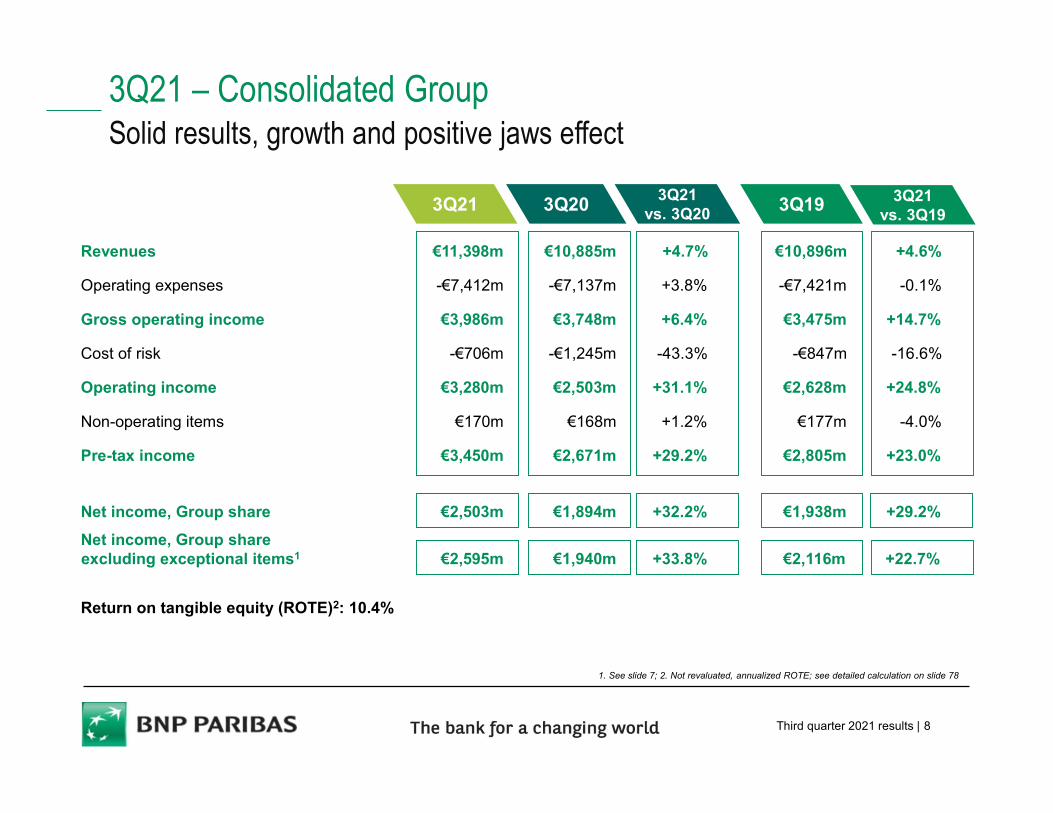
3Q21 – Consolidated GroupSolid results, growth and positive jaws effect
1. See slide 7; 2. Not revaluated, annualized ROTE; see detailed calculation on slide 78
Revenues €11,398m €10,885m +4.7% €10,896m +4.6%
Operating expenses -€7,412m -€7,137m +3.8% -€7,421m -0.1%
Gross operating income €3,986m €3,748m +6.4% €3,475m +14.7%
Cost of risk -€706m -€1,245m -43.3% -€847m -16.6%
Operating income €3,280m €2,503m +31.1% €2,628m +24.8%
Non-operating items €170m €168m +1.2% €177m -4.0%
Pre-tax income €3,450m €2,671m +29.2% €2,805m +23.0%
Net income, Group share €2,503m €1,894m +32.2% €1,938m +29.2%
Net income, Group shareexcluding exceptional items1 €2,595m €1,940m +33.8% €2,116m +22.7%
Return on tangible equity (ROTE)2: 10.4%
Third quarter 2021 results | 9
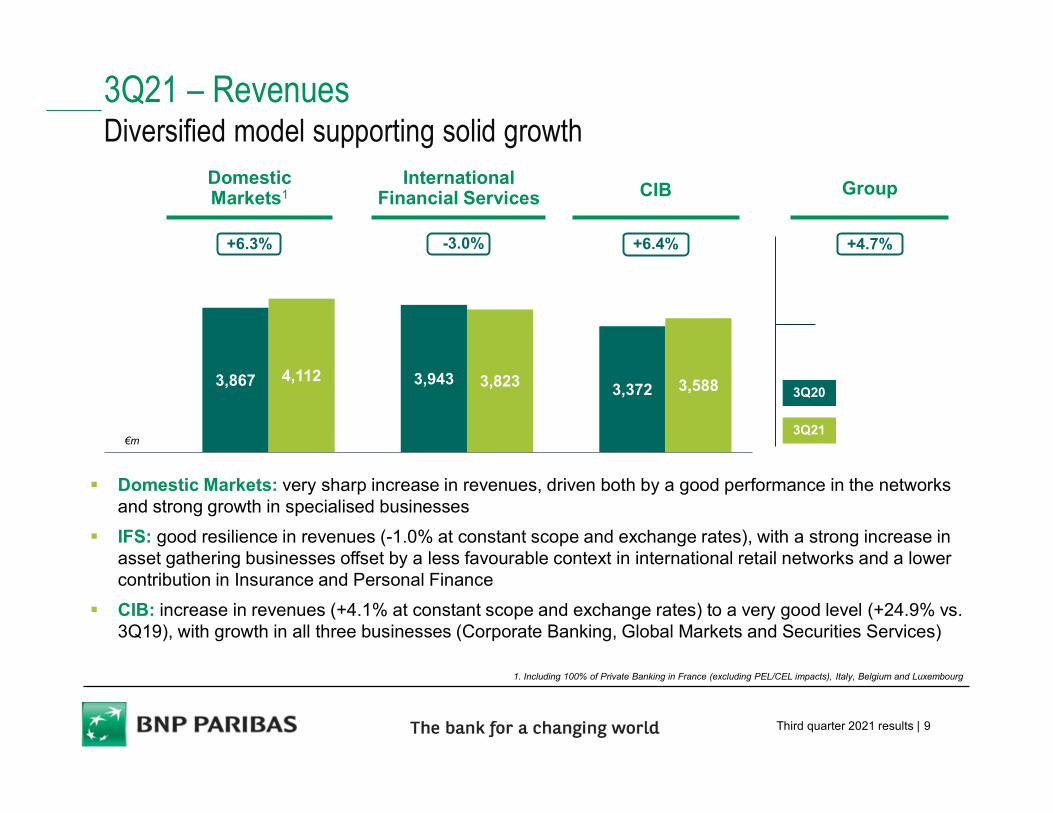
+4.7%+6.3%
3Q21 – RevenuesDiversified model supporting solid growth
1. Including 100% of Private Banking in France (excluding PEL/CEL impacts), Italy, Belgium and Luxembourg
€m
DomesticMarkets1
International Financial Services CIB Group
3Q21
3Q20
-3.0% +6.4%
Domestic Markets: very sharp increase in revenues, driven both by a good performance in the networks and strong growth in specialised businesses
IFS: good resilience in revenues (-1.0% at constant scope and exchange rates), with a strong increase in asset gathering businesses offset by a less favourable context in international retail networks and a lower contribution in Insurance and Personal Finance
CIB: increase in revenues (+4.1% at constant scope and exchange rates) to a very good level (+24.9% vs. 3Q19), with growth in all three businesses (Corporate Banking, Global Markets and Securities Services)
3,867 4,112 3,943 3,823 3,372 3,588
Third quarter 2021 results | 10
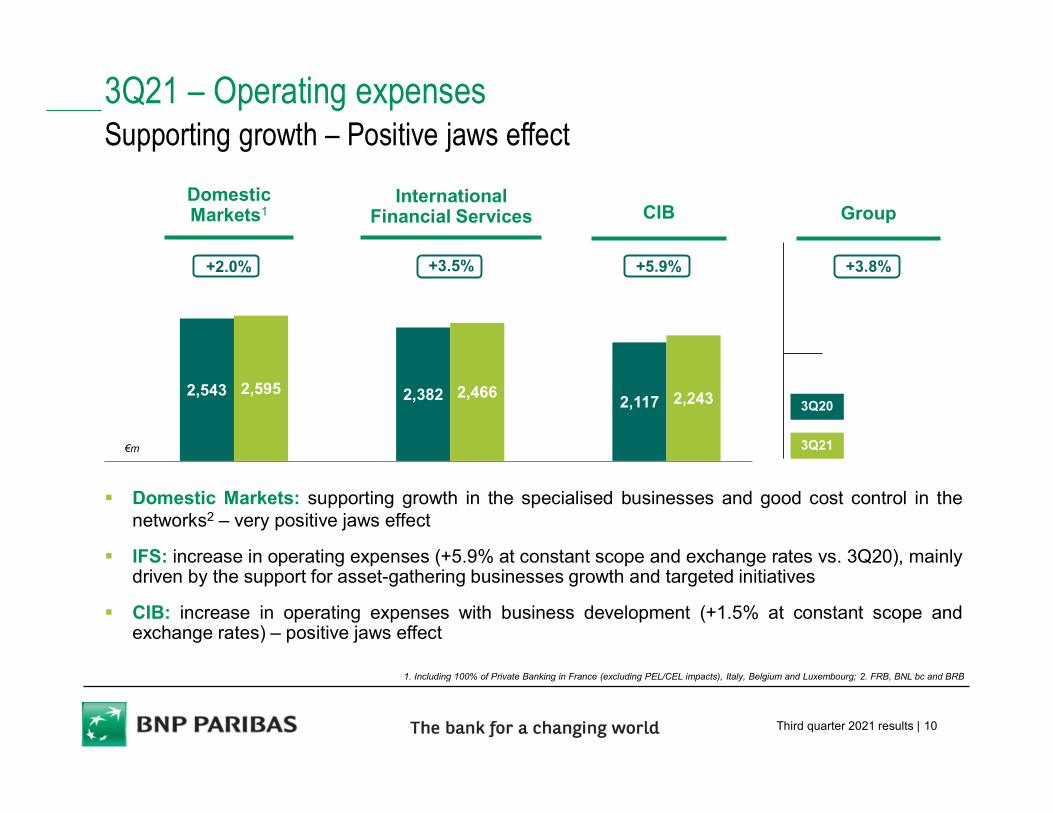
+3.8%+2.0% +3.5% +5.9%
2,543 2,595 2,382 2,4662,117 2,243
3Q21 – Operating expenses Supporting growth – Positive jaws effect
1. Including 100% of Private Banking in France (excluding PEL/CEL impacts), Italy, Belgium and Luxembourg; 2. FRB, BNL bc and BRB
€m
Domestic Markets: supporting growth in the specialised businesses and good cost control in thenetworks2 – very positive jaws effect
IFS: increase in operating expenses (+5.9% at constant scope and exchange rates vs. 3Q20), mainlydriven by the support for asset-gathering businesses growth and targeted initiatives
CIB: increase in operating expenses with business development (+1.5% at constant scope andexchange rates) – positive jaws effect
GroupDomesticMarkets1
InternationalFinancial Services CIB
3Q21
3Q20
Third quarter 2021 results | 11
39 35 3966 67 65 57
74
42 38 32
2017 2018 2019 2020 1Q20 2Q20 3Q20 4Q20 1Q21 2Q21 3Q21
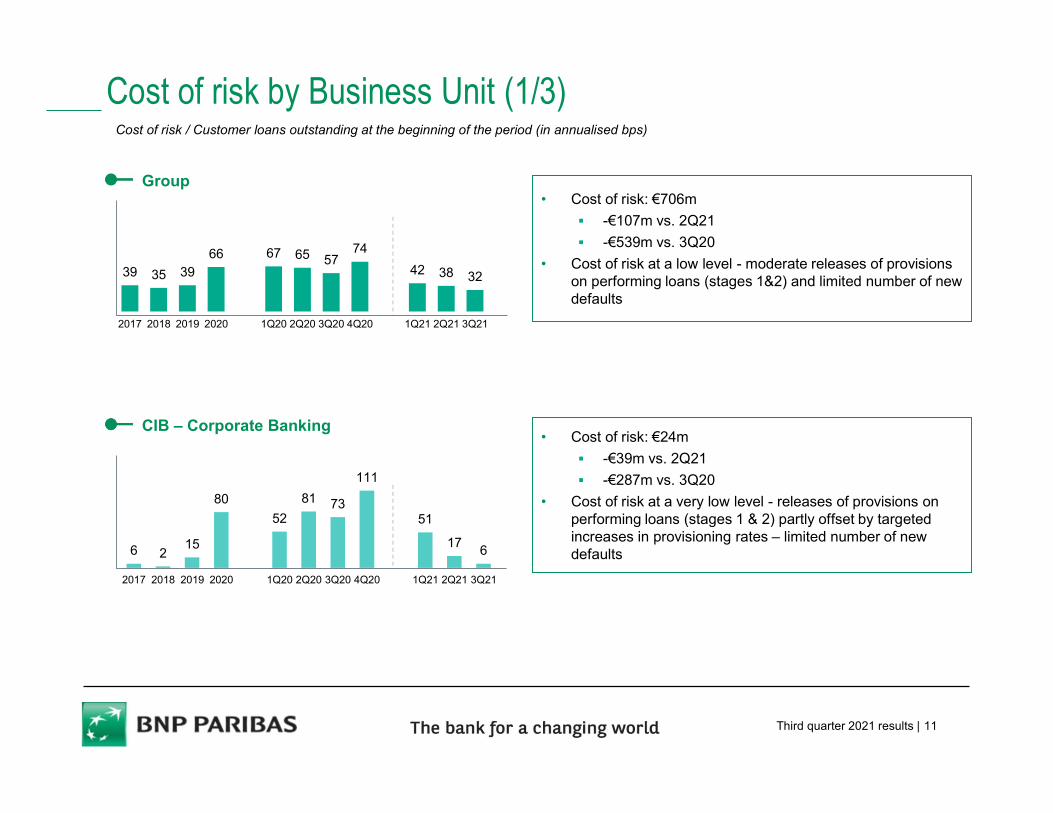
Cost of risk by Business Unit (1/3)
• Cost of risk: €706m
-€107m vs. 2Q21
-€539m vs. 3Q20
• Cost of risk at a low level - moderate releases of provisions on performing loans (stages 1&2) and limited number of new defaults
Group
• Cost of risk: €24m
-€39m vs. 2Q21
-€287m vs. 3Q20
• Cost of risk at a very low level - releases of provisions on performing loans (stages 1 & 2) partly offset by targeted increases in provisioning rates – limited number of new defaults6 2
15
80
52
81 73
111
51
176
2017 2018 2019 2020 1Q20 2Q20 3Q20 4Q20 1Q21 2Q21 3Q21
CIB – Corporate Banking
Cost of risk / Customer loans outstanding at the beginning of the period (in annualised bps)
Third quarter 2021 results | 12
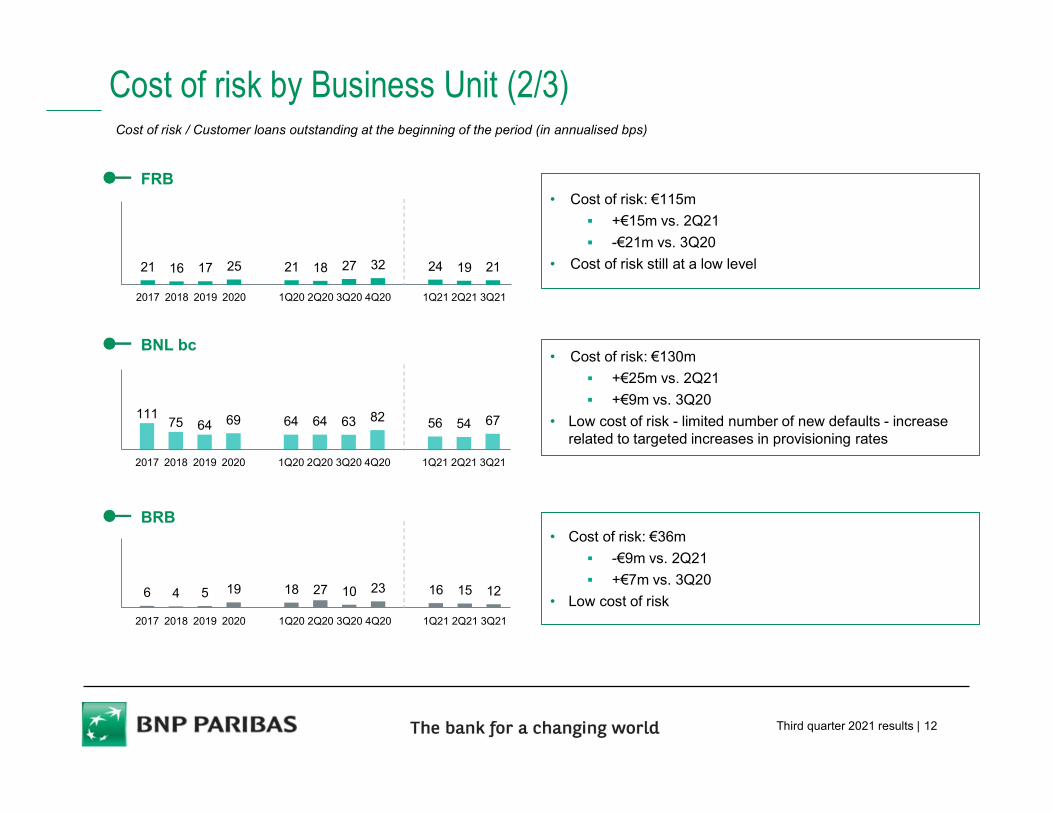
Cost of risk by Business Unit (2/3)
• Cost of risk: €115m
+€15m vs. 2Q21
-€21m vs. 3Q20
• Cost of risk still at a low level
FRB
21 16 17 25 21 18 27 32 24 19 21
2017 2018 2019 2020 1Q20 2Q20 3Q20 4Q20 1Q21 2Q21 3Q21
• Cost of risk: €130m
+€25m vs. 2Q21
+€9m vs. 3Q20
• Low cost of risk - limited number of new defaults - increase related to targeted increases in provisioning rates
11175 64 69 64 64 63 82 56 54 67
2017 2018 2019 2020 1Q20 2Q20 3Q20 4Q20 1Q21 2Q21 3Q21
BNL bc
• Cost of risk: €36m
-€9m vs. 2Q21
+€7m vs. 3Q20
• Low cost of risk6 4 5 19 18 27 10 23 16 15 12
2017 2018 2019 2020 1Q20 2Q20 3Q20 4Q20 1Q21 2Q21 3Q21
BRB
Cost of risk / Customer loans outstanding at the beginning of the period (in annualised bps)
Third quarter 2021 results | 13
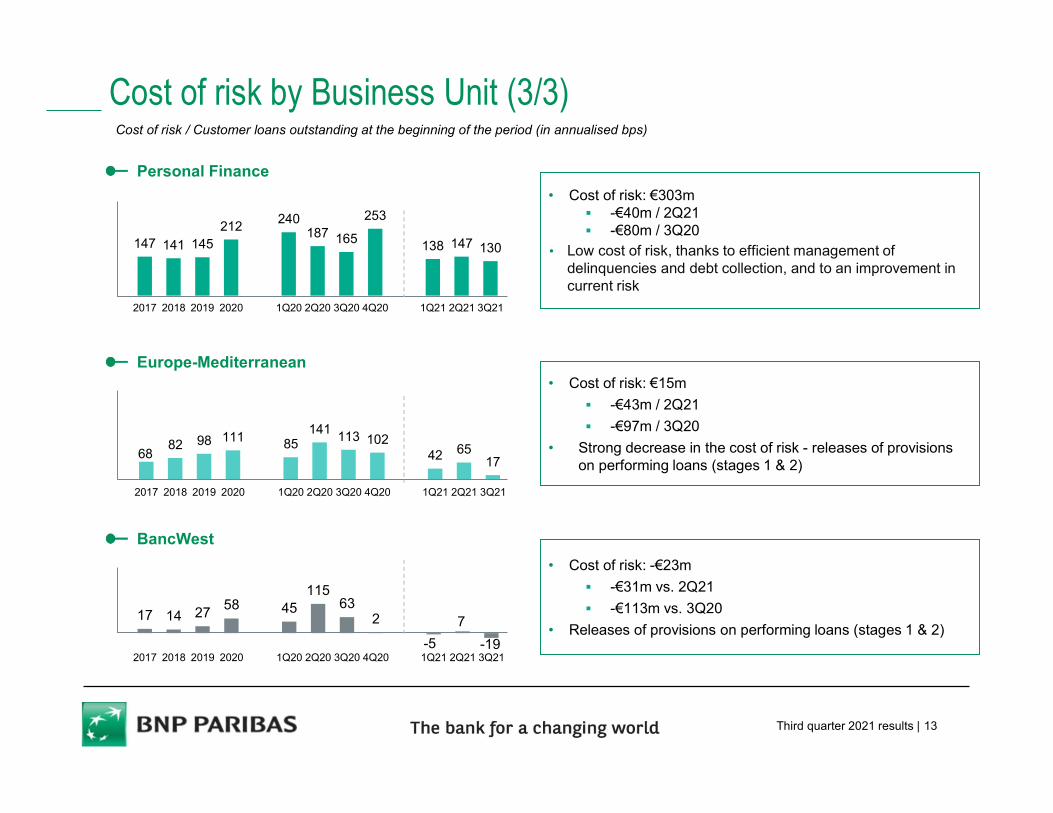
Cost of risk by Business Unit (3/3)
• Cost of risk: €303m -€40m / 2Q21 -€80m / 3Q20
• Low cost of risk, thanks to efficient management of delinquencies and debt collection, and to an improvement in current risk
Personal Finance
147 141 145212
240187 165
253
138 147 130
2017 2018 2019 2020 1Q20 2Q20 3Q20 4Q20 1Q21 2Q21 3Q21
• Cost of risk: €15m
-€43m / 2Q21
-€97m / 3Q20
• Strong decrease in the cost of risk - releases of provisions on performing loans (stages 1 & 2)
6882 98 111 85
141 113 10242 65
17
2017 2018 2019 2020 1Q20 2Q20 3Q20 4Q20 1Q21 2Q21 3Q21
Europe-Mediterranean
• Cost of risk: -€23m
-€31m vs. 2Q21
-€113m vs. 3Q20
• Releases of provisions on performing loans (stages 1 & 2)17 14 27
58 45115
632
-5
7
-192017 2018 2019 2020 1Q20 2Q20 3Q20 4Q20 1Q21 2Q21 3Q21
BancWest
Cost of risk / Customer loans outstanding at the beginning of the period (in annualised bps)
Third quarter 2021 results | 14
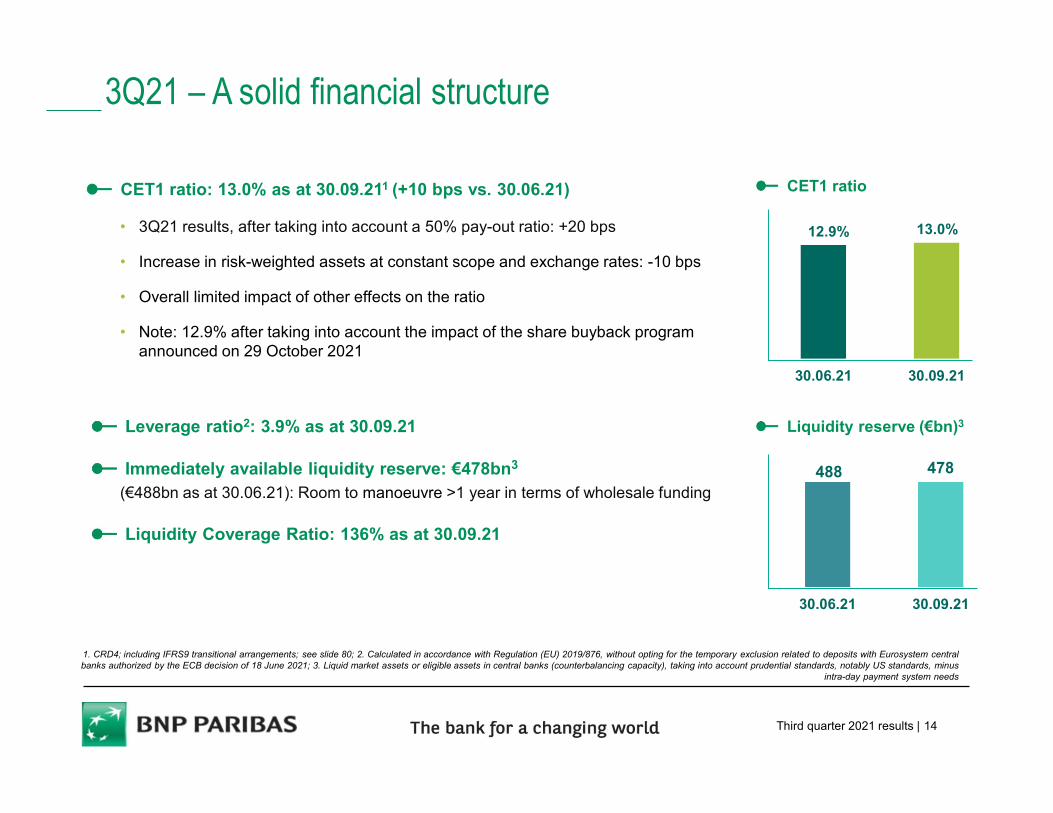
3Q21 – A solid financial structure
CET1 ratio: 13.0% as at 30.09.211 (+10 bps vs. 30.06.21)
• 3Q21 results, after taking into account a 50% pay-out ratio: +20 bps
• Increase in risk-weighted assets at constant scope and exchange rates: -10 bps
• Overall limited impact of other effects on the ratio
• Note: 12.9% after taking into account the impact of the share buyback program announced on 29 October 2021
1. CRD4; including IFRS9 transitional arrangements; see slide 80; 2. Calculated in accordance with Regulation (EU) 2019/876, without opting for the temporary exclusion related to deposits with Eurosystem central banks authorized by the ECB decision of 18 June 2021; 3. Liquid market assets or eligible assets in central banks (counterbalancing capacity), taking into account prudential standards, notably US standards, minus
intra-day payment system needs
30.06.21 30.09.21
CET1 ratio
12.9% 13.0%
Leverage ratio2: 3.9% as at 30.09.21
Immediately available liquidity reserve: €478bn3
(€488bn as at 30.06.21): Room to manoeuvre >1 year in terms of wholesale funding
Liquidity Coverage Ratio: 136% as at 30.09.21
488 478
30.06.21 30.09.21
Liquidity reserve (€bn)3
Third quarter 2021 results | 15
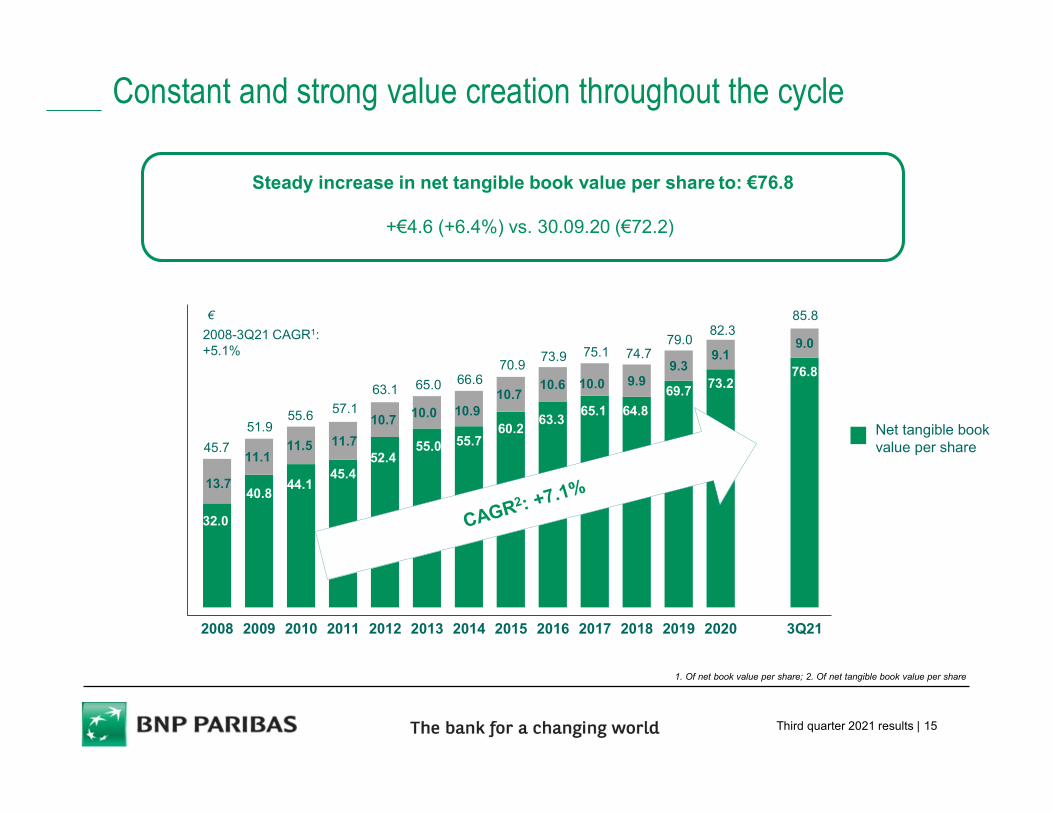
Constant and strong value creation throughout the cycle
Steady increase in net tangible book value per share to: €76.8
+€4.6 (+6.4%) vs. 30.09.20 (€72.2)
1. Of net book value per share; 2. Of net tangible book value per share
32.0
40.844.1
45.452.4
55.0 55.760.2
63.365.1 64.8
69.773.2
76.8
13.7
11.111.5 11.7
10.7 10.0 10.910.7
10.6 10.0 9.99.3
9.19.0
2008 2009 2010 2011 2012 2013 2014 2015 2016 2017 2018 2019 2020 3Q21
45.7
51.955.6 57.1
63.166.6
70.9
65.0
73.9 74.775.179.0
85.8
Net tangible book value per share
€
2008-3Q21 CAGR1: +5.1%
82.3
Third quarter 2021 results | 16
A reinforced Internal Control Set-up
• Ongoing improvement of the operating model for combating money laundering and terrorismfinancing: A standards-based, risk-adjusted approach, with a risk management set-up shared between business
lines and Compliance (know-your-client, reviewing unusual transactions, etc.) Reinforced Group-level steering with regular reporting to monitoring and supervisory bodies
• Ongoing reinforcement of set-up for complying with international financial sanctions: Broad dissemination of the procedures and intense centralisation, guaranteeing effective and
consistent coverage of the surveillance perimeter Continuous optimisation of cross-border transaction filtering tools and screening of relationship
databases
• Ongoing improvement of the anti-corruption framework with increased integration into theGroup’s operational processes
• Intensified on-line training programme: compulsory programmes on financial security for allemployees (Sanctions & Embargos, Combatting Money Laundering & Terrorism Financing), on combatingcorruption, and on professional ethics for all new employees
• Ongoing missions of the General Inspection dedicated to ensuring financial security withinentities whose USD flows are centralised at BNP Paribas New York. The first round of audits waslaunched in 2015, and the fourth round was completed in April 2021, marking a milestone in ongoingefforts over the past six years to improve the audit mechanisms. Despite public health constraints, the fifthcycle began in May and is expected to be completed in summer 2022.
An even more solid control and compliance set-up and ongoing efforts in inserting a reinforced compliance culture into daily operations
The remediation plan agreed as part of the June 2014 comprehensive settlement with the US authorities is now mostly completed
Third quarter 2021 results | 17
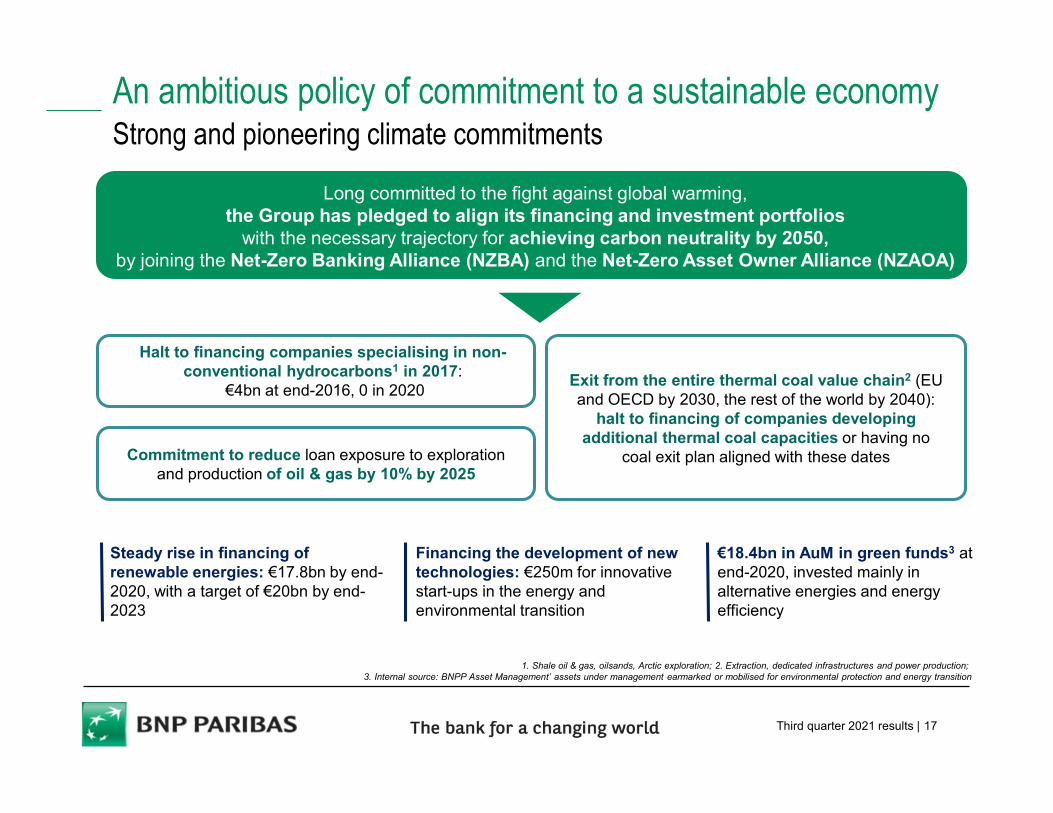
Halt to financing companies specialising in non-conventional hydrocarbons1 in 2017:
€4bn at end-2016, 0 in 2020
An ambitious policy of commitment to a sustainable economyStrong and pioneering climate commitments
Long committed to the fight against global warming, the Group has pledged to align its financing and investment portfolios
with the necessary trajectory for achieving carbon neutrality by 2050, by joining the Net-Zero Banking Alliance (NZBA) and the Net-Zero Asset Owner Alliance (NZAOA)
Commitment to reduce loan exposure to exploration and production of oil & gas by 10% by 2025
Exit from the entire thermal coal value chain2 (EU and OECD by 2030, the rest of the world by 2040):
halt to financing of companies developing additional thermal coal capacities or having no
coal exit plan aligned with these dates
Steady rise in financing of renewable energies: €17.8bn by end-2020, with a target of €20bn by end-2023
Financing the development of new technologies: €250m for innovative start-ups in the energy and environmental transition
€18.4bn in AuM in green funds3 at end-2020, invested mainly in alternative energies and energy efficiency
1. Shale oil & gas, oilsands, Arctic exploration; 2. Extraction, dedicated infrastructures and power production; 3. Internal source: BNPP Asset Management’ assets under management earmarked or mobilised for environmental protection and energy transition
Third quarter 2021 results | 18
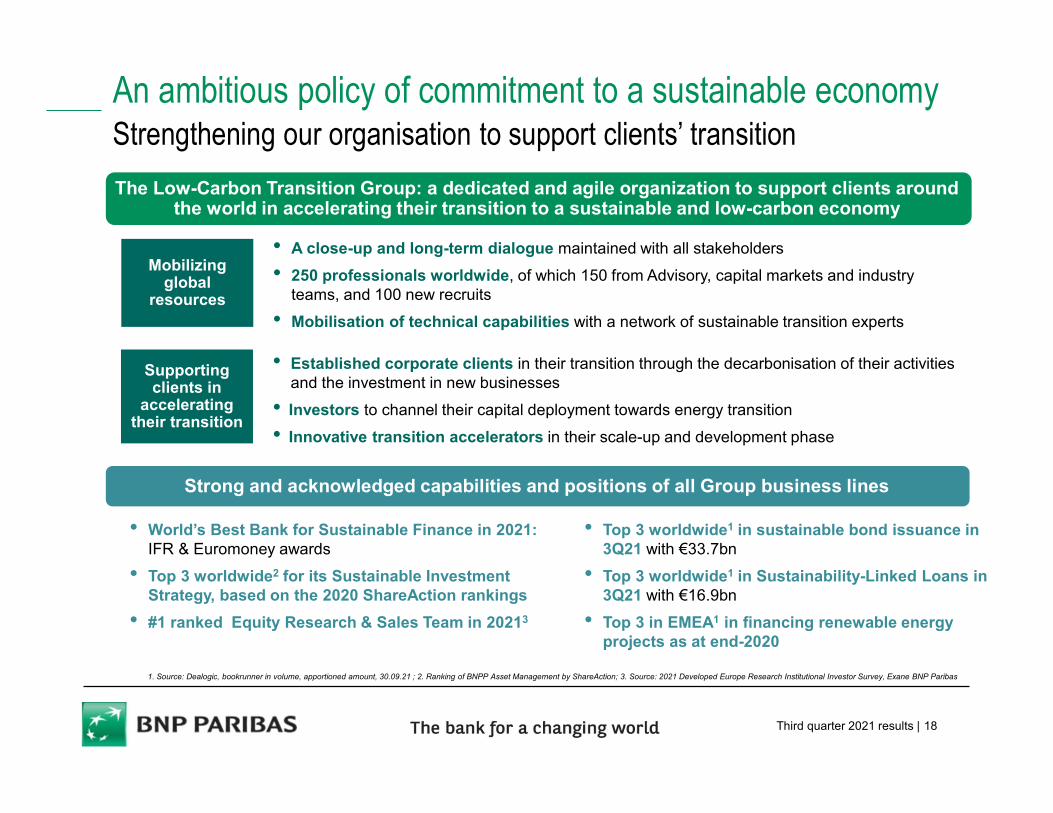
• Top 3 worldwide1 in sustainable bond issuance in 3Q21 with €33.7bn
• Top 3 worldwide1 in Sustainability-Linked Loans in 3Q21 with €16.9bn
• Top 3 in EMEA1 in financing renewable energy projects as at end-2020
• A close-up and long-term dialogue maintained with all stakeholders
• 250 professionals worldwide, of which 150 from Advisory, capital markets and industry teams, and 100 new recruits
• Mobilisation of technical capabilities with a network of sustainable transition experts
The Low-Carbon Transition Group: a dedicated and agile organization to support clients around the world in accelerating their transition to a sustainable and low-carbon economy
• Established corporate clients in their transition through the decarbonisation of their activities and the investment in new businesses
• Investors to channel their capital deployment towards energy transition
• Innovative transition accelerators in their scale-up and development phase
Strong and acknowledged capabilities and positions of all Group business lines
• World’s Best Bank for Sustainable Finance in 2021:IFR & Euromoney awards
• Top 3 worldwide2 for its Sustainable Investment Strategy, based on the 2020 ShareAction rankings
• #1 ranked Equity Research & Sales Team in 20213
An ambitious policy of commitment to a sustainable economyStrengthening our organisation to support clients’ transition
Mobilizing global
resources
Supporting clients in
accelerating their transition
1. Source: Dealogic, bookrunner in volume, apportioned amount, 30.09.21 ; 2. Ranking of BNPP Asset Management by ShareAction; 3. Source: 2021 Developed Europe Research Institutional Investor Survey, Exane BNP Paribas
Third quarter 2021 results | 19
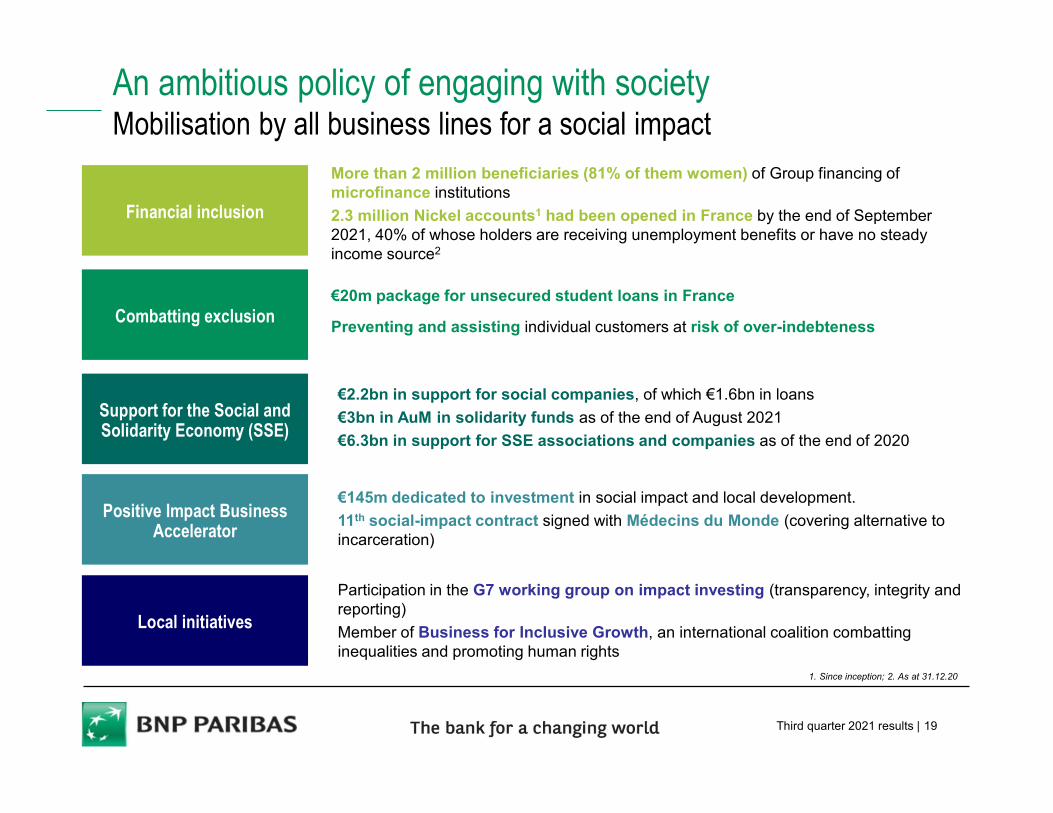
An ambitious policy of engaging with societyMobilisation by all business lines for a social impact
More than 2 million beneficiaries (81% of them women) of Group financing of microfinance institutions
2.3 million Nickel accounts1 had been opened in France by the end of September 2021, 40% of whose holders are receiving unemployment benefits or have no steady income source2
Support for the Social and Solidarity Economy (SSE)
Positive Impact Business Accelerator
Combatting exclusion
Financial inclusion
Local initiatives
€2.2bn in support for social companies, of which €1.6bn in loans
€3bn in AuM in solidarity funds as of the end of August 2021
€6.3bn in support for SSE associations and companies as of the end of 2020
€145m dedicated to investment in social impact and local development.
11th social-impact contract signed with Médecins du Monde (covering alternative to incarceration)
Participation in the G7 working group on impact investing (transparency, integrity and reporting)
Member of Business for Inclusive Growth, an international coalition combatting inequalities and promoting human rights
€20m package for unsecured student loans in France
Preventing and assisting individual customers at risk of over-indebteness
1. Since inception; 2. As at 31.12.20
9M21 DETAILED RESULTS
DIVISION RESULTS
APPENDICES
GROUP RESULTS
CONCLUSION
Third quarter 2021 results | 21
€bn
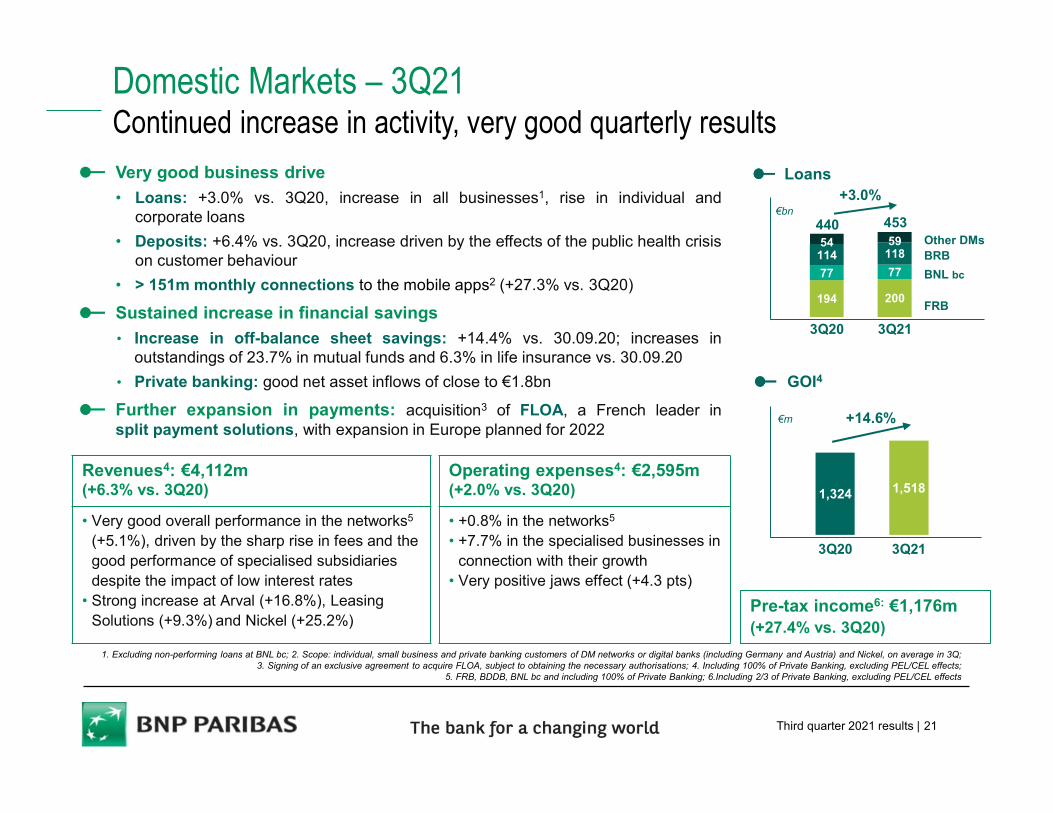
Revenues4: €4,112m (+6.3% vs. 3Q20)
• Very good overall performance in the networks5
(+5.1%), driven by the sharp rise in fees and the good performance of specialised subsidiaries despite the impact of low interest rates
• Strong increase at Arval (+16.8%), Leasing Solutions (+9.3%) and Nickel (+25.2%)
1. Excluding non-performing loans at BNL bc; 2. Scope: individual, small business and private banking customers of DM networks or digital banks (including Germany and Austria) and Nickel, on average in 3Q; 3. Signing of an exclusive agreement to acquire FLOA, subject to obtaining the necessary authorisations; 4. Including 100% of Private Banking, excluding PEL/CEL effects;
5. FRB, BDDB, BNL bc and including 100% of Private Banking; 6.Including 2/3 of Private Banking, excluding PEL/CEL effects
Very good business drive
• Loans: +3.0% vs. 3Q20, increase in all businesses1, rise in individual andcorporate loans
• Deposits: +6.4% vs. 3Q20, increase driven by the effects of the public health crisison customer behaviour
• > 151m monthly connections to the mobile apps2 (+27.3% vs. 3Q20)
Sustained increase in financial savings
• Increase in off-balance sheet savings: +14.4% vs. 30.09.20; increases inoutstandings of 23.7% in mutual funds and 6.3% in life insurance vs. 30.09.20
• Private banking: good net asset inflows of close to €1.8bn
Further expansion in payments: acquisition3 of FLOA, a French leader insplit payment solutions, with expansion in Europe planned for 2022
Domestic Markets – 3Q21Continued increase in activity, very good quarterly results
194 200
77 77
114 11854 59
3Q20 3Q21
Other DMs
FRB
BNL bc
Loans
BRB
440
+3.0%
Operating expenses4: €2,595m(+2.0% vs. 3Q20)
• +0.8% in the networks5
• +7.7% in the specialised businesses in connection with their growth
• Very positive jaws effect (+4.3 pts)
GOI4
€m +14.6%
1,324 1,518
3Q20 3Q21
453
Pre-tax income6: €1,176m (+27.4% vs. 3Q20)
Third quarter 2021 results | 22
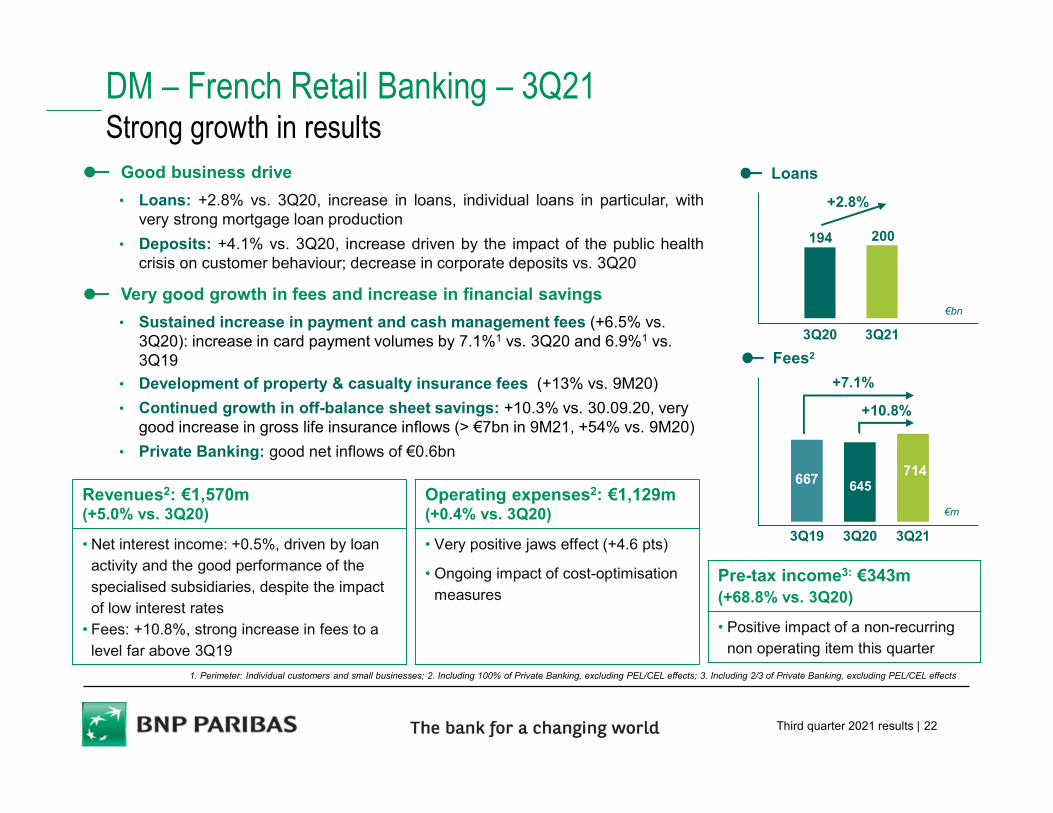
DM – French Retail Banking – 3Q21Strong growth in results
Good business drive
• Loans: +2.8% vs. 3Q20, increase in loans, individual loans in particular, withvery strong mortgage loan production
• Deposits: +4.1% vs. 3Q20, increase driven by the impact of the public healthcrisis on customer behaviour; decrease in corporate deposits vs. 3Q20
Very good growth in fees and increase in financial savings
• Sustained increase in payment and cash management fees (+6.5% vs. 3Q20): increase in card payment volumes by 7.1%1 vs. 3Q20 and 6.9%1 vs. 3Q19
• Development of property & casualty insurance fees (+13% vs. 9M20)
• Continued growth in off-balance sheet savings: +10.3% vs. 30.09.20, very good increase in gross life insurance inflows (> €7bn in 9M21, +54% vs. 9M20)
• Private Banking: good net inflows of €0.6bn
Fees2
Revenues2: €1,570m (+5.0% vs. 3Q20)
• Net interest income: +0.5%, driven by loan activity and the good performance of the
specialised subsidiaries, despite the impact of low interest rates
• Fees: +10.8%, strong increase in fees to a
level far above 3Q19
Operating expenses2: €1,129m (+0.4% vs. 3Q20)
• Very positive jaws effect (+4.6 pts)
• Ongoing impact of cost-optimisation
measures
3Q20 3Q21
€bn
+2.8%
194 200
Loans
Pre-tax income3: €343m (+68.8% vs. 3Q20)
• Positive impact of a non-recurring non operating item this quarter
1. Perimeter: Individual customers and small businesses; 2. Including 100% of Private Banking, excluding PEL/CEL effects; 3. Including 2/3 of Private Banking, excluding PEL/CEL effects
667 645714
3Q19 3Q20 3Q21
€m
+7.1%
+10.8%
Third quarter 2021 results | 23
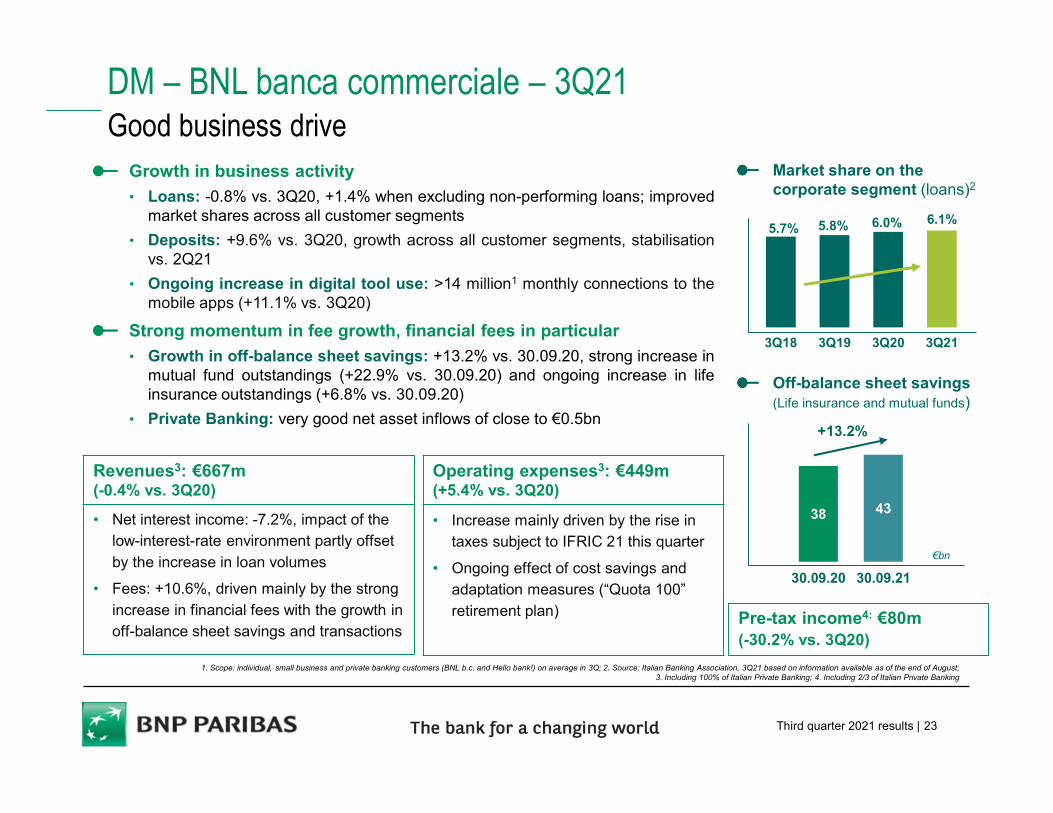
38 43
30.09.20 30.09.21
+13.2%
1. Scope: individual, small business and private banking customers (BNL b.c. and Hello bank!) on average in 3Q; 2. Source: Italian Banking Association, 3Q21 based on information available as of the end of August; 3. Including 100% of Italian Private Banking; 4. Including 2/3 of Italian Private Banking
DM – BNL banca commerciale – 3Q21Good business drive
Growth in business activity
• Loans: -0.8% vs. 3Q20, +1.4% when excluding non-performing loans; improvedmarket shares across all customer segments
• Deposits: +9.6% vs. 3Q20, growth across all customer segments, stabilisationvs. 2Q21
• Ongoing increase in digital tool use: >14 million1 monthly connections to themobile apps (+11.1% vs. 3Q20)
Strong momentum in fee growth, financial fees in particular
• Growth in off-balance sheet savings: +13.2% vs. 30.09.20, strong increase inmutual fund outstandings (+22.9% vs. 30.09.20) and ongoing increase in lifeinsurance outstandings (+6.8% vs. 30.09.20)
• Private Banking: very good net asset inflows of close to €0.5bn
Revenues3: €667m(-0.4% vs. 3Q20)
• Net interest income: -7.2%, impact of the low-interest-rate environment partly offset
by the increase in loan volumes
• Fees: +10.6%, driven mainly by the strong
increase in financial fees with the growth in off-balance sheet savings and transactions
Operating expenses3: €449m(+5.4% vs. 3Q20)
• Increase mainly driven by the rise in taxes subject to IFRIC 21 this quarter
• Ongoing effect of cost savings and adaptation measures (“Quota 100”
retirement plan)
Off-balance sheet savings(Life insurance and mutual funds)
€bn
5.7% 5.8% 6.0% 6.1%
3Q18 3Q19 3Q20 3Q21
Market share on the corporate segment (loans)2
Pre-tax income4: €80m (-30.2% vs. 3Q20)
Third quarter 2021 results | 24
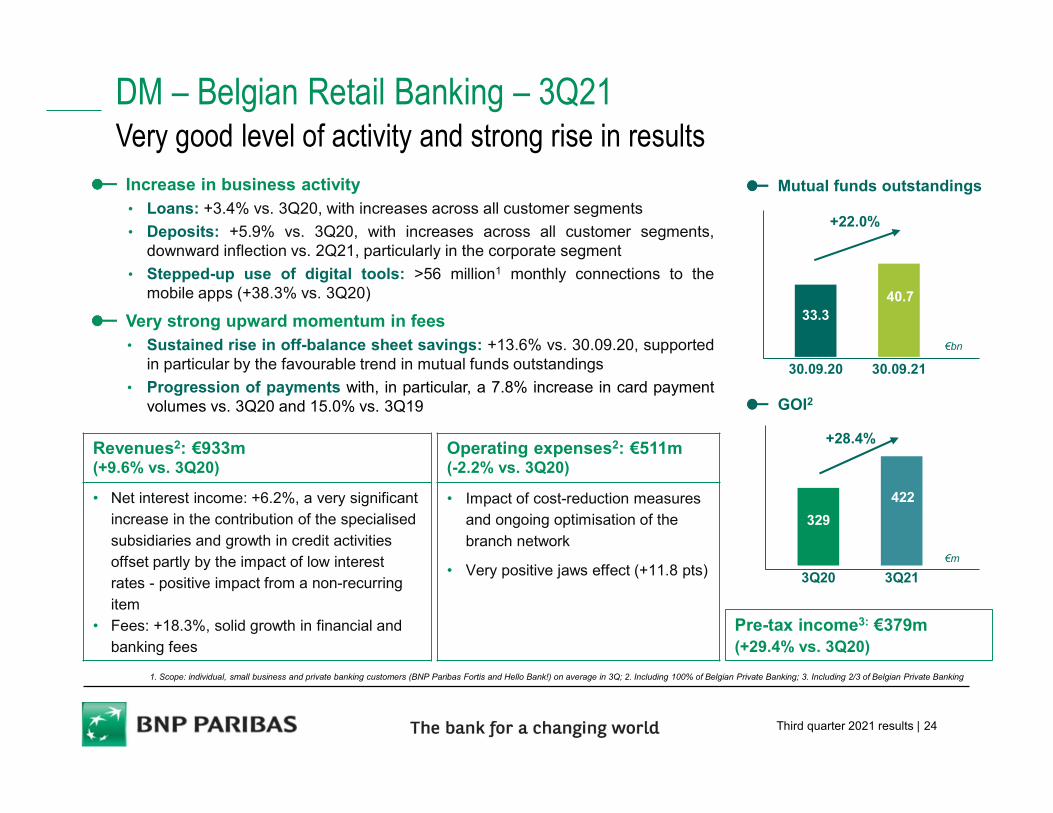
33.340.7
30.09.20 30.09.21
1. Scope: individual, small business and private banking customers (BNP Paribas Fortis and Hello Bank!) on average in 3Q; 2. Including 100% of Belgian Private Banking; 3. Including 2/3 of Belgian Private Banking
DM – Belgian Retail Banking – 3Q21Very good level of activity and strong rise in results
Increase in business activity• Loans: +3.4% vs. 3Q20, with increases across all customer segments
• Deposits: +5.9% vs. 3Q20, with increases across all customer segments,downward inflection vs. 2Q21, particularly in the corporate segment
• Stepped-up use of digital tools: >56 million1 monthly connections to themobile apps (+38.3% vs. 3Q20)
Very strong upward momentum in fees• Sustained rise in off-balance sheet savings: +13.6% vs. 30.09.20, supported
in particular by the favourable trend in mutual funds outstandings
• Progression of payments with, in particular, a 7.8% increase in card paymentvolumes vs. 3Q20 and 15.0% vs. 3Q19
Mutual funds outstandings
+22.0%
€bn
Revenues2: €933m (+9.6% vs. 3Q20)
• Net interest income: +6.2%, a very significant increase in the contribution of the specialised
subsidiaries and growth in credit activities offset partly by the impact of low interest rates - positive impact from a non-recurring
item• Fees: +18.3%, solid growth in financial and
banking fees
Operating expenses2: €511m (-2.2% vs. 3Q20)
• Impact of cost-reduction measures and ongoing optimisation of the
branch network
• Very positive jaws effect (+11.8 pts)
GOI2
329
422
3Q20 3Q21
+28.4%
€m
Pre-tax income3: €379m (+29.4% vs. 3Q20)
Third quarter 2021 results | 25
30.09.19 30.09.20 30.09.21
>1.3m
1. Average fleet in thousands of vehicles; 2. At constant scope and exchange rates; 3. Since inception, in France; 4. A competitiveness task force established by the French state to support and promote growth in innovative projects – Note: Nickel does not have the status of a credit institution;
5. Including 100% of Private Banking in Luxembourg; 6. Including 2/3 of Private Banking in Luxembourg
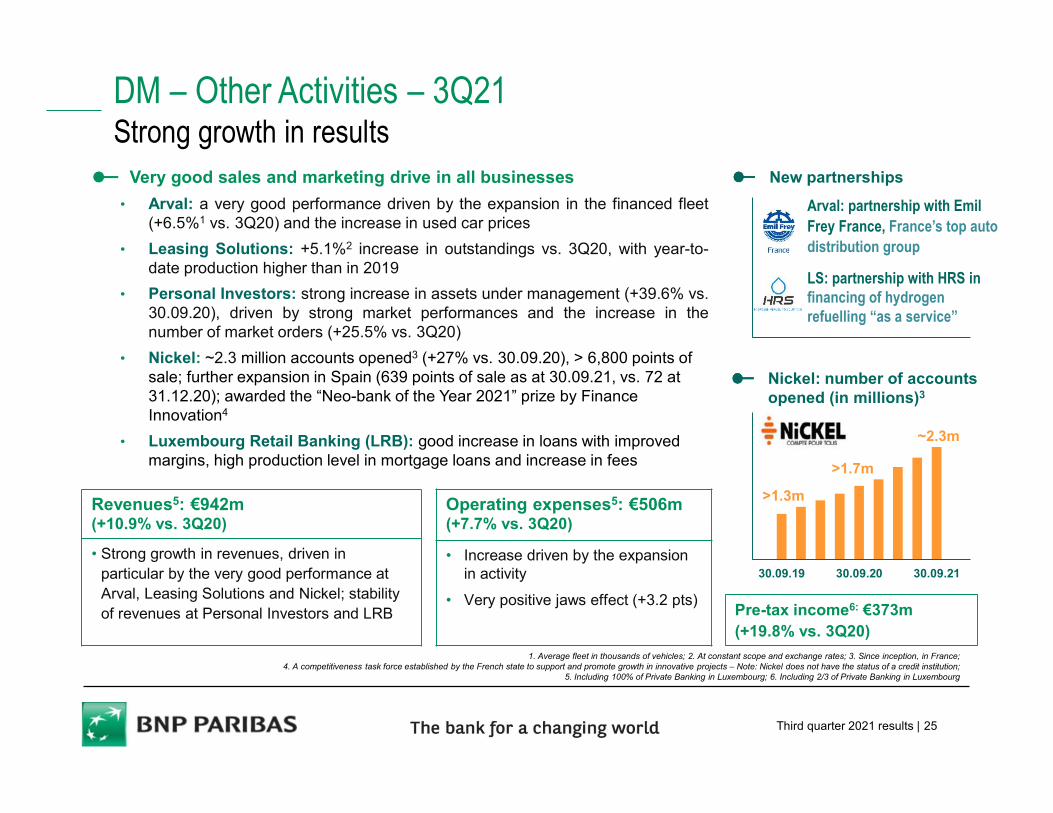
DM – Other Activities – 3Q21Strong growth in results
Very good sales and marketing drive in all businesses
• Arval: a very good performance driven by the expansion in the financed fleet(+6.5%1 vs. 3Q20) and the increase in used car prices
• Leasing Solutions: +5.1%2 increase in outstandings vs. 3Q20, with year-to-date production higher than in 2019
• Personal Investors: strong increase in assets under management (+39.6% vs.30.09.20), driven by strong market performances and the increase in thenumber of market orders (+25.5% vs. 3Q20)
• Nickel: ~2.3 million accounts opened3 (+27% vs. 30.09.20), > 6,800 points of sale; further expansion in Spain (639 points of sale as at 30.09.21, vs. 72 at 31.12.20); awarded the “Neo-bank of the Year 2021” prize by Finance Innovation4
• Luxembourg Retail Banking (LRB): good increase in loans with improved margins, high production level in mortgage loans and increase in fees
New partnerships
Revenues5: €942m (+10.9% vs. 3Q20)
• Strong growth in revenues, driven in particular by the very good performance at Arval, Leasing Solutions and Nickel; stability of revenues at Personal Investors and LRB
Operating expenses5: €506m (+7.7% vs. 3Q20)
• Increase driven by the expansion in activity
• Very positive jaws effect (+3.2 pts)Pre-tax income6: €373m (+19.8% vs. 3Q20)
Nickel: number of accounts opened (in millions)3
~2.3m
>1.7m
Arval: partnership with Emil Frey France, France’s top auto distribution group
LS: partnership with HRS in financing of hydrogen refuelling “as a service”
Third quarter 2021 results | 26
Sustained business drive in international retail networks and atPersonal Finance
• Good sales and marketing activity at Personal Finance: increase in production with the gradual lifting of public health measures in 2021
• Strong business drive in international retail networks1: a good level of loan production and a very strong upward momentum in fees
Very good level in asset-gathering activities
• Sustained net asset inflows (+€29.9bn over 9M21) and increase in assetsunder management (+9.8% vs. 30.09.20), driven by favourable market trendsand good management performances
• Continued rebound in Real Estate Services and good business drive inInsurance
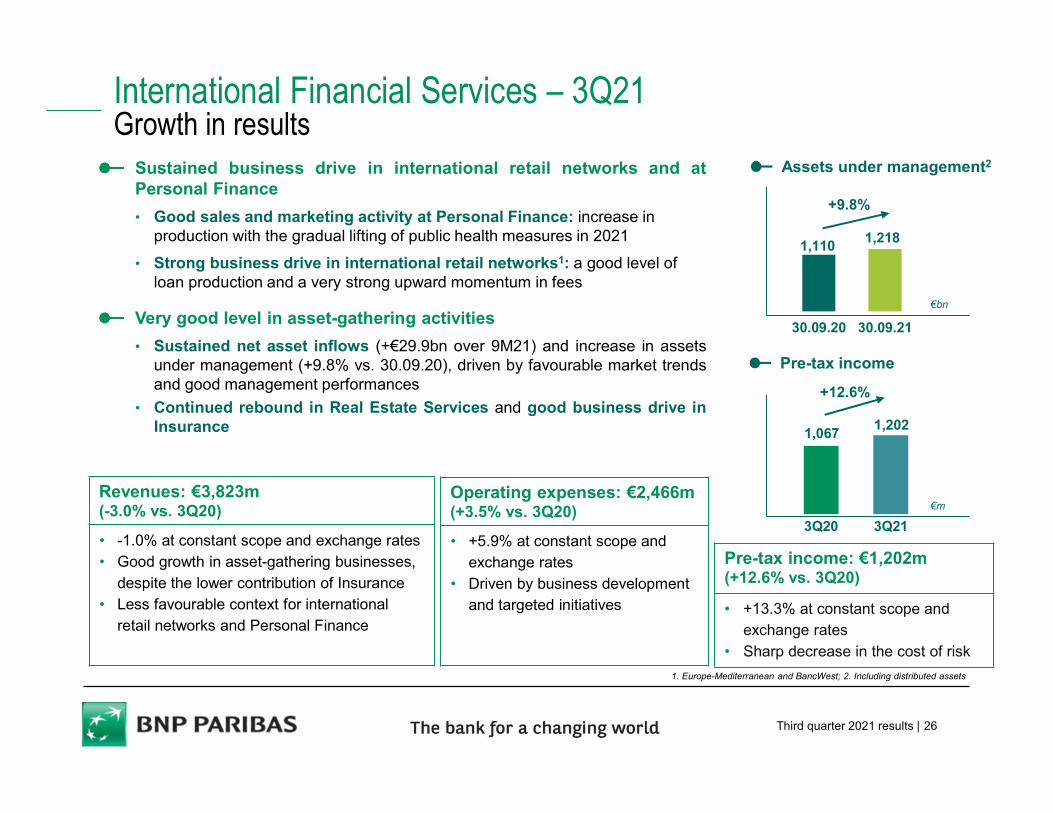
International Financial Services – 3Q21Growth in results
1. Europe-Mediterranean and BancWest; 2. Including distributed assets
Revenues: €3,823m (-3.0% vs. 3Q20)
• -1.0% at constant scope and exchange rates• Good growth in asset-gathering businesses,
despite the lower contribution of Insurance• Less favourable context for international
retail networks and Personal Finance
Pre-tax income: €1,202m (+12.6% vs. 3Q20)
• +13.3% at constant scope and exchange rates
• Sharp decrease in the cost of risk
Operating expenses: €2,466m(+3.5% vs. 3Q20)
• +5.9% at constant scope and exchange rates
• Driven by business development and targeted initiatives
30.09.20 30.09.21
1,2181,110
Assets under management2
€bn
+9.8%
1,0671,202
3Q20 3Q21
+12.6%
€m
Pre-tax income
Third quarter 2021 results | 27
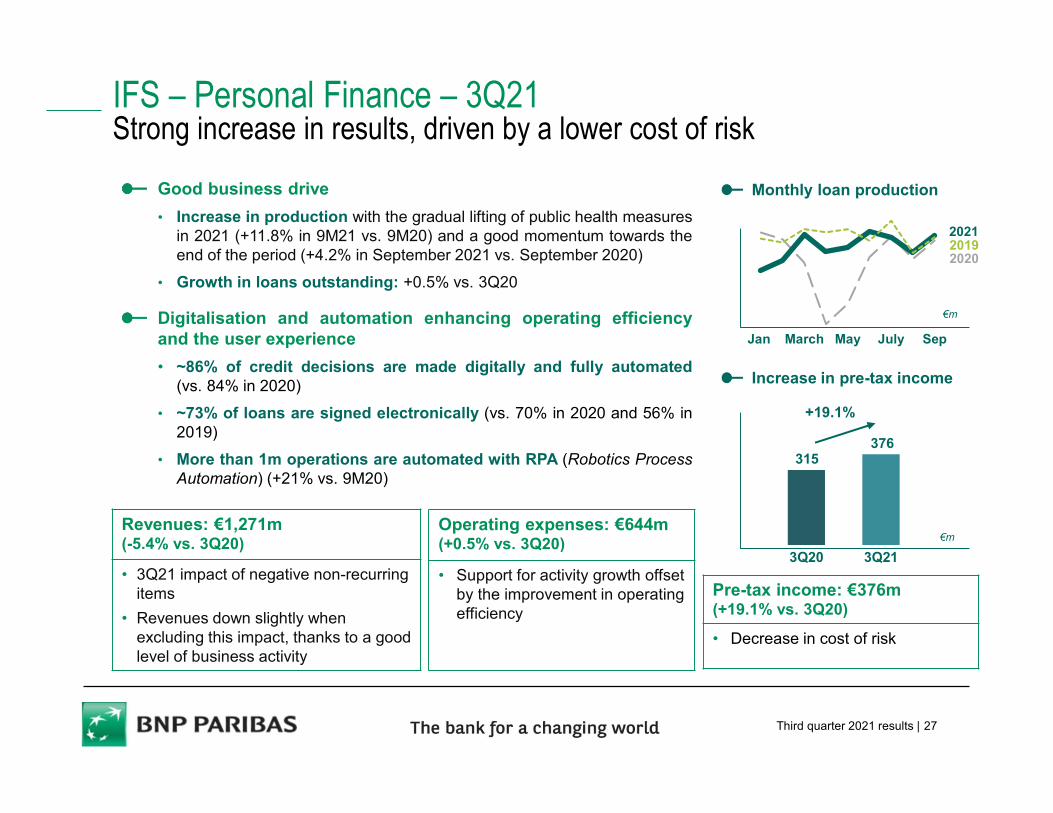
Good business drive
• Increase in production with the gradual lifting of public health measuresin 2021 (+11.8% in 9M21 vs. 9M20) and a good momentum towards theend of the period (+4.2% in September 2021 vs. September 2020)
• Growth in loans outstanding: +0.5% vs. 3Q20
Digitalisation and automation enhancing operating efficiencyand the user experience
• ~86% of credit decisions are made digitally and fully automated(vs. 84% in 2020)
• ~73% of loans are signed electronically (vs. 70% in 2020 and 56% in2019)
• More than 1m operations are automated with RPA (Robotics ProcessAutomation) (+21% vs. 9M20)
315376
3Q20 3Q21
Pre-tax income: €376m (+19.1% vs. 3Q20)
• Decrease in cost of risk
IFS – Personal Finance – 3Q21Strong increase in results, driven by a lower cost of risk
Revenues: €1,271m (-5.4% vs. 3Q20)
• 3Q21 impact of negative non-recurring items
• Revenues down slightly when excluding this impact, thanks to a good level of business activity
Monthly loan production
Operating expenses: €644m (+0.5% vs. 3Q20)
• Support for activity growth offset by the improvement in operating efficiency
Increase in pre-tax income
+19.1%
€m
202120192020
€m
Jan March May July Sep
Third quarter 2021 results | 28
3Q20 3Q21
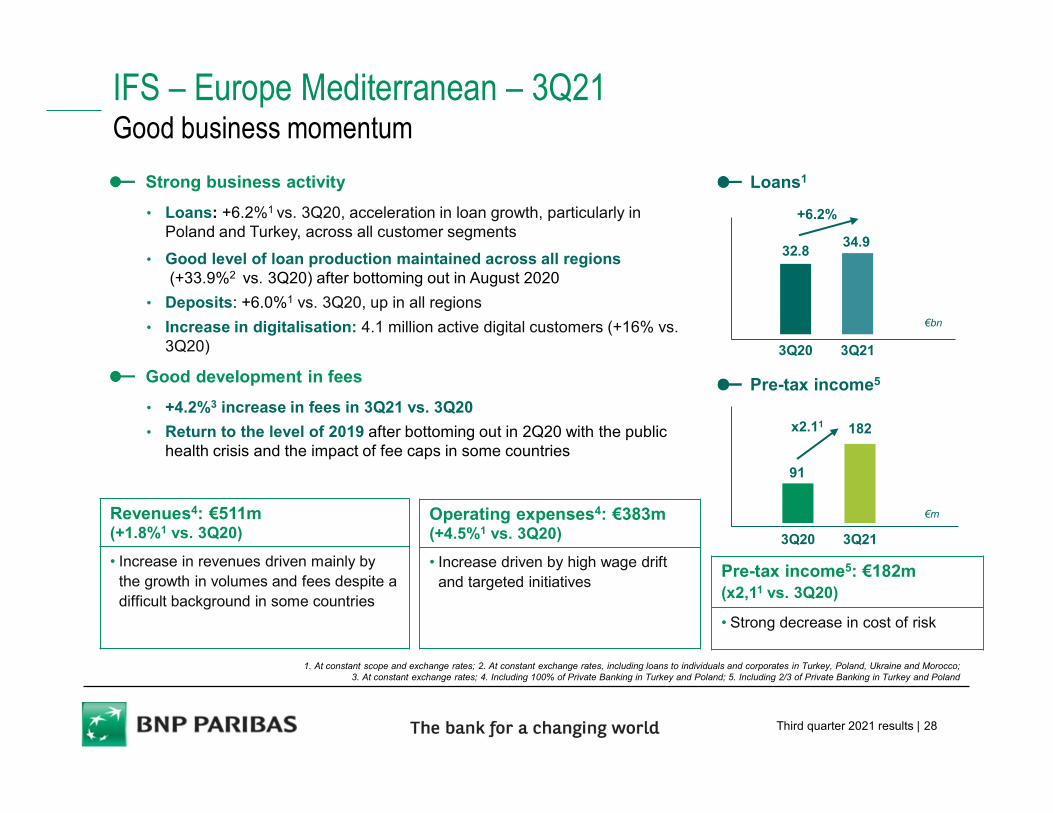
IFS – Europe Mediterranean – 3Q21Good business momentum
Strong business activity
• Loans: +6.2%1 vs. 3Q20, acceleration in loan growth, particularly in Poland and Turkey, across all customer segments
• Good level of loan production maintained across all regions(+33.9%2 vs. 3Q20) after bottoming out in August 2020
• Deposits: +6.0%1 vs. 3Q20, up in all regions
• Increase in digitalisation: 4.1 million active digital customers (+16% vs. 3Q20)
Good development in fees
• +4.2%3 increase in fees in 3Q21 vs. 3Q20
• Return to the level of 2019 after bottoming out in 2Q20 with the public health crisis and the impact of fee caps in some countries
1. At constant scope and exchange rates; 2. At constant exchange rates, including loans to individuals and corporates in Turkey, Poland, Ukraine and Morocco; 3. At constant exchange rates; 4. Including 100% of Private Banking in Turkey and Poland; 5. Including 2/3 of Private Banking in Turkey and Poland
Revenues4: €511m(+1.8%1 vs. 3Q20)
• Increase in revenues driven mainly by the growth in volumes and fees despite a difficult background in some countries
Operating expenses4: €383m (+4.5%1 vs. 3Q20)
• Increase driven by high wage drift and targeted initiatives
Pre-tax income5: €182m(x2,11 vs. 3Q20)
• Strong decrease in cost of risk
3Q20 3Q21
€m
x2.11
91
182
Pre-tax income5
Loans1
€bn
+6.2%
32.834.9
Third quarter 2021 results | 29
1. Production on loans to individuals, production and flows on SMEs and corporates excluding Paycheck Protection Program loans; 2. At constant scope and exchange rates (figures at historical scope and exchange rates in the appendices);3. Deposits excluding treasury activities; 4. Source: JD Power’s Retail Banking Study during the April - June 21 period; 5. Including 100% of Private Banking in the United States; 6. Including 2/3 of Private Banking in the US
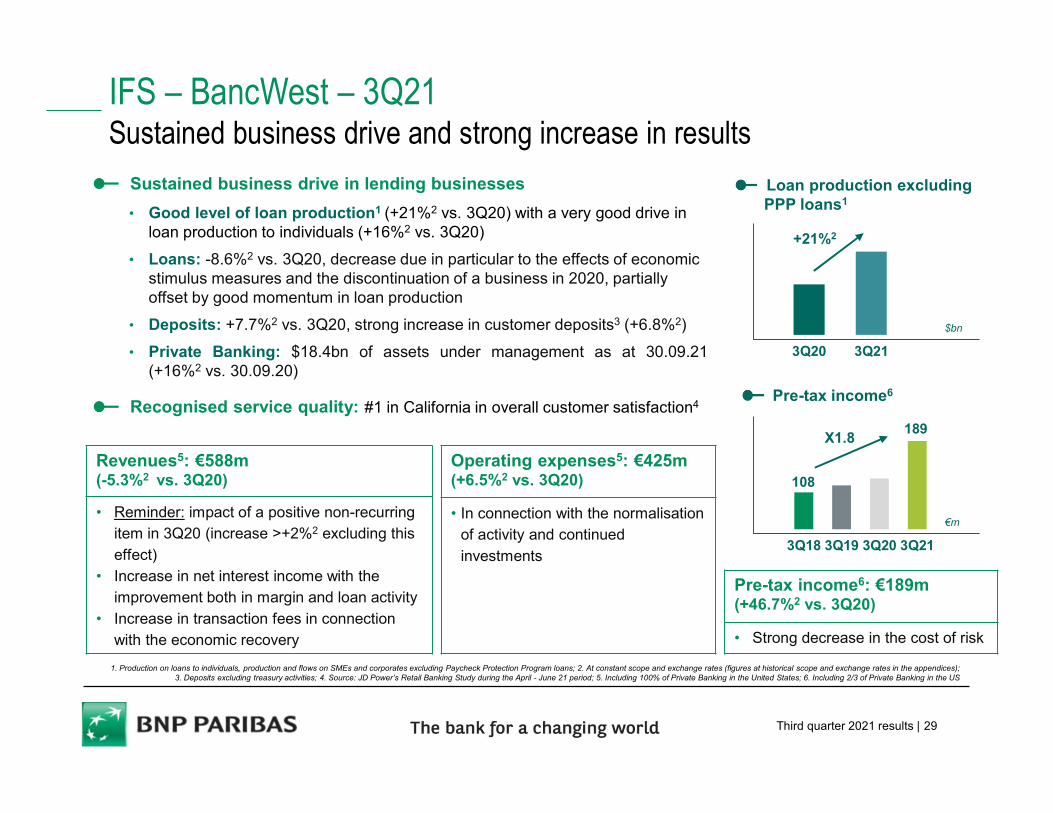
IFS – BancWest – 3Q21 Sustained business drive and strong increase in results
Sustained business drive in lending businesses
• Good level of loan production1 (+21%2 vs. 3Q20) with a very good drive in loan production to individuals (+16%2 vs. 3Q20)
• Loans: -8.6%2 vs. 3Q20, decrease due in particular to the effects of economic stimulus measures and the discontinuation of a business in 2020, partially offset by good momentum in loan production
• Deposits: +7.7%2 vs. 3Q20, strong increase in customer deposits3 (+6.8%2)
• Private Banking: $18.4bn of assets under management as at 30.09.21(+16%2 vs. 30.09.20)
Recognised service quality: #1 in California in overall customer satisfaction4Pre-tax income6
€m
3Q18 3Q19 3Q20 3Q21
X1.8
Loan production excluding PPP loans1
Revenues5: €588m (-5.3%2 vs. 3Q20)
• Reminder: impact of a positive non-recurring item in 3Q20 (increase >+2%2 excluding this
effect)• Increase in net interest income with the
improvement both in margin and loan activity
• Increase in transaction fees in connection with the economic recovery
Pre-tax income6: €189m (+46.7%2 vs. 3Q20)
• Strong decrease in the cost of risk
Operating expenses5: €425m (+6.5%2 vs. 3Q20)
• In connection with the normalisation of activity and continued
investments
189
108
3Q20 3Q21
$bn
+21%2
Third quarter 2021 results | 30
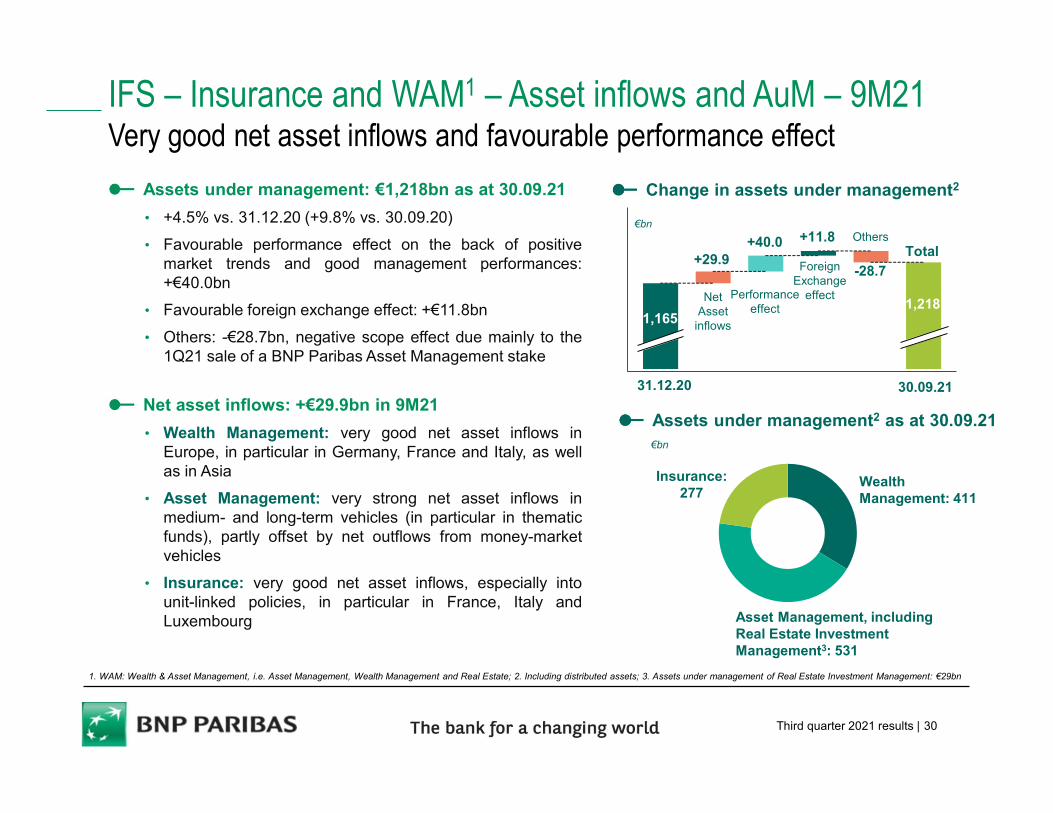
IFS – Insurance and WAM1 – Asset inflows and AuM – 9M21Very good net asset inflows and favourable performance effect
Wealth Management: 411
Asset Management, including Real Estate InvestmentManagement3: 531
Insurance: 277
€bn
Assets under management2 as at 30.09.21
Assets under management: €1,218bn as at 30.09.21
• +4.5% vs. 31.12.20 (+9.8% vs. 30.09.20)
• Favourable performance effect on the back of positivemarket trends and good management performances:+€40.0bn
• Favourable foreign exchange effect: +€11.8bn
• Others: -€28.7bn, negative scope effect due mainly to the1Q21 sale of a BNP Paribas Asset Management stake
Net asset inflows: +€29.9bn in 9M21
• Wealth Management: very good net asset inflows inEurope, in particular in Germany, France and Italy, as wellas in Asia
• Asset Management: very strong net asset inflows inmedium- and long-term vehicles (in particular in thematicfunds), partly offset by net outflows from money-marketvehicles
• Insurance: very good net asset inflows, especially intounit-linked policies, in particular in France, Italy andLuxembourg
1. WAM: Wealth & Asset Management, i.e. Asset Management, Wealth Management and Real Estate; 2. Including distributed assets; 3. Assets under management of Real Estate Investment Management: €29bn
€bn
1,218
Total
1,165
Change in assets under management2
+29.9
Others+40.0 +11.8
-28.7
31.12.20 30.09.21
Net Asset
inflows
Performance effect
Foreign Exchange
effect
Third quarter 2021 results | 31
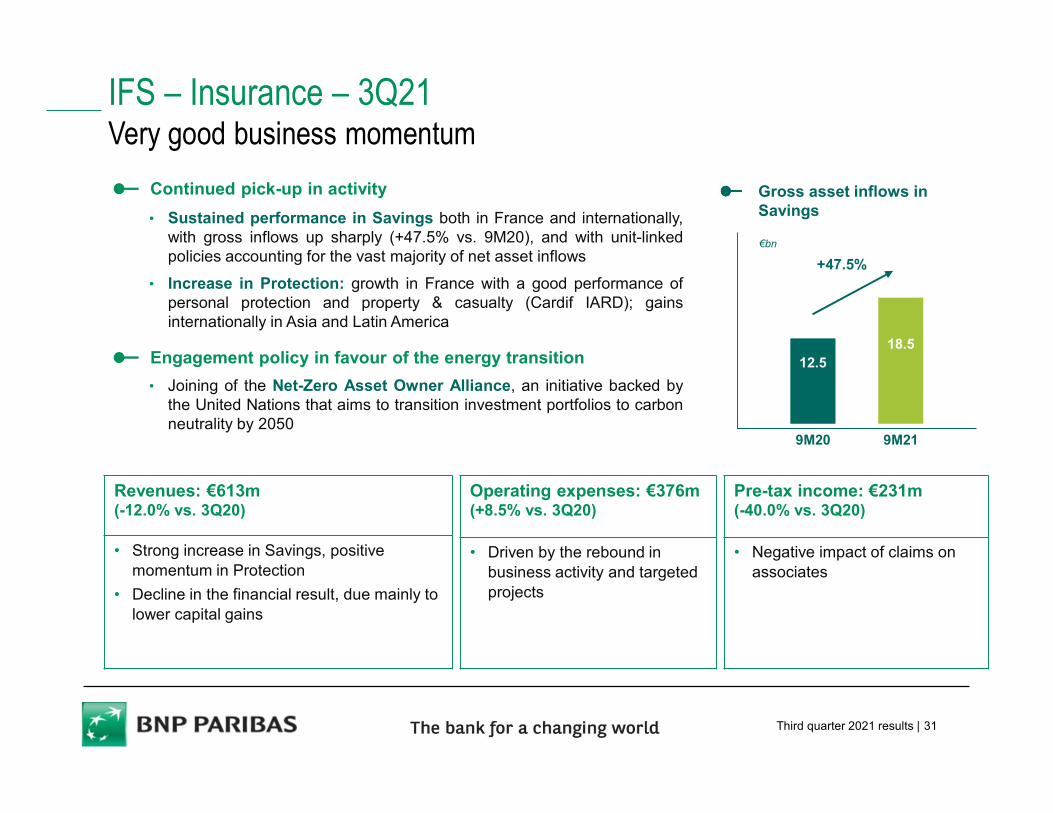
IFS – Insurance – 3Q21Very good business momentum
Continued pick-up in activity
• Sustained performance in Savings both in France and internationally,with gross inflows up sharply (+47.5% vs. 9M20), and with unit-linkedpolicies accounting for the vast majority of net asset inflows
• Increase in Protection: growth in France with a good performance ofpersonal protection and property & casualty (Cardif IARD); gainsinternationally in Asia and Latin America
Engagement policy in favour of the energy transition
• Joining of the Net-Zero Asset Owner Alliance, an initiative backed bythe United Nations that aims to transition investment portfolios to carbonneutrality by 2050
Revenues: €613m (-12.0% vs. 3Q20)
• Strong increase in Savings, positive momentum in Protection
• Decline in the financial result, due mainly to lower capital gains
Pre-tax income: €231m (-40.0% vs. 3Q20)
• Negative impact of claims on associates
Operating expenses: €376m (+8.5% vs. 3Q20)
• Driven by the rebound in business activity and targeted projects
Gross asset inflows in Savings
12.518.5
9M20 9M21
€bn
+47.5%
Third quarter 2021 results | 32
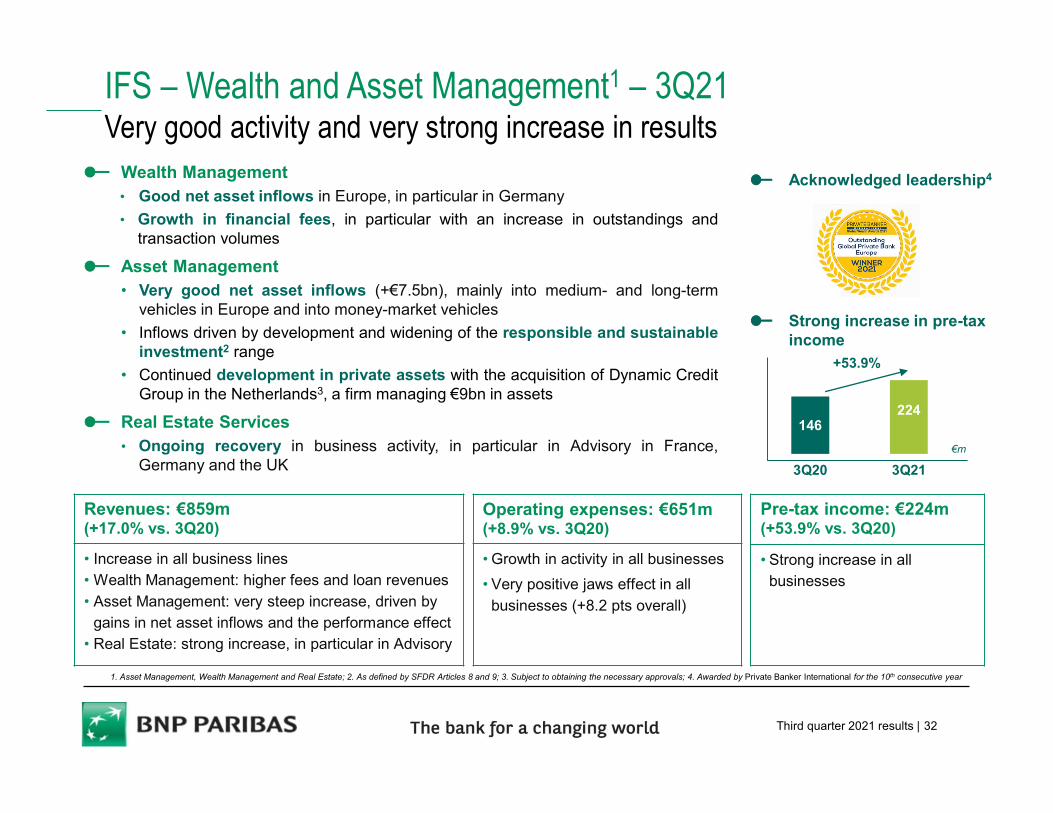
IFS – Wealth and Asset Management1 – 3Q21Very good activity and very strong increase in results
Revenues: €859m (+17.0% vs. 3Q20)
• Increase in all business lines• Wealth Management: higher fees and loan revenues
• Asset Management: very steep increase, driven by gains in net asset inflows and the performance effect
• Real Estate: strong increase, in particular in Advisory
Pre-tax income: €224m (+53.9% vs. 3Q20)
• Strong increase in all businesses
Operating expenses: €651m (+8.9% vs. 3Q20)
• Growth in activity in all businesses
• Very positive jaws effect in all
businesses (+8.2 pts overall)
Wealth Management• Good net asset inflows in Europe, in particular in Germany
• Growth in financial fees, in particular with an increase in outstandings andtransaction volumes
Asset Management• Very good net asset inflows (+€7.5bn), mainly into medium- and long-term
vehicles in Europe and into money-market vehicles
• Inflows driven by development and widening of the responsible and sustainableinvestment2 range
• Continued development in private assets with the acquisition of Dynamic CreditGroup in the Netherlands3, a firm managing €9bn in assets
Real Estate Services• Ongoing recovery in business activity, in particular in Advisory in France,
Germany and the UK
146224
3Q20 3Q21
€m
Strong increase in pre-tax income
+53.9%
1. Asset Management, Wealth Management and Real Estate; 2. As defined by SFDR Articles 8 and 9; 3. Subject to obtaining the necessary approvals; 4. Awarded by Private Banker International for the 10th consecutive year
Acknowledged leadership4
Third quarter 2021 results | 33
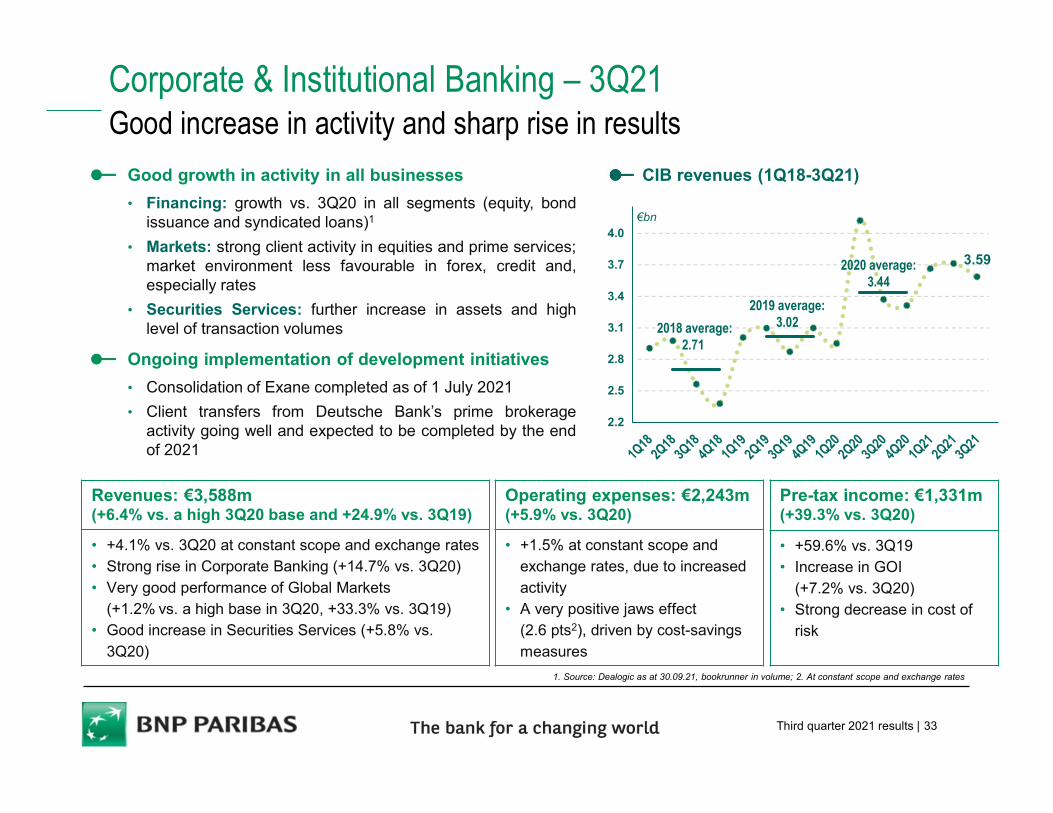
3.59
2.2
2.5
2.8
3.1
3.4
3.7
4.0€bn
Pre-tax income: €1,331m (+39.3% vs. 3Q20)
• +59.6% vs. 3Q19• Increase in GOI
(+7.2% vs. 3Q20)• Strong decrease in cost of
risk
Good growth in activity in all businesses
• Financing: growth vs. 3Q20 in all segments (equity, bondissuance and syndicated loans)1
• Markets: strong client activity in equities and prime services;market environment less favourable in forex, credit and,especially rates
• Securities Services: further increase in assets and highlevel of transaction volumes
Ongoing implementation of development initiatives
• Consolidation of Exane completed as of 1 July 2021
• Client transfers from Deutsche Bank’s prime brokerageactivity going well and expected to be completed by the endof 2021
1. Source: Dealogic as at 30.09.21, bookrunner in volume; 2. At constant scope and exchange rates
Corporate & Institutional Banking – 3Q21Good increase in activity and sharp rise in results
CIB revenues (1Q18-3Q21)
Revenues: €3,588m (+6.4% vs. a high 3Q20 base and +24.9% vs. 3Q19)
• +4.1% vs. 3Q20 at constant scope and exchange rates• Strong rise in Corporate Banking (+14.7% vs. 3Q20)
• Very good performance of Global Markets (+1.2% vs. a high base in 3Q20, +33.3% vs. 3Q19)
• Good increase in Securities Services (+5.8% vs.
3Q20)
Operating expenses: €2,243m (+5.9% vs. 3Q20)
• +1.5% at constant scope and exchange rates, due to increased
activity• A very positive jaws effect
(2.6 pts2), driven by cost-savings
measures
2018 average:2.71
2019 average:3.02
2020 average:3.44
Third quarter 2021 results | 34
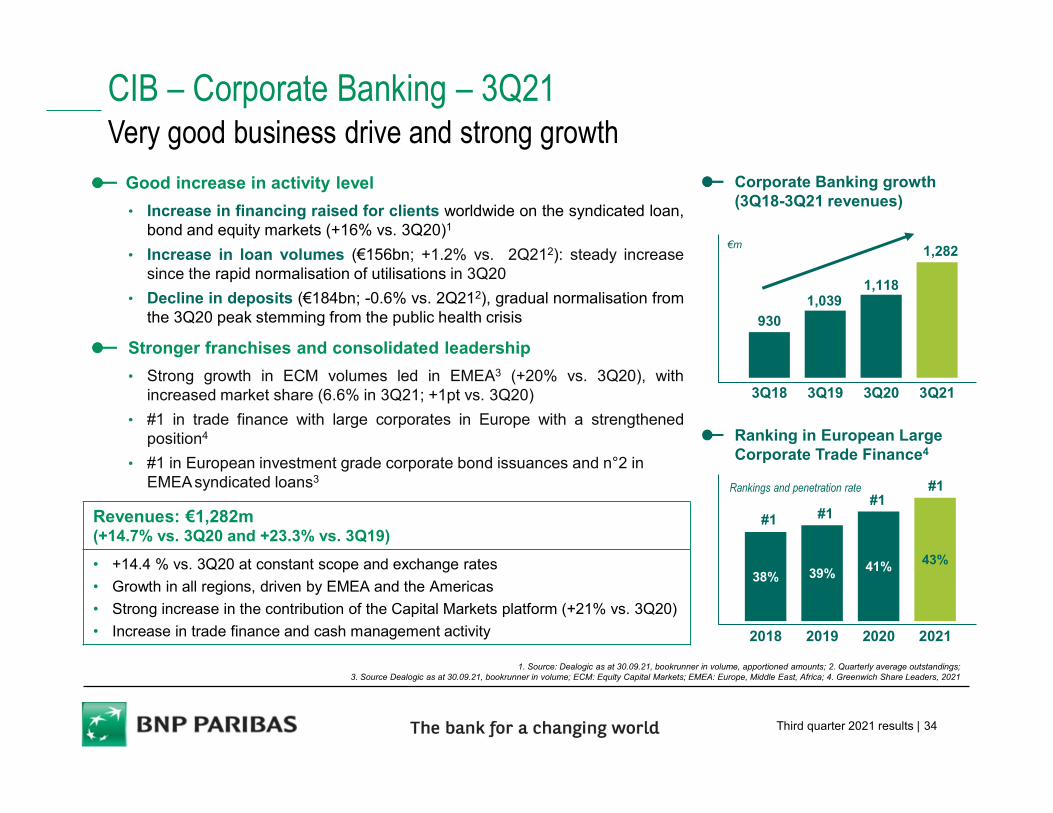
CIB – Corporate Banking – 3Q21Very good business drive and strong growth
Good increase in activity level
• Increase in financing raised for clients worldwide on the syndicated loan,bond and equity markets (+16% vs. 3Q20)1
• Increase in loan volumes (€156bn; +1.2% vs. 2Q212): steady increasesince the rapid normalisation of utilisations in 3Q20
• Decline in deposits (€184bn; -0.6% vs. 2Q212), gradual normalisation fromthe 3Q20 peak stemming from the public health crisis
Stronger franchises and consolidated leadership
• Strong growth in ECM volumes led in EMEA3 (+20% vs. 3Q20), withincreased market share (6.6% in 3Q21; +1pt vs. 3Q20)
• #1 in trade finance with large corporates in Europe with a strengthenedposition4
• #1 in European investment grade corporate bond issuances and n°2 in EMEAsyndicated loans3
Corporate Banking growth (3Q18-3Q21 revenues)
Revenues: €1,282m(+14.7% vs. 3Q20 and +23.3% vs. 3Q19)
• +14.4 % vs. 3Q20 at constant scope and exchange rates
• Growth in all regions, driven by EMEA and the Americas
• Strong increase in the contribution of the Capital Markets platform (+21% vs. 3Q20)
• Increase in trade finance and cash management activity
930
1,0391,118
1,282
3Q18 3Q19 3Q20 3Q21
€m
Rankings and penetration rate
Ranking in European Large Corporate Trade Finance4
1. Source: Dealogic as at 30.09.21, bookrunner in volume, apportioned amounts; 2. Quarterly average outstandings; 3. Source Dealogic as at 30.09.21, bookrunner in volume; ECM: Equity Capital Markets; EMEA: Europe, Middle East, Africa; 4. Greenwich Share Leaders, 2021
38% 39% 41% 43%
2018 2019 2020 2021
#1
#1 #1
#1
Third quarter 2021 results | 35
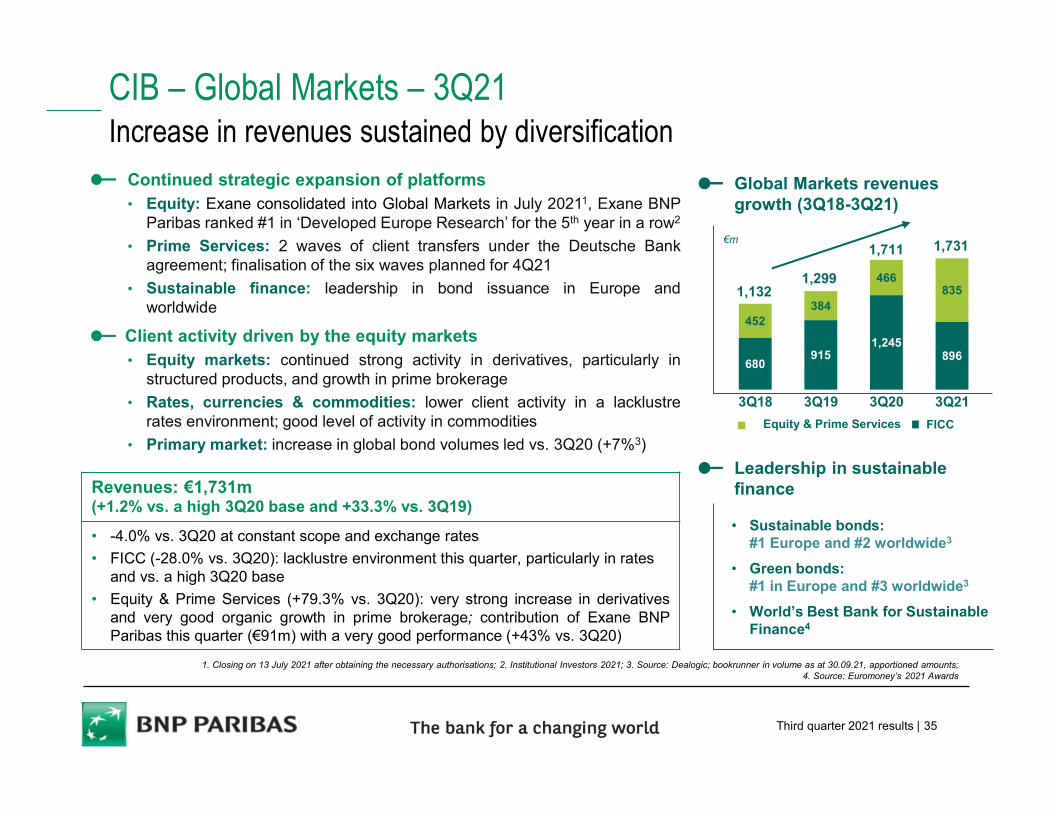
Equity & Prime Services
• Sustainable bonds: #1 Europe and #2 worldwide3
• Green bonds: #1 in Europe and #3 worldwide3
• World’s Best Bank for SustainableFinance4
Continued strategic expansion of platforms• Equity: Exane consolidated into Global Markets in July 20211, Exane BNP
Paribas ranked #1 in ‘Developed Europe Research’ for the 5th year in a row2
• Prime Services: 2 waves of client transfers under the Deutsche Bankagreement; finalisation of the six waves planned for 4Q21
• Sustainable finance: leadership in bond issuance in Europe andworldwide
Client activity driven by the equity markets• Equity markets: continued strong activity in derivatives, particularly in
structured products, and growth in prime brokerage
• Rates, currencies & commodities: lower client activity in a lacklustrerates environment; good level of activity in commodities
• Primary market: increase in global bond volumes led vs. 3Q20 (+7%3)
CIB – Global Markets – 3Q21Increase in revenues sustained by diversification
Global Markets revenues growth (3Q18-3Q21)
1. Closing on 13 July 2021 after obtaining the necessary authorisations; 2. Institutional Investors 2021; 3. Source: Dealogic; bookrunner in volume as at 30.09.21, apportioned amounts; 4. Source: Euromoney’s 2021 Awards
Leadership in sustainable financeRevenues: €1,731m
(+1.2% vs. a high 3Q20 base and +33.3% vs. 3Q19)
• -4.0% vs. 3Q20 at constant scope and exchange rates
• FICC (-28.0% vs. 3Q20): lacklustre environment this quarter, particularly in rates and vs. a high 3Q20 base
• Equity & Prime Services (+79.3% vs. 3Q20): very strong increase in derivativesand very good organic growth in prime brokerage; contribution of Exane BNPParibas this quarter (€91m) with a very good performance (+43% vs. 3Q20)
680915
1,245896
452384
466835
3Q18 3Q19 3Q20 3Q21
FICC
€m 1,7311,711
1,2991,132
Third quarter 2021 results | 36
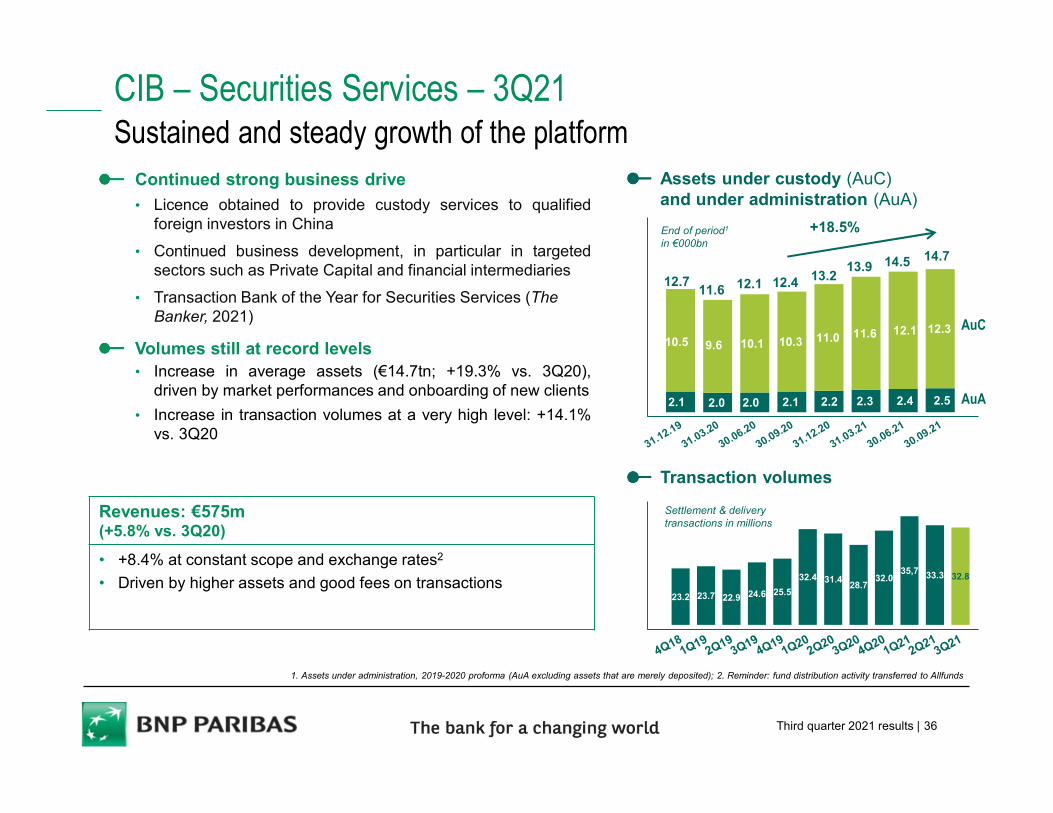
23.2 23.7 22.9 24.6 25.5
32.4 31.428.7
32.035,7 33.3 32.8
CIB – Securities Services – 3Q21Sustained and steady growth of the platform
Continued strong business drive
• Licence obtained to provide custody services to qualifiedforeign investors in China
• Continued business development, in particular in targetedsectors such as Private Capital and financial intermediaries
• Transaction Bank of the Year for Securities Services (The Banker, 2021)
Volumes still at record levels• Increase in average assets (€14.7tn; +19.3% vs. 3Q20),
driven by market performances and onboarding of new clients
• Increase in transaction volumes at a very high level: +14.1%vs. 3Q20
Transaction volumes
Settlement & delivery transactions in millions
1. Assets under administration, 2019-2020 proforma (AuA excluding assets that are merely deposited); 2. Reminder: fund distribution activity transferred to Allfunds
Assets under custody (AuC) and under administration (AuA)
2.1 2.0 2.0 2.1 2.2 2.3 2.4 2.5
10.5 9.6 10.1 10.3 11.0 11.6 12.1 12.3
End of period1
in €000bn
AuA
AuC
12.7
+18.5%
11.6 12.1 12.4
Revenues: €575m(+5.8% vs. 3Q20)
• +8.4% at constant scope and exchange rates2
• Driven by higher assets and good fees on transactions
13.214.513.9
14.7
9M21 DETAILED RESULTS
DIVISION RESULTS
APPENDICES
GROUP RESULTS
CONCLUSION
Third quarter 2021 results | 38
6.3 5.57.2
9M19 9M20 9M21
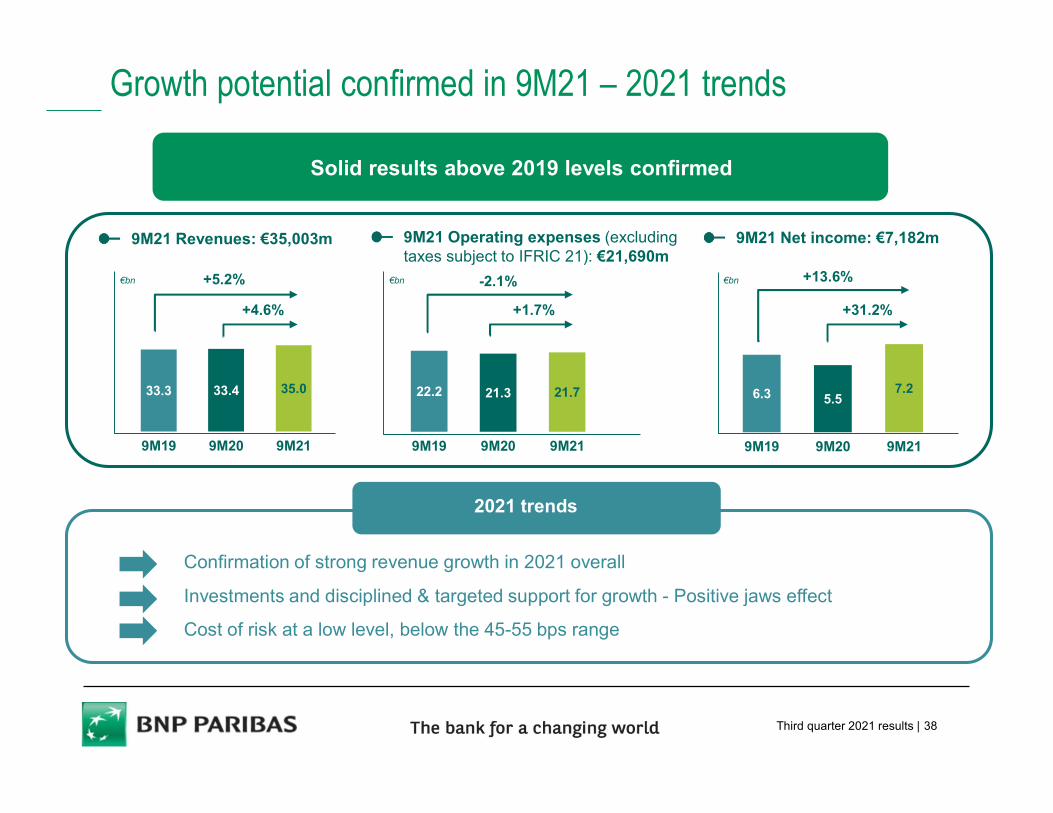
9M21 Net income: €7,182m
€bn +13.6%
+31.2%
33.3 33.4 35.0
9M19 9M20 9M21
9M21 Revenues: €35,003m
€bn +5.2%
+4.6%
22.2 21.3 21.7
9M19 9M20 9M21
9M21 Operating expenses (excluding taxes subject to IFRIC 21): €21,690m
€bn -2.1%
+1.7%
Growth potential confirmed in 9M21 – 2021 trends
Résultats solides au-delà des niveaux de 2019 confirmés
Confirmation of strong revenue growth in 2021 overall
Investments and disciplined & targeted support for growth - Positive jaws effect
Cost of risk at a low level, below the 45-55 bps range
2021 trends
Solid results above 2019 levels confirmed
Third quarter 2021 results | 39
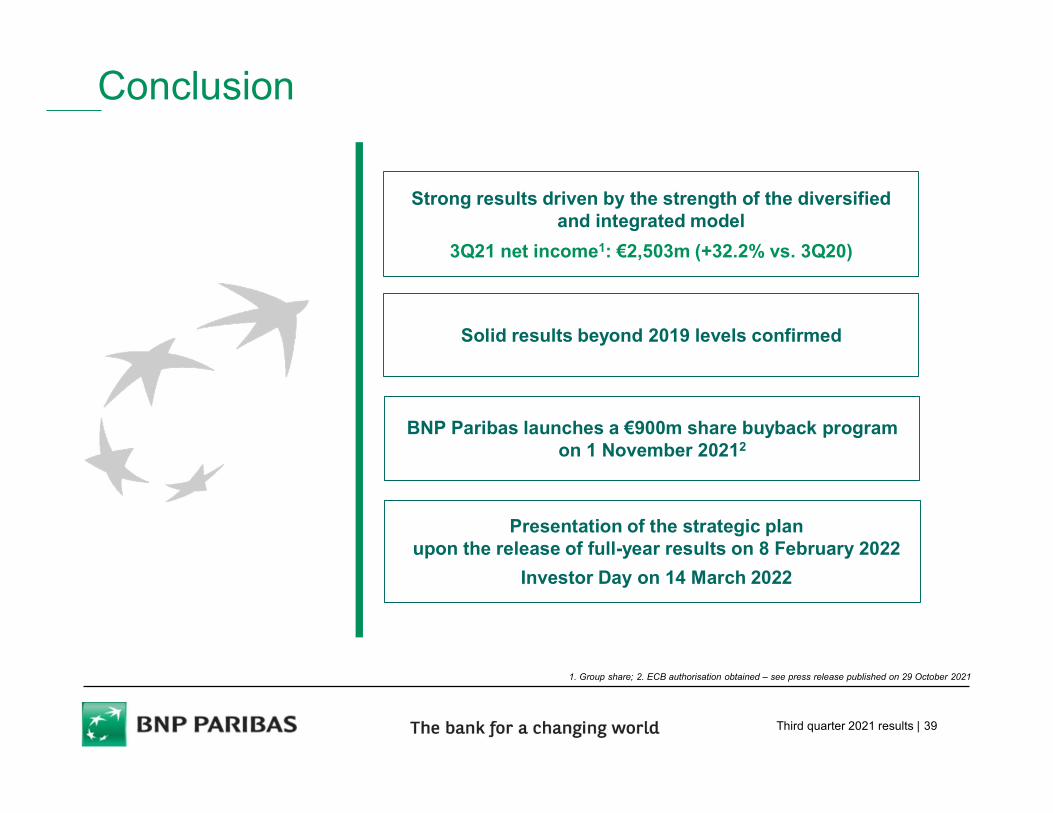
Conclusion
Strong results driven by the strength of the diversified and integrated model
3Q21 net income1: €2,503m (+32.2% vs. 3Q20)
Solid results beyond 2019 levels confirmed
Presentation of the strategic plan upon the release of full-year results on 8 February 2022
Investor Day on 14 March 2022
BNP Paribas launches a €900m share buyback program on 1 November 20212
1. Group share; 2. ECB authorisation obtained – see press release published on 29 October 2021
9M21 DETAILED RESULTSAPPENDICES
GROUP RESULTS
DIVISION RESULTS
CONCLUSION
Third quarter 2021 results | 41
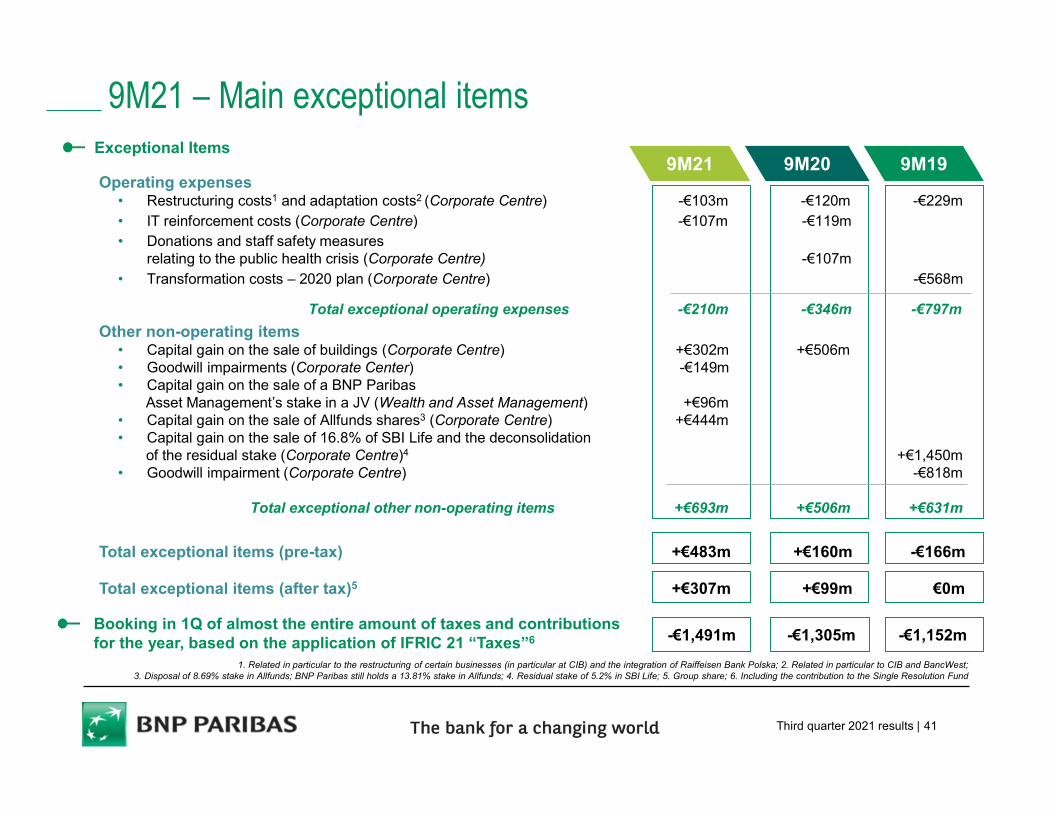
Operating expenses • Restructuring costs1 and adaptation costs2 (Corporate Centre) -€103m -€120m -€229m• IT reinforcement costs (Corporate Centre) -€107m -€119m• Donations and staff safety measures
relating to the public health crisis (Corporate Centre) -€107m• Transformation costs – 2020 plan (Corporate Centre) -€568m
Total exceptional operating expenses -€210m -€346m -€797m
Other non-operating items• Capital gain on the sale of buildings (Corporate Centre) +€302m +€506m• Goodwill impairments (Corporate Center) -€149m• Capital gain on the sale of a BNP Paribas
Asset Management’s stake in a JV (Wealth and Asset Management) +€96m• Capital gain on the sale of Allfunds shares3 (Corporate Centre) +€444m• Capital gain on the sale of 16.8% of SBI Life and the deconsolidation
of the residual stake (Corporate Centre)4 +€1,450m• Goodwill impairment (Corporate Centre) -€818m
Total exceptional other non-operating items +€693m +€506m +€631m
Total exceptional items (pre-tax) +€483m +€160m -€166m
Total exceptional items (after tax)5 +€307m +€99m €0m
9M209M21Exceptional Items
1. Related in particular to the restructuring of certain businesses (in particular at CIB) and the integration of Raiffeisen Bank Polska; 2. Related in particular to CIB and BancWest; 3. Disposal of 8.69% stake in Allfunds; BNP Paribas still holds a 13.81% stake in Allfunds; 4. Residual stake of 5.2% in SBI Life; 5. Group share; 6. Including the contribution to the Single Resolution Fund
9M21 – Main exceptional items
9M19
Booking in 1Q of almost the entire amount of taxes and contributions for the year, based on the application of IFRIC 21 “Taxes”6 -€1,491m -€1,305m -€1,152m
Third quarter 2021 results | 42
9M21 9M209M21
vs. 9M20 9M19 9M21vs. 9M19
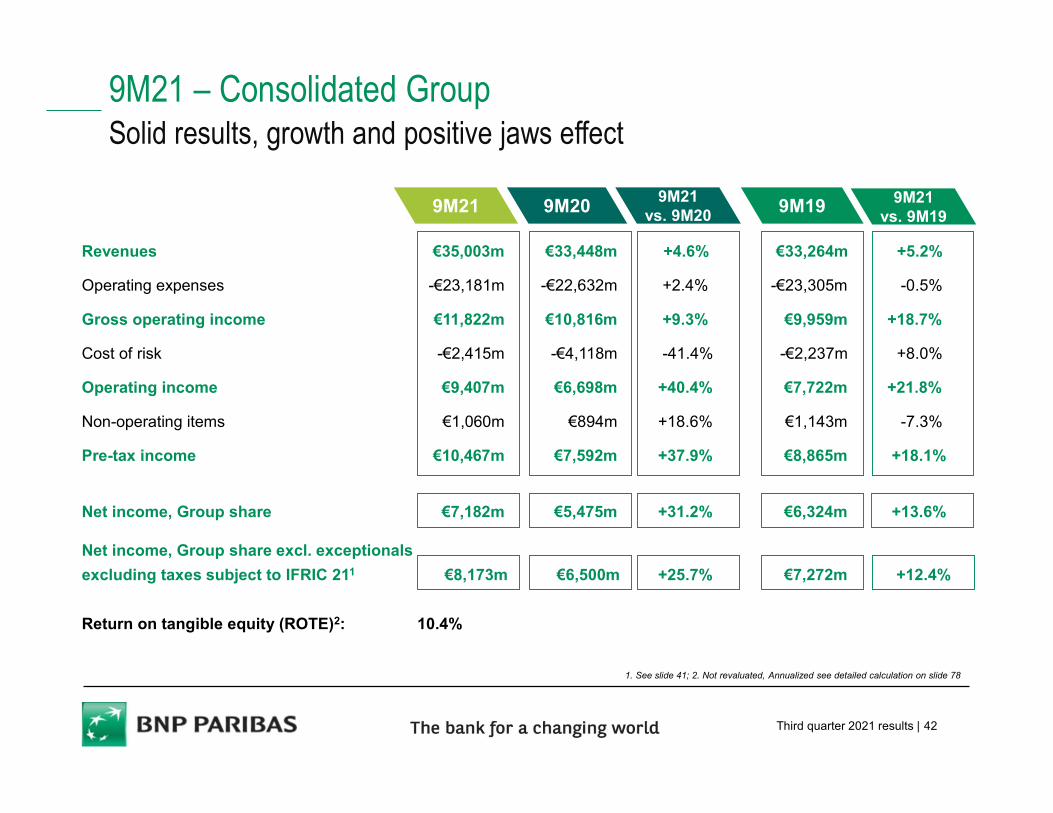
9M21 – Consolidated GroupSolid results, growth and positive jaws effect
1. See slide 41; 2. Not revaluated, Annualized see detailed calculation on slide 78
Revenues €35,003m €33,448m +4.6% €33,264m +5.2%
Operating expenses -€23,181m -€22,632m +2.4% -€23,305m -0.5%
Gross operating income €11,822m €10,816m +9.3% €9,959m +18.7%
Cost of risk -€2,415m -€4,118m -41.4% -€2,237m +8.0%
Operating income €9,407m €6,698m +40.4% €7,722m +21.8%
Non-operating items €1,060m €894m +18.6% €1,143m -7.3%
Pre-tax income €10,467m €7,592m +37.9% €8,865m +18.1%
Net income, Group share €7,182m €5,475m +31.2% €6,324m +13.6%
Net income, Group share excl. exceptionals
excluding taxes subject to IFRIC 211 €8,173m €6,500m +25.7% €7,272m +12.4%
Return on tangible equity (ROTE)2: 10.4%
Third quarter 2021 results | 43
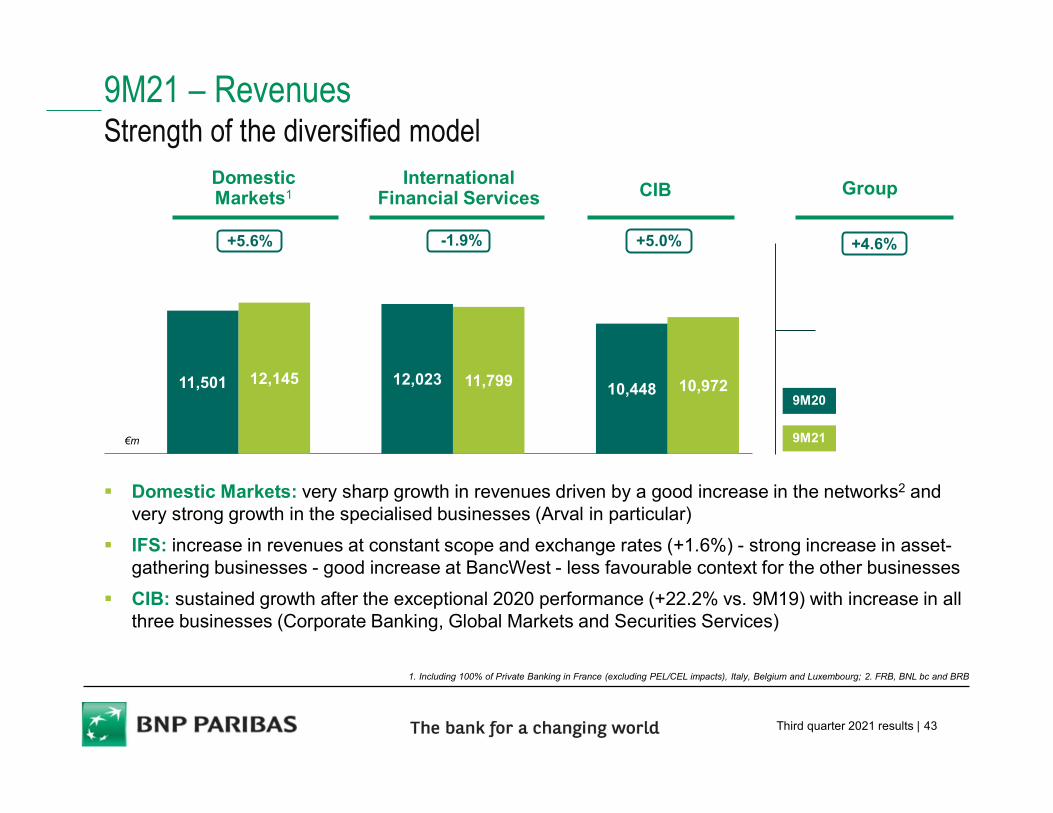
+4.6%+5.6%
9M21 – RevenuesStrength of the diversified model
1. Including 100% of Private Banking in France (excluding PEL/CEL impacts), Italy, Belgium and Luxembourg; 2. FRB, BNL bc and BRB
€m
DomesticMarkets1
International Financial Services CIB Group
9M21
9M20
-1.9% +5.0%
Domestic Markets: very sharp growth in revenues driven by a good increase in the networks2 and very strong growth in the specialised businesses (Arval in particular)
IFS: increase in revenues at constant scope and exchange rates (+1.6%) - strong increase in asset-gathering businesses - good increase at BancWest - less favourable context for the other businesses
CIB: sustained growth after the exceptional 2020 performance (+22.2% vs. 9M19) with increase in all three businesses (Corporate Banking, Global Markets and Securities Services)
11,501 12,145 12,023 11,799 10,448 10,972
Third quarter 2021 results | 44
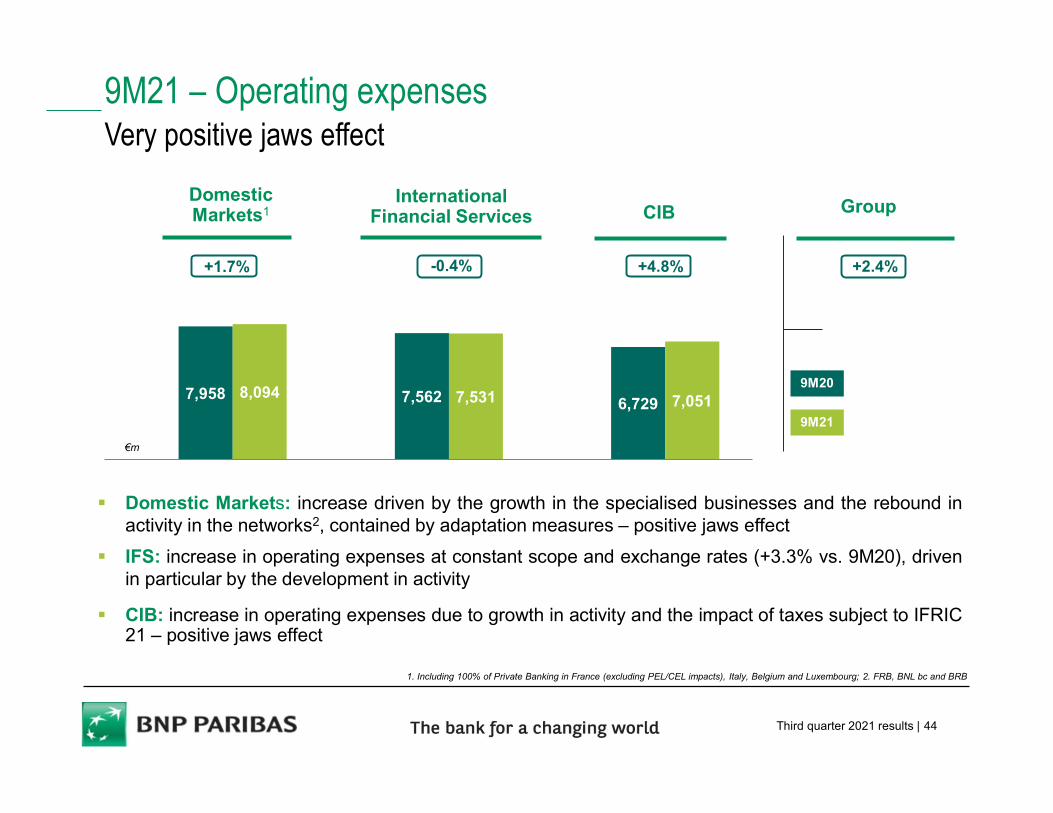
+2.4%+1.7% -0.4% +4.8%
7,958 8,094 7,562 7,531 6,729 7,051
9M21 – Operating expenses Very positive jaws effect
1. Including 100% of Private Banking in France (excluding PEL/CEL impacts), Italy, Belgium and Luxembourg; 2. FRB, BNL bc and BRB
€m
Domestic Markets: increase driven by the growth in the specialised businesses and the rebound inactivity in the networks2, contained by adaptation measures – positive jaws effect
IFS: increase in operating expenses at constant scope and exchange rates (+3.3% vs. 9M20), drivenin particular by the development in activity
CIB: increase in operating expenses due to growth in activity and the impact of taxes subject to IFRIC21 – positive jaws effect
GroupDomesticMarkets1
InternationalFinancial Services CIB
9M21
9M20
Third quarter 2021 results | 45
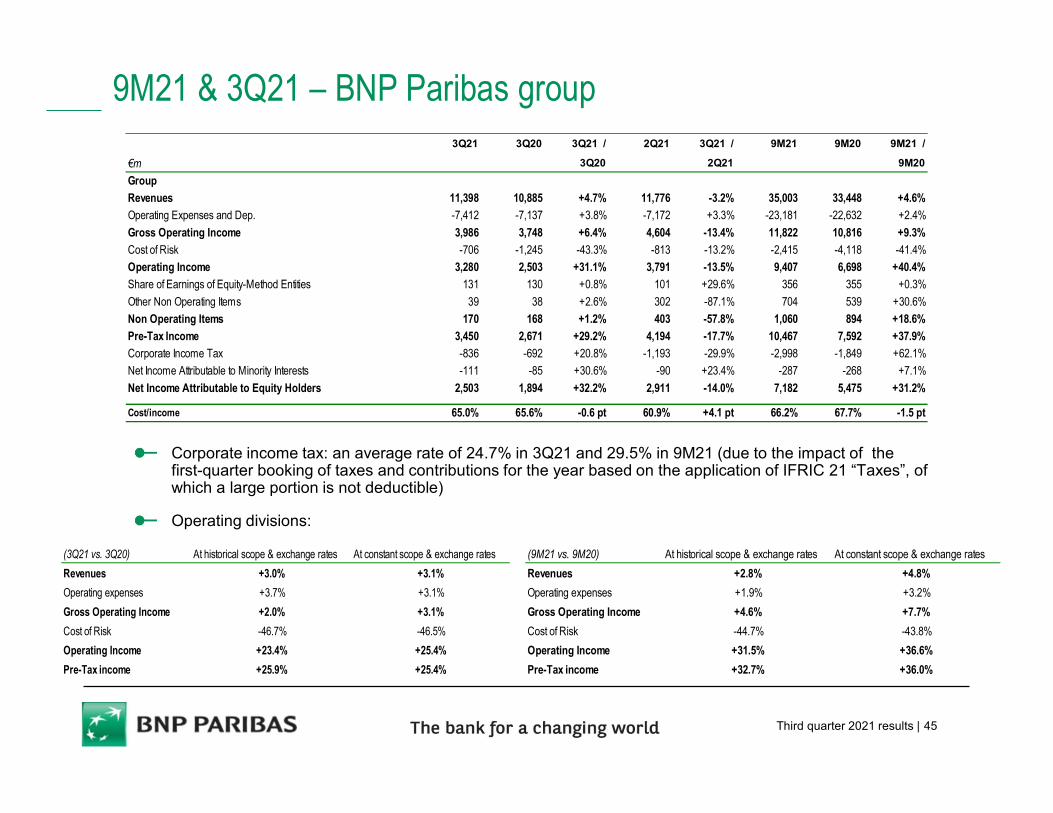
9M21 & 3Q21 – BNP Paribas group
Corporate income tax: an average rate of 24.7% in 3Q21 and 29.5% in 9M21 (due to the impact of the first-quarter booking of taxes and contributions for the year based on the application of IFRIC 21 “Taxes”, of which a large portion is not deductible)
Operating divisions:
3Q21 3Q20 3Q21 / 2Q21 3Q21 / 9M21 9M20 9M21 /
€m 3Q20 2Q21 9M20
Group n.s. n.s. n.s.
Revenues 11,398 10,885 +4.7% 11,776 -3.2% 35,003 33,448 +4.6%
Operating Expenses and Dep. -7,412 -7,137 +3.8% -7,172 +3.3% -23,181 -22,632 +2.4%
Gross Operating Income 3,986 3,748 +6.4% 4,604 -13.4% 11,822 10,816 +9.3%
Cost of Risk -706 -1,245 -43.3% -813 -13.2% -2,415 -4,118 -41.4%
Operating Income 3,280 2,503 +31.1% 3,791 -13.5% 9,407 6,698 +40.4%
Share of Earnings of Equity-Method Entities 131 130 +0.8% 101 +29.6% 356 355 +0.3%
Other Non Operating Items 39 38 +2.6% 302 -87.1% 704 539 +30.6%
Non Operating Items 170 168 +1.2% 403 -57.8% 1,060 894 +18.6%
Pre-Tax Income 3,450 2,671 +29.2% 4,194 -17.7% 10,467 7,592 +37.9%
Corporate Income Tax -836 -692 +20.8% -1,193 -29.9% -2,998 -1,849 +62.1%
Net Income Attributable to Minority Interests -111 -85 +30.6% -90 +23.4% -287 -268 +7.1%
Net Income Attributable to Equity Holders 2,503 1,894 +32.2% 2,911 -14.0% 7,182 5,475 +31.2%
Cost/income 65.0% 65.6% -0.6 pt 60.9% +4.1 pt 66.2% 67.7% -1.5 pt
(9M21 vs. 9M20) At historical scope & exchange rates At constant scope & exchange rates
Revenues +2.8% +4.8%
Operating expenses +1.9% +3.2%
Gross Operating Income +4.6% +7.7%
Cost of Risk -44.7% -43.8%
Operating Income +31.5% +36.6%
Pre-Tax income +32.7% +36.0%
(3Q21 vs. 3Q20) At historical scope & exchange rates At constant scope & exchange rates
Revenues +3.0% +3.1%
Operating expenses +3.7% +3.1%
Gross Operating Income +2.0% +3.1%
Cost of Risk -46.7% -46.5%
Operating Income +23.4% +25.4%
Pre-Tax income +25.9% +25.4%
Third quarter 2021 results | 46
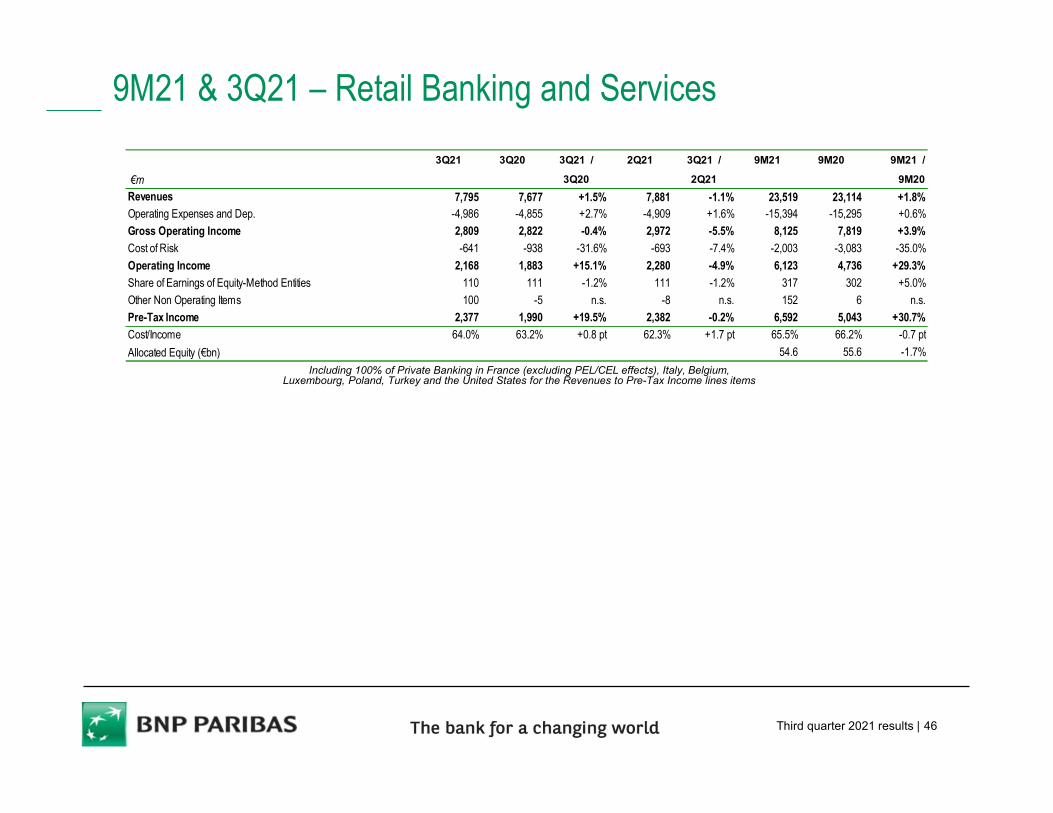
9M21 & 3Q21 – Retail Banking and Services
Including 100% of Private Banking in France (excluding PEL/CEL effects), Italy, Belgium, Luxembourg, Poland, Turkey and the United States for the Revenues to Pre-Tax Income lines items
3Q21 3Q20 3Q21 / 2Q21 3Q21 / 9M21 9M20 9M21 /
€m 0 0 3Q20 0 2Q21 0 0 9M20
Revenues 7,795 7,677 +1.5% 7,881 -1.1% 23,519 23,114 +1.8%Operating Expenses and Dep. -4,986 -4,855 +2.7% -4,909 +1.6% -15,394 -15,295 +0.6%
Gross Operating Income 2,809 2,822 -0.4% 2,972 -5.5% 8,125 7,819 +3.9%
Cost of Risk -641 -938 -31.6% -693 -7.4% -2,003 -3,083 -35.0%
Operating Income 2,168 1,883 +15.1% 2,280 -4.9% 6,123 4,736 +29.3%
Share of Earnings of Equity-Method Entities 110 111 -1.2% 111 -1.2% 317 302 +5.0%
Other Non Operating Items 100 -5 n.s. -8 n.s. 152 6 n.s.
Pre-Tax Income 2,377 1,990 +19.5% 2,382 -0.2% 6,592 5,043 +30.7%
Cost/Income 64.0% 63.2% +0.8 pt 62.3% +1.7 pt 65.5% 66.2% -0.7 pt
Allocated Equity (€bn) 54.6 55.6 -1.7%
Third quarter 2021 results | 47
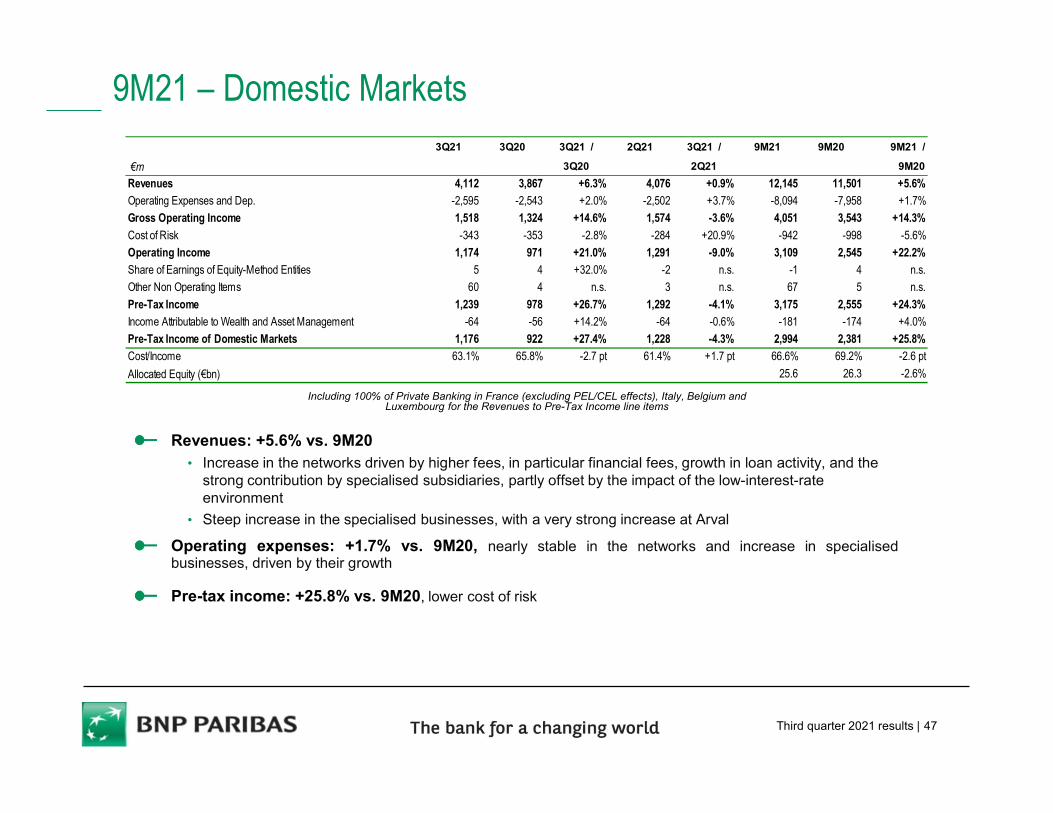
9M21 – Domestic Markets
Including 100% of Private Banking in France (excluding PEL/CEL effects), Italy, Belgium and Luxembourg for the Revenues to Pre-Tax Income line items
Revenues: +5.6% vs. 9M20• Increase in the networks driven by higher fees, in particular financial fees, growth in loan activity, and the
strong contribution by specialised subsidiaries, partly offset by the impact of the low-interest-rate environment
• Steep increase in the specialised businesses, with a very strong increase at Arval
Operating expenses: +1.7% vs. 9M20, nearly stable in the networks and increase in specialisedbusinesses, driven by their growth
Pre-tax income: +25.8% vs. 9M20, lower cost of risk
3Q21 3Q20 3Q21 / 2Q21 3Q21 / 9M21 9M20 9M21 /
€m 0 0 3Q20 0 2Q21 0 0 9M20
Revenues 4,112 3,867 +6.3% 4,076 +0.9% 12,145 11,501 +5.6%
Operating Expenses and Dep. -2,595 -2,543 +2.0% -2,502 +3.7% -8,094 -7,958 +1.7%
Gross Operating Income 1,518 1,324 +14.6% 1,574 -3.6% 4,051 3,543 +14.3%
Cost of Risk -343 -353 -2.8% -284 +20.9% -942 -998 -5.6%
Operating Income 1,174 971 +21.0% 1,291 -9.0% 3,109 2,545 +22.2%
Share of Earnings of Equity-Method Entities 5 4 +32.0% -2 n.s. -1 4 n.s.
Other Non Operating Items 60 4 n.s. 3 n.s. 67 5 n.s.
Pre-Tax Income 1,239 978 +26.7% 1,292 -4.1% 3,175 2,555 +24.3%
Income Attributable to Wealth and Asset Management -64 -56 +14.2% -64 -0.6% -181 -174 +4.0%
Pre-Tax Income of Domestic Markets 1,176 922 +27.4% 1,228 -4.3% 2,994 2,381 +25.8%
Cost/Income 63.1% 65.8% -2.7 pt 61.4% +1.7 pt 66.6% 69.2% -2.6 pt
Allocated Equity (€bn) 25.6 26.3 -2.6%
Third quarter 2021 results | 48
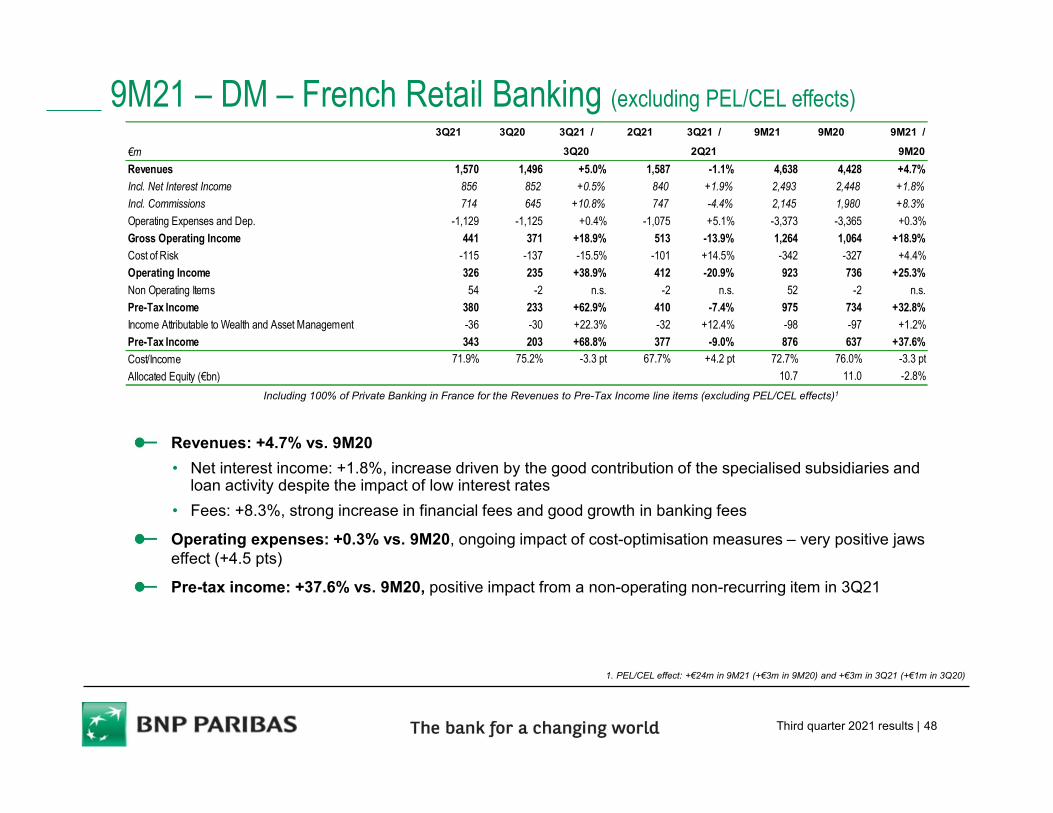
Including 100% of Private Banking in France for the Revenues to Pre-Tax Income line items (excluding PEL/CEL effects)1
9M21 – DM – French Retail Banking (excluding PEL/CEL effects)
1. PEL/CEL effect: +€24m in 9M21 (+€3m in 9M20) and +€3m in 3Q21 (+€1m in 3Q20)
Revenues: +4.7% vs. 9M20
• Net interest income: +1.8%, increase driven by the good contribution of the specialised subsidiaries and loan activity despite the impact of low interest rates
• Fees: +8.3%, strong increase in financial fees and good growth in banking fees
Operating expenses: +0.3% vs. 9M20, ongoing impact of cost-optimisation measures – very positive jaws effect (+4.5 pts)
Pre-tax income: +37.6% vs. 9M20, positive impact from a non-operating non-recurring item in 3Q21
3Q21 3Q20 3Q21 / 2Q21 3Q21 / 9M21 9M20 9M21 /
€m 0 0 3Q20 0 2Q21 0 0 9M20
Revenues 1,570 1,496 +5.0% 1,587 -1.1% 4,638 4,428 +4.7%
Incl. Net Interest Income 856 852 +0.5% 840 +1.9% 2,493 2,448 +1.8%
Incl. Commissions 714 645 +10.8% 747 -4.4% 2,145 1,980 +8.3%
Operating Expenses and Dep. -1,129 -1,125 +0.4% -1,075 +5.1% -3,373 -3,365 +0.3%
Gross Operating Income 441 371 +18.9% 513 -13.9% 1,264 1,064 +18.9%
Cost of Risk -115 -137 -15.5% -101 +14.5% -342 -327 +4.4%
Operating Income 326 235 +38.9% 412 -20.9% 923 736 +25.3%
Non Operating Items 54 -2 n.s. -2 n.s. 52 -2 n.s.
Pre-Tax Income 380 233 +62.9% 410 -7.4% 975 734 +32.8%
Income Attributable to Wealth and Asset Management -36 -30 +22.3% -32 +12.4% -98 -97 +1.2%
Pre-Tax Income 343 203 +68.8% 377 -9.0% 876 637 +37.6%
Cost/Income 71.9% 75.2% -3.3 pt 67.7% +4.2 pt 72.7% 76.0% -3.3 pt
Allocated Equity (€bn) 10.7 11.0 -2.8%
Third quarter 2021 results | 49
DM – French Retail Banking Volumes
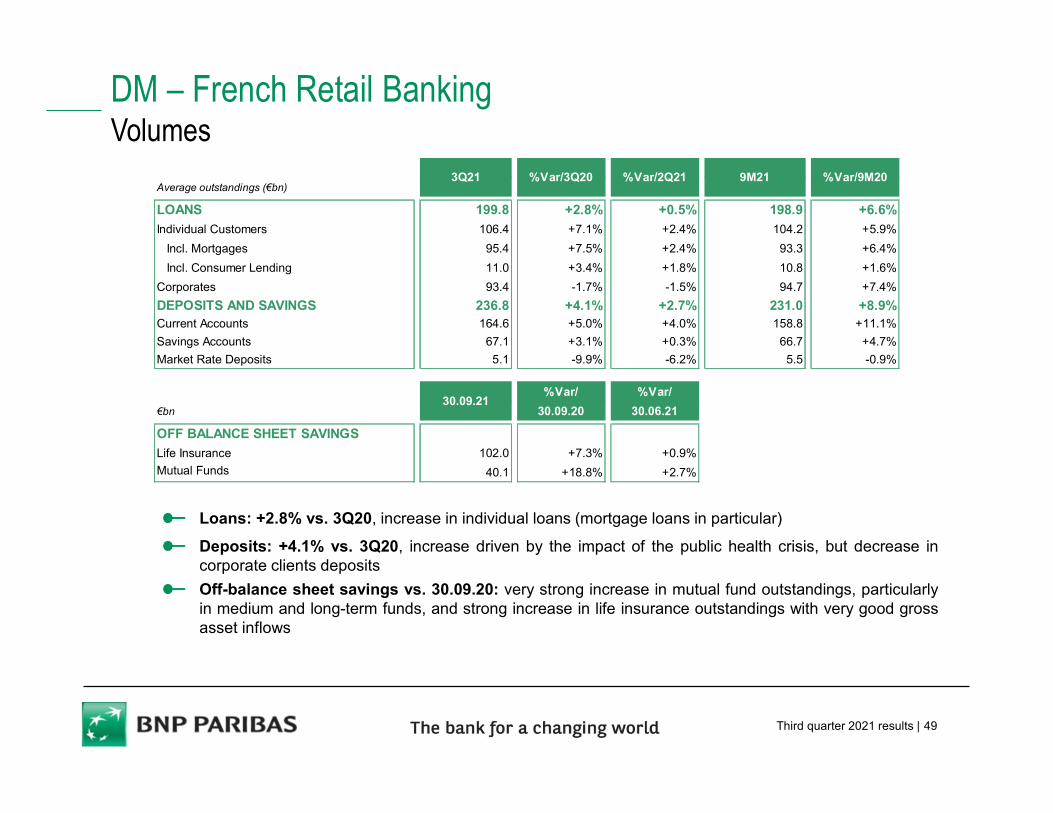
Loans: +2.8% vs. 3Q20, increase in individual loans (mortgage loans in particular)
Deposits: +4.1% vs. 3Q20, increase driven by the impact of the public health crisis, but decrease incorporate clients deposits
Off-balance sheet savings vs. 30.09.20: very strong increase in mutual fund outstandings, particularlyin medium and long-term funds, and strong increase in life insurance outstandings with very good grossasset inflows
Average outstandings (€bn)
LOANS 199.8 +2.8% +0.5% 198.9 +6.6%
Individual Customers 106.4 +7.1% +2.4% 104.2 +5.9%
Incl. Mortgages 95.4 +7.5% +2.4% 93.3 +6.4%
Incl. Consumer Lending 11.0 +3.4% +1.8% 10.8 +1.6%
Corporates 93.4 -1.7% -1.5% 94.7 +7.4%
DEPOSITS AND SAVINGS 236.8 +4.1% +2.7% 231.0 +8.9%Current Accounts 164.6 +5.0% +4.0% 158.8 +11.1%
Savings Accounts 67.1 +3.1% +0.3% 66.7 +4.7%
Market Rate Deposits 5.1 -9.9% -6.2% 5.5 -0.9%
%Var/ %Var/
€bn 30.09.20 30.06.21
OFF BALANCE SHEET SAVINGS n.s. n.s.Life Insurance 102.0 +7.3% +0.9%
Mutual Funds 40.1 +18.8% +2.7%
%Var/3Q20 %Var/2Q21 %Var/9M20
30.09.21
3Q21 9M21
Third quarter 2021 results | 50
9M21 – DM – BNL banca commerciale
Including 100% of Private Banking in Italy for the Revenues to Pre-Tax Income line items
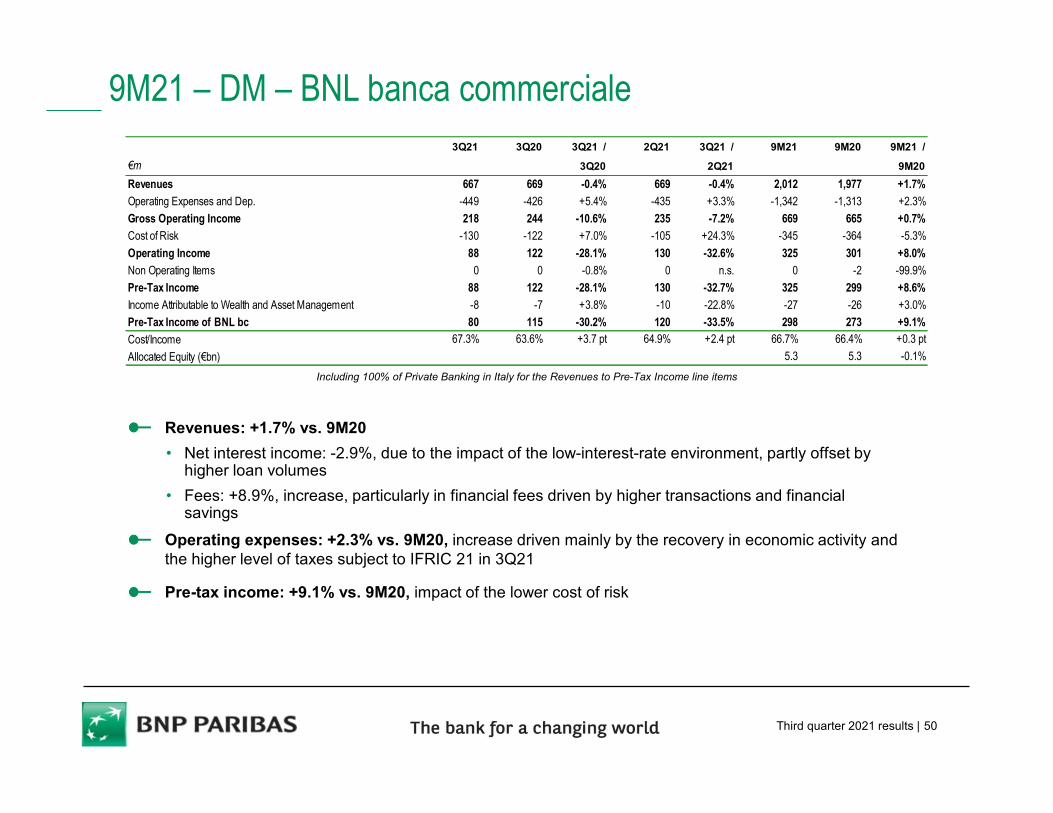
Revenues: +1.7% vs. 9M20
• Net interest income: -2.9%, due to the impact of the low-interest-rate environment, partly offset by higher loan volumes
• Fees: +8.9%, increase, particularly in financial fees driven by higher transactions and financial savings
Operating expenses: +2.3% vs. 9M20, increase driven mainly by the recovery in economic activity and the higher level of taxes subject to IFRIC 21 in 3Q21
Pre-tax income: +9.1% vs. 9M20, impact of the lower cost of risk
3Q21 3Q20 3Q21 / 2Q21 3Q21 / 9M21 9M20 9M21 /
€m 3Q20 2Q21 9M20
Revenues 667 669 -0.4% 669 -0.4% 2,012 1,977 +1.7%
Operating Expenses and Dep. -449 -426 +5.4% -435 +3.3% -1,342 -1,313 +2.3%
Gross Operating Income 218 244 -10.6% 235 -7.2% 669 665 +0.7%
Cost of Risk -130 -122 +7.0% -105 +24.3% -345 -364 -5.3%
Operating Income 88 122 -28.1% 130 -32.6% 325 301 +8.0%
Non Operating Items 0 0 -0.8% 0 n.s. 0 -2 -99.9%
Pre-Tax Income 88 122 -28.1% 130 -32.7% 325 299 +8.6%
Income Attributable to Wealth and Asset Management -8 -7 +3.8% -10 -22.8% -27 -26 +3.0%
Pre-Tax Income of BNL bc 80 115 -30.2% 120 -33.5% 298 273 +9.1%
Cost/Income 67.3% 63.6% +3.7 pt 64.9% +2.4 pt 66.7% 66.4% +0.3 pt
Allocated Equity (€bn) 5.3 5.3 -0.1%
Third quarter 2021 results | 51
DM – BNL banca commercialeVolumes
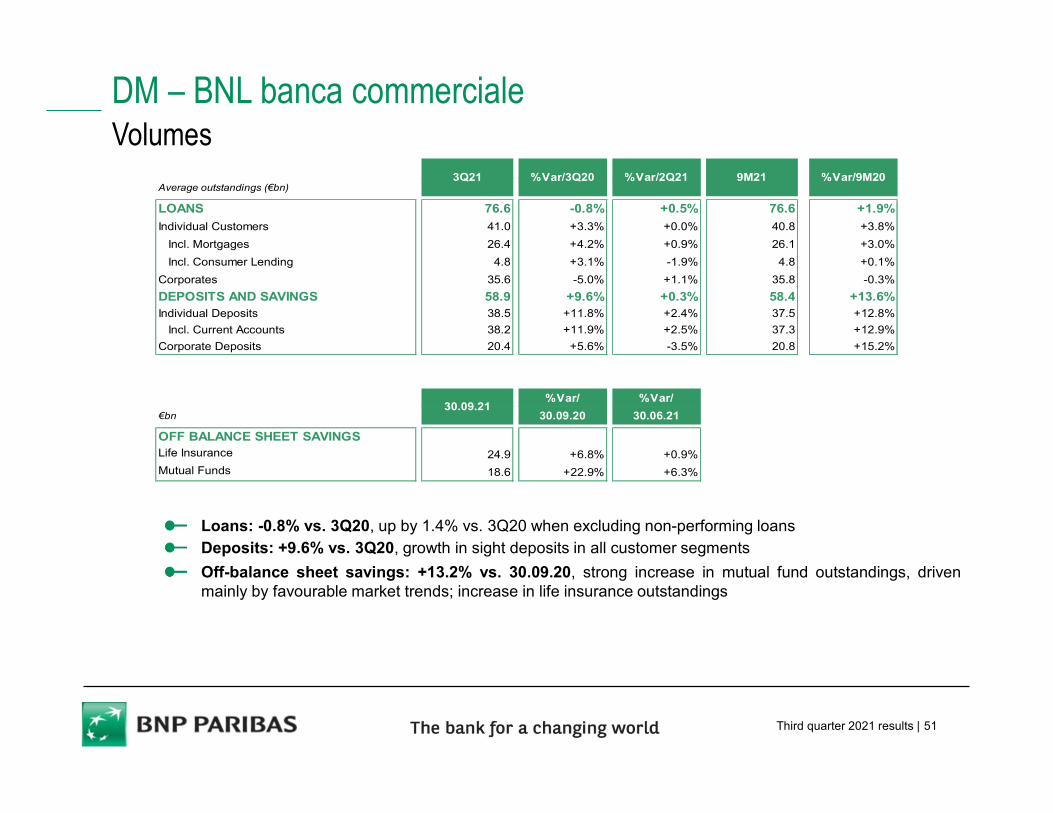
Loans: -0.8% vs. 3Q20, up by 1.4% vs. 3Q20 when excluding non-performing loansDeposits: +9.6% vs. 3Q20, growth in sight deposits in all customer segments
Off-balance sheet savings: +13.2% vs. 30.09.20, strong increase in mutual fund outstandings, drivenmainly by favourable market trends; increase in life insurance outstandings
Average outstandings (€bn)
LOANS 76.6 -0.8% +0.5% 76.6 +1.9%
Individual Customers 41.0 +3.3% +0.0% 40.8 +3.8%
Incl. Mortgages 26.4 +4.2% +0.9% 26.1 +3.0%
Incl. Consumer Lending 4.8 +3.1% -1.9% 4.8 +0.1%
Corporates 35.6 -5.0% +1.1% 35.8 -0.3%
DEPOSITS AND SAVINGS 58.9 +9.6% +0.3% 58.4 +13.6%Individual Deposits 38.5 +11.8% +2.4% 37.5 +12.8%
Incl. Current Accounts 38.2 +11.9% +2.5% 37.3 +12.9%
Corporate Deposits 20.4 +5.6% -3.5% 20.8 +15.2%
%Var/ %Var/
€bn 30.09.20 30.06.21
OFF BALANCE SHEET SAVINGS n.s. n.s.Life Insurance 24.9 +6.8% +0.9%
Mutual Funds 18.6 +22.9% +6.3%
%Var/3Q20 %Var/2Q21 %Var/9M20
30.09.21
3Q21 9M21
Third quarter 2021 results | 52
9M21 – DM – Belgian Retail Banking
Including 100% of Private Banking in Belgium for the Revenues to Pre-Tax Income line items
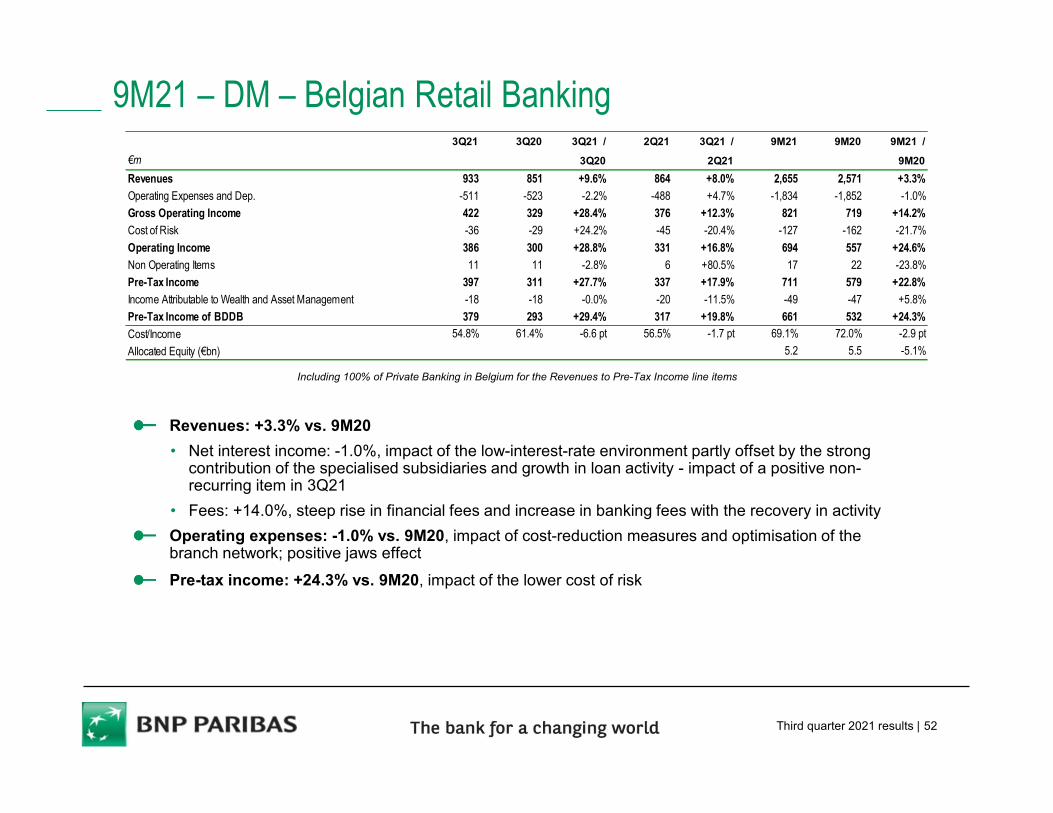
Revenues: +3.3% vs. 9M20
• Net interest income: -1.0%, impact of the low-interest-rate environment partly offset by the strong contribution of the specialised subsidiaries and growth in loan activity - impact of a positive non-recurring item in 3Q21
• Fees: +14.0%, steep rise in financial fees and increase in banking fees with the recovery in activity
Operating expenses: -1.0% vs. 9M20, impact of cost-reduction measures and optimisation of the branch network; positive jaws effect
Pre-tax income: +24.3% vs. 9M20, impact of the lower cost of risk
3Q21 3Q20 3Q21 / 2Q21 3Q21 / 9M21 9M20 9M21 /
€m 3Q20 2Q21 9M20
Revenues 933 851 +9.6% 864 +8.0% 2,655 2,571 +3.3%
Operating Expenses and Dep. -511 -523 -2.2% -488 +4.7% -1,834 -1,852 -1.0%
Gross Operating Income 422 329 +28.4% 376 +12.3% 821 719 +14.2%
Cost of Risk -36 -29 +24.2% -45 -20.4% -127 -162 -21.7%
Operating Income 386 300 +28.8% 331 +16.8% 694 557 +24.6%
Non Operating Items 11 11 -2.8% 6 +80.5% 17 22 -23.8%
Pre-Tax Income 397 311 +27.7% 337 +17.9% 711 579 +22.8%
Income Attributable to Wealth and Asset Management -18 -18 -0.0% -20 -11.5% -49 -47 +5.8%
Pre-Tax Income of BDDB 379 293 +29.4% 317 +19.8% 661 532 +24.3%
Cost/Income 54.8% 61.4% -6.6 pt 56.5% -1.7 pt 69.1% 72.0% -2.9 pt
Allocated Equity (€bn) 5.2 5.5 -5.1%
Third quarter 2021 results | 53
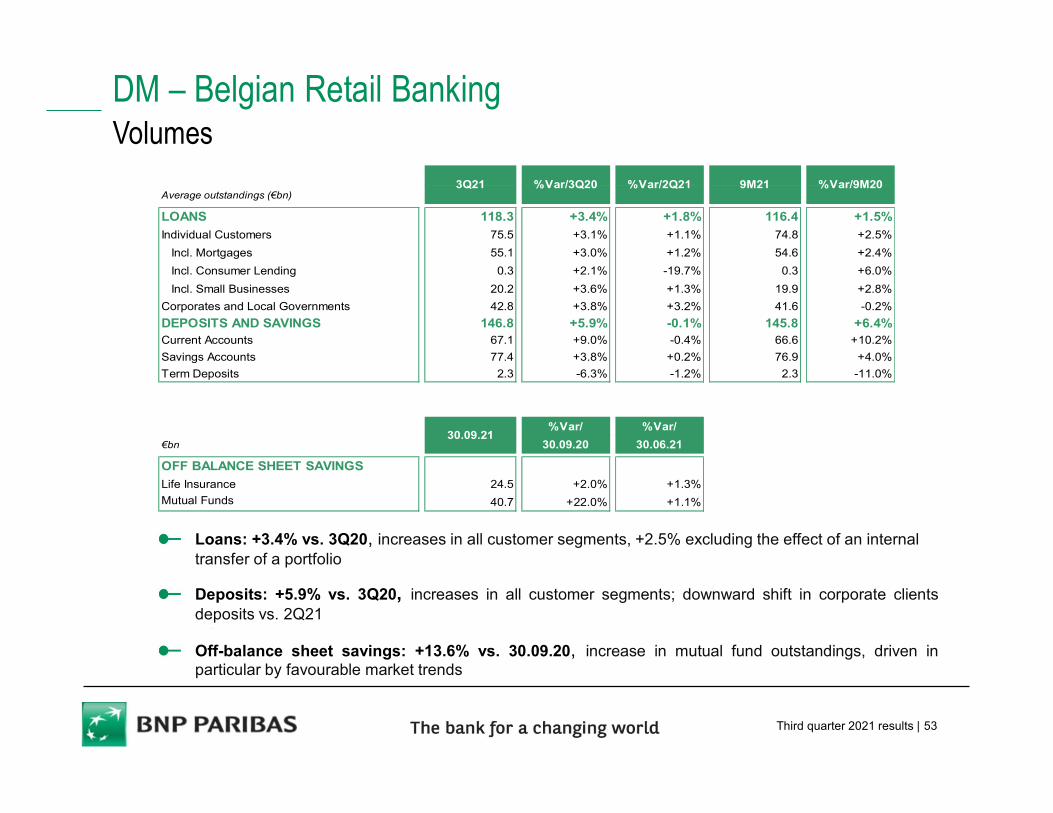
DM – Belgian Retail BankingVolumes
Loans: +3.4% vs. 3Q20, increases in all customer segments, +2.5% excluding the effect of an internal transfer of a portfolio
Deposits: +5.9% vs. 3Q20, increases in all customer segments; downward shift in corporate clientsdeposits vs. 2Q21
•
Off-balance sheet savings: +13.6% vs. 30.09.20, increase in mutual fund outstandings, driven inparticular by favourable market trends
Average outstandings (€bn)
LOANS 118.3 +3.4% +1.8% 116.4 +1.5%
Individual Customers 75.5 +3.1% +1.1% 74.8 +2.5%
Incl. Mortgages 55.1 +3.0% +1.2% 54.6 +2.4%
Incl. Consumer Lending 0.3 +2.1% -19.7% 0.3 +6.0%
Incl. Small Businesses 20.2 +3.6% +1.3% 19.9 +2.8%
Corporates and Local Governments 42.8 +3.8% +3.2% 41.6 -0.2%
DEPOSITS AND SAVINGS 146.8 +5.9% -0.1% 145.8 +6.4%Current Accounts 67.1 +9.0% -0.4% 66.6 +10.2%
Savings Accounts 77.4 +3.8% +0.2% 76.9 +4.0%
Term Deposits 2.3 -6.3% -1.2% 2.3 -11.0%
%Var/ %Var/
€bn 30.09.20 30.06.21
OFF BALANCE SHEET SAVINGS n.s. n.s.Life Insurance 24.5 +2.0% +1.3%
Mutual Funds 40.7 +22.0% +1.1%
%Var/3Q20 %Var/2Q21 %Var/9M20
30.09.21
3Q21 9M21
Third quarter 2021 results | 54
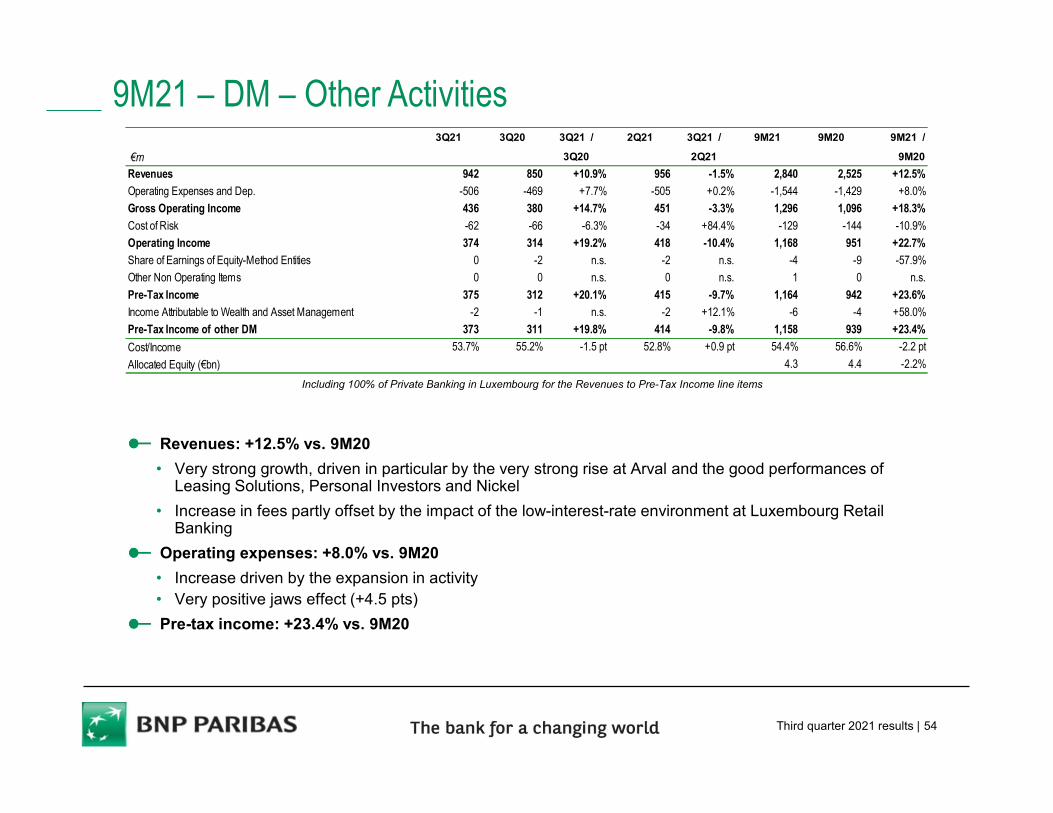
9M21 – DM – Other Activities
Including 100% of Private Banking in Luxembourg for the Revenues to Pre-Tax Income line items
Revenues: +12.5% vs. 9M20
• Very strong growth, driven in particular by the very strong rise at Arval and the good performances of Leasing Solutions, Personal Investors and Nickel
• Increase in fees partly offset by the impact of the low-interest-rate environment at Luxembourg Retail Banking
Operating expenses: +8.0% vs. 9M20
• Increase driven by the expansion in activity • Very positive jaws effect (+4.5 pts)
Pre-tax income: +23.4% vs. 9M20
3Q21 3Q20 3Q21 / 2Q21 3Q21 / 9M21 9M20 9M21 /
€m 0 0 3Q20 0 2Q21 0 0 9M20
Revenues 942 850 +10.9% 956 -1.5% 2,840 2,525 +12.5%
Operating Expenses and Dep. -506 -469 +7.7% -505 +0.2% -1,544 -1,429 +8.0%
Gross Operating Income 436 380 +14.7% 451 -3.3% 1,296 1,096 +18.3%
Cost of Risk -62 -66 -6.3% -34 +84.4% -129 -144 -10.9%
Operating Income 374 314 +19.2% 418 -10.4% 1,168 951 +22.7%
Share of Earnings of Equity-Method Entities 0 -2 n.s. -2 n.s. -4 -9 -57.9%
Other Non Operating Items 0 0 n.s. 0 n.s. 1 0 n.s.
Pre-Tax Income 375 312 +20.1% 415 -9.7% 1,164 942 +23.6%
Income Attributable to Wealth and Asset Management -2 -1 n.s. -2 +12.1% -6 -4 +58.0%
Pre-Tax Income of other DM 373 311 +19.8% 414 -9.8% 1,158 939 +23.4%
Cost/Income 53.7% 55.2% -1.5 pt 52.8% +0.9 pt 54.4% 56.6% -2.2 pt
Allocated Equity (€bn) 4.3 4.4 -2.2%
Third quarter 2021 results | 55
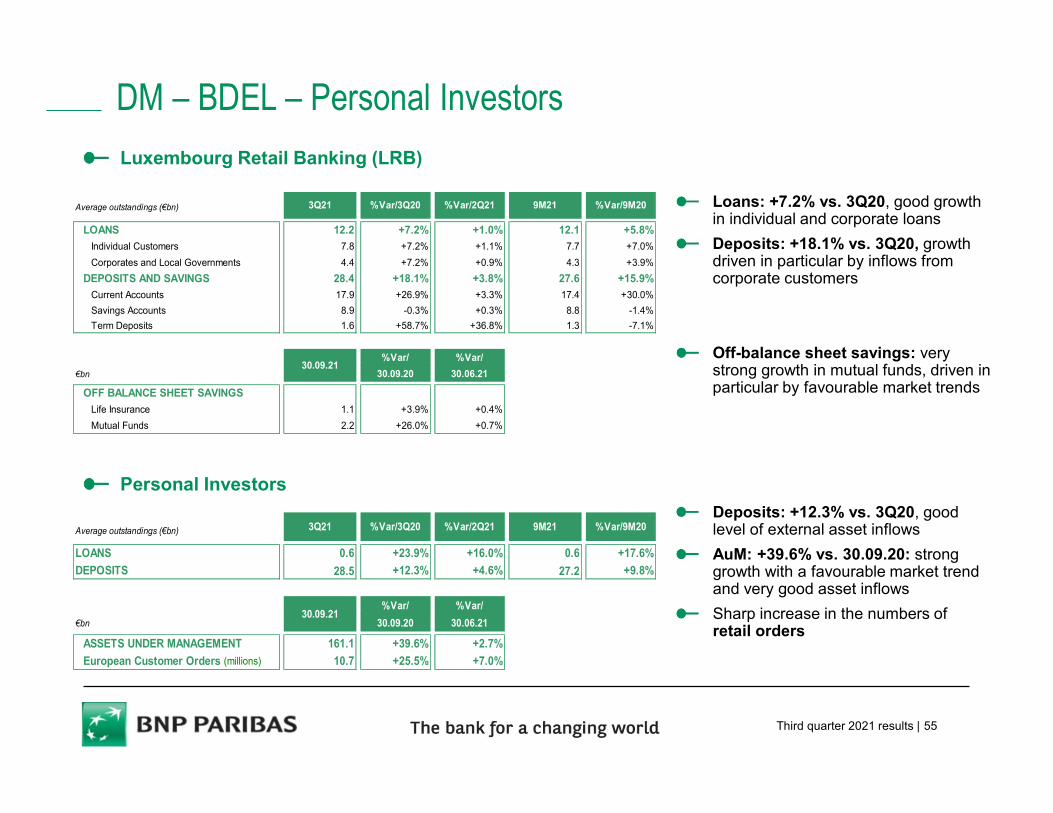
DM – BDEL – Personal Investors
Loans: +7.2% vs. 3Q20, good growth in individual and corporate loans
Deposits: +18.1% vs. 3Q20, growth driven in particular by inflows from corporate customers
Off-balance sheet savings: very strong growth in mutual funds, driven in particular by favourable market trends
Deposits: +12.3% vs. 3Q20, good level of external asset inflows
AuM: +39.6% vs. 30.09.20: strong growth with a favourable market trend and very good asset inflows
Sharp increase in the numbers of retail orders
Personal Investors
Luxembourg Retail Banking (LRB)
Average outstandings (€bn) 3Q21 %Var/3Q20 %Var/2Q21 9M21 %Var/9M20
LOANS 12.2 +7.2% +1.0% 12.1 +5.8%
Individual Customers 7.8 +7.2% +1.1% 7.7 +7.0%
Corporates and Local Governments 4.4 +7.2% +0.9% 4.3 +3.9%
DEPOSITS AND SAVINGS 28.4 +18.1% +3.8% 27.6 +15.9%
Current Accounts 17.9 +26.9% +3.3% 17.4 +30.0%
Savings Accounts 8.9 -0.3% +0.3% 8.8 -1.4%
Term Deposits 1.6 +58.7% +36.8% 1.3 -7.1%
%Var/ %Var/
€bn 30.09.20 30.06.21
OFF BALANCE SHEET SAVINGS n.s. n.s.Life Insurance 1.1 +3.9% +0.4%
Mutual Funds 2.2 +26.0% +0.7%
30.09.21
Average outstandings (€bn) 3Q21 %Var/3Q20 %Var/2Q21 9M21 %Var/9M20
LOANS 0.6 +23.9% +16.0% 0.6 +17.6%
DEPOSITS 28.5 +12.3% +4.6% 27.2 +9.8%
%Var/ %Var/
€bn 30.09.20 30.06.21
ASSETS UNDER MANAGEMENT 161.1 +39.6% +2.7%
European Customer Orders (millions) 10.7 +25.5% +7.0%
30.09.21
Third quarter 2021 results | 56
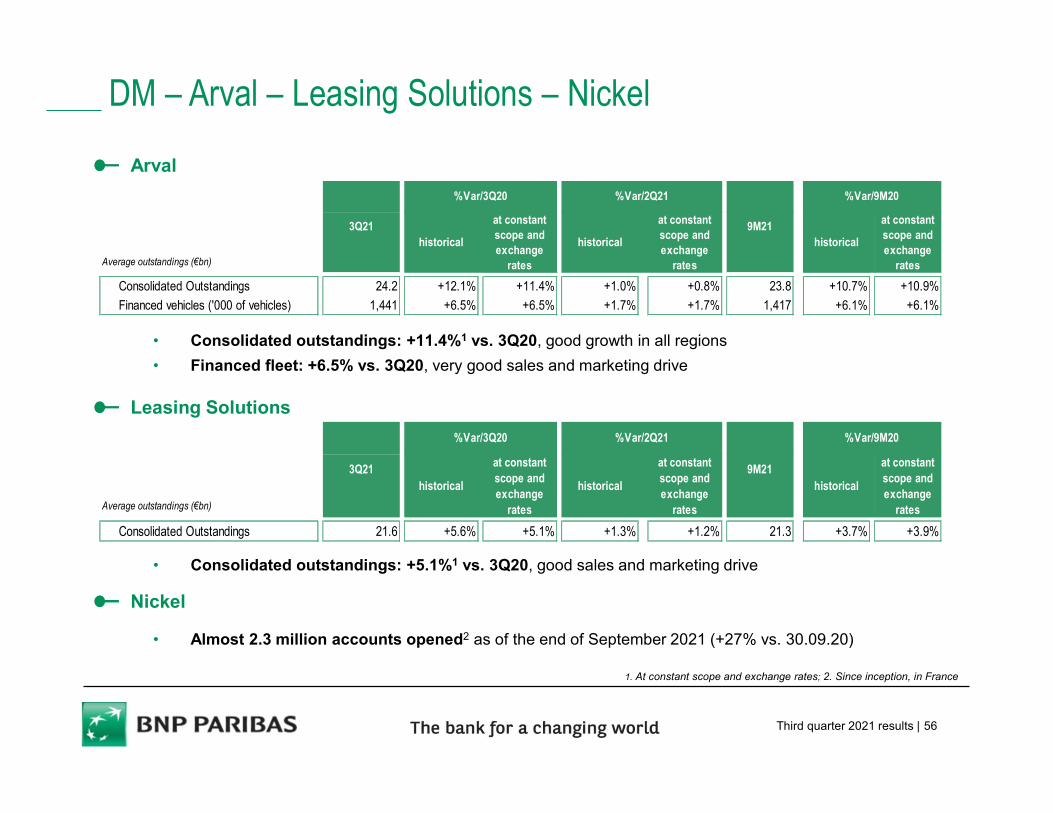
DM – Arval – Leasing Solutions – Nickel
• Consolidated outstandings: +11.4%1 vs. 3Q20, good growth in all regions
• Financed fleet: +6.5% vs. 3Q20, very good sales and marketing drive
• Consolidated outstandings: +5.1%1 vs. 3Q20, good sales and marketing drive
• Almost 2.3 million accounts opened2 as of the end of September 2021 (+27% vs. 30.09.20)
1. At constant scope and exchange rates; 2. Since inception, in France
Arval
Leasing Solutions
Nickel
Average outstandings (€bn)
historical
at constant scope and exchange
rates
historical
at constant scope and exchange
rates
historical
at constant scope and exchange
rates
Consolidated Outstandings 24.2 +12.1% +11.4% +1.0% +0.8% 23.8 +10.7% +10.9%
Financed vehicles ('000 of vehicles) 1,441 +6.5% +6.5% +1.7% +1.7% 1,417 +6.1% +6.1%
3Q21
%Var/3Q20 %Var/2Q21
9M21
%Var/9M20
Average outstandings (€bn)
historical
at constant scope and exchange
rates
historical
at constant scope and exchange
rates
historical
at constant scope and exchange
rates
Consolidated Outstandings 21.6 +5.6% +5.1% +1.3% +1.2% 21.3 +3.7% +3.9%
%Var/9M20
3Q21
%Var/3Q20 %Var/2Q21
9M21
Third quarter 2021 results | 57
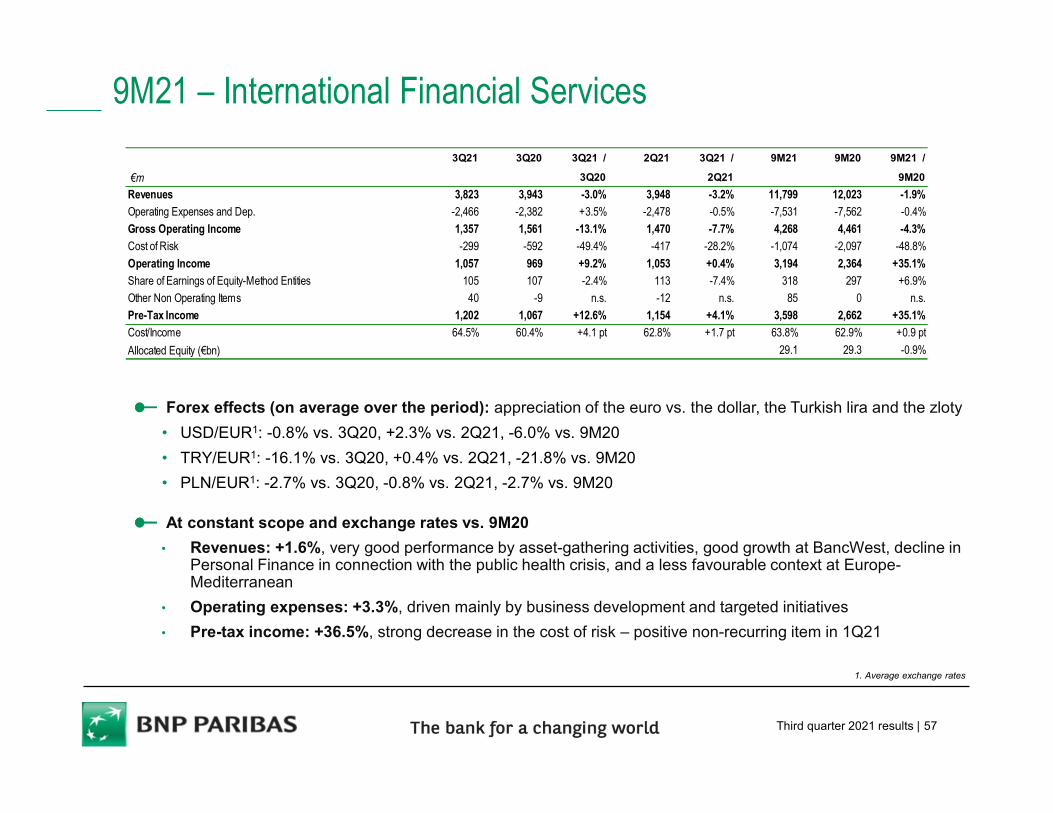
9M21 – International Financial Services
Forex effects (on average over the period): appreciation of the euro vs. the dollar, the Turkish lira and the zloty
• USD/EUR1: -0.8% vs. 3Q20, +2.3% vs. 2Q21, -6.0% vs. 9M20
• TRY/EUR1: -16.1% vs. 3Q20, +0.4% vs. 2Q21, -21.8% vs. 9M20
• PLN/EUR1: -2.7% vs. 3Q20, -0.8% vs. 2Q21, -2.7% vs. 9M20
At constant scope and exchange rates vs. 9M20
• Revenues: +1.6%, very good performance by asset-gathering activities, good growth at BancWest, decline in Personal Finance in connection with the public health crisis, and a less favourable context at Europe-Mediterranean
• Operating expenses: +3.3%, driven mainly by business development and targeted initiatives
• Pre-tax income: +36.5%, strong decrease in the cost of risk – positive non-recurring item in 1Q21
1. Average exchange rates
3Q21 3Q20 3Q21 / 2Q21 3Q21 / 9M21 9M20 9M21 /
€m 3Q20 2Q21 9M20
Revenues 3,823 3,943 -3.0% 3,948 -3.2% 11,799 12,023 -1.9%
Operating Expenses and Dep. -2,466 -2,382 +3.5% -2,478 -0.5% -7,531 -7,562 -0.4%
Gross Operating Income 1,357 1,561 -13.1% 1,470 -7.7% 4,268 4,461 -4.3%
Cost of Risk -299 -592 -49.4% -417 -28.2% -1,074 -2,097 -48.8%
Operating Income 1,057 969 +9.2% 1,053 +0.4% 3,194 2,364 +35.1%
Share of Earnings of Equity-Method Entities 105 107 -2.4% 113 -7.4% 318 297 +6.9%
Other Non Operating Items 40 -9 n.s. -12 n.s. 85 0 n.s.
Pre-Tax Income 1,202 1,067 +12.6% 1,154 +4.1% 3,598 2,662 +35.1%
Cost/Income 64.5% 60.4% +4.1 pt 62.8% +1.7 pt 63.8% 62.9% +0.9 pt
Allocated Equity (€bn) 0.0 n.s. 29.1 29.3 -0.9%
Third quarter 2021 results | 58
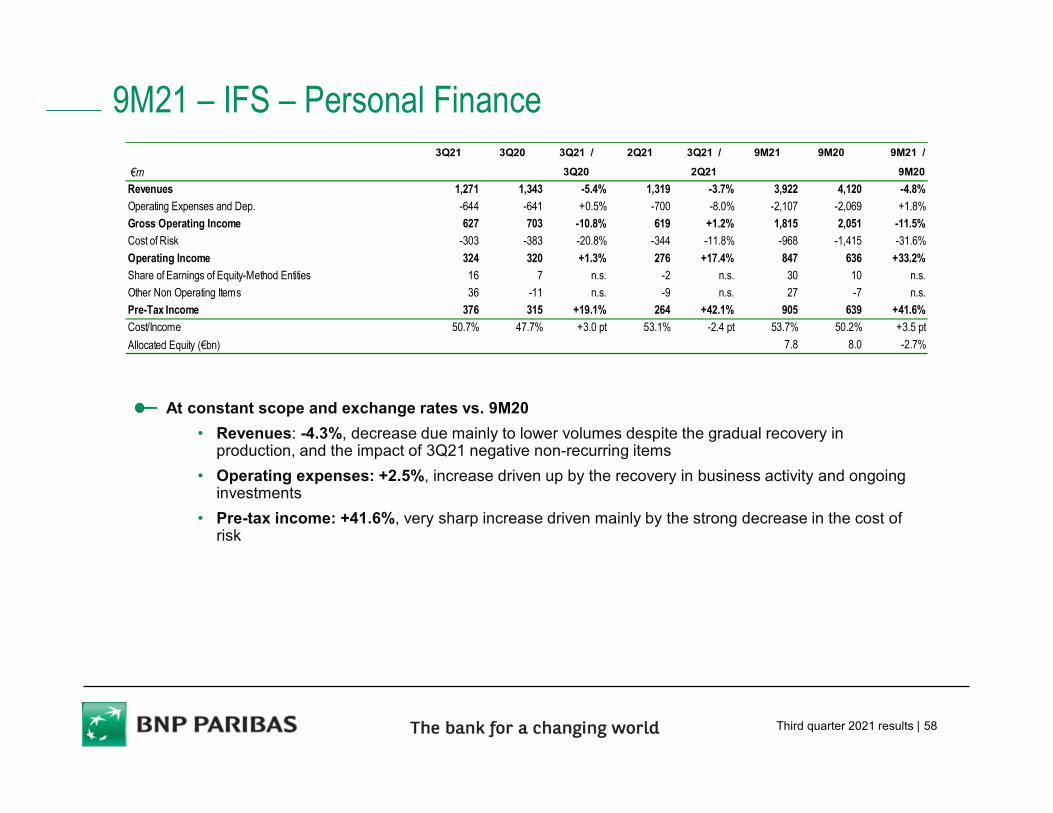
9M21 – IFS – Personal Finance
At constant scope and exchange rates vs. 9M20
• Revenues: -4.3%, decrease due mainly to lower volumes despite the gradual recovery in production, and the impact of 3Q21 negative non-recurring items
• Operating expenses: +2.5%, increase driven up by the recovery in business activity and ongoing investments
• Pre-tax income: +41.6%, very sharp increase driven mainly by the strong decrease in the cost of risk
3Q21 3Q20 3Q21 / 2Q21 3Q21 / 9M21 9M20 9M21 /
€m 0 0 3Q20 0 2Q21 0 0 9M20
Revenues 1,271 1,343 -5.4% 1,319 -3.7% 3,922 4,120 -4.8%
Operating Expenses and Dep. -644 -641 +0.5% -700 -8.0% -2,107 -2,069 +1.8%
Gross Operating Income 627 703 -10.8% 619 +1.2% 1,815 2,051 -11.5%
Cost of Risk -303 -383 -20.8% -344 -11.8% -968 -1,415 -31.6%
Operating Income 324 320 +1.3% 276 +17.4% 847 636 +33.2%
Share of Earnings of Equity-Method Entities 16 7 n.s. -2 n.s. 30 10 n.s.
Other Non Operating Items 36 -11 n.s. -9 n.s. 27 -7 n.s.
Pre-Tax Income 376 315 +19.1% 264 +42.1% 905 639 +41.6%
Cost/Income 50.7% 47.7% +3.0 pt 53.1% -2.4 pt 53.7% 50.2% +3.5 pt
Allocated Equity (€bn) 7.8 8.0 -2.7%
Third quarter 2021 results | 59
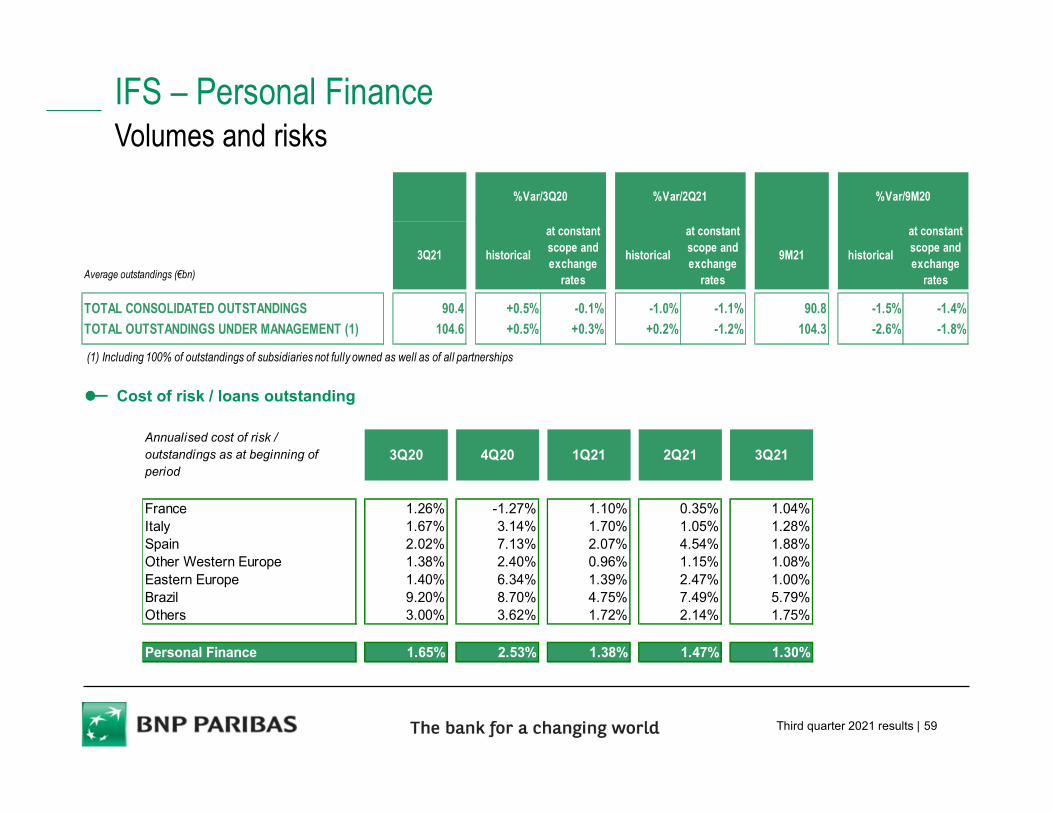
IFS – Personal Finance Volumes and risks
Cost of risk / loans outstanding
Average outstandings (€bn)
3Q21 historical
at constant scope and exchange
rates
historical
at constant scope and exchange
rates
9M21 historical
at constant scope and exchange
ratesn.s. n.s. n.s. n.s. n.s. n.s.
TOTAL CONSOLIDATED OUTSTANDINGS 90.4 +0.5% -0.1% -1.0% -1.1% 90.8 -1.5% -1.4%
TOTAL OUTSTANDINGS UNDER MANAGEMENT (1) 104.6 +0.5% +0.3% +0.2% -1.2% 104.3 -2.6% -1.8%n.s. n.s. n.s. n.s. n.s. n.s.n.s. n.s. n.s. n.s. n.s. n.s.
%Var/3Q20 %Var/2Q21 %Var/9M20
(1) Including 100% of outstandings of subsidiaries not fully owned as well as of all partnerships
Annualised cost of risk / outstandings as at beginning of period
3Q20 4Q20 1Q21 2Q21 3Q21
France 1.26% -1.27% 1.10% 0.35% 1.04%Italy 1.67% 3.14% 1.70% 1.05% 1.28%Spain 2.02% 7.13% 2.07% 4.54% 1.88%Other Western Europe 1.38% 2.40% 0.96% 1.15% 1.08%Eastern Europe 1.40% 6.34% 1.39% 2.47% 1.00%Brazil 9.20% 8.70% 4.75% 7.49% 5.79%Others 3.00% 3.62% 1.72% 2.14% 1.75%
Personal Finance 1.65% 2.53% 1.38% 1.47% 1.30%
Third quarter 2021 results | 60
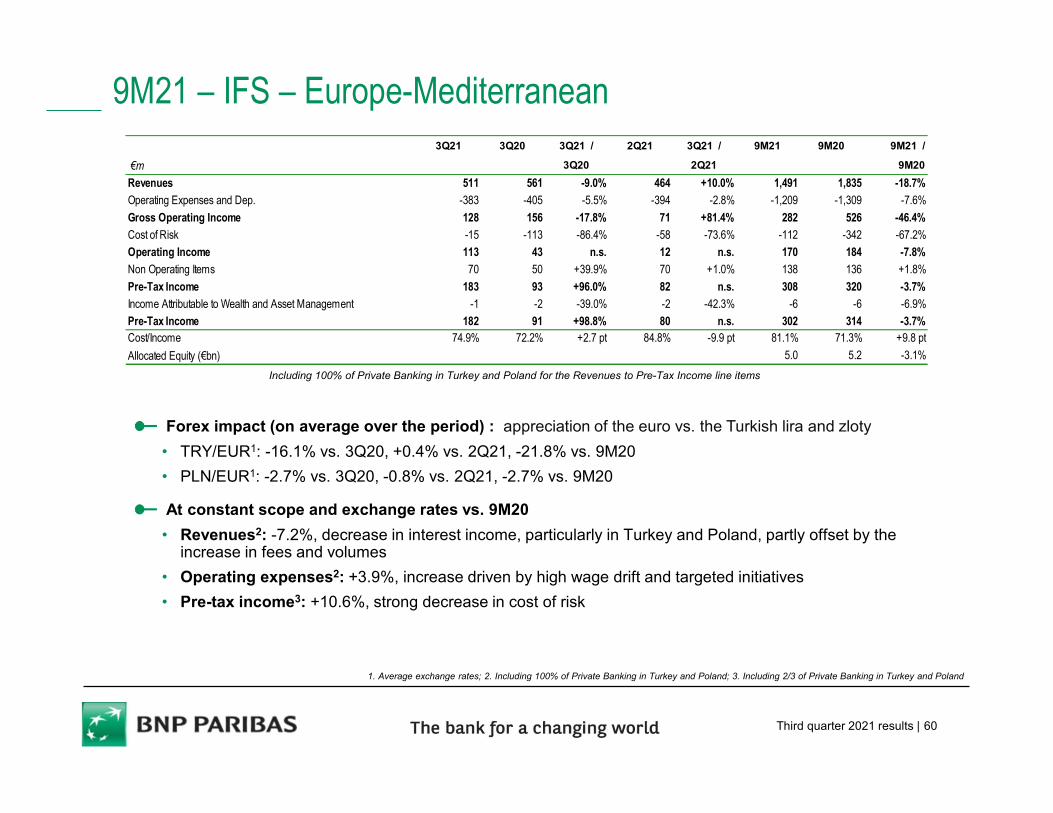
9M21 – IFS – Europe-Mediterranean
Forex impact (on average over the period) : appreciation of the euro vs. the Turkish lira and zloty
• TRY/EUR1: -16.1% vs. 3Q20, +0.4% vs. 2Q21, -21.8% vs. 9M20
• PLN/EUR1: -2.7% vs. 3Q20, -0.8% vs. 2Q21, -2.7% vs. 9M20
At constant scope and exchange rates vs. 9M20
• Revenues2: -7.2%, decrease in interest income, particularly in Turkey and Poland, partly offset by the increase in fees and volumes
• Operating expenses2: +3.9%, increase driven by high wage drift and targeted initiatives
• Pre-tax income3: +10.6%, strong decrease in cost of risk
1. Average exchange rates; 2. Including 100% of Private Banking in Turkey and Poland; 3. Including 2/3 of Private Banking in Turkey and Poland
Including 100% of Private Banking in Turkey and Poland for the Revenues to Pre-Tax Income line items
3Q21 3Q20 3Q21 / 2Q21 3Q21 / 9M21 9M20 9M21 /
€m 0 0 3Q20 0 2Q21 0 0 9M20
Revenues 511 561 -9.0% 464 +10.0% 1,491 1,835 -18.7%
Operating Expenses and Dep. -383 -405 -5.5% -394 -2.8% -1,209 -1,309 -7.6%
Gross Operating Income 128 156 -17.8% 71 +81.4% 282 526 -46.4%
Cost of Risk -15 -113 -86.4% -58 -73.6% -112 -342 -67.2%
Operating Income 113 43 n.s. 12 n.s. 170 184 -7.8%
Non Operating Items 70 50 +39.9% 70 +1.0% 138 136 +1.8%
Pre-Tax Income 183 93 +96.0% 82 n.s. 308 320 -3.7%
Income Attributable to Wealth and Asset Management -1 -2 -39.0% -2 -42.3% -6 -6 -6.9%
Pre-Tax Income 182 91 +98.8% 80 n.s. 302 314 -3.7%Cost/Income 74.9% 72.2% +2.7 pt 84.8% -9.9 pt 81.1% 71.3% +9.8 pt
Allocated Equity (€bn) 5.0 5.2 -3.1%
Third quarter 2021 results | 61
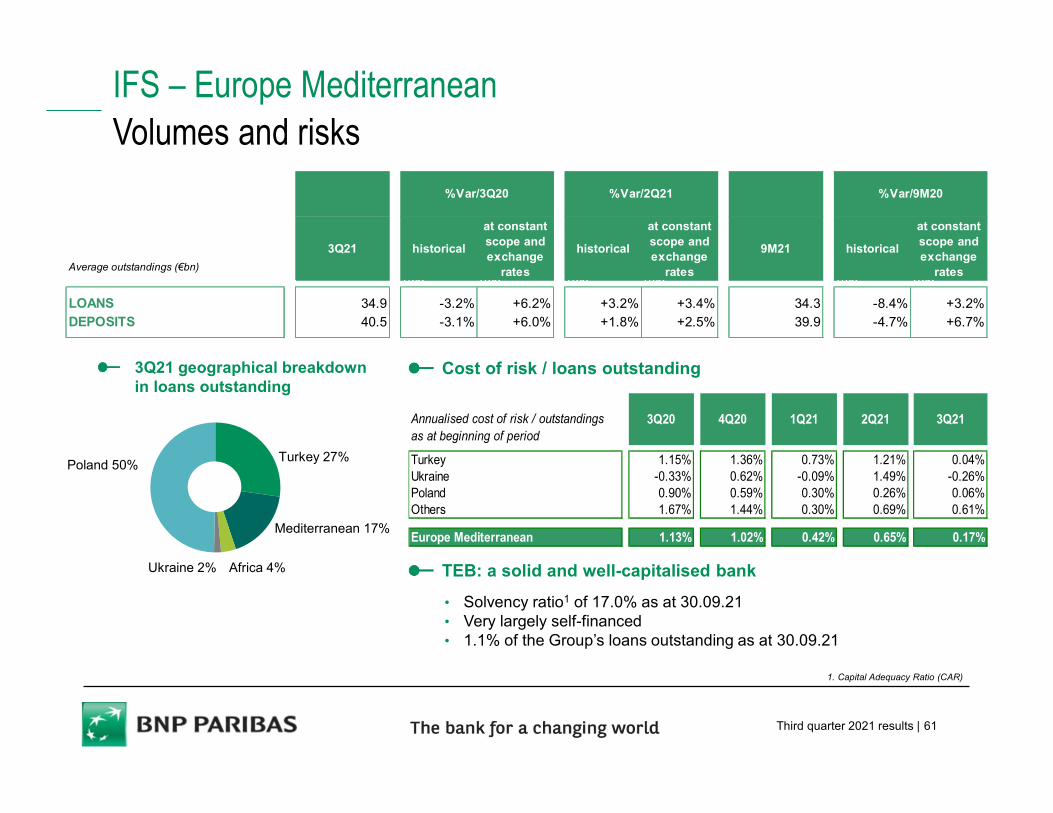
IFS – Europe Mediterranean Volumes and risks
• Solvency ratio1 of 17.0% as at 30.09.21• Very largely self-financed• 1.1% of the Group’s loans outstanding as at 30.09.21
1. Capital Adequacy Ratio (CAR)
Cost of risk / loans outstanding
TEB: a solid and well-capitalised bank
3Q21 geographical breakdown in loans outstanding
Mediterranean 17%
Ukraine 2%
Poland 50%Turkey 27%
Africa 4%
Average outstandings (€bn)
3Q21 historical
at constant scope and exchange
rates
historical
at constant scope and exchange
rates
9M21 historical
at constant scope and exchange
ratesn.s. n.s. n.s. n.s. n.s. n.s.n.s. n.s. n.s. n.s. n.s. n.s.
LOANS 34.9 -3.2% +6.2% +3.2% +3.4% 34.3 -8.4% +3.2%DEPOSITS 40.5 -3.1% +6.0% +1.8% +2.5% 39.9 -4.7% +6.7%
n.s. n.s. n.s. n.s. n.s. n.s.
%Var/3Q20 %Var/2Q21 %Var/9M20
Annualised cost of risk / outstandings as at beginning of period
3Q20 4Q20 1Q21 2Q21 3Q21
Turkey 1.15% 1.36% 0.73% 1.21% 0.04%Ukraine -0.33% 0.62% -0.09% 1.49% -0.26%Poland 0.90% 0.59% 0.30% 0.26% 0.06%Others 1.67% 1.44% 0.30% 0.69% 0.61%
Europe Mediterranean 1.13% 1.02% 0.42% 0.65% 0.17%
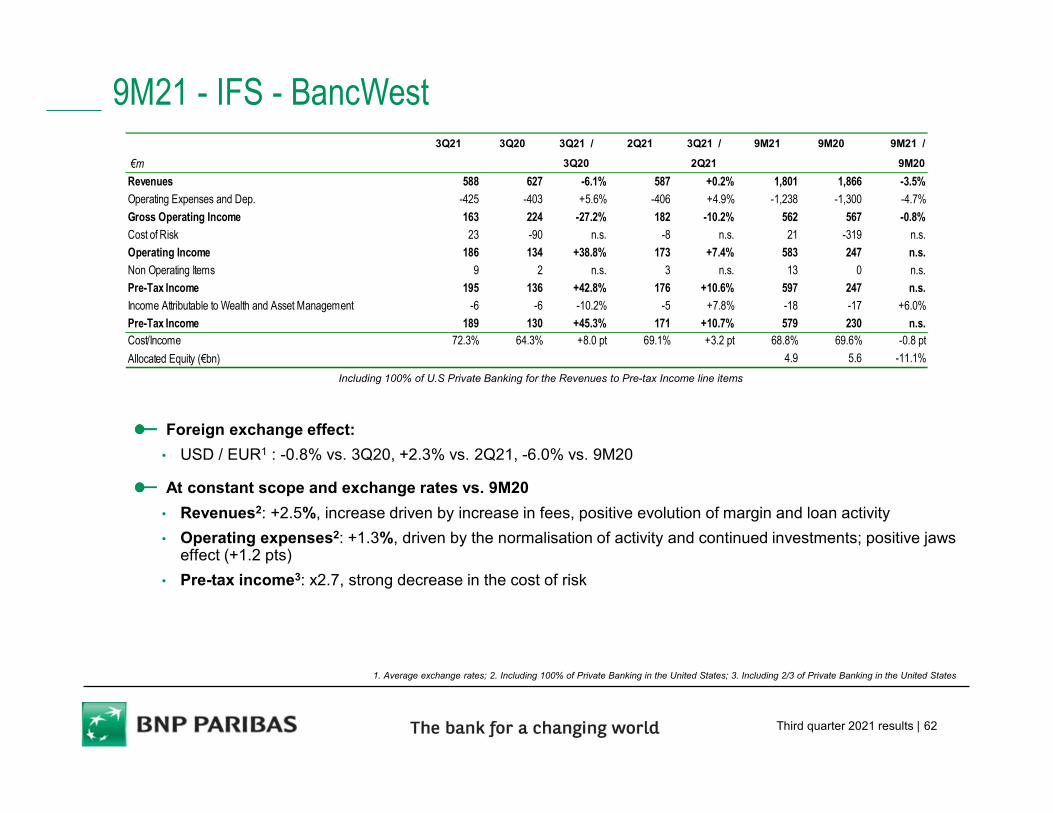
Third quarter 2021 results | 62
9M21 - IFS - BancWest
Foreign exchange effect:
• USD / EUR1 : -0.8% vs. 3Q20, +2.3% vs. 2Q21, -6.0% vs. 9M20
At constant scope and exchange rates vs. 9M20
• Revenues2: +2.5%, increase driven by increase in fees, positive evolution of margin and loan activity
• Operating expenses2: +1.3%, driven by the normalisation of activity and continued investments; positive jaws effect (+1.2 pts)
• Pre-tax income3: x2.7, strong decrease in the cost of risk
1. Average exchange rates; 2. Including 100% of Private Banking in the United States; 3. Including 2/3 of Private Banking in the United States
Including 100% of U.S Private Banking for the Revenues to Pre-tax Income line items
3Q21 3Q20 3Q21 / 2Q21 3Q21 / 9M21 9M20 9M21 /
€m 0 0 3Q20 0 2Q21 0 0 9M20
Revenues 588 627 -6.1% 587 +0.2% 1,801 1,866 -3.5%
Operating Expenses and Dep. -425 -403 +5.6% -406 +4.9% -1,238 -1,300 -4.7%
Gross Operating Income 163 224 -27.2% 182 -10.2% 562 567 -0.8%
Cost of Risk 23 -90 n.s. -8 n.s. 21 -319 n.s.
Operating Income 186 134 +38.8% 173 +7.4% 583 247 n.s.
Non Operating Items 9 2 n.s. 3 n.s. 13 0 n.s.
Pre-Tax Income 195 136 +42.8% 176 +10.6% 597 247 n.s.
Income Attributable to Wealth and Asset Management -6 -6 -10.2% -5 +7.8% -18 -17 +6.0%
Pre-Tax Income 189 130 +45.3% 171 +10.7% 579 230 n.s.Cost/Income 72.3% 64.3% +8.0 pt 69.1% +3.2 pt 68.8% 69.6% -0.8 pt
Allocated Equity (€bn) 4.9 5.6 -11.1%
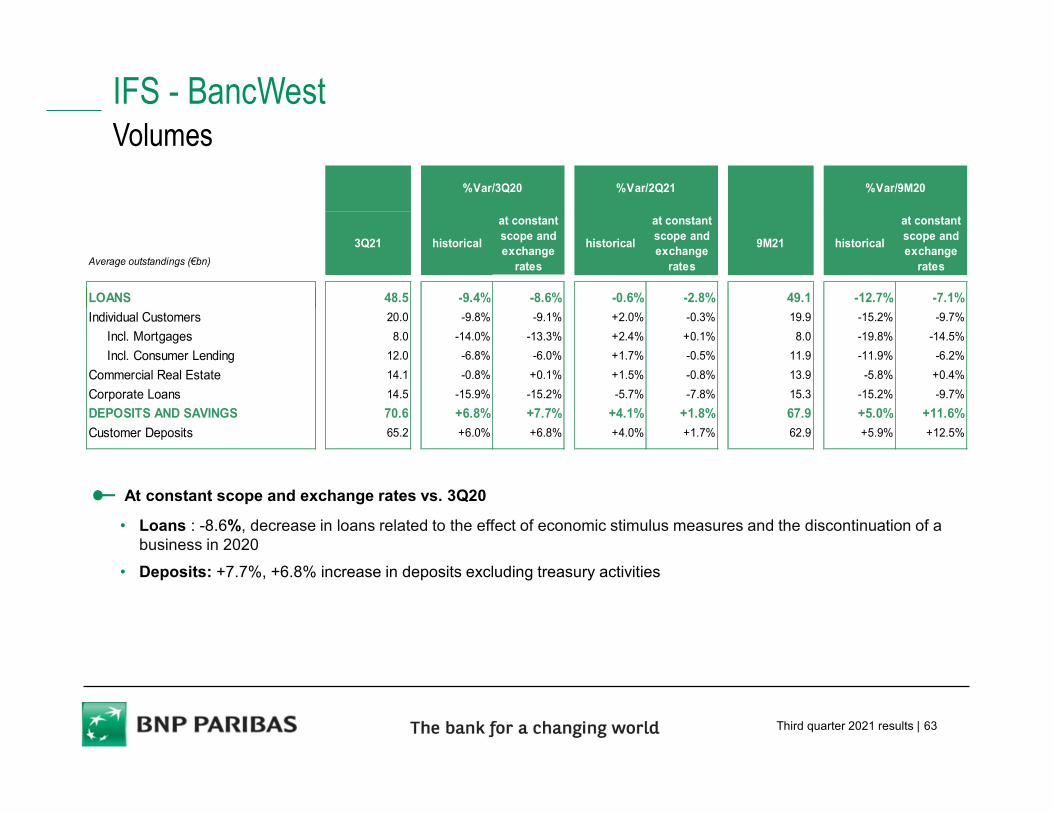
Third quarter 2021 results | 63
IFS - BancWestVolumes
At constant scope and exchange rates vs. 3Q20
• Loans : -8.6%, decrease in loans related to the effect of economic stimulus measures and the discontinuation of a business in 2020
• Deposits: +7.7%, +6.8% increase in deposits excluding treasury activities
Average outstandings (€bn)
3Q21 historical
at constant scope and exchange
rates
historical
at constant scope and exchange
rates
9M21 historical
at constant scope and exchange
ratesn.s. n.s. n.s. n.s. n.s. n.s.n.s. n.s. n.s. n.s. n.s. n.s.
LOANS 48.5 -9.4% -8.6% -0.6% -2.8% 49.1 -12.7% -7.1%
Individual Customers 20.0 -9.8% -9.1% +2.0% -0.3% 19.9 -15.2% -9.7%
Incl. Mortgages 8.0 -14.0% -13.3% +2.4% +0.1% 8.0 -19.8% -14.5%
Incl. Consumer Lending 12.0 -6.8% -6.0% +1.7% -0.5% 11.9 -11.9% -6.2%
Commercial Real Estate 14.1 -0.8% +0.1% +1.5% -0.8% 13.9 -5.8% +0.4%
Corporate Loans 14.5 -15.9% -15.2% -5.7% -7.8% 15.3 -15.2% -9.7%
DEPOSITS AND SAVINGS 70.6 +6.8% +7.7% +4.1% +1.8% 67.9 +5.0% +11.6%
Customer Deposits 65.2 +6.0% +6.8% +4.0% +1.7% 62.9 +5.9% +12.5%n.s. n.s. n.s. n.s. n.s. n.s.
%Var/3Q20 %Var/9M20%Var/2Q21
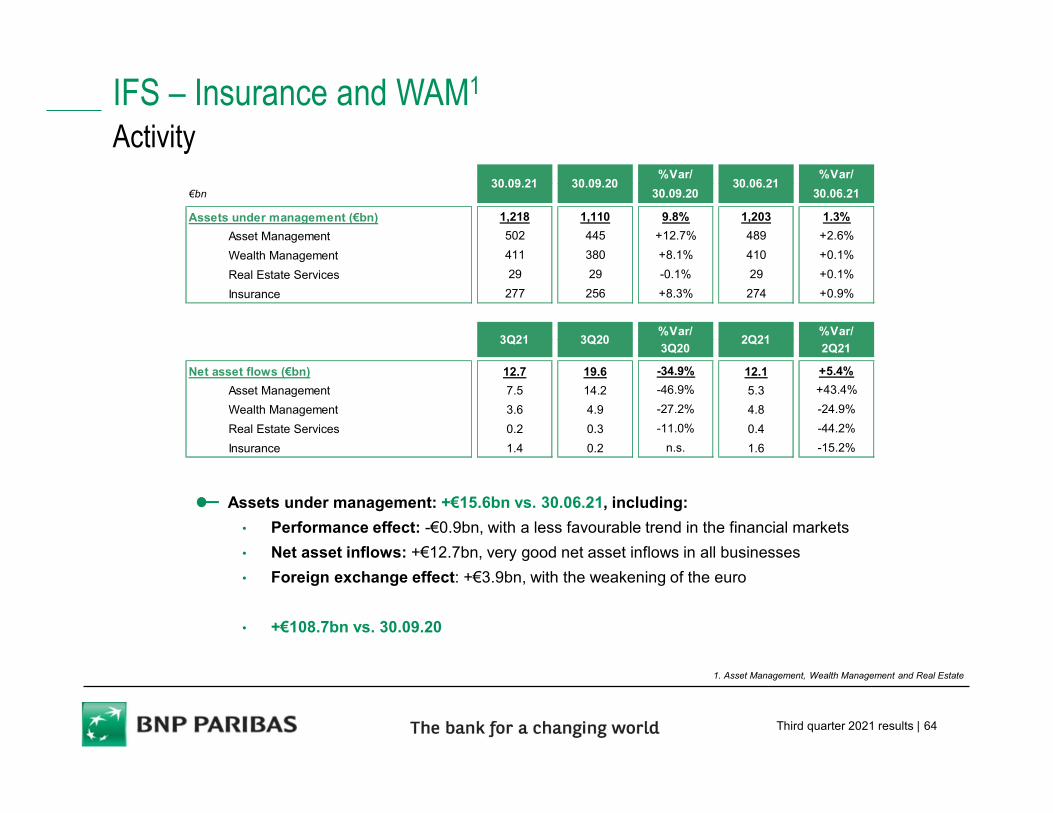
Third quarter 2021 results | 64
IFS – Insurance and WAM1
Activity
1. Asset Management, Wealth Management and Real Estate
Assets under management: +€15.6bn vs. 30.06.21, including:
• Performance effect: -€0.9bn, with a less favourable trend in the financial markets
• Net asset inflows: +€12.7bn, very good net asset inflows in all businesses
• Foreign exchange effect: +€3.9bn, with the weakening of the euro
• +€108.7bn vs. 30.09.20
%Var/ %Var/
€bn 30.09.20 30.06.21
Assets under management (€bn) 1,218 1,110 9.8% 1,203 1.3%
Asset Management 502 445 +12.7% 489 +2.6%
Wealth Management 411 380 +8.1% 410 +0.1%
Real Estate Services 29 29 -0.1% 29 +0.1%
Insurance 277 256 +8.3% 274 +0.9%
%Var/ %Var/
3Q20 2Q21
Net asset flows (€bn) 12.7 19.6 -34.9% 12.1 +5.4%
Asset Management 7.5 14.2 -46.9% 5.3 +43.4%
Wealth Management 3.6 4.9 -27.2% 4.8 -24.9%
Real Estate Services 0.2 0.3 -11.0% 0.4 -44.2%
Insurance 1.4 0.2 n.s. 1.6 -15.2%
30.09.21 30.09.20 30.06.21
3Q21 3Q20 2Q21
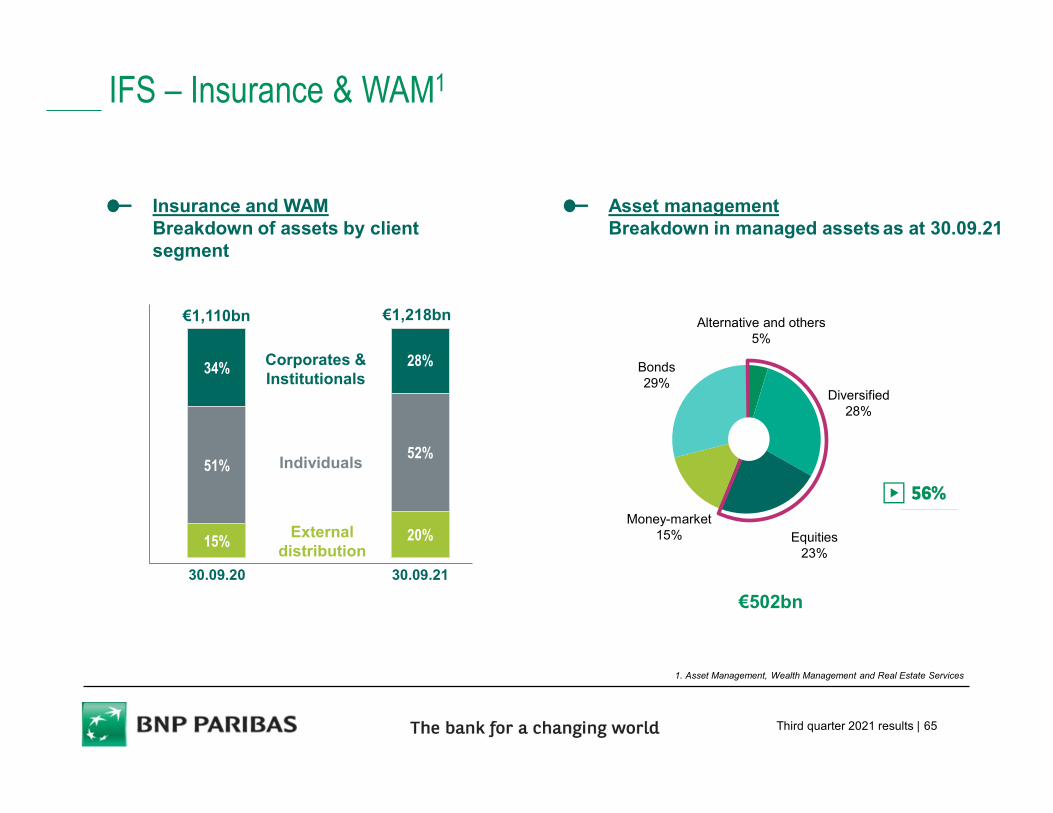
Third quarter 2021 results | 65
IFS – Insurance & WAM1
1. Asset Management, Wealth Management and Real Estate Services
15% 20%
51%52%
34% 28%
30.09.20 30.09.21
Corporates & Institutionals
Individuals
External distribution
€1,110bn €1,218bn
€502bn
Asset managementBreakdown in managed assets as at 30.09.21
Money-market15% Equities
23%
Diversified28%
Alternative and others5%
Bonds29%
▶ 56%
Insurance and WAMBreakdown of assets by client segment
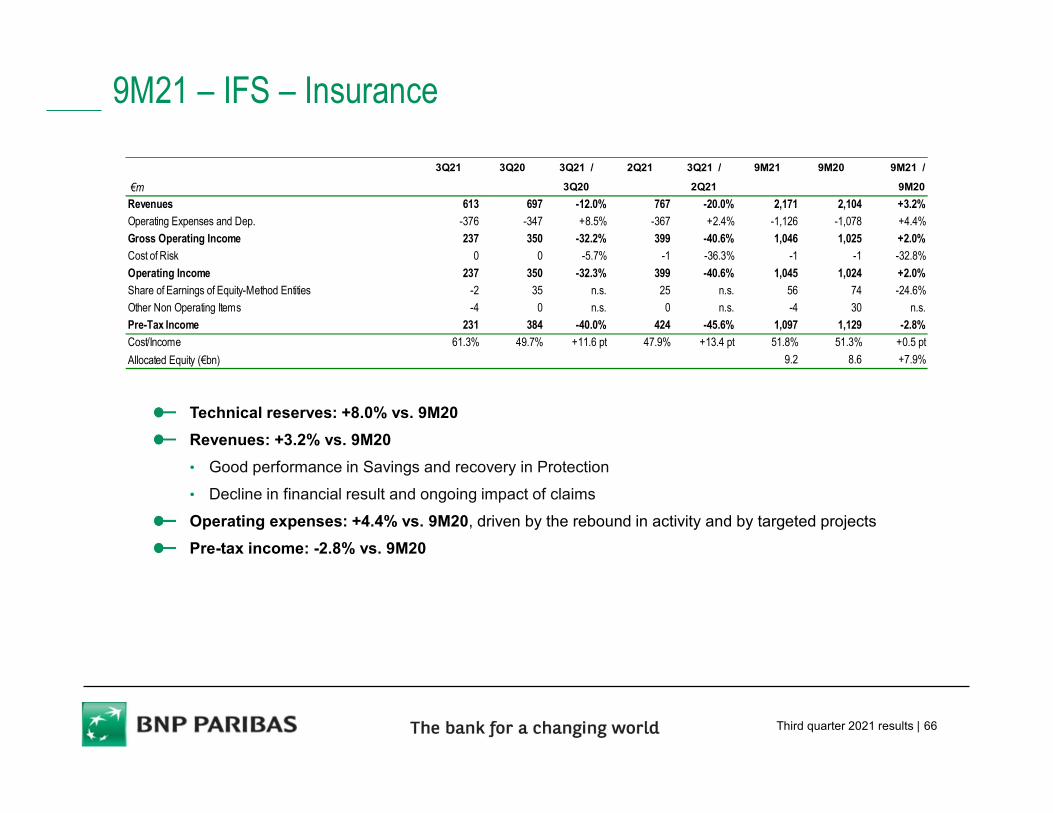
Third quarter 2021 results | 66
9M21 – IFS – Insurance
Technical reserves: +8.0% vs. 9M20
Revenues: +3.2% vs. 9M20
• Good performance in Savings and recovery in Protection
• Decline in financial result and ongoing impact of claims
Operating expenses: +4.4% vs. 9M20, driven by the rebound in activity and by targeted projects
Pre-tax income: -2.8% vs. 9M20
3Q21 3Q20 3Q21 / 2Q21 3Q21 / 9M21 9M20 9M21 /
€m 0 0 3Q20 0 2Q21 0 0 9M20
Revenues 613 697 -12.0% 767 -20.0% 2,171 2,104 +3.2%
Operating Expenses and Dep. -376 -347 +8.5% -367 +2.4% -1,126 -1,078 +4.4%
Gross Operating Income 237 350 -32.2% 399 -40.6% 1,046 1,025 +2.0%
Cost of Risk 0 0 -5.7% -1 -36.3% -1 -1 -32.8%
Operating Income 237 350 -32.3% 399 -40.6% 1,045 1,024 +2.0%
Share of Earnings of Equity-Method Entities -2 35 n.s. 25 n.s. 56 74 -24.6%
Other Non Operating Items -4 0 n.s. 0 n.s. -4 30 n.s.
Pre-Tax Income 231 384 -40.0% 424 -45.6% 1,097 1,129 -2.8%
Cost/Income 61.3% 49.7% +11.6 pt 47.9% +13.4 pt 51.8% 51.3% +0.5 pt
Allocated Equity (€bn) 9.2 8.6 +7.9%
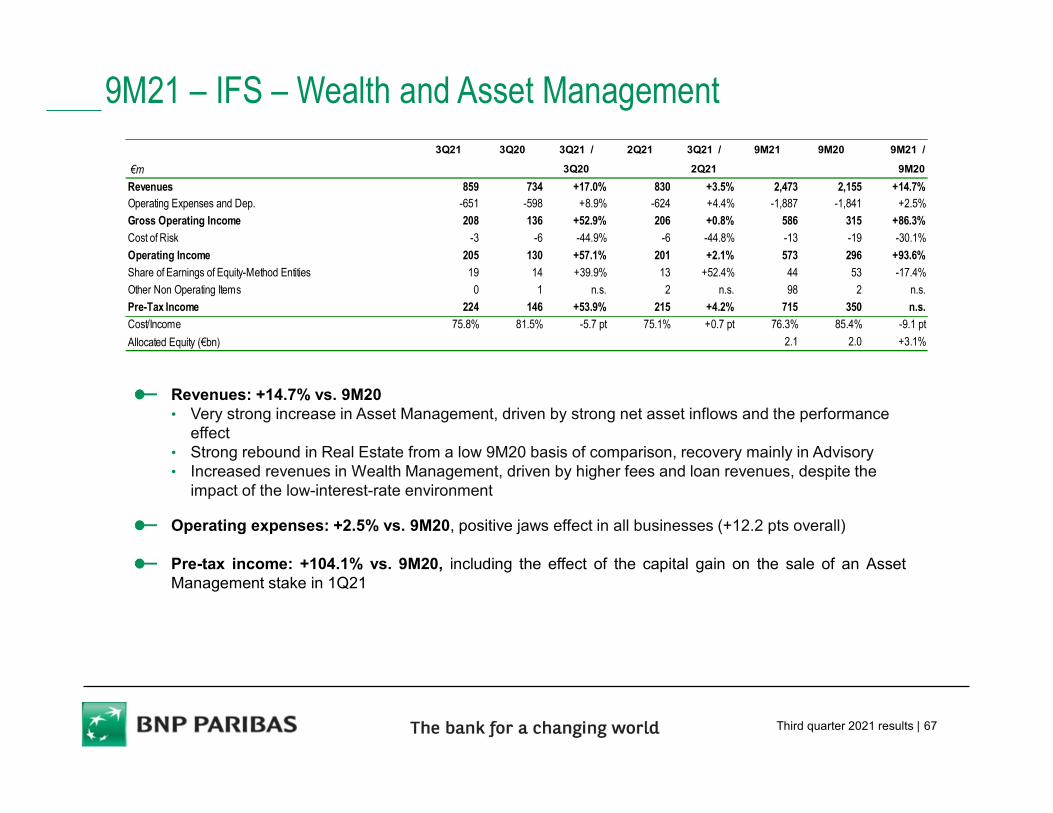
Third quarter 2021 results | 67
9M21 – IFS – Wealth and Asset Management
Revenues: +14.7% vs. 9M20• Very strong increase in Asset Management, driven by strong net asset inflows and the performance
effect• Strong rebound in Real Estate from a low 9M20 basis of comparison, recovery mainly in Advisory• Increased revenues in Wealth Management, driven by higher fees and loan revenues, despite the
impact of the low-interest-rate environment
Operating expenses: +2.5% vs. 9M20, positive jaws effect in all businesses (+12.2 pts overall)
Pre-tax income: +104.1% vs. 9M20, including the effect of the capital gain on the sale of an AssetManagement stake in 1Q21
3Q21 3Q20 3Q21 / 2Q21 3Q21 / 9M21 9M20 9M21 /
€m 0 0 3Q20 0 2Q21 0 0 9M20
Revenues 859 734 +17.0% 830 +3.5% 2,473 2,155 +14.7%Operating Expenses and Dep. -651 -598 +8.9% -624 +4.4% -1,887 -1,841 +2.5%
Gross Operating Income 208 136 +52.9% 206 +0.8% 586 315 +86.3%
Cost of Risk -3 -6 -44.9% -6 -44.8% -13 -19 -30.1%
Operating Income 205 130 +57.1% 201 +2.1% 573 296 +93.6%
Share of Earnings of Equity-Method Entities 19 14 +39.9% 13 +52.4% 44 53 -17.4%
Other Non Operating Items 0 1 n.s. 2 n.s. 98 2 n.s.
Pre-Tax Income 224 146 +53.9% 215 +4.2% 715 350 n.s.
Cost/Income 75.8% 81.5% -5.7 pt 75.1% +0.7 pt 76.3% 85.4% -9.1 pt
Allocated Equity (€bn) 2.1 2.0 +3.1%
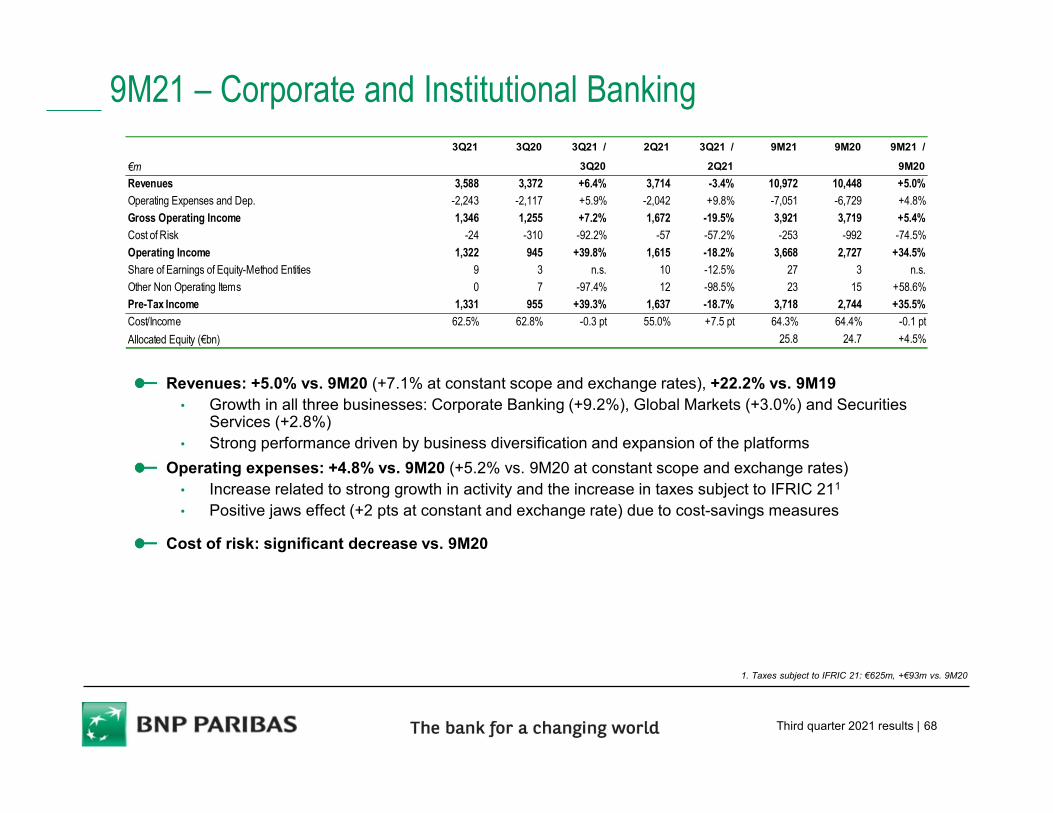
Third quarter 2021 results | 68
9M21 – Corporate and Institutional Banking
Revenues: +5.0% vs. 9M20 (+7.1% at constant scope and exchange rates), +22.2% vs. 9M19• Growth in all three businesses: Corporate Banking (+9.2%), Global Markets (+3.0%) and Securities
Services (+2.8%)• Strong performance driven by business diversification and expansion of the platforms
Operating expenses: +4.8% vs. 9M20 (+5.2% vs. 9M20 at constant scope and exchange rates) • Increase related to strong growth in activity and the increase in taxes subject to IFRIC 211
• Positive jaws effect (+2 pts at constant and exchange rate) due to cost-savings measures
Cost of risk: significant decrease vs. 9M20
1. Taxes subject to IFRIC 21: €625m, +€93m vs. 9M20
3Q21 3Q20 3Q21 / 2Q21 3Q21 / 9M21 9M20 9M21 /
€m 3Q20 2Q21 9M20
Revenues 3,588 3,372 +6.4% 3,714 -3.4% 10,972 10,448 +5.0%
Operating Expenses and Dep. -2,243 -2,117 +5.9% -2,042 +9.8% -7,051 -6,729 +4.8%
Gross Operating Income 1,346 1,255 +7.2% 1,672 -19.5% 3,921 3,719 +5.4%
Cost of Risk -24 -310 -92.2% -57 -57.2% -253 -992 -74.5%
Operating Income 1,322 945 +39.8% 1,615 -18.2% 3,668 2,727 +34.5%
Share of Earnings of Equity-Method Entities 9 3 n.s. 10 -12.5% 27 3 n.s.
Other Non Operating Items 0 7 -97.4% 12 -98.5% 23 15 +58.6%
Pre-Tax Income 1,331 955 +39.3% 1,637 -18.7% 3,718 2,744 +35.5%
Cost/Income 62.5% 62.8% -0.3 pt 55.0% +7.5 pt 64.3% 64.4% -0.1 pt
Allocated Equity (€bn) 25.8 24.7 +4.5%
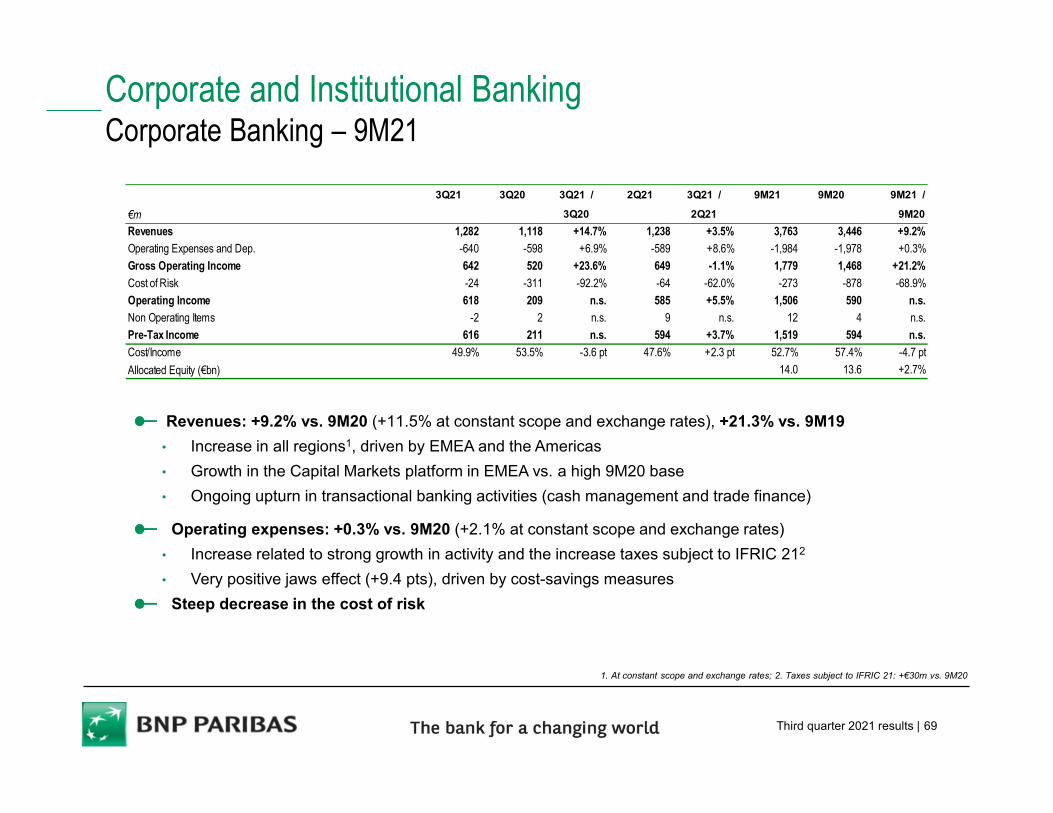
Third quarter 2021 results | 69
Corporate and Institutional Banking Corporate Banking – 9M21
Revenues: +9.2% vs. 9M20 (+11.5% at constant scope and exchange rates), +21.3% vs. 9M19
• Increase in all regions1, driven by EMEA and the Americas
• Growth in the Capital Markets platform in EMEA vs. a high 9M20 base
• Ongoing upturn in transactional banking activities (cash management and trade finance)
Operating expenses: +0.3% vs. 9M20 (+2.1% at constant scope and exchange rates)
• Increase related to strong growth in activity and the increase taxes subject to IFRIC 212
• Very positive jaws effect (+9.4 pts), driven by cost-savings measures
Steep decrease in the cost of risk
1. At constant scope and exchange rates; 2. Taxes subject to IFRIC 21: +€30m vs. 9M20
3Q21 3Q20 3Q21 / 2Q21 3Q21 / 9M21 9M20 9M21 /
€m 0 0 3Q20 0 2Q21 0 0 9M20
Revenues 1,282 1,118 +14.7% 1,238 +3.5% 3,763 3,446 +9.2%
Operating Expenses and Dep. -640 -598 +6.9% -589 +8.6% -1,984 -1,978 +0.3%
Gross Operating Income 642 520 +23.6% 649 -1.1% 1,779 1,468 +21.2%
Cost of Risk -24 -311 -92.2% -64 -62.0% -273 -878 -68.9%
Operating Income 618 209 n.s. 585 +5.5% 1,506 590 n.s.
Non Operating Items -2 2 n.s. 9 n.s. 12 4 n.s.
Pre-Tax Income 616 211 n.s. 594 +3.7% 1,519 594 n.s.
Cost/Income 49.9% 53.5% -3.6 pt 47.6% +2.3 pt 52.7% 57.4% -4.7 pt
Allocated Equity (€bn) 14.0 13.6 +2.7%
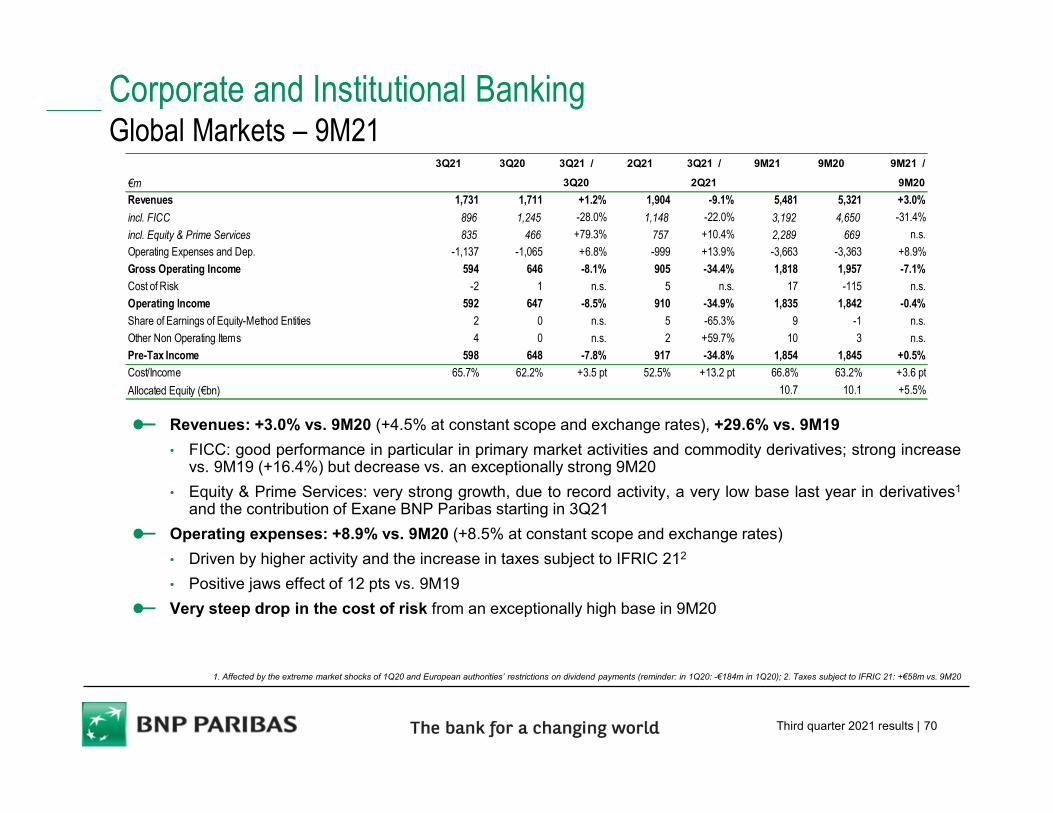
Third quarter 2021 results | 70
Corporate and Institutional BankingGlobal Markets – 9M21
Revenues: +3.0% vs. 9M20 (+4.5% at constant scope and exchange rates), +29.6% vs. 9M19
• FICC: good performance in particular in primary market activities and commodity derivatives; strong increasevs. 9M19 (+16.4%) but decrease vs. an exceptionally strong 9M20
• Equity & Prime Services: very strong growth, due to record activity, a very low base last year in derivatives1
and the contribution of Exane BNP Paribas starting in 3Q21
Operating expenses: +8.9% vs. 9M20 (+8.5% at constant scope and exchange rates)
• Driven by higher activity and the increase in taxes subject to IFRIC 212
• Positive jaws effect of 12 pts vs. 9M19
Very steep drop in the cost of risk from an exceptionally high base in 9M20
1. Affected by the extreme market shocks of 1Q20 and European authorities’ restrictions on dividend payments (reminder: in 1Q20: -€184m in 1Q20); 2. Taxes subject to IFRIC 21: +€58m vs. 9M20
3Q21 3Q20 3Q21 / 2Q21 3Q21 / 9M21 9M20 9M21 /
€m 0 0 3Q20 0 2Q21 0 0 9M20
Revenues 1,731 1,711 +1.2% 1,904 -9.1% 5,481 5,321 +3.0%
incl. FICC 896 1,245 -28.0% 1,148 -22.0% 3,192 4,650 -31.4%
incl. Equity & Prime Services 835 466 +79.3% 757 +10.4% 2,289 669 n.s.
Operating Expenses and Dep. -1,137 -1,065 +6.8% -999 +13.9% -3,663 -3,363 +8.9%
Gross Operating Income 594 646 -8.1% 905 -34.4% 1,818 1,957 -7.1%
Cost of Risk -2 1 n.s. 5 n.s. 17 -115 n.s.
Operating Income 592 647 -8.5% 910 -34.9% 1,835 1,842 -0.4%
Share of Earnings of Equity-Method Entities 2 0 n.s. 5 -65.3% 9 -1 n.s.
Other Non Operating Items 4 0 n.s. 2 +59.7% 10 3 n.s.
Pre-Tax Income 598 648 -7.8% 917 -34.8% 1,854 1,845 +0.5%
Cost/Income 65.7% 62.2% +3.5 pt 52.5% +13.2 pt 66.8% 63.2% +3.6 pt
Allocated Equity (€bn) 10.7 10.1 +5.5%
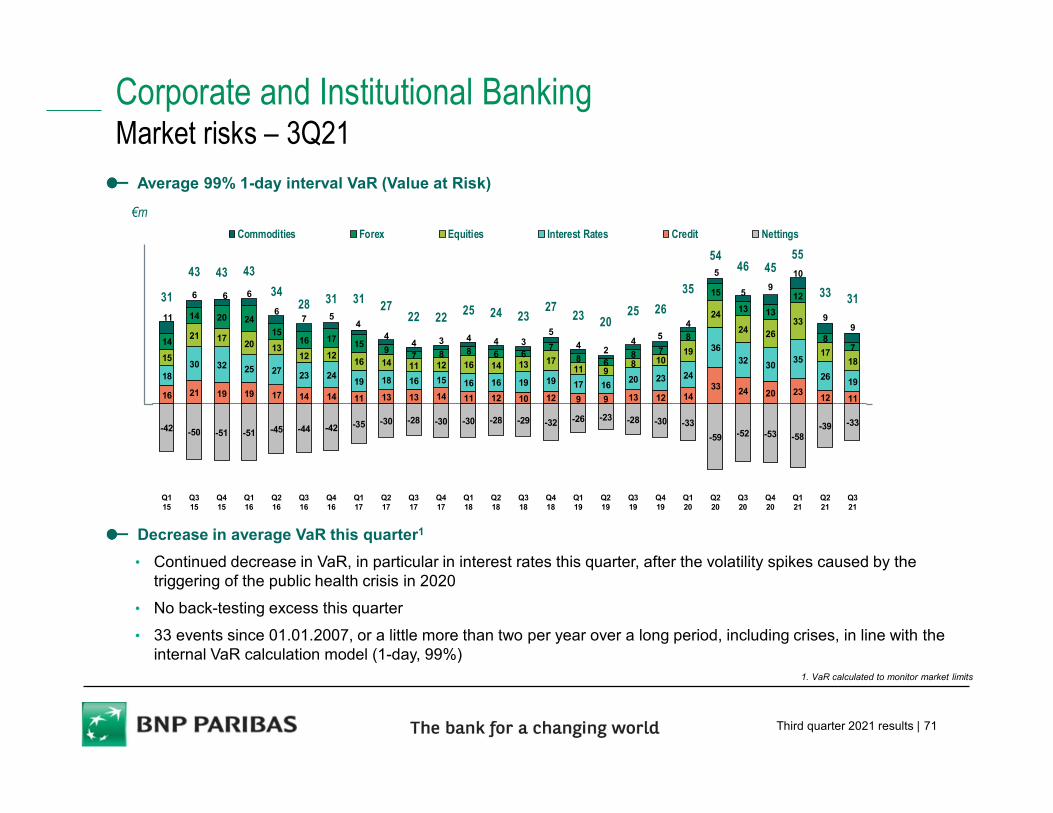
Third quarter 2021 results | 71
Corporate and Institutional BankingMarket risks – 3Q21
€m
1. VaR calculated to monitor market limits
Average 99% 1-day interval VaR (Value at Risk)
Decrease in average VaR this quarter1
• Continued decrease in VaR, in particular in interest rates this quarter, after the volatility spikes caused by the triggering of the public health crisis in 2020
• No back-testing excess this quarter
• 33 events since 01.01.2007, or a little more than two per year over a long period, including crises, in line with the internal VaR calculation model (1-day, 99%)
-42 -50 -51 -51 -45 -44 -42 -35 -30 -28 -30 -30 -28 -29 -32 -26 -23 -28 -30 -33
-59 -52 -53 -58-39 -33
16 21 19 19 17 14 14 11 13 13 14 11 12 10 12 9 9 13 12 1433 24 20 23
12 11
1830 32 25 27 23 24
19 18 16 15 16 16 19 19 17 1620 23 24
3632 30
35
2619
15
21 1720 13
12 1216 14 11 12 16 14 13 17
11 98 10
19
24
24 2633
1718
14
14 20 2415
16 17 159
7 8 8 6 67
8 68 7
8
15
13 13
12
87
11
6 6 6
67 5
44
4 3 4 4 35
4 24 5
4
5
59
10
99
31
43 43 43
3428 31 31 27
22 22 25 24 2327
23 2025 26
35
5446 45
55
33 31
Q115
Q315
Q415
Q116
Q216
Q316
Q416
Q117
Q217
Q317
Q417
Q118
Q218
Q318
Q418
Q119
Q219
Q319
Q419
Q120
Q220
Q320
Q420
Q121
Q221
Q321
Commodities Forex Equities Interest Rates Credit Nettings
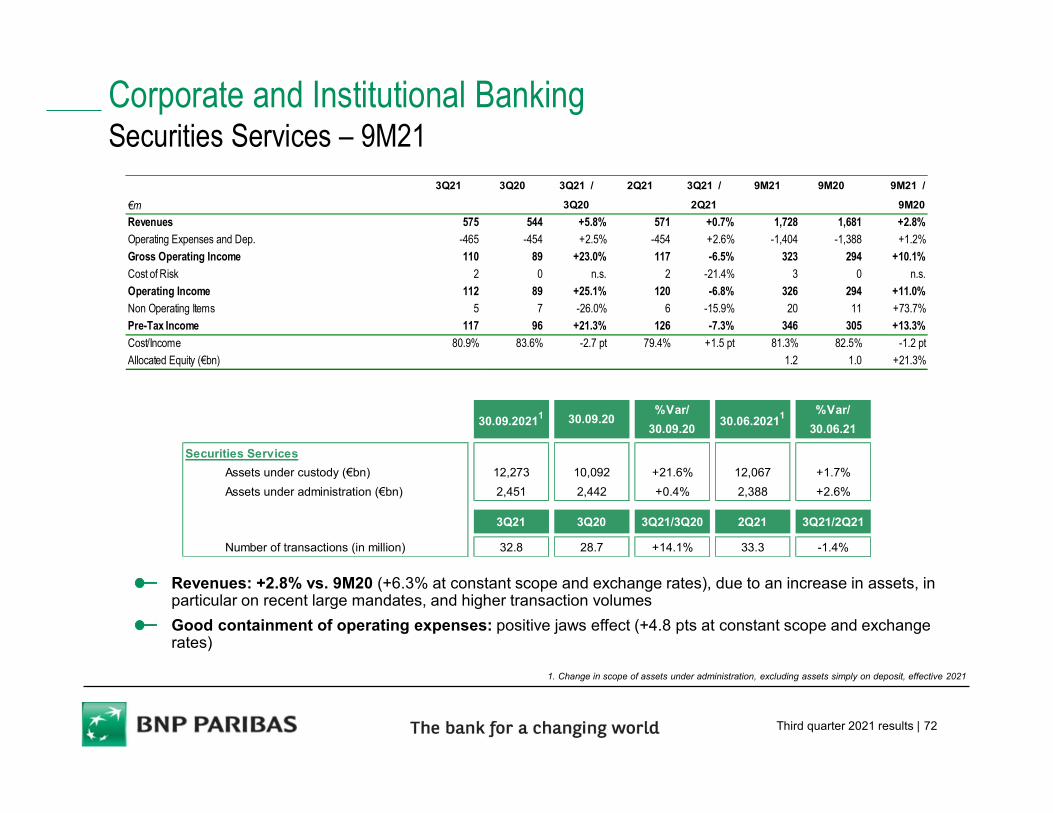
Third quarter 2021 results | 72
Corporate and Institutional BankingSecurities Services – 9M21
1. Change in scope of assets under administration, excluding assets simply on deposit, effective 2021
Revenues: +2.8% vs. 9M20 (+6.3% at constant scope and exchange rates), due to an increase in assets, in particular on recent large mandates, and higher transaction volumes
Good containment of operating expenses: positive jaws effect (+4.8 pts at constant scope and exchange rates)
3Q21 3Q20 3Q21 / 2Q21 3Q21 / 9M21 9M20 9M21 /
€m 0 0 3Q20 0 2Q21 0 0 9M20
Revenues 575 544 +5.8% 571 +0.7% 1,728 1,681 +2.8%
Operating Expenses and Dep. -465 -454 +2.5% -454 +2.6% -1,404 -1,388 +1.2%
Gross Operating Income 110 89 +23.0% 117 -6.5% 323 294 +10.1%
Cost of Risk 2 0 n.s. 2 -21.4% 3 0 n.s.
Operating Income 112 89 +25.1% 120 -6.8% 326 294 +11.0%
Non Operating Items 5 7 -26.0% 6 -15.9% 20 11 +73.7%
Pre-Tax Income 117 96 +21.3% 126 -7.3% 346 305 +13.3%
Cost/Income 80.9% 83.6% -2.7 pt 79.4% +1.5 pt 81.3% 82.5% -1.2 pt
Allocated Equity (€bn) 1.2 1.0 +21.3%
%Var/ %Var/
30.09.20 30.06.21
Securities Services n.s. n.s.
Assets under custody (€bn) 12,273 10,092 +21.6% 12,067 +1.7%
Assets under administration (€bn) 2,451 2,442 +0.4% 2,388 +2.6%
3Q21 3Q20 3Q21/3Q20 2Q21 3Q21/2Q21
Number of transactions (in million) 32.8 28.7 +14.1% 33.3 -1.4%
30.09.20211 30.09.20 30.06.2021
1
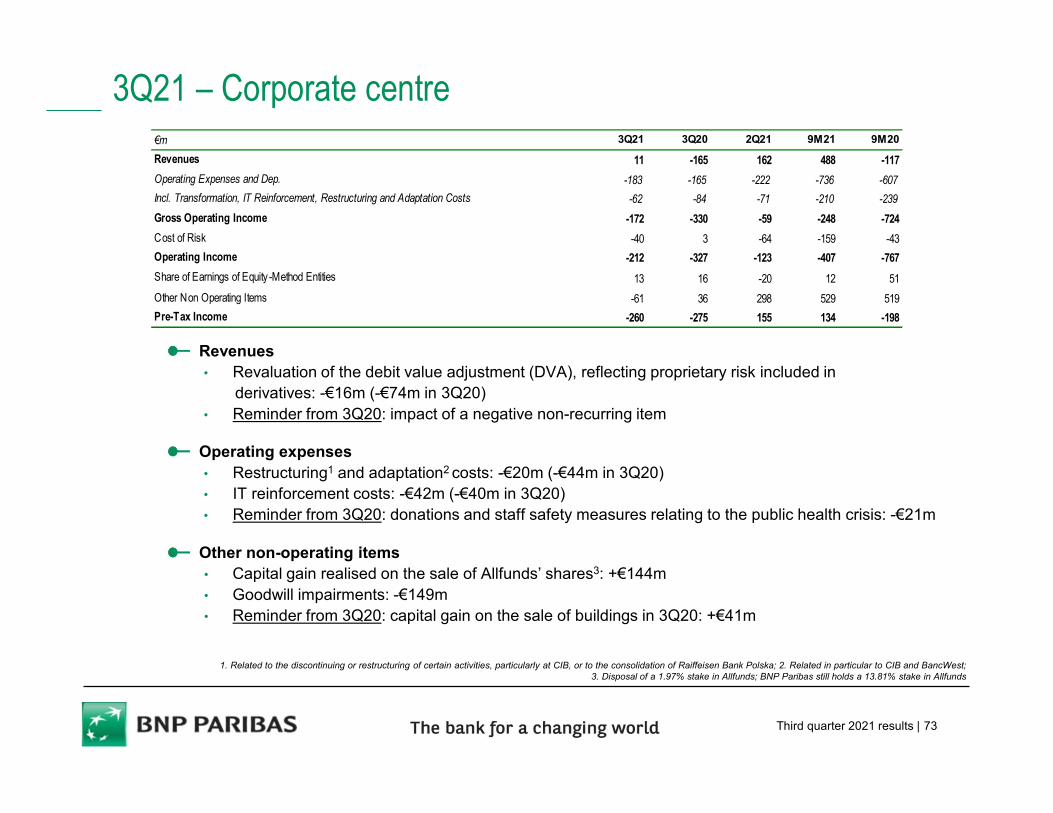
Third quarter 2021 results | 73
3Q21 – Corporate centre
Revenues • Revaluation of the debit value adjustment (DVA), reflecting proprietary risk included in
derivatives: -€16m (-€74m in 3Q20)• Reminder from 3Q20: impact of a negative non-recurring item
Operating expenses• Restructuring1 and adaptation2 costs: -€20m (-€44m in 3Q20)• IT reinforcement costs: -€42m (-€40m in 3Q20) • Reminder from 3Q20: donations and staff safety measures relating to the public health crisis: -€21m
Other non-operating items• Capital gain realised on the sale of Allfunds’ shares3: +€144m• Goodwill impairments: -€149m• Reminder from 3Q20: capital gain on the sale of buildings in 3Q20: +€41m
1. Related to the discontinuing or restructuring of certain activities, particularly at CIB, or to the consolidation of Raiffeisen Bank Polska; 2. Related in particular to CIB and BancWest; 3. Disposal of a 1.97% stake in Allfunds; BNP Paribas still holds a 13.81% stake in Allfunds
€m 3Q21 3Q20 2Q21 9M21 9M20
Revenues 11 -165 162 488 -117
Operating Expenses and Dep. -183 -165 -222 -736 -607
Incl. Transformation, IT Reinforcement, Restructuring and Adaptation Costs -62 -84 -71 -210 -239
Gross Operating Income -172 -330 -59 -248 -724
Cost of Risk -40 3 -64 -159 -43
Operating Income -212 -327 -123 -407 -767
Share of Earnings of Equity -Method Entities 13 16 -20 12 51
Other Non Operating Items -61 36 298 529 519
Pre-Tax Income -260 -275 155 134 -198
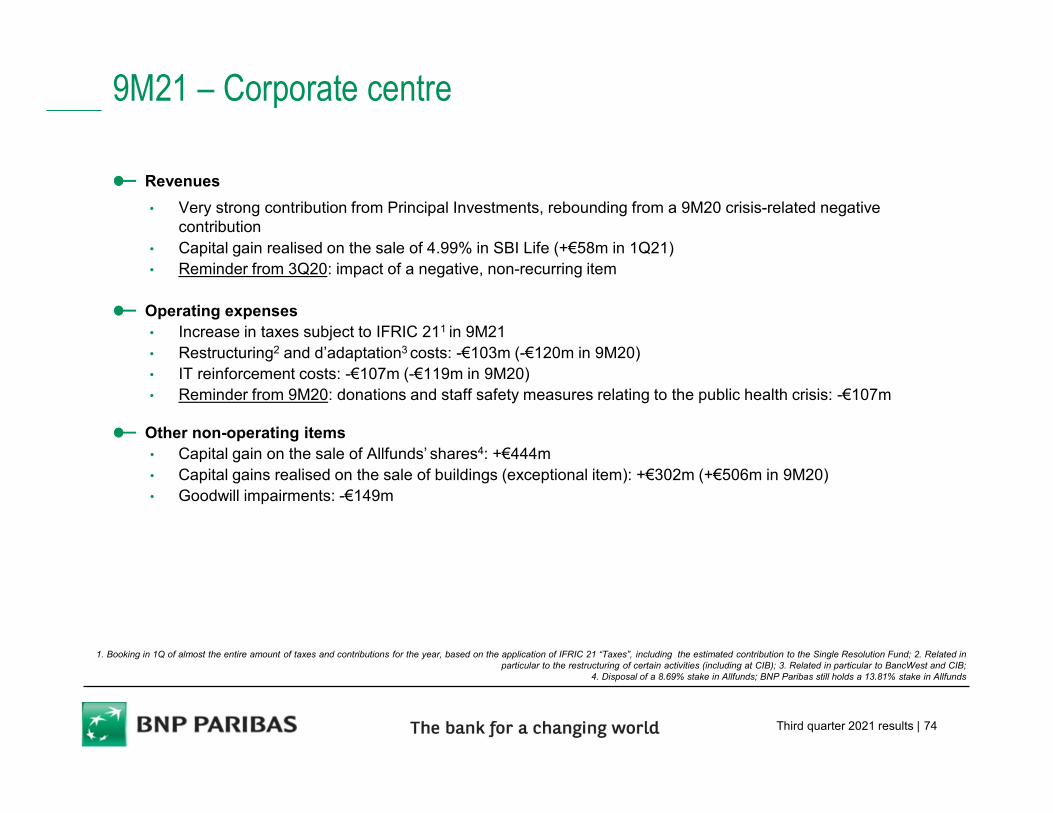
Third quarter 2021 results | 74
9M21 – Corporate centre
Revenues
• Very strong contribution from Principal Investments, rebounding from a 9M20 crisis-related negative contribution
• Capital gain realised on the sale of 4.99% in SBI Life (+€58m in 1Q21)• Reminder from 3Q20: impact of a negative, non-recurring item
Operating expenses• Increase in taxes subject to IFRIC 211 in 9M21• Restructuring2 and d’adaptation3 costs: -€103m (-€120m in 9M20)• IT reinforcement costs: -€107m (-€119m in 9M20) • Reminder from 9M20: donations and staff safety measures relating to the public health crisis: -€107m
Other non-operating items• Capital gain on the sale of Allfunds’ shares4: +€444m• Capital gains realised on the sale of buildings (exceptional item): +€302m (+€506m in 9M20)• Goodwill impairments: -€149m
1. Booking in 1Q of almost the entire amount of taxes and contributions for the year, based on the application of IFRIC 21 “Taxes”, including the estimated contribution to the Single Resolution Fund; 2. Related in particular to the restructuring of certain activities (including at CIB); 3. Related in particular to BancWest and CIB;
4. Disposal of a 8.69% stake in Allfunds; BNP Paribas still holds a 13.81% stake in Allfunds
9M21 DETAILED RESULTS
APPENDICES
GROUP RESULTS
DIVISION RESULTS
CONCLUSION
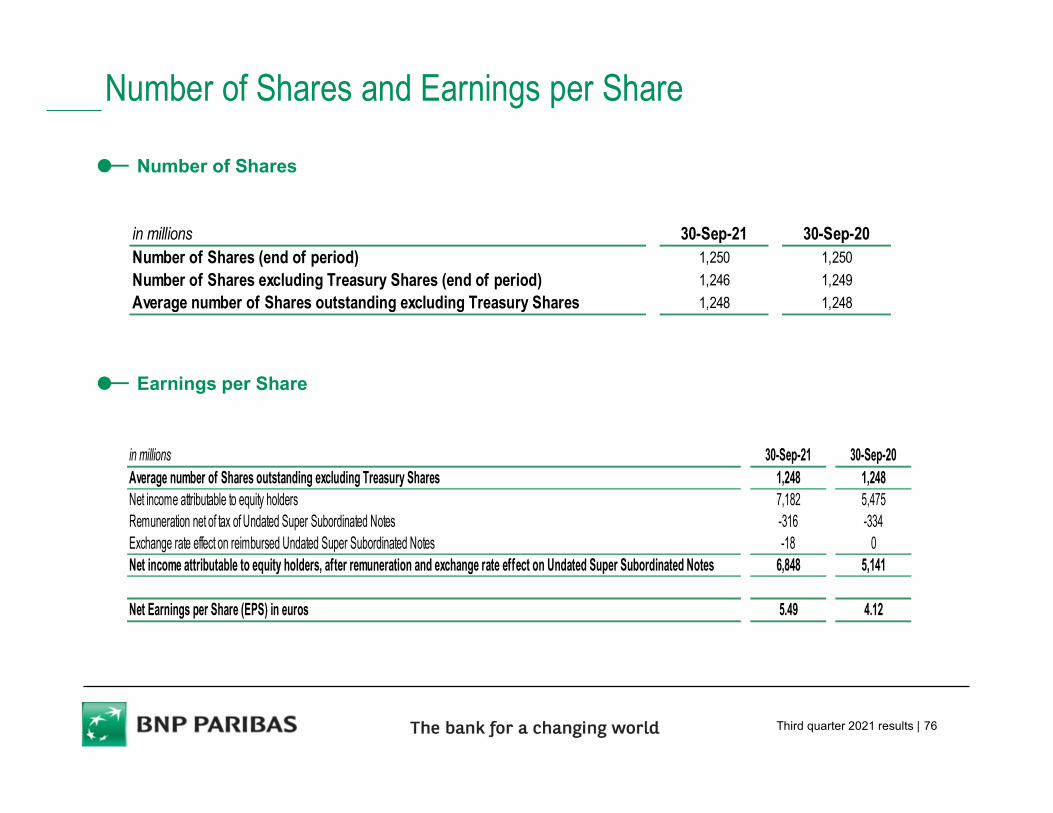
Third quarter 2021 results | 76
Number of Shares
Earnings per Share
Number of Shares and Earnings per Share
in millions 30-Sep-21 30-Sep-20Number of Shares (end of period) 1,250 1,250
Number of Shares excluding Treasury Shares (end of period) 1,246 1,249
Average number of Shares outstanding excluding Treasury Shares 1,248 1,248
in millions 30-Sep-21 30-Sep-20Average number of Shares outstanding excluding Treasury Shares 1,248 1,248Net income attributable to equity holders 7,182 5,475Remuneration net of tax of Undated Super Subordinated Notes -316 -334Exchange rate effect on reimbursed Undated Super Subordinated Notes -18 0Net income attributable to equity holders, after remuneration and exchange rate effect on Undated Super Subordinated Notes 6,848 5,141
Net Earnings per Share (EPS) in euros 5.49 4.12
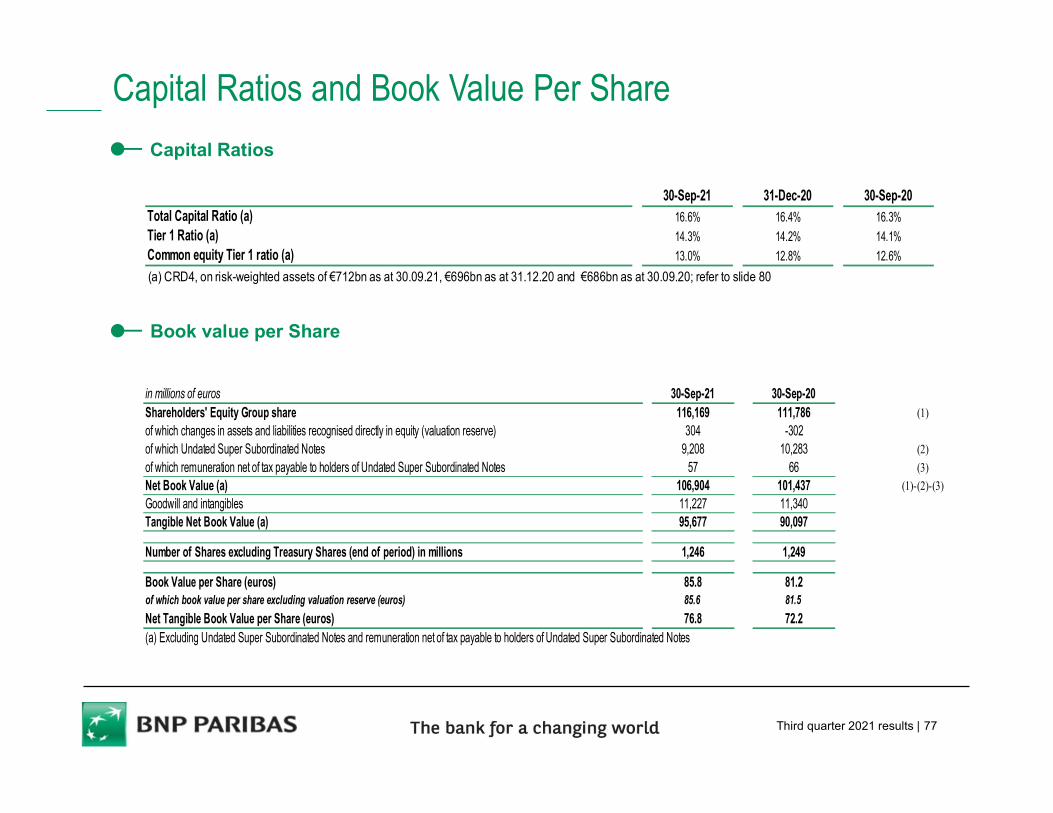
Third quarter 2021 results | 77
Capital Ratios and Book Value Per Share
Capital Ratios
Book value per Share
30-Sep-21 31-Dec-20 30-Sep-20Total Capital Ratio (a) 16.6% 16.4% 16.3%Tier 1 Ratio (a) 14.3% 14.2% 14.1%Common equity Tier 1 ratio (a) 13.0% 12.8% 12.6%
(a) CRD4, on risk-weighted assets of €712bn as at 30.09.21, €696bn as at 31.12.20 and €686bn as at 30.09.20; refer to slide 80
in millions of euros 30-Sep-21 30-Sep-20Shareholders' Equity Group share 116,169 111,786 (1)
of which changes in assets and liabilities recognised directly in equity (valuation reserve) 304 -302of which Undated Super Subordinated Notes 9,208 10,283 (2)
of which remuneration net of tax payable to holders of Undated Super Subordinated Notes 57 66 (3)
Net Book Value (a) 106,904 101,437 (1)-(2)-(3)
Goodwill and intangibles 11,227 11,340Tangible Net Book Value (a) 95,677 90,097
Number of Shares excluding Treasury Shares (end of period) in millions 1,246 1,249
Book Value per Share (euros) 85.8 81.2of which book value per share excluding valuation reserve (euros) 85.6 81.5
Net Tangible Book Value per Share (euros) 76.8 72.2(a) Excluding Undated Super Subordinated Notes and remuneration net of tax payable to holders of Undated Super Subordinated Notes
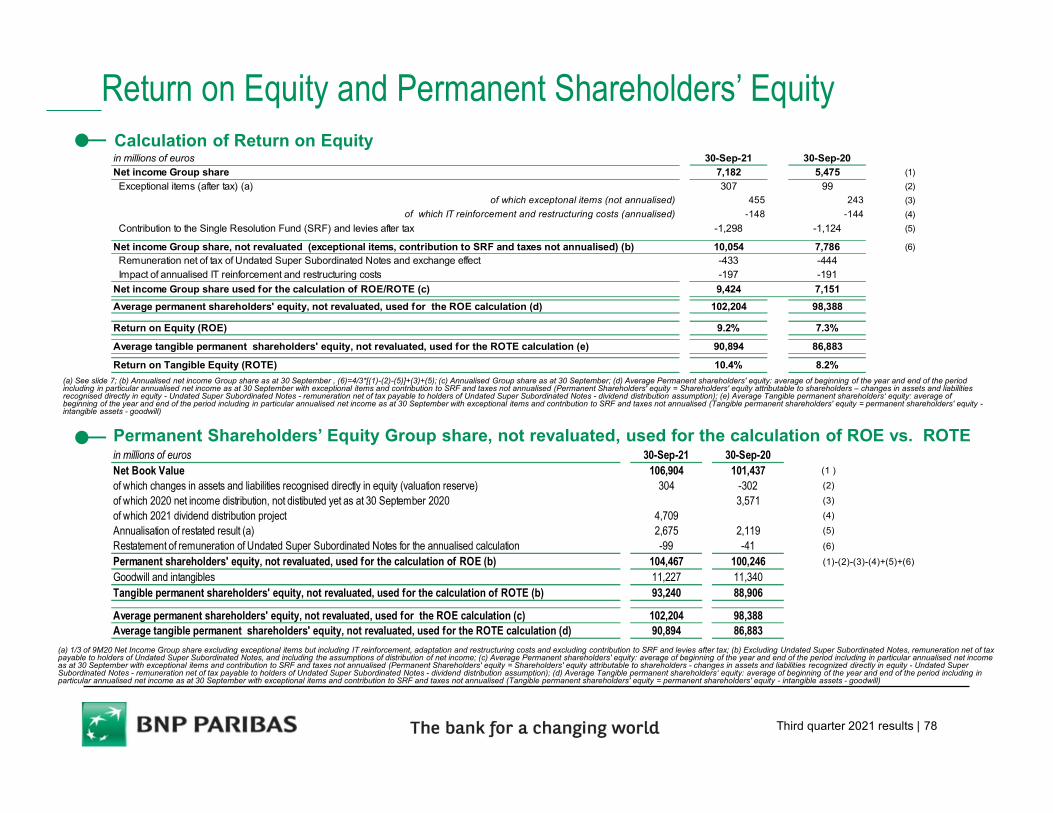
Third quarter 2021 results | 78
Calculation of Return on Equity
Return on Equity and Permanent Shareholders’ Equity
(a) See slide 7; (b) Annualised net income Group share as at 30 September , (6)=4/3*[(1)-(2)-(5)]+(3)+(5); (c) Annualised Group share as at 30 September; (d) Average Permanent shareholders' equity: average of beginning of the year and end of the period including in particular annualised net income as at 30 September with exceptional items and contribution to SRF and taxes not annualised (Permanent Shareholders' equity = Shareholders' equity attributable to shareholders – changes in assets and liabilitiesrecognised directly in equity - Undated Super Subordinated Notes - remuneration net of tax payable to holders of Undated Super Subordinated Notes - dividend distribution assumption); (e) Average Tangible permanent shareholders‘ equity: average of beginning of the year and end of the period including in particular annualised net income as at 30 September with exceptional items and contribution to SRF and taxes not annualised (Tangible permanent shareholders' equity = permanent shareholders' equity -intangible assets - goodwill)
(a) 1/3 of 9M20 Net Income Group share excluding exceptional items but including IT reinforcement, adaptation and restructuring costs and excluding contribution to SRF and levies after tax; (b) Excluding Undated Super Subordinated Notes, remuneration net of tax payable to holders of Undated Super Subordinated Notes, and including the assumptions of distribution of net income; (c) Average Permanent shareholders' equity: average of beginning of the year and end of the period including in particular annualised net income as at 30 September with exceptional items and contribution to SRF and taxes not annualised (Permanent Shareholders' equity = Shareholders' equity attributable to shareholders - changes in assets and liabilities recognized directly in equity - Undated Super Subordinated Notes - remuneration net of tax payable to holders of Undated Super Subordinated Notes - dividend distribution assumption); (d) Average Tangible permanent shareholders‘ equity: average of beginning of the year and end of the period including in particular annualised net income as at 30 September with exceptional items and contribution to SRF and taxes not annualised (Tangible permanent shareholders' equity = permanent shareholders' equity - intangible assets - goodwill)
Permanent Shareholders’ Equity Group share, not revaluated, used for the calculation of ROE vs. ROTE
in millions of euros 30-Sep-21 30-Sep-20Net income Group share 7,182 5,475 (1)
Exceptional items (after tax) (a) 307 99 (2)
of which exceptonal items (not annualised) 455 243 (3)
of which IT reinforcement and restructuring costs (annualised) -148 -144 (4)
Contribution to the Single Resolution Fund (SRF) and levies after tax -1,298 -1,124 (5)
Net income Group share, not revaluated (exceptional items, contribution to SRF and taxes not annualised) (b) 10,054 7,786 (6)
Remuneration net of tax of Undated Super Subordinated Notes and exchange effect -433 -444 Impact of annualised IT reinforcement and restructuring costs -197 -191
Net income Group share used for the calculation of ROE/ROTE (c) 9,424 7,151
Average permanent shareholders' equity, not revaluated, used for the ROE calculation (d) 102,204 98,388
Return on Equity (ROE) 9.2% 7.3%
Average tangible permanent shareholders' equity, not revaluated, used for the ROTE calculation (e) 90,894 86,883
Return on Tangible Equity (ROTE) 10.4% 8.2%
in millions of euros 30-Sep-21 30-Sep-20Net Book Value 106,904 101,437 (1 )
of which changes in assets and liabilities recognised directly in equity (valuation reserve) 304 -302 (2)
of which 2020 net income distribution, not distibuted yet as at 30 September 2020 3,571 (3)
of which 2021 dividend distribution project 4,709 (4)
Annualisation of restated result (a) 2,675 2,119 (5)
Restatement of remuneration of Undated Super Subordinated Notes for the annualised calculation -99 -41 (6)
Permanent shareholders' equity, not revaluated, used for the calculation of ROE (b) 104,467 100,246 (1)-(2)-(3)-(4)+(5)+(6)
Goodwill and intangibles 11,227 11,340Tangible permanent shareholders' equity, not revaluated, used for the calculation of ROTE (b) 93,240 88,906
Average permanent shareholders' equity, not revaluated, used for the ROE calculation (c) 102,204 98,388Average tangible permanent shareholders' equity, not revaluated, used for the ROTE calculation (d) 90,894 86,883
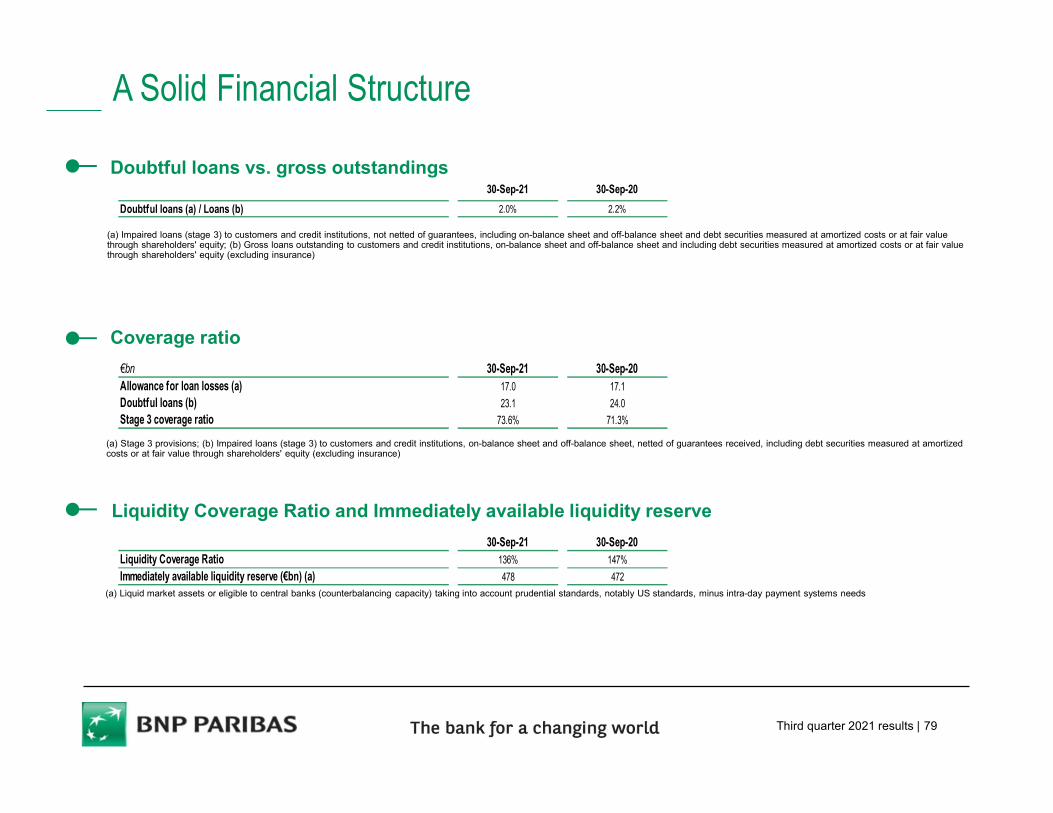
Third quarter 2021 results | 79
A Solid Financial Structure
Doubtful loans vs. gross outstandings
Coverage ratio
Liquidity Coverage Ratio and Immediately available liquidity reserve
(a) Stage 3 provisions; (b) Impaired loans (stage 3) to customers and credit institutions, on-balance sheet and off-balance sheet, netted of guarantees received, including debt securities measured at amortized costs or at fair value through shareholders' equity (excluding insurance)
(a) Impaired loans (stage 3) to customers and credit institutions, not netted of guarantees, including on-balance sheet and off-balance sheet and debt securities measured at amortized costs or at fair value through shareholders' equity; (b) Gross loans outstanding to customers and credit institutions, on-balance sheet and off-balance sheet and including debt securities measured at amortized costs or at fair value through shareholders' equity (excluding insurance)
(a) Liquid market assets or eligible to central banks (counterbalancing capacity) taking into account prudential standards, notably US standards, minus intra-day payment systems needs
30-Sep-21 30-Sep-20
Doubtful loans (a) / Loans (b) 2.0% 2.2%
€bn 30-Sep-21 30-Sep-20Allowance for loan losses (a) 17.0 17.1
Doubtful loans (b) 23.1 24.0Stage 3 coverage ratio 73.6% 71.3%
30-Sep-21 30-Sep-20Liquidity Coverage Ratio 136% 147%
Immediately available liquidity reserve (€bn) (a) 478 472
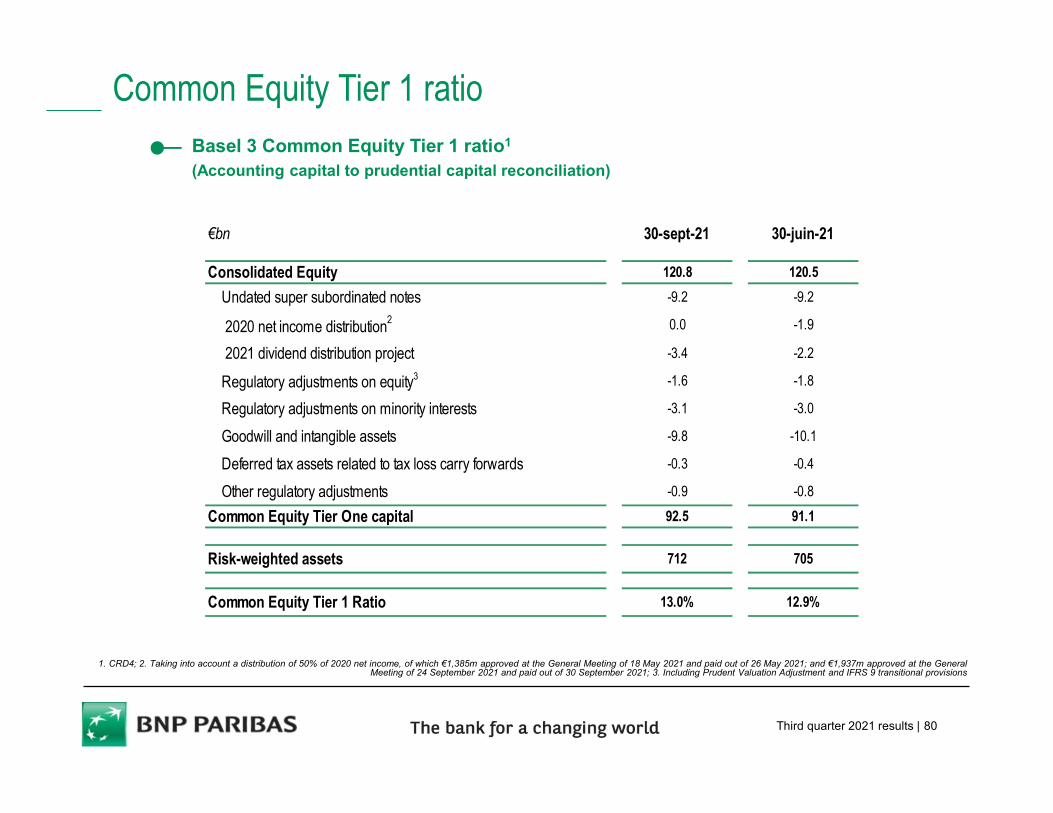
Third quarter 2021 results | 80
Common Equity Tier 1 ratioBasel 3 Common Equity Tier 1 ratio1
(Accounting capital to prudential capital reconciliation)
1. CRD4; 2. Taking into account a distribution of 50% of 2020 net income, of which €1,385m approved at the General Meeting of 18 May 2021 and paid out of 26 May 2021; and €1,937m approved at the General Meeting of 24 September 2021 and paid out of 30 September 2021; 3. Including Prudent Valuation Adjustment and IFRS 9 transitional provisions
€bn 30-sept-21 30-juin-21
Consolidated Equity 120.8 120.5
Undated super subordinated notes -9.2 -9.2
2020 net income distribution2 0.0 -1.9
2021 dividend distribution project -3.4 -2.2
Regulatory adjustments on equity3 -1.6 -1.8
Regulatory adjustments on minority interests -3.1 -3.0
Goodwill and intangible assets -9.8 -10.1
Deferred tax assets related to tax loss carry forwards -0.3 -0.4
Other regulatory adjustments -0.9 -0.8
Common Equity Tier One capital 92.5 91.1
Risk-weighted assets 712 705
Common Equity Tier 1 Ratio 13.0% 12.9%
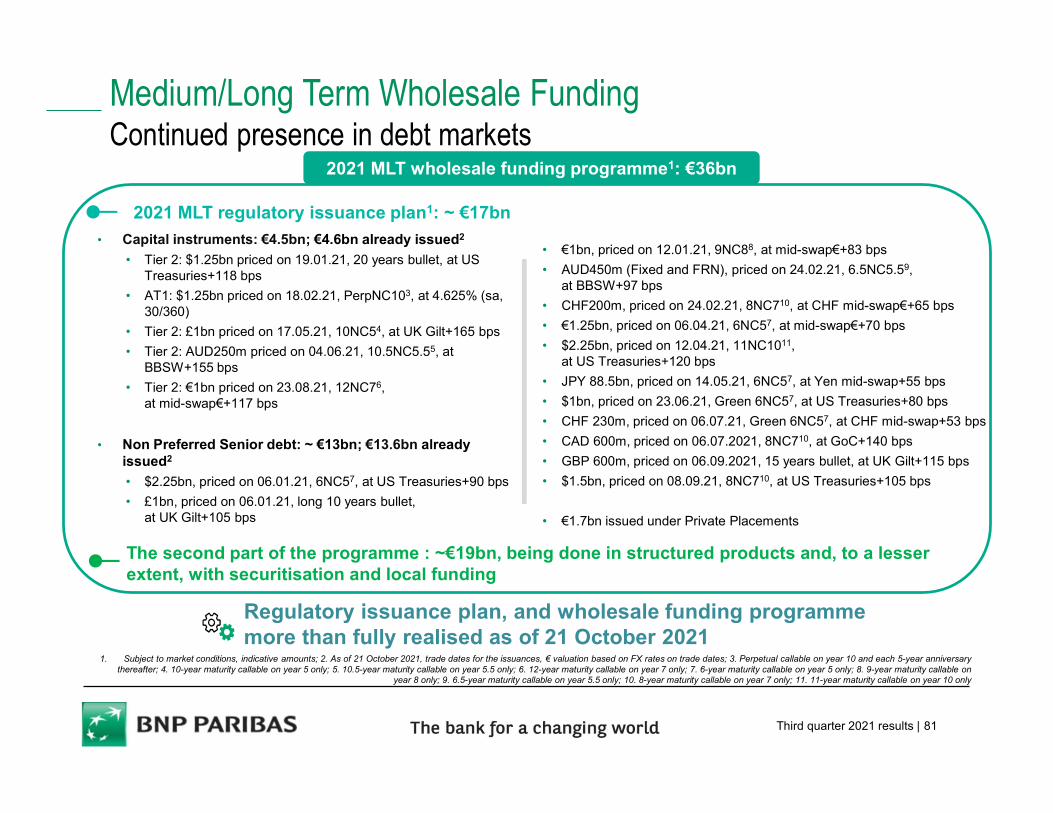
Third quarter 2021 results | 81
• €1bn, priced on 12.01.21, 9NC88, at mid-swap€+83 bps
• AUD450m (Fixed and FRN), priced on 24.02.21, 6.5NC5.59,at BBSW+97 bps
• CHF200m, priced on 24.02.21, 8NC710, at CHF mid-swap€+65 bps
• €1.25bn, priced on 06.04.21, 6NC57, at mid-swap€+70 bps
• $2.25bn, priced on 12.04.21, 11NC1011, at US Treasuries+120 bps
• JPY 88.5bn, priced on 14.05.21, 6NC57, at Yen mid-swap+55 bps
• $1bn, priced on 23.06.21, Green 6NC57, at US Treasuries+80 bps
• CHF 230m, priced on 06.07.21, Green 6NC57, at CHF mid-swap+53 bps
• CAD 600m, priced on 06.07.2021, 8NC710, at GoC+140 bps
• GBP 600m, priced on 06.09.2021, 15 years bullet, at UK Gilt+115 bps
• $1.5bn, priced on 08.09.21, 8NC710, at US Treasuries+105 bps
• €1.7bn issued under Private Placements
2021 MLT wholesale funding programme1: €36bn
Medium/Long Term Wholesale FundingContinued presence in debt markets
1. Subject to market conditions, indicative amounts; 2. As of 21 October 2021, trade dates for the issuances, € valuation based on FX rates on trade dates; 3. Perpetual callable on year 10 and each 5-year anniversary thereafter; 4. 10-year maturity callable on year 5 only; 5. 10.5-year maturity callable on year 5.5 only; 6. 12-year maturity callable on year 7 only; 7. 6-year maturity callable on year 5 only; 8. 9-year maturity callable on
year 8 only; 9. 6.5-year maturity callable on year 5.5 only; 10. 8-year maturity callable on year 7 only; 11. 11-year maturity callable on year 10 only
2021 MLT regulatory issuance plan1: ~ €17bn
• Capital instruments: €4.5bn; €4.6bn already issued2
• Tier 2: $1.25bn priced on 19.01.21, 20 years bullet, at US Treasuries+118 bps
• AT1: $1.25bn priced on 18.02.21, PerpNC103, at 4.625% (sa, 30/360)
• Tier 2: £1bn priced on 17.05.21, 10NC54, at UK Gilt+165 bps
• Tier 2: AUD250m priced on 04.06.21, 10.5NC5.55, at BBSW+155 bps
• Tier 2: €1bn priced on 23.08.21, 12NC76, at mid-swap€+117 bps
• Non Preferred Senior debt: ~ €13bn; €13.6bn already issued2
• $2.25bn, priced on 06.01.21, 6NC57, at US Treasuries+90 bps
• £1bn, priced on 06.01.21, long 10 years bullet, at UK Gilt+105 bps
The second part of the programme : ~€19bn, being done in structured products and, to a lesser extent, with securitisation and local funding
Regulatory issuance plan, and wholesale funding programme more than fully realised as of 21 October 2021
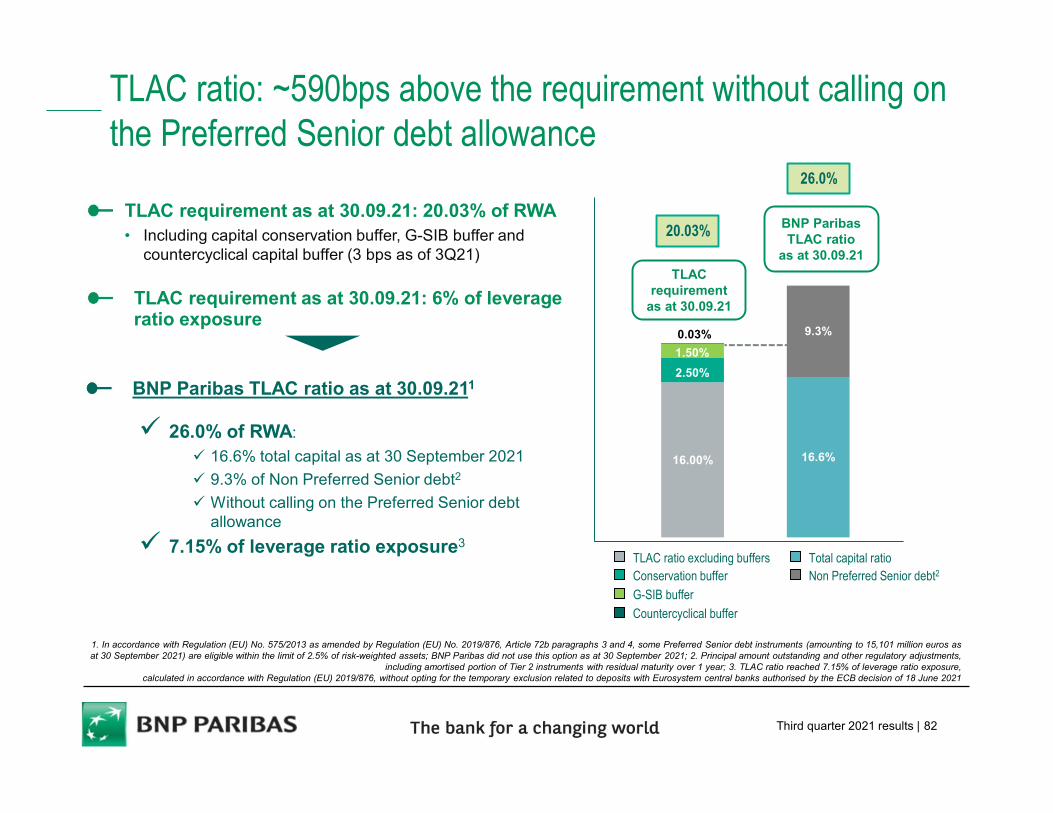
Third quarter 2021 results | 82
16.00% 16.6%
2.50%
9.3%
1.50%
0.03%
TLAC ratio: ~590bps above the requirement without calling on the Preferred Senior debt allowance
TLAC requirement as at 30.09.21: 20.03% of RWA • Including capital conservation buffer, G-SIB buffer and
countercyclical capital buffer (3 bps as of 3Q21)
TLAC requirement as at 30.09.21: 6% of leverage ratio exposure
TLAC requirement
as at 30.09.21
TLAC ratio excluding buffersConservation buffer
G-SIB buffer
Countercyclical buffer
Total capital ratioNon Preferred Senior debt2
BNP Paribas TLAC ratio
as at 30.09.21
BNP Paribas TLAC ratio as at 30.09.211
26.0% of RWA:
16.6% total capital as at 30 September 2021
9.3% of Non Preferred Senior debt2
Without calling on the Preferred Senior debt allowance
7.15% of leverage ratio exposure3
20.03%
1. In accordance with Regulation (EU) No. 575/2013 as amended by Regulation (EU) No. 2019/876, Article 72b paragraphs 3 and 4, some Preferred Senior debt instruments (amounting to 15,101 million euros asat 30 September 2021) are eligible within the limit of 2.5% of risk-weighted assets; BNP Paribas did not use this option as at 30 September 2021; 2. Principal amount outstanding and other regulatory adjustments,
including amortised portion of Tier 2 instruments with residual maturity over 1 year; 3. TLAC ratio reached 7.15% of leverage ratio exposure, calculated in accordance with Regulation (EU) 2019/876, without opting for the temporary exclusion related to deposits with Eurosystem central banks authorised by the ECB decision of 18 June 2021
26.0%
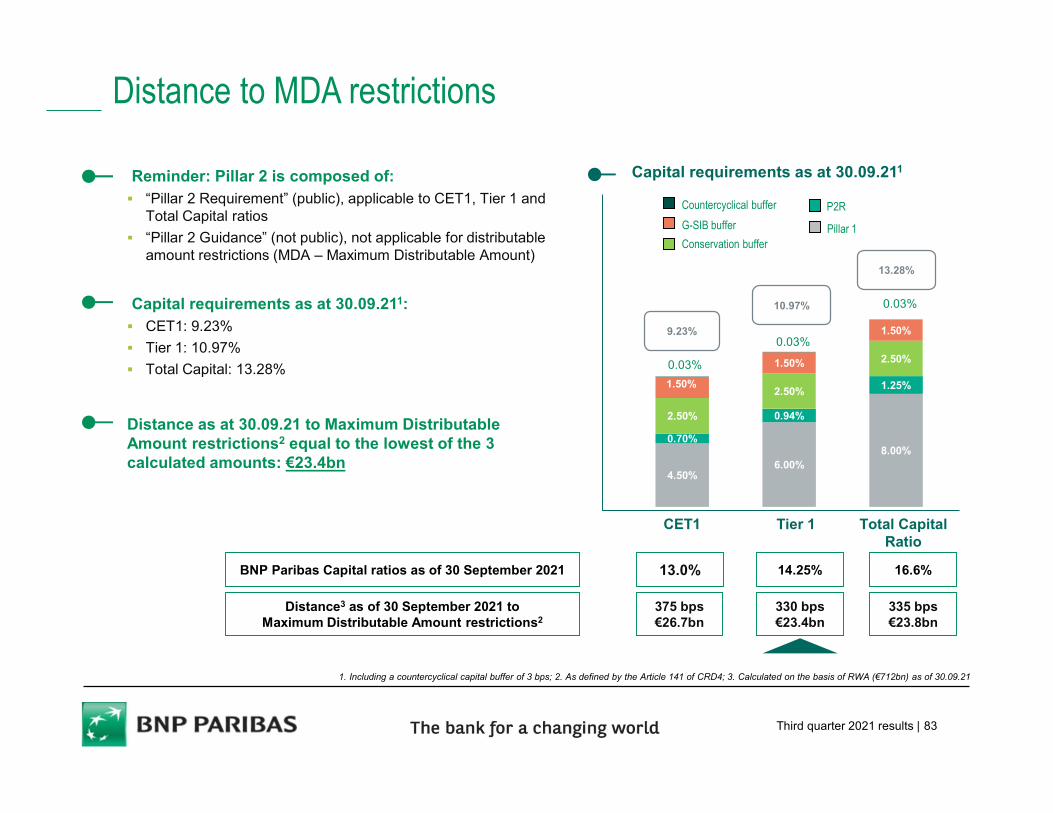
Third quarter 2021 results | 83
4.50%6.00%
8.00%0.70%
0.94%
1.25%
2.50%
2.50%
2.50%
1.50%
1.50%
1.50%9.23%
10.97%
13.28%
G-SIB buffer
P2RCountercyclical buffer
Distance to MDA restrictions
Reminder: Pillar 2 is composed of: “Pillar 2 Requirement” (public), applicable to CET1, Tier 1 and
Total Capital ratios
“Pillar 2 Guidance” (not public), not applicable for distributable amount restrictions (MDA – Maximum Distributable Amount)
Capital requirements as at 30.09.211: CET1: 9.23%
Tier 1: 10.97%
Total Capital: 13.28%
Distance as at 30.09.21 to Maximum Distributable Amount restrictions2 equal to the lowest of the 3 calculated amounts: €23.4bn
Conservation bufferPillar 1
Capital requirements as at 30.09.211
Tier 1 Total Capital Ratio
CET1
0.03%
0.03%
0.03%
16.6%
335 bps€23.8bn
14.25%
330 bps€23.4bn
13.0%
375 bps€26.7bn
BNP Paribas Capital ratios as of 30 September 2021
Distance3 as of 30 September 2021 to Maximum Distributable Amount restrictions2
1. Including a countercyclical capital buffer of 3 bps; 2. As defined by the Article 141 of CRD4; 3. Calculated on the basis of RWA (€712bn) as of 30.09.21
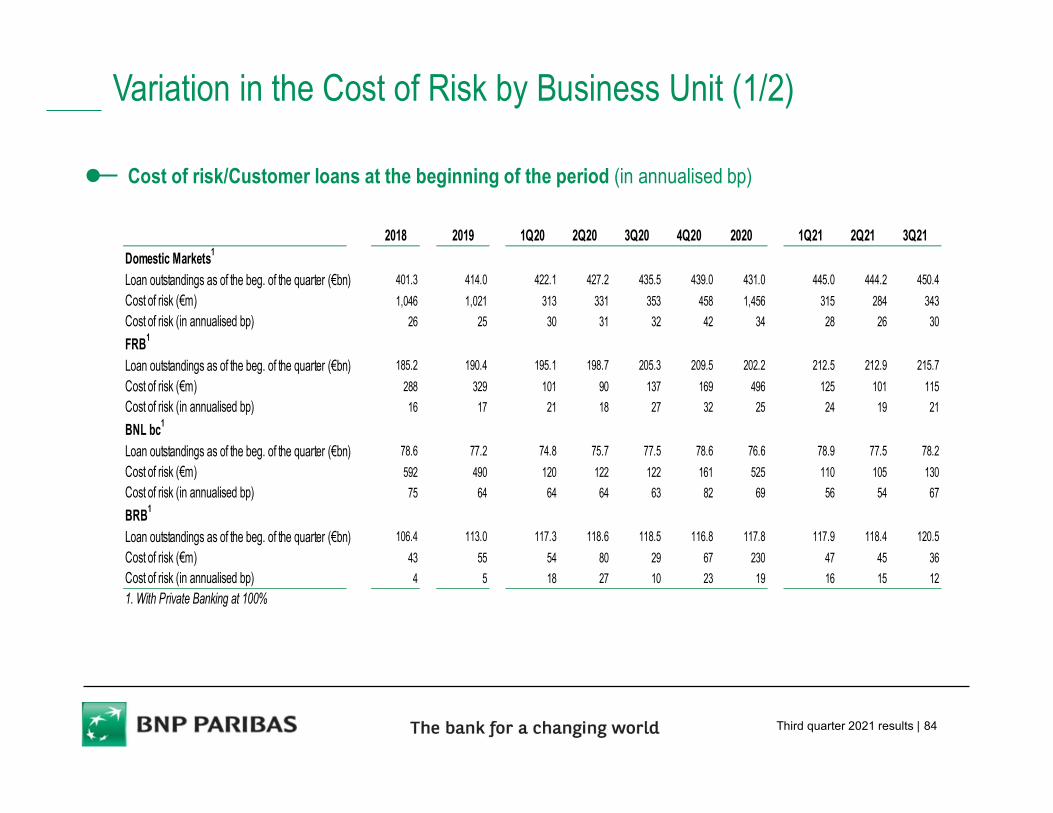
Third quarter 2021 results | 84
Variation in the Cost of Risk by Business Unit (1/2)
Cost of risk/Customer loans at the beginning of the period (in annualised bp)
2018 2019 1Q20 2Q20 3Q20 4Q20 2020 1Q21 2Q21 3Q21
Domestic Markets1
Loan outstandings as of the beg. of the quarter (€bn) 401.3 414.0 422.1 427.2 435.5 439.0 431.0 445.0 444.2 450.4
Cost of risk (€m) 1,046 1,021 313 331 353 458 1,456 315 284 343
Cost of risk (in annualised bp) 26 25 30 31 32 42 34 28 26 30
FRB1
Loan outstandings as of the beg. of the quarter (€bn) 185.2 190.4 195.1 198.7 205.3 209.5 202.2 212.5 212.9 215.7
Cost of risk (€m) 288 329 101 90 137 169 496 125 101 115
Cost of risk (in annualised bp) 16 17 21 18 27 32 25 24 19 21
BNL bc1
Loan outstandings as of the beg. of the quarter (€bn) 78.6 77.2 74.8 75.7 77.5 78.6 76.6 78.9 77.5 78.2
Cost of risk (€m) 592 490 120 122 122 161 525 110 105 130
Cost of risk (in annualised bp) 75 64 64 64 63 82 69 56 54 67
BRB1
Loan outstandings as of the beg. of the quarter (€bn) 106.4 113.0 117.3 118.6 118.5 116.8 117.8 117.9 118.4 120.5
Cost of risk (€m) 43 55 54 80 29 67 230 47 45 36
Cost of risk (in annualised bp) 4 5 18 27 10 23 19 16 15 12
1. With Private Banking at 100%
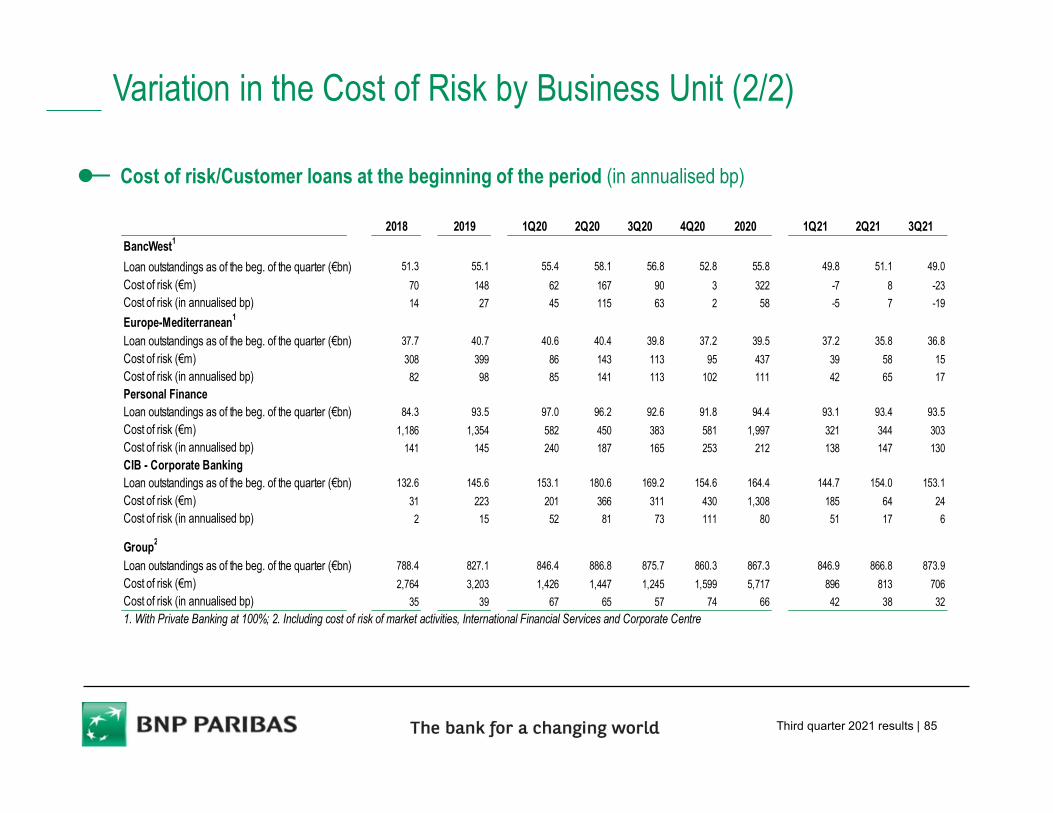
Third quarter 2021 results | 85
Variation in the Cost of Risk by Business Unit (2/2)
Cost of risk/Customer loans at the beginning of the period (in annualised bp)
2018 2019 1Q20 2Q20 3Q20 4Q20 2020 1Q21 2Q21 3Q21
BancWest1
Loan outstandings as of the beg. of the quarter (€bn) 51.3 55.1 55.4 58.1 56.8 52.8 55.8 49.8 51.1 49.0
Cost of risk (€m) 70 148 62 167 90 3 322 -7 8 -23
Cost of risk (in annualised bp) 14 27 45 115 63 2 58 -5 7 -19
Europe-Mediterranean1
Loan outstandings as of the beg. of the quarter (€bn) 37.7 40.7 40.6 40.4 39.8 37.2 39.5 37.2 35.8 36.8
Cost of risk (€m) 308 399 86 143 113 95 437 39 58 15
Cost of risk (in annualised bp) 82 98 85 141 113 102 111 42 65 17
Personal FinanceLoan outstandings as of the beg. of the quarter (€bn) 84.3 93.5 97.0 96.2 92.6 91.8 94.4 93.1 93.4 93.5
Cost of risk (€m) 1,186 1,354 582 450 383 581 1,997 321 344 303
Cost of risk (in annualised bp) 141 145 240 187 165 253 212 138 147 130
CIB - Corporate BankingLoan outstandings as of the beg. of the quarter (€bn) 132.6 145.6 153.1 180.6 169.2 154.6 164.4 144.7 154.0 153.1
Cost of risk (€m) 31 223 201 366 311 430 1,308 185 64 24
Cost of risk (in annualised bp) 2 15 52 81 73 111 80 51 17 6
Group2
Loan outstandings as of the beg. of the quarter (€bn) 788.4 827.1 846.4 886.8 875.7 860.3 867.3 846.9 866.8 873.9
Cost of risk (€m) 2,764 3,203 1,426 1,447 1,245 1,599 5,717 896 813 706
Cost of risk (in annualised bp) 35 39 67 65 57 74 66 42 38 32
1. With Private Banking at 100%; 2. Including cost of risk of market activities, International Financial Services and Corporate Centre
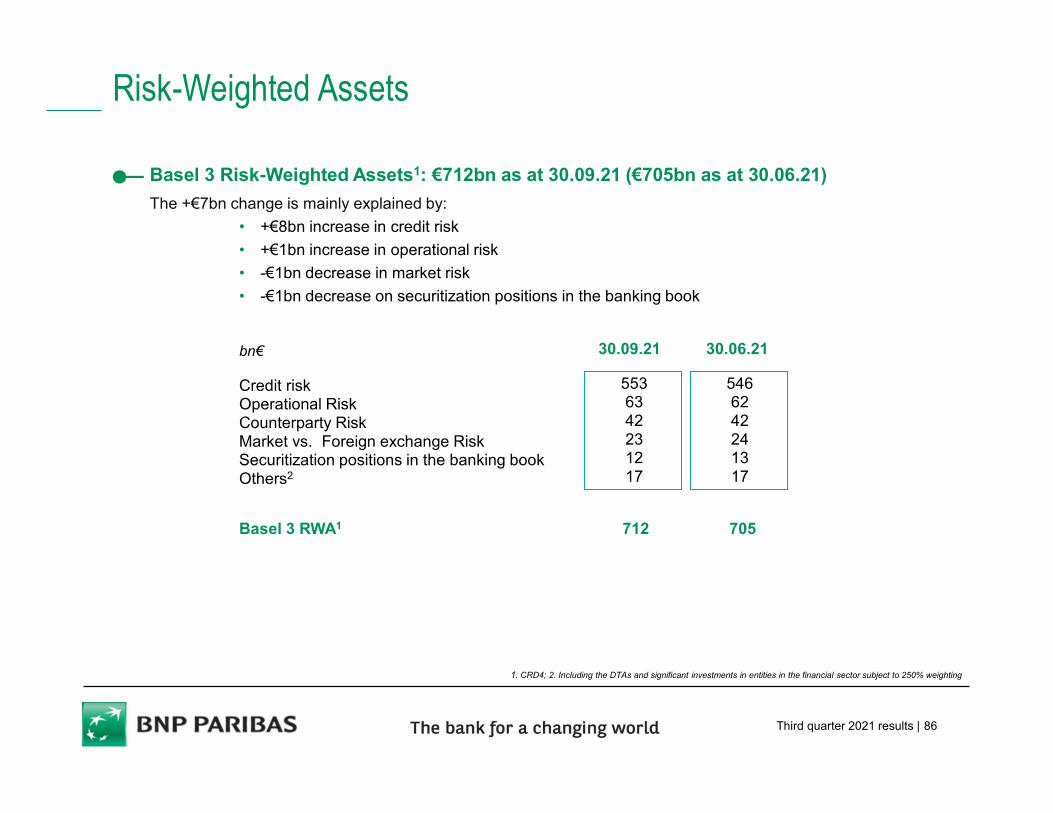
Third quarter 2021 results | 86
Risk-Weighted Assets
1. CRD4; 2. Including the DTAs and significant investments in entities in the financial sector subject to 250% weighting
Basel 3 Risk-Weighted Assets1: €712bn as at 30.09.21 (€705bn as at 30.06.21)
The +€7bn change is mainly explained by:
• +€8bn increase in credit risk
• +€1bn increase in operational risk
• -€1bn decrease in market risk
• -€1bn decrease on securitization positions in the banking book
Credit riskOperational RiskCounterparty RiskMarket vs. Foreign exchange Risk Securitization positions in the banking bookOthers2
bn€
Basel 3 RWA1 712 705
30.09.21 30.06.21
5536342231217
5466242241317
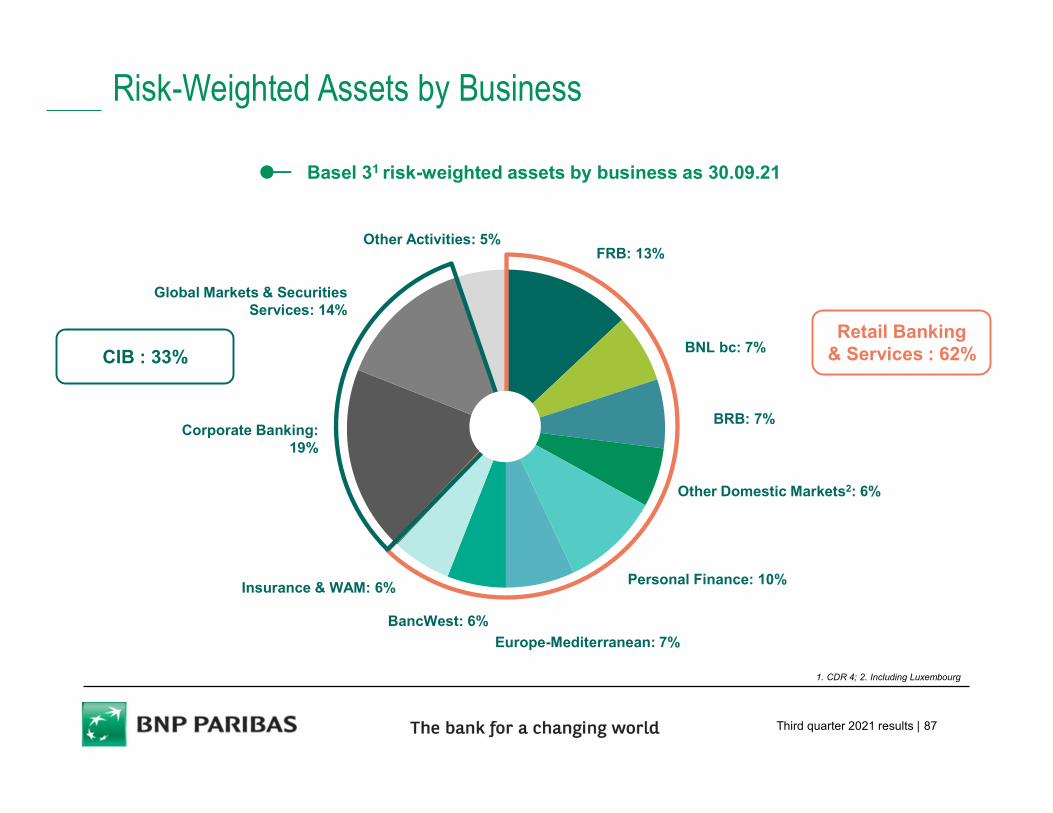
Third quarter 2021 results | 87
Risk-Weighted Assets by Business
Other Domestic Markets2: 6%
BNL bc: 7%
Personal Finance: 10%
BancWest: 6%
BRB: 7%
Europe-Mediterranean: 7%
FRB: 13%
Insurance & WAM: 6%
Corporate Banking: 19%
Other Activities: 5%
Global Markets & Securities Services: 14%
Basel 31 risk-weighted assets by business as 30.09.21
1. CDR 4; 2. Including Luxembourg
CIB : 33%Retail Banking
& Services : 62%