second quarter 2007 - alfa laval
TRANSCRIPT
Second quarter 2007
Alfa Laval AB (publ) PO Box 73 SE-221 00 Lund Sweden Corporate registration number: 556587-8054
Visiting address: Rudeboksvägen 1 Phone: + 46 46 36 65 00 Website: www.alfalaval.com
For more information, please contact: Mikael Sjöblom, Investor Relations Manager Phone: +46 46 36 74 82, Mobile: +46 709 78 74 82, E-mail: [email protected]
Yet another strong quarter! “During the second quarter 2007 we had another record quarter with the highest ever operating result as well as operating margin. Orders received increased organically with 12 percent and reached SEK 6.8 billion. The strongest market segments were Process Industry and Sanitary. Orders received grew with 70 percent in Latin America, while Asia and Western Europe were stable on a high level. Lars Renström, President and CEO, Alfa Laval With the acquisition of AGC Engineering in the US and the increase of ownership in Alfa Laval (India) Ltd we have further strengthened our position in these important countries. For the near future we expect a lower activity level for large orders, particularly in our market segment Energy & Environment. This is due to the very high global demand that creates a lack of capacity among larger end-customers and contractors. The operating margin in the quarter reached 18.5 percent. The combination of very high capacity utilisation, favourable product mix and high internal efficiency contributed to the result. For the near future we expect the operating margin to remain well above 15 percent.”
Second quarter:
Order intake increased by 12.7 percent * to SEK 6,822 (6,217) million.
Net sales increased by 28.6 percent * to SEK 6,094 (4,876) million.
Adjusted EBITA was SEK 1,130 (706) million, including adverse foreign exchange effects of SEK 76 million.
Adjusted EBITA-margin was 18.5 (14.5) percent.
Result after financial items was SEK 1,037 (587) million.
Result after tax increased to SEK 733 (455) million.
Earnings per share increased to SEK 6.48 (3.97). Cash flow from operating activities was SEK 488 (517) million.
Six months:
Order intake increased by 23.4 percent * to SEK 13,827 (11,698) million.
Net sales increased by 30.9 percent * to SEK 11,244 (8,952) million.
Adjusted EBITA was SEK 1,965 (1,231) million, including adverse foreign exchange effects of SEK 155 million.
Adjusted EBITA-margin was 17.5 (13.8) percent.
Result after financial items was SEK 1,718 (1,013) million.
Result after tax increased to SEK 1,202 (788) million.
Earnings per share increased to SEK 10.59 (6.87).
Cash flow from operating activities was SEK 1,038 (909) million.
* excluding exchange rate variations
Alfa Laval AB (publ) Interim report April 1 – June 30, 2007
Outlook for the near future "In many of the markets, geographical as well as customer segments that Alfa Laval serves, a continued very strong demand is expected." Earlier published outlook (April 23, 2007): "In most of the markets, geographical as well as customer segments that Alfa Laval serves, a continued very strong demand is expected."
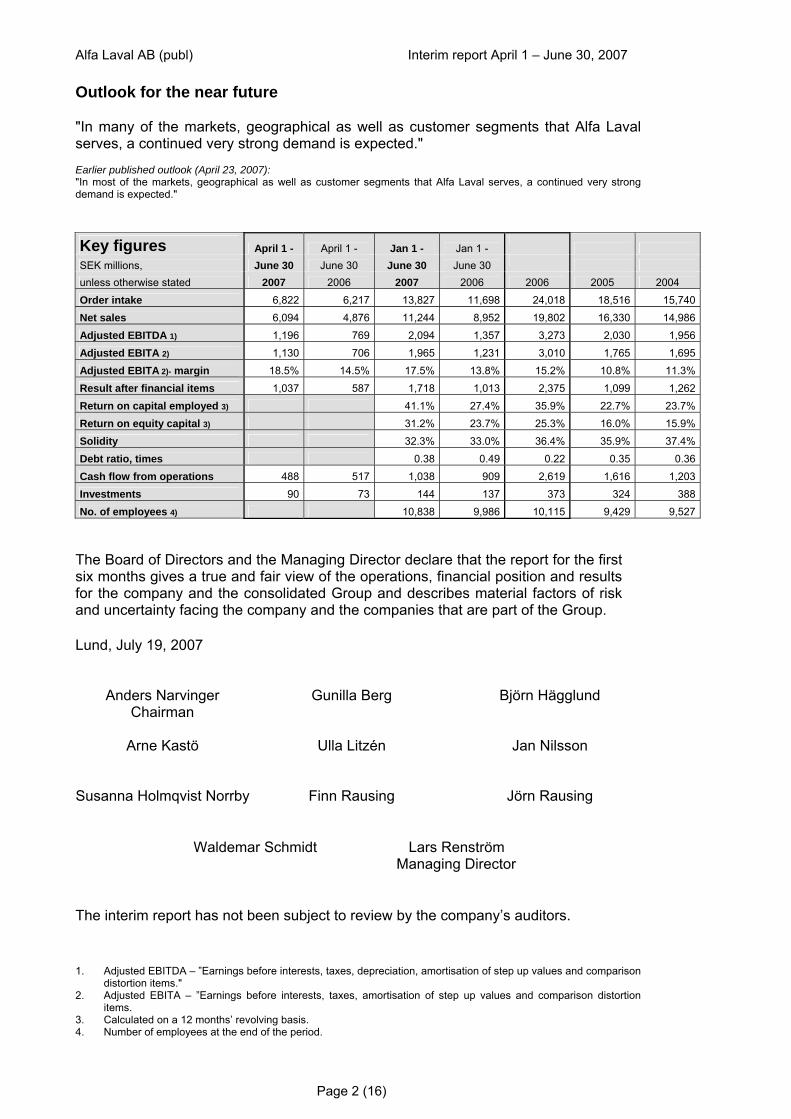
Key figures April 1 - April 1 - Jan 1 - Jan 1 -
SEK millions, June 30 June 30 June 30 June 30 unless otherwise stated 2007 2006 2007 2006 2006 2005 2004 Order intake 6,822 6,217 13,827 11,698 24,018 18,516 15,740Net sales 6,094 4,876 11,244 8,952 19,802 16,330 14,986Adjusted EBITDA 1) 1,196 769 2,094 1,357 3,273 2,030 1,956Adjusted EBITA 2) 1,130 706 1,965 1,231 3,010 1,765 1,695Adjusted EBITA 2)- margin 18.5% 14.5% 17.5% 13.8% 15.2% 10.8% 11.3%Result after financial items 1,037 587 1,718 1,013 2,375 1,099 1,262Return on capital employed 3) 41.1% 27.4% 35.9% 22.7% 23.7%Return on equity capital 3) 31.2% 23.7% 25.3% 16.0% 15.9%Solidity 32.3% 33.0% 36.4% 35.9% 37.4%Debt ratio, times 0.38 0.49 0.22 0.35 0.36Cash flow from operations 488 517 1,038 909 2,619 1,616 1,203Investments 90 73 144 137 373 324 388No. of employees 4) 10,838 9,986 10,115 9,429 9,527
The Board of Directors and the Managing Director declare that the report for the first six months gives a true and fair view of the operations, financial position and results for the company and the consolidated Group and describes material factors of risk and uncertainty facing the company and the companies that are part of the Group. Lund, July 19, 2007
Anders Narvinger Gunilla Berg Björn Hägglund Chairman
Arne Kastö Ulla Litzén Jan Nilsson
Susanna Holmqvist Norrby Finn Rausing Jörn Rausing
Waldemar Schmidt
Lars Renström Managing Director
The interim report has not been subject to review by the company’s auditors.
1. Adjusted EBITDA – ”Earnings before interests, taxes, depreciation, amortisation of step up values and comparison
distortion items." 2. Adjusted EBITA – ”Earnings before interests, taxes, amortisation of step up values and comparison distortion
items. 3. Calculated on a 12 months’ revolving basis. 4. Number of employees at the end of the period.
Page 2 (16)
Alfa Laval AB (publ) Interim report April 1 – June 30, 2007
Management’s discussion and analysis Orders received
01,0002,0003,0004,0005,0006,0007,000
Q1 Q2 Q3 Q4 Q1 Q2 Q3 Q4 Q1 Q2 Q3 Q4 Q1 Q2
2004 2005 2006 2007
SEK millionsquarter
0
5,000
10,000
15,000
20,000
25,000
30,000
SEK millions12 months
Order intake per quarter Orders received rolling 12 months value
+ 20
%
+ 5%
+ 5%
+ 9%
+ 25
%
+ 23
%
+ 28
%
+ 35
%
+ 17
%
+ 36
%
% = change by quarter compared to corresponding period last year, at constant rates
+ 15
%
+ 13
%
+ 23
%
+ 40
%
Order analysis April 1 - June 30
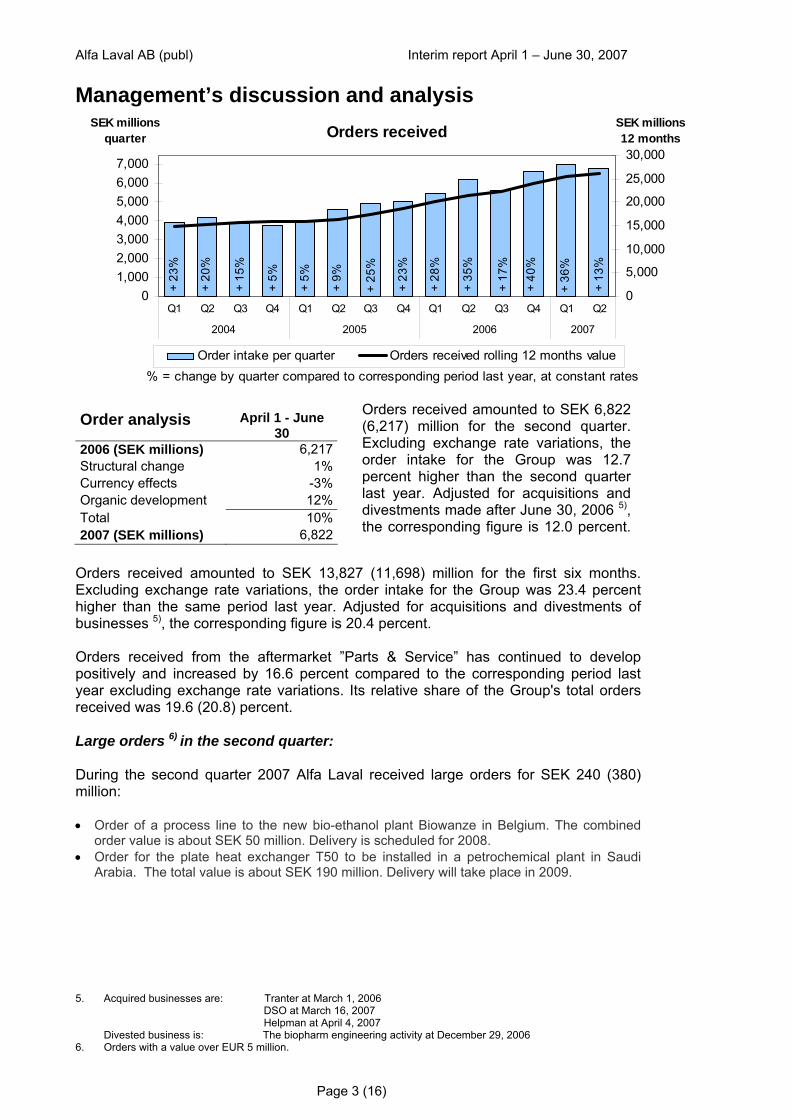
2006 (SEK millions) 6,217Structural change 1%Currency effects -3%Organic development 12%Total 10%2007 (SEK millions) 6,822
Orders received amounted to SEK 13,82Excluding exchange rate variations, the ohigher than the same period last year. Abusinesses 5), the corresponding figure is 2 Orders received from the aftermarket ”Ppositively and increased by 16.6 percent year excluding exchange rate variations. Ireceived was 19.6 (20.8) percent. Large orders 6) in the second quarter: During the second quarter 2007 Alfa Lavamillion: • Order of a process line to the new bio-eth
order value is about SEK 50 million. Delivery• Order for the plate heat exchanger T50 to
Arabia. The total value is about SEK 190 m 5. Acquired businesses are: Tranter at March 1,
DSO at March 16, 2Helpman at April 4,
Divested business is: The biopharm engin6. Orders with a value over EUR 5 million.
Page 3
Orders received amounted to SEK 6,822(6,217) million for the second quarter.Excluding exchange rate variations, theorder intake for the Group was 12.7percent higher than the second quarterlast year. Adjusted for acquisitions anddivestments made after June 30, 2006 5),the corresponding figure is 12.0 percent.
7 (11,698) million for the first six months. rder intake for the Group was 23.4 percent djusted for acquisitions and divestments of 0.4 percent.
arts & Service” has continued to develop compared to the corresponding period last ts relative share of the Group's total orders
l received large orders for SEK 240 (380)
anol plant Biowanze in Belgium. The combined is scheduled for 2008. be installed in a petrochemical plant in Saudi illion. Delivery will take place in 2009.
2006 007
2007 eering activity at December 29, 2006
(16)
Alfa Laval AB (publ) Interim report April 1 – June 30, 2007
Order backlog June 30
4,7936,597
8,5141,611
4,486
6,059
0
3,000
6,000
9,000
12,000
15,000
2005 2006 2007
SEK millions
For delivery nextyear or later
For delivery duringrest of current year
6,404
11,083
14,573
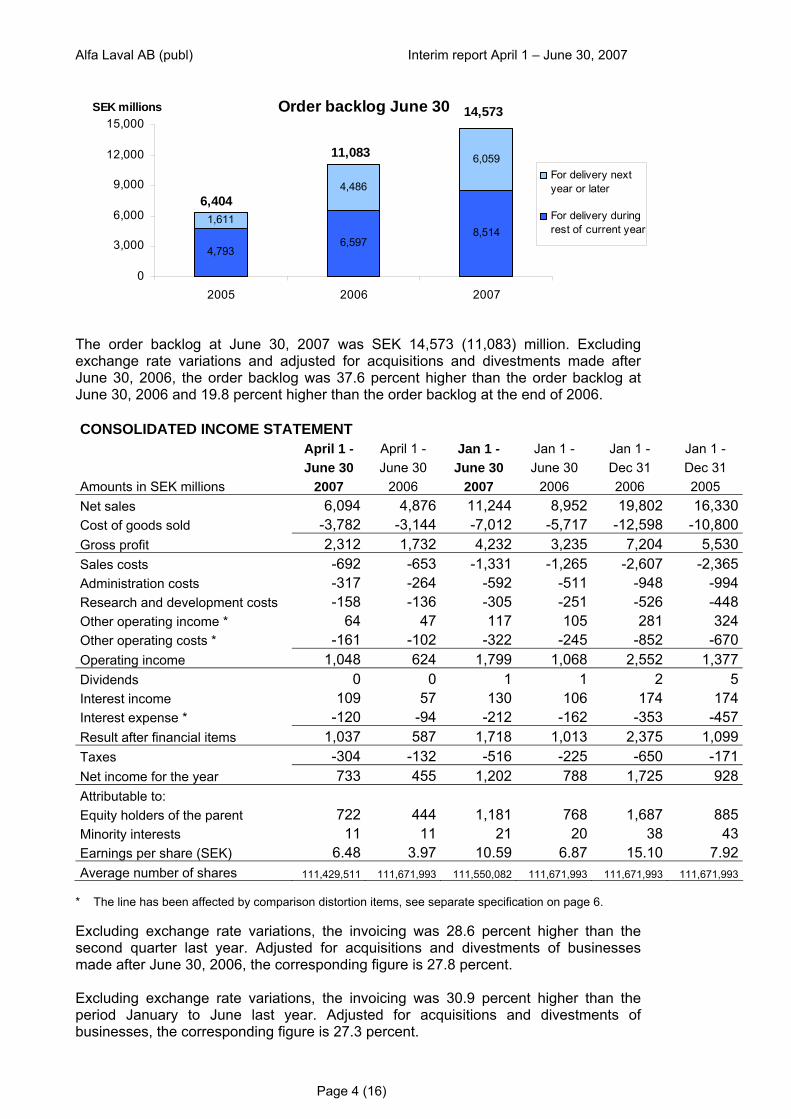
The order backlog at June 30, 2007 was SEK 14,573 (11,083) million. Excluding exchange rate variations and adjusted for acquisitions and divestments made after June 30, 2006, the order backlog was 37.6 percent higher than the order backlog at June 30, 2006 and 19.8 percent higher than the order backlog at the end of 2006. CONSOLIDATED INCOME STATEMENT April 1 - April 1 - Jan 1 - Jan 1 - Jan 1 - Jan 1 - June 30 June 30 June 30 June 30 Dec 31 Dec 31 Amounts in SEK millions 2007 2006 2007 2006 2006 2005 Net sales 6,094 4,876 11,244 8,952 19,802 16,330Cost of goods sold -3,782 -3,144 -7,012 -5,717 -12,598 -10,800Gross profit 2,312 1,732 4,232 3,235 7,204 5,530Sales costs -692 -653 -1,331 -1,265 -2,607 -2,365Administration costs -317 -264 -592 -511 -948 -994Research and development costs -158 -136 -305 -251 -526 -448Other operating income * 64 47 117 105 281 324Other operating costs * -161 -102 -322 -245 -852 -670Operating income 1,048 624 1,799 1,068 2,552 1,377Dividends 0 0 1 1 2 5Interest income 109 57 130 106 174 174Interest expense * -120 -94 -212 -162 -353 -457Result after financial items 1,037 587 1,718 1,013 2,375 1,099Taxes -304 -132 -516 -225 -650 -171Net income for the year 733 455 1,202 788 1,725 928Attributable to: Equity holders of the parent 722 444 1,181 768 1,687 885Minority interests 11 11 21 20 38 43Earnings per share (SEK) 6.48 3.97 10.59 6.87 15.10 7.92Average number of shares 111,429,511 111,671,993 111,550,082 111,671,993 111,671,993 111,671,993
* The line has been affected by comparison distortion items, see separate specification on page 6. Excluding exchange rate variations, the invoicing was 28.6 percent higher than the second quarter last year. Adjusted for acquisitions and divestments of businesses made after June 30, 2006, the corresponding figure is 27.8 percent. Excluding exchange rate variations, the invoicing was 30.9 percent higher than the period January to June last year. Adjusted for acquisitions and divestments of businesses, the corresponding figure is 27.3 percent.
Page 4 (16)
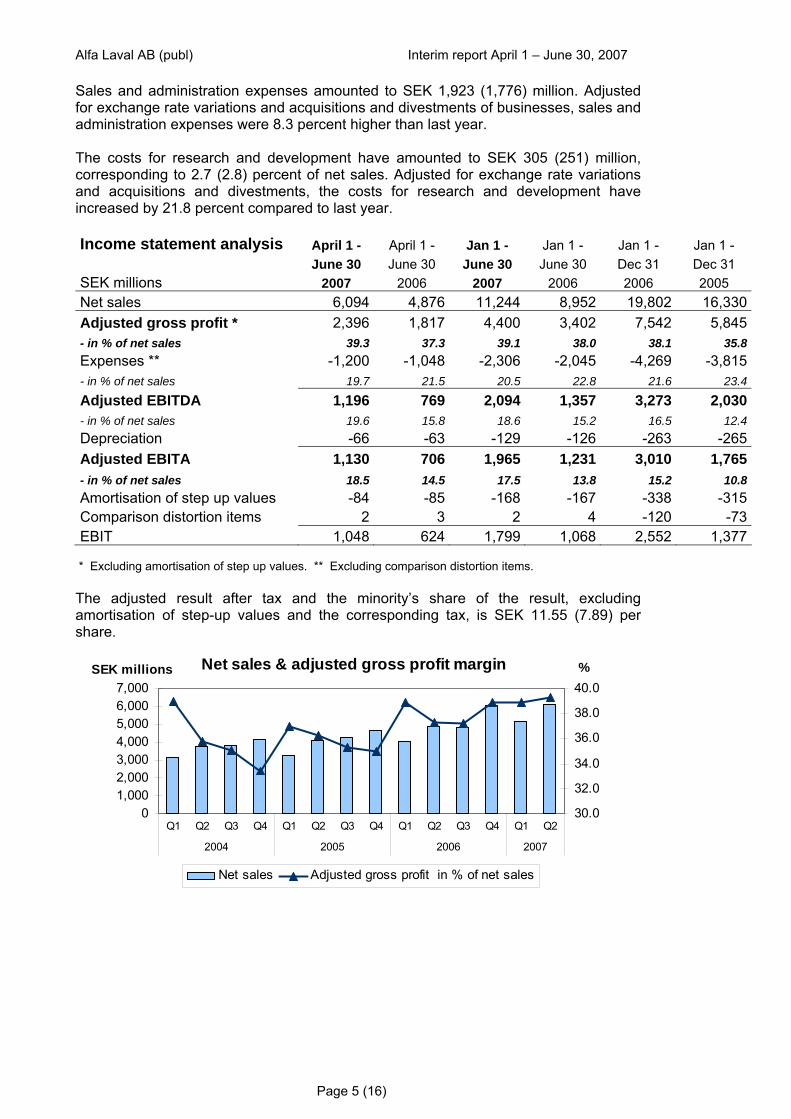
Alfa Laval AB (publ) Interim report April 1 – June 30, 2007 Sales and administration expenses amounted to SEK 1,923 (1,776) million. Adjusted for exchange rate variations and acquisitions and divestments of businesses, sales and administration expenses were 8.3 percent higher than last year. The costs for research and development have amounted to SEK 305 (251) million, corresponding to 2.7 (2.8) percent of net sales. Adjusted for exchange rate variations and acquisitions and divestments, the costs for research and development have increased by 21.8 percent compared to last year. Income statement analysis April 1 - April 1 - Jan 1 - Jan 1 - Jan 1 - Jan 1 - June 30 June 30 June 30 June 30 Dec 31 Dec 31 SEK millions 2007 2006 2007 2006 2006 2005 Net sales 6,094 4,876 11,244 8,952 19,802 16,330Adjusted gross profit * 2,396 1,817 4,400 3,402 7,542 5,845- in % of net sales 39.3 37.3 39.1 38.0 38.1 35.8Expenses ** -1,200 -1,048 -2,306 -2,045 -4,269 -3,815- in % of net sales 19.7 21.5 20.5 22.8 21.6 23.4
Adjusted EBITDA 1,196 769 2,094 1,357 3,273 2,030- in % of net sales 19.6 15.8 18.6 15.2 16.5 12.4Depreciation -66 -63 -129 -126 -263 -265Adjusted EBITA 1,130 706 1,965 1,231 3,010 1,765- in % of net sales 18.5 14.5 17.5 13.8 15.2 10.8Amortisation of step up values -84 -85 -168 -167 -338 -315Comparison distortion items 2 3 2 4 -120 -73EBIT 1,048 624 1,799 1,068 2,552 1,377
* Excluding amortisation of step up values. ** Excluding comparison distortion items. The adjusted result after tax and the minority’s share of the result, excluding amortisation of step-up values and the corresponding tax, is SEK 11.55 (7.89) per share.
Net sales & adjusted gross profit margin
01,0002,0003,0004,0005,0006,0007,000
Q1 Q2 Q3 Q4 Q1 Q2 Q3 Q4 Q1 Q2 Q3 Q4 Q1 Q2
2004 2005 2006 2007
SEK millions
30.0
32.0
34.0
36.0
38.0
40.0%
Net sales Adjusted gross profit in % of net sales
Page 5 (16)
Alfa Laval AB (publ) Interim report April 1 – June 30, 2007
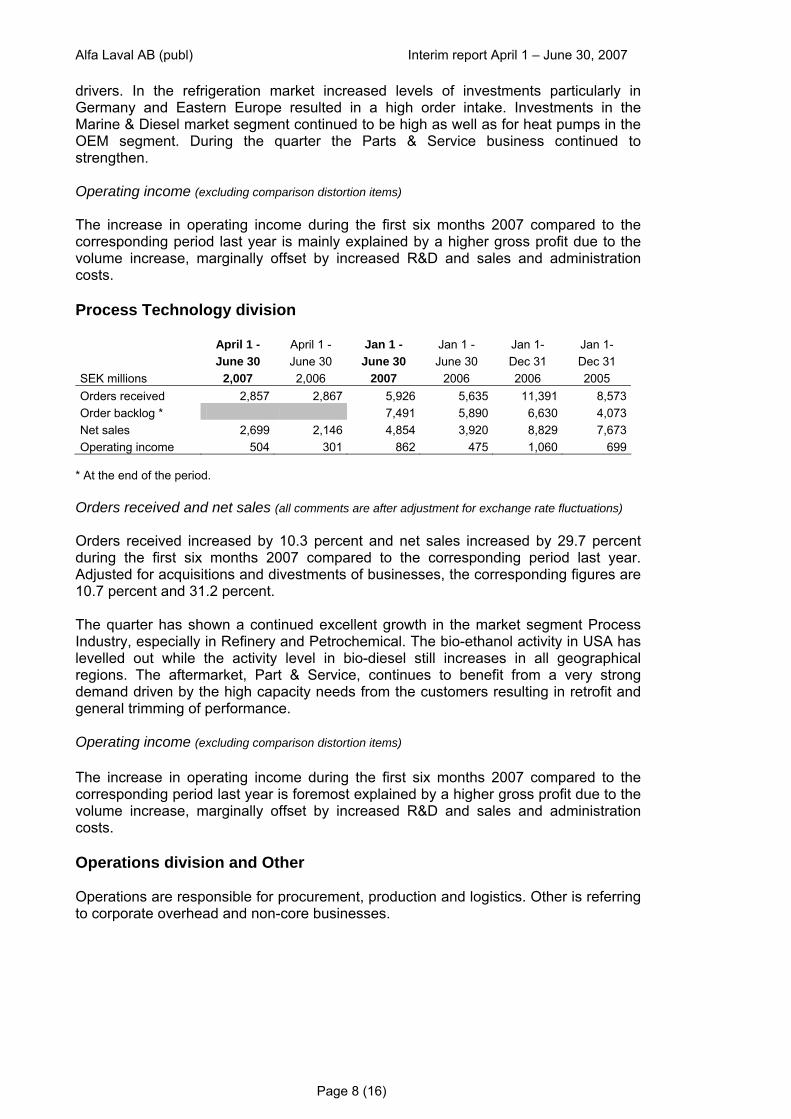
Adjusted EBITA
0
200
400
600
800
1,000
1,200
Q1 Q2 Q3 Q4 Q1 Q2 Q3 Q4 Q1 Q2 Q3 Q4 Q1 Q2
2004 2005 2006 2007
SEK millions
0.0
4.0
8.0
12.0
16.0
20.0%
Adjusted EBITA Adjusted EBITA in % of net sales
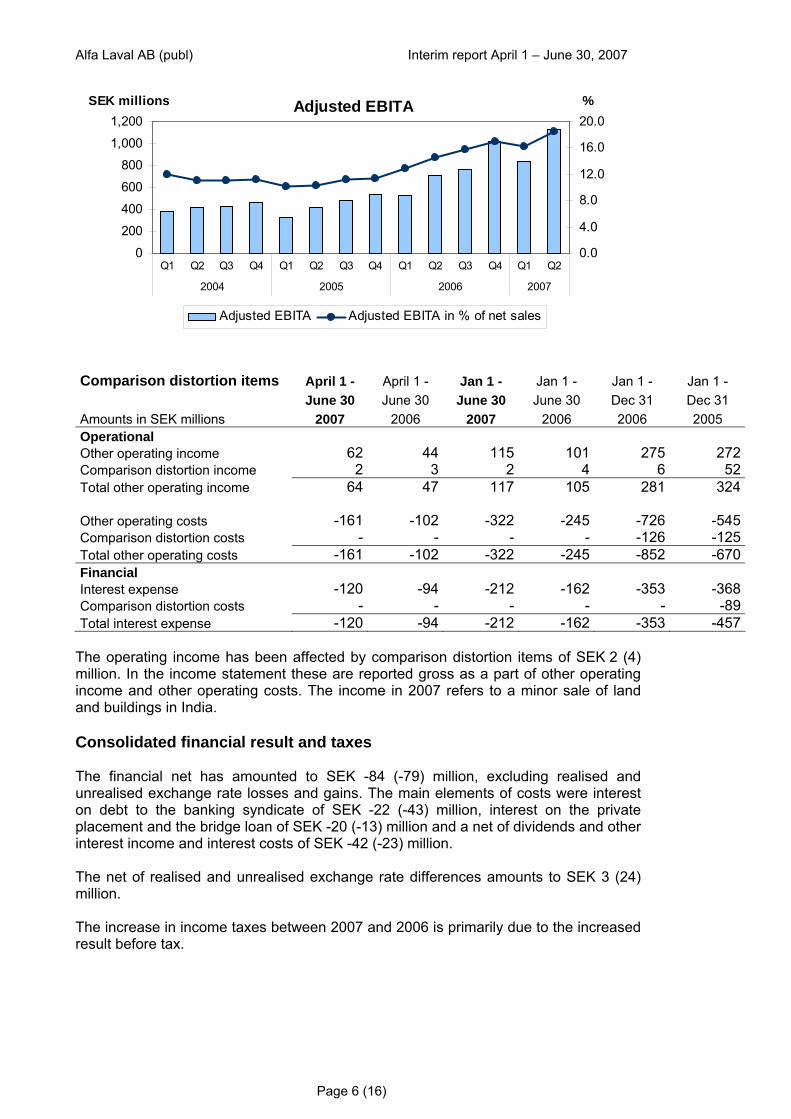
Comparison distortion items April 1 - April 1 - Jan 1 - Jan 1 - Jan 1 - Jan 1 - June 30 June 30 June 30 June 30 Dec 31 Dec 31 Amounts in SEK millions 2007 2006 2007 2006 2006 2005 Operational Other operating income 62 44 115 101 275 272Comparison distortion income 2 3 2 4 6 52Total other operating income 64 47 117 105 281 324 Other operating costs -161 -102 -322 -245 -726 -545Comparison distortion costs - - - - -126 -125Total other operating costs -161 -102 -322 -245 -852 -670Financial Interest expense -120 -94 -212 -162 -353 -368Comparison distortion costs - - - - - -89Total interest expense -120 -94 -212 -162 -353 -457
The operating income has been affected by comparison distortion items of SEK 2 (4) million. In the income statement these are reported gross as a part of other operating income and other operating costs. The income in 2007 refers to a minor sale of land and buildings in India. Consolidated financial result and taxes The financial net has amounted to SEK -84 (-79) million, excluding realised and unrealised exchange rate losses and gains. The main elements of costs were interest on debt to the banking syndicate of SEK -22 (-43) million, interest on the private placement and the bridge loan of SEK -20 (-13) million and a net of dividends and other interest income and interest costs of SEK -42 (-23) million. The net of realised and unrealised exchange rate differences amounts to SEK 3 (24) million. The increase in income taxes between 2007 and 2006 is primarily due to the increased result before tax.
Page 6 (16)
Alfa Laval AB (publ) Interim report April 1 – June 30, 2007
Divisional reporting Orders received by segment Q2 2007
Marine & Diesel
Fluids & Utility
OEM
SanitaryFood
Technology
Energy & Environment
Process Industry
Parts & Service
Life Science
Comfort & Refrigeration
Orders received by segment YTD 2007
Fluids & Utility
OEM
SanitaryFood
Technology
Energy & Environment
Process Industry
Parts & Service
Comfort & Refrigeration
Life ScienceMarine & Diesel
= increase
= decrease compared to corresponding period last year, at constant rates adjusted for acquisitions and divestments
■ = Equipment
■ = Process Technology
■ = Parts & Service
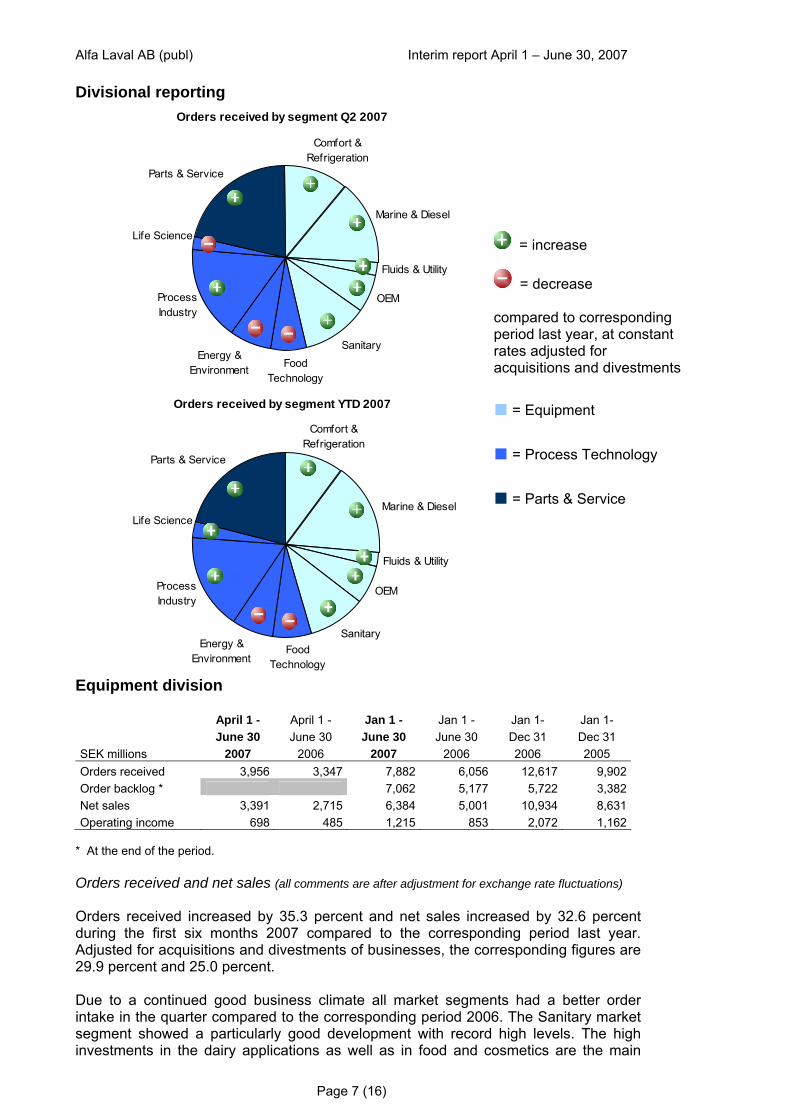
Equipment division April 1 - April 1 - Jan 1 - Jan 1 - Jan 1- Jan 1- June 30 June 30 June 30 June 30 Dec 31 Dec 31 SEK millions 2007 2006 2007 2006 2006 2005 Orders received 3,956 3,347 7,882 6,056 12,617 9,902 Order backlog * 7,062 5,177 5,722 3,382 Net sales 3,391 2,715 6,384 5,001 10,934 8,631 Operating income 698 485 1,215 853 2,072 1,162
* At the end of the period. Orders received and net sales (all comments are after adjustment for exchange rate fluctuations) Orders received increased by 35.3 percent and net sales increased by 32.6 percent during the first six months 2007 compared to the corresponding period last year. Adjusted for acquisitions and divestments of businesses, the corresponding figures are 29.9 percent and 25.0 percent. Due to a continued good business climate all market segments had a better order intake in the quarter compared to the corresponding period 2006. The Sanitary market segment showed a particularly good development with record high levels. The high investments in the dairy applications as well as in food and cosmetics are the main
Page 7 (16)
Alfa Laval AB (publ) Interim report April 1 – June 30, 2007 drivers. In the refrigeration market increased levels of investments particularly in Germany and Eastern Europe resulted in a high order intake. Investments in the Marine & Diesel market segment continued to be high as well as for heat pumps in the OEM segment. During the quarter the Parts & Service business continued to strengthen. Operating income (excluding comparison distortion items) The increase in operating income during the first six months 2007 compared to the corresponding period last year is mainly explained by a higher gross profit due to the volume increase, marginally offset by increased R&D and sales and administration costs. Process Technology division April 1 - April 1 - Jan 1 - Jan 1 - Jan 1- Jan 1- June 30 June 30 June 30 June 30 Dec 31 Dec 31 SEK millions 2,007 2,006 2007 2006 2006 2005 Orders received 2,857 2,867 5,926 5,635 11,391 8,573 Order backlog * 7,491 5,890 6,630 4,073 Net sales 2,699 2,146 4,854 3,920 8,829 7,673 Operating income 504 301 862 475 1,060 699
* At the end of the period. Orders received and net sales (all comments are after adjustment for exchange rate fluctuations) Orders received increased by 10.3 percent and net sales increased by 29.7 percent during the first six months 2007 compared to the corresponding period last year. Adjusted for acquisitions and divestments of businesses, the corresponding figures are 10.7 percent and 31.2 percent. The quarter has shown a continued excellent growth in the market segment Process Industry, especially in Refinery and Petrochemical. The bio-ethanol activity in USA has levelled out while the activity level in bio-diesel still increases in all geographical regions. The aftermarket, Part & Service, continues to benefit from a very strong demand driven by the high capacity needs from the customers resulting in retrofit and general trimming of performance. Operating income (excluding comparison distortion items) The increase in operating income during the first six months 2007 compared to the corresponding period last year is foremost explained by a higher gross profit due to the volume increase, marginally offset by increased R&D and sales and administration costs. Operations division and Other Operations are responsible for procurement, production and logistics. Other is referring to corporate overhead and non-core businesses.
Page 8 (16)
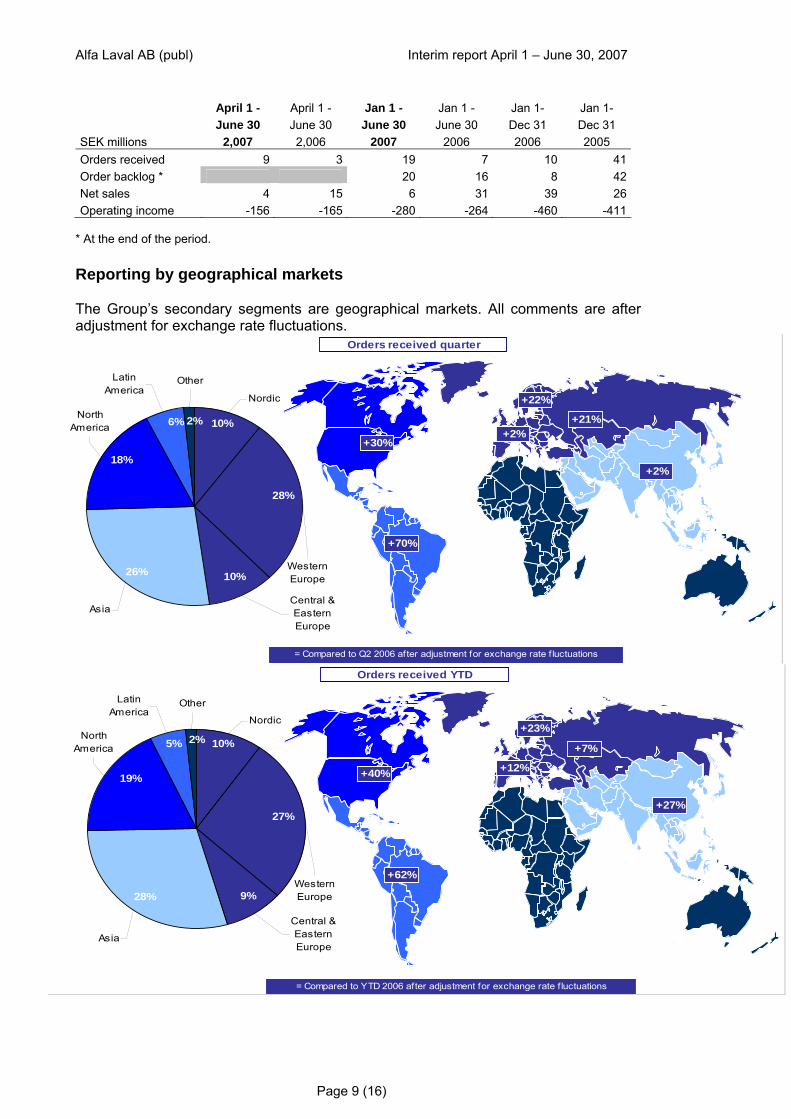
Alfa Laval AB (publ) Interim report April 1 – June 30, 2007 April 1 - April 1 - Jan 1 - Jan 1 - Jan 1- Jan 1- June 30 June 30 June 30 June 30 Dec 31 Dec 31 SEK millions 2,007 2,006 2007 2006 2006 2005 Orders received 9 3 19 7 10 41 Order backlog * 20 16 8 42 Net sales 4 15 6 31 39 26 Operating income -156 -165 -280 -264 -460 -411
* At the end of the period. Reporting by geographical markets The Group’s secondary segments are geographical markets. All comments are after adjustment for exchange rate fluctuations.
Western Europe
Central & Eastern Europe
Nordic
Other Latin America
North America
Asia
Orders received quarter
= Compared to Q2 2006 after adjustment for exchange rate f luctuations
10%
+21%2%
28%
+2%
26%
+2%
+22%
10%
+70%
+30%18%
6%
Western Europe
Central & Eastern Europe
Nordic
Other Latin America
North America
Asia
= Compared to YTD 2006 after adjustment for exchange rate f luctuations
Orders received YTD
9%
+7%2%
27%
+12%
28%
+23%10%
+27%
+62%
+40%19%
5%
Page 9 (16)
Alfa Laval AB (publ) Interim report April 1 – June 30, 2007 Western Europe including Nordic Capital sales in the Equipment Division and sales in the aftermarket have shown a continued strong development. In the Equipment Division the best development was in the market segments Refrigeration, Sanitary and Fluids & Utilities. In the Process Technology Division the base business for capital sales was flat compared to the second quarter 2006 at the same time as a large order in France last year was not repeated. The strongest development was seen in the market segment Process Industry. Central and Eastern Europe Overall it was a strong quarter in the region with excellent growth in the market segments Sanitary, Process Industry, Energy & Environment as well as the aftermarket, Parts & Service. The level of base orders developed strongly, which shows that investments in presence and focus on Parts & Service is paying off. The strongest order development came from Russia and Poland. North America Base sales during the quarter were above last year and the aftermarket Parts & Service showed a continued strong development. The best segment with a very strong development was Process Industry that received a number of large orders. Latin America There has been a continued very good development across the region and especially in Brazil. The market segments Process Industry, Sanitary and Energy and Environment as well as the aftermarket, Parts & Service, are showing excellent growth. Most of the growth comes from the base business, which shows that investment in training of sales force and focus on Parts & Service is paying off. Asia Orders received during the quarter were on the same level as the same period last year, which was a very strong quarter. Base sales for the second quarter showed a positive development reflecting a continuing strong business climate. The best performing market segments were Sanitary, Refrigeration & Cooling and Fluids & Utilities. The best growth was in South East Asia, Oceania, Korea and India. The marine market continues to show a positive trend in the main shipbuilding countries Japan, Korea and China. Similarly, the energy market continues to shows a strong demand, although orders received were below the level of the second quarter 2006 when some large orders were received that were not repeated in 2007
Page 10 (16)
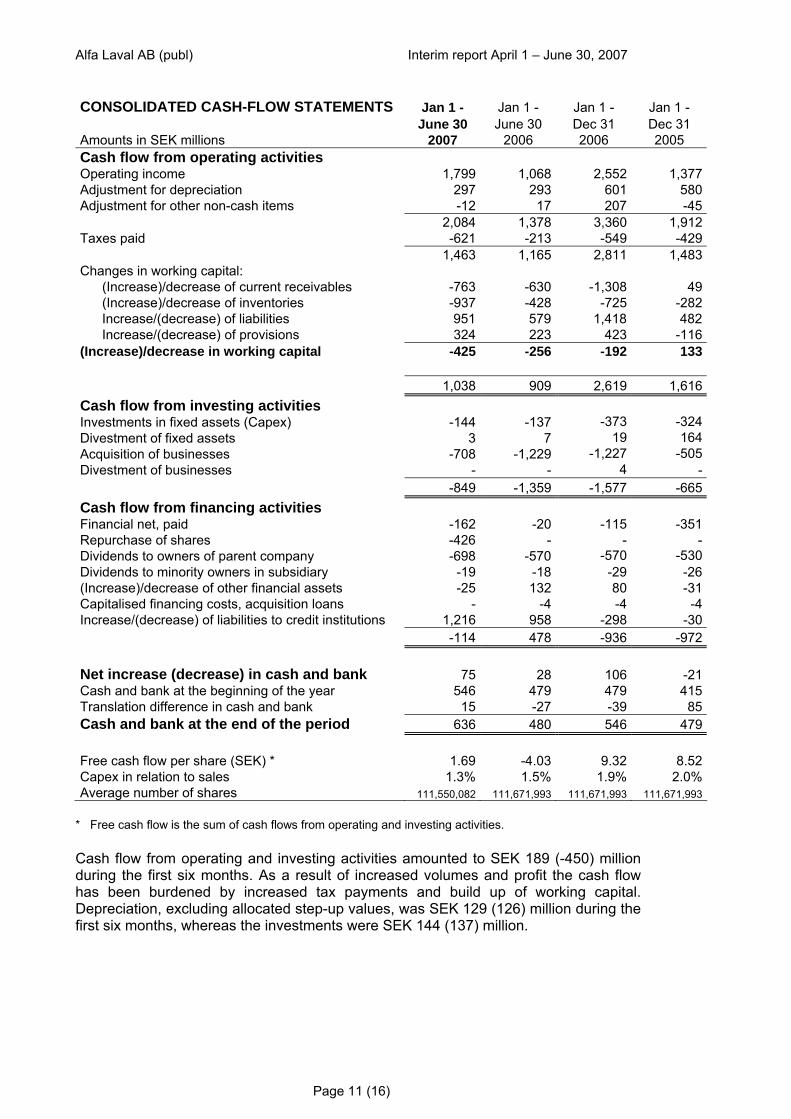
Alfa Laval AB (publ) Interim report April 1 – June 30, 2007 CONSOLIDATED CASH-FLOW STATEMENTS Jan 1 - Jan 1 - Jan 1 - Jan 1 - June 30 June 30 Dec 31 Dec 31 Amounts in SEK millions 2007 2006 2006 2005 Cash flow from operating activities Operating income 1,799 1,068 2,552 1,377Adjustment for depreciation 297 293 601 580Adjustment for other non-cash items -12 17 207 -45 2,084 1,378 3,360 1,912Taxes paid -621 -213 -549 -429 1,463 1,165 2,811 1,483Changes in working capital: (Increase)/decrease of current receivables -763 -630 -1,308 49 (Increase)/decrease of inventories -937 -428 -725 -282 Increase/(decrease) of liabilities 951 579 1,418 482 Increase/(decrease) of provisions 324 223 423 -116(Increase)/decrease in working capital -425 -256 -192 133 1,038 909 2,619 1,616Cash flow from investing activities Investments in fixed assets (Capex) -144 -137 -373 -324Divestment of fixed assets 3 7 19 164Acquisition of businesses -708 -1,229 -1,227 -505Divestment of businesses - - 4 - -849 -1,359 -1,577 -665Cash flow from financing activities Financial net, paid -162 -20 -115 -351Repurchase of shares -426 - - -Dividends to owners of parent company -698 -570 -570 -530Dividends to minority owners in subsidiary -19 -18 -29 -26(Increase)/decrease of other financial assets -25 132 80 -31Capitalised financing costs, acquisition loans - -4 -4 -4Increase/(decrease) of liabilities to credit institutions 1,216 958 -298 -30 -114 478 -936 -972 Net increase (decrease) in cash and bank 75 28 106 -21Cash and bank at the beginning of the year 546 479 479 415Translation difference in cash and bank 15 -27 -39 85Cash and bank at the end of the period 636 480 546 479 Free cash flow per share (SEK) * 1.69 -4.03 9.32 8.52Capex in relation to sales 1.3% 1.5% 1.9% 2.0%Average number of shares 111,550,082 111,671,993 111,671,993 111,671,993
* Free cash flow is the sum of cash flows from operating and investing activities. Cash flow from operating and investing activities amounted to SEK 189 (-450) million during the first six months. As a result of increased volumes and profit the cash flow has been burdened by increased tax payments and build up of working capital. Depreciation, excluding allocated step-up values, was SEK 129 (126) million during the first six months, whereas the investments were SEK 144 (137) million.
Page 11 (16)
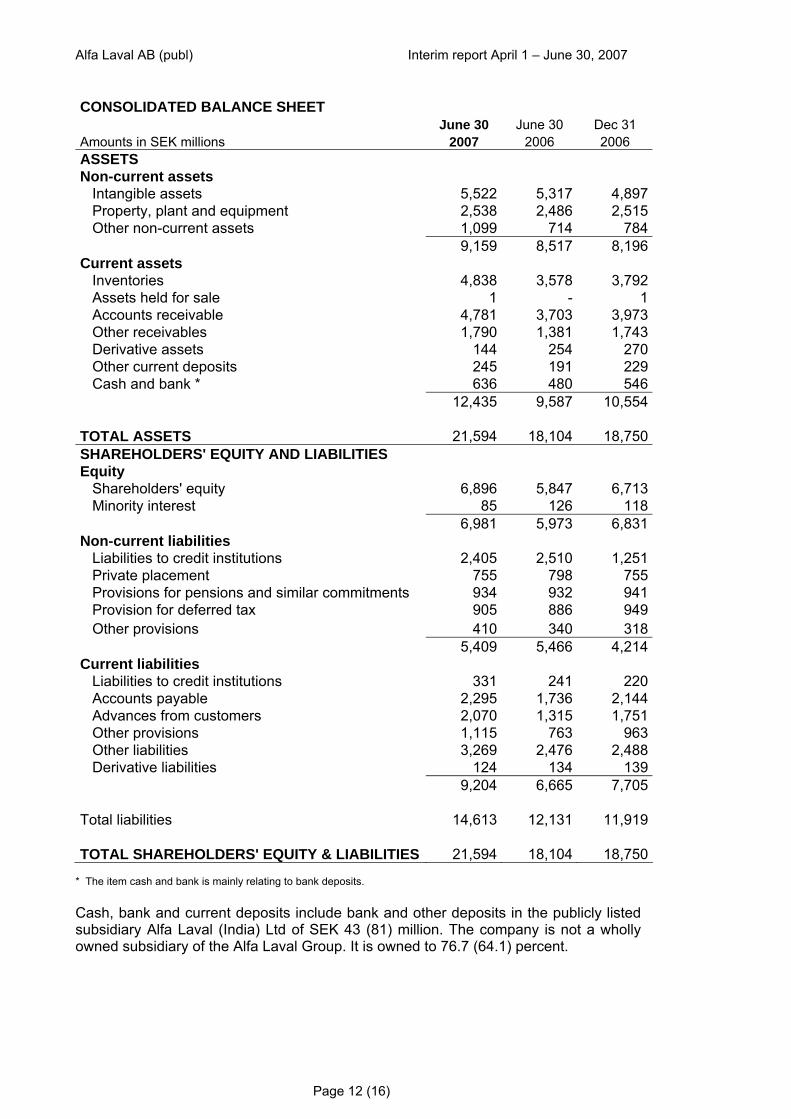
Alfa Laval AB (publ) Interim report April 1 – June 30, 2007 CONSOLIDATED BALANCE SHEET June 30 June 30 Dec 31 Amounts in SEK millions 2007 2006 2006 ASSETS Non-current assets Intangible assets 5,522 5,317 4,897 Property, plant and equipment 2,538 2,486 2,515 Other non-current assets 1,099 714 784 9,159 8,517 8,196 Current assets Inventories 4,838 3,578 3,792 Assets held for sale 1 - 1 Accounts receivable 4,781 3,703 3,973 Other receivables 1,790 1,381 1,743 Derivative assets 144 254 270 Other current deposits 245 191 229 Cash and bank * 636 480 546 12,435 9,587 10,554 TOTAL ASSETS 21,594 18,104 18,750 SHAREHOLDERS' EQUITY AND LIABILITIES Equity Shareholders' equity 6,896 5,847 6,713 Minority interest 85 126 118 6,981 5,973 6,831 Non-current liabilities Liabilities to credit institutions 2,405 2,510 1,251 Private placement 755 798 755 Provisions for pensions and similar commitments 934 932 941 Provision for deferred tax 905 886 949 Other provisions 410 340 318 5,409 5,466 4,214 Current liabilities Liabilities to credit institutions 331 241 220 Accounts payable 2,295 1,736 2,144 Advances from customers 2,070 1,315 1,751 Other provisions 1,115 763 963 Other liabilities 3,269 2,476 2,488 Derivative liabilities 124 134 139 9,204 6,665 7,705 Total liabilities 14,613 12,131 11,919 TOTAL SHAREHOLDERS' EQUITY & LIABILITIES 21,594 18,104 18,750
* The item cash and bank is mainly relating to bank deposits. Cash, bank and current deposits include bank and other deposits in the publicly listed subsidiary Alfa Laval (India) Ltd of SEK 43 (81) million. The company is not a wholly owned subsidiary of the Alfa Laval Group. It is owned to 76.7 (64.1) percent.
Page 12 (16)
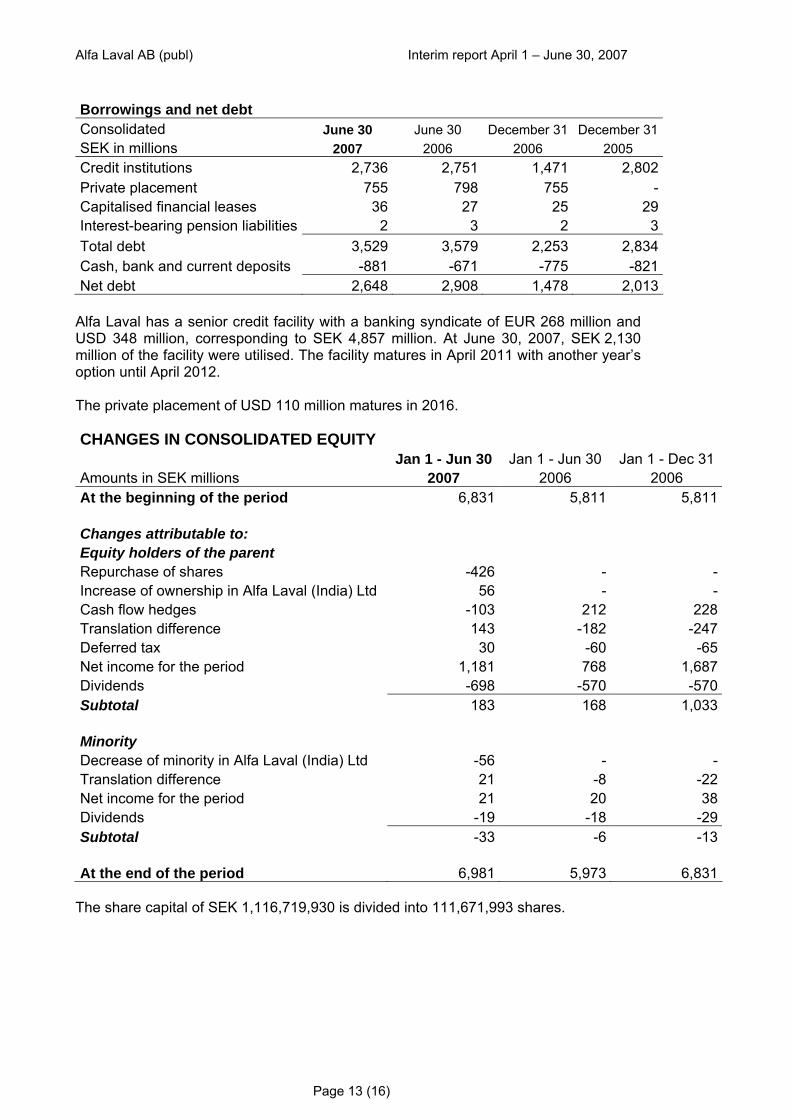
Alfa Laval AB (publ) Interim report April 1 – June 30, 2007 Borrowings and net debt Consolidated June 30 June 30 December 31 December 31SEK in millions 2007 2006 2006 2005 Credit institutions 2,736 2,751 1,471 2,802Private placement 755 798 755 -Capitalised financial leases 36 27 25 29Interest-bearing pension liabilities 2 3 2 3Total debt 3,529 3,579 2,253 2,834Cash, bank and current deposits -881 -671 -775 -821Net debt 2,648 2,908 1,478 2,013
Alfa Laval has a senior credit facility with a banking syndicate of EUR 268 million and USD 348 million, corresponding to SEK 4,857 million. At June 30, 2007, SEK 2,130 million of the facility were utilised. The facility matures in April 2011 with another year’s option until April 2012. The private placement of USD 110 million matures in 2016. CHANGES IN CONSOLIDATED EQUITY Jan 1 - Jun 30 Jan 1 - Jun 30 Jan 1 - Dec 31 Amounts in SEK millions 2007 2006 2006 At the beginning of the period 6,831 5,811 5,811 Changes attributable to: Equity holders of the parent Repurchase of shares -426 - -Increase of ownership in Alfa Laval (India) Ltd 56 - -Cash flow hedges -103 212 228Translation difference 143 -182 -247Deferred tax 30 -60 -65Net income for the period 1,181 768 1,687Dividends -698 -570 -570Subtotal 183 168 1,033 Minority Decrease of minority in Alfa Laval (India) Ltd -56 - -Translation difference 21 -8 -22Net income for the period 21 20 38Dividends -19 -18 -29Subtotal -33 -6 -13 At the end of the period 6,981 5,973 6,831
The share capital of SEK 1,116,719,930 is divided into 111,671,993 shares.
Page 13 (16)
Alfa Laval AB (publ) Interim report April 1 – June 30, 2007
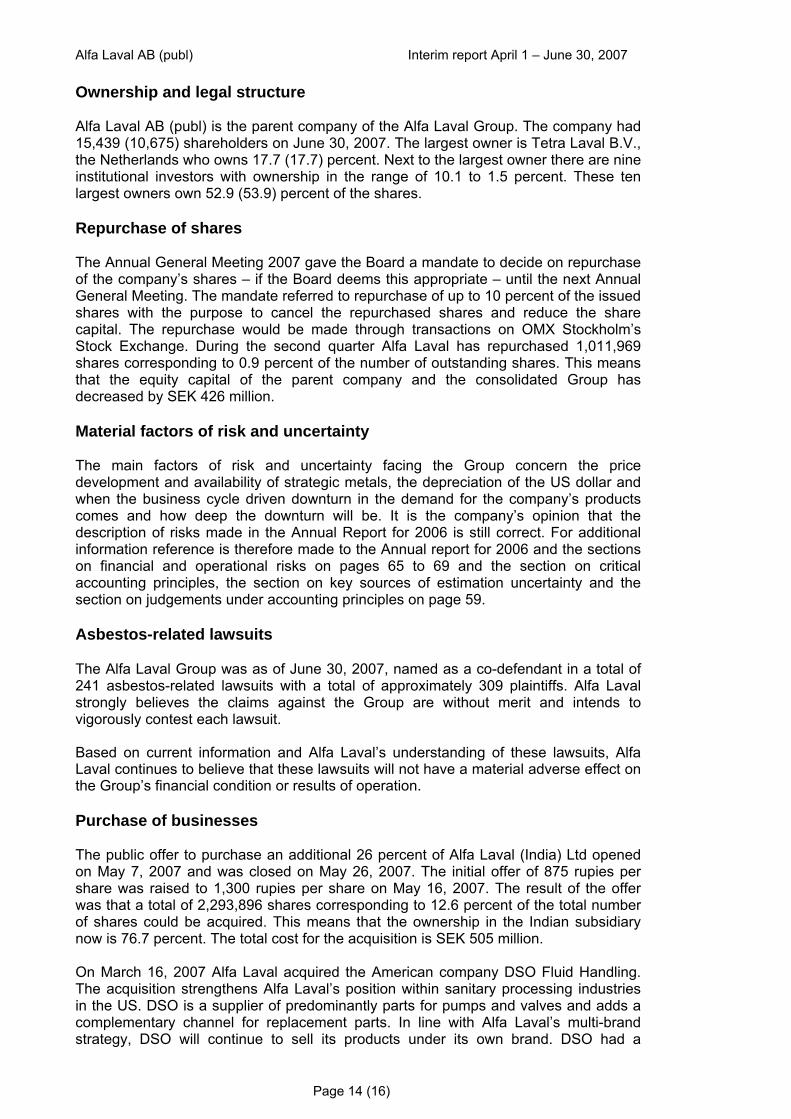
Ownership and legal structure Alfa Laval AB (publ) is the parent company of the Alfa Laval Group. The company had 15,439 (10,675) shareholders on June 30, 2007. The largest owner is Tetra Laval B.V., the Netherlands who owns 17.7 (17.7) percent. Next to the largest owner there are nine institutional investors with ownership in the range of 10.1 to 1.5 percent. These ten largest owners own 52.9 (53.9) percent of the shares. Repurchase of shares The Annual General Meeting 2007 gave the Board a mandate to decide on repurchase of the company’s shares – if the Board deems this appropriate – until the next Annual General Meeting. The mandate referred to repurchase of up to 10 percent of the issued shares with the purpose to cancel the repurchased shares and reduce the share capital. The repurchase would be made through transactions on OMX Stockholm’s Stock Exchange. During the second quarter Alfa Laval has repurchased 1,011,969 shares corresponding to 0.9 percent of the number of outstanding shares. This means that the equity capital of the parent company and the consolidated Group has decreased by SEK 426 million. Material factors of risk and uncertainty The main factors of risk and uncertainty facing the Group concern the price development and availability of strategic metals, the depreciation of the US dollar and when the business cycle driven downturn in the demand for the company’s products comes and how deep the downturn will be. It is the company’s opinion that the description of risks made in the Annual Report for 2006 is still correct. For additional information reference is therefore made to the Annual report for 2006 and the sections on financial and operational risks on pages 65 to 69 and the section on critical accounting principles, the section on key sources of estimation uncertainty and the section on judgements under accounting principles on page 59. Asbestos-related lawsuits The Alfa Laval Group was as of June 30, 2007, named as a co-defendant in a total of 241 asbestos-related lawsuits with a total of approximately 309 plaintiffs. Alfa Laval strongly believes the claims against the Group are without merit and intends to vigorously contest each lawsuit. Based on current information and Alfa Laval’s understanding of these lawsuits, Alfa Laval continues to believe that these lawsuits will not have a material adverse effect on the Group’s financial condition or results of operation. Purchase of businesses The public offer to purchase an additional 26 percent of Alfa Laval (India) Ltd opened on May 7, 2007 and was closed on May 26, 2007. The initial offer of 875 rupies per share was raised to 1,300 rupies per share on May 16, 2007. The result of the offer was that a total of 2,293,896 shares corresponding to 12.6 percent of the total number of shares could be acquired. This means that the ownership in the Indian subsidiary now is 76.7 percent. The total cost for the acquisition is SEK 505 million. On March 16, 2007 Alfa Laval acquired the American company DSO Fluid Handling. The acquisition strengthens Alfa Laval’s position within sanitary processing industries in the US. DSO is a supplier of predominantly parts for pumps and valves and adds a complementary channel for replacement parts. In line with Alfa Laval’s multi-brand strategy, DSO will continue to sell its products under its own brand. DSO had a
Page 14 (16)
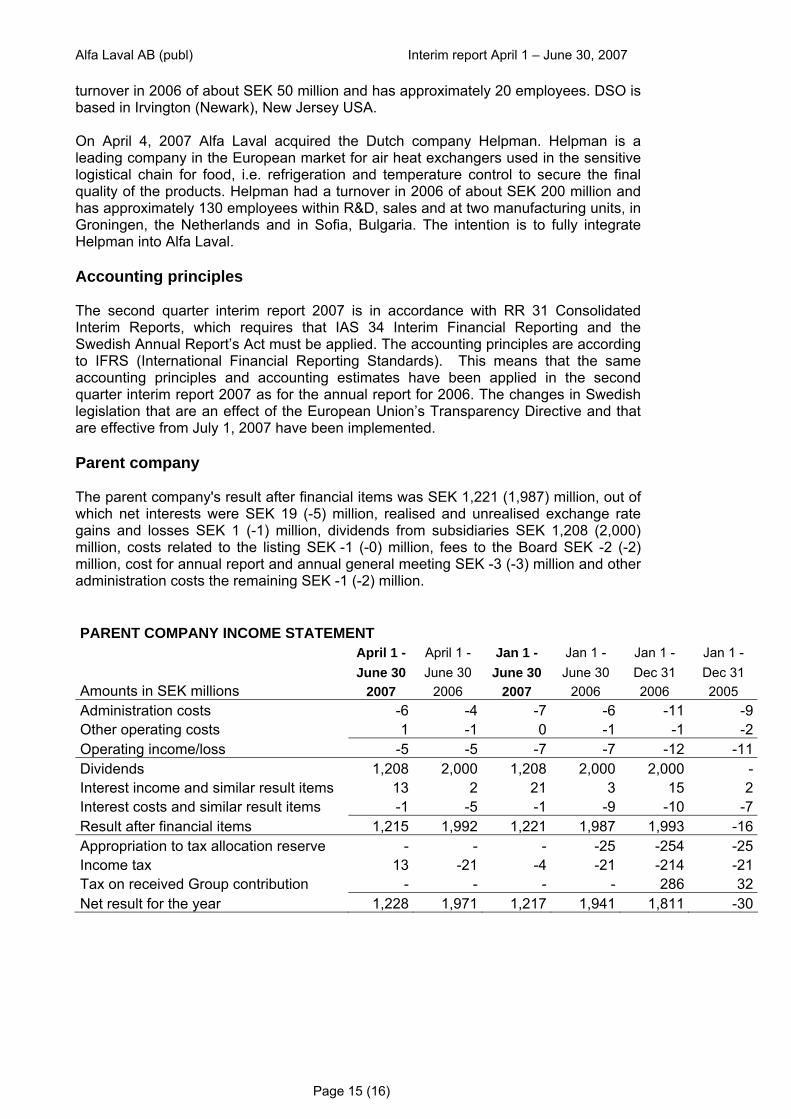
Alfa Laval AB (publ) Interim report April 1 – June 30, 2007 turnover in 2006 of about SEK 50 million and has approximately 20 employees. DSO is based in Irvington (Newark), New Jersey USA. On April 4, 2007 Alfa Laval acquired the Dutch company Helpman. Helpman is a leading company in the European market for air heat exchangers used in the sensitive logistical chain for food, i.e. refrigeration and temperature control to secure the final quality of the products. Helpman had a turnover in 2006 of about SEK 200 million and has approximately 130 employees within R&D, sales and at two manufacturing units, in Groningen, the Netherlands and in Sofia, Bulgaria. The intention is to fully integrate Helpman into Alfa Laval. Accounting principles The second quarter interim report 2007 is in accordance with RR 31 Consolidated Interim Reports, which requires that IAS 34 Interim Financial Reporting and the Swedish Annual Report’s Act must be applied. The accounting principles are according to IFRS (International Financial Reporting Standards). This means that the same accounting principles and accounting estimates have been applied in the second quarter interim report 2007 as for the annual report for 2006. The changes in Swedish legislation that are an effect of the European Union’s Transparency Directive and that are effective from July 1, 2007 have been implemented. Parent company The parent company's result after financial items was SEK 1,221 (1,987) million, out of which net interests were SEK 19 (-5) million, realised and unrealised exchange rate gains and losses SEK 1 (-1) million, dividends from subsidiaries SEK 1,208 (2,000) million, costs related to the listing SEK -1 (-0) million, fees to the Board SEK -2 (-2) million, cost for annual report and annual general meeting SEK -3 (-3) million and other administration costs the remaining SEK -1 (-2) million. PARENT COMPANY INCOME STATEMENT April 1 - April 1 - Jan 1 - Jan 1 - Jan 1 - Jan 1 - June 30 June 30 June 30 June 30 Dec 31 Dec 31 Amounts in SEK millions 2007 2006 2007 2006 2006 2005 Administration costs -6 -4 -7 -6 -11 -9Other operating costs 1 -1 0 -1 -1 -2Operating income/loss -5 -5 -7 -7 -12 -11Dividends 1,208 2,000 1,208 2,000 2,000 -Interest income and similar result items 13 2 21 3 15 2Interest costs and similar result items -1 -5 -1 -9 -10 -7Result after financial items 1,215 1,992 1,221 1,987 1,993 -16Appropriation to tax allocation reserve - - - -25 -254 -25Income tax 13 -21 -4 -21 -214 -21Tax on received Group contribution - - - - 286 32Net result for the year 1,228 1,971 1,217 1,941 1,811 -30
Page 15 (16)
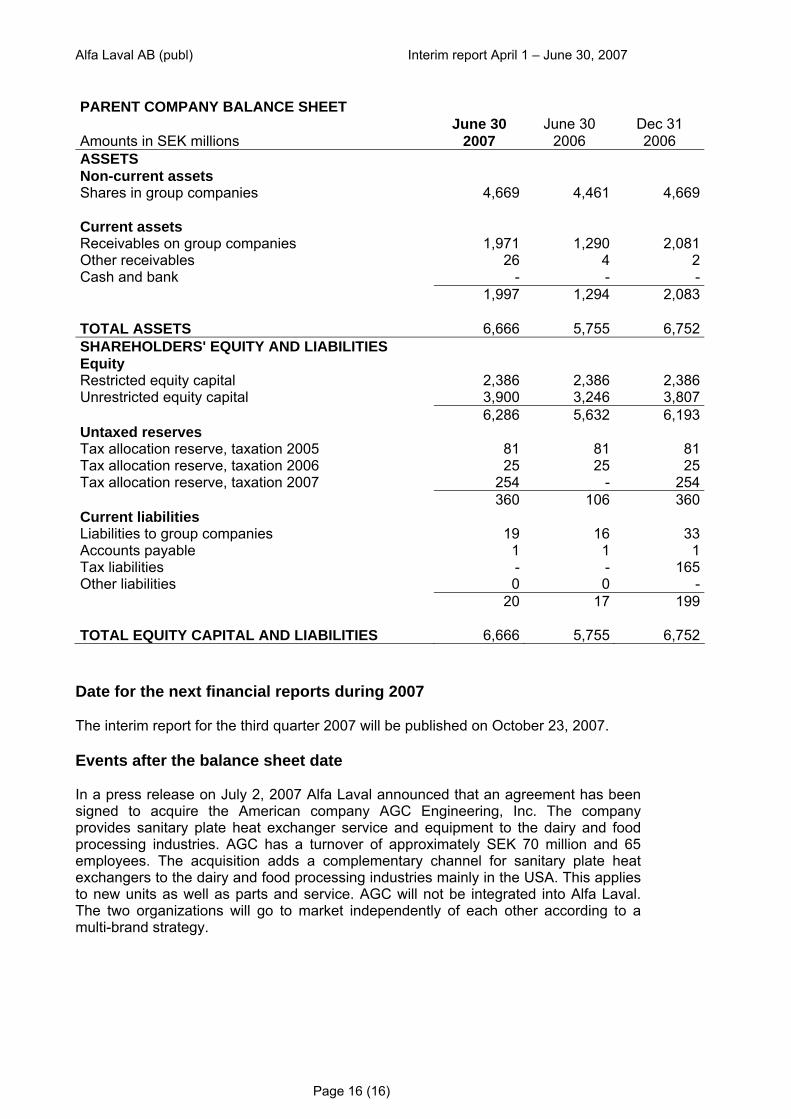
Alfa Laval AB (publ) Interim report April 1 – June 30, 2007 PARENT COMPANY BALANCE SHEET June 30 June 30 Dec 31 Amounts in SEK millions 2007 2006 2006 ASSETS Non-current assets Shares in group companies 4,669 4,461 4,669 Current assets Receivables on group companies 1,971 1,290 2,081Other receivables 26 4 2Cash and bank - - - 1,997 1,294 2,083 TOTAL ASSETS 6,666 5,755 6,752SHAREHOLDERS' EQUITY AND LIABILITIES Equity Restricted equity capital 2,386 2,386 2,386Unrestricted equity capital 3,900 3,246 3,807 6,286 5,632 6,193Untaxed reserves Tax allocation reserve, taxation 2005 81 81 81Tax allocation reserve, taxation 2006 25 25 25Tax allocation reserve, taxation 2007 254 - 254 360 106 360Current liabilities Liabilities to group companies 19 16 33Accounts payable 1 1 1Tax liabilities - - 165Other liabilities 0 0 - 20 17 199 TOTAL EQUITY CAPITAL AND LIABILITIES 6,666 5,755 6,752
Date for the next financial reports during 2007 The interim report for the third quarter 2007 will be published on October 23, 2007. Events after the balance sheet date In a press release on July 2, 2007 Alfa Laval announced that an agreement has been signed to acquire the American company AGC Engineering, Inc. The company provides sanitary plate heat exchanger service and equipment to the dairy and food processing industries. AGC has a turnover of approximately SEK 70 million and 65 employees. The acquisition adds a complementary channel for sanitary plate heat exchangers to the dairy and food processing industries mainly in the USA. This applies to new units as well as parts and service. AGC will not be integrated into Alfa Laval. The two organizations will go to market independently of each other according to a multi-brand strategy.
Page 16 (16)