quarterly monitoring report third quarter
TRANSCRIPT

REPORT
QUARTERLY MONITORING REPORT
THIRD QUARTER 2020
RAVENSDALE SITE
28131 Ravensdale-Black Diamond Road Ravensdale, Washington 98051
Submitted to:
Mr. Chris Martin, Washington State Department of Ecology Northwest Regional Office
3190 106th Avenue SE
Bellevue, WA 98008-5452 USA
Submitted by:
Golder Associates Inc.
18300 NE Union Hill Road, Suite 200
Redmond, Washington, USA 98052
+1 425 883-0777
1520304
October 14, 2020

October 14, 2020 1520304
i
Distribution List Final - Chris Martin, Ecology + 2 Hard copies
Electronic Only:
Alan L. Noell
Fred White
Darshan Dhillon
Leah Helms
Randy Sandin
Keith Dearborn
Travis Bennett
Marisa Floyd
Matt Wells
Tim O'Connor
Greg Jacoby
Mark Coldiron
Douglas Steding
Carla Brock
Dave Cook

October 14, 2020 1520304
ii
Table of Contents
1.0 INTRODUCTION ............................................................................................................................................. 1
1.1 Site Description .................................................................................................................................... 1
1.2 Purpose and Scope .............................................................................................................................. 1
2.0 BACKGROUND .............................................................................................................................................. 2
2.1 Site Background ................................................................................................................................... 2
2.1.1 LDA Background ............................................................................................................................. 2
2.1.2 DSP Background............................................................................................................................. 3
2.2 Monitoring Locations ............................................................................................................................ 3
2.2.1 LDA ................................................................................................................................................. 3
2.2.2 DSP ................................................................................................................................................. 3
2.2.3 LDA Interceptor Trench ................................................................................................................... 4
2.3 Mitigation Activities ............................................................................................................................... 4
2.3.1 LDA Cover Upgrade ........................................................................................................................ 4
2.3.2 LDA Seep Collection System Test Trenches .................................................................................. 4
2.3.3 LDA Seep Collection Ditch and Seepage Treatment System ........................................................ 4
2.3.4 LDA Interceptor Trench ................................................................................................................... 5
2.3.5 DSP Cover Upgrade ....................................................................................................................... 5
2.4 Groundwater and Surface Water Monitoring Schedule ....................................................................... 5
2.4.1 LDA Groundwater Sampling ........................................................................................................... 5
2.4.2 LDA Surface Water Sampling ......................................................................................................... 5
2.4.3 DSP Groundwater Sampling ........................................................................................................... 5
2.4.4 LDA Interceptor Trench Sampling................................................................................................... 6
3.0 OPERATIONS AND MAINTENANCE OF THE LEACHATE TREATMENT SYSTEM .................................. 6
4.0 SAMPLING ACTIVITIES ................................................................................................................................. 7
4.1 Common Elements ............................................................................................................................... 7
4.1.1 Field Parameter Measurements...................................................................................................... 7

October 14, 2020 1520304
iii
4.1.2 Laboratory Analysis ........................................................................................................................ 7
4.2 Sampling Procedures ........................................................................................................................... 8
4.2.1 LDA Groundwater Sampling ........................................................................................................... 8
4.2.2 LDA Surface Water Sampling ......................................................................................................... 8
4.2.3 DSP Groundwater Sampling ........................................................................................................... 9
4.2.4 LDA Interceptor Trench Sampling................................................................................................... 9
5.0 RESULTS ........................................................................................................................................................ 9
5.1 Preliminary Standards .......................................................................................................................... 9
5.2 Method Detection Limits and Reporting Limits .................................................................................... 9
5.3 Data Validation ................................................................................................................................... 10
5.4 Measurement Results ........................................................................................................................ 10
6.0 LIMITATIONS ................................................................................................................................................ 11
7.0 REFERENCES .............................................................................................................................................. 12
TABLES
Table 1: Third Quarter 2020 Water Level Measurements
Table 2: Third Quarter 2020 Field Parameters and Analytical Data
Table 3: Preliminary Standards
Table 4: Interceptor Trench Discharge Monitoring
Table 5: Third Quarter 2020 Treatment System Metals Monitoring
FIGURES
Figure 1: Vicinity Map
Figure 2: Site Plan
APPENDICES
APPENDIX A Summary Data Tables for Individual Wells and Monitoring Locations
APPENDIX A-1 Summary of Lower Disposal Area – Surface Water Sampling Results
Appendix A-2 Summary of Lower Disposal Area – Shallow/Alluvial Groundwater Sampling Results

October 14, 2020 1520304
iv
APPENDIX A-3 Summary of Lower Disposal Area – Bedrock Groundwater Sampling Results
APPENDIX A-4 Summary of Dale Strip Pit – Bedrock Groundwater Sampling Results
APPENDIX B Data Graphs
APPENDIX B-1 LDA Shallow/Alluvial Monitoring Wells Data Graphs
APPENDIX C Data Validation Report and Laboratory Analytical Results
No table of figures entries found.
No table of figures entries found.
October 14, 2020 1520304
1
1.0 INTRODUCTION
This report, prepared by Golder Associates Inc. (Golder) for Holcim (US) Inc., presents the results of surface
water and groundwater monitoring conducted at the Ravensdale Site during the third quarter of 2020. The
quarterly monitoring was completed during August 2020.
1.1 Site Description
The Ravensdale Site (Site) is located at 28131 Ravensdale-Black Diamond Road in Ravensdale, Washington.
Figure 1 shows the Site location. For the purposes of this monitoring report, the Site is comprised of two distinct
areas: the Lower Disposal Area (LDA) and the Dale Strip Pit (DSP). The LDA encompasses about 7 acres and is
in the northwestern portion of the Site. The DSP, an area of about 6 acres, is in the southeastern portion of the
Site. The LDA and DSP are shown in Figure 2.
Historically, sand and coal mining operations occurred on the Site. The Site is currently owned and operated by
the Reserve Silica Corporation and is in the reclamation phase. The Site’s historical background and previous
environmental investigations are discussed further in Section 2.0.
1.2 Purpose and Scope
The purpose of the quarterly monitoring activities is to assess the groundwater and surface water conditions with
respect to potential impact from buried cement kiln dust (CKD). Previously, quarterly monitoring and reporting
activities were conducted under requirements of Post-Closure Care and Maintenance Permits issued by Public
Health – Seattle and King County (Public Health). The Site entered Agreed Order (AO) No. DE 16052 in
December 2019, which requires that the Site complete a Remedial Investigation/Feasibility Study (RI/FS) under
the Model Toxics Control Act (MTCA) and complete any necessary interim remedial actions as agreed upon by
the Washington State Department of Ecology (Ecology). An RI Work Plan is being prepared under the
requirements of the AO. The Work Plan and supporting Sampling and Analysis Plan will describe the monitoring
that will occur in association with the RI. Until the RI Work Plan is completed and approved by Ecology,
groundwater and surface water monitoring will continue under the requirements provided in the 2020 Post-
Closure Care and Maintenance Permit (PR0015708).
Monitoring and reporting are conducted in accordance with procedures established in the Sampling and Analysis
and Quality Assurance Project Plan (SAP/QAPP) (ARCADIS 2006). The SAP/QAPP was approved by the
Interagency Group (Washington State Department of Ecology, Public Health – Seattle and King County, and King
County Department of Development and Environmental Services) in a letter to ARCADIS U.S., Inc. (ARCADIS)
dated August 3, 2006 (Ecology 2006). Modifications to the SAP/QAPP related to sampling locations, test
parameters, and sampling frequency were agreed upon as documented in the ARCADIS March 3, 2008 letter to
Ecology. Modifications to the sampling frequency for a period of 3 years were agreed upon as documented in the
Golder April 9, 2015 letter to Public Health and a subsequent approval letter from Public Health dated April 7,
2016. An additional 2-year extension of the modifications to the sampling frequency was subsequently approved
by Public Health in a letter dated October 10, 2019. The current variance expires on October 10, 2021.
The groundwater and surface water monitoring scope of work includes the following:
Quarterly collection of groundwater samples from six on-site shallow/alluvial groundwater monitoring wells
(MW-1A, MW-2A, MW-3A, MW-4A, MW-5A, and MW-6A) as part of the LDA monitoring program.

October 14, 2020 1520304
2
Annual collection of groundwater samples from three on-site bedrock groundwater monitoring wells (MWB-
1LDA, MWB-2LDA, and MWB-3LDA) as part of the LDA monitoring program.
Annual collection of groundwater samples from four on-site bedrock groundwater-monitoring wells (MWB-
1SDSP, MWB-1DDSP, MWB-5DSP, MWB-6DSP) as part of the DSP monitoring program.
Semi-annual measurement of water levels and field parameters in monitoring wells MWB-2DSP and MWB-
4SDSP.
Quarterly collection of surface water samples from Infiltration Ponds #1, Weir (or the constructed wetlands
located upstream if the Weir is dry), South Pond, and Still Well as part of the LDA surface water sampling
program.
Annual collection of water samples from the culvert that discharges from the former mine Portal (the Portal)
as part of the DSP sampling program.
Measurement of field parameters in water purged from the groundwater monitoring wells and directly from
the surface water areas. Field parameters include: groundwater level readings (in wells only), pH,
conductivity, temperature, dissolved oxygen (DO), oxidation-reduction potential (ORP), and turbidity.
Analysis of the groundwater, surface water, and quality control samples for some combination of dissolved
arsenic, lead, iron, manganese, potassium, and total dissolved solids (TDS).
Analysis of duplicate samples for quality control.
Quarterly Interceptor Trench monitoring for instantaneous flow volume and sampling for pH, TDS, and
turbidity.
Figure 2 shows the location of the monitoring wells and surface water collection points. Table 1 presents
construction details and water levels for each monitoring well.
2.0 BACKGROUND
2.1 Site Background
The following is a brief description of the historical mining and reclamation activities that occurred at the Site as
provided by ARCADIS (ARCADIS 2009). This section also includes a discussion of the quarterly monitoring
program.
2.1.1 LDA Background
The LDA is a former open pit sand mine that was reclaimed by placing CKD and other material into the mine
excavation from June 1979 to October 1982. The LDA was filled with approximately 175,000 tons of CKD.
Records indicate that a cap consisting of clay and up to 7 feet of overburden material from sand mining operations
was placed over the CKD.
Historically, high pH seepage surfaced along the slope west of the LDA. The outbreaks are primarily located
along the northern half of the western boundary of the LDA. The leachate drained through low-lying, marshy
areas and commingled with stormwater before flowing to the three infiltration ponds (the Infiltration Ponds as
shown in Figure 2) near the Ravensdale-Black Diamond Road (ARCADIS 2004). In 2013 a new seepage
collection ditch was installed to intercept and collect the seepage (see Section 2.3.3 of this report), which then

October 14, 2020 1520304
3
flowed inside a pipe to the infiltration ponds. In 2018, a water treatment system was constructed, and the high pH
water captured by the collection ditch is currently piped to on-site treatment area for pH neutralization and
dissolved metals removal. The treated water discharges from the treatment system to the infiltration ponds.
2.1.2 DSP Background
The DSP was created to mine the Dale No. 4 coal seam from the surface in 1946. Prior to 1946, the coal seam
was worked from an underground mine. The underground mining chutes were driven upward to the surface to
provide ventilation and allow the transportation of timbers into the mine. Construction of the mine allowed
groundwater to drain by gravity to the mine portal (Portal). The Portal has since collapsed, and now a pipe in the
collapsed Portal allows water to continuously drain from the mine under an Ecology Sand and Gravel General
Permit (Ecology 2005) with monitoring as described below. The Portal is located north of the LDA on the east
side of the main haul road.
The DSP was approximately 1,800 feet long (north to south), averaged 140 feet wide (east to west), and
averaged 40 feet deep. It was filled in the 1970s and 1980s with approximately 250,000 cubic yards of material
including CKD, borrow, and other materials pursuant to a permit from Public Health – Seattle and King County. It
is estimated that about one third of the DSP was filled with CKD (ARCADIS 2004).
2.2 Monitoring Locations
2.2.1 LDA
Shallow/alluvial monitoring wells were installed near the LDA in July 2005 and are monitored to assess the
shallow/alluvial groundwater conditions with respect to potential impact from the CKD. Four of the wells (MW-1A,
MW-2A, MW-5A, and MW-6A) are located around the infiltration ponds. MW-3A is located west of the high pH
seepage area. MW-4A, a background well, is located south of, and upstream with respect to groundwater flow
and surface water drainage, the high pH seepage area.
Bedrock monitoring wells were installed along the west side of the main access road, west of the LDA, in
December 2006 to assess bedrock groundwater conditions in the vicinity of the LDA. MWB-1LDA is located near
the northern tip of the LDA, MWB-2LDA is located near the center of the LDA, and MWB-3 LDA is located near
the southern end of the LDA.
The LDA surface water sampling locations were chosen to evaluate the high pH seepage in the vicinity of the
LDA. Infiltration Ponds #1 sampling location is situated in the westernmost infiltration pond. The infiltration ponds
are located at the north end of the Site, near Ravensdale-Black Diamond Road. The Weir is located north of the
access road to MW-3A immediately below the discharge point from the wetlands. If no flow is observed at the
Weir, the constructed wetlands upstream are the alternative sampling location. The South Pond is a closed
depression located west of MWB-2LDA near the southern end of the high pH seepage zone. The Still Well is a
2-inch-diameter flush-mount well located along the high pH seepage zone west of the LDA.
The LDA groundwater and surface water sampling locations are shown in Figure 2.
2.2.2 DSP
The DSP bedrock groundwater monitoring program was required by Public Health – Seattle and King County and
Ecology as a condition of the CKD exemption as a dangerous waste on December 13, 1984 (Public Health 1984).
The DSP bedrock groundwater monitoring program includes four wells in the DSP area (MWB-1SDSP,
MWB-1DDSP, MWB-5DSP, and MWB-6DSP), which evaluate groundwater quality beneath, upgradient, and

October 14, 2020 1520304
4
downgradient of the DSP. Groundwater discharging from the Portal is also monitored. The Portal was originally
constructed to drain water from the Dale Strip Coal mine. There are two additional monitoring wells (MWB-2DSP
and MWB-4SDSP) located in the DSP area that are being monitored for water levels and field parameters.
The DSP groundwater monitoring locations are shown in Figure 2.
2.2.3 LDA Interceptor Trench
The purpose of the Interceptor Trench is to intercept clean groundwater before the water enters the Lower
Disposal Area CKD deposit and direct the water away from the deposit. Monitoring is performed at the Interceptor
Trench outfall for flow, pH, turbidity, and total dissolved solids. The purpose of the monitoring is to ensure that the
trench is not collecting impacted groundwater.
2.3 Mitigation Activities
2.3.1 LDA Cover Upgrade
During September and October 2007, the existing soil cover on the LDA was regraded to provide positive
drainage at all locations, reduce overly-steep slope areas, and place a minimum 2-foot-thick clean soil cover over
the entire area, including locations where CKD was exposed at the surface. The construction activities are
described in the Construction Summary Report (Golder 2008a).
2.3.2 LDA Seep Collection System Test Trenches
During September and October 2008, test trenches for collecting high pH seepage were constructed (Golder
2008b). The purpose of this test system was to evaluate the feasibility of using a more extensive trench system to
collect high pH seepage that would otherwise discharge at the ground surface adjacent to the LDA. Details of the
test trench construction are presented in the Construction Summary Report (Golder 2009a).
Between October 2008 and September 2009, Golder monitored seepage flow rates from each of two test
trenches and the tightline discharge once per month, on average. A summary of activities and results of this
monitoring program is presented in the flow monitoring report (Golder 2009b).
2.3.3 LDA Seep Collection Ditch and Seepage Treatment System
In February 2013, a surface water collection ditch and concrete catch basin were constructed on the bench below
the main access road on the west side of the LDA. This system was installed to capture leachate seeps emerging
from the bank along the east side of the bench (west of the main access road) and direct them into the existing
tightline that carries flow from the test trenches to the infiltration pond. In April 2015, the 4-inch diameter pipeline
from the catch basin to the infiltration ponds, approximately 1,000 feet in length, was replaced with a 12-inch
diameter pipeline to alleviate plugging issues.
In December 2017, the seepage collection trench was further extended approximately 100 feet to the north to
collect additional seepage that was not previously captured. Seepage water was then redirected into a seepage
treatment system, which completed construction and started initial operations on September 28, 2018. The
treatment system uses carbon dioxide (CO2) sparging to neutralize pH levels and arsenic and lead adsorption
using an iron-based adsorption media.
During the initial year of operation, the system operated intermittingly, with system shut-downs occurring as
various upgrades and modifications were completed to increase the long-term operational efficiency of the

October 14, 2020 1520304
5
treatment system. The system began continuous operating in June 2019, with only minor shutdowns occurring to
complete routine maintenance.
2.3.4 LDA Interceptor Trench
In September 2013, a gravel-filled interceptor trench that included a perforated drain pipe and vertical
downgradient liner was installed south of the LDA to intercept clean groundwater moving in a northerly direction
prior to encountering the cement kiln dust in the LDA.
2.3.5 DSP Cover Upgrade
Cover upgrade activities began at the DSP in November 2010 and were completed in July 2011. Cover upgrade
activities included stripping surficial vegetation and topsoil, regrading the existing surface to establish positive
drainage, placing low permeability soil to provide a minimum 2-foot-thick layer at all locations, filling the existing
ditch along the northeast side of the DSP, replacing topsoil, and revegetating the cover surface.
2.4 Groundwater and Surface Water Monitoring Schedule
Various levels of groundwater and surface water monitoring have been conducted at the Site since 2002.
ARCADIS performed monthly and quarterly monitoring activities through the second quarter of 2009. Golder
assumed responsibility for monitoring activities in August 2009 and conducted groundwater and surface water
monitoring until April 2014. GeoEngineers performed groundwater and surface monitoring from May to December
2014. Golder resumed the groundwater and surface monitoring in February 2015.
2.4.1 LDA Groundwater Sampling
Groundwater monitoring of the shallow/alluvial monitoring wells generally occurred on a quarterly schedule from
July 2005 to September 2008. After the seep collection test trenches were installed, groundwater monitoring
frequency for the four wells around the infiltration ponds was increased to monthly through September 2009. At
the end of the formal test trench monitoring program in October 2009, the sampling frequency for these four wells
returned to quarterly.
Groundwater monitoring of the bedrock monitoring wells generally occurred on a quarterly schedule since
December 2006. A letter was submitted to Public Health dated April 9, 2015 requesting a variance to the LDA
bedrock groundwater monitoring frequency. In a letter to Golder dated April 7, 2016, Public Health granted a
variance for three years to reduce the monitoring frequency of the Ravensdale LDA bedrock wells to annually
(Public Health 2016). Public Health subsequently granted an additional 2-year extension to the variance in a
letter dated October 10, 2019 (Public Health 2019). The variance expires on October 10, 2021.
2.4.2 LDA Surface Water Sampling
Surface water monitoring of Infiltration Ponds #1, Weir (or the constructed wetlands located upstream if the Weir
was dry), South Pond, and Still Well generally occurred on a monthly schedule from February 2005 to June 2008
and then was reduced to the current quarterly schedule.
2.4.3 DSP Groundwater Sampling
Groundwater monitoring of wells MWB-1SDSP and MWB-1DDSP generally occurred on a quarterly schedule
starting in December 2002. Monitoring of well MWB-5DSP generally occurred on a monthly schedule from
December 2006 to June 2008 and then monitoring was reduced to quarterly. Groundwater monitoring of well
MWB-6DSP generally occurred on a quarterly schedule starting in December 2006. Groundwater levels and field
October 14, 2020 1520304
6
parameters are being measured in wells MWB-2DSP and MWB-4SDSP on a quarterly schedule. Surface water
monitoring of the Portal discharge generally occurred on a quarterly schedule starting in March 2002.
In a letter to Golder dated May 16, 2012, Public Health granted a variance for three years to reduce the
monitoring frequency of the Ravensdale DSP wells and Portal to semi-annually (Public Health 2012). During this
variance period, groundwater monitoring of the DSP wells occurred during the first and third quarters each year.
During the second and fourth quarters, only water levels were measured in these wells. This variance expired in
May 2015. A letter was submitted to the Public Health dated April 9, 2015, requesting a variance to the
groundwater monitoring frequency. Pending approval, sampling of the DSP and Portal was reverted to quarterly,
starting with the August 2015 sampling quarter. In a letter to Golder dated April 7, 2016, Public Health granted a
variance for three years to reduce the monitoring frequency of the DSP wells and Portal to annually (Public Health
2016). Public Health subsequently granted an additional 2-year extension to the variance in a letter dated
October 10, 2019 (Public Health 2019). The variance expires on October 10, 2021.
2.4.4 LDA Interceptor Trench Sampling
The Interceptor Trench was monitored monthly from October 2013 to December 2014 and data showed that the
water being collected and discharged is not impacted. A reduction in monitoring frequency to quarterly was
approved by King County Public Health in an email to Joel Bolduc of Holcim dated January 2, 2015 (Public Health
2015). The Interceptor Trench is being monitored for pH, turbidity, and TDS.
3.0 OPERATIONS AND MAINTENANCE OF THE LEACHATE TREATMENT SYSTEM
The leachate treatment system first began operating in September 2018. System upgrades occurred from
December 2018 to May 2019 and included various upgrades and modifications to improve long-term operating
efficiency. The system began continuous operations in June 2019, with minor shutdowns occurring to complete
routine maintenance and continued minor modifications to improve long term operating efficiency.
The treatment system includes a 4,200-gallon mixing tank (steel rectangular box shaped tank) that receives the
influent water coming from the seepage collection ditch and piping. Water from the tank constantly flows through
the CO2 sparge unit, which continuously monitors the water pH and activates CO2 sparging when the water pH
exceeds 8.3. CO2 sparging continues until the pH reduces to 7.5. The sparged water is pumped back into the
mixing tank to maintain the neutralized the water within the tank. The influent flow, pumping from the tank and
through the CO2 sparge unit, and discharge from the sparge unit back into the tank are all specifically located in
different areas of the mixing tank to provide a constant circulation effectively providing pH neutralization
throughout the tank. The mixing tank contains a float switch activated discharge pump that activates when the
water reaches a set height within the tank and turns the pump off when the water is lowered to the desired height.
Neutralized water pumped from the tank is discharged through filters and an iron-based adsorption media to
remove arsenic, prior to discharge of the water to the Infiltration Ponds.
The continuous pH monitoring system is connected to telemetry that sends pH readings and alerts to Golder
engineer’s cell phones if readings outside of the set ranges occurs allowing for response and trouble shooting.
Routine inspections of the treatment system are conducted approximately once every two weeks. The
inspections include routine maintenance activities such as cleaning scale off pump parts, hoses, and probes to
sustain continued operations of the treatment system. The treatment system has been effective in reducing the
pH of the seepage water to below 8 standard units and reducing metals concentrations before discharge to the
infiltration ponds. Table 5 provides the 2020 third quarter laboratory analytical data pre- and post- iron-based

October 14, 2020 1520304
7
adsorption media showing the reduction in lead and arsenic concentrations. The validated laboratory analytical
report is provided in Appendix C.
The treatment system has been effective in reducing the impacts to groundwater in the immediate vicinity of the
infiltrations ponds that were historically observed in groundwater monitoring wells MW-5A and MW-6A. Additional
modifications and improvements are anticipated to occur to the treatment system during the MTCA cleanup
process to improve system performance, efficiency, and meet Site specific cleanup standards that are protective
of human health and the environment.
4.0 SAMPLING ACTIVITIES
The following section summarizes the activities associated with the monitoring event.
4.1 Common Elements
4.1.1 Field Parameter Measurements
Field parameters for groundwater and surface water were measured as part of the sampling activities described in
the following sections. These measurements were performed with the following equipment:
YSI ProDSS multimeter with pH, ORP (oxidation-reduction potential), conductivity, dissolved oxygen, and
temperature probes
Hach 2100P Turbidimeter
4.1.2 Laboratory Analysis
Laboratory analyses were performed on samples collected from the various locations described in the following
sections. Although the analytic parameters varied between the types of samples, the following elements are
common to all the sampling and analysis activities:
The collected samples were transported to the laboratory within appropriate sample hold times following
chain-of-custody protocols.
The testing was performed by Analytical Resources, Inc. (ARI) of Tukwila, Washington.
All samples were tested for the following parameters using the methods indicated:
Arsenic (dissolved) EPA Method 200.8
Lead (dissolved) EPA Method 200.8
Potassium (dissolved) EPA Method 6010C
Iron (dissolved) EPA Method 6010C
Manganese (dissolved) EPA Method 6010C
Total Dissolved Solids (TDS) EPA Method 160.1
Interceptor Trench samples were tested for the following parameters using the method indicated:
pH Field Measurement
TDS EPA Method 160.1
Turbidity Field Measurement
October 14, 2020 1520304
8
Summaries of historical analytic data for the various sampling locations are presented in Appendix A.
Validated analytical laboratory data packages are provided electronically on the flash drive in Appendix C.
4.2 Sampling Procedures
4.2.1 LDA Groundwater Sampling
On August 12 and August 13, 2020, Golder sampled groundwater from the LDA shallow/alluvial groundwater
monitoring wells (MW-1A, MW-2A, MW-3A, MW-4A, MW-5A, and MW-6A). The following methods and
procedures were used in collecting the groundwater samples:
Depth to groundwater was measured in the wells prior to purging and sampling. Table 1 presents depth to
water measurements and elevations.
Using dedicated tubing connected to a portable, stainless steel bladder pump or a peristaltic pump (if
groundwater elevation allowed), water from wells MW-1A, MW-2A, MW-3A, MW-4A, MW-5A, and MW-6A
was purged at a rate between approximately 250 and 400 milliliters (mL) per minute.
Field parameters of pH, conductivity, temperature, dissolved oxygen, oxidation-reduction potential, and
turbidity were measured and recorded during purging at approximately five-minute intervals until parameters
were stable. Parameters were considered stable when three consecutive readings of pH, temperature, and
conductivity were within five percent.
Once the field parameters stabilized, the purging phase of the process was concluded. Groundwater
samples were then collected directly from the dedicated sample tubing. Samples collected for dissolved
metals were field-filtered through a 0.45 micrometer (um) in-line filter.
For quality control purposes, a duplicate sample was collected from MW-2A (labeled as MW-7A).
Laboratory-provided containers were used to collect the samples. For each groundwater sample, one
500-mL bottle preserved with nitric acid and one 1-Liter (L) un-preserved bottle were collected. The samples
were then labeled and placed in a cooler with ice.
In addition, water levels and field parameters were measured in LDA monitoring wells MW-1LDA, MW-2LDA, and
MW-3LDA on August 12 and 13, 2020.
All groundwater and quality control samples were analyzed for the parameters listed in Section 4.1.2. Analytical
results are discussed in Section 5.0, and the field parameters and analytical data are presented in Table 2.
4.2.2 LDA Surface Water Sampling
On August 12 and August 13, 2020, Golder sampled surface water from the Still Well and the Infiltration Ponds #1
sampling locations. The South Pond and Weir sampling locations were dry and therefore not sampled. The
following methods and procedures were used in collecting the surface water samples:
Field parameters of pH, conductivity, temperature, dissolved oxygen, oxidation-reduction potential, and
turbidity were measured and recorded. These parameters were measured and recorded at each of the
surface water locations at the time of sample collection.
Grab surface water samples were collected using dedicated sample tubing connected to a peristaltic pump.
Samples collected for dissolved metals were field-filtered through a 0.45 um in-line filter.

October 14, 2020 1520304
9
For quality control purposes, a duplicate sample was collected from Infiltration Ponds #1 (labeled as
Infiltration Ponds #2).
Laboratory-provided containers were used to collect the surface water samples. For each surface water
sample, one 500-mL bottle preserved with nitric acid and one unpreserved 1-L bottle were collected. The
samples were then labeled and placed in a cooler with ice.
The pH of the LDA surface water samples is typically high (greater than 10). Sampling protocol requires that
the preserved samples for dissolved metals analysis have a pH of less than 2 upon receipt at the laboratory.
In order to meet this requirement, the pH of the LDA surface water samples collected for metals analysis
were checked at the time of sample collection using pH test paper strips. If the pH was higher than 2, nitric
acid (provided by the laboratory) was added until the pH of the sample was less than 2.
All surface water and quality control samples were analyzed for the parameters listed in Section 4.1.2. Analytical
results are discussed in Section 5.0, and the field parameters and analytical data are presented in Table 2.
4.2.3 DSP Groundwater Sampling
On August 12 and August 13, 2020, Golder measured water levels and field parameters in the DSP groundwater
monitoring wells (MWB-1SDSP, MWB-1DDSP, MWB-2DSP, MWB-4DSP, MWB-5DSP, and MWB-6DSP), as well
as field parameters at the Portal. Field parameter data are presented in Table 2.
4.2.4 LDA Interceptor Trench Sampling
On August 13, 2020, Golder sampled groundwater from the Interceptor Trench. The following methods and
procedures were used in collecting the groundwater sample:
Field pH, turbidity, and the flow rate at the Interceptor Trench outfall were measured and recorded.
Grab water samples were collected from the Interceptor Trench by placing the sample bottles under the flow
of water. pH and turbidity were measured and recorded at the Interceptor Trench at the time of sample
collection.
Laboratory-provided containers were used to collect the sample for TDS lab analysis. One 1-L unpreserved
bottle was collected. The sample was then labeled and placed in a cooler with ice.
The Interceptor Trench sample was analyzed for the parameters listed in Section 4.1.2. Analytical results are
discussed in Section 5.0, and the field parameters and analytical data are presented in Table 2.
5.0 RESULTS
5.1 Preliminary Standards
Preliminary standards have been established from the Washington State Administrative Code (WAC) 173-200
and 246-290-310(3)(a) for some of the field parameters and analytes measured as part of the monitoring
program. These standards are presented in Table 3.
5.2 Method Detection Limits and Reporting Limits
The Method Detection Limit (MDL) is the minimum concentration of an analyte that the laboratory can detect
using the specified analytical method and equipment. The Reporting Limit (RL) is the lowest concentration that

October 14, 2020 1520304
10
the laboratory can report with certainty after adjustments have been made for sample dilution, sample weight, and
other factors.
Where the laboratory analytical results indicate non-detection (ND), the concentration of an analyte is below the
MDL. On the trend graphs presented in Appendix B, non-detections for sampling events prior to the December
2009 fourth quarter monitoring were plotted as fifty percent of the RL value. Beginning with the December 2009
fourth quarter monitoring event, non-detections are plotted as the MDL value, which is more representative of
actual laboratory results. Method Detection Limits are not available for all the historical data; therefore,
non-detect data prior to December 2009 remains plotted as fifty percent of the RL value. For TDS results,
non-detect data are plotted at the RL.
5.3 Data Validation
All analytical data were subject to a data validation review. Data validation was conducted in accordance with the
USEPA Contract Laboratory Program National Functional Guidelines for Inorganic Data Review (EPA 2017) and
the Site Sampling and Analysis and Quality Assurance Project Plan (ARCADIS 2006). Data reporting qualifiers
are included with the analytical results in Appendix A. Copies of the data validation checklist are included in
Appendix C, along with the raw analytical data packages provided by the laboratory. The data validation review
found that all the data were considered valid and usable.
5.4 Measurement Results
A summary of the groundwater field parameters and analytical results for the August 2020 third quarter monitoring
are included in Table 2. Interceptor Trench results are provided in Table 4. Trend graphs of pH, TDS, and
arsenic and potassium concentrations measured in each monitoring well are presented in Appendix B.
Results observed during this monitoring round were generally consistent with previous sampling rounds. pH
levels and arsenic concentrations detected in the infiltration ponds and the two groundwater monitoring wells
(MW-5A and MW-6A) located immediately downgradient of the infiltration ponds continue to attenuate in response
to operation of the treatment system. Concentrations of arsenic in the infiltration ponds have remained steady to
slightly decreasing over the past 4 monitoring events. Concentrations of arsenic in MW-5A and MW-6A during
2020 averaged 0.006 and 0.004 mg/L; respectively. Concentrations of arsenic in MW-5A and MW-6A during
2019 averaged 0.02 and 0.03 mg/L; respectively. The 2020 concentrations of arsenic in MW-5 and MW-6 are
approximately one order of magnitude lower than average concentrations measured during 2019.
Concentrations of lead reporting in samples from the infiltration ponds, MW-5A, and MW-6A have also steadily
decreased from levels routinely measured during 2019 and earlier. Concentrations of lead detected in all samples
were below the preliminary standard. The noted decreases in pH levels and reported concentrations of arsenic
and lead in the infiltration ponds and in groundwater immediately downgradient of the infiltration ponds indicated
the mitigating effects produced by the treatment system.
October 14, 2020 1520304
11
6.0 LIMITATIONS
Golder has prepared this report for the exclusive use of Holcim (US) Inc. and their authorized agents. It may also
be submitted to regulatory agencies.
Within the limitations of scope, schedule and budget, our services have been executed in accordance with
generally accepted environmental science practices in this area at the time this report was prepared. No warranty
or other conditions, express or implied, should be understood. This report was prepared, in part, based on
previous investigations and data collected by others. Golder Associates Inc. is not responsible for any data that
were inaccurately reported by others and reproduced here.
https://golderassociates.sharepoint.com/sites/11287g/groundwater monitoring/golder reports/2020 year/2020 3q/final/1520304-r-reva-ravensdale 2020 q3 monitoring-100920.docx

October 14, 2020 1520304
12
7.0 REFERENCES
ARCADIS (U.S.) Inc. (ARCADIS). 2004. Lower Disposal Area and Dale Strip Pit Conceptual Design Plan,
Reserve Silica Property, 28131 Black Diamond-Ravensdale Road, Ravensdale, Washington. April 28.
ARCADIS. 2006. Sampling and Analysis and Quality Assurance Project Plan, Reserve Silica Site, Ravensdale,
Washington. March 2.
ARCADIS. 2009. Quarterly Monitoring Report, Second Quarter 2009, Reserve Silica Site, Ravensdale,
Washington. September 16.
Golder Associates Inc. (Golder). 2008a. Construction Summary Report, Lower Disposal Area Cover Upgrade,
Reserve Silica Site, Reserve Silica Site, Ravensdale, Washington, July 25.
Golder. 2008b. Draft Workplan for Seep Collection Test Trenches, Lower Disposal Area, Reserve Silica Site,
Ravensdale, Washington. August 4.
Golder. 2009a. Construction Summary Report, Seep Collection System Test Trenches, Reserve Silica Site,
Ravensdale, Washington. March 6.
Golder. 2009b. Flow Monitoring Seep Collection System Test Trenches, Reserve Silica Site, Lower Disposal
Area, Ravensdale, Washington. December.
Golder. 2019. Quarterly Monitoring Report Second Quarter 2019, Ravensdale Site, Ravensdale, Washington.
July 2.
Public Health – Seattle and King County (Public Health). 1984. Letter from Mr. Greg Bishop to Mr. Victor Hoffman
of Industrial Mineral Products, Re: Status of Solid Waste Disposal Site Permit Application at Ravensdale Silica
Sand Mine. December 13.
Public Health. 2012. Letter from Mr. Bill Lasby to Mr. Frank Shuri of Golder, Re: Request for Public Health
Variance, Reserve Silica Corporation, Service Request SR1221672. May 16.
Public Health. 2015. Email from Ms. Yolanda Pon to Mr. Joel Bolduc of Holcim, Re: Request to Reduce
Interceptor Trench Monitoring. January 2.
Public Health. 2016. Letter from Mr. Darshan Dhillon to Ms. Sarah Morgan and Mr. Gary Zimmerman of Golder,
Re: Request for Public Health Variance, Reserve Silica Corporation, Service Request SR1380540. April 7.
Public Health. 2019. Letter from Mr. Darshan Dhillon to Ms. Sarah Morgan and Mr. Gary Zimmerman of Golder,
Re: Request for Public Health Variance, Reserve Silica Corporation, Service Request SR1380540. October10.
Washington Administrative Code. 1990. Water Quality Standards for Ground Waters of the State of Washington,
Chapter WAC 173-200. December 1.
Washington Administrative Code. 2010. Maximum Contaminant Levels (MCLs) and Maximum Residual
Disinfectant Levels (MRDLs). Chapter WAC 246-290-310(3)(a). Effective January 4, 2010.
Washington State Department of Ecology. 2005. Sand and Gravel General Permit. Limit for Discharge to Ground
Water. January 5.

October 14, 2020 1520304
13
Washington State Department of Ecology. 2006. (Approval) Work Plan, Bedrock Monitor Well Installation,
Sampling and Analysis Plan, and Quality Assurance Project Plan, Reserve Silica Site, Ravensdale, Washington.
August 3.
USEPA (EPA). 2017. National Functional Guidelines for Inorganic Superfund Data Review. USEPA Contract
Laboratory Program. OSWER 9355.0-131, EPA 540-R-013-001. January.

TABLES

October 2020 152030420Page 1 of 1
SampleArea
SampleLocation ID
Date Measured
Tota
l Wel
l Dep
th
(feet
bgs
)
Scre
ened
In
terv
al
(fe
et b
gs)
Ben
toni
te S
eal
(feet
bgs
)
Cas
ing
Dia
met
er
(inch
es)
TOC
Ele
vatio
n(fe
et m
sl)
Dep
th to
Wat
er(fe
et b
toc)
Gro
undw
ater
El
evat
ion
(fee
t msl
)
MW-1A 8/12/2020 44 28-43 2-26 2 609.83 36.61 573.22MW-2A 8/12/2020 40 25-40 2-23 2 603.61 30.41 573.20MW-3A 8/12/2020 20 4-20 2-4 2 685.51 9.33 676.18MW-4A 8/12/2020 20 5-20 2-4 2 701.85 7.73 694.12MW-5A 8/12/2020 40 25-40 2-23 2 607.61 34.50 573.11MW-6A 8/12/2020 39 24-39 2-22 2 605.35 32.30 573.05
MWB-1LDA 8/12/2020 135 115-135 - 2 701.08 23.92 677.16MWB-2LDA 8/12/2020 125 110-125 - 2 738.06 37.21 700.85MWB-3LDA 8/12/2020 145 125-145 - 2 740.59 4.59 736.00
MWB-1SDSP 8/12/2020 165 150-160 138-148 2 932.69 43.99 888.70MWB-1DDSP 8/12/2020 270 255-265 243-253 2 931.77 57.57 874.20MWB-2DSP 8/12/2020 256 236-256 - 2 931.22 200.97 730.25
MWB-4SDSP 8/12/2020 36 25-36 - 2 928.81 21.96 906.85MWB-5DSP 8/12/2020 83 73-83 - 2 931.45 27.37 904.08MWB-6DSP 8/12/2020 195 120-195 - 2 Note 1 25.94 Note 1
Notes: - Not measured or not availablefeet bgs Feet below ground surfacefeet bmp Feet below measuring pointfeet msl Feet above mean sea levelTOC Top of casing inside PVC well
Note 1
DSP - Bedrock Groundwater
Table 1: Third Quarter 2020 Water Level Measurements
Well Data Water Levels
LDA - Shallow/Alluvial
Groundwater
LDA - Bedrock Groundwater
MWB-6DSP casing was raised by Reserve Silica in between August and November 2019. The New TOC elevation has not been surveyed.
1520304-Tables and Appendix A.xlsm

October 2020 152030420Page 1 of 2
Gen. Chem.
SampleArea
SampleLocation ID
Date Sampled
TOC
Ele
vatio
n(fe
et m
sl)
Dep
th to
Wat
er(fe
et b
toc)
Gro
undw
ater
Ele
vatio
n (f
eet m
sl)
Tem
pera
ture
(°C
)
Con
duct
ivity
(µm
hos/
cm)
Dis
solv
ed O
xyge
n (m
g/L)
Oxi
datio
n R
educ
tion
Pote
ntia
l (R
el m
V)
Turb
idity
(NTU
)
pH(s
tand
ard
units
)
Tota
l Dis
solv
ed S
olid
s(m
g/L)
Ars
enic
Iron
Lead
Man
gane
se
Pota
ssiu
m
MW-1A 8/12/2020 609.83 36.61 573.22 9.5 285 5.01 198.7 0.8 6.96 214 0.00114 0.0034 J 0.0001 U 0.0009 J 14.1
MW-2A 8/12/2020 603.61 30.41 573.20 9.5 463 6.6 185.5 72.9 7.03 359 0.0012 0.0151 J 0.0001 U 0.0013 22.4
MW-2A dupl MW-7A 8/12/2020 - - - - - - - - - 353 0.00126 0.0112 J 0.0001 U 0.0014 22.5
MW-3A 8/13/2020 685.51 9.33 676.18 11.8 884 0.64 -81.6 4.28 6.76 683 0.0109 3.29 0.0001 U 2.16 119
MW-4A 8/13/2020 701.85 7.73 694.12 13.5 334 0.62 58.3 0.51 6.19 238 0.000711 0.248 0.0001 U 0.171 0.921
MW-5A 8/12/2020 607.61 34.50 573.11 11.2 1381 4.00 125.0 2.75 7.52 1250 0.00537 0.012 J 0.0001 U 0.0839 333
MW-6A 8/12/2020 605.35 32.30 573.05 11.0 2360 2.25 162.9 13.4 8.16 2060 0.00628 0.0089 J 0.000088 J 0.0061 709
MWB-1LDA 8/13/2020 701.08 23.92 677.16 11.0 284 0.60 -113.5 0.44 7.55 - - - - - -
MWB-1LDA dupl MWB-7LDA - - - - - - - - - - - - - - - -
MWB-2LDA 8/13/2020 738.06 37.21 700.85 11.6 266 0.54 -118.2 1.35 7.50 - - - - - -
MWB-3LDA 8/13/2020 740.59 4.59 736.00 13.6 189 4.26 50.3 1.60 7.19 - - - - - -
South Pond 8/13/2020 - - - DRY DRY DRY DRY DRY DRY DRY DRY DRY DRY DRY DRY
Still Well 8/13/2020 - - - 15.0 6817 2.55 -42.8 2.02 12.39 2620 0.0419 0.0063 J 0.00086 0.0009 J 659
Weir 8/13/2020 - - - DRY DRY DRY DRY DRY DRY DRY DRY DRY DRY DRY DRY
Infiltration #1 8/12/2020 - - - 18.3 3655 4.33 123.5 5.7 8.98 2570 0.0208 0.124 J 0.00259 0.0048 J 988
Infiltration #1 dupl Infiltration #2 8/12/2020 - - - - - - - - - 2650 0.021 0.129 J 0.00264 0.0053 1000
LDA - Shallow/Alluvial Groundwater
Table 2: Third Quarter 2020 Field Parameters and Analytical Data
Field Parameters Dissolved Metals (mg/L)
LDA - Bedrock Groundwater3
LDA- Surface Water
1520304-Tables and Appendix A.xlsm

October 2020 152030420Page 2 of 2
Gen. Chem.
SampleArea
SampleLocation ID
Date Sampled
TOC
Ele
vatio
n(fe
et m
sl)
Dep
th to
Wat
er(fe
et b
toc)
Gro
undw
ater
Ele
vatio
n (f
eet m
sl)
Tem
pera
ture
(°C
)
Con
duct
ivity
(µm
hos/
cm)
Dis
solv
ed O
xyge
n (m
g/L)
Oxi
datio
n R
educ
tion
Pote
ntia
l (R
el m
V)
Turb
idity
(NTU
)
pH(s
tand
ard
units
)
Tota
l Dis
solv
ed S
olid
s(m
g/L)
Ars
enic
Iron
Lead
Man
gane
se
Pota
ssiu
m
Table 2: Third Quarter 2020 Field Parameters and Analytical Data
Field Parameters Dissolved Metals (mg/L)
MWB-1SDSP 8/13/2020 932.69 43.99 888.70 11.7 1176 0.56 -67.7 0.18 6.78 - - - - - -
MWB-1DDSP 8/13/2020 931.77 57.57 874.20 11.1 739 0.91 -145.8 0.31 7.17 - - - - - -
MWB-2DSP 8/13/2020 931.22 200.97 730.25 12.2 422 3.04 35.0 0.96 7.42 - - - - - -
MWB-4SDSP 8/13/2020 928.81 21.96 906.85 12.6 503 8.74 -39.8 1.89 7.83 - - - - - -
MWB-5DSP 8/13/2020 931.45 27.37 904.08 11.8 619 0.55 -70.6 0.40 6.89 - - - - - -
MWB-6DSP 8/13/2020 Note 5 25.94 Note 5 11.7 403 0.65 -64.3 0.60 7.07 - - - - - -
MWB-6DSP dupl MWB-9DSP - - - - - - - - - - - - - - - -
Portal 8/13/2020 - - - 10.1 569 10.01 -27.0 12.2 7.12 - - - - - -
- - - - 700 - - - 6.5-8.5 500 TBDb 0.3 0.05 0.05 -Notes: bold Bold values indicate parameter results above the Preliminary Standard. TOC Top of casing inside PVC well- Not measured or not available. °C Degrees Celsius* Depth to water (DTW) measurements for all shallow/alluvial wells collected on the same day; date noted is sampling date. feet bmp Feet below measuring point< Analyte not detected above the reporting limit shown. feet msl Feet above mean sea levela Preliminary standard is the standard listed or the site-specific (natural) background concentration, whichever is highest. mg/L Milligrams per literb Site background arsenic value to be determined (TBD). mV MillivoltsJ Data validation code; estimated value. NTU Nephelometric Turbidity UnitJ+ Data validation code; estimated value with positive bias µmhos/cm Micromhos per centimeterU Data validation code; not detected at the Reporting Limit (RL).1234 ORP measurements not available due to faulty sensor.5 MWB-6DSP casing was raised by Reserve Silica in between August and November 2019. The New TOC elevation has not been surveyed.DRY Location is dry. Unable to collect field parameters or samples.
Reduction in monitoring frequency approved by Public Health – Seattle and King County in a letter to Golder Associates Inc. dated April 7, 2016.
DSP - Bedrock Groundwater3
Preliminary Standarda
Reduction in monitoring frequency approved by Public Health – Seattle and King County in a letter to Golder Associates Inc. dated May 16, 2012.
Reduction in monitoring frequency approved by Public Health – Seattle and King County in a letter to Golder Associates Inc. dated October 10, 2019.
1520304-Tables and Appendix A.xlsm

October 2020 152030420Page 1 of 1
Parameter Preliminary Standard Reference
Conductivity 700 μmhos/cm WAC 246-290-310(3)(a)
pH 6.5 – 8.5 WAC 173-200; WSDOE Permit 2005
Turbidity None None
Total Dissolved Solids 500 mg/L WAC 173-200
Dissolved Iron 0.3 mg/L WAC 173-200
Dissolved Lead 0.05 mg/L WAC 173-200
Dissolved Manganese 0.05 mg/L WAC 173-200
Dissolved Arsenic TBD TBD
Dissolved Potassium None NoneNotes: µmhos/cm Micromhos per centimetermg/L Milligrams per literWAC Washington State Administrative CodeWSDOETBD
Washington State Department of EcologySite background arsenic value to be determined
Table 3: Preliminary Standards
1520304-Tables and Appendix A.xlsm

October 2020 152030420Page 1 of 2
Date Sampled Time Sampled
Flow
(gpm
)
Fiel
d pH
(sta
ndar
d un
its)
Turb
idity
(NTU
)
Tota
l Dis
solv
ed S
olid
s (m
g/L)
19-Oct-13 8:45 0.3 7.47 - -19-Nov-13 9:25 0.7 7.52 - -23-Dec-13 15:25 1.2 7.27 - -20-Jan-14 11:15 0.8 7.58 1.0 277
- - - - - -31-Mar-14 11:12 1.0 7.22 1.6 25722-Apr-14 16:05 3.6 6.85 474 21427-May-14 15:30 0.8 7.12 21.9 29427-Jun-14 11:10 0.3 7.13 13.3 13631-Jul-14 19:45 0.2 6.95 4.1 30528-Aug-14 14:00 0.1 7.20 1.8 29429-Sep-14 13:39 0.1 7.87 1.4 34029-Oct-14 11:45 0.3 7.03 1.1 31924-Nov-14 11:50 0.8 7.09 0.7 22922-Dec-14 8:00 0.4 7.08 0.4 25330-Jan-151 10:10 1.1 7.09 0.7 2704-May-15 9:30 0.3 7.54 2.1 2904-Aug-15 12:20 0.1 7.61 1.5 2683-Nov-15 13:15 0.8 7.38 36.9 3208-Feb-16 10:40 1.9 7.23 9.3 2792-May-16 16:00 0.5 7.77 22.5 43122-Aug-16 11:00 0.1 7.78 3.3 3021-Nov-16 11:40 2.4 8.16 96.3 3452-Feb-17 9:25 4.5 7.61 0.9 514
30-May-17 15:45 4.5 7.33 4.0 32418-Aug-17 8:50 0.1 7.57 34.0 30010-Nov-17 11:20 1.1 6.81 12.9 365
Table 4: Interceptor Trench Discharge Monitoring
1520304-Tables and Appendix A.xlsm

October 2020 152030420Page 2 of 2
Date Sampled Time Sampled
Flow
(gpm
)
Fiel
d pH
(sta
ndar
d un
its)
Turb
idity
(NTU
)
Tota
l Dis
solv
ed S
olid
s (m
g/L)
Table 4: Interceptor Trench Discharge Monitoring
28-Feb-18 10:16 2.2 7.02 37.9 3812-May-18 11:45 1.2 7.46 2.9 33922-Aug-18 10:00 0.1 7.32 19.3 2877-Nov-18 14:40 0.3 7.24 3.1 34213-Mar-19 11:31 1.4 7.61 19.4 3139-May-19 10:30 0.9 7.77 8.9 39426-Aug-19 18:15 0.4 7.25 26.4 36114-Nov-19 13:30 0.4 7.05 34.5 44713-Feb-20 12:35 1.6 6.95 1.8 30613-Aug-20 12:00 0.2 7.32 20.8 339
Notes: - Not measured or not availablegpm Gallons per minuteNTU Nephelometric Turbidity Unitmg/L Milligrams per liter1 Reduction in monitoring frequency to quarterly approved by Public Health
– Seattle and King County in an email to Holcim dated January 2, 2015.
1520304-Tables and Appendix A.xlsm

October 2020 152030420Page 1 of 1
Table 5: Third Quarter 2020 Treatment System Metals Monitoring
Sample Location Sample ID Date Sampled Arsenic (mg/L) Lead (mg/L)Influent Tank-Effluent 14-Aug-20 0.0255 0.0429Effluent As2-Effluent 14-Aug-20 0.0015 0.0142
Notes: - Not measured or not availablemg/L Milligrams per liter
1520304-Tables and Appendix A.xlsm

FIGURES

CLIENT
CONSULTANT
PREPARED
DESIGN
PROJECT
APPROVED
TITLE
REVIEW
YYYY-MM-DD
PROJECT No. Rev. FigurePhase
G:\H
OLC
IM\R
aven
sdal
e\99
_PR
OJE
CTS
\152
0304
_201
5Mon
itorin
g\70
0\02
_PR
OD
UC
TIO
N\IN
DD
\152
0304
_700
_001
.indd
VICINITY MAP
HOLCIM (US). INC. RAVENSDALE
719 11520304
REDMOND
2018-03-22
Site
SCALE IN FEET
20000

01 in
1520304PHASE
719FIGURE
2A
2018-06-05
REDMOND
JX
JM
GZ
RAVENSDALEHOLCIM
SITE PLAN TITLE
PROJECT NO. REV.
PROJECTCLIENT
CONSULTANT
PREPARED
DESIGNED
REVIEWED
APPROVED
YYYY-MM-DD
Path
: \\re
dm
ond.g
old
er.
gds\g
eom
at$
\geom
atics\H
OLC
IM\R
avensdale
\99_P
RO
JE
CT
S\1
520304_In
terc
epto
rTre
nchE
xt\718_M
onitoring2018\0
2_P
RO
DU
CT
ION
\DW
G\
|
File
Nam
e:
152030401_718_001.d
wg
| L
ast
Edited B
y:
trybar
Date
: 2
018-1
1-0
2
Tim
e:1
2:4
5:0
2 P
M
| P
rinte
d B
y:
TR
ybar
D
ate
: 2018-1
1-0
2
Tim
e:1
2:4
6:0
9 P
M
IF T
HIS
ME
AS
UR
EM
EN
T D
OE
S N
OT
MA
TC
H W
HA
T I
S S
HO
WN
, T
HE
SH
EE
T S
IZE
HA
S B
EE
N M
OD
IFIE
D F
RO
M:
AN
SI
D
0
FEET
150 300
1'' = 150'
1. BASE TOPOGRAPHY OUTSIDE OF LDA FOOTPRINT PREPARED BY AERO-METRIC,
INC., SEATTLE, WA FROM AERIAL PHOTOS FLOWN ON FEBRUARY 10, 2007.
HORIZONTAL DATUM: WASHINGTON STATE PLANE NORTH ZONE,
NAD 27 US FEET - TRANSLATED TO NAD83/91 (HARN)
VERTICAL DATUM: NGVD 29 - TRANSLATED TO NAVD88
CONTOUR INTERVAL: 5 FT
2. BASE TOPOGRAPHY INSIDE OF LDA FOOTPRINT PREPARED BY PACIFIC
GEOMATIC SERVICES, INC., MOUNTLAKE TERRACE, WA FROM FIELD DATA
TAKEN ON NOVEMBER 1, 2007.
HORIZONTAL DATUM: WASHINGTON STATE PLANE NORTH ZONE,
NAD 27 US FEET - TRANSLATED TO NAD83/91 (HARN)
VERTICAL DATUM: NGVD 29 - TRANSLATED TO NAVD88
CONTOUR INTERVAL: 1 FT
3. BASE TOPOGRAPHY INSIDE OF DSP FOOTPRINT PREPARED BY PARAMETRIX,
INC., BELLEVUE, WA FROM FIELD DATA TAKEN ON JULY 6, 2011.
HORIZONTAL DATUM: WASHINGTON STATE PLANE NORTH ZONE,
NAD 27 US FEET - TRANSLATED TO NAD83/91 (HARN)
VERTICAL DATUM: NGVD 29 - TRANSLATED TO NAVD88
CONTOUR INTERVAL: 1 FT
MW-1A
MWB-1DDSP
MWB-2DSP
NOTE(S)
LEGEND
COVER AREA
ALLUVIAL MONITORING WELL
BEDROCK MONITORING WELL
BEDROCK MONITORING WELL (NOTE 4)
LDA SURFACE WATER SAMPLING LOCATION
DSP BEDROCK SAMPLING LOCATION (PORTAL)
INTERCEPTOR TRENCH SAMPLING LOCATION
FENCE LINEX X
APPENDIX A
Summary Data Tables for Individual
Wells and Monitoring Locations
APPENDIX A-1
Summary of Lower Disposal Area –
Surface Water Sampling Results Table A-1A Still Well
Table A-1B Infiltration Ponds #1 Table A-1C Weir Table A-1D South Pond

October 2020 152030420Page 1 of 2
Ravensdale Site, Ravensdale, Washington
DateSampled
Tem
pera
ture
(°C
)
Con
duct
ivity
(µm
hos/
cm)
Dis
solv
ed O
xyge
n(m
g/L)
Oxi
datio
n-R
educ
tion
Pote
ntia
l (R
el m
V)
Turb
idity
(NTU
)
pH(s
tand
ard
units
)
Tota
l Dis
solv
ed S
olid
s(m
g/L)
pH m
easu
red
in la
b(s
tand
ard
units
)
Ars
enic
Iron
Lead
Man
gane
se
Pota
ssiu
m
1-Feb-05 8.10 10658 - - 6.59 12.87 2860 12.58 0.04990 <0.100 0.00552 <0.0100 -9-Mar-05 13.23 7393 - - 7.42 12.51 2860 12.53 0.11500 0.228 0.01470 <0.0100 -5-Apr-05 9.50 11310 - - 10.90 12.44 2900 12.32 0.05560 <0.100 0.01160 <0.0200 -
10-May-05 13.99 11871 - - 3.60 12.53 2810 12.57 0.05540 <0.100 0.01250 <0.0200 -7-Jun-05 13.83 10888 - - 22.60 12.54 2490 12.51 <0.00500 <0.100 <0.00500 <0.0200 -
15-Jul-05a 18.21 11331 - - 14.80 12.50 3800 12.6 0.00272 <0.150 0.00607 <0.0100 -15-Jul-05b - - - - - - 2540 12.61 0.03980 <0.100 0.00757 <0.0200 -9-Aug-05a 21.45 12087 - - 17.90 11.78 3500 12.6 0.12000 0.288 0.01090 0.0101 -9-Aug-05b - - - - - - 2820 12.46 0.09150 <0.100 0.00953 <0.0200 -
14-Sept-05a 17.38 9507 - - 14.00 12.36 3600 12.5 0.11800 <0.750 0.01120 <0.0500 -14-Sept-05b - - - - - - 2830 12.61 0.11500 0.363 0.01440 - -
5-Oct-05 13.31 11481 - - 62.70 12.47 3020 12.6 0.08520 <0.100 0.01190 <0.0200 -9-Nov-05 9.58 14417 - - 11.00 12.34 3400 12.6 0.07400 <0.150 <0.01000 <0.0100 -9-Dec-05 6.18 7138 - - 12.50 12.82 2800 12.6 0.01450 <0.150 0.00107 <0.0100 -19-Jan-06 8.66 8265 1.74 - 11.80 13.06 1900 J 12.6 J 0.01520 J <0.150 <0.00100 <0.0100 -16-Feb-06 8.13 9019 2.81 195.6 6.16 12.27 3200 J 12.6 0.01340 J <0.150 0.00189 <0.0100 -15-Mar-06 7.98 9033 0.79 114.8 8.93 12.60 3300 J 12.6 0.00236 <0.150 0.00250 J <0.0100 -7-Apr-06 9.98 10450 0.57 34.8 6.08 12.51 3400 12.6 0.01520 <0.150 0.00283 <0.0100 -
16-May-06 12.79 11060 0.14 45.4 9.28 12.40 3500 12.6 0.00404 <0.150 0.00159 <0.0100 -23-Jun-06 13.29 11680 0.44 - 14.60 12.90 3600 12.6 0.05260 <0.150 0.01650 <0.0100 -20-Jul-06 16.20 12240 0.14 -217.8 10.40 12.47 4300 12.7 0.01930 <0.150 0.00357 <0.0100 -22-Aug-06 17.14 10920 1.22 -146.0 13.30 12.66 3800 12.7 0.14400 <0.150 0.00914 J <0.0100 -26-Sep-06 15.72 9599 0.42 -263.3 61.40 12.59 3800 12.5 0.12300 0.171 0.00463 0.0154 -26-Oct-06 10.99 9955 0.88 -207.5 82.30 12.93 3600 12.6 0.16100 <1.500 0.01950 <0.1000 -15-Nov-06 10.58 12040 1.82 149.2 188.00 12.87 3400 12.5 0.03060 J <0.150 0.00450 <0.0100 -20-Dec-06 8.85 10990 0.71 -152.0 32.80 13.02 2600 J 12.8 0.05260 <0.150 0.01300 <0.0100 -24-Jan-07 8.29 10440 0.97 -139.8 13.70 13.05 2500 J 12.4 0.05860 <0.150 0.01310 <0.0100 -12-Feb-07 8.88 10590 0.86 -125.8 56.40 13.06 3400 12.5 0.06130 <0.150 0.01400 <0.0100 -27-Mar-07 9.45 9163 1.25 -42.4 18.40 11.53 2900 J 12.5 J 0.04410 <0.150 0.00181 <0.0100 -18-Apr-07 8.90 8155 2.63 2.3 37.20 12.77 3300 J 12.4 0.02930 <0.150 0.00198 <0.0100 -31-May-07 20.12 11050 5.30 -153.9 9.31 11.59 2800 J 12.5 0.04850 <0.150 0.01510 J <0.0100 -20-Jun-07 18.28 12000 5.41 -122.5 16.10 12.04 4300 J 12.4 J 0.02680 <0.150 0.00233 <0.0100 -31-Jul-07 16.53 12200 1.70 -151.6 24.80 12.48 6000 12.6 J 0.08760 <0.150 0.00103 <0.0100 -29-Aug-07 17.00 9570 1.12 -183.1 268.00 12.78 4600 J 12.6 J 0.10600 <0.150 0.00946 <0.0100 -27-Sep-07 14.49 8263 52.40 -183.0 211.00 12.42 2800 12.5 J 0.12500 <0.150 0.01540 <0.0100 -26-Oct-07 9.49 6144 4.88 -147.2 92.40 12.85 3300 J 12.3 J 0.12400 0.260 0.02490 0.0101 -30-Nov-07 5.53 7703 2.13 -122.6 127.00 12.67 2200 12.4 J 0.17400 0.184 0.01410 <0.0100 -12-Dec-07 5.24 11609 3.43 -144.8 116.00 12.60 4100 12.4 J 0.11000 <0.150 0.01130 <0.0100 -24-Jan-08 3.73 9649 13.81 -138.0 - 10.74 2500 11.8 J 0.10100 1.530 0.00974 0.0815 -28-Feb-08 - - - - 51.20 - 2900 12.4 J 0.05850 <0.150 0.01260 <0.0100 -25-Mar-08 7.06 8623 5.52 -11.2 17.40 11.26 3400 12.5 J 0.07430 <0.150 0.01040 <0.0100 -29-Apr-08 9.74 11332 4.29 -1.3 27.70 12.82 3000 J 12.5 J 0.07660 <0.150 0.01330 <0.0100 -20-May-08 14.53 11955 1.74 -35.8 72.70 12.82 3400 12.5 J 0.08730 <0.150 0.01510 <0.0100 -18-Jun-08 12.77 10267 3.34 -27.0 34.00 12.86 3200 J 12.4 J 0.06320 <0.150 0.01690 <0.0100 -26-Aug-08 15.86 7703 1.06 -72.8 38.30 12.67 2600 J 12.2 J 0.43000 1.220 0.03500 0.0497 75920-Nov-08 9.59 8762 0.91 -65.6 74.10 13.32 3500 12.4 J 0.07000 <0.150 0.01680 <0.0100 84812-Feb-09 3.25 554 14.29 - 108.00 13.03 550 11.8 J 0.04720 <0.150 0.01370 <0.0100 55119-May-09 11.53 276 8.80 26.0 43.40 9.83 2500 J 12.4 J 0.03780 <0.150 0.01500 <0.0100 68922-Sep-09 12.47 9760 1.50 159.1 625.00 12.47 3000 - 0.16000 0.200 0.03700 0.0100 J 99015-Dec-09 5.20 11650 1.90 237.0 26.30 12.85 3000 - 0.08600 0.067 J 0.02100 0.0047 J 900 J22-Mar-10 9.70 1035 - 182.0 19.40 12.58 3000 - 0.07300 <0.200 0.01700 <0.0200 87017-Jun-10 11.70 9610 0.08 - 6.59 12.48 2700 - 0.06600 0.095 J 0.01500 0.0020 J 78021-Sep-10 15.00 6710 1.26 152.6 140.00 12.29 2400 - 0.30000 1.100 J+ 0.03900 0.0300 J+ 5708-Dec-10 8.30 10110 1.00 - 5.44 12.63 2600 - 0.06400 <0.200 0.01000 <0.0200 86030-Mar-11 8.60 4810 0.46 136.3 13.70 14.31 2500 J - 0.06500 <0.200 0.00960 <0.0200 72021-Jun-11 16.60 10420 1.63 111.9 3.40 12.36 5200 - 0.06000 <0.200 0.00910 0.0017 J 77028-Sep-11 14.80 5270 2.34 70.0 66.70 12.17 2200 - 0.22000 0.360 0.01100 0.0072 J 100015-Dec-11 6.00 7330 2.47 104.2 18.30 13.09 2800 - 0.08300 <0.200 0.00290 <0.0200 88021-Mar-12 5.50 11040 3.15 294.2 12.00 12.39 2600 - 0.06700 <0.200 0.00470 <0.0200 76019-Jun-12 5.50 11040 3.15 294.2 12.00 12.39 2600 - 0.05800 <0.200 0.00670 <0.0200 69020-Sep-12 16.10 9560 3.27 76.0 10.70 12.35 2900 - 0.08400 <0.200 0.00300 <0.0200 83019-Dec-12 4.10 1320 10.11 303.1 5.86 9.69 700 - 0.07500 0.690 0.00430 0.0710 250
Table A-1a: Summary of Lower Disposal Area - Surface Water Sampling Results - Still Well
Field Parameters GeneralChemistry Dissolved Metals (mg/L)
1520304-Tables and Appendix A.xlsm

October 2020 152030420Page 2 of 2
Ravensdale Site, Ravensdale, Washington
DateSampled
Tem
pera
ture
(°C
)
Con
duct
ivity
(µm
hos/
cm)
Dis
solv
ed O
xyge
n(m
g/L)
Oxi
datio
n-R
educ
tion
Pote
ntia
l (R
el m
V)
Turb
idity
(NTU
)
pH(s
tand
ard
units
)
Tota
l Dis
solv
ed S
olid
s(m
g/L)
pH m
easu
red
in la
b(s
tand
ard
units
)
Ars
enic
Iron
Lead
Man
gane
se
Pota
ssiu
m
Table A-1a: Summary of Lower Disposal Area - Surface Water Sampling Results - Still Well
Field Parameters GeneralChemistry Dissolved Metals (mg/L)
26-Feb-13 7.30 9950 1.77 161.8 25.50 12.66 2000 - 0.07000 <0.500 0.00029 J <0.0200 72023-May-13 11.50 8040 2.23 266.8 22.70 12.47 2500 - 0.05700 <0.500 0.00340 <0.0200 69022-Aug-13 17.40 8810 2.42 10.8 38.50 12.79 2590 - 0.05780 <0.100 0.00150 0.0020 86319-Nov-13 9.00 7090 2.47 79.0 62.80 12.54 2720 - 0.05250 <0.100 0.00420 <0.0020 9091-Apr-14 10.30 6080 0.55 128.2 37.10 6.08 1890 - 0.05460 <0.100 0.00110 <0.0013 687
22-May-14 13.60 7360 1.22 34.4 - 11.75 2330 - 0.06090 <0.100 0.00200 <0.0020 68913-Aug-14 18.26 7844 0.33 1.2 7.30 12.53 2770 - 0.07000 <0.100 0.00210 <0.0020 84912-Nov-14 9.00 585 3.17 -47.8 17.50 12.93 2450 - 0.08320 <0.100 0.00390 <0.0020 83712-Feb-15 10.70 7540 2.68 -18.6 9.64 12.71 2150 - 0.05160 <0.100 0.00030 <0.0020 6904-May-15 12.90 9140 2.73 110.4 26.80 13.02 2520 - 0.05460 <0.100 0.00022 J <0.0020 7345-Aug-15 19.50 8060 2.58 -29.8 61.10 12.62 2980 - 0.06390 <0.250 0.00170 0.0047 J 8983-Nov-15 11.10 5150 0.37 38.6 171.00 8.93 1840 - 0.10900 0.270 0.02170 0.0130 7479-Feb-16 9.70 7390 0.78 80.8 7.79 13.07 2170 - 0.05360 <0.100 0.00120 0.0060 6013-May-16 14.70 7530 1.40 358.1 2.65 12.98 2480 - 0.0542 <0.100 0.00170 J- 0.0020 71122-Aug-16 20.50 8 2.10 - 59.00 12.95 2780 - 0.09130 <0.250 0.00587 0.0023 J 8311-Nov-16 12.30 2884 2.66 -72.1 19.10 13.17 2620 - 0.04620 <0.100 0.00964 <0.0020 84131-Jan-17 7.40 8510 2.37 -167.0 7.35 13.17 2050 - 0.05250 0.026 J 0.00119 0.0016 J 58231-May-17 14.60 7500 2.44 - 4.17 12.89 1900 - 0.04540 0.011 J 0.00068 J+ 0.0007 J 61517-Aug-17 18.30 8460 3.35 -84.0 15.90 12.79 2680 - 0.05680 0.003 J 0.00214 0.0013 J 7509-Nov-17 8.20 7215 3.48 90.9 18.20 12.65 2360 - 0.0621 <0.1 0.00352 0.0025 82227-Feb-18 6.60 5312 3.75 2.3 2.49 12.11 1970 - 0.0502 <0.1 0.00753 0.0025 5212-May-18 11.10 8260 1.70 - 13.00 12.92 2360 - 0.0434 0.133 0.02170 J+ 0.0088 55221-Aug-18 20.22 6260 4.71 -42.1 5.84 12.58 2100 - 0.0522 0.10 U 0.000138 <0.002 6297-Nov-18 9.70 995 6.72 126.8 20.60 9.15 1880 - 0.644 1.35 0.0802 0.0491 502 J+11-Mar-19 10.60 1354 5.93 -18.7 7.19 10.31 1710 - 0.0528 0.0091 J 0.0212 0.0013 J 5019-May-19 13.80 6973 6.40 18.1 16.70 12.36 1980 - 0.0416 0.0079 J 0.0134 0.0008 J 52126-Aug-19 17.80 6405 3.91 Note 1 5.15 12.56 2570 - 0.0425 <0.1 0.0154 0.001 J 72214-Nov-19 9.70 6065 0.41 -53.3 12.00 12.67 1750 - 0.167 0.121 J 0.0239 0.0065 56313-Feb-20 7.60 4936 0.37 -139.0 2.56 12.66 1630 - 0.0486 0.0136 J 0.00608 0.0031 49013-Aug-20 15.00 6817 2.55 -42.8 2.02 12.39 2620 - 0.0419 0.0063 J 0.00086 0.0009 J 659
Preliminary Standardc - 700 - - - 6.5-8.5 500 6.5-8.5 TBDd 0.3 0.05 0.05 -
Notes: - Not analyzed or not available< Analyte not detected above the reporting limit showna North Creek Analytical, Inc.b Severn Trent Laboratoriesc Preliminary standard is the standard listed or the site-specific (natural) background concentration, whichever is highestd Site background arsenic value to be determined (TBD)U Data validation code; not detected at the Reporting Limit (RL)J Data validation code; estimated valueJ+ Data validation code; estimated value with positive bias°C Degrees CelsiusNote 1 ORP measurements not available due to faulty sensor.µmhos/cm Micromhos per centimeter mg/L Milligrams per literfeet bmp Feet below measuring point mV Millivoltsfeet msl Feet above mean sea level NTU Nephelometric Turbidity Unit
1520304-Tables and Appendix A.xlsm

October 2020 152030420Page 1 of 2
Ravensdale Site, Ravensdale, Washington
DateSampled
Tem
pera
ture
(°C
)
Con
duct
ivity
(µm
hos/
cm)
Dis
solv
ed O
xyge
n(m
g/L)
Oxi
datio
n-R
educ
tion
Pote
ntia
l (R
el m
V)
Turb
idity
(NTU
)
pH(s
tand
ard
units
)
Tota
l Dis
solv
ed S
olid
s(m
g/L)
pH m
easu
red
in la
b(s
tand
ard
units
)
Ars
enic
Iron
Lead
Man
gane
se
Pota
ssiu
m
1-Feb-05 8.17 1315 - - 8.13 9.95 874 9.75 0.08490 0.234 0.00499 0.0249 -9-Mar-05 14.04 1183 - - 23.00 9.59 960 9.46 0.09620 0.470 0.00392 0.0321 -5-Apr-05 11.00 1115 - - 43.70 9.80 800 9.49 0.06230 0.574 0.00321 <0.0200 -
10-May-05 14.91 1275 - - 564.00 9.83 844 9.79 0.07650 0.790 <0.00500 0.0462 -7-Jun-05 15.11 1140 - - 239.00 9.61 804 9.53 0.08430 0.722 <0.00500 0.0327 -
15-Jul-05a 23.56 1276 - - 94.40 9.30 1100 9.54 0.09250 <0.300 0.00414 0.0534 -15-Jul-05b - - - - - - 874 9.45 0.09990 0.533 0.00382 <0.0200 -9-Aug-05a 19.05 1744 - - 57.20 9.44 1000 9.22 0.12300 0.792 0.00510 0.0499 -9-Aug-05b - - - - - - 1030 9.05 0.14000 0.339 0.00612 0.0308 -
14-Sept-05a 13.59 1154 - - 99.80 8.97 790 9.04 0.11000 <0.750 0.00354 <0.0500 -14-Sept-05b - - - - - - 806 9.03 0.11800 0.877 0.00518 - -
5-Oct-05 14.82 970 - - 82.70 8.98 736 8.73 0.08930 0.329 0.00283 0.0263 -9-Nov-05 8.43 1285 - - 135.00 8.83 970 9.28 0.04600 0.194 <0.01000 0.0295 -9-Dec-05 2.12 1361 - - 14.20 9.71 980 9.54 0.06460 0.179 0.00311 0.0399 -19-Jan-06 6.66 728 7.96 - 64.70 10.13 470 J 9.77 0.04070 0.181 0.00229 0.0402 -16-Feb-06 2.63 624 9.75 30.3 25.20 8.54 530 J 8.99 0.01330 <0.150 <0.00100 0.1190 -15-Mar-06 7.16 639 11.61 236.8 23.10 9.22 530 J 9.19 0.02250 0.167 <0.00100 0.0791 -7-Apr-06 11.91 1013 10.81 27.8 18.80 9.98 780 9.72 0.06380 0.344 0.00324 0.0483 -
16-May-06 15.58 1160 7.58 50.6 16.50 9.57 950 9.65 0.07790 0.462 0.00249 0.0505 -23-Jun-06 18.63 1261 7.41 - 126.00 9.85 920 9.35 0.07070 0.228 0.00365 0.0366 -20-Jul-06 20.65 932 5.36 -35.1 279.00 8.94 980 8.79 0.10800 0.287 0.00348 0.0285 -22-Aug-06 15.65 860 7.64 86.5 218.00 9.22 760 9.15 0.11600 0.734 0.00384 0.0237 -26-Sep-06 21.86 903 8.98 -72.8 263.00 8.89 820 8.76 0.07580 0.616 0.00306 0.0558 -26-Oct-06 11.04 702 9.97 90.4 221.00 8.56 760 8.59 0.06830 <1.500 0.00166 <0.1000 -15-Nov-06 7.73 715 9.21 149.2 33.60 9.07 500 9.25 0.02080 0.174 0.00229 0.0367 -20-Dec-06 4.98 1082 9.05 86.3 9.29 9.78 680 9.83 0.05130 0.269 0.00267 0.0549 -24-Jan-07 2.12 1058 10.71 130.4 20.50 9.97 640 J 9.97 0.06610 <0.150 0.00758 0.0403 -12-Feb-07 10.10 1218 12.40 -61.8 103.00 9.98 860 9.97 0.09010 0.642 0.00449 0.0451 -27-Mar-07 7.94 772 9.67 13.3 25.50 8.27 540 J 9.96 J 0.04980 <0.150 0.00274 0.0336 -18-Apr-07 7.52 2418 9.23 84.4 58.10 11.73 1400 11.4 J 0.07920 0.212 0.01050 0.0296 -31-May-07 15.45 1879 6.47 -92.2 3.15 9.79 1300 10 J 0.16500 <0.750 0.00811 0.1340 -20-Jun-07 24.18 1925 10.88 -52.1 251.00 10.24 1300 J 10.1 J 0.14400 <0.150 0.00534 <0.0100 -31-Jul-07 19.05 1418 5.97 -36.1 128.00 9.81 1200 9.4 J 0.14000 1.070 0.00723 0.0433 -29-Aug-07 18.00 1193 5.60 -35.4 158.00 9.29 1300 J 9.48 J 0.16400 0.427 J 0.00701 0.0277 J -27-Sep-07 14.97 987 5.44 45.9 186.00 8.99 970 9.15 J 0.19600 0.438 0.00549 0.0326 -26-Oct-07 2.66 504 6.02 63.1 282.00 8.64 770 J 8.17 J 0.04290 0.422 0.00225 0.0602 -30-Nov-07 1.86 955 9.77 190.1 163.00 10.02 570 8.9 J 0.04890 0.205 0.00162 0.0271 -12-Dec-07 4.22 790 11.11 126.8 56.00 9.40 520 9.05 J 0.03430 0.179 0.00167 0.0175 -24-Jan-08 2.12 875 19.35 142.0 - 8.68 640 9.24 J 0.04280 0.162 0.00166 0.0155 -28-Feb-08 - - - - 25.60 - 510 9.18 J 0.04130 <0.150 0.00266 0.0159 -25-Mar-08 5.27 937 14.46 91.0 86.80 9.60 630 9.55 J 0.05020 0.180 0.00215 0.0213 -29-Apr-08 9.02 1079 10.56 190.8 61.30 9.87 670 J 9.76 J 0.06600 0.27 J 0.00287 0.0286 -20-May-08 15.42 1191 7.58 160.0 91.40 9.75 820 9.7 J 0.08590 0.334 0.00485 0.0432 -18-Jun-08 12.94 1124 9.62 167.3 76.90 9.65 810 J 9.55 J 0.07760 0.486 0.00367 0.0222 -26-Aug-08 15.95 880 3.75 53.5 490.00 8.00 650 J 7.81 J 0.07690 0.334 0.00164 0.0713 14420-Nov-08 6.91 897 7.02 183.5 376.00 10.22 960 10.1 J 0.08720 0.196 0.00421 0.0584 J 31312-Feb-09 1.29 - 13.72 - 10.20 10.52 800 10.1 J 0.11800 0.177 0.00584 0.0561 27119-May-09 11.90 862 6.52 71.9 133.00 9.59 840 J 9.9 J 0.09130 0.350 0.00399 0.0366 23818-Nov-09 5.70 852 6.61 185.9 68.00 9.88 490 - 0.04000 0.700 0.00440 0.0350 16015-Dec-09 2.30 1162 8.22 460.1 63.30 9.97 640 - 0.07100 0.850 0.00720 0.0500 22024-Mar-10 13.00 1299 5.83 408.2 13.00 10.48 1,000 - 0.14000 0.720 0.00850 0.0370 34017-Jun-10 12.00 947 4.45 332.1 33.60 10.56 540 - 0.06200 0.660 0.00620 0.0630 22022-Sep-10 15.60 1736 3.14 342.5 33.00 9.84 1300 - 0.13000 2.900 0.02100 0.1700 J+ 3608-Dec-10 5.40 1382 7.73 371.1 12.10 10.75 870 - 0.10000 0.490 0.01200 0.0370 30029-Mar-11 9.60 627 5.16 577.6 19.80 11.05 760 J - 0.07800 0.200 J+ 0.00310 0.0210 27021-Jun-11 21.00 1778 5.46 239.1 11.60 10.44 1700 J - 0.07800 0.810 0.01100 0.0650 34027-Sep-11 14.80 1382 3.98 239.8 33.40 9.58 1600 - 0.12000 1.600 0.01300 0.0820 670
Field Parameters
Table A-1b: Summary of Lower Disposal Area - Surface Water Sampling Results - Infiltration Ponds #1
GeneralChemistry Dissolved Metals (mg/L)
1520304-Tables and Appendix A.xlsm

October 2020 152030420Page 2 of 2
Ravensdale Site, Ravensdale, Washington
DateSampled
Tem
pera
ture
(°C
)
Con
duct
ivity
(µm
hos/
cm)
Dis
solv
ed O
xyge
n(m
g/L)
Oxi
datio
n-R
educ
tion
Pote
ntia
l (R
el m
V)
Turb
idity
(NTU
)
pH(s
tand
ard
units
)
Tota
l Dis
solv
ed S
olid
s(m
g/L)
pH m
easu
red
in la
b(s
tand
ard
units
)
Ars
enic
Iron
Lead
Man
gane
se
Pota
ssiu
m
Field Parameters
Table A-1b: Summary of Lower Disposal Area - Surface Water Sampling Results - Infiltration Ponds #1
GeneralChemistry Dissolved Metals (mg/L)
14-Dec-11 3.10 1046 5.60 281.7 15.70 9.93 1100 - 0.08700 1.100 0.01400 0.0630 33020-Mar-12 6.10 986 11.04 271.1 11.70 10.32 500 - 0.07100 0.470 0.00330 0.0590 18019-Jun-12 14.80 862 7.83 352.2 38.80 9.57 500 - 0.06400 0.560 J+ 0.00370 0.0540 18020-Sep-12 12.40 1961 1.81 419.0 10.30 9.43 4600 J - 0.13000 0.480 0.00210 0.0470 44019-Dec-12 4.10 1320 10.11 303.1 5.86 9.69 700 - 0.07500 0.690 0.00430 0.0710 25025-Feb-13 7.10 1963 9.30 234.7 26.60 11.30 1000 - 0.09000 0.100 J 0.00600 0.0230 37022-May-13 10.50 4380 7.72 411.7 202.00 12.56 1400 - 0.02500 <0.500 0.01100 0.0064 J 53021-Aug-13 20.10 12850 1.24 -2.3 18.20 12.18 3430 - 0.10600 0.270 0.04750 0.0210 118020-Nov-13 5.70 1198 8.03 131.9 22.20 10.23 704 - 0.04130 0.210 0.00620 0.0400 2601-Apr-14 9.80 1708 9.77 136.4 8.79 12.26 832 - 0.02410 0.049 J 0.00300 0.0050 J+ 317
23-May-14 12.63 6574 8.63 120.8 - 12.61 2120 - 0.00480 <0.100 0.03540 <0.0020 81113-Aug-14 18.99 3273 6.29 77.7 89.00 12.34 1660 - 0.07140 <0.100 0.00630 J 0.0070 54811-Nov-14 8.80 578 3.55 179.2 62.50 12.73 2000 - 0.05670 <0.100 0.02040 <0.0020 73911-Feb-15 9.70 487 9.97 66.2 42.00 9.40 337 - 0.00910 0.120 0.00090 0.0120 87.74-May-15 14.30 4210 5.60 281.2 7.67 12.53 1670 - 0.03530 0.039 J 0.00740 0.0014 J 5895-Aug-15 19.90 4890 5.14 18.8 89.80 11.79 3080 - 0.08540 0.390 0.01810 0.0120 11503-Nov-15 9.20 760 6.39 129.9 34.60 9.78 707 - 0.02350 0.270 0.00530 0.0150 2359-Feb-16 10.20 - 10.29 100.3 8.01 12.78 1330 - 0.00530 <0.1000 0.02480 0.0030 530
2-May-16 e - - - - - - 2490 - 0.02400 0.0754 J 0.0370 J- 0.0041 J 99623-Aug-16 19.30 4250 3.95 386.5 46.30 11.76 2970 - 0.10500 0.404 0.01430 0.0113 9891-Nov-16 11.70 229 9.26 185.2 48.90 10.33 508 - 0.01260 0.155 0.00079 0.0067 1641-Feb-17 2.40 8890 10.78 26.1 3.17 13.36 2220 - 0.01010 <0.250 0.04680 <0.0050 854
30-May-17 14.70 6800 56.90 17.7 1.38 12.73 1720 - 0.00175 0.030 J 0.03160 J+ 0.0009 J 75917-Aug-17 18.10 5410 3.88 -19.5 14.90 11.93 3080 - 0.06260 0.122 J 0.03280 0.0111 115010-Nov-17 7.90 2016 7.72 64.4 30.70 12.00 1520 - 0.063 0.156 0.0322 0.0141 57827-Feb-18 5.70 5062 8.76 42.0 3.74 12.28 1620 - 0.015 <0.1 0.0546 <0.002 6781-May-18 12.30 6620 5.25 - 1.94 12.73 2070 - 0.00242 0.0117 J 0.03010 J+ 0.0010 J 74521-Aug-18 23.85 5058 2.95 106.0 5.62 11.64 3090 - 0.0773 0.25 U 0.0288 0.0094 12006-Nov-18 11.70 1078 3.50 -5.4 46.90 8.48 1180 - 0.00603 <0.5 0.00544 0.0298 359 J+13-Mar-19 3.90 331 8.08 183.7 29.10 10.72 455 - 0.0119 0.131 0.00221 0.0053 1858-May-19 17.20 6113 6.38 6.4 6.17 12.39 2040 - 0.0077 0.0246 J 0.0268 0.0018 J 83026-Aug-19 24.22 4177 2.47 Note 1 7.21 9.12 2840 - 0.0172 J 0.405 J 0.00527 J 0.0172 J 102013-Nov-19 8.70 2523 1.61 -201.7 33.00 8.67 1930 - 0.0325 0.211 0.00444 0.024 72612-Feb-20 7.80 971 7.99 150.3 16.00 7.92 836 - 0.0143 0.0234 J 0.00396 0.0279 24312-Aug-20 18.30 3655 4.33 123.5 5.74 8.98 2570 - 0.0208 0.124 J 0.00259 0.0048 J 988
Preliminary Standardc - 700 - - - 6.5-8.5 500 6.5-8.5 TBDd 0.3 0.05 0.05 -
Notes: - Not analyzed or not available< Analyte not detected above the reporting limit showna North Creek Analytical, Inc.b Severn Trent Laboratoriesc Preliminary standard is the standard listed or the site-specific (natural) background concentration, whichever is highestd Site background arsenic value to be determined (TBD)eU Data validation code; not detected at the Reporting Limit (RL)J Data validation code; estimated valueJ+ Data validation code; estimated value with positive bias°C Degrees CelsiusNote 1 ORP measurements not available due to faulty sensor.µmhos/cm Micromhos per centimeter mg/L Milligrams per literfeet bmp Feet below measuring point mV Millivoltsfeet msl Feet above mean sea level NTU Nephelometric Turbidity Unit
Field parameters for Infiltration Ponds #1 were inadvertently not collected during May 2016 sampling
1520304-Tables and Appendix A.xlsm

October 2020 152030420Page 1 of 2
Ravensdale Site, Ravensdale, Washington
DateSampled
Tem
pera
ture
(°C
)
Con
duct
ivity
(µm
hos/
cm)
Dis
solv
ed O
xyge
n(m
g/L)
Oxi
datio
n-R
educ
tion
Pote
ntia
l (m
V)
Turb
idity
(NTU
)
pH
(sta
ndar
d un
its)
Wei
r Flo
w R
ate
(gpm
)
Tota
l Dis
solv
ed S
olid
s(m
g/L)
pH m
easu
red
in la
b(s
tand
ard
units
)
Ars
enic
Iron
Lead
Man
gane
se
Pota
ssiu
m
1-Feb-05 8.47 2205 - - 6.24 10.23 - 1440 10.37 0.14900 0.323 0.01070 0.0569 -9-Mar-05 11.38 2054 - - 7.80 10.15 2.64 1630 10.11 0.20000 0.526 0.01190 0.0938 -5-Apr-05 7.7 2169 - - 7.99 10.42 10.00 1420 10.18 0.12900 1.150 0.00861 0.0540 -
10-May-05 14.1 1912 - - 562.00 9.87 25.00 1210 9.85 0.10500 1.460 0.00763 0.0818 -7-Jun-05 15.74 2588 - - 11.60 10.03 6.82 1570 10.18 0.13800 1.470 0.01010 0.1170 -
15-Jul-05a 20.38 3184 - - 8.91 10.36 0.94 3200 10.3 0.19200 0.367 0.00998 0.2060 -15-Jul-05b - - - - - - - 1990 10.44 0.18900 1.460 0.01080 0.1640 -9-Aug-05a - - - - - - Dry - - - - - - -9-Aug-05b - - - - - - Dry - - - - - - -
14-Sept-05a 15.60 3792 - - 14.50 9.92 0.07 2800 10 0.20800 1.250 0.05780 0.1000 -14-Sept-05b - - - - - - - 2730 10.16 0.22300 1.070 0.07330 - -
5-Oct-05 12.96 3237 - - 4.99 9.89 0.32 2150 9.97 0.17000 1.430 0.01250 0.2250 -9-Nov-05 8.40 2545 - - 13.80 9.64 7.50 1900 9.88 0.07820 0.167 <0.01000 0.0835 -9-Dec-05 3.34 1377 - - 8.03 10.43 5.00 1700 10.4 0.13000 0.189 0.00612 0.0857 -19-Jan-06 7.37 1424 7.92 - 12.20 10.61 7.50 1000 J 10.4 0.08950 0.449 0.00481 0.1040 -16-Feb-06 3.74 1680 12.19 * 14.60 10.78 7.50 1400 J 10.8 0.10500 0.343 0.00546 0.0817 -15-Mar-06 7.21 1634 12.61 194.4 7.44 10.63 5.28 1300 J 10.7 0.12800 0.204 0.00638 0.0750 -7-Apr-06 14.33 2055 8.54 55.3 9.21 10.84 3.17 1500 10.4 0.14300 0.552 0.00663 0.1140 -
16-May-06 21.65 2474 6.09 11.6 9.37 10.69 0.83 2000 10.6 0.15700 0.921 0.00819 0.2000 -23-Jun-06 24.58 2820 6.66 - 15.40 11.64 0.63 1400 10.6 0.15400 0.210 0.01310 0.1090 -20-Jul-06 21.17 3291 8.56 -85.5 68.30 10.75 Dry* 2300 10.8 0.13100 0.454 0.00941 0.0406 -22-Aug-06 - - - - - - Dry - - - - - - -26-Sep-06 16.38 2997 3.00 -57.1 31.60 9.92 Dry* 2900 9.94 0.10300 1.070 0.01680 0.1010 -26-Oct-06 11.00 2650 5.35 59.6 25.80 9.65 0.63 2300 9.45 0.13200 2.220 0.02630 <0.100 -15-Nov-06 8.51 1708 8.16 -35.7 34.70 10.15 17.14 1200 10.1 0.06740 0.518 0.00807 0.0794 -20-Dec-06 5.07 1927 8.84 14.8 7.94 10.67 10.91 1200 10.5 0.09970 0.384 0.00478 0.0844 -24-Jan-07 2.30 1846 10.72 5.9 11.70 10.37 9.00 1100 J 10.6 0.12600 0.359 0.01610 0.0729 -12-Feb-07 9.26 1777 11.75 -91.3 26.70 10.56 6.00 1100 10.3 0.13900 0.283 0.00712 0.0808 -27-Mar-07 8.71 1219 9.18 -12.6 13.80 8.70 24.00 840 J 10.2 J 0.08850 0.289 0.00486 0.0821 -18-Apr-07 7.39 4563 8.65 41.0 16.80 12.12 9.00 2000 11.9 J 0.09750 0.830 0.03250 0.0408 -31-May-07 - 3916 6.33 -149.5 10.70 10.96 1.36 2100 11.5 J 0.27500 <0.750 0.02290 0.1560 -20-Jun-07 22.59 3336 8.50 -20.4 42.50 10.46 0.29 2400 J 10.4 J 0.25500 <0.150 0.02740 0.0309 -31-Jul-07 18.94 3915 7.85 -69.2 41.30 10.92 0.06 3300 10.8 J 0.23600 1.100 0.01260 0.0846 -29-Aug-07 21.52 2406 5.75 -5.3 24.10 9.72 Dry* 2300 J 9.53 J 0.12900 0.627 0.00845 0.1940 -27-Sep-07 13.88 2009 5.75 15.5 28.30 9.56 0.06 1600 9.51 J 0.20700 1.150 0.00437 0.4170 -26-Oct-07 7.68 1662 9.06 80.5 13.00 9.92 2.04 1800 J 9.74 J 0.13200 0.591 0.00753 0.1960 -30-Nov-07 4.34 2446 9.63 26.7 11.70 9.86 2.63 1600 9.74 J 0.13500 0.432 0.00827 0.1000 -12-Dec-07 5.88 2056 10.34 39.3 10.30 10.18 2.63 1500 9.85 J 0.10500 0.324 0.00573 0.0784 -24-Jan-08 3.05 1601 15.03 42.3 - 9.40 2.63 1000 9.73 J 0.08740 0.451 0.00406 0.1500 -28-Feb-08 - - - - 9.22 - 4.13 1200 10.1 J 0.11800 0.260 0.00892 0.0714 -25-Mar-08 6.80 1622 12.37 95.1 16.40 9.98 5.25 1100 9.98 J 0.11000 0.307 0.00386 0.0683 -29-Apr-08 7.53 1997 9.10 137.4 11.90 10.29 7.50 1100 J 10.4 J 0.12400 0.328 0.00705 0.0789 -20-May-08 16.35 2504 9.03 77.4 32.90 10.92 7.50 1700 10.8 J 0.14600 0.558 0.01470 0.1580 -18-Jun-08 11.82 2925 8.32 68.3 25.70 11.14 1.69 1800 J 10.9 J 0.20800 0.351 0.00848 0.1540 -26-Aug-08 17.69 3376 7.98 62.8 41.10 10.43 0.84 2200 J 10.3 J 0.28700 0.391 0.01320 0.4630 64720-Nov-08 8.10 1447 9.65 112.0 43.70 11.00 11.25 1400 10.6 J 0.12100 0.386 0.01620 0.0888 48512-Feb-09 2.99 1214 14.46 - 14.60 10.93 4.06 1200 10.6 J 0.21900 0.410 0.01180 0.0986 43419-May-09 13.05 1962 7.92 32.6 36.70 10.23 7.50 1800 J 10.8 J 0.21000 0.620 0.01370 0.1430 52124-Sep-09 16.30 2792 1.59 263.8 13.70 8.82 Dry* 2400 - 0.13000 8.600 0.05300 0.6400 73015-Dec-09 2.80 1702 7.47 343.0 - 10.18 6.67 1200 - 0.17000 2.300 0.02200 0.1200 33024-Mar-10 13.80 2629 2.09 270.7 263.00 11.46 6.03 1800 - 0.18000 0.660 0.02000 0.0360 60017-Jun-10 12.00 1876 0.01 - 157.00 10.76 14.15 1200 - 0.02700 1.600 0.00390 0.1700 41020-Sep-10 11.40 3100 6.34 198.6 12.20 10.63 2.38 2800 - 0.25000 4.800 0.04000 0.4600 5807-Dec-10 6.60 2455 4.03 154.0 11.00 11.61 16.69 1600 - 0.24000 1.300 0.02600 0.0710 51030-Mar-11 8.10 848 0.22 136.1 31.50 13.08 58.61 940 J - 0.09100 0.720 J+ 0.00990 0.0500 33022-Jun-11 14.40 2286 5.68 164.2 13.20 11.28 5.68 2600 J - 0.12000 1.200 0.02500 0.1000 490
Table A-1c: Summary of Lower Disposal Area - Surface Water Sampling Results - Weir
Field Parameters GeneralChemistry Dissolved Metals (mg/L)
1520304-Tables and Appendix A.xlsm
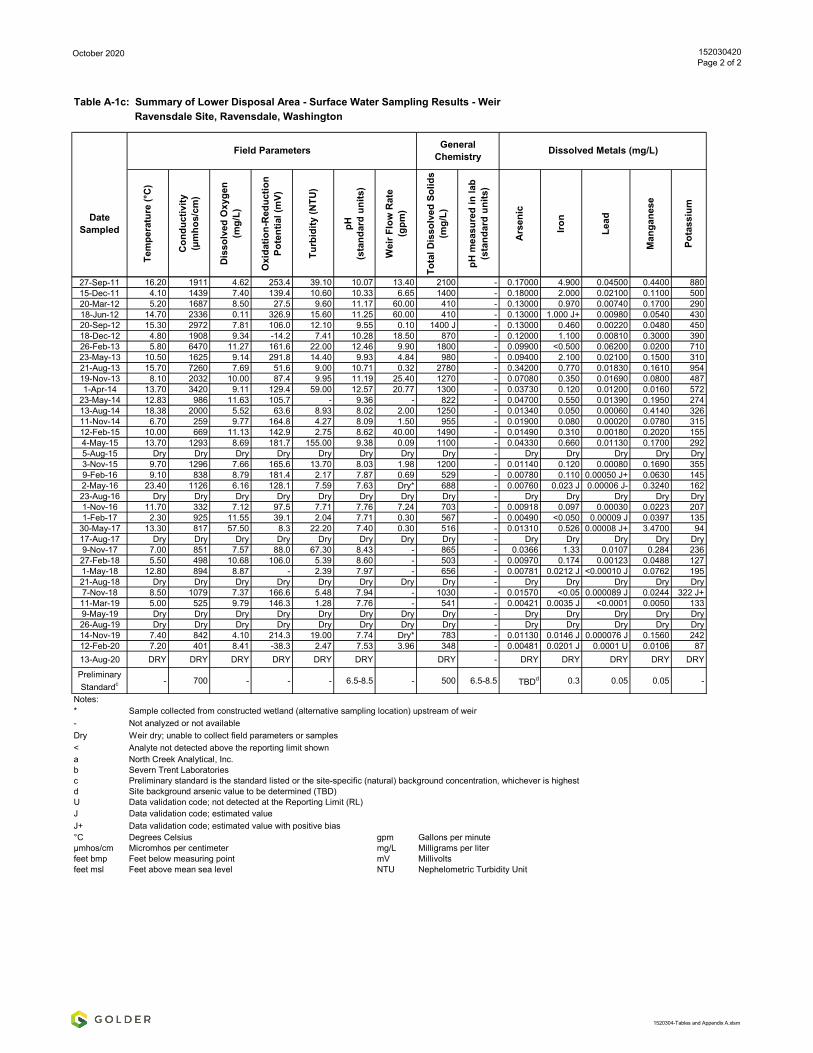
October 2020 152030420Page 2 of 2
Ravensdale Site, Ravensdale, Washington
DateSampled
Tem
pera
ture
(°C
)
Con
duct
ivity
(µm
hos/
cm)
Dis
solv
ed O
xyge
n(m
g/L)
Oxi
datio
n-R
educ
tion
Pote
ntia
l (m
V)
Turb
idity
(NTU
)
pH
(sta
ndar
d un
its)
Wei
r Flo
w R
ate
(gpm
)
Tota
l Dis
solv
ed S
olid
s(m
g/L)
pH m
easu
red
in la
b(s
tand
ard
units
)
Ars
enic
Iron
Lead
Man
gane
se
Pota
ssiu
m
Table A-1c: Summary of Lower Disposal Area - Surface Water Sampling Results - Weir
Field Parameters GeneralChemistry Dissolved Metals (mg/L)
27-Sep-11 16.20 1911 4.62 253.4 39.10 10.07 13.40 2100 - 0.17000 4.900 0.04500 0.4400 88015-Dec-11 4.10 1439 7.40 139.4 10.60 10.33 6.65 1400 - 0.18000 2.000 0.02100 0.1100 50020-Mar-12 5.20 1687 8.50 27.5 9.60 11.17 60.00 410 - 0.13000 0.970 0.00740 0.1700 29018-Jun-12 14.70 2336 0.11 326.9 15.60 11.25 60.00 410 - 0.13000 1.000 J+ 0.00980 0.0540 43020-Sep-12 15.30 2972 7.81 106.0 12.10 9.55 0.10 1400 J - 0.13000 0.460 0.00220 0.0480 45018-Dec-12 4.80 1908 9.34 -14.2 7.41 10.28 18.50 870 - 0.12000 1.100 0.00810 0.3000 39026-Feb-13 5.80 6470 11.27 161.6 22.00 12.46 9.90 1800 - 0.09900 <0.500 0.06200 0.0200 71023-May-13 10.50 1625 9.14 291.8 14.40 9.93 4.84 980 - 0.09400 2.100 0.02100 0.1500 31021-Aug-13 15.70 7260 7.69 51.6 9.00 10.71 0.32 2780 - 0.34200 0.770 0.01830 0.1610 95419-Nov-13 8.10 2032 10.00 87.4 9.95 11.19 25.40 1270 - 0.07080 0.350 0.01690 0.0800 4871-Apr-14 13.70 3420 9.11 129.4 59.00 12.57 20.77 1300 - 0.03730 0.120 0.01200 0.0160 572
23-May-14 12.83 986 11.63 105.7 - 9.36 - 822 - 0.04700 0.550 0.01390 0.1950 27413-Aug-14 18.38 2000 5.52 63.6 8.93 8.02 2.00 1250 - 0.01340 0.050 0.00060 0.4140 32611-Nov-14 6.70 259 9.77 164.8 4.27 8.09 1.50 955 - 0.01900 0.080 0.00020 0.0780 31512-Feb-15 10.00 669 11.13 142.9 2.75 8.62 40.00 1490 - 0.01490 0.310 0.00180 0.2020 1554-May-15 13.70 1293 8.69 181.7 155.00 9.38 0.09 1100 - 0.04330 0.660 0.01130 0.1700 2925-Aug-15 Dry Dry Dry Dry Dry Dry Dry Dry - Dry Dry Dry Dry Dry3-Nov-15 9.70 1296 7.66 165.6 13.70 8.03 1.98 1200 - 0.01140 0.120 0.00080 0.1690 3559-Feb-16 9.10 838 8.79 181.4 2.17 7.87 0.69 529 - 0.00780 0.110 0.00050 J+ 0.0630 1452-May-16 23.40 1126 6.16 128.1 7.59 7.63 Dry* 688 - 0.00760 0.023 J 0.00006 J- 0.3240 16223-Aug-16 Dry Dry Dry Dry Dry Dry Dry Dry - Dry Dry Dry Dry Dry1-Nov-16 11.70 332 7.12 97.5 7.71 7.76 7.24 703 - 0.00918 0.097 0.00030 0.0223 2071-Feb-17 2.30 925 11.55 39.1 2.04 7.71 0.30 567 - 0.00490 <0.050 0.00009 J 0.0397 135
30-May-17 13.30 817 57.50 8.3 22.20 7.40 0.30 516 - 0.01310 0.526 0.00008 J+ 3.4700 9417-Aug-17 Dry Dry Dry Dry Dry Dry Dry Dry - Dry Dry Dry Dry Dry9-Nov-17 7.00 851 7.57 88.0 67.30 8.43 - 865 - 0.0366 1.33 0.0107 0.284 23627-Feb-18 5.50 498 10.68 106.0 5.39 8.60 - 503 - 0.00970 0.174 0.00123 0.0488 1271-May-18 12.80 894 8.87 - 2.39 7.97 - 656 - 0.00781 0.0212 J <0.00010 J 0.0762 19521-Aug-18 Dry Dry Dry Dry Dry Dry Dry Dry - Dry Dry Dry Dry Dry7-Nov-18 8.50 1079 7.37 166.6 5.48 7.94 - 1030 - 0.01570 <0.05 0.000089 J 0.0244 322 J+11-Mar-19 5.00 525 9.79 146.3 1.28 7.76 - 541 - 0.00421 0.0035 J <0.0001 0.0050 1339-May-19 Dry Dry Dry Dry Dry Dry Dry Dry - Dry Dry Dry Dry Dry26-Aug-19 Dry Dry Dry Dry Dry Dry Dry Dry - Dry Dry Dry Dry Dry14-Nov-19 7.40 842 4.10 214.3 19.00 7.74 Dry* 783 - 0.01130 0.0146 J 0.000076 J 0.1560 24212-Feb-20 7.20 401 8.41 -38.3 2.47 7.53 3.96 348 - 0.00481 0.0201 J 0.0001 U 0.0106 8713-Aug-20 DRY DRY DRY DRY DRY DRY DRY - DRY DRY DRY DRY DRY
Preliminary Standardc - 700 - - - 6.5-8.5 - 500 6.5-8.5 TBDd 0.3 0.05 0.05 -
Notes: * Sample collected from constructed wetland (alternative sampling location) upstream of weir- Not analyzed or not availableDry Weir dry; unable to collect field parameters or samples< Analyte not detected above the reporting limit showna North Creek Analytical, Inc.b Severn Trent Laboratoriesc Preliminary standard is the standard listed or the site-specific (natural) background concentration, whichever is highestd Site background arsenic value to be determined (TBD)U Data validation code; not detected at the Reporting Limit (RL)J Data validation code; estimated valueJ+ Data validation code; estimated value with positive bias°C Degrees Celsius gpm Gallons per minuteµmhos/cm Micromhos per centimeter mg/L Milligrams per literfeet bmp Feet below measuring point mV Millivoltsfeet msl Feet above mean sea level NTU Nephelometric Turbidity Unit
1520304-Tables and Appendix A.xlsm

October 2020 152030420Page 1 of 3
Ravensdale Site, Ravensdale, Washington
DateSampled
Tem
pera
ture
(°C
)
Con
duct
ivity
(µm
hos/
cm)
Dis
solv
ed O
xyge
n(m
g/L)
Oxi
datio
n-R
educ
tion
Pote
ntia
l (R
el m
V)
Turb
idity
(NTU
)
pH(s
tand
ard
units
)
Tota
l Dis
solv
ed S
olid
s(m
g/L)
pH m
easu
red
in la
b(s
tand
ard
units
)
Ars
enic
Iron
Lead
Man
gane
se
Pota
ssiu
m
1-Feb-05 7.13 9580 - - 4.19 13.02 4080 12.61 0.17400 1.140 0.02430 0.0694 -9-Mar-05 14.28 9979 - - 6.79 12.52 4640 12.57 0.24000 0.988 0.04210 0.0853 -5-Apr-05 9.90 10820 - - 43.50 11.99 3830 12.31 0.13300 2.520 0.00985 0.1280 -
10-May-05 15.10 6091 - - 45.60 12.14 3270 12.4 0.09290 0.866 0.02550 0.0339 -7-Jun-05 14.49 8257 - - 24.20 12.19 3780 12.32 0.13200 1.540 0.02470 0.0526 -
15-Jul-05a 18.34 6937 - - 6.89 11.69 5000 11.6 0.28100 1.260 0.03180 0.0922 -15-Jul-05b - - - - - - 4260 11.8 0.23700 0.286 0.03420 <0.0200 -9-Aug-05a 23.53 7654 - - 17.l 10.26 6600 10.3 0.32200 8.360 0.04450 0.1480 -9-Aug-05b - - - - - - 5580 10.35 0.34000 0.648 0.03710 0.0828 -
14-Sept-05a 18.55 6730 - - 10.00 10.51 5100 11.1 0.23500 1.860 0.01930 0.1550 -14-Sept-05b - - - - - - 4750 11.78 0.26800 2.270 0.03420 - -
5-Oct-05 12.14 4323 - - 17.60 9.80 3090 10.15 0.13000 0.947 0.02650 0.0638 -9-Nov-05 6.78 3784 - - 11.80 11.12 2600 11.5 0.12100 0.504 0.02170 0.0802 -9-Dec-05 3.22 8745 - - 12.90 12.85 3900 12.3 0.17500 5.720 0.01410 0.1490 -19-Jan-06 7.73 5215 5.43 - 13.30 12.52 2000 J 12.3 J 0.02030 0.556 0.00324 0.0355 -16-Feb-06 3.96 9342 8.97 231.2 9.08 12.30 4100 J 12.6 0.04300 1.480 0.02560 0.0548 -15-Mar-06 8.72 12910 9.59 222.1 7.64 12.60 5100 J 12.7 0.03860 <0.150 0.04180 <0.0100 -7-Apr-06 14.26 15220 6.90 18.9 3.65 12.92 5700 12.7 0.04850 0.382 0.06560 0.0119 -
16-May-06 19.75 10880 2.61 33.8 15.40 12.46 5100 12.6 0.13000 3.200 0.09210 0.0916 -23-Jun-06 22.76 7586 2.98 - 14.10 12.65 5100 11.9 0.13000 0.606 0.05790 0.0618 -20-Jul-06 24.33 7457 0.73 -148.4 16.70 11.33 6400 11.5 0.27200 1.180 0.05130 0.0418 -22-Aug-06 15.03 7481 3.75 61.0 14.10 10.40 6100 10.3 0.31800 0.824 0.03320 0.0390 -26-Sep-06 17.30 8409 1.31 -312.4 15.10 12.38 5500 12.2 0.23000 0.966 0.04570 0.0490 -26-Oct-06 10.95 6075 4.10 -265.6 13.30 12.18 4600 11.7 0.24300 3.980 0.04150 <0.2000 -15-Nov-06 8.07 5022 7.71 -152.7 21.50 12.24 2600 11.9 0.07620 0.217 0.00368 0.1110 -20-Dec-06 6.32 9148 5.73 -139.6 12.20 12.85 2900 J 12.6 0.04610 1.630 0.00128 0.0820 -24-Jan-07 2.15 12690 9.24 -98.4 9.74 13.10 3000 J 12.4 0.01920 <0.150 0.02680 <0.0100 -12-Feb-07 9.35 14110 8.43 -86.7 32.50 13.13 4700 12.6 0.09620 <0.150 0.08350 0.0233 -27-Mar-07 9.16 10560 8.41 -46.2 7.42 11.31 2900 J 12.5 J 0.00598 <0.150 0.01450 <0.0100 -18-Apr-07 8.27 14570 8.32 10.8 10.30 12.79 5200 12.5 J 0.01980 <0.300 0.02210 <0.0200 -31-May-07 23.66 13410 6.42 -95.0 31.20 11.77 5100 12.5 J 0.07840 <1.500 0.05040 <0.100 -20-Jun-07 26.35 10050 5.53 -195.7 27.90 12.29 5300 J 12.4 J 0.11200 0.315 0.03820 0.0207 -31-Jul-07 21.39 6666 4.76 -106.4 72.00 10.86 6300 10.9 J 0.20800 2.540 0.06880 0.1160 -29-Aug-07 22.61 6950 1.57 -193.4 61.80 12.05 6300 J 11.7 J 0.14900 0.835 0.03060 0.0710 -27-Sep-07 11.45 5059 2.66 -180.4 78.40 11.43 4800 11.3 J 0.19000 1.430 0.01740 0.1140 -
Field Parameters
Table A-1d: Summary of Lower Disposal Area - Surface Water Sampling Results - South Pond
GeneralChemistry Dissolved Metals (mg/L)
1520304-Tables and Appendix A.xlsm

October 2020 152030420Page 2 of 3
Ravensdale Site, Ravensdale, Washington
DateSampled
Tem
pera
ture
(°C
)
Con
duct
ivity
(µm
hos/
cm)
Dis
solv
ed O
xyge
n(m
g/L)
Oxi
datio
n-R
educ
tion
Pote
ntia
l (R
el m
V)
Turb
idity
(NTU
)
pH(s
tand
ard
units
)
Tota
l Dis
solv
ed S
olid
s(m
g/L)
pH m
easu
red
in la
b(s
tand
ard
units
)
Ars
enic
Iron
Lead
Man
gane
se
Pota
ssiu
m
Field Parameters
Table A-1d: Summary of Lower Disposal Area - Surface Water Sampling Results - South Pond
GeneralChemistry Dissolved Metals (mg/L)
26-Oct-07 6.98 4147 1.44 -204.7 39.50 12.48 3900 J 11.8 J 0.16800 1.510 0.02550 0.0861 -30-Nov-07 2.86 5030 8.50 -74.9 12.40 12.20 2600 11.7 J 0.12100 0.885 0.01430 0.1120 -12-Dec-07 4.45 3564 2.03 -141.8 20.70 10.93 2700 11 J 0.07930 1.130 0.00987 0.1640 -24-Jan-08 1.13 4859 4.10 -186.8 - 11.19 2200 12.4 J 0.08610 <0.150 0.00679 <0.0100 -28-Feb-08 - - - - 18.10 - 2800 11.2 J 0.18300 0.499 0.07340 0.0279 -25-Mar-08 7.37 5413 7.88 -58.2 122.00 12.29 2900 11.7 J 0.18200 0.548 0.01300 0.0583 -29-Apr-08 8.43 3685 9.04 59.3 19.20 11.63 2400 J 11.2 J 0.15200 0.708 0.01600 0.0520 -20-May-08 18.03 3554 6.69 58.0 156.00 11.01 2100 10.8 J 0.13700 0.406 0.03830 0.0688 -18-Jun-08 13.01 5680 6.46 57.5 71.80 11.14 4000 J 11 J 0.27900 0.381 0.03440 0.0423 -26-Aug-08 18.02 2800 5.72 16.9 49.80 10.08 2500 J 9.9 J 0.09170 0.404 0.01860 0.0532 55720-Nov-08 7.46 2011 9.04 38.3 23.60 10.49 2300 10.1 J 0.07290 1.980 0.00920 0.1710 56612-Feb-09 1.63 1870 11.74 - 46.10 10.83 2300 10.6 J 0.12900 0.982 0.01720 0.1130 73819-May-09 12.73 1895 5.37 -16.4 168.00 9.82 1700 J 9.94 J 0.07890 1.320 0.01130 0.0736 51523-Sep-09 21.50 4190 0.09 175.1 14.40 9.70 4100 - 0.12000 4.500 0.09900 0.0890 130014-Dec-09 + + + + + + + + + + + + +22-Mar-10 13.10 2480 - 342.0 15.60 10.05 1700 - 0.07600 5.700 0.03400 0.1400 52017-Jun-10 13.40 2429 5.14 - 26.10 10.77 2100 - 0.12000 7.700 0.08900 0.1100 63021-Sep-10 16.30 2733 1.10 216.8 21.50 9.81 2200 - 0.02500 4.400 J 0.02700 0.2400 5108-Dec-10 6.00 1994 2.70 - 18.70 10.05 1400 - 0.05300 6.000 0.01800 0.2100 49030-Mar-11 9.10 509 0.37 179.2 13.80 12.04 730 J - 0.03600 3.000 0.01400 0.0760 26021-Jun-11 21.60 2092 1.90 192.2 13.60 10.07 2800 J - 0.06200 4.300 0.02900 0.0890 38027-Sep-11 14.60 1516 9.34 220.4 32.50 9.34 1800 - 0.07800 2.800 0.03600 0.0580 78015-Dec-11 3.00 1449 1.90 94.6 13.80 10.75 2100 - 0.14000 6.200 0.07400 0.0810 63021-Mar-12 2.60 1088 8.10 285.7 13.10 9.95 780 - 0.03000 2.800 0.00720 0.0580 24019-Jun-12 17.10 1747 5.54 345.3 10.80 9.93 780 - 0.07000 4.200 0.02900 0.0620 40020-Sep-12 - - - - - - - - - - - - -19-Dec-12 4.00 1771 6.37 104.0 6.12 10.71 1300 - 0.04700 4.000 0.01800 0.0960 44026-Feb-13 6.90 3720 5.40 196.7 10.60 11.86 1100 - 0.14000 4.000 0.03900 0.1000 69023-May-13 11.50 2335 5.21 323.5 44.10 12.48 1800 - 0.13000 3.100 0.05000 0.0510 53022-Aug-13 Dry Dry Dry Dry Dry Dry Dry - Dry Dry Dry Dry Dry19-Nov-13 8.20 1256 4.12 79.3 18.20 9.89 1260 - 0.03980 0.650 0.02040 0.0590 4871-Apr-14 15.30 2053 4.42 130.9 772.00 11.27 1800 - 0.11300 1.270 0.04220 0.0520 649
23-May-14 14.15 2187 5.50 77.3 - 10.19 1860 - 0.11200 1.180 0.02360 0.0840 62313-Aug-14 20.29 1298 5.35 40.1 24.80 9.63 949 - 0.04490 0.560 0.02280 0.0480 30612-Nov-14 1.30 315 4.55 -0.5 22.10 10.45 2440 - 0.12200 1.160 0.03420 0.0480 804
1520304-Tables and Appendix A.xlsm

October 2020 152030420Page 3 of 3
Ravensdale Site, Ravensdale, Washington
DateSampled
Tem
pera
ture
(°C
)
Con
duct
ivity
(µm
hos/
cm)
Dis
solv
ed O
xyge
n(m
g/L)
Oxi
datio
n-R
educ
tion
Pote
ntia
l (R
el m
V)
Turb
idity
(NTU
)
pH(s
tand
ard
units
)
Tota
l Dis
solv
ed S
olid
s(m
g/L)
pH m
easu
red
in la
b(s
tand
ard
units
)
Ars
enic
Iron
Lead
Man
gane
se
Pota
ssiu
m
Field Parameters
Table A-1d: Summary of Lower Disposal Area - Surface Water Sampling Results - South Pond
GeneralChemistry Dissolved Metals (mg/L)
12-Feb-15 11.10 1267 4.01 -8.2 23.90 10.20 905 - 0.02720 2.500 0.00960 0.0440 3204-May-15 15.60 3200 4.35 240.5 9.21 10.42 2280 - 0.15400 1.320 0.03080 0.0580 7745-Aug-15 Dry Dry Dry Dry Dry Dry Dry - Dry Dry Dry Dry Dry3-Nov-15 8.30 1143 2.01 88.1 35.40 9.22 1050 - 0.02800 0.660 0.02820 0.0430 3649-Feb-16 7.30 1672 3.45 95.9 7.79 10.45 1170 - 0.05100 J+ 0.880 0.03400 0.0540 4103-May-16 14.20 3150 3.61 335.2 63.80 10.35 2260 - 0.14800 1.430 0.09790 J- 0.0600 77724-Aug-16 Dry Dry Dry Dry Dry Dry Dry - Dry Dry Dry Dry Dry1-Nov-16 12.10 401 5.56 -65.9 15.00 9.43 742 - 0.02190 0.423 0.01410 0.0213 3561-Feb-17 2.10 2064 4.82 5.0 17.80 10.27 1330 - 0.05760 0.963 0.13900 0.0693 455
31-May-17 14.50 2594 5.36 - 22.70 9.93 1920 - 0.10500 0.888 0.05150 J+ 0.0472 66417-Aug-17 Dry Dry Dry Dry Dry Dry Dry - Dry Dry Dry Dry Dry9-Nov-17 6.50 1049 6.38 92.3 14.40 10.13 1260 - 0.0588 1.46 0.0534 J+ 0.0661 44127-Feb-18 6.50 1379 4.05 -71.0 6.11 10.94 865 - 0.06170 0.752 0.0477 J- 0.0267 4292-May-18 11.60 2547 - - 25.30 10.36 1860 - 0.08590 0.886 0.02670 J+ 0.0436 61122-Aug-18 Dry Dry Dry Dry Dry Dry Dry - Dry Dry Dry Dry Dry7-Nov-18 9.70 995 6.72 126.8 20.60 9.15 1040 - 0.07600 0.950 0.06550 0.0450 333 J+11-Mar-19 10.60 1354 5.93 -18.7 7.19 10.31 1270 - 0.04930 0.708 0.04170 0.0833 4589-May-19 Dry Dry Dry Dry Dry Dry Dry - Dry Dry Dry Dry Dry26-Aug-19 Dry Dry Dry Dry Dry Dry Dry - Dry Dry Dry Dry Dry14-Nov-19 8.70 1180 5.98 30.9 7.38 9.03 1120 - 0.0672 0.787 0.0764 0.0599 41813-Feb-20 4.30 1032 2.51 -126.9 6.10 10.46 927 - 0.0281 0.466 0.0130 0.0680 34813-Aug-20 DRY DRY DRY DRY DRY DRY DRY - DRY DRY DRY DRY DRY
Preliminary Standardc - 700 - - - 6.5-8.5 500 6.5-8.5 TBDd 0.3 0.05 0.05 -
Notes: - Not analyzed or not available< Analyte not detected above the reporting limit shown+ South Pond frozen; unable to collect field parameters or samplesDry South Pond dry; unable to collect field parameters or samplesa North Creek Analytical, Inc.b Severn Trent Laboratoriesc Preliminary standard is the standard listed or the site-specific (natural) background concentration, whichever is highestd Site background arsenic value to be determined (TBD)U Data validation code; not detected at the Reporting Limit (RL)J Data validation code; estimated valueJ+ Data validation code; estimated value with positive bias°C Degrees Celsiusµmhos/cm Micromhos per centimeter mg/L Milligrams per literfeet bmp Feet below measuring point mV Millivoltsfeet msl Feet above mean sea level NTU Nephelometric Turbidity Unit
1520304-Tables and Appendix A.xlsm

APPENDIX A-2
Summary of Lower Disposal Area –
Shallow/Alluvial Groundwater
Sampling Results Table A-2A Well MW-1a Table A-2B Well MW-2a Table A-2C Well MW-3a Table A-2D Well MW-4a Table A-2E Well MW-5a Table A-2F Well MW-6a

October 2020 152030420Page 1 of 2
Ravensdale Site, Ravensdale, Washington
Gen. Chem.
Date Sampled*
Dep
th to
Wat
er(fe
et b
toc)
Gro
undw
ater
Ele
vatio
n (f
eet m
sl)
Tem
pera
ture
(°C
)
Con
duct
ivity
(µm
hos/
cm)
Dis
solv
ed O
xyge
n (m
g/L)
Oxi
datio
n-R
educ
tion
Pote
ntia
l (R
el m
V)
Turb
idity
(NTU
)
pH(s
tand
ard
units
)
Tota
l Dis
solv
ed S
olid
s(m
g/L)
Ars
enic
Iron
Lead
Man
gane
se
Pota
ssiu
m
15-Jul-05 35.43 574.40 15.17 883 - - 358.00 7.03 664 0.00847 <0.100 <0.00200 0.6020 -9-Nov-05 31.83 578.00 10.77 1037 - - 22.20 6.89 680 0.00345 <0.150 <0.00100 0.0286 -15-Feb-06 23.91 585.92 9.14 623 1.53 497.4 6.76 7.26 470 J 0.00325 <0.150 <0.00100 <0.0100 -17-May-06 31.91 577.92 11.32 1029 1.33 121.6 10.30 7.18 600 0.00518 <0.150 <0.00100 0.3160 -23-Aug-06 35.35 574.48 19.21 481 5.97 60.4 6.30 6.67 340 0.00170 <0.150 <0.00100 0.0234 -14-Nov-06 20.00 589.83 10.35 635 4.55 95.1 22.20 7.23 550 0.00307 <0.150 <0.00100 0.0131 -14-Feb-07 29.29 580.54 11.13 435 3.88 85.6 32.10 6.76 260 0.00200 <0.150 <0.00100 0.0116 -30-May-07 32.90 576.93 10.30 545 6.63 145.7 6.93 6.81 320 0.00248 <0.150 <0.00100 <0.0100 -27-Aug-07 35.68 574.15 10.49 428 7.13 76.7 8.65 6.95 260 J 0.00187 <0.150 <0.00100 0.0189 -29-Nov-07 32.75 577.08 10.10 625 7.14 144.3 12.20 6.96 340 J 0.00232 <0.150 <0.00100 <0.0100 -27-Feb-08 27.83 582.00 - - - - 19.60 - 320 0.00258 <0.150 <0.00100 <0.0100 -20-May-08 31.86 577.97 10.22 471 6.38 177.0 109.00 6.48 290 J 0.00224 <0.150 <0.00100 0.0253 -27-Aug-08 36.04 573.79 9.84 427 7.40 118.4 63.60 7.08 260 0.00205 <0.150 <0.00100 0.0173 23.026-Sep-0816-Oct-08 35.65 574.18 9.51 443 9.78 113.9 38.00 7.38 260 J 0.00179 <0.150 <0.00100 0.0136 22.920-Nov-08 25.62 584.21 9.49 563 6.11 231.0 5.48 7.18 430 0.00368 <0.150 <0.00100 <0.0100 106.030-Dec-08 23.14 586.69 9.84 402 8.40 106.9 8.92 7.25 280 J 0.00247 <0.150 <0.00100 0.0130 43.915-Jan-09 20.66 589.17 8.40 336 9.65 229.6 1.07 6.88 290 0.00225 <0.150 <0.00100 <0.0100 35.712-Feb-09 30.00 579.83 9.05 372 8.46 - 16.70 7.34 320 0.00193 <0.150 <0.00100 0.0165 27.012-Mar-09 31.30 578.53 9.13 409 8.60 174.9 15.80 7.03 340 0.00166 <0.150 <0.00100 <0.0100 20.616-Apr-09 23.88 585.95 8.17 343 10.24 131.8 13.50 6.78 310 0.00177 <0.150 <0.00100 <0.0100 24.619-May-09 30.50 579.33 8.99 392 8.69 82.6 23.70 7.75 340 J 0.00156 <0.150 <0.00100 <0.0100 19.623-Jun-09 34.00 575.83 9.21 480 9.56 79.0 22.90 7.89 430 <0.00200 <0.200 <0.00200 <0.0200 20.025-Aug-09 36.95 572.88 13.10 373 6.47 311.9 4.98 6.76 270 J+ 0.00064 J <0.200 <0.00200 0.0042 J 17.023-Sep-09 37.12 572.71 11.30 336 6.90 368.3 21.30 6.73 240 <0.00200 0.054 J 0.00018 J 0.0120 J 14.015-Dec-09 28.30 581.53 9.20 643 5.30 567.0 18.00 6.72 330 <0.00200 0.033 J <0.00200 0.0065 J 26.024-Mar-10 30.03 579.80 9.80 562 5.72 545.9 5.04 6.74 370 0.00190 J <0.200 <0.00200<0.0200 U 19.016-Jun-10 23.55 586.28 9.20 506 5.93 405.4 16.10 6.53 <40 0.00360 0.110 J <0.00200 0.0110 J 20.021-Sep-10 35.89 573.94 10.40 593 4.82 288.5 117.00 6.96 370 0.00260 <0.200 0.00023 J 0.0350 J+ 19.07-Dec-10 27.39 582.44 10.00 504 1.45 198.4 139.00 7.15 330 0.00230 0.650 <0.00200 0.1700 14.029-Mar-11 29.76 580.07 8.10 247 2.47 169.0 6.81 7.14 300 0.00240 0.290 J+ <0.00200 0.0540 15.021-Jun-11 30.45 579.38 9.30 606 4.58 332.9 3.56 7.17 400 J <0.00500 <0.200 <0.00200 0.0100 J 16.027-Sep-11 36.65 573.18 9.90 366 7.27 356.2 2.18 6.85 310 <0.00500 <0.200 <0.00200 0.0060 J 17.014-Dec-11 31.53 578.30 9.20 407 1.97 234.7 20.40 7.09 370 <0.00500 0.330 <0.00200 0.0860 16.020-Mar-12 21.60 588.23 7.70 561 7.06 385.4 4.80 7.18 280 0.00230 <0.200 <0.00040 0.0029 J 16.0
Test Trench Drain Line Installed
Field Parameters
Table A-2a: Summary of Lower Disposal Area - Shallow/Alluvial Groundwater Sampling Results - Well MW-1A
Dissolved Metals (mg/L)
1520304-Tables and Appendix A.xlsm

October 2020 152030420Page 2 of 2
Ravensdale Site, Ravensdale, Washington
Gen. Chem.
Date Sampled*
Dep
th to
Wat
er(fe
et b
toc)
Gro
undw
ater
Ele
vatio
n (f
eet m
sl)
Tem
pera
ture
(°C
)
Con
duct
ivity
(µm
hos/
cm)
Dis
solv
ed O
xyge
n (m
g/L)
Oxi
datio
n-R
educ
tion
Pote
ntia
l (R
el m
V)
Turb
idity
(NTU
)
pH(s
tand
ard
units
)
Tota
l Dis
solv
ed S
olid
s(m
g/L)
Ars
enic
Iron
Lead
Man
gane
se
Pota
ssiu
m
Field Parameters
Table A-2a: Summary of Lower Disposal Area - Shallow/Alluvial Groundwater Sampling Results - Well MW-1A
Dissolved Metals (mg/L)
19-Jun-12 21.60 588.23 10.00 575 7.04 378.2 5.60 7.31 330 0.00250 <0.200 <0.00040 0.0068 J 16.019-Sep-12 36.42 573.41 11.30 561 8.76 286.0 2.49 7.02 310 0.00240 <0.200 <0.00040 <0.0200 17.019-Dec-12 23.43 586.40 9.30 671 6.67 348.2 0.74 7.26 <20 0.00170 <0.200 <0.00040 <0.0200 17.025-Feb-13 29.32 580.51 8.00 572 9.51 337.0 26.00 7.28 300 0.00250 <0.500 <0.00040 <0.0200 16.022-May-13 31.23 578.60 9.00 518 8.59 397.7 4.68 7.40 310 0.00180 <0.500 <0.00040 <0.0200 15.021-Aug-13 37.02 572.81 10.20 534 9.27 152.7 1.46 7.11 227 0.00120 <0.050 <0.00010 0.0030 14.120-Nov-13 29.69 580.14 9.50 852 7.62 243.5 39.50 6.75 419 0.00160 <0.050 <0.00010 0.0020 19.91-Apr-14 23.29 586.54 8.90 347 7.60 248.1 2.54 7.30 247 0.00200 <0.050 <0.00010 <0.0007 16.5
21-May-14 28.31 581.52 9.50 349 4.02 178.6 - 7.12 280 0.00180 <0.050 <0.00010 0.0150 15.113-Aug-14 36.52 573.31 12.10 441 9.22 51.9 6.20 7.10 283 0.00140 <0.050 <0.00010 0.0030 15.213-Nov-14 31.63 578.20 11.50 438 8.80 173.0 14.70 7.10 352 0.00160 <0.050 <0.00010 0.0020 17.111-Feb-15 23.02 586.81 9.40 498 3.89 98.1 10.50 7.72 319 0.00910 0.180 0.00030 0.0040 42.94-May-15 31.93 577.90 9.80 578 7.35 416.9 1.05 7.26 413 0.00170 0.008 J <0.00010 0.0100 16.06-Aug-15 37.65 572.18 10.70 447 0.17 71.6 49.00 7.21 343 0.00390 0.110 <0.00010 0.2140 10.34-Nov-15 32.89 576.94 9.50 657 8.56 240.5 5.70 6.92 554 0.00230 0.013 J <0.00010 <0.0010 49.310-Feb-16 25.39 584.44 9.80 322 7.36 204.8 3.21 7.31 202 0.00200 0.0076 J <0.00010 0.0070 22.22-May-16 32.32 577.51 10.80 579 5.95 250.2 4.70 7.02 350 0.00180 <0.050 0.00004 J- 0.0040 17.823-Aug-16 37.66 572.17 11.00 488 1.34 459.9 259.00 7.08 413 0.00388 0.130 0.00007 J 0.6220 14.62-Nov-16 31.30 578.53 9.70 280 3.94 225.0 6.13 7.18 531 0.00213 <0.050 0.00012 0.0020 37.71-Feb-17 29.01 580.82 8.60 510 5.26 187.7 0.97 7.04 270 0.00147 <0.050 <0.00010 0.0035 19.0
30-May-17 28.47 581.36 9.50 483 6.89 4.7 4.85 6.96 290 0.00209 0.005 J <0.00010 0.0034 15.717-Aug-17 36.30 573.53 10.50 536 3.79 82.5 6.44 6.96 283 0.00155 0.061 <0.00010 0.0524 15.59-Nov-17 32.20 577.63 9.20 460 5.89 75.1 2.70 7.01 380 0.00163 <0.05 <0.0001 0.0019 16.327-Feb-18 25.18 584.65 8.90 215 7.35 121.6 6.04 6.31 186 0.00172 <0.05 <0.0001 0.0084 15.51-May-18 26.98 582.85 9.50 391 7.82 - 3.06 6.94 214 0.00165 0.0042 J <0.00010 J <0.0003 14.121-Aug-18 37.29 572.54 10.02 266 7.37 75.6 129.00 6.84 215 0.00151 0.148 <0.0001 0.0150 13.36-Nov-18 34.18 575.65 9.60 340 9.13 215.4 1.00 6.93 327 0.00167 <0.05 <0.0001 <0.001 16.611-Mar-19 27.75 582.08 8.90 323 5.65 185.3 4.29 6.94 269 0.00136 <0.05 <0.0001 0.0111 14.48-May-19 30.05 579.78 9.80 448 7.77 97.6 1.11 6.87 320 0.00125 0.0068 J <0.0001 0.0005 J 15.126-Aug-19 37.02 572.81 9.83 329 1.16 Note 1 7.97 7.11 258 0.00090 0.0039 J <0.0001 0.0317 10.713-Nov-19 35.13 574.70 9.20 376 5.50 144.0 8.26 6.87 320 0.00123 0.0133 J <0.0001 0.0055 15.812-Feb-20 20.38 589.45 9.00 381 2.58 191.6 1.33 7.15 268 0.00125 0.0083 J 0.0001 U 0.0228 26.612-Aug-20 36.61 573.22 9.50 285 5.01 198.7 0.80 6.96 214 0.00114 0.0034 J 0.0001 U 0.0009 J 14.1
Preliminary Standarda - - - 700 - - - 6.5-8.5 500 TBDb 0.3 0.05 0.05 -
Notes: Top of casing elevation (feet msl): 609.83- Not measured or not available< Analyte not detected above the reporting limit shown* Depth to water (DTW) measurements for all shallow/alluvial wells collected on the same day; date noted is sampling datea Preliminary standard is the standard listed or the site-specific (natural) background concentration, whichever is highestb Site background arsenic value to be determined (TBD)U Data validation code; not detected at the Reporting Limit (RL)J Data validation code; estimated valueJ+ Data validation code; estimated value with positive bias°C Degrees CelsiusNote 1 ORP measurements not available due to faulty sensor.µmhos/cm Micromhos per centimeter mg/L Milligrams per literfeet bmp Feet below measuring point mV Millivoltsfeet msl Feet above mean sea level NTU Nephelometric Turbidity Unit
1520304-Tables and Appendix A.xlsm

October 2020 152030420Page 1 of 2
Ravensdale Site, Ravensdale, Washington
Gen. Chem.
Date Sampled*
Dep
th to
Wat
er(fe
et b
toc)
Gro
undw
ater
Ele
vatio
n (f
eet m
sl)
Tem
pera
ture
(°C
)
Con
duct
ivity
(µm
hos/
cm)
Dis
solv
ed O
xyge
n (m
g/L)
Oxi
datio
n-R
educ
tion
Pote
ntia
l (R
el m
V)
Turb
idity
(NTU
)
pH(s
tand
ard
units
)
Tota
l Dis
solv
ed S
olid
s(m
g/L)
Ars
enic
Iron
Lead
Man
gane
se
Pota
ssiu
m
15-Jul-05 29.18 574.43 13.78 853 - - 28.30 7.70 606 <0.00200 <0.100 <0.00200 0.2090 -9-Nov-05 25.64 577.97 10.95 860 - - 3.82 7.43 550 0.00131 <0.150 <0.00100 0.4490 -15-Feb-06 17.64 585.97 7.81 709 0.82 467.7 3.96 7.86 520 J 0.00106 <0.150 <0.00100 0.1340 -17-May-06 25.76 577.85 9.67 810 2.17 246.1 3.01 7.06 490 0.00113 <0.150 <0.00100 0.0596 -23-Aug-06 29.13 574.48 12.86 759 2.60 12.0 9.82 7.40 570 0.00154 <0.150 <0.00100 0.2300 -14-Nov-06 13.74 589.87 10.44 649 3.72 63.6 9.78 7.72 460 0.00136 <0.150 <0.00100 0.0553 -14-Feb-07 22.09 581.52 10.77 648 1.69 11.5 52.40 7.51 380 0.00107 <0.150 <0.00100 0.1650 -30-May-07 26.72 576.89 11.46 732 2.05 72.2 12.80 7.44 480 0.00117 <0.150 <0.00100 0.1870 -27-Aug-07 29.45 574.16 10.80 829 7.41 62.8 117.00 7.58 590 J 0.00109 <0.150 <0.00100 0.1160 -29-Nov-07 26.57 577.04 10.74 899 2.00 81.1 392.00 6.05 490 0.00103 <0.150 <0.00100 0.1260 -27-Feb-08 21.45 582.16 - - - - 446.00 - 400 0.00109 <0.150 <0.00100 0.1230 -20-May-08 25.73 577.88 9.48 706 3.07 110.2 419.00 7.26 420 J 0.00121 <0.150 <0.00100 0.0835 -27-Aug-08 29.84 573.77 9.87 824 4.74 91.5 571.00 7.43 550 J 0.00130 <0.150 <0.00100 0.0929 65.126-Sep-0816-Oct-08 29.13 574.48 9.76 820 4.56 53.6 227.00 7.33 520 J 0.00130 <0.150 <0.00100 0.0496 76.320-Nov-08 19.48 584.13 9.31 462 5.24 240.1 6.16 7.35 360 0.00176 <0.150 <0.00100 0.0149 67.030-Dec-08 16.93 586.68 9.85 480 6.18 66.8 56.10 7.35 390 J 0.00155 <0.150 <0.00100 0.0157 61.515-Jan-09 14.46 589.15 7.71 402 7.47 177.8 1.61 7.61 360 0.00157 <0.150 <0.00100 <0.0100 58.512-Feb-09 23.84 579.77 9.63 - 8.72 - 74.90 7.54 390 0.00130 <0.150 <0.00100 0.0371 J 48.112-Mar-09 25.15 578.46 9.11 454 7.22 163.7 573.00 7.19 400 0.00117 <0.150 <0.00100 0.0135 43.116-Apr-09 17.72 585.89 8.40 417 8.27 126.4 128.00 7.26 400 0.00140 <0.150 <0.00100 0.0107 48.819-May-09 24.38 579.23 8.80 448 6.88 72.0 178.00 7.95 410 J 0.00110 <0.150 <0.00100 <0.0100 44.023-Jun-09 27.85 575.76 8.95 507 7.76 61.9 256.00 8.07 490 <0.00200 <0.200 <0.00200 <0.0200 39.025-Aug-09 30.68 572.93 10.50 707 6.94** 307.4 4.38 7.17 530 J+ <0.00200 0.091 J 0.00018 J 0.0300 49.023-Sep-09 30.84 572.77 11.20 661 5.41 374.7 15.00 7.28 500 <0.00200 <0.200 <0.00200 0.0041 J 51.015-Dec-09 22.10 581.51 9.50 720 5.10 579.0 39.00 6.92 380 <0.00200 <0.200 <0.00200 <0.0200 42.024-Mar-10 23.82 579.79 10.00 602 4.10 535.3 43.30 6.93 370 0.00170 J 0.062 J <0.00200<0.0200 U 39.017-Jun-10 17.45 586.16 9.30 547 4.06 - 157.00 6.57 350 0.00390 0.063 J <0.00200 0.0030 J 39.022-Sep-10 29.66 573.95 10.20 722 5.77 360.2 7.20 7.22 450 0.00330 <0.200 <0.00200 <0.0200 55.08-Dec-10 22.10 581.51 9.90 566 6.69 - 64.60 7.09 350 <0.00200 <0.200 <0.00200 0.0018 J 35.029-Mar-11 19.94 583.67 8.40 251 6.95 620.0 28.00 7.13 250 J 0.00140 J <0.200 <0.00200 0.0030 J 30.021-Jun-11 24.25 579.36 9.90 628 5.23 344.3 37.00 7.29 410 J <0.00500 <0.200 <0.00200 0.0056 J 28.028-Sep-11 30.41 573.20 9.50 58 6.54 481.7 13.80 7.24 500 <0.00500 <0.200 <0.00200 <0.0200 54.014-Dec-11 25.35 578.26 9.30 441 3.86 346.5 386.00 7.26 440 <0.00500 <0.200 <0.00200 0.0037 J 29.020-Mar-12 15.45 588.16 7.70 580 1.53 382.0 32.30 7.40 280 0.00220 0.200 <0.00040 <0.0200 26.0
Test Trench Drain Line Installed
Field Parameters
Table A-2b: Summary of Lower Disposal Area - Shallow/Alluvial Groundwater Sampling Results - Well MW-2A
Dissolved Metals (mg/L)
1520304-Tables and Appendix A.xlsm

October 2020 152030420Page 2 of 2
Ravensdale Site, Ravensdale, Washington
Gen. Chem.
Date Sampled*
Dep
th to
Wat
er(fe
et b
toc)
Gro
undw
ater
Ele
vatio
n (f
eet m
sl)
Tem
pera
ture
(°C
)
Con
duct
ivity
(µm
hos/
cm)
Dis
solv
ed O
xyge
n (m
g/L)
Oxi
datio
n-R
educ
tion
Pote
ntia
l (R
el m
V)
Turb
idity
(NTU
)
pH(s
tand
ard
units
)
Tota
l Dis
solv
ed S
olid
s(m
g/L)
Ars
enic
Iron
Lead
Man
gane
se
Pota
ssiu
m
Field Parameters
Table A-2b: Summary of Lower Disposal Area - Shallow/Alluvial Groundwater Sampling Results - Well MW-2A
Dissolved Metals (mg/L)
19-Jun-12 23.88 579.73 9.00 590 1.85 388.1 55.70 7.74 320 0.00250 <0.200 <0.00040 <0.0200 23.019-Sep-12 30.18 573.43 11.10 695 7.03 297.0 9.31 7.41 420 0.00270 <0.200 <0.00040 <0.0200 42.019-Dec-12 17.24 586.37 9.40 704 6.33 317.0 55.20 7.40 310 0.00170 <0.200 <0.00040 <0.0200 25.025-Feb-13 23.12 580.49 9.10 585 6.04 339.0 110.00 7.46 370 0.00250 <0.500 <0.00040 <0.0200 24.022-May-13 25.05 578.56 8.60 537 8.41 391.5 12.30 7.51 310 0.00190 <0.500 <0.00040 <0.0200 22.021-Aug-13 30.75 572.86 10.60 684 8.42 150.2 5.85 7.74 419 0.00150 <0.050 0.00020 0.0020 27.720-Nov-13 23.51 580.10 9.60 513 6.19 230.4 32.10 6.81 364 0.00130 <0.050 <0.00010 0.0010 27.51-Apr-14 17.11 586.50 8.50 386 7.32 243.1 14.60 7.46 294 0.00140 0.009 J <0.00010 <0.0005 31.7
21-May-14 22.07 581.54 9.10 365 6.02 212.7 - 6.93 273 0.00130 <0.050 <0.00010 <0.0010 24.712-Aug-14 31.32 572.29 13.16 552 6.56 76.7 6.80 7.36 394 0.00150 <0.050 <0.00010 <0.0010 25.313-Nov-14 25.48 578.13 12.30 460 7.22 189.8 7.20 7.19 367 0.00140 <0.050 <0.00010 0.0010 25.511-Feb-15 16.83 586.78 9.30 447 6.76 134.4 36.60 7.52 286 0.00170 0.026 J <0.00010 0.0007 J 30.44-May-15 25.78 577.83 10.20 619 6.27 407.1 7.70 7.36 382 0.00140 <0.050 <0.00010 0.0004 J 25.26-Aug-15 31.87 571.74 11.30 500 9.18 207.1 28.10 7.23 394 0.00150 <0.050 <0.00010 0.0030 22.04-Nov-15 26.74 576.87 9.90 481 8.76 222.6 16.80 6.88 381 0.00110 <0.050 <0.00010 0.0190 21.810-Feb-16 19.19 584.42 9.00 376 7.35 206.0 40.20 7.68 261 0.00360 0.0140 J <0.00010 0.0040 37.12-May-16 26.14 577.47 11.30 552 3.19 194.5 87.80 7.35 344 0.00210 0.0045 J 0.00001 J- 0.0020 31.223-Aug-16 31.64 571.97 10.50 545 7.62 486.5 10.80 7.18 412 0.00154 <0.050 <0.00010 0.0011 32.62-Nov-16 25.12 578.49 10.20 220 4.01 238.9 245.00 7.19 431 0.00140 <0.050 <0.00010 0.0015 30.61-Feb-17 22.84 580.77 9.10 580 5.06 186.3 13.60 7.35 317 0.00317 0.010 J <0.00010 <0.0010 51.1
30-May-17 22.31 581.30 9.40 520 7.01 5.0 40.20 7.18 322 0.00178 0.010 J <0.00010 <0.0010 34.117-Aug-17 30.08 573.53 10.60 626 5.63 134.2 32.30 7.21 370 0.00128 0.014 J <0.00010 0.0009 J 28.99-Nov-17 26.04 577.57 9.80 480 5.79 74.4 68.80 7.00 391 0.00139 <0.05 <0.0001 0.0005 J 25.427-Feb-18 19.03 584.58 8.80 293 7.43 185.2 15.10 6.90 254 0.00398 <0.05 <0.0001 <0.001 41.91-May-18 20.84 582.77 9.10 531 7.46 - 25.00 7.35 316 0.00300 0.0216 J <0.00010 J 0.0018 40.621-Aug-18 31.09 572.52 10.39 437 7.33 115.2 19.10 7.04 358 0.00148 0.05 U <0.0001 0.0011 26.96-Nov-18 28.00 575.61 9.70 420 8.17 210.3 6.74 6.97 418 0.00130 <0.05 <0.0001 <0.001 23.411-Mar-19 21.61 582.00 9.00 351 9.20 187.1 20.60 7.11 312 0.00157 0.0057 J <0.0001 0.0012 32.78-May-19 23.88 579.73 9.80 443 8.05 109.6 7.79 7.06 316 0.00166 0.005 J <0.0001 0.0005 J 32.926-Aug-19 30.90 572.71 10.91 495 8.65 Note 1 12.70 6.91 394 0.00128 <0.05 <0.0001 0.0004 J 21.113-Nov-19 28.91 574.70 9.80 506 7.81 180.4 14.40 6.87 429 0.00134 0.0031 J <0.0001 <0.001 22.912-Feb-20 14.21 589.40 8.10 319 9.95 189.3 14.60 7.27 277 0.00195 0.0093 J 0.0001 U 0.001 U 56.312-Aug-20 30.41 573.20 9.50 463 6.60 185.5 72.90 7.03 359 0.00120 0.0151 J 0.0001 U 0.0013 22.4
Preliminary Standarda - - - 700 - - - 6.5-8.5 500 TBDb 0.3 0.05 0.05 -
Notes: Top of casing elevation (feet msl): 603.61- Not measured or not available< Analyte not detected above the reporting limit shown* Depth to water (DTW) measurements for all shallow/alluvial wells collected on the same day; date noted is sampling date** Dissolved Oxygen meter working incorrectly at the time of sample collectiona Preliminary standard is the standard listed or the site-specific (natural) background concentration, whichever is highestb Site background arsenic value to be determined (TBD)U Data validation code; not detected at the Reporting Limit (RL)J Data validation code; estimated valueJ+ Data validation code; estimated value with positive bias°C Degrees CelsiusNote 1 ORP measurements not available due to faulty sensor.µmhos/cm Micromhos per centimeter mg/L Milligrams per literfeet bmp Feet below measuring point mV Millivoltsfeet msl Feet above mean sea level NTU Nephelometric Turbidity Unit
1520304-Tables and Appendix A.xlsm
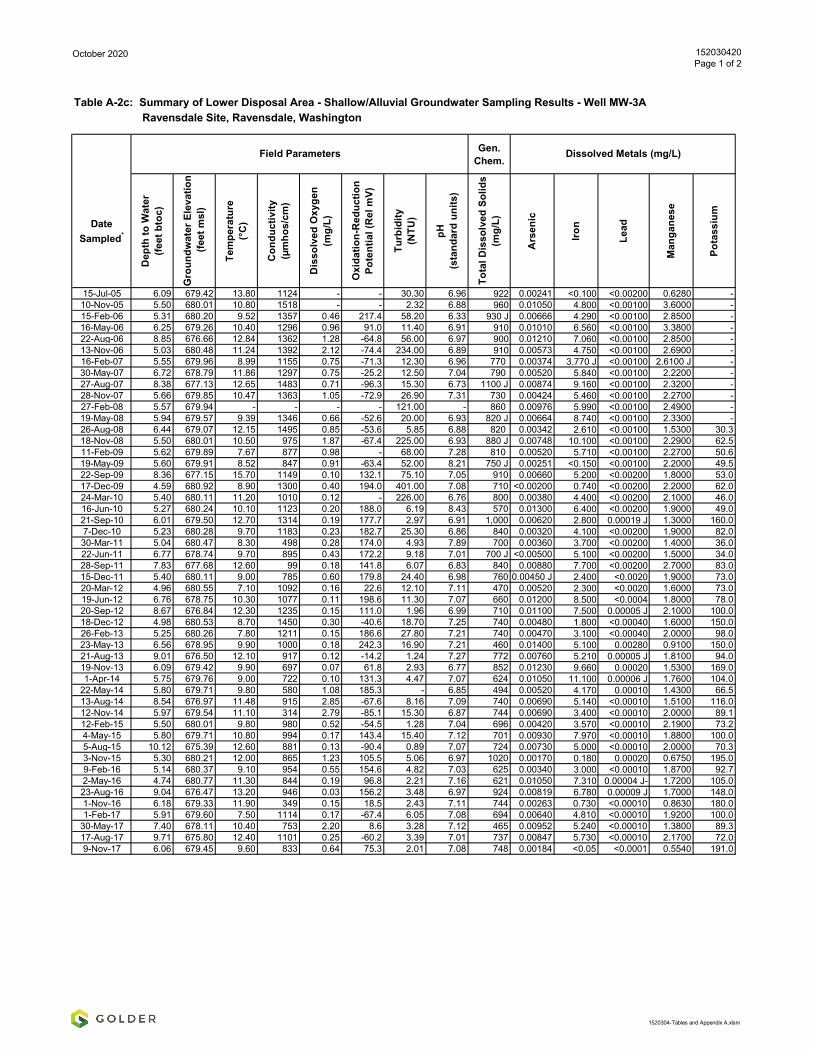
October 2020 152030420Page 1 of 2
Ravensdale Site, Ravensdale, Washington
Gen. Chem.
Date Sampled*
Dep
th to
Wat
er(fe
et b
toc)
Gro
undw
ater
Ele
vatio
n (f
eet m
sl)
Tem
pera
ture
(°C
)
Con
duct
ivity
(µm
hos/
cm)
Dis
solv
ed O
xyge
n (m
g/L)
Oxi
datio
n-R
educ
tion
Pote
ntia
l (R
el m
V)
Turb
idity
(NTU
)
pH(s
tand
ard
units
)
Tota
l Dis
solv
ed S
olid
s(m
g/L)
Ars
enic
Iron
Lead
Man
gane
se
Pota
ssiu
m
15-Jul-05 6.09 679.42 13.80 1124 - - 30.30 6.96 922 0.00241 <0.100 <0.00200 0.6280 -10-Nov-05 5.50 680.01 10.80 1518 - - 2.32 6.88 960 0.01050 4.800 <0.00100 3.6000 -15-Feb-06 5.31 680.20 9.52 1357 0.46 217.4 58.20 6.33 930 J 0.00666 4.290 <0.00100 2.8500 -16-May-06 6.25 679.26 10.40 1296 0.96 91.0 11.40 6.91 910 0.01010 6.560 <0.00100 3.3800 -22-Aug-06 8.85 676.66 12.84 1362 1.28 -64.8 56.00 6.97 900 0.01210 7.060 <0.00100 2.8500 -13-Nov-06 5.03 680.48 11.24 1392 2.12 -74.4 234.00 6.89 910 0.00573 4.750 <0.00100 2.6900 -16-Feb-07 5.55 679.96 8.99 1155 0.75 -71.3 12.30 6.96 770 0.00374 3.770 J <0.00100 2.6100 J -30-May-07 6.72 678.79 11.86 1297 0.75 -25.2 12.50 7.04 790 0.00520 5.840 <0.00100 2.2200 -27-Aug-07 8.38 677.13 12.65 1483 0.71 -96.3 15.30 6.73 1100 J 0.00874 9.160 <0.00100 2.3200 -28-Nov-07 5.66 679.85 10.47 1363 1.05 -72.9 26.90 7.31 730 0.00424 5.460 <0.00100 2.2700 -27-Feb-08 5.57 679.94 - - - - 121.00 - 860 0.00976 5.990 <0.00100 2.4900 -19-May-08 5.94 679.57 9.39 1346 0.66 -52.6 20.00 6.93 820 J 0.00664 8.740 <0.00100 2.3300 -26-Aug-08 6.44 679.07 12.15 1495 0.85 -53.6 5.85 6.88 820 0.00342 2.610 <0.00100 1.5300 30.318-Nov-08 5.50 680.01 10.50 975 1.87 -67.4 225.00 6.93 880 J 0.00748 10.100 <0.00100 2.2900 62.511-Feb-09 5.62 679.89 7.67 877 0.98 - 68.00 7.28 810 0.00520 5.710 <0.00100 2.2700 50.619-May-09 5.60 679.91 8.52 847 0.91 -63.4 52.00 8.21 750 J 0.00251 <0.150 <0.00100 2.2000 49.522-Sep-09 8.36 677.15 15.70 1149 0.10 132.1 75.10 7.05 910 0.00660 5.200 <0.00200 1.8000 53.017-Dec-09 4.59 680.92 8.90 1300 0.40 194.0 401.00 7.08 710 <0.00200 0.740 <0.00200 2.2000 62.024-Mar-10 5.40 680.11 11.20 1010 0.12 - 226.00 6.76 800 0.00380 4.400 <0.00200 2.1000 46.016-Jun-10 5.27 680.24 10.10 1123 0.20 188.0 6.19 8.43 570 0.01300 6.400 <0.00200 1.9000 49.021-Sep-10 6.01 679.50 12.70 1314 0.19 177.7 2.97 6.91 1,000 0.00620 2.800 0.00019 J 1.3000 160.07-Dec-10 5.23 680.28 9.70 1183 0.23 182.7 25.30 6.86 840 0.00320 4.100 <0.00200 1.9000 82.030-Mar-11 5.04 680.47 8.30 498 0.28 174.0 4.93 7.89 700 0.00360 3.700 <0.00200 1.4000 36.022-Jun-11 6.77 678.74 9.70 895 0.43 172.2 9.18 7.01 700 J <0.00500 5.100 <0.00200 1.5000 34.028-Sep-11 7.83 677.68 12.60 99 0.18 141.8 6.07 6.83 840 0.00880 7.700 <0.00200 2.7000 83.015-Dec-11 5.40 680.11 9.00 785 0.60 179.8 24.40 6.98 760 0.00450 J 2.400 <0.0020 1.9000 73.020-Mar-12 4.96 680.55 7.10 1092 0.16 22.6 12.10 7.11 470 0.00520 2.300 <0.0020 1.6000 73.019-Jun-12 6.76 678.75 10.30 1077 0.11 198.6 11.30 7.07 660 0.01200 8.500 <0.0004 1.8000 78.020-Sep-12 8.67 676.84 12.30 1235 0.15 111.0 1.96 6.99 710 0.01100 7.500 0.00005 J 2.1000 100.018-Dec-12 4.98 680.53 8.70 1450 0.30 -40.6 18.70 7.25 740 0.00480 1.800 <0.00040 1.6000 150.026-Feb-13 5.25 680.26 7.80 1211 0.15 186.6 27.80 7.21 740 0.00470 3.100 <0.00040 2.0000 98.023-May-13 6.56 678.95 9.90 1000 0.18 242.3 16.90 7.21 460 0.01400 5.100 0.00280 0.9100 150.021-Aug-13 9.01 676.50 12.10 917 0.12 -14.2 1.24 7.27 772 0.00760 5.210 0.00005 J 1.8100 94.019-Nov-13 6.09 679.42 9.90 697 0.07 61.8 2.93 6.77 852 0.01230 9.660 0.00020 1.5300 169.01-Apr-14 5.75 679.76 9.00 722 0.10 131.3 4.47 7.07 624 0.01050 11.100 0.00006 J 1.7600 104.0
22-May-14 5.80 679.71 9.80 580 1.08 185.3 - 6.85 494 0.00520 4.170 0.00010 1.4300 66.513-Aug-14 8.54 676.97 11.48 915 2.85 -67.6 8.16 7.09 740 0.00690 5.140 <0.00010 1.5100 116.012-Nov-14 5.97 679.54 11.10 314 2.79 -85.1 15.30 6.87 744 0.00690 3.400 <0.00010 2.0000 89.112-Feb-15 5.50 680.01 9.80 980 0.52 -54.5 1.28 7.04 696 0.00420 3.570 <0.00010 2.1900 73.24-May-15 5.80 679.71 10.80 994 0.17 143.4 15.40 7.12 701 0.00930 7.970 <0.00010 1.8800 100.05-Aug-15 10.12 675.39 12.60 881 0.13 -90.4 0.89 7.07 724 0.00730 5.000 <0.00010 2.0000 70.33-Nov-15 5.30 680.21 12.00 865 1.23 105.5 5.06 6.97 1020 0.00170 0.180 0.00020 0.6750 195.09-Feb-16 5.14 680.37 9.10 954 0.55 154.6 4.82 7.03 625 0.00340 3.000 <0.00010 1.8700 92.72-May-16 4.74 680.77 11.30 844 0.19 96.8 2.21 7.16 621 0.01050 7.310 0.00004 J- 1.7200 105.023-Aug-16 9.04 676.47 13.20 946 0.03 156.2 3.48 6.97 924 0.00819 6.780 0.00009 J 1.7000 148.01-Nov-16 6.18 679.33 11.90 349 0.15 18.5 2.43 7.11 744 0.00263 0.730 <0.00010 0.8630 180.01-Feb-17 5.91 679.60 7.50 1114 0.17 -67.4 6.05 7.08 694 0.00640 4.810 <0.00010 1.9200 100.0
30-May-17 7.40 678.11 10.40 753 2.20 8.6 3.28 7.12 465 0.00952 5.240 <0.00010 1.3800 89.317-Aug-17 9.71 675.80 12.40 1101 0.25 -60.2 3.39 7.01 737 0.00847 5.730 <0.00010 2.1700 72.09-Nov-17 6.06 679.45 9.60 833 0.64 75.3 2.01 7.08 748 0.00184 <0.05 <0.0001 0.5540 191.0
Field Parameters
Table A-2c: Summary of Lower Disposal Area - Shallow/Alluvial Groundwater Sampling Results - Well MW-3A
Dissolved Metals (mg/L)
1520304-Tables and Appendix A.xlsm

October 2020 152030420Page 2 of 2
Ravensdale Site, Ravensdale, Washington
Gen. Chem.
Date Sampled*
Dep
th to
Wat
er(fe
et b
toc)
Gro
undw
ater
Ele
vatio
n (f
eet m
sl)
Tem
pera
ture
(°C
)
Con
duct
ivity
(µm
hos/
cm)
Dis
solv
ed O
xyge
n (m
g/L)
Oxi
datio
n-R
educ
tion
Pote
ntia
l (R
el m
V)
Turb
idity
(NTU
)
pH(s
tand
ard
units
)
Tota
l Dis
solv
ed S
olid
s(m
g/L)
Ars
enic
Iron
Lead
Man
gane
se
Pota
ssiu
m
Field Parameters
Table A-2c: Summary of Lower Disposal Area - Shallow/Alluvial Groundwater Sampling Results - Well MW-3A
Dissolved Metals (mg/L)
27-Feb-18 5.16 680.35 7.60 791 0.21 -75.4 9.52 6.64 506 0.00297 1.410 <0.0001 1.3800 92.01-May-18 5.41 680.10 10.00 847 0.93 - 5.82 7.36 547 0.00381 0.961 <0.00010 J 0.8960 120.021-Aug-18 10.81 674.70 14.54 909 2.96 -17.2 1.67 6.92 722 0.00648 2.610 <0.0001 2.0700 101.07-Nov-18 5.85 679.66 11.20 931 0.66 179.0 0.87 6.97 828 0.00203 <0.05 0.000073 J 0.2780 202 J+11-Mar-19 5.26 680.25 6.10 478 1.25 53.7 2.39 7.34 486 0.00144 0.051 <0.0001 0.3490 125.09-May-19 5.44 680.07 10.20 678 3.72 -9.4 1.85 7.04 574 0.00302 0.274 0.000083 J 0.5940 143.026-Aug-19 9.30 676.21 13.96 1041 0.60 Note 1 0.02 6.83 843 0.00615 2.160 <0.0001 2.3600 142.013-Nov-19 5.58 679.93 9.40 803 0.31 12.8 0.02 6.97 724 0.00220 0.132 0.000077 J 0.4760 174.012-Feb-20 5.10 680.41 7.80 349 0.37 -62.4 1.40 7.25 287 0.00186 0.257 0.0001 U 0.4760 74.213-Aug-20 9.33 676.18 11.80 884 0.64 -81.6 4.28 6.76 683 0.01090 3.290 0.0001 U 2.1600 119.0
Preliminary Standarda - - - 700 - - - 6.5-8.5 500 TBDb 0.3 0.05 0.05 -
Notes: Top of casing elevation (feet msl): 685.51- Not measured or not available< Analyte not detected above the reporting limit shown* Depth to water (DTW) measurements for all shallow/alluvial wells collected on the same day; date noted is sampling datea Preliminary standard is the standard listed or the site-specific (natural) background concentration, whichever is highestb Site background arsenic value to be determined (TBD)U Data validation code; not detected at the Reporting Limit (RL)J Data validation code; estimated valueJ+ Data validation code; estimated value with positive bias°C Degrees CelsiusNote 1 ORP measurements not available due to faulty sensor.µmhos/cm Micromhos per centimeter mg/L Milligrams per literfeet bmp Feet below measuring point mV Millivoltsfeet msl Feet above mean sea level NTU Nephelometric Turbidity Unit
1520304-Tables and Appendix A.xlsm

October 2020 152030420Page 1 of 2
Ravensdale Site, Ravensdale, Washington
Gen. Chem.
Date Sampled*
Dep
th to
Wat
er(fe
et b
toc)
Gro
undw
ater
El
evat
ion
(fee
t msl
)
Tem
pera
ture
(°C
)
Con
duct
ivity
(µm
hos/
cm)
Dis
solv
ed O
xyge
n (m
g/L)
Oxi
datio
n-R
educ
tion
Pote
ntia
l (R
el m
V)
Turb
idity
(NTU
)
pH(s
tand
ard
units
)
Tota
l Dis
solv
ed
Solid
s (m
g/L)
Ars
enic
Iron
Lead
Man
gane
se
Pota
ssiu
m
15-Jul-05 4.60 697.25 12.43 629 - - 6.07 6.45 490 <0.00200 <0.100 <0.00200 0.4260 -10-Nov-05 3.70 698.15 11.98 441 - - 7.40 6.22 290 <0.00100 <0.150 <0.00100 0.0991 -19-Jan-06 3.56 698.29 8.29 319 0.42 - 1.46 6.53 290 J <0.00100 <0.150 <0.00100 0.0908 -15-Feb-06 3.82 698.03 8.32 326 0.62 99.7 3.50 7.39 220 J <0.00100 <0.150 <0.00100 0.0341 -15-Mar-06 3.79 698.06 7.58 254 0.87 201.9 0.82 6.65 210 J <0.00100 <0.150 <0.00100 0.0650 -7-Apr-06 3.87 697.98 9.36 295 0.55 157.4 0.24 6.34 220 <0.00100 <0.150 <0.00100 0.0724 -
16-May-06 4.92 696.93 10.80 321 0.45 142.1 0.99 6.36 220 <0.00100 <0.150 <0.00100 0.0376 -23-Jun-06 4.41 697.44 12.62 316 0.57 - 2.05 6.25 200 <0.00100 <0.150 0.00264 0.0638 -20-Jul-06 6.90 694.95 13.43 347 0.23 -20.9 0.32 6.11 120 <0.00100 <0.150 <0.00100 0.1040 -22-Aug-06 8.46 693.39 13.68 406 0.90 153.5 2.20 6.13 280 <0.00100 <0.150 <0.00100 0.1510 -26-Sep-06 6.50 695.35 14.59 417 2.47 -35.2 2.42 6.33 290 <0.00100 <0.150 <0.00100 0.0835 -26-Oct-06 5.98 695.87 12.82 434 3.30 124.1 0.82 6.12 320 <0.00100 <0.150 <0.00100 0.2160 -13-Nov-06 3.02 698.83 11.70 386 5.06 187.8 2.47 6.13 280 <0.00100 <0.150 <0.00100 0.0442 -20-Dec-06 3.60 698.25 9.64 379 4.30 150.5 1.03 6.07 250 <0.00100 <0.150 <0.00100 0.0568 -23-Jan-07 3.68 698.17 8.37 239 3.96 58.9 0.66 6.28 220 <0.00100 <0.150 <0.00100 0.1800 -14-Feb-07 3.74 698.11 8.18 325 2.85 110.8 0.53 6.25 210 <0.00100 <0.150 <0.00100 0.0398 -27-Mar-07 3.32 698.53 8.27 289 2.07 61.5 0.88 6.83 210 J <0.00100 <0.150 <0.00100 0.2290 -17-Apr-07 3.89 697.96 9.59 306 1.80 102.3 2.31 6.34 190 <0.00100 <0.150 <0.00100 0.2220 -30-May-07 4.70 697.15 11.27 285 1.78 101.7 1.37 6.37 180 <0.00100 <0.150 <0.00100 0.0246 -20-Jun-07 4.69 697.16 12.37 350 1.67 9.3 1.25 6.90 240 J <0.00100 <0.150 <0.00100 0.0321 -31-Jul-07 6.38 695.47 14.57 402 1.15 5.5 0.60 6.37 250 0.00129 <0.150 <0.00100 0.0307 -29-Aug-07 7.44 694.41 13.78 353 1.11 128.3 1.87 6.18 280 J <0.00100 <0.150 <0.00100 0.0490 -27-Sep-07 8.25 693.60 13.60 375 0.96 142.6 0.70 6.70 300 <0.00100 <0.150 <0.00100 0.1170 -26-Oct-07 4.09 697.76 12.16 343 2.27 75.9 3.93 6.10 310 J <0.00100 <0.150 <0.00100 0.0117 -29-Nov-07 3.93 697.92 10.13 428 3.17 197.3 1.63 6.32 270 <0.00100 <0.150 <0.00100 0.0164 -12-Dec-07 5.82 696.03 9.51 384 3.37 185.0 0.80 6.06 260 <0.00100 <0.150 <0.00100 0.0392 -24-Jan-08 3.86 697.99 7.74 354 3.09 109.0 - 6.35 250 <0.00100 <0.150 <0.00100 0.0376 -28-Feb-08 4.04 697.81 - - - - 1.06 - 220 <0.00100 <0.150 <0.00100 0.0275 -19-May-08 4.35 697.50 9.79 329 1.38 209.2 1.20 6.08 200 J <0.00100 <0.150 <0.00100 0.0191 -26-Aug-08 7.83 694.02 12.66 431 1.38 210.5 0.28 6.19 270 <0.00100 <0.150 <0.00100 0.0493 <3.018-Nov-08 3.64 698.21 10.43 235 3.95 217.5 0.66 6.03 210 <0.00100 <0.150 <0.00100 0.0208 <3.011-Feb-09 4.09 697.76 7.24 188 2.13 - 0.12 6.54 180 <0.00100 <0.150 <0.00100 0.0180 <3.019-May-09 3.79 698.06 8.19 173 1.28 111.9 1.78 7.18 170 J <0.00100 <0.150 <0.00100 0.0163 <3.022-Sep-09 9.70 692.15 16.50 440 0.82 383.3 12.50 6.31 370 J <0.00200 <0.200 <0.00200 0.0700 1.2 J17-Dec-09 3.47 698.38 9.20 311 4.37 470.0 16.00 6.25 110 <0.00200 <0.200 <0.00200 0.0200 J 0.7 J24-Mar-10 3.87 697.98 9.40 410 0.34 204.8 30.70 6.65 240 0.00081 J <0.200 <0.00200 0.1700 1.3 J16-Jun-10 3.77 698.08 10.30 298 0.99 397.8 1.11 7.40 180 0.00360 0.049 J <0.00200 0.0320 0.9 J21-Sep-10 5.82 696.03 13.70 350 1.01 302.5 1.04 6.25 200 0.00140 J <0.200 0.0002 J <0.0200 1.2 J7-Dec-10 3.83 698.02 9.60 283 0.72 405.6 0.42 6.16 190 <0.00200 <0.200 <0.00200 0.0090 J 0.8 J30-Mar-11 3.91 697.94 8.20 133 0.51 248.2 0.29 9.87 140 J 0.00035 J <0.200 <0.00200 0.0091 J 5.022-Jun-11 3.99 697.86 11.00 219 0.16 222.5 0.22 6.13 160 <0.00500 0.180 J <0.00200 0.1900 0.7 J28-Sep-11 8.54 693.31 14.30 35 0.26 333.9 2.45 6.30 270 <0.00500 0.110 J <0.00200 0.1300 2.1 J15-Dec-11 4.12 697.73 9.40 217 1.15 414.3 2.74 6.28 200 <0.00500 <0.200 <0.00200 0.0170 J 1.2 J21-Mar-12 3.35 698.50 8.40 346 0.42 438.4 0.48 6.14 220 0.00480 <0.200 <0.00040 0.0280 1.3 J19-Jun-12 3.78 698.07 11.30 290 0.09 314.0 0.46 6.28 170 J+ 0.00130 <0.200 <0.00040 0.0710 <3.320-Sep-12 8.53 693.32 14.40 419 0.26 309.0 1.07 6.39 240 0.00160 0.085 J <0.00040 0.1300 2.9 J18-Dec-12 3.49 698.36 9.10 491 2.56 264.4 1.38 6.63 170 <0.00100 <0.200 <0.00040 0.0480 1.2 J26-Feb-13 3.91 697.94 8.40 324 2.59 404.2 1.01 7.03 140 0.00110 <0.500 <0.00040 0.0079 J 3.423-May-13 3.76 698.09 10.60 338 1.15 465.9 0.57 6.31 190 <0.00100 <0.500 <0.00040 0.0060 J <3.322-Aug-13 8.28 693.57 13.10 284 0.33 32.2 0.89 6.34 220 0.00040 <0.050 <0.00010 0.0320 1.319-Nov-13 3.33 698.52 10.30 323 1.70 109.2 0.64 6.27 200 0.00020 <0.050 <0.00010 0.0070 0.81-Apr-14 3.69 698.16 8.20 244 0.45 180.7 0.28 6.33 173 0.00018 J <0.050 <0.00010 0.0050 J+ 0.7
22-May-14 4.52 697.33 10.80 195 0.65 75.0 - 7.20 152 0.00030 <0.050 0.00010 0.0240 0.613-Aug-14 7.56 694.29 12.62 269 0.44 37.7 1.12 5.89 181 0.00080 0.200 <0.00010 0.0930 0.912-Nov-14 3.73 698.12 11.70 231 1.29 108.2 1.32 6.17 191 0.00030 <0.050 <0.00010 0.0450 1.011-Feb-15 3.50 698.35 9.20 270 0.53 -34.2 0.73 6.30 170 0.00020 0.021 J <0.00010 0.0160 0.74-May-15 4.69 697.16 10.90 250 0.28 378.1 0.57 6.29 341 0.00020 0.012 J <0.00010 0.0790 0.65-Aug-15 9.44 692.41 13.90 316 0.72 -38.1 1.16 6.45 262 0.00030 <0.050 <0.00010 0.0150 1.23-Nov-15 4.21 697.64 11.80 192 8.59 205.6 5.39 6.34 166 0.00020 J <0.050 <0.00010 0.0008 J 0.8
Field Parameters
Table A-2d: Summary of Lower Disposal Area - Shallow/Alluvial Groundwater Sampling Results - Well MW-4A
Dissolved Metals (mg/L)
1520304-Tables and Appendix A.xlsm

October 2020 152030420Page 2 of 2
Ravensdale Site, Ravensdale, Washington
Gen. Chem.
Date Sampled*
Dep
th to
Wat
er(fe
et b
toc)
Gro
undw
ater
El
evat
ion
(fee
t msl
)
Tem
pera
ture
(°C
)
Con
duct
ivity
(µm
hos/
cm)
Dis
solv
ed O
xyge
n (m
g/L)
Oxi
datio
n-R
educ
tion
Pote
ntia
l (R
el m
V)
Turb
idity
(NTU
)
pH(s
tand
ard
units
)
Tota
l Dis
solv
ed
Solid
s (m
g/L)
Ars
enic
Iron
Lead
Man
gane
se
Pota
ssiu
m
Field Parameters
Table A-2d: Summary of Lower Disposal Area - Shallow/Alluvial Groundwater Sampling Results - Well MW-4A
Dissolved Metals (mg/L)
9-Feb-16 3.82 698.03 9.20 292 4.61 230.7 0.49 6.45 164 0.00017 J <0.050 <0.00010 0.0050 0.83-May-16 4.61 697.24 10.90 310 2.39 253.0 1.01 6.34 178 0.00030 <0.050 0.00001 J- 0.0020 0.924-Aug-16 8.76 693.09 13.20 287 1.24 490.4 1.01 6.35 177 0.00020 J <0.050 <0.00010 0.0093 0.81-Nov-16 3.34 698.51 12.20 100 3.69 177.2 0.40 6.38 205 0.00019 J <0.050 <0.00010 0.0062 1.02-Feb-17 3.94 697.91 7.80 363 3.11 190.0 0.10 6.39 223 0.00017 J <0.050 <0.00010 0.0080 0.8
31-May-17 4.68 697.17 10.30 300 4.50 - 2.48 6.30 182 0.00020 <0.050 <0.00010 0.0145 0.818-Aug-17 8.61 693.24 12.70 393 0.51 120.2 0.87 6.44 228 0.00031 0.096 <0.00010 0.0516 1.310-Nov-17 3.58 698.27 11.00 264 3.88 56.5 0.76 6.01 217 0.000186 J <0.05 <0.0001 0.0054 0.727-Feb-18 3.76 698.09 8.30 302 3.19 221.1 0.55 6.29 238 0.000176 J <0.05 <0.0001 0.0045 0.92-May-18 4.02 697.83 10.00 343 3.02 - 0.59 6.36 215 0.00015 J 0.0026 J <0.00010 J 0.0045 1.022-Aug-18 9.35 692.50 12.17 330 1.99 142.0 2.31 6.27 265 0.00032 0.05 U <0.0001 0.0310 1.27-Nov-18 5.25 696.60 11.70 317 5.45 124.4 0.76 6.23 250 0.000199 J <0.05 <0.0001 0.0007 J 0.811-Mar-19 3.96 697.89 7.60 226 3.96 220.8 0.70 6.38 233 0.000146 J <0.05 <0.0001 0.0034 0.99-May-19 4.70 697.15 12.50 283 3.60 82.3 1.56 6.14 230 0.000154 J 0.007 J <0.0001 0.0041 0.826-Aug-19 8.20 693.65 13.13 374 0.86 Note 1 0.02 6.30 264 0.00030 0.0324 J <0.0001 0.0547 0.914-Nov-19 4.35 697.50 10.80 309 3.19 109.5 0.02 6.15 240 0.00025 0.082 <0.0001 0.0723 0.913-Feb-20 3.70 698.15 7.90 284 2.98 102.2 0.91 6.18 283 0.000176 J 0.067 0.0001 U 0.0723 0.913-Aug-20 7.73 694.12 13.50 334 0.62 58.3 0.51 6.19 238 0.00071 0.248 0.0001 U 0.1710 0.9Preliminary Standarda - - - 700 - - - 6.5-8.5 500 TBDb 0.3 0.05 0.05 -
Notes: Top of casing elevation (feet msl): 701.85- Not measured or not available< Analyte not detected above the reporting limit shown* Depth to water (DTW) measurements for all shallow/alluvial wells collected on the same day; date noted is sampling datea Preliminary standard is the standard listed or the site-specific (natural) background concentration, whichever is highestb Site background arsenic value to be determined (TBD)U Data validation code; not detected at the Reporting Limit (RL)J Data validation code; estimated valueJ+ Data validation code; estimated value with positive bias°C Degrees CelsiusNote 1 ORP measurements not available due to faulty sensor.µmhos/cm Micromhos per centimeter mg/L Milligrams per literfeet bmp Feet below measuring point mV Millivoltsfeet msl Feet above mean sea level NTU Nephelometric Turbidity Unit
1520304-Tables and Appendix A.xlsm

October 2020 152030420Page 1 of 2
Ravensdale Site, Ravensdale, Washington
Gen. Chem.
Date Sampled*
Dep
th to
Wat
er(fe
et b
toc)
Gro
undw
ater
El
evat
ion
(fee
t msl
)
Tem
pera
ture
(°C
)
Con
duct
ivity
(µm
hos/
cm)
Dis
solv
ed O
xyge
n (m
g/L)
Oxi
datio
n-R
educ
tion
Pote
ntia
l (R
el m
V)
Turb
idity
(NTU
)
pH(s
tand
ard
units
)
Tota
l Dis
solv
ed S
olid
s(m
g/L)
Ars
enic
Iron
Lead
Man
gane
se
Pota
ssiu
m
15-Jul-05 33.33 574.28 12.02 956 - - 496.00 7.34 600 0.00201 <0.100 <0.00200 1.1300 -10-Nov-05 29.62 577.99 11.24 1,212 - - 27.60 7.32 800 0.00840 <0.150 <0.00100 0.0183 -15-Feb-06 21.70 585.91 6.45 665 2.59 280.3 11.10 7.86 520 J 0.02230 0.256 <0.00100 0.0169 -17-May-06 29.80 577.81 7.74 831 0.88 101.9 8.67 7.79 580 0.01100 <0.150 <0.00100 0.0207 -23-Aug-06 33.25 574.36 15.19 737 1.76 33.5 19.60 7.32 660 0.00253 <0.150 <0.00100 0.5820 -14-Nov-06 17.79 589.82 10.86 699 4.50 76.3 38.70 7.55 490 0.00315 <0.150 <0.00100 0.0134 -16-Feb-07 27.08 580.53 8.08 630 6.07 2.3 57.60 8.26 500 0.01440 <0.150 UJ <0.00100 0.016 J -30-May-07 30.75 576.86 9.60 894 2.59 13.3 13.40 7.76 540 0.00843 <0.150 <0.00100 <0.0100 -29-Aug-07 33.60 574.01 9.56 684 7.64 67.0 - 7.10 670 J 0.00197 <0.150 <0.00100 0.4540 -29-Nov-07 30.60 577.01 11.00 1075 3.53 151.5 23.50 8.37 560 0.00517 <0.150 <0.00100 <0.0100 -27-Feb-08 25.68 581.93 - - - - 29.90 - 400 0.01070 <0.150 <0.00100 <0.0100 -20-May-08 29.73 577.88 7.93 768 4.27 180.7 77.80 7.39 480 J 0.00567 <0.150 <0.00100 0.0124 -27-Aug-08 33.97 573.64 10.17 862 4.07 81.2 - 7.43 540 J 0.00117 <0.150 <0.00100 0.0644 87.526-Sep-0816-Oct-08 33.55 574.06 8.89 845 5.39 86.3 852.00 7.53 440 J 0.00103 <0.150 <0.00100 0.0578 90.720-Nov-08 23.48 584.13 9.34 577 5.27 234.3 9.48 7.50 470 0.00624 <0.150 <0.00200 0.0121 138.030-Dec-08 20.88 586.73 8.39 510 8.89 99.0 44.80 8.02 430 J 0.01420 0.202 0.00111 0.0251 138.015-Jan-09 18.50 589.11 4.97 347 8.90 154.8 17.20 8.47 380 0.02440 0.172 <0.00100 0.0238 J 104.012-Feb-09 27.90 579.71 8.47 - 10.21 - 22.00 7.60 420 J 0.00611 <0.150 <0.00100 <0.0100 99.012-Mar-09 29.19 578.42 7.47 521 6.15 171.7 26.80 7.39 480 0.00897 <0.150 <0.00100 <0.0100 124.016-Apr-09 21.70 585.91 6.99 456 7.60 151.6 72.70 8.66 470 0.02820 0.162 0.00101 0.0135 126.019-May-09 28.37 579.24 8.08 509 6.38 64.4 31.30 8.07 450 J 0.00919 <0.150 <0.00100 <0.0100 105.023-Jun-09 31.95 575.66 8.84 551 5.97 69.1 74.30 8.28 500 0.00430 <0.200 <0.00200 <0.0200 71.025-Aug-09 35.08 572.53 - - - - - - - - - - - -24-Sep-09 35.29 572.32 11.70 714 2.28 371.9 258.00 7.26 550 J 0.00076 J 0.180 J 0.00017 J 0.1200 88.015-Dec-09 26.11 581.50 8.60 928 2.89 544.0 89.00 7.14 450 0.00110 J <0.200 <0.00200 0.0024 J 110.024-Mar-10 27.86 579.75 8.30 697 3.52 505.1 18.10 7.47 450 0.02300 0.160 J 0.00046 J 0.0280 110.016-Jun-10 21.35 586.26 10.70 783 2.07 379.0 41.40 7.73 340 0.05300 0.760 0.00210 0.0300 150.022-Sep-10 33.88 573.73 10.40 938 4.30 467.1 7.93 7.10 620 0.00500 <0.200 <0.00200 0.0770 J+ 100.07-Dec-10 25.22 582.39 10.20 781 3.86 353.7 11.10 7.39 500 0.01200 0.094 J 0.00053 J 0.011 J 130.029-Mar-11 23.59 584.02 7.00 354 3.47 708.0 22.22 9.52 440 J 0.06300 0.650 J+ 0.00140 J 0.0250 140.021-Jun-11 28.33 579.28 11.60 1000 2.22 285.3 10.60 9.06 1100 J 0.04300 0.420 0.00120 J 0.0230 180.027-Sep-11 34.70 572.91 12.70 641 1.46 307.2 12.80 7.30 680 <0.00500 0.063 J 0.00023 J 0.2800 100.014-Dec-11 29.46 578.15 9.50 691 1.95 757.1 9.69 7.35 690 0.00690 <0.200 0.00018 J 0.0019 J 180.020-Mar-12 19.50 588.11 6.20 841 3.98 320.2 8.52 8.25 350 0.02600 0.470 0.00100 J 0.0300 140.0
Table A-2e: Summary of Lower Disposal Area - Shallow/Alluvial Groundwater Sampling Results - Well MW-5A
Field Parameters
Test Trench Drain Line Installed
Dissolved Metals (mg/L)
1520304-Tables and Appendix A.xlsm

October 2020 152030420Page 2 of 2
Ravensdale Site, Ravensdale, Washington
Gen. Chem.
Date Sampled*
Dep
th to
Wat
er(fe
et b
toc)
Gro
undw
ater
El
evat
ion
(fee
t msl
)
Tem
pera
ture
(°C
)
Con
duct
ivity
(µm
hos/
cm)
Dis
solv
ed O
xyge
n (m
g/L)
Oxi
datio
n-R
educ
tion
Pote
ntia
l (R
el m
V)
Turb
idity
(NTU
)
pH(s
tand
ard
units
)
Tota
l Dis
solv
ed S
olid
s(m
g/L)
Ars
enic
Iron
Lead
Man
gane
se
Pota
ssiu
m
Table A-2e: Summary of Lower Disposal Area - Shallow/Alluvial Groundwater Sampling Results - Well MW-5A
Field Parameters Dissolved Metals (mg/L)
19-Jun-12 27.91 579.70 10.20 800 3.22 365.9 2.76 7.66 510 0.00870 <0.200 <0.00040 0.0290 120.020-Sep-12 34.53 573.08 11.00 859 0.73 387.0 46.80 7.64 530 0.00260 <0.200 <0.00040 0.6300 100.019-Dec-12 21.26 586.35 8.90 983 1.73 279.0 778.00 7.71 530 0.01100 0.110 J 0.00062 0.0670 180.025-Feb-13 27.19 580.42 7.50 682 7.61 330.5 4.36 7.85 380 0.01300 <0.500 0.00015 J 0.0110 J 74.022-May-13 29.09 578.52 8.80 828 3.88 411.4 8.11 8.29 350 0.02500 0.085 J 0.00053 0.0220 100.021-Aug-13 35.15 572.46 17.10 1248 3.41 114.2 144.00 7.78 1060 0.00150 0.060 0.00005 J 0.4870 95.020-Nov-13 27.45 580.16 10.00 1032 4.13 196.5 31.70 7.18 699 0.01450 0.100 0.00140 0.0080 202.01-Apr-14 21.08 586.53 8.40 567 3.04 168.2 15.70 10.24 413 0.06270 0.210 0.00150 0.0140 150.0
21-May-14 26.11 581.50 10.30 670 0.49 198.4 - 7.45 565 0.09500 0.200 0.00160 0.0480 166.012-Aug-14 34.56 573.05 14.07 812 3.64 87.7 1519.00 7.51 560 0.00300 0.070 <0.00010 0.1370 107.013-Nov-14 29.48 578.13 12.90 1135 3.50 241.7 10.46 7.69 956 0.02080 <0.050 0.00010 0.0020 295.011-Feb-15 20.81 586.80 7.70 619 6.17 81.4 18.00 9.63 430 0.03920 0.380 0.00130 0.0110 126.04-May-15 29.80 577.81 10.50 924 2.54 361.3 8.70 9.74 623 0.04230 0.110 0.00050 0.0130 192.06-Aug-15 36.08 571.53 12.80 781 2.40 129.6 261.00 7.24 Dry Dry Dry Dry Dry Dry4-Nov-15 30.80 576.81 10.70 1234 4.98 205.6 11.80 7.13 1130 0.00660 0.048 J 0.00030 0.0020 318.010-Feb-16 23.56 584.05 6.40 602 1.62 197.7 11.90 10.19 451 0.13200 0.190 0.00140 0.0190 148.02-May-16 30.19 577.42 11.50 1008 0.80 110.6 9.76 10.14 751 0.17100 0.250 0.00270 J- 0.0480 232.023-Aug-16 35.79 571.82 13.10 729 2.00 436.2 51.40 7.20 1010 0.00401 <0.050 <0.00010 0.1820 137.02-Nov-16 29.06 578.55 10.90 570 4.98 103.1 32.10 7.55 1180 0.01120 0.185 0.00056 0.0050 372.01-Feb-17 26.86 580.75 8.10 992 2.21 99.7 7.19 9.73 632 0.10900 0.089 0.00097 0.0179 194.0
30-May-17 26.86 580.75 10.50 814 6.12 5.8 5.74 9.73 487 0.04250 0.084 0.00036 J+ 0.0044 168.017-Aug-17 34.23 573.38 11.70 1054 5.43 125.1 5.68 7.65 731 0.00652 0.029 J <0.00010 0.0604 156.010-Nov-17 29.96 577.65 10.00 1077 4.65 85.2 10.50 7.18 953 0.00582 0.069 0.00034 0.0042 308.027-Feb-18 23.02 584.59 7.70 584 1.91 120.4 12.60 9.96 530 0.08630 0.143 0.00064 0.0068 174.01-May-18 24.85 582.76 9.10 1082 2.16 - 11.80 10.34 682 0.11300 0.2140.000775 J+ 0.0222 196.021-Aug-18 35.17 572.44 14.83 1095 4.02 131.0 123.00 7.40 936 0.00365 0.05 U <0.0001 0.8700 214.06-Nov-18 32.00 575.61 10.30 1192 5.93 198.1 2.35 7.49 1200 0.00487 <0.05 0.000077 J <0.001 363 J+13-Mar-19 25.12 582.49 7.40 695 2.19 189.7 15.80 9.48 632 0.04410 0.091 0.00063 0.0076 200.08-May-19 27.89 579.72 10.70 844 4.95 60.5 5.19 9.30 697 0.04190 0.0953 J 0.00068 0.0140 182.026-Aug-19 35.02 572.59 11.89 1111 1.52 Note 1 22.90 7.26 995 0.00246 0.0152 J <0.0001 0.9700 177.013-Nov-19 33.00 574.61 9.80 932 5.27 66.1 0.02 7.18 776 0.00389 0.0049 J <0.0001 0.0006 J 211.012-Feb-20 18.23 589.38 7.00 533 7.58 140.4 10.60 8.32 463 0.00631 0.0436 J 0.00015 0.0015 183.012-Aug-20 34.50 573.11 11.20 1381 4.00 125.0 2.75 7.52 1250 0.00537 0.012 J 0.0001 U 0.0839 333.0
Preliminary Standarda - - - 700 - - - 6.5-8.5 500 TBDb 0.3 0.05 0.05 -
Notes: Top of casing elevation (feet msl): 607.61- Not measured or not available< Analyte not detected above the reporting limit shown* Depth to water (DTW) measurements for all shallow/alluvial wells collected on the same day; date noted is sampling dateDry Well went dry during sampling. Unable to collect sample.a Preliminary standard is the standard listed or the site-specific (natural) background concentration, whichever is highestb Site background arsenic value to be determined (TBD)U Data validation code; not detected at the Reporting Limit (RL)J Data validation code; estimated valueJ+ Data validation code; estimated value with positive bias°C Degrees CelsiusNote 1 ORP measurements not available due to faulty sensor.µmhos/cm Micromhos per centimeter mg/L Milligrams per literfeet bmp Feet below measuring point mV Millivoltsfeet msl Feet above mean sea level NTU Nephelometric Turbidity Unit
1520304-Tables and Appendix A.xlsm
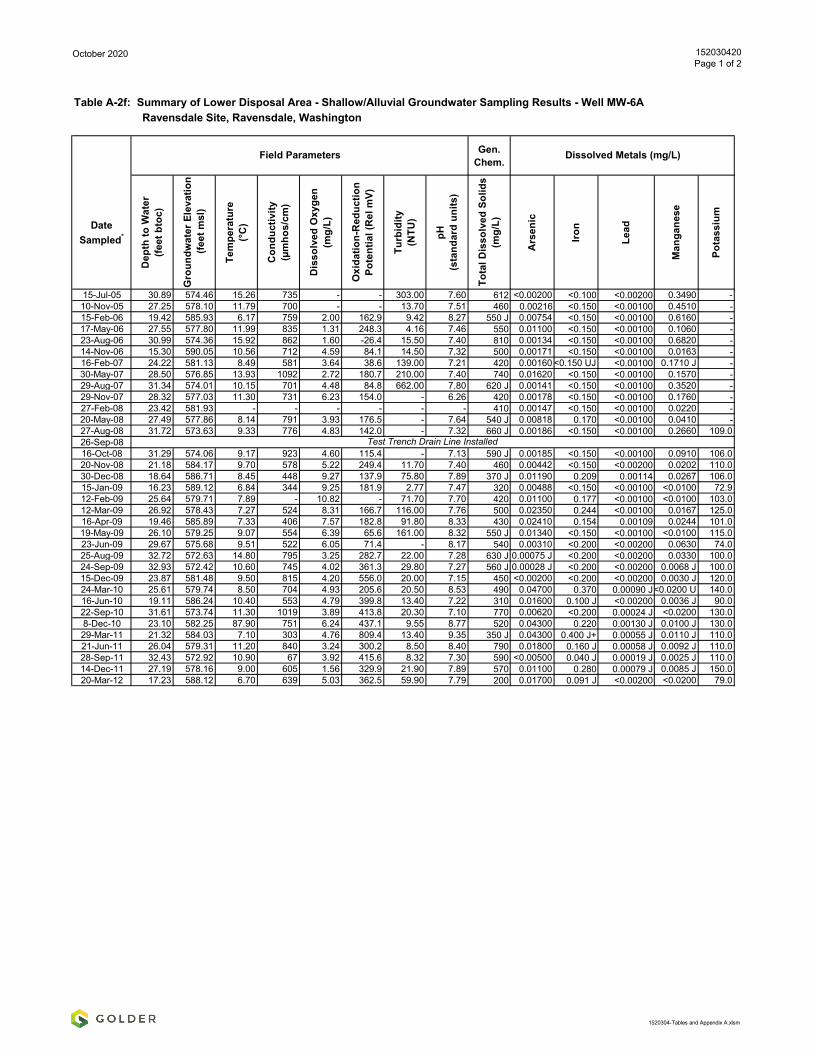
October 2020 152030420Page 1 of 2
Ravensdale Site, Ravensdale, Washington
Gen. Chem.
Date Sampled*
Dep
th to
Wat
er(fe
et b
toc)
Gro
undw
ater
Ele
vatio
n (f
eet m
sl)
Tem
pera
ture
(°C
)
Con
duct
ivity
(µm
hos/
cm)
Dis
solv
ed O
xyge
n (m
g/L)
Oxi
datio
n-R
educ
tion
Pote
ntia
l (R
el m
V)
Turb
idity
(NTU
)
pH(s
tand
ard
units
)
Tota
l Dis
solv
ed S
olid
s(m
g/L)
Ars
enic
Iron
Lead
Man
gane
se
Pota
ssiu
m
15-Jul-05 30.89 574.46 15.26 735 - - 303.00 7.60 612 <0.00200 <0.100 <0.00200 0.3490 -10-Nov-05 27.25 578.10 11.79 700 - - 13.70 7.51 460 0.00216 <0.150 <0.00100 0.4510 -15-Feb-06 19.42 585.93 6.17 759 2.00 162.9 9.42 8.27 550 J 0.00754 <0.150 <0.00100 0.6160 -17-May-06 27.55 577.80 11.99 835 1.31 248.3 4.16 7.46 550 0.01100 <0.150 <0.00100 0.1060 -23-Aug-06 30.99 574.36 15.92 862 1.60 -26.4 15.50 7.40 810 0.00134 <0.150 <0.00100 0.6820 -14-Nov-06 15.30 590.05 10.56 712 4.59 84.1 14.50 7.32 500 0.00171 <0.150 <0.00100 0.0163 -16-Feb-07 24.22 581.13 8.49 581 3.64 38.6 139.00 7.21 420 0.00160 <0.150 UJ <0.00100 0.1710 J -30-May-07 28.50 576.85 13.93 1092 2.72 180.7 210.00 7.40 740 0.01620 <0.150 <0.00100 0.1570 -29-Aug-07 31.34 574.01 10.15 701 4.48 84.8 662.00 7.80 620 J 0.00141 <0.150 <0.00100 0.3520 -29-Nov-07 28.32 577.03 11.30 731 6.23 154.0 - 6.26 420 0.00178 <0.150 <0.00100 0.1760 -27-Feb-08 23.42 581.93 - - - - - - 410 0.00147 <0.150 <0.00100 0.0220 -20-May-08 27.49 577.86 8.14 791 3.93 176.5 - 7.64 540 J 0.00818 0.170 <0.00100 0.0410 -27-Aug-08 31.72 573.63 9.33 776 4.83 142.0 - 7.32 660 J 0.00186 <0.150 <0.00100 0.2660 109.026-Sep-0816-Oct-08 31.29 574.06 9.17 923 4.60 115.4 - 7.13 590 J 0.00185 <0.150 <0.00100 0.0910 106.020-Nov-08 21.18 584.17 9.70 578 5.22 249.4 11.70 7.40 460 0.00442 <0.150 <0.00200 0.0202 110.030-Dec-08 18.64 586.71 8.45 448 9.27 137.9 75.80 7.89 370 J 0.01190 0.209 0.00114 0.0267 106.015-Jan-09 16.23 589.12 6.84 344 9.25 181.9 2.77 7.47 320 0.00488 <0.150 <0.00100 <0.0100 72.912-Feb-09 25.64 579.71 7.89 - 10.82 - 71.70 7.70 420 0.01100 0.177 <0.00100 <0.0100 103.012-Mar-09 26.92 578.43 7.27 524 8.31 166.7 116.00 7.76 500 0.02350 0.244 <0.00100 0.0167 125.016-Apr-09 19.46 585.89 7.33 406 7.57 182.8 91.80 8.33 430 0.02410 0.154 0.00109 0.0244 101.019-May-09 26.10 579.25 9.07 554 6.39 65.6 161.00 8.32 550 J 0.01340 <0.150 <0.00100 <0.0100 115.023-Jun-09 29.67 575.68 9.51 522 6.05 71.4 - 8.17 540 0.00310 <0.200 <0.00200 0.0630 74.025-Aug-09 32.72 572.63 14.80 795 3.25 282.7 22.00 7.28 630 J 0.00075 J <0.200 <0.00200 0.0330 100.024-Sep-09 32.93 572.42 10.60 745 4.02 361.3 29.80 7.27 560 J 0.00028 J <0.200 <0.00200 0.0068 J 100.015-Dec-09 23.87 581.48 9.50 815 4.20 556.0 20.00 7.15 450 <0.00200 <0.200 <0.00200 0.0030 J 120.024-Mar-10 25.61 579.74 8.50 704 4.93 205.6 20.50 8.53 490 0.04700 0.370 0.00090 J<0.0200 U 140.016-Jun-10 19.11 586.24 10.40 553 4.79 399.8 13.40 7.22 310 0.01600 0.100 J <0.00200 0.0036 J 90.022-Sep-10 31.61 573.74 11.30 1019 3.89 413.8 20.30 7.10 770 0.00620 <0.200 0.00024 J <0.0200 130.08-Dec-10 23.10 582.25 87.90 751 6.24 437.1 9.55 8.77 520 0.04300 0.220 0.00130 J 0.0100 J 130.029-Mar-11 21.32 584.03 7.10 303 4.76 809.4 13.40 9.35 350 J 0.04300 0.400 J+ 0.00055 J 0.0110 J 110.021-Jun-11 26.04 579.31 11.20 840 3.24 300.2 8.50 8.40 790 0.01800 0.160 J 0.00058 J 0.0092 J 110.028-Sep-11 32.43 572.92 10.90 67 3.92 415.6 8.32 7.30 590 <0.00500 0.040 J 0.00019 J 0.0025 J 110.014-Dec-11 27.19 578.16 9.00 605 1.56 329.9 21.90 7.89 570 0.01100 0.280 0.00079 J 0.0085 J 150.020-Mar-12 17.23 588.12 6.70 639 5.03 362.5 59.90 7.79 200 0.01700 0.091 J <0.00200 <0.0200 79.0
Field Parameters
Table A-2f: Summary of Lower Disposal Area - Shallow/Alluvial Groundwater Sampling Results - Well MW-6A
Test Trench Drain Line Installed
Dissolved Metals (mg/L)
1520304-Tables and Appendix A.xlsm
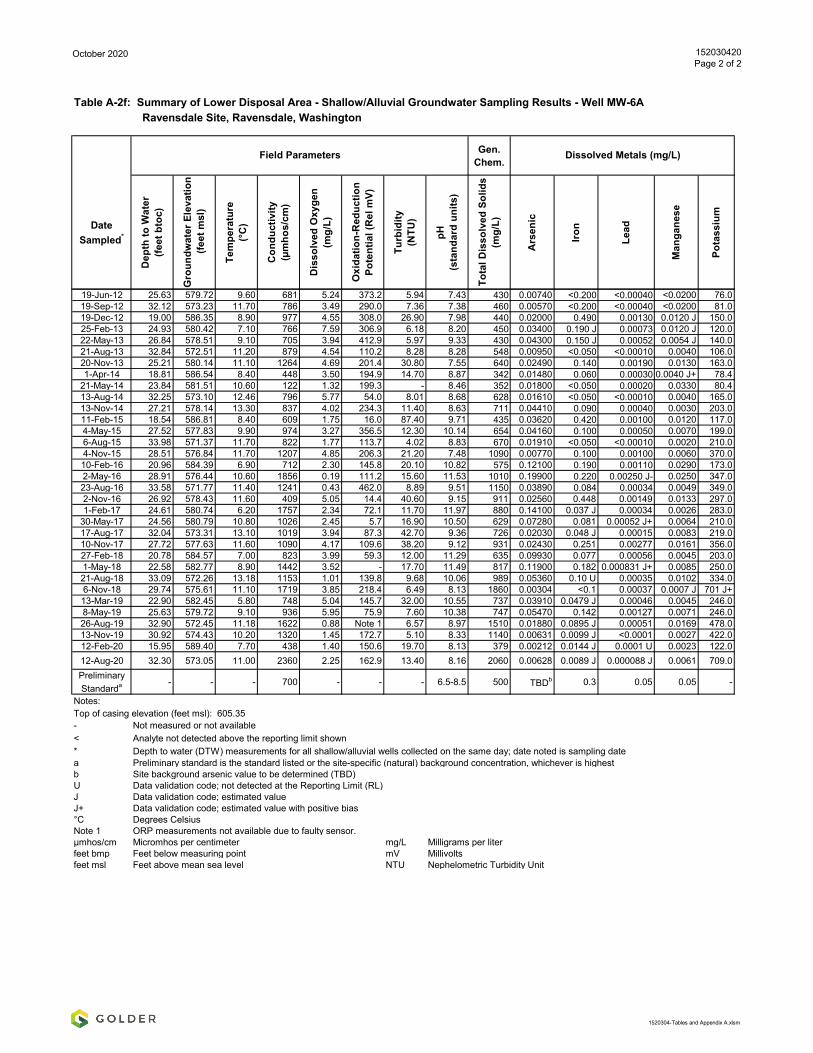
October 2020 152030420Page 2 of 2
Ravensdale Site, Ravensdale, Washington
Gen. Chem.
Date Sampled*
Dep
th to
Wat
er(fe
et b
toc)
Gro
undw
ater
Ele
vatio
n (f
eet m
sl)
Tem
pera
ture
(°C
)
Con
duct
ivity
(µm
hos/
cm)
Dis
solv
ed O
xyge
n (m
g/L)
Oxi
datio
n-R
educ
tion
Pote
ntia
l (R
el m
V)
Turb
idity
(NTU
)
pH(s
tand
ard
units
)
Tota
l Dis
solv
ed S
olid
s(m
g/L)
Ars
enic
Iron
Lead
Man
gane
se
Pota
ssiu
m
Field Parameters
Table A-2f: Summary of Lower Disposal Area - Shallow/Alluvial Groundwater Sampling Results - Well MW-6A
Dissolved Metals (mg/L)
19-Jun-12 25.63 579.72 9.60 681 5.24 373.2 5.94 7.43 430 0.00740 <0.200 <0.00040 <0.0200 76.019-Sep-12 32.12 573.23 11.70 786 3.49 290.0 7.36 7.38 460 0.00570 <0.200 <0.00040 <0.0200 81.019-Dec-12 19.00 586.35 8.90 977 4.55 308.0 26.90 7.98 440 0.02000 0.490 0.00130 0.0120 J 150.025-Feb-13 24.93 580.42 7.10 766 7.59 306.9 6.18 8.20 450 0.03400 0.190 J 0.00073 0.0120 J 120.022-May-13 26.84 578.51 9.10 705 3.94 412.9 5.97 9.33 430 0.04300 0.150 J 0.00052 0.0054 J 140.021-Aug-13 32.84 572.51 11.20 879 4.54 110.2 8.28 8.28 548 0.00950 <0.050 <0.00010 0.0040 106.020-Nov-13 25.21 580.14 11.10 1264 4.69 201.4 30.80 7.55 640 0.02490 0.140 0.00190 0.0130 163.01-Apr-14 18.81 586.54 8.40 448 3.50 194.9 14.70 8.87 342 0.01480 0.060 0.00030 0.0040 J+ 78.4
21-May-14 23.84 581.51 10.60 122 1.32 199.3 - 8.46 352 0.01800 <0.050 0.00020 0.0330 80.413-Aug-14 32.25 573.10 12.46 796 5.77 54.0 8.01 8.68 628 0.01610 <0.050 <0.00010 0.0040 165.013-Nov-14 27.21 578.14 13.30 837 4.02 234.3 11.40 8.63 711 0.04410 0.090 0.00040 0.0030 203.011-Feb-15 18.54 586.81 8.40 609 1.75 16.0 87.40 9.71 435 0.03620 0.420 0.00100 0.0120 117.04-May-15 27.52 577.83 9.90 974 3.27 356.5 12.30 10.14 654 0.04160 0.100 0.00050 0.0070 199.06-Aug-15 33.98 571.37 11.70 822 1.77 113.7 4.02 8.83 670 0.01910 <0.050 <0.00010 0.0020 210.04-Nov-15 28.51 576.84 11.70 1207 4.85 206.3 21.20 7.48 1090 0.00770 0.100 0.00100 0.0060 370.010-Feb-16 20.96 584.39 6.90 712 2.30 145.8 20.10 10.82 575 0.12100 0.190 0.00110 0.0290 173.02-May-16 28.91 576.44 10.60 1856 0.19 111.2 15.60 11.53 1010 0.19900 0.220 0.00250 J- 0.0250 347.023-Aug-16 33.58 571.77 11.40 1241 0.43 462.0 8.89 9.51 1150 0.03890 0.084 0.00034 0.0049 349.02-Nov-16 26.92 578.43 11.60 409 5.05 14.4 40.60 9.15 911 0.02560 0.448 0.00149 0.0133 297.01-Feb-17 24.61 580.74 6.20 1757 2.34 72.1 11.70 11.97 880 0.14100 0.037 J 0.00034 0.0026 283.0
30-May-17 24.56 580.79 10.80 1026 2.45 5.7 16.90 10.50 629 0.07280 0.081 0.00052 J+ 0.0064 210.017-Aug-17 32.04 573.31 13.10 1019 3.94 87.3 42.70 9.36 726 0.02030 0.048 J 0.00015 0.0083 219.010-Nov-17 27.72 577.63 11.60 1090 4.17 109.6 38.20 9.12 931 0.02430 0.251 0.00277 0.0161 356.027-Feb-18 20.78 584.57 7.00 823 3.99 59.3 12.00 11.29 635 0.09930 0.077 0.00056 0.0045 203.01-May-18 22.58 582.77 8.90 1442 3.52 - 17.70 11.49 817 0.11900 0.182 0.000831 J+ 0.0085 250.021-Aug-18 33.09 572.26 13.18 1153 1.01 139.8 9.68 10.06 989 0.05360 0.10 U 0.00035 0.0102 334.06-Nov-18 29.74 575.61 11.10 1719 3.85 218.4 6.49 8.13 1860 0.00304 <0.1 0.00037 0.0007 J 701 J+13-Mar-19 22.90 582.45 5.80 748 5.04 145.7 32.00 10.55 737 0.03910 0.0479 J 0.00046 0.0045 246.08-May-19 25.63 579.72 9.10 936 5.95 75.9 7.60 10.38 747 0.05470 0.142 0.00127 0.0071 246.026-Aug-19 32.90 572.45 11.18 1622 0.88 Note 1 6.57 8.97 1510 0.01880 0.0895 J 0.00051 0.0169 478.013-Nov-19 30.92 574.43 10.20 1320 1.45 172.7 5.10 8.33 1140 0.00631 0.0099 J <0.0001 0.0027 422.012-Feb-20 15.95 589.40 7.70 438 1.40 150.6 19.70 8.13 379 0.00212 0.0144 J 0.0001 U 0.0023 122.012-Aug-20 32.30 573.05 11.00 2360 2.25 162.9 13.40 8.16 2060 0.00628 0.0089 J 0.000088 J 0.0061 709.0Preliminary Standarda - - - 700 - - - 6.5-8.5 500 TBDb 0.3 0.05 0.05 -
Notes: Top of casing elevation (feet msl): 605.35- Not measured or not available< Analyte not detected above the reporting limit shown* Depth to water (DTW) measurements for all shallow/alluvial wells collected on the same day; date noted is sampling datea Preliminary standard is the standard listed or the site-specific (natural) background concentration, whichever is highestb Site background arsenic value to be determined (TBD)U Data validation code; not detected at the Reporting Limit (RL)J Data validation code; estimated valueJ+ Data validation code; estimated value with positive bias°C Degrees CelsiusNote 1 ORP measurements not available due to faulty sensor.µmhos/cm Micromhos per centimeter mg/L Milligrams per literfeet bmp Feet below measuring point mV Millivoltsfeet msl Feet above mean sea level NTU Nephelometric Turbidity Unit
1520304-Tables and Appendix A.xlsm

APPENDIX A-3
Summary of Lower Disposal Area –
Bedrock Groundwater Sampling
Results Table A-3A Well MWB-1LDA Table A-3B Well MWB-2LDA Table A-3C Well MWB-3LDA

October 2020 152030420Page 1 of 2
Ravensdale Site, Ravensdale, Washington
Gen. Chem.
DateSampled
Dep
th to
Wat
er*
(feet
bto
c)
Gro
undw
ater
Ele
vatio
n (f
eet m
sl)
Tem
pera
ture
(°C
)
Con
duct
ivity
(µm
hos/
cm)
Dis
solv
ed O
xyge
n (m
g/L)
Oxi
datio
n R
educ
tion
Pote
ntia
l (R
el m
V)
Turb
idity
(NTU
)
pH(s
tand
ard
units
)
Tota
l Dis
solv
ed S
olid
s(m
g/L)
Ars
enic
Iron
Lead
Man
gane
se
Pota
ssiu
m
19-Dec-06 26.51 674.57 10.96 546 0.43 -115.4 1.05 7.70 310 0.15100 <0.150 <0.00100 0.0377 -14-Feb-07 26.08 675.00 10.62 397 1.02 -90.8 3.07 7.53 240 0.16000 0.208 <0.00100 0.0463 -31-May-07 25.96 675.12 10.83 386 0.36 -172.8 4.20 8.20 220 0.12200 0.183 <0.00100 0.0442 -27-Aug-07 25.66 675.42 10.97 372 0.76 -128.2 1.08 7.51 240 0.08990 0.166 <0.00100 0.0466 -28-Nov-07 26.81 674.27 10.56 371 0.42 -121.2 1.29 8.03 220 0.08830 <0.150 <0.00100 0.0547 -27-Feb-08 25.80 675.28 10.62 371 2.01 - 1.07 - 230 0.08090 0.159 <0.00100 0.0553 <3.020-May-08 25.62 675.46 10.61 391 0.36 -53.0 1.11 7.28 230 0.06430 0.162 <0.00100 0.0521 -27-Aug-08 26.14 674.94 10.58 394 0.50 -63.9 1.02 7.35 230 J 0.06400 0.170 <0.00100 0.0482 <3.019-Nov-08 25.16 675.92 10.33 269 0.45 -88.6 0.48 7.51 230 0.05960 0.166 <0.00100 0.0536 <3.011-Feb-09 25.08 676.00 10.04 268 0.48 - 0.97 7.89 230 0.05600 0.182 <0.00100 0.0519 <3.018-May-09 24.83 676.25 10.10 271 0.42 -50.5 1.81 8.05 230 J 0.04660 <0.150 <0.00100 0.0500 <3.024-Sep-09 26.32 674.76 11.80 323 0.24 202.0 3.59 7.57 260 0.02700 0.080 J <0.00200 0.0650 1.1 J17-Dec-09 25.06 676.02 10.10 370 0.94 179.0 4.16 7.77 <40 0.03400 0.052 J <0.00200 0.0700 1.2 J23-Mar-10 24.83 676.25 10.90 344 0.21 397.4 3.17 7.57 240 0.02500 0.058 J <0.00200 0.0660 1.3 J15-Jun-10 24.38 676.70 10.50 355 0.08 195.5 0.42 7.66 150 0.02700 0.083 J <0.00200 0.0590 1.1 J20-Sep-10 25.74 675.34 10.50 354 0.06 192.9 0.20 7.65 200 0.02200 <0.200 <0.00200 0.0660 J+ 1.1 J6-Dec-10 24.59 676.49 10.00 347 0.09 99.3 0.17 7.86 230 0.02200 <0.200 <0.00200 0.0510 1.0 J28-Mar-11 24.01 677.07 10.00 173 0.16 90.6 0.88 7.58 200 0.02200 <0.200 <0.00200 0.0500 1.0 J20-Jun-11 24.11 676.97 10.30 330 0.07 121.5 0.17 7.65 250 0.02200 0.110 J <0.00200 0.0510 0.9 J26-Sep-11 25.39 675.69 10.40 2906 0.06 123.6 0.43 7.65 280 0.01500 0.130 J <0.00200 0.0560 1.1 J14-Dec-11 24.61 676.47 9.90 245 0.10 193.8 1.76 7.57 230 0.02100 0.110 J <0.00200 0.0540 1.2 J21-Mar-12 23.70 677.38 10.10 392 0.07 392.0 0.22 7.47 240 0.02300 0.110 J <0.00200 0.0480 1.1 J18-Jun-12 23.90 677.18 10.50 383 0.02 342.8 0.30 7.67 230 0.02000 <0.200 <0.00040 0.0510 <3.319-Sep-12 25.38 675.70 10.30 402 0.01 151.0 0.44 7.63 220 0.01900 0.110 J <0.00040 0.0550 1.0 J18-Dec-12 23.59 677.49 10.10 492 0.00 -45.7 0.16 7.70 92 0.01700 0.120 J <0.00040 0.0490 1.2 J25-Feb-13 23.73 677.35 9.90 377 0.00 177.1 0.37 7.53 270 J 0.01900 0.140 J <0.00040 0.0450 1.0 J22-May-13 23.85 677.23 9.90 398 0.00 430.4 0.44 7.73 290 0.01700 0.130 J <0.00040 0.0460 <3.321-Aug-13 25.34 675.74 10.40 467 0.01 -31.7 0.55 7.68 238 0.01680 0.140 0.00008 J 0.0480 1.119-Nov-13 24.25 676.83 10.10 361 0.00 70.3 0.32 7.30 232 0.01570 0.160 <0.00010 0.0500 1.031-Mar-14 22.36 678.72 10.70 286 0.01 107.4 0.21 7.79 211 0.01380 0.160 <0.00010 0.0490 1.021-May-14 23.29 677.79 8.54 271 1.35 54.3 - 7.14 198 0.01310 0.160 <0.00010 0.0460 1.012-Aug-14 24.87 676.21 14.79 335 0.41 -16.0 2.02 7.05 216 0.01190 0.140 <0.00010 0.0450 1.011-Nov-14 24.96 676.12 10.10 262 0.79 11.1 1.51 7.49 221 0.01360 0.160 <0.00010 0.0450 1.110-Feb-15 23.23 677.85 10.40 319 0.25 -114.0 0.36 7.70 240 0.01330 0.160 <0.00010 0.0450 1.04-May-15 23.62 677.46 10.20 370 0.05 175.1 0.16 7.70 224 0.01170 0.180 <0.00010 0.0480 1.04-Aug-15 25.30 675.78 11.00 279 0.06 -30.5 0.72 7.72 234 0.01440 0.180 <0.00010 0.0460 1.04-Nov-15 25.35 675.73 10.60 263 0.00 51.2 0.46 7.46 233 0.01100 0.170 <0.00010 0.0450 1.28-Feb-16 23.03 678.05 10.20 319 0.03 206.5 0.20 7.77 210 0.01210 0.190 <0.00010 0.0480 1.12-May-16 23.49 677.5922-Aug-16 25.00 676.08 11.10 323 0.02 -55.2 1.10 7.641-Nov-16 24.29 676.7931-Jan-17 23.06 678.02 10.20 391 0.05 169.3 0.13 7.66 223 0.01190 0.177 <0.00010 0.0418 1.030-May-17 22.45 678.6316-Aug-17 24.27 676.81 10.70 385 0.15 123.4 0.40 7.649-Nov-17 23.92 677.16
Monitored Annually1
Monitored Semi-Annually1 Monitored Annually1
Monitored Semi-Annually1 Monitored Annually1
Monitored Annually1
Monitored Semi-Annually1 Monitored Annually1
Dissolved Metals (mg/L)Field Parameters
Table A-3a: Summary of Lower Disposal Area - Bedrock Groundwater Sampling Results - Well MWB-1LDA
Monitored Semi-Annually1 Monitored Annually1
1520304-Tables and Appendix A.xlsm
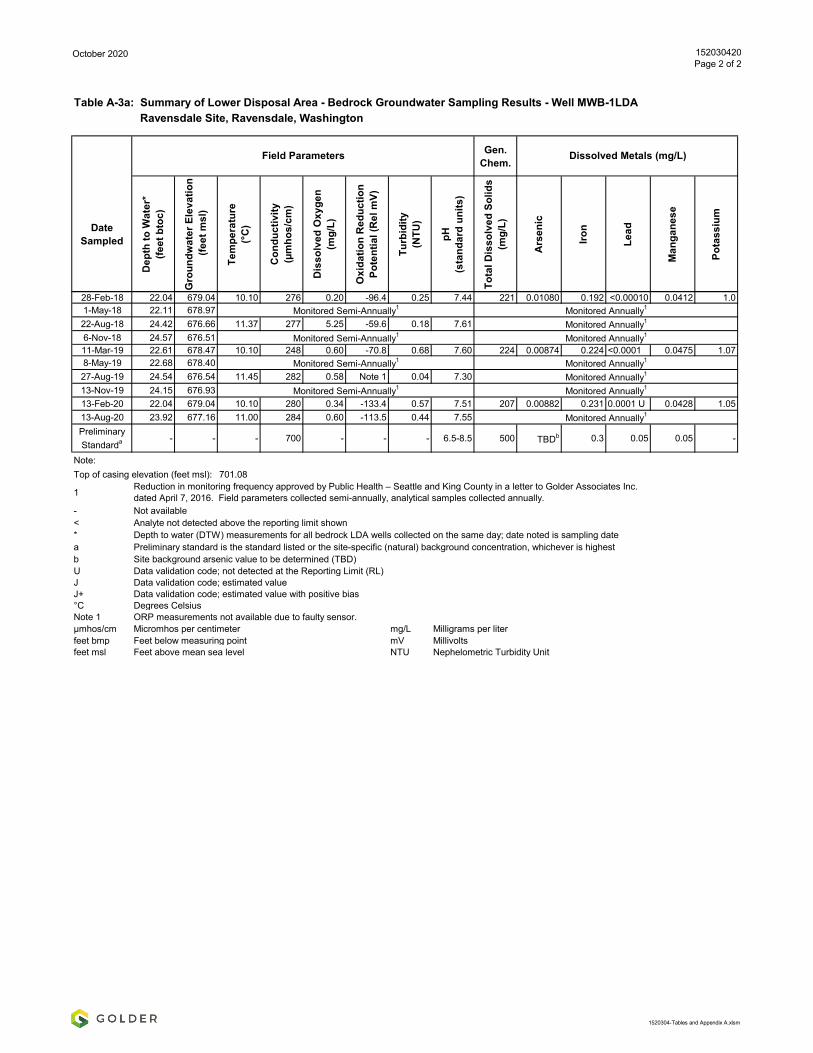
October 2020 152030420Page 2 of 2
Ravensdale Site, Ravensdale, Washington
Gen. Chem.
DateSampled
Dep
th to
Wat
er*
(feet
bto
c)
Gro
undw
ater
Ele
vatio
n (f
eet m
sl)
Tem
pera
ture
(°C
)
Con
duct
ivity
(µm
hos/
cm)
Dis
solv
ed O
xyge
n (m
g/L)
Oxi
datio
n R
educ
tion
Pote
ntia
l (R
el m
V)
Turb
idity
(NTU
)
pH(s
tand
ard
units
)
Tota
l Dis
solv
ed S
olid
s(m
g/L)
Ars
enic
Iron
Lead
Man
gane
se
Pota
ssiu
m
Dissolved Metals (mg/L)Field Parameters
Table A-3a: Summary of Lower Disposal Area - Bedrock Groundwater Sampling Results - Well MWB-1LDA
28-Feb-18 22.04 679.04 10.10 276 0.20 -96.4 0.25 7.44 221 0.01080 0.192 <0.00010 0.0412 1.01-May-18 22.11 678.9722-Aug-18 24.42 676.66 11.37 277 5.25 -59.6 0.18 7.616-Nov-18 24.57 676.5111-Mar-19 22.61 678.47 10.10 248 0.60 -70.8 0.68 7.60 224 0.00874 0.224 <0.0001 0.0475 1.078-May-19 22.68 678.4027-Aug-19 24.54 676.54 11.45 282 0.58 Note 1 0.04 7.3013-Nov-19 24.15 676.9313-Feb-20 22.04 679.04 10.10 280 0.34 -133.4 0.57 7.51 207 0.00882 0.231 0.0001 U 0.0428 1.0513-Aug-20 23.92 677.16 11.00 284 0.60 -113.5 0.44 7.55Preliminary Standarda - - - 700 - - - 6.5-8.5 500 TBDb 0.3 0.05 0.05 -
Note: Top of casing elevation (feet msl): 701.08
1
- Not available< Analyte not detected above the reporting limit shown* Depth to water (DTW) measurements for all bedrock LDA wells collected on the same day; date noted is sampling datea Preliminary standard is the standard listed or the site-specific (natural) background concentration, whichever is highestb Site background arsenic value to be determined (TBD)U Data validation code; not detected at the Reporting Limit (RL)J Data validation code; estimated valueJ+ Data validation code; estimated value with positive bias°C Degrees CelsiusNote 1 ORP measurements not available due to faulty sensor.µmhos/cm Micromhos per centimeter mg/L Milligrams per literfeet bmp Feet below measuring point mV Millivoltsfeet msl Feet above mean sea level NTU Nephelometric Turbidity Unit
Monitored Annually1
Reduction in monitoring frequency approved by Public Health – Seattle and King County in a letter to Golder Associates Inc. dated April 7, 2016. Field parameters collected semi-annually, analytical samples collected annually.
Monitored Semi-Annually1 Monitored Annually1
Monitored Semi-Annually1 Monitored Annually1
Monitored Annually1
Monitored Semi-Annually1 Monitored Annually1
Monitored Annually1
Monitored Semi-Annually1 Monitored Annually1
1520304-Tables and Appendix A.xlsm
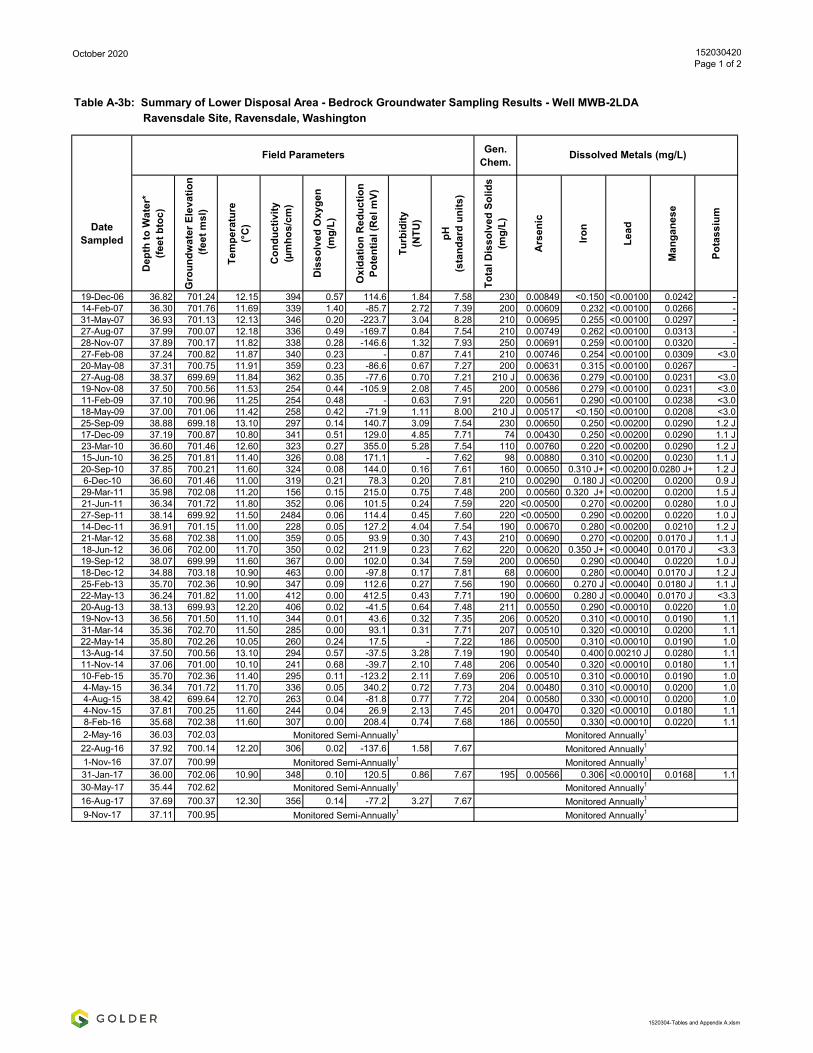
October 2020 152030420Page 1 of 2
Ravensdale Site, Ravensdale, Washington
Gen. Chem.
DateSampled
Dep
th to
Wat
er*
(feet
bto
c)
Gro
undw
ater
Ele
vatio
n (f
eet m
sl)
Tem
pera
ture
(°C
)
Con
duct
ivity
(µm
hos/
cm)
Dis
solv
ed O
xyge
n (m
g/L)
Oxi
datio
n R
educ
tion
Pote
ntia
l (R
el m
V)
Turb
idity
(NTU
)
pH(s
tand
ard
units
)
Tota
l Dis
solv
ed S
olid
s(m
g/L)
Ars
enic
Iron
Lead
Man
gane
se
Pota
ssiu
m
19-Dec-06 36.82 701.24 12.15 394 0.57 114.6 1.84 7.58 230 0.00849 <0.150 <0.00100 0.0242 -14-Feb-07 36.30 701.76 11.69 339 1.40 -85.7 2.72 7.39 200 0.00609 0.232 <0.00100 0.0266 -31-May-07 36.93 701.13 12.13 346 0.20 -223.7 3.04 8.28 210 0.00695 0.255 <0.00100 0.0297 -27-Aug-07 37.99 700.07 12.18 336 0.49 -169.7 0.84 7.54 210 0.00749 0.262 <0.00100 0.0313 -28-Nov-07 37.89 700.17 11.82 338 0.28 -146.6 1.32 7.93 250 0.00691 0.259 <0.00100 0.0320 -27-Feb-08 37.24 700.82 11.87 340 0.23 - 0.87 7.41 210 0.00746 0.254 <0.00100 0.0309 <3.020-May-08 37.31 700.75 11.91 359 0.23 -86.6 0.67 7.27 200 0.00631 0.315 <0.00100 0.0267 -27-Aug-08 38.37 699.69 11.84 362 0.35 -77.6 0.70 7.21 210 J 0.00636 0.279 <0.00100 0.0231 <3.019-Nov-08 37.50 700.56 11.53 254 0.44 -105.9 2.08 7.45 200 0.00586 0.279 <0.00100 0.0231 <3.011-Feb-09 37.10 700.96 11.25 254 0.48 - 0.63 7.91 220 0.00561 0.290 <0.00100 0.0238 <3.018-May-09 37.00 701.06 11.42 258 0.42 -71.9 1.11 8.00 210 J 0.00517 <0.150 <0.00100 0.0208 <3.025-Sep-09 38.88 699.18 13.10 297 0.14 140.7 3.09 7.54 230 0.00650 0.250 <0.00200 0.0290 1.2 J17-Dec-09 37.19 700.87 10.80 341 0.51 129.0 4.85 7.71 74 0.00430 0.250 <0.00200 0.0290 1.1 J23-Mar-10 36.60 701.46 12.60 323 0.27 355.0 5.28 7.54 110 0.00760 0.220 <0.00200 0.0290 1.2 J15-Jun-10 36.25 701.81 11.40 326 0.08 171.1 - 7.62 98 0.00880 0.310 <0.00200 0.0230 1.1 J20-Sep-10 37.85 700.21 11.60 324 0.08 144.0 0.16 7.61 160 0.00650 0.310 J+ <0.00200 0.0280 J+ 1.2 J6-Dec-10 36.60 701.46 11.00 319 0.21 78.3 0.20 7.81 210 0.00290 0.180 J <0.00200 0.0200 0.9 J29-Mar-11 35.98 702.08 11.20 156 0.15 215.0 0.75 7.48 200 0.00560 0.320 J+ <0.00200 0.0200 1.5 J21-Jun-11 36.34 701.72 11.80 352 0.06 101.5 0.24 7.59 220 <0.00500 0.270 <0.00200 0.0280 1.0 J27-Sep-11 38.14 699.92 11.50 2484 0.06 114.4 0.45 7.60 220 <0.00500 0.290 <0.00200 0.0220 1.0 J14-Dec-11 36.91 701.15 11.00 228 0.05 127.2 4.04 7.54 190 0.00670 0.280 <0.00200 0.0210 1.2 J21-Mar-12 35.68 702.38 11.00 359 0.05 93.9 0.30 7.43 210 0.00690 0.270 <0.00200 0.0170 J 1.1 J18-Jun-12 36.06 702.00 11.70 350 0.02 211.9 0.23 7.62 220 0.00620 0.350 J+ <0.00040 0.0170 J <3.319-Sep-12 38.07 699.99 11.60 367 0.00 102.0 0.34 7.59 200 0.00650 0.290 <0.00040 0.0220 1.0 J18-Dec-12 34.88 703.18 10.90 463 0.00 -97.8 0.17 7.81 68 0.00600 0.280 <0.00040 0.0170 J 1.2 J25-Feb-13 35.70 702.36 10.90 347 0.09 112.6 0.27 7.56 190 0.00660 0.270 J <0.00040 0.0180 J 1.1 J22-May-13 36.24 701.82 11.00 412 0.00 412.5 0.43 7.71 190 0.00600 0.280 J <0.00040 0.0170 J <3.320-Aug-13 38.13 699.93 12.20 406 0.02 -41.5 0.64 7.48 211 0.00550 0.290 <0.00010 0.0220 1.019-Nov-13 36.56 701.50 11.10 344 0.01 43.6 0.32 7.35 206 0.00520 0.310 <0.00010 0.0190 1.131-Mar-14 35.36 702.70 11.50 285 0.00 93.1 0.31 7.71 207 0.00510 0.320 <0.00010 0.0200 1.122-May-14 35.80 702.26 10.05 260 0.24 17.5 - 7.22 186 0.00500 0.310 <0.00010 0.0190 1.013-Aug-14 37.50 700.56 13.10 294 0.57 -37.5 3.28 7.19 190 0.00540 0.400 0.00210 J 0.0280 1.111-Nov-14 37.06 701.00 10.10 241 0.68 -39.7 2.10 7.48 206 0.00540 0.320 <0.00010 0.0180 1.110-Feb-15 35.70 702.36 11.40 295 0.11 -123.2 2.11 7.69 206 0.00510 0.310 <0.00010 0.0190 1.04-May-15 36.34 701.72 11.70 336 0.05 340.2 0.72 7.73 204 0.00480 0.310 <0.00010 0.0200 1.04-Aug-15 38.42 699.64 12.70 263 0.04 -81.8 0.77 7.72 204 0.00580 0.330 <0.00010 0.0200 1.04-Nov-15 37.81 700.25 11.60 244 0.04 26.9 2.13 7.45 201 0.00470 0.320 <0.00010 0.0180 1.18-Feb-16 35.68 702.38 11.60 307 0.00 208.4 0.74 7.68 186 0.00550 0.330 <0.00010 0.0220 1.12-May-16 36.03 702.0322-Aug-16 37.92 700.14 12.20 306 0.02 -137.6 1.58 7.671-Nov-16 37.07 700.9931-Jan-17 36.00 702.06 10.90 348 0.10 120.5 0.86 7.67 195 0.00566 0.306 <0.00010 0.0168 1.130-May-17 35.44 702.6216-Aug-17 37.69 700.37 12.30 356 0.14 -77.2 3.27 7.679-Nov-17 37.11 700.95
Monitored Semi-Annually1 Monitored Annually1
Monitored Annually1
Monitored Semi-Annually1 Monitored Annually1
Monitored Semi-Annually1 Monitored Annually1
Monitored Annually1
Monitored Semi-Annually1 Monitored Annually1
Table A-3b: Summary of Lower Disposal Area - Bedrock Groundwater Sampling Results - Well MWB-2LDA
Field Parameters Dissolved Metals (mg/L)
1520304-Tables and Appendix A.xlsm
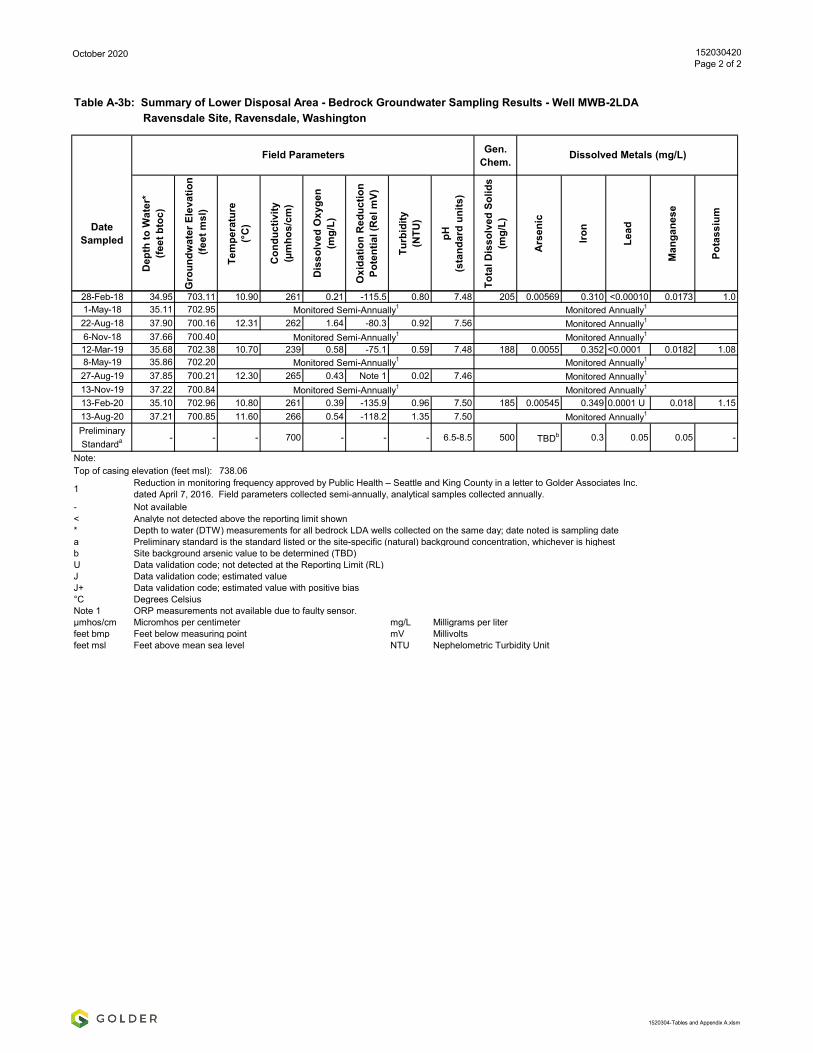
October 2020 152030420Page 2 of 2
Ravensdale Site, Ravensdale, Washington
Gen. Chem.
DateSampled
Dep
th to
Wat
er*
(feet
bto
c)
Gro
undw
ater
Ele
vatio
n (f
eet m
sl)
Tem
pera
ture
(°C
)
Con
duct
ivity
(µm
hos/
cm)
Dis
solv
ed O
xyge
n (m
g/L)
Oxi
datio
n R
educ
tion
Pote
ntia
l (R
el m
V)
Turb
idity
(NTU
)
pH(s
tand
ard
units
)
Tota
l Dis
solv
ed S
olid
s(m
g/L)
Ars
enic
Iron
Lead
Man
gane
se
Pota
ssiu
m
Table A-3b: Summary of Lower Disposal Area - Bedrock Groundwater Sampling Results - Well MWB-2LDA
Field Parameters Dissolved Metals (mg/L)
28-Feb-18 34.95 703.11 10.90 261 0.21 -115.5 0.80 7.48 205 0.00569 0.310 <0.00010 0.0173 1.01-May-18 35.11 702.9522-Aug-18 37.90 700.16 12.31 262 1.64 -80.3 0.92 7.566-Nov-18 37.66 700.4012-Mar-19 35.68 702.38 10.70 239 0.58 -75.1 0.59 7.48 188 0.0055 0.352 <0.0001 0.0182 1.088-May-19 35.86 702.2027-Aug-19 37.85 700.21 12.30 265 0.43 Note 1 0.02 7.4613-Nov-19 37.22 700.8413-Feb-20 35.10 702.96 10.80 261 0.39 -135.9 0.96 7.50 185 0.00545 0.349 0.0001 U 0.018 1.1513-Aug-20 37.21 700.85 11.60 266 0.54 -118.2 1.35 7.50Preliminary Standarda - - - 700 - - - 6.5-8.5 500 TBDb 0.3 0.05 0.05 -
Note: Top of casing elevation (feet msl): 738.06
1
- Not available< Analyte not detected above the reporting limit shown* Depth to water (DTW) measurements for all bedrock LDA wells collected on the same day; date noted is sampling datea Preliminary standard is the standard listed or the site-specific (natural) background concentration, whichever is highestb Site background arsenic value to be determined (TBD)U Data validation code; not detected at the Reporting Limit (RL)J Data validation code; estimated valueJ+ Data validation code; estimated value with positive bias°C Degrees CelsiusNote 1 ORP measurements not available due to faulty sensor.µmhos/cm Micromhos per centimeter mg/L Milligrams per literfeet bmp Feet below measuring point mV Millivoltsfeet msl Feet above mean sea level NTU Nephelometric Turbidity Unit
Reduction in monitoring frequency approved by Public Health – Seattle and King County in a letter to Golder Associates Inc. dated April 7, 2016. Field parameters collected semi-annually, analytical samples collected annually.
Monitored Semi-Annually1 Monitored Annually1
Monitored Semi-Annually1 Monitored Annually1Monitored Annually1
Monitored Semi-Annually1 Monitored Annually1
Monitored Annually1
Monitored Semi-Annually1 Monitored Annually1
Monitored Annually1
1520304-Tables and Appendix A.xlsm

October 2020 152030420Page 1 of 2
Ravensdale Site, Ravensdale, Washington
Gen. Chem.
DateSampled
Dep
th to
Wat
er*
(feet
bto
c)
Gro
undw
ater
Ele
vatio
n (f
eet m
sl)
Tem
pera
ture
(°C
)
Con
duct
ivity
(µm
hos/
cm)
Dis
solv
ed O
xyge
n (m
g/L)
Oxi
datio
n R
educ
tion
Pote
ntia
l (R
el m
V)
Turb
idity
(NTU
)
pH(s
tand
ard
units
)
Tota
l Dis
solv
ed S
olid
s(m
g/L)
Ars
enic
Iron
Lead
Man
gane
se
Pota
ssiu
m
19-Dec-06 7.08 733.51 11.37 670 0.42 -171.2 1.20 9.23 500 0.02570 0.173 <0.00100 0.0476 -23-Jan-07 5.62 734.97 13.07 383 0.51 -275.0 1.53 8.63 270 0.01840 0.450 <0.00100 0.0787 -14-Feb-07 5.81 734.78 12.57 328 1.09 -158.2 115.00 7.86 310 0.01510 <0.150 <0.00100 0.0718 -29-Mar-07 4.78 735.81 12.44 458 0.57 -140.8 4.25 7.78 260 J 0.03790 0.261 <0.00100 0.0601 -17-Apr-07 4.86 735.73 12.79 389 0.27 -102.4 1.22 7.46 240 0.02300 0.451 <0.00100 0.0900 -31-May-07 6.39 734.20 12.98 394 0.29 -223.8 3.32 8.14 240 0.02120 0.443 <0.00100 0.0998 -20-Jun-07 6.86 733.73 13.41 412 6.10 -128.5 1.35 8.02 230 J 0.02380 0.274 <0.00100 0.0898 -31-Jul-07 7.96 732.63 13.47 417 0.77 -174.1 0.92 7.64 250 0.01890 0.609 <0.00100 0.1190 -27-Aug-07 8.50 732.09 12.84 395 0.46 -132.4 1.97 7.43 250 0.01760 0.315 <0.00100 0.1040 -27-Sep-07 9.58 731.01 12.68 294 0.51 -133.8 0.53 7.87 250 0.01930 0.451 <0.00100 0.1170 -26-Oct-07 9.65 730.94 12.49 288 0.84 -111.9 9.83 7.60 240 J 0.01100 0.949 <0.00100 0.1970 -28-Nov-07 10.23 730.36 11.95 362 0.64 -86.1 1.58 7.87 200 0.01780 0.315 <0.00100 0.0819 -12-Dec-07 9.66 730.93 11.83 334 0.26 -93.2 0.63 7.63 280 J 0.01740 0.458 <0.00100 0.0953 -24-Jan-08 8.20 732.39 11.09 335 0.44 -108.3 - 7.46 220 0.01920 0.456 <0.00100 0.0861 -26-Feb-08 7.61 732.98 12.26 337 0.48 - 2.40 7.45 210 0.02200 0.448 <0.00100 0.0916 <3.025-Mar-08 7.22 733.37 11.94 337 1.01 -48.6 2.80 7.51 210 0.01780 0.296 <0.00100 0.0789 -29-Apr-08 6.75 733.84 12.53 332 0.77 -50.3 1.95 7.41 200 J 0.01820 0.449 <0.00100 0.0826 -19-May-08 7.17 733.42 12.37 336 0.57 -57.2 2.19 7.34 200 J 0.01870 0.373 <0.00100 0.0758 -18-Jun-08 7.26 733.33 12.11 323 0.48 -64.1 0.83 7.13 190 J 0.01950 0.461 <0.00100 0.0896 -26-Aug-08 8.78 731.81 12.31 329 1.16 -36.5 2.89 7.30 200 J 0.01770 0.298 <0.00100 0.0532 <3.019-Nov-08 9.03 731.56 11.91 243 0.52 -93.1 1.69 7.40 190 0.01820 0.394 <0.00100 0.0690 <3.011-Feb-09 7.07 733.52 11.74 227 0.65 - 1.03 7.76 180 0.01770 0.582 <0.00100 0.1020 <3.018-May-09 6.50 734.09 12.11 225 0.67 -63.9 1.51 7.83 190 J 0.01290 <0.150 <0.00100 0.0886 <3.025-Sep-09 10.47 730.12 13.50 260.1 0.36 215.3 4.14 7.61 220 0.01700 0.260 0.00094 J 0.0440 12.017-Dec-09 8.39 732.20 11.50 301.0 0.44 110.0 3.10 7.71 270 0.02300 0.610 <0.00200 0.0970 1.3 J23-Mar-10 6.46 734.13 12.20 294.8 0.43 332.5 3.52 7.57 150 J 0.02700 0.380 <0.00200 0.0760 1.3 J16-Jun-10 5.34 735.25 11.10 281.7 0.05 117.0 - 7.71 160 0.02700 0.490 <0.00200 0.0760 1.3 J21-Sep-10 7.72 732.87 11.80 276.3 0.06 169.5 0.36 7.54 140 0.02300 0.600 J+ <0.00200 0.0910 J+ 1.3 J7-Dec-10 6.48 734.11 11.00 263.0 0.15 77.2 0.38 7.58 180 0.02000 0.360 <0.00200 0.0680 1.2 J28-Mar-11 4.42 736.17 10.80 134.0 0.44 75.6 1.06 7.46 160 J 0.02100 0.610 J+ <0.00200 0.0720 1.7 J20-Jun-11 4.76 735.83 12.10 252.7 0.07 68.4 0.13 7.48 200 J 0.01600 0.650 <0.00200 0.08900 1.0 J27-Sep-11 7.86 732.73 11.90 2064.0 0.04 102.6 0.37 7.48 170 0.01800 0.620 <0.00200 0.08300 1.1 J14-Dec-11 7.17 733.42 11.00 188.2 0.03 140.8 1.87 7.50 770 0.02200 0.310 <0.00200 0.05600 1.3 J21-Mar-12 4.68 735.91 10.70 297.8 0.07 130.6 0.41 7.39 170 0.02100 0.360 <0.00200 0.04600 1.1 J18-Jun-12 4.75 735.84 11.60 289.0 0.16 271.3 0.55 7.54 150 J+ 0.01900 0.440 J+ <0.00040 0.05300 <3.319-Sep-12 7.65 732.94 12.60 299.9 0.10 121.0 0.42 7.50 160 0.01800 0.370 <0.00040 0.05500 1.1 J18-Dec-12 5.58 735.01 10.90 384.0 0.03 15.6 1.39 7.50 200 0.01900 0.150 J <0.00040 0.04100 1.3 J25-Feb-13 4.80 735.79 10.60 284.2 0.03 140.4 0.30 7.53 150 0.02200 0.390 J <0.00040 0.05400 1.2 J22-May-13 4.81 735.78 11.00 294.9 0.14 387.7 0.52 7.61 160 0.01800 0.420 J <0.00040 0.05800 <3.320-Aug-13 7.63 732.96 12.60 383.0 0.81 -8.4 0.80 7.26 164 0.01670 0.350 <0.00010 0.05200 1.119-Nov-13 7.11 733.48 11.30 218.1 0.14 54.3 0.73 7.20 169 0.01660 0.290 <0.00010 0.05200 1.11-Apr-14 4.08 736.51 10.70 222.6 0.15 158.5 1.12 7.50 168 0.01330 0.480 <0.00010 0.07300 1.1
22-May-14 4.21 736.38 9.98 206.0 1.59 27.1 - 7.17 158 0.01120 0.150 <0.00010 0.06500 1.013-Aug-14 6.95 733.64 13.50 237.0 1.14 9.8 4.70 6.92 154 0.01050 0.160 <0.00010 0.07900 1.012-Nov-14 6.04 734.55 8.40 185.1 0.28 -10.1 3.42 7.36 162 0.01610 0.440 <0.00010 0.09300 1.111-Feb-15 4.62 735.97 11.50 205.1 1.20 68.1 1.32 7.41 169 0.00900 <0.050 <0.00010 0.07900 1.14-May-15 4.93 735.66 12.20 262.0 1.64 190.2 0.84 7.43 168 0.01090 0.640 <0.00010 0.12400 1.04-Aug-15 7.44 733.15 13.20 211.3 1.62 81.9 2.02 7.39 173 0.00680 0.043 J <0.00010 0.05100 1.05-Nov-15 8.14 732.45 12.50 186.0 1.49 166.9 1.87 7.10 162 0.00350 0.017 J <0.00010 0.08600 1.08-Feb-16 3.20 737.39 11.70 240.5 2.13 196.9 0.88 7.23 150 0.01120 1.060 <0.00010 0.13300 1.02-May-16 3.77 736.8222-Aug-16 6.81 733.78 13.10 238.0 2.40 168.5 2.39 7.411-Nov-16 6.59 734.0031-Jan-17 4.02 736.57 11.30 265.8 2.79 218.2 1.39 7.34 154 0.00323 0.008 J <0.00010 0.02720 1.030-May-17 2.32 738.27
Table A-3c: Summary of Lower Disposal Area - Bedrock Groundwater Sampling Results - Well MWB-3LDA
Monitored Semi-Annually1 Monitored Annually1
Dissolved Metals (mg/L)Field Parameters
Monitored Annually1
Monitored Semi-Annually1 Monitored Annually1
Monitored Semi-Annually1 Monitored Annually1
1520304-Tables and Appendix A.xlsm

October 2020 152030420Page 2 of 2
Ravensdale Site, Ravensdale, Washington
Gen. Chem.
DateSampled
Dep
th to
Wat
er*
(feet
bto
c)
Gro
undw
ater
Ele
vatio
n (f
eet m
sl)
Tem
pera
ture
(°C
)
Con
duct
ivity
(µm
hos/
cm)
Dis
solv
ed O
xyge
n (m
g/L)
Oxi
datio
n R
educ
tion
Pote
ntia
l (R
el m
V)
Turb
idity
(NTU
)
pH(s
tand
ard
units
)
Tota
l Dis
solv
ed S
olid
s(m
g/L)
Ars
enic
Iron
Lead
Man
gane
se
Pota
ssiu
m
Table A-3c: Summary of Lower Disposal Area - Bedrock Groundwater Sampling Results - Well MWB-3LDA
Dissolved Metals (mg/L)Field Parameters
16-Aug-17 5.48 735.11 13.20 258.4 3.54 92.2 2.50 7.419-Nov-17 6.00 734.5928-Feb-18 1.13 739.46 10.80 186.9 4.11 142.0 1.83 7.18 159 0.00253 0.02 J <0.00010 0.01230 0.81-May-18 1.60 738.9922-Aug-18 5.93 734.66 13.55 194 7.63 16.9 0.77 7.116-Nov-18 6.78 733.8112-Mar-19 2.32 738.27 10.50 166 4.32 167.7 1.34 7.14 149 0.00187 0.0023 J <0.0001 <0.001 0.9538-May-19 2.57 738.0227-Aug-19 5.76 734.83 13.62 192 3.94 Note 1 0.02 7.0913-Nov-19 6.00 734.5913-Feb-20 1.69 738.90 10.70 180 3.20 88.5 1.21 7.11 140 0.00169 0.05 U 0.0001 U 0.0062 0.91513-Aug-20 4.59 736.00 13.60 188.7 4.26 50.3 1.60 7.19Preliminary Standarda - - - 700 - - - 6.5-8.5 500 TBDb 0.3 0.05 0.05 -
Note: Top of casing elevation (feet msl): 740.59
1
- Not available< Analyte not detected above the reporting limit shown* Depth to water (DTW) measurements for all bedrock LDA wells collected on the same day; date noted is sampling datea Preliminary standard is the standard listed or the site-specific (natural) background concentration, whichever is highestb Site background arsenic value to be determined (TBD)U Data validation code; not detected at the Reporting Limit (RL)J Data validation code; estimated valueJ+ Data validation code; estimated value with positive bias°C Degrees CelsiusNote 1 ORP measurements not available due to faulty sensor.µmhos/cm Micromhos per centimeter mg/L Milligrams per literfeet bmp Feet below measuring point mV Millivoltsfeet msl Feet above mean sea level NTU Nephelometric Turbidity Unit
Reduction in monitoring frequency approved by Public Health – Seattle and King County in a letter to Golder Associates Inc. dated April 7, 2016. Field parameters collected semi-annually, analytical samples collected annually.
Monitored Semi-Annually1 Monitored Annually1
Monitored Semi-Annually1 Monitored Annually1Monitored Annually1
Monitored Semi-Annually1 Monitored Annually1
Monitored Annually1
Monitored Semi-Annually1 Monitored Annually1
Monitored Annually1
Monitored Semi-Annually1 Monitored Annually1Monitored Annually1
1520304-Tables and Appendix A.xlsm

APPENDIX A-4
Summary of Dale Strip Pit – Bedrock
Groundwater Sampling Results Table A-4A Well MWB-1SDSP Table A-4B Well MWB-1DDSP Table A-4C Well MWB-5DSP Table A-4D Well MWB-6DSP Table A-4E Portal Table A-4F Well MWB-2DSP Table A-4G Well MWB-4SDSP
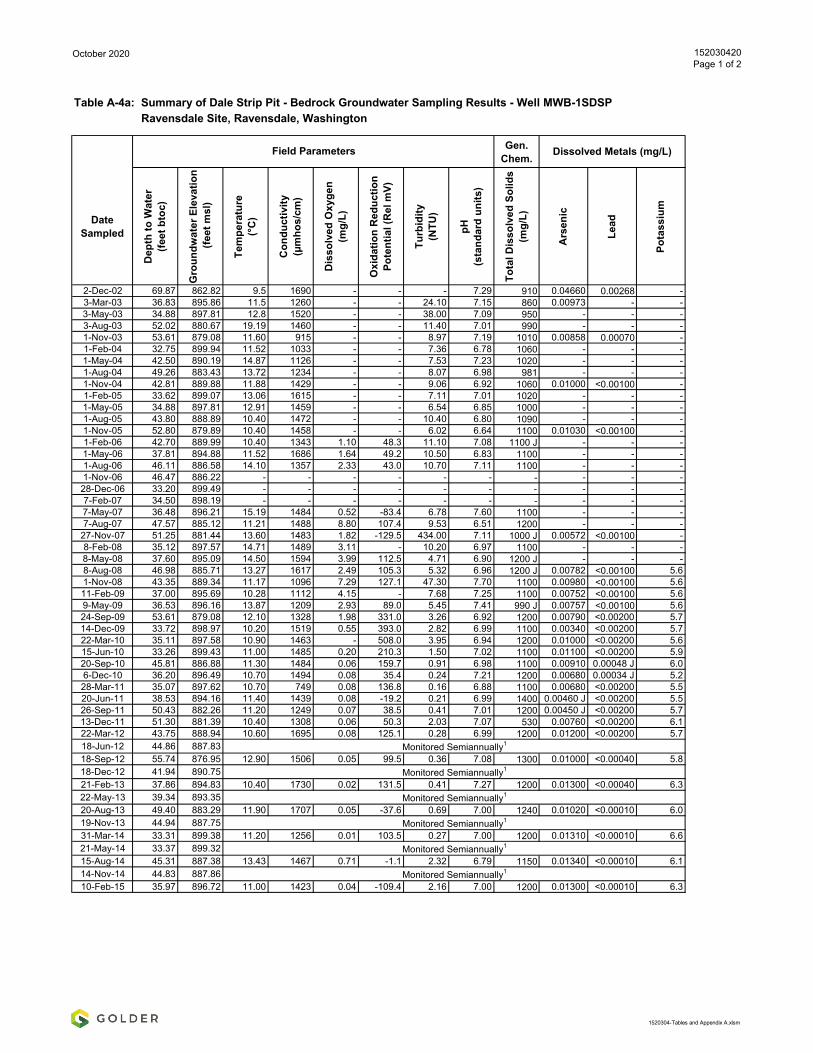
October 2020 152030420Page 1 of 2
Ravensdale Site, Ravensdale, Washington
Gen. Chem.
Date Sampled
Dep
th to
Wat
er(fe
et b
toc)
Gro
undw
ater
Ele
vatio
n (f
eet m
sl)
Tem
pera
ture
(°C
)
Con
duct
ivity
(µm
hos/
cm)
Dis
solv
ed O
xyge
n (m
g/L)
Oxi
datio
n R
educ
tion
Pote
ntia
l (R
el m
V)
Turb
idity
(NTU
)
pH(s
tand
ard
units
)
Tota
l Dis
solv
ed S
olid
s(m
g/L)
Ars
enic
Lead
Pota
ssiu
m
2-Dec-02 69.87 862.82 9.5 1690 - - - 7.29 910 0.04660 0.00268 -3-Mar-03 36.83 895.86 11.5 1260 - - 24.10 7.15 860 0.00973 - -3-May-03 34.88 897.81 12.8 1520 - - 38.00 7.09 950 - - -3-Aug-03 52.02 880.67 19.19 1460 - - 11.40 7.01 990 - - -1-Nov-03 53.61 879.08 11.60 915 - - 8.97 7.19 1010 0.00858 0.00070 -1-Feb-04 32.75 899.94 11.52 1033 - - 7.36 6.78 1060 - - -1-May-04 42.50 890.19 14.87 1126 - - 7.53 7.23 1020 - - -1-Aug-04 49.26 883.43 13.72 1234 - - 8.07 6.98 981 - - -1-Nov-04 42.81 889.88 11.88 1429 - - 9.06 6.92 1060 0.01000 <0.00100 -1-Feb-05 33.62 899.07 13.06 1615 - - 7.11 7.01 1020 - - -1-May-05 34.88 897.81 12.91 1459 - - 6.54 6.85 1000 - - -1-Aug-05 43.80 888.89 10.40 1472 - - 10.40 6.80 1090 - - -1-Nov-05 52.80 879.89 10.40 1458 - - 6.02 6.64 1100 0.01030 <0.00100 -1-Feb-06 42.70 889.99 10.40 1343 1.10 48.3 11.10 7.08 1100 J - - -1-May-06 37.81 894.88 11.52 1686 1.64 49.2 10.50 6.83 1100 - - -1-Aug-06 46.11 886.58 14.10 1357 2.33 43.0 10.70 7.11 1100 - - -1-Nov-06 46.47 886.22 - - - - - - - - - -28-Dec-06 33.20 899.49 - - - - - - - - - -7-Feb-07 34.50 898.19 - - - - - - - - - -7-May-07 36.48 896.21 15.19 1484 0.52 -83.4 6.78 7.60 1100 - - -7-Aug-07 47.57 885.12 11.21 1488 8.80 107.4 9.53 6.51 1200 - - -
27-Nov-07 51.25 881.44 13.60 1483 1.82 -129.5 434.00 7.11 1000 J 0.00572 <0.00100 -8-Feb-08 35.12 897.57 14.71 1489 3.11 - 10.20 6.97 1100 - - -8-May-08 37.60 895.09 14.50 1594 3.99 112.5 4.71 6.90 1200 J - - -8-Aug-08 46.98 885.71 13.27 1617 2.49 105.3 5.32 6.96 1200 J 0.00782 <0.00100 5.61-Nov-08 43.35 889.34 11.17 1096 7.29 127.1 47.30 7.70 1100 0.00980 <0.00100 5.611-Feb-09 37.00 895.69 10.28 1112 4.15 - 7.68 7.25 1100 0.00752 <0.00100 5.69-May-09 36.53 896.16 13.87 1209 2.93 89.0 5.45 7.41 990 J 0.00757 <0.00100 5.624-Sep-09 53.61 879.08 12.10 1328 1.98 331.0 3.26 6.92 1200 0.00790 <0.00200 5.714-Dec-09 33.72 898.97 10.20 1519 0.55 393.0 2.82 6.99 1100 0.00340 <0.00200 5.722-Mar-10 35.11 897.58 10.90 1463 - 508.0 3.95 6.94 1200 0.01000 <0.00200 5.615-Jun-10 33.26 899.43 11.00 1485 0.20 210.3 1.50 7.02 1100 0.01100 <0.00200 5.920-Sep-10 45.81 886.88 11.30 1484 0.06 159.7 0.91 6.98 1100 0.00910 0.00048 J 6.06-Dec-10 36.20 896.49 10.70 1494 0.08 35.4 0.24 7.21 1200 0.00680 0.00034 J 5.228-Mar-11 35.07 897.62 10.70 749 0.08 136.8 0.16 6.88 1100 0.00680 <0.00200 5.520-Jun-11 38.53 894.16 11.40 1439 0.08 -19.2 0.21 6.99 1400 0.00460 J <0.00200 5.526-Sep-11 50.43 882.26 11.20 1249 0.07 38.5 0.41 7.01 1200 0.00450 J <0.00200 5.713-Dec-11 51.30 881.39 10.40 1308 0.06 50.3 2.03 7.07 530 0.00760 <0.00200 6.122-Mar-12 43.75 888.94 10.60 1695 0.08 125.1 0.28 6.99 1200 0.01200 <0.00200 5.718-Jun-12 44.86 887.8318-Sep-12 55.74 876.95 12.90 1506 0.05 99.5 0.36 7.08 1300 0.01000 <0.00040 5.818-Dec-12 41.94 890.7521-Feb-13 37.86 894.83 10.40 1730 0.02 131.5 0.41 7.27 1200 0.01300 <0.00040 6.322-May-13 39.34 893.3520-Aug-13 49.40 883.29 11.90 1707 0.05 -37.6 0.69 7.00 1240 0.01020 <0.00010 6.019-Nov-13 44.94 887.7531-Mar-14 33.31 899.38 11.20 1256 0.01 103.5 0.27 7.00 1200 0.01310 <0.00010 6.621-May-14 33.37 899.3215-Aug-14 45.31 887.38 13.43 1467 0.71 -1.1 2.32 6.79 1150 0.01340 <0.00010 6.114-Nov-14 44.83 887.8610-Feb-15 35.97 896.72 11.00 1423 0.04 -109.4 2.16 7.00 1200 0.01300 <0.00010 6.3
Dissolved Metals (mg/L)
Monitored Semiannually1
Table A-4a: Summary of Dale Strip Pit - Bedrock Groundwater Sampling Results - Well MWB-1SDSP
Monitored Semiannually1
Monitored Semiannually1
Monitored Semiannually1
Field Parameters
Monitored Semiannually1
Monitored Semiannually1
1520304-Tables and Appendix A.xlsm

October 2020 152030420Page 2 of 2
Ravensdale Site, Ravensdale, Washington
Gen. Chem.
Date Sampled
Dep
th to
Wat
er(fe
et b
toc)
Gro
undw
ater
Ele
vatio
n (f
eet m
sl)
Tem
pera
ture
(°C
)
Con
duct
ivity
(µm
hos/
cm)
Dis
solv
ed O
xyge
n (m
g/L)
Oxi
datio
n R
educ
tion
Pote
ntia
l (R
el m
V)
Turb
idity
(NTU
)
pH(s
tand
ard
units
)
Tota
l Dis
solv
ed S
olid
s(m
g/L)
Ars
enic
Lead
Pota
ssiu
m
Dissolved Metals (mg/L)
Table A-4a: Summary of Dale Strip Pit - Bedrock Groundwater Sampling Results - Well MWB-1SDSP
Field Parameters
4-May-15 38.67 894.024-Aug-15 49.21 883.48 12.50 1253 0.04 -100.7 0.26 7.07 1230 0.01390 <0.00010 6.15-Nov-15 56.85 875.84 11.20 1159 0.02 57.4 0.91 6.75 1190 0.01490 <0.00010 7.08-Feb-16 33.02 899.67 11.60 1429 0.00 167.6 0.10 7.05 1190 0.01940 <0.00010 6.72-May-16 37.48 895.2122-Aug-16 49.78 882.91 12.10 1232 0.06 -143.8 0.77 7.001-Nov-16 47.49 885.2031-Jan-17 35.57 897.12 11.10 1620 0.05 -241.6 0.24 6.99 1260 0.02180 <0.00010 6.730-May-17 34.70 897.9916-Aug-17 44.32 888.37 11.90 1621 0.12 -144.5 0.47 6.979-Nov-17 44.71 887.9828-Feb-18 32.04 900.65 10.70 1278 0.16 -58.5 0.11 6.82 1244 0.02240 <0.00010 6.51-May-18 33.99 898.7022-Aug-18 47.95 884.74 11.97 1246 1.17 4.10 0.17 6.886-Nov-18 52.94 879.7512-Mar-19 33.09 899.60 10.40 1157 0.55 -23.0 0.62 6.81 1200 0.02 <0.0001 0.958-May-19 34.37 898.3227-Aug-19 47.88 884.81 12.51 1314 0.15 Note 1 0.39 6.8013-Nov-19 47.03 885.6614-Feb-20 31.08 901.61 10.60 1249 0.38 -82.2 0.10 6.61 1230 0.0183 0.0001 U 6.3613-Aug-20 43.99 888.70 11.70 1176 0.56 -67.7 0.18 6.78Preliminary Standarda - - - 700 - - - 6.5-8.5 500 TBDb 0.05 -
Notes: Top of casing elevation (feet msl): 932.69- Not measured or not available< Analyte not detected above the reporting limit shown1
2
a Preliminary standard is the standard listed or the site-specific (natural) background concentration, whichever is highestb Site background arsenic value to be determined (TBD)U Data validation code; not detected at the Reporting Limit (RL)J Data validation code; estimated valueJ+ Data validation code; estimated value with positive bias°C Degrees CelsiusNote 1 ORP measurements not available due to faulty sensor.µmhos/cm Micromhos per centimeter mg/L Milligrams per literfeet bmp Feet below measuring point mV Millivoltsfeet msl Feet above mean sea level NTU Nephelometric Turbidity Unit
Monitored Annually2
Monitored Annually2
Reduction in monitoring frequency approved by Public Health – Seattle and King County in a letter to Golder Associates Inc. dated May 16, 2012
Monitored Semiannually2 Monitored Annually2
Monitored Annually2Monitored Annually2
Monitored Annually2Monitored Semiannually2
Monitored Semiannually2 Monitored Annually2
Monitored Semiannually2
Monitored Semiannually1
Monitored Semiannually2
Reduction in monitoring frequency approved by Public Health – Seattle and King County in a letter to Golder Associates Inc. dated April 7, 2016. Field parameters collected semi-annually, analytical samples collected annually.
Monitored Annually2Monitored Semiannually2
Monitored Annually2
Monitored Semiannually2 Monitored Annually2
Monitored Semiannually2 Monitored Annually2
Monitored Annually2
Monitored Annually2
1520304-Tables and Appendix A.xlsm

October 2020 152030420Page 1 of 2
Ravensdale Site, Ravensdale, Washington
Gen. Chem.
Date Sampled
Dep
th to
Wat
er(fe
et b
toc)
Gro
undw
ater
Ele
vatio
n (f
eet m
sl)
Tem
pera
ture
(°C
)
Con
duct
ivity
(µm
hos/
cm)
Dis
solv
ed O
xyge
n (m
g/L)
Oxi
datio
n R
educ
tion
Pote
ntia
l (R
el m
V)
Turb
idity
(NTU
)
pH(s
tand
ard
units
)
Tota
l Dis
solv
ed S
olid
s(m
g/L)
Ars
enic
Lead
Pota
ssiu
m
2-Dec-02 87.28 844.49 11.1 557 - - - 7.72 540 0.03270 <0.00050 -3-Mar-03 48.63 883.14 12.0 623 - - 24.00 7.48 370 0.00708 - -3-May-03 47.12 884.65 12.1 548 - - 264.00 7.54 440 - - -3-Aug-03 64.60 867.17 23.23 675 - - 195.00 7.36 450 - - -1-Nov-03 66.14 865.63 11.0 400 - - 15.50 8.10 437 0.00603 <0.00050 -1-Feb-04 46.55 885.22 10.68 455 - - 8.70 7.15 440 - - -1-May-04 55.82 875.95 13.61 508 - - 12.40 7.58 429 - - -1-Aug-04 61.89 869.88 13.15 585 - - 15.70 7.47 399 - - -1-Nov-04 56.83 874.94 10.94 655 - - 9.40 7.22 477 0.00308 <0.00100 -1-Feb-05 47.31 884.46 12.80 778 - - 8.39 7.35 451 - - -1-May-05 48.60 883.17 12.86 743 - - 4.22 7.25 432 - - -1-Aug-05 56.80 874.97 14.17 746 - - 3.10 6.99 518 - - -1-Nov-05 66.85 864.92 10.20 702 - - 5.36 7.11 470 0.00360 <0.00100 -1-Feb-06 47.88 883.89 10.11 648 0.71 109.4 2.72 7.53 450 J - - -1-May-06 52.23 879.54 12.22 686 1.82 43.7 3.68 7.43 450 - - -1-Aug-06 59.41 872.36 12.28 665 1.06 -74.0 14.20 7.36 480 - - -1-Nov-06 61.84 869.93 - - - - - - - - - -28-Dec-06 48.26 883.51 - - - - - -7-Feb-07 49.64 882.13 - - - - - - - - - -7-May-07 53.24 878.53 12.44 722 0.74 -150.8 6.06 7.94 470 - - -7-Aug-07 60.45 871.32 13.76 712 0.79 -50.0 4.53 7.28 500 - - -
27-Nov-07 63.40 868.37 14.41 711 0.45 -194.4 7.07 7.34 470 J 0.00289 <0.00100 -8-Feb-08 49.23 882.54 14.07 737 0.62 - 6.28 7.46 500 - - -8-May-08 51.31 880.46 13.52 793 0.55 27.9 4.42 7.40 520 J - - -8-Aug-08 59.69 872.08 13.73 812 0.67 -24.7 9.33 7.37 560 J 0.00226 <0.00100 <3.01-Nov-08 57.38 874.39 14.75 619 0.89 -42.5 4.40 7.45 480 0.00222 <0.00100 <3.010-Feb-09 50.92 880.85 6.50 618 10.51 - 655.00 7.69 J 530 0.00219 <0.00100 3.09-May-09 51.25 880.52 13.95 637 2.21 39.3 5.87 7.74 540 J 0.00242 <0.00100 <3.025-Sep-09 65.46 866.31 13.20 678 2.25 331.8 2.29 7.15 570 0.00180 J <0.00200 3.317-Dec-09 49.40 882.37 10.60 794 0.99 224.0 3.97 7.58 440 0.00070 J <0.00200 3.2 J22-Mar-10 49.18 882.59 10.40 762 - 245.0 0.74 7.39 580 0.00450 <0.00200 3.2 J15-Jun-10 46.88 884.89 12.10 762 0.05 142.1 0.47 7.50 420 0.00550 <0.00200 3.320-Sep-10 58.97 872.80 11.40 765 0.07 89.6 0.47 7.47 520 0.00470 0.00027 J 3.46-Dec-10 50.66 881.11 10.20 763 0.19 58.9 0.32 7.72 550 0.00130 J <0.00200 3.2 J28-Mar-11 48.89 882.88 10.50 376 0.55 165.0 0.73 7.53 470 0.00370 <0.00200 3.0 J20-Jun-11 52.13 879.64 13.40 718 0.45 -65.1 0.75 7.53 600 J <0.00500 <0.00200 3.526-Sep-11 63.02 868.75 11.80 633 1.73 -6.0 1.72 7.61 560 <0.00500 <0.00200 3.513-Dec-11 63.88 867.89 8.60 678 0.69 -24.7 1.95 7.56 530 0.00570 <0.00200 4.122-Mar-12 56.96 874.81 5.60 877 1.89 -26.6 0.84 7.69 540 0.00340 <0.00040 3.0 J18-Jun-12 58.01 873.7618-Sep-12 67.78 863.99 26.30 838 3.62 12.4 1.27 7.70 540 0.00310 <0.00040 3.1 J18-Dec-12 56.10 875.6721-Feb-13 51.62 880.15 4.30 895 7.54 31.3 0.83 8.04 510 0.00360 <0.00040 3.622-May-13 53.14 878.6320-Aug-13 62.35 869.42 12.30 526 0.08 -60.4 2.91 7.47 585 0.00320 <0.00010 3.219-Nov-13 58.70 873.0731-Mar-14 46.60 885.17 11.10 622 0.04 48.4 0.45 7.52 561 0.00180 <0.00010 3.321-May-14 46.96 884.8115-Aug-14 58.62 873.15 12.48 732 0.90 -62.4 2.04 7.16 564 0.00200 0.00020 3.114-Nov-14 59.59 872.1810-Feb-15 49.61 882.16 10.90 717 0.03 -114.4 1.82 7.48 551 0.00290 <0.00010 3.3
Table A-4b: Summary of Dale Strip Pit - Bedrock Groundwater Sampling Results - Well MWB-1DDSP
Field Parameters
Monitored Semiannually1
Monitored Semiannually1
Dissolved Metals (mg/L)
Monitored Semiannually1
Monitored Semiannually1
Monitored Semiannually1
Monitored Semiannually1
1520304-Tables and Appendix A.xlsm
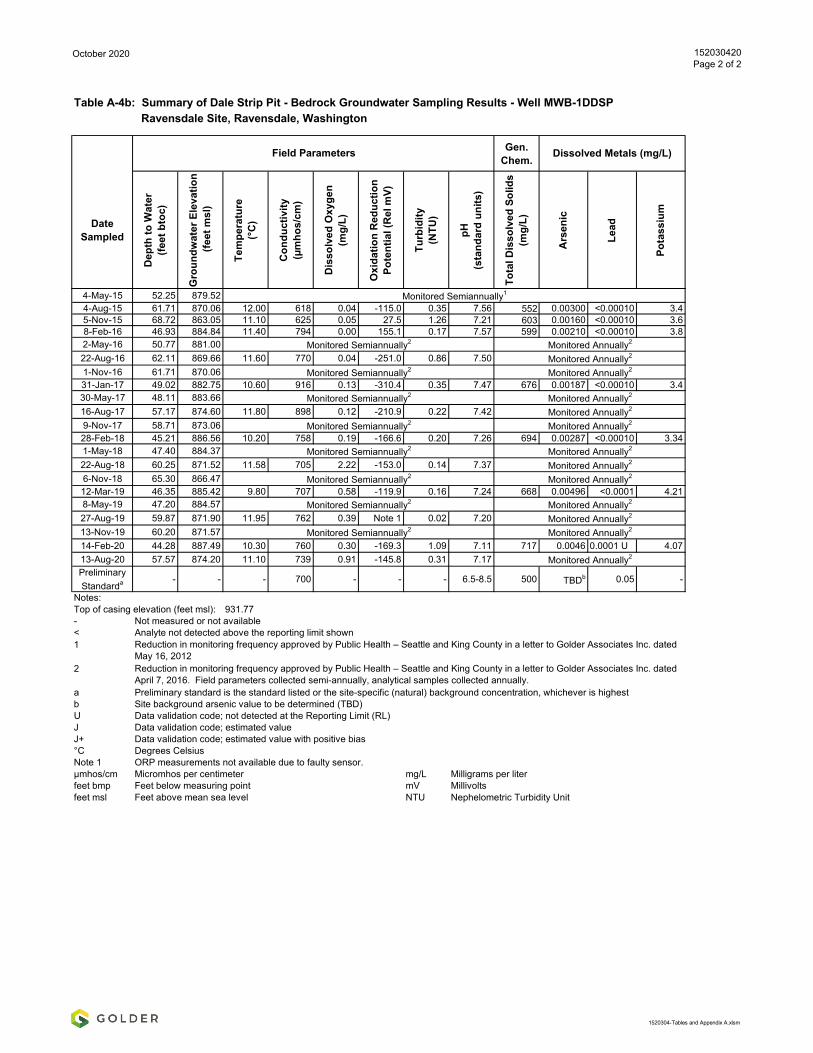
October 2020 152030420Page 2 of 2
Ravensdale Site, Ravensdale, Washington
Gen. Chem.
Date Sampled
Dep
th to
Wat
er(fe
et b
toc)
Gro
undw
ater
Ele
vatio
n (f
eet m
sl)
Tem
pera
ture
(°C
)
Con
duct
ivity
(µm
hos/
cm)
Dis
solv
ed O
xyge
n (m
g/L)
Oxi
datio
n R
educ
tion
Pote
ntia
l (R
el m
V)
Turb
idity
(NTU
)
pH(s
tand
ard
units
)
Tota
l Dis
solv
ed S
olid
s(m
g/L)
Ars
enic
Lead
Pota
ssiu
m
Table A-4b: Summary of Dale Strip Pit - Bedrock Groundwater Sampling Results - Well MWB-1DDSP
Field Parameters Dissolved Metals (mg/L)
4-May-15 52.25 879.524-Aug-15 61.71 870.06 12.00 618 0.04 -115.0 0.35 7.56 552 0.00300 <0.00010 3.45-Nov-15 68.72 863.05 11.10 625 0.05 27.5 1.26 7.21 603 0.00160 <0.00010 3.68-Feb-16 46.93 884.84 11.40 794 0.00 155.1 0.17 7.57 599 0.00210 <0.00010 3.82-May-16 50.77 881.0022-Aug-16 62.11 869.66 11.60 770 0.04 -251.0 0.86 7.501-Nov-16 61.71 870.0631-Jan-17 49.02 882.75 10.60 916 0.13 -310.4 0.35 7.47 676 0.00187 <0.00010 3.430-May-17 48.11 883.6616-Aug-17 57.17 874.60 11.80 898 0.12 -210.9 0.22 7.429-Nov-17 58.71 873.0628-Feb-18 45.21 886.56 10.20 758 0.19 -166.6 0.20 7.26 694 0.00287 <0.00010 3.341-May-18 47.40 884.3722-Aug-18 60.25 871.52 11.58 705 2.22 -153.0 0.14 7.376-Nov-18 65.30 866.4712-Mar-19 46.35 885.42 9.80 707 0.58 -119.9 0.16 7.24 668 0.00496 <0.0001 4.218-May-19 47.20 884.5727-Aug-19 59.87 871.90 11.95 762 0.39 Note 1 0.02 7.2013-Nov-19 60.20 871.5714-Feb-20 44.28 887.49 10.30 760 0.30 -169.3 1.09 7.11 717 0.0046 0.0001 U 4.0713-Aug-20 57.57 874.20 11.10 739 0.91 -145.8 0.31 7.17Preliminary Standarda - - - 700 - - - 6.5-8.5 500 TBDb 0.05 -
Notes: Top of casing elevation (feet msl): 931.77- Not measured or not available< Analyte not detected above the reporting limit shown1
2
a Preliminary standard is the standard listed or the site-specific (natural) background concentration, whichever is highestb Site background arsenic value to be determined (TBD)U Data validation code; not detected at the Reporting Limit (RL)J Data validation code; estimated valueJ+ Data validation code; estimated value with positive bias°C Degrees CelsiusNote 1 ORP measurements not available due to faulty sensor.µmhos/cm Micromhos per centimeter mg/L Milligrams per literfeet bmp Feet below measuring point mV Millivoltsfeet msl Feet above mean sea level NTU Nephelometric Turbidity Unit
Monitored Semiannually2 Monitored Annually2
Reduction in monitoring frequency approved by Public Health – Seattle and King County in a letter to Golder Associates Inc. dated April 7, 2016. Field parameters collected semi-annually, analytical samples collected annually.
Monitored Annually2
Monitored Semiannually2 Monitored Annually2
Monitored Annually2
Monitored Semiannually2 Monitored Annually2
Monitored Annually2
Monitored Semiannually2 Monitored Annually2
Monitored Semiannually2 Monitored Annually2
Monitored Annually2
Monitored Semiannually2 Monitored Annually2
Reduction in monitoring frequency approved by Public Health – Seattle and King County in a letter to Golder Associates Inc. dated May 16, 2012
Monitored Semiannually1
Monitored Semiannually2 Monitored Annually2
Monitored Annually2
Monitored Semiannually2 Monitored Annually2
1520304-Tables and Appendix A.xlsm

October 2020 152030420Page 1 of 2
Ravensdale Site, Ravensdale, Washington
Gen. Chem.
Date Sampled
Dep
th to
Wat
er(fe
et b
toc)
Gro
undw
ater
Ele
vatio
n (f
eet m
sl)
Tem
pera
ture
(°C
)
Con
duct
ivity
(µm
hos/
cm)
Dis
solv
ed O
xyge
n (m
g/L)
Oxi
datio
n R
educ
tion
Pote
ntia
l (R
el m
V)
Turb
idity
(NTU
)
pH(s
tand
ard
units
)
Tota
l Dis
solv
ed S
olid
s(m
g/L)
Ars
enic
Lead
Pota
ssiu
m
18-Dec-06 20.56 910.89 11.30 1054 0.59 -10.5 6.76 7.01 630 0.00446 <0.00100 -7-Jan-07 18.48 912.97 12.53 700 0.61 -70.6 33.50 7.11 540 0.00519 <0.00100 -7-Feb-07 21.53 909.92 11.59 557 0.57 -59.1 33.50 6.88 530 0.00519 <0.00100 -7-Mar-07 15.34 916.11 11.71 817 0.45 -2.4 91.20 6.52 550 J 0.00491 <0.00100 -7-Apr-07 17.97 913.48 11.96 909 0.25 0.2 121.00 6.91 560 0.00475 <0.00100 -1-May-07 26.92 904.53 12.55 880 4.20 -14.3 63.70 7.13 540 0.00490 <0.00100 -7-Jun-07 29.94 901.51 13.12 1016 3.20 -5.6 3.58 7.52 600 J 0.00437 <0.00100 -7-Jul-07 35.27 896.18 13.00 910 1.74 -27.4 9.97 7.24 550 0.00491 <0.00100 -7-Aug-07 39.55 891.90 12.40 1065 0.92 -14.6 4.62 6.99 590 0.00446 <0.00100 -7-Sep-07 44.69 886.76 12.36 696 0.68 -33.3 3.22 7.29 590 0.00492 <0.00100 -26-Oct-07 38.90 892.55 11.46 667 0.56 -18.3 22.60 6.98 620 J 0.00443 <0.00100 -27-Nov-07 38.79 892.66 11.71 914 0.56 -46.7 3.32 6.91 560 J 0.00490 <0.00100 -12-Dec-07 35.33 896.12 12.61 909 0.53 -27.3 4.28 6.87 820 0.00409 <0.00100 -24-Jan-08 28.97 902.48 10.72 872 0.78 -49.1 - 7.14 550 0.00472 <0.00100 -8-Feb-08 26.00 905.45 11.25 888 0.44 - 4.18 6.85 550 0.00450 <0.00100 -8-Mar-08 26.03 905.42 10.94 915 0.59 -95.6 3.19 6.89 550 0.00521 <0.00100 -8-Apr-08 25.03 906.42 11.27 931 0.61 -20.1 3.44 6.89 550 J 0.00488 <0.00100 -8-May-08 27.33 904.12 11.68 949 0.68 -6.7 5.37 6.62 580 J 0.00534 <0.00100 -8-Jun-08 28.38 903.07 11.40 948 0.75 -50.4 1.59 6.68 580 J 0.00445 <0.00100 -8-Aug-08 39.80 891.65 11.80 970 0.68 -78.6 1.72 6.84 610 J 0.00464 <0.00100 <3.01-Nov-08 33.96 897.49 11.20 682 0.63 -115.4 0.95 6.82 540 0.00480 <0.00100 <3.010-Feb-09 25.56 905.89 10.54 671 0.71 -71.7 0.98 7.05 610 0.00473 <0.00100 <3.09-May-09 25.79 905.66 11.23 682 0.55 -5.8 0.86 7.68 560 J 0.00340 <0.00100 <3.022-Sep-09 46.68 884.77 18.70 737 0.64 214.5 0.99 6.91 580 J 0.00390 <0.00200 2.7 J14-Dec-09 30.45 901.00 9.80 901 0.18 200.0 0.70 6.96 450 0.00170 J <0.00200 2.5 J23-Mar-10 19.92 911.53 11.30 773 0.25 148.0 4.40 6.86 510 0.00560 <0.00200 2.6 J15-Jun-10 16.74 914.71 11.00 838 0.10 202.3 2.89 7.01 860 J 0.00820 <0.00200 2.8 J20-Sep-10 33.31 898.14 11.20 852 0.09 174.7 0.60 6.97 540 0.00620 <0.00200 2.7 J6-Dec-10 19.81 911.64 10.80 838 0.10 30.5 0.47 7.17 530 0.00380 <0.00200 2.3 J28-Mar-11 17.16 914.29 10.80 403 0.15 48.4 1.13 6.89 500 J 0.00230 <0.00200 2.3 J20-Jun-11 18.95 912.50 11.10 775 0.05 -29.1 0.37 7.01 610 J <0.00500 <0.00200 2.4 J26-Sep-11 33.71 897.74 11.20 690 0.03 -8.7 0.54 7.00 560 0.00410 J <0.00200 2.8 J13-Dec-11 24.48 906.97 10.50 730 0.05 93.6 1.92 7.07 520 0.00610 <0.00200 2.8 J21-Mar-12 15.54 915.91 10.70 883 0.06 106.9 0.34 6.90 500 0.00650 <0.00200 2.4 J19-Jun-12 17.01 914.4419-Sep-12 29.82 901.63 11.90 877 0.00 122.0 0.47 7.08 490 0.00690 <0.00040 2.6 J18-Dec-12 17.39 914.0621-Feb-13 18.84 912.61 10.60 875 0.05 103.3 0.40 7.32 510 0.00590 <0.00040 2.6 J22-May-13 20.25 911.2020-Aug-13 30.15 901.30 12.10 530 0.06 -50.3 0.75 6.98 510 0.00560 <0.00010 2.519-Nov-13 22.73 908.7231-Mar-14 15.50 915.95 11.30 574 0.06 95.7 0.53 7.15 447 0.00560 <0.00010 2.721-May-14 14.83 916.6215-Aug-14 25.16 906.29 14.49 741 0.48 -24.0 2.92 6.87 477 0.00590 <0.00010 2.614-Nov-14 22.25 909.2010-Feb-15 15.98 915.47 11.40 693 0.04 -117.5 0.80 7.13 503 0.00590 <0.00010 2.64-May-15 20.05 911.404-Aug-15 31.90 899.55 11.90 620 0.16 -71.1 0.47 7.13 517 0.00640 <0.00010 2.75-Nov-15 32.00 899.45 11.40 605 0.00 37.5 1.16 6.84 511 0.00530 <0.00010 3.18-Feb-16 17.13 914.32 11.80 720 0.00 160.4 0.08 7.34 480 0.00600 <0.00010 3.0
Table A-4c: Summary of Dale Strip Pit - Bedrock Groundwater Sampling Results - Well MWB-5DSP
Monitored Semiannually1
Monitored Semiannually1
Dissolved Metals (mg/L)Field Parameters
Monitored Semiannually1
Monitored Semiannually1
Monitored Semiannually1
Monitored Semiannually1
Monitored Semiannually1
1520304-Tables and Appendix A.xlsm

October 2020 152030420Page 2 of 2
Ravensdale Site, Ravensdale, Washington
Gen. Chem.
Date Sampled
Dep
th to
Wat
er(fe
et b
toc)
Gro
undw
ater
Ele
vatio
n (f
eet m
sl)
Tem
pera
ture
(°C
)
Con
duct
ivity
(µm
hos/
cm)
Dis
solv
ed O
xyge
n (m
g/L)
Oxi
datio
n R
educ
tion
Pote
ntia
l (R
el m
V)
Turb
idity
(NTU
)
pH(s
tand
ard
units
)
Tota
l Dis
solv
ed S
olid
s(m
g/L)
Ars
enic
Lead
Pota
ssiu
m
Table A-4c: Summary of Dale Strip Pit - Bedrock Groundwater Sampling Results - Well MWB-5DSP
Dissolved Metals (mg/L)Field Parameters
2-May-16 23.31 908.1422-Aug-16 34.07 897.38 12.50 571 0.00 - 0.66 7.111-Nov-16 26.04 905.4131-Jan-17 19.36 912.09 12.20 808 0.07 -219.2 0.30 7.21 509 0.00676 <0.00010 2.830-May-17 17.31 914.1416-Aug-17 28.13 903.32 12.40 826 0.12 -71.9 0.66 7.109-Nov-17 27.17 904.2828-Feb-18 16.55 914.90 10.90 657 0.15 -97.6 0.35 7.02 528 0.00539 <0.00010 2.61-May-18 17.69 913.7622-Aug-18 32.63 898.82 12.46 655 0.81 -46.4 0.26 7.016-Nov-18 32.44 899.0112-Mar-19 18.84 912.61 10.90 597 0.56 -28.1 0.86 6.96 512 0.00451 <0.0001 2.898-May-19 19.75 911.7027-Aug-19 33.26 911.70 13.08 688 0.26 Note 1 0.02 6.8913-Nov-19 33.03 898.4214-Feb-20 16.70 914.75 10.90 626 0.34 -99.8 0.33 6.88 524 0.00431 0.0001 U 2.6513-Aug-20 27.37 904.08 11.80 619 0.55 -70.6 0.40 6.89Preliminary Standarda - - - 700 - - - 6.5-8.5 500 TBDb 0.05 -
Notes: Top of casing elevation (feet msl): 931.45- Not measured or not available< Analyte not detected above the reporting limit shown1
2
a Preliminary standard is the standard listed or the site-specific (natural) background concentration, whichever is highestb Site background arsenic value to be determined (TBD)U Data validation code; not detected at the Reporting Limit (RL)J Data validation code; estimated valueJ+ Data validation code; estimated value with positive bias°C Degrees CelsiusNote 1 ORP measurements not available due to faulty sensor.µmhos/cm Micromhos per centimeter mg/L Milligrams per literfeet bmp Feet below measuring point mV Millivoltsfeet msl Feet above mean sea level NTU Nephelometric Turbidity Unit
Monitored Semiannually2
Reduction in monitoring frequency approved by Public Health – Seattle and King County in a letter to Golder Associates Inc. dated April 7, 2016. Field parameters collected semi-annually, analytical samples collected annually.
Monitored Annually2
Monitored Annually2
Monitored Semiannually2 Monitored Annually2
Monitored Annually2
Monitored Annually2
Monitored Annually2
Monitored Annually2
Monitored Semiannually2 Monitored Annually2
Monitored Semiannually2 Monitored Annually2
Monitored Annually2
Monitored Annually2Monitored Semiannually2
Reduction in monitoring frequency approved by Public Health – Seattle and King County in a letter to Golder Associates Inc. dated May 16, 2012
Monitored Semiannually2 Monitored Annually2
Monitored Annually2Monitored Semiannually2
Monitored Semiannually2
1520304-Tables and Appendix A.xlsm

October 2020 152030420Page 1 of 2
Ravensdale Site, Ravensdale, Washington
Gen. Chem.
Date Sampled
Dep
th to
Wat
er(fe
et b
toc)
Gro
undw
ater
Ele
vatio
n (f
eet m
sl)
Tem
pera
ture
(°C
)
Con
duct
ivity
(µm
hos/
cm)
Dis
solv
ed O
xyge
n (m
g/L)
Oxi
datio
n R
educ
tion
Pote
ntia
l (R
el m
V)
Turb
idity
(NTU
)
pH(s
tand
ard
units
)
Tota
l Dis
solv
ed S
olid
s(m
g/L)
Ars
enic
Lead
Pota
ssiu
m
18-Dec-06 8.13 894.22 9.93 525 0.54 -54.5 0.61 7.78 300 0.00537 <0.00100 -7-Feb-07 9.40 892.95 11.79 479 1.19 -30.0 7.40 7.41 330 0.00601 <0.00100 -7-May-07 10.73 891.62 12.26 729 2.83 -103.6 16.40 7.63 480 0.01010 <0.00100 -7-Aug-07 15.14 887.21 11.42 882 0.75 -11.5 1.82 7.10 470 0.00325 <0.00100 -
27-Nov-07 16.16 886.19 10.98 748 0.37 -47.9 0.83 6.99 440 J 0.00282 <0.00100 -8-Feb-08 9.66 892.69 11.01 645 0.31 - 0.90 7.05 380 0.00268 <0.00100 -8-May-08 10.34 892.01 11.27 665 0.64 13.4 1.52 6.93 380 J 0.00240 <0.00100 -8-Aug-08 14.17 888.18 11.23 683 0.72 -8.2 2.49 7.05 390 J 0.00218 <0.00100 <3.01-Nov-08 12.98 889.37 10.61 488 0.60 -45.6 1.35 6.80 380 0.00204 <0.00100 <3.010-Feb-09 9.64 892.71 10.32 398 0.52 -57.0 1.20 7.31 350 0.00200 <0.00100 <3.09-May-09 9.91 892.44 10.50 405 0.73 -4.0 1.26 7.77 320 J 0.00169 <0.00100 <3.023-Sep-09 17.16 885.19 12.50 541 0.25 216.2 5.38 7.14 400 J 0.00091 J <0.00200 1.3 J14-Dec-09 12.73 889.62 9.10 580 0.47 231.0 2.70 7.23 270 <0.00200 <0.00200 1.3 J22-Mar-10 9.62 892.73 10.90 504 - 321.7 3.50 7.22 320 0.00200 <0.00200 1.2 J15-Jun-10 8.30 894.05 11.00 495 0.11 205.1 1.41 7.29 320 0.00420 <0.00200 1.3 J20-Sep-10 14.90 887.45 10.90 560 0.10 187.2 0.28 7.29 270 0.00300 <0.00200 1.4 J6-Dec-10 10.47 891.88 10.50 515 0.12 87.8 0.14 7.47 300 <0.00200 <0.00200 1.1 J28-Mar-11 8.71 893.64 10.30 241 0.19 58.9 1.86 7.19 300 <0.00200 <0.00200 1.1 J20-Jun-11 9.87 892.48 10.80 477 0.06 141.2 0.20 7.27 340 <0.00500 <0.00200 1.1 J26-Sep-11 14.82 887.53 10.80 467 0.05 114.8 0.92 7.26 380 <0.00500 <0.00200 1.5 J13-Dec-11 13.02 889.33 10.20 491 0.06 131.3 1.69 7.29 340 <0.00500 <0.00200 1.6 J21-Mar-12 8.13 894.22 10.20 550 0.09 160.0 0.07 7.14 310 0.00250 <0.00040 1.2 J18-Jun-12 - -18-Sep-12 14.76 887.59 12.50 587 0.00 122.0 0.35 7.31 370 0.00280 <0.00040 1.3 J18-Dec-12 8.16 894.1921-Feb-13 8.45 893.90 10.10 594 0.02 152.7 0.28 7.49 300 0.00190 <0.00040 1.3 J22-May-13 9.36 892.9920-Aug-13 13.28 889.07 11.70 478 0.01 -43.8 0.54 7.22 349 J 0.00160 <0.00010 1.319-Nov-13 9.71 892.6431-Mar-14 8.42 893.93 10.70 455 0.06 166.1 0.27 7.35 315 0.00140 <0.00010 1.321-May-14 5.99 896.3614-Aug-14 12.03 890.32 13.45 512 0.56 -21.4 1.99 6.95 317 0.00170 <0.00010 1.314-Nov-14 10.68 891.67
Table A-4d: Summary of Dale Strip Pit - Bedrock Groundwater Sampling Results - Well MWB-6DSP
Monitored Semiannually1
Monitored Semiannually1
Monitored Semiannually1
Monitored Semiannually1
Dissolved Metals (mg/L)Field Parameters
Monitored Semiannually1
Monitored Semiannually1
1520304-Tables and Appendix A.xlsm

October 2020 152030420Page 2 of 2
Ravensdale Site, Ravensdale, Washington
Gen. Chem.
Date Sampled
Dep
th to
Wat
er(fe
et b
toc)
Gro
undw
ater
Ele
vatio
n (f
eet m
sl)
Tem
pera
ture
(°C
)
Con
duct
ivity
(µm
hos/
cm)
Dis
solv
ed O
xyge
n (m
g/L)
Oxi
datio
n R
educ
tion
Pote
ntia
l (R
el m
V)
Turb
idity
(NTU
)
pH(s
tand
ard
units
)
Tota
l Dis
solv
ed S
olid
s(m
g/L)
Ars
enic
Lead
Pota
ssiu
m
Table A-4d: Summary of Dale Strip Pit - Bedrock Groundwater Sampling Results - Well MWB-6DSP
Dissolved Metals (mg/L)Field Parameters
10-Feb-15 7.39 894.96 10.90 482 0.03 -86.2 0.59 7.32 337 0.00140 <0.00010 1.24-May-15 9.17 893.184-Aug-15 13.64 888.71 12.40 449 0.18 -81.7 0.27 7.33 385 0.00170 <0.00010 1.35-Nov-15 13.98 888.37 11.50 435 2.23 85.2 1.09 7.04 354 0.00130 <0.00010 1.58-Feb-16 6.74 895.61 11.50 495 0.03 187.2 0.25 7.39 297 0.00140 <0.00010 1.42-May-16 8.64 893.7122-Aug-16 13.27 889.08 12.20 559 0.03 -52.7 0.80 7.281-Nov-16 11.36 890.9931-Jan-17 7.91 894.44 10.90 539 0.08 124.4 0.18 7.31 321 0.00148 <0.00010 1.330-May-17 2.65 899.7016-Aug-17 12.08 890.27 12.10 573 0.12 -46.9 1.39 7.269-Nov-17 11.70 890.6528-Feb-18 6.50 895.85 11.00 423 0.19 -61.0 0.18 7.12 138 0.00156 <0.00010 1.21-May-18 6.80 895.5522-Aug-18 13.47 888.88 11.61 441 7.44 26.6 0.21 7.116-Nov-18 13.96 888.3912-Mar-19 7.30 895.05 10.30 363 0.56 -25.1 0.27 7.16 294 0.00147 <0.0001 1.348-May-19 7.77 894.5827-Aug-19 13.16 889.19 12.19 454 0.45 Note 1 0.02 7.0513-Nov-19 26.35 Note 213-Feb-20 20.79 Note 2 10.60 387 0.39 -76.5 1.05 7.1313-Aug-20 25.94 Note 2 11.70 403 0.65 -64.3 0.60 7.07Preliminary Standarda - - - 700 - - - 6.5-8.5 500 TBDb 0.05 -
Notes: Top of casing elevation (feet msl): Note 2- Not measured or not available< Analyte not detected above the reporting limit shown1
2
a Preliminary standard is the standard listed or the site-specific (natural) background concentration, whichever is highestb Site background arsenic value to be determined (TBD)U Data validation code; not detected at the Reporting Limit (RL)J Data validation code; estimated valueJ+ Data validation code; estimated value with positive bias°C Degrees CelsiusNote 1 ORP measurements not available due to faulty sensor.
Note 2
µmhos/cm Micromhos per centimeter mg/L Milligrams per literfeet bmp Feet below measuring point mV Millivoltsfeet msl Feet above mean sea level NTU Nephelometric Turbidity Unit
Monitored Annually2Monitored Semiannually2
Monitored Semiannually2 Monitored Annually2
Reduction in monitoring frequency approved by Public Health – Seattle and King County in a letter to Golder Associates Inc. dated April 7, 2016. Field parameters collected semi-annually, analytical samples collected annually.
Reduction in monitoring frequency approved by Public Health – Seattle and King County in a letter to Golder Associates Inc. dated May 16, 2012
Monitored Annually2
MWB-6DSP casing was raised by Reserve Silica in between August and November 2019. The New TOC elevation has not been surveyed.
Monitored Annually2313
Monitored Annually2
Monitored Semiannually2
Monitored Semiannually2
Monitored Annually2
Monitored Annually2
Monitored Annually2
Monitored Semiannually2 Monitored Annually2
Monitored Semiannually2
Monitored Annually2
Monitored Annually2
Monitored Semiannually1
Monitored Semiannually2
Monitored Annually2Monitored Annually2
Monitored Semiannually2
1520304-Tables and Appendix A.xlsm
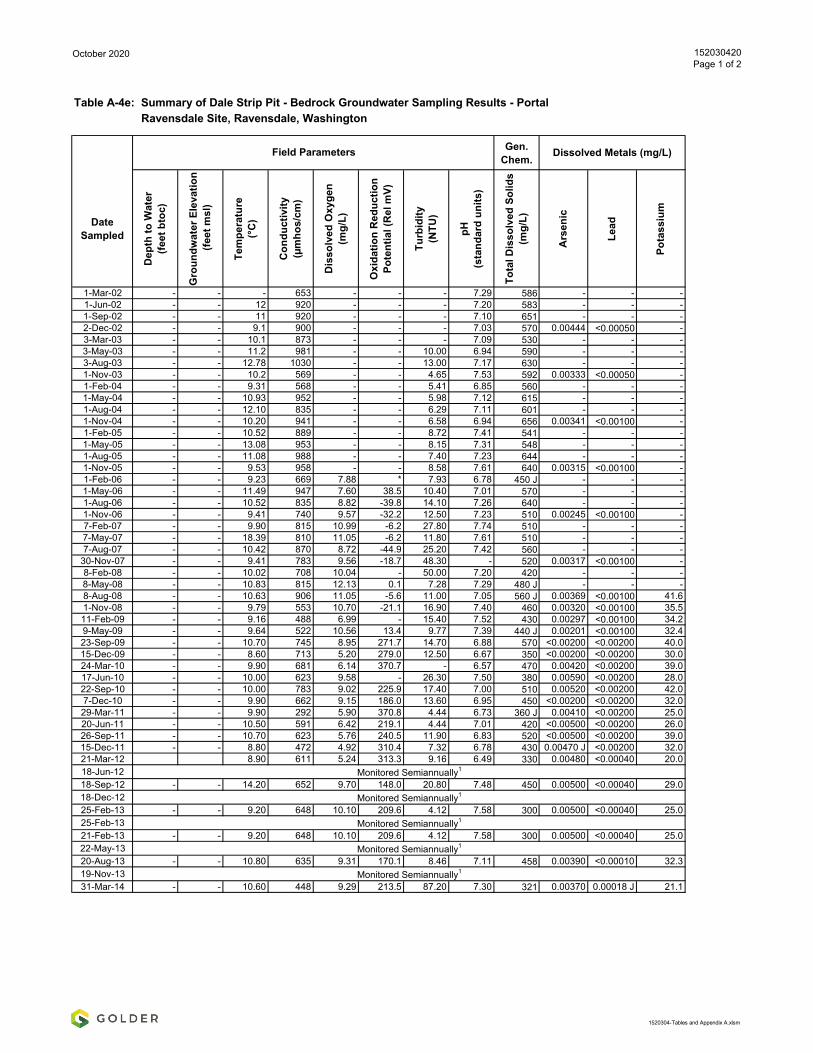
October 2020 152030420Page 1 of 2
Ravensdale Site, Ravensdale, Washington
Gen. Chem.
Date Sampled
Dep
th to
Wat
er(fe
et b
toc)
Gro
undw
ater
Ele
vatio
n (f
eet m
sl)
Tem
pera
ture
(°C
)
Con
duct
ivity
(µm
hos/
cm)
Dis
solv
ed O
xyge
n (m
g/L)
Oxi
datio
n R
educ
tion
Pote
ntia
l (R
el m
V)
Turb
idity
(NTU
)
pH(s
tand
ard
units
)
Tota
l Dis
solv
ed S
olid
s(m
g/L)
Ars
enic
Lead
Pota
ssiu
m
1-Mar-02 - - - 653 - - - 7.29 586 - - -1-Jun-02 - - 12 920 - - - 7.20 583 - - -1-Sep-02 - - 11 920 - - - 7.10 651 - - -2-Dec-02 - - 9.1 900 - - - 7.03 570 0.00444 <0.00050 -3-Mar-03 - - 10.1 873 - - - 7.09 530 - - -3-May-03 - - 11.2 981 - - 10.00 6.94 590 - - -3-Aug-03 - - 12.78 1030 - - 13.00 7.17 630 - - -1-Nov-03 - - 10.2 569 - - 4.65 7.53 592 0.00333 <0.00050 -1-Feb-04 - - 9.31 568 - - 5.41 6.85 560 - - -1-May-04 - - 10.93 952 - - 5.98 7.12 615 - - -1-Aug-04 - - 12.10 835 - - 6.29 7.11 601 - - -1-Nov-04 - - 10.20 941 - - 6.58 6.94 656 0.00341 <0.00100 -1-Feb-05 - - 10.52 889 - - 8.72 7.41 541 - - -1-May-05 - - 13.08 953 - - 8.15 7.31 548 - - -1-Aug-05 - - 11.08 988 - - 7.40 7.23 644 - - -1-Nov-05 - - 9.53 958 - - 8.58 7.61 640 0.00315 <0.00100 -1-Feb-06 - - 9.23 669 7.88 * 7.93 6.78 450 J - - -1-May-06 - - 11.49 947 7.60 38.5 10.40 7.01 570 - - -1-Aug-06 - - 10.52 835 8.82 -39.8 14.10 7.26 640 - - -1-Nov-06 - - 9.41 740 9.57 -32.2 12.50 7.23 510 0.00245 <0.00100 -7-Feb-07 - - 9.90 815 10.99 -6.2 27.80 7.74 510 - - -7-May-07 - - 18.39 810 11.05 -6.2 11.80 7.61 510 - - -7-Aug-07 - - 10.42 870 8.72 -44.9 25.20 7.42 560 - - -
30-Nov-07 - - 9.41 783 9.56 -18.7 48.30 - 520 0.00317 <0.00100 -8-Feb-08 - - 10.02 708 10.04 - 50.00 7.20 420 - - -8-May-08 - - 10.83 815 12.13 0.1 7.28 7.29 480 J - - -8-Aug-08 - - 10.63 906 11.05 -5.6 11.00 7.05 560 J 0.00369 <0.00100 41.61-Nov-08 - - 9.79 553 10.70 -21.1 16.90 7.40 460 0.00320 <0.00100 35.511-Feb-09 - - 9.16 488 6.99 - 15.40 7.52 430 0.00297 <0.00100 34.29-May-09 - - 9.64 522 10.56 13.4 9.77 7.39 440 J 0.00201 <0.00100 32.423-Sep-09 - - 10.70 745 8.95 271.7 14.70 6.88 570 <0.00200 <0.00200 40.015-Dec-09 - - 8.60 713 5.20 279.0 12.50 6.67 350 <0.00200 <0.00200 30.024-Mar-10 - - 9.90 681 6.14 370.7 - 6.57 470 0.00420 <0.00200 39.017-Jun-10 - - 10.00 623 9.58 - 26.30 7.50 380 0.00590 <0.00200 28.022-Sep-10 - - 10.00 783 9.02 225.9 17.40 7.00 510 0.00520 <0.00200 42.07-Dec-10 - - 9.90 662 9.15 186.0 13.60 6.95 450 <0.00200 <0.00200 32.029-Mar-11 - - 9.90 292 5.90 370.8 4.44 6.73 360 J 0.00410 <0.00200 25.020-Jun-11 - - 10.50 591 6.42 219.1 4.44 7.01 420 <0.00500 <0.00200 26.026-Sep-11 - - 10.70 623 5.76 240.5 11.90 6.83 520 <0.00500 <0.00200 39.015-Dec-11 - - 8.80 472 4.92 310.4 7.32 6.78 430 0.00470 J <0.00200 32.021-Mar-12 8.90 611 5.24 313.3 9.16 6.49 330 0.00480 <0.00040 20.018-Jun-1218-Sep-12 - - 14.20 652 9.70 148.0 20.80 7.48 450 0.00500 <0.00040 29.018-Dec-1225-Feb-13 - - 9.20 648 10.10 209.6 4.12 7.58 300 0.00500 <0.00040 25.025-Feb-1321-Feb-13 - - 9.20 648 10.10 209.6 4.12 7.58 300 0.00500 <0.00040 25.022-May-1320-Aug-13 - - 10.80 635 9.31 170.1 8.46 7.11 458 0.00390 <0.00010 32.319-Nov-1331-Mar-14 - - 10.60 448 9.29 213.5 87.20 7.30 321 0.00370 0.00018 J 21.1
Table A-4e: Summary of Dale Strip Pit - Bedrock Groundwater Sampling Results - Portal
Monitored Semiannually1
Monitored Semiannually1
Monitored Semiannually1
Monitored Semiannually1
Field Parameters Dissolved Metals (mg/L)
Monitored Semiannually1
1520304-Tables and Appendix A.xlsm

October 2020 152030420Page 2 of 2
Ravensdale Site, Ravensdale, Washington
Gen. Chem.
Date Sampled
Dep
th to
Wat
er(fe
et b
toc)
Gro
undw
ater
Ele
vatio
n (f
eet m
sl)
Tem
pera
ture
(°C
)
Con
duct
ivity
(µm
hos/
cm)
Dis
solv
ed O
xyge
n (m
g/L)
Oxi
datio
n R
educ
tion
Pote
ntia
l (R
el m
V)
Turb
idity
(NTU
)
pH(s
tand
ard
units
)
Tota
l Dis
solv
ed S
olid
s(m
g/L)
Ars
enic
Lead
Pota
ssiu
m
Table A-4e: Summary of Dale Strip Pit - Bedrock Groundwater Sampling Results - Portal
Field Parameters Dissolved Metals (mg/L)
21-May-1415-Aug-14 - - 10.01 595 10.01 -35.2 6.43 6.99 427 0.00350 <0.00010 31.514-Nov-1410-Feb-15 - - 10.60 515 9.88 183.5 6.84 7.26 363 0.00280 0.00007 J 27.24-May-154-Aug-15 - - 10.90 554 9.98 95.8 8.68 7.48 438 0.00260 <0.00010 34.75-Nov-15 - - 10.30 503 10.24 177.6 13.40 7.46 449 0.00280 <0.00010 31.88-Feb-16 - - 9.30 541 11.30 215.0 5.12 7.30 293 0.00320 <0.00010 23.1
-24-Aug-16 - - 13.40 585 9.32 410.0 8.50 7.231-Nov-16 - - 10.90 242 9.13 51.4 7.57 7.4131-Jan-17 - - 8.90 663 10.87 -57.4 6.23 7.50 3390 0.00397 <0.00010 29.2
-17-Aug-17 - - 11.40 712 9.67 -12.4 9.87 7.309-Nov-1727-Feb-18 - - 9.50 427 9.94 -46.4 16.70 7.72 354 0.00411 <0.00010 20.41-May-1821-Aug-18 - - 13.13 582 12.46 -23.0 23.10 7.246-Nov-1812-Mar-19 - - 8.00 406 11.35 -2.8 10.70 7.97 388 0.00156 <0.0001 24.78-May-1927-Aug-19 - - 10.55 576 11.80 Note 1 154.00 6.7813-Nov-1913-Feb-20 - - 9.20 382 9.19 -1.3 13.40 6.9313-Aug-20 - - 10.10 569 10.01 -27.0 12.20 7.12Preliminary Standarda - - - 700 - - - 6.5-8.5 500 TBDb 0.05 -
Notes: - Not measured or not available< Analyte not detected above the reporting limit shown* Measurement invalid and not shown1
2
a Preliminary standard is the standard listed or the site-specific (natural) background concentration, whichever is highestb Site background arsenic value to be determined (TBD)U Data validation code; not detected at the Reporting Limit (RL)J Data validation code; estimated valueJ+ Data validation code; estimated value with positive bias°C Degrees CelsiusNote 1 ORP measurements not available due to faulty sensor.µmhos/cm Micromhos per centimeter mg/L Milligrams per literfeet bmp Feet below measuring point mV Millivoltsfeet msl Feet above mean sea level NTU Nephelometric Turbidity Unit
Monitored Annually2
Reduction in monitoring frequency approved by Public Health – Seattle and King County in a letter to Golder Associates Inc. dated April 7, 2016. Field parameters collected semi-annually, analytical samples collected annually.
Reduction in monitoring frequency approved by Public Health – Seattle and King County in a letter to Golder Associates Inc. dated May 16, 2012
Monitored Annually2Monitored Semiannually2
Monitored Annually2259
Monitored Semiannually2
Monitored Annually2
Monitored Annually2Monitored Semiannually2
Monitored Semiannually2 Monitored Annually2
Monitored Semiannually2 Monitored Annually2
Monitored Annually2
Monitored Annually2Monitored Semiannually2
Monitored Semiannually2
Monitored Annually2
Monitored Annually2
Monitored Annually2
Monitored Annually2
Monitored Semiannually1
Monitored Semiannually1
Monitored Semiannually1
1520304-Tables and Appendix A.xlsm

October 2020 152030420Page 1 of 2
Ravensdale Site, Ravensdale, Washington
Gen. Chem.
Date Sampled
Dep
th to
Wat
er(fe
et b
toc)
Gro
undw
ater
Ele
vatio
n (f
eet m
sl)
Tem
pera
ture
(°C
)
Con
duct
ivity
(µm
hos/
cm)
Dis
solv
ed O
xyge
n (m
g/L)
Oxi
datio
n R
educ
tion
Pote
ntia
l (R
el m
V)
Turb
idity
(NTU
)
pH(s
tand
ard
units
)
Tota
l Dis
solv
ed S
olid
s(m
g/L)
Ars
enic
Lead
Pota
ssiu
m
1-Mar-02 - - - 542 - - - 7.22 467 - - -1-Jun-02 197.34 731.88 12.00 750 - - - 7.10 459 - - -1-Sep-02 199.29 729.93 14.00 660 - - - 6.90 499 - - -2-Dec-02 200.09 729.13 10.80 675 - - - 6.89 440 <0.00100 <0.00050 -3-Mar-03 190.21 739.01 11.90 763 - - - 6.98 450 - - -3-May-03 191.78 737.44 12.30 730 - - 233.00 6.98 550 - - -3-Aug-03 199.82 729.40 16.50 848 - - 17.00 6.92 520 - - -1-Nov-03 199.97 729.25 11.60 559 - - 9.20 7.04 522 0.00098 <0.00050 -1-Feb-04 188.78 740.44 11.96 608 - - 4.86 6.68 560 - - -1-May-04 198.45 730.77 13.69 614 - - 6.17 6.80 478 - - -1-Aug-04 199.17 730.05 14.38 731 - - 5.48 6.71 460 - - -1-Nov-04 197.92 731.30 11.62 785 - - 12.30 6.75 512 <0.00100 <0.00100 -1-Feb-05 186.36 742.86 11.64 806 - - 1.47 6.94 487 - - -1-May-05 - - 12.87 790 - - 15.80 6.89 338 - - -1-Aug-05 196.10 733.12 15.01 603 - - 45.70 6.44 388 - - -1-Nov-05 196.78 732.44 9.91 549 - - 13.30 6.66 350 <0.00100 <0.00100 -1-Feb-06 193.93 735.29 8.10 641 2.11 269.2 35.70 6.82 400 J - - -1-May-06 197.90 731.32 10.88 798 1.67 27.3 5.38 6.50 380 - - -1-Aug-06 198.80 730.42 11.44 534 2.52 205.7 8.74 6.67 360 - - -1-Nov-06 187.36 741.86 10.77 680 2.12 -19.9 18.90 7.06 430 <0.00100 <0.00100 -28-Dec-06 192.37 736.85 - - - - - - - - - -7-Feb-07 197.46 731.76 10.24 621 0.64 -16.7 27.80 6.89 420 - - -7-May-07 198.49 730.73 - - - - - - - - - -1-Aug-07 198.45 730.77 - - - - - - - - - -
27-Nov-07 196.48 732.74 - - - - - - - - - -8-Feb-08 191.30 737.92 - - - - - - - - - -8-May-08 193.95 735.27 - - - - - - - - - -27-Sep-11 197.32 731.90 - - - - - - - - - -13-Dec-11 192.15 737.07 9.60 421 2.10 313.0 16.10 7.49 - - - -22-Mar-12 183.35 747.87 8.90 546 12.83 166.3 0.56 7.47 - - - -18-Jun-12 192.54 738.68 - - - - - - - - - -18-Sep-12 199.51 731.71 16.20 508 2.21 120.0 1.27 7.58 - - - -18-Dec-12 184.52 746.70 - - - - - - - - - -21-Feb-13 190.65 740.57 7.60 678 5.33 342.6 6.61 8.02 - - - -22-May-13 198.05 733.17 - - - - - - - - - -20-Aug-13 200.47 730.75 13.00 488 3.26 90.2 8.47 7.42 - - - -19-Nov-13 196.59 734.63 - - - - - - - - - -31-Mar-14 186.78 744.44 11.40 421 7.28 195.1 1.70 7.47 - - - -21-May-14 192.27 738.95 - - - - - - - - - -15-Aug-14 199.97 731.25 18.90 492 0.97 1.4 52.50 7.01 - - - -14-Nov-14 196.60 734.62 - - - - - - - - - -10-Feb-15 183.97 747.25 10.20 450 7.65 121.4 1.02 7.34 - - - -4-May-15 194.19 737.03 - - - - - - - - - -4-Aug-15 198.35 732.87 13.60 432 3.07 18.6 0.27 7.47 - - - -3-Nov-15 198.25 732.97 10.30 405 2.57 106.2 7.07 7.35 - - - -8-Feb-16 188.43 742.79 12.50 536 2.77 189.8 0.25 7.78 - - - -2-May-16 195.72 735.50 - - - -22-Aug-16 197.89 733.33 14.00 418 1.27 -123.1 4.36 7.32 - - - -1-Nov-16 195.49 735.73 - - - -31-Jan-17 186.94 744.28 9.20 506 5.26 -45.4 0.38 7.45 - - - -30-May-17 190.62 740.60 - - - -
Table A-4f: Summary of Dale Strip Pit - Bedrock Groundwater Sampling Results - Well MWB-2DSP
Field Parameters Dissolved Metals (mg/L)
Monitored Semiannually1
Monitored Semiannually1
Monitored Semiannually1
1520304-Tables and Appendix A.xlsm
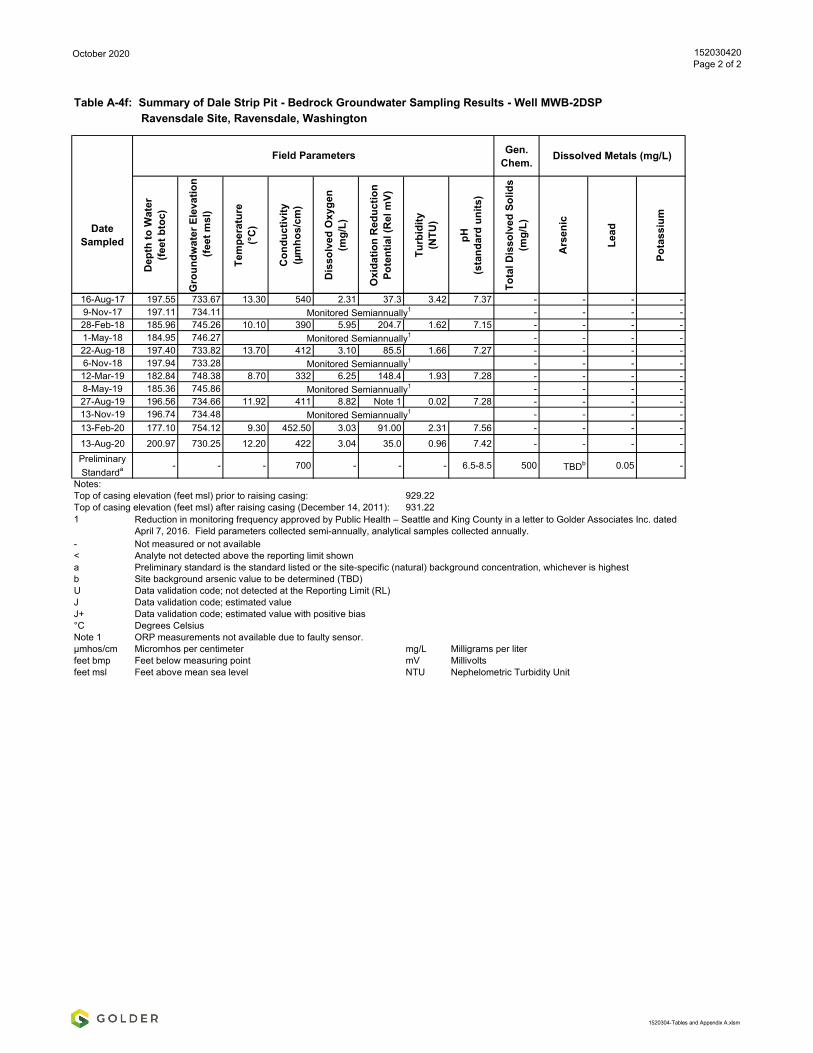
October 2020 152030420Page 2 of 2
Ravensdale Site, Ravensdale, Washington
Gen. Chem.
Date Sampled
Dep
th to
Wat
er(fe
et b
toc)
Gro
undw
ater
Ele
vatio
n (f
eet m
sl)
Tem
pera
ture
(°C
)
Con
duct
ivity
(µm
hos/
cm)
Dis
solv
ed O
xyge
n (m
g/L)
Oxi
datio
n R
educ
tion
Pote
ntia
l (R
el m
V)
Turb
idity
(NTU
)
pH(s
tand
ard
units
)
Tota
l Dis
solv
ed S
olid
s(m
g/L)
Ars
enic
Lead
Pota
ssiu
m
Table A-4f: Summary of Dale Strip Pit - Bedrock Groundwater Sampling Results - Well MWB-2DSP
Field Parameters Dissolved Metals (mg/L)
16-Aug-17 197.55 733.67 13.30 540 2.31 37.3 3.42 7.37 - - - -9-Nov-17 197.11 734.11 - - - -28-Feb-18 185.96 745.26 10.10 390 5.95 204.7 1.62 7.15 - - - -1-May-18 184.95 746.27 - - - -22-Aug-18 197.40 733.82 13.70 412 3.10 85.5 1.66 7.27 - - - -6-Nov-18 197.94 733.28 - - - -12-Mar-19 182.84 748.38 8.70 332 6.25 148.4 1.93 7.28 - - - -8-May-19 185.36 745.86 - - - -27-Aug-19 196.56 734.66 11.92 411 8.82 Note 1 0.02 7.28 - - - -13-Nov-19 196.74 734.48 - - - -13-Feb-20 177.10 754.12 9.30 452.50 3.03 91.00 2.31 7.56 - - - -13-Aug-20 200.97 730.25 12.20 422 3.04 35.0 0.96 7.42 - - - -Preliminary Standarda - - - 700 - - - 6.5-8.5 500 TBDb 0.05 -
Notes: Top of casing elevation (feet msl) prior to raising casing: 929.22Top of casing elevation (feet msl) after raising casing (December 14, 2011): 931.221
- Not measured or not available< Analyte not detected above the reporting limit showna Preliminary standard is the standard listed or the site-specific (natural) background concentration, whichever is highestb Site background arsenic value to be determined (TBD)U Data validation code; not detected at the Reporting Limit (RL)J Data validation code; estimated valueJ+ Data validation code; estimated value with positive bias°C Degrees CelsiusNote 1 ORP measurements not available due to faulty sensor.µmhos/cm Micromhos per centimeter mg/L Milligrams per literfeet bmp Feet below measuring point mV Millivoltsfeet msl Feet above mean sea level NTU Nephelometric Turbidity Unit
Reduction in monitoring frequency approved by Public Health – Seattle and King County in a letter to Golder Associates Inc. dated April 7, 2016. Field parameters collected semi-annually, analytical samples collected annually.
Monitored Semiannually1
Monitored Semiannually1
Monitored Semiannually1
Monitored Semiannually1
Monitored Semiannually1
1520304-Tables and Appendix A.xlsm
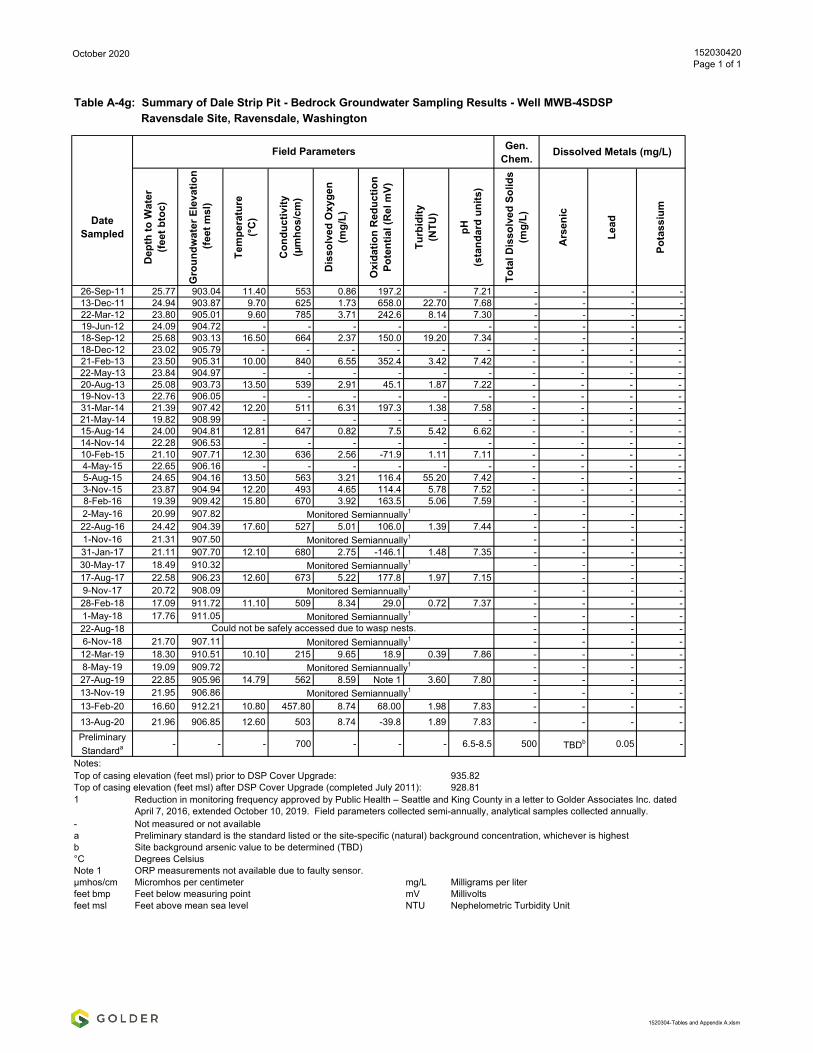
October 2020 152030420Page 1 of 1
Ravensdale Site, Ravensdale, Washington
Gen. Chem.
Date Sampled
Dep
th to
Wat
er(fe
et b
toc)
Gro
undw
ater
Ele
vatio
n (f
eet m
sl)
Tem
pera
ture
(°C
)
Con
duct
ivity
(µm
hos/
cm)
Dis
solv
ed O
xyge
n (m
g/L)
Oxi
datio
n R
educ
tion
Pote
ntia
l (R
el m
V)
Turb
idity
(NTU
)
pH(s
tand
ard
units
)
Tota
l Dis
solv
ed S
olid
s(m
g/L)
Ars
enic
Lead
Pota
ssiu
m
26-Sep-11 25.77 903.04 11.40 553 0.86 197.2 - 7.21 - - - -13-Dec-11 24.94 903.87 9.70 625 1.73 658.0 22.70 7.68 - - - -22-Mar-12 23.80 905.01 9.60 785 3.71 242.6 8.14 7.30 - - - -19-Jun-12 24.09 904.72 - - - - - - - - - -18-Sep-12 25.68 903.13 16.50 664 2.37 150.0 19.20 7.34 - - - -18-Dec-12 23.02 905.79 - - - - - - - - - -21-Feb-13 23.50 905.31 10.00 840 6.55 352.4 3.42 7.42 - - - -22-May-13 23.84 904.97 - - - - - - - - - -20-Aug-13 25.08 903.73 13.50 539 2.91 45.1 1.87 7.22 - - - -19-Nov-13 22.76 906.05 - - - - - - - - - -31-Mar-14 21.39 907.42 12.20 511 6.31 197.3 1.38 7.58 - - - -21-May-14 19.82 908.99 - - - - - - - - - -15-Aug-14 24.00 904.81 12.81 647 0.82 7.5 5.42 6.62 - - - -14-Nov-14 22.28 906.53 - - - - - - - - - -10-Feb-15 21.10 907.71 12.30 636 2.56 -71.9 1.11 7.11 - - - -4-May-15 22.65 906.16 - - - - - - - - - -5-Aug-15 24.65 904.16 13.50 563 3.21 116.4 55.20 7.42 - - - -3-Nov-15 23.87 904.94 12.20 493 4.65 114.4 5.78 7.52 - - - -8-Feb-16 19.39 909.42 15.80 670 3.92 163.5 5.06 7.59 - - - -2-May-16 20.99 907.82 - - - -22-Aug-16 24.42 904.39 17.60 527 5.01 106.0 1.39 7.44 - - - -1-Nov-16 21.31 907.50 - - - -31-Jan-17 21.11 907.70 12.10 680 2.75 -146.1 1.48 7.35 - - - -30-May-17 18.49 910.32 - - - -17-Aug-17 22.58 906.23 12.60 673 5.22 177.8 1.97 7.15 - - -9-Nov-17 20.72 908.09 - - - -28-Feb-18 17.09 911.72 11.10 509 8.34 29.0 0.72 7.37 - - - -1-May-18 17.76 911.05 - - - -22-Aug-18 - - - -6-Nov-18 21.70 907.11 - - - -12-Mar-19 18.30 910.51 10.10 215 9.65 18.9 0.39 7.86 - - - -8-May-19 19.09 909.72 - - - -27-Aug-19 22.85 905.96 14.79 562 8.59 Note 1 3.60 7.80 - - - -13-Nov-19 21.95 906.86 - - - -13-Feb-20 16.60 912.21 10.80 457.80 8.74 68.00 1.98 7.83 - - - -13-Aug-20 21.96 906.85 12.60 503 8.74 -39.8 1.89 7.83 - - - -Preliminary Standarda - - - 700 - - - 6.5-8.5 500 TBDb 0.05 -
Notes: Top of casing elevation (feet msl) prior to DSP Cover Upgrade: 935.82Top of casing elevation (feet msl) after DSP Cover Upgrade (completed July 2011): 928.811
- Not measured or not availablea Preliminary standard is the standard listed or the site-specific (natural) background concentration, whichever is highestb Site background arsenic value to be determined (TBD)°C Degrees CelsiusNote 1 ORP measurements not available due to faulty sensor.µmhos/cm Micromhos per centimeter mg/L Milligrams per literfeet bmp Feet below measuring point mV Millivoltsfeet msl Feet above mean sea level NTU Nephelometric Turbidity Unit
Monitored Semiannually1
Table A-4g: Summary of Dale Strip Pit - Bedrock Groundwater Sampling Results - Well MWB-4SDSP
Field Parameters Dissolved Metals (mg/L)
Reduction in monitoring frequency approved by Public Health – Seattle and King County in a letter to Golder Associates Inc. dated April 7, 2016, extended October 10, 2019. Field parameters collected semi-annually, analytical samples collected annually.
Monitored Semiannually1
Monitored Semiannually1
Monitored Semiannually1
Monitored Semiannually1
Monitored Semiannually1
Could not be safely accessed due to wasp nests.Monitored Semiannually1
Monitored Semiannually1
1520304-Tables and Appendix A.xlsm

APPENDIX B
Data Graphs
APPENDIX B-1
LDA Shallow/Alluvial Monitoring
Wells Data Graphs

1520304_LDA Infiltration GW Monitoring Results-Graphs.xlsm 152030420
0.0
20.0
40.0
60.0
80.0
100.0
120.0
140.0
160.0
180.0
200.0
0.0000
0.0100
0.0200
0.0300
0.0400
0.0500
0.0600
12-Ju
n-05
10-O
ct-0
57-
Feb-
067-
Jun-
065-
Oct
-06
2-Fe
b-07
2-Ju
n-07
30-S
ep-0
728
-Jan-
0827
-May
-08
24-S
ep-0
822
-Jan-
0922
-May
-09
19-S
ep-0
917
-Jan-
1017
-May
-10
14-S
ep-1
012
-Jan-
1112
-May
-11
9-Se
p-11
7-Ja
n-12
6-M
ay-1
23-
Sep-
121-
Jan-
131-
May
-13
29-A
ug-1
327
-Dec
-13
26-A
pr-1
424
-Aug
-14
22-D
ec-1
421
-Apr
-15
19-A
ug-1
517
-Dec
-15
15-A
pr-1
613
-Aug
-16
11-D
ec-1
610
-Apr
-17
8-Au
g-17
6-De
c-17
5-Ap
r-18
3-Au
g-18
1-De
c-18
31-M
ar-1
929
-Jul-1
926
-Nov
-19
25-M
ar-2
023
-Jul-2
020
-Nov
-20
20-M
ar-2
118
-Jul-2
1
Pota
ssiu
m (m
g/L)
Arse
nic
(mg/
L)
Date
LDA Shallow/Alluvial Monitoring WellsMW-1A
Arsenic Arsenic Non-Detections PotassiumNon-detections plotted at MDL beginning in December, 2009; prior non-detections plotted at 50% of the RL
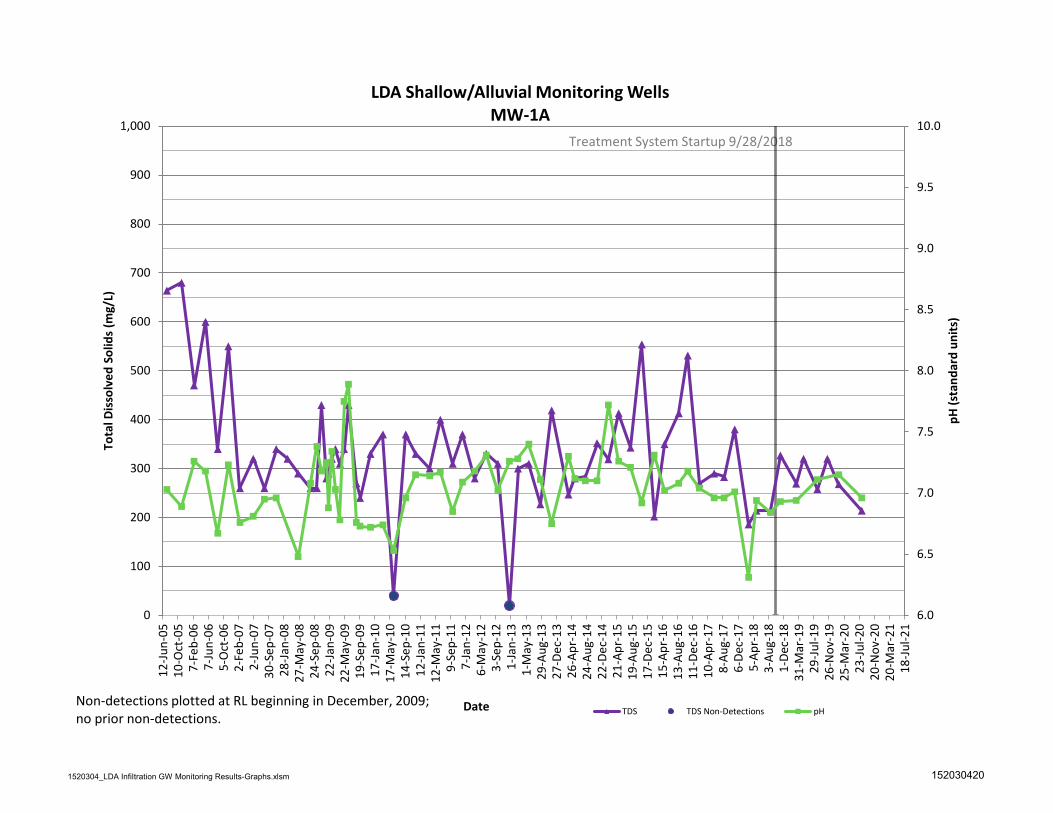
1520304_LDA Infiltration GW Monitoring Results-Graphs.xlsm 152030420
6.0
6.5
7.0
7.5
8.0
8.5
9.0
9.5
10.0
0
100
200
300
400
500
600
700
800
900
1,000
12-Ju
n-05
10-O
ct-0
57-
Feb-
067-
Jun-
065-
Oct
-06
2-Fe
b-07
2-Ju
n-07
30-S
ep-0
728
-Jan-
0827
-May
-08
24-S
ep-0
822
-Jan-
0922
-May
-09
19-S
ep-0
917
-Jan-
1017
-May
-10
14-S
ep-1
012
-Jan-
1112
-May
-11
9-Se
p-11
7-Ja
n-12
6-M
ay-1
23-
Sep-
121-
Jan-
131-
May
-13
29-A
ug-1
327
-Dec
-13
26-A
pr-1
424
-Aug
-14
22-D
ec-1
421
-Apr
-15
19-A
ug-1
517
-Dec
-15
15-A
pr-1
613
-Aug
-16
11-D
ec-1
610
-Apr
-17
8-Au
g-17
6-De
c-17
5-Ap
r-18
3-Au
g-18
1-De
c-18
31-M
ar-1
929
-Jul-1
926
-Nov
-19
25-M
ar-2
023
-Jul-2
020
-Nov
-20
20-M
ar-2
118
-Jul-2
1
pH (s
tand
ard
units
)
Tota
l Dis
solv
ed S
olid
s (m
g/L)
Date
LDA Shallow/Alluvial Monitoring WellsMW-1A
TDS TDS Non-Detections pHNon-detections plotted at RL beginning in December, 2009; no prior non-detections.

1520304_LDA Infiltration GW Monitoring Results-Graphs.xlsm 152030420
0.0
20.0
40.0
60.0
80.0
100.0
120.0
140.0
160.0
180.0
200.0
0.0000
0.0100
0.0200
0.0300
0.0400
0.0500
0.0600
12-Ju
n-05
10-O
ct-0
57-
Feb-
067-
Jun-
065-
Oct
-06
2-Fe
b-07
2-Ju
n-07
30-S
ep-0
728
-Jan-
0827
-May
-08
24-S
ep-0
822
-Jan-
0922
-May
-09
19-S
ep-0
917
-Jan-
1017
-May
-10
14-S
ep-1
012
-Jan-
1112
-May
-11
9-Se
p-11
7-Ja
n-12
6-M
ay-1
23-
Sep-
121-
Jan-
131-
May
-13
29-A
ug-1
327
-Dec
-13
26-A
pr-1
424
-Aug
-14
22-D
ec-1
421
-Apr
-15
19-A
ug-1
517
-Dec
-15
15-A
pr-1
613
-Aug
-16
11-D
ec-1
610
-Apr
-17
8-Au
g-17
6-De
c-17
5-Ap
r-18
3-Au
g-18
1-De
c-18
31-M
ar-1
929
-Jul-1
926
-Nov
-19
25-M
ar-2
023
-Jul-2
020
-Nov
-20
20-M
ar-2
118
-Jul-2
1
Pota
ssiu
m (m
g/L)
Arse
nic
(mg/
L)
Date
LDA Shallow/Alluvial Monitoring WellsMW-2A
Arsenic Arsenic Non-Detections PotassiumNon-detections plotted at MDL beginning in December, 2009; prior non-detections plotted at 50% of the RL

1520304_LDA Infiltration GW Monitoring Results-Graphs.xlsm 152030420
6.0
6.5
7.0
7.5
8.0
8.5
9.0
9.5
10.0
0
100
200
300
400
500
600
700
800
900
1,000
12-Ju
n-05
10-O
ct-0
57-
Feb-
067-
Jun-
065-
Oct
-06
2-Fe
b-07
2-Ju
n-07
30-S
ep-0
728
-Jan-
0827
-May
-08
24-S
ep-0
822
-Jan-
0922
-May
-09
19-S
ep-0
917
-Jan-
1017
-May
-10
14-S
ep-1
012
-Jan-
1112
-May
-11
9-Se
p-11
7-Ja
n-12
6-M
ay-1
23-
Sep-
121-
Jan-
131-
May
-13
29-A
ug-1
327
-Dec
-13
26-A
pr-1
424
-Aug
-14
22-D
ec-1
421
-Apr
-15
19-A
ug-1
517
-Dec
-15
15-A
pr-1
613
-Aug
-16
11-D
ec-1
610
-Apr
-17
8-Au
g-17
6-De
c-17
5-Ap
r-18
3-Au
g-18
1-De
c-18
31-M
ar-1
929
-Jul-1
926
-Nov
-19
25-M
ar-2
023
-Jul-2
020
-Nov
-20
20-M
ar-2
118
-Jul-2
1
pH (s
tand
ard
units
)
Tota
l Dis
solv
ed S
olid
s (m
g/L)
Date
LDA Shallow/Alluvial Monitoring WellsMW-2A
TDS pHNon-detections plotted at RL beginning in December, 2009; no prior non-detections.

1520304_LDA Infiltration GW Monitoring Results-Graphs.xlsm 152030420
0.0
50.0
100.0
150.0
200.0
250.0
0.0000
0.0100
0.0200
0.0300
0.0400
0.0500
0.0600
12-Ju
n-05
10-O
ct-0
57-
Feb-
067-
Jun-
065-
Oct
-06
2-Fe
b-07
2-Ju
n-07
30-S
ep-0
728
-Jan-
0827
-May
-08
24-S
ep-0
822
-Jan-
0922
-May
-09
19-S
ep-0
917
-Jan-
1017
-May
-10
14-S
ep-1
012
-Jan-
1112
-May
-11
9-Se
p-11
7-Ja
n-12
6-M
ay-1
23-
Sep-
121-
Jan-
131-
May
-13
29-A
ug-1
327
-Dec
-13
26-A
pr-1
424
-Aug
-14
22-D
ec-1
421
-Apr
-15
19-A
ug-1
517
-Dec
-15
15-A
pr-1
613
-Aug
-16
11-D
ec-1
610
-Apr
-17
8-Au
g-17
6-De
c-17
5-Ap
r-18
3-Au
g-18
1-De
c-18
31-M
ar-1
929
-Jul-1
926
-Nov
-19
25-M
ar-2
023
-Jul-2
020
-Nov
-20
20-M
ar-2
118
-Jul-2
1
Pota
ssiu
m (m
g/L)
Arse
nic
(mg/
L)
Date
LDA Shallow/Alluvial Monitoring WellsMW-3A
Arsenic Arsenic Non-Detections PotassiumNon-detections plotted at MDL beginning in December, 2009; prior non-detections plotted at 50% of the RL
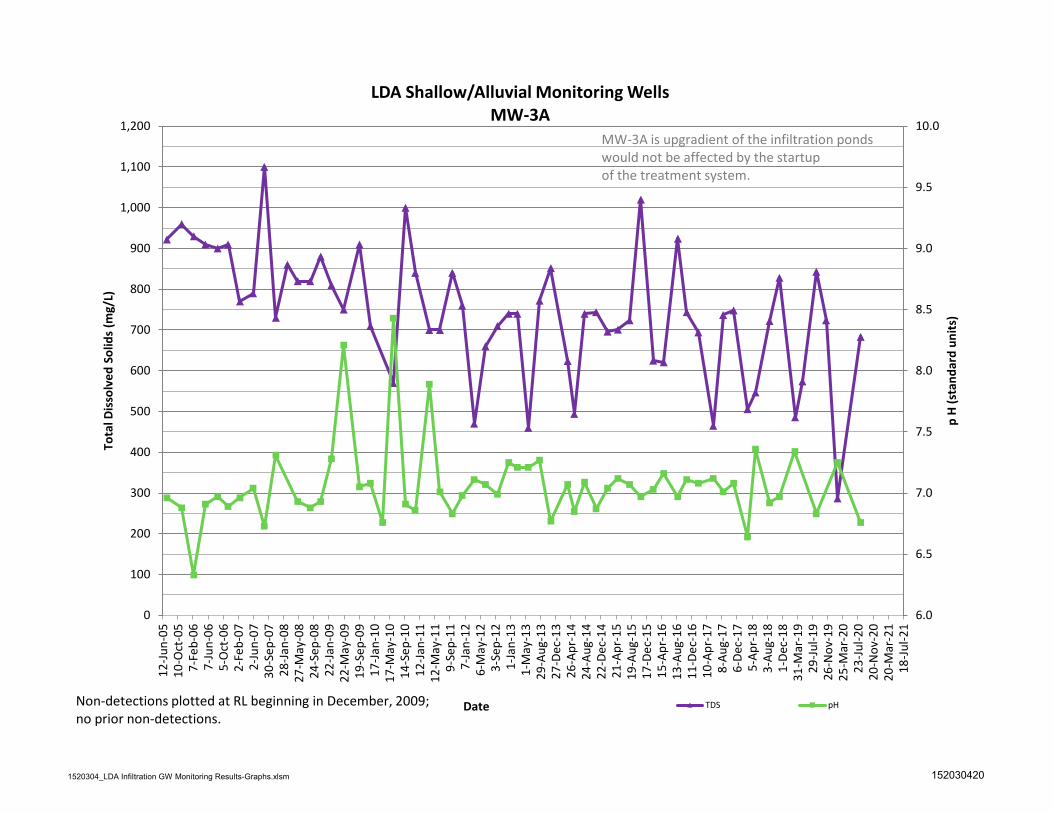
1520304_LDA Infiltration GW Monitoring Results-Graphs.xlsm 152030420
6.0
6.5
7.0
7.5
8.0
8.5
9.0
9.5
10.0
0
100
200
300
400
500
600
700
800
900
1,000
1,100
1,200
12-Ju
n-05
10-O
ct-0
57-
Feb-
067-
Jun-
065-
Oct
-06
2-Fe
b-07
2-Ju
n-07
30-S
ep-0
728
-Jan-
0827
-May
-08
24-S
ep-0
822
-Jan-
0922
-May
-09
19-S
ep-0
917
-Jan-
1017
-May
-10
14-S
ep-1
012
-Jan-
1112
-May
-11
9-Se
p-11
7-Ja
n-12
6-M
ay-1
23-
Sep-
121-
Jan-
131-
May
-13
29-A
ug-1
327
-Dec
-13
26-A
pr-1
424
-Aug
-14
22-D
ec-1
421
-Apr
-15
19-A
ug-1
517
-Dec
-15
15-A
pr-1
613
-Aug
-16
11-D
ec-1
610
-Apr
-17
8-Au
g-17
6-De
c-17
5-Ap
r-18
3-Au
g-18
1-De
c-18
31-M
ar-1
929
-Jul-1
926
-Nov
-19
25-M
ar-2
023
-Jul-2
020
-Nov
-20
20-M
ar-2
118
-Jul-2
1
p H
(sta
ndar
d un
its)
Tota
l Dis
solv
ed S
olid
s (m
g/L)
Date
LDA Shallow/Alluvial Monitoring WellsMW-3A
TDS pHNon-detections plotted at RL beginning in December, 2009; no prior non-detections.

1520304_LDA Infiltration GW Monitoring Results-Graphs.xlsm 152030420
0.0
20.0
40.0
60.0
80.0
100.0
120.0
140.0
160.0
180.0
200.0
0.0000
0.0100
0.0200
0.0300
0.0400
0.0500
0.0600
12-Ju
n-05
10-O
ct-0
57-
Feb-
067-
Jun-
065-
Oct
-06
2-Fe
b-07
2-Ju
n-07
30-S
ep-0
728
-Jan-
0827
-May
-08
24-S
ep-0
822
-Jan-
0922
-May
-09
19-S
ep-0
917
-Jan-
1017
-May
-10
14-S
ep-1
012
-Jan-
1112
-May
-11
9-Se
p-11
7-Ja
n-12
6-M
ay-1
23-
Sep-
121-
Jan-
131-
May
-13
29-A
ug-1
327
-Dec
-13
26-A
pr-1
424
-Aug
-14
22-D
ec-1
421
-Apr
-15
19-A
ug-1
517
-Dec
-15
15-A
pr-1
613
-Aug
-16
11-D
ec-1
610
-Apr
-17
8-Au
g-17
6-De
c-17
5-Ap
r-18
3-Au
g-18
1-De
c-18
31-M
ar-1
929
-Jul-1
926
-Nov
-19
25-M
ar-2
023
-Jul-2
020
-Nov
-20
20-M
ar-2
118
-Jul-2
1
Pota
ssiu
m (m
g/L)
Arse
nic
(mg/
L)
Date
LDA Shallow/Alluvial Monitoring WellsMW-4A
Arsenic Arsenic Non-Detections Potassium Potassium Non-DetectionsNon-detections plotted at MDL beginning in December, 2009; prior non-detections plotted at 50% of the RL
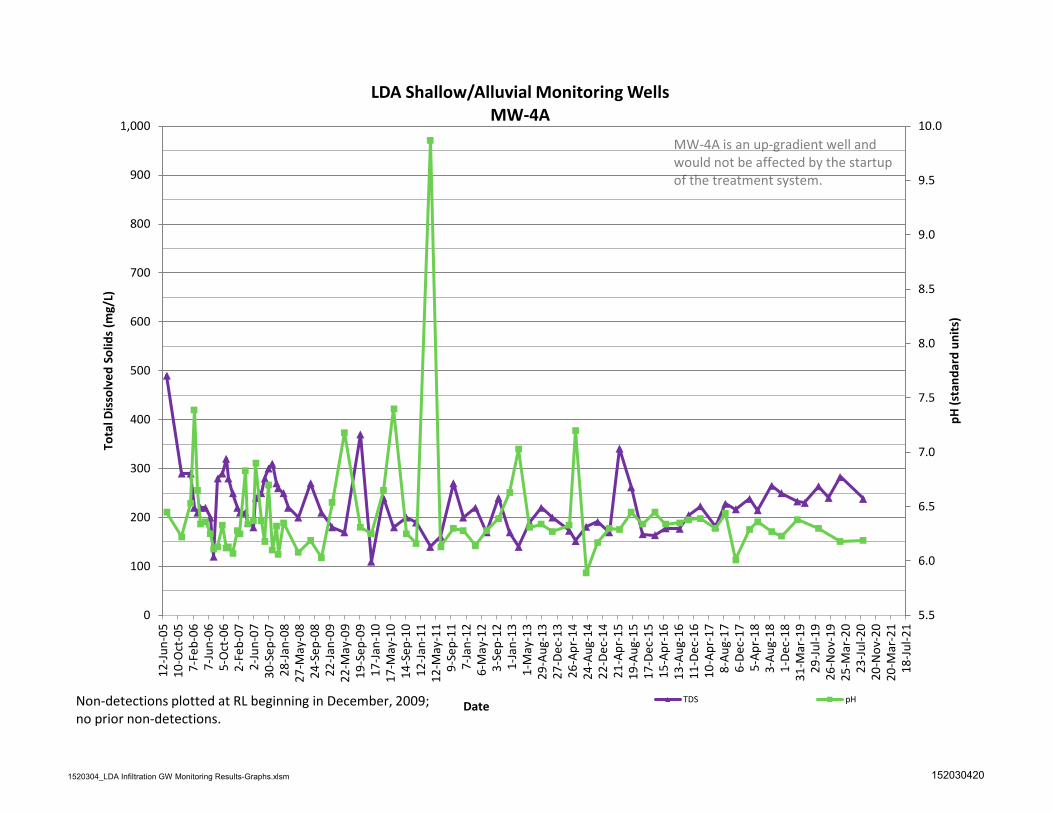
1520304_LDA Infiltration GW Monitoring Results-Graphs.xlsm 152030420
5.5
6.0
6.5
7.0
7.5
8.0
8.5
9.0
9.5
10.0
0
100
200
300
400
500
600
700
800
900
1,000
12-Ju
n-05
10-O
ct-0
57-
Feb-
067-
Jun-
065-
Oct
-06
2-Fe
b-07
2-Ju
n-07
30-S
ep-0
728
-Jan-
0827
-May
-08
24-S
ep-0
822
-Jan-
0922
-May
-09
19-S
ep-0
917
-Jan-
1017
-May
-10
14-S
ep-1
012
-Jan-
1112
-May
-11
9-Se
p-11
7-Ja
n-12
6-M
ay-1
23-
Sep-
121-
Jan-
131-
May
-13
29-A
ug-1
327
-Dec
-13
26-A
pr-1
424
-Aug
-14
22-D
ec-1
421
-Apr
-15
19-A
ug-1
517
-Dec
-15
15-A
pr-1
613
-Aug
-16
11-D
ec-1
610
-Apr
-17
8-Au
g-17
6-De
c-17
5-Ap
r-18
3-Au
g-18
1-De
c-18
31-M
ar-1
929
-Jul-1
926
-Nov
-19
25-M
ar-2
023
-Jul-2
020
-Nov
-20
20-M
ar-2
118
-Jul-2
1
pH (s
tand
ard
units
)
Tota
l Dis
solv
ed S
olid
s (m
g/L)
Date
LDA Shallow/Alluvial Monitoring WellsMW-4A
TDS pHNon-detections plotted at RL beginning in December, 2009; no prior non-detections.

1520304_LDA Infiltration GW Monitoring Results-Graphs.xlsm 152030420
0.0
50.0
100.0
150.0
200.0
250.0
300.0
350.0
400.0
0.0000
0.0100
0.0200
0.0300
0.0400
0.0500
0.0600
0.0700
0.0800
0.0900
0.1000
0.1100
0.1200
0.1300
0.1400
0.1500
0.1600
0.1700
0.1800
12-Ju
n-05
10-O
ct-0
57-
Feb-
067-
Jun-
065-
Oct
-06
2-Fe
b-07
2-Ju
n-07
30-S
ep-0
728
-Jan-
0827
-May
-08
24-S
ep-0
822
-Jan-
0922
-May
-09
19-S
ep-0
917
-Jan-
1017
-May
-10
14-S
ep-1
012
-Jan-
1112
-May
-11
9-Se
p-11
7-Ja
n-12
6-M
ay-1
23-
Sep-
121-
Jan-
131-
May
-13
29-A
ug-1
327
-Dec
-13
26-A
pr-1
424
-Aug
-14
22-D
ec-1
421
-Apr
-15
19-A
ug-1
517
-Dec
-15
15-A
pr-1
613
-Aug
-16
11-D
ec-1
610
-Apr
-17
8-Au
g-17
6-De
c-17
5-Ap
r-18
3-Au
g-18
1-De
c-18
31-M
ar-1
929
-Jul-1
926
-Nov
-19
25-M
ar-2
023
-Jul-2
020
-Nov
-20
20-M
ar-2
118
-Jul-2
1
Pota
ssiu
m (m
g/L)
Arse
nic
(mg/
L)
Date
LDA Shallow/Alluvial Monitoring WellsMW-5A
Arsenic Arsenic Non-Detections PotassiumNon-detections plotted at MDL beginning in December, 2009; prior non-detections plotted at 50% of the RL

1520304_LDA Infiltration GW Monitoring Results-Graphs.xlsm 152030420
6.0
6.5
7.0
7.5
8.0
8.5
9.0
9.5
10.0
10.5
11.0
0
100
200
300
400
500
600
700
800
900
1,000
1,100
1,200
1,300
1,400
12-Ju
n-05
10-O
ct-0
57-
Feb-
067-
Jun-
065-
Oct
-06
2-Fe
b-07
2-Ju
n-07
30-S
ep-0
728
-Jan-
0827
-May
-08
24-S
ep-0
822
-Jan-
0922
-May
-09
19-S
ep-0
917
-Jan-
1017
-May
-10
14-S
ep-1
012
-Jan-
1112
-May
-11
9-Se
p-11
7-Ja
n-12
6-M
ay-1
23-
Sep-
121-
Jan-
131-
May
-13
29-A
ug-1
327
-Dec
-13
26-A
pr-1
424
-Aug
-14
22-D
ec-1
421
-Apr
-15
19-A
ug-1
517
-Dec
-15
15-A
pr-1
613
-Aug
-16
11-D
ec-1
610
-Apr
-17
8-Au
g-17
6-De
c-17
5-Ap
r-18
3-Au
g-18
1-De
c-18
31-M
ar-1
929
-Jul-1
926
-Nov
-19
25-M
ar-2
023
-Jul-2
020
-Nov
-20
20-M
ar-2
118
-Jul-2
1
pH (s
tand
ard
units
)
Tota
l Dis
solv
ed S
olid
s (m
g/L)
Date
LDA Shallow/Alluvial Monitoring WellsMW-5A
TDS pHNon-detections plotted at RL beginning in December, 2009; no prior non-detections.

1520304_LDA Infiltration GW Monitoring Results-Graphs.xlsm 152030420
0.0
100.0
200.0
300.0
400.0
500.0
600.0
700.0
800.0
0.0000
0.0500
0.1000
0.1500
0.2000
0.2500
12-Ju
n-05
10-O
ct-0
57-
Feb-
067-
Jun-
065-
Oct
-06
2-Fe
b-07
2-Ju
n-07
30-S
ep-0
728
-Jan-
0827
-May
-08
24-S
ep-0
822
-Jan-
0922
-May
-09
19-S
ep-0
917
-Jan-
1017
-May
-10
14-S
ep-1
012
-Jan-
1112
-May
-11
9-Se
p-11
7-Ja
n-12
6-M
ay-1
23-
Sep-
121-
Jan-
131-
May
-13
29-A
ug-1
327
-Dec
-13
26-A
pr-1
424
-Aug
-14
22-D
ec-1
421
-Apr
-15
19-A
ug-1
517
-Dec
-15
15-A
pr-1
613
-Aug
-16
11-D
ec-1
610
-Apr
-17
8-Au
g-17
6-De
c-17
5-Ap
r-18
3-Au
g-18
1-De
c-18
31-M
ar-1
929
-Jul-1
926
-Nov
-19
25-M
ar-2
023
-Jul-2
020
-Nov
-20
20-M
ar-2
118
-Jul-2
1
Pota
ssiu
m (m
g/L)
Arse
nic
(mg/
L)
Date
LDA Shallow/Alluvial Monitoring WellsMW-6A
Arsenic Arsenic Non-Detections PotassiumNon-detections plotted at MDL beginning in December, 2009; prior non-detections plotted at 50% of the RL

1520304_LDA Infiltration GW Monitoring Results-Graphs.xlsm 152030420
6.0
6.5
7.0
7.5
8.0
8.5
9.0
9.5
10.0
10.5
11.0
11.5
12.0
12.5
13.0
13.5
14.0
0
500
1,000
1,500
2,000
2,500
12-Ju
n-05
10-O
ct-0
57-
Feb-
067-
Jun-
065-
Oct
-06
2-Fe
b-07
2-Ju
n-07
30-S
ep-0
728
-Jan-
0827
-May
-08
24-S
ep-0
822
-Jan-
0922
-May
-09
19-S
ep-0
917
-Jan-
1017
-May
-10
14-S
ep-1
012
-Jan-
1112
-May
-11
9-Se
p-11
7-Ja
n-12
6-M
ay-1
23-
Sep-
121-
Jan-
131-
May
-13
29-A
ug-1
327
-Dec
-13
26-A
pr-1
424
-Aug
-14
22-D
ec-1
421
-Apr
-15
19-A
ug-1
517
-Dec
-15
15-A
pr-1
613
-Aug
-16
11-D
ec-1
610
-Apr
-17
8-Au
g-17
6-De
c-17
5-Ap
r-18
3-Au
g-18
1-De
c-18
31-M
ar-1
929
-Jul-1
926
-Nov
-19
25-M
ar-2
023
-Jul-2
020
-Nov
-20
20-M
ar-2
118
-Jul-2
1
pH (s
tand
ard
units
)
Tota
l Dis
solv
ed S
olid
s (m
g/L)
Date
LDA Shallow/Alluvial Monitoring WellsMW-6A
TDS pHNon-detections plotted at RL beginning in December, 2009; no prior non-detections.

1520304_LDA Infiltration GW Monitoring Results-Graphs.xlsm 152030420
0.0000
0.0500
0.1000
0.1500
0.200012
-Jun-
0510
-Oct
-05
7-Fe
b-06
7-Ju
n-06
5-O
ct-0
62-
Feb-
072-
Jun-
0730
-Sep
-07
28-Ja
n-08
27-M
ay-0
824
-Sep
-08
22-Ja
n-09
22-M
ay-0
919
-Sep
-09
17-Ja
n-10
17-M
ay-1
014
-Sep
-10
12-Ja
n-11
12-M
ay-1
19-
Sep-
117-
Jan-
126-
May
-12
3-Se
p-12
1-Ja
n-13
1-M
ay-1
329
-Aug
-13
27-D
ec-1
326
-Apr
-14
24-A
ug-1
422
-Dec
-14
21-A
pr-1
519
-Aug
-15
17-D
ec-1
515
-Apr
-16
13-A
ug-1
611
-Dec
-16
10-A
pr-1
78-
Aug-
176-
Dec-
175-
Apr-
183-
Aug-
181-
Dec-
1831
-Mar
-19
29-Ju
l-19
26-N
ov-1
925
-Mar
-20
23-Ju
l-20
20-N
ov-2
020
-Mar
-21
18-Ju
l-21
Arse
nic
(mg/
L)
Date
LDA Shallow/Alluvial Monitoring WellsArsenic (mg/L)
MW-1A MW-2AMW-3A MW-4AMW-5A MW-6AArsenic Non-Detections
Non-detections plotted at MDL beginning in December, 2009; prior non-detections plotted at 50% of the RL

1520304_LDA Infiltration GW Monitoring Results-Graphs.xlsm 152030420
0.0
200.0
400.0
600.0
800.0
1,000.0
12-Ju
n-05
10-O
ct-0
57-
Feb-
067-
Jun-
065-
Oct
-06
2-Fe
b-07
2-Ju
n-07
30-S
ep-0
728
-Jan-
0827
-May
-08
24-S
ep-0
822
-Jan-
0922
-May
-09
19-S
ep-0
917
-Jan-
1017
-May
-10
14-S
ep-1
012
-Jan-
1112
-May
-11
9-Se
p-11
7-Ja
n-12
6-M
ay-1
23-
Sep-
121-
Jan-
131-
May
-13
29-A
ug-1
327
-Dec
-13
26-A
pr-1
424
-Aug
-14
22-D
ec-1
421
-Apr
-15
19-A
ug-1
517
-Dec
-15
15-A
pr-1
613
-Aug
-16
11-D
ec-1
610
-Apr
-17
8-Au
g-17
6-De
c-17
5-Ap
r-18
3-Au
g-18
1-De
c-18
31-M
ar-1
929
-Jul-1
926
-Nov
-19
25-M
ar-2
023
-Jul-2
020
-Nov
-20
20-M
ar-2
118
-Jul-2
1
Pota
ssiu
m (m
g/L)
Date
LDA Shallow/Alluvial Monitoring WellsPotassium (mg/L)
MW-1A MW-2AMW-3A MW-4AMW-5A MW-6APotassium Non-Detections
Non-detections plotted at MDL beginning in December, 2009; prior non-detections plotted at 50% of the RL
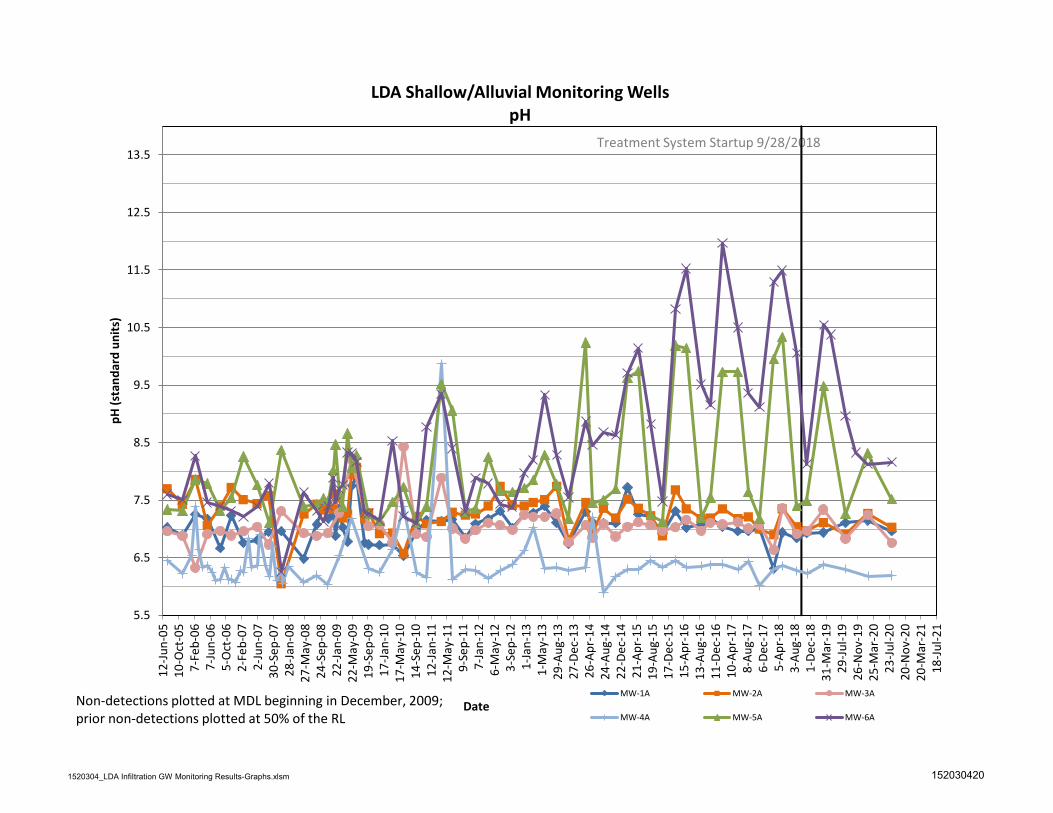
1520304_LDA Infiltration GW Monitoring Results-Graphs.xlsm 152030420
5.5
6.5
7.5
8.5
9.5
10.5
11.5
12.5
13.512
-Jun-
0510
-Oct
-05
7-Fe
b-06
7-Ju
n-06
5-O
ct-0
62-
Feb-
072-
Jun-
0730
-Sep
-07
28-Ja
n-08
27-M
ay-0
824
-Sep
-08
22-Ja
n-09
22-M
ay-0
919
-Sep
-09
17-Ja
n-10
17-M
ay-1
014
-Sep
-10
12-Ja
n-11
12-M
ay-1
19-
Sep-
117-
Jan-
126-
May
-12
3-Se
p-12
1-Ja
n-13
1-M
ay-1
329
-Aug
-13
27-D
ec-1
326
-Apr
-14
24-A
ug-1
422
-Dec
-14
21-A
pr-1
519
-Aug
-15
17-D
ec-1
515
-Apr
-16
13-A
ug-1
611
-Dec
-16
10-A
pr-1
78-
Aug-
176-
Dec-
175-
Apr-
183-
Aug-
181-
Dec-
1831
-Mar
-19
29-Ju
l-19
26-N
ov-1
925
-Mar
-20
23-Ju
l-20
20-N
ov-2
020
-Mar
-21
18-Ju
l-21
pH (s
tand
ard
units
)
Date
LDA Shallow/Alluvial Monitoring WellspH
MW-1A MW-2A MW-3A
MW-4A MW-5A MW-6ANon-detections plotted at MDL beginning in December, 2009; prior non-detections plotted at 50% of the RL
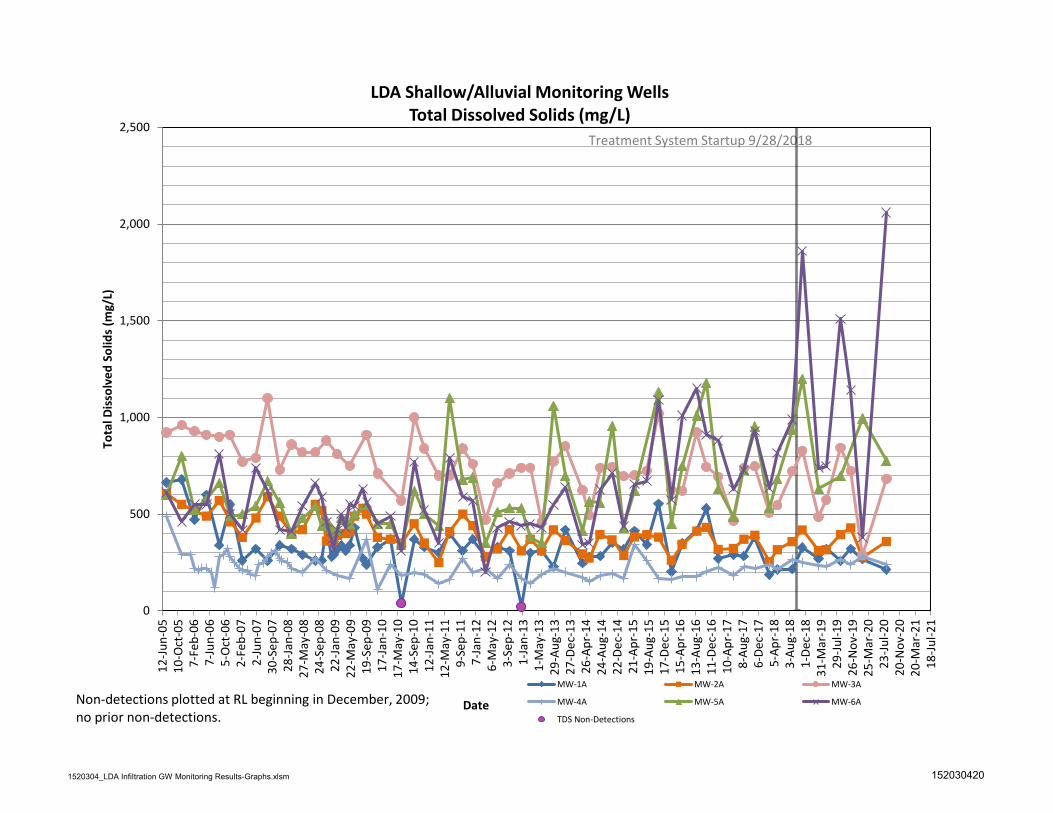
1520304_LDA Infiltration GW Monitoring Results-Graphs.xlsm 152030420
0
500
1,000
1,500
2,000
2,500
12-Ju
n-05
10-O
ct-0
57-
Feb-
067-
Jun-
065-
Oct
-06
2-Fe
b-07
2-Ju
n-07
30-S
ep-0
728
-Jan-
0827
-May
-08
24-S
ep-0
822
-Jan-
0922
-May
-09
19-S
ep-0
917
-Jan-
1017
-May
-10
14-S
ep-1
012
-Jan-
1112
-May
-11
9-Se
p-11
7-Ja
n-12
6-M
ay-1
23-
Sep-
121-
Jan-
131-
May
-13
29-A
ug-1
327
-Dec
-13
26-A
pr-1
424
-Aug
-14
22-D
ec-1
421
-Apr
-15
19-A
ug-1
517
-Dec
-15
15-A
pr-1
613
-Aug
-16
11-D
ec-1
610
-Apr
-17
8-Au
g-17
6-De
c-17
5-Ap
r-18
3-Au
g-18
1-De
c-18
31-M
ar-1
929
-Jul-1
926
-Nov
-19
25-M
ar-2
023
-Jul-2
020
-Nov
-20
20-M
ar-2
118
-Jul-2
1
Tota
l Dis
solv
ed S
olid
s (m
g/L)
Date
LDA Shallow/Alluvial Monitoring WellsTotal Dissolved Solids (mg/L)
MW-1A MW-2A MW-3A
MW-4A MW-5A MW-6A
TDS Non-Detections
Non-detections plotted at RL beginning in December, 2009; no prior non-detections.

APPENDIX C
Data Validation Report and
Laboratory Analytical Results

https://golderassociates.sharepoint.com/sites/11287g/groundwater monitoring/lab-data/data validation/2020/2020-3q/2020-3q filter sampling ravensdale-dv.docx 1
DATA VALIDATION CHECKLIST
Project Name: Ravensdale Project
Project Number: 1520304.420
Sample Identification(s):
Tank-Influent, Tank-Effluent, As2-Effluent
Sample Date(s): 8/14/2020
Sample Team: Joseph Xi, Golder Associates
Sample Matrix: Aqueous
Analyzing Laboratory: Analytical Resources, Inc. – Tukwila, WA
Analyses: Metals (EPA 6010C, 200.8): Total As, Pb
Laboratory Report No.: 20H0156
FIELD DATA PACKAGE DOCUMENTATION
Field Sampling Logs:
Reported Performance Acceptable
Not Required
NO YES NO YES
1. Sampling dates noted X X
2. Sampling team indicated X X
3. Sampling identification traceable to location collected X X
4. Sample location X X
5. Collection technique (bailer, pump, etc.) X X
6. Sample container type X X
7. Preservation methods X X
8. Chain-of-custody form completed X X
9. Required analytical methods requested X X
10. Field sample logs completed properly and signed X X
11. Number and type of field QC samples collected X X
12. Field equipment calibration X X
13. Field equipment decontamination X X
QC – quality control
COMMENTS:
Performance was acceptable. Two sample containers were received at pH >2, but were preserved by the
lab to <2 with additional acid.

https://golderassociates.sharepoint.com/sites/11287g/groundwater monitoring/lab-data/data validation/2020/2020-3q/2020-3q filter sampling ravensdale-dv.docx 2
ANALYTICAL DATA PACKAGE DOCUMENTATION
GENERAL INFORMATION
Reported
Performance Acceptable
Not Required
NO YES NO YES
1. Sample results X X
2. Parameters analyzed X X
3. Method of analysis X X
4. Reporting limits of analysis X X
5. Sample collection date X X
6. Laboratory sample received date X X
7. Sample preparation/extraction date X X
8. Sample analysis date X X
9. Copy of chain-of-custody form signed by lab sample custodian X X
10. Narrative summary of QA or sample problems provided X X
QA – quality assurance
COMMENTS:
Performance was acceptable, with no exceptions.

https://golderassociates.sharepoint.com/sites/11287g/groundwater monitoring/lab-data/data validation/2020/2020-3q/2020-3q filter sampling ravensdale-dv.docx 3
INORGANIC ANALYSES
Metals (EPA 6010/6020)
Reported Performance Acceptable
Not Required
NO YES NO YES
1. Holding times X X
2. Reporting limits X X
3. Blanks
a. Method blanks X X
b. Equipment rinsate blanks X X
4. Laboratory control sample (LCS) %R X X
5. Matrix spike (MS) %R X X
6. LCS duplicate (LCSD) %R X X
7. MS duplicate (MSD) %R X X
8. MS / MSD RPD X X
9. LCS / LCSD RPD X X
10. Laboratory Duplicate RPD X X
11.Field duplicate comparison X X
%R – percent recovery RPD – relative percent difference
COMMENTS:
Performance was acceptable, with no exceptions.
• The laboratory did not provide LCSD, MS, MSD, or laboratory duplicate results. These QC
elements are not required because sufficient precision and accuracy data was provided by the lab
with LCS analyses.

https://golderassociates.sharepoint.com/sites/11287g/groundwater monitoring/lab-data/data validation/2020/2020-3q/2020-3q filter sampling ravensdale-dv.docx 4
GENERAL WET CHEMISTRY
TDS (EPA 160.1)
Reported Performance Acceptable
Not Required
NO YES NO YES
1. Holding times X X
2. Reporting limits X X
3. Blanks
a. Method blanks X X
b. Equipment rinsate blanks X X
4. Laboratory control sample (LCS) %R X X
5. Matrix spike (MS) %R X X
6. LCS duplicate (LCSD) %R X X
7. MS duplicate (MSD) %R X X
8. MS/MSD RPD X X
9. LCS/LCSD RPD X X
10. Laboratory Duplicate RPD X X
11. Field duplicate comparison X X
%R – percent recovery RPD – relative percent difference
COMMENTS:
Performance was acceptable, with no exceptions.
• The laboratory did not provide LCSD, MS, or MSD results. These QC elements are not required
because sufficient precision and accuracy data was provided by the lab with laboratory duplicate
and LCS analyses.

https://golderassociates.sharepoint.com/sites/11287g/groundwater monitoring/lab-data/data validation/2020/2020-3q/2020-3q filter sampling ravensdale-dv.docx 5
DATA VALIDATION CHECKLIST
SUMMARY AND DATA QUALIFIER CODES
Project Name: Ravensdale Project
Project Number: 1520304.420
Sample Identification(s):
Tank-Influent, Tank-Effluent, As2-Effluent
Sample Date(s): 8/14/2020
Sample Team: Joseph Xi, Golder Associates
Sample Matrix: Aqueous
Analyzing Laboratory: Analytical Resources, Inc. – Tukwila, WA
Analyses: Metals (EPA 6010C, 200.8): Total As, Pb
Laboratory Report No.: 20H0156
Sample ID Analyte(s) Old Result
Old Qualifier
New Result
New Qualifier
Reason(s)
All samples All analytes - - Remove any lab applied “D” qualifiers
VALIDATION PERFORMED BY: Joseph Xi, Golder Associates
DATE: September 4, 2020

Analytical Resources, Incorporated
Analytical Chemists and Consultants
Golder Associates
RE: Ravensdale
Redmond, WA 98052-3333
18300 NE Union Hill Road Suite 200
Gary Zimmerman
Please find enclosed sample receipt documentation and analytical results for samples from the project referenced
above.
Sample analyses were performed according to ARI's Quality Assurance Plan and any provided project specific
Quality Assurance Plan. Each analytical section of this report has been approved and reviewed by an analytical
peer, the appropriate Laboratory Supervisor or qualified substitute, and a technical reviewer.
Should you have any questions or problems, please feel free to contact us at your convenience.
28 August 2020
Associated Work Order(s) Associated SDG ID(s)
20H0156 N/A
-----
I certify that this data package is in compliance with the terms and conditions of the contract, both technically
and for completeness, for other than the conditions detailed in the enclose Narrative. ARI, an accredited
laboratory, certifies that the report results for which ARI is accredited meets all the requirements of the
accrediting body. A list of certified analyses, accreditations, and expiration dates is included in this report.
Release of the data contained in this hardcopy data package has been authorized by the Laboratory Manager or
his/her designee, as verified by the following signature.
Analytical Resources, Inc. The results in this report apply to the samples analyzed in accordance with the
chain of custody document. This analytical report must be reproduced in its
entirety.
Cert# 100006
PJLA TestingAccreditation # 66169
Page 1 of 16 20H0156 ARISample FINAL 28 Aug 2020 1612

Page 2 of 16 20H0156 ARISample FINAL 28 Aug 2020 1612

Project:
Project Number:
Project Manager:
Reported:
Golder Associates
18300 NE Union Hill Road Suite 200 Ravensdale
Gary Zimmerman
Ravensdale
28-Aug-2020 16:12Redmond WA, 98052-3333
Analytical ReportAnalytical Chemists and Consultants
Analytical Resources, Incorporated
ANALYTICAL REPORT FOR SAMPLES
Sample ID Laboratory ID Matrix Date Sampled Date Received
Tank-Influent 20H0156-01 Water 14-Aug-2020 12:20 14-Aug-2020 15:08
Tank-Effluent 20H0156-02 Water 14-Aug-2020 12:25 14-Aug-2020 15:08
As2-Effluent 20H0156-03 Water 14-Aug-2020 12:30 14-Aug-2020 15:08
Analytical Resources, Inc. The results in this report apply to the samples analyzed in accordance with the
chain of custody document. This analytical report must be reproduced in its
entirety.
Page 3 of 16 20H0156 ARISample FINAL 28 Aug 2020 1612
Project:
Project Number:
Project Manager:
Reported:
Golder Associates
18300 NE Union Hill Road Suite 200 Ravensdale
Gary Zimmerman
Ravensdale
28-Aug-2020 16:12Redmond WA, 98052-3333
Analytical ReportAnalytical Chemists and Consultants
Analytical Resources, Incorporated
Total Metals - EPA Method 200.8
The sample(s) were digested and analyzed within the recommended holding times.
Initial and continuing calibrations were within method requirements.
The method blank(s) were clean at the reporting limits.
The blank spike (BS/LCS) percent recoveries were within control limits.
Work Order Case Narrative
Analytical Resources, Inc. The results in this report apply to the samples analyzed in accordance with the
chain of custody document. This analytical report must be reproduced in its
entirety.
Page 4 of 16 20H0156 ARISample FINAL 28 Aug 2020 1612
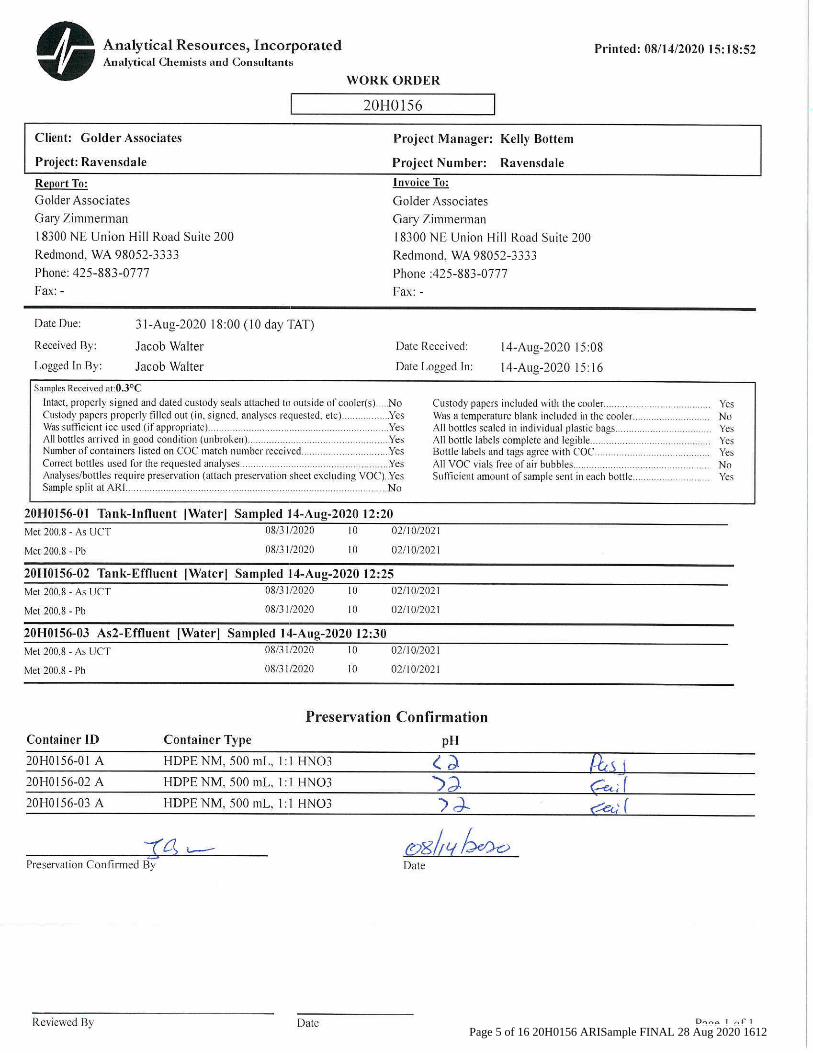
Page 5 of 16 20H0156 ARISample FINAL 28 Aug 2020 1612

Page 6 of 16 20H0156 ARISample FINAL 28 Aug 2020 1612

Page 7 of 16 20H0156 ARISample FINAL 28 Aug 2020 1612

Project:
Project Number:
Project Manager:
Reported:
Golder Associates
18300 NE Union Hill Road Suite 200 Ravensdale
Gary Zimmerman
Ravensdale
28-Aug-2020 16:12Redmond WA, 98052-3333
Analytical ReportAnalytical Chemists and Consultants
Analytical Resources, Incorporated
Tank-Influent
20H0156-01 (Water)
Sampled: 08/14/2020 12:20Method: EPA 200.8
Metals and Metallic Compounds
Instrument: ICPMS1 Analyst: MCB Analyzed: 08/24/2020 22:13
Preparation Batch: BIH0403
Prepared: 08/21/2020 Final Volume: 25 mL
Preparation Method: REN EPA 600/4-79-020 4.1.4 HNO3 matrixSample Preparation:
Sample Size: 25 mL
Extract ID: 20H0156-01 A 01
Detection
Analyte Limit
Reporting
Result Notes UnitsDilution LimitCAS Number
1 ug/L0.1000.06807439-92-1Lead 75.9
Analytical Resources, Inc. The results in this report apply to the samples analyzed in accordance with the
chain of custody document. This analytical report must be reproduced in its
entirety.
Page 8 of 16 20H0156 ARISample FINAL 28 Aug 2020 1612

Project:
Project Number:
Project Manager:
Reported:
Golder Associates
18300 NE Union Hill Road Suite 200 Ravensdale
Gary Zimmerman
Ravensdale
28-Aug-2020 16:12Redmond WA, 98052-3333
Analytical ReportAnalytical Chemists and Consultants
Analytical Resources, Incorporated
Tank-Influent
20H0156-01 (Water)
Sampled: 08/14/2020 12:20Method: EPA 200.8 UCT-KED
Metals and Metallic Compounds
Instrument: ICPMS2 Analyst: MCB Analyzed: 08/26/2020 20:07
Preparation Batch: BIH0403
Prepared: 08/21/2020 Final Volume: 25 mL
Preparation Method: REN EPA 600/4-79-020 4.1.4 HNO3 matrixSample Preparation:
Sample Size: 25 mL
Extract ID: 20H0156-01 A 01
Detection
Analyte Limit
Reporting
Result Notes UnitsDilution LimitCAS Number
5 ug/L1.000.1107440-38-2 DArsenic 24.4
Analytical Resources, Inc. The results in this report apply to the samples analyzed in accordance with the
chain of custody document. This analytical report must be reproduced in its
entirety.
Page 9 of 16 20H0156 ARISample FINAL 28 Aug 2020 1612

Project:
Project Number:
Project Manager:
Reported:
Golder Associates
18300 NE Union Hill Road Suite 200 Ravensdale
Gary Zimmerman
Ravensdale
28-Aug-2020 16:12Redmond WA, 98052-3333
Analytical ReportAnalytical Chemists and Consultants
Analytical Resources, Incorporated
Tank-Effluent
20H0156-02 (Water)
Sampled: 08/14/2020 12:25Method: EPA 200.8
Metals and Metallic Compounds
Instrument: ICPMS1 Analyst: MCB Analyzed: 08/24/2020 22:17
Preparation Batch: BIH0403
Prepared: 08/21/2020 Final Volume: 25 mL
Preparation Method: REN EPA 600/4-79-020 4.1.4 HNO3 matrixSample Preparation:
Sample Size: 25 mL
Extract ID: 20H0156-02 A 01
Detection
Analyte Limit
Reporting
Result Notes UnitsDilution LimitCAS Number
1 ug/L0.1000.06807439-92-1Lead 42.9
Analytical Resources, Inc. The results in this report apply to the samples analyzed in accordance with the
chain of custody document. This analytical report must be reproduced in its
entirety.
Page 10 of 16 20H0156 ARISample FINAL 28 Aug 2020 1612

Project:
Project Number:
Project Manager:
Reported:
Golder Associates
18300 NE Union Hill Road Suite 200 Ravensdale
Gary Zimmerman
Ravensdale
28-Aug-2020 16:12Redmond WA, 98052-3333
Analytical ReportAnalytical Chemists and Consultants
Analytical Resources, Incorporated
Tank-Effluent
20H0156-02 (Water)
Sampled: 08/14/2020 12:25Method: EPA 200.8 UCT-KED
Metals and Metallic Compounds
Instrument: ICPMS2 Analyst: MCB Analyzed: 08/26/2020 19:58
Preparation Batch: BIH0403
Prepared: 08/21/2020 Final Volume: 25 mL
Preparation Method: REN EPA 600/4-79-020 4.1.4 HNO3 matrixSample Preparation:
Sample Size: 25 mL
Extract ID: 20H0156-02 A 01
Detection
Analyte Limit
Reporting
Result Notes UnitsDilution LimitCAS Number
5 ug/L1.000.1107440-38-2 DArsenic 25.5
Analytical Resources, Inc. The results in this report apply to the samples analyzed in accordance with the
chain of custody document. This analytical report must be reproduced in its
entirety.
Page 11 of 16 20H0156 ARISample FINAL 28 Aug 2020 1612

Project:
Project Number:
Project Manager:
Reported:
Golder Associates
18300 NE Union Hill Road Suite 200 Ravensdale
Gary Zimmerman
Ravensdale
28-Aug-2020 16:12Redmond WA, 98052-3333
Analytical ReportAnalytical Chemists and Consultants
Analytical Resources, Incorporated
As2-Effluent
20H0156-03 (Water)
Sampled: 08/14/2020 12:30Method: EPA 200.8
Metals and Metallic Compounds
Instrument: ICPMS1 Analyst: MCB Analyzed: 08/24/2020 22:22
Preparation Batch: BIH0403
Prepared: 08/21/2020 Final Volume: 25 mL
Preparation Method: REN EPA 600/4-79-020 4.1.4 HNO3 matrixSample Preparation:
Sample Size: 25 mL
Extract ID: 20H0156-03 A 01
Detection
Analyte Limit
Reporting
Result Notes UnitsDilution LimitCAS Number
1 ug/L0.1000.06807439-92-1Lead 14.2
Analytical Resources, Inc. The results in this report apply to the samples analyzed in accordance with the
chain of custody document. This analytical report must be reproduced in its
entirety.
Page 12 of 16 20H0156 ARISample FINAL 28 Aug 2020 1612

Project:
Project Number:
Project Manager:
Reported:
Golder Associates
18300 NE Union Hill Road Suite 200 Ravensdale
Gary Zimmerman
Ravensdale
28-Aug-2020 16:12Redmond WA, 98052-3333
Analytical ReportAnalytical Chemists and Consultants
Analytical Resources, Incorporated
As2-Effluent
20H0156-03 (Water)
Sampled: 08/14/2020 12:30Method: EPA 200.8 UCT-KED
Metals and Metallic Compounds
Instrument: ICPMS2 Analyst: MCB Analyzed: 08/26/2020 19:48
Preparation Batch: BIH0403
Prepared: 08/21/2020 Final Volume: 25 mL
Preparation Method: REN EPA 600/4-79-020 4.1.4 HNO3 matrixSample Preparation:
Sample Size: 25 mL
Extract ID: 20H0156-03 A 01
Detection
Analyte Limit
Reporting
Result Notes UnitsDilution LimitCAS Number
2 ug/L0.4000.04407440-38-2 DArsenic 1.52
Analytical Resources, Inc. The results in this report apply to the samples analyzed in accordance with the
chain of custody document. This analytical report must be reproduced in its
entirety.
Page 13 of 16 20H0156 ARISample FINAL 28 Aug 2020 1612

Project:
Project Number:
Project Manager:
Reported:
Golder Associates
18300 NE Union Hill Road Suite 200 Ravensdale
Gary Zimmerman
Ravensdale
28-Aug-2020 16:12Redmond WA, 98052-3333
Analytical ReportAnalytical Chemists and Consultants
Analytical Resources, Incorporated
Batch BIH0403 - REN EPA 600/4-79-020 4.1.4 HNO3 matrix
Metals and Metallic Compounds - Quality Control
Instrument: ICPMS1 Analyst: MCB
Result Limit
Reporting
Units Level
Spike
Result
Source
%REC
%REC
Limits RPD
RPD
Limit Notes QC Sample/Analyte
Detection
LimitIsotope
Prepared: 21-Aug-2020 Analyzed: 24-Aug-2020 14:32Blank (BIH0403-BLK1)
0.100ND ug/L U0.0680Lead 208
0.200ND ug/L U0.0220Arsenic 75a
Prepared: 21-Aug-2020 Analyzed: 24-Aug-2020 14:28LCS (BIH0403-BS1)
0.10026.7 80-120107ug/L 25.00.0680Lead 208
0.20025.1 80-120100ug/L 25.00.0220Arsenic 75a
Analytical Resources, Inc. The results in this report apply to the samples analyzed in accordance with the
chain of custody document. This analytical report must be reproduced in its
entirety.
Page 14 of 16 20H0156 ARISample FINAL 28 Aug 2020 1612
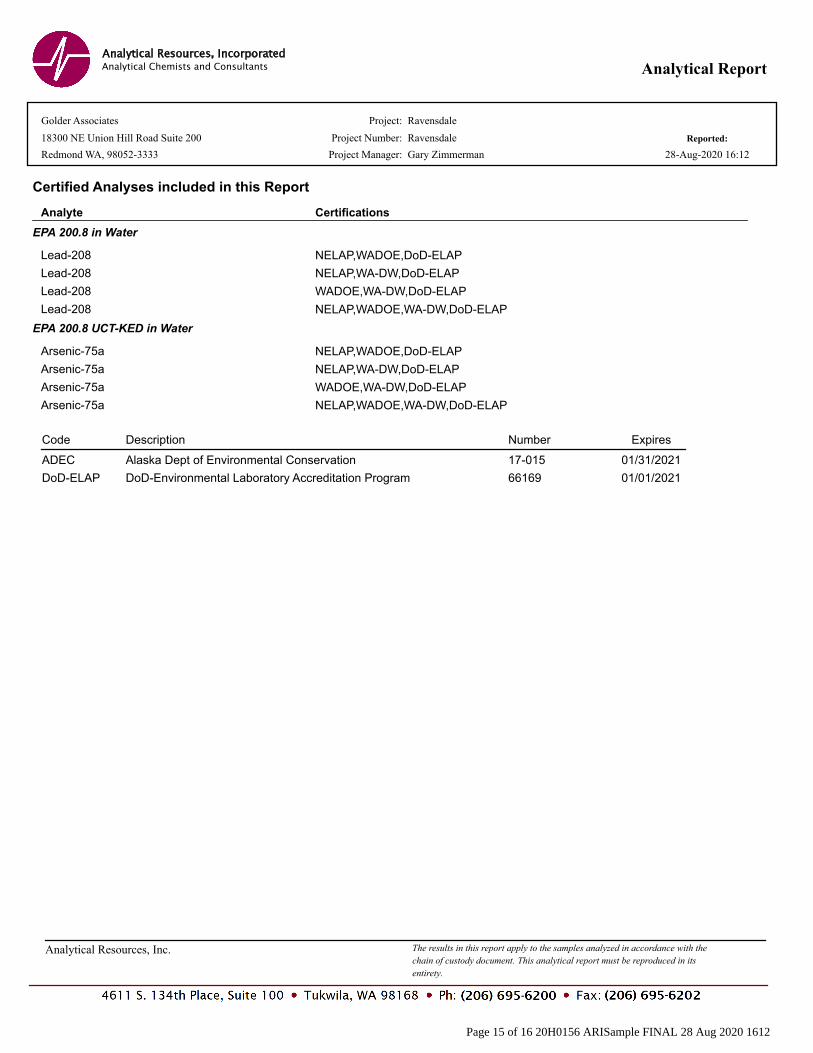
Project:
Project Number:
Project Manager:
Reported:
Golder Associates
18300 NE Union Hill Road Suite 200 Ravensdale
Gary Zimmerman
Ravensdale
28-Aug-2020 16:12Redmond WA, 98052-3333
Analytical ReportAnalytical Chemists and Consultants
Analytical Resources, Incorporated
Certified Analyses included in this Report
CertificationsAnalyte
EPA 200.8 in Water
Lead-208 NELAP,WADOE,DoD-ELAP
Lead-208 NELAP,WA-DW,DoD-ELAP
Lead-208 WADOE,WA-DW,DoD-ELAP
Lead-208 NELAP,WADOE,WA-DW,DoD-ELAP
EPA 200.8 UCT-KED in Water
Arsenic-75a NELAP,WADOE,DoD-ELAP
Arsenic-75a NELAP,WA-DW,DoD-ELAP
Arsenic-75a WADOE,WA-DW,DoD-ELAP
Arsenic-75a NELAP,WADOE,WA-DW,DoD-ELAP
Code Description Number Expires
17-015Alaska Dept of Environmental Conservation 01/31/2021ADEC
66169DoD-Environmental Laboratory Accreditation Program 01/01/2021DoD-ELAP
Analytical Resources, Inc. The results in this report apply to the samples analyzed in accordance with the
chain of custody document. This analytical report must be reproduced in its
entirety.
Page 15 of 16 20H0156 ARISample FINAL 28 Aug 2020 1612

Project:
Project Number:
Project Manager:
Reported:
Golder Associates
18300 NE Union Hill Road Suite 200 Ravensdale
Gary Zimmerman
Ravensdale
28-Aug-2020 16:12Redmond WA, 98052-3333
Analytical ReportAnalytical Chemists and Consultants
Analytical Resources, Incorporated
Notes and Definitions
The reported value is from a dilutionD
Estimated concentration value detected below the reporting limit.J
This analyte is not detected above the reporting limit (RL) or if noted, not detected above the limit of detection (LOD).U
Sample results reported on a dry weight basis
Relative Percent DifferenceRPD
dry
Not ReportedNR
Analyte NOT DETECTED at or above the reporting limitND
Analyte DETECTEDDET
[2C] Indicates this result was quantified on the second column on a dual column analysis.
Page 16 of 16 20H0156 ARISample FINAL 28 Aug 2020 1612

https://golderassociates.sharepoint.com/sites/11287g/groundwater monitoring/lab-data/data validation/2020/2020-3q/2020-3q ravensdale-dv.docx 1
DATA VALIDATION CHECKLIST
Project Name: Ravensdale Project
Project Number: 152030420
Sample Identification(s):
EB, Infiltration #1, Infiltration #2, MW-1A, MW-2A, MW-3A, MW-4A, MW-5A, MW-6A, MW-7A, Still Well, Interceptor Trench
Sample Date(s): 8/12 - 8/13/2020
Sample Team: Joseph Xi, Tom Haskins, Golder Associates
Sample Matrix: Aqueous
Analyzing Laboratory: Analytical Resources, Inc. – Tukwila, WA
Analyses: TDS (SM 2540 C), Metals (EPA 6010C, 200.8): Dissolved As, Pb, K, Fe, Mn
Laboratory Report No.: 20H0157
FIELD DATA PACKAGE DOCUMENTATION
Field Sampling Logs:
Reported Performance Acceptable
Not Required
NO YES NO YES
1. Sampling dates noted X X
2. Sampling team indicated X X
3. Sampling identification traceable to location collected X X
4. Sample location X X
5. Collection technique (bailer, pump, etc.) X X
6. Sample container type X X
7. Preservation methods X X
8. Chain-of-custody form completed X X
9. Required analytical methods requested X X
10. Field sample logs completed properly and signed X X
11. Number and type of field QC samples collected X X
12. Field equipment calibration X X
13. Field equipment decontamination X X
QC – quality control
COMMENTS:
Performance was acceptable, with no exceptions.

https://golderassociates.sharepoint.com/sites/11287g/groundwater monitoring/lab-data/data validation/2020/2020-3q/2020-3q ravensdale-dv.docx 2
ANALYTICAL DATA PACKAGE DOCUMENTATION
GENERAL INFORMATION
Reported
Performance Acceptable
Not Required
NO YES NO YES
1. Sample results X X
2. Parameters analyzed X X
3. Method of analysis X X
4. Reporting limits of analysis X X
5. Sample collection date X X
6. Laboratory sample received date X X
7. Sample preparation/extraction date X X
8. Sample analysis date X X
9. Copy of chain-of-custody form signed by lab sample custodian X X
10. Narrative summary of QA or sample problems provided X X
QA – quality assurance
COMMENTS:
Performance was acceptable, with the following notes:
• The reporting limits (RLs) and method detection limits (MDLs) of Analytical Resources Inc. were
reviewed to ensure data quality objectives were met. The following table is a comparison of the
laboratory RLs and MDLs as compared to the preliminary standards for the site. All RLs and
MDLs were less than the preliminary standards.
Parameter
Preliminary Standards Analytical Resources Inc.
Method (mg/L) Method RL (mg/L) MDL (mg/L)
Total Dissolved Solids (TDS)
EPA 160.1 500 SM 2540 C 5 5
Iron EPA 6010B 0.3 EPA 6010C 0.05 0.0013
Manganese EPA 6010B 0.05 EPA 6010C 0.001 0.0003
Potassium EPA 6010B NA EPA 6010C 0.5 0.052
Arsenic EPA 6020 TBD EPA 200.8 0.0002 0.000022
Lead EPA 6020 0.05 EPA 200.8 0.0001 0.000068

https://golderassociates.sharepoint.com/sites/11287g/groundwater monitoring/lab-data/data validation/2020/2020-3q/2020-3q ravensdale-dv.docx 3
INORGANIC ANALYSES
Metals (EPA 6010/6020)
Reported Performance Acceptable
Not Required
NO YES NO YES
1. Holding times X X
2. Reporting limits X X
3. Blanks
a. Method blanks X X
b. Equipment rinsate blanks X X
4. Laboratory control sample (LCS) %R X X
5. Matrix spike (MS) %R X X
6. LCS duplicate (LCSD) %R X X
7. MS duplicate (MSD) %R X X
8. MS / MSD RPD X X
9. LCS / LCSD RPD X X
10. Laboratory Duplicate RPD X X
11.Field duplicate comparison X X
%R – percent recovery RPD – relative percent difference
COMMENTS:
Performance was acceptable, with the following exceptions and/or notes:
• The Equipment Blank (EB) had a low detection of dissolved iron (0.0031 J mg/L) and of dissolved
potassium (0.169 J mg/L). Validation guidelines do not require qualification of equipment blank
data. Following historic project practice, no formal qualifications are applied, but it is advisory that
low detections of iron and potassium in the primary samples may be biased high.
• The Total Dissolved Solids analysis of the EB was reports as non-detect U, but was analyzed
outside hold time. This result is flagged UJ.
• Field duplicates were collected at MW-2A (field duplicate ID is MW-7A) and Infiltration #1 (field
duplicate ID is Infiltration #2). All precision is acceptable.
• The laboratory did not provide LCSD results. This QC element is not required because sufficient
precision and accuracy data was provided by the lab with laboratory duplicate, MS/MSD, and
LCS analyses.

https://golderassociates.sharepoint.com/sites/11287g/groundwater monitoring/lab-data/data validation/2020/2020-3q/2020-3q ravensdale-dv.docx 4
GENERAL WET CHEMISTRY
TDS (EPA 160.1)
Reported Performance Acceptable
Not Required
NO YES NO YES
1. Holding times X X
2. Reporting limits X X
3. Blanks
a. Method blanks X X
b. Equipment rinsate blanks X X
4. Laboratory control sample (LCS) %R X X
5. Matrix spike (MS) %R X X
6. LCS duplicate (LCSD) %R X X
7. MS duplicate (MSD) %R X X
8. MS/MSD RPD X X
9. LCS/LCSD RPD X X
10. Laboratory Duplicate RPD X X
11. Field duplicate comparison X X
%R – percent recovery RPD – relative percent difference
COMMENTS:
Performance was acceptable, with the following exceptions and/or notes:
• Field duplicates were collected at MW-2A (field duplicate ID is MW-7A) and Infiltration #1 (field
duplicate ID is Infiltration #2). All precision is acceptable.
• The laboratory did not provide LCSD, MS, or MSD results. These QC elements are not required
because sufficient precision and accuracy data was provided by the lab with laboratory duplicate
and LCS analyses.

https://golderassociates.sharepoint.com/sites/11287g/groundwater monitoring/lab-data/data validation/2020/2020-3q/2020-3q ravensdale-dv.docx 5
DATA VALIDATION CHECKLIST
SUMMARY AND DATA QUALIFIER CODES
Project Name: Ravensdale Project
Project Number: 152030420
Sample Identification(s):
EB, Infiltration #1, Infiltration #2, MW-1A, MW-2A, MW-3A, MW-4A, MW-5A, MW-6A, MW-7A, Still Well, Interceptor Trench
Sample Date(s): 8/12 - 8/13/2020
Sample Team: Joseph Xi, Tom Haskins, Golder Associates
Sample Matrix: Aqueous
Analyzing Laboratory: Analytical Resources, Inc. – Tukwila, WA
Analyses: TDS (SM 2540 C), Metals (EPA 6010C, 200.8): Dissolved As, Pb, K, Fe, Mn
Laboratory Report No.: 20H0157
Sample ID Analyte(s) Old Result
Old Qualifier
New Result
New Qualifier
Reason(s)
All samples All analytes - - Remove any lab applied “D” qualifiers
EB Total Dissolved Solids
5 mg/L U 5 mg/L UJ Analyzed outside of hold time.
VALIDATION PERFORMED BY: Joseph Xi, Golder Associates
DATE: September 4, 2020

Analytical Resources, Incorporated
Analytical Chemists and Consultants
Golder Associates
RE: Ravensdale
Redmond, WA 98052-3333
18300 NE Union Hill Road Suite 200
Gary Zimmerman
Please find enclosed sample receipt documentation and analytical results for samples from the project referenced
above.
Sample analyses were performed according to ARI's Quality Assurance Plan and any provided project specific
Quality Assurance Plan. Each analytical section of this report has been approved and reviewed by an analytical
peer, the appropriate Laboratory Supervisor or qualified substitute, and a technical reviewer.
Should you have any questions or problems, please feel free to contact us at your convenience.
28 August 2020
Associated Work Order(s) Associated SDG ID(s)
20H0157 N/A
-----
I certify that this data package is in compliance with the terms and conditions of the contract, both technically
and for completeness, for other than the conditions detailed in the enclose Narrative. ARI, an accredited
laboratory, certifies that the report results for which ARI is accredited meets all the requirements of the
accrediting body. A list of certified analyses, accreditations, and expiration dates is included in this report.
Release of the data contained in this hardcopy data package has been authorized by the Laboratory Manager or
his/her designee, as verified by the following signature.
Analytical Resources, Inc. The results in this report apply to the samples analyzed in accordance with the
chain of custody document. This analytical report must be reproduced in its
entirety.
Cert# 100006
PJLA TestingAccreditation # 66169
Page 1 of 58 20H0157 ARISample FINAL 28 Aug 2020 1622

Page 2 of 58 20H0157 ARISample FINAL 28 Aug 2020 1622

Page 3 of 58 20H0157 ARISample FINAL 28 Aug 2020 1622

Project:
Project Number:
Project Manager:
Reported:
Golder Associates
18300 NE Union Hill Road Suite 200 Ravensdale
Gary Zimmerman
Ravensdale
28-Aug-2020 16:22Redmond WA, 98052-3333
Analytical ReportAnalytical Chemists and Consultants
Analytical Resources, Incorporated
ANALYTICAL REPORT FOR SAMPLES
Sample ID Laboratory ID Matrix Date Sampled Date Received
MW-1A 20H0157-01 Water 12-Aug-2020 09:55 14-Aug-2020 15:08
MW-2A 20H0157-02 Water 12-Aug-2020 11:35 14-Aug-2020 15:08
MW-7A 20H0157-03 Water 12-Aug-2020 11:40 14-Aug-2020 15:08
MW-6A 20H0157-04 Water 12-Aug-2020 13:00 14-Aug-2020 15:08
EB 20H0157-05 Water 12-Aug-2020 14:15 14-Aug-2020 15:08
MW-5A 20H0157-06 Water 12-Aug-2020 14:16 14-Aug-2020 15:08
Infiltration #1 20H0157-07 Water 12-Aug-2020 14:35 14-Aug-2020 15:08
Infiltration #2 20H0157-08 Water 12-Aug-2020 14:40 14-Aug-2020 15:08
MW-3A 20H0157-09 Water 13-Aug-2020 09:15 14-Aug-2020 15:08
Still Well 20H0157-10 Water 13-Aug-2020 09:45 14-Aug-2020 15:08
Interceptor Trench 20H0157-11 Water 13-Aug-2020 12:00 14-Aug-2020 15:08
MW-4A 20H0157-12 Water 13-Aug-2020 12:55 14-Aug-2020 15:08
Analytical Resources, Inc. The results in this report apply to the samples analyzed in accordance with the
chain of custody document. This analytical report must be reproduced in its
entirety.
Page 4 of 58 20H0157 ARISample FINAL 28 Aug 2020 1622

Project:
Project Number:
Project Manager:
Reported:
Golder Associates
18300 NE Union Hill Road Suite 200 Ravensdale
Gary Zimmerman
Ravensdale
28-Aug-2020 16:22Redmond WA, 98052-3333
Analytical ReportAnalytical Chemists and Consultants
Analytical Resources, Incorporated
Dissolved Metals - EPA Method 200.8 and 6010
The sample(s) were digested and analyzed within the recommended holding times.
Initial and continuing calibrations were within method requirements.
The method blank(s) were clean at the reporting limits.
The blank spike (BS/LCS) percent recoveries were within control limits.
The matrix spike (MS) percent recoveries and the duplicate (DUP) relative percent difference (RPD) were within limits.
Wet Chemistry
The sample(s) were prepared and analyzed within the recommended holding times.
Initial and continuing calibrations were within method requirements.
The method blank(s) were clean at the reporting limits.
The blank spike (BS/LCS) percent recoveries were within control limits.
The reference material (SRM) percent recoveries were within control limits.
Work Order Case Narrative
Analytical Resources, Inc. The results in this report apply to the samples analyzed in accordance with the
chain of custody document. This analytical report must be reproduced in its
entirety.
Page 5 of 58 20H0157 ARISample FINAL 28 Aug 2020 1622

Page 6 of 58 20H0157 ARISample FINAL 28 Aug 2020 1622
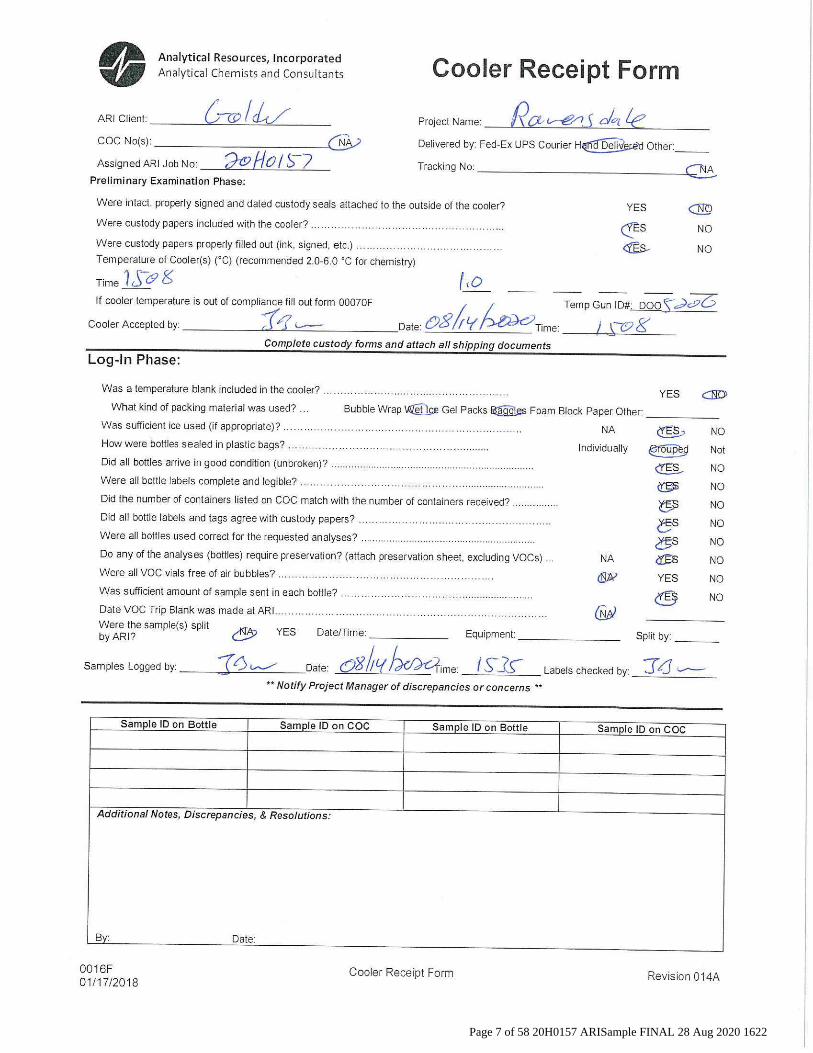
Page 7 of 58 20H0157 ARISample FINAL 28 Aug 2020 1622
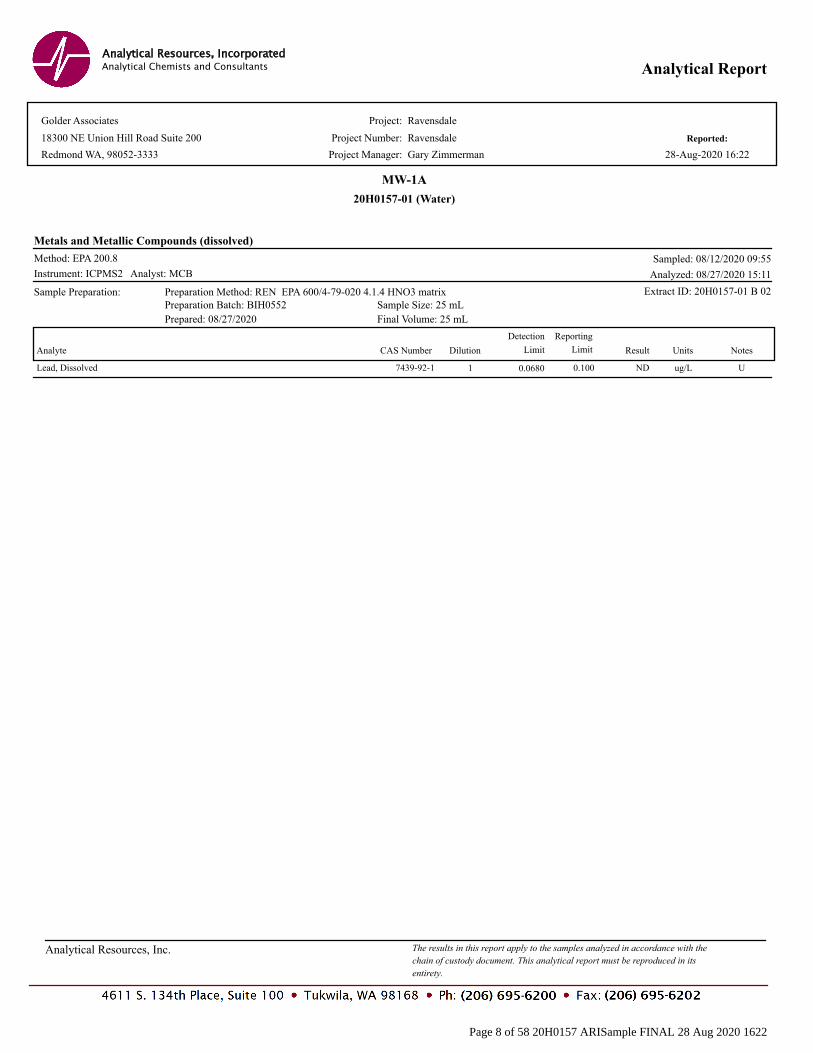
Project:
Project Number:
Project Manager:
Reported:
Golder Associates
18300 NE Union Hill Road Suite 200 Ravensdale
Gary Zimmerman
Ravensdale
28-Aug-2020 16:22Redmond WA, 98052-3333
Analytical ReportAnalytical Chemists and Consultants
Analytical Resources, Incorporated
MW-1A
20H0157-01 (Water)
Sampled: 08/12/2020 09:55Method: EPA 200.8
Metals and Metallic Compounds (dissolved)
Instrument: ICPMS2 Analyst: MCB Analyzed: 08/27/2020 15:11
Preparation Batch: BIH0552
Prepared: 08/27/2020 Final Volume: 25 mL
Preparation Method: REN EPA 600/4-79-020 4.1.4 HNO3 matrixSample Preparation:
Sample Size: 25 mL
Extract ID: 20H0157-01 B 02
Detection
Analyte Limit
Reporting
Result Notes UnitsDilution LimitCAS Number
1 ug/L0.1000.06807439-92-1 ULead, Dissolved ND
Analytical Resources, Inc. The results in this report apply to the samples analyzed in accordance with the
chain of custody document. This analytical report must be reproduced in its
entirety.
Page 8 of 58 20H0157 ARISample FINAL 28 Aug 2020 1622

Project:
Project Number:
Project Manager:
Reported:
Golder Associates
18300 NE Union Hill Road Suite 200 Ravensdale
Gary Zimmerman
Ravensdale
28-Aug-2020 16:22Redmond WA, 98052-3333
Analytical ReportAnalytical Chemists and Consultants
Analytical Resources, Incorporated
MW-1A
20H0157-01 (Water)
Sampled: 08/12/2020 09:55Method: EPA 200.8 UCT-KED
Metals and Metallic Compounds (dissolved)
Instrument: ICPMS2 Analyst: MCB Analyzed: 08/27/2020 15:11
Preparation Batch: BIH0552
Prepared: 08/27/2020 Final Volume: 25 mL
Preparation Method: REN EPA 600/4-79-020 4.1.4 HNO3 matrixSample Preparation:
Sample Size: 25 mL
Extract ID: 20H0157-01 B 02
Detection
Analyte Limit
Reporting
Result Notes UnitsDilution LimitCAS Number
1 ug/L0.2000.02207440-38-2Arsenic, Dissolved 1.14
Analytical Resources, Inc. The results in this report apply to the samples analyzed in accordance with the
chain of custody document. This analytical report must be reproduced in its
entirety.
Page 9 of 58 20H0157 ARISample FINAL 28 Aug 2020 1622

Project:
Project Number:
Project Manager:
Reported:
Golder Associates
18300 NE Union Hill Road Suite 200 Ravensdale
Gary Zimmerman
Ravensdale
28-Aug-2020 16:22Redmond WA, 98052-3333
Analytical ReportAnalytical Chemists and Consultants
Analytical Resources, Incorporated
MW-1A
20H0157-01 (Water)
Sampled: 08/12/2020 09:55Method: EPA 6010C
Metals and Metallic Compounds (dissolved)
Instrument: ICP2 Analyst: SKM Analyzed: 08/24/2020 12:20
Preparation Batch: BIH0419
Prepared: 08/21/2020 Final Volume: 25 mL
Preparation Method: WMN (No Prep)Sample Preparation:
Sample Size: 25 mL
Extract ID: 20H0157-01 B 01
Detection
Analyte Limit
Reporting
Result Notes UnitsDilution LimitCAS Number
1 mg/L0.05000.00137439-89-6 JIron, Dissolved 0.0034
1 mg/L0.00100.00037439-96-5 JManganese, Dissolved 0.0009
1 mg/L0.5000.05207440-09-7Potassium, Dissolved 14.1
Analytical Resources, Inc. The results in this report apply to the samples analyzed in accordance with the
chain of custody document. This analytical report must be reproduced in its
entirety.
Page 10 of 58 20H0157 ARISample FINAL 28 Aug 2020 1622

Project:
Project Number:
Project Manager:
Reported:
Golder Associates
18300 NE Union Hill Road Suite 200 Ravensdale
Gary Zimmerman
Ravensdale
28-Aug-2020 16:22Redmond WA, 98052-3333
Analytical ReportAnalytical Chemists and Consultants
Analytical Resources, Incorporated
MW-1A
20H0157-01 (Water)
Sampled: 08/12/2020 09:55Method: SM 2540 C-97
Wet Chemistry
Instrument: BAL2 Analyst: UW Analyzed: 08/17/2020 15:46
Preparation Batch: BIH0328
Prepared: 08/17/2020 Final Volume: 200 mL
Preparation Method: No Prep Wet ChemSample Preparation:
Sample Size: 200 mL
Extract ID: 20H0157-01
Limit
Reporting
Result Notes UnitsDilutionAnalyte
Detection
LimitCAS Number
1 mg/L55Dissolved Solids 214
Analytical Resources, Inc. The results in this report apply to the samples analyzed in accordance with the
chain of custody document. This analytical report must be reproduced in its
entirety.
Page 11 of 58 20H0157 ARISample FINAL 28 Aug 2020 1622

Project:
Project Number:
Project Manager:
Reported:
Golder Associates
18300 NE Union Hill Road Suite 200 Ravensdale
Gary Zimmerman
Ravensdale
28-Aug-2020 16:22Redmond WA, 98052-3333
Analytical ReportAnalytical Chemists and Consultants
Analytical Resources, Incorporated
MW-2A
20H0157-02 (Water)
Sampled: 08/12/2020 11:35Method: EPA 200.8
Metals and Metallic Compounds (dissolved)
Instrument: ICPMS2 Analyst: MCB Analyzed: 08/27/2020 15:18
Preparation Batch: BIH0552
Prepared: 08/27/2020 Final Volume: 25 mL
Preparation Method: REN EPA 600/4-79-020 4.1.4 HNO3 matrixSample Preparation:
Sample Size: 25 mL
Extract ID: 20H0157-02 B 02
Detection
Analyte Limit
Reporting
Result Notes UnitsDilution LimitCAS Number
1 ug/L0.1000.06807439-92-1 ULead, Dissolved ND
Analytical Resources, Inc. The results in this report apply to the samples analyzed in accordance with the
chain of custody document. This analytical report must be reproduced in its
entirety.
Page 12 of 58 20H0157 ARISample FINAL 28 Aug 2020 1622

Project:
Project Number:
Project Manager:
Reported:
Golder Associates
18300 NE Union Hill Road Suite 200 Ravensdale
Gary Zimmerman
Ravensdale
28-Aug-2020 16:22Redmond WA, 98052-3333
Analytical ReportAnalytical Chemists and Consultants
Analytical Resources, Incorporated
MW-2A
20H0157-02 (Water)
Sampled: 08/12/2020 11:35Method: EPA 200.8 UCT-KED
Metals and Metallic Compounds (dissolved)
Instrument: ICPMS2 Analyst: MCB Analyzed: 08/27/2020 15:18
Preparation Batch: BIH0552
Prepared: 08/27/2020 Final Volume: 25 mL
Preparation Method: REN EPA 600/4-79-020 4.1.4 HNO3 matrixSample Preparation:
Sample Size: 25 mL
Extract ID: 20H0157-02 B 02
Detection
Analyte Limit
Reporting
Result Notes UnitsDilution LimitCAS Number
1 ug/L0.2000.02207440-38-2Arsenic, Dissolved 1.20
Analytical Resources, Inc. The results in this report apply to the samples analyzed in accordance with the
chain of custody document. This analytical report must be reproduced in its
entirety.
Page 13 of 58 20H0157 ARISample FINAL 28 Aug 2020 1622

Project:
Project Number:
Project Manager:
Reported:
Golder Associates
18300 NE Union Hill Road Suite 200 Ravensdale
Gary Zimmerman
Ravensdale
28-Aug-2020 16:22Redmond WA, 98052-3333
Analytical ReportAnalytical Chemists and Consultants
Analytical Resources, Incorporated
MW-2A
20H0157-02 (Water)
Sampled: 08/12/2020 11:35Method: EPA 6010C
Metals and Metallic Compounds (dissolved)
Instrument: ICP2 Analyst: SKM Analyzed: 08/24/2020 12:25
Preparation Batch: BIH0419
Prepared: 08/21/2020 Final Volume: 25 mL
Preparation Method: WMN (No Prep)Sample Preparation:
Sample Size: 25 mL
Extract ID: 20H0157-02 B 01
Detection
Analyte Limit
Reporting
Result Notes UnitsDilution LimitCAS Number
1 mg/L0.05000.00137439-89-6 JIron, Dissolved 0.0151
1 mg/L0.00100.00037439-96-5Manganese, Dissolved 0.0013
1 mg/L0.5000.05207440-09-7Potassium, Dissolved 22.4
Analytical Resources, Inc. The results in this report apply to the samples analyzed in accordance with the
chain of custody document. This analytical report must be reproduced in its
entirety.
Page 14 of 58 20H0157 ARISample FINAL 28 Aug 2020 1622

Project:
Project Number:
Project Manager:
Reported:
Golder Associates
18300 NE Union Hill Road Suite 200 Ravensdale
Gary Zimmerman
Ravensdale
28-Aug-2020 16:22Redmond WA, 98052-3333
Analytical ReportAnalytical Chemists and Consultants
Analytical Resources, Incorporated
MW-2A
20H0157-02 (Water)
Sampled: 08/12/2020 11:35Method: SM 2540 C-97
Wet Chemistry
Instrument: BAL2 Analyst: UW Analyzed: 08/17/2020 15:46
Preparation Batch: BIH0328
Prepared: 08/17/2020 Final Volume: 200 mL
Preparation Method: No Prep Wet ChemSample Preparation:
Sample Size: 100 mL
Extract ID: 20H0157-02
Limit
Reporting
Result Notes UnitsDilutionAnalyte
Detection
LimitCAS Number
1 mg/L1010Dissolved Solids 359
Analytical Resources, Inc. The results in this report apply to the samples analyzed in accordance with the
chain of custody document. This analytical report must be reproduced in its
entirety.
Page 15 of 58 20H0157 ARISample FINAL 28 Aug 2020 1622

Project:
Project Number:
Project Manager:
Reported:
Golder Associates
18300 NE Union Hill Road Suite 200 Ravensdale
Gary Zimmerman
Ravensdale
28-Aug-2020 16:22Redmond WA, 98052-3333
Analytical ReportAnalytical Chemists and Consultants
Analytical Resources, Incorporated
MW-7A
20H0157-03 (Water)
Sampled: 08/12/2020 11:40Method: EPA 200.8
Metals and Metallic Compounds (dissolved)
Instrument: ICPMS2 Analyst: MCB Analyzed: 08/27/2020 15:24
Preparation Batch: BIH0552
Prepared: 08/27/2020 Final Volume: 25 mL
Preparation Method: REN EPA 600/4-79-020 4.1.4 HNO3 matrixSample Preparation:
Sample Size: 25 mL
Extract ID: 20H0157-03 B 02
Detection
Analyte Limit
Reporting
Result Notes UnitsDilution LimitCAS Number
1 ug/L0.1000.06807439-92-1 ULead, Dissolved ND
Analytical Resources, Inc. The results in this report apply to the samples analyzed in accordance with the
chain of custody document. This analytical report must be reproduced in its
entirety.
Page 16 of 58 20H0157 ARISample FINAL 28 Aug 2020 1622

Project:
Project Number:
Project Manager:
Reported:
Golder Associates
18300 NE Union Hill Road Suite 200 Ravensdale
Gary Zimmerman
Ravensdale
28-Aug-2020 16:22Redmond WA, 98052-3333
Analytical ReportAnalytical Chemists and Consultants
Analytical Resources, Incorporated
MW-7A
20H0157-03 (Water)
Sampled: 08/12/2020 11:40Method: EPA 200.8 UCT-KED
Metals and Metallic Compounds (dissolved)
Instrument: ICPMS2 Analyst: MCB Analyzed: 08/27/2020 15:24
Preparation Batch: BIH0552
Prepared: 08/27/2020 Final Volume: 25 mL
Preparation Method: REN EPA 600/4-79-020 4.1.4 HNO3 matrixSample Preparation:
Sample Size: 25 mL
Extract ID: 20H0157-03 B 02
Detection
Analyte Limit
Reporting
Result Notes UnitsDilution LimitCAS Number
1 ug/L0.2000.02207440-38-2Arsenic, Dissolved 1.26
Analytical Resources, Inc. The results in this report apply to the samples analyzed in accordance with the
chain of custody document. This analytical report must be reproduced in its
entirety.
Page 17 of 58 20H0157 ARISample FINAL 28 Aug 2020 1622

Project:
Project Number:
Project Manager:
Reported:
Golder Associates
18300 NE Union Hill Road Suite 200 Ravensdale
Gary Zimmerman
Ravensdale
28-Aug-2020 16:22Redmond WA, 98052-3333
Analytical ReportAnalytical Chemists and Consultants
Analytical Resources, Incorporated
MW-7A
20H0157-03 (Water)
Sampled: 08/12/2020 11:40Method: EPA 6010C
Metals and Metallic Compounds (dissolved)
Instrument: ICP2 Analyst: SKM Analyzed: 08/24/2020 12:29
Preparation Batch: BIH0419
Prepared: 08/21/2020 Final Volume: 25 mL
Preparation Method: WMN (No Prep)Sample Preparation:
Sample Size: 25 mL
Extract ID: 20H0157-03 B 01
Detection
Analyte Limit
Reporting
Result Notes UnitsDilution LimitCAS Number
1 mg/L0.05000.00137439-89-6 JIron, Dissolved 0.0112
1 mg/L0.00100.00037439-96-5Manganese, Dissolved 0.0014
1 mg/L0.5000.05207440-09-7Potassium, Dissolved 22.5
Analytical Resources, Inc. The results in this report apply to the samples analyzed in accordance with the
chain of custody document. This analytical report must be reproduced in its
entirety.
Page 18 of 58 20H0157 ARISample FINAL 28 Aug 2020 1622

Project:
Project Number:
Project Manager:
Reported:
Golder Associates
18300 NE Union Hill Road Suite 200 Ravensdale
Gary Zimmerman
Ravensdale
28-Aug-2020 16:22Redmond WA, 98052-3333
Analytical ReportAnalytical Chemists and Consultants
Analytical Resources, Incorporated
MW-7A
20H0157-03 (Water)
Sampled: 08/12/2020 11:40Method: SM 2540 C-97
Wet Chemistry
Instrument: BAL2 Analyst: UW Analyzed: 08/17/2020 15:46
Preparation Batch: BIH0328
Prepared: 08/17/2020 Final Volume: 200 mL
Preparation Method: No Prep Wet ChemSample Preparation:
Sample Size: 100 mL
Extract ID: 20H0157-03
Limit
Reporting
Result Notes UnitsDilutionAnalyte
Detection
LimitCAS Number
1 mg/L1010Dissolved Solids 353
Analytical Resources, Inc. The results in this report apply to the samples analyzed in accordance with the
chain of custody document. This analytical report must be reproduced in its
entirety.
Page 19 of 58 20H0157 ARISample FINAL 28 Aug 2020 1622

Project:
Project Number:
Project Manager:
Reported:
Golder Associates
18300 NE Union Hill Road Suite 200 Ravensdale
Gary Zimmerman
Ravensdale
28-Aug-2020 16:22Redmond WA, 98052-3333
Analytical ReportAnalytical Chemists and Consultants
Analytical Resources, Incorporated
MW-6A
20H0157-04 (Water)
Sampled: 08/12/2020 13:00Method: EPA 200.8
Metals and Metallic Compounds (dissolved)
Instrument: ICPMS2 Analyst: MCB Analyzed: 08/27/2020 15:29
Preparation Batch: BIH0552
Prepared: 08/27/2020 Final Volume: 25 mL
Preparation Method: REN EPA 600/4-79-020 4.1.4 HNO3 matrixSample Preparation:
Sample Size: 25 mL
Extract ID: 20H0157-04 B 02
Detection
Analyte Limit
Reporting
Result Notes UnitsDilution LimitCAS Number
1 ug/L0.1000.06807439-92-1 JLead, Dissolved 0.0880
Analytical Resources, Inc. The results in this report apply to the samples analyzed in accordance with the
chain of custody document. This analytical report must be reproduced in its
entirety.
Page 20 of 58 20H0157 ARISample FINAL 28 Aug 2020 1622

Project:
Project Number:
Project Manager:
Reported:
Golder Associates
18300 NE Union Hill Road Suite 200 Ravensdale
Gary Zimmerman
Ravensdale
28-Aug-2020 16:22Redmond WA, 98052-3333
Analytical ReportAnalytical Chemists and Consultants
Analytical Resources, Incorporated
MW-6A
20H0157-04 (Water)
Sampled: 08/12/2020 13:00Method: EPA 200.8 UCT-KED
Metals and Metallic Compounds (dissolved)
Instrument: ICPMS2 Analyst: MCB Analyzed: 08/27/2020 15:29
Preparation Batch: BIH0552
Prepared: 08/27/2020 Final Volume: 25 mL
Preparation Method: REN EPA 600/4-79-020 4.1.4 HNO3 matrixSample Preparation:
Sample Size: 25 mL
Extract ID: 20H0157-04 B 02
Detection
Analyte Limit
Reporting
Result Notes UnitsDilution LimitCAS Number
1 ug/L0.2000.02207440-38-2Arsenic, Dissolved 6.28
Analytical Resources, Inc. The results in this report apply to the samples analyzed in accordance with the
chain of custody document. This analytical report must be reproduced in its
entirety.
Page 21 of 58 20H0157 ARISample FINAL 28 Aug 2020 1622

Project:
Project Number:
Project Manager:
Reported:
Golder Associates
18300 NE Union Hill Road Suite 200 Ravensdale
Gary Zimmerman
Ravensdale
28-Aug-2020 16:22Redmond WA, 98052-3333
Analytical ReportAnalytical Chemists and Consultants
Analytical Resources, Incorporated
MW-6A
20H0157-04 (Water)
Sampled: 08/12/2020 13:00Method: EPA 6010C
Metals and Metallic Compounds (dissolved)
Instrument: ICP2 Analyst: SKM Analyzed: 08/24/2020 15:51
Preparation Batch: BIH0419
Prepared: 08/21/2020 Final Volume: 25 mL
Preparation Method: WMN (No Prep)Sample Preparation:
Sample Size: 25 mL
Extract ID: 20H0157-04 B 01
Detection
Analyte Limit
Reporting
Result Notes UnitsDilution LimitCAS Number
2 mg/L0.1000.00267439-89-6 J, DIron, Dissolved 0.0089
2 mg/L0.00200.00077439-96-5 DManganese, Dissolved 0.0061
2 mg/L1.000.1047440-09-7 DPotassium, Dissolved 709
Analytical Resources, Inc. The results in this report apply to the samples analyzed in accordance with the
chain of custody document. This analytical report must be reproduced in its
entirety.
Page 22 of 58 20H0157 ARISample FINAL 28 Aug 2020 1622
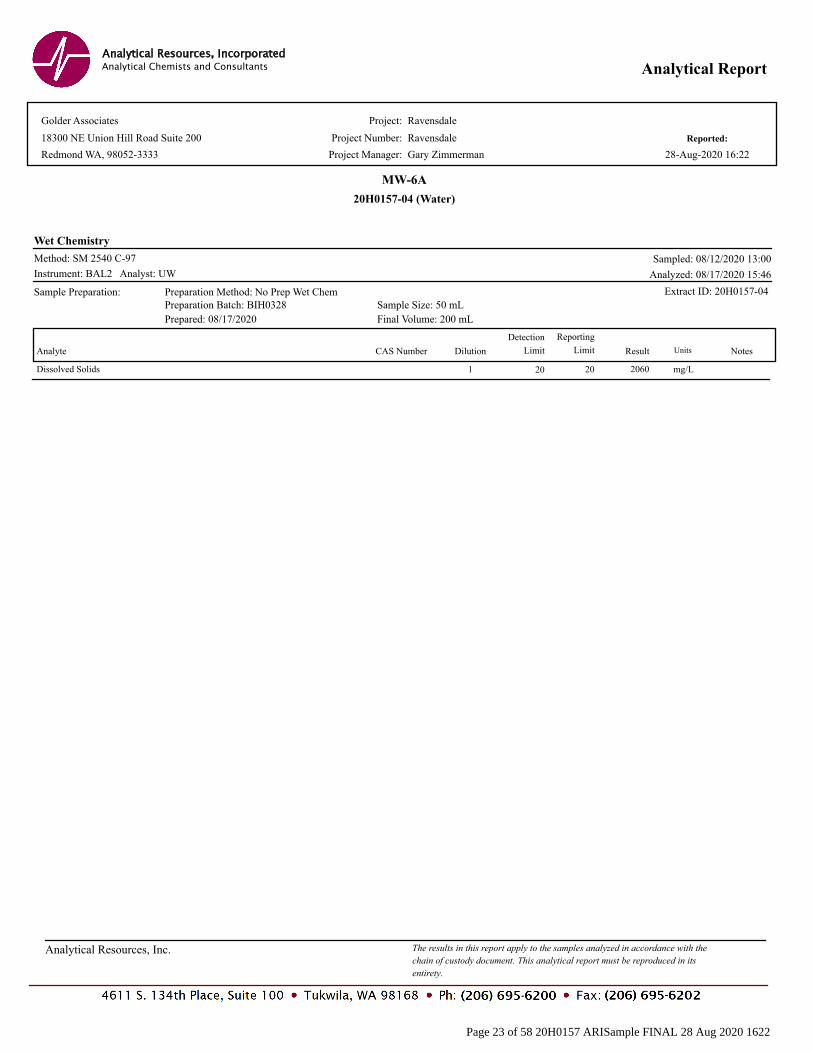
Project:
Project Number:
Project Manager:
Reported:
Golder Associates
18300 NE Union Hill Road Suite 200 Ravensdale
Gary Zimmerman
Ravensdale
28-Aug-2020 16:22Redmond WA, 98052-3333
Analytical ReportAnalytical Chemists and Consultants
Analytical Resources, Incorporated
MW-6A
20H0157-04 (Water)
Sampled: 08/12/2020 13:00Method: SM 2540 C-97
Wet Chemistry
Instrument: BAL2 Analyst: UW Analyzed: 08/17/2020 15:46
Preparation Batch: BIH0328
Prepared: 08/17/2020 Final Volume: 200 mL
Preparation Method: No Prep Wet ChemSample Preparation:
Sample Size: 50 mL
Extract ID: 20H0157-04
Limit
Reporting
Result Notes UnitsDilutionAnalyte
Detection
LimitCAS Number
1 mg/L2020Dissolved Solids 2060
Analytical Resources, Inc. The results in this report apply to the samples analyzed in accordance with the
chain of custody document. This analytical report must be reproduced in its
entirety.
Page 23 of 58 20H0157 ARISample FINAL 28 Aug 2020 1622

Project:
Project Number:
Project Manager:
Reported:
Golder Associates
18300 NE Union Hill Road Suite 200 Ravensdale
Gary Zimmerman
Ravensdale
28-Aug-2020 16:22Redmond WA, 98052-3333
Analytical ReportAnalytical Chemists and Consultants
Analytical Resources, Incorporated
EB
20H0157-05 (Water)
Sampled: 08/12/2020 14:15Method: EPA 200.8
Metals and Metallic Compounds (dissolved)
Instrument: ICPMS2 Analyst: MCB Analyzed: 08/27/2020 15:34
Preparation Batch: BIH0552
Prepared: 08/27/2020 Final Volume: 25 mL
Preparation Method: REN EPA 600/4-79-020 4.1.4 HNO3 matrixSample Preparation:
Sample Size: 25 mL
Extract ID: 20H0157-05 B 02
Detection
Analyte Limit
Reporting
Result Notes UnitsDilution LimitCAS Number
1 ug/L0.1000.06807439-92-1 ULead, Dissolved ND
Analytical Resources, Inc. The results in this report apply to the samples analyzed in accordance with the
chain of custody document. This analytical report must be reproduced in its
entirety.
Page 24 of 58 20H0157 ARISample FINAL 28 Aug 2020 1622
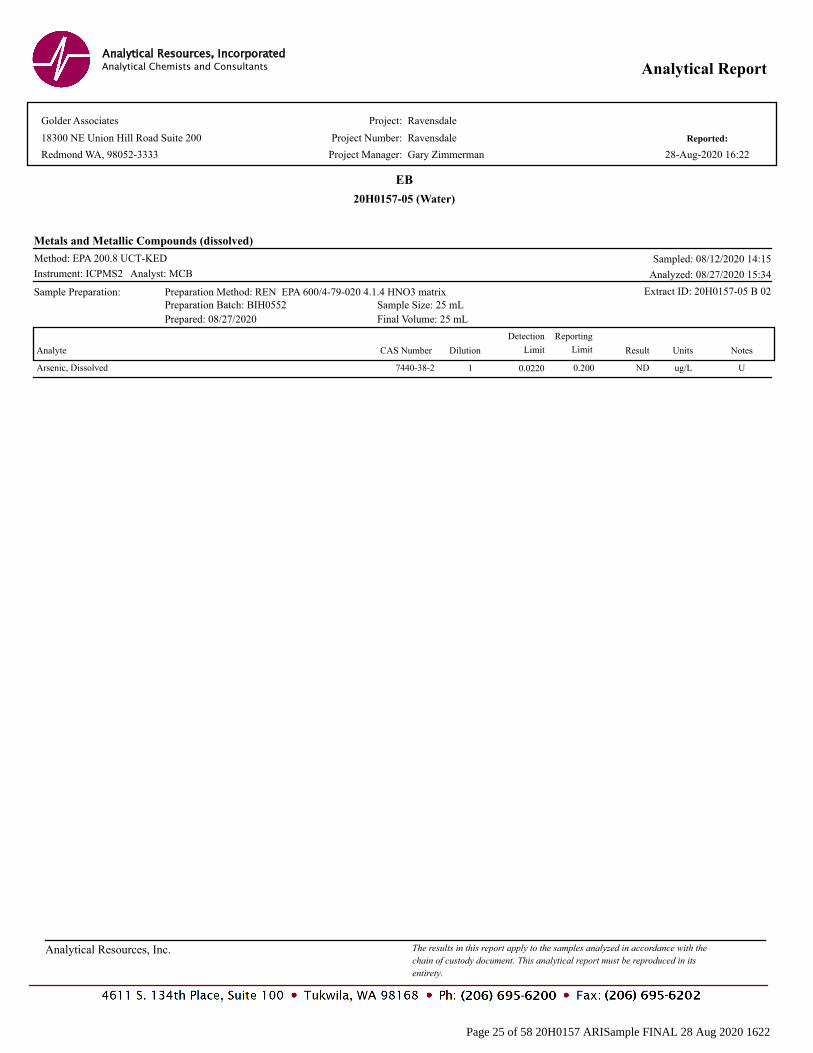
Project:
Project Number:
Project Manager:
Reported:
Golder Associates
18300 NE Union Hill Road Suite 200 Ravensdale
Gary Zimmerman
Ravensdale
28-Aug-2020 16:22Redmond WA, 98052-3333
Analytical ReportAnalytical Chemists and Consultants
Analytical Resources, Incorporated
EB
20H0157-05 (Water)
Sampled: 08/12/2020 14:15Method: EPA 200.8 UCT-KED
Metals and Metallic Compounds (dissolved)
Instrument: ICPMS2 Analyst: MCB Analyzed: 08/27/2020 15:34
Preparation Batch: BIH0552
Prepared: 08/27/2020 Final Volume: 25 mL
Preparation Method: REN EPA 600/4-79-020 4.1.4 HNO3 matrixSample Preparation:
Sample Size: 25 mL
Extract ID: 20H0157-05 B 02
Detection
Analyte Limit
Reporting
Result Notes UnitsDilution LimitCAS Number
1 ug/L0.2000.02207440-38-2 UArsenic, Dissolved ND
Analytical Resources, Inc. The results in this report apply to the samples analyzed in accordance with the
chain of custody document. This analytical report must be reproduced in its
entirety.
Page 25 of 58 20H0157 ARISample FINAL 28 Aug 2020 1622

Project:
Project Number:
Project Manager:
Reported:
Golder Associates
18300 NE Union Hill Road Suite 200 Ravensdale
Gary Zimmerman
Ravensdale
28-Aug-2020 16:22Redmond WA, 98052-3333
Analytical ReportAnalytical Chemists and Consultants
Analytical Resources, Incorporated
EB
20H0157-05 (Water)
Sampled: 08/12/2020 14:15Method: EPA 6010C
Metals and Metallic Compounds (dissolved)
Instrument: ICP2 Analyst: SKM Analyzed: 08/24/2020 13:12
Preparation Batch: BIH0419
Prepared: 08/21/2020 Final Volume: 25 mL
Preparation Method: WMN (No Prep)Sample Preparation:
Sample Size: 25 mL
Extract ID: 20H0157-05 B 01
Detection
Analyte Limit
Reporting
Result Notes UnitsDilution LimitCAS Number
1 mg/L0.05000.00137439-89-6 JIron, Dissolved 0.0031
1 mg/L0.00100.00037439-96-5 UManganese, Dissolved ND
1 mg/L0.5000.05207440-09-7 JPotassium, Dissolved 0.169
Analytical Resources, Inc. The results in this report apply to the samples analyzed in accordance with the
chain of custody document. This analytical report must be reproduced in its
entirety.
Page 26 of 58 20H0157 ARISample FINAL 28 Aug 2020 1622
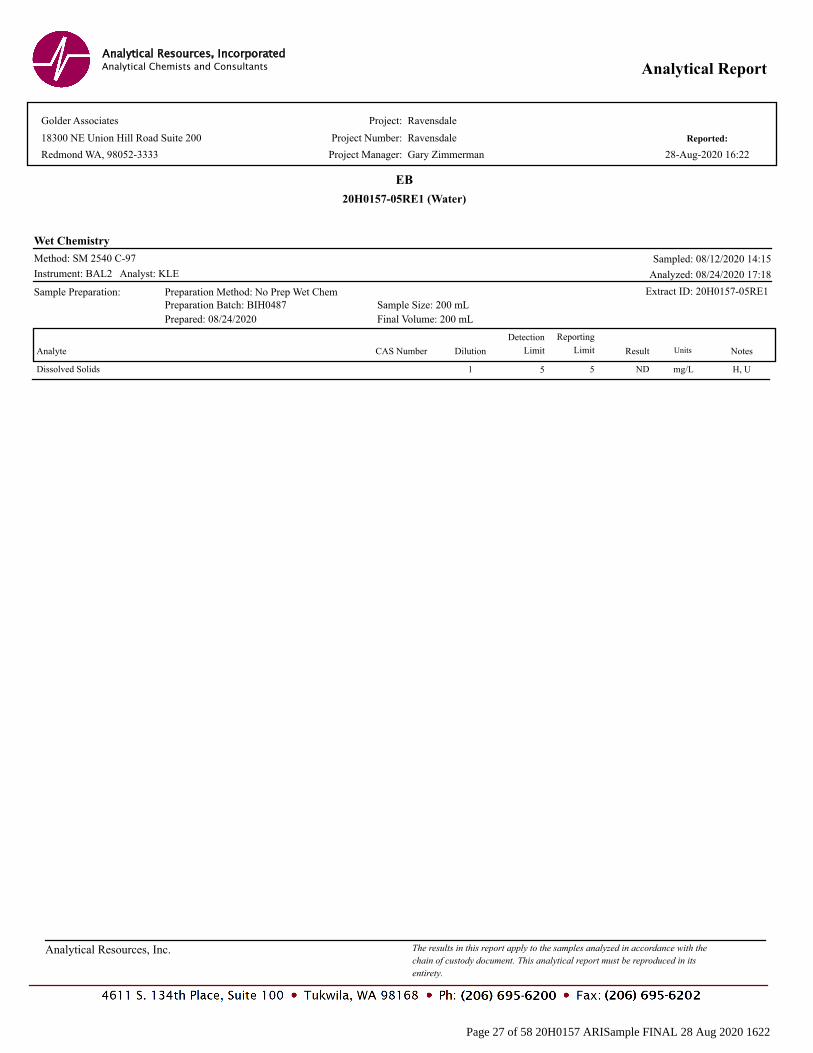
Project:
Project Number:
Project Manager:
Reported:
Golder Associates
18300 NE Union Hill Road Suite 200 Ravensdale
Gary Zimmerman
Ravensdale
28-Aug-2020 16:22Redmond WA, 98052-3333
Analytical ReportAnalytical Chemists and Consultants
Analytical Resources, Incorporated
EB
20H0157-05RE1 (Water)
Sampled: 08/12/2020 14:15Method: SM 2540 C-97
Wet Chemistry
Instrument: BAL2 Analyst: KLE Analyzed: 08/24/2020 17:18
Preparation Batch: BIH0487
Prepared: 08/24/2020 Final Volume: 200 mL
Preparation Method: No Prep Wet ChemSample Preparation:
Sample Size: 200 mL
Extract ID: 20H0157-05RE1
Limit
Reporting
Result Notes UnitsDilutionAnalyte
Detection
LimitCAS Number
1 mg/L55 H, UDissolved Solids ND
Analytical Resources, Inc. The results in this report apply to the samples analyzed in accordance with the
chain of custody document. This analytical report must be reproduced in its
entirety.
Page 27 of 58 20H0157 ARISample FINAL 28 Aug 2020 1622

Project:
Project Number:
Project Manager:
Reported:
Golder Associates
18300 NE Union Hill Road Suite 200 Ravensdale
Gary Zimmerman
Ravensdale
28-Aug-2020 16:22Redmond WA, 98052-3333
Analytical ReportAnalytical Chemists and Consultants
Analytical Resources, Incorporated
MW-5A
20H0157-06 (Water)
Sampled: 08/12/2020 14:16Method: EPA 200.8
Metals and Metallic Compounds (dissolved)
Instrument: ICPMS2 Analyst: MCB Analyzed: 08/27/2020 15:39
Preparation Batch: BIH0552
Prepared: 08/27/2020 Final Volume: 25 mL
Preparation Method: REN EPA 600/4-79-020 4.1.4 HNO3 matrixSample Preparation:
Sample Size: 25 mL
Extract ID: 20H0157-06 B 02
Detection
Analyte Limit
Reporting
Result Notes UnitsDilution LimitCAS Number
1 ug/L0.1000.06807439-92-1 ULead, Dissolved ND
Analytical Resources, Inc. The results in this report apply to the samples analyzed in accordance with the
chain of custody document. This analytical report must be reproduced in its
entirety.
Page 28 of 58 20H0157 ARISample FINAL 28 Aug 2020 1622

Project:
Project Number:
Project Manager:
Reported:
Golder Associates
18300 NE Union Hill Road Suite 200 Ravensdale
Gary Zimmerman
Ravensdale
28-Aug-2020 16:22Redmond WA, 98052-3333
Analytical ReportAnalytical Chemists and Consultants
Analytical Resources, Incorporated
MW-5A
20H0157-06 (Water)
Sampled: 08/12/2020 14:16Method: EPA 200.8 UCT-KED
Metals and Metallic Compounds (dissolved)
Instrument: ICPMS2 Analyst: MCB Analyzed: 08/27/2020 15:39
Preparation Batch: BIH0552
Prepared: 08/27/2020 Final Volume: 25 mL
Preparation Method: REN EPA 600/4-79-020 4.1.4 HNO3 matrixSample Preparation:
Sample Size: 25 mL
Extract ID: 20H0157-06 B 02
Detection
Analyte Limit
Reporting
Result Notes UnitsDilution LimitCAS Number
1 ug/L0.2000.02207440-38-2Arsenic, Dissolved 5.37
Analytical Resources, Inc. The results in this report apply to the samples analyzed in accordance with the
chain of custody document. This analytical report must be reproduced in its
entirety.
Page 29 of 58 20H0157 ARISample FINAL 28 Aug 2020 1622

Project:
Project Number:
Project Manager:
Reported:
Golder Associates
18300 NE Union Hill Road Suite 200 Ravensdale
Gary Zimmerman
Ravensdale
28-Aug-2020 16:22Redmond WA, 98052-3333
Analytical ReportAnalytical Chemists and Consultants
Analytical Resources, Incorporated
MW-5A
20H0157-06 (Water)
Sampled: 08/12/2020 14:16Method: EPA 6010C
Metals and Metallic Compounds (dissolved)
Instrument: ICP2 Analyst: SKM Analyzed: 08/24/2020 13:17
Preparation Batch: BIH0419
Prepared: 08/21/2020 Final Volume: 25 mL
Preparation Method: WMN (No Prep)Sample Preparation:
Sample Size: 25 mL
Extract ID: 20H0157-06 B 01
Detection
Analyte Limit
Reporting
Result Notes UnitsDilution LimitCAS Number
1 mg/L0.05000.00137439-89-6 JIron, Dissolved 0.0120
1 mg/L0.00100.00037439-96-5Manganese, Dissolved 0.0839
1 mg/L0.5000.05207440-09-7Potassium, Dissolved 333
Analytical Resources, Inc. The results in this report apply to the samples analyzed in accordance with the
chain of custody document. This analytical report must be reproduced in its
entirety.
Page 30 of 58 20H0157 ARISample FINAL 28 Aug 2020 1622

Project:
Project Number:
Project Manager:
Reported:
Golder Associates
18300 NE Union Hill Road Suite 200 Ravensdale
Gary Zimmerman
Ravensdale
28-Aug-2020 16:22Redmond WA, 98052-3333
Analytical ReportAnalytical Chemists and Consultants
Analytical Resources, Incorporated
MW-5A
20H0157-06 (Water)
Sampled: 08/12/2020 14:16Method: SM 2540 C-97
Wet Chemistry
Instrument: BAL2 Analyst: UW Analyzed: 08/17/2020 15:46
Preparation Batch: BIH0328
Prepared: 08/17/2020 Final Volume: 200 mL
Preparation Method: No Prep Wet ChemSample Preparation:
Sample Size: 75 mL
Extract ID: 20H0157-06
Limit
Reporting
Result Notes UnitsDilutionAnalyte
Detection
LimitCAS Number
1 mg/L1313Dissolved Solids 1250
Analytical Resources, Inc. The results in this report apply to the samples analyzed in accordance with the
chain of custody document. This analytical report must be reproduced in its
entirety.
Page 31 of 58 20H0157 ARISample FINAL 28 Aug 2020 1622

Project:
Project Number:
Project Manager:
Reported:
Golder Associates
18300 NE Union Hill Road Suite 200 Ravensdale
Gary Zimmerman
Ravensdale
28-Aug-2020 16:22Redmond WA, 98052-3333
Analytical ReportAnalytical Chemists and Consultants
Analytical Resources, Incorporated
Infiltration #1
20H0157-07 (Water)
Sampled: 08/12/2020 14:35Method: EPA 200.8
Metals and Metallic Compounds (dissolved)
Instrument: ICPMS2 Analyst: MCB Analyzed: 08/27/2020 16:21
Preparation Batch: BIH0552
Prepared: 08/27/2020 Final Volume: 25 mL
Preparation Method: REN EPA 600/4-79-020 4.1.4 HNO3 matrixSample Preparation:
Sample Size: 25 mL
Extract ID: 20H0157-07 B 02
Detection
Analyte Limit
Reporting
Result Notes UnitsDilution LimitCAS Number
1 ug/L0.1000.06807439-92-1Lead, Dissolved 2.59
Analytical Resources, Inc. The results in this report apply to the samples analyzed in accordance with the
chain of custody document. This analytical report must be reproduced in its
entirety.
Page 32 of 58 20H0157 ARISample FINAL 28 Aug 2020 1622

Project:
Project Number:
Project Manager:
Reported:
Golder Associates
18300 NE Union Hill Road Suite 200 Ravensdale
Gary Zimmerman
Ravensdale
28-Aug-2020 16:22Redmond WA, 98052-3333
Analytical ReportAnalytical Chemists and Consultants
Analytical Resources, Incorporated
Infiltration #1
20H0157-07 (Water)
Sampled: 08/12/2020 14:35Method: EPA 200.8 UCT-KED
Metals and Metallic Compounds (dissolved)
Instrument: ICPMS2 Analyst: MCB Analyzed: 08/27/2020 16:21
Preparation Batch: BIH0552
Prepared: 08/27/2020 Final Volume: 25 mL
Preparation Method: REN EPA 600/4-79-020 4.1.4 HNO3 matrixSample Preparation:
Sample Size: 25 mL
Extract ID: 20H0157-07 B 02
Detection
Analyte Limit
Reporting
Result Notes UnitsDilution LimitCAS Number
1 ug/L0.2000.02207440-38-2Arsenic, Dissolved 20.8
Analytical Resources, Inc. The results in this report apply to the samples analyzed in accordance with the
chain of custody document. This analytical report must be reproduced in its
entirety.
Page 33 of 58 20H0157 ARISample FINAL 28 Aug 2020 1622

Project:
Project Number:
Project Manager:
Reported:
Golder Associates
18300 NE Union Hill Road Suite 200 Ravensdale
Gary Zimmerman
Ravensdale
28-Aug-2020 16:22Redmond WA, 98052-3333
Analytical ReportAnalytical Chemists and Consultants
Analytical Resources, Incorporated
Infiltration #1
20H0157-07 (Water)
Sampled: 08/12/2020 14:35Method: EPA 6010C
Metals and Metallic Compounds (dissolved)
Instrument: ICP2 Analyst: SKM Analyzed: 08/24/2020 15:57
Preparation Batch: BIH0419
Prepared: 08/21/2020 Final Volume: 25 mL
Preparation Method: WMN (No Prep)Sample Preparation:
Sample Size: 25 mL
Extract ID: 20H0157-07 B 01
Detection
Analyte Limit
Reporting
Result Notes UnitsDilution LimitCAS Number
5 mg/L0.2500.00657439-89-6 J, DIron, Dissolved 0.124
5 mg/L0.00500.00177439-96-5 J, DManganese, Dissolved 0.0048
5 mg/L2.500.2607440-09-7 DPotassium, Dissolved 988
Analytical Resources, Inc. The results in this report apply to the samples analyzed in accordance with the
chain of custody document. This analytical report must be reproduced in its
entirety.
Page 34 of 58 20H0157 ARISample FINAL 28 Aug 2020 1622

Project:
Project Number:
Project Manager:
Reported:
Golder Associates
18300 NE Union Hill Road Suite 200 Ravensdale
Gary Zimmerman
Ravensdale
28-Aug-2020 16:22Redmond WA, 98052-3333
Analytical ReportAnalytical Chemists and Consultants
Analytical Resources, Incorporated
Infiltration #1
20H0157-07 (Water)
Sampled: 08/12/2020 14:35Method: SM 2540 C-97
Wet Chemistry
Instrument: BAL2 Analyst: UW Analyzed: 08/17/2020 15:46
Preparation Batch: BIH0328
Prepared: 08/17/2020 Final Volume: 200 mL
Preparation Method: No Prep Wet ChemSample Preparation:
Sample Size: 30 mL
Extract ID: 20H0157-07
Limit
Reporting
Result Notes UnitsDilutionAnalyte
Detection
LimitCAS Number
1 mg/L3333Dissolved Solids 2570
Analytical Resources, Inc. The results in this report apply to the samples analyzed in accordance with the
chain of custody document. This analytical report must be reproduced in its
entirety.
Page 35 of 58 20H0157 ARISample FINAL 28 Aug 2020 1622

Project:
Project Number:
Project Manager:
Reported:
Golder Associates
18300 NE Union Hill Road Suite 200 Ravensdale
Gary Zimmerman
Ravensdale
28-Aug-2020 16:22Redmond WA, 98052-3333
Analytical ReportAnalytical Chemists and Consultants
Analytical Resources, Incorporated
Infiltration #2
20H0157-08 (Water)
Sampled: 08/12/2020 14:40Method: EPA 200.8
Metals and Metallic Compounds (dissolved)
Instrument: ICPMS2 Analyst: MCB Analyzed: 08/27/2020 16:34
Preparation Batch: BIH0552
Prepared: 08/27/2020 Final Volume: 25 mL
Preparation Method: REN EPA 600/4-79-020 4.1.4 HNO3 matrixSample Preparation:
Sample Size: 25 mL
Extract ID: 20H0157-08 B 02
Detection
Analyte Limit
Reporting
Result Notes UnitsDilution LimitCAS Number
1 ug/L0.1000.06807439-92-1Lead, Dissolved 2.64
Analytical Resources, Inc. The results in this report apply to the samples analyzed in accordance with the
chain of custody document. This analytical report must be reproduced in its
entirety.
Page 36 of 58 20H0157 ARISample FINAL 28 Aug 2020 1622

Project:
Project Number:
Project Manager:
Reported:
Golder Associates
18300 NE Union Hill Road Suite 200 Ravensdale
Gary Zimmerman
Ravensdale
28-Aug-2020 16:22Redmond WA, 98052-3333
Analytical ReportAnalytical Chemists and Consultants
Analytical Resources, Incorporated
Infiltration #2
20H0157-08 (Water)
Sampled: 08/12/2020 14:40Method: EPA 200.8 UCT-KED
Metals and Metallic Compounds (dissolved)
Instrument: ICPMS2 Analyst: MCB Analyzed: 08/27/2020 16:34
Preparation Batch: BIH0552
Prepared: 08/27/2020 Final Volume: 25 mL
Preparation Method: REN EPA 600/4-79-020 4.1.4 HNO3 matrixSample Preparation:
Sample Size: 25 mL
Extract ID: 20H0157-08 B 02
Detection
Analyte Limit
Reporting
Result Notes UnitsDilution LimitCAS Number
1 ug/L0.2000.02207440-38-2Arsenic, Dissolved 21.0
Analytical Resources, Inc. The results in this report apply to the samples analyzed in accordance with the
chain of custody document. This analytical report must be reproduced in its
entirety.
Page 37 of 58 20H0157 ARISample FINAL 28 Aug 2020 1622

Project:
Project Number:
Project Manager:
Reported:
Golder Associates
18300 NE Union Hill Road Suite 200 Ravensdale
Gary Zimmerman
Ravensdale
28-Aug-2020 16:22Redmond WA, 98052-3333
Analytical ReportAnalytical Chemists and Consultants
Analytical Resources, Incorporated
Infiltration #2
20H0157-08 (Water)
Sampled: 08/12/2020 14:40Method: EPA 6010C
Metals and Metallic Compounds (dissolved)
Instrument: ICP2 Analyst: SKM Analyzed: 08/24/2020 16:04
Preparation Batch: BIH0419
Prepared: 08/21/2020 Final Volume: 25 mL
Preparation Method: WMN (No Prep)Sample Preparation:
Sample Size: 25 mL
Extract ID: 20H0157-08 B 01
Detection
Analyte Limit
Reporting
Result Notes UnitsDilution LimitCAS Number
5 mg/L0.2500.00657439-89-6 J, DIron, Dissolved 0.129
5 mg/L0.00500.00177439-96-5 DManganese, Dissolved 0.0053
5 mg/L2.500.2607440-09-7 DPotassium, Dissolved 1000
Analytical Resources, Inc. The results in this report apply to the samples analyzed in accordance with the
chain of custody document. This analytical report must be reproduced in its
entirety.
Page 38 of 58 20H0157 ARISample FINAL 28 Aug 2020 1622

Project:
Project Number:
Project Manager:
Reported:
Golder Associates
18300 NE Union Hill Road Suite 200 Ravensdale
Gary Zimmerman
Ravensdale
28-Aug-2020 16:22Redmond WA, 98052-3333
Analytical ReportAnalytical Chemists and Consultants
Analytical Resources, Incorporated
Infiltration #2
20H0157-08 (Water)
Sampled: 08/12/2020 14:40Method: SM 2540 C-97
Wet Chemistry
Instrument: BAL2 Analyst: UW Analyzed: 08/17/2020 15:46
Preparation Batch: BIH0328
Prepared: 08/17/2020 Final Volume: 200 mL
Preparation Method: No Prep Wet ChemSample Preparation:
Sample Size: 30 mL
Extract ID: 20H0157-08
Limit
Reporting
Result Notes UnitsDilutionAnalyte
Detection
LimitCAS Number
1 mg/L3333Dissolved Solids 2650
Analytical Resources, Inc. The results in this report apply to the samples analyzed in accordance with the
chain of custody document. This analytical report must be reproduced in its
entirety.
Page 39 of 58 20H0157 ARISample FINAL 28 Aug 2020 1622

Project:
Project Number:
Project Manager:
Reported:
Golder Associates
18300 NE Union Hill Road Suite 200 Ravensdale
Gary Zimmerman
Ravensdale
28-Aug-2020 16:22Redmond WA, 98052-3333
Analytical ReportAnalytical Chemists and Consultants
Analytical Resources, Incorporated
MW-3A
20H0157-09 (Water)
Sampled: 08/13/2020 09:15Method: EPA 200.8
Metals and Metallic Compounds (dissolved)
Instrument: ICPMS2 Analyst: MCB Analyzed: 08/27/2020 16:46
Preparation Batch: BIH0552
Prepared: 08/27/2020 Final Volume: 25 mL
Preparation Method: REN EPA 600/4-79-020 4.1.4 HNO3 matrixSample Preparation:
Sample Size: 25 mL
Extract ID: 20H0157-09 B 02
Detection
Analyte Limit
Reporting
Result Notes UnitsDilution LimitCAS Number
1 ug/L0.1000.06807439-92-1 ULead, Dissolved ND
Analytical Resources, Inc. The results in this report apply to the samples analyzed in accordance with the
chain of custody document. This analytical report must be reproduced in its
entirety.
Page 40 of 58 20H0157 ARISample FINAL 28 Aug 2020 1622

Project:
Project Number:
Project Manager:
Reported:
Golder Associates
18300 NE Union Hill Road Suite 200 Ravensdale
Gary Zimmerman
Ravensdale
28-Aug-2020 16:22Redmond WA, 98052-3333
Analytical ReportAnalytical Chemists and Consultants
Analytical Resources, Incorporated
MW-3A
20H0157-09 (Water)
Sampled: 08/13/2020 09:15Method: EPA 200.8 UCT-KED
Metals and Metallic Compounds (dissolved)
Instrument: ICPMS2 Analyst: MCB Analyzed: 08/27/2020 16:46
Preparation Batch: BIH0552
Prepared: 08/27/2020 Final Volume: 25 mL
Preparation Method: REN EPA 600/4-79-020 4.1.4 HNO3 matrixSample Preparation:
Sample Size: 25 mL
Extract ID: 20H0157-09 B 02
Detection
Analyte Limit
Reporting
Result Notes UnitsDilution LimitCAS Number
1 ug/L0.2000.02207440-38-2Arsenic, Dissolved 10.9
Analytical Resources, Inc. The results in this report apply to the samples analyzed in accordance with the
chain of custody document. This analytical report must be reproduced in its
entirety.
Page 41 of 58 20H0157 ARISample FINAL 28 Aug 2020 1622

Project:
Project Number:
Project Manager:
Reported:
Golder Associates
18300 NE Union Hill Road Suite 200 Ravensdale
Gary Zimmerman
Ravensdale
28-Aug-2020 16:22Redmond WA, 98052-3333
Analytical ReportAnalytical Chemists and Consultants
Analytical Resources, Incorporated
MW-3A
20H0157-09 (Water)
Sampled: 08/13/2020 09:15Method: EPA 6010C
Metals and Metallic Compounds (dissolved)
Instrument: ICP2 Analyst: SKM Analyzed: 08/24/2020 13:21
Preparation Batch: BIH0419
Prepared: 08/21/2020 Final Volume: 25 mL
Preparation Method: WMN (No Prep)Sample Preparation:
Sample Size: 25 mL
Extract ID: 20H0157-09 B 01
Detection
Analyte Limit
Reporting
Result Notes UnitsDilution LimitCAS Number
1 mg/L0.05000.00137439-89-6Iron, Dissolved 3.29
1 mg/L0.00100.00037439-96-5Manganese, Dissolved 2.16
1 mg/L0.5000.05207440-09-7Potassium, Dissolved 119
Analytical Resources, Inc. The results in this report apply to the samples analyzed in accordance with the
chain of custody document. This analytical report must be reproduced in its
entirety.
Page 42 of 58 20H0157 ARISample FINAL 28 Aug 2020 1622

Project:
Project Number:
Project Manager:
Reported:
Golder Associates
18300 NE Union Hill Road Suite 200 Ravensdale
Gary Zimmerman
Ravensdale
28-Aug-2020 16:22Redmond WA, 98052-3333
Analytical ReportAnalytical Chemists and Consultants
Analytical Resources, Incorporated
MW-3A
20H0157-09 (Water)
Sampled: 08/13/2020 09:15Method: SM 2540 C-97
Wet Chemistry
Instrument: BAL2 Analyst: UW Analyzed: 08/17/2020 15:46
Preparation Batch: BIH0328
Prepared: 08/17/2020 Final Volume: 200 mL
Preparation Method: No Prep Wet ChemSample Preparation:
Sample Size: 100 mL
Extract ID: 20H0157-09
Limit
Reporting
Result Notes UnitsDilutionAnalyte
Detection
LimitCAS Number
1 mg/L1010Dissolved Solids 683
Analytical Resources, Inc. The results in this report apply to the samples analyzed in accordance with the
chain of custody document. This analytical report must be reproduced in its
entirety.
Page 43 of 58 20H0157 ARISample FINAL 28 Aug 2020 1622

Project:
Project Number:
Project Manager:
Reported:
Golder Associates
18300 NE Union Hill Road Suite 200 Ravensdale
Gary Zimmerman
Ravensdale
28-Aug-2020 16:22Redmond WA, 98052-3333
Analytical ReportAnalytical Chemists and Consultants
Analytical Resources, Incorporated
Still Well
20H0157-10 (Water)
Sampled: 08/13/2020 09:45Method: EPA 200.8
Metals and Metallic Compounds (dissolved)
Instrument: ICPMS2 Analyst: MCB Analyzed: 08/27/2020 16:52
Preparation Batch: BIH0552
Prepared: 08/27/2020 Final Volume: 25 mL
Preparation Method: REN EPA 600/4-79-020 4.1.4 HNO3 matrixSample Preparation:
Sample Size: 25 mL
Extract ID: 20H0157-10 B 02
Detection
Analyte Limit
Reporting
Result Notes UnitsDilution LimitCAS Number
1 ug/L0.1000.06807439-92-1Lead, Dissolved 0.860
Analytical Resources, Inc. The results in this report apply to the samples analyzed in accordance with the
chain of custody document. This analytical report must be reproduced in its
entirety.
Page 44 of 58 20H0157 ARISample FINAL 28 Aug 2020 1622

Project:
Project Number:
Project Manager:
Reported:
Golder Associates
18300 NE Union Hill Road Suite 200 Ravensdale
Gary Zimmerman
Ravensdale
28-Aug-2020 16:22Redmond WA, 98052-3333
Analytical ReportAnalytical Chemists and Consultants
Analytical Resources, Incorporated
Still Well
20H0157-10 (Water)
Sampled: 08/13/2020 09:45Method: EPA 200.8 UCT-KED
Metals and Metallic Compounds (dissolved)
Instrument: ICPMS2 Analyst: MCB Analyzed: 08/27/2020 16:52
Preparation Batch: BIH0552
Prepared: 08/27/2020 Final Volume: 25 mL
Preparation Method: REN EPA 600/4-79-020 4.1.4 HNO3 matrixSample Preparation:
Sample Size: 25 mL
Extract ID: 20H0157-10 B 02
Detection
Analyte Limit
Reporting
Result Notes UnitsDilution LimitCAS Number
1 ug/L0.2000.02207440-38-2Arsenic, Dissolved 41.9
Analytical Resources, Inc. The results in this report apply to the samples analyzed in accordance with the
chain of custody document. This analytical report must be reproduced in its
entirety.
Page 45 of 58 20H0157 ARISample FINAL 28 Aug 2020 1622

Project:
Project Number:
Project Manager:
Reported:
Golder Associates
18300 NE Union Hill Road Suite 200 Ravensdale
Gary Zimmerman
Ravensdale
28-Aug-2020 16:22Redmond WA, 98052-3333
Analytical ReportAnalytical Chemists and Consultants
Analytical Resources, Incorporated
Still Well
20H0157-10 (Water)
Sampled: 08/13/2020 09:45Method: EPA 6010C
Metals and Metallic Compounds (dissolved)
Instrument: ICP2 Analyst: SKM Analyzed: 08/24/2020 16:10
Preparation Batch: BIH0419
Prepared: 08/21/2020 Final Volume: 25 mL
Preparation Method: WMN (No Prep)Sample Preparation:
Sample Size: 25 mL
Extract ID: 20H0157-10 B 01
Detection
Analyte Limit
Reporting
Result Notes UnitsDilution LimitCAS Number
2 mg/L0.1000.00267439-89-6 J, DIron, Dissolved 0.0063
2 mg/L0.00200.00077439-96-5 J, DManganese, Dissolved 0.0009
2 mg/L1.000.1047440-09-7 DPotassium, Dissolved 659
Analytical Resources, Inc. The results in this report apply to the samples analyzed in accordance with the
chain of custody document. This analytical report must be reproduced in its
entirety.
Page 46 of 58 20H0157 ARISample FINAL 28 Aug 2020 1622

Project:
Project Number:
Project Manager:
Reported:
Golder Associates
18300 NE Union Hill Road Suite 200 Ravensdale
Gary Zimmerman
Ravensdale
28-Aug-2020 16:22Redmond WA, 98052-3333
Analytical ReportAnalytical Chemists and Consultants
Analytical Resources, Incorporated
Still Well
20H0157-10 (Water)
Sampled: 08/13/2020 09:45Method: SM 2540 C-97
Wet Chemistry
Instrument: BAL2 Analyst: UW Analyzed: 08/17/2020 15:46
Preparation Batch: BIH0328
Prepared: 08/17/2020 Final Volume: 200 mL
Preparation Method: No Prep Wet ChemSample Preparation:
Sample Size: 10 mL
Extract ID: 20H0157-10
Limit
Reporting
Result Notes UnitsDilutionAnalyte
Detection
LimitCAS Number
1 mg/L100100Dissolved Solids 2620
Analytical Resources, Inc. The results in this report apply to the samples analyzed in accordance with the
chain of custody document. This analytical report must be reproduced in its
entirety.
Page 47 of 58 20H0157 ARISample FINAL 28 Aug 2020 1622

Project:
Project Number:
Project Manager:
Reported:
Golder Associates
18300 NE Union Hill Road Suite 200 Ravensdale
Gary Zimmerman
Ravensdale
28-Aug-2020 16:22Redmond WA, 98052-3333
Analytical ReportAnalytical Chemists and Consultants
Analytical Resources, Incorporated
Interceptor Trench
20H0157-11 (Water)
Sampled: 08/13/2020 12:00Method: SM 2540 C-97
Wet Chemistry
Instrument: BAL2 Analyst: UW Analyzed: 08/17/2020 15:46
Preparation Batch: BIH0328
Prepared: 08/17/2020 Final Volume: 200 mL
Preparation Method: No Prep Wet ChemSample Preparation:
Sample Size: 100 mL
Extract ID: 20H0157-11
Limit
Reporting
Result Notes UnitsDilutionAnalyte
Detection
LimitCAS Number
1 mg/L1010Dissolved Solids 339
Analytical Resources, Inc. The results in this report apply to the samples analyzed in accordance with the
chain of custody document. This analytical report must be reproduced in its
entirety.
Page 48 of 58 20H0157 ARISample FINAL 28 Aug 2020 1622

Project:
Project Number:
Project Manager:
Reported:
Golder Associates
18300 NE Union Hill Road Suite 200 Ravensdale
Gary Zimmerman
Ravensdale
28-Aug-2020 16:22Redmond WA, 98052-3333
Analytical ReportAnalytical Chemists and Consultants
Analytical Resources, Incorporated
MW-4A
20H0157-12 (Water)
Sampled: 08/13/2020 12:55Method: EPA 200.8
Metals and Metallic Compounds (dissolved)
Instrument: ICPMS2 Analyst: MCB Analyzed: 08/27/2020 17:56
Preparation Batch: BIH0552
Prepared: 08/27/2020 Final Volume: 25 mL
Preparation Method: REN EPA 600/4-79-020 4.1.4 HNO3 matrixSample Preparation:
Sample Size: 25 mL
Extract ID: 20H0157-12 D 01
Detection
Analyte Limit
Reporting
Result Notes UnitsDilution LimitCAS Number
1 ug/L0.1000.06807439-92-1 ULead, Dissolved ND
Analytical Resources, Inc. The results in this report apply to the samples analyzed in accordance with the
chain of custody document. This analytical report must be reproduced in its
entirety.
Page 49 of 58 20H0157 ARISample FINAL 28 Aug 2020 1622

Project:
Project Number:
Project Manager:
Reported:
Golder Associates
18300 NE Union Hill Road Suite 200 Ravensdale
Gary Zimmerman
Ravensdale
28-Aug-2020 16:22Redmond WA, 98052-3333
Analytical ReportAnalytical Chemists and Consultants
Analytical Resources, Incorporated
MW-4A
20H0157-12 (Water)
Sampled: 08/13/2020 12:55Method: EPA 200.8 UCT-KED
Metals and Metallic Compounds (dissolved)
Instrument: ICPMS2 Analyst: MCB Analyzed: 08/27/2020 17:56
Preparation Batch: BIH0552
Prepared: 08/27/2020 Final Volume: 25 mL
Preparation Method: REN EPA 600/4-79-020 4.1.4 HNO3 matrixSample Preparation:
Sample Size: 25 mL
Extract ID: 20H0157-12 D 01
Detection
Analyte Limit
Reporting
Result Notes UnitsDilution LimitCAS Number
1 ug/L0.2000.02207440-38-2Arsenic, Dissolved 0.711
Analytical Resources, Inc. The results in this report apply to the samples analyzed in accordance with the
chain of custody document. This analytical report must be reproduced in its
entirety.
Page 50 of 58 20H0157 ARISample FINAL 28 Aug 2020 1622

Project:
Project Number:
Project Manager:
Reported:
Golder Associates
18300 NE Union Hill Road Suite 200 Ravensdale
Gary Zimmerman
Ravensdale
28-Aug-2020 16:22Redmond WA, 98052-3333
Analytical ReportAnalytical Chemists and Consultants
Analytical Resources, Incorporated
MW-4A
20H0157-12 (Water)
Sampled: 08/13/2020 12:55Method: EPA 6010C
Metals and Metallic Compounds (dissolved)
Instrument: ICP2 Analyst: SKM Analyzed: 08/24/2020 13:30
Preparation Batch: BIH0419
Prepared: 08/21/2020 Final Volume: 25 mL
Preparation Method: WMN (No Prep)Sample Preparation:
Sample Size: 25 mL
Extract ID: 20H0157-12 B 01
Detection
Analyte Limit
Reporting
Result Notes UnitsDilution LimitCAS Number
1 mg/L0.05000.00137439-89-6Iron, Dissolved 0.248
1 mg/L0.00100.00037439-96-5Manganese, Dissolved 0.171
1 mg/L0.5000.05207440-09-7Potassium, Dissolved 0.921
Analytical Resources, Inc. The results in this report apply to the samples analyzed in accordance with the
chain of custody document. This analytical report must be reproduced in its
entirety.
Page 51 of 58 20H0157 ARISample FINAL 28 Aug 2020 1622

Project:
Project Number:
Project Manager:
Reported:
Golder Associates
18300 NE Union Hill Road Suite 200 Ravensdale
Gary Zimmerman
Ravensdale
28-Aug-2020 16:22Redmond WA, 98052-3333
Analytical ReportAnalytical Chemists and Consultants
Analytical Resources, Incorporated
MW-4A
20H0157-12 (Water)
Sampled: 08/13/2020 12:55Method: SM 2540 C-97
Wet Chemistry
Instrument: BAL2 Analyst: UW Analyzed: 08/17/2020 15:46
Preparation Batch: BIH0328
Prepared: 08/17/2020 Final Volume: 200 mL
Preparation Method: No Prep Wet ChemSample Preparation:
Sample Size: 200 mL
Extract ID: 20H0157-12
Limit
Reporting
Result Notes UnitsDilutionAnalyte
Detection
LimitCAS Number
1 mg/L55Dissolved Solids 238
Analytical Resources, Inc. The results in this report apply to the samples analyzed in accordance with the
chain of custody document. This analytical report must be reproduced in its
entirety.
Page 52 of 58 20H0157 ARISample FINAL 28 Aug 2020 1622
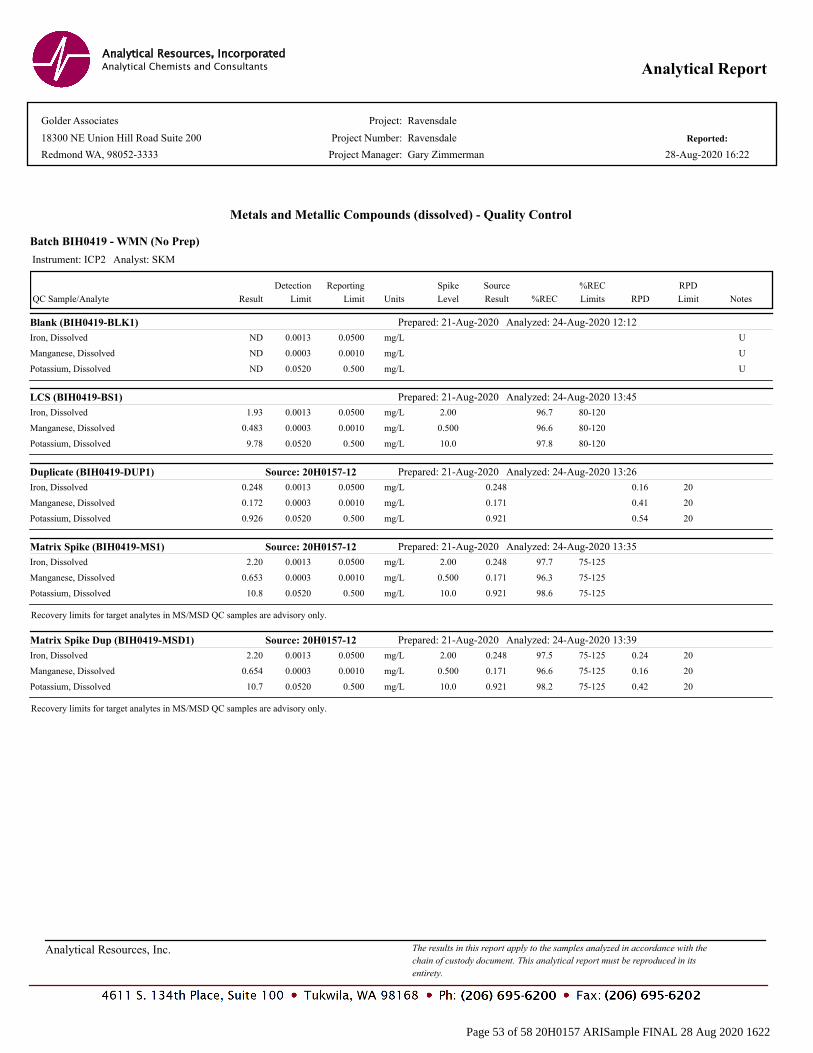
Project:
Project Number:
Project Manager:
Reported:
Golder Associates
18300 NE Union Hill Road Suite 200 Ravensdale
Gary Zimmerman
Ravensdale
28-Aug-2020 16:22Redmond WA, 98052-3333
Analytical ReportAnalytical Chemists and Consultants
Analytical Resources, Incorporated
Batch BIH0419 - WMN (No Prep)
Metals and Metallic Compounds (dissolved) - Quality Control
Instrument: ICP2 Analyst: SKM
Result Limit
Reporting
Units Level
Spike
Result
Source
%REC
%REC
Limits RPD
RPD
Limit Notes QC Sample/Analyte
Detection
Limit
Prepared: 21-Aug-2020 Analyzed: 24-Aug-2020 12:12Blank (BIH0419-BLK1)
0.0500ND mg/L U0.0013Iron, Dissolved
0.0010ND mg/L U0.0003Manganese, Dissolved
0.500ND mg/L U0.0520Potassium, Dissolved
Prepared: 21-Aug-2020 Analyzed: 24-Aug-2020 13:45LCS (BIH0419-BS1)
0.05001.93 80-12096.7mg/L 2.000.0013Iron, Dissolved
0.00100.483 80-12096.6mg/L 0.5000.0003Manganese, Dissolved
0.5009.78 80-12097.8mg/L 10.00.0520Potassium, Dissolved
Prepared: 21-Aug-2020 Analyzed: 24-Aug-2020 13:26Source: 20H0157-12Duplicate (BIH0419-DUP1)
0.05000.248 0.248 200.16mg/L0.0013Iron, Dissolved
0.00100.172 0.171 200.41mg/L0.0003Manganese, Dissolved
0.5000.926 0.921 200.54mg/L0.0520Potassium, Dissolved
Prepared: 21-Aug-2020 Analyzed: 24-Aug-2020 13:35Source: 20H0157-12Matrix Spike (BIH0419-MS1)
0.05002.20 0.248 75-12597.7mg/L 2.000.0013Iron, Dissolved
0.00100.653 0.171 75-12596.3mg/L 0.5000.0003Manganese, Dissolved
0.50010.8 0.921 75-12598.6mg/L 10.00.0520Potassium, Dissolved
Recovery limits for target analytes in MS/MSD QC samples are advisory only.
Prepared: 21-Aug-2020 Analyzed: 24-Aug-2020 13:39Source: 20H0157-12Matrix Spike Dup (BIH0419-MSD1)
0.05002.20 0.248 2075-12597.5 0.24mg/L 2.000.0013Iron, Dissolved
0.00100.654 0.171 2075-12596.6 0.16mg/L 0.5000.0003Manganese, Dissolved
0.50010.7 0.921 2075-12598.2 0.42mg/L 10.00.0520Potassium, Dissolved
Recovery limits for target analytes in MS/MSD QC samples are advisory only.
Analytical Resources, Inc. The results in this report apply to the samples analyzed in accordance with the
chain of custody document. This analytical report must be reproduced in its
entirety.
Page 53 of 58 20H0157 ARISample FINAL 28 Aug 2020 1622
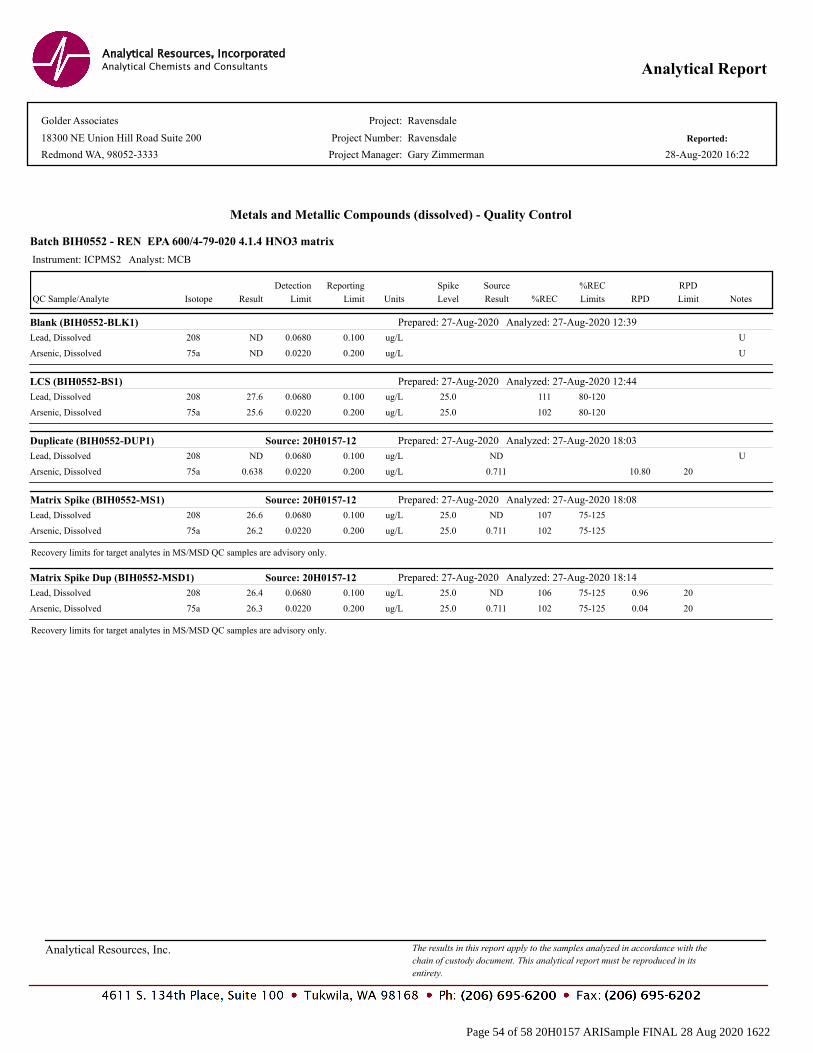
Project:
Project Number:
Project Manager:
Reported:
Golder Associates
18300 NE Union Hill Road Suite 200 Ravensdale
Gary Zimmerman
Ravensdale
28-Aug-2020 16:22Redmond WA, 98052-3333
Analytical ReportAnalytical Chemists and Consultants
Analytical Resources, Incorporated
Batch BIH0552 - REN EPA 600/4-79-020 4.1.4 HNO3 matrix
Metals and Metallic Compounds (dissolved) - Quality Control
Instrument: ICPMS2 Analyst: MCB
Result Limit
Reporting
Units Level
Spike
Result
Source
%REC
%REC
Limits RPD
RPD
Limit Notes QC Sample/Analyte
Detection
LimitIsotope
Prepared: 27-Aug-2020 Analyzed: 27-Aug-2020 12:39Blank (BIH0552-BLK1)
0.100ND ug/L U0.0680Lead, Dissolved 208
0.200ND ug/L U0.0220Arsenic, Dissolved 75a
Prepared: 27-Aug-2020 Analyzed: 27-Aug-2020 12:44LCS (BIH0552-BS1)
0.10027.6 80-120111ug/L 25.00.0680Lead, Dissolved 208
0.20025.6 80-120102ug/L 25.00.0220Arsenic, Dissolved 75a
Prepared: 27-Aug-2020 Analyzed: 27-Aug-2020 18:03Source: 20H0157-12Duplicate (BIH0552-DUP1)
0.100ND NDug/L U0.0680Lead, Dissolved 208
0.2000.638 0.711 2010.80ug/L0.0220Arsenic, Dissolved 75a
Prepared: 27-Aug-2020 Analyzed: 27-Aug-2020 18:08Source: 20H0157-12Matrix Spike (BIH0552-MS1)
0.10026.6 ND 75-125107ug/L 25.00.0680Lead, Dissolved 208
0.20026.2 0.711 75-125102ug/L 25.00.0220Arsenic, Dissolved 75a
Recovery limits for target analytes in MS/MSD QC samples are advisory only.
Prepared: 27-Aug-2020 Analyzed: 27-Aug-2020 18:14Source: 20H0157-12Matrix Spike Dup (BIH0552-MSD1)
0.10026.4 ND 2075-125106 0.96ug/L 25.00.0680Lead, Dissolved 208
0.20026.3 0.711 2075-125102 0.04ug/L 25.00.0220Arsenic, Dissolved 75a
Recovery limits for target analytes in MS/MSD QC samples are advisory only.
Analytical Resources, Inc. The results in this report apply to the samples analyzed in accordance with the
chain of custody document. This analytical report must be reproduced in its
entirety.
Page 54 of 58 20H0157 ARISample FINAL 28 Aug 2020 1622

Project:
Project Number:
Project Manager:
Reported:
Golder Associates
18300 NE Union Hill Road Suite 200 Ravensdale
Gary Zimmerman
Ravensdale
28-Aug-2020 16:22Redmond WA, 98052-3333
Analytical ReportAnalytical Chemists and Consultants
Analytical Resources, Incorporated
Batch BIH0328 - No Prep Wet Chem
Wet Chemistry - Quality Control
Instrument: BAL2 Analyst: UW
Result Limit
Reporting
Units Level
Spike
Result
Source
%REC
%REC
Limits RPD
RPD
Limit Notes QC Sample/Analyte
Detection
Limit
Prepared: 17-Aug-2020 Analyzed: 17-Aug-2020 15:46Blank (BIH0328-BLK1)
5ND mg/L U5Dissolved Solids
Prepared: 17-Aug-2020 Analyzed: 17-Aug-2020 15:46LCS (BIH0328-BS1)
5465 90-11093.0mg/L 5005Dissolved Solids
Prepared: 17-Aug-2020 Analyzed: 17-Aug-2020 15:46Source: 20H0157-12Duplicate (BIH0328-DUP1)
5242 238 201.67mg/L5Dissolved Solids
Analytical Resources, Inc. The results in this report apply to the samples analyzed in accordance with the
chain of custody document. This analytical report must be reproduced in its
entirety.
Page 55 of 58 20H0157 ARISample FINAL 28 Aug 2020 1622

Project:
Project Number:
Project Manager:
Reported:
Golder Associates
18300 NE Union Hill Road Suite 200 Ravensdale
Gary Zimmerman
Ravensdale
28-Aug-2020 16:22Redmond WA, 98052-3333
Analytical ReportAnalytical Chemists and Consultants
Analytical Resources, Incorporated
Batch BIH0487 - No Prep Wet Chem
Wet Chemistry - Quality Control
Instrument: BAL2 Analyst: KLE
Result Limit
Reporting
Units Level
Spike
Result
Source
%REC
%REC
Limits RPD
RPD
Limit Notes QC Sample/Analyte
Detection
Limit
Prepared: 24-Aug-2020 Analyzed: 24-Aug-2020 17:18Blank (BIH0487-BLK1)
5ND mg/L U5Dissolved Solids
Prepared: 24-Aug-2020 Analyzed: 24-Aug-2020 17:18LCS (BIH0487-BS1)
10471 90-11094.2mg/L 50010Dissolved Solids
Analytical Resources, Inc. The results in this report apply to the samples analyzed in accordance with the
chain of custody document. This analytical report must be reproduced in its
entirety.
Page 56 of 58 20H0157 ARISample FINAL 28 Aug 2020 1622
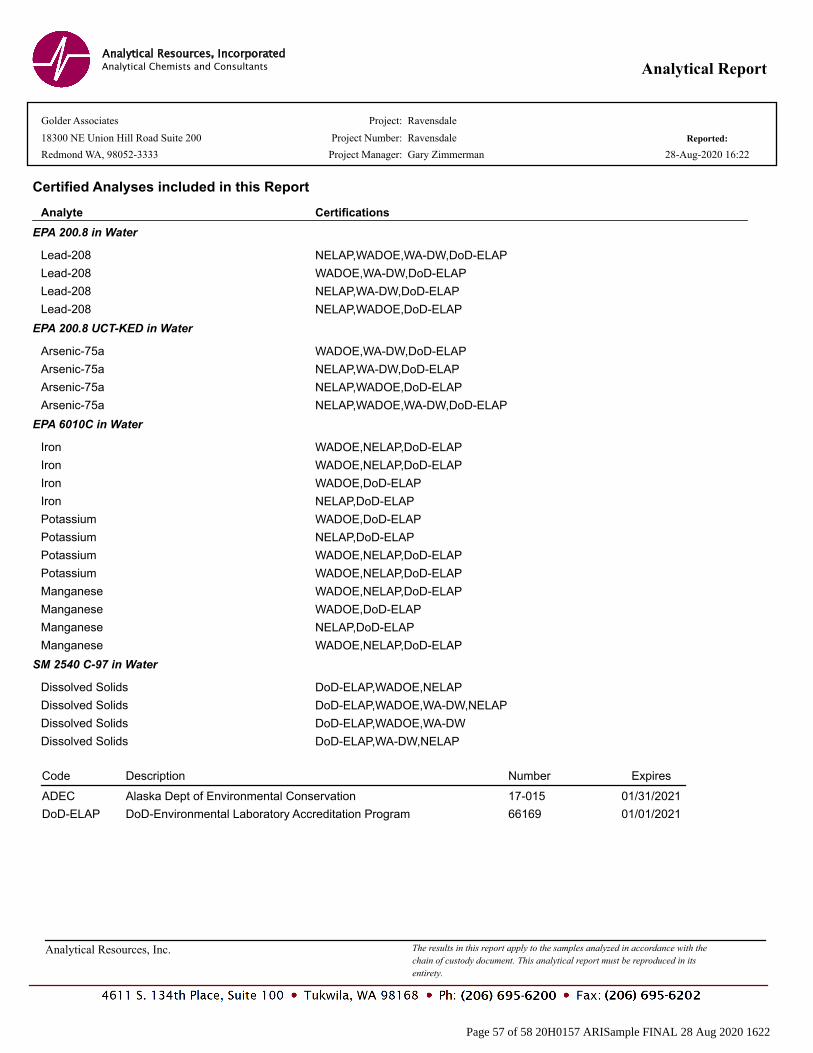
Project:
Project Number:
Project Manager:
Reported:
Golder Associates
18300 NE Union Hill Road Suite 200 Ravensdale
Gary Zimmerman
Ravensdale
28-Aug-2020 16:22Redmond WA, 98052-3333
Analytical ReportAnalytical Chemists and Consultants
Analytical Resources, Incorporated
Certified Analyses included in this Report
CertificationsAnalyte
EPA 200.8 in Water
Lead-208 NELAP,WADOE,WA-DW,DoD-ELAP
Lead-208 WADOE,WA-DW,DoD-ELAP
Lead-208 NELAP,WA-DW,DoD-ELAP
Lead-208 NELAP,WADOE,DoD-ELAP
EPA 200.8 UCT-KED in Water
Arsenic-75a WADOE,WA-DW,DoD-ELAP
Arsenic-75a NELAP,WA-DW,DoD-ELAP
Arsenic-75a NELAP,WADOE,DoD-ELAP
Arsenic-75a NELAP,WADOE,WA-DW,DoD-ELAP
EPA 6010C in Water
Iron WADOE,NELAP,DoD-ELAP
Iron WADOE,NELAP,DoD-ELAP
Iron WADOE,DoD-ELAP
Iron NELAP,DoD-ELAP
Potassium WADOE,DoD-ELAP
Potassium NELAP,DoD-ELAP
Potassium WADOE,NELAP,DoD-ELAP
Potassium WADOE,NELAP,DoD-ELAP
Manganese WADOE,NELAP,DoD-ELAP
Manganese WADOE,DoD-ELAP
Manganese NELAP,DoD-ELAP
Manganese WADOE,NELAP,DoD-ELAP
SM 2540 C-97 in Water
Dissolved Solids DoD-ELAP,WADOE,NELAP
Dissolved Solids DoD-ELAP,WADOE,WA-DW,NELAP
Dissolved Solids DoD-ELAP,WADOE,WA-DW
Dissolved Solids DoD-ELAP,WA-DW,NELAP
Code Description Number Expires
17-015Alaska Dept of Environmental Conservation 01/31/2021ADEC
66169DoD-Environmental Laboratory Accreditation Program 01/01/2021DoD-ELAP
Analytical Resources, Inc. The results in this report apply to the samples analyzed in accordance with the
chain of custody document. This analytical report must be reproduced in its
entirety.
Page 57 of 58 20H0157 ARISample FINAL 28 Aug 2020 1622

Project:
Project Number:
Project Manager:
Reported:
Golder Associates
18300 NE Union Hill Road Suite 200 Ravensdale
Gary Zimmerman
Ravensdale
28-Aug-2020 16:22Redmond WA, 98052-3333
Analytical ReportAnalytical Chemists and Consultants
Analytical Resources, Incorporated
Notes and Definitions
The reported value is from a dilutionD
Hold time violation - Hold time was exceeded.H
Estimated concentration value detected below the reporting limit.J
This analyte is not detected above the reporting limit (RL) or if noted, not detected above the limit of detection (LOD).U
Sample results reported on a dry weight basis
Relative Percent DifferenceRPD
dry
Not ReportedNR
Analyte NOT DETECTED at or above the reporting limitND
Analyte DETECTEDDET
[2C] Indicates this result was quantified on the second column on a dual column analysis.
Page 58 of 58 20H0157 ARISample FINAL 28 Aug 2020 1622

golder.com